UNITED STATES
SECURITIES AND EXCHANGE COMMISSION
Washington, D.C. 20549
FORMN-CSR
CERTIFIED SHAREHOLDER REPORT OF REGISTERED
MANAGEMENT INVESTMENT COMPANIES
Investment Company Act file number:811-23117
JPMorgan Trust IV
(Exact name of registrant as specified in charter)
277 Park Avenue
New York, NY 10172
(Address of principal executive offices) (Zip code)
Gregory S. Samuels
277 Park Avenue
New York, NY 10172
(Name and Address of Agent for Service)
Registrant’s telephone number, including area code: (800)480-4111
Date of fiscal year end: October 31
Date of reporting period: November 1, 2018 through October 31, 2019
FormN-CSR is to be used by management investment companies to file reports with the Commission not later than 10 days after the transmission to stockholders of any report that is required to be transmitted to stockholders under Rule30e-1 under the Investment Company Act of 1940 (17 CFR270.30e-1). The Commission may use the information provided on FormN-CSR in its regulatory, disclosure review, inspection, and policymaking roles.
A registrant is required to disclose the information specified by FormN-CSR, and the Commission will make this information public. A registrant is not required to respond to the collection of information contained in FormN-CSR unless the Form displays a currently valid Office of Management and Budget (“OMB”) control number. Please direct comments concerning the accuracy of the information collection burden estimate and any suggestions for reducing the burden to Secretary, Securities and Exchange Commission, 450 Fifth Street, NW, Washington, DC 20549-0609. The OMB has reviewed this collection of information under the clearance requirements of 44 U.S.C. Section 3507.
ITEM 1. REPORTS TO STOCKHOLDERS.
The following is a copy of the report transmitted to shareholders pursuant to Rule30e-1 under the Investment Company Act of 1940 (17 CFR270.30e-1).
Annual Report
J.P. Morgan International Equity Funds
October 31, 2019
JPMorgan Emerging Markets Equity Fund
JPMorgan Emerging Markets Research Enhanced Equity Fund
JPMorgan Europe Dynamic Fund
JPMorgan Global Research Enhanced Index Fund
JPMorgan International Advantage Fund
JPMorgan International Equity Fund
JPMorgan International Hedged Equity Fund
JPMorgan International Research Enhanced Equity Fund
JPMorgan International Unconstrained Equity Fund
JPMorgan International Value Fund
Beginning on January 1, 2021, as permitted by regulations adopted by the Securities and Exchange Commission, paper copies of the Funds’ annual and semi-annual shareholder reports will no longer be sent by mail, unless you specifically request paper copies of the reports. Instead, the reports will be made available on the Funds’ websitewww.jpmorganfunds.com and you will be notified by mail each time a report is posted and provided with a website to access the report. If you already elected to receive shareholder reports electronically, you will not be affected by this change and you need not take any action.
You may elect to receive shareholder reports and other communications from the Funds electronically anytime by contacting your financial intermediary (such as a broker dealer, bank, or retirement plan) or, if you are a direct investor, by going towww.jpmorganfunds.com/edelivery.
You may elect to receive paper copies of all future reports free of charge. Contact your financial intermediary or, if you invest directly with the Funds, email us atfunds.website.support@jpmorganfunds.com or call 1-800-480-4111. Your election to receive paper reports will apply to all funds held within your account(s).

CONTENTS
Investments in a Fund are not deposits or obligations of, or guaranteed or endorsed by, any bank and are not insured or guaranteed by the FDIC, the Federal Reserve Board or any other government agency. You could lose money if you sell when a Fund’s share price is lower than when you invested.
Past performance is no guarantee of future performance. The general market views expressed in this report are opinions based on market and other conditions through the end of the reporting period and are subject to change without notice. These views are not intended to predict the future performance of a Fund or the securities markets. References to specific securities and their issuers are for illustrative purposes only and are not intended to be, and should not be interpreted as, recommendations to purchase or sell such securities. Such views are not meant as investment advice and may not be relied on as an indication of trading intent on behalf of any Fund.
Prospective investors should refer to the Funds’ prospectuses for a discussion of the Funds’ investment objectives, strategies and risks. Call J.P. Morgan Funds Service Center at1-800-480-4111 for a prospectus containing more complete information about a Fund, including management fees and other expenses. Please read it carefully before investing.
LETTER TO SHAREHOLDERS
December 12, 2019 (Unaudited)
Dear Shareholders,
By way of introduction, I am head of the Americas Client organization for J.P. Morgan Asset Management, as well as a twenty year veteran of J.P. Morgan, nearly all of those years with Asset Management. The reason I joined J.P. Morgan Asset Management over twenty years ago is the same reason I still come to work energized every day; shareholders & clients. Shareholders & clients are our highest priority and at the center of everything we do. As such, I plan to use our Letter to Shareholders as an opportunity to provide updates on recent market events and may, from time to time, also highlight initiatives happening within J.P. Morgan Asset Management that are designed in part to continue to improve the shareholder & client experiences.
| | |
 | | “Shareholders and clients are our highest priority and at the center of everything we do.”
— Andrea L. Lisher |
Financial markets have largely provided positive returns in 2019, supported by leading central banks and a slowing but still expanding global economy. U.S. equity markets continued to lead the way, rebounding from a sharpsell-off in late 2018 and withstanding intermittent volatility driven partly by ongoing
U.S.-China trade tensions. In July, the U.S. Federal Reserve cut interest rates for the first time in more than a decade amid concerns about slowing economic growth and then cut rates again in September and once more in October. Notably, the S&P 500 Index rallied in October and reached record highs in the final week of the month. Elsewhere, the European Central Bank announced in September it would resume monthly asset purchases to bolster flagging economic growth and below-target inflation and China’s central bank also responded to a slowdown in economic output with measures to increase lending by banks. International equity markets may exhibit continued volatility in the coming year but a reduction in trade tensions could provide support to financial markets. Given this outlook, we believe investors can benefit from a patient outlook and a well-diversified investment portfolio.
On behalf of J.P. Morgan Asset Management, thank you for entrusting us to manage your assets. Should you have any questions, please visit www.jpmorganfunds.com or contact the J.P. Morgan Funds Service Center at1-800-480-4111.
Sincerely yours,

Andrea L. Lisher
Head of Americas, Client
J.P. Morgan Asset Management
| | | | | | | | |
| | | |
| OCTOBER 31, 2019 | | J.P. MORGAN INTERNATIONAL EQUITY FUNDS | | | | | 1 | |
J.P. Morgan International Equity Funds
MARKET OVERVIEW
TWELVE MONTHS ENDED OCTOBER 31, 2019 (Unaudited)
Global equity markets generally provided positive returns for the reporting period amid slowing but continued growth in both the global economy and corporate profits. Investor optimism over U.S.-China trade negotiations and an extension of the deadline for Britain’s exit from the European Union (“Brexit”) also bolstered investor sentiment. Bond markets also provided positive returns for the period but generally underperformed equity markets. Emerging markets debt and U.S. investment grade bonds largely outperformed U.S. Treasury bonds.
In the final months of 2018, global equity markets generally slumped as investors faced both slowing global economic growth — particularly in China and Europe — and the prospect of rising U.S. interest rates. Equity prices largely rebounded in the first months of 2019, and markets remained buoyant through April 2019. Global equity markets were hit with a selloff in May 2019 and leading indexes in the U.S. and Asian developed markets, as well as in emerging markets, dropped by more than 6%. Equity prices rebounded again in June and received further support at the end of July 2019, when the U.S. Federal Reserve (the “Fed”) responded to slowing economic growth by raising interest rates for the first time in more than a decade.
Investor concerns about increased U.S.-China trade tensions and uncertainty over Britain’s Brexit strategy led to increased market volatility in the final months of the reporting period. However, the Fed cut interest rates again in mid-September 2019 and, by the end of October 2019, leading U.S. equity indexes had returned to record highs.
For the twelve months ended October 31, 2019, the S&P 500 returned 14.33%, the MSCI EAFE Index returned 11.63% and the MSCI Emerging Markets Index returned 12.29%. Within bond markets, the Bloomberg Barclays Emerging Markets Aggregate Index returned 12.73% and the Bloomberg Barclays U.S. Aggregate Index returned 11.51%.
| | | | | | |
| | | |
| 2 | | | | J.P. MORGAN INTERNATIONAL EQUITY FUNDS | | OCTOBER 31, 2019 |
JPMorgan Emerging Markets Equity Fund
FUND COMMENTARY
TWELVE MONTHS ENDED OCTOBER 31, 2019 (Unaudited)
| | | | |
| Reporting Period Return: | | | |
| Fund (Class L Shares)* | | | 27.20% | |
| MSCI Emerging Markets Index (net of foreign withholding taxes) | | | 11.86% | |
| |
| Net Assets as of 10/31/2019 (In Thousands) | | $ | 6,313,677 | |
INVESTMENT OBJECTIVE**
The JPMorgan Emerging Markets Equity Fund (the “Fund”) seeks to provide high total return.
WHAT WERE THE MAIN DRIVERS OF THE FUND’S PERFORMANCE?
The Fund’s Class L Shares outperformed the MSCI Emerging Markets Index (net of foreign withholding taxes) (the “Benchmark”) for the twelve months ended October 31, 2019.
By sector, the Fund’s security selection in the financials and consumer discretionary sectors was a leading contributor to performance relative to the Benchmark. The Fund’s lack of holdings in the real estate sector and its underweight position in the utilities sector were leading detractors from relative performance.
By country, the Fund’s security selection in China and its security selection and overweight position in India were leading contributors to performance relative to the Benchmark, while the Fund’s out-of-Benchmark position in Spain and its overweight position in Peru were leading detractors from relative performance.
Leading individual contributors to relative performance included the Fund’s out-of-Benchmark positions in AIA Group Ltd., MercadoLibre Inc. and HDFC Bank Ltd. Shares of AIA Group, a Hong Kong life insurer, rose after the company reported a 20% increase in the value of new business in the first half of 2019. Shares of MercadoLibre, an Argentinian provider of e-commerce and related services, rose after the company reported better-than-expected earnings and revenue for the second quarter of 2019. Shares of HDFC Bank, an Indian banking and financial services company, rose amid continued growth in earnings during the twelve months ended October 31, 2109.
Leading individual detractors from relative performance included the Fund’s underweight positions in Gazprom PJSC,
Naspers Ltd. and Reliance Industries Ltd. Shares of Gazprom, a Russian natural gas producer and distributor not held in the Fund, rose after the company said it planned to raise its dividend payout ratio to 50% of the company’s net profits. Shares of Naspers, a South African internet commerce company not held in the Fund, rose after the company reported strong investment gains from its stake in Tencent Holdings Ltd. Shares of Reliance Industries, an Indian energy and retail conglomerate, rose after the company reported better-than-expected earnings for the third quarter of 2019.
HOW WAS THE FUND POSITIONED?
The Fund’s portfolio managers employed an active strategy in which portfolio construction was focused on the highest-conviction ideas found at the security level. The Fund’s portfolio managers used bottom-up fundamental research to determine the Fund’s security weightings, researching companies in an attempt to determine their underlying value and potential for future earnings growth.
As a result of this process, the Fund’s largest sector overweight positions relative to the Benchmark were in the financials, consumer discretionary and consumer staples sectors and its largest relative underweight positions were in the energy, materials and communication services sectors. The Fund’s largest country overweight positions relative to the Benchmark were in India, China and Argentina and its largest relative underweight positions were in South Korea, Taiwan and Thailand.
| * | | The return shown is based on net asset values calculated for shareholder transactions and may differ from the return shown in the financial highlights, which reflects adjustments made to the net asset values in accordance with accounting principles generally accepted in the United States of America. |
| ** | | The adviser seeks to achieve the Fund’s objective. There can be no guarantee it will be achieved. |
| | | | | | | | |
| | | |
| OCTOBER 31, 2019 | | J.P. MORGAN INTERNATIONAL EQUITY FUNDS | | | | | 3 | |
JPMorgan Emerging Markets Equity Fund
FUND COMMENTARY
TWELVE MONTHS ENDED OCTOBER 31, 2019 (Unaudited) (continued)
| | | | | | | | |
| TOP TEN EQUITY HOLDINGS OF THE PORTFOLIO*** | |
| | 1. | | | Alibaba Group Holding Ltd., ADR (China) | | | 5.3 | % |
| | 2. | | | Taiwan Semiconductor Manufacturing Co. Ltd., ADR (Taiwan) | | | 5.2 | |
| | 3. | | | AIA Group Ltd. (Hong Kong) | | | 4.4 | |
| | 4. | | | Housing Development Finance Corp. Ltd. (India) | | | 4.0 | |
| | 5. | | | Tencent Holdings Ltd. (China) | | | 3.5 | |
| | 6. | | | Samsung Electronics Co. Ltd. (South Korea) | | | 3.4 | |
| | 7. | | | Sberbank of Russia PJSC (Russia) | | | 3.1 | |
| | 8. | | | HDFC Bank Ltd. (India) | | | 2.5 | |
| | 9. | | | Ping An Insurance Group Co. of China Ltd., Class H (China) | | | 2.5 | |
| | 10. | | | Techtronic Industries Co. Ltd. (Hong Kong) | | | 2.0 | |
| | | | |
PORTFOLIO COMPOSITION BY COUNTRY*** | |
China | | | 28.8 | % |
India | | | 19.5 | |
Hong Kong | | | 7.5 | |
Taiwan | | | 6.7 | |
Brazil | | | 5.4 | |
South Korea | | | 4.7 | |
South Africa | | | 4.0 | |
Mexico | | | 3.8 | |
Russia | | | 3.1 | |
Indonesia | | | 2.4 | |
United States | | | 1.8 | |
Argentina | | | 1.5 | |
Portugal | | | 1.4 | |
Hungary | | | 1.2 | |
Macau | | | 1.2 | |
Peru | | | 1.1 | |
Others (each less than 1.0%) | | | 3.2 | |
Short-Term Investments | | | 2.7 | |
| *** | | Percentages indicated are based on total investments as of October 31, 2019. The Fund’s portfolio composition is subject to change. |
| | | | | | |
| | | |
| 4 | | | | J.P. MORGAN INTERNATIONAL EQUITY FUNDS | | OCTOBER 31, 2019 |
| | | | | | | | | | | | | | |
AVERAGE ANNUAL TOTAL RETURNSAS OF OCTOBER 31, 2019 | |
| | | | |
| | | INCEPTION DATE OF
CLASS | | 1 YEAR | | | 5 YEAR | | | 10 YEAR | |
CLASS A SHARES | | September 28, 2001 | | | | | | | | | | | | |
With Sales Charge* | | | | | 20.12 | % | | | 4.28 | % | | | 4.65 | % |
Without Sales Charge | | | | | 26.77 | | | | 5.41 | | | | 5.22 | |
CLASS C SHARES | | February 28, 2006 | | | | | | | | | | | | |
With CDSC** | | | | | 25.12 | | | | 4.89 | | | | 4.69 | |
Without CDSC | | | | | 26.12 | | | | 4.89 | | | | 4.69 | |
CLASS I SHARES | | September 10, 2001 | | | 27.04 | | | | 5.67 | | | | 5.48 | |
CLASS L SHARES | | November 15, 1993 | | | 27.20 | | | | 5.81 | | | | 5.63 | |
CLASS R2 SHARES | | July 31, 2017 | | | 26.35 | | | | 5.20 | | | | 5.11 | |
CLASS R3 SHARES | | July 31, 2017 | | | 26.67 | | | | 5.39 | | | | 5.21 | |
CLASS R4 SHARES | | July 31, 2017 | | | 26.98 | | | | 5.65 | | | | 5.47 | |
CLASS R5 SHARES | | September 9, 2016 | | | 27.19 | | | | 5.81 | | | | 5.63 | |
CLASS R6 SHARES | | December 23, 2013 | | | 27.36 | | | | 5.93 | | | | 5.69 | |
| * | | Sales Charge for Class A Shares is 5.25%. |
| ** | | Assumes a 1% CDSC (contingent deferred sales charge) for the one year period and 0% CDSC thereafter. |
TEN YEAR PERFORMANCE(10/31/09 TO 10/31/19)
The performance quoted is past performance and is not a guarantee of future results. Mutual funds are subject to certain market risks. Investment returns and principal value of an investment will fluctuate so that an investor’s shares, when redeemed, may be worth more or less than their original cost. Current performance may be higher or lower than the performance data shown. Forup-to-datemonth-end performance information pleasecall 1-800-480-4111.
Returns for Class R5 Shares and Class R6 Shares prior to their inception dates are based on the performance of Class L Shares. The actual returns of Class R5 Shares and Class R6 Shares would have been different than those shown because Class R5 Shares and Class R6 Shares have different expenses than Class L Shares.
Returns shown for Class R2 Shares and Class R3 Shares prior to their inception are based on the performance of Class A Shares. The actual returns of Class R2 Shares and Class R3 Shares would have been lower than those shown because Class R2 Shares and Class R3 Shares have higher expenses than Class A Shares.
Returns for Class R4 Shares prior to its inception date are based on the performance of Class I Shares. The actual returns of Class R4 Shares would have been lower than those shown because Class R4 Shares have higher expenses than Class I Shares.
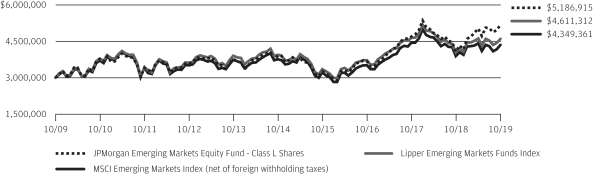
The graph illustrates comparative performance for $3,000,000 invested in Class L Shares of the JPMorgan Emerging Markets Equity Fund, the MSCI Emerging Markets Index (net of foreign withholding taxes) and the Lipper Emerging Markets Funds Index from October 31, 2009 to October 31, 2019. The performance of the Fund assumes reinvestment of all dividends and capital gain distributions, if any, and does not include a sales charge. The performance of the MSCI Emerging Markets Index (net of foreign withholding taxes) does not reflect the deduction of expenses or a sales charge associated with a mutual fund and approximates the minimum possible dividend reinvestment of the securities included in the benchmark, if applicable. The dividend is reinvested after deduction of withholding tax, applying the maximum rate to non-resident individual investors who do not benefit from double taxation treaties. The performance of the Lipper Emerging Markets Funds Index includes expenses associated with a mutual fund, such as investment management fees. These expenses are not identical to the expenses incurred by the Fund. The MSCI Emerging Markets Index (net of foreign withholding taxes) is a free float-adjusted market capitalization weighted index that is designed to measure the equity market performance of emerging markets. The Lipper Emerging Markets Funds Index is an index based on the total returns of certain mutual funds within the Fund’s designated category, as determined by Lipper, Inc. Investors cannot invest directly in an index.
Class L Shares have a $3,000,000 minimum initial investment.
| | | | | | | | |
| | | |
| OCTOBER 31, 2019 | | J.P. MORGAN INTERNATIONAL EQUITY FUNDS | | | | | 5 | |
JPMorgan Emerging Markets Equity Fund
FUND COMMENTARY
TWELVE MONTHS ENDED OCTOBER 31, 2019 (Unaudited) (continued)
Fund performance may reflect the waiver of the Fund’s fees and reimbursement of expenses for certain periods since the inception date. Without these waivers and reimbursements, performance would have been lower. Also, performance shown in this section does not reflect the deduction of taxes that a shareholder would pay on Fund distributions or redemptions of Fund shares.
International investing involves a greater degree of risk and increased volatility. Changes in currency exchange rates and differences in accounting and taxation
policies outside the U.S. can raise or lower returns. Also, some overseas markets may not be as politically and economically stable as the United States and other nations.
The returns shown are based on net asset values calculated for shareholder transactions and may differ from the returns shown in the financial highlights, which reflect adjustments made to the net asset values in accordance with accounting principles generally accepted in the United States of America.
| | | | | | |
| | | |
| 6 | | | | J.P. MORGAN INTERNATIONAL EQUITY FUNDS | | OCTOBER 31, 2019 |
JPMorgan Emerging Markets Research Enhanced Equity Fund
FUND COMMENTARY
FOR THE PERIOD DECEMBER 11, 2018 (INCEPTION DATE) THROUGH OCTOBER 31, 2019 (Unaudited)
| | | | |
| REPORTING PERIOD RETURN: | | | |
| Fund (Class R6 Shares)* | | | 12.60% | |
| MSCI Emerging Markets Index (net of foreign withholding taxes) | | | 10.73% | |
| |
| Net Assets as of 10/31/2019 (In Thousands) | | $ | 2,090,574 | |
INVESTMENT OBJECTIVE**
The JPMorgan Emerging Markets Research Enhanced Equity Fund (the “Fund”) seeks to provide long-term capital appreciation.
WHAT WERE THE MAIN DRIVERS OF THE FUND’S PERFORMANCE?
The Fund’s Class R6 Shares outperformed the MSCI Emerging Markets Index (net of foreign withholding taxes) (the “Benchmark”) for the period from the Fund’s inception on December 11, 2018 to October 31, 2019.
By sector, the Fund’s security selection in the energy and consumer discretionary sectors was a leading detractor from relative performance, while the Fund’s security selection in the financials and industrials sectors was a leading contributor to relative performance.
By country, the Fund’s security selection and underweight position in China and its security selection in Mexico were leading contributors to performance relative to the Benchmark, while the Fund’s security selection and underweight position in Taiwan and its underweight position in Russia were leading detractors from relative performance.
Leading individual contributors to relative performance included the Fund’s overweight positions in Taiwan Semiconductor Manufacturing Co., Country Garden Holdings Co. and Luxshare Precision Industry Co. Shares of Taiwan Semiconductor Manufacturing, a maker of integrated circuits and wafer semiconductor devices, rebounded from a slowdown in global demand for semiconductors during the early part of the reporting period. Shares of Country Garden Holdings, a Chinese real estate developer, rose after the company reported strong revenue and profit growth for 2018. Shares of Luxshare Precision Industry, a China-based manufacturer of electronic components and a leading supplier to Apple Inc., rose after the company reported growth in earnings during the reporting period.
Leading individual detractors from relative performance included the Fund’s underweight positions in Reliance Industries Ltd., Gazprom PJSC and New Oriental Education & Technology Group Inc. Shares of Reliance Industries, an Indian business conglomerate not held in the Fund, rose after the company reported better-than-expected profit for the three months ended June 30, 2019. Shares of Gazprom, a Russian natural gas producer and distributor, rose after the company said it planned to raise its dividend payout ratio to 50% of the company’s net profits. Shares of New Oriental Education & Technology Group, a Chinese private education provider not held in the Fund, rose amid continued growth in revenue.
HOW WAS THE FUND POSITIONED?
The Fund’s portfolio managers employed a combination of disciplined portfolio construction with in-depth fundamental research conducted
by a global network of research analysts to identify what they believed to be overvalued and undervalued stocks.
As a result of this process, the Fund’s sole overweight sector position relative to the Benchmark was in the financials sector and its largest relative underweight positions were in the industrials and information technology sectors. By country, the Fund’s largest overweight positions relative to the Benchmark were in Hungary and Mexico and the largest relative underweight positions were in India and Taiwan.
| | | | | | | | |
| TOP TEN EQUITY HOLDINGS OF THE PORTFOLIO*** | |
| | 1. | | | iShares MSCI India ETF (United States) | | | 8.7 | % |
| | 2. | | | Alibaba Group Holding Ltd., ADR (China) | | | 4.8 | |
| | 3. | | | Taiwan Semiconductor Manufacturing Co. Ltd., ADR (Taiwan) | | | 4.7 | |
| | 4. | | | Samsung Electronics Co. Ltd. (South Korea) | | | 4.5 | |
| | 5. | | | Tencent Holdings Ltd. (China) | | | 4.5 | |
| | 6. | | | China Construction Bank Corp., Class H (China) | | | 1.6 | |
| | 7. | | | Ping An Insurance Group Co. of China Ltd., Class H (China) | | | 1.5 | |
| | 8. | | | Industrial & Commercial Bank of China Ltd., Class H (China) | | | 1.2 | |
| | 9. | | | Itau Unibanco Holding SA (Preference) (Brazil) | | | 1.1 | |
| | 10. | | | Petroleo Brasileiro SA (Preference) (Brazil) | | | 1.1 | |
| | | | |
PORTFOLIO COMPOSITION BY COUNTRY*** | |
China | | | 32.0 | % |
South Korea | | | 13.0 | |
Taiwan | | | 11.5 | |
United States | | | 8.7 | |
Brazil | | | 7.2 | |
Russia | | | 4.5 | |
South Africa | | | 4.2 | |
Mexico | | | 3.3 | |
Thailand | | | 2.3 | |
Indonesia | | | 2.1 | |
Saudi Arabia | | | 2.1 | |
Malaysia | | | 1.2 | |
Poland | | | 1.1 | |
Others (each less than 1.0%) | | | 5.7 | |
| Short-Term Investments | | | 1.1 | |
| * | | The return shown is based on net asset values calculated for shareholder transactions and may differ from the return shown in the financial highlights, which reflects adjustments made to the net asset values in accordance with accounting principles generally accepted in the United States of America. |
| ** | | The adviser seeks to achieve the Fund’s objective. There can be no guarantee it will be achieved. |
| *** | | Percentages indicated are based on total investments as of October 31, 2019. The Fund’s portfolio composition is subject to change. |
| | | | | | | | |
| | | |
| OCTOBER 31, 2019 | | J.P. MORGAN INTERNATIONAL EQUITY FUNDS | | | | | 7 | |
JPMorgan Emerging Markets Research Enhanced Equity Fund
FUND COMMENTARY
FOR THE PERIOD DECEMBER 11, 2018 (INCEPTION DATE) THROUGH OCTOBER 31, 2019 (Unaudited) (continued)
| | | | | | |
TOTAL RETURNSAS OF OCTOBER 31, 2019 | |
| | |
| | | INCEPTION DATE OF
CLASS | | SINCE
INCEPTION* | |
CLASS I SHARES | | January 30, 2019 | | | 12.46 | % |
CLASS R6 SHARES | | December 11, 2018 | | | 12.60 | |
LIFE OF FUND PERFORMANCE(12/11/18 TO 10/31/19)
The performance quoted is past performance and is not a guarantee of future results. Mutual funds are subject to certain market risks. Investment returns and principal value of an investment will fluctuate so that an investor’s shares, when redeemed, may be worth more or less than their original cost. Current performance may be higher or lower than the performance data shown. For up-to-date month-end performance information pleasecall 1-800-480-4111.
The Fund commenced operations on December 11, 2018.
Returns for Class I Shares prior to its inception date are based on the performance of Class R6 Shares. The actual returns of Class I Shares would have been lower than those shown because Class I Shares have higher expenses than Class R6 Shares.
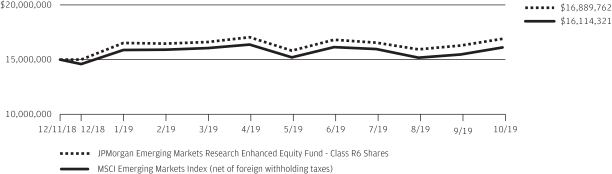
The graph illustrates comparative performance for $15,000,000 invested in Class R6 Shares of the JPMorgan Emerging Markets Research Enhanced Equity Fund and the MSCI Emerging Markets Index (net of foreign withholding taxes) from December 11, 2018 to October 31, 2019. The performance of the Fund assumes reinvestment of all dividends and capital gain distributions, if any, and does not include a sales charge. The performance of the MSCI Emerging Markets Index (net of foreign withholding taxes) does not reflect the deduction of expenses or a sales charge associated with a mutual fund and approximates the minimum possible dividend reinvestment of the securities included in the benchmark, if applicable. The dividend is reinvested after deduction of
withholding tax, applying the maximum rate to non-resident individual investors who do not benefit from double taxation treaties. The MSCI Emerging Markets Index (net of foreign withholding taxes) is a free float-adjusted market capitalization weighted index that is designed to measure the equity market performance of emerging markets. Investors cannot invest directly in an index.
Class R6 Shares have a $15,000,000 minimum initial investment.
Fund performance may reflect the waiver of the Fund’s fees and reimbursement of expenses for certain periods since the inception date. Without these waivers and reimbursements, performance would have been lower. Also, performance shown in this section does not reflect the deduction of taxes that a shareholder would pay on Fund distributions or redemptions of Fund shares.
International investing involves a greater degree of risk and increased volatility. Changes in currency exchange rates and differences in accounting and taxation policies outside the U.S. can raise or lower returns. Also, some overseas markets may not be as politically and economically stable as the U.S. and other nations.
The returns shown are based on net asset values calculated for shareholder transactions and may differ from the returns shown in the financial highlights, which reflect adjustments made to the net asset values in accordance with accounting principles generally accepted in the United States of America.
| | | | | | |
| | | |
| 8 | | | | J.P. MORGAN INTERNATIONAL EQUITY FUNDS | | OCTOBER 31, 2019 |
JPMorgan Europe Dynamic Fund
FUND COMMENTARY
TWELVE MONTHS ENDED OCTOBER 31, 2019 (Unaudited)
| | | | |
| REPORTING PERIOD RETURN: | |
| Fund (Class A Shares, without a sales charge)* | | | 8.14% | |
| MSCI Europe Index (net of foreign withholding taxes) | | | 10.90% | |
| |
| Net Assets as of 10/31/2019 (In Thousands) | | $ | 542,245 | |
INVESTMENT OBJECTIVE**
The JPMorgan Europe Dynamic Fund (the “Fund”) seeks total return from long-term capital growth. Total return consists of capital growth and current income.
WHAT WERE THE MAIN DRIVERS OF THE FUND’S PERFORMANCE?
The Fund’s Class A Shares, without a sales charge, underperformed the MSCI Europe Index (net of foreign withholding taxes) (the “Benchmark”) for the twelve months ended October 31, 2019.
By sector, the Fund’s security selection in the food, beverages & tobacco sector and in the diversified financial sector was a leading detractor from performance relative to the Benchmark. The Fund’s overweight position and security selection in the insurance sector and its security selection in the utilities sector were leading contributors to relative performance.
Leading individual detractors from relative performance included the Fund’s overweight positions in Burford Capital Ltd., ABN Amro Bank NV and ASR Nederland NV. Shares of Burford Capital, a U.K. provider of litigation financing that was not held in the Benchmark, fell after an investment group claimed the company inflated the value of its assets. Shares of ABN Amro Bank, a Netherlands bank, fell amid an anti-money
laundering investigation by Dutch prosecutors. Shares of ASR Nederland, a Netherlands insurance company not held in the Benchmark, fell after the company failed to complete a large corporate acquisition.
Leading individual contributors to relative performance included the Fund’s overweight positions in Enel SpA and Zurich Insurance Group AG and its underweight position in Royal Dutch Shell PLC. Shares of Enel SpA, an Italian electric utility, rose amid an easing of political tensions between the European Union and Italy’s government. Shares of Zurich Insurance Group, a Swiss insurance company, rose after the company reported growth in earnings and forecast it would meet or surpass its 2019 financial targets. Shares of Royal Dutch Shell, a petroleum oil and natural gas producer not held in the Fund, fell amid lower energy prices during the reporting period.
HOW WAS THE FUND POSITIONED?
The Fund’s portfolio managers believe that attractively valued, high quality securities with positive momentum have the potential to outperform the market. During the reporting period, the Fund’s portfolio managers invested in securities that they believed had these style characteristics. Portfolio positions were based onbottom-up security selection rather thantop-down asset allocation decisions.
| | | | | | | | |
| | | |
| OCTOBER 31, 2019 | | J.P. MORGAN INTERNATIONAL EQUITY FUNDS | | | | | 9 | |
JPMorgan Europe Dynamic Fund
FUND COMMENTARY
TWELVE MONTHS ENDED OCTOBER 31, 2019 (Unaudited) (continued)
| | | | | | | | |
| TOP TEN EQUITY HOLDINGS OF THE PORTFOLIO*** | |
| | 1. | | | Nestle SA (Registered) (Switzerland) | | | 5.0 | % |
| | 2. | | | Roche Holding AG (Switzerland) | | | 4.8 | |
| | 3. | | | Novartis AG (Registered) (Switzerland) | | | 4.0 | |
| | 4. | | | Allianz SE (Registered) (Germany) | | | 3.1 | |
| | 5. | | | GlaxoSmithKline plc (United Kingdom) | | | 2.9 | |
| | 6. | | | Zurich Insurance Group AG (Switzerland) | | | 2.8 | |
| | 7. | | | TOTAL SA (France) | | | 2.6 | |
| | 8. | | | SAP SE (Germany) | | | 2.4 | |
| | 9. | | | Linde plc (United Kingdom) | | | 2.3 | |
| | 10. | | | LVMH Moet Hennessy Louis Vuitton SE (France) | | | 2.1 | |
| | | | |
PORTFOLIO COMPOSITION BY COUNTRY*** | |
Switzerland | | | 21.6 | % |
United Kingdom | | | 18.1 | |
France | | | 16.1 | |
Germany | | | 12.6 | |
Netherlands | | | 8.0 | |
Italy | | | 4.6 | |
Sweden | | | 3.2 | |
Finland | | | 3.1 | |
Spain | | | 2.6 | |
Australia | | | 2.4 | |
Norway | | | 1.8 | |
Belgium | | | 1.6 | |
Russia | | | 1.4 | |
South Africa | | | 1.2 | |
United States | | | 1.0 | |
Others (each less than 1.0%) | | | 0.7 | |
| Short-Term Investments | | | 0.0 | (a) |
| * | | The return shown is based on net asset values calculated for shareholder transactions and may differ from the return shown in the financial highlights, which reflects adjustments made to the net asset values in accordance with accounting principles generally accepted in the United States of America. |
| ** | | The adviser seeks to achieve the Fund’s objective. There can be no guarantee it will be achieved. |
| *** | | Percentages indicated are based on total investments as of October 31, 2019. The Fund’s portfolio composition is subject to change. |
| (a) | | Amount rounds to less than 0.05%. |
| | | | | | |
| | | |
| 10 | | | | J.P. MORGAN INTERNATIONAL EQUITY FUNDS | | OCTOBER 31, 2019 |
| | | | | | | | | | | | | | |
AVERAGE ANNUAL TOTAL RETURNSAS OF OCTOBER 31, 2019 | |
| | | | |
| | | INCEPTION DATE OF
CLASS | | 1 YEAR | | | 5 YEAR | | | 10 YEAR | |
CLASS A SHARES | | November 2, 1995 | | | | | | | | | | | | |
With Sales Charge* | | | | | 2.48 | % | | | 0.77 | % | | | 5.01 | % |
Without Sales Charge | | | | | 8.14 | | | | 1.86 | | | | 5.57 | |
CLASS C SHARES | | November 1, 1998 | | | | | | | | | | | | |
With CDSC** | | | | | 6.59 | | | | 1.35 | | | | 5.04 | |
Without CDSC | | | | | 7.59 | | | | 1.35 | | | | 5.04 | |
CLASS I SHARES | | September 10, 2001 | | | 8.44 | | | | 2.17 | | | | 5.86 | |
CLASS L SHARES | | September 10, 2001 | | | 8.49 | | | | 2.31 | | | | 6.06 | |
CLASS R6 SHARES | | October 1, 2018 | | | 8.60 | | | | 2.33 | | | | 6.07 | |
| * | | Sales Charge for Class A Shares is 5.25%. |
| ** | | Assumes a 1% CDSC (contingent deferred sales charge) for the one year period and 0% CDSC thereafter. |
TEN YEAR PERFORMANCE(10/31/09 TO 10/31/19)
The performance quoted is past performance and is not a guarantee of future results. Mutual funds are subject to certain market risks. Investment returns and principal value of an investment will fluctuate so that an investor’s shares, when redeemed, may be worth more or less than their original cost. Current performance may be higher or lower than the performance data shown. For up-to-date month-end performance information please call 1-800-480-4111.
Returns for Class R6 Shares prior to its inception date are based on the performance of Class L Shares. The actual returns of Class R6 Shares would have been different than those shown because Class R6 Shares have different expenses than Class L Shares.
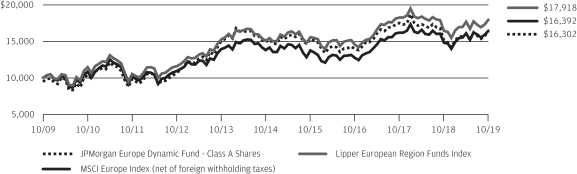
The graph illustrates comparative performance for $10,000 invested in Class A Shares of the JPMorgan Europe Dynamic Fund, the MSCI Europe Index (net of foreign withholding taxes) and the Lipper European Region Funds Index from October 31, 2009 to October 31, 2019. The performance of the Fund assumes reinvestment of all dividends and capital gain distributions, if any, and includes a sales charge. The performance of the MSCI Europe Index (net of foreign withholding taxes) does not reflect the deduction of expenses or a sales charge associated with a mutual fund and approximates the minimum possible dividend reinvestment of the securities included in the benchmark, if applicable. The dividend is reinvested after deduction of withholding tax, applying the maximum rate to non-resident individual investors who do not benefit from double taxation treaties. The performance of the Lipper European Region Funds Index includes expenses associated with a mutual fund, such as investment management fees.
These expenses are not identical to the expenses incurred by the Fund. The MSCI Europe Index (net of foreign withholding taxes) is a free float-adjusted market capitalization weighted index that is designed to measure the equity market performance of the developed markets in Europe. The Lipper European Region Funds Index represents the total returns of certain mutual funds within the Fund’s designated category as determined by Lipper, Inc. Investors cannot invest directly in an index.
Class A Shares have a $1,000 minimum initial investment and carry a 5.25% sales charge.
Fund performance may reflect the waiver of the Fund’s fees and reimbursement of expenses for certain periods since the inception date. Without these waivers and reimbursements, performance would have been lower. Also, performance shown in this section does not reflect the deduction of taxes that a shareholder would pay on Fund distributions or redemptions of Fund shares.
International investing involves a greater degree of risk and increased volatility. Changes in currency exchange rates and differences in accounting and taxation policies outside the U.S. can raise or lower returns. Also, some overseas markets may not be as politically and economically stable as the U.S. and other nations.
The returns shown are based on net asset values calculated for shareholder transactions and may differ from the returns shown in the financial highlights, which reflect adjustments made to the net asset values in accordance with accounting principles generally accepted in the United States of America.
| | | | | | | | |
| | | |
| OCTOBER 31, 2019 | | J.P. MORGAN INTERNATIONAL EQUITY FUNDS | | | | | 11 | |
JPMorgan Global Research Enhanced Index Fund
FUND COMMENTARY
TWELVE MONTHS ENDED OCTOBER 31, 2019 (Unaudited)
| | | | |
| REPORTING PERIOD RETURN: | | | |
| Fund (Class I Shares)* | | | 13.38% | |
| MSCI World Index (net of foreign withholding taxes) | | | 12.69% | |
| |
| Net Assets as of 10/31/2019 (In Thousands) | | $ | 4,230,153 | |
INVESTMENT OBJECTIVE**
The JPMorgan Global Research Enhanced Index Fund (the “Fund”) seeks to provide long-term capital appreciation.
WHAT WERE THE MAIN DRIVERS OF THE FUND’S PERFORMANCE?
The Fund’s Class I Shares outperformed the MSCI World Index (net of foreign withholding taxes) (the “Benchmark”) for the twelve months ended October 31, 2019.
By sector, the Fund’s security selection in the utilities and industrial cyclical sectors was a leading contributor to performance relative to the Benchmark, while the Fund’s security selection in the financial services and automobiles & auto parts sectors was a leading detractor from relative performance.
By region, the Fund’s security selection in continental Europe and the U.K. was a leading contributor to relative performance. There were no significant regional detractors from relative performance during the reporting period.
Due to the Fund holding a relatively large number of securities during the reporting period, the impact of individual holdings on the Fund’s relative performance tended to be small.
HOW WAS THE FUND POSITIONED?
The Fund sought to outperform the Benchmark over time, while seeking to achieve sector, geographic and risk characteristics similar to that of the Benchmark. Using the fundamental equity insights generated by JPMorgan’s team of analysts, the Fund’s portfolio managers took marginally overweight positions in securities that they considered undervalued, while being marginally underweight in, or not holding, certain securities in the Benchmark that they considered to be overvalued.
| | | | | | | | |
| TOP TEN EQUITY HOLDINGS OF THE PORTFOLIO*** | |
| | 1. | | | Apple, Inc. (United States) | | | 2.9 | % |
| | 2. | | | Microsoft Corp. (United States) | | | 2.8 | |
| | 3. | | | Amazon.com, Inc. (United States) | | | 1.9 | |
| | 4. | | | Alphabet, Inc., Class C (United States) | | | 1.1 | |
| | 5. | | | Alphabet, Inc., Class A (United States) | | | 1.0 | |
| | 6. | | | Bank of America Corp. (United States) | | | 0.9 | |
| | 7. | | | Facebook, Inc., Class A (United States) | | | 0.9 | |
| | 8. | | | Mastercard, Inc., Class A (United States) | | | 0.9 | |
| | 9. | | | Nestle SA (Registered) (Switzerland) | | | 0.9 | |
| | 10. | | | Coca-Cola Co. (The) (United States) | | | 0.8 | |
| | | | |
PORTFOLIO COMPOSITION BY COUNTRY*** | |
United States | | | 62.4 | % |
Japan | | | 8.2 | |
United Kingdom | | | 4.8 | |
France | | | 4.3 | |
Canada | | | 3.5 | |
Australia | | | 3.0 | |
Germany | | | 2.8 | |
Switzerland | | | 2.8 | |
Netherlands | | | 2.1 | |
Hong Kong | | | 1.1 | |
Others (each less than 1.0%) | | | 5.0 | |
| * | | The return shown is based on net asset values calculated for shareholder transactions and may differ from the return shown in the financial highlights, which reflects adjustments made to the net asset values in accordance with accounting principles generally accepted in the United States of America. |
| ** | | The adviser seeks to achieve the Fund’s objective. There can be no guarantee it will be achieved. |
| *** | | Percentages indicated are based on total investments as of October 31, 2019. The Fund’s portfolio composition is subject to change. |
| | | | | | |
| | | |
| 12 | | | | J.P. MORGAN INTERNATIONAL EQUITY FUNDS | | OCTOBER 31, 2019 |
| | | | | | | | | | | | | | |
AVERAGE ANNUAL TOTAL RETURNSAS OF OCTOBER 31, 2019 | |
| | | | |
| | | INCEPTION DATE OF
CLASS | | 1 YEAR | | | 5 YEAR | | | SINCE
INCEPTION | |
CLASS I SHARES | | February 28, 2013 | | | 13.38 | % | | | 7.46 | % | | | 9.45 | % |
CLASS R6 SHARES | | November 1, 2017 | | | 13.50 | | | | 7.50 | | | | 9.48 | |
LIFE OF FUND PERFORMANCE(2/28/13 TO 10/31/19)
The performance quoted is past performance and is not a guarantee of future results. Mutual funds are subject to certain market risks. Investment returns and principal value of an investment will fluctuate so that an investor’s shares, when redeemed, may be worth more or less than their original cost. Current performance may be higher or lower than the performance data shown. For up-to-date, month-end performance information please call 1-800-480-4111.
The Fund commenced operations on February 28, 2013.
Returns for Class R6 Shares prior to its inception date are based on the performance of Class I Shares. The actual returns of Class R6 Shares would have been different than those shown because Class R6 Shares have different expenses than Class I Shares.
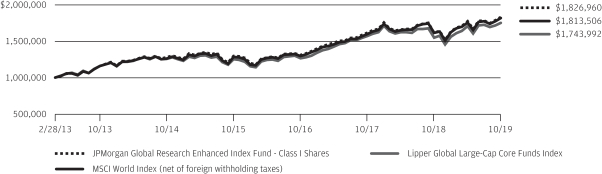
The graph illustrates comparative performance for $1,000,000 invested in Class I Shares of the JPMorgan Global Research Enhanced Index Fund, the MSCI World Index (net of foreign withholding taxes) and the Lipper Global Large-Cap Core Funds Index from February 28, 2013 to October 31, 2019. The performance of the Fund assumes reinvestment of all dividends and capital gain distributions, if any, and does not include a sales charge. The performance of the MSCI World Index (net of foreign withholding taxes) does not reflect the deduction of expenses or a sales charge associated with a mutual fund and has been adjusted to reflect reinvestment of all dividends and capital gain distributions of the securities included in the benchmark, if applicable. The performance of the Lipper Global Large-Cap Core Funds Index includes expenses associated with a mutual fund, such as investment management fees. These expenses are not identical to the expenses incurred by the Fund. The MSCI World Index (net of foreign withholding taxes) is a free float-adjusted market capitalization weighted index that is designed to measure the equity market performance of developed markets. The Lipper Global Large-Cap Core Funds Index is an index based on the total returns of certain mutual funds within the Fund’s designated category, as determined by Lipper, Inc. Investors cannot invest directly in an index.
Class I Shares have a $1,000,000 minimum initial investment.
Fund performance may reflect the waiver of the Fund’s fees and reimbursement of expenses for certain periods since the inception date. Without these waivers and reimbursements, performance would have been lower. Also, performance shown in this section does not reflect the deduction of taxes that a shareholder would pay on Fund distributions or redemptions of Fund shares.
International investing involves a greater degree of risk and increased volatility. Changes in currency exchange rates and differences in accounting and taxation policies outside the U.S. can raise or lower returns. Also, some overseas markets may not be as politically and economically stable as the United States and other nations.
The returns shown are based on net asset values calculated for shareholder transactions and may differ from the returns shown in the financial highlights, which reflect adjustments made to the net asset values in accordance with accounting principles generally accepted in the United States of America.
The MSCI information may only be used for your internal use, may not be reproduced or redisseminated in any form and may not be used as a basis for or a component of any financial instruments or products or indices. None of the MSCI information is intended to constitute investment advice or a recommendation to make (or refrain from making) any kind of investment decision and may not be relied on as such. Historical data and analysis should not be taken as an indication or guarantee of any future performance analysis, forecast or prediction. The MSCI information is provided on an “as is” basis and the user of this information assumes the entire risk of any use made of this information. MSCI, each of its affiliates and each other person involved in or related to compiling, computing or creating any MSCI information (collectively, the “MSCI Parties”) expressly disclaims all warranties (including, without limitation, any warranties of originality, accuracy, completeness, timeliness, non-infringement, merchantability and fitness for a particular purpose) with respect to this information. Without limiting any of the foregoing, in no event shall any MSCI Party have any liability for any direct, indirect, special, incidental, punitive, consequential (including, without limitation, lost profits) or any other damages. (www.msci.com)
| | | | | | | | |
| | | |
| OCTOBER 31, 2019 | | J.P. MORGAN INTERNATIONAL EQUITY FUNDS | | | | | 13 | |
JPMorgan International Advantage Fund
FUND COMMENTARY
TWELVE MONTHS ENDED OCTOBER 31, 2019 (Unaudited)
| | | | |
| REPORTING PERIOD RETURN: | |
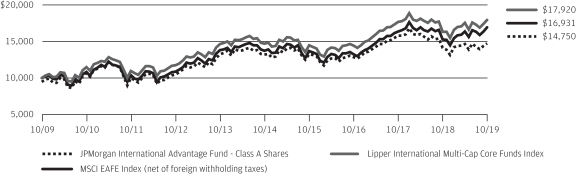
| Fund (Class A Shares, without a sales charge)* | | | 4.51% | |
| MSCI EAFE Index (net of foreign withholding taxes) | | | 11.04% | |
| |
| Net Assets as of 10/31/2019 (In Thousands) | | | $1,811,349 | |
INVESTMENT OBJECTIVE**
The JPMorgan International Advantage Fund (the “Fund”) seeks to maximize long-term capital growth by investing primarily in equity securities in developed markets outside the U.S.
WHAT WERE THE MAIN DRIVERS OF THE FUND’S PERFORMANCE?
The Fund’s Class A Shares, without a sales charge, underperformed the MSCI EAFE Index (net of foreign withholding taxes) (the “Benchmark”) for the twelve months ended October 31, 2019.
By sector, the Fund’s security selection in the industrials and materials sectors was a leading detractor from performance relative to the Benchmark, while the Fund’s security selection in the consumer discretionary and financials sectors was a leading contributor to relative performance.
By country, the Fund’s security selection in Japan and Australia was a leading detractor from relative performance, while the Fund’s security selection in Germany and Israel was a leading contributor to relative performance.
The Fund targeted investments in companies that exhibited specific growth, value and quality characteristics during the period. Due to the relatively large number of securities held in the Fund during the reporting period, the impact of individual holdings on the Fund’s relative performance tended to be small.
HOW WAS THE FUND POSITIONED?
The Fund’s portfolio managers believe that attractively valued, high quality securities with positive momentum have the potential to outperform the market. During the reporting period, the Fund’s portfolio managers invested in securities that they believed were attractive based on their proprietary multifactor model.
| | | | | | | | |
| TOP TEN EQUITY HOLDINGS OF THE PORTFOLIO*** | |
| | 1. | | | Nestle SA (Registered) (Switzerland) | | | 3.0 | % |
| | 2. | | | Roche Holding AG (Switzerland) | | | 2.4 | |
| | 3. | | | Novartis AG (Registered) (Switzerland) | | | 2.3 | |
| | 4. | | | Royal Dutch Shell plc, Class B (Netherlands) | | | 2.1 | |
| | 5. | | | BHP Group Ltd. (Australia) | | | 1.8 | |
| | 6. | | | Allianz SE (Registered) (Germany) | | | 1.7 | |
| | 7. | | | Toyota Motor Corp. (Japan) | | | 1.6 | |
| | 8. | | | Rio Tinto plc (Australia) | | | 1.5 | |
| | 9. | | | Unilever plc (United Kingdom) | | | 1.4 | |
| | 10. | | | adidas AG (Germany) | | | 1.3 | |
| | | | |
PORTFOLIO COMPOSITION BY COUNTRY*** | |
| |
Japan | | | 23.9 | % |
United Kingdom | | | 12.6 | |
Switzerland | | | 11.4 | |
Australia | | | 8.6 | |
France | | | 8.3 | |
Germany | | | 8.2 | |
Netherlands | | | 6.4 | |
Spain | | | 4.0 | |
Norway | | | 2.0 | |
Singapore | | | 1.8 | |
Belgium | | | 1.8 | |
Sweden | | | 1.1 | |
Finland | | | 1.1 | |
South Africa | | | 1.1 | |
Denmark | | | 1.0 | |
Others (each less than 1.0%) | | | 4.3 | |
Short-Term Investments | | | 2.4 | |
| * | | The return shown is based on net asset values calculated for shareholder transactions and may differ from the return shown in the financial highlights, which reflects adjustments made to the net asset values in accordance with accounting principles generally accepted in the United States of America. |
| ** | | The adviser seeks to achieve the Fund’s objective. There can be no guarantee it will be achieved. |
| *** | | Percentages indicated are based on total investments as of October 31, 2019. The Fund’s portfolio composition is subject to change. |
| | | | | | |
| | | |
| 14 | | | | J.P. MORGAN INTERNATIONAL EQUITY FUNDS | | OCTOBER 31, 2019 |
| | | | | | | | | | | | | | |
AVERAGE ANNUAL TOTAL RETURNSAS OF OCTOBER 31, 2019 | |
| | | | |
| | | INCEPTION DATE OF
CLASS | | 1 YEAR | | | 5 YEAR | | | 10 YEAR | |
CLASS A SHARES | | April 30, 2001 | | | | | | | | | | | | |
With Sales Charge* | | | | | (0.98 | )% | | | 1.15 | % | | | 3.96 | % |
Without Sales Charge | | | | | 4.51 | | | | 2.25 | | | | 4.52 | |
CLASS C SHARES | | February 28, 2006 | | | | | | | | | | | | |
With CDSC** | | | | | 2.92 | | | | 1.74 | | | | 4.00 | |
Without CDSC | | | | | 3.92 | | | | 1.74 | | | | 4.00 | |
CLASS I SHARES | | February 28, 2006 | | | 4.70 | | | | 2.55 | | | | 4.81 | |
CLASS R2 SHARES | | November 3, 2008 | | | 4.15 | | | | 1.97 | | | | 4.25 | |
CLASS R6 SHARES | | May 29, 2015 | | | 4.94 | | | | 2.74 | | | | 5.04 | |
| * | | Sales Charge for Class A Shares is 5.25%. |
| ** | | Assumes a 1% CDSC (contingent deferred sales charge) for the one year period and 0% CDSC thereafter. |
TEN YEAR PERFORMANCE(10/31/09 TO 10/31/19)
The performance quoted is past performance and is not a guarantee of future results. Mutual funds are subject to certain market risks. Investment returns and principal value of an investment will fluctuate so that an investor’s shares, when redeemed, may be worth more or less than their original cost. Current performance may be higher or lower than the performance data shown. Forup-to-datemonth-end performance information please call1-800-480-4111.
Returns for Class R6 Shares prior to its inception date are based on the performance of the now liquidated Institutional Class Shares. The actual returns of Class R6 Shares would have been different than those shown because Class R6 Shares have different expenses than Institutional Class Shares.
The graph illustrates comparative performance for $10,000 invested in Class A Shares of the JPMorgan International Advantage Fund, the MSCI EAFE Index (net of foreign withholding taxes) and the Lipper InternationalMulti-Cap Core Funds Index from October 31, 2009 to October 31, 2019. The performance of the Fund assumes reinvestment of all dividends and capital gain distributions, if any, and does not include a sales charge. The performance of the MSCI EAFE Index (net of foreign withholding taxes) does not reflect the deduction of expenses or a sales charge associated with a mutual fund and approximates the minimum possible dividend reinvestment of the securities included in the benchmark, if applicable. The dividend is reinvested after deduction of withholding tax, applying the maximum rate to non-resident institutional investors who do not benefit from double taxation treaties. The performance of the Lipper InternationalMulti-Cap Core Funds Index includes expenses associated with a mutual fund, such as investment management fees. These expenses are not identical to the expenses incurred by the Fund. The MSCI
EAFE Index (net of foreign withholding taxes) is a free float-adjusted market capitalization weighted index that is designed to measure the equity market performance of developed markets, excluding the U.S. and Canada. The Lipper InternationalMulti-Cap Core Funds Index is an index based on the total returns of certain mutual funds within the Fund’s designated category, as determined by Lipper, Inc. Investors cannot invest directly in an index.
Class A Shares have a $1,000 minimum initial investment and carry a 5.25% sales charge.
Fund performance may reflect the waiver of the Fund’s fees and reimbursement of expenses for certain periods since the inception date. Without these waivers and reimbursements, performance would have been lower. Also, performance shown in this section does not reflect the deduction of taxes that a shareholder would pay on Fund distributions or redemptions of Fund shares.
International investing involves a greater degree of risk and increased volatility. Changes in currency exchange rates and differences in accounting and taxation policies outside the U.S. can raise or lower returns. Also, some overseas markets may not be as politically and economically stable as the U.S. and other nations.
The returns shown are based on net asset values calculated for shareholder transactions and may differ from the returns shown in the financial highlights, which reflect adjustments made to the net asset values in accordance with accounting principles generally accepted in the United States of America.
| | | | | | | | |
| | | |
| OCTOBER 31, 2019 | | J.P. MORGAN INTERNATIONAL EQUITY FUNDS | | | | | 15 | |
JPMorgan International Equity Fund
FUND COMMENTARY
TWELVE MONTHS ENDED OCTOBER 31, 2019 (Unaudited)
| | | | |
| REPORTING PERIOD RETURN: | |
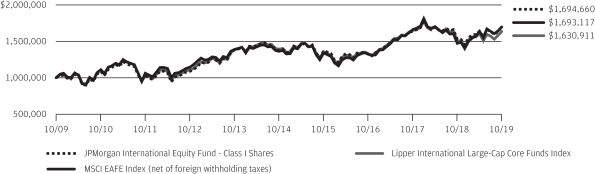
| Fund (Class I Shares)* | | | 15.20% | |
| MSCI EAFE Index (net of foreign withholding taxes) | | | 11.04% | |
| |
| Net Assets as of 10/31/2019 (In Thousands) | | $ | 2,997,006 | |
INVESTMENT OBJECTIVE**
The JPMorgan International Equity Fund (the “Fund”) seeks total return from long-term capital growth and income. Total return consists of capital growth and current income.
WHAT WERE THE MAIN DRIVERS OF THE FUND’S PERFORMANCE?
The Fund’s Class I Shares outperformed the MSCI EAFE Index (net of foreign withholding taxes) (the “Benchmark”) for the twelve months ended October 31, 2019.
By sector, the Fund’s security selection in the financials and consumer staples sectors was a leading contributor to performance relative to the Benchmark, while the Fund’s underweight position in the utilities sector, where the Fund had no holdings, and in the real estate sector were leading detractors from relative performance.
By region, the Fund’s security selection in continental Europe and the U.K. was a leading contributor to performance relative to the Benchmark, while the Fund’s security selection in Japan was the smallest contributor to relative performance.
Leading individual contributors to the Fund’s relative performance included the Fund’s overweight positions in ASML Holding NV, HDFC Bank Ltd. and London Stock Exchange Group PLC. Shares of ASML Holding, a Netherlands semiconductor manufacturer, rose after the company reported better-than-expected earnings growth for the fourth quarter of 2018 and proposed raising its full-year dividend. Shares of HDFC Bank, an Indian banking and financial services company not held in the Benchmark, rose amid continued growth in earnings during the reporting period. Shares of London Stock Exchange Group, an operator of financial exchanges, rose following a $39 million takeover offer from Hong Kong Exchanges & Clearing Ltd. that was subsequently withdrawn.
Leading individual detractors from the Fund’s relative performance included its overweight positions in Continental AG and Sumitomo Mitsui Financial Group Ltd. and its position in Anheuser-Busch InBev SA. Shares of Continental, a German tire and auto parts manufacturer, fell after the company reported a decline in 2019 second quarter earnings. Shares of Sumitomo Mitsui Financial Group, a Japanese financial services provider, fell as yields on its foreign bond holdings declined. Shares of Anheuser-Busch InBev, a brewery and beverages company, fell late in the reporting period after the company reported flat profits for the third quarter of 2019.
HOW WAS THE FUND POSITIONED?
The Fund’s portfolio managers continued to focus on security selection to build a portfolio of international equities. They usedbottom-up fundamental research to identify what they believed were attractively priced securities of companies with solid financial positions that possessed the potential to increase their earnings faster than their industry peers.
| | | | | | | | |
| TOP TEN EQUITY HOLDINGS OF THE PORTFOLIO*** | |
| | 1. | | | Nestle SA (Registered) (Switzerland) | | | 4.1 | % |
| | 2. | | | Royal Dutch Shell plc, Class A (Netherlands) | | | 2.8 | |
| | 3. | | | Roche Holding AG (Switzerland) | | | 2.7 | |
| | 4. | | | Novartis AG (Registered) (Switzerland) | | | 2.6 | |
| | 5. | | | AIA Group Ltd. (Hong Kong) | | | 2.6 | |
| | 6. | | | GlaxoSmithKline plc (United Kingdom) | | | 2.2 | |
| | 7. | | | SAP SE (Germany) | | | 2.1 | |
| | 8. | | | Diageo plc (United Kingdom) | | | 2.0 | |
| | 9. | | | ASML Holding NV (Netherlands) | | | 2.0 | |
| | 10. | | | Unilever plc (United Kingdom) | | | 1.8 | |
| | | | |
PORTFOLIO COMPOSITION BY COUNTRY*** | |
Japan | | | 16.9 | % |
United Kingdom | | | 15.1 | |
France | | | 14.8 | |
Switzerland | | | 11.7 | |
Germany | | | 7.9 | |
Netherlands | | | 5.7 | |
Hong Kong | | | 4.2 | |
China | | | 3.0 | |
United States | | | 3.0 | |
Sweden | | | 2.3 | |
| Australia | | | 1.9 | |
| Denmark | | | 1.7 | |
Belgium | | | 1.7 | |
India | | | 1.5 | |
Taiwan | | | 1.4 | |
South Korea | | | 1.3 | |
Singapore | | | 1.3 | |
Spain | | | 1.1 | |
Others (each less than 1.0%) | | | 1.9 | |
Short-Term Investments | | | 1.6 | |
| * | | The return shown is based on net asset values calculated for shareholder transactions and may differ from the return shown in the financial highlights, which reflects adjustments made to the net asset values in accordance with accounting principles generally accepted in the United States of America. |
| ** | | The adviser seeks to achieve the Fund’s objective. There can be no guarantee it will be achieved. |
| *** | | Percentages indicated are based on total investments as of October 31, 2019. The Fund’s portfolio composition is subject to change. |
| | | | | | |
| | | |
| 16 | | | | J.P. MORGAN INTERNATIONAL EQUITY FUNDS | | OCTOBER 31, 2019 |
| | | | | | | | | | | | | | |
AVERAGE ANNUAL TOTAL RETURNSAS OF OCTOBER 31, 2019 | |
| | | | |
| | | INCEPTION DATE OF
CLASS | | 1 YEAR | | | 5 YEAR | | | 10 YEAR | |
CLASS A SHARES | | February 28, 2002 | | | | | | | | | | | | |
With Sales Charge* | | | | | 8.91 | % | | | 3.11 | % | | | 4.59 | % |
Without Sales Charge | | | | | 14.93 | | | | 4.22 | | | | 5.15 | |
CLASS C SHARES | | January 31, 2003 | | | | | | | | | | | | |
With CDSC** | | | | | 13.39 | | | | 3.71 | | | | 4.62 | |
Without CDSC | | | | | 14.39 | | | | 3.71 | | | | 4.62 | |
CLASS I SHARES | | January 1, 1997 | | | 15.20 | | | | 4.49 | | | | 5.42 | |
CLASS R2 SHARES | | November 3, 2008 | | | 14.58 | | | | 3.94 | | | | 4.88 | |
CLASS R5 SHARES | | May 15, 2006 | | | 15.38 | | | | 4.65 | | | | 5.60 | |
CLASS R6 SHARES | | November 30, 2010 | | | 15.50 | | | | 4.73 | | | | 5.66 | |
| * | | Sales Charge for Class A Shares is 5.25%. |
| ** | | Assumes a 1% CDSC (contingent deferred sales charge) for the one year period and 0% CDSC thereafter. |
TEN YEAR PERFORMANCE(10/31/09 TO 10/31/19)
The performance quoted is past performance and is not a guarantee of future results. Mutual funds are subject to certain market risks. Investment returns and principal value of an investment will fluctuate so that an investor’s shares, when redeemed, may be worth more or less than their original cost. Current performance may be higher or lower than the performance data shown. Forup-to-datemonth-end performance information please call1-800-480-4111.
Returns for Class R6 Shares prior to its inception date are based on the performance of Class R5 Shares. The actual returns of Class R6 Shares would have been different than those shown because Class R6 Shares have different expenses than Class R5 Shares.
The graph illustrates comparative performance for $1,000,000 invested in Class I Shares of the JPMorgan International Equity Fund, the MSCI EAFE Index (net of foreign withholding taxes) and the Lipper InternationalLarge-Cap Core Funds Index from October 31, 2009 to October 31, 2019. The performance of the Fund assumes reinvestment of all dividends and capital gain distributions, if any, and does not include a sales charge. The performance of the MSCI EAFE Index (net of foreign withholding taxes) does not reflect the deduction of expenses or a sales charge associated with a mutual fund and approximates the minimum possible dividend reinvestment of the securities included in the benchmark, if applicable. The dividend is reinvested after deduction of withholding tax, applying the maximum rate to non-resident institutional investors who do not benefit from double taxation treaties. The performance of the Lipper InternationalLarge-Cap Core Funds Index includes expenses associated with a mutual fund, such as investment management fees. These expenses are
not identical to the expenses incurred by the Fund. The MSCI EAFE Index (net of foreign withholding taxes) is a free float-adjusted market capitalization weighted index that is designed to measure the equity market performance of developed markets, excluding the U.S. and Canada. The Lipper InternationalLarge-Cap Core Funds Index is an index based on the total returns of certain mutual funds within the Fund’s designated category, as determined by Lipper, Inc. Investors cannot invest directly in an index.
Class I Shares have a $1,000,000 minimum initial investment.
Fund performance may reflect the waiver of the Fund’s fees and reimbursement of expenses for certain periods since the inception date. Without these waivers and reimbursements, performance would have been lower. Also, performance shown in this section does not reflect the deduction of taxes that a shareholder would pay on Fund distributions or redemptions of Fund shares.
International investing involves a greater degree of risk and increased volatility. Changes in currency exchange rates and differences in accounting and taxation policies outside the U.S. can raise or lower returns. Also, some overseas markets may not be as politically and economically stable as the United States and other nations.
The returns shown are based on net asset values calculated for shareholder transactions and may differ from the returns shown in the financial highlights, which reflect adjustments made to the net asset values in accordance with accounting principles generally accepted in the United States of America.
| | | | | | | | |
| | | |
| OCTOBER 31, 2019 | | J.P. MORGAN INTERNATIONAL EQUITY FUNDS | | | | | 17 | |
JPMorgan International Hedged Equity Fund
FUND SUMMARY
FOR THE PERIOD MARCH 15, 2019 (INCEPTION DATE) THROUGH OCTOBER 31, 2019 (Unaudited)
| | | | |
| REPORTING PERIOD RETURN: | |
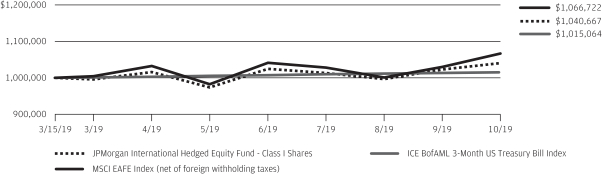
| Fund (Class I Shares)* | | | 4.07% | |
| MSCI EAFE Index (net of foreign withholding taxes) | | | 5.79% | |
| ICE BofAML3-Month U.S. Treasury Bill Index | | | 1.51% | |
| |
| Net Assets as of 10/31/2019 (In Thousands) | | | $60,242 | |
INVESTMENT OBJECTIVE**
The JPMorgan International Hedged Equity Fund (the “Fund”) seeks to provide capital appreciation.
WHAT WERE THE MAIN DRIVERS OF THE FUND’S PERFORMANCE?
The Fund’s Class I Shares underperformed the MSCI EAFE Index (net of foreign withholding taxes) (the “Benchmark”) and outperformed the ICE BofAML3-Month U.S. Treasury Bill Index for the period from the Fund’s inception on March 15, 2019 to October 31, 2019.
By sector, the Fund’s security selection in the utilities and information technology sectors was a leading contributor to performance relative to the Benchmark, while the Fund’s security selection in the industrials and consumer discretionary sectors was a leading detractor from relative performance.
By region, the Fund’s security selection in Germany and Italy was a leading contributor to performance relative to the Benchmark, while the Fund’s security selection in Finland and Australia was a leading detractor from relative performance.
Leading individual detractors from relative performance included the Fund’s overweight positions in Wartsila Oyj, Renault SA and ArcelorMittal SA. Shares of Wartsila, a Finnish maker of power plants and engines, fell after the company reported lower-than-expected results for the second quarter of 2019 and forecast lower demand for its marine and energy businesses. Shares of Renault, a French automaker, fell after the company lowered its 2019 revenue forecast. Shares of ArcelorMittal, a Luxembourg-based steelmaker, fell amid low steel prices and high costs of raw materials.
Leading individual contributors to the Fund’s relative performance included the Fund’s overweight positions in Enel SpA and Daikin Industries Ltd. and its position in Nintendo Co. Shares of Enel, an Italian electric utility, rose amid easing of political tensions between the European Union and the Italian government. Shares of Daikin Industries, a Japanese maker of air conditioning and refrigeration equipment, rose amid investor expectations that it would benefit from a reduction in U.S.-China trade tensions. Shares of Nintendo, a Japanese maker of home entertainment products, fell after the company issued a lower-than-expected forecast for sales of its Switch console.
HOW WAS THE FUND POSITIONED?
The Fund’s portfolio managers continued to focus on security selection to build a portfolio of international equities. They usedbottom-up fundamental research to identify what they believed were attractively priced securities of companies with solid financial positions that possessed the potential to increase their earnings faster than their industry peers.
| | | | | | | | |
| TOP TEN EQUITY HOLDINGS OF THE PORTFOLIO*** | |
| | 1. | | | Nestle SA (Registered) (Switzerland) | | | 3.1 | % |
| | 2. | | | Roche Holding AG (Switzerland) | | | 2.3 | |
| | 3. | | | Toyota Motor Corp. (Japan) | | | 1.8 | |
| | 4. | | | SAP SE (Germany) | | | 1.7 | |
| | 5. | | | Novartis AG (Registered) (Switzerland) | | | 1.6 | |
| | 6. | | | Enel SpA (Italy) | | | 1.6 | |
| | 7. | | | BP plc (United Kingdom) | | | 1.5 | |
| | 8. | | | Novo Nordisk A/S, Class B (Denmark) | | | 1.5 | |
| | 9. | | | TOTAL SA (France) | | | 1.4 | |
| | 10. | | | Air Liquide SA (France) | | | 1.4 | |
| | | | |
PORTFOLIO COMPOSITION BY COUNTRY*** | |
Japan | | | 23.5 | % |
United Kingdom | | | 15.2 | |
France | | | 13.7 | |
Switzerland | | | 10.2 | |
Germany | | | 8.8 | |
Netherlands | | | 5.0 | |
Australia | | | 4.9 | |
Spain | | | 3.2 | |
Italy | | | 2.6 | |
Hong Kong | | | 2.4 | |
Denmark | | | 1.8 | |
Sweden | | | 1.4 | |
Belgium | | | 1.0 | |
Others (each less than 1.0%) | | | 4.9 | |
Short-Term Investments | | | 1.4 | |
| * | | The return shown is based on net asset values calculated for shareholder transactions and may differ from the return shown in the financial highlights, which reflects adjustments made to the net asset values in accordance with accounting principles generally accepted in the United States of America. |
| ** | | The adviser seeks to achieve the Fund’s objective. There can be no guarantee it will be achieved. |
| *** | | Percentages indicated are based on total investments as of October 31, 2019. The Fund’s portfolio composition is subject to change. |
| | | | | | |
| | | |
| 18 | | | | J.P. MORGAN INTERNATIONAL EQUITY FUNDS | | OCTOBER 31, 2019 |
| | | | | | | | |
TOTAL RETURNSAS OF OCTOBER 31, 2019 | |
| | |
| | | INCEPTION DATE OF
CLASS | | | SINCE
INCEPTION* | |
| |
CLASS A SHARES | | | March 15, 2019 | | | | | |
With Sales Charge** | | | | | | | (1.58 | )% |
Without Sales Charge | | | | | | | 3.87 | |
CLASS C SHARES | | | March 15, 2019 | | | | | |
With CDSC*** | | | | | | | 2.53 | |
Without CDSC | | | | | | | 3.53 | |
CLASS I SHARES | | | March 15, 2019 | | | | 4.07 | |
CLASS R5 SHARES | | | March 15, 2019 | | | | 4.13 | |
CLASS R6 SHARES | | | March 15, 2019 | | | | 4.20 | |
| ** | | Sales Charge for Class A Shares is 5.25%. |
| *** | | Assumes a 1% CDSC (contingent deferred sales charge) for the period. |
LIFE OF FUND PERFORMANCE(3/15/19 TO 10/31/19)
The performance quoted is past performance and is not a guarantee of future results. Mutual funds are subject to certain market risks. Investment returns and principal value of an investment will fluctuate so that an investor’s shares, when redeemed, may be worth more or less than their original cost. Current performance may be higher or lower than the performance data shown. Forup-to-datemonth-end performance information please call1-800-480-4111.
The Fund commenced operations on March 15, 2019.
The graph illustrates comparative performance for $1,000,000 invested in Class I Shares of the JPMorgan International Hedged Equity Fund, the MSCI EAFE Index (net of foreign withholding taxes) and the ICE BofAML3-Month US Treasury Bill Index from March 15, 2019 to October 31, 2019. The performance of the Fund assumes reinvestment of all dividends and capital gain distributions, if any, and does not include a sales charge. The performance of the MSCI EAFE Index (net of foreign withholding taxes) does not reflect the deduction of expenses or a sales charge associated with a mutual fund and approximates the minimum possible dividend reinvestment of the securities included in the benchmark, if applicable. The dividend is reinvested after deduction of withholding tax, applying the maximum rate tonon-resident institutional investors who do not benefit from double taxation treaties. The performance of the ICE BofAML3-Month US Treasury Bill Index does not reflect the deduction of expenses or a sales charge associated with a mutual fund and has been adjusted to reflect reinvestment of all dividends and capital gain distributions of securities included in the benchmarks, if applicable. The MSCI EAFE Index (net of foreign withholding taxes) is a free float-adjusted market
capitalization weighted index that is designed to measure the equity market performance of developed markets, excluding the U.S. and Canada. The ICE BofAML3-Month US Treasury Bill Index is comprised of a single issue purchased at the beginning of the month and held for a full month. Each month the index is rebalanced and the issue selected is the outstanding Treasury Bill that matures closest to, but not beyond, 3 months from the rebalancing date. Investors cannot invest directly in an index.
Class I Shares have a $1,000,000 minimum initial investment.
Fund performance may reflect the waiver of the Fund’s fees and reimbursement of expenses for certain periods since the inception date. Without these waivers and reimbursements, performance would have been lower. Also, performance shown in this section does not reflect the deduction of taxes that a shareholder would pay on Fund distributions or redemptions of Fund shares.
International investing involves a greater degree of risk and increased volatility. Changes in currency exchange rates and differences in accounting and taxation policies outside the U.S. can raise or lower returns. Also, some overseas markets may not be as politically and economically stable as the U.S. and other nations.
The returns shown are based on net asset values calculated for shareholder transactions and may differ from the returns shown in the financial highlights, which reflect adjustments made to the net asset values in accordance with accounting principles generally accepted in the United States of America.
| | | | | | | | |
| | | |
| OCTOBER 31, 2019 | | J.P. MORGAN INTERNATIONAL EQUITY FUNDS | | | | | 19 | |
JPMorgan International Research Enhanced Equity Fund
FUND COMMENTARY
TWELVE MONTHS ENDED OCTOBER 31, 2019 (Unaudited)
| | | | |
| REPORTING PERIOD RETURN: | |
| Fund (Class I Shares)* | | | 10.65% | |
| MSCI EAFE Index (net of foreign withholding taxes) | | | 11.04% | |
| |
| Net Assets as of 10/31/2019 (In Thousands) | | $ | 4,834,474 | |
INVESTMENT OBJECTIVE**
The JPMorgan International Research Enhanced Equity Fund (the “Fund”) seeks to provide long-term capital appreciation.
WHAT WERE THE MAIN DRIVERS OF THE FUND’S PERFORMANCE?
The Fund’s Class I Shares underperformed the MSCI EAFE Index (net of foreign withholding taxes) (the “Benchmark”) for the twelve months ended October 31, 2019.
By sector, the Fund’s security selection in the industrial cyclical and retail sectors was a leading detractor from performance relative to the Benchmark, while the Fund’s security selection in the utilities and technology-software sectors was a leading contributor to relative performance.
By region, the Fund’s security selection in the Pacific, excluding Japan, and in the U.K. was a leading contributor to performance relative to the Benchmark, while the Fund’s security selection in Japan and continental Europe was a leading detractor from relative performance.
Due to the Fund holding a relatively large number of securities during the reporting period, the impact of individual holdings on the Fund’s relative performance tended to be small.
HOW WAS THE FUND POSITIONED?
The Fund sought to outperform the Benchmark over time, while seeking to achieve sector, geographic and risk characteristics similar to that of the Benchmark. Using the fundamental equity insights generated by analysts, the Fund’s portfolio managers took a marginally overweight position in securities included within the universe of the Benchmark that they considered undervalued, while marginally underweighting or not holding securities in the Benchmark that they considered overvalued.
| | | | | | | | |
| TOP TEN EQUITY HOLDINGS OF THE PORTFOLIO*** | |
| | 1. | | | Nestle SA (Registered) (Switzerland) | | | 3.1 | % |
| | 2. | | | Roche Holding AG (Switzerland) | | | 2.3 | |
| | 3. | | | Toyota Motor Corp. (Japan) | | | 1.8 | |
| | 4. | | | SAP SE (Germany) | | | 1.8 | |
| | 5. | | | Novartis AG (Registered) (Switzerland) | | | 1.6 | |
| | 6. | | | Enel SpA (Italy) | | | 1.6 | |
| | 7. | | | BP plc (United Kingdom) | | | 1.5 | |
| | 8. | | | Novo Nordisk A/S, Class B (Denmark) | | | 1.5 | |
| | 9. | | | TOTAL SA (France) | | | 1.4 | |
| | 10. | | | Air Liquide SA (France) | | | 1.4 | |
| | | | |
PORTFOLIO COMPOSITION BY COUNTRY*** | |
Japan | | | 22.6 | % |
United Kingdom | | | 14.7 | |
France | | | 13.2 | |
Switzerland | | | 9.8 | |
Germany | | | 8.5 | |
Netherlands | | | 4.8 | |
Australia | | | 4.8 | |
Spain | | | 3.1 | |
United States | | | 2.7 | |
Italy | | | 2.5 | |
Hong Kong | | | 2.3 | |
Denmark | | | 1.7 | |
Sweden | | | 1.3 | |
Belgium | | | 1.0 | |
Others (each less than 1.0%) | | | 3.9 | |
Short-Term Investments | | | 3.1 | |
| * | | The return shown is based on net asset values calculated for shareholder transactions and may differ from the return shown in the financial highlights, which reflects adjustments made to the net asset values in accordance with accounting principles generally accepted in the United States of America. |
| ** | | The adviser seeks to achieve the Fund’s objective. There can be no guarantee it will be achieved. |
| *** | | Percentages indicated are based on total investments as of October 31, 2019. The Fund’s portfolio composition is subject to change. |
| | | | | | |
| | | |
| 20 | | | | J.P. MORGAN INTERNATIONAL EQUITY FUNDS | | OCTOBER 31, 2019 |
| | | | | | | | | | | | | | |
AVERAGE ANNUAL TOTAL RETURNSAS OF OCTOBER 31, 2019 | |
| | | | |
| | | INCEPTION DATE OF
CLASS | | 1 YEAR | | | 5 YEAR | | | 10 YEAR | |
| |
CLASS A SHARES | | April 23, 1993 | | | | | | | | | | | | |
With Sales Charge* | | | | | 4.59 | % | | | 2.67 | % | | | 3.94 | % |
Without Sales Charge | | | | | 10.39 | | | | 3.79 | | | | 4.50 | |
CLASS I SHARES | | October 28, 1992 | | | 10.65 | | | | 4.05 | | | | 4.77 | |
CLASS R6 SHARES | | November 1, 2017 | | | 10.78 | | | | 4.10 | | | | 4.79 | |
| * | | Sales Charge for Class A Shares is 5.25%. |
TEN YEAR PERFORMANCE(10/31/09 TO 10/31/19)
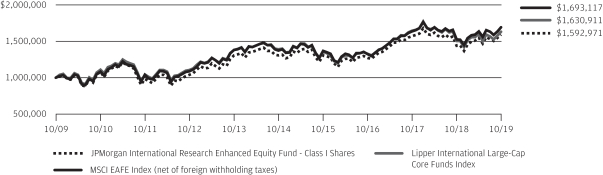
The performance quoted is past performance and is not a guarantee of future results. Mutual funds are subject to certain market risks. Investment returns and principal value of an investment will fluctuate so that an investor’s shares, when redeemed, may be worth more or less than their original cost. Current performance may be higher or lower than the performance data shown. Forup-to-datemonth-end performance information please call1-800-480-4111.
Returns for Class R6 Shares prior to its inception date are based on the performance of Class I Shares. The actual returns of Class R6 Shares would have been different than those shown because Class R6 Shares have different expenses than Class I Shares.
The graph illustrates comparative performance for $1,000,000 invested in Class I Shares of the JPMorgan International Research Enhanced Equity Fund, the MSCI EAFE Index (net of foreign withholding taxes) and the Lipper InternationalLarge-Cap Core Funds Index from October 31, 2009 to October 31, 2019. The performance of the Fund assumes reinvestment of all dividends and capital gain distributions, if any, and does not include a sales charge. The performance of the MSCI EAFE Index (net of foreign withholding taxes) does not reflect the deduction of expenses or a sales charge associated with a mutual fund and approximates the minimum possible dividend reinvestment of the securities included in the benchmark, if applicable. The dividend is reinvested after deduction of withholding tax, applying the maximum rate to non-resident institutional investors who do not benefit from double taxation treaties. The performance of the Lipper InternationalLarge-Cap Core Funds Index includes expenses associated with a mutual fund, such as investment management fees. These expenses are not identical to the expenses incurred by the Fund. The MSCI EAFE Index (net of foreign withholding taxes) is a free float-adjusted market capitalization weighted index that is designed to measure the equity market performance of developed markets, excluding the U.S. and Canada. The Lipper InternationalLarge-Cap Core Funds Index is an index based on the total returns of certain mutual funds within the Fund’s designated category as determined by Lipper, Inc. Investors cannot invest directly in an index.
Class I Shares have a $1,000,000 minimum initial investment.
Fund performance may reflect the waiver of the Fund’s fees and reimbursement of expenses for certain periods since the inception date. Without these waivers and reimbursements, performance would have been lower. Also, performance shown in this section does not reflect the deduction of taxes that a shareholder would pay on Fund distributions or redemptions of Fund shares.
International investing involves a greater degree of risk and increased volatility. Changes in currency exchange rates and differences in accounting and taxation policies outside of the U.S. can raise or lower returns. Also, some overseas markets may not be as politically and economically stable as the United States and other nations.
The returns shown are based on net asset values calculated for shareholder transactions and may differ from the returns shown in the financial highlights, which reflect adjustments made to the net asset values in accordance with accounting principles generally accepted in the United States of America.
The MSCI information may only be used for your internal use, may not be reproduced or redisseminated in any form and may not be used as a basis for or a component of any financial instruments or products or indices. None of the MSCI information is intended to constitute investment advice or a recommendation to make (or refrain from making) any kind of investment decision and may not be relied on as such. Historical data and analysis should not be taken as an indication or guarantee of any future performance analysis, forecast or prediction. The MSCI information is provided on an “as is” basis and the user of this information assumes the entire risk of any use made of this information. MSCI, each of its affiliates and each other person involved in or related to compiling, computing or creating any MSCI information (collectively, the “MSCI Parties”) expressly disclaims all warranties (including, without limitation, any warranties of originality, accuracy, completeness, timeliness, non-infringement, merchantability and fitness for a particular purpose) with respect to this information. Without limiting any of the foregoing, in no event shall any MSCI Party have any liability for any direct, indirect, special, incidental, punitive, consequential (including, without limitation, lost profits) or any other damages. (www.msci.com)
| | | | | | | | |
| | | |
| OCTOBER 31, 2019 | | J.P. MORGAN INTERNATIONAL EQUITY FUNDS | | | | | 21 | |
JPMorgan International Unconstrained Equity Fund
FUND COMMENTARY
TWELVE MONTHS ENDED OCTOBER 31, 2019 (Unaudited)
| | | | |
| REPORTING PERIOD RETURN: | |
| Fund (Class I Shares) * | | | 18.62% | |
| MSCI All Country World Index,Ex-U.S. (net of foreign withholding taxes) | | | 11.27% | |
| |
| Net Assets as of 10/31/2019 (In Thousands) | | | $2,599,641 | |
INVESTMENT OBJECTIVE**
The JPMorgan International Unconstrained Equity Fund (the “Fund”) seeks to provide long-term capital appreciation.
WHAT WERE THE MAIN DRIVERS OF THE FUND’S PERFORMANCE?
The Fund’s Class I Shares outperformed the MSCI All Country World Index,Ex-U.S. (net of foreign withholding taxes) (the “Benchmark”) for the twelve months ended October 31, 2019.
By sector, the Fund’s security selection in the financials and consumer staples sectors was a leading contributor to performance relative to the Benchmark. The Fund’s security selection in the consumer discretionary and real estate sectors was a leading detractor from relative performance.
By region, the Fund’s security selection across all regions made a positive contribution to relative performance. The largest contribution came from security selection in the U.K. and emerging markets, while the smallest contribution came from the Pacific region, excluding Japan.
Leading individual contributors to the Fund’s relative performance included its overweight positions in HDFC Bank Ltd., AIA Group Ltd. and PT Bank Central Asia. Shares of HDFC Bank, an Indian banking and financial services company not held in the Benchmark, rose amid continued growth in earnings during the reporting period. Shares of AIA Group, a Hong Kong life insurer, rose amid investor optimism for reduced U.S.-China trade tensions. Shares of PT Bank Central Asia, an Indonesian bank, rose amid growth in profits during the reporting period.
Leading individual detractors from the Fund’s relative performance included its underweight positions in Enel SpA and Roche Holding AG and its overweight position in Fanuc Corp. Shares of Enel, an Italian electric utility not held in the Fund, rose amid easing political tensions between the European Union and the Italian government. Shares of Roche Holding, a Swiss pharmaceuticals manufacturer not held in the Fund, rose after the company reported strong revenue growth for the first nine months of 2019 and raised its forecast for revenue growth for the full year. Shares of Fanuc, a Japanese robotics company, fell after the company reduced its profit forecast amid U.S.-China trade tensions.
HOW WAS THE FUND POSITIONED?
By harnessing their team’s global sector specialists, the Fund’s portfolio managers sought to build a high-conviction, benchmark-agnostic portfolio of growth, value and unique companies, whose future prospects, the managers believed, were under-appreciated by the market and thus possessed the potential to deliver higher-than-expected earnings that could have a positive effect on the share price.
| * | | The return shown is based on net asset values calculated for shareholder transactions and may differ from the return shown in the financial highlights, which reflects adjustments made to the net asset values in accordance with accounting principles generally accepted in the United States of America. |
| ** | | The adviser seeks to achieve the Fund’s objective. There can be no guarantee it will be achieved. |
| | | | | | |
| | | |
| 22 | | | | J.P. MORGAN INTERNATIONAL EQUITY FUNDS | | OCTOBER 31, 2019 |
| | | | | | | | |
| TOP TEN EQUITY HOLDINGS OF THE PORTFOLIO*** | |
| | 1. | | | Nestle SA (Registered) (Switzerland) | | | 4.7 | % |
| | 2. | | | HDFC Bank Ltd., ADR (India) | | | 3.6 | |
| | 3. | | | AIA Group Ltd. (Hong Kong) | | | 3.5 | |
| | 4. | | | Ping An Insurance Group Co. of China Ltd., Class H (China) | | | 3.3 | |
| | 5. | | | Royal Dutch Shell plc, Class A (Netherlands) | | | 3.0 | |
| | 6. | | | Tencent Holdings Ltd. (China) | | | 2.8 | |
| | 7. | | | Alibaba Group Holding Ltd., ADR (China) | | | 2.7 | |
| | 8. | | | GlaxoSmithKline plc (United Kingdom) | | | 2.6 | |
| | 9. | | | SAP SE (Germany) | | | 2.5 | |
| | 10. | | | Taiwan Semiconductor Manufacturing Co. Ltd., ADR (Taiwan) | | | 2.5 | |
| | | | |
PORTFOLIO COMPOSITION BY COUNTRY*** | |
United Kingdom | | | 17.7 | % |
Germany | | | 9.4 | |
Switzerland | | | 9.2 | |
China | | | 8.4 | |
France | | | 7.2 | |
Japan | | | 7.2 | |
Canada | | | 7.0 | |
Hong Kong | | | 5.2 | |
Netherlands | | | 5.1 | |
United States | | | 4.9 | |
| India | | | 3.4 | |
| Taiwan | | | 2.4 | |
Denmark | | | 2.1 | |
Indonesia | | | 1.8 | |
Australia | | | 1.7 | |
Austria | | | 1.6 | |
Sweden | | | 1.6 | |
Brazil | | | 1.4 | |
Others (each less than 1.0%) | | | 0.9 | |
Short-Term Investments | | | 1.8 | |
| *** | | Percentages indicated are based on total investments as of October 31, 2019. The Fund’s portfolio composition is subject to change. |
| | | | | | | | |
| | | |
| OCTOBER 31, 2019 | | J.P. MORGAN INTERNATIONAL EQUITY FUNDS | | | | | 23 | |
JPMorgan International Unconstrained Equity Fund
FUND COMMENTARY
TWELVE MONTHS ENDED OCTOBER 31, 2019 (Unaudited) (continued)
| | | | | | | | |
AVERAGE ANNUAL TOTAL RETURNSAS OF OCTOBER 31, 2019 |
| | | | | | | | | | | | | | |
| | | | |
| | | INCEPTION DATE OF
CLASS | | 1 YEAR | | | 5 YEAR | | | SINCE
INCEPTION | |
CLASS A SHARES | | November 30, 2011 | | | | | | | | | | | | |
With Sales Charge* | | | | | 12.14 | % | | | 4.27 | % | | | 6.87 | % |
Without Sales Charge | | | | | 18.35 | | | | 5.40 | | | | 7.60 | |
CLASS C SHARES | | November 30, 2011 | | | | | | | | | | | | |
With CDSC** | | | | | 16.73 | | | | 4.85 | | | | 7.05 | |
Without CDSC | | | | | 17.73 | | | | 4.85 | | | | 7.05 | |
CLASS I SHARES | | November 30, 2011 | | | 18.62 | | | | 5.71 | | | | 7.90 | |
CLASS R2 SHARES | | November 30, 2011 | | | 18.01 | | | | 5.10 | | | | 7.31 | |
CLASS R5 SHARES | | November 30, 2011 | | | 18.76 | | | | 5.82 | | | | 8.05 | |
CLASS R6 SHARES | | November 30, 2011 | | | 18.89 | | | | 5.90 | | | | 8.12 | |
| * | | Sales Charge for Class A Shares is 5.25%. |
| ** | | Assumes a 1% CDSC (contingent deferred sales charge) for the one year period and 0% CDSC thereafter. |
LIFE OF FUND PERFORMANCE(11/30/11 TO 10/31/19)
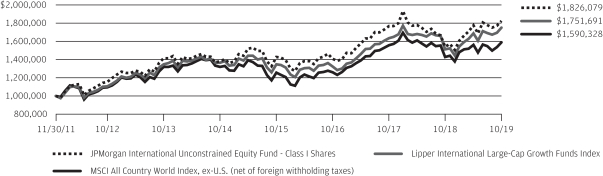
The performance quoted is past performance and is not a guarantee of future results. Mutual funds are subject to certain market risks. Investment returns and principal value of an investment will fluctuate so that an investor’s shares, when redeemed, may be worth more or less than their original cost. Current performance may be higher or lower than the performance data shown. For up-to-date, month-end performance information please call 1-800-480-4111.
The Fund commenced operations on November 30, 2011.
The graph illustrates comparative performance for $1,000,000 invested in Class I Shares of the JPMorgan International Unconstrained Equity Fund, the MSCI All Country World Index, ex-U.S. (net of foreign withholding taxes) and the Lipper International Large-Cap Growth Funds Index from November 30, 2011 to October 31, 2019. The performance of the Fund assumes reinvestment of all dividends and capital gain distributions, if any, and does not include a sales charge. The performance of the MSCI All Country World Index, ex-U.S. (net of foreign withholding taxes) does not reflect the deduction of expenses or a sales charge associated with a mutual fund and approximates the minimum possible dividend reinvestment of the securities included in the benchmark, if applicable. The dividend is reinvested after deduction of withholding tax, applying the maximum rate to non-resident institutional investors who do not benefit from double taxation treaties. The performance of the Lipper International Large-Cap Growth Funds Index includes expenses associated with a mutual fund, such as investment management fees. These expenses are not identical to the expenses incurred by the Fund. The MSCI All Country World Index, ex-U.S. (net of foreign withholding taxes) is a free float-adjusted market capitalization
weighted index that is designed to measure the equity market performance of developed and emerging markets, excluding the United States. The Lipper International Large-Cap Growth Funds Index is an index based on the total returns of certain mutual funds within the Fund’s designated category, as determined by Lipper, Inc. Investors cannot invest directly in an index.
Class I Shares have a $1,000,000 minimum initial investment.
Subsequent to the inception date of the Fund and through May 30, 2013, the Fund did not experience any shareholder activity. If such shareholder activity had occurred, the Fund’s performance may have been impacted.
Fund performance may reflect the waiver of the Fund’s fees and reimbursement of expenses for certain periods since the inception date. Without these waivers and reimbursements, performance would have been lower. Also, performance shown in this section does not reflect the deduction of taxes that a shareholder would pay on Fund distributions or redemptions of Fund shares.
International investing involves a greater degree of risk and increased volatility. Changes in currency exchange rates and differences in accounting and taxation policies outside of the U.S. can raise or lower returns. Also, some overseas markets may not be as politically and economically stable as the United States and other nations.
The returns shown are based on net asset values calculated for shareholder transactions and may differ from the returns shown in the financial highlights, which reflect adjustments made to the net asset values in accordance with accounting principles generally accepted in the United States of America.
| | | | | | |
| | | |
| 24 | | | | J.P. MORGAN INTERNATIONAL EQUITY FUNDS | | OCTOBER 31, 2019 |
JPMorgan International Value Fund
FUND COMMENTARY
TWELVE MONTHS ENDED OCTOBER 31, 2019 (Unaudited)
| | | | |
| REPORTING PERIOD RETURN: | |
| Fund (Class L Shares)* | | | 2.69% | |
| MSCI EAFE Value Index (net of foreign withholding taxes) | | | 5.51% | |
| |
| Net Assets as of 10/31/2019 (In Thousands) | | | $393,272 | |
INVESTMENT OBJECTIVE**
The JPMorgan International Value Fund (the “Fund”) seeks to provide long-term capital appreciation.
WHAT WERE THE MAIN DRIVERS OF THE FUND’S PERFORMANCE?
The Fund’s Class L Shares underperformed the MSCI EAFE Value Index (net of foreign withholding taxes) (the “Benchmark”) for the twelve months ended October 31, 2019.
By sector, the Fund’s underweight position and security selection in the utilities sector and its security selection in the industrial cyclical sector were leading detractors from performance relative to the Benchmark. The Fund’s security selection in the technology—semiconductors & hardware sector and the transportation sector was a leading contributor to relative performance.
By region, the Fund’s security selection across all regions detracted from relative performance. The Fund’s security selection in Europe, excluding the U.K., and its security selection and underweight exposure to the Pacific region, excluding Japan, were leading detractors from performance. The Fund’s security selection in the U.K. and Japan was the smallest detractor from relative performance.
Leading individual detractors from relative performance included the Fund’s underweight positions in Commonwealth Bank of Australia, Vodafone Group and National Australia Bank Ltd. Shares of Commonwealth Bank of Australia, a banking and financial services company not held in the Fund, rose as investors responded positively to there-election of Australia’s conservative coalition government in May 2019. Shares of Vodafone Group, a U.K. telecommunications provider, rose after the company unveiled plans to sell its European
telecommunications tower business. Shares of National Australia Bank, a banking and financial services company, fell amid declining earnings during the reporting period.
Leading individual contributors to relative performance included the Fund’s overweight positions in BHP Group Ltd., Dialog Semiconductor PLC and Advantest Corp. Shares of BHP Group, an Australian mining and minerals company, rose amid strong profit growth during the reporting period. Shares of Dialog Semiconductor, a U.K. semiconductor manufacturer not held in the Benchmark, rose after the company reported better-than-expected earnings for the second quarter of 2019, bolstered by licensing revenue from the transfer of patents to Apple Inc. Shares of Advantest, a Japanese maker of semiconductor manufacturing equipment that was not held in the Benchmark, rose after the company reported better-than-expected sales during the reporting period.
HOW WAS THE FUND POSITIONED?
The Fund’s portfolio managers employed behavioral-based and quantitative screens in addition to conducting fundamental analysis to seek out companies that they believed had attractive valuations. As a result of this process, the Fund’s largest overweight sector positions relative to the Benchmark were in the materials and capital goods sectors, while the largest underweight sector positions were in the real estate and utilities sectors.
| * | | The return shown is based on net asset values calculated for shareholder transactions and may differ from the return shown in the financial highlights, which reflects adjustments made to the net asset values in accordance with accounting principles generally accepted in the United States of America. |
| ** | | The adviser seeks to achieve the Fund’s objective. There can be no guarantee it will be achieved. |
| | | | | | | | |
| | | |
| OCTOBER 31, 2019 | | J.P. MORGAN INTERNATIONAL EQUITY FUNDS | | | | | 25 | |
JPMorgan International Value Fund
FUND COMMENTARY
TWELVE MONTHS ENDED OCTOBER 31, 2019 (Unaudited) (continued)
| | | | | | | | |
| TOP TEN EQUITY HOLDINGS OF THE PORTFOLIO*** | |
| | 1. | | | Royal Dutch Shell plc, Class A (Netherlands) | | | 3.6 | % |
| | 2. | | | Toyota Motor Corp. (Japan) | | | 2.5 | |
| | 3. | | | HSBC Holdings plc (United Kingdom) | | | 2.3 | |
| | 4. | | | TOTAL SA (France) | | | 2.1 | |
| | 5. | | | BP plc (United Kingdom) | | | 2.0 | |
| | 6. | | | BHP Group Ltd. (Australia) | | | 1.9 | |
| | 7. | | | GlaxoSmithKline plc (United Kingdom) | | | 1.8 | |
| | 8. | | | Rio Tinto plc (Australia) | | | 1.4 | |
| | 9. | | | British American Tobacco plc (United Kingdom) | | | 1.4 | |
| | 10. | | | Allianz SE (Registered) (Germany) | | | 1.2 | |
| | | | |
PORTFOLIO COMPOSITION BY COUNTRY*** | |
Japan | | | 21.8 | % |
United Kingdom | | | 17.4 | |
Australia | | | 9.2 | |
Germany | | | 8.0 | |
France | | | 8.0 | |
Switzerland | | | 6.2 | |
Netherlands | | | 5.8 | |
Sweden | | | 2.9 | |
Italy | | | 2.9 | |
Spain | | | 2.7 | |
Norway | | | 2.5 | |
| Hong Kong | | | 2.0 | |
Singapore | | | 1.4 | |
Finland | | | 1.3 | |
United States | | | 1.2 | |
Austria | | | 1.2 | |
Belgium | | | 1.2 | |
Others (each less than 1.0%) | | | 3.4 | |
Short-Term Investments | | | 0.9 | |
| *** | | Percentages indicated are based on total investments as of October 31, 2019. The Fund’s portfolio composition is subject to change. |
| | | | | | |
| | | |
| 26 | | | | J.P. MORGAN INTERNATIONAL EQUITY FUNDS | | OCTOBER 31, 2019 |
| | | | | | | | | | | | | | |
AVERAGE ANNUAL TOTAL RETURNSAS OF OCTOBER 31, 2019 | |
| | | | |
| | | INCEPTION DATE OF
CLASS | | 1 YEAR | | | 5 YEAR | | | 10 YEAR | |
CLASS A SHARES | | September 28, 2001 | | | | | | | | | | | | |
With Sales Charge* | | | | | (3.07 | )% | | | (0.71 | )% | | | 2.39 | % |
Without Sales Charge | | | | | 2.30 | | | | 0.37 | | | | 2.94 | |
CLASS C SHARES | | July 11, 2006 | | | | | | | | | | | | |
With CDSC** | | | | | 0.82 | | | | (0.13 | ) | | | 2.42 | |
Without CDSC | | | | | 1.82 | | | | (0.13 | ) | | | 2.42 | |
CLASS I SHARES | | September 10, 2001 | | | 2.56 | | | | 0.66 | | | | 3.21 | |
CLASS L SHARES | | November 4, 1993 | | | 2.69 | | | | 0.77 | | | | 3.35 | |
CLASS R2 SHARES | | November 3, 2008 | | | 2.08 | | | | 0.11 | | | | 2.67 | |
CLASS R5 SHARES | | September 9, 2016 | | | 2.64 | | | | 0.76 | | | | 3.34 | |
CLASS R6 SHARES | | November 30, 2010 | | | 2.83 | | | | 0.91 | | | | 3.46 | |
| * | | Sales Charge for Class A Shares is 5.25%. |
| ** | | Assumes a 1% CDSC (contingent deferred sales charge) for the one year period and 0% CDSC thereafter. |
TEN YEAR PERFORMANCE(10/31/09 TO 10/31/19)
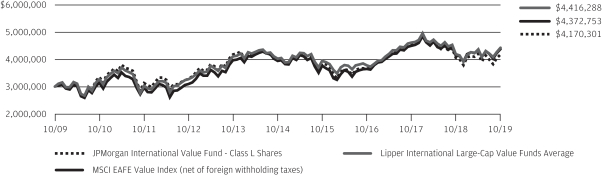
The performance quoted is past performance and is not a guarantee of future results. Mutual funds are subject to certain market risks. Investment returns and principal value of an investment will fluctuate so that an investor’s shares, when redeemed, may be worth more or less than their original cost. Current performance may be higher or lower than the performance data shown. Forup-to-datemonth-end performance information please call1-800-480-4111. Effective May 2018, some of the Fund’s investment strategies changed. The Fund’s past performance would have been different if the Fund was managed under the current strategies.
Returns for Class R5 Shares and Class R6 Shares prior to their inception dates are based on the performance of Class L Shares. The actual returns of Class R5 Shares and Class R6 Shares would have been different than those shown because Class R5 Shares and Class R6 Shares have different expenses than Class L Shares.
The graph illustrates comparative performance for $3,000,000 invested in Class L Shares of the JPMorgan International Value Fund, the MSCI EAFE Value Index (net of foreign withholding taxes) and the Lipper InternationalLarge-Cap Value Funds Average from October 31, 2009 to October 31, 2019. The performance of the Fund assumes reinvestment of all dividends and capital gain distributions, if any, and does not include a sales charge. The performance of the MSCI EAFE Value Index (net of foreign withholding taxes) does not reflect the deduction of expenses or a sales charge associated with a mutual fund and approximates the minimum possible dividend reinvestment of the securities included in the benchmark, if applicable. The dividend is reinvested after deduction of withholding tax, applying the maximum rate to non-resident institutional investors who do not benefit from double taxation treaties. The performance of the Lipper InternationalLarge-Cap Value
Funds Average includes expenses associated with a mutual fund, such as investment management fees. These expenses are not identical to the expenses incurred by the Fund. The MSCI EAFE Value Index (net of foreign withholding taxes) is a free float-adjusted market capitalization weighted index that is designed to measure the performance of value-oriented stocks in the world’s equity markets, excluding the U.S. and Canada. Investors cannot invest directly in an index. The Lipper InternationalLarge-Cap Value Funds Average is an average based on the total returns of all mutual funds within the Fund’s designated category as determined by Lipper, Inc.
Class L Shares have a $3,000,000 minimum initial investment.
Fund performance may reflect the waiver of the Fund’s fees and reimbursement of expenses for certain periods since the inception date. Without these waivers and reimbursements, performance would have been lower. Also, performance shown in this section does not reflect the deduction of taxes that a shareholder would pay on Fund distributions or redemptions of Fund shares.
International investing involves a greater degree of risk and increased volatility. Changes in currency exchange rates and differences in accounting and taxation policies outside the U.S. can raise or lower returns. Also, some overseas markets may not be as politically and economically stable as the United States and other nations.
The returns shown are based on net asset values calculated for shareholder transactions and may differ from the returns shown in the financial highlights, which reflect adjustments made to the net asset values in accordance with accounting principles generally accepted in the United States of America.
| | | | | | | | |
| | | |
| OCTOBER 31, 2019 | | J.P. MORGAN INTERNATIONAL EQUITY FUNDS | | | | | 27 | |
JPMorgan Emerging Markets Equity Fund
SCHEDULE OF PORTFOLIO INVESTMENTS
AS OF OCTOBER 31, 2019
| | | | | | | | |
| INVESTMENTS | | SHARES
(000) | | | VALUE
($000) | |
Common Stocks — 97.8% | |
|
Argentina — 1.5% | |
| | |
MercadoLibre, Inc. * | | | 183 | | | | 95,260 | |
| | | | | | | | |
|
Australia — 0.3% | |
| | |
Oil Search Ltd. | | | 3,787 | | | | 18,691 | |
| | | | | | | | |
|
Brazil — 5.5% | |
| | |
Ambev SA, ADR * | | | 17,247 | | | | 74,336 | |
| | |
B3 SA — Brasil Bolsa Balcao | | | 7,991 | | | | 96,461 | |
| | |
Itau Unibanco Holding SA, ADR | | | 8,271 | | | | 74,687 | |
| | |
Lojas Renner SA | | | 5,329 | | | | 67,617 | |
| | |
Raia Drogasil SA * | | | 1,163 | | | | 31,885 | |
| | | | | | | | |
| | |
| | | | | | | 344,986 | |
| | | | | | | | |
|
China — 29.0% | |
| | |
Alibaba Group Holding Ltd., ADR * | | | 1,869 | | | | 330,150 | |
| | |
Budweiser Brewing Co. APAC Ltd.* (a) | | | 34,773 | | | | 127,137 | |
| | |
Foshan Haitian Flavouring & Food Co. Ltd., Class A | | | 5,182 | | | | 82,226 | |
| | |
Hangzhou Robam Appliances Co. Ltd., Class A | | | 7,247 | | | | 32,414 | |
| | |
Huazhu Group Ltd., ADR (b) | | | 2,030 | | | | 76,870 | |
| | |
Inner Mongolia Yili Industrial Group Co. Ltd., Class A | | | 14,983 | | | | 61,704 | |
| | |
Kweichow Moutai Co. Ltd., Class A | | | 456 | | | | 76,386 | |
| | |
Meituan Dianping, Class B * (a) | | | 7,649 | | | | 91,244 | |
| | |
Midea Group Co. Ltd., Class A | | | 9,820 | | | | 77,387 | |
| | |
NetEase, Inc., ADR | | | 287 | | | | 82,021 | |
| | |
New Oriental Education & Technology Group, Inc., ADR * | | | 874 | | | | 106,735 | |
| | |
Ping An Bank Co. Ltd., Class A | | | 32,804 | | | | 75,742 | |
| | |
Ping An Insurance Group Co. of China Ltd., Class H | | | 13,918 | | | | 160,633 | |
| | |
Shenzhou International Group Holdings Ltd. | | | 3,907 | | | | 53,985 | |
| | |
Tencent Holdings Ltd. | | | 5,483 | | | | 222,419 | |
| | |
Wuxi Biologics Cayman, Inc. * (a) (b) | | | 7,284 | | | | 85,592 | |
| | |
Yum China Holdings, Inc. | | | 2,112 | | | | 89,741 | |
| | | | | | | | |
| | |
| | | | | | | 1,832,386 | |
| | | | | | | | |
|
Egypt — 0.9% | |
| | |
Commercial International Bank Egypt SAE (Registered), GDR (a) | | | 11,635 | | | | 57,475 | |
| | | | | | | | |
|
Hong Kong — 7.6% | |
| | |
AIA Group Ltd. | | | 795 | | | | 7,918 | |
| | |
AIA Group Ltd. | | | 26,257 | | | | 261,475 | |
| | |
Hong Kong Exchanges & Clearing Ltd. | | | 2,637 | | | | 82,153 | |
| | |
Techtronic Industries Co. Ltd. | | | 16,325 | | | | 127,576 | |
| | | | | | | | |
| | |
| | | | | | | 479,122 | |
| | | | | | | | |
|
Hungary — 1.2% | |
| | |
OTP Bank Nyrt. | | | 1,662 | | | | 76,660 | |
| | | | | | | | |
| | | | | | | | |
| INVESTMENTS | | SHARES
(000) | | | VALUE
($000) | |
| | | | | | | | |
|
India — 19.6% | |
| | |
Asian Paints Ltd. | | | 1,695 | | | | 43,204 | |
| | |
Britannia Industries Ltd. | | | 879 | | | | 40,460 | |
| | |
HDFC Bank Ltd. | | | 9,359 | | | | 162,165 | |
| | |
HDFC Bank Ltd., ADR | | | 1,947 | | | | 118,930 | |
| | |
HDFC Life Insurance Co. Ltd. (a) | | | 10,579 | | | | 93,290 | |
| | |
Hindustan Unilever Ltd. | | | 2,784 | | | | 85,331 | |
| | |
Housing Development Finance Corp. Ltd. | | | 8,380 | | | | 251,494 | |
| | |
IndusInd Bank Ltd. | | | 3,123 | | | | 57,762 | |
| | |
ITC Ltd. | | | 22,200 | | | | 80,567 | |
| | |
Kotak Mahindra Bank Ltd. | | | 4,888 | | | | 108,413 | |
| | |
Maruti Suzuki India Ltd. | | | 943 | | | | 100,423 | |
| | |
Tata Consultancy Services Ltd. | | | 3,003 | | | | 96,081 | |
| | | | | | | | |
| | |
| | | | | | | 1,238,120 | |
| | | | | | | | |
|
Indonesia — 2.4% | |
| | |
Bank Central Asia Tbk. PT | | | 32,830 | | | | 73,484 | |
| | |
Bank Rakyat Indonesia Persero Tbk. PT | | | 261,981 | | | | 78,499 | |
| | | | | | | | |
| | |
| | | | | | | 151,983 | |
| | | | | | | | |
|
Macau — 1.2% | |
| | |
Sands China Ltd. | | | 15,304 | | | | 75,382 | |
| | | | | | | | |
|
Mexico — 3.9% | |
| | |
Fomento Economico Mexicano SAB de CV, ADR | | | 449 | | | | 39,935 | |
| | |
Grupo Financiero Banorte SAB de CV, Class O | | | 16,949 | | | | 92,674 | |
| | |
Infraestructura Energetica Nova SAB de CV * | | | 8,509 | | | | 37,601 | |
| | |
Wal-Mart de Mexico SAB de CV | | | 24,832 | | | | 74,418 | |
| | | | | | | | |
| | |
| | | | | | | 244,628 | |
| | | | | | | | |
|
Panama — 0.9% | |
| | |
Copa Holdings SA, Class A | | | 579 | | | | 58,883 | |
| | | | | | | | |
|
Peru — 1.1% | |
| | |
Credicorp Ltd. | | | 316 | | | | 67,581 | |
| | | | | | | | |
|
Portugal — 1.4% | |
| | |
Jeronimo Martins SGPS SA | | | 5,296 | | | | 88,997 | |
| | | | | | | | |
|
Russia — 3.1% | |
| | |
Sberbank of Russia PJSC | | | 53,721 | | | | 196,883 | |
| | | | | | | | |
|
South Africa — 4.0% | |
| | |
Bid Corp. Ltd. | | | 4,328 | | | | 100,972 | |
| | |
Capitec Bank Holdings Ltd. (b) | | | 930 | | | | 84,519 | |
| | |
Mr Price Group Ltd. | | | 2,200 | | | | 23,263 | |
| | |
Sanlam Ltd. | | | 8,699 | | | | 45,781 | |
| | | | | | | | |
| | |
| | | | | | | 254,535 | |
| | | | | | | | |
|
South Korea — 4.8% | |
| | |
NCSoft Corp. | | | 183 | | | | 81,353 | |
| | |
Samsung Electronics Co. Ltd. | | | 5,049 | | | | 218,200 | |
| | | | | | | | |
| | |
| | | | | | | 299,553 | |
| | | | | | | | |
SEE NOTES TO FINANCIAL STATEMENTS.
| | | | | | |
| | | |
| 28 | | | | J.P. MORGAN INTERNATIONAL EQUITY FUNDS | | OCTOBER 31, 2019 |
| | | | | | | | |
| INVESTMENTS | | SHARES
(000) | | | VALUE
($000) | |
Common Stocks — continued | | | | | | | | |
|
Spain — 0.3% | |
| | |
Prosegur Cia de Seguridad SA | | | 4,280 | | | | 16,614 | |
| | | | | | | | |
|
Taiwan — 6.7% | |
| | |
Largan Precision Co. Ltd. | | | 315 | | | | 46,221 | |
| | |
President Chain Store Corp. | | | 5,581 | | | | 55,677 | |
| | |
Taiwan Semiconductor Manufacturing Co. Ltd., ADR | | | 6,265 | | | | 323,436 | |
| | | | | | | | |
| | |
| | | | | | | 425,334 | |
| | | | | | | | |
|
Turkey — 0.8% | |
| | |
BIM Birlesik Magazalar A/S | | | 4,889 | | | | 40,462 | |
| | |
Ford Otomotiv Sanayi A/S | | | 1,070 | | | | 12,067 | |
| | | | | | | | |
| | |
| | | | | | | 52,529 | |
| | | | | | | | |
|
United States — 1.6% | |
| | |
EPAM Systems, Inc. * | | | 563 | | | | 99,098 | |
| | | | | | | | |
| | |
Total Common Stocks
(Cost $4,432,405) | | | | | | | 6,174,700 | |
| | | | | | | | |
Short-Term Investments — 2.7% | |
|
Investment Companies — 2.7% | |
| | |
JPMorgan Prime Money Market Fund Class Institutional Shares, 1.88% (c) (d)
(Cost $168,352) | | | 168,301 | | | | 168,369 | |
| | | | | | | | |
Investment of Cash Collateral from Securities Loaned — 0.2% | |
| | |
JPMorgan Securities Lending Money Market Fund Class Agency SL Shares, 1.98% (c) (d) | | | 8,001 | | | | 8,001 | |
| | |
JPMorgan U.S. Government Money Market Fund Class IM Shares, 1.70% (c) (d) | | | 5,485 | | | | 5,485 | |
| | | | | | | | |
| | |
Total Investment of Cash Collateral from Securities Loaned
(Cost $13,486) | | | | | | | 13,486 | |
| | | | | | | | |
Total Investments — 100.7%
(Cost $4,614,243) | | | | | | | 6,356,555 | |
Liabilities in Excess of
Other Assets — (0.7)% | | | | | | | (42,878 | ) |
| | | | | | | | |
NET ASSETS — 100.0% | | | | | | | 6,313,677 | |
| | | | | | | | |
Percentages indicated are based on net assets.
Summary of Investments by Industry, October 31, 2019
The following table represents the portfolio investments of the Fund by industry classifications as a percentage of total investments:
| | | | |
| INDUSTRY | | PERCENTAGE | |
| |
Banks | | | 20.9 | % |
| |
Insurance | | | 9.0 | |
| |
Internet & Direct Marketing Retail | | | 8.1 | |
| |
Food & Staples Retailing | | | 6.2 | |
| |
Semiconductors & Semiconductor Equipment | | | 5.1 | |
| |
Beverages | | | 5.0 | |
| |
Thrifts & Mortgage Finance | | | 4.0 | |
| |
Hotels, Restaurants & Leisure | | | 3.7 | |
| |
Interactive Media & Services | | | 3.5 | |
| |
Technology Hardware, Storage & Peripherals | | | 3.4 | |
| |
IT Services | | | 3.1 | |
| |
Food Products | | | 2.9 | |
| |
Capital Markets | | | 2.8 | |
| |
Entertainment | | | 2.6 | |
| |
Machinery | | | 2.0 | |
| |
Automobiles | | | 1.8 | |
| |
Household Durables | | | 1.7 | |
| |
Diversified Consumer Services | | | 1.7 | |
| |
Life Sciences Tools & Services | | | 1.3 | |
| |
Household Products | | | 1.3 | |
| |
Tobacco | | | 1.3 | |
| |
Multiline Retail | | | 1.1 | |
| |
Others (each less than 1.0%) | | | 4.9 | |
| |
Short-Term Investments | | | 2.6 | |
Abbreviations
| | |
| ADR | | American Depositary Receipt |
| GDR | | Global Depositary Receipt |
| PJSC | | Public Joint Stock Company |
| PT | | Limited liability company |
| SGPS | | Holding company |
| |
| (a) | | Security exempt from registration pursuant to Regulation S under the Securities Act of 1933, as amended. Regulation S applies to securities offerings that are made outside of the United States and do not involve direct selling efforts in the United States and as such may have restrictions on resale. |
| (b) | | The security or a portion of this security is on loan at October 31, 2019. The total value of securities on loan at October 31, 2019 is approximately $13,200,000. |
| (c) | | Investment in an affiliated fund, which is registered under the Investment Company Act of 1940, as amended, and is advised by J.P. Morgan Investment Management Inc. |
| (d) | | The rate shown is the current yield as of October 31, 2019. |
| * | | Non-income producing security. |
SEE NOTES TO FINANCIAL STATEMENTS.
| | | | | | | | |
| | | |
| OCTOBER 31, 2019 | | J.P. MORGAN INTERNATIONAL EQUITY FUNDS | | | | | 29 | |
JPMorgan Emerging Markets Research Enhanced Equity Fund
SCHEDULE OF PORTFOLIO INVESTMENTS
AS OF OCTOBER 31, 2019
| | | | | | | | |
| INVESTMENTS | | SHARES
(000) | | | VALUE
($000) | |
Common Stocks — 90.1% | |
|
Argentina — 0.1% | |
| | |
MercadoLibre, Inc. * | | | 4 | | | | 2,089 | |
| | | | | | | | |
|
Brazil — 7.2% | |
| | |
Ambev SA * | | | 2,921 | | | | 12,642 | |
| | |
B3 SA — Brasil Bolsa Balcao | | | 1,013 | | | | 12,227 | |
| | |
Banco Bradesco SA (Preference) | | | 1,659 | | | | 14,590 | |
| | |
Banco do Brasil SA * | | | 362 | | | | 4,333 | |
| | |
Cogna Educacao | | | 1,152 | | | | 2,782 | |
| | |
CVC Brasil Operadora e Agencia de Viagens SA | | | 224 | | | | 2,859 | |
| | |
Equatorial Energia SA | | | 284 | | | | 7,209 | |
| | |
Gerdau SA (Preference) | | | 1,755 | | | | 5,875 | |
| | |
Itau Unibanco Holding SA (Preference) | | | 2,435 | | | | 22,020 | |
| | |
Lojas Renner SA | | | 718 | | | | 9,108 | |
| | |
Petroleo Brasileiro SA (Preference) | | | 2,893 | | | | 21,916 | |
| | |
Raia Drogasil SA * | | | 213 | | | | 5,833 | |
| | |
Telefonica Brasil SA (Preference) | | | 540 | | | | 7,150 | |
| | |
TIM Participacoes SA, ADR (a) | | | 365 | | | | 5,163 | |
| | |
Vale SA, ADR * | | | 1,378 | | | | 16,182 | |
| | | | | | | | |
| | |
| | | | | | | 149,889 | |
| | | | | | | | |
|
Chile — 0.2% | |
| | |
Cencosud SA | | | 1,133 | | | | 1,538 | |
| | |
Cia Cervecerias Unidas SA, ADR | | | 93 | | | | 1,838 | |
| | | | | | | | |
| | |
| | | | | | | 3,376 | |
| | | | | | | | |
|
China — 32.0% | |
| | |
51job, Inc., ADR * | | | 55 | | | | 4,362 | |
| | |
Alibaba Group Holding Ltd., ADR * | | | 558 | | | | 98,657 | |
| | |
ANTA Sports Products Ltd. | | | 446 | | | | 4,363 | |
| | |
Baidu, Inc., ADR * | | | 91 | | | | 9,298 | |
| | |
Bank of China Ltd., Class H | | | 39,080 | | | | 15,936 | |
| | |
Baoshan Iron & Steel Co. Ltd., Class A | | | 6,133 | | | | 5,051 | |
| | |
Beijing Enterprises Holdings Ltd. | | | 445 | | | | 2,095 | |
| | |
BOE Technology Group Co. Ltd., Class A | | | 2,782 | | | | 1,409 | |
| | |
CGN Power Co. Ltd., Class H (b) | | | 16,202 | | | | 4,208 | |
| | |
China Conch Venture Holdings Ltd. | | | 1,158 | | | | 4,529 | |
| | |
China Construction Bank Corp., Class H | | | 42,018 | | | | 33,668 | |
| | |
China Everbright International Ltd. | | | 5,742 | | | | 4,340 | |
| | |
China Life Insurance Co. Ltd., Class H | | | 4,718 | | | | 12,133 | |
| | |
China Longyuan Power Group Corp. Ltd., Class H | | | 7,745 | | | | 4,184 | |
| | |
China Merchants Bank Co. Ltd., Class H | | | 2,270 | | | | 10,826 | |
| | |
China Mobile Ltd. | | | 2,003 | | | | 16,278 | |
| | |
China Oilfield Services Ltd., Class H | | | 4,362 | | | | 6,073 | |
| | |
China Overseas Land & Investment Ltd. | | | 2,848 | | | | 8,987 | |
| | |
China Pacific Insurance Group Co. Ltd., Class H | | | 1,638 | | | | 5,943 | |
| | |
China Petroleum & Chemical Corp., Class H | | | 17,092 | | | | 9,722 | |
| | | | | | | | |
| | | | | | | | |
| INVESTMENTS | | SHARES
(000) | | | VALUE
($000) | |
| | | | | | | | |
|
China — continued | |
| | |
China Railway Group Ltd., Class H | | | 4,540 | | | | 2,736 | |
| | |
China Resources Land Ltd. | | | 980 | | | | 4,168 | |
| | |
China Shenhua Energy Co. Ltd., Class H | | | 3,472 | | | | 7,051 | |
| | |
China State Construction International Holdings Ltd. | | | 2,136 | | | | 1,967 | |
| | |
China Unicom Hong Kong Ltd. | | | 7,300 | | | | 7,187 | |
| | |
China Vanke Co. Ltd., Class H | | | 2,185 | | | | 7,969 | |
| | |
CNOOC Ltd. | | | 3,828 | | | | 5,697 | |
| | |
Country Garden Holdings Co. Ltd. | | | 6,810 | | | | 9,454 | |
| | |
Country Garden Services Holdings Co. Ltd. | | | 1,291 | | | | 4,374 | |
| | |
CSPC Pharmaceutical Group Ltd. | | | 3,116 | | | | 7,980 | |
| | |
Ctrip.com International Ltd., ADR * | | | 204 | | | | 6,715 | |
| | |
Far East Horizon Ltd. | | | 3,472 | | | | 3,287 | |
| | |
Fosun International Ltd. | | | 2,048 | | | | 2,677 | |
| | |
Geely Automobile Holdings Ltd. | | | 4,540 | | | | 8,591 | |
| | |
Greentown Service Group Co. Ltd. (b) | | | 2,226 | | | | 2,526 | |
| | |
Hangzhou Robam Appliances Co. Ltd., Class A | | | 1,451 | | | | 6,490 | |
| | |
Huayu Automotive Systems Co. Ltd., Class A | | | 632 | | | | 2,254 | |
| | |
Industrial & Commercial Bank of China Ltd., Class H | | | 33,872 | | | | 24,266 | |
| | |
Inner Mongolia Yili Industrial Group Co. Ltd., Class A | | | 552 | | | | 2,273 | |
| | |
JD.com, Inc., ADR * | | | 307 | | | | 9,565 | |
| | |
Jiangsu Hengrui Medicine Co. Ltd., Class A | | | 475 | | | | 6,133 | |
| | |
Jiangsu Yanghe Brewery Joint-Stock Co. Ltd., Class A | | | 312 | | | | 4,453 | |
| | |
Jointown Pharmaceutical Group Co. Ltd., Class A | | | 1,611 | | | | 2,957 | |
| | |
Kingdee International Software Group Co. Ltd. | | | 3,784 | | | | 4,146 | |
| | |
Kunlun Energy Co. Ltd. | | | 4,630 | | | | 4,309 | |
| | |
Kweichow Moutai Co. Ltd., Class A | | | 44 | | | | 7,452 | |
| | |
KWG Group Holdings Ltd. * | | | 3,383 | | | | 3,407 | |
| | |
Longfor Group Holdings Ltd. (b) | | | 1,736 | | | | 7,205 | |
| | |
Luxshare Precision Industry Co. Ltd., Class A | | | 1,323 | | | | 5,967 | |
| | |
Meituan Dianping, Class B * (b) | | | 258 | | | | 3,080 | |
| | |
Midea Group Co. Ltd., Class A | | | 717 | | | | 5,647 | |
| | |
NARI Technology Co. Ltd., Class A | | | 1,255 | | | | 3,911 | |
| | |
NetEase, Inc., ADR | | | 45 | | | | 12,749 | |
| | |
Nexteer Automotive Group Ltd. | | | 1,202 | | | | 1,120 | |
| | |
PetroChina Co. Ltd., Class H | | | 8,990 | | | | 4,384 | |
| | |
PICC Property & Casualty Co. Ltd., Class H | | | 5,876 | | | | 7,436 | |
| | |
Ping An Bank Co. Ltd., Class A | | | 256 | | | | 590 | |
| | |
Ping An Bank Co. Ltd., Class A | | | 2,179 | | | | 5,031 | |
| | |
Ping An Insurance Group Co. of China Ltd., Class H | | | 2,760 | | | | 31,850 | |
| | |
Postal Savings Bank of China Co. Ltd., Class H (b) | | | 11,795 | | | | 7,563 | |
| | |
Prosus NV * | | | 96 | | | | 6,627 | |
| | |
SAIC Motor Corp. Ltd., Class A | | | 1,603 | | | | 5,351 | |
SEE NOTES TO FINANCIAL STATEMENTS.
| | | | | | |
| | | |
| 30 | | | | J.P. MORGAN INTERNATIONAL EQUITY FUNDS | | OCTOBER 31, 2019 |
| | | | | | | | |
| INVESTMENTS | | SHARES
(000) | | | VALUE
($000) | |
| | |
Common Stocks — continued | | | | | | | | |
|
China — continued | |
| | |
Shenzhou International Group Holdings Ltd. | | | 570 | | | | 7,873 | |
| | |
Sinopharm Group Co. Ltd., Class H | | | 1,816 | | | | 6,504 | |
| | |
Sunny Optical Technology Group Co. Ltd. | | | 525 | | | | 8,442 | |
| | |
Suofeiya Home Collection Co. Ltd., Class A | | | 1,349 | | | | 3,322 | |
| | |
Tencent Holdings Ltd. | | | 2,275 | | | | 92,260 | |
| | |
Wuxi Biologics Cayman, Inc. * (b) | | | 557 | | | | 6,540 | |
| | |
Xinyangfeng Agricultural Technology Co. Ltd., Class A | | | 2,435 | | | | 2,922 | |
| | |
Yum China Holdings, Inc. | | | 248 | | | | 10,533 | |
| | | | | | | | |
| | |
| | | | | | | 669,053 | |
| | | | | | | | |
|
Colombia — 0.3% | |
| | |
Bancolombia SA | | | 275 | | | | 3,348 | |
| | |
Ecopetrol SA, ADR | | | 119 | | | | 2,178 | |
| | | | | | | | |
| | |
| | | | | | | 5,526 | |
| | | | | | | | |
|
Czech Republic — 0.3% | |
| | |
Komercni banka A/S | | | 127 | | | | 4,282 | |
| | |
Moneta Money Bank A/S (b) | | | 966 | | | | 3,206 | |
| | | | | | | | |
| | |
| | | | | | | 7,488 | |
| | | | | | | | |
|
Greece — 0.1% | |
| | |
OPAP SA | | | 188 | | | | 2,043 | |
| | | | | | | | |
|
Hong Kong — 0.7% | |
| | |
China Gas Holdings Ltd. | | | 1,691 | | | | 7,205 | |
| | |
Haier Electronics Group Co. Ltd. | | | 1,068 | | | | 3,049 | |
| | |
Hutchison China MediTech Ltd., ADR * | | | 98 | | | | 1,858 | |
| | |
Techtronic Industries Co. Ltd. | | | 379 | | | | 2,958 | |
| | | | | | | | |
| | |
| | | | | | | 15,070 | |
| | | | | | | | |
|
Hungary — 0.7% | |
| | |
OTP Bank Nyrt. | | | 209 | | | | 9,650 | |
| | |
Richter Gedeon Nyrt. | | | 231 | | | | 4,282 | |
| | | | | | | | |
| | |
| | | | | | | 13,932 | |
| | | | | | | | |
|
India — 0.7% | |
| | |
HDFC Bank Ltd., ADR | | | 67 | | | | 4,105 | |
| | |
ICICI Bank Ltd., ADR | | | 348 | | | | 4,529 | |
| | |
Infosys Ltd., ADR | | | 692 | | | | 6,637 | |
| | | | | | | | |
| | |
| | | | | | | 15,271 | |
| | | | | | | | |
|
Indonesia — 2.1% | |
| | |
Astra International Tbk. PT | | | 11,604 | | | | 5,739 | |
| | |
Bank Central Asia Tbk. PT | | | 6,280 | | | | 14,057 | |
| | |
Bank Rakyat Indonesia Persero Tbk. PT | | | 35,550 | | | | 10,652 | |
| | |
Hanjaya Mandala Sampoerna Tbk. PT | | | 17,007 | | | | 2,579 | |
| | |
Telekomunikasi Indonesia Persero Tbk. PT | | | 35,319 | | | | 10,307 | |
| | | | | | | | |
| INVESTMENTS | | SHARES
(000) | | | VALUE
($000) | |
| | | | | | | | |
|
Indonesia — continued | |
| | |
United Tractors Tbk. PT | | | 890 | | | | 1,374 | |
| | | | | | | | |
| | |
| | | | | | | 44,708 | |
| | | | | | | | |
|
Malaysia — 1.2% | |
| | |
CIMB Group Holdings Bhd. | | | 2,991 | | | | 3,754 | |
| | |
IHH Healthcare Bhd. | | | 2,404 | | | | 3,276 | |
| | |
Petronas Chemicals Group Bhd. | | | 3,129 | | | | 5,590 | |
| | |
Public Bank Bhd. | | | 1,571 | | | | 7,626 | |
| | |
Tenaga Nasional Bhd. | | | 1,727 | | | | 5,719 | |
| | | | | | | | |
| | |
| | | | | | | 25,965 | |
| | | | | | | | |
|
Mexico — 3.3% | |
| | |
Alfa SAB de CV, Class A | | | 2,930 | | | | 2,550 | |
| | |
America Movil SAB de CV, Series L | | | 17,212 | | | | 13,627 | |
| | |
Banco Santander Mexico SA Institucion de Banca Multiple Grupo Financiero Santand | | | 2,526 | | | | 3,398 | |
| | |
Fomento Economico Mexicano SAB de CV, ADR | | | 111 | | | | 9,886 | |
| | |
Grupo Aeroportuario del Pacifico SAB de CV, Class B | | | 441 | | | | 4,621 | |
| | |
Grupo Aeroportuario del Sureste SAB de CV, Class B | | | 333 | | �� | | 5,455 | |
| | |
Grupo Financiero Banorte SAB de CV, Class O | | | 1,870 | | | | 10,226 | |
| | |
Grupo Mexico SAB de CV, Series B | | | 3,025 | | | | 7,987 | |
| | |
Wal-Mart de Mexico SAB de CV | | | 3,468 | | | | 10,393 | |
| | | | | | | | |
| | |
| | | | | | | 68,143 | |
| | | | | | | | |
|
Peru — 0.5% | |
| | |
Credicorp Ltd. | | | 48 | | | | 10,318 | |
| | | | | | | | |
|
Philippines — 0.5% | |
| | |
Ayala Corp. | | | 198 | | | | 3,346 | |
| | |
Ayala Land, Inc. | | | 4,635 | | | | 4,429 | |
| | |
International Container Terminal Services, Inc. | | | 1,174 | | | | 2,744 | |
| | | | | | | | |
| | |
| | | | | | | 10,519 | |
| | | | | | | | |
|
Poland — 1.1% | |
| | |
Bank Polska Kasa Opieki SA | | | 253 | | | | 7,151 | |
| | |
CCC SA | | | 69 | | | | 2,016 | |
| | |
CD Projekt SA | | | 75 | | | | 4,945 | |
| | |
Dino Polska SA * (b) | | | 78 | | | | 3,049 | |
| | |
Polski Koncern Naftowy ORLEN SA | | | 213 | | | | 5,831 | |
| | | | | | | | |
| | |
| | | | | | | 22,992 | |
| | | | | | | | |
|
Qatar — 0.4% | |
| | |
Qatar National Bank QPSC | | | 1,527 | | | | 8,049 | |
| | | | | | | | |
|
Russia — 4.5% | |
| | |
Alrosa PJSC | | | 4,254 | | | | 4,946 | |
| | |
Gazprom PJSC, ADR | | | 1,784 | | | | 14,299 | |
SEE NOTES TO FINANCIAL STATEMENTS.
| | | | | | | | |
| | | |
| OCTOBER 31, 2019 | | J.P. MORGAN INTERNATIONAL EQUITY FUNDS | | | | | 31 | |
JPMorgan Emerging Markets Research Enhanced Equity Fund
SCHEDULE OF PORTFOLIO INVESTMENTS
AS OF OCTOBER 31, 2019 (continued)
| | | | | | | | |
| INVESTMENTS | | SHARES
(000) | | | VALUE
($000) | |
Common Stocks — continued | | | | | | | | |
|
Russia — continued | |
| | |
LUKOIL PJSC, ADR | | | 216 | | | | 19,889 | |
| | |
Magnitogorsk Iron & Steel Works PJSC | | | 5,273 | | | | 3,006 | |
| | |
MMC Norilsk Nickel PJSC, ADR | | | 121 | | | | 3,359 | |
| | |
Mobile TeleSystems PJSC, ADR | | | 365 | | | | 3,265 | |
| | |
Moscow Exchange MICEX-RTS PJSC | | | 3,604 | | | | 5,342 | |
| | |
Novatek PJSC, GDR (b) | | | 16 | | | | 3,524 | |
| | |
Rosneft Oil Co. PJSC, GDR (b) | | | 405 | | | | 2,690 | |
| | |
Sberbank of Russia PJSC, ADR | | | 1,342 | | | | 19,732 | |
| | |
Severstal PJSC, GDR (b) | | | 348 | | | | 4,759 | |
| | |
Tatneft PJSC, ADR | | | 69 | | | | 4,808 | |
| | |
X5 Retail Group NV, GDR (b) | | | 166 | | | | 5,536 | |
| | | | | | | | |
| | |
| | | | | | | 95,155 | |
| | | | | | | | |
|
Saudi Arabia — 2.1% | |
| | |
Al Rajhi Bank | | | 712 | | | | 11,469 | |
| | |
Alinma Bank | | | 945 | | | | 5,285 | |
| | |
Almarai Co. JSC | | | 297 | | | | 3,952 | |
| | |
Bupa Arabia for Cooperative Insurance Co. | | | 87 | | | | 2,483 | |
| | |
Mouwasat Medical Services Co. | | | 134 | | | | 2,923 | |
| | |
National Commercial Bank | | | 642 | | | | 7,456 | |
| | |
Saudi Basic Industries Corp. | | | 216 | | | | 5,041 | |
| | |
Saudi Telecom Co. | | | 179 | | | | 4,583 | |
| | | | | | | | |
| | |
| | | | | | | 43,192 | |
| | | | | | | | |
|
Singapore — 0.1% | |
| | |
BOC Aviation Ltd. (b) | | | 218 | | | | 2,049 | |
| | | | | | | | |
|
South Africa — 4.2% | |
| | |
Absa Group Ltd. | | | 661 | | | | 6,781 | |
| | |
Bid Corp. Ltd. | | | 389 | | | | 9,065 | |
| | |
Capitec Bank Holdings Ltd. | | | 67 | | | | 6,126 | |
| | |
Clicks Group Ltd. | | | 392 | | | | 6,368 | |
| | |
FirstRand Ltd. (a) | | | 2,066 | | | | 8,933 | |
| | |
Mr Price Group Ltd. | | | 114 | | | | 1,206 | |
| | |
MTN Group Ltd. | | | 321 | | | | 1,988 | |
| | |
Naspers Ltd., Class N | | | 138 | | | | 19,500 | |
| | |
Pick n Pay Stores Ltd. | | | 805 | | | | 3,522 | |
| | |
Sanlam Ltd. | | | 1,593 | | | | 8,384 | |
| | |
Sappi Ltd. | | | 610 | | | | 1,566 | |
| | |
Shoprite Holdings Ltd. | | | 256 | | | | 2,298 | |
| | |
SPAR Group Ltd. (The) | | | 364 | | | | 4,893 | |
| | |
Vodacom Group Ltd. | | | 831 | | | | 7,263 | |
| | | | | | | | |
| | |
| | | | | | | 87,893 | |
| | | | | | | | |
|
South Korea — 12.9% | |
| | |
BGF retail Co. Ltd. | | | 14 | | | | 2,100 | |
| | |
Daelim Industrial Co. Ltd. | | | 38 | | | | 2,989 | |
| | | | | | | | |
| INVESTMENTS | | SHARES
(000) | | | VALUE
($000) | |
| | | | | | | | |
|
South Korea — continued | |
| | |
Hana Financial Group, Inc. | | | 284 | | | | 8,209 | |
| | |
HDC Hyundai Development Co-Engineering & Construction, Class E | | | 43 | | | | 1,138 | |
| | |
Hyundai Glovis Co. Ltd. | | | 25 | | | | 3,217 | |
| | |
Hyundai Heavy Industries Holdings Co. Ltd. | | | 11 | | | | 3,337 | |
| | |
Hyundai Mobis Co. Ltd. | | | 50 | | | | 10,166 | |
| | |
Hyundai Motor Co. | | | 108 | | | | 11,362 | |
| | |
Industrial Bank of Korea | | | 195 | | | | 1,971 | |
| | |
KB Financial Group, Inc. | | | 287 | | | | 10,324 | |
| | |
Kia Motors Corp. | | | 148 | | | | 5,422 | |
| | |
KIWOOM Securities Co. Ltd. | | | 32 | | | | 1,901 | |
| | |
Korea Electric Power Corp. * | | | 131 | | | | 2,855 | |
| | |
KT&G Corp. | | | 97 | | | | 8,318 | |
| | |
LG Chem Ltd. | | | 32 | | | | 8,514 | |
| | |
Lotte Chemical Corp. | | | 27 | | | | 5,343 | |
| | |
Mando Corp. | | | 112 | | | | 3,424 | |
| | |
NAVER Corp. | | | 74 | | | | 10,468 | |
| | |
NCSoft Corp. | | | 17 | | | | 7,408 | |
| | |
POSCO | | | 51 | | | | 9,223 | |
| | |
Samsung Electronics Co. Ltd. | | | 2,162 | | | | 93,460 | |
| | |
Samsung SDI Co. Ltd. | | | 43 | | | | 8,417 | |
| | |
Shinhan Financial Group Co. Ltd. | | | 292 | | | | 10,634 | |
| | |
SK Holdings Co. Ltd. | | | 29 | | | | 6,369 | |
| | |
SK Hynix, Inc. | | | 267 | | | | 18,791 | |
| | |
SK Innovation Co. Ltd. | | | 49 | | | | 6,639 | |
| | |
S-Oil Corp. | | | 81 | | | | 6,921 | |
| | |
Woori Financial Group, Inc. | | | 189 | | | | 1,908 | |
| | | | | | | | |
| | |
| | | | | | | 270,828 | |
| | | | | | | | |
|
Taiwan — 11.5% | |
| | |
Advantech Co. Ltd. | | | 445 | | | | 4,396 | |
| | |
ASE Technology Holding Co. Ltd. | | | 1,869 | | | | 4,849 | |
| | |
Catcher Technology Co. Ltd. | | | 846 | | | | 7,171 | |
| | |
Chailease Holding Co. Ltd. | | | 1,692 | | | | 7,623 | |
| | |
China Life Insurance Co. Ltd. * | | | 6,332 | | | | 5,219 | |
| | |
CTBC Financial Holding Co. Ltd. | | | 14,866 | | | | 10,335 | |
| | |
Delta Electronics, Inc. | | | 1,869 | | | | 8,206 | |
| | |
E.Sun Financial Holding Co. Ltd. | | | 9,886 | | | | 8,933 | |
| | |
Formosa Chemicals & Fibre Corp. | | | 1,113 | | | | 3,235 | |
| | |
Formosa Plastics Corp. | | | 3,427 | | | | 11,000 | |
| | |
Fubon Financial Holding Co. Ltd. | | | 5,475 | | | | 8,010 | |
| | |
Globalwafers Co. Ltd. | | | 312 | | | | 3,723 | |
| | |
Hon Hai Precision Industry Co. Ltd. | | | 2,582 | | | | 6,819 | |
| | |
Inventec Corp. | | | 5,297 | | | | 3,838 | |
| | |
Largan Precision Co. Ltd. | | | 75 | | | | 11,005 | |
SEE NOTES TO FINANCIAL STATEMENTS.
| | | | | | |
| | | |
| 32 | | | | J.P. MORGAN INTERNATIONAL EQUITY FUNDS | | OCTOBER 31, 2019 |
| | | | | | | | |
| INVESTMENTS | | SHARES
(000) | | | VALUE
($000) | |
Common Stocks — continued | | | | | | | | |
|
Taiwan — continued | |
| | |
MediaTek, Inc. | | | 757 | | | | 10,110 | |
| | |
Quanta Computer, Inc. | | | 2,760 | | | | 5,294 | |
| | |
Taiwan Mobile Co. Ltd. | | | 1,158 | | | | 4,318 | |
| | |
Taiwan Semiconductor Manufacturing Co. Ltd., ADR | | | 1,860 | | | | 96,014 | |
| | |
Uni-President Enterprises Corp. | | | 3,561 | | | | 8,797 | |
| | |
Vanguard International Semiconductor Corp. | | | 2,582 | | | | 5,517 | |
| | |
Yuanta Financial Holding Co. Ltd. | | | 9,213 | | | | 5,758 | |
| | | | | | | | |
| | |
| | | | | | | 240,170 | |
| | | | | | | | |
|
Thailand — 2.3% | |
| | |
Kasikornbank PCL | | | 1,660 | | | | 7,658 | |
| | |
Minor International PCL | | | 4,389 | | | | 5,233 | |
| | |
PTT Exploration & Production PCL | | | 1,803 | | | | 7,192 | |
| | |
PTT Global Chemical PCL | | | 1,059 | | | | 1,789 | |
| | |
PTT PCL | | | 7,562 | | | | 11,337 | |
| | |
Siam Cement PCL (The) (Registered) | | | 672 | | | | 8,236 | |
| | |
Thai Oil PCL | | | 2,559 | | | | 5,806 | |
| | | | | | | | |
| | |
| | | | | | | 47,251 | |
| | | | | | | | |
|
Turkey — 0.9% | |
| | |
BIM Birlesik Magazalar A/S | | | 536 | | | | 4,440 | |
| | |
Eregli Demir ve Celik Fabrikalari TAS | | | 3,405 | | | | 3,892 | |
| | |
Ford Otomotiv Sanayi A/S | | | 224 | | | | 2,530 | |
| | |
KOC Holding A/S | | | 1,029 | | | | 3,374 | |
| | |
Tofas Turk Otomobil Fabrikasi A/S | | | 724 | | | | 2,831 | |
| | |
Turkcell Iletisim Hizmetleri A/S | | | 1,216 | | | | 2,674 | |
| | | | | | | | |
| | |
| | | | | | | 19,741 | |
| | | | | | | | |
|
United Arab Emirates — 0.1% | |
| | |
DP World plc | | | 164 | | | | 2,173 | |
| | | | | | | | |
|
United Kingdom — 0.1% | |
| | |
Mondi plc | | | 84 | | | | 1,733 | |
| | | | | | | | |
| | |
Total Common Stocks
(Cost $1,850,526) | | | | | | | 1,884,616 | |
| | | | | | | | |
Exchange-Traded Funds — 8.6% | |
|
United States — 8.6% | |
| | |
iShares MSCI India ETF
(Cost $172,153) | | | 5,164 | | | | 178,948 | |
| | | | | | | | |
Short-Term Investments — 1.1% | |
|
Investment Companies — 1.1% | |
| | |
JPMorgan Prime Money Market Fund Class Institutional Shares, 1.88% (c) (d)
(Cost $22,222) | | | 22,217 | | | | 22,226 | |
| | | | | | | | |
| | | | | | | | |
| INVESTMENTS | | SHARES
(000) | | | VALUE
($000) | |
Investment of Cash Collateral from Securities Loaned — 0.1% | |
| | |
JPMorgan U.S. Government Money Market Fund Class IM Shares, 1.70% (c) (d)
(Cost $2,216) | | | 2,216 | | | | 2,216 | |
| | | | | | | | |
Total Investments — 99.9%
(Cost $2,047,117) | | | | | | | 2,088,006 | |
Other Assets Less Liabilities — 0.1% | | | | | | | 2,568 | |
| | | | | | | | |
NET ASSETS — 100.0% | | | | | | | 2,090,574 | |
| | | | | | | | |
Percentages indicated are based on net assets.
Summary of Investments by Industry, October 31, 2019
The following table represents the portfolio investments of the Fund by industry classifications as a percentage of total investments:
| | | | |
| INDUSTRY | | PERCENTAGE | |
| |
Banks | | | 17.2 | % |
| |
Mutual Funds | | | 8.6 | |
| |
Internet & Direct Marketing Retail | | | 7.0 | |
| |
Oil, Gas & Consumable Fuels | | | 6.8 | |
| |
Semiconductors & Semiconductor Equipment | | | 6.7 | |
| |
Technology Hardware, Storage & Peripherals | | | 5.5 | |
| |
Interactive Media & Services | | | 5.4 | |
| |
Insurance | | | 3.9 | |
| |
Metals & Mining | | | 3.1 | |
| |
Food & Staples Retailing | | | 2.8 | |
| |
Wireless Telecommunication Services | | | 2.6 | |
| |
Electronic Equipment, Instruments & Components | | | 2.4 | |
| |
Real Estate Management & Development | | | 2.2 | |
| |
Chemicals | | | 2.1 | |
| |
Automobiles | | | 2.0 | |
| |
Beverages | | | 1.7 | |
| |
Diversified Telecommunication Services | | | 1.4 | |
| |
Capital Markets | | | 1.2 | |
| |
Entertainment | | | 1.2 | |
| |
Hotels, Restaurants & Leisure | | | 1.0 | |
| |
Pharmaceuticals | | | 1.0 | |
| |
Diversified Financial Services | | | 1.0 | |
| |
Others (each less than 1.0%) | | | 12.1 | |
| |
Short-Term Investments | | | 1.1 | |
SEE NOTES TO FINANCIAL STATEMENTS.
| | | | | | | | |
| | | |
| OCTOBER 31, 2019 | | J.P. MORGAN INTERNATIONAL EQUITY FUNDS | | | | | 33 | |
JPMorgan Emerging Markets Research Enhanced Equity Fund
SCHEDULE OF PORTFOLIO INVESTMENTS
AS OF OCTOBER 31, 2019 (continued)
Abbreviations
| | |
| ADR | | American Depositary Receipt |
| ETF | | Exchange-Traded Fund |
| GDR | | Global Depositary Receipt |
| JSC | | Joint Stock Company |
| PJSC | | Public Joint Stock Company |
| Preference | | A special type of equity investment that shares in the earnings of the company, has limited voting rights, and may have a dividend preference. Preference shares may also have liquidation preference. |
| PT | | Limited liability company |
| RTS | | Russian Trading System |
| |
| (a) | | The security or a portion of this security is on loan at October 31, 2019. The total value of securities on loan at October 31, 2019 is approximately $2,092,000. |
| | |
| (b) | | Security exempt from registration pursuant to Regulation S under the Securities Act of 1933, as amended. Regulation S applies to securities offerings that are made outside of the United States and do not involve direct selling efforts in the United States and as such may have restrictions on resale. |
| (c) | | Investment in an affiliated fund, which is registered under the Investment Company Act of 1940, as amended, and is advised by J.P. Morgan Investment Management Inc. |
| (d) | | The rate shown is the current yield as of October 31, 2019. |
| * | | Non-income producing security. |
SEE NOTES TO FINANCIAL STATEMENTS.
| | | | | | |
| | | |
| 34 | | | | J.P. MORGAN INTERNATIONAL EQUITY FUNDS | | OCTOBER 31, 2019 |
JPMorgan Europe Dynamic Fund
SCHEDULE OF PORTFOLIO INVESTMENTS
AS OF OCTOBER 31, 2019
| | | | | | | | |
| INVESTMENTS | | SHARES
(000) | | | VALUE
($000) | |
Common Stocks — 99.6% | |
|
Australia — 2.4% | |
| | |
BHP Group plc | | | 270 | | | | 5,727 | |
| | |
Rio Tinto plc | | | 133 | | | | 6,939 | |
| | | | | | | | |
| | |
| | | | | | | 12,666 | |
| | | | | | | | |
|
Austria — 0.7% | |
| | |
Wienerberger AG | | | 137 | | | | 3,723 | |
| | | | | | | | |
|
Belgium — 1.6% | |
| | |
KBC Group NV | | | 122 | | | | 8,595 | |
| | | | | | | | |
|
Finland — 3.1% | |
| | |
Fortum OYJ | | | 248 | | | | 6,059 | |
| | |
Neste OYJ | | | 116 | | | | 4,205 | |
| | |
UPM-Kymmene OYJ | | | 204 | | | | 6,644 | |
| | | | | | | | |
| | |
| | | | | | | 16,908 | |
| | | | | | | | |
|
France — 16.1% | |
| | |
Airbus SE | | | 33 | | | | 4,721 | |
| | |
Capgemini SE | | | 33 | | | | 3,724 | |
| | |
Eiffage SA | | | 64 | | | | 6,850 | |
| | |
Faurecia SE | | | 91 | | | | 4,260 | |
| | |
Ingenico Group SA | | | 50 | | | | 5,329 | |
| | |
Kering SA | | | 17 | | | | 9,913 | |
| | |
LVMH Moet Hennessy Louis Vuitton SE | | | 27 | | | | 11,586 | |
| | |
Peugeot SA | | | 326 | | | | 8,260 | |
| | |
Safran SA | | | 65 | | | | 10,312 | |
| | |
Schneider Electric SE | | | 88 | | | | 8,159 | |
| | |
TOTAL SA | | | 263 | | | | 13,882 | |
| | | | | | | | |
| | |
| | | | | | | 86,996 | |
| | | | | | | | |
|
Germany — 12.6% | |
| | |
Allianz SE (Registered) | | | 68 | | | | 16,541 | |
| | |
Deutsche Telekom AG (Registered) | | | 552 | | | | 9,707 | |
| | |
MTU Aero Engines AG | | | 27 | | | | 7,220 | |
| | |
SAP SE | | | 100 | | | | 13,219 | |
| | |
Stroeer SE & Co. KGaA | | | 66 | | | | 5,281 | |
| | |
TeamViewer AG * | | | 178 | | | | 4,696 | |
| | |
Varta AG * | | | 33 | | | | 3,714 | |
| | |
Volkswagen AG (Preference) | | | 41 | | | | 7,746 | |
| | | | | | | | |
| | |
| | | | | | | 68,124 | |
| | | | | | | | |
|
Italy — 4.6% | |
| | |
Enel SpA | | | 1,441 | | | | 11,171 | |
| | |
Eni SpA | | | 578 | | | | 8,762 | |
| | |
Poste Italiane SpA (a) | | | 411 | | | | 4,997 | |
| | | | | | | | |
| | |
| | | | | | | 24,930 | |
| | | | | | | | |
|
Netherlands — 7.9% | |
| | |
ABN AMRO Bank NV, CVA (a) | | | 283 | | | | 5,267 | |
| | | | | | | | |
| INVESTMENTS | | SHARES
(000) | | | VALUE
($000) | |
| | | | | | | | |
|
Netherlands — continued | |
| | |
ASM International NV | | | 84 | | | | 8,491 | |
| | |
ASML Holding NV | | | 22 | | | | 5,716 | |
| | |
ASR Nederland NV | | | 150 | | | | 5,484 | |
| | |
Koninklijke Ahold Delhaize NV | | | 217 | | | | 5,409 | |
| | |
NN Group NV | | | 208 | | | | 7,954 | |
| | |
Wolters Kluwer NV | | | 63 | | | | 4,676 | |
| | | | | | | | |
| | |
| | | | | | | 42,997 | |
| | | | | | | | |
| | |
Norway — 1.8% | | | | | | | | |
| | |
DNB ASA | | | 544 | | | | 9,902 | |
| | | | | | | | |
|
Russia — 1.4% | |
| | |
Polymetal International plc | | | 448 | | | | 7,370 | |
| | | | | | | | |
|
South Africa — 1.2% | |
| | |
Anglo American plc | | | 260 | | | | 6,688 | |
| | | | | | | | |
|
Spain — 2.6% | |
| | |
Masmovil Ibercom SA * | | | 193 | | | | 4,480 | |
| | |
Repsol SA | | | 588 | | | | 9,684 | |
| | | | | | | | |
| | |
| | | | | | | 14,164 | |
| | | | | | | | |
|
Sweden — 3.2% | |
| | |
Evolution Gaming Group AB (a) (b) | | | 180 | | | | 4,317 | |
| | |
Telefonaktiebolaget LM Ericsson, Class B | | | 894 | | | | 7,810 | |
| | |
Volvo AB, Class B | | | 354 | | | | 5,299 | |
| | | | | | | | |
| | |
| | | | | | | 17,426 | |
| | | | | | | | |
|
Switzerland — 21.5% | |
| | |
LafargeHolcim Ltd. (Registered) * | | | 158 | | | | 8,177 | |
| | |
Logitech International SA (Registered) | | | 97 | | | | 3,979 | |
| | |
Nestle SA (Registered) | | | 253 | | | | 27,058 | |
| | |
Novartis AG (Registered) | | | 244 | | | | 21,361 | |
| | |
Roche Holding AG | | | 87 | | | | 26,058 | |
| | |
STMicroelectronics NV | | | 282 | | | | 6,409 | |
| | |
Swisscom AG (Registered) | | | 17 | | | | 8,536 | |
| | |
Zurich Insurance Group AG | | | 39 | | | | 15,163 | |
| | | | | | | | |
| | |
| | | | | | | 116,741 | |
| | | | | | | | |
|
United Kingdom — 18.0% | |
| | |
Ashtead Group plc | | | 207 | | | | 6,304 | |
| | |
Avast plc (a) | | | 1,329 | | | | 7,136 | |
| | |
Diageo plc | | | 250 | | | | 10,229 | |
| | |
GlaxoSmithKline plc | | | 690 | | | | 15,812 | |
| | |
Intermediate Capital Group plc | | | 332 | | | | 6,388 | |
| | |
Linde plc | | | 63 | | | | 12,370 | |
| | |
Prudential plc | | | 472 | | | | 8,246 | |
| | |
Segro plc, REIT | | | 703 | | | | 7,694 | |
| | |
Serco Group plc * | | | 2,758 | | | | 5,573 | |
SEE NOTES TO FINANCIAL STATEMENTS.
| | | | | | | | |
| | | |
| OCTOBER 31, 2019 | | J.P. MORGAN INTERNATIONAL EQUITY FUNDS | | | | | 35 | |
JPMorgan Europe Dynamic Fund
SCHEDULE OF PORTFOLIO INVESTMENTS
AS OF OCTOBER 31, 2019 (continued)
| | | | | | | | |
| INVESTMENTS | | SHARES
(000) | | | VALUE
($000) | |
Common Stocks — continued | | | | | | | | |
|
United Kingdom — continued | |
| | |
Taylor Wimpey plc | | | 3,789 | | | | 8,127 | |
| | |
Trainline plc * (a) | | | 466 | | | | 2,512 | |
| | |
WPP plc | | | 593 | | | | 7,395 | |
| | | | | | | | |
| | |
| | | | | | | 97,786 | |
| | | | | | | | |
|
United States — 0.9% | |
| | |
Softwareone Holding AG * | | | 272 | | | | 4,970 | |
| | | | | | | | |
| | |
Total Common Stocks
(Cost $494,606) | | | | | | | 539,986 | |
| | | | | | | | |
Short-Term Investments — 0.0% (c) | |
|
Investment Companies — 0.0% (c) | |
| | |
JPMorgan Prime Money Market Fund Class Institutional Shares, 1.88% (d) (e)
(Cost $130) | | | 130 | | | | 130 | |
| | | | | | | | |
Investment of Cash Collateral from Securities Loaned — 0.1% | |
| | |
JPMorgan U.S. Government Money Market Fund Class IM Shares, 1.70% (d) (e)
(Cost $286) | | | 286 | | | | 286 | |
| | | | | | | | |
Total Investments — 99.7%
(Cost $495,022) | | | | | | | 540,402 | |
Other Assets Less Liabilities — 0.3% | | | | | | | 1,843 | |
| | | | | | | | |
NET ASSETS — 100.0% | | | | | | | 542,245 | |
| | | | | | | | |
Percentages indicated are based on net assets.
Summary of Investments by Industry, October 31, 2019
The following table represents the portfolio investments of the Fund by industry classifications as a percentage of total investments:
| | | | |
| INDUSTRY | | PERCENTAGE | |
| |
Pharmaceuticals | | | 11.7 | % |
| |
Insurance | | | 10.8 | |
| |
Oil, Gas & Consumable Fuels | | | 6.8 | |
| |
Food Products | | | 5.0 | |
| |
Metals & Mining | | | 4.9 | |
| |
Software | | | 4.6 | |
| |
Banks | | | 4.4 | |
| |
Diversified Telecommunication Services | | | 4.2 | |
| |
Aerospace & Defense | | | 4.1 | |
| |
Textiles, Apparel & Luxury Goods | | | 4.0 | |
| |
Semiconductors & Semiconductor Equipment | | | 3.8 | |
| |
Electric Utilities | | | 3.2 | |
| |
Automobiles | | | 3.0 | |
| |
Media | | | 2.3 | |
| |
Chemicals | | | 2.3 | |
| |
Construction Materials | | | 2.2 | |
| |
Electrical Equipment | | | 2.2 | |
| |
Beverages | | | 1.9 | |
| |
IT Services | | | 1.6 | |
| |
Household Durables | | | 1.5 | |
| |
Communications Equipment | | | 1.4 | |
| |
Equity Real Estate Investment Trusts (REITs) | | | 1.4 | |
| |
Construction & Engineering | | | 1.3 | |
| |
Paper & Forest Products | | | 1.2 | |
| |
Capital Markets | | | 1.2 | |
| |
Trading Companies & Distributors | | | 1.2 | |
| |
Commercial Services & Supplies | | | 1.0 | |
| |
Food & Staples Retailing | | | 1.0 | |
| |
Electronic Equipment, Instruments & Components | | | 1.0 | |
| |
Machinery | | | 1.0 | |
| |
Others (each less than 1.0%) | | | 3.8 | |
| |
Short-Term Investments | | | 0.0 | (f) |
SEE NOTES TO FINANCIAL STATEMENTS.
| | | | | | |
| | | |
| 36 | | | | J.P. MORGAN INTERNATIONAL EQUITY FUNDS | | OCTOBER 31, 2019 |
Abbreviations
| | |
| CVA | | Dutch Certification |
| OYJ | | Public Limited Company |
| Preference | | A special type of equity investment that shares in the earnings of the company, has limited voting rights, and may have a dividend preference. Preference shares may also have liquidation preference. |
| REIT | | Real Estate Investment Trust |
| |
| (a) | | Security exempt from registration pursuant to Regulation S under the Securities Act of 1933, as amended. Regulation S applies to securities offerings that are made outside of the United States and do not involve direct selling efforts in the United States and as such may have restrictions on resale. |
| | |
| (b) | | The security or a portion of this security is on loan at October 31, 2019. The total value of securities on loan at October 31, 2019 is approximately $275,000. |
| (c) | | Amount rounds to less than 0.1% of net assets. |
| (d) | | Investment in an affiliated fund, which is registered under the Investment Company Act of 1940, as amended, and is advised by J.P. Morgan Investment Management Inc. |
| (e) | | The rate shown is the current yield as of October 31, 2019. |
| (f) | | Amount rounds to less than 0.1%. |
| * | | Non-income producing security. |
| | | | | | | | | | | | | | | | | | | | |
| Futures contracts outstanding as of October 31, 2019 (amounts in thousands, except number of contracts): | |
| DESCRIPTION | | NUMBER OF
CONTRACTS | | | EXPIRATION
DATE | | | TRADING
CURRENCY | | | NOTIONAL
AMOUNT ($) | | | VALUE AND
UNREALIZED
APPRECIATION
(DEPRECIATION) ($) | |
| | | | | |
Short Contracts | | | | | | | | | | | | | | | | | | | | |
EURO STOXX 50 Index | | | (137) | | | | 12/2019 | | | | EUR | | | | (5,508) | | | | (9) | |
FTSE 100 Index | | | (19) | | | | 12/2019 | | �� | | GBP | | | | (1,783) | | | | (3) | |
| | | | | | | | | | | | | | | | | | | | |
| | | | | |
| | | | | | | | | | | | | | | | | | | (12) | |
| | | | | | | | | | | | | | | | | | | | |
Abbreviations
| | |
| EUR | | Euro |
| FTSE | | Financial Times and the London Stock Exchange |
| GBP | | British Pound |
SEE NOTES TO FINANCIAL STATEMENTS.
| | | | | | | | |
| | | |
| OCTOBER 31, 2019 | | J.P. MORGAN INTERNATIONAL EQUITY FUNDS | | | | | 37 | |
JPMorgan Global Research Enhanced Index Fund
SCHEDULE OF PORTFOLIO INVESTMENTS
AS OF OCTOBER 31, 2019
| | | | | | | | |
| INVESTMENTS | | SHARES
(000) | | | VALUE
($000) | |
Common Stocks — 98.5% | |
|
Argentina — 0.0% (a) | |
| | |
MercadoLibre, Inc. * | | | 4 | | | | 2,054 | |
| | | | | | | | |
|
Australia — 2.9% | |
| | |
AGL Energy Ltd. | | | 56 | | | | 764 | |
| | |
Alumina Ltd. | | | 580 | | | | 905 | |
| | |
APA Group | | | 158 | | | | 1,266 | |
| | |
Aristocrat Leisure Ltd. | | | 38 | | | | 829 | |
| | |
Aurizon Holdings Ltd. | | | 347 | | | | 1,413 | |
| | |
Australia & New Zealand Banking Group Ltd. | | | 400 | | | | 7,351 | |
| | |
BHP Group Ltd. | | | 361 | | | | 8,853 | |
| | |
BHP Group plc | | | 355 | | | | 7,531 | |
| | |
Boral Ltd. | | | 144 | | | | 500 | |
| | |
Brambles Ltd. | | | 165 | | | | 1,366 | |
| | |
Caltex Australia Ltd. | | | 40 | | | | 752 | |
| | |
Coca-Cola Amatil Ltd. | | | 124 | | | | 867 | |
| | |
Cochlear Ltd. | | | 10 | | | | 1,388 | |
| | |
Coles Group Ltd. | | | 116 | | | | 1,202 | |
| | |
Commonwealth Bank of Australia | | | 168 | | | | 9,135 | |
| | |
Computershare Ltd. | | | 91 | | | | 998 | |
| | |
Crown Resorts Ltd. | | | 10 | | | | 87 | |
| | |
CSL Ltd. | | | 51 | | | | 8,969 | |
| | |
Fortescue Metals Group Ltd. | | | 85 | | | | 523 | |
| | |
Goodman Group, REIT | | | 225 | | | | 2,229 | |
| | |
GPT Group (The), REIT | | | 702 | | | | 2,880 | |
| | |
Incitec Pivot Ltd. | | | 183 | | | | 434 | |
| | |
Insurance Australia Group Ltd. | | | 220 | | | | 1,203 | |
| | |
Lendlease Group | | | 62 | | | | 805 | |
| | |
Macquarie Group Ltd. | | | 37 | | | | 3,414 | |
| | |
Mirvac Group, REIT | | | 1,466 | | | | 3,249 | |
| | |
National Australia Bank Ltd. | | | 246 | | | | 4,829 | |
| | |
Newcrest Mining Ltd. | | | 77 | | | | 1,676 | |
| | |
Oil Search Ltd. | | | 175 | | | | 864 | |
| | |
Orica Ltd. | | | 67 | | | | 1,056 | |
| | |
Origin Energy Ltd. | | | 163 | | | | 886 | |
| | |
QBE Insurance Group Ltd. | | | 271 | | | | 2,354 | |
| | |
Ramsay Health Care Ltd. | | | 20 | | | | 936 | |
| | |
REA Group Ltd. (b) | | | 13 | | | | 952 | |
| | |
Rio Tinto Ltd. | | | 57 | | | | 3,537 | |
| | |
Rio Tinto plc | | | 162 | | | | 8,437 | |
| | |
Santos Ltd. | | | 192 | | | | 1,075 | |
| | |
SEEK Ltd. | | | 6 | | | | 97 | |
| | |
Sonic Healthcare Ltd. | | | 33 | | | | 640 | |
| | |
South32 Ltd. | | | 704 | | | | 1,233 | |
| | |
Stockland, REIT | | | 332 | | | | 1,122 | |
| | |
Suncorp Group Ltd. | | | 245 | | | | 2,274 | |
| | | | | | | | |
| INVESTMENTS | | SHARES
(000) | | | VALUE
($000) | |
| |
|
Australia — continued | |
| | |
Sydney Airport | | | 186 | | | | 1,127 | |
| | |
Tabcorp Holdings Ltd. | | | 264 | | | | 875 | |
| | |
Telstra Corp. Ltd. | | | 160 | | | | 386 | |
| | |
TPG Telecom Ltd. | | | 106 | | | | 478 | |
| | |
Transurban Group | | | 267 | | | | 2,734 | |
| | |
Treasury Wine Estates Ltd. | | | 67 | | | | 807 | |
| | |
Wesfarmers Ltd. | | | 116 | | | | 3,190 | |
| | |
Westpac Banking Corp. | | | 421 | | | | 8,182 | |
| | |
Woodside Petroleum Ltd. | | | 77 | | | | 1,697 | |
| | |
Woolworths Group Ltd. | | | 161 | | | | 4,147 | |
| | | | | | | | |
| | |
| | | | | | | 124,504 | |
| | | | | | | | |
|
Austria — 0.1% | |
| | |
Erste Group Bank AG | | | 179 | | | | 6,320 | |
| | | | | | | | |
|
Belgium — 0.2% | |
| | |
Anheuser-Busch InBev SA/NV | | | 62 | | | | 4,990 | |
| | |
KBC Group NV | | | 76 | | | | 5,338 | |
| | | | | | | | |
| | |
| | | | | | | 10,328 | |
| | | | | | | | |
|
Canada — 3.5% | |
| | |
Agnico Eagle Mines Ltd. | | | 27 | | | | 1,654 | |
| | |
Alimentation Couche-Tard, Inc., Class B | | | 108 | | | | 3,230 | |
| | |
Bank of Montreal (b) | | | 80 | | | | 5,928 | |
| | |
Bank of Nova Scotia (The) | | | 145 | | | | 8,309 | |
| | |
Barrick Gold Corp. | | | 142 | | | | 2,473 | |
| | |
BCE, Inc. | | | 20 | | | | 937 | |
| | |
Brookfield Asset Management, Inc., Class A | | | 114 | | | | 6,310 | |
| | |
Canadian Imperial Bank of Commerce | | | 51 | | | | 4,318 | |
| | |
Canadian National Railway Co. | | | 97 | | | | 8,677 | |
| | |
Canadian Natural Resources Ltd. | | | 140 | | | | 3,522 | |
| | |
Canadian Pacific Railway Ltd. | | | 19 | | | | 4,223 | |
| | |
Canadian Tire Corp. Ltd., Class A (b) | | | 9 | | | | 957 | |
| | |
Cenovus Energy, Inc. | | | 108 | | | | 920 | |
| | |
CGI, Inc. * | | | 28 | | | | 2,200 | |
| | |
Constellation Software, Inc. | | | 2 | | | | 2,404 | |
| | |
Dollarama, Inc. | | | 45 | | | | 1,498 | |
| | |
Enbridge, Inc. | | | 100 | | | | 3,652 | |
| | |
Encana Corp. | | | 109 | | | | 428 | |
| | |
Fairfax Financial Holdings Ltd. | | | 3 | | | | 1,210 | |
| | |
Fortis, Inc. | | | 36 | | | | 1,482 | |
| | |
Franco-Nevada Corp. | | | 22 | | | | 2,136 | |
| | |
George Weston Ltd. | | | 4 | | | | 313 | |
| | |
Gildan Activewear, Inc. | | | 31 | | | | 789 | |
| | |
Great-West Lifeco, Inc. | | | 37 | | | | 909 | |
| | |
Imperial Oil Ltd. | | | 38 | | | | 944 | |
SEE NOTES TO FINANCIAL STATEMENTS.
| | | | | | |
| | | |
| 38 | | | | J.P. MORGAN INTERNATIONAL EQUITY FUNDS | | OCTOBER 31, 2019 |
| | | | | | | | |
| INVESTMENTS | | SHARES
(000) | | | VALUE
($000) | |
Common Stocks — continued | |
|
Canada — continued | |
| | |
Intact Financial Corp. | | | 17 | | | | 1,727 | |
| | |
Inter Pipeline Ltd. | | | 45 | | | | 764 | |
| | |
Kinross Gold Corp. * | | | 160 | | | | 776 | |
| | |
Loblaw Cos. Ltd. (b) | | | 29 | | | | 1,542 | |
| | |
Magna International, Inc. | | | 51 | | | | 2,731 | |
| | |
Manulife Financial Corp. | | | 251 | | | | 4,677 | |
| | |
Metro, Inc. | | | 32 | | | | 1,364 | |
| | |
National Bank of Canada | | | 42 | | | | 2,193 | |
| | |
Nutrien Ltd. | | | 84 | | | | 4,037 | |
| | |
Open Text Corp. | | | 32 | | | | 1,312 | |
| | |
Pembina Pipeline Corp. | | | 48 | | | | 1,697 | |
| | |
Power Corp. of Canada | | | 48 | | | | 1,105 | |
| | |
Power Financial Corp. | | | 34 | | | | 784 | |
| | |
Restaurant Brands International, Inc. | | | 28 | | | | 1,830 | |
| | |
Rogers Communications, Inc., Class B | | | 46 | | | | 2,174 | |
| | |
Royal Bank of Canada | | | 174 | | | | 13,997 | |
| | |
Saputo, Inc. | | | 33 | | | | 947 | |
| | |
Shaw Communications, Inc., Class B | | | 52 | | | | 1,061 | |
| | |
SNC-Lavalin Group, Inc. | | | 20 | | | | 361 | |
| | |
Sun Life Financial, Inc. | | | 79 | | | | 3,522 | |
| | |
Suncor Energy, Inc. | | | 198 | | | | 5,881 | |
| | |
TC Energy Corp. | | | 90 | | | | 4,554 | |
| | |
Teck Resources Ltd., Class B | | | 69 | | | | 1,085 | |
| | |
Thomson Reuters Corp. | | | 44 | | | | 2,948 | |
| | |
Toronto-Dominion Bank (The) | | | 219 | | | | 12,492 | |
| | |
Wheaton Precious Metals Corp. | | | 53 | | | | 1,494 | |
| | | | | | | | |
| | |
| | | | | | | 146,478 | |
| | | | | | | | |
|
China — 0.1% | |
| | |
BOC Hong Kong Holdings Ltd. | | | 736 | | | | 2,529 | |
| | |
Prosus NV * | | | 23 | | | | 1,612 | |
| | |
Yangzijiang Shipbuilding Holdings Ltd. | | | 311 | | | | 218 | |
| | | | | | | | |
| | |
| | | | | | | 4,359 | |
| | | | | | | | |
|
Denmark — 0.7% | |
| | |
Carlsberg A/S, Class B | | | 37 | | | | 5,171 | |
| | |
Chr Hansen Holding A/S (b) | | | 44 | | | | 3,369 | |
| | |
Novo Nordisk A/S, Class B | | | 281 | | | | 15,467 | |
| | |
Novozymes A/S, Class B (b) | | | 93 | | | | 4,365 | |
| | | | | | | | |
| | |
| | | | | | | 28,372 | |
| | | | | | | | |
|
Finland — 0.4% | |
| | |
Elisa OYJ | | | 73 | | | | 3,984 | |
| | |
Nokia OYJ | | | 413 | | | | 1,515 | |
| | |
UPM-Kymmene OYJ | | | 220 | | | | 7,181 | |
| | |
Wartsila OYJ Abp | | | 224 | | | | 2,366 | |
| | | | | | | | |
| | |
| | | | | | | 15,046 | |
| | | | | | | | |
| | | | | | | | |
| INVESTMENTS | | SHARES
(000) | | | VALUE
($000) | |
| |
|
France — 4.2% | |
| | |
Accor SA | | | 110 | | | | 4,736 | |
| | |
Air Liquide SA | | | 60 | | | | 7,955 | |
| | |
Airbus SE | | | 99 | | | | 14,143 | |
| | |
Alstom SA | | | 97 | | | | 4,182 | |
| | |
Arkema SA | | | 47 | | | | 4,826 | |
| | |
AXA SA | | | 284 | | | | 7,510 | |
| | |
BioMerieux | | | 51 | | | | 4,179 | |
| | |
BNP Paribas SA | | | 208 | | | | 10,855 | |
| | |
Capgemini SE | | | 39 | | | | 4,372 | |
| | |
Dassault Systemes SE (b) | | | 29 | | | | 4,380 | |
| | |
Eiffage SA | | | 51 | | | | 5,430 | |
| | |
Kering SA | | | 13 | | | | 7,617 | |
| | |
L’Oreal SA | | | 18 | | | | 5,339 | |
| | |
LVMH Moet Hennessy Louis Vuitton SE | | | 33 | | | | 14,091 | |
| | |
Orange SA | | | 406 | | | | 6,542 | |
| | |
Pernod Ricard SA | | | 32 | | | | 5,954 | |
| | |
Renault SA | | | 72 | | | | 3,657 | |
| | |
Safran SA | | | 60 | | | | 9,493 | |
| | |
Sanofi | | | 76 | | | | 6,974 | |
| | |
Schneider Electric SE | | | 120 | | | | 11,108 | |
| | |
Thales SA | | | 47 | | | | 4,595 | |
| | |
TOTAL SA | | | 280 | | | | 14,805 | |
| | |
Valeo SA | | | 84 | | | | 3,117 | |
| | |
Vinci SA (b) | | | 85 | | | | 9,541 | |
| | |
Vivendi SA | | | 149 | | | | 4,152 | |
| | | | | | | | |
| | |
| | | | | | | 179,553 | |
| | | | | | | | |
|
Germany — 2.8% | |
| | |
adidas AG | | | 26 | | | | 8,079 | |
| | |
Allianz SE (Registered) | | | 57 | | | | 13,811 | |
| | |
BASF SE | | | 60 | | | | 4,538 | |
| | |
Bayer AG (Registered) | | | 90 | | | | 6,994 | |
| | |
Daimler AG (Registered) | | | 55 | | | | 3,203 | |
| | |
Deutsche Post AG (Registered) | | | 266 | | | | 9,434 | |
| | |
Deutsche Telekom AG (Registered) | | | 530 | | | | 9,332 | |
| | |
Fresenius SE & Co. KGaA | | | 113 | | | | 5,951 | |
| | |
Infineon Technologies AG | | | 339 | | | | 6,573 | |
| | |
Merck KGaA | | | 46 | | | | 5,544 | |
| | |
Muenchener Rueckversicherungs-Gesellschaft AG (Registered) | | | 31 | | | | 8,500 | |
| | |
RWE AG | | | 170 | | | | 5,168 | |
| | |
SAP SE | | | 108 | | | | 14,253 | |
| | |
Siemens AG (Registered) | | | 71 | | | | 8,150 | |
| | |
Volkswagen AG (Preference) | | | 49 | | | | 9,389 | |
| | | | | | | | |
| | |
| | | | | | | 118,919 | |
| | | | | | | | |
SEE NOTES TO FINANCIAL STATEMENTS.
| | | | | | | | |
| | | |
| OCTOBER 31, 2019 | | J.P. MORGAN INTERNATIONAL EQUITY FUNDS | | | | | 39 | |
JPMorgan Global Research Enhanced Index Fund
SCHEDULE OF PORTFOLIO INVESTMENTS
AS OF OCTOBER 31, 2019 (continued)
| | | | | | | | |
| INVESTMENTS | | SHARES
(000) | | | VALUE
($000) | |
Common Stocks — continued | |
|
Hong Kong — 1.1% | |
| | |
AIA Group Ltd. | | | 1,291 | | | | 12,860 | |
| | |
ASM Pacific Technology Ltd. | | | 45 | | | | 627 | |
| | |
Bank of East Asia Ltd. (The) | | | 41 | | | | 99 | |
| | |
CK Asset Holdings Ltd. | | | 228 | | | | 1,589 | |
| | |
CK Infrastructure Holdings Ltd. | | | 188 | | | | 1,349 | |
| | |
CLP Holdings Ltd. | | | 209 | | | | 2,165 | |
| | |
Hang Lung Properties Ltd. | | | 59 | | | | 130 | |
| | |
Hang Seng Bank Ltd. (b) | | | 90 | | | | 1,884 | |
| | |
Henderson Land Development Co. Ltd. | | | 231 | | | | 1,156 | |
| | |
HKT Trust & HKT Ltd. | | | 371 | | | | 577 | |
| | |
Hong Kong & China Gas Co. Ltd. | | | 771 | | | | 1,497 | |
| | |
Hong Kong Exchanges & Clearing Ltd. | | | 182 | | | | 5,667 | |
| | |
Hongkong Land Holdings Ltd. | | | 125 | | | | 688 | |
| | |
Jardine Matheson Holdings Ltd. | | | 13 | | | | 713 | |
| | |
Kerry Properties Ltd. | | | 177 | | | | 572 | |
| | |
Link, REIT | | | 202 | | | | 2,195 | |
| | |
MTR Corp. Ltd. | | | 135 | | | | 771 | |
| | |
New World Development Co. Ltd. | | | 410 | | | | 587 | |
| | |
NWS Holdings Ltd. | | | 274 | | | | 408 | |
| | |
Power Assets Holdings Ltd. | | | 222 | | | | 1,584 | |
| | |
Sino Land Co. Ltd. | | | 606 | | | | 906 | |
| | |
Sun Hung Kai Properties Ltd. | | | 188 | | | | 2,849 | |
| | |
Swire Pacific Ltd., Class A | | | 106 | | | | 1,010 | |
| | |
Techtronic Industries Co. Ltd. | | | 135 | | | | 1,051 | |
| | |
WH Group Ltd. (c) | | | 692 | | | | 730 | |
| | |
Wharf Holdings Ltd. (The) | | | 232 | | | | 526 | |
| | |
Wharf Real Estate Investment Co. Ltd. | | | 189 | | | | 1,112 | |
| | |
Wheelock & Co. Ltd. | | | 174 | | | | 1,076 | |
| | |
Yue Yuen Industrial Holdings Ltd. | | | 167 | | | | 469 | |
| | | | | | | | |
| | |
| | | | | | | 46,847 | |
| | | | | | | | |
|
Ireland — 0.6% | |
| | |
CRH plc | | | 208 | | | | 7,589 | |
| | |
Kerry Group plc, Class A | | | 48 | | | | 5,801 | |
| | |
Kingspan Group plc | | | 91 | | | | 4,721 | |
| | |
Kingspan Group plc | | | 8 | | | | 392 | |
| | |
Ryanair Holdings plc, ADR * | | | 64 | | | | 4,792 | |
| | | | | | | | |
| | |
| | | | | | | 23,295 | |
| | | | | | | | |
|
Israel — 0.0% (a) | |
| | |
Teva Pharmaceutical Industries Ltd., ADR * | | | 155 | | | | 1,261 | |
| | | | | | | | |
|
Italy — 0.7% | |
| | |
Davide Campari-Milano SpA (b) | | | 455 | | | | 4,176 | |
| | |
Enel SpA | | | 1,418 | | | | 10,989 | |
| | |
FinecoBank Banca Fineco SpA | | | 254 | | | | 2,861 | |
| | | | | | | | |
| INVESTMENTS | | SHARES
(000) | | | VALUE
($000) | |
| |
|
Italy — continued | |
| | |
Snam SpA | | | 955 | | | | 4,904 | |
| | |
UniCredit SpA (b) | | | 432 | | | | 5,480 | |
| | | | | | | | |
| | |
| | | | | | | 28,410 | |
| | | | | | | | |
|
Japan — 8.2% | |
| | |
Alfresa Holdings Corp. | | | 22 | | | | 498 | |
| | |
Amada Holdings Co. Ltd. | | | 116 | | | | 1,315 | |
| | |
Asahi Group Holdings Ltd. | | | 71 | | | | 3,560 | |
| | |
Asahi Intecc Co. Ltd. | | | 11 | | | | 314 | |
| | |
Asahi Kasei Corp. | | | 243 | | | | 2,700 | |
| | |
Astellas Pharma, Inc. | | | 162 | | | | 2,785 | |
| | |
Bandai Namco Holdings, Inc. | | | 31 | | | | 1,925 | |
| | |
Bridgestone Corp. | | | 39 | | | | 1,612 | |
| | |
Canon, Inc. | | | 70 | | | | 1,918 | |
| | |
Central Japan Railway Co. | | | 15 | | | | 3,077 | |
| | |
Chubu Electric Power Co., Inc. | | | 106 | | | | 1,586 | |
| | |
Chugai Pharmaceutical Co. Ltd. | | | 14 | | | | 1,161 | |
| | |
Dai Nippon Printing Co. Ltd. | | | 25 | | | | 676 | |
| | |
Daicel Corp. | | | 85 | | | | 759 | |
| | |
Daifuku Co. Ltd. | | | 4 | | | | 228 | |
| | |
Dai-ichi Life Holdings, Inc. | | | 84 | | | | 1,366 | |
| | |
Daiichi Sankyo Co. Ltd. | | | 74 | | | | 4,846 | |
| | |
Daikin Industries Ltd. | | | 33 | | | | 4,549 | |
| | |
Daito Trust Construction Co. Ltd. | | | 4 | | | | 504 | |
| | |
Daiwa House Industry Co. Ltd. | | | 106 | | | | 3,649 | |
| | |
Daiwa House REIT Investment Corp., REIT | | | — | (d) | | | 402 | |
| | |
Denso Corp. | | | 75 | | | | 3,478 | |
| | |
Dentsu, Inc. | | | 33 | | | | 1,162 | |
| | |
East Japan Railway Co. | | | 46 | | | | 4,185 | |
| | |
Eisai Co. Ltd. | | | 6 | | | | 456 | |
| | |
Electric Power Development Co. Ltd. | | | 70 | | | | 1,697 | |
| | |
FANUC Corp. | | | 13 | | | | 2,466 | |
| | |
Fast Retailing Co. Ltd. | | | 5 | | | | 3,145 | |
| | |
FUJIFILM Holdings Corp. | | | 63 | | | | 2,748 | |
| | |
Fujitsu Ltd. | | | 14 | | | | 1,214 | |
| | |
Fukuoka Financial Group, Inc. | | | 59 | | | | 1,132 | |
| | |
Hankyu Hanshin Holdings, Inc. | | | 38 | | | | 1,501 | |
| | |
Hino Motors Ltd. | | | 96 | | | | 910 | |
| | |
Hitachi High-Technologies Corp. | | | 20 | | | | 1,251 | |
| | |
Hitachi Ltd. | | | 140 | | | | 5,218 | |
| | |
Honda Motor Co. Ltd. | | | 222 | | | | 6,003 | |
| | |
Hoya Corp. | | | 46 | | | | 4,083 | |
| | |
Idemitsu Kosan Co. Ltd. | | | 14 | | | | 417 | |
| | |
Inpex Corp. | | | 41 | | | | 374 | |
| | |
ITOCHU Corp. | | | 188 | | | | 3,939 | |
SEE NOTES TO FINANCIAL STATEMENTS.
| | | | | | |
| | | |
| 40 | | | | J.P. MORGAN INTERNATIONAL EQUITY FUNDS | | OCTOBER 31, 2019 |
| | | | | | | | |
| INVESTMENTS | | SHARES
(000) | | | VALUE
($000) | |
Common Stocks — continued | | | | | | | | |
|
Japan — continued | |
| | |
J Front Retailing Co. Ltd. | | | 120 | | | | 1,522 | |
| | |
Japan Airlines Co. Ltd. | | | 56 | | | | 1,729 | |
| | |
Japan Exchange Group, Inc. | | | 102 | | | | 1,689 | |
| | |
Japan Post Holdings Co. Ltd. | | | 49 | | | | 446 | |
| | |
Japan Prime Realty Investment Corp., REIT | | | — | (d) | | | 481 | |
| | |
Japan Real Estate Investment Corp., REIT | | | — | (d) | | | 764 | |
| | |
Japan Retail Fund Investment Corp., REIT | | | — | (d) | | | 908 | |
| | |
Japan Tobacco, Inc. | | | 119 | | | | 2,678 | |
| | |
JFE Holdings, Inc. | | | 24 | | | | 303 | |
| | |
JTEKT Corp. | | | 26 | | | | 326 | |
| | |
JXTG Holdings, Inc. | | | 627 | | | | 2,931 | |
| | |
Kajima Corp. | | | 157 | | | | 2,162 | |
| | |
Kansai Paint Co. Ltd. | | | 18 | | | | 443 | |
| | |
Kao Corp. | | | 71 | | | | 5,732 | |
| | |
KDDI Corp. | | | 139 | | | | 3,846 | |
| | |
Keikyu Corp. | | | 30 | | | | 587 | |
| | |
Keyence Corp. | | | 11 | | | | 7,082 | |
| | |
Kikkoman Corp. | | | 7 | | | | 356 | |
| | |
Kintetsu Group Holdings Co. Ltd. | | | 14 | | | | 758 | |
| | |
Kirin Holdings Co. Ltd. | | | 101 | | | | 2,143 | |
| | |
Komatsu Ltd. | | | 119 | | | | 2,775 | |
| | |
Konami Holdings Corp. | | | 20 | | | | 878 | |
| | |
Kubota Corp. | | | 185 | | | | 2,932 | |
| | |
Kuraray Co. Ltd. | | | 79 | | | | 936 | |
| | |
Kyocera Corp. | | | 33 | | | | 2,132 | |
| | |
Kyowa Kirin Co. Ltd. | | | 104 | | | | 1,906 | |
| | |
M3, Inc. | | | 68 | | | | 1,618 | |
| | |
Marui Group Co. Ltd. (b) | | | 87 | | | | 1,943 | |
| | |
MEIJI Holdings Co. Ltd. | | | 7 | | | | 476 | |
| | |
MINEBEA MITSUMI, Inc. | | | 60 | | | | 1,141 | |
| | |
MISUMI Group, Inc. | | | 16 | | | | 392 | |
| | |
Mitsubishi Corp. | | | 197 | | | | 5,013 | |
| | |
Mitsubishi Electric Corp. | | | 166 | | | | 2,373 | |
| | |
Mitsubishi Estate Co. Ltd. | | | 160 | | | | 3,105 | |
| | |
Mitsubishi UFJ Financial Group, Inc. | | | 1,416 | | | | 7,340 | |
| | |
Mitsui & Co. Ltd. | | | 188 | | | | 3,225 | |
| | |
Mitsui Chemicals, Inc. | | | 82 | | | | 1,957 | |
| | |
Mitsui Fudosan Co. Ltd. | | | 155 | | | | 3,960 | |
| | |
Mizuho Financial Group, Inc. | | | 1,353 | | | | 2,100 | |
| | |
MS&AD Insurance Group Holdings, Inc. | | | 30 | | | | 969 | |
| | |
Murata Manufacturing Co. Ltd. | | | 31 | | | | 1,704 | |
| | |
Nabtesco Corp. | | | 46 | | | | 1,471 | |
| | |
Nexon Co. Ltd. * | | | 39 | | | | 448 | |
| | |
NGK Spark Plug Co. Ltd. | | | 79 | | | | 1,594 | |
| | |
NH Foods Ltd. | | | 23 | | | | 945 | |
| | |
Nidec Corp. | | | 31 | | | | 4,623 | |
| | | | | | | | |
| INVESTMENTS | | SHARES
(000) | | | VALUE
($000) | |
| | | | | | | | |
|
Japan — continued | |
| | |
Nintendo Co. Ltd. | | | 14 | | | | 5,135 | |
| | |
Nippon Building Fund, Inc., REIT | | | — | (d) | | | 850 | |
| | |
Nippon Prologis REIT, Inc., REIT | | | — | (d) | | | 385 | |
| | |
Nippon Steel Corp. | | | 124 | | | | 1,803 | |
| | |
Nippon Telegraph & Telephone Corp. | | | 97 | | | | 4,835 | |
| | |
Nippon Yusen KK | | | 50 | | | | 900 | |
| | |
Nissan Motor Co. Ltd. | | | 225 | | | | 1,419 | |
| | |
Nissin Foods Holdings Co. Ltd. | | | 19 | | | | 1,420 | |
| | |
Nitori Holdings Co. Ltd. | | | 16 | | | | 2,466 | |
| | |
Nitto Denko Corp. | | | 33 | | | | 1,842 | |
| | |
Nomura Holdings, Inc. | | | 241 | | | | 1,096 | |
| | |
Nomura Real Estate Master Fund, Inc., REIT | | | — | (d) | | | 759 | |
| | |
Nomura Research Institute Ltd. | | | 92 | | | | 1,962 | |
| | |
NTT DOCOMO, Inc. | | | 197 | | | | 5,409 | |
| | |
Obic Co. Ltd. | | | 5 | | | | 639 | |
| | |
Oji Holdings Corp. | | | 72 | | | | 374 | |
| | |
Olympus Corp. | | | 80 | | | | 1,087 | |
| | |
Ono Pharmaceutical Co. Ltd. | | | 57 | | | | 1,066 | |
| | |
Oriental Land Co. Ltd. | | | 11 | | | | 1,642 | |
| | |
ORIX Corp. | | | 178 | | | | 2,804 | |
| | |
Otsuka Corp. | | | 46 | | | | 1,863 | |
| | |
Otsuka Holdings Co. Ltd. | | | 82 | | | | 3,431 | |
| | |
Pan Pacific International Holdings Corp. | | | 23 | | | | 359 | |
| | |
Panasonic Corp. | | | 279 | | | | 2,348 | |
| | |
PeptiDream, Inc. * | | | 6 | | | | 286 | |
| | |
Persol Holdings Co. Ltd. | | | 59 | | | | 1,127 | |
| | |
Rakuten, Inc. | | | 45 | | | | 424 | |
| | |
Recruit Holdings Co. Ltd. | | | 106 | | | | 3,513 | |
| | |
Renesas Electronics Corp. * | | | 195 | | | | 1,319 | |
| | |
Resona Holdings, Inc. | | | 440 | | | | 1,911 | |
| | |
Ricoh Co. Ltd. | | | 35 | | | | 312 | |
| | |
Rohm Co. Ltd. | | | 20 | | | | 1,569 | |
| | |
Ryohin Keikaku Co. Ltd. | | | 63 | | | | 1,403 | |
| | |
Santen Pharmaceutical Co. Ltd. | | | 25 | | | | 443 | |
| | |
SBI Holdings, Inc. | | | 52 | | | | 1,140 | |
| | |
Secom Co. Ltd. | | | 11 | | | | 1,047 | |
| | |
Sega Sammy Holdings, Inc. | | | 106 | | | | 1,492 | |
| | |
Seibu Holdings, Inc. | | | 111 | | | | 1,956 | |
| | |
Sekisui House Ltd. | | | 73 | | | | 1,579 | |
| | |
Seven & i Holdings Co. Ltd. | | | 91 | | | | 3,442 | |
| | |
Shimadzu Corp. | | | 36 | | | | 967 | |
| | |
Shimano, Inc. | | | 6 | | | | 1,065 | |
| | |
Shimizu Corp. | | | 114 | | | | 1,058 | |
| | |
Shin-Etsu Chemical Co. Ltd. | | | 51 | | | | 5,709 | |
| | |
Shionogi & Co. Ltd. | | | 12 | | | | 744 | |
| | |
Shiseido Co. Ltd. | | | 51 | | | | 4,221 | |
SEE NOTES TO FINANCIAL STATEMENTS.
| | | | | | | | |
| | | |
| OCTOBER 31, 2019 | | J.P. MORGAN INTERNATIONAL EQUITY FUNDS | | | | | 41 | |
JPMorgan Global Research Enhanced Index Fund
SCHEDULE OF PORTFOLIO INVESTMENTS
AS OF OCTOBER 31, 2019 (continued)
| | | | | | | | |
| INVESTMENTS | | SHARES
(000) | | | VALUE
($000) | |
Common Stocks — continued | | | | | | | | |
|
Japan — continued | |
| | |
SMC Corp. | | | 6 | | | | 2,765 | |
| | |
Softbank Corp. | | | 99 | | | | 1,353 | |
| | |
SoftBank Group Corp. | | | 154 | | | | 5,924 | |
| | |
Sompo Holdings, Inc. | | | 21 | | | | 821 | |
| | |
Sony Corp. | | | 146 | | | | 8,881 | |
| | |
Stanley Electric Co. Ltd. | | | 13 | | | | 354 | |
| | |
Subaru Corp. | | | 21 | | | | 608 | |
| | |
Sumitomo Electric Industries Ltd. | | | 114 | | | | 1,556 | |
| | |
Sumitomo Metal Mining Co. Ltd. | | | 16 | | | | 545 | |
| | |
Sumitomo Mitsui Financial Group, Inc. | | | 173 | | | | 6,153 | |
| | |
Sumitomo Mitsui Trust Holdings, Inc. | | | 44 | | | | 1,593 | |
| | |
Suntory Beverage & Food Ltd. | | | 13 | | | | 560 | |
| | |
Suzuken Co. Ltd. | | | 31 | | | | 1,666 | |
| | |
Suzuki Motor Corp. | | | 62 | | | | 2,918 | |
| | |
T&D Holdings, Inc. | | | 163 | | | | 1,820 | |
| | |
Taiheiyo Cement Corp. | | | 38 | | | | 1,061 | |
| | |
Takeda Pharmaceutical Co. Ltd. | | | 163 | | | | 5,904 | |
| | |
TDK Corp. | | | 8 | | | | 799 | |
| | |
Terumo Corp. | | | 56 | | | | 1,834 | |
| | |
Tohoku Electric Power Co., Inc. | | | 74 | | | | 758 | |
| | |
Tokio Marine Holdings, Inc. | | | 81 | | | | 4,390 | |
| | |
Tokyo Electric Power Co. Holdings, Inc. * | | | 73 | | | | 337 | |
| | |
Tokyo Electron Ltd. | | | 8 | | | | 1,560 | |
| | |
Tokyo Gas Co. Ltd. | | | 74 | | | | 1,797 | |
| | |
Tokyu Corp. | | | 143 | | | | 2,699 | |
| | |
Tokyu Fudosan Holdings Corp. | | | 143 | | | | 947 | |
| | |
Toppan Printing Co. Ltd. | | | 29 | | | | 533 | |
| | |
Toray Industries, Inc. | | | 101 | | | | 714 | |
| | |
Toshiba Corp. | | | 43 | | | | 1,453 | |
| | |
Toyota Industries Corp. | | | 9 | | | | 540 | |
| | |
Toyota Motor Corp. | | | 249 | | | | 17,255 | |
| | |
Toyota Tsusho Corp. | | | 13 | | | | 442 | |
| | |
Trend Micro, Inc. | | | 7 | | | | 358 | |
| | |
Unicharm Corp. | | | 18 | | | | 600 | |
| | |
United Urban Investment Corp., REIT | | | — | (d) | | | 480 | |
| | |
Yakult Honsha Co. Ltd. | | | 7 | | | | 424 | |
| | |
Yamato Holdings Co. Ltd. | | | 40 | | | | 673 | |
| | |
Yaskawa Electric Corp. | | | 11 | | | | 430 | |
| | |
Z Holdings Corp. | | | 145 | | | | 445 | |
| | | | | | | | |
| | |
| | | | | | | 346,222 | |
| | | | | | | | |
|
Macau — 0.1% | |
| | |
Galaxy Entertainment Group Ltd. | | | 289 | | | | 1,990 | |
| | |
Sands China Ltd. | | | 339 | | | | 1,671 | |
| | |
Wynn Macau Ltd. | | | 211 | | | | 457 | |
| | | | | | | | |
| | |
| | | | | | | 4,118 | |
| | | | | | | | |
| | | | | | | | |
| INVESTMENTS | | SHARES
(000) | | | VALUE
($000) | |
| | | | | | | | |
|
Netherlands — 2.1% | |
| | |
Akzo Nobel NV | | | 78 | | | | 7,197 | |
| | |
ASML Holding NV | | | 55 | | | | 14,511 | |
| | |
Heineken NV | | | 45 | | | | 4,643 | |
| | |
ING Groep NV | | | 866 | | | | 9,811 | |
| | |
Koninklijke Ahold Delhaize NV | | | 325 | | | | 8,089 | |
| | |
Koninklijke Philips NV | | | 110 | | | | 4,841 | |
| | |
NN Group NV | | | 137 | | | | 5,210 | |
| | |
NXP Semiconductors NV | | | 34 | | | | 3,835 | |
| | |
Randstad NV | | | 53 | | | | 2,923 | |
| | |
Royal Dutch Shell plc, Class A | | | 569 | | | | 16,487 | |
| | |
Royal Dutch Shell plc, Class B | | | 274 | | | | 7,880 | |
| | |
Wolters Kluwer NV | | | 68 | | | | 5,011 | |
| | | | | | | | |
| | |
| | | | | | | 90,438 | |
| | | | | | | | |
|
New Zealand — 0.1% | |
| | |
Auckland International Airport Ltd. | | | 178 | | | | 1,061 | |
| | |
Fletcher Building Ltd. | | | 159 | | | | 468 | |
| | |
Ryman Healthcare Ltd. | | | 79 | | | | 652 | |
| | |
Spark New Zealand Ltd. | | | 341 | | | | 978 | |
| | | | | | | | |
| | |
| | | | | | | 3,159 | |
| | | | | | | | |
|
Norway — 0.1% | |
| | |
Telenor ASA | | | 290 | | | | 5,424 | |
| | | | | | | | |
|
Singapore — 0.5% | |
| | |
Ascendas, REIT | | | 401 | | | | 934 | |
| | |
CapitaLand Ltd. | | | 446 | | | | 1,180 | |
| | |
CapitaLand Mall Trust, REIT | | | 299 | | | | 559 | |
| | |
ComfortDelGro Corp. Ltd. | | | 260 | | | | 439 | |
| | |
DBS Group Holdings Ltd. | | | 274 | | | | 5,213 | |
| | |
Genting Singapore Ltd. | | | 582 | | | | 402 | |
| | |
Jardine Cycle & Carriage Ltd. | | | 13 | | | | 305 | |
| | |
Keppel Corp. Ltd. | | | 220 | | | | 1,109 | |
| | |
Oversea-Chinese Banking Corp. Ltd. | | | 587 | | | | 4,722 | |
| | |
Singapore Airlines Ltd. | | | 64 | | | | 440 | |
| | |
Singapore Press Holdings Ltd. | | | 153 | | | | 249 | |
| | |
Singapore Telecommunications Ltd. | | | 1,372 | | | | 3,322 | |
| | |
United Overseas Bank Ltd. | | | 40 | | | | 793 | |
| | |
Wilmar International Ltd. | | | 400 | | | | 1,099 | |
| | | | | | | | |
| | |
| | | | | | | 20,766 | |
| | | | | | | | |
|
Spain — 0.8% | |
| | |
Amadeus IT Group SA | | | 88 | | | | 6,483 | |
| | |
Banco Santander SA (b) | | | 1,036 | | | | 4,160 | |
| | |
Endesa SA | | | 163 | | | | 4,426 | |
| | |
Iberdrola SA | | | 1,039 | | | | 10,677 | |
| | |
Industria de Diseno Textil SA | | | 130 | | | | 4,063 | |
SEE NOTES TO FINANCIAL STATEMENTS.
| | | | | | |
| | | |
| 42 | | | | J.P. MORGAN INTERNATIONAL EQUITY FUNDS | | OCTOBER 31, 2019 |
| | | | | | | | |
| INVESTMENTS | | SHARES
(000) | | | VALUE
($000) | |
Common Stocks — continued | | | | | | | | |
|
Spain — continued | |
| | |
Telefonica SA | | | 352 | | | | 2,702 | |
| | | | | | | | |
| | |
| | | | | | | 32,511 | |
| | | | | | | | |
|
Sweden — 0.6% | |
| | |
Boliden AB | | | 129 | | | | 3,478 | |
| | |
Lundin Petroleum AB (b) | | | 92 | | | | 3,039 | |
| | |
Sandvik AB | | | 260 | | | | 4,601 | |
| | |
SKF AB, Class B | | | 117 | | | | 2,119 | |
| | |
Svenska Handelsbanken AB, Class A (b) | | | 718 | | | | 7,205 | |
| | |
Volvo AB, Class B | | | 213 | | | | 3,185 | |
| | | | | | | | |
| | |
| | | | | | | 23,627 | |
| | | | | | | | |
|
Switzerland — 2.8% | |
| | |
ABB Ltd. (Registered) | | | 159 | | | | 3,333 | |
| | |
Cie Financiere Richemont SA (Registered) | | | 55 | | | | 4,310 | |
| | |
Credit Suisse Group AG (Registered) * | | | 545 | | | | 6,750 | |
| | |
LafargeHolcim Ltd. (Registered) * | | | 92 | | | | 4,771 | |
| | |
Lonza Group AG (Registered) * | | | 18 | | | | 6,581 | |
| | |
Nestle SA (Registered) | | | 333 | | | | 35,643 | |
| | |
Novartis AG (Registered) | | | 260 | | | | 22,720 | |
| | |
Roche Holding AG | | | 88 | | | | 26,407 | |
| | |
UBS Group AG (Registered) * | | | 322 | | | | 3,808 | |
| | |
Zurich Insurance Group AG | | | 9 | | | | 3,528 | |
| | | | | | | | |
| | |
| | | | | | | 117,851 | |
| | | | | | | | |
|
United Kingdom — 4.8% | |
| | |
3i Group plc | | | 444 | | | | 6,481 | |
| | |
AstraZeneca plc | | | 83 | | | | 8,096 | |
| | |
Barclays plc | | | 2,931 | | | | 6,359 | |
| | |
Beazley plc | | | 531 | | | | 4,035 | |
| | |
BP plc | | | 2,747 | | | | 17,419 | |
| | |
British American Tobacco plc | | | 145 | | | | 5,074 | |
| | |
Burberry Group plc | | | 164 | | | | 4,340 | |
| | |
CK Hutchison Holdings Ltd. | | | 345 | | | | 3,184 | |
| | |
Compass Group plc | | | 101 | | | | 2,688 | |
| | |
Diageo plc | | | 337 | | | | 13,807 | |
| | |
Fiat Chrysler Automobiles NV | | | 256 | | | | 3,979 | |
| | |
GlaxoSmithKline plc | | | 296 | | | | 6,783 | |
| | |
HSBC Holdings plc | | | 1,573 | | | | 11,884 | |
| | |
Imperial Brands plc | | | 148 | | | | 3,255 | |
| | |
InterContinental Hotels Group plc | | | 60 | | | | 3,654 | |
| | |
Intertek Group plc | | | 57 | | | | 3,922 | |
| | |
Liberty Global plc, Class C * | | | 19 | | | | 459 | |
| | |
Linde plc | | | 56 | | | | 11,068 | |
| | |
Lloyds Banking Group plc | | | 5,868 | | | | 4,316 | |
| | |
London Stock Exchange Group plc | | | 62 | | | | 5,547 | |
| | | | | | | | |
| INVESTMENTS | | SHARES
(000) | | | VALUE
($000) | |
| | | | | | | | |
|
United Kingdom — continued | |
| | |
M&G plc * | | | 525 | | | | 1,454 | |
| | |
Persimmon plc | | | 109 | | | | 3,215 | |
| | |
Prudential plc | | | 525 | | | | 9,168 | |
| | |
Reckitt Benckiser Group plc | | | 74 | | | | 5,692 | |
| | |
RELX plc | | | 282 | | | | 6,789 | |
| | |
SSE plc | | | 409 | | | | 6,808 | |
| | |
St James’s Place plc | | | 284 | | | | 3,836 | |
| | |
Standard Chartered plc | | | 715 | | | | 6,489 | |
| | |
Taylor Wimpey plc | | | 2,443 | | | | 5,240 | |
| | |
Tesco plc | | | 1,811 | | | | 5,527 | |
| | |
Unilever NV (b) | | | 196 | | | | 11,561 | |
| | |
Unilever plc | | | 84 | | | | 5,041 | |
| | |
Vodafone Group plc | | | 2,146 | | | | 4,379 | |
| | | | | | | | |
| | |
| | | | | | | 201,549 | |
| | | | | | | | |
|
United States — 61.1% | |
| | |
Abbott Laboratories | | | 60 | | | | 5,012 | |
| | |
AbbVie, Inc. | | | 250 | | | | 19,906 | |
| | |
Accenture plc, Class A | | | 93 | | | | 17,263 | |
| | |
Adobe, Inc. * | | | 23 | | | | 6,281 | |
| | |
Advance Auto Parts, Inc. | | | 41 | | | | 6,733 | |
| | |
Advanced Micro Devices, Inc. * | | | 258 | | | | 8,739 | |
| | |
AES Corp. | | | 67 | | | | 1,143 | |
| | |
Akamai Technologies, Inc. * | | | 10 | | | | 869 | |
| | |
Alexion Pharmaceuticals, Inc. * | | | 60 | | | | 6,352 | |
| | |
Alleghany Corp. * | | | 1 | | | | 516 | |
| | |
Allergan plc | | | 33 | | | | 5,782 | |
| | |
Allstate Corp. (The) | | | 65 | | | | 6,885 | |
| | |
Alphabet, Inc., Class A * | | | 32 | | | | 39,692 | |
| | |
Alphabet, Inc., Class C * | | | 37 | | | | 47,013 | |
| | |
Altice USA, Inc., Class A * | | | 153 | | | | 4,746 | |
| | |
Altria Group, Inc. | | | 179 | | | | 8,015 | |
| | |
Amazon.com, Inc. * | | | 45 | | | | 80,005 | |
| | |
American Electric Power Co., Inc. | | | 88 | | | | 8,282 | |
| | |
American Express Co. | | | 96 | | | | 11,270 | |
| | |
American International Group, Inc. | | | 259 | | | | 13,713 | |
| | |
American Tower Corp., REIT | | | 6 | | | | 1,372 | |
| | |
Ameriprise Financial, Inc. | | | 62 | | | | 9,430 | |
| | |
Amgen, Inc. | | | 15 | | | | 3,274 | |
| | |
Analog Devices, Inc. | | | 150 | | | | 15,972 | |
| | |
Anthem, Inc. | | | 50 | | | | 13,339 | |
| | |
Apple, Inc. | | | 482 | | | | 119,865 | |
| | |
Aramark | | | 25 | | | | 1,107 | |
| | |
Arch Capital Group Ltd. * | | | 15 | | | | 613 | |
| | |
Arrow Electronics, Inc. * | | | 9 | | | | 726 | |
SEE NOTES TO FINANCIAL STATEMENTS.
| | | | | | | | |
| | | |
| OCTOBER 31, 2019 | | J.P. MORGAN INTERNATIONAL EQUITY FUNDS | | | | | 43 | |
JPMorgan Global Research Enhanced Index Fund
SCHEDULE OF PORTFOLIO INVESTMENTS
AS OF OCTOBER 31, 2019 (continued)
| | | | | | | | |
| INVESTMENTS | | SHARES
(000) | | | VALUE
($000) | |
Common Stocks — continued | | | | | | | | |
|
United States — continued | |
| | |
AT&T, Inc. | | | 372 | | | | 14,310 | |
| | |
Automatic Data Processing, Inc. | | | 121 | | | | 19,709 | |
| | |
AutoZone, Inc. * | | | 11 | | | | 12,269 | |
| | |
AvalonBay Communities, Inc., REIT | | | 25 | | | | 5,452 | |
| | |
Avery Dennison Corp. | | | 32 | | | | 4,100 | |
| | |
Bank of America Corp. | | | 1,240 | | | | 38,786 | |
| | |
BB&T Corp. | | | 77 | | | | 4,058 | |
| | |
Becton Dickinson and Co. | | | 42 | | | | 10,818 | |
| | |
Berkshire Hathaway, Inc., Class B * | | | 127 | | | | 26,993 | |
| | |
Best Buy Co., Inc. | | | 153 | | | | 11,015 | |
| | |
Biogen, Inc. * | | | 34 | | | | 10,274 | |
| | |
BioMarin Pharmaceutical, Inc. * | | | 16 | | | | 1,156 | |
| | |
BlackRock, Inc. | | | 28 | | | | 12,971 | |
| | |
Boeing Co. (The) | | | 27 | | | | 9,012 | |
| | |
Booking Holdings, Inc. * | | | 4 | | | | 7,240 | |
| | |
BorgWarner, Inc. | | | 31 | | | | 1,297 | |
| | |
Boston Properties, Inc., REIT | | | 14 | | | | 1,974 | |
| | |
Boston Scientific Corp. * | | | 374 | | | | 15,605 | |
| | |
Bristol-Myers Squibb Co. | | | 233 | | | | 13,369 | |
| | |
Broadcom, Inc. | | | 12 | | | | 3,409 | |
| | |
Cadence Design Systems, Inc. * | | | 28 | | | | 1,852 | |
| | |
Camden Property Trust, REIT | | | 7 | | | | 821 | |
| | |
Capital One Financial Corp. | | | 115 | | | | 10,681 | |
| | |
Caterpillar, Inc. | | | 67 | | | | 9,267 | |
| | |
CBRE Group, Inc., Class A * | | | 34 | | | | 1,817 | |
| | |
CDK Global, Inc. | | | 13 | | | | 675 | |
| | |
CDW Corp. | | | 15 | | | | 1,878 | |
| | |
Celanese Corp. | | | 84 | | | | 10,150 | |
| | |
Celgene Corp. * | | | 96 | | | | 10,318 | |
| | |
Cerner Corp. | | | 10 | | | | 702 | |
| | |
Charles Schwab Corp. (The) | | | 156 | | | | 6,365 | |
| | |
Charter Communications, Inc., Class A * | | | 44 | | | | 20,726 | |
| | |
Cheniere Energy, Inc. * | | | 22 | | | | 1,381 | |
| | |
Chevron Corp. | | | 256 | | | | 29,687 | |
| | |
Chubb Ltd. | | | 17 | | | | 2,564 | |
| | |
Cigna Corp. | | | 101 | | | | 18,046 | |
| | |
Cincinnati Financial Corp. | | | 16 | | | | 1,793 | |
| | |
Cisco Systems, Inc. | | | 236 | | | | 11,210 | |
| | |
Citigroup, Inc. | | | 417 | | | | 29,933 | |
| | |
Citizens Financial Group, Inc. | | | 184 | | | | 6,482 | |
| | |
CME Group, Inc. | | | 8 | | | | 1,581 | |
| | |
CMS Energy Corp. | | | 106 | | | | 6,744 | |
| | |
Coca-Cola Co. (The) | | | 632 | | | | 34,378 | |
| | |
Cognizant Technology Solutions Corp., Class A | | | 185 | | | | 11,291 | |
| | | | | | | | |
| INVESTMENTS | | SHARES
(000) | | | VALUE
($000) | |
| | | | | | | | |
|
United States — continued | |
| | |
Comcast Corp., Class A | | | 678 | | | | 30,409 | |
| | |
Conagra Brands, Inc. | | | 51 | | | | 1,385 | |
| | |
Concho Resources, Inc. | | | 53 | | | | 3,548 | |
| | |
Constellation Brands, Inc., Class A | | | 24 | | | | 4,588 | |
| | |
Cooper Cos., Inc. (The) | | | 4 | | | | 1,177 | |
| | |
Corteva, Inc. | | | 242 | | | | 6,377 | |
| | |
Crown Holdings, Inc. * | | | 101 | | | | 7,327 | |
| | |
Cummins, Inc. | | | 64 | | | | 10,967 | |
| | |
CVS Health Corp. | | | 31 | | | | 2,085 | |
| | |
Danaher Corp. | | | 46 | | | | 6,406 | |
| | |
Darden Restaurants, Inc. | | | 11 | | | | 1,188 | |
| | |
DaVita, Inc. * | | | 10 | | | | 596 | |
| | |
Deere & Co. | | | 61 | | | | 10,674 | |
| | |
Dell Technologies, Inc., Class C * | | | 14 | | | | 736 | |
| | |
Delta Air Lines, Inc. | | | 143 | | | | 7,849 | |
| | |
DexCom, Inc. * | | | 3 | | | | 516 | |
| | |
Diamondback Energy, Inc. | | | 82 | | | | 7,036 | |
| | |
Digital Realty Trust, Inc., REIT | | | 10 | | | | 1,214 | |
| | |
Discovery, Inc., Class A * (b) | | | 159 | | | | 4,281 | |
| | |
Discovery, Inc., Class C * | | | 190 | | | | 4,806 | |
| | |
Dow, Inc. | | | 118 | | | | 5,939 | |
| | |
DuPont de Nemours, Inc. | | | 97 | | | | 6,404 | |
| | |
E *TRADE Financial Corp. | | | 24 | | | | 1,015 | |
| | |
Eastman Chemical Co. | | | 113 | | | | 8,616 | |
| | |
Eaton Corp. plc | | | 195 | | | | 16,991 | |
| | |
Edison International | | | 159 | | | | 10,006 | |
| | |
Edwards Lifesciences Corp. * | | | 9 | | | | 2,179 | |
| | |
Electronic Arts, Inc. * | | | 87 | | | | 8,346 | |
| | |
Eli Lilly & Co. | | | 154 | | | | 17,542 | |
| | |
Emerson Electric Co. | | | 28 | | | | 1,954 | |
| | |
Entergy Corp. | | | 90 | | | | 10,934 | |
| | |
EOG Resources, Inc. | | | 195 | | | | 13,508 | |
| | |
Equinix, Inc., REIT | | | 12 | | | | 6,652 | |
| | |
Equity Residential, REIT | | | 95 | | | | 8,430 | |
| | |
Essex Property Trust, Inc., REIT | | | 20 | | | | 6,601 | |
| | |
Estee Lauder Cos., Inc. (The), Class A | | | 8 | | | | 1,412 | |
| | |
Everest Re Group Ltd. | | | 5 | | | | 1,164 | |
| | |
Exelon Corp. | | | 119 | | | | 5,431 | |
| | |
Expedia Group, Inc. | | | 81 | | | | 11,022 | |
| | |
Exxon Mobil Corp. | | | 231 | | | | 15,617 | |
| | |
F5 Networks, Inc. * | | | 5 | | | | 779 | |
| | |
Facebook, Inc., Class A * | | | 200 | | | | 38,404 | |
| | |
Federal Realty Investment Trust, REIT | | | 43 | | | | 5,900 | |
| | |
Ferguson plc | | | 28 | | | | 2,430 | |
SEE NOTES TO FINANCIAL STATEMENTS.
| | | | | | |
| | | |
| 44 | | | | J.P. MORGAN INTERNATIONAL EQUITY FUNDS | | OCTOBER 31, 2019 |
| | | | | | | | |
| INVESTMENTS | | SHARES
(000) | | | VALUE
($000) | |
Common Stocks — continued | | | | | | | | |
|
United States — continued | |
| | |
Fidelity National Financial, Inc. | | | 11 | | | | 521 | |
| | |
Fidelity National Information Services, Inc. | | | 10 | | | | 1,272 | |
| | |
Fifth Third Bancorp | | | 239 | | | | 6,959 | |
| | |
Fiserv, Inc. * | | | 53 | | | | 5,674 | |
| | |
Flex Ltd. * | | | 25 | | | | 300 | |
| | |
Ford Motor Co. | | | 415 | | | | 3,562 | |
| | |
Fortinet, Inc. * | | | 14 | | | | 1,166 | |
| | |
Franklin Resources, Inc. | | | 177 | | | | 4,883 | |
| | |
Freeport-McMoRan, Inc. | | | 135 | | | | 1,322 | |
| | |
General Dynamics Corp. | | | 91 | | | | 16,121 | |
| | |
General Mills, Inc. | | | 150 | | | | 7,612 | |
| | |
General Motors Co. | | | 173 | | | | 6,442 | |
| | |
Gilead Sciences, Inc. | | | 83 | | | | 5,297 | |
| | |
H&R Block, Inc. | | | 19 | | | | 486 | |
| | |
Hartford Financial Services Group, Inc. (The) | | | 228 | | | | 13,010 | |
| | |
Hasbro, Inc. | | | 22 | | | | 2,092 | |
| | |
HD Supply Holdings, Inc. * | | | 103 | | | | 4,068 | |
| | |
Hilton Worldwide Holdings, Inc. | | | 83 | | | | 8,089 | |
| | |
Hologic, Inc. * | | | 28 | | | | 1,362 | |
| | |
Home Depot, Inc. (The) | | | 145 | | | | 34,011 | |
| | |
Honeywell International, Inc. | | | 146 | | | | 25,222 | |
| | |
Host Hotels & Resorts, Inc., REIT | | | 212 | | | | 3,470 | |
| | |
HP, Inc. | | | 415 | | | | 7,211 | |
| | |
IDEXX Laboratories, Inc. * | | | 8 | | | | 2,288 | |
| | |
Illumina, Inc. * | | | 14 | | | | 4,078 | |
| | |
Ingersoll-Rand plc | | | 93 | | | | 11,748 | |
| | |
Intel Corp. | | | 218 | | | | 12,343 | |
| | |
Intercontinental Exchange, Inc. | | | 194 | | | | 18,263 | |
| | |
International Business Machines Corp. | | | 62 | | | | 8,247 | |
| | |
Intuit, Inc. | | | 70 | | | | 17,945 | |
| | |
Intuitive Surgical, Inc. * | | | 11 | | | | 6,104 | |
| | |
Invesco Ltd. | | | 97 | | | | 1,636 | |
| | |
Invitation Homes, Inc., REIT | | | 19 | | | | 595 | |
| | |
James Hardie Industries plc, CHDI | | | 69 | | | | 1,186 | |
| | |
JM Smucker Co. (The) | | | 11 | | | | 1,143 | |
| | |
Johnson & Johnson | | | 201 | | | | 26,574 | |
| | |
Jones Lang LaSalle, Inc. | | | 4 | | | | 534 | |
| | |
Kansas City Southern | | | 52 | | | | 7,373 | |
| | |
KeyCorp | | | 519 | | | | 9,327 | |
| | |
Kimberly-Clark Corp. | | | 34 | | | | 4,474 | |
| | |
KLA Corp. | | | 17 | | | | 2,829 | |
| | |
Las Vegas Sands Corp. | | | 33 | | | | 2,014 | |
| | |
Lear Corp. | | | 5 | | | | 533 | |
| | |
Leidos Holdings, Inc. | | | 57 | | | | 4,907 | |
| | | | | | | | |
| INVESTMENTS | | SHARES
(000) | | | VALUE
($000) | |
| | | | | | | | |
|
United States — continued | |
| | |
Lennar Corp., Class A | | | 123 | | | | 7,325 | |
| | |
Liberty Broadband Corp., Class C * | | | 11 | | | | 1,303 | |
| | |
Lincoln National Corp. | | | 39 | | | | 2,208 | |
| | |
Lowe’s Cos., Inc. | | | 158 | | | | 17,672 | |
| | |
Lyft, Inc., Class A * | | | 42 | | | | 1,752 | |
| | |
LyondellBasell Industries NV, Class A | | | 28 | | | | 2,546 | |
| | |
ManpowerGroup, Inc. | | | 7 | | | | 612 | |
| | |
Marathon Petroleum Corp. | | | 202 | | | | 12,928 | |
| | |
Marvell Technology Group Ltd. | | | 131 | | | | 3,202 | |
| | |
Masco Corp. | | | 184 | | | | 8,507 | |
| | |
Mastercard, Inc., Class A | | | 138 | | | | 38,315 | |
| | |
McDonald’s Corp. | | | 66 | | | | 13,080 | |
| | |
McKesson Corp. | | | 46 | | | | 6,129 | |
| | |
Medtronic plc | | | 206 | | | | 22,390 | |
| | |
Merck & Co., Inc. | | | 329 | | | | 28,545 | |
| | |
MetLife, Inc. | | | 226 | | | | 10,577 | |
| | |
Microsoft Corp. | | | 801 | | | | 114,861 | |
| | |
Mid-America Apartment Communities, Inc., REIT | | | 12 | | | | 1,677 | |
| | |
Mondelez International, Inc., Class A | | | 328 | | | | 17,222 | |
| | |
Morgan Stanley | | | 423 | | | | 19,468 | |
| | |
Motorola Solutions, Inc. | | | 12 | | | | 1,947 | |
| | |
National Retail Properties, Inc., REIT | | | 14 | | | | 806 | |
| | |
Netflix, Inc. * | | | 56 | | | | 16,230 | |
| | |
Newmont Goldcorp Corp. | | | 38 | | | | 1,487 | |
| | |
NextEra Energy, Inc. | | | 90 | | | | 21,497 | |
| | |
Nielsen Holdings plc | | | 54 | | | | 1,088 | |
| | |
NIKE, Inc., Class B | | | 151 | | | | 13,484 | |
| | |
Norfolk Southern Corp. | | | 99 | | | | 17,935 | |
| | |
Northrop Grumman Corp. | | | 27 | | | | 9,486 | |
| | |
Nucor Corp. | | | 31 | | | | 1,694 | |
| | |
NVIDIA Corp. | | | 79 | | | | 15,819 | |
| | |
ON Semiconductor Corp. * | | | 240 | | | | 4,898 | |
| | |
ONEOK, Inc. | | | 180 | | | | 12,536 | |
| | |
Oracle Corp. | | | 44 | | | | 2,407 | |
| | |
O’Reilly Automotive, Inc. * | | | 17 | | | | 7,345 | |
| | |
Owens Corning | | | 10 | | | | 629 | |
| | |
PACCAR, Inc. | | | 52 | | | | 3,969 | |
| | |
Packaging Corp. of America | | | 40 | | | | 4,344 | |
| | |
Palo Alto Networks, Inc. * | | | 7 | | | | 1,682 | |
| | |
Parker-Hannifin Corp. | | | 43 | | | | 7,833 | |
| | |
Parsley Energy, Inc., Class A | | | 103 | | | | 1,623 | |
| | |
PayPal Holdings, Inc. * | | | 224 | | | | 23,355 | |
| | |
PepsiCo, Inc. | | | 50 | | | | 6,849 | |
| | |
Pfizer, Inc. | | | 333 | | | | 12,795 | |
SEE NOTES TO FINANCIAL STATEMENTS.
| | | | | | | | |
| | | |
| OCTOBER 31, 2019 | | J.P. MORGAN INTERNATIONAL EQUITY FUNDS | | | | | 45 | |
JPMorgan Global Research Enhanced Index Fund
SCHEDULE OF PORTFOLIO INVESTMENTS
AS OF OCTOBER 31, 2019 (continued)
| | | | | | | | |
| INVESTMENTS | | SHARES
(000) | | | VALUE
($000) | |
Common Stocks — continued | | | | | | | | |
|
United States — continued | |
| | |
Philip Morris International, Inc. | | | 272 | | | | 22,118 | |
| | |
Pioneer Natural Resources Co. | | | 92 | | | | 11,339 | |
| | |
Principal Financial Group, Inc. | | | 28 | | | | 1,471 | |
| | |
Procter & Gamble Co. (The) | | | 243 | | | | 30,293 | |
| | |
Prologis, Inc., REIT | | | 132 | | | | 11,572 | |
| | |
Prudential Financial, Inc. | | | 65 | | | | 5,928 | |
| | |
Public Storage, REIT | | | 15 | | | | 3,396 | |
| | |
PulteGroup, Inc. | | | 23 | | | | 913 | |
| | |
QUALCOMM, Inc. | | | 15 | | | | 1,207 | |
| | |
Ralph Lauren Corp. | | | 21 | | | | 2,049 | |
| | |
Regeneron Pharmaceuticals, Inc. * | | | 16 | | | | 4,843 | |
| | |
Regions Financial Corp. | | | 60 | | | | 973 | |
| | |
Reinsurance Group of America, Inc. | | | 6 | | | | 969 | |
| | |
Ross Stores, Inc. | | | 85 | | | | 9,301 | |
| | |
Royal Caribbean Cruises Ltd. | | | 59 | | | | 6,418 | |
| | |
S&P Global, Inc. | | | 24 | | | | 6,089 | |
| | |
Sabre Corp. | | | 25 | | | | 596 | |
| | |
salesforce.com, Inc. * | | | 130 | | | | 20,311 | |
| | |
SBA Communications Corp., REIT | | | 11 | | | | 2,676 | |
| | |
Sempra Energy | | | 63 | | | | 9,113 | |
| | |
ServiceNow, Inc. * | | | 17 | | | | 4,203 | |
| | |
Snap, Inc., Class A * (b) | | | 76 | | | | 1,150 | |
| | |
Snap-on, Inc. | | | 40 | | | | 6,572 | |
| | |
Southern Co. (The) | | | 39 | | | | 2,422 | |
| | |
Spirit AeroSystems Holdings, Inc., Class A | | | 5 | | | | 442 | |
| | |
Stanley Black & Decker, Inc. | | | 52 | | | | 7,914 | |
| | |
Steel Dynamics, Inc. | | | 10 | | | | 318 | |
| | |
SunTrust Banks, Inc. | | | 98 | | | | 6,689 | |
| | |
Synchrony Financial | | | 161 | | | | 5,699 | |
| | |
Target Corp. | | | 17 | | | | 1,819 | |
| | |
TD Ameritrade Holding Corp. | | | 113 | | | | 4,318 | |
| | |
Teradyne, Inc. | | | 185 | | | | 11,318 | |
| | |
Texas Instruments, Inc. | | | 190 | | | | 22,407 | |
| | |
Thermo Fisher Scientific, Inc. | | | 66 | | | | 19,823 | |
| | |
TJX Cos., Inc. (The) | | | 233 | | | | 13,445 | |
| | |
T-Mobile US, Inc. * | | | 48 | | | | 3,991 | |
| | |
Tyson Foods, Inc., Class A | | | 30 | | | | 2,495 | |
| | |
Union Pacific Corp. | | | 102 | | | | 16,796 | |
| | |
United Airlines Holdings, Inc. * | | | 6 | | | | 511 | |
| | |
United Technologies Corp. | | | 130 | | | | 18,706 | |
| | |
UnitedHealth Group, Inc. | | | 128 | | | | 32,246 | |
| | |
Ventas, Inc., REIT | | | 89 | | | | 5,810 | |
| | |
VEREIT, Inc., REIT | | | 118 | | | | 1,158 | |
| | |
Verizon Communications, Inc. | | | 475 | | | | 28,737 | |
| | | | | | | | |
| INVESTMENTS | | SHARES
(000) | | | VALUE
($000) | |
| | | | | | | | |
|
United States — continued | |
| | |
Vertex Pharmaceuticals, Inc. * | | | 61 | | | | 11,980 | |
| | |
Viacom, Inc., Class B | | | 68 | | | | 1,469 | |
| | |
VICI Properties, Inc., REIT (b) | | | 47 | | | | 1,100 | |
| | |
Visa, Inc., Class A | | | 175 | | | | 31,266 | |
| | |
VMware, Inc., Class A | | | 8 | | | | 1,285 | |
| | |
Walmart, Inc. | | | 63 | | | | 7,397 | |
| | |
Walt Disney Co. (The) | | | 96 | | | | 12,525 | |
| | |
Waste Management, Inc. | | | 84 | | | | 9,466 | |
| | |
Wells Fargo & Co. | | | 497 | | | | 25,679 | |
| | |
Weyerhaeuser Co., REIT | | | 44 | | | | 1,287 | |
| | |
Workday, Inc., Class A * | | | 27 | | | | 4,359 | |
| | |
Xcel Energy, Inc. | | | 190 | | | | 12,079 | |
| | |
Xilinx, Inc. | | | 36 | | | | 3,272 | |
| | |
Yum! Brands, Inc. | | | 118 | | | | 11,984 | |
| | |
Zimmer Biomet Holdings, Inc. | | | 104 | | | | 14,404 | |
| | | | | | | | |
| | |
| | | | | | | 2,584,981 | |
| | | | | | | | |
| | |
Total Common Stocks
(Cost $2,936,016) | | | | | | | 4,166,392 | |
| | | | | | | | |
Investment of Cash Collateral from Securities Loaned — 0.9% | |
| | |
JPMorgan Securities Lending Money Market Fund Class Agency SL Shares, 1.98% (e) (f) | | | 27,501 | | | | 27,504 | |
| | |
JPMorgan U.S. Government Money Market Fund Class IM Shares, 1.70% (e) (f) | | | 11,680 | | | | 11,680 | |
| | | | | | | | |
| | |
Total Investment of Cash Collateral from
Securities Loaned
(Cost $39,184) | | | | | | | 39,184 | |
| | | | | | | | |
Total Investments — 99.4%
(Cost $2,975,200) | | | | | | | 4,205,576 | |
Other Assets Less Liabilities — 0.6% | | | | | | | 24,576 | |
| | | | | | | | |
NET ASSETS — 100.0% | | | | | | | 4,230,152 | |
| | | | | | | | |
Percentages indicated are based on net assets.
SEE NOTES TO FINANCIAL STATEMENTS.
| | | | | | |
| | | |
| 46 | | | | J.P. MORGAN INTERNATIONAL EQUITY FUNDS | | OCTOBER 31, 2019 |
Summary of Investments by Industry, October 31, 2019
The following table represents the portfolio investments of the Fund by industry classifications as a percentage of total investments:
| | | | |
| INDUSTRY | | PERCENTAGE | |
| |
Banks | | | 7.6 | % |
| |
Pharmaceuticals | | | 5.4 | |
| |
Oil, Gas & Consumable Fuels | | | 4.7 | |
| |
Software | | | 4.7 | |
| |
IT Services | | | 4.3 | |
| |
Insurance | | | 3.7 | |
| |
Semiconductors & Semiconductor Equipment | | | 3.2 | |
| |
Technology Hardware, Storage & Peripherals | | | 3.1 | |
| |
Capital Markets | | | 3.1 | |
| |
Interactive Media & Services | | | 3.0 | |
| |
Specialty Retail | | | 2.9 | |
| |
Electric Utilities | | | 2.7 | |
| |
Health Care Equipment & Supplies | | | 2.5 | |
| |
Chemicals | | | 2.5 | |
| |
Machinery | | | 2.5 | |
| |
Internet & Direct Marketing Retail | | | 2.4 | |
| |
Beverages | | | 2.2 | |
| |
Equity Real Estate Investment Trusts (REITs) | | | 2.1 | |
| |
Health Care Providers & Services | | | 2.0 | |
| |
Biotechnology | | | 2.0 | |
| |
Diversified Telecommunication Services | | | 2.0 | |
| |
Aerospace & Defense | | | 1.9 | |
| |
Food Products | | | 1.8 | |
| |
Road & Rail | | | 1.8 | |
| |
Media | | | 1.6 | |
| |
Hotels, Restaurants & Leisure | | | 1.5 | |
| |
Automobiles | | | 1.4 | |
| |
Textiles, Apparel & Luxury Goods | | | 1.3 | |
| |
Metals & Mining | | | 1.3 | |
| |
Entertainment | | | 1.2 | |
| |
Tobacco | | | 1.0 | |
| |
Household Products | | | 1.0 | |
| |
Electrical Equipment | | | 1.0 | |
| |
Industrial Conglomerates | | | 1.0 | |
| |
Others (each less than 1.0%) | | | 13.4 | |
| |
Short-Term Investments | | | 0.2 | |
Abbreviations
| | |
| ADR | | American Depositary Receipt |
| CHDI | | Clearing House Electronic Subregister System (CHESS) Depository Interest |
| OYJ | | Public Limited Company |
| Preference | | A special type of equity investment that shares in the earnings of the company, has limited voting rights, and may have a dividend preference. Preference shares may also have liquidation preference. |
| REIT | | Real Estate Investment Trust |
| |
| (a) | | Amount rounds to less than 0.1% of net assets. |
| (b) | | The security or a portion of this security is on loan at October 31, 2019. The total value of securities on loan at October 31, 2019 is approximately $37,095,000. |
| (c) | | Security exempt from registration pursuant to Regulation S under the Securities Act of 1933, as amended. Regulation S applies to securities offerings that are made outside of the United States and do not involve direct selling efforts in the United States and as such may have restrictions on resale. |
| (d) | | Amount rounds to less than one thousand. |
| (e) | | Investment in an affiliated fund, which is registered under the Investment Company Act of 1940, as amended, and is advised by J.P. Morgan Investment Management Inc. |
| (f) | | The rate shown is the current yield as of October 31, 2019. |
| * | | Non-income producing security. |
SEE NOTES TO FINANCIAL STATEMENTS.
| | | | | | | | |
| | | |
| OCTOBER 31, 2019 | | J.P. MORGAN INTERNATIONAL EQUITY FUNDS | | | | | 47 | |
JPMorgan Global Research Enhanced Index Fund
SCHEDULE OF PORTFOLIO INVESTMENTS
AS OF OCTOBER 31, 2019 (continued)
| | | | | | | | | | | | | | | | | | | | |
| Futures contracts outstanding as of October 31, 2019 (amounts in thousands, except number of contracts): | |
| DESCRIPTION | | NUMBER OF
CONTRACTS | | | EXPIRATION
DATE | | | TRADING
CURRENCY | | | NOTIONAL
AMOUNT ($) | | | VALUE AND
UNREALIZED
APPRECIATION
(DEPRECIATION) ($) | |
| | | | | |
Long Contracts | | | | | | | | | | | | | | | | | | | | |
| | | | | |
S&P 500E-Mini Index | | | 279 | | | | 12/2019 | | | | USD | | | | 42,338 | | | | 30 | |
| | | | | | | | | | | | | | | | | | | | |
| | |
Abbreviations | | |
| USD | | United States Dollar |
SEE NOTES TO FINANCIAL STATEMENTS.
| | | | | | |
| | | |
| 48 | | | | J.P. MORGAN INTERNATIONAL EQUITY FUNDS | | OCTOBER 31, 2019 |
JPMorgan International Advantage Fund
SCHEDULE OF PORTFOLIO INVESTMENTS
AS OF OCTOBER 31, 2019
| | | | | | | | |
| INVESTMENTS | | SHARES
(000) | | | VALUE
($000) | |
Common Stocks — 96.1% | |
|
Australia — 8.5% | |
| | |
AGL Energy Ltd. | | | 384 | | | | 5,248 | |
| | |
Alumina Ltd. | | | 4,467 | | | | 6,974 | |
| | |
Aurizon Holdings Ltd. | | | 3,099 | | | | 12,608 | |
| | |
Beach Energy Ltd. | | | 5,285 | | | | 8,313 | |
| | |
BHP Group Ltd. | | | 1,248 | | | | 30,593 | |
| | |
Evolution Mining Ltd. | | | 3,097 | | | | 8,834 | |
| | |
Fortescue Metals Group Ltd. | | | 784 | | | | 4,800 | |
| | |
Independence Group NL | | | 1,231 | | | | 5,390 | |
| | |
IPH Ltd. | | | 195 | | | | 1,086 | |
| | |
JB Hi-Fi Ltd. | | | 289 | | | | 7,395 | |
| | |
Magellan Financial Group Ltd. | | | 250 | | | | 8,286 | |
| | |
Metcash Ltd. | | | 1,747 | | | | 3,395 | |
| | |
Newcrest Mining Ltd. | | | 173 | | | | 3,782 | |
| | |
Orica Ltd. | | | 211 | | | | 3,341 | |
| | |
Qantas Airways Ltd. | | | 3,141 | | | | 13,894 | |
| | |
Regis Resources Ltd. | | | 1,080 | | | | 3,660 | |
| | |
Rio Tinto plc | | | 512 | | | | 26,676 | |
| | | | | | | | |
| | |
| | | | | | | 154,275 | |
| | | | | | | | |
|
Austria — 0.9% | |
| | |
OMV AG | | | 254 | | | | 14,865 | |
| | |
Verbund AG | | | 29 | | | | 1,552 | |
| | | | | | | | |
| | |
| | | | | | | 16,417 | |
| | | | | | | | |
|
Belgium — 1.7% | |
| | |
Ageas | | | 310 | | | | 17,902 | |
| | |
Barco NV | | | 19 | | | | 4,096 | |
| | |
Telenet Group Holding NV * | | | 190 | | | | 9,320 | |
| | | | | | | | |
| | |
| | | | | | | 31,318 | |
| | | | | | | | |
|
China — 0.2% | |
| | |
BOC Hong Kong Holdings Ltd. | | | 1,141 | | | | 3,918 | |
| | | | | | | | |
|
Denmark — 1.0% | |
| | |
Carlsberg A/S, Class B | | | 36 | | | | 5,009 | |
| | |
Novo Nordisk A/S, Class B | | | 186 | | | | 10,236 | |
| | |
Topdanmark A/S | | | 77 | | | | 3,437 | |
| | | | | | | | |
| | |
| | | | | | | 18,682 | |
| | | | | | | | |
|
Finland — 1.1% | |
| | |
Neste OYJ | | | 547 | | | | 19,779 | |
| | | | | | | | |
|
France — 8.2% | |
| | |
Airbus SE | | | 31 | | | | 4,477 | |
| | |
Capgemini SE | | | 155 | | | | 17,498 | |
| | |
Cie de Saint-Gobain | | | 189 | | | | 7,704 | |
| | |
Dassault Aviation SA | | | 4 | | | | 5,225 | |
| | | | | | | | |
| INVESTMENTS | | SHARES
(000) | | | VALUE
($000) | |
| |
|
France — continued | |
| | |
Edenred | | | 147 | | | | 7,752 | |
| | |
Eiffage SA | | | 142 | | | | 15,251 | |
| | |
Gaztransport Et Technigaz SA | | | 67 | | | | 6,151 | |
| | |
Ingenico Group SA | | | 46 | | | | 4,916 | |
| | |
LVMH Moet Hennessy Louis Vuitton SE (a) | | | 3 | | | | 1,258 | |
| | |
Peugeot SA | | | 703 | | | | 17,793 | |
| | |
Safran SA | | | 138 | | | | 21,863 | |
| | |
Sanofi | | | 50 | | | | 4,571 | |
| | |
Schneider Electric SE | | | 232 | | | | 21,607 | |
| | |
Sodexo SA | | | 30 | | | | 3,331 | |
| | |
SPIE SA | | | 325 | | | | 6,855 | |
| | |
TOTAL SA | | | 44 | | | | 2,314 | |
| | | | | | | | |
| | |
| | | | | | | 148,566 | |
| | | | | | | | |
|
Germany — 8.1% | |
| | |
adidas AG | | | 71 | | | | 21,968 | |
| | |
Allianz SE (Registered) | | | 122 | | | | 29,757 | |
| | |
CANCOM SE | | | 17 | | | | 916 | |
| | |
CECONOMY AG * | | | 440 | | | | 2,215 | |
| | |
Deutsche Pfandbriefbank AG (b) | | | 202 | | | | 2,755 | |
| | |
E.ON SE | | | 604 | | | | 6,094 | |
| | |
Hannover Rueck SE | | | 63 | | | | 11,196 | |
| | |
HeidelbergCement AG | | | 80 | | | | 5,955 | |
| | |
METRO AG | | | 602 | | | | 9,826 | |
| | |
Muenchener Rueckversicherungs-Gesellschaft AG (Registered) | | | 78 | | | | 21,809 | |
| | |
RWE AG (a) | | | 574 | | | | 17,506 | |
| | |
SAP SE | | | 73 | | | | 9,667 | |
| | |
Stroeer SE & Co. KGaA (a) | | | 86 | | | | 6,906 | |
| | | | | | | | |
| | |
| | | | | | | 146,570 | |
| | | | | | | | |
|
Ghana — 0.3% | |
| | |
Tullow Oil plc | | | 2,215 | | | | 5,920 | |
| | | | | | | | |
|
Hong Kong — 0.9% | |
| | |
AIA Group Ltd. | | | 790 | | | | 7,867 | |
| | |
Hang Seng Bank Ltd. | | | 426 | | | | 8,888 | |
| | | | | | | | |
| | |
| | | | | | | 16,755 | |
| | | | | | | | |
|
India — 0.1% | |
| | |
Rhi Magnesita NV | | | 35 | | | | 1,589 | |
| | | | | | | | |
|
Ireland — 0.2% | |
| | |
Greencore Group plc | | | 1,067 | | | | 3,208 | |
| | | | | | | | |
|
Israel — 0.4% | |
| | |
Israel Discount Bank Ltd., Class A | | | 1,447 | | | | 6,611 | |
| | | | | | | | |
SEE NOTES TO FINANCIAL STATEMENTS.
| | | | | | | | |
| | | |
| OCTOBER 31, 2019 | | J.P. MORGAN INTERNATIONAL EQUITY FUNDS | | | | | 49 | |
JPMorgan International Advantage Fund
SCHEDULE OF PORTFOLIO INVESTMENTS
AS OF OCTOBER 31, 2019 (continued)
| | | | | | | | |
| INVESTMENTS | | SHARES
(000) | | | VALUE
($000) | |
Common Stocks — continued | |
|
Italy — 0.9% | |
| | |
Snam SpA | | | 3,055 | | | | 15,684 | |
| | | | | | | | |
|
Japan — 23.6% | |
| | |
Advantest Corp. | | | 210 | | | | 9,543 | |
| | |
Alfresa Holdings Corp. | | | 98 | | | | 2,193 | |
| | |
Amano Corp. | | | 103 | | | | 3,034 | |
| | |
Bandai Namco Holdings, Inc. | | | 159 | | | | 9,789 | |
| | |
Brother Industries Ltd. | | | 363 | | | | 6,817 | |
| | |
Capcom Co. Ltd. | | | 273 | | | | 6,448 | |
| | |
Dai-ichi Life Holdings, Inc. | | | 327 | | | | 5,332 | |
| | |
Digital Garage, Inc. | | | 119 | | | | 3,909 | |
| | |
DMG Mori Co. Ltd. | | | 496 | | | | 8,037 | |
| | |
Fuji Electric Co. Ltd. | | | 210 | | | | 6,665 | |
| | |
FUJIFILM Holdings Corp. | | | 235 | | | | 10,304 | |
| | |
GungHo Online Entertainment, Inc. | | | 113 | | | | 2,438 | |
| | |
Hikari Tsushin, Inc. | | | 18 | | | | 3,836 | |
| | |
Hitachi Ltd. | | | 343 | | | | 12,794 | |
| | |
ITOCHU Corp. | | | 576 | | | | 12,045 | |
| | |
Japan Aviation Electronics Industry Ltd. | | | 114 | | | | 2,129 | |
| | |
Kaken Pharmaceutical Co. Ltd. | | | 29 | | | | 1,427 | |
| | |
Kamigumi Co. Ltd. | | | 55 | | | | 1,248 | |
| | |
KDDI Corp. | | | 523 | | | | 14,469 | |
| | |
K’s Holdings Corp. | | | 263 | | | | 3,004 | |
| | |
Kureha Corp. | | | 15 | | | | 965 | |
| | |
Marubeni Corp. | | | 1,391 | | | | 9,789 | |
| | |
Medipal Holdings Corp. | | | 147 | | | | 3,347 | |
| | |
Meitec Corp. | | | 45 | | | | 2,351 | |
| | |
Mitsubishi Heavy Industries Ltd. | | | 207 | | | | 8,381 | |
| | |
Mitsubishi UFJ Financial Group, Inc. | | | 3,067 | | | | 15,901 | |
| | |
Mitsubishi UFJ Lease & Finance Co. Ltd. | | | 938 | | | | 5,757 | |
| | |
Mitsui Fudosan Co. Ltd. | | | 421 | | | | 10,765 | |
| | |
Morinaga & Co. Ltd. | | | 88 | | | | 4,342 | |
| | |
Nexon Co. Ltd. * | | | 587 | | | | 6,798 | |
| | |
Nihon Unisys Ltd. | | | 207 | | | | 6,846 | |
| | |
Nippon Telegraph & Telephone Corp. | | | 262 | | | | 12,982 | |
| | |
NOF Corp. | | | 107 | | | | 3,608 | |
| | |
Nomura Real Estate Holdings, Inc. | | | 355 | | | | 8,418 | |
| | |
NS Solutions Corp. | | | 59 | | | | 2,002 | |
| | |
Obayashi Corp. | | | 300 | | | | 3,086 | |
| | |
ORIX Corp. | | | 604 | | | | 9,496 | |
| | |
Otsuka Corp. | | | 94 | | | | 3,782 | |
| | |
Sankyu, Inc. | | | 99 | | | | 5,043 | |
| | |
SCSK Corp. | | | 51 | | | | 2,591 | |
| | |
Sekisui House Ltd. | | | 495 | | | | 10,677 | |
| | |
Shinsei Bank Ltd. | | | 556 | | | | 8,662 | |
| | | | | | | | |
| INVESTMENTS | | SHARES
(000) | | | VALUE
($000) | |
| |
|
Japan — continued | |
| | |
Shionogi & Co. Ltd. | | | 174 | | | | 10,432 | |
| | |
Ship Healthcare Holdings, Inc. | | | 34 | | | | 1,466 | |
| | |
Showa Denko KK | | | 254 | | | | 7,112 | |
| | |
Sony Corp. | | | 308 | | | | 18,772 | |
| | |
Sumitomo Corp. | | | 372 | | | | 6,039 | |
| | |
Sumitomo Mitsui Financial Group, Inc. | | | 403 | | | | 14,304 | |
| | |
Sumitomo Mitsui Trust Holdings, Inc. | | | 262 | | | | 9,549 | |
| | |
Taiheiyo Cement Corp. | | | 169 | | | | 4,784 | |
| | |
Teijin Ltd. | | | 164 | | | | 3,276 | |
| | |
TIS, Inc. | | | 117 | | | | 7,070 | |
| | |
Tokuyama Corp. | | | 133 | | | | 3,553 | |
| | |
Tokyo Electron Ltd. | | | 57 | | | | 11,548 | |
| | |
Tokyo Tatemono Co. Ltd. | | | 474 | | | | 6,741 | |
| | |
Toyota Motor Corp. | | | 411 | | | | 28,495 | |
| | |
Toyota Tsusho Corp. | | | 167 | | | | 5,751 | |
| | |
TS Tech Co. Ltd. | | | 111 | | | | 3,545 | |
| | |
West Japan Railway Co. | | | 60 | | | | 5,231 | |
| | |
Yokohama Rubber Co. Ltd. (The) | | | 202 | | | | 4,505 | |
| | |
Zeon Corp. | | | 368 | | | | 4,192 | |
| | | | | | | | |
| | |
| | | | | | | 427,415 | |
| | | | | | | | |
|
Netherlands — 6.3% | |
| | |
Adyen NV * (b) | | | 11 | | | | 7,858 | |
| | |
ASM International NV | | | 156 | | | | 15,733 | |
| | |
BE Semiconductor Industries NV | | | 127 | | | | 4,701 | |
| | |
Euronext NV (b) | | | 83 | | | | 6,719 | |
| | |
EXOR NV | | | 143 | | | | 10,973 | |
| | |
Intertrust NV (b) | | | 128 | | | | 2,429 | |
| | |
Koninklijke Ahold Delhaize NV | | | 117 | | | | 2,922 | |
| | |
Royal Dutch Shell plc, Class B | | | 1,283 | | | | 36,943 | |
| | |
Signify NV (b) | | | 238 | | | | 6,965 | |
| | |
Wolters Kluwer NV | | | 257 | | | | 18,919 | |
| | | | | | | | |
| | |
| | | | | | | 114,162 | |
| | | | | | | | |
| | |
Norway — 1.9% | | | | | | | | |
| | |
DNB ASA | | | 1,026 | | | | 18,679 | |
| | |
Telenor ASA | | | 869 | | | | 16,260 | |
| | | | | | | | |
| | |
| | | | | | | 34,939 | |
| | | | | | | | |
|
Russia — 0.3% | |
| | |
Evraz plc | | | 1,019 | | | | 4,864 | |
| | | | | | | | |
|
Singapore — 1.7% | |
| | |
DBS Group Holdings Ltd. | | | 979 | | | | 18,666 | |
| | |
Jardine Cycle & Carriage Ltd. | | | 55 | | | | 1,313 | |
| | |
United Overseas Bank Ltd. | | | 579 | | | | 11,407 | |
| | | | | | | | |
| | |
| | | | | | | 31,386 | |
| | | | | | | | |
SEE NOTES TO FINANCIAL STATEMENTS.
| | | | | | |
| | | |
| 50 | | | | J.P. MORGAN INTERNATIONAL EQUITY FUNDS | | OCTOBER 31, 2019 |
| | | | | | | | |
| INVESTMENTS | | SHARES
(000) | | | VALUE
($000) | |
Common Stocks — continued | |
|
South Africa — 1.1% | |
| | |
Anglo American plc | | | 741 | | | | 19,074 | |
| | | | | | | | |
|
Spain — 3.9% | |
| | |
ACS Actividades de Construccion y Servicios SA | | | 437 | | | | 17,730 | |
| | |
Aena SME SA (b) | | | 83 | | | | 15,273 | |
| | |
CIE Automotive SA | | | 44 | | | | 1,106 | |
| | |
Enagas SA | | | 433 | | | | 10,723 | |
| | |
Endesa SA | | | 647 | | | | 17,624 | |
| | |
Mediaset Espana Comunicacion SA | | | 827 | | | | 5,059 | |
| | |
Repsol SA | | | 233 | | | | 3,846 | |
| | | | | | | | |
| | |
| | | | | | | 71,361 | |
| | | | | | | | |
|
Sweden — 1.1% | |
| | |
Betsson AB * | | | 188 | | | | 927 | |
| | |
Skandinaviska Enskilda Banken AB, Class A | | | 955 | | | | 9,158 | |
| | |
SKF AB, Class B | | | 536 | | | | 9,702 | |
| | | | | | | | |
| | |
| | | | | | | 19,787 | |
| | | | | | | | |
|
Switzerland — 11.3% | |
| | |
Adecco Group AG (Registered) | | | 273 | | | | 16,256 | |
| | |
Bucher Industries AG (Registered) | | | 9 | | | | 2,875 | |
| | |
LafargeHolcim Ltd. (Registered) * | | | 74 | | | | 3,805 | |
| | |
Landis+Gyr Group AG * | | | 101 | | | | 9,383 | |
| | |
Logitech International SA (Registered) | | | 290 | | | | 11,904 | |
| | |
Nestle SA (Registered) | | | 484 | | | | 51,816 | |
| | |
Novartis AG (Registered) | | | 454 | | | | 39,643 | |
| | |
Roche Holding AG | | | 142 | | | | 42,594 | |
| | |
Swiss Life Holding AG (Registered) | | | 38 | | | | 18,897 | |
| | |
Swisscom AG (Registered) | | | 14 | | | | 6,999 | |
| | | | | | | | |
| | |
| | | | | | | 204,172 | |
| | | | | | | | |
|
United Kingdom — 12.4% | |
| | |
3i Group plc | | | 726 | | | | 10,607 | |
| | |
Ashtead Group plc | | | 509 | | | | 15,491 | |
| | |
Avast plc (b) | | | 2,815 | | | | 15,117 | |
| | |
Barratt Developments plc | | | 834 | | | | 6,819 | |
| | |
Berkeley Group Holdings plc | | | 155 | | | | 8,860 | |
| | |
Bovis Homes Group plc | | | 123 | | | | 1,859 | |
| | |
BP plc | | | 316 | | | | 2,007 | |
| | |
Britvic plc | | | 180 | | | | 2,306 | |
| | |
Coca-Cola European Partners plc | | | 325 | | | | 17,373 | |
| | |
Computacenter plc | | | 99 | | | | 1,749 | |
| | |
Diageo plc | | | 102 | | | | 4,166 | |
| | |
Dialog Semiconductor plc * | | | 266 | | | | 11,966 | |
| | |
Dunelm Group plc | | | 508 | | | | 5,190 | |
| | |
Firstgroup plc * | | | 888 | | | | 1,484 | |
| | | | | | | | |
| INVESTMENTS | | SHARES
(000) | | | VALUE
($000) | |
| |
|
United Kingdom — continued | |
| | |
GlaxoSmithKline plc | | | 920 | | | | 21,077 | |
| | |
Howden Joinery Group plc | | | 270 | | | | 2,022 | |
| | |
HSBC Holdings plc | | | 819 | | | | 6,190 | |
| | |
Legal & General Group plc | | | 5,644 | | | | 19,294 | |
| | |
National Express Group plc | | | 182 | | | | 1,053 | |
| | |
Next plc | | | 234 | | | | 19,934 | |
| | |
Pets at Home Group plc | | | 412 | | | | 1,102 | |
| | |
Redrow plc | | | 1,138 | | | | 8,870 | |
| | |
Savills plc | | | 77 | | | | 914 | |
| | |
Tate & Lyle plc | | | 461 | | | | 4,024 | |
| | |
Taylor Wimpey plc | | | 3,088 | | | | 6,623 | |
| | |
Ultra Electronics Holdings plc | | | 172 | | | | 4,340 | |
| | |
Unilever plc | | | 396 | | | | 23,709 | |
| | | | | | | | |
| | |
| | | | | | | 224,146 | |
| | | | | | | | |
| | |
Total Common Stocks
(Cost $1,555,196) | | | | | | | 1,740,598 | |
| | | | | | | | |
Short-Term Investments — 2.3% | |
|
Investment Companies — 2.3% | |
| | |
JPMorgan Prime Money Market Fund Class Institutional Shares, 1.88% (c) (d)
(Cost $42,359) | | | 42,349 | | | | 42,366 | |
| | | | | | | | |
Investment of Cash Collateral from Securities Loaned — 0.1% | |
| | |
JPMorgan Securities Lending Money Market Fund Class Agency SL Shares, 1.98% (c) (d) | | | 1,005 | | | | 1,005 | |
| | |
JPMorgan U.S. Government Money Market Fund Class IM Shares, 1.70% (c) (d) | | | 966 | | | | 966 | |
| | | | | | | | |
| | |
Total Investment of Cash Collateral from Securities Loaned
(cost $1,971) | | | | | | | 1,971 | |
| | | | | | | | |
Total Investments — 98.5%
(Cost $1,599,526) | | | | | | | 1,784,935 | |
Other Assets Less Liabilities — 1.5% | | | | | | | 26,414 | |
| | | | | | | | |
NET ASSETS — 100.0% | | | | | | | 1,811,349 | |
| | | | | | | | |
Percentages indicated are based on net assets.
SEE NOTES TO FINANCIAL STATEMENTS.
| | | | | | | | |
| | | |
| OCTOBER 31, 2019 | | J.P. MORGAN INTERNATIONAL EQUITY FUNDS | | | | | 51 | |
JPMorgan International Advantage Fund
SCHEDULE OF PORTFOLIO INVESTMENTS
AS OF OCTOBER 31, 2019 (continued)
Summary of Investments by Industry, October 31, 2019
The following table represents the portfolio investments of the Fund by industry classifications as a percentage of total investments:
| | | | |
| INDUSTRY | | PERCENTAGE | |
| |
Insurance | | | 7.6 | % |
| |
Banks | | | 7.4 | |
| |
Pharmaceuticals | | | 7.3 | |
| |
Metals & Mining | | | 6.4 | |
| |
Oil, Gas & Consumable Fuels | | | 5.6 | |
| |
Food Products | | | 3.6 | |
| |
Household Durables | | | 3.5 | |
| |
IT Services | | | 3.0 | |
| |
Semiconductors & Semiconductor Equipment | | | 3.0 | |
| |
Trading Companies & Distributors | | | 2.9 | |
| |
Automobiles | | | 2.6 | |
| |
Professional Services | | | 2.3 | |
| |
Electronic Equipment, Instruments & Components | | | 2.0 | |
| |
Diversified Telecommunication Services | | | 2.0 | |
| |
Construction & Engineering | | | 2.0 | |
| |
Aerospace & Defense | | | 2.0 | |
| |
Electrical Equipment | | | 2.0 | |
| |
Technology Hardware, Storage & Peripherals | | | 1.6 | |
| |
Machinery | | | 1.6 | |
| |
Beverages | | | 1.6 | |
| |
Multi-Utilities | | | 1.6 | |
| |
Real Estate Management & Development | | | 1.5 | |
| |
Gas Utilities | | | 1.5 | |
| |
Diversified Financial Services | | | 1.5 | |
| |
Chemicals | | | 1.5 | |
| |
Capital Markets | | | 1.4 | |
| |
Road & Rail | | | 1.4 | |
| |
Software | | | 1.4 | |
| |
Personal Products | | | 1.3 | |
| |
Textiles, Apparel & Luxury Goods | | | 1.3 | |
| |
Specialty Retail | | | 1.3 | |
| |
Media | | | 1.2 | |
| |
Multiline Retail | | | 1.1 | |
| |
Electric Utilities | | | 1.1 | |
| |
Others (each less than 1.0%) | | | 8.5 | |
| |
Short-Term Investments | | | 2.4 | |
| | |
| Abbreviations | | |
| OYJ | | Public Limited Company |
| |
| (a) | | The security or a portion of this security is on loan at October 31, 2019. The total value of securities on loan at October 31, 2019 is approximately $1,858,000. |
| (b) | | Security exempt from registration pursuant to Regulation S under the Securities Act of 1933, as amended. Regulation S applies to securities offerings that are made outside of the United States and do not involve direct selling efforts in the United States and as such may have restrictions on resale. |
| (c) | | Investment in an affiliated fund, which is registered under the Investment Company Act of 1940, as amended, and is advised by J.P. Morgan Investment Management Inc. |
| (d) | | The rate shown is the current yield as of October 31, 2019. |
| * | | Non-income producing security. |
SEE NOTES TO FINANCIAL STATEMENTS.
| | | | | | |
| | | |
| 52 | | | | J.P. MORGAN INTERNATIONAL EQUITY FUNDS | | OCTOBER 31, 2019 |
| | | | | | | | | | | | | | | | | | | | |
| Futures contracts outstanding as of October 31, 2019 (amounts in thousands, except number of contracts): | |
| DESCRIPTION | | NUMBER OF
CONTRACTS | | | EXPIRATION
DATE | | | TRADING
CURRENCY | | | NOTIONAL
AMOUNT ($) | | | VALUE AND
UNREALIZED
APPRECIATION
(DEPRECIATION) ($) | |
| | | | | |
Long Contracts | | | | | | | | | | | | | | | | | | | | |
| | | | | |
EURO STOXX 50 Index | | | 505 | | | | 12/2019 | | | | EUR | | | | 20,304 | | | | 1,035 | |
| | | | | |
FTSE 100 Index | | | 111 | | | | 12/2019 | | | | GBP | | | | 10,414 | | | | 179 | |
| | | | | |
TOPIX Index | | | 79 | | | | 12/2019 | | | | JPY | | | | 12,111 | | | | 803 | |
| | | | | | | | | | | | | | | | | | | | |
| | | | | |
| | | | | | | | | | | | | | | | | | | 2,017 | |
| | | | | | | | | | | | | | | | | | | | |
| | |
Abbreviations | | |
| EUR | | Euro |
| FTSE | | Financial Times and the London Stock Exchange |
| GBP | | British Pound |
| JPY | | Japanese Yen |
| TOPIX | | Tokyo Stock Price Index |
SEE NOTES TO FINANCIAL STATEMENTS.
| | | | | | | | |
| | | |
| OCTOBER 31, 2019 | | J.P. MORGAN INTERNATIONAL EQUITY FUNDS | | | | | 53 | |
JPMorgan International Equity Fund
SCHEDULE OF PORTFOLIO INVESTMENTS
AS OF OCTOBER 31, 2019
| | | | | | | | |
| INVESTMENTS | | SHARES
(000) | | | VALUE
($000) | |
Common Stocks — 97.7% | | | | | | | | |
| | |
Australia — 1.9% | | | | | | | | |
| | |
BHP Group Ltd. | | | 1,399 | | | | 34,287 | |
| | |
BHP Group plc | | | 1,057 | | | | 22,413 | |
| | | | | | | | |
| | |
| | | | | | | 56,700 | |
| | | | | | | | |
| | |
Austria — 0.5% | | | | | | | | |
| | |
Erste Group Bank AG | | | 392 | | | | 13,853 | |
| | | | | | | | |
| | |
Belgium — 1.7% | | | | | | | | |
| | |
Anheuser-Busch InBev SA/NV | | | 433 | | | | 34,926 | |
| | |
KBC Group NV | | | 221 | | | | 15,536 | |
| | | | | | | | |
| | |
| | | | | | | 50,462 | |
| | | | | | | | |
| | |
Brazil — 0.7% | | | | | | | | |
| | |
Itau Unibanco Holding SA, ADR | | | 2,258 | | | | 20,387 | |
| | | | | | | | |
| | |
China — 3.1% | | | | | | | | |
| | |
Alibaba Group Holding Ltd., ADR * | | | 135 | | | | 23,883 | |
| | |
Ping An Insurance Group Co. of China Ltd., Class H | | | 3,043 | | | | 35,116 | |
| | |
Prosus NV * | | | 171 | | | | 11,805 | |
| | |
Tencent Holdings Ltd. | | | 535 | | | | 21,705 | |
| | | | | | | | |
| | |
| | | | | | | 92,509 | |
| | | | | | | | |
| | |
Denmark — 1.7% | | | | | | | | |
| | |
Novo Nordisk A/S, Class B | | | 943 | | | | 51,841 | |
| | | | | | | | |
| | |
France — 15.0% | | | | | | | | |
| | |
Accor SA (a) | | | 618 | | | | 26,601 | |
| | |
Airbus SE | | | 249 | | | | 35,775 | |
| | |
AXA SA | | | 961 | | | | 25,427 | |
| | |
Capgemini SE | | | 276 | | | | 31,123 | |
| | |
EssilorLuxottica SA | | | 177 | | | | 26,965 | |
| | |
Legrand SA | | | 377 | | | | 29,436 | |
| | |
L’Oreal SA | | | 112 | | | | 32,643 | |
| | |
LVMH Moet Hennessy Louis Vuitton SE | | | 120 | | | | 51,073 | |
| | |
Orange SA | | | 1,997 | | | | 32,138 | |
| | |
Pernod Ricard SA | | | 193 | | | | 35,717 | |
| | |
Safran SA | | | 204 | | | | 32,360 | |
| | |
Schneider Electric SE | | | 433 | | | | 40,251 | |
| | |
TOTAL SA | | | 951 | | | | 50,265 | |
| | | | | | | | |
| | |
| | | | | | | 449,774 | |
| | | | | | | | |
| | |
Germany — 8.0% | | | | | | | | |
| | |
adidas AG | | | 93 | | | | 28,689 | |
| | |
Allianz SE (Registered) | | | 213 | | | | 52,116 | |
| | |
Continental AG | | | 185 | | | | 24,760 | |
| | |
Deutsche Boerse AG | | | 186 | | | | 28,818 | |
| | |
Fresenius Medical Care AG & Co. KGaA | | | 261 | | | | 18,823 | |
| | |
Muenchener Rueckversicherungs-Gesellschaft AG (Registered) | | | 91 | | | | 25,162 | |
| | | | | | | | |
| INVESTMENTS | | SHARES
(000) | | | VALUE
($000) | |
| | | | | | | | |
| | |
Germany — continued | | | | | | | | |
| | |
SAP SE | | | 461 | | | | 61,143 | |
| | | | | | | | |
| | |
| | | | | | | 239,511 | |
| | | | | | | | |
| | |
Hong Kong — 4.2% | | | | | | | | |
| | |
AIA Group Ltd. | | | 7,504 | | | | 74,723 | |
| | |
CK Asset Holdings Ltd. | | | 3,906 | | | | 27,173 | |
| | |
Hong Kong Exchanges & Clearing Ltd. | | | 783 | | | | 24,390 | |
| | | | | | | | |
| | |
| | | | | | | 126,286 | |
| | | | | | | | |
| | |
India — 1.6% | | | | | | | | |
| | |
HDFC Bank Ltd., ADR | | | 764 | | | | 46,674 | |
| | | | | | | | |
| | |
Japan — 17.1% | | | | | | | | |
| | |
Daikin Industries Ltd. | | | 232 | | | | 32,401 | |
| | |
FANUC Corp. | | | 123 | | | | 24,262 | |
| | |
Honda Motor Co. Ltd. | | | 827 | | | | 22,360 | |
| | |
Kao Corp. | | | 378 | | | | 30,407 | |
| | |
Keyence Corp. | | | 70 | | | | 44,387 | |
| | |
Komatsu Ltd. | | | 1,386 | | | | 32,441 | |
| | |
Kubota Corp. | | | 1,985 | | | | 31,520 | |
| | |
Makita Corp. | | | 704 | | | | 23,673 | |
| | |
Mitsui Fudosan Co. Ltd. | | | 1,118 | | | | 28,609 | |
| | |
Nidec Corp. | | | 194 | | | | 28,562 | |
| | |
Recruit Holdings Co. Ltd. | | | 729 | | | | 24,238 | |
| | |
Shin-Etsu Chemical Co. Ltd. | | | 342 | | | | 38,167 | |
| | |
Shiseido Co. Ltd. | | | 336 | | | | 27,669 | |
| | |
SMC Corp. | | | 64 | | | | 27,521 | |
| | |
Sony Corp. | | | 813 | | | | 49,474 | |
| | |
Sumitomo Mitsui Financial Group, Inc. | | | 1,277 | | | | 45,320 | |
| | | | | | | | |
| | |
| | | | | | | 511,011 | |
| | | | | | | | |
| | |
Macau — 0.8% | | | | | | | | |
| | |
Sands China Ltd. | | | 4,872 | | | | 24,000 | |
| | | | | | | | |
| | |
Netherlands — 5.8% | | | | | | | | |
| | |
ASML Holding NV | | | 223 | | | | 58,505 | |
| | |
ING Groep NV | | | 2,783 | | | | 31,510 | |
| | |
Royal Dutch Shell plc, Class A | | | 2,838 | | | | 82,268 | |
| | | | | | | | |
| | |
| | | | | | | 172,283 | |
| | | | | | | | |
| | |
Singapore — 1.3% | | | | | | | | |
| | |
DBS Group Holdings Ltd. | | | 2,062 | | | | 39,309 | |
| | | | | | | | |
| | |
South Korea — 1.3% | | | | | | | | |
| | |
Samsung Electronics Co. Ltd., GDR (b) | | | 37 | | | | 39,189 | |
| | |
Samsung Electronics Co. Ltd., GDR (b) | | | 1 | | | | 1,041 | |
| | | | | | | | |
| | |
| | | | | | | 40,230 | |
| | | | | | | | |
| | |
Spain — 1.1% | | | | | | | | |
| | |
Industria de Diseno Textil SA (a) | | | 1,066 | | | | 33,220 | |
| | | | | | | | |
SEE NOTES TO FINANCIAL STATEMENTS.
| | | | | | |
| | | |
| 54 | | | | J.P. MORGAN INTERNATIONAL EQUITY FUNDS | | OCTOBER 31, 2019 |
| | | | | | | | |
| INVESTMENTS | | SHARES
(000) | | | VALUE
($000) | |
Common Stocks — continued | | | | | | | | |
| | |
Sweden — 2.3% | | | | | | | | |
| | |
Atlas Copco AB, Class A (a) | | | 864 | | | | 30,482 | |
| | |
Epiroc AB, Class A | | | 1,179 | | | | 13,285 | |
| | |
Svenska Handelsbanken AB, Class A | | | 2,575 | | | | 25,845 | |
| | | | | | | | |
| | |
| | | | | | | 69,612 | |
| | | | | | | | |
| | |
Switzerland — 11.8% | | | | | | | | |
| | |
Alcon, Inc. * | | | 337 | | | | 19,953 | |
| | |
Cie Financiere Richemont SA (Registered) | | | 367 | | | | 28,861 | |
| | |
LafargeHolcim Ltd. (Registered) * | | | 589 | | | | 30,378 | |
| | |
Nestle SA (Registered) | | | 1,119 | | | | 119,701 | |
| | |
Novartis AG (Registered) | | | 879 | | | | 76,809 | |
| | |
Roche Holding AG | | | 261 | | | | 78,494 | |
| | | | | | | | |
| | |
| | | | | | | 354,196 | |
| | | | | | | | |
| | |
Taiwan — 1.4% | | | | | | | | |
| | |
Taiwan Semiconductor Manufacturing Co. Ltd., ADR | | | 813 | | | | 41,995 | |
| | | | | | | | |
| | |
United Kingdom — 15.2% | | | | | | | | |
| | |
Aviva plc | | | 4,163 | | | | 22,441 | |
| | |
Burberry Group plc | | | 1,341 | | | | 35,551 | |
| | |
Diageo plc | | | 1,432 | | | | 58,604 | |
| | |
GlaxoSmithKline plc | | | 2,765 | | | | 63,325 | |
| | |
Legal & General Group plc | | | 8,085 | | | | 27,636 | |
| | |
Linde plc | | | 195 | | | | 38,477 | |
| | |
London Stock Exchange Group plc | | | 373 | | | | 33,610 | |
| | |
M&G plc * | | | 1,707 | | | | 4,727 | |
| | |
Prudential plc | | | 1,707 | | | | 29,811 | |
| | |
RELX plc | | | 1,412 | | | | 33,979 | |
| | |
Smith & Nephew plc | | | 1,348 | | | | 28,935 | |
| | |
Unilever plc | | | 902 | | | | 54,019 | |
| | |
WPP plc | | | 2,061 | | | | 25,719 | |
| | | | | | | | |
| | |
| | | | | | | 456,834 | |
| | | | | | | | |
| | |
United States — 1.2% | | | | | | | | |
| | |
Ferguson plc | | | 438 | | | | 37,404 | |
| | | | | | | | |
| | |
Total Common Stocks
(Cost $2,167,677) | | | | | | | 2,928,091 | |
| | | | | | | | |
Short-Term Investments — 1.6% | | | | | | | | |
| | |
Investment Companies — 1.6% | | | | | | | | |
| | |
JPMorgan Prime Money Market Fund Class Institutional Shares, 1.88% (c) (d)
(Cost $49,188) | | | 49,177 | | | | 49,197 | |
| | | | | | | | |
| | | | | | | | |
| INVESTMENTS | | SHARES
(000) | | | VALUE
($000) | |
Investment of Cash Collateral from Securities Loaned — 1.8% | |
| | |
JPMorgan Securities Lending Money Market Fund Class Agency SL Shares, 1.98% (c) (d) | | | 39,999 | | | | 40,003 | |
| | |
JPMorgan U.S. Government Money Market Fund Class IM Shares, 1.70% (c) (d) | | | 12,516 | | | | 12,516 | |
| | | | | | | | |
| | |
Total Investment of Cash Collateral from Securities Loaned
(cost $52,519) | | | | | | | 52,519 | |
| | | | | | | | |
Total Investments — 101.1%
(Cost $2,269,384) | | | | | | | 3,029,807 | |
Liabilities in Excess of
Other Assets — (1.1)% | | | | | | | (32,801 | ) |
| | | | | | | | |
NET ASSETS — 100.0% | | | | | | | 2,997,006 | |
| | | | | | | | |
Percentages indicated are based on net assets.
SEE NOTES TO FINANCIAL STATEMENTS.
| | | | | | | | |
| | | |
| OCTOBER 31, 2019 | | J.P. MORGAN INTERNATIONAL EQUITY FUNDS | | | | | 55 | |
JPMorgan International Equity Fund
SCHEDULE OF PORTFOLIO INVESTMENTS
AS OF OCTOBER 31, 2019 (continued)
Summary of Investments by Industry, October 31, 2019
The following table represents the portfolio investments of the Fund by industry classifications as a percentage of total investments:
| | | | |
| INDUSTRY | | PERCENTAGE | |
| |
Insurance | | | 9.8 | % |
| |
Pharmaceuticals | | | 8.9 | |
| |
Banks | | | 7.9 | |
| |
Machinery | | | 6.0 | |
| |
Textiles, Apparel & Luxury Goods | | | 5.6 | |
| |
Personal Products | | | 4.8 | |
| |
Oil, Gas & Consumable Fuels | | | 4.4 | |
| |
Beverages | | | 4.3 | |
| |
Food Products | | | 4.0 | |
| |
Semiconductors & Semiconductor Equipment | | | 3.3 | |
| |
Electrical Equipment | | | 3.2 | |
| |
Capital Markets | | | 2.9 | |
| |
Chemicals | | | 2.5 | |
| |
Aerospace & Defense | | | 2.2 | |
| |
Software | | | 2.0 | |
| |
Professional Services | | | 1.9 | |
| |
Metals & Mining | | | 1.9 | |
| |
Real Estate Management & Development | | | 1.8 | |
| |
Investment of cash collateral from securities loaned | | | 1.7 | |
| |
Hotels, Restaurants & Leisure | | | 1.7 | |
| |
Household Durables | | | 1.6 | |
| |
Health Care Equipment & Supplies | | | 1.6 | |
| |
Electronic Equipment, Instruments & Components | | | 1.5 | |
| |
Technology Hardware, Storage & Peripherals | | | 1.3 | |
| |
Trading Companies & Distributors | | | 1.2 | |
| |
Internet & Direct Marketing Retail | | | 1.2 | |
| |
Specialty Retail | | | 1.1 | |
| |
Building Products | | | 1.1 | |
| |
Diversified Telecommunication Services | | | 1.1 | |
| |
IT Services | | | 1.0 | |
| |
Construction Materials | | | 1.0 | |
| |
Others (each less than 1.0%) | | | 3.9 | |
| |
Short-Term Investments | | | 1.6 | |
| | |
Abbreviations | | |
| ADR | | American Depositary Receipt |
| GDR | | Global Depositary Receipt |
| |
| (a) | | The security or a portion of this security is on loan at October 31, 2019. The total value of securities on loan at October 31, 2019 is approximately $49,506,000. |
| (b) | | Security exempt from registration pursuant to Regulation S under the Securities Act of 1933, as amended. Regulation S applies to securities offerings that are made outside of the United States and do not involve direct selling efforts in the United States and as such may have restrictions on resale. |
| (c) | | Investment in an affiliated fund, which is registered under the Investment Company Act of 1940, as amended, and is advised by J.P. Morgan Investment Management Inc. |
| (d) | | The rate shown is the current yield as of October 31, 2019. |
| * | | Non-income producing security. |
SEE NOTES TO FINANCIAL STATEMENTS.
| | | | | | |
| | | |
| 56 | | | | J.P. MORGAN INTERNATIONAL EQUITY FUNDS | | OCTOBER 31, 2019 |
JPMorgan International Hedged Equity Fund
SCHEDULE OF PORTFOLIO INVESTMENTS
AS OF OCTOBER 31, 2019
| | | | | | | | |
| INVESTMENTS | | SHARES
(000) | | | VALUE
($000) | |
Common Stocks — 98.0% | | | | | | | | |
| | |
Australia — 4.9% | | | | | | | | |
| | |
Australia & New Zealand Banking Group Ltd. | | | 29 | | | | 527 | |
| | |
BHP Group Ltd. | | | 25 | | | | 621 | |
| | |
Commonwealth Bank of Australia | | | 2 | | | | 118 | |
| | |
CSL Ltd. | | �� | 2 | | | | 318 | |
| | |
Dexus, REIT | | | 34 | | | | 278 | |
| | |
Goodman Group, REIT | | | 31 | | | | 309 | |
| | |
Macquarie Group Ltd. | | | 1 | | | | 56 | |
| | |
National Australia Bank Ltd. | | | 4 | | | | 70 | |
| | |
Rio Tinto Ltd. | | | 7 | | | | 429 | |
| | |
Rio Tinto plc | | | 2 | | | | 130 | |
| | |
Westpac Banking Corp. | | | 6 | | | | 110 | |
| | | | | | | | |
| | |
| | | | | | | 2,966 | |
| | | | | | | | |
| | |
Austria — 0.6% | | | | | | | | |
| | |
Erste Group Bank AG | | | 11 | | | | 374 | |
| | | | | | | | |
| | |
Belgium — 1.0% | | | | | | | | |
| | |
Anheuser-Busch InBev SA/NV | | | 8 | | | | 608 | |
| | | | | | | | |
| | |
Denmark — 1.8% | | | | | | | | |
| | |
Chr Hansen Holding A/S | | | 2 | | | | 171 | |
| | |
Novo Nordisk A/S, Class B | | | 16 | | | | 892 | |
| | | | | | | | |
| | |
| | | | | | | 1,063 | |
| | | | | | | | |
| | |
Finland — 0.6% | | | | | | | | |
| | |
Nokia OYJ | | | 25 | | | | 94 | |
| | |
Wartsila OYJ Abp | | | 27 | | | | 287 | |
| | | | | | | | |
| | |
| | | | | | | 381 | |
| | | | | | | | |
| | |
France — 13.6% | | | | | | | | |
| | |
Air Liquide SA | | | 6 | | | | 844 | |
| | |
Airbus SE | | | 4 | | | | 574 | |
| | |
Alstom SA | | | 9 | | | | 375 | |
| | |
AXA SA | | | 7 | | | | 183 | |
| | |
BNP Paribas SA | | | 13 | | | | 654 | |
| | |
Capgemini SE | | | 2 | | | | 273 | |
| | |
Natixis SA | | | 59 | | | | 273 | |
| | |
Orange SA | | | 20 | | | | 318 | |
| | |
Pernod Ricard SA | | | 3 | | | | 628 | |
| | |
Renault SA | | | 7 | | | | 364 | |
| | |
Safran SA | | | 3 | | | | 544 | |
| | |
Sanofi | | | 9 | | | | 824 | |
| | |
Schneider Electric SE | | | 7 | | | | 681 | |
| | |
Sodexo SA | | | 2 | | | | 198 | |
| | |
Thales SA | | | 3 | | | | 318 | |
| | |
TOTAL SA | | | 16 | | | | 847 | |
| | |
Unibail-Rodamco-Westfield, REIT | | | 1 | | | | 169 | |
| | |
Vinci SA | | | 1 | | | | 155 | |
| | | | | | | | |
| | |
| | | | | | | 8,222 | |
| | | | | | | | |
| | | | | | | | |
| INVESTMENTS | | SHARES
(000) | | | VALUE
($000) | |
| | | | | | | | |
| | |
Germany — 8.8% | | | | | | | | |
| | |
adidas AG | | | 1 | | | | 307 | |
| | |
Allianz SE (Registered) | | | 1 | | | | 130 | |
| | |
BASF SE | | | 2 | | | | 130 | |
| | |
Bayer AG (Registered) | | | 4 | | | | 343 | |
| | |
Brenntag AG | | | 7 | | | | 365 | |
| | |
Daimler AG (Registered) | | | 10 | | | | 581 | |
| | |
Deutsche Bank AG (Registered) | | | 9 | | | | 68 | |
| | |
Deutsche Boerse AG | | | 2 | | | | 369 | |
| | |
Deutsche Post AG (Registered) | | | 12 | | | | 428 | |
| | |
Deutsche Telekom AG (Registered) | | | 30 | | | | 531 | |
| | |
Henkel AG & Co. KGaA (Preference) | | | 4 | | | | 380 | |
| | |
Infineon Technologies AG | | | 16 | | | | 318 | |
| | |
RWE AG | | | 4 | | | | 134 | |
| | |
SAP SE | | | 8 | | | | 1,037 | |
| | |
Siemens AG (Registered) | | | 1 | | | | 161 | |
| | | | | | | | |
| | |
| | | | | | | 5,282 | |
| | | | | | | | |
| | |
Hong Kong — 2.3% | | | | | | | | |
| | |
AIA Group Ltd. | | | 77 | | | | 771 | |
| | |
CK Asset Holdings Ltd. | | | 29 | | | | 202 | |
| | |
Hong Kong Exchanges & Clearing Ltd. | | | 14 | | | | 442 | |
| | | | | | | | |
| | |
| | | | | | | 1,415 | |
| | | | | | | | |
| | |
Ireland — 0.8% | | | | | | | | |
| | |
CRH plc | | | 3 | | | | 124 | |
| | |
Ryanair Holdings plc, ADR * | | | 5 | | | | 356 | |
| | | | | | | | |
| | |
| | | | | | | 480 | |
| | | | | | | | |
| | |
Italy — 2.6% | | | | | | | | |
| | |
Assicurazioni Generali SpA | | | 14 | | | | 293 | |
| | |
Enel SpA | | | 119 | | | | 921 | |
| | |
FinecoBank Banca Fineco SpA | | | 25 | | | | 283 | |
| | |
UniCredit SpA | | | 4 | | | | 47 | |
| | | | | | | | |
| | |
| | | | | | | 1,544 | |
| | | | | | | | |
| | |
Japan — 23.4% | | | | | | | | |
| | |
Asahi Group Holdings Ltd. | | | 1 | | | | 65 | |
| | |
Bridgestone Corp. | | | 8 | | | | 332 | |
| | |
Central Japan Railway Co. | | | 2 | | | | 349 | |
| | |
Daicel Corp. | | | 33 | | | | 292 | |
| | |
Daikin Industries Ltd. | | | 4 | | | | 546 | |
| | |
DMG Mori Co. Ltd. | | | 24 | | | | 380 | |
| | |
Electric Power Development Co. Ltd. | | | 4 | | | | 104 | |
| | |
Hitachi Ltd. | | | 6 | | | | 213 | |
| | |
Honda Motor Co. Ltd. | | | 20 | | | | 536 | |
| | |
Japan Airlines Co. Ltd. | | | 7 | | | | 203 | |
| | |
Japan Tobacco, Inc. | | | 14 | | | | 305 | |
| | |
Kao Corp. | | | 7 | | | | 571 | |
SEE NOTES TO FINANCIAL STATEMENTS.
| | | | | | | | |
| | | |
| OCTOBER 31, 2019 | | J.P. MORGAN INTERNATIONAL EQUITY FUNDS | | | | | 57 | |
JPMorgan International Hedged Equity Fund
SCHEDULE OF PORTFOLIO INVESTMENTS
AS OF OCTOBER 31, 2019 (continued)
| | | | | | | | |
| INVESTMENTS | | SHARES
(000) | | | VALUE
($000) | |
Common Stocks — continued | | | | | | | | |
| | |
Japan — continued | | | | | | | | |
| | |
Keyence Corp. | | | — | (a) | | | 126 | |
| | |
Mabuchi Motor Co. Ltd. | | | 11 | | | | 434 | |
| | |
Marui Group Co. Ltd. | | | 16 | | | | 351 | |
| | |
Mitsubishi Corp. | | | 14 | | | | 364 | |
| | |
Mitsubishi UFJ Financial Group, Inc. | | | 104 | | | | 539 | |
| | |
Mitsui Fudosan Co. Ltd. | | | 15 | | | | 371 | |
| | |
NGK Spark Plug Co. Ltd. | | | 13 | | | | 268 | |
| | |
Nintendo Co. Ltd. | | | 2 | | | | 660 | |
| | |
Nippon Telegraph & Telephone Corp. | | | 12 | | | | 576 | |
| | |
Nomura Research Institute Ltd. | | | 7 | | | | 147 | |
| | |
Olympus Corp. | | | 8 | | | | 114 | |
| | |
Otsuka Corp. | | | 10 | | | | 399 | |
| | |
Otsuka Holdings Co. Ltd. | | | 12 | | | | 484 | |
| | |
Panasonic Corp. | | | 32 | | | | 268 | |
| | |
Persol Holdings Co. Ltd. | | | 10 | | | | 192 | |
| | |
Renesas Electronics Corp. * | | | 21 | | | | 142 | |
| | |
Ryohin Keikaku Co. Ltd. | | | 10 | | | | 218 | |
| | |
Seven & i Holdings Co. Ltd. | | | 13 | | | | 502 | |
| | |
Sony Corp. | | | 5 | | | | 292 | |
| | |
Sumitomo Electric Industries Ltd. | | | 13 | | | | 182 | |
| | |
Sumitomo Mitsui Financial Group, Inc. | | | 14 | | | | 479 | |
| | |
T&D Holdings, Inc. | | | 30 | | | | 336 | |
| | |
Tokio Marine Holdings, Inc. | | | 10 | | | | 514 | |
| | |
Tokyo Gas Co. Ltd. | | | 5 | | | | 117 | |
| | |
Tokyu Corp. | | | 26 | | | | 496 | |
| | |
Toray Industries, Inc. | | | 35 | | | | 250 | |
| | |
Toyota Motor Corp. | | | 15 | | | | 1,041 | |
| | |
West Japan Railway Co. | | | 3 | | | | 252 | |
| | |
Yamato Holdings Co. Ltd. | | | 6 | | | | 96 | |
| | | | | | | | |
| | |
| | | | | | | 14,106 | |
| | | | | | | | |
| | |
Luxembourg — 0.3% | | | | | | | | |
| | |
ArcelorMittal | | | 13 | | | | 199 | |
| | | | | | | | |
| | |
Netherlands — 5.0% | | | | | | | | |
| | |
Akzo Nobel NV | | | 5 | | | | 431 | |
| | |
ASML Holding NV | | | 3 | | | | 818 | |
| | |
Heineken NV | | | 2 | | | | 178 | |
| | |
ING Groep NV | | | 37 | | | | 418 | |
| | |
Koninklijke Philips NV | | | 4 | | | | 193 | |
| | |
Royal Dutch Shell plc, Class A | | | 16 | | | | 468 | |
| | |
Royal Dutch Shell plc, Class B | | | 17 | | | | 485 | |
| | | | | | | | |
| | |
| | | | | | | 2,991 | |
| | | | | | | | |
| | |
Norway — 0.8% | | | | | | | | |
| | |
Telenor ASA | | | 25 | | | | 470 | |
| | | | | | | | |
| | | | | | | | |
| INVESTMENTS | | SHARES
(000) | | | VALUE
($000) | |
| | | | | | | | |
| | |
Singapore — 0.9% | | | | | | | | |
| | |
DBS Group Holdings Ltd. | | | 27 | | | | 511 | |
| | |
United Overseas Bank Ltd. | | | 3 | | | | 57 | |
| | | | | | | | |
| | |
| | | | | | | 568 | |
| | | | | | | | |
| | |
Spain — 3.2% | | | | | | | | |
| | |
Banco Santander SA | | | 59 | | | | 237 | |
| | |
Bankia SA | | | 93 | | | | 177 | |
| | |
Iberdrola SA | | | 78 | | | | 806 | |
| | |
Industria de Diseno Textil SA | | | 19 | | | | 605 | |
| | |
Telefonica SA | | | 15 | | | | 119 | |
| | | | | | | | |
| | |
| | | | | | | 1,944 | |
| | | | | | | | |
| | |
Sweden — 1.4% | | | | | | | | |
| | |
Lundin Petroleum AB | | | 13 | | | | 414 | |
| | |
Svenska Handelsbanken AB, Class A | | | 43 | | | | 428 | |
| | | | | | | | |
| | |
| | | | | | | 842 | |
| | | | | | | | |
| | |
Switzerland — 10.2% | | | | | | | | |
| | |
Cie Financiere Richemont SA (Registered) | | | 7 | | | | 573 | |
| | |
Credit Suisse Group AG (Registered) * | | | 20 | | | | 250 | |
| | |
LafargeHolcim Ltd. (Registered) * | | | 10 | | | | 501 | |
| | |
Nestle SA (Registered) | | | 17 | | | | 1,832 | |
| | |
Novartis AG (Registered) | | | 11 | | | | 966 | |
| | |
Roche Holding AG | | | 4 | | | | 1,336 | |
| | |
Swiss Re AG | | | 5 | | | | 484 | |
| | |
Zurich Insurance Group AG | | | — | (a) | | | 175 | |
| | | | | | | | |
| | |
| | | | | | | 6,117 | |
| | | | | | | | |
| | |
United Kingdom — 15.2% | | | | | | | | |
| | |
3i Group plc | | | 38 | | | | 562 | |
| | |
AstraZeneca plc | | | 3 | | | | 281 | |
| | |
Aviva plc | | | 27 | | | | 143 | |
| | |
Barratt Developments plc | | | 33 | | | | 266 | |
| | |
BP plc | | | 144 | | | | 913 | |
| | |
British American Tobacco plc | | | 19 | | | | 671 | |
| | |
Burberry Group plc | | | 14 | | | | 376 | |
| | |
CK Hutchison Holdings Ltd. | | | 24 | | | | 217 | |
| | |
Diageo plc | | | 2 | | | | 93 | |
| | |
Dixons Carphone plc | | | 99 | | | | 169 | |
| | |
GlaxoSmithKline plc | | | 33 | | | | 760 | |
| | |
HSBC Holdings plc | | | 65 | | | | 491 | |
| | |
InterContinental Hotels Group plc | | | 10 | | | | 592 | |
| | |
ITV plc | | | 180 | | | | 312 | |
| | |
Lloyds Banking Group plc | | | 295 | | | | 217 | |
| | |
M&G plc * | | | 94 | | | | 261 | |
| | |
Prudential plc | | | 36 | | | | 635 | |
| | |
SSE plc | | | 32 | | | | 528 | |
SEE NOTES TO FINANCIAL STATEMENTS.
| | | | | | |
| | | |
| 58 | | | | J.P. MORGAN INTERNATIONAL EQUITY FUNDS | | OCTOBER 31, 2019 |
| | | | | | | | |
| INVESTMENTS | | SHARES
(000) | | | VALUE
($000) | |
Common Stocks — continued | | | | | | | | |
| | |
United Kingdom — continued | | | | | | | | |
| | |
Standard Chartered plc | | | 53 | | | | 484 | |
| | |
Taylor Wimpey plc | | | 110 | | | | 237 | |
| | |
Unilever NV | | | 12 | | | | 709 | |
| | |
Vodafone Group plc | | | 44 | | | | 90 | |
| | |
Whitbread plc | | | 3 | | | | 141 | |
| | | | | | | | |
| | |
| | | | | | | 9,148 | |
| | | | | | | | |
| | |
United States — 0.6% | | | | | | | | |
| | |
Ferguson plc | | | 4 | | | | 358 | |
| | | | | | | | |
| | |
Total Common Stocks
(Cost $57,538) | | | | | | | 59,078 | |
| | | | | | | | |
| | |
| | | NO. OF
CONTRACTS | | | MARKET
VALUE
($000) | |
Options Purchased — 0.3% | | | | | | | | |
| | |
Put Options Purchased — 0.3% | | | | | | | | |
| | |
Mauritius — 0.3% | | | | | | | | |
| | |
MSCI EAFE Index 12/20/2019 at USD 1,810.00, Vanilla, European Style Notional Amount: USD 60,424,000 Exchange-Traded *
(Cost $547) | | | 309 | | | | 162 | |
| | | | | | | | |
| | |
| | | SHARES
(000) | | | VALUE
($000) | |
Short-Term Investments — 1.4% | | | | | | | | |
| | |
Investment Companies — 1.4% | | | | | | | | |
| | |
JPMorgan U.S. Government Money Market Fund Class Institutional Shares, 1.64% (b) (c)
(Cost $850) | | | 850 | | | | 850 | |
| | | | | | | | |
Total Investments — 99.7%
(Cost $58,935) | | | | | | | 60,090 | |
Other Assets Less Liabilities — 0.3% | | | | | | | 152 | |
| | | | | | | | |
NET ASSETS — 100.0% | | | | | | | 60,242 | |
| | | | | | | | |
Percentages indicated are based on net assets.
Summary of Investments by Industry, October 31, 2019
The following table represents the portfolio investments of the Fund by industry classifications as a percentage of total investments:
| | | | |
| INDUSTRY | | PERCENTAGE | |
| |
Banks | | | 10.4 | % |
| |
Pharmaceuticals | | | 9.8 | |
| |
Insurance | | | 6.1 | |
| |
Oil, Gas & Consumable Fuels | | | 5.2 | |
| |
Automobiles | | | 4.2 | |
| |
Electric Utilities | | | 3.8 | |
| |
Chemicals | | | 3.5 | |
| |
Capital Markets | | | 3.4 | |
| |
Diversified Telecommunication Services | | | 3.4 | |
| |
Food Products | | | 3.0 | |
| |
Beverages | | | 2.6 | |
| |
Aerospace & Defense | | | 2.4 | |
| |
Metals & Mining | | | 2.3 | |
| |
Personal Products | | | 2.1 | |
| |
Semiconductors & Semiconductor Equipment | | | 2.1 | |
| |
Textiles, Apparel & Luxury Goods | | | 2.1 | |
| |
Electrical Equipment | | | 1.9 | |
| |
Road & Rail | | | 1.8 | |
| |
Trading Companies & Distributors | | | 1.8 | |
| |
Household Durables | | | 1.8 | |
| |
Machinery | | | 1.7 | |
| |
Software | | | 1.7 | |
| |
Tobacco | | | 1.6 | |
| |
Hotels, Restaurants & Leisure | | | 1.5 | |
| |
IT Services | | | 1.4 | |
| |
Auto Components | | | 1.3 | |
| |
Specialty Retail | | | 1.3 | |
| |
Equity Real Estate Investment Trusts (REITs) | | | 1.3 | |
| |
Entertainment | | | 1.1 | |
| |
Construction Materials | | | 1.0 | |
| |
Real Estate Management & Development | | | 1.0 | |
| |
Others (each less than 1.0%) | | | 10.0 | |
| |
Short-Term Investments | | | 1.4 | |
SEE NOTES TO FINANCIAL STATEMENTS.
| | | | | | | | |
| | | |
| OCTOBER 31, 2019 | | J.P. MORGAN INTERNATIONAL EQUITY FUNDS | | | | | 59 | |
JPMorgan International Hedged Equity Fund
SCHEDULE OF PORTFOLIO INVESTMENTS
AS OF OCTOBER 31, 2019 (continued)
| | |
Abbreviations | | |
| ADR | | American Depositary Receipt |
| EAFE | | Europe, Australasia and Far East |
| OYJ | | Public Limited Company |
| Preference | | A special type of equity investment that shares in the earnings of the company, has limited voting rights, and may have a dividend preference. Preference shares may also have liquidation preference. |
| REIT | | Real Estate Investment Trust |
| | |
| USD | | United States Dollar |
| |
| (a) | | Amount rounds to less than one thousand. |
| (b) | | Investment in an affiliated fund, which is registered under the Investment Company Act of 1940, as amended, and is advised by J.P. Morgan Investment Management Inc. |
| (c) | | The rate shown is the current yield as of October 31, 2019. |
| * | | Non-income producing security. |
| | | | | | | | | | | | | | | | | | | | |
| Futures contracts outstanding as of October 31, 2019 (amounts in thousands, except number of contracts): | |
| DESCRIPTION | | NUMBER OF
CONTRACTS | | | EXPIRATION
DATE | | | TRADING
CURRENCY | | | NOTIONAL
AMOUNT ($) | | | VALUE AND
UNREALIZED
APPRECIATION
(DEPRECIATION) ($) | |
| | | | | |
Long Contracts | | | | | | | | | | | | | | | | | | | | |
| | | | | |
SPI 200 Index | | | 8 | | | | 12/2019 | | | | AUD | | | | 914 | | | | (4 | ) |
| | | | | | | | | | | | | | | | | | | | |
| | |
Abbreviations | | |
| AUD | | Australian Dollar |
| SPI | | Australian Securities Exchange |
| | | | | | | | | | | | | | | | | | | | | | | | |
| Written Call Options contracts as of October 31, 2019 (amounts in thousands, except number of contracts): | |
| DESCRIPTION | | COUNTERPARTY | | | NUMBER OF
CONTRACTS | | | NOTIONAL
AMOUNT | | | EXERCISE
PRICE | | | EXPIRATION
DATE | | | VALUE ($) | |
| | | | | | |
| MSCI EAFE Index | | | Exchange-Traded | | | | 309 | | | | USD 60,424 | | | | USD 1,980 | | | | 12/20/2019 | | | | (581 | ) |
| | | | | | | | | | | | | | | | | | | | | | | | |
| Written Put Options contracts as of October 31, 2019 (amounts in thousands, except number of contracts): | |
| DESCRIPTION | | COUNTERPARTY | | | NUMBER OF
CONTRACTS | | | NOTIONAL
AMOUNT | | | EXERCISE
PRICE | | | EXPIRATION
DATE | | | VALUE ($) | |
| | | | | | |
| MSCI EAFE Index | | | Exchange-Traded | | | | 309 | | | | USD 60,424 | | | | USD 1,530 | | | | 12/20/2019 | | | | (11 | ) |
| | | | | | | | | | | | | | | | | | | | | | | | |
| | | | |
Total Written Options contracts (Premiums Received $512) | | | | | | | | | | | | | | | | (592 | ) |
| | | | | | | | | | | | | | | | | | | | | | | | |
| | |
Abbreviations | | |
| EAFE | | Europe, Australasia, and Far East |
| MSCI | | Morgan Stanley Capital International |
| USD | | United States Dollar |
SEE NOTES TO FINANCIAL STATEMENTS.
| | | | | | |
| | | |
| 60 | | | | J.P. MORGAN INTERNATIONAL EQUITY FUNDS | | OCTOBER 31, 2019 |
JPMorgan International Research Enhanced Equity Fund
SCHEDULE OF PORTFOLIO INVESTMENTS
AS OF OCTOBER 31, 2019
| | | | | | | | |
| INVESTMENTS | | SHARES
(000) | | | VALUE
($000) | |
Common Stocks — 96.0% | |
|
Australia — 4.8% | |
| | |
Australia & New Zealand Banking Group Ltd. | | | 2,252 | | | | 41,392 | |
| | |
BHP Group Ltd. | | | 1,981 | | | | 48,568 | |
| | |
Commonwealth Bank of Australia | | | 174 | | | | 9,411 | |
| | |
CSL Ltd. | | | 141 | | | | 24,915 | |
| | |
Dexus, REIT | | | 2,646 | | | | 21,821 | |
| | |
Goodman Group, REIT | | | 2,444 | | | | 24,271 | |
| | |
Macquarie Group Ltd. | | | 50 | | | | 4,592 | |
| | |
National Australia Bank Ltd. | | | 292 | | | | 5,727 | |
| | |
Rio Tinto Ltd. | | | 538 | | | | 33,644 | |
| | |
Rio Tinto plc | | | 199 | | | | 10,356 | |
| | |
Westpac Banking Corp. | | | 452 | | | | 8,780 | |
| | | | | | | | |
| | |
| | | | | | | 233,477 | |
| | | | | | | | |
|
Austria — 0.6% | |
| | |
Erste Group Bank AG | | | 830 | | | | 29,363 | |
| | |
IMMOFINANZ AG * | | | 1 | | | | 41 | |
| | | | | | | | |
| | |
| | | | | | | 29,404 | |
| | | | | | | | |
|
Belgium — 1.0% | |
| | |
Anheuser-Busch InBev SA/NV | | | 591 | | | | 47,700 | |
| | | | | | | | |
|
Denmark — 1.7% | |
| | |
Chr Hansen Holding A/S (a) | | | 176 | | | | 13,474 | |
| | |
Novo Nordisk A/S, Class B | | | 1,275 | | | | 70,113 | |
| | | | | | | | |
| | |
| | | | | | | 83,587 | |
| | | | | | | | |
|
Finland — 0.6% | |
| | |
Nokia OYJ | | | 1,995 | | | | 7,323 | |
| | |
Wartsila OYJ Abp | | | 2,137 | | | | 22,580 | |
| | | | | | | | |
| | |
| | | | | | | 29,903 | |
| | | | | | | | |
|
France — 13.4% | |
| | |
Air Liquide SA | | | 498 | | | | 66,242 | |
| | |
Airbus SE | | | 314 | | | | 45,023 | |
| | |
Alstom SA | | | 682 | | | | 29,498 | |
| | |
AXA SA | | | 543 | | | | 14,375 | |
| | |
BNP Paribas SA | | | 984 | | | | 51,417 | |
| | |
Capgemini SE | | | 190 | | | | 21,436 | |
| | |
Natixis SA | | | 4,665 | | | | 21,432 | |
| | |
Orange SA | | | 1,552 | | | | 24,973 | |
| | |
Pernod Ricard SA | | | 267 | | | | 49,288 | |
| | |
Renault SA | | | 560 | | | | 28,605 | |
| | |
Safran SA | | | 270 | | | | 42,742 | |
| | |
Sanofi | | | 702 | | | | 64,728 | |
| | |
Schneider Electric SE | | | 576 | | | | 53,524 | |
| | |
Sodexo SA | | | 142 | | | | 15,565 | |
| | |
Thales SA | | | 255 | | | | 24,941 | |
| | | | | | | | |
| INVESTMENTS | | SHARES
(000) | | | VALUE
($000) | |
| | | | | | | | |
|
France — continued | |
| | |
TOTAL SA | | | 1,256 | | | | 66,418 | |
| | |
Unibail-Rodamco-Westfield, REIT | | | 86 | | | | 13,284 | |
| | |
Vinci SA (a) | | | 111 | | | | 12,418 | |
| | | | | | | | |
| | |
| | | | | | | 645,909 | |
| | | | | | | | |
|
Germany — 8.6% | |
| | |
adidas AG | | | 78 | | | | 24,026 | |
| | |
Allianz SE (Registered) | | | 43 | | | | 10,415 | |
| | |
BASF SE | | | 137 | | | | 10,423 | |
| | |
Bayer AG (Registered) | | | 348 | | | | 26,996 | |
| | |
Brenntag AG | | | 572 | | | | 28,652 | |
| | |
Daimler AG (Registered) | | | 781 | | | | 45,656 | |
| | |
Deutsche Bank AG (Registered) (a) | | | 776 | | | | 5,625 | |
| | |
Deutsche Boerse AG | | | 187 | | | | 28,972 | |
| | |
Deutsche Post AG (Registered) | | | 950 | | | | 33,662 | |
| | |
Deutsche Telekom AG (Registered) | | | 2,373 | | | | 41,748 | |
| | |
Henkel AG & Co. KGaA (Preference) | | | 288 | | | | 29,897 | |
| | |
Infineon Technologies AG (a) | | | 1,289 | | | | 24,971 | |
| | |
RWE AG | | | 345 | | | | 10,514 | |
| | |
SAP SE | | | 614 | | | | 81,320 | |
| | |
Siemens AG (Registered) | | | 111 | | | | 12,864 | |
| | | | | | | | |
| | |
| | | | | | | 415,741 | |
| | | | | | | | |
|
Hong Kong — 2.3% | |
| | |
AIA Group Ltd. | | | 6,062 | | | | 60,367 | |
| | |
CK Asset Holdings Ltd. | | | 2,247 | | | | 15,632 | |
| | |
Hong Kong Exchanges & Clearing Ltd. | | | 1,106 | | | | 34,444 | |
| | |
I-CABLE Communications Ltd. * | | | 254 | | | | 2 | |
| | | | | | | | |
| | |
| | | | | | | 110,445 | |
| | | | | | | | |
|
Ireland — 0.8% | |
| | |
CRH plc | | | 272 | | | | 9,914 | |
| | |
Ryanair Holdings plc, ADR * | | | 375 | | | | 27,988 | |
| | | | | | | | |
| | |
| | | | | | | 37,902 | |
| | | | | | | | |
|
Italy — 2.5% | |
| | |
Assicurazioni Generali SpA | | | 1,134 | | | | 22,990 | |
| | |
Enel SpA | | | 9,337 | | | | 72,365 | |
| | |
FinecoBank Banca Fineco SpA (a) | | | 1,971 | | | | 22,215 | |
| | |
UniCredit SpA | | | 306 | | | | 3,879 | |
| | | | | | | | |
| | |
| | | | | | | 121,449 | |
| | | | | | | | |
|
Japan — 22.9% | |
| | |
Asahi Group Holdings Ltd. | | | 96 | | | | 4,782 | |
| | |
Bridgestone Corp. | | | 624 | | | | 25,923 | |
| | |
Central Japan Railway Co. | | | 132 | | | | 27,037 | |
| | |
Daicel Corp. | | | 2,557 | | | | 22,862 | |
SEE NOTES TO FINANCIAL STATEMENTS.
| | | | | | | | |
| | | |
| OCTOBER 31, 2019 | | J.P. MORGAN INTERNATIONAL EQUITY FUNDS | | | | | 61 | |
JPMorgan International Research Enhanced Equity Fund
SCHEDULE OF PORTFOLIO INVESTMENTS
AS OF OCTOBER 31, 2019 (continued)
| | | | | | | | |
| INVESTMENTS | | SHARES
(000) | | | VALUE
($000) | |
Common Stocks — continued | |
|
Japan — continued | |
| | |
Daikin Industries Ltd. | | | 305 | | | | 42,756 | |
| | |
DMG Mori Co. Ltd. | | | 1,839 | | | | 29,769 | |
| | |
Electric Power Development Co. Ltd. | | | 337 | | | | 8,173 | |
| | |
Hitachi Ltd. | | | 435 | | | | 16,250 | |
| | |
Honda Motor Co. Ltd. | | | 1,553 | | | | 42,026 | |
| | |
Japan Airlines Co. Ltd. | | | 511 | | | | 15,908 | |
| | |
Japan Tobacco, Inc. | | | 1,061 | | | | 23,984 | |
| | |
Kao Corp. | | | 558 | | | | 44,879 | |
| | |
Keyence Corp. | | | 18 | | | | 11,571 | |
| | |
Mabuchi Motor Co. Ltd. | | | 838 | | | | 33,953 | |
| | |
Marui Group Co. Ltd. | | | 1,244 | | | | 27,646 | |
| | |
Mitsubishi Corp. | | | 1,123 | | | | 28,555 | |
| | |
Mitsubishi UFJ Financial Group, Inc. | | | 8,130 | | | | 42,149 | |
| | |
Mitsui Fudosan Co. Ltd. | | | 1,144 | | | | 29,254 | |
| | |
NGK Spark Plug Co. Ltd. | | | 1,027 | | | | 20,829 | |
| | |
Nintendo Co. Ltd. | | | 139 | | | | 50,873 | |
| | |
Nippon Telegraph & Telephone Corp. | | | 920 | | | | 45,681 | |
| | |
Nomura Research Institute Ltd. | | | 548 | | | | 11,626 | |
| | |
Olympus Corp. | | | 671 | | | | 9,127 | |
| | |
Otsuka Corp. | | | 778 | | | | 31,375 | |
| | |
Otsuka Holdings Co. Ltd. | | | 916 | | | | 38,184 | |
| | |
Panasonic Corp. | | | 2,486 | | | | 20,897 | |
| | |
Persol Holdings Co. Ltd. | | | 785 | | | | 15,075 | |
| | |
Renesas Electronics Corp. * | | | 1,643 | | | | 11,121 | |
| | |
Ryohin Keikaku Co. Ltd. | | | 787 | | | | 17,527 | |
| | |
Seven & i Holdings Co. Ltd. | | | 1,042 | | | | 39,363 | |
| | |
Sony Corp. | | | 383 | | | | 23,324 | |
| | |
Sumitomo Electric Industries Ltd. | | | 1,054 | | | | 14,453 | |
| | |
Sumitomo Mitsui Financial Group, Inc. | | | 1,055 | | | | 37,452 | |
| | |
T&D Holdings, Inc. | | | 2,373 | | | | 26,432 | |
| | |
Tokio Marine Holdings, Inc. | | | 748 | | | | 40,414 | |
| | |
Tokyo Gas Co. Ltd. | | | 389 | | | | 9,506 | |
| | |
Tokyu Corp. | | | 2,049 | | | | 38,752 | |
| | |
Toray Industries, Inc. | | | 2,766 | | | | 19,545 | |
| | |
Toyota Motor Corp. | | | 1,174 | | | | 81,482 | |
| | |
West Japan Railway Co. | | | 220 | | | | 19,081 | |
| | |
Yamato Holdings Co. Ltd. | | | 446 | | | | 7,474 | |
| | | | | | | | |
| | |
| | | | | | | 1,107,070 | |
| | | | | | | | |
|
Luxembourg — 0.3% | |
| | |
ArcelorMittal | | | 1,051 | | | | 15,620 | |
| | | | | | | | |
|
Malta — 0.0% (b) | |
| | |
BGP Holdings plc * ‡ | | | 449 | | | | 1 | |
| | | | | | | | |
|
Netherlands — 4.8% | |
| | |
Akzo Nobel NV | | | 366 | | | | 33,780 | |
| | | | | | | | |
| INVESTMENTS | | SHARES
(000) | | | VALUE
($000) | |
| | | | | | | | |
|
Netherlands — continued | |
| | |
ASML Holding NV | | | 245 | | | | 64,287 | |
| | |
Heineken NV | | | 137 | | | | 13,945 | |
| | |
ING Groep NV | | | 2,903 | | | | 32,872 | |
| | |
Koninklijke Philips NV | | | 346 | | | | 15,160 | |
| | |
Royal Dutch Shell plc, Class A | | | 1,267 | | | | 36,734 | |
| | |
Royal Dutch Shell plc, Class B | | | 1,322 | | | | 38,069 | |
| | | | | | | | |
| | |
| | | | | | | 234,847 | |
| | | | | | | | |
|
Norway — 0.8% | |
| | |
Telenor ASA | | | 1,970 | | | | 36,872 | |
| | | | | | | | |
|
Singapore — 0.9% | |
| | |
DBS Group Holdings Ltd. | | | 2,090 | | | | 39,842 | |
| | |
United Overseas Bank Ltd. | | | 230 | | | | 4,518 | |
| | | | | | | | |
| | |
| | | | | | | 44,360 | |
| | | | | | | | |
|
Spain — 3.2% | |
| | |
Banco Santander SA (a) | | | 4,638 | | | | 18,623 | |
| | |
Bankia SA | | | 7,282 | | | | 13,892 | |
| | |
Iberdrola SA | | | 6,155 | | | | 63,272 | |
| | |
Industria de Diseno Textil SA (a) | | | 1,527 | | | | 47,593 | |
| | |
Telefonica SA | | | 1,235 | | | | 9,488 | |
| | | | | | | | |
| | |
| | | | | | | 152,868 | |
| | | | | | | | |
|
Sweden — 1.4% | |
| | |
Lundin Petroleum AB | | | 981 | | | | 32,479 | |
| | |
Svenska Handelsbanken AB, Class A | | | 3,354 | | | | 33,662 | |
| | | | | | | | |
| | |
| | | | | | | 66,141 | |
| | | | | | | | |
|
Switzerland — 9.9% | |
| | |
Cie Financiere Richemont SA (Registered) | | | 572 | | | | 44,982 | |
| | |
Credit Suisse Group AG (Registered) * | | | 1,584 | | | | 19,606 | |
| | |
LafargeHolcim Ltd. (Registered) * | | | 762 | | | | 39,330 | |
| | |
Nestle SA (Registered) | | | 1,346 | | | | 144,001 | |
| | |
Novartis AG (Registered) | | | 869 | | | | 75,931 | |
| | |
Roche Holding AG | | | 349 | | | | 104,935 | |
| | |
Swiss Re AG | | | 363 | | | | 38,048 | |
| | |
Zurich Insurance Group AG | | | 37 | | | | 14,306 | |
| | | | | | | | |
| | |
| | | | | | | 481,139 | |
| | | | | | | | |
|
United Kingdom — 14.9% | |
| | |
3i Group plc | | | 3,023 | | | | 44,182 | |
| | |
AstraZeneca plc | | | 226 | | | | 22,079 | |
| | |
Aviva plc | | | 2,089 | | | | 11,258 | |
| | |
Barratt Developments plc | | | 2,558 | | | | 20,918 | |
| | |
BP plc | | | 11,310 | | | | 71,721 | |
| | |
British American Tobacco plc | | | 1,509 | | | | 52,771 | |
SEE NOTES TO FINANCIAL STATEMENTS.
| | | | | | |
| | | |
| 62 | | | | J.P. MORGAN INTERNATIONAL EQUITY FUNDS | | OCTOBER 31, 2019 |
| | | | | | | | |
| INVESTMENTS | | SHARES
(000) | | | VALUE
($000) | |
Common Stocks — continued | |
|
United Kingdom — continued | |
| | |
Burberry Group plc | | | 1,114 | | | | 29,549 | |
| | |
CK Hutchison Holdings Ltd. | | | 1,827 | | | | 16,866 | |
| | |
Diageo plc | | | 182 | | | | 7,435 | |
| | |
Dixons Carphone plc | | | 7,955 | | | | 13,528 | |
| | |
GlaxoSmithKline plc | | | 2,607 | | | | 59,708 | |
| | |
HSBC Holdings plc | | | 5,104 | | | | 38,564 | |
| | |
InterContinental Hotels Group plc | | | 769 | | | | 46,543 | |
| | |
ITV plc | | | 14,154 | | | | 24,554 | |
| | |
Lloyds Banking Group plc | | | 23,170 | | | | 17,044 | |
| | |
M&G plc * | | | 7,384 | | | | 20,450 | |
| | |
Prudential plc | | | 2,854 | | | | 49,854 | |
| | |
SSE plc | | | 2,492 | | | | 41,462 | |
| | |
Standard Chartered plc | | | 4,185 | | | | 37,978 | |
| | |
Taylor Wimpey plc | | | 8,665 | | | | 18,583 | |
| | |
Unilever NV (a) | | | 943 | | | | 55,708 | |
| | |
Vodafone Group plc | | | 3,472 | | | | 7,085 | |
| | |
Whitbread plc | | | 214 | | | | 11,265 | |
| | | | | | | | |
| | |
| | | | | | | 719,105 | |
| | | | | | | | |
|
United States — 0.6% | |
| | |
Ferguson plc | | | 330 | | | | 28,150 | |
| | | | | | | | |
| | |
Total Common Stocks
(Cost $4,420,959) | | | | | | | 4,641,690 | |
| | | | | | | | |
Short-Term Investments — 3.2% | |
|
Investment Companies — 3.2% | |
| | |
JPMorgan Prime Money Market Fund Class Institutional Shares, 1.88% (c) (d)
(Cost $154,133) | | | 154,089 | | | | 154,151 | |
| | | | | | | | |
Investment of Cash Collateral from Securities Loaned — 2.2% | |
| | |
JPMorgan Securities Lending Money Market Fund Class Agency SL Shares, 1.98% (c) (d) | | | 75,998 | | | | 76,005 | |
| | |
JPMorgan U.S. Government Money Market Fund Class IM Shares, 1.70% (c) (d) | | | 30,261 | | | | 30,261 | |
| | | | | | | | |
| | |
Total Investment of Cash Collateral from Securities Loaned
(Cost $106,266) | | | | | | | 106,266 | |
| | | | | | | | |
Total Investments — 101.4%
(Cost $4,681,358) | | | | | | | 4,902,107 | |
Liabilities in Excess of
Other Assets — (1.4)% | | | | | | | (67,633 | ) |
| | | | | | | | |
NET ASSETS — 100.0% | | | | | | | 4,834,474 | |
| | | | | | | | |
Percentages indicated are based on net assets.
Summary of Investments by Industry, October 31, 2019
The following table represents the portfolio investments of the Fund by industry classifications as a percentage of total investments:
| | | | |
| INDUSTRY | | PERCENTAGE | |
| |
Banks | | | 10.0 | % |
| |
Pharmaceuticals | | | 9.4 | |
| |
Insurance | | | 5.9 | |
| |
Oil, Gas & Consumable Fuels | | | 5.0 | |
| |
Automobiles | | | 4.0 | |
| |
Electric Utilities | | | 3.6 | |
| |
Chemicals | | | 3.4 | |
| |
Capital Markets | | | 3.2 | |
| |
Diversified Telecommunication Services | | | 3.2 | |
| |
Food Products | | | 2.9 | |
| |
Beverages | | | 2.5 | |
| |
Aerospace & Defense | | | 2.3 | |
| |
Metals & Mining | | | 2.2 | |
| |
Investment of cash collateral from securities loaned | | | 2.2 | |
| |
Personal Products | | | 2.1 | |
| |
Semiconductors & Semiconductor Equipment | | | 2.1 | |
| |
Textiles, Apparel & Luxury Goods | | | 2.0 | |
| |
Electrical Equipment | | | 1.8 | |
| |
Trading Companies & Distributors | | | 1.7 | |
| |
Road & Rail | | | 1.7 | |
| |
Household Durables | | | 1.7 | |
| |
Machinery | | | 1.7 | |
| |
Software | | | 1.7 | |
| |
Tobacco | | | 1.6 | |
| |
Hotels, Restaurants & Leisure | | | 1.5 | |
| |
IT Services | | | 1.3 | |
| |
Auto Components | | | 1.3 | |
| |
Specialty Retail | | | 1.3 | |
| |
Equity Real Estate Investment Trusts (REITs) | | | 1.2 | |
| |
Entertainment | | | 1.0 | |
| |
Construction Materials | | | 1.0 | |
| |
Others (each less than 1.0%) | | | 10.4 | |
| |
Short-Term Investments | | | 3.1 | |
SEE NOTES TO FINANCIAL STATEMENTS.
| | | | | | | | |
| | | |
| OCTOBER 31, 2019 | | J.P. MORGAN INTERNATIONAL EQUITY FUNDS | | | | | 63 | |
JPMorgan International Research Enhanced Equity Fund
SCHEDULE OF PORTFOLIO INVESTMENTS
AS OF OCTOBER 31, 2019 (continued)
Abbreviations
| | |
| ADR | | American Depositary Receipt |
| OYJ | | Public Limited Company |
| Preference | | A special type of equity investment that shares in the earnings of the company, has limited voting rights, and may have a dividend preference. Preference shares may also have liquidation preference. |
| REIT | | Real Estate Investment Trust |
| |
| (a) | | The security or a portion of this security is on loan at October 31, 2019. The total value of securities on loan at October 31, 2019 is approximately $99,554,000. |
| | |
| (b) | | Amount rounds to less than 0.1% of net assets. |
| (c) | | Investment in an affiliated fund, which is registered under the Investment Company Act of 1940, as amended, and is advised by J.P. Morgan Investment Management Inc. |
| (d) | | The rate shown is the current yield as of October 31, 2019. |
| * | | Non-income producing security. |
| ‡ | | Value determined using significant unobservable inputs. |
| | | | | | | | | | | | | | | | | | |
| Futures contracts outstanding as of October 31, 2019 (amounts in thousands, except number of contracts): | |
| DESCRIPTION | | NUMBER OF
CONTRACTS | | EXPIRATION
DATE | | | TRADING
CURRENCY | | | NOTIONAL
AMOUNT ($) | | | VALUE AND
UNREALIZED
APPRECIATION
(DEPRECIATION) ($) | |
| | | | | |
Long Contracts | | | | | | | | | | | | | | | | | | |
| | | | | |
| SPI 200 Index | | 784 | | | 12/2019 | | | | AUD | | | | 89,619 | | | | (410 | ) |
| | | | | |
| TOPIX Index | | 229 | | | 12/2019 | | | | JPY | | | | 35,106 | | | | 1,967 | |
| | | | | | | | | | | | | | | | | | |
| | | | | |
| | | | | | | | | | | | | | | | | 1,557 | |
| | | | | | | | | | | | | | | | | | |
Abbreviations
| | |
| AUD | | Australian Dollar |
| JPY | | Japanese Yen |
| SPI | | Australian Securities Exchange |
| TOPIX | | Tokyo Stock Price Index |
SEE NOTES TO FINANCIAL STATEMENTS.
| | | | | | |
| | | |
| 64 | | | | J.P. MORGAN INTERNATIONAL EQUITY FUNDS | | OCTOBER 31, 2019 |
JPMorgan International Unconstrained Equity Fund
SCHEDULE OF PORTFOLIO INVESTMENTS
AS OF OCTOBER 31, 2019
| | | | | | | | |
| INVESTMENTS | | SHARES
(000) | | | VALUE
($000) | |
Common Stocks — 98.5% | |
|
Australia — 1.8% | |
| | |
BHP Group plc | | | 2,175 | | | | 46,135 | |
| | | | | | | | |
|
Austria — 1.7% | |
| | |
Erste Group Bank AG | | | 1,213 | | | | 42,914 | |
| | | | | | | | |
|
Belgium — 0.9% | |
| | |
Anheuser-Busch InBev SA/NV | | | 301 | | | | 24,287 | |
| | | | | | | | |
|
Brazil — 1.5% | |
| | |
Itau Unibanco Holding SA (Preference) | | | 4,177 | | | | 37,762 | |
| | | | | | | | |
|
Canada — 7.2% | |
| | |
Alimentation Couche-Tard, Inc., Class B | | | 1,630 | | | | 48,891 | |
| | |
Canadian National Railway Co. | | | 543 | | | | 48,583 | |
| | |
Canadian Pacific Railway Ltd. | | | 198 | | | | 44,935 | |
| | |
Toronto-Dominion Bank (The) | | | 788 | | | | 44,997 | |
| | | | | | | | |
| | |
| | | | | | | 187,406 | |
| | | | | | | | |
|
China — 8.7% | |
| | |
Alibaba Group Holding Ltd., ADR * | | | 396 | | | | 69,896 | |
| | |
Ping An Insurance Group Co. of China Ltd., Class H | | | 7,234 | | | | 83,493 | |
| | |
Tencent Holdings Ltd. | | | 1,793 | | | | 72,734 | |
| | | | | | | | |
| | |
| | | | | | | 226,123 | |
| | | | | | | | |
|
Denmark — 2.2% | |
| | |
Novo Nordisk A/S, Class B | | | 1,032 | | | | 56,772 | |
| | | | | | | | |
|
France — 7.4% | |
| | |
Airbus SE | | | 297 | | | | 42,567 | |
| | |
LVMH Moet Hennessy Louis Vuitton SE | | | 128 | | | | 54,571 | |
| | |
Safran SA | | | 208 | | | | 33,002 | |
| | |
Schneider Electric SE | | | 679 | | | | 63,113 | |
| | | | | | | | |
| | |
| | | | | | | 193,253 | |
| | | | | | | | |
|
Germany — 9.7% | |
| | |
Continental AG | | | 384 | | | | 51,448 | |
| | |
Delivery Hero SE * (a) (b) | | | 613 | | | | 28,782 | |
| | |
Deutsche Boerse AG | | | 310 | | | | 47,953 | |
| | |
Muenchener Rueckversicherungs-Gesellschaft AG (Registered) | | | 214 | | | | 59,574 | |
| | |
SAP SE | | | 480 | | | | 63,667 | |
| | | | | | | | |
| | |
| | | | | | | 251,424 | |
| | | | | | | | |
|
Hong Kong — 5.4% | |
| | |
AIA Group Ltd. | | | 9,081 | | | | 90,433 | |
| | |
CK Asset Holdings Ltd. | | | 7,033 | | | | 48,930 | |
| | | | | | | | |
| | |
| | | | | | | 139,363 | |
| | | | | | | | |
|
India — 3.5% | |
| | |
HDFC Bank Ltd., ADR | | | 1,508 | | | | 92,096 | |
| | | | | | | | |
| | | | | | | | |
| INVESTMENTS | | SHARES
(000) | | | VALUE
($000) | |
| | | | | | | | |
|
Indonesia — 1.9% | |
| | |
Bank Central Asia Tbk. PT | | | 21,893 | | | | 49,003 | |
| | | | | | | | |
|
Japan — 7.4% | |
| | |
Keyence Corp. | | | 62 | | | | 39,013 | |
| | |
Komatsu Ltd. | | | 1,724 | | | | 40,358 | |
| | |
Shiseido Co. Ltd. | | | 373 | | | | 30,745 | |
| | |
SMC Corp. | | | 80 | | | | 34,736 | |
| | |
Sony Corp. | | | 791 | | | | 48,159 | |
| | | | | | | | |
| | |
| | | | | | | 193,011 | |
| | | | | | | | |
|
Netherlands — 5.3% | |
| | |
ASML Holding NV | | | 231 | | | | 60,570 | |
| | |
Royal Dutch Shell plc, Class A (a) | | | 2,667 | | | | 77,469 | |
| | | | | | | | |
| | |
| | | | | | | 138,039 | |
| | | | | | | | |
|
Sweden — 1.6% | |
| | |
Svenska Handelsbanken AB, Class A | | | 4,264 | | | | 42,792 | |
| | | | | | | | |
|
Switzerland — 9.5% | |
| | |
Alcon, Inc. * | | | 474 | | | | 28,022 | |
| | |
LafargeHolcim Ltd. (Registered) * | | | 777 | | | | 40,084 | |
| | |
Nestle SA (Registered) | | | 1,121 | | | | 119,943 | |
| | |
Novartis AG (Registered) | | | 682 | | | | 59,599 | |
| | | | | | | | |
| | |
| | | | | | | 247,648 | |
| | | | | | | | |
|
Taiwan — 2.5% | |
| | |
Taiwan Semiconductor Manufacturing Co. Ltd., ADR | | | 1,233 | | | | 63,645 | |
| | | | | | | | |
|
United Kingdom — 18.2% | |
| | |
Burberry Group plc | | | 1,482 | | | | 39,301 | |
| | |
Diageo plc | | | 1,412 | | | | 57,805 | |
| | |
GlaxoSmithKline plc | | | 2,867 | | | | 65,663 | |
| | |
Legal & General Group plc | | | 17,475 | | | | 59,737 | |
| | |
Linde plc | | | 261 | | | | 51,544 | |
| | |
London Stock Exchange Group plc | | | 509 | | | | 45,842 | |
| | |
RELX plc | | | 1,783 | | | | 42,908 | |
| | |
Smith & Nephew plc | | | 2,250 | | | | 48,290 | |
| | |
Unilever NV (a) | | | 1,065 | | | | 62,922 | |
| | | | | | | | |
| | |
| | | | | | | 474,012 | |
| | | | | | | | |
|
United States — 2.1% | |
| | |
Ferguson plc | | | 640 | | | | 54,630 | |
| | | | | | | | |
| | |
Total Common Stocks
(Cost $2,428,039) | | | | | | | 2,560,315 | |
| | | | | | | | |
Short-Term Investments — 1.9% | |
|
Investment Companies — 1.9% | |
| | |
JPMorgan Prime Money Market Fund Class Institutional Shares, 1.88% (c) (d)
(Cost $48,912) | | | 48,902 | | | | 48,921 | |
| | | | | | | | |
SEE NOTES TO FINANCIAL STATEMENTS.
| | | | | | | | |
| | | |
| OCTOBER 31, 2019 | | J.P. MORGAN INTERNATIONAL EQUITY FUNDS | | | | | 65 | |
JPMorgan International Unconstrained Equity Fund
SCHEDULE OF PORTFOLIO INVESTMENTS
AS OF OCTOBER 31, 2019 (continued)
| | | | | | | | |
| INVESTMENTS | | SHARES
(000) | | | VALUE
($000) | |
Investment of Cash Collateral from Securities Loaned — 2.9% | |
| | |
JPMorgan Securities Lending Money Market Fund Class Agency SL Shares, 1.98% (c) (d) | | | 54,995 | | | | 55,000 | |
| | |
JPMorgan U.S. Government Money Market Fund Class IM Shares, 1.70% (c) (d) | | | 20,853 | | | | 20,853 | |
| | | | | | | | |
| | |
Total Investment of Cash Collateral from Securities Loaned
(Cost $75,853) | | | | | | | 75,853 | |
| | | | | | | | |
Total Investments — 103.3%
(Cost $2,552,804) | | | | | | | 2,685,089 | |
Liabilities in Excess of
Other Assets — (3.3)% | | | | | | | (85,448 | ) |
| | | | | | | | |
NET ASSETS — 100.0% | | | | | | | 2,599,641 | |
| | | | | | | | |
Percentages indicated are based on net assets.
Summary of Investments by Industry, October 31, 2019
The following table represents the portfolio investments of the Fund by industry classifications as a percentage of total investments:
| | | | |
| INDUSTRY | | PERCENTAGE | |
| |
Banks | | | 11.5 | % |
| |
Insurance | | | 10.9 | |
| |
Pharmaceuticals | | | 6.8 | |
| |
Semiconductors & Semiconductor Equipment | | | 4.6 | |
| |
Food Products | | | 4.5 | |
| |
Internet & Direct Marketing Retail | | | 3.7 | |
| |
Textiles, Apparel & Luxury Goods | | | 3.5 | |
| |
Capital Markets | | | 3.5 | |
| |
Personal Products | | | 3.5 | |
| |
Road & Rail | | | 3.5 | |
| |
Beverages | | | 3.1 | |
| |
Oil, Gas & Consumable Fuels | | | 2.9 | |
| |
Health Care Equipment & Supplies | | | 2.8 | |
| |
Investment of cash collateral from securities loaned | | | 2.8 | |
| | | | |
| INDUSTRY | | PERCENTAGE | |
| |
Aerospace & Defense | | | 2.8 | % |
| |
Machinery | | | 2.8 | |
| |
Interactive Media & Services | | | 2.7 | |
| |
Software | | | 2.4 | |
| |
Electrical Equipment | | | 2.4 | |
| |
Trading Companies & Distributors | | | 2.0 | |
| |
Chemicals | | | 1.9 | |
| |
Auto Components | | | 1.9 | |
| |
Real Estate Management & Development | | | 1.8 | |
| |
Food & Staples Retailing | | | 1.8 | |
| |
Household Durables | | | 1.8 | |
| |
Metals & Mining | | | 1.7 | |
| |
Professional Services | | | 1.6 | |
| |
Construction Materials | | | 1.5 | |
| |
Electronic Equipment, Instruments & Components | | | 1.5 | |
| |
Short-Term Investments | | | 1.8 | |
Abbreviations
| | |
| ADR | | American Depositary Receipt |
| Preference | | A special type of equity investment that shares in the earnings of the company, has limited voting rights, and may have a dividend preference. Preference shares may also have liquidation preference. |
| PT | | Limited liability company |
| |
| (a) | | The security or a portion of this security is on loan at October 31, 2019. The total value of securities on loan at October 31, 2019 is approximately $70,848,000. |
| (b) | | Security exempt from registration pursuant to Regulation S under the Securities Act of 1933, as amended. Regulation S applies to securities offerings that are made outside of the United States and do not involve direct selling efforts in the United States and as such may have restrictions on resale. |
| (c) | | Investment in an affiliated fund, which is registered under the Investment Company Act of 1940, as amended, and is advised by J.P. Morgan Investment Management Inc. |
| (d) | | The rate shown is the current yield as of October 31, 2019. |
| * | | Non-income producing security. |
SEE NOTES TO FINANCIAL STATEMENTS.
| | | | | | |
| | | |
| 66 | | | | J.P. MORGAN INTERNATIONAL EQUITY FUNDS | | OCTOBER 31, 2019 |
JPMorgan International Value Fund
SCHEDULE OF PORTFOLIO INVESTMENTS
AS OF OCTOBER 31, 2019
| | | | | | | | |
| INVESTMENTS | | SHARES
(000) | | | VALUE
($000) | |
Common Stocks — 98.3% | |
|
Australia — 9.2% | |
| | |
AGL Energy Ltd. | | | 59 | | | | 809 | |
| | |
Alumina Ltd. | | | 567 | | | | 885 | |
| | |
Australia & New Zealand Banking Group Ltd. | | | 201 | | | | 3,688 | |
| | |
Beach Energy Ltd. | | | 342 | | | | 538 | |
| | |
BHP Group Ltd. | | | 302 | | | | 7,397 | |
| | |
BlueScope Steel Ltd. | | | 80 | | | | 734 | |
| | |
Challenger Ltd. | | | 122 | | | | 669 | |
| | |
CSR Ltd. | | | 182 | | | | 522 | |
| | |
Downer EDI Ltd. | | | 83 | | | | 462 | |
| | |
Fortescue Metals Group Ltd. | | | 200 | | | | 1,227 | |
| | |
Harvey Norman Holdings Ltd. | | | 196 | | | | 552 | |
| | |
Incitec Pivot Ltd. | | | 190 | | | | 453 | |
| | |
IOOF Holdings Ltd. | | | 117 | | | | 593 | |
| | |
JB Hi-Fi Ltd. | | | 32 | | | | 822 | |
| | |
Metcash Ltd. | | | 365 | | | | 709 | |
| | |
National Australia Bank Ltd. | | | 183 | | | | 3,583 | |
| | |
Origin Energy Ltd. | | | 101 | | | | 547 | |
| | |
Qantas Airways Ltd. | | | 172 | | | | 761 | |
| | |
QBE Insurance Group Ltd. | | | 61 | | | | 533 | |
| | |
Rio Tinto plc | | | 102 | | | | 5,322 | |
| | |
Santos Ltd. | | | 106 | | | | 591 | |
| | |
St Barbara Ltd. | | | 229 | | | | 442 | |
| | |
Westpac Banking Corp. | | | 219 | | | | 4,249 | |
| | | | | | | | |
| | |
| | | | | | | 36,088 | |
| | | | | | | | |
| | |
Austria — 1.2% | | | | | | | | |
| | |
AT&S Austria Technologie & Systemtechnik AG | | | 31 | | | | 583 | |
| | |
BAWAG Group AG (a) | | | 18 | | | | 731 | |
| | |
Erste Group Bank AG | | | 30 | | | | 1,077 | |
| | |
OMV AG | | | 22 | | | | 1,286 | |
| | |
Raiffeisen Bank International AG | | | 27 | | | | 653 | |
| | |
Telekom Austria AG * | | | 65 | | | | 504 | |
| | | | | | | | |
| | |
| | | | | | | 4,834 | |
| | | | | | | | |
| | |
Belgium — 1.2% | | | | | | | | |
| | |
Ageas | | | 24 | | | | 1,367 | |
| | |
bpost SA | | | 46 | | | | 529 | |
| | |
KBC Group NV | | | 24 | | | | 1,668 | |
| | |
Orange Belgium SA | | | 24 | | | | 530 | |
| | |
Telenet Group Holding NV * | | | 10 | | | | 486 | |
| | | | | | | | |
| | |
| | | | | | | 4,580 | |
| | | | | | | | |
|
China — 0.3% | |
| | |
BOC Hong Kong Holdings Ltd. | | | 349 | | | | 1,199 | |
| | | | | | | | |
|
Denmark — 0.6% | |
| | |
Pandora A/S | | | 14 | | | | 681 | |
| | |
Scandinavian Tobacco Group A/S, Class A (a) | | | 63 | | | | 748 | |
| | | | | | | | |
| INVESTMENTS | | SHARES
(000) | | | VALUE
($000) | |
| |
|
Denmark — continued | |
| | |
Sydbank A/S | | | 25 | | | | 496 | |
| | |
TCM Group A/S (a) | | | 16 | | | | 263 | |
| | | | | | | | |
| | |
| | | | | | | 2,188 | |
| | | | | | | | |
|
Finland — 1.3% | |
| | |
Cramo OYJ | | | 44 | | | | 468 | |
| | |
Sanoma OYJ | | | 72 | | | | 751 | |
| | |
Tieto OYJ | | | 17 | | | | 483 | |
| | |
Tokmanni Group Corp. | | | 70 | | | | 899 | |
| | |
UPM-Kymmene OYJ | | | 46 | | | | 1,493 | |
| | |
Valmet OYJ | | | 23 | | | | 524 | |
| | |
YIT OYJ | | | 78 | | | | 467 | |
| | | | | | | | |
| | |
| | | | | | | 5,085 | |
| | | | | | | | |
|
France — 8.0% | |
| | |
Air France-KLM * | | | 53 | | | | 632 | |
| | |
ALD SA (a) (b) | | | 41 | | | | 577 | |
| | |
Arkema SA | | | 5 | | | | 554 | |
| | |
Atos SE | | | 8 | | | | 593 | |
| | |
AXA SA | | | 138 | | | | 3,656 | |
| | |
BNP Paribas SA | | | 73 | | | | 3,816 | |
| | |
Cie Generale des Etablissements Michelin SCA | | | 10 | | | | 1,212 | |
| | |
CNP Assurances | | | 34 | | | | 675 | |
| | |
Credit Agricole SA | | | 101 | | | | 1,317 | |
| | |
Derichebourg SA (b) | | | 124 | | | | 447 | |
| | |
Eutelsat Communications SA (b) | | | 34 | | | | 637 | |
| | |
Faurecia SE | | | 13 | | | | 607 | |
| | |
Gecina SA, REIT | | | 6 | | | | 947 | |
| | |
Groupe Crit | | | 9 | | | | 679 | |
| | |
IPSOS | | | 20 | | | | 603 | |
| | |
Kaufman & Broad SA | | | 19 | | | | 740 | |
| | |
Metropole Television SA | | | 27 | | | | 469 | |
| | |
Peugeot SA | | | 40 | | | | 1,016 | |
| | |
Publicis Groupe SA | | | 21 | | | | 924 | |
| | |
Quadient | | | 23 | | | | 503 | |
| | |
Rexel SA | | | 54 | | | | 668 | |
| | |
Rothschild & Co. | | | 18 | | | | 493 | |
| | |
Sopra Steria Group | | | 5 | | | | 691 | |
| | |
SPIE SA | | | 28 | | | | 591 | |
| | |
Television Francaise 1 (b) | | | 50 | | | | 417 | |
| | |
TOTAL SA | | | 151 | | | | 7,964 | |
| | | | | | | | |
| | |
| | | | | | | 31,428 | |
| | | | | | | | |
|
Georgia — 0.1% | |
| | |
Bank of Georgia Group plc | | | 29 | | | | 482 | |
| | | | | | | | |
SEE NOTES TO FINANCIAL STATEMENTS.
| | | | | | | | |
| | | |
| OCTOBER 31, 2019 | | J.P. MORGAN INTERNATIONAL EQUITY FUNDS | | | | | 67 | |
JPMorgan International Value Fund
SCHEDULE OF PORTFOLIO INVESTMENTS
AS OF OCTOBER 31, 2019 (continued)
| | | | | | | | |
| INVESTMENTS | | SHARES
(000) | | | VALUE
($000) | |
Common Stocks — continued | |
|
Germany — 8.0% | |
| | |
Allianz SE (Registered) | | | 19 | | | | 4,620 | |
| | |
Bayer AG (Registered) | | | 59 | | | | 4,582 | |
| | |
CECONOMY AG * | | | 94 | | | | 473 | |
| | |
Covestro AG (a) | | | 22 | | | | 1,043 | |
| | |
Deutsche Pfandbriefbank AG (a) | | | 45 | | | | 609 | |
| | |
Deutsche Post AG (Registered) | | | 70 | | | | 2,474 | |
| | |
Deutsche Telekom AG (Registered) | | | 235 | | | | 4,131 | |
| | |
Evonik Industries AG | | | 39 | | | | 1,028 | |
| | |
Freenet AG | | | 23 | | | | 515 | |
| | |
HeidelbergCement AG | | | 13 | | | | 993 | |
| | |
JOST Werke AG (a) | | | 25 | | | | 698 | |
| | |
KION Group AG | | | 8 | | | | 533 | |
| | |
METRO AG | | | 39 | | | | 630 | |
| | |
Muenchener Rueckversicherungs-Gesellschaft AG (Registered) | | | 7 | | | | 1,909 | |
| | |
RWE AG | | | 46 | | | | 1,399 | |
| | |
Siltronic AG (b) | | | 6 | | | | 555 | |
| | |
Software AG | | | 20 | | | | 621 | |
| | |
Takkt AG | | | 55 | | | | 659 | |
| | |
Volkswagen AG (Preference) | | | 17 | | | | 3,188 | |
| | |
Wuestenrot & Wuerttembergische AG | | | 40 | | | | 812 | |
| | | | | | | | |
| | |
| | | | | | | 31,472 | |
| | | | | | | | |
|
Ghana — 0.1% | |
| | |
Tullow Oil plc | | | 216 | | | | 578 | |
| | | | | | | | |
|
Hong Kong — 2.0% | |
| | |
CK Asset Holdings Ltd. | | | 209 | | | | 1,454 | |
| | |
Hang Lung Properties Ltd. | | | 325 | | | | 714 | |
| | |
Hysan Development Co. Ltd. | | | 153 | | | | 603 | |
| | |
New World Development Co. Ltd. | | | 685 | | | | 980 | |
| | |
Sun Hung Kai Properties Ltd. | | | 121 | | | | 1,834 | |
| | |
Swire Properties Ltd. | | | 143 | | | | 449 | |
| | |
VTech Holdings Ltd. | | | 61 | | | | 535 | |
| | |
Wheelock & Co. Ltd. | | | 151 | | | | 934 | |
| | |
Xinyi Glass Holdings Ltd. | | | 462 | | | | 519 | |
| | | | | | | | |
| | |
| | | | | | | 8,022 | |
| | | | | | | | |
|
India — 0.1% | |
| | |
Rhi Magnesita NV | | | 10 | | | | 441 | |
| | | | | | | | |
|
Ireland — 0.4% | |
| | |
AerCap Holdings NV * | | | 17 | | | | 961 | |
| | |
Smurfit Kappa Group plc | | | 18 | | | | 598 | |
| | | | | | | | |
| | |
| | | | | | | 1,559 | |
| | | | | | | | |
| | | | | | | | |
| INVESTMENTS | | SHARES
(000) | | | VALUE
($000) | |
| | | | | | | | |
|
Israel — 0.5% | |
| | |
Bank Leumi Le-Israel BM | | | 155 | | | | 1,128 | |
| | |
Israel Discount Bank Ltd., Class A | | | 142 | | | | 650 | |
| | | | | | | | |
| | |
| | | | | | | 1,778 | |
| | | | | | | | |
|
Italy — 2.9% | |
| | |
ASTM SpA | | | 23 | | | | 731 | |
| | |
Banca Farmafactoring SpA (a) | | | 84 | | | | 512 | |
| | |
Eni SpA | | | 193 | | | | 2,934 | |
| | |
Intesa Sanpaolo SpA | | | 1,035 | | | | 2,592 | |
| | |
Mediaset SpA * | | | 153 | | | | 457 | |
| | |
Mediobanca Banca di Credito Finanziario SpA | | | 106 | | | | 1,263 | |
| | |
Poste Italiane SpA (a) | | | 70 | | | | 850 | |
| | |
Rizzoli Corriere Della Sera Mediagroup SpA (b) | | | 601 | | | | 618 | |
| | |
Unieuro SpA (a) | | | 56 | | | | 807 | |
| | |
Unipol Gruppo SpA | | | 102 | | | | 571 | |
| | | | | | | | |
| | |
| | | | | | | 11,335 | |
| | | | | | | | |
| | |
Japan — 21.8% | | | | | | | | |
| | |
Acom Co. Ltd. | | | 120 | | | | 481 | |
| | |
AEON Financial Service Co. Ltd. | | | 35 | | | | 539 | |
| | |
Aeon Mall Co. Ltd. | | | 33 | | | | 534 | |
| | |
Aozora Bank Ltd. | | | 25 | | | | 636 | |
| | |
Bridgestone Corp. | | | 44 | | | | 1,828 | |
| | |
Brother Industries Ltd. | | | 53 | | | | 1,002 | |
| | |
Concordia Financial Group Ltd. | | | 177 | | | | 722 | |
| | |
Dai-ichi Life Holdings, Inc. | | | 111 | | | | 1,803 | |
| | |
DIC Corp. | | | 16 | | | | 455 | |
| | |
DMG Mori Co. Ltd. | | | 52 | | | | 848 | |
| | |
Dowa Holdings Co. Ltd. | | | 15 | | | | 504 | |
| | |
Fuji Electric Co. Ltd. | | | 24 | | | | 763 | |
| | |
FUJIFILM Holdings Corp. | | | 11 | | | | 483 | |
| | |
Fuyo General Lease Co. Ltd. | | | 8 | | | | 528 | |
| | |
GS Yuasa Corp. | | | 15 | | | | 275 | |
| | |
Hitachi Ltd. | | | 39 | | | | 1,459 | |
| | |
Hokuhoku Financial Group, Inc. | | | 48 | | | | 468 | |
| | |
ITOCHU Corp. | | | 113 | | | | 2,367 | |
| | |
Iwatani Corp. | | | 14 | | | | 472 | |
| | |
Jafco Co. Ltd. | | | 13 | | | | 481 | |
| | |
Japan Airlines Co. Ltd. | | | 21 | | | | 664 | |
| | |
Kaken Pharmaceutical Co. Ltd. | | | 10 | | | | 471 | |
| | |
KDDI Corp. | | | 129 | | | | 3,567 | |
| | |
K’s Holdings Corp. | | | 46 | | | | 522 | |
| | |
Kureha Corp. | | | 9 | | | | 556 | |
| | |
Kyudenko Corp. | | | 15 | | | | 503 | |
| | |
Kyushu Financial Group, Inc. | | | 112 | | | | 450 | |
| | |
Marubeni Corp. | | | 198 | | | | 1,396 | |
SEE NOTES TO FINANCIAL STATEMENTS.
| | | | | | |
| | | |
| 68 | | | | J.P. MORGAN INTERNATIONAL EQUITY FUNDS | | OCTOBER 31, 2019 |
| | | | | | | | |
| INVESTMENTS | | SHARES
(000) | | | VALUE
($000) | |
Common Stocks — continued | |
| | |
Japan — continued | | | | | | | | |
| | |
MINEBEA MITSUMI, Inc. | | | 26 | | | | 496 | |
| | |
Mitsubishi Heavy Industries Ltd. | | | 31 | | | | 1,267 | |
| | |
Mitsubishi UFJ Financial Group, Inc. | | | 830 | | | | 4,302 | |
| | |
Mitsubishi UFJ Lease & Finance Co. Ltd. | | | 150 | | | | 923 | |
| | |
Mitsui & Co. Ltd. | | | 121 | | | | 2,075 | |
| | |
Mitsui Fudosan Co. Ltd. | | | 56 | | | | 1,433 | |
| | |
MS&AD Insurance Group Holdings, Inc. | | | 37 | | | | 1,185 | |
| | |
Nexon Co. Ltd. * | | | 41 | | | | 479 | |
| | |
Nichias Corp. | | | 26 | | | | 542 | |
| | |
Nippon Light Metal Holdings Co. Ltd. | | | 245 | | | | 476 | |
| | |
Nippon Telegraph & Telephone Corp. | | | 52 | | | | 2,596 | |
| | |
Nomura Real Estate Holdings, Inc. | | | 30 | | | | 706 | |
| | |
NTT DOCOMO, Inc. | | | 93 | | | | 2,561 | |
| | |
ORIX Corp. | | | 111 | | | | 1,743 | |
| | |
Rakuten, Inc. | | | 50 | | | | 473 | |
| | |
Rengo Co. Ltd. | | | 68 | | | | 491 | |
| | |
Resona Holdings, Inc. | | | 226 | | | | 983 | |
| | |
Sankyu, Inc. | | | 9 | | | | 437 | |
| | |
Sawai Pharmaceutical Co. Ltd. | | | 9 | | | | 491 | |
| | |
SBI Holdings, Inc. | | | 35 | | | | 768 | |
| | |
Sekisui House Ltd. | | | 60 | | | | 1,285 | |
| | |
Shinsei Bank Ltd. | | | 63 | | | | 987 | |
| | |
Shizuoka Bank Ltd. (The) | | | 101 | | | | 764 | |
| | |
Showa Denko KK | | | 22 | | | | 606 | |
| | |
Sojitz Corp. | | | 162 | | | | 509 | |
| | |
Sompo Holdings, Inc. | | | 10 | | | | 405 | |
| | |
Sony Corp. | | | 13 | | | | 767 | |
| | |
Subaru Corp. | | | 54 | | | | 1,556 | |
| | |
SUMCO Corp. | | | 40 | | | | 664 | |
| | |
Sumitomo Bakelite Co. Ltd. | | | 12 | | | | 489 | |
| | |
Sumitomo Chemical Co. Ltd. | | | 180 | | | | 824 | |
| | |
Sumitomo Corp. | | | 96 | | | | 1,559 | |
| | |
Sumitomo Forestry Co. Ltd. | | | 33 | | | | 475 | |
| | |
Sumitomo Heavy Industries Ltd. | | | 28 | | | | 857 | |
| | |
Sumitomo Mitsui Financial Group, Inc. | | | 97 | | | | 3,458 | |
| | |
Sumitomo Mitsui Trust Holdings, Inc. | | | 40 | | | | 1,440 | |
| | |
Taiheiyo Cement Corp. | | | 34 | | | | 967 | |
| | |
Teijin Ltd. | | | 39 | | | | 771 | |
| | |
THK Co. Ltd. | | | 24 | | | | 690 | |
| | |
Tokuyama Corp. | | | 27 | | | | 732 | |
| | |
Tokyo Tatemono Co. Ltd. | | | 41 | | | | 576 | |
| | |
Tokyu Fudosan Holdings Corp. | | | 121 | | | | 801 | |
| | |
Tosoh Corp. | | | 54 | | | | 733 | |
| | |
Toyota Motor Corp. | | | 141 | | | | 9,783 | |
| | |
Toyota Tsusho Corp. | | | 34 | | | | 1,187 | |
| | | | | | | | |
| INVESTMENTS | | SHARES
(000) | | | VALUE
($000) | |
| | | | | | | | |
| | |
Japan — continued | | | | | | | | |
| | |
TS Tech Co. Ltd. | | | 23 | | | | 743 | |
| | |
Ube Industries Ltd. | | | 24 | | | | 503 | |
| | |
Yamaguchi Financial Group, Inc. | | | 69 | | | | 487 | |
| | |
Yamato Kogyo Co. Ltd. | | | 19 | | | | 488 | |
| | |
Yokohama Rubber Co. Ltd. (The) | | | 44 | | | | 981 | |
| | |
Zeon Corp. | | | 48 | | | | 543 | |
| | | | | | | | |
| | |
| | | | | | | 85,834 | |
| | | | | | | | |
|
Luxembourg — 0.2% | |
| | |
RTL Group SA | | | 15 | | | | 783 | |
| | | | | | | | |
|
Malta — 0.1% | |
| | |
Kindred Group plc, SDR | | | 62 | | | | 450 | |
| | | | | | | | |
|
Netherlands — 5.8% | |
| | |
Arcadis NV | | | 27 | | | | 540 | |
| | |
ASR Nederland NV | | | 20 | | | | 744 | |
| | |
Heijmans NV, CVA * (b) | | | 80 | | | | 647 | |
| | |
ING Groep NV | | | 263 | | | | 2,982 | |
| | |
Intertrust NV (a) | | | 25 | | | | 474 | |
| | |
NIBC Holding NV (a) | | | 89 | | | | 726 | |
| | |
NN Group NV | | | 29 | | | | 1,111 | |
| | |
Randstad NV | | | 18 | | | | 1,008 | |
| | |
Royal Dutch Shell plc, Class A | | | 483 | | | | 13,990 | |
| | |
Signify NV (a) | | | 26 | | | | 752 | |
| | | | | | | | |
| | |
| | | | | | | 22,974 | |
| | | | | | | | |
|
New Zealand — 0.3% | |
| | |
Air New Zealand Ltd. | | | 386 | | | | 698 | |
| | |
Z Energy Ltd. | | | 123 | | | | 423 | |
| | | | | | | | |
| | |
| | | | | | | 1,121 | |
| | | | | | | | |
|
Norway — 2.5% | |
| | |
DNB ASA | | | 97 | | | | 1,772 | |
| | |
Elkem ASA (a) | | | 145 | | | | 345 | |
| | |
Equinor ASA (b) | | | 67 | | | | 1,252 | |
| | |
Europris ASA (a) | | | 157 | | | | 425 | |
| | |
Komplett Bank ASA * | | | 409 | | | | 489 | |
| | |
Kvaerner ASA | | | 285 | | | | 362 | |
| | |
Norwegian Finans Holding ASA * | | | 85 | | | | 825 | |
| | |
Olav Thon Eiendomsselskap ASA | | | 27 | | | | 429 | |
| | |
Selvaag Bolig ASA | | | 106 | | | | 583 | |
| | |
SpareBank 1 Nord Norge | | | 105 | | | | 815 | |
| | |
SpareBank 1 SMN | | | 68 | | | | 732 | |
| | |
SpareBank 1 SR-Bank ASA | | | 74 | | | | 792 | |
| | |
Stolt-Nielsen Ltd. | | | 29 | | | | 357 | |
| | |
Storebrand ASA | | | 88 | | | | 625 | |
| | | | | | | | |
| | |
| | | | | | | 9,803 | |
| | | | | | | | |
SEE NOTES TO FINANCIAL STATEMENTS.
| | | | | | | | |
| | | |
| OCTOBER 31, 2019 | | J.P. MORGAN INTERNATIONAL EQUITY FUNDS | | | | | 69 | |
JPMorgan International Value Fund
SCHEDULE OF PORTFOLIO INVESTMENTS
AS OF OCTOBER 31, 2019 (continued)
| | | | | | | | |
| INVESTMENTS | | SHARES
(000) | | | VALUE
($000) | |
Common Stocks — continued | |
|
Portugal — 0.1% | |
| | |
Altri SGPS SA | | | 66 | | | | 405 | |
| | | | | | | | |
|
Russia — 0.2% | |
| | |
Evraz plc | | | 139 | | | | 662 | |
| | | | | | | | |
|
Singapore — 1.4% | |
| | |
BW LPG Ltd. (a) | | | 38 | | | | 263 | |
| | |
DBS Group Holdings Ltd. | | | 70 | | | | 1,332 | |
| | |
Jardine Cycle & Carriage Ltd. | | | 27 | | | | 659 | |
| | |
Oversea-Chinese Banking Corp. Ltd. | | | 180 | | | | 1,450 | |
| | |
United Overseas Bank Ltd. | | | 65 | | | | 1,270 | |
| | |
Venture Corp. Ltd. | | | 42 | | | | 481 | |
| | | | | | | | |
| | |
| | | | | | | 5,455 | |
| | | | | | | | |
|
South Africa — 0.6% | |
| | |
Anglo American plc | | | 91 | | | | 2,331 | |
| | | | | | | | |
|
Spain — 2.7% | |
| | |
ACS Actividades de Construccion y Servicios SA | | | 34 | | | | 1,373 | |
| | |
Banco Bilbao Vizcaya Argentaria SA (b) | | | 464 | | | | 2,441 | |
| | |
Enagas SA | | | 29 | | | | 725 | |
| | |
Mediaset Espana Comunicacion SA | | | 77 | | | | 472 | |
| | |
Repsol SA | | | 132 | | | | 2,168 | |
| | |
Talgo SA * (a) | | | 80 | | | | 499 | |
| | |
Telefonica SA | | | 367 | | | | 2,815 | |
| | | | | | | | |
| | |
| | | | | | | 10,493 | |
| | | | | | | | |
|
Sweden — 2.9% | |
| | |
Betsson AB * | | | 96 | | | | 474 | |
| | |
Boliden AB | | | 29 | | | | 776 | |
| | |
Dometic Group AB (b) (c) | | | 60 | | | | 558 | |
| | |
Granges AB | | | 43 | | | | 419 | |
| | |
Intrum AB (b) | | | 19 | | | | 500 | |
| | |
Inwido AB | | | 84 | | | | 561 | |
| | |
LeoVegas AB (a) (b) | | | 111 | | | | 389 | |
| | |
Lindab International AB | | | 64 | | | | 720 | |
| | |
Resurs Holding AB (a) | | | 123 | | | | 727 | |
| | |
Scandic Hotels Group AB (a) | | | 52 | | | | 498 | |
| | |
Skandinaviska Enskilda Banken AB, Class A | | | 173 | | | | 1,655 | |
| | |
SKF AB, Class B | | | 27 | | | | 492 | |
| | |
Svenska Handelsbanken AB, Class A | | | 143 | | | | 1,439 | |
| | |
Swedbank AB, Class A | | | 82 | | | | 1,154 | |
| | |
Tethys Oil AB | | | 93 | | | | 706 | |
| | |
Volvo AB, Class B | | | 33 | | | | 497 | |
| | | | | | | | |
| | |
| | | | | | | 11,565 | |
| | | | | | | | |
|
Switzerland — 6.2% | |
| | |
Adecco Group AG (Registered) | | | 19 | | | | 1,156 | |
| | |
Credit Suisse Group AG (Registered) * | | | 98 | | | | 1,209 | |
| | | | | | | | |
| INVESTMENTS | | SHARES
(000) | | | VALUE
($000) | |
| | | | | | | | |
|
Switzerland — continued | |
| | |
Glencore plc * | | | 769 | | | | 2,320 | |
| | |
Julius Baer Group Ltd. * | | | 10 | | | | 447 | |
| | |
LafargeHolcim Ltd. (Registered) * | | | 25 | | | | 1,279 | |
| | |
Novartis AG (Registered) | | | 49 | | | | 4,306 | |
| | |
Roche Holding AG | | | 3 | | | | 772 | |
| | |
Swiss Life Holding AG (Registered) | | | 3 | | | | 1,738 | |
| | |
Swiss Re AG | | | 25 | | | | 2,580 | |
| | |
Swisscom AG (Registered) | | | 2 | | | | 1,222 | |
| | |
UBS Group AG (Registered) * | | | 268 | | | | 3,175 | |
| | |
Zurich Insurance Group AG | | | 11 | | | | 4,142 | |
| | | | | | | | |
| | |
| | | | | | | 24,346 | |
| | | | | | | | |
|
United Kingdom — 17.4% | |
| | |
Babcock International Group plc | | | 85 | | | | 613 | |
| | |
Barratt Developments plc | | | 113 | | | | 925 | |
| | |
Bellway plc | | | 15 | | | | 594 | |
| | |
Berkeley Group Holdings plc | | | 17 | | | | 964 | |
| | |
Bovis Homes Group plc | | | 49 | | | | 748 | |
| | |
BP plc | | | 1,229 | | | | 7,797 | |
| | |
British American Tobacco plc | | | 151 | | | | 5,279 | |
| | |
British Land Co. plc (The), REIT | | | 116 | | | | 936 | |
| | |
Card Factory plc | | | 247 | | | | 543 | |
| | |
CK Hutchison Holdings Ltd. | | | 203 | | | | 1,870 | |
| | |
Countryside Properties plc (a) | | | 145 | | | | 664 | |
| | |
Crest Nicholson Holdings plc | | | 116 | | | | 586 | |
| | |
Dart Group plc | | | 50 | | | | 824 | |
| | |
Derwent London plc, REIT | | | 11 | | | | 506 | |
| | |
Dialog Semiconductor plc * | | | 16 | | | | 731 | |
| | |
Fiat Chrysler Automobiles NV | | | 56 | | | | 862 | |
| | |
Firstgroup plc * | | | 453 | | | | 758 | |
| | |
Forterra plc (a) | | | 214 | | | | 742 | |
| | |
Gamesys Group plc * | | | 75 | | | | 785 | |
| | |
Genel Energy plc | | | 251 | | | | 620 | |
| | |
GlaxoSmithKline plc | | | 303 | | | | 6,939 | |
| | |
Great Portland Estates plc, REIT | | | 46 | | | | 469 | |
| | |
Gulf Keystone Petroleum Ltd. | | | 183 | | | | 487 | |
| | |
GVC Holdings plc | | | 75 | | | | 860 | |
| | |
HSBC Holdings plc | | | 1,202 | | | | 9,081 | |
| | |
Imperial Brands plc | | | 82 | | | | 1,807 | |
| | |
Inchcape plc | | | 94 | | | | 783 | |
| | |
International Consolidated Airlines Group SA | | | 118 | | | | 810 | |
| | |
ITV plc | | | 688 | | | | 1,193 | |
| | |
John Laing Group plc (a) | | | 105 | | | | 495 | |
| | |
Legal & General Group plc | | | 577 | | | | 1,972 | |
| | |
M&G plc * | | | 175 | | | | 483 | |
SEE NOTES TO FINANCIAL STATEMENTS.
| | | | | | |
| | | |
| 70 | | | | J.P. MORGAN INTERNATIONAL EQUITY FUNDS | | OCTOBER 31, 2019 |
| | | | | | | | |
| INVESTMENTS | | SHARES
(000) | | | VALUE
($000) | |
Common Stocks — continued | |
|
United Kingdom — continued | |
| | |
Micro Focus International plc | | | 38 | | | | 526 | |
| | |
Mitchells & Butlers plc * | | | 165 | | | | 908 | |
| | |
Morgan Sindall Group plc | | | 44 | | | | 727 | |
| | |
National Express Group plc | | | 80 | | | | 465 | |
| | |
OneSavings Bank plc | | | 156 | | | | 728 | |
| | |
Paragon Banking Group plc | | | 83 | | | | 539 | |
| | |
Playtech plc | | | 91 | | | | 461 | |
| | |
Prudential plc | | | 175 | | | | 3,049 | |
| | |
Reach plc | | | 217 | | | | 277 | |
| | |
Redrow plc | | | 73 | | | | 573 | |
| | |
Savills plc | | | 43 | | | | 514 | |
| | |
Scottish Salmon Co. plc (The) | | | 143 | | | | 441 | |
| | |
St Modwen Properties plc | | | 82 | | | | 477 | |
| | |
Taylor Wimpey plc | | | 409 | | | | 877 | |
| | |
Vodafone Group plc | | | 1,754 | | | | 3,580 | |
| | |
WPP plc | | | 130 | | | | 1,627 | |
| | | | | | | | |
| | |
| | | | | | | 68,495 | |
| | | | | | | | |
| | |
United States — 0.2% | | | | | | | | |
| | |
Samsonite International SA (a) (b) | | | 207 | | | | 422 | |
| | |
TI Fluid Systems plc (a) | | | 190 | | | | 452 | |
| | | | | | | | |
| | |
| | | | | | | 874 | |
| | | | | | | | |
| | |
Total Common Stocks
(Cost $391,873) | | | | | | | 386,660 | |
| | | | | | | | |
| | |
| | | NO. OF
RIGHTS
(000) | | | | |
Rights — 0.0%(d) | |
|
Italy — 0.0%(d) | |
| | |
Mediaset SpA, expiring 11/7/2019 *
(Cost $—) | | | 187 | | | | — | (e) |
| | | | | | | | |
| | |
| | | SHARES
(000) | | | | |
Short-Term Investments — 0.9% | |
|
Investment Companies — 0.9% | |
| | |
JPMorgan Prime Money Market Fund Class Institutional Shares, 1.88% (f) (g)
(Cost $3,486) | | | 3,486 | | | | 3,487 | |
| | | | | | | | |
| | | | | | | | |
| INVESTMENTS | | SHARES
(000) | | | VALUE
($000) | |
Investment of Cash Collateral from Securities Loaned — 1.0% | |
| | |
JPMorgan Securities Lending Money Market Fund Class Agency SL Shares, 1.98% (f) (g) | | | 2,000 | | | | 2,000 | |
| | |
JPMorgan U.S. Government Money Market Fund Class IM Shares, 1.70% (f) (g) | | | 2,026 | | | | 2,026 | |
| | | | | | | | |
| | |
Total Investment of Cash Collateral from Securities Loaned
(Cost $4,026) | | | | | | | 4,026 | |
| | | | | | | | |
Total Investments — 100.2%
(Cost $399,385) | | | | | | | 394,173 | |
Liabilities in Excess of
Other Assets — (0.2)% | | | | | | | (901 | ) |
| | | | | | | | |
NET ASSETS — 100.0% | | | | | | | 393,272 | |
| | | | | | | | |
Percentages indicated are based on net assets.
Summary of Investments by Industry, October 31, 2019
The following table represents the portfolio investments of the Fund by industry classifications as a percentage of total investments:
| | | | |
| INDUSTRY | | PERCENTAGE | |
| |
Banks | | | 18.3 | % |
| |
Oil, Gas & Consumable Fuels | | | 10.8 | |
| |
Insurance | | | 8.7 | |
| |
Metals & Mining | | | 6.1 | |
| |
Pharmaceuticals | | | 4.5 | |
| |
Automobiles | | | 4.2 | |
| |
Real Estate Management & Development | | | 3.3 | |
| |
Diversified Telecommunication Services | | | 2.9 | |
| |
Trading Companies & Distributors | | | 2.8 | |
| |
Wireless Telecommunication Services | | | 2.7 | |
| |
Media | | | 2.5 | |
| |
Chemicals | | | 2.4 | |
| |
Household Durables | | | 2.4 | |
| |
Tobacco | | | 2.0 | |
| |
Machinery | | | 1.9 | |
| |
Capital Markets | | | 1.8 | |
| |
Auto Components | | | 1.7 | |
| |
Construction Materials | | | 1.3 | |
| |
Diversified Financial Services | | | 1.2 | |
| |
Hotels, Restaurants & Leisure | | | 1.2 | |
| |
Construction & Engineering | | | 1.2 | |
| |
Airlines | | | 1.1 | |
| |
Investment of cash collateral from securities loaned | | | 1.0 | |
| |
Others (each less than 1.0%) | | | 13.1 | |
| |
Short-Term Investments | | | 0.9 | |
SEE NOTES TO FINANCIAL STATEMENTS.
| | | | | | | | |
| | | |
| OCTOBER 31, 2019 | | J.P. MORGAN INTERNATIONAL EQUITY FUNDS | | | | | 71 | |
JPMorgan International Value Fund
SCHEDULE OF PORTFOLIO INVESTMENTS
AS OF OCTOBER 31, 2019 (continued)
Abbreviations
| | |
| CVA | | Dutch Certification |
| OYJ | | Public Limited Company |
| Preference | | A special type of equity investment that shares in the earnings of the company, has limited voting rights, and may have a dividend preference. Preference shares may also have liquidation preference. |
| REIT | | Real Estate Investment Trust |
| SCA | | Limited partnership with share capital |
| SDR | | Swedish Depositary Receipt |
| SGPS | | Holding company |
| |
| (a) | | Security exempt from registration pursuant to Regulation S under the Securities Act of 1933, as amended. Regulation S applies to securities offerings that are made outside of the United States and do not involve direct selling efforts in the United States and as such may have restrictions on resale. |
| | |
| (b) | | The security or a portion of this security is on loan at October 31, 2019. The total value of securities on loan at October 31, 2019 is approximately $3,789,000. |
| (c) | | Securities exempt from registration under Rule 144A or section 4 (a)(2), of the Securities Act of 1933, as amended. |
| (d) | | Amount rounds to less than 0.1% of net assets. |
| (e) | | Amount rounds to less than one thousand. |
| (f) | | Investment in an affiliated fund, which is registered under the Investment Company Act of 1940, as amended, and is advised by J.P. Morgan Investment Management Inc. |
| (g) | | The rate shown is the current yield as of October 31, 2019. |
| * | | Non-income producing security. |
| | | | | | | | | | | | | | | | | | | | |
| Futures contracts outstanding as of October 31, 2019 (amounts in thousands, except number of contracts): | |
| DESCRIPTION | | NUMBER OF
CONTRACTS | | | EXPIRATION
DATE | | | TRADING
CURRENCY | | | NOTIONAL
AMOUNT ($) | | | VALUE AND
UNREALIZED
APPRECIATION
(DEPRECIATION) ($) | |
| | | | | |
Long Contracts | | | | | | | | | | | | | | | | | | | | |
| | | | | |
| EURO STOXX 50 Index | | | 41 | | | | 12/2019 | | | | EUR | | | | 1,648 | | | | 20 | |
| | | | | |
| FTSE 100 Index | | | 13 | | | | 12/2019 | | | | GBP | | | | 1,220 | | | | (7 | ) |
| | | | | |
| TOPIX Index | | | 8 | | | | 12/2019 | | | | JPY | | | | 1,226 | | | | 30 | |
| | | | | | | | | | | | | | | | | | | | |
| | | | | | | | | | | | | | | | | | | 43 | |
| | | | | | | | | | | | | | | | | | | | |
Abbreviations
| | |
| EUR | | Euro |
| FTSE | | Financial Times and the London Stock Exchange |
| GBP | | British Pound |
| JPY | | Japanese Yen |
| TOPIX | | Tokyo Stock Price Index |
SEE NOTES TO FINANCIAL STATEMENTS.
| | | | | | |
| | | |
| 72 | | | | J.P. MORGAN INTERNATIONAL EQUITY FUNDS | | OCTOBER 31, 2019 |
THIS PAGE IS INTENTIONALLY LEFT BLANK
| | | | | | | | |
| | | |
| OCTOBER 31, 2019 | | J.P. MORGAN INTERNATIONAL EQUITY FUNDS | | | | | 73 | |
STATEMENTS OF ASSETS AND LIABILITIES
AS OF OCTOBER 31, 2019
(Amounts in thousands, except per share amounts)
| | | | | | | | | | | | |
| | | |
| | | JPMorgan
Emerging
Markets
Equity Fund | | | JPMorgan
Emerging
Markets
Research
Enhanced
Equity Fund | | | JPMorgan
Europe
Dynamic
Fund | |
ASSETS: | | | | | | | | | | | | |
Investments in non-affiliates, at value | | $ | 6,174,700 | | | $ | 2,063,564 | | | $ | 539,986 | |
Investments in affiliates, at value | | | 168,369 | | | | 22,226 | | | | 130 | |
Investment of cash collateral received from securities loaned, at value (See Note 2.C.) | | | 13,486 | | | | 2,216 | | | | 286 | |
Cash | | | 178 | | | | 2,379 | | | | 100 | |
Foreign currency, at value | | | 669 | | | | 3,113 | | | | 1,182 | |
Deferred offering cost (See Note 2.G.) | | | — | | | | 5 | | | | — | |
Receivables: | | | | | | | | | | | | |
Due from custodian | | | — | | | | — | | | | 3,487 | |
Investment securities sold | | | — | | | | 1,097 | | | | 12,560 | |
Fund shares sold | | | 13,722 | | | | 2 | | | | 1 | |
Dividends from non-affiliates | | | 3,671 | | | | 959 | | | | 307 | |
Dividends from affiliates | | | 200 | | | | 245 | | | | 8 | |
Tax reclaims | | | 996 | | | | 23 | | | | 3,918 | |
Securities lending income (See Note 2.C.) | | | 5 | | | | — | (a) | | | 3 | |
| | | | | | | | | | | | |
Total Assets | | | 6,375,996 | | | | 2,095,829 | | | | 561,968 | |
| | | | | | | | | | | | |
| | | |
LIABILITIES: | | | | | | | | | | | | |
Payables: | | | | | | | | | | | | |
Investment securities purchased | | | 17,380 | | | | 544 | | | | 18,649 | |
Collateral received on securities loaned (See Note 2.C.) | | | 13,486 | | | | 2,216 | | | | 286 | |
Fund shares redeemed | | | 6,204 | | | | 1,977 | | | | 199 | |
Variation margin on futures contracts | | | — | | | | — | | | | 12 | |
Accrued liabilities: | | | | | | | | | | | | |
Investment advisory fees | | | 3,042 | | | | 268 | | | | 269 | |
Administration fees | | | 92 | | | | 36 | | | | 34 | |
Distribution fees | | | 142 | | | | — | | | | 33 | |
Service fees | | | 436 | | | | — | (a) | | | 45 | |
Custodian and accounting fees | | | 478 | | | | 111 | | | | 42 | |
Trustees’ and Chief Compliance Officer’s fees | | | — | (a) | | | — | | | | — | (a) |
Deferred foreign capital gains tax | | | 20,407 | | | | — | | | | — | |
Audit fees | | | 67 | | | | 70 | | | | 80 | |
Other | | | 585 | | | | 33 | | | | 74 | |
| | | | | | | | | | | | |
Total Liabilities | | | 62,319 | | | | 5,255 | | | | 19,723 | |
| | | | | | | | | | | | |
Net Assets | | $ | 6,313,677 | | | $ | 2,090,574 | | | $ | 542,245 | |
| | | | | | | | | | | | |
| (a) | Amount rounds to less than one thousand. |
SEE NOTES TO FINANCIAL STATEMENTS.
| | | | | | |
| | | |
| 74 | | | | J.P. MORGAN INTERNATIONAL EQUITY FUNDS | | OCTOBER 31, 2019 |
| | | | | | | | | | | | |
| | | |
| | | JPMorgan
Emerging
Markets
Equity Fund | | | JPMorgan
Emerging
Markets
Research
Enhanced
Equity Fund | | | JPMorgan
Europe
Dynamic
Fund | |
NET ASSETS: | | | | | | | | | | | | |
Paid-in-Capital | | $ | 4,675,089 | | | $ | 2,036,055 | | | $ | 596,615 | |
Total distributable earnings (loss) | | | 1,638,588 | | | | 54,519 | | | | (54,370 | ) |
| | | | | | | | | | | | |
Total Net Assets | | $ | 6,313,677 | | | $ | 2,090,574 | | | $ | 542,245 | |
| | | | | | | | | | | | |
| | | |
Net Assets: | | | | | | | | | | | | |
Class A | | $ | 524,357 | | | $ | — | | | $ | 98,294 | |
Class C | | | 56,830 | | | | — | | | | 19,798 | |
Class I | | | 1,725,882 | | | | 5 | | | | 86,582 | |
Class L | | | 926,781 | | | | — | | | | 65,686 | |
Class R2 | | | 145 | | | | — | | | | — | |
Class R3 | | | 2,151 | | | | — | | | | — | |
Class R4 | | | 1,300 | | | | — | | | | — | |
Class R5 | | | 41,872 | | | | — | | | | — | |
Class R6 | | | 3,034,359 | | | | 2,090,569 | | | | 271,885 | |
| | | | | | | | | | | | |
Total | | $ | 6,313,677 | | | $ | 2,090,574 | | | $ | 542,245 | |
| | | | | | | | | | | | |
Outstanding units of beneficial interest (shares) ($0.0001 par value; unlimited number of shares authorized): | | | | | | | | | | | | |
Class A | | | 17,439 | | | | — | | | | 4,053 | |
Class C | | | 1,955 | | | | — | | | | 922 | |
Class I | | | 56,049 | | | | — | (a) | | | 3,499 | |
Class L | | | 29,867 | | | | — | | | | 2,622 | |
Class R2 | | | 5 | | | | — | | | | — | |
Class R3 | | | 72 | | | | — | | | | — | |
Class R4 | | | 42 | | | | — | | | | — | |
Class R5 | | | 1,352 | | | | — | | | | — | |
Class R6 | | | 97,896 | | | | 124,461 | | | | 10,895 | |
| | | |
Net Asset Value (b): | | | | | | | | | | | | |
Class A — Redemption price per share | | $ | 30.07 | | | $ | — | | | $ | 24.25 | |
Class C — Offering price per share (c) | | | 29.07 | | | | — | | | | 21.47 | |
Class I — Offering and redemption price per share | | | 30.79 | | | | 16.78 | | | | 24.75 | |
Class L — Offering and redemption price per share | | | 31.03 | | | | — | | | | 25.05 | |
Class R2 — Offering and redemption price per share | | | 29.78 | | | | — | | | | — | |
Class R3 — Offering and redemption price per share | | | 29.96 | | | | — | | | | — | |
Class R4 — Offering and redemption price per share | | | 30.68 | | | | — | | | | — | |
Class R5 — Offering and redemption price per share | | | 30.96 | | | | — | | | | — | |
Class R6 — Offering and redemption price per share | | | 31.00 | | | | 16.80 | | | | 24.96 | |
Class A maximum sales charge | | | 5.25 | % | | | — | % | | | 5.25 | % |
Class A maximum public offering price per share
[net asset value per share/(100% — maximum sales charge)] | | $ | 31.74 | | | $ | — | | | $ | 25.59 | |
| | | | | | | | | | | | |
| | | |
Cost of investments in non-affiliates | | $ | 4,432,405 | | | $ | 2,022,679 | | | $ | 494,606 | |
Cost of investments in affiliates | | | 168,352 | | | | 22,222 | | | | 130 | |
Cost of foreign currency | | | 666 | | | | 3,098 | | | | 1,178 | |
Investment securities on loan, at value (See Note 2.C.) | | | 13,200 | | | | 2,092 | | | | 275 | |
Cost of investment of cash collateral (See Note 2.C.) | | | 13,486 | | | | 2,216 | | | | 286 | |
| (a) | Amount rounds to less than one thousand. |
| (b) | Per share amounts may not recalculate due to rounding of net assets and/or shares outstanding. |
| (c) | Redemption price for Class C Shares varies based upon length of time the shares are held. |
SEE NOTES TO FINANCIAL STATEMENTS.
| | | | | | | | |
| | | |
| OCTOBER 31, 2019 | | J.P. MORGAN INTERNATIONAL EQUITY FUNDS | | | | | 75 | |
STATEMENTS OF ASSETS AND LIABILITIES
AS OF OCTOBER 31, 2019 (continued)
(Amounts in thousands, except per share amounts)
| | | | | | | | | | | | |
| | | |
| | | JPMorgan
Global
Research
Enhanced
Index Fund | | | JPMorgan
International
Advantage
Fund | | | JPMorgan
International
Equity Fund | |
ASSETS: | | | | | | | | | | | | |
Investments in non-affiliates, at value | | $ | 4,166,392 | | | $ | 1,740,598 | | | $ | 2,928,091 | |
Investments in affiliates, at value | |
| —
|
| | | 42,366 | | | | 49,197 | |
Investment of cash collateral received from securities loaned, at value (See Note 2.C.) | | | 39,184 | | | | 1,971 | | | | 52,519 | |
Cash | | | 65 | | | | 88 | | | | 286 | |
Foreign currency, at value | | | — | | | | 191 | | | | — | |
Deposits at broker for futures contracts | | | 1,934 | | | | 2,497 | | | | — | |
Receivables: | | | | | | | | | | | | |
Due from custodian | | | — | | | | — | | | | 2,053 | |
Investment securities sold | | | 56,232 | | | | 6,075 | | | | 1 | |
Fund shares sold | | | 131 | | | | 60 | | | | 4,369 | |
Dividends from non-affiliates | | | 6,782 | | | | 8,282 | | | | 6,800 | |
Dividends from affiliates | | | 28 | | | | 65 | | | | 74 | |
Tax reclaims | | | 7,735 | | | | 12,740 | | | | 12,561 | |
Securities lending income (See Note 2.C.) | | | 9 | | | | 40 | | | | 4 | |
| | | | | | | | | | | | |
Total Assets | | | 4,278,492 | | | | 1,814,973 | | | | 3,055,955 | |
| | | | | | | | | | | | |
| | | |
LIABILITIES: | | | | | | | | | | | | |
Payables: | | | | | | | | | | | | |
Foreign currency due to custodian, at value | | | 6 | | | | — | | | | 222 | |
Investment securities purchased | | | 2,436 | | | | — | | | | 2,941 | |
Collateral received on securities loaned (See Note 2.C.) | | | 39,184 | | | | 1,971 | | | | 52,519 | |
Interfund lending | | | 3,663 | | | | — | | | | — | |
Fund shares redeemed | | | 1,527 | | | | 335 | | | | 1,611 | |
Variation margin on futures contracts | | | 179 | | | | 138 | | | | 1 | |
Accrued liabilities: | | | | | | | | | | | | |
Investment advisory fees | | | 611 | | | | 759 | | | | 1,125 | |
Administration fees | | | 204 | | | | 54 | | | | 59 | |
Distribution fees | | | — | | | | 46 | | | | 77 | |
Service fees | | | 27 | | | | 36 | | | | 84 | |
Custodian and accounting fees | | | 67 | | | | 83 | | | | 98 | |
Trustees’ and Chief Compliance Officer’s fees | | | — | (a) | | | — | | | | — | (a) |
Audit fees | | | 77 | | | | 74 | | | | 85 | |
Other | | | 359 | | | | 128 | | | | 127 | |
| | | | | | | | | | | | |
Total Liabilities | | | 48,340 | | | | 3,624 | | | | 58,949 | |
| | | | | | | | | | | | |
Net Assets | | $ | 4,230,152 | | | $ | 1,811,349 | | | $ | 2,997,006 | |
| | | | | | | | | | | | |
| (a) | Amount rounds to less than one thousand. |
SEE NOTES TO FINANCIAL STATEMENTS.
| | | | | | |
| | | |
| 76 | | | | J.P. MORGAN INTERNATIONAL EQUITY FUNDS | | OCTOBER 31, 2019 |
| | | | | | | | | | | | |
| | | |
| | | JPMorgan
Global
Research
Enhanced
Index Fund | | | JPMorgan
International
Advantage
Fund | | | JPMorgan
International
Equity Fund | |
NET ASSETS: | |
Paid-in-Capital | | $ | 2,671,923 | | | $ | 1,815,564 | | | $ | 2,208,654 | |
Total distributable earnings (loss) | | | 1,558,229 | | | | (4,215 | ) | | | 788,352 | |
| | | | | | | | | | | | |
Total Net Assets | | $ | 4,230,152 | | | $ | 1,811,349 | | | $ | 2,997,006 | |
| | | | | | | | | | | | |
| | | |
Net Assets: | | | | | | | | | | | | |
Class A | | $ | — | | | $ | 156,230 | | | $ | 328,312 | |
Class C | | | — | | | | 1,210 | | | | 14,549 | |
Class I | | | 354,659 | | | | 67,146 | | | | 190,885 | |
Class R2 | | | — | | | | 30,819 | | | | 2,099 | |
Class R5 | | | — | | | | — | | | | 3,778 | |
Class R6 | | | 3,875,493 | | | | 1,555,944 | | | | 2,457,383 | |
| | | | | | | | | | | | |
Total | | $ | 4,230,152 | | | $ | 1,811,349 | | | $ | 2,997,006 | |
| | | | | | | | | | | | |
Outstanding units of beneficial interest (shares) ($0.0001 par value; unlimited number of shares authorized): | | | | | | | | | | | | |
Class A | | | — | | | | 7,852 | | | | 19,007 | |
Class C | | | — | | | | 60 | | | | 893 | |
Class I | | | 15,784 | | | | 3,242 | | | | 10,867 | |
Class R2 | | | — | | | | 1,575 | | | | 122 | |
Class R5 | | | — | | | | — | | | | 215 | |
Class R6 | | | 174,523 | | | | 76,272 | | | | 139,533 | |
| | | |
Net Asset Value (a): | | | | | | | | | | | | |
Class A — Redemption price per share | | $ | — | | | $ | 19.90 | | | $ | 17.27 | |
Class C — Offering price per share (b) | | | — | | | | 20.13 | | | | 16.29 | |
Class I — Offering and redemption price per share | | | 22.47 | | | | 20.71 | | | | 17.56 | |
Class R2 — Offering and redemption price per share | | | — | | | | 19.57 | | | | 17.14 | |
Class R5 — Offering and redemption price per share | | | — | | | | — | | | | 17.60 | |
Class R6 — Offering and redemption price per share | | | 22.21 | | | | 20.40 | | | | 17.61 | |
Class A maximum sales charge | | | — | % | | | 5.25 | % | | | 5.25 | % |
Class A maximum public offering price per share
[net asset value per share/(100% — maximum sales charge)] | | $ | — | | | $ | 21.00 | | | $ | 18.23 | |
| | | | | | | | | | | | |
| | | |
Cost of investments in non-affiliates | | $ | 2,936,016 | | | $ | 1,555,196 | | | $ | 2,167,677 | |
Cost of investments in affiliates | | | — | | | | 42,359 | | | | 49,188 | |
Cost of foreign currency | | | — | | | | 190 | | | | — | |
Investment securities on loan, at value (See Note 2.C.) | | | 37,095 | | | | 1,858 | | | | 49,506 | |
Cost of investment of cash collateral (See Note 2.C.) | | | 39,184 | | | | 1,971 | | | | 52,519 | |
| (a) | Per share amounts may not recalculate due to rounding of net assets and/or shares outstanding. |
| (b) | Redemption price for Class C Shares varies based upon length of time the shares are held. |
SEE NOTES TO FINANCIAL STATEMENTS.
| | | | | | | | |
| | | |
| OCTOBER 31, 2019 | | J.P. MORGAN INTERNATIONAL EQUITY FUNDS | | | | | 77 | |
STATEMENTS OF ASSETS AND LIABILITIES
AS OF OCTOBER 31, 2019 (continued)
(Amounts in thousands, except per share amounts)
| | | | | | | | | | | | | | | | |
| | | | |
| | | JPMorgan
International
Hedged
Equity Fund | | | JPMorgan
International
Research
Enhanced
Equity Fund | | | JPMorgan
International
Unconstrained
Equity Fund | | | JPMorgan
International
Value Fund | |
ASSETS: | |
Investments in non-affiliates, at value | | $ | 59,078 | | | $ | 4,641,690 | | | $ | 2,560,315 | | | $ | 386,660 | |
Investments in affiliates, at value | | | 850 | | | | 154,151 | | | | 48,921 | | | | 3,487 | |
Investment of cash collateral received from securities loaned, at value (See Note 2.C.) | | | — | | | | 106,266 | | | | 75,853 | | | | 4,026 | |
Options purchased, at value | | | 162 | | | | — | | | | — | | | | — | |
Cash | | | 367 | | | | 50 | | | | 201 | | | | 50 | |
Foreign currency, at value | | | 20 | | | | 5,806 | | | | 346 | | | | 106 | |
Deposits at broker for futures contracts | | | 171 | | | | 5,552 | | | | — | | | | 242 | |
Deposits at broker for options contracts | | | 100 | | | | — | | | | — | | | | — | |
Deferred offering cost (See Note 2.G.) | | | 39 | | | | — | | | | — | | | | — | |
Receivables: | | | | | | | | | | | | | | | | |
Investment securities sold | | | — | | | | — | | | | — | (a) | | | 328 | |
Fund shares sold | | | 20 | | | | 2,644 | | | | 925 | | | | 398 | |
Dividends from non-affiliates | | | 183 | | | | 14,403 | | | | 1,695 | | | | 1,385 | |
Dividends from affiliates | | | 2 | | | | 287 | | | | 143 | | | | 12 | |
Tax reclaims | | | 74 | | | | 13,392 | | | | 661 | | | | 2,852 | |
Securities lending income (See Note 2.C.) | | | — | | | | 10 | | | | 6 | | | | 3 | |
Due from adviser | | | 4 | | | | — | | | | — | | | | — | |
| | | | | | | | | | | | | | | | |
Total Assets | | | 61,070 | | | | 4,944,251 | | | | 2,689,066 | | | | 399,549 | |
| | | | | | | | | | | | | | | | |
| | | | |
LIABILITIES: | | | | | | | | | | | | | | | | |
Payables: | | | | | | | | | | | | | | | | |
Due to broker for options contracts | | | 100 | | | | — | | | | — | | | | — | |
Investment securities purchased | | | — | | | | 285 | | | | 622 | | | | 494 | |
Collateral received on securities loaned (See Note 2.C.) | | | — | | | | 106,266 | | | | 75,853 | | | | 4,026 | |
Fund shares redeemed | | | — | | | | 490 | | | | 11,755 | | | | 1,054 | |
Variation margin on futures contracts | | | 12 | | | | 1,377 | | | | 2 | | | | 14 | |
Outstanding options written, at fair value | | | 592 | | | | — | | | | — | | | | — | |
Accrued liabilities: | | | | | | | | | | | | | | | | |
Investment advisory fees | | | — | | | | 639 | | | | 900 | | | | 137 | |
Administration fees | | | — | | | | 214 | | | | 29 | | | | — | |
Distribution fees | | | — | (a) | | | 44 | | | | 36 | | | | 44 | |
Service fees | | | 12 | | | | 28 | | | | 50 | | | | 42 | |
Custodian and accounting fees | | | 13 | | | | 125 | | | | 28 | | | | 41 | |
Trustees’ and Chief Compliance Officer’s fees | | | — | (a) | | | — | (a) | | | — | | | | — | (a) |
Audit fees | | | 88 | | | | 54 | | | | 74 | | | | 87 | |
Other | | | 11 | | | | 255 | | | | 76 | | | | 338 | |
| | | | | | | | | | | | | | | | |
Total Liabilities | | | 828 | | | | 109,777 | | | | 89,425 | | | | 6,277 | |
| | | | | | | | | | | | | | | | |
Net Assets | | $ | 60,242 | | | $ | 4,834,474 | | | $ | 2,599,641 | | | $ | 393,272 | |
| | | | | | | | | | | | | | | | |
| (a) | Amount rounds to less than one thousand. |
SEE NOTES TO FINANCIAL STATEMENTS.
| | | | | | |
| | | |
| 78 | | | | J.P. MORGAN INTERNATIONAL EQUITY FUNDS | | OCTOBER 31, 2019 |
| | | | | | | | | | | | | | | | |
| | | | |
| | | JPMorgan
International
Hedged
Equity Fund | | | JPMorgan
International
Research
Enhanced
Equity Fund | | | JPMorgan
International
Unconstrained
Equity Fund | | | JPMorgan
International
Value Fund | |
NET ASSETS: | |
Paid-in-Capital | | $ | 58,037 | | | $ | 4,705,353 | | | $ | 2,510,664 | | | $ | 430,573 | |
Total distributable earnings (loss) | | | 2,205 | | | | 129,121 | | | | 88,977 | | | | (37,301 | ) |
| | | | | | | | | | | | | | | | |
Total Net Assets | | $ | 60,242 | | | $ | 4,834,474 | | | $ | 2,599,641 | | | $ | 393,272 | |
| | | | | | | | | | | | | | | | |
| | | | |
Net Assets: | | | | | | | | | | | | | | | | |
Class A | | $ | 330 | | | $ | 213,256 | | | $ | 114,629 | | | $ | 181,458 | |
Class C | | | 119 | | | | — | | | | 18,447 | | | | 9,358 | |
Class I | | | 59,751 | | | | 185,680 | | | | 177,764 | | | | 45,503 | |
Class L | | | — | | | | — | | | | — | | | | 30,256 | |
Class R2 | | | — | | | | — | | | | 1,049 | | | | 722 | |
Class R5 | | | 21 | | | | — | | | | 3,082 | | | | 88 | |
Class R6 | | | 21 | | | | 4,435,538 | | | | 2,284,670 | | | | 125,887 | |
| | | | | | | | | | | | | | | | |
Total | | $ | 60,242 | | | $ | 4,834,474 | | | $ | 2,599,641 | | | $ | 393,272 | |
| | | | | | | | | | | | | | | | |
Outstanding units of beneficial interest (shares) ($0.0001 par value; unlimited number of shares authorized): | | | | | | | | | | | | | | | | |
Class A | | | 21 | | | | 11,894 | | | | 5,421 | | | | 14,846 | |
Class C | | | 8 | | | | — | | | | 884 | | | | 792 | |
Class I | | | 3,829 | | | | 10,220 | | | | 8,294 | | | | 3,629 | |
Class L | | | — | | | | — | | | | — | | | | 2,427 | |
Class R2 | | | — | | | | — | | | | 50 | | | | 60 | |
Class R5 | | | 1 | | | | — | | | | 144 | | | | 7 | |
Class R6 | | | 1 | | | | 244,980 | | | | 106,575 | | | | 10,130 | |
| | | | |
Net Asset Value (a): | | | | | | | | | | | | | | | | |
Class A — Redemption price per share | | $ | 15.58 | | | $ | 17.93 | | | $ | 21.15 | | | $ | 12.22 | |
Class C — Offering price per share (b) | | | 15.53 | | | | — | | | | 20.86 | | | | 11.81 | |
Class I — Offering and redemption price per share | | | 15.61 | | | | 18.17 | | | | 21.43 | | | | 12.54 | |
Class L — Offering and redemption price per share | | | — | | | | — | | | | — | | | | 12.47 | |
Class R2 — Offering and redemption price per share | | | — | | | | — | | | | 20.99 | | | | 11.96 | |
Class R5 — Offering and redemption price per share | | | 15.62 | | | | — | | | | 21.42 | | | | 12.40 | |
Class R6 — Offering and redemption price per share | | | 15.63 | | | | 18.11 | | | | 21.44 | | | | 12.43 | |
Class A maximum sales charge | | | 5.25 | % | | | 5.25 | % | | | 5.25 | % | | | 5.25 | % |
Class A maximum public offering price per share
[net asset value per share/(100% — maximum sales charge)] | | $ | 16.44 | | | $ | 18.92 | | | $ | 22.32 | | | $ | 12.90 | |
| | | | | | | | | | | | | | | | |
| | | | |
Cost of investments in non-affiliates | | $ | 57,538 | | | $ | 4,420,959 | | | $ | 2,428,039 | | | $ | 391,873 | |
Cost of investments in affiliates | | | 850 | | | | 154,133 | | | | 48,912 | | | | 3,486 | |
Cost of options purchased | | | 547 | | | | — | | | | — | | | | — | |
Cost of foreign currency | | | 19 | | | | 5,733 | | | | 346 | | | | 106 | |
Investment securities on loan, at value (See Note 2.C.) | | | — | | | | 99,554 | | | | 70,848 | | | | 3,789 | |
Cost of investment of cash collateral (See Note 2.C.) | | | — | | | | 106,266 | | | | 75,853 | | | | 4,026 | |
Premiums received from options written | | | 512 | | | | — | | | | — | | | | — | |
| (a) | Per share amounts may not recalculate due to rounding of net assets and/or shares outstanding. |
| (b) | Redemption price for Class C Shares varies based upon length of time the shares are held. |
SEE NOTES TO FINANCIAL STATEMENTS.
| | | | | | | | |
| | | |
| OCTOBER 31, 2019 | | J.P. MORGAN INTERNATIONAL EQUITY FUNDS | | | | | 79 | |
STATEMENTS OF OPERATIONS
FOR THE YEAR ENDED OCTOBER 31, 2019
(Amounts in thousands)
| | | | | | | | | | | | |
| | | |
| | | JPMorgan
Emerging
Markets
Equity Fund | | | JPMorgan
Emerging
Markets
Research
Enhanced
Equity Fund (a) | | | JPMorgan
Europe
Dynamic
Fund | |
INVESTMENT INCOME: | |
Interest income from non-affiliates | | $ | 10 | | | $ | 6 | | | $ | 253 | |
Interest income from affiliates | | | 11 | | | | 8 | | | | 1 | |
Dividend income from non-affiliates | | | 107,796 | | | | 10,003 | | | | 22,256 | |
Dividend income from affiliates | | | 1,919 | | | | 463 | | | | 306 | |
Non-cash dividend income from non-affiliates | | | — | | | | 2,910 | | | | 1,313 | |
Income from securities lending (net) (See Note 2.C.) | | | 592 | | | | 2 | | | | 203 | |
Foreign taxes withheld | | | (5,470 | ) | | | (846 | ) | | | (1,835 | ) |
| | | | | | | | | | | | |
Total investment income | | | 104,858 | | | | 12,546 | | | | 22,497 | |
| | | | | | | | | | | | |
| | | |
EXPENSES: | | | | | | | | | | | | |
Investment advisory fees | | | 44,342 | | | | 967 | | | | 3,695 | |
Administration fees | | | 4,192 | | | | 290 | | | | 441 | |
Distribution fees: | | | | | | | | | | | | |
Class A | | | 1,082 | | | | — | | | | 269 | |
Class C | | | 385 | | | | — | | | | 179 | |
Class R2 | | | 1 | | | | — | | | | — | |
Class R3 | | | 3 | | | | — | | | | — | |
Service fees: | | | | | | | | | | | | |
Class A | | | 1,082 | | | | — | | | | 269 | |
Class C | | | 128 | | | | — | | | | 60 | |
Class I (b) | | | 2,877 | | | | 8 | | | | 254 | |
Class L | | | 658 | | | | — | | | | 79 | |
Class R2 | | | — | (c) | | | — | | | | — | |
Class R3 | | | 3 | | | | — | | | | — | |
Class R4 | | | 3 | | | | — | | | | — | |
Class R5 | | | 33 | | | | — | | | | — | |
Custodian and accounting fees | | | 3,143 | | | | 343 | | | | 148 | |
Interest expense to affiliates | | | 64 | | | | — | (c) | | | 11 | |
Professional fees | | | 154 | | | | 79 | | | | 100 | |
Trustees’ and Chief Compliance Officer’s fees | | | 46 | | | | 21 | | | | 28 | |
Printing and mailing costs | | | 582 | | | | 11 | | | | 35 | |
Registration and filing fees | | | 401 | | | | 18 | | | | 115 | |
Transfer agency fees (See Note 2.I.) | | | 179 | | | | 2 | | | | 34 | |
Offering costs (See Note 2.G.) | | | — | | | | 43 | | | | — | |
Other | | | 94 | | | | 8 | | | | 21 | |
| | | | | | | | | | | | |
Total expenses | | | 59,452 | | | | 1,790 | | | | 5,738 | |
| | | | | | | | | | | | |
Less fees waived | | | (10,418 | ) | | | (410 | ) | | | (182 | ) |
Less expense reimbursements | | | (36 | ) | | | (47 | ) | | | — | |
| | | | | | | | | | | | |
Net expenses | | | 48,998 | | | | 1,333 | | | | 5,556 | |
| | | | | | | | | | | | |
Net investment income (loss) | | | 55,860 | | | | 11,213 | | | | 16,941 | |
| | | | | | | | | | | | |
| | | |
REALIZED/UNREALIZED GAINS (LOSSES): | | | | | | | | | | | | |
Net realized gain (loss) on transactions from: | | | | | | | | | | | | |
Investments in non-affiliates | | | (2,860 | )(d) | | | (2,167 | ) | | | (56,959 | ) |
Investments in affiliates | | | 3 | | | | 3 | | | | — | (c) |
Futures contracts | | | 2,644 | | | | 5,136 | | | | 529 | |
Foreign currency transactions | | | (1,928 | ) | | | (549 | ) | | | (109 | ) |
| | | | | | | | | | | | |
Net realized gain (loss) | | | (2,141 | ) | | | 2,423 | | | | (56,539 | ) |
| | | | | | | | | | | | |
Change in net unrealized appreciation/depreciation on: | | | | | | | | | | | | |
Investments in non-affiliates | | | 1,186,355 | (e) | | | 40,885 | | | | 83,496 | |
Investments in affiliates | | | 17 | | | | 4 | | | | — | (c) |
Futures contracts | | | — | | | | — | | | | (213 | ) |
Foreign currency translations | | | 48 | | | | 20 | | | | 42 | |
| | | | | | | | | | | | |
Change in net unrealized appreciation/depreciation | | | 1,186,420 | | | | 40,909 | | | | 83,325 | |
| | | | | | | | | | | | |
Net realized/unrealized gains (losses) | | | 1,184,279 | | | | 43,332 | | | | 26,786 | |
| | | | | | | | | | | | |
Change in net assets resulting from operations | | $ | 1,240,139 | | | $ | 54,545 | | | $ | 43,727 | |
| | | | | | | | | | | | |
| (a) | Commencement of operations was December 11, 2018. |
| (b) | Commencement of offering of class of shares effective January 30, 2019 for JPMorgan Emerging Markets Research Enhanced Equity Fund. |
| (c) | Amount rounds to less than one thousand. |
| (d) | Net of foreign capital gains tax of approximately $(842,000) for JPMorgan Emerging Markets Equity Fund. |
| (e) | Net of change in foreign capital gains tax of approximately $(16,616,000) for JPMorgan Emerging Markets Equity Fund. |
SEE NOTES TO FINANCIAL STATEMENTS.
| | | | | | |
| | | |
| 80 | | | | J.P. MORGAN INTERNATIONAL EQUITY FUNDS | | OCTOBER 31, 2019 |
| | | | | | | | | | | | |
| | | |
| | | JPMorgan
Global
Research
Enhanced
Index Fund | | | JPMorgan
International
Advantage
Fund | | | JPMorgan
International
Equity Fund | |
INVESTMENT INCOME: | | | | | | | | | | | | |
Interest income fromnon-affiliates | | $ | 55 | | | $ | 486 | | | $ | — | |
Interest income from affiliates | | | 5 | | | | — | (a) | | | 4 | |
Dividend income fromnon-affiliates | | | 118,601 | | | | 129,476 | | | | 131,173 | |
Dividend income from affiliates | | | 630 | | | | 1,280 | | | | 1,713 | |
Income from securities lending (net) (See Note 2.C.) | | | 652 | | | | 974 | | | | 538 | |
Foreign taxes withheld | | | (4,987 | ) | | | (9,948 | ) | | | (9,280 | ) |
| | | | | | | | | | | | |
Total investment income | | | 114,956 | | | | 122,268 | | | | 124,148 | |
| | | | | | | | | | | | |
| | | |
EXPENSES: | | | | | | | | | | | | |
Investment advisory fees | | | 9,234 | | | | 18,706 | | | | 25,617 | |
Administration fees | | | 3,521 | | | | 2,462 | | | | 3,194 | |
Distribution fees: | | | | | | | | | | | | |
Class A | | | — | | | | 383 | | | | 683 | |
Class C | | | — | | | | 11 | | | | 126 | |
Class R2 | | | — | | | | 155 | | | | 8 | |
Service fees: | | | | | | | | | | | | |
Class A | | | — | | | | 383 | | | | 683 | |
Class C | | | — | | | | 4 | | | | 42 | |
Class I | | | 955 | | | | 160 | | | | 436 | |
Class R2 | | | — | | | | 78 | | | | 4 | |
Class R5 | | | — | | | | — | | | | 18 | |
Custodian and accounting fees | | | 397 | | | | 558 | | | | 598 | |
Interest expense to affiliates | | | 111 | | | | 36 | | | | 40 | |
Professional fees | | | 187 | | | | 162 | | | | 188 | |
Trustees’ and Chief Compliance Officer’s fees | | | 44 | | | | 38 | | | | 42 | |
Printing and mailing costs | | | 226 | | | | 84 | | | | 127 | |
Registration and filing fees | | | 131 | | | | 106 | | | | 126 | |
Transfer agency fees (See Note 2.I.) | | | 43 | | | | 117 | | | | 87 | |
Other | | | 81 | | | | 76 | | | | 73 | |
| | | | | | | | | | | | |
Total expenses | | | 14,930 | | | | 23,519 | | | | 32,092 | |
| | | | | | | | | | | | |
Less fees waived | | | (2,984 | ) | | | (5,791 | ) | | | (9,447 | ) |
Less expense reimbursements | | | — | | | | — | | | | (3 | ) |
| | | | | | | | | | | | |
Net expenses | | | 11,946 | | | | 17,728 | | | | 22,642 | |
| | | | | | | | | | | | |
Net investment income (loss) | | | 103,010 | | | | 104,540 | | | | 101,506 | |
| | | | | | | | | | | | |
| | | |
REALIZED/UNREALIZED GAINS (LOSSES): | | | | | | | | | | | | |
Net realized gain (loss) on transactions from: | | | | | | | | | | | | |
Investments innon-affiliates | | | 387,148 | | | | (248,044 | ) | | | (45,984 | ) |
Investments in affiliates | | | 4 | | | | 10 | | | | 8 | |
Futures contracts | | | (894 | ) | | | (1,247 | ) | | | (3,617 | ) |
Foreign currency transactions | | | 966 | | | | 2,445 | | | | 2,853 | |
| | | | | | | | | | | | |
Net realized gain (loss) | | | 387,224 | | | | (246,836 | ) | | | (46,740 | ) |
| | | | | | | | | | | | |
Change in net unrealized appreciation/depreciation on: | | | | | | | | | | | | |
Investments innon-affiliates | | | 38,268 | | | | 251,551 | | | | 522,433 | |
Investments in affiliates | |
| —
| (a)
| | | 7 | | | | 9 | |
Futures contracts | | | (898 | ) | | | 2,869 | | | | — | |
Foreign currency translations | | | 84 | | | | 228 | | | | 169 | |
| | | | | | | | | | | | |
Change in net unrealized appreciation/depreciation | | | 37,454 | | | | 254,655 | | | | 522,611 | |
| | | | | | | | | | | | |
Net realized/unrealized gains (losses) | | | 424,678 | | | | 7,819 | | | | 475,871 | |
| | | | | | | | | | | | |
Change in net assets resulting from operations | | $ | 527,688 | | | $ | 112,359 | | | $ | 577,377 | |
| | | | | | | | | | | | |
| (a) | Amount rounds to less than one thousand. |
SEE NOTES TO FINANCIAL STATEMENTS.
| | | | | | | | |
| | | |
| OCTOBER 31, 2019 | | J.P. MORGAN INTERNATIONAL EQUITY FUNDS | | | | | 81 | |
STATEMENTS OF OPERATIONS
FOR THE YEAR ENDED OCTOBER 31, 2019 (continued)
(Amounts in thousands)
| | | | | | | | | | | | | | | | |
| | | | |
| | | JPMorgan
International
Hedged
Equity Fund (a) | | | JPMorgan
International
Research
Enhanced
Equity Fund | | | JPMorgan
International
Unconstrained
Equity Fund | | | JPMorgan
International
Value Fund | |
INVESTMENT INCOME: | |
Interest income from non-affiliates | | $ | 2 | | | $ | 147 | | | $ | — | (b) | | $ | 953 | |
Interest income from affiliates | | | 2 | | | | 1 | | | | 1 | | | | 1 | |
Dividend income from non-affiliates | | | 1,429 | | | | 172,717 | | | | 13,772 | | | | 19,714 | |
Dividend income from affiliates | | | 19 | | | | 2,748 | | | | 468 | | | | 169 | |
Income from securities lending (net) (See Note 2.C.) | | | — | | | | 1,066 | | | | 33 | | | | 122 | |
Foreign taxes withheld | | | (132 | ) | | | (13,684 | ) | | | (873 | ) | | | (1,256 | ) |
| | | | | | | | | | | | | | | | |
Total investment income | | | 1,320 | | | | 162,995 | | | | 13,401 | | | | 19,703 | |
| | | | | | | | | | | | | | | | |
| | | | |
EXPENSES: | | | | | | | | | | | | | | | | |
Investment advisory fees | | | 83 | | | | 9,019 | | | | 4,133 | | | | 2,474 | |
Administration fees | | | 25 | | | | 3,431 | | | | 489 | | | | 320 | |
Distribution fees: | | | | | | | | | | | | | | | | |
Class A | | | — | (b) | | | 509 | | | | 239 | | | | 474 | |
Class C | | | — | (b) | | | — | | | | 149 | | | | 82 | |
Class R2 | | | — | | | | — | | | | 5 | | | | 5 | |
Service fees: | | | | | | | | | | | | | | | | |
Class A | | | — | (b) | | | 509 | | | | 239 | | | | 474 | |
Class C | | | — | (b) | | | — | | | | 50 | | | | 27 | |
Class I | | | 83 | | | | 411 | | | | 441 | | | | 135 | |
Class L | | | — | | | | — | | | | — | | | | 42 | |
Class R2 | | | — | | | | — | | | | 3 | | | | 3 | |
Class R5 | | | — | (b) | | | — | | | | 3 | | | | — | (b) |
Custodian and accounting fees | | | 39 | | | | 651 | | | | 137 | | | | 129 | |
Interest expense to affiliates | | | — | (b) | | | 10 | | | | 12 | | | | 18 | |
Professional fees | | | 88 | | | | 175 | | | | 83 | | | | 159 | |
Trustees’ and Chief Compliance Officer’s fees | | | 13 | | | | 43 | | | | 27 | | | | 27 | |
Printing and mailing costs | | | 9 | | | | 227 | | | | 58 | | | | 5 | |
Registration and filing fees | | | 5 | | | | 53 | | | | 153 | | | | 87 | |
Transfer agency fees (See Note 2.I.) | | | 2 | | | | 95 | | | | 37 | | | | 28 | |
Offering costs (See Note 2.G.) | | | 64 | | | | — | | | | — | | | | — | |
Other | | | 8 | | | | 114 | | | | 12 | | | | 12 | |
| | | | | | | | | | | | | | | | |
Total expenses | | | 419 | | | | 15,247 | | | | 6,270 | | | | 4,501 | |
| | | | | | | | | | | | | | | | |
Less fees waived | | | (112 | ) | | | (3,292 | ) | | | (1,752 | ) | | | (1,067 | ) |
Less expense reimbursements | | | (109 | ) | | | — | | | | (1 | ) | | | — | (b) |
| | | | | | | | | | | | | | | | |
Net expenses | | | 198 | | | | 11,955 | | | | 4,517 | | | | 3,434 | |
| | | | | | | | | | | | | | | | |
Net investment income (loss) | | | 1,122 | | | | 151,040 | | | | 8,884 | | | | 16,269 | |
| | | | | | | | | | | | | | | | |
| | | | |
REALIZED/UNREALIZED GAINS (LOSSES): | | | | | | | | | | | | | | | | |
Net realized gain (loss) on transactions from: | | | | | | | | | | | | | | | | |
Investments in non-affiliates | | | (61 | ) | | | (174,555 | ) | | | (22,834 | ) | | | (47,702 | ) |
Investments in affiliates | | | — | (b) | | | 6 | | | | — | (b) | | | — | (b) |
Options purchased | | | (956 | ) | | | — | | | | — | | | | — | |
Futures contracts | | | 82 | | | | 13,990 | | | | 144 | | | | 1,233 | |
Foreign currency transactions | | | 14 | | | | (595 | ) | | | 1,289 | | | | 237 | |
Forward foreign currency exchange contracts | | | — | | | | — | | | | (1,105 | ) | | | — | |
Options written | | | 931 | | | | — | | | | — | | | | — | |
| | | | | | | | | | | | | | | | |
Net realized gain (loss) | | | 10 | | | | (161,154 | ) | | | (22,506 | ) | | | (46,232 | ) |
| | | | | | | | | | | | | | | | |
Change in net unrealized appreciation/depreciation on: | | | | | | | | | | | | | | | | |
Investments in non-affiliates | | | 1,540 | | | | 479,719 | | | | 157,776 | | | | 36,124 | |
Investments in affiliates | | | — | | | | 18 | | | | 9 | | | | 1 | |
Options purchased | | | (385 | ) | | | — | | | | — | | | | — | |
Futures contracts | | | (4 | ) | | | 3,708 | | | | — | | | | 43 | |
Foreign currency translations | | | 2 | | | | 386 | | | | 14 | | | | (4 | ) |
Options written | | | (80 | ) | | | — | | | | — | | | | — | |
| | | | | | | | | | | | | | | | |
Change in net unrealized appreciation/depreciation | | | 1,073 | | | | 483,831 | | | | 157,799 | | | | 36,164 | |
| | | | | | | | | | | | | | | | |
Net realized/unrealized gains (losses) | | | 1,083 | | | | 322,677 | | | | 135,293 | | | | (10,068 | ) |
| | | | | | | | | | | | | | | | |
Change in net assets resulting from operations | | $ | 2,205 | | | $ | 473,717 | | | $ | 144,177 | | | $ | 6,201 | |
| | | | | | | | | | | | | | | | |
| (a) | Commencement of operations was March 15, 2019. |
| (b) | Amount rounds to less than one thousand. |
SEE NOTES TO FINANCIAL STATEMENTS.
| | | | | | |
| | | |
| 82 | | | | J.P. MORGAN INTERNATIONAL EQUITY FUNDS | | OCTOBER 31, 2019 |
STATEMENTS OF CHANGES IN NET ASSETS
FOR THE PERIODS INDICATED
(Amounts in thousands)
| | | | | | | | | | | | |
| | | JPMorgan Emerging Markets Equity Fund | | | JPMorgan
Emerging Markets
Research Enhanced
Equity Fund | |
| | | Year Ended
October 31, 2019 | | | Year Ended
October 31, 2018 | | | Period Ended
October 31, 2019 (a) | |
CHANGE IN NET ASSETS RESULTING FROM OPERATIONS: | |
Net investment income (loss) | | $ | 55,860 | | | $ | 45,111 | | | $ | 11,213 | |
Net realized gain (loss) | | | (2,141 | ) | | | (15,331 | ) | | | 2,423 | |
Change in net unrealized appreciation/depreciation | | | 1,186,420 | | | | (763,494 | ) | | | 40,909 | |
| | | | | | | | | | | | |
Change in net assets resulting from operations | | | 1,240,139 | | | | (733,714 | ) | | | 54,545 | |
| | | | | | | | | | | | |
| | | |
DISTRIBUTIONS TO SHAREHOLDERS: | | | | | | | | | | | | |
Class A | | | (1,554 | ) | | | (788 | ) | | | — | |
Class C | | | (59 | ) | | | (4 | ) | | | — | |
Class I (b) | | | (6,646 | ) | | | (2,829 | ) | | | — | |
Class L | | | (4,471 | ) | | | (2,054 | ) | | | — | |
Class R2 | | | (1 | ) | | | — | (c) | | | — | |
Class R3 | | | (1 | ) | | | — | (c) | | | — | |
Class R4 | | | (11 | ) | | | — | (c) | | | — | |
Class R5 | | | (296 | ) | | | (1 | ) | | | — | |
Class R6 | | | (30,900 | ) | | | (16,464 | ) | | | (26 | ) |
| | | | | | | | | | | | |
Total distributions to shareholders | | | (43,939 | ) | | | (22,140 | ) | | | (26 | ) |
| | | | | | | | | | | | |
| | | |
CAPITAL TRANSACTIONS: | | | | | | | | | | | | |
Change in net assets resulting from capital transactions | | | 516,272 | | | | 909,171 | | | | 2,036,055 | |
| | | | | | | | | | | | |
| | | |
NET ASSETS: | | | | | | | | | | | | |
Change in net assets | | | 1,712,472 | | | | 153,317 | | | | 2,090,574 | |
Beginning of period | | | 4,601,205 | | | | 4,447,888 | | | | — | |
| | | | | | | | | | | | |
End of period | | $ | 6,313,677 | | | $ | 4,601,205 | | | $ | 2,090,574 | |
| | | | | | | | | | | | |
| (a) | Commencement of operations was December 11, 2018. |
| (b) | Commencement of offering of class of shares effective January 30, 2019 for JPMorgan Emerging Markets Research Enhanced Equity Fund. |
| (c) | Amount rounds to less than one thousand. |
SEE NOTES TO FINANCIAL STATEMENTS.
| | | | | | | | |
| | | |
| OCTOBER 31, 2019 | | J.P. MORGAN INTERNATIONAL EQUITY FUNDS | | | | | 83 | |
STATEMENTS OF CHANGES IN NET ASSETS
FOR THE PERIODS INDICATED (continued)
(Amounts in thousands)
| | | | | | | | | | | | | | | | |
| | | JPMorgan Europe Dynamic Fund | | | JPMorgan
Global Research Enhanced Index Fund | |
| | | Year Ended
October 31, 2019 | | | Year Ended
October 31, 2018 | | | Year Ended
October 31, 2019 | | | Year Ended
October 31, 2018 | |
CHANGE IN NET ASSETS RESULTING FROM OPERATIONS: | | | | | | | | | | | | | | | | |
Net investment income (loss) | | $ | 16,941 | | | $ | 16,413 | | | $ | 103,010 | | | $ | 165,412 | |
Net realized gain (loss) | | | (56,539 | ) | | | 2,070 | | | | 387,224 | | | | 641,468 | |
Change in net unrealized appreciation/depreciation | | | 83,325 | | | | (138,449 | ) | | | 37,454 | | | | (659,780 | ) |
| | | | | | | | | | | | | | | | |
Change in net assets resulting from operations | | | 43,727 | | | | (119,966 | ) | | | 527,688 | | | | 147,100 | |
| | | | | | | | | | | | | | | | |
| | | | |
DISTRIBUTIONS TO SHAREHOLDERS: | | | | | | | | | | | | | | | | |
Class A | | | (2,841 | ) | | | (2,283 | ) | | | — | | | | — | |
Class C | | | (583 | ) | | | (435 | ) | | | — | | | | — | |
Class I | | | (3,245 | ) | | | (2,988 | ) | | | (40,630 | ) | | | (14,541 | ) |
Class L | | | (2,456 | ) | | | (9,949 | ) | | | — | | | | — | |
Class R6 (a)(b) | | | (7,813 | ) | | | — | | | | (509,389 | ) | | | (144,723 | ) |
| | | | | | | | | | | | | | | | |
Total distributions to shareholders | | | (16,938 | ) | | | (15,655 | ) | | | (550,019 | ) | | | (159,264 | ) |
| | | | | | | | | | | | | | | | |
| | | | |
CAPITAL TRANSACTIONS: | | | | | | | | | | | | | | | | |
Change in net assets resulting from capital transactions | | | (169,891 | ) | | | (156,528 | ) | | | (1,594,493 | ) | | | (2,804,320 | ) |
| | | | | | | | | | | | | | | | |
| | | | |
NET ASSETS: | | | | | | | | | | | | | | | | |
Change in net assets | | | (143,102 | ) | | | (292,149 | ) | | | (1,616,824 | ) | | | (2,816,484 | ) |
Beginning of period | | | 685,347 | | | | 977,496 | | | | 5,846,976 | | | | 8,663,460 | |
| | | | | | | | | | | | | | | | |
End of period | | $ | 542,245 | | | $ | 685,347 | | | $ | 4,230,152 | | | $ | 5,846,976 | |
| | | | | | | | | | | | | | | | |
| (a) | Commencement of offering of class of shares effective October 1, 2018 for JPMorgan Europe Dynamic Fund. |
| (b) | Commencement of offering of class of shares effective November 1, 2017 for JPMorgan Global Research Enhanced Index Fund. |
SEE NOTES TO FINANCIAL STATEMENTS.
| | | | | | |
| | | |
| 84 | | | | J.P. MORGAN INTERNATIONAL EQUITY FUNDS | | OCTOBER 31, 2019 |
| | | | | | | | | | | | | | | | |
| | | JPMorgan International Advantage Fund | | | JPMorgan International Equity Fund | |
| | | Year Ended
October 31, 2019 | | | Year Ended
October 31, 2018 | | | Year Ended
October 31, 2019 | | | Year Ended
October 31, 2018 | |
CHANGE IN NET ASSETS RESULTING FROM OPERATIONS: | | | | | | | | | | | | | | | | |
Net investment income (loss) | | $ | 104,540 | | | $ | 90,413 | | | $ | 101,506 | | | $ | 105,451 | |
Net realized gain (loss) | | | (246,836 | ) | | | (37,511 | ) | | | (46,740 | ) | | | 91,823 | |
Change in net unrealized appreciation/depreciation | | | 254,655 | | | | (455,595 | ) | | | 522,611 | | | | (738,163 | ) |
| | | | | | | | | | | | | | | | |
Change in net assets resulting from operations | | | 112,359 | | | | (402,693 | ) | | | 577,377 | | | | (540,889 | ) |
| | | | | | | | | | | | | | | | |
| | | | |
DISTRIBUTIONS TO SHAREHOLDERS: | | | | | | | | | | | | | | | | |
Class A | | | (3,427 | ) | | | (4,177 | ) | | | (8,158 | ) | | | (4,237 | ) |
Class C | | | (25 | ) | | | (19 | ) | | | (520 | ) | | | (224 | ) |
Class I | | | (1,458 | ) | | | (1,091 | ) | | | (5,904 | ) | | | (2,341 | ) |
Class R2 | | | (638 | ) | | | (172 | ) | | | (56 | ) | | | (26 | ) |
Class R5 | | | — | | | | — | | | | (691 | ) | | | (355 | ) |
Class R6 | | | (82,457 | ) | | | (61,869 | ) | | | (140,365 | ) | | | (59,589 | ) |
| | | | | | | | | | | | | | | | |
Total distributions to shareholders | | | (88,005 | ) | | | (67,328 | ) | | | (155,694 | ) | | | (66,772 | ) |
| | | | | | | | | | | | | | | | |
| | | | |
CAPITAL TRANSACTIONS: | | | | | | | | | | | | | | | | |
Change in net assets resulting from capital transactions | | | (1,616,261 | ) | | | 717,668 | | | | (1,693,771 | ) | | | 869,664 | |
| | | | | | | | | | | | | | | | |
| | | | |
NET ASSETS: | | | | | | | | | | | | | | | | |
Change in net assets | | | (1,591,907 | ) | | | 247,647 | | | | (1,272,088 | ) | | | 262,003 | |
Beginning of period | | | 3,403,256 | | | | 3,155,609 | | | | 4,269,094 | | | | 4,007,091 | |
| | | | | | | | | | | | | | | | |
End of period | | $ | 1,811,349 | | | $ | 3,403,256 | | | $ | 2,997,006 | | | $ | 4,269,094 | |
| | | | | | | | | | | | | | | | |
SEE NOTES TO FINANCIAL STATEMENTS.
| | | | | | | | |
| | | |
| OCTOBER 31, 2019 | | J.P. MORGAN INTERNATIONAL EQUITY FUNDS | | | | | 85 | |
STATEMENTS OF CHANGES IN NET ASSETS
FOR THE PERIODS INDICATED (continued)
(Amounts in thousands)
| | | | | | | | | | | | |
| | | JPMorgan
International
Hedged Equity Fund | | | JPMorgan International Research
Enhanced Equity Fund | |
| | | Period Ended
October 31, 2019 (a) | | | Year Ended
October 31, 2019 | | | Year Ended
October 31, 2018 | |
CHANGE IN NET ASSETS RESULTING FROM OPERATIONS: | |
Net investment income (loss) | | $ | 1,122 | | | $ | 151,040 | | | $ | 155,204 | |
Net realized gain (loss) | | | 10 | | | | (161,154 | ) | | | (30,100 | ) |
Change in net unrealized appreciation/depreciation | | | 1,073 | | | | 483,831 | | | | (588,793 | ) |
| | | | | | | | | | | | |
Change in net assets resulting from operations | | | 2,205 | | | | 473,717 | | | | (463,689 | ) |
| | | | | | | | | | | | |
| | | |
DISTRIBUTIONS TO SHAREHOLDERS: | | | | | | | | | | | | |
Class A | | | — | | | | (6,271 | ) | | | (6,079 | ) |
Class I | | | — | | | | (5,060 | ) | | | (22,656 | ) |
Class R6 (b) | | | — | | | | (149,729 | ) | | | (79,541 | ) |
| | | | | | | | | | | | |
Total distributions to shareholders | | | — | | | | (161,060 | ) | | | (108,276 | ) |
| | | | | | | | | | | | |
| | | |
CAPITAL TRANSACTIONS: | | | | | | | | | | | | |
Change in net assets resulting from capital transactions | | | 58,037 | | | | (178,801 | ) | | | 233,881 | |
| | | | | | | | | | | | |
| | | |
NET ASSETS: | | | | | | | | | | | | |
Change in net assets | | | 60,242 | | | | 133,856 | | | | (338,084 | ) |
Beginning of period | | | — | | | | 4,700,618 | | | | 5,038,702 | |
| | | | | | | | | | | | |
End of period | | $ | 60,242 | | | $ | 4,834,474 | | | $ | 4,700,618 | |
| | | | | | | | | | | | |
| (a) | Commencement of operations was March 15, 2019. |
| (b) | Commencement of offering of class of shares effective November 1, 2017 for JPMorgan International Research Enhanced Equity Fund. |
SEE NOTES TO FINANCIAL STATEMENTS.
| | | | | | |
| | | |
| 86 | | | | J.P. MORGAN INTERNATIONAL EQUITY FUNDS | | OCTOBER 31, 2019 |
| | | | | | | | | | | | | | | | |
| | | JPMorgan International
Unconstrained Equity Fund | | | JPMorgan International Value Fund | |
| | | Year Ended
October 31, 2019 | | | Year Ended
October 31, 2018 | | | Year Ended
October 31, 2019 | | | Year Ended
October 31, 2018 | |
CHANGE IN NET ASSETS RESULTING FROM OPERATIONS: | | | | | | | | | | | | | | | | |
Net investment income (loss) | | $ | 8,884 | | | $ | 10,358 | | | $ | 16,269 | | | $ | 19,670 | |
Net realized gain (loss) | | | (22,506 | ) | | | (26,039 | ) | | | (46,232 | ) | | | 29,907 | |
Change in net unrealized appreciation/depreciation | | | 157,799 | | | | (65,981 | ) | | | 36,164 | | | | (113,795 | ) |
| | | | | | | | | | | | | | | | |
Change in net assets resulting from operations | | | 144,177 | | | | (81,662 | ) | | | 6,201 | | | | (64,218 | ) |
| | | | | | | | | | | | | | | | |
| | | | |
DISTRIBUTIONS TO SHAREHOLDERS: | | | | | | | | | | | | | | | | |
Class A | | | (1,618 | ) | | | (451 | ) | | | (7,451 | ) | | | (6,784 | ) |
Class C | | | (296 | ) | | | (86 | ) | | | (419 | ) | | | (316 | ) |
Class I | | | (3,745 | ) | | | (1,315 | ) | | | (2,481 | ) | | | (3,872 | ) |
Class L | | | — | | | | — | | | | (2,611 | ) | | | (4,302 | ) |
Class R2 | | | (15 | ) | | | (2 | ) | | | (40 | ) | | | (27 | ) |
Class R5 | | | (72 | ) | | | (1 | ) | | | (3 | ) | | | (2 | ) |
Class R6 | | | (4,394 | ) | | | (1,288 | ) | | | (5,309 | ) | | | (2,922 | ) |
| | | | | | | | | | | | | | | | |
Total distributions to shareholders | | | (10,140 | ) | | | (3,143 | ) | | | (18,314 | ) | | | (18,225 | ) |
| | | | | | | | | | | | | | | | |
| | | | |
CAPITAL TRANSACTIONS: | | | | | | | | | | | | | | | | |
Change in net assets resulting from capital transactions | | | 1,990,374 | | | | 202,406 | | | | (116,184 | ) | | | (189,775 | ) |
| | | | | | | | | | | | | | | | |
| | | | |
NET ASSETS: | | | | | | | | | | | | | | | | |
Change in net assets | | | 2,124,411 | | | | 117,601 | | | | (128,297 | ) | | | (272,218 | ) |
Beginning of period | | | 475,230 | | | | 357,629 | | | | 521,569 | | | | 793,787 | |
| | | | | | | | | | | | | | | | |
End of period | | $ | 2,599,641 | | | $ | 475,230 | | | $ | 393,272 | | | $ | 521,569 | |
| | | | | | | | | | | | | | | | |
SEE NOTES TO FINANCIAL STATEMENTS.
| | | | | | | | |
| | | |
| OCTOBER 31, 2019 | | J.P. MORGAN INTERNATIONAL EQUITY FUNDS | | | | | 87 | |
STATEMENTS OF CHANGES IN NET ASSETS
FOR THE PERIODS INDICATED (continued)
(Amounts in thousands)
| | | | | | | | | | | | |
| | | JPMorgan Emerging Markets Equity Fund | | | JPMorgan
Emerging Markets
Research Enhanced
Equity Fund | |
| | | Year Ended
October 31, 2019 | | | Year Ended
October 31, 2018 | | | Period Ended
October 31, 2019 (a) | |
CAPITAL TRANSACTIONS: | | | | | | | | | | | | |
Class A | | | | | | | | | | | | |
Proceeds from shares issued | | $ | 312,341 | | | $ | 170,141 | | | $ | — | |
Distributions reinvested | | | 1,529 | | | | 781 | | | | — | |
Cost of shares redeemed | | | (252,175 | ) | | | (268,020 | ) | | | — | |
| | | | | | | | | | | | |
Change in net assets resulting from Class A capital transactions | | $ | 61,695 | | | $ | (97,098 | ) | | $ | — | |
| | | | | | | | | | | | |
Class C | | | | | | | | | | | | |
Proceeds from shares issued | | $ | 19,144 | | | $ | 18,903 | | | $ | — | |
Distributions reinvested | | | 58 | | | | 4 | | | | — | |
Cost of shares redeemed | | | (17,205 | ) | | | (15,849 | ) | | | — | |
| | | | | | | | | | | | |
Change in net assets resulting from Class C capital transactions | | $ | 1,997 | | | $ | 3,058 | | | $ | — | |
| | | | | | | | | | | | |
Class I(b) | | | | | | | | | | | | |
Proceeds from shares issued | | $ | 1,177,539 | | | $ | 573,932 | | | $ | 12,188 | |
Distributions reinvested | | | 5,945 | | | | 2,460 | | | | — | |
Cost of shares redeemed | | | (465,628 | ) | | | (295,493 | ) | | | (11,910 | ) |
| | | | | | | | | | | | |
Change in net assets resulting from Class I capital transactions | | $ | 717,856 | | | $ | 280,899 | | | $ | 278 | |
| | | | | | | | | | | | |
Class L | | | | | | | | | | | | |
Proceeds from shares issued | | $ | 534,452 | | | $ | 284,033 | | | $ | — | |
Distributions reinvested | | | 3,845 | | | | 1,682 | | | | — | |
Cost of shares redeemed | | | (228,859 | ) | | | (159,480 | ) | | | — | |
| | | | | | | | | | | | |
Change in net assets resulting from Class L capital transactions | | $ | 309,438 | | | $ | 126,235 | | | $ | — | |
| | | | | | | | | | | | |
Class R2 | | | | | | | | | | | | |
Proceeds from shares issued | | $ | 51 | | | $ | 94 | | | $ | — | |
Distributions reinvested | | | 1 | | | | — | (c) | | | — | |
Cost of shares redeemed | | | (26 | ) | | | (5 | ) | | | — | |
| | | | | | | | | | | | |
Change in net assets resulting from Class R2 capital transactions | | $ | 26 | | | $ | 89 | | | $ | — | |
| | | | | | | | | | | | |
Class R3 | | | | | | | | | | | | |
Proceeds from shares issued | | $ | 2,108 | | | $ | 460 | | | $ | — | |
Distributions reinvested | | | 1 | | | | — | (c) | | | — | |
Cost of shares redeemed | | | (478 | ) | | | (40 | ) | | | — | |
| | | | | | | | | | | | |
Change in net assets resulting from Class R3 capital transactions | | $ | 1,631 | | | $ | 420 | | | $ | — | |
| | | | | | | | | | | | |
Class R4 | | | | | | | | | | | | |
Proceeds from shares issued | | $ | 1,602 | | | $ | 42 | | | $ | — | |
Distributions reinvested | | | 11 | | | | — | (c) | | | — | |
Cost of shares redeemed | | | (608 | ) | | | (30 | ) | | | — | |
| | | | | | | | | | | | |
Change in net assets resulting from Class R4 capital transactions | | $ | 1,005 | | | $ | 12 | | | $ | — | |
| | | | | | | | | | | | |
Class R5 | | | | | | | | | | | | |
Proceeds from shares issued | | $ | 42,685 | | | $ | 2,991 | | | $ | — | |
Distributions reinvested | | | 296 | | | | 1 | | | | — | |
Cost of shares redeemed | | | (9,680 | ) | | | (1,077 | ) | | | — | |
| | | | | | | | | | | | |
Change in net assets resulting from Class R5 capital transactions | | $ | 33,301 | | | $ | 1,915 | | | $ | — | |
| | | | | | | | | | | | |
Class R6 | | | | | | | | | | | | |
Proceeds from shares issued | | $ | 1,266,740 | | | $ | 968,052 | | | $ | 2,052,510 | |
Distributions reinvested | | | 30,363 | | | | 16,155 | | | | 26 | |
Cost of shares redeemed | | | (1,907,780 | ) | | | (390,566 | ) | | | (16,759 | ) |
| | | | | | | | | | | | |
Change in net assets resulting from Class R6 capital transactions | | $ | (610,677 | ) | | $ | 593,641 | | | $ | 2,035,777 | |
| | | | | | | | | | | | |
Total change in net assets resulting from capital transactions | | $ | 516,272 | | | $ | 909,171 | | | $ | 2,036,055 | |
| | | | | | | | | | | | |
| (a) | Commencement of operations was December 11, 2018. |
| (b) | Commencement of offering of class of shares effective January 30, 2019 for JPMorgan Emerging Markets Research Enhanced Equity Fund. |
| (c) | Amount rounds to less than one thousand. |
SEE NOTES TO FINANCIAL STATEMENTS.
| | | | | | |
| | | |
| 88 | | | | J.P. MORGAN INTERNATIONAL EQUITY FUNDS | | OCTOBER 31, 2019 |
| | | | | | | | | | | | |
| | |
JPMorgan
Emerging Markets Equity Fund | | | JPMorgan
Emerging Markets
Research Enhanced
Equity Fund | |
| | | Year Ended
October 31, 2019 | | | Year Ended
October 31, 2018 | | | Period Ended October 31, 2019 (a) | |
SHARE TRANSACTIONS: | |
Class A | |
Issued | | | 11,352 | | | | 5,977 | | | | — | |
Reinvested | | | 64 | | | | 28 | | | | — | |
Redeemed | | | (9,475 | ) | | | (9,556 | ) | | | — | |
| | | | | | | | | | | | |
Change in Class A Shares | | | 1,941 | | | | (3,551 | ) | | | — | |
| | | | | | | | | | | | |
Class C | | | | | | | | | | | | |
Issued | | | 712 | | | | 679 | | | | — | |
Reinvested | | | 3 | | | | — | (b) | | | — | |
Redeemed | | | (650 | ) | | | (598 | ) | | | — | |
| | | | | | | | | | | | |
Change in Class C Shares | | | 65 | | | | 81 | | | | — | |
| | | | | | | | | | | | |
Class I(c) | | | | | | | | | | | | |
Issued | | | 41,001 | | | | 19,902 | | | | 744 | |
Reinvested | | | 243 | | | | 84 | | | | — | |
Redeemed | | | (16,821 | ) | | | (10,613 | ) | | | (744 | ) |
| | | | | | | | | | | | |
Change in Class I Shares | | | 24,423 | | | | 9,373 | | | | — | (b) |
| | | | | | | | | | | | |
Class L | | | | | | | | | | | | |
Issued | | | 18,682 | | | | 9,765 | | | | — | |
Reinvested | | | 156 | | | | 57 | | | | — | |
Redeemed | | | (8,295 | ) | | | (5,623 | ) | | | — | |
| | | | | | | | | | | | |
Change in Class L Shares | | | 10,543 | | | | 4,199 | | | | — | |
| | | | | | | | | | | | |
Class R2 | | | | | | | | | | | | |
Issued | | | 2 | | | | 3 | | | | — | |
Reinvested | | | — | (b) | | | — | (b) | | | — | |
Redeemed | | | (1 | ) | | | — | (b) | | | — | |
| | | | | | | | | | | | |
Change in Class R2 Shares | | | 1 | | | | 3 | | | | — | |
| | | | | | | | | | | | |
Class R3 | | | | | | | | | | | | |
Issued | | | 75 | | | | 15 | | | | — | |
Reinvested | | | — | (b) | | | — | (b) | | | — | |
Redeemed | | | (17 | ) | | | (2 | ) | | | — | |
| | | | | | | | | | | | |
Change in Class R3 Shares | | | 58 | | | | 13 | | | | — | |
| | | | | | | | | | | | |
Class R4 | | | | | | | | | | | | |
Issued | | | 62 | | | | 1 | | | | — | |
Reinvested | | | — | (b) | | | — | (b) | | | — | |
Redeemed | | | (21 | ) | | | (1 | ) | | | — | |
| | | | | | | | | | | | |
Change in Class R4 Shares | | | 41 | | | | — | (b) | | | — | |
| | | | | | | | | | | | |
Class R5 | | | | | | | | | | | | |
Issued | | | 1,616 | | | | 100 | | | | — | |
Reinvested | | | 12 | | | | — | (b) | | | — | |
Redeemed | | | (344 | ) | | | (39 | ) | | | — | |
| | | | | | | | | | | | |
Change in Class R5 Shares | | | 1,284 | | | | 61 | | | | — | |
| | | | | | | | | | | | |
Class R6 | | | | | | | | | | | | |
Issued | | | 43,818 | | | | 33,718 | | | | 125,486 | |
Reinvested | | | 1,233 | | | | 550 | | | | 2 | |
Redeemed | | | (66,518 | ) | | | (13,768 | ) | | | (1,027 | ) |
| | | | | | | | | | | | |
Change in Class R6 Shares | | | (21,467 | ) | | | 20,500 | | | | 124,461 | |
| | | | | | | | | | | | |
| (a) | Commencement of operations was December 11, 2018. |
| (b) | Amount rounds to less than one thousand. |
| (c) | Commencement of offering of class of shares effective January 30, 2019 for JPMorgan Emerging Markets Research Enhanced Equity Fund. |
SEE NOTES TO FINANCIAL STATEMENTS.
| | | | | | | | |
| | | |
| OCTOBER 31, 2019 | | J.P. MORGAN INTERNATIONAL EQUITY FUNDS | | | | | 89 | |
STATEMENTS OF CHANGES IN NET ASSETS
FOR THE PERIODS INDICATED (continued)
(Amounts in thousands)
| | | | | | | | | | | | | | | | |
| | | JPMorgan Europe Dynamic Fund | | | JPMorgan Global
Research Enhanced Index Fund | |
| | | Year Ended
October 31, 2019 | | | Year Ended
October 31, 2018 | | | Year Ended
October 31, 2019 | | | Year Ended
October 31, 2018 | |
CAPITAL TRANSACTIONS: | | | | | | | | | | | | | | | | |
Class A | | | | | | | | | | | | | | | | |
Proceeds from shares issued | | $ | 5,583 | | | $ | 26,652 | | | $ | — | | | $ | — | |
Distributions reinvested | | | 2,751 | | | | 2,203 | | | | — | | | | — | |
Cost of shares redeemed | | | (39,739 | ) | | | (46,333 | ) | | | — | | | | — | |
| | | | | | | | | | | | | | | | |
Change in net assets resulting from Class A capital transactions | | $ | (31,405 | ) | | $ | (17,478 | ) | | $ | — | | | $ | — | |
| | | | | | | | | | | | | | | | |
Class C | | | | | | | | | | | | | | | | |
Proceeds from shares issued | | $ | 246 | | | $ | 6,854 | | | $ | — | | | $ | — | |
Distributions reinvested | | | 552 | | | | 395 | | | | — | | | | — | |
Cost of shares redeemed | | | (12,991 | ) | | | (16,722 | ) | | | — | | | | — | |
| | | | | | | | | | | | | | | | |
Change in net assets resulting from Class C capital transactions | | $ | (12,193 | ) | | $ | (9,473 | ) | | $ | — | | | $ | — | |
| | | | | | | | | | | | | | | | |
Class I | | | | | | | | | | | | | | | | |
Proceeds from shares issued | | $ | 10,005 | | | $ | 40,086 | | | $ | 41,718 | | | $ | 388,984 | |
Distributions reinvested | | | 3,023 | | | | 2,739 | | | | 38,286 | | | | 14,320 | |
Cost of shares redeemed | | | (69,458 | ) | | | (63,918 | ) | | | (169,787 | ) | | | (8,753,055 | ) |
| | | | | | | | | | | | | | | | |
Change in net assets resulting from Class I capital transactions | | $ | (56,430 | ) | | $ | (21,093 | ) | | $ | (89,783 | ) | | $ | (8,349,751 | ) |
| | | | | | | | | | | | | | | | |
Class L | | | | | | | | | | | | | | | | |
Proceeds from shares issued | | $ | 13,398 | | | $ | 55,265 | | | $ | — | | | $ | — | |
Distributions reinvested | | | 2,405 | | | | 8,412 | | | | — | | | | — | |
Cost of shares redeemed | | | (346,212 | ) | | | (172,181 | ) | | | — | | | | — | |
| | | | | | | | | | | | | | | | |
Change in net assets resulting from Class L capital transactions | | $ | (330,409 | ) | | $ | (108,504 | ) | | $ | — | | | $ | — | |
| | | | | | | | | | | | | | | | |
Class R6(a)(b) | | | | | | | | | | | | | | | | |
Proceeds from shares issued | | $ | 294,863 | | | $ | 20 | | | $ | 53,701 | | | $ | 9,245,823 | |
Distributions reinvested | | | 7,813 | | | | — | | | | 506,228 | | | | 144,635 | |
Cost of shares redeemed | | | (42,130 | ) | | | — | | | | (2,064,639 | ) | | | (3,845,027 | ) |
| | | | | | | | | | | | | | | | |
Change in net assets resulting from Class R6 capital transactions | | $ | 260,546 | | | $ | 20 | | | $ | (1,504,710 | ) | | $ | 5,545,431 | |
| | | | | | | | | | | | | | | | |
Total change in net assets resulting from capital transactions | | $ | (169,891 | ) | | $ | (156,528 | ) | | $ | (1,594,493 | ) | | $ | (2,804,320 | ) |
| | | | | | | | | | | | | | | | |
| (a) | Commencement of offering of class of shares effective October 1, 2018 for JPMorgan Europe Dynamic Fund. |
| (b) | Commencement of offering of class of shares effective November 1, 2017 for JPMorgan Global Research Enhanced Index Fund. |
SEE NOTES TO FINANCIAL STATEMENTS.
| | | | | | |
| | | |
| 90 | | | | J.P. MORGAN INTERNATIONAL EQUITY FUNDS | | OCTOBER 31, 2019 |
| | | | | | | | | | | | | | | | |
| | | JPMorgan Europe Dynamic Fund | | | JPMorgan Global
Research Enhanced Index Fund | |
| | | Year Ended
October 31, 2019 | | | Year Ended
October 31, 2018 | | | Year Ended
October 31, 2019 | | | Year Ended
October 31, 2018 | |
SHARE TRANSACTIONS: | |
Class A | |
Issued | | | 248 | | | | 1,011 | | | | — | | | | — | |
Reinvested | | | 131 | | | | 83 | | | | — | | | | — | |
Redeemed | | | (1,745 | ) | | | (1,777 | ) | | | — | | | | — | |
| | | | | | | | | | | | | | | | |
Change in Class A Shares | | | (1,366 | ) | | | (683 | ) | | | — | | | | — | |
| | | | | | | | | | | | | | | | |
Class C | | | | | | | | | | | | | | | | |
Issued | | | 12 | | | | 288 | | | | — | | | | — | |
Reinvested | | | 30 | | | | 17 | | | | — | | | | — | |
Redeemed | | | (646 | ) | | | (721 | ) | | | — | | | | — | |
| | | | | | | | | | | | | | | | |
Change in Class C Shares | | | (604 | ) | | | (416 | ) | | | — | | | | — | |
| | | | | | | | | | | | | | | | |
Class I | | | | | | | | | | | | | | | | |
Issued | | | 440 | | | | 1,455 | | | | 2,067 | | | | 17,041 | |
Reinvested | | | 141 | | | | 102 | | | | 1,955 | | | | 633 | |
Redeemed | | | (3,038 | ) | | | (2,401 | ) | | | (8,197 | ) | | | (388,734 | ) |
| | | | | | | | | | | | | | | | |
Change in Class I Shares | | | (2,457 | ) | | | (844 | ) | | | (4,175 | ) | | | (371,060 | ) |
| | | | | | | | | | | | | | | | |
Class L | | | | | | | | | | | | | | | | |
Issued | | | 577 | | | | 2,041 | | | | — | | | | — | |
Reinvested | | | 111 | | | | 310 | | | | — | | | | — | |
Redeemed | | | (14,510 | ) | | | (6,665 | ) | | | — | | | | — | |
| | | | | | | | | | | | | | | | |
Change in Class L Shares | | | (13,822 | ) | | | (4,314 | ) | | | — | | | | — | |
| | | | | | | | | | | | | | | | |
Class R6(a)(b) | | | | | | | | | | | | | | | | |
Issued | | | 12,295 | | | | 1 | | | | 2,688 | | | | 411,331 | |
Reinvested | | | 363 | | | | — | | | | 26,139 | | | | 6,466 | |
Redeemed | | | (1,764 | ) | | | — | | | | (102,812 | ) | | | (169,289 | ) |
| | | | | | | | | | | | | | | | |
Change in Class R6 Shares | | | 10,894 | | | | 1 | | | | (73,985 | ) | | | 248,508 | |
| | | | | | | | | | | | | | | | |
| (a) | Commencement of offering of class of shares effective October 1, 2018 for JPMorgan Europe Dynamic Fund. |
| (b) | Commencement of offering of class of shares effective November 1, 2017 for JPMorgan Global Research Enhanced Index Fund. |
SEE NOTES TO FINANCIAL STATEMENTS.
| | | | | | | | |
| | | |
| OCTOBER 31, 2019 | | J.P. MORGAN INTERNATIONAL EQUITY FUNDS | | | | | 91 | |
STATEMENTS OF CHANGES IN NET ASSETS
FOR THE PERIODS INDICATED (continued)
(Amounts in thousands)
| | | | | | | | | | | | | | | | |
| | | JPMorgan
International Advantage Fund | | | JPMorgan
International Equity Fund | |
| | | Year Ended
October 31, 2019 | | | Year Ended
October 31, 2018 | | | Year Ended
October 31, 2019 | | | Year Ended
October 31, 2018 | |
CAPITAL TRANSACTIONS: | | | | | | | | | | | | | | | | |
Class A | | | | | | | | | | | | | | | | |
Proceeds from shares issued | | $ | 38,451 | | | $ | 51,817 | | | $ | 125,560 | | | $ | 100,845 | |
Distributions reinvested | | | 3,422 | | | | 4,173 | | | | 8,068 | | | | 4,198 | |
Cost of shares redeemed | | | (45,280 | ) | | | (109,134 | ) | | | (76,633 | ) | | | (131,999 | ) |
| | | | | | | | | | | | | | | | |
Change in net assets resulting from Class A capital transactions | | $ | (3,407 | ) | | $ | (53,144 | ) | | $ | 56,995 | | | $ | (26,956 | ) |
| | | | | | | | | | | | | | | | |
Class C | | | | | | | | | | | | | | | | |
Proceeds from shares issued | | $ | 175 | | | $ | 733 | | | $ | 2,176 | | | $ | 5,285 | |
Distributions reinvested | | | 25 | | | | 19 | | | | 495 | | | | 210 | |
Cost of shares redeemed | | | (662 | ) | | | (631 | ) | | | (8,733 | ) | | | (7,946 | ) |
| | | | | | | | | | | | | | | | |
Change in net assets resulting from Class C capital transactions | | $ | (462 | ) | | $ | 121 | | | $ | (6,062 | ) | | $ | (2,451 | ) |
| | | | | | | | | | | | | | | | |
Class I | | | | | | | | | | | | | | | | |
Proceeds from shares issued | | $ | 19,041 | | | $ | 29,375 | | | $ | 77,428 | | | $ | 111,356 | |
Distributions reinvested | | | 1,457 | | | | 1,088 | | | | 5,819 | | | | 2,206 | |
Cost of shares redeemed | | | (15,652 | ) | | | (15,042 | ) | | | (90,398 | ) | | | (47,783 | ) |
| | | | | | | | | | | | | | | | |
Change in net assets resulting from Class I capital transactions | | $ | 4,846 | | | $ | 15,421 | | | $ | (7,151 | ) | | $ | 65,779 | |
| | | | | | | | | | | | | | | | |
Class R2 | | | | | | | | | | | | | | | | |
Proceeds from shares issued | | $ | 6,565 | | | $ | 36,008 | | | $ | 1,194 | | | $ | 597 | |
Distributions reinvested | | | 631 | | | | 165 | | | | 29 | | | | 12 | |
Cost of shares redeemed | | | (8,605 | ) | | | (8,962 | ) | | | (1,136 | ) | | | (597 | ) |
| | | | | | | | | | | | | | | | |
Change in net assets resulting from Class R2 capital transactions | | $ | (1,409 | ) | | $ | 27,211 | | | $ | 87 | | | $ | 12 | |
| | | | | | | | | | | | | | | | |
Class R5 | | | | | | | | | | | | | | | | |
Proceeds from shares issued | | $ | — | | | $ | — | | | $ | 744 | | | $ | 547 | |
Distributions reinvested | | | — | | | | — | | | | 691 | | | | 354 | |
Cost of shares redeemed | | | — | | | | — | | | | (18,958 | ) | | | (461 | ) |
| | | | | | | | | | | | | | | | |
Change in net assets resulting from Class R5 capital transactions | | $ | — | | | $ | — | | | $ | (17,523 | ) | | $ | 440 | |
| | | | | | | | | | | | | | | | |
Class R6 | | | | | | | | | | | | | | | | |
Proceeds from shares issued | | $ | 108,992 | | | $ | 857,123 | | | $ | 458,174 | | | $ | 1,112,330 | |
Distributions reinvested | | | 82,457 | | | | 61,869 | | | | 140,364 | | | | 59,589 | |
Cost of shares redeemed | | | (1,807,278 | ) | | | (190,933 | ) | | | (2,318,655 | ) | | | (339,079 | ) |
| | | | | | | | | | | | | | | | |
Change in net assets resulting from Class R6 capital transactions | | $ | (1,615,829 | ) | | $ | 728,059 | | | $ | (1,720,117 | ) | | $ | 832,840 | |
| | | | | | | | | | | | | | | | |
Total change in net assets resulting from capital transactions | | $ | (1,616,261 | ) | | $ | 717,668 | | | $ | (1,693,771 | ) | | $ | 869,664 | |
| | | | | | | | | | | | | | | | |
SEE NOTES TO FINANCIAL STATEMENTS.
| | | | | | |
| | | |
| 92 | | | | J.P. MORGAN INTERNATIONAL EQUITY FUNDS | | OCTOBER 31, 2019 |
| | | | | | | | | | | | | | | | |
| | | JPMorgan
International Advantage Fund | | |
JPMorgan
International Equity Fund | |
| | | Year Ended
October 31, 2019 | | | Year Ended
October 31, 2018 | | | Year Ended
October 31, 2019 | | | Year Ended
October 31, 2018 | |
SHARE TRANSACTIONS: | |
Class A | |
Issued | | | 2,015 | | | | 2,376 | | | | 7,833 | | | | 5,747 | |
Reinvested | | | 193 | | | | 191 | | | | 554 | | | | 235 | |
Redeemed | | | (2,379 | ) | | | (5,011 | ) | | | (4,832 | ) | | | (7,496 | ) |
| | | | | | | | | | | | | | | | |
Change in Class A Shares | | | (171 | ) | | | (2,444 | ) | | | 3,555 | | | | (1,514 | ) |
| | | | | | | | | | | | | | | | |
Class C | | | | | | | | | | | | | | | | |
Issued | | | 8 | | | | 33 | | | | 147 | | | | 309 | |
Reinvested | | | 2 | | | | 1 | | | | 36 | | | | 12 | |
Redeemed | | | (34 | ) | | | (29 | ) | | | (577 | ) | | | (477 | ) |
| | | | | | | | | | | | | | | | |
Change in Class C Shares | | | (24 | ) | | | 5 | | | | (394 | ) | | | (156 | ) |
| | | | | | | | | | | | | | | | |
Class I | | | | | | | | | | | | | | | | |
Issued | | | 962 | | | | 1,323 | | | | 4,793 | | | | 6,224 | |
Reinvested | | | 79 | | | | 48 | | | | 394 | | | | 122 | |
Redeemed | | | (792 | ) | | | (665 | ) | | | (5,690 | ) | | | (2,700 | ) |
| | | | | | | | | | | | | | | | |
Change in Class I Shares | | | 249 | | | | 706 | | | | (503 | ) | | | 3,646 | |
| | | | | | | | | | | | | | | | |
Class R2 | | | | | | | | | | | | | | | | |
Issued | | | 348 | | | | 1,658 | | | | 74 | | | | 35 | |
Reinvested | | | 36 | | | | 7 | | | | 2 | | | | 1 | |
Redeemed | | | (455 | ) | | | (418 | ) | | | (73 | ) | | | (35 | ) |
| | | | | | | | | | | | | | | | |
Change in Class R2 Shares | | | (71 | ) | | | 1,247 | | | | 3 | | | | 1 | |
| | | | | | | | | | | | | | | | |
Class R5 | | | | | | | | | | | | | | | | |
Issued | | | — | | | | — | | | | 45 | | | | 30 | |
Reinvested | | | — | | | | — | | | | 47 | | | | 19 | |
Redeemed | | | — | | | | — | | | | (1,108 | ) | | | (26 | ) |
| | | | | | | | | | | | | | | | |
Change in Class R5 Shares | | | — | | | | — | | | | (1,016 | ) | | | 23 | |
| | | | | | | | | | | | | | | | |
Class R6 | | | | | | | | | | | | | | | | |
Issued | | | 5,671 | | | | 37,675 | | | | 27,715 | | | | 61,155 | |
Reinvested | | | 4,558 | | | | 2,771 | | | | 9,522 | | | | 3,289 | |
Redeemed | | | (91,586 | ) | | | (8,343 | ) | | | (137,801 | ) | | | (18,321 | ) |
| | | | | | | | | | | | | | | | |
Change in Class R6 Shares | | | (81,357 | ) | | | 32,103 | | | | (100,564 | ) | | | 46,123 | |
| | | | | | | | | | | | | | | | |
SEE NOTES TO FINANCIAL STATEMENTS.
| | | | | | | | |
| | | |
| OCTOBER 31, 2019 | | J.P. MORGAN INTERNATIONAL EQUITY FUNDS | | | | | 93 | |
STATEMENTS OF CHANGES IN NET ASSETS
FOR THE PERIODS INDICATED (continued)
(Amounts in thousands)
| | | | | | | | | | | | |
| | | JPMorgan
International
Hedged Equity
Fund | | | JPMorgan International
Research Enhanced Equity Fund | |
| | | Period Ended
October 31, 2019 (a) | | | Year Ended
October 31, 2019 | | | Year Ended
October 31, 2018 | |
CAPITAL TRANSACTIONS: | | | | | | | | | | | | |
Class A | | | | | | | | | | | | |
Proceeds from shares issued | | $ | 321 | | | $ | 51,799 | | | $ | 49,806 | |
Distributions reinvested | | | — | | | | 6,196 | | | | 6,000 | |
Cost of shares redeemed | | | — | | | | (62,547 | ) | | | (125,460 | ) |
| | | | | | | | | | | | |
Change in net assets resulting from Class A capital transactions | | $ | 321 | | | $ | (4,552 | ) | | $ | (69,654 | ) |
| | | | | | | | | | | | |
Class C | | | | | | | | | | | | |
Proceeds from shares issued | | $ | 118 | | | $ | — | | | $ | — | |
| | | | | | | | | | | | |
Change in net assets resulting from Class C capital transactions | | $ | 118 | | | $ | — | | | $ | — | |
| | | | | | | | | | | | |
Class I | | | | | | | | | | | | |
Proceeds from shares issued | | $ | 57,561 | | | $ | 82,525 | | | $ | 296,315 | |
Distributions reinvested | | | — | | | | 5,050 | | | | 22,644 | |
Cost of shares redeemed | | | (3 | ) | | | (66,489 | ) | | | (4,846,022 | ) |
| | | | | | | | | | | | |
Change in net assets resulting from Class I capital transactions | | $ | 57,558 | | | $ | 21,086 | | | $ | (4,527,063 | ) |
| | | | | | | | | | | | |
Class R5 | | | | | | | | | | | | |
Proceeds from shares issued | | $ | 20 | | | $ | — | | | $ | — | |
| | | | | | | | | | | | |
Change in net assets resulting from Class R5 capital transactions | | $ | 20 | | | $ | — | | | $ | — | |
| | | | | | | | | | | | |
Class R6(b) | | | | | | | | | | | | |
Proceeds from shares issued | | $ | 20 | | | $ | 567,656 | | | $ | 6,049,894 | |
Distributions reinvested | | | — | | | | 149,727 | | | | 79,541 | |
Cost of shares redeemed | | | — | | | | (912,718 | ) | | | (1,298,837 | ) |
| | | | | | | | | | | | |
Change in net assets resulting from Class R6 capital transactions | | $ | 20 | | | $ | (195,335 | ) | | $ | 4,830,598 | |
| | | | | | | | | | | | |
Total change in net assets resulting from capital transactions | | $ | 58,037 | | | $ | (178,801 | ) | | $ | 233,881 | |
| | | | | | | | | | | | |
| (a) | Commencement of operations was March 15, 2019. |
| (b) | Commencement of offering of class of shares effective November 1, 2017 for JPMorgan International Research Enhanced Equity Fund. |
SEE NOTES TO FINANCIAL STATEMENTS.
| | | | | | |
| | | |
| 94 | | | | J.P. MORGAN INTERNATIONAL EQUITY FUNDS | | OCTOBER 31, 2019 |
| | | | | | | | | | | | |
| | | JPMorgan
International
Hedged Equity
Fund | | | JPMorgan International Research
Enhanced Equity Fund | |
| | | Period Ended
October 31, 2019 (a) | | | Year Ended
October 31, 2019 | | | Year Ended
October 31, 2018 | |
SHARE TRANSACTIONS: | |
Class A | |
Issued | | | 21 | | | | 3,097 | | | | 2,675 | |
Reinvested | | | — | | | | 402 | | | | 321 | |
Redeemed | | | — | | | | (3,722 | ) | | | (6,773 | ) |
| | | | | | | | | | | | |
Change in Class A Shares | | | 21 | | | | (223 | ) | | | (3,777 | ) |
| | | | | | | | | | | | |
Class C | | | | | | | | | | | | |
Issued | | | 8 | | | | — | | | | — | |
| | | | | | | | | | | | |
Change in Class C Shares | | | 8 | | | | — | | | | — | |
| | | | | | | | | | | | |
Class I | | | | | | | | | | | | |
Issued | | | 3,829 | | | | 4,837 | | | | 15,589 | |
Reinvested | | | — | | | | 324 | | | | 1,199 | |
Redeemed | | | — | (b) | | | (3,915 | ) | | | (258,407 | ) |
| | | | | | | | | | | | |
Change in Class I Shares | | | 3,829 | | | | 1,246 | | | | (241,619 | ) |
| | | | | | | | | | | | |
Class R5 | | | | | | | | | | | | |
Issued | | | 1 | | | | — | | | | — | |
| | | | | | | | | | | | |
Change in Class R5 Shares | | | 1 | | | | — | | | | — | |
| | | | | | | | | | | | |
Class R6(c) | | | | | | | | | | | | |
Issued | | | 1 | | | | 32,819 | | | | 321,785 | |
Reinvested | | | — | | | | 9,647 | | | | 4,222 | |
Redeemed | | | — | | | | (53,561 | ) | | | (69,932 | ) |
| | | | | | | | | | | | |
Change in Class R6 Shares | | | 1 | | | | (11,095 | ) | | | 256,075 | |
| | | | | | | | | | | | |
| (a) | Commencement of operations was March 15, 2019. |
| (b) | Amount rounds to less than one thousand. |
| (c) | Commencement of offering of class of shares effective November 1, 2017 for JPMorgan International Research Enhanced Equity Fund. |
SEE NOTES TO FINANCIAL STATEMENTS.
| | | | | | | | |
| | | |
| OCTOBER 31, 2019 | | J.P. MORGAN INTERNATIONAL EQUITY FUNDS | | | | | 95 | |
STATEMENTS OF CHANGES IN NET ASSETS
FOR THE PERIODS INDICATED (continued)
(Amounts in thousands)
| | | | | | | | | | | | | | | | |
| | | JPMorgan
International Unconstrained Equity Fund | | |
JPMorgan
International Value Fund | |
| | | Year Ended
October 31, 2019 | | | Year Ended
October 31, 2018 | | | Year Ended
October 31, 2019 | | | Year Ended
October 31, 2018 | |
CAPITAL TRANSACTIONS: | | | | | | | | | | | | | | | | |
Class A | | | | | | | | | | | | | | | | |
Proceeds from shares issued | | $ | 47,607 | | | $ | 70,900 | | | $ | 27,178 | | | $ | 59,408 | |
Distributions reinvested | | | 1,609 | | | | 450 | | | | 7,349 | | | | 6,704 | |
Cost of shares redeemed | | | (32,948 | ) | | | (40,013 | ) | | | (90,605 | ) | | | (101,490 | ) |
| | | | | | | | | | | | | | | | |
Change in net assets resulting from Class A capital transactions | | $ | 16,268 | | | $ | 31,337 | | | $ | (56,078 | ) | | $ | (35,378 | ) |
| | | | | | | | | | | | | | | | |
Class C | | | | | | | | | | | | | | | | |
Proceeds from shares issued | | $ | 2,738 | | | $ | 20,087 | | | $ | 419 | | | $ | 2,122 | |
Distributions reinvested | | | 294 | | | | 85 | | | | 378 | | | | 287 | |
Cost of shares redeemed | | | (10,067 | ) | | | (7,910 | ) | | | (5,138 | ) | | | (7,191 | ) |
| | | | | | | | | | | | | | | | |
Change in net assets resulting from Class C capital transactions | | $ | (7,035 | ) | | $ | 12,262 | | | $ | (4,341 | ) | | $ | (4,782 | ) |
| | | | | | | | | | | | | | | | |
Class I | | | | | | | | | | | | | | | | |
Proceeds from shares issued | | $ | 86,285 | | | $ | 234,151 | | | $ | 8,440 | | | $ | 38,003 | |
Distributions reinvested | | | 3,656 | | | | 1,282 | | | | 2,109 | | | | 3,381 | |
Cost of shares redeemed | | | (125,224 | ) | | | (139,690 | ) | | | (29,305 | ) | | | (109,004 | ) |
| | | | | | | | | | | | | | | | |
Change in net assets resulting from Class I capital transactions | | $ | (35,283 | ) | | $ | 95,743 | | | $ | (18,756 | ) | | $ | (67,620 | ) |
| | | | | | | | | | | | | | | | |
Class L | | | | | | | | | | | | | | | | |
Proceeds from shares issued | | $ | — | | | $ | — | | | $ | 2,046 | | | $ | 6,316 | |
Distributions reinvested | | | — | | | | — | | | | 762 | | | | 1,069 | |
Cost of shares redeemed | | | — | | | | — | | | | (42,881 | ) | | | (122,248 | ) |
| | | | | | | | | | | | | | | | |
Change in net assets resulting from Class L capital transactions | | $ | — | | | $ | — | | | $ | (40,073 | ) | | $ | (114,863 | ) |
| | | | | | | | | | | | | | | | |
Class R2 | | | | | | | | | | | | | | | | |
Proceeds from shares issued | | $ | 494 | | | $ | 887 | | | $ | 312 | | | $ | 224 | |
Distributions reinvested | | | 15 | | | | 2 | | | | 15 | | | | 9 | |
Cost of shares redeemed | | | (377 | ) | | | (88 | ) | | | (590 | ) | | | (420 | ) |
| | | | | | | | | | | | | | | | |
Change in net assets resulting from Class R2 capital transactions | | $ | 132 | | | $ | 801 | | | $ | (263 | ) | | $ | (187 | ) |
| | | | | | | | | | | | | | | | |
Class R5 | | | | | | | | | | | | | | | | |
Proceeds from shares issued | | $ | 603 | | | $ | 5,082 | | | $ | 16 | | | $ | 16 | |
Distributions reinvested | | | 72 | | | | 1 | | | | 3 | | | | 2 | |
Cost of shares redeemed | | | (1,414 | ) | | | (952 | ) | | | — | (a) | | | — | (a) |
| | | | | | | | | | | | | | | | |
Change in net assets resulting from Class R5 capital transactions | | $ | (739 | ) | | $ | 4,131 | | | $ | 19 | | | $ | 18 | |
| | | | | | | | | | | | | | | | |
Class R6 | | | | | | | | | | | | | | | | |
Proceeds from shares issued | | $ | 2,126,631 | | | $ | 67,300 | | | $ | 40,286 | | | $ | 59,355 | |
Distributions reinvested | | | 4,394 | | | | 1,288 | | | | 4,629 | | | | 2,922 | |
Cost of shares redeemed | | | (113,994 | ) | | | (10,456 | ) | | | (41,607 | ) | | | (29,240 | ) |
| | | | | | | | | | | | | | | | |
Change in net assets resulting from Class R6 capital transactions | | $ | 2,017,031 | | | $ | 58,132 | | | $ | 3,308 | | | $ | 33,037 | |
| | | | | | | | | | | | | | | | |
Total change in net assets resulting from capital transactions | | $ | 1,990,374 | | | $ | 202,406 | | | $ | (116,184 | ) | | $ | (189,775 | ) |
| | | | | | | | | | | | | | | | |
| (a) | Amount rounds to less than one thousand. |
SEE NOTES TO FINANCIAL STATEMENTS.
| | | | | | |
| | | |
| 96 | | | | J.P. MORGAN INTERNATIONAL EQUITY FUNDS | | OCTOBER 31, 2019 |
| | | | | | | | | | | | | | | | |
| | | JPMorgan
International Unconstrained Equity Fund | | |
JPMorgan
International Value Fund | |
| | | Year Ended
October 31, 2019 | | | Year Ended
October 31, 2018 | | | Year Ended
October 31, 2019 | | | Year Ended
October 31, 2018 | |
SHARE TRANSACTIONS: | |
Class A | |
Issued | | | 2,430 | | | | 3,352 | | | | 2,279 | | | | 4,254 | |
Reinvested | | | 93 | | | | 21 | | | | 663 | | | | 472 | |
Redeemed | | | (1,724 | ) | | | (1,953 | ) | | | (7,568 | ) | | | (7,447 | ) |
| | | | | | | | | | | | | | | | |
Change in Class A Shares | | | 799 | | | | 1,420 | | | | (4,626 | ) | | | (2,721 | ) |
| | | | | | | | | | | | | | | | |
Class C | | | | | | | | | | | | | | | | |
Issued | | | 141 | | | | 952 | | | | 37 | | | | 155 | |
Reinvested | | | 17 | | | | 4 | | | | 35 | | | | 21 | |
Redeemed | | | (527 | ) | | | (398 | ) | | | (449 | ) | | | (531 | ) |
| | | | | | | | | | | | | | | | |
Change in Class C Shares | | | (369 | ) | | | 558 | | | | (377 | ) | | | (355 | ) |
| | | | | | | | | | | | | | | | |
Class I | | | | | | | | | | | | | | | | |
Issued | | | 4,374 | | | | 10,891 | | | | 695 | | | | 2,606 | |
Reinvested | | | 209 | | | | 60 | | | | 186 | | | | 233 | |
Redeemed | | | (6,516 | ) | | | (6,860 | ) | | | (2,449 | ) | | | (7,550 | ) |
| | | | | | | | | | | | | | | | |
Change in Class I Shares | | | (1,933 | ) | | | 4,091 | | | | (1,568 | ) | | | (4,711 | ) |
| | | | | | | | | | | | | | | | |
Class L | | | | | | | | | | | | | | | | |
Issued | | | — | | | | — | | | | 184 | | | | 432 | |
Reinvested | | | — | | | | — | | | | 67 | | | | 74 | |
Redeemed | | | — | | | | — | | | | (3,624 | ) | | | (8,567 | ) |
| | | | | | | | | | | | | | | | |
Change in Class L Shares | | | — | | | | — | | | | (3,373 | ) | | | (8,061 | ) |
| | | | | | | | | | | | | | | | |
Class R2 | | | | | | | | | | | | | | | | |
Issued | | | 25 | | | | 42 | | | | 27 | | | | 16 | |
Reinvested | | | 1 | | | | — | (a) | | | 1 | | | | 1 | |
Redeemed | | | (19 | ) | | | (4 | ) | | | (52 | ) | | | (31 | ) |
| | | | | | | | | | | | | | | | |
Change in Class R2 Shares | | | 7 | | | | 38 | | | | (24 | ) | | | (14 | ) |
| | | | | | | | | | | | | | | | |
Class R5 | | | | | | | | | | | | | | | | |
Issued | | | 30 | | | | 223 | | | | 2 | | | | 1 | |
Reinvested | | | 4 | | | | — | (a) | | | — | (a) | | | — | (a) |
Redeemed | | | (71 | ) | | | (46 | ) | | | — | (a) | | | — | (a) |
| | | | | | | | | | | | | | | | |
Change in Class R5 Shares | | | (37 | ) | | | 177 | | | | 2 | | | | 1 | |
| | | | | | | | | | | | | | | | |
Class R6 | | | | | | | | | | | | | | | | |
Issued | | | 102,465 | | | | 3,197 | | | | 3,351 | | | | 4,227 | |
Reinvested | | | 252 | | | | 61 | | | | 412 | | | | 203 | |
Redeemed | | | (5,610 | ) | | | (513 | ) | | | (3,438 | ) | | | (2,078 | ) |
| | | | | | | | | | | | | | | | |
Change in Class R6 Shares | | | 97,107 | | | | 2,745 | | | | 325 | | | | 2,352 | |
| | | | | | | | | | | | | | | | |
| (a) | Amount rounds to less than one thousand. |
SEE NOTES TO FINANCIAL STATEMENTS.
| | | | | | | | |
| | | |
| OCTOBER 31, 2019 | | J.P. MORGAN INTERNATIONAL EQUITY FUNDS | | | | | 97 | |
FINANCIAL HIGHLIGHTS
FOR THE PERIODS INDICATED
| | | | | | | | | | | | | | | | | | | | |
| | | Per share operating performance | |
| | | | | | Investment operations | | | Distributions | |
| | | Net asset
value,
beginning
of period | | | Net
investment
income
(loss) (b) | | | Net realized
and unrealized
gains
(losses) on
investments | | | Total from
investment
operations | | | Net
investment
income | |
JPMorgan Emerging Markets Equity Fund | | | | | | | | | | | | | | | | | | | | |
Class A | | | | | | | | | | | | | | | | | | | | |
Year Ended October 31, 2019 | | $ | 23.84 | | | $ | 0.19 | | | $ | 6.16 | | | $ | 6.35 | | | $ | (0.12 | ) |
Year Ended October 31, 2018 | | | 27.58 | | | | 0.14 | | | | (3.84 | ) | | | (3.70 | ) | | | (0.04 | ) |
Year Ended October 31, 2017 | | | 21.79 | | | | 0.09 | | | | 5.80 | | | | 5.89 | | | | (0.10 | ) |
Year Ended October 31, 2016 | | | 19.53 | | | | 0.09 | | | | 2.28 | | | | 2.37 | | | | (0.11 | ) |
Year Ended October 31, 2015 | | | 23.72 | | | | 0.12 | (f) | | | (4.12 | ) | | | (4.00 | ) | | | (0.19 | ) |
| | | | | |
Class C | | | | | | | | | | | | | | | | | | | | |
Year Ended October 31, 2019 | | | 23.08 | | | | 0.04 | | | | 5.98 | | | | 6.02 | | | | (0.03 | ) |
Year Ended October 31, 2018 | | | 26.80 | | | | 0.02 | | | | (3.74 | ) | | | (3.72 | ) | | | — | (g) |
Year Ended October 31, 2017 | | | 21.18 | | | | (0.04 | ) | | | 5.67 | | | | 5.63 | | | | (0.01 | ) |
Year Ended October 31, 2016 | | | 18.96 | | | | (0.01 | ) | | | 2.23 | | | | 2.22 | | | | — | |
Year Ended October 31, 2015 | | | 23.03 | | | | 0.03 | (f) | | | (4.02 | ) | | | (3.99 | ) | | | (0.08 | ) |
| | | | | |
Class I | | | | | | | | | | | | | | | | | | | | |
Year Ended October 31, 2019 | | | 24.45 | | | | 0.27 | | | | 6.29 | | | | 6.56 | | | | (0.22 | ) |
Year Ended October 31, 2018 | | | 28.29 | | | | 0.24 | | | | (3.96 | ) | | | (3.72 | ) | | | (0.12 | ) |
Year Ended October 31, 2017 | | | 22.33 | | | | 0.16 | | | | 5.94 | | | | 6.10 | | | | (0.14 | ) |
Year Ended October 31, 2016 | | | 19.98 | | | | 0.13 | | | | 2.35 | | | | 2.48 | | | | (0.13 | ) |
Year Ended October 31, 2015 | | | 24.24 | | | | 0.19 | (f) | | | (4.21 | ) | | | (4.02 | ) | | | (0.24 | ) |
| | | | | |
Class L | | | | | | | | | | | | | | | | | | | | |
Year Ended October 31, 2019 | | | 24.63 | | | | 0.29 | | | | 6.35 | | | | 6.64 | | | | (0.24 | ) |
Year Ended October 31, 2018 | | | 28.49 | | | | 0.26 | | | | (3.99 | ) | | | (3.73 | ) | | | (0.13 | ) |
Year Ended October 31, 2017 | | | 22.49 | | | | 0.21 | | | | 5.96 | | | | 6.17 | | | | (0.17 | ) |
Year Ended October 31, 2016 | | | 20.15 | | | | 0.17 | | | | 2.35 | | | | 2.52 | | | | (0.18 | ) |
Year Ended October 31, 2015 | | | 24.42 | | | | 0.23 | (f) | | | (4.26 | ) | | | (4.03 | ) | | | (0.24 | ) |
| | | | | |
Class R2 | | | | | | | | | | | | | | | | | | | | |
Year Ended October 31, 2019 | | | 23.73 | | | | 0.08 | | | | 6.13 | | | | 6.21 | | | | (0.16 | ) |
Year Ended October 31, 2018 | | | 27.57 | | | | 0.07 | | | | (3.83 | ) | | | (3.76 | ) | | | (0.08 | ) |
July 31, 2017 (h) through October 31, 2017 | | | 26.40 | | | | (0.01 | ) | | | 1.18 | | | | 1.17 | | | | — | |
| | | | | |
Class R3 | | | | | | | | | | | | | | | | | | | | |
Year Ended October 31, 2019 | | | 23.78 | | | | 0.25 | | | | 6.06 | | | | 6.31 | | | | (0.13 | ) |
Year Ended October 31, 2018 | | | 27.59 | | | | 0.22 | | | | (3.92 | ) | | | (3.70 | ) | | | (0.11 | ) |
July 31, 2017 (h) through October 31, 2017 | | | 26.40 | | | | 0.01 | | | | 1.18 | | | | 1.19 | | | | — | |
| | | | | |
Class R4 | | | | | | | | | | | | | | | | | | | | |
Year Ended October 31, 2019 | | | 24.42 | | | | 0.27 | | | | 6.25 | | | | 6.52 | | | | (0.26 | ) |
Year Ended October 31, 2018 | | | 28.28 | | | | 0.18 | | | | (3.91 | ) | | | (3.73 | ) | | | (0.13 | ) |
July 31, 2017 (h) through October 31, 2017 | | | 27.05 | | | | 0.02 | | | | 1.21 | | | | 1.23 | | | | — | |
| | | | | |
Class R5 | | | | | | | | | | | | | | | | | | | | |
Year Ended October 31, 2019 | | | 24.60 | | | | 0.31 | | | | 6.31 | | | | 6.62 | | | | (0.26 | ) |
Year Ended October 31, 2018 | | | 28.47 | | | | 0.39 | | | | (4.11 | ) | | | (3.72 | ) | | | (0.15 | ) |
Year Ended October 31, 2017 | | | 22.49 | | | | 0.15 | | | | 6.01 | | | | 6.16 | | | | (0.18 | ) |
September 9, 2016 (h) through October 31, 2016 | | | 22.40 | | | | 0.01 | | | | 0.08 | | | | 0.09 | | | | — | |
| | | | | |
Class R6 | | | | | | | | | | | | | | | | | | | | |
Year Ended October 31, 2019 | | | 24.60 | | | | 0.31 | | | | 6.35 | | | | 6.66 | | | | (0.26 | ) |
Year Ended October 31, 2018 | | | 28.46 | | | | 0.29 | | | | (3.99 | ) | | | (3.70 | ) | | | (0.16 | ) |
Year Ended October 31, 2017 | | | 22.46 | | | | 0.21 | | | | 5.98 | | | | 6.19 | | | | (0.19 | ) |
Year Ended October 31, 2016 | | | 20.13 | | | | 0.19 | | | | 2.35 | | | | 2.54 | | | | (0.21 | ) |
Year Ended October 31, 2015 | | | 24.44 | | | | 0.22 | (f) | | | (4.23 | ) | | | (4.01 | ) | | | (0.30 | ) |
| (a) | Annualized for periods less than one year, unless otherwise noted. |
| (b) | Calculated based upon average shares outstanding. |
| (c) | Not annualized for periods less than one year. |
| (d) | Includes adjustments in accordance with accounting principles generally accepted in the United States of America and as such, the net asset values for financial reporting purposes and the returns based upon those net asset values may differ from the net asset values and returns for shareholder transactions. |
| (e) | Includes interest expense, if applicable, which is less than 0.005% unless otherwise noted. |
| (f) | Net investment income (loss) may appear disproportionate among the classes due to the timing of recognition of income and changes in the relative size of the classes. |
| (g) | Amount rounds to less than $0.005. |
| (h) | Commencement of offering of class of shares. |
SEE NOTES TO FINANCIAL STATEMENTS.
| | | | | | |
| | | |
| 98 | | | | J.P. MORGAN INTERNATIONAL EQUITY FUNDS | | OCTOBER 31, 2019 |
| | | | | | | | | | | | | | | | | | | | | | | | | | |
| | | Ratios/Supplemental data | |
| | | | | | | | | | Ratios to average net assets (a) | | | | |
Net asset
value,
end of
period | | | Total return
(excludes
sales charge) (c)(d) | | | Net assets,
end of
period
(000’s) | | | Net
expenses (e) | | | Net
investment
income
(loss) | | | Expenses
without waivers
and reimbursements | | | Portfolio
turnover
rate (c) | |
| | | | | | | | | | | | | | | | | | | | | | | | | | |
| | | | | | | | | | | | | | | | | | | | | | | | | | |
| $ | 30.07 | | | | 26.77 | % | | $ | 524,357 | | | | 1.24 | % | | | 0.69 | % | | | 1.47 | % | | | 34 | % |
| | 23.84 | | | | (13.44 | ) | | | 369,490 | | | | 1.24 | | | | 0.51 | | | | 1.52 | | | | 13 | |
| | 27.58 | | | | 27.22 | | | | 525,451 | | | | 1.35 | | | | 0.36 | | | | 1.58 | | | | 22 | |
| | 21.79 | | | | 12.25 | | | | 411,713 | | | | 1.44 | | | | 0.44 | | | | 1.76 | | | | 23 | |
| | 19.53 | | | | (16.95 | ) | | | 274,710 | | | | 1.61 | | | | 0.57 | (f) | | | 1.88 | | | | 35 | |
| | | | | | |
| | | | | | | | | | | | | | | | | | | | | | | | | | |
| | 29.07 | | | | 26.12 | | | | 56,830 | | | | 1.74 | | | | 0.15 | | | | 1.98 | | | | 34 | |
| | 23.08 | | | | (13.87 | ) | | | 43,612 | | | | 1.74 | | | | 0.06 | | | | 2.02 | | | | 13 | |
| | 26.80 | | | | 26.58 | | | | 48,497 | | | | 1.85 | | | | (0.15 | ) | | | 2.09 | | | | 22 | |
| | 21.18 | | | | 11.71 | | | | 39,568 | | | | 1.95 | | | | (0.06 | ) | | | 2.26 | | | | 23 | |
| | 18.96 | | | | (17.38 | ) | | | 43,387 | | | | 2.10 | | | | 0.13 | (f) | | | 2.33 | | | | 35 | |
| | | | | | |
| | | | | | | | | | | | | | | | | | | | | | | | | | |
| | 30.79 | | | | 27.04 | | | | 1,725,882 | | | | 0.99 | | | | 0.94 | | | | 1.21 | | | | 34 | |
| | 24.45 | | | | (13.23 | ) | | | 773,142 | | | | 0.99 | | | | 0.84 | | | | 1.26 | | | | 13 | |
| | 28.29 | | | | 27.54 | | | | 629,451 | | | | 1.10 | | | | 0.62 | | | | 1.30 | | | | 22 | |
| | 22.33 | | | | 12.51 | | | | 301,959 | | | | 1.20 | | | | 0.66 | | | | 1.43 | | | | 23 | |
| | 19.98 | | | | (16.70 | ) | | | 502,729 | | | | 1.35 | | | | 0.88 | (f) | | | 1.48 | | | | 35 | |
| | | | | | |
| | | | | | | | | | | | | | | | | | | | | | | | | | |
| | 31.03 | | | | 27.20 | | | | 926,781 | | | | 0.89 | | | | 1.00 | | | | 1.06 | | | | 34 | |
| | 24.63 | | | | (13.16 | ) | | | 475,997 | | | | 0.89 | | | | 0.91 | | | | 1.11 | | | | 13 | |
| | 28.49 | | | | 27.72 | | | | 430,860 | | | | 0.95 | | | | 0.84 | | | | 1.14 | | | | 22 | |
| | 22.49 | | | | 12.71 | | | | 390,647 | | | | 1.04 | | | | 0.84 | | | | 1.22 | | | | 23 | |
| | 20.15 | | | | (16.60 | ) | | | 316,635 | | | | 1.21 | | | | 1.05 | (f) | | | 1.31 | | | | 35 | |
| | | | | | |
| | | | | | | | | | | | | | | | | | | | | | | | | | |
| | 29.78 | | | | 26.35 | | | | 145 | | | | 1.54 | | | | 0.31 | | | | 2.26 | | | | 34 | |
| | 23.73 | | | | (13.69 | ) | | | 95 | | | | 1.54 | | | | 0.26 | | | | 2.04 | | | | 13 | |
| | 27.57 | | | | 4.43 | | | | 21 | | | | 1.60 | | | | (0.17 | ) | | | 1.80 | | | | 22 | |
| | | | | | |
| | | | | | | | | | | | | | | | | | | | | | | | | | |
| | 29.96 | | | | 26.67 | | | | 2,151 | | | | 1.29 | | | | 0.90 | | | | 1.49 | | | | 34 | |
| | 23.78 | | | | (13.49 | ) | | | 341 | | | | 1.29 | | | | 0.81 | | | | 1.59 | | | | 13 | |
| | 27.59 | | | | 4.51 | | | | 21 | | | | 1.35 | | | | 0.08 | | | | 1.55 | | | | 22 | |
| | | | | | |
| | | | | | | | | | | | | | | | | | | | | | | | | | |
| | 30.68 | | | | 26.98 | | | | 1,300 | | | | 1.04 | | | | 0.94 | | | | 1.23 | | | | 34 | |
| | 24.42 | | | | (13.25 | ) | | | 26 | | | | 1.04 | | | | 0.63 | | | | 1.62 | | | | 13 | |
| | 28.28 | | | | 4.55 | | | | 21 | | | | 1.10 | | | | 0.33 | | | | 1.30 | | | | 22 | |
| | | | | | |
| | | | | | | | | | | | | | | | | | | | | | | | | | |
| | 30.96 | | | | 27.19 | | | | 41,872 | | | | 0.89 | | | | 1.08 | | | | 1.08 | | | | 34 | |
| | 24.60 | | | | (13.14 | ) | | | 1,672 | | | | 0.89 | | | | 1.37 | | | | 1.11 | | | | 13 | |
| | 28.47 | | | | 27.72 | | | | 217 | | | | 0.95 | | | | 0.58 | | | | 3.36 | | | | 22 | |
| | 22.49 | | | | 0.40 | | | | 20 | | | | 0.90 | | | | 0.28 | | | | 1.08 | | | | 23 | |
| | | | | | |
| | | | | | | | | | | | | | | | | | | | | | | | | | |
| | 31.00 | | | | 27.36 | | | | 3,034,359 | | | | 0.79 | | | | 1.09 | | | | 0.96 | | | | 34 | |
| | 24.60 | | | | (13.08 | ) | | | 2,936,830 | | | | 0.79 | | | | 1.00 | | | | 1.01 | | | | 13 | |
| | 28.46 | | | | 27.87 | | | | 2,813,349 | | | | 0.85 | | | | 0.85 | | | | 1.01 | | | | 22 | |
| | 22.46 | | | | 12.83 | | | | 1,980,671 | | | | 0.94 | | | | 0.96 | | | | 1.08 | | | | 23 | |
| | 20.13 | | | | (16.54 | ) | | | 1,128,390 | | | | 1.10 | | | | 0.99 | (f) | | | 1.16 | | | | 35 | |
SEE NOTES TO FINANCIAL STATEMENTS.
| | | | | | | | |
| | | |
| OCTOBER 31, 2019 | | J.P. MORGAN INTERNATIONAL EQUITY FUNDS | | | | | 99 | |
FINANCIAL HIGHLIGHTS
FOR THE PERIODS INDICATED (continued)
| | | | | | | | | | | | | | | | | | | | |
| | | Per share operating performance | |
| | | | | | Investment operations | | | Distributions | |
| | | Net asset
value,
beginning
of period | | | Net
investment
income
(loss) (b) | | | Net realized
and unrealized
gains
(losses) on
investments | | | Total from
investment
operations | | | Net
investment
income | |
JPMorgan Emerging Markets Research Enhanced Equity Fund | | | | | | | | | | | | | | | | | | | | |
Class I | | | | | | | | | | | | | | | | | | | | |
January 30, 2019 (g) through October 31, 2019 | | $ | 16.22 | | | $ | 0.31 | | | $ | 0.25 | | | $ | 0.56 | | | $ | — | |
| | | | | |
Class R6 | | | | | | | | | | | | | | | | | | | | |
December 11, 2018 (h) through October 31, 2019 | | | 15.00 | | | | 0.42 | | | | 1.46 | | | | 1.88 | | | | (0.08 | ) |
| (a) | Annualized for periods less than one year, unless otherwise noted. |
| (b) | Calculated based upon average shares outstanding. |
| (c) | Not annualized for periods less than one year. |
| (d) | Includes adjustments in accordance with accounting principles generally accepted in the United States of America and as such, the net asset values for financial reporting purposes and the returns based upon those net asset values may differ from the net asset values and returns for shareholder transactions. |
| (e) | Includes interest expense, if applicable, which is less than 0.005% unless otherwise noted. |
| (f) | Certain non-recurring expenses incurred by the Fund were not annualized for the period indicated. |
| (g) | Commencement of offering of class of shares. |
| (h) | Commencement of operations. |
SEE NOTES TO FINANCIAL STATEMENTS.
| | | | | | |
| | | |
| 100 | | | | J.P. MORGAN INTERNATIONAL EQUITY FUNDS | | OCTOBER 31, 2019 |
| | | | | | | | | | | | | | | | | | | | | | | | | | |
| | | Ratios/Supplemental data | |
| | | | | | | | | | Ratios to average net assets (a) | | | | |
Net asset
value,
end of
period | | | Total return
(excludes
sales charge) (c)(d) | | | Net assets,
end of
period
(000’s) | | | Net
expenses (e)(f) | | | Net
investment
income
(loss) (f) | | |
Expenses
without waivers
and reimbursements (f) | | | Portfolio
turnover
rate (c) | |
| | | | | | | | | | | | | | | | | | | | | | | | | | |
| | | | | | | | | | | | | | | | | | | | | | | | | | |
| $ | 16.78 | | | | 3.45 | % | | $ | 5 | | | | 0.44 | % | | | 2.52 | % | | | 0.70 | % | | | 28 | % |
| | | | | | |
| | | | | | | | | | | | | | | | | | | | | | | | | | |
| | 16.80 | | | | 12.60 | | | | 2,090,569 | | | | 0.34 | | | | 2.90 | | | | 0.46 | | | | 28 | |
SEE NOTES TO FINANCIAL STATEMENTS.
| | | | | | | | |
| | | |
| OCTOBER 31, 2019 | | J.P. MORGAN INTERNATIONAL EQUITY FUNDS | | | | | 101 | |
FINANCIAL HIGHLIGHTS
FOR THE PERIODS INDICATED (continued)
| | | | | | | | | | | | | | | | | | | | |
| | | | | | Per share operating performance | |
| | | | | | Investment operations | | | Distributions | |
| | | Net asset
value,
beginning
of period | | | Net
investment
income
(loss) (b) | | | Net realized
and unrealized
gains
(losses) on
investments | | | Total from
investment
operations | | | Net
investment
income | |
JPMorgan Europe Dynamic Fund | | | | | | | | | | | | | | | | | | | | |
Class A | | | | | | | | | | | | | | | | | | | | |
Year Ended October 31, 2019 | | $ | 23.01 | | | $ | 0.61 | | | $ | 1.18 | | | $ | 1.79 | | | $ | (0.55 | ) |
Year Ended October 31, 2018 | | | 27.04 | | | | 0.42 | | | | (4.08 | ) | | | (3.66 | ) | | | (0.37 | ) |
Year Ended October 31, 2017 | | | 21.94 | | | | 0.37 | | | | 5.15 | | | | 5.52 | | | | (0.42 | ) |
Year Ended October 31, 2016 | | | 24.41 | | | | 0.37 | | | | (2.55 | ) | | | (2.18 | ) | | | (0.29 | ) |
Year Ended October 31, 2015 | | | 24.54 | | | | 0.36 | | | | 0.32 | | | | 0.68 | | | | (0.81 | ) |
| | | | | |
Class C | | | | | | | | | | | | | | | | | | | | |
Year Ended October 31, 2019 | | | 20.39 | | | | 0.44 | | | | 1.06 | | | | 1.50 | | | | (0.42 | ) |
Year Ended October 31, 2018 | | | 24.00 | | | | 0.25 | | | | (3.62 | ) | | | (3.37 | ) | | | (0.24 | ) |
Year Ended October 31, 2017 | | | 19.52 | | | | 0.23 | | | | 4.58 | | | | 4.81 | | | | (0.33 | ) |
Year Ended October 31, 2016 | | | 21.77 | | | | 0.23 | | | | (2.27 | ) | | | (2.04 | ) | | | (0.21 | ) |
Year Ended October 31, 2015 | | | 21.99 | | | | 0.21 | | | | 0.29 | | | | 0.50 | | | | (0.72 | ) |
| | | | | |
Class I | | | | | | | | | | | | | | | | | | | | |
Year Ended October 31, 2019 | | | 23.48 | | | | 0.67 | | | | 1.21 | | | | 1.88 | | | | (0.61 | ) |
Year Ended October 31, 2018 | | | 27.60 | | | | 0.49 | | | | (4.17 | ) | | | (3.68 | ) | | | (0.44 | ) |
Year Ended October 31, 2017 | | | 22.37 | | | | 0.46 | | | | 5.25 | | | | 5.71 | | | | (0.48 | ) |
Year Ended October 31, 2016 | | | 24.83 | | | | 0.44 | | | | (2.59 | ) | | | (2.15 | ) | | | (0.31 | ) |
Year Ended October 31, 2015 | | | 24.95 | | | | 0.45 | | | | 0.32 | | | | 0.77 | | | | (0.89 | ) |
| | | | | |
Class L | | | | | | | | | | | | | | | | | | | | |
Year Ended October 31, 2019 | | | 23.70 | | | | 0.65 | | | | 1.27 | | | | 1.92 | | | | (0.57 | ) |
Year Ended October 31, 2018 | | | 27.85 | | | | 0.51 | | | | (4.18 | ) | | | (3.67 | ) | | | (0.48 | ) |
Year Ended October 31, 2017 | | | 22.61 | | | | 0.52 | | | | 5.27 | | | | 5.79 | | | | (0.55 | ) |
Year Ended October 31, 2016 | | | 25.13 | | | | 0.49 | | | | (2.60 | ) | | | (2.11 | ) | | | (0.41 | ) |
Year Ended October 31, 2015 | | | 25.23 | | | | 0.54 | | | | 0.28 | | | | 0.82 | | | | (0.92 | ) |
| | | | | |
Class R6 | | | | | | | | | | | | | | | | | | | | |
Year Ended October 31, 2019 | | | 23.70 | | | | 0.75 | | | | 1.19 | | | | 1.94 | | | | (0.68 | ) |
October 1, 2018 (f) through October 31, 2018 | | | 26.32 | | | | 0.01 | | | | (2.63 | ) | | | (2.62 | ) | | | — | |
| (a) | Annualized for periods less than one year, unless otherwise noted. |
| (b) | Calculated based upon average shares outstanding. |
| (c) | Not annualized for periods less than one year. |
| (d) | Includes adjustments in accordance with accounting principles generally accepted in the United States of America and as such, the net asset values for financial reporting purposes and the returns based upon those net asset values may differ from the net asset values and returns for shareholder transactions. |
| (e) | Includes interest expense, if applicable, which is less than 0.005% unless otherwise noted. |
| (f) | Commencement of offering of class of shares. |
SEE NOTES TO FINANCIAL STATEMENTS.
| | | | | | |
| | | |
| 102 | | | | J.P. MORGAN INTERNATIONAL EQUITY FUNDS | | OCTOBER 31, 2019 |
| | | | | | | | | | | | | | | | | | | | | | | | | | |
| | | Ratios/Supplemental data | |
| | | | | | | | | | Ratios to average net assets (a) | | | | |
Net asset
value,
end of
period | | | Total return
(excludes
sales charge) (c)(d) | | | Net assets,
end of
period
(000’s) | | | Net
expenses (e) | | | Net
investment
income
(loss) | | |
Expenses
without waivers
and reimbursements | | | Portfolio
turnover
rate (c) | |
| | | | | | | | | | | | | | | | | | | | | | | | | | |
| | | | | | | | | | | | | | | | | | | | | | | | | | |
| $ | 24.25 | | | | 8.14 | % | | $ | 98,294 | | | | 1.24 | % | | | 2.67 | % | | | 1.31 | % | | | 83 | % |
| | 23.01 | | | | (13.72 | ) | | | 124,681 | | | | 1.24 | | | | 1.58 | | | | 1.29 | | | | 149 | |
| | 27.04 | | | | 25.65 | | | | 165,020 | | | | 1.36 | | | | 1.52 | | | | 1.36 | | | | 189 | |
| | 21.94 | | | | (8.98 | ) | | | 162,767 | | | | 1.42 | | | | 1.66 | | | | 1.43 | | | | 142 | |
| | 24.41 | | | | 2.86 | | | | 219,548 | | | | 1.41 | | | | 1.48 | | | | 1.41 | | | | 167 | |
| | | | | | |
| | | | | | | | | | | | | | | | | | | | | | | | | | |
| | 21.47 | | | | 7.64 | | | | 19,798 | | | | 1.74 | | | | 2.15 | | | | 1.80 | | | | 83 | |
| | 20.39 | | | | (14.18 | ) | | | 31,125 | | | | 1.74 | | | | 1.08 | | | | 1.79 | | | | 149 | |
| | 24.00 | | | | 25.02 | | | | 46,615 | | | | 1.85 | | | | 1.07 | | | | 1.86 | | | | 189 | |
| | 19.52 | | | | (9.42 | ) | | | 50,152 | | | | 1.91 | | | | 1.16 | | | | 1.92 | | | | 142 | |
| | 21.77 | | | | 2.37 | | | | 75,145 | | | | 1.91 | | | | 0.98 | | | | 1.91 | | | | 167 | |
| | | | | | |
| | | | | | | | | | | | | | | | | | | | | | | | | | |
| | 24.75 | | | | 8.44 | | | | 86,582 | | | | 0.99 | | | | 2.86 | | | | 1.05 | | | | 83 | |
| | 23.48 | | | | (13.53 | ) | | | 139,858 | | | | 0.99 | | | | 1.84 | | | | 1.04 | | | | 149 | |
| | 27.60 | | | | 26.06 | | | | 187,678 | | | | 1.06 | | | | 1.85 | | | | 1.07 | | | | 189 | |
| | 22.37 | | | | (8.73 | ) | | | 145,080 | | | | 1.10 | | | | 1.95 | | | | 1.10 | | | | 142 | |
| | 24.83 | | | | 3.22 | | | | 579,389 | | | | 1.07 | | | | 1.81 | | | | 1.07 | | | | 167 | |
| | | | | | |
| | | | | | | | | | | | | | | | | | | | | | | | | | |
| | 25.05 | | | | 8.49 | | | | 65,686 | | | | 0.89 | | | | 2.77 | | | | 0.90 | | | | 83 | |
| | 23.70 | | | | (13.41 | ) | | | 389,665 | | | | 0.88 | | | | 1.88 | | | | 0.89 | | | | 149 | |
| | 27.85 | | | | 26.22 | | | | 578,183 | | | | 0.90 | | | | 2.07 | | | | 0.91 | | | | 189 | |
| | 22.61 | | | | (8.48 | ) | | | 424,388 | | | | 0.90 | | | | 2.16 | | | | 0.90 | | | | 142 | |
| | 25.13 | | | | 3.36 | | | | 194,930 | | | | 0.90 | | | | 2.16 | | | | 0.91 | | | | 167 | |
| | | | | | |
| | | | | | | | | | | | | | | | | | | | | | | | | | |
| | 24.96 | | | | 8.65 | | | | 271,885 | | | | 0.79 | | | | 3.17 | | | | 0.79 | | | | 83 | |
| | 23.70 | | | | (9.95 | ) | | | 18 | | | | 0.82 | | | | 0.67 | | | | 0.83 | | | | 149 | |
SEE NOTES TO FINANCIAL STATEMENTS.
| | | | | | | | |
| | | |
| OCTOBER 31, 2019 | | J.P. MORGAN INTERNATIONAL EQUITY FUNDS | | | | | 103 | |
FINANCIAL HIGHLIGHTS
FOR THE PERIODS INDICATED (continued)
| | | | | | | | | | | | | | | | | | | | | | | | | | | | |
| | | | | | Per share operating performance | |
| | | | | | Investment operations | | | Distributions | |
| | | Net asset
value,
beginning
of period | | | Net
investment
income
(loss) (b) | | | Net realized
and unrealized
gains
(losses) on
investments | | | Total from
investment
operations | | | Net
investment
income | | | Net
realized
gain | | | Total
distributions | |
JPMorgan Global Research Enhanced Index Fund | |
Class I | | | | | | | | | | | | | | | | | | | | | | | | | | | | |
Year Ended October 31, 2019 | | $ | 21.98 | | | $ | 0.45 | | | $ | 2.13 | | | $ | 2.58 | | | $ | (0.58 | ) | | $ | (1.51 | ) | | $ | (2.09 | ) |
Year Ended October 31, 2018 | | | 22.16 | | | | 0.43 | | | | (0.41 | ) | | | 0.02 | | | | (0.20 | ) | | | — | | | | (0.20 | ) |
Year Ended October 31, 2017 | | | 18.37 | | | | 0.39 | | | | 3.82 | | | | 4.21 | | | | (0.42 | ) | | | — | | | | (0.42 | ) |
Year Ended October 31, 2016 | | | 18.56 | | | | 0.39 | | | | (0.24 | ) | | | 0.15 | | | | (0.34 | ) | | | — | | | | (0.34 | ) |
Year Ended October 31, 2015 | | | 18.81 | | | | 0.39 | | | | (0.12 | ) | | | 0.27 | | | | (0.27 | ) | | | (0.25 | ) | | | (0.52 | ) |
| | | | | | | |
Class R6 | | | | | | | | | | | | | | | | | | | | | | | | | | | | |
Year Ended October 31, 2019 | | | 21.76 | | | | 0.47 | | | | 2.10 | | | | 2.57 | | | | (0.61 | ) | | | (1.51 | ) | | | (2.12 | ) |
November 1, 2017 (f) through October 31, 2018 | | | 22.19 | | | | 0.47 | | | | (0.45 | ) | | | 0.02 | | | | (0.45 | ) | | | — | | | | (0.45 | ) |
| (a) | Annualized for periods less than one year, unless otherwise noted. |
| (b) | Calculated based upon average shares outstanding. |
| (c) | Not annualized for periods less than one year. |
| (d) | Includes adjustments in accordance with accounting principles generally accepted in the United States of America and as such, the net asset values for financial reporting purposes and the returns based upon those net asset values may differ from the net asset values and returns for shareholder transactions. |
| (e) | Includes interest expense, if applicable, which is less than 0.005% unless otherwise noted. |
| (f) | Commencement of offering of class of shares. |
SEE NOTES TO FINANCIAL STATEMENTS.
| | | | | | |
| | | |
| 104 | | | | J.P. MORGAN INTERNATIONAL EQUITY FUNDS | | OCTOBER 31, 2019 |
| | | | | | | | | | | | | | | | | | | | | | | | | | |
| | | Ratios/Supplemental data | |
| | | | | | | | | | Ratios to average net assets (a) | | | | |
Net asset
value,
end of
period | | | Total return
(excludes
sales charge) (c)(d) | | | Net assets,
end of
period
(000’s) | | | Net
expenses (e) | | | Net
investment
income
(loss) | | |
Expenses
without waivers
and reimbursements | | | Portfolio
turnover
rate (c) | |
| | | | | | | | | | | | | | | | | | | | | | | | | | |
| | | | | | | | | | | | | | | | | | | | | | | | | | |
| $ | 22.47 | | | | 13.38 | % | | $ | 354,659 | | | | 0.34 | % | | | 2.15 | % | | | 0.55 | % | | | 29 | % |
| | 21.98 | | | | 0.09 | | | | 438,715 | | | | 0.34 | | | | 1.88 | | | | 0.55 | | | | 45 | |
| | 22.16 | | | | 23.29 | | | | 8,663,460 | | | | 0.34 | | | | 1.93 | | | | 0.55 | | | | 33 | |
| | 18.37 | | | | 0.91 | | | | 6,907,246 | | | | 0.34 | | | | 2.19 | | | | 0.55 | | | | 35 | |
| | 18.56 | | | | 1.51 | | | | 7,415,218 | | | | 0.33 | | | | 2.06 | | | | 0.56 | | | | 44 | |
| | | | | | |
| | | | | | | | | | | | | | | | | | | | | | | | | | |
| | 22.21 | | | | 13.50 | | | | 3,875,493 | | | | 0.25 | | | | 2.24 | | | | 0.30 | | | | 29 | |
| | 21.76 | | | | 0.03 | | | | 5,408,261 | | | | 0.25 | | | | 2.07 | | | | 0.30 | | | | 45 | |
SEE NOTES TO FINANCIAL STATEMENTS.
| | | | | | | | |
| | | |
| OCTOBER 31, 2019 | | J.P. MORGAN INTERNATIONAL EQUITY FUNDS | | | | | 105 | |
FINANCIAL HIGHLIGHTS
FOR THE PERIODS INDICATED (continued)
| | | | | | | | | | | | | | | | | | | | |
| | | | | | Per share operating performance | |
| | | | | | Investment operations | | | Distributions | |
| | | Net asset
value,
beginning
of period | | | Net
investment
income
(loss) (b) | | | Net realized
and unrealized
gains
(losses) on
investments | | | Total from
investment
operations | | | Net
investment
income | |
JPMorgan International Advantage Fund | | | | | | | | | | | | | | | | | | | | |
Class A | | | | | | | | | | | | | | | | | | | | |
Year Ended October 31, 2019 | | $ | 19.49 | | | $ | 0.52 | | | $ | 0.31 | | | $ | 0.83 | | | $ | (0.42 | ) |
Year Ended October 31, 2018 | | | 22.22 | | | | 0.44 | | | | (2.77 | ) | | | (2.33 | ) | | | (0.40 | ) |
Year Ended October 31, 2017 | | | 18.44 | | | | 0.33 | | | | 3.83 | | | | 4.16 | | | | (0.38 | ) |
Year Ended October 31, 2016 | | | 19.36 | | | | 0.40 | (f) | | | (0.99 | ) | | | (0.59 | ) | | | (0.33 | ) |
Year Ended October 31, 2015 | | | 19.49 | | | | 0.34 | (f) | | | (0.26 | ) | | | 0.08 | | | | (0.21 | ) |
| | | | | |
Class C | | | | | | | | | | | | | | | | | | | | |
Year Ended October 31, 2019 | | | 19.70 | | | | 0.43 | | | | 0.31 | | | | 0.74 | | | | (0.31 | ) |
Year Ended October 31, 2018 | | | 22.40 | | | | 0.37 | | | | (2.83 | ) | | | (2.46 | ) | | | (0.24 | ) |
Year Ended October 31, 2017 | | | 18.57 | | | | 0.22 | | | | 3.87 | | | | 4.09 | | | | (0.26 | ) |
Year Ended October 31, 2016 | | | 19.52 | | | | 0.28 | (f) | | | (0.97 | ) | | | (0.69 | ) | | | (0.26 | ) |
Year Ended October 31, 2015 | | | 19.63 | | | | 0.23 | (f) | | | (0.24 | ) | | | (0.01 | ) | | | (0.10 | ) |
| | | | | |
Class I | | | | | | | | | | | | | | | | | | | | |
Year Ended October 31, 2019 | | | 20.30 | | | | 0.60 | | | | 0.29 | | | | 0.89 | | | | (0.48 | ) |
Year Ended October 31, 2018 | | | 23.12 | | | | 0.54 | | | | (2.90 | ) | | | (2.36 | ) | | | (0.46 | ) |
Year Ended October 31, 2017 | | | 19.20 | | | | 0.42 | | | | 3.97 | | | | 4.39 | | | | (0.47 | ) |
Year Ended October 31, 2016 | | | 20.13 | | | | 0.46 | (f) | | | (1.01 | ) | | | (0.55 | ) | | | (0.38 | ) |
Year Ended October 31, 2015 | | | 20.22 | | | | 0.42 | (f) | | | (0.26 | ) | | | 0.16 | | | | (0.25 | ) |
| | | | | |
Class R2 | | | | | | | | | | | | | | | | | | | | |
Year Ended October 31, 2019 | | | 19.21 | | | | 0.46 | | | | 0.29 | | | | 0.75 | | | | (0.39 | ) |
Year Ended October 31, 2018 | | | 22.01 | | | | 0.52 | | | | (2.88 | ) | | | (2.36 | ) | | | (0.44 | ) |
Year Ended October 31, 2017 | | | 18.29 | | | | 0.01 | | | | 4.07 | | | | 4.08 | | | | (0.36 | ) |
Year Ended October 31, 2016 | | | 19.21 | | | | 0.36 | (f) | | | (1.01 | ) | | | (0.65 | ) | | | (0.27 | ) |
Year Ended October 31, 2015 | | | 19.31 | | | | 0.38 | (f) | | | (0.34 | ) | | | 0.04 | | | | (0.14 | ) |
| | | | | |
Class R6 | | | | | | | | | | | | | | | | | | | | |
Year Ended October 31, 2019 | | | 20.00 | | | | 0.64 | | | | 0.28 | | | | 0.92 | | | | (0.52 | ) |
Year Ended October 31, 2018 | | | 22.78 | | | | 0.58 | | | | (2.87 | ) | | | (2.29 | ) | | | (0.49 | ) |
Year Ended October 31, 2017 | | | 18.91 | | | | 0.43 | | | | 3.92 | | | | 4.35 | | | | (0.48 | ) |
Year Ended October 31, 2016 | | | 19.84 | | | | 0.49 | (f) | | | (1.01 | ) | | | (0.52 | ) | | | (0.41 | ) |
May 29, 2015 (g) through October 31, 2015 | | | 21.08 | | | | 0.12 | (f) | | | (1.36 | ) | | | (1.24 | ) | | | — | |
| (a) | Annualized for periods less than one year, unless otherwise noted. |
| (b) | Calculated based upon average shares outstanding. |
| (c) | Not annualized for periods less than one year. |
| (d) | Includes adjustments in accordance with accounting principles generally accepted in the United States of America and as such, the net asset values for financial reporting purposes and the returns based upon those net asset values may differ from the net asset values and returns for shareholder transactions. |
| (e) | Includes interest expense, if applicable, which is less than 0.005% unless otherwise noted. |
| (f) | Net investment income (loss) may appear disproportionate among the classes due to the timing of recognition of income and changes in the relative size of the classes. |
| (g) | Commencement of offering of class of shares. |
SEE NOTES TO FINANCIAL STATEMENTS.
| | | | | | |
| | | |
| 106 | | | | J.P. MORGAN INTERNATIONAL EQUITY FUNDS | | OCTOBER 31, 2019 |
| | | | | | | | | | | | | | | | | | | | | | | | | | |
| | | Ratios/Supplemental data | |
| | | | | | | | | | Ratios to average net assets (a) | | | | |
Net asset
value,
end of
period | | | Total return
(excludes
sales charge) (c)(d) | | | Net assets,
end of
period
(000’s) | | | Net
expenses (e) | | | Net
investment
income
(loss) | | |
Expenses
without waivers
and reimbursements | | | Portfolio
turnover
rate (c) | |
| | | | | | | | | | | | | | | | | | | | | | | | | | |
| | | | | | | | | | | | | | | | | | | | | | | | | | |
| $ | 19.90 | | | | 4.51 | % | | $ | 156,230 | | | | 0.96 | % | | | 2.72 | % | | | 1.20 | % | | | 74 | % |
| | 19.49 | | | | (10.69 | ) | | | 156,382 | | | | 1.00 | | | | 2.02 | | | | 1.22 | | | | 51 | |
| | 22.22 | | | | 22.98 | | | | 232,530 | | | | 1.21 | | | | 1.66 | | | | 1.22 | | | | 82 | |
| | 18.44 | | | | (3.07 | ) | | | 164,327 | | | | 1.25 | | | | 2.21 | (f) | | | 1.29 | | | | 38 | |
| | 19.36 | | | | 0.45 | | | | 152,834 | | | | 1.29 | | | | 1.75 | (f) | | | 1.49 | | | | 33 | |
| | | | | | |
| | | | | | | | | | | | | | | | | | | | | | | | | | |
| | 20.13 | | | | 3.92 | | | | 1,210 | | | | 1.47 | | | | 2.19 | | | | 1.72 | | | | 74 | |
| | 19.70 | | | | (11.08 | ) | | | 1,652 | | | | 1.50 | | | | 1.69 | | | | 1.74 | | | | 51 | |
| | 22.40 | | | | 22.30 | | | | 1,773 | | | | 1.75 | | | | 1.07 | | | | 1.81 | | | | 82 | |
| | 18.57 | | | | (3.56 | ) | | | 2,287 | | | | 1.75 | | | | 1.52 | (f) | | | 1.87 | | | | 38 | |
| | 19.52 | | | | (0.05 | ) | | | 2,789 | | | | 1.78 | | | | 1.17 | (f) | | | 1.91 | | | | 33 | |
| | | | | | |
| | | | | | | | | | | | | | | | | | | | | | | | | | |
| | 20.71 | | | | 4.70 | | | | 67,146 | | | | 0.71 | | | | 3.02 | | | | 0.94 | | | | 74 | |
| | 20.30 | | | | (10.43 | ) | | | 60,739 | | | | 0.75 | | | | 2.37 | | | | 0.96 | | | | 51 | |
| | 23.12 | | | | 23.39 | | | | 52,871 | | | | 0.90 | | | | 1.99 | | | | 0.99 | | | | 82 | |
| | 19.20 | | | | (2.73 | ) | | | 16,363 | | | | 0.90 | | | | 2.44 | (f) | | | 1.08 | | | | 38 | |
| | 20.13 | | | | 0.80 | | | | 19,292 | | | | 0.97 | | | | 2.04 | (f) | | | 1.12 | | | | 33 | |
| | | | | | |
| | | | | | | | | | | | | | | | | | | | | | | | | | |
| | 19.57 | | | | 4.15 | | | | 30,819 | | | | 1.26 | | | | 2.44 | | | | 1.66 | | | | 74 | |
| | 19.21 | | | | (10.93 | ) | | | 31,619 | | | | 1.30 | | | | 2.45 | | | | 1.69 | | | | 51 | |
| | 22.01 | | | | 22.70 | | | | 8,790 | | | | 1.49 | | | | 0.07 | | | | 1.54 | | | | 82 | |
| | 18.29 | | | | (3.36 | ) | | | 503 | | | | 1.50 | | | | 2.02 | (f) | | | 1.75 | | | | 38 | |
| | 19.21 | | | | 0.24 | | | | 227 | | | | 1.52 | | | | 1.91 | (f) | | | 1.69 | | | | 33 | |
| | | | | | |
| | | | | | | | | | | | | | | | | | | | | | | | | | |
| | 20.40 | | | | 4.94 | | | | 1,555,944 | | | | 0.52 | | | | 3.27 | | | | 0.69 | | | | 74 | |
| | 20.00 | | | | (10.26 | ) | | | 3,152,864 | | | | 0.55 | | | | 2.59 | | | | 0.71 | | | | 51 | |
| | 22.78 | | | | 23.59 | | | | 2,859,645 | | | | 0.71 | | | | 2.12 | | | | 0.71 | | | | 82 | |
| | 18.91 | | | | (2.59 | ) | | | 2,487,086 | | | | 0.71 | | | | 2.65 | (f) | | | 0.72 | | | | 38 | |
| | 19.84 | | | | (5.88 | ) | | | 1,854,941 | | | | 0.73 | | | | 1.47 | (f) | | | 0.74 | | | | 33 | |
SEE NOTES TO FINANCIAL STATEMENTS.
| | | | | | | | |
| | | |
| OCTOBER 31, 2019 | | J.P. MORGAN INTERNATIONAL EQUITY FUNDS | | | | | 107 | |
FINANCIAL HIGHLIGHTS
FOR THE PERIODS INDICATED (continued)
| | | | | | | | | | | | | | | | | | | | | | | | | | | | |
| | | | | | Per share operating performance | |
| | | | | | Investment operations | | | Distributions | |
| | | Net asset
value,
beginning
of period | | | Net
investment
income
(loss) (a) | | | Net realized
and unrealized
gains
(losses) on
investments | | | Total from
investment
operations | | | Net
investment
income | | | Net
realized
gain | | | Total
distributions | |
JPMorgan International Equity Fund | |
Class A | | | | | | | | | | | | | | | | | | | | | | | | | | | | |
Year Ended October 31, 2019 | | $ | 15.56 | | | $ | 0.33 | | | $ | 1.89 | | | $ | 2.22 | | | $ | (0.33 | ) | | $ | (0.18 | ) | | $ | (0.51 | ) |
Year Ended October 31, 2018 | | | 17.81 | | | | 0.33 | | | | (2.33 | ) | | | (2.00 | ) | | | (0.25 | ) | | | — | | | | (0.25 | ) |
Year Ended October 31, 2017 | | | 14.24 | | | | 0.22 | | | | 3.39 | | | | 3.61 | | | | (0.04 | ) | | | — | | | | (0.04 | ) |
Year Ended October 31, 2016 | | | 14.75 | | | | 0.22 | | | | (0.51 | ) | | | (0.29 | ) | | | (0.22 | ) | | | — | | | | (0.22 | ) |
Year Ended October 31, 2015 | | | 15.25 | | | | 0.23 | | | | (0.50 | ) | | | (0.27 | ) | | | (0.23 | ) | | | — | | | | (0.23 | ) |
| | | | | | | |
Class C | | | | | | | | | | | | | | | | | | | | | | | | | | | | |
Year Ended October 31, 2019 | | | 14.68 | | | | 0.23 | | | | 1.80 | | | | 2.03 | | | | (0.24 | ) | | | (0.18 | ) | | | (0.42 | ) |
Year Ended October 31, 2018 | | | 16.83 | | | | 0.25 | | | | (2.23 | ) | | | (1.98 | ) | | | (0.17 | ) | | | — | | | | (0.17 | ) |
Year Ended October 31, 2017 | | | 13.50 | | | | 0.12 | | | | 3.22 | | | | 3.34 | | | | (0.01 | ) | | | — | | | | (0.01 | ) |
Year Ended October 31, 2016 | | | 14.02 | | | | 0.13 | | | | (0.47 | ) | | | (0.34 | ) | | | (0.18 | ) | | | — | | | | (0.18 | ) |
Year Ended October 31, 2015 | | | 14.52 | | | | 0.15 | | | | (0.48 | ) | | | (0.33 | ) | | | (0.17 | ) | | | — | | | | (0.17 | ) |
| | | | | | | |
Class I | | | | | | | | | | | | | | | | | | | | | | | | | | | | |
Year Ended October 31, 2019 | | | 15.82 | | | | 0.36 | | | | 1.93 | | | | 2.29 | | | | (0.37 | ) | | | (0.18 | ) | | | (0.55 | ) |
Year Ended October 31, 2018 | | | 18.09 | | | | 0.41 | | | | (2.40 | ) | | | (1.99 | ) | | | (0.28 | ) | | | — | | | | (0.28 | ) |
Year Ended October 31, 2017 | | | 14.45 | | | | 0.26 | | | | 3.44 | | | | 3.70 | | | | (0.06 | ) | | | — | | | | (0.06 | ) |
Year Ended October 31, 2016 | | | 14.95 | | | | 0.24 | | | | (0.48 | ) | | | (0.24 | ) | | | (0.26 | ) | | | — | | | | (0.26 | ) |
Year Ended October 31, 2015 | | | 15.45 | | | | 0.29 | | | | (0.53 | ) | | | (0.24 | ) | | | (0.26 | ) | | | — | | | | (0.26 | ) |
| | | | | | | |
Class R2 | | | | | | | | | | | | | | | | | | | | | | | | | | | | |
Year Ended October 31, 2019 | | | 15.44 | | | | 0.28 | | | | 1.88 | | | | 2.16 | | | | (0.28 | ) | | | (0.18 | ) | | | (0.46 | ) |
Year Ended October 31, 2018 | | | 17.70 | | | | 0.29 | | | | (2.33 | ) | | | (2.04 | ) | | | (0.22 | ) | | | — | | | | (0.22 | ) |
Year Ended October 31, 2017 | | | 14.17 | | | | 0.17 | | | | 3.38 | | | | 3.55 | | | | (0.02 | ) | | | — | | | | (0.02 | ) |
Year Ended October 31, 2016 | | | 14.69 | | | | 0.18 | | | | (0.50 | ) | | | (0.32 | ) | | | (0.20 | ) | | | — | | | | (0.20 | ) |
Year Ended October 31, 2015 | | | 15.19 | | | | 0.20 | | | | (0.51 | ) | | | (0.31 | ) | | | (0.19 | ) | | | — | | | | (0.19 | ) |
| | | | | | | |
Class R5 | | | | | | | | | | | | | | | | | | | | | | | | | | | | |
Year Ended October 31, 2019 | | | 15.85 | | | | 0.38 | | | | 1.94 | | | | 2.32 | | | | (0.39 | ) | | | (0.18 | ) | | | (0.57 | ) |
Year Ended October 31, 2018 | | | 18.13 | | | | 0.41 | | | | (2.40 | ) | | | (1.99 | ) | | | (0.29 | ) | | | — | | | | (0.29 | ) |
Year Ended October 31, 2017 | | | 14.47 | | | | 0.21 | | | | 3.52 | | | | 3.73 | | | | (0.07 | ) | | | — | | | | (0.07 | ) |
Year Ended October 31, 2016 | | | 14.97 | | | | 0.27 | | | | (0.49 | ) | | | (0.22 | ) | | | (0.28 | ) | | | — | | | | (0.28 | ) |
Year Ended October 31, 2015 | | | 15.46 | | | | 0.29 | | | | (0.49 | ) | | | (0.20 | ) | | | (0.29 | ) | | | — | | | | (0.29 | ) |
| | | | | | | |
Class R6 | | | | | | | | | | | | | | | | | | | | | | | | | | | | |
Year Ended October 31, 2019 | | | 15.86 | | | | 0.40 | | | | 1.93 | | | | 2.33 | | | | (0.40 | ) | | | (0.18 | ) | | | (0.58 | ) |
Year Ended October 31, 2018 | | | 18.13 | | | | 0.43 | | | | (2.39 | ) | | | (1.96 | ) | | | (0.31 | ) | | | — | | | | (0.31 | ) |
Year Ended October 31, 2017 | | | 14.46 | | | | 0.29 | | | | 3.46 | | | | 3.75 | | | | (0.08 | ) | | | — | | | | (0.08 | ) |
Year Ended October 31, 2016 | | | 14.97 | | | | 0.29 | | | | (0.51 | ) | | | (0.22 | ) | | | (0.29 | ) | | | — | | | | (0.29 | ) |
Year Ended October 31, 2015 | | | 15.46 | | | | 0.32 | | | | (0.52 | ) | | | (0.20 | ) | | | (0.29 | ) | | | — | | | | (0.29 | ) |
| (a) | Calculated based upon average shares outstanding. |
| (b) | Includes adjustments in accordance with accounting principles generally accepted in the United States of America and as such, the net asset values for financial reporting purposes and the returns based upon those net asset values may differ from the net asset values and returns for shareholder transactions. |
| (c) | Includes interest expense, if applicable, which is less than 0.005% unless otherwise noted. |
SEE NOTES TO FINANCIAL STATEMENTS.
| | | | | | |
| | | |
| 108 | | | | J.P. MORGAN INTERNATIONAL EQUITY FUNDS | | OCTOBER 31, 2019 |
| | | | | | | | | | | | | | | | | | | | | | | | | | |
| | | Ratios/Supplemental data | |
| | | | | | | | | | Ratios to average net assets | | | | |
Net asset
value,
end of
period | | | Total return
(excludes
sales charge) (b) | | | Net assets,
end of
period
(000’s) | | | Net
expenses (c) | | | Net
investment
income
(loss) | | |
Expenses
without waivers
and reimbursements | | | Portfolio
turnover
rate | |
| | | | | | | | | | | | | | | | | | | | | | | | | | |
| | | | | | | | | | | | | | | | | | | | | | | | | | |
| $ | 17.27 | | | | 14.93 | % | | $ | 328,312 | | | | 0.95 | % | | | 2.03 | % | | | 1.22 | % | | | 25 | % |
| | 15.56 | | | | (11.42 | ) | | | 240,394 | | | | 0.95 | | | | 1.88 | | | | 1.32 | | | | 33 | |
| | 17.81 | | | | 25.43 | | | | 302,130 | | | | 1.23 | | | | 1.39 | | | | 1.35 | | | | 17 | |
| | 14.24 | | | | (1.83 | ) | | | 216,932 | | | | 1.31 | | | | 1.62 | | | | 1.49 | | | | 11 | |
| | 14.75 | | | | (1.89 | ) | | | 224,370 | | | | 1.31 | | | | 1.50 | | | | 1.59 | | | | 13 | |
| | | | | | |
| | | | | | | | | | | | | | | | | | | | | | | | | | |
| | 16.29 | | | | 14.39 | | | | 14,549 | | | | 1.45 | | | | 1.51 | | | | 1.74 | | | | 25 | |
| | 14.68 | | | | (11.89 | ) | | | 18,899 | | | | 1.45 | | | | 1.48 | | | | 1.83 | | | | 33 | |
| | 16.83 | | | | 24.79 | | | | 24,281 | | | | 1.74 | | | | 0.83 | | | | 1.88 | | | | 17 | |
| | 13.50 | | | | (2.31 | ) | | | 22,235 | | | | 1.81 | | | | 0.97 | | | | 2.06 | | | | 11 | |
| | 14.02 | | | | (2.36 | ) | | | 28,313 | | | | 1.81 | | | | 1.02 | | | | 2.05 | | | | 13 | |
| | | | | | |
| | | | | | | | | | | | | | | | | | | | | | | | | | |
| | 17.56 | | | | 15.20 | | | | 190,885 | | | | 0.70 | | | | 2.22 | | | | 0.96 | | | | 25 | |
| | 15.82 | | | | (11.20 | ) | | | 179,831 | | | | 0.70 | | | | 2.30 | | | | 1.06 | | | | 33 | |
| | 18.09 | | | | 25.69 | | | | 139,715 | | | | 0.99 | | | | 1.59 | | | | 1.10 | | | | 17 | |
| | 14.45 | | | | (1.50 | ) | | | 94,362 | | | | 1.06 | | | | 1.69 | | | | 1.24 | | | | 11 | |
| | 14.95 | | | | (1.66 | ) | | | 522,402 | | | | 1.06 | | | | 1.84 | | | | 1.19 | | | | 13 | |
| | | | | | |
| | | | | | | | | | | | | | | | | | | | | | | | | | |
| | 17.14 | | | | 14.58 | | | | 2,099 | | | | 1.25 | | | | 1.75 | | | | 1.57 | | | | 25 | |
| | 15.44 | | | | (11.68 | ) | | | 1,833 | | | | 1.25 | | | | 1.64 | | | | 1.60 | | | | 33 | |
| | 17.70 | | | | 25.12 | | | | 2,096 | | | | 1.49 | | | | 1.07 | | | | 1.71 | | | | 17 | |
| | 14.17 | | | | (2.08 | ) | | | 1,461 | | | | 1.56 | | | | 1.28 | | | | 1.95 | | | | 11 | |
| | 14.69 | | | | (2.14 | ) | | | 1,203 | | | | 1.56 | | | | 1.28 | | | | 1.92 | | | | 13 | |
| | | | | | |
| | | | | | | | | | | | | | | | | | | | | | | | | | |
| | 17.60 | | | | 15.38 | | | | 3,778 | | | | 0.60 | | | | 2.31 | | | | 0.83 | | | | 25 | |
| | 15.85 | | | | (11.16 | ) | | | 19,516 | | | | 0.60 | | | | 2.31 | | | | 0.91 | | | | 33 | |
| | 18.13 | | | | 25.88 | | | | 21,891 | | | | 0.84 | | | | 1.36 | | | | 0.93 | | | | 17 | |
| | 14.47 | | | | (1.34 | ) | | | 58,836 | | | | 0.86 | | | | 1.93 | | | | 1.02 | | | | 11 | |
| | 14.97 | | | | (1.42 | ) | | | 57,500 | | | | 0.86 | | | | 1.88 | | | | 1.06 | | | | 13 | |
| | | | | | |
| | | | | | | | | | | | | | | | | | | | | | | | | | |
| | 17.61 | | | | 15.50 | | | | 2,457,383 | | | | 0.50 | | | | 2.46 | | | | 0.72 | | | | 25 | |
| | 15.86 | | | | (11.04 | ) | | | 3,808,621 | | | | 0.50 | | | | 2.42 | | | | 0.81 | | | | 33 | |
| | 18.13 | | | | 26.04 | | | | 3,516,978 | | | | 0.74 | | | | 1.84 | | | | 0.81 | | | | 17 | |
| | 14.46 | | | | (1.36 | ) | | | 3,030,640 | | | | 0.81 | | | | 2.05 | | | | 0.91 | | | | 11 | |
| | 14.97 | | | | (1.37 | ) | | | 2,088,835 | | | | 0.80 | | | | 2.03 | | | | 0.91 | | | | 13 | |
SEE NOTES TO FINANCIAL STATEMENTS.
| | | | | | | | |
| | | |
| OCTOBER 31, 2019 | | J.P. MORGAN INTERNATIONAL EQUITY FUNDS | | | | | 109 | |
FINANCIAL HIGHLIGHTS
FOR THE PERIODS INDICATED (continued)
| | | | | | | | | | | | | | | | |
| | | Per share operating performance | | | | |
| | | | | | Investment operations | |
| | | Net asset
value,
beginning
of period | | | Net
investment
income
(loss) (b) | | | Net realized
and unrealized
gains
(losses) on
investments | | | Total from
investment
operations | |
JPMorgan International Hedged Equity Fund | |
Class A | |
March 15, 2019 (g) through October 31, 2019 | | $ | 15.00 | | | $ | 0.19 | | | $ | 0.39 | | | $ | 0.58 | |
| | | | |
Class C | | | | | | | | | | | | | | | | |
March 15, 2019 (g) through October 31, 2019 | | | 15.00 | | | | 0.16 | | | | 0.37 | | | | 0.53 | |
| | | | |
Class I | | | | | | | | | | | | | | | | |
March 15, 2019 (g) through October 31, 2019 | | | 15.00 | | | | 0.32 | | | | 0.29 | | | | 0.61 | |
| | | | |
Class R5 | | | | | | | | | | | | | | | | |
March 15, 2019 (g) through October 31, 2019 | | | 15.00 | | | | 0.34 | | | | 0.28 | | | | 0.62 | |
| | | | |
Class R6 | | | | | | | | | | | | | | | | |
March 15, 2019 (g) through October 31, 2019 | | | 15.00 | | | | 0.35 | | | | 0.28 | | | | 0.63 | |
| (a) | Annualized for periods less than one year, unless otherwise noted. |
| (b) | Calculated based upon average shares outstanding. |
| (c) | Not annualized for periods less than one year. |
| (d) | Includes adjustments in accordance with accounting principles generally accepted in the United States of America and as such, the net asset values for financial reporting purposes and the returns based upon those net asset values may differ from the net asset values and returns for shareholder transactions. |
| (e) | Includes interest expense, if applicable, which is less than 0.005% unless otherwise noted. |
| (f) | Certain non-recurring expenses incurred by the Fund were not annualized for the period indicated. |
| (g) | Commencement of operations. |
SEE NOTES TO FINANCIAL STATEMENTS.
| | | | | | |
| | | |
| 110 | | | | J.P. MORGAN INTERNATIONAL EQUITY FUNDS | | OCTOBER 31, 2019 |
| | | | | | | | | | | | | | | | | | | | | | | | | | |
| | | Ratios/Supplemental data | |
| | | | | | | | | | Ratios to average net assets (a) | | | | |
Net asset
value,
end of
period | | | Total return
(excludes
sales charge) (c)(d) | | | Net assets,
end of
period
(000’s) | | | Net
expenses (e)(f) | | | Net
investment
income
(loss) (f) | | |
Expenses
without waivers
and reimbursements (f) | | | Portfolio
turnover
rate (c) | |
| | | | | | | | | | | | | | | | | | | | | | | | | | |
| | | | | | | | | | | | | | | | | | | | | | | | | | |
| $ | 15.58 | | | | 3.87 | % | | $ | 330 | | | | 0.85 | % | | | 1.95 | % | | | 1.31 | % | | | 9 | % |
| | | | | | |
| | | | | | | | | | | | | | | | | | | | | | | | | | |
| | 15.53 | | | | 3.53 | | | | 119 | | | | 1.35 | | | | 1.73 | | | | 1.92 | | | | 9 | |
| | | | | | |
| | | | | | | | | | | | | | | | | | | | | | | | | | |
| | 15.61 | | | | 4.07 | | | | 59,751 | | | | 0.60 | | | | 3.38 | | | | 1.19 | | | | 9 | |
| | | | | | |
| | | | | | | | | | | | | | | | | | | | | | | | | | |
| | 15.62 | | | | 4.13 | | | | 21 | | | | 0.45 | | | | 3.59 | | | | 1.03 | | | | 9 | |
| | | | | | |
| | | | | | | | | | | | | | | | | | | | | | | | | | |
| | 15.63 | | | | 4.20 | | | | 21 | | | | 0.35 | | | | 3.69 | | | | 0.93 | | | | 9 | |
SEE NOTES TO FINANCIAL STATEMENTS.
| | | | | | | | |
| | | |
| OCTOBER 31, 2019 | | J.P. MORGAN INTERNATIONAL EQUITY FUNDS | | | | | 111 | |
FINANCIAL HIGHLIGHTS
FOR THE PERIODS INDICATED (continued)
| | | | | | | | | | | | | | | | | | | | | | | | | | | | |
| | | | | | Per share operating performance | |
| | | | | | Investment operations | | | Distributions | |
| | | Net asset
value,
beginning
of period | | | Net
investment
income
(loss) (b) | | | Net realized
and unrealized
gains
(losses) on
investments | | | Total from
investment
operations | | | Net
investment
income | | | Net
realized
gain | | | Total
distributions | |
JPMorgan International Research Enhanced Equity Fund | |
Class A | | | | | | | | | | | | | | | | | | | | | | | | | | | | |
Year Ended October 31, 2019 | | $ | 16.79 | | | $ | 0.51 | | | $ | 1.15 | | | $ | 1.66 | | | $ | (0.52 | ) | | $ | — | | | $ | (0.52 | ) |
Year Ended October 31, 2018 | | | 18.76 | | | | 0.45 | | | | (2.04 | ) | | | (1.59 | ) | | | (0.19 | ) | | | (0.19 | ) | | | (0.38 | ) |
Year Ended October 31, 2017 | | | 15.54 | | | | 0.34 | | | | 3.23 | | | | 3.57 | | | | (0.35 | ) | | | — | | | | (0.35 | ) |
Year Ended October 31, 2016 | | | 16.54 | | | | 0.40 | (f) | | | (0.89 | ) | | | (0.49 | ) | | | (0.36 | ) | | | (0.15 | ) | | | (0.51 | ) |
Year Ended October 31, 2015 | | | 20.38 | | | | 0.43 | | | | (0.60 | ) | | | (0.17 | ) | | | (0.40 | ) | | | (3.27 | ) | | | (3.67 | ) |
| | | | | | | |
Class I | | | | | | | | | | | | | | | | | | | | | | | | | | | | |
Year Ended October 31, 2019 | | | 17.01 | | | | 0.56 | | | | 1.16 | | | | 1.72 | | | | (0.56 | ) | | | — | | | | (0.56 | ) |
Year Ended October 31, 2018 | | | 18.92 | | | | 0.35 | | | | (1.91 | ) | | | (1.56 | ) | | | (0.16 | ) | | | (0.19 | ) | | | (0.35 | ) |
Year Ended October 31, 2017 | | | 15.68 | | | | 0.41 | | | | 3.23 | | | | 3.64 | | | | (0.40 | ) | | | — | | | | (0.40 | ) |
Year Ended October 31, 2016 | | | 16.70 | | | | 0.46 | (f) | | | (0.92 | ) | | | (0.46 | ) | | | (0.41 | ) | | | (0.15 | ) | | | (0.56 | ) |
Year Ended October 31, 2015 | | | 20.54 | | | | 0.48 | | | | (0.60 | ) | | | (0.12 | ) | | | (0.45 | ) | | | (3.27 | ) | | | (3.72 | ) |
| | | | | | | |
Class R6 | | | | | | | | | | | | | | | | | | | | | | | | | | | | |
Year Ended October 31, 2019 | | | 16.97 | | | | 0.57 | | | | 1.16 | | | | 1.73 | | | | (0.59 | ) | | | — | | | | (0.59 | ) |
November 1, 2017 (h) through October 31, 2018 | | | 18.98 | | | | 0.56 | | | | (2.16 | ) | | | (1.60 | ) | | | (0.22 | ) | | | (0.19 | ) | | | (0.41 | ) |
| (a) | Annualized for periods less than one year, unless otherwise noted. |
| (b) | Calculated based upon average shares outstanding. |
| (c) | Not annualized for periods less than one year. |
| (d) | Includes adjustments in accordance with accounting principles generally accepted in the United States of America and as such, the net asset values for financial reporting purposes and the returns based upon those net asset values may differ from the net asset values and returns for shareholder transactions. |
| (e) | Includes interest expense, if applicable, which is less than 0.005% unless otherwise noted. |
| (f) | Net investment income (loss) may appear disproportionate among the classes due to the timing of recognition of income and changes in the relative size of the classes. |
| (g) | Amount rounds to less than 0.005%. |
| (h) | Commencement of offering of class of shares. |
SEE NOTES TO FINANCIAL STATEMENTS.
| | | | | | |
| | | |
| 112 | | | | J.P. MORGAN INTERNATIONAL EQUITY FUNDS | | OCTOBER 31, 2019 |
| | | | | | | | | | | | | | | | | | | | | | | | | | |
| | | Ratios/Supplemental data | |
| | | | | | | | | | Ratios to average net assets (a) | | | | |
Net asset
value,
end of
period | | | Total return
(excludes
sales charge) (c)(d) | | | Net assets,
end of
period
(000’s) | | | Net
expenses (e) | | | Net
investment
income
(loss) | | |
Expenses
without waivers
and reimbursements | | | Portfolio
turnover
rate (c) | |
| | | | | | | | | | | | | | | | | | | | | | | | | | |
| | | | | | | | | | | | | | | | | | | | | | | | | | |
| $ | 17.93 | | | | 10.39 | % | | $ | 213,256 | | | | 0.60 | % | | | 3.00 | % | | | 0.83 | % | | | 22 | % |
| | 16.79 | | | | (8.66 | ) | | | 203,437 | | | | 0.60 | | | | 2.40 | | | | 0.84 | | | | 42 | |
| | 18.76 | | | | 23.41 | | | | 298,112 | | | | 0.59 | | | | 1.98 | | | | 0.90 | | | | 33 | |
| | 15.54 | | | | (2.94 | ) | | | 69,626 | | | | 0.60 | | | | 2.60 | (f) | | | 1.02 | | | | 24 | |
| | 16.54 | | | | (0.29 | ) | | | 82,667 | | | | 0.60 | | | | 2.51 | | | | 0.99 | | | | 39 | |
| | | | | | |
| | | | | | | | | | | | | | | | | | | | | | | | | | |
| | 18.17 | | | | 10.65 | | | | 185,680 | | | | 0.35 | | | | 3.28 | | | | 0.56 | | | | 22 | |
| | 17.01 | | | | (8.42 | ) | | | 152,610 | | | | 0.35 | | | | 1.85 | | | | 0.56 | | | | 42 | |
| | 18.92 | | | | 23.71 | | | | 4,740,590 | | | | 0.34 | | | | 2.37 | | | | 0.58 | | | | 33 | |
| | 15.68 | | | | (2.72 | ) | | | 1,241,856 | | | | 0.34 | | | | 2.98 | (f) | | | 0.59 | | | | 24 | |
| | 16.70 | | | | 0.00 | (g) | | | 779,908 | | | | 0.35 | | | | 2.79 | | | | 0.60 | | | | 39 | |
| | | | | | |
| | | | | | | | | | | | | | | | | | | | | | | | | | |
| | 18.11 | | | | 10.78 | | | | 4,435,538 | | | | 0.25 | | | | 3.37 | | | | 0.31 | | | | 22 | |
| | 16.97 | | | | (8.60 | ) | | | 4,344,571 | | | | 0.25 | | | | 3.00 | | | | 0.32 | | | | 42 | |
SEE NOTES TO FINANCIAL STATEMENTS.
| | | | | | | | |
| | | |
| OCTOBER 31, 2019 | | J.P. MORGAN INTERNATIONAL EQUITY FUNDS | | | | | 113 | |
FINANCIAL HIGHLIGHTS
FOR THE PERIODS INDICATED (continued)
| | | | | | | | | | | | | | | | | | | | | | | | | | | | |
| | | Per share operating performance | |
| | | | | | Investment operations | | | Distributions | |
| | | Net asset
value,
beginning
of period | | | Net
investment
income
(loss) (a) | | | Net realized
and unrealized
gains
(losses) on
investments | | | Total from
investment
operations | | | Net
investment
income | | | Net
realized
gain | | | Total
distributions | |
JPMorgan International Unconstrained Equity Fund | | | | | | | | | | | | | | | | | | | | | | | | | | | | |
Class A | | | | | | | | | | | | | | | | | | | | | | | | | | | | |
Year Ended October 31, 2019 | | $ | 18.24 | | | $ | 0.26 | | | $ | 3.02 | | | $ | 3.28 | | | $ | (0.37 | ) | | $ | — | | | $ | (0.37 | ) |
Year Ended October 31, 2018 | | | 21.14 | | | | 0.36 | | | | (3.13 | ) | | | (2.77 | ) | | | (0.13 | ) | | | — | | | | (0.13 | ) |
Year Ended October 31, 2017 | | | 17.24 | | | | 0.16 | | | | 4.09 | | | | 4.25 | | | | (0.35 | ) | | | — | | | | (0.35 | ) |
Year Ended October 31, 2016 | | | 17.61 | | | | 0.22 | (d) | | | (0.55 | ) | | | (0.33 | ) | | | (0.04 | ) | | | — | | | | (0.04 | ) |
Year Ended October 31, 2015 | | | 18.59 | | | | 0.09 | (d) | | | 0.39 | | | | 0.48 | | | | (0.17 | ) | | | (1.29 | ) | | | (1.46 | ) |
| | | | | | | |
Class C | | | | | | | | | | | | | | | | | | | | | | | | | | | | |
Year Ended October 31, 2019 | | | 17.98 | | | | 0.16 | | | | 2.97 | | | | 3.13 | | | | (0.25 | ) | | | — | | | | (0.25 | ) |
Year Ended October 31, 2018 | | | 20.90 | | | | 0.26 | | | | (3.09 | ) | | | (2.83 | ) | | | (0.09 | ) | | | — | | | | (0.09 | ) |
Year Ended October 31, 2017 | | | 17.04 | | | | 0.05 | | | | 4.06 | | | | 4.11 | | | | (0.25 | ) | | | — | | | | (0.25 | ) |
Year Ended October 31, 2016 | | | 17.45 | | | | 0.13 | (d) | | | (0.53 | ) | | | (0.40 | ) | | | (0.01 | ) | | | — | | | | (0.01 | ) |
Year Ended October 31, 2015 | | | 18.44 | | | | (0.02 | )(d) | | | 0.39 | | | | 0.37 | | | | (0.07 | ) | | | (1.29 | ) | | | (1.36 | ) |
| | | | | | | |
Class I | | | | | | | | | | | | | | | | | | | | | | | | | | | | |
Year Ended October 31, 2019 | | | 18.49 | | | | 0.31 | | | | 3.04 | | | | 3.35 | | | | (0.41 | ) | | | — | | | | (0.41 | ) |
Year Ended October 31, 2018 | | | 21.41 | | | | 0.44 | | | | (3.19 | ) | | | (2.75 | ) | | | (0.17 | ) | | | — | | | | (0.17 | ) |
Year Ended October 31, 2017 | | | 17.45 | | | | 0.23 | | | | 4.13 | | | | 4.36 | | | | (0.40 | ) | | | — | | | | (0.40 | ) |
Year Ended October 31, 2016 | | | 17.71 | | | | 0.24 | (d) | | | (0.50 | ) | | | (0.26 | ) | | | — | | | | — | | | | — | |
Year Ended October 31, 2015 | | | 18.67 | | | | 0.15 | (d) | | | 0.38 | | | | 0.53 | | | | (0.20 | ) | | | (1.29 | ) | | | (1.49 | ) |
| | | | | | | |
Class R2 | | | | | | | | | | | | | | | | | | | | | | | | | | | | |
Year Ended October 31, 2019 | | | 18.14 | | | | 0.21 | | | | 2.98 | | | | 3.19 | | | | (0.34 | ) | | | — | | | | (0.34 | ) |
Year Ended October 31, 2018 | | | 21.11 | | | | 0.35 | | | | (3.17 | ) | | | (2.82 | ) | | | (0.15 | ) | | | — | | | | (0.15 | ) |
Year Ended October 31, 2017 | | | 17.21 | | | | 0.06 | | | | 4.14 | | | | 4.20 | | | | (0.30 | ) | | | — | | | | (0.30 | ) |
Year Ended October 31, 2016 | | | 17.57 | | | | 0.15 | (d) | | | (0.51 | ) | | | (0.36 | ) | | | — | | | | — | | | | — | |
Year Ended October 31, 2015 | | | 18.55 | | | | 0.03 | (d) | | | 0.39 | | | | 0.42 | | | | (0.11 | ) | | | (1.29 | ) | | | (1.40 | ) |
| | | | | | | |
Class R5 | | | | | | | | | | | | | | | | | | | | | | | | | | | | |
Year Ended October 31, 2019 | | | 18.49 | | | | 0.34 | | | | 3.03 | | | | 3.37 | | | | (0.44 | ) | | | — | | | | (0.44 | ) |
Year Ended October 31, 2018 | | | 21.39 | | | | 0.53 | | | | (3.25 | ) | | | (2.72 | ) | | | (0.18 | ) | | | — | | | | (0.18 | ) |
Year Ended October 31, 2017 | | | 17.44 | | | | 0.20 | | | | 4.17 | | | | 4.37 | | | | (0.42 | ) | | | — | | | | (0.42 | ) |
Year Ended October 31, 2016 | | | 17.75 | | | | 0.27 | (d) | | | (0.52 | ) | | | (0.25 | ) | | | (0.06 | ) | | | — | | | | (0.06 | ) |
Year Ended October 31, 2015 | | | 18.72 | | | | 0.16 | (d) | | | 0.39 | | | | 0.55 | | | | (0.23 | ) | | | (1.29 | ) | | | (1.52 | ) |
| | | | | | | |
Class R6 | | | | | | | | | | | | | | | | | | | | | | | | | | | | |
Year Ended October 31, 2019 | | | 18.50 | | | | 0.27 | | | | 3.13 | | | | 3.40 | | | | (0.46 | ) | | | — | | | | (0.46 | ) |
Year Ended October 31, 2018 | | | 21.40 | | | | 0.44 | | | | (3.16 | ) | | | (2.72 | ) | | | (0.18 | ) | | | — | | | | (0.18 | ) |
Year Ended October 31, 2017 | | | 17.45 | | | | 0.26 | | | | 4.12 | | | | 4.38 | | | | (0.43 | ) | | | — | | | | (0.43 | ) |
Year Ended October 31, 2016 | | | 17.76 | | | | 0.29 | (d) | | | (0.52 | ) | | | (0.23 | ) | | | (0.08 | ) | | | — | | | | (0.08 | ) |
Year Ended October 31, 2015 | | | 18.73 | | | | (0.01 | )(d) | | | 0.57 | | | | 0.56 | | | | (0.24 | ) | | | (1.29 | ) | | | (1.53 | ) |
| (a) | Calculated based upon average shares outstanding. |
| (b) | Includes adjustments in accordance with accounting principles generally accepted in the United States of America and as such, the net asset values for financial reporting purposes and the returns based upon those net asset values may differ from the net asset values and returns for shareholder transactions. |
| (c) | Includes interest expense, if applicable, which is less than 0.005% unless otherwise noted. |
| (d) | Net investment income (loss) may appear disproportionate among the classes due to the timing of recognition of income and changes in the relative size of the classes. |
SEE NOTES TO FINANCIAL STATEMENTS.
| | | | | | |
| | | |
| 114 | | | | J.P. MORGAN INTERNATIONAL EQUITY FUNDS | | OCTOBER 31, 2019 |
| | | | | | | | | | | | | | | | | | | | | | | | | | |
| | | Ratios/Supplemental data | |
| | | | | | | | | | Ratios to average net assets | | | | |
Net asset
value,
end of
period | | | Total return
(excludes
sales charge) (b) | | | Net assets,
end of
period
(000’s) | | | Net
expenses (c) | | | Net
investment
income
(loss) | | |
Expenses
without waivers
and reimbursements | | | Portfolio
turnover
rate | |
| | | | | | | | | | | | | | | | | | | | | | | | | | |
| | | | | | | | | | | | | | | | | | | | | | | | | | |
| $ | 21.15 | | | | 18.41 | % | | $ | 114,629 | | | | 1.00 | % | | | 1.33 | % | | | 1.32 | % | | | 34 | % |
| | 18.24 | | | | (13.20 | ) | | | 84,325 | | | | 1.00 | | | | 1.75 | | | | 1.38 | | | | 63 | |
| | 21.14 | | | | 25.16 | | | | 67,684 | | | | 1.24 | | | | 0.83 | | | | 1.46 | | | | 38 | |
| | 17.24 | | | | (1.86 | ) | | | 14,034 | | | | 1.24 | | | | 1.28 | (d) | | | 1.61 | | | | 51 | |
| | 17.61 | | | | 3.04 | | | | 5,824 | | | | 1.24 | | | | 0.49 | (d) | | | 2.31 | | | | 42 | |
| | | | | | |
| | | | | | | | | | | | | | | | | | | | | | | | | | |
| | 20.86 | | | | 17.73 | | | | 18,447 | | | | 1.50 | | | | 0.83 | | | | 1.84 | | | | 34 | |
| | 17.98 | | | | (13.60 | ) | | | 22,532 | | | | 1.50 | | | | 1.29 | | | | 1.89 | | | | 63 | |
| | 20.90 | | | | 24.51 | | | | 14,534 | | | | 1.74 | | | | 0.27 | | | | 2.00 | | | | 38 | |
| | 17.04 | | | | (2.28 | ) | | | 4,626 | | | | 1.74 | | | | 0.75 | (d) | | | 2.14 | | | | 51 | |
| | 17.45 | | | | 2.39 | | | | 3,439 | | | | 1.74 | | | | (0.12 | )(d) | | | 2.79 | | | | 42 | |
| | | | | | |
| | | | | | | | | | | | | | | | | | | | | | | | | | |
| | 21.43 | | | | 18.62 | | | | 177,764 | | | | 0.75 | | | | 1.57 | | | | 1.08 | | | | 34 | |
| | 18.49 | | | | (12.96 | ) | | | 189,061 | | | | 0.75 | | | | 2.09 | | | | 1.13 | | | | 63 | |
| | 21.41 | | | | 25.60 | | | | 131,356 | | | | 0.89 | | | | 1.14 | | | | 1.19 | | | | 38 | |
| | 17.45 | | | | (1.47 | ) | | | 9,929 | | | | 0.89 | | | | 1.41 | (d) | | | 1.35 | | | | 51 | |
| | 17.71 | | | | 3.29 | | | | 59,858 | | | | 0.89 | | | | 0.83 | (d) | | | 1.84 | | | | 42 | |
| | | | | | |
| | | | | | | | | | | | | | | | | | | | | | | | | | |
| | 20.99 | | | | 18.01 | | | | 1,049 | | | | 1.30 | | | | 1.05 | | | | 1.74 | | | | 34 | |
| | 18.14 | | | | (13.46 | ) | | | 773 | | | | 1.30 | | | | 1.70 | | | | 1.72 | | | | 63 | |
| | 21.11 | | | | 24.85 | | | | 97 | | | | 1.49 | | | | 0.31 | | | | 2.79 | | | | 38 | |
| | 17.21 | | | | (2.05 | ) | | | 20 | | | | 1.49 | | | | 0.87 | (d) | | | 4.37 | | | | 51 | |
| | 17.57 | | | | 2.67 | | | | 20 | | | | 1.51 | | | | 0.19 | (d) | | | 5.11 | | | | 42 | |
| | | | | | |
| | | | | | | | | | | | | | | | | | | | | | | | | | |
| | 21.42 | | | | 18.76 | | | | 3,082 | | | | 0.65 | | | | 1.71 | | | | 1.04 | | | | 34 | |
| | 18.49 | | | | (12.84 | ) | | | 3,341 | | | | 0.65 | | | | 2.56 | | | | 1.07 | | | | 63 | |
| | 21.39 | | | | 25.67 | | | | 90 | | | | 0.79 | | | | 1.01 | | | | 2.44 | | | | 38 | |
| | 17.44 | | | | (1.38 | ) | | | 20 | | | | 0.80 | | | | 1.57 | (d) | | | 3.59 | | | | 51 | |
| | 17.75 | | | | 3.43 | | | | 20 | | | | 0.81 | | | | 0.89 | (d) | | | 4.43 | | | | 42 | |
| | | | | | |
| | | | | | | | | | | | | | | | | | | | | | | | | | |
| | 21.44 | | | | 18.95 | | | | 2,284,670 | | | | 0.55 | | | | 1.32 | | | | 0.77 | | | | 34 | |
| | 18.50 | | | | (12.81 | ) | | | 175,198 | | | | 0.55 | | | | 2.12 | | | | 0.87 | | | | 63 | |
| | 21.40 | | | | 25.72 | | | | 143,868 | | | | 0.74 | | | | 1.37 | | | | 0.95 | | | | 38 | |
| | 17.45 | | | | (1.29 | ) | | | 81,146 | | | | 0.74 | | | | 1.70 | (d) | | | 1.02 | | | | 51 | |
| | 17.76 | | | | 3.48 | | | | 5,335 | | | | 0.74 | | | | (0.05 | )(d) | | | 2.87 | | | | 42 | |
SEE NOTES TO FINANCIAL STATEMENTS.
| | | | | | | | |
| | | |
| OCTOBER 31, 2019 | | J.P. MORGAN INTERNATIONAL EQUITY FUNDS | | | | | 115 | |
FINANCIAL HIGHLIGHTS
FOR THE PERIODS INDICATED (continued)
| | | | | | | | | | | | | | | | | | | | |
| | | Per share operating performance | |
| | | | | | Investment operations | | | Distributions | |
| | | Net asset
value,
beginning
of period | | | Net
investment
income
(loss) (b) | | | Net realized
and unrealized
gains
(losses) on
investments | | | Total from
investment
operations | | | Net
investment
income | |
JPMorgan International Value Fund | | | | | | | | | | | | | | | | | | | | |
Class A | | | | | | | | | | | | | | | | | | | | |
Year Ended October 31, 2019 | | $ | 12.44 | | | $ | 0.44 | | | $ | (0.20 | ) | | $ | 0.24 | | | $ | (0.46 | ) |
Year Ended October 31, 2018 | | | 14.26 | | | | 0.36 | | | | (1.87 | ) | | | (1.51 | ) | | | (0.31 | ) |
Year Ended October 31, 2017 | | | 12.23 | | | | 0.22 | | | | 2.50 | | | | 2.72 | | | | (0.69 | ) |
Year Ended October 31, 2016 | | | 13.02 | | | | 0.23 | | | | (0.88 | ) | | | (0.65 | ) | | | (0.14 | ) |
Year Ended October 31, 2015 | | | 14.14 | | | | 0.18 | (f) | | | (0.83 | ) | | | (0.65 | ) | | | (0.47 | ) |
| | | | | |
Class C | | | | | | | | | | | | | | | | | | | | |
Year Ended October 31, 2019 | | | 12.02 | | | | 0.36 | | | | (0.18 | ) | | | 0.18 | | | | (0.39 | ) |
Year Ended October 31, 2018 | | | 13.78 | | | | 0.28 | | | | (1.82 | ) | | | (1.54 | ) | | | (0.22 | ) |
Year Ended October 31, 2017 | | | 11.88 | | | | 0.15 | | | | 2.42 | | | | 2.57 | | | | (0.67 | ) |
Year Ended October 31, 2016 | | | 12.65 | | | | 0.17 | | | | (0.87 | ) | | | (0.70 | ) | | | (0.07 | ) |
Year Ended October 31, 2015 | | | 13.72 | | | | 0.10 | (f) | | | (0.78 | ) | | | (0.68 | ) | | | (0.39 | ) |
| | | | | |
Class I | | | | | | | | | | | | | | | | | | | | |
Year Ended October 31, 2019 | | | 12.76 | | | | 0.48 | | | | (0.20 | ) | | | 0.28 | | | | (0.50 | ) |
Year Ended October 31, 2018 | | | 14.62 | | | | 0.41 | | | | (1.92 | ) | | | (1.51 | ) | | | (0.35 | ) |
Year Ended October 31, 2017 | | | 12.57 | | | | 0.28 | | | | 2.55 | | | | 2.83 | | | | (0.78 | ) |
Year Ended October 31, 2016 | | | 13.37 | | | | 0.28 | | | | (0.91 | ) | | | (0.63 | ) | | | (0.17 | ) |
Year Ended October 31, 2015 | | | 14.48 | | | | 0.23 | (f) | | | (0.84 | ) | | | (0.61 | ) | | | (0.50 | ) |
| | | | | |
Class L | | | | | | | | | | | | | | | | | | | | |
Year Ended October 31, 2019 | | | 12.70 | | | | 0.46 | | | | (0.17 | ) | | | 0.29 | | | | (0.52 | ) |
Year Ended October 31, 2018 | | | 14.55 | | | | 0.41 | | | | (1.90 | ) | | | (1.49 | ) | | | (0.36 | ) |
Year Ended October 31, 2017 | | | 12.50 | | | | 0.27 | | | | 2.57 | | | | 2.84 | | | | (0.79 | ) |
Year Ended October 31, 2016 | | | 13.29 | | | | 0.31 | | | | (0.93 | ) | | | (0.62 | ) | | | (0.17 | ) |
Year Ended October 31, 2015 | | | 14.41 | | | | 0.23 | (f) | | | (0.83 | ) | | | (0.60 | ) | | | (0.52 | ) |
| | | | | |
Class R2 | | | | | | | | | | | | | | | | | | | | |
Year Ended October 31, 2019 | | | 12.20 | | | | 0.40 | | | | (0.20 | ) | | | 0.20 | | | | (0.44 | ) |
Year Ended October 31, 2018 | | | 14.01 | | | | 0.31 | | | | (1.84 | ) | | | (1.53 | ) | | | (0.28 | ) |
Year Ended October 31, 2017 | | | 12.04 | | | | 0.19 | | | | 2.46 | | | | 2.65 | | | | (0.68 | ) |
Year Ended October 31, 2016 | | | 12.83 | | | | 0.19 | | | | (0.87 | ) | | | (0.68 | ) | | | (0.11 | ) |
Year Ended October 31, 2015 | | | 13.93 | | | | 0.14 | (f) | | | (0.81 | ) | | | (0.67 | ) | | | (0.43 | ) |
| | | | | |
Class R5 | | | | | | | | | | | | | | | | | | | | |
Year Ended October 31, 2019 | | | 12.65 | | | | 0.49 | | | | (0.21 | ) | | | 0.28 | | | | (0.53 | ) |
Year Ended October 31, 2018 | | | 14.51 | | | | 0.42 | | | | (1.91 | ) | | | (1.49 | ) | | | (0.37 | ) |
Year Ended October 31, 2017 | | | 12.51 | | | | 0.23 | | | | 2.59 | | | | 2.82 | | | | (0.82 | ) |
September 9, 2016 (g) through October 31, 2016 | | | 12.55 | | | | 0.03 | | | | (0.07 | ) | | | (0.04 | ) | | | — | |
| | | | | |
Class R6 | | | | | | | | | | | | | | | | | | | | |
Year Ended October 31, 2019 | | | 12.67 | | | | 0.51 | | | | (0.21 | ) | | | 0.30 | | | | (0.54 | ) |
Year Ended October 31, 2018 | | | 14.53 | | | | 0.43 | | | | (1.91 | ) | | | (1.48 | ) | | | (0.38 | ) |
Year Ended October 31, 2017 | | | 12.51 | | | | 0.31 | | | | 2.53 | | | | 2.84 | | | | (0.82 | ) |
Year Ended October 31, 2016 | | | 13.31 | | | | 0.37 | | | | (0.96 | ) | | | (0.59 | ) | | | (0.21 | ) |
Year Ended October 31, 2015 | | | 14.42 | | | | 0.18 | (f) | | | (0.76 | ) | | | (0.58 | ) | | | (0.53 | ) |
| (a) | Annualized for periods less than one year, unless otherwise noted. |
| (b) | Calculated based upon average shares outstanding. |
| (c) | Not annualized for periods less than one year. |
| (d) | Includes adjustments in accordance with accounting principles generally accepted in the United States of America and as such, the net asset values for financial reporting purposes and the returns based upon those net asset values may differ from the net asset values and returns for shareholder transactions. |
| (e) | Includes interest expense, if applicable, which is less than 0.005% unless otherwise noted. |
| (f) | Net investment income (loss) may appear disproportionate among the classes due to the timing of recognition of income and changes in the relative size of the classes. |
| (g) | Commencement of offering of class of shares. |
SEE NOTES TO FINANCIAL STATEMENTS.
| | | | | | |
| | | |
| 116 | | | | J.P. MORGAN INTERNATIONAL EQUITY FUNDS | | OCTOBER 31, 2019 |
| | | | | | | | | | | | | | | | | | | | | | | | | | |
| | | Ratios/Supplemental data | |
| | | | | | | | | | Ratios to average net assets (a) | | | | |
Net asset
value,
end of
period | | | Total return
(excludes
sales charge) (c)(d) | | | Net assets,
end of
period
(000’s) | | | Net
expenses (e) | | | Net
investment
income
(loss) | | |
Expenses
without waivers
and reimbursements | | | Portfolio
turnover
rate (c) | |
| | | | | | | | | | | | | | | | | | | | | | | | | | |
| | | | | | | | | | | | | | | | | | | | | | | | | | |
| $ | 12.22 | | | | 2.30 | % | | $ | 181,458 | | | | 1.00 | % | | | 3.69 | % | | | 1.28 | % | | | 61 | % |
| | 12.44 | | | | (10.88 | ) | | | 242,231 | | | | 1.00 | | | | 2.59 | | | | 1.27 | | | | 90 | |
| | 14.26 | | | | 23.30 | | | | 316,510 | | | | 1.35 | | | | 1.71 | | | | 1.35 | | | | 31 | |
| | 12.23 | | | | (5.01 | ) | | | 573,449 | | | | 1.35 | | | | 1.91 | | | | 1.43 | | | | 61 | |
| | 13.02 | | | | (4.63 | ) | | | 695,251 | | | | 1.35 | | | | 1.31 | (f) | | | 1.45 | | | | 74 | |
| | | | | | |
| | | | | | | | | | | | | | | | | | | | | | | | | | |
| | 11.81 | | | | 1.82 | | | | 9,358 | | | | 1.50 | | | | 3.15 | | | | 1.80 | | | | 61 | |
| | 12.02 | | | | (11.37 | ) | | | 14,055 | | | | 1.50 | | | | 2.06 | | | | 1.78 | | | | 90 | |
| | 13.78 | | | | 22.67 | | | | 20,997 | | | | 1.85 | | | | 1.21 | | | | 1.87 | | | | 31 | |
| | 11.88 | | | | (5.54 | ) | | | 24,453 | | | | 1.85 | | | | 1.43 | | | | 1.91 | | | | 61 | |
| | 12.65 | | | | (5.01 | ) | | | 31,296 | | | | 1.85 | | | | 0.79 | (f) | | | 1.90 | | | | 74 | |
| | | | | | |
| | | | | | | | | | | | | | | | | | | | | | | | | | |
| | 12.54 | | | | 2.56 | | | | 45,503 | | | | 0.75 | | | | 3.91 | | | | 1.03 | | | | 61 | |
| | 12.76 | | | | (10.62 | ) | | | 66,291 | | | | 0.75 | | | | 2.84 | | | | 1.02 | | | | 90 | |
| | 14.62 | | | | 23.66 | | | | 144,875 | | | | 1.04 | | | | 2.07 | | | | 1.04 | | | | 31 | |
| | 12.57 | | | | (4.74 | ) | | | 157,867 | | | | 1.01 | | | | 2.28 | | | | 1.02 | | | | 61 | |
| | 13.37 | | | | (4.28 | ) | | | 233,045 | | | | 1.03 | | | | 1.62 | (f) | | | 1.03 | | | | 74 | |
| | | | | | |
| | | | | | | | | | | | | | | | | | | | | | | | | | |
| | 12.47 | | | | 2.69 | | | | 30,256 | | | | 0.65 | | | | 3.81 | | | | 0.87 | | | | 61 | |
| | 12.70 | | | | (10.57 | ) | | | 73,651 | | | | 0.65 | | | | 2.84 | | | | 0.87 | | | | 90 | |
| | 14.55 | | | | 23.88 | | | | 201,672 | | | | 0.87 | | | | 2.03 | | | | 0.88 | | | | 31 | |
| | 12.50 | | | | (4.63 | ) | | | 523,251 | | | | 0.90 | | | | 2.53 | | | | 0.91 | | | | 61 | |
| | 13.29 | | | | (4.23 | ) | | | 1,480,321 | | | | 0.95 | | | | 1.63 | (f) | | | 0.99 | | | | 74 | |
| | | | | | |
| | | | | | | | | | | | | | | | | | | | | | | | | | |
| | 11.96 | | | | 2.00 | | | | 722 | | | | 1.30 | | | | 3.47 | | | | 1.69 | | | | 61 | |
| | 12.20 | | | | (11.19 | ) | | | 1,025 | | | | 1.30 | | | | 2.27 | | | | 1.59 | | | | 90 | |
| | 14.01 | | | | 23.02 | | | | 1,369 | | | | 1.58 | | | | 1.52 | | | | 1.73 | | | | 31 | |
| | 12.04 | | | | (5.28 | ) | | | 1,182 | | | | 1.59 | | | | 1.65 | | | | 1.91 | | | | 61 | |
| | 12.83 | | | | (4.84 | ) | | | 1,929 | | | | 1.60 | | | | 1.01 | (f) | | | 2.01 | | | | 74 | |
| | | | | | |
| | | | | | | | | | | | | | | | | | | | | | | | | | |
| | 12.40 | | | | 2.64 | | | | 88 | | | | 0.65 | | | | 4.08 | | | | 0.87 | | | | 61 | |
| | 12.65 | | | | (10.58 | ) | | | 70 | | | | 0.65 | | | | 2.97 | | | | 0.91 | | | | 90 | |
| | 14.51 | | | | 23.81 | | | | 62 | | | | 0.93 | | | | 1.69 | | | | 4.00 | | | | 31 | |
| | 12.51 | | | | (0.32 | ) | | | 20 | | | | 0.79 | | | | 1.52 | | | | 0.79 | | | | 61 | |
| | | | | | |
| | | | | | | | | | | | | | | | | | | | | | | | | | |
| | 12.43 | | | | 2.83 | | | | 125,887 | | | | 0.55 | | | | 4.22 | | | | 0.77 | | | | 61 | |
| | 12.67 | | | | (10.49 | ) | | | 124,246 | | | | 0.55 | | | | 3.06 | | | | 0.77 | | | | 90 | |
| | 14.53 | | | | 23.99 | | | | 108,302 | | | | 0.80 | | | | 2.28 | | | | 0.82 | | | | 31 | |
| | 12.51 | | | | (4.45 | ) | | | 27,998 | | | | 0.72 | | | | 3.00 | | | | 0.73 | | | | 61 | |
| | 13.31 | | | | (4.04 | ) | | | 2,354 | | | | 0.73 | | | | 1.32 | (f) | | | 0.73 | | | | 74 | |
SEE NOTES TO FINANCIAL STATEMENTS.
| | | | | | | | |
| | | |
| OCTOBER 31, 2019 | | J.P. MORGAN INTERNATIONAL EQUITY FUNDS | | | | | 117 | |
NOTES TO FINANCIAL STATEMENTS
AS OF OCTOBER 31, 2019
1. Organization
JPMorgan Trust I (“JPM I”), JPMorgan Trust II (“JPM II”) and JPMorgan Trust IV (“JPM IV”) (collectively, the “Trusts”) were formed on November 12, 2004, November 12, 2004 and November 11, 2015, respectively, as Delaware statutory trusts, pursuant to Declarations of Trust dated November 5, 2004, November 5, 2004 and November 11, 2015, respectively, and are registered under the Investment Company Act of 1940, as amended (the “1940 Act”), asopen-end management investment companies.
The following are 10 separate funds of the Trusts (each, a “Fund” and collectively, the “Funds”) covered by this report:
| | | | | | |
| | | Classes Offered | | Trust | | Diversification
Classification |
| JPMorgan Emerging Markets Equity Fund | | Class A, Class C, Class I, Class L, Class R2, Class R3, Class R4, Class R5 and Class R6 | | JPM I | | Diversified |
| JPMorgan Emerging Markets Research Enhanced Equity Fund(1) | | Class I(2) and Class R6 | | JPM IV | | Diversified |
| JPMorgan Europe Dynamic Fund | | Class A, Class C, Class I, Class L and Class R6(3) | | JPM I | | Diversified |
| JPMorgan Global Research Enhanced Index Fund | | Class I and Class R6(4) | | JPM I | | Diversified |
| JPMorgan International Advantage Fund | | Class A, Class C, Class I, Class R2 and Class R6 | | JPM I | | Diversified |
| JPMorgan International Equity Fund | | Class A, Class C, Class I, Class R2, Class R5 and Class R6 | | JPM I | | Diversified |
| JPMorgan International Hedged Equity Fund(5) | | Class A, Class C, Class I, Class R5 and Class R6 | | JPM IV | | Diversified |
| JPMorgan International Research Enhanced Equity Fund | | Class A, Class I and Class R6(4) | | JPM II | | Diversified |
| JPMorgan International Unconstrained Equity Fund | | Class A, Class C, Class I, Class R2, Class R5 and Class R6 | | JPM I | | Diversified |
| JPMorgan International Value Fund | | Class A, Class C, Class I, Class L, Class R2, Class R5 and Class R6 | | JPM I | | Diversified |
| (1) | The JPMorgan Emerging Markets Research Enhanced Equity Fund commenced operations on December 11, 2018. |
| (2) | Class I commenced operations on January 30, 2019. |
| (3) | Class R6 Shares commenced operations on October 1, 2018. |
| (4) | Class R6 Shares commenced operations on November 1, 2017. |
| (5) | The JPMorgan International Hedged Equity Fund commenced operations on March 15, 2019. |
Class L Shares of the JPMorgan Emerging Markets Equity Fund (“Emerging Markets Equity Fund”), JPMorgan Europe Dynamic Fund (“Europe Dynamic Fund”) and JPMorgan International Value Fund (“International Value Fund”) are publicly offered on a limited basis.
As of October 9, 2017, Class A Shares of the JPMorgan International Research Enhanced Equity Fund (“International Research Enhanced Equity Fund”) were publicly offered on a limited basis.
The investment objective of Emerging Markets Equity Fund is to seek to provide high total return.
The investment objective of JPMorgan Emerging Markets Research Enhanced Equity Fund (“Emerging Markets Research Enhanced Equity Fund”), JPMorgan Global Research Enhanced Index Fund (“Global Research Enhanced Index Fund”), International Research Enhanced Equity Fund, JPMorgan International Unconstrained Equity Fund (“International Unconstrained Equity Fund”) and International Value Fund is to seek to provide long-term capital appreciation.
The investment objective of Europe Dynamic Fund is to seek total return from long-term capital growth. Total return consists of capital growth and current income.
The investment objective of JPMorgan International Advantage Fund (“International Advantage Fund”) is to seek to maximize long-term capital growth by investing primarily in equity securities in developed markets outside the U.S.
The investment objective of JPMorgan International Equity Fund (“International Equity Fund”) is to seek total return from long-term capital growth and income. Total return consists of capital growth and current income.
The investment objective of JPMorgan International Hedged Equity Fund (“International Hedged Equity Fund”) is to seek to provide capital appreciation.
Class A Shares generally provide for afront-end sales charge while Class C Shares provide for a contingent deferred sales charge (“CDSC”). No sales charges are assessed with respect to Class I, Class L, Class R2, Class R3, Class R4, Class R5 and Class R6 Shares. Certain Class A Shares, for whichfront-end sales charges have been waived, may be subject to a CDSC as described in the Funds’ prospectus. Beginning on November 14, 2017, Class C Shares automatically convert to Class A Shares after ten years. All classes of shares have equal rights as to earnings, assets and voting privileges, except that each class may bear different transfer agency, distribution and service fees and each class has exclusive voting rights with respect to its distribution plan and shareholder servicing agreements.
| | | | | | |
| | | |
| 118 | | | | J.P. MORGAN INTERNATIONAL EQUITY FUNDS | | OCTOBER 31, 2019 |
J.P. Morgan Investment Management Inc. (“JPMIM”), an indirect, wholly owned subsidiary of JPMorgan Chase & Co. (“JPMorgan”), acts as Adviser (the “Adviser”) and Administrator (the “Administrator”) to the Funds.
2. Significant Accounting Policies
The following is a summary of significant accounting policies followed by the Funds in the preparation of their financial statements. The Funds are investment companies and, thus, follow the investment company accounting and reporting guidance of the Financial Accounting Standards Board (“FASB”) Accounting Standards Codification Topic 946 — Investment Companies, which is part of U.S. generally accepted accounting principles (“GAAP”). The preparation of financial statements in conformity with GAAP requires management to make estimates and assumptions that affect (i) the reported amounts of assets and liabilities, (ii) disclosure of contingent assets and liabilities at the date of the financial statements, and (iii) the reported amounts of increases and decreases in net assets from operations during the reporting period. Actual results could differ from those estimates.
A. Valuation of Investments — Investments are valued in accordance with GAAP and the Funds’ valuation policies set forth by, and under the supervision and responsibility of, the Boards of Trustees of the Trusts (the “Boards”), which established the following approach to valuation, as described more fully below: (i) investments for which market quotations are readily available shall be valued at their market value and (ii) all other investments for which market quotations are not readily available shall be valued at their fair value as determined in good faith by the Boards.
The Administrator has established the J.P. Morgan Asset Management Americas Valuation Committee (“AVC”) to assist the Boards with the oversight and monitoring of the valuation of the Funds’ investments. The Administrator implements the valuation policies of the Funds’ investments, as directed by the Boards. The AVC oversees and carries out the policies for the valuation of investments held in the Funds. This includes monitoring the appropriateness of fair values based on results of ongoing valuation oversight including, but not limited to, consideration of macro or security specific events, market events, and pricing vendor and broker due diligence. The Administrator is responsible for discussing and assessing the potential impacts to the fair values on an ongoing basis, and at least on a quarterly basis, with the AVC and the Boards.
A market-based approach is primarily used to value the Funds’ investments. Investments for which market quotations are not readily available are fair valued by approved affiliated and/or unaffiliated pricing vendors or third party broker-dealers (collectively referred to as “Pricing Services”) or may be internally fair valued using methods set forth by the valuation policies approved by the Boards. This may include the use of related or comparable assets or liabilities, recent transactions, market multiples, book values and other relevant information for the investment. An income-based valuation approach may be used in which the anticipated future cash flows of the investment are discounted to calculate the fair value. Discounts may also be applied due to the nature or duration of any restrictions on the disposition of the investments. Valuations may be based upon current market prices of securities that are comparable in coupon, rating, maturity and industry. It is possible that the estimated values may differ significantly from the values that would have been used had a ready market for the investments existed, and such differences could be material.
Equities and other exchange-traded instruments are valued at the last sale price or official market closing price on the primary exchange on which the instrument is traded before the net asset values (“NAV”) of the Funds are calculated on a valuation date. Certain foreign equity instruments, as well as certain derivatives with equity reference obligations, are valued by applying international fair value factors provided by approved Pricing Services. The factors seek to adjust the local closing price for movements of local markets post closing, but prior to the time the NAVs are calculated.
Investments inopen-end investment companies (“Underlying Funds”) are valued at each Underlying Fund’s NAV per share as of the report date.
Futures contracts and options are generally valued on the basis of available market quotations. Forward foreign currency exchange contracts are valued utilizing market quotations from approved Pricing Services.
Valuations reflected in this report are as of the report date. As a result, changes in valuation due to market events and/or issuer-related events after the report date and prior to issuance of the report are not reflected herein.
The various inputs that are used in determining the valuation of the Funds’ investments are summarized into the three broad levels listed below.
| • | | Level 1 — Unadjusted inputs using quoted prices in active markets for identical investments. |
| • | | Level 2 — Other significant observable inputs including, but not limited to, quoted prices for similar investments, inputs other than quoted prices that are observable for investments (such as interest rates, prepayment speeds, credit risk, etc.) or other market corroborated inputs. |
| • | | Level 3 — Significant inputs based on the best information available in the circumstances, to the extent observable inputs are not available (including the Funds’ assumptions in determining the fair value of investments). |
A financial instrument’s level within the fair value hierarchy is based on the lowest level of any input, both individually and in the aggregate, that is significant to the fair value measurement. The inputs or methodology used for valuing instruments are not necessarily an indication of the risk associated with investing in those instruments.
| | | | | | | | |
| | | |
| OCTOBER 31, 2019 | | J.P. MORGAN INTERNATIONAL EQUITY FUNDS | | | | | 119 | |
NOTES TO FINANCIAL STATEMENTS
AS OF OCTOBER 31, 2019 (continued)
The following tables represent each valuation input as presented on the Schedules of Portfolio Investments (“SOIs”) (amounts in thousands):
Emerging Markets Equity Fund
| | | | | | | | | | | | | | | | |
| | | Level 1
Quoted prices | | | Level 2
Other significant
observable inputs | | | Level 3 Significant
unobservable inputs | | | Total | |
Investments in Securities | | | | | | | | | | | | | | | | |
Common Stocks | | | | | | | | | | | | | | | | |
Australia | | $ | — | | | $ | 18,691 | | | $ | — | | | $ | 18,691 | |
China | | | 812,654 | | | | 1,019,732 | | | | — | | | | 1,832,386 | |
Hong Kong | | | — | | | | 479,122 | | | | — | | | | 479,122 | |
Hungary | | | — | | | | 76,660 | | | | — | | | | 76,660 | |
India | | | 215,011 | | | | 1,023,109 | | | | — | | | | 1,238,120 | |
Indonesia | | | — | | | | 151,983 | | | | — | | | | 151,983 | |
Macau | | | — | | | | 75,382 | | | | — | | | | 75,382 | |
Portugal | | | — | | | | 88,997 | | | | — | | | | 88,997 | |
Russia | | | 33,911 | | | | 162,972 | | | | — | | | | 196,883 | |
South Africa | | | — | | | | 254,535 | | | | — | | | | 254,535 | |
South Korea | | | — | | | | 299,553 | | | | — | | | | 299,553 | |
Taiwan | | | 323,436 | | | | 101,898 | | | | — | | | | 425,334 | |
Turkey | | | 40,462 | | | | 12,067 | | | | — | | | | 52,529 | |
Other Common Stocks | | | 984,525 | | | | — | | | | — | | | | 984,525 | |
| | | | | | | | | | | | | | | | |
Total Common Stocks | | | 2,409,999 | | | | 3,764,701 | | | | — | | | | 6,174,700 | |
| | | | | | | | | | | | | | | | |
Short-Term Investments | |
Investment Companies | | | 168,369 | | | | — | | | | — | | | | 168,369 | |
Investment of cash collateral from securities loaned | | | 13,486 | | | | — | | | | — | | | | 13,486 | |
| | | | | | | | | | | | | | | | |
Total Investments in Securities | | $ | 2,591,854 | | | $ | 3,764,701 | | | $ | — | | | $ | 6,356,555 | |
| | | | | | | | | | | | | | | | |
Emerging Markets Research Enhanced Equity Fund
| | | | | | | | | | | | | | | | |
| | | Level 1 Quoted prices | | | Level 2
Other significant
observable inputs | | | Level 3 Significant
unobservable inputs | | | Total | |
Investments in Securities | | | | | | | | | | | | | | | | |
Common Stocks | | | | | | | | | | | | | | | | |
China | | $ | 158,506 | | | $ | 510,547 | | | $ | — | | | $ | 669,053 | |
Czech Republic | | | — | | | | 7,488 | | | | — | | | | 7,488 | |
Greece | | | — | | | | 2,043 | | | | — | | | | 2,043 | |
Hong Kong | | | 1,858 | | | | 13,212 | | | | — | | | | 15,070 | |
Hungary | | | 4,282 | | | | 9,650 | | | | — | | | | 13,932 | |
Indonesia | | | — | | | | 44,708 | | | | — | | | | 44,708 | |
Malaysia | | | — | | | | 25,965 | | | | — | | | | 25,965 | |
Philippines | | | — | | | | 10,519 | | | | — | | | | 10,519 | |
Poland | | | — | | | | 22,992 | | | | — | | | | 22,992 | |
Qatar | | | — | | | | 8,049 | | | | — | | | | 8,049 | |
Russia | | | 21,318 | | | | 73,837 | | | | — | | | | 95,155 | |
Saudi Arabia | | | 2,923 | | | | 40,269 | | | | — | | | | 43,192 | |
Singapore | | | — | | | | 2,049 | | | | — | | | | 2,049 | |
South Africa | | | 3,522 | | | | 84,371 | | | | — | | | | 87,893 | |
South Korea | | | — | | | | 270,828 | | | | — | | | | 270,828 | |
Taiwan | | | 96,014 | | | | 144,156 | | | | — | | | | 240,170 | |
Thailand | | | 21,064 | | | | 26,187 | | | | — | | | | 47,251 | |
Turkey | | | 4,440 | | | | 15,301 | | | | — | | | | 19,741 | |
United Arab Emirates | | | — | | | | 2,173 | | | | — | | | | 2,173 | |
United Kingdom | | | — | | | | 1,733 | | | | — | | | | 1,733 | |
Other Common Stocks | | | 254,612 | | | | — | | | | — | | | | 254,612 | |
| | | | | | | | | | | | | | | | |
Total Common Stocks | | | 568,539 | | | | 1,316,077 | | | | — | | | | 1,884,616 | |
| | | | | | | | | | | | | | | | |
| | | | | | |
| | | |
| 120 | | | | J.P. MORGAN INTERNATIONAL EQUITY FUNDS | | OCTOBER 31, 2019 |
Emerging Markets Research Enhanced Equity Fund(continued)
| | | | | | | | | | | | | | | | |
| | | Level 1 Quoted prices | | | Level 2
Other significant
observable inputs | | | Level 3 Significant
unobservable inputs | | | Total | |
Exchange-Traded Funds | | $ | 178,948 | | | $ | — | | | $ | — | | | $ | 178,948 | |
Short-Term Investments | | | | | | | | | | | | | | | | |
Investment Companies | | | 22,226 | | | | — | | | | — | | | | 22,226 | |
Investment of cash collateral from securities loaned | | | 2,216 | | | | — | | | | — | | | | 2,216 | |
| | | | | | | | | | | | | | | | |
Total Investments in Securities | | $ | 771,929 | | | $ | 1,316,077 | | | $ | ��� | | | $ | 2,088,006 | |
| | | | | | | | | | | | | | | | |
Europe Dynamic Fund
| | | | | | | | | | | | | | | | |
| | | Level 1
Quoted prices | | | Level 2
Other significant
observable inputs | | | Level 3
Significant
unobservable inputs | | | Total | |
Investments in Securities | | | | | | | | | | | | | | | | |
Common Stocks | |
Australia | | $ | — | | | $ | 12,666 | | | $ | — | | | $ | 12,666 | |
Austria | | | — | | | | 3,723 | | | | — | | | | 3,723 | |
Belgium | | | — | | | | 8,595 | | | | — | | | | 8,595 | |
Finland | | | — | | | | 16,908 | | | | — | | | | 16,908 | |
France | | | — | | | | 86,996 | | | | — | | | | 86,996 | |
Germany | | | 4,696 | | | | 63,428 | | | | — | | | | 68,124 | |
Italy | | | — | | | | 24,930 | | | | — | | | | 24,930 | |
Netherlands | | | — | | | | 42,997 | | | | — | | | | 42,997 | |
Norway | | | — | | | | 9,902 | | | | — | | | | 9,902 | |
Russia | | | — | | | | 7,370 | | | | — | | | | 7,370 | |
South Africa | | | — | | | | 6,688 | | | | — | | | | 6,688 | |
Spain | | | — | | | | 14,164 | | | | — | | | | 14,164 | |
Sweden | | | — | | | | 17,426 | | | | — | | | | 17,426 | |
Switzerland | | | — | | | | 116,741 | | | | — | | | | 116,741 | |
United Kingdom | | | 8,085 | | | | 89,701 | | | | — | | | | 97,786 | |
Other Common Stocks | | | 4,970 | | | | — | | | | — | | | | 4,970 | |
| | | | | | | | | | | | | | | | |
Total Common Stocks | | | 17,751 | | | | 522,235 | | | | — | | | | 539,986 | |
| | | | | | | | | | | | | | | | |
Short-Term Investments | |
Investment Companies | | | 130 | | | | — | | | | — | | | | 130 | |
Investment of cash collateral from securities loaned | | | 286 | | | | — | | | | — | | | | 286 | |
| | | | | | | | | | | | | | | | |
Total Investments in Securities | | $ | 18,167 | | | $ | 522,235 | | | $ | — | | | $ | 540,402 | |
| | | | | | | | | | | | | | | | |
Depreciation in Other Financial Instruments | |
Futures Contracts | | $ | (12 | ) | | $ | — | | | $ | — | | | $ | (12 | ) |
| | | | | | | | | | | | | | | | |
| | | | | | | | |
| | | |
| OCTOBER 31, 2019 | | J.P. MORGAN INTERNATIONAL EQUITY FUNDS | | | | | 121 | |
NOTES TO FINANCIAL STATEMENTS
AS OF OCTOBER 31, 2019 (continued)
Global Research Enhanced Index Fund
| | | | | | | | | | | | | | | | |
| | | Level 1
Quoted prices | | | Level 2
Other significant
observable inputs | | | Level 3
Significant
unobservable inputs | | | Total | |
Investments in Securities | | | | | | | | | | | | | | | | |
Common Stocks | |
Australia | | $ | — | | | $ | 124,504 | | | $ | — | | | $ | 124,504 | |
Austria | | | — | | | | 6,320 | | | | — | | | | 6,320 | |
Belgium | | | — | | | | 10,328 | | | | — | | | | 10,328 | |
China | | | 1,612 | | | | 2,747 | | | | — | | | | 4,359 | |
Denmark | | | — | | | | 28,372 | | | | — | | | | 28,372 | |
Finland | | | 3,984 | | | | 11,062 | | | | — | | | | 15,046 | |
France | | | — | | | | 179,553 | | | | — | | | | 179,553 | |
Germany | | | 11,282 | | | | 107,637 | | | | — | | | | 118,919 | |
Hong Kong | | | — | | | | 46,847 | | | | — | | | | 46,847 | |
Ireland | | | 5,184 | | | | 18,111 | | | | — | | | | 23,295 | |
Italy | | | — | | | | 28,410 | | | | — | | | | 28,410 | |
Japan | | | 1,389 | | | | 344,833 | | | | — | | | | 346,222 | |
Macau | | | — | | | | 4,118 | | | | — | | | | 4,118 | |
Netherlands | | | 3,835 | | | | 86,603 | | | | — | | | | 90,438 | |
New Zealand | | | — | | | | 3,159 | | | | — | | | | 3,159 | |
Norway | | | — | | | | 5,424 | | | | — | | | | 5,424 | |
Singapore | | | — | | | | 20,766 | | | | — | | | | 20,766 | |
Spain | | | — | | | | 32,511 | | | | — | | | | 32,511 | |
Sweden | | | — | | | | 23,627 | | | | — | | | | 23,627 | |
Switzerland | | | — | | | | 117,851 | | | | — | | | | 117,851 | |
United Kingdom | | | 12,981 | | | | 188,568 | | | | — | | | | 201,549 | |
United States | | | 2,581,365 | | | | 3,616 | | | | — | | | | 2,584,981 | |
Other Common Stocks | | | 149,793 | | | | — | | | | — | | | | 149,793 | |
| | | | | | | | | | | | | | | | |
Total Common Stocks | | | 2,771,425 | | | | 1,394,967 | | | | — | | | | 4,166,392 | |
| | | | | | | | | | | | | | | | |
Investment of cash collateral from securities loaned | | | 39,184 | | | | — | | | | — | | | | 39,184 | |
| | | | | | | | | | | | | | | | |
Total Investments in Securities | | $ | 2,810,609 | | | $ | 1,394,967 | | | $ | — | | | | 4,205,576 | |
| | | | | | | | | | | | | | | | |
Appreciation in Other Financial Instruments | |
Futures Contracts | | $ | 30 | | | $ | — | | | $ | — | | | $ | 30 | |
| | | | | | | | | | | | | | | | |
| | | | | | |
| | | |
| 122 | | | | J.P. MORGAN INTERNATIONAL EQUITY FUNDS | | OCTOBER 31, 2019 |
International Advantage Fund
| | | | | | | | | | | | | | | | |
| | | Level 1
Quoted prices | | | Level 2
Other significant
observable inputs | | | Level 3
Significant
unobservable inputs | | | Total | |
Investments in Securities | | | | | | | | | | | | | | | | |
Common Stocks | | | | | | | | | | | | | | | | |
Australia | | $ | — | | | $ | 154,275 | | | $ | — | | | $ | 154,275 | |
Austria | | | — | | | | 16,417 | | | | — | | | | 16,417 | |
Belgium | | | — | | | | 31,318 | | | | — | | | | 31,318 | |
China | | | — | | | | 3,918 | | | | — | | | | 3,918 | |
Denmark | | | 3,437 | | | | 15,245 | | | | — | | | | 18,682 | |
Finland | | | — | | | | 19,779 | | | | — | | | | 19,779 | |
France | | | 3,331 | | | | 145,235 | | | | — | | | | 148,566 | |
Germany | | | 21,968 | | | | 124,602 | | | | — | | | | 146,570 | |
Ghana | | | — | | | | 5,920 | | | | — | | | | 5,920 | |
Hong Kong | | | — | | | | 16,755 | | | | — | | | | 16,755 | |
India | | | — | | | | 1,589 | | | | — | | | | 1,589 | |
Ireland | | | — | | | | 3,208 | | | | — | | | | 3,208 | |
Israel | | | — | | | | 6,611 | | | | — | | | | 6,611 | |
Italy | | | — | | | | 15,684 | | | | — | | | | 15,684 | |
Japan | | | — | | | | 427,415 | | | | — | | | | 427,415 | |
Netherlands | | | — | | | | 114,162 | | | | — | | | | 114,162 | |
Norway | | | — | | | | 34,939 | | | | — | | | | 34,939 | |
Russia | | | — | | | | 4,864 | | | | — | | | | 4,864 | |
Singapore | | | — | | | | 31,386 | | | | — | | | | 31,386 | |
South Africa | | | — | | | | 19,074 | | | | — | | | | 19,074 | |
Spain | | | — | | | | 71,361 | | | | — | | | | 71,361 | |
Sweden | | | — | | | | 19,787 | | | | — | | | | 19,787 | |
Switzerland | | | — | | | | 204,172 | | | | — | | | | 204,172 | |
United Kingdom | | | 28,061 | | | | 196,085 | | | | — | | | | 224,146 | |
| | | | | | | | | | | | | | | | |
Total Common Stocks | | | 56,797 | | | | 1,683,801 | | | | — | | | | 1,740,598 | |
| | | | | | | | | | | | | | | | |
Short-Term Investments | | | | | | | | | | | | | | | | |
Investment Companies | | | 42,366 | | | | — | | | | — | | | | 42,366 | |
Investment of cash collateral from securities loaned | | | 1,971 | | | | — | | | | — | | | | 1,971 | |
| | | | | | | | | | | | | | | | |
Total Investments in Securities | | $ | 101,134 | | | $ | 1,683,801 | | | $ | — | | | $ | 1,784,935 | |
| | | | | | | | | | | | | | | | |
Appreciation in Other Financial Instruments | | | | | | | | | | | | | | | | |
Futures Contracts | | $ | 2,017 | | | $ | — | | | $ | — | | | $ | 2,017 | |
| | | | | | | | | | | | | | | | |
| | | | | | | | |
| | | |
| OCTOBER 31, 2019 | | J.P. MORGAN INTERNATIONAL EQUITY FUNDS | | | | | 123 | |
NOTES TO FINANCIAL STATEMENTS
AS OF OCTOBER 31, 2019 (continued)
International Equity Fund
| | | | | | | | | | | | | | | | |
| | | Level 1
Quoted prices | | | Level 2
Other significant
observable inputs | | | Level 3
Significant
unobservable inputs | | | Total | |
Investments in Securities | | | | | | | | | | | | | | | | |
Common Stocks | | | | | | | | | | | | | | | | |
Australia | | $ | — | | | $ | 56,700 | | | $ | — | | | $ | 56,700 | |
Austria | | | — | | | | 13,853 | | | | — | | | | 13,853 | |
Belgium | | | — | | | | 50,462 | | | | — | | | | 50,462 | |
China | | | 35,688 | | | | 56,821 | | | | — | | | | 92,509 | |
Denmark | | | — | | | | 51,841 | | | | — | | | | 51,841 | |
France | | | — | | | | 449,774 | | | | — | | | | 449,774 | |
Germany | | | 28,689 | | | | 210,822 | | | | — | | | | 239,511 | |
Hong Kong | | | — | | | | 126,286 | | | | — | | | | 126,286 | |
Japan | | | — | | | | 511,011 | | | | — | | | | 511,011 | |
Macau | | | — | | | | 24,000 | | | | — | | | | 24,000 | |
Netherlands | | | — | | | | 172,283 | | | | — | | | | 172,283 | |
Singapore | | | — | | | | 39,309 | | | | — | | | | 39,309 | |
South Korea | | | — | | | | 40,230 | | | | — | | | | 40,230 | |
Spain | | | — | | | | 33,220 | | | | — | | | | 33,220 | |
Sweden | | | — | | | | 69,612 | | | | — | | | | 69,612 | |
Switzerland | | | — | | | | 354,196 | | | | — | | | | 354,196 | |
United Kingdom | | | 4,727 | | | | 452,107 | | | | — | | | | 456,834 | |
United States | | | — | | | | 37,404 | | | | — | | | | 37,404 | |
Other Common Stocks | | | 109,056 | | | | — | | | | — | | | | 109,056 | |
| | | | | | | | | | | | | | | | |
Total Common Stocks | | | 178,160 | | | | 2,749,931 | | | | — | | | | 2,928,091 | |
| | | | | | | | | | | | | | | | |
Short-Term Investments | | | | | | | | | | | | | | | | |
Investment Companies | | | 49,197 | | | | — | | | | — | | | | 49,197 | |
Investment of cash collateral from securities loaned | | | 52,519 | | | | — | | | | — | | | | 52,519 | |
| | | | | | | | | | | | | | | | |
Total Investments in Securities | | $ | 279,876 | | | $ | 2,749,931 | | | $ | — | | | $ | 3,029,807 | |
| | | | | | | | | | | | | | | | |
| | | | | | |
| | | |
| 124 | | | | J.P. MORGAN INTERNATIONAL EQUITY FUNDS | | OCTOBER 31, 2019 |
International Hedged Equity Fund
| | | | | | | | | | | | | | | | |
| | | Level 1
Quoted prices | | | Level 2
Other significant
observable inputs | | | Level 3
Significant
unobservable inputs | | | Total | |
Investments in Securities | | | | | | | | | | | | | | | | |
Common Stocks | | | | | | | | | | | | | | | | |
Australia | | $ | — | | | $ | 2,966 | | | $ | — | | | $ | 2,966 | |
Austria | | | — | | | | 374 | | | | — | | | | 374 | |
Belgium | | | — | | | | 608 | | | | — | | | | 608 | |
Denmark | | | — | | | | 1,063 | | | | — | | | | 1,063 | |
Finland | | | — | | | | 381 | | | | — | | | | 381 | |
France | | | 367 | | | | 7,855 | | | | — | | | | 8,222 | |
Germany | | | 888 | | | | 4,394 | | | | — | | | | 5,282 | |
Hong Kong | | | — | | | | 1,415 | | | | — | | | | 1,415 | |
Ireland | | | 356 | | | | 124 | | | | — | | | | 480 | |
Italy | | | — | | | | 1,544 | | | | — | | | | 1,544 | |
Japan | | | — | | | | 14,106 | | | | — | | | | 14,106 | |
Luxembourg | | | — | | | | 199 | | | | — | | | | 199 | |
Netherlands | | | — | | | | 2,991 | | | | — | | | | 2,991 | |
Norway | | | — | | | | 470 | | | | — | | | | 470 | |
Singapore | | | — | | | | 568 | | | | — | | | | 568 | |
Spain | | | — | | | | 1,944 | | | | — | | | | 1,944 | |
Sweden | | | — | | | | 842 | | | | — | | | | 842 | |
Switzerland | | | — | | | | 6,117 | | | | — | | | | 6,117 | |
United Kingdom | | | 261 | | | | 8,887 | | | | — | | | | 9,148 | |
United States | | | — | | | | 358 | | | | — | | | | 358 | |
| | | | | | | | | | | | | | | | |
Total Common Stocks | | | 1,872 | | | | 57,206 | | | | — | | | | 59,078 | |
| | | | | | | | | | | | | | | | |
Options Purchased | | | 162 | | | | — | | | | — | | | | 162 | |
Short-Term Investments | |
Investment Companies | | | 850 | | | | — | | | | — | | | | 850 | |
| | | | | | | | | | | | | | | | |
Total Investments in Securities | | $ | 2,884 | | | $ | 57,206 | | | $ | — | | | $ | 60,090 | |
| | | | | | | | | | | | | | | | |
Depreciation in Other Financial Instruments | |
Futures Contracts | | $ | — | | | $ | (4 | ) | | $ | — | | | $ | (4 | ) |
Options Written | | | | | | | | | | | | | | | | |
Call Options Written | | | (581 | ) | | | — | | | | — | | | | (581 | ) |
Put Options Written | | | (11 | ) | | | — | | | | — | | | | (11 | ) |
| | | | | | | | | | | | | | | | |
Total Depreciation in Other Financial Instruments | | $ | (592 | ) | | $ | (4 | ) | | $ | — | | | $ | (596 | ) |
| | | | | | | | | | | | | | | | |
| | | | | | | | |
| | | |
| OCTOBER 31, 2019 | | J.P. MORGAN INTERNATIONAL EQUITY FUNDS | | | | | 125 | |
NOTES TO FINANCIAL STATEMENTS
AS OF OCTOBER 31, 2019 (continued)
International Research Enhanced Equity Fund
| | | | | | | | | | | | | | | | |
| | | Level 1
Quoted prices | | | Level 2
Other significant
observable inputs | | | Level 3
Significant
unobservable inputs | | | Total | |
Investments in Securities | | | | | | | | | | | | | | | | |
Common Stocks | | | | | | | | | | | | | | | | |
Australia | | $ | — | | | $ | 233,477 | | | $ | — | | | $ | 233,477 | |
Austria | | | — | | | | 29,404 | | | | — | | | | 29,404 | |
Belgium | | | — | | | | 47,700 | | | | — | | | | 47,700 | |
Denmark | | | — | | | | 83,587 | | | | — | | | | 83,587 | |
Finland | | | — | | | | 29,903 | | | | — | | | | 29,903 | |
France | | | 28,849 | | | | 617,060 | | | | — | | | | 645,909 | |
Germany | | | 69,682 | | | | 346,059 | | | | — | | | | 415,741 | |
Hong Kong | | | — | | | | 110,445 | | | | — | | | | 110,445 | |
Ireland | | | 27,988 | | | | 9,914 | | | | — | | | | 37,902 | |
Italy | | | — | | | | 121,449 | | | | — | | | | 121,449 | |
Japan | | | — | | | | 1,107,070 | | | | — | | | | 1,107,070 | |
Luxembourg | | | — | | | | 15,620 | | | | — | | | | 15,620 | |
Malta | | | — | | | | — | | | | 1 | | | | 1 | |
Netherlands | | | — | | | | 234,847 | | | | — | | | | 234,847 | |
Norway | | | — | | | | 36,872 | | | | — | | | | 36,872 | |
Singapore | | | — | | | | 44,360 | | | | — | | | | 44,360 | |
Spain | | | — | | | | 152,868 | | | | — | | | | 152,868 | |
Sweden | | | — | | | | 66,141 | | | | — | | | | 66,141 | |
Switzerland | | | — | | | | 481,139 | | | | — | | | | 481,139 | |
United Kingdom | | | 20,450 | | | | 698,655 | | | | — | | | | 719,105 | |
United States | | | — | | | | 28,150 | | | | — | | | | 28,150 | |
| | | | | | | | | | | | | | | | |
Total Common Stocks | | | 146,969 | | | | 4,494,720 | | | | 1 | | | | 4,641,690 | |
| | | | | | | | | | | | | | | | |
Short-Term Investments | | | | | | | | | | | | | | | | |
Investment Companies | | | 154,151 | | | | — | | | | — | | | | 154,151 | |
Investment of cash collateral from securities loaned | | | 106,266 | | | | — | | | | — | | | | 106,266 | |
| | | | | | | | | | | | | | | | |
Total Investments in Securities | | $ | 407,386 | | | $ | 4,494,720 | | | $ | 1 | | | $ | 4,902,107 | |
| | | | | | | | | | | | | | | | |
Appreciation in Other Financial Instruments | | | | | | | | | | | | | | | | |
Futures Contracts | | $ | 1,967 | | | $ | — | | | $ | — | | | $ | 1,967 | |
| | | | | | | | | | | | | | | | |
Depreciation in Other Financial Instruments | | | | | | | | | | | | | | | | |
Futures Contracts | | $ | — | | | $ | (410 | ) | | $ | — | | | $ | (410 | ) |
| | | | | | | | | | | | | | | | |
| | | | | | |
| | | |
| 126 | | | | J.P. MORGAN INTERNATIONAL EQUITY FUNDS | | OCTOBER 31, 2019 |
International Unconstrained Equity Fund
| | | | | | | | | | | | | | | | |
| | | Level 1
Quoted prices | | | Level 2
Other significant
observable inputs | | | Level 3
Significant
unobservable inputs | | | Total | |
Investments in Securities | | | | | | | | | | | | | | | | |
Common Stocks | | | | | | | | | | | | | | | | |
Australia | | $ | — | | | $ | 46,135 | | | $ | — | | | $ | 46,135 | |
Austria | | | — | | | | 42,914 | | | | — | | | | 42,914 | |
Belgium | | | — | | | | 24,287 | | | | — | | | | 24,287 | |
China | | | 69,896 | | | | 156,227 | | | | — | | | | 226,123 | |
Denmark | | | — | | | | 56,772 | | | | — | | | | 56,772 | |
France | | | — | | | | 193,253 | | | | — | | | | 193,253 | |
Germany | | | — | | | | 251,424 | | | | — | | | | 251,424 | |
Hong Kong | | | — | | | | 139,363 | | | | — | | | | 139,363 | |
Indonesia | | | — | | | | 49,003 | | | | — | | | | 49,003 | |
Japan | | | — | | | | 193,011 | | | | — | | | | 193,011 | |
Netherlands | | | — | | | | 138,039 | | | | — | | | | 138,039 | |
Sweden | | | — | | | | 42,792 | | | | — | | | | 42,792 | |
Switzerland | | | — | | | | 247,648 | | | | — | | | | 247,648 | |
United Kingdom | | | — | | | | 474,012 | | | | — | | | | 474,012 | |
United States | | | — | | | | 54,630 | | | | — | | | | 54,630 | |
Other Common Stocks | | | 380,909 | | | | — | | | | — | | | | 380,909 | |
| | | | | | | | | | | | | | | | |
Total Common Stocks | | | 450,805 | | | | 2,109,510 | | | | — | | | | 2,560,315 | |
| | | | | | | | | | | | | | | | |
Short-Term Investments | |
Investment Companies | | | 48,921 | | | | — | | | | — | | | | 48,921 | |
Investment of cash collateral from securities loaned | | | 75,853 | | | | — | | | | — | | | | 75,853 | |
| | | | | | | | | | | | | | | | |
Total Investments in Securities | | $ | 575,579 | | | $ | 2,109,510 | | | $ | — | | | $ | 2,685,089 | |
| | | | | | | | | | | | | | | | |
| | | | | | | | |
| | | |
| OCTOBER 31, 2019 | | J.P. MORGAN INTERNATIONAL EQUITY FUNDS | | | | | 127 | |
NOTES TO FINANCIAL STATEMENTS
AS OF OCTOBER 31, 2019 (continued)
International Value Fund
| | | | | | | | | | | | | | | | |
| | | Level 1
Quoted prices | | | Level 2
Other significant
observable inputs | | | Level 3
Significant
unobservable inputs | | | Total | |
Investments in Securities | | | | | | | | | | | | | | | | |
Common Stocks | | | | | | | | | | | | | | | | |
Australia | | $ | — | | | $ | 36,088 | | | $ | — | | | $ | 36,088 | |
Austria | | | 504 | | | | 4,330 | | | | — | | | | 4,834 | |
Belgium | | | 530 | | | | 4,050 | | | | — | | | | 4,580 | |
China | | | — | | | | 1,199 | | | | — | | | | 1,199 | |
Denmark | | | 1,507 | | | | 681 | | | | — | | | | 2,188 | |
Finland | | | 2,601 | | | | 2,484 | | | | — | | | | 5,085 | |
France | | | — | | | | 31,428 | | | | — | | | | 31,428 | |
Georgia | | | — | | | | 482 | | | | — | | | | 482 | |
Germany | | | 2,169 | | | | 29,303 | | | | — | | | | 31,472 | |
Ghana | | | — | | | | 578 | | | | — | | | | 578 | |
Hong Kong | | | — | | | | 8,022 | | | | — | | | | 8,022 | |
India | | | — | | | | 441 | | | | — | | | | 441 | |
Ireland | | | 961 | | | | 598 | | | | — | | | | 1,559 | |
Israel | | | — | | | | 1,778 | | | | — | | | | 1,778 | |
Italy | | | 731 | | | | 10,604 | | | | — | | | | 11,335 | |
Japan | | | — | | | | 85,834 | | | | — | | | | 85,834 | |
Malta | | | — | | | | 450 | | | | — | | | | 450 | |
Netherlands | | | 647 | | | | 22,327 | | | | — | | | | 22,974 | |
New Zealand | | | — | | | | 1,121 | | | | — | | | | 1,121 | |
Norway | | | 1,375 | | | | 8,428 | | | | — | | | | 9,803 | |
Portugal | | | — | | | | 405 | | | | — | | | | 405 | |
Russia | | | — | | | | 662 | | | | — | | | | 662 | |
Singapore | | | — | | | | 5,455 | | | | — | | | | 5,455 | |
South Africa | | | — | | | | 2,331 | | | | — | | | | 2,331 | |
Spain | | | — | | | | 10,493 | | | | — | | | | 10,493 | |
Sweden | | | 389 | | | | 11,176 | | | | — | | | | 11,565 | |
Switzerland | | | — | | | | 24,346 | | | | — | | | | 24,346 | |
United Kingdom | | | 8,676 | | | | 59,819 | | | | — | | | | 68,495 | |
United States | | | 452 | | | | 422 | | | | — | | | | 874 | |
Other Common Stocks | | | 783 | | | | — | | | | — | | | | 783 | |
| | | | | | | | | | | | | | | | |
Total Common Stocks | | | 21,325 | | | | 365,335 | | | | — | | | | 386,660 | |
| | | | | | | | | | | | | | | | |
Rights | | | — | | | | — | (a) | | | — | | | | — | (a) |
Short-Term Investments | |
Investment Companies | | | 3,487 | | | | — | | | | — | | | | 3,487 | |
Investment of cash collateral from securities loaned | | | 4,026 | | | | — | | | | — | | | | 4,026 | |
| | | | | | | | | | | | | | | | |
Total Investments in Securities | | $ | 28,838 | | | $ | 365,335 | | | $ | — | | | $ | 394,173 | |
| | | | | | | | | | | | | | | | |
Appreciation in Other Financial Instruments | |
Futures Contracts | | $ | 50 | | | $ | — | | | $ | — | | | $ | 50 | |
| | | | | | | | | | | | | | | | |
Depreciation in Other Financial Instruments | |
Futures Contracts | | $ | (7 | ) | | $ | — | | | $ | — | | | $ | (7 | ) |
| | | | | | | | | | | | | | | | |
| (a) | Amount rounds to less than one thousand. |
There were no transfers into or out of level 3 for the year ended October 31, 2019.
B. Restricted Securities — Certain securities held by the Funds may be subject to legal or contractual restrictions on resale. Restricted securities generally are resold in transactions exempt from registration under the Securities Act of 1933, as amended (the “Securities Act”). Disposal of these securities may involve time-consuming negotiations and expense. Prompt sale at the current valuation may be difficult and could adversely affect the net asset value of the Funds.
As of October 31, 2019, the Funds had no investments in restricted securities other than securities sold to the Funds under Rule 144A or Regulation S under the Securities Act.
| | | | | | |
| | | |
| 128 | | | | J.P. MORGAN INTERNATIONAL EQUITY FUNDS | | OCTOBER 31, 2019 |
C. Securities Lending — Effective October 5, 2018, the Funds became authorized to engage in securities lending in order to generate additional income. The Funds are able to lend to approved borrowers. Citibank N.A. (“Citibank”) serves as lending agent for the Funds, pursuant to a Securities Lending Agency Agreement (the “Securities Lending Agency Agreement”). Securities loaned are collateralized by cash equal to at least 100% of the market value plus accrued interest on the securities lent, which is invested in IM Shares of JPMorgan U.S. Government Money Market Fund and/or the Agency SL Shares of the JPMorgan Securities Lending Money Market Fund. The Funds retain loan fees and the interest on cash collateral investments but are required to pay the borrower a rebate for the use of cash collateral. In cases where the lent security is of high value to borrowers, there may be a negative rebate (i.e., a net payment from the borrower to the Funds). Upon termination of a loan, the Funds are required to return to the borrower an amount equal to the cash collateral, plus any rebate owed to the borrowers. The remaining maturities of the securities lending transactions are considered overnight and continuous. Loans are subject to termination by the Funds or the borrower at any time.
The net income earned on the securities lending (after payment of rebates and Citibank’s fee) is included on the Statements of Operations as Income from securities lending (net). The Funds also receive payments from the borrower during the period of the loan, equivalent to dividends and interest earned on the securities loaned, which are recorded as Dividend or Interest income, respectively, on the Statements of Operations.
Under the Securities Lending Agency Agreement, Citibank marks to market the loaned securities on a daily basis. In the event the cash received from the borrower is less than 102% of the value of the loaned securities (105% for loans ofnon-U.S. securities), Citibank requests additional cash from the borrower so as to maintain a collateralization level of at least 102% of the value of the loaned securities plus accrued interest (105% for loans ofnon-U.S. securities), subject to certainde minimis amounts.
The value of securities out on loan is recorded as an asset on the Statements of Assets and Liabilities. The value of the cash collateral received is recorded as a liability on the Statements of Assets and Liabilities and details of collateral investments are disclosed on the SOIs.
The Funds bear the risk of loss associated with the collateral investments and are not entitled to additional collateral from the borrower to cover any such losses. To the extent that the value of the collateral investments declines below the amount owed to a borrower, the Funds may incur losses that exceed the amount they earned on lending the security. Upon termination of a loan, the Funds may use leverage (borrow money) to repay the borrower for cash collateral posted if the Adviser does not believe that it is prudent to sell the collateral investments to fund the payment of this liability.
The following table presents for each lending Fund, the value of the securities on loan with Citibank, net of amounts available for offset under the master netting arrangements and any related collateral received or posted by the Funds as of October 31, 2019 (amounts in thousands).
| | | | | | | | | | | | |
| | | Investment Securities
on Loan, at value,
Presented on the
Statements of Assets
and Liabilities | | | Cash Collateral
Posted by Borrower* | | | Net Amount Due
to Counterparty
(not less than zero) | |
Emerging Markets Equity Fund | | $ | 13,200 | | | $ | (13,200 | ) | | $ | — | |
Emerging Markets Research Enhanced Equity Fund | | | 2,092 | | | | (2,092 | ) | | | — | |
Europe Dynamic Fund | | | 275 | | | | (275 | ) | | | — | |
Global Research Enhanced Index Fund | | | 37,095 | | | | (37,095 | ) | | | — | |
International Advantage Fund | | | 1,858 | | | | (1,858 | ) | | | — | |
International Equity Fund | | | 49,506 | | | | (49,506 | ) | | | — | |
International Research Enhanced Equity Fund | | | 99,554 | | | | (99,554 | ) | | | — | |
International Unconstrained Equity Fund | | | 70,848 | | | | (70,848 | ) | | | — | |
International Value Fund | | | 3,789 | | | | (3,789 | ) | | | — | |
| * | Collateral posted reflects the value of securities on loan and does not include any additional amounts received from the borrower. |
Securities lending also involves counterparty risks, including the risk that the loaned securities may not be returned in a timely manner or at all. Subject to certain conditions, Citibank has agreed to indemnify the Funds from losses resulting from a borrower’s failure to return a loaned security.
JPMIM voluntarily waived investment advisory fees charged to the Funds to reduce the impact of the cash collateral investment in the JPMorgan U.S. Government Money Market Fund from 0.16% to 0.06%. JPMIM waived fees associated with the Funds’ investment in JPMorgan U.S. Government Money Market Fund as follows (amounts in thousands):
| | | | |
Emerging Markets Equity Fund | | $ | 7 | |
Emerging Markets Research Enhanced Equity Fund | | | — | (a) |
Europe Dynamic Fund | | | 4 | |
Global Research Enhanced Index Fund | | | 7 | |
International Advantage Fund | | | 9 | |
International Equity Fund | | | 9 | |
International Research Enhanced Equity Fund | | | 13 | |
International Unconstrained Equity Fund | | | 3 | |
International Value Fund | | | 3 | |
| (a) | Amount rounds to less than one thousand. |
| | | | | | | | |
| | | |
| OCTOBER 31, 2019 | | J.P. MORGAN INTERNATIONAL EQUITY FUNDS | | | | | 129 | |
NOTES TO FINANCIAL STATEMENTS
AS OF OCTOBER 31, 2019 (continued)
The above waiver is included in the determination of earnings on cash collateral investment and in the calculation of Citibank’s compensation and is included on the Statements of Operations as Income from securities lending (net).
International Hedged Equity Fund did not have any securities out on loan at October 31, 2019.
D. Investment Transactions with Affiliates — The Funds invested in Underlying Funds which are advised by the Adviser. An issuer which is under common control with the Funds may be considered an affiliate. For the purposes of the financial statements, the Funds assume the issuers listed in the table below to be affiliated issuers. Underlying Funds’ distributions may be reinvested into the Underlying Funds. Reinvestment amounts are included in the purchase cost amounts in the table below. Amounts in the table below are in thousands.
| | | | | | | | | | | | | | | | | | | | | | | | | | | | | | | | | | | | |
| Emerging Markets Equity Fund | | | | | | | | | | | | | | | | | | | | | | | | | |
| For the year ended October 31, 2019 | |
| Security Description | | Value at
October 31,
2018 | | | Purchases
at Cost | | | Proceeds
from Sales | | | Net
Realized
Gain
(Loss) | | | Change in
Unrealized
Appreciation/
(Depreciation) | | | Value at
October 31,
2019 | | | Shares at
October 31,
2019 | | | Dividend
Income | | | Capital Gain
Distributions | |
JPMorgan Prime Money Market Fund Class Institutional Shares, 1.88% (a) (b) | | $ | — | | | $ | 1,291,368 | | | $ | 1,123,019 | | | $ | 3 | | | $ | 17 | | | $ | 168,369 | | | | 168,301 | | | $ | 1,368 | | | $ | — | |
JPMorgan Securities Lending Money Market Fund Class Agency SL Shares, 1.98% (a) (b) | | | — | | | | 327,000 | | | | 319,000 | | | | 1 | * | | | — | (d) | | | 8,001 | | | | 8,001 | | | | 616 | * | | | — | |
JPMorgan U.S. Government Money Market Fund Class IM Shares, 1.70% (a) (b) | | | — | | | | 188,694 | | | | 183,209 | | | | — | | | | — | | | | 5,485 | | | | 5,485 | | | | 191 | * | | | — | |
JPMorgan U.S. Government Money Market Fund Class Institutional Shares (a) | | | 58,479 | | | | 728,130 | | | | 786,609 | | | | — | | | | — | | | | — | | | | — | | | | 551 | | | | — | |
| | | | | | | | | | | | | | | | | | | | | | | | | | | | | | | | | | | | |
Total | | $ | 58,479 | | | $ | 2,535,192 | | | $ | 2,411,837 | | | $ | 4 | | | $ | 17 | | | $ | 181,855 | | | | | | | $ | 2,726 | | | $ | — | |
| | | | | | | | | | | | | | | | | | | | | | | | | | | | | | | | | | | | |
| | | | | | |
| Emerging Markets Research Enhanced Equity Fund | | | | | | | | | | | | | | | | | | | | | | | | | |
| For the period ended October 31, 2019 | |
| Security Description | | Value at
December 11,
2018 (c) | | | Purchases
at Cost | | | Proceeds
from Sales | | | Net
Realized
Gain
(Loss) | | | Change in
Unrealized
Appreciation/
(Depreciation) | | | Value at
October 31,
2019 | | | Shares at
October 31,
2019 | | | Dividend
Income | | | Capital Gain
Distributions | |
JPMorgan Prime Money Market Fund Class Institutional Shares, 1.88% (a) (b) | | $ | — | | | $ | 1,047,506 | | | $ | 1,025,287 | | | $ | 3 | | | $ | 4 | | | $ | 22,226 | | | | 22,217 | | | $ | 378 | | | $ | — | |
JPMorgan U.S. Government Money Market Fund Class IM Shares, 1.70% (a) (b) | | | — | | | | 13,455 | | | | 11,239 | | | | — | | | | — | | | | 2,216 | | | | 2,216 | | | | 9 | * | | | — | |
JPMorgan U.S. Government Money Market Fund Class Institutional Shares (a) | | | — | | | | 234,153 | | | | 234,153 | | | | — | | | | — | | | | — | | | | — | | | | 85 | | | | — | |
| | | | | | | | | | | | | | | | | | | | | | | | | | | | | | | | | | | | |
Total | | $ | — | | | $ | 1,295,114 | | | $ | 1,270,679 | | | $ | 3 | | | $ | 4 | | | $ | 24,442 | | | | | | | $ | 472 | | | $ | — | |
| | | | | | | | | | | | | | | | | | | | | | | | | | | | | | | | | | | | |
| | | | | | |
| | | |
| 130 | | | | J.P. MORGAN INTERNATIONAL EQUITY FUNDS | | OCTOBER 31, 2019 |
| | | | | | | | | | | | | | | | | | | | | | | | | | | | | | | | | | | | |
| Europe Dynamic Fund | | | | | | | | | | | | | | | | | | | | | | | | | |
| For the year ended October 31, 2019 | |
| Security Description | | Value at
October 31,
2018 | | | Purchases
at Cost | | | Proceeds
from Sales | | | Net
Realized
Gain
(Loss) | | | Change in
Unrealized
Appreciation/
(Depreciation) | | | Value at
October 31,
2019 | | | Shares at
October 31,
2019 | | | Dividend
Income | | | Capital Gain
Distributions | |
JPMorgan Prime Money Market Fund Class Institutional Shares, 1.88% (a) (b) | | $ | — | | | $ | 158,446 | | | $ | 158,316 | | | $ | — | (d) | | $ | — | (d) | | $ | 130 | | | | 130 | | | $ | 120 | | | $ | — | |
JPMorgan Securities Lending Money Market Fund Class Agency SL Shares (a) | | | — | | | | 137,000 | | | | 137,000 | | | | — | | | | — | | | | — | | | | — | | | | 158 | * | | | — | |
JPMorgan U.S. Government Money Market Fund Class IM Shares, 1.70% (a) (b) | | | — | | | | 146,507 | | | | 146,221 | | | | — | | | | — | | | | 286 | | | | 286 | | | | 116 | * | | | — | |
JPMorgan U.S. Government Money Market Fund Class Institutional Shares (a) | | | 51,037 | | | | 162,751 | | | | 213,788 | | | | — | | | | — | | | | — | | | | — | | | | 186 | | | | — | |
| | | | | | | | | | | | | | | | | | | | | | | | | | | | | | | | | | | | |
Total | | $ | 51,037 | | | $ | 604,704 | | | $ | 655,325 | | | $ | — | (d) | | $ | — | (d) | | $ | 416 | | | | | | | $ | 580 | | | $ | — | |
| | | | | | | | | | | | | | | | | | | | | | | | | | | | | | | | | | | | |
| | | | | | |
| Global Research Enhanced Index Fund | | | | | | | | | | | | | | | | | | | | | | | | | |
| For the year ended October 31, 2019 | |
| Security Description | | Value at
October 31,
2018 | | | Purchases
at Cost | | | Proceeds
from Sales | | | Net
Realized
Gain
(Loss) | | | Change in
Unrealized
Appreciation/
(Depreciation) | | | Value at
October 31,
2019 | | | Shares at
October 31,
2019 | | | Dividend
Income | | | Capital Gain
Distributions | |
JPMorgan Prime Money Market Fund Class Institutional Shares, 1.88% (a) (b) | | $ | — | | | $ | 458,029 | | | $ | 458,033 | | | $ | 4 | | | $ | — | | | $ | — | | | | — | | | $ | 360 | | | $ | — | |
JPMorgan Securities Lending Money Market Fund Class Agency SL Shares, 1.98% (a) (b) | | | — | | | | 419,000 | | | | 391,500 | | | | 4 | * | | | — | (d) | | | 27,504 | | | | 27,501 | | | | 625 | * | | | — | |
JPMorgan U.S. Government Money Market Fund Class IM Shares, 1.70% (a) (b) | | | — | | | | 385,683 | | | | 374,003 | | | | — | | | | — | | | | 11,680 | | | | 11,680 | | | | 211 | * | | | — | |
JPMorgan U.S. Government Money Market Fund Class Institutional Shares (a) | | | — | | | | 639,681 | | | | 639,681 | | | | — | | | | — | | | | — | | | | — | | | | 270 | | | | — | |
| | | | | | | | | | | | | | | | | | | | | | | | | | | | | | | | | | | | |
Total | | $ | — | | | $ | 1,902,393 | | | $ | 1,863,217 | | | $ | 8 | | | $ | — | (d) | | $ | 39,184 | | | | | | | $ | 1,466 | | | $ | — | |
| | | | | | | | | | | | | | | | | | | | | | | | | | | | | | | | | | | | |
| | | | | | | | |
| | | |
| OCTOBER 31, 2019 | | J.P. MORGAN INTERNATIONAL EQUITY FUNDS | | | | | 131 | |
NOTES TO FINANCIAL STATEMENTS
AS OF OCTOBER 31, 2019 (continued)
| | | | | | | | | | | | | | | | | | | | | | | | | | | | | | | | | | | | |
| | | | | | |
| International Advantage Fund | | | | | | | | | | | | | | | | | | | | | | | | | |
| For the year ended October 31, 2019 | |
| Security Description | | Value at
October 31,
2018 | | | Purchases
at Cost | | | Proceeds
from Sales | | | Net
Realized
Gain
(Loss) | | | Change in
Unrealized
Appreciation/
(Depreciation) | | | Value at
October 31,
2019 | | | Shares at
October 31,
2019 | | | Dividend
Income | | | Capital Gain
Distributions | |
JPMorgan Prime Money Market Fund Class Institutional Shares, 1.88% (a) (b) | | $ | — | | | $ | 554,637 | | | $ | 512,288 | | | $ | 10 | | | $ | 7 | | | $ | 42,366 | | | | 42,349 | | | $ | 733 | | | $ | — | |
JPMorgan Securities Lending Money Market Fund Class Agency SL Shares, 1.98% (a) (b) | | | — | | | | 537,000 | | | | 536,000 | | | | 5 | * | | | — | (d) | | | 1,005 | | | | 1,005 | | | | 873 | * | | | — | |
JPMorgan U.S. Government Money Market Fund Class IM Shares, 1.70% (a) (b) | | | — | | | | 363,391 | | | | 362,425 | | | | — | | | | — | | | | 966 | | | | 966 | | | | 264 | * | | | — | |
JPMorgan U.S. Government Money Market Fund Class Institutional Shares (a) | | | 52,914 | | | | 397,224 | | | | 450,138 | | | | — | | | | — | | | | — | | | | — | | | | 547 | | | | — | |
| | | | | | | | | | | | | | | | | | | | | | | | | | | | | | | | | | | | |
Total | | $ | 52,914 | | | $ | 1,852,252 | | | $ | 1,860,851 | | | $ | 15 | | | $ | 7 | | | $ | 44,337 | | | | | | | $ | 2,417 | | | $ | — | |
| | | | | | | | | | | | | | | | | | | | | | | | | | | | | | | | | | | | |
| | | | | | |
| International Equity Fund | | | | | | | | | | | | | | | | | | | | | | | | | |
| For the year ended October 31, 2019 | |
| Security Description | | Value at
October 31,
2018 | | | Purchases
at Cost | | | Proceeds
from Sales | | | Net
Realized
Gain
(Loss) | | | Change in
Unrealized
Appreciation/
(Depreciation) | | | Value at
October 31,
2019 | | | Shares at
October 31,
2019 | | | Dividend
Income | | | Capital Gain
Distributions | |
JPMorgan Prime Money Market Fund Class Institutional Shares, 1.88% (a) (b) | | $ | — | | | $ | 777,161 | | | $ | 727,981 | | | $ | 8 | | | $ | 9 | | | $ | 49,197 | | | | 49,177 | | | $ | 1,007 | | | $ | — | |
JPMorgan Securities Lending Money Market Fund Class Agency SL Shares, 1.98% (a) (b) | | | — | | | | 764,000 | | | | 724,000 | | | | 3 | * | | | — | | | | 40,003 | | | | 39,999 | | | | 755 | * | | | — | |
JPMorgan U.S. Government Money Market Fund Class IM Shares, 1.70% (a) (b) | | | — | | | | 399,925 | | | | 387,409 | | | | — | | | | — | | | | 12,516 | | | | 12,516 | | | | 260 | * | | | — | |
JPMorgan U.S. Government Money Market Fund Class Institutional Shares (a) | | | 166,797 | | | | 311,392 | | | | 478,189 | | | | — | | | | — | | | | — | | | | — | | | | 706 | | | | — | |
| | | | | | | | | | | | | | | | | | | | | | | | | | | | | | | | | | | | |
Total | | $ | 166,797 | | | $ | 2,252,478 | | | $ | 2,317,579 | | | $ | 11 | | | $ | 9 | | | $ | 101,716 | | | | | | | $ | 2,728 | | | $ | — | |
| | | | | | | | | | | | | | | | | | | | | | | | | | | | | | | | | | | | |
| | | | | | |
| | | |
| 132 | | | | J.P. MORGAN INTERNATIONAL EQUITY FUNDS | | OCTOBER 31, 2019 |
| | | | | | | | | | | | | | | | | | | | | | | | | | | | | | | | | | | | |
| | | | | | |
| International Hedged Equity Fund | | | | | | | | | | | | | | | | | | | | | | | | | |
| For the period ended October 31, 2019 | |
| Security Description | | Value at
March 15,
2019 (e) | | | Purchases
at Cost | | | Proceeds
from Sales | | | Net
Realized
Gain
(Loss) | | | Change in
Unrealized
Appreciation/
(Depreciation) | | | Value at
October 31,
2019 | | | Shares at
October 31,
2019 | | | Dividend
Income | | | Capital Gain
Distributions | |
JPMorgan U.S. Government Money Market Fund Class Institutional Shares, 1.64% (a) (b) | | $ | — | | | $ | 11,038 | | | $ | 10,188 | | | $ | — | (d) | | $ | — | | | $ | 850 | | | | 850 | | | $ | 19 | | | $ | — | |
| | | | | | | | | | | | | | | | | | | | | | | | | | | | | | | | | | | | |
| | | | | | |
| International Research Enhanced Equity Fund | | | | | | | | | | | | | | | | | | | | | | | | | |
| For the year ended October 31, 2019 | |
| Security Description | | Value at
October 31,
2018 | | | Purchases
at Cost | | | Proceeds
from Sales | | | Net
Realized
Gain
(Loss) | | | Change in
Unrealized
Appreciation/
(Depreciation) | | | Value at
October 31,
2019 | | | Shares at
October 31,
2019 | | | Dividend
Income | | | Capital Gain
Distributions | |
JPMorgan Prime Money Market Fund Class Institutional Shares, 1.88% (a) (b) | | $ | — | | | $ | 948,493 | | | $ | 794,366 | | | $ | 6 | | | $ | 18 | | | $ | 154,151 | | | | 154,809 | | | $ | 1,992 | | | $ | — | |
JPMorgan Securities Lending Money Market Fund Class Agency SL Shares, 1.98% (a) (b) | | | — | | | | 832,000 | | | | 756,000 | | | | 5 | * | | | — | | | | 76,005 | | | | 75,998 | | | | 1,157 | * | | | — | |
JPMorgan U.S. Government Money Market Fund Class IM Shares, 1.70% (a) (b) | | | — | | | | 555,506 | | | | 525,245 | | | | — | | | | — | | | | 30,261 | | | | 30,261 | | | | 361 | * | | | — | |
JPMorgan U.S. Government Money Market Fund Class Institutional Shares (a) | | | 56,728 | | | | 434,807 | | | | 491,535 | | | | — | | | | — | | | | — | | | | — | | | | 756 | | | | — | |
| | | | | | | | | | | | | | | | | | | | | | | | | | | | | | | | | | | | |
Total | | $ | 56,728 | | | $ | 2,770,806 | | | $ | 2,567,146 | | | $ | 11 | | | $ | 18 | | | $ | 260,417 | | | | | | | $ | 4,266 | | | $ | — | |
| | | | | | | | | | | | | | | | | | | | | | | | | | | | | | | | | | | | |
| | | | | | |
| International Unconstrained Equity Fund | | | | | | | | | | | | | | | | | | | | | | | | | |
| For the year ended October 31, 2019 | |
| Security Description | | Value at
October 31,
2018 | | | Purchases
at Cost | | | Proceeds
from Sales | | | Net
Realized
Gain
(Loss) | | | Change in
Unrealized
Appreciation/
(Depreciation) | | | Value at
October 31,
2019 | | | Shares at
October 31,
2019 | | | Dividend
Income | | | Capital Gain
Distributions | |
JPMorgan Prime Money Market Fund Class Institutional Shares, 1.88% (a) (b) | | $ | — | | | $ | 836,644 | | | $ | 787,732 | | | $ | — | (d) | | $ | 9 | | | $ | 48,921 | | | | 48,902 | | | $ | 410 | | | $ | — | |
JPMorgan Securities Lending Money Market Fund Class Agency SL Shares, 1.98% (a) (b) | | | — | | | | 150,000 | | | | 95,000 | | | | — | | | | — | | | | 55,000 | | | | 54,995 | | | | 63 | * | | | — | |
JPMorgan U.S. Government Money Market Fund Class IM Shares, 1.70% (a) (b) | | | — | | | | 132,839 | | | | 111,986 | | | | — | | | | — | | | | 20,853 | | | | 20,853 | | | | 99 | * | | | — | |
JPMorgan U.S. Government Money Market Fund Class Institutional Shares (a) | | | 1,995 | | | | 88,014 | | | | 90,009 | | | | — | | | | — | | | | — | | | | — | | | | 58 | | | | — | |
| | | | | | | | | | | | | | | | | | | | | | | | | | | | | | | | | | | | |
Total | | $ | 1,995 | | | $ | 1,207,497 | | | $ | 1,084,727 | | | $ | — | (d) | | $ | 9 | | | $ | 124,774 | | | | | | | $ | 630 | | | $ | — | |
| | | | | | | | | | | | | | | | | | | | | | | | | | | | | | | | | | | | |
| | | | | | | | |
| | | |
| OCTOBER 31, 2019 | | J.P. MORGAN INTERNATIONAL EQUITY FUNDS | | | | | 133 | |
NOTES TO FINANCIAL STATEMENTS
AS OF OCTOBER 31, 2019 (continued)
| | | | | | | | | | | | | | | | | | | | | | | | | | | | | | | | | | | | |
| | | | | | |
| International Value Fund | | | | | | | | | | | | | | | | | | | | | | | | | |
| For the year ended October 31, 2019 | |
| Security Description | | Value at
October 31,
2018 | | | Purchases
at Cost | | | Proceeds
from Sales | | | Net
Realized
Gain
(Loss) | | | Change in
Unrealized
Appreciation/
(Depreciation) | | | Value at
October 31,
2019 | | | Shares at
October 31,
2019 | | | Dividend
Income | | | Capital Gain
Distributions | |
JPMorgan Prime Money Market Fund Class Institutional Shares, 1.88% (a) (b) | | $ | — | | | $ | 59,834 | | | $ | 56,348 | | | $ | — | (d) | | $ | 1 | | | $ | 3,487 | | | | 3,486 | | | $ | 100 | | | $ | — | |
JPMorgan Securities Lending Money Market Fund Class Agency SL Shares, 1.98% (a) (b) | | | — | | | | 17,000 | | | | 15,000 | | | | — | | | | — | | | | 2,000 | | | | 2,000 | | | | 29 | * | | | — | |
JPMorgan U.S. Government Money Market Fund Class IM Shares, 1.70% (a) (b) | | | — | | | | 81,513 | | | | 79,487 | | | | — | | | | — | | | | 2,026 | | | | 2,026 | | | | 94 | * | | | — | |
JPMorgan U.S. Government Money Market Fund Class Institutional Shares (a) | | | — | | | | 51,039 | | | | 51,039 | | | | — | | | | — | | | | — | | | | — | | | | 69 | | | | — | |
| | | | | | | | | | | | | | | | | | | | | | | | | | | | | | | | | | | | |
Total | | $ | — | | | $ | 209,386 | | | $ | 201,874 | | | $ | — | (d) | | $ | 1 | | | $ | 7,513 | | | | | | | $ | 292 | | | $ | — | |
| | | | | | | | | | | | | | | | | | | | | | | | | | | | | | | | | | | | |
| (a) | Investment in an affiliated fund, which is registered under the Investment Company Act of 1940, as amended, and is advised by J.P. Morgan Investment Management Inc. |
| (b) | The rate shown is the current yield as of October 31, 2019. |
| (c) | Commencement of operations was December 11, 2018. |
| (d) | Amount rounds to less than one thousand. |
| (e) | Commencement of operations was March 15, 2019. |
| * | Amount is included on the Statements of Operations as Income from securities lending (net) (after payments of rebates and Citibank’s fee). |
E. Derivatives — The Funds used derivative instruments including futures, forward foreign currency exchange contracts and options in connection with their investment strategies. Derivative instruments may be used as substitutes for securities in which the Funds can invest, to hedge portfolio investments or to generate income or gain to the Funds. Derivatives may also be used to manage duration, sector and yield curve exposures and credit and spread volatility.
The Funds may be subject to various risks from the use of derivatives, including the risk that changes in the value of a derivative may not correlate perfectly with the underlying asset, rate or index; counterparty credit risk related to derivatives counterparties’ failure to perform under contract terms; liquidity risk related to the lack of a liquid market for these contracts allowing the Funds to close out their position(s); and documentation risk relating to disagreement over contract terms. Investing in certain derivatives also results in a form of leverage and as such, the Funds’ risk of loss associated with these instruments may exceed their value, as recorded on the Statements of Assets and Liabilities.
The Funds are party to various derivative contracts governed by International Swaps and Derivatives Association master agreements (“ISDA agreements”). The Funds’ ISDA agreements, which are separately negotiated with each dealer counterparty, may contain provisions allowing, absent other considerations, a counterparty to exercise rights, to the extent not otherwise waived, against the Funds in the event the Funds’ net assets decline over time by apre-determined percentage or fall below apre-determined floor. The ISDA agreements may also contain provisions allowing, absent other conditions, the Funds to exercise rights, to the extent not otherwise waived, against a counterparty (e.g., decline in a counterparty’s credit rating below a specified level). Such rights for both a counterparty and the Funds often include the ability to terminate (i.e., close out) open contracts at prices which may favor a counterparty, which could have an adverse effect on the Funds. The ISDA agreements give the Funds and a counterparty the right, upon an event of default, to close out all transactions traded under such agreements and to net amounts owed or due across all transactions and will offset such net payable or receivable with collateral posted to a segregated account by one party to the other.
Counterparty credit risk may be mitigated to the extent a counterparty posts collateral for mark to market gains to the Funds.
Notes E(1) — E(3) below describe the various derivatives used by the Funds.
(1). Options — International Hedged Equity Fund purchased and sold (“wrote”) put and call options on indices to manage and hedge equity risk within its portfolio. A purchaser of a put option has the right, but not the obligation, to sell the underlying instrument at an agreed upon price (“strike price”) to the option seller. A purchaser of a call option has the right, but not the obligation, to purchase the underlying instrument at the strike price from the option seller.
Options Purchased —Premiums paid by the Fund for options purchased are included on the Statements of Assets and Liabilities as Options purchased. The option is adjusted daily to reflect the current market value of the option and the change is recorded as Change in net unrealized
| | | | | | |
| | | |
| 134 | | | | J.P. MORGAN INTERNATIONAL EQUITY FUNDS | | OCTOBER 31, 2019 |
appreciation/depreciation on options purchased on the Statements of Operations. If the option is allowed to expire, the Fund will lose the entire premium it paid and record a loss for the premium amount. Premiums paid for options purchased which are exercised or closed are added to the amounts paid or will offset against the proceeds on the underlying investment transaction to determine the realized gain (loss) or cost basis of the underlying investment.
Options Written —Premiums received by the Fund for options written are included on the Statements of Assets and Liabilities as a liability. The amount of the liability is adjusted daily to reflect the current market value of the option written and the change in market value is recorded as Change in net unrealized appreciation/depreciation on options written on the Statements of Operations. Premiums received from options written that expire are treated as realized gains. If a written option is closed, the Fund records a realized gain or loss on options written based on whether the cost of the closing transaction exceeds the premium received. If a call option is exercised by the option buyer, the premium received by the Fund is added to the proceeds from the sale of the underlying security to the option buyer and compared to the cost of the closing transaction to determine whether there has been a realized gain or loss. If a put option is exercised by an option buyer, the premium received by the option seller reduces the cost basis of the purchased security.
The Fund pledges collateral to the counterparty in the form of securities for options written. Securities designated as collateral are denoted on the SOI.
Written uncovered call options subject the Fund to unlimited risk of loss. Written covered call options limit the upside potential of a security above the strike price. Written put options subject the Fund to risk of loss if the value of the security declines below the exercise price minus the put premium.
The Fund is not subject to credit risk on options written as the counterparty has already performed its obligation by paying the premium at the inception of the contract.
The Fund’s exchange-traded option contracts are not subject to master netting arrangements (the right to close out all transactions traded with a counterparty and net amounts owed or due across transactions). The Fund’sover-the-counter (“OTC”) options are subject to master netting agreements.
The Fund may be required to post or receive collateral for OTC options. Cash collateral posted by the Fund is considered restricted.
The table below discloses the volume of the Fund’s options contracts activity during the year ended October 31, 2019 (amounts in thousands, except number of contracts):
| | | | |
| | | International
Hedged
Equity Fund | |
Exchange-Traded Options: | | | | |
Average Number of Contracts Purchased | | | 280 | (a) |
Average Number of Contracts Written | | | 560 | (a) |
Ending Number of Contracts Purchased | | | 309 | |
Ending Number of Contracts Written | | | 618 | |
| (a) | For the period March 15, 2019 through October 31, 2019. |
(2). Futures Contracts — The Funds used index futures contracts to gain or reduce exposure to the stock market, maintain liquidity or minimize transaction costs. The Funds also bought futures contracts to invest incoming cash in the market or sold futures in response to cash outflows, thereby simulating an invested position in the underlying index while maintaining a cash balance for liquidity.
Futures contracts provide for the delayed delivery of the underlying instrument at a fixed price or are settled for a cash amount based on the change in the value of the underlying instrument at a specific date in the future. Upon entering into a futures contract, the Funds are required to deposit with the broker, cash or securities in an amount equal to a certain percentage of the contract amount, which is referred to as the initial margin deposit. Subsequent payments, referred to as variation margin, are made or received by the Funds periodically and are based on changes in the market value of open futures contracts. Changes in the market value of open futures contracts are recorded as Change in net unrealized appreciation/depreciation on the Statements of Operations. Realized gains or losses, representing the difference between the value of the contract at the time it was opened and the value at the time it was closed, are reported on the Statements of Operations at the closing or expiration of the futures contract. Securities deposited as initial margin are designated in the SOIs, while cash deposited, which is considered restricted, is recorded on the Statements of Assets and Liabilities. A receivable from and/or a payable to brokers for the daily variation margin is also recorded on the Statements of Assets and Liabilities.
The use of futures contracts exposes the Funds to equity price risk. The Funds may be subject to the risk that the change in the value of the futures contract may not correlate perfectly with the underlying instrument. Use of long futures contracts subjects the Funds to risk of loss in excess of the amounts shown on the Statements of Assets and Liabilities, up to the notional amount of the futures contracts. Use of short futures contracts subjects the Funds to unlimited risk of loss. The Funds may enter into futures contracts only on exchanges or boards of trade. The exchange or board of trade acts as the counterparty to each futures transaction; therefore, the Funds’ credit risk is limited to failure of the exchange or board of trade. Under some circumstances, futures exchanges may establish daily limits on the amount that the price of a futures contract can vary from the previous day’s settlement price, which could effectively prevent liquidation of positions.
| | | | | | | | |
| | | |
| OCTOBER 31, 2019 | | J.P. MORGAN INTERNATIONAL EQUITY FUNDS | | | | | 135 | |
NOTES TO FINANCIAL STATEMENTS
AS OF OCTOBER 31, 2019 (continued)
The Funds’ futures contracts are not subject to master netting arrangements (the right to close out all transactions traded with a counterparty and net amounts owed or due across transactions).
| | | | | | | | | | | | | | | | | | | | | | | | | | | | | | | | | | | | | | | | |
| | | Emerging
Markets
Equity
Fund | | | Emerging
Markets
Research
Enhanced
Equity
Fund | | | Europe
Dynamic
Fund | | | Global
Research
Enhanced
Index
Fund | | | International
Advantage
Fund | | | International
Equity Fund | | | International
Hedged
Equity Fund | | | International
Research
Enhanced
Equity Fund | | | International
Unconstrained
Equity Fund | | | International
Value Fund | |
Futures Contracts — Equity: | | | | | | | | | | | | | | | | | | | | | | | | | | | | | | | | | |
Average Notional Balance Long | | $ | 70,560 | (a) | | $ | 11,177 | | | $ | 7,718 | | | $ | 50,186 | | | $ | 57,014 | | | $ | 4,497,350 | (b) | | $ | 1,231 | (c) | | $ | 121,732 | | | $ | 2,533,321 | (b) | | $ | 8,684 | (d) |
Average Notional Balance Short | | | — | | | | — | | | | 7,291 | (e) | | | — | | | | — | | | | — | | | | — | | | | — | | | | 2,274,798 | (b) | | | — | |
Ending Notional Balance Long | | | — | | | | — | | | | — | | | | 42,338 | | | | 42,829 | | | | — | | | | 914 | | | | 124,725 | | | | — | | | | 4,094 | |
Ending Notional Balance Short | | | — | | | | — | | | | 7,291 | | | | — | | | | — | | | | — | | | | — | | | | — | | | | — | | | | — | |
| (a) | For the period January 1, 2019 through January 31, 2019. |
| (b) | For the period September 1, 2019 through October 31, 2019. |
| (c) | For the period March 15, 2019 through October 31, 2019. |
| (d) | For the period January 1, 2019 through October 31, 2019. |
| (e) | For the period October 1, 2019 through October 31, 2019. |
(3). Forward Foreign Currency Exchange Contracts — International Unconstrained Equity Fund is exposed to foreign currency risks associated with some or all of its portfolio investments and used forward foreign currency exchange contracts to hedge or manage certain of these exposures as part of an investment strategy. Forward foreign currency exchange contracts represent obligations to purchase or sell foreign currency on a specified future date at a price fixed at the time the contracts are entered into.Non-deliverable forward foreign currency exchange contracts are settled with the counterparty in U.S. dollars without the delivery of foreign currency.
The values of the forward foreign currency exchange contracts are adjusted daily based on the applicable exchange rate of the underlying currency. Changes in the value of these contracts are recorded as unrealized appreciation or depreciation until the contract settlement date. When the forward foreign currency exchange contract is closed, the Fund records a realized gain or loss equal to the difference between the value at the time the contract was opened and the value at the time it was closed. The Fund also records a realized gain or loss when a forward foreign currency exchange contract offsets another forward foreign currency exchange contract with the same counterparty upon settlement.
The Fund’s forward foreign currency exchange contracts are subject to master netting arrangements (the right to close out all transactions with a counterparty and net amounts owed or due across transactions). The Fund may be required to post or receive collateral fornon-deliverable forward foreign currency exchange contracts.
The table below discloses the volume of the Fund’s forward foreign currency exchange contracts activity during the year ended October 31, 2019 (amounts in thousands):
| | | | |
| | | International
Unconstrained
Equity Fund | |
Forward Foreign Currency Exchange Contracts: | | | | |
Average Settlement Value Purchased | | $ | 54,509 | (a) |
Average Settlement Value Sold | | | 26,478 | (a) |
| (a) | For the period February 1, 2019 through February 28, 2019. |
(4). Summary of Derivatives Information— The following tables present the value of derivatives held as of October 31, 2019, by their primary underlying risk exposure and respective location on the Statements of Assets and Liabilities (amounts in thousands):
Europe Dynamic Fund
| | | | | | |
| Derivative Contracts | | Statements of Assets and Liabilities Location | | | |
| Gross Liabilities: | | | | Futures Contracts (a) | |
Equity contracts | | Payables, Net Assets — Unrealized Depreciation | | $ | (12 | ) |
| | | | | | |
Global Research Enhanced Index Fund
| | | | | | |
| Derivative Contracts | | Statements of Assets and Liabilities Location | | | |
| Gross Assets: | | | | Futures Contracts (a) | |
Equity contracts | | Receivables, Net Assets — Unrealized Appreciation | | $ | 30 | |
| | | | | | |
| | | | | | |
| | | |
| 136 | | | | J.P. MORGAN INTERNATIONAL EQUITY FUNDS | | OCTOBER 31, 2019 |
International Advantage Fund
| | | | | | |
| Derivative Contracts | | Statements of Assets and Liabilities Location | | | |
| Gross Assets: | | | | Futures Contracts (a) | |
Equity contracts | | Receivables, Net Assets — Unrealized Appreciation | | $ | 2,017 | |
| | | | | | |
International Hedged Equity Fund
| | | | | | | | | | | | | | |
| Derivative Contracts | | Statements of Assets and Liabilities Location | | | | | | | | | |
| Gross Assets: | | | | Options | | | Futures Contracts (a) | | | Total | |
Equity contracts | | Receivables | | $ | 162 | | | $ | — | | | $ | 162 | |
| | | | | | | | | | | | | | |
| | | | |
Gross Liabilities: | | | | | | | | | | | |
Equity contracts | | Payables, Net Assets — Unrealized Depreciation | | $ | (592 | ) | | $ | (4 | ) | | $ | (596 | ) |
| | | | | | | | | | | | | | |
International Research Enhanced Equity Fund
| | | | | | |
| Derivative Contracts | | Statements of Assets and Liabilities Location | | | |
| Gross Assets: | | | | Futures Contracts (a) | |
Equity contracts | | Receivables, Net Assets — Unrealized Appreciation | | $ | 1,967 | |
| | | | | | |
| | |
Gross Liabilities: | | | | | |
Equity contracts | | Payables, Net Assets — Unrealized Depreciation | | $ | (410 | ) |
| | | | | | |
International Value Fund
| | | | | | |
| Derivative Contracts | | Statements of Assets and Liabilities Location | | | |
| Gross Assets: | | | | Futures Contracts (a) | |
Equity contracts | | Receivables, Net Assets — Unrealized Appreciation | | $ | 50 | |
| | | | | | |
| | |
Gross Liabilities: | | | | | |
Equity contracts | | Payables, Net Assets — Unrealized Depreciation | | $ | (7 | ) |
| | | | | | |
| (a) | This amount represents the cumulative appreciation (depreciation) of futures contracts as reported on the SOIs. The Statements of Assets and Liabilities only reflect the current day variation margin receivable/payable from/to brokers. |
The following tables present the effect of derivatives on the Statements of Operations for the year ended October 31, 2019, by primary underlying risk exposure (amounts in thousands):
Emerging Markets Equity Fund
| | | | | | |
| Amount of Realized Gain (Loss) on Derivatives Recognized on the Statements of Operations | |
| Derivative Contracts | | | | Futures Contracts | |
Equity contracts | | | | $ | 2,644 | |
| | | | | | |
Emerging Markets Research Enhanced Equity Fund
| | | | | | |
| Amount of Realized Gain (Loss) on Derivatives Recognized on the Statements of Operations | |
| Derivative Contracts | | | | Futures Contracts | |
Equity contracts | | | | $ | 5,136 | |
| | | | | | |
Europe Dynamic Fund
| | | | | | |
| Amount of Realized Gain (Loss) on Derivatives Recognized on the Statements of Operations | |
| Derivative Contracts | | | | Futures Contracts | |
Equity contracts | | | | $ | 529 | |
| | | | | | |
| | | | | | |
| Amount of Change in Unrealized Appreciation (Depreciation) on Derivatives Recognized on the Statements of Operations | |
| Derivative Contracts | | | | Futures Contracts | |
Equity contracts | | | | $ | (213 | ) |
| | | | | | |
| | | | | | | | |
| | | |
| OCTOBER 31, 2019 | | J.P. MORGAN INTERNATIONAL EQUITY FUNDS | | | | | 137 | |
NOTES TO FINANCIAL STATEMENTS
AS OF OCTOBER 31, 2019 (continued)
Global Research Enhanced Index Fund
| | | | | | |
| | | Amount of Realized Gain (Loss) on Derivatives Recognized on the Statements of
Operations | | | |
| Derivative Contracts | | | | Futures Contracts | |
Equity contracts | | | | $ | (894 | ) |
| | | | | | |
| | | | | | |
| Amount of Change in Unrealized Appreciation (Depreciation) on Derivatives Recognized on the Statements of Operations | |
| Derivative Contracts | | | | Futures Contracts | |
Equity contracts | | | | $ | (898 | ) |
| | | | | | |
International Advantage Fund
| | | | | | |
| Amount of Realized Gain (Loss) on Derivatives Recognized on the Statements of Operations | |
| Derivative Contracts | | | | Futures Contracts | |
Equity contracts | | | | $ | (1,247 | ) |
| | | | | | |
| | | | | | |
| Amount of Change in Unrealized Appreciation (Depreciation) on Derivatives Recognized on the Statements of Operations | |
| Derivative Contracts | | | | Futures Contracts | |
Equity contracts | | | | $ | 2,869 | |
| | | | | | |
International Equity Fund
| | | | | | |
| Amount of Realized Gain (Loss) on Derivatives Recognized on the Statements of Operations | |
| Derivative Contracts | | | | Futures Contracts | |
Equity contracts | | | | $ | (3,617 | ) |
| | | | | | |
International Hedged Equity Fund
| | | | | | | | | | | | |
| Amount of Realized Gain (Loss) on Derivatives Recognized on the Statements of Operations | |
| Derivative Contracts | | Options | | | Futures Contracts | | | Total | |
Equity contracts | | $ | (25 | ) | | $ | 82 | | | $ | 57 | |
| | | | | | | | | | | | |
| | | | | | | | | | | | |
| Amount of Change in Unrealized Appreciation (Depreciation) on Derivatives Recognized on the Statements of Operations | |
| Derivative Contracts | | Options | | | Futures Contracts | | | Total | |
Equity contracts | | $ | (465 | ) | | $ | (4 | ) | | $ | (469 | ) |
| | | | | | | | | | | | |
International Research Enhanced Equity Fund
| | | | | | |
| Amount of Realized Gain (Loss) on Derivatives Recognized on the Statements of Operations | |
| Derivative Contracts | | | | Futures Contracts | |
Equity contracts | | | | $ | 13,990 | |
| | | | | | |
| | | | | | |
| Amount of Change in Unrealized Appreciation (Depreciation) on Derivatives Recognized on the Statements of Operations | |
| Derivative Contracts | | | | Futures Contracts | |
Equity contracts | | | | $ | 3,708 | |
| | | | | | |
International Unconstrained Equity Fund
| | | | | | | | | | | | |
| Amount of Realized Gain (Loss) on Derivatives Recognized on the Statements of Operations | |
| Derivative Contracts | | Futures Contracts | | | Forward Foreign
Currency Exchange
Contracts | | | Total | |
Equity contracts | | $ | 144 | | | $ | — | | | $ | 144 | |
Foreign exchange contracts | | | — | | | | (1,105 | ) | | | (1,105 | ) |
| | | | | | | | | | | | |
| | $ | 144 | | | $ | (1,105 | ) | | $ | (961 | ) |
| | | | | | | | | | | | |
| | | | | | |
| | | |
| 138 | | | | J.P. MORGAN INTERNATIONAL EQUITY FUNDS | | OCTOBER 31, 2019 |
International Value Fund
| | | | | | |
| Amount of Realized Gain (Loss) on Derivatives Recognized on the Statements of Operations | |
| Derivative Contracts | | | | Futures Contracts | |
Equity contracts | | | | $ | 1,233 | |
| | | | | | |
| | | | | | |
| Amount of Change in Unrealized Appreciation (Depreciation) on Derivatives Recognized on the Statements of Operations | |
| Derivative Contracts | | | | Futures Contracts | |
Equity contracts | | | | $ | 43 | |
| | | | | | |
The Funds’ derivatives contracts held at October 31, 2019 are not accounted for as hedging instruments under GAAP.
F. Foreign Currency Translation — The books and records of the Funds are maintained in U.S. dollars. Foreign currency amounts are translated into U.S. dollars at the prevailing exchange rates of such currencies against the U.S. dollar. The market value of investment securities and other assets and liabilities are translated at the exchange rate as of the valuation date. Purchases and sales of investment securities, income and expenses are translated at the exchange rate prevailing on the respective dates of such transactions.
The Funds do not isolate the effect of changes in foreign exchange rates from changes in market prices on securities held. Accordingly, such changes are included within Change in net unrealized appreciation/depreciation on investments on the Statements of Operations.
Reported realized foreign currency gains and losses arise from the disposition of foreign currency, currency gains or losses realized between the trade and settlement dates on securities transactions, and the difference between the amounts of dividends, interest and foreign withholding taxes recorded on each Fund’s books on the transaction date and the U.S. dollar equivalent of the amounts actually received or paid. These reported realized foreign currency gains and losses are included in Net realized gain (loss) on foreign currency transactions on the Statements of Operations. Unrealized foreign currency gains and losses arise from changes (due to changes in exchange rates) in the value of foreign currency and other assets and liabilities denominated in foreign currencies, which are held at period end and are included in Change in net unrealized appreciation/depreciation on foreign currency translations on the Statements of Operations.
G. Offering and Organization Costs — Total offering costs of approximately $48,000 and $103,000 paid in connection with the offering of shares of Emerging Markets Research Enhanced Equity Fund and International Hedged Equity Fund, respectively, are amortized on a straight line basis over 12 months from the date the Funds commenced operations. Costs paid in connection with the organization of Emerging Markets Research Enhanced Equity Fund and International Hedged Equity Fund, if any, were recorded as an expense at the time it commenced operations and are included as part of Professional fees on the Statements of Operations. For the year ended October 31, 2019, total offering costs amortized were approximately $43,000 and $64,000 for the Emerging Markets Research Enhanced Equity Fund and International Hedged Equity Fund, respectively.
H. Security Transactions and Investment Income — Investment transactions are accounted for on the trade date (the date the order to buy or sell is executed). Securities gains and losses are calculated on a specifically identified cost basis. Interest income is determined on the basis of coupon interest accrued using the effective interest method, which adjusts for amortization of premiums and accretion of discounts. Dividend income net of foreign taxes withheld, if any, is recorded on theex-dividend date or when a Fund first learns of the dividend. Certain Funds may receive other income from investments in loan assignments and/or unfunded commitments, including amendment fees, consent fees and commitment fees. These fees are recorded as income when received by the Funds. These amounts are included in Interest income fromnon-affiliates on the Statements of Operations.
I. Allocation of Income and Expenses — Expenses directly attributable to a Fund are charged directly to that Fund, while the expenses attributable to more than one fund of the Trusts are allocated among the applicable funds. Investment income, realized and unrealized gains and losses and expenses, other than class-specific expenses, are allocated daily to each class of shares based upon the proportion of net assets of each class at the beginning of each day.
| | | | | | | | |
| | | |
| OCTOBER 31, 2019 | | J.P. MORGAN INTERNATIONAL EQUITY FUNDS | | | | | 139 | |
NOTES TO FINANCIAL STATEMENTS
AS OF OCTOBER 31, 2019 (continued)
Transfer agency fees are class-specific expenses. The amount of the transfer agency fees charged to each class of the Funds for the year ended October 31, 2019 are as follows (amounts in thousands):
| | | | | | | | | | | | | | | | | | | | | | | | | | | | | | | | | | | | | | | | |
| | | Class A | | | Class C | | | Class I | | | Class L | | | Class R2 | | | Class R3 | | | Class R4 | | | Class R5 | | | Class R6 | | | Total | |
Emerging Markets Equity Fund | | | | | | | | | | | | | | | | | | | | | | | | | | | | | | | | | | | | | | | | |
Transfer agency fees | | $ | 58 | | | $ | 7 | | | $ | 56 | | | $ | 14 | | | $ | 1 | | | $ | — | (a) | | $ | — | (a) | | $ | 7 | | | $ | 36 | | | $ | 179 | |
Emerging Markets Research Enhanced Equity Fund | | | | | | | | | | | | | | | | | | | | | | | | | | | | | | | | | | | | | | | | |
Transfer agency fees | | | n/a | | | | n/a | | | | — | (a) | | | n/a | | | | n/a | | | | n/a | | | | n/a | | | | n/a | | | | 2 | | | | 2 | |
Europe Dynamic Fund | | | | | | | | | | | | | | | | | | | | | | | | | | | | | | | | | | | | | | | | |
Transfer agency fees | | | 22 | | | | 1 | | | | 6 | | | | 3 | | | | n/a | | | | n/a | | | | n/a | | | | n/a | | | | 2 | | | | 34 | |
Global Research Enhanced Index Fund | | | | | | | | | | | | | | | | | | | | | | | | | | | | | | | | | | | | | | | | |
Transfer agency fees | | | n/a | | | | n/a | | | | 2 | | | | n/a | | | | n/a | | | | n/a | | | | n/a | | | | n/a | | | | 41 | | | | 43 | |
International Advantage Fund | | | | | | | | | | | | | | | | | | | | | | | | | | | | | | | | | | | | | | | | |
Transfer agency fees | | | 24 | | | | 1 | | | | 2 | | | | n/a | | | | 69 | | | | n/a | | | | n/a | | | | n/a | | | | 21 | | | | 117 | |
International Equity Fund | | | | | | | | | | | | | | | | | | | | | | | | | | | | | | | | | | | | | | | | |
Transfer agency fees | | | 46 | | | | 4 | | | | 7 | | | | n/a | | | | 2 | | | | n/a | | | | n/a | | | | 1 | | | | 27 | | | | 87 | |
International Hedged Equity Fund | | | | | | | | | | | | | | | | | | | | | | | | | | | | | | | | | | | | | | | | |
Transfer agency fees | | | — | (a) | | | — | (a) | | | 2 | | | | n/a | | | | n/a | | | | n/a | | | | n/a | | | | — | (a) | | | — | (a) | | | 2 | |
International Research Enhanced Equity Fund | | | | | | | | | | | | | | | | | | | | | | | | | | | | | | | | | | | | | | | | |
Transfer agency fees | | | 57 | | | | n/a | | | | 4 | | | | n/a | | | | n/a | | | | n/a | | | | n/a | | | | n/a | | | | 34 | | | | 95 | |
International Unconstrained Equity Fund | | | | | | | | | | | | | | | | | | | | | | | | | | | | | | | | | | | | | | | | |
Transfer agency fees | | | 10 | | | | 4 | | | | 16 | | | | n/a | | | | 2 | | | | n/a | | | | n/a | | | | 4 | | | | 1 | | | | 37 | |
International Value Fund | | | | | | | | | | | | | | | | | | | | | | | | | | | | | | | | | | | | | | | | |
Transfer agency fees | | | 18 | | | | 3 | | | | 4 | | | | 1 | | | | 2 | | | | n/a | | | | n/a | | | | — | (a) | | | — | (a) | | | 28 | |
| (a) | Amount rounds to less than one thousand. |
J. Federal Income Taxes — Each Fund is treated as a separate taxable entity for Federal income tax purposes. Each Fund’s policy is to comply with the provisions of the Internal Revenue Code (the “Code”) applicable to regulated investment companies and to distribute to shareholders all of its distributable net investment income and net realized capital gains on investments. Accordingly, no provision for Federal income tax is necessary. Management has reviewed the Funds’ tax positions for all open tax years and has determined that as of October 31, 2019, no liability for Federal income tax is required in the Funds’ financial statements for net unrecognized tax benefits. However, management’s conclusions may be subject to future review based on changes in, or the interpretation of, the accounting standards or tax laws and regulations. Each of the Funds’ Federal tax returns for the prior three fiscal years, or since inception if shorter, remains subject to examination by the Internal Revenue Service.
K. Foreign Taxes — The Funds may be subject to foreign taxes on income, gains on investments or currency purchases/repatriation, a portion of which may be recoverable. The Funds will accrue such taxes and recoveries as applicable, based upon their current interpretation of tax rules and regulations that exist in the markets in which they invest. When a capital gain tax is determined to apply, the Funds record an estimated deferred tax liability in an amount that would be payable if the securities were disposed of on the valuation date.
L. Distributions to Shareholders — Distributions from net investment income, if any, are generally declared and paid annually. Distributions are declared separately for each class. No class has preferential dividend rights; differences in per share rates are due to differences in separate class expenses. Net realized capital gains, if any, are distributed by each Fund at least annually. The amount of distributions from net investment income and net realized capital gains is determined in accordance with Federal income tax regulations, which may differ from GAAP. To the extent these “book/tax” differences are permanent in nature (i.e., that they result from other than timing of recognition — “temporary differences”), such amounts are reclassified within the capital accounts based on their Federal tax basis treatment.
| | | | | | |
| | | |
| 140 | | | | J.P. MORGAN INTERNATIONAL EQUITY FUNDS | | OCTOBER 31, 2019 |
The following amounts were reclassified within the capital accounts (amounts in thousands):
| | | | | | | | | | | | |
| | | Paid-in-Capital | | | Accumulated
undistributed
(distributions
in excess of)
net investment
income | | | Accumulated
net realized
gains (losses) | |
Emerging Markets Equity Fund | | $ | — | | | $ | (2,770 | ) | | $ | 2,770 | |
Emerging Markets Research Enhanced Equity Fund | | | — | | | | (549 | ) | | | 549 | |
Europe Dynamic Fund | | | — | | | | (91 | ) | | | 91 | |
Global Research Enhanced Index Fund | | | 59,296 | | | | 2,304 | | | | (61,600 | ) |
International Advantage Fund | | | — | | | | 5,017 | | | | (5,017 | ) |
International Equity Fund | | | — | | | | (883 | ) | | | 883 | |
International Hedged Equity Fund | | | — | (a) | | | 14 | | | | (14 | ) |
International Research Enhanced Equity Fund | | | — | (a) | | | 1,022 | | | | (1,022 | ) |
International Unconstrained Equity Fund | | | — | | | | 183 | | | | (183 | ) |
International Value Fund | | | — | | | | 237 | | | | (237 | ) |
| (a) | Amount rounds to less than one thousand. |
The reclassifications for the Funds relate primarily to foreign currency gains or losses, investments in passive foreign investment companies (“PFICs”) and tax equalization.
3. Fees and Other Transactions with Affiliates
A. Investment Advisory Fee — Pursuant to Investment Advisory Agreements, the Adviser manages the investments of each Fund and for such services is paid a fee. The investment advisory fee is accrued daily and paid monthly based on each Fund’s respective average daily net assets.
The annual rate for each Fund is as follows:
| | | | |
Emerging Markets Equity Fund | | | 0.68 | %(1) |
Emerging Markets Research Enhanced Equity Fund | | | 0.25 | |
Europe Dynamic Fund | | | 0.60 | ( 2 ) |
Global Research Enhanced Index Fund | | | 0.20 | |
International Advantage Fund | | | 0.50 | ( 3 ) |
International Equity Fund | | | 0.50 | ( 4 ) |
International Hedged Equity Fund | | | 0.25 | |
International Research Enhanced Equity Fund | | | 0.20 | |
International Unconstrained Equity Fund | | | 0.60 | ( 5 ) |
International Value Fund | | | 0.55 | ( 3 ) |
| (1) | Prior to August 1, 2019, the investment advisory fee was accrued daily and paid monthly at an annual rate of 0.85% of the Fund’s respective average daily net assets. |
| (2) | Prior to August 1, 2019, the investment advisory fee was accrued daily and paid monthly at an annual rate of 0.65% of the Fund’s respective average daily net assets. |
| (3) | Prior to August 1, 2019, the investment advisory fee was accrued daily and paid monthly at an annual rate of 0.60% of each Fund’s respective average daily net assets. |
| (4) | Prior to March 1, 2019, the investment advisory fee was accrued daily and paid monthly at an annual rate of 0.70%. Prior to August 1, 2019, the investment advisory fee was accrued daily and paid monthly at an annual rate of 0.60% of the Fund’s respective average daily net assets. |
| (5) | Prior to March 1, 2019, the investment advisory fee was accrued daily and paid monthly at an annual rate of 0.70%. Prior to August 1, 2019, the investment advisory fee was accrued daily and paid monthly at an annual rate of 0.65% of the Fund’s respective average daily net assets. |
The Adviser waived investment advisory fees and/or reimbursed expenses as outlined in Note 3.F.
B. Administration Fee — Pursuant to Administration Agreements, the Administrator provides certain administration services to the Funds. In consideration of these services, effective January 1, 2019, the Administrator receives a fee accrued daily and paid monthly at an annual rate of 0.075% of the first $10 billion of each Fund’s respective average daily net assets, plus 0.050% of each Fund’s respective average daily net assets between $10 billion and $20 billion, plus 0.025% of each Fund’s respective average daily net assets between $20 billion and $25 billion, plus 0.01% of each Fund’s respective average daily net assets in excess of $25 billion. Prior to January 1, 2019, the Administrator received a fee accrued daily and paid monthly at an annual rate of 0.15% of the first $25 billion of the average daily net assets of all funds in the J.P. Morgan Funds Complex covered by the Administration Agreement (excluding certain funds of funds and money market funds) and 0.075% of the average daily net assets in excess of $25 billion of all such funds. For the year ended October 31, 2019, the effective rate was 0.08% of each Fund’s average daily net assets, notwithstanding any fee waivers and/or expense reimbursements.
| | | | | | | | |
| | | |
| OCTOBER 31, 2019 | | J.P. MORGAN INTERNATIONAL EQUITY FUNDS | | | | | 141 | |
NOTES TO FINANCIAL STATEMENTS
AS OF OCTOBER 31, 2019 (continued)
The Administrator waived administration fees as outlined in Note 3.F.
JPMorgan Chase Bank, N.A. (“JPMCB”), a wholly-owned subsidiary of JPMorgan, serves as the Funds’sub-administrator (the“Sub-administrator”). For its services asSub-administrator, JPMCB receives a portion of the fees payable to the Administrator.
C. Distribution Fees — Pursuant to a Distribution Agreement, JPMorgan Distribution Services, Inc. (“JPMDS”), an indirect, wholly-owned subsidiary of JPMorgan, serves as the Funds’ principal underwriter and promotes and arranges for the sale of each Fund’s shares. The Boards have adopted a Distribution Plan (the “Distribution Plan”) for Class A, Class C, Class R2 and Class R3 Shares of the Funds, as applicable, pursuant to Rule12b-1 under the 1940 Act. Class I, Class L, Class R4, Class R5 and Class R6 Shares of the Funds do not charge a distribution fee. The Distribution Plan provides that each Fund shall pay, with respect to the applicable share classes, distribution fees, including payments to JPMDS, at annual rates of the average daily net assets as shown in the table below:
| | | | | | | | | | | | | | | | |
| | | Class A | | | Class C | | | Class R2 | | | Class R3 | |
Emerging Markets Equity Fund | | | 0.25 | % | | | 0.75 | % | | | 0.50 | % | | | 0.25 | % |
Europe Dynamic Fund | | | 0.25 | | | | 0.75 | | | | n/a | | | | n/a | |
International Advantage Fund | | | 0.25 | | | | 0.75 | | | | 0.50 | | | | n/a | |
International Equity Fund | | | 0.25 | | | | 0.75 | | | | 0.50 | | | | n/a | |
International Hedged Equity Fund | | | 0.25 | | | | 0.75 | | | | n/a | | | | n/a | |
International Research Enhanced Equity Fund | | | 0.25 | | | | n/a | | | | n/a | | | | n/a | |
International Unconstrained Equity Fund | | | 0.25 | | | | 0.75 | | | | 0.50 | | | | n/a | |
International Value Fund | | | 0.25 | | | | 0.75 | | | | 0.50 | | | | n/a | |
In addition, JPMDS is entitled to receive thefront-end sales charges from purchases of Class A Shares and the CDSC from redemptions of Class C Shares and certain Class A Shares for whichfront-end sales charges have been waived. For the year ended October 31, 2019, JPMDS retained the following (amounts in thousands):
| | | | | | | | |
| | | Front-End
Sales Charge | | | CDSC | |
Emerging Markets Equity Fund | | $ | 83 | | | $ | 1 | |
Europe Dynamic Fund | | | 2 | | | | — | |
International Advantage Fund | | | 2 | | | | — | |
International Equity Fund | | | 97 | | | | — | |
International Hedged Equity Fund | | | 1 | | | | — | |
International Research Enhanced Equity Fund | | | — | (a) | | | — | |
International Unconstrained Equity Fund | | | 44 | | | | 1 | |
International Value Fund | | | 34 | | | | — | |
| (a) | Amount rounds to less than one thousand. |
D. Service Fees — The Trusts, on behalf of the Funds, have entered into a Shareholder Servicing Agreement with JPMDS under which JPMDS provides certain support services to fund shareholders. For performing these services, JPMDS receives a fee with respect to all share classes, except Class R6 Shares which do not charge a service fee, that is accrued daily and paid monthly equal to a percentage of the average daily net assets as shown in the table below:
| | | | | | | | | | | | | | | | | | | | | | | | | | | | | | | | |
| | | Class A | | | Class C | | | Class I | | | Class L | | | Class R2 | | | Class R3 | | | Class R4 | | | Class R5 | |
Emerging Markets Equity Fund | | | 0.25 | % | | | 0.25 | % | | | 0.25 | % | | | 0.10 | % | | | 0.25 | % | | | 0.25 | % | | | 0.25 | % | | | 0.10 | % |
Emerging Markets Research Enhanced Equity Fund | | | n/a | | | | n/a | | | | 0.25 | | | | n/a | | | | n/a | | | | n/a | | | | n/a | | | | n/a | |
Europe Dynamic Fund | | | 0.25 | | | | 0.25 | | | | 0.25 | | | | 0.10 | | | | n/a | | | | n/a | | | | n/a | | | | n/a | |
Global Research Enhanced Index Fund | | | n/a | | | | n/a | | | | 0.25 | | | | n/a | | | | n/a | | | | n/a | | | | n/a | | | | n/a | |
International Advantage Fund | | | 0.25 | | | | 0.25 | | | | 0.25 | | | | n/a | | | | 0.25 | | | | n/a | | | | n/a | | | | n/a | |
International Equity Fund | | | 0.25 | | | | 0.25 | | | | 0.25 | | | | n/a | | | | 0.25 | | | | n/a | | | | n/a | | | | 0.10 | |
International Hedged Equity Fund | | | 0.25 | | | | 0.25 | | | | 0.25 | | | | n/a | | | | n/a | | | | n/a | | | | n/a | | | | 0.10 | |
International Research Enhanced Equity Fund | | | 0.25 | | | | n/a | | | | 0.25 | | | | n/a | | | | n/a | | | | n/a | | | | n/a | | | | n/a | |
International Unconstrained Equity Fund | | | 0.25 | | | | 0.25 | | | | 0.25 | | | | n/a | | | | 0.25 | | | | n/a | | | | n/a | | | | 0.10 | |
International Value Fund | | | 0.25 | | | | 0.25 | | | | 0.25 | | | | 0.10 | | | | 0.25 | | | | n/a | | | | n/a | | | | 0.10 | |
JPMDS has entered into shareholder services contracts with affiliated and unaffiliated financial intermediaries who provide shareholder services and other related services to their clients or customers who invest in the Funds. Pursuant to such contracts, JPMDS will pay all or a portion of such fees earned to financial intermediaries for performing such services.
JPMDS waived service fees as outlined in Note 3.F.
| | | | | | |
| | | |
| 142 | | | | J.P. MORGAN INTERNATIONAL EQUITY FUNDS | | OCTOBER 31, 2019 |
E. Custodian and Accounting Fees — JPMCB provides portfolio custody and accounting services to the Funds. For performing these services, the Funds pay JPMCB transaction and asset-based fees that vary according to the number of transactions and positions, plusout-of-pocket expenses. The amounts paid directly to JPMCB by the Funds for custody and accounting services are included in Custodian and accounting fees on the Statements of Operations.
Interest income earned on cash balances at the custodian, if any, is included as Interest income from affiliates on the Statements of Operations.
Interest expense paid to the custodian related to cash overdrafts, if any, is included in Interest expense to affiliates on the Statements of Operations.
F. Waivers and Reimbursements — The Adviser, Administrator and/or JPMDS have contractually agreed to waive fees and/or reimburse the Funds to the extent that total annual operating expenses (excluding acquired fund fees and expenses other than certain money market fund fees as described below, dividend and interest expenses related to short sales, interest, taxes, expenses related to litigation and potential litigation, expenses related to trustee elections and extraordinary expenses) exceed the percentages of the Funds’ respective average daily net assets as shown in the table below:
| | | | | | | | | | | | | | | | | | | | | | | | | | | | | | | | | | | | |
| | | Class A | | | Class C | | | Class I | | | Class L | | | Class R2 | | | Class R3 | | | Class R4 | | | Class R5 | | | Class R6 | |
Emerging Markets Equity Fund | | | 1.24 | % | | | 1.74 | % | | | 0.99 | % | | | 0.95 | % | | | 1.54 | % | | | 1.29 | % | | | 1.04 | % | | | 0.89 | % | | | 0.79 | % |
Emerging Markets Research Enhanced Equity Fund | | | n/a | | | | n/a | | | | 0.45 | (1) | | | n/a | | | | n/a | | | | n/a | | | | n/a | | | | n/a | | | | 0.35 | (1) |
Europe Dynamic Fund | | | 1.24 | | | | 1.74 | | | | 0.99 | | | | n/a | (2) | | | n/a | | | | n/a | | | | n/a | | | | n/a | | | | n/a | (3) |
Global Research Enhanced Index Fund | | | n/a | | | | n/a | | | | 0.34 | | | | n/a | | | | n/a | | | | n/a | | | | n/a | | | | n/a | | | | 0.25 | |
International Advantage Fund(4) | | | 0.95 | | | | 1.45 | | | | 0.70 | | | | n/a | | | | 1.25 | | | | n/a | | | | n/a | | | | n/a | | | | 0.50 | |
International Equity Fund | | | 0.95 | | | | 1.45 | | | | 0.70 | | | | n/a | | | | 1.25 | | | | n/a | | | | n/a | | | | 0.60 | | | | 0.50 | |
International Hedged Equity Fund(5) | | | 0.85 | | | | 1.35 | | | | 0.60 | | | | n/a | | | | n/a | | | | n/a | | | | n/a | | | | 0.45 | | | | 0.35 | |
International Research Enhanced Equity Fund | | | 0.60 | | | | n/a | | | | 0.35 | | | | n/a | | | | n/a | | | | n/a | | | | n/a | | | | n/a | | | | 0.25 | |
International Unconstrained Equity Fund | | | 1.00 | | | | 1.50 | | | | 0.75 | | | | n/a | | | | 1.30 | | | | n/a | | | | n/a | | | | 0.65 | | | | 0.55 | |
International Value Fund | | | 1.00 | | | | 1.50 | | | | 0.75 | | | | n/a | (6) | | | 1.30 | | | | n/a | | | | n/a | | | | 0.65 | | | | 0.55 | |
| (1) | The contractual expense percentages in the table above are in place until at least December 31, 2019. Effective December 19, 2019, the contractual expense percentages in the table above were extended and are in place until at least February 28, 2021. |
| (2) | Effective March 1, 2019, the contractual expense limitation for Class L Shares expired. Prior to March 1, 2019, the contractual expense limitation was 1.00% for Class L Shares. |
| (3) | Effective October 1, 2019, the contractual expense limitation for Class R6 Shares expired. Prior to October 1, 2019, the contractual expense limitation was 0.84% for Class R6 Shares. |
| (4) | Prior to March 1, 2019, the contractual expense limitations were 1.00%, 1.50%, 0.75%, 1.30% and 0.55% for Class A, Class C, Class I, Class R2 and Class R6 Shares, respectively. |
| (5) | The contractual expense percentages in the table above are in place until at least January 31, 2020. Effective December 19, 2019, the contractual expense percentages in the table above were extended and are in place until at least February 28, 2021. |
| (6) | Effective March 1, 2019, the contractual expense limitation for Class L Shares expired. Prior to March 1, 2019, the contractual expense limitation was 0.95% for Class L Shares. |
Except as noted above, the expense limitation agreements were in effect for the year ended October 31, 2019 and are in place until February 29, 2020.
For the year ended October 31, 2019, the Funds’ service providers waived fees and/or reimbursed expenses for each of the Funds as follows (amounts in thousands). None of these parties expect the Funds to repay any such waived fees and/or reimbursed expenses in future years.
| | | | | | | | | | | | | | | | | | | | |
| | | Contractual Waivers | | | | |
| | | Investment
Advisory Fees | | | Administration
Fees | | | Service Fees | | | Total | | | Contractual
Reimbursements | |
Emerging Markets Equity Fund | | $ | 5,898 | | | $ | 3,416 | | | $ | 946 | | | $ | 10,260 | | | $ | 36 | |
Emerging Markets Research Enhanced Equity Fund | | | 247 | | | | 141 | | | | 5 | | | | 393 | | | | 47 | |
Europe Dynamic Fund | | | — | | | | — | | | | 150 | | | | 150 | | | | — | |
Global Research Enhanced Index Fund | | | 1,391 | | | | 926 | | | | 610 | | | | 2,927 | | | | — | |
International Advantage Fund | | | 3,387 | | | | 2,083 | | | | 203 | | | | 5,673 | | | | — | |
International Equity Fund | | | 6,092 | | | | 2,898 | | | | 288 | | | | 9,278 | | | | 3 | |
International Hedged Equity Fund | | | 83 | | | | 25 | | | | 2 | | | | 110 | | | | 109 | |
International Research Enhanced Equity Fund | | | 1,466 | | | | 978 | | | | 610 | | | | 3,054 | | | | — | |
International Unconstrained Equity Fund | | | 1,083 | | | | 460 | | | | 180 | | | | 1,723 | | | | 1 | |
International Value Fund | | | 583 | | | | 316 | | | | 154 | | | | 1,053 | | | | — | (a) |
| (a) | Amount rounds to less than one thousand. |
Additionally, the Funds may invest in one or more money market funds advised by the Adviser (affiliated money market funds). The Adviser, Administrator and/or JPMDS, as shareholder servicing agent, have contractually agreed to waive fees and/or reimburse expenses in an amount sufficient to offset the respective net fees each collects from the affiliated money market fund on the applicable Fund’s investment in such affiliated money market fund, except for investments of securities lending cash collateral.
| | | | | | | | |
| | | |
| OCTOBER 31, 2019 | | J.P. MORGAN INTERNATIONAL EQUITY FUNDS | | | | | 143 | |
NOTES TO FINANCIAL STATEMENTS
AS OF OCTOBER 31, 2019 (continued)
The amounts of these waivers resulting from investments in these money market funds for the year ended October 31, 2019 were as follows (amounts in thousands):
| | | | |
Emerging Markets Equity Fund | | $ | 158 | |
Emerging Markets Research Enhanced Equity Fund | | | 17 | |
Europe Dynamic Fund | | | 32 | |
Global Research Enhanced Index Fund | | | 57 | |
International Advantage Fund | | | 118 | |
International Equity Fund | | | 169 | |
International Hedged Equity Fund | | | 2 | |
International Research Enhanced Equity Fund | | | 238 | |
International Unconstrained Equity Fund | | | 29 | |
International Value Fund | | | 14 | |
G. Other — Certain officers of the Trusts are affiliated with the Adviser, the Administrator and JPMDS. Such officers, with the exception of the Chief Compliance Officer, receive no compensation from the Funds for serving in their respective roles.
The Boards designated and appointed a Chief Compliance Officer to the Funds pursuant to Rule38a-1 under the 1940 Act. Each Fund, along with affiliated funds, makes reimbursement payments, on apro-rata basis, to the Administrator for a portion of the fees associated with the office of the Chief Compliance Officer. Such fees are included in Trustees’ and Chief Compliance Officer’s fees on the Statements of Operations.
The Trusts adopted a Trustee Deferred Compensation Plan (the “Plan”) which allows the Independent Trustees to defer the receipt of all or a portion of compensation related to performance of their duties as Trustees. The deferred fees are invested in various J.P. Morgan Funds until distribution in accordance with the Plan.
During the year ended October 31, 2019, Global Research Enhanced Index Fund purchased securities from an underwriting syndicate in which the principal underwriter or members of the syndicate were affiliated with the Adviser.
The Securities and Exchange Commission (“SEC”) has granted an exemptive order permitting the Funds to engage in principal transactions with J.P. Morgan Securities, Inc., an affiliated broker, involving taxable money market instruments, subject to certain conditions.
4. Investment Transactions
During the year ended October 31, 2019, purchases and sales of investments (excluding short-term investments) were as follows (amounts in thousands):
| | | | | | | | |
| | | Purchases
(excluding
U.S. Government) | | | Sales
(excluding
U.S. Government) | |
Emerging Markets Equity Fund | | $ | 2,272,301 | | | $ | 1,858,138 | |
Emerging Markets Research Enhanced Equity Fund | | | 2,156,547 | | | | 131,715 | |
Europe Dynamic Fund | | | 474,065 | | | | 657,040 | |
Global Research Enhanced Index Fund | | | 1,338,109 | | | | 3,347,914 | |
International Advantage Fund | | | 2,280,936 | | | | 3,862,461 | |
International Equity Fund | | | 1,003,517 | | | | 2,650,774 | |
International Hedged Equity Fund | | | 62,168 | | | | 4,632 | |
International Research Enhanced Equity Fund | | | 963,928 | | | | 1,246,386 | |
International Unconstrained Equity Fund | | | 2,184,981 | | | | 234,602 | |
International Value Fund | | | 250,793 | | | | 367,626 | |
During the year ended October 31, 2019, there were no purchases or sales of U.S. Government securities.
| | | | | | |
| | | |
| 144 | | | | J.P. MORGAN INTERNATIONAL EQUITY FUNDS | | OCTOBER 31, 2019 |
5. Federal Income Tax Matters
For Federal income tax purposes, the estimated cost and unrealized appreciation (depreciation) in value of investments held at October 31, 2019 were as follows (amounts in thousands):
| | | | | | | | | | | | | | | | |
| | | Aggregate
Cost | | | Gross
Unrealized
Appreciation | | | Gross
Unrealized
Depreciation | | | Net Unrealized
Appreciation
(Depreciation) | |
Emerging Markets Equity Fund | | $ | 4,627,320 | | | $ | 1,778,340 | | | $ | 49,105 | | | $ | 1,729,235 | |
Emerging Markets Research Enhanced Equity Fund | | | 2,049,376 | | | | 72,213 | | | | 33,583 | | | | 38,630 | |
Europe Dynamic Fund | | | 497,631 | | | | 54,386 | | | | 11,627 | | | | 42,759 | |
Global Research Enhanced Index Fund | | | 3,034,304 | | | | 1,256,565 | | | | 85,263 | | | | 1,171,302 | |
International Advantage Fund | | | 1,619,466 | | | | 210,993 | | | | 43,507 | | | | 167,486 | |
International Equity Fund | | | 2,276,533 | | | | 805,120 | | | | 51,845 | | | | 753,275 | |
International Hedged Equity Fund | | | 58,043 | | | | 3,747 | | | | 2,296 | | | | 1,451 | |
International Research Enhanced Equity Fund | | | 4,754,816 | | | | 505,425 | | | | 356,577 | | | | 148,848 | |
International Unconstrained Equity Fund | | | 2,555,811 | | | | 143,607 | | | | 14,329 | | | | 129,278 | |
International Value Fund | | | 400,355 | | | | 23,303 | | | | 29,442 | | | | (6,139 | ) |
For the Funds, the difference between book and tax basis appreciation (depreciation) on investments is primarily attributed to investments in PFICs, mark to market of futures contracts, mark to market of options contracts and wash sale loss deferrals.
The tax character of distributions paid during the year ended October 31, 2019 was as follows (amounts in thousands):
| | | | | | | | | | | | |
| | | Ordinary
Income* | | | Net
Long-Term
Capital Gains | | | Total
Distributions
Paid | |
Emerging Markets Equity Fund | | $ | 43,939 | | | $ | — | | | $ | 43,939 | |
Emerging Markets Research Enhanced Equity Fund | | | 26 | | | | — | | | | 26 | |
Europe Dynamic Fund | | | 16,938 | | | | — | | | | 16,938 | |
Global Research Enhanced Index Fund | | | 157,658 | | | | 392,361 | | | | 550,019 | |
International Advantage Fund | | | 88,005 | | | | — | | | | 88,005 | |
International Equity Fund | | | 107,522 | | | | 48,172 | | | | 155,694 | |
International Research Enhanced Equity Fund | | | 161,060 | | | | — | | | | 161,060 | |
International Unconstrained Equity Fund | | | 10,140 | | | | — | | | | 10,140 | |
International Value Fund | | | 18,314 | | | | — | | | | 18,314 | |
| * | Short-term gain distributions are treated as ordinary income for income tax purposes. |
The tax character of distributions paid during the year ended October 31, 2018 was as follows (amounts in thousands):
| | | | | | | | | | | | |
| | | Ordinary
Income* | | | Net
Long-Term
Capital Gains | | | Total
Distributions
Paid | |
Emerging Markets Equity Fund | | $ | 22,140 | | | $ | — | | | $ | 22,140 | |
Europe Dynamic Fund | | | 15,655 | | | | — | | | | 15,655 | |
Global Research Enhanced Index Fund | | | 159,264 | | | | — | | | | 159,264 | |
International Advantage Fund | | | 67,328 | | | | — | | | | 67,328 | |
International Equity Fund | | | 66,772 | | | | — | | | | 66,772 | |
International Research Enhanced Equity Fund | | | 75,137 | | | | 33,139 | | | | 108,276 | |
International Unconstrained Equity Fund | | | 3,143 | | | | — | | | | 3,143 | |
International Value Fund | | | 18,225 | | | | — | | | | 18,225 | |
| * | Short-term gain distributions are treated as ordinary income for income tax purposes. |
| | | | | | | | |
| | | |
| OCTOBER 31, 2019 | | J.P. MORGAN INTERNATIONAL EQUITY FUNDS | | | | | 145 | |
NOTES TO FINANCIAL STATEMENTS
AS OF OCTOBER 31, 2019 (continued)
As of October 31, 2019, the estimated components of net assets (excludingpaid-in-capital) on a tax basis were as follows (amounts in thousands):
| | | | | | | | | | | | |
| | | Current
Distributable
Ordinary
Income | | | Current
Distributable
Long-Term
Capital Gain or
(Tax Basis Capital
Loss Carryover) | | | Unrealized
Appreciation
(Depreciation) | |
Emerging Markets Equity Fund | | $ | 52,211 | | | $ | (124,268 | ) | | $ | 1,709,824 | |
Emerging Markets Research Enhanced Equity Fund | | | 12,791 | | | | 3,082 | | | | 38,650 | |
Europe Dynamic Fund | | | 16,767 | | | | (114,081 | ) | | | 42,725 | |
Global Research Enhanced Index Fund | | | 85,164 | | | | 301,927 | | | | 1,171,164 | |
International Advantage Fund | | | 105,858 | | | | (277,463 | ) | | | 167,409 | |
International Equity Fund | | | 92,835 | | | | (57,757 | ) | | | 753,238 | |
International Hedged Equity Fund | | | 1,206 | | | | (450 | ) | | | 1,453 | |
International Research Enhanced Equity Fund | | | 142,376 | | | | (162,632 | ) | | | 148,779 | |
International Unconstrained Equity Fund | | | 8,733 | | | | (49,027 | ) | | | 129,275 | |
International Value Fund | | | 14,808 | | | | (46,060 | ) | | | (6,202 | ) |
For the Funds, the cumulative timing differences primarily consist of foreign taxes, mark to market of futures contracts, mark to market of options contracts, investments in PFICs and wash sale loss deferrals.
As of October 31, 2019, the following Funds had net capital loss carryforwards as follows (amounts in thousands):
| | | | | | | | |
| | | Capital Loss Carryforward Character | |
| | | Short-Term | | | Long-Term | |
Emerging Markets Equity Fund | | $ | 7,673 | | | $ | 116,595 | |
Europe Dynamic Fund | | | 111,146 | | | | 2,935 | |
International Advantage Fund | | | 222,918 | | | | 54,545 | |
International Equity Fund | | | 38,501 | | | | 19,256 | |
International Hedged Equity Fund | | | 153 | | | | 297 | |
International Research Enhanced Equity Fund | | | 16,878 | | | | 145,754 | |
International Unconstrained Equity Fund | | | 42,042 | * | | | 6,985 | * |
International Value Fund | | | 38,435 | | | | 7,625 | |
During the year ended October 31, 2019, the following Funds utilized capital loss carryforwards as follows (amounts in thousands):
| | | | | | | | |
| | | Capital Loss Utilized | |
| | | Short-Term | | | Long-Term | |
Emerging Markets Equity Fund | | $ | — | | | $ | 10,702 | |
| * | Amount includes capital loss carryforwards which are limited in future years under Internal Revenue Code sections 381 - 384. |
6. Borrowings
The Funds rely upon an exemptive order granted by the SEC (the “Order”) permitting the establishment and operation of an Interfund Lending Facility (the “Facility”). The Facility allows the Funds to directly lend and borrow money to or from any other fund relying upon the Order at rates beneficial to both the borrowing and lending funds. Advances under the Facility are taken primarily for temporary or emergency purposes, including the meeting of redemption requests that otherwise might require the untimely disposition of securities, and are subject to each Fund’s borrowing restrictions. The Interfund loan rate is determined, as specified in the Order, by averaging the current repurchase agreement rate and the current bank loan rate. The Order was granted to JPM II and may be relied upon by the Funds because the Funds and the series of JPM II are all investment companies in the same “group of investment companies” (as defined in Section 12(d)(1)(G) of the 1940 Act).
The following Fund had borrowings outstanding from another fund at October 31, 2019 (amounts in thousands, except number of days outstanding):
| | | | | | | | | | | | | | | | |
| | | Borrowings Outstanding | | | Interest
Rate Paid | | | Number of
Days
Outstanding | | | Interest
Paid | |
Global Research Enhanced Index Fund | | $ | 3,663 | | | | 2.29 | % | | | 1 | | | $ | — | (a) |
| (a) | Amount rounds to less than one thousand. |
| | | | | | |
| | | |
| 146 | | | | J.P. MORGAN INTERNATIONAL EQUITY FUNDS | | OCTOBER 31, 2019 |
Average borrowings from the Facility during the year ended October 31, 2019, were as follows (amounts in thousands, except number of days outstanding):
| | | | | | | | | | | | | | | | |
| | | Average
Borrowings | | | Average
Interest
Rate Paid | | | Number of
Days
Outstanding | | | Interest
Paid | |
Emerging Markets Equity Fund | | $ | 23,479 | | | | 3.01 | % | | | 31 | | | $ | 63 | |
Europe Dynamic Fund | | | 21,938 | | | | 2.94 | | | | 4 | | | | 7 | |
Global Research Enhanced Index Fund | | | 20,790 | | | | 3.10 | | | | 52 | | | | 96 | |
International Advantage Fund | | | 35,705 | | | | 2.89 | | | | 7 | | | | 20 | |
International Equity Fund | | | 64,779 | | | | 3.19 | | | | 6 | | | | 34 | |
International Value Fund | | | 5,131 | | | | 3.05 | | | | 27 | | | | 12 | |
The Trusts and JPMCB have entered into a financing arrangement. Under this arrangement, JPMCB provides an unsecured, uncommitted credit facility in the aggregate amount of $100 million to certain of the J.P. Morgan Funds, including the Funds. Advances under the arrangement are taken primarily for temporary or emergency purposes, including the meeting of redemption requests that otherwise might require the untimely disposition of securities, and are subject to each Fund’s borrowing restrictions. Interest on borrowings is payable at a rate determined by JPMCB at the time of borrowing. This agreement has been extended until November 2, 2020.
Interest expense paid as a result of borrowings from another fund or from the unsecured, uncommitted credit facility is included in Interest expense to affiliates on the Statements of Operations.
The Funds had no borrowings outstanding from the unsecured, uncommitted facility at October 31, 2019.
The Trusts, along with certain other trusts for J.P. Morgan Funds (“Borrowers”), have entered into a joint syndicated senior unsecured revolving credit facility totaling $1.5 billion (“Credit Facility”) with various lenders and The Bank of New York Mellon, as administrative agent for the lenders. This Credit Facility provides a source of funds to the Borrowers for temporary and emergency purposes, including the meeting of redemption requests that otherwise might require the untimely disposition of securities. Under the terms of the Credit Facility, a borrowing fund must have a minimum of $25,000,000 in adjusted net asset value and not exceed certain adjusted net asset coverage ratios prior to and during the time in which any borrowings are outstanding. If a fund does not comply with the aforementioned requirements, the fund must remediate within three business days with respect to the $25,000,000 minimum adjusted net asset value or within one business day with respect to certain asset coverage ratios or the administrative agent at the request of, or with the consent of, the lenders may terminate the Credit Facility and declare any outstanding borrowings to be due and payable immediately. Interest associated with any borrowing under the Credit Facility is charged to the borrowing fund at a rate of interest equal to 1.00% plus the greater of the federal funds effective rate or one month London InterBank Offered Rate (“LIBOR”). The annual commitment fee to maintain the Credit Facility is 0.15% and is incurred on the unused portion of the Credit Facility and is allocated to all participating funds pro rata based on their respective net assets. Effective August 13, 2019, this agreement has been amended and restated for a term of 364 days, unless extended.
The Funds had no borrowings outstanding from the Credit Facility at October 31, 2019. Average borrowings from the Credit Facility during the year ended October 31, 2019 were as follows (amounts in thousands, except number of days outstanding):
| | | | | | | | | | | | | | | | |
| | | Average
Borrowings | | | Average
Interest
Rate Paid | | | Number of
Days
Outstanding | | | Interest
Paid | |
Emerging Markets Equity Fund | | $ | 12,000 | | | | 3.38 | % | | | 1 | | | $ | 1 | |
7. Risks, Concentrations and Indemnifications
In the normal course of business, the Funds enter into contracts that contain a variety of representations which provide general indemnifications. Each Fund’s maximum exposure under these arrangements is unknown. The amount of exposure would depend on future claims that may be brought against each Fund. However, based on experience, the Funds expect the risk of loss to be remote.
Derivatives may be riskier than other types of investments because they may be more sensitive to changes in economic and market conditions and could result in losses that significantly exceed the Funds’ original investment. Many derivatives create leverage thereby causing the Funds to be more volatile than they would have been if they had not used derivatives. Derivatives also expose the Funds to counterparty risk (the risk that the derivative counterparty will not fulfill its contractual obligations), including credit risk of the derivative counterparty. The possible lack of a liquid secondary market for derivatives and the resulting inability of the Funds to sell or otherwise close a derivatives position could expose the Funds to losses.
| | | | | | | | |
| | | |
| OCTOBER 31, 2019 | | J.P. MORGAN INTERNATIONAL EQUITY FUNDS | | | | | 147 | |
NOTES TO FINANCIAL STATEMENTS
AS OF OCTOBER 31, 2019 (continued)
As of October 31, 2019, the following Funds had individual shareholder and/or omnibus accounts each owning more than 10% of the respective Fund’s outstanding shares as follows:
| | | | | | | | | | | | | | | | |
| | | Number of
individual
shareholder and/
or Affiliated
Omnibus Accounts | | | % of the Fund | | | Number of
individual
shareholder and/
orNon-Affiliated
Omnibus Accounts | | | % of the Fund | |
Emerging Markets Equity Fund | | | — | | | | — | % | | | 2 | | | | 27.0 | % |
Emerging Markets Research Enhanced Equity Fund | | | 4 | | | | 60.1 | | | | — | | | | — | |
Europe Dynamic Fund | | | 4 | | | | 58.8 | | | | 1 | | | | 12.1 | |
Global Research Enhanced Index Fund | | | 1 | | | | 85.4 | | | | — | | | | — | |
International Advantage Fund | | | 5 | | | | 65.5 | | | | — | | | | — | |
International Equity Fund | | | 3 | | | | 52.7 | | | | 1 | | | | 11.8 | |
International Hedged Equity Fund | | | 1 | | | | 86.4 | | | | 1 | | | | 10.7 | |
International Research Enhanced Equity Fund | | | 3 | | | | 31.4 | | | | — | | | | — | |
International Unconstrained Equity Fund | | | 4 | | | | 70.8 | | | | — | | | | — | |
International Value Fund | | | — | | | | — | | | | 1 | | | | 66.9 | |
Significant shareholder transactions by these shareholders may impact the Funds’ performance.
The Funds may have elements of risk not typically associated with investments in the United States of America due to concentrated investments in a limited number of countries or regions, which may vary throughout the period depending on the Fund. Such concentrations may subject the Funds to additional risks resulting from political or economic conditions in such countries or regions and the possible imposition of adverse governmental laws or currency exchange restrictions could cause the securities and their markets to be less liquid and their prices to be more volatile than those of comparable U.S. securities.
As of October 31, 2019, the J.P. Morgan Investor Funds, the JPMorgan SmartRetirement Funds and the SmartRetirement Blend Funds, which are affiliated funds of funds, owned in the aggregate, shares representing more than 10% of the net assets of the Funds as follows:
| | | | | | | | | | | | |
| | | J.P. Morgan
Investor
Funds | | | JPMorgan
SmartRetirement
Funds | | | JPMorgan
SmartRetirement
Blend Funds | |
Emerging Markets Equity Fund | | | — | % | | | 14.5 | % | | | — | % |
Emerging Markets Research Enhanced Equity Fund | | | 10.5 | | | | 66.3 | | | | 20.0 | |
Europe Dynamic Fund | | | 47.1 | | | | — | | | | — | |
International Advantage Fund | | | — | | | | 84.6 | | | | — | |
International Equity Fund | | | — | | | | 57.5 | | | | — | |
International Research Enhanced Equity Fund | | | 15.2 | | | | 64.7 | | | | — | |
International Unconstrained Equity Fund | | | — | | | | 78.0 | | | | — | |
As of October 31, 2019, the following Funds hadnon-U.S. country allocations representing greater than 10% of total investments (excluding investment of cash collateral from securities loaned) as follows:
| | | | | | | | | | | | | | | | | | | | |
| | | China | | | France | | | Germany | | | India | | | Japan | |
Emerging Markets Equity Fund | | | 28.9 | % | | | — | % | | | — | % | | | 19.5 | % | | | — | % |
Emerging Markets Research Enhanced Equity Fund | | | 32.1 | | | | — | | | | — | | | | — | | | | — | |
Europe Dynamic Fund | | | — | | | | 16.1 | | | | 12.6 | % | | | — | | | | — | |
International Advantage Fund | | | — | | | | — | | | | — | | | | — | | | | 24.0 | |
International Equity Fund | | | — | | | | 15.1 | | | | — | | | | — | | | | 17.2 | |
International Hedged Equity Fund | | | — | | | | 13.7 | | | | — | | | | — | | | | 23.5 | |
International Research Enhanced Equity Fund | | | — | | | | 13.5 | | | | — | | | | — | | | | 23.1 | |
International Value Fund | | | — | | | | — | | | | — | | | | — | | | | 22.0 | |
| | | | | | | | | | | | | | | | |
| | | South
Korea | | | Switzerland | | | Taiwan | | | United
Kingdom | |
Emerging Markets Research Enhanced Equity Fund | | | 13.0 | % | | | — | % | | | 11.5 | % | | | — | % |
Europe Dynamic Fund | | | — | | | | 21.6 | | | | — | | | | 18.1 | |
International Advantage Fund | | | — | | | | 11.5 | | | | — | | | | 12.6 | |
International Equity Fund | | | — | | | | 11.9 | | | | — | | | | 15.3 | |
International Hedged Equity Fund | | | — | | | | 10.2 | | | | — | | | | 15.2 | |
International Research Enhanced Equity Fund | | | — | | | | 10.0 | | | | — | | | | 15.0 | |
International Unconstrained Equity Fund | | | — | | | | — | | | | — | | | | 18.2 | |
International Value Fund | | | — | | | | — | | | | — | | | | 17.6 | |
| | | | | | |
| | | |
| 148 | | | | J.P. MORGAN INTERNATIONAL EQUITY FUNDS | | OCTOBER 31, 2019 |
As of October 31, 2019, a significant portion of each Fund’s investments consisted of securities that were denominated in foreign currencies. Changes in currency exchange rates will affect the value of, and investment income from, such securities.
LIBOR is intended to represent the rate at which contributing banks may obtain short-term borrowings from each other in the London interbank market. The regulatory authority that oversees financial services firms and financial markets in the U.K. has announced that, after the end of 2021, it would no longer persuade or compel contributing banks to make rate submissions for purposes of determining the LIBOR rate. As a result, it is possible that commencing in 2022, LIBOR may no longer be available or no longer deemed an appropriate reference rate upon which to determine the interest rate on or impacting certain loans, notes, derivatives and other instruments or investments comprising some or all of a Fund’s portfolio. In light of this eventuality, public and private sector industry initiatives are currently underway to identify new or alternative reference rates to be used in place of LIBOR. There is no assurance that the composition or characteristics of any such alternative reference rate will be similar to or produce the same value or economic equivalence as LIBOR or that it will have the same volume or liquidity as did LIBOR prior to its discontinuance or unavailability, which may affect the value or liquidity or return on certain investments of a Fund and result in costs incurred in connection with closing out positions and entering into new trades. These risks may also apply with respect to changes in connection with other interbank offering rates (e.g., Euribor) and a wide range of other index levels, rates and values that are treated as “benchmarks” and are the subject of recent regulatory reform.
| | | | | | | | |
| | | |
| OCTOBER 31, 2019 | | J.P. MORGAN INTERNATIONAL EQUITY FUNDS | | | | | 149 | |
REPORT OF INDEPENDENT REGISTERED PUBLIC ACCOUNTING FIRM
TotheBoards of Trustees of JPMorgan Trust I, JPMorgan Trust IIandJPMorgan Trust IV andShareholders of JPMorgan Emerging Markets Equity Fund, JPMorgan Emerging Markets Research Enhanced Equity Fund, JPMorgan Europe Dynamic Fund, JPMorgan Global Research Enhanced Index Fund, JPMorgan International Advantage Fund, JPMorgan International Equity Fund, JPMorgan International Hedged Equity Fund, JPMorgan International Research Enhanced Equity Fund, JPMorgan International Unconstrained Equity Fund and JPMorgan International Value Fund
Opinions on the Financial Statements
We have audited the accompanying statements of assets and liabilities, including the schedules of portfolio investments, ofJPMorgan Emerging Markets Equity Fund, JPMorgan Europe Dynamic Fund, JPMorgan Global Research Enhanced Index Fund, JPMorgan International Advantage Fund, JPMorgan International Equity Fund, JPMorgan International Unconstrained Equity Fund and JPMorgan International Value Fund (seven of the funds constituting JPMorgan Trust I) , JPMorgan International Research Enhanced Equity Fund (one of the funds constituting JPMorgan Trust II) and JPMorgan Emerging Markets Research Enhanced Equity Fund and JPMorgan International Hedged Equity Fund (two of the funds constituting JPMorgan Trust IV) (hereafter collectively referred to as the “Funds”) as of October 31, 2019, the related statements of operations and of changes in net assets for each of the periods indicated in the table below, including the related notes,and the financial highlights for each of the periods indicated therein (collectively referred to as the “financial statements”). In our opinion, the financial statements present fairly, in all material respects, the financial position of each of the Funds as of October 31, 2019, the results of each of their operations and the changes in each of their net assets for the periods indicated in the table below,and each of the financial highlights for each of the periods indicated therein, in conformity with accounting principles generally accepted in the United States of America.
| | |
| JPMorgan Emerging Markets Equity Fund (1) | | JPMorgan International Equity Fund (1) |
| JPMorgan Emerging Markets Research Enhanced Equity Fund (2) | | JPMorgan International Hedged Equity Fund (3) |
| JPMorgan Europe Dynamic Fund (1) | | JPMorgan International Research Enhanced Equity Fund (1) |
| JPMorgan Global Research Enhanced Index Fund (1) | | JPMorgan International Unconstrained Equity Fund (1) |
| JPMorgan International Advantage Fund (1) | | JPMorgan International Value Fund (1) |
(1) Statement of operations for the year ended October 31, 2019 and statements of changes in net assets for each of the two years ended October 31, 2019. |
(2) Statement of operations and statement of changes in net assets for the period December 11, 2018 (commencement of operations) through October 31, 2019. |
(3) Statement of operations and statement of changes in net assets for the period March 15, 2019 (commencement of operations) through October 31, 2019. |
Basis for Opinions
These financial statements are the responsibility of the Funds’ management. Our responsibility is to express an opinion on the Funds’ financial statements based on our audits. We are a public accounting firm registered with the Public Company Accounting Oversight Board (United States) (PCAOB) and are required to be independent with respect to the Funds in accordance with the U.S. federal securities laws and the applicable rules and regulations of the Securities and Exchange Commission and the PCAOB.
We conducted our audits of these financial statements in accordance with the standards of the PCAOB. Those standards require that we plan and perform the audit to obtain reasonable assurance about whether the financial statements are free of material misstatement, whether due to error or fraud.
Our audits included performing procedures to assess the risks of material misstatement of the financial statements, whether due to error or fraud, and performing procedures that respond to those risks. Such procedures included examining, on a test basis, evidence regarding the amounts and disclosures in the financial statements. Our audits also included evaluating the accounting principles used and significant estimates made by management, as well as evaluating the overall presentation of the financial statements. Our procedures included confirmation of securities owned as of October 31, 2019 by correspondence with the custodian, transfer agent and brokers; when replies were not received from brokers, we performed other auditing procedures. We believe that our audits provide a reasonable basis for our opinions.
/s/PricewaterhouseCoopers LLP
New York, New York
December 20, 2019
We have served as the auditor of one or more investment companies in the JPMorgan Funds complex since 1993.
| | | | | | |
| | | |
| 150 | | | | J.P. MORGAN INTERNATIONAL EQUITY FUNDS | | OCTOBER 31, 2019 |
TRUSTEES
(Unaudited)
The Funds’ Statement of Additional Information includes additional information about the Funds’ Trustees and is available, without charge, upon request by calling1-800-480-4111 or on the J.P. Morgan Funds’ website at www.jpmorganfunds.com.
| | | | | | |
Name (Year of Birth); Positions With the Funds(1) | | Principal Occupation During Past 5 Years | | Number of
Funds in Fund
Complex Overseen
by Trustee (2) | | Other Directorships Held During the Past 5 Years |
Independent Trustees | | |
| | | |
| John F. Finn (1947); Trustee of Trusts since 2005; Trustee of heritage One Group Mutual Funds since 1998. | | Chairman and Chief Executive Officer, Gardner, Inc. (supply chain management company serving industrial and consumer markets) (serving in various roles 1974-present). | | 130 | | Director, Greif, Inc. (GEF) (industrial package products and services)(2007-present); Trustee, Columbus Association for the Performing Arts (1988-present); Director, Cardinal Health, Inc. (CAH) (1994-2014). |
| | | |
| Stephen P. Fisher (1959); Trustee of Trusts since 2018. | | Retired; Chairman and Chief Executive Officer, NYLIFE Distributors LLC (registered broker-dealer) (serving in various roles2008-2013); Chairman, NYLIM Service Company LLC (transfer agent) (2008-2017); New York Life Investment Management LLC (registered investment adviser) (serving in various roles 2005-2017); Chairman, IndexIQ Advisors LLC (registered investment adviser for ETFs)(2014-2017); President, MainStay VP Funds Trust (2007-2017), MainStay DefinedTerm Municipal Opportunities Fund (2011-2017) and MainStay Funds Trust (2007-2017) (registered investment companies). | | 130 | | Advisory Board Member, Scholarship Committee Member and Investment Committee Member, The First Tee of Plainfield(non-profit youth sports organization that provides need-based scholarships) (2014-present); Honors Program Advisory Board Member, The Zicklin School of Business, Baruch College, The City University of New York (2017-present). |
| | | |
| Kathleen M. Gallagher (1958); Trustee of the Trusts since 2018. | | Retired; Chief Investment Officer — Benefit Plans, Ford Motor Company (serving in various roles 1985-2016). | | 130 | | Non-Executive Director, Legal & General Investment Management (Holdings) (2018-present); Non-Executive Director, Legal & General Investment Management America (financial services and insurance) (2017-present); Advisory Board Member, OCIO Board of State Street Global Advisors (2017-present); Member, Client Advisory Council, Financial Engines, LLC (registered investment adviser) (2011-2016); Director, Ford Pension Funds Investment Management Ltd.(2007-2016). |
| | | |
| Dr. Matthew Goldstein (1941); Chairman since 2013; Trustee of Trusts since 2005; Trustee of heritage J.P. Morgan Funds since 2003. | | Chancellor Emeritus, City University of New York (2015-present); Professor, City University of New York (2013-present); Chancellor, City University of New York (1999-2013); President, Adelphi University (New York) (1998-1999). | | 130 | | Trustee, Museum of Jewish Heritage(2011-present); Trustee, National Museum of Mathematics (present); Chair, Association of College and University Administrators (present). |
| | | |
| Dennis P. Harrington* (1950); Trustee of Trusts since 2017. | | Retired; Partner, Deloitte LLP (accounting firm) (serving in various roles 1984-2012). | | 130 | | None |
| | | |
| Frankie D. Hughes (1952); Trustee of Trusts since 2008. | | President, Ashland Hughes Properties (property management) (2014-present); President and Chief Investment Officer, Hughes Capital Management, Inc. (fixed income asset management) (1993-2014). | | 130 | | None |
| | | | | | | | |
| | | |
| OCTOBER 31, 2019 | | J.P. MORGAN INTERNATIONAL EQUITY FUNDS | | | | | 151 | |
TRUSTEES
(Unaudited) (continued)
| | | | | | |
Name (Year of Birth); Positions With the Funds(1) | | Principal Occupation During Past 5 Years | | Number of
Funds in Fund
Complex Overseen
by Trustee (2) | | Other Directorships Held During the Past 5 Years |
Independent Trustees (continued) | | |
| | | |
Raymond Kanner** (1953); Trustee of Trusts since 2017. | | Retired; Managing Director & Chief Investment Officer, IBM Retirement Funds (2007-2016). | | 130 | | Advisory Board Member, Los Angeles Capital (2018-present); Advisory Board Member, State Street Global Advisors OCIO Board (2017-present); Acting Executive Director, Committee on Investment of Employee Benefit Assets (CIEBA) (2016-2017); Advisory Board Member, Betterment for Business (robo advisor) (2016-2017); Advisory Board Member, Blue Star Indexes (index creator) (2013-2017); Director, Emerging Markets Growth Fund (registered investment company) (1997-2016); Member, Russell Index Client Advisory Board (2001-2015). |
| | | |
| Peter C. Marshall (1942); Trustee of Trusts since 2005; Trustee of heritage One Group Mutual Funds since 1985. | | Self-employed business consultant
(2002-present). | | 130 | | None |
| | | |
| Mary E. Martinez (1960); Trustee of Trusts since 2013. | | Associate, Special Properties, a Christie’s International Real Estate Affiliate(2010-present); Managing Director, Bank of America (Asset Management) (2007-2008); Chief Operating Officer, U.S. Trust Asset Management, U.S. Trust Company (asset management) (2003-2007); President, Excelsior Funds (registered investment companies) (2004-2005). | | 130 | | None |
| | | |
| Marilyn McCoy (1948); Trustee of Trusts since 2005; Trustee of heritage One Group Mutual Funds since 1999. | | Vice President of Administration and Planning, Northwestern University (1985-present). | | 130 | | None |
| | | |
| Mitchell M. Merin (1953); Trustee of Trusts since 2013. | | Retired; President and Chief Operating Officer, Morgan Stanley Investment Management, Member Morgan Stanley & Co. Management Committee (serving in various roles 1981-2006). | | 130 | | Director, Sun Life Financial (SLF) (financial services and insurance) (2007-2013). |
| | | |
| Dr. Robert A. Oden, Jr. (1946); Trustee of Trusts since 2005; Trustee of heritage One Group Mutual Funds since 1997. | | Retired; President, Carleton College(2002-2010); President, Kenyon College(1995-2002). | | 130 | | Trustee, Trout Unlimited(2017-present); Trustee, American Museum of Fly Fishing (2013-present); Vice Chair, Dartmouth-Hitchcock Medical Center (2011-present); Trustee, American University in Cairo (1999-2014). |
| | | |
| Marian U. Pardo*** (1946); Trustee of Trusts since 2013. | | Managing Director and Founder, Virtual Capital Management LLC (investment consulting)(2007-present); Managing Director, Credit Suisse Asset Management (portfolio manager)(2003-2006). | | 130 | | President and Member, Board of Governors, Columbus Citizens Foundation (not-for-profit supporting philanthropic and cultural programs) (2006-present). |
| | | | | | |
| | | |
| 152 | | | | J.P. MORGAN INTERNATIONAL EQUITY FUNDS | | OCTOBER 31, 2019 |
| (1) | Dr. Goldstein is retiring from the Board of Trustees effective the close of business on December 31, 2019. The Trustees serve for an indefinite term, subject to the Trusts’ current retirement policy, which is age 78 for all Trustees. |
| (2) | A Fund Complex means two or more registered investment companies that hold themselves out to investors as related companies for purposes of investment and investor services or have a common investment adviser or have an investment adviser that is an affiliated person of the investment adviser of any of the other registered investment companies. The J.P. Morgan Funds Complex for which the Boards of Trustees serve currently includes ten registered investment companies (130 funds). |
| * | Two family members of Mr. Harrington are partner and managing director, respectively, of the Funds’ independent registered public accounting firm. Such firm has represented to the Boards that those family members are not involved in the audit of the Funds’ financial statements and do not provide other services to the Funds. The Boards have concluded that such association does not interfere with Mr. Harrington’s exercise of independent judgment as an Independent Trustee. |
| ** | A family member of Mr. Kanner is employed by JPMorgan Chase Bank, which is affiliated with JPMIM and JPMDS. In that capacity, this employee provides services to various JPMorgan affiliates including JPMIM and JPMDS and for which JPMIM and JPMDS bear some portion of the expense thereof. |
| *** | In connection with prior employment with JPMorgan Chase, Ms. Pardo was the recipient ofnon-qualified pension plan payments from JPMorgan Chase in the amount of approximately $2,055 per month, which she irrevocably waived effective January 1, 2013, and deferred compensation payments from JPMorgan Chase in the amount of approximately $7,294 per year, which ended in January 2013. In addition, Ms. Pardo receives payments from a fully-funded qualified plan, which is not an obligation of JPMorgan Chase. |
The contact address for each of the Trustees is 277 Park Avenue, New York, NY 10172.
| | | | | | | | |
| | | |
| OCTOBER 31, 2019 | | J.P. MORGAN INTERNATIONAL EQUITY FUNDS | | | | | 153 | |
OFFICERS
(Unaudited)
| | |
Name (Year of Birth), Positions Held with the Trusts (Since) | | Principal Occupations During Past 5 Years |
| |
Brian S. Shlissel (1964),
President and Principal Executive Officer (2016) | | Managing Director and Chief Administrative Officer for J.P. Morgan pooled vehicles, J.P. Morgan Investment Management Inc. (formerly JPMorgan Funds Management, Inc.) (from 2014 to present); Managing Director and Head of Mutual Fund Services, Allianz Global Investors; President and Chief Executive Officer, Allianz Global Investors Mutual Funds and PIMCO Closed-End Funds (from 1999 to 2014). |
| |
Timothy J. Clemens (1975), Treasurer and Principal Financial Officer (2018)* | | Executive Director, J.P. Morgan Investment Management Inc. (formerly JPMorgan Funds Management, Inc.) since February 2016; Vice President, JPMorgan Funds Management, Inc. from October 2013 to January 2016. |
| |
Gregory S. Samuels (1980),
Secretary (2019) (formerly Assistant Secretary since 2010)* | | Executive Director and Assistant General Counsel, JPMorgan Chase since 2014; formerly Vice President and Assistant General Counsel, JPMorgan Chase from 2010 to February 2014. |
| |
Stephen M. Ungerman (1953),
Chief Compliance Officer (2005) | | Managing Director, JPMorgan Chase & Co.; Mr. Ungerman has been with JPMorgan Chase & Co. since 2000. |
| |
Elizabeth A. Davin (1964), Assistant Secretary (2005)** | | Executive Director and Assistant General Counsel, JPMorgan Chase since February 2012; formerly Vice President and Assistant General Counsel, JPMorgan Chase from 2005 to February 2012; Senior Counsel, JPMorgan Chase (formerly Bank One Corporation) from 2004 to 2005. |
| |
Jessica K. Ditullio (1962),
Assistant Secretary (2005)** | | Executive Director and Assistant General Counsel, JPMorgan Chase. Ms. Ditullio has been with JPMorgan Chase (formerly Bank One Corporation) since 1990. |
| |
Anthony Geron (1971),
Assistant Secretary (2018)* | | Vice President and Assistant General Counsel, JPMorgan Chase since September 2018; Lead Director and Counsel, AXA Equitable Life Insurance Company from 2015 to 2018 and Senior Director and Counsel, AXA Equitable Life Insurance Company from 2014 to 2015; Associate, Willkie Farr & Gallagher (law firm) from 2007 to 2014. |
| |
Carmine Lekstutis (1980),
Assistant Secretary (2011)* | | Executive Director and Assistant General Counsel, JPMorgan Chase since February 2015; formerly Vice President and Assistant General Counsel, JPMorgan Chase from 2011 to February 2015. |
| |
Keri E. Riemer (1976),
Assistant Secretary (2019)* | | Executive Director and Assistant General Counsel, JPMorgan Chase since February 2019; Counsel, Seward & Kissel LLP (2016-2019); Associate, Seward & Kissel LLP (2011-2016). |
| |
Zachary E. Vonnegut-Gabovitch (1986), Assistant Secretary (2017)* | | Vice President and Assistant General Counsel, JPMorgan Chase since September 2016; Associate, Morgan, Lewis & Bockius (law firm) from 2012 to 2016. |
| |
Michael M. D’Ambrosio (1969),
Assistant Treasurer (2012) | | Managing Director, J.P. Morgan Investment Management Inc. (formerly JPMorgan Funds Management, Inc.) since May 2014; formerly Executive Director, JPMorgan Funds Management, Inc. from 2012 to May 2014. |
| |
Aleksandr Fleytekh (1972), Assistant Treasurer (2019)* | | Vice President, J.P. Morgan Investment Management Inc. (formerly JPMorgan Funds Management, Inc.) since February 2012. |
| |
Shannon Gaines (1977),
Assistant Treasurer (2018)** | | Vice President, J.P. Morgan Investment Management Inc. (formerly JPMorgan Funds Management, Inc.) since January 2014. |
| |
Jeffrey D. House (1972), Assistant Treasurer (2017)** | | Vice President, J.P. Morgan Investment Management Inc. (formerly JPMorgan Funds Management, Inc.) since July 2006. |
| |
Lauren A. Paino (1973), Assistant Treasurer (2014)* | | Executive Director, J.P. Morgan Investment Management Inc. (formerly JPMorgan Funds Management, Inc.) since August 2013. |
| |
Joseph Parascondola (1963),
Assistant Treasurer (2011)* | | Vice President, J.P. Morgan Investment Management Inc. (formerly JPMorgan Funds Management, Inc.) since August 2006. |
| |
Gillian I. Sands (1969),
Assistant Treasurer (2012)* | | Vice President, J.P. Morgan Investment Management Inc. (formerly JPMorgan Funds Management, Inc.) since September 2012. |
The contact address for each of the officers, unless otherwise noted, is 277 Park Avenue, New York, NY 10172.
| * | The contact address for the officer is 4 New York Plaza, New York, NY 10004. |
| ** | The contact address for the officer is 1111 Polaris Parkway, Columbus, OH 43240. |
| | | | | | |
| | | |
| 154 | | | | J.P. MORGAN INTERNATIONAL EQUITY FUNDS | | OCTOBER 31, 2019 |
SCHEDULE OF SHAREHOLDER EXPENSES
(Unaudited)
Hypothetical $1,000 Investment
As a shareholder of the Funds, you incur two types of costs: (1) transaction costs, including sales charges (loads) on purchase payments and (2) ongoing costs, including investment advisory fees, administration fees, distribution fees and other Fund expenses. The examples below are intended to help you understand your ongoing costs (in dollars) of investing in the Funds and to compare these ongoing costs with the ongoing costs of investing in other mutual funds. The examples assume that you had a $1,000 investment in each Class at the beginning of the reporting period, May 1, 2019, and continued to hold your shares at the end of the reporting period, October 31, 2019.
Actual Expenses
For each Class of each Fund in the table below, the first line provides information about actual account values and actual expenses. You may use the information in this line, together with the amount you invested, to estimate the expenses that you paid over the period. Simply divide your account value by $1,000 (for example, an $8,600 account value divided by $1,000 = 8.6), then multiply the result by the number in the first line of each Class under the heading entitled “Expenses Paid During the Period” to estimate the expenses you paid on your account during this period.
Hypothetical Example for Comparison Purposes
The second line of each Class in the table below provides information about hypothetical account values and hypothetical expenses based on the Class’ actual expense ratio and an assumed rate of return of 5% per year before expenses, which is not the Class’ actual return. The hypothetical account values and expenses may not be used to estimate the actual ending account balance or expenses you paid for the period. You may use this information to compare the ongoing costs of investing in the Class of the Funds and other funds. To do so, compare this 5% hypothetical example with the 5% hypothetical examples that appear in the shareholder reports of the other funds. Please note that the expenses shown in the table are meant to highlight your ongoing costs only and do not reflect any transaction costs, such as sales charges (loads) or redemption fees. Therefore, the second line for each Class in the table is useful in comparing ongoing costs only, and will not help you determine the relative total costs of owning different funds. In addition, if these transaction costs were included, your costs would have been higher. The examples also assume all dividends and distributions have been reinvested.
| | | | | | | | | | | | | | | | |
| | | Beginning
Account Value
May 1, 2019 | | | Ending
Account Value
October 31, 2019 | | | Expenses
Paid During the
Period* | | | Annualized
Expense
Ratio | |
JPMorgan Emerging Markets Equity Fund | | | | | | | | | | | | | | | | |
Class A | | | | | | | | | | | | | | | | |
Actual | | $ | 1,000.00 | | | $ | 1,029.10 | | | $ | 6.34 | | | | 1.24 | % |
Hypothetical | | | 1,000.00 | | | | 1,018.95 | | | | 6.31 | | | | 1.24 | |
Class C | | | | | | | | | | | | | | | | |
Actual | | | 1,000.00 | | | | 1,026.10 | | | | 8.89 | | | | 1.74 | |
Hypothetical | | | 1,000.00 | | | | 1,016.43 | | | | 8.84 | | | | 1.74 | |
Class I | | | | | | | | | | | | | | | | |
Actual | | | 1,000.00 | | | | 1,030.10 | | | | 5.07 | | | | 0.99 | |
Hypothetical | | | 1,000.00 | | | | 1,020.21 | | | | 5.04 | | | | 0.99 | |
Class L | | | | | | | | | | | | | | | | |
Actual | | | 1,000.00 | | | | 1,030.60 | | | | 4.56 | | | | 0.89 | |
Hypothetical | | | 1,000.00 | | | | 1,020.72 | | | | 4.53 | | | | 0.89 | |
Class R2 | | | | | | | | | | | | | | | | |
Actual | | | 1,000.00 | | | | 1,027.30 | | | | 7.87 | | | | 1.54 | |
Hypothetical | | | 1,000.00 | | | | 1,017.44 | | | | 7.83 | | | | 1.54 | |
Class R3 | | | | | | | | | | | | | | | | |
Actual | | | 1,000.00 | | | | 1,028.50 | | | | 6.60 | | | | 1.29 | |
Hypothetical | | | 1,000.00 | | | | 1,018.70 | | | | 6.56 | | | | 1.29 | |
Class R4 | | | | | | | | | | | | | | | | |
Actual | | | 1,000.00 | | | | 1,029.90 | | | | 5.32 | | | | 1.04 | |
Hypothetical | | | 1,000.00 | | | | 1,019.96 | | | | 5.30 | | | | 1.04 | |
Class R5 | | | | | | | | | | | | | | | | |
Actual | | | 1,000.00 | | | | 1,030.60 | | | | 4.56 | | | | 0.89 | |
Hypothetical | | | 1,000.00 | | | | 1,020.72 | | | | 4.53 | | | | 0.89 | |
Class R6 | | | | | | | | | | | | | | | | |
Actual | | | 1,000.00 | | | | 1,031.30 | | | | 4.04 | | | | 0.79 | |
Hypothetical | | | 1,000.00 | | | | 1,021.22 | | | | 4.02 | | | | 0.79 | |
| | | | | | | | |
| | | |
| OCTOBER 31, 2019 | | J.P. MORGAN INTERNATIONAL EQUITY FUNDS | | | | | 155 | |
SCHEDULE OF SHAREHOLDER EXPENSES
(Unaudited) (continued)
Hypothetical $1,000 Investment
| | | | | | | | | | | | | | | | |
| | | Beginning
Account Value
May 1, 2019 | | | Ending
Account Value
October 31, 2019 | | | Expenses
Paid During the
Period* | | | Annualized
Expense
Ratio | |
JPMorgan Emerging Markets Research Enhanced Equity Fund | | | | | | | | | | | | | | | | |
Class I | | | | | | | | | | | | | | | | |
Actual | | $ | 1,000.00 | | | $ | 990.60 | | | $ | 2.26 | | | | 0.45 | % |
Hypothetical | | | 1,000.00 | | | | 1,022.94 | | | | 2.29 | | | | 0.45 | |
Class R6 | | | | | | | | | | | | | | | | |
Actual | | | 1,000.00 | | | | 991.20 | | | | 1.76 | | | | 0.35 | |
Hypothetical | | | 1,000.00 | | | | 1,023.44 | | | | 1.79 | | | | 0.35 | |
| | | | |
JPMorgan Europe Dynamic Fund | | | | | | | | | | | | | | | | |
Class A | | | | | | | | | | | | | | | | |
Actual | | | 1,000.00 | | | | 1,020.20 | | | | 6.31 | | | | 1.24 | |
Hypothetical | | | 1,000.00 | | | | 1,018.95 | | | | 6.31 | | | | 1.24 | |
Class C | | | | | | | | | | | | | | | | |
Actual | | | 1,000.00 | | | | 1,018.00 | | | | 8.85 | | | | 1.74 | |
Hypothetical | | | 1,000.00 | | | | 1,016.43 | | | | 8.84 | | | | 1.74 | |
Class I | | | | | | | | | | | | | | | | |
Actual | | | 1,000.00 | | | | 1,021.90 | | | | 5.05 | | | | 0.99 | |
Hypothetical | | | 1,000.00 | | | | 1,020.21 | | | | 5.04 | | | | 0.99 | |
Class L | | | | | | | | | | | | | | | | |
Actual | | | 1,000.00 | | | | 1,022.00 | | | | 4.48 | | | | 0.88 | |
Hypothetical | | | 1,000.00 | | | | 1,020.77 | | | | 4.48 | | | | 0.88 | |
Class R6 | | | | | | | | | | | | | | | | |
Actual | | | 1,000.00 | | | | 1,023.00 | | | | 3.98 | | | | 0.78 | |
Hypothetical | | | 1,000.00 | | | | 1,021.27 | | | | 3.97 | | | | 0.78 | |
| | | | |
JPMorgan Global Research Enhanced Index Fund | | | | | | | | | | | | | | | | |
Class I | | | | | | | | | | | | | | | | |
Actual | | | 1,000.00 | | | | 1,034.10 | | | | 1.74 | | | | 0.34 | |
Hypothetical | | | 1,000.00 | | | | 1,023.49 | | | | 1.73 | | | | 0.34 | |
Class R6 | | | | | | | | | | | | | | | | |
Actual | | | 1,000.00 | | | | 1,035.00 | | | | 1.28 | | | | 0.25 | |
Hypothetical | | | 1,000.00 | | | | 1,023.95 | | | | 1.28 | | | | 0.25 | |
| | | | |
JPMorgan International Advantage Fund | | | | | | | | | | | | | | | | |
Class A | | | | | | | | | | | | | | | | |
Actual | | | 1,000.00 | | | | 1,008.10 | | | | 4.81 | | | | 0.95 | |
Hypothetical | | | 1,000.00 | | | | 1,020.42 | | | | 4.84 | | | | 0.95 | |
Class C | | | | | | | | | | | | | | | | |
Actual | | | 1,000.00 | | | | 1,005.00 | | | | 7.33 | | | | 1.45 | |
Hypothetical | | | 1,000.00 | | | | 1,017.90 | | | | 7.38 | | | | 1.45 | |
Class I | | | | | | | | | | | | | | | | |
Actual | | | 1,000.00 | | | | 1,008.80 | | | | 3.54 | | | | 0.70 | |
Hypothetical | | | 1,000.00 | | | | 1,021.68 | | | | 3.57 | | | | 0.70 | |
Class R2 | | | | | | | | | | | | | | | | |
Actual | | | 1,000.00 | | | | 1,006.20 | | | | 6.32 | | | | 1.25 | |
Hypothetical | | | 1,000.00 | | | | 1,018.90 | | | | 6.36 | | | | 1.25 | |
Class R6 | | | | | | | | | | | | | | | | |
Actual | | | 1,000.00 | | | | 1,009.90 | | | | 2.53 | | | | 0.50 | |
Hypothetical | | | 1,000.00 | | | | 1,022.68 | | | | 2.55 | | | | 0.50 | |
| | | | |
JPMorgan International Equity Fund | | | | | | | | | | | | | | | | |
Class A | | | | | | | | | | | | | | | | |
Actual | | | 1,000.00 | | | | 1,038.40 | | | | 4.88 | | | | 0.95 | |
Hypothetical | | | 1,000.00 | | | | 1,020.42 | | | | 4.84 | | | | 0.95 | |
Class C | | | | | | | | | | | | | | | | |
Actual | | | 1,000.00 | | | | 1,035.50 | | | | 7.44 | | | | 1.45 | |
Hypothetical | | | 1,000.00 | | | | 1,017.90 | | | | 7.38 | | | | 1.45 | |
| | | | | | |
| | | |
| 156 | | | | J.P. MORGAN INTERNATIONAL EQUITY FUNDS | | OCTOBER 31, 2019 |
| | | | | | | | | | | | | | | | |
| | | Beginning
Account Value
May 1, 2019 | | | Ending
Account Value
October 31, 2019 | | | Expenses
Paid During the
Period* | | | Annualized
Expense
Ratio | |
JPMorgan International Equity Fund (continued) | | | | | | | | | | | | | | | | |
Class I | | | | | | | | | | | | | | | | |
Actual | | $ | 1,000.00 | | | $ | 1,039.60 | | | $ | 3.60 | | | | 0.70 | % |
Hypothetical | | | 1,000.00 | | | | 1,021.68 | | | | 3.57 | | | | 0.70 | |
Class R2 | | | | | | | | | | | | | | | | |
Actual | | | 1,000.00 | | | | 1,036.80 | | | | 6.42 | | | | 1.25 | |
Hypothetical | | | 1,000.00 | | | | 1,018.90 | | | | 6.36 | | | | 1.25 | |
Class R5 | | | | | | | | | | | | | | | | |
Actual | | | 1,000.00 | | | | 1,040.10 | | | | 3.09 | | | | 0.60 | |
Hypothetical | | | 1,000.00 | | | | 1,022.18 | | | | 3.06 | | | | 0.60 | |
Class R6 | | | | | | | | | | | | | | | | |
Actual | | | 1,000.00 | | | | 1,040.70 | | | | 2.57 | | | | 0.50 | |
Hypothetical | | | 1,000.00 | | | | 1,022.68 | | | | 2.55 | | | | 0.50 | |
| | | | |
JPMorgan International Hedged Equity Fund | | | | | | | | | | | | | | | | |
Class A | | | | | | | | | | | | | | | | |
Actual | | | 1,000.00 | | | | 1,023.70 | | | | 4.28 | | | | 0.84 | |
Hypothetical | | | 1,000.00 | | | | 1,020.97 | | | | 4.28 | | | | 0.84 | |
Class C | | | | | | | | | | | | | | | | |
Actual | | | 1,000.00 | | | | 1,021.00 | | | | 6.88 | | | | 1.35 | |
Hypothetical | | | 1,000.00 | | | | 1,018.40 | | | | 6.87 | | | | 1.35 | |
Class I | | | | | | | | | | | | | | | | |
Actual | | | 1,000.00 | | | | 1,025.00 | | | | 3.06 | | | | 0.60 | |
Hypothetical | | | 1,000.00 | | | | 1,022.18 | | | | 3.06 | | | | 0.60 | |
Class R5 | | | | | | | | | | | | | | | | |
Actual | | | 1,000.00 | | | | 1,025.60 | | | | 2.30 | | | | 0.45 | |
Hypothetical | | | 1,000.00 | | | | 1,022.94 | | | | 2.29 | | | | 0.45 | |
Class R6 | | | | | | | | | | | | | | | | |
Actual | | | 1,000.00 | | | | 1,026.30 | | | | 1.79 | | | | 0.35 | |
Hypothetical | | | 1,000.00 | | | | 1,023.44 | | | | 1.79 | | | | 0.35 | |
| | | | |
JPMorgan International Research Enhanced Equity Fund | | | | | | | | | | | | | | | | |
Class A | | | | | | | | | | | | | | | | |
Actual | | | 1,000.00 | | | | 1,026.30 | | | | 3.01 | | | | 0.59 | |
Hypothetical | | | 1,000.00 | | | | 1,022.23 | | | | 3.01 | | | | 0.59 | |
Class I | | | | | | | | | | | | | | | | |
Actual | | | 1,000.00 | | | | 1,027.70 | | | | 1.74 | | | | 0.34 | |
Hypothetical | | | 1,000.00 | | | | 1,023.49 | | | | 1.73 | | | | 0.34 | |
Class R6 | | | | | | | | | | | | | | | | |
Actual | | | 1,000.00 | | | | 1,028.40 | | | | 1.23 | | | | 0.24 | |
Hypothetical | | | 1,000.00 | | | | 1,024.00 | | | | 1.22 | | | | 0.24 | |
| | | | |
JPMorgan International Unconstrained Equity Fund | | | | | | | | | | | | | | | | |
Class A | | | | | | | | | | | | | | | | |
Actual | | | 1,000.00 | | | | 1,028.20 | | | | 5.11 | | | | 1.00 | |
Hypothetical | | | 1,000.00 | | | | 1,020.16 | | | | 5.09 | | | | 1.00 | |
Class C | | | | | | | | | | | | | | | | |
Actual | | | 1,000.00 | | | | 1,025.10 | | | | 7.66 | | | | 1.50 | |
Hypothetical | | | 1,000.00 | | | | 1,017.64 | | | | 7.63 | | | | 1.50 | |
Class I | | | | | | | | | | | | | | | | |
Actual | | | 1,000.00 | | | | 1,029.30 | | | | 3.84 | | | | 0.75 | |
Hypothetical | | | 1,000.00 | | | | 1,021.42 | | | | 3.82 | | | | 0.75 | |
Class R2 | | | | | | | | | | | | | | | | |
Actual | | | 1,000.00 | | | | 1,026.40 | | | | 6.64 | | | | 1.30 | |
Hypothetical | | | 1,000.00 | | | | 1,018.65 | | | | 6.61 | | | | 1.30 | |
| | | | | | | | |
| | | |
| OCTOBER 31, 2019 | | J.P. MORGAN INTERNATIONAL EQUITY FUNDS | | | | | 157 | |
SCHEDULE OF SHAREHOLDER EXPENSES
(Unaudited) (continued)
Hypothetical $1,000 Investment
| | | | | | | | | | | | | | | | |
| | | Beginning
Account Value
May 1, 2019 | | | Ending
Account Value
October 31, 2019 | | | Expenses
Paid During the
Period* | | | Annualized
Expense
Ratio | |
JPMorgan International Unconstrained Equity Fund (continued) | | | | | | | | | | | | | |
Class R5 | | | | | | | | | | | | | | | | |
Actual | | $ | 1,000.00 | | | $ | 1,029.80 | | | $ | 3.33 | | | | 0.65 | % |
Hypothetical | | | 1,000.00 | | | | 1,021.93 | | | | 3.31 | | | | 0.65 | |
Class R6 | | | | | | | | | | | | | | | | |
Actual | | | 1,000.00 | | | | 1,030.30 | | | | 2.81 | | | | 0.55 | |
Hypothetical | | | 1,000.00 | | | | 1,022.43 | | | | 2.80 | | | | 0.55 | |
| | | | |
JPMorgan International Value Fund | | | | | | | | | | | | | | | | |
Class A | | | | | | | | | | | | | | | | |
Actual | | | 1,000.00 | | | | 991.90 | | | | 5.02 | | | | 1.00 | |
Hypothetical | | | 1,000.00 | | | | 1,020.16 | | | | 5.09 | | | | 1.00 | |
Class C | | | | | | | | | | | | | | | | |
Actual | | | 1,000.00 | | | | 989.10 | | | | 7.52 | | | | 1.50 | |
Hypothetical | | | 1,000.00 | | | | 1,017.64 | | | | 7.63 | | | | 1.50 | |
Class I | | | | | | | | | | | | | | | | |
Actual | | | 1,000.00 | | | | 992.90 | | | | 3.77 | | | | 0.75 | |
Hypothetical | | | 1,000.00 | | | | 1,021.42 | | | | 3.82 | | | | 0.75 | |
Class L | | | | | | | | | | | | | | | | |
Actual | | | 1,000.00 | | | | 993.60 | | | | 3.27 | | | | 0.65 | |
Hypothetical | | | 1,000.00 | | | | 1,021.93 | | | | 3.31 | | | | 0.65 | |
Class R2 | | | | | | | | | | | | | | | | |
Actual | | | 1,000.00 | | | | 990.10 | | | | 6.52 | | | | 1.30 | |
Hypothetical | | | 1,000.00 | | | | 1,018.65 | | | | 6.61 | | | | 1.30 | |
Class R5 | | | | | | | | | | | | | | | | |
Actual | | | 1,000.00 | | | | 993.60 | | | | 3.27 | | | | 0.65 | |
Hypothetical | | | 1,000.00 | | | | 1,021.93 | | | | 3.31 | | | | 0.65 | |
Class R6 | | | | | | | | | | | | | | | | |
Actual | | | 1,000.00 | | | | 994.40 | | | | 2.76 | | | | 0.55 | |
Hypothetical | | | 1,000.00 | | | | 1,022.43 | | | | 2.80 | | | | 0.55 | |
| * | Expenses are equal to each Class’ respective annualized expense ratio, multiplied by the average account value over the period, multiplied by 184/365 (to reflect the one-half year period). |
| | | | | | |
| | | |
| 158 | | | | J.P. MORGAN INTERNATIONAL EQUITY FUNDS | | OCTOBER 31, 2019 |
BOARD APPROVAL OF INVESTMENT ADVISORY AGREEMENTS
(Unaudited)
The Board of Trustees has established various standing committees composed of Trustees with diverse backgrounds, to which the Board of Trustees has assigned specific subject matter responsibilities to further enhance the effectiveness of the Board’s oversight and decision making. The Board of Trustees and its investment committees (money market and alternative products, equity, and fixed income) meet regularly throughout the year and consider factors that are relevant to their annual consideration of investment advisory agreements at each meeting. They also meet for the specific purpose of considering investment advisory agreement annual renewals. The Board of Trustees held meetings in person in June and August 2019, at which the Trustees considered the continuation of the investment advisory agreements for the Emerging Markets Equity Fund, Europe Dynamic Fund, Global Research Enhanced Index Fund, International Advantage Fund, International Equity Fund, International Research Enhanced Equity Fund, International Unconstrained Equity Fund, and International Value Fund whose annual report is contained herein (each an “Advisory Agreement” and collectively, the “Advisory Agreements”). At the June meeting, the Board’s investment committees met to review and consider performance, expense and related information for the J.P. Morgan Funds. Each investment committee reported to the full Board, which then considered the investment committee’s preliminary findings. At the August meeting, the Trustees continued their review and consideration. The Trustees, including a majority of the Trustees who are not “interested persons” (as defined in the 1940 Act) of any party to the Advisory Agreements or any of their affiliates, approved the continuation of each Advisory Agreement on August 14, 2019.
As part of their review of the Advisory Agreements, the Trustees considered and reviewed performance and other information about the Funds received from the Adviser. This information includes the Funds’ performance as compared to the performance of their peers and benchmarks and analyses by the Adviser of the Funds’ performance. In addition, the Trustees have engaged an independent management consulting firm (“independent consultant”) to report on the performance of certain J.P. Morgan Funds at each of the Trustees’ regular meetings. In addition, in preparation for the June and August meetings, the Trustees requested, received and evaluated extensive materials from the Adviser, including performance and expense information compiled by Broadridge, using data from Lipper Inc., independent providers of investment company data (together, “Broadridge/Lipper”). The Trustees’ independent consultant also provided additional analyses of the performance of the Funds as compared to the Funds’ objectives and peers. Before voting on the Advisory Agreements, the Trustees reviewed the Advisory Agreements with representatives of the Adviser, counsel to the Trusts and independent legal counsel and received a memorandum from independent legal counsel to the Trustees discussing the legal
standards for their consideration of the Advisory Agreements. The Trustees also discussed the Advisory Agreements in executive sessions with independent legal counsel at which no representatives of the Adviser were present.
A summary of the material factors evaluated by the Trustees in determining whether to approve each Advisory Agreement is provided below. Each Trustee attributed different weights to the various factors and no factor alone was considered determinative. The Trustees considered information provided with respect to the Funds throughout the year, as well as materials furnished specifically in connection with the annual review process. From year to year, the Trustees consider and place emphasis on relevant information in light of changing circumstances in market and economic conditions.
After considering and weighing the factors and information they had received, the Trustees found that the compensation to be received by the Adviser from each Fund under the applicable Advisory Agreement was fair and reasonable under the circumstances and determined that the continuance of each Advisory Agreement was in the best interests of each Fund and its shareholders.
Nature, Extent and Quality of Services Provided by the Adviser
The Trustees received and considered information regarding the nature, extent and quality of services provided to each Fund under the applicable Advisory Agreement. The Trustees took into account information furnished throughout the year at Trustee meetings, as well as the materials furnished specifically in connection with this annual review process. The Trustees considered the background and experience of the Adviser’s senior management, personnel changes, if any, and the expertise of, and the amount of attention given to each Fund by, investment personnel of the Adviser. In addition, the Trustees reviewed the qualifications, backgrounds and responsibilities of the portfolio management team primarily responsible for the day-to-day management of each Fund and the infrastructure supporting the team, including personnel changes, if any. The Trustees also considered information provided by the Adviser and JPMorgan Distribution Services, Inc. (“JPMDS”) about the structure and distribution strategy of each Fund. The Trustees reviewed information relating to the Adviser’s risk governance model and reports showing the Adviser’s compliance structure and ongoing compliance processes. The Trustees also considered the quality of the administrative services provided by the Adviser in its role as administrator.
The Trustees also considered their knowledge of the nature and quality of services provided by the Adviser and its affiliates to the Funds gained from their experience as Trustees of the J.P. Morgan Funds. In addition, they considered the overall reputation and capabilities of the Adviser and its affiliates, the commitment of the Adviser to provide high quality service to
| | | | | | | | |
| | | |
| OCTOBER 31, 2019 | | J.P. MORGAN INTERNATIONAL EQUITY FUNDS | | | | | 159 | |
BOARD APPROVAL OF INVESTMENT ADVISORY AGREEMENTS
(Unaudited) (continued)
the Funds, their overall confidence in the Adviser’s integrity and the Adviser’s responsiveness to questions or concerns raised by them, including the Adviser’s willingness to consider and implement organizational and operational changes designed to improve investment results and the services provided to each Fund.
Based upon these considerations and other factors, the Trustees concluded that they were satisfied with the nature, extent and quality of the investment advisory services provided to the Funds by the Adviser.
Costs of Services Provided and Profitability to the Adviser and its Affiliates
The Trustees received and considered information regarding the profitability to the Adviser and its affiliates in providing services to each Fund. The Trustees reviewed and discussed this information. The Trustees recognized that this information is not audited and represents the Adviser’s determination of its and its affiliates’ revenues from the contractual services provided to the Funds, less expenses of providing such services. Expenses include direct and indirect costs and are calculated using an allocation methodology developed by the Adviser. The Trustees also recognized that it is difficult to make comparisons of profitability from fund investment advisory contracts because comparative information is not generally publicly available and is affected by numerous factors, including the structure of the particular adviser, the types of funds it manages, its business mix, numerous assumptions regarding allocations and the fact that publicly-traded fund managers’ operating profits and net income are net of distribution and marketing expenses. Based upon their review, and taking into consideration the factors noted above, the Trustees concluded that the profitability to the Adviser under each Advisory Agreement was not unreasonable in light of the services and benefits provided to each Fund.
The Trustees also considered that JPMDS, an affiliate of the Adviser, and the Adviser earn fees from the Funds for providing shareholder and administrative services, respectively. These fees were shown separately in the profitability analysis presented to the Trustees. The Trustees also considered the payments of Rule 12b-1 fees to JPMDS, which also acts as the Funds’ distributor and that these fees are in turn generally paid to financial intermediaries that sell the Funds, including financial intermediaries that are affiliates of the Adviser. The Trustees also considered the fees paid to JPMorgan Chase Bank, N.A. (“JPMCB”) for custody and fund accounting, and other related services.
Fall-Out Benefits
The Trustees reviewed information regarding potential “fallout” or ancillary benefits received by the Adviser and its affiliates as a result of their relationship with the Funds. The Trustees considered that the Funds’ operating accounts are held at JPMCB,
which, as a result, will receive float benefits for certain J.P. Morgan Funds. The Trustees also noted that the Adviser supports a diverse set of products and services, which benefits the Adviser by allowing it to leverage its infrastructure to serve additional clients. The Trustees also reviewed the Adviser’s allocation of fund brokerage for the J.P. Morgan Funds complex, including allocations to brokers who provide research to the Adviser.
Economies of Scale
The Trustees considered the extent to which the Funds may benefit from economies of scale. The Trustees considered that there may not be a direct relationship between economies of scale realized by the Funds and those realized by the Adviser as assets increase. The Trustees considered the extent to which the Funds were priced to scale and whether it would be appropriate to add advisory fee breakpoints. The Trustees noted each Fund with fee waivers and contractual expense limitations (“Fee Caps”) which allow a Fund’s shareholders to share potential economies of scale from a Fund’s inception, prior to reaching scale, as well as each Fund that had achieved scale and no longer had a Fee Cap in place for some or all of its classes. The Trustees noted that the fees remain competitive with peer funds. The Trustees considered the benefits to the Funds of the use of an affiliated distributor and custodian, including the ability to rely on existing infrastructure supporting distribution, custodial and transfer agent services and the ability to negotiate competitive fees for the Funds. The Trustees further considered the Adviser’s and JPMDS’s ongoing investments in their business in support of the Funds, including the Adviser’s and/or JPMDS’s investments in trading systems, technology (including improvements to the J.P. Morgan Funds’ website, and cybersecurity improvements), retention of key talent, and regulatory support enhancements. The Trustees concluded that the current fee structure for each Fund, including any Fee Caps the Adviser has in place that serve to limit the overall net expense ratios of each Fund at competitive levels, was reasonable. The Trustees concluded that the Funds’ shareholders received the benefits of potential economies of scale through the Fee Caps and the Adviser’s reinvestment in its operations to serve the Funds and their shareholders, and that, for those Funds that had achieved scale and no longer had Fee Caps in place for some or all of their classes, through lower average expenses as asset levels had increased, in addition to the reinvestment that ensures sufficient resources in terms of personnel and infrastructure to support the Funds.
Independent Written Evaluation of the Funds’ Senior/Chief Compliance Officer
The Trustees noted that, upon their direction, the Senior Officer for the International Equity Fund and International Research Enhanced Equity Fund had prepared an independent written evaluation in order to assist the Trustees in determining the
| | | | | | |
| | | |
| 160 | | | | J.P. MORGAN INTERNATIONAL EQUITY FUNDS | | OCTOBER 31, 2019 |
reasonableness of the proposed management fees. In determining whether to continue the Advisory Agreements, the Trustees considered the Senior Officer’s report.
The Trustees noted that, upon their direction, the Chief Compliance Officer for the Emerging Markets Equity Fund, Europe Dynamic Fund, Global Research Enhanced Index Fund, International Advantage Fund, International Unconstrained Equity Fund and International Value Fund had prepared an independent written evaluation in order to assist the Trustees in determining the reasonableness of the proposed management fees. The Trustees considered the written evaluation in determining whether to continue the Advisory Agreements.
Fees Relative to Adviser’s Other Clients
The Trustees received and considered information about the nature and extent of investment advisory services and fee rates offered to other clients of the Adviser, including institutional separate accounts and/or funds sub-advised by the Adviser, and for investment management styles substantially similar to that of each Fund. The Trustees considered the complexity of investment management for registered mutual funds relative to the Adviser’s other clients and noted differences in the regulatory, legal and other risks and responsibilities of providing services to the different clients. The Trustees considered that serving as an adviser to a registered mutual fund involves greater responsibilities and risks than acting as a sub-adviser and observed that sub-advisory fees may be lower than those charged by the Adviser to each Fund. The Trustees also noted that the adviser, not the mutual fund, pays the sub-advisory fee and that many responsibilities related to the advisory function are retained by the primary adviser. The Trustees concluded that the fee rates charged to each Fund in comparison to those charged to the Adviser’s other clients were reasonable.
Investment Performance
The Trustees received and considered absolute and/or relative performance information for the Funds in a report prepared by Broadridge/Lipper. The Trustees considered the total return performance information, which included the ranking of the Funds within a performance universe made up of funds with the same Broadridge/Lipper investment classification and objective (the “Universe”), as well as a subset of funds within the Universe (the “Peer Group”), by total return for applicable one-, three-, and five-year periods. The Trustees reviewed a description of Broadridge/Lipper’s methodology for selecting mutual funds in each Fund’s Universe and Peer Group and noted that Universe and Peer Group rankings were not calculated if the number of funds in the Universe and/or Peer Group did not meet a predetermined minimum. The Broadridge/Lipper materials provided to the Trustees highlighted information with respect to certain representative classes to assist the Trustees in their review. As part of this review, the Trustees also reviewed each Fund’s performance
against its benchmark and considered the performance information provided for the Funds at regular Board meetings by the Adviser and the Trustees’ independent consultant and also considered the special analysis prepared by the Trustees’ independent consultant. The Trustees also engaged with the Adviser to consider what steps might be taken to improve performance, as applicable. The Broadridge/Lipper performance data noted by the Trustees as part of their review and the determinations made by the Trustees with respect to each Fund’s performance for certain representative classes are summarized below:
The Trustees noted that the Emerging Markets Equity Fund’s performance for Class A shares was in the third, first and second quintiles based upon the Peer Group, and in the third, first and first quintiles based upon the Universe, for the one-, three- and five-year periods ended December 31, 2018, respectively. The Trustees noted that the performance for Class I shares was in the third, first and first quintiles based upon both the Peer Group and Universe for the one-, three- and five-year periods ended December 31, 2018, respectively. Trustees noted that the performance for Class R6 shares was in the third and first quintiles based upon the Peer Group for the one- and three-year periods ended December 31, 2018, respectively, and in the third, first and first quintiles based upon the Universe, for the one-, three- and five-year periods ended December 31, 2018, respectively. The Trustees discussed the performance and investment strategy of the Fund with the Adviser and reviewed the performance analysis and evaluation prepared by the independent consultant. Based upon these discussions and various other factors, the Trustees concluded that the Fund’s performance was satisfactory.
The Trustees noted that the Europe Dynamic Fund’s performance for Class A shares was in the fourth, third and second quintiles based upon the Peer Group, and in the fourth, fifth and fourth quintiles based upon the Universe, for the one-, three- and five-year periods ended December 31, 2018, respectively. The Trustees noted that performance for Class I shares was in the fourth quintile based upon the Universe for each of the one-, three- and five-year periods ended December 31, 2018. The Trustees discussed the performance and investment strategy of the Fund with the Adviser and reviewed the performance analysis and evaluation prepared by the independent consultant. Based upon these discussions and various other factors, the Trustees concluded that the Fund’s performance was satisfactory under the circumstances. They requested, however, that the Fund’s Adviser provide additional Fund performance information to be reviewed with the members of the equity committee at each of their regularly scheduled meetings over the course of the next year.
The Trustees noted that based upon the Universe, the Global Research Enhanced Index Fund’s performance for Class I
| | | | | | | | |
| | | |
| OCTOBER 31, 2019 | | J.P. MORGAN INTERNATIONAL EQUITY FUNDS | | | | | 161 | |
BOARD APPROVAL OF INVESTMENT ADVISORY AGREEMENTS
(Unaudited) (continued)
shares was in the second, third and first quintiles for the one-, three- and five-year periods ended December 31, 2018, respectively. The Trustees noted that the performance for Class R6 shares was in the second quintile based upon the Universe for the one-year period ended December 31, 2018. The Trustees discussed the performance and investment strategy of the Fund with the Adviser and reviewed the performance analyses and evaluation prepared by the independent consultant. Based upon these discussions and various other factors, the Trustees concluded that the performance was satisfactory.
The Trustees noted that the International Advantage Fund’s performance for Class A shares was in the fourth quintile based upon the Peer Group, and in the fifth, fifth and fourth quintiles based upon the Universe, for the one-, three- and five-year periods ended December 31, 2018, respectively. The Trustees noted that the performance for Class I shares was in the second quintile based upon the Peer Group for both the one- and three-year periods ended December 31, 2018, and in the fifth, fifth and fourth quintiles based upon the Universe, for the one-, three- and five-year periods ended December 31, 2018, respectively. The Trustees noted that the performance for Class R6 shares was in the fourth and fifth quintiles based upon the Peer Group and Universe, respectively, for both the one- and three-year periods ended December 31, 2018. The Trustees discussed the performance and investment strategy of the Fund with the Adviser and reviewed the performance analysis and evaluation prepared by the independent consultant. Based upon these discussions, and various other factors, the Trustees concluded that the performance was satisfactory under the circumstances. They requested, however, that the Fund’s Adviser provide additional Fund performance information to be reviewed with the members of the equity committee at each of their regularly scheduled meetings over the course of the next year.
The Trustees noted that the International Equity Fund’s performance for Class A shares was in the fourth, second and fourth quintiles based upon the Peer Group, and in the fifth, third and fourth quintiles based upon the Universe, for the one-, three- and five-year periods ended December 31, 2018, respectively. The Trustees noted that the performance for the Class I shares was in the fourth, third and fourth quintiles based upon the Peer Group, and in the fifth, third and fourth quintiles based upon the Universe, for the one-, three- and five-year periods ended December 31, 2018, respectively. The Trustees noted that the performance for Class R6 shares was in the fourth and third quintiles based upon the Peer Group for the one- and three-year periods ended December 31, 2018, respectively , and in the fifth, third and third quintiles based upon the Universe, for the one-, three- and five-year periods ended December 31, 2018, respectively. The Trustees discussed the performance and investment strategy of the Fund with the Adviser and reviewed the performance analysis and evaluation prepared by the independent consultant. Based upon these
discussions and various other factors, the Trustees concluded that the Fund’s performance was satisfactory under the circumstances.
The Trustees noted that the InternationalResearch Enhanced Equity Fund’s performance for Class A shares was in the third, second and first quintiles based upon the Universe, for the one-, three- and five-year periods ended December 31, 2018, respectively. The Trustees noted that performance for Class I shares was in the second, second and first quintiles based upon the Universe, for the one-, three- and five-year periods ended December 31, 2018, respectively. The Trustees noted that the performance for Class R6 shares was in the second quintile based upon both the Peer Group and Universe for the one-year period ended December 31, 2018. The Trustees discussed the performance and investment strategy of the Fund with the Adviser and reviewed the performance analysis and evaluation prepared by the independent consultant. Based upon these discussions, and various other factors, the Trustees concluded that the Fund’s performance was satisfactory.
The Trustees noted that the International Unconstrained Equity Fund’s performance for Class A shares was in the fifth, fourth and third quintiles based upon the Peer Group, and in the fourth, third and second quintiles based upon the Universe, for the one-, three- and five-year periods ended December 31, 2018, respectively. The Trustees noted that the performance for Class I shares was in the fourth quintile based upon the Peer Group for the one-year period ended December 31, 2018, and in the fourth, third and second quintiles based upon the Universe, for the one-, three- and five-year periods ended December 31, 2018, respectively. The Trustees noted that the performance for Class R6 shares was in the fifth quintile based upon the Peer Group for the one-year period ended December 31, 2018, and in the fourth, third and second quintiles based upon the Universe, for the one-, three- and five-year periods ended December 31, 2018, respectively. The Trustees discussed the performance and investment strategy of the Fund with the Adviser and reviewed the performance analysis and evaluation prepared by the independent consultant. Based upon these discussions, and various other factors, the Trustees concluded that the Fund’s performance was satisfactory under the circumstances.
The Trustees noted that the International Value Fund’s performance for Class A shares was in the fifth, fourth and fifth quintiles based upon the Universe, for the one-, three- and five-year periods ended December 31, 2018, respectively. The Trustees noted that the performance for Class I shares was in the fifth, third and fourth quintiles based upon the Universe, for the one-, three- and five-year periods ended December 31, 2018, respectively. The Trustees noted that the performance for Class R6 shares was in the fifth quintile based upon the Peer Group for each of the one-, three- and five-year periods ended December 31, 2018, and in the fourth, third and third quintiles based upon the Universe, for the one-, three- and five-year periods ended December 31, 2018,
| | | | | | |
| | | |
| 162 | | | | J.P. MORGAN INTERNATIONAL EQUITY FUNDS | | OCTOBER 31, 2019 |
respectively. The Trustees discussed the performance and investment strategy of the Fund with the Adviser and reviewed the performance analysis and evaluation prepared by the independent consultant. Based upon these discussions, and various other factors, the Trustees concluded that the Fund’s performance was satisfactory under the circumstances. They requested, however, that the Fund’s Adviser provide additional Fund performance information to be reviewed with members of the equity committee at each of their regular meetings over the course of the next year.
Advisory Fees and Expense Ratios
The Trustees considered the contractual advisory fee rate and administration fee rate paid by each Fund to the Adviser and compared the combined rate to the information prepared by Broadridge/Lipper concerning management fee rates paid by other funds in the same Broadridge/Lipper category as each Fund. The Trustees recognized that Broadridge/Lipper reported each Fund’s management fee rate as the combined contractual advisory fee and administration fee rates and that changes made to the administration agreement in January 2019, if applicable, were reflected in such rate. The Trustees also reviewed information about other expenses and the expense ratios for each Fund and noted that Universe and Peer Group rankings were not calculated if the number of funds in the Universe and/or Peer Groups did not meet a predetermined minimum. For each Fund that had a Fee Cap in place, the Trustees considered the net advisory fee rate and net expense ratio for each class, as applicable, taking into account any waivers and/or reimbursements. The Trustees also considered any proposed changes to a Fee Cap, and, where deemed appropriate by the Trustees, additional waivers and/or reimbursements. The Trustees recognized that it is difficult to make comparisons of advisory fees because there are variations in the services that are included in the fees paid by other funds. The Trustees’ determinations as a result of the review of each Fund’s advisory fees and expense ratios for certain representative classes are summarized below:
The Trustees noted that the Emerging Markets Equity Fund’s net advisory fee for Class A shares was in the first and second quintiles based upon the Peer Group and Universe, respectively, and that the actual total expenses for Class A shares were in the first quintile based upon both the Peer Group and Universe. The Trustees noted that the net advisory fee for Class I shares was in the first and second quintiles based upon the Peer Group and Universe, respectively, and that the actual total expenses for Class I shares were in the second quintile based upon both the Peer Group and Universe. The Trustees noted that the net advisory fee for Class R6 shares was in the first and second quintiles based upon the Peer Group and Universe, respectively, and that the actual total expenses for Class R6 shares were in the first quintile based upon both the Peer Group and Universe. After considering the factors
identified above, and noting a reduction in the contractual advisory fee effective August 1, 2019, in light of this information, the Trustees concluded that the advisory fees were satisfactory in light of the services provided to the Fund.
The Trustees noted that the Europe Dynamic Fund’s net advisory fee and actual total expenses for Class A shares were in the third and first quintiles, respectively, based upon both the Peer Group and Universe. The Trustees noted that both the net advisory fee and actual total expenses for Class I shares were in the second quintile based upon the Universe. The Trustees noted that the net advisory fee and actual total expenses for Class R6 shares were in the second and first quintiles, respectively, based upon both the Peer Group and Universe. After considering the factors identified above, and noting a reduction in the contractual advisory fee effective August 1, 2019, in light of this information, the Trustees concluded that the advisory fees were satisfactory in light of the services provided to the Fund.
The Trustees noted that the Global Research Enhanced Index Fund’s net advisory fee and actual total expenses for both Class I and Class R6 shares were in the first quintile based upon the Universe. After considering the factors identified above, in light of the information, the Trustees concluded that the advisory fees were satisfactory in light of the services provided to the Fund.
The Trustees noted that the International Advantage Fund’s net advisory fee and actual total expenses for Class A shares were in the first quintile based upon both the Peer Group and Universe. The Trustees noted that the net advisory fee for Class I shares was in the first and second quintiles based upon the Peer Group and Universe, respectively, and that the actual total expenses for the Class I shares were in the first quintile based upon both the Peer Group and Universe. The Trustees noted that the net advisory fee for Class R6 shares was in the first and second quintiles based upon the Peer Group and Universe, respectively, and that the actual total expenses for Class R6 shares were in the first quintile based upon both the Peer Group and Universe. After considering the factors identified above, and noting a reduction in the contractual advisory fee effective August 1, 2019, in light of this information, the Trustees concluded that the advisory fee was satisfactory in light of the services provided to the Fund.
The Trustees noted that the International Equity Fund’s net advisory fee and actual total expenses for Class A, Class I and Class R6 shares were in the first quintile based upon both the Peer Group and Universe. After considering the factors identified above, and noting a reduction in the contractual advisory fee effective August 1, 2019, in light of this information, the Trustees concluded that the advisory fees were satisfactory in light of the services provided to the Fund.
| | | | | | | | |
| | | |
| OCTOBER 31, 2019 | | J.P. MORGAN INTERNATIONAL EQUITY FUNDS | | | | | 163 | |
BOARD APPROVAL OF INVESTMENT ADVISORY AGREEMENTS
(Unaudited) (continued)
The Trustees noted that the International Research Enhanced Equity Fund’s net advisory fee and actual total expenses for both Class A and Class R6 shares were in the first quintile based upon both the Peer Group and Universe. The Trustees noted that the net advisory fee and actual total expenses for Class I shares were in the first quintile based upon the Universe. After considering the factors identified above, in light of this information, the Trustees concluded that the advisory fees were satisfactory in light of the services provided to the Fund.
The Trustees noted that the International Unconstrained Equity Fund’s net advisory fee and total actual expenses for Class A, Class I and Class R6 shares were in the first quintile based upon both the Peer Group and Universe. After considering the factors
identified above, and noting a reduction in the contractual advisory fee effective August 1, 2019, in light of this information, the Trustees concluded that the advisory fees were satisfactory in light of the services provided to the Fund.
The Trustees noted that the International Value Fund’s net advisory fee and total actual expenses for Class A, Class I and Class R6 shares were in the first quintile based upon the Peer Group and Universe. After considering the factors identified above, and noting a reduction in the contractual advisory fee effective August 1, 2019, in light of this information, the Trustees concluded that the advisory fees were satisfactory in light of the services provided to the Fund.
| | | | | | |
| | | |
| 164 | | | | J.P. MORGAN INTERNATIONAL EQUITY FUNDS | | OCTOBER 31, 2019 |
TAX LETTER
(Unaudited)
Certain tax information for the J.P. Morgan Funds is required to be provided to shareholders based upon the Funds’ income and distributions for the taxable year ended October 31, 2019. The information and distributions reported in this letter may differ from the information and taxable distributions reported to the shareholders for the calendar year ending December 31, 2019. The information necessary to complete your income tax returns for the calendar year ending December 31, 2019 will be provided under separate cover.
Dividends Received Deduction (DRD)
Each Fund listed below had the following percentage, or maximum allowable percentage, of ordinary income distributions eligible for the dividends received deduction for corporate shareholders for the fiscal year ended October 31, 2019:
| | | | |
| | | Dividends
Received
Deduction | |
JPMorgan Emerging Markets Equity Fund | | | 1.80 | % |
JPMorgan Emerging Markets Research Enhanced Equity Fund | | | 1.46 | |
JPMorgan Global Research Enhanced Index Fund | | | 32.13 | |
Long-Term Capital Gain
Each Fund listed below distributed the following amount, or maximum allowable amount, of long-term capital gain dividends for the fiscal year ended October 31, 2019 (amounts in thousands):
| | | | |
| | | Long-Term
Capital Gain
Distribution | |
JPMorgan Global Research Enhanced Index Fund | | $ | 451,912 | |
JPMorgan International Equity Fund | | | 48,172 | |
Qualified Dividend Income (QDI)
Each Fund listed below had the following amount, or maximum allowable amount, of ordinary income distributions treated as qualified dividends for the fiscal year ended October 31, 2019 (amounts in thousands):
| | | | |
| | | Qualified
Dividend
Income | |
JPMorgan Emerging Markets Equity Fund | | $ | 52,198 | |
JPMorgan Emerging Markets Research Enhanced Equity Fund | | | 1,090 | |
JPMorgan Europe Dynamic Fund | | | 18,083 | |
JPMorgan Global Research Enhanced Index Fund | |
| 103,134
|
|
JPMorgan International Advantage Fund | | | 95,074 | |
JPMorgan International Equity Fund | | | 108,080 | |
JPMorgan International Hedged Equity Fund | | | 131 | |
JPMorgan International Research Enhanced Equity Fund | | | 137,047 | |
JPMorgan International Unconstrained Equity Fund | | | 9,960 | |
JPMorgan International Value Fund | | | 16,541 | |
Foreign Source Income and Foreign Tax Credit Pass Through
For the fiscal year ended October 31, 2019, the following Funds intend to elect to pass through to shareholders taxes paid to foreign countries. Gross income and foreign tax expenses are as follows or amounts as finally determined (amounts in thousands):
| | | | | | | | |
| | | Gross
Income | | | Foreign Tax
Pass Through | |
JPMorgan Emerging Markets Equity Fund | | $ | 109,184 | | | $ | 8,259 | |
JPMorgan Emerging Markets Research Enhanced Equity Fund | | | 12,820 | | | | 1,064 | |
JPMorgan Europe Dynamic Fund | | | 23,802 | | | | 1,145 | |
JPMorgan International Advantage Fund | | | 129,942 | | | | 7,069 | |
JPMorgan International Equity Fund | | | 132,647 | | | | 7,654 | |
JPMorgan International Hedged Equity Fund | | | 1,431 | | | | 131 | |
JPMorgan International Research Enhanced Equity Fund | | | 172,142 | | | | 10,421 | |
JPMorgan International Unconstrained Equity Fund | | | 13,916 | | | | 856 | |
JPMorgan International Value Fund | | | 20,833 | | | | 200 | |
| | | | | | | | |
| | | |
| OCTOBER 31, 2019 | | J.P. MORGAN INTERNATIONAL EQUITY FUNDS | | | | | 165 | |

Rev. January 2011
| | |
| | |
| FACTS | | WHAT DOES J.P. MORGAN FUNDS DO WITH YOUR PERSONAL INFORMATION? |
| | |
| Why? | | Financial companies choose how they share your personal information. Federal law gives consumers the right to limit some but not all sharing. Federal law also requires us to tell you how we collect, share, and protect your personal information. Please read this notice carefully to understand what we do. |
| | |
| What? | | The types of personal information we collect and share depend on the product or service you have with us. This information can include: ◾ Social Security number and account balances ◾ transaction history and account transactions ◾ checking account information and wire transfer instructions When you areno longer our customer, we continue to share your information as described in this notice. |
| | |
| How? | | All financial companies need to share customers’ personal information to run their everyday business. In the section below, we list the reasons financial companies can share their customers’ personal information; the reasons J.P. Morgan Funds chooses to share; and whether you can limit this sharing. |
| | | | |
| | | |
| Reasons we can share your personal information | | Does J.P. Morgan
Funds share? | | Can you limit this
sharing? |
For our everyday business purposes — such as to process your transactions, maintain your account(s), respond to court orders and legal investigations, or report to credit bureaus | | Yes | | No |
For marketing purposes — to offer our products and services to you | | Yes | | No |
| For joint marketing with other financial companies | | No | | We don’t share |
For our affiliates’ everyday business purposes — information about your transactions and experiences | | No | | We don’t share |
For our affiliates’ everyday business purposes — information about your creditworthiness | | No | | We don’t share |
| For nonaffiliates to market to you | | No | | We don’t share |
| | |
| | |
| Questions? | | Call1-800-480-4111 or go to www.jpmorganfunds.com |

| | |
| |
| Who we are |
| Who is providing this notice? | | J.P. Morgan Funds |
| | |
| |
| What we do |
| How does J.P. Morgan Funds protect my personal information? | | To protect your personal information from unauthorized access and use, we use security measures that comply with federal law. These measures include computer safeguards and secured files and buildings. We authorize our employees to access your information only when they need it to do their work and we require companies that work for us to protect your information. |
How does J.P. Morgan Funds collect my personal information? | | We collect your personal information, for example, when you: ◾ open an account or provide contact information ◾ give us your account information or pay us by check ◾ make a wire transfer We also collect your personal information from others, such as credit bureaus, affiliates and other companies. |
| Why can’t I limit all sharing? | | Federal law gives you the right to limit only ◾ sharing for affiliates’ everyday business purposes – information about your creditworthiness ◾ affiliates from using your information to market to you ◾ sharing for nonaffiliates to market to you State laws and individual companies may give you additional rights to limit sharing. |
| | |
| |
| Definitions |
| Affiliates | | Companies related by common ownership or control. They can be financial and nonfinancial companies. ◾ J.P. Morgan Funds does not share with our affiliates. |
| Nonaffiliates | | Companies not related by common ownership or control. They can be financial and nonfinancial companies. ◾ J.P. Morgan Funds does not share with nonaffiliates so they can market to you. |
| Joint Marketing | | A formal agreement between nonaffiliated financial companies that together market financial products or services to you. ◾ J.P. Morgan Funds doesn’t jointly market. |
J.P. Morgan Funds are distributed by JPMorgan Distribution Services, Inc., which is an affiliate of JPMorgan Chase & Co. Affiliates of JPMorgan Chase & Co. receive fees for providing various services to the funds.
Contact JPMorgan Distribution Services, Inc. at1-800-480-4111 for a fund prospectus. You can also visit us at www.jpmorganfunds.com. Investors should carefully consider the investment objectives and risk as well as charges and expenses of the mutual fund before investing. The prospectus contains this and other information about the mutual fund. Read the prospectus carefully before investing.
Investors may obtain information about the Securities Investor Protection Corporation (SIPC), including the SIPC brochure, by visiting www.sipc.org or by calling SIPC at202-371-8300.
Each Fund files a complete schedule of its fund holdings for the first and third quarters of its fiscal year with the SEC onForm N-PORT. Prior to March 31, 2019, each Fund filed a complete schedule of its fund holdings for the first and third quarters of its fiscal year with the SEC on Form N-Q. The Funds’ Form N-PORT and Form N-Q are available on the SEC’s website at http://www.sec.gov. Each Fund’s quarterly holdings can be found by visiting the J.P. Morgan Funds’ website at www.jpmorganfunds.com.
A description of each Fund’s policies and procedures with respect to the disclosure of each Fund’s holdings is available in the prospectuses and Statement of Additional Information.
A copy of proxy policies and procedures is available without charge upon request by calling1-800-480-4111 and on the Funds’ website at www.jpmorganfunds.com. A description of such policies and procedures is on the SEC’s website at www.sec.gov. The Trustees have delegated the authority to vote proxies for securities owned by the Funds to the Adviser. A copy of the Funds’ voting record for the most recent12-month period ended June 30 is available on the SEC’s website at www.sec.gov or at the Funds’ website at www.jpmorganfunds.com no later than August 31 of each year. The Funds’ proxy voting record will include, among other things, a brief description of the matter voted on for each fund security, and will state how each vote was cast, for example, for or against the proposal.


J.P. Morgan Asset Management is the brand name for the asset management business of JPMorgan Chase & Co. and its affiliates worldwide.
| | | | |
| | © JPMorgan Chase & Co., 2019. All rights reserved. October 2019. | | AN-INTEQ-1019 |
J.P. Morgan Funds
Annual Report
October 31, 2019
JPMorgan International Equity Plus Fund
Contents
Investments in the Fund are not deposits or obligations of, or guaranteed or endorsed by, any bank and are not insured or guaranteed by the FDIC, the Federal Reserve Board or any other government agency. You could lose money if you sell when the Fund’s share price is lower than when you invested.
Past performance is no guarantee of future performance. The general market views expressed in this report are opinions based on market and other conditions through the end of the reporting period and are subject to change without notice. These views are not intended to predict the future performance of the Fund or the securities markets. References to specific securities and their issuers are for illustrative purposes only and are not intended to be, and should not be interpreted as, recommendations to purchase or sell such securities. Such views are not meant as investment advice and may not be relied on as an indication of trading intent on behalf of the Fund.
Prospective investors should refer to the Fund’s prospectus for a discussion of the Fund’s investment objective, strategy and risks. Call J.P. Morgan Funds Service Center at1-800-480-4111 for a prospectus containing more complete information about the Fund, including management fees and other expenses. Please read it carefully before investing.
LETTER TO SHAREHOLDERS
October 31, 2019 (Unaudited)
“Shareholders and clients are our highest priority and at the center of everything we do.”
- Andrea L. Lisher
December 12, 2019
Dear Shareholders,
By way of introduction, I am head of the Americas Client organization for J.P. Morgan Asset Management, as well as a twenty year veteran of J.P. Morgan, nearly all of those years with Asset Management. The reason I joined J.P. Morgan Asset Management over twenty years ago is the same reason I still come to work energized every day; shareholders & clients. Shareholders & clients are our highest priority and at the center of everything we do. As such, I plan to use our Letter to Shareholders as an opportunity to provide updates on recent market events and may, from time to time, also highlight initiatives happening within J.P. Morgan Asset Management that are designed in part to continue to improve the shareholder & client experiences.
Financial markets have largely provided positive returns in 2019, supported by leading central banks and a slowing but still expanding global economy. U.S. equity markets continued to lead the way, rebounding from a sharpsell-off in late 2018 and withstanding intermittent volatility driven partly by ongoing U.S.-China trade tensions. In July, the U.S. Federal Reserve cut interest rates for the first time in more than a decade amid concerns about slowing economic growth and then cut rates again in September and once more in October. Notably, the S&P 500 Index rallied in October and reached record highs in the final week of the month. Elsewhere, the European Central Bank announced in September it would resume monthly asset purchases to bolster flagging economic growth and below-target inflation and China’s central bank also responded to a slowdown in economic output with measures to increase lending by banks. International equity markets may exhibit continued volatility in the coming year but a reduction in trade tensions could provide support to financial markets. Given this outlook, we believe investors can benefit from a patient outlook and a well-diversified investment portfolio.
On behalf of J.P. Morgan Asset Management, thank you for entrusting us to manage your assets. Should you have any questions, please visit www.jpmorganfunds.com or contact the J.P. Morgan Funds Service Center at1-800-480-4111.
Sincerely yours,
Andrea L. Lisher
Head of Americas, Client
J.P. Morgan Asset Management
1
JPMorgan International Equity Plus Fund
FUND SUMMARY
FOR THE PERIOD JUNE 25, 2019 (INCEPTION DATE) THROUGH OCTOBER 31, 2019 (Unaudited)
| | | | |
| REPORTING PERIOD RETURN: | | | |
Fund (Class I Shares)* | | | 3.53% | |
MSCI EAFE Index (net of foreign withholding taxes) | | | 2.83% | |
Net Assets as of 10/31/2019 | | $ | 10,350,063 | |
INVESTMENT OBJECTIVE** AND STRATEGIES
The JPMorgan International Equity Plus Fund seeks to provide long-term capital appreciation. Under normal circumstances, at least 80% of the value of the Fund’s Assets, which are expected to include both long and short positions, will be invested in, or have exposure to, equity investments and derivatives tied to those equity investments. “Assets” means net assets, plus the amount of borrowings for investment purposes. The Fund’s assets are invested primarily in long and short positions of equity securities of companies from developed countries other than the United States. Developed countries include Australia, Canada, Japan, New Zealand, Hong Kong, Singapore, Israel, the United Kingdom, and most of the countries of Western Europe.
| | | | |
| TOP TEN EQUITY HOLDINGS OF THE PORTFOLIO*** | |
| |
1. Roche Holding AG (Switzerland) | | | 2.7 | % |
2. Iberdrola SA (Spain) | | | 2.1 | |
3. Enel SpA (Italy) | | | 2.1 | |
4. Air Liquide SA (France) | | | 2.0 | |
5. SAP SE (Germany) | | | 2.0 | |
6. Novo Nordisk A/S, Class B (Denmark) | | | 1.9 | |
7. AIA Group Ltd. (Hong Kong) | | | 1.9 | |
8. Nestle SA (Registered) (Switzerland) | | | 1.8 | |
9. Unilever NV (United Kingdom) | | | 1.7 | |
10. Sanofi (France) | | | 1.7 | |
| | | | |
| PORTFOLIO COMPOSITION BY COUNTRY*** | |
| |
Japan | | | 21.4 | % |
United Kingdom | | | 15.5 | |
France | | | 13.7 | |
Switzerland | | | 9.6 | |
Germany | | | 6.4 | |
Netherlands | | | 4.3 | |
Spain | | | 3.9 | |
Australia | | | 2.9 | |
Italy | | | 2.8 | |
Hong Kong | | | 2.6 | |
Denmark | | | 1.9 | |
Sweden | | | 1.8 | |
Belgium | | | 1.3 | |
India | | | 1.1 | |
Ireland | | | 1.1 | |
Short-Term Investments | | | 3.6 | |
Others (each less than 1.0%) | | | 6.1 | |
| * | The return shown is based on net asset values calculated for shareholder transactions and may differ from the return shown in the financial highlights, which reflects adjustments made to the net asset values in accordance with accounting principles generally accepted in the United States of America. |
2
JPMorgan International Equity Plus Fund
FUND SUMMARY
FOR THE PERIOD JUNE 25, 2019 (INCEPTION DATE) THROUGH OCTOBER 31, 2019 (Unaudited) (continued)
| ** | The adviser seeks to achieve the Fund’s objective. There can be no guarantee it will be achieved. |
| *** | Percentages indicated are based on total investments as of October 31, 2019. The Fund’s portfolio composition is subject to change. |
3
JPMorgan International Equity Plus Fund
FUND SUMMARY
FOR THE PERIOD JUNE 25, 2019 (INCEPTION DATE) THROUGH OCTOBER 31, 2019 (Unaudited) (continued)
| | | | | | | | | | |
| TOTAL RETURNSAS OF OCTOBER 31, 2019 | | | | |
| | |
| | | INCEPTION DATE
OF CLASS | | SINCE
INCEPTION* |
CLASS A SHARES | | | | June 25, 2019 | | | | | | |
With Sales Charge** | | | | | | | | | (2.02) | % |
Without Sales Charge | | | | | | | | | 3.40 | |
CLASS C SHARES | | | | June 25, 2019 | | | | | | |
With CDSC*** | | | | | | | | | 2.27 | |
Without CDSC | | | | | | | | | 3.27 | |
CLASS I SHARES | | | | June 25, 2019 | | | | | 3.53 | |
* Not annualized.
** Sales Charge for Class A Shares is 5.25%.
*** Assumes a 1% CDSC (contingent deferred sales charge) for the period.
LIFE OF FUND PERFORMANCE (6/25/19 TO 10/31/19)
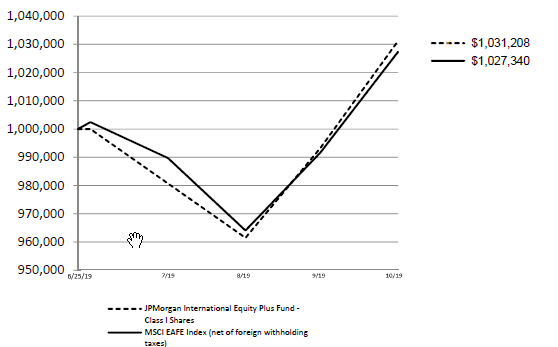
The performance quoted is past performance and is not a guarantee of future results. Mutual funds are subject to certain market risks. Investment returns and principal value of an investment will fluctuate so that an investor’s shares, when redeemed, may be worth more or less than their original cost. Current performance may be higher or lower than the performance data shown. Forup-to-datemonth-end performance information please call1-800-480-4111.
4
JPMorgan International Equity Plus Fund
FUND SUMMARY
FOR THE PERIOD JUNE 25, 2019 (INCEPTION DATE) THROUGH OCTOBER 31, 2019 (Unaudited) (continued)
The Fund commenced operations on June 25, 2019.
The graph illustrates comparative performance for $1,000,000 invested in Class I Shares of the JPMorgan International Equity Plus Fund and the MSCI EAFE Index from June 25, 2019 to October 31, 2019. The performance of the Fund assumes reinvestment of all dividends and capital gain distributions, if any, and does not include a sales charge. The performance of the MSCI EAFE Index does not reflect the deduction of expenses or a sales charge associated with a mutual fund and approximates the minimum possible dividend reinvestment of the securities included in the benchmark, if applicable. The dividend is reinvested after deduction of withholding tax, applying the maximum rate tonon-resident institutional investors who do not benefit from double taxation treaties. The MSCI EAFE Index is a free float-adjusted market capitalization weighted index that is designed to measure the equity market performance of developed markets, excluding the U.S. and Canada. Investors cannot invest directly in an index.
Class I Shares have a $1,000,000 minimum initial investment.
Fund performance may reflect the waiver of the Fund’s fees and reimbursement of expenses for certain periods since the inception date. Without these waivers and reimbursements, performance would have been lower. Also, performance shown in this section does not reflect the deduction of taxes that a shareholder would pay on Fund distributions or redemptions of Fund shares.
International investing involves a greater degree of risk and increased volatility. Changes in currency exchange rates and differences in accounting and taxation policies outside the U.S. can raise or lower returns. Also, some overseas markets may not be as politically and economically stable as the U.S. and other nations.
The returns shown are based on net asset values calculated for shareholder transactions and may differ from the returns shown in the financial highlights, which reflect adjustments made to the net asset values in accordance with accounting principles generally accepted in the United States of America.
5
JPMorgan International Equity Plus Fund
SCHEDULE OF PORTFOLIO INVESTMENTS
AS OF OCTOBER 31, 2019
| | | | | | | | |
Investments | | Shares | | | Value ($) |
| | |
COMMON STOCKS - 95.2% | | | | | | | | |
| | |
Australia - 2.8% | | | | | | | | |
Australia & New Zealand Banking Group Ltd. | | | 6,279 | | | | 115,390 | |
Goodman Group, REIT | | | 3,066 | | | | 30,443 | |
Rio Tinto Ltd. | | | 2,329 | | | | 145,639 | |
| | | | | | | | |
| | | | | | | 291,472 | |
| | | | | | | | |
| | |
Austria - 0.9% | | | | | | | | |
Erste Group Bank AG | | | 2,479 | | | | 87,677 | |
| | | | | | | | |
| | |
Belgium - 1.2% | | | | | | | | |
Anheuser-Busch InBev SA/NV | | | 1,590 | | | | 128,341 | |
| | | | | | | | |
| | |
Denmark - 1.9% | | | | | | | | |
Novo Nordisk A/S, Class B | | | 3,470 | | | | 190,811 | |
| | | | | | | | |
| | |
Finland - 0.6% | | | | | | | | |
Wartsila OYJ Abp | | | 6,034 | | | | 63,748 | |
| | | | | | | | |
| | |
France - 13.6% | | | | | | | | |
Air Liquide SA | | | 1,538 | | | | 204,494 | |
Airbus SE | | | 701 | | | | 100,564 | |
Alstom SA | | | 1,523 | | | | 65,890 | |
BNP Paribas SA | | | 2,324 | | | | 121,451 | |
Natixis SA | | | 12,056 | | | | 55,389 | |
Orange SA | | | 1,984 | | | | 31,932 | |
Pernod Ricard SA | | | 726 | | | | 134,117 | |
Renault SA | | | 1,380 | | | | 70,461 | |
Safran SA | | | 739 | | | | 117,050 | |
Sanofi | | | 1,854 | | | | 170,915 | |
Schneider Electric SE | | | 1,373 | | | | 127,607 | |
Thales SA | | | 628 | | | | 61,393 | |
TOTAL SA | | | 2,805 | | | | 148,296 | |
| | | | | | | | |
| | | | | | | 1,409,559 | |
| | | | | | | | |
| | |
Germany - 6.3% | | | | | | | | |
Bayer AG (Registered) | | | 712 | | | | 55,234 | |
Brenntag AG | | | 1,694 | | | | 84,904 | |
Daimler AG (Registered) | | | 1,886 | | | | 110,242 | |
Deutsche Boerse AG | | | 504 | | | | 78,049 | |
Henkel AG & Co. KGaA (Preference) | | | 461 | | | | 47,885 | |
Infineon Technologies AG | | | 4,066 | | | | 78,754 | |
SAP SE | | | 1,507 | | | | 199,680 | |
| | | | | | | | |
| | | | | | | 654,748 | |
| | | | | | | | |
| | |
Hong Kong - 2.7% | | | | | | | | |
AIA Group Ltd. | | | 19,000 | | | | 189,206 | |
Hong Kong Exchanges & Clearing Ltd. | | | 2,800 | | | | 87,231 | |
| | | | | | | | |
| | | | | | | 276,437 | |
| | | | | | | | |
| | |
India - 1.1% | | | | | | | | |
HDFC Bank Ltd., ADR | | | 1,890 | | | | 115,460 | |
| | | | | | | | |
| | |
Ireland - 1.1% | | | | | | | | |
Ryanair Holdings plc, ADR* | | | 1,489 | | | | 111,139 | |
| | | | | | | | |
| | | | | | | | |
Investments | | Shares | | | Value ($) |
Italy - 2.7% | | | | | | | | |
Enel SpA | | | 27,822 | | | | 215,630 | |
FinecoBank Banca Fineco SpA | | | 6,003 | | | | 67,674 | |
| | | | | | | | |
| | | | | | | 283,304 | |
| | | | | | | | |
| | |
Japan - 21.2% | | | | | | | | |
Ain Holdings, Inc. | | | 600 | | | | 34,331 | |
Bridgestone Corp. | | | 1,600 | | | | 66,480 | |
Daicel Corp. | | | 5,900 | | | | 52,743 | |
Daikin Industries Ltd. | | | 700 | | | | 97,972 | |
DMG Mori Co. Ltd. | | | 5,100 | | | | 82,570 | |
Honda Motor Co. Ltd. | | | 3,900 | | | | 105,511 | |
Japan Airlines Co. Ltd. | | | 1,600 | | | | 49,859 | |
Kao Corp. | | | 1,800 | | | | 144,718 | |
Mabuchi Motor Co. Ltd. | | | 1,600 | | | | 64,827 | |
Marui Group Co. Ltd. | | | 3,600 | | | | 80,029 | |
Mitsubishi Corp. | | | 3,200 | | | | 81,390 | |
Mitsubishi UFJ Financial Group, Inc. | | | 21,400 | | | | 110,944 | |
Mitsui Fudosan Co. Ltd. | | | 1,700 | | | | 43,491 | |
NGK Spark Plug Co. Ltd. | | | 2,600 | | | | 52,712 | |
Nintendo Co. Ltd. | | | 400 | | | | 146,715 | |
Nippon Telegraph & Telephone Corp. | | | 2,000 | | | | 99,286 | |
Otsuka Corp. | | | 2,200 | | | | 88,699 | |
Otsuka Holdings Co. Ltd. | | | 2,800 | | | | 116,733 | |
Ryohin Keikaku Co. Ltd. | | | 2,600 | | | | 57,882 | |
Seven & i Holdings Co. Ltd. | | | 2,800 | | | | 105,785 | |
Sumitomo Mitsui Financial Group, Inc. | | | 2,000 | | | | 71,006 | |
T&D Holdings, Inc. | | | 6,600 | | | | 73,509 | |
Tokio Marine Holdings, Inc. | | | 2,200 | | | | 118,944 | |
Tokyu Corp. | | | 5,500 | | | | 104,025 | |
Toyota Motor Corp. | | | 2,000 | | | | 138,762 | |
| | | | | | | | |
| | | | | | | 2,188,923 | |
| | | | | | | | |
| | |
Luxembourg - 0.4% | | | | | | | | |
ArcelorMittal | | | 2,445 | | | | 36,355 | |
| | | | | | | | |
| | |
Mexico - 0.7% | | | | | | | | |
Wal-Mart de Mexico SAB de CV | | | 23,889 | | | | 71,593 | |
| | | | | | | | |
| | |
Netherlands - 4.2% | | | | | | | | |
Akzo Nobel NV | | | 1,340 | | | | 123,539 | |
ASML Holding NV | | | 514 | | | | 134,727 | |
ING Groep NV | | | 6,588 | | | | 74,599 | |
Royal Dutch Shell plc, Class B | | | 3,566 | | | | 102,700 | |
| | | | | | | | |
| | | | | | | 435,565 | |
| | | | | | | | |
| | |
Norway - 0.9% | | | | | | | | |
Telenor ASA | | | 5,129 | | | | 95,993 | |
| | | | | | | | |
| | |
Peru - 0.6% | | | | | | | | |
Credicorp Ltd. | | | 281 | | | | 60,145 | |
| | | | | | | | |
| | |
Singapore - 0.8% | | | | | | | | |
DBS Group Holdings Ltd. | | | 4,200 | | | | 80,056 | |
| | | | | | | | |
| | |
Spain - 3.8% | | | | | | | | |
Bankia SA | | | 23,402 | | | | 44,647 | |
Iberdrola SA | | | 21,262 | | | | 218,552 | |
SEE NOTES TO FINANCIAL STATEMENTS.
6
JPMorgan International Equity Plus Fund
SCHEDULE OF PORTFOLIO INVESTMENTS
AS OF OCTOBER 31, 2019 (continued)
| | | | | | | | |
Investments | | Shares | | | Value ($) |
Industria de Diseno Textil SA | | | 4,249 | | | | 132,402 | |
| | | | | | | | |
| | | | | | | 395,601 | |
| | | | | | | | |
| | |
Sweden - 1.7% | | | | | | | | |
Lundin Petroleum AB | | | 3,028 | | | | 100,282 | |
Svenska Handelsbanken AB, Class A | | | 7,961 | | | | 79,895 | |
| | | | | | | | |
| | | | | | | 180,177 | |
| | | | | | | | |
| | |
Switzerland - 9.4% | | | | | | | | |
Cie Financiere Richemont SA (Registered) | | | 1,808 | | | | 142,075 | |
Credit Suisse Group AG (Registered)* | | | 2,277 | | | | 28,184 | |
LafargeHolcim Ltd. (Registered)* | | | 1,961 | | | | 101,224 | |
Nestle SA (Registered) | | | 1,741 | | | | 186,255 | |
Novartis AG (Registered) | | | 1,268 | | | | 110,792 | |
Roche Holding AG | | | 911 | | | | 274,171 | |
Swiss Re AG | | | 1,272 | | | | 133,418 | |
| | | | | | | | |
| | | | | | | 976,119 | |
| | | | | | | | |
| | |
Taiwan - 0.8% | | | | | | | | |
Taiwan Semiconductor Manufacturing Co. Ltd., ADR | | | 1,614 | | | | 83,331 | |
| | | | | | | | |
| | |
United Kingdom - 15.3% | | | | | | | | |
3i Group plc | | | 7,945 | | | | 116,099 | |
BP plc | | | 25,017 | | | | 158,642 | |
British American Tobacco plc | | | 4,596 | | | | 160,749 | |
Burberry Group plc | | | 3,384 | | | | 89,734 | |
GlaxoSmithKline plc | | | 4,449 | | | | 101,904 | |
HSBC Holdings plc | | | 6,217 | | | | 46,970 | |
| | | | | | | | |
Investments | | Shares | | | Value ($) |
InterContinental Hotels Group plc | | | 2,509 | | | | 151,832 | |
ITV plc | | | 44,284 | | | | 76,822 | |
M&G plc* | | | 22,127 | | | | 61,280 | |
Prudential plc | | | 9,293 | | | | 162,319 | |
SSE plc | | | 6,298 | | | | 104,774 | |
Standard Chartered plc | | | 10,418 | | | | 94,532 | |
Taylor Wimpey plc | | | 40,591 | | | | 87,056 | |
Unilever NV | | | 2,936 | | | | 173,537 | |
| | | | | | | | |
| | | | | | | 1,586,250 | |
| | | | | | | | |
| | |
United States - 0.5% | | | | | | | | |
Ferguson plc | | | 577 | | | | 49,272 | |
| | | | | | | | |
| | |
TOTAL COMMON STOCKS
(Cost $9,646,811) | | | | | | | 9,852,076 | |
| | | | | | | | |
| |
SHORT-TERM INVESTMENTS - 3.5% | | | | | |
| | |
INVESTMENT COMPANIES - 3.5% | | | | | | | | |
JPMorgan U.S. Government Money Market Fund Class Institutional Shares, 1.64%(a)(b)(Cost $364,271) | | | 364,271 | | | | 364,271 | |
| | | | | | | | |
| | |
Total Investments - 98.7%
(Cost $10,011,082) | | | | | | | 10,216,347 | |
Other Assets Less Liabilities - 1.3% | | | | | | | 133,716 | |
| | | | | | | | |
Net Assets - 100.0% | | | | | | | 10,350,063 | |
| | | | | | | | |
| | | | | | | | |
Percentages indicated are based on net assets. | | | | | |
SEE NOTES TO FINANCIAL STATEMENTS.
7
JPMorgan International Equity Plus Fund
SCHEDULE OF PORTFOLIO INVESTMENTS
AS OF OCTOBER 31, 2019 (continued)
Summary of Investments by Industry, October 31, 2019
The following table represents the portfolio investments of the Fund by industry classifications as a percentage of total investments:
| | | | |
| INDUSTRY | | PERCENTAGE | | |
Banks | | 11.5% | | |
Pharmaceuticals | | 10.0 | | |
Insurance | | 6.6 | | |
Electric Utilities | | 5.3 | | |
Oil, Gas & Consumable Fuels | | 5.0 | | |
Automobiles | | 4.2 | | |
Chemicals | | 3.7 | | |
Capital Markets | | 3.6 | | |
Personal Products | | 3.1 | | |
Semiconductors & Semiconductor Equipment | | 2.9 | | |
Aerospace & Defense | | 2.7 | | |
Beverages | | 2.5 | | |
Textiles, Apparel & Luxury Goods | | 2.3 | | |
Diversified Telecommunication Services | | 2.2 | | |
Trading Companies & Distributors | | 2.1 | | |
Machinery | | 2.1 | | |
Food & Staples Retailing | | 2.1 | | |
Software | | 1.9 | | |
Electrical Equipment | | 1.9 | | |
Food Products | | 1.8 | | |
Metals & Mining | | 1.8 | | |
Airlines | | 1.6 | | |
Tobacco | | 1.6 | | |
Hotels, Restaurants & Leisure | | 1.5 | | |
Entertainment | | 1.4 | | |
Multiline Retail | | 1.3 | | |
Specialty Retail | | 1.3 | | |
Auto Components | | 1.2 | | |
Road & Rail | | 1.0 | | |
Construction Materials | | 1.0 | | |
Building Products | | 1.0 | | |
Others (each less than 1.0%) | | 4.2 | | |
Short-Term Investments | | 3.6 | | |
| | | | |
| Abbreviations | | | | |
| ADR | | American Depositary Receipt | | |
| OYJ | | Public Limited Company | | |
| Preference | | A special type of equity investment that shares in the earnings of the company, has limited voting rights, and may have a dividend preference. Preference shares may also have liquidation preference. | | |
| REIT | | Real Estate Investment Trust | | |
| |
| (a) | | Investment in an affiliated fund, which is registered under the Investment Company Act of 1940, as amended, and is advised by J.P. Morgan Investment Management Inc. |
| (b) | | The rate shown is the current yield as of October 31, 2019. | | |
| * | | Non-income producing security. | | |
SEE NOTES TO FINANCIAL STATEMENTS.
8
JPMorgan International Equity Plus Fund
SCHEDULE OF PORTFOLIO INVESTMENTS
AS OF OCTOBER 31, 2019 (continued)
Futures contracts outstanding as of October 31, 2019:
| | | | | | | | | | | | | | | | | | | | | | | | |
| Description | | Number of Contracts | | | | | | Expiration
Date | | | Trading Currency | | | Notional Amount
($) | | | Value and
Unrealized
Appreciation
(Depreciation) ($) | |
Long Contracts | | | | | | | | | | | | | | | | | | | | | | | | |
SPI 200 Index | | | 2 | | | | | | | | 12/2019 | | | | AUD | | | | 228,619 | | | | (1,045) | |
TOPIX Index | | | 1 | | | | | | | | 12/2019 | | | | JPY | | | | 153,301 | | | | 10,730 | |
| | | | | | | | | | | | | | | | | | | | | | | | |
| | | | | | | | | | | | | | | | | | | | | | | 9,685 | |
| | | | | | | | | | | | | | | | | | | | | | | | |
| | |
| Abbreviations |
| AUD | | Australian Dollar |
| JPY | | Japanese Yen |
| SPI | | Australian Securities Exchange |
| TOPIX | | Tokyo Stock Price Index |
Forward foreign currency exchange contracts outstanding as of October 31, 2019:
| | | | | | | | | | | | | | | | | | | | | | |
| Currency Purchased | | | Currency Sold | | | Counterparty | | Settlement
Date | | | Unrealized
Appreciation
(Depreciation) ($) | |
AUD | | | 566,845 | | | | USD | | | | 387,418 | | | BNP Paribas | | | 11/29/2019 | | | | 3,606 | |
EUR | | | 20,977 | | | | USD | | | | 23,357 | | | Merrill Lynch International | | | 11/29/2019 | | | | 77 | |
GBP | | | 58,249 | | | | USD | | | | 75,171 | | | Merrill Lynch International | | | 11/29/2019 | | | | 341 | |
HKD | | | 585,669 | | | | USD | | | | 74,722 | | | BNP Paribas | | | 11/29/2019 | | | | 8 | |
JPY | | | 27,177,617 | | | | USD | | | | 250,565 | | | Merrill Lynch International | | | 11/29/2019 | | | | 1,463 | |
SGD | | | 73,101 | | | | USD | | | | 53,627 | | | TD Bank Financial Group | | | 11/29/2019 | | | | 119 | |
| | | | | | | | | | | | | | | | | | | | | | |
Total unrealized appreciation | | | | | | | | | | | | | | | | | | 5,614 | |
| | | | | | | | | | | | | | | | | | | | | | |
SEK | | | 823,322 | | | | USD | | | | 85,671 | | | BNP Paribas | | | 11/29/2019 | | | | (288) | |
USD | | | 458,381 | | | | EUR | | | | 411,094 | | | Merrill Lynch International | | | 11/29/2019 | | | | (858) | |
| | | | | | | | | | | | | | | | | | | | | | |
Total unrealized depreciation | | | | | | | | | | | | | | | | | | (1,146) | |
| | | | | | | | | | | | | | | | | | | | | | |
Net unrealized appreciation | | | | | | | | | | | | | | | | | | 4,468 | |
| | | | | | | | | | | | | | | | | | | | | | |
| | |
| Abbreviations |
| AUD | | Australian Dollar |
| EUR | | Euro |
| GBP | | British Pound |
| HKD | | Hong Kong Dollar |
| JPY | | Japanese Yen |
| SEK | | Swedish Krona |
| SGD | | Singapore Dollar |
| USD | | United States Dollar |
SEE NOTES TO FINANCIAL STATEMENTS.
9
JPMorgan International Equity Plus Fund
SCHEDULE OF PORTFOLIO INVESTMENTS
AS OF OCTOBER 31, 2019 (continued)
Over-the-Counter (“OTC”) Total Return Basket Swaps Outstanding at October 31, 2019
| | | | | | | | | | | | | | |
| | | | | | | | | | | NET CASH AND | | | |
| | | | | | | | | NET UNREALIZED | | OTHER | | | |
| | | | | TERMINATION | | NOTIONAL | | APPRECIATION | | RECEIVABLES | | | |
| COUNTERPARTY | | DESCRIPTION | | DATE | | VALUE(1) | | (DEPRECIATION)(2) | | (PAYABLES) | | VALUE | |
Citigroup | | The Fund receives the total return on a portfolio of long and short equity positions and pays or receives the net of one month LIBOR on long positions and short positions respectively, plus or minus a specified spread (rates range from (0.20)% to 0.25%), which is denominated in GBP based on the local currencies of the positions within the swaps. | | 8/4/2020 | | $202,494 | | $136 | | $– | | | $136 | |
| | | | | | | | | | | | | | |
| | | | | | | | | | | | | | | | |
| | | | | | | | | NET UNREALIZED | | | | |
| | | | | | NOTIONAL | | | APPRECIATION | | | PERCENTAGE | |
| | | | | | VALUE | | | (DEPRECIATION) | | | OF NET ASSETS | |
| REFERENCE ENTITY | | SHARES | | | ($)(1) | | | ($)(2) | | | (%) | |
| | | | |
Long Positions | | | | | | | | | | | | | | | | |
| | | | |
Common Stock | | | | | | | | | | | | | | | | |
United Kingdom | | | | | | | | | | | | | | | | |
3i Group plc | | | 3,287 | | | | 48,033 | | | | 4 | | | | 0.0(a) | |
Beazley plc | | | 4,035 | | | | 30,667 | | | | 12 | | | | 0.0(a) | |
Compass Group plc | | | 1,383 | | | | 36,821 | | | | (12) | | | | 0.0(a) | |
M&G plc* | | | 2,874 | | | | 7,959 | | | | – | | | | 0.0(a) | |
Persimmon plc | | | 2,331 | | | | 68,756 | | | | 3 | | | | 0.0(a) | |
Prudential plc | | | 2,874 | | | | 50,200 | | | | (3) | | | | 0.0(a) | |
RELX plc | | | 832 | | | | 20,031 | | | | 6 | | | | 0.0(a) | |
Smith & Nephew plc | | | 886 | | | | 19,019 | | | | 54 | | | | 0.0(a) | |
SSE plc | | | 4,471 | | | | 74,380 | | | | 46 | | | | 0.0(a) | |
St James’s Place plc | | | 2,136 | | | | 28,811 | | | | 7 | | | | 0.0(a) | |
| | | 25,109 | | | | 384,677 | | | | 117 | | | | 0.0(a) | |
United States | | | | | | | | | | | | | | | | |
Ferguson plc | | | 564 | | | | 48,162 | | | | 48 | | | | 0.0(a) | |
Total Long Positions of Total Return Basket Swap | | | 25,673 | | | | 432,839 | | | | 165 | | | | 0.0(a) | |
| | | | |
Short Positions | | | | | | | | | | | | | | | | |
| | | | |
Common Stock | | | | | | | | | | | | | | | | |
| | | | |
United Kingdom | | | | | | | | | | | | | | | | |
Ashmore Group plc | | | (4,328) | | | | (26,105) | | | | (2) | | | | 0.0(a) | |
Berkeley Group Holdings plc | | | (1,254) | | | | (71,477) | | | | 11 | | | | 0.0(a) | |
British Land Co. plc (The) | | | (3,135) | | | | (25,206) | | | | (4) | | | | 0.0(a) | |
Hiscox Ltd. | | | (1,483) | | | | (28,638) | | | | (34) | | | | 0.0(a) | |
Pennon Group plc | | | (6,783) | | | | (78,919) | | | | – | | | | 0.0(a) | |
| | | (16,983) | | | | (230,345) | | | | (29) | | | | 0.0(a) | |
Total Short Positions of Total Return Basket Swap | | | (16,983) | | | | (230,345) | | | | (29) | | | | 0.0(a) | |
Total of Long and Short Positions of Total Return Basket Swap | | | 8,690 | | | | 202,494 | | | | 136 | | | | 0.0(a) | |
SEE NOTES TO FINANCIAL STATEMENTS.
10
JPMorgan International Equity Plus Fund
SCHEDULE OF PORTFOLIO INVESTMENTS
AS OF OCTOBER 31, 2019 (continued)
| | | | | | | | | | | | | | |
| | | | | | | | | | | NET CASH AND | | | |
| | | | | | | | | NET UNREALIZED | | OTHER | | | |
| | | | | TERMINATION | | NOTIONAL | | APPRECIATION | | RECEIVABLES | | | |
| COUNTERPARTY | | DESCRIPTION | | DATE | | VALUE(1) | | (DEPRECIATION)(2) | | (PAYABLES) | | VALUE | |
Citigroup | | The Fund receives the total return on a portfolio of long and short equity positions and pays or receives the net of one month EURIBOR on long positions and short positions respectively, plus or minus a specified spread (rates range from (1.25)% to 0.25%), which is denominated in EUR based on the local currencies of the positions within the swaps. | | 8/4/2020 | | $155,340 | | $178 | | $– | | | $178 | |
| | | | | | | | | | | | | | |
| | | | | | | | | | | | | | | | |
| | | | | | | | | NET UNREALIZED | | | | |
| | | | | | NOTIONAL | | | APPRECIATION | | | PERCENTAGE | |
| | | | | | VALUE | | | (DEPRECIATION) | | | OF NET ASSETS | |
| REFERENCE ENTITY | | SHARES | | | ($)(1) | | | ($)(2) | | | (%) | |
| | | | |
Long Positions | | | | | | | | | | | | | | | | |
| | | | |
Common Stock | | | | | | | | | | | | | | | | |
| | | | |
Austria | | | | | | | | | | | | | | | | |
BAWAG Group AG*(b) | | | 1,021 | | | | 42,198 | | | | 66 | | | | 0.0 | (a) |
France | | | | | | | | | | | | | | | | |
Engie SA | | | 3,782 | | | | 63,329 | | | | 79 | | | | 0.0 | (a) |
Kering SA | | | 59 | | | | 33,571 | | | | (2) | | | | 0.0 | (a) |
LVMH Moet Hennessy Louis Vuitton SE | | | 95 | | | | 40,570 | | | | 43 | | | | 0.0 | (a) |
Schneider Electric SE | | | 346 | | | | 32,157 | | | | 28 | | | | 0.0 | (a) |
Societe Generale SA | | | 1,331 | | | | 37,852 | | | | 73 | | | | 0.0 | (a) |
Vinci SA | | | 753 | | | | 84,484 | | | | (2) | | | | 0.0 | (a) |
| | | 6,366 | | | | 291,963 | | | | 219 | | | | 0.0 | (a) |
Italy | | | | | | | | | | | | | | | | |
Davide Campari-Milano SpA | | | 4,105 | | | | 37,652 | | | | 42 | | | | 0.0 | (a) |
Intesa Sanpaolo SpA | | | 20,898 | | | | 52,367 | | | | 18 | | | | 0.0 | (a) |
Italgas SpA | | | 6,004 | | | | 38,652 | | | | 28 | | | | 0.0 | (a) |
UniCredit SpA | | | 3,110 | | | | 39,457 | | | | 25 | | | | 0.0 | (a) |
| | | 34,117 | | | | 168,128 | | | | 113 | | | | 0.0 | (a) |
Ireland | | | | | | | | | | | | | | | | |
Kingspan Group plc | | | 310 | | | | 16,063 | | | | – | | | | 0.0 | (a) |
Spain | | | | | | | | | | | | | | | | |
Endesa SA | | | 2,757 | | | | 75,087 | | | | 59 | | | | 0.0 | (a) |
Netherlands | | | | | | | | | | | | | | | | |
ASR Nederland NV | | | 1,932 | | | | 70,824 | | | | 127 | | | | 0.0 | (a) |
Koninklijke Ahold Delhaize NV | | | 2,084 | | | | 51,933 | | | | 44 | | | | 0.0 | (a) |
NN Group NV | | | 1,431 | | | | 54,603 | | | | 67 | | | | 0.0 | (a) |
| | | 5,447 | | | | 177,360 | | | | 238 | | | | 0.0 | (a) |
Germany | | | | | | | | | | | | | | | | |
Allianz SE (Registered) | | | 322 | | | | 78,640 | | | | (9) | | | | 0.0 | (a) |
Muenchener Rueckversicherungs-Gesellschaft AG (Registered) | | | 143 | | | | 39,731 | | | | 19 | | | | 0.0 | (a) |
RWE AG | | | 1,284 | | | | 39,129 | | | | (9) | | | | 0.0 | (a) |
| | | 1,749 | | | | 157,500 | | | | 1 | | | | 0.0 | (a) |
United States | | | | | | | | | | | | | | | | |
QIAGEN NV* | | | 473 | | | | 14,227 | | | | 31 | | | | 0.0 | (a) |
Total Long Positions of Total Return Basket Swap | | | 52,240 | | | | 942,526 | | | | 727 | | | | 0.0 | (a) |
| | | | |
Short Positions | | | | | | | | | | | | | | | | |
| | | | |
Common Stock | | | | | | | | | | | | | | | | |
SEE NOTES TO FINANCIAL STATEMENTS.
11
JPMorgan International Equity Plus Fund
SCHEDULE OF PORTFOLIO INVESTMENTS
AS OF OCTOBER 31, 2019 (continued)
| | | | | | | | | | | | | | | | |
| | | | | | | | | NET UNREALIZED | | | | |
| | | | | | NOTIONAL | | | APPRECIATION | | | PERCENTAGE | |
| | | | | | VALUE | | | (DEPRECIATION) | | | OF NET ASSETS | |
| REFERENCE ENTITY | | SHARES | | | ($)(1) | | | ($)(2) | | | (%) | |
France | | | | | | | | | | | | | | | | |
Aeroports de Paris | | | (135) | | | | (25,676) | | | | (19) | | | | 0.0 | (a) |
Credit Agricole SA | | | (3,055) | | | | (39,863) | | | | (49) | | | | 0.0 | (a) |
Remy Cointreau SA | | | (274) | | | | (36,667) | | | | (27) | | | | 0.0 | (a) |
Suez | | | (3,880) | | | | (60,518) | | | | (44) | | | | 0.0 | (a) |
Television Francaise 1 | | | (2,193) | | | | (18,403) | | | | (10) | | | | 0.0 | (a) |
Unibail-Rodamco-Westfield | | | (114) | | | | (17,629) | | | | – | | | | 0.0 | (a) |
| | | (9,651) | | | | (198,756) | | | | (149) | | | | 0.0 | (a) |
Italy | | | | | | | | | | | | | | | | |
Assicurazioni Generali SpA | | | (3,717) | | | | (75,371) | | | | (26) | | | | 0.0 | (a) |
Banca Generali SpA | | | (1,635) | | | | (53,377) | | | | (57) | | | | 0.0 | (a) |
Banco BPM SpA* | | | (18,688) | | | | (42,541) | | | | (84) | | | | 0.0 | (a) |
Eni SpA | | | (3,293) | | | | (49,958) | | | | (120) | | | | 0.0 | (a) |
Salvatore Ferragamo SpA | | | (1,735) | | | | (32,450) | | | | (38) | | | | 0.0 | (a) |
| | | (29,068) | | | | (253,697) | | | | (325) | | | | 0.0 | (a) |
Spain | | | | | | | | | | | | | | | | |
Aena SME SA(b) | | | (226) | | | | (41,485) | | | | (22) | | | | 0.0 | (a) |
Enagas SA | | | (1,736) | | | | (42,957) | | | | 7 | | | | 0.0 | (a) |
Mediaset Espana Comunicacion SA | | | (5,401) | | | | (33,048) | | | | (38) | | | | 0.0 | (a) |
Red Electrica Corp. SA | | | (1,757) | | | | (35,311) | | | | 59 | | | | 0.0 | (a) |
| | | (9,120) | | | | (152,801) | | | | 6 | | | | 0.0 | (a) |
Belgium | | | | | | | | | | | | | | | | |
Colruyt SA | | | (870) | | | | (48,360) | | | | – | | | | 0.0 | (a) |
Finland | | | | | | | | | | | | | | | | |
Sampo OYJ | | | (639) | | | | (26,186) | | | | (2) | | | | 0.0 | (a) |
Germany | | | | | | | | | | | | | | | | |
Fraport AG Frankfurt Airport Services Worldwide | | | (485) | | | | (40,538) | | | | (1) | | | | 0.0 | (a) |
Hannover Rueck SE | | | (234) | | | | (41,466) | | | | (22) | | | | 0.0 | (a) |
HUGO BOSS AG | | | (602) | | | | (25,382) | | | | (56) | | | | 0.0 | (a) |
| | | (1,321) | | | | (107,386) | | | | (79) | | | | 0.0 | (a) |
Total Short Positions of Total Return Basket Swap | | | (50,669) | | | | (787,186) | | | | (549) | | | | 0.0 | (a) |
Total of Long and Short Positions of Total Return Basket Swap | | | 1,571 | | | | 155,340 | | | | 178 | | | | 0.0 | (a) |
| | | | | | | | | | | | | | |
| | | | | | | | | | | NET CASH AND | | | |
| | | | | | | | | NET UNREALIZED | | OTHER | | | |
| | | | | TERMINATION | | NOTIONAL | | APPRECIATION | | RECEIVABLES | | | |
| COUNTERPARTY | | DESCRIPTION | | DATE | | VALUE(1) | | (DEPRECIATION)(2) | | (PAYABLES) | | VALUE | |
Citigroup | | The Fund receives the total return on a portfolio of long and short equity positions and pays or receives the net of one month NIBOR on long positions and short positions respectively, plus or minus a specified spread (rates range from (0.20)% to 0.25%), which is denominated in NOK based on the local currencies of the positions within the swaps. | | 8/4/2020 | | $(59,628) | | $(104) | | $– | | | $(104) | |
| | | | | | | | | | | | | | |
SEE NOTES TO FINANCIAL STATEMENTS.
12
JPMorgan International Equity Plus Fund
SCHEDULE OF PORTFOLIO INVESTMENTS
AS OF OCTOBER 31, 2019 (continued)
| | | | | | | | | | | | | | | | |
| | | | | | | | | NET UNREALIZED | | | | |
| | | | | | NOTIONAL | | | APPRECIATION | | | PERCENTAGE | |
| | | | | | VALUE | | | (DEPRECIATION) | | | OF NET ASSETS | |
| REFERENCE ENTITY | | SHARES | | | ($)(1) | | | ($)(2) | | | (%) | |
| | | | |
Long Positions | | | | | | | | | | | | | | | | |
| | | | |
Common Stock | | | | | | | | | | | | | | | | |
Norway | | | | | | | | | | | | | | | | |
Telenor ASA | | | 2,818 | | | | 52,741 | | | | (11) | | | | 0.0 | (a) |
| | | | |
Short Positions | | | | | | | | | | | | | | | | |
| | | | |
Common Stock | | | | | | | | | | | | | | | | |
Norway | | | | | | | | | | | | | | | | |
DNB ASA | | | (2,276) | | | | (41,440) | | | | (83) | | | | 0.0 | (a) |
Gjensidige Forsikring ASA | | | (3,794) | | | | (70,929) | | | | (10) | | | | 0.0 | (a) |
| | | (6,070) | | | | (112,369) | | | | (93) | | | | 0.0 | (a) |
Total Short Positions of Total Return Basket Swap | | | (6,070) | | | | (112,369) | | | | (93) | | | | 0.0 | (a) |
Total of Long and Short Positions of Total Return Basket Swap | | | (3,252) | | | | (59,628) | | | | (104) | | | | 0.0 | (a) |
| | | | | | | | | | | | | | |
| | | | | | | | | | | NET CASH AND | | | |
| | | | | | | | | NET UNREALIZED | | OTHER | | | |
| | | | | TERMINATION | | NOTIONAL | | APPRECIATION | | RECEIVABLES | | | |
| COUNTERPARTY | | DESCRIPTION | | DATE | | VALUE(1) | | (DEPRECIATION)(2) | | (PAYABLES) | | VALUE | |
Citigroup | | The Fund receives the total return on a portfolio of long and short equity positions and pays or receives the net of one month STIBOR on long positions and short positions respectively, plus or minus a specified spread (rates range from (0.20)% to 0.25%), which is denominated in SEK based on the local currencies of the positions within the swaps. | | 8/4/2020 | | $(51,321) | | $82 | | $– | | | $82 | |
| | | | | | | | | | | | | | |
| | | | | | | | | | | | | | | | |
| | | | | | | | | NET UNREALIZED | | | | |
| | | | | | NOTIONAL | | | APPRECIATION | | | PERCENTAGE | |
| | | | | | VALUE | | | (DEPRECIATION) | | | OF NET ASSETS | |
| REFERENCE ENTITY | | SHARES | | | ($)(1) | | | ($)(2) | | | (%) | |
| | | | |
Long Positions | | | | | | | | | | | | | | | | |
| | | | |
Common Stock | | | | | | | | | | | | | | | | |
Sweden | | | | | | | | | | | | | | | | |
Lundin Petroleum AB | | | 1,677 | | | | 55,539 | | | | 170 | | | | 0.0 | (a) |
| | | | |
Short Positions | | | | | | | | | | | | | | | | |
| | | | |
Common Stock | | | | | | | | | | | | | | | | |
Sweden | | | | | | | | | | | | | | | | |
Skanska AB | | | (2,223) | | | | (47,365) | | | | (54) | | | | 0.0 | (a) |
Telia Co. AB | | | (13,525) | | | | (59,495) | | | | (34) | | | | 0.0 | (a) |
| | | (15,748) | | | | (106,860) | | | | (88) | | | | 0.0 | (a) |
Total Short Positions of Total Return Basket Swap | | | (15,748) | | | | (106,860) | | | | (88) | | | | 0.0 | (a) |
Total of Long and Short Positions of Total Return Basket Swap | | | (14,071) | | | | (51,321) | | | | 82 | | | | 0.0 | (a) |
SEE NOTES TO FINANCIAL STATEMENTS.
13
JPMorgan International Equity Plus Fund
SCHEDULE OF PORTFOLIO INVESTMENTS
AS OF OCTOBER 31, 2019 (continued)
| | | | | | | | | | | | | | |
| | | | | | | | | | | NET CASH AND | | | |
| | | | | | | | | NET UNREALIZED | | OTHER | | | |
| | | | | TERMINATION | | NOTIONAL | | APPRECIATION | | RECEIVABLES | | | |
| COUNTERPARTY | | DESCRIPTION | | DATE | | VALUE(1) | | (DEPRECIATION)(2) | | (PAYABLES) | | VALUE | |
Citigroup | | The Fund receives the total return on a portfolio of long and short equity positions and pays or receives the net of one month BBSW on long positions and short positions respectively, plus or minus a specified spread (rates range from (0.30)% to 0.30%), which is denominated in AUD based on the local currencies of the positions within the swaps. | | 7/29/2020 | | $(29,121) | | $(134) | | $– | | | $(134) | |
| | | | | | | | | | | | | | |
| | | | | | | | | | | | | | | | |
| | | | | | | | | NET UNREALIZED | | | | |
| | | | | | NOTIONAL | | | APPRECIATION | | | PERCENTAGE | |
| | | | | | VALUE | | | (DEPRECIATION) | | | OF NET ASSETS | |
| REFERENCE ENTITY | | SHARES | | | ($)(1) | | | ($)(2) | | | (%) | |
| | | | |
Long Positions | | | | | | | | | | | | | | | | |
| | | | |
Common Stock | | | | | | | | | | | | | | | | |
Australia | | | | | | | | | | | | | | | | |
Westpac Banking Corp. | | | 4,687 | | | | 91,000 | | | | (146) | | | | 0.0 | (a) |
| | | | |
Short Positions | | | | | | | | | | | | | | | | |
| | | | |
Common Stock | | | | | | | | | | | | | | | | |
Australia | | | | | | | | | | | | | | | | |
ASX Ltd. | | | (499) | | | | (28,324) | | | | (7) | | | | 0.0 | (a) |
Bendigo & Adelaide Bank Ltd. | | | (5,918) | | | | (43,433) | | | | 15 | | | | 0.0 | (a) |
Commonwealth Bank of Australia | | | (892) | | | | (48,364) | | | | 4 | | | | 0.0 | (a) |
| | | (7,309) | | | | (120,121) | | | | 12 | | | | 0.0 | (a) |
Total Short Positions of Total Return Basket Swap | | | (7,309) | | | | (120,121) | | | | 12 | | | | 0.0 | (a) |
Total of Long and Short Positions of Total Return Basket Swap | | | (2,622) | | | | (29,121) | | | | (134) | | | | 0.0 | (a) |
| | | | | | | | | | | | | | |
| | | | | | | | | | | NET CASH AND | | | |
| | | | | | | | | NET UNREALIZED | | OTHER | | | |
| | | | | TERMINATION | | NOTIONAL | | APPRECIATION | | RECEIVABLES | | | |
| COUNTERPARTY | | DESCRIPTION | | DATE | | VALUE(1) | | (DEPRECIATION)(2) | | (PAYABLES) | | VALUE | |
Citigroup | | The Fund receives the total return on a portfolio of long and short equity positions and pays or receives the net of one month HIBOR on long positions and short positions respectively, plus or minus a specified spread (rates range from (0.30)% to 0.30%), which is denominated in HKD based on the local currencies of the positions within the swaps. | | 7/29/2020 | | $58,863 | | $(217) | | $– | | | $(217) | |
| | | | | | | | | | | | | | |
SEE NOTES TO FINANCIAL STATEMENTS.
14
JPMorgan International Equity Plus Fund
SCHEDULE OF PORTFOLIO INVESTMENTS
AS OF OCTOBER 31, 2019 (continued)
| | | | | | | | | | | | | | | | |
| | | | | | | | | NET UNREALIZED | | | | |
| | | | | | NOTIONAL | | | APPRECIATION | | | PERCENTAGE | |
| | | | | | VALUE | | | (DEPRECIATION) | | | OF NET ASSETS | |
| REFERENCE ENTITY | | SHARES | | | ($)(1) | | | ($)(2) | | | (%) | |
| | | | |
Long Positions | | | | | | | | | | | | | | | | |
| | | | |
Common Stock | | | | | | | | | | | | | | | | |
China | | | | | | | | | | | | | | | | |
BOC Hong Kong Holdings Ltd. | | | 14,500 | | | | 49,817 | | | | (145) | | | | 0.0 | (a) |
Hong Kong | | | | | | | | | | | | | | | | |
CLP Holdings Ltd. | | | 4,500 | | | | 46,734 | | | | 17 | | | | 0.0 | (a) |
Hong Kong Exchanges & Clearing Ltd. | | | 1,800 | | | | 56,077 | | | | (203) | | | | 0.0 | (a) |
| | | 6,300 | | | | 102,811 | | | | (186) | | | | 0.0 | (a) |
Total Long Positions of Total Return Basket Swap | | | 20,800 | | | | 152,628 | | | | (331) | | | | 0.0 | (a) |
| | | | |
Short Positions | | | | | | | | | | | | | | | | |
| | | | |
Common Stock | | | | | | | | | | | | | | | | |
Hong Kong | | | | | | | | | | | | | | | | |
Bank of East Asia Ltd. (The) | | | (7,400) | | | | (17,826) | | | | 23 | | | | 0.0 | (a) |
Hang Seng Bank Ltd. | | | (1,500) | | | | (31,298) | | | | 58 | | | | 0.0 | (a) |
Hong Kong & China Gas Co. Ltd. | | | (23,000) | | | | (44,641) | | | | 33 | | | | 0.0 | (a) |
| | | (31,900) | | | | (93,765) | | | | 114 | | | | 0.0 | (a) |
Total Short Positions of Total Return Basket Swap | | | (31,900) | | | | (93,765) | | | | 114 | | | | 0.0 | (a) |
Total of Long and Short Positions of Total Return Basket Swap | | | (11,100) | | | | 58,863 | | | | (217) | | | | 0.0 | (a) |
| | | | | | | | | | | | | | |
| | | | | | | | | | | NET CASH AND | | | |
| | | | | | | | | NET UNREALIZED | | OTHER | | | |
| | | | | TERMINATION | | NOTIONAL | | APPRECIATION | | RECEIVABLES | | | |
| COUNTERPARTY | | DESCRIPTION | | DATE | | VALUE(1) | | (DEPRECIATION)(2) | | (PAYABLES) | | VALUE | |
Citigroup | | The Fund receives the total return on a portfolio of long and short equity positions and pays or receives the net of one month LIBOR on long positions and short positions respectively, plus or minus a specified spread (rates range from (0.30)% to 0.30%), which is denominated in JPY based on the local currencies of the positions within the swaps. | | 7/29/2020 | | $31,858 | | $(506) | | $– | | | $(506) | |
| | | | | | | | | | | | | | |
| | | | | | | | | | | | | | | | |
| | | | | | | | | NET UNREALIZED | | | | |
| | | | | | NOTIONAL | | | APPRECIATION | | | PERCENTAGE | |
| | | | | | VALUE | | | (DEPRECIATION) | | | OF NET ASSETS | |
| REFERENCE ENTITY | | SHARES | | | ($)(1) | | | ($)(2) | | | (%) | |
| | | | |
Long Positions | | | | | | | | | | | | | | | | |
| | | | |
Common Stock | | | | | | | | | | | | | | | | |
Japan | | | | | | | | | | | | | | | | |
Hino Motors Ltd. | | | 3,300 | | | | 31,199 | | | | (337) | | | | 0.0(a) | |
JXTG Holdings, Inc. | | | 11,000 | | | | 51,417 | | | | (472) | | | | 0.0(a) | |
Kansai Electric Power Co., Inc. (The) | | | 2,500 | | | | 29,165 | | | | (108) | | | | 0.0(a) | |
Kyocera Corp. | | | 800 | | | | 52,486 | | | | (423) | | | | 0.0(a) | |
Nichirei Corp. | | | 3,000 | | | | 68,894 | | | | (140) | | | | 0.0(a) | |
Nippon Telegraph & Telephone Corp. | | | 1,100 | | | | 54,607 | | | | (153) | | | | 0.0(a) | |
Nitori Holdings Co. Ltd. | | | 300 | | | | 45,663 | | | | (202) | | | | 0.0(a) | |
Ono Pharmaceutical Co. Ltd. | | | 1,200 | | | | 22,604 | | | | (142) | | | | 0.0(a) | |
ORIX Corp. | | | 2,300 | | | | 36,144 | | | | (201) | | | | 0.0(a) | |
Panasonic Corp. | | | 2,900 | | | | 24,373 | | | | (250) | | | | 0.0(a) | |
SEE NOTES TO FINANCIAL STATEMENTS.
15
JPMorgan International Equity Plus Fund
SCHEDULE OF PORTFOLIO INVESTMENTS
AS OF OCTOBER 31, 2019 (continued)
| | | | | | | | | | | | | | | | |
| | | | | | | | | NET UNREALIZED | | | | |
| | | | | | NOTIONAL | | | APPRECIATION | | | PERCENTAGE | |
| | | | | | VALUE | | | (DEPRECIATION) | | | OF NET ASSETS | |
| REFERENCE ENTITY | | SHARES | | | ($)(1) | | | ($)(2) | | | (%) | |
Resona Holdings, Inc. | | | 6,900 | | | | 30,005 | | | | (351) | | | | 0.0(a) | |
Seven & i Holdings Co. Ltd. | | | 900 | | | | 34,002 | | | | (168) | | | | 0.0(a) | |
Suzuki Motor Corp. | | | 1,600 | | | | 75,543 | | | | (568) | | | | 0.0(a) | |
T&D Holdings, Inc. | | | 3,700 | | | | 41,210 | | | | (591) | | | | 0.0(a) | |
Tokyo Gas Co. Ltd. | | | 1,800 | | | | 43,940 | | | | (164) | | | | 0.0(a) | |
Yamaha Motor Co. Ltd. | | | 2,300 | | | | 45,018 | | | | (560) | | | | 0.0(a) | |
| | | 45,600 | | | | 686,270 | | | | (4,830) | | | | 0.0(a) | |
Total Long Positions of Total Return Basket Swap | | | 45,600 | | | | 686,270 | | | | (4,830) | | | | 0.0(a) | |
| | | | |
Short Positions | | | | | | | | | | | | | | | | |
| | | | |
Common Stock | | | | | | | | | | | | | | | | |
Japan | | | | | | | | | | | | | | | | |
Chugoku Electric Power Co., Inc. (The) | | | (2,800) | | | | (37,301) | | | | 62 | | | | 0.0(a) | |
FamilyMart Co. Ltd. | | | (1,400) | | | | (34,729) | | | | 223 | | | | 0.0(a) | |
Hirose Electric Co. Ltd. | | | (400) | | | | (50,388) | | | | 469 | | | | 0.0(a) | |
Idemitsu Kosan Co. Ltd. | | | (1,700) | | | | (49,972) | | | | 482 | | | | 0.0(a) | |
Isuzu Motors Ltd. | | | (2,100) | | | | (24,402) | | | | 246 | | | | 0.0(a) | |
Japan Post Holdings Co. Ltd. | | | (2,900) | | | | (26,620) | | | | 127 | | | | 0.0(a) | |
KDDI Corp. | | | (1,900) | | | | (52,575) | | | | 190 | | | | 0.0(a) | |
Lawson, Inc. | | | (800) | | | | (44,133) | | | | 167 | | | | 0.0(a) | |
Mazda Motor Corp. | | | (6,800) | | | | (62,426) | | | | 857 | | | | 0.0(a) | |
Mizuho Financial Group, Inc. | | | (20,300) | | | | (31,515) | | | | 216 | | | | 0.0(a) | |
Ricoh Co. Ltd. | | | (2,600) | | | | (23,155) | | | | 199 | | | | 0.0(a) | |
Shionogi & Co. Ltd. | | | (300) | | | | (18,007) | | | | 100 | | | | 0.0(a) | |
Softbank Corp. | | | (3,600) | | | | (49,382) | | | | 122 | | | | 0.0(a) | |
Sony Financial Holdings, Inc. | | | (1,900) | | | | (40,875) | | | | 277 | | | | 0.0(a) | |
Subaru Corp. | | | (1,600) | | | | (45,852) | | | | 419 | | | | 0.0(a) | |
Yamazaki Baking Co. Ltd.* | | | (3,700) | | | | (63,080) | | | | 168 | | | | 0.0(a) | |
| | | (54,800) | | | | (654,412) | | | | 4,324 | | | | 0.0(a) | |
Total Short Positions of Total Return Basket Swap | | | (54,800) | | | | (654,412) | | | | 4,324 | | | | 0.0(a) | |
Total of Long and Short Positions of Total Return Basket Swap | | | (9,200) | | | | 31,858 | | | | (506) | | | | 0.0(a) | |
| | | | | | | | | | | | | | |
| | | | | | | | | | | NET CASH AND | | | |
| | | | | | | | | NET UNREALIZED | | OTHER | | | |
| | | | | TERMINATION | | NOTIONAL | | APPRECIATION | | RECEIVABLES | | | |
| COUNTERPARTY | | DESCRIPTION | | DATE | | VALUE(1) | | (DEPRECIATION)(2) | | (PAYABLES) | | VALUE | |
Citigroup | | The Fund receives the total return on a portfolio of long and short equity positions and pays or receives the net of one month SIBOR on long positions and short positions respectively, plus or minus a specified spread (rates range from (1.00)% to 0.30%), which is denominated in SGD based on the local currencies of the positions within the swaps. | | 7/29/2020 | | $(30,639) | | $(21) | | $– | | | $(21) | |
| | | | | | | | | | | | | | |
SEE NOTES TO FINANCIAL STATEMENTS.
16
JPMorgan International Equity Plus Fund
SCHEDULE OF PORTFOLIO INVESTMENTS
AS OF OCTOBER 31, 2019 (continued)
| | | | | | | | | | | | | | | | |
| | | | | | | | | NET UNREALIZED | | | | |
| | | | | | NOTIONAL | | | APPRECIATION | | | PERCENTAGE | |
| | | | | | VALUE | | | (DEPRECIATION) | | | OF NET ASSETS | |
| REFERENCE ENTITY | | SHARES | | | ($)(1) | | | ($)(2) | | | (%) | |
| | | | |
Long Positions | | | | | | | | | | | | | | | | |
| | | | |
Common Stock | | | | | | | | | | | | | | | | |
Singapore | | | | | | | | | | | | | | | | |
Singapore Telecommunications Ltd. | | | 12,500 | | | | 30,269 | | | | (51) | | | | 0.0(a) | |
| | | | |
Short Positions | | | | | | | | | | | | | | | | |
| | | | |
Common Stock | | | | | | | | | | | | | | | | |
Singapore | | | | | | | | | | | | | | | | |
Singapore Exchange Ltd. | | | (5,100) | | | | (33,484) | | | | 30 | | | | 0.0(a) | |
StarHub Ltd. | | | (28,700) | | | | (27,424) | | | | – | | | | 0.0(a) | |
| | | (33,800) | | | | (60,908) | | | | 30 | | | | 0.0(a) | |
Total Short Positions of Total Return Basket Swap | | | (33,800) | | | | (60,908) | | | | 30 | | | | 0.0(a) | |
Total of Long and Short Positions of Total Return Basket Swap | | | (21,300) | | | | (30,639) | | | | (21) | | | | 0.0(a) | |
| | | | | | | | | | | | | | |
| | | | | | | | | | | NET CASH AND | | | |
| | | | | | | | | NET UNREALIZED | | OTHER | | | |
| | | | | TERMINATION | | NOTIONAL | | APPRECIATION | | RECEIVABLES | | | |
| COUNTERPARTY | | DESCRIPTION | | DATE | | VALUE(1) | | (DEPRECIATION)(2) | | (PAYABLES) | | VALUE | |
Citigroup | | The Fund receives the total return on a portfolio of long and short equity positions and pays or receives the net of one month LIBOR on long positions and short positions respectively, plus or minus a specified spread (rates range from (0.20)% to 0.25%), which is denominated in CHF based on the local currencies of the positions within the swaps. | | 8/4/2020 | | $(114,075) | | $(191) | | $– | | | $(191) | |
| | | | | | | | | | | | | | |
| | | | | | | | | | | | | | | | |
| | | | | | | | | NET UNREALIZED | | | | |
| | | | | | NOTIONAL | | | APPRECIATION | | | PERCENTAGE | |
| | | | | | VALUE | | | (DEPRECIATION) | | | OF NET ASSETS | |
| REFERENCE ENTITY | | SHARES | | | ($)(1) | | | ($)(2) | | | (%) | |
| | | | |
Long Positions | | | | | | | | | | | | | | | | |
| | | | |
Common Stock | | | | | | | | | | | | | | | | |
Switzerland | | | | | | | | | | | | | | | | |
Helvetia Holding AG (Registered) | | | 387 | | | | 54,361 | | | | 67 | | | | 0.0 | (a) |
Lonza Group AG (Registered)* | | | 134 | | | | 48,298 | | | | 77 | | | | 0.0 | (a) |
| | | 521 | | | | 102,659 | | | | 144 | | | | 0.0 | (a) |
Total Long Positions of Total Return Basket Swap | | | 521 | | | | 102,659 | | | | 144 | | | | 0.0 | (a) |
| | | | |
Short Positions | | | | | | | | | | | | | | | | |
| | | | |
Common Stock | | | | | | | | | | | | | | | | |
Switzerland | | | | | | | | | | | | | | | | |
ABB Ltd. (Registered) | | | (1,594) | | | | (33,474) | | | | (43) | | | | 0.0 | (a) |
Baloise Holding AG (Registered) | | | (260) | | | | (48,088) | | | | (68) | | | | 0.0 | (a) |
Geberit AG (Registered) | | | (32) | | | | (16,259) | | | | (20) | | | | 0.0 | (a) |
Sonova Holding AG (Registered) | | | (169) | | | | (38,782) | | | | (65) | | | | 0.0 | (a) |
Swiss Life Holding AG (Registered) | | | (160) | | | | (80,131) | | | | (139) | | | | 0.0 | (a) |
| | | (2,215) | | | | (216,734) | | | | (335) | | | | 0.0 | (a) |
Total Short Positions of Total Return Basket Swap | | | (2,215) | | | | (216,734) | | | | (335) | | | | 0.0 | (a) |
Total of Long and Short Positions of Total Return Basket Swap | | | (1,694) | | | | (114,075) | | | | (191) | | | | 0.0 | (a) |
SEE NOTES TO FINANCIAL STATEMENTS.
17
JPMorgan International Equity Plus Fund
SCHEDULE OF PORTFOLIO INVESTMENTS
AS OF OCTOBER 31, 2019 (continued)
| | | | | | | | | | | | | | |
| | | | | | | | | | | NET CASH AND | | | |
| | | | | | | | | NET UNREALIZED | | OTHER | | | |
| | | | | TERMINATION | | NOTIONAL | | APPRECIATION | | RECEIVABLES | | | |
| COUNTERPARTY | | DESCRIPTION | | DATE | | VALUE(1) | | (DEPRECIATION)(2) | | (PAYABLES) | | VALUE | |
Citigroup | | The Fund receives the total return on a portfolio of short equity positions and receives the net of one month CIBOR on short positions, plus or minus a specified spread of (0.20)%, which is denominated in DKK based on the local currencies of the positions within the swaps. | | 8/4/2020 | | $(72,093) | | $21 | | $– | | | $21 | |
| | | | | | | | | | | | | | |
| | | | | | | | | | | | | | | | |
| | | | | | | | | NET UNREALIZED | | | | |
| | | | | | NOTIONAL | | | APPRECIATION | | | PERCENTAGE | |
| | | | | | VALUE | | | (DEPRECIATION) | | | OF NET ASSETS | |
| REFERENCE ENTITY | | SHARES | | | ($)(1) | | | ($)(2) | | | (%) | |
| | | | |
Short Positions | | | | | | | | | | | | | | | | |
| | | | |
Common Stock | | | | | | | | | | | | | | | | |
Denmark | | | | | | | | | | | | | | | | |
Coloplast A/S | | | (402 | ) | | | (48,399 | ) | | | 41 | | | | 0.0 | (a) |
Demant A/S* | | | (897 | ) | | | (23,694 | ) | | | (20) | | | | 0.0 | (a) |
| | | (1,299 | ) | | | (72,093 | ) | | | 21 | | | | 0.0 | (a) |
| | | | |
Total Short Positions of Total Return Basket Swap | | | (1,299 | ) | | | (72,093 | ) | | | 21 | | | | 0.0 | (a) |
The following reference rates, and their values as ofperiod-end, are used for security descriptions:
| | | | | | | | |
| | | Value | | | | |
BBSW | | | 0.92 | % | | | | |
CIBOR | | | (0.50) | | | | | |
EURIBOR | | | (0.44) | | | | | |
HIBOR | | | 1.78 | | | | | |
CHF LIBOR | | | (0.79) | | | | | |
GBP LIBOR | | | 0.71 | | | | | |
JPY LIBOR | | | (0.11) | | | | | |
NIBOR | | | 1.68 | | | | | |
SIBOR | | | 1.78 | | | | | |
STIBOR | | | (0.09) | | | | | |
Summary of total OTC swap contracts outstanding as of October 31, 2019
| | | | | | | | | | |
| | | | | Net Upfront | | | | |
| | | | | Payments | | | | |
| | | | | (Receipts) ($) | | | Value ($) | |
| | | | | | |
Assets | | | | | | | | | | |
OTC total return basket swap contracts outstanding | | | — | | | | 417 | |
| | | | | | |
| | | |
Liabilities | | | | | | | | | | |
OTC total return basket swap contracts outstanding | | | — | | | | (1,173) | |
| | | | | | |
| | |
Abbreviations |
AUD | | Australian Dollar |
BBSW | | ASX Australia Bank Bill Swap Rate |
CHF | | Swiss Franc |
CIBOR | | Copenhagen Interbank Offered Rate |
DKK | | Danish Krone |
EUR | | Euro |
EURIBOR | | Euro Interbank Offered Rate |
GBP | | British Pound |
SEE NOTES TO FINANCIAL STATEMENTS.
18
JPMorgan International Equity Plus Fund
SCHEDULE OF PORTFOLIO INVESTMENTS
AS OF OCTOBER 31, 2019 (continued)
| | | | |
HKD | | Hong Kong Dollar | | |
| HIBOR | | Hong Kong Interbank Offered Rate | | |
| JPY | | Japanese Yen | | |
| LIBOR | | London Interbank Offered Rate | | |
| NIBOR | | Norwegian Inter bank Offered Rate | | |
| NOK | | Norwegian Krone | | |
| OYJ | | Public Limited Company | | |
| SEK | | Swedish Krona | | |
| SGD | | Singapore Dollar | | |
| SIBOR | | Singapore Interbank Offered Rate | | |
| STIBOR | | Stockholm Interbank Offered Rate | | |
| | |
| (a) | | Amount rounds to less than 0.1% of net assets. | | |
| (b) | | Security exempt from registration pursuant to Regulation S under the Securities Act of 1933, as amended. Regulation S applies to securities offerings that are made outside of the United States and do not involve direct selling efforts in the United States and as such may have restrictions on resale. | | |
| (1) | | Notional value represents market value as of October 31, 2019 of these positions based on the securities’ last sale or closing price on the principal exchange on which the securities are traded. | | |
| (2) | | Unrealized appreciation (depreciation) represents the unrealized gain(loss) of the positions subsequent to the swap reset. | | |
| * | | Non-income producing security. | | |
SEE NOTES TO FINANCIAL STATEMENTS.
19
STATEMENT OF ASSETS AND LIABILITIES
AS OF OCTOBER 31, 2019
| | | | |
| | | JPMorgan
International Equity
Plus Fund |
ASSETS: | | | | |
Investments innon-affiliates, at value | | $ | 9,852,076 | |
Investments in affiliates, at value | | | 364,271 | |
Cash | | | 102,146 | |
Foreign currency, at value | | | 19,541 | |
Deferred offering costs (See Note 2.F.) | | | 6,835 | |
Receivables: | | | | |
Dividends fromnon-affiliates | | | 31,142 | |
Dividends from affiliates | | | 535 | |
Tax reclaims | | | 2,744 | |
Variation margin on futures contracts | | | 18,235 | |
Unrealized appreciation on forward foreign currency exchange contracts | | | 5,614 | |
Outstanding OTC swap contracts, at value | | | 417 | |
Due from counterparty for swap contracts | | | 46,302 | |
Due from Adviser | | | 5,939 | |
| | | | |
Total Assets | | | 10,455,797 | |
| | | | |
| |
LIABILITIES: | | | | |
Payables: | | | | |
Unrealized depreciation on forward foreign currency exchange contracts | | | 1,146 | |
Outstanding OTC swap contracts, at value | | | 1,173 | |
Accrued liabilities: | | | | |
Distribution fees | | | 17 | |
Service fees | | | 1,000 | |
Custodian and accounting fees | | | 7,874 | |
Trustees’ and Chief Compliance Officer’s fees | | | 67 | |
Audit fees | | | 77,767 | |
Printing & Postage fees | | | 9,408 | |
Other | | | 7,282 | |
| | | | |
Total Liabilities | | | 105,734 | |
| | | | |
Net Assets | | $ | 10,350,063 | |
| | | | |
SEE NOTES TO FINANCIAL STATEMENTS.
20
STATEMENT OF ASSETS AND LIABILITIES
AS OF OCTOBER 31, 2019 (continued)
| | | | |
| | | JPMorgan
International Equity
Plus Fund |
NET ASSETS: | | | | |
Paid-in-Capital | | $ | 9,999,954 | |
Total distributable earnings (loss) | | | 350,109 | |
| | | | |
Total Net Assets | | $ | 10,350,063 | |
| | | | |
| |
Net Assets: | | | | |
Class A | | $ | 20,682 | |
Class C | | | 20,646 | |
Class I | | | 10,308,735 | |
| | | | |
Total | | $ | 10,350,063 | |
| | | | |
| |
Outstanding units of beneficial interest (shares) | | | | |
($0.0001 par value; unlimited number of shares authorized): | | | | |
Class A | | | 1,333 | |
Class C | | | 1,334 | |
Class I | | | 664,000 | |
| |
Net Asset Value (a): | | | | |
Class A - Redemption price per share | | $ | 15.51 | |
Class C - Offering price per share (b) | | | 15.48 | |
Class I - Offering and redemption price per share | | | 15.53 | |
Class A maximum sales charge | | | 5.25 | % |
Class A maximum public offering price per share
[net asset value per share/(100% – maximum sales charge)] | | $ | 16.37 | |
| | | | |
| |
Cost of investments innon-affiliates | | $ | 9,646,811 | |
Cost of investments in affiliates | | | 364,271 | |
Cost of foreign currency | | | 19,315 | |
(a) Per share amounts may not recalculate due to rounding of net assets and/or shares outstanding.
(b) Redemption price for Class C Shares varies based upon length of time the shares are held.
SEE NOTES TO FINANCIAL STATEMENTS.
21
STATEMENT OF OPERATIONS
FOR THE PERIOD ENDED OCTOBER 31, 2019
| | | | |
| | | JPMorgan
International
Equity Plus
Fund (a) |
INVESTMENT INCOME: | | | | |
Interest income from affiliates | | $ | 844 | |
Dividend income fromnon-affiliates | | | 98,006 | |
Dividend income from affiliates | | | 2,746 | |
Non-cash dividend income fromnon-affiliates | | | 4,624 | |
Foreign taxes withheld (net) | | | (9,262 | ) |
| | | | |
Total investment income | | | 96,958 | |
| | | | |
| |
EXPENSES: | | | | |
Investment advisory fees | | | 20,874 | |
Administration fees | | | 2,609 | |
Distribution fees: | | | | |
Class A | | | 17 | |
Class C | | | 52 | |
Service fees: | | | | |
Class A | | | 17 | |
Class C | | | 17 | |
Class I | | | 8,663 | |
Custodian and accounting fees | | | 13,671 | |
Interest expense to affiliates | | | 11 | |
Professional fees | | | 77,804 | |
Trustees’ and Chief Compliance Officer’s fees | | | 6,326 | |
Printing and mailing costs | | | 9,422 | |
Registration and filing fees | | | 561 | |
Transfer agency fees (See Note 2.H.) | | | 407 | |
Offering costs (See Note 2.F.) | | | 3,902 | |
Other | | | 8,149 | |
| | | | |
Total expenses | | | 152,502 | |
| | | | |
Less fees waived | | | (31,394 | ) |
Less expense reimbursements | | | (95,148 | ) |
| | | | |
Net expenses | | | 25,960 | |
| | | | |
Net investment income (loss) | | | 70,998 | |
| | | | |
| |
REALIZED/UNREALIZED GAINS (LOSSES): | | | | |
Net realized gain (loss) on transactions from: | | | | |
Investments innon-affiliates | | | (27,750 | ) |
Futures contracts | | | 12,622 | |
Foreign currency transactions | | | 7,337 | |
Forward foreign currency exchange contracts | | | (28,063 | ) |
Swaps | | | 95,786 | |
| | | | |
Net realized gain (loss) | | | 59,932 | |
| | | | |
Change in net unrealized appreciation/depreciation on: | | | | |
Investments innon-affiliates | | | 205,265 | |
Futures contracts | | | 9,685 | |
Foreign currency translations | | | 471 | |
Forward foreign currency exchange contracts | | | 4,468 | |
Swaps | | | (756 | ) |
| | | | |
Change in net unrealized appreciation/depreciation | | | 219,133 | |
| | | | |
Net realized/unrealized gains (losses) | | | 279,065 | |
| | | | |
Change in net assets resulting from operations | | $ | 350,063 | |
| | | | |
(a) Commencement of operations was June 25, 2019.
SEE NOTES TO FINANCIAL STATEMENTS.
22
STATEMENT OF CHANGES IN NET ASSETS
FOR THE PERIOD INDICATED
| | | | |
| | | JPMorgan International
Equity Plus Fund |
| | | Period Ended October 31, 2019(a) |
CHANGE IN NET ASSETS RESULTING FROM OPERATIONS: | | | | |
Net investment income (loss) | | $ | 70,998 | |
Net realized gain (loss) | | | 59,932 | |
Change in net unrealized appreciation/depreciation | | | 219,133 | |
| | | | |
Change in net assets resulting from operations | | | 350,063 | |
| | | | |
| |
CAPITAL TRANSACTIONS: | | | | |
Change in net assets resulting from capital transactions | | | 10,000,000 | |
| | | | |
| |
NET ASSETS: | | | | |
Change in net assets | | | 10,350,063 | |
Beginning of period | | | — | |
| | | | |
End of period | | $ | 10,350,063 | |
| | | | |
| |
CAPITAL TRANSACTIONS: | | | | |
Class A | | | | |
Proceeds from shares issued | | $ | 20,000 | |
| | | | |
Change in net assets resulting from Class A capital transactions | | $ | 20,000 | |
| | | | |
Class C | | | | |
Proceeds from shares issued | | $ | 20,000 | |
| | | | |
Change in net assets resulting from Class C capital transactions | | $ | 20,000 | |
| | | | |
Class I | | | | |
Proceeds from shares issued | | $ | 9,960,000 | |
| | | | |
Change in net assets resulting from Class I capital transactions | | $ | 9,960,000 | |
| | | | |
Total change in net assets resulting from capital transactions | | $ | 10,000,000 | |
| | | | |
| |
SHARE TRANSACTIONS: | | | | |
Class A | | | | |
Issued | | | 1,333 | |
| | | | |
Change in Class A Shares | | | 1,333 | |
| | | | |
Class C | | | | |
Issued | | | 1,334 | |
| | | | |
Change in Class C Shares | | | 1,334 | |
| | | | |
Class I | | | | |
Issued | | | 664,000 | |
| | | | |
Change in Class I Shares | | | 664,000 | |
| | | | |
(a) Commencement of operations was June 25, 2019.
SEE NOTES TO FINANCIAL STATEMENTS.
23
FINANCIAL HIGHLIGHTS
FOR THE PERIOD INDICATED
| | | | | | | | | | | | | | | | | | | | | | | | | | | | | | | | | | | | | | | | | | | | |
| | | Per share operating performance | | | Ratios/Supplemental data | |
| | | | | | Investment operations | | | | | | | | | | | | Ratios to average net assets (a) | | | | |
| | | | | | | | | | | | | | | | | | | | | | | | | | | | | | Expenses without | | | | |
| | | Net asset | | | Net | | | Net realized and | | | | | | | | | Total return | | | | | | | | | Net | | | waivers, | | | | |
| | | value, | | | investment | | | unrealized gains | | | Total from | | | Net asset | | | (excludes | | | | | | Net | | | investment | | | reimbursements | | | Portfolio | |
| | | beginning | | | income (loss) | | | (losses) on | | | investment | | | value, end | | | sales charge) | | | Net assets, end of | | | expenses | | | income | | | and earnings | | | turnover | |
| | | of period | | | (b) | | | investments | | | operations | | | of period | | | (c)(d) | | | period | | | (e)(f) | | | (loss) (f) | | | credits (f) | | | rate (c) | |
JPMorgan International Equity Plus Fund | | | | | | | | | | | | | | | | | | | | | | | | | | | | | | | | | | | | | | | | | | | | |
| | | | | | | | | | | |
Class A | | | | | | | | | | | | | | | | | | | | | | | | | | | | | | | | | | | | | | | | | | | | |
| | | | | | | | | | | |
June 25, 2019 (g) through October 31, 2019 | | | $15.00 | | | | $0.09 | | | | $0.42 | | | | $0.51 | | | | $15.51 | | | | 3.40% | | | | $20,682 | | | | 1.00% | | | | 1.79% | | | | 6.86% | | | | 8% | |
| | | | | | | | | | | |
Class C | | | | | | | | | | | | | | | | | | | | | | | | | | | | | | | | | | | | | | | | | | | | |
| | | | | | | | | | | |
June 25, 2019 (g) through October 31, 2019 | | | 15.00 | | | | 0.07 | | | | 0.41 | | | | 0.48 | | | | 15.48 | | | | 3.20 | | | | 20,646 | | | | 1.50 | | | | 1.29 | | | | 7.37 | | | | 8 | |
| | | | | | | | | | | |
Class I | | | | | | | | | | | | | | | | | | | | | | | | | | | | | | | | | | | | | | | | | | | | |
| | | | | | | | | | | |
June 25, 2019 (g) through October 31, 2019 | | | 15.00 | | | | 0.11 | | | | 0.42 | | | | 0.53 | | | | 15.53 | | | | 3.53 | | | | 10,308,735 | | | | 0.74 | | | | 2.04 | | | | 4.30 | | | | 8 | |
| (a) | Annualized for periods less than one year, unless otherwise noted. |
| (b) | Calculated based upon average shares outstanding. |
| (c) | Not annualized for periods less than one year. |
| (d) | Includes adjustments in accordance with accounting principles generally accepted in the United States of America and as such, the net asset values for financial reporting purposes and the returns based upon those net asset values may differ from the net asset values and returns for shareholder transactions. |
| (e) | Includes earnings credits and interest expense, if applicable, each of which is less than 0.005% unless otherwise noted. |
| (f) | Certainnon-recurring expenses incurred by the Fund were not annualized for the period indicated. |
| (g) | Commencement of operations. |
SEE NOTES TO FINANCIAL STATEMENTS.
24
NOTES TO FINANCIAL STATEMENTS
AS OF OCTOBER 31, 2019
1. Organization
JPMorgan Trust IV (the “Trust”) was formed on November 11, 2015, as a Delaware statutory trust, pursuant to a Declaration of Trust dated November 11, 2015, and is registered under the Investment Company Act of 1940, as amended (the “1940 Act”), as anopen-end management investment company.
The following is a separate fund of the Trust (the “Fund”) covered by this report:
| | | | |
| | | Classes Offered | | Diversification Classification |
JPMorgan International Equity Plus Fund | | Class A, Class C and Class I | | Diversified |
The investment objective of the Fund is to seek to provide long-term capital appreciation.
The Fund commenced operations on June 25, 2019. Currently, the Fund is not publicly offered for investment.
Class A Shares generally provide for afront-end sales charge while Class C Shares provide for a contingent deferred sales charge (“CDSC”). No sales charges are assessed with respect to Class I. Certain Class A Shares, for whichfront-end sales charges have been waived, may be subject to a CDSC as described in the Fund’s prospectus. Class C Shares automatically convert to Class A Shares after ten years. All classes of shares have equal rights as to earnings, assets and voting privileges, except that each class may bear different transfer agency, distribution and service fees and each class has exclusive voting rights with respect to its distribution plan and shareholder servicing agreements.
J.P. Morgan Investment Management Inc. (“JPMIM”), an indirect, wholly-owned subsidiary of JPMorgan Chase & Co. (“JPMorgan”), acts as Adviser (the “Adviser”) and Administrator (the “Administrator”) to the Fund.
2. Significant Accounting Policies
The following is a summary of significant accounting policies followed by the Fund in the preparation of their financial statements. The Fund is an investment company and, thus, follows the investment company accounting and reporting guidance of the Financial Accounting Standards Board (“FASB”) Accounting Standards Codification Topic 946 - Investment Companies, which is part of U.S. generally accepted accounting principles (“GAAP”). The preparation of financial statements in conformity with GAAP requires management to make estimates and assumptions that affect (i) the reported amounts of assets and liabilities, (ii) disclosure of contingent assets and liabilities at the date of the financial statements, and (iii) the reported amounts of increases and decreases in net assets from operations during the reporting period. Actual results could differ from those estimates.
A. Valuation of Investments — Investments are valued in accordance with GAAP and the Fund’s valuation policies set forth by, and under the supervision and responsibility of, the Board of Trustees of the Trust (the “Board”), which established the following approach to valuation, as described more fully below: (i) investments for which market quotations are readily available shall be valued at their market value and (ii) all other investments for which market quotations are not readily available shall be valued at their fair value as determined in good faith by the Board.
The Administrator has established the J.P. Morgan Asset Management Americas Valuation Committee (“AVC”) to assist the Board with the oversight and monitoring of the valuation of the Fund’s investments. The Administrator implements the valuation policies of the Fund’s investments, as directed by the Board. The AVC oversees and carries out the policies for the valuation of investments held in the Fund. This includes monitoring the appropriateness of fair values based on results of ongoing valuation oversight including, but not limited to, consideration of macro or security specific events, market events, and pricing vendor and broker due diligence. The Administrator is responsible for discussing and assessing the potential impacts to the fair values on an ongoing basis, and at least on a quarterly basis with the AVC and the Board.
Equities and other exchange-traded instruments are valued at the last sale price or official market closing price on the primary exchange on which the instrument is traded before the net asset value (“NAV”) of the Fund is calculated on a valuation date. Certain foreign equity instruments, as well as certain derivatives with equity reference obligations, are valued by applying international fair value factors provided by approved Pricing Services.
Investments inopen-end investment companies (“Underlying Funds”) are valued at each Underlying Fund’s NAV per share as of the report date.
Futures contracts are generally valued on the basis of available market quotations. Swaps and forward foreign currency exchange contracts are valued utilizing market quotations from approved Pricing Services.
Valuations reflected in this report are as of the report date. As a result, changes in valuation due to market events and/or issuer-related events after the report date and prior to issuance of the report are not reflected herein.
The various inputs that are used in determining the valuation of the Fund’s investments are summarized into the three broad levels listed below.
| • | Level 1 — Unadjusted inputs using quoted prices in active markets for identical investments. |
| • | Level 2 — Other significant observable inputs including, but not limited to, quoted prices for similar investments, inputs other than quoted prices that are observable for investments (such as interest rates, prepayment speeds, credit risk, etc.) or other market corroborated inputs. |
| • | Level 3 — Significant inputs based on the best information available in the circumstances, to the extent observable inputs are not available (including the Fund’s assumptions in determining the fair value of investments). |
A financial instrument’s level within the fair value hierarchy is based on the lowest level of any input, both individually and in the aggregate, that is significant to the fair value measurement. The inputs or methodology used for valuing instruments are not necessarily an indication of the risk associated with investing in those instruments.
25
The following table represents each valuation input as presented on the Schedule of Portfolio Investments (“SOI”):
| | | | | | | | | | | | | | | | |
| | | Level 1
Quoted prices | | | Level 2
Other significant observable
inputs | | | Level 3
Significant unobservable inputs | | | Total | |
Investments in Securities | | | | | | | | | | | | | | | | |
Common Stocks | | | | | | | | | | | | | | | | |
Australia | | $ | – | | | $ | 291,472 | | | $ | – | | | $ | 291,472 | |
Austria | | | – | | | | 87,677 | | | | – | | | | 87,677 | |
Belgium | | | – | | | | 128,341 | | | | – | | | | 128,341 | |
Denmark | | | – | | | | 190,811 | | | | – | | | | 190,811 | |
Finland | | | – | | | | 63,748 | | | | – | | | | 63,748 | |
France | | | – | | | | 1,409,559 | | | | – | | | | 1,409,559 | |
Germany | | | 110,242 | | | | 544,506 | | | | – | | | | 654,748 | |
Hong Kong | | | – | | | | 276,437 | | | | – | | | | 276,437 | |
Italy | | | – | | | | 283,304 | | | | – | | | | 283,304 | |
Japan | | | – | | | | 2,188,923 | | | | – | | | | 2,188,923 | |
Luxembourg | | | – | | | | 36,355 | | | | – | | | | 36,355 | |
Netherlands | | | – | | | | 435,565 | | | | – | | | | 435,565 | |
Norway | | | – | | | | 95,993 | | | | – | | | | 95,993 | |
Singapore | | | – | | | | 80,056 | | | | – | | | | 80,056 | |
Spain | | | – | | | | 395,601 | | | | – | | | | 395,601 | |
Sweden | | | – | | | | 180,177 | | | | – | | | | 180,177 | |
Switzerland | | | – | | | | 976,119 | | | | – | | | | 976,119 | |
United Kingdom | | | 61,280 | | | | 1,524,970 | | | | – | | | | 1,586,250 | |
United States | | | – | | | | 49,272 | | | | – | | | | 49,272 | |
Other Common Stocks | | | 441,668 | | | | – | | | | – | | | | 441,668 | |
| | | | |
Total Common Stocks | | | 613,190 | | | | 9,238,886 | | | | – | | | | 9,852,076 | |
Short-Term Investments | | | | | | | | | | | | | | | | |
Investment Companies | | | 364,271 | | | | – | | | | – | | | | 364,271 | |
| | | | |
Total Investments in Securities | | $ | 977,461 | | | $ | 9,238,886 | | | $ | – | | | $ | 10,216,347 | |
| | | | |
| Appreciation in Other Financial Instruments | | | | | | | | | | | | | | | | |
| Forward Foreign Currency Exchange Contracts | | $ | – | | | $ | 5,614 | | | $ | – | | | $ | 5,614 | |
Futures Contracts | | | 10,730 | | | | – | | | | – | | | | 10,730 | |
Swaps | | | – | | | | 417 | | | | – | | | | 417 | |
| | | | |
| Total Appreciation in Other Financial Instruments | | $ | 10,730 | | | $ | 6,031 | | | $ | – | | | $ | 16,761 | |
| | | | |
Depreciation in Other Financial Instruments | | | | | | | | | | | | | | | | |
| Forward Foreign Currency Exchange Contracts | | $ | – | | | $ | (1,146 | ) | | $ | – | | | $ | (1,146) | |
Futures Contracts | | | – | | | | (1,045 | ) | | | – | | | | (1,045) | |
Swaps | | | – | | | | (1,173 | ) | | | – | | | | (1,173) | |
| | | | |
| Total Depreciation in Other Financial Instruments | | $ | – | | | $ | (3,364 | ) | | $ | – | | | $ | (3,364) | |
| | | | |
There were no transfers into or out of level 3 for the period ended October 31, 2019.
B. Securities Lending —The Fund is authorized to engage in securities lending in order to generate additional income. The Fund is able to lend to approved borrowers. Citibank N.A. (“Citibank”) serves as lending agent for the Fund, pursuant to a Securities Lending Agency Agreement (the “Securities Lending Agency Agreement”). Securities loaned are collateralized by cash equal to at least 100% of the market value plus accrued interest on the securities lent, which is invested in an affiliated money market fund. The Fund retains loan fees and the interest on cash collateral investments but is required to pay the borrower a rebate for the use of cash collateral. In cases where the lent security is of high value to borrowers, there may be a negative rebate (i.e. a net payment to the Fund). Upon termination of a loan, the Fund is required to return to the borrower an amount equal to the cash collateral, plus any rebate owed to the borrowers. The remaining maturities of the securities lending transactions are considered overnight and continuous. Loans are subject to termination by the Fund or the borrower at any time.
The net income earned on the securities lending (after payment of rebates and Citibank’s fee) is included on the Statement of Operations as Income from securities lending (net). The Fund also receives payments from the borrower during the period of the loan, equivalent to dividends and interest earned on the securities loaned, which are recorded as Dividend or Interest income, respectively, on the Statement of Operations.
Under the Securities Lending Agency Agreement, Citibank marks to market the loaned securities on a daily basis. In the event the cash received from the borrower is less than 102% of the value of the loaned securities (105% for loans ofnon-U.S. securities), Citibank requests additional cash from the borrower so as to maintain a collateralization level of at least 102% of the value of the loaned securities plus accrued interest (105% for loans ofnon-U.S. securities), subject to certainde minimis amounts.
The value of securities out on loan is recorded as an asset on the Statement of Assets and Liabilities. The value of the cash collateral received is recorded as a liability on the Statement of Assets and Liabilities and details of collateral investments are disclosed on the SOI.
The Fund bears the risk of loss associated with the collateral investments and is not entitled to additional collateral from the borrower to cover any such losses. To the extent that the value of the collateral investments declines below the amount owed to a borrower, the Fund may incur losses that exceed the amount it earned on lending the security. Upon termination of a loan, the Fund may use leverage (borrow money) to repay the borrower for cash collateral posted if the Adviser does not believe that it is prudent to sell the collateral investments to fund the payment of this liability. Securities lending activity is subject to master netting arrangements.
26
Securities lending also involves counterparty risks, including the risk that the loaned securities may not be returned in a timely manner or at all. Subject to certain conditions, Citibank has agreed to indemnify the Fund from losses resulting from a borrower’s failure to return a loaned security.
The Fund did not lend out any securities during the period ended October 31, 2019.
C. Investment Transactions with Affiliates — The Fund invested in an Underlying Fund which is advised by the Adviser. An issuer which is under common control with the Fund may be considered an affiliate. For the purposes of the financial statements, the Fund assumes the issuer listed in the table below to be an affiliated issuer. Underlying Fund distributions may be reinvested into the Underlying Fund. Reinvestment amounts are included in the purchase cost amounts in the table below.
| | | | | | | | | | | | | | | | | | | | | | | | | | | | | | | | | | | | |
| | | For the period ended October 31, 2019 | |
| | | | | | | | | |
Security Description | | Value
at June
25, 2019 (a) | | | Purchases
at Cost | | | Proceeds
from Sales | | | Net
Realized
Gain
(Loss) | | | Change in
Unrealized
Appreciation/
(Depreciation) | | | Value at
October
31, 2019 | | | Shares at
October
31, 2019 | | | Dividend
Income | | | Capital Gain
Distributions | |
JPMorgan U.S. Government Money Market Fund Class Institutional Shares, 1.64%(b)(c) | | | $— | | | | $2,042,527 | | | | $1,678,256 | | | | $— | | | | $— | | | | $364,271 | | | | 364,271 | | | | $2,746 | | | | $— | |
| | | | | | | | | | | | |
(a) Commencement of operations was June 25, 2019.
(b) Investment in an affiliated fund, which is registered under the Investment Company Act of 1940, as amended, and is advised by J.P. Morgan Investment Management Inc.
(c) The rate shown is the current yield as of October 31, 2019.
D. Derivatives — The Fund used derivative instruments including futures, forward foreign currency exchange contracts and swaps, in connection with its respective investment strategies. Derivative instruments may be used as substitutes for securities in which the Fund can invest, to hedge portfolio investments or to generate income or gain to the Fund. Derivatives may also be used to manage duration, sector and yield curve exposures and credit and spread volatility.
The Fund may be subject to various risks from the use of derivatives, including the risk that changes in the value of a derivative may not correlate perfectly with the underlying asset, rate or index; counterparty credit risk related to derivatives counterparties’ failure to perform under contract terms; liquidity risk related to the lack of a liquid market for these contracts allowing the Fund to close out its position(s); and documentation risk relating to disagreement over contract terms. Investing in certain derivatives also results in a form of leverage and as such, the Fund’s risk of loss associated with these instruments may exceed their value, as recorded on the Statement of Assets and Liabilities.
The Fund is party to various derivative contracts governed by International Swaps and Derivatives Association master agreements (“ISDA agreements”). The Fund’s ISDA agreements, which are separately negotiated with each dealer counterparty, may contain provisions allowing, absent other considerations, a counterparty to exercise rights, to the extent not otherwise waived, against the Fund in the event the Fund’s net assets decline over time by apre-determined percentage or fall below apre-determined floor. The ISDA agreements may also contain provisions allowing, absent other conditions, the Fund to exercise rights, to the extent not otherwise waived, against a counterparty (e.g., decline in a counterparty’s credit rating below a specified level). Such rights for both a counterparty and the Fund often include the ability to terminate (i.e., close out) open contracts at prices which may favor a counterparty, which could have an adverse effect on the Fund. The ISDA agreements give the Fund and a counterparty the right, upon an event of default, to close out all transactions traded under such agreements and to net amounts owed or due across all transactions and offset such net payable or receivable with collateral posted to a segregated account by one party to the other.
Counterparty credit risk may be mitigated to the extent a counterparty posts collateral for mark to market gains to the Fund.
Notes D(1) — D(3) below describe the various derivatives used by the Fund.
(1). Futures Contracts — The Fund used index futures contracts to gain or reduce exposure to the stock market, maintain liquidity or minimize transaction costs. The Fund also bought futures contracts to invest incoming cash in the market or sold futures in response to cash outflows, thereby simulating an invested position in the underlying index while maintaining a cash balance for liquidity.
Futures contracts provide for the delayed delivery of the underlying instrument at a fixed price or are settled for a cash amount based on the change in the value of the underlying instrument at a specific date in the future. Upon entering into a futures contract, the Fund is required to deposit with the broker, cash or securities in an amount equal to a certain percentage of the contract amount, which is referred to as the initial margin deposit. Subsequent payments, referred to as variation margin, are made or received by the Fund periodically and are based on changes in the market value of open futures contracts. Changes in the market value of open futures contracts are recorded as Change in net unrealized appreciation/depreciation on the Statement of Operations. Realized gains or losses, representing the difference between the value of the contract at the time it was opened and the value at the time it was closed, are reported on the Statement of Operations at the closing or expiration of the futures contract. Securities deposited as initial margin are designated on the SOI, while cash deposited, which is considered restricted, is recorded on the Statement of Assets and Liabilities. A receivable from and/or a payable to brokers for the daily variation margin is also recorded on the Statement of Assets and Liabilities.
The use of futures contracts exposes the Fund to equity price risk. The Fund may be subject to the risk that the change in the value of the futures contract may not correlate perfectly with the underlying instrument. Use of long futures contracts subjects the Fund to risk of loss in excess of the
27
amounts shown on the Statement of Assets and Liabilities, up to the notional amount of the futures contracts. Use of short futures contracts subjects the Fund to unlimited risk of loss. The Fund may enter into futures contracts only on exchanges or boards of trade. The exchange or board of trade acts as the counterparty to each futures transaction; therefore, the Fund’s credit risk is limited to failure of the exchange or board of trade. Under some circumstances, futures exchanges may establish daily limits on the amount that the price of a futures contract can vary from the previous day’s settlement price, which could effectively prevent liquidation of positions.
The Fund’s futures contracts are not subject to master netting arrangements (the right to close out all transactions traded with a counterparty and net amounts owed or due across transactions).
(2). Forward Foreign Currency Exchange Contracts — The Fund is exposed to foreign currency risks associated with some or all of their portfolio investments and used forward foreign currency exchange contracts to hedge or manage certain of these exposures as part of an investment strategy. The Fund also bought forward foreign currency exchange contracts to gain exposure to currencies. Forward foreign currency exchange contracts represent obligations to purchase or sell foreign currency on a specified future date at a price fixed at the time the contracts are entered into.Non-deliverable forward foreign currency exchange contracts are settled with the counterparty in U.S. dollars without the delivery of foreign currency.
The values of the forward foreign currency exchange contracts are adjusted daily based on the applicable exchange rate of the underlying currency. Changes in the value of these contracts are recorded as unrealized appreciation or depreciation until the contract settlement date. When the forward foreign currency exchange contract is closed, the Fund records a realized gain or loss equal to the difference between the value at the time the contract was opened and the value at the time it was closed. The Fund also records a realized gain or loss when a forward foreign currency exchange contract offsets another forward foreign currency exchange contract with the same counterparty upon settlement.
The Fund’s forward foreign currency exchange contracts are subject to master netting arrangements (the right to close out all transactions with a counterparty and net amounts owed or due across transactions).
The Fund may be required to post or receive collateral fornon-deliverable forward foreign currency exchange contracts.
(3). Swaps — The Fund engaged in various swap transactions, including total return basket swaps to manage total return risk within its portfolio. The Fund also used swaps as alternatives to direct investments. Swap transactions are contracts negotiatedover-the-counter (“OTC swaps”) between a fund and a counterparty or are centrally cleared (“centrally cleared swaps”) through a central clearinghouse managed by a Futures Commission Merchant (“FCM”) that exchange investment cash flows, assets, foreign currencies or market-linked returns at specified, future intervals.
Upfront payments made and/or received are recorded as assets or liabilities, respectively, on the Statement of Assets and Liabilities and amortized over the term of the swap. The value of an OTC swap agreement is recorded as either an asset or a liability on the Statement of Assets and Liabilities at the beginning of the measurement period. Upon entering into a centrally cleared swap, the Fund is required to deposit with the FCM cash or securities, which is referred to as initial margin deposit. Securities deposited as initial margin are designated on the SOI, while cash deposited, which is considered restricted, is recorded on the Statement of Assets and Liabilities. Daily changes in valuation of centrally cleared swaps, if any, are recorded as a variation margin receivable or payable on the Statement of Assets and Liabilities. The change in the value of swaps, including accruals of periodic amounts of interest to be paid or received on swaps, is reported as change in net unrealized appreciation/depreciation on the Statement of Operations. A realized gain or loss is recorded upon payment or receipt of a periodic payment or payment made upon termination of a swap agreement.
The Fund may be required to post or receive collateral for OTC Swaps.
The Fund’s swap contracts (excluding centrally cleared swaps) are subject to master netting arrangements.
Total Return Basket Swaps
The Fund entered into a total return basket swap agreement to obtain exposure to a portfolio of long and short securities. This is a highly specialized activity.
Under the terms of the agreement, the swap is designed to function as a portfolio of direct investments in long and/or short equity positions. This means that the Fund has the ability to trade in and out of long and short positions within the swap and will receive all of the economic benefits and risks equivalent to direct investments in these positions such as: capital appreciation (depreciation), corporate actions and dividends received and paid, all of which are reflected in the swap value. The swap value also includes interest charges and credits related to the notional values of the long and short positions and cash balances within the swap. These interest charges and credits are based on defined market rates plus or minus a specified spread and are referred to herein as “financing costs” and net dividends. Positions within the swap, accrued financing costs and net dividends, are part of the periodic reset. During a reset, any unrealized gains (losses) on positions and accrued financing costs become available for cash settlement between the Fund and the swap counterparty are recorded as Due from/to counterparty on swap contract on the Statement of Assets and Liabilities and as Net realized gain (loss) on transactions from swap on the Statement of Operations.
Swaps involve additional risks than if the Fund had invested in the underlying positions directly including: the risk that changes in the value of the swap may not correlate perfectly with the underlying long and short securities; counterparty risk related to the counterparty’s failure to perform under contract terms; liquidity risk related to the lack of a liquid market for the swap contract, which may limit the ability of the Fund to close out its positions; and, documentation risk relating to disagreement over contract terms. The total return basket swap consists of securities that are denominated in foreign currencies. Changes in currency exchange rates will affect the value of, and investment income from, such securities. The Fund’s activities in the total return basket swap are concentrated with one counterparty. Investing in swaps results in a form of leverage (i.e., the Fund’s risk of loss associated with these instruments may exceed their value as recorded on the Statement of Assets and Liabilities).
28
The value of the swap is derived from a combination of (i) the net value of the underlying positions, which are valued daily using the last sale or closing prices on the principal exchange on which the underlying securities are traded; (ii) financing costs; (iii) the value of dividends; (iv) cash balances within the swap and/or other receivables (payables) from gains/(losses) realized when the swap resets; and (v) other factors, as applicable. The value of the swap is reflected on the Statement of Assets and Liabilities as Outstanding swap contracts, at value. Changes in the value of the swap are recognized as Change in net unrealized appreciation/depreciation of swaps on the Statement of Operations.
The total return basket swap contracts are subject to master netting arrangements. The Fund may be required to post or receive collateral for total return basket swaps.
(4). Summary of Derivatives Information — The following table present the value of derivatives held as of October 31, 2019, by their primary underlying risk exposure and respective location on the Statement of Assets and Liabilities:
| | | | | | | | | | | | | | | | | | |
| Derivative Contracts | | | | Statement of Assets and Liabilities Location | |
| |
| | | | | |
| Gross Assets: | | | | Futures
Contracts (a) | | | Forward
Foreign
Currency
Exchange
Contracts | | | Swaps | | | Total | |
| |
| | | | | |
Equity contracts | | Receivables, Net Assets — Unrealized Appreciation | | | $10,730 | | | | $ — | | | | $ 417 | | | | $11,147 | |
| | | | | |
Foreign exchange contracts | | Receivables | | | — | | | | 5,614 | | | | — | | | | 5,614 | |
| | | | | | | | | | | | | | | | | | |
| | | | | |
Total | | | | | $10,730 | | | | $ 5,614 | | | | $ 417 | | | | $16,761 | |
| | | | | | | | | | | | | | | | | | |
| | | | | |
Gross Liabilities: | | | | | | | | | | | | | | | | | | |
| | | | | |
Equity contracts | | Payables, Net Assets — Unrealized Depreciation | | | $(1,045) | | | | $ — | | | | $(1,173) | | | | $(2,218) | |
| | | | | |
Foreign exchange contracts | | Payables | | | — | | | | (1,146) | | | | — | | | | (1,146) | |
| | | | | | | | | | | | | | | | | | |
| | | | | |
Total | | | | | $(1,045) | | | | $(1,146) | | | | $(1,173) | | | | $(3,364) | |
| | | | | | | | | | | | | | | | | | |
(a) This amount represents the cumulative appreciation (depreciation) of futures contracts as reported on the SOI. The Statement of Assets and Liabilities only reflect the current day variation margin receivable/payable from/to brokers.
The following tables present the effect of derivatives on the Statement of Operations for the period ended October 31, 2019, by primary underlying risk exposure:
| | | | | | | | | | | | | | | | |
| Amount of Realized Gain (Loss) on Derivatives Recognized on the Statement of Operations | |
| |
| | | | |
| Derivative Contracts | | Futures Contracts | | | Forward Foreign Currency Exchange Contracts | | | Swaps | | | Total | |
| |
| | | | |
Equity contracts | | $ | 12,622 | | | $ | — | | | $ | 95,786 | | | $ | 108,408 | |
| | | | |
Foreign exchange contracts | | | — | | | | (28,063) | | | | — | | | | (28,063) | |
| | | | | | | | | | | | | | | | |
| | | | |
Total | | $ | 12,622 | | | $ | (28,063) | | | $ | 95,786 | | | $ | 80,345 | |
| | | | | | | | | | | | | | | | |
|
| Amount of Change in Unrealized Appreciation (Depreciation) on Derivatives Recognized on the Statement of Operations | |
| |
| | | | |
| Derivative Contracts | | Futures
Contracts | | | Forward Foreign
Currency Exchange
Contracts | | | Swaps | | | Total | |
| |
| | | | |
Equity contracts | | $ | 9,685 | | | $ | — | | | $ | (756) | | | $ | 8,929 | |
| | | | |
Foreign exchange contracts | | | — | | | | 4,468 | | | | — | | | | 4,468 | |
| | | | | | | | | | | | | | | | |
| | | | |
Total | | $ | 9,685 | | | $ | 4,468 | | | $ | (756) | | | $ | 13,397 | |
| | | | | | | | | | | | | | | | |
Derivatives Volume
The tables below discloses the volume of the Fund’s futures contracts, forward foreign currency exchange contracts and swaps activity during the period ended October 31, 2019. Please refer to the tables in the Summary of Derivatives Information for derivative-related gains and losses associated with volume activity:
| | | | | | | | |
| | | |
Futures Contracts — Equity: | | | | | | | | |
| | |
Average Notional Balance Long | | $ | 335,302 | | | | | (a) |
| | |
Ending Notional Balance Long | | | 381,920 | | | | | |
29
| | | | | | | | |
Forward Foreign Currency Exchange Contracts: | | | | | | | | |
| | |
Average Settlement Value Purchased | | | 2,757,486 | | | | | (a) |
| | |
Average Settlement Value Sold | | | 2,315,139 | | | | | (a) |
| | |
Ending Settlement Value Purchased | | | 950,531 | | | | | |
| | |
Ending Settlement Value Sold | | | 458,381 | | | | | |
| | |
Total Return Basket Swaps: | | | | | | | | |
| | |
Average Notional Balance Long | | | 2,425,843 | | | | | (a) |
| | |
Average Notional Balance Short | | | 2,376,488 | | | | | (a) |
| | |
Ending Notional Balance Long | | | 2,546,471 | | | | | |
| | |
Ending Notional Balance Short | | | 2,454,793 | | | | | |
(a) For the period June 25, 2019 through October 31, 2019.
The Fund may be required to post or receive collateral based on the net value of the Fund’s outstanding OTC swap contracts,non-deliverable forward foreign currency exchange contracts and/or OTC options with the counterparty in the form of cash or securities. Daily movement of cash collateral is subject to minimum threshold amounts. Collateral posted by the Fund is held in a segregated account at the Fund’s custodian bank. For certain counterparties, cash collateral posted by the Fund is invested in an affiliated money market fund (See Note 3.F.). Otherwise the cash collateral is included on the Statement of Assets and Liabilities as Restricted cash. Collateral received by the Fund is held in escrow in accounts maintained by JPMorgan Chase Bank, N.A. (“JPMCB”), an affiliate of the Fund, which provides collateral management services to the Fund. These amounts are not reflected on the Fund’s Statement of Assets and Liabilities.
The Fund’s derivatives contracts held at October 31, 2019 are not accounted for as hedging instruments under GAAP.
E. Foreign Currency Translation — The books and records of the Fund are maintained in U.S. dollars. Foreign currency amounts are translated into U.S. dollars at the prevailing exchange rates of such currencies against the U.S. dollar. The market value of investment securities and other assets and liabilities are translated at the exchange rate as of the valuation date. Purchases and sales of investment securities, income and expenses are translated at the exchange rate prevailing on the respective dates of such transactions.
The Fund does not isolate the effect of changes in foreign exchange rates from changes in market prices on securities held. Accordingly, such changes are included within Change in net unrealized appreciation/depreciation on investments on the Statement of Operations.
Reported realized foreign currency gains and losses arise from the disposition of foreign currency, currency gains or losses realized between the trade and settlement dates on securities transactions, and the difference between the amounts of dividends, interest and foreign withholding taxes recorded on the Fund’s books on the transaction date and the U.S. dollar equivalent of the amounts actually received or paid. These reported realized foreign currency gains and losses are included in Net realized gain (loss) on foreign currency transactions on the Statement of Operations. Unrealized foreign currency gains and losses arise from changes (due to changes in exchange rates) in the value of foreign currency and other assets and liabilities denominated in foreign currencies, which are held at period end are included in Change in net unrealized appreciation/depreciation on foreign currency translations on the Statement of Operations.
F. Offering and Organizational Costs — Total offering costs of $10,737 incurred in connection with the offering of shares of the Fund are amortized on a straight line basis over 12 months from the date the Fund commenced operations. Costs paid in connection with the organization of the Fund, if any, are recorded as an expense at the time the Fund commenced operations. For the period ended October 31, 2019, total offering costs amortized were $3,902.
G. Security Transactions and Investment Income — Investment transactions are accounted for on the trade date (the date the order to buy or sell is executed). Securities gains and losses are calculated on a specifically identified cost basis. Interest income and interest expense on securities sold short, if any, is determined on the basis of coupon interest accrued using the effective interest method, which adjusts for amortization of premiums and accretion of discounts. Dividend income, net of foreign tax withheld, if any, and dividend expense on securities sold short, are recorded on theex-dividend date or when the Fund first learns of the dividend.
H. Allocation of Income and Expenses — Expenses directly attributable to the Fund are charged directly to the Fund, while the expenses attributable to more than one fund of the Trust are allocated among the applicable funds. Investment income, realized and unrealized gains and losses and expenses, other than class specific expenses, are allocated daily to each class of shares based upon the proportion of net assets of each class at the beginning of each day.
Transfer agency fees are class-specific expenses. The amount of the transfer agency fees charged to each share class of the Fund for the period ended October 31, 2019 are as follows:
| | | | | | | | | | | | | | | | | | | | | | | | | | | | |
| | | Class A | | | | | | Class C | | | | | | Class I | | | | | | Total | |
| |
| | | $162 | | | | | | | | $161 | | | | | | | | $84 | | | | | | | | $407 | |
I. Federal Income Taxes — The Fund is treated as a separate taxable entity for Federal income tax purposes. The Fund’s policy is to comply with the provisions of the Internal Revenue Code (the “Code”) applicable to regulated investment companies and to distribute to shareholders all of its distributable net investment income and net realized capital gains on investments. Accordingly, no provision for Federal income tax is necessary.
30
Management has reviewed the Fund’s tax positions for all open tax years and has determined that as of October 31, 2019, no liability for Federal income tax is required in the Fund’s financial statements for net unrecognized tax benefits. However, management’s conclusions may be subject to future review based on changes in, or the interpretation of, the accounting standards or tax laws and regulations. The Fund’s Federal tax returns for the prior three fiscal years remain subject to examination by the Internal Revenue Service.
J. Foreign Taxes — The Fund may be subject to foreign taxes on income, gains on investments or currency purchases/repatriation, a portion of which may be recoverable. The Fund will accrue such taxes and recoveries as applicable, based upon its current interpretation of tax rules and regulations that exist in the markets in which it invests. When a capital gain tax is determined to apply, the Fund records an estimated deferred tax liability in an amount that would be payable if the securities were disposed of on the valuation date.
K. Distributions to Shareholders — Distributions from net investment income, if any, are generally declared and paid at least annually with respect to the Fund. Distributions are declared separately for each class. No class has preferential dividend rights; differences in per share rates are due to differences in separate class expenses. Net realized capital gains, if any, are distributed by the Fund at least annually. The amount of distributions from net investment income and net realized capital gains is determined in accordance with Federal income tax regulations, which may differ from GAAP. To the extent these “book/tax” differences are permanent in nature (i.e., that they result from other than timing of recognition — “temporary differences”), such amounts are reclassified within the capital accounts based on their Federal tax basis treatment.
The following amounts were reclassified within the capital accounts:
| | | | | | | | | | | | |
| | | Paid-in-Capital | | | Accumulated
undistributed
(distributions
in excess of)
net investment | | | Accumulated net
realized gains | |
| | | | | | income | | | (losses) | |
| |
| | $ | (46 | ) | | $ | 103,336 | | | $ | (103,290) | |
The reclassifications for the Fund relate primarily to foreign currency gains or losses and investments in swap contracts.
3. Fees and Other Transactions with Affiliates
A. Investment Advisory Fee — Pursuant to an Investment Advisory Agreement, the Adviser manages the investments of the Fund and for such services is paid a fee. The investment advisory fee is accrued daily and paid monthly at an annual rate of 0.60% of the Fund’s average daily net assets.
The Adviser waived investment advisory fees and/or reimbursed expenses as outlined in Note 3.F.
B. Administration Fee — Pursuant to an Administration Agreement, the Administrator provides certain administration services to the Fund. In consideration of these services, the Administrator receives a fee accrued daily and paid monthly at an annual rate of 0.075% of the first $10 billion of the Fund’s average daily net assets, plus 0.050% of the Fund’s average daily net assets between $10 billion and $20 billion, plus 0.025% of the Fund’s average daily net assets between $20 billion and $25 billion, plus 0.01% of the Fund’s average daily net assets in excess of $25 billion. For the period ended October 31, 2019, the effective rate was 0.08% of the Fund’s average daily net assets, notwithstanding any fee waivers and/or expense reimbursements.
The Administrator waived administration fees as outlined in Note 3.F.
JPMCB, a wholly-owned subsidiary of JPMorgan, serves as the Fund’ssub-administrator (the“Sub-administrator”). For its services asSub-administrator, JPMCB receives a portion of the fees payable to the Administrator.
C. Distribution Fees —Pursuant to a Distribution Agreement, JPMorgan Distribution Services, Inc. (“JPMDS”), an indirect, wholly-owned subsidiary of JPMorgan, serves as the Fund’s principal underwriter and promotes and arranges for the sale of the Fund’s shares.
The Board has adopted a Distribution Plan (the “Distribution Plan”) for Class A and Class C Shares of the Fund pursuant to Rule12b-1 under the 1940 Act. Class I Shares of the Fund do not charge a distribution fee. The Distribution Plan provides that the Fund shall pay, with respect to the applicable share classes, distribution fees, including payments to JPMDS, at annual rates of 0.25% and 0.75% of the average daily net assets of Class A and Class C Shares, respectively.
In addition, JPMDS is entitled to receive thefront-end sales charges from purchases of Class A Shares and the CDSC from redemptions of Class C Shares and certain Class A Shares for whichfront-end sales charges have been waived. For the period ended October 31, 2019, JPMDS did not retain anyfront-end sales charges or CDSC.
D. Service Fees — The Trust, on behalf of the Fund, has entered into a Shareholder Servicing Agreement with JPMDS under which JPMDS provides certain support services to fund shareholders. For performing these services, JPMDS receives a fee with respect to all share classes that is accrued daily and paid monthly at an annual rate of 0.25% for Class A, Class C and Class I Shares.
JPMDS has entered into shareholder services contracts with affiliated and unaffiliated financial intermediaries who provide shareholder services and other related services to their clients or customers who invest in the Fund. Pursuant to such contracts, JPMDS will pay all or a portion of such fees earned to financial intermediaries for performing such services.
JPMDS waived service fees as outlined in Note 3.F.
E. Custodian and Accounting Fees — JPMCB provides portfolio custody and accounting services to the Fund. For performing these services, the Fund pays JPMCB transaction and asset-based fees that vary according to the number of transactions and positions, plusout-of-pocket expenses. The amounts paid directly to JPMCB by the Fund for custody and accounting services are included in Custodian and accounting fees on the Statement of Operations.
31
Interest income earned on cash balances at the custodian, if any, is included in Interest income from affiliates on the Statement of Operations.
Interest expense paid to the custodian related to cash overdrafts, if any, is included in Interest expense to affiliates on the Statement of Operations.
F. Waivers and Reimbursements— The Adviser, Administrator and/or JPMDS have contractually agreed to waive fees and/or reimburse the Fund to the extent that total annual operating expenses (excluding acquired fund fees and expenses other than certain money market fund fees as described below, dividend and interest expenses related to short sales, interest, taxes, expenses related to litigation and potential litigation, expenses related to trustee elections and extraordinary expenses) exceed the percentages of the Fund’s average daily net assets as shown in the table below:
| | | | | | | | | | | | | | |
| | | | | Class A | | Class C | | | Class I | | | |
| | | | 1.00% | | | 1.50 | % | | | 0.75% | |
The expense limitation agreement was in effect for the period ended October 31, 2019 and is in place until at least June 30, 2020.
For the period ended October 31, 2019, the Fund’s service providers waived fees and/or reimbursed expenses for the Fund as follows. None of these parties expect the Fund to repay any such waived fees and/or reimbursed expenses in future years.
| | | | | | | | | | |
| | | Contractual Waivers | | |
| | | | |
Investment Advisory Fees | | Administration Fees | | Service Fees | | Total | | Contractual
Reimbursements |
| | $20,874 | | $2,609 | | $7,697 | | $31,180 | | $95,148 |
Additionally, the Fund may invest in one or more money market funds advised by the Adviser (affiliated money market funds). The Adviser, Administrator and/or JPMDS, as shareholder servicing agent, have contractually agreed to waive fees and/or reimburse expenses in an amount sufficient to offset the respective net fees each collects from the affiliated money market funds on the Fund’s investment in such affiliated money market funds, except for investments of securities lending cash collateral.
The amount of waivers resulting from investments in these money market funds for the period ended October 31, 2019 was $214.
G. Other — Certain officers of the Trust are affiliated with the Adviser, the Administrator and JPMDS. Such officers, with the exception of the Chief Compliance Officer, receive no compensation from the Fund for serving in their respective roles.
The Board designated and appointed a Chief Compliance Officer to the Fund pursuant to Rule38a-1 under the 1940 Act. The Fund, along with affiliated funds, makes reimbursement payments, on apro-rata basis, to the Administrator for a portion of the fees associated with the office of the Chief Compliance Officer. Such fees are included in Trustees’ and Chief Compliance Officer’s fees on the Statement of Operations.
The Trust adopted a Trustee Deferred Compensation Plan (the “Plan”) which allows the Independent Trustees to defer the receipt of all or a portion of compensation related to performance of their duties as Trustees. The deferred fees are invested in various J.P. Morgan Funds until distribution in accordance with the Plan.
The Securities and Exchange Commission (“SEC”) has granted an exemptive order permitting the Fund to engage in principal transactions with J.P. Morgan Securities, Inc., an affiliated broker, involving taxable money market instruments, subject to certain conditions.
4. Investment Transactions
During the period ended October 31, 2019, purchases and sales of investments (excluding short-term investments) were as follows:
| | | | |
| | | Purchases (excluding U.S. Government) | | Sales (excluding U.S. Government) |
| | $ 10,384,140 | | $ 725,513 |
During the period ended October 31, 2019, there were no purchases or sales of U.S. Government securities.
5. Federal Income Tax Matters
For Federal income tax purposes, the estimated cost and unrealized appreciation (depreciation) in value of investments held at October 31, 2019 were as follows:
| | | | | | | | |
| | | Aggregate Cost | | Gross Unrealized Appreciation | | Gross Unrealized Depreciation | | Net Unrealized Appreciation (Depreciation) |
| | $ 10,020,534 | | $ 477,067 | | $ 267,857 | | $ 209,210 |
The difference between book and tax basis appreciation (depreciation) on investments is primarily attributed to investments in passive foreign investment companies (“PFICs”).
32
As of October 31, 2019, the estimated components of net assets (excludingpaid-in-capital) on a tax basis were as follows:
| | | | | | | | | | | | |
| | | Current Distributable Ordinary
Income* | | | Current
Distributable
Long-Term
Capital Gain or
(Tax Basis Capital
Loss Carryover) | | | Unrealized Appreciation (Depreciation) | |
| | $ | 180,623 | | | $ | (38,005 | ) | | $ | 209,680 | |
The cumulative timing differences primarily consist of investments in PFICs.
*Short-term gain distributions are treated as ordinary income for income tax purposes.
As of October 31, 2019, the Fund had the following net capital loss carryforwards:
| | | | | | | | |
| | | Capital Loss Carryforward Character | |
| | | | |
| | | Short-Term | | | Long-Term | |
| | | | | | | |
| | $ | 29,918 | | | $ | 8,087 | |
6. Borrowings
The Fund relies upon an exemptive order granted by the SEC (the “Order”) permitting the establishment and operation of an Interfund Lending Facility (the “Facility”). The Facility allows the Fund to directly lend and borrow money to or from any other fund relying upon the Order at rates beneficial to both the borrowing and lending funds. Advances under the Facility are taken primarily for temporary or emergency purposes, including the meeting of redemption requests that otherwise might require the untimely disposition of securities, and are subject to the Fund’s borrowing restrictions. The Interfund loan rate is determined, as specified in the Order, by averaging the current repurchase agreement rate and the current bank loan rate. The Order was granted to JPMorgan Trust II and may be relied upon by the Fund because the Fund and the series of JPMorgan Trust II are all investment companies in the same “group of investment companies” (as defined in Section 12(d)(1)(G) of the 1940 Act).
The Fund had no borrowings outstanding from another fund during the period ended October 31, 2019.
The Trust and JPMCB have entered into a financing arrangement. Under this arrangement, JPMCB provides an unsecured, uncommitted credit facility in the aggregate amount of $100 million to certain of the J.P. Morgan Funds, including the Fund. Advances under the arrangement are taken primarily for temporary or emergency purposes, including the meeting of redemption requests that otherwise might require the untimely disposition of securities, and are subject to the Fund’s borrowing restrictions. Interest on borrowings is payable at a rate determined by JPMCB at the time of borrowing. This agreement has been extended until November 2, 2020.
The Fund had no borrowings outstanding from the unsecured, uncommitted credit facility during the period ended October 31, 2019.
7. Risks, Concentrations and Indemnifications
In the normal course of business, the Fund entered into contracts that contain a variety of representations which provide general indemnifications. The Fund’s maximum exposure under these arrangements is unknown. The amount of exposure would depend on future claims that may be brought against the Fund. However, based on experience, the Fund expects the risk of loss to be remote.
As of October 31, 2019, all of the Fund’s shares were held by the Adviser.
As of October 31, 2019, the Fund hadnon-U.S. country allocations representing greater than 10% of total investments (excluding investment of cash collateral from securities loaned) as follows:
| | | | | | | | | | | | |
| | | France | | | Japan | | | United
Kingdom | |
| | | |
| | | 13.7% | | | | 21.4% | | | | 15.5% | |
Derivatives may be riskier than other types of investments because they may be more sensitive to changes in economic and market conditions and could result in losses that significantly exceed the Fund’s original investment. Many derivatives create leverage thereby causing the Fund to be more volatile than it would have been if it had not used derivatives. Derivatives also expose the Fund to counterparty risk (the risk that the derivative counterparty will not fulfill its contractual obligations), including credit risk of the derivative counterparty. The possible lack of a liquid secondary market for derivatives and the resulting inability of the Fund to sell or otherwise close a derivatives position could expose the Fund to losses.
The Fund may have elements of risk not typically associated with investments in the United States of America due to concentrated investments in a limited number of countries or regions, which may vary throughout the period depending on the Fund. Such concentrations may subject the Fund to additional risks resulting from political or economic conditions in such countries or regions and the possible imposition of adverse governmental laws or currency exchange restrictions could cause the securities and their markets to be less liquid and their prices to be more volatile than those of comparable U.S. securities.
The London InterBank Offered Rate (“LIBOR”) is intended to represent the rate at which contributing banks may obtain short-term borrowings from each other in the London interbank market. The regulatory authority that oversees financial services firms and financial markets in the U.K. has announced that, after the end of 2021, it would no longer persuade or compel contributing banks to make rate submissions for purposes of determining the LIBOR rate. As a result, it is possible that commencing in 2022, LIBOR may no longer be available or no longer deemed an appropriate reference rate upon which to determine the interest rate on or impacting certain loans, notes, derivatives and other instruments or
33
investments comprising some or all of the Fund’s portfolio. In light of this eventuality, public and private sector industry initiatives are currently underway to identify new or alternative reference rates to be used in place of LIBOR. There is no assurance that the composition or characteristics of any such alternative reference rate will be similar to or produce the same value or economic equivalence as LIBOR or that it will have the same volume or liquidity as did LIBOR prior to its discontinuance or unavailability, which may affect the value or liquidity or return on certain investments of the Fund and result in costs incurred in connection with closing out positions and entering into new trades. These risks may also apply with respect to changes in connection with other interbank offering rates (e.g., Euribor) and a wide range of other index levels, rates and values that are treated as “benchmarks” and are the subject of recent regulatory reform.
34
Report of Independent Registered Public Accounting Firm
TotheBoard of Trustees of JPMorgan Trust IV and Shareholders of JPMorgan International Equity Plus Fund
Opinion on the Financial Statements
We have audited the accompanying statement of assets and liabilities, including the schedule of portfolio investments, ofJPMorgan International Equity Plus Fund (one of the funds constituting JPMorgan Trust IV, referred to hereafter as the “Fund”) as of October 31, 2019, and the related statements of operations and changes in net assets, including the related notes, and the financial highlights for the period June 25, 2019 (commencement of operations) through October 31, 2019(collectively referred to as the “financial statements”). In our opinion, the financial statements present fairly, in all material respects, the financial position of the Fund as of October 31, 2019, and the results of its operations, changes in its net assets, and the financial highlights for the period June 25, 2019 (commencement of operations) through October 31, 2019in conformity with accounting principles generally accepted in the United States of America.
Basis for Opinion
These financial statements are the responsibility of the Fund’s management. Our responsibility is to express an opinion on the Fund’s financial statements based on our audit. We are a public accounting firm registered with the Public Company Accounting Oversight Board (United States) (PCAOB) and are required to be independent with respect to the Fund in accordance with the U.S. federal securities laws and the applicable rules and regulations of the Securities and Exchange Commission and the PCAOB.
We conducted our audit of these financial statements in accordance with the standards of the PCAOB. Those standards require that we plan and perform the audit to obtain reasonable assurance about whether the financial statements are free of material misstatement, whether due to error or fraud.
Our audit included performing procedures to assess the risks of material misstatement of the financial statements, whether due to error or fraud, and performing procedures that respond to those risks. Such procedures included examining, on a test basis, evidence regarding the amounts and disclosures in the financial statements. Our audit also included evaluating the accounting principles used and significant estimates made by management, as well as evaluating the overall presentation of the financial statements. Our procedures included confirmation of securities owned as of October 31, 2019by correspondence with the custodian, transfer agent and brokers; when replies were not received from brokers, we performed other auditing procedures. We believe that our audit provides a reasonable basis for our opinion.
/s/PricewaterhouseCoopers LLP
New York, New York
December 20, 2019
We have served as the auditor of one or more investment companies in the JPMorgan Funds complex since 1993.
35
TRUSTEES
(Unaudited)
The Fund’s Statement of Additional Information includes additional information about the Fund’s Trustees and is available, without charge, upon request by calling1-800-480-4111 or on the J.P. Morgan Funds’ website at www.jpmorganfunds.com.
| | | | | | |
Name (Year of Birth); Positions With the Fund(1) | | Principal Occupation During Past 5 Years | | Number of
Funds in Fund
Complex Overseen
by Trustee (2) | | Other Directorships Held During the Past 5 Years |
Independent Trustees | | |
| | | |
| John F. Finn (1947); Trustee of Trust since 2005; Trustee of heritage One Group Mutual Funds since 1998. | | Chairman and Chief Executive Officer, Gardner, Inc. (supply chain management company serving industrial and consumer markets) (serving in various roles 1974-present). | | 130 | | Director, Greif, Inc. (GEF) (industrial package products and services)(2007-present); Trustee, Columbus Association for the Performing Arts (1988-present); Director, Cardinal Health, Inc. (CAH) (1994-2014). |
| | | |
| Stephen P. Fisher (1959); Trustee of Trust since 2018. | | Retired; Chairman and Chief Executive Officer, NYLIFE Distributors LLC (registered broker-dealer) (serving in various roles2008-2013); Chairman, NYLIM Service Company LLC (transfer agent) (2008-2017); New York Life Investment Management LLC (registered investment adviser) (serving in various roles 2005-2017); Chairman, IndexIQ Advisors LLC (registered investment adviser for ETFs)(2014-2017); President, MainStay VP Funds Trust (2007-2017), MainStay DefinedTerm Municipal Opportunities Fund (2011-2017) and MainStay Funds Trust (2007-2017) (registered investment companies). | | 130 | | Advisory Board Member, Scholarship Committee Member and Investment Committee Member, The First Tee of Plainfield(non-profit youth sports organization that provides need-based scholarships) (2014-present); Honors Program Advisory Board Member, The Zicklin School of Business, Baruch College, The City University of New York (2017-present). |
| | | |
| Kathleen M. Gallagher (1958); Trustee of the Trust since 2018. | | Retired; Chief Investment Officer – Benefit Plans, Ford Motor Company (serving in various roles 1985-2016). | | 130 | | Non-Executive Director, Legal & General Investment Management (Holdings) (2018-present); Non-Executive Director, Legal & General Investment Management America (financial services and insurance) (2017-present); Advisory Board Member, OCIO Board of State Street Global Advisors (2017-present); Member, Client Advisory Council, Financial Engines, LLC (registered investment adviser) (2011-2016); Director, Ford Pension Funds Investment Management Ltd.(2007-2016). |
| | | |
| Dr. Matthew Goldstein (1941); Chairman since 2013; Trustee of Trust since 2005; Trustee of heritage J.P. Morgan Funds since 2003. | | Chancellor Emeritus, City University of New York (2015-present); Professor, City University of New York (2013-present); Chancellor, City University of New York (1999-2013); President, Adelphi University (New York) (1998-1999). | | 130 | | Trustee, Museum of Jewish Heritage(2011-present); Trustee, National Museum of Mathematics (present); Chair, Association of College and University Administrators (present). |
| | | |
| Dennis P. Harrington* (1950); Trustee of Trust since 2017. | | Retired; Partner, Deloitte LLP (accounting firm) (serving in various roles 1984-2012). | | 130 | | None |
| | | |
| Frankie D. Hughes (1952); Trustee of Trust since 2008. | | President, Ashland Hughes Properties (property management) (2014-present); President and Chief Investment Officer, Hughes Capital Management, Inc. (fixed income asset management) (1993-2014). | | 130 | | None |
36
| | | | | | |
Name (Year of Birth); Positions With the Fund(1) | | Principal Occupation During Past 5 Years | | Number of
Funds in Fund
Complex Overseen
by Trustee (2) | | Other Directorships Held During the Past 5 Years |
Independent Trustees (continued) | | |
| | | |
Raymond Kanner** (1953); Trustee of Trust since 2017. | | Retired; Managing Director & Chief Investment Officer, IBM Retirement Funds (2007-2016). | | 130 | | Advisory Board Member, Los Angeles Capital (2018-present); Advisory Board Member, State Street Global Advisors OCIO Board (2017-present); Acting Executive Director, Committee on Investment of Employee Benefit Assets (CIEBA) (2016-2017); Advisory Board Member, Betterment for Business (robo advisor) (2016-2017); Advisory Board Member, Blue Star Indexes (index creator) (2013-2017); Director, Emerging Markets Growth Fund (registered investment company) (1997-2016); Member, Russell Index Client Advisory Board (2001-2015). |
| | | |
| Peter C. Marshall (1942); Trustee of Trust since 2005; Trustee of heritage One Group Mutual Funds since 1985. | | Self-employed business consultant
(2002-present). | | 130 | | None |
| | | |
| Mary E. Martinez (1960); Trustee of Trust since 2013. | | Associate, Special Properties, a Christie’s International Real Estate Affiliate(2010-present); Managing Director, Bank of America (Asset Management) (2007-2008); Chief Operating Officer, U.S. Trust Asset Management, U.S. Trust Company (asset management) (2003-2007); President, Excelsior Funds (registered investment companies) (2004-2005). | | 130 | | None |
| | | |
| Marilyn McCoy (1948); Trustee of Trust since 2005; Trustee of heritage One Group Mutual Funds since 1999. | | Vice President of Administration and Planning, Northwestern University (1985-present). | | 130 | | None |
| | | |
| Mitchell M. Merin (1953); Trustee of Trust since 2013. | | Retired; President and Chief Operating Officer, Morgan Stanley Investment Management, Member Morgan Stanley & Co. Management Committee (serving in various roles 1981-2006). | | 130 | | Director, Sun Life Financial (SLF) (financial services and insurance) (2007-2013). |
| | | |
| Dr. Robert A. Oden, Jr. (1946); Trustee of Trust since 2005; Trustee of heritage One Group Mutual Funds since 1997. | | Retired; President, Carleton College(2002-2010); President, Kenyon College(1995-2002). | | 130 | | Trustee, Trout Unlimited(2017-present); Trustee, American Museum of Fly Fishing (2013-present); Vice Chair, Dartmouth-Hitchcock Medical Center (2011-present); Trustee, American University in Cairo (1999-2014). |
| | | |
| Marian U. Pardo*** (1946); Trustee of Trust since 2013. | | Managing Director and Founder, Virtual Capital Management LLC (investment consulting)(2007-present); Managing Director, Credit Suisse Asset Management (portfolio manager)(2003-2006). | | 130 | | President and Member, Board of Governors, Columbus Citizens Foundation (not-for-profit supporting philanthropic and cultural programs) (2006-present). |
37
| (1) | Dr. Goldstein is retiring from the Board of Trustees effective the close of business on December 31, 2019. The Trustees serve for an indefinite term, subject to the Trust’s current retirement policy, which is age 78 for all Trustees. |
| (2) | A Fund Complex means two or more registered investment companies that hold themselves out to investors as related companies for purposes of investment and investor services or have a common investment adviser or have an investment adviser that is an affiliated person of the investment adviser of any of the other registered investment companies. The J.P. Morgan Funds Complex for which the Board of Trustees serves currently includes ten registered investment companies (130 funds). |
| * | Two family members of Mr. Harrington are partner and managing director, respectively, of the Fund’s independent registered public accounting firm. Such firm has represented to the Board that those family members are not involved in the audit of the Fund’s financial statements and do not provide other services to the Fund. The Board has concluded that such association does not interfere with Mr. Harrington’s exercise of independent judgment as an Independent Trustee. |
| ** | A family member of Mr. Kanner is employed by JPMorgan Chase Bank, which is affiliated with JPMIM and JPMDS. In that capacity, this employee provides services to various JPMorgan affiliates including JPMIM and JPMDS and for which JPMIM and JPMDS bear some portion of the expense thereof. |
| *** | In connection with prior employment with JPMorgan Chase, Ms. Pardo was the recipient ofnon-qualified pension plan payments from JPMorgan Chase in the amount of approximately $2,055 per month, which she irrevocably waived effective January 1, 2013, and deferred compensation payments from JPMorgan Chase in the amount of approximately $7,294 per year, which ended in January 2013. In addition, Ms. Pardo receives payments from a fully-funded qualified plan, which is not an obligation of JPMorgan Chase. |
The contact address for each of the Trustees is 277 Park Avenue, New York, NY 10172.
38
OFFICERS
(Unaudited)
| | |
Name (Year of Birth), Positions Held with the Trust (Since) | | Principal Occupations During Past 5 Years |
| |
Brian S. Shlissel (1964),
President and Principal Executive Officer (2016) | | Managing Director and Chief Administrative Officer for J.P. Morgan pooled vehicles, J.P. Morgan Investment Management Inc. (formerly JPMorgan Funds Management, Inc.) (from 2014 to present); Managing Director and Head of Mutual Fund Services, Allianz Global Investors; President and Chief Executive Officer, Allianz Global Investors Mutual Funds and PIMCO Closed-End Funds (from 1999 to 2014). |
| |
Timothy J. Clemens (1975), Treasurer and Principal Financial Officer (2018)* | | Executive Director, J.P. Morgan Investment Management Inc. (formerly JPMorgan Funds Management, Inc.) since February 2016; Vice President, JPMorgan Funds Management, Inc. from October 2013 to January 2016. |
| |
Gregory S. Samuels (1980),
Secretary (2019) (formerly Assistant Secretary since 2010)* | | Executive Director and Assistant General Counsel, JPMorgan Chase since 2014; formerly Vice President and Assistant General Counsel, JPMorgan Chase from 2010 to February 2014. |
| |
Stephen M. Ungerman (1953),
Chief Compliance Officer (2005) | | Managing Director, JPMorgan Chase & Co.; Mr. Ungerman has been with JPMorgan Chase & Co. since 2000. |
| |
Elizabeth A. Davin (1964), Assistant Secretary (2005)** | | Executive Director and Assistant General Counsel, JPMorgan Chase since February 2012; formerly Vice President and Assistant General Counsel, JPMorgan Chase from 2005 to February 2012; Senior Counsel, JPMorgan Chase (formerly Bank One Corporation) from 2004 to 2005. |
| |
Jessica K. Ditullio (1962),
Assistant Secretary (2005)** | | Executive Director and Assistant General Counsel, JPMorgan Chase. Ms. Ditullio has been with JPMorgan Chase (formerly Bank One Corporation) since 1990. |
| |
Anthony Geron (1971),
Assistant Secretary (2018)* | | Vice President and Assistant General Counsel, JPMorgan Chase since September 2018; Lead Director and Counsel, AXA Equitable Life Insurance Company from 2015 to 2018 and Senior Director and Counsel, AXA Equitable Life Insurance Company from 2014 to 2015; Associate, Willkie Farr & Gallagher (law firm) from 2007 to 2014. |
| |
Carmine Lekstutis (1980),
Assistant Secretary (2011)* | | Executive Director and Assistant General Counsel, JPMorgan Chase since February 2015; formerly Vice President and Assistant General Counsel, JPMorgan Chase from 2011 to February 2015. |
| |
Keri E. Riemer (1976),
Assistant Secretary (2019)* | | Executive Director and Assistant General Counsel, JPMorgan Chase since February 2019; Counsel, Seward & Kissel LLP (2016-2019); Associate, Seward & Kissel LLP (2011-2016). |
| |
Zachary E. Vonnegut-Gabovitch (1986), Assistant Secretary (2017)* | | Vice President and Assistant General Counsel, JPMorgan Chase since September 2016; Associate, Morgan, Lewis & Bockius (law firm) from 2012 to 2016. |
| |
Michael M. D’Ambrosio (1969),
Assistant Treasurer (2012) | | Managing Director, J.P. Morgan Investment Management Inc. (formerly JPMorgan Funds Management, Inc.) since May 2014; formerly Executive Director, JPMorgan Funds Management, Inc. from 2012 to May 2014. |
| |
Aleksandr Fleytekh (1972), Assistant Treasurer (2019)* | | Vice President, J.P. Morgan Investment Management Inc. (formerly JPMorgan Funds Management, Inc.) since February 2012. |
| |
Shannon Gaines (1977),
Assistant Treasurer (2018)** | | Vice President, J.P. Morgan Investment Management Inc. (formerly JPMorgan Funds Management, Inc.) since January 2014. |
| |
Jeffrey D. House (1972), Assistant Treasurer (2017)** | | Vice President, J.P. Morgan Investment Management Inc. (formerly JPMorgan Funds Management, Inc.) since July 2006. |
| |
Lauren A. Paino (1973), Assistant Treasurer (2014)* | | Executive Director, J.P. Morgan Investment Management Inc. (formerly JPMorgan Funds Management, Inc.) since August 2013. |
| |
Joseph Parascondola (1963),
Assistant Treasurer (2011)* | | Vice President, J.P. Morgan Investment Management Inc. (formerly JPMorgan Funds Management, Inc.) since August 2006. |
| |
Gillian I. Sands (1969),
Assistant Treasurer (2012)* | | Vice President, J.P. Morgan Investment Management Inc. (formerly JPMorgan Funds Management, Inc.) since September 2012. |
The contact address for each of the officers, unless otherwise noted, is 277 Park Avenue, New York, NY 10172.
| * | The contact address for the officer is 4 New York Plaza, New York, NY 10004. |
| ** | The contact address for the officer is 1111 Polaris Parkway, Columbus, OH 43240. |
39
SCHEDULE OF SHAREHOLDER EXPENSES (Unaudited)
Hypothetical $1,000 Investment
As a shareholder of the Fund, you incur two types of costs: (1) transaction costs, including sales charges (loads) on purchase payments and (2) ongoing costs, including investment advisory fees, administration fees, distribution fees and other Fund expenses. The examples below are intended to help you understand your ongoing costs (in dollars) of investing in the Fund and to compare these ongoing costs with the ongoing costs of investing in other mutual funds. The examples assume that you had a $1,000 investment in each Class at the beginning of the reporting period, June 25, 2019 and continued to hold your shares at the end of the reporting period, October 31, 2019.
Actual Expenses
For each Class of the Fund in the table below, the first line provides information about actual account values and actual expenses. You may use the information in this line, together with the amount you invested, to estimate the expenses that you paid over the period. Simply divide your account value by $1,000 (for example, an $8,600 account value divided by $1,000 = 8.6), then multiply the result by the number in the first line of each Class under the heading entitled “Expenses Paid During the Period” to estimate the expenses you paid on your account during this period.
Hypothetical Example for Comparison Purposes
The second line of each Class in the table below provides information about hypothetical account values and hypothetical expenses based on the Class’ actual expense ratio and an assumed rate of return of 5% per year before expenses, which is not the Class’ actual return. The hypothetical account values and expenses may not be used to estimate the actual ending account balance or expenses you paid for the period. You may use this information to compare the ongoing costs of investing in the Class of the Fund and other funds. To do so, compare this 5% hypothetical example with the 5% hypothetical examples that appear in the shareholder reports of the other funds. Please note that the expenses shown in the table are meant to highlight your ongoing costs only and do not reflect any transaction costs, such as sales charges (loads) or redemption fees. Therefore, the second line for each Class in the table is useful in comparing ongoing costs only, and will not help you determine the relative total costs of owning different funds. In addition, if these transaction costs were included, your costs would have been higher. The examples also assume all dividends and distributions have been reinvested.
| | | | | | | | | | | | | | | | |
| | | Beginning | | | Ending | | | Expenses | | | Annualized |
| | | Account Value | | | Account Value | | | Paid During the | | | Expense |
| | | June 25, 2019 | | | October 31, 2019 | | | Period* | | | Ratio |
| | | | |
JPMorgan International Equity Plus | | | | | | | | | | | | | | | | |
Fund | | | | | | | | | | | | | | | | |
Class A | | | | | | | | | | | | | | | | |
Actual | | | $1,000.00 | | | | $1,034.00 | | | | $3.57 | | | | 1.00% | |
Hypothetical | | | 1,000.00 | | | | 1,020.16 | | | | 5.09 | | | | 1.00 | |
Class C | | | | | | | | | | | | | | | | |
Actual | | | 1,000.00 | | | | 1,032.00 | | | | 5.34 | | | | 1.50 | |
Hypothetical | | | 1,000.00 | | | | 1,017.64 | | | | 7.63 | | | | 1.50 | |
Class I | | | | | | | | | | | | | | | | |
Actual | | | 1,000.00 | | | | 1,035.30 | | | | 2.64 | | | | 0.74 | |
Hypothetical | | | 1,000.00 | | | | 1,021.48 | | | | 3.77 | | | | 0.74 | |
| * | Expenses are equal to each Class’ respective annualized expense ratio, multiplied by the average account value over the period, multiplied by 128/365 (to reflect theone-half year period). |
40
JPMorgan International Equity Plus Fund only
The Board of Trustees has established various standing committees composed of Trustees with diverse backgrounds, to which the Board of Trustees has assigned specific subject matter responsibilities to further enhance the effectiveness of the Board’s oversight and decision making. The Board of Trustees and its investment committees (money market and alternative products, equity, and fixed income) meet regularly throughout the year and consider factors that are relevant to their annual consideration of investment advisory agreements at each meeting. They also meet for the specific purpose of considering approvals of initial advisory agreements for new funds. At their February 2019in-person meeting, the Trustees, including a majority of the Trustees who are not “interested persons” (as defined in the 1940 Act) of any party to the initial advisory agreement or any of their affiliates (“Independent Trustees”), approved the initial investment advisory agreement (the “New Advisory Agreement”) for the Fund.
In connection with the approval of the New Advisory Agreement, the Trustees reviewed written materials prepared by the Adviser and received oral presentations from Adviser personnel. Before voting on the proposed New Advisory Agreement, the Trustees reviewed the New Advisory Agreement with representatives of the Adviser, counsel to the Trust and independent legal counsel and received a memorandum from independent legal counsel to the Trustees discussing the legal standards for their consideration of the proposed agreement. The Trustees also discussed the proposed New Advisory Agreement in an executive session with independent legal counsel at which no representatives of the Adviser were present.
A summary of the material factors evaluated by the Trustees in determining whether to approve the New Advisory Agreement is provided below.
The Trustees considered information provided with respect to the Fund and the approval of the New Advisory Agreement. Each Trustee attributed different weights to the various factors and no factor alone was considered determinative. After considering and weighing the factors and information they had received, the Trustees found that the proposed compensation to be received by the Adviser from the Fund under the New Advisory Agreement was fair and reasonable under the circumstances and determined that the initial approval of the New Advisory Agreement was in the best interests of the Fund and its potential shareholders.
Nature, Extent and Quality of Services Provided by the Adviser
In connection with the approval of the New Advisory Agreement, the Trustees considered the materials furnished specifically in connection with the approval of the New Advisory Agreement, as well as other relevant information furnished throughout the year for the J.P. Morgan Funds complex, and the Trustees’ experience with the Adviser and its services. The Trustees considered the background and experience of the Adviser’s senior management, personnel changes, if any, and the expertise of, and the amount of attention to be given to the Fund by, investment personnel of the Adviser. In addition, the Trustees reviewed the qualifications, backgrounds and responsibilities of the portfolio management team primarily responsible for theday-to-day management of the Fund. The Trustees also considered the investment strategy and investment process for the Fund, and the infrastructure supporting the portfolio management team, including personnel changes, if any. In addition, the Trustees considered information about the structure and distribution strategy of the Fund, how it fits within the J.P. Morgan Funds lineup, and how it will be positioned against identified peers.
41
The Trustees also considered their knowledge of the nature and quality of services provided by the Adviser and its affiliates to the J.P. Morgan Funds gained from their experience as Trustees of the J.P. Morgan Funds. In addition, they considered the overall reputation and capabilities of the Adviser and its affiliates, the commitment of the Adviser to provide high quality service to the J.P. Morgan Funds, their overall confidence in the Adviser’s integrity and the Adviser’s responsiveness to questions or concerns raised by them, including the Adviser’s willingness to consider and implement organizational and operational changes designed to improve investment results and the services provided to the J.P. Morgan Funds.
Based upon these considerations and other factors, the Trustees concluded that they were satisfied with the nature, extent and quality of the investment advisory services to be provided to the Fund by the Adviser.
The Trustees also considered that JPMorgan Distribution Services, Inc. (“JPMDS”), an affiliate of the Adviser, and the Adviser, in its role as administrator, will earn fees from the Fund for providing shareholder and administrative services, respectively. The Trustees also considered the payments of Rule12b-1 fees to JPMDS, which also acts as the Fund’s distributor and that these fees are in turn generally paid to financial intermediaries that sell the Fund, including financial intermediaries that are affiliates of the Adviser. The Trustees also considered the fees paid to JPMorgan Chase Bank, N.A. (“JPMCB”) for custody and fund accounting and other related services.
Fall-Out Benefits
The Trustees reviewed information regarding potential“fall-out” or ancillary benefits received by the Adviser and its affiliates as a result of their relationship with the J.P. Morgan Funds. The Trustees considered that the Fund’s operating accounts are held at JPMCB, which, as a result, will receive float benefits for certain J.P. Morgan Funds. The Trustees also noted that the Adviser supports a diverse set of products and services, which benefits the Adviser by allowing it to leverage its infrastructure to serve additional clients. The Trustees also considered the Adviser’s allocation of fund brokerage for the J.P. Morgan Funds complex, including allocations to brokers who provide research to the Adviser.
Economies of Scale
The Trustees considered the extent to which the Fund may benefit from economies of scale. The Trustees considered that there may not be a direct relationship between economies of scale realized by the Fund and those realized by the Adviser as assets increase. The Trustees considered the extent to which the Fund was priced to scale and whether it would be appropriate to add advisory fee breakpoints, but noted that the Fund has implemented fee waivers and contractual expense limitations (“Fee Caps”) which allow the Fund’s shareholders to share potential economies of scale from the Fund’s inception and that the proposed fees are competitive with peer funds. The Trustees considered the benefits to the Fund of the use of an affiliated distributor and custodian, including the ability to rely on existing infrastructure supporting distribution, custodial and transfer agent services and the ability to negotiate competitive fees for the Fund. The Trustees further considered the Adviser’s and JPMDS’s ongoing investments in their business in support of the Fund, including the Adviser’s and/or JPMDS’s investments in trading systems, technology (including improvements to the J.P. Morgan Funds’ website, and cybersecurity improvements), retention of key talent, and regulatory support enhancements. The Trustees concluded that the current fee structure for the Fund, including any Fee Caps that the Adviser has in place that serve to limit the overall net expense ratios of the Fund at a competitive level, was reasonable. The Trustees concluded that the Fund’s shareholders received the benefits of potential economies of scale through the Fee Caps and the Adviser’s reinvestment in its operations to serve the Fund and its shareholders.
42
Investment Performance
The Trustees considered the Fund’s investment strategy and process, portfolio management team and competitive positioning against identified peer funds, and concluded that the prospects for competitive future performance were acceptable.
Advisory Fees and Expense Ratios
The Trustees considered the contractual advisory fee rate and administration fee rate that will be paid by the Fund to the Adviser and compared the combined rate to the information prepared by Broadridge, using data from Lipper Inc., independent providers of investment company data (together, “Broadridge/Lipper”) concerning management fee rates paid by other funds in the same Broadridge/Lipper category as the Fund. The Trustees recognized that Broadridge/Lipper reported the Fund’s management fee rate as the combined contractual advisory fee and administration fee rates. The Trustees also reviewed information about other projected expenses and the expense ratios for the Fund. The Trustees considered the projected Fee Caps proposed for the Fund, and the net advisory fee rate and net expense ratio after taking into account any projected waivers and/or reimbursements. The Trustees recognized that it is difficult to make comparisons of advisory fees because there are variations in the services that are included in the fees paid by other funds. The Trustees noted that the Fund’s estimated net advisory fees and total expenses, which were considered on aclass-by-class basis, were in line with identified peer funds. After considering all of the factors identified above, in light of the information, the Trustees concluded that the advisory fees were satisfactory.
43
Tax Letter
(Unaudited)
Certain tax information for the J.P. Morgan Funds is required to be provided to shareholders based upon the Fund’s income and distributions for the taxable year ended October 31, 2019. The information and distributions reported in this letter may differ from the information and taxable distributions reported to the shareholders for the calendar year ending December 31, 2019. The information necessary to complete your income tax returns for the calendar year ending December 31, 2019 will be provided under separate cover.
Qualified Dividend Income (QDI)
The Fund had $9,372 or maximum allowable amount, of ordinary income distributions treated as qualified dividends for the fiscal year ended October 31, 2019.
Foreign Source Income and Foreign Tax Credit Pass Through
For the fiscal year ended October 31, 2019, the Fund intends to elect to pass through to shareholders taxes paid to foreign countries. Gross income and foreign tax expenses are as follows or amounts as finally determined:
| | |
| Gross | | Foreign Tax |
| Income | | Pass Through |
| $ 103,225 | | $ 9,372 |
44

Rev. January 2011
| | |
| | |
FACTS | | WHAT DOES J.P. MORGAN FUNDS DO WITH YOUR PERSONAL INFORMATION? |
| | |
Why? | | Financial companies choose how they share your personal information. Federal law gives consumers the right to limit some but not all sharing. Federal law also requires us to tell you how we collect, share, and protect your personal information. Please read this notice carefully to understand what we do. |
| | |
What? | | The types of personal information we collect and share depend on the product or service you have with us. This information can include: ◾ Social Security number and account balances ◾ transaction history and account transactions ◾ checking account information and wire transfer instructions When you areno longer our customer, we continue to share your information as described in this notice. |
| | |
How? | | All financial companies need to share customers’ personal information to run their everyday business. In the section below, we list the reasons financial companies can share their customers’ personal information; the reasons J.P. Morgan Funds chooses to share; and whether you can limit this sharing. |
| | | | |
| | | |  |
| | | | |
| | | |
| Reasons we can share your personal information | | Does J.P. Morgan
Funds share? | | Can you limit this
sharing? |
For our everyday business purposes — such as to process your transactions, maintain your account(s), respond to court orders and legal investigations, or report to credit bureaus | | Yes | | No |
For marketing purposes — to offer our products and services to you | | Yes | | No |
For joint marketing with other financial companies | | No | | We don’t share |
For our affiliates’ everyday business purposes — information about your transactions and experiences | | No | | We don’t share |
For our affiliates’ everyday business purposes — information about your creditworthiness | | No | | We don’t share |
For nonaffiliates to market to you | | No | | We don’t share |
| | |
| | |
Questions? | | Call1-800-480-4111 or go to www.jpmorganfunds.com |
| | |
| |
Who we are |
Who is providing this notice? | | J.P. Morgan Funds |
| | |
| |
What we do |
How does J.P. Morgan Funds protect my personal information? | | To protect your personal information from unauthorized access and use, we use security measures that comply with federal law. These measures include computer safeguards and secured files and buildings. We authorize our employees to access your information only when they need it to do their work and we require companies that work for us to protect your information. |
How does J.P. Morgan Funds collect my personal information? | | We collect your personal information, for example, when you: ◾ open an account or provide contact information ◾ give us your account information or pay us by check ◾ make a wire transfer We also collect your personal information from others, such as credit bureaus, affiliates and other companies. |
Why can’t I limit all sharing? | | Federal law gives you the right to limit only ◾ sharing for affiliates’ everyday business purposes – information about your creditworthiness ◾ affiliates from using your information to market to you ◾ sharing for nonaffiliates to market to you State laws and individual companies may give you additional rights to limit sharing. |
| | |
| |
Definitions |
Affiliates | | Companies related by common ownership or control. They can be financial and nonfinancial companies. ◾ J.P. Morgan Funds does not share with our affiliates. |
Nonaffiliates | | Companies not related by common ownership or control. They can be financial and nonfinancial companies. ◾ J.P. Morgan Funds does not share with nonaffiliates so they can market to you. |
Joint Marketing | | A formal agreement between nonaffiliated financial companies that together market financial products or services to you. ◾ J.P. Morgan Funds doesn’t jointly market. |
J.P. Morgan Funds are distributed by JPMorgan Distribution Services, Inc., which is an affiliate of JPMorgan Chase & Co. Affiliates of JPMorgan Chase & Co. receive fees for providing various services to the funds.
Contact JPMorgan Distribution Services, Inc. at1-800-480-4111 for a fund prospectus. You can also visit us at www.jpmorganfunds.com. Investors should carefully consider the investment objectives and risk as well as charges and expenses of the mutual fund before investing. The prospectus contains this and other information about the mutual fund. Read the prospectus carefully before investing.
Investors may obtain information about the Securities Investor Protection Corporation (SIPC), including the SIPC brochure, by visiting www.sipc.org or by calling SIPC at202-371-8300.
The Fund files a complete schedule of its fund holdings for the first and third quarters of its fiscal year with the SEC on FormN-PORT. Prior to March 31, 2019, the Fund filed a complete schedule of its fund holdings for the first and third quarters of its fiscal year with the SEC on FormN-Q. The Fund’s FormN-PORT and FormN-Q are available on the SEC’s website at http://www.sec.gov. The Fund’s quarterly holdings can be found by visiting the J.P. Morgan Funds’ website at www.jpmorganfunds.com.
A description of the Fund’s policies and procedures with respect to the disclosure of the Fund’s holdings is available in the prospectuses and Statement of Additional Information.
A copy of proxy policies and procedures is available without charge upon request by calling1-800-480-4111 and on the Fund’s website at www.jpmorganfunds.com. A description of such policies and procedures is on the SEC’s website at www.sec.gov. The Trustees have delegated the authority to vote proxies for securities owned by the Fund to the Adviser. A copy of the Fund’s voting record for the most recent12-month period ended June 30 is available on the SEC’s website at www.sec.gov or at the Fund’s website at www.jpmorganfunds.com no later than August 31 of each year. The Fund’s proxy voting record will include, among other things, a brief description of the matter voted on for each fund security, and will state how each vote was cast, for example, for or against the proposal.

ITEM 2. CODE OF ETHICS.
Disclose whether, as of the end of the period covered by the report, the registrant has adopted a code of ethics that applies to the registrant’s principal executive officer, principal financial officer, principal accounting officer or controller, or persons performing similar functions, regardless of whether these individuals are employed by the registrant or a third party. If the registrant has not adopted such a code of ethics, explain why it has not done so.
The registrant must briefly describe the nature of any amendment, during the period covered by the report, to a provision of its code of ethics that applies to the registrant’s principal executive officer, principal financial officer, principal accounting officer or controller, or persons performing similar functions, regardless of whether these individuals are employed by the registrant or a third party, and that relates to any element of the code of ethics definition enumerated in paragraph (b) of this Item. The registrant must file a copy of any such amendment as an exhibit pursuant to Item 13(a)(1), unless the registrant has elected to satisfy paragraph (f) of this Item by positing its code of ethics on its website pursuant to paragraph (f)(2) of this Item, or by undertaking to provide its code of ethics to any person without charge, upon request, pursuant to paragraph (f)(3) of this Item.
If the registrant has, during the period covered by the report, granted a waiver, including an implicit waiver, from a provision of the code of ethics that applies to the registrant’s principal executive officer, principal financial officer, principal accounting officer or controller, or persons performing similar functions, regardless of whether these individuals are employed by the registrant or third party, that relates to one or more items set forth in paragraph (b) of this Item, the registrant must briefly describe the nature of the waiver, the name of the person to whom the waiver was granted, and the date of the waiver.
The Registrant has adopted a code of ethics that applies to the Registrant’s principal executive officer and principal financial officer. There were no amendments to the code of ethics or waivers granted with respect to the code of ethics in the period covered by the report.
ITEM 3. AUDIT COMMITTEE FINANCIAL EXPERT.
(a) (1) Disclose that the registrant’s board of directors has determined that the registrant either:
(i) Has at least one audit committee financial expert serving on its audit committee; or
(ii) Does not have an audit committee financial expert serving on its audit committee.
The Registrant’s Board of Trustees has determined that the Registrant has at least one audit committee financial expert serving on its audit committee. The Securities and Exchange Commission has stated that the designation or identification of a person as an audit committee financial expert pursuant to this Item 3 of FormN-CSR does not impose on such person any duties, obligations or liabilities that are greater than the duties, obligations and liabilities imposed on such person as a member of the Audit Committee and the Board of Trustees in the absence of such designation or identification.
(2) If the registrant provides the disclosure required by paragraph (a)(1)(i) of this Item, it must disclose the name of the audit committee financial expert and whether that person is “independent.” In order to be considered “independent” for purposes of this Item, a member of an audit committee may not, other than in his or her capacity as a member of the audit committee, the board of directors, or any other board committee:
(i) Accept directly or indirectly any consulting, advisory, or other compensatory fee from the issuer; or
(ii) Be an “interested person” of the investment company as defined in Section 2(a)(19) of the Act (15 U.S.C.80a-2(a)(19)).
The audit committee financial expert is Dennis P. Harrington. He is not an “interested person” of the Registrant and is also “independent” as defined by the U.S. Securities and Exchange Commission for purposes of audit committee financial expert determinations.
(3) If the registrant provides the disclosure required by paragraph (a)(1)(ii) of this Item, it must explain why it does not have an audit committee financial expert.
Not applicable.
ITEM 4. PRINCIPAL ACCOUNTANT FEES AND SERVICES.
(a) Disclose, under the caption Audit Fees, the aggregate fees billed for each of the last two fiscal years for professional services rendered by the principal accountant for the audit of the registrant’s annual financial statements or services that are normally provided by the accountant in connection with statutory and regulatory filings or engagements for those fiscal years.
AUDIT FEES
2019 – $160,296
2018 – $0
(b) Disclose, under the caption Audit-Related Fees, the aggregate fees billed in each of the last two fiscal years for assurance and related services by the principal accountant that are reasonably related to the performance of the audit of the registrant’s financial statements and are not reported under paragraph (a) of this Item. Registrants shall describe the nature of the services comprising the fees disclosed under this category.
AUDIT-RELATED FEES
2019 – $38,520
2018 – $0
Audit-related fees consists of semi-annual financial statement reviews and security count procedures performed as required under Rule17f-2 of the Investment Company Act of 1940 during the Registrant’s fiscal year.
(c) Disclose, under the caption Tax Fees, the aggregate fees billed in each of the last two fiscal years for professional services rendered by the principal accountant for tax compliance, tax advice, and tax planning. Registrants shall describe the nature of the services comprising the fees disclosed under this category.
TAX FEES
2019 – $46,919
2018 – $0
The tax fees consist of fees billed in connection with preparing the federal regulated investment company income tax returns for the Registrant for the tax years ended October 31, 2019 and 2018, respectively.
For the last fiscal year, no tax fees were required to be approved pursuant to paragraph (c)(7)(ii) of Rule2-01 of RegulationS-X.
(d) Disclose, under the caption All Other Fees, the aggregate fees billed in each of the last two fiscal years for products and services provided by the principal accountant, other than the services reported in paragraphs (a) through (c) of this Item. Registrants shall describe the nature of the services comprising the fees disclosed under this category.
ALL OTHER FEES
2019 – Not applicable
2018 – Not applicable
(e) (1) Disclose the audit committee’spre-approval policies and procedures described in paragraph (c)(7) of Rule2-01 of RegulationS-X.
Pursuant to the Registrant’s Audit Committee Charter and written policies and procedures for thepre-approval of audit andnon-audit services (the“Pre-approval Policy”), the Audit Committeepre-approves all audit andnon-audit services performed by the Registrant’s independent public registered accounting firm for the Registrant. In addition, the Audit Committeepre-approves the auditor’s engagement fornon-audit services with the Registrant’s investment adviser (not including asub-adviser whose role is primarily portfolio management and issub-contracted or overseen by another investment adviser) and any Service Affiliate in accordance with paragraph (c)(7)(ii) of Rule2-01 of RegulationS-X, if the engagement relates directly to the operations and financial reporting of the Registrant. Proposed services may bepre-approved either 1) without consideration of specificcase-by-case services or 2) require the specificpre-approval of the Audit Committee. Therefore, initially thePre-approval Policy listed a number of audit andnon-audit services that have been approved by the Audit Committee, or which were not subject topre-approval under the transition provisions of Sarbanes-Oxley Act of 2002 (the
“Pre-approval List”). The Audit Committee annually reviews andpre-approves the services included on thePre-approval List that may be provided by the independent public registered accounting firm without obtaining additional specificpre-approval of individual services from the Audit Committee. The Audit Committee adds to, or subtracts from, the list of generalpre-approved services from time to time, based on subsequent determinations. All other audit andnon-audit services not on thePre-approval List must be specificallypre-approved by the Audit Committee.
One or more members of the Audit Committee may be appointed as the Committee’s delegate for the purposes of considering whether to approve such services. Anypre-approvals granted by the delegate will be reported, for informational purposes only, to the Audit Committee at its next scheduled meeting. The Audit Committee’s responsibilities topre-approve services performed by the independent public registered accounting firm are not delegated to management.
(2) Disclose the percentage of services described in each of paragraphs (b) through (d) of this Item that were approved by the audit committee pursuant to paragraph (c)(7)(i)(C) of Rule2-01 of RegulationS-X.
2019 – 0.0%
2018 – 0.0%
(f) If greater than 50 percent, disclose the percentage of hours expended on the principal accountant’s engagement to audit the registrant’s financial statements for the most recent fiscal year that were attributed to work performed by persons other than the principal accountant’s full-time, permanent employees.
Not applicable - Less than 50%.
(g) Disclose the aggregatenon-audit fees billed by the registrant’s accountant for services rendered to the registrant, and rendered to the registrant’s investment adviser (not including anysub-adviser whose role is primarily portfolio management and is subcontracted with or overseen by another investment adviser), and any entity controlling, controlled by, or under common control with the adviser that provides ongoing services to the registrant for each of the last two fiscal years of the registrant.
The aggregatenon-audit fees billed by the independent registered public accounting firm for services rendered to the Registrant, and rendered to Service Affiliates, for the last two calendar year ends were:
2019 - $30.3 million
2018 - $0.0 million
(h) Disclose whether the registrant’s audit committee of the board of directors has considered whether the provision ofnon-audit services that were rendered to the registrant’s investment adviser (not including any subadviser whose role is primarily portfolio management and is subcontracted with or overseen by another investment adviser), and any entity controlling, controlled by, or under common control with the investment adviser that provides ongoing services to the registrant that were notpre-approved pursuant to paragraph (c)(7)(ii) of Rule2-01 of RegulationS-X is compatible with maintaining the principal accountant’s independence.
The Registrant’s Audit Committee has considered whether the provision of thenon-audit services that were rendered to Service Affiliates that were notpre-approved (not requiringpre-approval) is compatible with maintaining the independent public registered accounting firm’s independence. All services provided by the independent public registered accounting firm to the Registrant or to Service Affiliates that were required to bepre-approved werepre-approved as required.
ITEM 5. AUDIT COMMITTEE OF LISTED REGISTRANTS.
(a) If the registrant is a listed issuer as defined in Rule10A-3 under the Exchange Act (17CFR240.10A-3), state whether or not the registrant has a separately-designated standing audit committee established in accordance with Section 3(a)(58)(A) of the Exchange Act (15 U.S.C. 78c(a)(58)(A)). If the registrant has such a committee, however designated, identify each committee member. If the entire board of directors is acting as the registrant’s audit committee as specified in Section 3(a)(58)(B) of the Exchange Act (15 U.S.C. 78c(a)(58)(B)), so state.
(b) If applicable, provide the disclosure required by Rule10A-3(d) under the Exchange Act (17CFR240.10A-3(d)) regarding an exemption from the listing standards for all audit committees.
Not applicable.
ITEM 6. INVESTMENTS.
File Schedule I – Investments in securities of unaffiliated issuers as of the close of the reporting period as set forth inSection 210.12-12 of RegulationS-X, unless the schedule is included as part of the report to shareholders filed under Item 1 of this Form.
Included in Item 1.
ITEM 7. DISCLOSURE OF PROXY VOTING POLICIES AND PROCEDURES FORCLOSED-END MANAGEMENT INVESTMENT COMPANIES.
Not applicable.
ITEM 8. PORTFOLIO MANAGERS OFCLOSED-END MANAGEMENT INVESTMENT COMPANIES.
Not applicable.
ITEM 9. PURCHASE OF EQUITY SECURITIES BYCLOSED-END MANAGEMENT INVESTMENT COMPANY AND AFFILIATED PURCHASERS.
Not applicable.
ITEM 10. SUBMISSION OF MATTERS TO A VOTE OF SECURITY HOLDERS.
Describe any material changes to the procedures by which shareholders may recommend nominees to the registrant’s board of directors, where those changes were implemented after the registrant last provided disclosure in response to the requirements of Item 7(d)(2)(ii)(G) of Schedule 14A (17 CFR240.14a-101), or this Item.
No material changes to report.
ITEM 11. CONTROLS AND PROCEDURES.
(a) Disclose the conclusions of the registrant’s principal executive and principal financial officers, or persons performing similar functions, regarding the effectiveness of the registrant’s disclosure controls and procedures (as defined in Rule30a-3(c) under the Act (17 CFR270.30a-3(c))) as of a date within 90 days of the filing date of the report that includes the disclosure required by this paragraph, based on the evaluation of these controls and procedures required by Rule30a-3(b) under the Act (17 CFR270.30a-3(b)) and Rules13a-15(b) or15d-15(b) under the Exchange Act (17 CFR240.13a-15(b) or240.15d-15(b)).
The Registrant’s principal executive and principal financial officers have concluded, based on their evaluation of the Registrant’s disclosure controls and procedures as of a date within 90 days of the filing date of this report, that the Registrant’s disclosure controls and procedures are reasonably designed to ensure that information required to be disclosed by the Registrant on FormN-CSR is recorded, processed, summarized and reported within the required time periods and that information required to be disclosed by the Registrant in the reports that it files or submits on FormN-CSR is accumulated and communicated to the Registrant’s management, including its principal executive and principal financial officers, as appropriate to allow timely decisions regarding required disclosure.
(b) Disclose any change in the registrant’s internal control over financial reporting (as defined in Rule30a-3(d) under the Act (17 CFR270.30a-3(d)) that occurred during the registrant’s second fiscal quarter of the period covered by this report that has materially affected, or is reasonably likely to materially affect, the registrant’s internal control over financial reporting.
There were no changes in the Registrant’s internal control over financial reporting that occurred during the last fiscal quarter covered by this report that have materially affected, or are reasonably likely to materially affect, the Registrant’s internal control over financial reporting.
ITEM 12. DISCLOSURE OF SECURITIES LENDING ACTIVITIES FORCLOSED-END MANAGEMENT INVESTMENT COMPANIES.
Not applicable.
ITEM 13. EXHIBITS.
| | (a) | File the exhibits listed below as part of this Form. Letter or number the exhibits in the sequence indicated. |
(1) Any code of ethics, or amendment thereto, that is the subject of the disclosure required by Item 2, to the extent that the registrant intends to satisfy the Item 2 requirements through filing of an exhibit.
Code of Ethics applicable to its Principal Executive and Principal Financial Officers pursuant to Section 406 of the Sarbanes-Oxley Act of 2002 attached hereto.
(2) A separate certification for each principal executive officer and principal financial officer of the registrant as required by Rule30a-2(a) under the Act (17 CFR270.30a-2).
Certifications pursuant to Rule30a-2(a) under the Investment Company Act of 1940 are attached hereto.
(3) Any written solicitation to purchase securities under Rule23c-1 under the Act (17 CFR270.23c-1) sent or given during the period covered by the report by or on behalf of the registrant to 10 or more persons.
Not applicable.
| | (b) | A separate or combined certification for each principal executive officer and principal officer of the registrant as required by Rule30a-2(b) under the Act of 1940. |
Certifications pursuant to Rule30a-2(b) under the Investment Company Act of 1940 are attached hereto.
SIGNATURES
Pursuant to the requirements of the Securities Exchange Act of 1934 and the Investment Company Act of 1940, the registrant has duly caused this report to be signed on its behalf by the undersigned, thereunto duly authorized.
JPMorgan Trust IV
| | |
| By: | | /s/ Brian S. Shlissel |
| | Brian S. Shlissel |
| | President and Principal Executive Officer |
| | January 2, 2020 |
Pursuant to the requirements of the Securities Exchange Act of 1934 and the Investment Company Act of 1940, this report has been signed below by the following persons on behalf of the registrant and in the capacities and on the dates indicated.
| | |
| By: | | /s/ Brian S. Shlissel |
| | Brian S. Shlissel |
| | President and Principal Executive Officer |
| | January 2, 2020 |
| |
| By: | | /s/ Timothy J. Clemens |
| | Timothy J. Clemens |
| | Treasurer and Principal Financial Officer |
| | January 2, 2020 |