UNITED STATES
SECURITIES AND EXCHANGE COMMISSION
Washington, D.C. 20549
FORM N-CSR
CERTIFIED SHAREHOLDER REPORT OF REGISTERED
MANAGEMENT INVESTMENT COMPANIES
Investment Company Act file number: 811-23117
JPMorgan Trust IV
(Exact name of registrant as specified in charter)
277 Park Avenue
New York, NY 10172
(Address of principal executive offices) (Zip code)
Gregory S. Samuels
277 Park Avenue
New York, NY 10172
(Name and Address of Agent for Service)
Registrant’s telephone number, including area code: (800) 480-4111
Date of fiscal year end: October 31
Date of reporting period: November 1, 2019 through October 31, 2020
Form N-CSR is to be used by management investment companies to file reports with the Commission not later than 10 days after the transmission to stockholders of any report that is required to be transmitted to stockholders under Rule 30e-1 under the Investment Company Act of 1940 (17 CFR 270.30e-1). The Commission may use the information provided on Form N-CSR in its regulatory, disclosure review, inspection, and policymaking roles.
A registrant is required to disclose the information specified by Form N-CSR, and the Commission will make this information public. A registrant is not required to respond to the collection of information contained in Form N-CSR unless the Form displays a currently valid Office of Management and Budget (“OMB”) control number. Please direct comments concerning the accuracy of the information collection burden estimate and any suggestions for reducing the burden to Secretary, Securities and Exchange Commission, 450 Fifth Street, NW, Washington, DC 20549-0609. The OMB has reviewed this collection of information under the clearance requirements of 44 U.S.C. Section 3507.
ITEM 1. REPORTS TO STOCKHOLDERS.
The following is a copy of the report transmitted to shareholders pursuant to Rule 30e-1 under the Investment Company Act of 1940 (17 CFR 270.30e-1).
Annual Report
J.P. Morgan International Equity Funds
October 31, 2020
JPMorgan Emerging Markets Equity Fund
JPMorgan Emerging Markets Research Enhanced Equity Fund
JPMorgan Europe Dynamic Fund
JPMorgan International Advantage Fund
JPMorgan International Equity Fund
JPMorgan International Focus Fund
(formerly known as JPMorgan International Unconstrained Equity Fund)
JPMorgan International Hedged Equity Fund
JPMorgan International Research Enhanced Equity Fund
JPMorgan International Value Fund
Beginning on January 1, 2021, as permitted by regulations adopted by the Securities and Exchange Commission, paper copies of the Funds’ annual and semi-annual shareholder reports will no longer be sent by mail, unless you specifically request paper copies of the reports. Instead, the reports will be made available on the Funds’ website www.jpmorganfunds.com and you will be notified by mail each time a report is posted and provided with a website to access the report. If you already elected to receive shareholder reports electronically, you will not be affected by this change and you need not take any action.
You may elect to receive shareholder reports and other communications from the Funds electronically anytime by contacting your financial intermediary (such as a broker dealer, bank, or retirement plan) or, if you are a direct investor, by going to www.jpmorganfunds.com/edelivery.
You may elect to receive paper copies of all future reports free of charge. Contact your financial intermediary or, if you invest directly with the Funds, email us at funds.website.support@jpmorganfunds.com or call 1-800-480-4111. Your election to receive paper reports will apply to all funds held within your account(s).

CONTENTS
Investments in a Fund are not deposits or obligations of, or guaranteed or endorsed by, any bank and are not insured or guaranteed by the FDIC, the Federal Reserve Board or any other government agency. You could lose money if you sell when a Fund’s share price is lower than when you invested.
Past performance is no guarantee of future performance. The general market views expressed in this report are opinions based on market and other conditions through the end of the reporting period and are subject to change without notice. These views are not intended to predict the future performance of a Fund or the securities markets. References to specific securities and their issuers are for illustrative purposes only and are not intended to be, and should not be interpreted as, recommendations to purchase or sell such securities. Such views are not meant as investment advice and may not be relied on as an indication of trading intent on behalf of any Fund.
Prospective investors should refer to the Funds’ prospectuses for a discussion of the Funds’ investment objectives, strategies and risks. Call J.P. Morgan Funds Service Center at 1-800-480-4111 for a prospectus containing more complete information about a Fund, including management fees and other expenses. Please read it carefully before investing.
LETTER TO SHAREHOLDERS
DECEMBER 10, 2020 (Unaudited)
Dear Shareholders,
Even as the pandemic fueled deep uncertainty over the past year, global financial markets proved to be resilient with unprecedented support from central banks and broad investor optimism over advances in global efforts to end the pandemic. Over the twelve months ended October 31, 2020, equity prices in the U.S. and emerging markets generally led a broad but uneven recovery from lows reached in the first quarter of 2020. For the period, the S&P 500 Index returned 9.71%, the MSCI Emerging Markets Index returned 8.62% and the MSCI EAFE Index returned -6.46%.
| | |
 | | “We maintain an unwavering commitment to seeking to provide investors with innovative and timely solutions required to meet the demands and opportunities of any market environment.”
— Andrea L. Lisher |
The period began with upward momentum in global equity markets but by the end of March 2020, investors responded to the emerging pandemic with a broad sell-off that fed a sharp spike in financial market volatility. The swift response of leading central banks to seek to ensure market liquidity brought
some calm to financial markets and in the following months equity prices began to recover. Though the full economic impact of the pandemic remains unknown, investors have appeared to focus on specific efforts to contain Covid-19 and the timeline for the potential availability of vaccines against the virus.
Throughout this period, J.P. Morgan Asset Management has quickly adapted to unique challenges and has continued to operate utilizing the same fundamental practices and principles that have driven our success. We maintain an unwavering commitment to seeking to provide investors with innovative and timely solutions required to meet the demands and opportunities of any market environment. On behalf of J.P. Morgan Asset Management, thank you for entrusting us to manage your investment. Should you have any questions, please visit www.jpmorganfunds.com or contact the J.P. Morgan Funds Service Center at 1-800-480-4111.
Sincerely yours,

Andrea L. Lisher
Head of Americas, Client
J.P. Morgan Asset Management
| | | | | | | | |
| | | |
| OCTOBER 31, 2020 | | J.P. MORGAN INTERNATIONAL EQUITY FUNDS | | | | | 1 | |
J.P. Morgan International Equity Funds
MARKET OVERVIEW
TWELVE MONTHS ENDED OCTOBER 31, 2020 (Unaudited)
While global financial markets largely entered the reporting period with support from an improving economic and trade outlook, the economic shock of the pandemic response sparked a drop in global asset prices and a spike in market volatility in the first quarter of 2020. Rapid interventions by the world’s central banks helped to calm investors and set the stage for general but uneven recovery in financial markets.
The final months of 2019 were marked by rising prices for global equity - led by U.S. markets - driven partly by gains in U.S. and European manufacturing and an initial U.S.-China agreement to lower trade barriers. Amid already low interest rates, the U.S. Federal Reserve declined to cut rates further at its December meeting.
In the first days of January 2020, financial markets largely shrugged off a brief flare-up in military tensions between the U.S. and Iran. However, the emergence and spread of Covid-19 fed increasing investor uncertainty and by early March, the novel coronavirus was declared a pandemic by the World Health Organization. The closure of large sectors of national economies on a global scale sparked a dramatic sell-off in financial markets across the globe. Yields on developed market sovereign bonds fell sharply and prices for commodity gold spiked. By the end of the first quarter of 2020, leading developed market equity indexes had lost 20% or more of their value from the start of the year. Corporate bond prices generally fell and the price of crude oil ended the first quarter down by 60%.
Leading central banks promptly responded with lower interest rates and/or asset purchasing programs, which helped to support asset price stability and head off a potential liquidity crunch in credit markets. Governments also responded with a range of fiscal stimulus or paycheck protection programs designed to cushion the economic impact of the pandemic. In the ensuing months, global equity markets staged a slow and uneven rebound, led by U.S. and emerging markets.
For the twelve months ended October 31, 2020, the S&P 500 Index returned a total of 9.71%, MSCI Emerging Markets Index returned 8.62% and the MSCI EAFE Index returned -6.46%. Among bond market indexes, the Bloomberg Barclays U.S. Aggregate Index returned 6.19% and the Bloomberg Barclays Emerging Markets Index returned 3.38%
| | | | | | |
| | | |
| 2 | | | | J.P. MORGAN INTERNATIONAL EQUITY FUNDS | | OCTOBER 31, 2020 |
JPMorgan Emerging Markets Equity Fund
FUND COMMENTARY
TWELVE MONTHS ENDED OCTOBER 31, 2020 (Unaudited)
| | | | |
| REPORTING PERIOD RETURN: | | | |
| Fund (Class L Shares)* | | | 22.29% | |
| MSCI Emerging Markets Index (net of foreign withholding taxes) | | | 8.25% | |
| |
| Net Assets as of 10/31/2020 (In Thousands) | | $ | 11,220,225 | |
INVESTMENT OBJECTIVE**
The JPMorgan Emerging Markets Equity Fund (the “Fund”) seeks to provide high total return.
WHAT WERE THE MAIN DRIVERS OF THE FUND’S PERFORMANCE?
The Fund’s Class L Shares outperformed the MSCI Emerging Markets Index (net of foreign withholding taxes) (the “Benchmark”) for the twelve months ended October 31, 2020.
By sector, the Fund’s security selection in the communications services sector and its underweight position and security selection in the energy sector were leading contributors to relative to the Benchmark. The Fund’s overweight positions in the consumer staples and financials sectors were leading detractors from relative performance.
By country, the Fund’s security selection and overweight position in China and its out-of-Benchmark allocation to Singapore were leading contributors to performance relative performance. The Fund’s security selection and overweight position in India and its out-of-Benchmark allocation to Panama were leading detractors from relative performance.
Leading individual contributors to relative performance included the Fund’s out-of-Benchmark positions in Sea Ltd. and MercadoLibre Inc. and its overweight position in Meituan Dianping . Shares of Sea, a Singapore online gaming and electronic commerce provider with a presence in Southeast Asia, Taiwan and Latin America, rose amid growth in consumer demand for online services and entertainment. Shares of MercadoLibre, an
electronic commerce platform operator based in Argentina, rose amid growth in consumer demand for online services. Shares of Meituan Dianping, a Chinese provider of an electronic commerce platform, rose amid growth in consumer demand for online services.
Leading individual detractors from relative performance included the Fund’s out-of-Benchmark positions in IndusInd Bank Ltd., HDFC Bank Ltd., and Copa Holdings SA. Shares of IndusInd Bank and HDFC Bank, both Indian banking and financial services providers, fell amid investor expectations for a sharp contraction in the India’s economy due to Covid-19. Shares of Copa Holdings, an airline based in Panama, fell amid a decline in demand for passenger air travel.
HOW WAS THE FUND POSITIONED?
The Fund’s portfolio managers employed an active strategy in which portfolio construction was focused on the highest-conviction ideas found at the security level. The Fund’s portfolio managers used bottom-up fundamental research to determine the Fund’s security weightings, researching companies in an attempt to determine their underlying value and potential for future earnings growth.
As a result of this process, the Fund’s largest sector overweight allocations relative to the Benchmark were in the financials and consumer staples sectors and its largest relative underweight allocations were in the energy and materials sectors. The Fund’s largest country overweight allocations relative to the Benchmark were in India and China and its largest relative underweight allocations were in South Korea and Taiwan.
| | | | | | | | |
| | | |
| OCTOBER 31, 2020 | | J.P. MORGAN INTERNATIONAL EQUITY FUNDS | | | | | 3 | |
JPMorgan Emerging Markets Equity Fund
FUND COMMENTARY
TWELVE MONTHS ENDED OCTOBER 31, 2020 (Unaudited) (continued)
| | | | | | | | |
| TOP TEN EQUITY HOLDINGS OF THE PORTFOLIO*** | |
| | 1. | | | Taiwan Semiconductor Manufacturing Co. Ltd., ADR (Taiwan) | | | 6.8 | % |
| | 2. | | | Tencent Holdings Ltd. (China) | | | 4.6 | |
| | 3. | | | Alibaba Group Holding Ltd., ADR (China) | | | 4.4 | |
| | 4. | | | Samsung Electronics Co. Ltd., GDR (South Korea) | | | 3.7 | |
| | 5. | | | Meituan Dianping, Class B (China) | | | 3.0 | |
| | 6. | | | Sea Ltd., ADR (Taiwan) | | | 3.0 | |
| | 7. | | | EPAM Systems, Inc. (United States) | | | 3.0 | |
| | 8. | | | Wuxi Biologics Cayman, Inc. (China) | | | 2.7 | |
| | 9. | | | Alibaba Group Holding Ltd. (China) | | | 2.7 | |
| | 10. | | | MercadoLibre, Inc. (Argentina) | | | 2.5 | |
| | | | |
PORTFOLIO COMPOSITION BY COUNTRY*** | |
| China | | | 37.1 | % |
| India | | | 15.9 | |
| Taiwan | | | 10.2 | |
| Brazil | | | 6.3 | |
| Hong Kong | | | 5.7 | |
| South Korea | | | 5.0 | |
| United States | | | 3.0 | |
| Argentina | | | 2.4 | |
| Mexico | | | 2.2 | |
| Indonesia | | | 1.7 | |
| South Africa | | | 1.4 | |
| Portugal | | | 1.0 | |
| Others (each less than 1.0%) | | | 4.2 | |
| Short-Term Investments | | | 3.9 | |
| * | | The return shown is based on net asset values calculated for shareholder transactions and may differ from the return shown in the financial highlights, which reflects adjustments made to the net asset values in accordance with accounting principles generally accepted in the United States of America. |
| ** | | The adviser seeks to achieve the Fund’s objective. There can be no guarantee it will be achieved. |
| *** | | Percentages indicated are based on total investments as of October 31, 2020. The Fund’s portfolio composition is subject to change. |
| | | | | | |
| | | |
| 4 | | | | J.P. MORGAN INTERNATIONAL EQUITY FUNDS | | OCTOBER 31, 2020 |
| | | | | | | | | | | | | | |
AVERAGE ANNUAL TOTAL RETURNS AS OF OCTOBER 31, 2020 | |
| | | | |
| | | INCEPTION DATE OF
CLASS | | 1 YEAR | | | 5 YEAR | | | 10 YEAR | |
CLASS A SHARES | | September 28, 2001 | | | | | | | | | | | | |
With Sales Charge* | | | | | 15.43 | % | | | 12.59 | % | | | 4.37 | % |
Without Sales Charge | | | | | 21.84 | | | | 13.81 | | | | 4.94 | |
CLASS C SHARES | | February 28, 2006 | | | | | | | | | | | | |
With CDSC** | | | | | 20.24 | | | | 13.24 | | | | 4.52 | |
Without CDSC | | | | | 21.24 | | | | 13.24 | | | | 4.52 | |
CLASS I SHARES | | September 10, 2001 | | | 22.16 | | | | 14.08 | | | | 5.20 | |
CLASS L SHARES | | November 15, 1993 | | | 22.29 | | | | 14.22 | | | | 5.34 | |
CLASS R2 SHARES | | July 31, 2017 | | | 21.47 | | | | 13.52 | | | | 4.80 | |
CLASS R3 SHARES | | July 31, 2017 | | | 21.80 | | | | 13.78 | | | | 4.93 | |
CLASS R4 SHARES | | July 31, 2017 | | | 22.09 | | | | 14.04 | | | | 5.18 | |
CLASS R5 SHARES | | September 9, 2016 | | | 22.29 | | | | 14.23 | | | | 5.34 | |
CLASS R6 SHARES | | December 23, 2013 | | | 22.39 | | | | 14.35 | | | | 5.41 | |
| * | | Sales Charge for Class A Shares is 5.25%. |
| ** | | Assumes a 1% CDSC (contingent deferred sales charge) for the one year period and 0% CDSC thereafter. |
TEN YEAR PERFORMANCE (10/31/10 TO 10/31/20)
The performance quoted is past performance and is not a guarantee of future results. Mutual funds are subject to certain market risks. Investment returns and principal value of an investment will fluctuate so that an investor’s shares, when redeemed, may be worth more or less than their original cost. Current performance may be higher or lower than the performance data shown. For up-to-date month-end performance information please call 1-800-480-4111.
Returns for Class R5 Shares and Class R6 Shares prior to their inception dates are based on the performance of Class L Shares. The actual returns of Class R5 Shares and Class R6 Shares would have been different than those shown because Class R5 Shares and Class R6 Shares have different expenses than Class L Shares.
Returns shown for Class R2 Shares and Class R3 Shares prior to their inception dates are based on the performance of Class A Shares. The actual returns of Class R2 Shares and Class R3 Shares would have been lower than those shown because Class R2 Shares and Class R3 Shares have higher expenses than Class A Shares.
Returns for Class R4 Shares prior to its inception date are based on the performance of Class I Shares. The actual returns of Class R4 Shares would have been lower than those shown because Class R4 Shares have higher expenses than Class I Shares.
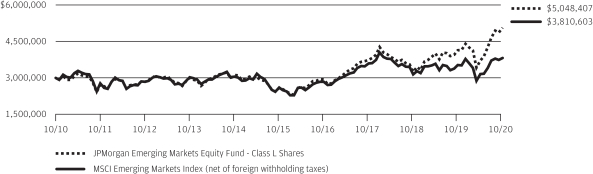
The graph illustrates comparative performance for $3,000,000 invested in Class L Shares of the JPMorgan Emerging Markets Equity Fund and the MSCI Emerging Markets Index (net of foreign withholding taxes) from October 31, 2010 to October 31, 2020. The performance of the Fund assumes reinvestment of all dividends and capital gain distributions, if any, and does not include a sales charge. The performance of the MSCI Emerging Markets Index (net of foreign withholding taxes) does not reflect the deduction of expenses or a sales charge associated with a mutual fund and approximates the minimum possible dividend reinvestment of the securities included in the benchmark, if applicable. The dividend is reinvested after deduction of withholding tax, applying the maximum rate to non-resident institutional investors who do not benefit from double taxation treaties. The MSCI Emerging Markets Index (net of foreign withholding taxes) is a free float-adjusted market capitalization weighted index that is designed to measure the equity market performance of emerging markets. Investors cannot invest directly in an index.
Class L Shares have a $3,000,000 minimum initial investment.
Fund performance may reflect the waiver of the Fund’s fees and reimbursement of expenses for certain periods since the applicable inception date. Without these waivers and reimbursements, performance would have been lower. Also, performance shown in this section does not reflect the deduction of taxes that a shareholder would pay on Fund distributions or on gains resulting from redemptions of Fund shares.
| | | | | | | | |
| | | |
| OCTOBER 31, 2020 | | J.P. MORGAN INTERNATIONAL EQUITY FUNDS | | | | | 5 | |
JPMorgan Emerging Markets Equity Fund
FUND COMMENTARY
TWELVE MONTHS ENDED OCTOBER 31, 2020 (Unaudited) (continued)
International investing involves a greater degree of risk and increased volatility. Changes in currency exchange rates and differences in accounting and taxation policies outside the U.S. can raise or lower returns. Also, some overseas markets may not be as politically and economically stable as the U.S. and other nations.
Because Class C Shares automatically convert to Class A Shares after 8 years, the 10 year average annual total return shown above for Class C reflects Class A performance for the period after conversion.
The returns shown are based on net asset values calculated for shareholder transactions and may differ from the returns shown in the financial highlights, which reflect adjustments made to the net asset values in accordance with accounting principles generally accepted in the United States of America.
| | | | | | |
| | | |
| 6 | | | | J.P. MORGAN INTERNATIONAL EQUITY FUNDS | | OCTOBER 31, 2020 |
JPMorgan Emerging Markets Research Enhanced Equity Fund
FUND COMMENTARY
TWELVE MONTHS ENDED OCTOBER 31, 2020 (Unaudited)
| | | | |
| REPORTING PERIOD RETURN: | | | |
Fund (Class R6 Shares)* | | | 8.28% | |
| MSCI Emerging Markets Index (net of foreign withholding taxes) | | | 8.25% | |
| |
| Net Assets as of 10/31/2020 (In Thousands) | | $ | 2,840,342 | |
INVESTMENT OBJECTIVE**
The JPMorgan Emerging Markets Research Enhanced Equity Fund (the “Fund”) seeks to provide long-term capital appreciation.
WHAT WERE THE MAIN DRIVERS OF THE FUND’S PERFORMANCE?
The Fund’s Class R6 Shares outperformed the MSCI Emerging Markets Index (net of foreign withholding taxes) (the “Benchmark”) for the twelve months ended October 31, 2020.
By sector, the Fund’s security selection in the financials and industrials sectors was a leading contributor to performance relative to the Benchmark, while the Fund’s security selection in the consumer discretionary and consumer staples sectors was a leading detractor from relative performance.
By country, the Fund’s underweight allocation to Brazil and its security selection in Saudi Arabia were leading contributors to relative performance, while the Fund’s security selection in China and its overweight allocation to Mexico were leading detractors from relative performance.
Leading individual contributors to relative performance included the Fund’s overweight positions in Taiwan Semiconductor Manufacturing Co., Wuxi Biologics (Cayman) Inc. and Alibaba Group Holding Ltd. Shares of Taiwan Semiconductor Manufacturing rose after the company reported consecutive quarters of better-than-expected earnings amid growth in demand for advanced semiconductors. Shares of Wuxi Biologics (Cayman), a Chinese developer of biological testing and drug research, rose amid investor expectations of increased demand for its products and services in response to the pandemic. Shares of Alibaba Group Holding, an electronic commerce platform provider, rose amid growth in demand for digital services.
Leading individual detractors from relative performance included the Fund’s underweight positions in Nio Inc., BYD Co. and Pinduoduo Inc. Shares of Nio, a Chinese maker of electric vehicles, rose after the company reported better-than-expected revenue for the second quarter of 2020 and raised its third quarter forecast amid continued growth in vehicle sales. Shares of BYD, a Chinese maker of electronic vehicles that was not held in the Fund, rose after the company won a contract to supply electric vehicle batteries to Ford Motor Corp. Shares of Pinduoduo, a Chinese electronic commerce platform provider, rose amid growth in consumer demand for online shopping.
HOW WAS THE FUND POSITIONED?
The Fund’s portfolio managers employed a combination of disciplined portfolio construction with in-depth fundamental research
conducted by a global network of research analysts to identify what they believed to be overvalued and undervalued stocks.
As a result of this process, by sector, the Fund’s sole overweight allocation relative to the Benchmark was in the information technology sector and its largest underweight allocations were in the financials and materials sectors. By country, the Fund’s largest overweight allocations relative to the Benchmark were in Mexico and Russia and its largest relative underweight allocations were in Taiwan and Malaysia.
| | | | | | | | |
| TOP TEN EQUITY HOLDINGS OF THE PORTFOLIO*** | |
| | 1. | | | Alibaba Group Holding Ltd. (China) | | | 8.2 | % |
| | 2. | | | Tencent Holdings Ltd. (China) | | | 7.0 | |
| | 3. | | | Taiwan Semiconductor Manufacturing Co. Ltd., ADR (Taiwan) | | | 5.7 | |
| | 4. | | | Samsung Electronics Co. Ltd. (South Korea) | | | 4.5 | |
| | 5. | | | Meituan Dianping, Class B (China) | | | 2.3 | |
| | 6. | | | Reliance Industries Ltd. (India) | | | 1.4 | |
| | 7. | | | Naspers Ltd., Class N (South Africa) | | | 1.3 | |
| | 8. | | | Ping An Insurance Group Co. of China Ltd., Class H (China) | | | 1.3 | |
| | 9. | | | China Construction Bank Corp., Class H (China) | | | 1.2 | |
| | 10. | | | Infosys Ltd., ADR (India) | | | 1.0 | |
| | | | |
PORTFOLIO COMPOSITION BY COUNTRY*** | |
| China | | | 43.7 | % |
| South Korea | | | 12.3 | |
| Taiwan | | | 11.9 | |
| India | | | 8.6 | |
| Brazil | | | 4.3 | |
| South Africa | | | 3.8 | |
| Russia | | | 3.0 | |
| Mexico | | | 2.3 | |
| Saudi Arabia | | | 2.0 | |
| Indonesia | | | 1.3 | |
| Thailand | | | 1.2 | |
| Others (each less than 1.0%) | | | 4.6 | |
| Short-Term Investments | | | 1.0 | |
| * | | The return shown is based on net asset values calculated for shareholder transactions and may differ from the return shown in the financial highlights, which reflects adjustments made to the net asset values in accordance with accounting principles generally accepted in the United States of America. |
| ** | | The adviser seeks to achieve the Fund’s objective. There can be no guarantee it will be achieved. |
| *** | | Percentages indicated are based on total investments as of October 31, 2020. The Fund’s portfolio composition is subject to change. |
| | | | | | | | |
| | | |
| OCTOBER 31, 2020 | | J.P. MORGAN INTERNATIONAL EQUITY FUNDS | | | | | 7 | |
JPMorgan Emerging Markets Research Enhanced Equity Fund
FUND COMMENTARY
TWELVE MONTHS ENDED OCTOBER 31, 2020 (Unaudited) (continued)
| | | | | | | | | | |
AVERAGE ANNUAL TOTAL RETURNS AS OF OCTOBER 31, 2020 | |
| | | |
| | | INCEPTION DATE OF
CLASS | | 1 YEAR | | | SINCE
INCEPTION | |
CLASS I SHARES | | January 30, 2019 | | | 8.15 | % | | | 10.93 | % |
CLASS R6 SHARES | | December 11, 2018 | | | 8.28 | | | | 11.07 | |
LIFE OF FUND PERFORMANCE (12/11/18 TO 10/31/2020)
The performance quoted is past performance and is not a guarantee of future results. Mutual funds are subject to certain market risks. Investment returns and principal value of an investment will fluctuate so that an investor’s shares, when redeemed, may be worth more or less than their original cost. Current performance may be higher or lower than the performance data shown. For up-to-date month-end performance information please call 1-800-480-4111.
The Fund commenced operations on December 11, 2018.
Returns for Class I Shares prior to its inception date are based on the performance of Class R6 Shares. The actual returns of Class I Shares would have been lower than those shown because Class I Shares have higher expenses than Class R6 Shares.
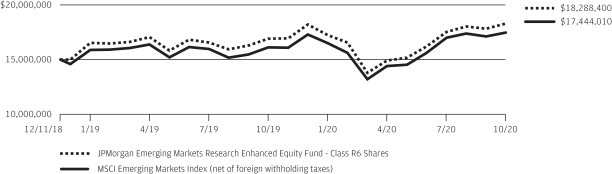
The graph illustrates comparative performance for $15,000,000 invested in Class R6 Shares of the JPMorgan Emerging Markets Research Enhanced Equity Fund and the MSCI Emerging Markets Index (net of foreign withholding taxes) from December 11, 2018 to October 31, 2020. The performance of the Fund assumes reinvestment of all dividends and capital gain distributions, if any, and does not include a sales charge. The performance of the MSCI Emerging Markets Index (net of foreign withholding taxes) does not reflect the deduction of expenses or a sales charge associated with a mutual fund and approximates the minimum possible dividend reinvestment of the securities included in the benchmark, if applicable. The dividend is reinvested after deduction of withholding tax, applying the maximum rate to non-resident institutional investors who do not benefit from double taxation treaties. The MSCI Emerging Markets Index (net of foreign withholding taxes) is a free float-adjusted market capitalization weighted index that is designed to measure the equity market performance of emerging markets. Investors cannot invest directly in an index.
Class R6 Shares have a $15,000,000 minimum initial investment.
Fund performance may reflect the waiver of the Fund’s fees and reimbursement of expenses for certain periods since the applicable inception date.
Without these waivers and reimbursements, performance would have been lower. Also, performance shown in this section does not reflect the deduction of taxes that a shareholder would pay on Fund distributions or on gains resulting from redemptions of Fund shares.
International investing involves a greater degree of risk and increased volatility. Changes in currency exchange rates and differences in accounting and taxation policies outside the U.S. can raise or lower returns. Also, some overseas markets may not be as politically and economically stable as the U.S. and other nations.
The returns shown are based on net asset values calculated for shareholder transactions and may differ from the returns shown in the financial highlights, which reflect adjustments made to the net asset values in accordance with accounting principles generally accepted in the United States of America.
The MSCI information may only be used for your internal use, may not be reproduced or redisseminated in any form and may not be used as a basis for or a component of any financial instruments or products or indices. None of the MSCI information is intended to constitute investment advice or a recommendation to make (or refrain from making) any kind of investment decision and may not be relied on as such. Historical data and analysis should not be taken as an indication or guarantee of any future performance analysis, forecast or prediction. The MSCI information is provided on an “as is” basis and the user of this information assumes the entire risk of any use made of this information. MSCI, each of its affiliates and each other person involved in or related to compiling, computing or creating any MSCI information (collectively, the “MSCI Parties”) expressly disclaims all warranties (including, without limitation, any warranties of originality, accuracy, completeness, timeliness, non-infringement, merchantability and fitness for a particular purpose) with respect to this information. Without limiting any of the foregoing, in no event shall any MSCI Party have any liability for any direct, indirect, special, incidental, punitive, consequential (including, without limitation, lost profits) or any other damages. (www.msci.com)
| | | | | | |
| | | |
| 8 | | | | J.P. MORGAN INTERNATIONAL EQUITY FUNDS | | OCTOBER 31, 2020 |
JPMorgan Europe Dynamic Fund
FUND COMMENTARY
TWELVE MONTHS ENDED OCTOBER 31, 2020 (Unaudited)
| | | | |
| REPORTING PERIOD RETURN: | |
| Fund (Class A Shares, without a sales charge)* | | | (8.21)% | |
| MSCI Europe Index (net of foreign withholding taxes) | | | (9.29)% | |
| |
| Net Assets as of 10/31/2020 (In Thousands) | | | $438,828 | |
INVESTMENT OBJECTIVE**
The JPMorgan Europe Dynamic Fund (the “Fund”) seeks total return from long-term capital growth. Total return consists of capital growth and current income.
WHAT WERE THE MAIN DRIVERS OF THE FUND’S PERFORMANCE?
The Fund’s Class A Shares, without a sales charge, outperformed the MSCI Europe Index (net of foreign withholding taxes) (the “Benchmark”) for the twelve months ended October 31, 2020.
By sector, the Fund’s security selection and underweight position in the energy services sector and its security selection in the software & services sector were leading contributors to relative performance. The Fund’s underweight position and security selection in the food, beverages & tobacco sector and its security selection and overweight position in the automobiles & components sector were leading detractors from performance relative to the Benchmark.
Leading individual contributors to relative performance included the Fund’s overweight position in Evolution Gaming Group AB, its out-of-Benchmark position in HelloFresh SE and its underweight position in Royal Dutch Shell PLC. Shares of Evolution Gaming Group, a Swedish provider of online casino games, rose amid strong demand for at-home entertainment during 2020. Shares of HelloFresh, a German provider of delivery meal kits, rose amid continued growth in consumer demand
for at-home meals in 2020. Shares of Royal Dutch Shell, an Anglo/Dutch integrated oil and gas company not held by the Fund, fell amid a sharp decline in energy demand in 2020.
Leading individual detractors from relative performance included the Fund’s overweight positions in Nestle SA and OMV AG and its underweight position in ASML Holdings NV
Shares of Nestle, a Swiss maker of prepared foods and beverages, fell after the company lowered its 2020 earnings and sales forecast at the end of July 2020, citing the impact of at-home quarantines across Europe and North America. Shares of OMV, an Austrian integrated oil and gas company, fell amid a sharp decline in energy demand during 2020. Shares of ASML Holdings, a Dutch provider of semiconductor manufacturing equipment, rose after the company reported better-than-expected earnings and revenue for the third quarter of 2020 and confirmed its positive outlook for fourth quarter 2020 results.
HOW WAS THE FUND POSITIONED?
The Fund’s portfolio managers believe that attractively valued, high quality securities with positive momentum have the potential to outperform the market. During the reporting period, the Fund’s portfolio managers invested in securities that they believed had these style characteristics. Portfolio positions were based on bottom-up security selection rather than top-down asset allocation decisions.
| | | | | | | | |
| | | |
| OCTOBER 31, 2020 | | J.P. MORGAN INTERNATIONAL EQUITY FUNDS | | | | | 9 | |
JPMorgan Europe Dynamic Fund
FUND COMMENTARY
TWELVE MONTHS ENDED OCTOBER 31, 2020 (Unaudited) (continued)
| | | | | | | | |
| TOP TEN EQUITY HOLDINGS OF THE PORTFOLIO*** | |
| | 1. | | | Nestle SA (Registered) (Switzerland) | | | 3.9 | % |
| | 2. | | | Roche Holding AG (Switzerland) | | | 2.9 | |
| | 3. | | | Novartis AG (Registered) (Switzerland) | | | 2.8 | |
| | 4. | | | Deutsche Telekom AG (Registered) (Germany) | | | 2.0 | |
| | 5. | | | Deutsche Post AG (Registered) (Germany) | | | 2.0 | |
| | 6. | | | Sanofi (France) | | | 1.9 | |
| | 7. | | | Schneider Electric SE (France) | | | 1.8 | |
| | 8. | | | Enel SpA (Italy) | | | 1.8 | |
| | 9. | | | Orsted A/S (Denmark) | | | 1.7 | |
| | 10. | | | ASM International NV (Netherlands) | | | 1.6 | |
| | | | |
PORTFOLIO COMPOSITION BY COUNTRY*** | |
| Switzerland | | | 18.2 | % |
| United Kingdom | | | 17.1 | |
| Germany | | | 14.2 | |
| France | | | 11.1 | |
| Sweden | | | 7.7 | |
| Netherlands | | | 7.1 | |
| Denmark | | | 4.3 | |
| Italy | | | 3.7 | |
| Ireland | | | 3.1 | |
| Australia | | | 2.9 | |
| Austria | | | 2.4 | |
| Finland | | | 2.2 | |
| China | | | 1.3 | |
| Spain | | | 1.1 | |
| United States | | | 1.1 | |
| Jordan | | | 1.0 | |
| Others (each less than 1.0%) | | | 0.4 | |
| Short-Term Investments | | | 1.1 | |
| * | | The return shown is based on net asset values calculated for shareholder transactions and may differ from the return shown in the financial highlights, which reflects adjustments made to the net asset values in accordance with accounting principles generally accepted in the United States of America. |
| ** | | The adviser seeks to achieve the Fund’s objective. There can be no guarantee it will be achieved. |
| *** | | Percentages indicated are based on total investments as of October 31, 2020. The Fund’s portfolio composition is subject to change. |
| | | | | | |
| | | |
| 10 | | | | J.P. MORGAN INTERNATIONAL EQUITY FUNDS | | OCTOBER 31, 2020 |
| | | | | | | | | | | | | | |
AVERAGE ANNUAL TOTAL RETURNS AS OF OCTOBER 31, 2020 | |
| | | | |
| | | INCEPTION DATE OF
CLASS | | 1 YEAR | | | 5 YEAR | | | 10 YEAR | |
CLASS A SHARES | | November 2, 1995 | | | | | | | | | | | | |
With Sales Charge* | | | | | (13.02 | )% | | | (1.48 | )% | | | 3.16 | % |
Without Sales Charge | | | | | (8.21 | ) | | | (0.42 | ) | | | 3.71 | |
CLASS C SHARES | | November 1, 1998 | | | | | | | | | | | | |
With CDSC** | | | | | (9.64 | ) | | | (0.91 | ) | | | 3.30 | |
Without CDSC | | | | | (8.64 | ) | | | (0.91 | ) | | | 3.30 | |
CLASS I SHARES | | September 10, 2001 | | | (7.98 | ) | | | (0.15 | ) | | | 3.99 | |
CLASS L SHARES | | September 10, 2001 | | | (7.86 | ) | | | (0.01 | ) | | | 4.18 | |
CLASS R6 SHARES | | October 1, 2018 | | | (7.75 | ) | | | 0.03 | | | | 4.20 | |
| * | | Sales Charge for Class A Shares is 5.25%. |
| ** | | Assumes a 1% CDSC (contingent deferred sales charge) for the one year period and 0% CDSC thereafter. |
TEN YEAR PERFORMANCE (10/31/10 TO 10/31/20)
The performance quoted is past performance and is not a guarantee of future results. Mutual funds are subject to certain market risks. Investment returns and principal value of an investment will fluctuate so that an investor’s shares, when redeemed, may be worth more or less than their original cost. Current performance may be higher or lower than the performance data shown. For up-to-date month-end performance information please call 1-800-480-4111.
Returns for Class R6 Shares prior to its inception date are based on the performance of Class L Shares. The actual returns of Class R6 Shares would have been different than those shown because Class R6 Shares have different expenses than Class L Shares.
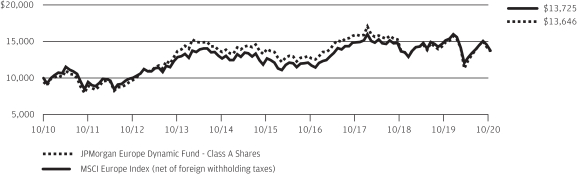
The graph illustrates comparative performance for $10,000 invested in Class A Shares of the JPMorgan Europe Dynamic Fund and the MSCI Europe Index (net of foreign withholding taxes) from October 31, 2010 to October 31, 2020. The performance of the Fund assumes reinvestment of all dividends and capital gain distributions, if any, and includes a sales charge. The performance of the MSCI Europe Index (net of foreign withholding taxes) does not reflect the deduction of expenses or a sales charge associated with a mutual fund and approximates the minimum possible dividend reinvestment of the securities included in the benchmark, if applicable. The dividend is reinvested after deduction of withholding tax, applying the maximum rate to non-resident institutional investors who do not benefit from double taxation treaties. The MSCI Europe Index (net of foreign withholding taxes) is a free float-adjusted market capitalization weighted
index that is designed to measure the equity market performance of the developed markets in Europe. Investors cannot invest directly in an index.
Class A Shares have a $1,000 minimum initial investment and carry a 5.25% sales charge.
Fund performance may reflect the waiver of the Fund’s fees and reimbursement of expenses for certain periods since the applicable inception date. Without these waivers and reimbursements, performance would have been lower. Also, performance shown in this section does not reflect the deduction of taxes that a shareholder would pay on Fund distributions or on gains resulting from redemptions of Fund shares.
International investing involves a greater degree of risk and increased volatility. Changes in currency exchange rates and differences in accounting and taxation policies outside the U.S. can raise or lower returns. Also, some overseas markets may not be as politically and economically stable as the U.S. and other nations.
Because Class C Shares automatically convert to Class A Shares after 8 years, the 10 year average annual total return shown above for Class C reflects Class A performance for the period after conversion.
The returns shown are based on net asset values calculated for shareholder transactions and may differ from the returns shown in the financial highlights, which reflect adjustments made to the net asset values in accordance with accounting principles generally accepted in the United States of America.
| | | | | | | | |
| | | |
| OCTOBER 31, 2020 | | J.P. MORGAN INTERNATIONAL EQUITY FUNDS | | | | | 11 | |
JPMorgan International Advantage Fund
FUND COMMENTARY
TWELVE MONTHS ENDED OCTOBER 31, 2020 (Unaudited)
| | | | |
| REPORTING PERIOD RETURN: | |
| Fund (Class A Shares, without a sales charge)* | | | (9.11)% | |
| MSCI EAFE Index (net of foreign withholding taxes) | | | (6.86)% | |
| |
| Net Assets as of 10/31/2020 (In Thousands) | | $ | 1,509,015 | |
INVESTMENT OBJECTIVE**
The JPMorgan International Advantage Fund (the “Fund”) seeks to maximize long-term capital growth by investing primarily in equity securities in developed markets outside the U.S.
WHAT WERE THE MAIN DRIVERS OF THE FUND’S PERFORMANCE?
The Fund’s Class A Shares, without a sales charge, underperformed the MSCI EAFE Index (net of foreign withholding taxes) (the “Benchmark”) for the twelve months ended October 31, 2020.
By sector, the Fund’s security selection in the industrials sector, and its security selection and underweight position in the health care sector were leading detractors from performance relative to the Benchmark, while the Fund’s underweight position in the energy sector and its security selection in the communication services sector were leading contributors to relative performance.
By country, the Fund’s security selection in Germany and Japan was a leading detractor from relative performance, while the Fund’s security selection in the U.K. and France was a leading contributor to relative performance.
The Fund targeted investments in companies that exhibited specific growth, value and quality characteristics during the period. Due to the relatively large number of securities held in the Fund during the reporting period, the impact of individual holdings on the Fund’s relative performance tended to be small.
HOW WAS THE FUND POSITIONED?
The Fund’s portfolio managers believe that attractively valued, high quality securities with positive momentum have the potential to outperform the market. During the reporting period, the Fund’s portfolio managers invested in securities that they believed were attractive based on proprietary multifactor screens that are used to rank securities in the Fund’s investment universe on the basis of value, quality and momentum characteristics.
| | | | | | | | |
| TOP TEN EQUITY HOLDINGS OF THE PORTFOLIO*** | |
| | 1. | | | Nestle SA (Registered) (Switzerland) | | | 3.1 | % |
| | 2. | | | Roche Holding AG (Switzerland) | | | 2.7 | |
| | 3. | | | BHP Group Ltd. (Australia) | | | 1.8 | |
| | 4. | | | Sanofi (France) | | | 1.7 | |
| | 5. | | | Novo Nordisk A/S, Class B (Denmark) | | | 1.7 | |
| | 6. | | | Toyota Motor Corp. (Japan) | | | 1.7 | |
| | 7. | | | Rio Tinto plc (Australia) | | | 1.6 | |
| | 8. | | | Schneider Electric SE (France) | | | 1.5 | |
| | 9. | | | Allianz SE (Registered) (Germany) | | | 1.4 | |
| | 10. | | | Sony Corp. (Japan) | | | 1.4 | |
| | | | |
PORTFOLIO COMPOSITION BY COUNTRY*** | |
| Japan | | | 26.0 | % |
| Switzerland | | | 10.6 | |
| United Kingdom | | | 10.5 | |
| Australia | | | 8.8 | |
| Germany | | | 8.7 | |
| France | | | 8.2 | |
| Netherlands | | | 6.4 | |
| Sweden | | | 3.1 | |
| Denmark | | | 2.6 | |
| Singapore | | | 1.7 | |
| Hong Kong | | | 1.7 | |
| Belgium | | | 1.6 | |
| Norway | | | 1.4 | |
| South Africa | | | 1.2 | |
| Italy | | | 1.1 | |
| Spain | | | 1.0 | |
| United States | | | 1.0 | |
| Others (each less than 1.0%) | | | 3.7 | |
| Short-Term Investments | | | 0.7 | |
| * | | The return shown is based on net asset values calculated for shareholder transactions and may differ from the return shown in the financial highlights, which reflects adjustments made to the net asset values in accordance with accounting principles generally accepted in the United States of America. |
| ** | | The adviser seeks to achieve the Fund’s objective. There can be no guarantee it will be achieved. |
| *** | | Percentages indicated are based on total investments as of October 31, 2020. The Fund’s portfolio composition is subject to change. |
| | | | | | |
| | | |
| 12 | | | | J.P. MORGAN INTERNATIONAL EQUITY FUNDS | | OCTOBER 31, 2020 |
| | | | | | | | | | | | | | |
AVERAGE ANNUAL TOTAL RETURNS AS OF OCTOBER 31, 2020 | |
| | | | |
| | | INCEPTION DATE OF
CLASS | | 1 YEAR | | | 5 YEAR | | | 10 YEAR | |
CLASS A SHARES | | April 30, 2001 | | | | | | | | | | | | |
With Sales Charge* | | | | | (13.87 | )% | | | (0.85 | )% | | | 1.76 | % |
Without Sales Charge | | | | | (9.11 | ) | | | 0.22 | | | | 2.32 | |
CLASS C SHARES | | February 28, 2006 | | | | | | | | | | | | |
With CDSC** | | | | | (10.54 | ) | | | (0.28 | ) | | | 1.90 | |
Without CDSC | | | | | (9.54 | ) | | | (0.28 | ) | | | 1.90 | |
CLASS I SHARES | | February 28, 2006 | | | (8.84 | ) | | | 0.51 | | | | 2.59 | |
CLASS R2 SHARES | | November 3, 2008 | | | (9.37 | ) | | | (0.06 | ) | | | 2.04 | |
CLASS R6 SHARES | | May 29, 2015 | | | (8.71 | ) | | | 0.69 | | | | 2.81 | |
| * | | Sales Charge for Class A Shares is 5.25%. |
| ** | | Assumes a 1% CDSC (contingent deferred sales charge) for the one year period and 0% CDSC thereafter. |
TEN YEAR PERFORMANCE (10/31/10 TO 10/31/20)
The performance quoted is past performance and is not a guarantee of future results. Mutual funds are subject to certain market risks. Investment returns and principal value of an investment will fluctuate so that an investor’s shares, when redeemed, may be worth more or less than their original cost. Current performance may be higher or lower than the performance data shown. For up-to-date month-end performance information please call 1-800-480-4111.
Returns for Class R6 Shares prior to its inception date are based on the performance of Class L Shares (liquidated on December 8, 2016). The actual returns of Class R6 Shares would have been different than those shown because Class R6 Shares have different expenses than Class L Shares.
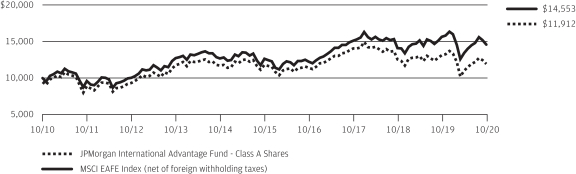
The graph illustrates comparative performance for $10,000 invested in Class A Shares of the JPMorgan International Advantage Fund and the MSCI EAFE Index (net of foreign withholding taxes) from October 31, 2010 to October 31, 2020. The performance of the Fund assumes reinvestment of all dividends and capital gain distributions, if any, and does not include a sales charge. The performance of the MSCI EAFE Index (net of foreign withholding taxes) does not reflect the deduction of expenses or a sales charge associated with a mutual fund and approximates the minimum possible dividend reinvestment of the securities included in the benchmark, if applicable. The dividend is reinvested after deduction of withholding tax, applying the maximum rate to non-resident institutional investors who do not benefit from double taxation treaties. The MSCI EAFE Index (net of foreign withholding taxes) is a free float-adjusted market capitalization weighted index that is designed to measure the equity market performance of developed markets, excluding the U.S. and Canada. Investors cannot invest directly in an index.
Class A Shares have a $1,000 minimum initial investment and carry a 5.25% sales charge.
Fund performance may reflect the waiver of the Fund’s fees and reimbursement of expenses for certain periods since the applicable inception date. Without these waivers and reimbursements, performance would have been lower. Also, performance shown in this section does not reflect the deduction of taxes that a shareholder would pay on Fund distributions or on gains resulting from redemptions of Fund shares.
International investing involves a greater degree of risk and increased volatility. Changes in currency exchange rates and differences in accounting and taxation policies outside the U.S. can raise or lower returns. Also, some overseas markets may not be as politically and economically stable as the U.S. and other nations.
Because Class C Shares automatically convert to Class A Shares after 8 years, the 10 year average annual total return shown above for Class C reflects Class A performance for the period after conversion.
The returns shown are based on net asset values calculated for shareholder transactions and may differ from the returns shown in the financial highlights, which reflect adjustments made to the net asset values in accordance with accounting principles generally accepted in the United States of America.
| | | | | | | | |
| | | |
| OCTOBER 31, 2020 | | J.P. MORGAN INTERNATIONAL EQUITY FUNDS | | | | | 13 | |
JPMorgan International Equity Fund
FUND COMMENTARY
TWELVE MONTHS ENDED OCTOBER 31, 2020 (Unaudited)
| | | | |
| REPORTING PERIOD RETURN: | |
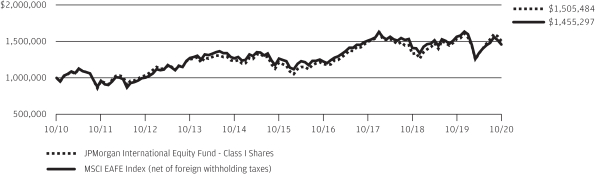
| Fund (Class I Shares)* | | | (1.64)% | |
| MSCI EAFE Index (net of foreign withholding taxes) | | | (6.86)% | |
| |
| Net Assets as of 10/31/2020 (In Thousands) | | | $2,930,922 | |
INVESTMENT OBJECTIVE**
The JPMorgan International Equity Fund (the “Fund”) seeks total return from long-term capital growth and income. Total return consists of capital growth and current income.
WHAT WERE THE MAIN DRIVERS OF THE FUND’S PERFORMANCE?
The Fund’s Class I Shares outperformed the MSCI EAFE Index (net of foreign withholding taxes) (the “Benchmark”) for the twelve months ended October 31, 2020.
By sector, the Fund’s security selection and overweight position in the industrials and information technology sectors were leading contributors to performance relative to the Benchmark, while the Fund’s security selection and underweight position in the health care sector and its security selection in the consumer staples sector were leading detractors from relative performance.
By region, the Fund’s out-of-Benchmark position in emerging markets and its security selection in Japan were leading contributors to performance relative to the Benchmark, while the Fund’s overweight positions in the U.K. and Continental Europe were the smallest contributors to relative performance.
Leading individual contributors to the Fund’s relative performance included the Fund’s out-of-Benchmark positions in Taiwan Semiconductor Manufacturing Co., Tencent Holdings Ltd. and Alibaba Group Holding Ltd. Shares of Taiwan Semiconductor Manufacturing, a maker of semiconductors, rose after the company reported consecutive quarters of better-than-
expected earnings amid growth in demand for advanced semiconductors during the period. Shares of Tencent Holdings, a Hong Kong online gaming, advertising and services company, rose amid growth in consumer demand for the company’s services. Shares of Alibaba Group Holding, an electronic commerce platform provider, rose amid increased demand for digital services for the period.
Leading individual detractors from the Fund’s relative performance included its out of Benchmark position in Itaú Unibanco Holding SA, its underweight position in Softbank Group Corp. and its overweight position in Royal Dutch Shell PLC. Shares of Itau Unibanco Holding, a Brazilian banking and financial services company, fell amid several consecutive quarters for lower-than-expected earnings in 2020. Shares of Softbank Group, a Japanese technology and investment company not held by the Fund, rose after it agreed to sell its Arm unit to Nvidia Corp. for $40 billion. Shares of Royal Dutch Shell, an Anglo/Dutch integrated oil and gas company, fell amid a sharp decline in energy demand in 2020. Shares of Royal Dutch Shell, a British/Dutch oil and natural gas producer and retailer, fell as global energy demand contracted and global oil prices fell sharply in 2020.
HOW WAS THE FUND POSITIONED?
The Fund’s portfolio managers continued to focus on security selection to build a portfolio of international equities. They used bottom-up fundamental research to identify what they believed were attractively priced securities of companies with solid financial positions that possessed the potential to increase their earnings faster than their industry peers.
| | | | | | |
| | | |
| 14 | | | | J.P. MORGAN INTERNATIONAL EQUITY FUNDS | | OCTOBER 31, 2020 |
| | | | | | | | |
| TOP TEN EQUITY HOLDINGS OF THE PORTFOLIO*** | |
| | 1. | | | Nestle SA (Registered) (Switzerland) | | | 3.6 | % |
| | 2. | | | Roche Holding AG (Switzerland) | | | 2.9 | |
| | 3. | | | ASML Holding NV (Netherlands) | | | 2.3 | |
| | 4. | | | Novartis AG (Registered) (Switzerland) | | | 2.1 | |
| | 5. | | | Sony Corp. (Japan) | | | 2.1 | |
| | 6. | | | Keyence Corp. (Japan) | | | 2.1 | |
| | 7. | | | AIA Group Ltd. (Hong Kong) | | | 2.1 | |
| | 8. | | | LVMH Moet Hennessy Louis Vuitton SE (France) | | | 2.0 | |
| | 9. | | | Unilever plc (United Kingdom) | | | 2.0 | |
| | 10. | | | Novo Nordisk A/S, Class B (Denmark) | | | 2.0 | |
| | | | |
PORTFOLIO COMPOSITION BY COUNTRY*** | |
| Japan | | | 19.8 | % |
| United Kingdom | | | 13.1 | |
| France | | | 12.1 | |
| Switzerland | | | 11.7 | |
| Germany | | | 8.0 | |
| Denmark | | | 4.1 | |
| China | | | 4.0 | |
| Australia | | | 3.9 | |
| Hong Kong | | | 3.3 | |
| Netherlands | | | 3.1 | |
| Spain | | | 3.0 | |
| Sweden | | | 2.2 | |
| Taiwan | | | 1.6 | |
| South Korea | | | 1.6 | |
| India | | | 1.4 | |
| Finland | �� | | 1.2 | |
| United States | | | 1.1 | |
| Others (each less than 1.0%) | | | 2.7 | |
| Short-Term Investments | | | 2.1 | |
| * | | The return shown is based on net asset values calculated for shareholder transactions and may differ from the return shown in the financial highlights, which reflects adjustments made to the net asset values in accordance with accounting principles generally accepted in the United States of America. |
| ** | | The adviser seeks to achieve the Fund’s objective. There can be no guarantee it will be achieved. |
| *** | | Percentages indicated are based on total investments as of October 31, 2020. The Fund’s portfolio composition is subject to change. |
| | | | | | | | |
| | | |
| OCTOBER 31, 2020 | | J.P. MORGAN INTERNATIONAL EQUITY FUNDS | | | | | 15 | |
JPMorgan International Equity Fund
FUND COMMENTARY
TWELVE MONTHS ENDED OCTOBER 31, 2020 (Unaudited) (continued)
| | | | | | | | | | | | | | |
AVERAGE ANNUAL TOTAL RETURNS AS OF OCTOBER 31, 2020 | |
| | | | |
| | | INCEPTION DATE OF
CLASS | | 1 YEAR | | | 5 YEAR | | | 10 YEAR | |
CLASS A SHARES | | February 28, 2002 | | | | | | | | | | | | |
With Sales Charge* | | | | | (7.05 | )% | | | 3.11 | % | | | 3.36 | % |
Without Sales Charge | | | | | (1.88 | ) | | | 4.23 | | | | 3.92 | |
CLASS C SHARES | | January 31, 2003 | | | | | | | | | | | | |
With CDSC** | | | | | (3.38 | ) | | | 3.70 | | | | 3.51 | |
Without CDSC | | | | | (2.38 | ) | | | 3.70 | | | | 3.51 | |
CLASS I SHARES | | January 1, 1997 | | | (1.64 | ) | | | 4.49 | | | | 4.18 | |
CLASS R2 SHARES | | November 3, 2008 | | | (2.21 | ) | | | 3.93 | | | | 3.64 | |
CLASS R5 SHARES | | May 15, 2006 | | | (1.52 | ) | | | 4.63 | | | | 4.36 | |
CLASS R6 SHARES | | November 30, 2010 | | | (1.46 | ) | | | 4.72 | | | | 4.42 | |
| * | | Sales Charge for Class A Shares is 5.25%. |
| ** | | Assumes a 1% CDSC (contingent deferred sales charge) for the one year period and 0% CDSC thereafter. |
TEN YEAR PERFORMANCE (10/31/10 TO 10/31/20)
The performance quoted is past performance and is not a guarantee of future results. Mutual funds are subject to certain market risks. Investment returns and principal value of an investment will fluctuate so that an investor’s shares, when redeemed, may be worth more or less than their original cost. Current performance may be higher or lower than the performance data shown. For up-to-date month-end performance information please call 1-800-480-4111.
Returns for Class R6 Shares prior to its inception date are based on the performance of Class R5 Shares. The actual returns of Class R6 Shares would have been different than those shown because Class R6 Shares have different expenses than Class R5 Shares.
The graph illustrates comparative performance for $1,000,000 invested in Class I Shares of the JPMorgan International Equity Fund and the MSCI EAFE Index (net of foreign withholding taxes) from October 31, 2010 to October 31, 2020. The performance of the Fund assumes reinvestment of all dividends and capital gain distributions, if any, and does not include a sales charge. The performance of the MSCI EAFE Index (net of foreign withholding taxes) does not reflect the deduction of expenses or a sales charge associated with a mutual fund and approximates the minimum possible dividend reinvestment of the securities included in the benchmark, if applicable. The dividend is reinvested after deduction of withholding tax, applying the maximum rate to non-resident institutional investors who do not benefit from double taxation treaties. The MSCI EAFE Index (net of foreign withholding taxes) is a free float-adjusted market capitalization weighted index that is designed to measure the equity market performance of developed
markets, excluding the U.S. and Canada. Investors cannot invest directly in an index.
Class I Shares have a $1,000,000 minimum initial investment.
Fund performance may reflect the waiver of the Fund’s fees and reimbursement of expenses for certain periods since the applicable inception date. Without these waivers and reimbursements, performance would have been lower. Also, performance shown in this section does not reflect the deduction of taxes that a shareholder would pay on Fund distributions or on gains resulting from redemptions of Fund shares.
International investing involves a greater degree of risk and increased volatility. Changes in currency exchange rates and differences in accounting and taxation policies outside the U.S. can raise or lower returns. Also, some overseas markets may not be as politically and economically stable as the U.S. and other nations.
Because Class C Shares automatically convert to Class A Shares after 8 years, the 10 year average annual total return shown above for Class C reflects Class A performance for the period after conversion.
The returns shown are based on net asset values calculated for shareholder transactions and may differ from the returns shown in the financial highlights, which reflect adjustments made to the net asset values in accordance with accounting principles generally accepted in the United States of America.
| | | | | | |
| | | |
| 16 | | | | J.P. MORGAN INTERNATIONAL EQUITY FUNDS | | OCTOBER 31, 2020 |
JPMorgan International Focus Fund
(formerly known as JPMorgan International Unconstrained Equity Fund)
FUND COMMENTARY
TWELVE MONTHS ENDED OCTOBER 31, 2020 (Unaudited)
| | | | |
| REPORTING PERIOD RETURN: | |
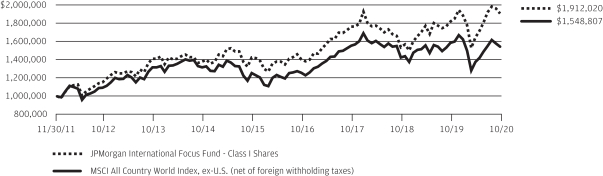
| Fund (Class I Shares)* | | | 4.71% | |
| MSCI All Country World Index, ex-U.S. (net of foreign withholding taxes) | | | (2.61)% | |
| |
| Net Assets as of 10/31/2020 (In Thousands) | | $ | 2,801,670 | |
INVESTMENT OBJECTIVE**
The JPMorgan International Focus Fund (the “Fund”) seeks to provide long-term capital appreciation.
WHAT WERE THE MAIN DRIVERS OF THE FUND’S PERFORMANCE?
The Fund’s Class I Shares outperformed the MSCI All Country World Index, Ex-U.S. (net of foreign withholding taxes) (the “Benchmark”) for the twelve months ended October 31, 2020.
By sector, the Fund’s security selection in the financials and consumer discretionary sectors was a leading contributor to performance relative to the Benchmark. The Fund’s security selection in the health care and materials sectors was a leading detractor from relative performance.
By region, the Fund’s security selection in continental Europe and the U.K. was a leading contributor to relative performance, while the Fund’s underweight position in Japan was the sole regional detractor from relative performance.
Leading individual contributors to the Fund’s relative performance included its overweight positions in Delivery Hero AG, Tencent Holdings Ltd. and Alibaba Group Holding Ltd. Shares of Delivery Hero, a German online food delivery service, rose amid increased consumer demand during 2020. Shares of Tencent
Holdings, a Hong Kong online gaming, advertising and services company, rose amid growth in consumer demand for the company’s services. Shares of Alibaba Group Holding, an electronic commerce platform provider, rose amid increased demand for digital services during the period.
Leading individual detractors from the Fund’s relative performance included its overweight positions in Airbus SE, Continental AG and Erste Group Bank AG. Shares of Airbus, a French airplanes and aerospace company, fell after the company slashed production due to decreased demand throughout the global response to the pandemic. Shares of Continental, a German automotive parts manufacturer, fell amid a sharp decline in auto production in 2020. Shares of Erste Group Bank, an Austrian regional bank, fell amid a sharp drop in earnings due to the pandemic.
HOW WAS THE FUND POSITIONED?
By harnessing their team’s global sector specialists, the Fund’s portfolio managers sought to build a high-conviction, benchmark-agnostic portfolio of growth, value and unique companies, whose future prospects, the portfolio managers believed, were under-appreciated by the market and thus possessed the potential to deliver higher-than-expected earnings that could have a positive effect on their share prices.
| | | | | | | | |
| | | |
| OCTOBER 31, 2020 | | J.P. MORGAN INTERNATIONAL EQUITY FUNDS | | | | | 17 | |
JPMorgan International Focus Fund
(formerly known as JPMorgan International Unconstrained Equity Fund)
FUND COMMENTARY
TWELVE MONTHS ENDED OCTOBER 31, 2020 (Unaudited) (continued)
| | | | | | | | |
| TOP TEN EQUITY HOLDINGS OF THE PORTFOLIO*** | |
| | 1. | | | Tencent Holdings Ltd. (China) | | | 4.4 | % |
| | 2. | | | Alibaba Group Holding Ltd., (China) | | | 4.4 | |
| | 3. | | | HDFC Bank Ltd., ADR (India) | | | 3.6 | |
| | 4. | | | Nestle SA (Registered) (Switzerland) | | | 3.6 | |
| | 5. | | | Samsung Electronics Co. Ltd. (South Korea) | | | 3.2 | |
| | 6. | | | Taiwan Semiconductor Manufacturing Co. Ltd., ADR (Taiwan) | | | 3.2 | |
| | 7. | | | AIA Group Ltd. (Hong Kong) | | | 3.1 | |
| | 8. | | | Ping An Insurance Group Co. of China Ltd., Class H (China) | | | 2.8 | |
| | 9. | | | Unilever NV (United Kingdom) | | | 2.7 | |
| | 10. | | | ASML Holding NV (Netherlands) | | | 2.3 | |
| | | | |
PORTFOLIO COMPOSITION BY COUNTRY*** | |
| United Kingdom | | | 17.2 | % |
| China | | | 11.7 | |
| Switzerland | | | 10.5 | |
| Germany | | | 7.0 | |
| Canada | | | 6.2 | |
| Japan | | | 5.3 | |
| Taiwan | | | 4.5 | |
| Hong Kong | | | 4.5 | |
| France | | | 4.2 | |
| India | | | 3.6 | |
| South Korea | | | 3.2 | |
| Spain | | | 3.0 | |
| Sweden | | | 2.8 | |
| Netherlands | | | 2.3 | |
| Denmark | | | 2.1 | |
| Australia | | | 1.9 | |
| Finland | | | 1.6 | |
| United States | | | 1.6 | |
| Indonesia | | | 1.4 | |
| Belgium | | | 1.2 | |
| Short-Term Investments | | | 4.2 | |
| * | | The return shown is based on net asset values calculated for shareholder transactions and may differ from the return shown in the financial highlights, which reflects adjustments made to the net asset values in accordance with accounting principles generally accepted in the United States of America. |
| ** | | The adviser seeks to achieve the Fund’s objective. There can be no guarantee it will be achieved. |
| *** | | Percentages indicated are based on total investments as of October 31, 2020. The Fund’s portfolio composition is subject to change. |
| | | | | | |
| | | |
| 18 | | | | J.P. MORGAN INTERNATIONAL EQUITY FUNDS | | OCTOBER 31, 2020 |
| | | | | | | | |
AVERAGE ANNUAL TOTAL RETURNS AS OF OCTOBER 31, 2020 |
| | | | | | | | | | | | | | |
| | | | |
| | | INCEPTION DATE OF
CLASS | | 1 YEAR | | | 5 YEAR | | | SINCE
INCEPTION | |
CLASS A SHARES | | November 30, 2011 | | | | | | | | | | | | |
With Sales Charge* | | | | | (1.04 | )% | | | 4.56 | % | | | 6.60 | % |
Without Sales Charge | | | | | 4.43 | | | | 5.70 | | | | 7.24 | |
CLASS C SHARES | | November 30, 2011 | | | | | | | | | | | | |
With CDSC** | | | | | 2.93 | | | | 5.16 | | | | 6.76 | |
Without CDSC | | | | | 3.93 | | | | 5.16 | | | | 6.76 | |
CLASS I SHARES | | November 30, 2011 | | | 4.71 | | | | 6.00 | | | | 7.54 | |
CLASS R2 SHARES | | November 30, 2011 | | | 4.14 | | | | 5.40 | | | | 6.95 | |
CLASS R5 SHARES | | November 30, 2011 | | | 4.79 | | | | 6.10 | | | | 7.68 | |
CLASS R6 SHARES | | November 30, 2011 | | | 4.89 | | | | 6.19 | | | | 7.75 | |
| * | | Sales Charge for Class A Shares is 5.25%. |
| ** | | Assumes a 1% CDSC (contingent deferred sales charge) for the one year period and 0% CDSC thereafter. |
LIFE OF FUND PERFORMANCE (11/30/11 TO 10/31/20)
The performance quoted is past performance and is not a guarantee of future results. Mutual funds are subject to certain market risks. Investment returns and principal value of an investment will fluctuate so that an investor’s shares, when redeemed, may be worth more or less than their original cost. Current performance may be higher or lower than the performance data shown. For up-to-date month-end performance information please call 1-800-480-4111.
The Fund commenced operations on November 30, 2011.
The graph illustrates comparative performance for $1,000,000 invested in Class I Shares of the JPMorgan International Focus Fund and the MSCI All Country World Index, ex-U.S. (net of foreign withholding taxes) from November 30, 2011 to October 31, 2020. The performance of the Fund assumes reinvestment of all dividends and capital gain distributions, if any, and does not include a sales charge. The performance of the MSCI All Country World Index, ex-U.S. (net of foreign withholding taxes) does not reflect the deduction of expenses or a sales charge associated with a mutual fund and approximates the minimum possible dividend reinvestment of the securities included in the benchmark, if applicable. The dividend is reinvested after deduction of withholding tax, applying the maximum rate to non-resident institutional investors who do not benefit from double taxation treaties. The MSCI All Country World Index, ex-U.S. (net of foreign withholding taxes) is a free float-adjusted market capitalization weighted index that is designed to measure the equity market performance of developed and emerging markets, excluding the United States. Investors cannot invest directly in an index.
Class I Shares have a $1,000,000 minimum initial investment.
Subsequent to the inception date of the Fund and through May 30, 2013, the Fund did not experience any shareholder activity. If such shareholder activity had occurred, the Fund’s performance may have been impacted.
Fund performance may reflect the waiver of the Fund’s fees and reimbursement of expenses for certain periods since the applicable inception date. Without these waivers and reimbursements, performance would have been lower. Also, performance shown in this section does not reflect the deduction of taxes that a shareholder would pay on Fund distributions or on gains resulting from redemptions of Fund shares.
International investing involves a greater degree of risk and increased volatility. Changes in currency exchange rates and differences in accounting and taxation policies outside the U.S. can raise or lower returns. Also, some overseas markets may not be as politically and economically stable as the U.S. and other nations.
The returns shown are based on net asset values calculated for shareholder transactions and may differ from the returns shown in the financial highlights, which reflect adjustments made to the net asset values in accordance with accounting principles generally accepted in the United States of America.
| | | | | | | | |
| | | |
| OCTOBER 31, 2020 | | J.P. MORGAN INTERNATIONAL EQUITY FUNDS | | | | | 19 | |
JPMorgan International Hedged Equity Fund
FUND COMMENTARY
TWELVE MONTHS ENDED OCTOBER 31, 2020 (Unaudited)
| | | | |
| REPORTING PERIOD RETURN: | |
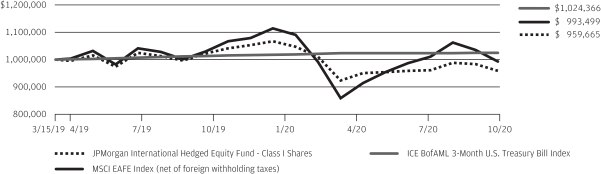
| Fund (Class I Shares)* | | | (7.78)% | |
| MSCI EAFE Index (net of foreign withholding taxes) | | | (6.86)% | |
| ICE BofAML 3-Month U.S. Treasury Bill Index | | | 0.92% | |
| |
| Net Assets as of 10/31/2020 (In Thousands) | | $ | 137,268 | |
INVESTMENT OBJECTIVE**
The JPMorgan International Hedged Equity Fund (the “Fund”) seeks to provide capital appreciation.
WHAT WERE THE MAIN DRIVERS OF THE FUND’S PERFORMANCE?
The Fund’s Class I Shares underperformed both the MSCI EAFE Index (net of foreign withholding taxes) (the “Benchmark”) and the ICE BofAML 3-Month U.S. Treasury Bill Index for the twelve months ended October 31, 2020. The Fund’s options hedge allowed the Fund to generally perform as designed during the reporting period with about 50% of the Benchmark’s volatility.
By sector, the Fund’s security selection in the consumer discretionary and industrials sectors was a leading detractor from performance relative to the Benchmark, while the Fund’s security selection in the information technology sector and the utilities sector was a leading contributor to relative performance.
By country, the Fund’s security selection in Japan and the U.K. was a leading detractor from performance relative to the Benchmark, while the Fund’s security in Italy and Germany was a leading contributor to relative performance.
Leading individual detractors from relative performance included the Fund’s overweight positions in BP PLC and Standard Chartered PLC and its underweight position in Softbank Group Corp. Shares of BP, a U.K. integrated oil and natural gas company, fell amid a sharp decline in energy demand in 2020 as a result of the global response to the pandemic. Shares of Standard Chartered, a U.K. banking and financial services company, fell amid declining earnings due to low interest rates and reduced business activity as a result of the pandemic. Shares of Softbank Group, a Japanese technology and investment company, rose after it agreed to sell its Arm unit to Nvidia Corp. for $40 billion.
Leading individual contributors to the Fund’s relative performance included the Fund’s overweight positions in Nintendo Ltd., ASML Holdings NV and Daikin Industries Ltd. Shares of Nintendo, a Japanese developer of home entertainment products, rose amid increased consumer demand during as a result of the pandemic. Shares of ASML Holdings, a Dutch provider of semiconductor manufacturing equipment, rose after the company reported better-than-expected earnings and revenue for the third quarter of 2020 and confirmed its positive outlook for fourth quarter 2020 results. Shares of Daikin Industries, a Japanese manufacturer of air conditioning equipment, rose amid increased demand for its products as a result of the pandemic.
HOW WAS THE FUND POSITIONED?
The Fund’s portfolio managers continued to focus on security selection to build a portfolio of international equities. They used bottom-up fundamental research to identify what they believed were attractively priced securities of companies with solid financial positions that possessed the potential to increase their earnings faster than their industry peers.
| | | | | | | | |
| TOP TEN EQUITY HOLDINGS OF THE PORTFOLIO*** | |
| | 1. | | | MSCI EAFE Index 12/18/2020 (United States) | | | 4.4 | % |
| | 2. | | | Nestle SA (Registered) (Switzerland) | | | 3.0 | |
| | 3. | | | Roche Holding AG (Switzerland) | | | 2.4 | |
| | 4. | | | Novartis AG (Registered) (Switzerland) | | | 1.9 | |
| | 5. | | | ASML Holding NV (Netherlands) | | | 1.7 | |
| | 6. | | | Novo Nordisk A/S, Class B (Denmark) | | | 1.5 | |
| | 7. | | | Toyota Motor Corp. (Japan) | | | 1.4 | |
| | 8. | | | LVMH Moet Hennessy Louis Vuitton SE (France) | | | 1.3 | |
| | 9. | | | Iberdrola SA (Spain) | | | 1.3 | |
| | 10. | | | Unilever NV (United Kingdom) | | | 1.2 | |
| | | | |
PORTFOLIO COMPOSITION BY COUNTRY*** | |
| Japan | | | 25.2 | % |
| United Kingdom | | | 11.1 | |
| Switzerland | | | 10.3 | |
| France | | | 9.9 | |
| Germany | | | 9.2 | |
| Australia | | | 5.2 | |
| Netherlands | | | 5.1 | |
| United States | | | 4.8 | |
| Denmark | | | 2.9 | |
| Spain | | | 2.2 | |
| Hong Kong | | | 2.2 | |
| Sweden | | | 2.1 | |
| Italy | | | 1.4 | |
| Others (each less than 1.0%) | | | 3.6 | |
| Short-Term Investments | | | 4.8 | |
| * | | The return shown is based on net asset values calculated for shareholder transactions and may differ from the return shown in the financial highlights, which reflects adjustments made to the net asset values in accordance with accounting principles generally accepted in the United States of America. |
| ** | | The adviser seeks to achieve the Fund’s objective. There can be no guarantee it will be achieved. |
| *** | | Percentages indicated are based on total investments as of October 31, 2020. The Fund’s portfolio composition is subject to change. |
| | | | | | |
| | | |
| 20 | | | | J.P. MORGAN INTERNATIONAL EQUITY FUNDS | | OCTOBER 31, 2020 |
| | | | | | | | | | | | |
AVERAGE ANNUAL TOTAL RETURNS AS OF OCTOBER 31, 2020 | |
| | | |
| | | INCEPTION DATE OF
CLASS | | | 1 YEAR | | | SINCE
INCEPTION | |
CLASS A SHARES | | | March 15, 2019 | | | | | | | | | |
With Sales Charge* | | | | | | | (12.83 | )% | | | (5.92 | )% |
Without Sales Charge | | | | | | | (8.02 | ) | | | (2.76 | ) |
CLASS C SHARES | | | March 15, 2019 | | | | | | | | | |
With CDSC** | | | | | | | (9.47 | ) | | | (3.24 | ) |
Without CDSC | | | | | | | (8.47 | ) | | | (3.24 | ) |
CLASS I SHARES | | | March 15, 2019 | | | | (7.78 | ) | | | (2.49 | ) |
CLASS R5 SHARES | | | March 15, 2019 | | | | (7.68 | ) | | | (2.39 | ) |
CLASS R6 SHARES | | | March 15, 2019 | | | | (7.53 | ) | | | (2.25 | ) |
| * | | Sales Charge for Class A Shares is 5.25%. |
| ** | | Assumes a 1% CDSC (contingent deferred sales charge) for the one year period and 0% CDSC thereafter. |
LIFE OF FUND PERFORMANCE (3/15/19 TO 10/31/20)
The performance quoted is past performance and is not a guarantee of future results. Mutual funds are subject to certain market risks. Investment returns and principal value of an investment will fluctuate so that an investor’s shares, when redeemed, may be worth more or less than their original cost. Current performance may be higher or lower than the performance data shown. For up-to-date month-end performance information please call 1-800-480-4111.
The Fund commenced operations on March 15, 2019.
The graph illustrates comparative performance for $1,000,000 invested in Class I Shares of the JPMorgan International Hedged Equity Fund, the MSCI EAFE Index (net of foreign withholding taxes) and the ICE BofAML 3-Month U.S. Treasury Bill Index from March 15, 2019 to October 31, 2020. The performance of the Fund assumes reinvestment of all dividends and capital gain distributions, if any, and does not include a sales charge. The performance of the MSCI EAFE Index (net of foreign withholding taxes) does not reflect the deduction of expenses or a sales charge associated with a mutual fund and approximates the minimum possible dividend reinvestment of the securities included in the benchmark, if applicable. The dividend is reinvested after deduction of withholding tax, applying the maximum rate to non-resident institutional investors who do not benefit from double taxation treaties. The performance of the ICE BofAML 3-Month U.S. Treasury Bill Index does not reflect the deduction of expenses or a sales charge associated with a mutual fund and has been adjusted to reflect reinvestment of all dividends and capital gain distributions of securities included in the benchmarks, if applicable. The MSCI EAFE Index (net of foreign withholding taxes) is a free float-adjusted market capitalization weighted index that is designed to measure the equity market performance of developed markets, excluding the U.S. and Canada. The ICE BofAML 3-Month U.S. Treasury Bill Index is comprised of a single issue
purchased at the beginning of the month and held for a full month. Each month the index is rebalanced and the issue selected is the outstanding Treasury Bill that matures closest to, but not beyond, 3 months from the rebalancing date. Investors cannot invest directly in an index.
Class I Shares have a $1,000,000 minimum initial investment.
Fund performance may reflect the waiver of the Fund’s fees and reimbursement of expenses for certain periods since the applicable inception date. Without these waivers and reimbursements, performance would have been lower. Also, performance shown in this section does not reflect the deduction of taxes that a shareholder would pay on Fund distributions or on gains resulting from redemptions of Fund shares.
International investing involves a greater degree of risk and increased volatility. Changes in currency exchange rates and differences in accounting and taxation policies outside the U.S. can raise or lower returns. Also, some overseas markets may not be as politically and economically stable as the U.S. and other nations.
The returns shown are based on net asset values calculated for shareholder transactions and may differ from the returns shown in the financial highlights, which reflect adjustments made to the net asset values in accordance with accounting principles generally accepted in the United States of America.
The MSCI information may only be used for your internal use, may not be reproduced or redisseminated in any form and may not be used as a basis for or a component of any financial instruments or products or indices. None of the MSCI information is intended to constitute investment advice or a recommendation to make (or refrain from making) any kind of investment decision and may not be relied on as such. Historical data and analysis should not be
| | | | | | | | |
| | | |
| OCTOBER 31, 2020 | | J.P. MORGAN INTERNATIONAL EQUITY FUNDS | | | | | 21 | |
JPMorgan International Hedged Equity Fund
FUND COMMENTARY
TWELVE MONTHS ENDED OCTOBER 31, 2020 (Unaudited) (continued)
taken as an indication or guarantee of any future performance analysis, forecast or prediction. The MSCI information is provided on an “as is” basis and the user of this information assumes the entire risk of any use made of this information. MSCI, each of its affiliates and each other person involved in or related to compiling, computing or creating any MSCI information (collectively, the “MSCI Parties”) expressly disclaims all warranties (including, without limitation, any warranties of originality, accuracy, completeness, timeliness, non-infringement, merchantability and fitness for a particular purpose) with respect to this information. Without limiting any of the foregoing, in no event shall any MSCI Party have any liability for any direct, indirect, special, incidental, punitive, consequential (including, without limitation, lost profits) or any other damages. (www.msci.com)
| | | | | | |
| | | |
| 22 | | | | J.P. MORGAN INTERNATIONAL EQUITY FUNDS | | OCTOBER 31, 2020 |
JPMorgan International Research Enhanced Equity Fund
FUND COMMENTARY
TWELVE MONTHS ENDED OCTOBER 31, 2020 (Unaudited)
| | | | |
| REPORTING PERIOD RETURN: | |
| Fund (Class I Shares)* | | | (9.05)% | |
| MSCI EAFE Index (net of foreign withholding taxes) | | | (6.86)% | |
| |
| Net Assets as of 10/31/2020 (In Thousands) | | | $4,862,349 | |
INVESTMENT OBJECTIVE
The JPMorgan International Research Enhanced Equity Fund (the “Fund”) seeks to provide long-term capital appreciation.
WHAT WERE THE MAIN DRIVERS OF THE FUND’S PERFORMANCE?
The Fund’s Class I Shares underperformed the MSCI EAFE Index (net of foreign withholding taxes) (the “Benchmark”) for the twelve months ended October 31, 2020.
By sector, the Fund’s security selection in the consumer cyclical & services sector and the retail sector was a leading detractor from performance relative to the Benchmark. The Fund’s security selection in the utilities and technology–semiconductors & hardware sectors was a leading contributor to relative performance.
By region, the Fund’s security selection in Japan and Europe was a leading detractor from performance relative to the Benchmark, while the Fund’s security selection in the Pacific, excluding Japan, was the sole regional contributor to relative performance.
Due to the Fund holding a relatively large number of securities during the reporting period, the impact of individual holdings on the Fund’s relative performance tended to be small.
HOW WAS THE FUND POSITIONED?
The Fund sought to outperform the Benchmark over time, while seeking to achieve sector, geographic and risk characteristics similar to that of the Benchmark. Using the fundamental equity insights generated by analysts, the Fund’s portfolio managers took a marginally overweight position in securities included within the universe of the Benchmark that they considered undervalued, while marginally underweighting or not holding securities in the Benchmark that they considered overvalued.
| | | | | | | | |
| TOP TEN EQUITY HOLDINGS OF THE PORTFOLIO*** | |
| | 1. | | | Nestle SA (Registered) (Switzerland) | | | 3.1 | % |
| | 2. | | | Roche Holding AG (Switzerland) | | | 2.5 | |
| | 3. | | | Novartis AG (Registered) (Switzerland) | | | 2.0 | |
| | 4. | | | ASML Holding NV (Netherlands) | | | 1.7 | |
| | 5. | | | Novo Nordisk A/S, Class B (Denmark) | | | 1.6 | |
| | 6. | | | Toyota Motor Corp. (Japan) | | | 1.4 | |
| | 7. | | | LVMH Moet Hennessy Louis Vuitton SE (France) | | | 1.4 | |
| | 8. | | | Iberdrola SA (Spain) | | | 1.3 | |
| | 9. | | | Unilever NV (United Kingdom) | | | 1.3 | |
| | 10. | | | SAP SE (Germany) | | | 1.2 | |
| | | | |
PORTFOLIO COMPOSITION BY COUNTRY*** | |
| Japan | | | 26.1 | % |
| United Kingdom | | | 11.7 | |
| Switzerland | | | 10.9 | |
| France | | | 10.5 | |
| Germany | | | 9.6 | |
| Australia | | | 5.5 | |
| Netherlands | | | 5.3 | |
| Denmark | | | 3.0 | |
| Spain | | | 2.4 | |
| Hong Kong | | | 2.2 | |
| Sweden | | | 2.2 | |
| Italy | | | 1.5 | |
| Others (each less than 1.0%) | | | 4.1 | |
| Short-Term Investments | | | 5.0 | |
| * | | The return shown is based on net asset values calculated for shareholder transactions and may differ from the return shown in the financial highlights, which reflects adjustments made to the net asset values in accordance with accounting principles generally accepted in the United States of America. |
| ** | | The adviser seeks to achieve the Fund’s objective. There can be no guarantee it will be achieved. |
| *** | | Percentages indicated are based on total investments as of October 31, 2020. The Fund’s portfolio composition is subject to change. |
| | | | | | | | |
| | | |
| OCTOBER 31, 2020 | | J.P. MORGAN INTERNATIONAL EQUITY FUNDS | | | | | 23 | |
JPMorgan International Research Enhanced Equity Fund
FUND COMMENTARY
TWELVE MONTHS ENDED OCTOBER 31, 2020 (Unaudited) (continued)
| | | | | | | | | | | | | | |
AVERAGE ANNUAL TOTAL RETURNS AS OF OCTOBER 31, 2020 | |
| | | | |
| | | INCEPTION DATE OF
CLASS | | 1 YEAR | | | 5 YEAR | | | 10 YEAR | |
CLASS A SHARES | | April 23, 1993 | | | | | | | | | | | | |
With Sales Charge* | | | | | (14.00 | )% | | | 0.75 | % | | | 2.14 | % |
Without Sales Charge | | | | | (9.26 | ) | | | 1.85 | | | | 2.69 | |
CLASS I SHARES | | October 28, 1992 | | | (9.05 | ) | | | 2.09 | | | | 2.94 | |
CLASS R6 SHARES | | November 1, 2017 | | | (8.96 | ) | | | 2.16 | | | | 2.98 | |
| * | | Sales Charge for Class A Shares is 5.25%. |
TEN YEAR PERFORMANCE (10/31/10 TO 10/31/20)
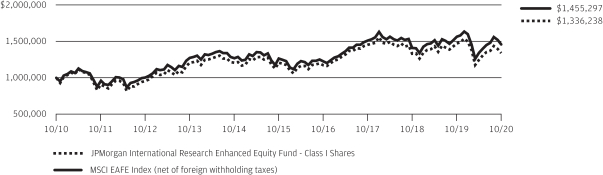
The performance quoted is past performance and is not a guarantee of future results. Mutual funds are subject to certain market risks. Investment returns and principal value of an investment will fluctuate so that an investor’s shares, when redeemed, may be worth more or less than their original cost. Current performance may be higher or lower than the performance data shown. For up-to-date month-end performance information please call 1-800-480-4111.
Returns for Class R6 Shares prior to its inception date are based on the performance of Class I Shares. The actual returns of Class R6 Shares would have been different than those shown because Class R6 Shares have different expenses than Class I Shares.
The graph illustrates comparative performance for $1,000,000 invested in Class I Shares of the JPMorgan International Research Enhanced Equity Fund and the MSCI EAFE Index (net of foreign withholding taxes) from October 31, 2010 to October 31, 2020. The performance of the Fund assumes reinvestment of all dividends and capital gain distributions, if any, and does not include a sales charge. The performance of the MSCI EAFE Index (net of foreign withholding taxes) does not reflect the deduction of expenses or a sales charge associated with a mutual fund and approximates the minimum possible dividend reinvestment of the securities included in the benchmark, if applicable. The dividend is reinvested after deduction of withholding tax, applying the maximum rate to non-resident institutional investors who do not benefit from double taxation treaties. The MSCI EAFE Index (net of foreign withholding taxes) is a free float-adjusted market capitalization weighted index that is designed to measure the equity market performance of developed markets, excluding the U.S. and Canada. Investors cannot invest directly in an index.
Class I Shares have a $1,000,000 minimum initial investment.
Fund performance may reflect the waiver of the Fund’s fees and reimbursement of expenses for certain periods since the applicable inception date. Without these waivers and reimbursements, performance would have been lower. Also, performance shown in this section does not reflect the deduction of taxes that a shareholder would pay on Fund distributions or on gains resulting from redemptions of Fund shares.
International investing involves a greater degree of risk and increased volatility. Changes in currency exchange rates and differences in accounting and taxation policies outside the U.S. can raise or lower returns. Also, some overseas markets may not be as politically and economically stable as the U.S. and other nations.
The returns shown are based on net asset values calculated for shareholder transactions and may differ from the returns shown in the financial highlights, which reflect adjustments made to the net asset values in accordance with accounting principles generally accepted in the United States of America.
The MSCI information may only be used for your internal use, may not be reproduced or redisseminated in any form and may not be used as a basis for or a component of any financial instruments or products or indices. None of the MSCI information is intended to constitute investment advice or a recommendation to make (or refrain from making) any kind of investment decision and may not be relied on as such. Historical data and analysis should not be taken as an indication or guarantee of any future performance analysis, forecast or prediction. The MSCI information is provided on an “as is” basis and the user of this information assumes the entire risk of any use made of this information. MSCI, each of its affiliates and each other person involved in or related to compiling, computing or creating any MSCI information (collectively, the “MSCI Parties”) expressly disclaims all warranties (including, without limitation, any warranties of originality, accuracy, completeness, timeliness, non-infringement, merchantability and fitness for a particular purpose) with respect to this information. Without limiting any of the foregoing, in no event shall any MSCI Party have any liability for any direct, indirect, special, incidental, punitive, consequential (including, without limitation, lost profits) or any other damages. (www.msci.com)
| | | | | | |
| | | |
| 24 | | | | J.P. MORGAN INTERNATIONAL EQUITY FUNDS | | OCTOBER 31, 2020 |
JPMorgan International Value Fund
FUND COMMENTARY
TWELVE MONTHS ENDED OCTOBER 31, 2020 (Unaudited)
| | | | |
| REPORTING PERIOD RETURN: | |
| Fund (Class L Shares)* | | | (19.25)% | |
| MSCI EAFE Value Index (net of foreign withholding taxes) | | | (18.42)% | |
| |
| Net Assets as of 10/31/2020 (In Thousands) | | | $267,864 | |
INVESTMENT OBJECTIVE**
The JPMorgan International Value Fund (the “Fund”) seeks to provide long-term capital appreciation.
WHAT WERE THE MAIN DRIVERS OF THE FUND’S PERFORMANCE?
The Fund’s Class L Shares underperformed the MSCI EAFE Value Index (net of foreign withholding taxes) (the “Benchmark”) for the twelve months ended October 31, 2020.
By sector, the Fund’s underweight position in the utilities sectors and its underweight position and security selection in the industrial cyclical sector were leading detractors from performance relative to the Benchmark. The Fund’s security selection in the basic industries and retail sectors was a leading contributor to relative performance.
By region, the Fund’s security selection in continental Europe and its underweight position in Japan were leading detractors from relative performance, while the Fund’s security selection in the Pacific, excluding Japan, and its underweight position in the U.K. were leading contributors to relative performance.
Leading individual detractors from relative performance included the Fund’s underweight positions in Softbank Group Corp., Commonwealth Bank of Australia and Z Holdings Corp. Shares of Softbank Group, a Japanese technology and investment company not held by the Fund, rose after it agreed to sell
its Arm unit to Nvidia Corp. for $40 billion. Shares of Commonwealth Bank of Australia, which were not held in the Fund, fell by a smaller magnitude than the Benchmark during the reporting period. Shares of Z Holdings, a provider of online advertising and business services as Yahoo Japan, rose in late 2019 after the company announced its planned acquisition of messaging application provider Line Corp.
Leading individual contributors to relative performance included the Fund’s underweight positions in HSBC Holdings PLC, Banco Santander SA and BASF SE. Shares of HSBC Holdings, a U.K. banking and financial services company, fell amid low interest rates and the impact of the pandemic. Shares of Banco Santander, a Spanish banking company not held in the Fund, fell amid low interest rates and the impact of the pandemic. Shares of BASF, a German chemicals company, fell amid investor uncertainty over the impact of the pandemic on the company’s businesses.
HOW WAS THE FUND POSITIONED?
The Fund’s portfolio managers employed behavioral-based and quantitative screens in addition to conducting fundamental analysis to seek out companies that they believed had attractive valuations. As a result of this process, the Fund’s largest overweight sector positions relative to the Benchmark were in the insurance and banks sectors, while the largest underweight sector positions were in the utilities and industrial cyclical sectors.
| | | | | | | | |
| | | |
| OCTOBER 31, 2020 | | J.P. MORGAN INTERNATIONAL EQUITY FUNDS | | | | | 25 | |
JPMorgan International Value Fund
FUND COMMENTARY
TWELVE MONTHS ENDED OCTOBER 31, 2020 (Unaudited) (continued)
| | | | | | | | |
| TOP TEN EQUITY HOLDINGS OF THE PORTFOLIO*** | |
| | 1. | | | Novartis AG (Registered) (Switzerland) | | | 2.8 | % |
| | 2. | | | Toyota Motor Corp. (Japan) | | | 2.2 | |
| | 3. | | | BHP Group Ltd. (Australia) | | | 2.0 | |
| | 4. | | | Royal Dutch Shell plc, Class A (Netherlands) | | | 1.7 | |
| | 5. | | | Siemens AG (Registered) (Germany) | | | 1.5 | |
| | 6. | | | GlaxoSmithKline plc (United Kingdom) | | | 1.4 | |
| | 7. | | | British American Tobacco plc (United Kingdom) | | | 1.3 | |
| | 8. | | | Allianz SE (Registered) (Germany) | | | 1.3 | |
| | 9. | | | TOTAL SE (France) | | | 1.2 | |
| | 10. | | | Rio Tinto plc (Australia) | | | 1.2 | |
| | | | |
PORTFOLIO COMPOSITION BY COUNTRY*** | |
| Japan | | | 24.2 | % |
| United Kingdom | | | 12.8 | |
| Germany | | | 9.8 | |
| France | | | 8.0 | |
| Switzerland | | | 7.3 | |
| Australia | | | 7.1 | |
| Netherlands | | | 4.7 | |
| Sweden | | | 3.3 | |
| Norway | | | 2.6 | |
| Hong Kong | | | 2.5 | |
| Italy | | | 2.3 | |
| Finland | | | 2.2 | |
| Spain | | | 1.9 | |
| Denmark | | | 1.6 | |
| Belgium | | | 1.5 | |
| Singapore | | | 1.2 | |
| Austria | | | 1.1 | |
| Others (each less than 1.0%) | | | 3.1 | |
| Short-Term Investments | | | 2.8 | |
| * | | The return shown is based on net asset values calculated for shareholder transactions and may differ from the return shown in the financial highlights, which reflects adjustments made to the net asset values in accordance with accounting principles generally accepted in the United States of America. |
| ** | | The adviser seeks to achieve the Fund’s objective. There can be no guarantee it will be achieved. |
| *** | | Percentages indicated are based on total investments as of October 31, 2020. The Fund’s portfolio composition is subject to change. |
| | | | | | |
| | | |
| 26 | | | | J.P. MORGAN INTERNATIONAL EQUITY FUNDS | | OCTOBER 31, 2020 |
| | | | | | | | | | | | | | |
AVERAGE ANNUAL TOTAL RETURNS AS OF OCTOBER 31, 2020 | |
| | | | |
| | | INCEPTION DATE OF
CLASS | | 1 YEAR | | | 5 YEAR | | | 10 YEAR | |
CLASS A SHARES | | September 28, 2001 | | | | | | | | | | | | |
With Sales Charge* | | | | | (23.75 | )% | | | (4.02 | )% | | | (0.88 | )% |
Without Sales Charge | | | | | (19.51 | ) | | | (2.98 | ) | | | (0.35 | ) |
CLASS C SHARES | | July 11, 2006 | | | | | | | | | | | | |
With CDSC** | | | | | (20.94 | ) | | | (3.49 | ) | | | (0.75 | ) |
Without CDSC | | | | | (19.94 | ) | | | (3.49 | ) | | | (0.75 | ) |
CLASS I SHARES | | September 10, 2001 | | | (19.31 | ) | | | (2.72 | ) | | | (0.08 | ) |
CLASS L SHARES | | November 4, 1993 | | | (19.25 | ) | | | (2.61 | ) | | | 0.04 | |
CLASS R2 SHARES | | November 3, 2008 | | | (19.81 | ) | | | (3.26 | ) | | | (0.61 | ) |
CLASS R5 SHARES | | September 9, 2016 | | | (19.17 | ) | | | (2.60 | ) | | | 0.05 | |
CLASS R6 SHARES | | November 30, 2010 | | | (19.13 | ) | | | (2.48 | ) | | | 0.16 | |
| * | | Sales Charge for Class A Shares is 5.25%. |
| ** | | Assumes a 1% CDSC (contingent deferred sales charge) for the one year period and 0% CDSC thereafter. |
TEN YEAR PERFORMANCE (10/31/10 TO 10/31/20)
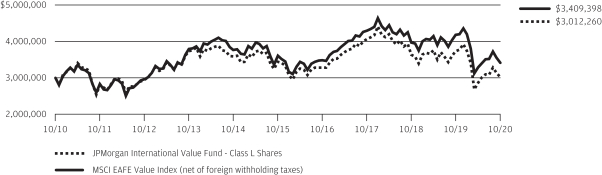
The performance quoted is past performance and is not a guarantee of future results. Mutual funds are subject to certain market risks. Investment returns and principal value of an investment will fluctuate so that an investor’s shares, when redeemed, may be worth more or less than their original cost. Current performance may be higher or lower than the performance data shown. For up-to-date month-end performance information please call 1-800-480-4111. Effective May 2018, some of the Fund’s investment strategies changed. The Fund’s past performance would have been different if the Fund was managed under the current strategies.
Returns for Class R5 Shares and Class R6 Shares prior to their inception dates are based on the performance of Class L Shares. The actual returns of Class R5 Shares and Class R6 Shares would have been different than those shown because Class R5 Shares and Class R6 Shares have different expenses than Class L Shares.
The graph illustrates comparative performance for $3,000,000 invested in Class L Shares of the JPMorgan International Value Fund and the MSCI EAFE Value Index (net of foreign withholding taxes) from October 31, 2010 to October 31, 2020. The performance of the Fund assumes reinvestment of all dividends and capital gain distributions, if any, and does not include a sales charge. The performance of the MSCI EAFE Value Index (net of foreign withholding taxes) does not reflect the deduction of expenses or a sales charge associated with a mutual fund and approximates the minimum possible dividend reinvestment of the securities included in the benchmark, if applicable. The dividend is reinvested after deduction of withholding tax, applying the maximum rate to non-resident institutional investors who do not benefit from double taxation treaties. The MSCI EAFE Value Index (net of
foreign withholding taxes) is a free float-adjusted market capitalization weighted index that is designed to measure the performance of value-oriented stocks in the world’s equity markets, excluding the U.S. and Canada. Investors cannot invest directly in an index.
Class L Shares have a $3,000,000 minimum initial investment.
Fund performance may reflect the waiver of the Fund’s fees and reimbursement of expenses for certain periods since the applicable inception date. Without these waivers and reimbursements, performance would have been lower. Also, performance shown in this section does not reflect the deduction of taxes that a shareholder would pay on Fund distributions or on gains resulting from redemptions of Fund shares.
International investing involves a greater degree of risk and increased volatility. Changes in currency exchange rates and differences in accounting and taxation policies outside the U.S. can raise or lower returns. Also, some overseas markets may not be as politically and economically stable as the U.S. and other nations.
Because Class C Shares automatically convert to Class A Shares after 8 years, the 10 year average annual total return shown above for Class C reflects Class A performance for the period after conversion.
The returns shown are based on net asset values calculated for shareholder transactions and may differ from the returns shown in the financial highlights, which reflect adjustments made to the net asset values in accordance with accounting principles generally accepted in the United States of America.
| | | | | | | | |
| | | |
| OCTOBER 31, 2020 | | J.P. MORGAN INTERNATIONAL EQUITY FUNDS | | | | | 27 | |
JPMorgan Emerging Markets Equity Fund
SCHEDULE OF PORTFOLIO INVESTMENTS
AS OF OCTOBER 31, 2020
| | | | | | | | |
| INVESTMENTS | | SHARES
(000) | | | VALUE
($000) | |
Common Stocks — 97.4% | | | | | |
| |
Argentina — 2.5% | | | | | |
| | |
MercadoLibre, Inc. * | | | 229 | | | | 278,586 | |
| | | | | | | | |
|
Brazil — 6.4% | |
| | |
B3 SA—Brasil Bolsa Balcao | | | 11,978 | | | | 106,068 | |
| | |
Localiza Rent a Car SA * | | | 8,674 | | | | 91,832 | |
| | |
Lojas Renner SA * | | | 11,073 | | | | 72,312 | |
| | |
Magazine Luiza SA | | | 35,196 | | | | 150,465 | |
| | |
Pagseguro Digital Ltd., Class A * (a) | | | 4,205 | | | | 153,959 | |
| | |
Raia Drogasil SA | | | 10,063 | | | | 42,337 | |
| | |
XP, Inc., Class A * | | | 2,376 | | | | 95,234 | |
| | | | | | | | |
| | |
| | | | | | | 712,207 | |
| | | | | | | | |
|
China — 37.6% | |
| | |
Alibaba Group Holding Ltd., ADR * | | | 1,652 | | | | 503,404 | |
| | |
Alibaba Group Holding Ltd. * | | | 8,088 | | | | 306,478 | |
| | |
Budweiser Brewing Co. APAC Ltd. (a) (b) | | | 57,850 | | | | 170,606 | |
| | |
China Gas Holdings Ltd. | | | 29,783 | | | | 91,523 | |
| | |
Foshan Haitian Flavouring & Food Co. Ltd., Class A | | | 7,485 | | | | 179,241 | |
| | |
JD.com, Inc., ADR * | | | 1,423 | | | | 116,017 | |
| | |
JD.com, Inc., Class A * | | | 2,789 | | | | 113,753 | |
| | |
Kweichow Moutai Co. Ltd., Class A | | | 406 | | | | 101,411 | |
| | |
Meituan Dianping, Class B * (b) | | | 9,290 | | | | 346,336 | |
| | |
Midea Group Co. Ltd., Class A | | | 11,045 | | | | 128,970 | |
| | |
NetEase, Inc. | | | 6,366 | | | | 111,348 | |
| | |
NetEase, Inc., ADR | | | 1,446 | | | | 125,481 | |
| | |
New Oriental Education & Technology Group, Inc., ADR * (a) | | | 1,069 | | | | 171,376 | |
| | |
Ping An Bank Co. Ltd., Class A | | | 72,223 | | | | 191,769 | |
| | |
Ping An Insurance Group Co. of China Ltd., Class H | | | 16,328 | | | | 168,821 | |
| | |
Shenzhen Mindray Bio-Medical Electronics Co. Ltd., Class A | | | 1,943 | | | | 112,558 | |
| | |
Shenzhou International Group Holdings Ltd. | | | 8,409 | | | | 146,313 | |
| | |
Sichuan Swellfun Co. Ltd., Class A | | | 4,921 | | | | 48,758 | |
| | |
Sunny Optical Technology Group Co. Ltd. | | | 6,886 | | | | 114,334 | |
| | |
Tencent Holdings Ltd. | | | 6,771 | | | | 517,305 | |
| | |
Wuxi Biologics Cayman, Inc. * (b) | | | 11,020 | | | | 309,469 | |
| | |
Yum China Holdings, Inc. | | | 2,589 | | | | 137,793 | |
| | | | | | | | |
| | |
| | | | | | | 4,213,064 | |
| | | | | | | | |
|
Egypt — 0.4% | |
| | |
Commercial International Bank Egypt SAE (Registered), GDR (b) | | | 11,635 | | | | 44,879 | |
| | | | | | | | |
|
Hong Kong — 5.8% | |
| | |
AIA Group Ltd. | | | 25,884 | | | | 246,344 | |
| | |
AIA Group Ltd. | | | 795 | | | | 7,524 | |
| | |
Hong Kong Exchanges & Clearing Ltd. | | | 2,524 | | | | 120,923 | |
| | |
Techtronic Industries Co. Ltd. | | | 20,673 | | | | 278,445 | |
| | | | | | | | |
| | |
| | | | | | | 653,236 | |
| | | | | | | | |
| | | | | | | | |
| INVESTMENTS | | SHARES
(000) | | | VALUE
($000) | |
| |
|
Hungary — 1.0% | |
| | |
OTP Bank Nyrt. * | | | 3,427 | | | | 106,892 | |
| | | | | | | | |
|
India — 16.1% | |
| | |
Asian Paints Ltd. | | | 1,773 | | | | 52,883 | |
| | |
Britannia Industries Ltd. | | | 1,686 | | | | 78,948 | |
| | |
HDFC Bank Ltd., ADR * | | | 3,322 | | | | 190,810 | |
| | |
HDFC Bank Ltd. * | | | 11,598 | | | | 185,213 | |
| | |
HDFC Life Insurance Co. Ltd. * (b) | | | 13,421 | | | | 106,755 | |
| | |
Hindustan Unilever Ltd. | | | 3,738 | | | | 104,525 | |
| | |
Housing Development Finance Corp. Ltd. | | | 9,651 | | | | 250,375 | |
| | |
IndusInd Bank Ltd. * | | | 3,941 | | | | 31,029 | |
| | |
ITC Ltd. | | | 39,908 | | | | 89,184 | |
| | |
Kotak Mahindra Bank Ltd. * | | | 8,811 | | | | 183,875 | |
| | |
Maruti Suzuki India Ltd. | | | 726 | | | | 68,174 | |
| | |
Reliance Industries Ltd. | | | 7,590 | | | | 210,419 | |
| | |
Tata Consultancy Services Ltd. | | | 7,107 | | | | 256,139 | |
| | | | | | | | |
| | |
| | | | | | | 1,808,329 | |
| | | | | | | | |
|
Indonesia — 1.7% | |
| | |
Bank Central Asia Tbk. PT | | | 53,178 | | | | 104,635 | |
| | |
Bank Rakyat Indonesia Persero Tbk. PT | | | 401,578 | | | | 90,906 | |
| | | | | | | | |
| | |
| | | | | | | 195,541 | |
| | | | | | | | |
|
Macau — 0.8% | |
| | |
Sands China Ltd. | | | 26,224 | | | | 92,037 | |
| | | | | | | | |
|
Mexico — 2.2% | |
| | |
Grupo Financiero Banorte SAB de CV, Class O * | | | 24,159 | | | | 107,747 | |
| | |
Wal-Mart de Mexico SAB de CV | | | 56,576 | | | | 136,989 | |
| | | | | | | | |
| | |
| | | | | | | 244,736 | |
| | | | | | | | |
|
Panama — 0.4% | |
| | |
Copa Holdings SA, Class A (a) | | | 910 | | | | 44,859 | |
| | | | | | | | |
|
Poland — 0.8% | |
| | |
Allegro.eu SA * (b) | | | 4,568 | | | | 92,826 | |
| | | | | | | | |
|
Portugal — 1.1% | |
| | |
Jeronimo Martins SGPS SA | | | 7,531 | | | | 119,612 | |
| | | | | | | | |
|
South Africa — 1.4% | |
| | |
Bid Corp. Ltd. | | | 4,381 | | | | 60,324 | |
| | |
Capitec Bank Holdings Ltd. * | | | 1,310 | | | | 92,098 | |
| | |
Mr Price Group Ltd. | | | 949 | | | | 7,176 | |
| | | | | | | | |
| | |
| | | | | | | 159,598 | |
| | | | | | | | |
|
South Korea — 5.0% | |
| | |
NCSoft Corp. | | | 204 | | | | 139,985 | |
| | |
Samsung Electronics Co. Ltd. | | | 8,417 | | | | 423,095 | |
| | | | | | | | |
| | |
| | | | | | | 563,080 | |
| | | | | | | | |
SEE NOTES TO FINANCIAL STATEMENTS.
| | | | | | |
| | | |
| 28 | | | | J.P. MORGAN INTERNATIONAL EQUITY FUNDS | | OCTOBER 31, 2020 |
| | | | | | | | |
| INVESTMENTS | | SHARES
(000) | | | VALUE
($000) | |
Common Stocks — (continued) | | | | | |
|
Taiwan — 10.3% | |
| | |
President Chain Store Corp. | | | 4,522 | | | | 40,815 | |
| | |
Sea Ltd., ADR * (a) | | | 2,186 | | | | 344,736 | |
| | |
Taiwan Semiconductor Manufacturing Co. Ltd., ADR | | | 9,163 | | | | 768,530 | |
| | | | | | | | |
| | |
| | | | | | | 1,154,081 | |
| | | | | | | | |
|
Turkey — 0.9% | |
| | |
BIM Birlesik Magazalar A/S | | | 10,764 | | | | 85,106 | |
| | |
Ford Otomotiv Sanayi A/S | | | 1,087 | | | | 14,066 | |
| | | | | | | | |
| | |
| | | | | | | 99,172 | |
| | | | | | | | |
|
United States — 3.0% | |
| | |
EPAM Systems, Inc. * | | | 1,105 | | | | 341,325 | |
| | | | | | | | |
| | |
Total Common Stocks
(Cost $7,187,443) | | | | | | | 10,924,060 | |
| | | | | | | | |
Short-Term Investments — 3.9% | | | | | | | | |
| | |
Investment Companies — 2.8% | | | | | | | | |
| | |
JPMorgan Prime Money Market Fund Class Institutional Shares, 0.05% (c) (d) (Cost $313,835) | | | 313,630 | | | | 313,818 | |
| | | | | | | | |
|
Investment of Cash Collateral from Securities Loaned — 1.1% | |
| | |
JPMorgan Securities Lending Money Market Fund Agency SL Class Shares, 0.15% (c) (d) | | | 117,532 | | | | 117,544 | |
| | |
JPMorgan U.S. Government Money Market Fund Class IM Shares, 0.04% (c) (d) | | | 12,077 | | | | 12,077 | |
| | | | | | | | |
| | |
Total Investment of Cash Collateral from Securities Loaned
(Cost $129,634) | | | | | | | 129,621 | |
| | | | | | | | |
| | |
Total Short-Term Investments
(Cost $443,469) | | | | | | | 443,439 | |
| | | | | | | | |
Total Investments — 101.3%
(Cost $7,630,912) | | | | | | | 11,367,499 | |
Liabilities in Excess of
Other Assets — (1.3)% | | | | | | | (147,274 | ) |
| | | | | | | | |
NET ASSETS — 100.0% | | | | | �� | | 11,220,225 | |
| | | | | | | | |
Percentages indicated are based on net assets.
Summary of Investments by Industry, October 31, 2020
The following table represents the portfolio investments of the Fund by industry classifications as a percentage of total investments:
| | | | |
| INDUSTRY | | PERCENTAGE | |
| |
Internet & Direct Marketing Retail | | | 15.5 | % |
| |
Banks | | | 11.7 | |
| |
Semiconductors & Semiconductor Equipment | | | 6.8 | |
| |
IT Services | | | 6.6 | |
| |
Entertainment | | | 6.3 | |
| |
Insurance | | | 4.7 | |
| |
Interactive Media & Services | | | 4.5 | |
| |
Food & Staples Retailing | | | 4.3 | |
| |
Technology Hardware, Storage & Peripherals | | | 3.7 | |
| |
Capital Markets | | | 2.8 | |
| |
Beverages | | | 2.8 | |
| |
Life Sciences Tools & Services | | | 2.7 | |
| |
Machinery | | | 2.4 | |
| |
Food Products | | | 2.3 | |
| |
Thrifts & Mortgage Finance | | | 2.2 | |
| |
Hotels, Restaurants & Leisure | | | 2.0 | |
| |
Multiline Retail | | | 2.0 | |
| |
Oil, Gas & Consumable Fuels | | | 1.9 | |
| |
Diversified Consumer Services | | | 1.5 | |
| |
Textiles, Apparel & Luxury Goods | | | 1.3 | |
| |
Household Durables | | | 1.1 | |
| |
Electronic Equipment, Instruments & Components | | | 1.0 | |
| |
Health Care Equipment & Supplies | | | 1.0 | |
| |
Others (each less than 1.0%) | | | 5.0 | |
| |
Short-Term Investments | | | 3.9 | |
| | |
Abbreviations | | |
| ADR | | American Depositary Receipt |
| GDR | | Global Depositary Receipt |
| PT | | Limited liability company |
| SGPS | | Holding company |
| |
| (a) | | The security or a portion of this security is on loan at October 31, 2020. The total value of securities on loan at October 31, 2020 is approximately $121,899,000. |
| (b) | | Security exempt from registration pursuant to Regulation S under the Securities Act of 1933, as amended. Regulation S applies to securities offerings that are made outside of the United States and do not involve direct selling efforts in the United States and as such may have restrictions on resale. |
| (c) | | Investment in an affiliated fund, which is registered under the Investment Company Act of 1940, as amended, and is advised by J.P. Morgan Investment Management Inc. |
| (d) | | The rate shown is the current yield as of October 31, 2020. |
| * | | Non-income producing security. |
SEE NOTES TO FINANCIAL STATEMENTS.
| | | | | | | | |
| | | |
| OCTOBER 31, 2020 | | J.P. MORGAN INTERNATIONAL EQUITY FUNDS | | | | | 29 | |
JPMorgan Emerging Markets Research Enhanced Equity Fund
SCHEDULE OF PORTFOLIO INVESTMENTS
AS OF OCTOBER 31, 2020
| | | | | | | | |
| INVESTMENTS | | SHARES
(000) | | | VALUE
($000) | |
Common Stocks — 100.5% | |
Argentina — 0.2% | |
| | |
MercadoLibre, Inc. * | | | 4 | | | | 5,140 | |
| | | | | | | | |
|
Brazil — 4.4% | |
| | |
Atacadao SA * | | | 1,743 | | | | 5,560 | |
| | |
B3 SA — Brasil Bolsa Balcao | | | 850 | | | | 7,524 | |
| | |
Banco Bradesco SA (Preference) | | | 1,620 | | | | 5,676 | |
| | |
Cia Brasileira de Distribuicao | | | 259 | | | | 2,796 | |
| | |
Gerdau SA (Preference) | | | 1,919 | | | | 7,294 | |
| | |
Itau Unibanco Holding SA (Preference) | | | 3,078 | | | | 12,601 | |
| | |
Itausa SA (Preference) | | | 2,811 | | | | 4,454 | |
| | |
Localiza Rent a Car SA * | | | 649 | | | | 6,868 | |
| | |
Lojas Renner SA * | | | 1,299 | | | | 8,481 | |
| | |
Magazine Luiza SA | | | 1,802 | | | | 7,702 | |
| | |
Petroleo Brasileiro SA (Preference) | | | 3,749 | | | | 12,362 | |
| | |
Raia Drogasil SA | | | 1,995 | | | | 8,395 | |
| | |
Suzano SA * | | | 954 | | | | 8,225 | |
| | |
Telefonica Brasil SA (Preference) | | | 313 | | | | 2,319 | |
| | |
TIM SA, ADR * | | | 449 | | | | 4,623 | |
| | |
Vale SA, ADR | | | 1,935 | | | | 20,449 | |
| | | | | | | | |
| | |
| | | | | | | 125,329 | |
| | | | | | | | |
|
Chile — 0.3% | |
| | |
Banco Santander Chile, ADR | | | 299 | | | | 4,144 | |
| | |
Cencosud SA | | | 1,393 | | | | 1,937 | |
| | |
Cia Cervecerias Unidas SA, ADR | | | 114 | | | | 1,225 | |
| | | | | | | | |
| | |
| | | | | | | 7,306 | |
| | | | | | | | |
|
China — 44.3% | |
| | |
51job, Inc., ADR * | | | 70 | | | | 4,904 | |
| | |
Alibaba Group Holding Ltd., ADR * | | | 80 | | | | 24,302 | |
| | |
Alibaba Group Holding Ltd. * | | | 6,217 | | | | 235,582 | |
| | |
Amoy Diagnostics Co. Ltd., Class A | | | 250 | | | | 3,147 | |
| | |
Anhui Conch Cement Co. Ltd., Class H | | | 584 | | | | 3,650 | |
| | |
ANTA Sports Products Ltd. | | | 667 | | | | 7,404 | |
| | |
Baidu, Inc., ADR * | | | 29 | | | | 3,909 | |
| | |
Bank of China Ltd., Class H | | | 34,394 | | | | 10,864 | |
| | |
Baoshan Iron & Steel Co. Ltd., Class A | | | 9,526 | | | | 7,612 | |
| | |
BeiGene Ltd., ADR * | | | 13 | | | | 3,841 | |
| | |
Bilibili, Inc., ADR * (a) | | | 163 | | | | 7,295 | |
| | |
BOE Technology Group Co. Ltd., Class A | | | 6,710 | | | | 4,755 | |
| | |
CGN Power Co. Ltd., Class H (b) | | | 20,470 | | | | 4,390 | |
| | |
China Conch Venture Holdings Ltd. | | | 1,463 | | | | 6,514 | |
| | |
China Construction Bank Corp., Class H | | | 50,415 | | | | 34,742 | |
| | |
China CYTS Tours Holding Co. Ltd., Class A | | | 1,691 | | | | 2,492 | |
| | |
China Gas Holdings Ltd. | | | 3,564 | | | | 10,951 | |
| | |
China Lesso Group Holdings Ltd. | | | 2,948 | | | | 4,779 | |
| | |
China Life Insurance Co. Ltd., Class H | | | 5,962 | | | | 13,009 | |
| | | | | | | | |
| INVESTMENTS | | SHARES
(000) | | | VALUE
($000) | |
| | |
| | | | | | | | |
|
China — continued | |
| | |
China Merchants Bank Co. Ltd., Class H | | | 3,799 | | | | 19,789 | |
| | |
China Mobile Ltd. | | | 3,132 | | | | 19,154 | |
| | |
China Molybdenum Co. Ltd., Class H | | | 11,775 | | | | 4,285 | |
| | |
China Oilfield Services Ltd., Class H | | | 10,098 | | | | 6,098 | |
| | |
China Overseas Land & Investment Ltd. | | | 3,597 | | | | 9,035 | |
| | |
China Pacific Insurance Group Co. Ltd., Class H | | | 3,829 | | | | 11,984 | |
| | |
China Resources Land Ltd. | | | 2,498 | | | | 10,216 | |
| | |
China Shenhua Energy Co. Ltd., Class H | | | 4,387 | | | | 7,600 | |
| | |
China State Construction Engineering Corp. Ltd., Class A | | | 7,445 | | | | 5,694 | |
| | |
China State Construction International Holdings Ltd. | | | 5,336 | | | | 3,702 | |
| | |
China Unicom Hong Kong Ltd. | | | 8,168 | | | | 5,035 | |
| | |
China Vanke Co. Ltd., Class H | | | 2,246 | | | | 6,972 | |
| | |
China Yangtze Power Co. Ltd., Class A | | | 2,511 | | | | 7,127 | |
| | |
CNOOC Ltd. | | | 13,963 | | | | 12,776 | |
| | |
Contemporary Amperex Technology Co. Ltd., Class A | | | 130 | | | | 4,773 | |
| | |
Country Garden Holdings Co. Ltd. | | | 2,198 | | | | 2,716 | |
| | |
Country Garden Services Holdings Co. Ltd. | | | 1,214 | | | | 7,645 | |
| | |
CSPC Pharmaceutical Group Ltd. | | | 5,259 | | | | 5,585 | |
| | |
Dada Nexus Ltd., ADR * (a) | | | 124 | | | | 4,098 | |
| | |
Dongfeng Motor Group Co. Ltd., Class H | | | 7,790 | | | | 5,487 | |
| | |
ENN Energy Holdings Ltd. | | | 653 | | | | 8,266 | |
| | |
GDS Holdings Ltd., ADR * (a) | | | 70 | | | | 5,911 | |
| | |
Greentown Service Group Co. Ltd. (b) | | | 3,134 | | | | 3,441 | |
| | |
Hangzhou Tigermed Consulting Co. Ltd., Class H * (b) | | | 375 | | | | 6,025 | |
| | |
Huazhu Group Ltd.* | | | 97 | | | | 4,109 | |
| | |
Industrial & Commercial Bank of China Ltd., Class H | | | 30,606 | | | | 17,380 | |
| | |
Inner Mongolia Yili Industrial Group Co. Ltd., Class A | | | 697 | | | | 4,146 | |
| | |
Innovent Biologics, Inc. * (b) | | | 1,336 | | | | 9,903 | |
| | |
iQIYI, Inc., ADR * | | | 254 | | | | 6,276 | |
| | |
JD.com, Inc., ADR * | | | 220 | | | | 17,894 | |
| | |
JD.com, Inc., Class A* | | | 487 | | | | 19,880 | |
| | |
Jiangsu Hengrui Medicine Co. Ltd., Class A | | | 626 | | | | 8,326 | |
| | |
Kingdee International Software Group Co. Ltd. * | | | 3,288 | | | | 8,681 | |
| | |
Kingsoft Corp. Ltd. | | | 1,633 | | | | 8,784 | |
| | |
Kunlun Energy Co. Ltd. | | | 5,852 | | | | 3,789 | |
| | |
Kweichow Moutai Co. Ltd., Class A | | | 63 | | | | 15,751 | |
| | |
Laobaixing Pharmacy Chain JSC, Class A | | | 153 | | | | 1,637 | |
| | |
Longfor Group Holdings Ltd. (b) | | | 2,007 | | | | 10,994 | |
| | |
Luxshare Precision Industry Co. Ltd., Class A | | | 515 | | | | 4,225 | |
| | |
Meituan Dianping, Class B * (b) | | | 1,777 | | | | 66,249 | |
| | |
Momo, Inc., ADR | | | 147 | | | | 2,207 | |
| | |
NetEase, Inc., ADR | | | 254 | | | | 22,123 | |
SEE NOTES TO FINANCIAL STATEMENTS.
| | | | | | |
| | | |
| 30 | | | | J.P. MORGAN INTERNATIONAL EQUITY FUNDS | | OCTOBER 31, 2020 |
| | | | | | | | |
| INVESTMENTS | | SHARES
(000) | | | VALUE
($000) | |
Common Stocks — continued | | | | | | | | |
| | |
China — continued | | | | | | | | |
| | |
New Oriental Education & Technology Group, Inc., ADR * | | | 113 | | | | 18,149 | |
| | |
NIO, Inc., ADR * | | | 277 | | | | 8,484 | |
| | |
Pharmaron Beijing Co. Ltd., Class H (b) | | | 235 | | | | 3,397 | |
| | |
PICC Property & Casualty Co. Ltd., Class H | | | 7,422 | | | | 5,037 | |
| | |
Pinduoduo, Inc., ADR * | | | 60 | | | | 5,417 | |
| | |
Ping An Bank Co. Ltd., Class A | | | 3,684 | | | | 9,783 | |
| | |
Ping An Insurance Group Co. of China Ltd., Class H | | | 3,597 | | | | 37,187 | |
| | |
Poly Developments and Holdings Group Co. Ltd., Class A | | | 2,804 | | | | 6,449 | |
| | |
Postal Savings Bank of China Co. Ltd., Class H (b) | | | 11,966 | | | | 5,872 | |
| | |
Sangfor Technologies, Inc., Class A | | | 91 | | | | 2,594 | |
| | |
Shanghai Liangxin Electrical Co. Ltd., Class A | | | 737 | | | | 2,990 | |
| | |
Shenzhen Mindray Bio-Medical Electronics Co. Ltd., Class A | | | 154 | | | | 8,896 | |
| | |
Shenzhou International Group Holdings Ltd. | | | 720 | | | | 12,522 | |
| | |
Silergy Corp. | | | 93 | | | | 5,734 | |
| | |
Sunny Optical Technology Group Co. Ltd. | | | 785 | | | | 13,037 | |
| | |
Suofeiya Home Collection Co. Ltd., Class A | | | 1,220 | | | | 5,151 | |
| | |
Tencent Holdings Ltd. | | | 2,635 | | | | 201,329 | |
| | |
Tianma Microelectronics Co. Ltd., Class A | | | 1,942 | | | | 4,151 | |
| | |
Trip.com Group Ltd., ADR * | | | 123 | | | | 3,526 | |
| | |
Wanhua Chemical Group Co. Ltd., Class A | | | 636 | | | | 7,483 | |
| | |
WuXi AppTec Co. Ltd., Class H (b) | | | 429 | | | | 6,860 | |
| | |
Wuxi Biologics Cayman, Inc. * (b) | | | 770 | | | | 21,610 | |
| | |
Xiaomi Corp., Class B * (b) | | | 6,592 | | | | 18,747 | |
| | |
Yum China Holdings, Inc. | | | 256 | | | | 13,609 | |
| | |
Yunnan Energy New Material Co. Ltd. | | | 296 | | | | 4,433 | |
| | |
Zai Lab Ltd., ADR * | | | 90 | | | | 7,376 | |
| | |
Zhejiang Chint Electrics Co. Ltd., Class A | | | 1,071 | | | | 4,700 | |
| | |
Zhejiang Expressway Co. Ltd., Class H | | | 3,432 | | | | 2,343 | |
| | | | | | | | |
| | |
| | | | | | | 1,256,776 | |
| | | | | | | | |
|
Colombia — 0.1% | |
| | |
Ecopetrol SA, ADR (a) | | | 443 | | | | 4,099 | |
| | | | | | | | |
|
Czech Republic — 0.1% | |
| | |
Moneta Money Bank A/S (b) | | | 1,188 | | | | 2,696 | |
| | | | | | | | |
|
Greece — 0.3% | |
| | |
Hellenic Telecommunications Organization SA | | | 370 | | | | 4,901 | |
| | |
OPAP SA | | | 447 | | | | 3,618 | |
| | | | | | | | |
| | |
| | | | | | | 8,519 | |
| | | | | | | | |
|
Hong Kong — 0.3% | |
| | |
Hutchison China MediTech Ltd., ADR * | | | 124 | | | | 3,655 | |
| | |
Techtronic Industries Co. Ltd. | | | 478 | | | | 6,432 | |
| | | | | | | | |
| | |
| | | | | | | 10,087 | |
| | | | | | | | |
| | | | | | | | |
| INVESTMENTS | | SHARES
(000) | | | VALUE
($000) | |
| | |
| | | | | | | | |
|
Hong Kong — continued | |
|
Hungary — 0.4% | |
| | |
OTP Bank Nyrt. * | | | 257 | | | | 8,030 | |
| | |
Richter Gedeon Nyrt. | | | 108 | | | | 2,212 | |
| | | | | | | | |
| | |
| | | | | | | 10,242 | |
| | | | | | | | |
|
India — 8.8% | |
| | |
Ashok Leyland Ltd. | | | 3,035 | | | | 3,224 | |
| | |
Axis Bank Ltd. * | | | 2,067 | | | | 13,699 | |
| | |
Britannia Industries Ltd. | | | 110 | | | | 5,165 | |
| | |
Eicher Motors Ltd. | | | 119 | | | | 3,351 | |
| | |
HDFC Bank Ltd., ADR * | | | 123 | | | | 7,086 | |
| | |
Hindalco Industries Ltd. | | | 1,529 | | | | 3,528 | |
| | |
Hindustan Unilever Ltd. | | | 603 | | | | 16,850 | |
| | |
Housing Development Finance Corp. Ltd. | | | 994 | | | | 25,779 | |
| | |
Infosys Ltd., ADR | | | 2,062 | | | | 29,430 | |
| | |
ITC Ltd. | | | 3,258 | | | | 7,281 | |
| | |
Kotak Mahindra Bank Ltd. * | | | 281 | | | | 5,861 | |
| | |
Larsen & Toubro Ltd. | | | 531 | | | | 6,651 | |
| | |
Maruti Suzuki India Ltd. | | | 114 | | | | 10,732 | |
| | |
NTPC Ltd. | | | 4,585 | | | | 5,417 | |
| | |
Oil & Natural Gas Corp. Ltd. | | | 3,767 | | | | 3,298 | |
| | |
Petronet LNG Ltd. | | | 2,143 | | | | 6,677 | |
| | |
Power Grid Corp. of India Ltd. | | | 3,204 | | | | 7,393 | |
| | |
Reliance Industries Ltd. | | | 1,430 | | | | 39,651 | |
| | |
Shriram Transport Finance Co. Ltd. | | | 356 | | | | 3,329 | |
| | |
Tata Consultancy Services Ltd. | | | 623 | | | | 22,447 | |
| | |
UltraTech Cement Ltd. | | | 168 | | | | 10,375 | |
| | |
United Spirits Ltd. * | | | 853 | | | | 5,801 | |
| | |
UPL Ltd. | | | 1,033 | | | | 6,313 | |
| | | | | | | | |
| | |
| | | | | | | 249,338 | |
| | | | | | | | |
|
Indonesia — 1.4% | |
| | |
Astra International Tbk. PT | | | 14,274 | | | | 5,213 | |
| | |
Bank Central Asia Tbk. PT | | | 7,445 | | | | 14,649 | |
| | |
Bank Rakyat Indonesia Persero Tbk. PT | | | 43,731 | | | | 9,899 | |
| | |
Telekomunikasi Indonesia Persero Tbk. PT | | | 49,920 | | | | 8,839 | |
| | | | | | | | |
| | |
| | | | | | | 38,600 | |
| | | | | | | | |
|
Malaysia — 0.8% | |
| | |
CIMB Group Holdings Bhd. | | | 3,680 | | | | 2,612 | |
| | |
Petronas Chemicals Group Bhd. | | | 3,849 | | | | 5,424 | |
| | |
Public Bank Bhd. | | | 1,933 | | | | 7,012 | |
| | |
Tenaga Nasional Bhd. | | | 2,125 | | | | 4,877 | |
| | |
Top Glove Corp. Bhd. | | | 1,339 | | | | 2,761 | |
| | | | | | | | |
| | |
| | | | | | | 22,686 | |
| | | | | | | | |
SEE NOTES TO FINANCIAL STATEMENTS.
| | | | | | | | |
| | | |
| OCTOBER 31, 2020 | | J.P. MORGAN INTERNATIONAL EQUITY FUNDS | | | | | 31 | |
JPMorgan Emerging Markets Research Enhanced Equity Fund
SCHEDULE OF PORTFOLIO INVESTMENTS
AS OF OCTOBER 31, 2020 (continued)
| | | | | | | | |
| INVESTMENTS | | SHARES
(000) | | | VALUE
($000) | |
Common Stocks — continued | | | | | | | | |
|
Mexico — 2.3% | |
| | |
America Movil SAB de CV, Series L (a) | | | 23,416 | | | | 14,230 | |
| | |
Fomento Economico Mexicano SAB de CV, ADR | | | 137 | | | | 7,345 | |
| | |
Grupo Aeroportuario del Sureste SAB de CV, Class B * (a) | | | 410 | | | | 4,754 | |
| | |
Grupo Financiero Banorte SAB de CV, Class O * | | | 3,152 | | | | 14,057 | |
| | |
Grupo Mexico SAB de CV, Series B | | | 2,722 | | | | 7,761 | |
| | |
Kimberly-Clark de Mexico SAB de CV, Class A | | | 3,424 | | | | 5,114 | |
| | |
Wal-Mart de Mexico SAB de CV | | | 5,234 | | | | 12,674 | |
| | | | | | | | |
| | |
| | | | | | | 65,935 | |
| | | | | | | | |
|
Peru — 0.3% | |
| | |
Credicorp Ltd. | | | 77 | | | | 8,817 | |
| | | | | | | | |
|
Philippines —0.4% | |
| | |
Ayala Corp. | | | 243 | | | | 3,832 | |
| | |
Ayala Land, Inc. | | | 5,702 | | | | 3,881 | |
| | |
International Container Terminal Services, Inc. | | | 1,444 | | | | 3,424 | |
| | | | | | | | |
| | |
| | | | | | | 11,137 | |
| | | | | | | | |
|
Poland — 0.4% | |
| | |
CD Projekt SA * | | | 85 | | | | 7,212 | |
| | |
Dino Polska SA * (b) | | | 96 | | | | 5,292 | |
| | | | | | | | |
| | |
| | | | | | | 12,504 | |
| | | | | | | | |
|
Qatar — 0.3% | |
| | |
Qatar National Bank QPSC | | | 1,878 | | | | 9,119 | |
| | | | | | | | |
|
Russia — 3.1% | |
| | |
Alrosa PJSC | | | 7,228 | | | | 6,505 | |
| | |
Gazprom PJSC, ADR | | | 1,712 | | | | 6,560 | |
| | |
LUKOIL PJSC, ADR | | | 271 | | | | 13,881 | |
| | |
Magnitogorsk Iron & Steel Works PJSC | | | 6,487 | | | | 3,079 | |
| | |
MMC Norilsk Nickel PJSC, ADR | | | 266 | | | | 6,336 | |
| | |
Moscow Exchange MICEX-RTS PJSC | | | 4,377 | | | | 7,392 | |
| | |
Moscow Exchange MICEX-RTS PJSC | | | 56 | | | | 95 | |
| | |
Novolipetsk Steel PJSC | | | 1,409 | | | | 3,305 | |
| | |
Sberbank of Russia PJSC, ADR | | | 1,762 | | | | 17,810 | |
| | |
Severstal PAO, GDR (b) | | | 556 | | | | 7,599 | |
| | |
Tatneft PJSC, ADR | | | 222 | | | | 6,867 | |
| | |
X5 Retail Group NV, GDR (b) | | | 226 | | | | 7,960 | |
| | | | | | | | |
| | |
| | | | | | | 87,389 | |
| | | | | | | | |
|
Saudi Arabia — 2.0% | |
| | |
Al Rajhi Bank | | | 978 | | | | 17,158 | |
| | |
Alinma Bank * | | | 1,551 | | | | 6,302 | |
| | |
Almarai Co. JSC | | | 366 | | | | 5,032 | |
| | |
Bupa Arabia for Cooperative Insurance Co. * | | | 87 | | | | 2,654 | |
| | |
National Commercial Bank | | | 790 | | | | 8,206 | |
| | | | | | | | |
| INVESTMENTS | | SHARES
(000) | | | VALUE
($000) | |
| | |
| | | | | | | | |
|
Saudi Arabia — continued | |
| | |
Saudi Basic Industries Corp. | | | 374 | | | | 8,966 | |
| | |
Saudi Telecom Co. | | | 221 | | | | 5,859 | |
| | |
Savola Group (The) | | | 303 | | | | 3,704 | |
| | | | | | | | |
| | |
| | | | | | | 57,881 | |
| | | | | | | | |
|
Singapore — 0.1% | |
| | |
BOC Aviation Ltd. (b) | | | 333 | | | | 2,063 | |
| | | | | | | | |
|
South Africa — 3.9% | |
| | |
Absa Group Ltd. | | | 1,060 | | | | 5,697 | |
| | |
Bid Corp. Ltd. | | | 412 | | | | 5,678 | |
| | |
Bidvest Group Ltd. (The) | | | 782 | | | | 6,431 | |
| | |
Capitec Bank Holdings Ltd. * | | | 113 | | | | 7,947 | |
| | |
Clicks Group Ltd. | | | 482 | | | | 6,987 | |
| | |
FirstRand Ltd. (a) | | | 4,130 | | | | 9,587 | |
| | |
Gold Fields Ltd., ADR | | | 206 | | | | 2,247 | |
| | |
Impala Platinum Holdings Ltd. | | | 508 | | | | 4,523 | |
| | |
Mr Price Group Ltd. | | | 564 | | | | 4,264 | |
| | |
MTN Group Ltd. | | | 1,287 | | | | 4,597 | |
| | |
Naspers Ltd., Class N * | | | 198 | | | | 38,733 | |
| | |
Pick n Pay Stores Ltd. | | | 990 | | | | 3,118 | |
| | |
SPAR Group Ltd. (The) | | | 597 | | | | 6,335 | |
| | |
Vodacom Group Ltd. | | | 620 | | | | 4,674 | |
| | | | | | | | |
| | |
| | | | | | | 110,818 | |
| | | | | | | | |
|
South Korea — 12.5% | |
| | |
BGF retail Co. Ltd. | | | 17 | | | | 1,754 | |
| | |
Celltrion, Inc. * | | | 20 | | | | 4,244 | |
| | |
Hana Financial Group, Inc. | | | 349 | | | | 9,421 | |
| | |
Hankook Tire & Technology Co. Ltd. | | | 200 | | | | 5,613 | |
| | |
Hanon Systems | | | 397 | | | | 3,937 | |
| | |
Hyundai Glovis Co. Ltd. | | | 31 | | | | 4,541 | |
| | |
Hyundai Mobis Co. Ltd. | | | 61 | | | | 12,287 | |
| | |
Hyundai Motor Co. | | | 56 | | | | 8,190 | |
| | |
Kia Motors Corp. | | | 288 | | | | 12,931 | |
| | |
KIWOOM Securities Co. Ltd. | | | 39 | | | | 3,606 | |
| | |
KT&G Corp. | | | 119 | | | | 8,511 | |
| | |
LG Chem Ltd. | | | 34 | | | | 18,652 | |
| | |
LG Household & Health Care Ltd. | | | 9 | | | | 12,576 | |
| | |
Lotte Chemical Corp. | | | 15 | | | | 3,173 | |
| | |
Mando Corp. | | | 137 | | | | 4,368 | |
| | |
NAVER Corp. | | | 78 | | | | 19,926 | |
| | |
NCSoft Corp. | | | 16 | | | | 11,036 | |
| | |
POSCO | | | 70 | | | | 12,864 | |
| | |
Samsung Electronics Co. Ltd. | | | 2,562 | | | | 128,777 | |
| | |
Samsung Fire & Marine Insurance Co. Ltd. | | | 61 | | | | 9,615 | |
SEE NOTES TO FINANCIAL STATEMENTS.
| | | | | | |
| | | |
| 32 | | | | J.P. MORGAN INTERNATIONAL EQUITY FUNDS | | OCTOBER 31, 2020 |
| | | | | | | | |
| INVESTMENTS | | SHARES
(000) | | | VALUE
($000) | |
Common Stocks — continued | | | | | | | | |
|
South Korea — continued | |
| | |
Samsung SDI Co. Ltd. | | | 12 | | | | 4,627 | |
| | |
Shinhan Financial Group Co. Ltd. | | | 359 | | | | 9,741 | |
| | |
SK Holdings Co. Ltd. | | | 22 | | | | 3,521 | |
| | |
SK Hynix, Inc. | | | 320 | | | | 22,703 | |
| | |
SK Innovation Co. Ltd. | | | 60 | | | | 6,671 | |
| | |
SK Telecom Co. Ltd. | | | 28 | | | | 5,264 | |
| | |
S-Oil Corp. | | | 119 | | | | 5,756 | |
| | | | | | | | |
| | |
| | | | | | | 354,305 | |
| | | | | | | | |
|
Taiwan — 12.1% | |
| | |
Accton Technology Corp. | | | 1,148 | | | | 8,341 | |
| | |
Advantech Co. Ltd. | | | 803 | | | | 8,125 | |
| | |
ASE Technology Holding Co. Ltd. | | | 4,788 | | | | 10,747 | |
| | |
Chailease Holding Co. Ltd. | | | 2,164 | | | | 10,514 | |
| | |
CTBC Financial Holding Co. Ltd. | | | 4,550 | | | | 2,873 | |
| | |
Delta Electronics, Inc. | | | 1,824 | | | | 12,136 | |
| | |
E.Sun Financial Holding Co. Ltd. | | | 8,994 | | | | 7,647 | |
| | |
Eclat Textile Co. Ltd. | | | 563 | | | | 7,491 | |
| | |
Feng TAY Enterprise Co. Ltd. | | | 542 | | | | 3,288 | |
| | |
Formosa Petrochemical Corp. | | | 2,331 | | | | 6,417 | |
| | |
Formosa Plastics Corp. | | | 2,307 | | | | 6,386 | |
| | |
Fubon Financial Holding Co. Ltd. | | | 6,973 | | | | 9,933 | |
| | |
Global Unichip Corp. | | | 350 | | | | 3,177 | |
| | |
Globalwafers Co. Ltd. | | | 384 | | | | 5,592 | |
| | |
Hiwin Technologies Corp. | | | 830 | | | | 7,243 | |
| | |
Hon Hai Precision Industry Co. Ltd. | | | 1,106 | | | | 3,000 | |
| | |
Inventec Corp. | | | 2,999 | | | | 2,374 | |
| | |
MediaTek, Inc. | | | 422 | | | | 10,031 | |
| | |
Nanya Technology Corp. | | | 1,767 | | | | 3,581 | |
| | |
Realtek Semiconductor Corp. | | | 766 | | | | 9,542 | |
| | |
Taiwan Semiconductor Manufacturing Co. Ltd. | | | 750 | | | | 11,347 | |
| | |
Taiwan Semiconductor Manufacturing Co. Ltd., ADR | | | 1,972 | | | | 165,357 | |
| | |
Uni-President Enterprises Corp. | | | 4,381 | | | | 9,391 | |
| | |
Vanguard International Semiconductor Corp. | | | 2,084 | | | | 6,808 | |
| | |
Wiwynn Corp. | | | 225 | | | | 5,725 | |
| | |
Yuanta Financial Holding Co. Ltd. | | | 11,786 | | | | 7,328 | |
| | | | | | | | |
| | |
| | | | | | | 344,394 | |
| | | | | | | | |
|
Tanzania, United Republic of — 0.2% | |
| | |
AngloGold Ashanti Ltd., ADR | | | 236 | | | | 5,468 | |
| | | | | | | | |
|
Thailand — 1.2% | |
| | |
Airports of Thailand PCL | | | 3,874 | | | | 6,424 | |
| | |
Kasikornbank PCL | | | 1,676 | | | | 4,037 | |
| | |
Minor International PCL* | | | 5,399 | | | | 2,889 | |
| | |
PTT Exploration & Production PCL | | | 2,218 | | | | 5,603 | |
| | | | | | | | |
| INVESTMENTS | | SHARES
(000) | | | VALUE
($000) | |
| | |
| | | | | | | | |
| | |
Thailand — continued | | | | | | | | |
| | |
PTT PCL | | | 5,110 | | | | 5,044 | |
| | |
Siam Cement PCL (The) (Registered) | | | 666 | | | | 7,213 | |
| | |
Thai Oil PCL | | | 3,925 | | | | 4,311 | |
| | | | | | | | |
| | |
| | | | | | | 35,521 | |
| | | | | | | | |
|
Turkey — 0.2% | |
| | |
BIM Birlesik Magazalar A/S | | | 802 | | | | 6,337 | |
| | | | | | | | |
|
United Arab Emirates — 0.1% | |
| | |
Emaar Properties PJSC* | | | 4,149 | | | | 2,973 | |
| | | | | | | | |
| | |
Total Common Stocks
(Cost $2,526,600) | | | | | | | 2,855,479 | |
| | | | | | | | |
Short-Term Investments — 1.1% | |
|
Investment Companies — 0.4% | |
| | |
JPMorgan Prime Money Market Fund Class Institutional Shares, 0.05% (c) (d) (Cost $12,125) | | | 12,118 | | | | 12,125 | |
| | | | | | | | |
|
Investment of Cash Collateral from Securities Loaned—0.7% | |
| | |
JPMorgan Securities Lending Money Market Fund Agency SL Class Shares, 0.15% (c) (d) | | | 15,994 | | | | 15,995 | |
| | |
JPMorgan U.S. Government Money Market Fund Class IM Shares, 0.04% (c) (d) | | | 2,093 | | | | 2,093 | |
| | | | | | | | |
| | |
Total Investment of Cash Collateral from Securities Loaned
(Cost $18,089) | | | | | | | 18,088 | |
| | | | | | | | |
| | |
Total Short-Term Investments
(Cost $30,214) | | | | | | | 30,213 | |
| | | | | | | | |
Total Investments — 101.6%
(Cost $2,556,814) | | | | | | | 2,885,692 | |
Liabilities in Excess of
Other Assets — (1.6)% | | | | | | | (45,350 | ) |
| | | | | | | | |
NET ASSETS — 100.0% | | | | 2,840,342 | |
| | | | | | | | |
Percentages indicated are based on net assets.
SEE NOTES TO FINANCIAL STATEMENTS.
| | | | | | | | |
| | | |
| OCTOBER 31, 2020 | | J.P. MORGAN INTERNATIONAL EQUITY FUNDS | | | | | 33 | |
JPMorgan Emerging Markets Research Enhanced Equity Fund
SCHEDULE OF PORTFOLIO INVESTMENTS
AS OF OCTOBER 31, 2020 (continued)
Summary of Investments by Industry, October 31, 2020
The following table represents the portfolio investments of the Fund by industry classifications as a percentage of total investments:
| | | | |
| INDUSTRY | | PERCENTAGE | |
| |
Internet & Direct Marketing Retail | | | 14.6 | % |
| |
Banks | | | 11.3 | |
| |
Semiconductors & Semiconductor Equipment | | | 8.8 | |
| |
Interactive Media & Services | | | 7.9 | |
| |
Technology Hardware, Storage & Peripherals | | | 5.7 | |
| |
Oil, Gas & Consumable Fuels | | | 5.1 | |
| |
Metals & Mining | | | 3.6 | |
| |
Insurance | | | 3.1 | |
| |
Food & Staples Retailing | | | 2.6 | |
| |
IT Services | | | 2.0 | |
| |
Chemicals | | | 2.0 | |
| |
Automobiles | | | 1.9 | |
| |
Entertainment | | | 1.9 | |
| |
Real Estate Management & Development | | | 1.8 | |
| |
Wireless Telecommunication Services | | | 1.8 | |
| |
Electronic Equipment, Instruments & Components | | | 1.6 | |
| |
Life Sciences Tools & Services | | | 1.3 | |
| |
Textiles, Apparel & Luxury Goods | | | 1.1 | |
| |
Beverages | | | 1.0 | |
| |
Biotechnology | | | 1.0 | |
| |
Food Products | | | 1.0 | |
| |
Others (each less than 1.0%) | | | 17.9 | |
| |
Short-Term Investments | | | 1.0 | |
Abbreviations
| | |
| ADR | | American Depositary Receipt |
| GDR | | Global Depositary Receipt |
| JSC | | Joint Stock Company |
| PJSC | | Public Joint Stock Company |
| Preference | | A special type of equity investment that shares in the earnings of the company, has limited voting rights, and may have a dividend preference. Preference shares may also have liquidation preference. |
| PT | | Limited liability company |
| RTS | | Russian Trading System |
| |
| (a) | | The security or a portion of this security is on loan at October 31, 2020. The total value of securities on loan at October 31, 2020 is approximately $17,283,000. |
| (b) | | Security exempt from registration pursuant to Regulation S under the Securities Act of 1933, as amended. Regulation S applies to securities offerings that are made outside of the United States and do not involve direct selling efforts in the United States and as such may have restrictions on resale. |
| (c) | | Investment in an affiliated fund, which is registered under the Investment Company Act of 1940, as amended, and is advised by J.P. Morgan Investment Management Inc. |
| (d) | | The rate shown is the current yield as of October 31, 2020. |
| * | | Non-income producing security. |
SEE NOTES TO FINANCIAL STATEMENTS.
| | | | | | |
| | | |
| 34 | | | | J.P. MORGAN INTERNATIONAL EQUITY FUNDS | | OCTOBER 31, 2020 |
JPMorgan Europe Dynamic Fund
SCHEDULE OF PORTFOLIO INVESTMENTS
AS OF OCTOBER 31, 2020
| | | | | | | | |
| INVESTMENTS | | SHARES
(000) | | | VALUE
($000) | |
Common Stocks — 98.9% | |
|
Australia — 2.9% | |
| | |
BHP Group plc | | | 306 | | | | 5,934 | |
| | |
Rio Tinto plc | | | 116 | | | | 6,556 | |
| | | | | | | | |
| | |
| | | | | | | 12,490 | |
| | | | | | | | |
|
Austria — 2.4% | |
| | |
ams AG * | | | 193 | | | | 4,130 | |
| | |
Erste Group Bank AG | | | 212 | | | | 4,355 | |
| | |
Wienerberger AG | | | 86 | | | | 2,169 | |
| | | | | | | | |
| | |
| | | | | | | 10,654 | |
| | | | | | | | |
|
China — 1.3% | |
| | |
Prosus NV * | | | 58 | | | | 5,808 | |
| | | | | | | | |
|
Denmark — 4.3% | |
| | |
AP Moller—Maersk A/S, Class B | | | 2 | | | | 3,946 | |
| | |
Orsted A/S (a) | | | 46 | | | | 7,308 | |
| | |
Pandora A/S | | | 27 | | | | 2,166 | |
| | |
Royal Unibrew A/S | | | 22 | | | | 2,166 | |
| | |
Vestas Wind Systems A/S | | | 20 | | | | 3,440 | |
| | | | | | | | |
| | |
| | | | | | | 19,026 | |
| | | | | | | | |
|
Finland — 2.2% | |
| | |
Cargotec OYJ, Class B (b) | | | 94 | | | | 3,231 | |
| | |
Neste OYJ | | | 124 | | | | 6,480 | |
| | | | | | | | |
| | |
| | | | | | | 9,711 | |
| | | | | | | | |
|
France — 11.1% | |
| | |
BNP Paribas SA * | | | 191 | | | | 6,646 | |
| | |
Capgemini SE | | | 40 | | | | 4,667 | |
| | |
Credit Agricole SA * | | | 416 | | | | 3,292 | |
| | |
Eiffage SA * | | | 29 | | | | 2,082 | |
| | |
La Francaise des Jeux SAEM (a) | | | 129 | | | | 4,855 | |
| | |
Peugeot SA * | | | 178 | | | | 3,198 | |
| | |
Publicis Groupe SA | | | 61 | | | | 2,125 | |
| | |
Safran SA * | | | 52 | | | | 5,474 | |
| | |
Sanofi | | | 93 | | | | 8,386 | |
| | |
Schneider Electric SE | | | 64 | | | | 7,816 | |
| | | | | | | | |
| | |
| | | | | | | 48,541 | |
| | | | | | | | |
|
Germany — 14.2% | |
| | |
Allianz SE (Registered) | | | 35 | | | | 6,178 | |
| | |
Daimler AG (Registered) | | | 105 | | | | 5,412 | |
| | |
Delivery Hero SE * (a) | | | 34 | | | | 3,933 | |
| | |
Deutsche Post AG (Registered) | | | 196 | | | | 8,691 | |
| | |
Deutsche Telekom AG (Registered) | | | 588 | | | | 8,933 | |
| | |
DWS Group GmbH & Co. KGaA * (a) | | | 98 | | | | 3,323 | |
| | |
GEA Group AG | | | 130 | | | | 4,340 | |
| | |
Schaeffler AG (Preference) | | | 509 | | | | 3,098 | |
| | | | | | | | |
| INVESTMENTS | | SHARES
(000) | | | VALUE
($000) | |
| | | | | | | | |
|
Germany — continued | |
| | |
Siemens AG (Registered) | | | 41 | | | | 4,827 | |
| | |
Softwareone Holding AG * | | | 115 | | | | 2,831 | |
| | |
Volkswagen AG (Preference) | | | 36 | | | | 5,311 | |
| | |
Zalando SE * (a) | | | 59 | | | | 5,459 | |
| | | | | | | | |
| | |
| | | | | | | 62,336 | |
| | | | | | | | |
|
Ireland — 3.1% | |
| | |
AIB Group plc * | | | 2,337 | | | | 2,607 | |
| | |
Bank of Ireland Group plc * | | | 1,444 | | | | 3,579 | |
| | |
Ryanair Holdings plc, ADR * | | | 47 | | | | 3,824 | |
| | |
Smurfit Kappa Group plc | | | 99 | | | | 3,724 | |
| | | | | | | | |
| | |
| | | | | | | 13,734 | |
| | | | | | | | |
|
Italy — 3.7% | |
| | |
Enel SpA | | | 972 | | | | 7,730 | |
| | |
Falck Renewables SpA | | | 355 | | | | 1,926 | |
| | |
Intesa Sanpaolo SpA * | | | 2,708 | | | | 4,496 | |
| | |
Poste Italiane SpA (a) | | | 229 | | | | 1,866 | |
| | | | | | | | |
| | |
| | | | | | | 16,018 | |
| | | | | | | | |
|
Jordan — 1.0% | |
| | |
Hikma Pharmaceuticals plc | | | 139 | | | | 4,504 | |
| | | | | | | | |
|
Netherlands — 7.1% | |
| | |
Adyen NV * (a) | | | 2 | | | | 2,662 | |
| | |
ASM International NV | | | 50 | | | | 7,192 | |
| | |
ASR Nederland NV | | | 97 | | | | 2,955 | |
| | |
BE Semiconductor Industries NV | | | 67 | | | | 2,716 | |
| | |
Euronext NV (a) | | | 18 | | | | 1,862 | |
| | |
Koninklijke Ahold Delhaize NV | | | 252 | | | | 6,899 | |
| | |
Shop Apotheke Europe NV * (a) | | | 17 | | | | 2,776 | |
| | |
Signify NV* (a) | | | 115 | | | | 4,075 | |
| | | | | | | | |
| | |
| | | | | | | 31,137 | |
| | | | | | | | |
|
Norway — 0.4% | |
| | |
Scatec Solar ASA (a) | | | 75 | | | | 1,656 | |
| | | | | | | | |
|
Spain — 1.1% | |
| | |
Endesa SA | | | 177 | | | | 4,739 | |
| | | | | | | | |
|
Sweden — 7.7% | |
| | |
Embracer Group AB * | | | 215 | | | | 4,328 | |
| | |
Evolution Gaming Group AB (a) | | | 72 | | | | 5,314 | |
| | |
Recipharm AB, Class B * | | | 151 | | | | 2,426 | |
| | |
Sinch AB * (a) | | | 55 | | | | 5,199 | |
| | |
SKF AB, Class B | | | 247 | | | | 5,063 | |
| | |
Stillfront Group AB * | | | 16 | | | | 1,910 | |
| | |
Swedish Match AB | | | 49 | | | | 3,669 | |
SEE NOTES TO FINANCIAL STATEMENTS.
| | | | | | | | |
| | | |
| OCTOBER 31, 2020 | | J.P. MORGAN INTERNATIONAL EQUITY FUNDS | | | | | 35 | |
JPMorgan Europe Dynamic Fund
SCHEDULE OF PORTFOLIO INVESTMENTS
AS OF OCTOBER 31, 2020 (continued)
| | | | | | | | |
| INVESTMENTS | | SHARES
(000) | | | VALUE
($000) | |
Common Stocks — continued | |
|
Sweden — continued | |
| | |
Volvo AB, Class B* | | | 298 | | | | 5,791 | |
| | | | | | | | |
| | |
| | | | | | | 33,700 | |
| | | | | | | | |
|
Switzerland — 18.2% | |
| | |
ALSO Holding AG (Registered)* | | | 12 | | | | 2,761 | |
| | |
Credit Suisse Group AG (Registered) | | | 491 | | | | 4,634 | |
| | |
LafargeHolcim Ltd. (Registered)* | | | 133 | | | | 5,711 | |
| | |
Logitech International SA (Registered) | | | 38 | | | | 3,170 | |
| | |
Nestle SA (Registered) | | | 154 | | | | 17,294 | |
| | |
Novartis AG (Registered) | | | 157 | | | | 12,256 | |
| | |
Roche Holding AG | | | 39 | | | | 12,633 | |
| | |
Schindler Holding AG | | | 15 | | | | 3,891 | |
| | |
Sonova Holding AG (Registered)* | | | 19 | | | | 4,498 | |
| | |
Swissquote Group Holding SA (Registered) | | | 30 | | | | 2,369 | |
| | |
Zur Rose Group AG* | | | 15 | | | | 4,196 | |
| | |
Zurich Insurance Group AG | | | 20 | | | | 6,559 | |
| | | | | | | | |
| | |
| | | | | | | 79,972 | |
| | | | | | | | |
|
United Kingdom — 17.1% | |
| | |
3i Group plc | | | 325 | | | | 4,063 | |
| | |
AstraZeneca plc | | | 28 | | | | 2,802 | |
| | |
Berkeley Group Holdings plc | | | 59 | | | | 3,092 | |
| | |
boohoo Group plc* | | | 855 | | | | 2,995 | |
| | |
Centrica plc | | | 8,181 | | | | 3,940 | |
| | |
Computacenter plc | | | 106 | | | | 3,117 | |
| | |
Dialog Semiconductor plc* | | | 101 | | | | 3,840 | |
| | |
Dunelm Group plc | | | 151 | | | | 2,554 | |
| | |
Games Workshop Group plc | | | 18 | | | | 2,419 | |
| | |
Informa plc | | | 459 | | | | 2,491 | |
| | |
Intermediate Capital Group plc | | | 207 | | | | 3,146 | |
| | |
Kingfisher plc* | | | 711 | | | | 2,646 | |
| | |
Linde plc | | | 22 | | | | 4,891 | |
| | |
M&G plc | | | 878 | | | | 1,670 | |
| | |
National Express Group plc | | | 2,001 | | | | 3,883 | |
| | |
Next plc | | | 81 | | | | 6,118 | |
| | |
Persimmon plc | | | 150 | | | | 4,530 | |
| | |
Pets at Home Group plc | | | 308 | | | | 1,546 | |
| | |
Prudential plc | | | 250 | | | | 3,059 | |
| | |
Reckitt Benckiser Group plc | | | 52 | | | | 4,623 | |
| | |
Segro plc, REIT | | | 378 | | | | 4,418 | |
| | |
Spirent Communications plc | | | 887 | | | | 3,332 | |
| | | | | | | | |
| | |
| | | | | | | 75,175 | |
| | | | | | | | |
|
United States — 1.1% | |
| | |
Ferguson plc | | | 46 | | | | 4,573 | |
| | | | | | | | |
| |
Total Common Stocks
(Cost $421,472) | | | | 433,774 | |
| | | | | |
| | | | | | | | |
| INVESTMENTS | | SHARES
(000) | | | VALUE
($000) | |
Short-Term Investments — 1.1% | |
|
Investment Companies — 0.5% | |
| | |
JPMorgan Prime Money Market Fund Class Institutional Shares, 0.05% (c) (d)
(Cost $2,182) | | | 2,180 | | | | 2,182 | |
| | | | | | | | |
|
Investment of Cash Collateral from Securities Loaned — 0.6% | |
| | |
JPMorgan U.S. Government Money Market Fund Class IM Shares, 0.04% (c) (d)
(Cost $2,662) | | | 2,662 | | | | 2,662 | |
| | | | | | | | |
| | |
Total Short-Term Investments
(Cost $4,844) | | | | | | | 4,844 | |
| | | | | | | | |
Total Investments — 100.0%
(Cost $426,316) | | | | | | | 438,618 | |
Other Assets Less
Liabilities — 0.0% (e) | | | | | | | 210 | |
| | | | | | | | |
NET ASSETS — 100.0% | | | | | | | 438,828 | |
| | | | | | | | |
Percentages indicated are based on net assets.
SEE NOTES TO FINANCIAL STATEMENTS.
| | | | | | |
| | | |
| 36 | | | | J.P. MORGAN INTERNATIONAL EQUITY FUNDS | | OCTOBER 31, 2020 |
Summary of Investments by Industry, October 31, 2020
The following table represents the portfolio investments of the Fund by industry classifications as a percentage of total investments:
| | | | |
| INDUSTRY | | PERCENTAGE | |
| |
Pharmaceuticals | | | 9.8 | % |
| |
Banks | | | 5.7 | |
| |
Machinery | | | 5.1 | |
| |
Internet & Direct Marketing Retail | | | 4.8 | |
| |
Insurance | | | 4.7 | |
| |
Electric Utilities | | | 4.5 | |
| |
Capital Markets | | | 4.4 | |
| |
Semiconductors & Semiconductor Equipment | | | 4.1 | |
| |
Food Products | | | 3.9 | |
| |
Electrical Equipment | | | 3.5 | |
| |
Automobiles | | | 3.2 | |
| |
Metals & Mining | | | 2.8 | |
| |
Food & Staples Retailing | | | 2.5 | |
| |
IT Services | | | 2.4 | |
| |
Hotels, Restaurants & Leisure | | | 2.3 | |
| |
Diversified Telecommunication Services | | | 2.0 | |
| |
Air Freight & Logistics | | | 2.0 | |
| |
Construction Materials | | | 1.8 | |
| |
Household Durables | | | 1.7 | |
| |
Specialty Retail | | | 1.5 | |
| |
Oil, Gas & Consumable Fuels | | | 1.5 | |
| |
Entertainment | | | 1.4 | |
| |
Multiline Retail | | | 1.4 | |
| |
Electronic Equipment, Instruments & Components | | | 1.3 | |
| |
Aerospace & Defense | | | 1.2 | |
| |
Software | | | 1.2 | |
| |
Chemicals | | | 1.1 | |
| |
Industrial Conglomerates | | | 1.1 | |
| |
Household Products | | | 1.1 | |
| |
Media | | | 1.1 | |
| |
Trading Companies & Distributors | | | 1.0 | |
| |
Health Care Equipment & Supplies | | | 1.0 | |
| |
Equity Real Estate Investment Trusts (REITs) | | | 1.0 | |
| |
Others (each less than 1.0%) | | | 10.8 | |
| |
Short-Term Investments | | | 1.1 | |
Abbreviations
| | |
| ADR | | American Depositary Receipt |
| OYJ | | Public Limited Company |
| Preference | | A special type of equity investment that shares in the earnings of the company, has limited voting rights, and may have a dividend preference. Preference shares may also have liquidation preference. |
| REIT | | Real Estate Investment Trust |
| |
| (a) | | Security exempt from registration pursuant to Regulation S under the Securities Act of 1933, as amended. Regulation S applies to securities offerings that are made outside of the United States and do not involve direct selling efforts in the United States and as such may have restrictions on resale. |
| (b) | | The security or a portion of this security is on loan at October 31, 2020. The total value of securities on loan at October 31, 2020 is approximately $2,626,000. |
| (c) | | Investment in an affiliated fund, which is registered under the Investment Company Act of 1940, as amended, and is advised by J.P. Morgan Investment Management Inc. |
| (d) | | The rate shown is the current yield as of October 31, 2020. |
| (e) | | Amount rounds to less than 0.1% of net assets. |
| * | | Non-income producing security. |
SEE NOTES TO FINANCIAL STATEMENTS.
| | | | | | | | |
| | | |
| OCTOBER 31, 2020 | | J.P. MORGAN INTERNATIONAL EQUITY FUNDS | | | | | 37 | |
JPMorgan International Advantage Fund
SCHEDULE OF PORTFOLIO INVESTMENTS
AS OF OCTOBER 31, 2020
| | | | | | | | |
| INVESTMENTS | | SHARES
(000) | | | VALUE
($000) | |
Common Stocks — 98.8% | |
|
Australia — 8.7% | |
| | |
AGL Energy Ltd. | | | 386 | | | | 3,379 | |
| | |
Ansell Ltd. | | | 485 | | | | 13,702 | |
| | |
Austal Ltd. | | | 975 | | | | 1,859 | |
| | |
BHP Group Ltd. | | | 1,099 | | | | 26,353 | |
| | |
Coles Group Ltd. | | | 559 | | | | 6,989 | |
| | |
CSL Ltd. | | | 53 | | | | 10,651 | |
| | |
CSR Ltd. | | | 1,951 | | | | 6,038 | |
| | |
Fortescue Metals Group Ltd. | | | 710 | | | | 8,688 | |
| | |
IOOF Holdings Ltd. | | | 470 | | | | 965 | |
| | |
JB Hi-Fi Ltd. | | | 179 | | | | 5,995 | |
| | |
Premier Investments Ltd. | | | 124 | | | | 1,858 | |
| | |
Qantas Airways Ltd. | | | 1,198 | | | | 3,526 | |
| | |
Rio Tinto plc | | | 417 | | | | 23,603 | |
| | |
Silver Lake Resources Ltd. * | | | 4,165 | | | | 6,237 | |
| | |
Super Retail Group Ltd. | | | 629 | | | | 4,949 | |
| | |
Wesfarmers Ltd. | | | 221 | | | | 7,155 | |
| | | | | | | | |
| | |
| | | | | | | 131,947 | |
| | | | | | | | |
|
Austria — 0.9% | |
| | |
ANDRITZ AG | | | 142 | | | | 4,779 | |
| | |
BAWAG Group AG (a) | | | 58 | | | | 2,119 | |
| | |
Wienerberger AG | | | 256 | | | | 6,449 | |
| | | | | | | | |
| | |
| | | | | | | 13,347 | |
| | | | | | | | |
|
Belgium — 1.6% | |
| | |
Ageas SA | | | 337 | | | | 13,553 | |
| | |
bpost SA | | | 333 | | | | 2,950 | |
| | |
D’ieteren SA/NV | | | 84 | | | | 4,222 | |
| | |
KBC Group NV | | | 60 | | | | 2,945 | |
| | | | | | | | |
| | |
| | | | | | | 23,670 | |
| | | | | | | | |
|
China — 0.8% | |
| | |
BOC Hong Kong Holdings Ltd. | | | 3,687 | | | | 10,241 | |
| | |
SITC International Holdings Co. Ltd. | | | 1,040 | | | | 1,606 | |
| | | | | | | | |
| | |
| | | | | | | 11,847 | |
| | | | | | | | |
|
Denmark — 2.6% | |
| | |
AP Moller — Maersk A/S, Class B | | | 8 | | | | 12,113 | |
| | |
Novo Nordisk A/S, Class B | | | 388 | | | | 24,769 | |
| | |
Scandinavian Tobacco Group A/S (a) | | | 200 | | | | 2,829 | |
| | | | | | | | |
| | |
| | | | | | | 39,711 | |
| | | | | | | | |
|
Finland — 0.7% | |
| | |
Neste OYJ | | | 97 | | | | 5,069 | |
| | |
Uponor OYJ | | | 65 | | | | 1,216 | |
| | |
Valmet OYJ | | | 186 | | | | 4,441 | |
| | | | | | | | |
| | |
| | | | | | | 10,726 | |
| | | | | | | | |
| | | | | | | | |
| INVESTMENTS | | SHARES
(000) | | | VALUE
($000) | |
| | | | | | | | |
|
France — 8.1% | |
| | |
Atos SE * | | | 164 | | | | 11,233 | |
| | |
BNP Paribas SA * | | | 92 | | | | 3,214 | |
| | |
Capgemini SE | | | 57 | | | | 6,562 | |
| | |
Cie de Saint-Gobain * | | | 204 | | | | 7,944 | |
| | |
L’Oreal SA | | | 10 | | | | 3,199 | |
| | |
LVMH Moet Hennessy Louis Vuitton SE | | | 33 | | | | 15,324 | |
| | |
Peugeot SA * | | | 757 | | | | 13,607 | |
| | |
Sanofi | | | 282 | | | | 25,494 | |
| | |
Schneider Electric SE | | | 185 | | | | 22,432 | |
| | |
Sopra Steria Group * | | | 40 | | | | 4,770 | |
| | |
SPIE SA | | | 350 | | | | 5,510 | |
| | |
TOTAL SE | | | 103 | | | | 3,107 | |
| | | | | | | | |
| | |
| | | | | | | 122,396 | |
| | | | | | | | |
|
Germany — 8.6% | |
| | |
Allianz SE (Registered) | | | 122 | | | | 21,412 | |
| | |
Daimler AG (Registered) (b) | | | 101 | | | | 5,203 | |
| | |
Deutsche Post AG (Registered) | | | 247 | | | | 10,964 | |
| | |
DWS Group GmbH & Co. KGaA * (a) | | | 131 | | | | 4,442 | |
| | |
Encavis AG (b) | | | 279 | | | | 5,477 | |
| | |
Fresenius Medical Care AG & Co. KGaA | | | 85 | | | | 6,454 | |
| | |
Hornbach Holding AG & Co. KGaA | | | 62 | | | | 5,967 | |
| | |
Muenchener Rueckversicherungs-Gesellschaft AG (Registered) | | | 68 | | | | 15,987 | |
| | |
RWE AG (b) | | | 343 | | | | 12,702 | |
| | |
SAP SE | | | 85 | | | | 9,024 | |
| | |
Schaeffler AG (Preference) | | | 1,310 | | | | 7,976 | |
| | |
Siemens AG (Registered) | | | 145 | | | | 17,060 | |
| | |
Siemens Energy AG * | | | 73 | | | | 1,592 | |
| | |
Softwareone Holding AG * | | | 231 | | | | 5,690 | |
| | | | | | | | |
| | |
| | | | | | | 129,950 | |
| | | | | | | | |
|
Hong Kong — 1.7% | |
| | |
AIA Group Ltd. | | | 852 | | | | 8,107 | |
| | |
VTech Holdings Ltd. | | | 558 | | | | 3,700 | |
| | |
WH Group Ltd. (a) | | | 7,227 | | | | 5,692 | |
| | |
Xinyi Glass Holdings Ltd. | | | 3,664 | | | | 8,046 | |
| | | | | | | | |
| | |
| | | | | | | 25,545 | |
| | | | | | | | |
|
Ireland — 0.3% | |
| | |
Ryanair Holdings plc, ADR * | | | 31 | | | | 2,477 | |
| | |
Smurfit Kappa Group plc | | | 54 | | | | 2,035 | |
| | | | | | | | |
| | |
| | | | | | | 4,512 | |
| | | | | | | | |
|
Israel — 0.3% | |
| | |
Bezeq The Israeli Telecommunication Corp. Ltd. * | | | 4,191 | | | | 4,726 | |
| | | | | | | | |
SEE NOTES TO FINANCIAL STATEMENTS.
| | | | | | |
| | | |
| 38 | | | | J.P. MORGAN INTERNATIONAL EQUITY FUNDS | | OCTOBER 31, 2020 |
| | | | | | | | |
| INVESTMENTS | | SHARES
(000) | | | VALUE
($000) | |
Common Stocks — continued | | | | | | | | |
|
Italy — 1.1% | |
| | |
Enel SpA | | | 1,355 | | | | 10,774 | |
| | |
GVS SpA * (a) | | | 131 | | | | 1,845 | |
| | |
Prysmian SpA | | | 127 | | | | 3,462 | |
| | | | | | | | |
| | |
| | | | | | | 16,081 | |
| | | | | | | | |
|
Japan — 25.8% | |
| | |
Advantest Corp. | | | 150 | | | | 8,700 | |
| | |
Astellas Pharma, Inc. | | | 664 | | | | 9,108 | |
| | |
Brother Industries Ltd. | | | 157 | | | | 2,421 | |
| | |
Capcom Co. Ltd. | | | 141 | | | | 7,728 | |
| | |
Fujitsu Ltd. | | | 84 | | | | 9,950 | |
| | |
GungHo Online Entertainment, Inc. | | | 155 | | | | 3,854 | |
| | |
Hitachi Ltd. | | | 241 | | | | 8,136 | |
| | |
Iida Group Holdings Co. Ltd. | | | 304 | | | | 5,504 | |
| | |
Internet Initiative Japan, Inc. | | | 95 | | | | 4,268 | |
| | |
ITOCHU Corp. | | | 456 | | | | 10,955 | |
| | |
Iwatani Corp. | | | 119 | | | | 5,386 | |
| | |
Kandenko Co. Ltd. | | | 118 | | | | 884 | |
| | |
KDDI Corp. | | | 432 | | | | 11,693 | |
| | |
Keyence Corp. | | | 6 | | | | 2,587 | |
| | |
Kinden Corp. | | | 242 | | | | 3,788 | |
| | |
Komeri Co. Ltd. | | | 112 | | | | 3,283 | |
| | |
K’s Holdings Corp. | | | 210 | | | | 2,686 | |
| | |
Kyudenko Corp. | | | 86 | | | | 2,344 | |
| | |
Medipal Holdings Corp. | | | 158 | | | | 2,816 | |
| | |
Meitec Corp. | | | 49 | | | | 2,414 | |
| | |
Mitsubishi UFJ Financial Group, Inc. | | | 3,297 | | | | 12,996 | |
| | |
Mitsubishi UFJ Lease & Finance Co. Ltd. | | | 1,011 | | | | 4,284 | |
| | |
Mixi, Inc. | | | 122 | | | | 3,360 | |
| | |
MS&AD Insurance Group Holdings, Inc. | | | 227 | | | | 6,217 | |
| | |
NEC Corp. | | | 103 | | | | 5,203 | |
| | |
Nexon Co. Ltd. | | | 348 | | | | 9,707 | |
| | |
Nihon Unisys Ltd. | | | 181 | | | | 5,326 | |
| | |
Nintendo Co. Ltd. | | | 13 | | | | 6,975 | |
| | |
Nippo Corp. | | | 99 | | | | 2,543 | |
| | |
Nippon Telegraph & Telephone Corp. | | | 424 | | | | 8,921 | |
| | |
Nomura Holdings, Inc. | | | 2,031 | | | | 9,097 | |
| | |
Nomura Real Estate Holdings, Inc. | | | 398 | | | | 6,943 | |
| | |
Obayashi Corp. | | | 742 | | | | 6,212 | |
| | |
Okinawa Electric Power Co., Inc. (The) | | | 53 | | | | 777 | |
| | |
Ono Pharmaceutical Co. Ltd. | | | 280 | | | | 7,993 | |
| | |
Open House Co. Ltd. | | | 163 | | | | 5,540 | |
| | |
ORIX Corp. | | | 652 | | | | 7,621 | |
| | |
Osaka Gas Co. Ltd. | | | 82 | | | | 1,550 | |
| | |
Otsuka Corp. | | | 101 | | | | 4,650 | |
| | | | | | | | |
| INVESTMENTS | | SHARES
(000) | | | VALUE
($000) | |
| | | | | | | | |
|
Japan — continued | |
| | |
Rengo Co. Ltd. | | | 530 | | | | 4,075 | |
| | |
Sekisui House Ltd. | | | 480 | | | | 7,971 | |
| | |
Seven Bank Ltd. | | | 1,263 | | | | 2,899 | |
| | |
Shinsei Bank Ltd. | | | 508 | | | | 6,110 | |
| | |
Shionogi & Co. Ltd. | | | 155 | | | | 7,288 | |
| | |
Ship Healthcare Holdings, Inc. | | | 37 | | | | 1,760 | |
| | |
SoftBank Corp. | | | 714 | | | | 8,305 | |
| | |
SoftBank Group Corp. | | | 54 | | | | 3,504 | |
| | |
Sony Corp. | | | 249 | | | | 20,717 | |
| | |
Sugi Holdings Co. Ltd. | | | 87 | | | | 5,712 | |
| | |
Sumitomo Mitsui Financial Group, Inc. | | | 429 | | | | 11,884 | |
| | |
Sumitomo Mitsui Trust Holdings, Inc. | | | 283 | | | | 7,596 | |
| | |
Teijin Ltd. | | | 176 | | | | 2,702 | |
| | |
TIS, Inc. | | | 342 | | | | 6,531 | |
| | |
Tokuyama Corp. | | | 230 | | | | 5,121 | |
| | |
Tokyo Electron Ltd. | | | 48 | | | | 12,750 | |
| | |
Tokyo Tatemono Co. Ltd. | | | 511 | | | | 5,876 | |
| | |
Tokyu Fudosan Holdings Corp. | | | 1,281 | | | | 5,599 | |
| | |
Toyobo Co. Ltd. | | | 141 | | | | 1,881 | |
| | |
Toyota Motor Corp. | | | 377 | | | | 24,749 | |
| | |
Toyota Tsusho Corp. | | | 167 | | | | 4,652 | |
| | |
TS Tech Co. Ltd. | | | 119 | | | | 3,305 | |
| | |
Valor Holdings Co. Ltd. | | | 90 | | | | 2,210 | |
| | |
Wacom Co. Ltd. | | | 290 | | | | 1,908 | |
| | | | | | | | |
| | |
| | | | | | | 389,525 | |
| | | | | | | | |
|
Netherlands — 6.3% | |
| | |
ASM International NV | | | 58 | | | | 8,297 | |
| | |
ASML Holding NV | | | 34 | | | | 12,276 | |
| | |
BE Semiconductor Industries NV | | | 81 | | | | 3,256 | |
| | |
Euronext NV (a) | | | 128 | | | | 13,341 | |
| | |
ING Groep NV | | | 506 | | | | 3,463 | |
| | |
Koninklijke Ahold Delhaize NV | | | 592 | | | | 16,230 | |
| | |
PostNL NV * | | | 1,875 | | | | 6,218 | |
| | |
Randstad NV * | | | 249 | | | | 12,438 | |
| | |
Royal Dutch Shell plc, Class B | | | 518 | | | | 6,247 | |
| | |
Signify NV * (a) | | | 337 | | | | 11,974 | |
| | |
Wolters Kluwer NV | | | 23 | | | | 1,900 | |
| | | | | | | | |
| | |
| | | | | | | 95,640 | |
| | | | | | | | |
|
New Zealand — 0.3% | |
| | |
Spark New Zealand Ltd. | | | 1,408 | | | | 4,179 | |
| | | | | | | | |
|
Norway — 1.4% | |
| | |
DNB ASA | | | 657 | | | | 8,873 | |
| | |
Fjordkraft Holding ASA (a) | | | 227 | | | | 1,872 | |
SEE NOTES TO FINANCIAL STATEMENTS.
| | | | | | | | |
| | | |
| OCTOBER 31, 2020 | | J.P. MORGAN INTERNATIONAL EQUITY FUNDS | | | | | 39 | |
JPMorgan International Advantage Fund
SCHEDULE OF PORTFOLIO INVESTMENTS
AS OF OCTOBER 31, 2020 (continued)
| | | | | | | | |
| INVESTMENTS | | SHARES
(000) | | | VALUE
($000) | |
Common Stocks — continued | | | | | | | | |
|
Norway — continued | |
| | |
Norwegian Finans Holding ASA* | | | 552 | | | | 3,980 | |
| | |
Scatec Solar ASA (a) | | | 291 | | | | 6,439 | |
| | | | | | | | |
| | |
| | | | | | | 21,164 | |
| | | | | | | | |
|
Portugal — 0.1% | |
| | |
Jeronimo Martins SGPS SA | | | 95 | | | | 1,507 | |
| | | | | | | | |
|
Russia — 0.4% | |
| | |
Polymetal International plc | | | 308 | | | | 6,555 | |
| | | | | | | | |
|
Singapore — 1.7% | |
| | |
DBS Group Holdings Ltd. | | | 1,100 | | | | 16,380 | |
| | |
United Overseas Bank Ltd. | | | 691 | | | | 9,601 | |
| | | | | | | | |
| | |
| | | | | | | 25,981 | |
| | | | | | | | |
|
South Africa — 1.2% | |
| | |
Anglo American plc | | | 753 | | | | 17,675 | |
| | | | | | | | |
|
Spain — 1.0% | |
| | |
Endesa SA | | | 568 | | | | 15,251 | |
| | | | | | | | |
|
Sweden — 3.1% | |
| | |
Betsson AB* | | | 643 | | | | 4,900 | |
| | |
Getinge AB, Class B (b) | | | 361 | | | | 7,076 | |
| | |
Skandinaviska Enskilda Banken AB, Class A* | | | 881 | | | | 7,563 | |
| | |
SKF AB, Class B | | | 578 | | | | 11,826 | |
| | |
Swedish Match AB | | | 194 | | | | 14,621 | |
| | | | | | | | |
| | |
| | | | | | | 45,986 | |
| | | | | | | | |
|
Switzerland — 10.6% | |
| | |
Adecco Group AG (Registered) | | | 204 | | | | 9,997 | |
| | |
DKSH Holding AG | | | 62 | | | | 3,983 | |
| | |
Galenica AG (a) | | | 81 | | | | 5,132 | |
| | |
Julius Baer Group Ltd. | | | 163 | | | | 7,275 | |
| | |
Kuehne + Nagel International AG (Registered) | | | 38 | | | | 7,578 | |
| | |
LafargeHolcim Ltd. (Registered)* | | | 106 | | | | 4,530 | |
| | |
Nestle SA (Registered) | | | 419 | | | | 47,089 | |
| | |
Novartis AG (Registered) | | | 131 | | | | 10,175 | |
| | |
Roche Holding AG | | | 125 | | | | 40,102 | |
| | |
Swissquote Group Holding SA (Registered) | | | 55 | | | | 4,345 | |
| | |
UBS Group AG (Registered) | | | 1,361 | | | | 15,841 | |
| | |
Zurich Insurance Group AG | | | 11 | | | | 3,755 | |
| | | | | | | | |
| | |
| | | | | | | 159,802 | |
| | | | | | | | |
|
United Kingdom — 10.5% | |
| | |
3i Group plc | | | 585 | | | | 7,307 | |
| | |
Ashtead Group plc | | | 443 | | | | 16,015 | |
| | |
AstraZeneca plc | | | 91 | | | | 9,141 | |
| | |
Avast plc (a) | | | 2,049 | | | | 12,592 | |
| | |
B&M European Value Retail SA | | | 1,012 | | | | 6,350 | |
| | | | | | | | |
| INVESTMENTS | | SHARES
(000) | | | VALUE
($000) | |
| | | | | | | | |
|
United Kingdom — continued | |
| | |
Balfour Beatty plc | | | 1,508 | | | | 4,167 | |
| | |
Berkeley Group Holdings plc | | | 168 | | | | 8,811 | |
| | |
British American Tobacco plc | | | 174 | | | | 5,521 | |
| | |
CMC Markets plc (a) | | | 301 | | | | 1,302 | |
| | |
Computacenter plc | | | 183 | | | | 5,396 | |
| | |
Dialog Semiconductor plc* | | | 186 | | | | 7,100 | |
| | |
Dunelm Group plc | | | 547 | | | | 9,250 | |
| | |
GlaxoSmithKline plc | | | 841 | | | | 14,040 | |
| | |
Legal & General Group plc | | | 4,012 | | | | 9,620 | |
| | |
Next plc | | | 113 | | | | 8,501 | |
| | |
Persimmon plc | | | 97 | | | | 2,950 | |
| | |
Pets at Home Group plc | | | 445 | | | | 2,233 | |
| | |
Savills plc | | | 83 | | | | 893 | |
| | |
Tate & Lyle plc | | | 497 | | | | 3,834 | |
| | |
TP ICAP plc | | | 97 | | | | 241 | |
| | |
Ultra Electronics Holdings plc | | | 172 | | | | 4,205 | |
| | |
Unilever plc | | | 322 | | | | 18,346 | |
| | | | | | | | |
| | |
| | | | | | | 157,815 | |
| | | | | | | | |
|
United States — 1.0% | |
| | |
Ferguson plc | | | 150 | | | | 14,898 | |
| | | | | | | | |
| |
Total Common Stocks
(Cost $1,436,870) | | | | 1,490,436 | |
| | | | | | | | |
Short-Term Investments — 0.6% | |
|
Investment Companies — 0.4% | |
| | |
JPMorgan Prime Money Market Fund Class Institutional Shares, 0.05% (c) (d) (Cost $5,325) | | | 5,322 | | | | 5,325 | |
| | | | | | | | |
|
Investment of Cash Collateral from Securities Loaned — 0.2% | |
| | |
JPMorgan Securities Lending Money Market Fund Agency SL Class Shares, 0.15% (c) (d) | | | 3,007 | | | | 3,007 | |
| | |
JPMorgan U.S. Government Money Market Fund Class IM Shares, 0.04% (c) (d) | | | 1,394 | | | | 1,394 | |
| | | | | | | | |
| |
Total Investment of Cash Collateral from Securities Loaned
(Cost $4,401) | | | | 4,401 | |
| | | | | | | | |
| | |
Total Short-Term Investments
(Cost $9,726) | | | | | | | 9,726 | |
| | | | | | | | |
Total Investments — 99.4%
(Cost $1,446,596) | | | | | | | 1,500,162 | |
Other Assets Less
Liabilities — 0.6% | | | | | | | 8,853 | |
| | | | | | | | |
NET ASSETS — 100.0% | | | | | | | 1,509,015 | |
| | | | | | | | |
Percentages indicated are based on net assets.
SEE NOTES TO FINANCIAL STATEMENTS.
| | | | | | |
| | | |
| 40 | | | | J.P. MORGAN INTERNATIONAL EQUITY FUNDS | | OCTOBER 31, 2020 |
Summary of Investments by Industry, October 31, 2020
The following table represents the portfolio investments of the Fund by industry classifications as a percentage of total investments:
| | | | |
| INDUSTRY | | PERCENTAGE | |
| |
Pharmaceuticals | | | 9.9 | % |
| |
Banks | | | 7.3 | |
| |
Metals & Mining | | | 5.9 | |
| |
Insurance | | | 5.2 | |
| |
Capital Markets | | | 4.3 | |
| |
IT Services | | | 4.0 | |
| |
Food Products | | | 3.8 | |
| |
Semiconductors & Semiconductor Equipment | | | 3.5 | |
| |
Trading Companies & Distributors | | | 3.1 | |
| |
Household Durables | | | 3.1 | |
| |
Automobiles | | | 2.9 | |
| |
Electrical Equipment | | | 2.6 | |
| |
Specialty Retail | | | 2.4 | |
| |
Food & Staples Retailing | | | 2.2 | |
| |
Professional Services | | | 2.1 | |
| |
Electric Utilities | | | 1.9 | |
| |
Entertainment | | | 1.9 | |
| |
Real Estate Management & Development | | | 1.7 | |
| |
Wireless Telecommunication Services | | | 1.6 | |
| |
Tobacco | | | 1.5 | |
| | | | |
| INDUSTRY | | PERCENTAGE | |
| |
Health Care Equipment & Supplies | | | 1.5 | % |
| |
Diversified Telecommunication Services | | | 1.5 | |
| |
Multiline Retail | | | 1.5 | |
| |
Software | | | 1.4 | |
| |
Personal Products | | | 1.4 | |
| |
Marine | | | 1.4 | |
| |
Machinery | | | 1.4 | |
| |
Air Freight & Logistics | | | 1.3 | |
| |
Construction & Engineering | | | 1.3 | |
| |
Oil, Gas & Consumable Fuels | | | 1.3 | |
| |
Auto Components | | | 1.3 | |
| |
Industrial Conglomerates | | | 1.1 | |
| |
Construction Materials | | | 1.1 | |
| |
Electronic Equipment, Instruments & Components | | | 1.1 | |
| |
Health Care Providers & Services | | | 1.1 | |
| |
Multi-Utilities | | | 1.1 | |
| |
Textiles, Apparel & Luxury Goods | | | 1.0 | |
| |
Others (each less than 1.0%) | | | 6.6 | |
| |
Short-Term Investments | | | 0.7 | |
| | |
| Abbreviations | | |
| |
| ADR | | American Depositary Receipt |
| OYJ | | Public Limited Company |
| Preference | | A special type of equity investment that shares in the earnings of the company, has limited voting rights, and may have a dividend preference. Preference shares may also have liquidation preference. |
SGPS | | Holding company |
| |
| (a) | | Security exempt from registration pursuant to Regulation S under the Securities Act of 1933, as amended. Regulation S applies to securities offerings that are made outside of the United States and do not involve direct selling efforts in the United States and as such may have restrictions on resale. |
| | |
| (b) | | The security or a portion of this security is on loan at October 31, 2020. The total value of securities on loan at October 31, 2020 is approximately $4,226,000. |
| (c) | | Investment in an affiliated fund, which is registered under the Investment Company Act of 1940, as amended, and is advised by J.P. Morgan Investment Management Inc. |
| (d) | | The rate shown is the current yield as of October 31, 2020. |
| * | | Non-income producing security. |
SEE NOTES TO FINANCIAL STATEMENTS.
| | | | | | | | |
| | | |
| OCTOBER 31, 2020 | | J.P. MORGAN INTERNATIONAL EQUITY FUNDS | | | | | 41 | |
JPMorgan International Advantage Fund
SCHEDULE OF PORTFOLIO INVESTMENTS
AS OF OCTOBER 31, 2020 (continued)
(amounts in thousands, except number of contracts)
| | | | | | | | | | | | | | | | | | | | |
| Futures contracts outstanding as of October 31, 2020: | | | | | | | |
| DESCRIPTION | | NUMBER OF
CONTRACTS | | | EXPIRATION
DATE | | | TRADING
CURRENCY | | | NOTIONAL
AMOUNT ($) | | | VALUE AND
UNREALIZED
APPRECIATION
(DEPRECIATION) ($) | |
| | | | | |
Long Contracts | | | | | | | | | | | | | | | | | | | | |
| | | | | |
| EURO STOXX 50 Index | | | 55 | | | | 12/2020 | | | | EUR | | | | 1,895 | | | | (152 | ) |
FTSE 100 Index | | | 22 | | | | 12/2020 | | | | GBP | | | | 1,586 | | | | (85 | ) |
| | | | | | | | | | | | | | | | | | | | |
| | | | | | | | | | | | | | | | | | | (237 | ) |
| | | | | | | | | | | | | | | | | | | | |
Abbreviations
| | |
| EUR | | Euro |
| FTSE | | Financial Times and the London Stock Exchange |
| GBP | | British Pound |
SEE NOTES TO FINANCIAL STATEMENTS.
| | | | | | |
| | | |
| 42 | | | | J.P. MORGAN INTERNATIONAL EQUITY FUNDS | | OCTOBER 31, 2020 |
JPMorgan International Equity Fund
SCHEDULE OF PORTFOLIO INVESTMENTS
AS OF OCTOBER 31, 2020
| | | | | | | | |
| INVESTMENTS | | SHARES
(000) | | | VALUE
($000) | |
Common Stocks — 98.3% | |
|
Australia — 3.9% | |
| | |
BHP Group Ltd. | | | 1,355 | | | | 32,484 | |
| | |
BHP Group plc | | | 783 | | | | 15,163 | |
| | |
Commonwealth Bank of Australia | | | 758 | | | | 36,783 | |
| | |
Rio Tinto plc | | | 537 | | | | 30,396 | |
| | | | | | | | |
| | |
| | | | | | | 114,826 | |
| | | | | | | | |
| | |
Austria — 0.5% | | | | | | | | |
| | |
Erste Group Bank AG | | | 644 | | | | 13,245 | |
| | | | | | | | |
| | |
Belgium — 0.6% | | | | | | | | |
| | |
KBC Group NV | | | 378 | | | | 18,700 | |
| | | | | | | | |
| | |
China — 4.1% | | | | | | | | |
| | |
Alibaba Group Holding Ltd.* | | | 860 | | | | 32,599 | |
| | |
Ping An Insurance Group Co. of China Ltd., Class H | | | 2,948 | | | | 30,481 | |
| | |
Prosus NV * | | | 222 | | | | 22,146 | |
| | |
Tencent Holdings Ltd. | | | 438 | | | | 33,443 | |
| | | | | | | | |
| | |
| | | | | | | 118,669 | |
| | | | | | | | |
| | |
Denmark — 4.1% | | | | | | | | |
| | |
Carlsberg A/S, Class B | | | 252 | | | | 31,930 | |
| | |
Novo Nordisk A/S, Class B | | | 904 | | | | 57,628 | |
| | |
Orsted A/S (a) (b) | | | 196 | | | | 31,115 | |
| | | | | | | | |
| | |
| | | | | | | 120,673 | |
| | | | | | | | |
| | |
Finland — 1.3% | | | | | | | | |
| | |
Kone OYJ, Class B | | | 459 | | | | 36,526 | |
| | | | | | | | |
| | |
France — 12.2% | | | | | | | | |
| | |
Accor SA * | | | 599 | | | | 15,271 | |
| | |
AXA SA | | | 1,294 | | | | 20,786 | |
| | |
Capgemini SE | | | 306 | | | | 35,368 | |
| | |
Kering SA | | | 53 | | | | 32,132 | |
| | |
Legrand SA | | | 365 | | | | 27,019 | |
| | |
L’Oreal SA | | | 125 | | | | 40,270 | |
| | |
LVMH Moet Hennessy Louis Vuitton SE | | | 127 | | | | 59,544 | |
| | |
Pernod Ricard SA | | | 181 | | | | 29,120 | |
| | |
Safran SA * | | | 259 | | | | 27,366 | |
| | |
Schneider Electric SE | | | 376 | | | | 45,744 | |
| | |
TOTAL SE | | | 815 | | | | 24,706 | |
| | | | | | | | |
| | |
| | | | | | | 357,326 | |
| | | | | | | | |
| | |
Germany — 8.0% | | | | | | | | |
| | |
adidas AG * | | | 113 | | | | 33,594 | |
| | |
Allianz SE (Registered) | | | 205 | | | | 36,035 | |
| | |
Delivery Hero SE * (b) | | | 181 | | | | 20,808 | |
| | |
Deutsche Boerse AG | | | 180 | | | | 26,565 | |
| | |
Muenchener Rueckversicherungs-Gesellschaft AG (Registered) | | | 121 | | | | 28,360 | |
| | |
SAP SE | | | 369 | | | | 39,320 | |
| | | | | | | | |
| INVESTMENTS | | SHARES
(000) | | | VALUE
($000) | |
| | | | | | | | |
| | |
Germany — continued | | | | | | | | |
| | |
Symrise AG | | | 183 | | | | 22,517 | |
| | |
Vonovia SE | | | 439 | | | | 28,028 | |
| | | | | | | | |
| | |
| | | | | | | 235,227 | |
| | | | | | | | |
| | |
Hong Kong — 3.3% | | | | | | | | |
| | |
AIA Group Ltd. | | | 6,377 | | | | 60,691 | |
| | |
Hong Kong Exchanges & Clearing Ltd. | | | 759 | | | | 36,346 | |
| | | | | | | | |
| | |
| | | | | | | 97,037 | |
| | | | | | | | |
| | |
India — 1.4% | | | | | | | | |
| | |
HDFC Bank Ltd., ADR * | | | 732 | | | | 42,069 | |
| | | | | | | | |
| | |
Japan — 19.9% | | | | | | | | |
| | |
Daikin Industries Ltd. | | | 217 | | | | 40,608 | |
| | |
FANUC Corp. | | | 138 | | | | 29,128 | |
| | |
Hoya Corp. | | | 410 | | | | 46,260 | |
| | |
Kao Corp. | | | 623 | | | | 44,371 | |
| | |
Keyence Corp. | | | 135 | | | | 61,130 | |
| | |
Komatsu Ltd. | | | 1,342 | | | | 30,261 | |
| | |
Kubota Corp. | | | 2,105 | | | | 36,577 | |
| | |
Makita Corp. | | | 577 | | | | 25,488 | |
| | |
Nidec Corp. | | | 377 | | | | 38,037 | |
| | |
Recruit Holdings Co. Ltd. | | | 1,088 | | | | 41,414 | |
| | |
Shin-Etsu Chemical Co. Ltd. | | | 332 | | | | 44,304 | |
| | |
SMC Corp. | | | 52 | | | | 27,659 | |
| | |
Sony Corp. | | | 747 | | | | 62,275 | |
| | |
Sysmex Corp. | | | 224 | | | | 21,012 | |
| | |
Tokyo Electron Ltd. | | | 129 | | | | 34,598 | |
| | | | | | | | |
| | |
| | | | | | | 583,122 | |
| | | | | | | | |
| | |
Macau — 0.6% | | | | | | | | |
| | |
Sands China Ltd. | | | 5,394 | | | | 18,932 | |
| | | | | | | | |
| | |
Netherlands — 3.1% | | | | | | | | |
| | |
ASML Holding NV | | | 191 | | | | 69,097 | |
| | |
ING Groep NV | | | 3,034 | | | | 20,783 | |
| | | | | | | | |
| | |
| | | | | | | 89,880 | |
| | | | | | | | |
| | |
Singapore — 0.9% | | | | | | | | |
| | |
DBS Group Holdings Ltd. | | | 1,847 | | | | 27,507 | |
| | | | | | | | |
| | |
South Korea — 1.6% | | | | | | | | |
| | |
Samsung Electronics Co. Ltd., GDR (b) | | | 36 | | | | 45,497 | |
| | |
Samsung Electronics Co. Ltd., GDR (b) | | | — | (c) | | | 13 | |
| | | | | | | | |
| | |
| | | | | | | 45,510 | |
| | | | | | | | |
| | |
Spain — 3.0% | | | | | | | | |
| | |
Cellnex Telecom SA (b) | | | 354 | | | | 22,727 | |
| | |
Iberdrola SA | | | 3,460 | | | | 40,859 | |
| | |
Industria de Diseno Textil SA (a) | | | 1,033 | | | | 25,499 | |
| | | | | | | | |
| | |
| | | | | | | 89,085 | |
| | | | | | | | |
| | | | | | | | |
| | | |
| OCTOBER 31, 2020 | | J.P. MORGAN INTERNATIONAL EQUITY FUNDS | | | | | 43 | |
JPMorgan International Equity Fund
SCHEDULE OF PORTFOLIO INVESTMENTS
AS OF OCTOBER 31, 2020 (continued)
| | | | | | | | |
| INVESTMENTS | | SHARES
(000) | | | VALUE
($000) | |
Common Stocks — continued | |
| | |
Sweden—2.2% | | | | | | | | |
| | |
Atlas Copco AB, Class A | | | 862 | | | | 38,050 | |
| | |
Svenska Handelsbanken AB, Class A * | | | 3,219 | | | | 26,080 | |
| | | | | | | | |
| | |
| | | | | | | 64,130 | |
| | | | | | | | |
| | |
Switzerland — 11.7% | | | | | | | | |
| | |
LafargeHolcim Ltd. (Registered) * | | | 781 | | | | 33,506 | |
| | |
Lonza Group AG (Registered) | | | 48 | | | | 29,187 | |
| | |
Nestle SA (Registered) | | | 949 | | | | 106,782 | |
| | |
Novartis AG (Registered) | | | 809 | | | | 63,045 | |
| | |
Roche Holding AG | | | 267 | | | | 85,898 | |
| | |
SGS SA (Registered) | | | 10 | | | | 25,847 | |
| | | | | | | | |
| | |
| | | | | | | 344,265 | |
| | | | | | | | |
| | |
Taiwan — 1.6% | | | | | | | | |
| | |
Taiwan Semiconductor Manufacturing Co. Ltd., ADR | | | 561 | | | | 47,021 | |
| | | | | | | | |
| | |
United Kingdom — 13.2% | | | | | | | | |
| | |
Diageo plc | | | 1,539 | | | | 49,742 | |
| | |
GlaxoSmithKline plc | | | 2,863 | | | | 47,813 | |
| | |
Legal & General Group plc | | | 11,017 | | | | 26,414 | |
| | |
Linde plc | | | 147 | | | | 32,161 | |
| | |
London Stock Exchange Group plc | | | 257 | | | | 27,753 | |
| | |
Persimmon plc | | | 919 | | | | 27,831 | |
| | |
Prudential plc | | | 1,976 | | | | 24,166 | |
| | |
Reckitt Benckiser Group plc | | | 409 | | | | 36,031 | |
| | |
RELX plc | | | 1,652 | | | | 32,689 | |
| | |
Smith & Nephew plc | | | 1,306 | | | | 22,675 | |
| | |
Unilever plc | | | 1,020 | | | | 58,140 | |
| | | | | | | | |
| | |
| | | | | | | 385,415 | |
| | | | | | | | |
| | |
United States — 1.1% | | | | | | | | |
| | |
Ferguson plc | | | 336 | | | | 33,395 | |
| | | | | | | | |
| | |
Total Common Stocks
(Cost $2,162,316) | | | | | | | 2,882,560 | |
| | | | | | | | |
Short-Term Investments — 2.1% | | | | | | | | |
| | |
Investment Companies — 1.4% | | | | | | | | |
| | |
JPMorgan Prime Money Market Fund Class Institutional Shares, 0.05% (d) (e)
(Cost $40,184) | | | 40,159 | | | | 40,182 | |
| | | | | | | | |
| | | | | | | | |
| INVESTMENTS | | SHARES
(000) | | | VALUE
($000) | |
|
Investment of Cash Collateral from Securities Loaned — 0.7% | |
| | |
JPMorgan Securities Lending Money Market Fund Agency SL Class Shares, 0.15% (d) (e) | | | 17,995 | | | | 17,997 | |
| | |
JPMorgan U.S. Government Money Market Fund Class IM Shares, 0.04% (d) (e) | | | 2,359 | | | | 2,359 | |
| | | | | | | | |
| | |
Total Investment of Cash Collateral from
Securities loaned
(Cost $20,356) | | | | | | | 20,356 | |
| | | | | | | | |
| | |
Total Short-Term Investments
(Cost $60,540) | | | | | | | 60,538 | |
| | | | | | | | |
Total Investments — 100.4%
(Cost $2,222,856) | | | | | | | 2,943,098 | |
Liabilities in Excess of
Other Assets — (0.4)% | | | | | | | (12,176 | ) |
| | | | | | | | |
NET ASSETS — 100.0% | | | | | | | 2,930,922 | |
| | | | | | | | |
Percentages indicated are based on net assets.
Summary of Investments by Industry, October 31, 2020
The following table represents the portfolio investments of the Fund by industry classifications as a percentage of total investments:
| | | | |
| INDUSTRY | | PERCENTAGE | |
| |
Pharmaceuticals | | | 8.6 | % |
| |
Insurance | | | 7.7 | |
| |
Machinery | | | 7.6 | |
| |
Banks | | | 6.3 | |
| |
Semiconductors & Semiconductor Equipment | | | 5.1 | |
| |
Personal Products | | | 4.8 | |
| |
Textiles, Apparel & Luxury Goods | | | 4.3 | |
| |
Electrical Equipment | | | 3.8 | |
| |
Beverages | | | 3.8 | |
| |
Food Products | | | 3.6 | |
| |
Professional Services | | | 3.4 | |
| |
Chemicals | | | 3.4 | |
| |
Capital Markets | | | 3.1 | |
| |
Household Durables | | | 3.1 | |
| |
Health Care Equipment & Supplies | | | 3.1 | |
| |
Metals & Mining | | | 2.6 | |
| |
Internet & Direct Marketing Retail | | | 2.6 | |
| |
Electric Utilities | | | 2.4 | |
| |
Electronic Equipment, Instruments & Components | | | 2.1 | |
| |
Technology Hardware, Storage & Peripherals | | | 1.5 | |
| |
Building Products | | | 1.4 | |
| |
Software | | | 1.3 | |
| |
Household Products | | | 1.2 | |
| |
IT Services | | | 1.2 | |
SEE NOTES TO FINANCIAL STATEMENTS.
| | | | | | |
| | | |
| 44 | | | | J.P. MORGAN INTERNATIONAL EQUITY FUNDS | | OCTOBER 31, 2020 |
| | | | |
| INDUSTRY | | PERCENTAGE | |
| |
Hotels, Restaurants & Leisure | | | 1.2 | % |
| |
Construction Materials | | | 1.1 | |
| |
Interactive Media & Services | | | 1.1 | |
| |
Trading Companies & Distributors | | | 1.1 | |
| |
Life Sciences Tools & Services | | | 1.0 | |
| |
Real Estate Management & Development | | | 1.0 | |
| |
Others (each less than 1.0%) | | | 3.4 | |
| |
Short-Term Investments | | | 2.1 | |
Abbreviations
| | |
| ADR | | American Depositary Receipt |
| GDR | | Global Depositary Receipt |
| OYJ | | Public Limited Company |
| |
| (a) | | The security or a portion of this security is on loan at October 31, 2020. The total value of securities on loan at October 31, 2020 is approximately $19,188,000. |
| (b) | | Security exempt from registration pursuant to Regulation S under the Securities Act of 1933, as amended. Regulation S applies to securities offerings that are made outside of the United States and do not involve direct selling efforts in the United States and as such may have restrictions on resale. |
| (c) | | Amount rounds to less than one thousand. |
| (d) | | Investment in an affiliated fund, which is registered under the Investment Company Act of 1940, as amended, and is advised by J.P. Morgan Investment Management Inc. |
| (e) | | The rate shown is the current yield as of October 31, 2020. |
| * | | Non-income producing security. |
SEE NOTES TO FINANCIAL STATEMENTS.
| | | | | | | | |
| | | |
| OCTOBER 31, 2020 | | J.P. MORGAN INTERNATIONAL EQUITY FUNDS | | | | | 45 | |
JPMorgan International Focus Fund
(formerly known as JPMorgan International Unconstrained Equity Fund)
SCHEDULE OF PORTFOLIO INVESTMENTS
AS OF OCTOBER 31, 2020
| | | | | | | | |
| INVESTMENTS | | SHARES
(000) | | | VALUE
($000) | |
Common Stocks — 98.4% | | | | | | | | |
| |
Australia — 2.0% | | | | | |
| | |
BHP Group plc | | | 2,846 | | | | 55,135 | |
| | | | | | | | |
| |
Belgium — 1.2% | | | | | |
| | |
KBC Group NV | | | 677 | | | | 33,462 | |
| | | | | | | | |
| |
Canada — 6.4% | | | | | |
| | |
Alimentation Couche-Tard, Inc., Class B | | | 1,322 | | | | 40,710 | |
| | |
Canadian National Railway Co. | | | 510 | | | | 50,628 | |
| | |
Canadian Pacific Railway Ltd. | | | 160 | | | | 47,946 | |
| | |
Toronto-Dominion Bank (The) | | | 898 | | | | 39,636 | |
| | | | | | | | |
| | |
| | | | | | | 178,920 | |
| | | | | | | | |
| |
China — 12.0% | | | | | |
| | |
Alibaba Group Holding Ltd.* | | | 3,347 | | | | 126,826 | |
| | |
Ping An Insurance Group Co. of China Ltd., Class H | | | 7,866 | | | | 81,332 | |
| | |
Tencent Holdings Ltd. | | | 1,675 | | | | 127,964 | |
| | | | | | | | |
| | |
| | | | | | | 336,122 | |
| | | | | | | | |
| |
Denmark — 2.1% | | | | | |
| | |
Novo Nordisk A/S, Class B | | | 941 | | | | 60,019 | |
| | | | | | | | |
| |
Finland — 1.6% | | | | | |
| | |
Kone OYJ, Class B | | | 580 | | | | 46,185 | |
| | | | | | | | |
| |
France — 4.3% | | | | | |
| | |
LVMH Moet Hennessy Louis Vuitton SE | | | 136 | | | | 63,603 | |
| | |
Schneider Electric SE | | | 463 | | | | 56,211 | |
| | | | | | | | |
| | |
| | | | | | | 119,814 | |
| | | | | | | | |
| |
Germany — 7.1% | | | | | |
| | |
Allianz SE (Registered) | | | 312 | | | | 54,944 | |
| | |
Delivery Hero SE* (a) (b) | | | 464 | | | | 53,210 | |
| | |
SAP SE | | | 456 | | | | 48,656 | |
| | |
Vonovia SE | | | 677 | | | | 43,206 | |
| | | | | | | | |
| | |
| | | | | | | 200,016 | |
| | | | | | | | |
| |
Hong Kong — 4.7% | | | | | |
| | |
AIA Group Ltd. | | | 9,488 | | | | 90,297 | |
| | |
Hong Kong Exchanges & Clearing Ltd. | | | 836 | | | | 40,070 | |
| | | | | | | | |
| | |
| | | | | | | 130,367 | |
| | | | | | | | |
| |
India — 3.7% | | | | | |
| | |
HDFC Bank Ltd., ADR* | | | 1,817 | | | | 104,355 | |
| | | | | | | | |
| |
Indonesia — 1.4% | | | | | |
| | |
Bank Central Asia Tbk. PT | | | 20,392 | | | | 40,123 | |
| | | | | | | | |
| |
Japan — 5.4% | | | | | |
| | |
Keyence Corp. | | | 116 | | | | 52,689 | |
| | |
SMC Corp. | | | 72 | | | | 38,403 | |
| | |
Sony Corp. | | | 726 | | | | 60,516 | |
| | | | | | | | |
| | |
| | | | | | | 151,608 | |
| | | | | | | | |
| | | | | | | | |
| INVESTMENTS | | SHARES
(000) | | | VALUE
($000) | |
| | | | | |
| |
Netherlands — 2.3% | | | | | |
| | |
ASML Holding NV | | | 181 | | | | 65,626 | |
| | | | | | | | |
| |
South Korea — 3.3% | | | | | |
| | |
Samsung Electronics Co. Ltd. | | | 1,836 | | | | 92,295 | |
| | | | | | | | |
| |
Spain — 3.1% | | | | | |
| | |
Cellnex Telecom SA (b) | | | 538 | | | | 34,530 | |
| | |
Iberdrola SA | | | 4,406 | | | | 52,019 | |
| | | | | | | | |
| | |
| | | | | | | 86,549 | |
| | | | | | | | |
| |
Sweden — 2.9% | | | | | |
| | |
Atlas Copco AB, Class A (a) | | | 991 | | | | 43,760 | |
| | |
Svenska Handelsbanken AB, Class A* | | | 4,570 | | | | 37,029 | |
| | | | | | | | |
| | |
| | | | | | | 80,789 | |
| | | | | | | | |
| |
Switzerland — 10.8% | | | | | |
| | |
LafargeHolcim Ltd. (Registered)* | | | 1,187 | | | | 50,950 | |
| | |
Lonza Group AG (Registered) | | | 72 | | | | 43,662 | |
| | |
Nestle SA (Registered) | | | 928 | | | | 104,327 | |
| | |
Roche Holding AG | | | 198 | | | | 63,488 | |
| | |
SGS SA (Registered) | | | 16 | | | | 39,860 | |
| | | | | | | | |
| | |
| | | | | | | 302,287 | |
| | | | | | | | |
| |
Taiwan — 4.7% | | | | | |
| | |
Sea Ltd., ADR* | | | 251 | | | | 39,603 | |
| | |
Taiwan Semiconductor Manufacturing Co. Ltd., ADR | | | 1,083 | | | | 90,809 | |
| | | | | | | | |
| | |
| | | | | | | 130,412 | |
| | | | | | | | |
| |
United Kingdom — 17.8% | | | | | |
| | |
Diageo plc | | | 1,960 | | | | 63,352 | |
| | |
GlaxoSmithKline plc | | | 3,202 | | | | 53,476 | |
| | |
InterContinental Hotels Group plc | | | 731 | | | | 37,155 | |
| | |
Legal & General Group plc | | | 17,336 | | | | 41,565 | |
| | |
Linde plc | | | 258 | | | | 56,507 | |
| | |
London Stock Exchange Group plc | | | 382 | | | | 41,131 | |
| | |
Persimmon plc | | | 1,448 | | | | 43,852 | |
| | |
Reckitt Benckiser Group plc | | | 450 | | | | 39,669 | |
| | |
RELX plc | | | 2,161 | | | | 42,757 | |
| | |
Unilever NV (a) | | | 1,395 | | | | 78,658 | |
| | | | | | | | |
| | |
| | | | | | | 498,122 | |
| | | | | | | | |
| |
United States — 1.6% | | | | | |
| | |
Ferguson plc | | | 449 | | | | 44,546 | |
| | | | | | | | |
| | |
Total Common Stocks
(Cost $2,393,208) | | | | | | | 2,756,752 | |
| | | | | | | | |
Short-Term Investments — 4.3% | |
| |
Investment Companies — 1.5% | | | | | |
| | |
JPMorgan Prime Money Market Fund Class Institutional Shares, 0.05% (c) (d)
(Cost $41,456) | | | 41,427 | | | | 41,452 | |
| | | | | | | | |
SEE NOTES TO FINANCIAL STATEMENTS.
| | | | | | |
| | | |
| 46 | | | | J.P. MORGAN INTERNATIONAL EQUITY FUNDS | | OCTOBER 31, 2020 |
| | | | | | | | |
| INVESTMENTS | | SHARES
(000) | | | VALUE
($000) | |
|
Investment of Cash Collateral from Securities Loaned — 2.8% | |
| | |
JPMorgan Securities Lending Money Market Fund Agency SL Class Shares, 0.15% (c) (d) | | | 70,229 | | | | 70,236 | |
| | |
JPMorgan U.S. Government Money Market Fund Class IM Shares, 0.04% (c) (d) | | | 8,292 | | | | 8,292 | |
| | | | | | | | |
| | |
Total Investment of Cash Collateral from Securities Loaned
(Cost $78,528) | | | | | | | 78,528 | |
| | | | | |
| | |
Total Short-Term Investments
(Cost $119,984) | | | | | | | 119,980 | |
| | | | | | | | |
Total Investments — 102.7%
(Cost $2,513,192) | | | | | | | 2,876,732 | |
Liabilities in Excess of
Other Assets — (2.7)% | | | | | | | (75,062 | ) |
| | | | | |
NET ASSETS — 100.0% | | | | | | | 2,801,670 | |
| | | | | |
Percentages indicated are based on net assets.
Summary of Investments by Industry, October 31, 2020
The following table represents the portfolio investments of the Fund by industry classifications as a percentage of total investments:
| | | | |
| INDUSTRY | | PERCENTAGE | |
| |
Insurance | | | 9.3 | % |
| |
Banks | | | 8.9 | |
| |
Internet & Direct Marketing Retail | | | 6.3 | |
| |
Pharmaceuticals | | | 6.2 | |
| |
Semiconductors & Semiconductor Equipment | | | 5.4 | |
| |
Machinery | | | 4.5 | |
| |
Interactive Media & Services | | | 4.4 | |
| |
Household Durables | | | 3.6 | |
| |
Food Products | | | 3.6 | |
| |
Road & Rail | | | 3.4 | |
| |
Technology Hardware, Storage & Peripherals | | | 3.2 | |
| |
Professional Services | | | 2.9 | |
| |
Capital Markets | | | 2.8 | |
| |
Personal Products | | | 2.7 | |
| |
Textiles, Apparel & Luxury Goods | | | 2.2 | |
| |
Beverages | | | 2.2 | |
| |
Chemicals | | | 2.0 | |
| |
Electrical Equipment | | | 2.0 | |
| |
Metals & Mining | | | 1.9 | |
| |
Electronic Equipment, Instruments & Components | | | 1.8 | |
| |
Electric Utilities | | | 1.8 | |
| |
Construction Materials | | | 1.8 | |
| |
Software | | | 1.7 | |
| | | | |
| INDUSTRY | | PERCENTAGE | |
| |
Trading Companies & Distributors | | | 1.5 | % |
| |
Life Sciences Tools & Services | | | 1.5 | |
| |
Real Estate Management & Development | | | 1.5 | |
| |
Food & Staples Retailing | | | 1.4 | |
| |
Household Products | | | 1.4 | |
| |
Entertainment | | | 1.4 | |
| |
Hotels, Restaurants & Leisure | | | 1.3 | |
| |
Diversified Telecommunication Services | | | 1.2 | |
| |
Short-Term Investments | | | 4.2 | |
Abbreviations
| | |
| ADR | | American Depositary Receipt |
| OYJ | | Public Limited Company |
| PT | | Limited liability company |
| |
| (a) | | The security or a portion of this security is on loan at October 31, 2020. The total value of securities on loan at October 31, 2020 is approximately $73,681,000. |
| (b) | | Security exempt from registration pursuant to Regulation S under the Securities Act of 1933, as amended. Regulation S applies to securities offerings that are made outside of the United States and do not involve direct selling efforts in the United States and as such may have restrictions on resale. |
| (c) | | Investment in an affiliated fund, which is registered under the Investment Company Act of 1940, as amended, and is advised by J.P. Morgan Investment Management Inc. |
| (d) | | The rate shown is the current yield as of October 31, 2020. |
| * | | Non-income producing security. |
SEE NOTES TO FINANCIAL STATEMENTS.
| | | | | | | | |
| | | |
| OCTOBER 31, 2020 | | J.P. MORGAN INTERNATIONAL EQUITY FUNDS | | | | | 47 | |
JPMorgan International Hedged Equity Fund
SCHEDULE OF PORTFOLIO INVESTMENTS
AS OF OCTOBER 31, 2020
| | | | | | | | |
| INVESTMENTS | | SHARES
(000) | | | VALUE
($000) | |
Common Stocks — 90.6% | |
|
Australia — 5.2% | |
| | |
Australia & New Zealand Banking Group Ltd. | | | 40 | | | | 532 | |
| | |
BHP Group Ltd. | | | 46 | | | | 1,097 | |
| | |
Commonwealth Bank of Australia | | | 9 | | | | 426 | |
| | |
CSL Ltd. | | | 5 | | | | 933 | |
| | |
Dexus, REIT | | | 60 | | | | 363 | |
| | |
Goodman Group, REIT | | | 59 | | | | 769 | |
| | |
GPT Group (The), REIT | | | 23 | | | | 64 | |
| | |
Macquarie Group Ltd. | | | 1 | | | | 132 | |
| | |
National Australia Bank Ltd. | | | 9 | | | | 113 | |
| | |
Newcrest Mining Ltd. | | | 8 | | | | 157 | |
| | |
Rio Tinto Ltd. | | | 18 | | | | 1,153 | |
| | |
Rio Tinto plc | | | 6 | | | | 348 | |
| | |
Wesfarmers Ltd. | | | 6 | | | | 209 | |
| | |
Westpac Banking Corp. | | | 50 | | | | 634 | |
| | |
Woolworths Group Ltd. | | | 8 | | | | 210 | |
| | | | | | | | |
| | |
| | | | | | | 7,140 | |
| | | | | | | | |
|
Austria — 0.4% | |
| | |
Erste Group Bank AG | | | 24 | | | | 492 | |
| | | | | | | | |
|
Belgium — 0.1% | |
| | |
KBC Group NV | | | 4 | | | | 175 | |
| | | | | | | | |
|
China — 0.7% | |
| | |
BOC Hong Kong Holdings Ltd. | | | 50 | | | | 137 | |
| | |
Prosus NV* | | | 8 | | | | 767 | |
| | | | | | | | |
| | |
| | | | | | | 904 | |
| | | | | | | | |
|
Denmark — 2.9% | |
| | |
Carlsberg A/S, Class B | | | 5 | | | | 651 | |
| | |
Chr Hansen Holding A/S | | | 2 | | | | 169 | |
| | |
Novo Nordisk A/S, Class B | | | 33 | | | | 2,087 | |
| | |
Orsted A/S (a) | | | 7 | | | | 1,071 | |
| | | | | | | | |
| | |
| | | | | | | 3,978 | |
| | | | | | | | |
|
Finland — 0.4% | |
| | |
Nokia OYJ* | | | 63 | | | | 212 | |
| | |
UPM-Kymmene OYJ | | | 12 | | | | 345 | |
| | | | | | | | |
| | |
| | | | | | | 557 | |
| | | | | | | | |
|
France — 9.9% | |
| | |
Accor SA* | | | 10 | | | | 258 | |
| | |
Air Liquide SA | | | 8 | | | | 1,168 | |
| | |
Airbus SE* | | | 11 | | | | 780 | |
| | |
Alstom SA* | | | 13 | | | | 586 | |
| | |
AXA SA | | | 17 | | | | 275 | |
| | |
BNP Paribas SA* | | | 26 | | | | 905 | |
| | | | | | | | |
| INVESTMENTS | | SHARES
(000) | | | VALUE
($000) | |
| | | | | | | | |
|
France — continued | |
| | |
Capgemini SE | | | 7 | | | | 841 | |
| | |
Kering SA | | | 1 | | | | 509 | |
| | |
L’Oreal SA | | | 3 | | | | 825 | |
| | |
LVMH Moet Hennessy Louis Vuitton SE | | | 4 | | | | 1,773 | |
| | |
Orange SA | | | 49 | | | | 548 | |
| | |
Pernod Ricard SA | | | 1 | | | | 173 | |
| | |
Safran SA* | | | 8 | | | | 825 | |
| | |
Sanofi | | | 11 | | | | 974 | |
| | |
Schneider Electric SE | | | 12 | | | | 1,474 | |
| | |
Thales SA | | | 3 | | | | 183 | |
| | |
TOTAL SE | | | 30 | | | | 905 | |
| | |
Vinci SA | | | 8 | | | | 642 | |
| | | | | | | | |
| | |
| | | | | | | 13,644 | |
| | | | | | | | |
|
Germany — 9.1% | |
| | |
adidas AG* | | | 4 | | | | 1,169 | |
| | |
Allianz SE (Registered) | | | 7 | | | | 1,185 | |
| | |
BASF SE | | | 4 | | | | 232 | |
| | |
Bayer AG (Registered) | | | 8 | | | | 385 | |
| | |
Brenntag AG | | | 4 | | | | 238 | |
| | |
Daimler AG (Registered) | | | 4 | | | | 200 | |
| | |
Deutsche Boerse AG | | | 2 | | | | 255 | |
| | |
Deutsche Post AG (Registered) | | | 21 | | | | 912 | |
| | |
Deutsche Telekom AG (Registered) | | | 67 | | | | 1,015 | |
| | |
Deutsche Wohnen SE | | | 4 | | | | 198 | |
| | |
Henkel AG & Co. KGaA (Preference) | | | 3 | | | | 246 | |
| | |
Infineon Technologies AG | | | 38 | | | | 1,056 | |
| | |
Merck KGaA | | | 2 | | | | 232 | |
| | |
Muenchener Rueckversicherungs-Gesellschaft AG (Registered) | | | 2 | | | | 517 | |
| | |
RWE AG | | | 21 | | | | 786 | |
| | |
SAP SE | | | 15 | | | | 1,585 | |
| | |
Siemens AG (Registered) | | | 9 | | | | 1,010 | |
| | |
Siemens Energy AG* | | | 5 | | | | 112 | |
| | |
Volkswagen AG (Preference) | | | 5 | | | | 709 | |
| | |
Vonovia SE | | | 8 | | | | 515 | |
| | | | | | | | |
| | |
| | | | | | | 12,557 | |
| | | | | | | | |
|
Hong Kong — 2.2% | |
| | |
AIA Group Ltd. | | | 157 | | | | 1,492 | |
| | |
CK Asset Holdings Ltd. | | | 49 | | | | 225 | |
| | |
CLP Holdings Ltd. | | | 19 | | | | 171 | |
| | |
Hong Kong Exchanges & Clearing Ltd. | | | 19 | | | | 925 | |
| | |
Sun Hung Kai Properties Ltd. | | | 13 | | | | 167 | |
| | | | | | | | |
| | |
| | | | | | | 2,980 | |
| | | | | | | | |
SEE NOTES TO FINANCIAL STATEMENTS.
| | | | | | |
| | | |
| 48 | | | | J.P. MORGAN INTERNATIONAL EQUITY FUNDS | | OCTOBER 31, 2020 |
| | | | | | | | |
| INVESTMENTS | | SHARES
(000) | | | VALUE
($000) | |
Common Stocks — continued | | | | | |
|
Ireland — 0.7% | |
| | |
CRH plc | | | 16 | | | | 558 | |
| | |
Kerry Group plc, Class A | | | 2 | | | | 227 | |
| | |
Kingspan Group plc | | | 2 | | | | 178 | |
| | | | | | | | |
| | |
| | | | | | | 963 | |
| | | | | | | | |
|
Italy — 1.4% | |
| | |
Enel SpA | | | 57 | | | | 457 | |
| | |
FinecoBank Banca Fineco SpA* | | | 53 | | | | 725 | |
| | |
Snam SpA | | | 153 | | | | 748 | |
| | | | | | | | |
| | |
| | | | | | | 1,930 | |
| | | | | | | | |
|
Japan — 25.1% | |
| | |
Advantest Corp. | | | 3 | | | | 191 | |
| | |
Asahi Group Holdings Ltd. | | | 14 | | | | 427 | |
| | |
Asahi Kasei Corp. | | | 48 | | | | 419 | |
| | |
Bridgestone Corp. | | | 7 | | | | 218 | |
| | |
Central Japan Railway Co. | | | 5 | | | | 580 | |
| | |
Daicel Corp. | | | 27 | | | | 191 | |
| | |
Daiichi Sankyo Co. Ltd. | | | 13 | | | | 351 | |
| | |
Daikin Industries Ltd. | | | 6 | | | | 1,085 | |
| | |
Daiwa House Industry Co. Ltd. | | | 13 | | | | 342 | |
| | |
Denso Corp. | | | 10 | | | | 471 | |
| | |
Electric Power Development Co. Ltd. | | | 19 | | | | 258 | |
| | |
ENEOS Holdings, Inc. | | | 132 | | | | 444 | |
| | |
Fast Retailing Co. Ltd. | | | 1 | | | | 349 | |
| | |
Hitachi Ltd. | | | 28 | | | | 940 | |
| | |
Honda Motor Co. Ltd. | | | 12 | | | | 277 | |
| | |
Hoya Corp. | | | 10 | | | | 1,072 | |
| | |
ITOCHU Corp. | | | 22 | | | | 528 | |
| | |
Japan Airlines Co. Ltd. | | | 15 | | | | 269 | |
| | |
Japan Tobacco, Inc. | | | 11 | | | | 215 | |
| | |
Kao Corp. | | | 13 | | | | 911 | |
| | |
Keyence Corp. | | | 4 | | | | 1,588 | |
| | |
Konami Holdings Corp. | | | 10 | | | | 387 | |
| | |
Kubota Corp. | | | 28 | | | | 485 | |
| | |
Kyowa Kirin Co. Ltd. | | | 17 | | | | 420 | |
| | |
Mabuchi Motor Co. Ltd. | | | 6 | | | | 252 | |
| | |
Marui Group Co. Ltd. | | | 19 | | | | 334 | |
| | |
Mitsubishi Corp. | | | 41 | | | | 919 | |
| | |
Mitsubishi UFJ Financial Group, Inc. | | | 140 | | | | 551 | |
| | |
Mitsui Fudosan Co. Ltd. | | | 22 | | | | 373 | |
| | |
Murata Manufacturing Co. Ltd. | | | 11 | | | | 764 | |
| | |
Nabtesco Corp. | | | 10 | | | | 374 | |
| | |
Nichirei Corp. | | | 7 | | | | 171 | |
| | |
Nidec Corp. | | | 5 | | | | 465 | |
| | |
Nintendo Co. Ltd. | | | 2 | | | | 1,298 | |
| | |
Nippon Express Co. Ltd. | | | 7 | | | | 393 | |
| | | | | | | | |
| INVESTMENTS | | SHARES
(000) | | | VALUE
($000) | |
| | | | | | | | |
| | |
Japan — continued | | | | | | | | |
| | |
Nippon Telegraph & Telephone Corp. | | | 31 | | | | 642 | |
| | |
Nitori Holdings Co. Ltd. | | | 4 | | | | 884 | |
| | |
Nomura Research Institute Ltd. | | | 16 | | | | 469 | |
| | |
Ono Pharmaceutical Co. Ltd. | | | 19 | | | | 542 | |
| | |
ORIX Corp. | | | 34 | | | | 395 | |
| | |
Otsuka Corp. | | | 12 | | | | 547 | |
| | |
Otsuka Holdings Co. Ltd. | | | 1 | | | | 19 | |
| | |
Panasonic Corp. | | | 20 | | | | 182 | |
| | |
Recruit Holdings Co. Ltd. | | | 7 | | | | 255 | |
| | |
Renesas Electronics Corp.* | | | 23 | | | | 188 | |
| | |
Seven & i Holdings Co. Ltd. | | | 14 | | | | 410 | |
| | |
Shimadzu Corp. | | | 14 | | | | 403 | |
| | |
Shin-Etsu Chemical Co. Ltd. | | | 6 | | | | 748 | |
| | |
Shiseido Co. Ltd. | | | 8 | | | | 471 | |
| | |
SMC Corp. | | | 1 | | | | 532 | |
| | |
SoftBank Group Corp. | | | 9 | | | | 560 | |
| | |
Sony Corp. | | | 16 | | | | 1,351 | |
| | |
Square Enix Holdings Co. Ltd. | | | 8 | | | | 482 | |
| | |
Sumitomo Electric Industries Ltd. | | | 22 | | | | 241 | |
| | |
Sumitomo Metal Mining Co. Ltd. | | | 17 | | | | 535 | |
| | |
Sumitomo Mitsui Financial Group, Inc. | | | 31 | | | | 864 | |
| | |
Sumitomo Realty & Development Co. Ltd. | | | 13 | | | | 345 | |
| | |
Suzuki Motor Corp. | | | 9 | | | | 391 | |
| | |
T&D Holdings, Inc. | | | 33 | | | | 330 | |
| | |
Takeda Pharmaceutical Co. Ltd. | | | 4 | | | | 111 | |
| | |
Tokio Marine Holdings, Inc. | | | 20 | | | | 894 | |
| | |
Tokyo Electron Ltd. | | | 2 | | | | 617 | |
| | |
Tokyo Gas Co. Ltd. | | | 8 | | | | 172 | |
| | |
Tokyu Corp. | | | 27 | | | | 325 | |
| | |
Toyota Motor Corp. | | | 29 | | | | 1,910 | |
| | |
West Japan Railway Co. | | | 5 | | | | 210 | |
| | |
Yamato Holdings Co. Ltd. | | | 5 | | | | 135 | |
| | | | | | | | |
| | |
| | | | | | | 34,472 | |
| | | | | | | | |
|
Luxembourg — 0.2% | |
| | |
ArcelorMittal SA* | | | 16 | | | | 214 | |
| | | | | | | | |
|
Netherlands — 5.1% | |
| | |
Akzo Nobel NV | | | 10 | | | | 996 | |
| | |
ASML Holding NV | | | 6 | | | | 2,345 | |
| | |
Heineken NV | | | 3 | | | | 285 | |
| | |
ING Groep NV | | | 83 | | | | 569 | |
| | |
Koninklijke Ahold Delhaize NV | | | 16 | | | | 438 | |
| | |
Koninklijke KPN NV | | | 214 | | | | 578 | |
| | |
Koninklijke Philips NV* | | | 5 | | | | 241 | |
| | |
NN Group NV | | | 17 | | | | 594 | |
| | |
Royal Dutch Shell plc, Class A | | | 40 | | | | 502 | |
SEE NOTES TO FINANCIAL STATEMENTS.
| | | | | | | | |
| | | |
| OCTOBER 31, 2020 | | J.P. MORGAN INTERNATIONAL EQUITY FUNDS | | | | | 49 | |
JPMorgan International Hedged Equity Fund
SCHEDULE OF PORTFOLIO INVESTMENTS
AS OF OCTOBER 31, 2020 (continued)
(Amounts in thousands, except number of contracts)
| | | | | | | | |
| INVESTMENTS | | SHARES
(000) | | | VALUE
($000) | |
Common Stocks — continued | | | | | |
| |
Netherlands—continued | | | | | |
| | |
Royal Dutch Shell plc, Class B | | | 17 | | | | 205 | |
| | |
Wolters Kluwer NV | | | 3 | | | | 258 | |
| | | | | | | | |
| | |
| | | | | | | 7,011 | |
| | | | | | | | |
|
Norway — 0.5% | |
| | |
Telenor ASA | | | 43 | | | | 658 | |
| | | | | | | | |
|
Singapore — 0.7% | |
| | |
DBS Group Holdings Ltd. | | | 44 | | | | 655 | |
| | |
Oversea-Chinese Banking Corp. Ltd. | | | 33 | | | | 203 | |
| | |
United Overseas Bank Ltd. | | | 7 | | | | 103 | |
| | | | | | | | |
| | |
| | | | | | | 961 | |
| | | | | | | | |
|
Spain — 2.2% | |
| | |
Banco Bilbao Vizcaya Argentaria SA | | | 96 | | | | 277 | |
| | |
Banco Santander SA | | | 146 | | | | 292 | |
| | |
Iberdrola SA | | | 146 | | | | 1,724 | |
| | |
Industria de Diseno Textil SA | | | 27 | | | | 660 | |
| | |
Telefonica SA | | | 37 | | | | 122 | |
| | | | | | | | |
| | |
| | | | | | | 3,075 | |
| | | | | | | | |
|
Sweden — 2.1% | |
| | |
Atlas Copco AB, Class A | | | 8 | | | | 335 | |
| | |
Lundin Energy AB | | | 20 | | | | 380 | |
| | |
SKF AB, Class B | | | 32 | | | | 648 | |
| | |
Svenska Handelsbanken AB, Class A * | | | 93 | | | | 751 | |
| | |
Volvo AB, Class B * | | | 36 | | | | 708 | |
| | | | | | | | |
| | |
| | | | | | | 2,822 | |
| | | | | | | | |
|
Switzerland — 10.3% | |
| | |
Adecco Group AG (Registered) | | | 7 | | | | 326 | |
| | |
Cie Financiere Richemont SA (Registered) | | | 4 | | | | 271 | |
| | |
Credit Suisse Group AG (Registered) | | | 43 | | | | 408 | |
| | |
Givaudan SA (Registered) | | | — | (b) | | | 188 | |
| | |
LafargeHolcim Ltd. (Registered) * | | | 12 | | | | 536 | |
| | |
Lonza Group AG (Registered) | | | 2 | | | | 1,241 | |
| | |
Nestle SA (Registered) | | | 36 | | | | 4,049 | |
| | |
Novartis AG (Registered) | | | 33 | | | | 2,597 | |
| | |
Roche Holding AG | | | 10 | | | | 3,236 | |
| | |
Swiss Re AG | | | 8 | | | | 561 | |
| | |
UBS Group AG (Registered) | | | 23 | | | | 271 | |
| | |
Zurich Insurance Group AG | | | 1 | | | | 490 | |
| | | | | | | | |
| | |
| | | | | | | 14,174 | |
| | | | | | | | |
|
United Kingdom — 11.0% | |
| | |
3i Group plc | | | 76 | | | | 955 | |
| | |
AstraZeneca plc | | | 9 | | | | 948 | |
| | |
Barratt Developments plc | | | 29 | | | | 182 | |
| | |
Beazley plc | | | 67 | | | | 255 | |
| | | | | | | | |
| INVESTMENTS | | SHARES
(000) | | | VALUE
($000) | |
| | | | | | | | |
|
United Kingdom — continued | |
| | |
BP plc | | | 369 | | | | 942 | |
| | |
British American Tobacco plc | | | 23 | | | | 721 | |
| | |
CK Hutchison Holdings Ltd. | | | 37 | | | | 224 | |
| | |
DCC plc | | | 2 | | | | 108 | |
| | |
Diageo plc | | | 43 | | | | 1,400 | |
| | |
GlaxoSmithKline plc | | | 46 | | | | 774 | |
| | |
HSBC Holdings plc | | | 120 | | | | 501 | |
| | |
InterContinental Hotels Group plc | | | 14 | | | | 688 | |
| | |
Lloyds Banking Group plc | | | 1,684 | | | | 613 | |
| | |
London Stock Exchange Group plc | | | 4 | | | | 476 | |
| | |
M&G plc | | | 109 | | | | 207 | |
| | |
Persimmon plc | | | 6 | | | | 191 | |
| | |
Prudential plc | | | 42 | | | | 511 | |
| | |
Reckitt Benckiser Group plc | | | 12 | | | | 1,052 | |
| | |
RELX plc | | | 42 | | | | 830 | |
| | |
Standard Chartered plc | | | 117 | | | | 534 | |
| | |
Taylor Wimpey plc | | | 379 | | | | 519 | |
| | |
Tesco plc | | | 276 | | | | 735 | |
| | |
Unilever NV | | | 29 | | | | 1,646 | |
| | |
Whitbread plc | | | 6 | | | | 154 | |
| | | | | | | | |
| | |
| | | | | | | 15,166 | |
| | | | | | | | |
|
United States — 0.4% | |
| | |
Ferguson plc | | | 6 | | | | 566 | |
| | | | | | | | |
| | |
Total Common Stocks
(Cost $122,221) | | | | | | | 124,439 | |
| | | | | |
| | |
| | | NO. OF
CONTRACTS | | | | |
|
Options Purchased — 4.4% | |
|
Put Options Purchased — 4.4% | |
|
United States — 4.4% | |
| | |
MSCI EAFE Index 12/18/2020 at USD 1,810.00, European Style Notional Amount: USD 139,256
Exchange-Traded *
(Cost $3,594) | | | 739 | | | | 5,997 | |
| | | | | | | | |
| | | | | | | | |
| | | SHARES
(000) | | | | |
Short-Term Investments — 4.8% | |
|
Investment Companies — 4.8% | |
| | |
JPMorgan U.S. Government Money Market Fund Class Institutional Shares, 0.01% (c) (d) (Cost $6,584) | | | 6,584 | | | | 6,584 | |
| | | | | | | | |
| |
Total Investments — 99.8%
(Cost $132,399) | | | | 137,020 | |
| |
Other Assets Less Liabilities — 0.2% | | | | 248 | |
| | | | | |
| |
NET ASSETS — 100.0% | | | | 137,268 | |
| | | | | |
Percentages indicated are based on net assets.
SEE NOTES TO FINANCIAL STATEMENTS.
| | | | | | |
| | | |
| 50 | | | | J.P. MORGAN INTERNATIONAL EQUITY FUNDS | | OCTOBER 31, 2020 |
Summary of Investments by Industry, October 31, 2020
The following table represents the portfolio investments of the Fund by industry classifications as a percentage of total investments:
| | | | |
| INDUSTRY | | PERCENTAGE | |
| |
Pharmaceuticals | | | 9.2 | % |
| |
Banks | | | 7.3 | |
| |
Insurance | | | 5.2 | |
| |
Index Funds | | | 4.4 | |
| |
Food Products | | | 3.2 | |
| |
Semiconductors & Semiconductor Equipment | | | 3.2 | |
| |
Chemicals | | | 3.0 | |
| |
Personal Products | | | 2.8 | |
| |
Textiles, Apparel & Luxury Goods | | | 2.7 | |
| |
Electronic Equipment, Instruments & Components | | | 2.7 | |
| |
Machinery | | | 2.7 | |
| |
Diversified Telecommunication Services | | | 2.6 | |
| |
Metals & Mining | | | 2.6 | |
| |
Automobiles | | | 2.5 | |
| |
Capital Markets | | | 2.5 | |
| |
Electric Utilities | | | 2.5 | |
| |
Oil, Gas & Consumable Fuels | | | 2.5 | |
| |
Beverages | | | 2.1 | |
| |
Household Durables | | | 1.8 | |
| |
Electrical Equipment | | | 1.7 | |
| |
Trading Companies & Distributors | | | 1.6 | |
| |
Entertainment | | | 1.6 | |
| |
Real Estate Management & Development | | | 1.6 | |
| |
Specialty Retail | | | 1.4 | |
| | | | |
| INDUSTRY | | PERCENTAGE | |
| |
IT Services | | | 1.3 | % |
| |
Food & Staples Retailing | | | 1.3 | |
| |
Aerospace & Defense | | | 1.3 | |
| |
Professional Services | | | 1.2 | |
| |
Software | | | 1.2 | |
| |
Road & Rail | | | 1.1 | |
| |
Industrial Conglomerates | | | 1.0 | |
| |
Health Care Equipment & Supplies | | | 1.0 | |
| |
Others (each less than 1.0%) | | | 12.4 | |
| |
Short-Term Investments | | | 4.8 | |
Abbreviations
| | |
EAFE | | Europe, Australasia and Far East |
OYJ | | Public Limited Company |
Preference | | A special type of equity investment that shares in the earnings of the company, has limited voting rights, and may have a dividend preference. Preference shares may also have liquidation preference. |
REIT | | Real Estate Investment Trust |
USD | | United States Dollar |
| |
(a) | | Security exempt from registration pursuant to Regulation S under the Securities Act of 1933, as amended. Regulation S applies to securities offerings that are made outside of the United States and do not involve direct selling efforts in the United States and as such may have restrictions on resale. |
(b) | | Amount rounds to less than one thousand. |
(c) | | Investment in an affiliated fund, which is registered under the Investment Company Act of 1940, as amended, and is advised by J.P. Morgan Investment Management Inc. |
(d) | | The rate shown is the current yield as of October 31, 2020. |
* | | Non-income producing security. |
| | | | | | | | | | | | | | | | | | | | |
| Futures contracts outstanding as of October 31, 2020: | |
| DESCRIPTION | | NUMBER OF
CONTRACTS | | | EXPIRATION
DATE | | | TRADING
CURRENCY | | | NOTIONAL
AMOUNT ($) | | | VALUE AND
UNREALIZED
APPRECIATION
(DEPRECIATION) ($) | |
| | | | | |
| Long Contracts | | | | | | | | | | | | | | | | | | | | |
| | | | | |
FTSE 100 Index | | | 5 | | | | 12/2020 | | | | GBP | | | | 361 | | | | (32 | ) |
| | | | | |
MSCI EAFE E-Mini Index | | | 29 | | | | 12/2020 | | | | USD | | | | 2,588 | | | | (133 | ) |
| | | | | |
SPI 200 Index | | | 39 | | | | 12/2020 | | | | AUD | | | | 4,072 | | | | 40 | |
| | | | | | | | | | | | | | | | | | | | |
| | | | | |
| | | | | | | | | | | | | | | | | | | (125 | ) |
| | | | | | | | | | | | | | | | | | | | |
SEE NOTES TO FINANCIAL STATEMENTS.
| | | | | | | | |
| | | |
| OCTOBER 31, 2020 | | J.P. MORGAN INTERNATIONAL EQUITY FUNDS | | | | | 51 | |
JPMorgan International Hedged Equity Fund
SCHEDULE OF PORTFOLIO INVESTMENTS
AS OF OCTOBER 31, 2020 (continued)
(Amounts in thousands, except number of contracts)
| | |
| Abbreviations |
| |
| AUD | | Australian Dollar |
EAFE | | Europe, Australasia and Far East |
| FTSE | | Financial Times and the London Stock Exchange |
| GBP | | British Pound |
MSCI | | Morgan Stanley Capital International |
| SPI | | Australian Securities Exchange |
USD | | United States Dollar |
| | | | | | | | | | | | | | | | | | | | | | | | |
| Written Call Options Contracts as of October 31, 2020: | |
| DESCRIPTION | | COUNTERPARTY | | | NUMBER OF
CONTRACTS | | | NOTIONAL
AMOUNT | | | EXERCISE
PRICE | | | EXPIRATION
DATE | | | VALUE ($) | |
MSCI EAFE Index | | | Exchange-Traded | | | | 739 | | |
| USD 139,256
|
| | | USD 1,990.00 | | | | 12/18/2020 | | | | (231 | ) |
| | | | | | | | | | | | | | | | | | | | | | | | |
|
| Written Put Options Contracts as of October 31, 2020: | |
| DESCRIPTION | | COUNTERPARTY | | | NUMBER OF
CONTRACTS | | | NOTIONAL
AMOUNT | | | EXERCISE
PRICE | | | EXPIRATION
DATE | | | VALUE ($) | |
| | | | | | |
| MSCI EAFE Index | | | Exchange-Traded | | | | 739 | | |
| USD 139,256
|
| | | USD 1,520.00 | | | | 12/18/2020 | | | | (1,108 | ) |
| | | | | | | | | | | | | | | | | | | | | | | | |
Total Written Options Contracts (Premiums Received $3,066) | | | | (1,339 | ) |
| | | | | | | | | | | | | | | | | | | | | | | | |
Abbreviations
| | |
| EAFE | | Europe, Australasia and Far East |
| MSCI | | Morgan Stanley Capital International |
| USD | | United States Dollar |
SEE NOTES TO FINANCIAL STATEMENTS.
| | | | | | |
| | | |
| 52 | | | | J.P. MORGAN INTERNATIONAL EQUITY FUNDS | | OCTOBER 31, 2020 |
JPMorgan International Research Enhanced Equity Fund
SCHEDULE OF PORTFOLIO INVESTMENTS
AS OF OCTOBER 31, 2020
| | | | | | | | |
| INVESTMENTS | | SHARES
(000) | | | VALUE
($000) | |
Common Stocks — 97.1% | |
|
Australia — 5.6% | |
| | |
Australia & New Zealand Banking Group Ltd. | | | 1,527 | | | | 20,271 | |
| | |
BHP Group Ltd. | | | 1,740 | | | | 41,699 | |
| | |
Commonwealth Bank of Australia | | | 333 | | | | 16,154 | |
| | |
CSL Ltd. | | | 175 | | | | 35,355 | |
| | |
Dexus, REIT | | | 2,274 | | | | 13,759 | |
| | |
Goodman Group, REIT | | | 2,266 | | | | 29,323 | |
| | |
GPT Group (The), REIT | | | 863 | | | | 2,445 | |
| | |
Macquarie Group Ltd. | | | 60 | | | | 5,336 | |
| | |
National Australia Bank Ltd. | | | 351 | | | | 4,594 | |
| | |
Newcrest Mining Ltd. | | | 281 | | | | 5,817 | |
| | |
Rio Tinto Ltd. | | | 672 | | | | 43,745 | |
| | |
Rio Tinto plc | | | 239 | | | | 13,540 | |
| | |
Wesfarmers Ltd. | | | 242 | | | | 7,834 | |
| | |
Westpac Banking Corp. | | | 1,902 | | | | 24,072 | |
| | |
Woolworths Group Ltd. | | | 294 | | | | 7,900 | |
| | | | | | | | |
| | |
| | | | | | | 271,844 | |
| | | | | | | | |
|
Austria — 0.4% | |
| | |
Erste Group Bank AG | | | 916 | | | | 18,821 | |
| | | | | | | | |
|
Belgium — 0.1% | |
| | |
KBC Group NV | | | 134 | | | | 6,610 | |
| | | | | | | | |
|
China — 0.7% | |
| | |
BOC Hong Kong Holdings Ltd. | | | 1,856 | | | | 5,155 | |
| | |
Prosus NV* | | | 288 | | | | 28,722 | |
| | | | | | | | |
| | |
| | | | | | | 33,877 | |
| | | | | | | | |
|
Denmark — 3.1% | |
| | |
Carlsberg A/S, Class B | | | 194 | | | | 24,574 | |
| | |
Chr Hansen Holding A/S (a) | | | 54 | | | | 5,411 | |
| | |
Novo Nordisk A/S, Class B | | | 1,249 | | | | 79,624 | |
| | |
Orsted A/S (b) | | | 256 | | | | 40,671 | |
| | | | | | | | |
| | |
| | | | | | | 150,280 | |
| | | | | | | | |
|
Finland — 0.4% | |
| | |
Nokia OYJ* | | | 2,401 | | | | 8,093 | |
| | |
UPM-Kymmene OYJ | | | 470 | | | | 13,285 | |
| | | | | | | | |
| | |
| | | | | | | 21,378 | |
| | | | | | | | |
|
France — 10.7% | |
| | |
Accor SA* (a) | | | 385 | | | | 9,812 | |
| | |
Air Liquide SA | | | 305 | | | | 44,572 | |
| | |
Airbus SE* (a) | | | 407 | | | | 29,805 | |
| | |
Alstom SA* | | | 496 | | | | 22,162 | |
| | |
AXA SA | | | 654 | | | | 10,495 | |
| | |
BNP Paribas SA* | | | 993 | | | | 34,614 | |
| | |
Capgemini SE | | | 278 | | | | 32,046 | |
| | |
Kering SA | | | 32 | | | | 19,252 | |
| | | | | | | | |
| INVESTMENTS | | SHARES
(000) | | | VALUE
($000) | |
| | | | | | | | |
|
France — continued | |
| | |
L’Oreal SA | | | 97 | | | | 31,200 | |
| | |
LVMH Moet Hennessy Louis Vuitton SE | | | 146 | | | | 68,423 | |
| | |
Orange SA | | | 1,867 | | | | 20,970 | |
| | |
Pernod Ricard SA | | | 40 | | | | 6,503 | |
| | |
Safran SA* | | | 299 | | | | 31,525 | |
| | |
Sanofi | | | 421 | | | | 38,042 | |
| | |
Schneider Electric SE | | | 465 | | | | 56,465 | |
| | |
Thales SA | | | 107 | | | | 6,991 | |
| | |
TOTAL SE | | | 1,140 | | | | 34,528 | |
| | |
Vinci SA | | | 312 | | | | 24,645 | |
| | | | | | | | |
| | |
| | | | | | | 522,050 | |
| | | | | | | | |
|
Germany — 9.8% | |
| | |
adidas AG* | | | 151 | | | | 45,003 | |
| | |
Allianz SE (Registered) | | | 256 | | | | 45,011 | |
| | |
BASF SE | | | 165 | | | | 9,036 | |
| | |
Bayer AG (Registered) | | | 317 | | | | 14,879 | |
| | |
Brenntag AG | | | 151 | | | | 9,628 | |
| | |
Daimler AG (Registered) | | | 145 | | | | 7,516 | |
| | |
Deutsche Boerse AG | | | 68 | | | | 9,957 | |
| | |
Deutsche Post AG (Registered) | | | 793 | | | | 35,176 | |
| | |
Deutsche Telekom AG (Registered) | | | 2,543 | | | | 38,655 | |
| | |
Deutsche Wohnen SE | | | 150 | | | | 7,555 | |
| | |
Henkel AG & Co. KGaA (Preference) | | | 86 | | | | 8,412 | |
| | |
Infineon Technologies AG | | | 1,378 | | | | 38,356 | |
| | |
Merck KGaA | | | 59 | | | | 8,721 | |
| | |
Muenchener Rueckversicherungs-Gesellschaft AG (Registered) | | | 82 | | | | 19,285 | |
| | |
RWE AG | | | 800 | | | | 29,604 | |
| | |
SAP SE | | | 571 | | | | 60,883 | |
| | |
Siemens AG (Registered) | | | 330 | | | | 38,679 | |
| | |
Siemens Energy AG* | | | 195 | | | | 4,274 | |
| | |
Volkswagen AG (Preference) | | | 186 | | | | 27,056 | |
| | |
Vonovia SE | | | 304 | | | | 19,423 | |
| | | | | | | | |
| | |
| | | | | | | 477,109 | |
| | | | | | | | |
|
Hong Kong — 2.3% | |
| | |
AIA Group Ltd. | | | 5,907 | | | | 56,220 | |
| | |
CK Asset Holdings Ltd. | | | 1,737 | | | | 8,064 | |
| | |
CLP Holdings Ltd. | | | 649 | | | | 5,980 | |
| | |
Hong Kong Exchanges & Clearing Ltd. | | | 709 | | | | 33,970 | |
| | |
Sun Hung Kai Properties Ltd. | | | 487 | | | | 6,268 | |
| | | | | | | | |
| | |
| | | | | | | 110,502 | |
| | | | | | | | |
|
Ireland — 0.8% | |
| | |
CRH plc | | | 614 | | | | 21,491 | |
| | |
Kerry Group plc, Class A | | | 72 | | | | 8,546 | |
SEE NOTES TO FINANCIAL STATEMENTS.
| | | | | | | | |
| | | |
| OCTOBER 31, 2020 | | J.P. MORGAN INTERNATIONAL EQUITY FUNDS | | | | | 53 | |
JPMorgan International Research Enhanced Equity Fund
SCHEDULE OF PORTFOLIO INVESTMENTS
AS OF OCTOBER 31, 2020 (continued)
| | | | | | | | |
| INVESTMENTS | | SHARES
(000) | | | VALUE
($000) | |
Common Stocks — continued | | | | | |
|
Ireland — continued | |
| | |
Kingspan Group plc | | | 77 | | | | 6,671 | |
| | | | | | | | |
| | |
| | | | | | | 36,708 | |
| | | | | | | | |
|
Italy — 1.5% | |
| | |
Enel SpA | | | 2,237 | | | | 17,785 | |
| | |
FinecoBank Banca Fineco SpA* (a) | | | 2,021 | | | | 27,745 | |
| | |
Snam SpA (a) | | | 5,759 | | | | 28,080 | |
| | | | | | | | |
| | |
| | | | | | | 73,610 | |
| | | | | | | | |
|
Japan — 26.7% | |
| | |
Advantest Corp. | | | 122 | | | | 7,090 | |
| | |
Asahi Group Holdings Ltd. | | | 497 | | | | 15,378 | |
| | |
Asahi Kasei Corp. | | | 1,818 | | | | 15,751 | |
| | |
Bridgestone Corp. | | | 242 | | | | 7,885 | |
| | |
Central Japan Railway Co. | | | 159 | | | | 19,178 | |
| | |
Daicel Corp. | | | 1,013 | | | | 7,229 | |
| | |
Daiichi Sankyo Co. Ltd. | | | 498 | | | | 13,152 | |
| | |
Daikin Industries Ltd. | | | 205 | | | | 38,342 | |
| | |
Daiwa House Industry Co. Ltd. | | | 485 | | | | 12,741 | |
| | |
Denso Corp. | | | 383 | | | | 17,837 | |
| | |
Electric Power Development Co. Ltd. | | | 722 | | | | 9,758 | |
| | |
ENEOS Holdings, Inc. | | | 4,976 | | | | 16,789 | |
| | |
Fast Retailing Co. Ltd. | | | 22 | | | | 14,997 | |
| | |
Hitachi Ltd. | | | 1,068 | | | | 35,983 | |
| | |
Honda Motor Co. Ltd. | | | 426 | | | | 10,086 | |
| | |
Hoya Corp. | | | 342 | | | | 38,597 | |
| | |
ITOCHU Corp. | | | 831 | | | | 19,962 | |
| | |
Japan Airlines Co. Ltd. | | | 580 | | | | 10,130 | |
| | |
Japan Tobacco, Inc. | | | 392 | | | | 7,377 | |
| | |
Kao Corp. | | | 486 | | | | 34,610 | |
| | |
Keyence Corp. | | | 121 | | | | 55,049 | |
| | |
Konami Holdings Corp. | | | 374 | | | | 14,649 | |
| | |
Kubota Corp. | | | 1,052 | | | | 18,280 | |
| | |
Kyowa Kirin Co. Ltd. | | | 635 | | | | 15,764 | |
| | |
Mabuchi Motor Co. Ltd. | | | 219 | | | | 9,025 | |
| | |
Marui Group Co. Ltd. | | | 681 | | | | 12,298 | |
| | |
Mitsubishi Corp. | | | 1,539 | | | | 34,335 | |
| | |
Mitsubishi UFJ Financial Group, Inc. | | | 5,239 | | | | 20,652 | |
| | |
Mitsui Fudosan Co. Ltd. | | | 833 | | | | 14,175 | |
| | |
Murata Manufacturing Co. Ltd. | | | 410 | | | | 28,781 | |
| | |
Nabtesco Corp. | | | 373 | | | | 13,938 | |
| | |
Nichirei Corp. | | | 251 | | | | 6,335 | |
| | |
Nidec Corp. | | | 171 | | | | 17,271 | |
| | |
Nintendo Co. Ltd. | | | 91 | | | | 49,311 | |
| | |
Nippon Express Co. Ltd. | | | 263 | | | | 14,771 | |
| | |
Nippon Telegraph & Telephone Corp. | | | 1,427 | | | | 30,022 | |
| | |
Nitori Holdings Co. Ltd. | | | 158 | | | | 32,437 | |
| | | | | | | | |
| INVESTMENTS | | SHARES
(000) | | | VALUE
($000) | |
| | | | | | | | |
|
Japan — continued | |
| | |
Nomura Research Institute Ltd. | | | 596 | | | | 17,563 | |
| | |
Ono Pharmaceutical Co. Ltd. | | | 713 | | | | 20,350 | |
| | |
ORIX Corp. | | | 1,272 | | | | 14,875 | |
| | |
Otsuka Corp. | | | 527 | | | | 24,226 | |
| | |
Otsuka Holdings Co. Ltd. | | | 142 | | | | 5,252 | |
| | |
Panasonic Corp. | | | 699 | | | | 6,456 | |
| | |
Recruit Holdings Co. Ltd. | | | 248 | | | | 9,444 | |
| | |
Renesas Electronics Corp.* | | | 854 | | | | 7,049 | |
| | |
Seven & i Holdings Co. Ltd. | | | 502 | | | | 15,249 | |
| | |
Shimadzu Corp. | | | 536 | | | | 15,320 | |
| | |
Shin-Etsu Chemical Co. Ltd. | | | 213 | | | | 28,436 | |
| | |
Shiseido Co. Ltd. | | | 286 | | | | 17,718 | |
| | |
SMC Corp. | | | 39 | | | | 20,744 | |
| | |
SoftBank Group Corp. | | | 315 | | | | 20,530 | |
| | |
Sony Corp. | | | 609 | | | | 50,785 | |
| | |
Square Enix Holdings Co. Ltd. | | | 318 | | | | 18,483 | |
| | |
Sumitomo Electric Industries Ltd. | | | 822 | | | | 9,079 | |
| | |
Sumitomo Metal Mining Co. Ltd. | | | 644 | | | | 20,002 | |
| | |
Sumitomo Mitsui Financial Group, Inc. | | | 1,159 | | | | 32,086 | |
| | |
Sumitomo Realty & Development Co. Ltd. | | | 488 | | | | 13,051 | |
| | |
Suzuki Motor Corp. | | | 346 | | | | 14,843 | |
| | |
T&D Holdings, Inc. | | | 1,229 | | | | 12,279 | |
| | |
Takeda Pharmaceutical Co. Ltd. | | | 138 | | | | 4,258 | |
| | |
Tokio Marine Holdings, Inc. | | | 748 | | | | 33,432 | |
| | |
Tokyo Electron Ltd. | | | 89 | | | | 23,835 | |
| | |
Tokyo Gas Co. Ltd. | | | 278 | | | | 6,304 | |
| | |
Tokyu Corp. | | | 1,025 | | | | 12,166 | |
| | |
Toyota Motor Corp. | | | 1,084 | | | | 71,175 | |
| | |
West Japan Railway Co. | | | 162 | | | | 6,945 | |
| | |
Yamato Holdings Co. Ltd. | | | 181 | | | | 4,796 | |
| | | | | | | | |
| | |
| | | | | | | 1,296,696 | |
| | | | | | | | |
|
Luxembourg — 0.2% | |
| | |
ArcelorMittal SA* | | | 614 | | | | 8,329 | |
| | | | | | | | |
|
Malta — 0.0% (c) | |
| | |
BGP Holdings plc*‡ | | | 449 | | | | 1 | |
| | | | | | | | |
|
Netherlands — 5.4% | |
| | |
Akzo Nobel NV | | | 396 | | | | 38,137 | |
| | |
ASML Holding NV | | | 236 | | | | 85,473 | |
| | |
Heineken NV | | | 123 | | | | 10,909 | |
| | |
ING Groep NV | | | 3,178 | | | | 21,769 | |
| | |
Koninklijke Ahold Delhaize NV | | | 602 | | | | 16,515 | |
| | |
Koninklijke KPN NV | | | 8,085 | | | | 21,837 | |
| | |
Koninklijke Philips NV* | | | 200 | | | | 9,284 | |
| | |
NN Group NV | | | 642 | | | | 22,336 | |
| | |
Royal Dutch Shell plc, Class A | | | 1,525 | | | | 19,184 | |
SEE NOTES TO FINANCIAL STATEMENTS.
| | | | | | |
| | | |
| 54 | | | | J.P. MORGAN INTERNATIONAL EQUITY FUNDS | | OCTOBER 31, 2020 |
| | | | | | | | |
| INVESTMENTS | | SHARES
(000) | | | VALUE
($000) | |
Common Stocks — continued | | | | | |
| |
Netherlands — continued | | | | | |
| | |
Royal Dutch Shell plc, Class B | | | 657 | | | | 7,920 | |
| | |
Wolters Kluwer NV | | | 120 | | | | 9,693 | |
| | | | | | | | |
| | |
| | | | | | | 263,057 | |
| | | | | | | | |
|
Norway — 0.6% | |
| | |
Telenor ASA | | | 1,736 | | | | 26,829 | |
| | | | | | | | |
|
Singapore — 0.7% | |
| | |
DBS Group Holdings Ltd. | | | 1,649 | | | | 24,570 | |
| | |
Oversea-Chinese Banking Corp. Ltd. | | | 1,236 | | | | 7,623 | |
| | |
United Overseas Bank Ltd. | | | 276 | | | | 3,836 | |
| | | | | | | | |
| | |
| | | | | | | 36,029 | |
| | | | | | | | |
|
Spain — 2.4% | |
| | |
Banco Bilbao Vizcaya Argentaria SA | | | 3,559 | | | | 10,269 | |
| | |
Banco Santander SA | | | 5,582 | | | | 11,177 | |
| | |
Iberdrola SA | | | 5,567 | | | | 65,737 | |
| | |
Industria de Diseno Textil SA (a) | | | 1,041 | | | | 25,693 | |
| | |
Telefonica SA | | | 1,487 | | | | 4,837 | |
| | | | | | | | |
| | |
| | | | | | | 117,713 | |
| | | | | | | | |
|
Sweden — 2.2% | |
| | |
Atlas Copco AB, Class A | | | 287 | | | | 12,689 | |
| | |
Lundin Energy AB (a) | | | 766 | | | | 14,638 | |
| | |
SKF AB, Class B | | | 1,207 | | | | 24,701 | |
| | |
Svenska Handelsbanken AB, Class A* | | | 3,544 | | | | 28,715 | |
| | |
Volvo AB, Class B* | | | 1,376 | | | | 26,738 | |
| | | | | | | | |
| | |
| | | | | | | 107,481 | |
| | | | | | | | |
|
Switzerland — 11.1% | |
| | |
Adecco Group AG (Registered) | | | 260 | | | | 12,768 | |
| | |
Cie Financiere Richemont SA (Registered) | | | 168 | | | | 10,511 | |
| | |
Credit Suisse Group AG (Registered) | | | 1,653 | | | | 15,587 | |
| | |
Givaudan SA (Registered) | | | 2 | | | | 7,161 | |
| | |
LafargeHolcim Ltd. (Registered)* | | | 484 | | | | 20,771 | |
| | |
Lonza Group AG (Registered) | | | 77 | | | | 46,879 | |
| | |
Nestle SA (Registered) | | | 1,370 | | | | 154,108 | |
| | |
Novartis AG (Registered) | | | 1,255 | | | | 97,808 | |
| | |
Roche Holding AG | | | 384 | | | | 123,268 | |
| | |
Swiss Re AG (a) | | | 299 | | | | 21,455 | |
| | |
UBS Group AG (Registered) | | | 878 | | | | 10,222 | |
| | |
Zurich Insurance Group AG | | | 56 | | | | 18,552 | |
| | | | | | | | |
| | |
| | | | | | | 539,090 | |
| | | | | | | | |
|
United Kingdom — 11.9% | |
| | |
3i Group plc | | | 2,949 | | | | 36,829 | |
| | |
AstraZeneca plc | | | 360 | | | | 36,194 | |
| | |
Barratt Developments plc | | | 1,135 | | | | 7,097 | |
| | |
Beazley plc | | | 2,352 | | | | 8,967 | |
| | | | | | | | |
| INVESTMENTS | | SHARES
(000) | | | VALUE
($000) | |
| | | | | | | | |
|
United Kingdom — continued | |
| | |
BP plc | | | 14,130 | | | | 36,040 | |
| | |
British American Tobacco plc | | | 898 | | | | 28,447 | |
| | |
CK Hutchison Holdings Ltd. | | | 1,391 | | | | 8,399 | |
| | |
DCC plc | | | 63 | | | | 4,080 | |
| | |
Diageo plc | | | 1,671 | | | | 53,996 | |
| | |
GlaxoSmithKline plc | | | 1,795 | | | | 29,974 | |
| | |
HSBC Holdings plc | | | 4,527 | | | | 18,972 | |
| | |
InterContinental Hotels Group plc | | | 500 | | | | 25,388 | |
| | |
Lloyds Banking Group plc | | | 64,243 | | | | 23,391 | |
| | |
London Stock Exchange Group plc | | | 166 | | | | 17,897 | |
| | |
M&G plc | | | 4,235 | | | | 8,055 | |
| | |
Persimmon plc | | | 239 | | | | 7,239 | |
| | |
Prudential plc | | | 1,595 | | | | 19,513 | |
| | |
Reckitt Benckiser Group plc | | | 447 | | | | 39,371 | |
| | |
RELX plc | | | 1,605 | | | | 31,767 | |
| | |
Standard Chartered plc | | | 4,455 | | | | 20,359 | |
| | |
Taylor Wimpey plc | | | 14,430 | | | | 19,771 | |
| | |
Tesco plc | | | 10,510 | | | | 27,972 | |
| | |
Unilever NV (a) | | | 1,120 | | | | 63,159 | |
| | |
Whitbread plc | | | 223 | | | | 6,204 | |
| | | | | | | | |
| | |
| | | | | | | 579,081 | |
| | | | | | | | |
|
United States — 0.5% | |
| | |
Ferguson plc | | | 218 | | | | 21,658 | |
| | | | | | | | |
| | |
Total Common Stocks
(Cost $4,657,260) | | | | | | | 4,718,753 | |
| | | | | |
Short-Term Investments — 5.1% | | | | | | | | |
| | |
Investment Companies — 3.3% | | | | | | | | |
| | |
JPMorgan Prime Money Market Fund Class Institutional Shares, 0.05% (d) (e)
(Cost $160,816) | | | 160,800 | | | | 160,896 | |
| | | | | | | | |
|
Investment of Cash Collateral from Securities loaned — 1.8% | |
| | |
JPMorgan Securities Lending Money Market Fund Agency SL Class Shares, 0.15% (d) (e) | | | 77,348 | | | | 77,355 | |
| | |
JPMorgan U.S. Government Money Market Fund Class IM Shares, 0.04% (d) (e) | | | 10,220 | | | | 10,220 | |
| | | | | | | | |
| |
Total Investment of Cash Collateral from Securities loaned
(Cost $87,577) | | | | 87,575 | |
| | | | | |
| | |
Total Short-Term Investments
(Cost $248,393) | | | | | | | 248,471 | |
| | | | | | | | |
Total Investments — 102.2%
(Cost $4,905,653) | | | | 4,967,224 | |
Liabilities in Excess of
Other Assets — (2.2)% | | | | (104,875 | ) |
| | | | | |
NET ASSETS — 100.0% | | | | | | | 4,862,349 | |
| | | | | |
Percentages indicated are based on net assets.
SEE NOTES TO FINANCIAL STATEMENTS.
| | | | | | | | |
| | | |
| OCTOBER 31, 2020 | | J.P. MORGAN INTERNATIONAL EQUITY FUNDS | | | | | 55 | |
JPMorgan International Research Enhanced Equity Fund
SCHEDULE OF PORTFOLIO INVESTMENTS
AS OF OCTOBER 31, 2020 (continued)
(Amounts in thousands, except number of contracts)
Summary of Investments by Industry, October 31, 2020
The following table represents the portfolio investments of the Fund by industry classifications as a percentage of total investments:
| | | | |
| INDUSTRY | | PERCENTAGE | |
| |
Pharmaceuticals | | | 9.8 | % |
| |
Banks | | | 7.7 | |
| |
Insurance | | | 5.4 | |
| |
Food Products | | | 3.4 | |
| |
Semiconductors & Semiconductor Equipment | | | 3.3 | |
| |
Chemicals | | | 3.1 | |
| |
Personal Products | | | 3.0 | |
| |
Textiles, Apparel & Luxury Goods | | | 2.9 | |
| |
Diversified Telecommunication Services | | | 2.9 | |
| |
Machinery | | | 2.8 | |
| |
Electronic Equipment, Instruments & Components | | | 2.7 | |
| |
Metals & Mining | | | 2.7 | |
| |
Automobiles | | | 2.6 | |
| |
Electric Utilities | | | 2.6 | |
| |
Capital Markets | | | 2.6 | |
| |
Oil, Gas & Consumable Fuels | | | 2.6 | |
| |
Beverages | | | 2.2 | |
| |
Household Durables | | | 1.8 | |
| |
Electrical Equipment | | | 1.7 | |
| |
Trading Companies & Distributors | | | 1.7 | |
| |
Entertainment | | | 1.7 | |
| |
Real Estate Management & Development | | | 1.6 | |
| |
IT Services | | | 1.5 | |
| |
Specialty Retail | | | 1.5 | |
| |
Aerospace & Defense | | | 1.4 | |
| |
Food & Staples Retailing | | | 1.4 | |
| |
Professional Services | | | 1.3 | |
| | | | |
| INDUSTRY | | PERCENTAGE | |
| |
Software | | | 1.2 | % |
| |
Road & Rail | | | 1.1 | |
| |
Industrial Conglomerates | | | 1.0 | |
| |
Health Care Equipment & Supplies | | | 1.0 | |
| |
Household Products | | | 1.0 | |
| |
Others (each less than 1.0%) | | | 11.8 | |
| |
Short-Term Investments | | | 5.0 | |
Abbreviations
| | |
| OYJ | | Public Limited Company |
| Preference | | A special type of equity investment that shares in the earnings of the company, has limited voting rights, and may have a dividend preference. Preference shares may also have liquidation preference. |
| REIT | | Real Estate Investment Trust |
| | |
| (a) | | The security or a portion of this security is on loan at October 31, 2020. The total value of securities on loan at October 31, 2020 is approximately $82,369,000. |
| (b) | | Security exempt from registration pursuant to Regulation S under the Securities Act of 1933, as amended. Regulation S applies to securities offerings that are made outside of the United States and do not involve direct selling efforts in the United States and as such may have restrictions on resale. |
| (c) | | Amount rounds to less than 0.1% of net assets. |
| (d) | | Investment in an affiliated fund, which is registered under the Investment Company Act of 1940, as amended, and is advised by J.P. Morgan Investment Management Inc. |
| (e) | | The rate shown is the current yield as of October 31, 2020. |
| * | | Non-income producing security. |
| ‡ | | Value determined using significant unobservable inputs. |
| | | | | | | | | | | | | | | | | | | | |
| Futures contracts outstanding as of October 31, 2020: | |
| DESCRIPTION | | NUMBER OF
CONTRACTS | | | EXPIRATION
DATE | | | TRADING
CURRENCY | | | NOTIONAL
AMOUNT ($) | | | VALUE AND
UNREALIZED
APPRECIATION
(DEPRECIATION) ($) | |
| | | | | |
Long Contracts | | | | | | | | | | | | | | | | | | | | |
SPI 200 Index | | | 1,437 | | | | 12/2020 | | | | AUD | | | | 150,045 | | | | 890 | |
| | | | | | | | | | | | | | | | | | | | |
Abbreviations
| | |
| AUD | | Australian Dollar |
| SPI | | Australian Securities Exchange |
SEE NOTES TO FINANCIAL STATEMENTS.
| | | | | | |
| | | |
| 56 | | | | J.P. MORGAN INTERNATIONAL EQUITY FUNDS | | OCTOBER 31, 2020 |
JPMorgan International Value Fund
SCHEDULE OF PORTFOLIO INVESTMENTS
AS OF OCTOBER 31, 2020
| | | | | | | | |
| INVESTMENTS | | SHARES
(000) | | | VALUE
($000) | |
Common Stocks — 97.1% | |
|
Australia — 7.1% | |
| | |
AGL Energy Ltd. | | | 65 | | | | 566 | |
| | |
Alumina Ltd. | | | 319 | | | | 322 | |
| | |
Ampol Ltd. | | | 17 | | | | 313 | |
| | |
Australia & New Zealand Banking Group Ltd. | | | 137 | | | | 1,824 | |
| | |
Beach Energy Ltd. | | | 324 | | | | 269 | |
| | |
BHP Group Ltd. | | | 222 | | | | 5,319 | |
| | |
BlueScope Steel Ltd. | | | 48 | | | | 499 | |
| | |
CSR Ltd. | | | 97 | | | | 300 | |
| | |
Fortescue Metals Group Ltd. | | | 118 | | | | 1,442 | |
| | |
Harvey Norman Holdings Ltd. (a) | | | 148 | | | | 462 | |
| | |
JB Hi-Fi Ltd. | | | 12 | | | | 396 | |
| | |
Macquarie Group Ltd. | | | 17 | | | | 1,508 | |
| | |
Metcash Ltd. | | | 142 | | | | 295 | |
| | |
Origin Energy Ltd. | | | 165 | | | | 465 | |
| | |
Qantas Airways Ltd. | | | 120 | | | | 352 | |
| | |
Rio Tinto plc | | | 56 | | | | 3,189 | |
| | |
South32 Ltd. | | | 466 | | | | 665 | |
| | |
Super Retail Group Ltd. | | | 65 | | | | 509 | |
| | |
Worley Ltd. | | | 42 | | | | 280 | |
| | | | | | | | |
| | |
| | | | | | | 18,975 | |
| | | | | | | | |
|
Austria — 1.1% | |
| | |
ams AG* | | | 14 | | | | 306 | |
| | |
ANDRITZ AG | | | 13 | | | | 433 | |
| | |
BAWAG Group AG (b) | | | 15 | | | | 552 | |
| | |
Erste Group Bank AG | | | 26 | | | | 532 | |
| | |
Raiffeisen Bank International AG* | | | 25 | | | | 363 | |
| | |
Telekom Austria AG | | | 62 | | | | 415 | |
| | |
Vienna Insurance Group AG Wiener Versicherung Gruppe | | | 17 | | | | 338 | |
| | | | | | | | |
| | |
| | | | | | | 2,939 | |
| | | | | | | | |
|
Belgium — 1.4% | |
| | |
Ageas SA | | | 21 | | | | 860 | |
| | |
Bekaert SA | | | 20 | | | | 423 | |
| | |
bpost SA | | | 58 | | | | 515 | |
| | |
KBC Group NV | | | 21 | | | | 1,046 | |
| | |
Orange Belgium SA | | | 23 | | | | 381 | |
| | |
Sofina SA | | | 1 | | | | 294 | |
| | |
Telenet Group Holding NV | | | 9 | | | | 361 | |
| | | | | | | | |
| | |
| | | | | | | 3,880 | |
| | | | | | | | |
|
Brazil — 0.2% | |
| | |
Yara International ASA | | | 18 | | | | 639 | |
| | | | | | | | |
|
China — 0.5% | |
| | |
BOC Hong Kong Holdings Ltd. | | | 331 | | | | 919 | |
| | |
Yangzijiang Shipbuilding Holdings Ltd. | | | 545 | | | | 367 | |
| | | | | | | | |
| | |
| | | | | | | 1,286 | |
| | | | | | | | |
| | | | | | | | |
| INVESTMENTS | | SHARES
(000) | | | VALUE
($000) | |
| | | | | | | | |
|
Denmark — 1.6% | |
| | |
AP Moller—Maersk A/S, Class B | | | — | (c) | | | 450 | |
| | |
H+H International A/S, Class B* | | | 25 | | | | 485 | |
| | |
Jyske Bank A/S (Registered)* | | | 12 | | | | 345 | |
| | |
Matas A/S* | | | 40 | | | | 448 | |
| | |
Pandora A/S | | | 5 | | | | 407 | |
| | |
Scandinavian Tobacco Group A/S (b) | | | 39 | | | | 554 | |
| | |
Solar A/S, Class B | | | 9 | | | | 437 | |
| | |
Spar Nord Bank A/S* | | | 46 | | | | 394 | |
| | |
Sydbank A/S* | | | 24 | | | | 410 | |
| | |
TCM Group A/S * (b) | | | 24 | | | | 463 | |
| | | | | | | | |
| | |
| | | | | | | 4,393 | |
| | | | | | | | |
|
Finland — 2.2% | |
| | |
Cargotec OYJ, Class B | | | 13 | | | | 438 | |
| | |
Caverion OYJ | | | 42 | | | | 277 | |
| | |
Fortum OYJ | | | 22 | | | | 407 | |
| | |
Kemira OYJ | | | 30 | | | | 370 | |
| | |
Konecranes OYJ | | | 14 | | | | 440 | |
| | |
Nordea Bank Abp | | | 211 | | | | 1,586 | |
| | |
Sanoma OYJ | | | 21 | | | | 316 | |
| | |
TietoEVRY OYJ | | | 11 | | | | 268 | |
| | |
UPM-Kymmene OYJ | | | 32 | | | | 903 | |
| | |
Uponor OYJ | | | 22 | | | | 417 | |
| | |
Valmet OYJ | | | 19 | | | | 455 | |
| | | | | | | | |
| | |
| | | | | | | 5,877 | |
| | | | | | | | |
|
France — 8.0% | |
| | |
Arkema SA | | | 5 | | | | 502 | |
| | |
Atos SE* | | | 9 | | | | 644 | |
| | |
AXA SA | | | 100 | | | | 1,601 | |
| | |
BNP Paribas SA* | | | 60 | | | | 2,110 | |
| | |
Carrefour SA | | | 48 | | | | 750 | |
| | |
Cie de Saint-Gobain* | | | 36 | | | | 1,403 | |
| | |
Cie Generale des Etablissements Michelin SCA | | | 10 | | | | 1,036 | |
| | |
CNP Assurances* | | | 32 | | | | 358 | |
| | |
Coface SA* | | | 43 | | | | 337 | |
| | |
Credit Agricole SA* | | | 96 | | | | 757 | |
| | |
Eutelsat Communications SA | | | 30 | | | | 307 | |
| | |
Faurecia SE* | | | 19 | | | | 702 | |
| | |
Fnac Darty SA* | | | 9 | | | | 401 | |
| | |
Groupe Crit* | | | 9 | | | | 532 | |
| | |
IPSOS | | | 19 | | | | 466 | |
| | |
Kaufman & Broad SA | | | 9 | | | | 312 | |
| | |
Metropole Television SA* | | | 34 | | | | 369 | |
SEE NOTES TO FINANCIAL STATEMENTS.
| | | | | | | | |
| | | |
| OCTOBER 31, 2020 | | J.P. MORGAN INTERNATIONAL EQUITY FUNDS | | | | | 57 | |
JPMorgan International Value Fund
SCHEDULE OF PORTFOLIO INVESTMENTS
AS OF OCTOBER 31, 2020 (continued)
| | | | | | | | |
| INVESTMENTS | | SHARES
(000) | | | VALUE
($000) | |
Common Stocks — continued | |
France — continued | |
| | |
Peugeot SA* | | | 50 | | | | 903 | |
| | |
Publicis Groupe SA | | | 21 | | | | 732 | |
| | |
Quadient SA | | | 28 | | | | 359 | |
| | |
Rexel SA* | | | 34 | | | | 354 | |
| | |
Sopra Steria Group* | | | 3 | | | | 350 | |
| | |
SPIE SA | | | 27 | | | | 418 | |
| | |
Tarkett SA* | | | 32 | | | | 390 | |
| | |
Television Francaise 1* | | | 59 | | | | 344 | |
| | |
TOTAL SE | | | 110 | | | | 3,324 | |
| | |
Valeo SA | | | 19 | | | | 581 | |
| | |
Veolia Environnement SA | | | 39 | | | | 733 | |
| | |
Vicat SA | | | 8 | | | | 250 | |
| | | | | | | | |
| | |
| | | | | | | 21,325 | |
| | | | | | | | |
|
Germany — 9.8% | |
| | |
1&1 Drillisch AG | | | 14 | | | | 293 | |
| | |
Allianz SE (Registered) | | | 20 | | | | 3,481 | |
| | |
Aurubis AG | | | 8 | | | | 484 | |
| | |
Bayerische Motoren Werke AG | | | 19 | | | | 1,322 | |
| | |
CECONOMY AG* | | | 62 | | | | 274 | |
| | |
Continental AG | | | 7 | | | | 766 | |
| | |
Daimler AG (Registered) | | | 42 | | | | 2,151 | |
| | |
Deutsche Post AG (Registered) | | | 47 | | | | 2,069 | |
| | |
Deutsche Telekom AG (Registered) | | | 172 | | | | 2,617 | |
| | |
DWS Group GmbH & Co. KGaA * (b) | | | 10 | | | | 350 | |
| | |
Freenet AG | | | 22 | | | | 390 | |
| | |
Fresenius SE & Co. KGaA | | | 29 | | | | 1,085 | |
| | |
HeidelbergCement AG | | | 13 | | | | 726 | |
| | |
HOCHTIEF AG | | | 5 | | | | 340 | |
| | |
Hornbach Holding AG & Co. KGaA | | | 5 | | | | 480 | |
| | |
JOST Werke AG (b) | | | 16 | | | | 583 | |
| | |
Jungheinrich AG (Preference) | | | 7 | | | | 266 | |
| | |
Kloeckner & Co. SE* | | | 74 | | | | 418 | |
| | |
Muenchener Rueckversicherungs-Gesellschaft AG (Registered) | | | 7 | | | | 1,651 | |
| | |
ProSiebenSat.1 Media SE* | | | 28 | | | | 314 | |
| | |
Schaeffler AG (Preference) | | | 51 | | | | 310 | |
| | |
Siemens AG (Registered) | | | 33 | | | | 3,924 | |
| | |
Talanx AG | | | 10 | | | | 301 | |
| | |
Volkswagen AG (Preference) | | | 11 | | | | 1,578 | |
| | | | | | | | |
| | |
| | | | | | | 26,173 | |
| | | | | | | | |
|
Hong Kong — 2.5% | |
| | |
CK Asset Holdings Ltd. | | | 199 | | | | 922 | |
| | |
CK Infrastructure Holdings Ltd. | | | 90 | | | | 422 | |
| | |
Haitong International Securities Group Ltd. | | | 1,484 | | | | 338 | |
| | | | | | | | |
| INVESTMENTS | | SHARES
(000) | | | VALUE
($000) | |
| | | | | | | | |
|
Hong Kong — continued | |
| | |
Hang Lung Properties Ltd. | | | 221 | | | | 538 | |
| | |
Johnson Electric Holdings Ltd. | | | 147 | | | | 303 | |
| | |
Kerry Properties Ltd. | | | 151 | | | | 371 | |
| | |
Luk Fook Holdings International Ltd. | | | 125 | | | | 306 | |
| | |
New World Development Co. Ltd. | | | 145 | | | | 692 | |
| | |
Shun Tak Holdings Ltd. | | | 976 | | | | 286 | |
| | |
Sun Hung Kai Properties Ltd. | | | 78 | | | | 1,004 | |
| | |
Swire Properties Ltd. | | | 167 | | | | 448 | |
| | |
VTech Holdings Ltd. | | | 60 | | | | 395 | |
| | |
WH Group Ltd. (b) | | | 775 | | | | 610 | |
| | | | | | | | |
| | |
| | | | | | | 6,635 | |
| | | | | | | | |
|
India — 0.1% | |
| | |
RHI Magnesita NV | | | 9 | | | | 307 | |
| | | | | | | | |
|
Ireland — 0.2% | |
| | |
Smurfit Kappa Group plc | | | 17 | | | | 643 | |
| | | | | | | | |
|
Italy — 2.3% | |
| | |
Anima Holding SpA (b) | | | 109 | | | | 409 | |
| | |
Assicurazioni Generali SpA | | | 67 | | | | 902 | |
| | |
Azimut Holding SpA | | | 23 | | | | 384 | |
| | |
Intesa Sanpaolo SpA* | | | 981 | | | | 1,628 | |
| | |
Mediobanca Banca di Credito Finanziario SpA | | | 77 | | | | 546 | |
| | |
Poste Italiane SpA (b) | | | 52 | | | | 427 | |
| | |
Telecom Italia SpA (a) | | | 1,598 | | | | 543 | |
| | |
UniCredit SpA* | | | 127 | | | | 948 | |
| | |
Unipol Gruppo SpA* | | | 97 | | | | 353 | |
| | | | | | | | |
| | |
| | | | | | | 6,140 | |
| | | | | | | | |
|
Japan — 24.1% | |
| | |
77 Bank Ltd. (The) | | | 28 | | | | 394 | |
| | |
Acom Co. Ltd. | | | 103 | | | | 461 | |
| | |
Aiful Corp. * (a) | | | 145 | | | | 430 | |
| | |
Aozora Bank Ltd. | | | 24 | | | | 388 | |
| | |
Bridgestone Corp. | | | 37 | | | | 1,216 | |
| | |
Brother Industries Ltd. | | | 42 | | | | 644 | |
| | |
Chiba Bank Ltd. (The) | | | 103 | | | | 533 | |
| | |
Concordia Financial Group Ltd. | | | 155 | | | | 511 | |
| | |
Dai-ichi Life Holdings, Inc. | | | 64 | | | | 948 | |
| | |
Daiwa Securities Group, Inc. | | | 131 | | | | 532 | |
| | |
DIC Corp. | | | 13 | | | | 324 | |
| | |
Dowa Holdings Co. Ltd. | | | 11 | | | | 321 | |
| | |
ENEOS Holdings, Inc. | | | 214 | | | | 723 | |
| | |
Fujitsu Ltd. | | | 11 | | | | 1,301 | |
| | |
Fuyo General Lease Co. Ltd. | | | 8 | | | | 442 | |
| | |
GS Yuasa Corp. | | | 21 | | | | 361 | |
| | |
Gunma Bank Ltd. (The) | | | 115 | | | | 365 | |
| | |
Hachijuni Bank Ltd. (The) | | | 101 | | | | 371 | |
SEE NOTES TO FINANCIAL STATEMENTS.
| | | | | | |
| | | |
| 58 | | | | J.P. MORGAN INTERNATIONAL EQUITY FUNDS | | OCTOBER 31, 2020 |
| | | | | | | | |
| INVESTMENTS | | SHARES
(000) | | | VALUE
($000) | |
Common Stocks — continued | |
|
Japan — continued | |
| | |
Hirogin Holdings, Inc. | | | 133 | | | | 725 | |
| | |
Hitachi Ltd. | | | 33 | | | | 1,109 | |
| | |
Hokuriku Electric Power Co. | | | 55 | | | | 391 | |
| | |
Honda Motor Co. Ltd. | | | 82 | | | | 1,928 | |
| | |
Iida Group Holdings Co. Ltd. | | | 23 | | | | 411 | |
| | |
ITOCHU Corp. | | | 52 | | | | 1,237 | |
| | |
Itoham Yonekyu Holdings, Inc. | | | 66 | | | | 443 | |
| | |
Iwatani Corp. | | | 7 | | | | 327 | |
| | |
Iyo Bank Ltd. (The) | | | 50 | | | | 312 | |
| | |
Japan Post Insurance Co. Ltd. | | | 38 | | | | 598 | |
| | |
Japan Tobacco, Inc. | | | 74 | | | | 1,384 | |
| | |
Kaken Pharmaceutical Co. Ltd. | | | 6 | | | | 252 | |
| | |
Kamigumi Co. Ltd. | | | 24 | | | | 429 | |
| | |
Kandenko Co. Ltd. | | | 43 | | | | 324 | |
| | |
KDDI Corp. | | | 89 | | | | 2,416 | |
| | |
Kinden Corp. | | | 24 | | | | 368 | |
| | |
Kintetsu World Express, Inc. | | | 14 | | | | 304 | |
| | |
K’s Holdings Corp. | | | 43 | | | | 554 | |
| | |
Kyudenko Corp. | | | 15 | | | | 398 | |
| | |
Kyushu Financial Group, Inc. | | | 85 | | | | 395 | |
| | |
Mebuki Financial Group, Inc. | | | 199 | | | | 400 | |
| | |
Medipal Holdings Corp. | | | 24 | | | | 431 | |
| | |
Mitsubishi Corp. | | | 49 | | | | 1,087 | |
| | |
Mitsubishi Gas Chemical Co., Inc. | | | 23 | | | | 412 | |
| | |
Mitsubishi UFJ Financial Group, Inc. | | | 614 | | | | 2,420 | |
| | |
Mitsui & Co. Ltd. | | | 99 | | | | 1,554 | |
| | |
Mixi, Inc. | | | 20 | | | | 545 | |
| | |
Mizuho Financial Group, Inc. | | | 133 | | | | 1,635 | |
| | |
MS&AD Insurance Group Holdings, Inc. | | | 25 | | | | 692 | |
| | |
Nichias Corp. | | | 15 | | | | 321 | |
| | |
Nichiha Corp. | | | 10 | | | | 303 | |
| | |
Nippon Light Metal Holdings Co. Ltd. | | | 22 | | | | 352 | |
| | |
Nippon Telegraph & Telephone Corp. | | | 82 | | | | 1,716 | |
| | |
Nippon Television Holdings, Inc. | | | 29 | | | | 305 | |
| | |
Nomura Holdings, Inc. | | | 214 | | | | 957 | |
| | |
Nomura Real Estate Holdings, Inc. | | | 21 | | | | 374 | |
| | |
Obayashi Corp. | | | 67 | | | | 556 | |
| | |
Open House Co. Ltd. | | | 9 | | | | 300 | |
| | |
ORIX Corp. | | | 100 | | | | 1,164 | |
| | |
Prima Meat Packers Ltd. | | | 11 | | | | 305 | |
| | |
Rengo Co. Ltd. | | | 38 | | | | 293 | |
| | |
Resona Holdings, Inc. | | | 200 | | | | 658 | |
| | |
Sanwa Holdings Corp. | | | 38 | | | | 437 | |
| | |
Sawai Pharmaceutical Co. Ltd. | | | 6 | | | | 275 | |
| | |
SBI Holdings, Inc. | | | 24 | | | | 562 | |
| | | | | | | | |
| INVESTMENTS | | SHARES
(000) | | | VALUE
($000) | |
| | | | | | | | |
|
Japan — continued | |
| | |
Sekisui House Ltd. | | | 47 | | | | 787 | |
| | |
Senko Group Holdings Co. Ltd. | | | 45 | | | | 402 | |
| | |
Shizuoka Bank Ltd. (The) | | | 95 | | | | 641 | |
| | |
SoftBank Corp. | | | 144 | | | | 1,676 | |
| | |
Sompo Holdings, Inc. | | | 24 | | | | 911 | |
| | |
Sony Corp. | | | 8 | | | | 675 | |
| | |
Sumitomo Bakelite Co. Ltd. | | | 11 | | | | 317 | |
| | |
Sumitomo Forestry Co. Ltd. | | | 31 | | | | 488 | |
| | |
Sumitomo Mitsui Financial Group, Inc. | | | 75 | | | | 2,073 | |
| | |
Sumitomo Mitsui Trust Holdings, Inc. | | | 31 | | | | 839 | |
| | |
T&D Holdings, Inc. | | | 68 | | | | 677 | |
| | |
Taiheiyo Cement Corp. | | | 17 | | | | 406 | |
| | |
Taikisha Ltd. | | | 12 | | | | 299 | |
| | |
Taisei Corp. | | | 19 | | | | 576 | |
| | |
Teijin Ltd. | | | 37 | | | | 559 | |
| | |
Toda Corp. | | | 58 | | | | 333 | |
| | |
Tohoku Electric Power Co., Inc. | | | 53 | | | | 467 | |
| | |
Tokuyama Corp. | | | 26 | | | | 579 | |
| | |
Tokyo Steel Manufacturing Co. Ltd. | | | 56 | | | | 355 | |
| | |
Tokyo Tatemono Co. Ltd. | | | 26 | | | | 298 | |
| | |
Tosoh Corp. | | | 39 | | | | 639 | |
| | |
Toyota Motor Corp. | | | 91 | | | | 5,954 | |
| | |
Toyota Tsusho Corp. | | | 20 | | | | 547 | |
| | |
TS Tech Co. Ltd. | | | 12 | | | | 338 | |
| | |
Ube Industries Ltd. | | | 17 | | | | 294 | |
| | |
Ulvac, Inc. | | | 9 | | | | 315 | |
| | |
Yamaguchi Financial Group, Inc. | | | 64 | | | | 414 | |
| | | | | | | | |
| | |
| | | | | | | 64,483 | |
| | | | | | | | |
|
Luxembourg — 0.4% | |
| | |
ArcelorMittal SA* | | | 50 | | | | 684 | |
| | |
RTL Group SA | | | 8 | | | | 297 | |
| | | | | | | | |
| | |
| | | | | | | 981 | |
| | | | | | | | |
|
Malta — 0.2% | |
| | |
Kindred Group plc, SDR | | | 68 | | | | 519 | |
| | | | | | | | |
|
Netherlands — 4.7% | |
| | |
Arcadis NV* | | | 14 | | | | 315 | |
| | |
ASR Nederland NV | | | 17 | | | | 527 | |
| | |
Flow Traders (b) | | | 10 | | | | 336 | |
| | |
ING Groep NV | | | 222 | | | | 1,518 | |
| | |
Intertrust NV (b) | | | 24 | | | | 366 | |
| | |
Koninklijke Ahold Delhaize NV | | | 67 | | | | 1,824 | |
| | |
NIBC Holding NV (a) (b) | | | 42 | | | | 363 | |
| | |
NN Group NV | | | 28 | | | | 960 | |
SEE NOTES TO FINANCIAL STATEMENTS.
| | | | | | | | |
| | | |
| OCTOBER 31, 2020 | | J.P. MORGAN INTERNATIONAL EQUITY FUNDS | | | | | 59 | |
JPMorgan International Value Fund
SCHEDULE OF PORTFOLIO INVESTMENTS
AS OF OCTOBER 31, 2020 (continued)
| | | | | | | | |
| INVESTMENTS | | SHARES
(000) | | | VALUE
($000) | |
Common Stocks — continued | |
|
Netherlands — continued | |
| | |
PostNL NV* | | | 122 | | | | 405 | |
| | |
Randstad NV* | | | 17 | | | | 859 | |
| | |
Royal Dutch Shell plc, Class A | | | 359 | | | | 4,510 | |
| | |
Signify NV* (b) | | | 19 | | | | 658 | |
| | | | | | | | |
| | |
| | | | | | | 12,641 | |
| | | | | | | | |
|
Norway — 2.6% | |
| | |
DNB ASA | | | 79 | | | | 1,067 | |
| | |
Equinor ASA | | | 63 | | | | 805 | |
| | |
Europris ASA (b) | | | 62 | | | | 322 | |
| | |
Fjordkraft Holding ASA (b) | | | 47 | | | | 389 | |
| | |
Norsk Hydro ASA* | | | 178 | | | | 501 | |
| | |
Norwegian Finans Holding ASA* | | | 71 | | | | 512 | |
| | |
Olav Thon Eiendomsselskap ASA* | | | 26 | | | | 356 | |
| | |
Selvaag Bolig ASA | | | 100 | | | | 499 | |
| | |
SpareBank 1 Nord Norge | | | 84 | | | | 564 | |
| | |
SpareBank 1 SMN | | | 45 | | | | 385 | |
| | |
SpareBank 1 SR-Bank ASA | | | 48 | | | | 386 | |
| | |
Storebrand ASA* | | | 63 | | | | 330 | |
| | |
Telenor ASA | | | 50 | | | | 766 | |
| | | | | | | | |
| | |
| | | | | | | 6,882 | |
| | | | | | | | |
|
Portugal — 0.1% | |
| | |
Sonae SGPS SA | | | 481 | | | | 284 | |
| | | | | | | | |
|
Russia — 0.5% | |
| | |
Evraz plc | | | 132 | | | | 612 | |
| | |
Polymetal International plc | | | 29 | | | | 620 | |
| | | | | | | | |
| | |
| | | | | | | 1,232 | |
| | | | | | | | |
|
Singapore — 1.2% | |
| | |
DBS Group Holdings Ltd. | | | 100 | | | | 1,496 | |
| | |
Oversea-Chinese Banking Corp. Ltd. | | | 217 | | | | 1,338 | |
| | |
United Overseas Bank Ltd. | | | 37 | | | | 513 | |
| | | | | | | | |
| | |
| | | | | | | 3,347 | |
| | | | | | | | |
|
South Africa — 0.6% | |
| | |
Anglo American plc | | | 64 | | | | 1,511 | |
| | | | | | | | |
|
Spain — 1.9% | |
| | |
ACS Actividades de Construccion y Servicios SA | | | 35 | | | | 822 | |
| | |
Banco Bilbao Vizcaya Argentaria SA | | | 377 | | | | 1,088 | |
| | |
CaixaBank SA | | | 307 | | | | 561 | |
| | |
ContourGlobal plc (b) | | | 141 | | | | 352 | |
| | |
Enagas SA | | | 24 | | | | 510 | |
| | |
Mediaset Espana Comunicacion SA* | | | 101 | | | | 338 | |
| | | | | | | | |
| INVESTMENTS | | SHARES
(000) | | | VALUE
($000) | |
| | | | | | | | |
|
Spain — continued | |
| | |
Tecnicas Reunidas SA* | | | 24 | | | | 189 | |
| | |
Telefonica SA | | | 284 | | | | 924 | |
| | |
Unicaja Banco SA* (b) | | | 567 | | | | 363 | |
| | | | | | | | |
| | |
| | | | | | | 5,147 | |
| | | | | | | | |
|
Sweden — 3.3% | |
| | |
Betsson AB* | | | 54 | | | | 408 | |
| | |
Bilia AB, Class A | | | 25 | | | | 332 | |
| | |
Bravida Holding AB (b) | | | 25 | | | | 285 | |
| | |
Clas Ohlson AB, Class B* | | | 44 | | | | 390 | |
| | |
Dustin Group AB (b) | | | 61 | | | | 385 | |
| | |
Intrum AB | | | 25 | | | | 609 | |
| | |
Inwido AB* | | | 60 | | | | 638 | |
| | |
LeoVegas AB (b) | | | 136 | | | | 455 | |
| | |
Lindab International AB | | | 17 | | | | 269 | |
| | |
Mekonomen AB* | | | 36 | | | | 346 | |
| | |
Nordic Waterproofing Holding A/S* (b) | | | 28 | | | | 388 | |
| | |
Resurs Holding AB (b) | | | 59 | | | | 270 | |
| | |
Scandi Standard AB* | | | 46 | | | | 313 | |
| | |
Securitas AB, Class B* (a) | | | 27 | | | | 382 | |
| | |
Skandinaviska Enskilda Banken AB, Class A* | | | 131 | | | | 1,126 | |
| | |
Skanska AB, Class B | | | 18 | | | | 341 | |
| | |
SKF AB, Class B | | | 30 | | | | 613 | |
| | |
Svenska Handelsbanken AB, Class A* | | | 110 | | | | 895 | |
| | |
Volvo AB, Class B* | | | 15 | | | | 293 | |
| | | | | | | | |
| | |
| | | | | | | 8,738 | |
| | | | | | | | |
|
Switzerland — 7.3% | |
| | |
Adecco Group AG (Registered) | | | 18 | | | | 903 | |
| | |
BKW AG | | | 4 | | | | 376 | |
| | |
Credit Suisse Group AG (Registered) | | | 107 | | | | 1,006 | |
| | |
Julius Baer Group Ltd. | | | 10 | | | | 425 | |
| | |
LafargeHolcim Ltd. (Registered)* | | | 31 | | | | 1,330 | |
| | |
Novartis AG (Registered) | | | 95 | | | | 7,410 | |
| | |
Roche Holding AG | | | 2 | | | | 656 | |
| | |
Sulzer AG (Registered) | | | 5 | | | | 362 | |
| | |
Swiss Life Holding AG (Registered)* | | | 3 | | | | 953 | |
| | |
Swisscom AG (Registered) | | | 2 | | | | 1,041 | |
| | |
UBS Group AG (Registered) | | | 202 | | | | 2,349 | |
| | |
Zurich Insurance Group AG | | | 8 | | | | 2,619 | |
| | | | | | | | |
| | |
| | | | | | | 19,430 | |
| | | | | | | | |
|
Ukraine — 0.1% | |
| | |
Ferrexpo plc | | | 165 | | | | 408 | |
| | | | | | | | |
SEE NOTES TO FINANCIAL STATEMENTS.
| | | | | | |
| | | |
| 60 | | | | J.P. MORGAN INTERNATIONAL EQUITY FUNDS | | OCTOBER 31, 2020 |
| | | | | | | | |
| INVESTMENTS | | SHARES
(000) | | | VALUE
($000) | |
Common Stocks — continued | |
|
United Kingdom — 12.9% | |
| | |
3i Group plc | | | 62 | | | | 776 | |
| | |
Aviva plc | | | 290 | | | | 967 | |
| | |
Barclays plc | | | 977 | | | | 1,354 | |
| | |
Barratt Developments plc | | | 93 | | | | 581 | |
| | |
Bellway plc | | | 11 | | | | 342 | |
| | |
Berkeley Group Holdings plc | | | 11 | | | | 604 | |
| | |
BP plc | | | 939 | | | | 2,395 | |
| | |
British American Tobacco plc | | | 113 | | | | 3,580 | |
| | |
Close Brothers Group plc | | | 21 | | | | 297 | |
| | |
Crest Nicholson Holdings plc | | | 110 | | | | 313 | |
| | |
Dialog Semiconductor plc* | | | 8 | | | | 295 | |
| | |
Dixons Carphone plc | | | 223 | | | | 278 | |
| | |
Drax Group plc | | | 155 | | | | 594 | |
| | |
Fiat Chrysler Automobiles NV* | | | 81 | | | | 989 | |
| | |
GlaxoSmithKline plc | | | 224 | | | | 3,741 | |
| | |
Halfords Group plc | | | 144 | | | | 449 | |
| | |
Imperial Brands plc | | | 75 | | | | 1,185 | |
| | |
Inchcape plc | | | 89 | | | | 569 | |
| | |
ITV plc* | | | 600 | | | | 561 | |
| | |
J Sainsbury plc | | | 248 | | | | 647 | |
| | |
Just Group plc* | | | 554 | | | | 302 | |
| | |
Keller Group plc | | | 47 | | | | 306 | |
| | |
Kingfisher plc* | | | 190 | | | | 705 | |
| | |
Legal & General Group plc | | | 478 | | | | 1,146 | |
| | |
Lloyds Banking Group plc | | | 3,695 | | | | 1,345 | |
| | |
M&G plc | | | 318 | | | | 606 | |
| | |
Morgan Sindall Group plc | | | 21 | | | | 295 | |
| | |
OneSavings Bank plc | | | 99 | | | | 394 | |
| | |
Paragon Banking Group plc | | | 78 | | | | 301 | |
| | |
Phoenix Group Holdings plc | | | 48 | | | | 416 | |
| | |
Playtech plc | | | 104 | | | | 457 | |
| | |
Premier Foods plc* | | | 586 | | | | 702 | |
| | |
Prudential plc | | | 148 | | | | 1,814 | |
| | |
Reach plc | | | 365 | | | | 497 | |
| | |
Redrow plc | | | 70 | | | | 375 | |
| | |
Royal Mail plc | | | 153 | | | | 452 | |
| | |
ScS Group plc | | | 125 | | | | 309 | |
| | |
Serco Group plc | | | 220 | | | | 368 | |
| | |
Standard Chartered plc | | | 188 | | | | 861 | |
| | |
TP ICAP plc | | | 87 | | | | 215 | |
| | |
Tyman plc* | | | 111 | | | | 385 | |
| | |
Vesuvius plc | | | 81 | | | | 417 | |
| | |
Vistry Group plc | | | 44 | | | | 310 | |
| | |
WPP plc | | | 124 | | | | 987 | |
| | | | | | | | |
| | |
| | | | | | | 34,482 | |
| | | | | | | | |
| | | | | | | | |
| INVESTMENTS | | SHARES
(000) | | | VALUE
($000) | |
|
| |
|
United States — 0.2% | |
| | |
Samsonite International SA* (b) | | | 197 | | | | 201 | |
| | |
TI Fluid Systems plc (b) | | | 180 | | | | 447 | |
| | | | | | | | |
| | |
| | | | | | | 648 | |
| | | | | | | | |
| |
Total Common Stocks
(Cost $305,104) | | | | 259,945 | |
| | | | | |
Short-Term Investments — 2.8% | |
|
Investment Companies — 2.1% | |
| | |
JPMorgan Prime Money Market Fund Class Institutional Shares, 0.05% (d) (e)
(Cost $5,627) | | | 5,623 | | | | 5,627 | |
| | | | | | | | |
|
Investment of Cash Collateral from Securities Loaned — 0.7% | |
| | |
JPMorgan Securities Lending Money Market Fund Agency SL Class Shares, 0.15% (d) (e) | | | 1,000 | | | | 1,000 | |
| | |
JPMorgan U.S. Government Money Market Fund Class IM Shares, 0.04% (d) (e) | | | 956 | | | | 956 | |
| | | | | | | | |
| |
Total Investment of Cash Collateral from Securities Loaned
(Cost $1,956) | | | | 1,956 | |
| | | | | |
| | |
Total Short-Term Investments
(Cost $7,583) | | | | | | | 7,583 | |
| | | | | | | | |
Total Investments — 99.9%
(Cost $312,687) | | | | 267,528 | |
Other Assets Less Liabilities — 0.1% | | | | 336 | |
| | | | | |
NET ASSETS — 100.0% | | | | 267,864 | |
| | | | | |
Percentages indicated are based on net assets.
Summary of Investments by Industry, October 31, 2020
The following table represents the portfolio investments of the Fund by industry classifications as a percentage of total investments:
| | | | |
| INDUSTRY | | PERCENTAGE | |
| |
Banks | | | 16.1 | % |
| |
Insurance | | | 9.1 | |
| |
Metals & Mining | | | 6.6 | |
| |
Automobiles | | | 5.5 | |
| |
Oil, Gas & Consumable Fuels | | | 4.9 | |
| |
Pharmaceuticals | | | 4.6 | |
| |
Capital Markets | | | 3.8 | |
| |
Diversified Telecommunication Services | | | 3.0 | |
| |
Tobacco | | | 2.5 | |
| |
Media | | | 2.3 | |
| |
Specialty Retail | | | 2.3 | |
| |
Real Estate Management & Development | | | 2.2 | |
| |
Auto Components | | | 2.1 | |
SEE NOTES TO FINANCIAL STATEMENTS.
| | | | | | | | |
| | | |
| OCTOBER 31, 2020 | | J.P. MORGAN INTERNATIONAL EQUITY FUNDS | | | | | 61 | |
JPMorgan International Value Fund
SCHEDULE OF PORTFOLIO INVESTMENTS
AS OF OCTOBER 31, 2020 (continued)
(amounts in thousands, except number of contracts)
| | | | |
| INDUSTRY | | PERCENTAGE | |
| |
Household Durables | | | 2.1 | % |
| |
Trading Companies & Distributors | | | 2.1 | |
| |
Construction & Engineering | | | 2.0 | |
| |
Wireless Telecommunication Services | | | 1.9 | |
| |
Building Products | | | 1.9 | |
| |
Machinery | | | 1.7 | |
| |
Chemicals | | | 1.7 | |
| |
Industrial Conglomerates | | | 1.6 | |
| | | | |
| INDUSTRY | | PERCENTAGE | |
| |
Construction Materials | | | 1.4 | % |
| |
Food & Staples Retailing | | | 1.4 | |
| |
Air Freight & Logistics | | | 1.4 | |
| |
Professional Services | | | 1.0 | |
| |
IT Services | | | 1.0 | |
| |
Others (each less than 1.0%) | | | 11.0 | |
| |
Short-Term Investments | | | 2.8 | |
Abbreviations
| | |
| OYJ | | Public Limited Company |
| Preference | | A special type of equity investment that shares in the earnings of the company, has limited voting rights, and may have a dividend preference. Preference shares may also have liquidation preference. |
| SCA | | Limited partnership with share capital |
| SDR | | Swedish Depositary Receipt |
| SGPS | | Holding company |
| |
| (a) | | The security or a portion of this security is on loan at October 31, 2020. The total value of securities on loan at October 31, 2020 is approximately $1,527,000. |
| | |
| (b) | | Security exempt from registration pursuant to Regulation S under the Securities Act of 1933, as amended. Regulation S applies to securities offerings that are made outside of the United States and do not involve direct selling efforts in the United States and as such may have restrictions on resale. |
| (c) | | Amount rounds to less than one thousand. |
| (d) | | Investment in an affiliated fund, which is registered under the Investment Company Act of 1940, as amended, and is advised by J.P. Morgan Investment Management Inc. |
| (e) | | The rate shown is the current yield as of October 31, 2020. |
| * | | Non-income producing security. |
| | | | | | | | | | | | | | | | | | |
| Futures contracts outstanding as of October 31, 2020: | |
| DESCRIPTION | | NUMBER OF
CONTRACTS | | EXPIRATION
DATE | | | TRADING
CURRENCY | | | NOTIONAL
AMOUNT ($) | | | VALUE AND
UNREALIZED
APPRECIATION
(DEPRECIATION) ($) | |
|
Long Contracts | |
| | | | | |
| EURO STOXX 50 Index | | 66 | | | 12/2020 | | | | EUR | | | | 2,275 | | | | (156 | ) |
| | | | | |
| FTSE 100 Index | | 16 | | | 12/2020 | | | | GBP | | | | 1,153 | | | | (57 | ) |
| | | | | |
| TOPIX Index | | 14 | | | 12/2020 | | | | JPY | | | | 2,132 | | | | (27 | ) |
| | | | | | | | | | | | | | | | | | |
| | | | | | | | | | | | | | | | | (240 | ) |
| | | | | | | | | | | | | | | | | | |
Abbreviations
| | |
| EUR | | Euro |
| FTSE | | Financial Times and the London Stock Exchange |
| GBP | | British Pound |
| JPY | | Japanese Yen |
| TOPIX | | Tokyo Stock Price Index |
SEE NOTES TO FINANCIAL STATEMENTS.
| | | | | | |
| | | |
| 62 | | | | J.P. MORGAN INTERNATIONAL EQUITY FUNDS | | OCTOBER 31, 2020 |
| | | | | | | | |
| | | |
| OCTOBER 31, 2020 | | J.P. MORGAN INTERNATIONAL EQUITY FUNDS | | | | | 63 | |
STATEMENTS OF ASSETS AND LIABILITIES
AS OF OCTOBER 31, 2020
(Amounts in thousands, except per share amounts)
| | | | | | | | | | | | |
| | | |
| | | JPMorgan
Emerging
Markets
Equity Fund | | |
JPMorgan
Emerging
Markets
Research
Enhanced
Equity Fund | | | JPMorgan
Europe
Dynamic
Fund | |
ASSETS: | | | | | | | | | | | | |
Investments in non-affiliates, at value | | $ | 10,924,060 | | | $ | 2,855,479 | | | $ | 433,774 | |
Investments in affiliates, at value | | | 313,818 | | | | 12,125 | | | | 2,182 | |
Investment of cash collateral received from securities loaned, at value (See Note 2.C.) | | | 129,621 | | | | 18,088 | | | | 2,662 | |
Cash | | | 264 | | | | 60 | | | | 100 | |
Foreign currency, at value | | | 1 | | | | 202 | | | | — | |
Receivables: | | | | | | | | | | | | |
Investment securities sold | | | — | | | | — | | | | 4,481 | |
Fund shares sold | | | 35,641 | | | | 5 | | | | 7 | |
Dividends from non-affiliates | | | 4,303 | | | | 3,368 | | | | 77 | |
Dividends from affiliates | | | 14 | | | | — | (a) | | | — | (a) |
Tax reclaims | | | 320 | | | | 50 | | | | 3,628 | |
Securities lending income (See Note 2.C.) | | | 21 | | | | 7 | | | | — | (a) |
| | | | | | | | | | | | |
Total Assets | | | 11,408,063 | | | | 2,889,384 | | | | 446,911 | |
| | | | | | | | | | | | |
| | | |
LIABILITIES: | | | | | | | | | | | | |
Payables: | | | | | | | | | | | | |
Investment securities purchased | | | — | | | | — | (a) | | | 4,721 | |
Collateral received on securities loaned (See Note 2.C.) | | | 129,621 | | | | 18,088 | | | | 2,662 | |
Fund shares redeemed | | | 30,428 | | | | 23,812 | | | | 249 | |
Accrued liabilities: | | | | | | | | | | | | |
Investment advisory fees | | | 6,264 | | | | 536 | | | | 236 | |
Administration fees | | | 595 | | | | 131 | | | | 30 | |
Distribution fees | | | 170 | | | | — | | | | 23 | |
Service fees | | | 949 | | | | — | | | | 28 | |
Custodian and accounting fees | | | 871 | | | | 122 | | | | 2 | |
Trustees’ and Chief Compliance Officer’s fees | | | — | | | | — | (a) | | | — | |
Deferred foreign capital gains tax | | | 18,545 | | | | 6,195 | | | | — | |
Other | | | 395 | | | | 158 | | | | 132 | |
| | | | | | | | | | | | |
Total Liabilities | | | 187,838 | | | | 49,042 | | | | 8,083 | |
| | | | | | | | | | | | |
Net Assets | | $ | 11,220,225 | | | $ | 2,840,342 | | | $ | 438,828 | |
| | | | | | | | | | | | |
| (a) | Amount rounds to less than one thousand. |
SEE NOTES TO FINANCIAL STATEMENTS.
| | | | | | |
| | | |
| 64 | | | | J.P. MORGAN INTERNATIONAL EQUITY FUNDS | | OCTOBER 31, 2020 |
| | | | | | | | | | | | |
| | | |
| | | JPMorgan
Emerging
Markets
Equity Fund | | |
JPMorgan
Emerging
Markets
Research
Enhanced
Equity Fund | | | JPMorgan
Europe
Dynamic
Fund | |
NET ASSETS: | | | | | | | | | | | | |
Paid-in-Capital | | $ | 7,643,498 | | | $ | 2,594,498 | | | $ | 552,071 | |
Total distributable earnings (loss) | | | 3,576,727 | | | | 245,844 | | | | (113,243 | ) |
| | | | | | | | | | | | |
Total Net Assets | | $ | 11,220,225 | | | $ | 2,840,342 | | | $ | 438,828 | |
| | | | | | | | | | | | |
| | | |
Net Assets: | | | | | | | | | | | | |
Class A | | $ | 578,112 | | | $ | — | | | $ | 68,882 | |
Class C | | | 72,364 | | | | — | | | | 11,082 | |
Class I | | | 4,016,180 | | | | 33 | | | | 52,841 | |
Class L | | | 1,877,489 | | | | — | | | | 55,597 | |
Class R2 | | | 414 | | | | — | | | | — | |
Class R3 | | | 5,797 | | | | — | | | | — | |
Class R4 | | | 2,962 | | | | — | | | | — | |
Class R5 | | | 57,909 | | | | — | | | | — | |
Class R6 | | | 4,608,998 | | | | 2,840,309 | | | | 250,426 | |
| | | | | | | | | | | | |
Total | | $ | 11,220,225 | | | $ | 2,840,342 | | | $ | 438,828 | |
| | | | | | | | | | | | |
| | | |
Outstanding units of beneficial interest (shares) ($0.0001 par value; unlimited number of shares authorized): | | | | | | | | | | | | |
Class A | | | 15,863 | | | | — | | | | 3,183 | |
Class C | | | 2,056 | | | | — | | | | 580 | |
Class I | | | 107,571 | | | | 2 | | | | 2,391 | |
Class L | | | 49,879 | | | | — | | | | 2,484 | |
Class R2 | | | 11 | | | | — | | | | — | |
Class R3 | | | 160 | | | | — | | | | — | |
Class R4 | | | 80 | | | | — | | | | — | |
Class R5 | | | 1,542 | | | | — | | | | — | |
Class R6 | | | 122,547 | | | | 157,673 | | | | 11,235 | |
| | | |
Net Asset Value (a): | | | | | | | | | | | | |
Class A — Redemption price per share | | $ | 36.44 | | | $ | — | | | $ | 21.64 | |
Class C — Offering price per share (b) | | | 35.20 | | | | — | | | | 19.10 | |
Class I — Offering and redemption price per share | | | 37.34 | | | | 18.11 | | | | 22.10 | |
Class L — Offering and redemption price per share | | | 37.64 | | | | — | | | | 22.38 | |
Class R2 — Offering and redemption price per share | | | 36.06 | | | | — | | | | — | |
Class R3 — Offering and redemption price per share | | | 36.25 | | | | — | | | | — | |
Class R4 — Offering and redemption price per share | | | 37.20 | | | | — | | | | — | |
Class R5 — Offering and redemption price per share | | | 37.56 | | | | — | | | | — | |
Class R6 — Offering and redemption price per share | | | 37.61 | | | | 18.01 | | | | 22.29 | |
Class A maximum sales charge | | | 5.25 | % | | | — | % | | | 5.25 | % |
Class A maximum public offering price per share
[net asset value per share/(100% — maximum sales charge)] | | $ | 38.46 | | | $ | — | | | $ | 22.84 | |
| | | | | | | | | | | | |
| | | |
Cost of investments in non-affiliates | | $ | 7,187,443 | | | $ | 2,526,600 | | | $ | 421,472 | |
Cost of investments in affiliates | | | 313,835 | | | | 12,125 | | | | 2,182 | |
Cost of foreign currency | | | 1 | | | | 203 | | | | — | |
Investment securities on loan, at value (See Note 2.C.) | | | 121,899 | | | | 17,283 | | | | 2,626 | |
Cost of investment of cash collateral (See Note 2.C.) | | | 129,634 | | | | 18,089 | | | | 2,662 | |
| (a) | Per share amounts may not recalculate due to rounding of net assets and/or shares outstanding. |
| (b) | Redemption price for Class C Shares varies based upon length of time the shares are held. |
SEE NOTES TO FINANCIAL STATEMENTS.
| | | | | | | | |
| | | |
| OCTOBER 31, 2020 | | J.P. MORGAN INTERNATIONAL EQUITY FUNDS | | | | | 65 | |
STATEMENTS OF ASSETS AND LIABILITIES
AS OF OCTOBER 31, 2020 (continued)
(Amounts in thousands, except per share amounts)
| | | | | | | | | | | | |
| | | |
| | | JPMorgan
International
Advantage
Fund | | | JPMorgan
International
Equity Fund | | | JPMorgan
International
Focus Fund
(formerly
known as
JPMorgan
International
Unconstrained
Equity Fund) | |
ASSETS: | | | | | | | | | | | | |
Investments in non-affiliates, at value | | $ | 1,490,436 | | | $ | 2,882,560 | | | $ | 2,756,752 | |
Investments in affiliates, at value | | | 5,325 | | | | 40,182 | | | | 41,452 | |
Investment of cash collateral received from securities loaned, at value (See Note 2.C.) | | | 4,401 | | | | 20,356 | | | | 78,528 | |
Cash | | | 50 | | | | 54 | | | | 50 | |
Foreign currency, at value | | | 176 | | | | 15,650 | | | | 453 | |
Deposits at broker for futures contracts | | | 584 | | | | — | | | | — | |
Receivables: | | | | | | | | | | | | |
Investment securities sold | | | 88 | | | | — | | | | — | |
Fund shares sold | | | 27 | | | | 5,707 | | | | 1,902 | |
Dividends from non-affiliates | | | 5,397 | | | | 2,974 | | | | 1,450 | |
Dividends from affiliates | | | 1 | | | | 2 | | | | 2 | |
Tax reclaims | | | 7,830 | | | | 7,546 | | | | 1,923 | |
Securities lending income (See Note 2.C.) | | | 5 | | | | 3 | | | | 3 | |
Variation margin on futures contracts | | | 15 | | | | — | | | | — | |
| | | | | | | | | | | | |
Total Assets | | | 1,514,335 | | | | 2,975,034 | | | | 2,882,515 | |
| | | | | | | | | | | | |
| | | |
LIABILITIES: | | | | | | | | | | | | |
Payables: | | | | | | | | | | | | |
Investment securities purchased | | | — | | | | 21,267 | | | | — | |
Collateral received on securities loaned (See Note 2.C.) | | | 4,401 | | | | 20,356 | | | | 78,528 | |
Fund shares redeemed | | | 31 | | | | 913 | | | | 705 | |
Accrued liabilities: | | | | | | | | | | | | |
Investment advisory fees | | | 600 | | | | 1,121 | | | | 1,257 | |
Administration fees | | | 48 | | | | 82 | | | | 34 | |
Distribution fees | | | 11 | | | | 67 | | | | 41 | |
Service fees | | | 10 | | | | 103 | | | | 90 | |
Custodian and accounting fees | | | 119 | | | | 94 | | | | 69 | |
Trustees’ and Chief Compliance Officer’s fees | | | — | | | | — | (a) | | | — | |
Other | | | 100 | | | | 109 | | | | 121 | |
| | | | | | | | | | | | |
Total Liabilities | | | 5,320 | | | | 44,112 | | | | 80,845 | |
| | | | | | | | | | | | |
Net Assets | | $ | 1,509,015 | | | $ | 2,930,922 | | | $ | 2,801,670 | |
| | | | | | | | | | | | |
| (a) | Amount rounds to less than one thousand. |
SEE NOTES TO FINANCIAL STATEMENTS.
| | | | | | |
| | | |
| 66 | | | | J.P. MORGAN INTERNATIONAL EQUITY FUNDS | | OCTOBER 31, 2020 |
| | | | | | | | | | | | |
| | | |
| | | JPMorgan
International
Advantage
Fund | | | JPMorgan
International
Equity Fund | | | JPMorgan
International
Focus Fund
(formerly
known as
JPMorgan
International
Unconstrained
Equity Fund) | |
NET ASSETS: | |
Paid-in-Capital | | $ | 1,816,846 | | | $ | 2,284,123 | | | $ | 2,600,157 | |
Total distributable earnings (loss) | | | (307,831 | ) | | | 646,799 | | | | 201,513 | |
| | | | | | | | | | | | |
Total Net Assets | | $ | 1,509,015 | | | $ | 2,930,922 | | | $ | 2,801,670 | |
| | | | | | | | | | | | |
| | | |
Net Assets: | | | | | | | | | | | | |
Class A | | $ | 5,976 | | | $ | 263,791 | | | $ | 135,527 | |
Class C | | | 778 | | | | 9,358 | | | | 15,463 | |
Class I | | | 21,640 | | | | 339,416 | | | | 372,068 | |
Class R2 | | | 5,061 | | | | 21,379 | | | | 1,441 | |
Class R5 | | | — | | | | 6,970 | | | | 2,772 | |
Class R6 | | | 1,475,560 | | | | 2,290,008 | | | | 2,274,399 | |
| | | | | | | | | | | | |
Total | | $ | 1,509,015 | | | $ | 2,930,922 | | | $ | 2,801,670 | |
| | | | | | | | | | | | |
| | | |
Outstanding units of beneficial interest (shares) ($0.0001 par value; unlimited number of shares authorized): | | | | | | | | | | | | |
Class A | | | 348 | | | | 16,018 | | | | 6,140 | |
Class C | | | 45 | | | | 603 | | | | 713 | |
Class I | | | 1,206 | | | | 20,249 | | | | 16,618 | |
Class R2 | | | 299 | | | | 1,311 | | | | 66 | |
Class R5 | | | — | | | | 414 | | | | 124 | |
Class R6 | | | 83,533 | | | | 136,222 | | | | 101,552 | |
| | | |
Net Asset Value (a): | | | | | | | | | | | | |
Class A — Redemption price per share | | $ | 17.20 | | | $ | 16.47 | | | $ | 22.07 | |
Class C — Offering price per share (b) | | | 17.44 | | | | 15.53 | | | | 21.68 | |
Class I — Offering and redemption price per share | | | 17.94 | | | | 16.76 | | | | 22.39 | |
Class R2 — Offering and redemption price per share | | | 16.91 | | | | 16.31 | | | | 21.85 | |
Class R5 — Offering and redemption price per share | | | — | | | | 16.85 | | | | 22.38 | |
Class R6 — Offering and redemption price per share | | | 17.66 | | | | 16.81 | | | | 22.40 | |
Class A maximum sales charge | | | 5.25 | % | | | 5.25 | % | | | 5.25 | % |
Class A maximum public offering price per share
[net asset value per share/(100% — maximum sales charge)] | | $ | 18.15 | | | $ | 17.38 | | | $ | 23.30 | |
| | | | | | | | | | | | |
| | | |
Cost of investments in non-affiliates | | $ | 1,436,870 | | | $ | 2,162,316 | | | $ | 2,393,208 | |
Cost of investments in affiliates | | | 5,325 | | | | 40,184 | | | | 41,456 | |
Cost of foreign currency | | | 176 | | | | 15,652 | | | | 453 | |
Investment securities on loan, at value (See Note 2.C.) | | | 4,226 | | | | 19,188 | | | | 73,681 | |
Cost of investment of cash collateral (See Note 2.C.) | | | 4,401 | | | | 20,356 | | | | 78,528 | |
| (a) | Per share amounts may not recalculate due to rounding of net assets and/or shares outstanding. |
| (b) | Redemption price for Class C Shares varies based upon length of time the shares are held. |
SEE NOTES TO FINANCIAL STATEMENTS.
| | | | | | | | |
| | | |
| OCTOBER 31, 2020 | | J.P. MORGAN INTERNATIONAL EQUITY FUNDS | | | | | 67 | |
STATEMENTS OF ASSETS AND LIABILITIES
AS OF OCTOBER 31, 2020 (continued)
(Amounts in thousands, except per share amounts)
| | | | | | | | | | | | |
| | | |
| | | JPMorgan
International
Hedged
Equity Fund | | | JPMorgan
International
Research
Enhanced
Equity Fund | | | JPMorgan
International
Value Fund | |
ASSETS: | |
Investments in non-affiliates, at value | | $ | 124,439 | | | $ | 4,718,753 | | | $ | 259,945 | |
Investments in affiliates, at value | | | 6,584 | | | | 160,896 | | | | 5,627 | |
Investment of cash collateral received from securities loaned, at value (See Note 2.C.) | | | — | | | | 87,575 | | | | 1,956 | |
Options purchased, at value | | | 5,997 | | | | — | | | | — | |
Cash | | | 793 | | | | 50 | | | | 50 | |
Foreign currency, at value | | | — | | | | 1,238 | | | | — | |
Deposits at broker for futures contracts | | | 645 | | | | 13,886 | | | | 676 | |
Deposits at broker for options contracts | | | 228 | | | | — | | | | — | |
Receivables: | | | | | | | | | | | | |
Investment securities sold | | | 2,744 | | | | 50,349 | | | | 983 | |
Fund shares sold | | | 91 | | | | 3,790 | | | | 386 | |
Dividends from non-affiliates | | | 291 | | | | 13,192 | | | | 1,045 | |
Dividends from affiliates | | | — | (a) | | | 9 | | | | 1 | |
Tax reclaims | | | 234 | | | | 12,211 | | | | 2,187 | |
Securities lending income (See Note 2.C.) | | | — | | | | 130 | | | | 2 | |
Due from adviser | | | 39 | | | | — | | | | — | |
| | | | | | | | | | | | |
Total Assets | | | 142,085 | | | | 5,062,079 | | | | 272,858 | |
| | | | | | | | | | | | |
| | | |
LIABILITIES: | | | | | | | | | | | | |
Payables: | | | | | | | | | | | | |
Due to custodian | | | — | | | | — | | | | 428 | |
Foreign currency due to custodian, at value | | | 1,290 | | | | — | | | | 349 | |
Investment securities purchased | | | 1,897 | | | | 67,753 | | | | 1,149 | |
Collateral received on securities loaned (See Note 2.C.) | | | — | | | | 87,575 | | | | 1,956 | |
Fund shares redeemed | | | 7 | | | | 40,319 | | | | 567 | |
Variation margin on futures contracts | | | 82 | | | | 2,601 | | | | 12 | |
Outstanding options written, at fair value | | | 1,339 | | | | — | | | | — | |
Accrued liabilities: | | | | | | | | | | | | |
Investment advisory fees | | | — | | | | 709 | | | | 95 | |
Administration fees | | | — | | | | 236 | | | | — | |
Distribution fees | | | — | (a) | | | 12 | | | | 31 | |
Service fees | | | 30 | | | | 49 | | | | 28 | |
Custodian and accounting fees | | | 58 | | | | 137 | | | | 32 | |
Trustees’ and Chief Compliance Officer’s fees | | | 1 | | | | 2 | | | | — | |
Other | | | 113 | | | | 337 | | | | 347 | |
| | | | | | | | | | | | |
Total Liabilities | | | 4,817 | | | | 199,730 | | | | 4,994 | |
| | | | | | | | | | | | |
Net Assets | | $ | 137,268 | | | $ | 4,862,349 | | | $ | 267,864 | |
| | | | | | | | | | | | |
| (a) | Amount rounds to less than one thousand. |
SEE NOTES TO FINANCIAL STATEMENTS.
| | | | | | |
| | | |
| 68 | | | | J.P. MORGAN INTERNATIONAL EQUITY FUNDS | | OCTOBER 31, 2020 |
| | | | | | | | | | | | |
| | | |
| | | JPMorgan
International
Hedged Equity
Fund | | | JPMorgan
International
Research
Enhanced
Equity Fund | | | JPMorgan
International
Value Fund | |
NET ASSETS: | |
Paid-in-Capital | | $ | 145,322 | | | $ | 5,316,492 | | | $ | 392,149 | |
Total distributable earnings (loss) | | | (8,054 | ) | | | (454,143 | ) | | | (124,285 | ) |
| | | | | | | | | | | | |
Total Net Assets | | $ | 137,268 | | | $ | 4,862,349 | | | $ | 267,864 | |
| | | | | | | | | | | | |
| | | |
Net Assets: | | | | | | | | | | | | |
Class A | | $ | 1,573 | | | $ | 52,118 | | | $ | 125,744 | |
Class C | | | 115 | | | | — | | | | 4,202 | |
Class I | | | 135,542 | | | | 472,455 | | | | 26,805 | |
Class L | | | — | | | | — | | | | 5,585 | |
Class R2 | | | — | | | | — | | | | 412 | |
Class R5 | | | 19 | | | | — | | | | 77 | |
Class R6 | | | 19 | | | | 4,337,776 | | | | 105,039 | |
| | | | | | | | | | | | |
Total | | $ | 137,268 | | | $ | 4,862,349 | | | $ | 267,864 | |
| | | | | | | | | | | | |
Outstanding units of beneficial interest (shares) ($0.0001 par value; unlimited number of shares authorized): | | | | | | | | | | | | |
Class A | | | 111 | | | | 3,290 | | | | 13,295 | |
Class C | | | 8 | | | | — | | | | 460 | |
Class I | | | 9,559 | | | | 29,435 | | | | 2,759 | |
Class L | | | — | | | | — | | | | 578 | |
Class R2 | | | — | | | | — | | | | 44 | |
Class R5 | | | 1 | | | | — | | | | 8 | |
Class R6 | | | 2 | | | | 271,140 | | | | 10,916 | |
| | | |
Net Asset Value (a): | | | | | | | | | | | | |
Class A — Redemption price per share | | $ | 14.12 | | | $ | 15.84 | | | $ | 9.46 | |
Class C — Offering price per share (b) | | | 14.06 | | | | — | | | | 9.14 | |
Class I — Offering and redemption price per share | | | 14.18 | | | | 16.05 | | | | 9.72 | |
Class L — Offering and redemption price per share | | | — | | | | — | | | | 9.66 | |
Class R2 — Offering and redemption price per share | | | — | | | | — | | | | 9.29 | |
Class R5 — Offering and redemption price per share | | | 14.20 | | | | — | | | | 9.60 | |
Class R6 — Offering and redemption price per share | | | 14.22 | | | | 16.00 | | | | 9.62 | |
Class A maximum sales charge | | | 5.25 | % | | | 5.25 | % | | | 5.25 | % |
Class A maximum public offering price per share
[net asset value per share/(100% — maximum sales charge)] | | $ | 14.90 | | | $ | 16.72 | | | $ | 9.98 | |
| | | | | | | | | | | | |
| | | |
Cost of investments in non-affiliates | | $ | 122,221 | | | $ | 4,657,260 | | | $ | 305,104 | |
Cost of investments in affiliates | | | 6,584 | | | | 160,816 | | | | 5,627 | |
Cost of options purchased | | | 3,594 | | | | — | | | | — | |
Cost of foreign currency | | | — | | | | 1,230 | | | | — | |
Investment securities on loan, at value (See Note 2.C.) | | | — | | | | 82,369 | | | | 1,527 | |
Cost of investment of cash collateral (See Note 2.C.) | | | — | | | | 87,577 | | | | 1,956 | |
Premiums received from options written | | | 3,066 | | | | — | | | | — | �� |
| (a) | Per share amounts may not recalculate due to rounding of net assets and/or shares outstanding. |
| (b) | Redemption price for Class C Shares varies based upon length of time the shares are held. |
SEE NOTES TO FINANCIAL STATEMENTS.
| | | | | | | | |
| | | |
| OCTOBER 31, 2020 | | J.P. MORGAN INTERNATIONAL EQUITY FUNDS | | | | | 69 | |
STATEMENTS OF OPERATIONS
FOR THE YEAR ENDED OCTOBER 31, 2020
(Amounts in thousands)
| | | | | | | | | | | | |
| | | JPMorgan
Emerging
Markets
Equity Fund | | | JPMorgan
Emerging
Markets
Research
Enhanced
Equity Fund | | | JPMorgan
Europe
Dynamic
Fund | |
INVESTMENT INCOME: | | | | | |
Interest income from non-affiliates | | $ | 6 | | | $ | 18 | | | $ | 5 | |
Interest income from affiliates | | | 4 | | | | 5 | | | | — | |
Dividend income from non-affiliates | | | 106,721 | | | | 63,349 | | | | 12,584 | |
Dividend income from affiliates | | | 1,325 | | | | 432 | | | | 113 | |
Income from securities lending (net) (See Note 2.C.) | | | 306 | | | | 152 | | | | 122 | |
Foreign taxes withheld (net) | | | (10,562 | ) | | | (5,951 | ) | | | (1,522 | ) |
| | | | | | | | | | | | |
Total investment income | | | 97,800 | | | | 58,005 | | | | 11,302 | |
| | | | | | | | | | | | |
| |
EXPENSES: | | | | | |
Investment advisory fees | | | 57,753 | | | | 6,527 | | | | 2,890 | |
Administration fees | | | 6,355 | | | | 1,958 | | | | 361 | |
Distribution fees: | | | | | | | | | | | | |
Class A | | | 1,395 | | | | — | | | | 204 | |
Class C | | | 473 | | | | — | | | | 112 | |
Class R2 | | | 1 | | | | — | | | | — | |
Class R3 | | | 10 | | | | — | | | | — | |
Service fees: | | | | | | | | | | | | |
Class A | | | 1,395 | | | | — | | | | 204 | |
Class C | | | 158 | | | | — | | | | 37 | |
Class I | | | 6,927 | | | | — | (a) | | | 168 | |
Class L | | | 1,307 | | | | — | | | | 60 | |
Class R2 | | | 1 | | | | — | | | | — | |
Class R3 | | | 10 | | | | — | | | | — | |
Class R4 | | | 5 | | | | — | | | | — | |
Class R5 | | | 46 | | | | — | | | | — | |
Custodian and accounting fees | | | 3,427 | | | | 1,408 | | | | 113 | |
Interest expense to affiliates | | | 7 | | | | 20 | | | | 2 | |
Professional fees | | | 184 | | | | 106 | | | | 120 | |
Trustees’ and Chief Compliance Officer’s fees | | | 52 | | | | 33 | | | | 27 | |
Printing and mailing costs | | | 612 | | | | 25 | | | | 26 | |
Registration and filing fees | | | 755 | | | | 416 | | | | 75 | |
Transfer agency fees (See Note 2.J.) | | | 345 | | | | 18 | | | | 26 | |
Offering costs (See Note 2.H.) | | | — | | | | 5 | | | | — | |
Other | | | 137 | | | | 60 | | | | 22 | |
| | | | | | | | | | | | |
Total expenses | | | 81,355 | | | | 10,576 | | | | 4,447 | |
| | | | | | | | | | | | |
Less fees waived | | | (4,287 | ) | | | (1,502 | ) | | | (65 | ) |
Less expense reimbursements | | | (189 | ) | | | (5 | ) | | | — | |
| | | | | | | | | | | | |
Net expenses | | | 76,879 | | | | 9,069 | | | | 4,382 | |
| | | | | | | | | | | | |
Net investment income (loss) | | | 20,921 | | | | 48,936 | | | | 6,920 | |
| | | | | | | | | | | | |
| | | |
REALIZED/UNREALIZED GAINS (LOSSES): | | | | | | | | | | | | |
Net realized gain (loss) on transactions from: | | | | | | | | | | | | |
Investments in non-affiliates | | | (22,243 | )(b) | | | (120,993 | )(c) | | | (19,469 | ) |
Investments in affiliates | | | 45 | | | | 24 | | | | 20 | |
Futures contracts | | | — | | | | 7,435 | | | | 3,355 | |
Foreign currency transactions | | | 706 | | | | (1,858 | ) | | | 15 | |
| | | | | | | | | | | | |
Net realized gain (loss) | | | (21,492 | ) | | | (115,392 | ) | | | (16,079 | ) |
| | | | | | | | | | | | |
Change in net unrealized appreciation/depreciation on: | | | | | | | | | | | | |
Investments in non-affiliates | | | 1,995,195 | (d) | | | 281,867 | (e) | | | (33,078 | ) |
Investments in affiliates | | | (47 | ) | | | (5 | ) | | | — | (a) |
Futures contracts | | | — | | | | — | | | | 12 | |
Foreign currency translations | | | 2 | | | | (35 | ) | | | 181 | |
| | | | | | | | | | | | |
Change in net unrealized appreciation/depreciation | | | 1,995,150 | | | | 281,827 | | | | (32,885 | ) |
| | | | | | | | | | | | |
Net realized/unrealized gains (losses) | | | 1,973,658 | | | | 166,435 | | | | (48,964 | ) |
| | | | | | | | | | | | |
Change in net assets resulting from operations | | $ | 1,994,579 | | | $ | 215,371 | | | $ | (42,044 | ) |
| | | | | | | | | | | | |
| (a) | Amount rounds to less than one thousand. |
| (b) | Net of foreign capital gains tax of approximately $854,000. |
| (c) | Net of foreign capital gains tax of approximately $(1,184,000). |
| (d) | Net of change in foreign capital gains tax of approximately $873,000. |
| (e) | Net of change in foreign capital gains tax of approximately $(6,127,000). |
SEE NOTES TO FINANCIAL STATEMENTS.
| | | | | | |
| | | |
| 70 | | | | J.P. MORGAN INTERNATIONAL EQUITY FUNDS | | OCTOBER 31, 2020 |
| | | | | | | | | | | | |
| | | JPMorgan
International
Advantage
Fund | | | JPMorgan
International
Equity Fund | | | JPMorgan
International
Focus Fund
(formerly
known as
JPMorgan
International
Unconstrained
Equity Fund) | |
INVESTMENT INCOME: | | | | | |
Interest income from non-affiliates | | $ | 21 | | | $ | 5 | | | $ | 3 | |
Interest income from affiliates | | | — | (a) | | | — | | | | 5 | |
Dividend income from non-affiliates | | | 51,731 | | | | 64,401 | | | | 54,865 | |
Dividend income from affiliates | | | 350 | | | | 426 | | | | 379 | |
Income from securities lending (net) (See Note 2.C.) | | | 177 | | | | 377 | | | | 238 | |
Foreign taxes withheld (net) | | | (4,077 | ) | | | (4,737 | ) | | | (4,103 | ) |
| | | | | | | | | | | | |
Total investment income | | | 48,202 | | | | 60,472 | | | | 51,387 | |
| | | | | | | | | | | | |
| |
EXPENSES: | | | | | |
Investment advisory fees | | | 8,705 | | | | 14,712 | | | | 16,637 | |
Administration fees | | | 1,306 | | | | 2,207 | | | | 2,080 | |
Distribution fees: | | | | | | | | | | | | |
Class A | | | 163 | | | | 746 | | | | 316 | |
Class C | | | 8 | | | | 92 | | | | 126 | |
Class R2 | | | 132 | | | | 13 | | | | 7 | |
Service fees: | | | | | | | | | | | | |
Class A | | | 163 | | | | 746 | | | | 316 | |
Class C | | | 3 | | | | 31 | | | | 42 | |
Class I | | | 122 | | | | 613 | | | | 627 | |
Class R2 | | | 66 | | | | 7 | | | | 4 | |
Class R5 | | | — | | | | 5 | | | | 3 | |
Custodian and accounting fees | | | 369 | | | | 413 | | | | 454 | |
Interest expense to affiliates | | | 25 | | | | 16 | | | | 31 | |
Professional fees | | | 155 | | | | 149 | | | | 125 | |
Trustees’ and Chief Compliance Officer’s fees | | | 32 | | | | 36 | | | | 33 | |
Printing and mailing costs | | | 12 | | | | 67 | | | | 77 | |
Registration and filing fees | | | 103 | | | | 133 | | | | 121 | |
Transfer agency fees (See Note 2.J.) | | | 75 | | | | 70 | | | | 49 | |
Other | | | 62 | | | | 66 | | | | 50 | |
| | | | | | | | | | | | |
Total expenses | | | 11,501 | | | | 20,122 | | | | 21,098 | |
| | | | | | | | | | | | |
Less fees waived | | | (2,213 | ) | | | (3,502 | ) | | | (4,641 | ) |
Less expense reimbursements | | | (6 | ) | | | (6 | ) | | | (19 | ) |
| | | | | | | | | | | | |
Net expenses | | | 9,282 | | | | 16,614 | | | | 16,438 | |
| | | | | | | | | | | | |
Net investment income (loss) | | | 38,920 | | | | 43,858 | | | | 34,949 | |
| | | | | | | | | | | | |
| |
REALIZED/UNREALIZED GAINS (LOSSES): | | | | | |
Net realized gain (loss) on transactions from: | | | | | | | | | | | | |
Investments in non-affiliates | | | (99,245 | ) | | | (49,329 | ) | | | (141,755 | ) |
Investments in affiliates | | | (29 | ) | | | (23 | ) | | | 51 | |
Futures contracts | | | (2,171 | ) | | | — | | | | — | |
Foreign currency transactions | | | 560 | | | | (22 | ) | | | (1,551 | ) |
| | | | | | | | | | | | |
Net realized gain (loss) | | | (100,885 | ) | | | (49,374 | ) | | | (143,255 | ) |
| | | | | | | | | | | | |
Change in net unrealized appreciation/depreciation on: | | | | | | | | | | | | |
Investments in non-affiliates | | | (131,836 | ) | | | (40,170 | ) | | | 231,268 | |
Investments in affiliates | | | (7 | ) | | | (11 | ) | | | (13 | ) |
Futures contracts | | | (2,254 | ) | | | — | | | | — | |
Foreign currency translations | | | 488 | | | | 535 | | | | 120 | |
| | | | | | | | | | | | |
Change in net unrealized appreciation/depreciation | | | (133,609 | ) | | | (39,646 | ) | | | 231,375 | |
| | | | | | | | | | | | |
Net realized/unrealized gains (losses) | | | (234,494 | ) | | | (89,020 | ) | | | 88,120 | |
| | | | | | | | | | | | |
Change in net assets resulting from operations | | $ | (195,574 | ) | | $ | (45,162 | ) | | $ | 123,069 | |
| | | | | | | | | | | | |
| (a) | Amount rounds to less than one thousand. |
SEE NOTES TO FINANCIAL STATEMENTS.
| | | | | | | | |
| | | |
| OCTOBER 31, 2020 | | J.P. MORGAN INTERNATIONAL EQUITY FUNDS | | | | | 71 | |
STATEMENTS OF OPERATIONS
FOR THE YEAR ENDED OCTOBER 31, 2020 (continued)
(Amounts in thousands)
| | | | | | | | | | | | |
| | | JPMorgan
International
Hedged
Equity Fund | | |
JPMorgan
International
Research
Enhanced
Equity Fund | | | JPMorgan
International
Value Fund | |
INVESTMENT INCOME: | | | | | |
Interest income from non-affiliates | | $ | 2 | | | $ | 40 | | | $ | 3 | |
Interest income from affiliates | | | — | (a) | | | — | | | | — | |
Dividend income from non-affiliates | | | 2,943 | | | | 138,197 | | | | 11,191 | |
Dividend income from affiliates | | | 19 | | | | 1,646 | | | | 67 | |
Non-cash dividend income from non-affiliates | | | — | | | | — | | | | 1,401 | |
Income from securities lending (net) (See Note 2.C.) | | | — | | | | 760 | | | | 94 | |
Foreign taxes withheld (net) | | | (256 | ) | | | (12,043 | ) | | | (1,092 | ) |
| | | | | | | | | | | | |
Total investment income | | | 2,708 | | | | 128,600 | | | | 11,664 | |
| | | | | | | | | | | | |
| | | |
EXPENSES: | | | | | | | | | | | | |
Investment advisory fees | | | 249 | | | | 9,906 | | | | 1,755 | |
Administration fees | | | 75 | | | | 3,715 | | | | 239 | |
Distribution fees: | | | | | | | | | | | | |
Class A | | | 2 | | | | 400 | | | | 375 | |
Class C | | | 1 | | | | — | | | | 48 | |
Class R2 | | | — | | | | — | | | | 3 | |
Service fees: | | | | | | | | | | | | |
Class A | | | 2 | | | | 400 | | | | 375 | |
Class C | | | — | (a) | | | — | | | | 16 | |
Class I | | | 246 | | | | 860 | | | | 88 | |
Class L | | | — | | | | — | | | | 19 | |
Class R2 | | | — | | | | — | | | | 1 | |
Class R5 | | | — | (a) | | | — | | | | — | (a) |
Custodian and accounting fees | | | 162 | | | | 708 | | | | 130 | |
Interest expense to affiliates | | | 3 | | | | 23 | | | | 2 | |
Professional fees | | | 105 | | | | 198 | | | | 127 | |
Trustees’ and Chief Compliance Officer’s fees | | | 26 | | | | 43 | | | | 26 | |
Printing and mailing costs | | | 1 | | | | 253 | | | | 17 | |
Registration and filing fees | | | 104 | | | | 15 | | | | 104 | |
Transfer agency fees (See Note 2.J.) | | | 1 | | | | 86 | | | | 17 | |
Offering costs (See Note 2.H.) | | | 39 | | | | — | | | | — | |
Other | | | 10 | | | | 179 | | | | 10 | |
| | | | | | | | | | | | |
Total expenses | | | 1,026 | | | | 16,786 | | | | 3,352 | |
| | | | | | | | | | | | |
Less fees waived | | | (317 | ) | | | (3,779 | ) | | | (774 | ) |
Less expense reimbursements | | | (111 | ) | | | — | | | | — | (a) |
| | | | | | | | | | | | |
Net expenses | | | 598 | | | | 13,007 | | | | 2,578 | |
| | | | | | | | | | | | |
Net investment income (loss) | | | 2,110 | | | | 115,593 | | | | 9,086 | |
| | | | | | | | | | | | |
| | | |
REALIZED/UNREALIZED GAINS (LOSSES): | | | | | | | | | | | | |
Net realized gain (loss) on transactions from: | | | | | | | | | | | | |
Investments in non-affiliates | | | (9,089 | ) | | | (373,247 | ) | | | (38,974 | ) |
Investments in affiliates | | | — | (a) | | | (66 | ) | | | 5 | |
Options purchased | | | 14,645 | | | | — | | | | — | |
Futures contracts | | | 47 | | | | (10,026 | ) | | | (879 | ) |
Foreign currency transactions | | | 56 | | | | (1,102 | ) | | | (99 | ) |
Options written | | | (21,823 | ) | | | — | | | | — | |
| | | | | | | | | | | | |
Net realized gain (loss) | | | (16,164 | ) | | | (384,441 | ) | | | (39,947 | ) |
| | | | | | | | | | | | |
Change in net unrealized appreciation/depreciation on: | | | | | | | | | | | | |
Investments in non-affiliates | | | 678 | | | | (159,238 | ) | | | (39,946 | ) |
Investments in affiliates | | | — | | | | 60 | | | | (1 | ) |
Options purchased | | | 2,788 | | | | — | | | | — | |
Futures contracts | | | (121 | ) | | | (667 | ) | | | (283 | ) |
Foreign currency translations | | | 12 | | | | 790 | | | | 156 | |
Options written | | | 1,807 | | | | — | | | | — | |
| | | | | | | | | | | | |
Change in net unrealized appreciation/depreciation | | | 5,164 | | | | (159,055 | ) | | | (40,074 | ) |
| | | | | | | | | | | | |
Net realized/unrealized gains (losses) | | | (11,000 | ) | | | (543,496 | ) | | | (80,021 | ) |
| | | | | | | | | | | | |
Change in net assets resulting from operations | | $ | (8,890 | ) | | $ | (427,903 | ) | | $ | (70,935 | ) |
| | | | | | | | | | | | |
| (a) | Amount rounds to less than one thousand. |
SEE NOTES TO FINANCIAL STATEMENTS.
| | | | | | |
| | | |
| 72 | | | | J.P. MORGAN INTERNATIONAL EQUITY FUNDS | | OCTOBER 31, 2020 |
STATEMENTS OF CHANGES IN NET ASSETS
FOR THE PERIODS INDICATED
(Amounts in thousands)
| | | | | | | | | | | | | | | | |
| | |
| | | JPMorgan Emerging Markets
Equity Fund | | | JPMorgan Emerging Markets Research
Enhanced Equity Fund | |
| | | Year Ended
October 31,
2020 | | | Year Ended
October 31,
2019 | | | Year Ended
October 31,
2020 | | | Period Ended
October 31,
2019 (a) | |
CHANGE IN NET ASSETS RESULTING FROM OPERATIONS: | | | | | | | | | | | | | | | | |
Net investment income (loss) | | $ | 20,921 | | | $ | 55,860 | | | $ | 48,936 | | | $ | 11,213 | |
Net realized gain (loss) | | | (21,492 | ) | | | (2,141 | ) | | | (115,392 | ) | | | 2,423 | |
Change in net unrealized appreciation/depreciation | | | 1,995,150 | | | | 1,186,420 | | | | 281,827 | | | | 40,909 | |
| | | | | | | | | | | | | | | | |
Change in net assets resulting from operations | | | 1,994,579 | | | | 1,240,139 | | | | 215,371 | | | | 54,545 | |
| | | | | | | | | | | | | | | | |
DISTRIBUTIONS TO SHAREHOLDERS: | | | | | | | | | | | | | | | | |
Class A | | | (3,084 | ) | | | (1,554 | ) | | | — | | | | — | |
Class C | | | (79 | ) | | | (59 | ) | | | — | | | | — | |
Class I (b) | | | (15,303 | ) | | | (6,646 | ) | | | — | (c) | | | — | |
Class L | | | (8,491 | ) | | | (4,471 | ) | | | — | | | | — | |
Class R2 | | | (1 | ) | | | (1 | ) | | | — | | | | — | |
Class R3 | | | (21 | ) | | | (1 | ) | | | — | | | | — | |
Class R4 | | | (11 | ) | | | (11 | ) | | | — | | | | — | |
Class R5 | | | (349 | ) | | | (296 | ) | | | — | | | | — | |
Class R6 | | | (29,101 | ) | | | (30,900 | ) | | | (24,046 | ) | | | (26 | ) |
| | | | | | | | | | | | | | | | |
Total distributions to shareholders | | | (56,440 | ) | | | (43,939 | ) | | | (24,046 | ) | | | (26 | ) |
| | | | | | | | | | | | | | | | |
| | | | |
CAPITAL TRANSACTIONS: | | | | | | | | | | | | | | | | |
Change in net assets resulting from capital transactions | | | 2,968,409 | | | | 516,272 | | | | 558,443 | | | | 2,036,055 | |
| | | | | | | | | | | | | | | | |
|
NET ASSETS: | |
Change in net assets | | | 4,906,548 | | | | 1,712,472 | | | | 749,768 | | | | 2,090,574 | |
Beginning of period | | | 6,313,677 | | | | 4,601,205 | | | | 2,090,574 | | | | — | |
| | | | | | | | | | | | | | | | |
End of period | | $ | 11,220,225 | | | $ | 6,313,677 | | | $ | 2,840,342 | | | $ | 2,090,574 | |
| | | | | | | | | | | | | | | | |
| (a) | Commencement of operations was December 11, 2018. |
| (b) | Commencement of offering of class of shares effective January 30, 2019 for JPMorgan Emerging Markets Research Enhanced Equity Fund. |
| (c) | Amount rounds to less than one thousand. |
SEE NOTES TO FINANCIAL STATEMENTS.
| | | | | | | | |
| | | |
| OCTOBER 31, 2020 | | J.P. MORGAN INTERNATIONAL EQUITY FUNDS | | | | | 73 | |
STATEMENTS OF CHANGES IN NET ASSETS
FOR THE PERIODS INDICATED (continued)
(Amounts in thousands)
| | | | | | | | | | | | | | | | |
| | |
| | | JPMorgan Europe Dynamic Fund | | | JPMorgan International Advantage Fund | |
| | | Year Ended
October 31, 2020 | | | Year Ended
October 31, 2019 | | | Year Ended
October 31, 2020 | | | Year Ended
October 31, 2019 | |
CHANGE IN NET ASSETS RESULTING FROM OPERATIONS: | | | | | | | | | | | | | | | | |
Net investment income (loss) | | $ | 6,920 | | | $ | 16,941 | | | $ | 38,920 | | | $ | 104,540 | |
Net realized gain (loss) | | | (16,079 | ) | | | (56,539 | ) | | | (100,885 | ) | | | (246,836 | ) |
Change in net unrealized appreciation/depreciation | | | (32,885 | ) | | | 83,325 | | | | (133,609 | ) | | | 254,655 | |
| | | | | | | | | | | | | | | | |
Change in net assets resulting from operations | | | (42,044 | ) | | | 43,727 | | | | (195,574 | ) | | | 112,359 | |
| | | | | | | | | | | | | | | | |
DISTRIBUTIONS TO SHAREHOLDERS: | | | | | | | | | | | | | | | | |
Class A | | | (2,780 | ) | | | (2,841 | ) | | | (8,620 | ) | | | (3,427 | ) |
Class C | | | (497 | ) | | | (583 | ) | | | (54 | ) | | | (25 | ) |
Class I | | | (2,605 | ) | | | (3,245 | ) | | | (5,381 | ) | | | (1,458 | ) |
Class L | | | (2,069 | ) | | | (2,456 | ) | | | — | | | | — | |
Class R2 | | | — | | | | — | | | | (1,467 | ) | | | (638 | ) |
Class R6 | | | (8,878 | ) | | | (7,813 | ) | | | (92,520 | ) | | | (82,457 | ) |
| | | | | | | | | | | | | | | | |
Total distributions to shareholders | | | (16,829 | ) | | | (16,938 | ) | | | (108,042 | ) | | | (88,005 | ) |
| | | | | | | | | | | | | | | | |
| | | | |
CAPITAL TRANSACTIONS: | | | | | | | | | | | | | | | | |
Change in net assets resulting from capital transactions | | | (44,544 | ) | | | (169,891 | ) | | | 1,282 | | | | (1,616,261 | ) |
| | | | | | | | | | | | | | | | |
|
NET ASSETS: | |
Change in net assets | | | (103,417 | ) | | | (143,102 | ) | | | (302,334 | ) | | | (1,591,907 | ) |
Beginning of period | | | 542,245 | | | | 685,347 | | | | 1,811,349 | | | | 3,403,256 | |
| | | | | | | | | | | | | | | | |
End of period | | $ | 438,828 | | | $ | 542,245 | | | $ | 1,509,015 | | | $ | 1,811,349 | |
| | | | | | | | | | | | | | | | |
SEE NOTES TO FINANCIAL STATEMENTS.
| | | | | | |
| | | |
| 74 | | | | J.P. MORGAN INTERNATIONAL EQUITY FUNDS | | OCTOBER 31, 2020 |
| | | | | | | | | | | | | | | | |
| | |
| | | JPMorgan International Equity Fund | | | JPMorgan International Focus Fund
(formerly known as JPMorgan International
Unconstrained Equity Fund) | |
| | | Year Ended
October 31, 2020 | | | Year Ended
October 31, 2019 | | | Year Ended
October 31, 2020 | | | Year Ended
October 31, 2019 | |
CHANGE IN NET ASSETS RESULTING FROM OPERATIONS: | | | | | | | | | | | | | | | | |
Net investment income (loss) | | $ | 43,858 | | | $ | 101,506 | | | $ | 34,949 | | | $ | 8,884 | |
Net realized gain (loss) | | | (49,374 | ) | | | (46,740 | ) | | | (143,255 | ) | | | (22,506 | ) |
Change in net unrealized appreciation/depreciation | | | (39,646 | ) | | | 522,611 | | | | 231,375 | | | | 157,799 | |
| | | | | | | | | | | | | | | | |
Change in net assets resulting from operations | | | (45,162 | ) | | | 577,377 | | | | 123,069 | | | | 144,177 | |
| | | | | | | | | | | | | | | | |
DISTRIBUTIONS TO SHAREHOLDERS: | | | | | | | | | | | | | | | | |
Class A | | | (9,505 | ) | | | (8,158 | ) | | | (46 | ) | | | (1,618 | ) |
Class C | | | (344 | ) | | | (520 | ) | | | — | | | | (296 | ) |
Class I | | | (6,207 | ) | | | (5,904 | ) | | | (431 | ) | | | (3,745 | ) |
Class R2 | | | (65 | ) | | | (56 | ) | | | — | | | | (15 | ) |
Class R5 | | | (124 | ) | | | (691 | ) | | | (9 | ) | | | (72 | ) |
Class R6 | | | (80,146 | ) | | | (140,365 | ) | | | (10,047 | ) | | | (4,394 | ) |
| | | | | | | | | | | | | | | | |
Total distributions to shareholders | | | (96,391 | ) | | | (155,694 | ) | | | (10,533 | ) | | | (10,140 | ) |
| | | | | | | | | | | | | | | | |
| | | | |
CAPITAL TRANSACTIONS: | | | | | | | | | | | | | | | | |
Change in net assets resulting from capital transactions | | | 75,469 | | | | (1,693,771 | ) | | | 89,493 | | | | 1,990,374 | |
| | | | | | | | | | | | | | | | |
|
NET ASSETS: | |
Change in net assets | | | (66,084 | ) | | | (1,272,088 | ) | | | 202,029 | | | | 2,124,411 | |
Beginning of period | | | 2,997,006 | | | | 4,269,094 | | | | 2,599,641 | | | | 475,230 | |
| | | | | | | | | | | | | | | | |
End of period | | $ | 2,930,922 | | | $ | 2,997,006 | | | $ | 2,801,670 | | | $ | 2,599,641 | |
| | | | | | | | | | | | | | | | |
SEE NOTES TO FINANCIAL STATEMENTS.
| | | | | | | | |
| | | |
| OCTOBER 31, 2020 | | J.P. MORGAN INTERNATIONAL EQUITY FUNDS | | | | | 75 | |
STATEMENTS OF CHANGES IN NET ASSETS
FOR THE PERIODS INDICATED (continued)
(Amounts in thousands)
| | | | | | | | | | | | | | | | |
| | |
| | | JPMorgan International Hedged Equity Fund | | | JPMorgan International Research
Enhanced Equity Fund | |
| | | Year Ended
October 31,
2020 | | | Period Ended
October 31, 2019 (a) | | | Year Ended
October 31,
2020 | | | Year Ended
October 31,
2019 | |
CHANGE IN NET ASSETS RESULTING FROM OPERATIONS: | | | | | | | | | | | | | | | | |
Net investment income (loss) | | $ | 2,110 | | | $ | 1,122 | | | $ | 115,593 | | | $ | 151,040 | |
Net realized gain (loss) | | | (16,164 | ) | | | 10 | | | | (384,441 | ) | | | (161,154 | ) |
Change in net unrealized appreciation/depreciation | | | 5,164 | | | | 1,073 | | | | (159,055 | ) | | | 483,831 | |
| | | | | | | | | | | | | | | | |
Change in net assets resulting from operations | | | (8,890 | ) | | | 2,205 | | | | (427,903 | ) | | | 473,717 | |
| | | | | | | | | | | | | | | | |
DISTRIBUTIONS TO SHAREHOLDERS: | | | | | | | | | | | | | | | | |
Class A | | | (5 | ) | | | — | | | | (5,482 | ) | | | (6,271 | ) |
Class C | | | (1 | ) | | | — | | | | — | | | | — | |
Class I | | | (1,362 | ) | | | — | | | | (6,829 | ) | | | (5,060 | ) |
Class R5 | | | — | (b) | | | — | | | | — | | | | — | |
Class R6 | | | (1 | ) | | | — | | | | (143,050 | ) | | | (149,729 | ) |
| | | | | | | | | | | | | | | | |
Total distributions to shareholders | | | (1,369 | ) | | | — | | | | (155,361 | ) | | | (161,060 | ) |
| | | | | | | | | | | | | | | | |
| | | | |
CAPITAL TRANSACTIONS: | | | | | | | | | | | | | | | | |
Change in net assets resulting from capital transactions | | | 87,285 | | | | 58,037 | | | | 611,139 | | | | (178,801 | ) |
| | | | | | | | | | | | | | | | |
|
NET ASSETS: | |
Change in net assets | | | 77,026 | | | | 60,242 | | | | 27,875 | | | | 133,856 | |
Beginning of period | | | 60,242 | | | | — | | | | 4,834,474 | | | | 4,700,618 | |
| | | | | | | | | | | | | | | | |
End of period | | $ | 137,268 | | | $ | 60,242 | | | $ | 4,862,349 | | | $ | 4,834,474 | |
| | | | | | | | | | | | | | | | |
| (a) | Commencement of operations was March 15, 2019. |
| (b) | Amount rounds to less than one thousand. |
SEE NOTES TO FINANCIAL STATEMENTS.
| | | | | | |
| | | |
| 76 | | | | J.P. MORGAN INTERNATIONAL EQUITY FUNDS | | OCTOBER 31, 2020 |
| | | | | | | | |
| | | JPMorgan International Value Fund | |
| | | Year Ended
October 31, 2020 | | | Year Ended
October 31, 2019 | |
CHANGE IN NET ASSETS RESULTING FROM OPERATIONS: | | | | | | | | |
Net investment income (loss) | | $ | 9,086 | | | $ | 16,269 | |
Net realized gain (loss) | | | (39,947 | ) | | | (46,232 | ) |
Change in net unrealized appreciation/depreciation | | | (40,074 | ) | | | 36,164 | |
| | | | | | | | |
Change in net assets resulting from operations | | | (70,935 | ) | | | 6,201 | |
| | | | | | | | |
DISTRIBUTIONS TO SHAREHOLDERS: | | | | | | | | |
Class A | | | (7,133 | ) | | | (7,451 | ) |
Class C | | | (299 | ) | | | (419 | ) |
Class I | | | (1,823 | ) | | | (2,481 | ) |
Class L | | | (1,237 | ) | | | (2,611 | ) |
Class R2 | | | (21 | ) | | | (40 | ) |
Class R5 | | | (4 | ) | | | (3 | ) |
Class R6 | | | (5,532 | ) | | | (5,309 | ) |
| | | | | | | | |
Total distributions to shareholders | | | (16,049 | ) | | | (18,314 | ) |
| | | | | | | | |
| | |
CAPITAL TRANSACTIONS: | | | | | | | | |
Change in net assets resulting from capital transactions | | | (38,424 | ) | | | (116,184 | ) |
| | | | | | | | |
|
NET ASSETS: | |
Change in net assets | | | (125,408 | ) | | | (128,297 | ) |
Beginning of period | | | 393,272 | | | | 521,569 | |
| | | | | | | | |
End of period | | $ | 267,864 | | | $ | 393,272 | |
| | | | | | | | |
SEE NOTES TO FINANCIAL STATEMENTS.
| | | | | | | | |
| | | |
| OCTOBER 31, 2020 | | J.P. MORGAN INTERNATIONAL EQUITY FUNDS | | | | | 77 | |
STATEMENTS OF CHANGES IN NET ASSETS
FOR THE PERIODS INDICATED (continued)
(Amounts in thousands)
| | | | | | | | | | | | | | | | |
| | | JPMorgan Emerging Markets Equity Fund | | | JPMorgan Emerging Markets
Research Enhanced Equity Fund | |
| | | Year Ended
October 31, 2020 | | | Year Ended
October 31, 2019 | | | Year Ended
October 31, 2020 | | | Period Ended
October 31, 2019 (a) | |
CAPITAL TRANSACTIONS: | | | | | | | | | | | | | | | | |
Class A | | | | | | | | | | | | | | | | |
Proceeds from shares issued | | $ | 396,625 | | | $ | 312,341 | | | $ | — | | | $ | — | |
Distributions reinvested | | | 3,026 | | | | 1,529 | | | | — | | | | — | |
Cost of shares redeemed | | | (433,578 | ) | | | (252,175 | ) | | | — | | | | — | |
| | | | | | | | | | | | | | | | |
Change in net assets resulting from Class A capital transactions | | $ | (33,927 | ) | | $ | 61,695 | | | $ | — | | | $ | — | |
| | | | | | | | | | | | | | | | |
Class C | | | | | | | | | | | | | | | | |
Proceeds from shares issued | | $ | 25,207 | | | $ | 19,144 | | | $ | — | | | $ | — | |
Distributions reinvested | | | 76 | | | | 58 | | | | — | | | | — | |
Cost of shares redeemed | | | (21,149 | ) | | | (17,205 | ) | | | — | | | | — | |
| | | | | | | | | | | | | | | | |
Change in net assets resulting from Class C capital transactions | | $ | 4,134 | | | $ | 1,997 | | | $ | — | | | $ | — | |
| | | | | | | | | | | | | | | | |
Class I (b) | | | | | | | | | | | | | | | | |
Proceeds from shares issued | | $ | 2,957,574 | | | $ | 1,177,539 | | | $ | 32 | | | $ | 12,188 | |
Distributions reinvested | | | 13,741 | | | | 5,945 | | | | — | (c) | | | — | |
Cost of shares redeemed | | | (1,376,247 | ) | | | (465,628 | ) | | | (6 | ) | | | (11,910 | ) |
| | | | | | | | | | | | | | | | |
Change in net assets resulting from Class I capital transactions | | $ | 1,595,068 | | | $ | 717,856 | | | $ | 26 | | | $ | 278 | |
| | | | | | | | | | | | | | | | |
Class L | | | | | | | | | | | | | | | | |
Proceeds from shares issued | | $ | 1,047,160 | | | $ | 534,452 | | | $ | — | | | $ | — | |
Distributions reinvested | | | 8,347 | | | | 3,845 | | | | — | | | | — | |
Cost of shares redeemed | | | (412,630 | ) | | | (228,859 | ) | | | — | | | | — | |
| | | | | | | | | | | | | | | | |
Change in net assets resulting from Class L capital transactions | | $ | 642,877 | | | $ | 309,438 | | | $ | — | | | $ | — | |
| | | | | | | | | | | | | | | | |
Class R2 | | | | | | | | | | | | | | | | |
Proceeds from shares issued | | $ | 281 | | | $ | 51 | | | $ | — | | | $ | — | |
Distributions reinvested | | | 1 | | | | 1 | | | | — | | | | — | |
Cost of shares redeemed | | | (78 | ) | | | (26 | ) | | | — | | | | — | |
| | | | | | | | | | | | | | | | |
Change in net assets resulting from Class R2 capital transactions | | $ | 204 | | | $ | 26 | | | $ | — | | | $ | — | |
| | | | | | | | | | | | | | | | |
Class R3 | | | | | | | | | | | | | | | | |
Proceeds from shares issued | | $ | 3,952 | | | $ | 2,108 | | | $ | — | | | $ | — | |
Distributions reinvested | | | 21 | | | | 1 | | | | — | | | | — | |
Cost of shares redeemed | | | (1,457 | ) | | | (478 | ) | | | — | | | | — | |
| | | | | | | | | | | | | | | | |
Change in net assets resulting from Class R3 capital transactions | | $ | 2,516 | | | $ | 1,631 | | | $ | — | | | $ | — | |
| | | | | | | | | | | | | | | | |
Class R4 | | | | | | | | | | | | | | | | |
Proceeds from shares issued | | $ | 2,143 | | | $ | 1,602 | | | $ | — | | | $ | — | |
Distributions reinvested | | | 11 | | | | 11 | | | | — | | | | — | |
Cost of shares redeemed | | | (1,072 | ) | | | (608 | ) | | | — | | | | — | |
| | | | | | | | | | | | | | | | |
Change in net assets resulting from Class R4 capital transactions | | $ | 1,082 | | | $ | 1,005 | | | $ | — | | | $ | — | |
| | | | | | | | | | | | | | | | |
Class R5 | | | | | | | | | | | | | | | | |
Proceeds from shares issued | | $ | 24,137 | | | $ | 42,685 | | | $ | — | | | $ | — | |
Distributions reinvested | | | 349 | | | | 296 | | | | — | | | | — | |
Cost of shares redeemed | | | (18,654 | ) | | | (9,680 | ) | | | — | | | | — | |
| | | | | | | | | | | | | | | | |
Change in net assets resulting from Class R5 capital transactions | | $ | 5,832 | | | $ | 33,301 | | | $ | — | | | $ | — | |
| | | | | | | | | | | | | | | | |
Class R6 | | | | | | | | | | | | | | | | |
Proceeds from shares issued | | $ | 2,138,500 | | | $ | 1,266,740 | | | $ | 1,073,935 | | | $ | 2,052,510 | |
Distributions reinvested | | | 28,461 | | | | 30,363 | | | | 24,046 | | | | 26 | |
Cost of shares redeemed | | | (1,416,338 | ) | | | (1,907,780 | ) | | | (539,564 | ) | | | (16,759 | ) |
| | | | | | | | | | | | | | | | |
Change in net assets resulting from Class R6 capital transactions | | $ | 750,623 | | | $ | (610,677 | ) | | $ | 558,417 | | | $ | 2,035,777 | |
| | | | | | | | | | | | | | | | |
Total change in net assets resulting from capital transactions | | $ | 2,968,409 | | | $ | 516,272 | | | $ | 558,443 | | | $ | 2,036,055 | |
| | | | | | | | | | | | | | | | |
| (a) | Commencement of operations was December 11, 2018. |
| (b) | Commencement of offering of class of shares effective January 30, 2019 for JPMorgan Emerging Markets Research Enhanced Equity Fund. |
| (c) | Amount rounds to less than one thousand. |
SEE NOTES TO FINANCIAL STATEMENTS.
| | | | | | |
| | | |
| 78 | | | | J.P. MORGAN INTERNATIONAL EQUITY FUNDS | | OCTOBER 31, 2020 |
| | | | | | | | | | | | | | | | |
| | | JPMorgan
Emerging Markets Equity Fund | | | JPMorgan Emerging Markets
Research Enhanced Equity Fund | |
| | | Year Ended
October 31, 2020 | | | Year Ended
October 31, 2019 | | | Year Ended
October 31, 2020 | | | Period Ended
October 31, 2019 (a) | |
SHARE TRANSACTIONS: | | | | | | | | | | | | | | | | |
Class A | | | | | | | | | | | | | | | | |
Issued | | | 12,772 | | | | 11,352 | | | | — | | | | — | |
Reinvested | | | 95 | | | | 64 | | | | — | | | | — | |
Redeemed | | | (14,443 | ) | | | (9,475 | ) | | | — | | | | — | |
| | | | | | | | | | | | | | | | |
Change in Class A Shares | | | (1,576 | ) | | | 1,941 | | | | — | | | | — | |
| | | | | | | | | | | | | | | | |
Class C | | | | | | | | | | | | | | | | |
Issued | | | 824 | | | | 712 | | | | — | | | | — | |
Reinvested | | | 2 | | | | 3 | | | | — | | | | — | |
Redeemed | | | (725 | ) | | | (650 | ) | | | — | | | | — | |
| | | | | | | | | | | | | | | | |
Change in Class C Shares | | | 101 | | | | 65 | | | | — | | | | — | |
| | | | | | | | | | | | | | | | |
Class I (b) | | | | | | | | | | | | | | | | |
Issued | | | 95,381 | | | | 41,001 | | | | 2 | | | | 744 | |
Reinvested | | | 423 | | | | 243 | | | | — | (c) | | | — | |
Redeemed | | | (44,282 | ) | | | (16,821 | ) | | | — | (c) | | | (744 | ) |
| | | | | | | | | | | | | | | | |
Change in Class I Shares | | | 51,522 | | | | 24,423 | | | | 2 | | | | — | (c) |
| | | | | | | | | | | | | | | | |
Class L | | | | | | | | | | | | | | | | |
Issued | | | 33,441 | | | | 18,682 | | | | — | | | | — | |
Reinvested | | | 255 | | | | 156 | | | | — | | | | — | |
Redeemed | | | (13,684 | ) | | | (8,295 | ) | | | — | | | | — | |
| | | | | | | | | | | | | | | | |
Change in Class L Shares | | | 20,012 | | | | 10,543 | | | | — | | | | — | |
| | | | | | | | | | | | | | | | |
Class R2 | | | | | | | | | | | | | | | | |
Issued | | | 8 | | | | 2 | | | | — | | | | — | |
Reinvested | | | — | (c) | | | — | (c) | | | — | | | | — | |
Redeemed | | | (2 | ) | | | (1 | ) | | | — | | | | — | |
| | | | | | | | | | | | | | | | |
Change in Class R2 Shares | | | 6 | | | | 1 | | | | — | | | | — | |
| | | | | | | | | | | | | | | | |
Class R3 | | | | | | | | | | | | | | | | |
Issued | | | 133 | | | | 75 | | | | — | | | | — | |
Reinvested | | | 1 | | | | — | (c) | | | — | | | | — | |
Redeemed | | | (46 | ) | | | (17 | ) | | | — | | | | — | |
| | | | | | | | | | | | | | | | |
Change in Class R3 Shares | | | 88 | | | | 58 | | | | — | | | | — | |
| | | | | | | | | | | | | | | | |
Class R4 | | | | | | | | | | | | | | | | |
Issued | | | 70 | | | | 62 | | | | — | | | | — | |
Reinvested | | | — | (c) | | | — | (c) | | | — | | | | — | |
Redeemed | | | (32 | ) | | | (21 | ) | | | — | | | | — | |
| | | | | | | | | | | | | | | | |
Change in Class R4 Shares | | | 38 | | | | 41 | | | | — | | | | — | |
| | | | | | | | | | | | | | | | |
Class R5 | | | | | | | | | | | | | | | | |
Issued | | | 754 | | | | 1,616 | | | | — | | | | — | |
Reinvested | | | 11 | | | | 12 | | | | — | | | | — | |
Redeemed | | | (575 | ) | | | (344 | ) | | | — | | | | — | |
| | | | | | | | | | | | | | | | |
Change in Class R5 Shares | | | 190 | | | | 1,284 | | | | — | | | | — | |
| | | | | | | | | | | | | | | | |
Class R6 | | | | | | | | | | | | | | | | |
Issued | | | 67,487 | | | | 43,818 | | | | 63,278 | | | | 125,486 | |
Reinvested | | | 871 | | | | 1,233 | | | | 1,356 | | | | 2 | |
Redeemed | | | (43,707 | ) | | | (66,518 | ) | | | (31,422 | ) | | | (1,027 | ) |
| | | | | | | | | | | | | | | | |
Change in Class R6 Shares | | | 24,651 | | | | (21,467 | ) | | | 33,212 | | | | 124,461 | |
| | | | | | | | | | | | | | | | |
| (a) | Commencement of operations was December 11, 2018. |
| (b) | Commencement of offering of class of shares effective January 30, 2019 for JPMorgan Emerging Markets Research Enhanced Equity Fund. |
| (c) | Amount rounds to less than one thousand. |
SEE NOTES TO FINANCIAL STATEMENTS.
| | | | | | | | |
| | | |
| OCTOBER 31, 2020 | | J.P. MORGAN INTERNATIONAL EQUITY FUNDS | | | | | 79 | |
STATEMENTS OF CHANGES IN NET ASSETS
FOR THE PERIODS INDICATED (continued)
(Amounts in thousands)
| | | | | | | | | | | | | | | | |
| | | JPMorgan Europe Dynamic Fund | | | JPMorgan International Advantage Fund | |
| | | Year Ended
October 31, 2020 | | | Year Ended
October 31, 2019 | | | Year Ended
October 31, 2020 | | | Year Ended
October 31, 2019 | |
CAPITAL TRANSACTIONS: | | | | | | | | | | | | | | | | |
Class A | | | | | | | | | | | | | | | | |
Proceeds from shares issued | | $ | 3,883 | | | $ | 5,583 | | | $ | 54,786 | | | $ | 38,451 | |
Distributions reinvested | | | 2,695 | | | | 2,751 | | | | 8,609 | | | | 3,422 | |
Cost of shares redeemed | | | (24,956 | ) | | | (39,739 | ) | | | (175,827 | ) | | | (45,280 | ) |
| | | | | | | | | | | | | | | | |
Change in net assets resulting from Class A capital transactions | | $ | (18,378 | ) | | $ | (31,405 | ) | | $ | (112,432 | ) | | $ | (3,407 | ) |
| | | | | | | | | | | | | | | | |
Class C | | | | | | | | | | | | | | | | |
Proceeds from shares issued | | $ | 157 | | | $ | 246 | | | $ | 149 | | | $ | 175 | |
Distributions reinvested | | | 476 | | | | 552 | | | | 54 | | | | 25 | |
Cost of shares redeemed | | | (7,338 | ) | | | (12,991 | ) | | | (457 | ) | | | (662 | ) |
| | | | | | | | | | | | | | | | |
Change in net assets resulting from Class C capital transactions | | $ | (6,705 | ) | | $ | (12,193 | ) | | $ | (254 | ) | | $ | (462 | ) |
| | | | | | | | | | | | | | | | |
Class I | | | | | | | | | | | | | | | | |
Proceeds from shares issued | | $ | 5,175 | | | $ | 10,005 | | | $ | 46,199 | | | $ | 19,041 | |
Distributions reinvested | | | 2,443 | | | | 3,023 | | | | 5,375 | | | | 1,457 | |
Cost of shares redeemed | | | (31,660 | ) | | | (69,458 | ) | | | (73,498 | ) | | | (15,652 | ) |
| | | | | | | | | | | | | | | | |
Change in net assets resulting from Class I capital transactions | | $ | (24,042 | ) | | $ | (56,430 | ) | | $ | (21,924 | ) | | $ | 4,846 | |
| | | | | | | | | | | | | | | | |
Class L | | | | | | | | | | | | | | | | |
Proceeds from shares issued | | $ | 11,572 | | | $ | 13,398 | | | $ | — | | | $ | — | |
Distributions reinvested | | | 2,057 | | | | 2,405 | | | | — | | | | — | |
Cost of shares redeemed | | | (16,771 | ) | | | (346,212 | ) | | | — | | | | — | |
| | | | | | | | | | | | | | | | |
Change in net assets resulting from Class L capital transactions | | $ | (3,142 | ) | | $ | (330,409 | ) | | $ | — | | | $ | — | |
| | | | | | | | | | | | | | | | |
Class R2 | | | | | | | | | | | | | | | | |
Proceeds from shares issued | | $ | — | | | $ | — | | | $ | 5,889 | | | $ | 6,565 | |
Distributions reinvested | | | — | | | | — | | | | 1,448 | | | | 631 | |
Cost of shares redeemed | | | — | | | | — | | | | (30,168 | ) | | | (8,605 | ) |
| | | | | | | | | | | | | | | | |
Change in net assets resulting from Class R2 capital transactions | | $ | — | | | $ | — | | | $ | (22,831 | ) | | $ | (1,409 | ) |
| | | | | | | | | | | | | | | | |
Class R6 | | | | | | | | | | | | | | | | |
Proceeds from shares issued | | $ | 7,681 | | | $ | 294,863 | | | $ | 227,822 | | | $ | 108,992 | |
Distributions reinvested | | | 8,878 | | | | 7,813 | | | | 92,498 | | | | 82,457 | |
Cost of shares redeemed | | | (8,836 | ) | | | (42,130 | ) | | | (161,597 | ) | | | (1,807,278 | ) |
| | | | | | | | | | | | | | | | |
Change in net assets resulting from Class R6 capital transactions | | $ | 7,723 | | | $ | 260,546 | | | $ | 158,723 | | | $ | (1,615,829 | ) |
| | | | | | | | | | | | | | | | |
Total change in net assets resulting from capital transactions | | $ | (44,544 | ) | | $ | (169,891 | ) | | $ | 1,282 | | | $ | (1,616,261 | ) |
| | | | | | | | | | | | | | | | |
SEE NOTES TO FINANCIAL STATEMENTS.
| | | | | | |
| | | |
| 80 | | | | J.P. MORGAN INTERNATIONAL EQUITY FUNDS | | OCTOBER 31, 2020 |
| | | | | | | | | | | | | | | | |
| | | JPMorgan Europe Dynamic Fund | | | JPMorgan International Advantage Fund | |
| | | Year Ended
October 31, 2020 | | | Year Ended
October 31, 2019 | | | Year Ended
October 31, 2020 | | | Year Ended
October 31, 2019 | |
SHARE TRANSACTIONS: | |
Class A | |
Issued | | | 171 | | | | 248 | | | | 2,745 | | | | 2,015 | |
Reinvested | | | 110 | | | | 131 | | | | 438 | | | | 193 | |
Redeemed | | | (1,151 | ) | | | (1,745 | ) | | | (10,687 | ) | | | (2,379 | ) |
| | | | | | | | | | | | | | | | |
Change in Class A Shares | | | (870 | ) | | | (1,366 | ) | | | (7,504 | ) | | | (171 | ) |
| | | | | | | | | | | | | | | | |
Class C | |
Issued | | | 8 | | | | 12 | | | | 8 | | | | 8 | |
Reinvested | | | 22 | | | | 30 | | | | 3 | | | | 2 | |
Redeemed | | | (372 | ) | | | (646 | ) | | | (26 | ) | | | (34 | ) |
| | | | | | | | | | | | | | | | |
Change in Class C Shares | | | (342 | ) | | | (604 | ) | | | (15 | ) | | | (24 | ) |
| | | | | | | | | | | | | | | | |
Class I | |
Issued | | | 220 | | | | 440 | | | | 2,218 | | | | 962 | |
Reinvested | | | 97 | | | | 141 | | | | 262 | | | | 79 | |
Redeemed | | | (1,425 | ) | | | (3,038 | ) | | | (4,516 | ) | | | (792 | ) |
| | | | | | | | | | | | | | | | |
Change in Class I Shares | | | (1,108 | ) | | | (2,457 | ) | | | (2,036 | ) | | | 249 | |
| | | | | | | | | | | | | | | | |
Class L | |
Issued | | | 539 | | | | 577 | | | | — | | | | — | |
Reinvested | | | 81 | | | | 111 | | | | — | | | | — | |
Redeemed | | | (758 | ) | | | (14,510 | ) | | | — | | | | — | |
| | | | | | | | | | | | | | | | |
Change in Class L Shares | | | (138 | ) | | | (13,822 | ) | | | — | | | | — | |
| | | | | | | | | | | | | | | | |
Class R2 | |
Issued | | | — | | | | — | | | | 339 | | | | 348 | |
Reinvested | | | — | | | | — | | | | 75 | | | | 36 | |
Redeemed | | | — | | | | — | | | | (1,690 | ) | | | (455 | ) |
| | | | | | | | | | | | | | | | |
Change in Class R2 Shares | | | — | | | | — | | | | (1,276 | ) | | | (71 | ) |
| | | | | | | | | | | | | | | | |
Class R6 | |
Issued | | | 382 | | | | 12,295 | | | | 11,248 | | | | 5,671 | |
Reinvested | | | 352 | | | | 363 | | | | 4,595 | | | | 4,558 | |
Redeemed | | | (394 | ) | | | (1,764 | ) | | | (8,582 | ) | | | (91,586 | ) |
| | | | | | | | | | | | | | | | |
Change in Class R6 Shares | | | 340 | | | | 10,894 | | | | 7,261 | | | | (81,357 | ) |
| | | | | | | | | | | | | | | | |
SEE NOTES TO FINANCIAL STATEMENTS.
| | | | | | | | |
| | | |
| OCTOBER 31, 2020 | | J.P. MORGAN INTERNATIONAL EQUITY FUNDS | | | | | 81 | |
STATEMENTS OF CHANGES IN NET ASSETS
FOR THE PERIODS INDICATED (continued)
(Amounts in thousands)
| | | | | | | | | | | | | | | | |
| | | JPMorgan International Equity Fund | | | JPMorgan International Focus Fund
(formerly known as JPMorgan
International Unconstrained Equity Fund) | |
| | | Year Ended
October 31, 2020 | | | Year Ended
October 31, 2019 | | | Year Ended
October 31, 2020 | | | Year Ended
October 31, 2019 | |
CAPITAL TRANSACTIONS: | | | | | | | | | | | | | | | | |
Class A | | | | | | | | | | | | | | | | |
Proceeds from shares issued | | $ | 169,254 | | | $ | 125,560 | | | $ | 45,058 | | | $ | 47,607 | |
Distributions reinvested | | | 9,447 | | | | 8,068 | | | | 45 | | | | 1,609 | |
Cost of shares redeemed | | | (221,474 | ) | | | (76,633 | ) | | | (28,905 | ) | | | (32,948 | ) |
| | | | | | | | | | | | | | | | |
Change in net assets resulting from Class A capital transactions | | $ | (42,773 | ) | | $ | 56,995 | | | $ | 16,198 | | | $ | 16,268 | |
| | | | | | | | | | | | | | | | |
Class C | | | | | | | | | | | | | | | | |
Proceeds from shares issued | | $ | 1,292 | | | $ | 2,176 | | | $ | 2,592 | | | $ | 2,738 | |
Distributions reinvested | | | 324 | | | | 495 | | | | — | | | | 294 | |
Cost of shares redeemed | | | (6,218 | ) | | | (8,733 | ) | | | (5,887 | ) | | | (10,067 | ) |
| | | | | | | | | | | | | | | | |
Change in net assets resulting from Class C capital transactions | | $ | (4,602 | ) | | $ | (6,062 | ) | | $ | (3,295 | ) | | $ | (7,035 | ) |
| | | | | | | | | | | | | | | | |
Class I | | | | | | | | | | | | | | | | |
Proceeds from shares issued | | $ | 268,211 | | | $ | 77,428 | | | $ | 291,678 | | | $ | 86,285 | |
Distributions reinvested | | | 6,146 | | | | 5,819 | | | | 415 | | | | 3,656 | |
Cost of shares redeemed | | | (119,723 | ) | | | (90,398 | ) | | | (100,152 | ) | | | (125,224 | ) |
| | | | | | | | | | | | | | | | |
Change in net assets resulting from Class I capital transactions | | $ | 154,634 | | | $ | (7,151 | ) | | $ | 191,941 | | | $ | (35,283 | ) |
| | | | | | | | | | | | | | | | |
Class R2 | | | | | | | | | | | | | | | | |
Proceeds from shares issued | | $ | 21,952 | | | $ | 1,194 | | | $ | 851 | | | $ | 494 | |
Distributions reinvested | | | 59 | | | | 29 | | | | — | | | | 15 | |
Cost of shares redeemed | | | (1,444 | ) | | | (1,136 | ) | | | (499 | ) | | | (377 | ) |
| | | | | | | | | | | | | | | | |
Change in net assets resulting from Class R2 capital transactions | | $ | 20,567 | | | $ | 87 | | | $ | 352 | | | $ | 132 | |
| | | | | | | | | | | | | | | | |
Class R5 | | | | | | | | | | | | | | | | |
Proceeds from shares issued | | $ | 5,313 | | | $ | 744 | | | $ | 506 | | | $ | 603 | |
Distributions reinvested | | | 123 | | | | 691 | | | | 9 | | | | 72 | |
Cost of shares redeemed | | | (1,904 | ) | | | (18,958 | ) | | | (962 | ) | | | (1,414 | ) |
| | | | | | | | | | | | | | | | |
Change in net assets resulting from Class R5 capital transactions | | $ | 3,532 | | | $ | (17,523 | ) | | $ | (447 | ) | | $ | (739 | ) |
| | | | | | | | | | | | | | | | |
Class R6 | | | | | | | | | | | | | | | | |
Proceeds from shares issued | | $ | 357,449 | | | $ | 458,174 | | | $ | 289,243 | | | $ | 2,126,631 | |
Distributions reinvested | | | 80,145 | | | | 140,364 | | | | 10,047 | | | | 4,394 | |
Cost of shares redeemed | | | (493,483 | ) | | | (2,318,655 | ) | | | (414,546 | ) | | | (113,994 | ) |
| | | | | | | | | | | | | | | | |
Change in net assets resulting from Class R6 capital transactions | | $ | (55,889 | ) | | $ | (1,720,117 | ) | | $ | (115,256 | ) | | $ | 2,017,031 | |
| | | | | | | | | | | | | | | | |
Total change in net assets resulting from capital transactions | | $ | 75,469 | | | $ | (1,693,771 | ) | | $ | 89,493 | | | $ | 1,990,374 | |
| | | | | | | | | | | | | | | | |
SEE NOTES TO FINANCIAL STATEMENTS.
| | | | | | |
| | | |
| 82 | | | | J.P. MORGAN INTERNATIONAL EQUITY FUNDS | | OCTOBER 31, 2020 |
| | | | | | | | | | | | | | | | |
| | | JPMorgan International Equity Fund | | | JPMorgan International Focus Fund
(formerly known as JPMorgan
International Unconstrained Equity Fund) | |
| | | Year Ended
October 31, 2020 | | | Year Ended
October 31, 2019 | | | Year Ended
October 31, 2020 | | | Year Ended
October 31, 2019 | |
SHARE TRANSACTIONS: | | | | | | | | | | | | | | | | |
Class A | | | | | | | | | | | | | | | | |
Issued | | | 10,373 | | | | 7,833 | | | | 2,122 | | | | 2,430 | |
Reinvested | | | 541 | | | | 554 | | | | 2 | | | | 93 | |
Redeemed | | | (13,903 | ) | | | (4,832 | ) | | | (1,405 | ) | | | (1,724 | ) |
| | | | | | | | | | | | | | | | |
Change in Class A Shares | | | (2,989 | ) | | | 3,555 | | | | 719 | | | | 799 | |
| | | | | | | | | | | | | | | | |
Class C | | | | | | | | | | | | | | | | |
Issued | | | 87 | | | | 147 | | | | 121 | | | | 141 | |
Reinvested | | | 20 | | | | 36 | | | | — | | | | 17 | |
Redeemed | | | (397 | ) | | | (577 | ) | | | (292 | ) | | | (527 | ) |
| | | | | | | | | | | | | | | | |
Change in Class C Shares | | | (290 | ) | | | (394 | ) | | | (171 | ) | | | (369 | ) |
| | | | | | | | | | | | | | | | |
Class I | | | | | | | | | | | | | | | | |
Issued | | | 16,370 | | | | 4,793 | | | | 13,175 | | | | 4,374 | |
Reinvested | | | 346 | | | | 394 | | | | 18 | | | | 209 | |
Redeemed | | | (7,334 | ) | | | (5,690 | ) | | | (4,869 | ) | | | (6,516 | ) |
| | | | | | | | | | | | | | | | |
Change in Class I Shares | | | 9,382 | | | | (503 | ) | | | 8,324 | | | | (1,933 | ) |
| | | | | | | | | | | | | | | | |
Class R2 | | | | | | | | | | | | | | | | |
Issued | | | 1,274 | | | | 74 | | | | 42 | | | | 25 | |
Reinvested | | | 3 | | | | 2 | | | | — | | | | 1 | |
Redeemed | | | (88 | ) | | | (73 | ) | | | (26 | ) | | | (19 | ) |
| | | | | | | | | | | | | | | | |
Change in Class R2 Shares | | | 1,189 | | | | 3 | | | | 16 | | | | 7 | |
| | | | | | | | | | | | | | | | |
Class R5 | | | | | | | | | | | | | | | | |
Issued | | | 306 | | | | 45 | | | | 23 | | | | 30 | |
Reinvested | | | 7 | | | | 47 | | | | 1 | | | | 4 | |
Redeemed | | | (114 | ) | | | (1,108 | ) | | | (44 | ) | | | (71 | ) |
| | | | | | | | | | | | | | | | |
Change in Class R5 Shares | | | 199 | | | | (1,016 | ) | | | (20 | ) | | | (37 | ) |
| | | | | | | | | | | | | | | | |
Class R6 | | | | | | | | | | | | | | | | |
Issued | | | 21,701 | | | | 27,715 | | | | 13,486 | | | | 102,465 | |
Reinvested | | | 4,510 | | | | 9,522 | | | | 444 | | | | 252 | |
Redeemed | | | (29,522 | ) | | | (137,801 | ) | | | (18,953 | ) | | | (5,610 | ) |
| | | | | | | | | | | | | | | | |
Change in Class R6 Shares | | | (3,311 | ) | | | (100,564 | ) | | | (5,023 | ) | | | 97,107 | |
| | | | | | | | | | | | | | | | |
SEE NOTES TO FINANCIAL STATEMENTS.
| | | | | | | | |
| | | |
| OCTOBER 31, 2020 | | J.P. MORGAN INTERNATIONAL EQUITY FUNDS | | | | | 83 | |
STATEMENTS OF CHANGES IN NET ASSETS
FOR THE PERIODS INDICATED (continued)
(Amounts in thousands)
| | | | | | | | | | | | | | | | |
| | | JPMorgan International Hedged
Equity Fund | | | JPMorgan International Research
Enhanced Equity Fund | |
| | | Year Ended
October 31, 2020 | | | Period Ended
October 31, 2019 (a) | | | Year Ended
October 31, 2020 | | | Year Ended
October 31, 2019 | |
CAPITAL TRANSACTIONS: | | | | | | | | | | | | | | | | |
Class A | | | | | | | | | | | | | | | | |
Proceeds from shares issued | | $ | 1,699 | | | $ | 321 | | | $ | 204,761 | | | $ | 51,799 | |
Distributions reinvested | | | 5 | | | | — | | | | 5,420 | | | | 6,196 | |
Cost of shares redeemed | | | (397 | ) | | | — | | | | (359,092 | ) | | | (62,547 | ) |
| | | | | | | | | | | | | | | | |
Change in net assets resulting from Class A capital transactions | | $ | 1,307 | | | $ | 321 | | | $ | (148,911 | ) | | $ | (4,552 | ) |
| | | | | | | | | | | | | | | | |
Class C | | | | | | | | | | | | | | | | |
Proceeds from shares issued | | $ | 7 | | | $ | 118 | | | $ | — | | | $ | — | |
Distributions reinvested | | | 1 | | | | — | | | | — | | | | — | |
Cost of shares redeemed | | | (1 | ) | | | — | | | | — | | | | — | |
| | | | | | | | | | | | | | | | |
Change in net assets resulting from Class C capital transactions | | $ | 7 | | | $ | 118 | | | $ | — | | | $ | — | |
| | | | | | | | | | | | | | | | |
Class I | | | | | | | | | | | | | | | | |
Proceeds from shares issued | | $ | 109,266 | | | $ | 57,561 | | | $ | 542,183 | | | $ | 82,525 | |
Distributions reinvested | | | 1,362 | | | | — | | | | 6,822 | | | | 5,050 | |
Cost of shares redeemed | | | (24,658 | ) | | | (3 | ) | | | (236,810 | ) | | | (66,489 | ) |
| | | | | | | | | | | | | | | | |
Change in net assets resulting from Class I capital transactions | | $ | 85,970 | | | $ | 57,558 | | | $ | 312,195 | | | $ | 21,086 | |
| | | | | | | | | | | | | | | | |
Class R5 | | | | | | | | | | | | | | | | |
Proceeds from shares issued | | $ | — | (b) | | $ | 20 | | | $ | — | | | $ | — | |
Distributions reinvested | | | — | (b) | | | — | | | | — | | | | — | |
Cost of shares redeemed | | | — | (b) | | | — | | | | — | | | | — | |
| | | | | | | | | | | | | | | | |
Change in net assets resulting from Class R5 capital transactions | | $ | — | (b) | | $ | 20 | | | $ | — | | | $ | — | |
| | | | | | | | | | | | | | | | |
Class R6 | | | | | | | | | | | | | | | | |
Proceeds from shares issued | | $ | — | (b) | | $ | 20 | | | $ | 899,967 | | | $ | 567,656 | |
Distributions reinvested | | | 1 | | | | — | | | | 143,050 | | | | 149,727 | |
Cost of shares redeemed | | | — | (b) | | | — | | | | (595,162 | ) | | | (912,718 | ) |
| | | | | | | | | | | | | | | | |
Change in net assets resulting from Class R6 capital transactions | | $ | 1 | | | $ | 20 | | | $ | 447,855 | | | $ | (195,335 | ) |
| | | | | | | | | | | | | | | | |
Total change in net assets resulting from capital transactions | | $ | 87,285 | | | $ | 58,037 | | | $ | 611,139 | | | $ | (178,801 | ) |
| | | | | | | | | | | | | | | | |
| (a) | Commencement of operations was March 15, 2019. |
| (b) | Amount rounds to less than one thousand. |
SEE NOTES TO FINANCIAL STATEMENTS.
| | | | | | |
| | | |
| 84 | | | | J.P. MORGAN INTERNATIONAL EQUITY FUNDS | | OCTOBER 31, 2020 |
| | | | | | | | | | | | | | | | |
| | | JPMorgan International Hedged
Equity Fund | | | JPMorgan International Research
Enhanced Equity Fund | |
| | | Year Ended
October 31, 2020 | | | Period Ended
October 31, 2019 (a) | | | Year Ended
October 31, 2020 | | | Year Ended
October 31, 2019 | |
SHARE TRANSACTIONS: | | | | | | | | | | | | | | | | |
Class A | | | | | | | | | | | | | | | | |
Issued | | | 117 | | | | 21 | | | | 13,389 | | | | 3,097 | |
Reinvested | | | — | (b) | | | — | | | | 298 | | | | 402 | |
Redeemed | | | (27 | ) | | | — | | | | (22,291 | ) | | | (3,722 | ) |
| | | | | | | | | | | | | | | | |
Change in Class A Shares | | | 90 | | | | 21 | | | | (8,604 | ) | | | (223 | ) |
| | | | | | | | | | | | | | | | |
Class C | | | | | | | | | | | | | | | | |
Issued | | | — | (b) | | | 8 | | | | — | | | | — | |
Reinvested | | | — | (b) | | | — | | | | — | | | | — | |
Redeemed | | | — | (b) | | | — | | | | — | | | | — | |
| | | | | | | | | | | | | | | | |
Change in Class C Shares | | | — | (b) | | | 8 | | | | — | | | | — | |
| | | | | | | | | | | | | | | | |
Class I | | | | | | | | | | | | | | | | |
Issued | | | 7,402 | | | | 3,829 | | | | 33,409 | | | | 4,837 | |
Reinvested | | | 86 | | | | — | | | | 371 | | | | 324 | |
Redeemed | | | (1,758 | ) | | | — | (b) | | | (14,565 | ) | | | (3,915 | ) |
| | | | | | | | | | | | | | | | |
Change in Class I Shares | | | 5,730 | | | | 3,829 | | | | 19,215 | | | | 1,246 | |
| | | | | | | | | | | | | | | | |
Class R5 | | | | | | | | | | | | | | | | |
Issued | | | — | | | | 1 | | | | — | | | | — | |
Reinvested | | | — | (b) | | | — | | | | — | | | | — | |
| | | | | | | | | | | | | | | | |
Change in Class R5 Shares | | | — | (b) | | | 1 | | | | — | | | | — | |
| | | | | | | | | | | | | | | | |
Class R6 | | | | | | | | | | | | | | | | |
Issued | | | — | | | | 1 | | | | 53,807 | | | | 32,819 | |
Reinvested | | | 1 | | | | — | | | | 7,817 | | | | 9,647 | |
Redeemed | | | — | | | | — | | | | (35,464 | ) | | | (53,561 | ) |
| | | | | | | | | | | | | | | | |
Change in Class R6 Shares | | | 1 | | | | 1 | | | | 26,160 | | | | (11,095 | ) |
| | | | | | | | | | | | | | | | |
| (a) | Commencement of operations was March 15, 2019. |
| (b) | Amount rounds to less than one thousand. |
SEE NOTES TO FINANCIAL STATEMENTS.
| | | | | | | | |
| | | |
| OCTOBER 31, 2020 | | J.P. MORGAN INTERNATIONAL EQUITY FUNDS | | | | | 85 | |
STATEMENTS OF CHANGES IN NET ASSETS
FOR THE PERIODS INDICATED (continued)
(Amounts in thousands)
| | | | | | | | |
| | | JPMorgan International Value Fund | |
| | | Year Ended
October 31, 2020 | | | Year Ended
October 31, 2019 | |
CAPITAL TRANSACTIONS: | | | | | | | | |
Class A | | | | | | | | |
Proceeds from shares issued | | $ | 21,982 | | | $ | 27,178 | |
Distributions reinvested | | | 7,043 | | | | 7,349 | |
Cost of shares redeemed | | | (43,855 | ) | | | (90,605 | ) |
| | | | | | | | |
Change in net assets resulting from Class A capital transactions | | $ | (14,830 | ) | | $ | (56,078 | ) |
| | | | | | | | |
Class C | | | | | | | | |
Proceeds from shares issued | | $ | 250 | | | $ | 419 | |
Distributions reinvested | | | 270 | | | | 378 | |
Cost of shares redeemed | | | (3,916 | ) | | | (5,138 | ) |
| | | | | | | | |
Change in net assets resulting from Class C capital transactions | | $ | (3,396 | ) | | $ | (4,341 | ) |
| | | | | | | | |
Class I | | | | | | | | |
Proceeds from shares issued | | $ | 5,772 | | | $ | 8,440 | |
Distributions reinvested | | | 1,679 | | | | 2,109 | |
Cost of shares redeemed | | | (15,094 | ) | | | (29,305 | ) |
| | | | | | | | |
Change in net assets resulting from Class I capital transactions | | $ | (7,643 | ) | | $ | (18,756 | ) |
| | | | | | | | |
Class L | | | | | | | | |
Proceeds from shares issued | | $ | 1,161 | | | $ | 2,046 | |
Distributions reinvested | | | 569 | | | | 762 | |
Cost of shares redeemed | | | (20,800 | ) | | | (42,881 | ) |
| | | | | | | | |
Change in net assets resulting from Class L capital transactions | | $ | (19,070 | ) | | $ | (40,073 | ) |
| | | | | | | | |
Class R2 | | | | | | | | |
Proceeds from shares issued | | $ | 151 | | | $ | 312 | |
Distributions reinvested | | | 17 | | | | 15 | |
Cost of shares redeemed | | | (319 | ) | | | (590 | ) |
| | | | | | | | |
Change in net assets resulting from Class R2 capital transactions | | $ | (151 | ) | | $ | (263 | ) |
| | | | | | | | |
Class R5 | | | | | | | | |
Proceeds from shares issued | | $ | 42 | | | $ | 16 | |
Distributions reinvested | | | 4 | | | | 3 | |
Cost of shares redeemed | | | (36 | ) | | | — | (a) |
| | | | | | | | |
Change in net assets resulting from Class R5 capital transactions | | $ | 10 | | | $ | 19 | |
| | | | | | | | |
Class R6 | | | | | | | | |
Proceeds from shares issued | | $ | 45,862 | | | $ | 40,286 | |
Distributions reinvested | | | 5,075 | | | | 4,629 | |
Cost of shares redeemed | | | (44,281 | ) | | | (41,607 | ) |
| | | | | | | | |
Change in net assets resulting from Class R6 capital transactions | | $ | 6,656 | | | $ | 3,308 | |
| | | | | | | | |
Total change in net assets resulting from capital transactions | | $ | (38,424 | ) | | $ | (116,184 | ) |
| | | | | | | | |
| (a) | Amount rounds to less than one thousand. |
SEE NOTES TO FINANCIAL STATEMENTS.
| | | | | | |
| | | |
| 86 | | | | J.P. MORGAN INTERNATIONAL EQUITY FUNDS | | OCTOBER 31, 2020 |
| | | | | | | | |
| | | JPMorgan International Value Fund | |
| | | Year Ended
October 31, 2020 | | | Year Ended
October 31, 2019 | |
SHARE TRANSACTIONS: | | | | | | | | |
Class A | | | | | | | | |
Issued | | | 2,106 | | | | 2,279 | |
Reinvested | | | 572 | | | | 663 | |
Redeemed | | | (4,229 | ) | | | (7,568 | ) |
| | | | | | | | |
Change in Class A Shares | | | (1,551 | ) | | | (4,626 | ) |
| | | | | | | | |
Class C | | | | | | | | |
Issued | | | 24 | | | | 37 | |
Reinvested | | | 23 | | | | 35 | |
Redeemed | | | (379 | ) | | | (449 | ) |
| | | | | | | | |
Change in Class C Shares | | | (332 | ) | | | (377 | ) |
| | | | | | | | |
Class I | | | | | | | | |
Issued | | | 509 | | | | 695 | |
Reinvested | | | 133 | | | | 186 | |
Redeemed | | | (1,512 | ) | | | (2,449 | ) |
| | | | | | | | |
Change in Class I Shares | | | (870 | ) | | | (1,568 | ) |
| | | | | | | | |
Class L | | | | | | | | |
Issued | | | 105 | | | | 184 | |
Reinvested | | | 46 | | | | 67 | |
Redeemed | | | (2,000 | ) | | | (3,624 | ) |
| | | | | | | | |
Change in Class L Shares | | | (1,849 | ) | | | (3,373 | ) |
| | | | | | | | |
Class R2 | | | | | | | | |
Issued | | | 15 | | | | 27 | |
Reinvested | | | 1 | | | | 1 | |
Redeemed | | | (32 | ) | | | (52 | ) |
| | | | | | | | |
Change in Class R2 Shares | | | (16 | ) | | | (24 | ) |
| | | | | | | | |
Class R5 | | | | | | | | |
Issued | | | 5 | | | | 2 | |
Reinvested | | | — | (a) | | | — | (a) |
Redeemed | | | (4 | ) | | | — | (a) |
| | | | | | | | |
Change in Class R5 Shares | | | 1 | | | | 2 | |
| | | | | | | | |
Class R6 | | | | | | | | |
Issued | | | 4,448 | | | | 3,351 | |
Reinvested | | | 407 | | | | 412 | |
Redeemed | | | (4,069 | ) | | | (3,438 | ) |
| | | | | | | | |
Change in Class R6 Shares | | | 786 | | | | 325 | |
| | | | | | | | |
| (a) | Amount rounds to less than one thousand. |
SEE NOTES TO FINANCIAL STATEMENTS.
| | | | | | | | |
| | | |
| OCTOBER 31, 2020 | | J.P. MORGAN INTERNATIONAL EQUITY FUNDS | | | | | 87 | |
FINANCIAL HIGHLIGHTS
FOR THE PERIODS INDICATED
| | | | | | | | | | | | | | | | | | | | |
| | | | | | Per share operating performance | |
| | | | | | Investment operations | | | Distributions | |
| | | Net asset
value,
beginning
of period | | | Net
investment
income
(loss) (b) | | | Net realized
and unrealized
gains
(losses) on
investments | | | Total from
investment
operations | | | Net
investment
income | |
JPMorgan Emerging Markets Equity Fund | | | | | | | | | | | | | | | | | | | | |
Class A | | | | | | | | | | | | | | | | | | | | |
Year Ended October 31, 2020 | | $ | 30.07 | | | $ | (0.02 | ) | | $ | 6.56 | | | $ | 6.54 | | | $ | (0.17 | ) |
Year Ended October 31, 2019 | | | 23.84 | | | | 0.19 | | | | 6.16 | | | | 6.35 | | | | (0.12 | ) |
Year Ended October 31, 2018 | | | 27.58 | | | | 0.14 | | | | (3.84 | ) | | | (3.70 | ) | | | (0.04 | ) |
Year Ended October 31, 2017 | | | 21.79 | | | | 0.09 | | | | 5.80 | | | | 5.89 | | | | (0.10 | ) |
Year Ended October 31, 2016 | | | 19.53 | | | | 0.09 | | | | 2.28 | | | | 2.37 | | | | (0.11 | ) |
| | | | | |
Class C | | | | | | | | | | | | | | | | | | | | |
Year Ended October 31, 2020 | | | 29.07 | | | | (0.18 | ) | | | 6.35 | | | | 6.17 | | | | (0.04 | ) |
Year Ended October 31, 2019 | | | 23.08 | | | | 0.04 | | | | 5.98 | | | | 6.02 | | | | (0.03 | ) |
Year Ended October 31, 2018 | | | 26.80 | | | | 0.02 | | | | (3.74 | ) | | | (3.72 | ) | | | — | (f) |
Year Ended October 31, 2017 | | | 21.18 | | | | (0.04 | ) | | | 5.67 | | | | 5.63 | | | | (0.01 | ) |
Year Ended October 31, 2016 | | | 18.96 | | | | (0.01 | ) | | | 2.23 | | | | 2.22 | | | | — | |
| | | | | |
Class I | | | | | | | | | | | | | | | | | | | | |
Year Ended October 31, 2020 | | | 30.79 | | | | 0.05 | | | | 6.75 | | | | 6.80 | | | | (0.25 | ) |
Year Ended October 31, 2019 | | | 24.45 | | | | 0.27 | | | | 6.29 | | | | 6.56 | | | | (0.22 | ) |
Year Ended October 31, 2018 | | | 28.29 | | | | 0.24 | | | | (3.96 | ) | | | (3.72 | ) | | | (0.12 | ) |
Year Ended October 31, 2017 | | | 22.33 | | | | 0.16 | | | | 5.94 | | | | 6.10 | | | | (0.14 | ) |
Year Ended October 31, 2016 | | | 19.98 | | | | 0.13 | | | | 2.35 | | | | 2.48 | | | | (0.13 | ) |
| | | | | |
Class L | | | | | | | | | | | | | | | | | | | | |
Year Ended October 31, 2020 | | | 31.03 | | | | 0.08 | | | | 6.80 | | | | 6.88 | | | | (0.27 | ) |
Year Ended October 31, 2019 | | | 24.63 | | | | 0.29 | | | | 6.35 | | | | 6.64 | | | | (0.24 | ) |
Year Ended October 31, 2018 | | | 28.49 | | | | 0.26 | | | | (3.99 | ) | | | (3.73 | ) | | | (0.13 | ) |
Year Ended October 31, 2017 | | | 22.49 | | | | 0.21 | | | | 5.96 | | | | 6.17 | | | | (0.17 | ) |
Year Ended October 31, 2016 | | | 20.15 | | | | 0.17 | | | | 2.35 | | | | 2.52 | | | | (0.18 | ) |
| | | | | |
Class R2 | | | | | | | | | | | | | | | | | | | | |
Year Ended October 31, 2020 | | | 29.78 | | | | (0.13 | ) | | | 6.52 | | | | 6.39 | | | | (0.11 | ) |
Year Ended October 31, 2019 | | | 23.73 | | | | 0.08 | | | | 6.13 | | | | 6.21 | | | | (0.16 | ) |
Year Ended October 31, 2018 | | | 27.57 | | | | 0.07 | | | | (3.83 | ) | | | (3.76 | ) | | | (0.08 | ) |
July 31, 2017 (g) through October 31, 2017 | | | 26.40 | | | | (0.01 | ) | | | 1.18 | | | | 1.17 | | | | — | |
| | | | | |
Class R3 | | | | | | | | | | | | | | | | | | | | |
Year Ended October 31, 2020 | | | 29.96 | | | | (0.05 | ) | | | 6.55 | | | | 6.50 | | | | (0.21 | ) |
Year Ended October 31, 2019 | | | 23.78 | | | | 0.25 | | | | 6.06 | | | | 6.31 | | | | (0.13 | ) |
Year Ended October 31, 2018 | | | 27.59 | | | | 0.22 | | | | (3.92 | ) | | | (3.70 | ) | | | (0.11 | ) |
July 31, 2017 (g) through October 31, 2017 | | | 26.40 | | | | 0.01 | | | | 1.18 | | | | 1.19 | | | | — | |
| | | | | |
Class R4 | | | | | | | | | | | | | | | | | | | | |
Year Ended October 31, 2020 | | | 30.68 | | | | 0.04 | | | | 6.70 | | | | 6.74 | | | | (0.22 | ) |
Year Ended October 31, 2019 | | | 24.42 | | | | 0.27 | | | | 6.25 | | | | 6.52 | | | | (0.26 | ) |
Year Ended October 31, 2018 | | | 28.28 | | | | 0.18 | | | | (3.91 | ) | | | (3.73 | ) | | | (0.13 | ) |
July 31, 2017 (g) through October 31, 2017 | | | 27.05 | | | | 0.02 | | | | 1.21 | | | | 1.23 | | | | — | |
| | | | | |
Class R5 | | | | | | | | | | | | | | | | | | | | |
Year Ended October 31, 2020 | | | 30.96 | | | | 0.08 | | | | 6.78 | | | | 6.86 | | | | (0.26 | ) |
Year Ended October 31, 2019 | | | 24.60 | | | | 0.31 | | | | 6.31 | | | | 6.62 | | | | (0.26 | ) |
Year Ended October 31, 2018 | | | 28.47 | | | | 0.39 | | | | (4.11 | ) | | | (3.72 | ) | | | (0.15 | ) |
Year Ended October 31, 2017 | | | 22.49 | | | | 0.15 | | | | 6.01 | | | | 6.16 | | | | (0.18 | ) |
September 9, 2016 (g) through October 31, 2016 | | | 22.40 | | | | 0.01 | | | | 0.08 | | | | 0.09 | | | | — | |
| | | | | |
Class R6 | | | | | | | | | | | | | | | | | | | | |
Year Ended October 31, 2020 | | | 31.00 | | | | 0.12 | | | | 6.78 | | | | 6.90 | | | | (0.29 | ) |
Year Ended October 31, 2019 | | | 24.60 | | | | 0.31 | | | | 6.35 | | | | 6.66 | | | | (0.26 | ) |
Year Ended October 31, 2018 | | | 28.46 | | | | 0.29 | | | | (3.99 | ) | | | (3.70 | ) | | | (0.16 | ) |
Year Ended October 31, 2017 | | | 22.46 | | | | 0.21 | | | | 5.98 | | | | 6.19 | | | | (0.19 | ) |
Year Ended October 31, 2016 | | | 20.13 | | | | 0.19 | | | | 2.35 | | | | 2.54 | | | | (0.21 | ) |
| (a) | Annualized for periods less than one year, unless otherwise noted. |
| (b) | Calculated based upon average shares outstanding. |
| (c) | Not annualized for periods less than one year. |
| (d) | Includes adjustments in accordance with accounting principles generally accepted in the United States of America and as such, the net asset values for financial reporting purposes and the returns based upon those net asset values may differ from the net asset values |
| (e) | Includes interest expense, if applicable, which is less than 0.005% unless otherwise noted. |
| (f) | Amount rounds to less than $0.005. |
| (g) | Commencement of offering of class of shares. |
SEE NOTES TO FINANCIAL STATEMENTS.
| | | | | | |
| | | |
| 88 | | | | J.P. MORGAN INTERNATIONAL EQUITY FUNDS | | OCTOBER 31, 2020 |
| | | | | | | | | | | | | | | | | | | | | | | | | | |
| | | Ratios/Supplemental data | |
| | | | | | | | | | Ratios to average net assets (a) | | | | |
Net asset
value,
end of
period | | | Total return
(excludes
sales charge) (c)(d) | | | Net assets,
end of
period
(000’s) | | | Net
expenses (e) | | | Net
investment
income
(loss) | | | Expenses
without waivers and reimbursements | | | Portfolio
turnover
rate (c) | |
| | | | | | | | | | | | | | | | | | | | | | | | | | |
| | | | | | | | | | | | | | | | | | | | | | | | | | |
| $ | 36.44 | | | | 21.84 | % | | $ | 578,112 | | | | 1.24 | % | | | (0.06 | )% | | | 1.33 | % | | | 15 | % |
| | 30.07 | | | | 26.77 | | | | 524,357 | | | | 1.24 | | | | 0.69 | | | | 1.47 | | | | 34 | |
| | 23.84 | | | | (13.44 | ) | | | 369,490 | | | | 1.24 | | | | 0.51 | | | | 1.52 | | | | 13 | |
| | 27.58 | | | | 27.22 | | | | 525,451 | | | | 1.35 | | | | 0.36 | | | | 1.58 | | | | 22 | |
| | 21.79 | | | | 12.25 | | | | 411,713 | | | | 1.44 | | | | 0.44 | | | | 1.76 | | | | 23 | |
| | | | | | |
| | | | | | | | | | | | | | | | | | | | | | | | | | |
| | 35.20 | | | | 21.24 | | | | 72,364 | | | | 1.74 | | | | (0.58 | ) | | | 1.83 | | | | 15 | |
| | 29.07 | | | | 26.12 | | | | 56,830 | | | | 1.74 | | | | 0.15 | | | | 1.98 | | | | 34 | |
| | 23.08 | | | | (13.87 | ) | | | 43,612 | | | | 1.74 | | | | 0.06 | | | | 2.02 | | | | 13 | |
| | 26.80 | | | | 26.58 | | | | 48,497 | | | | 1.85 | | | | (0.15 | ) | | | 2.09 | | | | 22 | |
| | 21.18 | | | | 11.71 | | | | 39,568 | | | | 1.95 | | | | (0.06 | ) | | | 2.26 | | | | 23 | |
| | | | | | |
| | | | | | | | | | | | | | | | | | | | | | | | | | |
| | 37.34 | | | | 22.19 | | | | 4,016,180 | | | | 0.99 | | | | 0.15 | | | | 1.07 | | | | 15 | |
| | 30.79 | | | | 27.04 | | | | 1,725,882 | | | | 0.99 | | | | 0.94 | | | | 1.21 | | | | 34 | |
| | 24.45 | | | | (13.23 | ) | | | 773,142 | | | | 0.99 | | | | 0.84 | | | | 1.26 | | | | 13 | |
| | 28.29 | | | | 27.54 | | | | 629,451 | | | | 1.10 | | | | 0.62 | | | | 1.30 | | | | 22 | |
| | 22.33 | | | | 12.51 | | | | 301,959 | | | | 1.20 | | | | 0.66 | | | | 1.43 | | | | 23 | |
| | | | | | |
| | | | | | | | | | | | | | | | | | | | | | | | | | |
| | 37.64 | | | | 22.29 | | | | 1,877,489 | | | | 0.89 | | | | 0.25 | | | | 0.92 | | | | 15 | |
| | 31.03 | | | | 27.20 | | | | 926,781 | | | | 0.89 | | | | 1.00 | | | | 1.06 | | | | 34 | |
| | 24.63 | | | | (13.16 | ) | | | 475,997 | | | | 0.89 | | | | 0.91 | | | | 1.11 | | | | 13 | |
| | 28.49 | | | | 27.72 | | | | 430,860 | | | | 0.95 | | | | 0.84 | | | | 1.14 | | | | 22 | |
| | 22.49 | | | | 12.71 | | | | 390,647 | | | | 1.04 | | | | 0.84 | | | | 1.22 | | | | 23 | |
| | | | | | |
| | | | | | | | | | | | | | | | | | | | | | | | | | |
| | 36.06 | | | | 21.51 | | | | 414 | | | | 1.54 | | | | (0.41 | ) | | | 2.00 | | | | 15 | |
| | 29.78 | | | | 26.35 | | | | 145 | | | | 1.54 | | | | 0.31 | | | | 2.26 | | | | 34 | |
| | 23.73 | | | | (13.69 | ) | | | 95 | | | | 1.54 | | | | 0.26 | | | | 2.04 | | | | 13 | |
| | 27.57 | | | | 4.43 | | | | 21 | | | | 1.60 | | | | (0.17 | ) | | | 1.80 | | | | 22 | |
| | | | | | |
| | | | | | | | | | | | | | | | | | | | | | | | | | |
| | 36.25 | | | | 21.80 | | | | 5,797 | | | | 1.29 | | | | (0.15 | ) | | | 1.33 | | | | 15 | |
| | 29.96 | | | | 26.67 | | | | 2,151 | | | | 1.29 | | | | 0.90 | | | | 1.49 | | | | 34 | |
| | 23.78 | | | | (13.49 | ) | | | 341 | | | | 1.29 | | | | 0.81 | | | | 1.59 | | | | 13 | |
| | 27.59 | | | | 4.51 | | | | 21 | | | | 1.35 | | | | 0.08 | | | | 1.55 | | | | 22 | |
| | | | | | |
| | | | | | | | | | | | | | | | | | | | | | | | | | |
| | 37.20 | | | | 22.09 | | | | 2,962 | | | | 1.04 | | | | 0.12 | | | | 1.08 | | | | 15 | |
| | 30.68 | | | | 26.98 | | | | 1,300 | | | | 1.04 | | | | 0.94 | | | | 1.23 | | | | 34 | |
| | 24.42 | | | | (13.25 | ) | | | 26 | | | | 1.04 | | | | 0.63 | | | | 1.62 | | | | 13 | |
| | 28.28 | | | | 4.55 | | | | 21 | | | | 1.10 | | | | 0.33 | | | | 1.30 | | | | 22 | |
| | | | | | |
| | | | | | | | | | | | | | | | | | | | | | | | | | |
| | 37.56 | | | | 22.29 | | | | 57,909 | | | | 0.89 | | | | 0.26 | | | | 0.93 | | | | 15 | |
| | 30.96 | | | | 27.19 | | | | 41,872 | | | | 0.89 | | | | 1.08 | | | | 1.08 | | | | 34 | |
| | 24.60 | | | | (13.14 | ) | | | 1,672 | | | | 0.89 | | | | 1.37 | | | | 1.11 | | | | 13 | |
| | 28.47 | | | | 27.72 | | | | 217 | | | | 0.95 | | | | 0.58 | | | | 3.36 | | | | 22 | |
| | 22.49 | | | | 0.40 | | | | 20 | | | | 0.90 | | | | 0.28 | | | | 1.08 | | | | 23 | |
| | | | | | |
| | | | | | | | | | | | | | | | | | | | | | | | | | |
| | 37.61 | | | | 22.39 | | | | 4,608,998 | | | | 0.79 | | | | 0.37 | | | | 0.82 | | | | 15 | |
| | 31.00 | | | | 27.36 | | | | 3,034,359 | | | | 0.79 | | | | 1.09 | | | | 0.96 | | | | 34 | |
| | 24.60 | | | | (13.08 | ) | | | 2,936,830 | | | | 0.79 | | | | 1.00 | | | | 1.01 | | | | 13 | |
| | 28.46 | | | | 27.87 | | | | 2,813,349 | | | | 0.85 | | | | 0.85 | | | | 1.01 | | | | 22 | |
| | 22.46 | | | | 12.83 | | | | 1,980,671 | | | | 0.94 | | | | 0.96 | | | | 1.08 | | | | 23 | |
SEE NOTES TO FINANCIAL STATEMENTS.
| | | | | | | | |
| | | |
| OCTOBER 31, 2020 | | J.P. MORGAN INTERNATIONAL EQUITY FUNDS | | | | | 89 | |
FINANCIAL HIGHLIGHTS
FOR THE PERIODS INDICATED (continued)
| | | | | | | | | | | | | | | | | | | | | | | | | | | | |
| | | | | | Per share operating performance | |
| | | | | | Investment operations | | | Distributions | |
| | | Net asset
value,
beginning
of period | | | Net
investment
income
(loss) (b) | | | Net realized
and unrealized
gains
(losses) on
investments | | | Total from
investment
operations | | | Net
investment
income | | | Net
realized
gain | | | Total
distributions | |
JPMorgan Emerging Markets Research Enhanced Equity Fund | |
Class I | |
Year Ended October 31, 2020 | | $ | 16.78 | | | $ | 0.33 | | | $ | 1.04 | | | $ | 1.37 | | | $ | — | | | $ | (0.04 | ) | | $ | (0.04 | ) |
January 30, 2019 (f) through October 31, 2019 | | | 16.22 | | | | 0.31 | | | | 0.25 | | | | 0.56 | | | | — | | | | — | | | | — | |
|
Class R6 | |
Year Ended October 31, 2020 | | | 16.80 | | | | 0.31 | | | | 1.07 | | | | 1.38 | | | | (0.13 | ) | | | (0.04 | ) | | | (0.17 | ) |
December 11, 2018 (h) through October 31, 2019 | | | 15.00 | | | | 0.42 | | | | 1.46 | | | | 1.88 | | | | (0.08 | ) | | | — | | | | (0.08 | ) |
| (a) | Annualized for periods less than one year, unless otherwise noted. |
| (b) | Calculated based upon average shares outstanding. |
| (c) | Not annualized for periods less than one year. |
| (d) | Includes adjustments in accordance with accounting principles generally accepted in the United States of America and as such, the net asset values for financial reporting purposes and the returns based upon those net asset values may differ from the net asset values and returns for shareholder transactions. |
| (e) | Includes interest expense, if applicable, which is less than 0.005% unless otherwise noted. |
| (f) | Commencement of offering of class of shares. |
| (g) | Certain non-recurring expenses incurred by the Fund were not annualized for the period indicated. |
| (h) | Commencement of operations. |
SEE NOTES TO FINANCIAL STATEMENTS.
| | | | | | |
| | | |
| 90 | | | | J.P. MORGAN INTERNATIONAL EQUITY FUNDS | | OCTOBER 31, 2020 |
| | | | | | | | | | | | | | | | | | | | | | | | | | |
| | | Ratios/Supplemental data | |
| | | | | | | | | | Ratios to average net assets (a) | | | | |
Net asset
value,
end of
period | | | Total return
(excludes
sales charge) (c)(d) | | | Net assets,
end of
period
(000’s) | | | Net
expenses (e) | | | Net
investment
income
(loss) | | | Expenses
without waivers
and reimbursements | | | Portfolio
turnover
rate (c) | |
| | | | | | | | | | | | | | | | | | | | | | | | | | |
| | | | | | | | | | | | | | | | | | | | | | | | | | |
| $ | 18.11 | | | | 8.15 | % | | $ | 33 | | | | 0.45 | % | | | 1.98 | % | | | 1.39 | % | | | 47 | % |
| | 16.78 | | | | 3.45 | | | | 5 | | | | 0.44 | (g) | | | 2.52 | (g) | | | 0.70 | (g) | | | 28 | |
| | | | | | |
| | | | | | | | | | | | | | | | | | | | | | | | | | |
| | 18.01 | | | | 8.22 | | | | 2,840,309 | | | | 0.35 | | | | 1.87 | | | | 0.41 | | | | 47 | |
| | 16.80 | | | | 12.60 | | | | 2,090,569 | | | | 0.34 | (g) | | | 2.90 | (g) | | | 0.46 | (g) | | | 28 | |
SEE NOTES TO FINANCIAL STATEMENTS.
| | | | | | | | |
| | | |
| OCTOBER 31, 2020 | | J.P. MORGAN INTERNATIONAL EQUITY FUNDS | | | | | 91 | |
FINANCIAL HIGHLIGHTS
FOR THE PERIODS INDICATED (continued)
| | | | | | | | | | | | | | | | | | | | |
| | | | | | Per share operating performance | |
| | | | | | Investment operations | | | Distributions | |
| | | Net asset
value,
beginning
of period | | | Net
investment
income
(loss) (b) | | | Net realized
and unrealized
gains
(losses) on
investments | | | Total from
investment
operations | | | Net
investment
income | |
JPMorgan Europe Dynamic Fund | | | | | | | | | | | | | | | | | | | | |
Class A | | | | | | | | | | | | | | | | | | | | |
Year Ended October 31, 2020 | | $ | 24.25 | | | $ | 0.25 | | | $ | (2.16 | ) | | $ | (1.91 | ) | | $ | (0.70 | ) |
Year Ended October 31, 2019 | | | 23.01 | | | | 0.61 | | | | 1.18 | | | | 1.79 | | | | (0.55 | ) |
Year Ended October 31, 2018 | | | 27.04 | | | | 0.42 | | | | (4.08 | ) | | | (3.66 | ) | | | (0.37 | ) |
Year Ended October 31, 2017 | | | 21.94 | | | | 0.37 | | | | 5.15 | | | | 5.52 | | | | (0.42 | ) |
Year Ended October 31, 2016 | | | 24.41 | | | | 0.37 | | | | (2.55 | ) | | | (2.18 | ) | | | (0.29 | ) |
| | | | | |
Class C | | | | | | | | | | | | | | | | | | | | |
Year Ended October 31, 2020 | | | 21.47 | | | | 0.12 | | | | (1.91 | ) | | | (1.79 | ) | | | (0.58 | ) |
Year Ended October 31, 2019 | | | 20.39 | | | | 0.44 | | | | 1.06 | | | | 1.50 | | | | (0.42 | ) |
Year Ended October 31, 2018 | | | 24.00 | | | | 0.25 | | | | (3.62 | ) | | | (3.37 | ) | | | (0.24 | ) |
Year Ended October 31, 2017 | | | 19.52 | | | | 0.23 | | | | 4.58 | | | | 4.81 | | | | (0.33 | ) |
Year Ended October 31, 2016 | | | 21.77 | | | | 0.23 | | | | (2.27 | ) | | | (2.04 | ) | | | (0.21 | ) |
| | | | | |
Class I | | | | | | | | | | | | | | | | | | | | |
Year Ended October 31, 2020 | | | 24.75 | | | | 0.31 | | | | (2.19 | ) | | | (1.88 | ) | | | (0.77 | ) |
Year Ended October 31, 2019 | | | 23.48 | | | | 0.67 | | | | 1.21 | | | | 1.88 | | | | (0.61 | ) |
Year Ended October 31, 2018 | | | 27.60 | | | | 0.49 | | | | (4.17 | ) | | | (3.68 | ) | | | (0.44 | ) |
Year Ended October 31, 2017 | | | 22.37 | | | | 0.46 | | | | 5.25 | | | | 5.71 | | | | (0.48 | ) |
Year Ended October 31, 2016 | | | 24.83 | | | | 0.44 | | | | (2.59 | ) | | | (2.15 | ) | | | (0.31 | ) |
| | | | | |
Class L | | | | | | | | | | | | | | | | | | | | |
Year Ended October 31, 2020 | | | 25.05 | | | | 0.35 | | | | (2.23 | ) | | | (1.88 | ) | | | (0.79 | ) |
Year Ended October 31, 2019 | | | 23.70 | | | | 0.65 | | | | 1.27 | | | | 1.92 | | | | (0.57 | ) |
Year Ended October 31, 2018 | | | 27.85 | | | | 0.51 | | | | (4.18 | ) | | | (3.67 | ) | | | (0.48 | ) |
Year Ended October 31, 2017 | | | 22.61 | | | | 0.52 | | | | 5.27 | | | | 5.79 | | | | (0.55 | ) |
Year Ended October 31, 2016 | | | 25.13 | | | | 0.49 | | | | (2.60 | ) | | | (2.11 | ) | | | (0.41 | ) |
| | | | | |
Class R6 | | | | | | | | | | | | | | | | | | | | |
Year Ended October 31, 2020 | | | 24.96 | | | | 0.37 | | | | (2.22 | ) | | | (1.85 | ) | | | (0.82 | ) |
Year Ended October 31, 2019 | | | 23.70 | | | | 0.75 | | | | 1.19 | | | | 1.94 | | | | (0.68 | ) |
October 1, 2018 (f) through October 31, 2018 | | | 26.32 | | | | 0.01 | | | | (2.63 | ) | | | (2.62 | ) | | | — | |
| (a) | Annualized for periods less than one year, unless otherwise noted. |
| (b) | Calculated based upon average shares outstanding. |
| (c) | Not annualized for periods less than one year. |
| (d) | Includes adjustments in accordance with accounting principles generally accepted in the United States of America and as such, the net asset values for financial reporting purposes and the returns based upon those net asset values may differ from the net asset values and returns for shareholder transactions. |
| (e) | Includes interest expense, if applicable, which is less than 0.005% unless otherwise noted. |
| (f) | Commencement of offering of class of shares. |
SEE NOTES TO FINANCIAL STATEMENTS.
| | | | | | |
| | | |
| 92 | | | | J.P. MORGAN INTERNATIONAL EQUITY FUNDS | | OCTOBER 31, 2020 |
| | | | | | | | | | | | | | | | | | | | | | | | | | |
| | | Ratios/Supplemental data | |
| | | | | | | | | | Ratios to average net assets (a) | | | | |
Net asset
value,
end of
period | | | Total return
(excludes
sales charge) (c)(d) | | | Net assets,
end of
period
(000’s) | | | Net
expenses (e) | | |
Net
investment
income
(loss) | | | Expenses
without waivers
and reimbursements | | | Portfolio
turnover
rate (c) | |
| | | | | | | | | | | | | | | | | | | | | | | | | | |
| | | | | | | | | | | | | | | | | | | | | | | | | | |
| $ | 21.64 | | | | (8.21 | )% | | $ | 68,882 | | | | 1.24 | % | | | 1.09 | % | | | 1.28 | % | | | 159 | % |
| | 24.25 | | | | 8.14 | | | | 98,294 | | | | 1.24 | | | | 2.67 | | | | 1.31 | | | | 83 | |
| | 23.01 | | | | (13.72 | ) | | | 124,681 | | | | 1.24 | | | | 1.58 | | | | 1.29 | | | | 149 | |
| | 27.04 | | | | 25.65 | | | | 165,020 | | | | 1.36 | | | | 1.52 | | | | 1.36 | | | | 189 | |
| | 21.94 | | | | (8.98 | ) | | | 162,767 | | | | 1.42 | | | | 1.66 | | | | 1.43 | | | | 142 | |
| | | | | | |
| | | | | | | | | | | | | | | | | | | | | | | | | | |
| | 19.10 | | | | (8.68 | ) | | | 11,082 | | | | 1.74 | | | | 0.59 | | | | 1.77 | | | | 159 | |
| | 21.47 | | | | 7.64 | | | | 19,798 | | | | 1.74 | | | | 2.15 | | | | 1.80 | | | | 83 | |
| | 20.39 | | | | (14.18 | ) | | | 31,125 | | | | 1.74 | | | | 1.08 | | | | 1.79 | | | | 149 | |
| | 24.00 | | | | 25.02 | | | | 46,615 | | | | 1.85 | | | | 1.07 | | | | 1.86 | | | | 189 | |
| | 19.52 | | | | (9.42 | ) | | | 50,152 | | | | 1.91 | | | | 1.16 | | | | 1.92 | | | | 142 | |
| | | | | | |
| | | | | | | | | | | | | | | | | | | | | | | | | | |
| | 22.10 | | | | (7.98 | ) | | | 52,841 | | | | 0.99 | | | | 1.33 | | | | 1.01 | | | | 159 | |
| | 24.75 | | | | 8.44 | | | | 86,582 | | | | 0.99 | | | | 2.86 | | | | 1.05 | | | | 83 | |
| | 23.48 | | | | (13.53 | ) | | | 139,858 | | | | 0.99 | | | | 1.84 | | | | 1.04 | | | | 149 | |
| | 27.60 | | | | 26.06 | | | | 187,678 | | | | 1.06 | | | | 1.85 | | | | 1.07 | | | | 189 | |
| | 22.37 | | | | (8.73 | ) | | | 145,080 | | | | 1.10 | | | | 1.95 | | | | 1.10 | | | | 142 | |
| | | | | | |
| | | | | | | | | | | | | | | | | | | | | | | | | | |
| | 22.38 | | | | (7.86 | ) | | | 55,597 | | | | 0.85 | | | | 1.49 | | | | 0.86 | | | | 159 | |
| | 25.05 | | | | 8.49 | | | | 65,686 | | | | 0.89 | | | | 2.77 | | | | 0.90 | | | | 83 | |
| | 23.70 | | | | (13.41 | ) | | | 389,665 | | | | 0.88 | | | | 1.88 | | | | 0.89 | | | | 149 | |
| | 27.85 | | | | 26.22 | | | | 578,183 | | | | 0.90 | | | | 2.07 | | | | 0.91 | | | | 189 | |
| | 22.61 | | | | (8.48 | ) | | | 424,388 | | | | 0.90 | | | | 2.16 | | | | 0.90 | | | | 142 | |
| | | | | | |
| | | | | | | | | | | | | | | | | | | | | | | | | | |
| | 22.29 | | | | (7.79 | ) | | | 250,426 | | | | 0.75 | | | | 1.61 | | | | 0.76 | | | | 159 | |
| | 24.96 | | | | 8.65 | | | | 271,885 | | | | 0.79 | | | | 3.17 | | | | 0.79 | | | | 83 | |
| | 23.70 | | | | (9.95 | ) | | | 18 | | | | 0.82 | | | | 0.67 | | | | 0.83 | | | | 149 | |
SEE NOTES TO FINANCIAL STATEMENTS.
| | | | | | | | |
| | | |
| OCTOBER 31, 2020 | | J.P. MORGAN INTERNATIONAL EQUITY FUNDS | | | | | 93 | |
FINANCIAL HIGHLIGHTS
FOR THE PERIODS INDICATED (continued)
| | | | | | | | | | | | | | | | | | | | |
| | | | | | Per share operating performance | |
| | | | | | Investment operations | | | Distributions | |
| | | Net asset
value,
beginning
of period | | | Net
investment
income
(loss) (a) | | | Net realized
and unrealized
gains
(losses) on
investments | | | Total from
investment
operations | | | Net
investment
income | |
JPMorgan International Advantage Fund | | | | | | | | | | | | | | | | | | | | |
Class A | | | | | | | | | | | | | | | | | | | | |
Year Ended October 31, 2020 | | $ | 19.90 | | | $ | 0.14 | | | $ | (1.83 | ) | | $ | (1.69 | ) | | $ | (1.01 | ) |
Year Ended October 31, 2019 | | | 19.49 | | | | 0.52 | | | | 0.31 | | | | 0.83 | | | | (0.42 | ) |
Year Ended October 31, 2018 | | | 22.22 | | | | 0.44 | | | | (2.77 | ) | | | (2.33 | ) | | | (0.40 | ) |
Year Ended October 31, 2017 | | | 18.44 | | | | 0.33 | | | | 3.83 | | | | 4.16 | | | | (0.38 | ) |
Year Ended October 31, 2016 | | | 19.36 | | | | 0.40 | (d) | | | (0.99 | ) | | | (0.59 | ) | | | (0.33 | ) |
| | | | | |
Class C | | | | | | | | | | | | | | | | | | | | |
Year Ended October 31, 2020 | | | 20.13 | | | | 0.24 | | | | (2.05 | ) | | | (1.81 | ) | | | (0.88 | ) |
Year Ended October 31, 2019 | | | 19.70 | | | | 0.43 | | | | 0.31 | | | | 0.74 | | | | (0.31 | ) |
Year Ended October 31, 2018 | | | 22.40 | | | | 0.37 | | | | (2.83 | ) | | | (2.46 | ) | | | (0.24 | ) |
Year Ended October 31, 2017 | | | 18.57 | | | | 0.22 | | | | 3.87 | | | | 4.09 | | | | (0.26 | ) |
Year Ended October 31, 2016 | | | 19.52 | | | | 0.28 | (d) | | | (0.97 | ) | | | (0.69 | ) | | | (0.26 | ) |
| | | | | |
Class I | | | | | | | | | | | | | | | | | | | | |
Year Ended October 31, 2020 | | | 20.71 | | | | 0.29 | | | | (1.99 | ) | | | (1.70 | ) | | | (1.07 | ) |
Year Ended October 31, 2019 | | | 20.30 | | | | 0.60 | | | | 0.29 | | | | 0.89 | | | | (0.48 | ) |
Year Ended October 31, 2018 | | | 23.12 | | | | 0.54 | | | | (2.90 | ) | | | (2.36 | ) | | | (0.46 | ) |
Year Ended October 31, 2017 | | | 19.20 | | | | 0.42 | | | | 3.97 | | | | 4.39 | | | | (0.47 | ) |
Year Ended October 31, 2016 | | | 20.13 | | | | 0.46 | (d) | | | (1.01 | ) | | | (0.55 | ) | | | (0.38 | ) |
| | | | | |
Class R2 | | | | | | | | | | | | | | | | | | | | |
Year Ended October 31, 2020 | | | 19.57 | | | | 0.27 | | | | (1.98 | ) | | | (1.71 | ) | | | (0.95 | ) |
Year Ended October 31, 2019 | | | 19.21 | | | | 0.46 | | | | 0.29 | | | | 0.75 | | | | (0.39 | ) |
Year Ended October 31, 2018 | | | 22.01 | | | | 0.52 | | | | (2.88 | ) | | | (2.36 | ) | | | (0.44 | ) |
Year Ended October 31, 2017 | | | 18.29 | | | | 0.01 | | | | 4.07 | | | | 4.08 | | | | (0.36 | ) |
Year Ended October 31, 2016 | | | 19.21 | | | | 0.36 | (d) | | | (1.01 | ) | | | (0.65 | ) | | | (0.27 | ) |
| | | | | |
Class R6 | | | | | | | | | | | | | | | | | | | | |
Year Ended October 31, 2020 | | | 20.40 | | | | 0.43 | | | | (2.07 | ) | | | (1.64 | ) | | | (1.10 | ) |
Year Ended October 31, 2019 | | | 20.00 | | | | 0.64 | | | | 0.28 | | | | 0.92 | | | | (0.52 | ) |
Year Ended October 31, 2018 | | | 22.78 | | | | 0.58 | | | | (2.87 | ) | | | (2.29 | ) | | | (0.49 | ) |
Year Ended October 31, 2017 | | | 18.91 | | | | 0.43 | | | | 3.92 | | | | 4.35 | | | | (0.48 | ) |
Year Ended October 31, 2016 | | | 19.84 | | | | 0.49 | (d) | | | (1.01 | ) | | | (0.52 | ) | | | (0.41 | ) |
| (a) | Calculated based upon average shares outstanding. |
| (b) | Includes adjustments in accordance with accounting principles generally accepted in the United States of America and as such, the net asset values for financial reporting purposes and the returns based upon those net asset values may differ from the net asset values and returns for shareholder transactions. |
| (c) | Includes interest expense, if applicable, which is less than 0.005% unless otherwise noted. |
| (d) | Net investment income (loss) may appear disproportionate among the classes due to the timing of recognition of income and changes in the relative size of the classes. |
SEE NOTES TO FINANCIAL STATEMENTS.
| | | | | | |
| | | |
| 94 | | | | J.P. MORGAN INTERNATIONAL EQUITY FUNDS | | OCTOBER 31, 2020 |
| | | | | | | | | | | | | | | | | | | | | | | | | | |
| | | Ratios/Supplemental data | |
| | | | | | | | | | Ratios to average net assets | | | | |
Net asset
value,
end of
period | | | Total return
(excludes
sales charge) (b) | | | Net assets,
end of
period
(000’s) | | | Net
expenses (c) | | |
Net
investment
income
(loss) | | | Expenses
without waivers
and reimbursements | | | Portfolio
turnover
rate | |
| | | | | | | | | | | | | | | | | | | | | | | | | | |
| | | | | | | | | | | | | | | | | | | | | | | | | | |
| $ | 17.20 | | | | (9.11 | )% | | $ | 5,976 | | | | 0.95 | % | | | 0.70 | % | | | 1.15 | % | | | 71 | % |
| | 19.90 | | | | 4.51 | | | | 156,230 | | | | 0.96 | | | | 2.72 | | | | 1.20 | | | | 74 | |
| | 19.49 | | | | (10.69 | ) | | | 156,382 | | | | 1.00 | | | | 2.02 | | | | 1.22 | | | | 51 | |
| | 22.22 | | | | 22.98 | | | | 232,530 | | | | 1.21 | | | | 1.66 | | | | 1.22 | | | | 82 | |
| | 18.44 | | | | (3.07 | ) | | | 164,327 | | | | 1.25 | | | | 2.21 | (d) | | | 1.29 | | | | 38 | |
| | | | | | |
| | | | | | | | | | | | | | | | | | | | | | | | | | |
| | 17.44 | | | | (9.54 | ) | | | 778 | | | | 1.45 | | | | 1.32 | | | | 1.78 | | | | 71 | |
| | 20.13 | | | | 3.92 | | | | 1,210 | | | | 1.47 | | | | 2.19 | | | | 1.72 | | | | 74 | |
| | 19.70 | | | | (11.08 | ) | | | 1,652 | | | | 1.50 | | | | 1.69 | | | | 1.74 | | | | 51 | |
| | 22.40 | | | | 22.30 | | | | 1,773 | | | | 1.75 | | | | 1.07 | | | | 1.81 | | | | 82 | |
| | 18.57 | | | | (3.56 | ) | | | 2,287 | | | | 1.75 | | | | 1.52 | (d) | | | 1.87 | | | | 38 | |
| | | | | | |
| | | | | | | | | | | | | | | | | | | | | | | | | | |
| | 17.94 | | | | (8.84 | ) | | | 21,640 | | | | 0.70 | | | | 1.51 | | | | 0.87 | | | | 71 | |
| | 20.71 | | | | 4.70 | | | | 67,146 | | | | 0.71 | | | | 3.02 | | | | 0.94 | | | | 74 | |
| | 20.30 | | | | (10.43 | ) | | | 60,739 | | | | 0.75 | | | | 2.37 | | | | 0.96 | | | | 51 | |
| | 23.12 | | | | 23.39 | | | | 52,871 | | | | 0.90 | | | | 1.99 | | | | 0.99 | | | | 82 | |
| | 19.20 | | | | (2.73 | ) | | | 16,363 | | | | 0.90 | | | | 2.44 | (d) | | | 1.08 | | | | 38 | |
| | | | | | |
| | | | | | | | | | | | | | | | | | | | | | | | | | |
| | 16.91 | | | | (9.37 | ) | | | 5,061 | | | | 1.25 | | | | 1.54 | | | | 1.54 | | | | 71 | |
| | 19.57 | | | | 4.15 | | | | 30,819 | | | | 1.26 | | | | 2.44 | | | | 1.66 | | | | 74 | |
| | 19.21 | | | | (10.93 | ) | | | 31,619 | | | | 1.30 | | | | 2.45 | | | | 1.69 | | | | 51 | |
| | 22.01 | | | | 22.70 | | | | 8,790 | | | | 1.49 | | | | 0.07 | | | | 1.54 | | | | 82 | |
| | 18.29 | | | | (3.36 | ) | | | 503 | | | | 1.50 | | | | 2.02 | (d) | | | 1.75 | | | | 38 | |
| | | | | | |
| | | | | | | | | | | | | | | | | | | | | | | | | | |
| | 17.66 | | | | (8.71 | ) | | | 1,475,560 | | | | 0.50 | | | | 2.33 | | | | 0.62 | | | | 71 | |
| | 20.40 | | | | 4.94 | | | | 1,555,944 | | | | 0.52 | | | | 3.27 | | | | 0.69 | | | | 74 | |
| | 20.00 | | | | (10.26 | ) | | | 3,152,864 | | | | 0.55 | | | | 2.59 | | | | 0.71 | | | | 51 | |
| | 22.78 | | | | 23.59 | | | | 2,859,645 | | | | 0.71 | | | | 2.12 | | | | 0.71 | | | | 82 | |
| | 18.91 | | | | (2.59 | ) | | | 2,487,086 | | | | 0.71 | | | | 2.65 | (d) | | | 0.72 | | | | 38 | |
SEE NOTES TO FINANCIAL STATEMENTS.
| | | | | | | | |
| | | |
| OCTOBER 31, 2020 | | J.P. MORGAN INTERNATIONAL EQUITY FUNDS | | | | | 95 | |
FINANCIAL HIGHLIGHTS
FOR THE PERIODS INDICATED (continued)
| | | | | | | | | | | | | | | | | | | | | | | | | | | | |
| | | | | | Per share operating performance | |
| | | | | | Investment operations | | | Distributions | |
| | | Net asset
value,
beginning
of period | | | Net
investment
income
(loss) (a) | | | Net realized
and unrealized
gains
(losses) on
investments | | | Total from
investment
operations | | | Net
investment
income | | | Net
realized
gain | | | Total
distributions | |
JPMorgan International Equity Fund | | | | | | | | | | | | | | | | | | | | | | | | | | | | |
Class A | | | | | | | | | | | | | | | | | | | | | | | | | | | | |
Year Ended October 31, 2020 | | $ | 17.27 | | | $ | 0.19 | | | $ | (0.49 | ) | | $ | (0.30 | ) | | $ | (0.50 | ) | | $ | — | | | $ | (0.50 | ) |
Year Ended October 31, 2019 | | | 15.56 | | | | 0.33 | | | | 1.89 | | | | 2.22 | | | | (0.33 | ) | | | (0.18 | ) | | | (0.51 | ) |
Year Ended October 31, 2018 | | | 17.81 | | | | 0.33 | | | | (2.33 | ) | | | (2.00 | ) | | | (0.25 | ) | | | — | | | | (0.25 | ) |
Year Ended October 31, 2017 | | | 14.24 | | | | 0.22 | | | | 3.39 | | | | 3.61 | | | | (0.04 | ) | | | — | | | | (0.04 | ) |
Year Ended October 31, 2016 | | | 14.75 | | | | 0.22 | | | | (0.51 | ) | | | (0.29 | ) | | | (0.22 | ) | | | — | | | | (0.22 | ) |
| | | | | | | |
Class C | | | | | | | | | | | | | | | | | | | | | | | | | | | | |
Year Ended October 31, 2020 | | | 16.29 | | | | 0.09 | | | | (0.45 | ) | | | (0.36 | ) | | | (0.40 | ) | | | — | | | | (0.40 | ) |
Year Ended October 31, 2019 | | | 14.68 | | | | 0.23 | | | | 1.80 | | | | 2.03 | | | | (0.24 | ) | | | (0.18 | ) | | | (0.42 | ) |
Year Ended October 31, 2018 | | | 16.83 | | | | 0.25 | | | | (2.23 | ) | | | (1.98 | ) | | | (0.17 | ) | | | — | | | | (0.17 | ) |
Year Ended October 31, 2017 | | | 13.50 | | | | 0.12 | | | | 3.22 | | | | 3.34 | | | | (0.01 | ) | | | — | | | | (0.01 | ) |
Year Ended October 31, 2016 | | | 14.02 | | | | 0.13 | | | | (0.47 | ) | | | (0.34 | ) | | | (0.18 | ) | | | — | | | | (0.18 | ) |
| | | | | | | |
Class I | | | | | | | | | | | | | | | | | | | | | | | | | | | | |
Year Ended October 31, 2020 | | | 17.56 | | | | 0.21 | | | | (0.47 | ) | | | (0.26 | ) | | | (0.54 | ) | | | — | | | | (0.54 | ) |
Year Ended October 31, 2019 | | | 15.82 | | | | 0.36 | | | | 1.93 | | | | 2.29 | | | | (0.37 | ) | | | (0.18 | ) | | | (0.55 | ) |
Year Ended October 31, 2018 | | | 18.09 | | | | 0.41 | | | | (2.40 | ) | | | (1.99 | ) | | | (0.28 | ) | | | — | | | | (0.28 | ) |
Year Ended October 31, 2017 | | | 14.45 | | | | 0.26 | | | | 3.44 | | | | 3.70 | | | | (0.06 | ) | | | — | | | | (0.06 | ) |
Year Ended October 31, 2016 | | | 14.95 | | | | 0.24 | | | | (0.48 | ) | | | (0.24 | ) | | | (0.26 | ) | | | — | | | | (0.26 | ) |
| | | | | | | |
Class R2 | | | | | | | | | | | | | | | | | | | | | | | | | | | | |
Year Ended October 31, 2020 | | | 17.14 | | | | 0.13 | | | | (0.48 | ) | | | (0.35 | ) | | | (0.48 | ) | | | — | | | | (0.48 | ) |
Year Ended October 31, 2019 | | | 15.44 | | | | 0.28 | | | | 1.88 | | | | 2.16 | | | | (0.28 | ) | | | (0.18 | ) | | | (0.46 | ) |
Year Ended October 31, 2018 | | | 17.70 | | | | 0.29 | | | | (2.33 | ) | | | (2.04 | ) | | | (0.22 | ) | | | — | | | | (0.22 | ) |
Year Ended October 31, 2017 | | | 14.17 | | | | 0.17 | | | | 3.38 | | | | 3.55 | | | | (0.02 | ) | | | — | | | | (0.02 | ) |
Year Ended October 31, 2016 | | | 14.69 | | | | 0.18 | | | | (0.50 | ) | | | (0.32 | ) | | | (0.20 | ) | | | — | | | | (0.20 | ) |
| | | | | | | |
Class R5 | | | | | | | | | | | | | | | | | | | | | | | | | | | | |
Year Ended October 31, 2020 | | | 17.60 | | | | 0.24 | | | | (0.48 | ) | | | (0.24 | ) | | | (0.51 | ) | | | — | | | | (0.51 | ) |
Year Ended October 31, 2019 | | | 15.85 | | | | 0.38 | | | | 1.94 | | | | 2.32 | | | | (0.39 | ) | | | (0.18 | ) | | | (0.57 | ) |
Year Ended October 31, 2018 | | | 18.13 | | | | 0.41 | | | | (2.40 | ) | | | (1.99 | ) | | | (0.29 | ) | | | — | | | | (0.29 | ) |
Year Ended October 31, 2017 | | | 14.47 | | | | 0.21 | | | | 3.52 | | | | 3.73 | | | | (0.07 | ) | | | — | | | | (0.07 | ) |
Year Ended October 31, 2016 | | | 14.97 | | | | 0.27 | | | | (0.49 | ) | | | (0.22 | ) | | | (0.28 | ) | | | — | | | | (0.28 | ) |
| | | | | | | |
Class R6 | | | | | | | | | | | | | | | | | | | | | | | | | | | | |
Year Ended October 31, 2020 | | | 17.61 | | | | 0.26 | | | | (0.49 | ) | | | (0.23 | ) | | | (0.57 | ) | | | — | | | | (0.57 | ) |
Year Ended October 31, 2019 | | | 15.86 | | | | 0.40 | | | | 1.93 | | | | 2.33 | | | | (0.40 | ) | | | (0.18 | ) | | | (0.58 | ) |
Year Ended October 31, 2018 | | | 18.13 | | | | 0.43 | | | | (2.39 | ) | | | (1.96 | ) | | | (0.31 | ) | | | — | | | | (0.31 | ) |
Year Ended October 31, 2017 | | | 14.46 | | | | 0.29 | | | | 3.46 | | | | 3.75 | | | | (0.08 | ) | | | — | | | | (0.08 | ) |
Year Ended October 31, 2016 | | | 14.97 | | | | 0.29 | | | | (0.51 | ) | | | (0.22 | ) | | | (0.29 | ) | | | — | | | | (0.29 | ) |
| (a) | Calculated based upon average shares outstanding. |
| (b) | Includes adjustments in accordance with accounting principles generally accepted in the United States of America and as such, the net asset values for financial reporting purposes and the returns based upon those net asset values may differ from the net asset values and returns for shareholder transactions. |
| (c) | Includes interest expense, if applicable, which is less than 0.005% unless otherwise noted. |
SEE NOTES TO FINANCIAL STATEMENTS.
| | | | | | |
| | | |
| 96 | | | | J.P. MORGAN INTERNATIONAL EQUITY FUNDS | | OCTOBER 31, 2020 |
| | | | | | | | | | | | | | | | | | | | | | | | | | |
| | | Ratios/Supplemental data | |
| | | | | | | | | | Ratios to average net assets | | | | |
Net asset
value,
end of
period | | | Total return
(excludes
sales charge) (b) | | | Net assets, end of
period (000’s) | | | Net
expenses (c) | | | Net
investment
income (loss) | | |
Expenses
without waivers
and reimbursements | | | Portfolio
turnover
rate | |
| | | | | | | | | | | | | | | | | | | | | | | | | | |
| | | | | | | | | | | | | | | | | | | | | | | | | | |
| $ | 16.47 | | | | (1.88 | )% | | $ | 263,791 | | | | 0.95 | % | | | 1.17 | % | | | 1.12 | % | | | 28 | % |
| | 17.27 | | | | 14.93 | | | | 328,312 | | | | 0.95 | | | | 2.03 | | | | 1.22 | | | | 25 | |
| | 15.56 | | | | (11.42 | ) | | | 240,394 | | | | 0.95 | | | | 1.88 | | | | 1.32 | | | | 33 | |
| | 17.81 | | | | 25.43 | | | | 302,130 | | | | 1.23 | | | | 1.39 | | | | 1.35 | | | | 17 | |
| | 14.24 | | | | (1.83 | ) | | | 216,932 | | | | 1.31 | | | | 1.62 | | | | 1.49 | | | | 11 | |
| | | | | | |
| | | | | | | | | | | | | | | | | | | | | | | | | | |
| | 15.53 | | | | (2.38 | ) | | | 9,358 | | | | 1.45 | | | | 0.61 | | | | 1.62 | | | | 28 | |
| | 16.29 | | | | 14.39 | | | | 14,549 | | | | 1.45 | | | | 1.51 | | | | 1.74 | | | | 25 | |
| | 14.68 | | | | (11.89 | ) | | | 18,899 | | | | 1.45 | | | | 1.48 | | | | 1.83 | | | | 33 | |
| | 16.83 | | | | 24.79 | | | | 24,281 | | | | 1.74 | | | | 0.83 | | | | 1.88 | | | | 17 | |
| | 13.50 | | | | (2.31 | ) | | | 22,235 | | | | 1.81 | | | | 0.97 | | | | 2.06 | | | | 11 | |
| | | | | | |
| | | | | | | | | | | | | | | | | | | | | | | | | | |
| | 16.76 | | | | (1.64 | ) | | | 339,416 | | | | 0.70 | | | | 1.26 | | | | 0.86 | | | | 28 | |
| | 17.56 | | | | 15.20 | | | | 190,885 | | | | 0.70 | | | | 2.22 | | | | 0.96 | | | | 25 | |
| | 15.82 | | | | (11.20 | ) | | | 179,831 | | | | 0.70 | | | | 2.30 | | | | 1.06 | | | | 33 | |
| | 18.09 | | | | 25.69 | | | | 139,715 | | | | 0.99 | | | | 1.59 | | | | 1.10 | | | | 17 | |
| | 14.45 | | | | (1.50 | ) | | | 94,362 | | | | 1.06 | | | | 1.69 | | | | 1.24 | | | | 11 | |
| | | | | | |
| | | | | | | | | | | | | | | | | | | | | | | | | | |
| | 16.31 | | | | (2.21 | ) | | | 21,379 | | | | 1.25 | | | | 0.79 | | | | 1.37 | | | | 28 | |
| | 17.14 | | | | 14.58 | | | | 2,099 | | | | 1.25 | | | | 1.75 | | | | 1.57 | | | | 25 | |
| | 15.44 | | | | (11.68 | ) | | | 1,833 | | | | 1.25 | | | | 1.64 | | | | 1.60 | | | | 33 | |
| | 17.70 | | | | 25.12 | | | | 2,096 | | | | 1.49 | | | | 1.07 | | | | 1.71 | | | | 17 | |
| | 14.17 | | | | (2.08 | ) | | | 1,461 | | | | 1.56 | | | | 1.28 | | | | 1.95 | | | | 11 | |
| | | | | | |
| | | | | | | | | | | | | | | | | | | | | | | | | | |
| | 16.85 | | | | (1.52 | ) | | | 6,970 | | | | 0.60 | | | | 1.41 | | | | 0.72 | | | | 28 | |
| | 17.60 | | | | 15.38 | | | | 3,778 | | | | 0.60 | | | | 2.31 | | | | 0.83 | | | | 25 | |
| | 15.85 | | | | (11.16 | ) | | | 19,516 | | | | 0.60 | | | | 2.31 | | | | 0.91 | | | | 33 | |
| | 18.13 | | | | 25.88 | | | | 21,891 | | | | 0.84 | | | | 1.36 | | | | 0.93 | | | | 17 | |
| | 14.47 | | | | (1.34 | ) | | | 58,836 | | | | 0.86 | | | | 1.93 | | | | 1.02 | | | | 11 | |
| | | | | | |
| | | | | | | | | | | | | | | | | | | | | | | | | | |
| | 16.81 | | | | (1.46 | ) | | | 2,290,008 | | | | 0.50 | | | | 1.56 | | | | 0.61 | | | | 28 | |
| | 17.61 | | | | 15.50 | | | | 2,457,383 | | | | 0.50 | | | | 2.46 | | | | 0.72 | | | | 25 | |
| | 15.86 | | | | (11.04 | ) | | | 3,808,621 | | | | 0.50 | | | | 2.42 | | | | 0.81 | | | | 33 | |
| | 18.13 | | | | 26.04 | | | | 3,516,978 | | | | 0.74 | | | | 1.84 | | | | 0.81 | | | | 17 | |
| | 14.46 | | | | (1.36 | ) | | | 3,030,640 | | | | 0.81 | | | | 2.05 | | | | 0.91 | | | | 11 | |
SEE NOTES TO FINANCIAL STATEMENTS.
| | | | | | | | |
| | | |
| OCTOBER 31, 2020 | | J.P. MORGAN INTERNATIONAL EQUITY FUNDS | | | | | 97 | |
FINANCIAL HIGHLIGHTS
FOR THE PERIODS INDICATED (continued)
| | | | | | | | | | | | | | | | | | | | |
| | | | | | Per share operating performance | |
| | | | | | Investment operations | | | Distributions | |
| | | Net asset
value,
beginning
of period | | | Net
investment
income
(loss) (a) | | | Net realized
and unrealized
gains
(losses) on
investments | | | Total from
investment
operations | | | Net
investment
income | |
JPMorgan International Focus Fund (formerly known as JPMorgan International Unconstrained Equity Fund) | |
Class A | | | | | | | | | | | | | | | | | | | | |
Year Ended October 31, 2020 | | $ | 21.15 | | | $ | 0.18 | | | $ | 0.75 | | | $ | 0.93 | | | $ | (0.01 | ) |
Year Ended October 31, 2019 | | | 18.24 | | | | 0.26 | | | | 3.02 | | | | 3.28 | | | | (0.37 | ) |
Year Ended October 31, 2018 | | | 21.14 | | | | 0.36 | | | | (3.13 | ) | | | (2.77 | ) | | | (0.13 | ) |
Year Ended October 31, 2017 | | | 17.24 | | | | 0.16 | | | | 4.09 | | | | 4.25 | | | | (0.35 | ) |
Year Ended October 31, 2016 | | | 17.61 | | | | 0.22 | (d) | | | (0.55 | ) | | | (0.33 | ) | | | (0.04 | ) |
| | | | | |
Class C | | | | | | | | | | | | | | | | | | | | |
Year Ended October 31, 2020 | | | 20.86 | | | | 0.07 | | | | 0.75 | | | | 0.82 | | | | — | |
Year Ended October 31, 2019 | | | 17.98 | | | | 0.16 | | | | 2.97 | | | | 3.13 | | | | (0.25 | ) |
Year Ended October 31, 2018 | | | 20.90 | | | | 0.26 | | | | (3.09 | ) | | | (2.83 | ) | | | (0.09 | ) |
Year Ended October 31, 2017 | | | 17.04 | | | | 0.05 | | | | 4.06 | | | | 4.11 | | | | (0.25 | ) |
Year Ended October 31, 2016 | | | 17.45 | | | | 0.13 | (d) | | | (0.53 | ) | | | (0.40 | ) | | | (0.01 | ) |
| | | | | |
Class I | | | | | | | | | | | | | | | | | | | | |
Year Ended October 31, 2020 | | | 21.43 | | | | 0.23 | | | | 0.78 | | | | 1.01 | | | | (0.05 | ) |
Year Ended October 31, 2019 | | | 18.49 | | | | 0.31 | | | | 3.04 | | | | 3.35 | | | | (0.41 | ) |
Year Ended October 31, 2018 | | | 21.41 | | | | 0.44 | | | | (3.19 | ) | | | (2.75 | ) | | | (0.17 | ) |
Year Ended October 31, 2017 | | | 17.45 | | | | 0.23 | | | | 4.13 | | | | 4.36 | | | | (0.40 | ) |
Year Ended October 31, 2016 | | | 17.71 | | | | 0.24 | (d) | | | (0.50 | ) | | | (0.26 | ) | | | — | |
| | | | | |
Class R2 | | | | | | | | | | | | | | | | | | | | |
Year Ended October 31, 2020 | | | 20.99 | | | | 0.13 | | | | 0.73 | | | | 0.86 | | | | — | |
Year Ended October 31, 2019 | | | 18.14 | | | | 0.21 | | | | 2.98 | | | | 3.19 | | | | (0.34 | ) |
Year Ended October 31, 2018 | | | 21.11 | | | | 0.35 | | | | (3.17 | ) | | | (2.82 | ) | | | (0.15 | ) |
Year Ended October 31, 2017 | | | 17.21 | | | | 0.06 | | | | 4.14 | | | | 4.20 | | | | (0.30 | ) |
Year Ended October 31, 2016 | | | 17.57 | | | | 0.15 | (d) | | | (0.51 | ) | | | (0.36 | ) | | | — | |
| | | | | |
Class R5 | | | | | | | | | | | | | | | | | | | | |
Year Ended October 31, 2020 | | | 21.42 | | | | 0.25 | | | | 0.78 | | | | 1.03 | | | | (0.07 | ) |
Year Ended October 31, 2019 | | | 18.49 | | | | 0.34 | | | | 3.03 | | | | 3.37 | | | | (0.44 | ) |
Year Ended October 31, 2018 | | | 21.39 | | | | 0.53 | | | | (3.25 | ) | | | (2.72 | ) | | | (0.18 | ) |
Year Ended October 31, 2017 | | | 17.44 | | | | 0.20 | | | | 4.17 | | | | 4.37 | | | | (0.42 | ) |
Year Ended October 31, 2016 | | | 17.75 | | | | 0.27 | (d) | | | (0.52 | ) | | | (0.25 | ) | | | (0.06 | ) |
| | | | | |
Class R6 | | | | | | | | | | | | | | | | | | | | |
Year Ended October 31, 2020 | | | 21.44 | | | | 0.28 | | | | 0.77 | | | | 1.05 | | | | (0.09 | ) |
Year Ended October 31, 2019 | | | 18.50 | | | | 0.27 | | | | 3.13 | | | | 3.40 | | | | (0.46 | ) |
Year Ended October 31, 2018 | | | 21.40 | | | | 0.44 | | | | (3.16 | ) | | | (2.72 | ) | | | (0.18 | ) |
Year Ended October 31, 2017 | | | 17.45 | | | | 0.26 | | | | 4.12 | | | | 4.38 | | | | (0.43 | ) |
Year Ended October 31, 2016 | | | 17.76 | | | | 0.29 | (d) | | | (0.52 | ) | | | (0.23 | ) | | | (0.08 | ) |
| (a) | Calculated based upon average shares outstanding. |
| (b) | Includes adjustments in accordance with accounting principles generally accepted in the United States of America and as such, the net asset values for financial reporting purposes and the returns based upon those net asset values may differ from the net asset values and returns for shareholder transactions. |
| (c) | Includes interest expense, if applicable, which is less than 0.005% unless otherwise noted. |
| (d) | Net investment income (loss) may appear disproportionate among the classes due to the timing of recognition of income and changes in the relative size of the classes. |
SEE NOTES TO FINANCIAL STATEMENTS.
| | | | | | |
| | | |
| 98 | | | | J.P. MORGAN INTERNATIONAL EQUITY FUNDS | | OCTOBER 31, 2020 |
| | | | | | | | | | | | | | | | | | | | | | | | | | |
| | | Ratios/Supplemental data | |
| | | | | | | | | | Ratios to average net assets | | | | |
Net asset
value,
end of
period | | | Total return
(excludes
sales charge) (b) | | | Net assets,
end of
period
(000’s) | | | Net
expenses (c) | | | Net
investment
income
(loss) | | |
Expenses
without waivers
and reimbursements | | | Portfolio
turnover
rate | |
| | | | | | | | | | | | | | | | | | | | | | | | | | |
| | | | | | | | | | | | | | | | | | | | | | | | | | |
| $ | 22.07 | | | | 4.39 | % | | $ | 135,527 | | | | 1.00 | % | | | 0.86 | % | | | 1.22 | % | | | 38 | % |
| | 21.15 | | | | 18.41 | | | | 114,629 | | | | 1.00 | | | | 1.33 | | | | 1.32 | | | | 34 | |
| | 18.24 | | | | (13.20 | ) | | | 84,325 | | | | 1.00 | | | | 1.75 | | | | 1.38 | | | | 63 | |
| | 21.14 | | | | 25.16 | | | | 67,684 | | | | 1.24 | | | | 0.83 | | | | 1.46 | | | | 38 | |
| | 17.24 | | | | (1.86 | ) | | | 14,034 | | | | 1.24 | | | | 1.28 | (d) | | | 1.61 | | | | 51 | |
| | | | | | |
| | | | | | | | | | | | | | | | | | | | | | | | | | |
| | 21.68 | | | | 3.93 | | | | 15,463 | | | | 1.50 | | | | 0.32 | | | | 1.73 | | | | 38 | |
| | 20.86 | | | | 17.73 | | | | 18,447 | | | | 1.50 | | | | 0.83 | | | | 1.84 | | | | 34 | |
| | 17.98 | | | | (13.60 | ) | | | 22,532 | | | | 1.50 | | | | 1.29 | | | | 1.89 | | | | 63 | |
| | 20.90 | | | | 24.51 | | | | 14,534 | | | | 1.74 | | | | 0.27 | | | | 2.00 | | | | 38 | |
| | 17.04 | | | | (2.28 | ) | | | 4,626 | | | | 1.74 | | | | 0.75 | (d) | | | 2.14 | | | | 51 | |
| | | | | | |
| | | | | | | | | | | | | | | | | | | | | | | | | | |
| | 22.39 | | | | 4.71 | | | | 372,068 | | | | 0.75 | | | | 1.05 | | | | 0.96 | | | | 38 | |
| | 21.43 | | | | 18.62 | | | | 177,764 | | | | 0.75 | | | | 1.57 | | | | 1.08 | | | | 34 | |
| | 18.49 | | | | (12.96 | ) | | | 189,061 | | | | 0.75 | | | | 2.09 | | | | 1.13 | | | | 63 | |
| | 21.41 | | | | 25.60 | | | | 131,356 | | | | 0.89 | | | | 1.14 | | | | 1.19 | | | | 38 | |
| | 17.45 | | | | (1.47 | ) | | | 9,929 | | | | 0.89 | | | | 1.41 | (d) | | | 1.35 | | | | 51 | |
| | | | | | |
| | | | | | | | | | | | | | | | | | | | | | | | | | |
| | 21.85 | | | | 4.10 | | | | 1,441 | | | | 1.30 | | | | 0.61 | | | | 1.51 | | | | 38 | |
| | 20.99 | | | | 18.01 | | | | 1,049 | | | | 1.30 | | | | 1.05 | | | | 1.74 | | | | 34 | |
| | 18.14 | | | | (13.46 | ) | | | 773 | | | | 1.30 | | | | 1.70 | | | | 1.72 | | | | 63 | |
| | 21.11 | | | | 24.85 | | | | 97 | | | | 1.49 | | | | 0.31 | | | | 2.79 | | | | 38 | |
| | 17.21 | | | | (2.05 | ) | | | 20 | | | | 1.49 | | | | 0.87 | (d) | | | 4.37 | | | | 51 | |
| | | | | | |
| | | | | | | | | | | | | | | | | | | | | | | | | | |
| | 22.38 | | | | 4.79 | | | | 2,772 | | | | 0.65 | | | | 1.16 | | | | 0.88 | | | | 38 | |
| | 21.42 | | | | 18.76 | | | | 3,082 | | | | 0.65 | | | | 1.71 | | | | 1.04 | | | | 34 | |
| | 18.49 | | | | (12.84 | ) | | | 3,341 | | | | 0.65 | | | | 2.56 | | | | 1.07 | | | | 63 | |
| | 21.39 | | | | 25.67 | | | | 90 | | | | 0.79 | | | | 1.01 | | | | 2.44 | | | | 38 | |
| | 17.44 | | | | (1.38 | ) | | | 20 | | | | 0.80 | | | | 1.57 | (d) | | | 3.59 | | | | 51 | |
| | | | | | |
| | | | | | | | | | | | | | | | | | | | | | | | | | |
| | 22.40 | | | | 4.89 | | | | 2,274,399 | | | | 0.55 | | | | 1.31 | | | | 0.71 | | | | 38 | |
| | 21.44 | | | | 18.95 | | | | 2,284,670 | | | | 0.55 | | | | 1.32 | | | | 0.77 | | | | 34 | |
| | 18.50 | | | | (12.81 | ) | | | 175,198 | | | | 0.55 | | | | 2.12 | | | | 0.87 | | | | 63 | |
| | 21.40 | | | | 25.72 | | | | 143,868 | | | | 0.74 | | | | 1.37 | | | | 0.95 | | | | 38 | |
| | 17.45 | | | | (1.29 | ) | | | 81,146 | | | | 0.74 | | | | 1.70 | (d) | | | 1.02 | | | | 51 | |
SEE NOTES TO FINANCIAL STATEMENTS.
| | | | | | | | |
| | | |
| OCTOBER 31, 2020 | | J.P. MORGAN INTERNATIONAL EQUITY FUNDS | | | | | 99 | |
FINANCIAL HIGHLIGHTS
FOR THE PERIODS INDICATED (continued)
| | | | | | | | | | | | | | | | | | | | |
| | | | | | Per share operating performance | |
| | | | | | Investment operations | | | Distributions | |
| | | Net asset
value,
beginning
of period | | | Net
investment
income
(loss) (b) | | | Net realized
and unrealized
gains
(losses) on
investments | | | Total from
investment
operations | | | Net
investment
income | |
JPMorgan International Hedged Equity Fund | |
Class A | |
Year Ended October 31, 2020 | | $ | 15.58 | | | $ | 0.27 | | | $ | (1.49 | ) | | $ | (1.22 | ) | | $ | (0.24) | |
March 15, 2019 (f) through October 31, 2019 | | | 15.00 | | | | 0.19 | | | | 0.39 | | | | 0.58 | | | | — | |
|
Class C | |
Year Ended October 31, 2020 | | | 15.53 | | | | 0.20 | | | | (1.50 | ) | | | (1.30 | ) | | | (0.17 | ) |
March 15, 2019 (f) through October 31, 2019 | | | 15.00 | | | | 0.16 | | | | 0.37 | | | | 0.53 | | | | — | |
|
Class I | |
Year Ended October 31, 2020 | | | 15.61 | | | | 0.31 | | | | (1.50 | ) | | | (1.19 | ) | | | (0.24 | ) |
March 15, 2019 (f) through October 31, 2019 | | | 15.00 | | | | 0.32 | | | | 0.29 | | | | 0.61 | | | | — | |
|
Class R5 | |
Year Ended October 31, 2020 | | | 15.62 | | | | 0.31 | | | | (1.48 | ) | | | (1.17 | ) | | | (0.25 | ) |
March 15, 2019 (f) through October 31, 2019 | | | 15.00 | | | | 0.34 | | | | 0.28 | | | | 0.62 | | | | — | |
|
Class R6 | |
Year Ended October 31, 2020 | | | 15.63 | | | | 0.34 | | | | (1.49 | ) | | | (1.15 | ) | | | (0.26 | ) |
March 15, 2019 (f) through October 31, 2019 | | | 15.00 | | | | 0.35 | | | | 0.28 | | | | 0.63 | | | | — | |
| (a) | Annualized for periods less than one year, unless otherwise noted. |
| (b) | Calculated based upon average shares outstanding. |
| (c) | Not annualized for periods less than one year. |
| (d) | Includes adjustments in accordance with accounting principles generally accepted in the United States of America and as such, the net asset values for financial reporting purposes and the returns based upon those net asset values may differ from the net asset values and returns for shareholder transactions. |
| (e) | Includes interest expense, if applicable, which is less than 0.005% unless otherwise noted. |
| (f) | Commencement of operations. |
| (g) | Certain non-recurring expenses incurred by the Fund were not annualized for the period indicated. |
SEE NOTES TO FINANCIAL STATEMENTS.
| | | | | | |
| | | |
| 100 | | | | J.P. MORGAN INTERNATIONAL EQUITY FUNDS | | OCTOBER 31, 2020 |
| | | | | | | | | | | | | | | | | | | | | | | | | | |
| | | Ratios/Supplemental data | |
| | | | | | | | | | Ratios to average net assets (a) | | | | |
Net asset
value,
end of
period | | | Total return
(excludes
sales charge) (c)(d) | | | Net assets,
end of
period
(000’s) | | | Net
expenses (e) | | | Net
investment
income
(loss) | | |
Expenses
without waivers
and reimbursements | | | Portfolio
turnover
rate (c) | |
| | | | | | | | | | | | | | | | | | | | | | | �� | | | |
| | | | | | | | | | | | | | | | | | | | | | | | | | |
| $ | 14.12 | | | | (8.02 | )% | | $ | 1,573 | | | | 0.85 | % | | | 1.84 | % | | | 1.30 | % | | | 85 | % |
| | 15.58 | | | | 3.87 | | | | 330 | | | | 0.85 | (g) | | | 1.95 | (g) | | | 1.31 | (g) | | | 9 | |
| | | | | | |
| | | | | | | | | | | | | | | | | | | | | | | | | | |
| | 14.06 | | | | (8.47 | ) | | | 115 | | | | 1.35 | | | | 1.34 | | | | 1.81 | | | | 85 | |
| | 15.53 | | | | 3.53 | | | | 119 | | | | 1.35 | (g) | | | 1.73 | (g) | | | 1.92 | (g) | | | 9 | |
| | | | | | |
| | | | | | | | | | | | | | | | | | | | | | | | | | |
| | 14.18 | | | | (7.78 | ) | | | 135,542 | | | | 0.60 | | | | 2.12 | | | | 1.03 | | | | 85 | |
| | 15.61 | | | | 4.07 | | | | 59,751 | | | | 0.60 | (g) | | | 3.38 | (g) | | | 1.19 | (g) | | | 9 | |
| | | | | | |
| | | | | | | | | | | | | | | | | | | | | | | | | | |
| | 14.20 | | | | (7.68 | ) | | | 19 | | | | 0.45 | | | | 2.08 | | | | 1.04 | | | | 85 | |
| | 15.62 | | | | 4.13 | | | | 21 | | | | 0.45 | (g) | | | 3.59 | (g) | | | 1.03 | (g) | | | 9 | |
| | | | | | |
| | | | | | | | | | | | | | | | | | | | | | | | | | |
| | 14.22 | | | | (7.53 | ) | | | 19 | | | | 0.35 | | | | 2.33 | | | | 0.94 | | | | 85 | |
| | 15.63 | | | | 4.20 | | | | 21 | | | | 0.35 | (g) | | | 3.69 | (g) | | | 0.93 | (g) | | | 9 | |
SEE NOTES TO FINANCIAL STATEMENTS.
| | | | | | | | |
| | | |
| OCTOBER 31, 2020 | | J.P. MORGAN INTERNATIONAL EQUITY FUNDS | | | | | 101 | |
FINANCIAL HIGHLIGHTS
FOR THE PERIODS INDICATED (continued)
| | | | | | | | | | | | | | | | | | | | | | | | | | | | |
| | | | | | Per share operating performance | |
| | | | | | Investment operations | | | Distributions | |
| | | Net asset
value,
beginning
of period | | | Net
investment
income
(loss) (b) | | | Net realized
and unrealized
gains
(losses) on
investments | | | Total from
investment
operations | | | Net
investment
income | | | Net
realized
gain | | | Total
distributions | |
JPMorgan International Research Enhanced Equity Fund | | | | | | | | | | | | | | | | | |
Class A | | | | | | | | | | | | | | | | | | | | | | | | | | | | |
Year Ended October 31, 2020 | | $ | 17.93 | | | $ | 0.36 | | | $ | (1.96 | ) | | $ | (1.60 | ) | | $ | (0.49 | ) | | $ | — | | | $ | (0.49 | ) |
Year Ended October 31, 2019 | | | 16.79 | | | | 0.51 | | | | 1.15 | | | | 1.66 | | | | (0.52 | ) | | | — | | | | (0.52 | ) |
Year Ended October 31, 2018 | | | 18.76 | | | | 0.45 | | | | (2.04 | ) | | | (1.59 | ) | | | (0.19 | ) | | | (0.19 | ) | | | (0.38 | ) |
Year Ended October 31, 2017 | | | 15.54 | | | | 0.34 | | | | 3.23 | | | | 3.57 | | | | (0.35 | ) | | | — | | | | (0.35 | ) |
Year Ended October 31, 2016 | | | 16.54 | | | | 0.40 | (f) | | | (0.89 | ) | | | (0.49 | ) | | | (0.36 | ) | | | (0.15 | ) | | | (0.51 | ) |
| | | | | | | |
Class I | | | | | | | | | | | | | | | | | | | | | | | | | | | | |
Year Ended October 31, 2020 | | | 18.17 | | | | 0.36 | | | | (1.94 | ) | | | (1.58 | ) | | | (0.54 | ) | | | — | | | | (0.54 | ) |
Year Ended October 31, 2019 | | | 17.01 | | | | 0.56 | | | | 1.16 | | | | 1.72 | | | | (0.56 | ) | | | — | | | | (0.56 | ) |
Year Ended October 31, 2018 | | | 18.92 | | | | 0.35 | | | | (1.91 | ) | | | (1.56 | ) | | | (0.16 | ) | | | (0.19 | ) | | | (0.35 | ) |
Year Ended October 31, 2017 | | | 15.68 | | | | 0.41 | | | | 3.23 | | | | 3.64 | | | | (0.40 | ) | | | — | | | | (0.40 | ) |
Year Ended October 31, 2016 | | | 16.70 | | | | 0.46 | (f) | | | (0.92 | ) | | | (0.46 | ) | | | (0.41 | ) | | | (0.15 | ) | | | (0.56 | ) |
| | |
Class R6 | | | | | | | | | |
Year Ended October 31, 2020 | | | 18.11 | | | | 0.39 | | | | (1.94 | ) | | | (1.55 | ) | | | (0.56 | ) | | | — | | | | (0.56 | ) |
Year Ended October 31, 2019 | | | 16.97 | | | | 0.57 | | | | 1.16 | | | | 1.73 | | | | (0.59 | ) | | | — | | | | (0.59 | ) |
November 1, 2017 (g) through October 31, 2018 | | | 18.98 | | | | 0.56 | | | | (2.16 | ) | | | (1.60 | ) | | | (0.22 | ) | | | (0.19 | ) | | | (0.41 | ) |
| (a) | Annualized for periods less than one year, unless otherwise noted. |
| (b) | Calculated based upon average shares outstanding. |
| (c) | Not annualized for periods less than one year. |
| (d) | Includes adjustments in accordance with accounting principles generally accepted in the United States of America and as such, the net asset values for financial reporting purposes and the returns based upon those net asset values may differ from the net asset values and returns for shareholder transactions. |
| (e) | Includes interest expense, if applicable, which is less than 0.005% unless otherwise noted. |
| (f) | Net investment income (loss) may appear disproportionate among the classes due to the timing of recognition of income and changes in the relative size of the classes. |
| (g) | Commencement of offering of class of shares. |
SEE NOTES TO FINANCIAL STATEMENTS.
| | | | | | |
| | | |
| 102 | | | | J.P. MORGAN INTERNATIONAL EQUITY FUNDS | | OCTOBER 31, 2020 |
| | | | | | | | | | | | | | | | | | | | | | | | | | |
| | | Ratios/Supplemental data | |
| | | | | | | | | | Ratios to average net assets (a) | | | | |
Net asset
value,
end of
period | | | Total return
(excludes
sales charge) (c)(d) | | | Net assets,
end of
period
(000’s) | | | Net
expenses
(e) | | | Net
investment
income
(loss) | | | Expenses
without waivers
and reimbursements | | | Portfolio
turnover
rate (c) | |
| | |
| | |
| $ | 15.84 | | | | (9.26 | )% | | $ | 52,118 | | | | 0.60 | % | | | 2.21 | % | | | 0.83 | % | | | 52 | % |
| | 17.93 | | | | 10.39 | | | | 213,256 | | | | 0.60 | | | | 3.00 | | | | 0.83 | | | | 22 | |
| | 16.79 | | | | (8.66 | ) | | | 203,437 | | | | 0.60 | | | | 2.40 | | | | 0.84 | | | | 42 | |
| | 18.76 | | | | 23.41 | | | | 298,112 | | | | 0.59 | | | | 1.98 | | | | 0.90 | | | | 33 | |
| | 15.54 | | | | (2.94 | ) | | | 69,626 | | | | 0.60 | | | | 2.60 | (f) | | | 1.02 | | | | 24 | |
| | | | | | |
| | | | | | | | | | | | | | | | | | | | | | | | | | |
| | 16.05 | | | | (9.05 | ) | | | 472,455 | | | | 0.34 | | | | 2.15 | | | | 0.56 | | | | 52 | |
| | 18.17 | | | | 10.65 | | | | 185,680 | | | | 0.35 | | | | 3.28 | | | | 0.56 | | | | 22 | |
| | 17.01 | | | | (8.42 | ) | | | 152,610 | | | | 0.35 | | | | 1.85 | | | | 0.56 | | | | 42 | |
| | 18.92 | | | | 23.71 | | | | 4,740,590 | | | | 0.34 | | | | 2.37 | | | | 0.58 | | | | 33 | |
| | 15.68 | | | | (2.72 | ) | | | 1,241,856 | | | | 0.34 | | | | 2.98 | (f) | | | 0.59 | | | | 24 | |
| | | | | | |
| | | | | | | | | | | | | | | | | | | | | | | | | | |
| | 16.00 | | | | (8.96 | ) | | | 4,337,776 | | | | 0.24 | | | | 2.35 | | | | 0.30 | | | | 52 | |
| | 18.11 | | | | 10.78 | | | | 4,435,538 | | | | 0.25 | | | | 3.37 | | | | 0.31 | | | | 22 | |
| | 16.97 | | | | (8.60 | ) | | | 4,344,571 | | | | 0.25 | | | | 3.00 | | | | 0.32 | | | | 42 | |
SEE NOTES TO FINANCIAL STATEMENTS.
| | | | | | | | |
| | | |
| OCTOBER 31, 2020 | | J.P. MORGAN INTERNATIONAL EQUITY FUNDS | | | | | 103 | |
FINANCIAL HIGHLIGHTS
FOR THE PERIODS INDICATED (continued)
| | | | | | | | | | | | | | | | | | | | |
| | | | | | Per share operating performance | |
| | | | | | Investment operations | | | Distributions | |
| | | Net asset
value,
beginning
of period | | | Net
investment
income
(loss) (b) | | | Net realized
and unrealized
gains
(losses) on
investments | | | Total from
investment
operations | | | Net
investment
income | |
JPMorgan International Value Fund | | | | | | | | | | | | | | | | | | | | |
| | | | | |
Class A | | | | | | | | | | | | | | | | | | | | |
Year Ended October 31, 2020 | | $ | 12.22 | | | $ | 0.28 | | | $ | (2.55 | ) | | $ | (2.27 | ) | | $ | (0.49 | ) |
Year Ended October 31, 2019 | | | 12.44 | | | | 0.44 | | | | (0.20 | ) | | | 0.24 | | | | (0.46 | ) |
Year Ended October 31, 2018 | | | 14.26 | | | | 0.36 | | | | (1.87 | ) | | | (1.51 | ) | | | (0.31 | ) |
Year Ended October 31, 2017 | | | 12.23 | | | | 0.22 | | | | 2.50 | | | | 2.72 | | | | (0.69 | ) |
Year Ended October 31, 2016 | | | 13.02 | | | | 0.23 | | | | (0.88 | ) | | | (0.65 | ) | | | (0.14 | ) |
| | | | | |
Class C | | | | | | | | | | | | | | | | | | | | |
Year Ended October 31, 2020 | | | 11.81 | | | | 0.21 | | | | (2.47 | ) | | | (2.26 | ) | | | (0.41 | ) |
Year Ended October 31, 2019 | | | 12.02 | | | | 0.36 | | | | (0.18 | ) | | | 0.18 | | | | (0.39 | ) |
Year Ended October 31, 2018 | | | 13.78 | | | | 0.28 | | | | (1.82 | ) | | | (1.54 | ) | | | (0.22 | ) |
Year Ended October 31, 2017 | | | 11.88 | | | | 0.15 | | | | 2.42 | | | | 2.57 | | | | (0.67 | ) |
Year Ended October 31, 2016 | | | 12.65 | | | | 0.17 | | | | (0.87 | ) | | | (0.70 | ) | | | (0.07 | ) |
|
Class I | |
Year Ended October 31, 2020 | | | 12.54 | | | | 0.31 | | | | (2.61 | ) | | | (2.30 | ) | | | (0.52 | ) |
Year Ended October 31, 2019 | | | 12.76 | | | | 0.48 | | | | (0.20 | ) | | | 0.28 | | | | (0.50 | ) |
Year Ended October 31, 2018 | | | 14.62 | | | | 0.41 | | | | (1.92 | ) | | | (1.51 | ) | | | (0.35 | ) |
Year Ended October 31, 2017 | | | 12.57 | | | | 0.28 | | | | 2.55 | | | | 2.83 | | | | (0.78 | ) |
Year Ended October 31, 2016 | | | 13.37 | | | | 0.28 | | | | (0.91 | ) | | | (0.63 | ) | | | (0.17 | ) |
|
Class L | |
Year Ended October 31, 2020 | | | 12.47 | | | | 0.30 | | | | (2.58 | ) | | | (2.28 | ) | | | (0.53 | ) |
Year Ended October 31, 2019 | | | 12.70 | | | | 0.46 | | | | (0.17 | ) | | | 0.29 | | | | (0.52 | ) |
Year Ended October 31, 2018 | | | 14.55 | | | | 0.41 | | | | (1.90 | ) | | | (1.49 | ) | | | (0.36 | ) |
Year Ended October 31, 2017 | | | 12.50 | | | | 0.27 | | | | 2.57 | | | | 2.84 | | | | (0.79 | ) |
Year Ended October 31, 2016 | | | 13.29 | | | | 0.31 | | | | (0.93 | ) | | | (0.62 | ) | | | (0.17 | ) |
| | | | | |
Class R2 | | | | | | | | | | | | | | | | | | | | |
Year Ended October 31, 2020 | | | 11.96 | | | | 0.24 | | | | (2.51 | ) | | | (2.27 | ) | | | (0.40 | ) |
Year Ended October 31, 2019 | | | 12.20 | | | | 0.40 | | | | (0.20 | ) | | | 0.20 | | | | (0.44 | ) |
Year Ended October 31, 2018 | | | 14.01 | | | | 0.31 | | | | (1.84 | ) | | | (1.53 | ) | | | (0.28 | ) |
Year Ended October 31, 2017 | | | 12.04 | | | | 0.19 | | | | 2.46 | | | | 2.65 | | | | (0.68 | ) |
Year Ended October 31, 2016 | | | 12.83 | | | | 0.19 | | | | (0.87 | ) | | | (0.68 | ) | | | (0.11 | ) |
|
Class R5 | |
Year Ended October 31, 2020 | | | 12.40 | | | | 0.33 | | | | (2.59 | ) | | | (2.26 | ) | | | (0.54 | ) |
Year Ended October 31, 2019 | | | 12.65 | | | | 0.49 | | | | (0.21 | ) | | | 0.28 | | | | (0.53 | ) |
Year Ended October 31, 2018 | | | 14.51 | | | | 0.42 | | | | (1.91 | ) | | | (1.49 | ) | | | (0.37 | ) |
Year Ended October 31, 2017 | | | 12.51 | | | | 0.23 | | | | 2.59 | | | | 2.82 | | | | (0.82 | ) |
September 9, 2016 (f) through October 31, 2016 | | | 12.55 | | | | 0.03 | | | | (0.07 | ) | | | (0.04 | ) | | | — | |
|
Class R6 | |
Year Ended October 31, 2020 | | | 12.43 | | | | 0.34 | | | | (2.60 | ) | | | (2.26 | ) | | | (0.55 | ) |
Year Ended October 31, 2019 | | | 12.67 | | | | 0.51 | | | | (0.21 | ) | | | 0.30 | | | | (0.54 | ) |
Year Ended October 31, 2018 | | | 14.53 | | | | 0.43 | | | | (1.91 | ) | | | (1.48 | ) | | | (0.38 | ) |
Year Ended October 31, 2017 | | | 12.51 | | | | 0.31 | | | | 2.53 | | | | 2.84 | | | | (0.82 | ) |
Year Ended October 31, 2016 | | | 13.31 | | | | 0.37 | | | | (0.96 | ) | | | (0.59 | ) | | | (0.21 | ) |
| (a) | Annualized for periods less than one year, unless otherwise noted. |
| (b) | Calculated based upon average shares outstanding. |
| (c) | Not annualized for periods less than one year. |
| (d) | Includes adjustments in accordance with accounting principles generally accepted in the United States of America and as such, the net asset values for financial reporting purposes and the returns based upon those net asset values may differ from the net asset values and returns for shareholder transactions. |
| (e) | Includes interest expense, if applicable, which is less than 0.005% unless otherwise noted. |
| (f) | Commencement of offering of class of shares. |
SEE NOTES TO FINANCIAL STATEMENTS.
| | | | | | |
| | | |
| 104 | | | | J.P. MORGAN INTERNATIONAL EQUITY FUNDS | | OCTOBER 31, 2020 |
| | | | | | | | | | | | | | | | | | | | | | | | | | |
| | | Ratios/Supplemental data | |
| | | | | | | | | | Ratios to average net assets (a) | | | | |
Net asset
value,
end of
period | | | Total return
(excludes
sales charge) (c)(d) | | |
Net assets,
end of
period
(000’s) | | | Net
expenses (e) | | | Net
investment income
(loss) | | | Expenses
without waivers
and reimbursements | | | Portfolio
turnover
rate (c) | |
| | | | | | | | | | | | | | | | | | | | | | | | | | |
| | | | | | |
| | | | | | | | | | | | | | | | | | | | | | | | | | |
| $ | 9.46 | | | | (19.51 | )% | | $ | 125,744 | | | | 1.00 | % | | | 2.66 | % | | | 1.26 | % | | | 59 | % |
| | 12.22 | | | | 2.30 | | | | 181,458 | | | | 1.00 | | | | 3.69 | | | | 1.28 | | | | 61 | |
| | 12.44 | | | | (10.88 | ) | | | 242,231 | | | | 1.00 | | | | 2.59 | | | | 1.27 | | | | 90 | |
| | 14.26 | | | | 23.30 | | | | 316,510 | | | | 1.35 | | | | 1.71 | | | | 1.35 | | | | 31 | |
| | 12.23 | | | | (5.01 | ) | | | 573,449 | | | | 1.35 | | | | 1.91 | | | | 1.43 | | | | 61 | |
| | | | | | |
| | | | | | | | | | | | | | | | | | | | | | | | | | |
| | 9.14 | | | | (19.94 | ) | | | 4,202 | | | | 1.50 | | | | 2.07 | | | | 1.78 | | | | 59 | |
| | 11.81 | | | | 1.82 | | | | 9,358 | | | | 1.50 | | | | 3.15 | | | | 1.80 | | | | 61 | |
| | 12.02 | | | | (11.37 | ) | | | 14,055 | | | | 1.50 | | | | 2.06 | | | | 1.78 | | | | 90 | |
| | 13.78 | | | | 22.67 | | | | 20,997 | | | | 1.85 | | | | 1.21 | | | | 1.87 | | | | 31 | |
| | 11.88 | | | | (5.54 | ) | | | 24,453 | | | | 1.85 | | | | 1.43 | | | | 1.91 | | | | 61 | |
| | | | | | | | | | | | | | | | | | | | | | | | | | |
| | 9.72 | | | | (19.31 | ) | | | 26,805 | | | | 0.75 | | | | 2.88 | | | | 1.02 | | | | 59 | |
| | 12.54 | | | | 2.56 | | | | 45,503 | | | | 0.75 | | | | 3.91 | | | | 1.03 | | | | 61 | |
| | 12.76 | | | | (10.62 | ) | | | 66,291 | | | | 0.75 | | | | 2.84 | | | | 1.02 | | | | 90 | |
| | 14.62 | | | | 23.66 | | | | 144,875 | | | | 1.04 | | | | 2.07 | | | | 1.04 | | | | 31 | |
| | 12.57 | | | | (4.74 | ) | | | 157,867 | | | | 1.01 | | | | 2.28 | | | | 1.02 | | | | 61 | |
| | | | | | |
| | | | | | | | | | | | | | | | | | | | | | | | | | |
| | 9.66 | | | | (19.25 | ) | | | 5,585 | | | | 0.65 | | | | 2.72 | | | | 0.85 | | | | 59 | |
| | 12.47 | | | | 2.69 | | | | 30,256 | | | | 0.65 | | | | 3.81 | | | | 0.87 | | | | 61 | |
| | 12.70 | | | | (10.57 | ) | | | 73,651 | | | | 0.65 | | | | 2.84 | | | | 0.87 | | | | 90 | |
| | 14.55 | | | | 23.88 | | | | 201,672 | | | | 0.87 | | | | 2.03 | | | | 0.88 | | | | 31 | |
| | 12.50 | | | | (4.63 | ) | | | 523,251 | | | | 0.90 | | | | 2.53 | | | | 0.91 | | | | 61 | |
| | | | | | |
| | | | | | | | | | | | | | | | | | | | | | | | | | |
| | 9.29 | | | | (19.74 | ) | | | 412 | | | | 1.30 | | | | 2.27 | | | | 1.61 | | | | 59 | |
| | 11.96 | | | | 2.00 | | | | 722 | | | | 1.30 | | | | 3.47 | | | | 1.69 | | | | 61 | |
| | 12.20 | | | | (11.19 | ) | | | 1,025 | | | | 1.30 | | | | 2.27 | | | | 1.59 | | | | 90 | |
| | 14.01 | | | | 23.02 | | | | 1,369 | | | | 1.58 | | | | 1.52 | | | | 1.73 | | | | 31 | |
| | 12.04 | | | | (5.28 | ) | | | 1,182 | | | | 1.59 | | | | 1.65 | | | | 1.91 | | | | 61 | |
| | | | | | |
| | | | | | | | | | | | | | | | | | | | | | | | | | |
| | 9.60 | | | | (19.26 | ) | | | 77 | | | | 0.65 | | | | 3.13 | | | | 0.86 | | | | 59 | |
| | 12.40 | | | | 2.64 | | | | 88 | | | | 0.65 | | | | 4.08 | | | | 0.87 | | | | 61 | |
| | 12.65 | | | | (10.58 | ) | | | 70 | | | | 0.65 | | | | 2.97 | | | | 0.91 | | | | 90 | |
| | 14.51 | | | | 23.81 | | | | 62 | | | | 0.93 | | | | 1.69 | | | | 4.00 | | | | 31 | |
| | 12.51 | | | | (0.32 | ) | | | 20 | | | | 0.79 | | | | 1.52 | | | | 0.79 | | | | 61 | |
| | | | | | |
| | | | | | | | | | | | | | | | | | | | | | | | | | |
| | 9.62 | | | | (19.22 | ) | | | 105,039 | | | | 0.55 | | | | 3.18 | | | | 0.76 | | | | 59 | |
| | 12.43 | | | | 2.83 | | | | 125,887 | | | | 0.55 | | | | 4.22 | | | | 0.77 | | | | 61 | |
| | 12.67 | | | | (10.49 | ) | | | 124,246 | | | | 0.55 | | | | 3.06 | | | | 0.77 | | | | 90 | |
| | 14.53 | | | | 23.99 | | | | 108,302 | | | | 0.80 | | | | 2.28 | | | | 0.82 | | | | 31 | |
| | 12.51 | | | | (4.45 | ) | | | 27,998 | | | | 0.72 | | | | 3.00 | | | | 0.73 | | | | 61 | |
SEE NOTES TO FINANCIAL STATEMENTS.
| | | | | | | | |
| | | |
| OCTOBER 31, 2020 | | J.P. MORGAN INTERNATIONAL EQUITY FUNDS | | | | | 105 | |
NOTES TO FINANCIAL STATEMENTS
AS OF OCTOBER 31, 2020
1. Organization
JPMorgan Trust I (“JPM I”), JPMorgan Trust II (“JPM II”) and JPMorgan Trust IV (“JPM IV”) (collectively, the “Trusts”) were formed on November 12, 2004, November 12, 2004 and November 11, 2015, respectively, as Delaware statutory trusts, pursuant to Declarations of Trust dated November 5, 2004, November 5, 2004 and November 11, 2015, respectively, and are registered under the Investment Company Act of 1940, as amended (the “1940 Act”), as open-end management investment companies.
The following are 9 separate funds of the Trusts (each, a “Fund” and collectively, the “Funds”) covered by this report:
| | | | | | |
| | | Classes Offered | | Trust | | Diversification
Classification |
| JPMorgan Emerging Markets Equity Fund(1) | | Class A, Class C, Class I, Class L, Class R2, Class R3, Class R4, Class R5 and Class R6 | | JPM I | | Diversified |
| JPMorgan Emerging Markets Research Enhanced Equity Fund | | Class I and Class R6 | | JPM IV | | Diversified |
| JPMorgan Europe Dynamic Fund | | Class A, Class C, Class I, Class L and Class R6 | | JPM I | | Diversified |
| JPMorgan International Advantage Fund | | Class A, Class C, Class I, Class R2 and Class R6 | | JPM I | | Diversified |
| JPMorgan International Equity Fund | | Class A, Class C, Class I, Class R2, Class R5 and Class R6 | | JPM I | | Diversified |
| JPMorgan International Focus Fund(2) | | Class A, Class C, Class I, Class R2, Class R5 and Class R6 | | JPM I | | Diversified |
| JPMorgan International Hedged Equity Fund | | Class A, Class C, Class I, Class R5 and Class R6 | | JPM IV | | Diversified |
| JPMorgan International Research Enhanced Equity Fund | | Class A, Class I and Class R6 | | JPM II | | Diversified |
| JPMorgan International Value Fund | | Class A, Class C, Class I, Class L, Class R2, Class R5 and Class R6 | | JPM I | | Diversified |
| (1) | Effective as of the close of business on December 31, 2020, JPMorgan Emerging Markets Equity Fund will be publicly offered on a limited basis. |
| (2) | Effective April 20, 2020, JPMorgan International Unconstrained Equity Fund changed its name to JPMorgan International Focus Fund. |
Class L Shares of the JPMorgan Emerging Markets Equity Fund (“Emerging Markets Equity Fund”), JPMorgan Europe Dynamic Fund (“Europe Dynamic Fund”) and JPMorgan International Value Fund (“International Value Fund”) are publicly offered on a limited basis. As of October 9, 2017, Class A Shares of the JPMorgan International Research Enhanced Equity Fund (“International Research Enhanced Equity Fund”) are publicly offered on a limited basis. Investors are not eligible to purchase Class L Shares of Emerging Markets Equity Fund, Europe Dynamic Fund and International Value Fund and Class A Shares of International Research Enhanced Equity Fund unless they meet certain requirements as described in the Funds’ prospectus.
The investment objective of Emerging Markets Equity Fund is to seek to provide high total return.
The investment objective of JPMorgan Emerging Markets Research Enhanced Equity Fund (“Emerging Markets Research Enhanced Equity Fund”), JPMorgan International Focus Fund (“International Focus Fund”), International Research Enhanced Equity Fund and International Value Fund is to seek to provide long-term capital appreciation.
The investment objective of Europe Dynamic Fund is to seek total return from long-term capital growth. Total return consists of capital growth and current income.
The investment objective of JPMorgan International Advantage Fund (“International Advantage Fund”) is to seek to maximize long-term capital growth by investing primarily in equity securities in developed markets outside the U.S.
The investment objective of JPMorgan International Equity Fund (“International Equity Fund”) is to seek total return from long-term capital growth and income. Total return consists of capital growth and current income.
The investment objective of JPMorgan International Hedged Equity Fund (“International Hedged Equity Fund”) is to seek to provide capital appreciation.
Class A Shares generally provide for a front-end sales charge while Class C Shares provide for a contingent deferred sales charge (“CDSC”). No sales charges are assessed with respect to Class I, Class L, Class R2, Class R3, Class R4, Class R5 and Class R6 Shares. Certain Class A Shares, for which front-end sales charges have been waived, may be subject to a CDSC as described in the Funds’ prospectus. Effective October 1, 2020, Class C Shares automatically convert to Class A Shares after eight years. Prior to October 1, 2020, Class C Shares automatically converted to Class A Shares after ten years. All classes of shares have equal rights as to earnings, assets and voting privileges, except that each class may bear different transfer agency, distribution and service fees and each class has exclusive voting rights with respect to its distribution plan and shareholder servicing agreements.
| | | | | | |
| | | |
| 106 | | | | J.P. MORGAN INTERNATIONAL EQUITY FUNDS | | OCTOBER 31, 2020 |
J.P. Morgan Investment Management Inc. (“JPMIM”), an indirect, wholly-owned subsidiary of JPMorgan Chase & Co. (“JPMorgan”), acts as Adviser (the “Adviser”) and Administrator (the “Administrator”) to the Funds.
2. Significant Accounting Policies
The following is a summary of significant accounting policies followed by the Funds in the preparation of their financial statements. The Funds are investment companies and, accordingly, follow the investment company accounting and reporting guidance of the Financial Accounting Standards Board (“FASB”) Accounting Standards Codification Topic 946 — Investment Companies, which is part of U.S. generally accepted accounting principles (“GAAP”). The preparation of financial statements in conformity with GAAP requires management to make estimates and assumptions that affect (i) the reported amounts of assets and liabilities, (ii) disclosure of contingent assets and liabilities at the date of the financial statements, and (iii) the reported amounts of increases and decreases in net assets from operations during the reporting period. Actual results could differ from those estimates.
A. Valuation of Investments — Investments are valued in accordance with GAAP and the Funds’ valuation policies set forth by, and under the supervision and responsibility of, the Boards of Trustees of the Trusts (the “Boards”), which established the following approach to valuation, as described more fully below: (i) investments for which market quotations are readily available shall be valued at their market value and (ii) all other investments for which market quotations are not readily available shall be valued at their fair value as determined in good faith by the Boards.
The Administrator has established the J.P. Morgan Asset Management Americas Valuation Committee (“AVC”) to assist the Boards with the oversight and monitoring of the valuation of the Funds’ investments. The Administrator implements the valuation policies of the Funds’ investments, as directed by the Boards. The AVC oversees and carries out the policies for the valuation of investments held in the Funds. This includes monitoring the appropriateness of fair values based on results of ongoing valuation oversight including, but not limited to, consideration of macro or security specific events, market events, and pricing vendor and broker due diligence. The Administrator is responsible for discussing and assessing the potential impacts to the fair values on an ongoing basis, and, at least on a quarterly basis, with the AVC and the Boards.
A market-based approach is primarily used to value the Funds’ investments. Investments for which market quotations are not readily available are fair valued by approved affiliated and/or unaffiliated pricing vendors or third party broker-dealers (collectively referred to as “Pricing Services”) or may be internally fair valued using methods set forth by the valuation policies approved by the Boards. This may include the use of related or comparable assets or liabilities, recent transactions, market multiples, book values and other relevant information for the investment. An income-based valuation approach may be used in which the anticipated future cash flows of the investment are discounted to calculate the fair value. Discounts may also be applied due to the nature or duration of any restrictions on the disposition of the investments. Valuations may be based upon current market prices of securities that are comparable in coupon, rating, maturity and industry. It is possible that the estimated values may differ significantly from the values that would have been used had a ready market for the investments existed, and such differences could be material.
Equities and other exchange-traded instruments are valued at the last sale price or official market closing price on the primary exchange on which the instrument is traded before the net asset values (“NAV”) of the Funds are calculated on a valuation date. Certain foreign equity instruments, as well as certain derivatives with foreign equity reference obligations, are valued by applying international fair value factors provided by approved Pricing Services. The factors seek to adjust the local closing price for movements of local markets post-closing, but prior to the time the NAVs are calculated.
Investments in open-end investment companies (“Underlying Funds”) are valued at each Underlying Fund’s NAV per share as of the report date.
Futures contracts and options are generally valued on the basis of available market quotations.
Valuations reflected in this report are as of the report date. As a result, changes in valuation due to market events and/or issuer-related events after the report date and prior to issuance of the report are not reflected herein.
The various inputs that are used in determining the valuation of the Funds’ investments are summarized into the three broad levels listed below.
| • | | Level 1 — Unadjusted inputs using quoted prices in active markets for identical investments. |
| • | | Level 2 — Other significant observable inputs including, but not limited to, quoted prices for similar investments, inputs other than quoted prices that are observable for investments (such as interest rates, prepayment speeds, credit risk, etc.) or other market corroborated inputs. |
| • | | Level 3 — Significant inputs based on the best information available in the circumstances, to the extent observable inputs are not available (including the Funds’ assumptions in determining the fair value of investments). |
A financial instrument’s level within the fair value hierarchy is based on the lowest level of any input, both individually and in the aggregate, that is significant to the fair value measurement. The inputs or methodology used for valuing instruments are not necessarily an indication of the risk associated with investing in those instruments.
| | | | | | | | |
| | | |
| OCTOBER 31, 2020 | | J.P. MORGAN INTERNATIONAL EQUITY FUNDS | | | | | 107 | |
NOTES TO FINANCIAL STATEMENTS
AS OF OCTOBER 31, 2020 (continued)
The following tables represent each valuation input as presented on the Schedules of Portfolio Investments (“SOIs”) (amounts in thousands):
Emerging Markets Equity Fund
| | | | | | | | | | | | | | | | |
| | | Level 1
Quoted prices | | | Level 2
Other significant
observable inputs | | | Level 3
Significant
unobservable inputs | | | Total | |
| Investments in Securities | | | | | | | | | | | | | | | | |
Common Stocks | |
Argentina | | $ | 278,586 | | | $ | – | | | $ | – | | | $ | 278,586 | |
Brazil | | | 712,207 | | | | – | | | | – | | | | 712,207 | |
China | | | 1,054,071 | | | | 3,158,993 | | | | – | | | | 4,213,064 | |
Egypt | | | – | | | | 44,879 | | | | – | | | | 44,879 | |
Hong Kong | | | – | | | | 653,236 | | | | – | | | | 653,236 | |
Hungary | | | – | | | | 106,892 | | | | – | | | | 106,892 | |
India | | | 190,810 | | | | 1,617,519 | | | | – | | | | 1,808,329 | |
Indonesia | | | – | | | | 195,541 | | | | – | | | | 195,541 | |
Macau | | | – | | | | 92,037 | | | | – | | | | 92,037 | |
Mexico | | | 244,736 | | | | – | | | | – | | | | 244,736 | |
Panama | | | 44,859 | | | | – | | | | – | | | | 44,859 | |
Poland | | | 92,826 | | | | – | | | | – | | | | 92,826 | |
Portugal | | | – | | | | 119,612 | | | | – | | | | 119,612 | |
South Africa | | | – | | | | 159,598 | | | | – | | | | 159,598 | |
South Korea | | | – | | | | 563,080 | | | | – | | | | 563,080 | |
Taiwan | | | 1,113,266 | | | | 40,815 | | | | – | | | | 1,154,081 | |
Turkey | | | – | | | | 99,172 | | | | – | | | | 99,172 | |
United States | | | 341,325 | | | | – | | | | – | | | | 341,325 | |
| | | | | | | | | | | | | | | | |
Total Common Stocks | | | 4,072,686 | | | | 6,851,374 | | | | – | | | | 10,924,060 | |
| | | | | | | | | | | | | | | | |
Short-Term Investments | |
Investment Companies | | | 313,818 | | | | – | | | | – | | | | 313,818 | |
Investment of cash collateral from securities loaned | | | 129,621 | | | | – | | | | – | | | | 129,621 | |
| | | | | | | | | | | | | | | | |
Total Short-Term Investments | | | 443,439 | | | | – | | | | – | | | | 443,439 | |
| | | | | | | | | | | | | | | | |
Total Investments in Securities | | $ | 4,516,125 | | | $ | 6,851,374 | | | $ | – | | | $ | 11,367,499 | |
| | | | | | | | | | | | | | | | |
Emerging Markets Research Enhanced Equity Fund
| | | | | | | | | | | | | | | | |
| | | Level 1
Quoted prices | | | Level 2
Other significant
observable inputs | | | Level 3
Significant
unobservable inputs | | | Total | |
Investments in Securities | |
Common Stocks | |
Argentina | | $ | 5,140 | | | $ | – | | | $ | – | | | $ | 5,140 | |
Brazil | | | 125,329 | | | | – | | | | – | | | | 125,329 | |
Chile | | | 7,306 | | | | – | | | | – | | | | 7,306 | |
China | | | 172,445 | | | | 1,084,331 | | | | – | | | | 1,256,776 | |
Colombia | | | 4,099 | | | | – | | | | – | | | | 4,099 | |
Czech Republic | | | – | | | | 2,696 | | | | – | | | | 2,696 | |
Greece | | | – | | | | 8,519 | | | | – | | | | 8,519 | |
Hong Kong | | | 3,655 | | | | 6,432 | | | | – | | | | 10,087 | |
Hungary | | | – | | | | 10,242 | | | | – | | | | 10,242 | |
India | | | 39,867 | | | | 209,471 | | | | – | | | | 249,338 | |
Indonesia | | | – | | | | 38,600 | | | | – | | | | 38,600 | |
Malaysia | | | – | | | | 22,686 | | | | – | | | | 22,686 | |
Mexico | | | 65,935 | | | | – | | | | – | | | | 65,935 | |
Peru | | | 8,817 | | | | – | | | | – | | | | 8,817 | |
Philippines | | | – | | | | 11,137 | | | | – | | | | 11,137 | |
Poland | | | – | | | | 12,504 | | | | – | | | | 12,504 | |
Qatar | | | – | | | | 9,119 | | | | – | | | | 9,119 | |
| | | | | | |
| | | |
| 108 | | | | J.P. MORGAN INTERNATIONAL EQUITY FUNDS | | OCTOBER 31, 2020 |
Emerging Markets Research Enhanced Equity Fund (continued)
| | | | | | | | | | | | | | | | |
| | | Level 1
Quoted prices | | | Level 2
Other significant
observable inputs | | | Level 3
Significant
unobservable inputs | | | Total | |
Russia | | $ | 44,958 | | | $ | 42,431 | | | $ | – | | | $ | 87,389 | |
Saudi Arabia | | | 17,158 | | | | 40,723 | | | | – | | | | 57,881 | |
Singapore | | | – | | | | 2,063 | | | | – | | | | 2,063 | |
South Africa | | | 18,687 | | | | 92,131 | | | | – | | | | 110,818 | |
South Korea | | | – | | | | 354,305 | | | | – | | | | 354,305 | |
Taiwan | | | 165,357 | | | | 179,037 | | | | – | | | | 344,394 | |
Tanzania, United Republic of | | | 5,468 | | | | – | | | | – | | | | 5,468 | |
Thailand | | | 14,916 | | | | 20,605 | | | | – | | | | 35,521 | |
Turkey | | | – | | | | 6,337 | | | | – | | | | 6,337 | |
United Arab Emirates | | | – | | | | 2,973 | | | | – | | | | 2,973 | |
| | | | | | | | | | | | | | | | |
Total Common Stocks | | | 699,137 | | | | 2,156,342 | | | | – | | | | 2,855,479 | |
| | | | | | | | | | | | | | | | |
Short-Term Investments | |
Investment Companies | | | 12,125 | | | | – | | | | – | | | | 12,125 | |
Investment of cash collateral from securities loaned | | | 18,088 | | | | – | | | | – | | | | 18,088 | |
| | | | | | | | | | | | | | | | |
Total Short-Term Investments | | | 30,213 | | | | – | | | | – | | | | 30,213 | |
| | | | | | | | | | | | | | | | |
Total Investments in Securities | | $ | 729,350 | | | $ | 2,156,342 | | | $ | – | | | $ | 2,885,692 | |
| | | | | | | | | | | | | | | | |
Europe Dynamic Fund
| | | | | | | | | | | | | | | | |
| | | Level 1
Quoted prices | | | Level 2
Other significant
observable inputs | | | Level 3
Significant
unobservable inputs | | | Total | |
Investments in Securities | |
Common Stocks | |
Australia | | $ | – | | | $ | 12,490 | | | $ | – | | | $ | 12,490 | |
Austria | | | 2,169 | | | | 8,485 | | | | – | | | | 10,654 | |
China | | | – | | | | 5,808 | | | | – | | | | 5,808 | |
Denmark | | | 7,308 | | | | 11,718 | | | | – | | | | 19,026 | |
Finland | | | – | | | | 9,711 | | | | – | | | | 9,711 | |
France | | | – | | | | 48,541 | | | | – | | | | 48,541 | |
Germany | | | 3,323 | | | | 59,013 | | | | – | | | | 62,336 | |
Ireland | | | 6,431 | | | | 7,303 | | | | – | | | | 13,734 | |
Italy | | | – | | | | 16,018 | | | | – | | | | 16,018 | |
Jordan | | | – | | | | 4,504 | | | | – | | | | 4,504 | |
Netherlands | | | – | | | | 31,137 | | | | – | | | | 31,137 | |
Norway | | | – | | | | 1,656 | | | | – | | | | 1,656 | |
Spain | | | – | | | | 4,739 | | | | – | | | | 4,739 | |
Sweden | | | – | | | | 33,700 | | | | – | | | | 33,700 | |
Switzerland | | | – | | | | 79,972 | | | | – | | | | 79,972 | |
United Kingdom | | | – | | | | 75,175 | | | | – | | | | 75,175 | |
United States | | | – | | | | 4,573 | | | | – | | | | 4,573 | |
| | | | | | | | | | | | | | | | |
Total Common Stocks | | | 19,231 | | | | 414,543 | | | | – | | | | 433,774 | |
| | | | | | | | | | | | | | | | |
Short-Term Investments | |
Investment Companies | | | 2,182 | | | | – | | | | – | | | | 2,182 | |
Investment of cash collateral from securities loaned | | | 2,662 | | | | – | | | | – | | | | 2,662 | |
| | | | | | | | | | | | | | | | |
Total Short-Term Investments | | | 4,844 | | | | – | | | | – | | | | 4,844 | |
| | | | | | | | | | | | | | | | |
Total Investments in Securities | | $ | 24,075 | | | $ | 414,543 | | | $ | – | | | $ | 438,618 | |
| | | | | | | | | | | | | | | | |
| | | | | | | | |
| | | |
| OCTOBER 31, 2020 | | J.P. MORGAN INTERNATIONAL EQUITY FUNDS | | | | | 109 | |
NOTES TO FINANCIAL STATEMENTS
AS OF OCTOBER 31, 2020 (continued)
International Advantage Fund
| | | | | | | | | | | | | | | | |
| | | Level 1
Quoted prices | | | Level 2
Other significant
observable inputs | | | Level 3
Significant
unobservable inputs | | | Total | |
Investments in Securities | |
Common Stocks | |
Australia | | $ | – | | | $ | 131,947 | | | $ | – | | | $ | 131,947 | |
Austria | | | 6,449 | | | | 6,898 | | | | – | | | | 13,347 | |
Belgium | | | – | | | | 23,670 | | | | – | | | | 23,670 | |
China | | | – | | | | 11,847 | | | | – | | | | 11,847 | |
Denmark | | | – | | | | 39,711 | | | | – | | | | 39,711 | |
Finland | | | – | | | | 10,726 | | | | – | | | | 10,726 | |
France | | | – | | | | 122,396 | | | | – | | | | 122,396 | |
Germany | | | 12,001 | | | | 117,949 | | | | – | | | | 129,950 | |
Hong Kong | | | – | | | | 25,545 | | | | – | | | | 25,545 | |
Ireland | | | 2,477 | | | | 2,035 | | | | – | | | | 4,512 | |
Israel | | | – | | | | 4,726 | | | | – | | | | 4,726 | |
Italy | | | 1,845 | | | | 14,236 | | | | – | | | | 16,081 | |
Japan | | | – | | | | 389,525 | | | | – | | | | 389,525 | |
Netherlands | | | – | | | | 95,640 | | | | – | | | | 95,640 | |
New Zealand | | | – | | | | 4,179 | | | | – | | | | 4,179 | |
Norway | | | – | | | | 21,164 | | | | – | | | | 21,164 | |
Portugal | | | – | | | | 1,507 | | | | – | | | | 1,507 | |
Russia | | | – | | | | 6,555 | | | | – | | | | 6,555 | |
Singapore | | | – | | | | 25,981 | | | | – | | | | 25,981 | |
South Africa | | | – | | | | 17,675 | | | | – | | | | 17,675 | |
Spain | | | – | | | | 15,251 | | | | – | | | | 15,251 | |
Sweden | | | – | | | | 45,986 | | | | – | | | | 45,986 | |
Switzerland | | | – | | | | 159,802 | | | | – | | | | 159,802 | |
United Kingdom | | | 1,302 | | | | 156,513 | | | | – | | | | 157,815 | |
United States | | | – | | | | 14,898 | | | | – | | | | 14,898 | |
| | | | | | | | | | | | | | | | |
Total Common Stocks | | | 24,074 | | | | 1,466,362 | | | | – | | | | 1,490,436 | |
| | | | | | | | | | | | | | | | |
Short-Term Investments | |
Investment Companies | | | 5,325 | | | | – | | | | – | | | | 5,325 | |
Investment of cash collateral from securities loaned | | | 4,401 | | | | – | | | | – | | | | 4,401 | |
| | | | | | | | | | | | | | | | |
Total Short-Term Investments | | | 9,726 | | | | – | | | | – | | | | 9,726 | |
| | | | | | | | | | | | | | | | |
Total Investments in Securities | | $ | 33,800 | | | $ | 1,466,362 | | | $ | – | | | $ | 1,500,162 | |
| | | | | | | | | | | | | | | | |
Depreciation in Other Financial Instruments | |
Futures Contracts | | $ | (237 | ) | | $ | – | | | $ | – | | | $ | (237 | ) |
| | | | | | | | | | | | | | | | |
International Equity Fund
| | | | | | | | | | | | | | | | |
| | | Level 1
Quoted prices | | | Level 2
Other significant
observable inputs | | | Level 3
Significant
unobservable inputs | | | Total | |
Investments in Securities | | | | | | | | | | | | | | | | |
Common Stocks | | | | | | | | | | | | | | | | |
Australia | | $ | – | | | $ | 114,826 | | | $ | – | | | $ | 114,826 | |
Austria | | | – | | | | 13,245 | | | | – | | | | 13,245 | |
Belgium | | | – | | | | 18,700 | | | | – | | | | 18,700 | |
China | | | – | | | | 118,669 | | | | – | | | | 118,669 | |
Denmark | | | 31,115 | | | | 89,558 | | | | – | | | | 120,673 | |
Finland | | | – | | | | 36,526 | | | | – | | | | 36,526 | |
France | | | – | | | | 357,326 | | | | – | | | | 357,326 | |
Germany | | | – | | | | 235,227 | | | | – | | | | 235,227 | |
Hong Kong | | | – | | | | 97,037 | | | | – | | | | 97,037 | |
India | | | 42,069 | | | | – | | | | – | | | | 42,069 | |
Japan | | | – | | | | 583,122 | | | | – | | | | 583,122 | |
| | | | | | |
| | | |
| 110 | | | | J.P. MORGAN INTERNATIONAL EQUITY FUNDS | | OCTOBER 31, 2020 |
International Equity Fund (continued)
| | | | | | | | | | | | | | | | |
| | | Level 1
Quoted prices | | | Level 2
Other significant
observable inputs | | | Level 3
Significant
unobservable inputs | | | Total | |
Macau | | $ | – | | | $ | 18,932 | | | $ | – | | | $ | 18,932 | |
Netherlands | | | – | | | | 89,880 | | | | – | | | | 89,880 | |
Singapore | | | – | | | | 27,507 | | | | – | | | | 27,507 | |
South Korea | | | 13 | | | | 45,497 | | | | – | | | | 45,510 | |
Spain | | | – | | | | 89,085 | | | | – | | | | 89,085 | |
Sweden | | | – | | | | 64,130 | | | | – | | | | 64,130 | |
Switzerland | | | – | | | | 344,265 | | | | – | | | | 344,265 | |
Taiwan | | | 47,021 | | | | – | | | | – | | | | 47,021 | |
United Kingdom | | | – | | | | 385,415 | | | | – | | | | 385,415 | |
United States | | | – | | | | 33,395 | | | | – | | | | 33,395 | |
| | | | | | | | | | | | | | | | |
Total Common Stocks | | | 120,218 | | | | 2,762,342 | | | | – | | | | 2,882,560 | |
| | | | | | | | | | | | | | | | |
Short-Term Investments | | | | | | | | | | | | | | | | |
Investment Companies | | | 40,182 | | | | – | | | | – | | | | 40,182 | |
Investment of cash collateral from | | | | | | | | | | | | | | | | |
securities loaned | | | 20,356 | | | | – | | | | – | | | | 20,356 | |
| | | | | | | | | | | | | | | | |
Total Short-Term Investments | | | 60,538 | | | | – | | | | – | | | | 60,538 | |
| | | | | | | | | | | | | | | | |
Total Investments in Securities | | $ | 180,756 | | | $ | 2,762,342 | | | $ | – | | | $ | 2,943,098 | |
| | | | | | | | | | | | | | | | |
International Focus Fund
| | | | | | | | | | | | | | | | |
| | | Level 1
Quoted prices | | | Level 2
Other significant
observable inputs | | | Level 3
Significant
unobservable inputs | | | Total | |
Investments in Securities | | | | | | | | | | | | | | | | |
Common Stocks | | | | | | | | | | | | | | | | |
Australia | | $ | – | | | $ | 55,135 | | | $ | – | | | $ | 55,135 | |
Belgium | | | – | | | | 33,462 | | | | – | | | | 33,462 | |
Canada | | | 178,920 | | | | – | | | | – | | | | 178,920 | |
China | | | – | | | | 336,122 | | | | – | | | | 336,122 | |
Denmark | | | – | | | | 60,019 | | | | – | | | | 60,019 | |
Finland | | | – | | | | 46,185 | | | | – | | | | 46,185 | |
France | | | – | | | | 119,814 | | | | – | | | | 119,814 | |
Germany | | | – | | | | 200,016 | | | | – | | | | 200,016 | |
Hong Kong | | | – | | | | 130,367 | | | | – | | | | 130,367 | |
India | | | 104,355 | | | | – | | | | – | | | | 104,355 | |
Indonesia | | | – | | | | 40,123 | | | | – | | | | 40,123 | |
Japan | | | – | | | | 151,608 | | | | – | | | | 151,608 | |
Netherlands | | | – | | | | 65,626 | | | | – | | | | 65,626 | |
South Korea | | | – | | | | 92,295 | | | | – | | | | 92,295 | |
Spain | | | – | | | | 86,549 | | | | – | | | | 86,549 | |
Sweden | | | – | | | | 80,789 | | | | – | | | | 80,789 | |
Switzerland | | | – | | | | 302,287 | | | | – | | | | 302,287 | |
Taiwan | | | 130,412 | | | | – | | | | – | | | | 130,412 | |
United Kingdom | | | – | | | | 498,122 | | | | – | | | | 498,122 | |
United States | | | – | | | | 44,546 | | | | – | | | | 44,546 | |
| | | | | | | | | | | | | | | | |
Total Common Stocks | | | 413,687 | | | | 2,343,065 | | | | – | | | | 2,756,752 | |
| | | | | | | | | | | | | | | | |
Short-Term Investments | | | | | | | | | | | | | | | | |
Investment Companies | | | 41,452 | | | | – | | | | – | | | | 41,452 | |
Investment of cash collateral from | | | | | | | | | | | | | | | | |
securities loaned | | | 78,528 | | | | – | | | | – | | | | 78,528 | |
| | | | | | | | | | | | | | | | |
Total Short-Term Investments | | | 119,980 | | | | – | | | | – | | | | 119,980 | |
| | | | | | | | | | | | | | | | |
Total Investments in Securities | | $ | 533,667 | | | $ | 2,343,065 | | | $ | – | | | $ | 2,876,732 | |
| | | | | | | | | | | | | | | | |
| | | | | | | | |
| | | |
| OCTOBER 31, 2020 | | J.P. MORGAN INTERNATIONAL EQUITY FUNDS | | | | | 111 | |
NOTES TO FINANCIAL STATEMENTS
AS OF OCTOBER 31, 2020 (continued)
International Hedged Equity Fund
| | | | | | | | | | | | | | | | |
| | | Level 1
Quoted prices | | | Level 2
Other significant
observable inputs | | | Level 3
Significant
unobservable inputs | | | Total | |
Investments in Securities | | | | | | | | | | | | | | | | |
Common Stocks | | | | | | | | | | | | | | | | |
Australia | | $ | – | | | $ | 7,140 | | | $ | – | | | $ | 7,140 | |
Austria | | | – | | | | 492 | | | | – | | | | 492 | |
Belgium | | | – | | | | 175 | | | | – | | | | 175 | |
China | | | – | | | | 904 | | | | – | | | | 904 | |
Denmark | | | 1,071 | | | | 2,907 | | | | – | | | | 3,978 | |
Finland | | | – | | | | 557 | | | | – | | | | 557 | |
France | | | – | | | | 13,644 | | | | – | | | | 13,644 | |
Germany | | | 112 | | | | 12,445 | | | | – | | | | 12,557 | |
Hong Kong | | | – | | | | 2,980 | | | | – | | | | 2,980 | |
Ireland | | | – | | | | 963 | | | | – | | | | 963 | |
Italy | | | – | | | | 1,930 | | | | – | | | | 1,930 | |
Japan | | | – | | | | 34,472 | | | | – | | | | 34,472 | |
Luxembourg | | | – | | | | 214 | | | | – | | | | 214 | |
Netherlands | | | – | | | | 7,011 | | | | – | | | | 7,011 | |
Norway | | | – | | | | 658 | | | | – | | | | 658 | |
Singapore | | | – | | | | 961 | | | | – | | | | 961 | |
Spain | | | – | | | | 3,075 | | | | – | | | | 3,075 | |
Sweden | | | – | | | | 2,822 | | | | – | | | | 2,822 | |
Switzerland | | | – | | | | 14,174 | | | | – | | | | 14,174 | |
United Kingdom | | | – | | | | 15,166 | | | | – | | | | 15,166 | |
United States | | | – | | | | 566 | | | | – | | | | 566 | |
| | | | | | | | | | | | | | | | |
Total Common Stocks | | | 1,183 | | | | 123,256 | | | | – | | | | 124,439 | |
| | | | | | | | | | | | | | | | |
Options Purchased | | | | | | | | | | | | | | | | |
Put Options Purchased | | | 5,997 | | | | – | | | | – | | | | 5,997 | |
Short-Term Investments | | | | | | | | | | | | | | | | |
Investment Companies | | | 6,584 | | | | – | | | | – | | | | 6,584 | |
| | | | | | | | | | | | | | | | |
Total Investments in Securities | | $ | 13,764 | | | $ | 123,256 | | | $ | – | | | $ | 137,020 | |
| | | | | | | | | | | | | | | | |
Appreciation in Other Financial Instruments | | | | | | | | | | | | | | | | |
Futures Contracts | | $ | 40 | | | $ | – | | | $ | – | | | $ | 40 | |
| | | | | | | | | | | | | | | | |
Depreciation in Other Financial Instruments | | | | | | | | | | | | | |
Futures Contracts | | $ | (165 | ) | | $ | – | | | $ | – | | | $ | (165 | ) |
Options Written | | | | | | | | | | | | | | | | |
Call Options Written | | | (231 | ) | | | – | | | | – | | | | (231 | ) |
Put Options Written | | | (1,108 | ) | | | – | | | | – | | | | (1,108 | ) |
| | | | | | | | | | | | | | | | |
Total Depreciation in Other Financial Instruments | | $ | (1,504 | ) | | $ | – | | | $ | – | | | $ | (1,504 | ) |
| | | | | | | | | | | | | | | | |
| | | | | | |
| | | |
| 112 | | | | J.P. MORGAN INTERNATIONAL EQUITY FUNDS | | OCTOBER 31, 2020 |
International Research Enhanced Equity Fund
| | | | | | | | | | | | | | | | |
| | | Level 1
Quoted prices | | | Level 2
Other significant
observable inputs | | | Level 3
Significant
unobservable inputs | | | Total | |
Investments in Securities | | | | | | | | | | | | | | | | |
Common Stocks | | | | | | | | | | | | | | | | |
Australia | | $ | – | | | $ | 271,844 | | | $ | – | | | $ | 271,844 | |
Austria | | | – | | | | 18,821 | | | | – | | | | 18,821 | |
Belgium | | | – | | | | 6,610 | | | | – | | | | 6,610 | |
China | | | – | | | | 33,877 | | | | – | | | | 33,877 | |
Denmark | | | 40,671 | | | | 109,609 | | | | – | | | | 150,280 | |
Finland | | | – | | | | 21,378 | | | | – | | | | 21,378 | |
France | | | – | | | | 522,050 | | | | – | | | | 522,050 | |
Germany | | | 4,274 | | | | 472,835 | | | | – | | | | 477,109 | |
Hong Kong | | | – | | | | 110,502 | | | | – | | | | 110,502 | |
Ireland | | | – | | | | 36,708 | | | | – | | | | 36,708 | |
Italy | | | – | | | | 73,610 | | | | – | | | | 73,610 | |
Japan | | | – | | | | 1,296,696 | | | | – | | | | 1,296,696 | |
Luxembourg | | | – | | | | 8,329 | | | | – | | | | 8,329 | |
Malta | | | – | | | | – | | | | 1 | | | | 1 | |
Netherlands | | | – | | | | 263,057 | | | | – | | | | 263,057 | |
Norway | | | – | | | | 26,829 | | | | – | | | | 26,829 | |
Singapore | | | – | | | | 36,029 | | | | – | | | | 36,029 | |
Spain | | | – | | | | 117,713 | | | | – | | | | 117,713 | |
Sweden | | | – | | | | 107,481 | | | | – | | | | 107,481 | |
Switzerland | | | – | | | | 539,090 | | | | – | | | | 539,090 | |
United Kingdom | | | – | | | | 579,081 | | | | – | | | | 579,081 | |
United States | | | – | | | | 21,658 | | | | – | | | | 21,658 | |
| | | | | | | | | | | | | | | | |
Total Common Stocks | | | 44,945 | | | | 4,673,807 | | | | 1 | | | | 4,718,753 | |
| | | | | | | | | | | | | | | | |
Short-Term Investments | | | | | | | | | | | | | | | | |
Investment Companies | | | 160,896 | | | | – | | | | – | | | | 160,896 | |
Investment of cash collateral from | | | | | | | | | | | | | | | | |
securities loaned | | | 87,575 | | | | – | | | | – | | | | 87,575 | |
| | | | | | | | | | | | | | | | |
Total Short-Term Investments | | | 248,471 | | | | – | | | | – | | | | 248,471 | |
| | | | | | | | | | | | | | | | |
Total Investments in Securities | | $ | 293,416 | | | $ | 4,673,807 | | | $ | 1 | | | $ | 4,967,224 | |
| | | | | | | | | | | | | | | | |
Appreciation in Other Financial Instruments | | | | | | | | | | | | | |
Futures Contracts | | $ | 890 | | | $ | – | | | $ | – | | | $ | 890 | |
| | | | | | | | | | | | | | | | |
International Value Fund
| | | | | | | | | | | | | | | | |
| | | Level 1
Quoted prices | | | Level 2
Other significant
observable inputs | | | Level 3
Significant
unobservable inputs | | | Total | |
Investments in Securities | | | | | | | | | | | | | | | | |
Common Stocks | | | | | | | | | | | | | | | | |
Australia | | $ | – | | | $ | 18,975 | | | $ | – | | | $ | 18,975 | |
Austria | | | 753 | | | | 2,186 | | | | – | | | | 2,939 | |
Belgium | | | – | | | | 3,880 | | | | – | | | | 3,880 | |
Brazil | | | – | | | | 639 | | | | – | | | | 639 | |
China | | | – | | | | 1,286 | | | | – | | | | 1,286 | |
Denmark | | | 911 | | | | 3,482 | | | | – | | | | 4,393 | |
Finland | | | 316 | | | | 5,561 | | | | – | | | | 5,877 | |
France | | | 1,126 | | | | 20,199 | | | | – | | | | 21,325 | |
Germany | | | 1,413 | | | | 24,760 | | | | – | | | | 26,173 | |
Hong Kong | | | – | | | | 6,635 | | | | – | | | | 6,635 | |
India | | | – | | | | 307 | | | | – | | | | 307 | |
Ireland | | | – | | | | 643 | | | | – | | | | 643 | |
| | | | | | | | |
| | | |
| OCTOBER 31, 2020 | | J.P. MORGAN INTERNATIONAL EQUITY FUNDS | | | | | 113 | |
NOTES TO FINANCIAL STATEMENTS
AS OF OCTOBER 31, 2020 (continued)
International Value Fund (continued)
| | | | | | | | | | | | | | | | |
| | | Level 1
Quoted prices | | | Level 2
Other significant
observable inputs | | | Level 3
Significant
unobservable inputs | | | Total | |
Italy | | $ | – | | | $ | 6,140 | | | $ | – | | | $ | 6,140 | |
Japan | | | – | | | | 64,483 | | | | – | | | | 64,483 | |
Luxembourg | | | – | | | | 981 | | | | – | | | | 981 | |
Malta | | | – | | | | 519 | | | | – | | | | 519 | |
Netherlands | | | – | | | | 12,641 | | | | – | | | | 12,641 | |
Norway | | | 499 | | | | 6,383 | | | | – | | | | 6,882 | |
Portugal | | | – | | | | 284 | | | | – | | | | 284 | |
Russia | | | – | | | | 1,232 | | | | – | | | | 1,232 | |
Singapore | | | – | | | | 3,347 | | | | – | | | | 3,347 | |
South Africa | | | – | | | | 1,511 | | | | – | | | | 1,511 | |
Spain | | | – | | | | 5,147 | | | | – | | | | 5,147 | |
Sweden | | | 673 | | | | 8,065 | | | | – | | | | 8,738 | |
Switzerland | | | – | | | | 19,430 | | | | – | | | | 19,430 | |
Ukraine | | | – | | | | 408 | | | | – | | | | 408 | |
United Kingdom | | | 2,745 | | | | 31,737 | | | | – | | | | 34,482 | |
United States | | | 447 | | | | 201 | | | | – | | | | 648 | |
| | | | | | | | | | | | | | | | |
Total Common Stocks | | | 8,883 | | | | 251,062 | | | | – | | | | 259,945 | |
| | | | | | | | | | | | | | | | |
Short-Term Investments | | | | | | | | | | | | | | | | |
Investment Companies | | | 5,627 | | | | – | | | | – | | | | 5,627 | |
Investment of cash collateral from | | | | | | | | | | | | | | | | |
securities loaned | | | 1,956 | | | | – | | | | – | | | | 1,956 | |
| | | | | | | | | | | | | | | | |
Total Short-Term Investments | | | 7,583 | | | | – | | | | – | | | | 7,583 | |
| | | | | | | | | | | | | | | | |
Total Investments in Securities | | $ | 16,466 | | | $ | 251,062 | | | $ | – | | | $ | 267,528 | |
| | | | | | | | | | | | | | | | |
Depreciation in Other Financial Instruments | | | | | | | | | | | | | |
Futures Contracts | | $ | (240 | ) | | $ | – | | | $ | – | | | $ | (240 | ) |
| | | | | | | | | | | | | | | | |
B. Restricted Securities — Certain securities held by the Funds may be subject to legal or contractual restrictions on resale. Restricted securities generally are resold in transactions exempt from registration under the Securities Act of 1933, as amended (the “Securities Act”). Disposal of these securities may involve time-consuming negotiations and expense. Prompt sale at the current valuation may be difficult and could adversely affect the net asset value of the Funds.
As of October 31, 2020, the Funds had no investments in restricted securities other than securities sold to the Funds under Rule 144A or Regulation S under the Securities Act.
C. Securities Lending — The Funds are authorized to engage in securities lending in order to generate additional income. The Funds are able to lend to approved borrowers. Citibank N.A. (“Citibank”) serves as lending agent for the Funds, pursuant to a Securities Lending Agency Agreement (the “Securities Lending Agency Agreement”). Securities loaned are collateralized by cash equal to at least 100% of the market value plus accrued interest on the securities lent, which is invested in the Class IM Shares of the JPMorgan U.S. Government Money Market Fund and/or the Agency SL Class Shares of the JPMorgan Securities Lending Money Market Fund. The Funds retain loan fees and the interest on cash collateral investments but are required to pay the borrower a rebate for the use of cash collateral. In cases where the lent security is of high value to borrowers, there may be a negative rebate (i.e., a net payment from the borrower to the Funds). Upon termination of a loan, the Funds are required to return to the borrower an amount equal to the cash collateral, plus any rebate owed to the borrowers. The remaining maturities of the securities lending transactions are considered overnight and continuous. Loans are subject to termination by the Funds or the borrower at any time.
The net income earned on the securities lending (after payment of rebates and Citibank’s fee) is included on the Statements of Operations as Income from securities lending (net). The Funds also receive payments from the borrower during the period of the loan, equivalent to dividends and interest earned on the securities loaned, which are recorded as Dividend or Interest income, respectively, on the Statements of Operations.
Under the Securities Lending Agency Agreement, Citibank marks to market the loaned securities on a daily basis. In the event the cash received from the borrower is less than 102% of the value of the loaned securities (105% for loans of non-U.S. securities), Citibank requests additional cash from the borrower so as to maintain a collateralization level of at least 102% of the value of the loaned securities plus accrued interest (105% for loans of non-U.S. securities), subject to certain de minimis amounts.
The value of securities out on loan is recorded as an asset on the Statements of Assets and Liabilities. The value of the cash collateral received is recorded as a liability on the Statements of Assets and Liabilities and details of collateral investments are disclosed on the SOIs.
| | | | | | |
| | | |
| 114 | | | | J.P. MORGAN INTERNATIONAL EQUITY FUNDS | | OCTOBER 31, 2020 |
The Funds bear the risk of loss associated with the collateral investments and are not entitled to additional collateral from the borrower to cover any such losses. To the extent that the value of the collateral investments declines below the amount owed to a borrower, the Funds may incur losses that exceed the amount they earned on lending the security. Upon termination of a loan, the Funds may use leverage (borrow money) to repay the borrower for cash collateral posted if the Adviser does not believe that it is prudent to sell the collateral investments to fund the payment of this liability. Securities lending activity is subject to master netting arrangements.
The following table presents for each lending Fund, the value of the securities on loan with Citibank, net of amounts available for offset under the master netting arrangements and any related collateral received or posted by the Funds as of October 31, 2020 (amounts in thousands).
| | | | | | | | | | | | |
| | | Investment Securities
on Loan, at value,
Presented on the
Statements of Assets
and Liabilities | | | Cash Collateral
Posted by Borrower* | | | Net Amount Due
to Counterparty
(not less than zero) | |
Emerging Markets Equity Fund | | $ | 121,899 | | | $ | (121,899 | ) | | $ | — | |
Emerging Markets Research Enhanced Equity Fund | | | 17,283 | | | | (17,283 | ) | | | — | |
Europe Dynamic Fund | | | 2,626 | | | | (2,626 | ) | | | — | |
International Advantage Fund | | | 4,226 | | | | (4,226 | ) | | | — | |
International Equity Fund | | | 19,188 | | | | (19,188 | ) | | | — | |
International Focus Fund | | | 73,681 | | | | (73,681 | ) | | | — | |
International Research Enhanced Equity Fund | | | 82,369 | | | | (82,369 | ) | | | — | |
International Value Fund | | | 1,527 | | | | (1,527 | ) | | | — | |
| * | Collateral posted reflects the value of securities on loan and does not include any additional amounts received from the borrower. |
Securities lending also involves counterparty risks, including the risk that the loaned securities may not be returned in a timely manner or at all. Subject to certain conditions, Citibank has agreed to indemnify the Funds from losses resulting from a borrower’s failure to return a loaned security.
JPMIM voluntarily waived investment advisory fees charged to the Funds to reduce the impact of the cash collateral investment in the JPMorgan U.S. Government Money Market Fund from 0.15% to 0.06%. For the year ended October 31, 2020, JPMIM waived fees associated with the Funds’ investment in the JPMorgan U.S. Government Money Market Fund as follows (amounts in thousands):
| | | | |
Emerging Markets Equity Fund | | $ | 9 | |
Emerging Markets Research Enhanced Equity Fund | | | 4 | |
Europe Dynamic Fund | | | 3 | |
International Advantage Fund | | | 5 | |
International Equity Fund | | | 7 | |
International Focus Fund | | | 8 | |
International Research Enhanced Equity Fund | | | 11 | |
International Value Fund | | | 2 | |
The above waiver is included in the determination of earnings on cash collateral investment and in the calculation of Citibank’s compensation and is included on the Statements of Operations as Income from securities lending (net).
International Hedged Equity Fund did not lend out any securities during the year ended October 31, 2020.
D. Investment Transactions with Affiliates — The Funds invested in Underlying Funds which are advised by the Adviser. An issuer which is under common control with the Funds may be considered an affiliate. For the purposes of the financial statements, the Funds assume the issuers listed in the tables below to be affiliated issuers. Underlying Funds’ distributions may be reinvested into the Underlying Funds. Reinvestment amounts are included in the purchase cost amounts in the tables below. Amounts in the tables below are in thousands.
| | | | | | | | |
| | | |
| OCTOBER 31, 2020 | | J.P. MORGAN INTERNATIONAL EQUITY FUNDS | | | | | 115 | |
NOTES TO FINANCIAL STATEMENTS
AS OF OCTOBER 31, 2020 (continued)
| | | | | | | | | | | | | | | | | | | | | | | | | | | | | | | | | | | | |
| Emerging Markets Equity Fund | | | | | | | | | | | | | | | | | | | | | | | | | |
| For the year ended October 31, 2020 | |
| Security Description | | Value at
October 31,
2019 | | | Purchases at Cost | | | Proceeds from Sales | | | Net
Realized
Gain
(Loss) | | | Change in
Unrealized
Appreciation/
(Depreciation) | | | Value at
October 31,
2020 | | | Shares at
October 31,
2020 | | | Dividend
Income | | | Capital Gain
Distributions | |
JPMorgan Prime Money Market Fund Class Institutional Shares, 0.05% (a)(b) | | $ | 168,369 | | | $ | 2,757,635 | | | $ | 2,612,197 | | | $ | 45 | | | $ | (34 | ) | | $ | 313,818 | | | | 313,630 | | �� | $ | 1,325 | | | $ | — | |
JPMorgan Securities Lending Money Market Fund Agency SL Class Shares, 0.15% (a)(b) | | | 8,001 | | | | 586,000 | | | | 476,500 | | | | 56 | * | | | (13 | ) | | | 117,544 | | | | 117,532 | | | | 310 | * | | | — | |
JPMorgan U.S. Government Money Market Fund Class IM Shares, 0.04% (a)(b) | | | 5,485 | | | | 584,002 | | | $ | 577,410 | | | | — | | | | — | | | | 12,077 | | | | 12,077 | | | | 48 | * | | | — | |
| | | | | | | | | | | | | | | | | | | | | | | | | | | | | | | | | | | | |
Total | | $ | 181,855 | | | $ | 3,927,637 | | | $ | 3,666,107 | | | $ | 101 | | | $ | (47 | ) | | $ | 443,439 | | | | | | | $ | 1,683 | | | $ | — | |
| | | | | | | | | | | | | | | | | | | | | | | | | | | | | | | | | | | | |
| | | | | | |
| Emerging Markets Research Enhanced Equity Fund | | | | | | | | | | | | | | | | | | | | | | | | | |
| For the year ended October 31, 2020 | |
| Security Description | | Value at
October 31,
2019 | | | Purchases at Cost | | | Proceeds
from Sales | | | Net
Realized
Gain
(Loss) | | | Change in
Unrealized
Appreciation/
(Depreciation) | | | Value at
October 31,
2020 | | | Shares at
October 31,
2020 | | | Dividend
Income | | | Capital Gain
Distributions | |
JPMorgan Prime Money Market Fund Class Institutional Shares, 0.05% (a)(b) | | $ | 22,226 | | | $ | 1,141,322 | | | $ | 1,151,443 | | | $ | 24 | | | $ | (4 | ) | | $ | 12,125 | | | | 12,118 | | | $ | 432 | | | $ | — | |
JPMorgan Securities Lending Money Market Fund Agency SL Class Shares, 0.15% (a)(b) | | | — | | | | 324,000 | | | | 307,992 | | | | (12 | )* | | | (1 | ) | | | 15,995 | | | | 15,994 | | | | 118 | * | | | — | |
JPMorgan U.S. Government Money Market Fund Class IM Shares, 0.04% (a)(b) | | | 2,216 | | | | 269,065 | | | | 269,188 | | | | — | | | | — | | | | 2,093 | | | | 2,093 | | | | 30 | * | | | — | |
| | | | | | | | | | | | | | | | | | | | | | | | | | | | | | | | | | | | |
Total | | $ | 24,442 | | | $ | 1,734,387 | | | $ | 1,728,623 | | | $ | 12 | | | $ | (5 | ) | | $ | 30,213 | | | | | | | $ | 580 | | | $ | — | |
| | | | | | | | | | | | | | | | | | | | | | | | | | | | | | | | | | | | |
| | | | | | |
| Europe Dynamic Fund | | | | | | | | | | | | | | | | | | | | | | | | | |
| For the year ended October 31, 2020 | |
| Security Description | | Value at
October 31,
2019 | | | Purchases
at Cost | | | Proceeds
from Sales | | | Net
Realized
Gain
(Loss) | | | Change in
Unrealized
Appreciation/
(Depreciation) | | | Value at
October 31,
2020 | | | Shares at
October 31,
2020 | | | Dividend
Income | | | Capital Gain
Distributions | |
JPMorgan Prime Money Market Fund Class Institutional Shares, 0.05% (a)(b) | | $ | 130 | | | $ | 316,896 | | | $ | 314,864 | | | $ | 20 | | | $ | — | (c) | | $ | 2,182 | | | | 2,180 | | | $ | 113 | | | $ | — | |
JPMorgan Securities Lending Money Market Fund Agency SL Class Shares (a) | | | — | | | | 46,000 | | | | 46,011 | | | | 11 | * | | | — | | | | — | | | | — | | | | 23 | * | | | — | |
JPMorgan U.S. Government Money Market Fund Class IM Shares, 0.04% (a)(b) | | | 286 | | | | 105,157 | | | | 102,781 | | | | — | | | | — | | | | 2,662 | | | | 2,662 | | | | 15 | * | | | — | |
| | | | | | | | | | | | | | | | | | | | | | | | | | | | | | | | | | | | |
Total | | $ | 416 | | | $ | 468,053 | | | $ | 463,656 | | | $ | 31 | | | $ | — | (c) | | $ | 4,844 | | | | | | | $ | 151 | | | $ | — | |
| | | | | | | | | | | | | | | | | | | | | | | | | | | | | | | | | | | | |
| | | | | | | | | | | | | | | | | | | | | | | | | | | | | | | | | | | | |
| | | | | | |
| | | |
| 116 | | | | J.P. MORGAN INTERNATIONAL EQUITY FUNDS | | OCTOBER 31, 2020 |
| | | | | | | | | | | | | | | | | | | | | | | | | | | | | | | | | | | | |
| International Advantage Fund | | | | | | | | | | | | | | | | | | | | | | | | | |
| For the year ended October 31, 2020 | |
| Security Description | | Value at
October 31,
2019 | | | Purchases
at Cost | | | Proceeds
from Sales | | | Net
Realized
Gain
(Loss) | | | Change in
Unrealized
Appreciation/
(Depreciation) | | | Value at
October 31,
2020 | | | Shares at
October 31,
2020 | | | Dividend
Income | | | Capital Gain
Distributions | |
JPMorgan Prime Money Market Fund Class Institutional Shares, 0.05% (a)(b) | | $ | 42,366 | | | $ | 621,773 | | | $ | 658,778 | | | $ | (29 | ) | | $ | (7 | ) | | $ | 5,325 | | | | 5,322 | | | $ | 350 | | | $ | — | |
JPMorgan Securities Lending Money Market Fund Agency SL Class Shares, 0.15% (a)(b) | | | 1,005 | | | | 214,000 | | | | 212,000 | | | | 2 | * | | | — | (c) | | | 3,007 | | | | 3,007 | | | | 98 | * | | | — | |
JPMorgan U.S. Government Money Market Fund Class IM Shares, 0.04% (a)(b) | | | 966 | | | | 240,051 | | | | 239,623 | | | | — | | | | — | | | | 1,394 | | | | 1,394 | | | | 38 | * | | | — | |
| | | | | | | | | | | | | | | | | | | | | | | | | | | | | | | | | | | | |
Total | | $ | 44,337 | | | $ | 1,075,824 | | | $ | 1,110,401 | | | $ | (27 | ) | | $ | (7 | ) | | $ | 9,726 | | | | | | | $ | 486 | | | $ | — | |
| | | | | | | | | | | | | | | | | | | | | | | | | | | | | | | | | | | | |
| | | | | | |
| International Equity Fund | | | | | | | | | | | | | | | | | | | | | | | | | |
| For the year ended October 31, 2020 | |
| Security Description | | Value at
October 31,
2019 | | | Purchases
at Cost | | | Proceeds
from Sales | | | Net
Realized
Gain
(Loss) | | | Change in
Unrealized
Appreciation/
(Depreciation) | | | Value at
October 31,
2020 | | | Shares at
October 31,
2020 | | | Dividend
Income | | | Capital Gain
Distributions | |
JPMorgan Prime Money Market Fund Class Institutional Shares, 0.05% (a)(b) | | $ | 49,197 | | | $ | 809,538 | | | $ | 818,519 | | | $ | (23 | ) | | $ | (11 | ) | | $ | 40,182 | | | | 40,159 | | | $ | 426 | | | $ | — | |
JPMorgan Securities Lending Money Market Fund Agency SL Class Shares, 0.15% (a)(b) | | | 40,003 | | | | 480,000 | | | | 502,028 | | | | 22 | * | | | — | | | | 17,997 | | | | 17,995 | | | | 282 | * | | | — | |
JPMorgan U.S. Government Money Market Fund Class IM Shares, 0.04% (a)(b) | | | 12,516 | | | | 398,832 | | | | 408,989 | | | | — | | | | — | | | | 2,359 | | | | 2,359 | | | | 52 | * | | | — | |
| | | | | | | | | | | | | | | | | | | | | | | | | | | | | | | | | | | | |
Total | | $ | 101,716 | | | $ | 1,688,370 | | | $ | 1,729,536 | | | $ | (1 | ) | | $ | (11 | ) | | $ | 60,538 | | | | | | | $ | 760 | | | $ | — | |
| | | | | | | | | | | | | | | | | | | | | | | | | | | | | | | | | | | | |
| | | | | | |
| International Focus Fund | | | | | | | | | | | | | | | | | | | | | | | | | |
| For the year ended October 31, 2020 | |
| Security Description | | Value at
October 31,
2019 | | | Purchases
at Cost | | | Proceeds
from Sales | | | Net
Realized
Gain
(Loss) | | | Change in
Unrealized
Appreciation/
(Depreciation) | | | Value at
October 31,
2020 | | | Shares at
October 31,
2020 | | | Dividend
Income | | | Capital Gain
Distributions | |
JPMorgan Prime Money Market Fund Class Institutional Shares, 0.05% (a)(b) | | $ | 48,921 | | | $ | 884,436 | | | $ | 891,943 | | | $ | 51 | | | $ | (13 | ) | | $ | 41,452 | | | | 41,427 | | | $ | 379 | | | $ | — | |
JPMorgan Securities Lending Money Market Fund Agency SL Class Shares, 0.15% (a)(b) | | | 55,000 | | | | 589,000 | | | | 573,800 | | | | 36 | * | | | — | | | | 70,236 | | | | 70,229 | | | | 301 | * | | | — | |
JPMorgan U.S. Government Money Market Fund Class IM Shares, 0.04% (a)(b) | | | 20,853 | | | | 515,856 | | | | 528,417 | | | | — | | | | — | | | | 8,292 | | | | 8,292 | | | | 71 | * | | | — | |
| | | | | | | | | | | | | | | | | | | | | | | | | | | | | | | | | | | | |
Total | | $ | 124,774 | | | $ | 1,989,292 | | | $ | 1,994,160 | | | $ | 87 | | | $ | (13 | ) | | $ | 119,980 | | | | | | | $ | 751 | | | $ | — | |
| | | | | | | | | | | | | | | | | | | | | | | | | | | | | | | | | | | | |
| | | | | | | | |
| | | |
| OCTOBER 31, 2020 | | J.P. MORGAN INTERNATIONAL EQUITY FUNDS | | | | | 117 | |
NOTES TO FINANCIAL STATEMENTS
AS OF OCTOBER 31, 2020 (continued)
| | | | | | | | | | | | | | | | | | | | | | | | | | | | | | | | | | | | |
| International Hedged Equity Fund | | | | | | | | | | | | | | | | | | | | | | | | | |
| For the year ended October 31, 2020 | |
| Security Description | | Value at
October 31,
2019 | | | Purchases
at Cost | | | Proceeds
from Sales | | | Net
Realized
Gain
(Loss) | | | Change in
Unrealized
Appreciation/
(Depreciation) | | | Value at
October 31,
2020 | | | Shares at
October 31,
2020 | | | Dividend
Income | | | Capital Gain
Distributions | |
JPMorgan U.S. Government Money Market Fund Class Institutional Shares, 0.01% (a)(b) | | $ | 850 | | | $ | 127,625 | | | $ | 121,891 | | | $ | — | (c) | | $ | — | | | $ | 6,584 | | | | 6,584 | | | $ | 19 | | | $ | — | |
| | | | | | | | | | | | | | | | | | | | | | | | | | | | | | | | | | | | |
| | | | | | |
| International Research Enhanced Equity Fund | | | | | | | | | | | | | | | | | | | | | | | | | |
| For the year ended October 31, 2020 | |
| Security Description | | Value at
October 31,
2019 | | | Purchases
at Cost | | | Proceeds
from Sales | | | Net
Realized
Gain
(Loss) | | | Change in
Unrealized
Appreciation/
(Depreciation) | | | Value at
October 31,
2020 | | | Shares at
October 31,
2020 | | | Dividend
Income | | | Capital Gain
Distributions | |
JPMorgan Prime Money Market Fund Class Institutional Shares, 0.05% (a)(b) | | $ | 154,151 | | | $ | 1,658,549 | | | $ | 1,651,800 | | | $ | (66 | ) | | $ | 62 | | | $ | 160,896 | | | | 160,800 | | | $ | 1,646 | | | $ | — | |
JPMorgan Securities Lending Money Market Fund Agency SL Class Shares, 0.15% (a)(b) | | | 76,005 | | | | 727,500 | | | | 726,200 | | | | 52 | * | | | (2 | ) | | | 77,355 | | | | 77,348 | | | | 314 | * | | | — | |
JPMorgan U.S. Government Money Market Fund Class IM Shares, 0.04% (a)(b) | | | 30,261 | | | | 646,729 | | | | 666,770 | | | | — | | | | — | | | | 10,220 | | | | 10,220 | | | | 86 | * | | | — | |
| | | | | | | | | | | | | | | | | | | | | | | | | | | | | | | | | | | | |
Total | | $ | 260,417 | | | $ | 3,032,778 | | | $ | 3,044,770 | | | $ | (14 | ) | | $ | 60 | | | $ | 248,471 | | | | | | | $ | 2,046 | | | $ | — | |
| | | | | | | | | | | | | | | | | | | | | | | | | | | | | | | | | | | | |
| | | | | | |
| International Value Fund | | | | | | | | | | | | | | | | | | | | | | | | | |
| For the year ended October 31, 2020 | |
| Security Description | | Value at
October 31,
2019 | | | Purchases
at Cost | | | Proceeds
from Sales | | | Net
Realized
Gain
(Loss) | | | Change in
Unrealized
Appreciation/
(Depreciation) | | | Value at
October 31,
2020 | | | Shares at
October 31,
2020 | | | Dividend
Income | | | Capital Gain
Distributions | |
JPMorgan Prime Money Market Fund Class Institutional Shares, 0.05% (a)(b) | | $ | 3,487 | | | $ | 80,563 | | | $ | 78,427 | | | $ | 5 | | | $ | (1 | ) | | $ | 5,627 | | | | 5,623 | | | $ | 67 | | | $ | — | |
JPMorgan Securities Lending Money Market Fund Agency SL Class Shares, 0.15% (a)(b) | | | 2,000 | | | | 15,000 | | | | 16,000 | | | | — | *(c) | | | — | (c) | | | 1,000 | | | | 1,000 | | | | 14 | * | | | — | |
JPMorgan U.S. Government Money Market Fund Class IM Shares, 0.04% (a)(b) | | | 2,026 | | | | 54,520 | | | | 55,590 | | | | — | | | | — | | | | 956 | | | | 956 | | | | 16 | * | | | — | |
| | | | | | | | | | | | | | | | | | | | | | | | | | | | | | | | | | | | |
Total | | $ | 7,513 | | | $ | 150,083 | | | $ | 150,017 | | | $ | 5 | | | $ | (1 | ) | | $ | 7,583 | | | | | | | $ | 97 | | | $ | — | |
| | | | | | | | | | | | | | | | | | | | | | | | | | | | | | | | | | | | |
| (a) | Investment in an affiliated fund, which is registered under the Investment Company Act of 1940, as amended, and is advised by J.P. Morgan Investment Management Inc. |
| (b) | The rate shown is the current yield as of October 31, 2020. |
| (c) | Amount rounds to less than one thousand. |
| * | Amount is included on the Statements of Operations as Income from securities lending (net) (after payments of rebates and Citibank’s fee). |
| | | | | | |
| | | |
| 118 | | | | J.P. MORGAN INTERNATIONAL EQUITY FUNDS | | OCTOBER 31, 2020 |
E. Foreign Currency Translation — The books and records of the Funds are maintained in U.S. dollars. Foreign currency amounts are translated into U.S. dollars at the prevailing exchange rates of such currencies against the U.S. dollar. The market value of investment securities and other assets and liabilities are translated at the exchange rate as of the valuation date. Purchases and sales of investment securities, income and expenses are translated at the exchange rate prevailing on the respective dates of such transactions.
The Funds do not isolate the effect of changes in foreign exchange rates from changes in market prices on securities held. Accordingly, such changes are included within Change in net unrealized appreciation/depreciation on investments in non-affiliates on the Statements of Operations.
Reported realized foreign currency gains and losses arise from the disposition of foreign currency, currency gains or losses realized between the trade and settlement dates on securities transactions, and the difference between the amounts of dividends, interest and foreign withholding taxes recorded on each Fund’s books on the transaction date and the U.S. dollar equivalent of the amounts actually received or paid. These reported realized foreign currency gains and losses are included in Net realized gain (loss) on foreign currency transactions on the Statements of Operations. Unrealized foreign currency gains and losses arise from changes (due to changes in exchange rates) in the value of foreign currency and other assets and liabilities denominated in foreign currencies, which are held at period end and are included in Change in net unrealized appreciation/depreciation on foreign currency translations on the Statements of Operations.
F. Options — International Hedged Equity Fund purchased and sold (“wrote”) put and call options on indices to manage and hedge equity risk within its portfolio. A purchaser of a put option has the right, but not the obligation, to sell the underlying instrument at an agreed upon price (“strike price”) to the option seller. A purchaser of a call option has the right, but not the obligation, to purchase the underlying instrument at the strike price from the option seller.
Options Purchased — Premiums paid by the Fund for options purchased are included on the Statements of Assets and Liabilities as Options purchased. The option is adjusted daily to reflect the current market value of the option and the change is recorded as Change in net unrealized appreciation/depreciation on options purchased on the Statements of Operations. If the option is allowed to expire, the Fund will lose the entire premium it paid and record a realized loss for the premium amount. Premiums paid for options purchased which are exercised or closed are added to the amounts paid or will offset against the proceeds on the underlying investment transaction to determine the realized gain (loss) or cost basis of the underlying investment.
Options Written — Premiums received by the Fund for options written are included on the Statements of Assets and Liabilities as a liability. The amount of the liability is adjusted daily to reflect the current market value of the option written and the change in market value is recorded as Change in net unrealized appreciation/depreciation on options written on the Statements of Operations. Premiums received from options written that expire are treated as realized gains. If a written option is closed, the Fund records a realized gain or loss on options written based on whether the cost of the closing transaction exceeds the premium received. If a call option is exercised by the option buyer, the premium received by the Fund is added to the proceeds from the sale of the underlying security to the option buyer and compared to the cost of the closing transaction to determine whether there has been a realized gain or loss. If a put option is exercised by an option buyer, the premium received by the option seller reduces the cost basis of the purchased security.
Written uncovered call options subject the Fund to unlimited risk of loss. Written covered call options limit the upside potential of a security above the strike price. Written put options subject the Fund to risk of loss if the value of the security declines below the exercise price minus the put premium.
The Fund is not subject to credit risk on options written as the counterparty has already performed its obligation by paying the premium at the inception of the contract.
The Fund’s exchange-traded option contracts are not subject to master netting arrangements (the right to close out all transactions traded with a counterparty and net amounts owed or due across transactions). The Fund’s over-the-counter (“OTC”) options are subject to master netting agreements.
The Fund may be required to post or receive collateral for OTC options. Cash collateral posted by the Fund is considered restricted.
The table below discloses the volume of the Fund’s options contracts activity during the year ended October 31, 2020 (amounts in thousands, except number of contracts):
| | | | |
| | | International
Hedged
Equity Fund | |
Exchange-Traded Options: | | | | |
Average Number of Contracts Purchased | | | 544 | |
Average Number of Contracts Written | | | 1,088 | |
Ending Number of Contracts Purchased | | | 739 | |
Ending Number of Contracts Written | | | 1,478 | |
| | | | | | | | |
| | | |
| OCTOBER 31, 2020 | | J.P. MORGAN INTERNATIONAL EQUITY FUNDS | | | | | 119 | |
NOTES TO FINANCIAL STATEMENTS
AS OF OCTOBER 31, 2020 (continued)
G. Futures Contracts — Emerging Markets Research Enhanced Equity Fund, Europe Dynamic Fund, International Advantage Fund, International Hedged Equity Fund, International Research Enhanced Equity Fund and International Value Fund used index futures contracts to gain or reduce exposure to the stock market, or maintain liquidity or minimize transaction costs. The Funds also purchased futures contracts to invest incoming cash in the market or sold futures in response to cash outflows, thereby simulating an invested position in the underlying index while maintaining a cash balance for liquidity.
Futures contracts provide for the delayed delivery of the underlying instrument at a fixed price or are settled for a cash amount based on the change in the value of the underlying instrument at a specific date in the future. Upon entering into a futures contract, the Funds are required to deposit with the broker, cash or securities in an amount equal to a certain percentage of the contract amount, which is referred to as the initial margin deposit. Subsequent payments, referred to as variation margin, are made or received by the Funds periodically and are based on changes in the market value of open futures contracts. Changes in the market value of open futures contracts are recorded as Change in net unrealized appreciation/depreciation on futures contracts on the Statements of Operations. Realized gains or losses, representing the difference between the value of the contract at the time it was opened and the value at the time it was closed, are reported on the Statements of Operations at the closing or expiration of the futures contract. Securities deposited as initial margin are designated on the SOIs, while cash deposited, which is considered restricted, is recorded on the Statements of Assets and Liabilities. A receivable from and/or a payable to brokers for the daily variation margin is also recorded on the Statements of Assets and Liabilities.
The use of futures contracts exposes the Funds to equity price risk. The Funds may be subject to the risk that the change in the value of the futures contract may not correlate perfectly with the underlying instrument. Use of long futures contracts subjects the Funds to risk of loss in excess of the amounts shown on the Statements of Assets and Liabilities, up to the notional amount of the futures contracts. Use of short futures contracts subjects the Funds to unlimited risk of loss. The Funds may enter into futures contracts only on exchanges or boards of trade. The exchange or board of trade acts as the counterparty to each futures transaction; therefore, the Funds’ credit risk is limited to failure of the exchange or board of trade. Under some circumstances, futures exchanges may establish daily limits on the amount that the price of a futures contract can vary from the previous day’s settlement price, which could effectively prevent liquidation of positions.
The table below discloses the volume of the Funds’ futures contracts activity during the year ended October 31, 2020 (amounts in thousands):
| | | | | | | | | | | | | | | | | | | | | | | | |
| | | Emerging
Markets
Research
Enhanced
Equity
Fund | | | Europe
Dynamic
Fund | | | International
Advantage
Fund | | | International
Hedged
Equity Fund | | | International
Research
Enhanced
Equity Fund | | | International
Value Fund | |
Futures Contracts — Equity: | | | | | | | | | | | | | | | | | | | | | | | | |
Average Notional Balance Long | | $ | 20,178 | | | $ | 6,741 | | | $ | 28,639 | | | $ | 4,476 | | | $ | 167,146 | | | $ | 7,118 | |
Average Notional Balance Short | | | — | | | | 7,291 | (a) | | | — | | | | — | | | | — | | | | — | |
Ending Notional Balance Long | | | — | | | | — | | | | 3,481 | | | | 7,021 | | | | 150,045 | | | | 5,560 | |
| (a) | For the period November 1, 2019 through November 30, 2019. |
The Funds’ futures contracts are not subject to master netting arrangements (the right to close out all transactions traded with a counterparty and net amounts owed or due across transactions).
H. Offering and Organization Costs — Total offering costs of approximately $48,000 and $103,000 incurred in connection with the offering of shares of Emerging Markets Research Enhanced Equity Fund and International Hedged Equity Fund, respectively, are amortized on a straight line basis over 12 months from the date the Funds commenced operations. Costs paid in connection with the organization of Emerging Markets Research Enhanced Equity Fund and International Hedged Equity Fund, if any, were recorded as an expense at the time it commenced operations. For the year ended October 31, 2020, total offering costs amortized were approximately $5,000 and $39,000 for the Emerging Markets Research Enhanced Equity Fund and International Hedged Equity Fund, respectively.
I. Security Transactions and Investment Income — Investment transactions are accounted for on the trade date (the date the order to buy or sell is executed). Securities gains and losses are calculated on a specifically identified cost basis. Interest income is determined on the basis of coupon interest accrued using the effective interest method, which adjusts for amortization of premiums and accretion of discounts. Dividend income net of foreign taxes withheld, if any, is recorded on the ex-dividend date or when a Fund first learns of the dividend. Certain Funds may receive other income from investments in loan assignments and/or unfunded commitments, including amendment fees, consent fees and commitment fees. These fees are recorded as income when received by the Funds. These amounts are included in Interest income from non-affiliates on the Statements of Operations.
J. Allocation of Income and Expenses — Expenses directly attributable to a Fund are charged directly to that Fund, while the expenses attributable to more than one fund of the Trusts are allocated among the applicable funds. Investment income, realized and unrealized gains and losses and expenses, other than class-specific expenses, are allocated daily to each class of shares based upon the proportion of net assets of each class at the beginning of each day.
| | | | | | |
| | | |
| 120 | | | | J.P. MORGAN INTERNATIONAL EQUITY FUNDS | | OCTOBER 31, 2020 |
Transfer agency fees are class-specific expenses. The amount of the transfer agency fees charged to each share class of the Funds for the year ended October 31, 2020 are as follows (amounts in thousands):
| | | | | | | | | | | | | | | | | | | | | | | | | | | | | | | | | | | | | | | | |
| | | Class A | | | Class C | | | Class I | | | Class L | | | Class R2 | | | Class R3 | | | Class R4 | | | Class R5 | | | Class R6 | | | Total | |
Emerging Markets Equity Fund | | | | | | | | | | | | | | | | | | | | | | | | | | | | | | | | | | | | | | | | |
Transfer agency fees | | $ | 56 | | | $ | 8 | | | $ | 68 | | | $ | 16 | | | $ | 1 | | | $ | 1 | | | $ | — | (a) | | $ | 7 | | | $ | 188 | | | $ | 345 | |
Emerging Markets Research Enhanced Equity Fund | | | | | | | | | | | | | | | | | | | | | | | | | | | | | | | | | | | | | | | | |
Transfer agency fees | | | n/a | | | | n/a | | | | — | (a) | | | n/a | | | | n/a | | | | n/a | | | | n/a | | | | n/a | | | | 18 | | | | 18 | |
Europe Dynamic Fund | | | | | | | | | | | | | | | | | | | | | | | | | | | | | | | | | | | | | | | | |
Transfer agency fees | | | 16 | | | | 2 | | | | 6 | | | | — | (a) | | | n/a | | | | n/a | | | | n/a | | | | n/a | | | | 2 | | | | 26 | |
International Advantage Fund | | | | | | | | | | | | | | | | | | | | | | | | | | | | | | | | | | | | | | | | |
Transfer agency fees | | | 18 | | | | 2 | | | | 1 | | | | n/a | | | | 45 | | | | n/a | | | | n/a | | | | n/a | | | | 9 | | | | 75 | |
International Equity Fund | | | | | | | | | | | | | | | | | | | | | | | | | | | | | | | | | | | | | | | | |
Transfer agency fees | | | 44 | | | | 2 | | | | 6 | | | | n/a | | | | — | (a) | | | n/a | | | | n/a | | | | 1 | | | | 17 | | | | 70 | |
International Focus Fund | | | | | | | | | | | | | | | | | | | | | | | | | | | | | | | | | | | | | | | | |
Transfer agency fees | | | 11 | | | | 4 | | | | 11 | | | | n/a | | | | 1 | | | | n/a | | | | n/a | | | | 2 | | | | 20 | | | | 49 | |
International Hedged Equity Fund | | | | | | | | | | | | | | | | | | | | | | | | | | | | | | | | | | | | | | | | |
Transfer agency fees | | | — | (a) | | | — | (a) | | | 1 | | | | n/a | | | | n/a | | | | n/a | | | | n/a | | | | — | (a) | | | — | (a) | | | 1 | |
International Research Enhanced Equity Fund | | | | | | | | | | | | | | | | | | | | | | | | | | | | | | | | | | | | | | | | |
Transfer agency fees | | | 44 | | | | n/a | | | | 6 | | | | n/a | | | | n/a | | | | n/a | | | | n/a | | | | n/a | | | | 36 | | | | 86 | |
International Value Fund | | | | | | | | | | | | | | | | | | | | | | | | | | | | | | | | | | | | | | | | |
Transfer agency fees | | | 11 | | | | 1 | | | | 4 | | | | — | (a) | | | 1 | | | | n/a | | | | n/a | | | | — | (a) | | | — | (a) | | | 17 | |
| (a) | Amount rounds to less than one thousand. |
K. Federal Income Taxes — Each Fund is treated as a separate taxable entity for Federal income tax purposes. Each Fund’s policy is to comply with the provisions of the Internal Revenue Code (the “Code”) applicable to regulated investment companies and to distribute to shareholders all of its distributable net investment income and net realized capital gains on investments. Accordingly, no provision for Federal income tax is necessary. Management has reviewed the Funds’ tax positions for all open tax years and has determined that as of October 31, 2020, no liability for Federal income tax is required in the Funds’ financial statements for net unrecognized tax benefits. However, management’s conclusions may be subject to future review based on changes in, or the interpretation of, the accounting standards or tax laws and regulations. Each Fund’s Federal tax returns for the prior three fiscal years, or since inception if shorter, remain subject to examination by the Internal Revenue Service.
L. Foreign Taxes — The Funds may be subject to foreign taxes on income, gains on investments or currency purchases/repatriation, a portion of which may be recoverable. The Funds will accrue such taxes and recoveries as applicable, based upon their current interpretation of tax rules and regulations that exist in the markets in which they invest. When a capital gain tax is determined to apply, the Funds record an estimated deferred tax liability in an amount that would be payable if the securities were disposed of on the valuation date.
M. Distributions to Shareholders — Distributions from net investment income, if any, are generally declared and paid annually. Distributions are declared separately for each class. No class has preferential dividend rights; differences in per share rates are due to differences in separate class expenses. Net realized capital gains, if any, are distributed by each Fund at least annually. The amount of distributions from net investment income and net realized capital gains is determined in accordance with Federal income tax regulations, which may differ from GAAP. To the extent these “book/tax” differences are permanent in nature (i.e., that they result from other than timing of recognition — “temporary differences”), such amounts are reclassified within the capital accounts based on their Federal tax basis treatment.
The following amounts were reclassified within the capital accounts (amounts in thousands):
| | | | | | | | | | | | |
| | | Paid-in-Capital | | | Accumulated
undistributed
(distributions in
excess of)
net investment
income | | | Accumulated
net realized
gains (losses) | |
Emerging Markets Equity Fund | | $ | — | | | $ | 1,559 | | | $ | (1,559 | ) |
Emerging Markets Research Enhanced Equity Fund | | | — | | | | (2,289 | ) | | | 2,289 | |
Europe Dynamic Fund | | | — | | | | 74 | | | | (74 | ) |
International Advantage Fund | | | — | | | | 1,070 | | | | (1,070 | ) |
International Equity Fund | | | — | | | | (22 | ) | | | 22 | |
International Focus Fund | | | — | | | | (1,551 | ) | | | 1,551 | |
International Hedged Equity Fund | | | — | (a) | | | 57 | | | | (57 | ) |
International Research Enhanced Equity Fund | | | — | (a) | | | (1,042 | ) | | | 1,042 | |
International Value Fund | | | — | | | | 75 | | | | (75 | ) |
| (a) | Amount rounds to less than one thousand. |
| | | | | | | | |
| | | |
| OCTOBER 31, 2020 | | J.P. MORGAN INTERNATIONAL EQUITY FUNDS | | | | | 121 | |
NOTES TO FINANCIAL STATEMENTS
AS OF OCTOBER 31, 2020 (continued)
The reclassifications for the Funds relate primarily to foreign currency gains or losses and investments in passive foreign investment companies (“PFICs”).
N. Recent Accounting Pronouncement — In March 2020, the FASB issued Accounting Standards Update No. 2020-04 (“ASU 2020-04”), Reference Rate Reform (Topic 848) – Facilitation of the Effects of Reference Rate Reform on Financial Reporting. ASU 2020-04 provides optional temporary financial reporting relief from the effect of certain types of contract modifications due to the planned discontinuation of the London Interbank Offered Rate (“LIBOR”) and other interbank-offered based reference rates as of the end of 2021. ASU 2020-04 became effective upon the issuance and its optional relief can be applied through December 31, 2022. Management is currently evaluating the impact, if any, to the Funds’ financial statements of applying ASU 2020-04.
3. Fees and Other Transactions with Affiliates
A. Investment Advisory Fee — Pursuant to Investment Advisory Agreements, the Adviser manages the investments of each Fund and for such services is paid a fee. The investment advisory fee is accrued daily and paid monthly at an annual rate based on each Fund’s respective average daily net assets.
The annual rate for each Fund is as follows:
| | | | |
Emerging Markets Equity Fund | | | 0.68 | % |
Emerging Markets Research Enhanced Equity Fund | | | 0.25 | |
Europe Dynamic Fund | | | 0.60 | |
International Advantage Fund | | | 0.50 | |
International Equity Fund | | | 0.50 | |
International Focus Fund | | | 0.60 | |
International Hedged Equity Fund | | | 0.25 | |
International Research Enhanced Equity Fund | | | 0.20 | |
International Value Fund | | | 0.55 | |
The Adviser waived investment advisory fees and/or reimbursed expenses as outlined in Note 3.F.
B. Administration Fee — Pursuant to Administration Agreements, the Administrator provides certain administration services to each Fund. In consideration of these services, the Administrator receives a fee accrued daily and paid monthly at an annual rate of 0.075% of the first $10 billion of each Fund’s respective average daily net assets, plus 0.050% of each Fund’s respective average daily net assets between $10 billion and $20 billion, plus 0.025% of each Fund’s respective average daily net assets between $20 billion and $25 billion, plus 0.01% of each Fund’s respective average daily net assets in excess of $25 billion. For the year ended October 31, 2020, the effective rate was 0.08% of each Fund’s average daily net assets, notwithstanding any fee waivers and/or expense reimbursements, with the exception of Emerging Markets Equity Fund which had an effective annualized rate of 0.07%.
The Administrator waived administration fees as outlined in Note 3.F.
JPMorgan Chase Bank, N.A. (“JPMCB”), a wholly-owned subsidiary of JPMorgan, serves as the Funds’ sub-administrator (the “Sub-administrator”). For its services as Sub-administrator, JPMCB receives a portion of the fees payable to the Administrator.
C. Distribution Fees — Pursuant to a Distribution Agreement, JPMorgan Distribution Services, Inc. (“JPMDS”), an indirect, wholly-owned subsidiary of JPMorgan, serves as each Fund’s principal underwriter and promotes and arranges for the sale of each Fund’s shares.
The Boards have adopted a Distribution Plan (the “Distribution Plan”) for Class A, Class C, Class R2 and Class R3 Shares of the Funds, as applicable, pursuant to Rule 12b-1 under the 1940 Act. Class I, Class L, Class R4, Class R5 and Class R6 Shares of the Funds do not charge a distribution fee. The Distribution Plan provides that each Fund shall pay, with respect to the applicable share classes, distribution fees, including payments to JPMDS, at annual rates of the average daily net assets as shown in the table below:
| | | | | | | | | | | | | | | | |
| | | Class A | | | Class C | | | Class R2 | | | Class R3 | |
Emerging Markets Equity Fund | | | 0.25 | % | | | 0.75 | % | | | 0.50 | % | | | 0.25 | % |
Europe Dynamic Fund | | | 0.25 | | | | 0.75 | | | | n/a | | | | n/a | |
International Advantage Fund | | | 0.25 | | | | 0.75 | | | | 0.50 | | | | n/a | |
International Equity Fund | | | 0.25 | | | | 0.75 | | | | 0.50 | | | | n/a | |
International Focus Fund | | | 0.25 | | | | 0.75 | | | | 0.50 | | | | n/a | |
International Hedged Equity Fund | | | 0.25 | | | | 0.75 | | | | n/a | | | | n/a | |
International Research Enhanced Equity Fund | | | 0.25 | | | | n/a | | | | n/a | | | | n/a | |
International Value Fund | | | 0.25 | | | | 0.75 | | | | 0.50 | | | | n/a | |
| | | | | | |
| | | |
| 122 | | | | J.P. MORGAN INTERNATIONAL EQUITY FUNDS | | OCTOBER 31, 2020 |
In addition, JPMDS is entitled to receive the front-end sales charges from purchases of Class A Shares and the CDSC from redemptions of Class C Shares and certain Class A Shares for which front-end sales charges have been waived. For the year ended October 31, 2020, JPMDS retained the following (amounts in thousands):
| | | | | | | | |
| | | Front-End Sales Charge | | | CDSC | |
Emerging Markets Equity Fund | | $ | 102 | | | $ | — | (a) |
Europe Dynamic Fund | | | 2 | | | | — | |
International Advantage Fund | | | 1 | | | | — | |
International Equity Fund | | | 101 | | | | 1 | |
International Focus Fund | | | 28 | | | | — | (a) |
International Hedged Equity Fund | | | 1 | | | | — | |
International Research Enhanced Equity Fund | | | 1 | | | | — | |
International Value Fund | | | 27 | | | | — | |
| (a) | Amount rounds to less than one thousand. |
D. Service Fees — The Trusts, on behalf of the Funds, have entered into a Shareholder Servicing Agreement with JPMDS under which JPMDS provides certain support services to fund shareholders. For performing these services, JPMDS receives a fee with respect to all share classes, except Class R6 Shares which do not charge a service fee, that is accrued daily and paid monthly equal to a percentage of the average daily net assets as shown in the table below:
| | | | | | | | | | | | | | | | | | | | | | | | | | | | | | | | |
| | | Class A | | | Class C | | | Class I | | | Class L | | | Class R2 | | | Class R3 | | | Class R4 | | | Class R5 | |
Emerging Markets Equity Fund | | | 0.25 | % | | | 0.25 | % | | | 0.25 | % | | | 0.10 | % | | | 0.25 | % | | | 0.25 | % | | | 0.25 | % | | | 0.10 | % |
Emerging Markets Research Enhanced Equity Fund | | | n/a | | | | n/a | | | | 0.25 | | | | n/a | | | | n/a | | | | n/a | | | | n/a | | | | n/a | |
Europe Dynamic Fund | | | 0.25 | | | | 0.25 | | | | 0.25 | | | | 0.10 | | | | n/a | | | | n/a | | | | n/a | | | | n/a | |
International Advantage Fund | | | 0.25 | | | | 0.25 | | | | 0.25 | | | | n/a | | | | 0.25 | | | | n/a | | | | n/a | | | | n/a | |
International Equity Fund | | | 0.25 | | | | 0.25 | | | | 0.25 | | | | n/a | | | | 0.25 | | | | n/a | | | | n/a | | | | 0.10 | |
International Focus Fund | | | 0.25 | | | | 0.25 | | | | 0.25 | | | | n/a | | | | 0.25 | | | | n/a | | | | n/a | | | | 0.10 | |
International Hedged Equity Fund | | | 0.25 | | | | 0.25 | | | | 0.25 | | | | n/a | | | | n/a | | | | n/a | | | | n/a | | | | 0.10 | |
International Research Enhanced Equity Fund | | | 0.25 | | | | n/a | | | | 0.25 | | | | n/a | | | | n/a | | | | n/a | | | | n/a | | | | n/a | |
International Value Fund | | | 0.25 | | | | 0.25 | | | | 0.25 | | | | 0.10 | | | | 0.25 | | | | n/a | | | | n/a | | | | 0.10 | |
JPMDS has entered into shareholder services contracts with affiliated and unaffiliated financial intermediaries who provide shareholder services and other related services to their clients or customers who invest in the Funds. Pursuant to such contracts, JPMDS will pay all or a portion of such fees earned to financial intermediaries for performing such services.
JPMDS waived service fees as outlined in Note 3.F.
E. Custodian and Accounting Fees — JPMCB provides portfolio custody and accounting services to the Funds. For performing these services, the Funds pay JPMCB transaction and asset-based fees that vary according to the number of transactions and positions, plus out-of-pocket expenses. The amounts paid directly to JPMCB by the Funds for custody and accounting services are included in Custodian and accounting fees on the Statements of Operations.
Interest income earned on cash balances at the custodian, if any, is included in Interest income from affiliates on the Statements of Operations.
Interest expense paid to the custodian related to cash overdrafts, if any, is included in Interest expense to affiliates on the Statements of Operations.
F. Waivers and Reimbursements — The Adviser, Administrator and/or JPMDS have contractually agreed to waive fees and/or reimburse the Funds to the extent that total annual operating expenses (excluding acquired fund fees and expenses other than certain money market fund fees as described below, dividend and interest expenses related to short sales, interest, taxes, expenses related to litigation and potential litigation, expenses related to trustee elections and extraordinary expenses) exceed the percentages of the Funds’ respective average daily net assets as shown in the table below:
| | | | | | | | | | | | | | | | | | | | | | | | | | | | | | | | | | | | |
| | | Class A | | | Class C | | | Class I | | | Class L | | | Class R2 | | | Class R3 | | | Class R4 | | | Class R5 | | | Class R6 | |
Emerging Markets Equity Fund | | | 1.24 | % | | | 1.74 | % | | | 0.99 | % | | | n/a | (1) | | | 1.54 | % | | | 1.29 | % | | | 1.04 | % | | | 0.89 | % | | | 0.79 | % |
Emerging Markets Research Enhanced Equity Fund | | | n/a | | | | n/a | | | | 0.45 | | | | n/a | | | | n/a | | | | n/a | | | | n/a | | | | n/a | | | | 0.35 | |
Europe Dynamic Fund | | | 1.24 | | | | 1.74 | | | | 0.99 | | | | n/a | | | | n/a | | | | n/a | | | | n/a | | | | n/a | | | | n/a | |
International Advantage Fund | | | 0.95 | | | | 1.45 | | | | 0.70 | | | | n/a | | | | 1.25 | | | | n/a | | | | n/a | | | | n/a | | | | 0.50 | |
International Equity Fund | | | 0.95 | | | | 1.45 | | | | 0.70 | | | | n/a | | | | 1.25 | | | | n/a | | | | n/a | | | | 0.60 | | | | 0.50 | |
International Focus Fund | | | 1.00 | | | | 1.50 | | | | 0.75 | | | | n/a | | | | 1.30 | | | | n/a | | | | n/a | | | | 0.65 | | | | 0.55 | |
International Hedged Equity Fund | | | 0.85 | | | | 1.35 | | | | 0.60 | | | | n/a | | | | n/a | | | | n/a | | | | n/a | | | | 0.45 | | | | 0.35 | |
International Research Enhanced Equity Fund | | | 0.60 | | | | n/a | | | | 0.35 | | | | n/a | | | | n/a | | | | n/a | | | | n/a | | | | n/a | | | | 0.25 | |
International Value Fund | | | 1.00 | | | | 1.50 | | | | 0.75 | | | | n/a | | | | 1.30 | | | | n/a | | | | n/a | | | | 0.65 | | | | 0.55 | |
| (1) | Effective March 1, 2020, the contractual expense limitation for Class L Shares expired. Prior to March 1, 2020, the contractual expense limitation was 0.95% for Class L Shares. |
| | | | | | | | |
| | | |
| OCTOBER 31, 2020 | | J.P. MORGAN INTERNATIONAL EQUITY FUNDS | | | | | 123 | |
NOTES TO FINANCIAL STATEMENTS
AS OF OCTOBER 31, 2020 (continued)
Except as noted above, the expense limitation agreements were in effect for the year ended October 31, 2020 and the contractual expense limitation percentages in the table above are in place until at least February 28, 2021.
For the year ended October 31, 2020, the Funds’ service providers waived fees and/or reimbursed expenses for each of the Funds as follows (amounts in thousands). None of these parties expect the Funds to repay any such waived fees and/or reimbursed expenses in future years.
| | | | | | | | | | | | | | | | | | | | |
| | | Contractual Waivers | | | | |
| | | Investment
Advisory
Fees | | | Administration
Fees | | | Service Fees | | | Total | | | Contractual
Reimbursements | |
Emerging Markets Equity Fund | | $ | 1,309 | | | $ | 870 | | | $ | 1,836 | | | $ | 4,015 | | | $ | 189 | |
Emerging Markets Research Enhanced Equity Fund | | | 845 | | | | 564 | | | | — | (a) | | | 1,409 | | | | 5 | |
Europe Dynamic Fund | | | — | | | | — | | | | 45 | | | | 45 | | | | — | |
International Advantage Fund | | | 1,216 | | | | 811 | | | | 116 | | | | 2,143 | | | | 6 | |
International Equity Fund | | | 1,851 | | | | 1,232 | | | | 329 | | | | 3,412 | | | | 6 | |
International Focus Fund | | | 2,596 | | | | 1,731 | | | | 226 | | | | 4,553 | | | | 19 | |
International Hedged Equity Fund | | | 235 | | | | 74 | | | | 1 | | | | 310 | | | | 111 | |
International Research Enhanced Equity Fund | | | 1,559 | | | | 1,040 | | | | 802 | | | | 3,401 | | | | — | |
International Value Fund | | | 419 | | | | 230 | | | | 113 | | | | 762 | | | | — | (a) |
| (a) | Amount rounds to less than one thousand. |
Additionally, the Funds may invest in one or more money market funds advised by the Adviser (affiliated money market funds). The Adviser, Administrator and/or JPMDS, as shareholder servicing agent, have contractually agreed to waive fees and/or reimburse expenses in an amount sufficient to offset the respective net fees each collects from the affiliated money market fund on the applicable Fund’s investment in such affiliated money market fund, except for investments of securities lending cash collateral. None of these parties expect the Funds to repay any such waived fees and/or reimbursed expenses in future years.
The amounts of these waivers resulting from investments in these money market funds for the year ended October 31, 2020 were as follows (amounts in thousands):
| | | | |
Emerging Markets Equity Fund | | $ | 272 | |
Emerging Markets Research Enhanced Equity Fund | | | 93 | |
Europe Dynamic Fund | | | 20 | |
International Advantage Fund | | | 70 | |
International Equity Fund | | | 90 | |
International Focus Fund | | | 88 | |
International Hedged Equity Fund | | | 7 | |
International Research Enhanced Equity Fund | | | 378 | |
International Value Fund | | | 12 | |
G. Other — Certain officers of the Trusts are affiliated with the Adviser, the Administrator and JPMDS. Such officers, with the exception of the Chief Compliance Officer, receive no compensation from the Funds for serving in their respective roles.
The Boards designated and appointed a Chief Compliance Officer to the Funds pursuant to Rule 38a-1 under the 1940 Act. Each Fund, along with affiliated funds, makes reimbursement payments, on a pro-rata basis, to the Administrator for a portion of the fees associated with the office of the Chief Compliance Officer. Such fees are included in Trustees’ and Chief Compliance Officer’s fees on the Statements of Operations.
The Trusts adopted a Trustee Deferred Compensation Plan (the “Plan”) which allows the independent Trustees to defer the receipt of all or a portion of compensation related to performance of their duties as Trustees. The deferred fees are invested in various J.P. Morgan Funds until distribution in accordance with the Plan.
During the year ended October 31, 2020, Europe Dynamic Fund, International Advantage Fund and International Value Fund purchased securities from an underwriting syndicate in which the principal underwriter or members of the syndicate were affiliated with the Adviser.
The Securities and Exchange Commission (“SEC”) has granted an exemptive order permitting the Funds to engage in principal transactions with J.P. Morgan Securities LLC, an affiliated broker, involving taxable money market instruments, subject to certain conditions.
| | | | | | |
| | | |
| 124 | | | | J.P. MORGAN INTERNATIONAL EQUITY FUNDS | | OCTOBER 31, 2020 |
4. Investment Transactions
During the year ended October 31, 2020, purchases and sales of investments (excluding short-term investments) were as follows (amounts in thousands):
| | | | | | | | |
| | | Purchases
(excluding U.S.
Government) | | | Sales
(excluding
U.S.
Government) | |
Emerging Markets Equity Fund | | $ | 4,070,876 | | | $ | 1,264,356 | |
Emerging Markets Research Enhanced Equity Fund | | | 1,812,799 | | | | 1,188,972 | |
Europe Dynamic Fund | | | 740,397 | | | | 794,062 | |
International Advantage Fund | | | 1,187,253 | | | | 1,206,602 | |
International Equity Fund | | | 856,205 | | | | 812,958 | |
International Focus Fund | | | 1,142,607 | | | | 1,036,859 | |
International Hedged Equity Fund | | | 153,610 | | | | 79,815 | |
International Research Enhanced Equity Fund | | | 3,044,485 | | | | 2,432,513 | |
International Value Fund | | | 181,934 | | | | 229,969 | |
During the year ended October 31, 2020, there were no purchases or sales of U.S. Government securities.
5. Federal Income Tax Matters
For Federal income tax purposes, the estimated cost and unrealized appreciation (depreciation) in value of investments held at October 31, 2020 were as follows (amounts in thousands):
| | | | | | | | | | | | | | | | |
| | | Aggregate
Cost | | | Gross
Unrealized
Appreciation | | | Gross
Unrealized
Depreciation | | | Net Unrealized
Appreciation
(Depreciation) | |
Emerging Markets Equity Fund | | $ | 7,640,289 | | | $ | 4,013,001 | | | $ | 285,791 | | | $ | 3,727,210 | |
Emerging Markets Research Enhanced Equity Fund | | | 2,595,505 | | | | 547,829 | | | | 257,642 | | | | 290,187 | |
Europe Dynamic Fund | | | 440,045 | | | | 29,782 | | | | 31,209 | | | | (1,427 | ) |
International Advantage Fund | | | 1,459,044 | | | | 168,546 | | | | 127,665 | | | | 40,881 | |
International Equity Fund | | | 2,226,130 | | | | 845,017 | | | | 128,049 | | | | 716,968 | |
International Focus Fund | | | 2,519,667 | | | | 459,889 | | | | 102,824 | | | | 357,065 | |
International Hedged Equity Fund | | | 138,997 | | | | 7,962 | | | | 11,403 | | | | (3,441 | ) |
International Research Enhanced Equity Fund | | | 4,990,455 | | | | 552,761 | | | | 575,102 | | | | (22,341 | ) |
International Value Fund | | | 315,132 | | | | 12,010 | | | | 59,854 | | | | (47,844 | ) |
For the Funds, the difference between book and tax basis appreciation (depreciation) on investments is primarily attributed to investments in PFICs, mark to market of futures contracts, mark to market of options contracts and wash sale loss deferrals.
The tax character of distributions paid during the year ended October 31, 2020 was as follows (amounts in thousands):
| | | | | | | | | | | | |
| | | Ordinary
Income* | | | Net
Long-Term
Capital Gains | | | Total
Distributions
Paid | |
Emerging Markets Equity Fund | | $ | 56,440 | | | $ | — | | | $ | 56,440 | |
Emerging Markets Research Enhanced Equity Fund | | | 20,964 | | | | 3,082 | | | | 24,046 | |
Europe Dynamic Fund | | | 16,829 | | | | — | | | | 16,829 | |
International Advantage Fund | | | 108,042 | | | | — | | | | 108,042 | |
International Equity Fund | | | 96,391 | | | | — | | | | 96,391 | |
International Focus Fund | | | 10,533 | | | | — | | | | 10,533 | |
International Hedged Equity Fund | | | 1,369 | | | | — | | | | 1,369 | |
International Research Enhanced Equity Fund | | | 155,361 | | | | — | | | | 155,361 | |
International Value Fund | | | 16,049 | | | | — | | | | 16,049 | |
| | | | | | | | |
| | | |
| OCTOBER 31, 2020 | | J.P. MORGAN INTERNATIONAL EQUITY FUNDS | | | | | 125 | |
NOTES TO FINANCIAL STATEMENTS
AS OF OCTOBER 31, 2020 (continued)
The tax character of distributions paid during the year ended October 31, 2019 was as follows (amounts in thousands):
| | | | | | | | | | | | |
| | | Ordinary
Income* | | | Net
Long-Term
Capital Gains | | | Total
Distributions
Paid | |
Emerging Markets Equity Fund | | $ | 43,939 | | | $ | — | | | $ | 43,939 | |
Emerging Markets Research Enhanced Equity Fund | | | 26 | | | | — | | | | 26 | |
Europe Dynamic Fund | | | 16,938 | | | | — | | | | 16,938 | |
International Advantage Fund | | | 88,005 | | | | — | | | | 88,005 | |
International Equity Fund | | | 107,522 | | | | 48,172 | | | | 155,694 | |
International Focus Fund | | | 10,140 | | | | — | | | | 10,140 | |
International Research Enhanced Equity Fund | | | 161,060 | | | | — | | | | 161,060 | |
International Value Fund | | | 18,314 | | | | — | | | | 18,314 | |
| * | Short-term gain distributions are treated as ordinary income for income tax purposes. |
As of October 31, 2020, the estimated components of net assets (excluding paid-in-capital) on a tax basis were as follows (amounts in thousands):
| | | | | | | | | | | | |
| | | Current
Distributable
Ordinary
Income | | | Current
Distributable
Long-Term
Capital Gain
(Tax Basis Capital
Loss Carryover) | | | Unrealized
Appreciation
(Depreciation) | |
Emerging Markets Equity Fund | | $ | 19,142 | | | $ | (151,019 | ) | | $ | 3,708,674 | |
Emerging Markets Research Enhanced Equity Fund | | | 45,314 | | | | (83,502 | ) | | | 284,044 | |
Europe Dynamic Fund | | | 6,935 | | | | (118,860 | ) | | | (1,280 | ) |
International Advantage Fund | | | 34,987 | | | | (384,065 | ) | | | 41,293 | |
International Equity Fund | | | 40,418 | | | | (110,986 | ) | | | 717,466 | |
International Focus Fund | | | 31,621 | | | | (187,265 | ) | | | 357,185 | |
International Hedged Equity Fund | | | 2,064 | | | | (6,681 | ) | | | (3,427 | ) |
International Research Enhanced Equity Fund | | | 97,350 | | | | (529,814 | ) | | | (21,619 | ) |
International Value Fund | | | 8,463 | | | | (84,934 | ) | | | (47,751 | ) |
For the Funds, the cumulative timing differences primarily consist of mark to market of futures contracts, mark to market of options contracts, investments in PFICs and wash sale loss deferrals.
At October 31, 2020, the following Funds had net capital loss carryforwards as follows (amounts in thousands):
| | | | | | | | |
| | | Capital Loss Carryforward Character | |
| | | Short-Term | | | Long-Term | |
Emerging Markets Equity Fund | | $ | — | | | $ | 151,019 | |
Emerging Markets Research Enhanced Equity Fund | | | 64,652 | | | | 18,850 | |
Europe Dynamic Fund | | | 118,860 | | | | — | |
International Advantage Fund | | | 306,805 | | | | 77,260 | |
International Equity Fund | | | 56,024 | | | | 54,962 | |
International Focus Fund | | | 165,558 | | | | 21,707 | |
International Hedged Equity Fund | | | 2,619 | * | | | 4,062 | * |
International Research Enhanced Equity Fund | | | 33,296 | | | | 496,518 | |
International Value Fund | | | 53,664 | | | | 31,270 | |
| * | Amount includes capital loss carryforwards which are limited in future years under Internal Revenue Code sections 381-384. |
During the year ended October 31, 2020, the following Funds utilized capital loss carryforwards as follows (amounts in thousands):
| | | | | | | | |
| | | Capital Loss Utilized | |
| | | Short-Term | | | Long-Term | |
Emerging Markets Equity Fund | | $ | 7,660 | | | $ | — | |
Europe Dynamic Fund | | | — | | | | 2,935 | |
| | | | | | |
| | | |
| 126 | | | | J.P. MORGAN INTERNATIONAL EQUITY FUNDS | | OCTOBER 31, 2020 |
6. Borrowings
The Funds rely upon an exemptive order granted by the SEC (the “Order”) permitting the establishment and operation of an Interfund Lending Facility (the “Facility”). The Facility allows the Funds to directly lend and borrow money to or from any other fund relying upon the Order at rates beneficial to both the borrowing and lending funds. Advances under the Facility are taken primarily for temporary or emergency purposes, including the meeting of redemption requests that otherwise might require the untimely disposition of securities, and are subject to each Fund’s borrowing restrictions. The Interfund loan rate is determined, as specified in the Order, by averaging the current repurchase agreement rate and the current bank loan rate. The Order was granted to JPM II and may be relied upon by the Funds because the Funds and the series of JPM II are all investment companies in the same “group of investment companies” (as defined in Section 12(d)(1)(G) of the 1940 Act).
The Funds had no borrowings outstanding from another fund at October 31, 2020. Average borrowings from the Facility during the year ended October 31, 2020, were as follows (amounts in thousands, except number of days outstanding):
| | | | | | | | | | | | | | | | |
| | | Average
Borrowings | | | Average
Interest
Rate Paid | | | Number of
Days
Outstanding | | | Interest
Paid | |
Emerging Markets Research Enhanced Equity Fund | | $ | 15,646 | | | | 0.97 | % | | | 23 | | | $ | 9 | |
Europe Dynamic Fund | | | 2,350 | | | | 1.59 | | | | 4 | | | | — | (a) |
International Advantage Fund | | | 20,534 | | | | 1.87 | | | | 3 | | | | 4 | |
International Equity Fund | | | 1,817 | | | | 0.83 | | | | 1 | | | | — | (a) |
International Focus Fund | | | 8,828 | | | | 0.83 | | | | 1 | | | | — | (a) |
International Hedged Equity Fund | | | 3,784 | | | | 0.79 | | | | 2 | | | | — | (a) |
| (a) | Amount rounds to less than one thousand. |
The Trusts and JPMCB have entered into a financing arrangement. Under this arrangement, JPMCB provides an unsecured, uncommitted credit facility in the aggregate amount of $100 million to certain of the J.P. Morgan Funds, including the Funds. Advances under the arrangement are taken primarily for temporary or emergency purposes, including the meeting of redemption requests that otherwise might require the untimely disposition of securities, and are subject to each Fund’s borrowing restrictions. Interest on borrowings is payable at a rate determined by JPMCB at the time of borrowing. This agreement has been extended until November 1, 2021.
The Funds had no borrowings outstanding from the unsecured, uncommitted credit facility during the year ended October 31, 2020.
The Trusts, along with certain other trusts for J.P. Morgan Funds (“Borrowers”), have entered into a joint syndicated senior unsecured revolving credit facility totaling $1.5 billion (“Credit Facility”) with various lenders and The Bank of New York Mellon, as administrative agent for the lenders. This Credit Facility provides a source of funds to the Borrowers for temporary and emergency purposes, including the meeting of redemption requests that otherwise might require the untimely disposition of securities. Under the terms of the Credit Facility, a borrowing fund must have a minimum of $25,000,000 in adjusted net asset value and not exceed certain adjusted net asset coverage ratios prior to and during the time in which any borrowings are outstanding. If a fund does not comply with the aforementioned requirements, the fund must remediate within three business days with respect to the $25,000,000 minimum adjusted net asset value or within one business day with respect to certain asset coverage ratios or the administrative agent at the request of, or with the consent of, the lenders may terminate the Credit Facility and declare any outstanding borrowings to be due and payable immediately.
Interest associated with any borrowing under the Credit Facility is charged to the borrowing fund at a rate of interest equal to 1.00%, which has increased to 1.25% pursuant to the amendment referenced below, plus the greater of the federal funds effective rate or one month LIBOR. The annual commitment fee to maintain the Credit Facility is 0.15% and is incurred on the unused portion of the Credit Facility and is allocated to all participating funds pro rata based on their respective net assets. Effective August 11, 2020, this agreement has been amended and restated for a term of 364 days, unless extended, and to include the change to the interest rate charged for borrowing from the Credit Facility to 1.25%, as noted above, and an upfront fee of 0.075% of the Credit Facility to be charged and paid by all participating funds of the Credit Facility.
The Funds did not utilize the Credit Facility during the year ended October 31, 2020.
7. Risks, Concentrations and Indemnifications
In the normal course of business, the Funds enter into contracts that contain a variety of representations which provide general indemnifications. Each Fund’s maximum exposure under these arrangements is unknown. The amount of exposure would depend on future claims that may be brought against each Fund. However, based on experience, the Funds expect the risk of loss to be remote.
| | | | | | | | |
| | | |
| OCTOBER 31, 2020 | | J.P. MORGAN INTERNATIONAL EQUITY FUNDS | | | | | 127 | |
NOTES TO FINANCIAL STATEMENTS
AS OF OCTOBER 31, 2020 (continued)
As of October 31, 2020, the Funds had individual shareholder and/or omnibus accounts each owning more than 10% of the respective Fund’s outstanding shares as follows:
| | | | | | | | | | | | | | | | |
| | | Number of
individual
shareholder and/
or Affiliated
Omnibus Accounts | | | % of the Fund | | | Number of
individual
shareholder and/
or Non-Affiliated
Omnibus Accounts | | | % of the Fund | |
Emerging Markets Equity Fund | | | — | | | | — | % | | | 3 | | | | 35.9 | % |
Emerging Markets Research Enhanced Equity Fund | | | 4 | | | | 53.6 | | | | — | | | | — | |
Europe Dynamic Fund | | | 4 | | | | 61.2 | | | | 1 | | | | 12.5 | |
International Advantage Fund | | | 5 | | | | 74.6 | | | | — | | | | — | |
International Equity Fund | | | 2 | | | | 36.4 | | | | 1 | | | | 12.2 | |
International Focus Fund | | | 4 | | | | 63.4 | | | | — | | | | — | |
International Hedged Equity Fund | | | 1 | | | | 35.0 | | | | 4 | | | | 57.2 | |
International Research Enhanced Equity Fund | | | — | | | | — | | | | 1 | | | | 10.2 | |
International Value Fund | | | — | | | | — | | | | 1 | | | | 74.1 | |
Significant shareholder transactions by these shareholders may impact the Funds’ performance and liquidity.
As of October 31, 2020, the J.P. Morgan Investor Funds, the JPMorgan SmartRetirement Funds and the SmartRetirement Blend Funds, which are affiliated funds of funds, owned in the aggregate, shares representing more than 10% of the net assets of the Funds as follows:
| | | | | | | | | | | | |
| | | J.P. Morgan
Investor
Funds | | | JPMorgan
SmartRetirement
Funds | | | JPMorgan
SmartRetirement
Blend Funds | |
Emerging Markets Research Enhanced Equity Fund | | | — | % | | | 60.4 | % | | | 21.1 | % |
Europe Dynamic Fund | | | 54.6 | | | | — | | | | — | |
International Advantage Fund | | | — | | | | 97.1 | | | | — | |
International Equity Fund | | | 10.1 | | | | 48.1 | | | | — | |
International Focus Fund | | | — | | | | 71.2 | | | | — | |
International Research Enhanced Equity Fund | | | 17.2 | | | | 58.5 | | | | — | |
The Funds may have elements of risk not typically associated with investments in the United States of America due to concentrated investments in a limited number of countries or regions, which may vary throughout the period. Such concentrations may subject the Funds to additional risks resulting from political or economic conditions in such countries or regions and the possible imposition of adverse governmental laws or currency exchange restrictions could cause the securities and their markets to be less liquid and their prices to be more volatile than those of comparable U.S. securities.
As of October 31, 2020, the following Funds had non-U.S. country allocations representing greater than 10% of total investments (excluding investment of cash collateral from securities loaned) as follows:
| | | | | | | | | | | | | | | | | | | | | | | | | | | | | | | | | | | | |
| | | Emerging
Markets
Equity
Fund | | | Emerging
Markets
Research
Enhanced
Equity
Fund | | | Europe
Dynamic
Fund | | | International
Advantage
Fund | | | International
Equity Fund | | | International
Focus Fund | | | International
Hedged
Equity Fund | | | International
Research
Enhanced
Equity Fund | | | International
Value Fund | |
China | | | 37.5 | % | | | 43.8 | % | | | — | % | | | — | % | | | — | % | | | 12.0 | % | | | — | % | | | — | % | | | — | % |
France | | | — | | | | — | | | | 11.1 | | | | — | | | | 12.2 | | | | — | | | | — | | | | 10.7 | | | | — | |
Germany | | | — | | | | — | | | | 14.3 | | | | — | | | | — | | | | — | | | | — | | | | — | | | | — | |
India | | | 16.1 | | | | — | | | | — | | | | — | | | | — | | | | — | | | | — | | | | — | | | | — | |
Japan | | | — | | | | — | | | | — | | | | 26.0 | | | | 20.0 | | | | — | | | | 25.2 | | | | 26.6 | | | | 24.3 | |
South Korea | | | — | | | | 12.4 | | | | — | | | | — | | | | — | | | | — | | | | — | | | | — | | | | — | |
Switzerland | | | — | | | | — | | | | 18.3 | | | | 10.7 | | | | 11.8 | | | | 10.8 | | | | 10.3 | | | | 11.0 | | | | — | |
Taiwan | | | 10.3 | | | | 12.0 | | | | — | | | | — | | | | — | | | | — | | | | — | | | | — | | | | — | |
United Kingdom | | | — | | | | — | | | | 17.2 | | | | 10.6 | | | | 13.2 | | | | 17.8 | | | | 11.1 | | | | 11.9 | | | | 13.0 | |
As of October 31, 2020, a significant portion of each Fund’s investments consisted of securities that were denominated in foreign currencies. Changes in currency exchange rates will affect the value of, and investment income from, such securities.
Derivatives may be riskier than other types of investments because they may be more sensitive to changes in economic and market conditions and could result in losses that significantly exceed the Funds’ original investment. Many derivatives create leverage thereby causing the Funds to be more volatile than they would have been if they had not used derivatives. Derivatives also expose the Funds to counterparty risk (the risk that the
| | | | | | |
| | | |
| 128 | | | | J.P. MORGAN INTERNATIONAL EQUITY FUNDS | | OCTOBER 31, 2020 |
derivative counterparty will not fulfill its contractual obligations), including credit risk of the derivative counterparty. The possible lack of a liquid secondary market for derivatives and the resulting inability of the Funds to sell or otherwise close a derivatives position could expose the Funds to losses.
LIBOR is intended to represent the rate at which contributing banks may obtain short-term borrowings from each other in the London interbank market. The regulatory authority that oversees financial services firms and financial markets in the U.K. has announced that, after the end of 2021, it would no longer persuade or compel contributing banks to make rate submissions for purposes of determining the LIBOR rate. As a result, it is possible that commencing in 2022, LIBOR may no longer be available or no longer deemed an appropriate reference rate upon which to determine the interest rate on or impacting certain loans, notes, derivatives and other instruments or investments comprising some or all of a Fund’s portfolio. In light of this eventuality, public and private sector industry initiatives are currently underway to identify new or alternative reference rates to be used in place of LIBOR. There is no assurance that the composition or characteristics of any such alternative reference rate will be similar to or produce the same value or economic equivalence as LIBOR or that it will have the same volume or liquidity as did LIBOR prior to its discontinuance or unavailability, which may affect the value or liquidity or return on certain investments of a Fund and result in costs incurred in connection with closing out positions and entering into new trades. These risks may also apply with respect to changes in connection with other interbank offering rates (e.g., Euribor) and a wide range of other index levels, rates and values that are treated as “benchmarks” and are the subject of recent regulatory reform.
The Funds are subject to infectious disease epidemics/pandemics risk. Recently, the worldwide outbreak of COVID-19, a novel coronavirus disease, has negatively affected economies, markets and individual companies throughout the world. The effects of this COVID-19 pandemic to public health, and business and market conditions, including exchange trading suspensions and closures may continue to have a significant negative impact on the performance of a Fund’s investments, increase a Fund’s volatility, exacerbate other pre-existing political, social and economic risks to the Funds and negatively impact broad segments of businesses and populations. The Funds’ operations may be interrupted as a result, which may have a significant negative impact on investment performance. In addition, governments, their regulatory agencies, or self-regulatory organizations may take actions in response to the pandemic that affect the instruments in which the Funds invest, or the issuers of such instruments, in ways that could also have a significant negative impact on a Fund’s investment performance. The full impact of this COVID-19 pandemic, or other future epidemics/pandemics, is currently unknown.
| | | | | | | | |
| | | |
| OCTOBER 31, 2020 | | J.P. MORGAN INTERNATIONAL EQUITY FUNDS | | | | | 129 | |
REPORT OF INDEPENDENT REGISTERED PUBLIC ACCOUNTING FIRM
To the Boards of Trustees of JPMorgan Trust I, JPMorgan Trust II and JPMorgan Trust IV and Shareholders of JPMorgan Emerging Markets Equity Fund, JPMorgan Emerging Markets Research Enhanced Equity Fund, JPMorgan Europe Dynamic Fund, JPMorgan International Advantage Fund, JPMorgan International Equity Fund, JPMorgan International Focus Fund, JPMorgan International Hedged Equity Fund, JPMorgan International Research Enhanced Equity Fund and JPMorgan International Value Fund
Opinions on the Financial Statements
We have audited the accompanying statements of assets and liabilities, including the schedules of portfolio investments, of JPMorgan Emerging Markets Equity Fund, JPMorgan Europe Dynamic Fund, JPMorgan International Advantage Fund, JPMorgan International Equity Fund, JPMorgan International Focus Fund (formerly known as JPMorgan International Unconstrained Equity Fund) and JPMorgan International Value Fund (six of the funds constituting JPMorgan Trust I), JPMorgan International Research Enhanced Equity Fund (one of the funds constituting JPMorgan Trust II) and JPMorgan Emerging Markets Research Enhanced Equity Fund and JPMorgan International Hedged Equity Fund (two of the funds constituting JPMorgan Trust IV) (hereafter collectively referred to as the “Funds”) as of October 31, 2020, the related statements of operations for the year ended October 31, 2020 and the statements of changes in net assets and the financial highlights for each of the periods indicated in the table below, including the related notes (collectively referred to as the “financial statements”). In our opinion, the financial statements present fairly, in all material respects, the financial position of each of the Funds as of October 31, 2020, the results of each of their operations for the year then ended and the changes in each of their net assets and each of the financial highlights for each of the periods indicated in the table below, in conformity with accounting principles generally accepted in the United States of America.
| | |
JPMorgan Emerging Markets Equity Fund JPMorgan Europe Dynamic Fund JPMorgan International Advantage Fund JPMorgan International Equity Fund JPMorgan International Focus Fund (formerly known as JPMorgan International Unconstrained Equity Fund) JPMorgan International Value Fund JPMorgan International Research Enhanced Equity Fund | | Statements of changes in net assets for each of the two years in the period ended October 31, 2020 and the financial highlights for each of the periods indicated therein |
| | |
| JPMorgan Emerging Markets Research Enhanced Equity Fund | | Statement of changes in net assets and the financial highlights for the year ended October 31, 2020 and the period December 11, 2018 (commencement of operations) through October 31, 2019 |
| | |
| JPMorgan International Hedged Equity Fund | | Statement of changes in net assets and the financial highlights for the year ended October 31, 2020 and the period March 15, 2019 (commencement of operations) through October 31, 2019 |
Basis for Opinions
These financial statements are the responsibility of the Funds’ management. Our responsibility is to express an opinion on the Funds’ financial statements based on our audits. We are a public accounting firm registered with the Public Company Accounting Oversight Board (United States) (PCAOB) and are required to be independent with respect to the Funds in accordance with the U.S. federal securities laws and the applicable rules and regulations of the Securities and Exchange Commission and the PCAOB.
We conducted our audits of these financial statements in accordance with the standards of the PCAOB. Those standards require that we plan and perform the audit to obtain reasonable assurance about whether the financial statements are free of material misstatement, whether due to error or fraud.
Our audits included performing procedures to assess the risks of material misstatement of the financial statements, whether due to error or fraud, and performing procedures that respond to those risks. Such procedures included examining, on a test basis, evidence regarding the amounts and disclosures in the financial statements. Our audits also included evaluating the accounting principles used and significant estimates made by management, as well as evaluating the overall presentation of the financial statements. Our
| | | | | | |
| | | |
| 130 | | | | J.P. MORGAN INTERNATIONAL EQUITY FUNDS | | OCTOBER 31, 2020 |
procedures included confirmation of securities owned as of October 31, 2020 by correspondence with the custodian, transfer agent and brokers; when replies were not received from brokers, we performed other auditing procedures. We believe that our audits provide a reasonable basis for our opinions.
/s/PricewaterhouseCoopers LLP
New York, New York
December 21, 2020
We have served as the auditor of one or more investment companies in the JPMorgan Funds complex since 1993.
| | | | | | | | |
| | | |
| OCTOBER 31, 2020 | | J.P. MORGAN INTERNATIONAL EQUITY FUNDS | | | | | 131 | |
TRUSTEES
(Unaudited)
The Funds’ Statement of Additional Information includes additional information about the Funds’ Trustees and is available, without charge, upon request by calling 1-800-480-4111 or on the J.P. Morgan Funds’ website at www.jpmorganfunds.com.
| | | | | | |
Name (Year of Birth); Positions With the Funds (1) | | Principal Occupation During Past 5 Years | | Number of
Funds in Fund
Complex Overseen
by Trustee (2) | | Other Directorships Held During the Past 5 Years |
Independent Trustees | | |
| | | |
| John F. Finn (1947); Chairman since 2020; Trustee of Trusts since 2005; Trustee of heritage One Group Mutual Funds since 1998. | | Chairman, Gardner, Inc. (supply chain management company serving industrial and consumer markets) (serving in various roles 1974-present). | | 126 | | Director, Greif, Inc. (GEF) (industrial package products and services) (2007-present); Trustee, Columbus Association for the Performing Arts (1988-present); Director, Cardinal Health, Inc. (CAH) (1994-2014). |
| | | |
| Stephen P. Fisher (1959); Trustee of Trusts since 2018. | | Retired; Chairman and Chief Executive Officer, NYLIFE Distributors LLC (registered broker-dealer) (serving in various roles 2008-2013); Chairman, NYLIM Service Company LLC (transfer agent) (2008-2017); New York Life Investment Management LLC (registered investment adviser) (serving in various roles 2005-2017); Chairman, IndexIQ Advisors LLC (registered investment adviser for ETFs) (2014-2017); President, MainStay VP Funds Trust (2007-2017), MainStay DefinedTerm Municipal Opportunities Fund (2011-2017) and MainStay Funds Trust (2007-2017) (registered investment companies). | | 126 | | Honors Program Advisory Board Member, The Zicklin School of Business, Baruch College, The City University of New York (2017-present). |
| | | |
| Kathleen M. Gallagher (1958); Trustee of the Trusts since 2018. | | Retired; Chief Investment Officer — Benefit Plans, Ford Motor Company (serving in various roles 1985-2016). | | 126 | | Non-Executive Director, Legal & General Investment Management (Holdings) (2018-present); Non-Executive Director, Legal & General Investment Management America (financial services and insurance) (2017-present); Advisory Board Member, Fiduciary Solutions, State Street Global Advisors (2017-present); Member, Client Advisory Council, Financial Engines, LLC (registered investment adviser) (2011-2016); Director, Ford Pension Funds Investment Management Ltd. (2007-2016). |
| | | |
| Dennis P. Harrington* (1950); Trustee of Trusts since 2017. | | Retired; Partner, Deloitte LLP (accounting firm) (serving in various roles 1984-2012). | | 126 | | None |
| | | |
| Frankie D. Hughes (1952); Trustee of Trusts since 2008. | | President, Ashland Hughes Properties (property management) (2014-present); President and Chief Investment Officer, Hughes Capital Management, Inc. (fixed income asset management) (1993-2014). | | 126 | | None |
| | | | | | |
| | | |
| 132 | | | | J.P. MORGAN INTERNATIONAL EQUITY FUNDS | | OCTOBER 31, 2020 |
| | | | | | |
Name (Year of Birth); Positions With the Funds (1) | | Principal Occupation During Past 5 Years | | Number of
Funds in Fund
Complex Overseen
by Trustee (2) | | Other Directorships Held During the Past 5 Years |
Independent Trustees (continued) | | |
| | | |
Raymond Kanner** (1953); Trustee of Trusts since 2017. | | Retired; Managing Director & Chief Investment Officer, IBM Retirement Funds (2007-2016). | | 126 | | Advisory Board Member, Penso Advisors LLC (2020-present); Advisory Board Member, Los Angeles Capital (2018-present); Advisory Board Member, State Street Global Advisors Fiduciary Solutions Board (2017-present); Acting Executive Director, Committee on Investment of Employee Benefit Assets (CIEBA) (2016-2017); Advisory Board Member, Betterment for Business (robo advisor) (2016-2017); Advisory Board Member, BlueStar Indexes (index creator) (2013-2017); Director, Emerging Markets Growth Fund (registered investment company) (1997-2016); Member, Russell Index Client Advisory Board (2001-2015). |
| | | |
| Peter C. Marshall (1942); Trustee of Trusts since 2005; Trustee of heritage One Group Mutual Funds since 1985. | | Self-employed business consultant
(2002-present). | | 126 | | None |
| | | |
| Mary E. Martinez (1960); Trustee of Trusts since 2013. | | Associate, Special Properties, a Christie’s International Real Estate Affiliate (2010-present); Managing Director, Bank of America (Asset Management) (2007-2008); Chief Operating Officer, U.S. Trust Asset Management, U.S. Trust Company (asset management) (2003-2007); President, Excelsior Funds (registered investment companies) (2004-2005). | | 126 | | None |
| | | |
| Marilyn McCoy (1948); Trustee of Trusts since 2005; Trustee of heritage One Group Mutual Funds since 1999. | | Vice President of Administration and Planning, Northwestern University (1985-present). | | 126 | | None |
| | | |
| Mitchell M. Merin (1953); Trustee of Trusts since 2013. | | Retired; President and Chief Operating Officer, Morgan Stanley Investment Management, Member Morgan Stanley & Co. Management Committee (serving in various roles 1981-2006). | | 126 | | Director, Sun Life Financial (SLF) (financial services and insurance) (2007-2013). |
| | | |
| Dr. Robert A. Oden, Jr. (1946); Trustee of Trusts since 2005; Trustee of heritage One Group Mutual Funds since 1997. | | Retired; President, Carleton College (2002-2010); President, Kenyon College (1995-2002). | | 126 | | Trustee and Vice Chair, Trout Unlimited (2017-present); Trustee, American Museum of Fly Fishing (2013-present); Vice Chair, Dartmouth-Hitchcock Medical Center (2011-present); Trustee, American University in Cairo (1999-2014). |
| | | |
| Marian U. Pardo*** (1946); Trustee of Trusts since 2013. | | Managing Director and Founder, Virtual Capital Management LLC (investment consulting) (2007-present); Managing Director, Credit Suisse Asset Management (portfolio manager) (2003-2006). | | 126 | | President and Member, Board of Governors, Columbus Citizens Foundation (not-for-profit supporting philanthropic and cultural programs) (2006-present). |
| | | | | | | | |
| | | |
| OCTOBER 31, 2020 | | J.P. MORGAN INTERNATIONAL EQUITY FUNDS | | | | | 133 | |
TRUSTEES
AS OF OCTOBER 31, 2020
| (1) | Mr. Marshall is retiring from the Board of Trustees effective the close of business on December 31, 2020. The Trustees serve for an indefinite term, subject to the Trusts’ current retirement policy, which is age 78 for all Trustees. |
| (2) | A Fund Complex means two or more registered investment companies that hold themselves out to investors as related companies for purposes of investment and investor services or have a common investment adviser or have an investment adviser that is an affiliated person of the investment adviser of any of the other registered investment companies. The J.P. Morgan Funds Complex for which the Boards of Trustees serve currently includes ten registered investment companies (126 funds). |
| * | Two family members of Mr. Harrington are partner and managing director, respectively, of the Funds’ independent registered public accounting firm. Such firm has represented to the Boards that those family members are not involved in the audit of the Funds’ financial statements and do not provide other services to the Funds. The Boards have concluded that such association does not interfere with Mr. Harrington’s exercise of independent judgment as an Independent Trustee. |
| ** | A family member of Mr. Kanner is employed by JPMorgan Chase Bank, which is affiliated with JPMIM and JPMDS. In that capacity, this employee provides services to various JPMorgan affiliates including JPMIM and JPMDS and for which JPMIM and JPMDS bear some portion of the expense thereof. |
| *** | In connection with prior employment with JPMorgan Chase, Ms. Pardo was the recipient of non-qualified pension plan payments from JPMorgan Chase in the amount of approximately $2,055 per month, which she irrevocably waived effective January 1, 2013, and deferred compensation payments from JPMorgan Chase in the amount of approximately $7,294 per year, which ended in January 2013. In addition, Ms. Pardo receives payments from a fully-funded qualified plan, which is not an obligation of JPMorgan Chase. |
The contact address for each of the Trustees is 277 Park Avenue, New York, NY 10172.
| | | | | | |
| | | |
| 134 | | | | J.P. MORGAN INTERNATIONAL EQUITY FUNDS | | OCTOBER 31, 2020 |
OFFICERS
(Unaudited)
| | |
Name (Year of Birth), Positions Held with the Trusts (Since) | | Principal Occupations During Past 5 Years |
| |
Brian S. Shlissel (1964),
President and Principal Executive Officer (2016)* | | Managing Director and Chief Administrative Officer for J.P. Morgan pooled vehicles, J.P. Morgan Investment Management Inc. (formerly JPMorgan Funds Management, Inc.) (from 2014 to present); Managing Director and Head of Mutual Fund Services, Allianz Global Investors; President and Chief Executive Officer, Allianz Global Investors Mutual Funds and PIMCO Closed-End Funds (from 1999 to 2014). |
| |
Timothy J. Clemens (1975), Treasurer and Principal Financial Officer (2018)** | | Executive Director, J.P. Morgan Investment Management Inc. (formerly JPMorgan Funds Management, Inc.) since February 2016; Vice President, JPMorgan Funds Management, Inc. from October 2013 to January 2016. |
| |
Gregory S. Samuels (1980),
Secretary (2019) (formerly Assistant Secretary since 2010)** | | Executive Director and Assistant General Counsel, JPMorgan Chase. Mr. Samuels has been with JPMorgan Chase since 2010. |
| |
Stephen M. Ungerman (1953),
Chief Compliance Officer (2005) | | Managing Director, JPMorgan Chase & Co.; Mr. Ungerman has been with JPMorgan Chase & Co. since 2000. |
| |
Elizabeth A. Davin (1964), Assistant Secretary (2005)*** | | Executive Director and Assistant General Counsel, JPMorgan Chase since February 2012; formerly Vice President and Assistant General Counsel, JPMorgan Chase from 2005 to February 2012; Senior Counsel, JPMorgan Chase (formerly Bank One Corporation) from 2004 to 2005. |
| |
Jessica K. Ditullio (1962),
Assistant Secretary (2005)*** | | Executive Director and Assistant General Counsel, JPMorgan Chase. Ms. Ditullio has been with JPMorgan Chase (formerly Bank One Corporation) since 1990. |
| |
Anthony Geron (1971),
Assistant Secretary (2018)** | | Vice President and Assistant General Counsel, JPMorgan Chase since September 2018; Lead Director and Counsel, AXA Equitable Life Insurance Company from 2015 to 2018 and Senior Director and Counsel, AXA Equitable Life Insurance Company from 2014 to 2015. |
| |
Carmine Lekstutis (1980),
Assistant Secretary (2011)** | | Executive Director and Assistant General Counsel, JPMorgan Chase. Mr. Lekstutis has been with JPMorgan Chase since 2011. |
| |
Zachary E. Vonnegut-Gabovitch (1986), Assistant Secretary (2017)** | | Vice President and Assistant General Counsel, JPMorgan Chase since September 2016; Associate, Morgan, Lewis & Bockius (law firm) from 2012 to 2016. |
| |
Michael M. D’Ambrosio (1969),
Assistant Treasurer (2012) | | Managing Director, J.P. Morgan Investment Management Inc. (formerly JPMorgan Funds Management, Inc.). Mr. D’Ambrosio has been with J.P. Morgan Investment Management Inc. since 2012. |
| |
Aleksandr Fleytekh (1972), Assistant Treasurer (2019)** | | Vice President, J.P. Morgan Investment Management Inc. (formerly JPMorgan Funds Management, Inc.) since February 2012. |
| |
Shannon Gaines (1977),
Assistant Treasurer (2018)*** | | Vice President, J.P. Morgan Investment Management Inc. (formerly JPMorgan Funds Management, Inc.) since January 2014. |
| |
Jeffrey D. House (1972), Assistant Treasurer (2017)*** | | Vice President, J.P. Morgan Investment Management Inc. (formerly JPMorgan Funds Management, Inc.) since July 2006. |
| |
Michael Mannarino (1985),
Assistant Treasurer (2020) | | Vice President, J.P. Morgan Investment Management Inc. (formerly JPMorgan Funds Management, Inc.) since 2014. |
| |
Joseph Parascondola (1963),
Assistant Treasurer (2011)* | | Executive Director, J.P. Morgan Investment Management, Inc. since February 2020, formerly Vice President, J.P. Morgan Investment Management Inc. (formerly JPMorgan Funds Management, Inc.) from August 2006 to January 2020. |
| |
Gillian I. Sands (1969),
Assistant Treasurer (2012)** | | Vice President, J.P. Morgan Investment Management Inc. (formerly JPMorgan Funds Management, Inc.) since September 2012. |
The contact address for each of the officers, unless otherwise noted, is 277 Park Avenue, New York, NY 10172.
| * | The contact address for the officer is 575 Washington Boulevard, Jersey City, NJ 07310. |
| ** | The contact address for the officer is 4 New York Plaza, New York, NY 10004. |
| *** | The contact address for the officer is 1111 Polaris Parkway, Columbus, OH 43240. |
| | | | | | | | |
| | | |
| OCTOBER 31, 2020 | | J.P. MORGAN INTERNATIONAL EQUITY FUNDS | | | | | 135 | |
SCHEDULE OF SHAREHOLDER EXPENSES
(Unaudited)
Hypothetical $1,000 Investment
As a shareholder of the Funds, you incur two types of costs: (1) transaction costs, including sales charges (loads) on purchase payments and (2) ongoing costs, including investment advisory fees, administration fees, distribution fees and other Fund expenses. The examples below are intended to help you understand your ongoing costs (in dollars) of investing in the Funds and to compare these ongoing costs with the ongoing costs of investing in other mutual funds. The examples assume that you had a $1,000 investment in each Class at the beginning of the reporting period, May 1, 2020, and continued to hold your shares at the end of the reporting period, October 31, 2020.
Actual Expenses
For each Class of each Fund in the table below, the first line provides information about actual account values and actual expenses. You may use the information in this line, together with the amount you invested, to estimate the expenses that you paid over the period. Simply divide your account value by $1,000 (for example, an $8,600 account value divided by $1,000 = 8.6), then multiply the result by the number in the first line of each Class under the heading titled “Expenses Paid During the Period” to estimate the expenses you paid on your account during this period.
Hypothetical Example for Comparison Purposes
The second line of each Class in the table below provides information about hypothetical account values and hypothetical expenses based on the Class’ actual expense ratio and an assumed rate of return of 5% per year before expenses, which is not the Class’ actual return. The hypothetical account values and expenses may not be used to estimate the actual ending account balance or expenses you paid for the period. You may use this information to compare the ongoing costs of investing in the Class of the Funds and other funds. To do so, compare this 5% hypothetical example with the 5% hypothetical examples that appear in the shareholder reports of the other funds. Please note that the expenses shown in the table are meant to highlight your ongoing costs only and do not reflect any transaction costs, such as sales charges (loads) or redemption fees. Therefore, the second line for each Class in the table is useful in comparing ongoing costs only, and will not help you determine the relative total costs of owning different funds. In addition, if these transaction costs were included, your costs would have been higher. The examples also assume all dividends and distributions have been reinvested.
| | | | | | | | | | | | | | | | |
| | | Beginning
Account Value
May 1, 2020 | | | Ending
Account Value
October 31, 2020 | | | Expenses
Paid During the
Period* | | | Annualized
Expense
Ratio | |
JPMorgan Emerging Markets Equity Fund | | | | | | | | | | | | | | | | |
Class A | | | | | | | | | | | | | | | | |
Actual | | $ | 1,000.00 | | | $ | 1,357.70 | | | $ | 7.35 | | | | 1.24 | % |
Hypothetical | | | 1,000.00 | | | | 1,018.90 | | | | 6.29 | | | | 1.24 | |
Class C | | | | | | | | | | | | | | | | |
Actual | | | 1,000.00 | | | | 1,354.40 | | | | 10.24 | | | | 1.73 | |
Hypothetical | | | 1,000.00 | | | | 1,016.44 | | | | 8.77 | | | | 1.73 | |
Class I | | | | | | | | | | | | | | | | |
Actual | | | 1,000.00 | | | | 1,359.80 | | | | 5.87 | | | | 0.99 | |
Hypothetical | | | 1,000.00 | | | | 1,020.16 | | | | 5.03 | | | | 0.99 | |
Class L | | | | | | | | | | | | | | | | |
Actual | | | 1,000.00 | | | | 1,359.80 | | | | 5.28 | | | | 0.89 | |
Hypothetical | | | 1,000.00 | | | | 1,020.66 | | | | 4.52 | | | | 0.89 | |
Class R2 | | | | | | | | | | | | | | | | |
Actual | | | 1,000.00 | | | | 1,355.60 | | | | 9.12 | | | | 1.54 | |
Hypothetical | | | 1,000.00 | | | | 1,017.39 | | | | 7.81 | | | | 1.54 | |
Class R3 | | | | | | | | | | | | | | | | |
Actual | | | 1,000.00 | | | | 1,357.20 | | | | 7.64 | | | | 1.29 | |
Hypothetical | | | 1,000.00 | | | | 1,018.65 | | | | 6.55 | | | | 1.29 | |
Class R4 | | | | | | | | | | | | | | | | |
Actual | | | 1,000.00 | | | | 1,359.20 | | | | 6.17 | | | | 1.04 | |
Hypothetical | | | 1,000.00 | | | | 1,019.91 | | | | 5.28 | | | | 1.04 | |
Class R5 | | | | | | | | | | | | | | | | |
Actual | | | 1,000.00 | | | | 1,359.90 | | | | 5.28 | | | | 0.89 | |
Hypothetical | | | 1,000.00 | | | | 1,020.66 | | | | 4.52 | | | | 0.89 | |
Class R6 | | | | | | | | | | | | | | | | |
Actual | | | 1,000.00 | | | | 1,360.70 | | | | 4.69 | | | | 0.79 | |
Hypothetical | | | 1,000.00 | | | | 1,021.17 | | | | 4.01 | | | | 0.79 | |
| | | | | | |
| | | |
| 136 | | | | J.P. MORGAN INTERNATIONAL EQUITY FUNDS | | OCTOBER 31, 2020 |
| | | | | | | | | | | | | | | | |
| | | Beginning
Account Value
May 1, 2020 | | | Ending
Account Value
October 31, 2020 | | | Expenses
Paid During the
Period* | | | Annualized
Expense
Ratio | |
JPMorgan Emerging Markets Research Enhanced Equity Fund | | | | | | | | | | | | | | | | |
Class I | | | | | | | | | | | | | | | | |
Actual | | $ | 1,000.00 | | | $ | 1,226.10 | | | $ | 2.52 | | | | 0.45 | % |
Hypothetical | | | 1,000.00 | | | | 1,022.87 | | | | 2.29 | | | | 0.45 | |
Class R6 | | | | | | | | | | | | | | | | |
Actual | | | 1,000.00 | | | | 1,226.00 | | | | 1.96 | | | | 0.35 | |
Hypothetical | | | 1,000.00 | | | | 1,023.38 | | | | 1.78 | | | | 0.35 | |
| | | | |
JPMorgan Europe Dynamic Fund | | | | | | | | | | | | | | | | |
Class A | | | | | | | | | | | | | | | | |
Actual | | | 1,000.00 | | | | 1,101.30 | | | | 6.55 | | | | 1.24 | |
Hypothetical | | | 1,000.00 | | | | 1,018.90 | | | | 6.29 | | | | 1.24 | |
Class C | | | | | | | | | | | | | | | | |
Actual | | | 1,000.00 | | | | 1,099.00 | | | | 9.18 | | | | 1.74 | |
Hypothetical | | | 1,000.00 | | | | 1,016.39 | | | | 8.82 | | | | 1.74 | |
Class I | | | | | | | | | | | | | | | | |
Actual | | | 1,000.00 | | | | 1,102.80 | | | | 5.23 | | | | 0.99 | |
Hypothetical | | | 1,000.00 | | | | 1,020.16 | | | | 5.03 | | | | 0.99 | |
Class L | | | | | | | | | | | | | | | | |
Actual | | | 1,000.00 | | | | 1,103.60 | | | | 4.55 | | | | 0.86 | |
Hypothetical | | | 1,000.00 | | | | 1,020.81 | | | | 4.37 | | | | 0.86 | |
Class R6 | | | | | | | | | | | | | | | | |
Actual | | | 1,000.00 | | | | 1,104.00 | | | | 4.02 | | | | 0.76 | |
Hypothetical | | | 1,000.00 | | | | 1,021.32 | | | | 3.86 | | | | 0.76 | |
| | | | |
JPMorgan International Advantage Fund | | | | | | | | | | | | | | | | |
Class A | | | | | | | | | | | | | | | | |
Actual | | | 1,000.00 | | | | 1,084.50 | | | | 4.93 | | | | 0.94 | |
Hypothetical | | | 1,000.00 | | | | 1,020.41 | | | | 4.77 | | | | 0.94 | |
Class C | | | | | | | | | | | | | | | | |
Actual | | | 1,000.00 | | | | 1,081.20 | | | $ | 7.59 | | | | 1.45 | |
Hypothetical | | | 1,000.00 | | | | 1,017.85 | | | | 7.35 | | | | 1.45 | |
Class I | | | | | | | | | | | | | | | | |
Actual | | | 1,000.00 | | | | 1,086.00 | | | | 3.67 | | | | 0.70 | |
Hypothetical | | | 1,000.00 | | | | 1,021.62 | | | | 3.56 | | | | 0.70 | |
Class R2 | | | | | | | | | | | | | | | | |
Actual | | | 1,000.00 | | | | 1,082.60 | | | | 6.54 | | | | 1.25 | |
Hypothetical | | | 1,000.00 | | | | 1,018.85 | | | | 6.34 | | | | 1.25 | |
Class R6 | | | | | | | | | | | | | | | | |
Actual | | | 1,000.00 | | | | 1,086.10 | | | | 2.62 | | | | 0.50 | |
Hypothetical | | | 1,000.00 | | | | 1,022.62 | | | | 2.54 | | | | 0.50 | |
| | | | |
JPMorgan International Equity Fund | | | | | | | | | | | | | | | | |
Class A | | | | | | | | | | | | | | | | |
Actual | | | 1,000.00 | | | | 1,122.70 | | | | 5.07 | | | | 0.95 | |
Hypothetical | | | 1,000.00 | | | | 1,020.36 | | | | 4.82 | | | | 0.95 | |
Class C | | | | | | | | | | | | | | | | |
Actual | | | 1,000.00 | | | | 1,120.50 | | | | 7.73 | | | | 1.45 | |
Hypothetical | | | 1,000.00 | | | | 1,017.85 | | | | 7.35 | | | | 1.45 | |
Class I | | | | | | | | | | | | | | | | |
Actual | | | 1,000.00 | | | | 1,124.10 | | | | 3.74 | | | | 0.70 | |
Hypothetical | | | 1,000.00 | | | | 1,021.62 | | | | 3.56 | | | | 0.70 | |
Class R2 | | | | | | | | | | | | | | | | |
Actual | | | 1,000.00 | | | | 1,121.00 | | | | 6.66 | | | | 1.25 | |
Hypothetical | | | 1,000.00 | | | | 1,018.85 | | | | 6.34 | | | | 1.25 | |
Class R5 | | | | | | | | | | | | | | | | |
Actual | | | 1,000.00 | | | | 1,124.80 | | | | 3.20 | | | | 0.60 | |
Hypothetical | | | 1,000.00 | | | | 1,022.12 | | | | 3.05 | | | | 0.60 | |
Class R6 | | | | | | | | | | | | | | | | |
Actual | | | 1,000.00 | | | | 1,125.20 | | | | 2.67 | | | | 0.50 | |
Hypothetical | | | 1,000.00 | | | | 1,022.62 | | | | 2.54 | | | | 0.50 | |
| | | | | | | | |
| | | |
| OCTOBER 31, 2020 | | J.P. MORGAN INTERNATIONAL EQUITY FUNDS | | | | | 137 | |
SCHEDULE OF SHAREHOLDER EXPENSES
(Unaudited) (continued)
Hypothetical $1,000 Investment
| | | | | | | | | | | | | | | | |
| | | Beginning
Account Value
May 1, 2020 | | | Ending
Account Value
October 31, 2020 | | | Expenses
Paid During the
Period* | | | Annualized
Expense
Ratio | |
JPMorgan International Focus Fund (formerly known as JPMorgan International Unconstrained Equity Fund) | | | | | | | | | | | | | | | | |
Class A | | | | | | | | | | | | | | | | |
Actual | | $ | 1,000.00 | | | $ | 1,156.70 | | | $ | 5.42 | | | | 1.00 | % |
Hypothetical | | | 1,000.00 | | | | 1,020.11 | | | | 5.08 | | | | 1.00 | |
Class C | | | | | | | | | | | | | | | | |
Actual | | | 1,000.00 | | | | 1,153.80 | | | | 8.12 | | | | 1.50 | |
Hypothetical | | | 1,000.00 | | | | 1,017.60 | | | | 7.61 | | | | 1.50 | |
Class I | | | | | | | | | | | | | | | | |
Actual | | | 1,000.00 | | | | 1,158.30 | | | | 4.07 | | | | 0.75 | |
Hypothetical | | | 1,000.00 | | | | 1,021.37 | | | | 3.81 | | | | 0.75 | |
Class R2 | | | | | | | | | | | | | | | | |
Actual | | | 1,000.00 | | | | 1,154.90 | | | | 7.04 | | | | 1.30 | |
Hypothetical | | | 1,000.00 | | | | 1,018.60 | | | | 6.60 | | | | 1.30 | |
Class R5 | | | | | | | | | | | | | | | | |
Actual | | | 1,000.00 | | | | 1,159.00 | | | | 3.53 | | | | 0.65 | |
Hypothetical | | | 1,000.00 | | | | 1,021.87 | | | | 3.30 | | | | 0.65 | |
Class R6 | | | | | | | | | | | | | | | | |
Actual | | | 1,000.00 | | | | 1,159.40 | | | | 2.99 | | | | 0.55 | |
Hypothetical | | | 1,000.00 | | | | 1,022.37 | | | | 2.80 | | | | 0.55 | |
| | | | |
JPMorgan International Hedged Equity Fund | | | | | | | | | | | | | | | | |
Class A | | | | | | | | | | | | | | | | |
Actual | | | 1,000.00 | | | | 1,007.10 | | | | 4.29 | | | | 0.85 | |
Hypothetical | | | 1,000.00 | | | | 1,020.86 | | | | 4.32 | | | | 0.85 | |
Class C | | | | | | | | | | | | | | | | |
Actual | | | 1,000.00 | | | | 1,005.00 | | | | 6.80 | | | | 1.35 | |
Hypothetical | | | 1,000.00 | | | | 1,018.35 | | | | 6.85 | | | | 1.35 | |
Class I | | | | | | | | | | | | | | | | |
Actual | | | 1,000.00 | | | | 1,008.50 | | | | 3.03 | | | | 0.60 | |
Hypothetical | | | 1,000.00 | | | | 1,022.12 | | | | 3.05 | | | | 0.60 | |
Class R5 | | | | | | | | | | | | | | | | |
Actual | | | 1,000.00 | | | | 1,008.50 | | | | 2.22 | | | | 0.44 | |
Hypothetical | | | 1,000.00 | | | | 1,022.92 | | | | 2.24 | | | | 0.44 | |
Class R6 | | | | | | | | | | | | | | | | |
Actual | | | 1,000.00 | | | | 1,009.90 | | | | 1.77 | | | | 0.35 | |
Hypothetical | | | 1,000.00 | | | | 1,023.38 | | | | 1.78 | | | | 0.35 | |
| | | | |
JPMorgan International Research Enhanced Equity Fund | | | | | | | | | | | | | | | | |
Class A | | | | | | | | | | | | | | | | |
Actual | | | 1,000.00 | | | | 1,070.30 | | | | 3.12 | | | | 0.60 | |
Hypothetical | | | 1,000.00 | | | | 1,022.12 | | | | 3.05 | | | | 0.60 | |
Class I | | | | | | | | | | | | | | | | |
Actual | | | 1,000.00 | | | | 1,071.40 | | | | 1.77 | | | | 0.34 | |
Hypothetical | | | 1,000.00 | | | | 1,023.43 | | | | 1.73 | | | | 0.34 | |
Class R6 | | | | | | | | | | | | | | | | |
Actual | | | 1,000.00 | | | | 1,072.40 | | | | 1.25 | | | | 0.24 | |
Hypothetical | | | 1,000.00 | | | | 1,023.93 | | | | 1.22 | | | | 0.24 | |
| | | | |
JPMorgan International Value Fund | | | | | | | | | | | | | | | | |
Class A | | | | | | | | | | | | | | | | |
Actual | | | 1,000.00 | | | | 1,048.80 | | | | 5.15 | | | | 1.00 | |
Hypothetical | | | 1,000.00 | | | | 1,020.11 | | | | 5.08 | | | | 1.00 | |
Class C | | | | | | | | | | | | | | | | |
Actual | | | 1,000.00 | | | | 1,045.80 | | | | 7.71 | | | | 1.50 | |
Hypothetical | | | 1,000.00 | | | | 1,017.60 | | | | 7.61 | | | | 1.50 | |
| | | | | | |
| | | |
| 138 | | | | J.P. MORGAN INTERNATIONAL EQUITY FUNDS | | OCTOBER 31, 2020 |
| | | | | | | | | | | | | | | | |
| | | Beginning
Account Value
May 1, 2020 | | | Ending
Account Value
October 31, 2020 | | | Expenses
Paid During the
Period* | | | Annualized
Expense
Ratio | |
JPMorgan International Value Fund (continued) | | | | | | | | | | | | | | | | |
Class I | | | | | | | | | | | | | | | | |
Actual | | $ | 1,000.00 | | | $ | 1,049.70 | | | $ | 3.86 | | | | 0.75 | % |
Hypothetical | | | 1,000.00 | | | | 1,021.37 | | | | 3.81 | | | | 0.75 | |
Class L | | | | | | | | | | | | | | | | |
Actual | | | 1,000.00 | | | | 1,050.00 | | | | 3.35 | | | | 0.65 | |
Hypothetical | | | 1,000.00 | | | | 1,021.87 | | | | 3.30 | | | | 0.65 | |
Class R2 | | | | | | | | | | | | | | | | |
Actual | | | 1,000.00 | | | | 1,046.20 | | | | 6.69 | | | | 1.30 | |
Hypothetical | | | 1,000.00 | | | | 1,018.60 | | | | 6.60 | | | | 1.30 | |
Class R5 | | | | | | | | | | | | | | | | |
Actual | | | 1,000.00 | | | | 1,050.30 | | | | 3.35 | | | | 0.65 | |
Hypothetical | | | 1,000.00 | | | | 1,021.87 | | | | 3.30 | | | | 0.65 | |
Class R6 | | | | | | | | | | | | | | | | |
Actual | | | 1,000.00 | | | | 1,050.20 | | | | 2.83 | | | | 0.55 | |
Hypothetical | | | 1,000.00 | | | | 1,022.37 | | | | 2.80 | | | | 0.55 | |
| * | Expenses are equal to each Class’ respective annualized expense ratio, multiplied by the average account value over the period, multiplied by 184/366 (to reflect the one-half year period). |
| | | | | | | | |
| | | |
| OCTOBER 31, 2020 | | J.P. MORGAN INTERNATIONAL EQUITY FUNDS | | | | | 139 | |
BOARD APPROVAL OF INVESTMENT ADVISORY AGREEMENTS
(Unaudited)
The Board of Trustees has established various standing committees composed of Trustees with diverse backgrounds, to which the Board of Trustees has assigned specific subject matter responsibilities to further enhance the effectiveness of the Board’s oversight and decision making. The Board of Trustees and its investment committees (money market and alternative products, equity, and fixed income) meet regularly throughout the year and consider factors that are relevant to their annual consideration of investment advisory agreements at each meeting. They also meet for the specific purpose of considering investment advisory agreement annual renewals. The Board of Trustees held meetings in June and August 2020, at which the Trustees considered the continuation of the investment advisory agreements for each Fund whose annual report is contained herein (each an “Advisory Agreement” and collectively, the “Advisory Agreements”). In accordance with SEC guidance, due to the COVID-19 pandemic, the meetings were conducted through video conference. At the June meeting, the Boards’ investment committees met to review and consider performance, expense and related information for the J.P. Morgan Funds. Each investment committee reported to the full Board, which then considered the investment committee’s preliminary findings. At the August meeting, the Trustees continued their review and consideration. The Trustees, including a majority of the Trustees who are not parties to an Advisory Agreement or “interested persons” (as defined in the 1940 Act) of any party to an Advisory Agreement or any of their affiliates, approved the continuation of each Advisory Agreement on August 11, 2020.
As part of their review of the Advisory Agreements, the Trustees considered and reviewed performance and other information about the Funds received from the Adviser. This information includes the Funds’ performance as compared to the performance of their peers and benchmarks and analyses by the Adviser of the Funds’ performance. In addition, at each of their regular meetings throughout the year, the Trustees considered reports on the performance of certain J.P. Morgan Funds provided by an independent management consulting firm (“independent consultant”). In addition, in preparation for the June and August meetings, the Trustees requested, received and evaluated extensive materials from the Adviser, including performance and expense information compiled by Broadridge, using data from Lipper Inc. and/or Morningstar Inc., independent providers of investment company data (together, “Broadridge”). The Trustees’ independent consultant also provided additional analyses of the performance of the Funds as compared to the Funds’ objectives and peers. Before voting on the Advisory Agreements, the Trustees reviewed the Advisory Agreements with representatives of the Adviser, counsel to the Trusts and independent legal counsel and received a memorandum from independent legal counsel to the Trustees discussing the legal standards for their consideration of the Advisory Agreements. The Trustees also discussed the Advisory Agreements in executive sessions with independent
legal counsel at which no representatives of the Adviser were present.
A summary of the material factors evaluated by the Trustees in determining whether to approve each Advisory Agreement is provided below. Each Trustee attributed different weights to the various factors and no factor alone was considered determinative. The Trustees considered information provided with respect to the Funds throughout the year including additional reporting and information provided in connection with the market volatility caused by the COVID-19 pandemic, as well as materials furnished specifically in connection with the annual review process. From year to year, the Trustees consider and place emphasis on relevant information in light of changing circumstances in market and economic conditions.
After considering and weighing the factors and information they had received, the Trustees found that the compensation to be received by the Adviser from each Fund under the applicable Advisory Agreement was fair and reasonable under the circumstances and determined that the continuance of each Advisory Agreement was in the best interests of each Fund and its shareholders.
Nature, Extent and Quality of Services Provided by the Adviser
The Trustees received and considered information regarding the nature, extent and quality of services provided to each Fund under the applicable Advisory Agreement. The Trustees took into account information furnished throughout the year at Trustee meetings, as well as the materials furnished specifically in connection with this annual review process. The Trustees considered the background and experience of the Adviser’s senior management, personnel changes, if any, and the expertise of, and the amount of attention given to each Fund by, investment personnel of the Adviser. In addition, the Trustees reviewed the qualifications, backgrounds and responsibilities of the portfolio management team primarily responsible for the day-to-day management of each Fund and the infrastructure supporting the team, including personnel changes, if any. In addition, the Board considered its discussions with the Adviser regarding the Adviser’s business continuity plan and steps the Adviser was taking to provide ongoing services to the Funds during the COVID-19 pandemic, and the Adviser’s success in continuing to provide services to the Funds and their shareholders throughout this period. The Trustees also considered information provided by the Adviser and JPMorgan Distribution Services, Inc. (“JPMDS”) about the structure and distribution strategy of each Fund. The Trustees reviewed information relating to the Adviser’s risk governance model and reports showing the Adviser’s compliance structure and ongoing compliance processes. The Trustees also considered the quality of the administration services provided by the Adviser in its role as administrator.
| | | | | | |
| | | |
| 140 | | | | J.P. MORGAN INTERNATIONAL EQUITY FUNDS | | OCTOBER 31, 2020 |
The Trustees also considered their knowledge of the nature and quality of services provided by the Adviser and its affiliates to the Funds gained from their experience as Trustees of the J.P. Morgan Funds. In addition, they considered the overall reputation and capabilities of the Adviser and its affiliates, the commitment of the Adviser to provide high quality service to the Funds, their overall confidence in the Adviser’s integrity and the Adviser’s responsiveness to questions or concerns raised by them, including the Adviser’s willingness to consider and implement organizational and operational changes designed to improve investment results and the services provided to each Fund.
Based upon these considerations and other factors, the Trustees concluded that they were satisfied with the nature, extent and quality of the investment advisory services provided to the Funds by the Adviser.
Costs of Services Provided and Profitability to the Adviser and its Affiliates
The Trustees received and considered information regarding the profitability to the Adviser and its affiliates in providing services to each Fund. The Trustees reviewed and discussed this information. The Trustees recognized that this information is not audited and represents the Adviser’s determination of its and its affiliates’ revenues from the contractual services provided to the Funds, less expenses of providing such services. Expenses include direct and indirect costs and are calculated using an allocation methodology developed by the Adviser. The Trustees also recognized that it is difficult to make comparisons of profitability from fund investment advisory contracts because comparative information is not generally publicly available and is affected by numerous factors, including the structure of the particular adviser, the types of funds it manages, its business mix, numerous assumptions regarding allocations and the fact that publicly-traded fund managers’ operating profits and net income are net of distribution and marketing expenses. Based upon their review, and taking into consideration the factors noted above, the Trustees concluded that the profitability to the Adviser under each Advisory Agreement was not unreasonable in light of the services and benefits provided to each Fund.
The Trustees also considered that JPMDS, an affiliate of the Adviser, and the Adviser earn fees from the Funds for providing shareholder and administration services, respectively. These fees were shown separately in the profitability analysis presented to the Trustees. The Trustees also considered the payments of Rule 12b-1 fees to JPMDS, which also acts as the Funds’ distributor and that these fees are in turn generally paid to financial intermediaries that sell the Funds, including financial intermediaries that are affiliates of the Adviser (although they are retained by JPMDS in certain instances). The Trustees also considered the fees paid to JPMorgan Chase Bank, N.A.
(“JPMCB”) for custody and fund accounting, and other related services.
Fall-Out Benefits
The Trustees reviewed information regarding potential “fall-out” or ancillary benefits received by the Adviser and its affiliates as a result of their relationship with the Funds. The Trustees considered that the J.P. Morgan Funds’ operating accounts are held at JPMCB, which, as a result, will receive float benefits for certain J.P. Morgan Funds, as applicable. The Trustees also noted that the Adviser supports a diverse set of products and services, which benefits the Adviser by allowing it to leverage its infrastructure to serve additional clients, including benefits that may be received by the Adviser and its affiliates in connection with the Funds’ potential investments in other funds advised by the Adviser. The Trustees also reviewed the Adviser’s allocation of fund brokerage for the J.P. Morgan Funds complex, including allocations to brokers who provide research to the Adviser.
Economies of Scale
The Trustees considered the extent to which the Funds may benefit from economies of scale. The Trustees considered that there may not be a direct relationship between economies of scale realized by the Funds and those realized by the Adviser as assets increase. The Trustees considered the extent to which the Funds were priced to scale and whether it would be appropriate to add advisory fee breakpoints. The Trustees noted certain Funds with contractual expense limitations and fee waivers (“Fee Caps”) which allow a Fund’s shareholders to share potential economies of scale from a Fund’s inception, prior to reaching scale. The Trustees also noted that other Funds which had achieved scale as asset levels had increased, no longer had Fee Caps in place for some or all of their share classes, but shared economies of scale through lower average expenses. The Trustees noted that the fees remain satisfactory relative to peer funds. The Trustees considered the benefits to the Funds of the use of an affiliated distributor and custodian, including the ability to rely on existing infrastructure supporting distribution, custodial and transfer agent services and the ability to negotiate competitive fees for the Funds. The Trustees further considered the Adviser’s and JPMDS’s ongoing investments in their business in support of the Funds, including the Adviser’s and/or JPMDS’s investments in trading systems, technology (including improvements to the J.P. Morgan Funds’ website, and cybersecurity improvements), retention of key talent, and regulatory support enhancements. The Trustees concluded that the current fee structure for each Fund, including any Fee Caps the Adviser has in place that serve to limit the overall net expense ratios of each Fund at competitive levels, was reasonable. The Trustees concluded that, for Funds with expense caps in place for some or all of their share classes, the relevant Fund’s shareholders received the benefits of potential
| | | | | | | | |
| | | |
| OCTOBER 31, 2020 | | J.P. MORGAN INTERNATIONAL EQUITY FUNDS | | | | | 141 | |
BOARD APPROVAL OF INVESTMENT ADVISORY AGREEMENTS
(Unaudited) (continued)
economies of scale through the Fee Caps and, for Funds that achieved scale and no longer had Fee Caps in place for some or all of their share classes, the relevant Fund’s shareholders benefited from lower average expenses resulting from increased assets. The Trustees also concluded that all Funds benefited from the Adviser’s reinvestment in its operations to serve the Funds and their shareholders. The Trustees noted that the Adviser’s reinvestment ensures sufficient resources in terms of personnel and infrastructure to support the Funds.
Independent Written Evaluation of the Funds’ Senior/Chief Compliance Officer
The Trustees noted that, upon their direction, the Senior Officer for the International Equity Fund and International Research Enhanced Equity Fund had prepared an independent written evaluation in order to assist the Trustees in determining the reasonableness of the proposed management fees. In determining whether to continue the Advisory Agreements, the Trustees considered the Senior Officer’s report.
The Trustees noted that, upon their direction, the Chief Compliance Officer for the Emerging Markets Equity Fund, Europe Dynamic Fund, International Advantage Fund, International Focus Fund and International Value Fund had prepared an independent written evaluation in order to assist the Trustees in determining the reasonableness of the proposed management fees. The Trustees considered the written evaluation in determining whether to continue the Advisory Agreements.
Fees Relative to Adviser’s Other Clients
The Trustees received and considered information about the nature and extent of investment advisory services and fee rates offered to other clients of the Adviser, including institutional separate accounts, collective investment trusts, ETFs and/or funds sub-advised by the Adviser, for investment management styles substantially similar to that of each Fund. The Trustees considered the complexity of investment management for registered mutual funds relative to the Adviser’s other clients and noted differences, as applicable, in the regulatory, legal and other risks and responsibilities of providing services to the different clients. The Trustees considered that serving as an adviser to a registered mutual fund involves greater responsibilities and risks than acting as a sub-adviser and observed that sub-advisory fees may be lower than those charged by the Adviser to each Fund. The Trustees also noted that the adviser, not the mutual fund, pays the sub-advisory fee and that many responsibilities related to the advisory function are retained by the primary adviser. The Trustees concluded that the fee rates charged to each Fund in comparison to those charged to the Adviser’s other clients were reasonable.
Investment Performance
The Trustees received and considered absolute and/or relative performance information for the Funds in a report prepared by
Broadridge. The Trustees considered the total return performance information, which included the ranking of the Funds within a performance universe made up of funds with the same Broadridge investment classification and objective (the “Universe”), as well as a subset of funds within the Universe (the “Peer Group”), by total return for the applicable one-, three- and five-year periods. The Trustees reviewed a description of Broadridge’s methodology for selecting mutual funds in each Fund’s Universe and Peer Group and noted that Universe and Peer Group rankings were not calculated if the number of funds in the Universe and/or Peer Group did not meet a predetermined minimum. The Broadridge materials provided to the Trustees highlighted information with respect to certain representative classes to assist the Trustees in their review. As part of this review, the Trustees also reviewed each Fund’s performance against its benchmark and considered the performance information provided for the Funds at regular Board meetings by the Adviser and the Trustees’ independent consultant and also considered the special analysis prepared by the Trustees’ independent consultant. The Trustees also engaged with the Adviser to consider what steps might be taken to improve performance, as applicable. The Broadridge performance data noted by the Trustees as part of their review and the determinations made by the Trustees with respect to each Fund’s performance for certain representative classes are summarized below:
The Trustees noted that the Emerging Markets Equity Fund’s performance for Class A and Class I shares was in the first quintile based upon both the Peer Group and Universe for each of the one-, three- and five-year periods ended December 31, 2019. The Trustees noted that the performance for Class R6 shares was in the first quintile based upon the Peer Group for each of the one- and three-year periods ended December 31, 2019, and in the first quintile based upon the Universe for each of the one-, three- and five-year periods ended December 31, 2019. The Trustees discussed the performance and investment strategy of the Fund with the Adviser and reviewed the performance analysis and evaluation prepared by the independent consultant. Based upon these discussions and various other factors, the Trustees concluded that the Fund’s performance was satisfactory.
The Trustees noted that the Emerging Markets Research Enhanced Equity Fund’s performance for Class I and Class R6 shares was in the third quintile based upon both the Peer Group and Universe, for the one-year period ended December 31, 2019. The Trustees discussed the performance and investment strategy of the Fund with the Adviser and reviewed the performance analysis and evaluation prepared by the independent consultant. Based upon these discussions and various other factors, the Trustees concluded that the Fund’s performance was satisfactory.
| | | | | | |
| | | |
| 142 | | | | J.P. MORGAN INTERNATIONAL EQUITY FUNDS | | OCTOBER 31, 2020 |
The Trustees noted that the Europe Dynamic Fund’s performance for Class A shares was in the fifth, fourth and fourth quintiles based upon the Peer Group for the one-, three- and five-year periods ended December 31, 2019, respectively, and in the fifth quintile based upon the Universe for each of the one-, three- and five-year periods ended December 31, 2019. The Trustees noted that performance for Class I shares was in the fourth, fifth and fifth quintiles based upon the Universe for the one-, three- and five-year periods ended December 31, 2019, respectively. The Trustees noted that performance for Class R6 shares was in the fifth quintile based upon the Peer Group, and in the fourth quintile based upon the Universe, for the one-year period ended December 31, 2019. The Trustees discussed the performance and investment strategy of the Fund with the Adviser and reviewed the performance analysis and evaluation prepared by the independent consultant. Based upon these discussions and various other factors, the Trustees concluded that the Fund’s performance was satisfactory under the circumstances. They requested, however, that the Fund’s Adviser provide additional Fund performance information to be reviewed with the members of the equity committee at each of their regularly scheduled meetings over the course of the next year.
The Trustees noted that the International Advantage Fund’s performance for Class A shares was in the fourth, fourth and fifth quintiles based upon the Peer Group for the one-, three- and five-year periods ended December 31, 2019, respectively, and in the fifth quintile based upon the Universe for each of the one-, three- and five-year periods ended December 31, 2019. The Trustees noted that the performance for Class I shares was in the fifth, fifth and fourth quintiles based upon the Peer Group for the one-, three- and five-year periods ended December 31, 2019, respectively, and in the fifth quintile based upon the Universe for each of the one-, three- and five-year periods ended December 31, 2019. The Trustees noted that the performance for Class R6 shares was in the fifth quintile based upon both the Peer Group and Universe for both the one- and three-year periods ended December 31, 2019. The Trustees discussed the performance and investment strategy of the Fund with the Adviser and reviewed the performance analysis and evaluation prepared by the independent consultant. Based upon these discussions, and various other factors, the Trustees concluded that the performance was satisfactory under the circumstances. They requested, however, that the Fund’s Adviser provide additional Fund performance information to be reviewed with the members of the equity committee at each of their regularly scheduled meetings over the course of the next year.
The Trustees noted that the International Equity Fund’s performance for Class A shares was in the third quintile for each of the one-, three- and five-year periods ended December 31, 2019 based upon the Peer Group, and in the third, fourth and third quintiles based upon the Universe, for the one-, three- and five-year periods ended December 31, 2019, respectively.
The Trustees noted that the performance for the Class I shares was in the second, third and second quintiles based upon the Peer Group, and in the third, fourth and third quintiles based upon the Universe, for the one-, three- and five-year periods ended December 31, 2019, respectively. The Trustees noted that the performance for Class R6 shares was in the fourth, third and third quintiles based upon the Peer Group for the one-, three- and five-year periods ended December 31, 2019, respectively, and in the second, fourth and third quintiles based upon the Universe, for the one-, three- and five-year periods ended December 31, 2019, respectively. The Trustees discussed the performance and investment strategy of the Fund with the Adviser and reviewed the performance analysis and evaluation prepared by the independent consultant. Based upon these discussions and various other factors, the Trustees concluded that the Fund’s performance was satisfactory under the circumstances.
The Trustees noted that the International Focus Fund’s performance for Class A shares was in the first, fourth and first quintiles based upon the Peer Group, and in the first, third and second quintiles based upon the Universe, for the one-, three- and five-year periods ended December 31, 2019, respectively. The Trustees noted that the performance for Class I shares was in the first, third and first quintiles based upon the Peer Group, and in the first, third and second quintiles based upon the Universe, for the one-, three- and five-year periods ended December 31, 2019, respectively. The Trustees noted that the performance for Class R6 shares was in the first, fourth and second quintiles based upon the Peer Group, and in the first, third and second quintiles based upon the Universe, for the one-, three- and five-year periods ended December 31, 2019, respectively. The Trustees discussed the performance and investment strategy of the Fund with the Adviser and reviewed the performance analysis and evaluation prepared by the independent consultant. Based upon these discussions, and various other factors, the Trustees concluded that the Fund’s performance was satisfactory under the circumstances.
The Trustees noted the performance of the International Hedged Equity Fund since its inception on March 15, 2019 as compared with that of its benchmark index. The Trustees discussed the performance and investment strategy of the Fund with the Advisor and, based upon this discussion and various other factors, concluded that the performance was satisfactory.
The Trustees noted that the International Research Enhanced Equity Fund’s performance for Class A shares was in the third, third and second quintiles based upon the Universe for the one-, three- and five-year periods ended December 31, 2019, respectively. The Trustees noted that performance for Class I shares was in the third, third and first quintiles based upon the Universe for the one-, three- and five-year periods ended December 31, 2019, respectively. The Trustees noted that the performance for Class R6 shares was in the third quintile based
| | | | | | | | |
| | | |
| OCTOBER 31, 2020 | | J.P. MORGAN INTERNATIONAL EQUITY FUNDS | | | | | 143 | |
BOARD APPROVAL OF INVESTMENT ADVISORY AGREEMENTS
(Unaudited) (continued)
upon the Universe for the one-year period ended December 31, 2019. The Trustees discussed the performance and investment strategy of the Fund with the Adviser and reviewed the performance analysis and evaluation prepared by the independent consultant. Based upon these discussions, and various other factors, the Trustees concluded that the Fund’s performance was satisfactory.
The Trustees noted that the International Value Fund’s performance for Class A shares was in the fourth, fifth and fourth quintiles based upon both the Peer Group and Universe for the one-, three- and five-year periods ended December 31, 2019, respectively. The Trustees noted that the performance for Class I shares was in the third, fourth and fourth quintiles based upon the Peer Group, and in the fourth, fifth and fourth quintiles based upon the Universe, for the one-, three- and five-year periods ended December 31, 2019, respectively. The Trustees noted that the performance for Class R6 shares was in the fourth quintile based upon both the Peer Group and Universe for each of the one-, three- and five-year periods ended December 31, 2019. The Trustees discussed the performance and investment strategy of the Fund with the Adviser and reviewed the performance analysis and evaluation prepared by the independent consultant. Based upon these discussions, and various other factors, the Trustees concluded that the Fund’s performance was satisfactory under the circumstances. They requested, however, that the Fund’s Adviser provide additional Fund performance information to be reviewed with members of the equity committee at each of their regular meetings over the course of the next year.
Advisory Fees and Expense Ratios
The Trustees considered the contractual advisory fee rate and administration fee rate paid by each Fund to the Adviser and compared the combined rate to the information prepared by Broadridge concerning management fee rates paid by other funds in the same Broadridge category as each Fund. The Trustees recognized that Broadridge reported each Fund’s management fee rate as the combined contractual advisory fee and administration fee rates. The Trustees also reviewed information about other expenses and the expense ratios for each Fund and noted that Universe and Peer Group rankings were not calculated if the number of funds in the Universe and/or Peer Group did not meet a predetermined minimum. For each Fund that had a Fee Cap in place, the Trustees considered the net advisory fee rate and net expense ratio for each share class, as applicable, taking into account any waivers and/or reimbursements. The Trustees also considered any proposed changes to a Fee Cap, and, where deemed appropriate by the Trustees, additional waivers and/or reimbursements. The Trustees recognized that it is difficult to make comparisons of advisory fees because there are variations in the services that are included in the fees paid by other funds. The Trustees’ determinations as a result of the review of each
Fund’s advisory fees and expense ratios for certain representative classes are summarized below:
The Trustees noted that the Emerging Markets Equity Fund’s net advisory fee for Class A shares was in the first and second quintiles based upon the Peer Group and Universe, respectively, and that the actual total expenses for Class A shares were in the first quintile based upon both the Peer Group and Universe. The Trustees noted that the net advisory fee and actual total expenses for Class I shares were both in the first quintile based upon the Peer Group and both in the second quintile based upon the Universe. The Trustees noted that the net advisory fee for Class R6 shares was in the first and second quintile based upon the Peer Group and Universe, respectively, and that the actual total expenses for Class R6 shares were in the first quintile based upon both the Peer Group and Universe. After considering the factors identified above, in light of this information, the Trustees concluded that the advisory fees were satisfactory in light of the services provided to the Fund.
The Trustees noted that the Emerging Markets Research Enhanced Equity Fund’s net advisory fee and actual total expenses for both the Class I and Class R6 shares were both in the first quintile based upon both the Peer Group and Universe. After considering the factors identified above, in light of this information, the Trustees concluded that the advisory fees were satisfactory in light of the services provided to the Fund.
The Trustees noted that the Europe Dynamic Fund’s net advisory fee and actual total expenses for both the Class A and Class R6 shares were both in the first quintile based upon both the Peer Group and Universe. The Trustees noted that the net advisory fee for Class I shares was in the first quintile, and that the actual total expenses for Class I shares were in the second quintile based upon the Universe. After considering the factors identified above, in light of this information, the Trustees concluded that the advisory fees were satisfactory in light of the services provided to the Fund.
The Trustees noted that the International Advantage Fund’s net advisory fee and actual total expenses for Class A shares were both in the first quintile based upon both the Peer Group and Universe. The Trustees noted that the net advisory fee for Class I shares was in the second quintile based upon both the Peer Group and Universe and that the actual total expenses for the Class I shares were in the first quintile based upon both the Peer Group and Universe. The Trustees noted that the net advisory fee for Class R6 shares was in the first and second quintiles based upon the Peer Group and Universe, respectively, and that the actual total expenses for Class R6 shares were in the first quintile based upon both the Peer Group and Universe. After considering the factors identified above, in light of this information, the Trustees concluded that the advisory fees were satisfactory in light of the services provided to the Fund.
| | | | | | |
| | | |
| 144 | | | | J.P. MORGAN INTERNATIONAL EQUITY FUNDS | | OCTOBER 31, 2020 |
The Trustees noted that the International Equity Fund’s net advisory fee and actual total expenses for each of the Class A, Class I and Class R6 shares were in the first quintile based upon both the Peer Group and Universe. After considering the factors identified above, in light of this information, the Trustees concluded that the advisory fees were satisfactory in light of the services provided to the Fund.
The Trustees noted that the International Focus Fund’s net advisory fee and total actual expenses for Class A shares were both in the first quintile based upon both the Peer Group and Universe. The Trustees noted that the net advisory fee and actual total expenses for Class I shares were in the second and first quintiles, respectively, based upon both the Peer Group and Universe. The Trustees noted that the net advisory fee for Class R6 shares was in the first and second quintiles based upon the Peer Group and Universe, respectively, and that the actual total expenses for Class R6 shares were in the first quintile based upon both the Peer Group and Universe. After considering the factors identified above, in light of this information, the Trustees concluded that the advisory fees were satisfactory in light of the services provided to the Fund.
The Trustees noted that the International Hedged Equity Fund’s net advisory fee and total actual expenses for both the Class A
and Class I shares were both in the first quintile based upon both the Peer Group and Universe. The Trustees noted that the net advisory fee and actual total expenses for Class R6 shares were both in the first quintile based upon the Universe. After considering the factors identified above, in light of this information, the Trustees concluded that the advisory fees were satisfactory in light of the services provided to the Fund.
The Trustees noted that the International Research Enhanced Equity Fund’s net advisory fee and actual total expenses for each of the Class A, Class I and Class R6 shares were both in the first quintile based upon both the Peer Group and Universe. After considering the factors identified above, in light of this information, the Trustees concluded that the advisory fees were satisfactory in light of the services provided to the Fund.
The Trustees noted that the International Value Fund’s net advisory fee and total actual expenses for each of the Class A, Class I and Class R6 shares were both in the first quintile based upon both the Peer Group and Universe. After considering the factors identified above, in light of this information, the Trustees concluded that the advisory fees were satisfactory in light of the services provided to the Fund.
| | | | | | | | |
| | | |
| OCTOBER 31, 2020 | | J.P. MORGAN INTERNATIONAL EQUITY FUNDS | | | | | 145 | |
TAX LETTER
(Unaudited)
Certain tax information for the J.P. Morgan Funds is required to be provided to shareholders based upon the Funds’ income and distributions for the taxable year ended October 31, 2020. The information and distributions reported in this letter may differ from the information and taxable distributions reported to the shareholders for the calendar year ending December 31, 2020. The information necessary to complete your income tax returns for the calendar year ending December 31, 2020 will be provided under separate cover.
Long-Term Capital Gain
Each Fund listed below distributed the following amount, or maximum allowable amount, of long-term capital gain dividends for the fiscal year ended October 31, 2020 (amounts in thousands):
| | | | |
| | | Long-Term
Capital Gain
Distribution | |
JPMorgan Emerging Markets Research Enhanced Equity Fund | | $ | 3,082 | |
Qualified Dividend Income (QDI)
Each Fund listed below had the following amount, or maximum allowable amount, of ordinary income distributions treated as qualified dividends for the fiscal year ended October 31, 2020 (amounts in thousands):
| | | | |
| | | Qualified
Dividend
Income | |
JPMorgan Emerging Markets Equity Fund | | $ | 66,960 | |
JPMorgan Emerging Markets Research Enhanced Equity Fund | | | 25,595 | |
JPMorgan Europe Dynamic Fund | | | 10,093 | |
JPMorgan International Advantage Fund | | | 51,797 | |
JPMorgan International Equity Fund | | | 54,253 | |
JPMorgan International Focus Fund | | | 14,063 | |
JPMorgan International Hedged Equity Fund | | | 1,623 | |
JPMorgan International Research Enhanced Equity Fund | | | 112,146 | |
JPMorgan International Value Fund | | | 9,794 | |
Foreign Source Income and Foreign Tax Credit Pass Through
For the fiscal year ended October 31, 2020, the following Funds intend to elect to pass through to shareholders taxes paid to foreign countries. Gross income and foreign tax expenses are as follows or amounts as finally determined (amounts in thousands):
| | | | | | | | |
| | | Gross
Income | | | Foreign Tax
Pass Through | |
JPMorgan Emerging Markets Equity Fund | | $ | 108,474 | | | $ | 10,520 | |
JPMorgan Emerging Markets Research Enhanced Equity Fund | | | 64,814 | | | | 4,631 | |
JPMorgan Europe Dynamic Fund | | | 12,480 | | | | 1,071 | |
JPMorgan International Advantage Fund | | | 51,695 | | | | 3,503 | |
JPMorgan International Equity Fund | | | 65,325 | | | | 3,682 | |
JPMorgan International Focus Fund | | | 55,594 | | | | 3,530 | |
JPMorgan International Hedged Equity Fund | | | 2,946 | | | | 254 | |
JPMorgan International Research Enhanced Equity Fund | | | 138,374 | | | | 8,982 | |
JPMorgan International Value Fund | | | 12,678 | | | | 780 | |
| | | | | | |
| | | |
| 146 | | | | J.P. MORGAN INTERNATIONAL EQUITY FUNDS | | OCTOBER 31, 2020 |

Rev. January 2011
| | |
| | |
| FACTS | | WHAT DOES J.P. MORGAN FUNDS DO WITH YOUR PERSONAL INFORMATION? |
| | |
| Why? | | Financial companies choose how they share your personal information. Federal law gives consumers the right to limit some but not all sharing. Federal law also requires us to tell you how we collect, share, and protect your personal information. Please read this notice carefully to understand what we do. |
| | |
| What? | | The types of personal information we collect and share depend on the product or service you have with us. This information can include: ◾ Social Security number and account balances ◾ transaction history and account transactions ◾ checking account information and wire transfer instructions When you are no longer our customer, we continue to share your information as described in this notice. |
| | |
| How? | | All financial companies need to share customers’ personal information to run their everyday business. In the section below, we list the reasons financial companies can share their customers’ personal information; the reasons J.P. Morgan Funds chooses to share; and whether you can limit this sharing. |
| | | | |
| | | |
| Reasons we can share your personal information | | Does J.P. Morgan
Funds share? | | Can you limit this
sharing? |
For our everyday business purposes — such as to process your transactions, maintain your account(s), respond to court orders and legal investigations, or report to credit bureaus | | Yes | | No |
For marketing purposes — to offer our products and services to you | | Yes | | No |
| For joint marketing with other financial companies | | No | | We don’t share |
For our affiliates’ everyday business purposes — information about your transactions and experiences | | No | | We don’t share |
For our affiliates’ everyday business purposes — information about your creditworthiness | | No | | We don’t share |
| For nonaffiliates to market to you | | No | | We don’t share |
| | |
| | |
| Questions? | | Call 1-800-480-4111 or go to www.jpmorganfunds.com |

| | |
| |
| Who we are |
| Who is providing this notice? | | J.P. Morgan Funds |
| | |
| |
| What we do |
| How does J.P. Morgan Funds protect my personal information? | | To protect your personal information from unauthorized access and use, we use security measures that comply with federal law. These measures include computer safeguards and secured files and buildings. We authorize our employees to access your information only when they need it to do their work and we require companies that work for us to protect your information. |
How does J.P. Morgan Funds collect my personal information? | | We collect your personal information, for example, when you: ◾ open an account or provide contact information ◾ give us your account information or pay us by check ◾ make a wire transfer We also collect your personal information from others, such as credit bureaus, affiliates and other companies. |
| Why can’t I limit all sharing? | | Federal law gives you the right to limit only ◾ sharing for affiliates’ everyday business purposes – information about your creditworthiness ◾ affiliates from using your information to market to you ◾ sharing for nonaffiliates to market to you State laws and individual companies may give you additional rights to limit sharing. |
| | |
| |
| Definitions |
| Affiliates | | Companies related by common ownership or control. They can be financial and nonfinancial companies. ◾ J.P. Morgan Funds does not share with our affiliates. |
| Nonaffiliates | | Companies not related by common ownership or control. They can be financial and nonfinancial companies. ◾ J.P. Morgan Funds does not share with nonaffiliates so they can market to you. |
| Joint Marketing | | A formal agreement between nonaffiliated financial companies that together market financial products or services to you. ◾ J.P. Morgan Funds doesn’t jointly market. |
J.P. Morgan Funds are distributed by JPMorgan Distribution Services, Inc., which is an affiliate of JPMorgan Chase & Co. Affiliates of JPMorgan Chase & Co. receive fees for providing various services to the funds.
Contact JPMorgan Distribution Services, Inc. at 1-800-480-4111 for a fund prospectus. You can also visit us at www.jpmorganfunds.com. Investors should carefully consider the investment objectives and risk as well as charges and expenses of the mutual fund before investing. The prospectus contains this and other information about the mutual fund. Read the prospectus carefully before investing.
Investors may obtain information about the Securities Investor Protection Corporation (SIPC), including the SIPC brochure, by visiting www.sipc.org or by calling SIPC at 202-371-8300.
Each Fund files a complete schedule of its fund holdings for the first and third quarters of its fiscal year with the SEC as an exhibit to its report on Form N-PORT. The Funds’ Form N-PORT reports are available on the SEC’s website at http://www.sec.gov. Each Fund’s quarterly holdings can be found by visiting the J.P. Morgan Funds’ website at www.jpmorganfunds.com.
A description of each Fund’s policies and procedures with respect to the disclosure of each Fund’s holdings is available in the prospectuses and Statement of Additional Information.
A copy of proxy policies and procedures is available without charge upon request by calling 1-800-480-4111 and on the Funds’ website at www.jpmorganfunds.com. A description of such policies and procedures is on the SEC’s website at www.sec.gov. The Trustees have delegated the authority to vote proxies for securities owned by the Funds to the Adviser. A copy of the Funds’ voting record for the most recent 12-month period ended June 30 is available on the SEC’s website at www.sec.gov or at the Funds’ website at www.jpmorganfunds.com no later than August 31 of each year. The Funds’ proxy voting record will include, among other things, a brief description of the matter voted on for each fund security, and will state how each vote was cast, for example, for or against the proposal.


J.P. Morgan Asset Management is the brand name for the asset management business of JPMorgan Chase & Co. and its affiliates worldwide.
| | | | |
| | © JPMorgan Chase & Co., 2020. All rights reserved. October 2020. | | AN-INTEQ-1020 |
Annual Report
J.P. Morgan Specialty Funds
October 31, 2020
JPMorgan Macro Opportunities Fund
JPMorgan Opportunistic Equity Long/Short Fund
JPMorgan Research Market Neutral Fund
Beginning on January 1, 2021, as permitted by regulations adopted by the Securities and Exchange Commission, paper copies of the Funds’ annual and semi-annual shareholder reports will no longer be sent by mail, unless you specifically request paper copies of the reports. Instead, the reports will be made available on the Funds’ website www.jpmorganfunds.com and you will be notified by mail each time a report is posted and provided with a website to access the report. If you already elected to receive shareholder reports electronically, you will not be affected by this change and you need not take any action.
You may elect to receive shareholder reports and other communications from the Funds electronically anytime by contacting your financial intermediary (such as a broker dealer, bank, or retirement plan) or, if you are a direct investor, by going to www.jpmorganfunds.com/edelivery.
You may elect to receive paper copies of all future reports free of charge. Contact your financial intermediary or, if you invest directly with the Funds, email us at funds.website.support@jpmorganfunds.com or call 1-800-480-4111. Your election to receive paper reports will apply to all funds held within your account(s).

CONTENTS
Investments in a Fund are not deposits or obligations of, or guaranteed or endorsed by, any bank and are not insured or guaranteed by the FDIC, the Federal Reserve Board or any other government agency. You could lose money if you sell when a Fund’s share price is lower than when you invested.
Past performance is no guarantee of future performance. The general market views expressed in this report are opinions based on market and other conditions through the end of the reporting period and are subject to change without notice. These views are not intended to predict the future performance of a Fund or the securities markets. References to specific securities and their issuers are for illustrative purposes only and are not intended to be, and should not be interpreted as, recommendations to purchase or sell such securities. Such views are not meant as investment advice and may not be relied on as an indication of trading intent on behalf of any Fund.
Prospective investors should refer to the Funds’ prospectuses for a discussion of the Funds’ investment objectives, strategies and risks. Call J.P. Morgan Funds Service Center at 1-800-480-4111 for a prospectus containing more complete information about a Fund, including management fees and other expenses. Please read it carefully before investing.
LETTER TO SHAREHOLDERS
DECEMBER 10, 2020 (Unaudited)
Dear Shareholders,
Even as the pandemic fueled deep uncertainty over the past year, global financial markets proved to be resilient with unprecedented support from central banks and broad investor optimism over advances in global efforts to end the pandemic. Over the twelve months ended October 31, 2020, equity prices in the U.S. and emerging markets generally led a broad but uneven recovery from lows reached in the first quarter of 2020. For the period, the S&P 500 Index returned 9.71%, the MSCI Emerging Markets Index returned 8.62% and the MSCI EAFE Index returned -6.46%.
| | |
 | | “We maintain an unwavering commitment to seeking to provide investors with innovative and timely solutions required to meet the demands and opportunities of any market environment.”
— Andrea L. Lisher |
The period began with upward momentum in global equity markets but by the end of March 2020, investors responded to the emerging pandemic with a broad sell-off that fed a sharp spike in financial market volatility. The swift response of leading central banks to seek to ensure market liquidity brought
some calm to financial markets and in the following months equity prices began to recover. Though the full economic impact of the pandemic remains unknown, investors have appeared to focus on specific efforts to contain Covid-19 and the timeline for the potential availability of vaccines against the virus.
Throughout this period, J.P. Morgan Asset Management has quickly adapted to unique challenges and has continued to operate utilizing the same fundamental practices and principles that have driven our success. We maintain an unwavering commitment to seeking to provide investors with innovative and timely solutions required to meet the demands and opportunities of any market environment. On behalf of J.P. Morgan Asset Management, thank you for entrusting us to manage your investment. Should you have any questions, please visit www.jpmorganfunds.com or contact the J.P. Morgan Funds Service Center at 1-800-480-4111.
Sincerely yours,

Andrea L. Lisher
Head of Americas, Client
J.P. Morgan Asset Management
| | | | | | | | |
| | | |
| OCTOBER 31, 2020 | | J.P. MORGAN SPECIALTY FUNDS | | | | | 1 | |
J.P. Morgan Specialty Funds
MARKET OVERVIEW
TWELVE MONTHS ENDED OCTOBER 31, 2020 (Unaudited)
While global financial markets largely entered the reporting period with support from an improving economic and trade outlook, the economic shock of the pandemic response sparked a drop in global asset prices and a spike in market volatility in the first quarter of 2020. Rapid interventions by the world’s central banks helped to calm investors and set the stage for general but uneven recovery in financial markets.
The final months of 2019 were marked by rising prices for global equity — led by U.S. markets — driven partly by gains in U.S. and European manufacturing and an initial U.S.-China agreement to lower trade barriers. Amid already low interest rates, the U.S. Federal Reserve declined to cut rates further at its December meeting.
In the first days of January 2020, financial markets largely shrugged off a brief flare-up in military tensions between the U.S. and Iran. However, the emergence and spread of Covid-19 fed increasing investor uncertainty and by early March, the novel coronavirus was declared a pandemic by the World Health Organization. The closure of large sectors of national economies on a global scale sparked a dramatic sell-off in financial markets across the globe. Yields on developed market sovereign bonds fell sharply and prices for commodity gold spiked. By the end of the first quarter of 2020, leading developed market equity indexes had lost 20% or more of their value from the start of the year. Corporate bond prices generally fell and the price of crude oil ended the first quarter down by 60%.
Leading central banks promptly responded with lower interest rates and/or asset purchasing programs, which helped to support asset price stability and head off a potential liquidity crunch in credit markets. Governments also responded with a range of fiscal stimulus or paycheck protection programs designed to cushion the economic impact of the pandemic. In the ensuing months, global equity markets staged a slow and uneven rebound, led by U.S. and emerging markets.
For the twelve months ended October 31, 2020, the S&P 500 Index returned a total of 9.71%, MSCI Emerging Markets Index returned 8.62% and the MSCI EAFE Index returned -6.46%. Among bond market indexes, the Bloomberg Barclays U.S. Aggregate Index returned 6.19% and the Bloomberg Barclays Emerging Markets Index returned 3.38%
| | | | | | |
| | | |
| 2 | | | | J.P. MORGAN SPECIALTY FUNDS | | OCTOBER 31, 2020 |
JPMorgan Macro Opportunities Fund
FUND COMMENTARY
FOR THE PERIOD APRIL 15, 2020 (INCEPTION DATE) THROUGH OCTOBER 31, 2020 (Unaudited)
| | | | |
| REPORTING PERIOD RETURN: | | | |
| Fund (Class I Shares)* | | | 2.60% | |
| ICE BofAML 3-Month U.S. Treasury Bill Index | | | 0.06% | |
| |
| Net Assets as of 10/31/2020 (In Thousands) | | $ | 15,432 | |
INVESTMENT OBJECTIVE**
The JPMorgan Macro Opportunities Fund (the “Fund”) seeks to provide long-term capital appreciation.
WHAT WERE THE MAIN DRIVERS OF THE FUND’S PERFORMANCE?
The Fund’s Class I Shares outperformed the ICE BofAML 3-Month U.S. Treasury Bill Index (the “Benchmark”) for the period from inception on April 15, 2020 to October 31, 2020.
The Fund’s long equity strategies were leading contributors to absolute performance during the reporting period. The Fund’s fixed income strategies also contributed to absolute performance, while the Fund’s short bias equity strategies and currency positioning detracted from absolute performance.
In equity, the Fund’s security selections in the technology and European utilities sectors were leading contributors to absolute performance. The technology companies in which the Fund was invested benefitted from continued growth in online retail sales and the increased adoption of cloud computing during the period. Shares of select European utilities rose following the EU’s announcement of a 750 billion euro pandemic recovery fund that included an emphasis on investment in renewable energy.
In fixed income, the Fund’s long position in Italian treasury bonds versus its short position in German government bonds also contributed to absolute performance as the EU’s pandemic recovery fund announcement led to narrowing of yield spreads between the two countries’ sovereign debt.
The leading detractors from absolute performance were the Fund’s short positions in U.S. and emerging markets equity via
futures and options contracts as better-than-expected global economic data provided support for global equity. The Fund’s long position in the U.S. dollar, obtained through foreign exchange forward contracts, also detracted from absolute performance as improved economic growth held down the relative value of the dollar.
The Fund’s allocation to equity was the leading contributor to performance relative to the Benchmark, which is a fixed-income index that contains no equity.
HOW WAS THE FUND POSITIONED?
During the reporting period, the Fund maintained a modest level of portfolio risk and tilted exposures to benefit from the recovery environment, while being mindful of the ongoing risk of pandemic resurgence. The Fund maintained a modest level of net equity risk, achieved through long and short exposures, a low level of duration across developed and emerging markets, as well as defensive positioning in currencies, and exposure to the gold price through equity holdings in gold mining companies. Duration measures the price sensitivity of bonds relative to changes in interest rates. Generally, bonds of shorter duration will experience a smaller decrease in price when interest rates decline.
| * | | The return shown is based on net asset values calculated for shareholder transactions and may differ from the return shown in the financial highlights, which reflects adjustments made to the net asset values in accordance with accounting principles generally accepted in the United States of America. |
| ** | | The adviser seeks to achieve the Fund’s objective. There can be no guarantee it will be achieved. |
| | | | | | | | |
| | | |
| OCTOBER 31, 2020 | | J.P. MORGAN SPECIALTY FUNDS | | | | | 3 | |
JPMorgan Macro Opportunities Fund
FUND COMMENTARY
FOR THE PERIOD APRIL 15, 2020 (INCEPTION DATE) THROUGH OCTOBER 31, 2020 (Unaudited) (continued)
| | | | | | | | |
| TOP TEN HOLDINGS OF THE PORTFOLIO*** | |
| | 1. | | | Alibaba Group Holding Ltd., ADR (China) | | | 2.7 | % |
| | 2. | | | Amazon.com, Inc. | | | 2.3 | |
| | 3. | | | Alphabet, Inc., Class A | | | 2.3 | |
| | 4. | | | Microsoft Corp. | | | 2.1 | |
| | 5. | | | Visa, Inc., Class A | | | 2.0 | |
| | 6. | | | Enel SpA (Italy) | | | 1.9 | |
| | 7. | | | Orsted A/S (Denmark) | | | 1.8 | |
| | 8. | | | Ping An Insurance Group Co. of China Ltd., Class H (China) | | | 1.7 | |
| | 9. | | | Mastercard, Inc., Class A | | | 1.7 | |
| | 10. | | | PayPal Holdings, Inc. | | | 1.7 | |
| | | | |
PORTFOLIO COMPOSITION BY SECTOR*** | |
| Information Technology | | | 15.5 | % |
| Financials | | | 14.1 | |
| Consumer Discretionary | | | 11.6 | |
| Utilities | | | 6.9 | |
| Health Care | | | 5.4 | |
| Industrials | | | 3.9 | |
| Communication Services | | | 3.3 | |
| Materials | | | 3.1 | |
| Consumer Staples | | | 1.0 | |
| Others (each less than 1.0%) | | | 0.4 | |
| Short-Term Investments | | | 34.8 | |
| *** | | Percentages indicated are based on total investments as of October 31, 2020. The Fund’s portfolio composition is subject to change. |
| | | | | | |
| | | |
| 4 | | | | J.P. MORGAN SPECIALTY FUNDS | | OCTOBER 31, 2020 |
| | | | | | |
TOTAL RETURNS AS OF OCTOBER 31, 2020 | |
| | |
| | | INCEPTION DATE OF
CLASS | | SINCE
INCEPTION* | |
CLASS A SHARES | | April 15, 2020 | | | | |
With Sales Charge** | | | | | (2.91 | )% |
Without Sales Charge | | | | | 2.47 | |
CLASS C SHARES | | April 15, 2020 | | | | |
With CDSC*** | | | | | 1.20 | |
Without CDSC | | | | | 2.20 | |
CLASS I SHARES | | April 15, 2020 | | | 2.60 | |
CLASS R6 SHARES | | September 30, 2020 | | | 2.67 | |
| ** | | Sales Charge for Class A Shares is 5.25%. |
| *** | | Assumes a 1% CDSC (contingent deferred sales charge) for the period. |
LIFE OF FUND PERFORMANCE (04/15/20 TO 10/31/20)
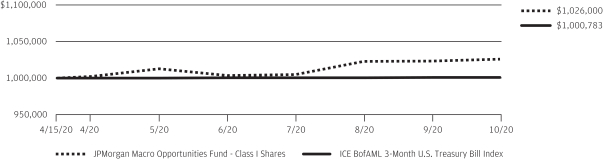
The performance quoted is past performance and is not a guarantee of future results. Mutual funds are subject to certain market risks. Investment returns and principal value of an investment will fluctuate so that an investor’s shares, when redeemed, may be worth more or less than their original cost. Current performance may be higher or lower than the performance data shown. For up-to-date month-end performance information please call 1-800-480-4111.
The Fund commenced operations on April 15, 2020.
Returns for Class R6 Shares prior to its inception are based on the performance of Class I Shares. The actual returns of Class R6 Shares would have been different than those shown because Class R6 Shares have different expenses than Class I Shares.
The graph illustrates comparative performance for $1,000,000 invested in Class I Shares of the JPMorgan Macro Opportunities Fund and the ICE BofAML 3-Month U.S. Treasury Bill Index from April 15, 2020 to October 31, 2020. The performance of the Fund assumes reinvestment of all dividends and capital gain distributions, if any, and does not include a sales charge. The performance of the ICE BofAML 3-Month U.S. Treasury Bill Index does not reflect the deduction of expenses or a sales charge associated with a mutual fund and has
been adjusted to reflect reinvestment of all dividends and capital gains distributions of the securities included in the benchmark, if applicable. The ICE BofAML 3-Month U.S. Treasury Bill Index is comprised of a single issue purchased at the beginning of the month and held for a full month. Each month the index is rebalanced and the issue selected is the outstanding Treasury Bill that matures closest to, but not beyond, 3 months from the rebalancing date. Investors cannot invest directly in an index.
Class I Shares have a $1,000,000 minimum initial investment.
Fund performance may reflect the waiver of the Fund’s fees and reimbursement of expenses for certain periods since the applicable inception date. Without these waivers and reimbursements, performance would have been lower. Also, performance shown in this section does not reflect the deduction of taxes that a shareholder would pay on Fund distributions or on gains resulting from redemptions of Fund shares.
The returns shown are based on net asset values calculated for shareholder transactions and may differ from the returns shown in the financial highlights, which reflect adjustments made to the net asset values in accordance with accounting principles generally accepted in the United States of America.
| | | | | | | | |
| | | |
| OCTOBER 31, 2020 | | J.P. MORGAN SPECIALTY FUNDS | | | | | 5 | |
JPMorgan Opportunistic Equity Long/Short Fund
FUND COMMENTARY
TWELVE MONTHS ENDED OCTOBER 31, 2020 (Unaudited)
| | | | |
| REPORTING PERIOD RETURN: | |
| Fund (Class I Shares)* | | | 18.65% | |
| S&P 500 Index | | | 9.71% | |
| ICE BofAML 3-Month U.S. Treasury Bill Index | | | 0.92% | |
| |
| Net Assets as of 10/31/2020 (In Thousands) | | | $485,516 | |
INVESTMENT OBJECTIVE**
The JPMorgan Opportunistic Equity Long/Short Fund (the “Fund”) seeks capital appreciation.
WHAT WERE THE MAIN DRIVERS OF THE FUND’S PERFORMANCE?
The Fund’s Class I Shares outperformed the S&P 500 Index (the “Benchmark”) for the twelve months ended October 31, 2020.
The Fund’s long positions in the consumer discretionary and communications services sectors were leading contributors to performance relative to the Benchmark. The Fund’s long position in the information technology sector and its short positions in the health care sector were leading detractors from relative performance.
Leading individual contributors to absolute performance included the Fund’s long positions in Tesla Inc., Nvidia Corp. and Alibaba Group Holding Ltd. Shares of Tesla, a maker of electric automobiles and energy generation and storage systems, rose on growth in quarterly earnings and investor demand for large cap technology stocks. Shares of Nvidia, a semiconductor manufacturer, rose as the company increased market share in key businesses and expanded into other technology businesses. Shares of Alibaba Group Holding, an electronic commerce platform provider, rose amid increased demand for digital services.
Leading individual detractors from absolute performance included the Fund’s long position in Berkshire Hathaway Inc. and short positions in Square Inc. and Simon Property Group Inc. Shares of Berkshire Hathaway, a holding company
conglomerate, fell after the company reported lower-than-expected results for the first quarter of 2020, largely due to the impact of the pandemic on the company’s insurance business. Shares of Square, a credit-card processing company, rose amid an increase in cashless transactions driven by the pandemic. Shares of Simon Property Group, a retail sector real estate investment trust, rebounded from the broad sell-off in in the first quarter of 2020 amid investor expectations that it would emerge from pandemic lockdowns in a better competitive position than its peers.
HOW WAS THE FUND POSITIONED?
During the twelve months ended October 31, 2020, the Fund invested an average of 109% of its assets in long and short positions in equity securities, selecting from a universe of equity securities with market capitalizations similar to those included in the Russell 1000 Index and/or the Benchmark. The Fund’s manager sought to achieve lower volatility than the Benchmark through a disciplined research process, security selection and risk management. For the twelve month reporting period, the Fund’s average gross exposure was 109% and its average net exposure was 63%.
| * | | The return shown is based on net asset values calculated for shareholder transactions and may differ from the return shown in the financial highlights, which reflects adjustments made to the net asset values in accordance with accounting principles generally accepted in the United States of America. |
| ** | | The adviser seeks to achieve the Fund’s objective. There can be no guarantee it will be achieved. |
| | | | | | |
| | | |
| 6 | | | | J.P. MORGAN SPECIALTY FUNDS | | OCTOBER 31, 2020 |
| | | | | | | | |
| TOP TEN LONG POSITIONS OF THE PORTFOLIO*** | |
| | 1. | | | Alibaba Group Holding Ltd., ADR (China) | | | 7.1 | % |
| | 2. | | | Charter Communications, Inc., Class A | | | 6.5 | |
| | 3. | | | Cigna Corp. | | | 6.2 | |
| | 4. | | | NXP Semiconductors NV (Netherlands) | | | 5.7 | |
| | 5. | | | Fiserv, Inc. | | | 5.5 | |
| | 6. | | | Best Buy Co., Inc. | | | 4.4 | |
| | 7. | | | Tesla, Inc. | | | 3.9 | |
| | 8. | | | Altice USA, Inc., Class A | | | 3.5 | |
| | 9. | | | NextEra Energy, Inc. | | | 3.3 | |
| | 10. | | | NVIDIA Corp. | | | 3.3 | |
| | | | | | | | |
| TOP TEN SHORT POSITIONS OF THE PORTFOLIO**** | |
| | 1. | | | Varian Medical Systems, Inc. | | | 19.6 | % |
| | 2. | | | National General Holdings Corp. | | | 16.4 | |
| | 3. | | | SPDR S&P 500 ETF Trust | | | 16.0 | |
| | 4. | | | Sirius XM Holdings, Inc. | | | 13.8 | |
| | 5. | | | Acacia Communications, Inc. | | | 13.5 | |
| | 6. | | | Walgreens Boots Alliance, Inc. | | | 5.4 | |
| | 7. | | | Host Hotels & Resorts, Inc. | | | 5.0 | |
| | 8. | | | CVS Health Corp. | | | 3.1 | |
| | 9. | | | Exelon Corp. | | | 1.5 | |
| | 10. | | | Consolidated Edison, Inc. | | | 1.5 | |
| | | | |
LONG POSITION PORTFOLIO COMPOSITION BY SECTOR*** | |
Information Technology | | | 20.3 | % |
Communication Services | | | 17.7 | |
Consumer Discretionary | | | 16.8 | |
Health Care | | | 10.2 | |
Materials | | | 4.8 | |
Utilities | | | 3.3 | |
Financials | | | 2.3 | |
Industrials | | | 1.3 | |
Others (each less than 1.0%) | | | 0.9 | |
Short-Term Investments | | | 22.4 | |
| | | | |
SHORT POSITION PORTFOLIO COMPOSITION BY SECTOR**** | |
Health Care | | | 22.6 | % |
Financials | | | 16.4 | |
Exchange-Traded Fund | | | 16.0 | |
Communication Services | | | 13.8 | |
Information Technology | | | 13.5 | |
Real Estate | | | 7.2 | |
Consumer Staples | | | 5.7 | |
Utilities | | | 4.4 | |
Others (each less than 1.0%) | | | 0.4 | |
| *** | | Percentages indicated are based on total long investments as of October 31, 2020. The Fund’s portfolio composition is subject to change. |
| **** | | Percentages indicated are based on total short investments as of October 31, 2020. The Fund’s portfolio composition is subject to change. |
| | | | | | | | |
| | | |
| OCTOBER 31, 2020 | | J.P. MORGAN SPECIALTY FUNDS | | | | | 7 | |
JPMorgan Opportunistic Equity Long/Short Fund
FUND COMMENTARY
TWELVE MONTHS ENDED OCTOBER 31, 2020 (Unaudited) (continued)
| | | | | | | | | | | | | | |
AVERAGE ANNUAL TOTAL RETURNS AS OF OCTOBER 31, 2020 | |
| | | | |
| | | INCEPTION DATE OF
CLASS | | 1 YEAR | | | 5 YEAR | | | SINCE
INCEPTION | |
CLASS A SHARES | | August 29, 2014 | | | | | | | | | | | | |
With Sales Charge* | | | | | 12.19 | % | | | 4.57 | % | | | 6.25 | % |
Without Sales Charge | | | | | 18.40 | | | | 5.70 | | | | 7.18 | |
CLASS C SHARES | | August 29, 2014 | | | | | | | | | | | | |
With CDSC** | | | | | 16.78 | | | | 5.17 | | | | 6.65 | |
Without CDSC | | | | | 17.78 | | | | 5.17 | | | | 6.65 | |
CLASS I SHARES | | August 29, 2014 | | | 18.65 | | | | 5.96 | | | | 7.44 | |
CLASS R6 SHARES | | August 29, 2014 | | | 18.96 | | | | 6.22 | | | | 7.72 | |
| * | | Sales Charge for Class A Shares is 5.25%. |
| ** | | Assumes a 1% CDSC (contingent deferred sales charge) for the one year period and 0% CDSC thereafter. |
LIFE OF FUND PERFORMANCE (8/29/14 TO 10/31/20)
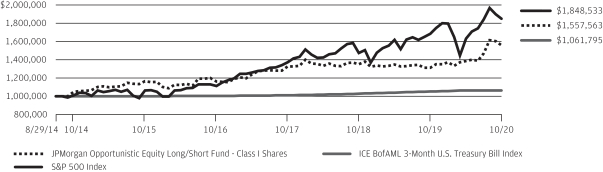
The performance quoted is past performance and is not a guarantee of future results. Mutual funds are subject to certain market risks. Investment returns and principal value of an investment will fluctuate so that an investor’s shares, when redeemed, may be worth more or less than their original cost. Current performance may be higher or lower than the performance data shown. For up-to-date month-end performance information please call 1-800-480-4111.
The Fund commenced operations on August 29, 2014.
The graph illustrates comparative performance for $1,000,000 invested in Class I Shares of the JPMorgan Opportunistic Equity Long/Short Fund, the S&P 500 Index and the ICE BofAML 3-Month U.S. Treasury Bill Index from August 29, 2014 to October 31, 2020. The performance of the Fund assumes reinvestment of all dividends and capital gain distributions, if any, and does not include a sales charge. The performance of the S&P 500 Index and ICE BofAML 3-Month U.S. Treasury Bill Index does not reflect the deduction of expenses or a sales charge associated with a mutual fund and has been adjusted to reflect reinvestment of all dividends and capital gain distributions of securities included in the benchmarks, if applicable. The S&P 500 Index is an unmanaged index generally representative of the performance of large companies in the
U.S. stock market. The ICE BofAML 3-Month U.S. Treasury Bill Index is comprised of a single issue purchased at the beginning of the month and held for a full month. Each month the index is rebalanced and the issue selected is the outstanding Treasury Bill that matures closest to, but not beyond, 3 months from the rebalancing date. Investors cannot invest directly in an index.
From the inception of the Fund through January 23, 2015, the Fund did not experience any shareholder activity. If such activity had occurred, the Fund’s performance may have been impacted.
Class I Shares have a $1,000,000 minimum initial investment.
Fund performance may reflect the waiver of the Fund’s fees and reimbursement of expenses for certain periods since the applicable inception date. Without these waivers and reimbursements, performance would have been lower. Also, performance shown in this section does not reflect the deduction of taxes that a shareholder would pay on Fund distributions or on gains resulting from redemptions of Fund shares.
The returns shown are based on net asset values calculated for shareholder transactions and may differ from the returns shown in the financial highlights, which reflect adjustments made to the net asset values in accordance with accounting principles generally accepted in the United States of America.
| | | | | | |
| | | |
| 8 | | | | J.P. MORGAN SPECIALTY FUNDS | | OCTOBER 31, 2020 |
JPMorgan Research Market Neutral Fund
FUND COMMENTARY
TWELVE MONTHS ENDED OCTOBER 31, 2020 (Unaudited)
| | | | |
| REPORTING PERIOD RETURN: | |
| Fund (Class I Shares)* | | | 12.26% | |
| ICE BofAML 3-Month US Treasury Bill Index | | | 0.92% | |
| |
| Net Assets as of 10/31/2020 (In Thousands) | | | $141,439 | |
INVESTMENT OBJECTIVE**
The JPMorgan Research Market Neutral Fund (the “Fund”) seeks to provide long-term capital appreciation from a broadly diversified portfolio of U.S. stocks while neutralizing the general risks associated with stock market investing.
WHAT WERE THE MAIN DRIVERS OF THE FUND’S PERFORMANCE?
The Fund’s Class I Shares outperformed the ICE BofAML 3-Month US Treasury Bill Index (the “Benchmark”) for the twelve months ended October 31, 2020.
The Fund’s security selection in the software & hardware sector and its overweight position in the semiconductors sector were leading contributors to performance relative to the Benchmark, while the Fund’s security selection in the consumer stable and the pharmaceutical & health care sector was a leading detractor from relative performance.
Leading individual contributors to relative performance included the Fund’s long position in Amazon.com Inc. and its short positions in Cinemark Holdings Inc. and Boeing Co. Shares of Amazon.com, a provider of online retail shopping and related services, rose amid consumer demand for online shopping and services. Shares of Cinemark Holdings, an operator of movie theaters, fell amid the closure of cinemas and other entertainment venues in response to the pandemic. Shares of Boeing, an airplane manufacturing and aerospace company, fell amid a sharp global decrease in air travel.
Leading individual detractors from relative performance included the Fund’s short positions in Spotify Technology SA,
and Kroger Co. and its long position in Diamondback Energy Inc. Shares of Spotify Technology, a provider of digital music streaming services, rose after the company reported better-than-expected user growth during the third quarter of 2020. Shares of Kroger, a grocery supermarket chain, rose after the company reported better-than-expected sales and earnings for the second quarter of 2020 and unveiled a $1 billion share repurchase plan. Shares of Diamondback Energy, an oil and gas company focused on U.S. shale deposits, fell amid consecutive quarters of lower-than-expected earnings.
HOW WAS THE FUND POSITIONED?
The Fund’s portfolio managers aimed to construct a portfolio of long and short positions with a low correlation to the broader market for stocks and bonds. The Fund’s portfolio managers used fundamental research to estimate companies’ long-term earnings forecasts, ranking approximately 600 large and mid cap stocks into five quintiles. The Fund’s portfolio managers looked to the top two quintiles for potential long positions in stocks that they believed were undervalued and the bottom two quintiles for potential short positions in stocks that they believed were overvalued.
| * | | The return shown is based on net asset values calculated for shareholder transactions and may differ from the return shown in the financial highlights, which reflects adjustments made to the net asset values in accordance with accounting principles generally accepted in the United States of America. |
| ** | | The adviser seeks to achieve the Fund’s objective. There can be no guarantee it will be achieved. |
| | | | | | | | |
| | | |
| OCTOBER 31, 2020 | | J.P. MORGAN SPECIALTY FUNDS | | | | | 9 | |
JPMorgan Research Market Neutral Fund
FUND COMMENTARY
TWELVE MONTHS ENDED OCTOBER 31, 2020 (Unaudited) (continued)
| | | | | | | | |
| TOP TEN LONG POSITIONS OF THE PORTFOLIO*** | |
| | 1. | | | Amazon.com, Inc. | | | 2.0 | % |
| | 2. | | | NXP Semiconductors NV (Netherlands) | | | 2.0 | |
| | 3. | | | Netflix, Inc. | | | 1.7 | |
| | 4. | | | Trane Technologies plc | | | 1.5 | |
| | 5. | | | Truist Financial Corp. | | | 1.3 | |
| | 6. | | | Stanley Black & Decker, Inc. | | | 1.3 | |
| | 7. | | | Mastercard, Inc., Class A | | | 1.3 | |
| | 8. | | | Analog Devices, Inc. | | | 1.1 | |
| | 9. | | | O’Reilly Automotive, Inc. | | | 1.1 | |
| | 10. | | | Norfolk Southern Corp. | | | 1.1 | |
| | | | | | | | |
| TOP TEN SHORT POSITIONS OF THE PORTFOLIO**** | |
| | 1. | | | Cisco Systems, Inc. | | | 3.1 | % |
| | 2. | | | Broadcom, Inc. | | | 2.4 | |
| | 3. | | | ViacomCBS, Inc. | | | 2.4 | |
| | 4. | | | Walt Disney Co. (The) | | | 2.1 | |
| | 5. | | | Spotify Technology SA | | | 1.9 | |
| | 6. | | | Kroger Co. (The) | | | 1.9 | |
| | 7. | | | Clorox Co. (The) | | | 1.8 | |
| | 8. | | | Take-Two Interactive Software, Inc. | | | 1.8 | |
| | 9. | | | General Electric Co. | | | 1.7 | |
| | 10. | | | Gilead Sciences, Inc. | | | 1.7 | |
| | | | |
LONG POSITION PORTFOLIO COMPOSITION BY SECTOR*** | |
Information Technology | | | 17.9 | % |
Industrials | | | 11.9 | |
Consumer Discretionary | | | 10.5 | |
Health Care | | | 9.0 | |
Communication Services | | | 7.8 | |
Financials | | | 6.7 | |
Materials | | | 4.6 | |
Energy | | | 4.3 | |
Real Estate | | | 3.8 | |
Consumer Staples | | | 2.9 | |
Utilities | | | 2.9 | |
Short-Term Investments | | | 17.7 | |
| | | | |
SHORT POSITION PORTFOLIO COMPOSITION BY SECTOR**** | |
Information Technology | | | 15.9 | % |
Communication Services | | | 14.3 | |
Industrials | | | 13.6 | |
Health Care | | | 10.0 | |
Financials | | | 9.3 | |
Consumer Staples | | | 8.1 | |
Consumer Discretionary | | | 7.8 | |
Energy | | | 6.5 | |
Materials | | | 5.4 | |
Real Estate | | | 5.3 | |
Utilities | | | 3.8 | |
| *** | | Percentages indicated are based on total long investments as of October 31, 2020. The Fund’s portfolio composition is subject to change. |
| **** | | Percentages indicated are based on total short investments as of October 31, 2020. The Fund’s portfolio composition is subject to change. |
| | | | | | |
| | | |
| 10 | | | | J.P. MORGAN SPECIALTY FUNDS | | OCTOBER 31, 2020 |
| | | | | | | | | | | | | | |
AVERAGE ANNUAL TOTAL RETURNS AS OF OCTOBER 31, 2020 | |
| | | | |
| | | INCEPTION DATE OF
CLASS | | 1 YEAR | | | 5 YEAR | | | 10 YEAR | |
CLASS A SHARES | | February 28, 2002 | | | | | | | | | | | | |
With Sales Charge* | | | | | 6.06 | % | | | 2.21 | % | | | 0.64 | % |
Without Sales Charge | | | | | 11.97 | | | | 3.32 | | | | 1.19 | |
CLASS C SHARES | | November 2, 2009 | | | | | | | | | | | | |
With CDSC** | | | | | 10.36 | | | | 2.80 | | | | 0.78 | |
Without CDSC | | | | | 11.36 | | | | 2.80 | | | | 0.78 | |
CLASS I SHARES | | November 2, 2009 | | | 12.26 | | | | 3.58 | | | | 1.44 | |
| * | | Sales Charge for Class A Shares is 5.25%. |
| ** | | Assumes a 1% CDSC (contingent deferred sales charge) for the one year period and 0% CDSC thereafter. |
TEN YEAR FUND PERFORMANCE (10/31/10 TO 10/31/20)
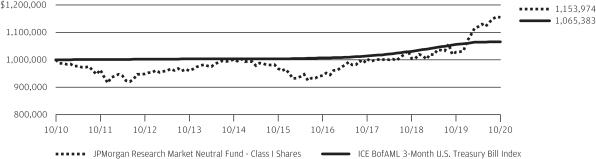
The performance quoted is past performance and is not a guarantee of future results. Mutual funds are subject to certain market risks. Investment returns and principal value of an investment will fluctuate so that an investor’s shares, when redeemed, may be worth more or less than their original cost. Current performance may be higher or lower than the performance data shown. For up-to-date month-end performance information please call 1-800-480-4111.
The graph illustrates comparative performance for $1,000,000 invested in Class I Shares of the JPMorgan Research Market Neutral Fund and ICE BofAML 3-Month U.S. Treasury Bill Index from October 31, 2010 to October 31, 2020. The performance of the Fund assumes reinvestment of all dividends and capital gain distributions, if any, and does not include a sales charge. The performance of the ICE BofAML 3-Month U.S. Treasury Bill Index does not reflect the deduction of expenses or a sales charge associated with a mutual fund and has been adjusted to reflect reinvestment of all dividends and capital gain distributions of the securities included in the benchmark, if applicable. The ICE BofAML 3-Month U.S. Treasury Bill Index is comprised of a single issue purchased at the beginning of the month and held for a full month. Each month the index is rebalanced and the issue selected is the outstanding Treasury Bill
that matures closest to, but not beyond, 3 months from the rebalancing date. Investors cannot invest directly in an index.
Class I Shares have a $1,000,000 minimum initial investment.
Fund performance may reflect the waiver of the Fund’s fees and reimbursement of expenses for certain periods since the applicable inception date. Without these waivers and reimbursements, performance would have been lower. Also, performance shown in this section does not reflect the deduction of taxes that a shareholder would pay on Fund distributions or on gains resulting from redemptions of Fund shares.
Because Class C Shares automatically convert to Class A Shares after 8 years, the 10 year average annual total return shown above for Class C reflects Class A performance for the period after conversion.
The returns shown are based on net asset values calculated for shareholder transactions and may differ from the returns shown in the financial highlights, which reflect adjustments made to the net asset values in accordance with accounting principles generally accepted in the United States of America.
| | | | | | | | |
| | | |
| OCTOBER 31, 2020 | | J.P. MORGAN SPECIALTY FUNDS | | | | | 11 | |
JPMorgan Macro Opportunities Fund
SCHEDULE OF PORTFOLIO INVESTMENTS
AS OF OCTOBER 31, 2020
| | | | | | | | |
| INVESTMENTS | |
SHARES
(000) | | | VALUE
($000) | |
Common Stocks — 56.6% | | | | | | | | |
| | |
Banks — 5.5% | | | | | | | | |
| | |
Bank Central Asia Tbk. PT (Indonesia) | | | 64 | | | | 126 | |
| | |
Fifth Third Bancorp | | | 3 | | | | 68 | |
| | |
First Republic Bank | | | 1 | | | | 172 | |
| | |
HDFC Bank Ltd., ADR (India) * | | | 3 | | | | 179 | |
| | |
PNC Financial Services Group, Inc. (The) | | | 1 | | | | 73 | |
| | |
Sberbank of Russia PJSC, ADR (Russia) | | | 11 | | | | 114 | |
| | |
Sberbank of Russia PJSC, ADR (Russia) | | | 5 | | | | 47 | |
| | |
Signature Bank | | | 1 | | | | 70 | |
| | | | | | | | |
| | |
| | | | | | | 849 | |
| | | | | | | | |
| | |
Capital Markets — 0.9% | | | | | | | | |
| | |
S&P Global, Inc. | | | — | (a) | | | 136 | |
| | | | | | | | |
| | |
Electric Utilities — 5.5% | | | | | | | | |
| | |
EDP — Energias de Portugal SA (Portugal) | | | 24 | | | | 121 | |
| | |
Enel SpA (Italy) | | | 34 | | | | 271 | |
| | |
Iberdrola SA (Spain) | | | 17 | | | | 204 | |
| | |
Orsted A/S (Denmark) (b) | | | 2 | | | | 257 | |
| | | | | | | | |
| | |
| | | | | | | 853 | |
| | | | | | | | |
| | |
Electrical Equipment — 1.7% | | | | | | | | |
| | |
Rockwell Automation, Inc. | | | — | (a) | | | 107 | |
| | |
Schneider Electric SE (France) | | | 1 | | | | 150 | |
| | | | | | | | |
| | |
| | | | | | | 257 | |
| | | | | | | | |
| | |
Entertainment — 1.0% | | | | | | | | |
| | |
Walt Disney Co. (The) | | | 1 | | | | 147 | |
| | | | | | | | |
| | |
Health Care Equipment & Supplies — 0.7% | | | | | | | | |
| | |
Abbott Laboratories | | | 1 | | | | 114 | |
| | | | | | | | |
| | |
Hotels, Restaurants & Leisure — 0.9% | | | | | | | | |
| | |
Compass Group plc (United Kingdom) | | | 11 | | | | 145 | |
| | | | | | | | |
| | |
Insurance — 3.4% | | | | | | | | |
| | |
AIA Group Ltd. (Hong Kong) | | | 17 | | | | 162 | |
| | |
Aon plc, Class A | | | 1 | | | | 125 | |
| | |
Ping An Insurance Group Co. of China Ltd., Class H (China) | | | 24 | | | | 243 | |
| | | | | | | | |
| | |
| | | | | | | 530 | |
| | | | | | | | |
| | |
Interactive Media & Services — 2.1% | | | | | | | | |
| | |
Alphabet, Inc., Class A * | | | — | (a) | | | 327 | |
| | | | | | | | |
| | |
Internet & Direct Marketing Retail — 4.6% | | | | | | | | |
| | |
Alibaba Group Holding Ltd., ADR (China) * | | | 1 | | | | 381 | |
| | |
Amazon.com, Inc. * | | | — | (a) | | | 334 | |
| | | | | | | | |
| | |
| | | | | | | 715 | |
| | | | | | | | |
| | | | | | | | |
| INVESTMENTS | |
SHARES
(000) | | | VALUE
($000) | |
| | | | | | | | |
| | |
IT Services — 4.9% | | | | | | | | |
| | |
Mastercard, Inc., Class A | | | 1 | | | | 241 | |
| | |
PayPal Holdings, Inc. * | | | 1 | | | | 238 | |
| | |
Visa, Inc., Class A | | | 2 | | | | 282 | |
| | | | | | | | |
| | |
| | | | | | | 761 | |
| | | | | | | | |
| | |
Life Sciences Tools & Services — 0.9% | | | | | | | | |
| | |
Thermo Fisher Scientific, Inc. | | | — | (a) | | | 136 | |
| | | | | | | | |
| | |
Machinery — 1.9% | | | | | | | | |
| | |
Stanley Black & Decker, Inc. | | | 1 | | | | 155 | |
| | |
Volvo AB, Class B (Sweden) * | | | 7 | | | | 139 | |
| | | | | | | | |
| | |
| | | | | | | 294 | |
| | | | | | | | |
| | |
Metals & Mining — 2.9% | | | | | | | | |
| | |
Barrick Gold Corp. (Canada) | | | 8 | | | | 215 | |
| | |
Newmont Corp. | | | 4 | | | | 224 | |
| | | | | | | | |
| | |
| | | | | | | 439 | |
| | | | | | | | |
| | |
Multi-Utilities — 0.8% | | | | | | | | |
| | |
RWE AG (Germany) | | | 3 | | | | 129 | |
| | | | | | | | |
| | |
Personal Products — 0.9% | | | | | | | | |
| | |
Estee Lauder Cos., Inc. (The), Class A | | | 1 | | | | 141 | |
| | | | | | | | |
| | |
Pharmaceuticals — 3.4% | | | | | | | | |
| | |
AstraZeneca plc (United Kingdom) | | | 1 | | | | 119 | |
| | |
Johnson & Johnson | | | 1 | | | | 121 | |
| | |
Novo Nordisk A/S, Class B (Denmark) | | | 2 | | | | 141 | |
| | |
Roche Holding AG (Switzerland) | | | — | (a) | | | 143 | |
| | | | | | | | |
| | |
| | | | | | | 524 | |
| | | | | | | | |
| |
Semiconductors & Semiconductor Equipment — 4.1% | | | | | |
| | |
Analog Devices, Inc. | | | 1 | | | | 165 | |
| | |
Microchip Technology, Inc. | | | 1 | | | | 152 | |
| | |
NVIDIA Corp. | | | — | (a) | | | 135 | |
| | |
Texas Instruments, Inc. | | | 1 | | | | 173 | |
| | | | | | | | |
| | |
| | | | | | | 625 | |
| | | | | | | | |
| | |
Software — 5.3% | | | | | | | | |
| | |
Adobe, Inc. * | | | — | (a) | | | 94 | |
| | |
Atlassian Corp. plc, Class A * | | | — | (a) | | | 91 | |
| | |
Microsoft Corp. | | | 1 | | | | 297 | |
| | |
salesforce.com, Inc. * | | | 1 | | | | 230 | |
| | |
ServiceNow, Inc. * | | | — | (a) | | | 103 | |
| | | | | | | | |
| | |
| | | | | | | 815 | |
| | | | | | | | |
| | |
Specialty Retail — 1.9% | | | | | | | | |
| | |
Burlington Stores, Inc. * | | | 1 | | | | 109 | |
SEE NOTES TO FINANCIAL STATEMENTS.
| | | | | | |
| | | |
| 12 | | | | J.P. MORGAN SPECIALTY FUNDS | | OCTOBER 31, 2020 |
| | | | | | | | |
| INVESTMENTS | |
SHARES
(000) | | | VALUE
($000) | |
Common Stocks — continued | | | | | | | | |
| | |
Specialty Retail — continued | | | | | | | | |
| | |
TJX Cos., Inc. (The) | | | 4 | | | | 180 | |
| | | | | | | | |
| | |
| | | | | | | 289 | |
| | | | | | | | |
| | |
Textiles, Apparel & Luxury Goods — 3.3% | | | | | | | | |
| | |
Lululemon Athletica, Inc. * | | | — | (a) | | | 80 | |
| | |
LVMH Moet Hennessy Louis Vuitton SE (France) | | | — | (a) | | | 225 | |
| | |
NIKE, Inc., Class B | | | 2 | | | | 200 | |
| | | | | | | | |
| | |
| | | | | | | 505 | |
| | | | | | | | |
| | |
Total Common Stocks
(Cost $7,587) | | | | | | | 8,731 | |
| | | | | | | | |
| | | PRINCIPAL
AMOUNT
($000) | | | | |
Foreign Government Securities — 3.2% | | | | | | | | |
| | |
Bonos de la Tesoreria (Peru) 5.94%, 2/12/2029 | | PEN | 332 | | | | 109 | |
| | |
Romania Government Bond (Romania) | | | | | | | | |
| | |
2.75%, 2/26/2026 (b) | | EUR | 60 | | | | 76 | |
| | |
3.62%, 5/26/2030 (b) | | EUR | 58 | | | | 77 | |
| | |
United Mexican States (Mexico) 4.50%, 4/22/2029 | | | 200 | | | | 226 | |
| | | | | | | | |
| | |
Total Foreign Government Securities
(Cost $483) | | | | | | | 488 | |
| | | | | | | | |
| | | NO. OF
CONTRACTS | | | | |
Options Purchased — 0.4% | |
| |
Call Options Purchased — 0.3% | | | | | |
| |
Aerospace & Defense — 0.0% (c) | | | | | |
| | |
Airbus SE (France) 12/17/2021 at EUR 100.00, American Style Notional Amount: EUR 69 Exchange-Traded * | | EUR | 11 | | | | 3 | |
| | |
Boeing Co. (The) 1/21/2022 at USD 300.00, American Style Notional Amount: USD 58 Exchange-Traded * | | | 4 | | | | 2 | |
| | | | | | | | |
| | |
| | | | | | | 5 | |
| | | | | | | | |
| | |
Airlines — 0.0% (c) | | | | | | | | |
| | |
American Airlines Group, Inc. 1/21/2022 at USD 37.00, American Style Notional Amount: USD 36 Exchange-Traded * | | | 32 | | | | 2 | |
| | |
United Airlines Holdings, Inc. 1/21/2022 at USD 90.00, American Style Notional Amount: USD 41 Exchange-Traded * | | | 12 | | | | 1 | |
| | | | | | | | |
| | |
| | | | | | | 3 | |
| | | | | | | | |
| | |
Automobiles — 0.0% (c) | | | | | | | | |
| | |
Renault SA (France) 12/17/2021 at EUR 40.00, American Style Notional Amount: EUR 36 Exchange-Traded * | | EUR | 17 | | | | 1 | |
| | | | | | | | |
| | | | | | | | |
| INVESTMENTS | |
NO. OF
CONTRACTS | | | VALUE
($000) | |
| | | | | | | | |
| | |
Banks — 0.1% | | | | | | | | |
| | |
Natwest Group plc (United Kingdom) 12/17/2021 at GBP 160.00, American Style Notional Amount: GBP 0 Exchange-Traded * | | GBP | 33 | | | | 4 | |
| | |
Signature Bank 9/17/2021 at USD 100.00, American Style Notional Amount: USD 81 Exchange-Traded * | | | 10 | | | | 6 | |
| | |
Societe Generale SA (France) 12/17/2021 at EUR 20.00, American Style Notional Amount: EUR 42 Exchange-Traded * | | | EUR 36 | | | | 2 | |
| | |
Wells Fargo & Co. 1/21/2022 at USD 40.00, American Style Notional Amount: USD 51 Exchange-Traded * | | | 24 | | | | 1 | |
| | | | | | | | |
| | |
| | | | | | | 13 | |
| | | | | | | | |
| |
Equity Real Estate Investment Trusts (REITs) — 0.0% (c) | | | | | |
| | |
Simon Property Group, Inc. 1/21/2022 at USD 135.00, American Style Notional Amount: USD 50 Exchange-Traded * | | | 8 | | | | 2 | |
| | | | | | | | |
| |
Hotels, Restaurants & Leisure — 0.0% (c) | | | | | |
| | |
Carnival Corp. 1/21/2022 at USD 40.00, American Style Notional Amount: USD 34 Exchange-Traded * | | | 25 | | | | 3 | |
| | |
MGM Resorts International 1/21/2022 at USD 40.00, American Style Notional Amount: USD 51 Exchange-Traded * | | | 25 | | | | 3 | |
| | |
Norwegian Cruise Line Holdings Ltd. 1/21/2022 at USD 75.00, American Style Notional Amount: USD 37 Exchange-Traded * | | | 22 | | | | 1 | |
| | | | | | | | |
| | |
| | | | | | | 7 | |
| | | | | | | | |
| |
Index Funds — 0.2% | | | | | |
| | |
Russell 2000 Index 3/19/2021 at USD 1,750.00, European Style Notional Amount: USD 1,077 Exchange-Traded * | | | 7 | | | | 23 | |
| | |
STOXX Europe 600 Utilities Index (Germany) 12/18/2020 at EUR 370.00, European Style Notional Amount: EUR 359 Exchange-Traded * | | EUR | 21 | | | | 3 | |
| | |
12/18/2020 at EUR 400.00, European Style Notional Amount: EUR 360 Exchange-Traded * | | EUR | 21 | | | | — | (a) |
| | | | | | | | |
| | |
| | | | | | | 26 | |
| | | | | | | | |
| | |
Total Call Options Purchased | | | | | | | 57 | |
| | | | | | | | |
|
Put Options Purchased — 0.1% | |
| |
Index Funds — 0.1% | | | | | |
| | |
S&P 500 Index 11/2/2020 at USD 3,240.00, European Style Notional Amount: USD 2,394 Exchange-Traded * | | | 7 | | | | 13 | |
| | | | | | | | |
| | |
Total Options Purchased
(Cost $139) | | | | | | | 70 | |
| | | | | | | | |
SEE NOTES TO FINANCIAL STATEMENTS.
| | | | | | | | |
| | | |
| OCTOBER 31, 2020 | | J.P. MORGAN SPECIALTY FUNDS | | | | | 13 | |
JPMorgan Macro Opportunities Fund
SCHEDULE OF PORTFOLIO INVESTMENTS
AS OF OCTOBER 31, 2020 (continued)
| | | | | | | | |
| INVESTMENTS | | PRINCIPAL
AMOUNT
($000) | | | VALUE
($000) | |
Short-Term Investments — 32.2% | |
| |
Foreign Government Treasury Bills — 16.9% | | | | | |
| | |
Japan Treasury Discount Bills (Japan) | | | | | | | | |
| | |
(0.08)%, 11/2/2020 (d) | | JPY | 64,250 | | | | 614 | |
| | |
(0.09)%, 11/16/2020 (d) | | JPY | 64,850 | | | | 620 | |
| | |
(0.09)%, 1/18/2021 (d) | | JPY | 34,950 | | | | 334 | |
| | |
(0.09)%, 2/1/2021 (d) | | JPY | 62,000 | | | | 592 | |
| | |
Letras do Tesouro Nacional (Brazil) 4.32%, 7/1/2023 (d) | | BRL | 3,000 | | | | 449 | |
| | | | | | | | |
| | |
Total Foreign Government Treasury Bills
(Cost $2,640) | | | | | | | 2,609 | |
| | | | | | | | |
| | | SHARES
(000) | | | | |
Investment Companies — 15.3% | | | | | |
| | |
JPMorgan Prime Money Market Fund Class IM Shares, 0.11% (e) (f)
(Cost $2,356) | | | 2,355 | | | | 2,356 | |
| | | | | | | | |
| | |
Total Short-Term Investments
(Cost $4,996) | | | | | | | 4,965 | |
| | | | | | | | |
Total Investments — 92.4%
(Cost $13,205) | | | | | | | 14,254 | |
Other Assets Less Liabilities — 7.6% | | | | | | | 1,178 | |
| | | | | | | | |
NET ASSETS — 100.0% | | | | | | | 15,432 | |
| | | | | | | | |
Percentages indicated are based on net assets.
| | |
Abbreviations | | |
| |
| ADR | | American Depositary Receipt |
| BRL | | Brazilian Real |
| EUR | | Euro |
| GBP | | British Pound |
| JPY | | Japanese Yen |
| PEN | | Peruvian Nuevo Sol |
| PJSC | | Public Joint Stock Company |
| PT | | Limited liability company |
| USD | | United States Dollar |
| |
| (a) | | Amount rounds to less than one thousand. |
| (b) | | Security exempt from registration pursuant to Regulation S under the Securities Act of 1933, as amended. Regulation S applies to securities offerings that are made outside of the United States and do not involve direct selling efforts in the United States and as such may have restrictions on resale. |
| (c) | | Amount rounds to less than 0.1% of net assets. |
| (d) | | The rate shown is the effective yield as of October 31, 2020. |
| (e) | | Investment in an affiliated fund, which is registered under the Investment Company Act of 1940, as amended, and is advised by J.P. Morgan Investment Management Inc. |
| (f) | | The rate shown is the current yield as of October 31, 2020. |
| * | | Non-income producing security. |
Futures contracts outstanding as of October 31, 2020 (amounts in thousands, except number of contracts):
| | | | | | | | | | | | | | | | | | |
| DESCRIPTION | | NUMBER OF
CONTRACTS | | | EXPIRATION
DATE | | | TRADING
CURRENCY | | NOTIONAL
AMOUNT ($) | | | VALUE AND
UNREALIZED
APPRECIATION
(DEPRECIATION) ($) | |
Long Contracts | |
E-Mini Industrial Select Sector | | | 4 | | | | 12/2020 | | | USD | | | 305 | | | | (10 | ) |
Euro-BTP | | | 5 | | | | 12/2020 | | | EUR | | | 870 | | | | 21 | |
Russell 2000 E-Mini Index | | | 3 | | | | 12/2020 | | | USD | | | 231 | | | | 1 | |
U.S. Treasury 10 Year Note | | | 5 | | | | 12/2020 | | | USD | | | 691 | | | | (6 | ) |
| | | | | | | | | | | | | | | | | | |
| | | | | | | | | | | | | | | | | 6 | |
| | | | | | | | | | | | | | | | | | |
Short Contracts | |
EURO STOXX 50 Index | | | (24 | ) | | | 12/2020 | | | EUR | | | (827 | ) | | | 96 | |
Euro-Bund | | | (4 | ) | | | 12/2020 | | | EUR | | | (821 | ) | | | (11 | ) |
MSCI Emerging Markets E-Mini Index | | | (3 | ) | | | 12/2020 | | | USD | | | (165 | ) | | | 1 | |
S&P 500 E-Mini Index | | | (16 | ) | | | 12/2020 | | | USD | | | (2,612 | ) | | | 103 | |
E-mini Consumer Staples Select Sector | | | (5 | ) | | | 12/2020 | | | USD | | | (312 | ) | | | 14 | |
E-mini Utilities Select Sector | | | (2 | ) | | | 12/2020 | | | USD | | | (126 | ) | | | 4 | |
E-mini Health Care Select Sector | | | (1 | ) | | | 12/2020 | | | USD | | | (103 | ) | | | 5 | |
| | | | | | | | | | | | | | | | | | |
| | | | | | | | | | | | | | | | | 212 | |
| | | | | | | | | | | | | | | | | | |
| | | | | | | | | | | | | | | | | 218 | |
| | | | | | | | | | | | | | | | | | |
| | |
Abbreviations |
| EUR | | Euro |
| MSCI | | Morgan Stanley Capital International |
| USD | | United States Dollar |
SEE NOTES TO FINANCIAL STATEMENTS.
| | | | | | |
| | | |
| 14 | | | | J.P. MORGAN SPECIALTY FUNDS | | OCTOBER 31, 2020 |
Forward foreign currency exchange contracts outstanding as of October 31, 2020 (amounts in thousands):
| | | | | | | | | | | | | | | | | | | | | | |
CURRENCY
PURCHASED | | | CURRENCY SOLD | | | COUNTERPARTY | | SETTLEMENT
DATE | | | UNREALIZED
APPRECIATION
(DEPRECIATION) ($) | |
MXN | | | 8,166 | | | | USD | | | | 380 | | | Barclays Bank plc | | | 11/24/2020 | | | | 4 | |
USD | | | 470 | | | | BRL | | | | 2,609 | | | Citibank, NA** | | | 11/24/2020 | | | | 16 | |
USD | | | 36 | | | | DKK | | | | 225 | | | Merrill Lynch International | | | 11/24/2020 | | | | 1 | |
USD | | | 454 | | | | DKK | | | | 2,873 | | | TD Bank Financial Group | | | 11/24/2020 | | | | 4 | |
USD | | | 430 | | | | HKD | | | | 3,330 | | | Citibank, NA | | | 11/24/2020 | | | | — | (a) |
USD | | | 431 | | | | HKD | | | | 3,339 | | | TD Bank Financial Group | | | 11/24/2020 | | | | — | (a) |
USD | | | 159 | | | | INR | | | | 11,690 | | | Citibank, NA** | | | 11/24/2020 | | | | 1 | |
USD | | | 34 | | | | INR | | | | 2,507 | | | Goldman Sachs International** | | | 11/24/2020 | | | | — | (a) |
USD | | | 113 | | | | PEN | | | | 404 | | | Citibank, NA** | | | 11/24/2020 | | | | 1 | |
USD | | | 201 | | | | RUB | | | | 15,658 | | | Goldman Sachs International** | | | 11/24/2020 | | | | 5 | |
JPY | | | 31,386 | | | | USD | | | | 298 | | | Goldman Sachs International | | | 1/25/2021 | | | | 2 | |
USD | | | 182 | | | | CHF | | | | 166 | | | Goldman Sachs International | | | 1/25/2021 | | | | 1 | |
USD | | | 1,621 | | | | EUR | | | | 1,377 | | | Goldman Sachs International | | | 1/25/2021 | | | | 14 | |
USD | | | 972 | | | | GBP | | | | 748 | | | Goldman Sachs International | | | 1/25/2021 | | | | 2 | |
USD | | | 166 | | | | SEK | | | | 1,460 | | | Goldman Sachs International | | | 1/25/2021 | | | | 1 | |
| | | | | | | | | | | | | | | | | | | | | | |
Total unrealized appreciation | | | | | | | 52 | |
| | | | | | | | |
CNY | | | 2,649 | | | | USD | | | | 396 | | | Barclays Bank plc** | | | 11/24/2020 | | | | (1 | ) |
DKK | | | 308 | | | | USD | | | | 49 | | | Goldman Sachs International | | | 11/24/2020 | | | | — | (a) |
DKK | | | 293 | | | | USD | | | | 47 | | | Merrill Lynch International | | | 11/24/2020 | | | | (1 | ) |
HKD | | | 231 | | | | USD | | | | 30 | | | TD Bank Financial Group | | | 11/24/2020 | | | | — | (a) |
RUB | | | 2,418 | | | | USD | | | | 31 | | | Goldman Sachs International** | | | 11/24/2020 | | | | — | (a) |
USD | | | 34 | | | | CNY | | | | 229 | | | Barclays Bank plc** | | | 11/24/2020 | | | | — | (a) |
USD | | | 358 | | | | CNY | | | | 2,420 | | | Merrill Lynch International** | | | 11/24/2020 | | | | (2 | ) |
USD | | | 110 | | | | IDR | | | | 1,633,287 | | | Citibank, NA** | | | 11/24/2020 | | | | (1 | ) |
USD | | | 387 | | | | ZAR | | | | 6,420 | | | Citibank, NA | | | 11/24/2020 | | | | (7 | ) |
CHF | | | 33 | | | | USD | | | | 36 | | | Goldman Sachs International | | | 1/25/2021 | | | | — | (a) |
EUR | | | 595 | | | | USD | | | | 705 | | | Goldman Sachs International | | | 1/25/2021 | | | | (10 | ) |
GBP | | | 173 | | | | USD | | | | 226 | | | Goldman Sachs International | | | 1/25/2021 | | | | (2 | ) |
USD | | | 1,857 | | | | JPY | | | | 194,949 | | | Goldman Sachs International | | | 1/25/2021 | | | | (8 | ) |
| | | | | | | | | | | | | | | | | | | | | | |
Total unrealized depreciation | | | | | | | (32 | ) |
| | | | | | | | |
Net unrealized appreciation | | | | | | | 20 | |
| | | | | | | | |
| | |
Abbreviations |
| BRL | | Brazilian Real |
| CHF | | Swiss Franc |
| CNY | | China Yuan |
| DKK | | Danish Krone |
| EUR | | Euro |
| GBP | | British Pound |
| HKD | | Hong Kong Dollar |
| IDR | | Indonesian Rupiah |
| INR | | Indian Rupee |
| JPY | | Japanese Yen |
| MXN | | Mexican Peso |
| PEN | | Peruvian Nuevo Sol |
| RUB | | Russian Ruble |
| SEK | | Swedish Krona |
| USD | | United States Dollar |
| ZAR | | South African Rand |
| |
| (a) | | Amount rounds to less than one thousand. |
| ** | | Non-deliverable forward. |
SEE NOTES TO FINANCIAL STATEMENTS.
| | | | | | | | |
| | | |
| OCTOBER 31, 2020 | | J.P. MORGAN SPECIALTY FUNDS | | | | | 15 | |
JPMorgan Opportunistic Equity Long/Short Fund
SCHEDULE OF PORTFOLIO INVESTMENTS
AS OF OCTOBER 31, 2020
| | | | | | | | |
| INVESTMENTS | | SHARES
(000) | | | VALUE
($000) | |
Long Positions — 105.6% | |
|
Common Stocks — 82.0% | |
|
Automobiles — 4.1% | |
| | |
Tesla, Inc. * | | | 51 | | | | 19,761 | |
| | | | | | | | |
|
Banks — 0.6% | |
| | |
Comerica, Inc. | | | 68 | | | | 3,097 | |
| | | | | | | | |
|
Chemicals — 5.1% | |
| | |
Air Products and Chemicals, Inc. (a) | | | 61 | | | | 16,718 | |
| | |
Sherwin-Williams Co. (The) (a) | | | 12 | | | | 7,952 | |
| | | | | | | | |
| | |
| | | | | | | 24,670 | |
| | | | | | | | |
|
Consumer Finance — 1.8% | |
| | |
LendingTree, Inc. * | | | 27 | | | | 8,797 | |
| | | | | | | | |
|
Electric Utilities — 3.5% | |
| | |
NextEra Energy, Inc. | | | 232 | | | | 16,980 | |
| | | | | | | | |
|
Entertainment — 2.4% | |
| | |
Netflix, Inc. * (a) | | | 25 | | | | 11,672 | |
| | | | | | | | |
|
Food Products — 1.0% | |
| | |
Beyond Meat, Inc. * (a) | | | 32 | | | | 4,596 | |
| | | | | | | | |
|
Health Care Providers & Services — 9.8% | |
| | |
Cigna Corp. (a) | | | 192 | | | | 32,043 | |
| | |
UnitedHealth Group, Inc. (a) | | | 50 | | | | 15,341 | |
| | | | | | | | |
| | |
| | | | | | | 47,384 | |
| | | | | | | | |
|
Interactive Media & Services — 1.5% | |
| | |
Alphabet, Inc., Class A * | | | — | (b) | | | 522 | |
| | |
Zillow Group, Inc., Class C * (a) | | | 78 | | | | 6,923 | |
| | | | | | | | |
| | |
| | | | | | | 7,445 | |
| | | | | | | | |
|
Internet & Direct Marketing Retail — 8.5% | |
| | |
Alibaba Group Holding Ltd., ADR (China) * (a) | | | 120 | | | | 36,626 | |
| | |
Amazon.com, Inc. * | | | 2 | | | | 4,840 | |
| | | | | | | | |
| | |
| | | | | | | 41,466 | |
| | | | | | | | |
|
IT Services — 6.7% | |
| | |
Fidelity National Information Services, Inc. (a) | | | 3 | | | | 406 | |
| | |
Fiserv, Inc. * (a) | | | 296 | | | | 28,280 | |
| | |
Mastercard, Inc., Class A | | | 2 | | | | 441 | |
| | |
Twilio, Inc., Class A * | | | 11 | | | | 3,043 | |
| | |
Visa, Inc., Class A(a) | | | 2 | | | | 414 | |
| | | | | | | | |
| | |
| | | | | | | 32,584 | |
| | | | | | | | |
|
Life Sciences Tools & Services — 1.1% | |
| | |
Thermo Fisher Scientific, Inc. | | | 11 | | | | 5,123 | |
| | | | | | | | |
|
Media — 14.7% | |
| | |
Altice USA, Inc., Class A * (a) | | | 661 | | | | 17,810 | |
| | |
Charter Communications, Inc., Class A * (a) | | | 55 | | | | 33,386 | |
| | | | | | | | |
| INVESTMENTS | | SHARES
(000) | | | VALUE
($000) | |
| | | | | | | | |
| | | | | | | | |
|
Media — continued | |
| | |
Liberty Media Corp.-Liberty SiriusXM, Class A * | | | 316 | | | | 10,929 | |
| | |
Liberty Media Corp.-Liberty SiriusXM, Class C * | | | 273 | | | | 9,432 | |
| | | | | | | | |
| | |
| | | | | | | 71,557 | |
| | | | | | | | |
|
Road & Rail — 1.4% | |
| | |
Canadian Pacific Railway Ltd. (Canada) | | | 21 | | | | 6,196 | |
| | |
Lyft, Inc., Class A * | | | 9 | | | | 196 | |
| | |
Uber Technologies, Inc. * | | | 7 | | | | 230 | |
| | | | | | | | |
| | |
| | | | | | | 6,622 | |
| | | | | | | | |
|
Semiconductors & Semiconductor Equipment — 9.5% | |
| | |
NVIDIA Corp. (a) | | | 34 | | | | 16,834 | |
| | |
NXP Semiconductors NV (Netherlands) | | | 217 | | | | 29,317 | |
| | | | | | | | |
| | |
| | | | | | | 46,151 | |
| | | | | | | | |
|
Software — 3.3% | |
| | |
Microsoft Corp. | | | 35 | | | | 7,056 | |
| | |
RingCentral, Inc., Class A * | | | 35 | | | | 8,925 | |
| | | | | | | | |
| | |
| | | | | | | 15,981 | |
| | | | | | | | |
|
Specialty Retail — 5.1% | |
| | |
Best Buy Co., Inc. | | | 202 | | | | 22,545 | |
| | |
Lowe’s Cos., Inc. | | | 15 | | | | 2,328 | |
| | | | | | | | |
| | |
| | | | | | | 24,873 | |
| | | | | | | | |
|
Technology Hardware, Storage & Peripherals — 1.9% | |
| | |
Apple, Inc. | | | 85 | | | | 9,250 | |
| | | | | | | | |
| | |
Total Common Stocks
(Cost $334,770) | | | | | | | 398,009 | |
| | | | | | | | |
Short-Term Investments — 23.6% | |
|
Investment Companies — 23.6% | |
| | |
JPMorgan Prime Money Market Fund Class Institutional Shares, 0.05% (c) (d) (Cost $114,889) | | | 114,820 | | | | 114,889 | |
| | | | | | | | |
| | |
Total Long Positions
(Cost $449,659) | | | | | | | 512,898 | |
| | | | | | | | |
Short Positions — (31.1)% | |
|
Common Stocks — (26.1)% | |
| | |
Beverages — (0.1)% | | | | | | | | |
| | |
Molson Coors Beverage Co., Class B | | | (15 | ) | | | (518 | ) |
| | | | | | | | |
|
Communications Equipment — (4.2)% | |
| | |
Acacia Communications, Inc. * | | | (300 | ) | | | (20,334 | ) |
| | | | | | | | |
|
Electric Utilities — (0.7)% | |
| | |
Exelon Corp. | | | (57 | ) | | | (2,280 | ) |
| | |
Pinnacle West Capital Corp. | | | (13 | ) | | | (1,087 | ) |
| | | | | | | | |
| | |
| | | | | | | (3,367 | ) |
| | | | | | | | |
SEE NOTES TO FINANCIAL STATEMENTS.
| | | | | | |
| | | |
| 16 | | | | J.P. MORGAN SPECIALTY FUNDS | | OCTOBER 31, 2020 |
| | | | | | | | |
| INVESTMENTS | | SHARES
(000) | | | VALUE
($000) | |
Short Positions — continued | |
|
Energy Equipment & Services — (0.1)% | |
| | |
Schlumberger NV | | | (43 | ) | | | (649 | ) |
| | | | | | | | |
|
Equity Real Estate Investment Trusts (REITs) — (2.2)% | |
| | |
AvalonBay Communities, Inc. | | | (14 | ) | | | (1,976 | ) |
| | |
Host Hotels & Resorts, Inc. | | | (722 | ) | | | (7,565 | ) |
| | |
Vornado Realty Trust | | | (42 | ) | | | (1,291 | ) |
| | | | | | | | |
| | |
| | | | | | | (10,832 | ) |
| | | | | | | | |
|
Food & Staples Retailing — (1.7)% | |
| | |
Walgreens Boots Alliance, Inc. | | | (239 | ) | | | (8,146 | ) |
| | | | | | | | |
|
Health Care Equipment & Supplies — (6.1)% | |
| | |
Varian Medical Systems, Inc. * | | | (171 | ) | | | (29,552 | ) |
| | | | | | | | |
|
Health Care Providers & Services — (0.9)% | |
| | |
CVS Health Corp. | | | (83 | ) | | | (4,664 | ) |
| | | | | | | | |
|
Insurance — (5.1)% | |
| | |
National General Holdings Corp. | | | (728 | ) | | | (24,729 | ) |
| | | | | | | | |
|
Media — (4.3)% | |
| | |
Sirius XM Holdings, Inc. | | | (3,631 | ) | | | (20,803 | ) |
| | | | | | | | |
|
Multi-Utilities — (0.7)% | |
| | |
Consolidated Edison, Inc. | | | (29 | ) | | | (2,255 | ) |
| | |
DTE Energy Co. | | | (9 | ) | | | (1,054 | ) |
| | | | | | | | |
| | |
| | | | | | | (3,309 | ) |
| | | | | | | | |
| | |
Total Common Stocks
(Proceeds $(127,400)) | | | | | | | (126,903 | ) |
| | | | | | | | |
|
Exchange-traded Funds — (5.0)% | |
|
U.S. Equity — (5.0)% | |
| | |
SPDR S&P 500 ETF Trust(Proceeds $(24,614)) | | | (74 | ) | | | (24,243 | ) |
| | | | | | | | |
| | |
Total Short Positions
(Proceeds $(152,014)) | | | | | | | (151,146 | ) |
| | | | | | | | |
Total Investments — 74.5%
(Cost $297,645) | | | | | | | 361,752 | |
Other Assets Less Liabilities — 25.5% | | | | | | | 123,764 | |
| | | | | | | | |
NET ASSETS — 100.0% | | | | | | | 485,516 | |
| | | | | |
Percentages indicated are based on net assets.
| | |
Abbreviations | | |
| ADR | | American Depositary Receipt |
| ETF | | Exchange-Traded Fund |
| SPDR | | Standard & Poor’s Depository Receipts |
| |
| (a) | | All or a portion of this security is segregated as collateral for short sales. The total value of securities and cash segregated as collateral is approximately $110,619,000 and $186,652,000 respectively. |
| (b) | | Amount rounds to less than one thousand. |
| (c) | | Investment in an affiliated fund, which is registered under the Investment Company Act of 1940, as amended, and is advised by J.P. Morgan Investment Management Inc. |
| (d) | | The rate shown is the current yield as of October 31, 2020. |
| * | | Non-income producing security. |
SEE NOTES TO FINANCIAL STATEMENTS.
| | | | | | | | |
| | | |
| OCTOBER 31, 2020 | | J.P. MORGAN SPECIALTY FUNDS | | | | | 17 | |
JPMorgan Research Market Neutral Fund
SCHEDULE OF PORTFOLIO INVESTMENTS
AS OF OCTOBER 31, 2020
| | | | | | | | |
| INVESTMENTS | | SHARES
(000) | | | VALUE
($000) | |
Long Positions — 95.0% | |
|
Common Stocks — 78.2% | |
|
Aerospace & Defense — 1.0% | |
| | |
Northrop Grumman Corp. | | | 3 | | | | 813 | |
| | |
Raytheon Technologies Corp. | | | 10 | | | | 542 | |
| | | | | | | | |
| | |
| | | | | | | 1,355 | |
| | | | | | | | |
|
Air Freight & Logistics — 0.2% | |
| | |
FedEx Corp. | | | 1 | | | | 260 | |
| | |
United Parcel Service, Inc., Class B | | | 1 | | | | 81 | |
| | | | | | | | |
| | |
| | | | | | | 341 | |
| | | | | | | | |
|
Auto Components — 0.7% | |
| | |
Aptiv plc | | | 4 | | | | 352 | |
| | |
BorgWarner, Inc. | | | 1 | | | | 41 | |
| | |
Magna International, Inc. (Canada) | | | 12 | | | | 604 | |
| | | | | | | | |
| | |
| | | | | | | 997 | |
| | | | | | | | |
|
Automobiles — 0.1% | |
| | |
General Motors Co. | | | 4 | | | | 151 | |
| | | | | | | | |
|
Banks — 2.0% | |
| | |
Regions Financial Corp. | | | 37 | | | | 494 | |
| | |
SVB Financial Group * | | | 1 | | | | 340 | |
| | |
Truist Financial Corp. | | | 43 | | | | 1,806 | |
| | |
Wells Fargo & Co. | | | 10 | | | | 221 | |
| | | | | | | | |
| | |
| | | | | | | 2,861 | |
| | | | | | | | |
|
Beverages — 0.9% | |
| | |
Coca-Cola Co. (The) | | | 5 | | | | 232 | |
| | |
Constellation Brands, Inc., Class A | | | 3 | | | | 467 | |
| | |
PepsiCo, Inc. | | | 5 | | | | 635 | |
| | | | | | | | |
| | |
| | | | | | | 1,334 | |
| | | | | | | | |
|
Biotechnology — 2.2% | |
| | |
AbbVie, Inc. | | | 12 | | | | 1,032 | |
| | |
Alexion Pharmaceuticals, Inc. * | | | 5 | | | | 601 | |
| | |
Biogen, Inc. * | | | 4 | | | | 915 | |
| | |
Vertex Pharmaceuticals, Inc. * | | | 2 | | | | 516 | |
| | | | | | | | |
| | |
| | | | | | | 3,064 | |
| | | | | | | | |
|
Building Products — 1.8% | |
| | |
Allegion plc | | | 1 | | | | 102 | |
| | |
Masco Corp. | | | 7 | | | | 389 | |
| | |
Trane Technologies plc | | | 15 | | | | 2,043 | |
| | | | | | | | |
| | |
| | | | | | | 2,534 | |
| | | | | | | | |
|
Capital Markets — 1.3% | |
| | |
Ameriprise Financial, Inc. | | | — | (a) | | | 61 | |
| | |
Charles Schwab Corp. (The) | | | 12 | | | | 507 | |
| | |
Intercontinental Exchange, Inc. | | | 3 | | | | 310 | |
| | | | | | | | |
| INVESTMENTS | | SHARES
(000) | | | VALUE
($000) | |
| | | | | | | | |
| | | | | | | | |
|
Capital Markets — continued | |
| | |
Morgan Stanley | | | 13 | | | | 637 | |
| | |
MSCI, Inc. | | | — | (a) | | | 174 | |
| | |
State Street Corp. | | | 3 | | | | 182 | |
| | | | | | | | |
| | |
| | | | | | | 1,871 | |
| | | | | | | | |
|
Chemicals — 4.1% | |
| | |
Air Products and Chemicals, Inc. (b) | | | 1 | | | | 363 | |
| | |
Celanese Corp. | | | 6 | | | | 707 | |
| | |
Corteva, Inc. | | | 15 | | | | 483 | |
| | |
DuPont de Nemours, Inc. | | | 15 | | | | 877 | |
| | |
Eastman Chemical Co. (b) | | | 13 | | | | 1,047 | |
| | |
FMC Corp. | | | 3 | | | | 342 | |
| | |
Linde plc (United Kingdom) | | | 6 | | | | 1,242 | |
| | |
PPG Industries, Inc. | | | 5 | | | | 680 | |
| | |
Sherwin-Williams Co. (The) | | | — | (a) | | | 91 | |
| | | | | | | | |
| | |
| | | | | | | 5,832 | |
| | | | | | | | |
|
Consumer Finance — 0.8% | |
| | |
Capital One Financial Corp. | | | 16 | | | | 1,141 | |
| | | | | | | | |
|
Containers & Packaging — 0.2% | |
| | |
Crown Holdings, Inc. * | | | 4 | | | | 303 | |
| | | | | | | | |
|
Diversified Financial Services — 0.4% | |
| | |
Voya Financial, Inc. | | | 10 | | | | 496 | |
| | | | | | | | |
|
Electric Utilities — 1.9% | |
| | |
Entergy Corp. | | | 2 | | | | 251 | |
| | |
NextEra Energy, Inc. | | | 18 | | | | 1,331 | |
| | |
Xcel Energy, Inc. (b) | | | 15 | | | | 1,062 | |
| | | | | | | | |
| | |
| | | | | | | 2,644 | |
| | | | | | | | |
|
Electrical Equipment — 1.3% | |
| | |
AMETEK, Inc. | | | 7 | | | | 679 | |
| | |
Eaton Corp. plc | | | 6 | | | | 643 | |
| | |
Rockwell Automation, Inc. | | | — | (a) | | | 71 | |
| | |
Sensata Technologies Holding plc * | | | 11 | | | | 495 | |
| | | | | | | | |
| | |
| | | | | | | 1,888 | |
| | | | | | | | |
|
Electronic Equipment, Instruments & Components — 0.6% | |
| | |
TE Connectivity Ltd. | | | 8 | | | | 821 | |
| | | | | | | | |
|
Energy Equipment & Services — 0.3% | |
| | |
Baker Hughes Co. | | | 27 | | | | 398 | |
| | | | | | | | |
|
Entertainment — 2.9% | |
| | |
Electronic Arts, Inc. * | | | 7 | | | | 873 | |
| | |
Netflix, Inc. * (b) | | | 5 | | | | 2,272 | |
| | |
Warner Music Group Corp., Class A | | | 38 | | | | 1,005 | |
| | | | | | | | |
| | |
| | | | | | | 4,150 | |
| | | | | | | | |
SEE NOTES TO FINANCIAL STATEMENTS.
| | | | | | |
| | | |
| 18 | | | | J.P. MORGAN SPECIALTY FUNDS | | OCTOBER 31, 2020 |
| | | | | | | | |
| INVESTMENTS | | SHARES
(000) | | | VALUE
($000) | |
Long Positions — continued | |
|
Common Stocks — continued | |
|
Equity Real Estate Investment Trusts (REITs) — 3.6% | |
| | |
Brixmor Property Group, Inc. | | | 43 | | | | 470 | |
| | |
Camden Property Trust | | | 6 | | | | 599 | |
| | |
Equity LifeStyle Properties, Inc. | | | 17 | | | | 987 | |
| | |
Host Hotels & Resorts, Inc. | | | 5 | | | | 56 | |
| | |
Kimco Realty Corp. | | | 23 | | | | 235 | |
| | |
Prologis, Inc. | | | 6 | | | | 603 | |
| | |
Realty Income Corp. | | | 2 | | | | 107 | |
| | |
SBA Communications Corp. | | | 1 | | | | 236 | |
| | |
Sun Communities, Inc. | | | 1 | | | | 89 | |
| | |
UDR, Inc. | | | 11 | | | | 331 | |
| | |
Ventas, Inc. | | | 20 | | | | 775 | |
| | |
WP Carey, Inc. | | | 9 | | | | 573 | |
| | | | | | | | |
| | |
| | | | | | | 5,061 | |
| | | | | | | | |
|
Food & Staples Retailing — 0.4% | |
| | |
Albertsons Cos., Inc., Class A | | | 26 | | | | 376 | |
| | |
Costco Wholesale Corp. | | | 1 | | | | 196 | |
| | | | | | | | |
| | |
| | | | | | | 572 | |
| | | | | | | | |
|
Food Products — 0.6% | |
| | |
Conagra Brands, Inc. | | | 9 | | | | 324 | |
| | |
Mondelez International, Inc., Class A | | | 9 | | | | 484 | |
| | | | | | | | |
| | |
| | | | | | | 808 | |
| | | | | | | | |
|
Health Care Equipment & Supplies — 2.4% | |
| | |
Baxter International, Inc. | | | 1 | | | | 97 | |
| | |
Becton Dickinson and Co. | | | 1 | | | | 128 | |
| | |
Boston Scientific Corp. * | | | 19 | | | | 666 | |
| | |
Intuitive Surgical, Inc. * | | | 1 | | | | 853 | |
| | |
Medtronic plc | | | 6 | | | | 609 | |
| | |
Zimmer Biomet Holdings, Inc. | | | 7 | | | | 989 | |
| | | | | | | | |
| | |
| | | | | | | 3,342 | |
| | | | | | | | |
|
Health Care Providers & Services — 1.6% | |
| | |
Centene Corp. * | | | 5 | | | | 294 | |
| | |
Cigna Corp.(b) | | | 4 | | | | 705 | |
| | |
McKesson Corp. | | | 7 | | | | 1,055 | |
| | |
UnitedHealth Group, Inc. (b) | | | — | (a) | | | 151 | |
| | | | | | | | |
| | |
| | | | | | | 2,205 | |
| | | | | | | | |
|
Hotels, Restaurants & Leisure — 1.7% | |
| | |
Choice Hotels International, Inc. | | | 2 | | | | 179 | |
| | |
Hilton Worldwide Holdings, Inc. | | | 3 | | | | 270 | |
| | |
Las Vegas Sands Corp. | | | 7 | | | | 340 | |
| | |
McDonald’s Corp. | | | 1 | | | | 188 | |
| | |
Yum! Brands, Inc. (b) | | | 15 | | | | 1,421 | |
| | | | | | | | |
| | |
| | | | | | | 2,398 | |
| | | | | | | | |
| | | | | | | | |
| INVESTMENTS | | SHARES
(000) | | | VALUE
($000) | |
| | | | | | | | |
| | | | | | | | |
|
Household Durables — 0.5% | |
| | |
KB Home | | | 14 | | | | 436 | |
| | |
Lennar Corp., Class A | | | 1 | | | | 62 | |
| | |
Mohawk Industries, Inc. * | | | 1 | | | | 68 | |
| | |
Toll Brothers, Inc. | | | 4 | | | | 173 | |
| | | | | | | | |
| | |
| | | | | | | 739 | |
| | | | | | | | |
|
Household Products — 0.6% | |
| | |
Kimberly-Clark Corp. | | | 2 | | | | 227 | |
| | |
Procter & Gamble Co. (The) | | | 5 | | | | 637 | |
| | | | | | | | |
| | |
| | | | | | | 864 | |
| | | | | | | | |
|
Industrial Conglomerates — 0.4% | |
| | |
Honeywell International, Inc. | | | 4 | | | | 618 | |
| | | | | | | | |
|
Insurance — 1.8% | |
| | |
American International Group, Inc. | | | 4 | | | | 125 | |
| | |
Arthur J Gallagher & Co. | | | 4 | | | | 379 | |
| | |
Chubb Ltd. | | | 9 | | | | 1,110 | |
| | |
Marsh & McLennan Cos., Inc. | | | 4 | | | | 405 | |
| | |
Progressive Corp. (The) | | | 6 | | | | 530 | |
| | |
RenaissanceRe Holdings Ltd. (Bermuda) | | | — | (a) | | | 48 | |
| | | | | | | | |
| | |
| | | | | | | 2,597 | |
| | | | | | | | |
|
Interactive Media & Services — 1.4% | |
| | |
Alphabet, Inc., Class C * (b) | | | 1 | | | | 1,357 | |
| | |
Facebook, Inc., Class A * | | | 2 | | | | 566 | |
| | | | | | | | |
| | |
| | | | | | | 1,923 | |
| | | | | | | | |
|
Internet & Direct Marketing Retail — 2.1% | |
| | |
Amazon.com, Inc. * (b) | | | 1 | | | | 2,730 | |
| | |
Booking Holdings, Inc. * | | | — | (a) | | | 258 | |
| | | | | | | | |
| | |
| | | | | | | 2,988 | |
| | | | | | | | |
|
IT Services — 4.9% | |
| | |
Booz Allen Hamilton Holding Corp. | | | 4 | | | | 321 | |
| | |
DXC Technology Co. | | | 6 | | | | 115 | |
| | |
Fiserv, Inc. * (b) | | | 11 | | | | 1,016 | |
| | |
FleetCor Technologies, Inc. * | | | 4 | | | | 808 | |
| | |
Leidos Holdings, Inc. (b) | | | 14 | | | | 1,150 | |
| | |
Mastercard, Inc., Class A (b) | | | 6 | | | | 1,754 | |
| | |
PayPal Holdings, Inc. * (b) | | | 5 | | | | 998 | |
| | |
WEX, Inc. * | | | 6 | | | | 726 | |
| | | | | | | | |
| | |
| | | | | | | 6,888 | |
| | | | | | | | |
|
Life Sciences Tools & Services — 0.8% | |
| | |
Thermo Fisher Scientific, Inc. | | | 2 | | | | 1,094 | |
| | | | | | | | |
SEE NOTES TO FINANCIAL STATEMENTS.
| | | | | | | | |
| | | |
| OCTOBER 31, 2020 | | J.P. MORGAN SPECIALTY FUNDS | | | | | 19 | |
JPMorgan Research Market Neutral Fund
SCHEDULE OF PORTFOLIO INVESTMENTS
AS OF OCTOBER 31, 2020 (continued)
| | | | | | | | |
| INVESTMENTS | | SHARES
(000) | | | VALUE
($000) | |
Long Positions — continued | |
|
Common Stocks — continued | |
|
Machinery — 2.3% | |
| | |
Deere & Co. | | | 2 | | | | 365 | |
| | |
Parker-Hannifin Corp. (b) | | | 5 | | | | 1,081 | |
| | |
Stanley Black & Decker, Inc. (b) | | | 11 | | | | 1,757 | |
| | | | | | | | |
| | |
| | | | | | | 3,203 | |
| | | | | | | | |
|
Media — 2.2% | |
| | |
Altice USA, Inc., Class A * | | | 2 | | | | 60 | |
| | |
Charter Communications, Inc., Class A * | | | 2 | | | | 1,119 | |
| | |
Comcast Corp., Class A | | | 15 | | | | 629 | |
| | |
Discovery, Inc., Class A * | | | 57 | | | | 1,146 | |
| | |
Discovery, Inc., Class C * | | | 8 | | | | 147 | |
| | | | | | | | |
| | |
| | | | | | | 3,101 | |
| | | | | | | | |
|
Multiline Retail — 0.4% | |
| | |
Dollar Tree, Inc. * | | | 7 | | | | 613 | |
| | | | | | | | |
|
Multi-Utilities — 0.9% | |
| | |
Ameren Corp. | | | 9 | | | | 712 | |
| | |
CMS Energy Corp. | | | 4 | | | | 261 | |
| | |
Public Service Enterprise Group, Inc. | | | 6 | | | | 338 | |
| | | | | | | | |
| | |
| | | | | | | 1,311 | |
| | | | | | | | |
|
Oil, Gas & Consumable Fuels — 3.8% | |
| | |
Cheniere Energy, Inc. * | | | 8 | | | | 399 | |
| | |
Chevron Corp.(b) | | | 6 | | | | 397 | |
| | |
Concho Resources, Inc. | | | 2 | | | | 83 | |
| | |
Diamondback Energy, Inc. | | | 41 | | | | 1,053 | |
| | |
EOG Resources, Inc. | | | 5 | | | | 164 | |
| | |
Kinder Morgan, Inc. | | | 56 | | | | 669 | |
| | |
Parsley Energy, Inc., Class A | | | 57 | | | | 571 | |
| | |
Pioneer Natural Resources Co. (b) | | | 7 | | | | 569 | |
| | |
TC Energy Corp. (Canada) | | | 21 | | | | 832 | |
| | |
Williams Cos., Inc. (The) | | | 31 | | | | 594 | |
| | | | | | | | |
| | |
| | | | | | | 5,331 | |
| | | | | | | | |
|
Personal Products — 0.3% | |
| | |
Estee Lauder Cos., Inc. (The), Class A | | | 2 | | | | 398 | |
| | | | | | | | |
|
Pharmaceuticals — 1.7% | |
| | |
Bristol-Myers Squibb Co. | | | 16 | | | | 959 | |
| | |
Elanco Animal Health, Inc. * | | | 7 | | | | 204 | |
| | |
Eli Lilly and Co. | | | 7 | | | | 909 | |
| | |
Merck & Co., Inc. | | | 4 | | | | 313 | |
| | | | | | | | |
| | |
| | | | | | | 2,385 | |
| | | | | | | | |
|
Road & Rail — 4.1% | |
| | |
Canadian Pacific Railway Ltd. (Canada) | | | 2 | | | | 483 | |
| | |
CSX Corp. | | | 11 | | | | 883 | |
| | | | | | | | |
| INVESTMENTS | | SHARES
(000) | | | VALUE
($000) | |
| | | | | | | | |
| | | | | | | | |
|
Road & Rail — continued | |
| | |
Lyft, Inc., Class A * | | | 46 | | | | 1,041 | |
| | |
Norfolk Southern Corp. (b) | | | 7 | | | | 1,446 | |
| | |
Old Dominion Freight Line, Inc. | | | 2 | | | | 447 | |
| | |
Uber Technologies, Inc. * | | | 36 | | | | 1,204 | |
| | |
Union Pacific Corp. | | | 2 | | | | 312 | |
| | | | | | | | |
| | |
| | | | | | | 5,816 | |
| | | | | | | | |
|
Semiconductors & Semiconductor Equipment — 7.2% | |
| | |
Advanced Micro Devices, Inc. * (b) | | | 17 | | | | 1,267 | |
| | |
Analog Devices, Inc. (b) | | | 12 | | | | 1,463 | |
| | |
Applied Materials, Inc. | | | 3 | | | | 172 | |
| | |
ASML Holding NV (Registered), NYRS (Netherlands) | | | — | (a) | | | 145 | |
| | |
Lam Research Corp. | | | 3 | | | | 1,189 | |
| | |
Microchip Technology, Inc. | | | 4 | | | | 374 | |
| | |
Micron Technology, Inc. * | | | 20 | | | | 987 | |
| | |
NXP Semiconductors NV (Netherlands) | | | 20 | | | | 2,677 | |
| | |
ON Semiconductor Corp. * | | | 19 | | | | 488 | |
| | |
Qorvo, Inc. * | | | 4 | | | | 452 | |
| | |
Taiwan Semiconductor Manufacturing Co. Ltd., ADR (Taiwan) | | | 11 | | | | 903 | |
| | |
Texas Instruments, Inc. (b) | | | 1 | | | | 121 | |
| | | | | | | | |
| | |
| | | | | | | 10,238 | |
| | | | | | | | |
|
Software — 3.8% | |
| | |
Ceridian HCM Holding, Inc. * | | | 10 | | | | 832 | |
| | |
Coupa Software, Inc. * | | | 3 | | | | 778 | |
| | |
Intuit, Inc. (b) | | | 1 | | | | 464 | |
| | |
Microsoft Corp. (b) | | | 4 | | | | 882 | |
| | |
Paylocity Holding Corp. * | | | 5 | | | | 884 | |
| | |
salesforce.com, Inc. * | | | 4 | | | | 923 | |
| | |
ServiceNow, Inc. * | | | 1 | | | | 259 | |
| | |
Workday, Inc., Class A * | | | 2 | | | | 332 | |
| | | | | | | | |
| | |
| | | | | | | 5,354 | |
| | | | | | | | |
|
Specialty Retail — 3.9% | |
| | |
AutoZone, Inc. * | | | 1 | | | | 1,136 | |
| | |
Best Buy Co., Inc. | | | 8 | | | | 937 | |
| | |
Home Depot, Inc. (The) | | | 1 | | | | 322 | |
| | |
Lowe’s Cos., Inc. (b) | | | 8 | | | | 1,278 | |
| | |
O’Reilly Automotive, Inc. * (b) | | | 3 | | | | 1,458 | |
| | |
Ross Stores, Inc. | | | — | (a) | | | 29 | |
| | |
TJX Cos., Inc. (The) | | | 6 | | | | 327 | |
| | | | | | | | |
| | |
| | | | | | | 5,487 | |
| | | | | | | | |
SEE NOTES TO FINANCIAL STATEMENTS.
| | | | | | |
| | | |
| 20 | | | | J.P. MORGAN SPECIALTY FUNDS | | OCTOBER 31, 2020 |
| | | | | | | | |
| INVESTMENTS | | SHARES
(000) | | | VALUE
($000) | |
Long Positions — continued | |
|
Common Stocks — continued | |
|
Technology Hardware, Storage & Peripherals — 0.5% | |
| | |
Seagate Technology plc | | | 16 | | | | 763 | |
| | | | | | | | |
|
Textiles, Apparel & Luxury Goods — 0.5% | |
| | |
Carter’s, Inc. | | | 7 | | | | 574 | |
| | |
NIKE, Inc., Class B | | | 1 | | | | 169 | |
| | | | | | | | |
| | |
| | | | | | | 743 | |
| | | | | | | | |
|
Trading Companies & Distributors — 0.2% | |
| | |
WW Grainger, Inc. | | | 1 | | | | 273 | |
| | | | | | | | |
|
Wireless Telecommunication Services — 0.9% | |
| | |
T-Mobile US, Inc. * | | | 12 | | | | 1,271 | |
| | | | | | | | |
| | |
Total Common Stocks
(Cost $97,714) | | | | | | | 110,565 | |
| | | | | | | | |
Short-Term Investments — 16.8% | |
|
Investment Companies — 16.8% | |
| | |
JPMorgan Prime Money Market Fund Class Institutional Shares, 0.05% (c) (d)
(Cost $23,767) | | | 23,759 | | | | 23,773 | |
| | | | | | | | |
| | |
Total Long Positions
(Cost $121,481) | | | | | | | 134,338 | |
| | | | | | | | |
Short Positions — (70.6)% | |
|
Common Stocks — (70.6)% | |
|
Aerospace & Defense — (1.4)% | |
| | |
Boeing Co. (The) | | | (3 | ) | | | (447 | ) |
| | |
HEICO Corp. | | | (3 | ) | | | (336 | ) |
| | |
Huntington Ingalls Industries, Inc. | | | (3 | ) | | | (396 | ) |
| | |
Lockheed Martin Corp. | | | (1 | ) | | | (476 | ) |
| | |
TransDigm Group, Inc. | | | (1 | ) | | | (357 | ) |
| | | | | | | | |
| | |
| | | | | | | (2,012 | ) |
| | | | | | | | |
|
Air Freight & Logistics — (0.9)% | |
| | |
CH Robinson Worldwide, Inc. | | | (8 | ) | | | (668 | ) |
| | |
Expeditors International of Washington, Inc. | | | (7 | ) | | | (594 | ) |
| | | | | | | | |
| | |
| | | | | | | (1,262 | ) |
| | | | | | | | |
|
Auto Components — (0.1)% | |
| | |
Autoliv, Inc. (Sweden) | | | (1 | ) | | | (105 | ) |
| | | | | | | | |
|
Automobiles — (0.6)% | |
| | |
Ford Motor Co. | | | (97 | ) | | | (752 | ) |
| | |
Harley-Davidson, Inc. | | | (4 | ) | | | (141 | ) |
| | | | | | | | |
| | |
| | | | | | | (893 | ) |
| | | | | | | | |
|
Banks — (1.9)% | |
| | |
Associated Banc-Corp. | | | (7 | ) | | | (92 | ) |
| | |
Bank of Hawaii Corp. | | | (4 | ) | | | (269 | ) |
| | |
Citizens Financial Group, Inc. | | | (13 | ) | | | (362 | ) |
| | | | | | | | |
| INVESTMENTS | | SHARES
(000) | | | VALUE
($000) | |
| |
|
| |
|
Banks — continued | |
| | |
First Republic Bank | | | (3 | ) | | | (323 | ) |
| | |
Huntington Bancshares, Inc. | | | (30 | ) | | | (315 | ) |
| | |
KeyCorp | | | (39 | ) | | | (511 | ) |
| | |
PNC Financial Services Group, Inc. (The) | | | (7 | ) | | | (749 | ) |
| | | | | | | | |
| | |
| | | | | | | (2,621 | ) |
| | | | | | | | |
|
Beverages — (0.1)% | |
| | |
Brown-Forman Corp., Class B | | | (2 | ) | | | (129 | ) |
| | | | | | | | |
|
Biotechnology — (2.1)% | |
| | |
Amgen, Inc. | | | (6 | ) | | | (1,222 | ) |
| | |
Gilead Sciences, Inc. | | | (29 | ) | | | (1,685 | ) |
| | | | | | | | |
| | |
| | | | | | | (2,907 | ) |
| | | | | | | | |
|
Building Products — (0.4)% | |
| | |
Fortune Brands Home & Security, Inc. | | | (2 | ) | | | (181 | ) |
| | |
Johnson Controls International plc | | | (10 | ) | | | (429 | ) |
| | | | | | | | |
| | |
| | | | | | | (610 | ) |
| | | | | | | | |
|
Capital Markets — (2.7)% | |
| | |
BlackRock, Inc. | | | — | (a) | | | (244 | ) |
| | |
CME Group, Inc. | | | (1 | ) | | | (111 | ) |
| | |
Franklin Resources, Inc. | | | (40 | ) | | | (750 | ) |
| | |
Moody’s Corp. | | | (1 | ) | | | (222 | ) |
| | |
Nasdaq, Inc. | | | (7 | ) | | | (867 | ) |
| | |
Northern Trust Corp. | | | (11 | ) | | | (888 | ) |
| | |
T. Rowe Price Group, Inc. | | | (1 | ) | | | (91 | ) |
| | |
Waddell & Reed Financial, Inc., Class A | | | (41 | ) | | | (630 | ) |
| | | | | | | | |
| | |
| | | | | | | (3,803 | ) |
| | | | | | | | |
|
Chemicals — (1.0)% | |
| | |
Albemarle Corp. | | | (11 | ) | | | (1,009 | ) |
| | |
Ecolab, Inc. | | | (2 | ) | | | (449 | ) |
| | | | | | | | |
| | |
| | | | | | | (1,458 | ) |
| | | | | | | | |
|
Commercial Services & Supplies — (0.3)% | |
| | |
Republic Services, Inc. | | | (5 | ) | | | (447 | ) |
| | | | | | | | |
|
Communications Equipment — (2.8)% | |
| | |
Cisco Systems, Inc. | | | (86 | ) | | | (3,099 | ) |
| | |
Juniper Networks, Inc. | | | (47 | ) | | | (924 | ) |
| | | | | | | | |
| | |
| | | | | | | (4,023 | ) |
| | | | | | | | |
|
Construction Materials — (0.7)% | |
| | |
Martin Marietta Materials, Inc. | | | (1 | ) | | | (367 | ) |
| | |
Vulcan Materials Co. | | | (4 | ) | | | (569 | ) |
| | | | | | | | |
| | |
| | | | | | | (936 | ) |
| | | | | | | | |
SEE NOTES TO FINANCIAL STATEMENTS.
| | | | | | | | |
| | | |
| OCTOBER 31, 2020 | | J.P. MORGAN SPECIALTY FUNDS | | | | | 21 | |
JPMorgan Research Market Neutral Fund
SCHEDULE OF PORTFOLIO INVESTMENTS
AS OF OCTOBER 31, 2020 (continued)
| | | | | | | | |
| INVESTMENTS | | SHARES
(000) | | | VALUE
($000) | |
Short Positions — continued | |
|
Common Stocks — continued | |
|
Consumer Finance — (0.2)% | |
| | |
American Express Co. | | | (3 | ) | | | (245 | ) |
| | | | | | | | |
|
Containers & Packaging — (2.1)% | |
| | |
Avery Dennison Corp. | | | (1 | ) | | | (200 | ) |
| | |
Ball Corp. | | | (9 | ) | | | (805 | ) |
| | |
International Paper Co. | | | (29 | ) | | | (1,251 | ) |
| | |
Sealed Air Corp. | | | (4 | ) | | | (148 | ) |
| | |
Sonoco Products Co. | | | (13 | ) | | | (631 | ) |
| | | | | | | | |
| | |
| | | | | | | (3,035 | ) |
| | | | | | | | |
|
Diversified Telecommunication Services — (2.0)% | |
| | |
AT&T, Inc. | | | (62 | ) | | | (1,662 | ) |
| | |
CenturyLink, Inc. | | | (93 | ) | | | (800 | ) |
| | |
Verizon Communications, Inc. | | | (7 | ) | | | (427 | ) |
| | | | | | | | |
| | |
| | | | | | | (2,889 | ) |
| | | | | | | | |
|
Electric Utilities — (1.4)% | |
| | |
American Electric Power Co., Inc. | | | (6 | ) | | | (570 | ) |
| | |
Duke Energy Corp. | | | (4 | ) | | | (339 | ) |
| | |
FirstEnergy Corp. | | | (7 | ) | | | (201 | ) |
| | |
PPL Corp. | | | (8 | ) | | | (216 | ) |
| | |
Southern Co. (The) | | | (11 | ) | | | (660 | ) |
| | | | | | | | |
| | |
| | | | | | | (1,986 | ) |
| | | | | | | | |
|
Electrical Equipment — (0.8)% | |
| | |
Acuity Brands, Inc. | | | (12 | ) | | | (1,043 | ) |
| | |
Hubbell, Inc. | | | (1 | ) | | | (89 | ) |
| | | | | | | | |
| | |
| | | | | | | (1,132 | ) |
| | | | | | | | |
|
Electronic Equipment, Instruments & Components — (0.2)% | |
| | |
Cognex Corp. | | | (5 | ) | | | (331 | ) |
| | | | | | | | |
|
Energy Equipment & Services — (1.2)% | |
| | |
Halliburton Co. | | | (78 | ) | | | (940 | ) |
| | |
Schlumberger NV | | | (46 | ) | | | (685 | ) |
| | | | | | | | |
| | |
| | | | | | | (1,625 | ) |
| | | | | | | | |
|
Entertainment — (4.2)% | |
| | |
Cinemark Holdings, Inc. | | | (11 | ) | | | (94 | ) |
| | |
Spotify Technology SA * | | | (8 | ) | | | (1,948 | ) |
| | |
Take-Two Interactive Software, Inc. * | | | (12 | ) | | | (1,787 | ) |
| | |
Walt Disney Co. (The) | | | (17 | ) | | | (2,053 | ) |
| | | | | | | | |
| | |
| | | | | | | (5,882 | ) |
| | | | | | | | |
|
Equity Real Estate Investment Trusts (REITs) — (3.7)% | |
| | |
AvalonBay Communities, Inc. | | | (3 | ) | | | (358 | ) |
| | |
Crown Castle International Corp. | | | (1 | ) | | | (97 | ) |
| | |
Duke Realty Corp. | | | (7 | ) | | | (262 | ) |
| | | | | | | | |
| INVESTMENTS | | SHARES
(000) | | | VALUE
($000) | |
| |
|
| |
|
Equity Real Estate Investment Trusts (REITs) — continued | |
| | |
Equity Residential | | | (10 | ) | | | (470 | ) |
| | |
Essex Property Trust, Inc. | | | (2 | ) | | | (408 | ) |
| | |
Extra Space Storage, Inc. | | | (3 | ) | | | (391 | ) |
| | |
Iron Mountain, Inc. | | | (42 | ) | | | (1,100 | ) |
| | |
National Retail Properties, Inc. | | | (13 | ) | | | (403 | ) |
| | |
Simon Property Group, Inc. | | | (17 | ) | | | (1,071 | ) |
| | |
Vornado Realty Trust | | | (10 | ) | | | (316 | ) |
| | |
Welltower, Inc. | | | (8 | ) | | | (419 | ) |
| | | | | | | | |
| | |
| | | | | | | (5,295 | ) |
| | | | | | | | |
|
Food & Staples Retailing — (2.9)% | |
| | |
Kroger Co. (The) | | | (60 | ) | | | (1,929 | ) |
| | |
Sysco Corp. | | | (7 | ) | | | (363 | ) |
| | |
Walgreens Boots Alliance, Inc. | | | (15 | ) | | | (521 | ) |
| | |
Walmart, Inc. | | | (9 | ) | | | (1,225 | ) |
| | | | | | | | |
| | |
| | | | | | | (4,038 | ) |
| | | | | | | | |
|
Food Products — (1.5)% | |
| | |
Campbell Soup Co. | | | (17 | ) | | | (806 | ) |
| | |
General Mills, Inc. | | | (9 | ) | | | (538 | ) |
| | |
Kellogg Co. | | | (12 | ) | | | (732 | ) |
| | | | | | | | |
| | |
| | | | | | | (2,076 | ) |
| | | | | | | | |
|
Health Care Equipment & Supplies — (1.6)% | |
| | |
Abbott Laboratories | | | (5 | ) | | | (478 | ) |
| | |
Dentsply Sirona, Inc. | | | (2 | ) | | | (81 | ) |
| | |
Edwards Lifesciences Corp. * | | | (3 | ) | | | (217 | ) |
| | |
Stryker Corp. | | | (7 | ) | | | (1,437 | ) |
| | | | | | | | |
| | |
| | | | | | | (2,213 | ) |
| | | | | | | | |
|
Health Care Providers & Services — (1.4)% | |
| | |
AmerisourceBergen Corp. | | | (11 | ) | | | (1,022 | ) |
| | |
Henry Schein, Inc. * | | | (15 | ) | | | (935 | ) |
| | |
Patterson Cos., Inc. | | | (3 | ) | | | (84 | ) |
| | | | | | | | |
| | |
| | | | | | | (2,041 | ) |
| | | | | | | | |
|
Health Care Technology — (0.6)% | |
| | |
Cerner Corp. | | | (12 | ) | | | (815 | ) |
| | | | | | | | |
|
Hotels, Restaurants & Leisure — (1.8)% | |
| | |
Chipotle Mexican Grill, Inc. * | | | (1 | ) | | | (762 | ) |
| | |
Darden Restaurants, Inc. | | | (7 | ) | | | (651 | ) |
| | |
Marriott International, Inc., Class A | | | (1 | ) | | | (91 | ) |
| | |
Starbucks Corp. | | | (12 | ) | | | (1,010 | ) |
| | | | | | | | |
| | |
| | | | | | | (2,514 | ) |
| | | | | | | | |
SEE NOTES TO FINANCIAL STATEMENTS.
| | | | | | |
| | | |
| 22 | | | | J.P. MORGAN SPECIALTY FUNDS | | OCTOBER 31, 2020 |
| | | | | | | | |
| INVESTMENTS | | SHARES
(000) | | | VALUE
($000) | |
Short Positions — continued | |
|
Common Stocks — continued | |
|
Household Durables — (0.2)% | |
| | |
NVR, Inc. * | | | — | (a) | | | (59 | ) |
| | |
PulteGroup, Inc. | | | (4 | ) | | | (151 | ) |
| | | | | | | | |
| | |
| | | | | | | (210 | ) |
| | | | | | | | |
|
Household Products — (1.3)% | |
| | |
Clorox Co. (The) | | | (9 | ) | | | (1,823 | ) |
| | | | | | | | |
|
Industrial Conglomerates — (2.0)% | |
| | |
3M Co. | | | (7 | ) | | | (1,189 | ) |
| | |
General Electric Co. | | | (229 | ) | | | (1,696 | ) |
| | | | | | | | |
| | |
| | | | | | | (2,885 | ) |
| | | | | | | | |
|
Insurance — (1.9)% | |
| | |
Aflac, Inc. | | | (6 | ) | | | (194 | ) |
| | |
Allstate Corp. (The) | | | (7 | ) | | | (592 | ) |
| | |
Aon plc, Class A | | | (2 | ) | | | (385 | ) |
| | |
Axis Capital Holdings Ltd. | | | (4 | ) | | | (191 | ) |
| | |
MetLife, Inc. | | | (6 | ) | | | (240 | ) |
| | |
Principal Financial Group, Inc. | | | (9 | ) | | | (338 | ) |
| | |
Travelers Cos., Inc. (The) | | | (6 | ) | | | (689 | ) |
| | | | | | | | |
| | |
| | | | | | | (2,629 | ) |
| | | | | | | | |
|
Interactive Media & Services — (0.5)% | |
| | |
Twitter, Inc. * | | | (18 | ) | | | (740 | ) |
| | | | | | | | |
|
Internet & Direct Marketing Retail — (0.8)% | |
| | |
eBay, Inc. | | | (25 | ) | | | (1,170 | ) |
| | | | | | | | |
|
IT Services — (3.3)% | |
| | |
EPAM Systems, Inc. * | | | (1 | ) | | | (218 | ) |
| | |
Global Payments, Inc. | | | (2 | ) | | | (350 | ) |
| | |
Infosys Ltd., ADR (India) | | | (34 | ) | | | (483 | ) |
| | |
Jack Henry & Associates, Inc. | | | (5 | ) | | | (815 | ) |
| | |
Paychex, Inc. | | | (16 | ) | | | (1,328 | ) |
| | |
Western Union Co. (The) | | | (72 | ) | | | (1,406 | ) |
| | | | | | | | |
| | |
| | | | | | | (4,600 | ) |
| | | | | | | | |
|
Life Sciences Tools & Services — (0.6)% | |
| | |
Agilent Technologies, Inc. | | | (3 | ) | | | (328 | ) |
| | |
Waters Corp. * | | | (3 | ) | | | (576 | ) |
| | | | | | | | |
| | |
| | | | | | | (904 | ) |
| | | | | | | | |
|
Machinery — (2.0)% | |
| | |
Caterpillar, Inc. | | | (8 | ) | | | (1,197 | ) |
| | |
Illinois Tool Works, Inc. | | | (6 | ) | | | (1,267 | ) |
| | |
PACCAR, Inc. | | | (4 | ) | | | (317 | ) |
| | | | | | | | |
| | |
| | | | | | | (2,781 | ) |
| | | | | | | | |
| | | | | | | | |
| INVESTMENTS | | SHARES
(000) | | | VALUE
($000) | |
| |
|
| |
|
Media — (3.4)% | |
| | |
Fox Corp., Class A | | | (34 | ) | | | (889 | ) |
| | |
Omnicom Group, Inc. | | | (22 | ) | | | (1,038 | ) |
| | |
Sirius XM Holdings, Inc. | | | (74 | ) | | | (426 | ) |
| | |
ViacomCBS, Inc. | | | (84 | ) | | | (2,386 | ) |
| | | | | | | | |
| | |
| | | | | | | (4,739 | ) |
| | | | | | | | |
|
Multiline Retail — (1.1)% | |
| | |
Kohl’s Corp. | | | (14 | ) | | | (295 | ) |
| | |
Macy’s, Inc. | | | (83 | ) | | | (514 | ) |
| | |
Nordstrom, Inc. | | | (37 | ) | | | (452 | ) |
| | |
Target Corp. | | | (2 | ) | | | (321 | ) |
| | | | | | | | |
| | |
| | | | | | | (1,582 | ) |
| | | | | | | | |
|
Multi-Utilities — (1.2)% | |
| | |
Consolidated Edison, Inc. | | | (18 | ) | | | (1,414 | ) |
| | |
NiSource, Inc. | | | (15 | ) | | | (352 | ) |
| | | | | | | | |
| | |
| | | | | | | (1,766 | ) |
| | | | | | | | |
|
Oil, Gas & Consumable Fuels — (3.4)% | |
| | |
Apache Corp. | | | (19 | ) | | | (158 | ) |
| | |
Devon Energy Corp. | | | (58 | ) | | | (514 | ) |
| | |
Enbridge, Inc. (Canada) | | | (51 | ) | | | (1,406 | ) |
| | |
Exxon Mobil Corp. | | | (22 | ) | | | (732 | ) |
| | |
Hess Corp. | | | (22 | ) | | | (823 | ) |
| | |
HollyFrontier Corp. | | | (13 | ) | | | (240 | ) |
| | |
Marathon Oil Corp. | | | (72 | ) | | | (285 | ) |
| | |
Occidental Petroleum Corp. | | | (58 | ) | | | (531 | ) |
| | |
Valero Energy Corp. | | | (4 | ) | | | (150 | ) |
| | | | | | | | |
| | |
| | | | | | | (4,839 | ) |
| | | | | | | | |
|
Personal Products — 0.0% (e) | |
| | |
Coty, Inc., Class A | | | (23 | ) | | | (68 | ) |
| | | | | | | | |
|
Pharmaceuticals — (0.8)% | |
| | |
Johnson & Johnson | | | (4 | ) | | | (514 | ) |
| | |
Pfizer, Inc. | | | (17 | ) | | | (604 | ) |
| | | | | | | | |
| | |
| | | | | | | (1,118 | ) |
| | | | | | | | |
|
Professional Services — (0.4)% | |
| | |
Robert Half International, Inc. | | | (6 | ) | | | (294 | ) |
| | |
TransUnion | | | (3 | ) | | | (259 | ) |
| | | | | | | | |
| | |
| | | | | | | (553 | ) |
| | | | | | | | |
|
Road & Rail — (0.9)% | |
| | |
Canadian National Railway Co. (Canada) | | | (5 | ) | | | (450 | ) |
| | |
Heartland Express, Inc. | | | (17 | ) | | | (315 | ) |
| | |
JB Hunt Transport Services, Inc. | | | (2 | ) | | | (257 | ) |
SEE NOTES TO FINANCIAL STATEMENTS.
| | | | | | | | |
| | | |
| OCTOBER 31, 2020 | | J.P. MORGAN SPECIALTY FUNDS | | | | | 23 | |
JPMorgan Research Market Neutral Fund
SCHEDULE OF PORTFOLIO INVESTMENTS
AS OF OCTOBER 31, 2020 (continued)
| | | | | | | | |
| INVESTMENTS | | SHARES
(000) | | | VALUE
($000) | |
Short Positions — continued | |
|
Common Stocks — continued | |
|
Road & Rail — continued | |
| | |
Werner Enterprises, Inc. | | | (8 | ) | | | (295 | ) |
| | | | | | | | |
| | |
| | | | | | | (1,317 | ) |
| | | | | | | | |
|
Semiconductors & Semiconductor Equipment — (2.3)% | |
| | |
Broadcom, Inc. | | | (7 | ) | | | (2,391 | ) |
| | |
Intel Corp. | | | (20 | ) | | | (894 | ) |
| | | | | | | | |
| | |
| | | | | | | (3,285 | ) |
| | | | | | | | |
|
Software — (1.3)% | |
| | |
Adobe, Inc. * | | | (2 | ) | | | (739 | ) |
| | |
Oracle Corp. | | | (9 | ) | | | (487 | ) |
| | |
Splunk, Inc. * | | | (3 | ) | | | (547 | ) |
| | | | | | | | |
| | |
| | | | | | | (1,773 | ) |
| | | | | | | | |
|
Specialty Retail — (0.5)% | |
| | |
Gap, Inc. (The) | | | (5 | ) | | | (90 | ) |
| | |
Ulta Beauty, Inc. * | | | (1 | ) | | | (236 | ) |
| | |
Williams-Sonoma, Inc. | | | (4 | ) | | | (359 | ) |
| | | | | | | | |
| | |
| | | | | | | (685 | ) |
| | | | | | | | |
|
Technology Hardware, Storage & Peripherals — (1.3)% | |
| | |
HP, Inc. | | | (54 | ) | | | (970 | ) |
| | |
NetApp, Inc. | | | (17 | ) | | | (758 | ) |
| | |
Xerox Holdings Corp. | | | (9 | ) | | | (152 | ) |
| | | | | | | | |
| | |
| | | | | | | (1,880 | ) |
| | | | | | | | |
|
Textiles, Apparel & Luxury Goods — (0.4)% | |
| | |
Canada Goose Holdings, Inc. (Canada) * | | | (2 | ) | | | (54 | ) |
| | |
VF Corp. | | | (8 | ) | | | (555 | ) |
| | | | | | | | |
| | |
| | | | | | | (609 | ) |
| | | | | | | | |
| | | | | | | | |
| INVESTMENTS | | SHARES
(000) | | | VALUE
($000) | |
|
| |
|
| |
|
Trading Companies & Distributors — (0.4)% | |
| | |
Fastenal Co. | | | (10 | ) | | | (448 | ) |
| | |
HD Supply Holdings, Inc. * | | | (5 | ) | | | (187 | ) |
| | | | | | | | |
| | |
| | | | | | | (635 | ) |
| | | | | | | | |
| | |
Total Common Stocks
(Proceeds $(108,392)) | | | | | | | (99,914 | ) |
| | | | | | | | |
| | |
Total Short Positions
(Proceeds $(108,392)) | | | | | | | (99,914 | ) |
| | | | | | | | |
Total Investments — 24.4%
(Cost $13,089) | | | | | | | 34,424 | |
Other Assets Less Liabilities — 75.6% | | | | | | | 107,015 | |
| | | | | | | | |
NET ASSETS — 100.0% | | | | | | | 141,439 | |
| | | | | | | | |
Percentages indicated are based on net assets.
| | |
Abbreviations |
| |
| ADR | | American Depositary Receipt |
| NYRS | | New York Registry Shares |
| |
| (a) | | Amount rounds to less than one thousand. |
| (b) | | All or a portion of this security is segregated as collateral for short sales. The total value of securities and cash segregated as collateral is approximately $18,239,000 and $96,488,000 respectively. |
| (c) | | Investment in an affiliated fund, which is registered under the Investment Company Act of 1940, as amended, and is advised by J.P. Morgan Investment Management Inc. |
| (d) | | The rate shown is the current yield as of October 31, 2020. |
| (e) | | Amount rounds to less than 0.1% of net assets. |
| * | | Non-income producing security. |
Futures contracts outstanding as of October 31, 2020 (amounts in thousands, except number of contracts):
| | | | | | | | | | | | | | | | | | |
| DESCRIPTION | | NUMBER OF
CONTRACTS | | | EXPIRATION
DATE | | | TRADING
CURRENCY | | NOTIONAL
AMOUNT ($) | | | VALUE AND
UNREALIZED
APPRECIATION
(DEPRECIATION) ($) | |
Short Contracts | |
S&P 500 E-Mini Index | | | (12 | ) | | | 12/2020 | | | USD | | | (1,959 | ) | | | 85 | |
| | | | | | | | | | | | | | | | | | |
| | |
Abbreviations |
| USD | | United States Dollar |
SEE NOTES TO FINANCIAL STATEMENTS.
| | | | | | |
| | | |
| 24 | | | | J.P. MORGAN SPECIALTY FUNDS | | OCTOBER 31, 2020 |
THIS PAGE IS INTENTIONALLY LEFT BLANK
| | | | | | | | |
| | | |
| OCTOBER 31, 2020 | | J.P. MORGAN SPECIALTY FUNDS | | | | | 25 | |
STATEMENTS OF ASSETS AND LIABILITIES
AS OF OCTOBER 31, 2020
(Amounts in thousands, except per share amounts)
| | | | | | | | | | | | |
| | | JPMorgan
Macro
Opportunities
Fund | | | JPMorgan
Opportunistic
Equity
Long/Short Fund | | | JPMorgan
Research
Market
Neutral Fund | |
ASSETS: | | | | | | | | | | | | |
Investments in non-affiliates, at value | | $ | 11,828 | | | $ | 398,009 | | | $ | 110,565 | |
Investments in affiliates, at value | | | 2,356 | | | | 114,889 | | | | 23,773 | |
Options purchased, at value | | | 70 | | | | — | | | | — | |
Restricted cash for exchange-traded options | | | 676 | | | | — | | | | — | |
Cash | | | 390 | | | | — | | | | 1 | |
Foreign currency, at value | | | 93 | | | | — | | | | — | |
Deposits at broker for futures contracts | | | — | | | | — | | | | 284 | |
Deposits at broker for securities sold short | | | — | | | | 186,652 | | | | 96,488 | |
Deferred offering costs (See Note 2.G.) | | | 10 | | | | — | | | | — | |
Receivables: | | | | | | | | | | | | |
Investment securities sold | | | 62 | | | | 66,125 | | | | 5,689 | |
Fund shares sold | | | — | | | | 683 | | | | 11,298 | |
Interest and dividends from non-affiliates | | | 21 | | | | 124 | | | | 62 | |
Dividends from affiliates | | | — | (a) | | | 1 | | | | 2 | |
Tax reclaims | | | 1 | | | | — | | | | — | |
Variation margin on futures contracts | | | 589 | | | | — | | | | 23 | |
Unrealized appreciation on forward foreign currency exchange contracts | | | 52 | | | | — | | | | — | |
Due from adviser | | | 77 | | | | — | | | | — | |
| | | | | | | | | | | | |
Total Assets | | | 16,225 | | | | 766,483 | | | | 248,185 | |
| | | | | | | | | | | | |
| | | |
LIABILITIES: | | | | | | | | | | | | |
Payables: | | | | | | | | | | | | |
Due to broker | | | — | | | | 33 | | | | — | |
Securities sold short, at value | | | — | | | | 151,146 | | | | 99,914 | |
Dividend expense to non-affiliates on securities sold short | | | — | | | | 38 | | | | 104 | |
Investment securities purchased | | | 614 | | | | 128,688 | | | | 6,507 | |
Interest expense to non-affiliates on securities sold short | | | — | | | | 143 | | | | 12 | |
Fund shares redeemed | | | — | | | | 181 | | | | 34 | |
Unrealized depreciation on forward foreign currency exchange contracts | | | 32 | | | | — | | | | — | |
Accrued liabilities: | | | | | | | | | | | | |
Investment advisory fees | | | — | | | | 507 | | | | 7 | |
Administration fees | | | — | | | | 32 | | | | — | |
Distribution fees | | | — | (a) | | | 8 | | | | 5 | |
Service fees | | | 3 | | | | 55 | | | | 25 | |
Custodian and accounting fees | | | 6 | | | | 7 | | | | 23 | |
Trustees’ and Chief Compliance Officer’s fees | | | — | | | | — | (a) | | | 1 | |
Other | | | 138 | | | | 129 | | | | 114 | |
| | | | | | | | | | | | |
Total Liabilities | | | 793 | | | | 280,967 | | | | 106,746 | |
| | | | | | | | | | | | |
Net Assets | | $ | 15,432 | | | $ | 485,516 | | | $ | 141,439 | |
| | | | | | | | | | | | |
| (a) | Amount rounds to less than one thousand. |
SEE NOTES TO FINANCIAL STATEMENTS.
| | | | | | |
| | | |
| 26 | | | | J.P. MORGAN SPECIALTY FUNDS | | OCTOBER 31, 2020 |
| | | | | | | | | | | | |
| | | JPMorgan
Macro
Opportunities
Fund | | | JPMorgan
Opportunistic
Equity
Long/Short Fund | | | JPMorgan
Research
Market
Neutral Fund | |
NET ASSETS: | |
Paid-in-Capital | | $ | 14,791 | | | $ | 417,687 | | | $ | 152,893 | |
Total distributable earnings (loss) | | | 641 | | | | 67,829 | | | | (11,454 | ) |
| | | | | | | | | | | | |
Total Net Assets | | $ | 15,432 | | | $ | 485,516 | | | $ | 141,439 | |
| | | | | | | | | | | | |
| | | |
Net Assets: | | | | | | | | | | | | |
Class A | | $ | 27 | | | $ | 20,914 | | | $ | 18,205 | |
Class C | | | 20 | | | | 4,596 | | | | 1,949 | |
Class I | | | 15,365 | | | | 226,048 | | | | 121,285 | |
Class R6 | | | 20 | | | | 233,958 | | | | — | |
| | | | | | | | | | | | |
Total | | $ | 15,432 | | | $ | 485,516 | | | $ | 141,439 | |
| | | | | | | | | | | | |
| | | |
Outstanding units of beneficial interest (shares) | | | | | | | | | | | | |
($0.0001 par value; unlimited number of shares authorized): | | | | | | | | | | | | |
Class A | | | 2 | | | | 1,018 | | | | 1,399 | |
Class C | | | 1 | | | | 231 | | | | 166 | |
Class I | | | 998 | | | | 10,845 | | | | 8,778 | |
Class R6 | | | 1 | | | | 11,073 | | | | — | |
| | | |
Net Asset Value (a): | | | | | | | | | | | | |
Class A — Redemption price per share | | $ | 15.38 | | | $ | 20.54 | | | $ | 13.01 | |
Class C — Offering price per share (b) | | | 15.34 | | | | 19.88 | | | | 11.77 | |
Class I — Offering and redemption price per share | | | 15.40 | | | | 20.84 | | | | 13.82 | |
Class R6 — Offering and redemption price per share | | | 15.41 | | | | 21.13 | | | | — | |
Class A maximum sales charge | | | 5.25 | % | | | 5.25 | % | | | 5.25 | % |
Class A maximum public offering price per share
[net asset value per share/(100% — maximum sales charge)] | | $ | 16.23 | | | $ | 21.68 | | | $ | 13.73 | |
| | | | | | | | | | | | |
| | | |
Cost of investments in non-affiliates | | $ | 10,710 | | | $ | 334,770 | | | $ | 97,714 | |
Cost of investments in affiliates | | | 2,356 | | | | 114,889 | | | | 23,767 | |
Cost of options purchased | | | 139 | | | | — | | | | — | |
Cost of foreign currency | | | 93 | | | | — | | | | — | |
Proceeds from securities sold short | | | — | | | | 152,014 | | | | 108,392 | |
| (a) | Per share amounts may not recalculate due to rounding of net assets and/or shares outstanding. |
| (b) | Redemption price for Class C Shares varies based upon length of time the shares are held. |
SEE NOTES TO FINANCIAL STATEMENTS.
| | | | | | | | |
| | | |
| OCTOBER 31, 2020 | | J.P. MORGAN SPECIALTY FUNDS | | | | | 27 | |
STATEMENTS OF OPERATIONS
FOR THE YEAR ENDED OCTOBER 31, 2020
(Amounts in thousands)
| | | | | | | | | | | | |
| | | JPMorgan
Macro
Opportunities
Fund (a) | | | JPMorgan
Opportunistic
Equity
Long/Short Fund | | | JPMorgan
Research
Market
Neutral Fund | |
INVESTMENT INCOME: | | | | | | | | | | | | |
Interest income from non-affiliates | | $ | 12 | | | $ | — | (b) | | $ | — | (b) |
Interest income from affiliates | | | — | | | | — | | | | — | (b) |
Interest income from non-affiliates on securities sold short | | | — | | | | — | | | | 136 | |
Dividend income from non-affiliates | | | 65 | | | | 1,884 | | | | 999 | |
Dividend income from affiliates | | | 5 | | | | 589 | | | | 90 | |
Non-cash dividend income from non-affiliates | | | 6 | | | | — | | | | — | |
Foreign taxes withheld (net) | | | (4 | ) | | | — | | | | — | |
| | | | | | | | | | | | |
Total investment income | | | 84 | | | | 2,473 | | | | 1,225 | |
| | | | | | | | | | | | |
| | | |
EXPENSES: | | | | | | | | | | | | |
Investment advisory fees | | | 50 | | | | 4,376 | | | | 359 | |
Administration fees | | | 6 | | | | 274 | | | | 58 | |
Distribution fees: | | | | | | | | | | | | |
Class A | | | — | (b) | | | 40 | | | | 39 | |
Class C | | | — | (b) | | | 23 | | | | 21 | |
Service fees: | | | | | | | | | | | | |
Class A | | | — | (b) | | | 40 | | | | 39 | |
Class C | | | — | (b) | | | 8 | | | | 7 | |
Class I | | | 21 | | | | 387 | | | | 116 | |
Class L (c) | | | — | | | | — | | | | 12 | |
Custodian and accounting fees | | | 21 | | | | 35 | | | | 64 | |
Interest expense to affiliates | | | — | (b) | | | — | (b) | | | — | (b) |
Professional fees | | | 175 | | | | 99 | | | | 74 | |
Trustees’ and Chief Compliance Officer’s fees | | | 10 | | | | 26 | | | | 26 | |
Printing and mailing costs | | | 14 | | | | 9 | | | | 36 | |
Registration and filing fees | | | 44 | | | | 104 | | | | 65 | |
Transfer agency fees (See Note 2.I.) | | | — | (b) | | | 9 | | | | 12 | |
Offering costs (See Note 2.G.) | | | 11 | | | | — | | | | — | |
Dividend expense to non-affiliates on securities sold short | | | — | | | | 1,597 | | | | 1,652 | |
Interest expense to non-affiliates on securities sold short | | | — | | | | 109 | | | | — | |
Other | | | 5 | | | | 13 | | | | 8 | |
| | | | | | | | | | | | |
Total expenses | | | 357 | | | | 7,149 | | | | 2,588 | |
| | | | | | | | | | | | |
Less fees waived | | | (75 | ) | | | (149 | ) | | | (271 | ) |
Less expense reimbursements | | | (204 | ) | | | — | | | | — | |
| | | | | | | | | | | | |
Net expenses | | | 78 | | | | 7,000 | | | | 2,317 | |
| | | | | | | | | | | | |
Net investment income (loss) | | | 6 | | | | (4,527 | ) | | | (1,092 | ) |
| | | | | | | | | | | | |
| | | |
REALIZED/UNREALIZED GAINS (LOSSES): | | | | | | | | | | | | |
Net realized gain (loss) on transactions from: | | | | | | | | | | | | |
Investments in non-affiliates | | | 377 | | | | 48,661 | | | | 11,039 | |
Investments in affiliates | | | 2 | | | | 25 | | | | 6 | |
Options purchased | | | (215 | ) | | | (1,345 | ) | | | — | |
Futures contracts | | | (751 | ) | | | — | | | | (178 | ) |
Securities sold short | | | — | | | | (18,631 | ) | | | (6,573 | ) |
Foreign currency transactions | | | (5 | ) | | | — | | | | — | |
Forward foreign currency exchange contracts | | | (300 | ) | | | — | | | | — | |
Options written | | | — | (b) | | | 467 | | | | — | |
| | | | | | | | | | | | |
Net realized gain (loss) | | | (892 | ) | | | 29,177 | | | | 4,294 | |
| | | | | | | | | | | | |
Change in net unrealized appreciation/depreciation on: | | | | | | | | | | | | |
Investments in non-affiliates | | | 1,118 | | | | 39,536 | | | | 924 | |
Investments in affiliates | | | — | (b) | | | (14 | ) | | | 3 | |
Options purchased | | | (69 | ) | | | — | | | | — | |
Futures contracts | | | 218 | | | | — | | | | 84 | |
Securities sold short | | | — | | | | 1,030 | | | | 3,252 | |
Foreign currency translations | | | — | (b) | | | — | | | | — | |
Forward foreign currency exchange contracts | | | 20 | | | | — | | | | — | |
| | | | | | | | | �� | | | |
Change in net unrealized appreciation/depreciation | | | 1,287 | | | | 40,552 | | | | 4,263 | |
| | | | | | | | | | | | |
Net realized/unrealized gains (losses) | | | 395 | | | | 69,729 | | | | 8,557 | |
| | | | | | | | | | | | |
Change in net assets resulting from operations | | $ | 401 | | | $ | 65,202 | | | $ | 7,465 | |
| | | | | | | | | | | | |
| (a) | Commencement of operations was April 15, 2020. |
| (b) | Amount rounds to less than one thousand. |
| (c) | On July 2, 2020, Class L Shares for JPMorgan Research Market Neutral Fund were converted into Class I Shares. Additionally, as of July 2, 2020, the Class L Shares are no longer offered. |
SEE NOTES TO FINANCIAL STATEMENTS.
| | | | | | |
| | | |
| 28 | | | | J.P. MORGAN SPECIALTY FUNDS | | OCTOBER 31, 2020 |
STATEMENTS OF CHANGES IN NET ASSETS
FOR THE PERIODS INDICATED
(Amounts in thousands)
| | | | | | | | | | | | |
| | | JPMorgan Macro
Opportunities Fund | | | JPMorgan Opportunistic Equity Long/Short Fund | |
| | | Period Ended
October 31, 2020 (a) | | | Year Ended
October 31, 2020 | | | Year Ended
October 31, 2019 | |
CHANGE IN NET ASSETS RESULTING FROM OPERATIONS: | | | | | | | | | | | | |
Net investment income (loss) | | $ | 6 | | | $ | (4,527 | ) | | $ | 1,539 | |
Net realized gain (loss) | | | (892 | ) | | | 29,177 | | | | (16,144 | ) |
Change in net unrealized appreciation/depreciation | | | 1,287 | | | | 40,552 | | | | 6,014 | |
| | | | | | | | | | | | |
Change in net assets resulting from operations | | | 401 | | | | 65,202 | | | | (8,591 | ) |
| | | | | | | | | | | | |
| | | |
DISTRIBUTIONS TO SHAREHOLDERS: | | | | | | | | | | | | |
Class A | | | — | | | | — | | | | (720 | ) |
Class C | | | — | | | | — | | | | (66 | ) |
Class I | | | — | | | | (191 | ) | | | (2,975 | ) |
Class R2 (b) | | | — | | | | — | | | | — | (c) |
Class R5 (b) | | | — | | | | — | | | | — | (c) |
Class R6 (d) | | | — | | | | (727 | ) | | | (1,030 | ) |
| | | | | | | | | | | | |
Total distributions to shareholders | | | — | | | | (918 | ) | | | (4,791 | ) |
| | | | | | | | | | | | |
| | | |
CAPITAL TRANSACTIONS: | | | | | | | | | | | | |
Change in net assets resulting from capital transactions | | | 15,031 | | | | 102,197 | | | | 70,324 | |
| | | | | | | | | | | | |
| | | |
NET ASSETS: | | | | | | | | | | | | |
Change in net assets | | | 15,432 | | | | 166,481 | | | | 56,942 | |
Beginning of period | | | — | | | | 319,035 | | | | 262,093 | |
| | | | | | | | | | | | |
End of period | | $ | 15,432 | | | $ | 485,516 | | | $ | 319,035 | |
| | | | | | | | | | | | |
| (a) | Commencement of operations was April 15, 2020. |
| (b) | Liquidated on February 26, 2019 for JPMorgan Opportunistic Equity Long/Short Fund. |
| (c) | Amount rounds to less than one thousand. |
| (d) | Commencement of offering of class of shares effective September 30, 2020 for JPMorgan Macro Opportunities Fund. |
SEE NOTES TO FINANCIAL STATEMENTS.
| | | | | | | | |
| | | |
| OCTOBER 31, 2020 | | J.P. MORGAN SPECIALTY FUNDS | | | | | 29 | |
STATEMENTS OF CHANGES IN NET ASSETS
FOR THE PERIODS INDICATED (continued)
(Amounts in thousands)
| | | | | | | | |
| | | JPMorgan Research Market Neutral Fund | |
| | | Year Ended
October 31, 2020 | | | Year Ended
October 31, 2019 | |
CHANGE IN NET ASSETS RESULTING FROM OPERATIONS: | |
Net investment income (loss) | | $ | (1,092 | ) | | $ | 108 | |
Net realized gain (loss) | | | 4,294 | | | | 26,257 | |
Change in net unrealized appreciation/depreciation | | | 4,263 | | | | (23,376 | ) |
| | | | | | | | |
Change in net assets resulting from operations | | | 7,465 | | | | 2,989 | |
| | | | | | | | |
| | |
DISTRIBUTIONS TO SHAREHOLDERS: | | | | | | | | |
Class A | | | (1,559 | ) | | | (1,481 | ) |
Class C | | | (450 | ) | | | (543 | ) |
Class I | | | (2,527 | ) | | | (3,249 | ) |
Class L (a) | | | (1,689 | ) | | | (8,556 | ) |
| | | | | | | | |
Total distributions to shareholders | | | (6,225 | ) | | | (13,829 | ) |
| | | | | | | | |
|
CAPITAL TRANSACTIONS: | |
Change in net assets resulting from capital transactions | | | 77,802 | | | | (111,968 | ) |
| | | | | | | | |
|
NET ASSETS: | |
Change in net assets | | | 79,042 | | | | (122,808 | ) |
Beginning of period | | | 62,397 | | | | 185,205 | |
| | | | | | | | |
End of period | | $ | 141,439 | | | $ | 62,397 | |
| | | | | | | | |
| (a) | On July 2, 2020, the Fund’s Class L Shares were converted into Class I Shares. Additionally, as of July 2, 2020, the Class L Shares are no longer offered. |
SEE NOTES TO FINANCIAL STATEMENTS.
| | | | | | |
| | | |
| 30 | | | | J.P. MORGAN SPECIALTY FUNDS | | OCTOBER 31, 2020 |
| | | | | | | | | | | | |
| | | JPMorgan Macro
Opportunities Fund | | | JPMorgan Opportunistic Equity Long/Short Fund | |
| | | Period Ended
October 31, 2020 (a) | | | Year Ended
October 31, 2020 | | | Year Ended
October 31, 2019 | |
CAPITAL TRANSACTIONS: | | | | | | | | | | | | |
Class A | | | | | | | | | | | | |
Proceeds from shares issued | | $ | 33 | | | $ | 10,155 | | | $ | 4,832 | |
Distributions reinvested | | | — | | | | — | | | | 717 | |
Cost of shares redeemed | | | (7 | ) | | | (11,256 | ) | | | (35,501 | ) |
| | | | | | | | | | | | |
Change in net assets resulting from Class A capital transactions | | $ | 26 | | | $ | (1,101 | ) | | $ | (29,952 | ) |
| | | | | | | | | | | | |
Class C | | | | | | | | | | | | |
Proceeds from shares issued | | $ | 20 | | | $ | 2,177 | | | $ | 825 | |
Distributions reinvested | | | — | | | | — | | | | 66 | |
Cost of shares redeemed | | | — | | | | (684 | ) | | | (1,660 | ) |
| | | | | | | | | | | | |
Change in net assets resulting from Class C capital transactions | | $ | 20 | | | $ | 1,493 | | | $ | (769 | ) |
| | | | | | | | | | | | |
Class I | | | | | | | | | | | | |
Proceeds from shares issued | | $ | 14,965 | | | $ | 180,729 | | | $ | 145,908 | |
Distributions reinvested | | | — | | | | 185 | | | | 2,820 | |
Cost of shares redeemed | | | — | | | | (115,513 | ) | | | (159,718 | ) |
| | | | | | | | | | | | |
Change in net assets resulting from Class I capital transactions | | $ | 14,965 | | | $ | 65,401 | | | $ | (10,990 | ) |
| | | | | | | | | | | | |
Class R2 (b) | | | | | | | | | | | | |
Proceeds from shares issued | | $ | — | | | $ | — | | | $ | 4 | |
Distributions reinvested | | | — | | | | — | | | | — | (c) |
Cost of shares redeemed | | | — | | | | — | | | | (28 | ) |
| | | | | | | | | | | | |
Change in net assets resulting from Class R2 capital transactions | | $ | — | | | $ | — | | | $ | (24 | ) |
| | | | | | | | | | | | |
Class R5 (b) | | | | | | | | | | | | |
Distributions reinvested | | | — | | | | — | | | | — | (c) |
Cost of shares redeemed | | | — | | | | — | | | | (24 | ) |
| | | | | | | | | | | | |
Change in net assets resulting from Class R5 capital transactions | | $ | — | | | $ | — | | | $ | (24 | ) |
| | | | | | | | | | | | |
Class R6 (d) | | | | | | | | | | | | |
Proceeds from shares issued | | $ | 20 | | | $ | 93,501 | | | $ | 125,697 | |
Distributions reinvested | | | — | | | | 131 | | | | 375 | |
Cost of shares redeemed | | | — | | | | (57,228 | ) | | | (13,989 | ) |
| | | | | | | | | | | | |
Change in net assets resulting from Class R6 capital transactions | | $ | 20 | | | $ | 36,404 | | | $ | 112,083 | |
| | | | | | | | | | | | |
Total change in net assets resulting from capital transactions | | $ | 15,031 | | | $ | 102,197 | | | $ | 70,324 | |
| | | | | | | | | | | | |
| (a) | Commencement of operations was April 15, 2020. |
| (b) | Liquidated on February 26, 2019 for JPMorgan Opportunistic Equity Long/Short Fund. |
| (c) | Amount rounds to less than one thousand. |
| (d) | Commencement of offering of class of shares effective September 30, 2020 for JPMorgan Macro Opportunities Fund. |
SEE NOTES TO FINANCIAL STATEMENTS.
| | | | | | | | |
| | | |
| OCTOBER 31, 2020 | | J.P. MORGAN SPECIALTY FUNDS | | | | | 31 | |
STATEMENTS OF CHANGES IN NET ASSETS
FOR THE PERIODS INDICATED (continued)
(Amounts in thousands)
| | | | | | | | | | | | |
| | | JPMorgan Macro
Opportunities Fund | | | JPMorgan Opportunistic Equity Long/Short Fund | |
| | | Period Ended
October 31, 2020 (a) | | | Year Ended
October 31, 2020 | | | Year Ended
October 31, 2019 | |
SHARE TRANSACTIONS: | |
Class A | |
Issued | | | 2 | | | | 515 | | | | 273 | |
Reinvested | | | — | | | | — | | | | 40 | |
Redeemed | | | — | (b) | | | (613 | ) | | | (1,985 | ) |
| | | | | | | | | | | | |
Change in Class A Shares | | | 2 | | | | (98 | ) | | | (1,672 | ) |
| | | | | | | | | | | | |
Class C | |
Issued | | | 1 | | | | 115 | | | | 47 | |
Reinvested | | | — | | | | — | | | | 4 | |
Redeemed | | | — | | | | (38 | ) | | | (96 | ) |
| | | | | | | | | | | | |
Change in Class C Shares | | | 1 | | | | 77 | | | | (45 | ) |
| | | | | | | | | | | | |
Class I | |
Issued | | | 998 | | | | 9,392 | | | | 8,147 | |
Reinvested | | | — | | | | 11 | | | | 156 | |
Redeemed | | | — | | | | (6,104 | ) | | | (8,966 | ) |
| | | | | | | | | | | | |
Change in Class I Shares | | | 998 | | | | 3,299 | | | | (663 | ) |
| | | | | | | | | | | | |
Class R2 (c) | |
Issued | | | — | | | | — | | | | — | (b) |
Reinvested | | | — | | | | — | | | | — | (b) |
Redeemed | | | — | | | | — | | | | (1 | ) |
| | | | | | | | | | | | |
Change in Class R2 Shares | | | — | | | | — | | | | (1 | ) |
| | | | | | | | | | | | |
Class R5 (c) | |
Reinvested | | | — | | | | — | | | | — | (b) |
Redeemed | | | — | | | | — | | | | (1 | ) |
| | | | | | | | | | | | |
Change in Class R5 Shares | | | — | | | | — | | | | (1 | ) |
| | | | | | | | | | | | |
Class R6 (d) | |
Issued | | | 1 | | | | 4,846 | | | | 6,949 | |
Reinvested | | | — | | | | 7 | | | | 20 | |
Redeemed | | | — | | | | (3,003 | ) | | | (775 | ) |
| | | | | | | | | | | | |
Change in Class R6 Shares | | | 1 | | | | 1,850 | | | | 6,194 | |
| | | | | | | | | | | | |
| (a) | Commencement of operations was April 15, 2020. |
| (b) | Amount rounds to less than one thousand. |
| (c) | Liquidated on February 26, 2019 for JPMorgan Opportunistic Equity Long/Short Fund. |
| (d) | Commencement of offering of class of shares effective September 30, 2020 for JPMorgan Macro Opportunities Fund. |
SEE NOTES TO FINANCIAL STATEMENTS.
| | | | | | |
| | | |
| 32 | | | | J.P. MORGAN SPECIALTY FUNDS | | OCTOBER 31, 2020 |
| | | | | | | | |
| | | JPMorgan Research Market Neutral Fund | |
| | | Year Ended
October 31, 2020 | | | Year Ended
October 31, 2019 | |
CAPITAL TRANSACTIONS: | | | | | | | | |
Class A | | | | | | | | |
Proceeds from shares issued | | $ | 10,274 | | | $ | 3,101 | |
Distributions reinvested | | | 1,461 | | | | 1,394 | |
Cost of shares redeemed | | | (7,858 | ) | | | (4,003 | ) |
| | | | | | | | |
Change in net assets resulting from Class A capital transactions | | $ | 3,877 | | | $ | 492 | |
| | | | | | | | |
Class C | | | | | | | | |
Proceeds from shares issued | | $ | 1,554 | | | $ | 446 | |
Distributions reinvested | | | 426 | | | | 506 | |
Cost of shares redeemed | | | (3,621 | ) | | | (2,914 | ) |
| | | | | | | | |
Change in net assets resulting from Class C capital transactions | | $ | (1,641 | ) | | $ | (1,962 | ) |
| | | | | | | | |
Class I | | | | | | | | |
Proceeds from shares issued | | $ | 128,845 | | | $ | 11,144 | |
Distributions reinvested | | | 2,418 | | | | 3,139 | |
Cost of shares redeemed | | | (65,906 | ) | | | (18,992 | ) |
Conversion from Class L Shares | | | 26,571 | | | | — | |
| | | | | | | | |
Change in net assets resulting from Class I capital transactions | | $ | 91,928 | | | $ | (4,709 | ) |
| | | | | | | | |
Class L (a) | | | | | | | | |
Proceeds from shares issued | | $ | 17,165 | | | $ | 2,711 | |
Distributions reinvested | | | 1,660 | | | | 8,526 | |
Cost of shares redeemed | | | (8,616 | ) | | | (117,026 | ) |
Conversion to Class I Shares | | | (26,571 | ) | | | — | |
| | | | | | | | |
Change in net assets resulting from Class L capital transactions | | $ | (16,362 | ) | | $ | (105,789 | ) |
| | | | | | | | |
Total change in net assets resulting from capital transactions | | $ | 77,802 | | | $ | (111,968 | ) |
| | | | | | | | |
|
SHARE TRANSACTIONS: | |
Class A | |
Issued | | | 812 | | | | 225 | |
Reinvested | | | 126 | | | | 106 | |
Redeemed | | | (628 | ) | | | (290 | ) |
| | | | | | | | |
Change in Class A Shares | | | 310 | | | | 41 | |
| | | | | | | | |
Class C | |
Issued | | | 136 | | | | 34 | |
Reinvested | | | 40 | | | | 42 | |
Redeemed | | | (319 | ) | | | (229 | ) |
| | | | | | | | |
Change in Class C Shares | | | (143 | ) | | | (153 | ) |
| | | | | | | | |
Class I | |
Issued | | | 9,519 | | | | 765 | |
Reinvested | | | 197 | | | | 228 | |
Redeemed | | | (4,916 | ) | | | (1,325 | ) |
Conversion from Class L Shares | | | 1,971 | | | | — | |
| | | | | | | | |
Change in Class I Shares | | | 6,771 | | | | (332 | ) |
| | | | | | | | |
Class L (a) | |
Issued | | | 1,254 | | | | 183 | |
Reinvested | | | 132 | | | | 603 | |
Redeemed | | | (651 | ) | | | (8,081 | ) |
Conversion to Class I Shares | | | (1,917 | ) | | | — | |
| | | | | | | | |
Change in Class L Shares | | | (1,182 | ) | | | (7,295 | ) |
| | | | | | | | |
| (a) | On July 2, 2020, the Fund’s Class L Shares were converted into Class I Shares. Additionally, as of July 2, 2020, the Class L Shares are no longer offered. |
SEE NOTES TO FINANCIAL STATEMENTS.
| | | | | | | | |
| | | |
| OCTOBER 31, 2020 | | J.P. MORGAN SPECIALTY FUNDS | | | | | 33 | |
FINANCIAL HIGHLIGHTS
FOR THE PERIODS INDICATED
| | | | | | | | | | | | | | | | |
| | | | | | Per share operating performance | |
| | | | | | Investment operations | |
| | | Net asset
value,
beginning
of period | | | Net
investment
income
(loss) (b) | | | Net realized
and unrealized
gains
(losses) on
investments | | | Total from
investment
operations | |
JPMorgan Macro Opportunities Fund | | | | | | | | | | | | | | | | |
Class A | | | | | | | | | | | | | | | | |
April 15, 2020 (g) through October 31, 2020 | | $ | 15.00 | | | $ | (0.01 | ) | | $ | 0.39 | | | $ | 0.38 | |
| | | | |
Class C | | | | | | | | | | | | | | | | |
April 15, 2020 (g) through October 31, 2020 | | | 15.00 | | | | (0.06 | ) | | | 0.40 | | | | 0.34 | |
| | | | |
Class I | | | | | | | | | | | | | | | | |
April 15, 2020 (g) through October 31, 2020 | | | 15.00 | | | | — | (h) | | | 0.40 | | | | 0.40 | |
| | | | |
Class R6 | | | | | | | | | | | | | | | | |
September 30, 2020 (i) through October 31, 2020 | | | 15.35 | | | | 0.01 | | | | 0.05 | | | | 0.06 | |
| (a) | Annualized for periods less than one year, unless otherwise noted. |
| (b) | Calculated based upon average shares outstanding. |
| (c) | Not annualized for periods less than one year. |
| (d) | Includes adjustments in accordance with accounting principles generally accepted in the United States of America and as such, the net asset values for financial reporting purposes and the returns based upon those net asset values may differ from the net asset values and returns for shareholder transactions. |
| (e) | Certain non-recurring expenses incurred by the Fund were not annualized for the period indicated. |
| (f) | Includes earnings credits and interest expense, if applicable, each of which is less than 0.005% unless otherwise noted. |
| (g) | Commencement of operations. |
| (h) | Amount rounds to less than $0.005. |
| (i) | Commencement of offering of class of shares. |
SEE NOTES TO FINANCIAL STATEMENTS.
| | | | | | |
| | | |
| 34 | | | | J.P. MORGAN SPECIALTY FUNDS | | OCTOBER 31, 2020 |
| | | | | | | | | | | | | | | | | | | | | | | | | | |
| | | Ratios/Supplemental data | |
| | | | | | | | | | Ratios to average net assets (a) | | | | |
Net asset
value,
end of
period | | | Total return
(excludes
sales charge) (c)(d) | | | Net assets,
end of
period
(000’s) | | | Net
expenses (e)(f) | | | Net
investment income
(loss) (e) | | |
Expenses
without waivers,
reimbursements and
earnings credits (e) | | | Portfolio
turnover
rate (c) | |
| | | | | | | | | | | | | | | | | | | | | | | | | | |
| | | | | | | | | | | | | | | | | | | | | | | | | | |
| $ | 15.38 | | | | 2.53 | % | | $ | 27 | | | | 1.20 | % | | | (0.18 | )% | | | 5.12 | % | | | 49 | % |
| | | | | | |
| | | | | | | | | | | | | | | | | | | | | | | | | | |
| | 15.34 | | | | 2.27 | | | | 20 | | | | 1.70 | | | | (0.70 | ) | | | 5.76 | | | | 49 | |
| | | | | | |
| | | | | | | | | | | | | | | | | | | | | | | | | | |
| | 15.40 | | | | 2.67 | | | | 15,365 | | | | 0.95 | | | | 0.05 | | | | 4.24 | | | | 49 | |
| | | | | | |
| | | | | | | | | | | | | | | | | | | | | | | | | | |
| | 15.41 | | | | 0.39 | | | | 20 | | | | 0.77 | | | | 0.84 | | | | 7.24 | | | | 49 | |
SEE NOTES TO FINANCIAL STATEMENTS.
| | | | | | | | |
| | | |
| OCTOBER 31, 2020 | | J.P. MORGAN SPECIALTY FUNDS | | | | | 35 | |
FINANCIAL HIGHLIGHTS
FOR THE PERIODS INDICATED (continued)
| | | | | | | | | | | | | | | | | | | | | | | | | | | | |
| | | | | | Per share operating performance | |
| | | | | | Investment operations | | | Distributions | |
| | | Net asset
value,
beginning
of period | | | Net
investment
income
(loss) (a) | | | Net realized
and unrealized
gains
(losses) on
investments | | | Total from
investment
operations | | | Net
investment
income | | | Net
realized
gain | | | Total
distributions | |
JPMorgan Opportunistic Equity Long/Short Fund | | | | | | | | | | | | | | | | | | | | | | | | | | | | |
Class A | | | | | | | | | | | | | | | | | | | | | | | | | | | | |
Year Ended October 31, 2020 | | $ | 17.34 | | | $ | (0.29 | ) | | $ | 3.49 | | | $ | 3.20 | | | $ | — | | | $ | — | | | $ | — | |
Year Ended October 31, 2019 | | | 18.22 | | | | — | (e) | | | (0.55 | ) | | | (0.55 | ) | | | — | | | | (0.33 | ) | | | (0.33 | ) |
Year Ended October 31, 2018 | | | 18.13 | | | | (0.21 | ) | | | 0.53 | | | | 0.32 | | | | — | | | | (0.23 | ) | | | (0.23 | ) |
Year Ended October 31, 2017 | | | 17.12 | | | | (0.19 | ) | | | 2.46 | | | | 2.27 | | | | — | | | | (1.26 | ) | | | (1.26 | ) |
Year Ended October 31, 2016 | | | 17.37 | | | | (0.16 | ) | | | 0.07 | | | | (0.09 | ) | | | — | | | | (0.16 | ) | | | (0.16 | ) |
| | | | | | | |
Class C | | | | | | | | | | | | | | | | | | | | | | | | | | | | |
Year Ended October 31, 2020 | | | 16.87 | | | | (0.39 | ) | | | 3.40 | | | | 3.01 | | | | — | | | | — | | | | — | |
Year Ended October 31, 2019 | | | 17.83 | | | | (0.08 | ) | | | (0.55 | ) | | | (0.63 | ) | | | — | | | | (0.33 | ) | | | (0.33 | ) |
Year Ended October 31, 2018 | | | 17.83 | | | | (0.29 | ) | | | 0.52 | | | | 0.23 | | | | — | | | | (0.23 | ) | | | (0.23 | ) |
Year Ended October 31, 2017 | | | 16.94 | | | | (0.27 | ) | | | 2.42 | | | | 2.15 | | | | — | | | | (1.26 | ) | | | (1.26 | ) |
Year Ended October 31, 2016 | | | 17.27 | | | | (0.24 | ) | | | 0.07 | | | | (0.17 | ) | | | — | | | | (0.16 | ) | | | (0.16 | ) |
| | | | | | | |
Class I | | | | | | | | | | | | | | | | | | | | | | | | | | | | |
Year Ended October 31, 2020 | | | 17.58 | | | | (0.27 | ) | | | 3.56 | | | | 3.29 | | | | (0.03 | ) | | | — | | | | (0.03 | ) |
Year Ended October 31, 2019 | | | 18.43 | | | | 0.07 | | | | (0.59 | ) | | | (0.52 | ) | | | — | | | | (0.33 | ) | | | (0.33 | ) |
Year Ended October 31, 2018 | | | 18.28 | | | | (0.16 | ) | | | 0.54 | | | | 0.38 | | | | — | | | | (0.23 | ) | | | (0.23 | ) |
Year Ended October 31, 2017 | | | 17.21 | | | | (0.14 | ) | | | 2.47 | | | | 2.33 | | | | — | | | | (1.26 | ) | | | (1.26 | ) |
Year Ended October 31, 2016 | | | 17.42 | | | | (0.12 | ) | | | 0.07 | | | | (0.05 | ) | | | — | | | | (0.16 | ) | | | (0.16 | ) |
| | | | | | | |
Class R6 | | | | | | | | | | | | | | | | | | | | | | | | | | | | |
Year Ended October 31, 2020 | | | 17.83 | | | | (0.21 | ) | | | 3.59 | | | | 3.38 | | | | (0.08 | ) | | | — | | | | (0.08 | ) |
Year Ended October 31, 2019 | | | 18.63 | | | | 0.17 | | | | (0.64 | ) | | | (0.47 | ) | | | — | | | | (0.33 | ) | | | (0.33 | ) |
Year Ended October 31, 2018 | | | 18.44 | | | | (0.12 | ) | | | 0.54 | | | | 0.42 | | | | — | | | | (0.23 | ) | | | (0.23 | ) |
Year Ended October 31, 2017 | | | 17.31 | | | | (0.10 | ) | | | 2.49 | | | | 2.39 | | | | — | | | | (1.26 | ) | | | (1.26 | ) |
Year Ended October 31, 2016 | | | 17.48 | | | | (0.08 | ) | | | 0.07 | | | | (0.01 | ) | | | — | | | | (0.16 | ) | | | (0.16 | ) |
| (a) | Calculated based upon average shares outstanding. |
| (b) | Includes adjustments in accordance with accounting principles generally accepted in the United States of America and as such, the net asset values for financial reporting purposes and the returns based upon those net asset values may differ from the net asset values and returns for shareholder transactions. |
| (c) | Includes earnings credits and interest expense, if applicable, each of which is less than 0.005% unless otherwise noted. |
| (d) | The net expenses and expenses without waivers, reimbursements and earnings credits (excluding dividend expense and interest expense for securities sold short) for Class A are 1.81% and 1.86% for the year ended October 31, 2020, 1.79% and 1.90% for the year ended October 31, 2019, 1.82% and 1.90% for the year ended October 31, 2018, 1.83% and 2.02% for the year ended October 31, 2017 and 1.80% and 2.07% for the year ended October 31, 2016; for Class C are 2.32% and 2.38% for the year ended October 31, 2020, 2.28% and 2.39% for the year ended October 31, 2019, 2.32% and 2.40% for the year ended October 31, 2018, 2.31% and 2.52% for the year ended October 31, 2017 and 2.29% and 2.52% for the year ended October 31, 2016; for Class I are 1.57% and 1.61% for the year ended October 31, 2020, 1.53% and 1.64% for the year ended October 31, 2019, 1.57% and 1.65% for the year ended October 31, 2018, 1.56% and 1.73% for the year ended October 31, 2017 and 1.54% and 1.71% for the year ended October 31, 2016; for Class R6 are 1.31% and 1.35% for the year ended October 31, 2020, 1.29% and 1.39% for the year ended October 31, 2019, 1.32% and 1.38% for the year ended October 31, 2018, 1.31% and 1.47% for the year ended October 31, 2017 and 1.29% and 1.60% for the year ended October 31, 2016, respectively. |
| (e) | Amount rounds to less than $0.005. |
| (f) | Amount rounds to less than 0.005%. |
SEE NOTES TO FINANCIAL STATEMENTS.
| | | | | | |
| | | |
| 36 | | | | J.P. MORGAN SPECIALTY FUNDS | | OCTOBER 31, 2020 |
| | | | | | | | | | | | | | | | | | | | | | | | | | | | | | |
| | | Ratios/Supplemental data | |
| | | | | | | | | | Ratios to average net assets | | | | | | | |
Net asset
value,
end of
period | | | Total return
(excludes
sales charge) (b) | | | Net assets,
end of
period
(000’s) | | | Net expenses
(including dividend and interest expense for
securities sold
short) (c)(d) | | | Net
investment income
(loss) | | | Expenses without waivers,
reimbursements and earnings credits
(including dividend
and interest expense
for securities sold
short) (d) | | | Portfolio turnover rate
(excluding securities
sold short) | | | Portfolio turnover rate
(including securities
sold short) | |
| | | | | | | | | | | | | | | | | | | | | | | | | | | | | | |
| | | | | | | | | | | | | | | | | | | | | | | | | | | | | | |
| $ | 20.54 | | | | 18.45 | % | | $ | 20,914 | | | | 2.28 | % | | | (1.54 | )% | | | 2.33 | % | | | 511 | % | | | 1,058 | % |
| | 17.34 | | | | (3.10 | ) | | | 19,352 | | | | 2.25 | | | | 0.00 | (f) | | | 2.36 | | | | 636 | | | | 1,232 | |
| | 18.22 | | | | 1.80 | | | | 50,803 | | | | 2.55 | | | | (1.11 | ) | | | 2.63 | | | | 548 | | | | 995 | |
| | 18.13 | | | | 13.58 | | | | 49,338 | | | | 2.42 | | | | (1.05 | ) | | | 2.61 | | | | 493 | | | | 795 | |
| | 17.12 | | | | (0.53 | ) | | | 43,298 | | | | 2.26 | | | | (0.96 | ) | | | 2.53 | | | | 463 | | | | 749 | |
| | | | | | | |
| | | | | | | | | | | | | | | | | | | | | | | | | | | | | | |
| | 19.88 | | | | 17.84 | | | | 4,596 | | | | 2.79 | | | | (2.12 | ) | | | 2.85 | | | | 511 | | | | 1,058 | |
| | 16.87 | | | | (3.62 | ) | | | 2,599 | | | | 2.74 | | | | (0.45 | ) | | | 2.85 | | | | 636 | | | | 1,232 | |
| | 17.83 | | | | 1.32 | | | | 3,544 | | | | 3.05 | | | | (1.61 | ) | | | 3.13 | | | | 548 | | | | 995 | |
| | 17.83 | | | | 13.00 | | | | 2,594 | | | | 2.90 | | | | (1.53 | ) | | | 3.11 | | | | 493 | | | | 795 | |
| | 16.94 | | | | (1.00 | ) | | | 3,273 | | | | 2.75 | | | | (1.46 | ) | | | 2.98 | | | | 463 | | | | 749 | |
| | | | | | | |
| | | | | | | | | | | | | | | | | | | | | | | | | | | | | | |
| | 20.84 | | | | 18.71 | | | | 226,048 | | | | 2.04 | | | | (1.38 | ) | | | 2.08 | | | | 511 | | | | 1,058 | |
| | 17.58 | | | | (2.89 | ) | | | 132,665 | | | | 1.99 | | | | 0.40 | | | | 2.10 | | | | 636 | | | | 1,232 | |
| | 18.43 | | | | 2.12 | | | | 151,261 | | | | 2.30 | | | | (0.87 | ) | | | 2.38 | | | | 548 | | | | 995 | |
| | 18.28 | | | | 13.86 | | | | 103,091 | | | | 2.15 | | | | (0.81 | ) | | | 2.32 | | | | 493 | | | | 795 | |
| | 17.21 | | | | (0.29 | ) | | | 158,589 | | | | 2.00 | | | | (0.69 | ) | | | 2.17 | | | | 463 | | | | 749 | |
| | | | | | | |
| | | | | | | | | | | | | | | | | | | | | | | | | | | | | | |
| | 21.13 | | | | 19.01 | | | | 233,958 | | | | 1.78 | | | | (1.09 | ) | | | 1.82 | | | | 511 | | | | 1,058 | |
| | 17.83 | | | | (2.59 | ) | | | 164,419 | | | | 1.75 | | | | 0.91 | | | | 1.85 | | | | 636 | | | | 1,232 | |
| | 18.63 | | | | 2.32 | | | | 56,436 | | | | 2.05 | | | | (0.66 | ) | | | 2.11 | | | | 548 | | | | 995 | |
| | 18.44 | | | | 14.13 | | | | 6,350 | | | | 1.90 | | | | (0.56 | ) | | | 2.06 | | | | 493 | | | | 795 | |
| | 17.31 | | | | (0.06 | ) | | | 8,432 | | | | 1.75 | | | | (0.45 | ) | | | 2.06 | | | | 463 | | | | 749 | |
SEE NOTES TO FINANCIAL STATEMENTS.
| | | | | | | | |
| | | |
| OCTOBER 31, 2020 | | J.P. MORGAN SPECIALTY FUNDS | | | | | 37 | |
FINANCIAL HIGHLIGHTS
FOR THE PERIODS INDICATED (continued)
| | | | | | | | | | | | | | | | | | | | |
| | | | | | Per share operating performance | |
| | | | | | Investment operations | | | Distributions | |
| | | Net asset
value,
beginning
of period | | | Net
investment
income
(loss) (a) | | |
Net realized
and unrealized
gains
(losses) on
investments | | | Total from
investment
operations | | | Net
realized gain | |
JPMorgan Research Market Neutral Fund | | | | | | | | | | | | | | | | | | | | |
Class A | | | | | | | | | | | | | | | | | | | | |
Year Ended October 31, 2020 | | $ | 13.11 | | | $ | (0.20 | ) | | $ | 1.59 | | | $ | 1.39 | | | $ | (1.49 | ) |
Year Ended October 31, 2019 | | | 14.29 | | | | (0.04 | ) | | | 0.31 | | | | 0.27 | | | | (1.45 | ) |
Year Ended October 31, 2018 | | | 14.69 | | | | (0.11 | ) | | | 0.10 | | | | (0.01 | ) | | | (0.39 | ) |
Year Ended October 31, 2017 | | | 13.84 | | | | (0.22 | ) | | | 1.07 | | | | 0.85 | | | | — | |
Year Ended October 31, 2016 | | | 14.25 | | | | (0.28 | ) | | | (0.13 | ) | | | (0.41 | ) | | | — | |
| | | | | |
Class C | | | | | | | | | | | | | | | | | | | | |
Year Ended October 31, 2020 | | | 12.06 | | | | (0.23 | ) | | | 1.43 | | | | 1.20 | | | | (1.49 | ) |
Year Ended October 31, 2019 | | | 13.32 | | | | (0.10 | ) | | | 0.29 | | | | 0.19 | | | | (1.45 | ) |
Year Ended October 31, 2018 | | | 13.79 | | | | (0.17 | ) | | | 0.09 | | | | (0.08 | ) | | | (0.39 | ) |
Year Ended October 31, 2017 | | | 13.06 | | | | (0.27 | ) | | | 1.00 | | | | 0.73 | | | | — | |
Year Ended October 31, 2016 | | | 13.51 | | | | (0.32 | ) | | | (0.13 | ) | | | (0.45 | ) | | | — | |
| | | | | |
Class I | | | | | | | | | | | | | | | | | | | | |
Year Ended October 31, 2020 | | | 13.80 | | | | (0.19 | ) | | | 1.70 | | | | 1.51 | | | | (1.49 | ) |
Year Ended October 31, 2019 | | | 14.93 | | | | — | (e) | | | 0.32 | | | | 0.32 | | | | (1.45 | ) |
Year Ended October 31, 2018 | | | 15.30 | | | | (0.07 | ) | | | 0.09 | | | | 0.02 | | | | (0.39 | ) |
Year Ended October 31, 2017 | | | 14.37 | | | | (0.18 | ) | | | 1.11 | | | | 0.93 | | | | — | |
Year Ended October 31, 2016 | | | 14.76 | | | | (0.25 | ) | | | (0.14 | ) | | | (0.39 | ) | | | — | |
| (a) | Calculated based upon average shares outstanding. |
| (b) | Includes adjustments in accordance with accounting principles generally accepted in the United States of America and as such, the net asset values for financial reporting purposes and the returns based upon those net asset values may differ from the net asset values and returns for shareholder transactions. |
| (c) | Includes earnings credits and interest expense, if applicable, each of which is less than 0.005% unless otherwise noted. |
| (d) | The net expenses and expenses without waivers, reimbursements and earnings credits (excluding dividend expense and interest expense for securities sold short) for Class A are 1.08% and 1.46% for the year ended October 31, 2020, 1.22% and 1.62% for the year ended October 31, 2019, 1.22% and 1.55% for the year ended October 31, 2018, 1.24% and 1.53% for the year ended October 31, 2017 and 1.22% and 1.53% for the year ended October 31, 2016; for Class C are 1.60% and 1.95% for the year ended October 31, 2020, 1.73% and 2.09% for the year ended October 31, 2019, 1.73% and 2.02% for the year ended October 31, 2018, 1.72% and 2.07% for the year ended October 31, 2017 and 1.72% and 2.02% for the year ended October 31, 2016; for Class I are 0.76% and 1.13% for the year ended October 31, 2020, 0.96% and 1.32% for the year ended October 31, 2019, 0.96% and 1.25% for the year ended October 31, 2018, 0.96% and 1.25% for the year ended October 31, 2017 and 0.96% and 1.27% for the year ended October 31, 2016, respectively. |
| (e) | Amount rounds to less than $0.005. |
SEE NOTES TO FINANCIAL STATEMENTS.
| | | | | | |
| | | |
| 38 | | | | J.P. MORGAN SPECIALTY FUNDS | | OCTOBER 31, 2020 |
| | | | | | | | | | | | | | | | | | | | | | | | | | | | | | |
| | | Ratios/Supplemental data | |
| | | | | | | | | | Ratios to average net assets | | | | | | | |
Net asset
value,
end of
period | | | Total return
(excludes
sales charge) (b) | | | Net assets,
end of
period
(000’s) | | | Net expenses
(including dividend expense for
securities sold
short) (c)(d) | | | Net
investment
income
(loss) | | | Expenses without waivers,
reimbursements and
earnings credits
(including dividend expense for securities sold
short) (d) | | | Portfolio turnover rate
(excluding securities
sold short) | | | Portfolio turnover rate
(including securities
sold short) | |
| | | | | | | | | | | | | | | | | | | | | | | | | | | | | | |
| | | | | | | | | | | | | | | | | | | | | | | | | | | | | | |
| $ | 13.01 | | | | 11.97 | % | | $ | 18,205 | | | | 3.23 | % | | | (1.57 | )% | | | 3.61 | % | | | 224 | % | | | 531 | % |
| | 13.11 | | | | 2.01 | | | | 14,276 | | | | 3.69 | | | | (0.26 | ) | | | 4.09 | | | | 125 | | | | 356 | |
| | 14.29 | | | | (0.01 | ) | | | 14,973 | | | | 3.50 | | | | (0.73 | ) | | | 3.83 | | | | 131 | | | | 252 | |
| | 14.69 | | | | 6.14 | | | | 17,932 | | | | 3.66 | | | | (1.51 | ) | | | 3.95 | | | | 109 | | | | 278 | |
| | 13.84 | | | | (2.88 | ) | | | 25,393 | | | | 3.33 | | | | (2.07 | ) | | | 3.64 | | | | 133 | | | | 298 | |
| | | | | | | |
| | | | | | | | | | | | | | | | | | | | | | | | | | | | | | |
| | 11.77 | | | | 11.36 | | | | 1,949 | | | | 3.75 | | | | (2.00 | ) | | | 4.10 | | | | 224 | | | | 531 | |
| | 12.06 | | | | 1.52 | | | | 3,731 | | | | 4.20 | | | | (0.74 | ) | | | 4.56 | | | | 125 | | | | 356 | |
| | 13.32 | | | | (0.53 | ) | | | 6,155 | | | | 4.01 | | | | (1.26 | ) | | | 4.30 | | | | 131 | | | | 252 | |
| | 13.79 | | | | 5.59 | | | | 10,920 | | | | 4.14 | | | | (2.01 | ) | | | 4.49 | | | | 109 | | | | 278 | |
| | 13.06 | | | | (3.33 | ) | | | 15,003 | | | | 3.83 | | | | (2.53 | ) | | | 4.13 | | | | 133 | | | | 298 | |
| | | | | | | |
| | | | | | | | | | | | | | | | | | | | | | | | | | | | | | |
| | 13.82 | | | | 12.26 | | | | 121,285 | | | | 2.91 | | | | (1.42 | ) | | | 3.28 | | | | 224 | | | | 531 | |
| | 13.80 | | | | 2.27 | | | | 27,694 | | | | 3.43 | | | | 0.01 | | | | 3.79 | | | | 125 | | | | 356 | |
| | 14.93 | | | | 0.20 | | | | 34,927 | | | | 3.24 | | | | (0.47 | ) | | | 3.53 | | | | 131 | | | | 252 | |
| | 15.30 | | | | 6.47 | | | | 44,219 | | | | 3.37 | | | | (1.24 | ) | | | 3.68 | | | | 109 | | | | 278 | |
| | 14.37 | | | | (2.64 | ) | | | 53,221 | | | | 3.07 | | | | (1.82 | ) | | | 3.38 | | | | 133 | | | | 298 | |
SEE NOTES TO FINANCIAL STATEMENTS.
| | | | | | | | |
| | | |
| OCTOBER 31, 2020 | | J.P. MORGAN SPECIALTY FUNDS | | | | | 39 | |
NOTES TO FINANCIAL STATEMENTS
AS OF OCTOBER 31, 2020
1. Organization
JPMorgan Trust I (the “JPM I”) and JPMorgan Trust IV (“JPM IV”) (collectively, the “Trusts”) were formed on November 12, 2004 and November 11, 2015, respectively, as Delaware statutory trusts, pursuant to Declarations of Trust dated November 5, 2004 and November 11, 2015, respectively, and are registered under the Investment Company Act of 1940, as amended (the “1940 Act”), as open-end management investment companies.
The following are 3 separate funds of the Trusts (each, a “Fund” and collectively, the “Funds”) covered by this report:
| | | | | | |
| | | Classes Offered | | Trust | | Diversification Classification |
| JPMorgan Macro Opportunities Fund(1) | | Class A, Class C and Class I, Class R6(2) | | JPM IV | | Diversified |
| JPMorgan Opportunistic Equity Long/Short Fund | | Class A, Class C, Class I, Class R2(3), Class R5(3) and Class R6 | | JPM I | | Non-Diversified |
| JPMorgan Research Market Neutral Fund | | Class A, Class C, Class I(4) | | JPM I | | Diversified |
| (1) | The Fund commenced operations on April 15, 2020. |
| (2) | Class R6 commenced operations on September 30, 2020. |
| (3) | On February 26, 2019, Class R2 and Class R5 Shares were liquidated. |
| (4) | On July 2, 2020, the Fund’s Class L Shares were converted into Class I Shares. Additionally, as of July 2, 2020, Class L Shares are no longer offered. |
The investment objective of the JPMorgan Macro Opportunities Fund (“Macro Opportunities Fund”) is to seek to provide long-term capital appreciation.
The investment objective of the JPMorgan Opportunistic Equity Long/Short Fund (“Opportunistic Equity Long/Short Fund”) is to seek capital appreciation.
The investment objective of the JPMorgan Research Market Neutral Fund (“Research Market Neutral Fund”) is to seek to provide long-term capital appreciation from a broadly diversified portfolio of U.S. stocks while neutralizing the general risks associated with stock market investing.
Class A Shares generally provide for a front-end sales charge while Class C Shares provide for a contingent deferred sales charge (“CDSC”). No sales charges are assessed with respect to Class I and Class R6 Shares. Certain Class A Shares, for which front-end sales charges have been waived, may be subject to a CDSC as described in the Funds’ prospectuses. Effective October 1, 2020, Class C Shares automatically convert to Class A Shares after eight years. Prior to October 1, 2020, Class C Shares automatically converted to Class A Shares after ten years. All classes of shares have equal rights as to earnings, assets and voting privileges, except that each class may bear different transfer agency, distribution and service fees and each class has exclusive voting rights with respect to its distribution plan and shareholder servicing agreements.
J.P. Morgan Investment Management Inc. (“JPMIM”), an indirect, wholly-owned subsidiary of JPMorgan Chase & Co. (“JPMorgan”), acts as Adviser (the “Adviser”) and Administrator (the “Administrator”) to the Funds.
2. Significant Accounting Policies
The following is a summary of significant accounting policies followed by the Funds in the preparation of their financial statements. The Funds are investment companies and, accordingly, follow the investment company accounting and reporting guidance of the Financial Accounting Standards Board (“FASB”) Accounting Standards Codification Topic 946 — Investment Companies, which is part of U.S. generally accepted accounting principles (“GAAP”). The preparation of financial statements in conformity with GAAP requires management to make estimates and assumptions that affect (i) the reported amounts of assets and liabilities, (ii) disclosure of contingent assets and liabilities at the date of the financial statements, and (iii) the reported amounts of increases and decreases in net assets from operations during the reporting period. Actual results could differ from those estimates.
A. Valuation of Investments — Investments are valued in accordance with GAAP and the Funds’ valuation policies set forth by, and under the supervision and responsibility of, the Boards of Trustees of the Trusts (the “Boards”), which established the following approach to valuation, as described more fully below: (i) investments for which market quotations are readily available shall be valued at their market value and (ii) all other investments for which market quotations are not readily available shall be valued at their fair value as determined in good faith by the Boards.
The Administrator has established the J.P. Morgan Asset Management Americas Valuation Committee (“AVC”) to assist the Boards with the oversight and monitoring of the valuation of the Funds’ investments. The Administrator implements the valuation policies of the Funds’ investments, as directed by the Boards. The AVC oversees and carries out the policies for the valuation of investments held in the Funds. This includes monitoring the appropriateness of fair values based on results of ongoing valuation oversight including, but not limited to, consideration of macro or security specific events, market events, and pricing vendor and broker due diligence. The Administrator is responsible for discussing and assessing the potential impacts to the fair values on an ongoing basis, and, at least on a quarterly basis, with the AVC and the Boards.
Fixed income instruments are valued based on prices received from approved affiliated and unaffiliated pricing vendors or third party broker-dealers (collectively referred to as “Pricing Services”). The Pricing Services use multiple valuation techniques to determine the valuation of fixed income instruments. In instances where sufficient market activity exists, the Pricing Services may utilize a market based approach through which trades or quotes from market makers are used to determine the valuation of these instruments. In instances where sufficient market activity may not exist, the Pricing Services also utilize proprietary valuation models which may consider market transactions in comparable securities and the
| | | | | | |
| | | |
| 40 | | | | J.P. MORGAN SPECIALTY FUNDS | | OCTOBER 31, 2020 |
various relationships between securities in determining fair value and/or market characteristics in order to estimate the relevant cash flows, which are then discounted to calculate the fair values.
Equities and other exchange-traded instruments are valued at the last sale price or official market closing price on the primary exchange on which the instrument is traded before the net asset values (“NAV”) of the Funds are calculated on a valuation date. Investments in open-end investment companies excluding exchange-traded funds (“ETFs”) (“Underlying Funds”) are valued at each Underlying Fund’s NAV per share as of the report date.
Futures contracts and options are generally valued on the basis of available market quotations. Forward foreign currency exchange contracts are valued utilizing market quotations from approved Pricing Services.
Valuations reflected in this report are as of the report date. As a result, changes in valuation due to market events and/or issuer-related events after the report date and prior to issuance of the report are not reflected herein.
The various inputs that are used in determining the valuation of the Funds’ investments are summarized into the three broad levels listed below.
| • | | Level 1 — Unadjusted inputs using quoted prices in active markets for identical investments. |
| • | | Level 2 — Other significant observable inputs including, but not limited to, quoted prices for similar investments, inputs other than quoted prices that are observable for investments (such as interest rates, prepayment speeds, credit risk, etc.) or other market corroborated inputs. |
| • | | Level 3 — Significant inputs based on the best information available in the circumstances, to the extent observable inputs are not available (including the Funds’ assumptions in determining the fair value of investments). |
A financial instrument’s level within the fair value hierarchy is based on the lowest level of any input, both individually and in the aggregate, that is significant to the fair value measurement. The inputs or methodology used for valuing instruments are not necessarily an indication of the risk associated with investing in those instruments.
The following tables represent each valuation input as presented on the Schedules of Portfolio Investments (“SOIs”) (amounts in thousands):
Macro Opportunities Fund
| | | | | | | | | | | | | | | | |
| | | Level 1
Quoted prices | | | Level 2
Other significant
observable inputs | | | Level 3
Significant
unobservable inputs | | | Total | |
Investments in Securities | | | | | | | | | |
Common Stocks | | | | | | | | | |
Banks | | $ | 676 | | | $ | 173 | | | $ | — | | | $ | 849 | |
Capital Markets | | | 136 | | | | — | | | | — | | | | 136 | |
Electric Utilities | | | 257 | | | | 596 | | | | — | | | | 853 | |
Electrical Equipment | | | 107 | | | | 150 | | | | — | | | | 257 | |
Entertainment | | | 147 | | | | — | | | | — | | | | 147 | |
Health Care Equipment & Supplies | | | 114 | | | | — | | | | — | | | | 114 | |
Hotels, Restaurants & Leisure | | | — | | | | 145 | | | | — | | | | 145 | |
Insurance | | | 125 | | | | 405 | | | | — | | | | 530 | |
Interactive Media & Services | | | 327 | | | | — | | | | — | | | | 327 | |
Internet & Direct Marketing Retail | | | 715 | | | | — | | | | — | | | | 715 | |
IT Services | | | 761 | | | | — | | | | — | | | | 761 | |
Life Sciences Tools & Services | | | 136 | | | | — | | | | — | | | | 136 | |
Machinery | | | 155 | | | | 139 | | | | — | | | | 294 | |
Metals & Mining | | | 439 | | | | — | | | | — | | | | 439 | |
Multi-Utilities | | | — | | | | 129 | | | | — | | | | 129 | |
Personal Products | | | 141 | | | | — | | | | — | | | | 141 | |
Pharmaceuticals | | | 121 | | | | 403 | | | | — | | | | 524 | |
Semiconductors & Semiconductor Equipment | | | 625 | | | | — | | | | — | | | | 625 | |
Software | | | 815 | | | | — | | | | — | | | | 815 | |
Specialty Retail | | | 289 | | | | — | | | | — | | | | 289 | |
Textiles, Apparel & Luxury Goods | | | 280 | | | | 225 | | | | — | | | | 505 | |
| | | | | | | | | | | | | | | | |
Total Common Stocks | | | 6,366 | | | | 2,365 | | | | — | | | | 8,731 | |
| | | | | | | | | | | | | | | | |
| | | | | | | | |
| | | |
| OCTOBER 31, 2020 | | J.P. MORGAN SPECIALTY FUNDS | | | | | 41 | |
NOTES TO FINANCIAL STATEMENTS
AS OF OCTOBER 31, 2020 (continued)
| | | | | | | | | | | | | | | | |
Macro Opportunities Fund (continued) | | | | | | | | | | | | | | | | |
| | | Level 1
Quoted prices | | | Level 2
Other significant
observable inputs | | | Level 3
Significant
unobservable inputs | | | Total | |
Foreign Government Securities | | $ | — | | | $ | 488 | | | $ | — | | | $ | 488 | |
Options Purchased | | | | | | | | | |
Call Options Purchased | | | 47 | | | | 10 | | | | — | | | | 57 | |
Put Options Purchased | | | 13 | | | | — | | | | — | | | | 13 | |
| | | | | | | | | | | | | | | | |
Total Options Purchased | | | 60 | | | | 10 | | | | — | | | | 70 | |
| | | | | | | | | | | | | | | | |
Short-Term Investments | | | | | | | | | |
Foreign Government Treasury Bills | | | — | | | | 2,609 | | | | — | | | | 2,609 | |
Investment Companies | | | 2,356 | | | | — | | | | — | | | | 2,356 | |
| | | | | | | | | | | | | | | | |
Total Short-Term Investments | | | 2,356 | | | | 2,609 | | | | — | | | | 4,965 | |
| | | | | | | | | | | | | | | | |
Total Investments in Securities | | $ | 8,782 | | | $ | 5,472 | | | $ | — | | | $ | 14,254 | |
| | | | | | | | | | | | | | | | |
Appreciation in Other Financial Instruments | | | | | | | | | |
Forward Currency Contracts | | $ | — | | | $ | 52 | | | $ | — | | | $ | 52 | |
Futures Contracts | | | 245 | | | | — | | | | — | | | | 245 | |
| | | | | | | | | | | | | | | | |
Total Appreciation in Other Financial Instruments | | $ | 245 | | | $ | 52 | | | $ | — | | | $ | 297 | |
| | | | | | | | | | | | | | | | |
Depreciation in Other Financial Instruments | | | | | | | | | | | | | | | | |
Forward Foreign Currency Exchange Contracts | | $ | — | | | $ | (32 | ) | | $ | — | | | $ | (32 | ) |
Futures Contracts | | | (27 | ) | | | — | | | | — | | | | (27 | ) |
| | | | | | | | | | | | | | | | |
Total Depreciation in Other Financial Instruments | | $ | (27 | ) | | $ | (32 | ) | | $ | — | | | $ | (59 | ) |
| | | | | | | | | | | | | | | | |
| | | | |
| Opportunistic Equity Long/Short Fund | | | | | | | | | | | | | | | | |
| | | Level 1
Quoted prices | | | Level 2
Other significant
observable inputs | | | Level 3
Significant
unobservable inputs | | | Total | |
Total Investments in Securities (a) | | $ | 512,898 | | | $ | — | | | $ | — | | | $ | 512,898 | |
| | | | | | | | | | | | | | | | |
Total Liabilities for Securities Sold Short (a) | | $ | (151,146 | ) | | $ | — | | | $ | — | | | $ | (151,146 | ) |
| | | | | | | | | | | | | | | | |
| | | | |
| Research Market Neutral Fund | | | | | | | | | | | | | | | | |
| | | Level 1
Quoted prices | | | Level 2
Other significant
observable inputs | | | Level 3
Significant
unobservable inputs | | | Total | |
Total Investments in Securities (a) | | $ | 134,338 | | | $ | — | | | $ | — | | | $ | 134,338 | |
| | | | | | | | | | | | | | | | |
Total Liabilities for Securities Sold Short (a) | | $ | (99,914 | ) | | $ | — | | | $ | — | | | $ | (99,914 | ) |
| | | | | | | | | | | | | | | | |
Appreciation in Other Financial Instruments | |
Futures Contracts (a) | | $ | 85 | | | $ | — | | | $ | — | | | $ | 85 | |
| | | | | | | | | | | | | | | | |
| (a) | Please refer to the SOI’s for specifics of portfolio holdings. |
B. Securities Lending — The Funds are authorized to engage in securities lending in order to generate additional income. The Funds are able to lend to approved borrowers. Citibank N.A. (“Citibank”) serves as lending agent for the Funds, pursuant to a Securities Lending Agency Agreement (the “Securities Lending Agency Agreement”). Securities loaned are collateralized by cash equal to at least 100% of the market value plus accrued interest on the securities lent, which is invested in an affiliated money market fund. The Funds retain loan fees and the interest on cash collateral investments but are required to pay the borrower a rebate for the use of cash collateral. In cases where the lent security is of high value to borrowers, there may be a negative rebate (i.e., a net payment from the borrower to the Funds). Upon termination of a loan, the Funds are required to return to the borrower an amount equal to the cash collateral, plus any rebate owed to the borrowers. The remaining maturities of the securities lending transactions are considered overnight and continuous. Loans are subject to termination by the Funds or the borrower at any time.
The net income earned on the securities lending (after payment of rebates and Citibank’s fee) is included on the Statements of Operations as Income from securities lending (net). The Funds also receive payments from the borrower during the period of the loan, equivalent to dividends and interest earned on the securities loaned, which are recorded as Dividend or Interest income, respectively, on the Statements of Operations.
Under the Securities Lending Agency Agreement, Citibank marks to market the loaned securities on a daily basis. In the event the cash received from the borrower is less than 102% of the value of the loaned securities (105% for loans of non-U.S. securities), Citibank requests additional cash
| | | | | | |
| | | |
| 42 | | | | J.P. MORGAN SPECIALTY FUNDS | | OCTOBER 31, 2020 |
from the borrower so as to maintain a collateralization level of at least 102% of the value of the loaned securities plus accrued interest (105% for loans of non-U.S. securities), subject to certain de minimis amounts.
The value of securities out on loan is recorded as an asset on the Statements of Assets and Liabilities. The value of the cash collateral received is recorded as a liability on the Statements of Assets and Liabilities and details of collateral investments are disclosed on the SOIs.
The Funds bear the risk of loss associated with the collateral investments and are not entitled to additional collateral from the borrower to cover any such losses. To the extent that the value of the collateral investments declines below the amount owed to a borrower, the Funds may incur losses that exceed the amount they earned on lending the security. Upon termination of a loan, the Funds may use leverage (borrow money) to repay the borrower for cash collateral posted if the Adviser does not believe that it is prudent to sell the collateral investments to fund the payment of this liability. Securities lending activity is subject to master netting arrangements.
Securities lending also involves counterparty risks, including the risk that the loaned securities may not be returned in a timely manner or at all. Subject to certain conditions, Citibank has agreed to indemnify the Funds from losses resulting from a borrower’s failure to return a loaned security.
The Funds did not lend out any securities during the year ended October 31, 2020.
C. Investment Transactions with Affiliates — The Funds invested in Underlying Funds which are advised by the Adviser. An issuer which is under common control with the Funds may be considered an affiliate. For the purposes of the financial statements, the Funds assume the issuers listed in the tables below to be affiliated issuers. Underlying Funds’ distributions may be reinvested into the Underlying Funds. Reinvestment amounts are included in the purchase cost amounts in the tables below. Amounts in the tables below are in thousands.
Macro Opportunities Fund
| | | | | | | | | | | | | | | | | | | | | | | | | | | | | | | | | | | | |
| | | For the period ended October 31, 2020 | |
| Security Description | | Value at
April 15, 2020 (a) | | | Purchases
at Cost | | | Proceeds
from Sales | | | Net
Realized
Gain (Loss) | | | Change in
Unrealized
Appreciation/
(Depreciation) | | | Value at
October 31,
2020 | | | Shares at
October 31,
2020 | | | Dividend
Income | | | Capital Gain
Distributions | |
JPMorgan Prime Money Market Fund Class IM Shares, 0.11% (b) (c) | | $ | — | | | $ | 9,714 | | | $ | 7,360 | | | $ | 2 | | | $ | — | (d) | | $ | 2,356 | | | | 2,355 | | | $ | 5 | | | $ | — | |
| | | | | | | | | | | | | | | | | | | | | | | | | | | | | | | | | | | | |
Opportunistic Equity Long/Short Fund
| | | | | | | | | | | | | | | | | | | | | | | | | | | | | | | | | | | | |
| | | For the year ended October 31, 2020 | |
| Security Description | | Value at
October 31,
2019 | | | Purchases
at Cost | | | Proceeds
from Sales | | | Net
Realized
Gain (Loss) | | | Change in
Unrealized
Appreciation/
(Depreciation) | | | Value at
October 31,
2020 | | | Shares at
October 31,
2020 | | | Dividend
Income | | | Capital Gain
Distributions | |
JPMorgan Prime Money Market Fund Class Institutional Shares, 0.05% (b) (c) | | $ | 94,829 | | | $ | 933,656 | | | $ | 913,607 | | | $ | 25 | | | $ | (14 | ) | | $ | 114,889 | | | | 114,820 | | | $ | 589 | | | $ | — | |
| | | | | | | | | | | | | | | | | | | | | | | | | | | | | | | | | | | | |
Research Market Neutral Fund
| | | | | | | | | | | | | | | | | | | | | | | | | | | | | | | | | | | | |
| | | For the year ended October 31, 2020 | |
| Security Description | | Value at
October 31,
2019 | | | Purchases
at Cost | | | Proceeds
from Sales | | | Net
Realized
Gain (Loss) | | | Change in
Unrealized
Appreciation/
(Depreciation) | | | Value at
October 31,
2020 | | | Shares at
October 31,
2020 | | | Dividend
Income | | | Capital Gain
Distributions | |
JPMorgan Prime Money Market Fund Class Institutional Shares, 0.05% (b) (c) | | $ | 9,419 | | | $ | 238,986 | | | $ | 224,641 | | | $ | 6 | | | $ | 3 | | | $ | 23,773 | | | | 23,759 | | | $ | 90 | | | $ | — | |
| | | | | | | | | | | | | | | | | | | | | | | | | | | | | | | | | | | | |
| (a) | Commencement of operations was April 15, 2020. |
| (b) | Investment in an affiliated fund, which is registered under the Investment Company Act of 1940, as amended, and is advised by J.P. Morgan Investment Management Inc. |
| (c) | The rate shown is the current yield as of October 31, 2020. |
| (d) | Amount rounds to less than one thousand. |
| | | | | | | | |
| | | |
| OCTOBER 31, 2020 | | J.P. MORGAN SPECIALTY FUNDS | | | | | 43 | |
NOTES TO FINANCIAL STATEMENTS
AS OF OCTOBER 31, 2020 (continued)
D. Foreign Currency Translation — The books and records of Macro Opportunities Fund are maintained in U.S. dollars. Foreign currency amounts are translated into U.S. dollars at the prevailing exchange rates of such currencies against the U.S. dollar. The market value of investment securities and other assets and liabilities are translated at the exchange rate as of the valuation date. Purchases and sales of investment securities, income and expenses are translated at the exchange rate prevailing on the respective dates of such transactions.
The Fund does not isolate the effect of changes in foreign exchange rates from changes in market prices on securities held. Accordingly, such changes are included within Change in net unrealized appreciation/depreciation on investments in non-affiliates on the Statements of Operations.
Reported realized foreign currency gains and losses arise from the disposition of foreign currency, currency gains or losses realized between the trade and settlement dates on securities transactions, and the difference between the amounts of dividends, interest and foreign withholding taxes recorded on the Fund’s books on the transaction date and the U.S. dollar equivalent of the amounts actually received or paid. These reported realized foreign currency gains and losses are included in Net realized gain (loss) on foreign currency transactions on the Statements of Operations. Unrealized foreign currency gains and losses arise from changes (due to changes in exchange rates) in the value of foreign currency and other assets and liabilities denominated in foreign currencies, which are held at period end are included in Change in net unrealized appreciation/depreciation on foreign currency translations on the Statements of Operations.
E. Derivatives — The Funds used derivative instruments including options, futures and forward foreign currency exchange contracts, in connection with its respective investment strategies. Derivative instruments may be used as substitutes for securities in which the Funds can invest, to hedge portfolio investments or to generate income or gain to the Funds. Derivatives may also be used to effectively manage the long and short equity exposures in the portfolio, manage duration, sector and yield curve exposures and credit and spread volatility.
The Funds may be subject to various risks from the use of derivatives, including the risk that changes in the value of a derivative may not correlate perfectly with the underlying asset, rate or index; counterparty credit risk related to derivatives counterparties’ failure to perform under contract terms; liquidity risk related to the potential lack of a liquid market for these contracts allowing the Funds to close out its position(s); and documentation risk relating to disagreement over contract terms. Investing in certain derivatives also results in a form of leverage and as such, the Funds’ risk of loss associated with these instruments may exceed their value, as recorded on the Statements of Assets and Liabilities.
Macro Opportunities Fund is party to various derivative contracts governed by International Swaps and Derivatives Association master agreements (“ISDA agreements”). The Fund’s ISDA agreements, which are separately negotiated with each dealer counterparty, may contain provisions allowing, absent other considerations, a counterparty to exercise rights, to the extent not otherwise waived, against the Fund in the event the Fund’s net assets decline over time by a pre-determined percentage or fall below a pre-determined floor. The ISDA agreements may also contain provisions allowing, absent other conditions, the Fund to exercise rights, to the extent not otherwise waived, against a counterparty (e.g., decline in a counterparty’s credit rating below a specified level). Such rights for both a counterparty and the Fund often include the ability to terminate (i.e., close out) open contracts at prices which may favor a counterparty, which could have an adverse effect on the Fund. The ISDA agreements give the Fund and a counterparty the right, upon an event of default, to close out all transactions traded under such agreements and to net amounts owed or due across all transactions and offset such net payable or receivable against collateral posted to a segregated account by one party for the benefit of the other.
Counterparty credit risk may be mitigated to the extent a counterparty posts additional collateral for mark to market gains to the Fund.
Notes E(1) — E(3) below describe the various derivatives used by the Fund.
(1). Options — Macro Opportunities Fund and Opportunistic Equity Long/Short Fund purchased and/or sold (“wrote”) put and call options on various instruments including futures, securities, currencies and interest rate swaps (“swaptions”) to manage and hedge interest rate risks within its portfolio and also to gain long or short exposure to the underlying instrument, index, currency or rate. A purchaser of a put option has the right, but not the obligation, to sell the underlying instrument at an agreed upon price (“strike price”) to the option seller. A purchaser of a call option has the right, but not the obligation, to purchase the underlying instrument at the strike price from the option seller. Swaptions and Eurodollar options are settled for cash.
Options Purchased — Premiums paid by the Funds for options purchased are included on the Statements of Assets and Liabilities as Options purchased. The option is adjusted daily to reflect the current market value of the option and the change is recorded as Change in net unrealized appreciation/depreciation on options purchased on the Statements of Operations. If the option is allowed to expire, the Funds will lose the entire premium it paid and record a realized loss for the premium amount. Premiums paid for options purchased which are exercised or closed are added to the amounts paid or will offset against the proceeds on the underlying investment transaction to determine the realized gain (loss) or cost basis of the underlying investment.
Options Written — Premiums received by the Funds for options written are included on the Statements of Assets and Liabilities as a liability. The amount of the liability is adjusted daily to reflect the current market value of the option written and the change is recorded as Change in net unrealized appreciation/depreciation on options written on the Statements of Operations. Premiums received from options written that expire are treated as realized gains. If a written option is closed, the Funds record a realized gain or loss on options written based on whether the cost of the closing transaction exceeds the premium received. If a call option is exercised by the option buyer, the premium received by the Funds is added to the proceeds from the sale of the underlying security to the option buyer and compared to the cost of the closing transaction to determine whether there has been a realized gain or loss. If a put option is exercised by an option buyer, the premium received by the option seller reduces the cost basis of the purchased security.
| | | | | | |
| | | |
| 44 | | | | J.P. MORGAN SPECIALTY FUNDS | | OCTOBER 31, 2020 |
Written uncovered call options subject the Funds to unlimited risk of loss. Written covered call options limit the upside potential of a security above the strike price. Written put options subject the Funds to risk of loss if the value of the security declines below the exercise price minus the put premium.
The Funds are not subject to credit risk on options written as the counterparty has already performed its obligation by paying the premium at the inception of the contract.
The Funds’ exchange-traded option contracts are not subject to master netting arrangements (the right to close out all transactions traded with a counterparty and net amounts owed or due across transactions). The Funds’ over-the-counter (“OTC”) options are subject to master netting agreements.
The Funds may be required to post or receive collateral for OTC options and exchange-traded options. Cash collateral posted by the Funds is considered restricted.
(2). Futures Contracts — Macro Opportunities Fund and Research Market Neutral Fund used index and treasury financial futures contracts to gain or reduce exposure to the stock market, or maintain liquidity or minimize transaction costs. The Funds also used index futures contracts to more effectively manage the long and short equity exposures in the portfolio. The Funds also purchased futures contracts to invest incoming cash in the market or sold futures in response to cash outflows, thereby simulating an invested position in the underlying index while maintaining a cash balance for liquidity.
Futures contracts provide for the delayed delivery of the underlying instrument at a fixed price or are settled for a cash amount based on the change in the value of the underlying instrument at a specific date in the future. Upon entering into a futures contract, the Funds (excluding Macro Opportunities Fund) are required to deposit with the broker, cash or securities in an amount equal to a certain percentage of the contract amount, which is referred to as the initial margin deposit. Subsequent payments, referred to as variation margin, are made or received by the Funds periodically and are based on changes in the market value of open futures contracts. Changes in the market value of open futures contracts are recorded as Change in net unrealized appreciation/depreciation on futures contracts on the Statements of Operations. Realized gains or losses, representing the difference between the value of the contract at the time it was opened and the value at the time it was closed, are reported on the Statements of Operations at the closing or expiration of the futures contract. Securities deposited as initial margin are designated on the SOI, while cash deposited, which is considered restricted, is recorded on the Statements of Assets and Liabilities. A receivable from and/or a payable to brokers for the daily variation margin is also recorded on the Statements of Assets and Liabilities.
The use of futures contracts exposes the Funds to equity price risk. The Funds may be subject to the risk that the change in the value of the futures contract may not correlate perfectly with the underlying instrument. Use of long futures contracts subjects the Funds to risk of loss in excess of the amounts shown on the Statements of Assets and Liabilities, up to the notional amount of the futures contracts. Use of short futures contracts subjects the Funds to unlimited risk of loss. The Funds may enter into futures contracts only on exchanges or boards of trade. The exchange or board of trade acts as the counterparty to each futures transaction; therefore, the Funds’ credit risk is limited to failure of the exchange or board of trade. Under some circumstances, futures exchanges may establish daily limits on the amount that the price of a futures contract can vary from the previous day’s settlement price, which could effectively prevent liquidation of positions.
The Funds’ futures contracts are not subject to master netting arrangements (the right to close out all transactions traded with a counterparty and net amounts owed or due across transactions).
(3). Forward Foreign Currency Exchange Contracts — Macro Opportunities Fund is exposed to foreign currency risks associated with some or all of the portfolio investments and used forward foreign currency exchange contracts to hedge or manage certain of these exposures as part of an investment strategy. The Fund also bought forward foreign currency exchange contracts to gain exposure to currencies. Forward foreign currency exchange contracts represent obligations to purchase or sell foreign currency on a specified future date at a price fixed at the time the contracts are entered into. Non-deliverable forward foreign currency exchange contracts are settled with the counterparty in U.S. dollars without the delivery of the foreign currency.
The values of the forward foreign currency exchange contracts are adjusted daily based on the applicable exchange rate of the underlying currency. Changes in the value of these contracts are recorded as unrealized appreciation or depreciation until the contract settlement date. When the forward foreign currency exchange contract is closed, the Fund records a realized gain or loss equal to the difference between the value at the time the contract was opened and the value at the time it was closed. The Fund also records a realized gain or loss, upon settlement, when a forward foreign currency exchange contract offsets another forward foreign currency exchange contract with the same counterparty.
The Fund’s forward foreign currency exchange contracts are subject to master netting arrangements (the right to close out all transactions with a counterparty and net amounts owed or due across transactions).
The Fund may be required to post or receive collateral for non-deliverable forward foreign currency exchange contracts.
| | | | | | | | |
| | | |
| OCTOBER 31, 2020 | | J.P. MORGAN SPECIALTY FUNDS | | | | | 45 | |
NOTES TO FINANCIAL STATEMENTS
AS OF OCTOBER 31, 2020 (continued)
(4). Summary of Derivatives Information — The following tables present the value of derivatives held as of October 31, 2020 by their primary underlying risk exposure and respective location on the Statements of Assets and Liabilities:
Macro Opportunities Fund
| | | | | | | | | | | | | | | | | | |
| Derivative Contracts | | Statements of Assets and Liabilities Location | | | | | | | | | | | | |
| Gross Assets: | | | | Options | | | Futures
Contracts (a) | | | Forward Foreign
Currency Exchange
Contracts | | | Total | |
| Equity contracts | | Receivables, Net Assets — Unrealized Appreciation | | $ | 70 | | | $ | 224 | | | $ | — | | | $ | 294 | |
Foreign exchange contracts | | Receivables | | | — | | | | — | | | | 52 | | | | 52 | |
| Interest rate contracts | | Receivables, Net Assets — Unrealized Appreciation | | | — | | | | 21 | | | | — | | | | 21 | |
| | | | | | | | | | | | | | | | | | |
Total | | | | $ | 70 | | | $ | 245 | | | $ | 52 | | | $ | 367 | |
| | | | | | | | | | | | | | | | | | |
| | | | | |
Gross Liabilities: | | | | | | | | | | | | | | |
| Equity contracts | | Payables, Net Assets — Unrealized Depreciation | | $ | — | | | $ | (10 | ) | | $ | — | | | $ | (10 | ) |
| Foreign exchange contracts | | Payables | | | — | | | | — | | | | (32 | ) | | | (32 | ) |
| Interest rate contracts | | Payables, Net Assets — Unrealized Depreciation | | | — | | | | (17 | ) | | | — | | | | (17 | ) |
| | | | | | | | | | | | | | | | | | |
Total | | | | $ | — | | | $ | (27 | ) | | $ | (32 | ) | | $ | (59 | ) |
| | | | | | | | | | | | | | | | | | |
Research Market Neutral Fund
| | | | | | |
| Derivative Contracts | | Statements of Assets and Liabilities Location | | | |
| Gross Assets: | | | | Futures Contracts (a) | |
Equity contracts | | Receivables, Net Assets — Unrealized Appreciation | | $ | 85 | |
| | | | | | |
| (a) | This amount represents the cumulative appreciation (depreciation) of futures contracts as reported on the SOI. The Statements of Assets and Liabilities only reflect the current day variation margin receivable/payable from/to brokers. |
The following tables present the effect of derivatives on the Statements of Operations for the year ended October 31, 2020, by primary underlying risk exposure:
Macro Opportunities Fund
| | | | | | | | | | | | | | | | |
Amount of Realized Gain (Loss) on Derivatives Recognized on the Statements of Operations | |
| Derivative Contracts | | Options | | | Futures Contracts | | | Forward Foreign
Currency Exchange
Contracts | | | Total | |
Equity contracts | | $ | (206 | ) | | $ | (773 | ) | | $ | — | | | $ | (979 | ) |
Foreign exchange contracts | | | (9 | ) | | | — | | | | (300 | ) | | | (309 | ) |
Interest rate contracts | | | — | | | | 22 | | | | — | | | | 22 | |
| | | | | | | | | | | | | | | | |
Total | | $ | (215 | ) | | $ | (751 | ) | | $ | (300 | ) | | $ | (1,266 | ) |
| | | | | | | | | | | | | | | | |
| | | | | | | | | | | | | | | | |
Amount of Change in Unrealized Appreciation (Depreciation) on Derivatives Recognized on the Statements of Operations | |
| Derivative Contracts | | Options | | | Futures Contracts | | | Forward Foreign
Currency Exchange
Contracts | | | Total | |
Equity contracts | | $ | (69 | ) | | $ | 214 | | | $ | — | | | $ | 145 | |
Foreign exchange contracts | | | — | | | | — | | | | 20 | | | | 20 | |
Interest rate contracts | | | — | | | | 4 | | | | — | | | | 4 | |
| | | | | | | | | | | | | | | | |
Total | | $ | (69 | ) | | $ | 218 | | | $ | 20 | | | $ | 169 | |
| | | | | | | | | | | | | | | | |
| | | | | | |
| | | |
| 46 | | | | J.P. MORGAN SPECIALTY FUNDS | | OCTOBER 31, 2020 |
Opportunistic Equity Long/Short Fund
| | | | |
| Amount of Realized Gain (Loss) on Derivatives Recognized on the Statements of Operations | |
| Derivative Contracts | | Options | |
Equity contracts | | $ | (878 | ) |
| | | | |
Research Market Neutral Fund
| | | | |
| Amount of Realized Gain (Loss) on Derivatives Recognized on the Statements of Operations | |
| Derivative Contracts | | Futures Contracts | |
Equity contracts | | $ | (178 | ) |
| | | | |
| | | | |
| Amount of Change in Unrealized Appreciation (Depreciation) on Derivatives Recognized on the Statements of Operations | |
| Derivative Contracts | | Futures Contracts | |
Equity contracts | | $ | 84 | |
| | | | |
The Fund’s derivatives contracts held at October 31, 2020 are not accounted for as hedging instruments under GAAP.
Derivatives Volume
The tables below disclose the volume of the Funds’ futures contracts, forward foreign currency exchange contracts and options activity during the year ended October 31, 2020. Please refer to the tables in the Summary of Derivatives Information for derivative-related gains and losses associated with volume activity.
| | | | | | | | | | | | |
| | | Macro
Opportunities
Fund | | | Opportunistic
Equity Long/
Short Fund | | | Research
Market Neutral
Fund | |
Futures Contracts — Equity: | | | | | | | | | | | | |
Average Notional Balance Long | | $ | 494 | (a) | | | — | | | $ | 900 | (d) |
Average Notional Balance Short | | | 4,601 | (a) | | | — | | | | 2,878 | |
Ending Notional Balance Long | | | 536 | | | | — | | | | — | |
Ending Notional Balance Short | | | 4,145 | | | | — | | | | 1,959 | |
| | | |
Futures Contracts — Interest Rate: | | | | | | | | | | | | |
Average Notional Balance Long | | $ | 1,100 | (a) | | | — | | | | — | |
Average Notional Balance Short | | | 698 | (b) | | | — | | | | — | |
Ending Notional Balance Long | | | 1,561 | | | | — | | | | — | |
Ending Notional Balance Short | | | 821 | | | | — | | | | — | |
| | | |
Forward Foreign Currency Exchange Contracts: | | | | | | | | | | | | |
Average Settlement Value Purchased | | $ | 3,262 | (a) | | | — | | | | — | |
Average Settlement Value Sold | | | 9,523 | (a) | | | — | | | | — | |
Ending Settlement Value Purchased | | | 2,198 | | | | — | | | | — | |
Ending Settlement Value Sold | | | 8,015 | | | | — | | | | — | |
| | | |
Exchange-Traded Options: | | | | | | | | | | | | |
Average Number of Contracts Purchased | | | 225 | (a) | | | 21 | | | | — | |
Average Number of Contracts Written | | | 2 | | | | 156 | (c) | | | — | |
Ending Number of Contracts Purchased | | | 315 | | | | — | | | | — | |
| (a) | For the period April 15, 2020 through October 31, 2020. |
| (b) | For the period June 1, 2020 through October 31, 2020. |
| (c) | For the period June 1, 2020 through June 30, 2020. |
| (d) | For the period March 1, 2020 through March 31, 2020. |
Macro Opportunities Fund may be required to post or receive collateral based on the net value of the Fund’s outstanding OTC swap contracts, non-deliverable forward foreign currency exchange contracts and/or OTC options with the counterparty in the form of cash or securities. Daily movement of cash collateral is subject to minimum threshold amounts. Collateral posted by the Fund is held in a segregated account at the Fund’s custodian bank. For certain counterparties, cash collateral posted by the Fund is invested in an affiliated money market fund (See Note 3.F.). Otherwise the cash collateral is included on the Statements of Assets and Liabilities as Restricted cash. Collateral received by the Fund is held in a separate segregated account maintained by JPMorgan Chase Bank, N.A. (“JPMCB”), an affiliate of the Fund.
| | | | | | | | |
| | | |
| OCTOBER 31, 2020 | | J.P. MORGAN SPECIALTY FUNDS | | | | | 47 | |
NOTES TO FINANCIAL STATEMENTS
AS OF OCTOBER 31, 2020 (continued)
F. Short Sales — Opportunistic Equity Long/Short Fund and Research Market Neutral Fund engaged in short sales as part of their normal investment activities. In a short sale, the Funds sell securities they do not own in anticipation of a decline in the market value of those securities. In order to deliver securities to the purchaser, the Funds borrow securities from a broker. To close out a short position, the Funds deliver the same securities to the broker.
The Funds are required to pledge cash or securities to the broker as collateral for the securities sold short. Collateral requirements are calculated daily based on the current market value of the short positions. Cash collateral deposited with the broker is recorded as an asset on the Statements of Assets and Liabilities. Securities segregated as collateral are denoted on the SOIs. The Funds may receive or pay the net of the following amounts: (i) a portion of the income from the investment of cash collateral; (ii) the broker’s fee on the borrowed securities (calculated daily based upon the market value of each borrowed security and a variable rate that is dependent on availability of the security); and (iii) a financing charge for the difference between the market value of the short position and cash collateral deposited with the broker. The net amounts of income or fees are included as interest income or interest expense on securities sold short on the Statements of Operations.
The Funds are obligated to pay the broker dividends declared on short positions when a position is open on the record date. Dividends on short positions are reported on ex-dividend date on the Statements of Operations as Dividend expense on securities sold short.
Liabilities for securities sold short are reported at market value on the Statements of Assets and Liabilities and the change in market value is recorded as Change in net unrealized appreciation/depreciation on the Statements of Operations. Short sale transactions may result in unlimited losses as the security’s price increases and the short position loses value. There is no upward limit on the price a borrowed security could attain. The Funds are also subject to risk of loss if the broker were to fail to perform its obligations under the contractual terms.
The Funds will record a realized loss if the price of the borrowed security increases between the date of the short sale and the date on which the Funds replace the borrowed security. The Funds will record a realized gain if the price of the borrowed security declines between those dates.
As of October 31, 2020, the Funds had outstanding short sales as listed on their SOIs.
G. Offering and Organization Costs — Macro Opportunities Fund’s total offering costs of approximately $21,000 incurred in connection with the offering of shares of the Fund are amortized on a straight line basis over 12 months from the date the Fund commenced operations. Costs paid in connection with the organization of the Fund, if any, are recorded as an expense at the time the Fund commenced operations and are included as part of Professional fees on the Statements of Operations. For the year ended October 31, 2020, total offering costs amortized were approximately $11,000.
H. Security Transactions and Investment Income — Investment transactions are accounted for on the trade date (the date the order to buy or sell is executed). Securities gains and losses are calculated on a specifically identified cost basis. Interest income is determined on the basis of coupon interest accrued using the effective interest method, which adjusts for amortization of premiums and accretion of discounts. Dividend income, net of foreign taxes withheld, if any, and dividend expense on securities sold short are recorded on the ex-dividend date or when a Fund first learns of the dividend.
To the extent such information is publicly available, the Funds record distributions received in excess of income earned from underlying investments as a reduction of cost of investments and/or realized gain. Such amounts are based on estimates if actual amounts are not available and actual amounts of income, realized gain and return of capital may differ from the estimated amounts. The Funds adjust the estimated amounts of the components of distributions (and consequently their net investment income) as necessary, once the issuers provide information about the actual composition of the distributions.
I. Allocation of Income and Expenses — Expenses directly attributable to a Fund are charged directly to that Fund, while the expenses attributable to more than one fund of the Trusts are allocated among the applicable funds. Investment income, realized and unrealized gains and losses and expenses, other than class-specific expenses, are allocated daily to each class of shares based upon the proportion of net assets of each class at the beginning of each day.
Transfer agency fees are class-specific expenses. The amount of the transfer agency fees charged to each share class of the Funds for the year ended October 31, 2020 are as follows (amounts in thousands):
| | | | | | | | | | | | | | | | | | | | | | | | |
| | | Class A | | | Class C | | | Class I | | | Class L | | | Class R6 | | | Total | |
Macro Opportunities Fund | | | | | | | | | | | | | | | | | | | | | | | | |
Transfer agency fees | | $ | — | (a) | | $ | — | (a) | | $ | — | (a) | | | n/a | | | $ | — | (a) | | $ | — | (a) |
Opportunistic Equity Long/Short Fund | | | | | | | | | | | | | | | | | | | | | | | | |
Transfer agency fees | | | 1 | | | | 1 | | | | 7 | | | | n/a | | | | — | (a) | | | 9 | |
Research Market Neutral Fund | | | | | | | | | | | | | | | | | | | | | | | | |
Transfer agency fees | | | 8 | | | | — | (a) | | | 3 | | | $ | 1 | | | | n/a | | | | 12 | |
| (a) | Amount rounds to less than one thousand. |
J. Federal Income Taxes — Each Fund is treated as a separate taxable entity for Federal income tax purposes. Each Fund’s policy is to comply with the provisions of the Internal Revenue Code (the “Code”) applicable to regulated investment companies and to distribute to shareholders all of its
| | | | | | |
| | | |
| 48 | | | | J.P. MORGAN SPECIALTY FUNDS | | OCTOBER 31, 2020 |
distributable net investment income and net realized capital gains on investments. Accordingly, no provision for Federal income tax is necessary. Management has reviewed the Funds’ tax positions for all open tax years and has determined that as of October 31, 2020, no liability for Federal income tax is required in the Funds’ financial statements for net unrecognized tax benefits. However, management’s conclusions may be subject to future review based on changes in, or the interpretation of, the accounting standards or tax laws and regulations. Opportunistic Equity Long/Short Fund’s and Research Market Neutral Fund’s Federal tax returns for the prior three fiscal years remain subject to examination by the Internal Revenue Service. When filed, Macro Opportunities Fund’s Federal tax return since inception will be subject to examination by the Internal Revenue Service.
K. Foreign Taxes — Macro Opportunities Fund may be subject to foreign taxes on income, gains on investments or currency purchases/repatriation, a portion of which may be recoverable. The Fund will accrue such taxes and recoveries as applicable, based upon its current interpretation of tax rules and regulations that exist in the markets in which it invests. When a capital gain tax is determined to apply, the Fund records an estimated deferred tax liability in an amount that would be payable if the securities were disposed of on the valuation date.
L. Distributions to Shareholders — Distributions from net investment income, if any, are generally declared and paid annually for the Funds and are declared separately for each class. No class has preferential dividend rights; differences in per share rates are due to differences in separate class expenses. Net realized capital gains, if any, are distributed by each Fund at least annually. The amount of distributions from net investment income and net realized capital gains is determined in accordance with Federal income tax regulations, which may differ from GAAP. To the extent these “book/tax” differences are permanent in nature (i.e., that they result from other than timing of recognition — “temporary differences”), such amounts are reclassified within the capital accounts based on their Federal tax basis treatment.
The following amounts were reclassified within the capital accounts (amounts in thousands):
| | | | | | | | | | | | |
| | | Paid-in-Capital | | | Accumulated undistributed (distributions
in excess of) net investment income | | | Accumulated net realized gains (losses) | |
Macro Opportunities Fund | | $ | (240 | ) | | $ | (39 | ) | | $ | 279 | |
Opportunistic Equity Long/Short Fund | | | — | | | | 4,524 | | | | (4,524 | ) |
Research Market Neutral Fund | | | (36 | ) | | | 1,088 | | | | (1,052 | ) |
The reclassifications for the Funds relate primarily to dividend expense for securities sold short, foreign currency gain/loss and net operating losses.
M. Recent Accounting Pronouncement — In March 2020, the FASB issued Accounting Standards Update No. 2020-04 (“ASU 2020-04”), Reference Rate Reform (Topic 848) — Facilitation of the Effects of Reference Rate Reform on Financial Reporting. ASU 2020-04 provides optional temporary financial reporting relief from the effect of certain types of contract modifications due to the planned discontinuation of the London Interbank Offered Rate (“LIBOR”) and other interbank-offered based reference rates as of the end of 2021. ASU 2020-04 became effective upon the issuance and its optional relief can be applied through December 31, 2022. Management is currently evaluating the impact, if any, to the Funds’ financial statements of applying ASU 2020-04.
3. Fees and Other Transactions with Affiliates
A. Investment Advisory Fee — Pursuant to an Investment Advisory Agreement, the Adviser manages the investments of each Fund and for such services is paid a fee. The investment advisory fee is accrued daily and paid monthly at an annual rate of each Fund’s respective average daily net assets as follows:
| | | | |
Macro Opportunities Fund | | | 0.60 | % |
Opportunistic Equity Long/Short Fund | | | 1.20 | |
Research Market Neutral Fund | | | 0.35 | (1) |
| (1) | Prior to June 1, 2020, the investment advisory fee was accrued daily and paid monthly at an annual rate of 0.60% of the Fund’s respective average daily net assets. |
The Adviser waived investment advisory fees and/or reimbursed expenses as outlined in Note 3.G.
B. Administration Fee — Pursuant to an Administration Agreement, the Administrator provides certain administration services to each Fund. In consideration of these services, the Administrator receives a fee accrued daily and paid monthly at an annual rate of 0.075% of the first $10 billion of each Fund’s respective average daily net assets, plus 0.050% of each Fund’s respective average daily net assets between $10 billion and $20 billion, plus 0.025% of each Fund’s respective average daily net assets between $20 billion and $25 billion, plus 0.01% of each Fund’s respective average daily net assets in excess of $25 billion. For the year ended October 31, 2020, the effective rate was 0.08% of each Fund’s average daily net assets, notwithstanding any fee waivers and/or expense reimbursements.
The Administrator waived administration fees as outlined in Note 3.G.
| | | | | | | | |
| | | |
| OCTOBER 31, 2020 | | J.P. MORGAN SPECIALTY FUNDS | | | | | 49 | |
NOTES TO FINANCIAL STATEMENTS
AS OF OCTOBER 31, 2020 (continued)
JPMCB, a wholly-owned subsidiary of JPMorgan, serves as the Funds’ sub-administrator (the “Sub-administrator”). For its services as Sub-administrator, JPMCB receives a portion of the fees payable to the Administrator.
C. Distribution Fees — Pursuant to a Distribution Agreement, JPMorgan Distribution Services, Inc. (“JPMDS”), an indirect, wholly-owned subsidiary of JPMorgan, serves as each Fund’s principal underwriter and promotes and arranges for the sale of each Fund’s shares.
The Boards have adopted a Distribution Plan (the “Distribution Plan”) for Class A and Class C Shares of the Funds, as applicable, pursuant to Rule 12b-1 under the 1940 Act. Class I and Class R6 Shares of the Funds do not charge a distribution fee. The Distribution Plan provides that each Fund shall pay, with respect to the applicable share classes, distribution fees, including payments to JPMDS, at annual rates of the average daily net assets as shown in the table below:
| | | | | | | | |
| | | Class A | | | Class C | |
Macro Opportunities | | | 0.25 | % | | | 0.75 | % |
Opportunistic Equity Long/Short Fund | | | 0.25 | | | | 0.75 | |
Research Market Neutral Fund | | | 0.25 | | | | 0.75 | |
In addition, JPMDS is entitled to receive the front-end sales charges from purchases of Class A Shares and the CDSC from redemptions of Class C Shares and certain Class A Shares for which front-end sales charges have been waived. For the year ended October 31, 2020, JPMDS retained the following (amounts in thousands):
| | | | | | | | |
| | | Front-End Sales Charge | | | CDSC | |
Opportunistic Equity Long/Short Fund | | $ | 4 | | | $ | — | (a) |
Research Market Neutral Fund | | | 1 | | | | — | |
| (a) | Amount rounds to less than one thousand. |
D. Service Fees — The Trusts, on behalf of the Funds, have entered into a Shareholder Servicing Agreement with JPMDS under which JPMDS provides certain support services to fund shareholders. For performing these services, JPMDS receives a fee with respect to all share classes, except Class R6 Shares which do not charge a service fee, that is accrued daily and paid monthly equal to a percentage of the average daily net assets as shown in the table below:
| | | | | | | | | | | | |
| | | Class A | | | Class C | | | Class I | |
Macro Opportunities | | | 0.25 | % | | | 0.25 | % | | | 0.25 | % |
Opportunistic Equity Long/Short Fund | | | 0.25 | | | | 0.25 | | | | 0.25 | |
Research Market Neutral Fund | | | 0.25 | | | | 0.25 | | | | 0.25 | |
JPMDS has entered into shareholder services contracts with affiliated and unaffiliated financial intermediaries who provide shareholder services and other related services to their clients or customers who invest in the Funds. Pursuant to such contracts, JPMDS will pay all or a portion of such fees earned to financial intermediaries for performing such services.
JPMDS waived service fees as outlined in Note 3.F.
E. Custodian and Accounting Fees — JPMCB provides portfolio custody and accounting services to the Funds. For performing these services, the Funds pay JPMCB transaction and asset-based fees that vary according to the number of transactions and positions, plus out-of-pocket expense. The amounts paid directly to JPMCB by the Funds for custody and accounting services are included in Custodian and accounting fees on the Statements of Operations.
Interest income earned on cash balances at the custodian, if any, is included in Interest income from affiliates on the Statements of Operations.
Interest expense paid to the custodian related to cash overdrafts, if any, is included in Interest expense to affiliates on the Statements of Operations.
F. Waivers and Reimbursements — The Adviser, Administrator and/or JPMDS have contractually agreed to waive fees and/or reimburse the Funds to the extent that total annual operating expenses (excluding acquired fund fees and expenses other than certain money market fund fees as described below, dividend and interest expenses related to short sales, interest, taxes, expenses related to litigation and potential litigation, expenses related to trustee elections and extraordinary expenses) exceed the percentages of the Funds’ respective average daily net assets as shown in the table below:
| | | | | | | | | | | | | | | | |
| | | Class A | | | Class C | | | Class I | | | Class R6 | |
Macro Opportunities Fund(1) | | | 1.20 | % | | | 1.70 | % | | | 0.95 | % | | | 0.70 | % |
Opportunistic Equity Long/Short Fund(2) | | | 1.85 | | | | 2.35 | | | | 1.60 | | | | 1.35 | |
Research Market Neutral Fund(3) | | | 0.95 | | | | 1.45 | | | | 0.69 | | | | n/a | |
| (1) | The expense limitation agreements were in effect for the year ended October 31, 2020 and are in place until at least February 28, 2022. |
| (2) | The expense limitation agreements were in effect for the year ended October 31, 2020 and are in place until at least February 28, 2021. |
| (3) | Prior to June 1, 2020, the contractual expense limitations were 1.25%, 1.75% and 0.99% for Class A, Class C and Class I Shares, respectively. Effective June 1, 2020, the contractual expense percentages in the table above were extended and are in place until at least May 31, 2021 for Class A and Class C Shares, and May 31, 2022 for Class I Shares. |
| | | | | | |
| | | |
| 50 | | | | J.P. MORGAN SPECIALTY FUNDS | | OCTOBER 31, 2020 |
For the year ended October 31, 2020, the Funds’ service providers waived fees and/or reimbursed expenses for each of the Funds as follows (amounts in thousands). None of these parties expect the Funds to repay any such waived fees and/or reimbursed expenses in future years.
| | | | | | | | | | | | | | | | | | | | |
| | | Contractual Waivers | | | | |
| | | Investment
Advisory
Fees | | | Administration
Fees | | | Service
Fees | | | Total | | | Contractual
Reimbursements | |
Macro Opportunities Fund | | $ | 50 | | | $ | 6 | | | $ | 18 | | | $ | 74 | | | $ | 204 | |
Opportunistic Equity Long/Short Fund | | | 19 | | | | 13 | | | | 5 | | | | 37 | | | | — | |
Research Market Neutral Fund | | | 177 | | | | 51 | | | | 19 | | | | 247 | | | | — | |
Additionally, the Funds may invest in one or more money market funds advised by the Adviser (affiliated money market funds). The Adviser, Administrator and/or JPMDS, as shareholder servicing agent, have contractually agreed to waive fees and/or reimburse expenses in an amount sufficient to offset the respective net fees each collects from the affiliated money market fund on the applicable Fund’s investment in such affiliated money market fund, except for investments of securities lending cash collateral. None of these parties expect the Funds to repay any such waived fees and/or reimbursed expenses in future years.
The amounts of these waivers/reimbursements resulting from investments in these money market funds for the year ended October 31, 2020 were as follows (amounts in thousands):
| | | | |
Macro Opportunities Fund | | $ | 1 | |
Opportunistic Equity Long/Short Fund | | | 112 | |
Research Market Neutral Fund | | | 24 | |
G. Other — Certain officers of the Trusts are affiliated with the Adviser, the Administrator and JPMDS. Such officers, with the exception of the Chief Compliance Officer, receive no compensation from the Funds for serving in their respective roles.
The Board designated and appointed a Chief Compliance Officer to the Funds pursuant to Rule 38a-1 under the 1940 Act. Each Fund, along with affiliated funds, makes reimbursement payments, on a pro-rata basis, to the Administrator for a portion of the fees associated with the office of the Chief Compliance Officer. Such fees are included in Trustees’ and Chief Compliance Officer’s fees on the Statements of Operations.
The Trusts adopted a Trustee Deferred Compensation Plan (the “Plan”) which allows the independent Trustees to defer the receipt of all or a portion of compensation related to performance of their duties as Trustees. The deferred fees are invested in various J.P. Morgan Funds until distribution in accordance with the Plan.
During the year ended October 31, 2020, Research Market Neutral Fund purchased securities from an underwriting syndicate in which the principal underwriter or members of the syndicate were affiliated with the Adviser.
The Securities and Exchange Commission (“SEC”) has granted an exemptive order permitting the Funds to engage in principal transactions with J.P. Morgan Securities LLC, an affiliated broker, involving taxable money market instruments, subject to certain conditions.
4. Investment Transactions
During the year ended October 31, 2020, purchases and sales of investments (excluding short-term investments) were as follows (amounts in thousands):
| | | | | | | | | | | | | | | | |
| | | Purchases
(excluding
U.S. Government) | | | Sales (excluding
U.S. Government) | | | Securities
Sold Short | | | Covers on
Securities
Sold Short | |
Macro Opportunities Fund | | $ | 12,936 | | | $ | 4,642 | | | $ | — | | | $ | — | |
Opportunistic Equity Long/Short Fund | | | 1,716,138 | | | | 1,622,132 | | | | 1,736,773 | | | | 1,655,926 | |
Research Market Neutral Fund | | | 193,699 | | | | 147,574 | | | | 201,859 | | | | 157,358 | |
During the year ended October 31, 2020, there were no purchases or sales of U.S. Government securities.
5. Federal Income Tax Matters
For Federal income tax purposes, the estimated cost and unrealized appreciation (depreciation) in value of investments held at October 31, 2020 were as follows (amounts in thousands):
| | | | | | | | | | | | | | | | |
| | | Aggregate
Cost | | | Gross
Unrealized
Appreciation | | | Gross
Unrealized
Depreciation | | | Net Unrealized
Appreciation
(Depreciation) | |
Macro Opportunities Fund | | $ | 13,426 | | | $ | 1,382 | | | $ | 316 | | | $ | 1,066 | |
Opportunistic Equity Long/Short Fund* | | | 315,077 | | | | 48,838 | | | | 2,164 | | | | 46,674 | |
Research Market Neutral Fund* | | | 22,551 | | | | 17,456 | | | | 5,499 | | | | 11,957 | |
| * | The tax cost includes the proceeds from short sales which may result in a net negative cost. |
The difference between book and tax basis appreciation (depreciation) on investments is primarily attributed to mark to market of forward foreign currency contracts, mark to market of futures contracts, mark to market of options contracts and wash sale loss deferrals.
| | | | | | | | |
| | | |
| OCTOBER 31, 2020 | | J.P. MORGAN SPECIALTY FUNDS | | | | | 51 | |
NOTES TO FINANCIAL STATEMENTS
AS OF OCTOBER 31, 2020 (continued)
The tax character of distributions paid during the year ended October 31, 2020 was as follows (amounts in thousands):
| | | | | | | | | | | | |
| | | Ordinary Income* | | | Net Long-Term Capital Gains | | | Total Distributions Paid | |
Opportunistic Equity Long/Short Fund | | $ | 918 | | | $ | — | | | $ | 918 | |
Research Market Neutral Fund | | | — | | | | 6,225 | | | | 6,225 | |
| * | Short-term gain distributions are treated as ordinary income for income tax purposes. |
The tax character of distributions paid during the year ended October 31, 2019 was as follows (amounts in thousands):
| | | | | | | | | | | | |
| | | Ordinary Income* | | | Net Long-Term Capital Gains | | | Total Distributions Paid | |
Opportunistic Equity Long/Short Fund | | $ | — | (a) | | $ | 4,791 | | | $ | 4,791 | |
Research Market Neutral Fund | | | — | | | | 13,829 | | | | 13,829 | |
| (a) | Amount rounds to less than one thousand. |
| * | Short-term gain distributions are treated as ordinary income for income tax purposes. |
At October 31, 2020, the estimated components of net assets (excluding paid-in-capital) on a tax basis were as follows (amounts in thousands):
| | | | | | | | | | | | | | | | |
| | | Current Distributable Ordinary Income | | | Current Distributable Long-Term Capital Gain | | | (Tax Basis
Capital Loss
Carryover) | | | Unrealized Appreciation (Depreciation) | |
Macro Opportunities Fund | | $ | — | | | $ | — | | | $ | (408 | ) | | $ | 1,048 | |
Opportunistic Equity Long/Short Fund | | | 17,960 | | | | 3,382 | | | | — | | | | 46,513 | |
Research Market Neutral Fund | | | 1,667 | | | | 6,517 | | | | (31,380 | ) | | | 11,783 | |
For the Funds the cumulative timing differences primarily consist of mark to market of forward foreign currency contracts, mark to market of futures contracts, mark to market of options contracts, straddle loss deferral and wash sale loss deferrals.
As of October 31, 2020, the following Funds had post-enactment capital loss carryforwards as follows (amounts in thousands):
| | | | | | | | |
| | | Capital Loss Carryforward | |
| | | Short-Term | | | Long-Term | |
Macro Opportunities Fund | | $ | — | | | $ | 408 | |
Research Market Neutral Fund | | | 31,380 | * | | | — | |
| * | Amount includes capital loss carry forwards which are limited in future years under Internal Revenue Code sections 381-384. |
During the year ended October 31, 2020, the following Funds utilized capital loss carryforwards as follows (amounts in thousands):
| | | | | | | | |
| | | Capital Loss Utilized | |
| | | Short-Term | | | Long-Term | |
Opportunistic Equity Long/Short Fund | | $ | 14,015 | | | $ | — | |
Research Market Neutral Fund | | | 2,302 | | | | — | |
6. Borrowings
The Funds rely upon an exemptive order granted by the SEC (the “Order”) permitting the establishment and operation of an Interfund Lending Facility (the “Facility”). The Facility allows the Funds to directly lend and borrow money to or from any other fund relying upon the Order at rates beneficial to both the borrowing and lending funds. Advances under the Facility are taken primarily for temporary or emergency purposes, including the meeting of redemption requests that otherwise might require the untimely disposition of securities, and are subject to each Fund’s borrowing restrictions. The Interfund loan rate is determined, as specified in the Order, by averaging the current repurchase agreement rate and the current bank loan rate. The Order was granted to JPMorgan Trust II and may be relied upon by the Funds because the Funds and the series of JPMorgan Trust II are all investment companies in the same “group of investment companies” (as defined in Section 12(d)(1)(G) of the 1940 Act).
The Funds had no borrowings outstanding from another fund during the year ended October 31, 2020.
The Trusts and JPMCB have entered into a financing arrangement. Under this arrangement, JPMCB provides an unsecured, uncommitted credit facility in the aggregate amount of $100 million to certain of the J.P. Morgan Funds, including the Funds. Advances under the arrangement are taken primarily for temporary or emergency purposes, including the meeting of redemption requests that otherwise might require the untimely disposition of securities, and are subject to each Fund’s borrowing restrictions. Interest on borrowings is payable at a rate determined by JPMCB at the time of borrowing. This agreement has been extended until November 1, 2021.
| | | | | | |
| | | |
| 52 | | | | J.P. MORGAN SPECIALTY FUNDS | | OCTOBER 31, 2020 |
The Funds had no borrowings outstanding from the unsecured, uncommitted credit facility during the year ended October 31, 2020.
The Trusts, along with certain other trusts for J.P. Morgan Funds (“Borrowers”), have entered into a joint syndicated senior unsecured revolving credit facility totaling $1.5 billion (“Credit Facility”) with various lenders and The Bank of New York Mellon, as administrative agent for the lenders. This Credit Facility provides a source of funds to the Borrowers for temporary and emergency purposes, including the meeting of redemption requests that otherwise might require the untimely disposition of securities. Under the terms of the Credit Facility, a borrowing fund must have a minimum of $25,000,000 in adjusted net asset value and not exceed certain adjusted net asset coverage ratios prior to and during the time in which any borrowings are outstanding. If a fund does not comply with the aforementioned requirements, the fund must remediate within three business days with respect to the $25,000,000 minimum adjusted net asset value or within one business day with respect to certain asset coverage ratios or the administrative agent at the request of, or with the consent of, the lenders may terminate the Credit Facility and declare any outstanding borrowings to be due and payable immediately.
Interest associated with any borrowing under the Credit Facility is charged to the borrowing fund at a rate of interest equal to 1.00%, which has increased to 1.25% pursuant to the amendment referenced below, plus the greater of the federal funds effective rate or one month LIBOR. The annual commitment fee to maintain the Credit Facility is 0.15% and is incurred on the unused portion of the Credit Facility and is allocated to all participating funds pro rata based on their respective net assets. Effective August 11, 2020, this agreement has been amended and restated for a term of 364 days, unless extended, and to include the change to the interest rate charged for borrowing from the Credit Facility to 1.25%, as noted above, and an upfront fee of 0.075% of the Credit Facility to be charged and paid by all participating funds of the Credit Facility.
The Funds did not utilize the Credit Facility during the year ended October 31, 2020.
7. Risks, Concentrations and Indemnifications
In the normal course of business, the Funds enter into contracts that contain a variety of representations which provide general indemnifications. Each Fund’s maximum exposure under these arrangements is unknown. The amount of exposure would depend on future claims that may be brought against each Fund. However, based on experience, the Funds expect the risk of loss to be remote.
As of October 31, 2020, the Funds had non-U.S. country allocations representing greater than 10% of total investments (excluding investment of cash collateral from securities loaned) as follows:
| | | | | | | | |
| | | Macro
Opportunities
Fund | | | Opportunistic
Equity Long/
Short Fund | |
China | | | — | % | | | 10.1 | % |
Japan | | | 15.1 | | | | — | |
As of October 31, 2020, the Funds had individual shareholder and/or omnibus accounts which owned more than 10% of the respective Fund’s outstanding shares as follows:
| | | | | | | | | | | | | | | | |
| | | Number of
individual
shareholder
and/or
Affiliated Omnibus Accounts | | | % of the Fund | | | Number of
individual
shareholder
and/or
Non-Affiliated
Omnibus Accounts | | | % of the Fund | |
Macro Opportunities Fund | | | 1 | | | | 99.9 | % | | | — | | | | — | % |
Opportunistic Equity Long/Short Fund | | | — | | | | — | | | | 2 | | | | 53.2 | |
Research Market Neutral Fund | | | — | | | | — | | | | 3 | | | | 55.5 | |
Significant shareholder transactions by these shareholders may impact the Funds’ performance and liquidity.
Derivatives may be riskier than other types of investments because they may be more sensitive to changes in economic and market conditions and could result in losses that significantly exceed the Funds’ original investment. Many derivatives create leverage thereby causing the Funds to be more volatile than they would have been if they had not used derivatives. Derivatives also expose the Funds to counterparty risk (the risk that the derivative counterparty will not fulfill its contractual obligations), including credit risk of the derivative counterparty. The possible lack of a liquid secondary market for derivatives and the resulting inability of the Funds to sell or otherwise close a derivatives position could expose the Funds to losses.
Macro Opportunities Fund is also subject to counterparty credit risk, which is the risk that a counterparty fails to perform on agreements with the Fund, such as swap and option contracts and credit linked notes.
Macro Opportunities Fund and Opportunistic Equity Long/Short Fund may have elements of risk not typically associated with investments in the United States of America due to concentrated investments in a limited number of countries or regions, which may vary throughout the period depending on the Funds. Such concentrations may subject the Funds to additional risks resulting from political or economic conditions in such countries or regions and the possible imposition of adverse governmental laws or currency exchange restrictions could cause the securities and their markets to be less liquid and their prices to be more volatile than those of comparable U.S. securities.
| | | | | | | | |
| | | |
| OCTOBER 31, 2020 | | J.P. MORGAN SPECIALTY FUNDS | | | | | 53 | |
NOTES TO FINANCIAL STATEMENTS
AS OF OCTOBER 31, 2020 (continued)
Because Opportunistic Equity Long/Short Fund may invest a substantial portion of its assets in REITs, the Fund may be subject to certain risks similar to those associated with direct investments in real estate. REITs may be affected by changes in the value of their underlying properties and by defaults by tenants. REITs depend generally on their ability to generate cash flow to make distributions to shareholders, and certain REITs have self-liquidation provisions by which mortgages held may be paid in full and distributions of capital returns may be made at any time.
Since Opportunistic Equity Long/Short Fund is non-diversified, it may invest a greater percentage of its assets in a particular issuer or group of issuers than a diversified fund would. This increased investment in fewer issuers may result in the Fund’s shares being more sensitive to economic results of those issuing the securities.
As of October 31, 2020, the Opportunistic Equity Long/Short Fund and Research Market Neutral Fund pledged substantially all of their assets to Citigroup Global Markets, Inc. for securities sold short. For the Funds, deposits at broker for securities sold short, as noted on the Statements of Assets and Liabilities, are held at Citigroup Global Markets, Inc.
LIBOR is intended to represent the rate at which contributing banks may obtain short-term borrowings from each other in the London interbank market. The regulatory authority that oversees financial services firms and financial markets in the U.K. has announced that, after the end of 2021, it would no longer persuade or compel contributing banks to make rate submissions for purposes of determining the LIBOR rate. As a result, it is possible that commencing in 2022, LIBOR may no longer be available or no longer deemed an appropriate reference rate upon which to determine the interest rate on or impacting certain loans, notes, derivatives and other instruments or investments comprising some or all of a Fund’s portfolio. In light of this eventuality, public and private sector industry initiatives are currently underway to identify new or alternative reference rates to be used in place of LIBOR. There is no assurance that the composition or characteristics of any such alternative reference rate will be similar to or produce the same value or economic equivalence as LIBOR or that it will have the same volume or liquidity as did LIBOR prior to its discontinuance or unavailability, which may affect the value or liquidity or return on certain investments of a Fund and result in costs incurred in connection with closing out positions and entering into new trades. These risks may also apply with respect to changes in connection with other interbank offering rates (e.g., Euribor) and a wide range of other index levels, rates and values that are treated as “benchmarks” and are the subject of recent regulatory reform.
The Funds are subject to infectious disease epidemics/pandemics risk. Recently, the worldwide outbreak of COVID-19, a novel coronavirus disease, has negatively affected economies, markets and individual companies throughout the world. The effects of this COVID-19 pandemic to public health, and business and market conditions, including exchange trading suspensions and closures may continue to have a significant negative impact on the performance of a Fund’s investments, increase a Fund’s volatility, exacerbate other pre-existing political, social and economic risks to the Funds and negatively impact broad segments of businesses and populations. The Funds’ operations may be interrupted as a result, which may have a significant negative impact on investment performance. In addition, governments, their regulatory agencies, or self-regulatory organizations may take actions in response to the pandemic that affect the instruments in which the Funds invest, or the issuers of such instruments, in ways that could also have a significant negative impact on a Fund’s investment performance. The full impact of this COVID-19 pandemic, or other future epidemics/pandemics, is currently unknown.
| | | | | | |
| | | |
| 54 | | | | J.P. MORGAN SPECIALTY FUNDS | | OCTOBER 31, 2020 |
REPORT OF INDEPENDENT REGISTERED PUBLIC ACCOUNTING FIRM
To the Boards of Trustees of JPMorgan Trust I and JPMorgan Trust IV and Shareholders of JPMorgan Macro Opportunities Fund, JPMorgan Opportunistic Equity Long/Short Fund and JPMorgan Research Market Neutral Fund
Opinions on the Financial Statements
We have audited the accompanying statements of assets and liabilities, including the schedules of portfolio investments, of JPMorgan Opportunistic Equity Long/Short Fund and JPMorgan Research Market Neutral Fund (two of the funds constituting JPMorgan Trust I) and JPMorgan Macro Opportunities Fund (one of the funds constituting JPMorgan Trust IV) (hereafter collectively referred to as the “Funds”) as of October 31, 2020, the related statements of operations and of changes in net assets for each of the periods indicated in the table below, including the related notes, and the financial highlights for each of the periods indicated therein (collectively referred to as the “financial statements”). In our opinion, the financial statements present fairly, in all material respects, the financial position of each of the Funds as of October 31, 2020, the results of each of their operations and the changes in each of their net assets for the periods indicated in the table below, and each of the financial highlights for each of the periods indicated therein, in conformity with accounting principles generally accepted in the United States of America.
|
JPMorgan Macro Opportunities Fund (1) |
JPMorgan Opportunistic Equity Long/Short Fund (2) |
JPMorgan Research Market Neutral Fund (2) |
(1) Statement of operations and statement of changes in net assets for the period April 15, 2020 (commencement of operations) through October 31, 2020. |
(2) Statement of operations for the year ended October 31, 2020 and statement of changes in net assets for the years ended October 31, 2020 and 2019. |
Basis for Opinions
These financial statements are the responsibility of the Funds’ management. Our responsibility is to express an opinion on the Funds’ financial statements based on our audits. We are a public accounting firm registered with the Public Company Accounting Oversight Board (United States) (PCAOB) and are required to be independent with respect to the Funds in accordance with the U.S. federal securities laws and the applicable rules and regulations of the Securities and Exchange Commission and the PCAOB.
We conducted our audits of these financial statements in accordance with the standards of the PCAOB. Those standards require that we plan and perform the audit to obtain reasonable assurance about whether the financial statements are free of material misstatement, whether due to error or fraud.
Our audits included performing procedures to assess the risks of material misstatement of the financial statements, whether due to error or fraud, and performing procedures that respond to those risks. Such procedures included examining, on a test basis, evidence regarding the amounts and disclosures in the financial statements. Our audits also included evaluating the accounting principles used and significant estimates made by management, as well as evaluating the overall presentation of the financial statements. Our procedures included confirmation of securities owned as of October 31, 2020 by correspondence with the custodian, transfer agent and brokers; when replies were not received from brokers, we performed other auditing procedures. We believe that our audits provide a reasonable basis for our opinions.
/s/PricewaterhouseCoopers LLP
New York, New York
December 21, 2020
We have served as the auditor of one or more investment companies in the JPMorgan Funds complex since 1993.
| | | | | | | | |
| | | |
| OCTOBER 31, 2020 | | J.P. MORGAN SPECIALTY FUNDS | | | | | 55 | |
TRUSTEES
(Unaudited)
The Funds’ Statement of Additional Information includes additional information about the Funds’ Trustees and is available, without charge, upon request by calling 1-800-480-4111 or on the J.P. Morgan Funds’ website at www.jpmorganfunds.com.
| | | | | | |
Name (Year of Birth); Positions With the Funds (1) | | Principal Occupation During Past 5 Years | | Number of
Funds in Fund
Complex Overseen
by Trustee (2) | | Other Directorships Held During the Past 5 Years |
Independent Trustees | | |
| | | |
| John F. Finn (1947); Chairman since 2020; Trustee of Trusts since 2005; Trustee of heritage One Group Mutual Funds since 1998. | | Chairman, Gardner, Inc. (supply chain management company serving industrial and consumer markets) (serving in various roles 1974-present). | | 126 | | Director, Greif, Inc. (GEF) (industrial package products and services) (2007-present); Trustee, Columbus Association for the Performing Arts (1988-present); Director, Cardinal Health, Inc. (CAH) (1994-2014). |
| | | |
| Stephen P. Fisher (1959); Trustee of Trusts since 2018. | | Retired; Chairman and Chief Executive Officer, NYLIFE Distributors LLC (registered broker-dealer) (serving in various roles 2008-2013); Chairman, NYLIM Service Company LLC (transfer agent) (2008-2017); New York Life Investment Management LLC (registered investment adviser) (serving in various roles 2005-2017); Chairman, IndexIQ Advisors LLC (registered investment adviser for ETFs) (2014-2017); President, MainStay VP Funds Trust (2007-2017), MainStay DefinedTerm Municipal Opportunities Fund (2011-2017) and MainStay Funds Trust (2007-2017) (registered investment companies). | | 126 | | Honors Program Advisory Board Member, The Zicklin School of Business, Baruch College, The City University of New York (2017-present). |
| | | |
| Kathleen M. Gallagher (1958); Trustee of the Trusts since 2018. | | Retired; Chief Investment Officer — Benefit Plans, Ford Motor Company (serving in various roles 1985-2016). | | 126 | | Non-Executive Director, Legal & General Investment Management (Holdings) (2018-present); Non-Executive Director, Legal & General Investment Management America (financial services and insurance) (2017-present); Advisory Board Member, Fiduciary Solutions, State Street Global Advisors (2017-present); Member, Client Advisory Council, Financial Engines, LLC (registered investment adviser) (2011-2016); Director, Ford Pension Funds Investment Management Ltd. (2007-2016). |
| | | |
| Dennis P. Harrington* (1950); Trustee of Trusts since 2017. | | Retired; Partner, Deloitte LLP (accounting firm) (serving in various roles 1984-2012). | | 126 | | None |
| | | |
| Frankie D. Hughes (1952); Trustee of Trusts since 2008. | | President, Ashland Hughes Properties (property management) (2014-present); President and Chief Investment Officer, Hughes Capital Management, Inc. (fixed income asset management) (1993-2014). | | 126 | | None |
| | | | | | |
| | | |
| 56 | | | | J.P. MORGAN SPECIALTY FUNDS | | OCTOBER 31, 2020 |
| | | | | | |
Name (Year of Birth); Positions With the Funds (1) | | Principal Occupation During Past 5 Years | | Number of
Funds in Fund
Complex Overseen
by Trustee (2) | | Other Directorships Held During the Past 5 Years |
Independent Trustees (continued) | | |
| | | |
Raymond Kanner** (1953); Trustee of Trusts since 2017. | | Retired; Managing Director & Chief Investment Officer, IBM Retirement Funds (2007-2016). | | 126 | | Advisory Board Member, Penso Advisors LLC (2020-present); Advisory Board Member, Los Angeles Capital (2018-present); Advisory Board Member, State Street Global Advisors Fiduciary Solutions Board (2017-present); Acting Executive Director, Committee on Investment of Employee Benefit Assets (CIEBA) (2016-2017); Advisory Board Member, Betterment for Business (robo advisor) (2016-2017); Advisory Board Member, BlueStar Indexes (index creator) (2013-2017); Director, Emerging Markets Growth Fund (registered investment company) (1997-2016); Member, Russell Index Client Advisory Board (2001-2015). |
| | | |
| Peter C. Marshall (1942); Trustee of Trusts since 2005; Trustee of heritage One Group Mutual Funds since 1985. | | Self-employed business consultant
(2002-present). | | 126 | | None |
| | | |
| Mary E. Martinez (1960); Trustee of Trusts since 2013. | | Associate, Special Properties, a Christie’s International Real Estate Affiliate (2010-present); Managing Director, Bank of America (Asset Management) (2007-2008); Chief Operating Officer, U.S. Trust Asset Management, U.S. Trust Company (asset management) (2003-2007); President, Excelsior Funds (registered investment companies) (2004-2005). | | 126 | | None |
| | | |
| Marilyn McCoy (1948); Trustee of Trusts since 2005; Trustee of heritage One Group Mutual Funds since 1999. | | Vice President of Administration and Planning, Northwestern University (1985-present). | | 126 | | None |
| | | |
| Mitchell M. Merin (1953); Trustee of Trusts since 2013. | | Retired; President and Chief Operating Officer, Morgan Stanley Investment Management, Member Morgan Stanley & Co. Management Committee (serving in various roles 1981-2006). | | 126 | | Director, Sun Life Financial (SLF) (financial services and insurance) (2007-2013). |
| | | |
| Dr. Robert A. Oden, Jr. (1946); Trustee of Trusts since 2005; Trustee of heritage One Group Mutual Funds since 1997. | | Retired; President, Carleton College (2002-2010); President, Kenyon College (1995-2002). | | 126 | | Trustee and Vice Chair, Trout Unlimited (2017-present); Trustee, American Museum of Fly Fishing (2013-present); Vice Chair, Dartmouth-Hitchcock Medical Center (2011-present); Trustee, American University in Cairo (1999-2014). |
| | | |
| Marian U. Pardo*** (1946); Trustee of Trusts since 2013. | | Managing Director and Founder, Virtual Capital Management LLC (investment consulting) (2007-present); Managing Director, Credit Suisse Asset Management (portfolio manager) (2003-2006). | | 126 | | President and Member, Board of Governors, Columbus Citizens Foundation (not-for-profit supporting philanthropic and cultural programs) (2006-present). |
| | | | | | | | |
| | | |
| OCTOBER 31, 2020 | | J.P. MORGAN SPECIALTY FUNDS | | | | | 57 | |
TRUSTEES
(Unaudited) (continued)
| (1) | Mr. Marshall is retiring from the Board of Trustees effective the close of business on December 31, 2020. The Trustees serve for an indefinite term, subject to the Trusts’ current retirement policy, which is age 78 for all Trustees. |
| (2) | A Fund Complex means two or more registered investment companies that hold themselves out to investors as related companies for purposes of investment and investor services or have a common investment adviser or have an investment adviser that is an affiliated person of the investment adviser of any of the other registered investment companies. The J.P. Morgan Funds Complex for which the Boards of Trustees serve currently includes ten registered investment companies (126 funds). |
| * | Two family members of Mr. Harrington are partner and managing director, respectively, of the Funds’ independent registered public accounting firm. Such firm has represented to the Boards that those family members are not involved in the audit of the Funds’ financial statements and do not provide other services to the Funds. The Boards have concluded that such association does not interfere with Mr. Harrington’s exercise of independent judgment as an Independent Trustee. |
| ** | A family member of Mr. Kanner is employed by JPMorgan Chase Bank, which is affiliated with JPMIM and JPMDS. In that capacity, this employee provides services to various JPMorgan affiliates including JPMIM and JPMDS and for which JPMIM and JPMDS bear some portion of the expense thereof. |
| *** | In connection with prior employment with JPMorgan Chase, Ms. Pardo was the recipient of non-qualified pension plan payments from JPMorgan Chase in the amount of approximately $2,055 per month, which she irrevocably waived effective January 1, 2013, and deferred compensation payments from JPMorgan Chase in the amount of approximately $7,294 per year, which ended in January 2013. In addition, Ms. Pardo receives payments from a fully-funded qualified plan, which is not an obligation of JPMorgan Chase. |
The contact address for each of the Trustees is 277 Park Avenue, New York, NY 10172.
| | | | | | |
| | | |
| 58 | | | | J.P. MORGAN SPECIALTY FUNDS | | OCTOBER 31, 2020 |
OFFICERS
(Unaudited)
| | |
Name (Year of Birth), Positions Held with the Trusts (Since) | | Principal Occupations During Past 5 Years |
| |
Brian S. Shlissel (1964),
President and Principal Executive Officer (2016)* | | Managing Director and Chief Administrative Officer for J.P. Morgan pooled vehicles, J.P. Morgan Investment Management Inc. (formerly JPMorgan Funds Management, Inc.) (from 2014 to present); Managing Director and Head of Mutual Fund Services, Allianz Global Investors; President and Chief Executive Officer, Allianz Global Investors Mutual Funds and PIMCO Closed-End Funds (from 1999 to 2014). |
| |
Timothy J. Clemens (1975), Treasurer and Principal Financial Officer (2018)** | | Executive Director, J.P. Morgan Investment Management Inc. (formerly JPMorgan Funds Management, Inc.) since February 2016; Vice President, JPMorgan Funds Management, Inc. from October 2013 to January 2016. |
| |
Gregory S. Samuels (1980),
Secretary (2019) (formerly Assistant Secretary since 2010)** | | Executive Director and Assistant General Counsel, JPMorgan Chase. Mr. Samuels has been with JPMorgan Chase since 2010. |
| |
Stephen M. Ungerman (1953),
Chief Compliance Officer (2005) | | Managing Director, JPMorgan Chase & Co.; Mr. Ungerman has been with JPMorgan Chase & Co. since 2000. |
| |
Elizabeth A. Davin (1964), Assistant Secretary (2005)*** | | Executive Director and Assistant General Counsel, JPMorgan Chase since February 2012; formerly Vice President and Assistant General Counsel, JPMorgan Chase from 2005 to February 2012; Senior Counsel, JPMorgan Chase (formerly Bank One Corporation) from 2004 to 2005. |
| |
Jessica K. Ditullio (1962),
Assistant Secretary (2005)*** | | Executive Director and Assistant General Counsel, JPMorgan Chase. Ms. Ditullio has been with JPMorgan Chase (formerly Bank One Corporation) since 1990. |
| |
Anthony Geron (1971),
Assistant Secretary (2018)** | | Vice President and Assistant General Counsel, JPMorgan Chase since September 2018; Lead Director and Counsel, AXA Equitable Life Insurance Company from 2015 to 2018 and Senior Director and Counsel, AXA Equitable Life Insurance Company from 2014 to 2015. |
| |
Carmine Lekstutis (1980),
Assistant Secretary (2011)** | | Executive Director and Assistant General Counsel, JPMorgan Chase. Mr. Lekstutis has been with JPMorgan Chase since 2011. |
| |
Zachary E. Vonnegut-Gabovitch (1986), Assistant Secretary (2017)** | | Vice President and Assistant General Counsel, JPMorgan Chase since September 2016; Associate, Morgan, Lewis & Bockius (law firm) from 2012 to 2016. |
| |
Michael M. D’Ambrosio (1969),
Assistant Treasurer (2012) | | Managing Director, J.P. Morgan Investment Management Inc. (formerly JPMorgan Funds Management, Inc.). Mr. D’Ambrosio has been with J.P. Morgan Investment Management Inc. since 2012. |
| |
Aleksandr Fleytekh (1972), Assistant Treasurer (2019)** | | Vice President, J.P. Morgan Investment Management Inc. (formerly JPMorgan Funds Management, Inc.) since February 2012. |
| |
Shannon Gaines (1977),
Assistant Treasurer (2018)*** | | Vice President, J.P. Morgan Investment Management Inc. (formerly JPMorgan Funds Management, Inc.) since January 2014. |
| |
Jeffrey D. House (1972), Assistant Treasurer (2017)*** | | Vice President, J.P. Morgan Investment Management Inc. (formerly JPMorgan Funds Management, Inc.) since July 2006. |
| |
Michael Mannarino (1985),
Assistant Treasurer (2020) | | Vice President, J.P. Morgan Investment Management Inc. (formerly JPMorgan Funds Management, Inc.) since 2014. |
| |
Joseph Parascondola (1963),
Assistant Treasurer (2011)* | | Executive Director, J.P. Morgan Investment Management, Inc. since February 2020, formerly Vice President, J.P. Morgan Investment Management Inc. (formerly JPMorgan Funds Management, Inc.) from August 2006 to January 2020. |
| |
Gillian I. Sands (1969),
Assistant Treasurer (2012)** | | Vice President, J.P. Morgan Investment Management Inc. (formerly JPMorgan Funds Management, Inc.) since September 2012. |
The contact address for each of the officers, unless otherwise noted, is 277 Park Avenue, New York, NY 10172.
| * | The contact address for the officer is 575 Washington Boulevard, Jersey City, NJ 07310. |
| ** | The contact address for the officer is 4 New York Plaza, New York, NY 10004. |
| *** | The contact address for the officer is 1111 Polaris Parkway, Columbus, OH 43240. |
| | | | | | | | |
| | | |
| OCTOBER 31, 2020 | | J.P. MORGAN SPECIALTY FUNDS | | | | | 59 | |
SCHEDULE OF SHAREHOLDER EXPENSES
(Unaudited)
Hypothetical $1,000 Investment
As a shareholder of the Funds, you incur two types of costs: (1) transaction costs, including sales charges (loads) on purchase payments and (2) ongoing costs, including investment advisory fees, administration fees, distribution fees and other Fund expenses. The examples below are intended to help you understand your ongoing costs (in dollars) of investing in the Funds and to compare these ongoing costs with the ongoing costs of investing in other mutual funds. The examples assume that you had a $1,000 investment in each Class at the beginning of the reporting period, May 1, 2020, and continued to hold your shares at the end of the reporting period, October 31, 2020.
Actual Expenses
For each Class of each Fund in the table below, the first line provides information about actual account values and actual expenses. You may use the information in this line, together with the amount you invested, to estimate the expenses that you paid over the period. Simply divide your account value by $1,000 (for example, an $8,600 account value divided by $1,000 = 8.6), then multiply the result by the number in the first line of each Class under the heading titled “Expenses Paid During the Period” to estimate the expenses you paid on your account during this period.
Hypothetical Example for Comparison Purposes
The second line of each Class in the table below provides information about hypothetical account values and hypothetical expenses based on the Class’ actual expense ratio and an assumed rate of return of 5% per year before expenses, which is not the Class’ actual return. The hypothetical account values and expenses may not be used to estimate the actual ending account balance or expenses you paid for the period. You may use this information to compare the ongoing costs of investing in the Class of the Fund and other funds. To do so, compare this 5% hypothetical example with the 5% hypothetical examples that appear in the shareholder reports of the other funds. Please note that the expenses shown in the table are meant to highlight your ongoing costs only and do not reflect any transaction costs, such as sales charges (loads) or redemption fees. Therefore, the second line for each Class in the table is useful in comparing ongoing costs only, and will not help you determine the relative total costs of owning different funds. In addition, if these transaction costs were included, your costs would have been higher. The examples also assume all dividends and distributions have been reinvested.
| | | | | | | | | | | | | | | | |
| | | Beginning Account Value May 1, 2020 | | | Ending Account Value October 31, 2020 | | | Expenses
Paid During
the Period | | | Annualized
Expense
Ratio | |
JPMorgan Macro Opportunities Fund | | | | | | | | | | | | | | | | |
Class A | | | | | | | | | | | | | | | | |
Actual* | | $ | 1,000.00 | | | $ | 1,022.60 | | | $ | 6.46 | | | | 1.27 | % |
Hypothetical* | | | 1,000.00 | | | | 1,018.75 | | | | 6.44 | | | | 1.27 | |
Class C | | | | | | | | | | | | | | | | |
Actual* | | | 1,000.00 | | | | 1,020.60 | | | | 9.29 | | | | 1.83 | |
Hypothetical* | | | 1,000.00 | | | | 1,015.94 | | | | 9.27 | | | | 1.83 | |
Class I | | | | | | | | | | | | | | | | |
Actual* | | | 1,000.00 | | | | 1,023.90 | | | | 5.19 | | | | 1.02 | |
Hypothetical* | | | 1,000.00 | | | | 1,020.01 | | | | 5.18 | | | | 1.02 | |
Class R6 | | | | | | | | | | | | | | | | |
Actual** | | | 1,000.00 | | | | 1,003.90 | | | | 0.65 | | | | 0.77 | |
Hypothetical* | | | 1,000.00 | | | | 1,021.27 | | | | 3.91 | | | | 0.77 | |
| | | | |
JPMorgan Opportunistic Equity Long/Short Fund | | | | | | | | | | | | | | | | |
Class A | | | | | | | | | | | | | | | | |
Actual* | | | 1,000.00 | | | | 1,123.60 | | | | 11.97 | | | | 2.24 | |
Hypothetical* | | | 1,000.00 | | | | 1,013.87 | | | | 11.35 | | | | 2.24 | |
Class C | | | | | | | | | | | | | | | | |
Actual* | | | 1,000.00 | | | | 1,120.00 | | | | 14.61 | | | | 2.74 | |
Hypothetical* | | | 1,000.00 | | | | 1,011.35 | | | | 13.86 | | | | 2.74 | |
Class I | | | | | | | | | | | | | | | | |
Actual* | | | 1,000.00 | | | | 1,124.70 | | | | 10.69 | | | | 2.00 | |
Hypothetical* | | | 1,000.00 | | | | 1,015.07 | | | | 10.14 | | | | 2.00 | |
Class R6 | | | | | | | | | | | | | | | | |
Actual* | | | 1,000.00 | | | | 1,126.30 | | | | 9.36 | | | | 1.75 | |
Hypothetical* | | | 1,000.00 | | | | 1,016.33 | | | | 8.88 | | | | 1.75 | |
| | | | |
JPMorgan Research Market Neutral Fund | | | | | | | | | | | | | | | | |
Class A | | | | | | | | | | | | | | | | |
Actual* | | | 1,000.00 | | | | 1,028.60 | | | | 15.20 | | | | 2.98 | |
Hypothetical* | | | 1,000.00 | | | | 1,010.16 | | | | 15.06 | | | | 2.98 | |
Class C | | | | | | | | | | | | | | | | |
Actual* | | | 1,000.00 | | | | 1,025.40 | | | | 17.77 | | | | 3.49 | |
Hypothetical* | | | 1,000.00 | | | | 1,007.59 | | | | 17.61 | | | | 3.49 | |
Class I | | | | | | | | | | | | | | | | |
Actual* | | | 1,000.00 | | | | 1,030.00 | | | | 13.83 | | | | 2.71 | |
Hypothetical* | | | 1,000.00 | | | | 1,011.51 | | | | 13.70 | | | | 2.71 | |
| * | Expenses are equal to each Class’ respective annualized expense ratio, multiplied by the average account value over the period, multiplied by 184/366 (to reflect the one-half year period). |
| ** | Expenses are equal to each Class’ respective annualized expense ratio, multiplied by the average account value over the period, multiplied by 31/366 (to reflect the one-half year period). Commencement of operations was September 30, 2020. |
| | | | | | |
| | | |
| 60 | | | | J.P. MORGAN SPECIALTY FUNDS | | OCTOBER 31, 2020 |
BOARD APPROVAL OF INVESTMENT ADVISORY AGREEMENTS
(Unaudited)
The Board of Trustees has established various standing committees composed of Trustees with diverse backgrounds, to which the Board of Trustees has assigned specific subject matter responsibilities to further enhance the effectiveness of the Board’s oversight and decision making. The Board of Trustees and its investment committees (money market and alternative products, equity, and fixed income) meet regularly throughout the year and consider factors that are relevant to their annual consideration of investment advisory agreements at each meeting. They also meet for the specific purpose of considering investment advisory agreement annual renewals. The Board of Trustees held meetings in June and August 2020, at which the Trustees considered the continuation of the investment advisory agreements for the JPMorgan Opportunistic Equity Long Short Fund and JPMorgan Research Market Neutral Fund, whose annual report is contained herein (each an “Advisory Agreement” and collectively, the “Advisory Agreements”). In accordance with SEC guidance, due to the COVID-19 pandemic, the meetings were conducted through video conference. At the June meeting, the Board’s investment committees met to review and consider performance, expense and related information for the J.P. Morgan Funds. Each investment committee reported to the full Board, which then considered the investment committee’s preliminary findings. At the August meeting, the Trustees continued their review and consideration. The Trustees, including a majority of the Trustees who are not parties to an Advisory Agreement or “interested persons” (as defined in the 1940 Act) of any party to an Advisory Agreement or any of their affiliates, approved the continuation of each Advisory Agreement on August 11, 2020.
As part of their review of the Advisory Agreements, the Trustees considered and reviewed performance and other information about the Funds received from the Adviser. This information includes the Funds’ performance as compared to the performance of their peers and benchmarks and analyses by the Adviser of the Funds’ performance. In addition, at each of their regular meetings throughout the year, the Trustees considered reports on the performance of certain J.P. Morgan Funds provided by an independent management consulting firm (“independent consultant”). In addition, in preparation for the June and August meetings, the Trustees requested, received and evaluated extensive materials from the Adviser, including performance and expense information compiled by Broadridge, using data from Lipper Inc. and/or Morningstar Inc., independent providers of investment company data (together, “Broadridge”). The Trustees’ independent consultant also provided additional analyses of the performance of the Funds as compared to each Fund’s objectives and peer group. Before voting on the Advisory Agreements, the Trustees reviewed the Advisory Agreements with representatives of the Adviser, counsel to the Trust and independent legal counsel and received a memorandum from independent legal counsel to the Trustees discussing the legal standards for their
consideration of the Advisory Agreements. The Trustees also discussed the Advisory Agreements in executive sessions with independent legal counsel at which no representatives of the Adviser were present.
A summary of the material factors evaluated by the Trustees in determining whether to approve each Advisory Agreement is provided below. Each Trustee attributed different weights to the various factors and no factor alone was considered determinative. The Trustees considered information provided with respect to the Funds throughout the year, including additional reporting and information provided in connection with the market volatility caused by the COVID-19 pandemic, as well as materials furnished specifically in connection with the annual review process. From year to year, the Trustees consider and place emphasis on relevant information in light of changing circumstances in market and economic conditions. After considering and weighing the factors and information they had received, the Trustees found that the compensation to be received by the Adviser from each Fund under the applicable Advisory Agreement was fair and reasonable under the circumstances and determined that the continuance of each Advisory Agreement was in the best interests of each Fund and its shareholders.
Nature, Extent and Quality of Services Provided by the Adviser
The Trustees received and considered information regarding the nature, extent and quality of services provided to each Fund under the applicable Advisory Agreement. The Trustees took into account information furnished throughout the year at Trustee meetings, as well as the materials furnished specifically in connection with this annual review process. The Trustees considered the background and experience of the Adviser’s senior management, personnel changes, if any, and the expertise of, and the amount of attention given to each Fund by, investment personnel of the Adviser. In addition, the Trustees reviewed the qualifications, backgrounds and responsibilities of the portfolio management team primarily responsible for the day-to-day management of each Fund and the infrastructure supporting the team, including personnel changes, if any. In addition, the Board considered its discussions with the Adviser regarding the Adviser’s business continuity plan and steps the Adviser was taking to provide ongoing services to the Funds during the COVID-19 pandemic, and the Adviser’s success in continuing to provide services to the Funds and their shareholders throughout this period. The Trustees also considered information provided by the Adviser and JPMorgan Distribution Services, Inc. (“JPMDS”) about the structure and distribution strategy of each Fund. The Trustees reviewed information relating to the Adviser’s risk governance model and reports showing the Adviser’s compliance structure and ongoing compliance processes. The Trustees also considered the quality of the administration services provided by the Adviser in its role as administrator.
| | | | | | | | |
| | | |
| OCTOBER 31, 2020 | | J.P. MORGAN SPECIALTY FUNDS | | | | | 61 | |
BOARD APPROVAL OF INVESTMENT ADVISORY AGREEMENTS
(Unaudited) (continued)
The Trustees also considered their knowledge of the nature and quality of the services provided by the Adviser and its affiliates to the Funds gained from their experience as Trustees of the J.P. Morgan Funds. In addition, they considered the overall reputation and capabilities of the Adviser and its affiliates, the commitment of the Adviser to provide high quality service to the Funds, their overall confidence in the Adviser’s integrity and the Adviser’s responsiveness to questions or concerns raised by them, including the Adviser’s willingness to consider and implement organizational and operational changes designed to improve investment results and the services provided to each Fund.
Based upon these considerations and other factors, the Trustees concluded that they were satisfied with the nature, extent and quality of the investment advisory services provided to the Funds by the Adviser.
Costs of Services Provided and Profitability to the Adviser and its Affiliates
The Trustees received and considered information regarding the profitability to the Adviser and its affiliates in providing services to each Fund. The Trustees reviewed and discussed this information. The Trustees recognized that this information is not audited and represents the Adviser’s determination of its and its affiliates’ revenues from the contractual services provided to the Funds, less expenses of providing such services. Expenses include direct and indirect costs and are calculated using an allocation methodology developed by the Adviser. The Trustees also recognized that it is difficult to make comparisons of profitability from fund investment advisory contracts because comparative information is not generally publicly available and is affected by numerous factors, including the structure of the particular adviser, the types of funds it manages, its business mix, numerous assumptions regarding allocations and the fact that publicly-traded fund managers’ operating profits and net income are net of distribution and marketing expenses. Based upon their review, and taking into consideration the factors noted above, the Trustees concluded that the profitability to the Adviser under each Advisory Agreement was not unreasonable in light of the services and benefits provided to each Fund.
The Trustees also considered that JPMDS, an affiliate of the Adviser, and the Adviser earn fees from the Funds for providing shareholder and administration services, respectively. These fees were shown separately in the profitability analysis presented to the Trustees. The Trustees also considered the payments of Rule 12b-1 fees to JPMDS, which also acts as the Funds’ distributor and that these fees are in turn generally paid to financial intermediaries that sell the Funds, including financial intermediaries that are affiliates of the Adviser (although they are retained by JPMDS in certain instances). The
Trustees also considered the fees paid to JPMorgan Chase Bank, N.A. (“JPMCB”) for custody and fund accounting, and other related services.
Fall-Out Benefits
The Trustees reviewed information regarding potential “fallout” or ancillary benefits received by the Adviser and its affiliates as a result of their relationship with the Funds. The Trustees considered that the J.P. Morgan Funds’ operating accounts are held at JPMCB, which, as a result, will receive float benefits for certain J.P. Morgan Funds, as applicable. The Trustees also noted that the Adviser supports a diverse set of products and services, which benefits the Adviser by allowing it to leverage its infrastructure to serve additional clients. The Trustees also reviewed the Adviser’s allocation of fund brokerage for the J.P. Morgan Funds complex, including allocations to brokers who provide research to the Adviser.
Economies of Scale
The Trustees considered the extent to which the Funds may benefit from economies of scale. The Trustees considered that there may not be a direct relationship between economies of scale realized by the Funds and those realized by the Adviser as assets increase. The Trustees considered the extent to which the Funds were priced to scale and whether it would be appropriate to add advisory fee breakpoints. The Trustees noted certain Funds with contractual expense limitations and fee waivers (“Fee Caps”), which allow a Fund’s shareholders to share potential economies of scale from a Fund’s inception, prior to reaching scale. The Trustees also noted that other Funds which had achieved scale as asset levels had increased, no longer had Fee Caps in place for some or all of their share classes, but shared economies of scale through lower average expenses. The Trustees noted that the fees remain satisfactory relative to peer funds. The Trustees considered the benefits to the Funds of the use of an affiliated distributor and custodian, including the ability to rely on existing infrastructure supporting distribution, custodial and transfer agent services and the ability to negotiate competitive fees for the Funds. The Trustees further considered the Adviser’s and JPMDS’s ongoing investments in their business in support of the Funds, including the Adviser’s and/or JPMDS’s investments in trading systems, technology (including improvements to the J.P. Morgan Funds’ website, and cybersecurity improvements), retention of key talent, and regulatory support enhancements. The Trustees concluded that the current fee structure for each Fund, including any Fee Caps the Adviser has in place that serve to limit the overall net expense ratios of each Fund at competitive levels, was reasonable. The Trustees concluded that, for Funds with expense caps in place for some or all of their share classes, the relevant Fund’s shareholders received the benefits of potential economies of scale through the Fee Caps and, for
| | | | | | |
| | | |
| 62 | | | | J.P. MORGAN SPECIALTY FUNDS | | OCTOBER 31, 2020 |
Funds that achieved scale and no longer had Fee Caps in place for some or all of their share classes, the relevant Fund’s shareholders benefited from lower average expenses resulting from increased assets. The Trustees also concluded that all Funds benefited from the Adviser’s reinvestment in its operations to serve the Funds and their shareholders. The Trustees noted that the Adviser’s reinvestment ensures sufficient resources in terms of personnel and infrastructure to support the Funds.
Independent Written Evaluation of the Funds’ Chief Compliance Officer
The Trustees noted that, upon their direction, the Chief Compliance Officer for the Funds had prepared an independent written evaluation in order to assist the Trustees in determining the reasonableness of the proposed management fees. The Trustees considered the written evaluation in determining whether to continue the Advisory Agreements.
Fees Relative to Adviser’s Other Clients
The Trustees received and considered information about the nature and extent of investment advisory services and fee rates offered to other clients of the Adviser, including institutional separate accounts, collective investment trusts, ETFs and/or funds sub-advised by the Adviser, for investment management styles substantially similar to that of each Fund. The Trustees considered the complexity of investment management for registered mutual funds relative to the Adviser’s other clients and noted differences, as applicable, in the regulatory, legal and other risks and responsibilities of providing services to the different clients. The Trustees considered that serving as an adviser to a registered mutual fund involves greater responsibilities and risks than acting as a sub-adviser and observed that sub-advisory fees may be lower than those charged by the Adviser to each Fund. The Trustees also noted that the adviser, not the mutual fund, pays the sub-advisory fee and that many responsibilities related to the advisory function are retained by the primary adviser. The Trustees concluded that the fee rates charged to each Fund in comparison to those charged to the Adviser’s other clients were reasonable.
Investment Performance
The Trustees received and considered absolute and/or relative performance information for the Funds in a report prepared by Broadridge. The Trustees considered the total return performance information, which included the ranking of the Funds within a performance universe made up of funds with the same Broadridge investment classification and objective (the “Universe”), as well as a subset of funds within the Universe (the “Peer Group”), by total return for the applicable one-, three- and five-year periods. The Trustees reviewed a description of Broadridge methodology for selecting mutual funds in
each Fund’s Universe and Peer Group and noted that Universe and Peer Group rankings were not calculated if the number of funds in the Universe and/or Peer Group did not meet a predetermined minimum. The Broadridge materials provided to the Trustees highlighted information with respect to certain representative classes to assist the Trustees in their review. As part of this review, the Trustees also reviewed each Fund’s performance against its benchmark and considered the performance information provided for the Funds at regular Board meetings by the Adviser and the Trustees’ independent consultant, and also considered the special analysis prepared by the Trustees’ independent consultant. The Trustees also engaged with the Adviser to consider what steps might be taken to improve performance, as applicable. The Broadridge performance data noted by the Trustees as part of their review and the determinations made by the Trustees with respect to each Fund’s performance for certain representative classes are summarized below:
The Trustees noted that the Opportunistic Equity Long/Short Fund’s performance for Class A shares was in the fifth, third and second quintiles based upon the Peer Group for the one-, three-, and five-year periods ended December 31, 2019, respectively, and in the fifth, third and third quintiles based upon the Universe for the one-, three-, and five-year periods ended December 31, 2019, respectively. The Trustees noted that the performance for Class I shares was in the fifth, third and third quintiles based upon the Peer Group for the one-, three-, and five-year periods ended December 31, 2019, respectively, and in the fifth, third and second quintiles based upon the Universe for the one-,three-, and five-year periods ended December 31, 2019, respectively. The Trustees noted that the performance for Class R6 shares was in the fourth quintile based upon the Peer Group for the one-year period ended December 31, 2019, and in the fifth, third and second quintiles based upon the Universe for the one-, three-, and five-year periods ended December 31, 2019, respectively. The Trustees discussed the performance and investment strategy of the Fund with the Adviser and reviewed the performance analysis and evaluation prepared by the independent consultant. Based upon these discussions and various other factors, the Trustees concluded that the Fund’s performance was satisfactory under the circumstances.
The Trustees noted that the Research Market Neutral Fund’s performance for Class A shares was in the first, first and third quintiles based upon the Peer Group for the one-, three-, and five-year periods ended December 31, 2019, respectively, and in the second, second and third quintiles based upon the Universe for the one-, three-, and five-year periods ended December 31, 2019, respectively. The Trustees noted that the performance for Class I shares was in the second, second and third quintiles based upon the Universe for the one-, three-, and five-year periods ended December 31, 2019, respectively.
| | | | | | | | |
| | | |
| OCTOBER 31, 2020 | | J.P. MORGAN SPECIALTY FUNDS | | | | | 63 | |
BOARD APPROVAL OF INVESTMENT ADVISORY AGREEMENTS
(Unaudited) (continued)
The Trustees discussed the performance and investment strategy of the Fund with the Adviser and reviewed the performance analysis and evaluation prepared by the independent consultant. Based upon these discussions and various other factors, the Trustees concluded that the Fund’s performance was satisfactory.
Advisory Fees and Expense Ratios
The Trustees considered the contractual advisory fee rate and administration fee rate paid by each Fund to the Adviser and compared the combined rate to the information prepared by Broadridge concerning management fee rates paid by other funds in the same Broadridge category as each Fund. The Trustees recognized that Broadridge reported each Fund’s management fee rate as the combined contractual advisory fee and administration fee rates. The Trustees also reviewed information about other expenses and the expense ratios for each Fund and noted that Universe and Peer Group rankings were not calculated if the number of funds in the Universe and/or Peer Groups did not meet a predetermined minimum. For each Fund that had a Fee Cap in place, the Trustees considered the net advisory fee rate and net expense ratio for each class, as applicable, taking into account any waivers and/or reimbursements. The Trustees also considered any proposed changes to a Fee Cap, and, where deemed appropriate by the Trustees, additional waivers and/or reimbursements. The Trustees recognized that it is difficult to make comparisons of advisory fees because there are variations in the services that are included in the fees paid by other funds. The Trustees’ determinations as a result of the review of each
Fund’s advisory fees and expense ratios for certain representative classes are summarized below:
The Trustees noted that the Opportunistic Equity Long/Short Fund’s net advisory fee for Class A shares was in the fifth and fourth quintiles based upon the Peer Group and Universe, respectively, and that the actual total expenses for Class A shares were in the fourth and third quintiles based upon the Peer Group and Universe, respectively. The Trustees noted that the net advisory fee and actual total expenses for Class I shares were in the fourth quintile based upon both the Peer Group and Universe. The Trustees noted that the net advisory fee for Class R6 shares was in the third and fourth quintiles based upon the Peer Group and Universe, respectively, and that the actual total expenses for Class R6 shares were in the third quintile, based upon both the Peer Group and Universe. After considering the factors identified above, in light of this information, the Trustees concluded that the advisory fees were satisfactory in light of the services provided to the Fund.
The Trustees noted that the Research Market Neutral Fund’s net advisory fee for Class A shares was in the first quintile based upon both the Peer Group and Universe, and that the actual total expenses for Class A shares were in the first and second quintiles based upon the Peer Group and Universe, respectively. The Trustees noted that the net advisory fee and actual total expenses for Class I shares were in the first and second quintiles, respectively, based upon the Universe. After considering the factors identified above, and noting a reduction in the contractual advisory fee effective June 1, 2020, in light of this information, the Trustees concluded that the advisory fees were satisfactory in light of the services provided to the Fund.
| | | | | | |
| | | |
| 64 | | | | J.P. MORGAN SPECIALTY FUNDS | | OCTOBER 31, 2020 |
TAX LETTER
(Unaudited)
Certain tax information for the J.P. Morgan Funds is required to be provided to shareholders based upon the Fund’s income and distributions for the taxable year ended October 31, 2020. The information and distributions reported in this letter may differ from the information and taxable distributions reported to the shareholders for the calendar year ending December 31, 2020. The information necessary to complete your income tax returns for the calendar year ending December 31, 2020 will be provided under separate cover.
Dividends Received Deduction (DRD)
JPMorgan Opportunistic Equity Long/Short Fund had 100.00%, or maximum allowable percentage, of ordinary income distributions eligible for the dividends received deduction for corporate shareholders for the fiscal year ended October 31, 2020.
Long Term Capital Gain
JPMorgan Research Market Neutral Fund distributed approximately $6,225,000, or maximum allowable amount, of long-term capital gain dividends for the fiscal year ended October 31, 2020.
Qualified Dividend Income (QDI)
JPMorgan Opportunistic Long/Short Fund had approximately $918,000, or maximum allowable amount, of ordinary income distributions treated as qualified dividends for the fiscal year ended October 31, 2020.
| | | | | | | | |
| | | |
| OCTOBER 31, 2020 | | J.P. MORGAN SPECIALTY FUNDS | | | | | 65 | |

Rev. January 2011
| | |
| | |
| FACTS | | WHAT DOES J.P. MORGAN FUNDS DO WITH YOUR PERSONAL INFORMATION? |
| | |
| Why? | | Financial companies choose how they share your personal information. Federal law gives consumers the right to limit some but not all sharing. Federal law also requires us to tell you how we collect, share, and protect your personal information. Please read this notice carefully to understand what we do. |
| | |
| What? | | The types of personal information we collect and share depend on the product or service you have with us. This information can include: ◾ Social Security number and account balances ◾ transaction history and account transactions ◾ checking account information and wire transfer instructions When you are no longer our customer, we continue to share your information as described in this notice. |
| | |
| How? | | All financial companies need to share customers’ personal information to run their everyday business. In the section below, we list the reasons financial companies can share their customers’ personal information; the reasons J.P. Morgan Funds chooses to share; and whether you can limit this sharing. |
| | | | |
| | | |
| Reasons we can share your personal information | | Does J.P. Morgan
Funds share? | | Can you limit this
sharing? |
For our everyday business purposes — such as to process your transactions, maintain your account(s), respond to court orders and legal investigations, or report to credit bureaus | | Yes | | No |
For marketing purposes — to offer our products and services to you | | Yes | | No |
| For joint marketing with other financial companies | | No | | We don’t share |
For our affiliates’ everyday business purposes — information about your transactions and experiences | | No | | We don’t share |
For our affiliates’ everyday business purposes — information about your creditworthiness | | No | | We don’t share |
| For nonaffiliates to market to you | | No | | We don’t share |
| | |
| | |
| Questions? | | Call 1-800-480-4111 or go to www.jpmorganfunds.com |

| | |
| |
| Who we are |
| Who is providing this notice? | | J.P. Morgan Funds |
| | |
| |
| What we do |
| How does J.P. Morgan Funds protect my personal information? | | To protect your personal information from unauthorized access and use, we use security measures that comply with federal law. These measures include computer safeguards and secured files and buildings. We authorize our employees to access your information only when they need it to do their work and we require companies that work for us to protect your information. |
How does J.P. Morgan Funds collect my personal information? | | We collect your personal information, for example, when you: ◾ open an account or provide contact information ◾ give us your account information or pay us by check ◾ make a wire transfer We also collect your personal information from others, such as credit bureaus, affiliates and other companies. |
| Why can’t I limit all sharing? | | Federal law gives you the right to limit only ◾ sharing for affiliates’ everyday business purposes – information about your creditworthiness ◾ affiliates from using your information to market to you ◾ sharing for nonaffiliates to market to you State laws and individual companies may give you additional rights to limit sharing. |
| | |
| |
| Definitions |
| Affiliates | | Companies related by common ownership or control. They can be financial and nonfinancial companies. ◾ J.P. Morgan Funds does not share with our affiliates. |
| Nonaffiliates | | Companies not related by common ownership or control. They can be financial and nonfinancial companies. ◾ J.P. Morgan Funds does not share with nonaffiliates so they can market to you. |
| Joint Marketing | | A formal agreement between nonaffiliated financial companies that together market financial products or services to you. ◾ J.P. Morgan Funds doesn’t jointly market. |
J.P. Morgan Funds are distributed by JPMorgan Distribution Services, Inc., which is an affiliate of JPMorgan Chase & Co. Affiliates of JPMorgan Chase & Co. receive fees for providing various services to the funds.
Contact JPMorgan Distribution Services, Inc. at 1-800-480-4111 for a fund prospectus. You can also visit us at www.jpmorganfunds.com. Investors should carefully consider the investment objectives and risk as well as charges and expenses of the mutual fund before investing. The prospectus contains this and other information about the mutual fund. Read the prospectus carefully before investing.
Investors may obtain information about the Securities Investor Protection Corporation (SIPC), including the SIPC brochure, by visiting www.sipc.org or by calling SIPC at 202-371-8300.
Each Fund files a complete schedule of its fund holdings for the first and third quarters of its fiscal year with the SEC as an exhibit to its report on Form N-PORT. The Funds’ Form N-PORT reports are available on the SEC’s website at http://www.sec.gov. Each Fund’s quarterly holdings can be found by visiting the J.P. Morgan Funds’ website at www.jpmorganfunds.com.
A description of each Fund’s policies and procedures with respect to the disclosure of each Fund’s holdings is available in the prospectuses and Statement of Additional Information.
A copy of proxy policies and procedures is available without charge upon request by calling 1-800-480-4111 and on the Funds’ website at www.jpmorganfunds.com. A description of such policies and procedures is on the SEC’s website at www.sec.gov. The Trustees have delegated the authority to vote proxies for securities owned by the Funds to the Adviser. A copy of the Funds’ voting record for the most recent 12-month period ended June 30 is available on the SEC’s website at www.sec.gov or at the Funds’ website at www.jpmorganfunds.com no later than August 31 of each year. The Funds’ proxy voting record will include, among other things, a brief description of the matter voted on for each fund security, and will state how each vote was cast, for example, for or against the proposal.

J.P. Morgan Asset Management is the brand name for the asset management business of JPMorgan Chase & Co. and its affiliates worldwide.
| | | | |
| | © JPMorgan Chase & Co., 2020. All rights reserved. October 2020. | | AN-SPEC-1020 |
J.P. Morgan Funds
Annual Report
October 31, 2020
JPMorgan International Equity Plus Fund
Contents
Investments in the Fund are not deposits or obligations of, or guaranteed or endorsed by, any bank and are not insured or guaranteed by the FDIC, the Federal Reserve Board or any other government agency. You could lose money if you sell when the Fund’s share price is lower than when you invested.
Past performance is no guarantee of future performance. The general market views expressed in this report are opinions based on market and other conditions through the end of the reporting period and are subject to change without notice. These views are not intended to predict the future performance of the Fund or the securities markets. References to specific securities and their issuers are for illustrative purposes only and are not intended to be, and should not be interpreted as, recommendations to purchase or sell such securities. Such views are not meant as investment advice and may not be relied on as an indication of trading intent on behalf of the Fund.
Prospective investors should refer to the Fund’s prospectus for a discussion of the Fund’s investment objective, strategy and risks. Call J.P. Morgan Funds Service Center at 1-800-480-4111 for a prospectus containing more complete information about the Fund, including management fees and other expenses. Please read it carefully before investing.
LETTER TO SHAREHOLDERS
December 10, 2020 (Unaudited)
“We maintain an unwavering commitment to seeking to provide investors with innovative and timely solutions required to meet the demands and opportunities of any market environment.”
- Andrea L. Lisher
Dear Shareholders,
Even as the pandemic fueled deep uncertainty over the past year, global financial markets proved to be resilient with unprecedented support from central banks and broad investor optimism over advances in global efforts to end the pandemic. Over the twelve months ended October 31, 2020, equity prices in the U.S. and emerging markets generally led a broad but uneven recovery from lows reached in the first quarter of 2020. For the period, the S&P 500 Index returned 9.71%, the MSCI Emerging Markets Index returned 8.62% and the MSCI EAFE Index returned -6.46%.
The period began with upward momentum in global equity markets but by the end of March 2020, investors responded to the emerging pandemic with a broad sell-off that fed a sharp spike in financial market volatility. The swift response of leading central banks to seek to ensure market liquidity brought some calm to financial markets and in the following months equity prices began to recover. Though the full economic impact of the pandemic remains unknown, investors have appeared to focus on specific efforts to contain Covid-19 and the timeline for the potential availability of vaccines against the virus.
Throughout this period, J.P. Morgan Asset Management has quickly adapted to unique challenges and has continued to operate utilizing the same fundamental practices and principles that have driven our success. We maintain an unwavering commitment to seeking to provide investors with innovative and timely solutions required to meet the demands and opportunities of any market environment. On behalf of J.P. Morgan Asset Management, thank you for entrusting us to manage your investment. Should you have any questions, please visit www.jpmorganfunds.com or contact the J.P. Morgan Funds Service Center at 1-800-480-4111.
Sincerely yours,
Andrea L. Lisher
Head of Americas, Client
J.P. Morgan Asset Management
1
JPMorgan International Equity Plus Fund
FUND COMMENTARY
TWELVE MONTHS ENDED OCTOBER 31, 2020 (Unaudited)
| | |
| REPORTING PERIOD RETURN: | | |
Fund (Class I Shares)* | | (6.35)% |
MSCI EAFE Index (net of foreign withholding taxes) | | (6.86)% |
Net Assets as of 10/31/2020 | | $9,697,362 |
INVESTMENT OBJECTIVE**
The JPMorgan International Equity Plus Fund (the “Fund”) seeks to provide long term capital appreciation.
HOW DID THE MARKET PERFORM?
While global financial markets largely entered the reporting period with support from an improving economic and trade outlook, the economic shock of the pandemic response sparked a drop in global asset prices and a spike in market volatility in the first quarter of 2020. Rapid interventions by the world’s central banks helped to calm investors and set the stage for general but uneven recovery in financial markets.
The final months of 2019 were marked by rising prices for global equity - led by U.S. markets – driven partly by gains in U.S. and European manufacturing and an initial U.S.-China agreement to lower trade barriers. Amid already low interest rates, the U.S. Federal Reserve (the “Fed”) declined to cut rates further at its December meeting.
In the first days of January 2020, financial markets largely shrugged off a brief flare-up in military tensions between the U.S. and Iran. However, the emergence and spread of Covid-19 fed increasing investor uncertainty and by early March, the novel coronavirus was declared a pandemic by the World Health Organization. The closure of large sectors of national economies on a global scale sparked a dramatic sell-off in financial markets across the globe. Yields on developed market sovereign bonds fell sharply and prices for commodity gold spiked. By the end of the first quarter of 2020, leading developed market equity indexes had lost 20% or more of their value from the start of the year. Corporate bond prices generally fell and the prices of Brent crude oil ended the first quarter down by 60%.
Leading central banks promptly responded with lower interest rates and/or asset purchasing programs, which helped to support asset price stability and head off a potential liquidity crunch in credit markets. Governments also responded with a range of fiscal stimulus or paycheck protection programs designed to cushion the economic impact of the pandemic. In the ensuing months, global equity markets staged a slow and uneven rebound, led by U.S. and emerging markets.
WHAT WERE THE MAIN DRIVERS OF THE FUND’S PERFORMANCE?
The Fund’s Class I Shares outperformed the MSCI EAFE Index (net of foreign withholding taxes) (the “Benchmark”) for the twelve months ended October 31, 2020.
By sector, the Fund’s security selection and overweight position in the semiconductors & hardware sector and its security selection in the utilities sector were leading contributors to performance relative to the Benchmark. The Fund’s security selection in the retail and consumer staples sectors were leading detractors from relative performance.
By region, the Fund’s out-of-Benchmark allocation emerging markets and its security selection in the Pacific, excluding Japan, were leading contributors to performance relative to the Benchmark. The Fund’s security selection in the U.K. and its slight underweight position in Japan were the leading detractors from relative performance.
Leading individual contributors to the Fund’s relative performance included the Fund’s out-of-Benchmark position in Taiwan Semiconductor Manufacturing Co. and its overweight positions in Nintendo Co. and Air Liquide SA. Shares of Taiwan Semiconductor Manufacturing, which was not held rose after the company reported consecutive quarters of better-than-expected earnings amid growth in demand for advanced
2
JPMorgan International Equity Plus Fund
FUND COMMENTARY
TWELVE MONTHS ENDED OCTOBER 31, 2020 (Unaudited) (continued)
semiconductors during the period. Shares of Nintendo, a Japanese maker of home entertainment systems, rose amid increased consumer demand for its products during the reporting period. Shares of Air Liquide, a French manufacturer of industrial gases and related equipment, rose amid increased hospital demand for oxygen and ventilators as a result of the pandemic.
Leading individual detractors from the Fund’s relative performance included overweight positions in Anheuser-Busch InBev SA and Airbus SE, and its underweight position in Softbank Group Corp. Shares of Anheuser-Busch InBev, a beverage manufacturer based in Belgium, fell amid a sharp decline in consumer demand in the first half of 2020, largely due to pandemic-related restrictions. Shares of Airbus, a French airplane manufacturer, fell amid sharp decline in demand from airlines in response to the pandemic. Shares of Softbank Group, a Japanese technology and investment company not held by the Fund, rose after it agreed to sell its Arm unit to Nvidia Corp. for $40 billion.
HOW WAS THE FUND POSITIONED?
During the reporting period, the Fund’s largest sector allocations were in the pharmaceutical/medical technologies and consumer staples sectors, while its smallest allocations were in the health services & systems and property sectors. The Fund’s largest regional allocations were to Europe excluding the U.K. and Japan, while its smallest allocations were to emerging markets and the Pacific, excluding Japan.
| | | | |
TOP TEN EQUITY HOLDINGS OF THE PORTFOLIO *** | | | | |
| |
1. Nestle SA (Registered) (Switzerland) | | | 3.7% | |
2. Roche Holding AG (Switzerland) | | | 3.1 | |
3. Keyence Corp. (Japan) | | | 2.4 | |
4. ASML Holding NV (Netherlands) | | | 2.2 | |
5. Sony Corp. (Japan) | | | 2.1 | |
6. Unilever NV (United Kingdom) | | | 2.1 | |
7. Novo Nordisk A/S, Class B (Denmark) | | | 2.0 | |
8. AIA Group Ltd. (Hong Kong) | | | 2.0 | |
9. LVMH Moet Hennessy Louis Vuitton SE (France) | | | 2.0 | |
10. Novartis AG (Registered) (Switzerland) | | | 1.8 | |
| | | | |
| PORTFOLIO COMPOSITION BY COUNTRY *** | |
| |
Japan | | | 21.5 | % |
United Kingdom | | | 14.0 | |
France | | | 11.7 | |
Switzerland | | | 11.6 | |
Germany | | | 7.8 | |
Australia | | | 4.2 | |
China | | | 4.2 | |
Denmark | | | 4.1 | |
Hong Kong | | | 3.1 | |
Spain | | | 3.1 | |
Netherlands | | | 2.8 | |
Sweden | | | 2.1 | |
Taiwan | | | 1.6 | |
India | | | 1.6 | |
South Korea | | | 1.5 | |
Finland | | | 1.1 | |
United States | | | 1.1 | |
Singapore | | | 1.0 | |
Others (each less than 1.0%) | | | 1.9 | |
| * | The return shown is based on net asset values calculated for shareholder transactions and may differ from the return shown in the financial highlights, which reflects adjustments made to the net asset values in accordance with accounting principles generally accepted in the United States of America. |
3
JPMorgan International Equity Plus Fund
FUND COMMENTARY
TWELVE MONTHS ENDED OCTOBER 31, 2020 (Unaudited) (continued)
| ** | The adviser seeks to achieve the Fund’s objective. There can be no guarantee it will be achieved. |
| *** | Percentages indicated are based on total investments as of October 31, 2020. The Fund’s portfolio composition is subject to change. |
4
JPMorgan International Equity Plus Fund
FUND COMMENTARY
TWELVE MONTHS ENDED OCTOBER 31, 2020 (Unaudited) (continued)
| | | | | | | | | | | | | | | | |
| AVERAGE ANNUAL TOTAL RETURNS AS OF OCTOBER 31, 2020 | | | | |
| | | INCEPTION
DATE OF
CLASS | | | 1 YEAR | | | SINCE
INCEPTION | | | | |
| | | | |
CLASS A SHARES | | | June 25, 2019 | | | | | | | | | | | | | |
With Sales Charge* | | | | | | | (11.43)% | | | | (6.30)% | | | | | |
Without Sales Charge | | | | | | | (6.52) | | | | (2.49) | | | | | |
| | | | |
CLASS C SHARES | | | June 25, 2019 | | | | | | | | | | | | | |
With CDSC** | | | | | | | (8.05) | | | | (2.99) | | | | | |
Without CDSC | | | | | | | (7.05) | | | | (2.99) | | | | | |
| | | | |
CLASS I SHARES | | | June 25, 2019 | | | | (6.35) | | | | (2.26) | | | | | |
* Sales Charge for Class A Shares is 5.25%.
** Assumes a 1% CDSC (contingent deferred sales charge) for the one year period and 0% thereafter.
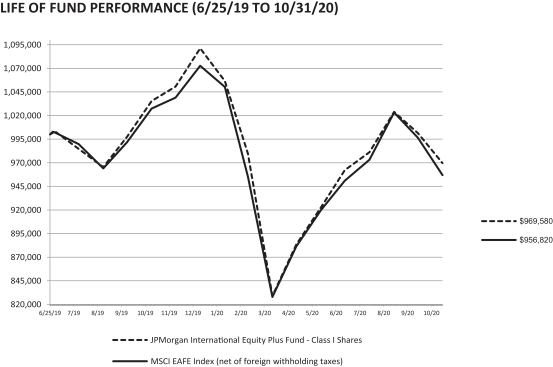
The performance quoted is past performance and is not a guarantee of future results. Mutual funds are subject to certain market risks. Investment returns and principal value of an investment will fluctuate so that an investor’s shares, when redeemed, may be worth more or less than their original cost. Current performance may be higher or lower than the performance data shown. For up-to-date month-end performance information please call 1-800-480-4111.
5
JPMorgan International Equity Plus Fund
FUND COMMENTARY
TWELVE MONTHS ENDED OCTOBER 31, 2020 (Unaudited) (continued)
The Fund commenced operations on June 25, 2019.
The graph illustrates comparative performance for $1,000,000 invested in Class I Shares of the JPMorgan International Equity Plus Fund and the MSCI EAFE Index from June 25, 2019 to October 31, 2020. The performance of the Fund assumes reinvestment of all dividends and capital gain distributions, if any, and does not include a sales charge. The performance of the MSCI EAFE Index does not reflect the deduction of expenses or a sales charge associated with a mutual fund and approximates the minimum possible dividend reinvestment of the securities included in the benchmark, if applicable. The dividend is reinvested after deduction of withholding tax, applying the maximum rate to non-resident institutional investors who do not benefit from double taxation treaties. The MSCI EAFE Index is a free float-adjusted market capitalization weighted index that is designed to measure the equity market performance of developed markets, excluding the U.S. and Canada. Investors cannot invest directly in an index.
Class I Shares have a $1,000,000 minimum initial investment.
Fund performance may reflect the waiver of the Fund’s fees and reimbursement of expenses for certain periods since the inception date. Without these waivers and reimbursements, performance would have been lower. Also, performance shown in this section does not reflect the deduction of taxes that a shareholder would pay on Fund distributions or on gains resulting from redemptions of Fund shares.
International investing involves a greater degree of risk and increased volatility. Changes in currency exchange rates and differences in accounting and taxation policies outside the U.S. can raise or lower returns. Also, some overseas markets may not be as politically and economically stable as the U.S. and other nations.
The returns shown are based on net asset values calculated for shareholder transactions and may differ from the returns shown in the financial highlights, which reflect adjustments made to the net asset values in accordance with accounting principles generally accepted in the United States of America.
6
JPMorgan International Equity Plus Fund
SCHEDULE OF PORTFOLIO INVESTMENTS
AS OF OCTOBER 31, 2020
| | | | | | | | |
Investments | | Shares | | | Value ($) | |
| | |
COMMON STOCKS - 98.9% | | | | | | | | |
| | |
Australia - 4.2% | | | | | | | | |
BHP Group Ltd. | | | 6,052 | | | | 145,076 | |
Commonwealth Bank of Australia | | | 2,558 | | | | 124,195 | |
Rio Tinto Ltd. | | | 2,098 | | | | 136,483 | |
| | | | | | | | |
| | | | | | | 405,754 | |
| | | | | | | | |
Austria - 0.5% | | | | | | | | |
Erste Group Bank AG | | | 2,426 | | | | 49,867 | |
| | | | | | | | |
| | |
Belgium - 0.6% | | | | | | | | |
KBC Group NV | | | 1,278 | | | | 63,142 | |
| | | | | | | | |
| | |
China - 4.2% | | | | | | | | |
Alibaba Group Holding Ltd.* | | | 3,000 | | | | 113,682 | |
Ping An Insurance Group Co. of | | | | | | | | |
China Ltd., Class H | | | 10,000 | | | | 103,397 | |
Prosus NV* | | | 737 | | | | 73,579 | |
Tencent Holdings Ltd. | | | 1,500 | | | | 114,608 | |
| | | | | | | | |
| | | | | | | 405,266 | |
| | | | | | | | |
Denmark - 4.1% | | | | | | | | |
Carlsberg A/S, Class B | | | 848 | | | | 107,374 | |
Novo Nordisk A/S, Class B | | | 3,052 | | | | 194,613 | |
Orsted A/S(a) | | | 594 | | | | 94,276 | |
| | | | | | | | |
| | | | | | | 396,263 | |
| | | | | | | | |
Finland - 1.1% | | | | | | | | |
Kone OYJ, Class B | | | 1,327 | | | | 105,647 | |
| | | | | | | | |
| | |
France - 11.6% | | | | | | | | |
AXA SA | | | 4,370 | | | | 70,179 | |
Capgemini SE | | | 1,034 | | | | 119,394 | |
Kering SA | | | 170 | | | | 102,734 | |
Legrand SA | | | 1,232 | | | | 91,192 | |
L’Oreal SA | | | 396 | | | | 127,981 | |
LVMH Moet Hennessy Louis | | | | | | | | |
Vuitton SE | | | 407 | | | | 190,780 | |
Pernod Ricard SA | | | 610 | | | | 98,272 | |
Safran SA* | | | 719 | | | | 75,840 | |
Schneider Electric SE | | | 918 | | | | 111,543 | |
TOTAL SE | | | 2,628 | | | | 79,620 | |
Vinci SA | | | 688 | | | | 54,342 | |
| | | | | | | | |
| | | | | | | 1,121,877 | |
| | | | | | | | |
Germany - 7.8% | | | | | | | | |
adidas AG* | | | 347 | | | | 103,095 | |
Allianz SE (Registered) | | | 691 | | | | 121,723 | |
Delivery Hero SE*(a) | | | 603 | | | | 69,221 | |
Deutsche Boerse AG | | | 511 | | | | 75,298 | |
Muenchener Rueckversicherungs-Gesellschaft AG (Registered) | | | 401 | | | | 93,985 | |
SAP SE | | | 1,225 | | | | 130,689 | |
Symrise AG | | | 617 | | | | 76,083 | |
Vonovia SE | | | 1,295 | | | | 82,703 | |
| | | | | | | | |
| | | | | | | 752,797 | |
| | | | | | | | |
Hong Kong - 3.1% | | | | | | | | |
AIA Group Ltd. | | | 20,400 | | | | 194,151 | |
Hong Kong Exchanges & Clearing | | | | | | | | |
Ltd. | | | 2,200 | | | | 105,421 | |
| | | | | | | | |
| | | | | | | 299,572 | |
| | | | | | | | |
| | | | | | | | |
Investments | | Shares | | | Value ($) | |
India - 1.5% | | | | | | | | |
HDFC Bank Ltd., ADR* | | | 2,613 | | | | 150,091 | |
| | | | | | | | |
| | |
Japan - 21.2% | | | | | | | | |
Daikin Industries Ltd. | | | 600 | | | | 112,280 | |
FANUC Corp. | | | 500 | | | | 105,612 | |
Hoya Corp. | | | 1,400 | | | | 158,000 | |
Kao Corp. | | | 2,100 | | | | 149,517 | |
Keyence Corp. | | | 500 | | | | 226,911 | |
Komatsu Ltd. | | | 4,500 | | | | 101,455 | |
Kubota Corp. | | | 7,100 | | | | 123,384 | |
Makita Corp. | | | 1,800 | | | | 79,566 | |
Nidec Corp. | | | 1,200 | | | | 121,203 | |
Nintendo Co. Ltd. | | | 200 | | | | 108,138 | |
Recruit Holdings Co. Ltd. | | | 3,600 | | | | 136,982 | |
Shin-Etsu Chemical Co. Ltd. | | | 1,100 | | | | 146,924 | |
SMC Corp. | | | 200 | | | | 106,381 | |
Sony Corp. | | | 2,400 | | | | 200,080 | |
Sysmex Corp. | | | 800 | | | | 75,143 | |
Tokyo Electron Ltd. | | | 400 | | | | 107,364 | |
| | | | | | | | |
| | | | | | | 2,058,940 | |
| | | | | | | | |
Macau - 0.7% | | | | | | | | |
Sands China Ltd. | | | 18,400 | | | | 64,577 | |
| | | | | | | | |
| | |
Netherlands - 2.8% | | | | | | | | |
ASML Holding NV | | | 575 | | | | 208,037 | |
ING Groep NV | | | 9,123 | | | | 62,490 | |
| | | | | | | | |
| | | | | | | 270,527 | |
| | | | | | | | |
Singapore - 1.0% | | | | | | | | |
DBS Group Holdings Ltd. | | | 6,400 | | | | 95,333 | |
| | | | | | | | |
| | |
South Korea - 1.5% | | | | | | | | |
Samsung Electronics Co. Ltd., | | | | | | | | |
GDR(a) | | | 113 | | | | 142,631 | |
| | | | | | | | |
| | |
Spain - 3.0% | | | | | | | | |
Cellnex Telecom SA(a) | | | 1,195 | | | | 76,708 | |
Iberdrola SA | | | 11,357 | | | | 134,099 | |
Industria de Diseno Textil SA | | | 3,488 | | | | 86,116 | |
| | | | | | | | |
| | | | | | | 296,923 | |
| | | | | | | | |
Sweden - 2.1% | | | | | | | | |
Atlas Copco AB, Class A | | | 2,568 | | | | 113,355 | |
Svenska Handelsbanken AB, Class A* | | | 10,868 | | | | 88,060 | |
| | | | | | | | |
| | | | | | | 201,415 | |
| | | | | | | | |
Switzerland - 11.5% | | | | | | | | |
LafargeHolcim Ltd. (Registered)* | | | 2,490 | | | | 106,870 | |
Lonza Group AG (Registered) | | | 163 | | | | 98,763 | |
Nestle SA (Registered) | | | 3,168 | | | | 356,330 | |
Novartis AG (Registered) | | | 2,209 | | | | 172,131 | |
Roche Holding AG | | | 914 | | | | 293,697 | |
SGS SA (Registered) | | | 35 | | | | 87,424 | |
| | | | | | | | |
| | | | | | | 1,115,215 | |
| | | | | | | | |
Taiwan - 1.6% | | | | | | | | |
Taiwan Semiconductor | | | | | | | | |
Manufacturing Co. Ltd., ADR | | | 1,816 | | | | 152,308 | |
| | | | | | | | |
| | |
United Kingdom - 13.8% | | | | | | | | |
Diageo plc | | | 5,197 | | | | 167,956 | |
GlaxoSmithKline plc | | | 9,668 | | | | 161,441 | |
SEE NOTES TO FINANCIAL STATEMENTS.
7
JPMorgan International Equity Plus Fund
SCHEDULE OF PORTFOLIO INVESTMENTS
AS OF OCTOBER 31, 2020 (continued)
| | | | | | | | |
Investments | | Shares | | | Value ($) | |
InterContinental Hotels Group plc | | | 1,285 | | | | 65,291 | |
Legal & General Group plc | | | 37,197 | | | | 89,184 | |
Linde plc | | | 440 | | | | 96,433 | |
London Stock Exchange Group plc | | | 869 | | | | 93,676 | |
Persimmon plc | | | 2,930 | | | | 88,710 | |
Prudential plc | | | 6,671 | | | | 81,590 | |
Reckitt Benckiser Group plc | | | 1,375 | | | | 121,122 | |
RELX plc | | | 5,328 | | | | 105,430 | |
Smith & Nephew plc | | | 4,114 | | | | 71,436 | |
Unilever NV | | | 3,505 | | | | 197,590 | |
| | | | | | | | |
| | | | | | | 1,339,859 | |
| | | | | | | | |
United States - 1.0% | | | | | | | | |
Ferguson plc | | | 1,027 | | | | 102,003 | |
| | | | | | | | |
| | |
TOTAL COMMON STOCKS
(Cost $9,753,218) | | | | | | | 9,590,007 | |
| | | | | | | | |
| | |
Total Investments - 98.9%
(Cost $9,753,218) | | | | | | | 9,590,007 | |
Other Assets Less Liabilities - 1.1% | | | | | | | 107,355 | |
| | | | | | | | |
Net Assets - 100.0% | | | | | | | 9,697,362 | |
| | | | | | | | |
Percentages indicated are based on net assets.
SEE NOTES TO FINANCIAL STATEMENTS.
8
JPMorgan International Equity Plus Fund
SCHEDULE OF PORTFOLIO INVESTMENTS
AS OF OCTOBER 31, 2020 (continued)
Summary of Investments by Industry, October 31, 2020
The following table represents the portfolio investments of the Fund by industry classifications as a percentage of total investments:
| | |
| INDUSTRY | | PERCENTAGE |
Pharmaceuticals | | 8.6% |
Insurance | | 7.9 |
Machinery | | 7.7 |
Banks | | 6.6 |
Personal Products | | 4.9 |
Semiconductors & Semiconductor Equipment | | 4.9 |
Textiles, Apparel & Luxury Goods | | 4.1 |
Beverages | | 3.9 |
Food Products | | 3.7 |
Professional Services | | 3.4 |
Electrical Equipment | | 3.4 |
Chemicals | | 3.3 |
Health Care Equipment & Supplies | | 3.2 |
Household Durables | | 3.0 |
Metals & Mining | | 2.9 |
Capital Markets | | 2.8 |
Internet & Direct Marketing Retail | | 2.7 |
Electric Utilities | | 2.4 |
Electronic Equipment, Instruments & Components | | 2.4 |
Technology Hardware, Storage & Peripherals | | 1.5 |
Software | | 1.4 |
Hotels, Restaurants & Leisure | | 1.3 |
Household Products | | 1.3 |
IT Services | | 1.2 |
Interactive Media & Services | | 1.2 |
Building Products | | 1.2 |
Entertainment | | 1.1 |
Construction Materials | | 1.1 |
Trading Companies & Distributors | | 1.1 |
Life Sciences Tools & Services | | 1.0 |
Others (each less than 1.0%) | | 4.8 |
| | | | |
| Abbreviations | | | | |
| ADR | | American Depositary Receipt | | |
| GDR | | Global Depositary Receipt | | |
| OYJ | | Public Limited Company | | |
| (a) | Security exempt from registration pursuant to Regulation S under the Securities Act of 1933, as amended. Regulation S applies to securities offerings that are made outside of the United States and do not involve direct selling efforts in the United States and as such may have restrictions on resale. |
| * | Non-income producing security. |
SEE NOTES TO FINANCIAL STATEMENTS.
9
JPMorgan International Equity Plus Fund
SCHEDULE OF PORTFOLIO INVESTMENTS
AS OF OCTOBER 31, 2020 (continued)
Over-the-Counter (“OTC”) Total Return Basket Swaps Outstanding at October 31, 2020
| | | | | | | | | | | | | | |
| | | | | | | | | | | NET CASH | | | |
| | | | | | | | | NET UNREALIZED | | AND OTHER | | | |
| | | | | TERMINATION | | NOTIONAL | | APPRECIATION | | RECEIVABLES | | | |
| COUNTERPARTY | | DESCRIPTION | | DATE | | VALUE(1) | | (DEPRECIATION)(2) | | (PAYABLES) | | VALUE | |
Citigroup | | The Fund receives the total return on a portfolio of long and short equity positions and pays or receives the net of one month LIBOR on long positions and short positions respectively, plus or minus a specified spread (rates range from 0.00% to 0.15%), which is denominated in GBP based on the local currencies of the positions within the swaps. | | 8/3/2021 | | $109,843 | | $1 | | $– | | | $1 | |
| | | | | | | | | | | | | | |
| | | | | | | | | | | | | | | | | | |
| | | | | | NOTIONAL
VALUE | | | NET UNREALIZED
APPRECIATION
(DEPRECIATION) | | | PERCENTAGE
OF NET | | | |
| REFERENCE ENTITY | | SHARES | | | ($)(1) | | | ($)(2) | | | ASSETS (%) | |
Long Positions | | | | | | | | | | | | | | | | |
Common Stock | | | | | | | | | | | | | | | | |
United Kingdom | | | | | | | | | | | | | | | | |
Lloyds Banking Group plc | | | 195,725 | | | | 71,265 | | | | 204 | | | | 0.0 | (a) |
Prudential plc | | | 4,443 | | | | 54,340 | | | | 73 | | | | 0.0 | (a) |
RELX plc | | | 2,168 | | | | 42,900 | | | | (2) | | | | 0.0 | (a) |
SSE plc | | | 3,020 | | | | 49,526 | | | | 426 | | | | 0.0 | (a) |
Taylor Wimpey plc | | | 94,401 | | | | 129,338 | | | | (51) | | | | 0.0 | (a) |
Wm Morrison Supermarkets plc | | | 40,074 | | | | 84,591 | | | | 20 | | | | 0.0 | (a) |
| | | 339,831 | | | | 431,960 | | | | 670 | | | | 0.0 | (a) |
United States | | | | | | | | | | | | | | | | |
Ferguson plc | | | 997 | | | | 99,023 | | | | (715) | | | | 0.0 | (a) |
Total Long Positions of Total Return Basket Swap | | | 340,828 | | | | 530,983 | | | | (45) | | | | 0.0 | (a) |
Short Positions | | | | | | | | | | | | | | | | |
Common Stock | | | | | | | | | | | | | | | | |
United Kingdom | | | | | | | | | | | | | | | | |
Barratt Developments plc | | | (14,587) | | | | (91,177) | | | | 3 | | | | 0.0 | (a) |
British Land Co. plc (The) | | | (16,287) | | | | (73,551) | | | | 3 | | | | 0.0 | (a) |
Pearson plc | | | (19,251) | | | | (127,187) | | | | 5 | | | | 0.0 | (a) |
Severn Trent plc | | | (4,106) | | | | (129,225) | | | | 35 | | | | 0.0 | (a) |
Total Short Positions of Total Return Basket Swap | | | (54,231) | | | | (421,140) | | | | 46 | | | | 0.0 | (a) |
Total of Long and Short Positions of Total Return Basket Swap | | | 286,597 | | | | 109,843 | | | | 1 | | | | 0.0 | (a) |
| | | | | | | | | | | | | | |
| | | | | | | | | | | NET CASH | | | |
| | | | | | | | | NET UNREALIZED | | AND OTHER | | | |
| | | | | TERMINATION | | NOTIONAL | | APPRECIATION | | RECEIVABLES | | | |
| COUNTERPARTY | | DESCRIPTION | | DATE | | VALUE(1) | | (DEPRECIATION)(2) | | (PAYABLES) | | VALUE | |
Citigroup | | The Fund receives the total return on a portfolio of long equity positions and pays or receives the net of one month CIBOR on long positions, plus or minus a specified spread of 0.15%, which is denominated in DKK based on the local currencies of the positions within the swaps. | | 9/6/2021 | | $155,613 | | $34 | | $– | | | $34 | |
| | | | | | | | | | | | | | |
SEE NOTES TO FINANCIAL STATEMENTS.
10
JPMorgan International Equity Plus Fund
SCHEDULE OF PORTFOLIO INVESTMENTS
AS OF OCTOBER 31, 2020 (continued)
| | | | | | | | | | | | | | | | | | |
| REFERENCE ENTITY | | SHARES | | | NOTIONAL
VALUE
($)(1) | | | NET UNREALIZED
APPRECIATION
(DEPRECIATION)
($)(2) | | | PERCENTAGE
OF NET ASSETS (%) | | | |
Long Positions | | | | | | | | | | | | | | | | |
Common Stock | | | | | | | | | | | | | | | | |
Denmark | | | | | | | | | | | | | | | | |
Carlsberg A/S | | | 606 | | | | 76,732 | | | | 34 | | | | 0.0(a) | |
Orsted A/S(b) | | | 497 | | | | 78,881 | | | | – | | | | – | |
Total Long Positions of Total Return Basket Swap | | | 1,103 | | | | 155,613 | | | | 34 | | | | 0.0(a) | |
| | | | | | | | | | | | | | |
| COUNTERPARTY | | DESCRIPTION | | TERMINATION
DATE | | NOTIONAL
VALUE(1) | | NET UNREALIZED
APPRECIATION
(DEPRECIATION)(2) | | NET CASH AND OTHER
RECEIVABLES
(PAYABLES) | | VALUE | |
Citigroup | | The Fund receives the total return on a portfolio of long and short equity positions and pays or receives the net of one month EURIBOR on long positions and short positions respectively, plus or minus a specified spread (rates range from 0.00% to 0.15%), which is denominated in EUR based on the local currencies of the positions within the swaps. | | 8/3/2021 | | $3,212 | | $(252) | | $– | | | $(252) | |
| | | | | | | | | | | | | | |
| | | | | | | | | | | | | | | | |
| | | | | | | | | NET UNREALIZED | | | | |
| | | | | | NOTIONAL | | | APPRECIATION | | | PERCENTAGE | |
| | | | | | VALUE | | | (DEPRECIATION) | | | OF NET | |
| REFERENCE ENTITY | | SHARES | | | ($)(1) | | | ($)(2) | | | ASSETS (%) | |
| | | | |
Long Positions | | | | | | | | | | | | | | | | |
| | | | |
Common Stock | | | | | | | | | | | | | | | | |
France | | | | | | | | | | | | | | | | |
Kering SA | | | 82 | | | | 49,554 | | | | 36 | | | | 0.0 | (a) |
LVMH Moet Hennessy Louis Vuitton SE | | | 62 | | | | 29,062 | | | | 13 | | | | 0.0 | (a) |
Schneider Electric SE | | | 559 | | | | 67,922 | | | | 84 | | | | 0.0 | (a) |
Vinci SA | | | 841 | | | | 66,427 | | | | (1) | | | | 0.0 | (a) |
| | | 1,544 | | | | 212,965 | | | | 132 | | | | 0.0 | (a) |
Germany | | | | | | | | | | | | | | | | |
adidas AG* | | | 289 | | | | 85,863 | | | | 34 | | | | 0.0 | (a) |
Deutsche Telekom AG (Registered) | | | 4,264 | | | | 64,807 | | | | (99) | | | | 0.0 | (a) |
E.ON SE | | | 6,668 | | | | 69,442 | | | | (79) | | | | 0.0 | (a) |
RWE AG | | | 1,568 | | | | 58,028 | | | | (26) | | | | 0.0 | (a) |
| | | 12,789 | | | | 278,140 | | | | (170) | | | | 0.0 | (a) |
Spain | | | | | | | | | | | | | | | | |
Iberdrola SA | | | 5,526 | | | | 65,249 | | | | 86 | | | | 0.0 | (a) |
Industria de Diseno Textil SA | | | 2,934 | | | | 72,439 | | | | 31 | | | | 0.0 | (a) |
| | | 8,460 | | | | 137,688 | | | | 117 | | | | 0.0 | (a) |
Italy | | | | | | | | | | | | | | | | |
Snam SpA | | | 15,261 | | | | 74,414 | | | | (58) | | | | 0.0 | (a) |
China | | | | | | | | | | | | | | | | |
Prosus NV* | | | 967 | | | | 96,541 | | | | (65) | | | | 0.0 | (a) |
Netherlands | | | | | | | | | | | | | | | | |
ASML Holding NV | | | 158 | | | | 57,165 | | | | (248) | | | | 0.0 | (a) |
Total Long Positions of Total Return Basket Swap | | | 39,179 | | | | 856,913 | | | | (292) | | | | 0.0 | (a) |
| | | | |
Short Positions | | | | | | | | | | | | | | | | |
| | | | |
Common Stock | | | | | | | | | | | | | | | | |
Germany | | | | | | | | | | | | | | | | |
Daimler AG (Registered) | | | (2,031) | | | | (104,979) | | | | 45 | | | | 0.0 | (a) |
Fraport AG Frankfurt Airport Services Worldwide* | | | (796) | | | | (28,790) | | | | (33) | | | | 0.0 | (a) |
SEE NOTES TO FINANCIAL STATEMENTS.
11
JPMorgan International Equity Plus Fund
SCHEDULE OF PORTFOLIO INVESTMENTS
AS OF OCTOBER 31, 2020 (continued)
| | | | | | | | | | | | | | | | | | |
| | | | | | | | | NET UNREALIZED | | | | | | |
| | | | | | NOTIONAL | | | APPRECIATION | | | PERCENTAGE | |
| REFERENCE ENTITY | | SHARES | | | VALUE
($)(1) | | | (DEPRECIATION)
($)(2) | | | OF NET
ASSETS (%) | |
Software AG | | | (996) | | | | (35,681) | | | | – | | | | – | |
Telefonica Deutschland Holding AG | | | (23,284) | | | | (58,729) | | | | 36 | | | | 0.0(a) | |
| | | (27,107) | | | | (228,179) | | | | 48 | | | | 0.0(a) | |
Italy | | | | | | | | | | | | | | | | |
Banco BPM SpA | | | (38,351) | | | | (69,473) | | | | (197) | | | | 0.0(a) | |
Eni SpA | | | (8,153) | | | | (57,112) | | | | (35) | | | | 0.0(a) | |
Salvatore Ferragamo SpA* | | | (3,833) | | | | (49,445) | | | | (27) | | | | 0.0(a) | |
Terna Rete Elettrica Nazionale SpA | | | (11,059) | | | | (74,668) | | | | 87 | | | | 0.0(a) | |
| | | (61,396) | | | | (250,698) | | | | (172) | | | | 0.0(a) | |
Netherlands | | | | | | | | | | | | | | | | |
Heineken NV | | | (899) | | | | (79,577) | | | | 206 | | | | 0.0(a) | |
Finland | | | | | | | | | | | | | | | | |
Fortum OYJ | | | (3,424) | | | | (64,360) | | | | 43 | | | | 0.0(a) | |
Belgium | | | | | | | | | | | | | | | | |
Etablissements Franz Colruyt NV | | | (1,613) | | | | (95,469) | | | | – | | | | – | |
Spain | | | | | | | | | | | | | | | | |
Aena SME SA*(b) | | | (309) | | | | (41,633) | | | | (32) | | | | 0.0(a) | |
Enagas SA | | | (2,917) | | | | (62,960) | | | | (8) | | | | 0.0(a) | |
| | | (3,226) | | | | (104,593) | | | | (40) | | | | 0.0(a) | |
France | | | | | | | | | | | | | | | | |
Aeroports de Paris | | | (315) | | | | (30,825) | | | | (45) | | | | 0.0(a) | |
Total Short Positions of Total Return Basket Swap | | | (97,980) | | | | (853,701) | | | | 40 | | | | 0.0(a) | |
Total of Long and Short Positions of Total Return Basket Swap | | | (58,801) | | | | 3,212 | | | | (252 | ) | | | 0.0(a) | |
| | | | | | | | | | | | | | |
| COUNTERPARTY | | DESCRIPTION | | TERMINATION
DATE | | NOTIONAL
VALUE(1) | | NET UNREALIZED
APPRECIATION
(DEPRECIATION)(2) | | NET CASH
AND OTHER
RECEIVABLES
(PAYABLES) | | VALUE | |
Citigroup | | The Fund receives the total return on a portfolio of short equity positions and pays or receives the net of one month NIBOR on short positions, plus or minus a specified spread of 0.00%, which is denominated in NOK based on the local currencies of the positions within the swaps. | | 8/3/2021 | | $(35,774) | | $(62) | | $– | | | $(62) | |
| | | | | | | | | | | | | | |
| | | | | | | | | | | | | | | | |
| REFERENCE ENTITY | | SHARES | | | NOTIONAL
VALUE
($)(1) | | | NET UNREALIZED
APPRECIATION
(DEPRECIATION)
($)(2) | | | PERCENTAGE
OF NET ASSETS (%) | |
Short Positions | | | | | | | | | | | | | | | | |
| | | | |
Common Stock | | | | | | | | | | | | | | | | |
Norway | | | | | | | | | | | | | | | | |
DNB ASA | | | (2,649) | | | | (35,774) | | | | (62 | ) | | | 0.0 | (a) |
SEE NOTES TO FINANCIAL STATEMENTS.
12
JPMorgan International Equity Plus Fund
SCHEDULE OF PORTFOLIO INVESTMENTS
AS OF OCTOBER 31, 2020 (continued)
| | | | | | | | | | | | | | |
| | | | | | | | | | | NET CASH | | | |
| | | | | | | | | NET UNREALIZED | | AND OTHER | | | |
| | | | | TERMINATION | | NOTIONAL | | APPRECIATION | | RECEIVABLES | | | |
| COUNTERPARTY | | DESCRIPTION | | DATE | | VALUE(1) | | (DEPRECIATION)(2) | | (PAYABLES) | | VALUE | |
Citigroup | | The Fund receives the total return on a portfolio of long and short equity positions and pays or receives the net of one month LIBOR on long positions and short positions respectively, plus or minus a specified spread (rates range from (0.30)% to 0.30%), which is denominated in JPY based on the local currencies of the positions within the swaps. | | 7/29/2021 | | $(112,530) | | $(1,432) | | $– | | | $(1,432) | |
| | | | | | | | | | | | | | |
| | | | | | | | | | | | | | | | | | |
| REFERENCE ENTITY | | SHARES | | | NOTIONAL
VALUE
($)(1) | | | NET UNREALIZED
APPRECIATION
(DEPRECIATION)
($)(2) | | | PERCENTAGE
OF NET ASSETS
(%) | | | |
Long Positions | | | | | | | | | | | | | | | | |
Common Stock | | | | | | | | | | | | | | | | |
Japan | | | | | | | | | | | | | | | | |
Hitachi Ltd. | �� | | 1,700 | | | | 57,297 | | | | 433 | | | | 0.0(a) | |
Hoya Corp. | | | 500 | | | | 56,428 | | | | 74 | | | | 0.0(a) | |
Kansai Paint Co. Ltd. | | | 2,400 | | | | 61,877 | | | | 235 | | | | 0.0(a) | |
Nippon Telegraph & Telephone Corp. | | | 2,000 | | | | 42,072 | | | | 121 | | | | 0.0(a) | |
ORIX Corp. | | | 4,800 | | | | 56,137 | | | | 410 | | | | 0.0(a) | |
Resona Holdings, Inc. | | | 19,200 | | | | 63,302 | | | | 491 | | | | 0.0(a) | |
Shiseido Co. Ltd. | | | 1,100 | | | | 68,098 | | | | 329 | | | | 0.0(a) | |
Sundrug Co. Ltd. | | | 2,400 | | | | 89,116 | | | | 287 | | | | 0.0(a) | |
Suzuki Motor Corp. | | | 1,200 | | | | 51,537 | | | | 452 | | | | 0.0(a) | |
Tokyo Electron Ltd. | | | 300 | | | | 80,523 | | | | 577 | | | | 0.0(a) | |
Total Long Positions of Total Return Basket Swap | | | 35,600 | | | | 626,387 | | | | 3,409 | | | | 0.0(a) | |
Short Positions | | | | | | | | | | | | | | | | |
Common Stock | | | | | | | | | | | | | | | | |
Japan | | | | | | | | | | | | | | | | |
Brother Industries Ltd. | | | (5,400) | | | | (83,442) | | | | (607) | | | | 0.0(a) | |
Fukuoka Financial Group, Inc. | | | (4,200) | | | | (70,255) | | | | (532) | | | | 0.0(a) | |
Isetan Mitsukoshi Holdings Ltd. | | | (12,700) | | | | (61,851) | | | | (592) | | | | 0.0(a) | |
Japan Post Holdings Co. Ltd. | | | (7,900) | | | | (54,205) | | | | (261) | | | | 0.0(a) | |
Kawasaki Heavy Industries Ltd. | | | (4,500) | | | | (53,762) | | | | (465) | | | | 0.0(a) | |
Mazda Motor Corp. | | | (8,600) | | | | (45,157) | | | | (307) | | | | 0.0(a) | |
Nippon Paint Holdings Co. Ltd. | | | (600) | | | | (54,048) | | | | (235) | | | | 0.0(a) | |
Seiko Epson Corp. | | | (4,400) | | | | (51,100) | | | | (500) | | | | 0.0(a) | |
SoftBank Corp. | | | (3,800) | | | | (44,222) | | | | (214) | | | | 0.0(a) | |
Takashimaya Co. Ltd. | | | (9,100) | | | | (68,023) | | | | (573) | | | | 0.0(a) | |
Yamada Denki Co. Ltd. | | | (17,200) | | | | (83,864) | | | | (406) | | | | 0.0(a) | |
Yamazaki Baking Co. Ltd. | | | (4,200) | | | | (68,988) | | | | (149) | | | | 0.0(a) | |
Total Short Positions of Total Return Basket Swap | | | (82,600) | | | | (738,917) | | | | (4,841) | | | | 0.0(a) | |
Total of Long and Short Positions of Total Return Basket Swap | | | (47,000) | | | | (112,530) | | | | (1,432) | | | | 0.0(a) | |
SEE NOTES TO FINANCIAL STATEMENTS.
13
JPMorgan International Equity Plus Fund
SCHEDULE OF PORTFOLIO INVESTMENTS
AS OF OCTOBER 31, 2020 (continued)
| | | | | | | | | | | | | | |
| | | | | | | | | | | NET CASH | | | |
| | | | | | | | | NET UNREALIZED | | AND OTHER | | | |
| | | | | TERMINATION | | NOTIONAL | | APPRECIATION | | RECEIVABLES | | | |
| COUNTERPARTY | | DESCRIPTION | | DATE | | VALUE(1) | | (DEPRECIATION)(2)
| | (PAYABLES) | | VALUE | |
Citigroup | | The Fund receives the total return on a portfolio of long and short equity positions and pays or receives the net of one month STIBOR on long positions and short positions respectively, plus or minus a specified spread (rates range from 0.00% to 0.15%), which is denominated in SEK based on the local currencies of the positions within the swaps. | | 8/3/2021 | | $11,942 | | $60 | | $– | | | $60 | |
| | | | | | | | | | | | | | |
| | | | | | | | | | | | | | | | |
| | | | | | | | | NET UNREALIZED | | | | |
| | | | | | NOTIONAL | | | APPRECIATION | | | PERCENTAGE | |
| | | | | | VALUE | | | (DEPRECIATION) | | | OF NET | |
| REFERENCE ENTITY | | SHARES | | | ($)(1) | | | ($)(2) | | | ASSETS (%) | |
| | | | |
Long Positions | | | | | | | | | | | | | | | | |
| | | | |
Common Stock | | | | | | | | | | | | | | | | |
Sweden | | | | | | | | | | | | | | | | |
Lundin Energy AB | | | 3,098 | | | | 59,224 | | | | 90 | | | | 0.0 | (a) |
Volvo AB* | | | 5,438 | | | | 105,700 | | | | (116) | | | | 0.0 | (a) |
| Total Long Positions of Total Return Basket Swap | | | 8,536 | | | | 164,924 | | | | (26) | | | | 0.0 | (a) |
| | | | |
Short Positions | | | | | | | | | | | | | | | | |
| | | | |
Common Stock | | | | | | | | | | | | | | | | |
Sweden | | | | | | | | | | | | | | | | |
Electrolux AB | | | (4,304) | | | | (97,048) | | | | 123 | | | | 0.0 | (a) |
Telefonaktiebolaget LM Ericsson | | | (5,010) | | | | (55,934) | | | | (37) | | | | 0.0 | (a) |
| Total Short Positions of Total Return Basket Swap | | | (9,314) | | | | (152,982) | | | | 86 | | | | 0.0 | (a) |
| Total of Long and Short Positions of Total Return Basket Swap | | | (778) | | | | 11,942 | | | | 60 | | | | 0.0 | (a) |
| | | | | | | | | | | | | | |
| | | | | | | | | | | NET CASH | | | |
| | | | | | | | | NET UNREALIZED | | AND OTHER | | | |
| | | | | TERMINATION | | NOTIONAL | | APPRECIATION | | RECEIVABLES | | | |
| COUNTERPARTY | | DESCRIPTION | | DATE | | VALUE(1) | | (DEPRECIATION)(2) | | (PAYABLES) | | VALUE | |
Citigroup | | The Fund receives the total return on a portfolio of long and short equity positions and pays or receives the net of one month BBSW on long positions and short positions respectively, plus or minus a specified spread (rates range from (0.30)% to 0.30%), which is denominated in AUD based on the local currencies of the positions within the swaps. | | 7/29/2021 | | $(2,070) | | $363 | | $– | | | $363 | |
| | | | | | | | | | | | | | |
| | | | | | | | | | | | | | | | |
| | | | | | | | | NET UNREALIZED | | | | |
| | | | | | NOTIONAL | | | APPRECIATION | | | PERCENTAGE | |
| | | | | | VALUE | | | (DEPRECIATION) | | | OF NET | |
| REFERENCE ENTITY | | SHARES | | | ($)(1) | | | ($)(2) | | | ASSETS (%) | |
| | | | |
Long Positions | | | | | | | | | | | | | | | | |
| | | | |
Common Stock | | | | | | | | | | | | | | | | |
Australia | | | | | | | | | | | | | | | | |
Westpac Banking Corp. | | | 5,944 | | | | 75,232 | | | | 404 | | | | 0.0(a) | |
| | | | |
Short Positions | | | | | | | | | | | | | | | | |
| | | | |
Common Stock | | | | | | | | | | | | | | | | |
SEE NOTES TO FINANCIAL STATEMENTS.
14
JPMorgan International Equity Plus Fund
SCHEDULE OF PORTFOLIO INVESTMENTS
AS OF OCTOBER 31, 2020 (continued)
| | | | | | | | | | | | | | | | |
| | | | | | | | | NET UNREALIZED | | | | |
| | | | | | NOTIONAL | | | APPRECIATION | | | PERCENTAGE | |
| | | | | | VALUE | | | (DEPRECIATION) | | | OF NET | |
| REFERENCE ENTITY | | SHARES | | | ($)(1) | | | ($)(2) | | | ASSETS (%) | |
Australia | | | | | | | | | | | | | | | | |
Bendigo & Adelaide Bank Ltd. | | | (8,320 | ) | | | (39,139 | ) | | | (15) | | | | 0.0 | (a) |
National Australia Bank Ltd. | | | (2,917 | ) | | | (38,163 | ) | | | (26) | | | | 0.0 | (a) |
Total Short Positions of Total Return Basket Swap | | | (11,237 | ) | | | (77,302 | ) | | | (41) | | | | 0.0 | (a) |
Total of Long and Short Positions of Total Return Basket Swap | | | (5,293 | ) | | | (2,070 | ) | | | 363 | | | | 0.0 | (a) |
| | | | | | | | | | | | | | |
| | | | | | | | | | | NET CASH | | | |
| | | | | | | | | NET UNREALIZED | | AND OTHER | | | |
| | | | | TERMINATION | | NOTIONAL | | APPRECIATION | | RECEIVABLES | | | |
| COUNTERPARTY | | DESCRIPTION | | DATE | | VALUE(1) | | (DEPRECIATION)(2) | | (PAYABLES) | | VALUE | |
Citigroup | | The Fund receives the total return on a portfolio of long and short equity positions and pays or receives the net of one month LIBOR on long positions and short positions respectively, plus or minus a specified spread (rates range from 0.00% to 0.15%), which is denominated in CHF based on the local currencies of the positions within the swaps. | | 8/3/2021 | | $(184,242) | | $(76) | | $– | | | $(76) | |
| | | | | | | | | | | | | | |
| | | | | | | | | | | | | | | | |
| | | | | | | | | NET UNREALIZED | | | | |
| | | | | | NOTIONAL | | | APPRECIATION | | | PERCENTAGE | |
| | | | | | VALUE | | | (DEPRECIATION) | | | OF NET | |
| REFERENCE ENTITY | | SHARES | | | ($)(1) | | | ($)(2) | | | ASSETS (%) | |
| | | | |
Long Positions | | | | | | | | | | | | | | | | |
| | | | |
Common Stock | | | | | | | | | | | | | | | | |
Switzerland | | | | | | | | | | | | | | | | |
Helvetia Holding AG (Registered) | | | 945 | | | | 74,100 | | | | 104 | | | | 0.0 | (a) |
Temenos AG (Registered) | | | 271 | | | | 29,125 | | | | 31 | | | | 0.0 | (a) |
Total Long Positions of Total Return Basket Swap | | | 1,216 | | | | 103,225 | | | | 135 | | | | 0.0 | (a) |
| | | | |
Short Positions | | | | | | | | | | | | | | | | |
| | | | |
Common Stock | | | | | | | | | | | | | | | | |
Switzerland | | | | | | | | | | | | | | | | |
ABB Ltd. (Registered) | | | (2,671) | | | | (64,812) | | | | 1 | | | | 0.0 | (a) |
Baloise Holding AG (Registered) | | | (589) | | | | (80,549) | | | | (63 | ) | | | 0.0 | (a) |
Swatch Group AG (The) | | | (401) | | | | (84,920) | | | | (102 | ) | | | 0.0 | (a) |
Swiss Life Holding AG (Registered)* | | | (170) | | | | (57,186) | | | | (47 | ) | | | 0.0 | (a) |
Total Short Positions of Total Return Basket Swap | | | (3,831) | | | | (287,467) | | | | (211 | ) | | | 0.0 | (a) |
| Total of Long and Short Positions of Total Return Basket Swap | | | (2,615) | | | | (184,242) | | | | (76 | ) | | | 0.0 | (a) |
| | | | | | | | | | | | | | |
| | | | | | | | | | | NET CASH | | | |
| | | | | | | | | NET UNREALIZED | | AND OTHER | | | |
| | | | | TERMINATION | | NOTIONAL | | APPRECIATION | | RECEIVABLES | | | |
| COUNTERPARTY | | DESCRIPTION | | DATE | | VALUE(1) | | (DEPRECIATION)(2) | | (PAYABLES) | | VALUE | |
Citigroup | | The Fund receives the total return on a portfolio of long equity positions and pays or receives the net of one month HIBOR on long positions, plus or minus a specified spread of 0.30%, which is denominated in HKD based on the local currencies of the positions within the swaps. | | 9/27/2021 | | $70,484 | | $194 | | $– | | | $194 | |
| | | | | | | | | | | | | | |
SEE NOTES TO FINANCIAL STATEMENTS.
15
JPMorgan International Equity Plus Fund
SCHEDULE OF PORTFOLIO INVESTMENTS
AS OF OCTOBER 31, 2020 (continued)
| | | | | | | | | | | | | | | | |
| | | | | | | | | NET UNREALIZED | | | | |
| | | | | | NOTIONAL | | | APPRECIATION | | | PERCENTAGE | |
| | | | | | VALUE | | | (DEPRECIATION) | | | OF NET | |
| REFERENCE ENTITY | | SHARES | | | ($)(1) | | | ($)(2) | | | ASSETS (%) | |
| | | | |
Long Positions | | | | | | | | | | | | | | | | |
| | | | |
Common Stock | | | | | | | | | | | | | | | | |
China | | | | | | | | | | | | | | | | |
Budweiser Brewing Co. APAC Ltd.(b) | | | 23,900 | | | | 70,484 | | | | 194 | | | | 0.0(a) | |
The following reference rates, and their values as of period-end, are used for security descriptions:
| | | | | | |
| | | Value |
BBSW | | | 0.05% | | | |
CHF LIBOR | | | (0.80) | | | |
CIBOR | | | (0.30) | | | |
EURIBOR | | | (0.55) | | | |
GBP LIBOR | | | 0.04 | | | |
HIBOR | | | 0.40 | | | |
JPY LIBOR | | | (0.09) | | | |
NIBOR | | | 0.43 | | | |
STIBOR | | | (0.05) | | | |
Summary of total OTC swap contracts outstanding as of October 31, 2020:
| | | | | | | | | | |
| | | | | Net Upfront | | | | |
| | | | | Payments | | | | |
| | | | | (Receipts) ($) | | | Value ($) | |
| | | | | | |
Assets | | | | | | | | | | |
OTC Total return basket swap contracts outstanding | | | — | | | | 652 | |
| | | | | | |
| | | |
Liabilities | | | | | | | | | | |
OTC Total return basket swap contracts outstanding | | | — | | | | (1,822) | |
| | | | | | |
| | | | |
Abbreviations | | |
AUD | | Australian Dollar | | |
BBSW | | ASX Australia Bank Bill Swap Rate | | |
CHF | | Swiss Franc | | |
CIBOR | | Copenhagen Interbank Offered Rate | | |
DKK | | Danish Krone | | |
EUR | | Euro | | |
EURIBOR | | Euro Interbank Offered Rate | | |
GBP | | British Pound | | |
HKD | | Hong Kong Dollar | | |
HIBOR | | Hong Kong Interbank Offered Rate | | |
JPY | | Japanese Yen | | |
LIBOR | | London Interbank Offered Rate | | |
NIBOR | | Norwegian Interbank Offered Rate | | |
NOK | | Norwegian Krone | | |
OYJ | | Public Limited Company | | |
SEK | | Swedish Krona | | |
STIBOR | | Stockholm Interbank Offered Rate | | |
| | |
| (a) | | Amount rounds to less than 0.1% of net assets. | | |
| (b) | | Security exempt from registration pursuant to Regulation S under the Securities Act of 1933, as amended. Regulation S applies to securities offerings that are made outside of the United States and do not involve direct selling efforts in the United States and as such may have restrictions on resale. | | |
| (1) | | Notional value represents market value as of October 31, 2020 of these positions based on the securities’ last sale or closing price on the principal exchange on which the securities are traded. | | |
| (2) | | Unrealized appreciation (depreciation) represents the unrealized gain (loss) of the positions subsequent to the swap reset. | | |
| * | | Non-income producing security. | | |
SEE NOTES TO FINANCIAL STATEMENTS.
16
STATEMENT OF ASSETS AND LIABILITIES
AS OF OCTOBER 31, 2020
| | | | |
| | | JPMorgan
International Equity
Plus Fund |
ASSETS: | | | | |
Investments in non-affiliates, at value | | $ | 9,590,007 | |
Cash | | | 69,980 | |
Foreign currency, at value | | | 1,237 | |
Receivables: | | | | |
Investment securities sold | | | 46,511 | |
Dividends from non-affiliates | | | 10,059 | |
Tax reclaims | | | 15,064 | |
Outstanding OTC swap contracts, at value | | | 652 | |
Due from counterparty for swap contracts | | | 87,361 | |
| | | | |
Total Assets | | | 9,820,871 | |
| | | | |
| |
LIABILITIES: | | | | |
Payables: | | | | |
Investment securities purchased | | | 18,575 | |
Outstanding OTC swap contracts, at value | | | 1,822 | |
Accrued liabilities: | | | | |
Investment advisory fees | | | 10,352 | |
Distribution fees | | | 17 | |
Service fees | | | 600 | |
Custodian and accounting fees | | | 6,860 | |
Trustees’ and Chief Compliance Officer’s fees | | | 38 | |
Other | | | 85,245 | |
| | | | |
Total Liabilities | | | 123,509 | |
| | | | |
Net Assets | | $ | 9,697,362 | |
| | | | |
| |
NET ASSETS: | | | | |
Paid-in-Capital | | $ | 10,203,945 | |
Total distributable earnings (loss) | | | (506,583 | ) |
| | | | |
Total Net Assets | | $ | 9,697,362 | |
| | | | |
| |
Net Assets: | | | | |
Class A | | $ | 19,329 | |
Class C | | | 19,199 | |
Class I | | | 9,658,834 | |
| | | | |
Total | | $ | 9,697,362 | |
| | | | |
| |
Outstanding units of beneficial interest (shares) ($0.0001 par value; unlimited number of shares authorized): | | | | |
Class A | | | 1,358 | |
Class C | | | 1,355 | |
Class I | | | 676,736 | |
| |
Net Asset Value (a): | | | | |
Class A - Redemption price per share | | $ | 14.24 | |
Class C - Offering price per share (b) | | | 14.17 | |
Class I - Offering and redemption price per share | | | 14.27 | |
Class A maximum sales charge | | | 5.25 | % |
Class A maximum public offering price per share [net asset value per share/(100% – maximum sales charge)] | | $ | 15.03 | |
| | | | |
Cost of investments in non-affiliates | | $ | 9,753,218 | |
Cost of foreign currency | | | 1,234 | |
(a) Per share amounts may not recalculate due to rounding of net assets and/or shares outstanding.
(b) Redemption price for Class C Shares varies based upon length of time the shares are held.
SEE NOTES TO FINANCIAL STATEMENTS.
17
STATEMENT OF OPERATIONS
FOR THE YEAR ENDED OCTOBER 31, 2020
| | | | |
| | | JPMorgan
International Equity
Plus Fund |
INVESTMENT INCOME: | | | | |
Interest income from non-affiliates | | $ | 105 | |
Interest income from affiliates | | | 35 | |
Dividend income from non-affiliates | | | 242,175 | |
Dividend income from affiliates | | | 2,066 | |
Foreign taxes withheld (net) | | | (23,352 | ) |
| | | | |
Total investment income | | | 221,029 | |
| | | | |
| |
EXPENSES: | | | | |
Investment advisory fees | | | 59,367 | |
Administration fees | | | 7,421 | |
Distribution fees: | | | | |
Class A | | | 49 | |
Class C | | | 148 | |
Service fees: | | | | |
Class A | | | 49 | |
Class C | | | 49 | |
Class I | | | 24,638 | |
Custodian and accounting fees | | | 50,685 | |
Interest expense to affiliates | | | 51 | |
Professional fees | | | 88,806 | |
Trustees’ and Chief Compliance Officer’s fees | | | 25,005 | |
Printing and mailing costs | | | 1,432 | |
Registration and filing fees | | | 725 | |
Transfer agency fees (See Note 2.I.) | | | 1,270 | |
Offering costs (See Note 2.G.) | | | 6,835 | |
Other | | | 233 | |
| | | | |
Total expenses | | | 266,763 | |
| | | | |
Less fees waived | | | (87,398 | ) |
| | | | |
Less expense reimbursements | | | (105,450 | ) |
| | | | |
Net expenses | | | 73,915 | |
Net investment income (loss) | | | 147,114 | |
| | | | |
| |
REALIZED/UNREALIZED GAINS (LOSSES): | | | | |
Net realized gain (loss) on transactions from: | | | | |
Investments in non-affiliates | | | (542,217 | ) |
Futures contracts | | | (716 | ) |
Foreign currency transactions | | | 13,507 | |
Forward foreign currency exchange contracts | | | (8,085 | ) |
Swaps | | | 120,212 | |
| | | | |
Net realized gain (loss) | | | (417,299 | ) |
| | | | |
Change in net unrealized appreciation/depreciation on: | | | | |
Investments in non-affiliates | | | (368,476 | ) |
Futures contracts | | | (9,685 | ) |
Foreign currency translations | | | 527 | |
Forward foreign currency exchange contracts | | | (4,468 | ) |
Swaps | | | (414 | ) |
| | | | |
Change in net unrealized appreciation/depreciation | | | (382,516 | ) |
| | | | |
Net realized/unrealized gains (losses) | | | (799,815 | ) |
| | | | |
Change in net assets resulting from operations | | $ | (652,701 | ) |
| | | | |
SEE NOTES TO FINANCIAL STATEMENTS.
18
STATEMENTS OF CHANGES IN NET ASSETS
FOR THE PERIODS INDICATED
| | | | | | | | | | | | | | | | |
| | | JPMorgan International Equity Plus Fund | |
| | | Year Ended
October 31, 2020 | | | | | | Period Ended
October 31, 2019 (a) | | | | |
CHANGE IN NET ASSETS RESULTING FROM OPERATIONS: | | | | | | | | | | | | | | | | |
Net investment income (loss) | | $ | 147,114 | | | | | | | $ | 70,998 | | | | | |
Net realized gain (loss) | | | (417,299 | ) | | | | | | | 59,932 | | | | | |
Change in net unrealized appreciation/depreciation | | | (382,516 | ) | | | | | | | 219,133 | | | | | |
| | | | |
Change in net assets resulting from operations | | | (652,701 | ) | | | | | | | 350,063 | | | | | |
| | | | |
| | | | |
DISTRIBUTIONS TO SHAREHOLDERS: | | | | | | | | | | | | | | | | |
Class A | | | (386 | ) | | | | | | | — | | | | | |
Class C | | | (341 | ) | | | | | | | — | | | | | |
Class I | | | (203,264 | ) | | | | | | | — | | | | | |
| | | | |
Total distributions to shareholders | | | (203,991 | ) | | | | | | | — | | | | | |
| | | | |
| | | | |
CAPITAL TRANSACTIONS: | | | | | | | | | | | | | | | | |
Change in net assets resulting from capital transactions | | | 203,991 | | | | | | | | 10,000,000 | | | | | |
| | | | |
| | | | |
NET ASSETS: | | | | | | | | | | | | | | | | |
Change in net assets | | | (652,701 | ) | | | | | | | 10,350,063 | | | | | |
Beginning of period | | | 10,350,063 | | | | | | | | — | | | | | |
| | | | |
End of period | | $ | 9,697,362 | | | | | | | $ | 10,350,063 | | | | | |
| | | | |
| | | | |
CAPITAL TRANSACTIONS: | | | | | | | | | | | | | | | | |
Class A | | | | | | | | | | | | | | | | |
Proceeds from shares issued | | $ | — | | | | | | | $ | 20,000 | | | | | |
Distributions reinvested | | | 386 | | | | | | | | — | | | | | |
| | | | |
Change in net assets resulting from Class A capital transactions | | $ | 386 | | | | | | | $ | 20,000 | | | | | |
| | | | |
Class C | | | | | | | | | | | | | | | | |
Proceeds from shares issued | | $ | — | | | | | | | $ | 20,000 | | | | | |
Distributions reinvested | | | 341 | | | | | | | | — | | | | | |
| | | | |
Change in net assets resulting from Class C capital transactions | | $ | 341 | | | | | | | $ | 20,000 | | | | | |
| | | | |
Class I | | | | | | | | | | | | | | | | |
Proceeds from shares issued | | $ | — | | | | | | | $ | 9,960,000 | | | | | |
Distributions reinvested | | | 203,264 | | | | | | | | — | | | | | |
| | | | |
Change in net assets resulting from Class I capital transactions | | $ | 203,264 | | | | | | | $ | 9,960,000 | | | | | |
| | | | |
Total change in net assets resulting from capital transactions | | $ | 203,991 | | | | | | | $ | 10,000,000 | | | | | |
| | | | |
| | | | |
SHARE TRANSACTIONS: | | | | | | | | | | | | | | | | |
Class A | | | | | | | | | | | | | | | | |
Issued | | | — | | | | | | | | 1,333 | | | | | |
Reinvested | | | 25 | | | | | | | | — | | | | | |
| | | | |
Change in Class A Shares | | | 25 | | | | | | | | 1,333 | | | | | |
| | | | |
Class C | | | | | | | | | | | | | | | | |
Issued | | | — | | | | | | | | 1,334 | | | | | |
Reinvested | | | 21 | | | | | | | | — | | | | | |
| | | | |
Change in Class C Shares | | | 21 | | | | | | | | 1,334 | | | | | |
| | | | |
Class I | | | | | | | | | | | | | | | | |
Issued | | | — | | | | | | | | 664,000 | | | | | |
Reinvested | | | 12,736 | | | | | | | | — | | | | | |
| | | | |
Change in Class I Shares | | | 12,736 | | | | | | | | 664,000 | | | | | |
| | | | |
(a) Commencement of operations was June 25, 2019.
SEE NOTES TO FINANCIAL STATEMENTS.
19
FINANCIAL HIGHLIGHTS
FOR THE PERIODS INDICATED
| | | | | | | | | | | | | | | | | | | | | | | | | | | | | | | | | | | | | | | | | | | | | | | | |
| | | Per share operating performance | | | | | | | | | | | | Ratios/Supplemental data | | | | |
| | | | | | Investment operations | | | Distributions | | | | | | | | | | | | Ratios to average net assets (a) | | | | |
| | | | | | | | | | | | |
| | | Net asset
value,
beginning of
period | | | Net
investment
income
(loss) (b) | | | Net realized and
unrealized gains
(losses) on
investments | | | Total from
investment
operations | | | Net
investment
income | | | Net asset
value, end
of period | | | Total return
(excludes sales charge) (c)(d) | | | Net assets, end of period | | | Net
expenses (e) | | | Net
investment
income
(loss) | | | Expenses without
waivers,
reimbursements and
earnings credits | | | Portfolio
turnover
rate (c) | |
JPMorgan International Equity Plus Fund | | | | | | | | | | | | | | | | | | | | | | | | | | | | | | | | | | | | | | | | | | | | | | | | |
| | | | | | | | | | | | |
Class A | | | | | | | | | | | | | | | | | | | | | | | | | | | | | | | | | | | | | | | | | | | | | | | | |
| | | | | | | | | | | | |
Year Ended October 31, 2020 | | | $15.51 | | | | $0.18 | | | | $(1.16) | | | | $(0.98) | | | | $(0.29) | | | | $14.24 | | | | (6.52)% | | | | $19,329 | | | | 1.00% | | | | 1.24% | | | | 2.93% | | | | 84% | |
| | | | | | | | | | | | |
June 25, 2019 (f) through October 31, 2019 | | | 15.00 | | | | 0.09 | | | | 0.42 | | | | 0.51 | | | | — | | | | 15.51 | | | | 3.40 | | | | 20,682 | | | | 1.00(g) | | | | 1.79(g) | | | | 6.86(g) | | | | 8 | |
| | | | | | | | | | | | |
Class C | | | | | | | | | | | | | | | | | | | | | | | | | | | | | | | | | | | | | | | | | | | | | | | | |
| | | | | | | | | | | | |
Year Ended October 31, 2020 | | | 15.48 | | | | 0.11 | | | | (1.16) | | | | (1.05) | | | | (0.26) | | | | 14.17 | | | | (6.99) | | | | 19,199 | | | | 1.50 | | | | 0.74 | | | | 3.62 | | | | 84 | |
| | | | | | | | | | | | |
June 25, 2019 (f) through October 31, 2019 | | | 15.00 | | | | 0.07 | | | | 0.41 | | | | 0.48 | | | | — | | | | 15.48 | | | | 3.20 | | | | 20,646 | | | | 1.50(g) | | | | 1.29(g) | | | | 7.37(g) | | | | 8 | |
| | | | | | | | | | | | |
Class I | | | | | | | | | | | | | | | | | | | | | | | | | | | | | | | | | | | | | | | | | | | | | | | | |
| | | | | | | | | | | | |
Year Ended October 31, 2020 | | | 15.53 | | | | 0.22 | | | | (1.17) | | | | (0.95) | | | | (0.31) | | | | 14.27 | | | | (6.35) | | | | 9,658,834 | | | | 0.75 | | | | 1.49 | | | | 2.70 | | | | 84 | |
| | | | | | | | | | | | |
June 25, 2019 (f) through October 31, 2019 | | | 15.00 | | | | 0.11 | | | | 0.42 | | | | 0.53 | | | | — | | | | 15.53 | | | | 3.53 | | | | 10,308,735 | | | | 0.74(g) | | | | 2.04(g) | | | | 4.30(g) | | | | 8 | |
| (a) | Annualized for periods less than one year, unless otherwise noted. |
| (b) | Calculated based upon average shares outstanding. |
| (c) | Not annualized for periods less than one year. |
| (d) | Includes adjustments in accordance with accounting principles generally accepted in the United States of America and as such, the net asset values for financial reporting purposes and the returns based upon those net asset values may differ from the net asset values and returns for shareholder transactions. |
| (e) | Includes earnings credits and interest expense, if applicable, each of which is less than 0.005% unless otherwise noted. |
| (f) | Commencement of operations. |
| (g) | Certain non-recurring expenses incurred by the Fund were not annualized for the period indicated. |
SEE NOTES TO FINANCIAL STATEMENTS.
20
NOTES TO FINANCIAL STATEMENTS
AS OF OCTOBER 31, 2020
1. Organization
JPMorgan Trust IV (the “Trust”) was formed on November 11, 2015, as a Delaware statutory trust, pursuant to a Declaration of Trust dated November 11, 2015, and is registered under the Investment Company Act of 1940, as amended (the “1940 Act”), as an open-end management investment company.
The following is a separate fund of the Trust (the “Fund”) covered by this report:
| | | | |
| | | Classes Offered | | Diversification Classification |
JPMorgan International Equity Plus Fund | | Class A, Class C and Class I | | Diversified |
The investment objective of the Fund is to seek to provide long-term capital appreciation.
The Fund commenced operations on June 25, 2019. Currently, the Fund is not publicly offered for investment.
Class A Shares generally provide for a front-end sales charge while Class C Shares provide for a contingent deferred sales charge (“CDSC”). No sales charges are assessed with respect to Class I. Certain Class A Shares, for which front-end sales charges have been waived, may be subject to a CDSC as described in the Fund’s prospectus. Effective October 1, 2020, Class C Shares automatically convert to Class A Shares after eight years. Prior to October 1, 2020, Class C Shares automatically converted to Class A Shares after ten years. All classes of shares have equal rights as to earnings, assets and voting privileges, except that each class may bear different transfer agency, distribution and service fees and each class has exclusive voting rights with respect to its distribution plan and shareholder servicing agreements.
J.P. Morgan Investment Management Inc. (“JPMIM”), an indirect, wholly-owned subsidiary of JPMorgan Chase & Co. (“JPMorgan”), acts as Adviser (the “Adviser”) and Administrator (the “Administrator”) to the Fund.
2. Significant Accounting Policies
The following is a summary of significant accounting policies followed by the Fund in the preparation of its financial statements. The Fund is an investment company and, accordingly, follows the investment company accounting and reporting guidance of the Financial Accounting Standards Board (“FASB”) Accounting Standards Codification Topic 946 - Investment Companies, which is part of U.S. generally accepted accounting principles (“GAAP”). The preparation of financial statements in conformity with GAAP requires management to make estimates and assumptions that affect (i) the reported amounts of assets and liabilities, (ii) disclosure of contingent assets and liabilities at the date of the financial statements, and (iii) the reported amounts of increases and decreases in net assets from operations during the reporting period. Actual results could differ from those estimates.
A. Valuation of Investments — Investments are valued in accordance with GAAP and the Fund’s valuation policies set forth by, and under the supervision and responsibility of, the Board of Trustees of the Trust (the “Board”), which established the following approach to valuation, as described more fully below: (i) investments for which market quotations are readily available shall be valued at their market value and (ii) all other investments for which market quotations are not readily available shall be valued at their fair value as determined in good faith by the Board.
The Administrator has established the J.P. Morgan Asset Management Americas Valuation Committee (“AVC”) to assist the Board with the oversight and monitoring of the valuation of the Fund’s investments. The Administrator implements the valuation policies of the Fund’s investments, as directed by the Board. The AVC oversees and carries out the policies for the valuation of investments held in the Fund. This includes monitoring the appropriateness of fair values based on results of ongoing valuation oversight including, but not limited to, consideration of macro or security specific events, market events, and pricing vendor and broker due diligence. The Administrator is responsible for discussing and assessing the potential impacts to the fair values on an ongoing basis, and, at least on a quarterly basis, with the AVC and the Board.
Equities and other exchange-traded instruments are valued at the last sale price or official market closing price on the primary exchange on which the instrument is traded before the net asset value (“NAV”) of the Fund is calculated on a valuation date. Certain foreign equity instruments, as well as certain derivatives with foreign equity reference obligations, are valued by applying international fair value factors provided by approved Pricing Services. The factors seek to adjust the local closing price for movements of local markets post-closing, but prior to the time the NAVs are calculated.
Investments in open-end investment companies (“Underlying Funds”) are valued at each Underlying Fund’s NAV per share as of the report date.
Futures contracts are generally valued on the basis of available market quotations. Swaps and forward foreign currency exchange contracts are valued utilizing market quotations from approved Pricing Services.
Valuations reflected in this report are as of the report date. As a result, changes in valuation due to market events and/or issuer-related events after the report date and prior to issuance of the report are not reflected herein.
The various inputs that are used in determining the valuation of the Fund’s investments are summarized into the three broad levels listed below.
| • | Level 1 — Unadjusted inputs using quoted prices in active markets for identical investments. |
| • | Level 2 — Other significant observable inputs including, but not limited to, quoted prices for similar investments, inputs other than quoted prices that are observable for investments (such as interest rates, prepayment speeds, credit risk, etc.) or other market corroborated inputs. |
| • | Level 3 — Significant inputs based on the best information available in the circumstances, to the extent observable inputs are not available (including the Fund’s assumptions in determining the fair value of investments). |
21
A financial instrument’s level within the fair value hierarchy is based on the lowest level of any input, both individually and in the aggregate, that is significant to the fair value measurement. The inputs or methodology used for valuing instruments are not necessarily an indication of the risk associated with investing in those instruments.
The following table represents each valuation input as presented on the Schedule of Portfolio Investments (“SOI”):
| | | | | | | | | | | | | | | | |
| | | Level 1
Quoted prices | | | Level 2
Other significant observable inputs | | | Level 3
Significant unobservable inputs | | | Total | |
Investments in Securities | | | | | | | | | | | | | | | | |
Common Stocks | | | | | | | | | | | | | | | | |
Australia | | $ | – | | | $ | 405,754 | | | $ | – | | | $ | 405,754 | |
Austria | | | – | | | | 49,867 | | | | – | | | | 49,867 | |
Belgium | | | – | | | | 63,142 | | | | – | | | | 63,142 | |
China | | | – | | | | 405,266 | | | | – | | | | 405,266 | |
Denmark | | | 94,276 | | | | 301,987 | | | | – | | | | 396,263 | |
Finland | | | – | | | | 105,647 | | | | – | | | | 105,647 | |
France | | | – | | | | 1,121,877 | | | | – | | | | 1,121,877 | |
Germany | | | – | | | | 752,797 | | | | – | | | | 752,797 | |
Hong Kong | | | – | | | | 299,572 | | | | – | | | | 299,572 | |
India | | | 150,091 | | | | – | | | | – | | | | 150,091 | |
Japan | | | – | | | | 2,058,940 | | | | – | | | | 2,058,940 | |
Macau | | | – | | | | 64,577 | | | | – | | | | 64,577 | |
Netherlands | | | – | | | | 270,527 | | | | – | | | | 270,527 | |
Singapore | | | – | | | | 95,333 | | | | – | | | | 95,333 | |
South Korea | | | 142,631 | | | | – | | | | – | | | | 142,631 | |
Spain | | | – | | | | 296,923 | | | | – | | | | 296,923 | |
Sweden | | | – | | | | 201,415 | | | | – | | | | 201,415 | |
Switzerland | | | – | | | | 1,115,215 | | | | – | | | | 1,115,215 | |
Taiwan | | | 152,308 | | | | – | | | | – | | | | 152,308 | |
United Kingdom | | | – | | | | 1,339,859 | | | | – | | | | 1,339,859 | |
United States | | | – | | | | 102,003 | | | | – | | | | 102,003 | |
| |
Total Common Stocks | | | 539,306 | | | | 9,050,701 | | | | – | | | | 9,590,007 | |
| |
Total Investments in Securities | | $ | 539,306 | | | $ | 9,050,701 | | | $ | – | | | $ | 9,590,007 | |
| |
Appreciation in Other Financial Instruments | | | | | | | | | | | | | |
Swaps | | $ | – | | | $ | 652 | | | $ | – | | | $ | 652 | |
| |
Depreciation in Other Financial Instruments | | | | | | | | | | | | | |
Swaps | | $ | – | | | $ | (1,822 | ) | | $ | – | | | $ | (1,822) | |
| |
B. Restricted Securities — Certain securities held by the Fund may be subject to legal or contractual restrictions on resale. Restricted securities generally are resold in transactions exempt from registration under the Securities Act of 1933, as amended (the “Securities Act”). Disposal of these securities may involve time-consuming negotiations and expense. Prompt sale at the current valuation may be difficult and could adversely affect the net asset value of the Fund.
As of October 31, 2020, the Fund had no investments in restricted securities other than securities sold to the Fund under Rule 144A and/or Regulation S under the Securities Act.
C. Securities Lending — The Fund is authorized to engage in securities lending in order to generate additional income. The Fund is able to lend to approved borrowers. Citibank N.A. (“Citibank”) serves as lending agent for the Fund, pursuant to a Securities Lending Agency Agreement (the “Securities Lending Agency Agreement”). Securities loaned are collateralized by cash equal to at least 100% of the market value plus accrued
22
interest on the securities lent, which is invested in an affiliated money market fund. The Fund retains loan fees and the interest on cash collateral investments but is required to pay the borrower a rebate for the use of cash collateral. In cases where the lent security is of high value to borrowers, there may be a negative rebate (i.e. a net payment from the borrower to the Fund). Upon termination of a loan, the Fund is required to return to the borrower an amount equal to the cash collateral, plus any rebate owed to the borrowers. The remaining maturities of the securities lending transactions are considered overnight and continuous. Loans are subject to termination by the Fund or the borrower at any time.
The net income earned on the securities lending (after payment of rebates and Citibank’s fee) is included on the Statement of Operations as Income from securities lending (net). The Fund also receives payments from the borrower during the period of the loan, equivalent to dividends and interest earned on the securities loaned, which are recorded as Dividend or Interest income, respectively, on the Statement of Operations.
Under the Securities Lending Agency Agreement, Citibank marks to market the loaned securities on a daily basis. In the event the cash received from the borrower is less than 102% of the value of the loaned securities (105% for loans of non-U.S. securities), Citibank requests additional cash from the borrower so as to maintain a collateralization level of at least 102% of the value of the loaned securities plus accrued interest (105% for loans of non-U.S. securities), subject to certain de minimis amounts.
The value of securities out on loan is recorded as an asset on the Statement of Assets and Liabilities. The value of the cash collateral received is recorded as a liability on the Statement of Assets and Liabilities and details of collateral investments are disclosed on the SOI.
The Fund bears the risk of loss associated with the collateral investments and is not entitled to additional collateral from the borrower to cover any such losses. To the extent that the value of the collateral investments declines below the amount owed to a borrower, the Fund may incur losses that exceed the amount it earned on lending the security. Upon termination of a loan, the Fund may use leverage (borrow money) to repay the borrower for cash collateral posted if the Adviser does not believe that it is prudent to sell the collateral investments to fund the payment of this liability. Securities lending activity is subject to master netting arrangements.
Securities lending also involves counterparty risks, including the risk that the loaned securities may not be returned in a timely manner or at all. Subject to certain conditions, Citibank has agreed to indemnify the Fund from losses resulting from a borrower’s failure to return a loaned security.
The Fund did not lend out any securities during the year ended October 31, 2020.
D. Investment Transactions with Affiliates — The Fund invested in an Underlying Fund which is advised by the Adviser. An issuer which is under common control with the Fund may be considered an affiliate. For the purposes of the financial statements, the Fund assumes the issuer listed in the table below to be an affiliated issuer. Underlying Fund distributions may be reinvested into the Underlying Fund. Reinvestment amounts are included in the purchase cost amounts in the table below.
| | | | | | | | | | | | | | | | | | |
| | | For the year ended October 31, 2020 |
| | | | | | | | | |
Security Description | | Value at October 31,
2019 | | Purchases
at Cost | | Proceeds
from
Sales | | Net
Realized
Gain
(Loss) | | Change in
Unrealized
Appreciation/
(Depreciation) | | Value at
October
31, 2020 | | Shares at
October
31, 2020 | | Dividend
Income | | Capital Gain
Distributions |
JPMorgan U.S. Government Money Market Fund Class Institutional Shares(a) | | $364,271 | | $249,352 | | $613,623 | | $— | | $— | | $— | | — | | $2,066 | | $— |
| | | | | | |
(a) Investment in an affiliated fund, which is registered under the Investment Company Act of 1940, as amended, and is advised by J.P. Morgan Investment Management Inc.
E. Foreign Currency Translation — The books and records of the Fund are maintained in U.S. dollars. Foreign currency amounts are translated into U.S. dollars at the prevailing exchange rates of such currencies against the U.S. dollar. The market value of investment securities and other assets and liabilities are translated at the exchange rate as of the valuation date. Purchases and sales of investment securities, income and expenses are translated at the exchange rate prevailing on the respective dates of such transactions.
The Fund does not isolate the effect of changes in foreign exchange rates from changes in market prices on securities held. Accordingly, such changes are included within Change in net unrealized appreciation/depreciation on investments in non-affiliates on the Statement of Operations.
Reported realized foreign currency gains and losses arise from the disposition of foreign currency, currency gains or losses realized between the trade and settlement dates on securities transactions, and the difference between the amounts of dividends, interest and foreign withholding taxes recorded on the Fund’s books on the transaction date and the U.S. dollar equivalent of the amounts actually received or paid. These reported realized foreign currency gains and losses are included in Net realized gain (loss) on foreign currency transactions on the Statement of Operations. Unrealized foreign currency gains and losses arise from changes (due to changes in exchange rates) in the value of foreign currency and other assets and liabilities denominated in foreign currencies, which are held at year end are included in Change in net unrealized appreciation/depreciation on foreign currency translations on the Statement of Operations.
23
F. Derivatives — The Fund used derivative instruments including futures, forward foreign currency exchange contracts and swaps, in connection with its respective investment strategies. Derivative instruments may be used as substitutes for securities in which the Fund can invest, to hedge portfolio investments or to generate income or gain to the Fund. Derivatives may also be used to manage duration, sector and yield curve exposures and credit and spread volatility.
The Fund may be subject to various risks from the use of derivatives, including the risk that changes in the value of a derivative may not correlate perfectly with the underlying asset, rate or index; counterparty credit risk related to derivatives counterparties’ failure to perform under contract terms; liquidity risk related to the potential lack of a liquid market for these contracts allowing the Fund to close out its position(s); and documentation risk relating to disagreement over contract terms. Investing in certain derivatives also results in a form of leverage and as such, the Fund’s risk of loss associated with these instruments may exceed their value, as recorded on the Statement of Assets and Liabilities.
The Fund is party to various derivative contracts governed by International Swaps and Derivatives Association master agreements (“ISDA agreements”). The Fund’s ISDA agreements, which are separately negotiated with each dealer counterparty, may contain provisions allowing, absent other considerations, a counterparty to exercise rights, to the extent not otherwise waived, against the Fund in the event the Fund’s net assets decline over time by a pre-determined percentage or fall below a pre-determined floor. The ISDA agreements may also contain provisions allowing, absent other conditions, the Fund to exercise rights, to the extent not otherwise waived, against a counterparty (e.g., decline in a counterparty’s credit rating below a specified level). Such rights for both a counterparty and the Fund often include the ability to terminate (i.e., close out) open contracts at prices which may favor a counterparty, which could have an adverse effect on the Fund. The ISDA agreements give the Fund and a counterparty the right, upon an event of default, to close out all transactions traded under such agreements and to net amounts owed or due across all transactions and offset such net payable or receivable against collateral posted to a segregated account by one party for the benefit of the other.
Counterparty credit risk may be mitigated to the extent a counterparty posts additional collateral for mark to market gains to the Fund.
Notes F(1) — F(3) below describe the various derivatives used by the Fund.
(1). Futures Contracts — The Fund used index futures contracts to gain or reduce exposure to the stock market, or maintain liquidity or minimize transaction costs. The Fund also purchased futures contracts to invest incoming cash in the market or sold futures in response to cash outflows, thereby simulating an invested position in the underlying index while maintaining a cash balance for liquidity.
Futures contracts provide for the delayed delivery of the underlying instrument at a fixed price or are settled for a cash amount based on the change in the value of the underlying instrument at a specific date in the future. Upon entering into a futures contract, the Fund is required to deposit with the broker, cash or securities in an amount equal to a certain percentage of the contract amount, which is referred to as the initial margin deposit. Subsequent payments, referred to as variation margin, are made or received by the Fund periodically and are based on changes in the market value of open futures contracts. Changes in the market value of open futures contracts are recorded as Change in net unrealized appreciation/depreciation on futures contracts on the Statement of Operations. Realized gains or losses, representing the difference between the value of the contract at the time it was opened and the value at the time it was closed, are reported on the Statement of Operations at the closing or expiration of the futures contract. Securities deposited as initial margin are designated on the SOI, while cash deposited, which is considered restricted, is recorded on the Statement of Assets and Liabilities. A receivable from and/or a payable to brokers for the daily variation margin is also recorded on the Statement of Assets and Liabilities.
The use of futures contracts exposes the Fund to equity price risk. The Fund may be subject to the risk that the change in the value of the futures contract may not correlate perfectly with the underlying instrument. Use of long futures contracts subjects the Fund to risk of loss in excess of the amounts shown on the Statement of Assets and Liabilities, up to the notional amount of the futures contracts. Use of short futures contracts subjects the Fund to unlimited risk of loss. The Fund may enter into futures contracts only on exchanges or boards of trade. The exchange or board of trade acts as the counterparty to each futures transaction; therefore, the Fund’s credit risk is limited to failure of the exchange or board of trade. Under some circumstances, futures exchanges may establish daily limits on the amount that the price of a futures contract can vary from the previous day’s settlement price, which could effectively prevent liquidation of positions.
The Fund’s futures contracts are not subject to master netting arrangements (the right to close out all transactions traded with a counterparty and net amounts owed or due across transactions).
(2). Forward Foreign Currency Exchange Contracts — The Fund is exposed to foreign currency risks associated with some or all of the portfolio investments and used forward foreign currency exchange contracts to hedge or manage certain of these exposures as part of an investment strategy. The Fund also bought forward foreign currency exchange contracts to gain exposure to currencies. Forward foreign currency exchange contracts represent obligations to purchase or sell foreign currency on a specified future date at a price fixed at the time the contracts are entered into. Non-deliverable forward foreign currency exchange contracts are settled with the counterparty in U.S. dollars without the delivery of the foreign currency.
The values of the forward foreign currency exchange contracts are adjusted daily based on the applicable exchange rate of the underlying currency. Changes in the value of these contracts are recorded as unrealized appreciation or depreciation until the contract settlement date. When the forward foreign currency exchange contract is closed, the Fund records a realized gain or loss equal to the difference between the value at the time the contract was opened and the value at the time it was closed. The Fund also records a realized gain or loss, upon settlement, when a forward foreign currency exchange contract offsets another forward foreign currency exchange contract with the same counterparty.
The Fund’s forward foreign currency exchange contracts are subject to master netting arrangements (the right to close out all transactions with a counterparty and net amounts owed or due across transactions).
24
The Fund may be required to post or receive collateral for non-deliverable forward foreign currency exchange contracts.
(3). Swaps — The Fund engaged in various swap transactions, including total return basket swaps to manage total return risk within its portfolio. The Fund also used swaps as alternatives to direct investments. Swap transactions are contracts negotiated over-the-counter (“OTC swaps”) between the Fund and a counterparty or are centrally cleared (“centrally cleared swaps”) through a central clearinghouse managed by a Futures Commission Merchant (“FCM”) that exchange investment cash flows, assets, foreign currencies or market-linked returns at specified, future intervals.
Upfront payments made and/or received by the Fund are recorded as assets or liabilities, respectively, on the Statement of Assets and Liabilities and amortized over the term of the swap. The value of an OTC swap agreement is recorded as either an asset or a liability on the Statement of Assets and Liabilities at the beginning of the measurement period. Upon entering into a centrally cleared swap, the Fund is required to deposit with the FCM cash or securities, which is referred to as initial margin deposit. Securities deposited as initial margin are designated on the SOI, while cash deposited, which is considered restricted, is recorded on the Statement of Assets and Liabilities. Daily changes in valuation of centrally cleared swaps, if any, are recorded as a variation margin receivable or payable on the Statement of Assets and Liabilities. The change in the value of swaps, including accruals of periodic amounts of interest to be paid or received on swaps, is reported as Change in net unrealized appreciation/depreciation on swaps on the Statement of Operations. A realized gain or loss is recorded upon payment or receipt of a periodic payment or payment made upon termination of a swap agreement.
The Fund’s OTC swap contracts are subject to master netting arrangements.
Total Return Basket Swaps
The Fund entered into total return basket swap agreements to obtain exposure to a portfolio of long and short securities. This is a highly specialized activity.
Under the terms of the agreement, each swap is designed to function as a portfolio of direct investments in long and/or short equity positions. This means that the Fund has the ability to trade in and out of long and short positions within each swap and will receive all of the economic benefits and risks equivalent to direct investments in these positions such as: capital appreciation (depreciation), corporate actions and dividends received and paid, all of which are reflected in each swap value. Each swap value also includes interest charges and credits related to the notional values of the long and short positions and cash balances within each swap. These interest charges and credits are based on defined market rates plus or minus a specified spread and are referred to herein as “financing costs” and net dividends. Positions within each swap, accrued financing costs and net dividends, are part of the periodic reset. During a reset, any unrealized gains (losses) on positions and accrued financing costs become available for cash settlement between the Fund and the swap counterparty are recorded as Due from/to counterparty on swap contract on the Statement of Assets and Liabilities and as Net realized gain (loss) on transactions from swaps on the Statement of Operations.
Each swap involves additional risks than if the Fund had invested in the underlying positions directly including: the risk that changes in the value of each swap may not correlate perfectly with the underlying long and short securities; counterparty risk related to the counterparty’s failure to perform under contract terms; liquidity risk related to the lack of a liquid market for each swap contract, which may limit the ability of the Fund to close out its positions; and, documentation risk relating to disagreement over contract terms. The total return basket swaps consist of securities that are denominated in foreign currencies. Changes in currency exchange rates will affect the value of, and investment income from, such securities. The Fund’s activities in each total return basket swap are concentrated with one counterparty. Investing in swaps results in a form of leverage (i.e., the Fund’s risk of loss associated with these instruments may exceed their value as recorded on the Statement of Assets and Liabilities).
The value of each swap is derived from a combination of (i) the net value of the underlying positions, which are valued daily using the last sale or closing prices on the principal exchange on which the underlying securities are traded; (ii) financing costs; (iii) the value of dividends; (iv) cash balances within the swap and/or other receivables (payables) from gains/(losses) realized when the swap resets; and (v) other factors, as applicable. The value of each swap is reflected on the Statement of Assets and Liabilities as Outstanding swap contracts, at value. Changes in the value of the swap are recognized as Change in net unrealized appreciation/depreciation on swaps on the Statement of Operations.
The total return basket swap contracts are subject to master netting arrangements. The Fund may be required to post or receive collateral for total return basket swaps.
(4). Summary of Derivatives Information — The following table present the value of derivatives held as of October 31, 2020 by their primary underlying risk exposure and respective location on the Statement of Assets and Liabilities:
| | | | |
| Derivative Contracts | | Statement of Assets and Liabilities Location |
|
| | |
Gross Assets: | | | | Swaps |
| | |
Equity contracts | | Receivables | | $652 |
| | | | |
| | |
Gross Liabilities: | | | | |
| | |
Equity contracts | | Payables | | $(1,822) |
| | | | |
25
The following tables present the effect of derivatives on the Statement of Operations for the year ended October 31, 2020, by primary underlying risk exposure:
| | | | | | | | | | | | | | | | |
| Amount of Realized Gain (Loss) on Derivatives Recognized on the Statement of Operations | |
| |
| | | | |
| Derivative Contracts | | Futures Contracts | | | Forward Foreign
Currency Exchange
Contracts | | | Swaps | | | Total | |
| |
| | | | |
Equity contracts | | $ | (716) | | | $ | — | | | $ | 120,212 | | | $ | 119,496 | |
| | | | |
Foreign exchange contracts | | | — | | | | (8,085) | | | | — | | | | (8,085) | |
| | | | | | | | | | | | | | | | |
| | | | |
Total | | $ | (716) | | | $ | (8,085) | | | $ | 120,212 | | | $ | 111,411 | |
| | | | | | | | | | | | | | | | |
|
| Amount of Change in Unrealized Appreciation (Depreciation) on Derivatives Recognized on the Statement of Operations | |
| |
| | | | |
| Derivative Contracts | | Futures
Contracts | | | Forward Foreign
Currency Exchange
Contracts | | | Swaps | | | Total | |
| |
| | | | |
Equity contracts | | $ | (9,685) | | | $ | — | | | $ | (414) | | | $ | (10,099) | |
| | | | |
Foreign exchange contracts | | | — | | | | (4,468) | | | | — | | | | (4,468) | |
| | | | | | | | | | | | | | | | |
| | | | |
Total | | $ | (9,685) | | | $ | (4,468) | | | $ | (414) | | | $ | (14,567) | |
| | | | | | | | | | | | | | | | |
Derivatives Volume
The tables below disclose the volume of the Fund’s futures contracts, forward foreign currency exchange contracts and swaps activity during the year ended October 31, 2020. Please refer to the tables in the Summary of Derivatives Information for derivative-related gains and losses associated with volume activity:
| | | | | | | | |
| | | |
Futures Contracts — Equity: | | | | | | | | |
| | |
Average Notional Balance Long | | $ | 347,078(a) | | | | | |
| | |
Forward Foreign Currency Exchange Contracts: | | | | | | | | |
| | |
Average Settlement Value Purchased | | | 1,392,305(b) | | | | | |
| | |
Average Settlement Value Sold | | | 942,175(b) | | | | | |
| | |
Total Return Basket Swaps: | | | | | | | | |
| | |
Average Notional Balance Long | | | 2,367,234 | | | | | |
| | |
Average Notional Balance Short | | | 2,347,035 | | | | | |
| | |
Ending Notional Balance Long | | | 2,583,761 | | | | | |
| | |
Ending Notional Balance Short | | | 2,567,283 | | | | | |
(a) For the period November 1, 2019 through August 31, 2020.
(b) For the period November 1, 2019 through September 30, 2020.
The Fund may be required to post or receive collateral based on the net value of the Fund’s outstanding OTC swap contracts, non-deliverable forward foreign currency exchange contracts and/or OTC options with the counterparty in the form of cash or securities. Daily movement of cash collateral is subject to minimum threshold amounts. Collateral posted by the Fund is held in a segregated account at the Fund’s custodian bank. For certain counterparties, cash collateral posted by the Fund is invested in an affiliated money market fund (See Note 3.F.). Otherwise the cash collateral is included on the Statement of Assets and Liabilities as Restricted cash. Collateral received by the Fund is held in a separate segregated account maintained by JPMorgan Chase Bank, N.A. (“JPMCB”), an affiliate of the Fund.
The Fund’s derivatives contracts held at October 31, 2020 are not accounted for as hedging instruments under GAAP.
G. Offering and Organizational Costs — Total offering costs of $10,737 incurred in connection with the offering of shares of the Fund are amortized on a straight line basis over 12 months from the date the Fund commenced operations. Costs paid in connection with the organization of the Fund, if any, are recorded as an expense at the time the Fund commenced operations. For the year ended October 31, 2020, total offering costs amortized were $6,835.
26
H. Security Transactions and Investment Income — Investment transactions are accounted for on the trade date (the date the order to buy or sell is executed). Securities gains and losses are calculated on a specifically identified cost basis. Interest income is determined on the basis of coupon interest accrued using the effective interest method, which adjusts for amortization of premiums and accretion of discounts. Dividend income, net of foreign taxes withheld, if any, is recorded on the ex-dividend date or when the Fund first learns of the dividend.
I. Allocation of Income and Expenses — Expenses directly attributable to the Fund are charged directly to the Fund, while the expenses attributable to more than one fund of the Trust are allocated among the applicable funds. Investment income, realized and unrealized gains and losses and expenses, other than class specific expenses, are allocated daily to each class of shares based upon the proportion of net assets of each class at the beginning of each day.
Transfer agency fees are class-specific expenses. The amount of the transfer agency fees charged to each share class of the Fund for the year ended October 31, 2020 are as follows:
| | | | | | | | | | | | | | | | | | | | | | | | | | | | |
| | | Class A | | | | | | Class C | | | | | | Class I | | | | | | Total | |
| |
| | | $- | | | | | | | | $37 | | | | | | | | $1,233 | | | | | | | | $1,270 | |
J. Federal Income Taxes — The Fund is treated as a separate taxable entity for Federal income tax purposes. The Fund’s policy is to comply with the provisions of the Internal Revenue Code (the “Code”) applicable to regulated investment companies and to distribute to shareholders all of its distributable net investment income and net realized capital gains on investments. Accordingly, no provision for Federal income tax is necessary. Management has reviewed the Fund’s tax positions for all open tax years and has determined that as of October 31, 2020, no liability for Federal income tax is required in the Fund’s financial statements for net unrecognized tax benefits. However, management’s conclusions may be subject to future review based on changes in, or the interpretation of, the accounting standards or tax laws and regulations. The Fund’s Federal tax returns for the prior three fiscal years, or since inception if shorter, remain subject to examination by the Internal Revenue Service.
K. Foreign Taxes — The Fund may be subject to foreign taxes on income, gains on investments or currency purchases/repatriation, a portion of which may be recoverable. The Fund will accrue such taxes and recoveries as applicable, based upon its current interpretation of tax rules and regulations that exist in the markets in which it invests. When a capital gain tax is determined to apply, the Fund records an estimated deferred tax liability in an amount that would be payable if the securities were disposed of on the valuation date.
L. Distributions to Shareholders — Distributions from net investment income, if any, are generally declared and paid at least annually with respect to the Fund. Distributions are declared separately for each class. No class has preferential dividend rights; differences in per share rates are due to differences in separate class expenses. Net realized capital gains, if any, are distributed by the Fund at least annually. The amount of distributions from net investment income and net realized capital gains is determined in accordance with Federal income tax regulations, which may differ from GAAP. To the extent these “book/tax” differences are permanent in nature (i.e., that they result from other than timing of recognition — “temporary differences”), such amounts are reclassified within the capital accounts based on their Federal tax basis treatment.
The following amounts were reclassified within the capital accounts:
| | | | | | | | | | | | |
| | | Paid-in-Capital | | | Accumulated
undistributed
(distributions
in excess of)
net investment
income | | | Accumulated net
realized gains
(losses) | |
| |
| | $ | - | | | $ | 130,369 | | | $ | (130,369) | |
The reclassifications for the Fund relate primarily to foreign currency gains or losses, investments in pass foreign investment companies (“PFICs”) and investments in swaps.
M. Recent Accounting Pronouncement - In March 2020, the FASB issued Accounting Standards Update No. 2020-04 (“ASU 2020-04”), Reference Rate Reform (Topic 848) – Facilitation of the Effects of Reference Rate Reform on Financial Reporting. ASU 2020-04 provides optional temporary financial reporting relief from the effect of certain types of contract modifications due to the planned discontinuation of the London Interbank Offered Rate (“LIBOR”) and other interbank-offered based reference rates as of the end of 2021. ASU 2020-04 became effective upon the issuance and its optional relief can be applied through December 31, 2022. Management is currently evaluating the impact, if any, to the Fund’s financial statements of applying ASU 2020-04.
3. Fees and Other Transactions with Affiliates
A. Investment Advisory Fee - Pursuant to an Investment Advisory Agreement, the Adviser manages the investments of the Fund and for such services is paid a fee. The investment advisory fee is accrued daily and paid monthly at an annual rate of 0.60% of the Fund’s average daily net assets.
The Adviser waived investment advisory fees and/or reimbursed expenses as outlined in Note 3.F.
27
B. Administration Fee — Pursuant to an Administration Agreement, the Administrator provides certain administration services to the Fund. In consideration of these services, the Administrator receives a fee accrued daily and paid monthly at an annual rate of 0.075% of the first $10 billion of the Fund’s average daily net assets, plus 0.050% of the Fund’s average daily net assets between $10 billion and $20 billion, plus 0.025% of the Fund’s average daily net assets between $20 billion and $25 billion, plus 0.01% of the Fund’s average daily net assets in excess of $25 billion. For the year ended October 31, 2020, the effective rate was 0.08% of the Fund’s average daily net assets, notwithstanding any fee waivers and/or expense reimbursements.
The Administrator waived administration fees as outlined in Note 3.F.
JPMCB, a wholly-owned subsidiary of JPMorgan, serves as the Fund’s sub-administrator (the “Sub-administrator”). For its services as Sub-administrator, JPMCB receives a portion of the fees payable to the Administrator.
C. Distribution Fees — Pursuant to a Distribution Agreement, JPMorgan Distribution Services, Inc. (“JPMDS”), an indirect, wholly-owned subsidiary of JPMorgan, serves as the Fund’s principal underwriter and promotes and arranges for the sale of the Fund’s shares.
The Board has adopted a Distribution Plan (the “Distribution Plan”) for Class A and Class C Shares of the Fund pursuant to Rule 12b-1 under the 1940 Act. Class I Shares of the Fund do not charge a distribution fee. The Distribution Plan provides that the Fund shall pay, with respect to the applicable share classes, distribution fees, including payments to JPMDS, at annual rates of 0.25% and 0.75% of the average daily net assets of Class A and Class C Shares, respectively.
In addition, JPMDS is entitled to receive the front-end sales charges from purchases of Class A Shares and the CDSC from redemptions of Class C Shares and certain Class A Shares for which front-end sales charges have been waived. For the year ended October 31, 2020, JPMDS did not retain any front-end sales charges or CDSC.
D. Service Fees — The Trust, on behalf of the Fund, has entered into a Shareholder Servicing Agreement with JPMDS under which JPMDS provides certain support services to fund shareholders. For performing these services, JPMDS receives a fee with respect to all share classes that is accrued daily and paid monthly at an annual rate of 0.25% of the average daily net assets of each share class.
JPMDS has entered into shareholder services contracts with affiliated and unaffiliated financial intermediaries who provide shareholder services and other related services to their clients or customers who invest in the Fund. Pursuant to such contracts, JPMDS will pay all or a portion of such fees earned to financial intermediaries for performing such services.
JPMDS waived service fees as outlined in Note 3.F.
E. Custodian and Accounting Fees — JPMCB provides portfolio custody and accounting services to the Fund. For performing these services, the Fund pays JPMCB transaction and asset-based fees that vary according to the number of transactions and positions, plus out-of-pocket expenses. The amounts paid directly to JPMCB by the Fund for custody and accounting services are included in Custodian and accounting fees on the Statement of Operations.
Interest income earned on cash balances at the custodian, if any, is included in Interest income from affiliates on the Statement of Operations.
Interest expense paid to the custodian related to cash overdrafts, if any, is included in Interest expense to affiliates on the Statement of Operations.
F. Waivers and Reimbursements — The Adviser, Administrator and/or JPMDS have contractually agreed to waive fees and/or reimburse the Fund to the extent that total annual operating expenses (excluding acquired fund fees and expenses other than certain money market fund fees as described below, dividend and interest expenses related to short sales, interest, taxes, expenses related to litigation and potential litigation, expenses related to trustee elections and extraordinary expenses) exceed the percentages of the Fund’s average daily net assets as shown in the table below:
| | | | | | | | | | | | | | |
| | | | | Class A | | Class C | | | Class I | | | |
| | | | 1.00% | | | 1.50 | % | | | 0.75% | |
The expense limitation agreement was in effect for the year ended October 31, 2020 and the contractual expense limitation percentages in the table above are in place until at least February 28, 2021.
For the year ended October 31, 2020, the Fund’s service providers waived fees and/or reimbursed expenses for the Fund as follows. None of these parties expect the Fund to repay any such waived fees and/or reimbursed expenses in future years.
| | | | | | | | | | |
| | | Contractual Waivers | | |
| | | | |
Investment Advisory Fees | | Administration
Fees | | Service Fees | | Total | | Contractual
Reimbursements |
| | $59,367 | | $7,421 | | $20,043 | | $86,831 | | $105,450 |
28
Additionally, the Fund may invest in one or more money market funds advised by the Adviser (affiliated money market funds). The Adviser, Administrator and/or JPMDS, as shareholder servicing agent, have contractually agreed to waive fees and/or reimburse expenses in an amount sufficient to offset the respective net fees each collects from the affiliated money market funds on the Fund’s investment in such affiliated money market funds, except for investments of securities lending cash collateral. None of these parties expect the Fund to repay any such waived fees and/or reimbursed expenses in future years.
The amount of these waivers resulting from investments in these money market funds for the year ended October 31, 2020 was $567.
G. Other — Certain officers of the Trust are affiliated with the Adviser, the Administrator and JPMDS. Such officers, with the exception of the Chief Compliance Officer, receive no compensation from the Fund for serving in their respective roles.
The Board designated and appointed a Chief Compliance Officer to the Fund pursuant to Rule 38a-1 under the 1940 Act. The Fund, along with affiliated funds, makes reimbursement payments, on a pro-rata basis, to the Administrator for a portion of the fees associated with the office of the Chief Compliance Officer. Such fees are included in Trustees’ and Chief Compliance Officer’s fees on the Statement of Operations.
The Trust adopted a Trustee Deferred Compensation Plan (the “Plan”) which allows the independent Trustees to defer the receipt of all or a portion of compensation related to performance of their duties as Trustees. The deferred fees are invested in various J.P. Morgan Funds until distribution in accordance with the Plan.
The Securities and Exchange Commission (“SEC”) has granted an exemptive order permitting the Fund to engage in principal transactions with J.P. Morgan Securities LLC, an affiliated broker, involving taxable money market instruments, subject to certain conditions.
4. Investment Transactions
During the year ended October 31, 2020, purchases and sales of investments (excluding short-term investments) were as follows:
| | | | |
| | | Purchases (excluding
U.S. Government) | | Sales (excluding
U.S. Government) |
| | $ 8,634,170 | | $ 7,977,556 |
During the year ended October 31, 2020, there were no purchases or sales of U.S. Government securities.
5. Federal Income Tax Matters
For Federal income tax purposes, the estimated cost and unrealized appreciation (depreciation) in value of investments held at October 31, 2020 were as follows:
| | | | | | | | |
| | | Aggregate
Cost | | Gross
Unrealized
Appreciation | | Gross Unrealized Depreciation | | Net Unrealized Appreciation (Depreciation) |
| | $ 9,768,267 | | $ 599,082 | | $ 778,512 | | $ (179,430) |
The difference between book and tax basis appreciation (depreciation) on investments is primarily attributed to wash sale loss deferrals.
The tax character of distributions paid during the year ended October 31, 2020 was as follows:
| | | | |
| | | Ordinary
Income* | | Total
Distributions Paid |
| | $ 203,991 | | $ 203,991 |
* Short-term gain distributions are treated as ordinary income for income tax purposes.
29
As of October 31, 2020, the estimated components of net assets (excluding paid-in-capital) on a tax basis were as follows:
| | | | | | | | | | | | |
| | | Current
Distributable
Ordinary
Income | | | Current
Distributable
Long-Term
Capital Gain on
(Tax Basis Capital
Loss Carryover) | | | Unrealized
Appreciation
(Depreciation) | |
| | $ | 254,448 | | | $ | (574,805 | ) | | $ | (178,433 | ) |
The cumulative timing differences primarily consist of trustee deferred compensation and wash sale loss deferrals.
At October 31, 2020, the Fund had the following net capital loss carryforwards:
| | | | | | | | |
| | | Capital Loss Carryforward Character | |
| | | Short-Term | | | Long-Term | |
| | | $ | 259,405 | | | $ | 315,400 | |
6. Borrowings
The Fund relies upon an exemptive order granted by the SEC (the “Order”) permitting the establishment and operation of an Interfund Lending Facility (the “Facility”). The Facility allows the Fund to directly lend and borrow money to or from any other fund relying upon the Order at rates beneficial to both the borrowing and lending funds. Advances under the Facility are taken primarily for temporary or emergency purposes, including the meeting of redemption requests that otherwise might require the untimely disposition of securities, and are subject to the Fund’s borrowing restrictions. The Interfund loan rate is determined, as specified in the Order, by averaging the current repurchase agreement rate and the current bank loan rate. The Order was granted to JPMorgan Trust II and may be relied upon by the Fund because the Fund and the series of JPMorgan Trust II are all investment companies in the same “group of investment companies” (as defined in Section 12(d)(1)(G) of the 1940 Act).
The Fund had no borrowings outstanding from another fund during the year ended October 31, 2020.
The Trust and JPMCB have entered into a financing arrangement. Under this arrangement, JPMCB provides an unsecured, uncommitted credit facility in the aggregate amount of $100 million to certain of the J.P. Morgan Funds, including the Fund. Advances under the arrangement are taken primarily for temporary or emergency purposes, including the meeting of redemption requests that otherwise might require the untimely disposition of securities, and are subject to the Fund’s borrowing restrictions. Interest on borrowings is payable at a rate determined by JPMCB at the time of borrowing. This agreement has been extended until November 1, 2021.
The Fund had no borrowings outstanding from the unsecured, uncommitted credit facility during the year ended October 31, 2020.
7. Risks, Concentrations and Indemnifications
In the normal course of business, the Fund entered into contracts that contain a variety of representations which provide general indemnifications. The Fund’s maximum exposure under these arrangements is unknown. The amount of exposure would depend on future claims that may be brought against the Fund. However, based on experience, the Fund expects the risk of loss to be remote.
As of October 31, 2020, all of the Fund’s shares were held by the Adviser.
The Fund may have elements of risk not typically associated with investments in the United States of America due to concentrated investments in a limited number of countries or regions, which may vary throughout the period. Such concentrations may subject the Fund to additional risks resulting from political or economic conditions in such countries or regions and the possible imposition of adverse governmental laws or currency exchange restrictions could cause the securities and their markets to be less liquid and their prices to be more volatile than those of comparable U.S. securities.
As of October 31, 2020, the Fund had non-U.S. country allocations representing greater than 10% of total investments (excluding investment of cash collateral from securities loaned) as follows:
| | |
|
France | | 11.7% |
Japan | | 21.5 |
Switzerland | | 11.6 |
United Kingdom | | 14.0 |
Derivatives may be riskier than other types of investments because they may be more sensitive to changes in economic and market conditions and could result in losses that significantly exceed the Fund’s original investment. Many derivatives create leverage thereby causing the Fund to be more volatile than it would have been if it had not used derivatives. Derivatives also expose the Fund to counterparty risk (the risk that the derivative counterparty will not fulfill its contractual obligations), including credit risk of the derivative counterparty. The possible lack of a liquid secondary market for derivatives and the resulting inability of the Fund to sell or otherwise close a derivatives position could expose the Fund to losses.
30
LIBOR is intended to represent the rate at which contributing banks may obtain short-term borrowings from each other in the London interbank market. The regulatory authority that oversees financial services firms and financial markets in the U.K. has announced that, after the end of 2021, it would no longer persuade or compel contributing banks to make rate submissions for purposes of determining the LIBOR rate. As a result, it is possible that commencing in 2022, LIBOR may no longer be available or no longer deemed an appropriate reference rate upon which to determine the interest rate on or impacting certain loans, notes, derivatives and other instruments or investments comprising some or all of the Fund’s portfolio. In light of this eventuality, public and private sector industry initiatives are currently underway to identify new or alternative reference rates to be used in place of LIBOR. There is no assurance that the composition or characteristics of any such alternative reference rate will be similar to or produce the same value or economic equivalence as LIBOR or that it will have the same volume or liquidity as did LIBOR prior to its discontinuance or unavailability, which may affect the value or liquidity or return on certain investments of the Fund and result in costs incurred in connection with closing out positions and entering into new trades. These risks may also apply with respect to changes in connection with other interbank offering rates (e.g., Euribor) and a wide range of other index levels, rates and values that are treated as “benchmarks” and are the subject of recent regulatory reform.
The Fund is subject to infectious disease epidemics/pandemics risk. Recently, the worldwide outbreak of COVID-19, a novel coronavirus disease, has negatively affected economies, markets and individual companies throughout the world. The effects of this COVID-19 pandemic to public health, and business and market conditions, including exchange trading suspensions and closures may continue to have a significant negative impact on the performance of the Fund’s investments, increase the Fund’s volatility, exacerbate other pre-existing political, social and economic risks to the Fund and negatively impact broad segments of businesses and populations. The Fund’s operations may be interrupted as a result, which may have a significant negative impact on investment performance. In addition, governments, their regulatory agencies, or self-regulatory organizations may take actions in response to the pandemic that affect the instruments in which the Fund invests, or the issuers of such instruments, in ways that could also have a significant negative impact on the Fund’s investment performance. The full impact of this COVID-19 pandemic, or other future epidemics/pandemics, is currently unknown.
31
Report of Independent Registered Public Accounting Firm
To the Board of Trustees of JPMorgan Trust IV and Shareholders of JPMorgan International Equity Plus Fund
Opinion on the Financial Statements
We have audited the accompanying statement of assets and liabilities, including the schedule of portfolio investments, of JPMorgan International Equity Plus Fund (one of the funds constituting JPMorgan Trust IV, referred to hereafter as the “Fund”) as of October 31, 2020, the related statement of operations for the year ended October 31, 2020 and the statements of changes in net assets and the financial highlights for the year ended October 31, 2020 and for the period June 25, 2019 (commencement of operations) through October 31, 2019, including the related notes (collectively referred to as the “financial statements”). In our opinion, the financial statements present fairly, in all material respects, the financial position of the Fund as of October 31, 2020, the results of its operations for the year ended October 31, 2020, and the changes in its net assets and the financial highlights for the year ended October 31, 2020 and for the period June 25, 2019 (commencement of operations) through October 31, 2019 in conformity with accounting principles generally accepted in the United States of America.
Basis for Opinion
These financial statements are the responsibility of the Fund’s management. Our responsibility is to express an opinion on the Fund’s financial statements based on our audits. We are a public accounting firm registered with the Public Company Accounting Oversight Board (United States) (PCAOB) and are required to be independent with respect to the Fund in accordance with the U.S. federal securities laws and the applicable rules and regulations of the Securities and Exchange Commission and the PCAOB.
We conducted our audits of these financial statements in accordance with the standards of the PCAOB. Those standards require that we plan and perform the audit to obtain reasonable assurance about whether the financial statements are free of material misstatement , whether due to error or fraud.
Our audits included performing procedures to assess the risks of material misstatement of the financial statements, whether due to error or fraud, and performing procedures that respond to those risks. Such procedures included examining, on a test basis, evidence regarding the amounts and disclosures in the financial statements. Our audits also included evaluating the accounting principles used and significant estimates made by management, as well as evaluating the overall presentation of the financial statements. Our procedures included confirmation of securities owned as of October 31, 2020 by correspondence with the custodian and brokers; when replies were not received from brokers, we performed other auditing procedures. We believe that our audits provide a reasonable basis for our opinion.
/s/PricewaterhouseCoopers LLP
New York, New York
December 21, 2020
We have served as the auditor of one or more investment companies in the JPMorgan Funds complex since 1993.
32
TRUSTEES
(Unaudited)
The Fund’s Statement of Additional Information includes additional information about the Fund’s Trustees and is available, without charge, upon request by calling 1-800-480-4111 or on the J.P. Morgan Funds’ website at www.jpmorganfunds.com.
| | | | | | |
Name (Year of Birth); Positions With the Fund (1) | | Principal Occupation During Past 5 Years | | Number of
Funds in Fund
Complex Overseen
by Trustee (2) | | Other Directorships Held During the Past 5 Years |
Independent Trustees | | |
| | | |
| John F. Finn (1947); Chairman since 2020; Trustee of Trust since 2005; Trustee of heritage One Group Mutual Funds since 1998. | | Chairman, Gardner, Inc. (supply chain management company serving industrial and consumer markets) (serving in various roles 1974-present). | | 126 | | Director, Greif, Inc. (GEF) (industrial package products and services) (2007-present); Trustee, Columbus Association for the Performing Arts (1988-present); Director, Cardinal Health, Inc. (CAH) (1994-2014). |
| | | |
| Stephen P. Fisher (1959); Trustee of Trust since 2018. | | Retired; Chairman and Chief Executive Officer, NYLIFE Distributors LLC (registered broker-dealer) (serving in various roles 2008-2013); Chairman, NYLIM Service Company LLC (transfer agent) (2008-2017); New York Life Investment Management LLC (registered investment adviser) (serving in various roles 2005-2017); Chairman, IndexIQ Advisors LLC (registered investment adviser for ETFs) (2014-2017); President, MainStay VP Funds Trust (2007-2017), MainStay DefinedTerm Municipal Opportunities Fund (2011-2017) and MainStay Funds Trust (2007-2017) (registered investment companies). | | 126 | | Honors Program Advisory Board Member, The Zicklin School of Business, Baruch College, The City University of New York (2017-present). |
| | | |
| Kathleen M. Gallagher (1958); Trustee of Trust since 2018. | | Retired; Chief Investment Officer — Benefit Plans, Ford Motor Company (serving in various roles 1985-2016). | | 126 | | Non-Executive Director, Legal & General Investment Management (Holdings) (2018-present); Non-Executive Director, Legal & General Investment Management America (financial services and insurance) (2017-present); Advisory Board Member, Fiduciary Solutions, State Street Global Advisors (2017-present); Member, Client Advisory Council, Financial Engines, LLC (registered investment adviser) (2011-2016); Director, Ford Pension Funds Investment Management Ltd. (2007-2016). |
| | | |
| Dennis P. Harrington* (1950); Trustee of Trust since 2017. | | Retired; Partner, Deloitte LLP (accounting firm) (serving in various roles 1984-2012). | | 126 | | None |
| | | |
| Frankie D. Hughes (1952); Trustee of Trust since 2008. | | President, Ashland Hughes Properties (property management) (2014-present); President and Chief Investment Officer, Hughes Capital Management, Inc. (fixed income asset management) (1993-2014). | | 126 | | None |
| | | | | | |
Name (Year of Birth); Positions With the Fund (1) | | Principal Occupation During Past 5 Years | | Number of
Funds in Fund
Complex Overseen
by Trustee (2) | | Other Directorships Held During the Past 5 Years |
Independent Trustees (continued) | | |
| | | |
Raymond Kanner** (1953); Trustee of Trust since 2017. | | Retired; Managing Director & Chief Investment Officer, IBM Retirement Funds (2007-2016). | | 126 | | Advisory Board Member, Penso Advisors LLC (2020-present); Advisory Board Member, Los Angeles Capital (2018-present); Advisory Board Member, State Street Global Advisors Fiduciary Solutions Board (2017-present); Acting Executive Director, Committee on Investment of Employee Benefit Assets (CIEBA) (2016-2017); Advisory Board Member, Betterment for Business (robo advisor) (2016-2017); Advisory Board Member, BlueStar Indexes (index creator) (2013-2017); Director, Emerging Markets Growth Fund (registered investment company) (1997-2016); Member, Russell Index Client Advisory Board (2001-2015). |
| | | |
| Peter C. Marshall (1942); Trustee of Trust since 2005; Trustee of heritage One Group Mutual Funds since 1985. | | Self-employed business consultant
(2002-present). | | 126 | | None |
| | | |
| Mary E. Martinez (1960); Trustee of Trust since 2013. | | Associate, Special Properties, a Christie’s International Real Estate Affiliate (2010-present); Managing Director, Bank of America (Asset Management) (2007-2008); Chief Operating Officer, U.S. Trust Asset Management, U.S. Trust Company (asset management) (2003-2007); President, Excelsior Funds (registered investment companies) (2004-2005). | | 126 | | None |
| | | |
| Marilyn McCoy (1948); Trustee of Trust since 2005; Trustee of heritage One Group Mutual Funds since 1999. | | Vice President of Administration and Planning, Northwestern University (1985-present). | | 126 | | None |
| | | |
| Mitchell M. Merin (1953); Trustee of Trust since 2013. | | Retired; President and Chief Operating Officer, Morgan Stanley Investment Management, Member Morgan Stanley & Co. Management Committee (serving in various roles 1981-2006). | | 126 | | Director, Sun Life Financial (SLF) (financial services and insurance) (2007-2013). |
| | | |
| Dr. Robert A. Oden, Jr. (1946); Trustee of Trust since 2005; Trustee of heritage One Group Mutual Funds since 1997. | | Retired; President, Carleton College (2002-2010); President, Kenyon College (1995-2002). | | 126 | | Trustee and Vice Chair, Trout Unlimited (2017-present); Trustee, American Museum of Fly Fishing (2013-present); Vice Chair, Dartmouth-Hitchcock Medical Center (2011-present); Trustee, American University in Cairo (1999-2014). |
| | | |
| Marian U. Pardo*** (1946); Trustee of Trust since 2013. | | Managing Director and Founder, Virtual Capital Management LLC (investment consulting) (2007-present); Managing Director, Credit Suisse Asset Management (portfolio manager) (2003-2006). | | 126 | | President and Member, Board of Governors, Columbus Citizens Foundation (not-for-profit supporting philanthropic and cultural programs) (2006-present). |
| (1) | Mr. Marshall is retiring from the Board of Trustees effective the close of business on December 31, 2020. The Trustees serve for an indefinite term, subject to the Trust’s current retirement policy, which is age 78 for all Trustees. |
| (2) | A Fund Complex means two or more registered investment companies that hold themselves out to investors as related companies for purposes of investment and investor services or have a common investment adviser or have an investment adviser that is an affiliated person of the investment adviser of any of the other registered investment companies. The J.P. Morgan Funds Complex for which the Board of Trustees serves currently includes ten registered investment companies (126 funds). |
| * | Two family members of Mr. Harrington are partner and managing director, respectively, of the Fund’s independent registered public accounting firm. Such firm has represented to the Board that those family members are not involved in the audit of the Fund’s financial statements and do not provide other services to the Fund. The Board has concluded that such association does not interfere with Mr. Harrington’s exercise of independent judgment as an Independent Trustee. |
| ** | A family member of Mr. Kanner is employed by JPMorgan Chase Bank, which is affiliated with JPMIM and JPMDS. In that capacity, this employee provides services to various JPMorgan affiliates including JPMIM and JPMDS and for which JPMIM and JPMDS bear some portion of the expense thereof. |
| *** | In connection with prior employment with JPMorgan Chase, Ms. Pardo was the recipient of non-qualified pension plan payments from JPMorgan Chase in the amount of approximately $2,055 per month, which she irrevocably waived effective January 1, 2013, and deferred compensation payments from JPMorgan Chase in the amount of approximately $7,294 per year, which ended in January 2013. In addition, Ms. Pardo receives payments from a fully-funded qualified plan, which is not an obligation of JPMorgan Chase. |
The contact address for each of the Trustees is 277 Park Avenue, New York, NY 10172.
35
OFFICERS
(Unaudited)
| | |
Name (Year of Birth), Positions Held with the Trust (Since) | | Principal Occupations During Past 5 Years |
| |
Brian S. Shlissel (1964),
President and Principal Executive Officer (2016)* | | Managing Director and Chief Administrative Officer for J.P. Morgan pooled vehicles, J.P. Morgan Investment Management Inc. (formerly JPMorgan Funds Management, Inc.) (from 2014 to present); Managing Director and Head of Mutual Fund Services, Allianz Global Investors; President and Chief Executive Officer, Allianz Global Investors Mutual Funds and PIMCO Closed-End Funds (from 1999 to 2014). |
| |
Timothy J. Clemens (1975), Treasurer and Principal Financial Officer (2018)** | | Executive Director, J.P. Morgan Investment Management Inc. (formerly JPMorgan Funds Management, Inc.) since February 2016; Vice President, JPMorgan Funds Management, Inc. from October 2013 to January 2016. |
| |
Gregory S. Samuels (1980),
Secretary (2019) (formerly Assistant Secretary since 2010)** | | Executive Director and Assistant General Counsel, JPMorgan Chase. Mr. Samuels has been with JPMorgan Chase since 2010. |
| |
Stephen M. Ungerman (1953),
Chief Compliance Officer (2005) | | Managing Director, JPMorgan Chase & Co.; Mr. Ungerman has been with JPMorgan Chase & Co. since 2000. |
| |
Elizabeth A. Davin (1964), Assistant Secretary (2005)*** | | Executive Director and Assistant General Counsel, JPMorgan Chase since February 2012; formerly Vice President and Assistant General Counsel, JPMorgan Chase from 2005 to February 2012; Senior Counsel, JPMorgan Chase (formerly Bank One Corporation) from 2004 to 2005. |
| |
Jessica K. Ditullio (1962),
Assistant Secretary (2005)*** | | Executive Director and Assistant General Counsel, JPMorgan Chase. Ms. Ditullio has been with JPMorgan Chase (formerly Bank One Corporation) since 1990. |
| |
Anthony Geron (1971),
Assistant Secretary (2018)** | | Vice President and Assistant General Counsel, JPMorgan Chase since September 2018; Lead Director and Counsel, AXA Equitable Life Insurance Company from 2015 to 2018 and Senior Director and Counsel, AXA Equitable Life Insurance Company from 2014 to 2015. |
| |
Carmine Lekstutis (1980),
Assistant Secretary (2011)** | | Executive Director and Assistant General Counsel, JPMorgan Chase. Mr. Lekstutis has been with JPMorgan Chase since 2011. |
| |
Zachary E. Vonnegut-Gabovitch (1986), Assistant Secretary (2017)** | | Vice President and Assistant General Counsel, JPMorgan Chase since September 2016; Associate, Morgan, Lewis & Bockius (law firm) from 2012 to 2016. |
| |
Michael M. D’Ambrosio (1969),
Assistant Treasurer (2012) | | Managing Director, J.P. Morgan Investment Management Inc. (formerly JPMorgan Funds Management, Inc.). Mr. D’Ambrosio has been with J.P. Morgan Investment Management Inc. since 2012. |
| |
Aleksandr Fleytekh (1972), Assistant Treasurer (2019)** | | Vice President, J.P. Morgan Investment Management Inc. (formerly JPMorgan Funds Management, Inc.) since February 2012. |
| |
Shannon Gaines (1977),
Assistant Treasurer (2018)*** | | Vice President, J.P. Morgan Investment Management Inc. (formerly JPMorgan Funds Management, Inc.) since January 2014. |
| |
Jeffrey D. House (1972), Assistant Treasurer (2017)*** | | Vice President, J.P. Morgan Investment Management Inc. (formerly JPMorgan Funds Management, Inc.) since July 2006. |
| |
Michael Mannarino (1985),
Assistant Treasurer (2020) | | Vice President, J.P. Morgan Investment Management Inc. (formerly JPMorgan Funds Management, Inc.) since 2014. |
| |
Joseph Parascondola (1963),
Assistant Treasurer (2011)* | | Executive Director, J.P. Morgan Investment Management, Inc. since February 2020, formerly Vice President, J.P. Morgan Investment Management Inc. (formerly JPMorgan Funds Management, Inc.) from August 2006 to January 2020. |
| |
Gillian I. Sands (1969),
Assistant Treasurer (2012)** | | Vice President, J.P. Morgan Investment Management Inc. (formerly JPMorgan Funds Management, Inc.) since September 2012. |
The contact address for each of the officers, unless otherwise noted, is 277 Park Avenue, New York, NY 10172.
| * | The contact address for the officer is 575 Washington Boulevard, Jersey City, NJ 07310. |
| ** | The contact address for the officer is 4 New York Plaza, New York, NY 10004. |
| *** | The contact address for the officer is 1111 Polaris Parkway, Columbus, OH 43240. |
36
SCHEDULE OF SHAREHOLDER EXPENSES
(Unaudited)
Hypothetical $1,000 Investment
As a shareholder of the Fund, you incur two types of costs: (1) transaction costs, including sales charges (loads) on purchase payments and (2) ongoing costs, including investment advisory fees, administration fees, distribution fees and other Fund expenses. The examples below are intended to help you understand your ongoing costs (in dollars) of investing in the Fund and to compare these ongoing costs with the ongoing costs of investing in other mutual funds. The examples assume that you had a $1,000 investment in each Class at the beginning of the reporting period, May 1, 2020, and continued to hold your shares at the end of the reporting period, October 31, 2020.
Actual Expenses
For each Class of the Fund in the table below, the first line provides information about actual account values and actual expenses. You may use the information in this line, together with the amount you invested, to estimate the expenses that you paid over the period. Simply divide your account value by $1,000 (for example, an $8,600 account value divided by $1,000 = 8.6), then multiply the result by the number in the first line of each Class under the heading titled “Expenses Paid During the Period” to estimate the expenses you paid on your account during this period.
Hypothetical Example for Comparison Purposes
The second line of each Class in the table below provides information about hypothetical account values and hypothetical expenses based on the Class’ actual expense ratio and an assumed rate of return of 5% per year before expenses, which is not the Class’ actual return. The hypothetical account values and expenses may not be used to estimate the actual ending account balance or expenses you paid for the period. You may use this information to compare the ongoing costs of investing in the Class of the Fund and other funds. To do so, compare this 5% hypothetical example with the 5% hypothetical examples that appear in the shareholder reports of the other funds. Please note that the expenses shown in the table are meant to highlight your ongoing costs only and do not reflect any transaction costs, such as sales charges (loads) or redemption fees. Therefore, the second line for each Class in the table is useful in comparing ongoing costs only, and will not help you determine the relative total costs of owning different funds. In addition, if these transaction costs were included, your costs would have been higher. The examples also assume all dividends and distributions have been reinvested.
| | | | | | | | | | | | | | | | | | | | |
| | | | | | | | Ending Account | | | | | | | | |
| | | | | Beginning | | | Value | | | Expenses Paid | | | Annualized | | |
| | | | | Account Value | | | October 31, | | | During the | | | Expense | | |
| | | | | May 1, 2020 | | | 2020 | | | Period* | | | Ratio | | |
| | | | | | |
| | JPMorgan International Equity Plus Fund | | | | | | | | | | | | | | | | | | |
| | Class A | | | | | | | | | | | | | | | | | | |
| | | | | | |
| | Actual | | | $1,000.00 | | | | $1,096.20 | | | | $5.27 | | | | 1.00% | | | |
| | | | | | |
| | Hypothetical | | | 1,000.00 | | | | 1,020.11 | | | | 5.08 | | | | 1.00 | | | |
| | Class C | | | | | | | | | | | | | | | | | | |
| | | | | | |
| | Actual | | | 1,000.00 | | | | 1,093.40 | | | | 7.89 | | | | 1.50 | | | |
| | | | | | |
| | Hypothetical | | | 1,000.00 | | | | 1,017.60 | | | | 7.61 | | | | 1.50 | | | |
| | Class I | | | | | | | | | | | | | | | | | | |
| | | | | | |
| | Actual | | | 1,000.00 | | | | 1,097.70 | | | | 3.95 | | | | 0.75 | | | |
| | | | | | |
| | Hypothetical | | | 1,000.00 | | | | 1,021.37 | | | | 3.81 | | | | 0.75 | | | |
*Expenses are equal to each Class’ respective annualized expense ratio, multiplied by the average account value over the period, multiplied by 184/366 (to reflect the one-half year period).
37
Tax Letter
(Unaudited)
Certain tax information for the J.P. Morgan Funds is required to be provided to shareholders based upon the Fund’s income and distributions for the taxable year ended October 31, 2020. The information and distributions reported in this letter may differ from the information and taxable distributions reported to the shareholders for the calendar year ending December 31, 2020. The information necessary to complete your income tax returns for the calendar year ending December 31, 2020 will be provided under separate cover.
Qualified Dividend Income (QDI)
The Fund had $223,428 or maximum allowable amount, of ordinary income distributions treated as qualified dividends for the fiscal year ended October 31, 2020.
Foreign Source Income and Foreign Tax Credit Pass Through
For the fiscal year ended October 31, 2020, the Fund intends to elect to pass through to shareholders taxes paid to foreign countries. Gross income and foreign tax expenses are as follows or amounts as finally determined:
| | |
| Gross | | Foreign Tax |
| Income | | Pass Through |
| |
| $ 242,941 | | $ 23,352 |
38

Rev. January 2011
| | |
| | |
FACTS | | WHAT DOES J.P. MORGAN FUNDS DO WITH YOUR PERSONAL INFORMATION? |
| | |
Why? | | Financial companies choose how they share your personal information. Federal law gives consumers the right to limit some but not all sharing. Federal law also requires us to tell you how we collect, share, and protect your personal information. Please read this notice carefully to understand what we do. |
| | |
What? | | The types of personal information we collect and share depend on the product or service you have with us. This information can include: ◾ Social Security number and account balances ◾ transaction history and account transactions ◾ checking account information and wire transfer instructions When you are no longer our customer, we continue to share your information as described in this notice. |
| | |
How? | | All financial companies need to share customers’ personal information to run their everyday business. In the section below, we list the reasons financial companies can share their customers’ personal information; the reasons J.P. Morgan Funds chooses to share; and whether you can limit this sharing. |
| | | | |
| | | |  |
| | | | |
| | | |
| Reasons we can share your personal information | | Does J.P. Morgan
Funds share? | | Can you limit this
sharing? |
For our everyday business purposes — such as to process your transactions, maintain your account(s), respond to court orders and legal investigations, or report to credit bureaus | | Yes | | No |
For marketing purposes — to offer our products and services to you | | Yes | | No |
For joint marketing with other financial companies | | No | | We don’t share |
For our affiliates’ everyday business purposes — information about your transactions and experiences | | No | | We don’t share |
For our affiliates’ everyday business purposes — information about your creditworthiness | | No | | We don’t share |
For nonaffiliates to market to you | | No | | We don’t share |
| | |
| | |
Questions? | | Call 1-800-480-4111 or go to www.jpmorganfunds.com |
| | |
| |
| Who we are |
Who is providing this notice? | | J.P. Morgan Funds |
| | |
| |
What we do |
How does J.P. Morgan Funds protect my personal information? | | To protect your personal information from unauthorized access and use, we use security measures that comply with federal law. These measures include computer safeguards and secured files and buildings. We authorize our employees to access your information only when they need it to do their work and we require companies that work for us to protect your information. |
How does J.P. Morgan Funds collect my personal information? | | We collect your personal information, for example, when you: ◾ open an account or provide contact information ◾ give us your account information or pay us by check ◾ make a wire transfer We also collect your personal information from others, such as credit bureaus, affiliates and other companies. |
Why can’t I limit all sharing? | | Federal law gives you the right to limit only ◾ sharing for affiliates’ everyday business purposes – information about your creditworthiness ◾ affiliates from using your information to market to you ◾ sharing for nonaffiliates to market to you State laws and individual companies may give you additional rights to limit sharing. |
| | | |
| |
Definitions |
Affiliates | | Companies related by common ownership or control. They can be financial and nonfinancial companies. ◾ J.P. Morgan Funds does not share with our affiliates. |
Nonaffiliates | | Companies not related by common ownership or control. They can be financial and nonfinancial companies. ◾ J.P. Morgan Funds does not share with nonaffiliates so they can market to you. |
Joint Marketing | | A formal agreement between nonaffiliated financial companies that together market financial products or services to you. ◾ J.P. Morgan Funds doesn’t jointly market. |
J.P. Morgan Fund.s are distributed by JPMorgan Distribution Services, Inc., which is an affiliate of JPMorgan Chase & Co. Affiliates of JPMorgan Chase & Co. receive fees for providing various services to the funds.
Contact JPMorgan Distribution Services, Inc. at 1-800-480-4111 for a fund prospectus. You can also visit us at www.jpmorganfunds.com. Investors should carefully consider the investment objectives and risk as well as charges and expenses of the mutual fund before investing. The prospectus contains this and other information about the mutual fund. Read the prospectus carefully before investing.
Investors may obtain information about the Securities Investor Protection Corporation (SIPC), including the SIPC brochure, by visiting www.sipc.org or by calling SIPC at 202-371-8300.
The Fund files a complete schedule of its fund holdings for the first and third quarters of its fiscal year with the SEC as an exhibit to its report on Form N-PORT. The Fund’s Form N-PORT reports are available on the SEC’s website at http://www.sec.gov. The Fund’s quarterly holdings can be found by visiting the J.P. Morgan Funds’ website at www.jpmorganfunds.com.
A description of the Fund’s policies and procedures with respect to the disclosure of the Fund’s holdings is available in the prospectuses and Statement of Additional Information.
A copy of proxy policies and procedures is available without charge upon request by calling 1-800-480-4111 and on the Fund’s website at www.jpmorganfunds.com. A description of such policies and procedures is on the SEC’s website at www.sec.gov. The Trustees have delegated the authority to vote proxies for securities owned by the Fund to the Adviser. A copy of the Fund’s voting record for the most recent 12-month period ended June 30 is available on the SEC’s website at www.sec.gov or at the Fund’s website at www.jpmorganfunds.com no later than August 31 of each year. The Fund’s proxy voting record will include, among other things, a brief description of the matter voted on for each fund security, and will state how each vote was cast, for example, for or against the proposal.

ITEM 2. CODE OF ETHICS.
Disclose whether, as of the end of the period covered by the report, the registrant has adopted a code of ethics that applies to the registrant’s principal executive officer, principal financial officer, principal accounting officer or controller, or persons performing similar functions, regardless of whether these individuals are employed by the registrant or a third party. If the registrant has not adopted such a code of ethics, explain why it has not done so.
The registrant must briefly describe the nature of any amendment, during the period covered by the report, to a provision of its code of ethics that applies to the registrant’s principal executive officer, principal financial officer, principal accounting officer or controller, or persons performing similar functions, regardless of whether these individuals are employed by the registrant or a third party, and that relates to any element of the code of ethics definition enumerated in paragraph (b) of this Item. The registrant must file a copy of any such amendment as an exhibit pursuant to Item 13(a)(1), unless the registrant has elected to satisfy paragraph (f) of this Item by positing its code of ethics on its website pursuant to paragraph (f)(2) of this Item, or by undertaking to provide its code of ethics to any person without charge, upon request, pursuant to paragraph (f)(3) of this Item.
If the registrant has, during the period covered by the report, granted a waiver, including an implicit waiver, from a provision of the code of ethics that applies to the registrant’s principal executive officer, principal financial officer, principal accounting officer or controller, or persons performing similar functions, regardless of whether these individuals are employed by the registrant or third party, that relates to one or more items set forth in paragraph (b) of this Item, the registrant must briefly describe the nature of the waiver, the name of the person to whom the waiver was granted, and the date of the waiver.
The Registrant has adopted a code of ethics that applies to the Registrant’s principal executive officer and principal financial officer. There were no amendments to the code of ethics or waivers granted with respect to the code of ethics in the period covered by the report.
ITEM 3. AUDIT COMMITTEE FINANCIAL EXPERT.
(a) (1) Disclose that the registrant’s board of directors has determined that the registrant either:
(i) Has at least one audit committee financial expert serving on its audit committee; or
(ii) Does not have an audit committee financial expert serving on its audit committee.
The Registrant’s Board of Trustees has determined that the Registrant has at least one audit committee financial expert serving on its audit committee. The Securities and Exchange Commission has stated that the designation or identification of a person as an audit committee financial expert pursuant to this Item 3 of Form N-CSR does not impose on such person any duties, obligations or liabilities that are greater than the duties, obligations and liabilities imposed on such person as a member of the Audit Committee and the Board of Trustees in the absence of such designation or identification.
(2) If the registrant provides the disclosure required by paragraph (a)(1)(i) of this Item, it must disclose the name of the audit committee financial expert and whether that person is “independent.” In order to be considered “independent” for purposes of this Item, a member of an audit committee may not, other than in his or her capacity as a member of the audit committee, the board of directors, or any other board committee:
(i) Accept directly or indirectly any consulting, advisory, or other compensatory fee from the issuer; or
(ii) Be an “interested person” of the investment company as defined in Section 2(a)(19) of the Act (15 U.S.C. 80a-2(a)(19)).
The audit committee financial expert is Dennis P. Harrington. He is not an “interested person” of the Registrant and is also “independent” as defined by the U.S. Securities and Exchange Commission for purposes of audit committee financial expert determinations.
(3) If the registrant provides the disclosure required by paragraph (a)(1)(ii) of this Item, it must explain why it does not have an audit committee financial expert.
Not applicable.
ITEM 4. PRINCIPAL ACCOUNTANT FEES AND SERVICES.
(a) Disclose, under the caption Audit Fees, the aggregate fees billed for each of the last two fiscal years for professional
services rendered by the principal accountant for the audit of the registrant’s annual financial statements or services that are normally provided by the accountant in connection with statutory and regulatory filings or engagements for those fiscal years.
AUDIT FEES
2020 – $290,593
2019 – $160,296
(b) Disclose, under the caption Audit-Related Fees, the aggregate fees billed in each of the last two fiscal years for assurance and related services by the principal accountant that are reasonably related to the performance of the audit of the registrant’s financial statements and are not reported under paragraph (a) of this Item. Registrants shall describe the nature of the services comprising the fees disclosed under this category.
AUDIT-RELATED FEES
2020 – $47,694
2019 – $38,520
Audit-related fees consists of semi-annual financial statement reviews and security count procedures performed as required under Rule 17f-2 of the Investment Company Act of 1940 during the Registrant’s fiscal year.
(c) Disclose, under the caption Tax Fees, the aggregate fees billed in each of the last two fiscal years for professional services rendered by the principal accountant for tax compliance, tax advice, and tax planning. Registrants shall describe the nature of the services comprising the fees disclosed under this category.
TAX FEES
2020 – $63,720
2019 – $46,919
The tax fees consist of fees billed in connection with preparing the federal regulated investment company income tax returns for the Registrant for the tax years ended October 31, 2020 and 2019, respectively.
For the last fiscal year, no tax fees were required to be approved pursuant to paragraph (c)(7)(ii) of Rule 2-01 of Regulation S-X.
(d) Disclose, under the caption All Other Fees, the aggregate fees billed in each of the last two fiscal years for products and services provided by the principal accountant, other than the services reported in paragraphs (a) through (c) of this Item. Registrants shall describe the nature of the services comprising the fees disclosed under this category.
ALL OTHER FEES
2020 – Not applicable
2019 – Not applicable
(e) (1) Disclose the audit committee’s pre-approval policies and procedures described in paragraph (c)(7) of Rule 2-01 of Regulation S-X.
Pursuant to the Registrant’s Audit Committee Charter and written policies and procedures for the pre-approval of audit and non-audit services (the “Pre-approval Policy”), the Audit Committee pre-approves all audit and non-audit services performed by the Registrant’s independent public registered accounting firm for the Registrant. In addition, the Audit Committee pre-approves the auditor’s engagement for non-audit services with the Registrant’s investment adviser (not including a sub-adviser whose role is primarily portfolio management and is sub-contracted or overseen by another investment adviser) and any Service Affiliate in accordance with paragraph (c)(7)(ii) of Rule 2-01 of Regulation S-X, if the engagement relates directly to the operations and financial reporting of the Registrant. Proposed services may be pre-approved either 1) without consideration of specific case-by-case services or 2) require the specific pre-approval of the Audit Committee. Therefore, initially the Pre-approval Policy listed a number of audit and non-audit services that have been approved by the Audit Committee, or which were not subject to pre-approval under the transition provisions of Sarbanes-Oxley Act of 2002 (the “Pre-approval List”). The Audit Committee annually reviews and pre-approves the services included on the Pre-approval List
that may be provided by the independent public registered accounting firm without obtaining additional specific pre-approval of individual services from the Audit Committee. The Audit Committee adds to, or subtracts from, the list of general pre-approved services from time to time, based on subsequent determinations. All other audit and non-audit services not on the Pre-approval List must be specifically pre-approved by the Audit Committee.
One or more members of the Audit Committee may be appointed as the Committee’s delegate for the purposes of considering whether to approve such services. Any pre-approvals granted by the delegate will be reported, for informational purposes only, to the Audit Committee at its next scheduled meeting. The Audit Committee’s responsibilities to pre-approve services performed by the independent public registered accounting firm are not delegated to management.
(2) Disclose the percentage of services described in each of paragraphs (b) through (d) of this Item that were approved by the audit committee pursuant to paragraph (c)(7)(i)(C) of Rule 2-01 of Regulation S-X.
2020 – 0.0%
2019 – 0.0%
(f) If greater than 50 percent, disclose the percentage of hours expended on the principal accountant’s engagement to audit the registrant’s financial statements for the most recent fiscal year that were attributed to work performed by persons other than the principal accountant’s full-time, permanent employees.
Not applicable - Less than 50%.
(g) Disclose the aggregate non-audit fees billed by the registrant’s accountant for services rendered to the registrant, and rendered to the registrant’s investment adviser (not including any sub-adviser whose role is primarily portfolio management and is subcontracted with or overseen by another investment adviser), and any entity controlling, controlled by, or under common control with the adviser that provides ongoing services to the registrant for each of the last two fiscal years of the registrant.
The aggregate non-audit fees billed by the independent registered public accounting firm for services rendered to the Registrant, and rendered to Service Affiliates, for the last two calendar year ends were:
2020 – $24.8 million
2019 – $30.3 million
(h) Disclose whether the registrant’s audit committee of the board of directors has considered whether the provision of non-audit services that were rendered to the registrant’s investment adviser (not including any subadviser whose role is primarily portfolio management and is subcontracted with or overseen by another investment adviser), and any entity controlling, controlled by, or under common control with the investment adviser that provides ongoing services to the registrant that were not pre-approved pursuant to paragraph (c)(7)(ii) of Rule 2-01 of Regulation S-X is compatible with maintaining the principal accountant’s independence.
The Registrant’s Audit Committee has considered whether the provision of the non-audit services that were rendered to Service Affiliates that were not pre-approved (not requiring pre-approval) is compatible with maintaining the independent public registered accounting firm’s independence. All services provided by the independent public registered accounting firm to the Registrant or to Service Affiliates that were required to be pre-approved were pre-approved as required.
ITEM 5. AUDIT COMMITTEE OF LISTED REGISTRANTS.
(a) If the registrant is a listed issuer as defined in Rule 10A-3 under the Exchange Act (17CFR 240.10A-3), state whether or not the registrant has a separately-designated standing audit committee established in accordance with Section 3(a)(58)(A) of the Exchange Act (15 U.S.C. 78c(a)(58)(A)). If the registrant has such a committee, however designated, identify each committee member. If the entire board of directors is acting as the registrant’s audit committee as specified in Section 3(a)(58)(B) of the Exchange Act (15 U.S.C. 78c(a)(58)(B)), so state.
(b) If applicable, provide the disclosure required by Rule 10A-3(d) under the Exchange Act (17CFR 240.10A-3(d)) regarding an exemption from the listing standards for all audit committees.
Not applicable.
ITEM 6. INVESTMENTS.
File Schedule I – Investments in securities of unaffiliated issuers as of the close of the reporting period as set forth in Section 210.12-12 of Regulation S-X, unless the schedule is included as part of the report to shareholders filed under Item 1 of this Form.
Included in Item 1.
ITEM 7. DISCLOSURE OF PROXY VOTING POLICIES AND PROCEDURES FOR CLOSED-END MANAGEMENT INVESTMENT COMPANIES.
Not applicable.
ITEM 8. PORTFOLIO MANAGERS OF CLOSED-END MANAGEMENT INVESTMENT COMPANIES.
Not applicable.
ITEM 9. PURCHASE OF EQUITY SECURITIES BY CLOSED-END MANAGEMENT INVESTMENT COMPANY AND AFFILIATED PURCHASERS.
Not applicable.
ITEM 10. SUBMISSION OF MATTERS TO A VOTE OF SECURITY HOLDERS.
Describe any material changes to the procedures by which shareholders may recommend nominees to the registrant’s board of directors, where those changes were implemented after the registrant last provided disclosure in response to the requirements of Item 7(d)(2)(ii)(G) of Schedule 14A (17 CFR 240.14a-101), or this Item.
No material changes to report.
ITEM 11. CONTROLS AND PROCEDURES.
(a) Disclose the conclusions of the registrant’s principal executive and principal financial officers, or persons performing similar functions, regarding the effectiveness of the registrant’s disclosure controls and procedures (as defined in Rule 30a-3(c) under the Act (17 CFR 270.30a-3(c))) as of a date within 90 days of the filing date of the report that includes the disclosure required by this paragraph, based on the evaluation of these controls and procedures required by Rule 30a-3(b) under the Act (17 CFR 270.30a-3(b)) and Rules 13a-15(b) or 15d-15(b) under the Exchange Act (17 CFR 240.13a-15(b) or 240.15d-15(b)).
The Registrant’s principal executive and principal financial officers have concluded, based on their evaluation of the Registrant’s disclosure controls and procedures as of a date within 90 days of the filing date of this report, that the Registrant’s disclosure controls and procedures are reasonably designed to ensure that information required to be disclosed by the Registrant on Form N-CSR is recorded, processed, summarized and reported within the required time periods and that information required to be disclosed by the Registrant in the reports that it files or submits on Form N-CSR is accumulated and communicated to the Registrant’s management, including its principal executive and principal financial officers, as appropriate to allow timely decisions regarding required disclosure.
(b) Disclose any change in the registrant’s internal control over financial reporting (as defined in Rule 30a-3(d) under the Act (17 CFR 270.30a-3(d)) that occurred during the registrant’s second fiscal quarter of the period covered by this report that has materially affected, or is reasonably likely to materially affect, the registrant’s internal control over financial reporting.
There were no changes in the Registrant’s internal control over financial reporting that occurred during the last fiscal quarter covered by this report that have materially affected, or are reasonably likely to materially affect, the Registrant’s internal control over financial reporting.
ITEM 12. DISCLOSURE OF SECURITIES LENDING ACTIVITIES FOR CLOSED-END MANAGEMENT INVESTMENT COMPANIES.
Not applicable.
ITEM 13. EXHIBITS.
| | (a) | File the exhibits listed below as part of this Form. Letter or number the exhibits in the sequence indicated. |
(1) Any code of ethics, or amendment thereto, that is the subject of the disclosure required by Item 2, to the extent that the registrant intends to satisfy the Item 2 requirements through filing of an exhibit.
Code of Ethics applicable to its Principal Executive and Principal Financial Officers pursuant to Section 406 of the Sarbanes-Oxley Act of 2002 attached hereto.
(2) A separate certification for each principal executive officer and principal financial officer of the registrant as required by Rule 30a-2(a) under the Act (17 CFR 270.30a-2).
Certifications pursuant to Rule 30a-2(a) under the Investment Company Act of 1940 are attached hereto.
(3) Any written solicitation to purchase securities under Rule 23c-1 under the Act (17 CFR 270.23c-1) sent or given during the period covered by the report by or on behalf of the registrant to 10 or more persons.
Not applicable.
| | (b) | A separate or combined certification for each principal executive officer and principal officer of the registrant as required by Rule 30a-2(b) under the Act of 1940. |
Certifications pursuant to Rule 30a-2(b) under the Investment Company Act of 1940 are attached hereto.
SIGNATURES
Pursuant to the requirements of the Securities Exchange Act of 1934 and the Investment Company Act of 1940, the registrant has duly caused this report to be signed on its behalf by the undersigned, thereunto duly authorized.
| | | | |
| JPMorgan Trust IV |
| | |
| By: | | | | /s/ Brian S. Shlissel |
| | | | Brian S. Shlissel |
| | | | President and Principal Executive Officer |
| | | | January 4, 2021 |
Pursuant to the requirements of the Securities Exchange Act of 1934 and the Investment Company Act of 1940, this report has been signed below by the following persons on behalf of the registrant and in the capacities and on the dates indicated.
| | | | |
| By: | | | | /s/ Brian S. Shlissel |
| | | | Brian S. Shlissel |
| | | | President and Principal Executive Officer |
| | | | January 4, 2021 |
| | | | |
| By: | | | | /s/ Timothy J. Clemens |
| | | | Timothy J. Clemens |
| | | | Treasurer and Principal Financial Officer |
| | | | January 4, 2021 |