UNITED STATES
SECURITIES AND EXCHANGE COMMISSION
Washington, D.C. 20549
FORM N-CSR
CERTIFIED SHAREHOLDER REPORT OF REGISTERED
MANAGEMENT INVESTMENT COMPANIES
Investment Company Act file number: 811-23117
JPMorgan Trust IV
(Exact name of registrant as specified in charter)
270 Park Avenue
New York, NY 10017
(Address of principal executive offices) (Zip code)
Frank J. Nasta
270 Park Avenue
New York, NY 10017
(Name and Address of Agent for Service)
Registrant’s telephone number, including area code: (800) 480-4111
Date of fiscal year end: June 30
Date of reporting period: July 1, 2016 through June 30, 2017
Form N-CSR is to be used by management investment companies to file reports with the Commission not later than 10 days after the transmission to stockholders of any report that is required to be transmitted to stockholders under Rule 30e-1 under the Investment Company Act of 1940 (17 CFR 270.30e-1). The Commission may use the information provided on Form N-CSR in its regulatory, disclosure review, inspection, and policymaking roles.
A registrant is required to disclose the information specified by Form N-CSR, and the Commission will make this information public. A registrant is not required to respond to the collection of information contained in Form N-CSR unless the Form displays a currently valid Office of Management and Budget (“OMB”) control number. Please direct comments concerning the accuracy of the information collection burden estimate and any suggestions for reducing the burden to Secretary, Securities and Exchange Commission, 450 Fifth Street, NW, Washington, DC 20549-0609. The OMB has reviewed this collection of information under the clearance requirements of 44 U.S.C. Section 3507.
ITEM 1. REPORTS TO STOCKHOLDERS.
The following is a copy of the report transmitted to shareholders pursuant to Rule 30e-1 under the Investment Company Act of 1940 (17 CFR 270.30e-1).
J.P. Morgan Funds
Annual Report
June 30, 2017
JPMorgan SmartSpendingSM 2050 Fund
Investments in the Fund are not deposits or obligations of, or guaranteed or endorsed by, any bank and are not insured or guaranteed by the FDIC, the Federal Reserve Board or any other government agency. You could lose money if you sell when the Fund’s share price is lower than when you invested.
Past performance is no guarantee of future performance. The general market views expressed in this report are opinions based on market and other conditions through the end of the reporting period and are subject to change without notice. These views are not intended to predict the future performance of the Fund or the securities markets. References to specific securities and their issuers are for illustrative purposes only and are not intended to be, and should not be interpreted as, recommendations to purchase or sell such securities. Such views are not meant as investment advice and may not be relied on as an indication of trading intent on behalf of the Fund.
Prospective investors should refer to the Fund’s prospectus for a discussion of the Fund’s investment objective, strategies and risks. Call J.P. Morgan Funds Service Center at 1-800-480-4111 for a prospectus containing more complete information about the Fund including management fees and other expenses. Please read it carefully before investing.
CEO’S LETTER
August 4, 2017 (Unaudited)
“In the U.S., the continued economic expansion, muted inflation, corporate earnings growth and historically low volatility in financial markets helped to drive key equity market indexes to multiple record closing highs throughout the past twelve months.”
- George C.W. Gatch
Dear Shareholder,
The current U.S. economic expansion entered its eighth year in 2017 and growth in developed and emerging market economies grew more synchronized even as U.S. growth showed some signs of easing. Global financial markets generally benefitted from steady economic growth amid an environment of low inflation, low volatility and rising corporate profits.
While economic growth in the U.S. and China largely drove the global recovery throughout 2016, by June 2017 the world’s other leading economies had picked up sufficiently enough for the Organization for Economic Co-operation and Development to forecast global growth at 3.5% in 2017 and 3.6% in 2018.
U.S. gross domestic product (GDP) growth slowed to 1.2% in the first quarter of 2017 from 2.5% and 3.5% growth in the fourth quarter and third quarters of 2016, respectively. Meanwhile, the U.S. unemployment rate continued its downward trend throughout the past twelve months, dropping to 4.4% in June 2017 from 4.9% one year earlier. In response to these numbers, along with nascent signs of price inflation, the U.S. Federal Reserve (the “Fed”) raised interest rates in December 2016 and again in June 2017 and signaled it would raise rates once more before the end of the year. Further, Fed Chairwoman Janet Yellen indicated she was prepared to begin partially unwinding the central bank’s $4.5 trillion balance sheet in assets purchased through its quantitative easing program. An increase in consumer spending helped second-quarter 2017 GDP climb by 2.6% from a year earlier.
Notably, by mid-2017 domestic price inflation had dropped below the Fed’s target of 2% growth and wage growth was below many economists’ expectations, the latter despite an environment of essentially full employment for U.S. workers. These trends – and the Fed’s acknowledgment of them – provided some near-term uncertainty about the central bank’s commitment to tightening monetary policy.
Throughout the twelve months ended June 30, 2017, global oil prices remained a key focal point for policy makers, economists and investors. Global crude prices reached 15-month highs in October 2016 and received further support from the Organization of Petroleum Exporting Countries’ December 2016 decision to curb production. However, continued oversupply of crude and natural gas, partly due to continued U.S. production, pushed the price of a barrel of benchmark West Texas Intermediate crude oil down to $46 by the end of June 2017.
1
Meanwhile, the leading economies of Europe continued to strengthen from what had been an anemic expansion. Annualized GDP for the 19 core euro area nations rose 1.9% in the first quarter of 2017 and 2.1% in the second quarter. The June 2017 aggregate unemployment rate for those nations fell to 9.1%, its lowest level since March 2009. Also, in separate elections in 2017, voters in the Netherlands and France largely rejected populist campaigns espousing policies to limit free trade and immigration. The election results provided another boost to global equity prices.
In the U.S., the continued economic expansion, muted inflation, corporate earnings growth and historically low volatility in financial markets helped to drive key equity market indexes to multiple record closing highs throughout the past twelve months. U.S. investors appeared to shrug off intermittent political and policy dramas emanating from Washington, D.C. and extended the run-up in U.S. equity prices into its eighth consecutive year – one of the longest on record.
Over the twelve month period, U.S. and foreign markets largely rewarded those who remained fully invested in financial markets and we believe the fundamental virtues of patience and diversification remain essential to prudent investment strategy.
We look forward to managing your investment needs for years to come. Should you have any questions, please visit www.jpmorganfunds.com or contact the J.P. Morgan Funds Service Center at 1-800-480-4111.
Sincerely yours,
George C.W. Gatch
CEO, Global Funds Management & Institutional, J.P. Morgan Asset Management
2
JPMorgan SmartSpendingSM 2050 Fund
FUND SUMMARY
For the period December 30, 2016 (Fund Inception Date) through June 30, 2017 (Unaudited)
| | | | |
| Reporting Period Return: | | | |
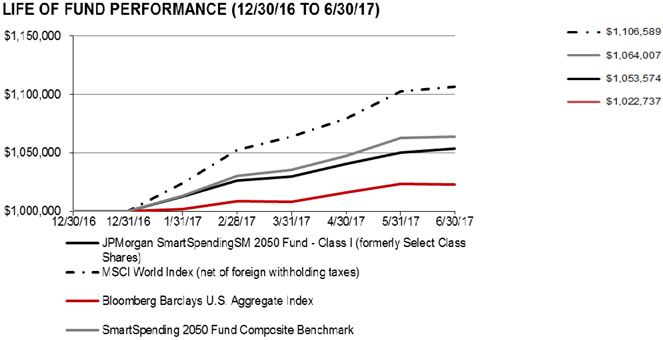
Fund (Class I Shares)*(1) | | | 5.36% | |
MSCI World Index (net of foreign withholding taxes) | | | 10.66% | |
Bloomberg Barclays U.S. Aggregate Index | | | 2.27% | |
JPMorgan SmartSpending 2050 Composite Benchmark | | | 6.40% | |
Net Assets as of 6/30/2017 | | $ | 30,941,579 | |
INVESTMENT OBJECTIVE**
The JPMorgan SmartSpendingSM 2050 Fund (the “Fund”) seeks to provide total return consisting of current income and capital appreciation.
HOW DID THE MARKET PERFORM?
Overall, U.S. equity markets provided positive returns and key stock market indexes reached multiple record highs throughout the reporting period. Steady global economic growth, continued low inflation and strong corporate earnings all served to support equity prices, both in the U.S. and elsewhere. Emerging market equities generally outperformed developed market equities during the reporting period.
Within fixed-income, emerging market bonds and high-yield U.S. bonds (also known as “junk bonds”) generally provided positive returns while investment grade corporate bonds and U.S. Treasury bonds underperformed amid investor expectations for rising interest rates in the U.S.
Notably, U.S. financial market volatility remained low throughout the reporting period. By the end of June 2017, the CBOE Volatility Index, which measures options on the Standard & Poor’s 500 Index to gauge market expectations of near-term volatility, stood at roughly half of its historical average.
WHAT WERE THE MAIN DRIVERS OF THE PORTFOLIO’S PERFORMANCE?
The Fund’s Class I Shares underperformed the MSCI World Index (net of foreign withholding taxes) (the “Benchmark”) and outperformed the Bloomberg Barclays U.S. Aggregate Index for the period from inception December 30, 2016 to June 30, 2017. The Fund also underperformed its composite benchmark (50% MSCI World Index (net of foreign withholding taxes) and 50% Bloomberg Barclays U.S. Aggregate Index) for the reporting period.
The Benchmark does not include debt securities and the Fund’s allocation to U.S. high-yield debt and emerging markets debt detracted from performance relative to the Benchmark as equity generally outperformed bonds during the reporting period. Relative to the Bloomberg Barclays U.S. Aggregate Index, which does not include equity securities, the Fund’s allocations to U.S. growth equities, non-U.S. developed market equities and U.S. core bonds contributed to performance.
The Fund’s allocations to U.S. real estate investment trusts, U.S. equity and U.S. Treasury Inflation Protected Securities detracted from performance relative to the composite benchmark, while the Fund’s allocations to non-U.S. equities and extended credit made a positive contribution relative to the composite benchmark.
HOW WAS THE PORTFOLIO POSITIONED?
The Funds invested in underlying J.P. Morgan Funds and third party Exchange Traded Funds to implement the Fund managers’ asset allocation decisions. The Fund’s portfolio managers used futures contracts to implement tactical asset allocations. The Fund managers used a systematic screening and selection process to choose the underlying funds in their construction of the Fund’s portfolio. Relative to its composite benchmark, the Fund invested in a broader range of asset classes. In addition, the portfolio managers utilized an active asset allocation approach to manage volatility of the Fund.
3
JPMorgan SmartSpendingSM 2050 Fund
FUND SUMMARY
For the period December 30, 2016 (Fund Inception Date) through June 30, 2017 (Unaudited) (continued)
| | | | |
| PORTFOLIO COMPOSITION BY ASSET CLASS*** | | | |
Fixed Income | | | 58.7 | % |
U.S. Equity | | | 23.4 | |
International Equity | | | 12.5 | |
Short-Term Investment | | | 2.7 | |
Alternative Assets | | | 1.5 | |
U.S. Treasury Obligation | | | 1.2 | |
| * | The return shown is based on net asset values calculated for shareholder transactions and may differ from the return shown in the financial highlights, which reflects adjustments made to the net asset values in accordance with accounting principles generally accepted in the United States of America. |
| ** | The adviser seeks to achieve the Fund’s objective. There can be no guarantee it will be achieved. |
| *** | Percentages indicated are based on total investments as of June 30, 2017. The Fund’s portfolio composition is subject to change. |
| (1) | On April 3, 2017, the Fund’s Select Class Shares were renamed Class I Shares. |
4
JPMorgan SmartSpendingSM 2050 Fund
FUND SUMMARY
For the period December 30, 2016 (Fund Inception Date) through June 30, 2017 (Unaudited) (continued)
| | | | | | | | |
TOTAL RETURNS AS OF JUNE 30, 2017 | | | | | | | | |
| | | INCEPTION DATE
OF CLASS | | | SINCE
INCEPTION* | |
CLASS A SHARES | | | December 30, 2016 | | | | | |
With Sales Charge** | | | | | | | 0.47 | % |
Without Sales Charge | | | | | | | 5.23 | |
CLASS C SHARES | | | December 30, 2016 | | | | | |
With CDSC*** | | | | | | | 3.97 | |
Without CDSC | | | | | | | 4.97 | |
CLASS I SHARES (FORMERLY SELECT | | | | | | | | |
CLASS SHARES) | | | December 30, 2016 | | | | 5.36 | |
CLASS R2 SHARES | | | December 30, 2016 | | | | 5.02 | |
CLASS R3 SHARES | | | December 30, 2016 | | | | 5.15 | |
CLASS R4 SHARES | | | December 30, 2016 | | | | 5.27 | |
CLASS R5 SHARES | | | December 30, 2016 | | | | 5.35 | |
CLASS R6 SHARES | | | December 30, 2016 | | | | 5.40 | |
| ** | Sales Charge for Class A Shares is 4.50%. |
| *** | Assumes a 1% CDSC (contingent deferred sales charge) for the period. |
5
JPMorgan SmartSpendingSM 2050 Fund
FUND SUMMARY
For the period December 30, 2016 (Fund Inception Date) through June 30, 2017 (Unaudited) (continued)
The performance quoted is past performance and is not a guarantee of future results. Mutual funds are subject to certain market risks. Investment returns and principal value of an investment will fluctuate so that an investor’s shares, when redeemed, may be worth more or less than their original cost. Current performance may be higher or lower than the performance data shown. For up-to-date, month-end performance information please call 1-800-480-4111.
The Fund commenced operations on December 30, 2016.
The graph illustrates comparative performance for $1,000,000 invested in Class I Shares of the JPMorgan SmartSpendingSM 2050 Fund, the MSCI World Index (net of foreign withholding taxes), the Bloomberg Barclays U.S. Aggregate Index and the JPMorgan SmartSpending 2050 Composite Benchmark from December 30, 2016 to June 30, 2017. The performance of the Fund may reflect the waiver of the Fund’s fees and reimbursement of expenses for certain periods since the inception date. Without these waivers and reimbursements, performance would have been lower. Also, performance shown in this section does not reflect the deduction of taxes that a shareholder would pay on Fund distributions or redemptions of Fund shares. The Bloomberg Barclays U.S. Aggregate Index is an unmanaged index representing SEC-registered taxable and dollar denominated securities. It covers the U.S. investment grade fixed rate bond market, with index components for government and corporate securities, mortgage pass-through, and asset-backed securities. The MSCI World Index (net of foreign withholding taxes) is a broad measure of the performance of developed countries’ equity markets. The JPMorgan SmartSpending 2050 Composite Benchmark is a composite benchmark of unmanaged indexes that includes 50% MSCI World Index (net of foreign withholding taxes) and 50% Bloomberg Barclays U.S. Aggregate Index. Investors cannot invest directly in an index.
Class I Shares have a $1,000,000 minimum initial investment.
Since the Fund’s inception, it has not experienced any shareholder activity. If shareholder activity had occurred, the Fund’s performance may have been impacted.
The returns shown are based on net asset values calculated for shareholder transactions and may differ from the returns shown in the financial highlights, which reflect adjustments made to the net asset values in accordance with accounting principles generally accepted in the United States of America.
6
JPMorgan SmartSpendingSM 2050 Fund
SCHEDULE OF PORTFOLIO INVESTMENTS
AS OF JUNE 30, 2017
| | | | | | | | |
| SHARES | | | SECURITY DESCRIPTION | | VALUE($) | |
| | Exchange Traded Funds — 35.3% | |
| | | | Fixed Income — 22.2% | | | | |
| | 41,617 | | | iShares Core U.S. Aggregate Bond Fund | | | 4,557,478 | |
| | 20,412 | | | iShares TIPS Bond Fund | | | 2,315,333 | |
| | | | | | | | |
| | | | Total Fixed Income | | | 6,872,811 | |
| | | | | | | | |
| | | | International Equity — 8.0% | | | | |
| | 22,930 | | | iShares Core MSCI EAFE Fund | | | 1,396,208 | |
| | 21,769 | | | iShares Core MSCI Emerging Markets Fund | | | 1,089,321 | |
| | | | | | | | |
| | | | Total International Equity | | | 2,485,529 | |
| | | | | | | | |
| | | | U.S. Equity — 5.1% | | | | |
| | 2,283 | | | iShares Russell 2000 Fund | | | 321,720 | |
| | 2,929 | | | iShares Russell Mid-Cap Fund | | | 562,690 | |
| | 8,282 | | | Vanguard REIT Fund | | | 689,311 | |
| | | | | | | | |
| | | | Total U.S. Equity | | | 1,573,721 | |
| | | | | | | | |
| | | | Total Exchange Traded Funds
(Cost $10,478,721) | | | 10,932,061 | |
| | | | | | | | |
| | Investment Companies — 61.2% (b) | |
| | | | Alternative Assets — 1.5% | | | | |
| | 54,213 | | | JPMorgan Commodities Strategy Fund, Class R6 Shares (a) | | | 470,571 | |
| | | | | | | | |
| | | | Fixed Income — 36.7% | | | | |
| | 504,776 | | | JPMorgan Core Bond Fund, Class R6 Shares | | | 5,870,543 | |
| | 84,716 | | | JPMorgan Corporate Bond Fund, Class R6 Shares | | | 859,025 | |
| | 51,793 | | | JPMorgan Emerging Markets Debt Fund, Class R6 Shares | | | 426,255 | |
| | 51,103 | | | JPMorgan Emerging Markets Strategic Debt Fund, Class R6 Shares | | | 426,202 | |
| | 80,883 | | | JPMorgan Floating Rate Income Fund, Class R6 Shares | | | 761,104 | |
| | 407,033 | | | JPMorgan High Yield Fund, Class R6 Shares | | | 3,028,327 | |
| | | | | | | | |
| | | | Total Fixed Income | | | 11,371,456 | |
| | | | | | | | |
| | | | International Equity — 4.6% | | | | |
| | 78,985 | | | JPMorgan International Research Enhanced Equity Fund, Class I Shares | | | 1,409,887 | |
| | | | | | | | |
| | | | U.S. Equity — 18.4% | | | | |
| | 82,416 | | | JPMorgan Equity Index Fund, Class R6 Shares | | | 3,085,665 | |
| | 41,094 | | | JPMorgan Growth Advantage Fund, Class R6 Shares (a) | | | 770,920 | |
| | 66,164 | | | JPMorgan U.S. Equity Fund, Class R6 Shares | | | 1,050,019 | |
| | | | | | | | |
| SHARES | | | SECURITY DESCRIPTION | | VALUE($) | |
| | |
| | | | U.S. Equity — continued | | | | |
| | 23,285 | | | JPMorgan Value Advantage Fund, Class R6 Shares | | | 782,599 | |
| | | | | | | | |
| | | | Total U.S. Equity | | | 5,689,203 | |
| | | | | | | | |
| | | | Total Investment Companies
(Cost $18,210,597) | | | 18,941,117 | |
| | | | | | | | |
| | |
PRINCIPAL
AMOUNT($) | | | | | | |
| | U.S. Treasury Obligation — 1.2% | |
| | 360,000 | | | U.S. Treasury Note, 0.750%, 01/31/18 (k)
(Cost $359,684) | | | 359,111 | |
| | | | | | | | |
| | |
| SHARES | | | | | | |
| | Short-Term Investment — 2.8% | |
| | | | Investment Company — 2.8% | |
| | 853,949 | | | JPMorgan U.S. Government Money Market Fund, Institutional Class Shares, 0.840% (b) (l)
(Cost $853,949) | | | 853,949 | |
| | | | | | | | |
| | | | Total Investments — 100.5%
(Cost $29,902,951) | | | 31,086,238 | |
| | | | Liabilities in Excess of Other Assets — (0.5)% | | | (144,659 | ) |
| | | | | | | | |
| | | | NET ASSETS — 100.0% | | $ | 30,941,579 | |
| | | | | | | | |
Percentages indicated are based on net assets.
SEE NOTES TO FINANCIAL STATEMENTS.
7
JPMorgan SmartSpendingSM 2050 Fund
SCHEDULE OF PORTFOLIO INVESTMENTS
AS OF JUNE 30, 2017 (continued)
| | | | | | | | | | | | | | | | | | |
NUMBER OF
CONTRACTS | | | DESCRIPTION | | EXPIRATION
DATE | | | TRADING
CURRENCY | | NOTIONAL
VALUE AT JUNE 30,
2017 | | | NET
UNREALIZED
APPRECIATION
(DEPRECIATION) | |
| | | | Long Futures Outstanding | | | | | | | | | | | | | | |
| | 4 | | | TOPIX Index | | | 09/07/17 | | | JPY | | $ | 575,354 | | | $ | 4,655 | |
| | 12 | | | 10 Year Australian Government Bond | | | 09/15/17 | | | AUD | | | 1,192,189 | | | | (19,497 | ) |
| | 3 | | | E-mini S&P 500 Index | | | 09/15/17 | | | USD | | | 363,135 | | | | (1,128 | ) |
| | 12 | | | Euro STOXX 50 Index | | | 09/15/17 | | | EUR | | | 471,000 | | | | (14,797 | ) |
| | 12 | | | Mini MSCI Emerging Markets Index | | | 09/15/17 | | | USD | | | 604,980 | | | | 5,700 | |
| | 2 | | | Mini Russell 2000 Index | | | 09/15/17 | | | USD | | | 141,430 | | | | (548 | ) |
| | 3 | | | SPI 200 Index | | | 09/21/17 | | | AUD | | | 325,458 | | | | (4,463 | ) |
| | | | Short Futures Outstanding | | | | | | | | | | | | | | |
| | (7) | | | Euro Bund | | | 09/07/17 | | | EUR | | | (1,294,159 | ) | | | 22,301 | |
| | (3) | | | FTSE 100 Index | | | 09/15/17 | | | GBP | | | (283,162 | ) | | | 6,923 | |
| | (3) | | | 10 Year Canadian Government Bond | | | 09/20/17 | | | CAD | | | (325,146 | ) | | | 8,740 | |
| | (4) | | | Long Gilt | | | 09/27/17 | | | GBP | | | (654,195 | ) | | | 12,752 | |
| | (20) | | | 5 Year U.S. Treasury Note | | | 09/29/17 | | | USD | | | (2,356,719 | ) | | | 5,114 | |
| | | | | | | | | | | | | | | | | | |
| | | | | | | | | | | | | | | | $ | 25,752 | |
| | | | | | | | | | | | | | | | | | |
| | |
NOTES TO SCHEDULE OF PORTFOLIO INVESTMENTS |
AUD | | — Australian Dollar |
CAD | | — Canadian Dollar |
EAFE | | — Europe, Australasia and Far East |
EUR | | — Euro |
FTSE | | — Financial Times and the London Stock Exchange |
GBP | | — British Pound |
JPY | | — Japanese Yen |
REIT | | — Real Estate Investment Trust |
SPI | | — Australian Securities Exchange |
TIPS | | — Treasury Inflation Protected Security |
TOPIX | | — Tokyo Stock Price Index |
USD | | — United States Dollar |
| |
(a) | | — Non-income producing security. |
(b) | | — Investment in affiliate. Fund is registered under the Investment
Company Act of 1940, as amended, and advised by
J.P. Morgan Investment Management Inc. |
(k) | | — All or a portion of this security is deposited with the broker as
initial margin for future contracts. |
(l) | | — The rate shown is the current yield as of June 30, 2017. |
|
| Detailed information about investment portfolios of the underlying funds can be found in shareholder reports filed with the Securities and Exchange Commission (SEC) by each such underlying fund semi-annually on Form N-CSR and in certified portfolio holdings filed quarterly on Form N-Q, and are available for download from both the SEC’s as well as each respective underlying fund’s website. Detailed information about underlying J.P. Morgan Funds can also be found at www.jpmorganfunds.com or by calling 1-800-480-4111. |
SEE NOTES TO FINANCIAL STATEMENTS.
8
STATEMENT OF ASSETS AND LIABILITIES
AS OF JUNE 30, 2017
| | | | |
| | | JPMorgan
SmartSpendingSM
2050 Fund | |
ASSETS: | | | | |
Investments in non-affiliates, at value | | $ | 11,291,172 | |
Investments in affiliates, at value | | | 19,795,066 | |
| | | | |
Total investment securities, at value | | | 31,086,238 | |
Receivables: | | | | |
Interest from non-affiliates | | | 1,126 | |
Dividends from affiliates | | | 460 | |
Variation margin on futures contracts | | | 88,856 | |
Due from Adviser | | | 20,405 | |
Deferred offering Costs | | | 47,104 | |
| | | | |
Total Assets | | | 31,244,189 | |
| | | | |
LIABILITIES: | | | | |
Payables: | | | | |
Due to custodian | | | 297 | |
Investment securities purchased | | | 98,361 | |
Fund shares redeemed | | | 166,667 | |
Accrued liabilities: | | | | |
Distribution fees | | | 30 | |
Service fees | | | 2,190 | |
Custodian and accounting fees | | | 2,754 | |
Audit fees | | | 25,401 | |
Other | | | 6,910 | |
| | | | |
Total Liabilities | | | 302,610 | |
| | | | |
Net Assets | | $ | 30,941,579 | |
| | | | |
NET ASSETS: | | | | |
Paid-in-Capital | | $ | 29,615,513 | |
Accumulated undistributed net investment income | | | 33,977 | |
Accumulated net realized gains (losses) | | | 84,920 | |
Net unrealized appreciation (depreciation) | | | 1,207,169 | |
| | | | |
Total Net Assets | | $ | 30,941,579 | |
| | | | |
Net Assets: | | | | |
Class A | | $ | 21,050 | |
Class C | | | 21,000 | |
Class I (formerly Select Class) | | | 30,794,263 | |
Class R2 | | | 21,009 | |
Class R3 | | | 21,035 | |
Class R4 | | | 21,060 | |
Class R5 | | | 21,076 | |
Class R6 | | | 21,086 | |
| | | | |
Total | | $ | 30,941,579 | |
| | | | |
Outstanding units of beneficial interest (shares) ($0.0001 par value; unlimited number of shares authorized): | | | | |
Class A | | | 1,344 | |
Class C | | | 1,341 | |
Class I (formerly Select Class) | | | 1,965,934 | |
Class R2 | | | 1,341 | |
Class R3 | | | 1,343 | |
Class R4 | | | 1,344 | |
Class R5 | | | 1,346 | |
Class R6 | | | 1,346 | |
Net Asset Value (a): | | | | |
Class A - Redemption price per share | | $ | 15.66 | |
Class C - Offering price per share (b) | | | 15.66 | |
Class I (formerly Select Class) - Offering and redemption price per share | | | 15.66 | |
Class R2 - Offering and redemption price per share | | | 15.66 | |
Class R3 - Offering and redemption price per share | | | 15.66 | |
Class R4 - Offering and redemption price per share | | | 15.66 | |
Class R5 - Offering and redemption price per share | | | 15.66 | |
Class R6 - Offering and redemption price per share | | | 15.66 | |
Class A maximum sales charge | | | 4.50 | % |
Class A maximum public offering price per share
[net asset value per share/(100% – maximum sales charge)] | | $ | 16.40 | |
| | | | |
Cost of investments in non-affiliates | | $ | 10,838,405 | |
Cost of investments in affiliates | | | 19,064,546 | |
| (a) | Per share amounts may not recalculate due to rounding of net assets and/or shares outstanding. |
| (b) | Redemption price for Class C Shares varies based upon length of time the shares are held. |
SEE NOTES TO FINANCIAL STATEMENTS.
9
STATEMENT OF OPERATIONS
FOR THE PERIOD ENDED JUNE 30, 2017
| | | | |
| | | JPMorgan
SmartSpendingSM
2050 Fund (a) | |
INVESTMENT INCOME: | | | | |
Dividend income from non-affiliates | | $ | 112,166 | |
Dividend income from affiliates | | | 237,055 | |
Interest income from non-affiliates | | | 1,363 | |
| | | | |
Total investment income | | | 350,584 | |
| | | | |
| |
EXPENSES: | | | | |
Investment advisory fees | | | 52,848 | |
Administration fees | | | 12,336 | |
Distribution fees: | | | | |
Class A | | | 25 | |
Class C | | | 76 | |
Class R2 | | | 50 | |
Class R3 | | | 25 | |
Service fees: | | | 37,708 | |
Class A | | | 25 | |
Class C | | | 25 | |
Class I (formerly Select Class) | | | 37,572 | |
Class R2 | | | 25 | |
Class R3 | | | 25 | |
Class R4 | | | 25 | |
Class R5 | | | 11 | |
Custodian and accounting fees | | | 15,530 | |
Professional fees | | | 25,527 | |
Trustees’ and Chief Compliance Officer’s fees | | | 10,390 | |
Printing and mailing costs | | | 1,001 | |
Registration and filing fees | | | 4,001 | |
Transfer agency fees (See Note 2.H.) | | | 2,144 | |
Sub-transfer agency fees (See Note 2.H.) | | | 1,753 | |
Offering costs | | | 46,683 | |
Other | | | 8,600 | |
| | | | |
Total expenses | | | 218,697 | |
| | | | |
Less fees waived | | | (71,249 | ) |
Less expense reimbursements | | | (117,329 | ) |
| | | | |
Net expenses | | | 30,119 | |
| | | | |
Net investment income (loss) | | | 320,465 | |
| | | | |
| |
REALIZED/UNREALIZED GAINS (LOSSES): | | | | |
Net realized gain (loss) on transactions from: | | | | |
Investments in non-affiliates | | | 31,500 | |
Investments in affiliates | | | 40,560 | |
Futures | | | 4,720 | |
Foreign currency transactions | | | 3,832 | |
| | | | |
Net realized gain (loss) | | | 80,612 | |
| | | | |
Change in net unrealized appreciation/depreciation on: | | | | |
Investments in non-affiliates | | | 452,767 | |
Investments in affiliates | | | 730,520 | |
Futures | | | 25,752 | |
Foreign currency translations | | | (1,870 | ) |
| | | | |
Change in net unrealized appreciation/depreciation | | | 1,207,169 | |
| | | | |
Net realized/unrealized gains (losses) | | | 1,287,781 | |
| | | | |
Change in net assets resulting from operations | | $ | 1,608,246 | |
| | | | |
| (a) | Inception date was December 30, 2016. |
SEE NOTES TO FINANCIAL STATEMENTS.
10
STATEMENT OF CHANGES IN NET ASSETS
FOR THE PERIOD INDICATED
| | | | |
| | | JPMorgan
SmartSpendingSM 2050
Fund | |
| | | Period Ended June 30,
2017 (a) | |
CHANGE IN NET ASSETS RESULTING FROM OPERATIONS: | | | | |
Net investment income (loss) | | $ | 320,465 | |
Net realized gain (loss) | | | 80,612 | |
Change in net unrealized appreciation/depreciation | | | 1,207,169 | |
| | | | |
Change in net assets resulting from operations | | | 1,608,246 | |
| | | | |
| |
DISTRIBUTIONS TO SHAREHOLDERS: | | | | |
Class A | | | | |
From net investment income | | | (164 | ) |
Class C | | | | |
From net investment income | | | (114 | ) |
Class I (formerly Select Class) | | | | |
From net investment income | | | (281,132 | ) |
Class R2 | | | | |
From net investment income | | | (122 | ) |
Class R3 | | | | |
From net investment income | | | (148 | ) |
Class R4 | | | | |
From net investment income | | | (173 | ) |
Class R5 | | | | |
From net investment income | | | (189 | ) |
Class R6 | | | | |
From net investment income | | | (199 | ) |
| | | | |
Total distributions to shareholders | | | (282,241 | ) |
| | | | |
CAPITAL TRANSACTIONS: | | | | |
Change in net assets resulting from capital transactions | | | 29,615,574 | |
| | | | |
| |
NET ASSETS: | | | | |
Change in net assets | | | 30,941,579 | |
Beginning of period | | | — | |
| | | | |
End of period | | $ | 30,941,579 | |
| | | | |
Accumulated undistributed net investment income | | $ | 33,977 | |
| | | | |
| (a) | Commencement of operations was December 30, 2016. |
SEE NOTES TO FINANCIAL STATEMENTS.
11
STATEMENT OF CHANGES IN NET ASSETS
FOR THE PERIOD INDICATED (continued)
| | | | |
| | | JPMorgan
SmartSpendingSM 2050
Fund | |
| | | Period Ended June 30,
2017 (a) | |
CAPITAL TRANSACTIONS: | | | | |
Class A | | | | |
Proceeds from shares issued | | $ | 20,000 | |
Distributions reinvested | | | 164 | |
| | | | |
Change in net assets resulting from Class A capital transactions | | $ | 20,164 | |
| | | | |
Class C | | | | |
Proceeds from shares issued | | $ | 20,000 | |
Distributions reinvested | | | 114 | |
| | | | |
Change in net assets resulting from Class C capital transactions | | $ | 20,114 | |
| | | | |
Class I (formerly Select Class) | | | | |
Proceeds from shares issued | | $ | 29,860,000 | |
Distributions reinvested | | | 281,132 | |
Cost of shares redeemed | | | (666,667 | ) |
| | | | |
Change in net assets resulting from Class I capital transactions | | $ | 29,474,465 | |
| | | | |
Class R2 | | | | |
Proceeds from shares issued | | $ | 20,000 | |
Distributions reinvested | | | 122 | |
| | | | |
Change in net assets resulting from Class R2 capital transactions | | $ | 20,122 | |
| | | | |
Class R3 | | | | |
Proceeds from shares issued | | $ | 20,000 | |
Distributions reinvested | | | 148 | |
| | | | |
Change in net assets resulting from Class R3 capital transactions | | $ | 20,148 | |
| | | | |
Class R4 | | | | |
Proceeds from shares issued | | $ | 20,000 | |
Distributions reinvested | | | 173 | |
| | | | |
Change in net assets resulting from Class R4 capital transactions | | $ | 20,173 | |
| | | | |
Class R5 | | | | |
Proceeds from shares issued | | $ | 20,000 | |
Distributions reinvested | | | 189 | |
| | | | |
Change in net assets resulting from Class R5 capital transactions | | $ | 20,189 | |
| | | | |
Class R6 | | | | |
Proceeds from shares issued | | $ | 20,000 | |
Distributions reinvested | | | 199 | |
| | | | |
Change in net assets resulting from Class R6 capital transactions | | $ | 20,199 | |
| | | | |
Total change in net assets resulting from capital transactions | | $ | 29,615,574 | |
| | | | |
| (a) | Commencement of operations was December 30, 2016. |
SEE NOTES TO FINANCIAL STATEMENTS.
12
STATEMENT OF CHANGES IN NET ASSETS
FOR THE PERIOD INDICATED (continued)
| | | | |
| | | JPMorgan
SmartSpendingSM 2050
Fund | |
| | | Period Ended June 30,
2017 (a) | |
SHARE TRANSACTIONS: | | | | |
Class A | | | | |
Issued | | | 1,333 | |
Reinvested | | | 11 | |
| | | | |
Change in Class A Shares | | | 1,344 | |
| | | | |
Class C | | | | |
Issued | | | 1,334 | |
Reinvested | | | 7 | |
| | | | |
Change in Class C Shares | | | 1,341 | |
| | | | |
Class I (formerly Select Class) | | | | |
Issued | | | 1,990,667 | |
Reinvested | | | 18,135 | |
Redeemed | | | (42,868 | ) |
| | | | |
Change in Class I Shares | | | 1,965,934 | |
| | | | |
Class R2 | | | | |
Issued | | | 1,333 | |
Reinvested | | | 8 | |
| | | | |
Change in Class R2 Shares | | | 1,341 | |
| | | | |
Class R3 | | | | |
Issued | | | 1,333 | |
Reinvested | | | 10 | |
| | | | |
Change in Class R3 Shares | | | 1,343 | |
| | | | |
Class R4 | | | | |
Issued | | | 1,333 | |
Reinvested | | | 11 | |
| | | | |
Change in Class R4 Shares | | | 1,344 | |
| | | | |
Class R5 | | | | |
Issued | | | 1,334 | |
Reinvested | | | 12 | |
| | | | |
Change in Class R5 Shares | | | 1,346 | |
| | | | |
Class R6 | | | | |
Issued | | | 1,333 | |
Reinvested | | | 13 | |
| | | | |
Change in Class R6 Shares | | | 1,346 | |
| | | | |
| (a) | Commencement of operations was December 30, 2016. |
SEE NOTES TO FINANCIAL STATEMENTS.
13
FINANCIAL HIGHLIGHTS
FOR THE PERIODS INDICATED
| | | | | | | | | | | | | | | | | | | | | | | | | | | | | | | | | | | | | | | | | | | | | | | | |
| | | Per share operating performance | | | Ratios/Supplemental data | |
| | | | | | Investment operations | | | Distributions | | | | | | | | | | | | Ratios to average net assets (a) | | | | |
| | | Net asset
value,
beginning
of period | | | Net
investment
income
(loss)
(b)(g) | | | Net realized and
unrealized gains
(losses) on
investments | | | Total from
investment
operations | | | Net
investment
income | | | Net asset
value, end
of period | | | Total return
(excludes
sales
charge)
(c)(d) | | | Net assets,
end of period | | | Net expenses
(e)(h) | | | Net
investment
income
(loss)
(e)(g) | | | Expenses without
waivers and
reimbursements
(e)(h) | | | Portfolio
turnover
rate (c) | |
SmartSpending 2050 Fund | | | | | | | | | | | | | | | | | | | | | | | | | | | | | | | | | | | | | | | | | | | | | | | | |
Class A | | | | | | | | | | | | | | | | | | | | | | | | | | | | | | | | | | | | | | | | | | | | | | | | |
December 30, 2016 (f) through June 30, 2017 | | $ | 15.00 | | | $ | 0.14 | | | $ | 0.64 | | | $ | 0.78 | | | $ | (0.12 | ) | | $ | 15.66 | | | | 5.23 | % | | $ | 21,050 | | | | 0.45 | % | | | 1.85 | % | | | 3.76 | % | | | 8 | % |
Class C | | | | | | | | | | | | | | | | | | | | | | | | | | | | | | | | | | | | | | | | | | | | | | | | |
December 30, 2016 (f) through June 30, 2017 | | | 15.00 | | | | 0.10 | | | | 0.64 | | | | 0.74 | | | | (0.08 | ) | | | 15.66 | | | | 4.97 | | | | 21,000 | | | | 0.93 | | | | 1.36 | | | | 4.32 | | | | 8 | |
Class I (formerly Select Class) | | | | | | | | | | | | | | | | | | | | | | | | | | | | | | | | | | | | | | | | | | | | | | | | |
December 30, 2016 (f) through June 30, 2017 | | | 15.00 | | | | 0.16 | | | | 0.64 | | | | 0.80 | | | | (0.14 | ) | | | 15.66 | | | | 5.36 | | | | 30,794,263 | | | | 0.19 | | | | 2.09 | | | | 1.26 | | | | 8 | |
Class R2 | | | | | | | | | | | | | | | | | | | | | | | | | | | | | | | | | | | | | | | | | | | | | | | | |
December 30, 2016 (f) through June 30, 2017 | | | 15.00 | | | | 0.11 | | | | 0.64 | | | | 0.75 | | | | (0.09 | ) | | | 15.66 | | | | 5.02 | | | | 21,009 | | | | 0.84 | | | | 1.44 | | | | 4.09 | | | | 8 | |
Class R3 | | | | | | | | | | | | | | | | | | | | | | | | | | | | | | | | | | | | | | | | | | | | | | | | |
December 30, 2016 (f) through June 30, 2017 | | | 15.00 | | | | 0.13 | | | | 0.64 | | | | 0.77 | | | | (0.11 | ) | | | 15.66 | | | | 5.15 | | | | 21,035 | | | | 0.59 | | | | 1.69 | | | | 3.82 | | | | 8 | |
Class R4 | | | | | | | | | | | | | | | | | | | | | | | | | | | | | | | | | | | | | | | | | | | | | | | | |
December 30, 2016 (f) through June 30, 2017 | | | 15.00 | | | | 0.15 | | | | 0.64 | | | | 0.79 | | | | (0.13 | ) | | | 15.66 | | | | 5.27 | | | | 21,060 | | | | 0.35 | | | | 1.94 | | | | 3.57 | | | | 8 | |
Class R5 | | | | | | | | | | | | | | | | | | | | | | | | | | | | | | | | | | | | | | | | | | | | | | | | |
December 30, 2016 (f) through June 30, 2017 | | | 15.00 | | | | 0.16 | | | | 0.64 | | | | 0.80 | | | | (0.14 | ) | | | 15.66 | | | | 5.35 | | | | 21,076 | | | | 0.20 | | | | 2.09 | | | | 3.43 | | | | 8 | |
Class R6 | | | | | | | | | | | | | | | | | | | | | | | | | | | | | | | | | | | | | | | | | | | | | | | | |
December 30, 2016 (f) through June 30, 2017 | | | 15.00 | | | | 0.17 | | | | 0.64 | | | | 0.81 | | | | (0.15 | ) | | | 15.66 | | | | 5.40 | | | | 21,086 | | | | 0.10 | | | | 2.19 | | | | 3.33 | | | | 8 | |
| (a) | Annualized for periods less than one year, unless otherwise noted. |
| (b) | Calculated based upon average shares outstanding. |
| (c) | Not annualized for periods less than one year. |
| (d) | Includes adjustments in accordance with accounting principles generally accepted in the United States of America and as such, the net asset values for financial reporting purposes and the returns based upon those net asset values may differ from the net asset values and returns for shareholder transactions. |
| (e) | Certain non-recurring expenses incurred by the Fund were not annualized for the period ended June 30, 2017. |
| (f) | Commencement of operations. |
| (g) | Net investment income (loss) is affected by timing of distributions from underlying Funds. |
| (h) | Does not include expenses of underlying Funds. |
SEE NOTES TO FINANCIAL STATEMENTS.
14
NOTES TO FINANCIAL STATEMENTS
AS OF JUNE 30, 2017
1. Organization
JPMorgan Trust IV (the “Trust”) was formed on November 11, 2015, as a Delaware statutory trust, pursuant to a Declaration of Trust dated November 11, 2015 and is registered under the Investment Company Act of 1940, as amended (the “1940 Act”), as an open-end management investment company.
The following is a separate fund of the Trust (the “Fund”) covered by this report:
| | |
| Classes Offered | | Diversified/Non-Diversified |
SmartSpendingSM 2050 Fund Class A, Class C, Class I*, Class R2, Class R3, Class R4, Class R5 and Class R6 | | Diversified |
| * | Effective April 3, 2017, Select Class was renamed Class I. |
The investment objective of the Fund is to seek to provide total return consisting of current income and capital appreciation.
The Fund commenced operations on December 30, 2016. Currently, the Fund is not publicly offered for investment.
Class A Shares generally provide for a front-end sales charge while Class C Shares provide for a contingent deferred sales charge (“CDSC”). No sales charges are assessed with respect to Class I, Class R2, Class R3, Class R4, Class R5 and Class R6 Shares. All classes of shares have equal rights as to earnings, assets and voting privileges, except that each class may bear different transfer agency, sub-transfer agency (through April 2, 2017), distribution and service fees and each class has exclusive voting rights with respect to its distribution plan and shareholder servicing agreements. Effective April 3, 2017, sub-transfer agency and shareholder servicing fees were consolidated into a single service fee. Certain Class A Shares, for which front-end sales charges have been waived, may be subject to a CDSC as described in the Fund’s prospectus. Beginning on November 14, 2017, Class C Shares will automatically convert to Class A Shares after ten years.
J.P. Morgan Investment Management Inc. (“JPMIM”), an indirect, wholly-owned subsidiary of JPMorgan Chase & Co. (“JPMorgan”), acts as Adviser (the “Adviser”) and Administrator (the “Administrator”) to the Fund.
2. Significant Accounting Policies
The following is a summary of significant accounting policies followed by the Fund in the preparation of its financial statements. The Fund is an investment company and, accordingly, follows the investment company accounting and reporting guidance of the Financial Accounting Standards Board Accounting Standards Codification Topic 946 — Investment Companies, which is part of U.S. generally accepted accounting principles (“GAAP”). The preparation of financial statements in conformity with GAAP requires management to make estimates and assumptions that affect the reported amounts of assets and liabilities and disclosure of contingent assets and liabilities at the date of the financial statements and the reported amounts of increases and decreases in net assets from operations during the reporting period. Actual results could differ from those estimates.
A. Valuation of Investments — The valuation of investments is in accordance with GAAP and the Fund’s valuation policies set forth by and under the supervision and responsibility of the Board of Trustees (the “Board”), which established the following approach to valuation, as described more fully below: (i) investments for which market quotations are readily available shall be valued at such unadjusted quoted prices and (ii) all other investments for which market quotations are not readily available shall be valued at their fair value as determined in good faith by the Board.
The Administrator has established the J.P. Morgan Investment Management Americas Valuation Committee (“AVC”) to assist the Board with the oversight and monitoring of the valuation of the Fund’s investments. The Administrator implements the valuation policies of the Fund’s investments, as directed by the Board. The AVC oversees and carries out the policies for the valuation of investments held in the Fund. This includes monitoring the appropriateness of fair values based on results of ongoing valuation oversight, including but not limited to consideration of macro or security specific events, market events and pricing vendor and broker due diligence. The Administrator is responsible for discussing and assessing the potential impacts to the fair values on an ongoing basis, and at least on a quarterly basis with the AVC and the Board.
Equities and other exchange-traded instruments are valued at the last sale price or official market closing price on the primary exchange on which the instrument is traded before the net asset values (“NAV”) of the Fund are calculated on a valuation date. Certain foreign equity instruments, as well as certain derivatives with equity reference obligations, are valued by applying international fair value factors provided by approved affiliated and unaffiliated pricing vendors or third party broker-dealers (collectively referred to as “Pricing Services”). The factors seek to adjust the local closing price for movements of local markets post closing, but prior to the time the NAVs are calculated. Investments in open-end investment companies, excluding exchange-traded funds (“ETFs”) (the “Underlying Funds”), are valued at each Underlying Fund’s NAV per share as of the report date. Fixed income instruments are valued based on prices received from Pricing Services. The Pricing Services use multiple valuation techniques to determine the valuation of fixed income instruments. In instances where sufficient market activity exists, the Pricing Services may utilize a market-based approach through which trades or quotes from market makers are used to determine the valuation of these instruments. In instances where sufficient market activity may not exist, the Pricing Services also utilize proprietary valuation models which may consider market transactions in comparable securities and the various relationships between securities in determining fair value and/or market characteristics in order to estimate the relevant cash flows, which are then discounted to calculate the fair values.
Futures are generally valued on the basis of available market quotations.
15
Valuations reflected in this report are as of the report date. As a result, changes in valuation due to market events and/or issuer related events after the report date and prior to issuance of the report are not reflected herein.
The various inputs that are used in determining the valuation of the Fund’s investments are summarized into the three broad levels listed below.
| | • | | Level 1 — Unadjusted inputs using quoted prices in active markets for identical investments. |
| | • | | Level 2 — Other significant observable inputs including, but not limited to, quoted prices for similar investments, inputs other than quoted prices that are observable for investments (such as interest rates, prepayment speeds, credit risk, etc.) or other market corroborated inputs. |
| | • | | Level 3 — Significant inputs based on the best information available in the circumstances, to the extent observable inputs are not available (including the Fund’s assumptions in determining the fair value of investments). |
A financial instrument’s level within the fair value hierarchy is based on the lowest level of any input, both individually and in the aggregate, that is significant to the fair value measurement. The inputs or methodology used for valuing instruments are not necessarily an indication of the risk associated with investing in those instruments.
The following table represents each valuation input as presented on the Schedule of Portfolio Investments (“SOI”):
| | | | | | | | | | | | | | | | |
| | | Level 1 Quoted prices | | | Level 2 Other significant
observable inputs | | | Level 3 Significant unobservable
inputs | | | Total | |
Total Investments in Securities (a) | | $ | 30,727,127 | | | $ | 359,111 | | | $ | — | | | $ | 31,086,238 | |
| | | | |
Appreciation in Other Financial Instruments | | | | | | | | | | | | | | | | |
Futures Contracts | | $ | 54,607 | | | $ | 11,578 | | | $ | — | | | $ | 66,185 | |
| | | | |
Depreciation in Other Financial Instruments | | | | | | | | | | | | | | | | |
Futures Contracts | | $ | (21,173 | ) | | $ | (19,260 | ) | | $ | — | | | $ | (40,433 | ) |
| | | | |
| (a) | All portfolio holdings designated in level 1 and level 2 are disclosed individually on the SOI. Level 2 consists of foreign futures with equity reference obligations and a U.S. Treasury Note held as initial margin for futures contracts. Please refer to the SOI for asset class specifics of portfolio holdings. |
There were no transfers among any levels during the period ended June 30, 2017.
B. Futures Contracts — The Fund used treasury and index futures contracts to gain exposure to or to overweight or underweight allocations among various sectors or markets, maintain liquidity or minimize transaction costs. The Fund also buys futures contracts to invest incoming cash in the market or sells futures in response to cash outflows, thereby simulating an invested position in the underlying index while maintaining a cash balance for liquidity.
Futures contracts provide for the delayed delivery of the underlying instrument at a fixed price or are settled for a cash amount based on the change in the value of the underlying instrument at a specific date in the future. Upon entering into a futures contract, the Fund is required to deposit with the broker, cash or securities in an amount equal to a certain percentage of the contract amount, which is referred to as the initial margin deposit. Subsequent payments, referred to as variation margin, are made or received by the Fund periodically and are based on changes in the market value of open futures contracts. Changes in the market value of open futures contracts are recorded as Change in net unrealized appreciation/ depreciation on the Statements of Operations. Realized gains or losses, representing the difference between the value of the contract at the time it was opened and the value at the time it was closed, are reported on the Statements of Operations at the closing or expiration of the futures contract. Securities deposited as initial margin are designated in the SOIs and cash deposited is recorded on the Statements of Assets and Liabilities. A receivable from and/or a payable to brokers for the daily variation margin is also recorded on the Statements of Assets and Liabilities.
The use of futures contracts exposes the Fund to equity price and interest rate risks. The Fund may be subject to the risk that the change in the value of the futures contract may not correlate perfectly with the underlying instrument. Use of long futures contracts subjects the Fund to risk of loss in excess of the amounts shown on the Statements of Assets and Liabilities, up to the notional amount of the futures contracts. Use of short futures contracts subjects the Fund to unlimited risk of loss. The Fund may enter into futures contracts only on exchanges or boards of trade. The exchange or board of trade acts as the counterparty to each futures transaction; therefore, the Fund’s credit risk is limited to failure of the exchange or board of trade. Under some circumstances, futures exchanges may establish daily limits on the amount that the price of a futures contract can vary from the previous day’s settlement price, which could effectively prevent liquidation of positions.
The tables below disclose the volume of the Fund’s futures contracts activity during the period ended June 30, 2017:
| | | | | | | | |
| | | Average
Notional
Balance | | | Ending
Notional
Balance | |
Long Futures Contracts: | | | | | | | | |
Equity | | $ | 2,120,900 | (a) | | $ | 2,481,357 | |
Interest Rate | | | 1,192,188 | (b) | | | 1,192,189 | |
16
| | | | | | | | |
Short Futures Contracts: | | | | | | | | |
Equity | | | 404,626 | (a) | | | 283,162 | |
Interest Rate | | | 3,404,928 | (a) | | | 4,630,219 | |
| (a) | For the period January 1, 2017 through June 30, 2017. |
| (b) | For the period June 1, 2017 through June 30, 2017. |
The Fund’s futures contracts are not subject to master netting arrangements (the right to close out all transactions traded with a counterparty and net amounts owed or due across transactions).
C. Summary of Derivatives Information — The following table presents the value of derivatives held as of June 30, 2017, by their primary underlying risk exposure and respective location on the Statements of Assets and Liabilities:
| | | | | | |
| Derivative Contracts | | Statements of Assets and Liabilities Location | | | |
| Gross Assets: | | | | Futures Contracts (a) | |
Equity contracts | | Receivables, Net Assets — Unrealized Appreciation | | $ | 17,278 | |
Interest rate contracts | | Receivables, Net Assets — Unrealized Appreciation | | | 48,907 | |
| | | | | | |
Total | | | | $ | 66,185 | |
| | | | | | |
| | |
Gross Liabilities: | | | | | |
Equity contracts | | Payables, Net Assets — Unrealized Depreciation | | $ | (20,936 | ) |
Interest rate contracts | | Payables, Net Assets — Unrealized Depreciation | | | (19,497 | ) |
| | | | | | |
Total | | | | $ | (40,433 | ) |
| | | | | | |
| (a) | This amount reflects the cumulative appreciation (depreciation) of futures contracts as reported on the SOIs. The Statements of Assets and Liabilities only reflect the current day variation margin receivable/payable to brokers. |
The following tables present the effect of derivatives on the Statements of Operations for the period ended June 30, 2017, by primary underlying risk exposure:
| | | | |
Amount of Realized Gain (Loss) on Derivatives Recognized on the Statement of Operations | |
| Derivative Contracts | | Futures Contracts | |
Equity contracts | | $ | 80,216 | |
Interest rate contracts | | | (75,496 | ) |
| | | | |
Total | | $ | 4,720 | |
| | | | |
| | | | |
Amount of Change in Unrealized Appreciation (Depreciation) on Derivatives Recognized on the Statement of Operations | |
| Derivative Contracts | | Futures Contracts | |
Equity contracts | | $ | (3,658 | ) |
Interest rate contracts | | | 29,410 | |
| | | | |
Total | | $ | 25,752 | |
| | | | |
The Fund’s derivatives contracts held at June 30, 2017 are not accounted for as hedging instruments under GAAP.
D. Investment Transactions with Affiliates — The Fund invested in Underlying Funds which are advised by the Adviser or its affiliates. An issuer which is under common control with the Fund may be considered an affiliate. For the purposes of the financial statements, the Fund assumes the issuers listed in the table below to be affiliated issuers. Underlying Funds’ distributions may be reinvested into the Underlying Funds. Reinvestment amounts are included in the purchase cost amounts in the table below. Included in the purchases and sales amounts in the table below are exchanges between certain share classes of the affiliated Underlying Funds. Such exchanges are not treated as purchases and sales for the purpose of recognizing realized gains (losses) or portfolio turnover. Included in the realized gain (loss) amounts in the table below are distributions of realized capital gains, if any, received from the affiliated Underlying Funds.
17
| | | | | | | | | | | | | | | | | | | | | | | | | | | | |
| | | | | | For the period ended June 30, 2017 | | | | | | | |
| Affiliate | | Value at
December 30,
2016 | | | Purchase
Cost | | | Sales
Proceeds | | | Realized
Gain/(Loss) | | | Dividend
Income | | | Shares at
June 30,
2017 | | | Value at
June 30, 2017 | |
JPMorgan Commodities Strategy Fund, Class R6 Shares | | $ | — | | | $ | 495,544 | | | $ | — | | | $ | — | | | $ | — | | | | 54,213 | | | $ | 470,571 | |
JPMorgan Core Bond Fund, Class R6 Shares | | | — | | | | 5,805,820 | | | | — | | | | — | | | | 80,015 | | | | 504,776 | | | | 5,870,543 | |
JPMorgan Corporate Bond Fund, Class R6 Shares | | | — | | | | 838,024 | | | | — | | | | — | | | | 13,024 | | | | 84,716 | | | | 859,025 | |
JPMorgan Emerging Markets Debt Fund, Class R6 Shares | | | — | | | | 423,332 | | | | — | | | | — | | | | 5,589 | | | | 51,793 | | | | 426,255 | |
JPMorgan Emerging Markets Strategic Debt Fund, Class R6 Shares | | | — | | | | 425,434 | | | | — | | | | — | | | | 5,069 | | | | 51,103 | | | | 426,202 | |
JPMorgan Equity Index Fund, Class R6 Shares | | | — | | | | 3,027,736 | | | | 187,240 | | | | 9,691 | | | | 27,742 | | | | 82,416 | | | | 3,085,665 | |
JPMorgan Floating Rate Income Fund, Class R6 Shares | | | — | | | | 764,330 | | | | — | | | | — | | | | 14,330 | | | | 80,883 | | | | 761,104 | |
JPMorgan Growth Advantage Fund, Class R6 Shares | | | — | | | | 750,000 | | | | 110,889 | | | | 10,993 | | | | — | | | | 41,094 | | | | 770,920 | |
JPMorgan High Yield Fund, Class R6 Shares | | | — | | | | 3,198,443 | | | | 202,020 | | | | 3,256 | | | | 84,547 | | | | 407,033 | | | | 3,028,327 | |
JPMorgan International Research Enhanced Equity Fund, Class I Shares | | | — | | | | 1,350,000 | | | | 121,598 | | | | 9,297 | | | | — | | | | 78,985 | | | | 1,409,887 | |
JPMorgan U.S. Equity Fund, Class R6 Shares | | | — | | | | 1,101,011 | | | | 137,889 | | | | 7,323 | | | | 5,043 | | | | 66,164 | | | | 1,050,019 | |
JPMorgan Value Advantage Fund, Class R6 Shares | | | — | | | | 750,000 | | | | — | | | | — | | | | — | | | | 23,285 | | | | 782,599 | |
JPMorgan U.S. Government Money Market Fund, Institutional Class Shares | | | — | | | | 2,710,767 | | | | 1,856,819 | | | | — | | | | 1,696 | | | | 853,949 | | | | 853,949 | |
| | | | | | | | | | | | | | | | | | | | | | | | | | | | |
| | $ | — | | | | | | | | | | | $ | 40,560 | | | $ | 237,055 | | | | | | | $ | 19,795,066 | |
| | | | | | | | | | | | | | | | | | | | | | | | | | | | |
E. Offering and Organizational Costs — Total offering costs of $93,787 incurred in connection with the offering of shares of the Fund are amortized on a straight line basis over 12 months from the date the Fund commenced operations. Costs paid in connection with the organization of the Fund, if any, were recorded as an expense at the time the Fund commenced operations and are included as part of Professional fees on the Statement of Operations. For the period ended June 30, 2017, total offering costs amortized were $46,683.
F. Foreign Currency Translation — The books and records of the Fund are maintained in U.S. dollars. Foreign currency amounts are translated into U.S. dollars at the prevailing exchange rates of such currencies against the U.S. dollar. The market value of investment securities and other assets and liabilities are translated at the exchange rate as of the valuation date. Purchases and sales of investment securities, income and expenses are translated at the exchange rate prevailing on the respective dates of such transactions.
The Fund does not isolate the effect of changes in foreign exchange rates from changes in market prices on securities held. Accordingly, such changes are included within Change in net unrealized appreciation/depreciation on investments on the Statement of Operations.
Reported realized foreign currency gains and losses arise from the disposition of foreign currency, currency gains or losses realized between the trade and settlement dates on securities transactions, and the difference between the amounts of dividends, interest and foreign withholding taxes recorded on the Fund’s books on the transaction date and the U.S. dollar equivalent of the amounts actually received or paid. These reported realized foreign currency gains and losses are included in Net realized gain (loss) on foreign currency transactions on the Statement of Operations. Unrealized foreign currency gains and losses arise from changes (due to changes in exchange rates) in the value of foreign currency and other assets and liabilities denominated in foreign currencies, which are held at year end are included in Change in net unrealized appreciation/depreciation on foreign currency translations on the Statement of Operations.
G. Security Transactions and Investment Income — Investment transactions are accounted for on the trade date (the date the order to buy or sell is executed). Securities gains and losses are calculated on a specifically identified cost basis. Interest income is determined on the basis of coupon interest accrued using the effective interest method which adjusts for amortization of premiums and accretion of discounts. Distributions of net investment income and realized capital gains from the Underlying Funds and ETFs, if any, are recorded on the ex-dividend date.
H. Allocation of Income and Expenses — Expenses directly attributable to a fund are charged directly to that fund, while the expenses attributable to more than one fund of the Trust are allocated among the respective funds. In calculating the NAV of each class, investment income, realized and unrealized gains and losses and expenses, other than class-specific expenses, are allocated daily to each class of shares based upon the proportion of net assets of each class at the beginning of each day.
Transfer agency fees are class-specific expenses and sub-transfer agency fees were class-specific expenses up through April 2, 2017. Effective April 3, 2017, the Fund ceased making direct payments to financial intermediaries for any applicable sub-transfer agency services. Payments to financial intermediaries for sub-transfer agency services are made by JPMorgan Distribution Services, Inc. from the Shareholder Servicing Fee, which has been renamed as the Service Fee. The amount of the transfer agency fees and sub-transfer agency fees charged to each class of the Fund for the period ended June 30, 2017 are as follows:
18
| | | | | | | | | | | | | | | | | | | | | | | | | | | | | | | | | | | | |
| | | Class A | | | Class C | | | Class I | | | Class R2 | | | Class R3 | | | Class R4 | | | Class R5 | | | Class R6 | | | Total | |
Transfer agency fees | | $ | 238 | | | $ | 238 | | | $ | 477 | | | $ | 238 | | | $ | 238 | | | $ | 239 | | | $ | 238 | | | $ | 238 | | | $ | 2,144 | |
Sub-transfer agency fees | | | 1 | | | | 1 | | | | 1,749 | | | | 2 | | | | — | | | | — | | | | — | | | | — | | | | 1,753 | |
The Fund invests in Underlying Funds and ETFs and, as a result, bears a portion of the expenses incurred by these Underlying Funds and ETFs. These expenses are not reflected in the expenses shown on the Statement of Operations and are not included in the ratios to average net assets shown in the Financial Highlights. Certain expenses of affiliated Underlying Funds and ETFs are waived as described in Note 3.F.
I. Federal Income Taxes — The Fund is treated as a separate taxable entity for Federal income tax purposes. The Fund’s policy is to comply with the provisions of the Internal Revenue Code of 1986, as amended (the “Code”), applicable to regulated investment companies and to distribute to shareholders all of its distributable net investment income and net realized capital gains on investments. Accordingly, no provision for Federal income tax is necessary. Management has reviewed the Fund’s tax positions for all open tax years and has determined that as of June 30, 2017, no liability for income tax is required in the Fund’s financial statements for net unrecognized tax benefits. However, management’s conclusions may be subject to future review based on changes in, or the interpretation of, the accounting standards or tax laws and regulations. The Fund’s Federal tax returns for the prior three fiscal years remains, or since inception if shorter, subject to examination by the Internal Revenue Service.
J. Distributions to Shareholders — Distributions from net investment income are generally declared and paid monthly and are declared separately for each class. No class has preferential dividend rights; differences in per share rates are due to differences in separate class expenses. Net realized capital gains, if any, are distributed at least annually. The amount of distributions from net investment income and net realized capital gains is determined in accordance with Federal income tax regulations, which may differ from GAAP. To the extent these “book/tax” differences are permanent in nature (i.e., that they result from other than timing of recognition — “temporary differences”), such amounts are reclassified within the capital accounts based on their Federal tax-basis treatment.
The following amounts were reclassified within the capital accounts:
| | | | | | | | | | | | |
| | | Paid-in-Capital | | | Accumulated undistributed (distributions in excess of) net investment income | | | Accumulated net realized gains (losses) | |
| | $ | (61 | ) | | $ | (4,247 | ) | | $ | 4,308 | |
The reclassifications for the Fund relate primarily to foreign currency gains or losses.
3. Fees and Other Transactions with Affiliates
A. Investment Advisory Fee — Pursuant to an Investment Advisory Agreement, the Adviser supervises the investments of the Fund and for such services is paid a fee. The fee is accrued daily and paid monthly at an annual rate of 0.35% of the Fund’s average daily net assets.
The Adviser waived Investment Advisory fees and/or reimbursed expenses as outlined in Note 3.F.
B. Administration Fee — Pursuant to an Administration Agreement, the Administrator provides certain administration services to the Fund. In consideration of these services, the Administrator receives a fee accrued daily and paid monthly at an annual rate of 0.15% of the first $25 billion of the average daily net assets of all funds in the J.P. Morgan Funds Complex covered by the Administration Agreement (excluding certain funds of funds and money market funds) and 0.075% of the average daily net assets in excess of $25 billion of all such funds. For the period ended June 30, 2017, the annualized rate was 0.08% of the Fund’s average daily net assets, notwithstanding any fee waivers and/or expense reimbursements.
JPMorgan Chase Bank, N.A. (“JPMCB”), a wholly-owned subsidiary of JPMorgan, serves as the Fund’s sub-administrator (the “Sub-administrator”). For its services as Sub-administrator, JPMCB receives a portion of the fees payable to the Administrator.
C. Distribution Fees — Pursuant to a Distribution Agreement, JPMorgan Distribution Services, Inc. (“JPMDS”), a wholly-owned subsidiary of JPMorgan, serves as the Trust’s principal underwriter and promotes and arranges for the sale of the Fund’s shares.
The Board has adopted a Distribution Plan (the “Distribution Plan”) for Class A, Class C, Class R2 and Class R3 Shares of the Fund in accordance with Rule 12b-1 under the 1940 Act. Class I, Class R4, Class R5 and Class R6 do not charge a distribution fee. The Distribution Plan provides that the Fund shall pay distribution fees, including payments to JPMDS, at annual rates of 0.25%, 0.75%, 0.50% and 0.25% of the average daily net assets of Class A, Class C, Class R2 and Class R3 Shares, respectively.
D. Service Fees — The Trust, on behalf of the Fund, has entered into a Shareholder Servicing Agreement with JPMDS under which JPMDS provides certain support services to the shareholders. The Class R6 Shares do not charge a service fee. For performing these services, JPMDS receives a fee that is accrued daily and paid monthly equal to a percentage of the average daily net assets as shown in the table below:
19
| | | | | | | | | | | | | | | | | | | | | | | | | | |
| Class A | | | Class C | | | Class I | | | R2 Class | | | R3 Class | | | R4 Class | | | R5 Class | |
| | 0.25 | % | | | 0.25 | % | | | 0.25 | % | | | 0.25 | % | | | 0.25 | % | | | 0.25 | % | | | 0.10 | % |
JPMDS has entered into shareholder services contracts with affiliated and unaffiliated financial intermediaries who provide shareholder services and other related services to their clients or customers who invest in the Fund under which JPMDS will pay all or a portion of such fees earned to financial intermediaries for performing such services.
E. Custodian and Accounting Fees — JPMCB provides portfolio custody and accounting services to the Fund. For performing these services, the Fund pays JPMCB transaction and asset-based fees that vary according to the number of transactions and positions, plus out-of-pocket expenses. The amounts paid directly to JPMCB by the Fund for custody and accounting services are included in Custodian and accounting fees on the Statement of Operations. Payments to the custodian may be reduced by credits earned by the Fund, based on uninvested cash balances held by the custodian. Such earnings credits, if any, are presented separately on the Statement of Operations.
Interest expense paid to the custodian related to cash overdrafts, if any, is included in Interest expense to affiliates on the Statement of Operations.
F. Waivers and Reimbursements — The Adviser, Administrator and JPMDS have contractually agreed to waive fees and/or reimburse expenses to the extent that total annual operating expenses of the Fund, Underlying Funds and ETFs (excluding dividend and interest expenses related to short sales, interest, taxes, expenses related to litigation and potential litigation, extraordinary expenses incurred by the Fund and any Underlying Fund and ETFs and acquired fund fees incurred by an Underlying Fund and ETFs) exceed the percentages of the Fund’s average daily net assets as shown in the table below:
| | | | | | | | | | | | | | | | | | | | | | | | | | | | | | |
| Class A | | | Class C | | | Class I | | | R2 Class | | | R3 Class | | | R4 Class | | | R5 Class | | | R6 Class | |
| | 0.74 | % | | | 1.24 | % | | | 0.49 | % | | | 1.15 | % | | | 0.90 | % | | | 0.65 | % | | | 0.50 | % | | | 0.40 | % |
The expense limitation agreement was in effect for the period ended June 30, 2017 and is in place until at least December 29, 2017.
For the period ended June 30, 2017, the Fund’s service providers waived fees and/or reimbursed expenses for the Fund as follows. None of these parties expect the Fund to repay any such waived fees and reimbursed expenses in future years.
| | | | | | | | | | | | | | | | | | | | |
| | | Contractual Waivers | | | | |
| | | Investment Advisory
Fees | | | Administration
Fees | | | Service
Fees | | | Total | | | Contractual
Reimbursement | |
| | $ | 52,848 | | | $ | 12,336 | | | $ | 6,065 | | | $ | 71,249 | | | $ | 117,329 | |
The Underlying Funds may impose separate advisory and servicing fees. To avoid charging a servicing fee at an effective rate above 0.25% for Class A, Class C, Class I, Class R2, Class R3 and Class R4 Shares and above 0.10% for Class R5 Shares, JPMDS may waive servicing fees with respect to the Fund in an amount equal to the weighted average pro-rata amount of servicing fees charged by the affiliated Underlying Funds. These waivers may be in addition to any waivers required to meet the Fund’s contractual expense limitations, but will not exceed the Fund’s servicing fees. .
G. Other — Certain officers of the Trust are affiliated with the Adviser, the Administrator and JPMDS. Such officers, with the exception of the Chief Compliance Officer, receive no compensation from the Fund for serving in their respective roles.
The Board appointed a Chief Compliance Officer to the Fund in accordance with Federal securities regulations. The Fund, along with other affiliated funds, makes reimbursement payments, on a pro-rata basis, to the Administrator for a portion of the fees associated with the Office of the Chief Compliance Officer. Such fees are included in Trustees’ and Chief Compliance Officer’s fees on the Statement of Operations.
The Trust adopted a Trustee Deferred Compensation Plan (the “Plan”) which allows the Independent Trustees to defer the receipt of all or a portion of compensation related to performance of their duties as Trustees. The deferred fees are invested in various J.P. Morgan Funds until distribution in accordance with the Plan.
The Fund may use related party broker-dealers. For the period ended June 30, 2017, the Fund did not incur any brokerage commissions with broker-dealers affiliated with the Adviser.
The SEC has granted an exemptive order permitting the Fund to invest in certain financial instruments in addition to Underlying Funds and securities.
4. Investment Transactions
During the period ended June 30, 2017, purchases and sales of investments (excluding short-term investments) were as follows:
| | | | | | | | | | | | |
| | | Purchases
(excluding
U.S. Government) | | | Sales
(excluding
U.S. Government) | | | Purchases
of
U.S. Government) | |
| | $ | 30,931,931 | | | $ | 2,314,674 | | | $ | 269,671 | |
20
5. Federal Income Tax Matters
For Federal income tax purposes, the estimated cost and unrealized appreciation (depreciation) in value of investment securities held at June 30, 2017 were as follows:
| | | | | | | | | | | | | | | | |
| | | Aggregate
Cost | | | Gross
Unrealized
Appreciation | | | Gross
Unrealized
Depreciation | | | Net Unrealized
Appreciation
(Depreciation) | |
| | $ | 29,902,951 | | | $ | 1,212,915 | | | $ | 29,628 | | | $ | 1,183,287 | |
The tax character of distributions paid during the period ended June 30, 2017 was as follows:
| | | | | | | | | | | | |
| | | Ordinary Income* | | | Net
Long-Term
Capital Gains | | | Total
Distributions
Paid | |
| | $ | 282,241 | | | $ | — | | | $ | 282,241 | |
| * | Short-term gains are treated as ordinary income for income tax purposes. |
As of June 30, 2017, the estimated components of net assets (excluding paid-in-capital) on a tax basis were as follows:
| | | | | | | | | | | | |
| | | Current
Distributable
Ordinary
Income | | | Current
Distributable
Long-Term
Capital Gain or
(Tax Basis
Loss Carryover) | | | Unrealized
Appreciation
(Depreciation) | |
| | $ | 143,169 | | | $ | 14,207 | | | $ | 1,170,851 | |
The cumulative timing differences primarily consist of mark to market of futures contracts.
At June 30, 2017, the Fund did not have any net capital loss carryforwards.
6. Borrowings
The Fund relies upon an exemptive order granted by the SEC (the “Order”) permitting the establishment and operation of an Interfund Lending Facility (the “Facility”). The Facility allows the Fund to directly lend and borrow money to or from any other fund relying upon the Order at rates beneficial to both the borrowing and lending funds. Advances under the Facility are taken primarily for temporary or emergency purposes, including the meeting of redemption requests that otherwise might require the untimely disposition of securities, and are subject to the Fund’s borrowing restrictions. The Interfund loan rate is determined, as specified in the Order, by averaging the current repurchase agreement rate and the current bank loan rate. The Order was granted to JPMorgan Trust II and may be relied upon by the Fund because the Fund and the series of JPMorgan Trust II are both investment companies in the same “group of investment companies” (as defined in Section 12(d)(1)(G) of the 1940 Act).
The Trust and JPMCB have entered into a financing arrangement. Under this arrangement, JPMCB provides an unsecured, uncommitted credit facility in the aggregate amount of $100 million to certain of the J.P. Morgan Funds, including the Fund. Advances under the arrangement are taken primarily for temporary or emergency purposes, including the meeting of redemption requests that otherwise might require the untimely disposition of securities, and are subject to the Fund’s borrowing restrictions. Interest on borrowings is payable at a rate determined by JPMCB at the time of borrowing. This agreement has been extended until November 6, 2017.
The Fund had no borrowings outstanding from another fund or from the unsecured, uncommitted credit facility during the period ended June 30, 2017.
7. Risks, Concentrations and Indemnifications
In the normal course of business, the Fund enters into contracts that contain a variety of representations which provide general indemnifications. The Fund’s maximum exposure under these arrangements is unknown. The amount of exposure would depend on future claims that may be made against the Fund that have not yet occurred. However, based on experience, the Fund expects the risk of loss to be remote.
As of June 30, 2017, all of the Fund’s shares were held by the Adviser.
Because of the Fund’s investments in the Underlying Funds and ETFs, the Fund indirectly pays a portion of the expenses incurred by the Underlying Funds and ETFs. As a result, the cost of investing in the Fund may be higher than the cost of investing in a mutual fund that invests directly in Individual securities and financial instruments. The Fund is also subject to certain risks related to the Underlying Funds’ and ETFs’ investments in securities and financial instruments such as equity securities, foreign and emerging markets securities and real estate securities. These securities are subject to risks specific to their structure, sector or market.
The Fund invests in unaffiliated ETFs. ETFs are pooled investment vehicles whose ownership interests are purchased and sold on a securities exchange. ETFs may be structured as investment companies, depositary receipts or other pooled investment vehicles and may be passively or actively managed. Passively managed ETFs generally seek to track the performance of a particular market index, including broad-based market indexes, as well as indexes relating to particular sectors, markets, regions or industries. Actively managed ETFs do not seek to track the
21
performance of a particular market index. The price movement of an index-based ETF may not track the underlying index and may result in a loss. In addition, ETFs may trade at a price below or above their NAV (also known as a discount or premium, respectively).
In addition, the Underlying Funds and ETFs may use derivative instruments in connection with their individual investment strategies including futures contracts, forward foreign currency exchange contracts, options, swaps and other derivatives, which are also subject to specific risks related to their structure, sector or market and may be riskier than investments in other types of securities.
Derivatives may be riskier than other types of investments because they may be more sensitive to changes in economic and market conditions and could result in losses that significantly exceed the Fund’s original investment. Derivatives also expose the Fund to counterparty risk (the risk that the derivative counterparty will not fulfill its contractual obligations), including credit risk of the derivative counterparty.
Specific risks and concentrations present in the Underlying Funds and ETFs are disclosed within their individual financial statements and registration statements, as appropriate.
8. Investment Company Reporting Modernization
In October 2016, the U.S. Securities and Exchange Commission adopted new rules and forms, and amendments to certain current rules and forms, to modernize the reporting and disclosure of information by registered investment companies. In part, the final rules amend Regulation S-X and will require standardized, enhanced disclosures about derivatives in investment company financial statements, as well as other amendments. The amendments to Regulation S-X will apply to Fund’s fiscal year ends on or after August 1, 2017. At this time, management is currently evaluating the impact of the regulation S-X amendments on the Fund’s financial statements and related disclosures. The adoption will have no effect on the Fund’s net assets or results of operations.
22
REPORT OF INDEPENDENT REGISTERED PUBLIC ACCOUNTING FIRM
To the Board of Trustees of JPMorgan Trust IV and the Shareholders of JPMorgan SmartSpending 2050 Fund
In our opinion, the accompanying statement of assets and liabilities, including the schedule of portfolio investments, and the related statements of operations and of changes in net assets and the financial highlights present fairly, in all material respects, the financial position of JPMorgan SmartSpending 2050 Fund (a separate series of JPMorgan Trust IV) (the “Fund”) as of June 30, 2017, and the results of its operations, the changes in its net assets and the financial highlights for the period December 30, 2016 (commencement of operations) through June 30, 2017, in conformity with accounting principles generally accepted in the United States of America. These financial statements and financial highlights (hereafter referred to as “financial statements”) are the responsibility of the Fund’s management. Our responsibility is to express an opinion on these financial statements based on our audit. We conducted our audit of these financial statements in accordance with the standards of the Public Company Accounting Oversight Board (United States). Those standards require that we plan and perform the audit to obtain reasonable assurance about whether the financial statements are free of material misstatement. An audit includes examining, on a test basis, evidence supporting the amounts and disclosures in the financial statements, assessing the accounting principles used and significant estimates made by management, and evaluating the overall financial statement presentation. We believe that our audit, which included confirmation of securities as of June 30, 2017 by correspondence with the transfer agent, custodian and brokers, provides a reasonable basis for our opinion.
PricewaterhouseCoopers LLP
New York, New York
August 25, 2017
23
TRUSTEES
(Unaudited)
The Fund’s Statement of Additional Information includes additional information about the Fund’s Trustees and is available, without charge, upon request by calling 1-800-480-4111 or on the J.P. Morgan Funds’ website at www.jpmorganfunds.com.
| | | | | | |
Name (Year of Birth); Positions With the Fund (1) | | Principal Occupations During Past 5 Years | | Number of
Portfolios in Fund
Complex Overseen
by Trustee (2) | | Other Directorships Held Outside Fund Complex During Past 5 Years |
Independent Trustees | | |
| | | |
| John F. Finn (1947); Trustee of Trust since 2005; Trustee of heritage One Group Mutual Funds since 1998. | | Chairman (1985-present), Chief Executive Officer, Gardner, Inc. (supply chain management company serving industrial and consumer markets) (1974-present). | | 150 | | Director, Greif, Inc. (GEF) (industrial package products and services) (2007-present); Trustee, Columbus Association for the Performing Arts (1988-present); Director, Cardinal Health, Inc. (CAH) (1994-2014). |
| | | |
| Dr. Matthew Goldstein (1941); Chairman since 2013; Trustee of Trust since 2005; Trustee of heritage J.P. Morgan Funds since 2003. | | Chancellor Emeritus, City University of New York (2015-present); Professor, City University of New York (2013-present); Chancellor, City University of New York (1999-2013); President, Adelphi University (New York) (1998-1999). | | 150 | | Trustee, Museum of Jewish Heritage (2011-present); Trustee, National Museum of Mathematics (present); Chair, Association of College and University Administrators (present). |
| | | |
| Dennis P. Harrington (1950); Trustee of Trust since 2017. | | Retired; Partner, Deloitte LLP (1984-2012). | | 149 | | None |
| | | |
| Frankie D. Hughes (1952); Trustee of Trust since 2008. | | President, Ashland Hughes Properties (property management) (2014-present); President and Chief Investment Officer, Hughes Capital Management, Inc. (fixed income asset management) (1993-2014). | | 150 | | None |
| | | |
Raymond Kanner (1953); Trustee of the Trusts since 2017. | | Retired; Managing Director & Chief Investment Officer, IBM Retirement Funds (2007-2016). | | 149 | | Director, Emerging Markets Growth Fund (1997-2016); Acting Executive Director, Committee on Investment of Employee Benefit Assets (CIEBA), 2016-17; Advisory Board Member, Betterment for Business (2016-present) (robo advisor); Advisory Board Member, Blue Star Indexes (2013-present) (index creator); Member, Russell Index Client Advisory Board (2001-2015). |
| | | |
| Peter C. Marshall (1942); Trustee of Trust since 2005; Trustee of heritage One Group Mutual Funds since 1985. | | Self-employed business consultant
(2002-present). | | 150 | | None |
| | | |
| Mary E. Martinez (1960); Trustee of Trust since 2013. | | Associate, Special Properties, a Christie’s International Real Estate Affiliate (2010-present); Managing Director, Bank of America (Asset Management) (2007-2008); Chief Operating Officer, U.S. Trust Asset Management, U.S. Trust Company (asset management) (2003-2007); President, Excelsior Funds (registered investment companies) (2004-2005). | | 150 | | None |
| | | |
| Marilyn McCoy* (1948); Trustee of Trust since 2005; Trustee of heritage One Group Mutual Funds since 1999. | | Vice President of Administration and Planning, Northwestern University (1985-present). | | 150 | | None |
24
| | | | | | |
Name (Year of Birth); Positions With the Fund (1) | | Principal Occupations During Past 5 Years | | Number of
Portfolios in Fund
Complex Overseen
by Trustee (2) | | Other Directorships Held Outside Fund Complex During Past 5 Years |
Independent Trustees (continued) | | |
| | | |
| Mitchell M. Merin (1953); Trustee of Trust since 2013. | | Retired; President and Chief Operating Officer, Morgan Stanley Investment Management, Member Morgan Stanley & Co. Management Committee (registered investment adviser) (1985-2005). | | 150 | | Director, Sun Life Financial (SLF) (2007-2013) (financial services and insurance). |
| | | |
| Dr. Robert A. Oden, Jr. (1946); Trustee of Trust since 2005; Trustee of heritage One Group Mutual Funds since 1997. | | Retired; President, Carleton College
(2002-2010); President, Kenyon College
(1995-2002). | | 150 | | Chairman, Dartmouth-Hitchcock Medical Center (2011-present); Trustee, American Schools of Oriental Research (2011-present); Trustee, American University in Cairo (1999-2014); Trustee, American Museum of Fly Fishing (2013-present). |
| | | |
| Marian U. Pardo** (1946); Trustee of Trust since 2013. | | Managing Director and Founder, Virtual Capital Management LLC (Investment Consulting) (2007-present); Managing Director, Credit Suisse Asset Management (portfolio manager) (2003-2006). | | 150 | | Member, Board of Governors, Columbus Citizens Foundation (not-for-profit supporting philanthropic and cultural programs) (2006-present). |
| | | |
| Frederick W. Ruebeck (1939); Trustee of Trust since 2005; Trustee of heritage One Group Mutual Funds since 1994. | | Consultant (2000-present); Advisor, JP Greene & Associates, LLC (broker-dealer) (2000-2009); Chief Investment Officer, Wabash College (2004-2015); Director of Investments, Eli Lilly and Company (pharmaceuticals) (1988-1999). | | 150 | | Trustee, Wabash College (2000-present). |
| | | |
| James J. Schonbachler (1943); Trustee of Trust since 2005; Trustee of heritage J.P. Morgan Funds since 2001. | | Retired; Managing Director of Bankers Trust Company (financial services) (1968-1998). | | 150 | | None |
| (1) | The Trustees serve for an indefinite term, subject to the Trust’s current retirement policy, which is age 78 for all Trustees. |
| (2) | A Fund Complex means two or more registered investment companies that hold themselves out to investors as related companies for purposes of investment and investor services or have a common investment adviser or have an investment adviser that is an affiliated person of the investment adviser of any of the other registered investment companies. The J.P. Morgan Funds Complex for which the Board of Trustees serves currently includes twelve registered investment companies (150 funds). |
| * | Two members of the Board of Trustees of Northwestern University are executive officers of registered investment advisers (not affiliated with JPMorgan) that are under common control with sub-advisers to certain J.P. Morgan Funds. |
| ** | In connection with prior employment with JPMorgan Chase, Ms. Pardo was the recipient of non-qualified pension plan payments from JPMorgan Chase in the amount of approximately $2,055 per month, which she irrevocably waived effective January 1, 2013, and deferred compensation payments from JPMorgan Chase in the amount of approximately $7,294 per year, which ended in January 2013. In addition, Ms. Pardo receives payments from a fully-funded qualified plan, which is not an obligation of JPMorgan Chase. |
The contact address for each of the Trustees is 270 Park Avenue, New York, NY 10017.
25
OFFICERS
(Unaudited)
| | |
Name (Year of Birth), Positions Held with the Trust (Since) | | Principal Occupations During Past 5 Years |
| |
Brian S. Shlissel (1964),
President and Principal Executive Officer (2016) | | Managing Director and Chief Administrative Officer for J.P. Morgan pooled vehicles, J.P. Morgan Investment Management Inc. (formerly JPMorgan Funds Management, Inc.) (2014 – present); Managing Director and Head of Mutual Fund Services, Allianz Global Investors; President and Chief Executive Officer, Allianz Global Investors Mutual Funds and PIMCO Closed-End Funds (1999-2014) |
| |
Laura M. Del Prato (1964),
Treasurer and Principal Financial Officer (2014)* | | Managing Director, J.P. Morgan Investment Management Inc. (formerly JPMorgan Funds Management, Inc.) since 2014; Partner, Cohen Fund Audit Services, Ltd. (2012-2013); Partner (2004-2012) and various other titles (1990-2004) at KPMG, LLP. |
| |
Frank J. Nasta (1964),
Secretary (2008) | | Managing Director and Associate General Counsel, JPMorgan Chase since 2008. |
| |
Stephen M. Ungerman (1953),
Chief Compliance Officer (2005) | | Managing Director, JPMorgan Chase & Co.; Mr. Ungerman has been with JPMorgan Chase & Co. since 2000. |
| |
Elizabeth A. Davin (1964), Assistant Secretary (2005)* | | Executive Director and Assistant General Counsel, JPMorgan Chase since February 2012; formerly Vice President and Assistant General Counsel, JPMorgan Chase from 2005 to February 2012; Senior Counsel, JPMorgan Chase (formerly Bank One Corporation) from 2004 to 2005. |
| |
Jessica K. Ditullio (1962),
Assistant Secretary (2005)* | | Executive Director and Assistant General Counsel, JPMorgan Chase. Ms. Ditullio has been with JPMorgan Chase (formerly Bank One Corporation) since 1990. |
| |
John T. Fitzgerald (1975),
Assistant Secretary (2008) | | Executive Director and Assistant General Counsel, JPMorgan Chase. Mr. Fitzgerald has been with JPMorgan Chase since 2005. |
| |
Carmine Lekstutis (1980),
Assistant Secretary (2011) | | Executive Director and Assistant General Counsel, JPMorgan Chase since February 2015; formerly Vice President and Assistant General Counsel, JPMorgan Chase from 2011 to February 2015. |
| |
Gregory S. Samuels (1980),
Assistant Secretary (2010) | | Executive Director and Assistant General Counsel, JPMorgan Chase since 2014; formerly Vice President and Assistant General Counsel, JPMorgan Chase since 2010. |
| |
Pamela L. Woodley (1971),
Assistant Secretary (2012)** | | Vice President and Assistant General Counsel, JPMorgan Chase since November 2004. |
| |
Zachary E. Vonnegut-Gabovitch (1986) Assistant Secretary (2017) | | Vice President and Assistant General Counsel, JPMorgan Chase since September 2016; Associate, Morgan, Lewis & Bockius (law firm) from 2012 to 2016. |
| |
Michael M. D’Ambrosio (1969),
Assistant Treasurer (2012) | | Managing Director, J.P. Morgan Investment Management Inc. (formerly JPMorgan Funds Management, Inc.) since May 2014; formerly Executive Director, JPMorgan Funds Management, Inc. from 2012 to May 2014; prior to joining JPMorgan Chase, Mr. D’Ambrosio was a Tax Director at PricewaterhouseCoopers LLP since 2006. |
| |
Lauren A. Paino (1973), Assistant Treasurer (2014)** | | Executive Director, J.P. Morgan Investment Management Inc. (formerly JPMorgan Funds Management, Inc.) since August 2013; formerly Director, Credit Suisse Asset Management from 2000-2013. |
| |
Joseph Parascondola (1963),
Assistant Treasurer (2011)** | | Vice President, J.P. Morgan Investment Management Inc. (formerly JPMorgan Funds Management, Inc.) since August 2006. |
| |
Matthew J. Plastina (1970),
Assistant Treasurer (2011)** | | Executive Director, J.P. Morgan Investment Management Inc. (formerly JPMorgan Funds Management, Inc.) since February 2016; Vice President, JPMorgan Funds Management, Inc. from 2010 to January 2016. |
| |
Gillian I. Sands (1969),
Assistant Treasurer (2012)** | | Vice President, J.P. Morgan Investment Management Inc. (formerly JPMorgan Funds Management, Inc.) since September 2012; Assistant Treasurer, Wells Fargo Funds Management (2007-2009). |
The contact address for each of the officers, unless otherwise noted, is 270 Park Avenue, New York, NY 10017.
| * | The contact address for the officer is 1111 Polaris Parkway, Columbus, OH 43240. |
| ** | The contact address for the officer is 4 New York Plaza, New York, NY 10004. |
26
SCHEDULE OF SHAREHOLDER EXPENSES
(Unaudited)
Hypothetical $1,000 Investment
As a shareholder of the Fund, you incur two types of costs: (1) transaction costs, including sales charges (loads) on purchase payments and (2) ongoing costs, including investment advisory fees, administration fees, distribution fees and other Fund expenses. The examples below are intended to help you understand your ongoing costs (in dollars) of investing in the Fund and to compare these ongoing costs with the ongoing costs of investing in other mutual funds. The examples assume that you had a $1,000 investment in each Class at the beginning of the reporting period, January 1, 2017, and continued to hold your shares at the end of the reporting period, June 30, 2017.
Actual Expenses
For each Class of the Fund in the table below, the first line provides information about actual account values and actual expenses. You may use the information in this line, together with the amount you invested, to estimate the expenses that you paid over the period. Simply divide your account value by $1,000 (for example, an $8,600 account value divided by $1,000 = 8.6), then multiply the result by the number in the first line of each Class under the heading entitled “Expenses Paid During the Period” to estimate the expenses you paid on your account during this period.
Hypothetical Example for Comparison Purposes
The second line of each Class in the table below provides information about hypothetical account values and hypothetical expenses based on the Class’ actual expense ratio and an assumed rate of return of 5% per year before expenses, which is not the Class’ actual return. The hypothetical account values and expenses may not be used to estimate the actual ending account balance or expenses you paid for the period. You may use this information to compare the ongoing costs of investing in the Class of the Fund and other funds. To do so, compare this 5% hypothetical example with the 5% hypothetical examples that appear in the shareholder reports of the other funds. Please note that the expenses shown in the table are meant to highlight your ongoing costs only and do not reflect any transaction costs, such as sales charges (loads) or redemption fees. Therefore, the second line for each Class in the table is useful in comparing ongoing costs only, and will not help you determine the relative total costs of owning different funds. In addition, if these transaction costs were included, your costs would have been higher. The examples also assume all dividends and distributions have been reinvested.
| | | | | | | | | | | | | | | | |
| | | Beginning
Account Value
January 1, 2017 | | | Ending
Account Value
June 30, 2017 | | | Expenses
Paid During the
Period* | | | Annualized
Expense
Ratio | |
SmartSpending 2050 Fund | | | | | | | | | | | | | | | | |
Class A | | | | | | | | | | | | | | | | |
Actual | | $ | 1,000.00 | | | | 1,052.30 | | | $ | 2.34 | | | | 0.46 | % |
Hypothetical | | | 1,000.00 | | | | 1,022.51 | | | | 2.31 | | | | 0.46 | |
Class C | | | | | | | | | | | | | | | | |
Actual | | | 1,000.00 | | | | 1,049.70 | | | | 4.73 | | | | 0.93 | |
Hypothetical | | | 1,000.00 | | | | 1,020.18 | | | | 4.66 | | | | 0.93 | |
Class I (formerly Select Class) | | | | | | | | | | | | | | | | |
Actual | | | 1,000.00 | | | | 1,053.60 | | | | 1.02 | | | | 0.20 | |
Hypothetical | | | 1,000.00 | | | | 1,023.80 | | | | 1.00 | | | | 0.20 | |
Class R2 | | | | | | | | | | | | | | | | |
Actual | | | 1,000.00 | | | | 1,050.20 | | | | 4.32 | | | | 0.85 | |
Hypothetical | | | 1,000.00 | | | | 1,020.58 | | | | 4.26 | | | | 0.85 | |
Class R3 | | | | | | | | | | | | | | | | |
Actual | | | 1,000.00 | | | | 1,051.50 | | | | 3.05 | | | | 0.60 | |
Hypothetical | | | 1,000.00 | | | | 1,021.82 | | | | 3.01 | | | | 0.60 | |
Class R4 | | | | | | | | | | | | | | | | |
Actual | | | 1,000.00 | | | | 1,052.70 | | | | 1.78 | | | | 0.35 | |
Hypothetical | | | 1,000.00 | | | | 1,023.06 | | | | 1.76 | | | | 0.35 | |
27
SCHEDULE OF SHAREHOLDER EXPENSES
(Unaudited) (continued)
Hypothetical $1,000 Investment
| | | | | | | | | | | | | | | | |
| | | Beginning
Account Value
January 1, 2017 | | | Ending
Account Value
June 30, 2017 | | | Expenses
Paid During the
Period* | | | Annualized
Expense
Ratio | |
Class R5 | | | | | | | | | | | | | | | | |
Actual | | $ | 1,000.00 | | | $ | 1,053.50 | | | $ | 1.02 | | | | 0.20 | % |
Hypothetical | | | 1,000.00 | | | | 1,023.80 | | | | 1.00 | | | | 0.20 | |
Class R6 | | | | | | | | | | | | | | | | |
Actual | | | 1,000.00 | | | | 1,054.00 | | | | 0.51 | | | | 0.10 | |
Hypothetical | | | 1,000.00 | | | | 1,024.30 | | | | 0.50 | | | | 0.10 | |
| * | Expenses are equal to each Class’ respective annualized expense ratio, multiplied by the average account value over the period, multiplied by 181/365 (to reflect the actual period). |
28
Tax Letter
(Unaudited)
Certain tax information for the J.P. Morgan Funds is required to be provided to shareholders based upon the Fund’s income and distributions for the taxable year ended June 30, 2017. The information and distributions reported in this letter may differ from the information and taxable distributions reported to the shareholders for the calendar year ending December 31, 2017. The information necessary to complete your income tax returns for the calendar year ending December 31, 2017 will be provided under separate cover.
Qualified Dividend Income (QDI)
The Fund had $34,752, or maximum allowable amount, of ordinary income distributions treated as qualified dividends for the fiscal year ended June 30, 2017.
29

Rev. January 2011
| | | | |
| FACTS | | WHAT DOES J.P. MORGAN FUNDS DO WITH YOUR PERSONAL INFORMATION? | | |
| | | | |
| Why? | | Financial companies choose how they share your personal information. Federal law gives consumers the right to limit some but not all sharing. Federal law also requires us to tell you how we collect, share, and protect your personal information. Please read this notice carefully to understand what we do. | | |
| | | | |
| What? | | The types of personal information we collect and share depend on the product or service you have with us. This information can include: • Social Security number and account balances • transaction history and account transactions • checking account information and wire transfer instructions When you are no longer our customer, we continue to share your information as described in this notice. | | |
| | | | |
| How? | | All financial companies need to share customers’ personal information to run their everyday business. In the section below, we list the reasons financial companies can share their customers’ personal information; the reasons J.P. Morgan Funds chooses to share; and whether you can limit this sharing. | | |
| | | | 
|
| | | | | | |
| Reasons we can share your personal information | | Does J.P. Morgan Funds share? | | Can you limit this sharing? | | |
For our everyday business purposes — such as to process your transactions, maintain your account(s), respond to court orders and legal investigations, or report to credit bureaus | | Yes | | No | | |
For marketing purposes — to offer our products and services to you | | Yes | | No | | |
| For joint marketing with other financial companies | | No | | We don’t share | | |
For our affiliates’ everyday business purposes — information about your transactions and experiences | | No | | We don’t share | | |
For our affiliates’ everyday business purposes — information about your creditworthiness | | No | | We don’t share | | |
| For nonaffiliates to market to you | | No | | We don’t share | | |
| | | | |
| Questions? | | Call 1-800-480-4111 or go to www.jpmorganfunds.com | | |
| | |
Who we are |
| Who is providing this notice? | | J.P. Morgan Funds |
| | |
What we do |
| How does J.P. Morgan Funds protect my personal information? | | To protect your personal information from unauthorized access and use, we use security measures that comply with federal law. These measures include computer safeguards and secured files and buildings. We authorize our employees to access your information only when they need it to do their work and we require companies that work for us to protect your information. |
How does J.P. Morgan Funds collect my personal information? | | We collect your personal information, for example, when you: • open an account or provide contact information • give us your account information or pay us by check • make a wire transfer We also collect your personal information from others, such as credit bureaus, affiliates and other companies. |
| Why can’t I limit all sharing? | | Federal law gives you the right to limit only • sharing for affiliates’ everyday business purposes - information about your creditworthiness • affiliates from using your information to market to you • sharing for nonaffiliates to market to you State laws and individual companies may give you additional rights to limit sharing. |
| | |
Definitions |
| Affiliates | | Companies related by common ownership or control. They can be financial and nonfinancial companies. • J.P. Morgan Funds does not share with our affiliates. |
| Nonaffiliates | | Companies not related by common ownership or control. They can be financial and nonfinancial companies. • J.P. Morgan Funds does not share with nonaffiliates so they can market to you. |
| Joint Marketing | | A formal agreement between nonaffiliated financial companies that together market financial products or services to you. • J.P. Morgan Funds doesn’t jointly market. |
J.P. Morgan Funds are distributed by JPMorgan Distribution Services, Inc., which is an affiliate of JPMorgan Chase & Co. Affiliates of JPMorgan Chase & Co. receive fees for providing various services to the funds.
Contact JPMorgan Distribution Services, Inc. at 1-800-480-4111 for a fund prospectus. You can also visit us at www.jpmorganfunds.com. Investors should carefully consider the investment objectives and risk as well as charges and expenses of the mutual fund before investing. The prospectus contains this and other information about the mutual fund. Read the prospectus carefully before investing.
Investors may obtain information about the Securities Investor Protection Corporation (SIPC), including the SIPC brochure by visiting www.sipc.org or by calling SIPC at 202-371-8300.
Each Fund files a complete schedule of its fund holdings for the first and third quarters of its fiscal year with the SEC on Form N-Q. The Funds’ Forms N-Q are available on the SEC’s website at http://www.sec.gov and may be reviewed and copied at the SEC’s Public Reference Room in Washington, DC. Information on the operation of the SEC’s Public Reference Room may be obtained by calling 1-800-SEC-0330. Shareholders may request the Form N-Q without charge by calling 1-800-480-4111 or by visiting the J.P. Morgan Funds’ website at www.jpmorganfunds.com.
A description of each Fund’s policies and procedures with respect to the disclosure of each Fund’s holdings is available in the prospectus and Statement of Additional Information.
A copy of proxy policies and procedures is available without charge upon request by calling 1-800-480-4111 and on the Funds’ website at www.jpmorganfunds.com. A description of such policies and procedures is on the SEC’s website at www.sec.gov. The Trustees have delegated the authority to vote proxies for securities owned by the Funds to the Adviser. A copy of the Funds’ voting record for the most recent 12-month period ended June 30 is available on the SEC’s website at www.sec.gov or at the Funds’ website at www.jpmorganfunds.com no later than August 31 of each year. The Funds’ proxy voting record will include, among other things, a brief description of the matter voted on for each fund security, and will state how each vote was cast, for example, for or against the proposal.
| | | | |
©JP Morgan Chase & Co., 2017. All rights reserved. June 2017. | | |  | |
J.P. Morgan Funds
Annual Report
June 30, 2017
JPMorgan Equity Low Volatility Income Fund
JPMorgan Value Plus Fund
Investments in a Fund are not deposits or obligations of, or guaranteed or endorsed by, any bank and are not insured or guaranteed by the FDIC, the Federal Reserve Board or any other government agency. You could lose money if you sell when a Fund’s share price is lower than when you invested.
Past performance is no guarantee of future performance. The general market views expressed in this report are opinions based on market and other conditions through the end of the reporting period and are subject to change without notice. These views are not intended to predict the future performance of a Fund or the securities markets. References to specific securities and their issuers are for illustrative purposes only and are not intended to be, and should not be interpreted as, recommendations to purchase or sell such securities. Such views are not meant as investment advice and may not be relied on as an indication of trading intent on behalf of any Fund.
Prospective investors should refer to the Funds’ prospectuses for a discussion of the Funds’ investment objective, strategies and risks. Call J.P. Morgan Funds Service Center at 1-800-480-4111 for a prospectus containing more complete information about a Fund including management fees and other expenses. Please read it carefully before investing.
CEO’S LETTER
August 4, 2017 (Unaudited)
Dear Shareholder,
The current U.S. economic expansion entered its eighth year in 2017 and growth in developed and emerging market economies grew more synchronized even as U.S. growth showed some signs of easing. Global financial markets generally benefitted from steady economic growth amid an environment of low inflation, low volatility and rising corporate profits.
While economic growth in the U.S. and China largely drove the global recovery throughout 2016, by June 2017 the world’s other leading economies had picked up sufficiently enough for the Organization for Economic Co-operation and Development to forecast global growth at 3.5% in 2017 and 3.6% in 2018.
U.S. gross domestic product (GDP) growth slowed to 1.2% in the first quarter of 2017 from 2.5% and 3.5% growth in the fourth quarter and third quarters of 2016, respectively. Meanwhile, the U.S. unemployment rate continued its downward trend throughout the past twelve months, dropping to 4.4% in June 2017 from 4.9% one year earlier. In response to these numbers, along with nascent signs of price inflation, the U.S. Federal Reserve (the “Fed”) raised interest rates in December 2016 and again in June 2017 and signaled it would raise rates once more before the end of the year. Further, Fed Chairwoman Janet Yellen indicated she was prepared to begin partially unwinding the central bank’s $4.5 trillion balance sheet in assets purchased through its quantitative easing program. An increase in consumer spending helped second-quarter 2017 GDP climb by 2.6% from a year earlier.
Notably, by mid-2017 domestic price inflation had dropped below the Fed’s target of 2% growth and wage growth was below many economists’ expectations, the latter despite an environment of essentially full employment for U.S. workers. These trends – and the Fed’s acknowledgment of them – provided some near-term uncertainty about the central bank’s commitment to tightening monetary policy.
Throughout the twelve months ended June 30, 2017, global oil prices remained a key focal point for policy makers, economists and investors. Global crude prices reached 15-month highs in October 2016 and received further support from the Organization of Petroleum Exporting Countries’ December 2016 decision to curb production. However, continued oversupply of crude and natural gas, partly due to continued U.S. production, pushed the price of a barrel of benchmark West Texas Intermediate crude oil down to $46 by the end of June 2017.
Meanwhile, the leading economies of Europe continued to strengthen from what had been an anemic expansion. Annualized GDP for the 19 core euro area nations rose 1.9% in the first quarter of 2017 and 2.1% in the second quarter. The June 2017 aggregate unemployment rate for those nations fell to 9.1%, its lowest level since March 2009. Also, in separate elections in 2017, voters in the Netherlands and France largely rejected populist campaigns espousing policies to limit free trade and immigration. The election results provided another boost to global equity prices.
In the U.S., the continued economic expansion, muted inflation, corporate earnings growth and historically low volatility in financial markets helped to drive key equity market indexes to multiple record closing highs throughout the past twelve months. U.S. investors appeared to shrug off intermittent political and policy dramas emanating from Washington, D.C. and extended the run-up in U.S. equity prices into its eighth consecutive year – one of the longest on record.
Over the twelve month period, U.S. and foreign markets largely rewarded those who remained fully invested in financial markets and we believe the fundamental virtues of patience and diversification remain essential to prudent investment strategy.
We look forward to managing your investment needs for years to come. Should you have any questions, please visit www.jpmorganfunds.com or contact the J.P. Morgan Funds Service Center at 1-800-480-4111.
Sincerely yours,
George C.W. Gatch
CEO, Global Funds Management & Institutional, J.P. Morgan Asset Management
1
JPMorgan Equity Low Volatility Income Fund
Fund Commentary
For the Period July 31, 2016 to June 30, 2017 (Unaudited)
| | | | |
| Reporting Period Return: | | | |
Portfolio (Class I Shares) 1* | | | 12.32% | |
S&P 500 Index | | | 13.70% | |
BofA Merrill Lynch U.S. 3-Month Treasury Bill Index | | | 0.46% | |
| |
Net Assets as of 6/30/2017 | | $ | 56,117,499 | |
| |
INVESTMENT OBJECTIVE**
The JPMorgan Equity Low Volatility Income Funds (the “Fund”) seeks total return, which includes current income and capital appreciation.
HOW DID THE MARKET PERFORM?
Overall, U.S. equity markets provided positive returns and key stock market indexes reached multiple record highs throughout the eleven month reporting period. Steady global economic growth, continued low inflation and strong corporate earnings all served to support equity prices, both in the U.S. and elsewhere. Small cap stocks generally outperformed large cap and mid cap stocks during the reporting period, while growth stocks generally outperformed value stocks.
Within the fixed-income sector, emerging market bonds and high-yield U.S. bonds (also known as “junk bonds”) generally provided positive returns, while investment grade corporate bonds and U.S. Treasury bonds underperformed amid investor expectations for rising interest rates in the U.S.
Notably, U.S. financial market volatility remained low throughout the reporting period, with a brief spike ahead of the November 2016 election. By the end of June 2017, the CBOE Volatility Index, which measures options on the Standard & Poor’s 500 Index to gauge market expectations of near-term volatility, stood at roughly half of its historical average.
WHAT WERE THE MAIN DRIVERS OF THE PORTFOLIO’S PERFORMANCE?
The Fund’s Class I Shares underperformed the S&P 500 (the “Benchmark”) and outperformed the BofA Merrill Lynch U.S. 3-Month Treasury Bill Index (the “Secondary Benchmark”) for the period July 31, 2016 to June 30, 2017.
Relative to the Benchmark, the Fund’s underweight position in the information technology sector and its overweight position in the consumer staples sector were leading detractors from performance, while the Fund’s overweight positions in the health care and energy sectors was a leading contributor to relative performance.
Relative to the Secondary Benchmark, the Fund’s security selection in the financials and health care sectors was a leading contributor to performance, while the Fund’s security selection in the telecommunications sector was a leading detractor from relative performance.
Leading individual detractors from performance relative to the Benchmark included the Fund’s underweight positions in Apple Inc. and its overweight positions in J.M. Smucker Co. and Verizon Communications Inc. Shares of Apple, a maker of smartphones, computers and related devices, rose after the company posted earnings growth on better-than-expected sales and pricing for its iPhones. Shares of J.M. Smucker, a food products manufacturer, fell after the company reported lower-than-expected sales and earnings. Shares of Verizon Communications, a provider of telecommunication services, fell after the company outbid AT&T Corp. to acquire Straight Path Communications and moved to acquire the operating business of Yahoo Inc.
Leading individual contributors to performance relative to the Benchmark included the Fund’s overweight positions in C.R. Bard Inc., Atrion Corp. and AG Mortgage Investment Trust Inc. Shares of C.R. Bard, a medical technology provider, rose on news reports that the company would be acquired by Becton Dickinson & Co. for $24 billion. Shares of Atrion, a medical products manufacturer that was not held in the Benchmark, rose on improved operating results. Shares of AG Mortgage Investment Trust, a residential property real estate investment trust that was not held in the Benchmark, rose on earnings growth and overall strength in the residential mortgage sector.
2
HOW WAS THE PORTFOLIO POSITIONED?
The Fund employs an investment process based on behavioral finance principles. Behavioral finance theorizes that investors behave irrationally in systematic and predictable ways because human psychology affects investment decision-making. This investor behavior results in market inefficiencies that persist over time. The Fund seeks to capitalize on these market anomalies through a disciplined investment process. Based on these principles, the Fund’s managers invested in equity securities that they believed to be attractive based on certain characteristics, including quality, valuation, momentum and/or volatility.
To implement this strategy, the Fund invested primarily in a diversified portfolio of equity investments across all market capitalizations, sectors and industries during the reporting period. Under normal circumstances, the Fund invests at least 80% of its assets in equity investments, including common stocks, real estate investment trusts and equity-linked notes.
| | | | | | |
TOP TEN EQUITY HOLDINGS OF THE
PORTFOLIO*** | | | | | |
|
| | |
1. McDonald’s Corp. | | | 2.8 | % | | |
2. Johnson & Johnson | | | 2.6 | | | |
3. UnitedHealth Group, Inc. | | | 2.6 | | | |
4. Royal Bank of Canada, ELN, 20.400%,
07/25/17 (linked to Teleflex, Inc.) | | | 2.6 | | | |
5. Amdocs Ltd. | | | 2.6 | | | |
6. Deutsche Bank AG, ELN, 13.230%, 07/25/17 (linked to Altria Group, Inc.) | | | 2.5 | | | |
7. Merrill Lynch International & Co., C.V., ELN, 15.040%, 07/25/17 (linked to Wal-Mart Stores, Inc.) | | | 2.5 | | | |
8. Ecolab, Inc. | | | 2.5 | | | |
9. UBS AG, ELN, 15.550%, 07/25/17 (linked to PepsiCo, Inc.) | | | 2.4 | | | |
10. Philip Morris International, Inc. | | | 2.4 | | | |
| |
| PORTFOLIO COMPOSITION BY SECTOR*** | | | |
|
| | |
Financials | | | 17.6 | % | | |
Health Care | | | 14.9 | | | |
Equity Linked Notes | | | 13.4 | | | |
Utilities | | | 12.0 | | | |
Consumer Staples | | | 9.5 | | | |
Consumer Discretionary | | | 6.1 | | | |
Industrials | | | 5.8 | | | |
Energy | | | 5.6 | | | |
Information Technology | | | 5.1 | | | |
Materials | | | 4.5 | | | |
Telecommunication Services | | | 1.8 | | | |
Exchanged Traded Funds | | | 1.2 | | | |
Real Estate | | | 1.2 | | | |
Short-Term Investment | | | 1.3 | | | |
3
| 1 | On April 3, 2017, the Fund’s Select Class Shares were renamed Class I Shares. |
| * | The return shown is based on net asset values calculated for shareholder transactions and may differ from the return shown in the financial highlights, which reflects adjustments made to the net asset values in accordance with accounting principles generally accepted in the United States of America. |
| ** | The adviser seeks to achieve the Fund’s objective. There can be no guarantee it will be achieved. |
| *** | Percentages indicated are based on total investments as of June 30, 2017. The Fund’s portfolio composition is subject to change. |
4
JPMorgan Equity Low Volatility Income Fund
Fund Summary
For the period July 20, 2016 (Fund Inception Date) through June 30, 2017 (Unaudited) (continued)
| | |
| AVERAGE ANNUAL TOTAL RETURNS AS OF JUNE 30, 2017 | | |
| | | | |
| | | INCEPTION DATE
OF CLASS | | SINCE
INCEPTION* |
| | |
CLASS A SHARES | | July 20, 2016 | | |
With Sales Charge** | | | | 6.18% |
Without Sales Charge | | | | 12.06 |
CLASS C SHARES | | July 20, 2016 | | |
With CDSC*** | | | | 10.54 |
Without CDSC | | | | 11.54 |
CLASS I SHARES (FORMERLY SELECT CLASS SHARES) | | July 20, 2016 | | 12.32 |
CLASS R5 SHARES | | July 20, 2016 | | 12.53 |
CLASS R6 SHARES | | July 20, 2016 | | 12.59 |
| ** | Sales Charge for Class A Shares is 5.25%. |
| *** | Assumes a 1% CDSC (contingent deferred sales charge) for the period and 0% CDSC thereafter. |
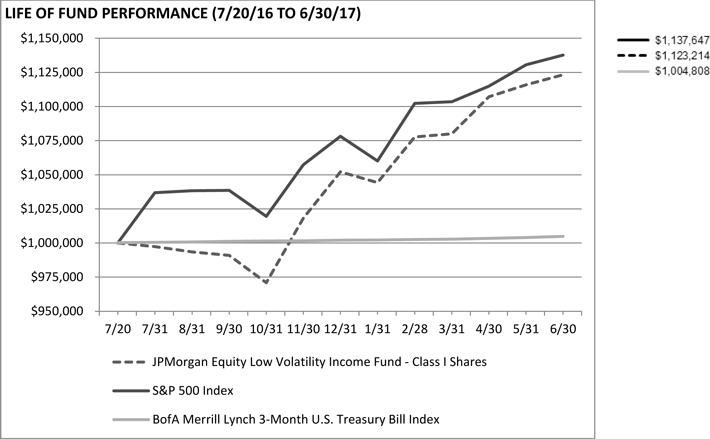
The performance quoted is past performance and is not a guarantee of future results. Mutual funds are subject to certain market risks. Investment returns and principal value of an investment will fluctuate so that an invest-or’s shares, when redeemed, may be worth more or less than their original cost. Current performance may be higher or lower than the performance data shown. For up-to-date month-end performance information please call 1-800-480-4111.
5
The Fund commenced operations on July 20, 2016.
The graph illustrates comparative performance for $1,000,000 invested in Class I Shares of the JPMorgan Equity Low Volatility Income Fund, the S&P 500 Index and the BofA Merrill Lynch 3-Month U.S. Treasury Bill Index from July 20, 2016 to June 30, 2017. The performance of the Fund assumes reinvestment of all dividends and capital gain distributions, if any, and does not include a sales charge. The performance of the S&P 500 Index does not reflect the deduction of expenses or a sales charge associated with a mutual fund and approximates the minimum possible dividend reinvestment of the securities included in the benchmark, if applicable. The dividend is reinvested after deduction of withholding tax, applying the maximum rate to non-resident institutional investors who do not benefit from double taxation treaties. The S&P 500 Index is an unmanaged index generally representative of the performance of large companies in the U.S. stock market. The BofA Merrill Lynch 3-Month U.S. Treasury Bill Index is comprised of a single issue purchased at the beginning of the month and held for a full month. The index is rebalanced monthly and the issue selected is the outstanding U.S. Treasury Bill that matures closest to, but not beyond 3 months from the rebalancing date. Investors cannot invest directly in an index.
Class I Shares have a $1,000,000 minimum initial investment.
Since the Fund’s inception, it has not experienced any shareholder activity. If shareholder activity had occurred, the Fund’s performance may have been impacted.
Fund performance may reflect the waiver of the Fund’s fees and reimbursement of expenses for certain periods since the inception date. Without these waivers and reimbursements, performance would have been lower. Also, performance shown in this section does not reflect the deduction of taxes that a shareholder would pay on Fund distributions or redemptions of Fund shares.
The returns shown are based on net asset values calculated for shareholder transactions and may differ from the returns shown in the financial highlights, which reflect adjustments made to the net asset values in accordance with accounting principles generally accepted in the United States of America.
6
JPMorgan Value Plus Fund
Fund Commentary
For the Period August 31, 2016 (Inception Date) to June 30, 2017 (Unaudited)
| | | | |
| Reporting Period Return: | | | |
Portfolio (Class I Shares) 1* | | | 23.22% | |
Russell 1000 Value Index | | | 11.41% | |
| |
Net Assets as of 6/30/2017 | | $ | 12,324,684 | |
INVESTMENT OBJECTIVE**
The JPMorgan Value Plus Fund (the “Fund”) seeks to provide long-term capital appreciation.
HOW DID THE MARKET PERFORM?
Overall, U.S. equity markets provided positive returns and key stock market indexes reached multiple record highs and mostly retained their elevated levels through the end of the ten month reporting period. Steady global economic growth, continued low inflation and strong corporate earnings all served to support equity prices, both in the U.S. and elsewhere. Notably, emerging market equities generally outperformed developed market equities during the reporting period.
While U.S. equity prices rose throughout most of 2016, they experienced a sustained rally following the November 8, 2016 election amid investor expectations for increased infrastructure spending and tax cuts under the incoming Trump administration and Republican Party majorities in the U.S. Congress. Even as those expectations faded, the U.S. equity prices continued to climb.
In February 2017, the Standard & Poor’s 500 Index (the “S&P 500”) reached nine new closing highs and the Dow Jones Industrial Average (the “DJIA”) closed at new highs for 12 consecutive days, matching a record set in 1987. The following month, the S&P 500 crossed 2,400 points in intraday trading for the first time and the DJIA crossed 21,000 points for the first time. While the rally in U.S. equities stalled in April 2017, record high U.S. corporate operating earnings rekindled the rise in stock prices and the S&P 500 posted seven new closing highs in May 2017 and four new closing highs in June 2017.
U.S. financial market volatility remained historically low throughout the reporting period, with a brief spike ahead of the November 2016 election. By the end of June 2017, the CBOE Volatility Index averaged 10.5 points, which was about half of its historical average. Small capitalization stocks generally outperformed large cap and mid cap stocks during the reporting period, while growth stocks generally outperformed value stocks.
WHAT WERE THE MAIN DRIVERS OF THE FUND’S PERFORMANCE?
The Fund’s Class I Shares outperformed the Russell 1000 Value Index (the “Benchmark”) for the period from August 31, 2016 to June 30, 2017. The Fund’s security selection in the consumer discretionary sector and its security selection and overweight position in the financials sector were leading contributors to performance relative to the Benchmark. The Fund’s security selection in the consumer staples sector was the leading detractor from relative performance.
Leading individual contributors to performance relative to the Benchmark included the Fund’s overweight positions in Royal Caribbean Cruises Ltd., Southwest Airlines Co. and KeyCorp. Shares of Royal Caribbean Cruises, a cruise ship operator, rose on better-than-expected earnings and revenue. Shares of Southwest Airlines, an airline operator that was not held in the Benchmark, rose after the company increased its quarterly dividend and announced a $2 billion share repurchase plan. Shares of KeyCorp., a banking and financial services company, rose along with other banking stocks after it successfully passed the U.S. Federal Reserve “stress test.”
Leading individual detractors from relative performance included the Fund’s overweight positions in Mosaic Co. and Macy’s and its short position in Tesla Inc. Shares of Mosaic, a maker of fertilizers and animal feed, fell after the company reported a loss. Shares of Macy’s, a department store operator, fell after the company warned investors about pressure on its profit margins. Shares of Tesla, a maker of electric cars, rose on continued strong demand for its vehicles.
7
HOW WAS THE PORTFOLIO POSITIONED?
The Fund employed a bottom-up fundamental approach to stock selection, researching companies to determine their underlying value and potential for future earnings growth. Overall, the Fund’s portfolio managers aimed to take advantage of mispriced stocks that appeared attractive relative to fair value for long positions, and looked for overvalued stocks in which to take short positions. The long-to-short exposure ratio at the end of the reporting period was 113% to 13%.
| | | | | | | | |
| TOP TEN LONG POSITIONS OF THE PORTFOLIO*** | |
| | |
1. Citigroup, Inc. | | | 4.4 | % | | | | |
2. Bank of America Corp. | | | 4.1 | | | | | |
3. Wells Fargo & Co. | | | 3.5 | | | | | |
4. General Motors Co. | | | 3.0 | | | | | |
5. KeyCorp. | | | 2.7 | | | | | |
6. Gilead Sciences, Inc. | | | 2.2 | | | | | |
7. Pfizer, Inc. | | | 2.2 | | | | | |
8. DR Horton, Inc. | | | 2.2 | | | | | |
9. Broadcom Ltd. | | | 2.0 | | | | | |
10. Charles Schwab Corp. (The) | | | 1.9 | | | | | |
|
| TOP TEN SHORT POSITIONS OF THE PORTFOLIO**** | |
| | |
1. Clorox Co. (The) | | | 6.9 | % | | | | |
2. Sprint Corp. | | | 6.4 | | | | | |
3. Tesla, Inc. | | | 6.0 | | | | | |
4. Legg Mason, Inc. | | | 5.7 | | | | | |
5. AbbVie, Inc. | | | 5.7 | | | | | |
6. Praxair, Inc. | | | 5.5 | | | | | |
7. Express Scripts Holding Co. | | | 4.1 | | | | | |
8. Lockheed Martin Corp. | | | 4.1 | | | | | |
9. Estee Lauder Cos., Inc. (The), Class A | | | 4.0 | | | | | |
10. Duke Energy Corp. | | | 3.9 | | | | | |
| LONG POSITION PORTFOLIO COMPOSITION BY SECTOR*** | |
| | |
Financials | | | 30.1 | % | | | | |
Consumer Discretionary | | | 21.2 | | | | | |
Industrials | | | 9.1 | | | | | |
Health Care | | | 8.4 | | | | | |
Energy | | | 8.2 | | | | | |
Information Technology | | | 7.3 | | | | | |
Materials | | | 6.0 | | | | | |
Real Estate | | | 3.7 | | | | | |
Consumer Staples | | | 2.4 | | | | | |
Telecommunication Services | | | 1.5 | | | | | |
Others (each less than 1.0%) | | | 0.3 | | | | | |
Short-Term Investment | | | 1.8 | | | | | |
|
| SHORT POSITION PORTFOLIO COMPOSITION BY SECTOR**** | |
| | |
Health Care | | | 16.9 | % | | | | |
Utilities | | | 15.0 | | | | | |
Consumer Staples | | | 12.8 | | | | | |
Materials | | | 11.5 | | | | | |
Real Estate | | | 10.9 | | | | | |
Consumer Discretionary | | | 9.5 | | | | | |
Financials | | | 8.9 | | | | | |
Telecommunication Services | | | 6.4 | | | | | |
Industrials | | | 4.1 | | | | | |
Information Technology | | | 4.0 | | | | | |
8
| 1 | On April 3, 2017, the Fund’s Select Class Shares were renamed Class I Shares. |
| * | The return shown is based on net asset values calculated for shareholder transactions and may differ from the return shown in the financial highlights, which reflects adjustments made to the net asset values in accordance with accounting principles generally accepted in the United States of America. |
| ** | The adviser seeks to achieve the Fund’s objective. There can be no guarantee it will be achieved. |
| *** | Percentages indicated are based on total long investments as of June 30, 2017. The Fund’s portfolio composition is subject to change. |
| **** | Percentages indicated are based on total short investments as of June 30, 2017. The Fund’s portfolio composition is subject to change. |
9
JPMorgan Value Plus Fund
Fund Summary
For the period August 31, 2016 (Fund Inception Date) through June 30, 2017 (Unaudited) (continued)
| | |
| AVERAGE ANNUAL TOTAL RETURNS AS OF JUNE 30, 2017 | | |
| | | | |
| | | INCEPTION DATE
OF CLASS | | SINCE
INCEPTION* |
| | |
CLASS A SHARES | | August 31, 2016 | | |
With Sales Charge** | | | | 16.54% |
Without Sales Charge | | | | 22.99 |
CLASS C SHARES | | August 31, 2016 | | |
With CDSC*** | | | | 21.47 |
Without CDSC | | | | 22.47 |
CLASS I SHARES (FORMERLY SELECT CLASS SHARES) | | August 31, 2016 | | 23.22 |
| ** | Sales Charge for Class A Shares is 5.25%. |
| *** | Assumes a 1% CDSC (contingent deferred sales charge) for the period and 0% CDSC thereafter. |
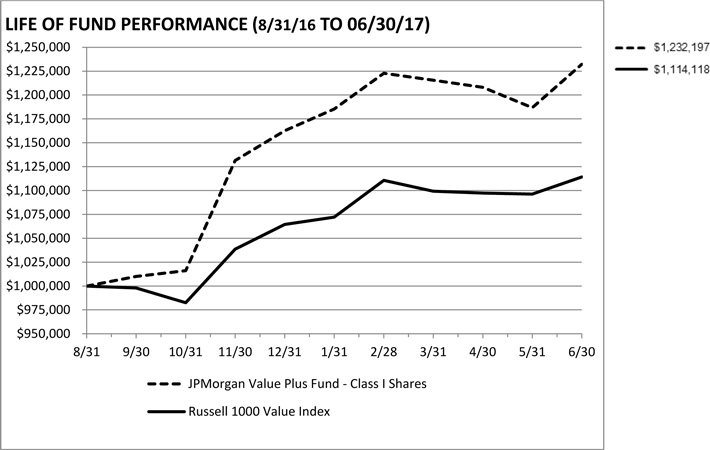
The performance quoted is past performance and is not a guarantee of future results. Mutual funds are subject to certain market risks. Investment returns and principal value of an investment will fluctuate so that an invest-or’s shares, when redeemed, may be worth more or less than their original cost. Current performance may be higher or lower than the performance data shown. For up-to-date month-end performance information please call 1-800-480-4111.
10
The Fund commenced operations on August 31, 2016.
The graph illustrates comparative performance for $1,000,000 invested in Class I Shares of the JPMorgan Value Plus Fund and the Russell 2000 Value Index from August 31, 2016 to June 30, 2017. The performance of the Fund assumes reinvestment of all dividends and capital gain distributions, if any, and does not include a sales charge. The performance of the Russell 1000 Value Index does not reflect the deduction of expenses or a sales charge associated with a mutual fund and approximates the minimum possible dividend reinvestment of the securities included in the benchmark, if applicable. The dividend is reinvested after deduction of withholding tax, applying the maximum rate to non-resident institutional investors who do not benefit from double taxation treaties. The Russell 1000 Value Index is an unmanaged index, which measures the performance of those Russell 1000 companies with lower price-to-book ratios and lower forecasted growth values. Investors cannot invest directly in an index.
Class I Shares have a $1,000,000 minimum initial investment.
Since the Fund’s inception, it has not experienced any shareholder activity. If shareholder activity had occurred, the Fund’s performance may have been impacted.
Fund performance may reflect the waiver of the Fund’s fees and reimbursement of expenses for certain periods since the inception date. Without these waivers and reimbursements, performance would have been lower. Also, performance shown in this section does not reflect the deduction of taxes that a shareholder would pay on Fund distributions or redemptions of Fund shares.
The returns shown are based on net asset values calculated for shareholder transactions and may differ from the returns shown in the financial highlights, which reflect adjustments made to the net asset values in accordance with accounting principles generally accepted in the United States of America.
11
JPMorgan Equity Low Volatility Income Fund
SCHEDULE OF PORTFOLIO INVESTMENTS
AS OF JUNE 30, 2017
| | | | | | | | |
SHARES | | | SECURITY DESCRIPTION | | VALUE($) | |
| |
| | Common Stocks — 83.6% | | | | |
| | |
| | | | Consumer Discretionary — 6.0% | | | | |
| |
| | | | Hotels, Restaurants & Leisure — 4.0% | |
| | |
| | 520 | | | Biglari Holdings, Inc. (a) | | | 207,865 | |
| | |
| | 10,210 | | | McDonald’s Corp. | | | 1,563,764 | |
| | |
| | 7,430 | | | Nathan’s Famous, Inc. (a) | | | 468,090 | |
| | | | | | | | |
| | |
| | | | | | | 2,239,719 | |
| | | | | | | | |
| | |
| | | | Specialty Retail — 2.0% | | | | |
| | |
| | 7,500 | | | Home Depot, Inc. (The) | | | 1,150,500 | |
| | | | | | | | |
| | |
| | | | Total Consumer Discretionary | | | 3,390,219 | |
| | | | | | | | |
| | |
| | | | Consumer Staples — 9.5% | | | | |
| | |
| | | | Beverages — 0.7% | | | | |
| | |
| | 4,130 | | | Dr Pepper Snapple Group, Inc. | | | 376,284 | |
| | | | | | | | |
| | |
| | | | Food & Staples Retailing — 2.3% | | | | |
| | |
| | 25,300 | | | Sysco Corp. | | | 1,273,349 | |
| | | | | | | | |
| | |
| | | | Food Products — 4.1% | | | | |
| | |
| | 18,700 | | | Fresh Del Monte Produce, Inc. | | | 952,017 | |
| | |
| | 1,700 | | | General Mills, Inc. | | | 94,180 | |
| | |
| | 8,000 | | | JM Smucker Co. (The) | | | 946,640 | |
| | |
| | 2,170 | | | McCormick & Co., Inc. (Non-Voting) | | | 211,597 | |
| | |
| | 1,700 | | | Tyson Foods, Inc., Class A | | | 106,471 | |
| | | | | | | | |
| | |
| | | | | | | 2,310,905 | |
| | | | | | | | |
| | |
| | | | Tobacco — 2.4% | | | | |
| | |
| | 11,400 | | | Philip Morris International, Inc. | | | 1,338,930 | |
| | | | | | | | |
| | |
| | | | Total Consumer Staples | | | 5,299,468 | |
| | | | | | | | |
| | |
| | | | Energy — 5.6% | | | | |
| |
| | | | Oil, Gas & Consumable Fuels — 5.6% | |
| | |
| | 4,440 | | | Chevron Corp. | | | 463,225 | |
| | |
| | 14,130 | | | Exxon Mobil Corp. | | | 1,140,715 | |
| | |
| | 5,800 | | | REX American Resources Corp. (a) | | | 560,048 | |
| | |
| | 71,670 | | | Ship Finance International Ltd., (Norway) | | | 974,712 | |
| | | | | | | | |
| | |
| | | | Total Energy | | | 3,138,700 | |
| | | | | �� | | | |
| | |
| | | | Financials — 17.5% | | | | |
| | |
| | | | Banks — 2.3% | | | | |
| | |
| | 5,060 | | | American National Bankshares, Inc. | | | 186,967 | |
| | |
| | 13,110 | | | Citizens & Northern Corp. | | | 304,938 | |
| | |
| | 4,550 | | | First Financial Corp. | | | 215,215 | |
| | |
| | 20,320 | | | Flushing Financial Corp. | | | 572,821 | |
| | | | | | | | |
| | |
| | | | | | | 1,279,941 | |
| | | | | | | | |
| | |
| | | | Insurance — 1.1% | | | | |
| | |
| | 6,800 | | | Blue Capital Reinsurance Holdings Ltd., (Bermuda) | | | 124,440 | |
| | |
| | 930 | | | Everest Re Group Ltd. | | | 236,769 | |
| | |
| | 3,920 | | | Safety Insurance Group, Inc. | | | 267,736 | |
| | | | | | | | |
| | |
| | | | | | | 628,945 | |
| | | | | | | | |
| |
| | | | Mortgage Real Estate Investment Trusts (REITs) — 3.4% | |
| | |
| | 73,000 | | | AG Mortgage Investment Trust, Inc. | | | 1,335,900 | |
| | | | | | | | |
SHARES | | | SECURITY DESCRIPTION | | VALUE($) | |
| |
| | | | | |
| |
| | | | Mortgage Real Estate Investment Trusts (REITs) — continued | |
| | |
| | 20,450 | | | Capstead Mortgage Corp. | | | 213,293 | |
| | |
| | 8,900 | | | Invesco Mortgage Capital, Inc. | | | 148,719 | |
| | |
| | 21,080 | | | Two Harbors Investment Corp. | | | 208,903 | |
| | | | | | | | |
| | |
| | | | | | | 1,906,815 | |
| | | | | | | | |
| |
| | | | Thrifts & Mortgage Finance — 10.7% | |
| | |
| | 23,940 | | | Charter Financial Corp. | | | 430,920 | |
| | |
| | 45,170 | | | Clifton Bancorp, Inc. | | | 746,660 | |
| | |
| | 14,340 | | | First Defiance Financial Corp. | | | 755,431 | |
| | |
| | 1,650 | | | Hingham Institution for Savings | | | 300,185 | |
| | |
| | 67,330 | | | Northwest Bancshares, Inc. | | | 1,051,021 | |
| | |
| | 13,730 | | | Provident Financial Holdings, Inc. | | | 264,303 | |
| | |
| | 22,380 | | | Territorial Bancorp, Inc. | | | 698,032 | |
| | |
| | 123,540 | | | TrustCo Bank Corp. | | | 957,435 | |
| | |
| | 29,530 | | | United Community Financial Corp. | | | 245,394 | |
| | |
| | 29,810 | | | Waterstone Financial, Inc. | | | 561,919 | |
| | | | | | | | |
| | |
| | | | | | | 6,011,300 | |
| | | | | | | | |
| | |
| | | | Total Financials | | | 9,827,001 | |
| | | | | | | | |
| | |
| | | | Health Care — 14.8% | | | | |
| | |
| | | | Biotechnology — 0.4% | | | | |
| | |
| | 1,300 | | | Amgen, Inc. | | | 223,899 | |
| | | | | | | | |
| |
| | | | Health Care Equipment & Supplies — 6.1% | |
| | |
| | 1,300 | | | Analogic Corp. | | | 94,445 | |
| | |
| | 1,655 | | | Atrion Corp. | | | 1,064,662 | |
| | |
| | 3,510 | | | Becton Dickinson and Co. | | | 684,836 | |
| | |
| | 15,670 | | | Danaher Corp. | | | 1,322,391 | |
| | |
| | 3,820 | | | Utah Medical Products, Inc. | | | 276,568 | |
| | | | | | | | |
| | |
| | | | | | | 3,442,902 | |
| | | | | | | | |
| |
| | | | Health Care Providers & Services — 3.7% | |
| | |
| | 2,600 | | | Humana, Inc. | | | 625,612 | |
| | |
| | 7,900 | | | UnitedHealth Group, Inc. | | | 1,464,818 | |
| | | | | | | | |
| | |
| | | | | | | 2,090,430 | |
| | | | | | | | |
| | |
| | | | Pharmaceuticals — 4.6% | | | | |
| | |
| | 600 | | | Allergan plc | | | 145,854 | |
| | |
| | 11,100 | | | Johnson & Johnson | | | 1,468,419 | |
| | |
| | 13,200 | | | Merck & Co., Inc. | | | 845,988 | |
| | |
| | 3,200 | | | Pfizer, Inc. | | | 107,488 | |
| | | | | | | | |
| | |
| | | | | | | 2,567,749 | |
| | | | | | | | |
| | |
| | | | Total Health Care | | | 8,324,980 | |
| | | | | | | | |
| | |
| | | | Industrials — 5.8% | | | | |
| |
| | | | Commercial Services & Supplies — 5.5% | |
| | |
| | 17,010 | | | Republic Services, Inc. | | | 1,084,047 | |
| | |
| | 19,590 | | | Tetra Tech, Inc. | | | 896,242 | |
| | |
| | 14,950 | | | Waste Management, Inc. | | | 1,096,583 | |
| | | | | | | | |
| | |
| | | | | | | 3,076,872 | |
| | | | | | | | |
SEE NOTES TO FINANCIAL STATEMENTS.
12
JPMorgan Equity Low Volatility Income Fund
SCHEDULE OF PORTFOLIO INVESTMENTS
AS OF JUNE 30, 2017 (continued)
| | | | | | | | |
SHARES | | | SECURITY DESCRIPTION | | VALUE($) | |
| |
| | Common Stocks — continued | | | | |
| |
| | | | Trading Companies & Distributors — 0.3% | |
| | |
| | 2,690 | | | Applied Industrial Technologies, Inc. | | | 158,845 | |
| | | | | | | | |
| | |
| | | | Total Industrials | | | 3,235,717 | |
| | | | | | | | |
| |
| | | | Information Technology — 5.1% | |
| |
| | | | Internet Software & Services — 0.7% | |
| | |
| | 19,000 | | | Blucora, Inc. (a) | | | 402,800 | |
| | | | | | | | |
| |
| | | | IT Services — 3.6% | |
| | |
| | 22,100 | | | Amdocs Ltd. | | | 1,424,566 | |
| | |
| | 11,160 | | | EVERTEC, Inc., (Puerto Rico) | | | 193,068 | |
| | |
| | 3,510 | | | Jack Henry & Associates, Inc. | | | 364,584 | |
| | | | | | | | |
| | |
| | | | | | | 1,982,218 | |
| | | | | | | | |
| |
| | | | Software — 0.8% | |
| | |
| | 3,510 | | | Intuit, Inc. | | | 466,163 | |
| | | | | | | | |
| | |
| | | | Total Information Technology | | | 2,851,181 | |
| | | | | | | | |
| |
| | | | Materials — 4.4% | |
| |
| | | | Chemicals — 4.4% | |
| | |
| | 10,310 | | | Ecolab, Inc. | | | 1,368,652 | |
| | |
| | 12,790 | | | Sensient Technologies Corp. | | | 1,029,979 | |
| | |
| | 1,200 | | | Trinseo SA | | | 82,440 | |
| | | | | | | | |
| | |
| | | | Total Materials | | | 2,481,071 | |
| | | | | | | | |
| |
| | | | Real Estate — 1.1% | |
| |
| | | | Equity Real Estate Investment Trusts (REITs) — 0.8% | |
| | |
| | 14,150 | | | CorEnergy Infrastructure Trust, Inc. | | | 475,299 | |
| | | | | | | | |
| |
| | | | Real Estate Management & Development — 0.3% | |
| | |
| | 3,310 | | | RMR Group, Inc. (The), Class A | | | 161,031 | |
| | | | | | | | |
| | |
| | | | Total Real Estate | | | 636,330 | |
| | | | | | | | |
| |
| | | | Telecommunication Services — 1.8% | |
| |
| | | | Diversified Telecommunication Services — 1.8% | |
| | |
| | 22,690 | | | Verizon Communications, Inc. | | | 1,013,335 | |
| | | | | | | | |
| | |
| | | | Utilities — 12.0% | | | | |
| | |
| | | | Electric Utilities — 3.0% | | | | |
| | |
| | 17,330 | | | Southern Co. (The) | | | 829,761 | |
| | |
| | 44,200 | | | Spark Energy, Inc., Class A | | | 830,960 | |
| | | | | | | | |
| | |
| | | | | | | 1,660,721 | |
| | | | | | | | |
| | |
| | | | Gas Utilities — 5.8% | | | | |
| | |
| | 16,290 | | | Northwest Natural Gas Co. | | | 974,956 | |
| | |
| | 19,080 | | | ONE Gas, Inc. | | | 1,331,975 | |
| | |
| | 13,720 | | | Spire, Inc. | | | 956,970 | |
| | | | | | | | |
| | |
| | | | | | | 3,263,901 | |
| | | | | | | | |
| | |
| | | | Multi-Utilities — 3.2% | | | | |
| | |
| | 9,280 | | | Consolidated Edison, Inc. | | | 750,010 | |
| | |
| | 21,350 | | | Unitil Corp. | | | 1,031,418 | |
| | | | | | | | |
| | |
| | | | | | | 1,781,428 | |
| | | | | | | | |
| | |
| | | | Total Utilities | | | 6,706,050 | |
| | | | | | | | |
| | |
| | | | Total Common Stocks
(Cost $43,658,823) | | | 46,904,052 | |
| | | | | | | | |
| | | | | | | | |
PRINCIPAL AMOUNT($) | | | SECURITY DESCRIPTION | | VALUE($) | |
| |
| | Equity-Linked Notes — 13.2% | | | | |
| | |
| | 18,800 | | | Deutsche Bank AG, ELN, 13.230%, 07/25/17 (linked to Altria Group, Inc.) (e) | | | 1,400,359 | |
| | |
| | 17,900 | | | Merrill Lynch International & Co., C.V., ELN, 15.040%, 07/25/17 (linked to Wal- Mart Stores, Inc.) (e) | | | 1,366,619 | |
| | |
| | 7,100 | | | Royal Bank of Canada, ELN, 20.400%, 07/25/17 (linked to Teleflex, Inc.) (e) | | | 1,441,926 | |
| | |
| | 6,700 | | | Royal Bank of Canada, ELN, 20.660%, 07/25/17 (linked to International Business Machines Corp.) (e) | | | 1,031,387 | |
| | |
| | 11,700 | | | UBS AG, ELN, 15.550%, 07/25/17 (linked to PepsiCo, Inc.) (e) | | | 1,354,412 | |
| | |
| | 2,400 | | | UBS AG, ELN, 23.000%, 07/25/17 (linked to Sherwin-Williams Co. (The)) (e) | | | 844,632 | |
| | | | | | | | |
| | |
| | | | Total Equity-Linked Notes
(Cost $7,508,248) | | | 7,439,335 | |
| | | | | | | | |
SHARES | | | | | | |
| |
| | Exchange Traded Funds — 1.2% | | | | |
| | |
| | | | U.S. Equity — 1.2% | | | | |
| | |
| | 1,840 | | | iShares Russell 2000 Fund | | | 259,293 | |
| | |
| | 1,759 | | | SPDR S&P500 Fund Trust | | | 425,326 | |
| | | | | | | | |
| | |
| | | | Total Exchange Traded Funds
(Cost $686,019) | | | 684,619 | |
| | | | | | | | |
| |
| | Short-Term Investment — 1.3% | | | | |
| | |
| | | | Investment Company — 1.3% | | | | |
| | |
| | 724,591 | | | JPMorgan U.S. Government Money Market Fund, Institutional Class Shares, 0.840% (b) (l)
(Cost $724,591) | | | 724,591 | |
| | | | | | | | |
| | |
| | | | Total Investments — 99.3%
(Cost $52,577,681) | | | 55,752,597 | |
| | |
| | | | Other Assets in Excess of
Liabilities — 0.7% | | | 364,902 | |
| | | | | | | | |
| | |
| | | | NET ASSETS — 100.0% | | $ | 56,117,499 | |
| | | | | | | | |
Percentages indicated are based on net assets.
SEE NOTES TO FINANCIAL STATEMENTS.
13
JPMorgan Value Plus Fund
SCHEDULE OF PORTFOLIO INVESTMENTS
AS OF JUNE 30, 2017
| | | | | | | | |
SHARES | | | SECURITY DESCRIPTION | | VALUE($) | |
| |
| | Long Positions — 112.2% | | | | |
| |
| | Common Stocks — 109.8% | | | | |
| |
| | | | Consumer Discretionary — 23.7% | |
| | |
| | | | Auto Components — 3.9% | | | | |
| | |
| | 1,915 | | | Delphi Automotive plc | | | 167,850 | |
| | |
| | 1,564 | | | Goodyear Tire & Rubber Co. (The) | | | 54,677 | |
| | |
| | 5,500 | | | Magna International, Inc., (Canada) | | | 254,815 | |
| | | | | | | | |
| | |
| | | | | | | 477,342 | |
| | | | | | | | |
| | |
| | | | Automobiles — 4.8% | | | | |
| | |
| | 15,702 | | | Ford Motor Co. (j) | | | 175,705 | |
| | |
| | 11,922 | | | General Motors Co. (j) | | | 416,436 | |
| | | | | | | | |
| | |
| | | | | | | 592,141 | |
| | | | | | | | |
| |
| | | | Hotels, Restaurants & Leisure — 5.0% | |
| | |
| | 8,189 | | | Arcos Dorados Holdings, Inc., (Uruguay), Class A (a) | | | 61,008 | |
| | |
| | 1,777 | | | Bloomin’ Brands, Inc. | | | 37,726 | |
| | |
| | 843 | | | Brinker International, Inc. | | | 32,118 | |
| | |
| | 2,831 | | | Carnival Corp. | | | 185,629 | |
| | |
| | 2,333 | | | Royal Caribbean Cruises Ltd. (j) | | | 254,834 | |
| | |
| | 1,157 | | | Yum China Holdings, Inc. (a) | | | 45,620 | |
| | | | | | | | |
| | |
| | | | | | | 616,935 | |
| | | | | | | | |
| | |
| | | | Household Durables — 4.7% | | | | |
| | |
| | 1,487 | | | CalAtlantic Group, Inc. | | | 52,566 | |
| | |
| | 8,623 | | | DR Horton, Inc. (j) | | | 298,097 | |
| | |
| | 5,822 | | | Toll Brothers, Inc. | | | 230,027 | |
| | | | | | | | |
| | |
| | | | | | | 580,690 | |
| | | | | | | | |
| | |
| | | | Leisure Products — 1.5% | | | | |
| | |
| | 3,030 | | | Brunswick Corp. | | | 190,072 | |
| | | | | | | | |
| | |
| | | | Media — 2.0% | | | | |
| | |
| | 3,943 | | | DISH Network Corp., Class A (a) | | | 247,462 | |
| | | | | | | | |
| | |
| | | | Specialty Retail — 1.5% | | | | |
| | |
| | 200 | | | AutoZone, Inc. (a) | | | 114,092 | |
| | |
| | 937 | | | Murphy USA, Inc. (a) | | | 69,441 | |
| | | | | | | | |
| | |
| | | | | | | 183,533 | |
| | | | | | | | |
| |
| | | | Textiles, Apparel & Luxury Goods — 0.3% | |
| | |
| | 800 | | | Coach, Inc. | | | 37,872 | |
| | | | | | | | |
| | |
| | | | Total Consumer Discretionary | | | 2,926,047 | |
| | | | | | | | |
| | |
| | | | Consumer Staples — 2.7% | | | | |
| | |
| | | | Beverages — 1.2% | | | | |
| | |
| | 1,639 | | | Molson Coors Brewing Co., Class B | | | 141,511 | |
| | | | | | | | |
| |
| | | | Food & Staples Retailing — 1.5% | |
| | |
| | 4,012 | | | Rite Aid Corp. (a) | | | 11,836 | |
| | |
| | 2,287 | | | US Foods Holding Corp. (a) | | | 62,252 | |
| | |
| | 1,478 | | | Walgreens Boots Alliance, Inc. | | | 115,742 | |
| | | | | | | | |
SHARES | | | SECURITY DESCRIPTION | | VALUE($) | |
| |
| | | | | |
| |
| | | | Food & Staples Retailing — continued | |
| | | | | | | | |
| | |
| | | | | | | 189,830 | |
| | | | | | | | |
| | |
| | | | Total Consumer Staples | | | 331,341 | |
| | | | | | | | |
| | |
| | | | Energy — 9.3% | | | | |
| |
| | | | Energy Equipment & Services — 0.2% | |
| | |
| | 4,534 | | | Ensco plc, Class A | | | 23,396 | |
| | | | | | | | |
| |
| | | | Oil, Gas & Consumable Fuels — 9.1% | |
| | |
| | 2,350 | | | Diamondback Energy, Inc. (a) | | | 208,703 | |
| | |
| | 1,794 | | | EOG Resources, Inc. | | | 162,393 | |
| | |
| | 858 | | | EQT Corp. | | | 50,270 | |
| | |
| | 3,200 | | | Kinder Morgan, Inc. | | | 61,312 | |
| | |
| | 1,248 | | | Marathon Petroleum Corp. | | | 65,308 | |
| | |
| | 2,931 | | | Occidental Petroleum Corp. | | | 175,479 | |
| | |
| | 2,605 | | | PBF Energy, Inc., Class A | | | 57,987 | |
| | |
| | 1,410 | | | Pioneer Natural Resources Co. (j) | | | 225,008 | |
| | |
| | 3,818 | | | Suncor Energy, Inc., (Canada) | | | 111,486 | |
| | | | | | | | |
| | |
| | | | | | | 1,117,946 | |
| | | | | | | | |
| | |
| | | | Total Energy | | | 1,141,342 | |
| | | | | | | | |
| | |
| | | | Financials — 33.8% | | | | |
| | |
| | | | Banks — 20.8% | | | | |
| | |
| | 23,262 | | | Bank of America Corp. (j) | | | 564,336 | |
| | |
| | 5,346 | | | Barclays plc, (United Kingdom), ADR | | | 56,614 | |
| | |
| | 3,600 | | | BB&T Corp. | | | 163,476 | |
| | |
| | 9,019 | | | Citigroup, Inc. (j) | | | 603,191 | |
| | |
| | 5,167 | | | Huntington Bancshares, Inc. | | | 69,858 | |
| | |
| | 1,500 | | | IBERIABANK Corp. | | | 122,250 | |
| | |
| | 20,155 | | | KeyCorp (j) | | | 377,704 | |
| | |
| | 17,600 | | | Lloyds Banking Group plc, (United Kingdom), ADR | | | 62,128 | |
| | |
| | 1,000 | | | SunTrust Banks, Inc. | | | 56,720 | |
| | |
| | 8,717 | | | Wells Fargo & Co. (j) | | | 483,009 | |
| | | | | | | | |
| | |
| | | | | | | 2,559,286 | |
| | | | | | | | |
| | |
| | | | Capital Markets — 6.6% | | | | |
| | |
| | 1,100 | | | Bank of New York Mellon Corp. (The) | | | 56,122 | |
| | |
| | 5,994 | | | Charles Schwab Corp. (The) | | | 257,502 | |
| | |
| | 4,425 | | | Deutsche Bank AG (Registered), (Germany) | | | 78,721 | |
| | |
| | 573 | | | Goldman Sachs Group, Inc. (The) | | | 127,149 | |
| | |
| | 3,900 | | | Morgan Stanley | | | 173,784 | |
| | |
| | 800 | | | State Street Corp. | | | 71,784 | |
| | |
| | 4,829 | | | WisdomTree Investments, Inc. | | | 49,111 | |
| | | | | | | | |
| | |
| | | | | | | 814,173 | |
| | | | | | | | |
| |
| | | | Consumer Finance — 1.0% | |
| | |
| | 2,401 | | | Ally Financial, Inc. | | | 50,181 | |
| | |
| | 2,500 | | | Synchrony Financial | | | 74,550 | |
| | | | | | | | |
| | |
| | | | | | | 124,731 | |
| | | | | | | | |
SEE NOTES TO FINANCIAL STATEMENTS.
14
JPMorgan Value Plus Fund
SCHEDULE OF PORTFOLIO INVESTMENTS
AS OF JUNE 30, 2017 (continued)
| | | | | | | | |
SHARES | | | SECURITY DESCRIPTION | | VALUE($) | |
| |
| | Long Positions — continued | | | | |
| |
| | | | Diversified Financial Services — 0.7% | |
| | |
| | 2,200 | | | Voya Financial, Inc. | | | 81,158 | |
| | | | | | | | |
| | |
| | | | Insurance — 4.7% | | | | |
| | |
| | 2,674 | | | Lincoln National Corp. | | | 180,709 | |
| | |
| | 3,200 | | | MetLife, Inc. (j) | | | 175,808 | |
| | |
| | 1,533 | | | Prudential Financial, Inc. | | | 165,779 | �� |
| | |
| | 1,300 | | | Prudential plc, (United Kingdom), ADR | | | 59,813 | |
| | | | | | | | |
| | |
| | | | | | | 582,109 | |
| | | | | | | | |
| | |
| | | | Total Financials | | | 4,161,457 | |
| | | | | | | | |
| | |
| | | | Health Care — 9.4% | | | | |
| | |
| | | | Biotechnology — 2.4% | | | | |
| | |
| | 4,249 | | | Gilead Sciences, Inc. (j) | | | 300,744 | |
| | | | | | | | |
| |
| | | | Health Care Equipment & Supplies — 1.0% | |
| | |
| | 1,472 | | | Boston Scientific Corp. (a) | | | 40,804 | |
| | |
| | 623 | | | Zimmer Biomet Holdings, Inc. | | | 79,993 | |
| | | | | | | | |
| | |
| | | | | | | 120,797 | |
| | | | | | | | |
| |
| | | | Health Care Providers & Services — 1.6% | |
| | |
| | 424 | | | Aetna, Inc. | | | 64,376 | |
| | |
| | 722 | | | UnitedHealth Group, Inc. | | | 133,873 | |
| | | | | | | | |
| | |
| | | | | | | 198,249 | |
| | | | | | | | |
| | |
| | | | Pharmaceuticals — 4.4% | | | | |
| | |
| | 989 | | | Allergan plc | | | 240,416 | |
| | |
| | 8,900 | | | Pfizer, Inc. | | | 298,951 | |
| | | | | | | | |
| | |
| | | | | | | 539,367 | |
| | | | | | | | |
| | |
| | | | Total Health Care | | | 1,159,157 | |
| | | | | | | | |
| | |
| | | | Industrials — 10.2% | | | | |
| |
| | | | Aerospace & Defense — 0.6% | |
| | |
| | 1,685 | | | Textron, Inc. | | | 79,364 | |
| | | | | | | | |
| | |
| | | | Airlines — 6.3% | | | | |
| | |
| | 1,300 | | | Alaska Air Group, Inc. | | | 116,688 | |
| | |
| | 1,200 | | | American Airlines Group, Inc. | | | 60,384 | |
| | |
| | 5,195 | | | Controladora Vuela Cia de Aviacion SAB de CV, (Mexico), ADR (a) | | | 75,587 | |
| | |
| | 3,506 | | | Delta Air Lines, Inc. | | | 188,412 | |
| | |
| | 3,629 | | | JetBlue Airways Corp. (a) | | | 82,850 | |
| | |
| | 2,212 | | | Southwest Airlines Co. | | | 137,454 | |
| | |
| | 1,574 | | | United Continental Holdings, Inc. (a) | | | 118,444 | |
| | | | | | | | |
| | |
| | | | | | | 779,819 | |
| | | | | | | | |
| | |
| | | | Building Products — 0.7% | | | | |
| | |
| | 1,969 | | | Johnson Controls International plc | | | 85,376 | |
| | | | | | | | |
| |
| | | | Industrial Conglomerates — 0.9% | |
| | |
| | 4,127 | | | General Electric Co. | | | 111,470 | |
| | | | | | | | |
| | | | | | | | |
SHARES | | | SECURITY DESCRIPTION | | VALUE($) | |
| |
| | | | | |
| | |
| | | | Road & Rail — 1.7% | | | | |
| | |
| | 5,200 | | | Hertz Global Holdings, Inc. (a) | | | 59,800 | |
| | |
| | 1,339 | | | Union Pacific Corp. | | | 145,830 | |
| | | | | | | | |
| | |
| | | | | | | 205,630 | |
| | | | | | | | |
| | |
| | | | Total Industrials | | | 1,261,659 | |
| | | | | | | | |
| |
| | | | Information Technology — 8.2% | |
| |
| | | | Communications Equipment — 0.9% | |
| | |
| | 3,000 | | | CommScope Holding Co., Inc. (a) | | | 114,090 | |
| | | | | | | | |
| |
| | | | Electronic Equipment, Instruments & Components — 0.5% | |
| | |
| | 820 | | | TE Connectivity Ltd. | | | 64,518 | |
| | | | | | | | |
| | |
| | | | IT Services — 2.7% | | | | |
| | |
| | 700 | | | Accenture plc, Class A | | | 86,576 | |
| | |
| | 300 | | | FleetCor Technologies, Inc. (a) | | | 43,263 | |
| | |
| | 948 | | | International Business Machines Corp. | | | 145,831 | |
| | |
| | 500 | | | WEX, Inc. (a) | | | 52,135 | |
| | | | | | | | |
| | |
| | | | | | | 327,805 | |
| | | | | | | | |
| |
| | | | Semiconductors & Semiconductor Equipment — 2.4% | |
| | |
| | 1,160 | | | Broadcom Ltd. (j) | | | 270,338 | |
| | |
| | 400 | | | Texas Instruments, Inc. | | | 30,772 | |
| | | | | | | | |
| | |
| | | | | | | 301,110 | |
| | | | | | | | |
| | |
| | | | Software — 0.5% | | | | |
| | |
| | 800 | | | Microsoft Corp. | | | 55,144 | |
| | | | | | | | |
| |
| | | | Technology Hardware, Storage & Peripherals — 1.2% | |
| | |
| | 1,647 | | | Western Digital Corp. | | | 145,924 | |
| | | | | | | | |
| | |
| | | | Total Information Technology | | | 1,008,591 | |
| | | | | | | | |
| | |
| | | | Materials — 6.7% | | | | |
| | |
| | | | Chemicals — 3.9% | | | | |
| | |
| | 626 | | | Celanese Corp., Series A (j) | | | 59,433 | |
| | |
| | 1,347 | | | Dow Chemical Co. (The) | | | 84,955 | |
| | |
| | 1,287 | | | Eastman Chemical Co. (j) | | | 108,095 | |
| | |
| | 700 | | | EI du Pont de Nemours & Co. | | | 56,497 | |
| | |
| | 6,163 | | | Mosaic Co. (The) | | | 140,701 | |
| | |
| | 1,000 | | | Olin Corp. | | | 30,280 | |
| | | | | | | | |
| | |
| | | | | | | 479,961 | |
| | | | | | | | |
| | |
| | | | Metals & Mining — 2.8% | | | | |
| | |
| | 9,200 | | | AK Steel Holding Corp. (a) | | | 60,444 | |
| | |
| | 1,978 | | | Alcoa Corp. | | | 64,582 | |
| | |
| | 5,330 | | | Alumina Ltd., (Australia), ADR | | | 31,553 | |
| | |
| | 3,773 | | | Freeport-McMoRan, Inc. (a) | | | 45,314 | |
| | |
| | 1,132 | | | Reliance Steel & Aluminum Co. | | | 82,421 | |
| | |
| | 3,016 | | | United States Steel Corp. | | | 66,774 | |
| | | | | | | | |
| | |
| | | | | | | 351,088 | |
| | | | | | | | |
| | |
| | | | Total Materials | | | 831,049 | |
| | | | | | | | |
SEE NOTES TO FINANCIAL STATEMENTS.
15
JPMorgan Value Plus Fund
SCHEDULE OF PORTFOLIO INVESTMENTS
AS OF JUNE 30, 2017 (continued)
| | | | | | | | |
SHARES | | | SECURITY DESCRIPTION | | VALUE($) | |
| |
| | Long Positions — continued | | | | |
| |
| | | | Real Estate — 4.1% | |
| |
| | | | Equity Real Estate Investment Trusts (REITs) — 4.1% | |
| | |
| | 4,100 | | | DDR Corp. | | | 37,187 | |
| | |
| | 500 | | | Federal Realty Investment Trust | | | 63,195 | |
| | |
| | 4,662 | | | Host Hotels & Resorts, Inc. | | | 85,175 | |
| | |
| | 2,300 | | | Kimco Realty Corp. | | | 42,205 | |
| | |
| | 2,160 | | | LaSalle Hotel Properties | | | 64,368 | |
| | |
| | 400 | | | Public Storage | | | 83,412 | |
| | |
| | 3,918 | | | Weyerhaeuser Co. | | | 131,253 | |
| | | | | | | | |
| | |
| | | | Total Real Estate | | | 506,795 | |
| | | | | | | | |
| |
| | | | Telecommunication Services — 1.7% | |
| |
| | | | Diversified Telecommunication Services — 1.1% | |
| | |
| | 3,696 | | | AT&T, Inc. | | | 139,450 | |
| | | | | | | | |
| |
| | | | Wireless Telecommunication Services — 0.6% | |
| | |
| | 1,132 | | | T-Mobile US, Inc. (a) (j) | | | 68,622 | |
| | | | | | | | |
| | |
| | | | Total Telecommunication Services | | | 208,072 | |
| | | | | | | | |
| | |
| | | | Total Common Stocks | | | | |
| | |
| | | | (Cost $12,271,090) | | | 13,535,510 | |
| | | | | | | | |
| |
| | Master Limited Partnership — 0.4% | | | | |
| |
| | | | Utilities — 0.4% | |
| |
| | | | Independent Power and Renewable Electricity Producers — 0.4% | |
| | |
| | 1,200 | | | NextEra Energy Partners LP | | | | |
| | |
| | | | (Cost $40,317) | | | 44,387 | |
| | | | | | | | |
| |
| | Short-Term Investment — 2.0% | | | | |
| |
| | | | Investment Company — 2.0% | |
| | |
| | 244,727 | | | JPMorgan U.S. Government Money Market Fund, Institutional Class Shares, 0.840% (b) (l)
(Cost $244,727) | | | 244,727 | |
| | | | | | | | |
| | |
| | | | Total Investments — 112.2% (Cost $12,556,134) | | | 13,824,624 | |
| | |
| | | | Liabilities in Excess of Other Assets — (12.2)% | | | (1,499,940) | |
| | | | | | | | |
| | |
| | | | NET ASSETS — 100.0% | | $ | 12,324,684 | |
| | | | | | | | |
| |
| | Short Positions — 12.7% | | | | |
| |
| | Common Stocks — 12.7% | | | | |
| |
| | | | Consumer Discretionary — 1.2% | |
| |
| | | | Automobiles — 0.8% | |
| | |
| | 258 | | | Tesla, Inc. (a) | | | 93,295 | |
| | | | | | | | |
| | | | | | | | |
SHARES | | | SECURITY DESCRIPTION | | VALUE($) | |
| |
| | | | | |
| |
| | | | Specialty Retail — 0.4% | |
| | |
| | 1,790 | | | Bed Bath & Beyond, Inc. | | | 54,416 | |
| | | | | | | | |
| | |
| | | | Total Consumer Discretionary | | | 147,711 | |
| | | | | | | | |
| |
| | | | Consumer Staples — 1.6% | |
| |
| | | | Household Products — 1.1% | |
| | |
| | 810 | | | Clorox Co. (The) | | | 107,925 | |
| | |
| | 336 | | | Procter & Gamble Co. (The) | | | 29,282 | |
| | | | | | | | |
| | |
| | | | | | | 137,207 | |
| | | | | | | | |
| |
| | | | Personal Products — 0.5% | |
| | |
| | 650 | | | Estee Lauder Cos., Inc. (The), Class A | | | 62,387 | |
| | | | | | | | |
| | |
| | | | Total Consumer Staples | | | 199,594 | |
| | | | | | | | |
| |
| | | | Financials — 1.1% | |
| |
| | | | Capital Markets — 1.1% | |
| | |
| | 2,330 | | | Legg Mason, Inc. | | | 88,913 | |
| | |
| | 1,077 | | | Thomson Reuters Corp., (Canada) | | | 49,854 | |
| | | | | | | | |
| | |
| | | | Total Financials | | | 138,767 | |
| | | | | | | | |
| |
| | | | Health Care — 2.2% | |
| |
| | | | Biotechnology — 1.1% | |
| | |
| | 1,220 | | | AbbVie, Inc. | | | 88,462 | |
| | |
| | 281 | | | Amgen, Inc. | | | 48,397 | |
| | | | | | | | |
| | |
| | | | | | | 136,859 | |
| | | | | | | | |
| |
| | | | Health Care Equipment & Supplies — 0.5% | |
| | |
| | 608 | | | Baxter International, Inc. | | | 36,808 | |
| | |
| | 215 | | | Edwards Lifesciences Corp. (a) | | | 25,422 | |
| | | | | | | | |
| | |
| | | | | | | 62,230 | |
| | | | | | | | |
| |
| | | | Health Care Providers & Services — 0.6% | |
| | |
| | 1,001 | | | Express Scripts Holding Co. (a) | | | 63,904 | |
| | | | | | | | |
| | |
| | | | Total Health Care | | | 262,993 | |
| | | | | | | | |
| |
| | | | Industrials — 0.5% | |
| |
| | | | Aerospace & Defense — 0.5% | |
| | |
| | 230 | | | Lockheed Martin Corp. | | | 63,850 | |
| | | | | | | | |
| |
| | | | Information Technology — 0.5% | |
| |
| | | | Internet Software & Services — 0.1% | |
| | |
| | 110 | | | LogMeIn, Inc. | | | 11,495 | |
| | | | | | | | |
| |
| | | | Software — 0.4% | |
| | |
| | 645 | | | Citrix Systems, Inc. (a) | | | 51,329 | |
| | | | | | | | |
| | |
| | | | Total Information Technology | | | 62,824 | |
| | | | | | | | |
| |
| | | | Materials — 1.5% | |
| |
| | | | Chemicals — 1.2% | |
| | |
| | 694 | | | LyondellBasell Industries NV, Class A | | | 58,567 | |
| | |
| | 650 | | | Praxair, Inc. | | | 86,157 | |
| | | | | | | | |
| | |
| | | | | | | 144,724 | |
| | | | | | | | |
| |
| | | | Containers & Packaging — 0.3% | |
| | |
| | 634 | | | Greif, Inc., Class A | | | 35,365 | |
SEE NOTES TO FINANCIAL STATEMENTS.
16
JPMorgan Value Plus Fund
SCHEDULE OF PORTFOLIO INVESTMENTS
AS OF JUNE 30, 2017 (continued)
| | | | | | | | |
SHARES | | | SECURITY DESCRIPTION | | VALUE($) | |
| |
| | Short Positions — continued | | | | |
| |
| | | | Containers & Packaging — continued | |
| | | | | | | | |
| | |
| | | | Total Materials | | | 180,089 | |
| | | | | | | | |
| |
| | | | Real Estate — 1.4% | |
| |
| | | | Equity Real Estate Investment Trusts (REITs) — 1.4% | |
| | |
| | 563 | | | Crown Castle International Corp. | | | 56,401 | |
| | |
| | 650 | | | Realty Income Corp. | | | 35,867 | |
| | |
| | 737 | | | Ventas, Inc. | | | 51,207 | |
| | |
| | 358 | | | Welltower, Inc. | | | 26,796 | |
| | | | | | | | |
| | |
| | | | Total Real Estate | | | 170,271 | |
| | | | | | | | |
| |
| | | | Telecommunication Services — 0.8% | |
| |
| | | | Wireless Telecommunication Services — 0.8% | |
| | |
| | 12,142 | | | Sprint Corp. (a) | | | 99,686 | |
| | | | | | | | |
| | |
| | | | Utilities — 1.9% | | | | |
| | |
| | | | Electric Utilities — 1.0% | | | | |
| | |
| | 720 | | | Duke Energy Corp. | | | 60,185 | |
| | |
| | 1,190 | | | Southern Co. (The) | | | 56,977 | |
| | | | | | | | |
| | |
| | | | | | | 117,162 | |
| | | | | | | | |
| | |
| | | | Multi-Utilities — 0.9% | | | | |
| | |
| | 710 | | | Consolidated Edison, Inc. | | | 57,382 | |
| | |
| | 775 | | | Dominion Energy, Inc. | | | 59,389 | |
| | | | | | | | |
| | |
| | | | | | | 116,771 | |
| | | | | | | | |
| | |
| | | | Total Utilities | | | 233,933 | |
| | | | | | | | |
| | |
| | | | Total Securities Sold Short
(Proceeds $1,489,500) | | $ | 1,559,718 | |
| | | | | | | | |
Percentages indicated are based on net assets.
SEE NOTES TO FINANCIAL STATEMENTS.
17
J.P. Morgan Funds
NOTES TO SCHEDULES OF PORTFOLIO INVESTMENTS
AS OF JUNE 30, 2017
| | | | | | |
ADR | | | — | | | American Depositary Receipt |
ELN | | | — | | | Equity-Linked Note |
| | |
(a) | | | — | | | Non-income producing security. |
(b) | | | — | | | Investment in affiliate. Money market fund is registered under |
| | | | | | the Investment Company Act of 1940, as amended, and |
| | | | | | advised by J.P. Morgan Investment Management Inc. |
(e) | | | — | | | Security is exempt from registration under Rule 144A of the |
| | | | | | Securities Act of 1933, as amended. Unless otherwise |
| | | | | | indicated, this security has been determined to be liquid under |
| | | | | | procedures established by the Board of Trustees and may be |
| | | | | | resold in transactions exempt from registration, normally to |
| | | | | | qualified institutional buyers. |
(j) | | | — | | | All or a portion of this security is segregated as collateral for short |
| | | | | | sales. The total value of securities and cash segregated as collateral |
| | | | | | is $2,752,904 and $3,529 respectively. |
(l) | | | — | | | The rate shown is the current yield as of June 30, 2017. |
SEE NOTES TO FINANCIAL STATEMENTS.
18
STATEMENTS OF ASSETS AND LIABILITIES
AS OF JUNE 30, 2017
| | | | | | | | |
| | | Equity Low
Volatility Income
Fund | | | Value Plus Fund | |
ASSETS: | | | | | | | | |
Investments in non-affiliates, at value | | $ | 55,028,006 | | | $ | 13,579,897 | |
Investments in affiliates, at value | | | 724,591 | | | | 244,727 | |
| | | | |
Total investment securities, at value | | | 55,752,597 | | | | 13,824,624 | |
Restricted cash | | | — | | | | 3,529 | |
Receivables: | | | | | | | | |
Investment securities sold | | | 518,394 | | | | 79,167 | |
Interest from non-affiliates | | | 172,410 | | | | 11,088 | |
Dividends from affiliates | | | 908 | | | | 184 | |
Tax reclaims | | | — | | | | 107 | |
Due from Adviser | | | 2,351 | | | | 2,155 | |
Deferred offering cost | | | 4,288 | | | | 2,402 | |
| | | | |
Total Assets | | | 56,450,948 | | | | 13,923,256 | |
| | | | |
| | |
LIABILITIES: | | | | | | | | |
Payables: | | | | | | | | |
Due to custodian | | | 32,252 | | | | 1,001 | |
Securities sold short, at value | | | — | | | | 1,559,718 | |
Dividend expense to non-affiliates on securities sold short | | | — | | | | 1,422 | |
Investment securities purchased | | | 237,246 | | | | — | |
Interest expense to non-affiliates on securities sold short | | | — | | | | 904 | |
Accrued liabilities: | | | | | | | | |
Distribution fees | | | 18 | | | | 20 | |
Service fees | | | 11,557 | | | | 1,372 | |
Custodian and accounting fees | | | 3,187 | | | | — | |
Audit fees | | | 43,893 | | | | 28,500 | |
Other | | | 5,296 | | | | 5,635 | |
| | | | |
Total Liabilities | | | 333,449 | | | | 1,598,572 | |
| | | | |
Net Assets | | $ | 56,117,499 | | | $ | 12,324,684 | |
| | | | |
SEE NOTES TO FINANCIAL STATEMENTS.
19
STATEMENTS OF ASSETS AND LIABILITIES
AS OF JUNE 30, 2017 (continued)
| | | | | | | | |
| | | Equity Low
Volatility Income
Fund | | | Value Plus Fund | |
NET ASSETS: | | | | | | | | |
Paid-in-Capital | | $ | 52,031,702 | | | $ | 10,027,263 | |
Accumulated undistributed (distributions in excess of) net investment income | | | 26,651 | | | | 41,371 | |
Accumulated net realized gains (losses) | | | 884,230 | | | | 1,057,778 | |
Net unrealized appreciation (depreciation) | | | 3,174,916 | | | | 1,198,272 | |
| | | | |
Total Net Assets | | $ | 56,117,499 | | | $ | 12,324,684 | |
| | | | |
| | |
Net Assets: | | | | | | | | |
Class A | | $ | 22,394 | | | $ | 24,599 | |
Class C | | | 22,289 | | | | 24,497 | |
Class I (formerly Select Class) | | | 56,027,827 | | | | 12,275,588 | |
Class R5 | | | 22,489 | | | | — | |
Class R6 | | | 22,500 | | | | — | |
| | | | |
Total | | $ | 56,117,499 | | | $ | 12,324,684 | |
| | | | |
| | |
Outstanding units of beneficial interest (shares) | | | | | | | | |
($0.0001 par value; unlimited number of shares authorized): | | | | | | | | |
Class A | | | 1,383 | | | | 1,335 | |
Class C | | | 1,376 | | | | 1,334 | |
Class I (formerly Select Class) | | | 3,459,027 | | | | 665,547 | |
Class R5 | | | 1,388 | | | | — | |
Class R6 | | | 1,389 | | | | — | |
| | |
Net Asset Value (a): | | | | | | | | |
Class A - Redemption price per share | | $ | 16.20 | | | $ | 18.42 | |
Class C - Offering price per share (b) | | | 16.20 | | | | 18.36 | |
Class I (formerly Select Class) - Offering and redemption price per share | | | 16.20 | | | | 18.44 | |
Class R5 - Offering and redemption price per share | | | 16.20 | | | | — | |
Class R6 - Offering and redemption price per share | | | 16.20 | | | | — | |
Class A maximum sales charge | | | 5.25% | | | | 5.25% | |
Class A maximum public offering price per share
[net asset value per share/(100% – maximum sales charge)] | | $ | 17.10 | | | $ | 19.44 | |
| | | | |
| | |
Cost of investments in non-affiliates | | $ | 51,853,090 | | | $ | 12,311,407 | |
Cost of investments in affiliates | | | 724,591 | | | | 244,727 | |
Proceeds from securities sold short | | | — | | | | 1,489,500 | |
| (a) | Per share amounts may not recalculate due to rounding of net assets and/or shares outstanding. |
| (b) | Redemption price for Class C Shares varies based upon length of time the shares are held. |
SEE NOTES TO FINANCIAL STATEMENTS.
20
STATEMENTS OF OPERATIONS FOR
THE PERIODS ENDED JUNE 30, 2017
| | | | | | | | |
| | | Equity Low Volatility Income Fund (a) | | | Value Plus Fund (b) | |
INVESTMENT INCOME: | | | | | | | | |
Dividend income from non-affiliates | | $ | 1,312,459 | | | $ | 191,795 | |
Dividend income from affiliates | | | 9,591 | | | | 1,265 | |
Interest income from non-affiliates | | | 1,149,892 | | | | — | |
| | | | |
Total investment income | | | 2,471,942 | | | | 193,060 | |
| | | | |
| | |
EXPENSES: | | | | | | | | |
Investment advisory fees | | | 221,901 | | | | 71,373 | |
Administration fees | | | 40,305 | | | | 7,781 | |
Distribution fees: | | | | | | | | |
Class A | | | 49 | | | | 48 | |
Class C | | | 148 | | | | 142 | |
Service fees: | | | | | | | | |
Class A | | | 49 | | | | 48 | |
Class C | | | 49 | | | | 47 | |
Class I (formerly Select Class) | | | 123,081 | | | | 23,696 | |
Class R5 | | | 13 | | | | — | |
Custodian and accounting fees | | | 31,283 | | | | 13,247 | |
Professional fees | | | 88,511 | | | | 58,316 | |
Trustees’ and Chief Compliance Officer’s fees | | | 23,514 | | | | 18,846 | |
Printing and mailing costs | | | 11,012 | | | | 4,999 | |
Registration and filing fees | | | 501 | | | | 1,662 | |
Transfer agency fees (See Note 2.H.) | | | 625 | | | | 124 | |
Offering costs | | | 73,978 | | | | 11,716 | |
Other | | | 7,167 | | | | 5,473 | |
Dividend expense to non-affiliates on securities sold short | | | — | | | | 29,982 | |
Interest expense to non-affiliates on securities sold short | | | — | | | | 7,003 | |
| | | | |
Total expenses | | | 622,186 | | | | 254,503 | |
| | | | |
Less fees waived | | | (137,453) | | | | (96,218) | |
Less expense reimbursements | | | (74,213) | | | | (30,940) | |
| | | | |
Net expenses | | | 410,520 | | | | 127,345 | |
| | | | |
Net investment income (loss) | | | 2,061,422 | | | | 65,715 | |
| | | | |
| | |
REALIZED/UNREALIZED GAINS (LOSSES): | | | | | | | | |
Net realized gain (loss) on transactions from: | | | | | | | | |
Investments in non-affiliates | | | 784,052 | | | | 1,097,768 | |
Futures | | | 97,109 | | | | — | |
Securities sold short | | | — | | | | (37,071) | |
| | | | |
Net realized gain (loss) | | | 881,161 | | | | 1,060,697 | |
| | | | |
Change in net unrealized appreciation/depreciation on: | | | | | | | | |
Investments in non-affiliates | | | 3,174,916 | | | | 1,268,490 | |
Securities sold short | | | — | | | | (70,218) | |
| | | | |
Change in net unrealized appreciation/depreciation | | | 3,174,916 | | | | 1,198,272 | |
| | | | |
Net realized/unrealized gains (losses) | | | 4,056,077 | | | | 2,258,969 | |
| | | | |
Change in net assets resulting from operations | | $ | 6,117,499 | | | $ | 2,324,684 | |
| | | | |
| (a) | Commencement of operations was July 20, 2016. |
| (b) | Commencement of operations was August 31, 2016. |
SEE NOTES TO FINANCIAL STATEMENTS.
21
STATEMENTS OF CHANGES IN NET ASSETS
FOR THE PERIODS ENDED JUNE 30, 2017
| | | | | | | | |
| | | Equity Low Volatility
Income Fund (a) | | | Value Plus Fund (b) | |
CHANGE IN NET ASSETS RESULTING FROM OPERATIONS: | | | | | | | | |
Operations: | | | | | | | | |
Net investment income (loss) | | $ | 2,061,422 | | | $ | 65,715 | |
Net realized gain (loss) | | | 881,161 | | | | 1,060,697 | |
Change in net unrealized appreciation/depreciation | | | 3,174,916 | | | | 1,198,272 | |
| | | | |
Change in net assets resulting from operations | | | 6,117,499 | | | | 2,324,684 | |
| | | | |
| | |
DISTRIBUTIONS TO SHAREHOLDERS: | | | | | | | | |
Class A | | | | | | | | |
From net investment income | | | (762) | | | | (37) | |
Class C | | | | | | | | |
From net investment income | | | (663) | | | | (14) | |
Class I (formerly Select Class) | | | | | | | | |
From net investment income | | | (2,028,610) | | | | (27,262) | |
Class R5 | | | | | | | | |
From net investment income | | | (853) | | | | — | |
Class R6 | | | | | | | | |
From net investment income | | | (863) | | | | — | |
| | | | |
Total distributions to shareholders | | | (2,031,751) | | | | (27,313) | |
| | | | |
CAPITAL TRANSACTIONS: | | | | | | | | |
Change in net assets resulting from capital transactions | | | 52,031,751 | | | | 10,027,313 | |
| | | | |
| | |
NET ASSETS: | | | | | | | | |
Change in net assets | | | 56,117,499 | | | | 12,324,684 | |
Beginning of period | | | — | | | | — | |
| | | | |
End of period | | $ | 56,117,499 | | | $ | 12,324,684 | |
| | | | |
Accumulated undistributed (distributions in excess of) net investment income | | $ | 26,651 | | | $ | 41,371 | |
| | | | |
| (a) | Commencement of operations was July 20, 2016. |
| (b) | Commencement of operations was August 31, 2016. |
SEE NOTES TO FINANCIAL STATEMENTS.
22
STATEMENTS OF CHANGES IN NET ASSETS
FOR THE PERIODS INDICATED ENDED JUNE 30, 2017 (continued)
| | | | | | | | |
| | | Equity Low
Volatility Income
Fund (a) | | | Value Plus Fund (b) | |
CAPITAL TRANSACTIONS: | | | | | | | | |
Class A | | | | | | | | |
Proceeds from shares issued | | $ | 20,000 | | | $ | 20,000 | |
Distributions reinvested | | | 762 | | | | 37 | |
| | | | |
Change in net assets resulting from Class A capital transactions | | $ | 20,762 | | | $ | 20,037 | |
| | | | |
Class C | | | | | | | | |
Proceeds from shares issued | | $ | 20,000 | | | $ | 20,000 | |
Distributions reinvested | | | 663 | | | | 14 | |
| | | | |
Change in net assets resulting from Class C capital transactions | | $ | 20,663 | | | $ | 20,014 | |
| | | | |
Class I (formerly Select Class) | | | | | | | | |
Proceeds from shares issued | | $ | 50,210,475 | | | $ | 10,437,694 | |
Distributions reinvested | | | 2,028,610 | | | | 27,262 | |
Cost of shares redeemed | | | (290,475 | ) | | | (477,694) | |
| | | | |
Change in net assets resulting from Class I capital transactions | | $ | 51,948,610 | | | $ | 9,987,262 | |
| | | | |
Class R5 | | | | | | | | |
Proceeds from shares issued | | $ | 20,000 | | | $ | — | |
Distributions reinvested | | | 853 | | | | — | |
| | | | |
Change in net assets resulting from Class R5 capital transactions | | $ | 20,853 | | | $ | — | |
| | | | |
Class R6 | | | | | | | | |
Proceeds from shares issued | | $ | 20,000 | | | $ | — | |
Distributions reinvested | | | 863 | | | | — | |
| | | | |
Change in net assets resulting from Class R6 capital transactions | | $ | 20,863 | | | $ | — | |
| | | | |
Total change in net assets resulting from capital transactions | | $ | 52,031,751 | | | $ | 10,027,313 | |
| | | | |
| | |
SHARE TRANSACTIONS: | | | | | | | | |
Class A | | | | | | | | |
Issued | | | 1,334 | | | | 1,333 | |
Reinvested | | | 49 | | | | 2 | |
| | | | |
Change in Class A Shares | | | 1,383 | | | | 1,335 | |
| | | | |
Class C | | | | | | | | |
Issued | | | 1,333 | | | | 1,333 | |
Reinvested | | | 43 | | | | 1 | |
| | | | |
Change in Class C Shares | | | 1,376 | | | | 1,334 | |
| | | | |
Class I (formerly Select Class) | | | | | | | | |
Issued | | | 3,346,948 | | | | 690,928 | |
Reinvested | | | 131,027 | | | | 1,546 | |
Redeemed | | | (18,948 | ) | | | (26,927) | |
| | | | |
Change in Class I Shares | | | 3,459,027 | | | | 665,547 | |
| | | | |
Class R5 | | | | | | | | |
Issued | | | 1,333 | | | | — | |
Reinvested | | | 55 | | | | — | |
| | | | |
Change in Class R5 Shares | | | 1,388 | | | | — | |
| | | | |
Class R6 | | | | | | | | |
Issued | | | 1,333 | | | | — | |
Reinvested | | | 56 | | | | — | |
| | | | |
Change in Class R6 Shares | | | 1,389 | | | | — | |
| | | | |
| (a) | Commencement of operations was July 20, 2016. |
| (b) | Commencement of operations was August 31, 2016. |
SEE NOTES TO FINANCIAL STATEMENTS.
23
STATEMENT OF CASH FLOWS
FOR THE PERIOD ENDED JUNE 30, 2017
| | | | |
| | | Value Plus
Fund (a) | |
INCREASE (DECREASE) IN CASH | | | | |
Cash flows provided (used) by operating activities: | | | | |
Increase in net assets resulting from operations | | $ | 2,324,684 | |
Adjustments to reconcile net increase / decrease in net assets resulting from operations to net cash provided (used) by operating activities: | | | | |
Purchase of investment securities | | | (22,482,928) | |
Proceeds from disposition of investment securities | | | 11,190,122 | |
Covers of investment securities sold short | | | (938,404) | |
Proceeds from investment securities sold short | | | 2,390,833 | |
Purchases of short-term investments - affiliates, net | | | (244,727) | |
Change in unrealized (appreciation) / depreciation on investments | | | (1,268,490) | |
Change in unrealized (appreciation) / depreciation on investment securities sold short | | | 70,218 | |
Net realized (gain) / loss on investments | | | (1,097,768) | |
Net realized (gain) / loss on investments securities sold short | | | 37,071 | |
Increase in restricted cash | | | (3,529) | |
Increase in dividends receivable | | | (11,088) | |
Increase in dividends from affiliates | | | (184) | |
Increase in tax reclaims | | | (107) | |
Increase in due from Adviser | | | (2,155) | |
Increase in deferred offering cost | | | (2,402) | |
Increase in dividend expenses to non-affiliates on securities sold short | | | 1,422 | |
Increase in interest expense to non-affiliates on securities sold short | | | 904 | |
Increase in distribution fees payable | | | 20 | |
Increase in service fees payable | | | 1,372 | |
Increase in other accrued expenses payable | | | 34,135 | |
| | | | |
Net cash provided (used) by operating activities | | | (10,001,001) | |
| | | | |
| |
Cash flows provided (used) by financing activities: | | | | |
Increase in due to custodian | | | 1,001 | |
Proceeds from shares issued | | | 10,477,694 | |
Payment for shares redeemed | | | (477,694) | |
| | | | |
Net cash provided (used) by financing activities | | | 10,001,001 | |
| | | | |
Net decrease in cash | | | - | |
| | | | |
| |
Cash: | | | | |
Beginning of period | | | - | |
| | | | |
End of period | | $ | - | |
| | | | |
| | | | | | |
| | Supplemental disclosure of cash flow information: For the period ended June 30, 2017, the Fund paid $6,099 in interest expenses for securities sold short. (a) Commencement of operations was August 31, 2016. For purposes of reporting the Statement of Cash Flows, the Fund considers all cash accounts that are not subject to withdrawal restrictions or penalties to be cash equivalents. | | | | |
SEE ACCOMPANYING NOTES TO FINANCIAL STATEMENTS.
24
FINANCIAL HIGHLIGHTS
FOR THE PERIODS INDICATED
| | | | | | | | | | | | | | | | | | | | | | | | | | | | | | | | | | | | | | | | | | | | | | | | |
| | | Per share operating performance | | | Ratios/Supplemental data | |
| | | | | | Investment operations | | | Distributions | | | | | | | | | | | | Ratios to average net assets (a) | | | | |
| | | | | | | | | | | | |
| | | Net asset
value,
beginning of
period | | | Net investment
income (loss) (b) | | | Net realized and
unrealized gains
(losses) on
investments | | | Total from
investment
operations | | | Net investment
income | | | Net asset
value, end of
period | | | Total return
(excludes sales
charge) (c)(d) | | | Net assets, end
of period | | | Net expenses
(e)(f) | | | Net
investment income
(loss) (f) | | | Expenses without
waivers,
reimbursements and
earnings credits (f) | | | Portfolio
turnover
rate (c) | |
Equity Low Volatility Income Fund | | | | | | | | | | | | | | | | | | | | | | | | | | | | | | | | | | | | | | | | | | | | | | | | |
Class A | | | | | | | | | | | | | | | | | | | | | | | | | | | | | | | | | | | | | | | | | | | | | | | | |
July 20, 2016 (g) through June 30, 2017 | | | $15.00 | | | | $0.57 | | | | $1.19 | | | | $1.76 | | | | $(0.56) | | | | $16.20 | | | | 11.99 | % | | | $22,394 | | | | 1.08 | % | | | 3.92 | % | | | 1.82 | % | | | 73 | % |
Class C | | | | | | | | | | | | | | | | | | | | | | | | | | | | | | | | | | | | | | | | | | | | | | | | |
July 20, 2016 (g) through June 30, 2017 | | | 15.00 | | | | 0.50 | | | | 1.19 | | | | 1.69 | | | | (0.49) | | | | 16.20 | | | | 11.47 | | | | 22,289 | | | | 1.58 | | | | 3.43 | | | | 2.34 | | | | 73 | |
Class I (formerly Select Class) | | | | | | | | | | | | | | | | | | | | | | | | | | | | | | | | | | | | | | | | | | | | | | | | |
July 20, 2016 (g) through June 30, 2017 | | | 15.00 | | | | 0.61 | | | | 1.19 | | | | 1.80 | | | | (0.60) | | | | 16.20 | | | | 12.25 | | | | 56,027,827 | | | | 0.83 | | | | 4.17 | | | | 1.25 | | | | 73 | |
Class R5 | | | | | | | | | | | | | | | | | | | | | | | | | | | | | | | | | | | | | | | | | | | | | | | | |
July 20, 2016 (g) through June 30, 2017 | | | 15.00 | | | | 0.64 | | | | 1.19 | | | | 1.83 | | | | (0.63) | | | | 16.20 | | | | 12.46 | | | | 22,489 | | | | 0.63 | | | | 4.37 | | | | 1.41 | | | | 73 | |
Class R6 | | | | | | | | | | | | | | | | | | | | | | | | | | | | | | | | | | | | | | | | | | | | | | | | |
July 20, 2016 (g) through June 30, 2017 | | | 15.00 | | | | 0.64 | | | | 1.20 | | | | 1.84 | | | | (0.64) | | | | 16.20 | | | | 12.52 | | | | 22,500 | | | | 0.58 | | | | 4.42 | | | | 1.34 | | | | 73 | |
| (a) | Annualized for periods less than one year, unless otherwise noted. |
| (b) | Calculated based upon average shares outstanding. |
| (c) | Not annualized for periods less than one year. |
| (d) | Includes adjustments in accordance with accounting principles generally accepted in the United States of America and as such, the net asset values for financial reporting purposes and the returns based upon those net asset values may differ from the net asset values and returns for shareholder transactions. |
| (e) | Include earnings credits and interest expenses, if applicable, each of which is less than 0.005% unless otherwise noted. |
| (f) | Certain non-recurring expenses incurred by the Fund were not annualized for the period ended June 30, 2017. |
| (g) | Commencement of operations. |
25
FINANCIAL HIGHLIGHTS
FOR THE PERIODS INDICATED
| | | | | | | | | | | | | | | | | | | | | | | | | | | | | | | | | | | | | | | | | | | | | | | | | | | | |
| | | Per share operating performance | | | | | | Ratios/Supplemental data | |
| | | | | | Investment operations | | | Distributions | | | | | | | | | | | | Ratios to average net assets (a) | | | | | | | |
| | | | | | | | | | | | | |
| | | Net asset
value,
beginning of
period | | | Net investment
income (loss) (b) | | | Net realized
and unrealized
gains (losses) on investments | | | Total from
investment
operations | | | Net
investment
income | | | Net asset
value, end
of period | | | Total return
(excludes
sales
charge)(c)
(d) | | | Net assets, end
of period | | | Net expenses
(including
dividend and
interest expense
for securities sold
short) (e)(f) | | | Net
investment income
(loss) (f) | | | Expenses without
waivers,
reimbursements and
earnings credits
(including dividend
and interest expense
for securities sold
short) (f)(g) | | | Portfolio
turnover
rate
(excluding
securities
sold short)
(c) | | | Portfolio
turnover rate
(including
securities sold
short) (c) | |
Value Plus Fund | | | | | | | | | | | | | | | | | | | | | | | | | | | | | | | | | | | | | | | | | | | | | | | | | | | | |
Class A | | | | | | | | | | | | | | | | | | | | | | | | | | | | | | | | | | | | | | | | | | | | | | | | | | | | |
August 31, 2016(h) through June 30, 2017 | | | $15.00 | | | | $0.06 | | | | $3.39 | | | | $3.45 | | | | $(0.03) | | | | $18.42 | | | | 22.99 | % | | | $24,599 | | | | 1.58 | % | | | 0.44 | % | | | 3.04 | % | | | 91 | % | | | 110 | % |
Class C | | | | | | | | | | | | | | | | | | | | | | | | | | | | | | | | | | | | | | | | | | | | | | | | | | | | |
August 31, 2016(h) through June 30, 2017 | | | 15.00 | | | | (0.01) | | | | 3.38 | | | | 3.37 | | | | (0.01) | | | | 18.36 | | | | 22.47 | | | | 24,497 | | | | 2.08 | | | | (0.06) | | | | 3.50 | | | | 91 | | | | 110 | |
Class I (formerly Select Class) | | | | | | | | | | | | | | | | | | | | | | | | | | | | | | | | | | | | | | | | | | | | | | | | | | | | |
August 31, 2016(h) through June 30, 2017 | | | 15.00 | | | | 0.10 | | | | 3.38 | | | | 3.48 | | | | (0.04) | | | | 18.44 | | | | 23.22 | | | | 12,275,588 | | | | 1.33 | | | | 0.69 | | | | 2.65 | | | | 91 | | | | 110 | |
| (a) | Annualized for periods less than one year, unless otherwise noted. |
| (b) | Calculated based upon average shares outstanding. |
| (c) | Not annualized for periods less than one year. |
| (d) | Includes adjustments in accordance with accounting principles generally accepted in the United States of America and as such, the net asset values for financial reporting purposes and the returns based upon those net asset values may differ from the net asset values and returns for shareholder transactions. |
| (e) | Includes earnings credits and interest expense, if applicable, each of which is less than 0.005% unless otherwise noted. |
| (f) | Certain non-recurring expenses incurred by the Fund were not annualized for the period ended June 30, 2017. |
| (g) | The net expenses and expenses without waivers, reimbursements and earnings credits (excluding dividend and interest expense for securities sold short) for Class A are 1.17% and 2.65% for the period ended 2017,Class C are 1.67% and 3.11% for the period ended 2017 and Class I are 0.93% and 2.26% for period ended 2017, respectively. |
| (h) | Commencement of operations. |
26
NOTES TO FINANCIAL STATEMENTS
AS OF JUNE 30, 2017
1. Organization
JPMorgan Trust I ( “JPM I”) and JPMorgan Trust IV (“JPM IV”) were formed on November 12, 2004 and November 11, 2015, respectively, as a Delaware statutory trusts, pursuant to Declarations of Trust dated November 5, 2004 and November 11, 2015, respectively and are registered under the Investment Company Act of 1940, as amended (the “1940 Act”), as an open-end management investment companies.
The following are 2 separate funds of the Trusts (collectively, the “Funds”) covered by this report:
| | | | | | | | | | |
| | | | | Classes Offered | | Trust | | Diversified/Non-
Diversified | | |
| | Equity Low Volatility Income Fund | | Class A, Class C, Class I^, Class R5 and Class R6 | | JPM I | | Diversified | | |
| | Value Plus Fund | | Class A, Class C and Class I^ | | JPM IV | | Diversified | | |
^ Effective April 3, 2017, Select Class was renamed Class I.
The investment objective of the Equity Low Volatility Income Fund is to seek total return which includes current income and capital appreciation.
The investment objective of the Value Plus Fund is to seek to provide long-term capital appreciation from a portfolio of U.S. large cap value stocks.
The Equity Low Volatility Income Fund and Value Plus Fund commenced operations on July 20, 2016 and August 31, 2016, respectively. Currently, the Funds are not publicly offered for investment.
Class A Shares generally provide for a front-end sales charge while Class C Shares provide for a contingent deferred sales charge (“CDSC”). No sales charges are assessed with respect to Class R5, Class R6 and Class I Shares. All classes of shares have equal rights as to earnings, assets and voting privileges, except that each class may bear different transfer agency, sub-transfer agency (through April 2, 2017), distribution and service fees and each class has exclusive voting rights with respect to its distribution plan and shareholder servicing agreements. Effective April 3, 2017 sub-transfer agency and shareholder servicing fees were consolidated into a single service fee. Certain Class A Shares, for which front-end sales charges have been waived, may be subject to a CDSC as described in the Fund’s prospectus. Beginning on November 14, 2017, Class C Shares will automatically convert to Class A Shares after ten years.
J.P. Morgan Investment Management Inc. (“JPMIM”), an indirect, wholly-owned subsidiary of JPMorgan Chase & Co. (“JPMorgan”), acts as Adviser (the “Adviser”) and Administrator (the “Administrator”) to the Funds.
2. Significant Accounting Policies
The following is a summary of significant accounting policies followed by the Funds in the preparation of their financial statements. The Funds are investment companies and, accordingly, follows the investment company accounting and reporting guidance of the Financial Accounting Standards Board Accounting Standards Codification Topic 946 - Investment Companies, which is part of U.S. generally accepted accounting principles (“GAAP”). The preparation of financial statements in conformity with GAAP requires management to make estimates and assumptions that affect the reported amounts of assets and liabilities and disclosure of contingent assets and liabilities at the date of the financial statements and the reported amounts of increases and decreases in net assets from operations during the reporting period. Actual results could differ from those estimates.
A. Valuation of Investments — The valuation of investments is in accordance with GAAP and the Funds’ valuation policies set forth by and under the supervision and responsibility of the Board of Trustees (the “Board”), which established the following approach to valuation, as described more fully below: (i) investments for which market quotations are readily available shall be valued at such unadjusted quoted prices and (ii) all other investments for which market quotations are not readily available shall be valued at their fair value as determined in good faith by the Board.
The Administrator has established the J.P. Morgan Investment Management Americas Valuation Committee (“AVC”) to assist the Board with the oversight and monitoring of the valuation of the Funds’ investments. The Administrator implements the valuation policies of the Funds’ investments, as directed by the Board. The AVC oversees and carries out the policies for the valuation of investments held in the Funds. This includes monitoring the appropriateness of fair values based on results of ongoing valuation oversight, including but not limited to consideration of macro or security specific events, market events and pricing vendor and broker due diligence. The Administrator is responsible for discussing and assessing the potential impacts to the fair values on an ongoing basis, and at least on a quarterly basis with the AVC and the Board.
Equities and other exchange-traded instruments are valued at the last sale price or official market closing price on the primary exchange on which the instrument is traded before the net asset values (“NAV”) of the Funds are calculated on a valuation date. Investments in open-end investment companies (the “Underlying Funds”), are valued at each Underlying Fund’s NAV per share as of the report date.
Fixed income instruments are valued based on prices received from affiliated and unaffiliated approved pricing vendors or third party broker-dealers (collectively referred to as “Pricing Services”). The Pricing Services use multiple valuation techniques to determine the valuation of fixed income instruments. In instances where sufficient market activity exists, the Pricing Services may utilize a market-based approach through which trades or quotes from market makers are used to determine the valuation of these instruments. In instances where sufficient market activity may not exist, the Pricing Services also utilize proprietary valuation models which may consider market transactions in comparable securities and the various relationships between securities in determining fair value and/or market characteristics in order to estimate the relevant cash flows, which are then discounted to calculate the fair values.
Futures are generally valued on the basis of available market quotations.
Valuations reflected in this report are as of the report date. As a result, changes in valuation due to market events and/or issuer related events after the report date and prior to issuance of the report are not reflected herein.
The various inputs that are used in determining the valuation of the Funds’ investments are summarized into the three broad levels listed below.
| • | | Level 1 — Unadjusted inputs using quoted prices in active markets for identical investments. |
| • | | Level 2 — Other significant observable inputs including, but not limited to, quoted prices for similar investments, inputs other than quoted prices that are observable for investments (such as interest rates, prepayment speeds, credit risk, etc.) or other market corroborated inputs. |
27
| • | | Level 3 — Significant inputs based on the best information available in the circumstances, to the extent observable inputs are not available (including the Fund’s assumptions in determining the fair value of investments). |
A financial instrument’s level within the fair value hierarchy is based on the lowest level of any input, both individually and in the aggregate, that is significant to the fair value measurement. The inputs or methodology used for valuing instruments are not necessarily an indication of the risk associated with investing in those instruments.
The following tables represent each valuation input as presented on the Schedules of Portfolio Investments (“SOIs”):
JPMorgan Equity Low Volatility Income Fund
| | | | | | | | | | | | | | | | | | | | | | | | | | | | | | | | |
| | | | | | Level 1
Quoted prices | | | | | | Level 2
Other significant
observable inputs | | | | | | Level 3 Significant
unobservable inputs | | | | | | Total | |
| |
Total Investments in Securities (a) | | $ | | | | | 48,313,262 | | | $ | | | | | 7,439,335 | | | $ | | | | | – | | | $ | | | | | 55,752,597 | |
| | | | |
| | | | | | | | |
JPMorgan Value Plus Fund | | | | | | | | | | | | | | | | | | | | | | | | | | | | | | | | |
| | | | | | Level 1
Quoted prices | | | | | | Level 2
Other significant
observable inputs | | | | | | Level 3 Significant
unobservable inputs | | | | | | Total | |
Total Investments in Securities (b) | | $ | | | | | 13,824,624 | | | $ | | | | | – | | | $ | | | | | – | | | $ | | | | | 13,824,624 | |
| | | | |
Total Liabilities for Securities Sold Short (b) | | $ | | | | | (1,559,718) | | | $ | | | | | – | | | $ | | | | | – | | | $ | | | | | (1,559,718) | |
| | | | |
| (a) | Portfolio holdings designated as level 1 and level 2 are disclosed individually on the SOI. Level 2 consists of Equity-Linked Notes. Please refer to the SOI for industry specifics of portfolio holdings. |
| (b) | Portfolio holdings designated as level 1 are disclosed individually on the SOI. Please refer to the SOI for industry specifics of portfolio holdings. |
There were no transfers among any levels during the periods ended June 30, 2017.
B. Restricted Securities — Certain securities held by the Funds may be subject to legal or contractual restrictions on resale. Restricted securities generally are resold in transactions exempt from registration under the Securities Act of 1933 (the “Securities Act”). Disposal of these securities may involve time-consuming negotiations and expense. Prompt sale at the current valuation may be difficult and could adversely affect the net asset value of the Funds.
As of June 30, 2017, the Funds had no investments in restricted securities other than securities sold to the Fund under Rule 144A and/or Regulation S under the Securities Act.
C. Futures Contracts — The Equity Low Volatility Income Fund used treasury, index or other financial futures contracts to gain or reduce exposure to the stock market, maintain liquidity or minimize transaction costs. The Fund also buys futures contracts to invest incoming cash in the market or sells futures in response to cash outflows, thereby simulating an invested position in the underlying index while maintaining a cash balance for liquidity.
Futures contracts provide for the delayed delivery of the underlying instrument at a fixed price or are settled for a cash amount based on the change in the value of the underlying instrument at a specific date in the future. Upon entering into a futures contract, the Fund is required to deposit with the broker, cash or securities in an amount equal to a certain percentage of the contract amount, which is referred to as the initial margin deposit. Subsequent payments, referred to as variation margin, are made or received by the Fund periodically and are based on changes in the market value of open futures contracts. Changes in the market value of open futures contracts are recorded as Change in net unrealized appreciation/depreciation on the Statement of Operations. Realized gains or losses, representing the difference between the value of the contract at the time it was opened and the value at the time it was closed, are reported on the Statements of Operations at the closing or expiration of the futures contract. Securities deposited as initial margin are designated on the SOI and cash deposited is recorded on the Statement of Assets and Liabilities. A receivable from and/or a payable to brokers for the daily variation margin is also recorded on the Statements of Assets and Liabilities.
The use of futures contracts exposes the Fund to equity price risk. The Fund may be subject to the risk that the change in the value of the futures contract may not correlate perfectly with the underlying instrument. Use of long futures contracts subjects the Fund to risk of loss in excess of the amounts shown on the Statement of Assets and Liabilities, up to the notional amount of the futures contracts. Use of short futures contracts subjects the Fund to unlimited risk of loss. The Fund may enter into futures contracts only on exchanges or boards of trade. The exchange or board of trade acts as the counterparty to each futures transaction; therefore, the Fund’s credit risk is limited to failure of the exchange or board of trade. Under some circumstances, futures exchanges may establish daily limits on the amount that the price of a futures contract can vary from the previous day’s settlement price, which could effectively prevent liquidation of positions.
The table below discloses the volume of the Equity Low Volatility Income Fund’s futures contracts activity during the period ended June 30, 2017.
| | |
| | | Equity Low Volatility Income Fund |
Futures Contracts: | | |
Average Notional Balance | | $ 647,261 (a) |
(a) For the period July 20, 2016 through June 30, 2017.
28
The Fund’s futures contracts are not subject to master netting arrangements (the right to close out all transactions traded with a counterparty and net amounts owed or due across transactions).
D. Equity-Linked Notes — The Equity Low Volatility Income Fund invested in Equity-Linked Notes (“ELNs”). These are hybrid instruments which combine both debt and equity characteristics into a single note form. ELNs values are linked to the performance of an underlying equity. ELNs are unsecured debt obligations of an issuer and may not be publically listed or traded on an exchanged. ELNS are valued daily, under procedures adopted by the Board, based upon values provided by an approved pricing source. These notes have a coupon which is accrued and recorded as interest income on the Statement of Operations. Changes in the market value of ELNs are recorded as Change in net unrealized appreciation or depreciation on the Statement of Operations. The Fund records a realized gain or loss when ELN is sold or matures.
As of June 30, 2017, the Fund had outstanding ELNs as listed on the SOI.
E. Short Sales — The Value Plus Fund engaged in short sales as part of its normal investment activities. In a short sale, the Fund sells securities it does not own in anticipation of a decline in the market value of those securities. In order to deliver securities to the purchaser, the Fund borrows securities from a broker. To close out a short position, the Fund delivers the same securities to the broker.
The Fund is required to pledge cash or securities to the broker as collateral for the securities sold short. Collateral requirements are calculated daily based on the current market value of the short positions. Cash collateral deposited with the broker is recorded as Deposits at broker for securities sold short, while cash collateral deposited at the Fund’s custodian for the benefit of the broker is recorded as Restricted cash on the Statements of Assets and Liabilities. Securities segregated as collateral are denoted on the SOI. The Fund may receive or pay the net of the following amounts: (i) a portion of the income from the investment of cash collateral; (ii) the broker’s fee on the borrowed securities (calculated daily based upon the market value of each borrowed security and a variable rate that is dependent on availability of the security); and (iii) a financing charge for the difference between the market value of the short position and cash collateral deposited with the broker. The net amounts of income or fees are included as Interest income or Interest expense on securities sold short on the Statements of Operations.
The Fund is obligated to pay the broker dividends declared on short positions when a position is open on the record date. Dividends on short positions are reported on ex-dividend date on the Statements of Operations as Dividend expense on securities sold short. Liabilities for securities sold short are reported at market value on the Statements of Assets and Liabilities and the change in market value is recorded as Change in net unrealized appreciation (depreciation) on the Statements of Operations. Short sale transactions may result in unlimited losses as the security’s price increases and the short position loses value. There is no upward limit on the price a borrowed security could attain. The Fund is also subject to risk of loss if the broker were to fail to perform its obligations under the contractual terms.
The Fund will record a realized loss if the price of the borrowed security increases between the date of the short sale and the date on which the Fund replace the borrowed security. The Fund will record a realized gain if the price of the borrowed security declines between those dates.
As of June 30, 2017, the Fund had outstanding short sales as listed on the SOI.
F. Offering and Organizational Costs — Total offering costs of $78,266 and $14,118 incurred in connection with the offering of shares of the Equity Low Volatility Income Fund and Value Plus Fund, respectively, are amortized on a straight line basis over 12 months from the date the Funds commenced operations. Costs paid in connection with the organization of the Funds, if any, were recorded as an expense at the time the Funds commenced operations and are included as part of Professional fees on the Statements of Operations. For the respective periods ended June 30, 2017, total offering costs amortized were $73,978 and $11,716, respectively.
G. Security Transactions and Investment Income — Investment transactions are accounted for on the trade date (the date the order to buy or sell is executed). Securities gains and losses are calculated on a specifically identified cost basis. Interest income and interest expense on securities sold short, if any, is determined on the basis of coupon interest accrued using the effective interest method which adjusts for amortization of premiums and accretion of discounts. Dividend income, net of foreign tax withheld, if any, and dividend expense on securities sold short, are recorded on the ex-dividend date or when the Fund first learns of the dividend. Certain Funds may receive other income from investment in loan assignments and/or unfunded commitments, including amendment fees, consent fees and commitment fees. These fees are recorded as income when received by the Fund. These amounts are included in Interest Income in the Statement of Operations.
To the extent such information is publicly available, the Funds record distributions received in excess of income earned from underlying investments as a reduction of cost of investments and/or realized gain. Such amounts are based on estimates if actual amounts are not available and actual amounts of income, realized gain and return of capital may differ from the estimated amounts. The Funds adjust the estimated amounts of the components of distributions (and consequently their net investment income) as necessary once the issuers provide information about the actual composition of the distributions.
H. Allocation of Income and Expenses — Expenses directly attributable to a fund are charged directly to that fund, while the expenses attributable to more than one fund of the Trusts are allocated among the respective funds. In calculating the NAV of each class, investment income, realized and unrealized gains and losses and expenses, other than class specific expenses, are allocated daily to each class of shares based upon the proportion of net assets of each class at the beginning of each day.
Transfer agency fees are class-specific expenses and sub-transfer agency fees were class-specific expenses up through April 2, 2017. Effective April 3, 2017, the Funds ceased making direct payments to financial intermediaries for any applicable sub-transfer agency services. Payments to financial intermediaries for sub-transfer agency services are made by JPMorgan Distribution Services, Inc. from the Shareholder Servicing Fee, which has been renamed as the Service Fee.
The amount of the transfer agency fees charged to each class of the Funds for the periods ended June 30, 2017 are as follows:
| | | | | | | | | | | | | | | | | | | | | | | | |
| | | Class A | | | Class C | | | Class I | | | Class R5 | | | Class R6 | | | Total | |
Equity Low Volatility Income Fund | | | | | | | | | | | | | | | | | | | | | | | | |
Transfer agency fees | | $ | 66 | | | $ | 66 | | | $ | 359 | | | $ | 67 | | | $ | 67 | | | $ | 625 | |
Value Plus Fund | | | | | | | | | | | | | | | | | | | | | | | | |
Transfer agency fees | | | 25 | | | | 22 | | | | 77 | | | | n/a | | | | n/a | | | | 124 | |
29
I. Federal Income Taxes — Each Fund is treated as a separate taxable entity for Federal income tax purposes. Each Fund’s policy is to comply with the provisions of the Internal Revenue Code of 1986, as amended (the “Code”), applicable to regulated investment companies and to distribute to shareholders all of its distributable net investment income and net realized capital gains on investments. Accordingly, no provision for Federal income tax is necessary. Management has reviewed the Funds’ tax positions for all open tax periods and has determined that as of June 30, 2017, no liability for income tax is required in the Funds’ financial statements for net unrecognized tax benefits. However, management’s conclusions may be subject to future review based on changes in, or the interpretation of, the accounting standards or tax laws and regulations. Each of the Funds’ Federal tax returns for the prior three fiscal periods, or since inception if shorter, remains subject to examination by the Internal Revenue Service.
J. Distributions to Shareholders — Distributions from net investment income are generally declared and paid at least annually, except for distributions from the Equity Low Volatility Fund, for which distributions are generally declared and paid monthly. Distributions are declared separately for each class. No class has preferential dividend rights; differences in per share rates are due to differences in separate class expenses. Net realized capital gains, if any, are distributed by each Fund at least annually. The amount of distributions from net investment income and net realized capital gains is determined in accordance with Federal income tax regulations, which may differ from GAAP. To the extent these “book/tax” differences are permanent in nature (i.e., that they result from other than timing of recognition — “temporary differences”), such amounts are reclassified within the capital accounts based on their Federal tax-basis treatment.
The following amounts were reclassified within the capital accounts:
| | | | | | | | | | | | |
| | | Paid-in-Capital | | | Accumulated
undistributed
distributions in
excess of)
net investment
income | | | Accumulated net realized gains (losses) | |
Equity Low Volatility Income Fund | | $ | (49) | | | $ | (3,020) | | | $ | 3,069 | |
Value Plus Fund | | | (50) | | | | 2,969 | | | | (2,919) | |
The reclassifications for the Funds relate primarily to non-taxable dividends and dividend expense on securities sold short.
3. Fees and Other Transactions with Affiliates
A. Investment Advisory Fee — Pursuant to an Investment Advisory Agreement, the Adviser supervises the investments of each Fund and for such services is paid a fee. The fee is accrued daily and paid monthly based on each Fund’s respective average daily net assets. The annual rate for each Fund is as follows:
| | | | |
Equity Low Volatility Income Fund | | | 0.45 | % |
Value Plus Fund | | | 0.75 | |
The Adviser waived Investment Advisory fees and/or reimbursed expenses as outlined in Note 3.F
B. Administration Fee — Pursuant to an Administration Agreement, the Administrator provides certain administration services to the Funds. In consideration of these services, the Administrator receives a fee accrued daily and paid monthly at an annual rate of 0.15% of the first $25 billion of the average daily net assets of all funds in the J.P. Morgan Funds Complex covered by the Administration Agreement (excluding certain funds of funds and money market funds) and 0.075% of the average daily net assets in excess of $25 billion of all such funds. For the periods ended June 30, 2017, the effective annualized rate was 0.08% of each Fund’s average daily net assets, notwithstanding any fee waivers and/or expense reimbursements.
The Administrator waived Administration fees as outlined in Note 3.F.
JPMCB, a wholly-owned subsidiary of JPMorgan, serves as the Funds’ sub-administrator (the “Sub-administrator”). For its services as Sub-administrator, JPMCB receives a portion of the fees payable to the Administrator.
C. Distribution Fees —Pursuant to a Distribution Agreement, JPMorgan Distribution Services, Inc. ( “JPMDS”), a wholly-owned subsidiary of JPMorgan, serves as the Trusts’ principal underwriter and promotes and arranges for the sale of each Fund’s shares.
The Board has adopted a Distribution Plan (the “Distribution Plan”) for Class A and Class C Shares of the Fund in accordance with Rule 12b-1 under the 1940 Act. The Class I, Class R5 and Class R6 Shares do not charge a distribution fee. The Distribution Plan provides that each Fund shall pay distribution fees, including payments to JPMDS, at annual rates of 0.25% and 0.75% of the average daily net assets of Class A, and Class C Shares, respectively.
In addition, JPMDS is entitled to receive the front-end sales charges from purchases of Class A Shares and the CDSC from redemptions of Class C Shares and certain Class A Shares for which front-end sales charges have been waived.
D. Service Fees — The Trusts, on behalf of the Funds, have entered into a Shareholder Servicing Agreement with JPMDS under which JPMDS provides certain support services to the shareholders. The Class R6 Shares do not charge a service fee. For performing these services, JPMDS receives a fee that is accrued daily and paid monthly equal to a percentage of the average daily net assets as shown in the table below:
| | | | | | | | | | | | | | | | |
| | | Class A | | | Class C | | | Class I | | | Class R5* | |
Equity Low Volatility Income Fund | | | 0.25 | % | | | 0.25 | % | | | 0.25 | % | | | 0.10% | |
Value Plus Fund | | | 0.25 | | | | 0.25 | | | | 0.25 | | | | n/a | |
* Prior to April 3, 2017, the service fee was 0.05% for Equity Low Volatility Income Fund.
30
JPMDS has entered into shareholder services contracts with affiliated and unaffiliated financial intermediaries who provide shareholder services and other related services to their clients or customers who invest in the Funds under which JPMDS will pay all or a portion of such fees earned to financial intermediaries for performing such services.
JPMDS waived service fees as outlined in Note 3.F.
E. Custodian and Accounting Fees — JPMCB provides portfolio custody and accounting services to the Funds. For performing these services, the Funds pay JPMCB transaction and asset-based fees that vary according to the number of transactions and positions, plus out-of-pocket expenses. The amounts paid directly to JPMCB by the Funds for custody and accounting services are included in Custodian and accounting fees on the Statements of Operations. Payments to the custodian may be reduced by credits earned by each Fund, based on uninvested cash balances held by the custodian. Such earnings credits, if any, are presented separately on the Statements of Operations.
Interest income earned on cash balances at the custodian, if any, is included in Interest income from affiliates on the Statements of Operations. Interest expense paid to the custodian related to cash overdrafts, if any, is included in Interest expense to affiliates on the Statements of Operations.
F. Waivers and Reimbursements — The Adviser, Administrator and/or JPMDS have contractually agreed to waive fees and/or reimburse the Funds to the extent that total annual operating expenses (excluding acquired fund fees and expenses other than certain money market fund fees as described below, dividend and interest expenses related to short sales, interest, taxes, expenses related to litigation and potential litigation, and extraordinary expenses) exceed the percentages of the Funds’ average daily net assets as shown in the table below:
| | | | | | | | | | | | | | | | | | | | |
| | | Class A | | | Class C | | | Class I | | | Class R5 | | | Class R6 | |
Equity Low Volatility Income Fund | | | 1.09 | % | | | 1.59 | % | | | 0.84 | % | | | 0.64% | | | | 0.59% | |
Value Plus Fund | | | 1.20 | % | | | 1.70 | % | | | 0.95 | | | | n/a | | | | n/a | |
The expense limitation agreement was in effect for the respective periods ended June 30, 2017 and is in place until at least October 31, 2017 for Equity Low Volatility Income Fund and August 31, 2017 for Value Plus Fund.
For the respective periods ended June 30, 2017, the Funds’ service providers waived fees and/or reimbursed expenses for each of the Funds as follows. None of these parties expect the Funds to repay any such waived fees and/or reimbursed expenses in future periods.
| | | | | | | | | | |
| | | Contractual Waivers | | |
| | | Investment
Advisory
fees | | Administration
Fees | | Service
Fees | | Total | | Reimbursements |
Equity Low Volatility Income Fund | | $93,189 | | $40,305 | | $ 115 | | $133,609 | | $74,213 |
Value Plus Fund | | 71,373 | | 7,781 | | 16,827 | | 95,981 | | 30,940 |
Additionally, the Funds may invest in one or more money market funds advised by the Adviser or its affiliates (affiliated money market funds). The Adviser, Administrator and/or JPMDS, as shareholder servicing agent, have contractually agreed to waive fees and/or reimburse expenses in an amount sufficient to offset the respective net fees each collects from the affiliated money market funds on the Funds’ investment in such affiliated money market funds.
The amounts of waivers resulting from investments in these money market funds for the periods ended June 30, 2017 were as follows:
| | | | |
Equity Low Volatility Income Fund | | $ | 3,844 | |
Value Plus Fund | | | 237 | |
G. Other — Certain officers of the Trusts are affiliated with the Adviser, the Administrator and JPMDS. Such officers, with the exception of the Chief Compliance Officer, receive no compensation from the Funds for serving in their respective roles.
The Board appointed a Chief Compliance Officer to the Funds in accordance with Federal securities regulations. Each Fund, along with other affiliated funds, makes reimbursement payments, on a pro-rata basis, to the Administrator for a portion of the fees associated with the Office of the Chief Compliance Officer. Such fees are included in Trustees’ and Chief Compliance Officer’s fees on the Statements of Operations.
The Trusts adopted a Trustee Deferred Compensation Plan (the “Plan”) which allows the Independent Trustees to defer the receipt of all or a portion of compensation related to performance of their duties as Trustees. The deferred fees are invested in various J.P. Morgan Funds until distribution in accordance with the Plan.
The Funds may use related party broker-dealers. For the periods ended June 30, 2017, the Funds did not incur any brokerage commissions with broker-dealers affiliated with the Adviser.
The Securities and Exchange Commission (“SEC”) has granted an exemptive order permitting the Funds to engage in principal transactions with J.P. Morgan Securities, Inc., an affiliated broker, involving taxable money market instruments, subject to certain conditions.
31
4. Investment Transactions
During the periods ended June 30, 2017, purchases and sales of investments (excluding short-term investments) were as follows:
| | | | | | | | | | | | | | | | |
| | | Purchases
(excluding
U.S. Government) | | | Sales
(excluding
U.S. Government) | | | Securities
Sold Short | | | Covers on
Securities
Sold Shorts | |
Equity Low Volatility Income Fund | | | $75,355,042 | | | | $32,344,388 | | | | $ - | | | | $ - | |
Value Plus Fund | | | 22,482,928 | | | | 11,264,263 | | | | 2,390,833 | | | | 938,404 | |
5. Federal Income Tax Matters
For Federal income tax purposes, the estimated cost and unrealized appreciation (depreciation) in value of investment securities held at June 30, 2017 were as follows:
| | | | | | | | | | | | | | | | |
| | | Aggregate
Cost | | | Gross
Unrealized
Appreciation | | | Gross
Unrealized
Depreciation | | | Net Unrealized Appreciation (Depreciation) | |
Equity Low Volatility Income Fund | | | $ 52,577,681 | | | | $4,258,411 | | | | $1,083,495 | | | | $ 3,174,916 | |
Value Plus Fund | | | 12,565,642 | | | | 1,585,390 | | | | 326,408 | | | | 1,258,982 | |
The difference between book and tax basis appreciation (depreciation) on investments is primarily attributed to wash sale loss deferrals.
The tax character of distributions paid during the periods ended June 30, 2017 was as follows:
| | | | |
| | | Ordinary Income* | |
Equity Low Volatility Income Fund | | $ | 2,031,751 | |
Value Plus Fund | | | 27,313 | |
* Short-term gains are treated as ordinary income for income tax purposes.
As of June 30, 2017, the estimated components of net assets (excluding paid-in-capital) on a tax basis were as follows:
| | | | | | | | | | | | |
| | | Current
Distributable
Ordinary
Income | | | Current
Distributable
Long-Term
Capital Gain or
(Tax Basis Capital
Loss Carryover) | | | Unrealized Appreciation (Depreciation) | |
Equity Low Volatility Income Fund | | $ | 858,014 | | | $ | 58,265 | | | $ | 3,174,916 | |
Value Plus Fund | | | 1,108,594 | | | | 4,366 | | | | 1,188,764 | |
For the Funds, the cumulative timing differences primarily consist of deferred compensation and wash sale loss deferrals.
As of June 30, 2017, the Funds did not have any net capital loss carryforwards.
6. Borrowings
The Funds rely upon an exemptive order granted by the SEC (the “Order”) permitting the establishment and operation of an Interfund Lending Facility (the “Facility”). The Facility allows the Funds to directly lend and borrow money to or from any other fund relying upon the Order at rates beneficial to both the borrowing and lending funds. Advances under the Facility are taken primarily for temporary or emergency purposes, including the meeting of redemption requests that otherwise might require the untimely disposition of securities, and are subject to each Fund’s borrowing restrictions. The Interfund loan rate is determined, as specified in the Order, by averaging the current repurchase agreement rate and the current bank loan rate. The Order was granted to JPMorgan Trust II and may be relied upon by the Funds because the Funds and the series of JPMorgan Trust II are all investment companies in the same “group of investment companies” (as defined in Section 12(d)(1)(G) of the 1940 Act).
The Trusts and JPMCB have entered into a financing arrangement. Under this arrangement, JPMCB provides an unsecured, uncommitted credit facility in the aggregate amount of $100 million to certain of the J.P. Morgan Funds, including the Funds. Advances under the arrangement are taken primarily for temporary or emergency purposes, including the meeting of redemption requests that otherwise might require the untimely disposition of securities, and are subject to each Fund’s borrowing restrictions. Interest on borrowings is payable at a rate determined by JPMCB at the time of borrowing. This agreement has been extended until November 6, 2017.
The Funds had no borrowings outstanding from another fund or from the unsecured, uncommitted credit facility during the periods ended June 30, 2017.
7. Risks, Concentrations and Indemnifications
In the normal course of business, the Funds entered into contracts that contain a variety of representations which provide general indemnifications. The Funds’ maximum exposure under these arrangements is unknown. The amount of exposure would depend on future claims that may be made against the Funds that have not yet occurred. However, based on experience, the Funds expect the risk of loss to be remote.
As of June 30, 2017, all of the Funds’ shares were currently held by the Adviser.
32
Equity Low Volatility Income Fund’s investments in ELNs entail varying degrees of risks. The Fund is subject to loss of their full principal amount. In addition, the ELNs are subject to a stated maximum return which may limit the payment at maturity. The fund may also be exposed to additional risks associated with structured notes including: counterparty credit risk related to the issuer’s ability to make payment at maturity; liquidity risk related to a lack of liquid market for these notes, preventing the funds from trading or selling the notes easily; and a greater degree of market risk than other types of debt securities because the investor bears the risk associated with the underlying financial instruments.
Derivatives may be riskier than other types of investments because they may be more sensitive to changes in economic and market conditions and could result in losses that significantly exceed the Fund’s original investment. Many derivatives create leverage thereby causing the Fund to be more volatile than it would have been if it had not used derivatives. Derivatives also expose the Fund to counterparty risk (the risk that the derivative counterparty will not fulfill its contractual obligations), including credit risk of the derivative counterparty.
8. Investment Company Reporting Modernization
In October 2016, the U.S. Securities and Exchange Commission adopted new rules and forms, and amendments to certain current rules and forms, to modernize the reporting and disclosure of information by registered investment companies. In part, the final rules amend Regulation S-X and will require standardized, enhanced disclosures about derivatives in investment company financial statements, as well as other amendments. The amendments to Regulation S-X will apply to Funds’ fiscal year ends on or after August 1, 2017. At this time, management is currently evaluating the impact of the Regulation S-X amendments on the Funds’ financial statements and related disclosures. The adoption will have no effect on the Funds’ net assets or results of operations.
33
REPORT OF INDEPENDENT REGISTERED PUBLIC ACCOUNTING FIRM
To the Board of Trustees of JPMorgan Trust I and JPMorgan Trust IV and the Shareholders of JPMorgan Equity Low Volatility Income Fund and JPMorgan Value Plus Fund
In our opinion, the accompanying statements of assets and liabilities, including the schedules of portfolio investments, and the related statements of operations, of changes in net assets and of cash flows and the financial highlights present fairly, in all material respects, the financial position of JPMorgan Equity Low Volatility Income Fund (a separate series of JPMorgan Trust I) and JPMorgan Value Plus Fund (a separate series of JPMorgan Trust IV) (hereafter collectively referred to as the “Funds”) as of June 30, 2017, and the results of each of their operations, the changes in each of their net assets, their cash flows (for JPMorgan Value Plus Fund), and the financial highlights for the period July 20, 2016 (commencement of operations for JPMorgan Equity Low Volatility Income Fund) through June 30, 2017 and the period August 31, 2016 (commencement of operations for JPMorgan Value Plus Fund) through June 30, 2017, in conformity with accounting principles generally accepted in the United States of America. These financial statements and financial highlights (hereafter referred to as “financial statements”) are the responsibility of the Fund’s management. Our responsibility is to express an opinion on these financial statements based on our audits. We conducted our audits of these financial statements in accordance with the standards of the Public Company Accounting Oversight Board (United States). Those standards require that we plan and perform the audit to obtain reasonable assurance about whether the financial statements are free of material misstatement. An audit includes examining, on a test basis, evidence supporting the amounts and disclosures in the financial statements, assessing the accounting principles used and significant estimates made by management, and evaluating the overall financial statement presentation. We believe that our audits, which included confirmation of securities as of June 30, 2017 by correspondence with the transfer agent, custodian and brokers, provides a reasonable basis for our opinions.
PricewaterhouseCoopers LLP
New York, New York
August 25, 2017
34
TRUSTEES
(Unaudited)
The Funds’ Statement of Additional Information includes additional information about the Funds’ Trustees and is available, without charge, upon request by calling 1-800-480-4111 or on the J.P. Morgan Funds’ website at www.jpmorganfunds.com.
| | | | | | |
Name (Year of Birth); Positions With the Funds (1) | | Principal Occupations During Past 5 Years | | Number of
Portfolios in Fund
Complex Overseen
by Trustee (2) | | Other Directorships Held Outside Fund Complex During Past 5 Years |
Independent Trustees | | |
| | | |
| John F. Finn (1947); Trustee of Trust since 2005; Trustee of heritage One Group Mutual Funds since 1998. | | Chairman (1985-present), Chief Executive Officer, Gardner, Inc. (supply chain management company serving industrial and consumer markets) (1974-present). | | 150 | | Director, Greif, Inc. (GEF) (industrial package products and services) (2007-present); Trustee, Columbus Association for the Performing Arts (1988-present); Director, Cardinal Health, Inc. (CAH) (1994-2014). |
| | | |
| Dr. Matthew Goldstein (1941); Chairman since 2013; Trustee of Trust since 2005; Trustee of heritage J.P. Morgan Funds since 2003. | | Chancellor Emeritus, City University of New York (2015-present); Professor, City University of New York (2013-present); Chancellor, City University of New York (1999-2013); President, Adelphi University (New York) (1998-1999). | | 150 | | Trustee, Museum of Jewish Heritage (2011-present) Trustee, National Museum of Mathematics (present); Chair, Association of College and University Administrators (present). |
| | | |
| Dennis P. Harrington (1950); Trustee of Trust since 2017. | | Retired; Partner, Deloitte LLP (1984-2012). | | 149 | | None |
| | | |
| Frankie D. Hughes (1952); Trustee of Trust since 2008. | | President, Ashland Hughes Properties (property management) (2014-present); President and Chief Investment Officer, Hughes Capital Management, Inc. (fixed income asset management) (1993-2014). | | 150 | | None |
| | | |
Raymond Kanner (1953); Trustee of the Trusts since 2017. | | Retired; Managing Director & Chief Investment Officer, IBM Retirement Funds (2007-2016). | | 149 | | Director, Emerging Markets Growth Fund (1997-2016); Acting Executive Director, Committee on Investment of Employee Benefit Assets (CIEBA), 2016-17; Advisory Board Member, Betterment for Business (2016-present) (robo advisor); Advisory Board Member, Blue Star Indexes (2013-present) (index creator); Member, Russell Index Client Advisory Board (2001-2015). |
| | | |
| Peter C. Marshall (1942); Trustee of Trust since 2005; Trustee of heritage One Group Mutual Funds since 1985. | | Self-employed business consultant
(2002-present). | | 150 | | None |
| | | |
| Mary E. Martinez (1960); Trustee of Trust since 2013. | | Associate, Special Properties, a Christie’s International Real Estate Affiliate (2010-present); Managing Director, Bank of America (Asset Management) (2007-2008); Chief Operating Officer, U.S. Trust Asset Management, U.S. Trust Company (asset management) (2003-2007); President, Excelsior Funds (registered investment companies) (2004-2005). | | 150 | | None |
| | | |
| Marilyn McCoy* (1948); Trustee of Trust since 2005; Trustee of heritage One Group Mutual Funds since 1999. | | Vice President of Administration and Planning, Northwestern University (1985-present). | | 150 | | None |
35
TRUSTEES
(Unaudited) (continued)
| | | | | | |
Name (Year of Birth); Positions With the Funds (1) | | Principal Occupations During Past 5 Years | | Number of
Portfolios in Fund
Complex Overseen
by Trustee (2) | | Other Directorships Held Outside Fund Complex During Past 5 Years |
Independent Trustees (continued) | | |
| | | |
| Mitchell M. Merin (1953); Trustee of Trust since 2013. | | Retired; President and Chief Operating Officer, Morgan Stanley Investment Management, Member Morgan Stanley & Co. Management Committee (registered investment adviser) (1985-2005). | | 150 | | Director, Sun Life Financial (SLF) (2007-2013) (financial services and insurance). |
| | | |
| Dr. Robert A. Oden, Jr. (1946); Trustee of Trust since 2005; Trustee of heritage One Group Mutual Funds since 1997. | | Retired; President, Carleton College
(2002-2010); President, Kenyon College
(1995-2002). | | 150 | | Chairman, Dartmouth-Hitchcock Medical Center (2011-present); Trustee, American Schools of Oriental Research (2011-present); Trustee, American University in Cairo (1999-2014); Trustee, American Museum of Fly Fishing (2013-present). |
| | | |
| Marian U. Pardo** (1946); Trustee of Trust since 2013. | | Managing Director and Founder, Virtual Capital Management LLC (Investment Consulting) (2007-present); Managing Director, Credit Suisse Asset Management (portfolio manager) (2003-2006). | | 150 | | Member, Board of Governors, Columbus Citizens Foundation (not-for-profit supporting philanthropic and cultural programs) (2006-present). |
| | | |
| Frederick W. Ruebeck (1939); Trustee of Trust since 2005; Trustee of heritage One Group Mutual Funds since 1994. | | Consultant (2000-present); Advisor, JP Greene & Associates, LLC (broker-dealer)
(2000-2009); Chief Investment Officer, Wabash College (2004-2015); Director of Investments, Eli Lilly and Company (pharmaceuticals) (1988-1999). | | 150 | | Trustee, Wabash College (2000-present). |
| | | |
| James J. Schonbachler (1943); Trustee of Trust since 2005; Trustee of heritage J.P. Morgan Funds since 2001. | | Retired; Managing Director of Bankers Trust Company (financial services) (1968-1998). | | 150 | | None |
| (1) | The Trustees serve for an indefinite term, subject to the Trust’s current retirement policy, which is age 78 for all Trustees. |
| (2) | A Fund Complex means two or more registered investment companies that hold themselves out to investors as related companies for purposes of investment and investor services or have a common investment adviser or have an investment adviser that is an affiliated person of the investment adviser of any of the other registered investment companies. The J.P. Morgan Funds Complex for which the Board of Trustees serves currently includes twelve registered investment companies (150 funds). |
| * | Two members of the Board of Trustees of Northwestern University are executive officers of registered investment advisers (not affiliated with JPMorgan) that are under common control with sub-advisers to certain J.P. Morgan Funds. |
| ** | In connection with prior employment with JPMorgan Chase, Ms. Pardo was the recipient of non-qualified pension plan payments from JPMorgan Chase in the amount of approximately $2,055 per month, which she irrevocably waived effective January 1, 2013, and deferred compensation payments from JPMorgan Chase in the amount of approximately $7,294 per year, which ended in January 2013. In addition, Ms. Pardo receives payments from a fully-funded qualified plan, which is not an obligation of JPMorgan Chase. |
The contact address for each of the Trustees is 270 Park Avenue, New York, NY 10017.
36
OFFICERS
(Unaudited)
| | |
Name (Year of Birth), Positions Held with the Trust (Since) | | Principal Occupations During Past 5 Years |
| |
Brian S. Shlissel (1964),
President and Principal Executive Officer (2016) | | Managing Director and Chief Administrative Officer for J.P. Morgan pooled vehicles, J.P. Morgan Investment Management Inc. (formerly JPMorgan Funds Management, Inc.) (2014 – present); Managing Director and Head of Mutual Fund Services, Allianz Global Investors; President and Chief Executive Officer, Allianz Global Investors Mutual Funds and PIMCO Closed-End Funds (1999-2014) |
| |
Laura M. Del Prato (1964),
Treasurer and Principal Financial Officer (2014)* | | Managing Director, J.P. Morgan Investment Management Inc. (formerly JPMorgan Funds Management, Inc.) since 2014; Partner, Cohen Fund Audit Services, Ltd. (2012-2013); Partner (2004-2012) and various other titles (1990-2004) at KPMG, LLP. |
| |
Frank J. Nasta (1964),
Secretary (2008) | | Managing Director and Associate General Counsel, JPMorgan Chase since 2008. |
| |
Stephen M. Ungerman (1953),
Chief Compliance Officer (2005) | | Managing Director, JPMorgan Chase & Co.; Mr. Ungerman has been with JPMorgan Chase & Co. since 2000. |
| |
Elizabeth A. Davin (1964), Assistant Secretary (2005)* | | Executive Director and Assistant General Counsel, JPMorgan Chase since February 2012; formerly Vice President and Assistant General Counsel, JPMorgan Chase from 2005 to February 2012; Senior Counsel, JPMorgan Chase (formerly Bank One Corporation) from 2004 to 2005. |
| |
Jessica K. Ditullio (1962),
Assistant Secretary (2005)* | | Executive Director and Assistant General Counsel, JPMorgan Chase. Ms. Ditullio has been with JPMorgan Chase (formerly Bank One Corporation) since 1990. |
| |
John T. Fitzgerald (1975),
Assistant Secretary (2008) | | Executive Director and Assistant General Counsel, JPMorgan Chase. Mr. Fitzgerald has been with JPMorgan Chase since 2005. |
| |
Carmine Lekstutis (1980),
Assistant Secretary (2011) | | Executive Director and Assistant General Counsel, JPMorgan Chase since February 2015; formerly Vice President and Assistant General Counsel, JPMorgan Chase from 2011 to February 2015. |
| |
Gregory S. Samuels (1980),
Assistant Secretary (2010) | | Executive Director and Assistant General Counsel, JPMorgan Chase since 2014; formerly Vice President and Assistant General Counsel, JPMorgan Chase since 2010. |
| |
Pamela L. Woodley (1971),
Assistant Secretary (2012)** | | Vice President and Assistant General Counsel, JPMorgan Chase since November 2004. |
| |
Zachary E. Vonnegut-Gabovitch (1986) Assistant Secretary (2017) | | Vice President and Assistant General Counsel, JPMorgan Chase since September 2016; Associate, Morgan, Lewis & Bockius (law firm) from 2012 to 2016. |
| |
Michael M. D’Ambrosio (1969),
Assistant Treasurer (2012) | | Managing Director, J.P. Morgan Investment Management Inc. (formerly JPMorgan Funds Management, Inc.) since May 2014; formerly Executive Director, JPMorgan Funds Management, Inc. from 2012 to May 2014; prior to joining JPMorgan Chase, Mr. D’Ambrosio was a Tax Director at PricewaterhouseCoopers LLP since 2006. |
| |
Lauren A. Paino (1973), Assistant Treasurer (2014)** | | Executive Director, J.P. Morgan Investment Management Inc. (formerly JPMorgan Funds Management, Inc.) since August 2013; formerly Director, Credit Suisse Asset Management from 2000-2013. |
| |
Joseph Parascondola (1963),
Assistant Treasurer (2011)** | | Vice President, J.P. Morgan Investment Management Inc. (formerly JPMorgan Funds Management, Inc.) since August 2006. |
| |
Matthew J. Plastina (1970),
Assistant Treasurer (2011)** | | Executive Director, J.P. Morgan Investment Management Inc. (formerly JPMorgan Funds Management, Inc.) since February 2016; Vice President, JPMorgan Funds Management, Inc. from 2010 to January 2016. |
| |
Gillian I. Sands (1969),
Assistant Treasurer (2012)** | | Vice President, J.P. Morgan Investment Management Inc. (formerly JPMorgan Funds Management, Inc.) since September 2012; Assistant Treasurer, Wells Fargo Funds Management (2007-2009). |
The contact address for each of the officers, unless otherwise noted, is 270 Park Avenue, New York, NY 10017.
| * | The contact address for the officer is 1111 Polaris Parkway, Columbus, OH 43240. |
| ** | The contact address for the officer is 4 New York Plaza, New York, NY 10004. |
37
SCHEDULE OF SHAREHOLDER EXPENSES (Unaudited)
Hypothetical $1,000 Investment
As a shareholder of the Funds, you incur two types of costs: (1) transaction costs, including sales charges (loads) on purchase payments and (2) ongoing costs, including investment advisory fees, administration fees, distribution fees and other Fund expenses. The examples below are intended to help you understand your ongoing costs (in dollars) of investing in the Fund and to compare these ongoing costs with the ongoing costs of investing in other mutual funds. The examples assume that you had a $1,000 investment in each Class at the beginning of the reporting period, January 1, 2017 and continued to hold your shares at the end of the reporting period, June 30, 2017.
Actual Expenses
For each Class of each Fund in the table below, the first line provides information about actual account values and actual expenses. You may use the information in this line, together with the amount you invested, to estimate the expenses that you paid over the period. Simply divide your account value by $1,000 (for example, an $8,600 account value divided by $1,000 = 8.6), then multiply the result by the number in the first line of each Class under the heading entitled “Expenses Paid During the Period” to estimate the expenses you paid on your account during this period.
Hypothetical Example for Comparison Purposes
The second line of each Class in the table below provides information about hypothetical account values and hypothetical expenses based on the Class’ actual expense ratio and an assumed rate of return of 5% per year before expenses, which is not the Class’ actual return. The hypothetical account values and expenses may not be used to estimate the actual ending account balance or expenses you paid for the period. You may use this information to compare the ongoing costs of investing in the Class of the Fund and other funds. To do so, compare this 5% hypothetical example with the 5% hypothetical examples that appear in the shareholder reports of the other funds. Please note that the expenses shown in the table are meant to highlight your ongoing costs only and do not reflect any transaction costs, such as sales charges (loads) or redemption fees. Therefore, the second line for each Class in the table is useful in comparing ongoing costs only, and will not help you determine the relative total costs of owning different funds. In addition, if these transaction costs were included, your costs would have been higher. The examples also assume all dividends and distributions have been reinvested.
| | | | | | | | | | | | | | | | |
| | | Beginning
Account Value
January 1,
2017 | | | Ending
Account Value
June 30, 2017 | | | Expenses
Paid During
the
Period* | | | Annualized Expense Ratio | |
Equity Low Volatility Income Fund | | | | | | | | | | | | | | | | |
Class A | | | | | | | | | | | | | | | | |
Actual | | | $1,000.00 | | | | $1,065.60 | | | | $5.53 | | | | 1.08% | |
Hypothetical | | | 1,000.00 | | | | 1,019.44 | | | | 5.41 | | | | 1.08 | |
Class C | | | | | | | | | | | | | | | | |
Actual | | | 1,000.00 | | | | 1,062.90 | | | | 8.08 | | | | 1.58 | |
Hypothetical | | | 1,000.00 | | | | 1,016.96 | | | | 7.90 | | | | 1.58 | |
Class I (formerly Select Class) | | | | | | | | | | | | | | | | |
Actual | | | 1,000.00 | | | | 1,066.90 | | | | 4.25 | | | | 0.83 | |
Hypothetical | | | 1,000.00 | | | | 1,020.68 | | | | 4.16 | | | | 0.83 | |
Class R5 | | | | | | | | | | | | | | | | |
Actual | | | 1,000.00 | | | | 1,067.90 | | | | 3.23 | | | | 0.63 | |
Hypothetical | | | 1,000.00 | | | | 1,021.67 | | | | 3.16 | | | | 0.63 | |
38
SCHEDULE OF SHAREHOLDER EXPENSES (Unaudited) (continued)
Hypothetical $1,000 Investment
| | | | | | | | | | | | | | | | |
Equity Low Volatility Income Fund (continue) | | | | | | | | | | | | | |
Class R6 | | | | | | | | | | | | | | | | |
Actual | | | 1,000.00 | | | | 1,068.20 | | | | 2.97 | | | | 0.58 | |
Hypothetical | | | 1,000.00 | | | | 1,021.92 | | | | 2.91 | | | | 0.58 | |
| | | | |
Value Plus Fund | | | | | | | | | | | | | | | | |
Class A | | | | | | | | | | | | | | | | |
Actual | | | 1,000.00 | | | | $1,058.60 | | | | 8.32 | | | | 1.63 | |
Hypothetical | | | 1,000.00 | | | | 1,016.71 | | | | 8.15 | | | | 1.63 | |
Class C | | | | | | | | | | | | | | | | |
Actual | | | 1,000.00 | | | | 1,055.80 | | | | 10.86 | | | | 2.13 | |
Hypothetical | | | 1,000.00 | | | | 1,014.23 | | | | 10.64 | | | | 2.13 | |
Class I (formerly Select Class) | | | | | | | | | | | | | | | | |
Actual | | | 1,000.00 | | | | 1,059.80 | | | | 7.05 | | | | 1.38 | |
Hypothetical | | | 1,000.00 | | | | 1,017.95 | | | | 6.90 | | | | 1.38 | |
| * | Expenses are equal to each Class’ respective annualized expense ratio, multiplied by the average account value over the period, multiplied by 181/365 (to reflect the actual period). Commencement of operations was July 20, 2016. |
39
TAX LETTER (Unaudited)
Certain tax information for the J.P. Morgan Funds is required to be provided to shareholders based upon the Funds’ income and distributions for the taxable year ended June 30, 2017. The information and distributions reported in this letter may differ from the information and taxable distributions reported to the shareholders for the calendar year ending December 31, 2017. The information necessary to complete your income tax returns for the calendar year ending December 31, 2017 will be provided under separate cover.
Dividends Received Deductions (DRD)
Each fund listed below had the following percentage, or maximum allowable percentage, of ordinary income distributions eligible for the 70% dividends received deductions for corporate shareholders for the fiscal year ended June 30, 2017:
| | |
| | | Dividend |
| | | Received |
| | | Deduction |
Equity Low Volatility Income Fund | | 41.61% |
| |
Value Plus Fund | | 11.90 |
Qualified Dividend Income (QDI)
Each fund listed below had the following amount, or maximum allowable amount, of ordinary income distributions treated as qualified dividends for the fiscal year ended June 30, 2017:
| | | | |
| | | Qualified | |
| | | Dividend | |
| | | Income | |
| | | Distribution | |
Equity Low Volatility Income Fund | | | $1,321,867 | |
| |
Value Plus Fund | | | 27,313 | |
40

Rev. January 2011
| | |
| | |
FACTS | | WHAT DOES J.P. MORGAN FUNDS DO WITH YOUR PERSONAL INFORMATION? |
| | |
| Why? | | Financial companies choose how they share your personal information. Federal law gives consumers the right to limit some but not all sharing. Federal law also requires us to tell you how we collect, share, and protect your personal information. Please read this notice carefully to understand what we do. |
| | |
| What? | | The types of personal information we collect and share depend on the product or service you have with us. This information can include: ◾ Social Security number and account balances ◾ transaction history and account transactions ◾ checking account information and wire transfer instructions When you are no longer our customer, we continue to share your information as described in this notice. |
| | | | | | | | |
| How? | | All financial companies need to share customers’ personal information to run their everyday business. In the section below, we list the reasons financial companies can share their customers’ personal information; the reasons J.P. Morgan Funds chooses to share; and whether you can limit this sharing. | |  |
| | | | | | | |
| | | | |
| Reasons we can share your personal information | | Does J.P. Morgan Funds share? | | Can you limit this sharing? |
For our everyday business purposes — such as to process your transactions, maintain your account(s), respond to court orders and legal investigations, or report to credit bureaus | | Yes | | No |
For marketing purposes — to offer our products and services to you | | Yes | | No |
| For joint marketing with other financial companies | | No | | We don’t share |
For our affiliates’ everyday business purposes — information about your transactions and experiences | | No | | We don’t share |
For our affiliates’ everyday business purposes — information about your creditworthiness | | No | | We don’t share |
| For nonaffiliates to market to you | | No | | We don’t share |
| | |
| | |
Questions? | | Call 1-800-480-4111 or go to www.jpmorganfunds.com |
| | |
| |
Who we are |
| | |
Who is providing this notice? | | J.P. Morgan Funds |
| | |
| |
What we do |
| | |
| How does J.P. Morgan Funds protect my personal information? | | To protect your personal information from unauthorized access and use, we use security measures that comply with federal law. These measures include computer safeguards and secured files and buildings. We authorize our employees to access your information only when they need it to do their work and we require companies that work for us to protect your information. |
| | |
How does J.P. Morgan Funds collect my personal information? | | We collect your personal information, for example, when you: ◾ open an account or provide contact information ◾ give us your account information or pay us by check ◾ make a wire transfer We also collect your personal information from others, such as credit bureaus, affiliates and other companies. |
| | |
| Why can’t I limit all sharing? | | Federal law gives you the right to limit only ◾ sharing for affiliates’ everyday business purposes – information about your creditworthiness ◾ affiliates from using your information to market to you ◾ sharing for nonaffiliates to market to you State laws and individual companies may give you additional rights to limit sharing. |
| | |
| |
Definitions |
| | |
| Affiliates | | Companies related by common ownership or control. They can be financial and nonfinancial companies. ◾ J.P. Morgan Funds does not share with our affiliates. |
| | |
| Nonaffiliates | | Companies not related by common ownership or control. They can be financial and nonfinancial companies. ◾ J.P. Morgan Funds does not share with nonaffiliates so they can market to you. |
| | |
| Joint Marketing | | A formal agreement between nonaffiliated financial companies that together market financial products or services to you. ◾ J.P. Morgan Funds doesn’t jointly market. |
J.P. Morgan Funds are distributed by JPMorgan Distribution Services, Inc., which is an affiliate of JPMorgan Chase & Co. Affiliates of JPMorgan Chase & Co. receive fees for providing various services to the funds.
Contact JPMorgan Distribution Services, Inc. at 1-800-480-4111 for a fund prospectus. You can also visit us at www.jpmorganfunds.com. Investors should carefully consider the investment objectives and risk as well as charges and expenses of the mutual fund before investing. The prospectus contains this and other information about the mutual fund. Read the prospectus carefully before investing.
Investors may obtain information about the Securities Investor Protection Corporation (SIPC), including the SIPC brochure by visiting www.sipc.org or by calling SIPC at 202-371-8300.
The Fund files a complete schedule of its fund holdings for the first and third quarters of its fiscal year with the SEC on Form N-Q. The Fund’s Forms N-Q are available on the SEC’s website at http://www.sec.gov and may be reviewed and copied at the SEC’s Public Reference Room in Washington, DC. Information on the operation of the SEC’s Public Reference Room may be obtained by calling 1-800-SEC-0330. Shareholders may request the Form N-Q without charge by calling 1-800-480-4111 or by visiting the J.P. Morgan Funds’ website at www.jpmorganfunds.com.
A description of the Fund’s policies and procedures with respect to the disclosure of the Fund’s holdings is available in the prospectus and Statement of Additional Information.
A copy of proxy policies and procedures is available without charge upon request by calling 1-800-480-4111 and on the Fund’s website at www.jpmorganfunds.com. A description of such policies and procedures is on the SEC’s website at www.sec.gov. The Trustees have delegated the authority to vote proxies for securities owned by the Fund to the Adviser. A copy of the Fund’s voting record for the most recent 12-month period ended June 30 is available on the SEC’s website at www.sec.gov or at the Fund’s website at www.jpmorganfunds.com no later than August 31 of each year. The Fund’s proxy voting record will include, among other things, a brief description of the matter voted on for each fund security, and will state how each vote was cast, for example, for or against the proposal.
| | |
| © JPMorgan Chase & Co., 2013. All rights reserved. December 2013. | |  |
ITEM 2. CODE OF ETHICS.
Disclose whether, as of the end of the period covered by the report, the registrant has adopted a code of ethics that applies to the registrant’s principal executive officer, principal financial officer, principal accounting officer or controller, or persons performing similar functions, regardless of whether these individuals are employed by the registrant or a third party. If the registrant has not adopted such a code of ethics, explain why it has not done so.
The registrant must briefly describe the nature of any amendment, during the period covered by the report, to a provision of its code of ethics that applies to the registrant’s principal executive officer, principal financial officer, principal accounting officer or controller, or persons performing similar functions, regardless of whether these individuals are employed by the registrant or a third party, and that relates to any element of the code of ethics definition enumerated in paragraph (b) of this Item. The registrant must file a copy of any such amendment as an exhibit pursuant to Item 12(a)(1), unless the registrant has elected to satisfy paragraph (f) of this Item by positing its code of ethics on its website pursuant to paragraph (f)(2) of this Item, or by undertaking to provide its code of ethics to any person without charge, upon request, pursuant to paragraph (f)(3) of this Item.
If the registrant has, during the period covered by the report, granted a waiver, including an implicit waiver, from a provision of the code of ethics that applies to the registrant’s principal executive officer, principal financial officer, principal accounting officer or controller, or persons performing similar functions, regardless of whether these individuals are employed by the registrant or third party, that relates to one or more items set forth in paragraph (b) of this Item, the registrant must briefly describe the nature of the waiver, the name of the person to whom the waiver was granted, and the date of the waiver.
The Registrant has adopted a code of ethics that applies to the Registrant’s principal executive officer and principal financial officer. There were no amendments to the code of ethics or waivers granted with respect to the code of ethics in the period covered by the report.
ITEM 3. AUDIT COMMITTEE FINANCIAL EXPERT.
(a) (1) Disclose that the registrant’s board of directors has determined that the registrant either:
(i) Has at least one audit committee financial expert serving on its audit committee; or
(ii) Does not have an audit committee financial expert serving on its audit committee.
The Registrant’s Board of Trustees has determined that the Registrant has at least one audit committee financial expert serving on its audit committee. The Securities and Exchange Commission has stated that the designation or identification of a person as an audit committee financial expert pursuant to this Item 3 of Form N-CSR does not impose on such person any duties, obligations or liabilities that are greater than the duties, obligations and liabilities imposed on such person as a member of the Audit Committee and the Board of Trustees in the absence of such designation or identification.
(2) If the registrant provides the disclosure required by paragraph (a)(1)(i) of this Item, it must disclose the name of the audit committee financial expert and whether that person is “independent.” In order to be considered “independent” for purposes of this Item, a member of an audit committee may not, other than in his or her capacity as a member of the audit committee, the board of directors, or any other board committee:
(i) Accept directly or indirectly any consulting, advisory, or other compensatory fee from the issuer; or
(ii) Be an “interested person” of the investment company as defined in Section 2(a)(19) of the Act (15 U.S.C. 80a-2(a)(19)).
The audit committee financial expert is James Schonbachler. He is not an “interested person” of the Registrant and is also “independent” as defined by the U.S. Securities and Exchange Commission for purposes of audit committee financial expert determinations.
(3) If the registrant provides the disclosure required by paragraph (a)(1)(ii) of this Item, it must explain why it does not have an audit committee financial expert.
Not applicable.
ITEM 4. PRINCIPAL ACCOUNTANT FEES AND SERVICES.
(a) Disclose, under the caption Audit Fees, the aggregate fees billed for each of the last two fiscal years for professional
services rendered by the principal accountant for the audit of the registrant’s annual financial statements or services that are normally provided by the accountant in connection with statutory and regulatory filings or engagements for those fiscal years.
AUDIT FEES
2017 – $57,452
2016 – Not applicable
(b) Disclose, under the caption Audit-Related Fees, the aggregate fees billed in each of the last two fiscal years for assurance and related services by the principal accountant that are reasonably related to the performance of the audit of the registrant’s financial statements and are not reported under paragraph (a) of this Item. Registrants shall describe the nature of the services comprising the fees disclosed under this category.
AUDIT-RELATED FEES
2017 – $11,620
2016 – Not applicable
Audit-related fees consists of security count procedures performed as required under Rule 17f-2 of the Investment Company Act of 1940 during the Registrant’s fiscal year.
(c) Disclose, under the caption Tax Fees, the aggregate fees billed in each of the last two fiscal years for professional services rendered by the principal accountant for tax compliance, tax advice, and tax planning. Registrants shall describe the nature of the services comprising the fees disclosed under this category.
TAX FEES
2017 – $22,122
2016 – Not applicable
The tax fees consist of fees billed in connection with preparing the federal regulated investment company income tax returns for the Registrant for the tax years ended June 30, 2017 and 2016, respectively.
For the last fiscal year, no tax fees were required to be approved pursuant to paragraph (c)(7)(ii) of Rule 2-01 of Regulation S-X.
(d) Disclose, under the caption All Other Fees, the aggregate fees billed in each of the last two fiscal years for products and services provided by the principal accountant, other than the services reported in paragraphs (a) through (c) of this Item. Registrants shall describe the nature of the services comprising the fees disclosed under this category.
ALL OTHER FEES
2017 – Not applicable
2016 – Not applicable
(e) (1) Disclose the audit committee’s pre-approval policies and procedures described in paragraph (c)(7) of Rule 2-01 of Regulation S-X.
Pursuant to the Registrant’s Audit Committee Charter and written policies and procedures for the pre-approval of audit and non-audit services (the “Pre-approval Policy”), the Audit Committee pre-approves all audit and non-audit services performed by the Registrant’s independent public registered accounting firm for the Registrant. In addition, the Audit Committee pre-approves the auditor’s engagement for non-audit services with the Registrant’s investment adviser (not including a sub-adviser whose role is primarily portfolio management and is sub-contracted or overseen by another investment adviser) and any Service Affiliate in accordance with paragraph (c)(7)(ii) of Rule 2-01 of Regulation S-X, if the engagement relates directly to the operations and financial reporting of the Registrant. Proposed services may be pre-approved either 1) without consideration of specific case-by-case services or 2) require the specific pre-approval of the Audit Committee. Therefore, initially the Pre-approval Policy listed a number of audit and non-audit services that have been approved by the Audit Committee, or which were not subject to pre-approval under the transition provisions of Sarbanes-Oxley Act of 2002 (the “Pre-approval List”). The Audit Committee annually reviews and pre-approves the services included on the Pre-approval List that may be provided by the independent public registered accounting firm without obtaining additional specific pre-approval of individual services from the Audit Committee. The Audit Committee adds to, or subtracts from, the list of general pre-approved services from time to time, based on subsequent determinations. All other audit and non-audit services not on the Pre-approval List must be specifically pre-approved by the Audit Committee.
One or more members of the Audit Committee may be appointed as the Committee’s delegate for the purposes of considering whether to approve such services. Any pre-approvals granted by the delegate will be reported, for informational purposes only, to the Audit Committee at its next scheduled meeting. The Audit Committee’s responsibilities to pre-approve services performed by the independent public registered accounting firm are not delegated to management.
(2) Disclose the percentage of services described in each of paragraphs (b) through (d) of this Item that were approved by the audit committee pursuant to paragraph (c)(7)(i)(C) of Rule 2-01 of Regulation S-X.
2017 – 0.0%
2016 – Not applicable
(f) If greater than 50 percent, disclose the percentage of hours expended on the principal accountant’s engagement to audit the registrant’s financial statements for the most recent fiscal year that were attributed to work performed by persons other than the principal accountant’s full-time, permanent employees.
Not applicable – Less than 50%.
(g) Disclose the aggregate non-audit fees billed by the registrant’s accountant for services rendered to the registrant, and rendered to the registrant’s investment adviser (not including any sub-adviser whose role is primarily portfolio management and is subcontracted with or overseen by another investment adviser), and any entity controlling, controlled by, or under common control with the adviser that provides ongoing services to the registrant for each of the last two fiscal years of the registrant.
The aggregate non-audit fees billed by the independent registered public accounting firm for services rendered to the Registrant, and rendered to Service Affiliates, for the last two calendar year ends were:
2016 – $28.3 million
2015 – $29.4 million
(h) Disclose whether the registrant’s audit committee of the board of directors has considered whether the provision of non-audit services that were rendered to the registrant’s investment adviser (not including any subadviser whose role is primarily portfolio management and is subcontracted with or overseen by another investment adviser), and any entity controlling, controlled by, or under common control with the investment adviser that provides ongoing services to the registrant that were not pre-approved pursuant to paragraph (c)(7)(ii) of Rule 2-01 of Regulation S-X is compatible with maintaining the principal accountant’s independence.
The Registrant’s Audit Committee has considered whether the provision of the non-audit services that were rendered to Service Affiliates that were not pre-approved (not requiring pre-approval) is compatible with maintaining the independent public registered accounting firm’s independence. All services provided by the independent public registered accounting firm to the Registrant or to Service Affiliates that were required to be pre-approved were pre-approved as required.
ITEM 5. AUDIT COMMITTEE OF LISTED REGISTRANTS.
(a) If the registrant is a listed issuer as defined in Rule 10A-3 under the Exchange Act (17CFR 240.10A-3), state whether or not the registrant has a separately-designated standing audit committee established in accordance with Section 3(a)(58)(A) of the Exchange Act (15 U.S.C. 78c(a)(58)(A)). If the registrant has such a committee, however designated, identify each committee member. If the entire board of directors is acting as the registrant’s audit committee as specified in Section 3(a)(58)(B) of the Exchange Act (15 U.S.C. 78c(a)(58)(B)), so state.
(b) If applicable, provide the disclosure required by Rule 10A-3(d) under the Exchange Act (17CFR 240.10A-3(d)) regarding an exemption from the listing standards for all audit committees.
Not applicable.
ITEM 6. SCHEDULE OF INVESTMENTS.
File Schedule I – Investments in securities of unaffiliated issuers as of the close of the reporting period as set forth in Section 210.12-12 of Regulation S-X, unless the schedule is included as part of the report to shareholders filed under Item 1 of this Form.
Included in Item 1.
ITEM 7. DISCLOSURE OF PROXY VOTING POLICIES AND PROCEDURES FOR CLOSED-END MANAGEMENT INVESTMENT COMPANIES.
A closed-end management investment company that is filing an annual report on this Form N-CSR must, unless it invests exclusively in non-voting securities, describe the policies and procedures that it uses to determine how to vote proxies relating to portfolio securities, including the procedures that the company uses when a vote presents a conflict between the interests of its shareholders, on the one hand, and those of the company’s investment adviser; principal underwriter; or any affiliated person (as defined in Section 2(a)(3) of the Investment Company Act of 1940 (15 U.S.C. 80a-2(a)(3)) and the rules thereunder) of the company, its investment adviser, or its principal underwriter, on the other. Include any policies and procedures of the company’s investment adviser, or any other third party, that the company uses, or that are used on the company’s behalf, to determine how to vote proxies relating to portfolio securities.
Not applicable.
ITEM 8. PORTFOLIO MANAGERS OF CLOSED-END MANAGEMENT INVESTMENT COMPANIES.
Not applicable.
ITEM 9. PURCHASE OF EQUITY SECURITIES BY CLOSED-END MANAGEMENT INVESTMENT COMPANY AND AFFILIATED PURCHASERS.
(a) If the registrant is a closed-end management investment company, provide the information specified in paragraph (b) of this Item with respect to any purchase made by or on behalf of the registrant or any “affiliated purchaser,” as defined in Rule 10b-18(a)(3) under the Exchange Act (17 CFR 240.10b-18(a)(3)), of shares or other units of any class of the registrant’s equity securities that is registered by the registrant pursuant to Section 12 of the Exchange Act (15 U.S.C. 781).
Not applicable.
ITEM 10. SUBMISSION OF MATTERS TO A VOTE OF SECURITY HOLDERS.
Describe any material changes to the procedures by which shareholders may recommend nominees to the registrant’s board of directors, where those changes were implemented after the registrant last provided disclosure in response to the requirements of Item 7(d)(2)(ii)(G) of Schedule 14A (17 CFR 240.14a-101), or this Item.
No material changes to report.
ITEM 11. CONTROLS AND PROCEDURES.
(a) Disclose the conclusions of the registrant’s principal executive and principal financial officers, or persons performing similar functions, regarding the effectiveness of the registrant’s disclosure controls and procedures (as defined in Rule 30a-3(c) under the Act (17 CFR 270.30a-3(c))) as of a date within 90 days of the filing date of the report that includes the disclosure required by this paragraph, based on the evaluation of these controls and procedures required by Rule 30a-3(b) under the Act (17 CFR 270.30a-3(b)) and Rules 13a-15(b) or 15d-15(b) under the Exchange Act (17 CFR 240.13a-15(b) or 240.15d-15(b)).
The Registrant’s principal executive and principal financial officers have concluded, based on their evaluation of the Registrant’s disclosure controls and procedures as of a date within 90 days of the filing date of this report, that the Registrant’s disclosure controls and procedures are reasonably designed to ensure that information required to be disclosed by the Registrant on Form N-CSR is recorded, processed, summarized and reported within the required time periods and that information required to be disclosed by the Registrant in the reports that it files or submits on Form N-CSR is accumulated and communicated to the Registrant’s management, including its principal executive and principal financial officers, as appropriate to allow timely decisions regarding required disclosure.
(b) Disclose any change in the registrant’s internal control over financial reporting (as defined in Rule 30a-3(d) under the Act (17 CFR 270.30a-3(d)) that occurred during the registrant’s second fiscal quarter of the period covered by this report that has materially affected, or is reasonably likely to materially affect, the registrant’s internal control over financial reporting.
There were no changes in the Registrant’s internal control over financial reporting that occurred during the last fiscal quarter covered by this report that have materially affected, or are reasonably likely to materially affect, the Registrant’s internal control over financial reporting.
ITEM 12. EXHIBITS.
(a) File the exhibits listed below as part of this Form. Letter or number the exhibits in the sequence indicated.
(a)(1) Any code of ethics, or amendment thereto, that is the subject of the disclosure required by Item 2, to the extent that the registrant intends to satisfy the Item 2 requirements through filing of an exhibit.
Code of Ethics applicable to its Principal Executive and Principal Financial Officers pursuant to Section 406 of the Sarbanes-Oxley Act of 2002 attached hereto.
(a)(2) A separate certification for each principal executive officer and principal financial officer of the registrant as required by Rule 30a-2(a) under the Act (17 CFR 270.30a-2).
Certifications pursuant to Rule 30a-2(a) under the Investment Company Act of 1940 are attached hereto.
(a)(3) Any written solicitation to purchase securities under Rule 23c-1 under the Act (17 CFR 270.23c-1) sent or given during the period covered by the report by or on behalf of the registrant to 10 or more persons.
Not applicable.
(b) A separate or combined certification for each principal executive officer and principal officer of the registrant as required by Rule 30a-2(b) under the Act of 1940.
Certifications pursuant to Rule 30a-2(b) under the Investment Company Act of 1940 are attached hereto.
SIGNATURES
Pursuant to the requirements of the Securities Exchange Act of 1934 and the Investment Company Act of 1940, the registrant has duly caused this report to be signed on its behalf by the undersigned, thereunto duly authorized.
| | |
| JPMorgan Trust IV |
| |
| By: | | /s/ Brian S. Shlissel |
| | Brian S. Shlissel |
| | President and Principal Executive Officer |
| | September 1, 2017 |
Pursuant to the requirements of the Securities Exchange Act of 1934 and the Investment Company Act of 1940, this report has been signed below by the following persons on behalf of the registrant and in the capacities and on the dates indicated.
| | |
| |
| By: | | /s/ Brian S. Shlissel |
| | Brian S. Shlissel |
| | President and Principal Executive Officer |
| | September 1, 2017 |
| |
| By: | | /s/ Laura M. Del Prato |
| | Laura M. Del Prato |
| | Treasurer and Principal Financial Officer |
| | September 1, 2017 |