United States Securities and Exchange Commission
Washington, D.C. 20549
FORM N-CSR
Certified Shareholder Report of Registered Management Investment Companies
Investment Company Act file number 811-23121
Clayton Street Trust
(Exact name of registrant as specified in charter)
151 Detroit Street, Denver, Colorado 80206
(Address of principal executive offices) (Zip code)
Michelle Rosenberg, 151 Detroit Street, Denver, Colorado 80206
(Name and address of agent for service)
Registrant's telephone number, including area code: 303-333-3863
Date of fiscal year end: 12/31
Date of reporting period: 6/30/16
Item 1 - Reports to Shareholders
SEMIANNUAL REPORT June 30, 2016 | |||
Protective Life Dynamic Allocation Series - Conservative Portfolio | |||
Clayton Street Trust | |||
| |||
HIGHLIGHTS · Portfolio management perspective · Investment strategy behind your portfolio · Portfolio performance, characteristics |
Table of Contents
Protective Life Dynamic Allocation Series - Conservative Portfolio
Protective Life Dynamic Allocation Series - Conservative Portfolio (unaudited)
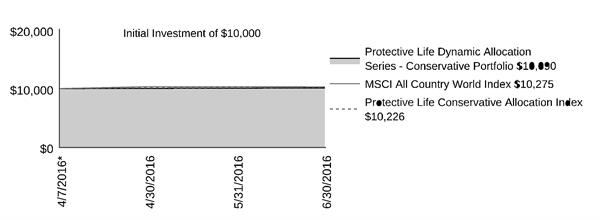
Protective Life Dynamic Allocation Series – Conservative Portfolio began investment operations on April 7, 2016. The information provided for Protective Life Dynamic Allocation Series – Conservative Portfolio reflects investment activity for the period April 7, 2016 to June 30, 2016.
Asset Allocation - (% of Net Assets) | |||||
Investment Companies | 87.3% | ||||
Repurchase Agreements | 34.8% | ||||
Other | (22.1)% | ||||
100.0% | |||||
Clayton Street Trust | 1 |
Protective Life Dynamic Allocation Series - Conservative Portfolio (unaudited)
Performance
See important disclosures on the next page. |
| Expense Ratios - per the April 6, 2016 | ||||||||||
Cumulative Total Return - for the period ended June 30, 2016 |
|
| prospectus (estimated for the fiscal year) | ||||||||
|
| Since |
|
| Total Annual Fund | Net Annual Fund | |||||
Protective Life Dynamic Allocation Series - Conservative Portfolio |
| 0.90% |
|
| 1.86% | 0.90% | |||||
MSCI All Country World Index |
| 2.75% |
|
|
|
| |||||
Protective Life Conservative Allocation Index |
| 2.26% |
|
|
|
| |||||
Expense ratios shown reflect estimated annualized expenses that the Portfolio expects to incur during its initial fiscal year.
Performance for very short time periods may not be indicative of future performance.
A Portfolio’s performance may be affected by risks that include those associated with nondiversification, non-investment grade debt securities, high-yield/high-risk securities, undervalued or overlooked companies, investments in specific industries or countries and potential conflicts of interest. Additional risks to a Portfolio may also include, but are not limited to, those associated with investing in foreign securities, emerging markets, initial public offerings, real estate investment trusts (REITs), derivatives, short sales, commodity-linked investments and companies with relatively small market capitalizations. Each Portfolio has different risks. Please see a Janus prospectus for more information about risks, portfolio holdings and other details.
Performance of the Protective Life Dynamic Allocation Series Portfolios depends on that of the underlying funds. They are subject to risk with respect to the aggregation of holdings of underlying funds which may result in increased volatility as a result of indirectly having concentrated assets in a particular industry, geographical sector, or single company.
No assurance can be given that the Protective Life Dynamic Allocation Series Portfolios’ investment strategy will be successful under all or any market conditions. Janus Capital does not have prior experience using the methodology, a proprietary methodology co-developed by Janus Capital and Protective Life Insurance Company. Although it is designed to achieve the Portfolios’ investment objectives, there is no guarantee that it will achieve the desired results.
These returns do not reflect the charges and expenses of any particular insurance product or qualified plan. Returns shown would have been lower had they included insurance charges.
Returns include reinvestment of all dividends and distributions and do not reflect the deduction of taxes that a shareholder would pay on Portfolio distributions or redemptions of Portfolio shares. The returns do not include adjustments in accordance with generally accepted accounting principles required at the period end for financial reporting purposes.
See Financial Highlights for actual expense ratios during the reporting period.
Until three years from inception, Janus Capital may recover expenses previously waived or reimbursed if the expense ratio falls below certain limits.
2 | JUNE 30, 2016 |
Protective Life Dynamic Allocation Series - Conservative Portfolio (unaudited)
Performance
There is no assurance that the investment process will consistently lead to successful investing.
See Notes to Schedule of Investments and Other Information for index definitions.
A Portfolio’s portfolio may differ significantly from the securities held in an index. An index is unmanaged and not available for direct investment; therefore, its performance does not reflect the expenses associated with the active management of an actual portfolio.
See “Useful Information About Your Portfolio Report.”
*The Portfolio’s inception date – April 7, 2016
Clayton Street Trust | 3 |
Protective Life Dynamic Allocation Series - Conservative Portfolio (unaudited)
Expense Examples
As a shareholder of the Portfolio, you incur two types of costs: (1) transaction costs and (2) ongoing costs, including management fees; 12b-1 distribution and shareholder servicing fees; transfer agent fees and expenses payable pursuant to the Transfer Agency Agreement; and other Portfolio expenses. This example is intended to help you understand your ongoing costs (in dollars) of investing in the Portfolio and to compare these costs with the ongoing costs of investing in other mutual funds. To do so, compare this 5% hypothetical example with the 5% hypothetical examples that appear in the shareholder reports of the other funds. The example is based upon an investment of $1,000 invested at the beginning of the period and held for the six-months indicated, unless noted otherwise in the table and footnotes below.
Actual Expenses
The information in the table under the heading “Actual” provides information about actual account values and actual expenses. You may use the information in these columns, together with the amount you invested, to estimate the expenses that you paid over the period. Simply divide your account value by $1,000 (for example, an $8,600 account value divided by $1,000 = 8.6), then multiply the result by the number in the appropriate column for your share class under the heading entitled “Expenses Paid During Period” to estimate the expenses you paid on your account during the period.
Hypothetical Example for Comparison Purposes
The information in the table under the heading “Hypothetical (5% return before expenses)” provides information about hypothetical account values and hypothetical expenses based upon the Portfolio’s actual expense ratio and an assumed rate of return of 5% per year before expenses, which is not the Portfolio’s actual return. The hypothetical account values and expenses may not be used to estimate the actual ending account balance or expenses you paid for the period. You may use this information to compare the ongoing costs of investing in the Portfolio and other funds. To do so, compare this 5% hypothetical example with the 5% hypothetical examples that appear in the shareholder reports of the other funds. Additionally, for an analysis of the fees associated with an investment in the Portfolio or other similar funds, please visit www.finra.org/fundanalyzer.
Please note that the expenses shown in the table are meant to highlight your ongoing costs only and do not reflect any transaction costs, such as any charges at the separate account level or contract level. These fees are fully described in the Portfolio’s prospectus. Therefore, the hypothetical examples are useful in comparing ongoing costs only, and will not help you determine the relative total costs of owning different funds. In addition, if these transaction costs were included, your costs would have been higher.
Actual | Hypothetical | |||||||||||
| Beginning | Ending | Expenses |
| Beginning | Ending | Expenses | Net Annualized | ||||
| $1,000.00 | $1,009.00 | $2.01 |
| $1,000.00 | $1,009.61 | $2.01 | 0.86% | ||||
* | Actual Expenses Paid During Period reflects only the inception period for the Portfolio (April 7, 2016 to June 30, 2016) and is equal to the Net Annualized Expense Ratio multiplied by the average account value over the period, multiplied by 85/366 (to reflect the period). Therefore, actual expenses shown are lower than would be expected for a six-month period. | |||||||||||
† | Hypothetical Expenses Paid During Period is equal to the Net Annualized Expense Ratio multiplied by the average account value over the period, multiplied by 182/366 (to reflect the one-half year period). Expenses in the examples include the effect of applicable fee waivers and/or expense reimbursements, if any. Had such waivers and/or reimbursements not been in effect, your expenses would have been higher. Please refer to the Notes to Financial Statements or the Portfolio’s prospectus for more information regarding waivers and/or reimbursements. | |||||||||||
4 | JUNE 30, 2016 |
Protective Life Dynamic Allocation Series - Conservative Portfolio
Schedule of Investments (unaudited)
June 30, 2016
Shares or | Value | ||||||
Investment Companies – 87.3% | |||||||
Exchange-Traded Funds (ETFs) – 87.3% | |||||||
iShares Core US Aggregate Bond | 15,499 | $1,744,722 | |||||
iShares MSCI All Country Asia ex Japan | 1,173 | 64,140 | |||||
iShares Russell 2000 | 2,199 | 252,819 | |||||
Powershares QQQ Trust Series 1 | 2,305 | 247,880 | |||||
SPDR S&P 500 Trust | 3,323 | 696,268 | |||||
Total Investment Companies (cost $2,976,577) | 3,005,829 | ||||||
Repurchase Agreements(a) – 34.8% | |||||||
Undivided interest of 0.5% in a joint repurchase agreement (principal amount $126,400,000 with a maturity value of $126,401,475) with Credit Agricole, New York, 0.4200%, dated 6/30/16, maturing 7/1/16 to be repurchased at $600,007 collateralized by $124,582,513 in U.S. Treasuries 0.1250% - 3.5000%, 4/15/18 - 1/31/21 with a value of $128,928,074 | $600,000 | 600,000 | |||||
Undivided interest of 0.2% in a joint repurchase agreement (principal amount $300,000,000 with a maturity value of $300,003,583) with Wells Fargo Securities LLC, 0.4300%, dated 6/30/16, maturing 7/1/16 to be repurchased at $600,007 collateralized by $288,813,889 in U.S. Government Agencies 3.0000% - 6.0000%, 2/15/38 - 6/20/46 with a value of $306,003,657 | 600,000 | 600,000 | |||||
Total Repurchase Agreements (cost $1,200,000) | 1,200,000 | ||||||
Total Investments (total cost $4,176,577) – 122.1% | 4,205,829 | ||||||
Liabilities, net of Cash, Receivables and Other Assets – (22.1)% | (760,618) | ||||||
Net Assets – 100% | $3,445,211 | ||||||
See Notes to Schedule of Investments and Other Information and Notes to Financial Statements. | |
Clayton Street Trust | 5 |
Protective Life Dynamic Allocation Series - Conservative Portfolio
Notes to Schedule of Investments and Other Information (unaudited)
MSCI All Country World IndexSM | An unmanaged, free float-adjusted market capitalization weighted index composed of stocks of companies located in countries throughout the world. It is designed to measure equity market performance in global developed and emerging markets. The index includes reinvestment of dividends, net of foreign withholding taxes. |
Protective Life Conservative Allocation Index | An internally-calculated, hypothetical combination of total returns from the MSCI All Country World Index (50%) and the Barclays Global Aggregate Bond Index (50%). |
LLC | Limited Liability Company |
SPDR | Standard & Poor's Depositary Receipt |
(a) | The Portfolio may have elements of risk due to concentrated investments. Such concentrations may subject the Portfolio to additional risks. |
The following is a summary of the inputs that were used to value the Portfolio’s investments in securities and other financial instruments as of June 30, 2016. See Notes to Financial Statements for more information. | |||
Valuation Inputs Summary | |||
| Level 1 - | Level 2 - | Level 3 - |
Assets | |||
Investments in Securities: | |||
Investment Companies | $ 3,005,829 | $ - | $ - |
Repurchase Agreements | - | 1,200,000 | - |
Total Assets | $ 3,005,829 | $ 1,200,000 | $ - |
6 | JUNE 30, 2016 |
Protective Life Dynamic Allocation Series - Conservative Portfolio
Statement of Assets and Liabilities (unaudited)
June 30, 2016
|
|
|
|
|
|
|
Assets: | ||||||
Investments, at cost(1) | $ | 4,176,577 | ||||
Unaffiliated investments, at value | 3,005,829 | |||||
Repurchase agreements, at value | 1,200,000 | |||||
Cash | 476,804 | |||||
Initial offering costs | 12,795 | |||||
Receivables: | ||||||
Investments sold | 40,677 | |||||
Due from adviser | 12,522 | |||||
Dividends | 2,921 | |||||
Total Assets |
|
| 4,751,548 |
| ||
Liabilities: | ||||||
Cash due to custodian | 400,000 | |||||
Payables: | — | |||||
Investments purchased | 865,284 | |||||
Initial offering costs | 16,666 | |||||
Professional fees | 10,289 | |||||
Portfolio administration fees | 4,361 | |||||
Non-interested Trustees' fees and expenses | 3,476 | |||||
Custodian fees | 1,137 | |||||
Portfolio shares repurchased | 1,113 | |||||
Advisory fees | 424 | |||||
12b-1 Distribution and shareholder servicing fees | 265 | |||||
Transfer agent fees and expenses | 106 | |||||
Accrued expenses and other payables | 3,216 | |||||
Total Liabilities |
|
| 1,306,337 |
| ||
Net Assets |
| $ | 3,445,211 |
| ||
Net Assets Consist of: | ||||||
Capital (par value and paid-in surplus) | $ | 3,414,959 | ||||
Undistributed net investment income/(loss) | 2,368 | |||||
Undistributed net realized gain/(loss) from investments | (1,368) | |||||
Unrealized net appreciation/(depreciation) of investments and non-interested Trustees’ deferred compensation | 29,252 | |||||
Total Net Assets |
| $ | 3,445,211 |
| ||
Net Assets | $ | 3,445,211 | ||||
Shares Outstanding, $0.01 Par Value (unlimited shares authorized) | 341,426 | |||||
Net Asset Value Per Share |
| $ | 10.09 |
| ||
(1) Includes cost of repurchase agreements of $1,200,000. |
See Notes to Financial Statements. | |
Clayton Street Trust | 7 |
Protective Life Dynamic Allocation Series - Conservative Portfolio
Statement of Operations (unaudited)
For the period ended June 30, 2016(1)
|
|
|
|
|
|
Investment Income: | |||||
| Dividends | $ | 3,282 | ||
Interest | 148 | ||||
Total Investment Income |
| 3,430 |
| ||
Expenses: | |||||
Advisory fees | 493 | ||||
12b-1 Distribution and shareholder servicing fees | 308 | ||||
Transfer agent administrative fees and expenses | 123 | ||||
Other transfer agent fees and expenses | 59 | ||||
Insurance Expense | 17,426 | ||||
Portfolio administration fees | 12,355 | ||||
Professional fees | 11,540 | ||||
Initial organization and offering costs | 3,871 | ||||
Non-interested Trustees’ fees and expenses | 3,476 | ||||
Accounting systems fee | 2,787 | ||||
Custodian fees | 1,204 | ||||
Shareholder reports expense | 429 | ||||
Total Expenses |
| 54,071 |
| ||
Less: Excess Expense Reimbursement |
| (53,009) |
| ||
Net Expenses |
| 1,062 |
| ||
Net Investment Income/(Loss) |
| 2,368 |
| ||
Net Realized Gain/(Loss) on Investments: | |||||
Investments | (1,368) | ||||
Total Net Realized Gain/(Loss) on Investments |
| (1,368) |
| ||
Change in Unrealized Net Appreciation/Depreciation: | |||||
Investments and non-interested Trustees’ deferred compensation | 29,252 | ||||
Total Change in Unrealized Net Appreciation/Depreciation |
| 29,252 |
| ||
Net Increase/(Decrease) in Net Assets Resulting from Operations | $ | 30,252 |
| ||
(1) Period from April 7, 2016 (inception date) through June 30, 2016. |
See Notes to Financial Statements. | |
8 | JUNE 30, 2016 |
Protective Life Dynamic Allocation Series - Conservative Portfolio
Statement of Changes in Net Assets
|
|
| Period ended |
| ||
Operations: | ||||||
Net investment income/(loss) | $ | 2,368 | ||||
Net realized gain/(loss) on investments | (1,368) | |||||
Change in unrealized net appreciation/depreciation | 29,252 | |||||
Net Increase/(Decrease) in Net Assets Resulting from Operations |
| 30,252 |
| |||
Capital Shares Transactions | 3,414,959 | |||||
Net Increase/(Decrease) in Net Assets |
| 3,445,211 |
| |||
Net Assets: | ||||||
Beginning of period | — | |||||
| End of period | $ | 3,445,211 |
| ||
Undistributed Net Investment Income/(Loss) | $ | 2,368 |
| |||
(1) Period from April 7, 2016 (inception date) through June 30, 2016. |
See Notes to Financial Statements. | |
Clayton Street Trust | 9 |
Protective Life Dynamic Allocation Series - Conservative Portfolio
Financial Highlights
For a share outstanding during the period ended June 30 (unaudited) |
| 2016(1) |
| |||
Net Asset Value, Beginning of Period |
| $10.00 |
| |||
Income/(Loss) from Investment Operations: | ||||||
Net investment income/(loss)(2) | 0.04 | |||||
Net realized and unrealized gain/(loss) | 0.05 | |||||
Total from Investment Operations |
| 0.09 |
| |||
Less Dividends and Distributions: | ||||||
Dividends (from net investment income) | — | |||||
Distributions (from capital gains) | — | |||||
Total Dividends and Distributions |
| — |
| |||
Net Asset Value, End of Period | $10.09 | |||||
Total Return* |
| 0.90% |
| |||
Net Assets, End of Period (in thousands) | $3,445 | |||||
Average Net Assets for the Period (in thousands) | $530 | |||||
Ratios to Average Net Assets**: |
|
|
| |||
Ratio of Gross Expenses | 43.89% | |||||
Ratio of Net Expenses (After Waivers and Expense Offsets) | 0.86% | |||||
Ratio of Net Investment Income/(Loss) | 1.92% | |||||
Portfolio Turnover Rate | 11% | |||||
* Total return not annualized for periods of less than one full year. ** Annualized for periods of less than one full year. (1) Period from April 7, 2016 (inception date) through June 30, 2016. (2) Per share amounts are calculated based on average shares outstanding during the year or period. |
See Notes to Financial Statements. | |
10 | JUNE 30, 2016 |
Protective Life Dynamic Allocation Series - Conservative Portfolio
Notes to Financial Statements (unaudited)
1. Organization and Significant Accounting Policies
Protective Life Dynamic Allocation Series - Conservative Portfolio (the “Portfolio”) is a series fund. The Portfolio operates as a “fund of funds,” meaning substantially all of the Portfolio’s assets will be invested in exchange-traded funds (the “underlying funds”). The Portfolio is part of Clayton Street Trust (the “Trust”), which is organized as a Delaware statutory trust and is registered under the Investment Company Act of 1940, as amended (the “1940 Act”), as an open-end management investment company, and therefore has applied the specialized accounting and reporting guidance in Financial Accounting Standards Board (“FASB”) Accounting Standards Codification (“ASC”) Topic 946. The Trust offers three Portfolios with differing investment objectives and policies. The Portfolio seeks total return through income and growth of capital, balanced by capital preservation. The Portfolio is classified as nondiversified, as defined in the 1940 Act.
The Portfolio currently offers one class of shares. The shares are offered in connection with investment in and payments under variable annuity contracts issued exclusively by Protective Life Insurance Company and its affiliates ("Protective Life").
Underlying Funds
The Portfolio invests in a dynamic portfolio of exchange-traded funds across seven different equity asset classes, as well as fixed-income investments, and a cash allocation, including money market instruments. The equity asset classes are adjusted weekly based on market conditions pursuant to a proprietary, quantitative-based allocation program. Over the long term, and when fully invested, the Portfolio seeks to maintain an asset allocation of approximately 50% global equity investments and 50% fixed income investments. Additional details and descriptions of the investment objectives and strategies of each of the potential underlying funds are available in the Portfolio's prospectus.
The following accounting policies have been followed by the Portfolio and are in conformity with accounting principles generally accepted in the United States of America.
Investment Valuation
Securities held by the Portfolio, including the underlying funds, are valued in accordance with policies and procedures established by and under the supervision of the Trustees (the “Valuation Procedures”). The values of the Portfolio's investments in the underlying funds are based upon the closing price of such underlying funds on the applicable exchange. Most debt securities are valued in accordance with the evaluated bid price supplied by the pricing service that is intended to reflect market value. The evaluated bid price supplied by the pricing service is an evaluation that may consider factors such as security prices, yields, maturities, and ratings. Certain short-term securities maturing within 60 days or less may be evaluated and valued on an amortized cost basis provided that the amortized cost determined approximates market value. Securities for which market quotations or evaluated prices are not readily available or are deemed unreliable are valued at fair value determined in good faith under the Valuation Procedures. Circumstances in which fair value pricing may be utilized include, but are not limited to: (i) a significant event that may affect the securities of a single issuer, such as a merger, bankruptcy, or significant issuer-specific development; (ii) an event that may affect an entire market, such as a natural disaster or significant governmental action; (iii) a nonsignificant event such as a market closing early or not opening, or a security trading halt; and (iv) pricing of a nonvalued security and a restricted or nonpublic security. Special valuation considerations may apply with respect to “odd-lot” fixed-income transactions which, due to their small size, may receive evaluated prices by pricing services which reflect a large block trade and not what actually could be obtained for the odd-lot position.
Valuation Inputs Summary
FASB ASC 820, Fair Value Measurements and Disclosures (“ASC 820”), defines fair value, establishes a framework for measuring fair value, and expands disclosure requirements regarding fair value measurements. This standard emphasizes that fair value is a market-based measurement that should be determined based on the assumptions that market participants would use in pricing an asset or liability and establishes a hierarchy that prioritizes inputs to valuation techniques used to measure fair value. These inputs are summarized into three broad levels:
Level 1 – Unadjusted quoted prices in active markets the Portfolio has the ability to access for identical assets or liabilities.
The Portfolio classifies each of its investments in underlying funds as Level 1, without consideration as to the classification level of the specific investments held by the underlying funds.
Clayton Street Trust | 11 |
Protective Life Dynamic Allocation Series - Conservative Portfolio
Notes to Financial Statements (unaudited)
Level 2 – Observable inputs other than unadjusted quoted prices included in Level 1 that are observable for the asset or liability either directly or indirectly. These inputs may include quoted prices for the identical instrument on an inactive market, prices for similar instruments, interest rates, prepayment speeds, credit risk, yield curves, default rates and similar data.
Assets or liabilities categorized as Level 2 in the hierarchy generally include: debt securities fair valued in accordance with the evaluated bid or ask prices supplied by a pricing service; securities traded on OTC markets and listed securities for which no sales are reported that are fair valued at the latest bid price (or yield equivalent thereof) obtained from one or more dealers transacting in a market for such securities or by a pricing service approved by the Portfolio’s Trustees; and certain short-term debt securities with maturities of 60 days or less that are fair valued at amortized cost. Other securities that may be categorized as Level 2 in the hierarchy include, but are not limited to, preferred stocks, bank loans, swaps, investments in unregistered investment companies, options, and forward contracts.
Level 3 – Unobservable inputs for the asset or liability to the extent that relevant observable inputs are not available, representing the Portfolio’s own assumptions about the assumptions that a market participant would use in valuing the asset or liability, and that would be based on the best information available.
There have been no significant changes in valuation techniques used in valuing any such positions held by the Portfolio since the beginning of the fiscal year.
The inputs or methodology used for fair valuing securities are not necessarily an indication of the risk associated with investing in those securities. The summary of inputs used as of June 30, 2016 to fair value the Portfolio’s investments in securities and other financial instruments is included in the “Valuation Inputs Summary” in the Notes to Schedule of Investments and Other Information.
There were no transfers between Level 1, Level 2 and Level 3 of the fair value hierarchy during the period. The Portfolio recognizes transfers between the levels as of the beginning of the fiscal year.
Initial Organization and Offering Costs
Organization costs paid in connection with the organization of the Portfolio are expensed at the time the Portfolio commences operations or as incurred thereafter. Offering costs paid in connection with the initial offering of shares are amortized using a straight-line basis over the first 12 months from the time the Portfolio commences. Amortized offering cost amounts and organization costs expensed are shown as “Initial organization and offering costs” on the Statement of Operations. Amounts remaining to be amortized are shown as “Initial offering costs” in the asset section of the Statement of Assets and Liabilities.
Investment Transactions and Investment Income
Investment transactions are accounted for as of the date purchased or sold (trade date). Dividend income is recorded on the ex dividend date. Any distributions from the underlying funds are recorded in accordance with the character of the distributions as designated by the underlying funds. Gains and losses are determined on the identified cost basis, which is the same basis used for federal income tax purposes.
Expenses
The Portfolio bears expenses incurred specifically on its behalf. Additionally, the Portfolio, as a shareholder in the underlying funds, will also indirectly bear its pro rata share of the expenses incurred by the underlying funds.
Estimates
The preparation of financial statements in conformity with accounting principles generally accepted in the United States of America requires management to make estimates and assumptions that affect the reported amount of assets and liabilities and disclosure of contingent assets and liabilities at the date of the financial statements, and the reported amounts of income and expenses during the reporting period. Actual results could differ from those estimates.
Indemnifications
In the normal course of business, the Portfolio may enter into contracts that contain provisions for indemnification of other parties against certain potential liabilities. The Portfolio’s maximum exposure under these arrangements is unknown, and would involve future claims that may be made against the Portfolio that have not yet occurred. Currently, the risk of material loss from such claims is considered remote.
12 | JUNE 30, 2016 |
Protective Life Dynamic Allocation Series - Conservative Portfolio
Notes to Financial Statements (unaudited)
Dividends and Distributions
The Portfolio may make semiannual distributions of substantially all of its investment income and an annual distribution of its net realized capital gains (if any).
Federal Income Taxes
The Portfolio intends to continue to qualify as a regulated investment company and distribute all of its taxable income in accordance with the requirements of Subchapter M of the Internal Revenue Code. Management has analyzed the Portfolio’s tax positions taken for all open federal income tax years, generally a three-year period, and has concluded that no provision for federal income tax is required in the Portfolio’s financial statements. The Portfolio is not aware of any tax positions for which it is reasonably possible that the total amounts of unrecognized tax benefits will significantly change in the next twelve months.
2. Other Investments and Strategies
Additional Investment Risk
The financial crisis in both the U.S. and global economies over the past several years has resulted, and may continue to result, in a significant decline in the value and liquidity of many securities of issuers worldwide in the equity and fixed-income/credit markets. In response to the crisis, the United States and certain foreign governments, along with the U.S. Federal Reserve and certain foreign central banks, took steps to support the financial markets. The withdrawal of this support, a failure of measures put in place to respond to the crisis, or investor perception that such efforts were not sufficient could each negatively affect financial markets generally, and the value and liquidity of specific securities. In addition, policy and legislative changes in the United States and in other countries continue to impact many aspects of financial regulation. The effect of these changes on the markets, and the practical implications for market participants, including the underlying funds, may not be fully known for some time. As a result, it may also be unusually difficult to identify both investment risks and opportunities, which could limit or preclude the underlying funds’s ability to achieve its investment objective. Therefore, it is important to understand that the value of your investment may fall, sometimes sharply, and you could lose money.
The enactment of the Dodd-Frank Wall Street Reform and Consumer Protection Act (the “Dodd-Frank Act”) provided for widespread regulation of financial institutions, consumer financial products and services, broker-dealers, OTC derivatives, investment advisers, credit rating agencies, and mortgage lending, which expanded federal oversight in the financial sector, including the investment management industry. Many provisions of the Dodd-Frank Act remain pending and will be implemented through future rulemaking. Therefore, the ultimate impact of the Dodd-Frank Act and the regulations under the Dodd-Frank Act on the underlying funds and the investment management industry as a whole, is not yet certain.
A number of countries in the European Union (“EU”) have experienced, and may continue to experience, severe economic and financial difficulties. In particular, many EU nations are susceptible to economic risks associated with high levels of debt, notably due to investments in sovereign debt of countries such as Greece, Italy, Spain, Portugal, and Ireland. Many non-governmental issuers, and even certain governments, have defaulted on, or been forced to restructure, their debts. Many other issuers have faced difficulties obtaining credit or refinancing existing obligations. Financial institutions have in many cases required government or central bank support, have needed to raise capital, and/or have been impaired in their ability to extend credit. As a result, financial markets in the EU experienced extreme volatility and declines in asset values and liquidity. Responses to these financial problems by European governments, central banks, and others, including austerity measures and reforms, may not work, may result in social unrest, and may limit future growth and economic recovery or have other unintended consequences. Further defaults or restructurings by governments and others of their debt could have additional adverse effects on economies, financial markets, and asset valuations around the world. Greece, Ireland, and Portugal have already received one or more "bailouts" from other Eurozone member states, and it is unclear how much additional funding they will require or if additional Eurozone member states will require bailouts in the future. The risk of investing in securities in the European markets may also be heightened due to the referendum in which the United Kingdom voted to exit the EU (known as “Brexit”). One or more other countries may also abandon the euro and/or withdraw from the EU, placing its currency and banking system in jeopardy.
Certain areas of the world have historically been prone to and economically sensitive to environmental events such as, but not limited to, hurricanes, earthquakes, typhoons, flooding, tidal waves, tsunamis, erupting volcanoes, wildfires or droughts, tornadoes, mudslides, or other weather-related phenomena. Such disasters, and the resulting physical or
Clayton Street Trust | 13 |
Protective Life Dynamic Allocation Series - Conservative Portfolio
Notes to Financial Statements (unaudited)
economic damage, could have a severe and negative impact on the Portfolio’s or an underlying fund's investment portfolio and, in the longer term, could impair the ability of issuers in which the Portfolio or an underlying fund invests to conduct their businesses as they would under normal conditions. Adverse weather conditions may also have a particularly significant negative effect on issuers in the agricultural sector and on insurance companies that insure against the impact of natural disasters.
Counterparties
Portfolio transactions involving a counterparty are subject to the risk that the counterparty or a third party will not fulfill its obligation to the Portfolio (“counterparty risk”). Counterparty risk may arise because of the counterparty’s financial condition (i.e., financial difficulties, bankruptcy, or insolvency), market activities and developments, or other reasons, whether foreseen or not. A counterparty’s inability to fulfill its obligation may result in significant financial loss to the Portfolio. The Portfolio may be unable to recover its investment from the counterparty or may obtain a limited recovery, and/or recovery may be delayed. The extent of the Portfolio’s exposure to counterparty risk with respect to financial assets and liabilities approximates its carrying value. See the "Offsetting Assets and Liabilities" section of this Note for further details.
The Portfolio may be exposed to counterparty risk through its investments in certain securities, including, but not limited to, repurchase agreements and debt securities. The Portfolio intends to enter into financial transactions with counterparties that Janus Capital believes to be creditworthy at the time of the transaction. There is always the risk that Janus Capital’s analysis of a counterparty’s creditworthiness is incorrect or may change due to market conditions. To the extent that the Portfolio focuses its transactions with a limited number of counterparties, it will have greater exposure to the risks associated with one or more counterparties.
Exchange-Traded Funds
ETFs are typically open-end investment companies, which may be actively managed or passively managed, that generally seek to track the performance of a specific index. ETFs are traded on a national securities exchange at market prices that may vary from the NAV of their underlying investments. Accordingly, there may be times when an ETF trades at a premium or discount. As a result, the Portfolio may pay more or less than NAV when it buys ETF shares, and may receive more or less than NAV when it sells those shares. ETFs also involve the risk that an active trading market for an ETF’s shares may not develop or be maintained. Similarly, because the value of ETF shares depends on the demand in the market, the Portfolio may not be able to purchase or sell an ETF at the most optimal time, which could adversely affect the Portfolio’s performance. In addition, ETFs that track particular indices may be unable to match the performance of such underlying indices due to the temporary unavailability of certain index securities in the secondary market or other factors, such as discrepancies with respect to the weighting of securities.
Offsetting Assets and Liabilities
The Portfolio presents gross and net information about transactions that are either offset in the financial statements or subject to an enforceable master netting arrangement or similar agreement with a designated counterparty, regardless of whether the transactions are actually offset in the Statement of Assets and Liabilities.
All repurchase agreements are transacted under legally enforceable master repurchase agreements that give the Portfolio, in the event of default by the counterparty, the right to liquidate securities held and to offset receivables and payables with the counterparty. For financial reporting purposes, the Portfolio does not offset financial instruments' payables and receivables and related collateral on the Statement of Assets and Liabilities. Repurchase agreements held by the Portfolio are fully collateralized, and such collateral is in the possession of the Portfolio’s custodian or, for tri-party agreements, the custodian designated by the agreement. The collateral is evaluated daily to ensure its market value exceeds the current market value of the repurchase agreements, including accrued interest.
The following table presents gross amounts of recognized assets and/or liabilities and the net amounts after deducting collateral that has been pledged by counterparties or has been pledged to counterparties (if applicable). For corresponding information grouped by type of instrument, see the Portfolio's Schedule of Investments.
14 | JUNE 30, 2016 |
Protective Life Dynamic Allocation Series - Conservative Portfolio
Notes to Financial Statements (unaudited)
Offsetting of Financial Assets and Derivative Assets | |||||||||
Gross Amounts | |||||||||
of Recognized | Offsetting Asset | Collateral | |||||||
Counterparty | Assets | or Liability(a) | Pledged(b) | Net Amount | |||||
Credit Agricole, New York | $ | 600,000 | $ | — | $ | (600,000) | $ | — | |
Wells Fargo Securities LLC | 600,000 | — | (600,000) | — | |||||
Total | $ | 1,200,000 | $ | — | $ | (1,200,000) | $ | — | |
(a) | Represents the amount of assets or liabilities that could be offset with the same counterparty under master netting or similar agreements that management elects not to offset on the Statement of Assets and Liabilities. | ||||||||
(b) | Collateral pledged is limited to the net outstanding amount due to/from an individual counterparty. The actual collateral amounts pledged may exceed these amounts and may fluctuate in value. | ||||||||
Repurchase Agreements
The Portfolio and other funds advised by Janus Capital or its affiliates may transfer daily uninvested cash balances into one or more joint trading accounts. Assets in the joint trading accounts are invested in money market instruments and the proceeds are allocated to the participating funds on a pro rata basis.
Repurchase agreements held by the Portfolio are fully collateralized, and such collateral is in the possession of the Portfolio’s custodian or, for tri-party agreements, the custodian designated by the agreement. The collateral is evaluated daily to ensure its market value exceeds the current market value of the repurchase agreements, including accrued interest. In the event of default on the obligation to repurchase, the Portfolio has the right to liquidate the collateral and apply the proceeds in satisfaction of the obligation. In the event of default or bankruptcy by the other party to the agreement, realization and/or retention of the collateral or proceeds may be subject to legal proceedings.
3. Investment Advisory Agreements and Other Transactions with Affiliates
The Portfolio pays Janus Capital an investment advisory fee which is calculated daily and paid monthly. The Portfolio’s contractual investment advisory fee rate (expressed as an annual rate) is 0.40% of its average daily net assets.
Janus Capital has contractually agreed to waive the advisory fee payable by the Portfolio or reimburse expenses in an amount equal to the amount, if any, that the Portfolio’s normal operating expenses in any fiscal year, including the investment advisory fee, but excluding the 12b-1 distribution and shareholder servicing fees, administrative services fees payable pursuant to the Transfer Agency Agreement, brokerage commissions, interest, dividends, taxes and extraordinary expenses, exceed the annual rate of 0.55% of the Portfolio’s average daily net assets. Janus Capital has agreed to continue the waiver until at least May 1, 2018. If applicable, amounts reimbursed to the Portfolio by Janus Capital are disclosed as “Excess Expense Reimbursement” on the Statement of Operations.
Janus Capital may recover from the Portfolio fees and expenses previously waived or reimbursed during the period beginning with the Portfolio’s commencement of operations and expiring on the third anniversary of the commencement of operations, which could then be considered a deferral. Janus Capital may elect to recoup such amounts only if: (i) recoupment is obtained within three years from the date an amount is waived or reimbursed to the Portfolio, and (ii) the Portfolio’s expense ratio at the time of recoupment, inclusive of the recoupment amounts, does not exceed the expense limit at the time of waiver or at the time of recoupment. If applicable, this amount is disclosed as “Recoupment expense” on the Statement of Operations. During the period ended June 30, 2016, Janus Capital reimbursed the Portfolio $53,009 of fees and expenses that are eligible for recoupment. As of June 30, 2016, the aggregate amount of recoupment that may potentially be made to Janus Capital is $53,009. The recoupment of such reimbursements expires April 7, 2019.
Janus Services LLC (“Janus Services”), a wholly-owned subsidiary of Janus Capital, is the Portfolio’s transfer agent. In addition, Janus Services provides or arranges for the provision of certain other administrative services including, but not limited to, recordkeeping, accounting, order processing, and other shareholder services for the Portfolio. These amounts are disclosed as “Other transfer agent fees and expenses” on the Statement of Operations.
Janus Services receives an administrative services fee at an annual rate of 0.10% of the Portfolio’s average daily net assets for providing, or arranging for the provision by Protective Life of administrative services, including recordkeeping,
Clayton Street Trust | 15 |
Protective Life Dynamic Allocation Series - Conservative Portfolio
Notes to Financial Statements (unaudited)
subaccounting, order processing, or other shareholder services provided on behalf of shareholders of the Portfolio. Janus Services expects to use this entire fee to compensate Protective Life for providing these services to its customers who invest in the Portfolio. These amounts are disclosed as “Transfer agent administrative fees and expenses” on the Statement of Operations.
Services provided by Protective Life may include, but are not limited to, recordkeeping, subaccounting, order processing, providing order confirmations, periodic statements, forwarding prospectuses, shareholder reports, and other materials to existing contract holders, answering inquiries regarding accounts, and other administrative services. Order processing includes the submission of transactions through the National Securities Clearing Corporation (“NSCC”) or similar systems, or those processed on a manual basis with Janus Capital.
Under a distribution and shareholder servicing plan (the “Plan”) adopted in accordance with Rule 12b-1 under the 1940 Act, the Portfolio may pay the Trust’s distributor, Janus Distributors LLC (“Janus Distributors”), a wholly-owned subsidiary of Janus Capital, a fee at an annual rate of up to 0.25% of the average daily net assets of the Portfolio. Under the terms of the Plan, the Trust is authorized to make payments to Janus Distributors for remittance to Protective Life or other intermediaries as compensation for distribution and/or shareholder services performed by Protective Life or its agents, or by such intermediary. These amounts are disclosed as “12b-1 Distribution and shareholder servicing fees” on the Statement of Operations. Payments under the Plan are not tied exclusively to actual 12b-1 distribution and servicing fees, and the payments may exceed 12b-1 distribution and servicing fees actually incurred. If any of the Portfolio’s actual 12b-1 distribution and servicing fees incurred during a calendar year are less than the payments made during a calendar year, the Portfolio will be refunded the difference. Refunds, if any, are included in “12b-1 Distribution fees and shareholder servicing fees” in the Statement of Operations.
Janus Capital furnishes certain administration, compliance, and accounting services for the Portfolio and is reimbursed by the Portfolio for certain of its costs in providing those services (to the extent Janus Capital seeks reimbursement and such costs are not otherwise waived). In addition, employees of Janus Capital and/or its affiliates may serve as officers of the Trust. The Portfolio also pays for salaries, fees, and expenses of certain Janus Capital employees and Portfolio officers, with respect to certain specified administration functions they perform on behalf of the Portfolio. The Portfolio pays these costs based on out-of-pocket expenses incurred by Janus Capital, and these costs are separate and apart from advisory fees and other expenses paid in connection with the investment advisory services Janus Capital provides to the Portfolio. These amounts are disclosed as “Portfolio administration fees” on the Statement of Operations. Some expenses related to compensation payable to the Portfolio's Chief Compliance Officer and compliance staff are shared with the Portfolio. Total compensation of $3 was paid to the Chief Compliance Officer and certain compliance staff by the Trust during the period ended June 30, 2016. The Portfolio's portion is reported as part of “Other expenses” on the Statement of Operations.
The Portfolio is permitted to purchase or sell securities (“cross-trade”) between itself and other funds or accounts managed by Janus Capital Management LLC in accordance with Rule 17a-7 under the Investment Company Act of 1940 (“Rule 17a-7”), when the transaction is consistent with the investment objectives and policies of the Portfolio and in accordance with the Internal Cross Trade Procedures adopted by the Trust’s Board of Trustees. These procedures have been designed to ensure that any cross-trade of securities by the Portfolio from or to another fund or account that is or could be considered an affiliate of the Portfolio under certain limited circumstances by virtue of having a common investment adviser, common Officer, or common Trustee complies with Rule 17a-7. Under these procedures, each cross-trade is effected at the current market price to save costs where allowed. During the period ended June 30, 2016, the Portfolio engaged in cross trades amounting to $1,553,266 in purchases and $1,163 in sales, resulting in a net realized loss of $22. The net realized loss is included in “Investments and foreign currency transactions” within the “Net Realized and Unrealized Gain/(Loss) on Investments” section of the Portfolio’s Statement of Operations.
4. Federal Income Tax
Income and capital gains distributions are determined in accordance with income tax regulations that may differ from accounting principles generally accepted in the United States of America. These differences are due to differing treatments for items such as net short-term gains, deferral of wash sale losses, foreign currency transactions, net investment losses, and capital loss carryovers.
The aggregate cost of investments and the composition of unrealized appreciation and depreciation of investment securities for federal income tax purposes as of June 30, 2016 are noted below.
16 | JUNE 30, 2016 |
Protective Life Dynamic Allocation Series - Conservative Portfolio
Notes to Financial Statements (unaudited)
Unrealized appreciation and unrealized depreciation in the table below exclude appreciation/depreciation on foreign currency translations. The primary difference between book and tax appreciation or depreciation of investments is wash sale loss deferrals.
Federal Tax Cost | Unrealized | Unrealized | Net Tax Appreciation/ |
$ 4,176,733 | $ 29,096 | $ - | $ 29,096 |
5. Capital Share Transactions
Period ended June 30, 2016(1) | |||
Shares | Amount | ||
Shares sold | 341,553 | $3,416,244 | |
Reinvested dividends and distributions | - | - | |
Shares repurchased | (127) | (1,285) | |
Net Increase/(Decrease) | 341,426 | $3,414,959 | |
(1) | Period from April 7, 2016 (inception date) through June 30, 2016. | ||
6. Purchases and Sales of Investment Securities
For the period ended June 30, 2016, the aggregate cost of purchases and proceeds from sales of investment securities (excluding any short-term securities, short-term options contracts, and in-kind transactions) was as follows:
Purchases of | Proceeds from Sales | Purchases of Long- | Proceeds from Sales |
$ 3,065,960 | $ 88,015 | $ - | $ - |
7. Subsequent Event
Management has evaluated whether any events or transactions occurred subsequent to June 30, 2016 and through the date of issuance of the Portfolio’s financial statements and determined that there were no material events or transactions that would require recognition or disclosure in the Portfolio’s financial statements.
Clayton Street Trust | 17 |
Protective Life Dynamic Allocation Series - Conservative Portfolio
Additional Information (unaudited)
Proxy Voting Policies and Voting Record
A description of the policies and procedures that the Portfolio uses to determine how to vote proxies relating to its portfolio securities is available without charge: (i) upon request, by calling 1-800-525-0020 (toll free); (ii) on the Portfolio’s website at janus.com/proxyvoting; and (iii) on the SEC’s website at http://www.sec.gov.
Quarterly Portfolio Holdings
The Portfolio files its complete portfolio holdings (schedule of investments) with the SEC for the first and third quarters of each fiscal year on Form N-Q within 60 days of the end of such fiscal quarter. The Portfolio’s Form N-Q: (i) is available on the SEC’s website at http://www.sec.gov; (ii) may be reviewed and copied at the SEC’s Public Reference Room in Washington, D.C. (information on the Public Reference Room may be obtained by calling 1-800-SEC-0330); and (iii) is available without charge, upon request, by calling Janus at 1-800-525-0020 (toll free).
APPROVAL OF ADVISORY AGREEMENTS DURING THE PERIOD
The Trustees of Clayton Street Trust (the “Trust”), the majority of whom serve as “independent” Trustees (the “Independent Trustees”) met on February 3, 2016 to consider the proposed investment advisory agreement (the “Investment Advisory Agreement”) for Protective Life Dynamic Allocation Series – Conservative Portfolio, Protective Life Dynamic Allocation Series – Moderate Portfolio, and Protective Life Dynamic Allocation Series – Growth Portfolio (each a “New Portfolio” and collectively, the “New Portfolios”). In the course of their consideration of the Investment Advisory Agreement, the Trustees met in executive session and were advised by their independent legal counsel. In this regard, the Board, including the Independent Trustees, evaluated the terms of the Investment Advisory Agreement and reviewed the duties and responsibilities of the Trustees in evaluating and approving such agreements. In considering approval of the Investment Advisory Agreement, the Board, including the Independent Trustees, reviewed the Board Materials and other information from counsel and from Janus Capital Management LLC, the investment adviser (the “Adviser”), including: (i) a copy of the form of Investment Advisory Agreement, with respect to the Adviser’s management of the assets of each New Portfolio; (ii) information describing the nature, extent and quality of the services that the Adviser will provide to the New Portfolios, and the fees the Adviser will charge to the New Portfolios; (iii) information concerning the Adviser’s financial condition, business, operations, portfolio management teams and compliance programs; (iv) information describing each New Portfolio’s anticipated advisory fee and operating expenses; (v) a copy of the Adviser’s current Form ADV; and (vi) a memorandum from counsel on the responsibilities of trustees in considering investment advisory arrangements under the 1940 Act. The Board also considered presentations made by, and discussions held with, representatives of the Adviser. The Board also received information comparing the advisory fees and expenses of the New Portfolios to those from fund complexes that were defined as competitors.
During its review of this information, the Board focused on and analyzed the factors that the Board deemed relevant, including: the nature, extent and quality of the services to be provided to each New Portfolio by the Adviser; the Advisers’ personnel and operations; each New Portfolio’s proposed expense level; the anticipated profitability to the Adviser under the Investment Advisory Agreement at certain asset levels; any “fall-out” benefits to the Adviser and its affiliates (i.e., the ancillary benefits realized by the Adviser and its affiliates from the Adviser’s relationship with the Trust); the effect of asset growth on each New Portfolio’s expenses; and possible conflicts of interest.
The Trustees also considered benefits that accrue to the Adviser and its affiliates from their relationships with the New Portfolios. They recognized that two affiliates of the Adviser would separately serve each New Portfolio as transfer agent and distributor, respectively. The Trustees also concluded that, other than the services provided by the Adviser and its affiliates pursuant to the agreements and the fees to be paid by each New Portfolio therefor, the New Portfolios and the Adviser may potentially benefit from their relationship with each other in other ways. They concluded that the success of the New Portfolios could attract other business to the Adviser or other Janus funds, and that the success of the Adviser could enhance the Adviser’s ability to serve the New Portfolios.
The Board, including the Independent Trustees, considered the following in respect of each New Portfolio:
Nature, Extent and Quality of Services.
The Trustees reviewed the nature, extent, and quality of the services to be provided by the Adviser, taking into account the investment objective and strategies of each New Portfolio and the similar types of services currently provided by the Adviser to other funds in the fund complex. In addition, the Trustees reviewed the resources and key personnel of the Adviser that will be providing investment and risk management services to each New Portfolio. The Trustees also considered other services provided to each New Portfolio by the Adviser, such as managing the execution of portfolio
18 | JUNE 30, 2016 |
Protective Life Dynamic Allocation Series - Conservative Portfolio
Additional Information (unaudited)
transactions and the broker selection process. The Trustees considered the Adviser’s role as administrator to each New Portfolio, noting that Janus Capital does not receive a fee for its services but is reimbursed for its out-of-pocket costs. The Trustees considered the role of the Adviser in monitoring adherence to each New Portfolio’s investment restrictions, providing support services for the Trustees and Trustee committees, communicating with shareholders and overseeing the activities of other service providers, including monitoring compliance with various policies and procedures of each New Portfolio and with applicable securities laws and regulations.
The Trustees concluded that the nature, extent, and quality of the services to be provided by the Adviser were appropriate and consistent with the terms of the proposed Investment Advisory Agreement. They also concluded that the Adviser had sufficient personnel, with the appropriate education and experience, to serve each New Portfolio effectively.
Costs of Services Provided.
The Trustees noted the information regarding the proposed fees and expenses of each New Portfolio in comparison to similar information for other comparable funds. With regard to each New Portfolio, the Board noted the following:
The Board noted that the Adviser was recommending a management fee that was lower than each New Portfolio’s respective peer group median, and that each New Portfolio’s total expense ratio was lower than each respective peer group’s median. The Board also noted that the Adviser had agreed to cap certain acquired fund fees and expenses for each New Portfolio.
The Trustees concluded that the proposed annual advisory fee rate to be paid by each New Portfolio was reasonable in relation to the nature, extent and quality of the services to be provided, taking into account the fees charged by other advisers for managing comparable mutual funds with similar strategies, the fees the Adviser charges to other clients, and the expense limitations proposed by the Adviser.
Economies of Scale.
The Trustees considered information about the potential for the Adviser to realize economies of scale as the assets of each New Portfolio increase. The Trustees noted that each New Portfolio is part of the overall Janus funds complex, which means, among other things, that each New Portfolio shares directly in economies of scale through the lower charges of third-party service providers that are based in part on the combined scale of all of the Janus funds.
Other Benefits to Janus Capital.
The Trustees also considered benefits that accrue to the Adviser and its affiliates from their relationship with each New Portfolio. They recognized that two affiliates of Janus Capital will separately serve each New Portfolio as transfer agent and distributor, respectively. The Trustees also concluded that, other than the services provided by the Adviser and its affiliates pursuant to the agreements, and the fees to be paid by each New Portfolio under those agreements, each New Portfolio and the Adviser may potentially benefit from their relationship with each other in other ways. The Trustees concluded that the success of the New Portfolio could attract other business to the Adviser or other Janus funds, and that the success of the Adviser could enhance its ability to serve each New Portfolio.
Conclusion.
No single factor was determinative to the decision of the Board. Based on the foregoing and such other matters as were deemed relevant, the Board concluded that the proposed advisory fee rate and projected total expense ratio are reasonable in relation to the services to be provided by the Adviser to each New Portfolio, as well as the costs to be incurred and benefits to be gained by the Adviser in providing such services. The Board also found the proposed advisory fees to be reasonable in comparison to the fees charged by advisers to other comparable funds of similar actual or anticipated size. As a result, the Board concluded that the initial approval of the proposed Investment Advisory Agreement was in the best interests of each New Portfolio.
After full consideration of the above factors, as well as other factors, the Trustees, including all of the Independent Trustees voting separately, determined to approve the Investment Advisory Agreement for each New Portfolio. The Board also considered and determined that the services provided by the Adviser to the New Portfolios were in addition to, rather than duplicative of, services provided under the advisory contracts of the underlying exchange traded funds in which each New Portfolio intended to invest.
Clayton Street Trust | 19 |
Protective Life Dynamic Allocation Series - Conservative Portfolio
Useful Information About Your Portfolio Report (unaudited)
The Management Commentary in this report includes valuable insight as well as statistical information to help you understand how your Portfolio’s performance and characteristics stack up against those of comparable indices.
If the Portfolio invests in foreign securities, this report may include information about country exposure. Country exposure is based primarily on the country of risk. A company may be allocated to a country based on other factors such as location of the company’s principal office, the location of the principal trading market for the company’s securities, or the country where a majority of the company’s revenues are derived.
Please keep in mind that the opinions expressed in the Management Commentary are just that: opinions. They are a reflection based on best judgment at the time this report was compiled, which was June 30, 2016. As the investing environment changes, so could opinions. These views are unique and are not necessarily shared by fellow employees or by Janus in general.
Performance Overviews
Performance overview graphs compare the performance of a hypothetical $10,000 investment in the Portfolio with one or more widely used market indices. When comparing the performance of the Portfolio with an index, keep in mind that market indices are not available for investment and do not reflect deduction of expenses.
Average annual total returns are quoted for a Portfolio with more than one year of performance history. Average annual total return is calculated by taking the growth or decline in value of an investment over a period of time, including reinvestment of dividends and distributions, then calculating the annual compounded percentage rate that would have produced the same result had the rate of growth been constant throughout the period. Average annual total return does not reflect the deduction of taxes that a shareholder would pay on Portfolio distributions or redemptions of Portfolio shares.
Cumulative total returns are quoted for a Portfolio with less than one year of performance history. Cumulative total return is the growth or decline in value of an investment over time, independent of the period of time involved. Cumulative total return does not reflect the deduction of taxes that a shareholder would pay on Portfolio distributions or redemptions of Portfolio shares.
Pursuant to federal securities rules, expense ratios shown in the performance chart reflect subsidized (if applicable) and unsubsidized ratios. The total annual fund operating expenses ratio is gross of any fee waivers, reflecting the Portfolio’s unsubsidized expense ratio. The net annual fund operating expenses ratio (if applicable) includes contractual waivers of Janus Capital and reflects the Portfolio’s subsidized expense ratio. Ratios may be higher or lower than those shown in the “Financial Highlights” in this report.
Schedule of Investments
Following the performance overview section is the Portfolio’s Schedule of Investments. This schedule reports the types of securities held in the Portfolio on the last day of the reporting period. Securities are usually listed by type (common stock, corporate bonds, U.S. Government obligations, etc.) and by industry classification (banking, communications, insurance, etc.). Holdings are subject to change without notice.
The value of each security is quoted as of the last day of the reporting period. The value of securities denominated in foreign currencies is converted into U.S. dollars.
If the Portfolio invests in foreign securities, it will also provide a summary of investments by country. This summary reports the Portfolio exposure to different countries by providing the percentage of securities invested in each country. The country of each security represents the country of risk. The Portfolio’s Schedule of Investments relies upon the industry group and country classifications published by Barclays and/or MSCI Inc.
Tables listing details of individual forward currency contracts, futures, written options, swaptions, and swaps follow the Portfolio’s Schedule of Investments (if applicable).
Statement of Assets and Liabilities
This statement is often referred to as the “balance sheet.” It lists the assets and liabilities of the Portfolio on the last day of the reporting period.
20 | JUNE 30, 2016 |
Protective Life Dynamic Allocation Series - Conservative Portfolio
Useful Information About Your Portfolio Report (unaudited)
The Portfolio’s assets are calculated by adding the value of the securities owned, the receivable for securities sold but not yet settled, the receivable for dividends declared but not yet received on securities owned, and the receivable for Portfolio shares sold to investors but not yet settled. The Portfolio’s liabilities include payables for securities purchased but not yet settled, Portfolio shares redeemed but not yet paid, and expenses owed but not yet paid. Additionally, there may be other assets and liabilities such as unrealized gain or loss on forward currency contracts.
The section entitled “Net Assets Consist of” breaks down the components of the Portfolio’s net assets. Because the Portfolio must distribute substantially all earnings, you will notice that a significant portion of net assets is shareholder capital.
The last section of this statement reports the net asset value (“NAV”) per share on the last day of the reporting period. The NAV is calculated by dividing the Portfolio’s net assets for each share class (assets minus liabilities) by the number of shares outstanding.
Statement of Operations
This statement details the Portfolio’s income, expenses, realized gains and losses on securities and currency transactions, and changes in unrealized appreciation or depreciation of Portfolio holdings.
The first section in this statement, entitled “Investment Income,” reports the dividends earned from securities and interest earned from interest-bearing securities in the Portfolio.
The next section reports the expenses incurred by the Portfolio, including the advisory fee paid to the investment adviser, transfer agent fees and expenses, and printing and postage for mailing statements, financial reports and prospectuses. Expense offsets and expense reimbursements, if any, are also shown.
The last section lists the amounts of realized gains or losses from investment and foreign currency transactions, and changes in unrealized appreciation or depreciation of investments and foreign currency-denominated assets and liabilities. The Portfolio will realize a gain (or loss) when it sells its position in a particular security. A change in unrealized gain (or loss) refers to the change in net appreciation or depreciation of the Portfolio during the reporting period. “Net Realized and Unrealized Gain/(Loss) on Investments” is affected both by changes in the market value of Portfolio holdings and by gains (or losses) realized during the reporting period.
Statements of Changes in Net Assets
These statements report the increase or decrease in the Portfolio’s net assets during the reporting period. Changes in the Portfolio’s net assets are attributable to investment operations, dividends and distributions to investors, and capital share transactions. This is important to investors because it shows exactly what caused the Portfolio’s net asset size to change during the period.
The first section summarizes the information from the Statement of Operations regarding changes in net assets due to the Portfolio’s investment operations. The Portfolio’s net assets may also change as a result of dividend and capital gains distributions to investors. If investors receive their dividends and/or distributions in cash, money is taken out of the Portfolio to pay the dividend and/or distribution. If investors reinvest their dividends and/or distributions, the Portfolio’s net assets will not be affected. If you compare the Portfolio’s “Net Decrease from Dividends and Distributions” to “Reinvested Dividends and Distributions,” you will notice that dividends and distributions have little effect on the Portfolio’s net assets. This is because the majority of the Portfolio’s investors reinvest their dividends and/or distributions.
The reinvestment of dividends and distributions is included under “Capital Share Transactions.” “Capital Shares” refers to the money investors contribute to the Portfolio through purchases or withdrawals via redemptions. The Portfolio’s net assets will increase and decrease in value as investors purchase and redeem shares from the Portfolio.
Financial Highlights
This schedule provides a per-share breakdown of the components that affect the Portfolio’s NAV for current and past reporting periods as well as total return, asset size, ratios, and portfolio turnover rate.
The first line in the table reflects the NAV per share at the beginning of the reporting period. The next line reports the net investment income/(loss) per share. Following is the per share total of net gains/(losses), realized and unrealized. Per share dividends and distributions to investors are then subtracted to arrive at the NAV per share at the end of the
Clayton Street Trust | 21 |
Protective Life Dynamic Allocation Series - Conservative Portfolio
Useful Information About Your Portfolio Report (unaudited)
period. The next line reflects the total return for the period. Also included are ratios of expenses and net investment income to average net assets.
The Portfolio’s expenses may be reduced through expense offsets and expense reimbursements. The ratios shown reflect expenses before and after any such offsets and reimbursements.
The ratio of net investment income/(loss) summarizes the income earned less expenses, divided by the average net assets of the Portfolio during the reporting period. Do not confuse this ratio with the Portfolio’s yield. The net investment income ratio is not a true measure of the Portfolio’s yield because it does not take into account the dividends distributed to the Portfolio’s investors.
The next figure is the portfolio turnover rate, which measures the buying and selling activity in the Portfolio. Portfolio turnover is affected by market conditions, changes in the asset size of the Portfolio, fluctuating volume of shareholder purchase and redemption orders, the nature of the Portfolio’s investments, and the investment style and/or outlook of the portfolio manager(s) and/or investment personnel. A 100% rate implies that an amount equal to the value of the entire portfolio was replaced once during the fiscal year; a 50% rate means that an amount equal to the value of half the portfolio is traded in a year; and a 200% rate means that an amount equal to the value of the entire portfolio is traded every six months.
22 | JUNE 30, 2016 |
Protective Life Dynamic Allocation Series - Conservative Portfolio
Notes
NotesPage1
Clayton Street Trust | 23 |
Protective Life Dynamic Allocation Series - Conservative Portfolio
Notes
NotesPage2
24 | JUNE 30, 2016 |
Protective Life Dynamic Allocation Series - Conservative Portfolio
Notes
NotesPage3
Clayton Street Trust | 25 |
Please consider the charges, risks, expenses and investment objectives carefully before investing. For a prospectus containing this and other information, please call Janus at 877.33JANUS (52687) or download the file from janus.com/variable-insurance/clayton. Read it carefully before you invest or send money. | ||||||||||||
Janus is a registered trademark of Janus International Holding LLC. © Janus International Holding LLC. Protective and Protective Life are registered service marks of Protective Life Insurance Company Corporation. Protective Life Dynamic Allocation Series Portfolios are distributed by Janus Distributors LLC and exclusively offered in connection with variable annuity contracts issued by Protective Life Insurance Company and its affiliates. Janus is not affiliated with Protective Life. | ||||||||||||
Investment products offered are: | NOT FDIC-INSURED | MAY LOSE VALUE | NO BANK GUARANTEE | |||||||||
C-0816-3435 | 109-24-93063 08-16 | |||||||||||
26 | JUNE 30, 2016 |
SEMIANNUAL REPORT June 30, 2016 | |||
Protective Life Dynamic Allocation Series - Growth Portfolio | |||
Clayton Street Trust | |||
| |||
HIGHLIGHTS · Portfolio management perspective · Investment strategy behind your portfolio · Portfolio performance, characteristics |
Table of Contents
Protective Life Dynamic Allocation Series - Growth Portfolio
Protective Life Dynamic Allocation Series - Growth Portfolio (unaudited)
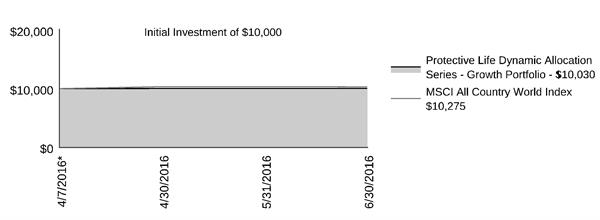
Protective Life Dynamic Allocation Series – Growth Portfolio began investment operations on April 7, 2016. The information provided for Protective Life Dynamic Allocation Series – Growth Portfolio reflects investment activity for the period April 7, 2016 to June 30, 2016.
Asset Allocation - (% of Net Assets) | |||||
Investment Companies | 69.0% | ||||
Repurchase Agreements | 27.8% | ||||
Other | 3.2% | ||||
100.0% | |||||
Clayton Street Trust | 1 |
Protective Life Dynamic Allocation Series - Growth Portfolio (unaudited)
Performance
See important disclosures on the next page. |
| Expense Ratios - per the April 6, 2016 | |||||||||
Cumulative Total Return - for the period ended June 30, 2016 |
|
| prospectus (estimated for the fiscal year) | |||||||
|
| Since |
|
| Total Annual Fund | Net Annual Fund | ||||
Protective Life Dynamic Allocation Series - Growth Portfolio |
| 0.30% |
|
| 1.90% | 0.90% | ||||
MSCI All Country World Index |
|
| 2.75% |
|
|
|
| |||
Expense ratios shown reflect estimated annualized expenses that the Portfolio expects to incur during its initial fiscal year.
Performance for very short time periods may not be indicative of future performance.
A Portfolio’s performance may be affected by risks that include those associated with nondiversification, non-investment grade debt securities, high-yield/high-risk securities, undervalued or overlooked companies, investments in specific industries or countries and potential conflicts of interest. Additional risks to a Portfolio may also include, but are not limited to, those associated with investing in foreign securities, emerging markets, initial public offerings, real estate investment trusts (REITs), derivatives, short sales, commodity-linked investments and companies with relatively small market capitalizations. Each Portfolio has different risks. Please see a Janus prospectus for more information about risks, portfolio holdings and other details.
Performance of the Protective Life Dynamic Allocation Series Portfolios depends on that of the underlying funds. They are subject to risk with respect to the aggregation of holdings of underlying funds which may result in increased volatility as a result of indirectly having concentrated assets in a particular industry, geographical sector, or single company.
No assurance can be given that the Protective Life Dynamic Allocation Series Portfolios’ investment strategy will be successful under all or any market conditions. Janus Capital does not have prior experience using the methodology, a proprietary methodology co-developed by Janus Capital and Protective Life Insurance Company. Although it is designed to achieve the Portfolios’ investment objectives, there is no guarantee that it will achieve the desired results.
These returns do not reflect the charges and expenses of any particular insurance product or qualified plan. Returns shown would have been lower had they included insurance charges.
Returns include reinvestment of all dividends and distributions and do not reflect the deduction of taxes that a shareholder would pay on Portfolio distributions or redemptions of Portfolio shares. The returns do not include adjustments in accordance with generally accepted accounting principles required at the period end for financial reporting purposes.
See Financial Highlights for actual expense ratios during the reporting period.
2 | JUNE 30, 2016 |
Protective Life Dynamic Allocation Series - Growth Portfolio (unaudited)
Performance
Until three years from inception, Janus Capital may recover expenses previously waived or reimbursed if the expense ratio falls below certain limits.
There is no assurance that the investment process will consistently lead to successful investing.
See Notes to Schedule of Investments and Other Information for index definitions.
A Portfolio’s portfolio may differ significantly from the securities held in an index. An index is unmanaged and not available for direct investment; therefore, its performance does not reflect the expenses associated with the active management of an actual portfolio.
See “Useful Information About Your Portfolio Report.”
* The Portfolio’s inception date – April 7, 2016
Clayton Street Trust | 3 |
Protective Life Dynamic Allocation Series - Growth Portfolio (unaudited)
Expense Examples
As a shareholder of the Portfolio, you incur two types of costs: (1) transaction costs and (2) ongoing costs, including management fees; 12b-1 distribution and shareholder servicing fees; transfer agent fees and expenses payable pursuant to the Transfer Agency Agreement; and other Portfolio expenses. This example is intended to help you understand your ongoing costs (in dollars) of investing in the Portfolio and to compare these costs with the ongoing costs of investing in other mutual funds. To do so, compare this 5% hypothetical example with the 5% hypothetical examples that appear in the shareholder reports of the other funds. The example is based upon an investment of $1,000 invested at the beginning of the period and held for the six-months indicated, unless noted otherwise in the table and footnotes below.
Actual Expenses
The information in the table under the heading “Actual” provides information about actual account values and actual expenses. You may use the information in these columns, together with the amount you invested, to estimate the expenses that you paid over the period. Simply divide your account value by $1,000 (for example, an $8,600 account value divided by $1,000 = 8.6), then multiply the result by the number in the appropriate column for your share class under the heading entitled “Expenses Paid During Period” to estimate the expenses you paid on your account during the period.
Hypothetical Example for Comparison Purposes
The information in the table under the heading “Hypothetical (5% return before expenses)” provides information about hypothetical account values and hypothetical expenses based upon the Portfolio’s actual expense ratio and an assumed rate of return of 5% per year before expenses, which is not the Portfolio’s actual return. The hypothetical account values and expenses may not be used to estimate the actual ending account balance or expenses you paid for the period. You may use this information to compare the ongoing costs of investing in the Portfolio and other funds. To do so, compare this 5% hypothetical example with the 5% hypothetical examples that appear in the shareholder reports of the other funds. Additionally, for an analysis of the fees associated with an investment in the Portfolio or other similar funds, please visit www.finra.org/fundanalyzer.
Please note that the expenses shown in the table are meant to highlight your ongoing costs only and do not reflect any transaction costs, such as any charges at the separate account level or contract level. These fees are fully described in the Portfolio’s prospectus. Therefore, the hypothetical examples are useful in comparing ongoing costs only, and will not help you determine the relative total costs of owning different funds. In addition, if these transaction costs were included, your costs would have been higher.
Actual | Hypothetical | ||||||||||||
| Beginning | Ending | Expenses |
| Beginning | Ending | Expenses | Net Annualized | |||||
| $1,000.00 | $1,003.00 | $1.93 |
| $1,000.00 | $1,009.68 | $1.94 | 0.83% | |||||
* | Actual Expenses Paid During Period reflects only the inception period for the Portfolio (April 7, 2016 to June 30, 2016) and is equal to the Net Annualized Expense Ratio multiplied by the average account value over the period, multiplied by 85/366 (to reflect the period). Therefore, actual expenses shown are lower than would be expected for a six-month period. | ||||||||||||
† | Hypothetical Expenses Paid During Period is equal to the Net Annualized Expense Ratio multiplied by the average account value over the period, multiplied by 182/366 (to reflect the one-half year period). Expenses in the examples include the effect of applicable fee waivers and/or expense reimbursements, if any. Had such waivers and/or reimbursements not been in effect, your expenses would have been higher. Please refer to the Notes to Financial Statements or the Portfolio’s prospectus for more information regarding waivers and/or reimbursements. | ||||||||||||
4 | JUNE 30, 2016 |
Protective Life Dynamic Allocation Series - Growth Portfolio
Schedule of Investments (unaudited)
June 30, 2016
Shares or | Value | ||||||
Investment Companies – 69.0% | |||||||
Exchange-Traded Funds (ETFs) – 69.0% | |||||||
iShares MSCI All Country Asia ex Japan | 1,845 | $100,885 | |||||
iShares Russell 2000 | 3,457 | 397,451 | |||||
Powershares QQQ Trust Series 1 | 3,625 | 389,833 | |||||
SPDR S&P 500 Trust | 5,225 | 1,094,793 | |||||
Total Investment Companies (cost $1,974,753) | 1,982,962 | ||||||
Repurchase Agreements(a) – 27.8% | |||||||
Undivided interest of 0.3% in a joint repurchase agreement (principal amount $126,400,000 with a maturity value of $126,401,475) with Credit Agricole, New York, 0.4200%, dated 6/30/16, maturing 7/1/16 to be repurchased at $400,005 collateralized by $124,582,513 in U.S. Treasuries 0.1250% - 3.5000%, 4/15/18 - 1/31/21 with a value of $128,928,074 | $400,000 | 400,000 | |||||
Undivided interest of 0.1% in a joint repurchase agreement (principal amount $300,000,000 with a maturity value of $300,003,583) with Wells Fargo Securities LLC, 0.4300%, dated 6/30/16, maturing 7/1/16 to be repurchased at $400,005 collateralized by $288,813,889 in U.S. Government Agencies 3.0000% - 6.0000%, 2/15/38 - 6/20/46 with a value of $306,003,657 | 400,000 | 400,000 | |||||
Total Repurchase Agreements (cost $800,000) | 800,000 | ||||||
Total Investments (total cost $2,774,753) – 96.8% | 2,782,962 | ||||||
Cash, Receivables and Other Assets, net of Liabilities – 3.2% | 91,678 | ||||||
Net Assets – 100% | $2,874,640 | ||||||
See Notes to Schedule of Investments and Other Information and Notes to Financial Statements. | |
Clayton Street Trust | 5 |
Protective Life Dynamic Allocation Series - Growth Portfolio
Notes to Schedule of Investments and Other Information (unaudited)
MSCI All Country World IndexSM An unmanaged, free float-adjusted market capitalization weighted index composed of stocks of companies located in countries throughout the world. It is designed to measure equity market performance in global developed and emerging markets. The index includes reinvestment of dividends, net of foreign withholding taxes.
LLC | Limited Liability Company |
SPDR | Standard & Poor's Depositary Receipt |
(a) | The Portfolio may have elements of risk due to concentrated investments. Such concentrations may subject the Portfolio to additional risks. |
The following is a summary of the inputs that were used to value the Portfolio’s investments in securities and other financial instruments as of June 30, 2016. See Notes to Financial Statements for more information. | |||
Valuation Inputs Summary | |||
| Level 1 - | Level 2 - | Level 3 - |
Assets | |||
Investments in Securities: | |||
Investment Companies | $1,982,962 | $ - | $- |
Repurchase Agreements | - | 800,000 | - |
Total Assets | $1,982,962 | $800,000 | $- |
6 | JUNE 30, 2016 |
Protective Life Dynamic Allocation Series - Growth Portfolio
Statement of Assets and Liabilities (unaudited)
June 30, 2016
|
|
|
|
|
|
|
Assets: | ||||||
Investments, at cost(1) | $ | 2,774,753 | ||||
Unaffiliated investments, at value | 1,982,962 | |||||
Repurchase agreements, at value | 800,000 | |||||
Cash | 147,548 | |||||
Initial offering costs | 12,796 | |||||
Receivables: | ||||||
Portfolio shares sold | 198,792 | |||||
Investments sold | 63,668 | |||||
Due from adviser | 12,514 | |||||
Dividends | 5,489 | |||||
Total Assets |
|
| 3,223,769 |
| ||
Liabilities: | ||||||
Due to custodian | 100,000 | |||||
Payables: | — | |||||
Investments purchased | 208,858 | |||||
Initial offering costs | 16,666 | |||||
Professional fees | 10,289 | |||||
Portfolio administration fees | 4,361 | |||||
Non-interested Trustees' fees and expenses | 3,476 | |||||
Custodian fees | 1,096 | |||||
Advisory fees | 626 | |||||
12b-1 Distribution and shareholder servicing fees | 391 | |||||
Transfer agent fees and expenses | 156 | |||||
Accrued expenses and other payables | 3,210 | |||||
Total Liabilities |
|
| 349,129 |
| ||
Net Assets |
| $ | 2,874,640 |
| ||
Net Assets Consist of: | ||||||
Capital (par value and paid-in surplus) | $ | 2,869,305 | ||||
Undistributed net investment income/(loss) | 4,316 | |||||
Undistributed net realized gain/(loss) from investments | (7,190) | |||||
Unrealized net appreciation/(depreciation) of investments and non-interested Trustees’ deferred compensation | 8,209 | |||||
Total Net Assets |
| $ | 2,874,640 |
| ||
Net Assets | $ | 2,874,640 | ||||
Shares Outstanding, $0.01 Par Value (unlimited shares authorized) | 286,610 | |||||
Net Asset Value Per Share |
| $ | 10.03 |
| ||
(1) Includes cost of repurchase agreements of $800,000. |
See Notes to Financial Statements. | |
Clayton Street Trust | 7 |
Protective Life Dynamic Allocation Series - Growth Portfolio
Statement of Operations (unaudited)
For the period ended June 30, 2016(1)
|
|
|
|
|
|
Investment Income: | |||||
| Dividends | $ | 5,659 | ||
Interest | 239 | ||||
Total Investment Income |
| 5,898 |
| ||
Expenses: | |||||
Advisory fees | 758 | ||||
12b-1 Distribution and shareholder servicing fees | 474 | ||||
Transfer agent administrative fees and expenses | 190 | ||||
Other transfer agent fees and expenses | 59 | ||||
Insurance Expense | 17,426 | ||||
Portfolio administration fees | 12,355 | ||||
Professional fees | 10,290 | ||||
Initial organization and offering costs | 5,121 | ||||
Non-interested Trustees’ fees and expenses | 3,476 | ||||
Accounting systems fee | 2,787 | ||||
Custodian fees | 1,204 | ||||
Shareholder reports expense | 429 | ||||
Total Expenses |
| 54,569 |
| ||
Less: Excess Expense Reimbursement |
| (52,987) |
| ||
Net Expenses |
| 1,582 |
| ||
Net Investment Income/(Loss) |
| 4,316 |
| ||
Net Realized Gain/(Loss) on Investments: | |||||
Investments | (7,190) | ||||
Total Net Realized Gain/(Loss) on Investments |
| (7,190) |
| ||
Change in Unrealized Net Appreciation/Depreciation: | |||||
Investments and non-interested Trustees’ deferred compensation | 8,209 | ||||
Total Change in Unrealized Net Appreciation/Depreciation |
| 8,209 |
| ||
Net Increase/(Decrease) in Net Assets Resulting from Operations | $ | 5,335 |
| ||
(1) Period from April 7, 2016 (inception date) through June 30, 2016. |
See Notes to Financial Statements. | |
8 | JUNE 30, 2016 |
Protective Life Dynamic Allocation Series - Growth Portfolio
Statement of Changes in Net Assets
|
|
| Period ended |
| ||
Operations: | ||||||
Net investment income/(loss) | $ | 4,316 | ||||
Net realized gain/(loss) on investments | (7,190) | |||||
Change in unrealized net appreciation/depreciation | 8,209 | |||||
Net Increase/(Decrease) in Net Assets Resulting from Operations |
| 5,335 |
| |||
Capital Shares Transactions | 2,869,305 | |||||
Net Increase/(Decrease) in Net Assets |
| 2,874,640 |
| |||
Net Assets: | ||||||
Beginning of period | — | |||||
| End of period | $ | 2,874,640 |
| ||
Undistributed Net Investment Income/(Loss) | $ | 4,316 |
| |||
(1) Period from April 7, 2016 (inception date) through June 30, 2016. |
See Notes to Financial Statements. | |
Clayton Street Trust | 9 |
Protective Life Dynamic Allocation Series - Growth Portfolio
Financial Highlights
For a share outstanding during the period ended June 30 (unaudited) |
| 2016(1) |
| |||
Net Asset Value, Beginning of Period |
| $10.00 |
| |||
Income/(Loss) from Investment Operations: | ||||||
Net investment income/(loss)(2) | 0.05 | |||||
Net realized and unrealized gain/(loss) | (0.02) | |||||
Total from Investment Operations |
| 0.03 |
| |||
Less Dividends and Distributions: | ||||||
Dividends (from net investment income) | — | |||||
Distributions (from capital gains) | — | |||||
Total Dividends and Distributions |
| — |
| |||
Net Asset Value, End of Period | $10.03 | |||||
Total Return* |
| 0.30% |
| |||
Net Assets, End of Period (in thousands) | $2,875 | |||||
Average Net Assets for the Period (in thousands) | $816 | |||||
Ratios to Average Net Assets**: |
|
|
| |||
Ratio of Gross Expenses | 28.79% | |||||
Ratio of Net Expenses (After Waivers and Expense Offsets) | 0.83% | |||||
Ratio of Net Investment Income/(Loss) | 2.28% | |||||
Portfolio Turnover Rate | 22% | |||||
* Total return not annualized for periods of less than one full year. ** Annualized for periods of less than one full year. (1) Period from April 7, 2016 (inception date) through June 30, 2016. (2) Per share amounts are calculated based on average shares outstanding during the year or period. |
See Notes to Financial Statements. | |
10 | JUNE 30, 2016 |
Protective Life Dynamic Allocation Series - Growth Portfolio
Notes to Financial Statements (unaudited)
1. Organization and Significant Accounting Policies
Protective Life Dynamic Allocation Series - Growth Portfolio (the “Portfolio”) is a series fund. The Portfolio operates as a “fund of funds,” meaning substantially all of the Portfolio’s assets will be invested in exchange-traded funds (the “underlying funds”). The Portfolio is part of Clayton Street Trust (the “Trust”), which is organized as a Delaware statutory trust and is registered under the Investment Company Act of 1940, as amended (the “1940 Act”), as an open-end management investment company, and therefore has applied the specialized accounting and reporting guidance in Financial Accounting Standards Board (“FASB”) Accounting Standards Codification (“ASC”) Topic 946. The Trust offers three Portfolios with differing investment objectives and policies. The Portfolio seeks total return through growth of capital, balanced by capital preservation. The Portfolio is classified as nondiversified, as defined in the 1940 Act.
The Portfolio currently offers one class of shares. The shares are offered in connection with investment in and payments under variable annuity contracts issued exclusively by Protective Life Insurance Company and its affiliates ("Protective Life").
Underlying Funds
The Portfolio invests in a dynamic portfolio of exchange-traded funds across seven different equity asset classes and a cash allocation, including money market instruments. The equity asset classes are adjusted weekly based on market conditions pursuant to a proprietary, quantitative-based allocation program. Over the long term, and when fully invested, the Portfolio seeks to maintain an asset allocation of approximately100% global equity investments . Additional details and descriptions of the investment objectives and strategies of each of the potential underlying funds are available in the Portfolio's prospectus.
The following accounting policies have been followed by the Portfolio and are in conformity with accounting principles generally accepted in the United States of America.
Investment Valuation
Securities held by the Portfolio, including the underlying funds, are valued in accordance with policies and procedures established by and under the supervision of the Trustees (the “Valuation Procedures”). The values of the Portfolio's investments in the underlying funds are based upon the closing price of such underlying funds on the applicable exchange. Most debt securities are valued in accordance with the evaluated bid price supplied by the pricing service that is intended to reflect market value. The evaluated bid price supplied by the pricing service is an evaluation that may consider factors such as security prices, yields, maturities, and ratings. Certain short-term securities maturing within 60 days or less may be evaluated and valued on an amortized cost basis provided that the amortized cost determined approximates market value. Securities for which market quotations or evaluated prices are not readily available or are deemed unreliable are valued at fair value determined in good faith under the Valuation Procedures. Circumstances in which fair value pricing may be utilized include, but are not limited to: (i) a significant event that may affect the securities of a single issuer, such as a merger, bankruptcy, or significant issuer-specific development; (ii) an event that may affect an entire market, such as a natural disaster or significant governmental action; (iii) a nonsignificant event such as a market closing early or not opening, or a security trading halt; and (iv) pricing of a nonvalued security and a restricted or nonpublic security. Special valuation considerations may apply with respect to “odd-lot” fixed-income transactions which, due to their small size, may receive evaluated prices by pricing services which reflect a large block trade and not what actually could be obtained for the odd-lot position.
Valuation Inputs Summary
FASB ASC 820, Fair Value Measurements and Disclosures (“ASC 820”), defines fair value, establishes a framework for measuring fair value, and expands disclosure requirements regarding fair value measurements. This standard emphasizes that fair value is a market-based measurement that should be determined based on the assumptions that market participants would use in pricing an asset or liability and establishes a hierarchy that prioritizes inputs to valuation techniques used to measure fair value. These inputs are summarized into three broad levels:
Level 1 – Unadjusted quoted prices in active markets the Portfolio has the ability to access for identical assets or liabilities.
The Portfolio classifies each of its investments in underlying funds as Level 1, without consideration as to the classification level of the specific investments held by the underlying funds.
Clayton Street Trust | 11 |
Protective Life Dynamic Allocation Series - Growth Portfolio
Notes to Financial Statements (unaudited)
Level 2 – Observable inputs other than unadjusted quoted prices included in Level 1 that are observable for the asset or liability either directly or indirectly. These inputs may include quoted prices for the identical instrument on an inactive market, prices for similar instruments, interest rates, prepayment speeds, credit risk, yield curves, default rates and similar data.
Assets or liabilities categorized as Level 2 in the hierarchy generally include: debt securities fair valued in accordance with the evaluated bid or ask prices supplied by a pricing service; securities traded on OTC markets and listed securities for which no sales are reported that are fair valued at the latest bid price (or yield equivalent thereof) obtained from one or more dealers transacting in a market for such securities or by a pricing service approved by the Portfolio’s Trustees; and certain short-term debt securities with maturities of 60 days or less that are fair valued at amortized cost. Other securities that may be categorized as Level 2 in the hierarchy include, but are not limited to, preferred stocks, bank loans, swaps, investments in unregistered investment companies, options, and forward contracts.
Level 3 – Unobservable inputs for the asset or liability to the extent that relevant observable inputs are not available, representing the Portfolio’s own assumptions about the assumptions that a market participant would use in valuing the asset or liability, and that would be based on the best information available.
There have been no significant changes in valuation techniques used in valuing any such positions held by the Portfolio since the beginning of the fiscal year.
The inputs or methodology used for fair valuing securities are not necessarily an indication of the risk associated with investing in those securities. The summary of inputs used as of June 30, 2016 to fair value the Portfolio’s investments in securities and other financial instruments is included in the “Valuation Inputs Summary” in the Notes to Schedule of Investments and Other Information.
There were no transfers between Level 1, Level 2 and Level 3 of the fair value hierarchy during the period. The Portfolio recognizes transfers between the levels as of the beginning of the fiscal year.
Initial Organization and Offering Costs
Organization costs paid in connection with the organization of the Portfolio are expensed at the time the Portfolio commences operations or as incurred thereafter. Offering costs paid in connection with the initial offering of shares are amortized using a straight-line basis over the first 12 months from the time the Portfolio commences. Amortized offering cost amounts and organization costs expensed are shown as “Initial organization and offering costs” on the Statement of Operations. Amounts remaining to be amortized are shown as “Initial offering costs” in the asset section of the Statement of Assets and Liabilities.
Investment Transactions and Investment Income
Investment transactions are accounted for as of the date purchased or sold (trade date). Dividend income is recorded on the ex dividend date. Any distributions from the underlying funds are recorded in accordance with the character of the distributions as designated by the underlying funds. Gains and losses are determined on the identified cost basis, which is the same basis used for federal income tax purposes.
Expenses
The Portfolio bears expenses incurred specifically on its behalf. Additionally, the Portfolio, as a shareholder in the underlying funds, will also indirectly bear its pro rata share of the expenses incurred by the underlying funds.
Estimates
The preparation of financial statements in conformity with accounting principles generally accepted in the United States of America requires management to make estimates and assumptions that affect the reported amount of assets and liabilities and disclosure of contingent assets and liabilities at the date of the financial statements, and the reported amounts of income and expenses during the reporting period. Actual results could differ from those estimates.
Indemnifications
In the normal course of business, the Portfolio may enter into contracts that contain provisions for indemnification of other parties against certain potential liabilities. The Portfolio’s maximum exposure under these arrangements is unknown, and would involve future claims that may be made against the Portfolio that have not yet occurred. Currently, the risk of material loss from such claims is considered remote.
12 | JUNE 30, 2016 |
Protective Life Dynamic Allocation Series - Growth Portfolio
Notes to Financial Statements (unaudited)
Dividends and Distributions
The Portfolio may make semiannual distributions of substantially all of its investment income and an annual distribution of its net realized capital gains (if any).
Federal Income Taxes
The Portfolio intends to continue to qualify as a regulated investment company and distribute all of its taxable income in accordance with the requirements of Subchapter M of the Internal Revenue Code. Management has analyzed the Portfolio’s tax positions taken for all open federal income tax years, generally a three-year period, and has concluded that no provision for federal income tax is required in the Portfolio’s financial statements. The Portfolio is not aware of any tax positions for which it is reasonably possible that the total amounts of unrecognized tax benefits will significantly change in the next twelve months.
2. Other Investments and Strategies
Additional Investment Risk
The financial crisis in both the U.S. and global economies over the past several years has resulted, and may continue to result, in a significant decline in the value and liquidity of many securities of issuers worldwide in the equity and fixed-income/credit markets. In response to the crisis, the United States and certain foreign governments, along with the U.S. Federal Reserve and certain foreign central banks, took steps to support the financial markets. The withdrawal of this support, a failure of measures put in place to respond to the crisis, or investor perception that such efforts were not sufficient could each negatively affect financial markets generally, and the value and liquidity of specific securities. In addition, policy and legislative changes in the United States and in other countries continue to impact many aspects of financial regulation. The effect of these changes on the markets, and the practical implications for market participants, including the underlying funds, may not be fully known for some time. As a result, it may also be unusually difficult to identify both investment risks and opportunities, which could limit or preclude the underlying funds’s ability to achieve its investment objective. Therefore, it is important to understand that the value of your investment may fall, sometimes sharply, and you could lose money.
The enactment of the Dodd-Frank Wall Street Reform and Consumer Protection Act (the “Dodd-Frank Act”) provided for widespread regulation of financial institutions, consumer financial products and services, broker-dealers, OTC derivatives, investment advisers, credit rating agencies, and mortgage lending, which expanded federal oversight in the financial sector, including the investment management industry. Many provisions of the Dodd-Frank Act remain pending and will be implemented through future rulemaking. Therefore, the ultimate impact of the Dodd-Frank Act and the regulations under the Dodd-Frank Act on the underlying funds and the investment management industry as a whole, is not yet certain.
A number of countries in the European Union (“EU”) have experienced, and may continue to experience, severe economic and financial difficulties. In particular, many EU nations are susceptible to economic risks associated with high levels of debt, notably due to investments in sovereign debt of countries such as Greece, Italy, Spain, Portugal, and Ireland. Many non-governmental issuers, and even certain governments, have defaulted on, or been forced to restructure, their debts. Many other issuers have faced difficulties obtaining credit or refinancing existing obligations. Financial institutions have in many cases required government or central bank support, have needed to raise capital, and/or have been impaired in their ability to extend credit. As a result, financial markets in the EU experienced extreme volatility and declines in asset values and liquidity. Responses to these financial problems by European governments, central banks, and others, including austerity measures and reforms, may not work, may result in social unrest, and may limit future growth and economic recovery or have other unintended consequences. Further defaults or restructurings by governments and others of their debt could have additional adverse effects on economies, financial markets, and asset valuations around the world. Greece, Ireland, and Portugal have already received one or more "bailouts" from other Eurozone member states, and it is unclear how much additional funding they will require or if additional Eurozone member states will require bailouts in the future. The risk of investing in securities in the European markets may also be heightened due to the referendum in which the United Kingdom voted to exit the EU (known as “Brexit”). One or more other countries may also abandon the euro and/or withdraw from the EU, placing its currency and banking system in jeopardy.
Certain areas of the world have historically been prone to and economically sensitive to environmental events such as, but not limited to, hurricanes, earthquakes, typhoons, flooding, tidal waves, tsunamis, erupting volcanoes, wildfires or droughts, tornadoes, mudslides, or other weather-related phenomena. Such disasters, and the resulting physical or
Clayton Street Trust | 13 |
Protective Life Dynamic Allocation Series - Growth Portfolio
Notes to Financial Statements (unaudited)
economic damage, could have a severe and negative impact on the Portfolio’s or an underlying fund's investment portfolio and, in the longer term, could impair the ability of issuers in which the Portfolio or an underlying fund invests to conduct their businesses as they would under normal conditions. Adverse weather conditions may also have a particularly significant negative effect on issuers in the agricultural sector and on insurance companies that insure against the impact of natural disasters.
Counterparties
Portfolio transactions involving a counterparty are subject to the risk that the counterparty or a third party will not fulfill its obligation to the Portfolio (“counterparty risk”). Counterparty risk may arise because of the counterparty’s financial condition (i.e., financial difficulties, bankruptcy, or insolvency), market activities and developments, or other reasons, whether foreseen or not. A counterparty’s inability to fulfill its obligation may result in significant financial loss to the Portfolio. The Portfolio may be unable to recover its investment from the counterparty or may obtain a limited recovery, and/or recovery may be delayed. The extent of the Portfolio’s exposure to counterparty risk with respect to financial assets and liabilities approximates its carrying value. See the "Offsetting Assets and Liabilities" section of this Note for further details.
The Portfolio may be exposed to counterparty risk through its investments in certain securities, including, but not limited to, repurchase agreements and debt securities. The Portfolio intends to enter into financial transactions with counterparties that Janus Capital believes to be creditworthy at the time of the transaction. There is always the risk that Janus Capital’s analysis of a counterparty’s creditworthiness is incorrect or may change due to market conditions. To the extent that the Portfolio focuses its transactions with a limited number of counterparties, it will have greater exposure to the risks associated with one or more counterparties.
Exchange-Traded Funds
ETFs are typically open-end investment companies, which may be actively managed or passively managed, that generally seek to track the performance of a specific index. ETFs are traded on a national securities exchange at market prices that may vary from the NAV of their underlying investments. Accordingly, there may be times when an ETF trades at a premium or discount. As a result, the Portfolio may pay more or less than NAV when it buys ETF shares, and may receive more or less than NAV when it sells those shares. ETFs also involve the risk that an active trading market for an ETF’s shares may not develop or be maintained. Similarly, because the value of ETF shares depends on the demand in the market, the Portfolio may not be able to purchase or sell an ETF at the most optimal time, which could adversely affect the Portfolio’s performance. In addition, ETFs that track particular indices may be unable to match the performance of such underlying indices due to the temporary unavailability of certain index securities in the secondary market or other factors, such as discrepancies with respect to the weighting of securities.
Offsetting Assets and Liabilities
The Portfolio presents gross and net information about transactions that are either offset in the financial statements or subject to an enforceable master netting arrangement or similar agreement with a designated counterparty, regardless of whether the transactions are actually offset in the Statement of Assets and Liabilities.
All repurchase agreements are transacted under legally enforceable master repurchase agreements that give the Portfolio, in the event of default by the counterparty, the right to liquidate securities held and to offset receivables and payables with the counterparty. For financial reporting purposes, the Portfolio does not offset financial instruments' payables and receivables and related collateral on the Statement of Assets and Liabilities. Repurchase agreements held by the Portfolio are fully collateralized, and such collateral is in the possession of the Portfolio’s custodian or, for tri-party agreements, the custodian designated by the agreement. The collateral is evaluated daily to ensure its market value exceeds the current market value of the repurchase agreements, including accrued interest.
The following table presents gross amounts of recognized assets and/or liabilities and the net amounts after deducting collateral that has been pledged by counterparties or has been pledged to counterparties (if applicable). For corresponding information grouped by type of instrument, see the Portfolio's Schedule of Investments.
14 | JUNE 30, 2016 |
Protective Life Dynamic Allocation Series - Growth Portfolio
Notes to Financial Statements (unaudited)
Offsetting of Financial Assets and Derivative Assets | |||||||||
Gross Amounts | |||||||||
of Recognized | Offsetting Asset | Collateral | |||||||
Counterparty | Assets | or Liability(a) | Pledged(b) | Net Amount | |||||
Credit Agricole, New York | $ | 400,000 | $ | — | $ | (400,000) | $ | — | |
Wells Fargo Securities LLC | 400,000 | — | (400,000) | — | |||||
Total | $ | 800,000 | $ | — | $ | (800,000) | $ | — | |
(a) | Represents the amount of assets or liabilities that could be offset with the same counterparty under master netting or similar agreements that management elects not to offset on the Statement of Assets and Liabilities. | ||||||||
(b) | Collateral pledged is limited to the net outstanding amount due to/from an individual counterparty. The actual collateral amounts pledged may exceed these amounts and may fluctuate in value. | ||||||||
Repurchase Agreements
The Portfolio and other funds advised by Janus Capital or its affiliates may transfer daily uninvested cash balances into one or more joint trading accounts. Assets in the joint trading accounts are invested in money market instruments and the proceeds are allocated to the participating funds on a pro rata basis.
Repurchase agreements held by the Portfolio are fully collateralized, and such collateral is in the possession of the Portfolio’s custodian or, for tri-party agreements, the custodian designated by the agreement. The collateral is evaluated daily to ensure its market value exceeds the current market value of the repurchase agreements, including accrued interest. In the event of default on the obligation to repurchase, the Portfolio has the right to liquidate the collateral and apply the proceeds in satisfaction of the obligation. In the event of default or bankruptcy by the other party to the agreement, realization and/or retention of the collateral or proceeds may be subject to legal proceedings.
3. Investment Advisory Agreements and Other Transactions with Affiliates
The Portfolio pays Janus Capital an investment advisory fee which is calculated daily and paid monthly. The Portfolio’s contractual investment advisory fee rate (expressed as an annual rate) is 0.40% of its average daily net assets.
Janus Capital has contractually agreed to waive the advisory fee payable by the Portfolio or reimburse expenses in an amount equal to the amount, if any, that the Portfolio’s normal operating expenses in any fiscal year, including the investment advisory fee, but excluding the 12b-1 distribution and shareholder servicing fees, administrative services fees payable pursuant to the Transfer Agency Agreement, brokerage commissions, interest, dividends, taxes and extraordinary expenses, exceed the annual rate of 0.55% of the Portfolio’s average daily net assets. Janus Capital has agreed to continue the waiver until at least May 1, 2018. If applicable, amounts reimbursed to the Portfolio by Janus Capital are disclosed as “Excess Expense Reimbursement” on the Statement of Operations.
Janus Capital may recover from the Portfolio fees and expenses previously waived or reimbursed during the period beginning with the Portfolio’s commencement of operations and expiring on the third anniversary of the commencement of operations, which could then be considered a deferral. Janus Capital may elect to recoup such amounts only if: (i) recoupment is obtained within three years from the date an amount is waived or reimbursed to the Portfolio, and (ii) the Portfolio’s expense ratio at the time of recoupment, inclusive of the recoupment amounts, does not exceed the expense limit at the time of waiver or at the time of recoupment. If applicable, this amount is disclosed as “Recoupment expense” on the Statement of Operations. During the period ended June 30, 2016, Janus Capital reimbursed the Portfolio $52,987 of fees and expenses that are eligible for recoupment. As of June 30, 2016, the aggregate amount of recoupment that may potentially be made to Janus Capital is $52,987. The recoupment of such reimbursements expires April 7, 2019.
Janus Services LLC (“Janus Services”), a wholly-owned subsidiary of Janus Capital, is the Portfolio’s transfer agent. In addition, Janus Services provides or arranges for the provision of certain other administrative services including, but not limited to, recordkeeping, accounting, order processing, and other shareholder services for the Portfolio. These amounts are disclosed as “Other transfer agent fees and expenses” on the Statement of Operations.
Janus Services receives an administrative services fee at an annual rate of 0.10% of the Portfolio’s average daily net assets for providing, or arranging for the provision by Protective Life of administrative services, including recordkeeping, subaccounting, order processing, or other shareholder services provided on behalf of shareholders of the Portfolio.
Clayton Street Trust | 15 |
Protective Life Dynamic Allocation Series - Growth Portfolio
Notes to Financial Statements (unaudited)
Janus Services expects to use this entire fee to compensate Protective Life for providing these services to its customers who invest in the Portfolio. These amounts are disclosed as “Transfer agent administrative fees and expenses” on the Statement of Operations.
Services provided by Protective Life may include, but are not limited to, recordkeeping, subaccounting, order processing, providing order confirmations, periodic statements, forwarding prospectuses, shareholder reports, and other materials to existing contract holders, answering inquiries regarding accounts, and other administrative services. Order processing includes the submission of transactions through the National Securities Clearing Corporation (“NSCC”) or similar systems, or those processed on a manual basis with Janus Capital.
Under a distribution and shareholder servicing plan (the “Plan”) adopted in accordance with Rule 12b-1 under the 1940 Act, the Portfolio may pay the Trust’s distributor, Janus Distributors LLC (“Janus Distributors”), a wholly-owned subsidiary of Janus Capital, a fee at an annual rate of up to 0.25% of the average daily net assets of the Portfolio. Under the terms of the Plan, the Trust is authorized to make payments to Janus Distributors for remittance to Protective Life or other intermediaries as compensation for distribution and/or shareholder services performed by Protective Life or its agents, or by such intermediary. These amounts are disclosed as “12b-1 Distribution and shareholder servicing fees” on the Statement of Operations. Payments under the Plan are not tied exclusively to actual 12b-1 distribution and servicing fees, and the payments may exceed 12b-1 distribution and servicing fees actually incurred. If any of the Portfolio’s actual 12b-1 distribution and servicing fees incurred during a calendar year are less than the payments made during a calendar year, the Portfolio will be refunded the difference. Refunds, if any, are included in “12b-1 Distribution fees and shareholder servicing fees” in the Statement of Operations.
Janus Capital furnishes certain administration, compliance, and accounting services for the Portfolio and is reimbursed by the Portfolio for certain of its costs in providing those services (to the extent Janus Capital seeks reimbursement and such costs are not otherwise waived). In addition, employees of Janus Capital and/or its affiliates may serve as officers of the Trust. The Portfolio also pays for salaries, fees, and expenses of certain Janus Capital employees and Portfolio officers, with respect to certain specified administration functions they perform on behalf of the Portfolio. The Portfolio pays these costs based on out-of-pocket expenses incurred by Janus Capital, and these costs are separate and apart from advisory fees and other expenses paid in connection with the investment advisory services Janus Capital provides to the Portfolio. These amounts are disclosed as “Portfolio administration fees” on the Statement of Operations. Some expenses related to compensation payable to the Portfolio's Chief Compliance Officer and compliance staff are shared with the Portfolio. Total compensation of $3 was paid to the Chief Compliance Officer and certain compliance staff by the Trust during the period ended June 30, 2016. The Portfolio's portion is reported as part of “Other expenses” on the Statement of Operations.
The Portfolio is permitted to purchase or sell securities (“cross-trade”) between itself and other funds or accounts managed by Janus Capital Management LLC in accordance with Rule 17a-7 under the Investment Company Act of 1940 (“Rule 17a-7”), when the transaction is consistent with the investment objectives and policies of the Portfolio and in accordance with the Internal Cross Trade Procedures adopted by the Trust’s Board of Trustees. These procedures have been designed to ensure that any cross-trade of securities by the Portfolio from or to another fund or account that is or could be considered an affiliate of the Portfolio under certain limited circumstances by virtue of having a common investment adviser, common Officer, or common Trustee complies with Rule 17a-7. Under these procedures, each cross-trade is effected at the current market price to save costs where allowed. During the period ended June 30, 2016, the Portfolio engaged in cross trades amounting to $82,572 in purchases and $677 in sales, resulting in a net realized gain/loss of $0. The net realized gain/loss is included in “Investments and foreign currency transactions” within the “Net Realized and Unrealized Gain/(Loss) on Investments” section of the Portfolio’s Statement of Operations.
4. Federal Income Tax
Income and capital gains distributions are determined in accordance with income tax regulations that may differ from accounting principles generally accepted in the United States of America. These differences are due to differing treatments for items such as net short-term gains, deferral of wash sale losses, foreign currency transactions, net investment losses, and capital loss carryovers.
The aggregate cost of investments and the composition of unrealized appreciation and depreciation of investment securities for federal income tax purposes as of June 30, 2016 are noted below.
16 | JUNE 30, 2016 |
Protective Life Dynamic Allocation Series - Growth Portfolio
Notes to Financial Statements (unaudited)
Unrealized appreciation and unrealized depreciation in the table below exclude appreciation/depreciation on foreign currency translations. The primary difference between book and tax appreciation or depreciation of investments is wash sale loss deferrals.
Federal Tax Cost | Unrealized | Unrealized | Net Tax Appreciation/ |
$ 2,775,011 | $ 10,329 | $ (2,378) | $ 7,951 |
5. Capital Share Transactions
Period ended June 30, 2016(1) | |||
Shares | Amount | ||
Shares sold | 286,610 | $2,869,305 | |
Reinvested dividends and distributions | - | - | |
Shares repurchased | - | - | |
Net Increase/(Decrease) | 286,610 | $2,869,305 | |
(1) | Period from April 7, 2016 (inception date) through June 30, 2016. | ||
6. Purchases and Sales of Investment Securities
For the period ended June 30, 2016, the aggregate cost of purchases and proceeds from sales of investment securities (excluding any short-term securities, short-term options contracts, and in-kind transactions) was as follows:
Purchases of | Proceeds from Sales | Purchases of Long- | Proceeds from Sales |
$ 2,132,519 | $ 150,575 | $ - | $ - |
7. Subsequent Event
Management has evaluated whether any events or transactions occurred subsequent to June 30, 2016 and through the date of issuance of the Portfolio’s financial statements and determined that there were no material events or transactions that would require recognition or disclosure in the Portfolio’s financial statements.
Clayton Street Trust | 17 |
Protective Life Dynamic Allocation Series - Growth Portfolio
Additional Information (unaudited)
Proxy Voting Policies and Voting Record
A description of the policies and procedures that the Portfolio uses to determine how to vote proxies relating to its portfolio securities is available without charge: (i) upon request, by calling 1-800-525-0020 (toll free); (ii) on the Portfolio’s website at janus.com/proxyvoting; and (iii) on the SEC’s website at http://www.sec.gov.
Quarterly Portfolio Holdings
The Portfolio files its complete portfolio holdings (schedule of investments) with the SEC for the first and third quarters of each fiscal year on Form N-Q within 60 days of the end of such fiscal quarter. The Portfolio’s Form N-Q: (i) is available on the SEC’s website at http://www.sec.gov; (ii) may be reviewed and copied at the SEC’s Public Reference Room in Washington, D.C. (information on the Public Reference Room may be obtained by calling 1-800-SEC-0330); and (iii) is available without charge, upon request, by calling Janus at 1-800-525-0020 (toll free).
APPROVAL OF ADVISORY AGREEMENTS DURING THE PERIOD
The Trustees of Clayton Street Trust (the “Trust”), the majority of whom serve as “independent” Trustees (the “Independent Trustees”) met on February 3, 2016 to consider the proposed investment advisory agreement (the “Investment Advisory Agreement”) for Protective Life Dynamic Allocation Series – Conservative Portfolio, Protective Life Dynamic Allocation Series – Moderate Portfolio, and Protective Life Dynamic Allocation Series – Growth Portfolio (each a “New Portfolio” and collectively, the “New Portfolios”). In the course of their consideration of the Investment Advisory Agreement, the Trustees met in executive session and were advised by their independent legal counsel. In this regard, the Board, including the Independent Trustees, evaluated the terms of the Investment Advisory Agreement and reviewed the duties and responsibilities of the Trustees in evaluating and approving such agreements. In considering approval of the Investment Advisory Agreement, the Board, including the Independent Trustees, reviewed the Board Materials and other information from counsel and from Janus Capital Management LLC, the investment adviser (the “Adviser”), including: (i) a copy of the form of Investment Advisory Agreement, with respect to the Adviser’s management of the assets of each New Portfolio; (ii) information describing the nature, extent and quality of the services that the Adviser will provide to the New Portfolios, and the fees the Adviser will charge to the New Portfolios; (iii) information concerning the Adviser’s financial condition, business, operations, portfolio management teams and compliance programs; (iv) information describing each New Portfolio’s anticipated advisory fee and operating expenses; (v) a copy of the Adviser’s current Form ADV; and (vi) a memorandum from counsel on the responsibilities of trustees in considering investment advisory arrangements under the 1940 Act. The Board also considered presentations made by, and discussions held with, representatives of the Adviser. The Board also received information comparing the advisory fees and expenses of the New Portfolios to those from fund complexes that were defined as competitors.
During its review of this information, the Board focused on and analyzed the factors that the Board deemed relevant, including: the nature, extent and quality of the services to be provided to each New Portfolio by the Adviser; the Advisers’ personnel and operations; each New Portfolio’s proposed expense level; the anticipated profitability to the Adviser under the Investment Advisory Agreement at certain asset levels; any “fall-out” benefits to the Adviser and its affiliates (i.e., the ancillary benefits realized by the Adviser and its affiliates from the Adviser’s relationship with the Trust); the effect of asset growth on each New Portfolio’s expenses; and possible conflicts of interest.
The Trustees also considered benefits that accrue to the Adviser and its affiliates from their relationships with the New Portfolios. They recognized that two affiliates of the Adviser would separately serve each New Portfolio as transfer agent and distributor, respectively. The Trustees also concluded that, other than the services provided by the Adviser and its affiliates pursuant to the agreements and the fees to be paid by each New Portfolio therefor, the New Portfolios and the Adviser may potentially benefit from their relationship with each other in other ways. They concluded that the success of the New Portfolios could attract other business to the Adviser or other Janus funds, and that the success of the Adviser could enhance the Adviser’s ability to serve the New Portfolios.
The Board, including the Independent Trustees, considered the following in respect of each New Portfolio:
Nature, Extent and Quality of Services
The Trustees reviewed the nature, extent, and quality of the services to be provided by the Adviser, taking into account the investment objective and strategies of each New Portfolio and the similar types of services currently provided by the Adviser to other funds in the fund complex. In addition, the Trustees reviewed the resources and key personnel of the Adviser that will be providing investment and risk management services to each New Portfolio. The Trustees also considered other services provided to each New Portfolio by the Adviser, such as managing the execution of portfolio
18 | JUNE 30, 2016 |
Protective Life Dynamic Allocation Series - Growth Portfolio
Additional Information (unaudited)
transactions and the broker selection process. The Trustees considered the Adviser’s role as administrator to each New Portfolio, noting that Janus Capital does not receive a fee for its services but is reimbursed for its out-of-pocket costs. The Trustees considered the role of the Adviser in monitoring adherence to each New Portfolio’s investment restrictions, providing support services for the Trustees and Trustee committees, communicating with shareholders and overseeing the activities of other service providers, including monitoring compliance with various policies and procedures of each New Portfolio and with applicable securities laws and regulations.
The Trustees concluded that the nature, extent, and quality of the services to be provided by the Adviser were appropriate and consistent with the terms of the proposed Investment Advisory Agreement. They also concluded that the Adviser had sufficient personnel, with the appropriate education and experience, to serve each New Portfolio effectively.
Costs of Services Provided
The Trustees noted the information regarding the proposed fees and expenses of each New Portfolio in comparison to similar information for other comparable funds. With regard to each New Portfolio, the Board noted the following:
The Board noted that the Adviser was recommending a management fee that was lower than each New Portfolio’s respective peer group median, and that each New Portfolio’s total expense ratio was lower than each respective peer group’s median. The Board also noted that the Adviser had agreed to cap certain acquired fund fees and expenses for each New Portfolio.
The Trustees concluded that the proposed annual advisory fee rate to be paid by each New Portfolio was reasonable in relation to the nature, extent and quality of the services to be provided, taking into account the fees charged by other advisers for managing comparable mutual funds with similar strategies, the fees the Adviser charges to other clients, and the expense limitations proposed by the Adviser.
Economies of Scale
The Trustees considered information about the potential for the Adviser to realize economies of scale as the assets of each New Portfolio increase. The Trustees noted that each New Portfolio is part of the overall Janus funds complex, which means, among other things, that each New Portfolio shares directly in economies of scale through the lower charges of third-party service providers that are based in part on the combined scale of all of the Janus funds.
Other Benefits to Janus Capital
The Trustees also considered benefits that accrue to the Adviser and its affiliates from their relationship with each New Portfolio. They recognized that two affiliates of Janus Capital will separately serve each New Portfolio as transfer agent and distributor, respectively. The Trustees also concluded that, other than the services provided by the Adviser and its affiliates pursuant to the agreements, and the fees to be paid by each New Portfolio under those agreements, each New Portfolio and the Adviser may potentially benefit from their relationship with each other in other ways. The Trustees concluded that the success of the New Portfolio could attract other business to the Adviser or other Janus funds, and that the success of the Adviser could enhance its ability to serve each New Portfolio.
Conclusion
No single factor was determinative to the decision of the Board. Based on the foregoing and such other matters as were deemed relevant, the Board concluded that the proposed advisory fee rate and projected total expense ratio are reasonable in relation to the services to be provided by the Adviser to each New Portfolio, as well as the costs to be incurred and benefits to be gained by the Adviser in providing such services. The Board also found the proposed advisory fees to be reasonable in comparison to the fees charged by advisers to other comparable funds of similar actual or anticipated size. As a result, the Board concluded that the initial approval of the proposed Investment Advisory Agreement was in the best interests of each New Portfolio.
After full consideration of the above factors, as well as other factors, the Trustees, including all of the Independent Trustees voting separately, determined to approve the Investment Advisory Agreement for each New Portfolio. The Board also considered and determined that the services provided by the Adviser to the New Portfolios were in addition to, rather than duplicative of, services provided under the advisory contracts of the underlying exchange traded funds in which each New Portfolio intended to invest.
Clayton Street Trust | 19 |
Protective Life Dynamic Allocation Series - Growth Portfolio
Useful Information About Your Portfolio Report (unaudited)
The Management Commentary in this report includes valuable insight as well as statistical information to help you understand how your Portfolio’s performance and characteristics stack up against those of comparable indices.
If the Portfolio invests in foreign securities, this report may include information about country exposure. Country exposure is based primarily on the country of risk. A company may be allocated to a country based on other factors such as location of the company’s principal office, the location of the principal trading market for the company’s securities, or the country where a majority of the company’s revenues are derived.
Please keep in mind that the opinions expressed in the Management Commentary are just that: opinions. They are a reflection based on best judgment at the time this report was compiled, which was June 30, 2016. As the investing environment changes, so could opinions. These views are unique and are not necessarily shared by fellow employees or by Janus in general.
Performance Overviews
Performance overview graphs compare the performance of a hypothetical $10,000 investment in the Portfolio with one or more widely used market indices. When comparing the performance of the Portfolio with an index, keep in mind that market indices are not available for investment and do not reflect deduction of expenses.
Average annual total returns are quoted for a Portfolio with more than one year of performance history. Average annual total return is calculated by taking the growth or decline in value of an investment over a period of time, including reinvestment of dividends and distributions, then calculating the annual compounded percentage rate that would have produced the same result had the rate of growth been constant throughout the period. Average annual total return does not reflect the deduction of taxes that a shareholder would pay on Portfolio distributions or redemptions of Portfolio shares.
Cumulative total returns are quoted for a Portfolio with less than one year of performance history. Cumulative total return is the growth or decline in value of an investment over time, independent of the period of time involved. Cumulative total return does not reflect the deduction of taxes that a shareholder would pay on Portfolio distributions or redemptions of Portfolio shares.
Pursuant to federal securities rules, expense ratios shown in the performance chart reflect subsidized (if applicable) and unsubsidized ratios. The total annual fund operating expenses ratio is gross of any fee waivers, reflecting the Portfolio’s unsubsidized expense ratio. The net annual fund operating expenses ratio (if applicable) includes contractual waivers of Janus Capital and reflects the Portfolio’s subsidized expense ratio. Ratios may be higher or lower than those shown in the “Financial Highlights” in this report.
Schedule of Investments
Following the performance overview section is the Portfolio’s Schedule of Investments. This schedule reports the types of securities held in the Portfolio on the last day of the reporting period. Securities are usually listed by type (common stock, corporate bonds, U.S. Government obligations, etc.) and by industry classification (banking, communications, insurance, etc.). Holdings are subject to change without notice.
The value of each security is quoted as of the last day of the reporting period. The value of securities denominated in foreign currencies is converted into U.S. dollars.
If the Portfolio invests in foreign securities, it will also provide a summary of investments by country. This summary reports the Portfolio exposure to different countries by providing the percentage of securities invested in each country. The country of each security represents the country of risk. The Portfolio’s Schedule of Investments relies upon the industry group and country classifications published by Barclays and/or MSCI Inc.
Tables listing details of individual forward currency contracts, futures, written options, swaptions, and swaps follow the Portfolio’s Schedule of Investments (if applicable).
Statement of Assets and Liabilities
This statement is often referred to as the “balance sheet.” It lists the assets and liabilities of the Portfolio on the last day of the reporting period.
20 | JUNE 30, 2016 |
Protective Life Dynamic Allocation Series - Growth Portfolio
Useful Information About Your Portfolio Report (unaudited)
The Portfolio’s assets are calculated by adding the value of the securities owned, the receivable for securities sold but not yet settled, the receivable for dividends declared but not yet received on securities owned, and the receivable for Portfolio shares sold to investors but not yet settled. The Portfolio’s liabilities include payables for securities purchased but not yet settled, Portfolio shares redeemed but not yet paid, and expenses owed but not yet paid. Additionally, there may be other assets and liabilities such as unrealized gain or loss on forward currency contracts.
The section entitled “Net Assets Consist of” breaks down the components of the Portfolio’s net assets. Because the Portfolio must distribute substantially all earnings, you will notice that a significant portion of net assets is shareholder capital.
The last section of this statement reports the net asset value (“NAV”) per share on the last day of the reporting period. The NAV is calculated by dividing the Portfolio’s net assets for each share class (assets minus liabilities) by the number of shares outstanding.
Statement of Operations
This statement details the Portfolio’s income, expenses, realized gains and losses on securities and currency transactions, and changes in unrealized appreciation or depreciation of Portfolio holdings.
The first section in this statement, entitled “Investment Income,” reports the dividends earned from securities and interest earned from interest-bearing securities in the Portfolio.
The next section reports the expenses incurred by the Portfolio, including the advisory fee paid to the investment adviser, transfer agent fees and expenses, and printing and postage for mailing statements, financial reports and prospectuses. Expense offsets and expense reimbursements, if any, are also shown.
The last section lists the amounts of realized gains or losses from investment and foreign currency transactions, and changes in unrealized appreciation or depreciation of investments and foreign currency-denominated assets and liabilities. The Portfolio will realize a gain (or loss) when it sells its position in a particular security. A change in unrealized gain (or loss) refers to the change in net appreciation or depreciation of the Portfolio during the reporting period. “Net Realized and Unrealized Gain/(Loss) on Investments” is affected both by changes in the market value of Portfolio holdings and by gains (or losses) realized during the reporting period.
Statements of Changes in Net Assets
These statements report the increase or decrease in the Portfolio’s net assets during the reporting period. Changes in the Portfolio’s net assets are attributable to investment operations, dividends and distributions to investors, and capital share transactions. This is important to investors because it shows exactly what caused the Portfolio’s net asset size to change during the period.
The first section summarizes the information from the Statement of Operations regarding changes in net assets due to the Portfolio’s investment operations. The Portfolio’s net assets may also change as a result of dividend and capital gains distributions to investors. If investors receive their dividends and/or distributions in cash, money is taken out of the Portfolio to pay the dividend and/or distribution. If investors reinvest their dividends and/or distributions, the Portfolio’s net assets will not be affected. If you compare the Portfolio’s “Net Decrease from Dividends and Distributions” to “Reinvested Dividends and Distributions,” you will notice that dividends and distributions have little effect on the Portfolio’s net assets. This is because the majority of the Portfolio’s investors reinvest their dividends and/or distributions.
The reinvestment of dividends and distributions is included under “Capital Share Transactions.” “Capital Shares” refers to the money investors contribute to the Portfolio through purchases or withdrawals via redemptions. The Portfolio’s net assets will increase and decrease in value as investors purchase and redeem shares from the Portfolio.
Financial Highlights
This schedule provides a per-share breakdown of the components that affect the Portfolio’s NAV for current and past reporting periods as well as total return, asset size, ratios, and portfolio turnover rate.
The first line in the table reflects the NAV per share at the beginning of the reporting period. The next line reports the net investment income/(loss) per share. Following is the per share total of net gains/(losses), realized and unrealized. Per share dividends and distributions to investors are then subtracted to arrive at the NAV per share at the end of the
Clayton Street Trust | 21 |
Protective Life Dynamic Allocation Series - Growth Portfolio
Useful Information About Your Portfolio Report (unaudited)
period. The next line reflects the total return for the period. Also included are ratios of expenses and net investment income to average net assets.
The Portfolio’s expenses may be reduced through expense offsets and expense reimbursements. The ratios shown reflect expenses before and after any such offsets and reimbursements.
The ratio of net investment income/(loss) summarizes the income earned less expenses, divided by the average net assets of the Portfolio during the reporting period. Do not confuse this ratio with the Portfolio’s yield. The net investment income ratio is not a true measure of the Portfolio’s yield because it does not take into account the dividends distributed to the Portfolio’s investors.
The next figure is the portfolio turnover rate, which measures the buying and selling activity in the Portfolio. Portfolio turnover is affected by market conditions, changes in the asset size of the Portfolio, fluctuating volume of shareholder purchase and redemption orders, the nature of the Portfolio’s investments, and the investment style and/or outlook of the portfolio manager(s) and/or investment personnel. A 100% rate implies that an amount equal to the value of the entire portfolio was replaced once during the fiscal year; a 50% rate means that an amount equal to the value of half the portfolio is traded in a year; and a 200% rate means that an amount equal to the value of the entire portfolio is traded every six months.
22 | JUNE 30, 2016 |
Protective Life Dynamic Allocation Series - Growth Portfolio
Notes
NotesPage1
Clayton Street Trust | 23 |
Protective Life Dynamic Allocation Series - Growth Portfolio
Notes
NotesPage2
24 | JUNE 30, 2016 |
Protective Life Dynamic Allocation Series - Growth Portfolio
Notes
NotesPage3
Clayton Street Trust | 25 |
Please consider the charges, risks, expenses and investment objectives carefully before investing. For a prospectus containing this and other information, please call Janus at 877.33JANUS (52687) or download the file from janus.com/variable-insurance/clayton. Read it carefully before you invest or send money. | ||||||||||||
Janus is a registered trademark of Janus International Holding LLC. © Janus International Holding LLC. Protective and Protective Life are registered service marks of Protective Life Insurance Company Corporation. Protective Life Dynamic Allocation Series Portfolios are distributed by Janus Distributors LLC and exclusively offered in connection with variable annuity contracts issued by Protective Life Insurance Company and its affiliates. Janus is not affiliated with Protective Life. | ||||||||||||
Investment products offered are: | NOT FDIC-INSURED | MAY LOSE VALUE | NO BANK GUARANTEE | |||||||||
C-0816-3425 | 109-24-93065 08-16 | |||||||||||
26 | JUNE 30, 2016 |
SEMIANNUAL REPORT June 30, 2016 | |||
Protective Life Dynamic Allocation Series - Moderate Portfolio | |||
Clayton Street Trust | |||
| |||
HIGHLIGHTS · Portfolio management perspective · Investment strategy behind your portfolio · Portfolio performance, characteristics |
Table of Contents
Protective Life Dynamic Allocation Series - Moderate Portfolio
Protective Life Dynamic Allocation Series - Moderate Portfolio (unaudited)
Protective Life Dynamic Allocation Series – Moderate Portfolio began investment operations on April 7, 2016. The information provided for Protective Life Dynamic Allocation Series – Moderate Portfolio reflects investment activity for the period April 7, 2016 to June 30, 2016.
Asset Allocation - (% of Net Assets) | |||||
Investment Companies | 79.0% | ||||
Repurchase Agreements | 13.8% | ||||
Other | 7.2% | ||||
100.0% | |||||
Clayton Street Trust | 1 |
Protective Life Dynamic Allocation Series - Moderate Portfolio (unaudited)
Performance
See important disclosures on the next page. |
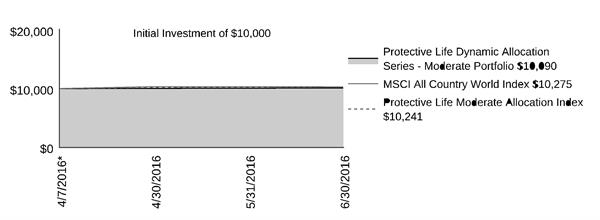
| Expense Ratios - per the April 6, 2016 | |||||||||
Cumulative Total Return - for the period ended June 30, 2016 |
|
| prospectus (estimated for the fiscal year) | |||||||
|
| Since |
|
| Total Annual Fund | Net Annual Fund | ||||
Protective Life Dynamic Allocation Series - Moderate Portfolio |
| 0.90% |
|
| 1.88% | 0.90% | ||||
MSCI All Country World Index |
| 2.75% |
|
|
|
| ||||
Protective Life Moderate Allocation Index |
| 2.41% |
|
|
|
| ||||
Expense ratios shown reflect estimated annualized expenses that the Portfolio expects to incur during its initial fiscal year.
Performance for very short time periods may not be indicative of future performance.
A Portfolio’s performance may be affected by risks that include those associated with nondiversification, non-investment grade debt securities, high-yield/high-risk securities, undervalued or overlooked companies, investments in specific industries or countries and potential conflicts of interest. Additional risks to a Portfolio may also include, but are not limited to, those associated with investing in foreign securities, emerging markets, initial public offerings, real estate investment trusts (REITs), derivatives, short sales, commodity-linked investments and companies with relatively small market capitalizations. Each Portfolio has different risks. Please see a Janus prospectus for more information about risks, portfolio holdings and other details.
Performance of the Protective Life Dynamic Allocation Series Portfolios depends on that of the underlying funds. They are subject to risk with respect to the aggregation of holdings of underlying funds which may result in increased volatility as a result of indirectly having concentrated assets in a particular industry, geographical sector, or single company.
No assurance can be given that the Protective Life Dynamic Allocation Series Portfolios’ investment strategy will be successful under all or any market conditions. Janus Capital does not have prior experience using the methodology, a proprietary methodology co-developed by Janus Capital and Protective Life Insurance Company. Although it is designed to achieve the Portfolios’ investment objectives, there is no guarantee that it will achieve the desired results.
These returns do not reflect the charges and expenses of any particular insurance product or qualified plan. Returns shown would have been lower had they included insurance charges.
Returns include reinvestment of all dividends and distributions and do not reflect the deduction of taxes that a shareholder would pay on Portfolio distributions or redemptions of Portfolio shares. The returns do not include adjustments in accordance with generally accepted accounting principles required at the period end for financial reporting purposes.
See Financial Highlights for actual expense ratios during the reporting period.
Until three years from inception, Janus Capital may recover expenses previously waived or reimbursed if the expense ratio falls below certain limits.
2 | JUNE 30, 2016 |
Protective Life Dynamic Allocation Series - Moderate Portfolio (unaudited)
Performance
There is no assurance that the investment process will consistently lead to successful investing.
See Notes to Schedule of Investments and Other Information for index definitions.
A Portfolio’s portfolio may differ significantly from the securities held in an index. An index is unmanaged and not available for direct investment; therefore, its performance does not reflect the expenses associated with the active management of an actual portfolio.
See “Useful Information About Your Portfolio Report.”
*The Portfolio’s inception date – April 7, 2016
Clayton Street Trust | 3 |
Protective Life Dynamic Allocation Series - Moderate Portfolio (unaudited)
Expense Examples
As a shareholder of the Portfolio, you incur two types of costs: (1) transaction costs and (2) ongoing costs, including management fees; 12b-1 distribution and shareholder servicing fees; transfer agent fees and expenses payable pursuant to the Transfer Agency Agreement; and other Portfolio expenses. This example is intended to help you understand your ongoing costs (in dollars) of investing in the Portfolio and to compare these costs with the ongoing costs of investing in other mutual funds. To do so, compare this 5% hypothetical example with the 5% hypothetical examples that appear in the shareholder reports of the other funds. The example is based upon an investment of $1,000 invested at the beginning of the period and held for the six-months indicated, unless noted otherwise in the table and footnotes below.
Actual Expenses
The information in the table under the heading “Actual” provides information about actual account values and actual expenses. You may use the information in these columns, together with the amount you invested, to estimate the expenses that you paid over the period. Simply divide your account value by $1,000 (for example, an $8,600 account value divided by $1,000 = 8.6), then multiply the result by the number in the appropriate column for your share class under the heading entitled “Expenses Paid During Period” to estimate the expenses you paid on your account during the period.
Hypothetical Example for Comparison Purposes
The information in the table under the heading “Hypothetical (5% return before expenses)” provides information about hypothetical account values and hypothetical expenses based upon the Portfolio’s actual expense ratio and an assumed rate of return of 5% per year before expenses, which is not the Portfolio’s actual return. The hypothetical account values and expenses may not be used to estimate the actual ending account balance or expenses you paid for the period. You may use this information to compare the ongoing costs of investing in the Portfolio and other funds. To do so, compare this 5% hypothetical example with the 5% hypothetical examples that appear in the shareholder reports of the other funds. Additionally, for an analysis of the fees associated with an investment in the Portfolio or other similar funds, please visit www.finra.org/fundanalyzer.
Please note that the expenses shown in the table are meant to highlight your ongoing costs only and do not reflect any transaction costs, such as any charges at the separate account level or contract level. These fees are fully described in the Portfolio’s prospectus. Therefore, the hypothetical examples are useful in comparing ongoing costs only, and will not help you determine the relative total costs of owning different funds. In addition, if these transaction costs were included, your costs would have been higher.
Actual | Hypothetical | |||||||||||
| Beginning | Ending | Expenses |
| Beginning | Ending | Expenses | Net Annualized | ||||
| $1,000.00 | $1,009.00 | $1.91 |
| $1,000.00 | $1,009.71 | $1.91 | 0.82% | ||||
* | Actual Expenses Paid During Period reflects only the inception period for the Portfolio (April 7, 2016 to June 30, 2016) and is equal to the Net Annualized Expense Ratio multiplied by the average account value over the period, multiplied by 85/366 (to reflect the period). Therefore, actual expenses shown are lower than would be expected for a six-month period. | |||||||||||
† | Hypothetical Expenses Paid During Period is equal to the Net Annualized Expense Ratio multiplied by the average account value over the period, multiplied by 182/366 (to reflect the one-half year period). Expenses in the examples include the effect of applicable fee waivers and/or expense reimbursements, if any. Had such waivers and/or reimbursements not been in effect, your expenses would have been higher. Please refer to the Notes to Financial Statements or the Portfolio’s prospectus for more information regarding waivers and/or reimbursements. | |||||||||||
4 | JUNE 30, 2016 |
Protective Life Dynamic Allocation Series - Moderate Portfolio
Schedule of Investments (unaudited)
June 30, 2016
Shares or | Value | ||||||
Investment Companies – 79.0% | |||||||
Exchange-Traded Funds (ETFs) – 79.0% | |||||||
iShares Core US Aggregate Bond | 15,184 | $1,709,263 | |||||
iShares MSCI All Country Asia ex Japan | 2,135 | 116,742 | |||||
iShares Russell 2000 | 3,998 | 459,650 | |||||
Powershares QQQ Trust Series 1 | 4,195 | 451,130 | |||||
SPDR S&P 500 Trust | 6,046 | 1,266,819 | |||||
Total Investment Companies (cost $3,945,774) | 4,003,604 | ||||||
Repurchase Agreements(a) – 13.8% | |||||||
Undivided interest of 0.3% in a joint repurchase agreement (principal amount $126,400,000 with a maturity value of $126,401,475) with Credit Agricole, New York, 0.4200%, dated 6/30/16, maturing 7/1/16 to be repurchased at $400,005 collateralized by $124,582,513 in U.S. Treasuries 0.1250% - 3.5000%, 4/15/18 - 1/31/21 with a value of $128,928,074 | $400,000 | 400,000 | |||||
Undivided interest of 0.1% in a joint repurchase agreement (principal amount $300,000,000 with a maturity value of $300,003,583) with Wells Fargo Securities LLC, 0.4300%, dated 6/30/16, maturing 7/1/16 to be repurchased at $300,004 collateralized by $288,813,889 in U.S. Government Agencies 3.0000% - 6.0000%, 2/15/38 - 6/20/46 with a value of $306,003,657 | 300,000 | 300,000 | |||||
Total Repurchase Agreements (cost $700,000) | 700,000 | ||||||
Total Investments (total cost $4,645,774) – 92.8% | 4,703,604 | ||||||
Cash, Receivables and Other Assets, net of Liabilities – 7.2% | 367,413 | ||||||
Net Assets – 100% | $5,071,017 | ||||||
See Notes to Schedule of Investments and Other Information and Notes to Financial Statements. | |
Clayton Street Trust | 5 |
Protective Life Dynamic Allocation Series - Moderate Portfolio
Notes to Schedule of Investments and Other Information (unaudited)
MSCI All Country World IndexSM | An unmanaged, free float-adjusted market capitalization weighted index composed of stocks of companies located in countries throughout the world. It is designed to measure equity market performance in global developed and emerging markets. The index includes reinvestment of dividends, net of foreign withholding taxes. |
Protective Life Moderate Allocation Index | An internally-calculated, hypothetical combination of total returns from the MSCI All Country World Index (65%) and the Barclays Global Aggregate Bond Index (35%). |
LLC | Limited Liability Company |
SPDR | Standard & Poor's Depositary Receipt |
(a) | The Portfolio may have elements of risk due to concentrated investments. Such concentrations may subject the Portfolio to additional risks. |
The following is a summary of the inputs that were used to value the Portfolio’s investments in securities and other financial instruments as of June 30, 2016. See Notes to Financial Statements for more information. | |||
Valuation Inputs Summary | |||
| Level 1 - | Level 2 - | Level 3 - |
Assets | |||
Investments in Securities: | |||
Investment Companies | $ 4,003,604 | $ - | $ - |
Repurchase Agreements | - | 700,000 | - |
Total Assets | $ 4,003,604 | $ 700,000 | $ - |
6 | JUNE 30, 2016 |
Protective Life Dynamic Allocation Series - Moderate Portfolio
Statement of Assets and Liabilities (unaudited)
June 30, 2016
|
|
|
|
|
|
|
Assets: | ||||||
Investments, at cost(1) | $ | 4,645,774 | ||||
Unaffiliated investments, at value | 4,003,604 | |||||
Repurchase agreements, at value | 700,000 | |||||
Cash | 57,315 | |||||
Initial offering costs | 12,795 | |||||
Receivables: | ||||||
Investments sold | 344,465 | |||||
Portfolio shares sold | 265,375 | |||||
Due from adviser | 12,358 | |||||
Dividends | 6,965 | |||||
Total Assets |
|
| 5,402,877 |
| ||
Liabilities: | ||||||
Payables: | — | |||||
Investments purchased | 289,819 | |||||
Initial offering costs | 16,666 | |||||
Professional fees | 10,290 | |||||
Portfolio administration fees | 4,361 | |||||
Non-interested Trustees' fees and expenses | 3,476 | |||||
Advisory fees | 1,675 | |||||
12b-1 Distribution and shareholder servicing fees | 1,047 | |||||
Custodian fees | 899 | |||||
Transfer agent fees and expenses | 419 | |||||
Accrued expenses and other payables | 3,208 | |||||
Total Liabilities |
|
| 331,860 |
| ||
Net Assets |
| $ | 5,071,017 |
| ||
Net Assets Consist of: | ||||||
Capital (par value and paid-in surplus) | $ | 5,040,924 | ||||
Undistributed net investment income/(loss) | 6,355 | |||||
Undistributed net realized gain/(loss) from investments | (34,092) | |||||
Unrealized net appreciation/(depreciation) of investments and non-interested Trustees’ deferred compensation | 57,830 | |||||
Total Net Assets |
| $ | 5,071,017 |
| ||
Net Assets | $ | 5,071,017 | ||||
Shares Outstanding, $0.01 Par Value (unlimited shares authorized) | 502,393 | |||||
Net Asset Value Per Share |
| $ | 10.09 |
| ||
(1) Includes cost of repurchase agreements of $700,000. |
See Notes to Financial Statements. | |
Clayton Street Trust | 7 |
Protective Life Dynamic Allocation Series - Moderate Portfolio
Statement of Operations (unaudited)
For the period ended June 30, 2016(1)
|
|
|
|
|
|
Investment Income: | |||||
| Dividends | $ | 10,816 | ||
Interest | 576 | ||||
Total Investment Income |
| 11,392 |
| ||
Expenses: | |||||
Advisory fees | 2,445 | ||||
12b-1 Distribution and shareholder servicing fees | 1,528 | ||||
Transfer agent administrative fees and expenses | 611 | ||||
Other transfer agent fees and expenses | 59 | ||||
Insurance Expense | 17,425 | ||||
Portfolio administration fees | 12,355 | ||||
Professional fees | 10,290 | ||||
Initial organization and offering costs | 5,121 | ||||
Non-interested Trustees’ fees and expenses | 3,476 | ||||
Custodian fees | 1,204 | ||||
Shareholder reports expense | 429 | ||||
Other expenses | 2,789 | ||||
Total Expenses |
| 57,732 |
| ||
Less: Excess Expense Reimbursement |
| (52,695) |
| ||
Net Expenses |
| 5,037 |
| ||
Net Investment Income/(Loss) |
| 6,355 |
| ||
Net Realized Gain/(Loss) on Investments: | |||||
Investments | (34,092) | ||||
Total Net Realized Gain/(Loss) on Investments |
| (34,092) |
| ||
Change in Unrealized Net Appreciation/Depreciation: | |||||
Investments and non-interested Trustees’ deferred compensation | 57,830 | ||||
Total Change in Unrealized Net Appreciation/Depreciation |
| 57,830 |
| ||
Net Increase/(Decrease) in Net Assets Resulting from Operations | $ | 30,093 |
| ||
(1) Period from April 7, 2016 (inception date) through June 30, 2016. |
See Notes to Financial Statements. | |
8 | JUNE 30, 2016 |
Protective Life Dynamic Allocation Series - Moderate Portfolio
Statement of Changes in Net Assets
|
|
| Period ended |
| ||
Operations: | ||||||
Net investment income/(loss) | $ | 6,355 | ||||
Net realized gain/(loss) on investments | (34,092) | |||||
Change in unrealized net appreciation/depreciation | 57,830 | |||||
Net Increase/(Decrease) in Net Assets Resulting from Operations |
| 30,093 |
| |||
Capital Shares Transactions | 5,040,924 | |||||
Net Increase/(Decrease) in Net Assets |
| 5,071,017 |
| |||
Net Assets: | ||||||
Beginning of period | — | |||||
| End of period | $ | 5,071,017 |
| ||
Undistributed Net Investment Income/(Loss) | $ | 6,355 |
| |||
(1) Period from April 7, 2016 (inception date) through June 30, 2016. |
See Notes to Financial Statements. | |
Clayton Street Trust | 9 |
Protective Life Dynamic Allocation Series - Moderate Portfolio
Financial Highlights
For a share outstanding during the period ended June 30 (unaudited) |
| 2016(1) |
| |||
Net Asset Value, Beginning of Period |
| $10.00 |
| |||
Income/(Loss) from Investment Operations: | ||||||
Net investment income/(loss)(2) | 0.02 | |||||
Net realized and unrealized gain/(loss) | 0.07 | |||||
Total from Investment Operations |
| 0.09 |
| |||
Less Dividends and Distributions: | ||||||
Dividends (from net investment income) | — | |||||
Distributions (from capital gains) | — | |||||
Total Dividends and Distributions |
| — |
| |||
Net Asset Value, End of Period | $10.09 | |||||
Total Return* |
| 0.90% |
| |||
Net Assets, End of Period (in thousands) | $5,071 | |||||
Average Net Assets for the Period (in thousands) | $2,632 | |||||
Ratios to Average Net Assets**: |
|
|
| |||
Ratio of Gross Expenses | 9.45% | |||||
Ratio of Net Expenses (After Waivers and Expense Offsets) | 0.82% | |||||
Ratio of Net Investment Income/(Loss) | 1.04% | |||||
Portfolio Turnover Rate | 107% | |||||
* Total return not annualized for periods of less than one full year. ** Annualized for periods of less than one full year. (1) Period from April 7, 2016 (inception date) through June 30, 2016. (2) Per share amounts are calculated based on average shares outstanding during the year or period. |
See Notes to Financial Statements. | |
10 | JUNE 30, 2016 |
Protective Life Dynamic Allocation Series - Moderate Portfolio
Notes to Financial Statements (unaudited)
1. Organization and Significant Accounting Policies
Protective Life Dynamic Allocation Series - Moderate Portfolio (the “Portfolio”) is a series fund. The Portfolio operates as a “fund of funds,” meaning substantially all of the Portfolio’s assets will be invested in exchange-traded funds (the “underlying funds”). The Portfolio is part of Clayton Street Trust (the “Trust”), which is organized as a Delaware statutory trust and is registered under the Investment Company Act of 1940, as amended (the “1940 Act”), as an open-end management investment company, and therefore has applied the specialized accounting and reporting guidance in Financial Accounting Standards Board (“FASB”) Accounting Standards Codification (“ASC”) Topic 946. The Trust offers three Portfolios with differing investment objectives and policies. The Portfolio seeks total return through growth of capital and income, balanced by capital preservation. The Portfolio is classified as nondiversified, as defined in the 1940 Act.
The Portfolio currently offers one class of shares. The shares are offered in connection with investment in and payments under variable annuity contracts issued exclusively by Protective Life Insurance Company and its affiliates ("Protective Life").
Underlying Funds
The Portfolio invests in a dynamic portfolio of exchange-traded funds across seven different equity asset classes, as well as fixed-income investments, and a cash allocation, including money market instruments. The equity asset classes are adjusted weekly based on market conditions pursuant to a proprietary, quantitative-based allocation program. Over the long term, and when fully invested, the Portfolio seeks to maintain an asset allocation of approximately 65% global equity investments and 35% fixed income investments. Additional details and descriptions of the investment objectives and strategies of each of the potential underlying funds are available in the Portfolio's prospectus.
The following accounting policies have been followed by the Portfolio and are in conformity with accounting principles generally accepted in the United States of America.
Investment Valuation
Securities held by the Portfolio, including the underlying funds, are valued in accordance with policies and procedures established by and under the supervision of the Trustees (the “Valuation Procedures”). The values of the Portfolio's investments in the underlying funds are based upon the closing price of such underlying funds on the applicable exchange. Most debt securities are valued in accordance with the evaluated bid price supplied by the pricing service that is intended to reflect market value. The evaluated bid price supplied by the pricing service is an evaluation that may consider factors such as security prices, yields, maturities, and ratings. Certain short-term securities maturing within 60 days or less may be evaluated and valued on an amortized cost basis provided that the amortized cost determined approximates market value. Securities for which market quotations or evaluated prices are not readily available or are deemed unreliable are valued at fair value determined in good faith under the Valuation Procedures. Circumstances in which fair value pricing may be utilized include, but are not limited to: (i) a significant event that may affect the securities of a single issuer, such as a merger, bankruptcy, or significant issuer-specific development; (ii) an event that may affect an entire market, such as a natural disaster or significant governmental action; (iii) a nonsignificant event such as a market closing early or not opening, or a security trading halt; and (iv) pricing of a nonvalued security and a restricted or nonpublic security. Special valuation considerations may apply with respect to “odd-lot” fixed-income transactions which, due to their small size, may receive evaluated prices by pricing services which reflect a large block trade and not what actually could be obtained for the odd-lot position.
Valuation Inputs Summary
FASB ASC 820, Fair Value Measurements and Disclosures (“ASC 820”), defines fair value, establishes a framework for measuring fair value, and expands disclosure requirements regarding fair value measurements. This standard emphasizes that fair value is a market-based measurement that should be determined based on the assumptions that market participants would use in pricing an asset or liability and establishes a hierarchy that prioritizes inputs to valuation techniques used to measure fair value. These inputs are summarized into three broad levels:
Level 1 – Unadjusted quoted prices in active markets the Portfolio has the ability to access for identical assets or liabilities.
The Portfolio classifies each of its investments in underlying funds as Level 1, without consideration as to the classification level of the specific investments held by the underlying funds.
Clayton Street Trust | 11 |
Protective Life Dynamic Allocation Series - Moderate Portfolio
Notes to Financial Statements (unaudited)
Level 2 – Observable inputs other than unadjusted quoted prices included in Level 1 that are observable for the asset or liability either directly or indirectly. These inputs may include quoted prices for the identical instrument on an inactive market, prices for similar instruments, interest rates, prepayment speeds, credit risk, yield curves, default rates and similar data.
Assets or liabilities categorized as Level 2 in the hierarchy generally include: debt securities fair valued in accordance with the evaluated bid or ask prices supplied by a pricing service; securities traded on OTC markets and listed securities for which no sales are reported that are fair valued at the latest bid price (or yield equivalent thereof) obtained from one or more dealers transacting in a market for such securities or by a pricing service approved by the Portfolio’s Trustees; and certain short-term debt securities with maturities of 60 days or less that are fair valued at amortized cost. Other securities that may be categorized as Level 2 in the hierarchy include, but are not limited to, preferred stocks, bank loans, swaps, investments in unregistered investment companies, options, and forward contracts.
Level 3 – Unobservable inputs for the asset or liability to the extent that relevant observable inputs are not available, representing the Portfolio’s own assumptions about the assumptions that a market participant would use in valuing the asset or liability, and that would be based on the best information available.
There have been no significant changes in valuation techniques used in valuing any such positions held by the Portfolio since the beginning of the fiscal year.
The inputs or methodology used for fair valuing securities are not necessarily an indication of the risk associated with investing in those securities. The summary of inputs used as of June 30, 2016 to fair value the Portfolio’s investments in securities and other financial instruments is included in the “Valuation Inputs Summary” in the Notes to Schedule of Investments and Other Information.
There were no transfers between Level 1, Level 2 and Level 3 of the fair value hierarchy during the period. The Portfolio recognizes transfers between the levels as of the beginning of the fiscal year.
Initial Organization and Offering Costs
Organization costs paid in connection with the organization of the Portfolio are expensed at the time the Portfolio commences operations or as incurred thereafter. Offering costs paid in connection with the initial offering of shares are amortized using a straight-line basis over the first 12 months from the time the Portfolio commences. Amortized offering cost amounts and organization costs expensed are shown as “Initial organization and offering costs” on the Statement of Operations. Amounts remaining to be amortized are shown as “Initial offering costs” in the asset section of the Statement of Assets and Liabilities.
Investment Transactions and Investment Income
Investment transactions are accounted for as of the date purchased or sold (trade date). Dividend income is recorded on the ex dividend date. Any distributions from the underlying funds are recorded in accordance with the character of the distributions as designated by the underlying funds. Gains and losses are determined on the identified cost basis, which is the same basis used for federal income tax purposes.
Expenses
The Portfolio bears expenses incurred specifically on its behalf. Additionally, the Portfolio, as a shareholder in the underlying funds, will also indirectly bear its pro rata share of the expenses incurred by the underlying funds.
Estimates
The preparation of financial statements in conformity with accounting principles generally accepted in the United States of America requires management to make estimates and assumptions that affect the reported amount of assets and liabilities and disclosure of contingent assets and liabilities at the date of the financial statements, and the reported amounts of income and expenses during the reporting period. Actual results could differ from those estimates.
Indemnifications
In the normal course of business, the Portfolio may enter into contracts that contain provisions for indemnification of other parties against certain potential liabilities. The Portfolio’s maximum exposure under these arrangements is unknown, and would involve future claims that may be made against the Portfolio that have not yet occurred. Currently, the risk of material loss from such claims is considered remote.
12 | JUNE 30, 2016 |
Protective Life Dynamic Allocation Series - Moderate Portfolio
Notes to Financial Statements (unaudited)
Dividends and Distributions
The Portfolio may make semiannual distributions of substantially all of its investment income and an annual distribution of its net realized capital gains (if any).
Federal Income Taxes
The Portfolio intends to continue to qualify as a regulated investment company and distribute all of its taxable income in accordance with the requirements of Subchapter M of the Internal Revenue Code. Management has analyzed the Portfolio’s tax positions taken for all open federal income tax years, generally a three-year period, and has concluded that no provision for federal income tax is required in the Portfolio’s financial statements. The Portfolio is not aware of any tax positions for which it is reasonably possible that the total amounts of unrecognized tax benefits will significantly change in the next twelve months.
2. Other Investments and Strategies
Additional Investment Risk
The financial crisis in both the U.S. and global economies over the past several years has resulted, and may continue to result, in a significant decline in the value and liquidity of many securities of issuers worldwide in the equity and fixed-income/credit markets. In response to the crisis, the United States and certain foreign governments, along with the U.S. Federal Reserve and certain foreign central banks, took steps to support the financial markets. The withdrawal of this support, a failure of measures put in place to respond to the crisis, or investor perception that such efforts were not sufficient could each negatively affect financial markets generally, and the value and liquidity of specific securities. In addition, policy and legislative changes in the United States and in other countries continue to impact many aspects of financial regulation. The effect of these changes on the markets, and the practical implications for market participants, including the underlying funds, may not be fully known for some time. As a result, it may also be unusually difficult to identify both investment risks and opportunities, which could limit or preclude the underlying funds’s ability to achieve its investment objective. Therefore, it is important to understand that the value of your investment may fall, sometimes sharply, and you could lose money.
The enactment of the Dodd-Frank Wall Street Reform and Consumer Protection Act (the “Dodd-Frank Act”) provided for widespread regulation of financial institutions, consumer financial products and services, broker-dealers, OTC derivatives, investment advisers, credit rating agencies, and mortgage lending, which expanded federal oversight in the financial sector, including the investment management industry. Many provisions of the Dodd-Frank Act remain pending and will be implemented through future rulemaking. Therefore, the ultimate impact of the Dodd-Frank Act and the regulations under the Dodd-Frank Act on the underlying funds and the investment management industry as a whole, is not yet certain.
A number of countries in the European Union (“EU”) have experienced, and may continue to experience, severe economic and financial difficulties. In particular, many EU nations are susceptible to economic risks associated with high levels of debt, notably due to investments in sovereign debt of countries such as Greece, Italy, Spain, Portugal, and Ireland. Many non-governmental issuers, and even certain governments, have defaulted on, or been forced to restructure, their debts. Many other issuers have faced difficulties obtaining credit or refinancing existing obligations. Financial institutions have in many cases required government or central bank support, have needed to raise capital, and/or have been impaired in their ability to extend credit. As a result, financial markets in the EU experienced extreme volatility and declines in asset values and liquidity. Responses to these financial problems by European governments, central banks, and others, including austerity measures and reforms, may not work, may result in social unrest, and may limit future growth and economic recovery or have other unintended consequences. Further defaults or restructurings by governments and others of their debt could have additional adverse effects on economies, financial markets, and asset valuations around the world. Greece, Ireland, and Portugal have already received one or more "bailouts" from other Eurozone member states, and it is unclear how much additional funding they will require or if additional Eurozone member states will require bailouts in the future. The risk of investing in securities in the European markets may also be heightened due to the referendum in which the United Kingdom voted to exit the EU (known as “Brexit”). One or more other countries may also abandon the euro and/or withdraw from the EU, placing its currency and banking system in jeopardy.
Certain areas of the world have historically been prone to and economically sensitive to environmental events such as, but not limited to, hurricanes, earthquakes, typhoons, flooding, tidal waves, tsunamis, erupting volcanoes, wildfires or droughts, tornadoes, mudslides, or other weather-related phenomena. Such disasters, and the resulting physical or
Clayton Street Trust | 13 |
Protective Life Dynamic Allocation Series - Moderate Portfolio
Notes to Financial Statements (unaudited)
economic damage, could have a severe and negative impact on the Portfolio’s or an underlying fund's investment portfolio and, in the longer term, could impair the ability of issuers in which the Portfolio or an underlying fund invests to conduct their businesses as they would under normal conditions. Adverse weather conditions may also have a particularly significant negative effect on issuers in the agricultural sector and on insurance companies that insure against the impact of natural disasters.
Counterparties
Portfolio transactions involving a counterparty are subject to the risk that the counterparty or a third party will not fulfill its obligation to the Portfolio (“counterparty risk”). Counterparty risk may arise because of the counterparty’s financial condition (i.e., financial difficulties, bankruptcy, or insolvency), market activities and developments, or other reasons, whether foreseen or not. A counterparty’s inability to fulfill its obligation may result in significant financial loss to the Portfolio. The Portfolio may be unable to recover its investment from the counterparty or may obtain a limited recovery, and/or recovery may be delayed. The extent of the Portfolio’s exposure to counterparty risk with respect to financial assets and liabilities approximates its carrying value. See the "Offsetting Assets and Liabilities" section of this Note for further details.
The Portfolio may be exposed to counterparty risk through its investments in certain securities, including, but not limited to, repurchase agreements and debt securities. The Portfolio intends to enter into financial transactions with counterparties that Janus Capital believes to be creditworthy at the time of the transaction. There is always the risk that Janus Capital’s analysis of a counterparty’s creditworthiness is incorrect or may change due to market conditions. To the extent that the Portfolio focuses its transactions with a limited number of counterparties, it will have greater exposure to the risks associated with one or more counterparties.
Exchange-Traded Funds
ETFs are typically open-end investment companies, which may be actively managed or passively managed, that generally seek to track the performance of a specific index. ETFs are traded on a national securities exchange at market prices that may vary from the NAV of their underlying investments. Accordingly, there may be times when an ETF trades at a premium or discount. As a result, the Portfolio may pay more or less than NAV when it buys ETF shares, and may receive more or less than NAV when it sells those shares. ETFs also involve the risk that an active trading market for an ETF’s shares may not develop or be maintained. Similarly, because the value of ETF shares depends on the demand in the market, the Portfolio may not be able to purchase or sell an ETF at the most optimal time, which could adversely affect the Portfolio’s performance. In addition, ETFs that track particular indices may be unable to match the performance of such underlying indices due to the temporary unavailability of certain index securities in the secondary market or other factors, such as discrepancies with respect to the weighting of securities.
Offsetting Assets and Liabilities
The Portfolio presents gross and net information about transactions that are either offset in the financial statements or subject to an enforceable master netting arrangement or similar agreement with a designated counterparty, regardless of whether the transactions are actually offset in the Statement of Assets and Liabilities.
All repurchase agreements are transacted under legally enforceable master repurchase agreements that give the Portfolio, in the event of default by the counterparty, the right to liquidate securities held and to offset receivables and payables with the counterparty. For financial reporting purposes, the Portfolio does not offset financial instruments' payables and receivables and related collateral on the Statement of Assets and Liabilities. Repurchase agreements held by the Portfolio are fully collateralized, and such collateral is in the possession of the Portfolio’s custodian or, for tri-party agreements, the custodian designated by the agreement. The collateral is evaluated daily to ensure its market value exceeds the current market value of the repurchase agreements, including accrued interest.
The following table presents gross amounts of recognized assets and/or liabilities and the net amounts after deducting collateral that has been pledged by counterparties or has been pledged to counterparties (if applicable). For corresponding information grouped by type of instrument, see the Portfolio's Schedule of Investments.
14 | JUNE 30, 2016 |
Protective Life Dynamic Allocation Series - Moderate Portfolio
Notes to Financial Statements (unaudited)
Offsetting of Financial Assets and Derivative Assets | |||||||||
Gross Amounts | |||||||||
of Recognized | Offsetting Asset | Collateral | |||||||
Counterparty | Assets | or Liability(a) | Pledged(b) | Net Amount | |||||
Credit Agricole, New York | $ | 400,000 | $ | — | $ | (400,000) | $ | — | |
Wells Fargo Securities LLC | 300,000 | — | (300,000) | — | |||||
Total | $ | 700,000 | $ | — | $ | (700,000) | $ | — | |
(a) | Represents the amount of assets or liabilities that could be offset with the same counterparty under master netting or similar agreements that management elects not to offset on the Statement of Assets and Liabilities. | ||||||||
(b) | Collateral pledged is limited to the net outstanding amount due to/from an individual counterparty. The actual collateral amounts pledged may exceed these amounts and may fluctuate in value. | ||||||||
Repurchase Agreements
The Portfolio and other funds advised by Janus Capital or its affiliates may transfer daily uninvested cash balances into one or more joint trading accounts. Assets in the joint trading accounts are invested in money market instruments and the proceeds are allocated to the participating funds on a pro rata basis.
Repurchase agreements held by the Portfolio are fully collateralized, and such collateral is in the possession of the Portfolio’s custodian or, for tri-party agreements, the custodian designated by the agreement. The collateral is evaluated daily to ensure its market value exceeds the current market value of the repurchase agreements, including accrued interest. In the event of default on the obligation to repurchase, the Portfolio has the right to liquidate the collateral and apply the proceeds in satisfaction of the obligation. In the event of default or bankruptcy by the other party to the agreement, realization and/or retention of the collateral or proceeds may be subject to legal proceedings.
3. Investment Advisory Agreements and Other Transactions with Affiliates
The Portfolio pays Janus Capital an investment advisory fee which is calculated daily and paid monthly. The Portfolio’s contractual investment advisory fee rate (expressed as an annual rate) is 0.40% of its average daily net assets.
Janus Capital has contractually agreed to waive the advisory fee payable by the Portfolio or reimburse expenses in an amount equal to the amount, if any, that the Portfolio’s normal operating expenses in any fiscal year, including the investment advisory fee, but excluding the 12b-1 distribution and shareholder servicing fees, administrative services fees payable pursuant to the Transfer Agency Agreement, brokerage commissions, interest, dividends, taxes and extraordinary expenses, exceed the annual rate of 0.55% of the Portfolio’s average daily net assets. Janus Capital has agreed to continue the waiver until at least May 1, 2018. If applicable, amounts reimbursed to the Portfolio by Janus Capital are disclosed as “Excess Expense Reimbursement” on the Statement of Operations.
Janus Capital may recover from the Portfolio fees and expenses previously waived or reimbursed during the period beginning with the Portfolio’s commencement of operations and expiring on the third anniversary of the commencement of operations, which could then be considered a deferral. Janus Capital may elect to recoup such amounts only if: (i) recoupment is obtained within three years from the date an amount is waived or reimbursed to the Portfolio, and (ii) the Portfolio’s expense ratio at the time of recoupment, inclusive of the recoupment amounts, does not exceed the expense limit at the time of waiver or at the time of recoupment. If applicable, this amount is disclosed as “Recoupment expense” on the Statement of Operations. During the period ended June 30, 2016, Janus Capital reimbursed the Portfolio $52,695 of fees and expenses that are eligible for recoupment. As of June 30, 2016, the aggregate amount of recoupment that may potentially be made to Janus Capital is $52,695. The recoupment of such reimbursements expires April 7, 2019.
Janus Services LLC (“Janus Services”), a wholly-owned subsidiary of Janus Capital, is the Portfolio’s transfer agent. In addition, Janus Services provides or arranges for the provision of certain other administrative services including, but not limited to, recordkeeping, accounting, order processing, and other shareholder services for the Portfolio. These amounts are disclosed as “Other transfer agent fees and expenses” on the Statement of Operations.
Janus Services receives an administrative services fee at an annual rate of 0.10% of the Portfolio’s average daily net assets for providing, or arranging for the provision by Protective Life of administrative services, including recordkeeping, subaccounting, order processing, or other shareholder services provided on behalf of shareholders of the Portfolio.
Clayton Street Trust | 15 |
Protective Life Dynamic Allocation Series - Moderate Portfolio
Notes to Financial Statements (unaudited)
Janus Services expects to use this entire fee to compensate Protective Life for providing these services to its customers who invest in the Portfolio. These amounts are disclosed as “Transfer agent administrative fees and expenses” on the Statement of Operations.
Services provided by Protective Life may include, but are not limited to, recordkeeping, subaccounting, order processing, providing order confirmations, periodic statements, forwarding prospectuses, shareholder reports, and other materials to existing contract holders, answering inquiries regarding accounts, and other administrative services. Order processing includes the submission of transactions through the National Securities Clearing Corporation (“NSCC”) or similar systems, or those processed on a manual basis with Janus Capital.
Under a distribution and shareholder servicing plan (the “Plan”) adopted in accordance with Rule 12b-1 under the 1940 Act, the Portfolio may pay the Trust’s distributor, Janus Distributors LLC (“Janus Distributors”), a wholly-owned subsidiary of Janus Capital, a fee at an annual rate of up to 0.25% of the average daily net assets of the Portfolio. Under the terms of the Plan, the Trust is authorized to make payments to Janus Distributors for remittance to Protective Life or other intermediaries as compensation for distribution and/or shareholder services performed by Protective Life or its agents, or by such intermediary. These amounts are disclosed as “12b-1 Distribution and shareholder servicing fees” on the Statement of Operations. Payments under the Plan are not tied exclusively to actual 12b-1 distribution and servicing fees, and the payments may exceed 12b-1 distribution and servicing fees actually incurred. If any of the Portfolio’s actual 12b-1 distribution and servicing fees incurred during a calendar year are less than the payments made during a calendar year, the Portfolio will be refunded the difference. Refunds, if any, are included in “12b-1 Distribution fees and shareholder servicing fees” in the Statement of Operations.
Janus Capital furnishes certain administration, compliance, and accounting services for the Portfolio and is reimbursed by the Portfolio for certain of its costs in providing those services (to the extent Janus Capital seeks reimbursement and such costs are not otherwise waived). In addition, employees of Janus Capital and/or its affiliates may serve as officers of the Trust. The Portfolio also pays for salaries, fees, and expenses of certain Janus Capital employees and Portfolio officers, with respect to certain specified administration functions they perform on behalf of the Portfolio. The Portfolio pays these costs based on out-of-pocket expenses incurred by Janus Capital, and these costs are separate and apart from advisory fees and other expenses paid in connection with the investment advisory services Janus Capital provides to the Portfolio. These amounts are disclosed as “Portfolio administration fees” on the Statement of Operations. Some expenses related to compensation payable to the Portfolio's Chief Compliance Officer and compliance staff are shared with the Portfolio. Total compensation of $3 was paid to the Chief Compliance Officer and certain compliance staff by the Trust during the period ended June 30, 2016. The Portfolio's portion is reported as part of “Other expenses” on the Statement of Operations.
The Portfolio is permitted to purchase or sell securities (“cross-trade”) between itself and other funds or accounts managed by Janus Capital Management LLC in accordance with Rule 17a-7 under the Investment Company Act of 1940 (“Rule 17a-7”), when the transaction is consistent with the investment objectives and policies of the Portfolio and in accordance with the Internal Cross Trade Procedures adopted by the Trust’s Board of Trustees. These procedures have been designed to ensure that any cross-trade of securities by the Portfolio from or to another fund or account that is or could be considered an affiliate of the Portfolio under certain limited circumstances by virtue of having a common investment adviser, common Officer, or common Trustee complies with Rule 17a-7. Under these procedures, each cross-trade is effected at the current market price to save costs where allowed. During the period ended June 30, 2016, the Portfolio engaged in cross trades amounting to $677 in purchases and $1,635,509 in sales, resulting in a net realized loss of $23,018. The net realized loss is included in “Investments and foreign currency transactions” within the “Net Realized and Unrealized Gain/(Loss) on Investments” section of the Portfolio’s Statement of Operations.
4. Federal Income Tax
Income and capital gains distributions are determined in accordance with income tax regulations that may differ from accounting principles generally accepted in the United States of America. These differences are due to differing treatments for items such as net short-term gains, deferral of wash sale losses, foreign currency transactions, net investment losses, and capital loss carryovers.
16 | JUNE 30, 2016 |
Protective Life Dynamic Allocation Series - Moderate Portfolio
Notes to Financial Statements (unaudited)
The aggregate cost of investments and the composition of unrealized appreciation and depreciation of investment securities for federal income tax purposes as of June 30, 2016 are noted below.
Unrealized appreciation and unrealized depreciation in the table below exclude appreciation/depreciation on foreign currency translations. The primary difference between book and tax appreciation or depreciation of investments is wash sale loss deferrals.
Federal Tax Cost | Unrealized | Unrealized | Net Tax Appreciation/ |
$ 4,671,412 | $ 40,757 | $ (8,565) | $ 32,192 |
5. Capital Share Transactions
Period ended June 30, 2016(1) | |||
Shares | Amount | ||
Shares sold | 728,417 | $7,303,179 | |
Reinvested dividends and distributions | - | - | |
Shares repurchased | (226,024) | (2,262,255) | |
Net Increase/(Decrease) | 502,393 | $5,040,924 | |
(1) | Period from April 7, 2016 (inception date) through June 30, 2016. | ||
6. Purchases and Sales of Investment Securities
For the period ended June 30, 2016, the aggregate cost of purchases and proceeds from sales of investment securities (excluding any short-term securities, short-term options contracts, and in-kind transactions) was as follows:
Purchases of | Proceeds from Sales | Purchases of Long- | Proceeds from Sales |
$ 6,057,518 | $ 2,077,652 | $ - | $ - |
7. Subsequent Event
Management has evaluated whether any events or transactions occurred subsequent to June 30, 2016 and through the date of issuance of the Portfolio’s financial statements and determined that there were no material events or transactions that would require recognition or disclosure in the Portfolio’s financial statements.
Clayton Street Trust | 17 |
Protective Life Dynamic Allocation Series - Moderate Portfolio
Additional Information (unaudited)
Proxy Voting Policies and Voting Record
A description of the policies and procedures that the Portfolio uses to determine how to vote proxies relating to its portfolio securities is available without charge: (i) upon request, by calling 1-800-525-0020 (toll free); (ii) on the Portfolio’s website at janus.com/proxyvoting; and (iii) on the SEC’s website at http://www.sec.gov.
Quarterly Portfolio Holdings
The Portfolio files its complete portfolio holdings (schedule of investments) with the SEC for the first and third quarters of each fiscal year on Form N-Q within 60 days of the end of such fiscal quarter. The Portfolio’s Form N-Q: (i) is available on the SEC’s website at http://www.sec.gov; (ii) may be reviewed and copied at the SEC’s Public Reference Room in Washington, D.C. (information on the Public Reference Room may be obtained by calling 1-800-SEC-0330); and (iii) is available without charge, upon request, by calling Janus at 1-800-525-0020 (toll free).
APPROVAL OF ADVISORY AGREEMENTS DURING THE PERIOD
The Trustees of Clayton Street Trust (the “Trust”), the majority of whom serve as “independent” Trustees (the “Independent Trustees”) met on February 3, 2016 to consider the proposed investment advisory agreement (the “Investment Advisory Agreement”) for Protective Life Dynamic Allocation Series – Conservative Portfolio, Protective Life Dynamic Allocation Series – Moderate Portfolio, and Protective Life Dynamic Allocation Series – Growth Portfolio (each a “New Portfolio” and collectively, the “New Portfolios”). In the course of their consideration of the Investment Advisory Agreement, the Trustees met in executive session and were advised by their independent legal counsel. In this regard, the Board, including the Independent Trustees, evaluated the terms of the Investment Advisory Agreement and reviewed the duties and responsibilities of the Trustees in evaluating and approving such agreements. In considering approval of the Investment Advisory Agreement, the Board, including the Independent Trustees, reviewed the Board Materials and other information from counsel and from Janus Capital Management LLC, the investment adviser (the “Adviser”), including: (i) a copy of the form of Investment Advisory Agreement, with respect to the Adviser’s management of the assets of each New Portfolio; (ii) information describing the nature, extent and quality of the services that the Adviser will provide to the New Portfolios, and the fees the Adviser will charge to the New Portfolios; (iii) information concerning the Adviser’s financial condition, business, operations, portfolio management teams and compliance programs; (iv) information describing each New Portfolio’s anticipated advisory fee and operating expenses; (v) a copy of the Adviser’s current Form ADV; and (vi) a memorandum from counsel on the responsibilities of trustees in considering investment advisory arrangements under the 1940 Act. The Board also considered presentations made by, and discussions held with, representatives of the Adviser. The Board also received information comparing the advisory fees and expenses of the New Portfolios to those from fund complexes that were defined as competitors.
During its review of this information, the Board focused on and analyzed the factors that the Board deemed relevant, including: the nature, extent and quality of the services to be provided to each New Portfolio by the Adviser; the Advisers’ personnel and operations; each New Portfolio’s proposed expense level; the anticipated profitability to the Adviser under the Investment Advisory Agreement at certain asset levels; any “fall-out” benefits to the Adviser and its affiliates (i.e., the ancillary benefits realized by the Adviser and its affiliates from the Adviser’s relationship with the Trust); the effect of asset growth on each New Portfolio’s expenses; and possible conflicts of interest.
The Trustees also considered benefits that accrue to the Adviser and its affiliates from their relationships with the New Portfolios. They recognized that two affiliates of the Adviser would separately serve each New Portfolio as transfer agent and distributor, respectively. The Trustees also concluded that, other than the services provided by the Adviser and its affiliates pursuant to the agreements and the fees to be paid by each New Portfolio therefor, the New Portfolios and the Adviser may potentially benefit from their relationship with each other in other ways. They concluded that the success of the New Portfolios could attract other business to the Adviser or other Janus funds, and that the success of the Adviser could enhance the Adviser’s ability to serve the New Portfolios.
The Board, including the Independent Trustees, considered the following in respect of each New Portfolio:
Nature, Extent and Quality of Services.
The Trustees reviewed the nature, extent, and quality of the services to be provided by the Adviser, taking into account the investment objective and strategies of each New Portfolio and the similar types of services currently provided by the Adviser to other funds in the fund complex. In addition, the Trustees reviewed the resources and key personnel of the Adviser that will be providing investment and risk management services to each New Portfolio. The Trustees also considered other services provided to each New Portfolio by the Adviser, such as managing the execution of portfolio
18 | JUNE 30, 2016 |
Protective Life Dynamic Allocation Series - Moderate Portfolio
Additional Information (unaudited)
transactions and the broker selection process. The Trustees considered the Adviser’s role as administrator to each New Portfolio, noting that Janus Capital does not receive a fee for its services but is reimbursed for its out-of-pocket costs. The Trustees considered the role of the Adviser in monitoring adherence to each New Portfolio’s investment restrictions, providing support services for the Trustees and Trustee committees, communicating with shareholders and overseeing the activities of other service providers, including monitoring compliance with various policies and procedures of each New Portfolio and with applicable securities laws and regulations.
The Trustees concluded that the nature, extent, and quality of the services to be provided by the Adviser were appropriate and consistent with the terms of the proposed Investment Advisory Agreement. They also concluded that the Adviser had sufficient personnel, with the appropriate education and experience, to serve each New Portfolio effectively.
Costs of Services Provided.
The Trustees noted the information regarding the proposed fees and expenses of each New Portfolio in comparison to similar information for other comparable funds. With regard to each New Portfolio, the Board noted the following:
The Board noted that the Adviser was recommending a management fee that was lower than each New Portfolio’s respective peer group median, and that each New Portfolio’s total expense ratio was lower than each respective peer group’s median. The Board also noted that the Adviser had agreed to cap certain acquired fund fees and expenses for each New Portfolio.
The Trustees concluded that the proposed annual advisory fee rate to be paid by each New Portfolio was reasonable in relation to the nature, extent and quality of the services to be provided, taking into account the fees charged by other advisers for managing comparable mutual funds with similar strategies, the fees the Adviser charges to other clients, and the expense limitations proposed by the Adviser.
Economies of Scale.
The Trustees considered information about the potential for the Adviser to realize economies of scale as the assets of each New Portfolio increase. The Trustees noted that each New Portfolio is part of the overall Janus funds complex, which means, among other things, that each New Portfolio shares directly in economies of scale through the lower charges of third-party service providers that are based in part on the combined scale of all of the Janus funds.
Other Benefits to Janus Capital.
The Trustees also considered benefits that accrue to the Adviser and its affiliates from their relationship with each New Portfolio. They recognized that two affiliates of Janus Capital will separately serve each New Portfolio as transfer agent and distributor, respectively. The Trustees also concluded that, other than the services provided by the Adviser and its affiliates pursuant to the agreements, and the fees to be paid by each New Portfolio under those agreements, each New Portfolio and the Adviser may potentially benefit from their relationship with each other in other ways. The Trustees concluded that the success of the New Portfolio could attract other business to the Adviser or other Janus funds, and that the success of the Adviser could enhance its ability to serve each New Portfolio.
Conclusion.
No single factor was determinative to the decision of the Board. Based on the foregoing and such other matters as were deemed relevant, the Board concluded that the proposed advisory fee rate and projected total expense ratio are reasonable in relation to the services to be provided by the Adviser to each New Portfolio, as well as the costs to be incurred and benefits to be gained by the Adviser in providing such services. The Board also found the proposed advisory fees to be reasonable in comparison to the fees charged by advisers to other comparable funds of similar actual or anticipated size. As a result, the Board concluded that the initial approval of the proposed Investment Advisory Agreement was in the best interests of each New Portfolio.
After full consideration of the above factors, as well as other factors, the Trustees, including all of the Independent Trustees voting separately, determined to approve the Investment Advisory Agreement for each New Portfolio. The Board also considered and determined that the services provided by the Adviser to the New Portfolios were in addition to, rather than duplicative of, services provided under the advisory contracts of the underlying exchange traded funds in which each New Portfolio intended to invest.
Clayton Street Trust | 19 |
Protective Life Dynamic Allocation Series - Moderate Portfolio
Useful Information About Your Portfolio Report (unaudited)
The Management Commentary in this report includes valuable insight as well as statistical information to help you understand how your Portfolio’s performance and characteristics stack up against those of comparable indices.
If the Portfolio invests in foreign securities, this report may include information about country exposure. Country exposure is based primarily on the country of risk. A company may be allocated to a country based on other factors such as location of the company’s principal office, the location of the principal trading market for the company’s securities, or the country where a majority of the company’s revenues are derived.
Please keep in mind that the opinions expressed in the Management Commentary are just that: opinions. They are a reflection based on best judgment at the time this report was compiled, which was June 30, 2016. As the investing environment changes, so could opinions. These views are unique and are not necessarily shared by fellow employees or by Janus in general.
Performance Overviews
Performance overview graphs compare the performance of a hypothetical $10,000 investment in the Portfolio with one or more widely used market indices. When comparing the performance of the Portfolio with an index, keep in mind that market indices are not available for investment and do not reflect deduction of expenses.
Average annual total returns are quoted for a Portfolio with more than one year of performance history. Average annual total return is calculated by taking the growth or decline in value of an investment over a period of time, including reinvestment of dividends and distributions, then calculating the annual compounded percentage rate that would have produced the same result had the rate of growth been constant throughout the period. Average annual total return does not reflect the deduction of taxes that a shareholder would pay on Portfolio distributions or redemptions of Portfolio shares.
Cumulative total returns are quoted for a Portfolio with less than one year of performance history. Cumulative total return is the growth or decline in value of an investment over time, independent of the period of time involved. Cumulative total return does not reflect the deduction of taxes that a shareholder would pay on Portfolio distributions or redemptions of Portfolio shares.
Pursuant to federal securities rules, expense ratios shown in the performance chart reflect subsidized (if applicable) and unsubsidized ratios. The total annual fund operating expenses ratio is gross of any fee waivers, reflecting the Portfolio’s unsubsidized expense ratio. The net annual fund operating expenses ratio (if applicable) includes contractual waivers of Janus Capital and reflects the Portfolio’s subsidized expense ratio. Ratios may be higher or lower than those shown in the “Financial Highlights” in this report.
Schedule of Investments
Following the performance overview section is the Portfolio’s Schedule of Investments. This schedule reports the types of securities held in the Portfolio on the last day of the reporting period. Securities are usually listed by type (common stock, corporate bonds, U.S. Government obligations, etc.) and by industry classification (banking, communications, insurance, etc.). Holdings are subject to change without notice.
The value of each security is quoted as of the last day of the reporting period. The value of securities denominated in foreign currencies is converted into U.S. dollars.
If the Portfolio invests in foreign securities, it will also provide a summary of investments by country. This summary reports the Portfolio exposure to different countries by providing the percentage of securities invested in each country. The country of each security represents the country of risk. The Portfolio’s Schedule of Investments relies upon the industry group and country classifications published by Barclays and/or MSCI Inc.
Tables listing details of individual forward currency contracts, futures, written options, swaptions, and swaps follow the Portfolio’s Schedule of Investments (if applicable).
Statement of Assets and Liabilities
This statement is often referred to as the “balance sheet.” It lists the assets and liabilities of the Portfolio on the last day of the reporting period.
20 | JUNE 30, 2016 |
Protective Life Dynamic Allocation Series - Moderate Portfolio
Useful Information About Your Portfolio Report (unaudited)
The Portfolio’s assets are calculated by adding the value of the securities owned, the receivable for securities sold but not yet settled, the receivable for dividends declared but not yet received on securities owned, and the receivable for Portfolio shares sold to investors but not yet settled. The Portfolio’s liabilities include payables for securities purchased but not yet settled, Portfolio shares redeemed but not yet paid, and expenses owed but not yet paid. Additionally, there may be other assets and liabilities such as unrealized gain or loss on forward currency contracts.
The section entitled “Net Assets Consist of” breaks down the components of the Portfolio’s net assets. Because the Portfolio must distribute substantially all earnings, you will notice that a significant portion of net assets is shareholder capital.
The last section of this statement reports the net asset value (“NAV”) per share on the last day of the reporting period. The NAV is calculated by dividing the Portfolio’s net assets for each share class (assets minus liabilities) by the number of shares outstanding.
Statement of Operations
This statement details the Portfolio’s income, expenses, realized gains and losses on securities and currency transactions, and changes in unrealized appreciation or depreciation of Portfolio holdings.
The first section in this statement, entitled “Investment Income,” reports the dividends earned from securities and interest earned from interest-bearing securities in the Portfolio.
The next section reports the expenses incurred by the Portfolio, including the advisory fee paid to the investment adviser, transfer agent fees and expenses, and printing and postage for mailing statements, financial reports and prospectuses. Expense offsets and expense reimbursements, if any, are also shown.
The last section lists the amounts of realized gains or losses from investment and foreign currency transactions, and changes in unrealized appreciation or depreciation of investments and foreign currency-denominated assets and liabilities. The Portfolio will realize a gain (or loss) when it sells its position in a particular security. A change in unrealized gain (or loss) refers to the change in net appreciation or depreciation of the Portfolio during the reporting period. “Net Realized and Unrealized Gain/(Loss) on Investments” is affected both by changes in the market value of Portfolio holdings and by gains (or losses) realized during the reporting period.
Statements of Changes in Net Assets
These statements report the increase or decrease in the Portfolio’s net assets during the reporting period. Changes in the Portfolio’s net assets are attributable to investment operations, dividends and distributions to investors, and capital share transactions. This is important to investors because it shows exactly what caused the Portfolio’s net asset size to change during the period.
The first section summarizes the information from the Statement of Operations regarding changes in net assets due to the Portfolio’s investment operations. The Portfolio’s net assets may also change as a result of dividend and capital gains distributions to investors. If investors receive their dividends and/or distributions in cash, money is taken out of the Portfolio to pay the dividend and/or distribution. If investors reinvest their dividends and/or distributions, the Portfolio’s net assets will not be affected. If you compare the Portfolio’s “Net Decrease from Dividends and Distributions” to “Reinvested Dividends and Distributions,” you will notice that dividends and distributions have little effect on the Portfolio’s net assets. This is because the majority of the Portfolio’s investors reinvest their dividends and/or distributions.
The reinvestment of dividends and distributions is included under “Capital Share Transactions.” “Capital Shares” refers to the money investors contribute to the Portfolio through purchases or withdrawals via redemptions. The Portfolio’s net assets will increase and decrease in value as investors purchase and redeem shares from the Portfolio.
Financial Highlights
This schedule provides a per-share breakdown of the components that affect the Portfolio’s NAV for current and past reporting periods as well as total return, asset size, ratios, and portfolio turnover rate.
The first line in the table reflects the NAV per share at the beginning of the reporting period. The next line reports the net investment income/(loss) per share. Following is the per share total of net gains/(losses), realized and unrealized. Per share dividends and distributions to investors are then subtracted to arrive at the NAV per share at the end of the
Clayton Street Trust | 21 |
Protective Life Dynamic Allocation Series - Moderate Portfolio
Useful Information About Your Portfolio Report (unaudited)
period. The next line reflects the total return for the period. Also included are ratios of expenses and net investment income to average net assets.
The Portfolio’s expenses may be reduced through expense offsets and expense reimbursements. The ratios shown reflect expenses before and after any such offsets and reimbursements.
The ratio of net investment income/(loss) summarizes the income earned less expenses, divided by the average net assets of the Portfolio during the reporting period. Do not confuse this ratio with the Portfolio’s yield. The net investment income ratio is not a true measure of the Portfolio’s yield because it does not take into account the dividends distributed to the Portfolio’s investors.
The next figure is the portfolio turnover rate, which measures the buying and selling activity in the Portfolio. Portfolio turnover is affected by market conditions, changes in the asset size of the Portfolio, fluctuating volume of shareholder purchase and redemption orders, the nature of the Portfolio’s investments, and the investment style and/or outlook of the portfolio manager(s) and/or investment personnel. A 100% rate implies that an amount equal to the value of the entire portfolio was replaced once during the fiscal year; a 50% rate means that an amount equal to the value of half the portfolio is traded in a year; and a 200% rate means that an amount equal to the value of the entire portfolio is traded every six months.
22 | JUNE 30, 2016 |
Protective Life Dynamic Allocation Series - Moderate Portfolio
Notes
NotesPage1
Clayton Street Trust | 23 |
Protective Life Dynamic Allocation Series - Moderate Portfolio
Notes
NotesPage2
24 | JUNE 30, 2016 |
Protective Life Dynamic Allocation Series - Moderate Portfolio
Notes
NotesPage3
Clayton Street Trust | 25 |
Please consider the charges, risks, expenses and investment objectives carefully before investing. For a prospectus containing this and other information, please call Janus at 877.33JANUS (52687) or download the file from janus.com/variable-insurance/clayton. Read it carefully before you invest or send money. | ||||||||||||
Janus is a registered trademark of Janus International Holding LLC. © Janus International Holding LLC. Protective and Protective Life are registered service marks of Protective Life Insurance Company Corporation. Protective Life Dynamic Allocation Series Portfolios are distributed by Janus Distributors LLC and exclusively offered in connection with variable annuity contracts issued by Protective Life Insurance Company and its affiliates. Janus is not affiliated with Protective Life. | ||||||||||||
Investment products offered are: | NOT FDIC-INSURED | MAY LOSE VALUE | NO BANK GUARANTEE | |||||||||
C-0816-3434 | 109-24-93064 08-16 | |||||||||||
26 | JUNE 30, 2016 |
Item 2 - Code of Ethics
Not applicable to semiannual reports.
Item 3 - Audit Committee Financial Expert
Not applicable to semiannual reports.
Item 4 - Principal Accountant Fees and Services
Not applicable to semiannual reports.
Item 5 - Audit Committee of Listed Registrants
Not applicable.
Item 6 - Investments
(a) Schedule of Investments is contained in the Reports to Shareholders included under Item 1 of this Form N-CSR.
(b) Not applicable.
Item 7 - Disclosure of Proxy Voting Policies and Procedures for Closed-End Management Investment Companies
Not applicable to this Registrant.
Item 8 - Portfolio Managers of Closed-End Management Investment Companies
Not applicable to this Registrant.
Item 9 - Purchases of Equity Securities by Closed-End Management Investment Company and Affiliated Purchasers
Not applicable to this Registrant.
Item 10 - Submission of Matters to a Vote of Security Holders
There have been no material changes to the procedures by which shareholders may recommend nominees to the Registrant's Board of Trustees.
Item 11 - Controls and Procedures
(a) The Registrant's Principal Executive Officer and Principal Financial Officer have evaluated the Registrant's disclosure controls and procedures (as defined in Rule 30a-3(c) under the Investment Company Act of 1940, as amended) within 90 days of this filing and have concluded that the Registrant's disclosure controls and procedures were effective, as of that date.
(b) There have been no changes in the Registrant's internal control over financial reporting (as defined in Rule 30a-3(d) under the Investment Company Act of 1940, as amended) that occurred during the Registrant's second fiscal quarter of the period covered by this report that have materially affected, or are reasonably likely to materially affect, the Registrant's internal control over financial reporting.
Item 12 - Exhibits
(a)(1) Not applicable because the Registrant has posted its Code of Ethics (as defined in Item 2(b) of Form N-CSR) on its website pursuant to paragraph (f)(2) of Item 2 of Form N-CSR.
(a)(2) Separate certifications for the Registrant's Principal Executive Officer and Principal Financial Officer, as required under Rule 30a-2(a) under the Investment Company Act of 1940, as amended, are attached as Ex99.CERT.
(a)(3) Not applicable to this Registrant.
(b) A certification for the Registrant's Principal Executive Officer and Principal Financial Officer, as required by Rule 30a-2(b) under the Investment Company Act of 1940, as amended, is attached as Ex99.906CERT.
Signatures
Pursuant to the requirements of the Securities Exchange Act of 1934, as amended, and the Investment Company Act of 1940, as amended, the Registrant has duly caused this report to be signed on its behalf by the undersigned, thereunto duly authorized.
Clayton Street Trust
By: /s/ Bruce Koepfgen
Bruce Koepfgen, President and Chief Executive Officer of Clayton Street Trust
(Principal Executive Officer)
Date: August 29, 2016
Pursuant to the requirements of the Securities Exchange Act of 1934, as amended, and the Investment Company Act of 1940, as amended, this report has been signed below by the following persons on behalf of the Registrant and in the capacities and on the dates indicated.
By: /s/ Bruce Koepfgen
Bruce Koepfgen, President and Chief Executive Officer of Clayton Street Trust
(Principal Executive Officer)
Date: August 29, 2016
By: /s/ Jesper Nergaard
Jesper Nergaard, Vice President, Chief Financial Officer, Treasurer and Principal Accounting Officer of Clayton Street Trust
(Principal Accounting Officer and Principal Financial Officer)
Date: August 29, 2016