Table of Contents
UNITED STATES
SECURITIES AND EXCHANGE COMMISSION
Washington, D.C. 20549
FORMN-CSR
CERTIFIED SHAREHOLDER REPORT OF REGISTERED
MANAGEMENT INVESTMENT COMPANIES
Investment Company Act file number811-23148
Guardian Variable Products Trust
(Exact name of registrant as specified in charter)
7 Hanover Square New York, N.Y. 10004
(Address of principal executive offices) (Zip code)
Gordon Dinsmore
President
Guardian Variable Products Trust
7 Hanover Square
New York, N.Y. 10004
(Name and address of agent for service)
Registrant’s telephone number, including area code:212-598-8000
Date of fiscal year end: December 31
Date of reporting period: December 31, 2018
Table of Contents
Item 1. Reports to Stockholders.
Table of Contents
Guardian Variable
Products Trust
2018
Annual Report
All Data as of December 31, 2018
Guardian Large Cap Fundamental Growth VIP Fund
Important Notice
Beginning on January 1, 2021, as permitted by regulations adopted by the Securities and Exchange Commission, paper copies of the Fund’s shareholder reports will no longer be sent by mail from The Guardian Insurance & Annuity Company, Inc. (“GIAC”). Instead, GIAC will mail you a notice when copies of the shareholder reports are made available on a website. You will be notified by mail each time a report is posted and provided with a website link to access the report.
If you have already elected to receive shareholder reports electronically, you will not be affected by this change and you need not take any action. If you have not yet elected electronic delivery, at any time, you may elect to receive the Fund’s shareholder reports and certain other communications from GIAC electronically, by going to www.guardianlife.com and registering for e-delivery.
You may instead elect to receive all future shareholder reports in paper free of charge. If you wish to receive paper copies of your shareholder reports, please call GIAC’s Customer Service Office Contact Center at 1-888-GUARDIAN (1-888-482-7342). Your election to receive reports in paper will apply to all the underlying funds available.

| Not FDIC insured. May lose value. No bank guarantee. | www.guardianlife.com |
Table of Contents
TABLE OF CONTENTS
Guardian Large Cap Fundamental Growth VIP Fund
Except as otherwise specifically stated, all information, including portfolio security positions, is as of December 31, 2018. The views expressed in the Fund Commentary are those of the Fund’s portfolio manager(s) as of the date of this report and are subject to change without notice. They do not necessarily represent the views of Park Avenue Institutional Advisers LLC or asub-adviser. The Fund Commentary may contain some forward-looking statements providing expectations or forecasts of future events as of the date of this report; they do not necessarily relate to historical or current facts. There can be no guarantee that any forward-looking statement will be realized. We undertake no obligation to update forward-looking statements, whether as a result of new information, future events, or otherwise. Any discussions of specific securities should not be considered a recommendation to buy or sell those securities. Fund holdings will vary. Information contained herein has been obtained from sources believed reliable, but is not guaranteed.
Table of Contents
GUARDIAN LARGE CAP FUNDAMENTAL GROWTH VIP FUND
FUND COMMENTARY OF CLEARBRIDGE INVESTMENTS LLC,SUB-ADVISER
Highlights
| • | Guardian Large Cap Fundamental Growth VIP Fund (the “Fund”) returned-1.81%, underperforming its benchmark, the Russell 1000® Growth Index1 (the “Index”), for the 12 months ended December 31, 2018. The Fund’s underperformance relative to the Index was primarily due to stock selection in the information technology sector. |
| • | The Index delivered a-1.51% return for the period. This performance was largely due to strength in the consumer discretionary, information technology and health care sectors but was offset by weakness in the energy, communication services and industrials sectors, especially late in the period. |
Market Overview
Stocks suffered losses for the 12 months ended December 31, 2018, with the Index declining 1.51%. Volatility rose sharply in the fourth quarter, sending U.S. equities to broad losses as investors fretted over risks related to slowing global growth, rising interest rates and stumbles by some of the market’s largest companies. The Standard & Poor’s 500®Index2 suffered its second-worst December on record(-9.03%) to finish down 13.52% for the fourth quarter and register its first annual loss(-4.38%) since the global financial crisis. The Index fell 15.89% for the quarter, but still outperformed its value counterpart, the Russell 1000® Value Index,3 by 676 basis points for the year. Momentum among the largest growth companies in the market weakened as the year progressed, yet the information technology and consumer discretionary sectors were the leading performers for the year. Health care stocks held their own during the year, finishing as one of just four sectors
with gains for the year. The energy sector was a headwind to performance as lower demand from slowing global growth and oversupply from U.S. shale drillers, Saudi Arabia, and Russia contributed to a more than 21% decline in crude oil prices. Market action late in 2018 also reflects a return to normalized valuations and earnings growth rates as monetary and fiscal stimulus measures are simultaneously removed from the economy.
Portfolio Review
Stock selection in the information technology, consumer discretionary and materials sectors and an underweight to the industrials sector contributed to relative performance. On the negative side, stock selection in the health care, financials and real estate sectors, as well as an overweight to energy negatively impacted relative returns.
Outlook
Many of the tailwinds that have driven equities higher through the long-running bull market are turning into headwinds, in our view. In this generally less advantageous environment, we believe it is essential to be much more selective in choosing companies to own for the long term. From a portfolio standpoint, we believe the Fund remains positioned for positive GDP growth but at a slower pace than the 3.4% rate in the third quarter. We have been opportunistically repositioning the Fund over the last 12 months, and seeking companies and industries that we believe are capable of generating visible and durable growth, and that we consider more insulated from macro risks than the general market.
| 1 | The Index is an unmanaged market-capitalization-weighted index that measures the performance of those companies in the Russell 1000® Index (which consists of the 1.000 largest U.S. companies based on total market capitalization) with higher price-to-book ratios and higher forecasted growth values. Index results assume the reinvestment of dividends paid on the stocks constituting the Index. You may not invest in the Index, and, unlike the Fund, the Index does not incur fees or expenses. |
| 2 | The Standard & Poor’s 500® Index (the “S&P 500 Index”) is an unmanaged market-capitalization-weighted index generally considered to be representative of U.S. equity market activity. The S&P 500 Index consists of 500 stocks representing leading industries of the U.S. economy. Index results assume the reinvestment of dividends paid on the stocks constituting the Index. You may not invest in the S&P 500 Index, and, unlike the Fund, the S&P 500 Index does not incur fees or expenses. |
| 3 | The Russell 1000® Value Index (the “Index”) is an unmanaged market-capitalization-weighted index that measures the performance of those companies in the Russell 1000® Index (which consists of the 1,000 largest U.S. companies based on total market capitalization) with lower price-to-book ratios and lower forecasted growth values. Index results assume the reinvestment of dividends paid on the stocks constituting the Index. You may not invest in the Index, and, unlike the Fund, the Index does not incur fees or expenses. |
| 1 |
Table of Contents
GUARDIAN LARGE CAP FUNDAMENTAL GROWTH VIP FUND
Funds in the Guardian Variable Products Trust are sold by prospectus only. You should carefully consider the investment objectives, risks, charges and expenses of the Funds before making an investment decision. The prospectus contains this and other important information. Please read it carefully before investing or sending money. Please visit our website at http://guardianvpt.onlineprospectus.net/GuardianVPT/Prospectuses or to obtain a printed copy, call1-888-GUARDIAN(1-888-482-7342).
As with all mutual funds, the value of an investment in the Fund could decline, and you could lose money. Diversification does not guarantee profit or protect against loss, and there can be no assurance that the Fund will achieve its investment objective. The Fund invests primarily in equity securities and therefore exposes you to the general risks of investing in stock markets. Investing in large-capitalization companies involves risks such as having low growth rates, and slow responsiveness to competitive challenges or opportunities than in the case of smaller companies. Investments in growth companies may be highly volatile. Growth stocks may not realize their perceived growth potential and during certain periods the Fund may underperform other equity funds that employ a different style. International investing involves special risks, which include changes in currency rates, foreign taxation and differences in auditing standards and securities regulations, political uncertainty and greater volatility. Foreign securities are subject to political, regulatory, economic, and exchange-rate risks not present in domestic investments. Investing in a more limited number of issuers and sectors can be subject to greater market fluctuation. Any discussions of specific securities should not be considered a recommendation to buy or sell those securities. Fund holdings will vary.
| 2 |
Table of Contents
GUARDIAN LARGE CAP FUNDAMENTAL GROWTH VIP FUND
Fund Characteristics (unaudited)
| Total Net Assets: $223,264,250 |
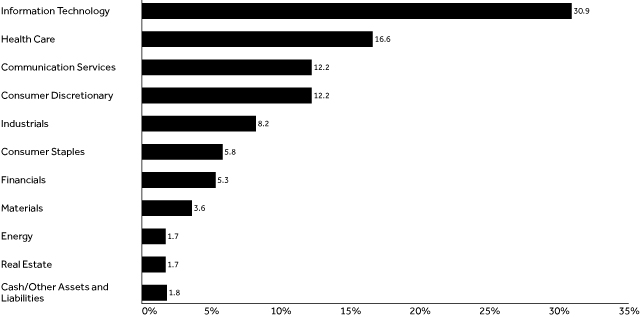
Sector Allocation1 As of December 31, 2018 |
 |
Top Ten Holdings2 As of December 31, 2018 | ||||
| Holding | % of Total Net Assets | |||
| Amazon.com, Inc. | 6.07% | |||
| Microsoft Corp. | 4.48% | |||
| Visa, Inc., Class A | 3.57% | |||
| Facebook, Inc., Class A | 3.52% | |||
| Alphabet, Inc., Class C | 3.20% | |||
| UnitedHealth Group, Inc. | 3.18% | |||
| Adobe, Inc. | 2.77% | |||
| Apple, Inc. | 2.30% | |||
| Zoetis, Inc. | 2.27% | |||
| WW Grainger, Inc. | 2.24% | |||
| Total | 33.60% | |||
| 1 | The Fund’s holdings are allocated to each sector based on the MSCI Global Industry Classification Standard (GICS®). Cash includes short-term investments and net other assets and liabilities. |
| 2 | Portfolio holdings are subject to change and should not be considered a recommendation to buy or sell individual securities. |
| 3 |
Table of Contents
GUARDIAN LARGE CAP FUNDAMENTAL GROWTH VIP FUND
Average Annual Total Returns As of December 31, 2018 | ||||||||||||||||||||
| Inception Date | 1 Year | 5 Year | 10 Year | Since Inception | ||||||||||||||||
| Guardian Large Cap Fundamental Growth VIP Fund | 9/1/2016 | -1.81% | — | — | 10.07% | |||||||||||||||
| Russell 1000® Growth Index | -1.51% | — | — | 11.84% | ||||||||||||||||
Results of a Hypothetical $10,000 Investment As of December 31, 2018 |
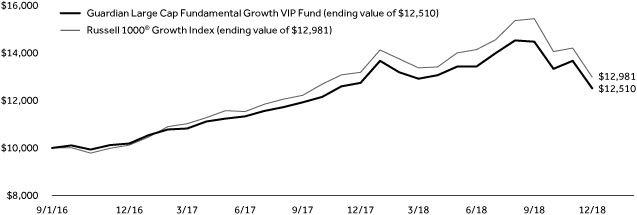 |
The chart above shows the performance of a hypothetical $10,000 investment made on inception date in Guardian Large Cap Fundamental Growth VIP Fund and the Russell 1000® Growth Index. Index returns do not include the fees and expenses of the Fund, but do include reinvestment of dividends, if any.
Performance quoted represents past performance and does not guarantee or predict future results. Investment return and principal value will fluctuate, so shares, when redeemed, may be worth more or less than their original cost. The Fund’s fees and expenses are detailed in the Financial Highlights section of this report. Fees and expenses are factored into the net asset value of Fund shares and any performance numbers we release. Total return figures include the effect of expense limitations in effect during the periods shown, if applicable; without such limitations, the performance shown would have been lower. Performance results assume the reinvestment of dividends and capital gains. The return figures shown do not reflect the deduction of taxes that a contract owner/policyholder may pay on redemption units. The actual total returns for owners of variable annuity contracts or variable life insurance policies that provide for investment in the Fund will be lower to reflect separate account and contract/policy charges. Current andmonth-end performance information, which may be lower or higher than that cited, is available by calling1-888-GUARDIAN(1-888-482-7342) and is periodically updated on our website: http://guardianlife.com.
| 4 |
Table of Contents
UNDERSTANDING YOUR FUND’S EXPENSES(UNAUDITED)
By investing in the Fund, you incur two types of costs: (1) transaction costs and (2) ongoing costs, including, as applicable, investment advisory fees, distribution and/or service(12b-1) fees and other Fund expenses. The example below is intended to help you understand your ongoing costs (in dollars) of investing in the Fund and to compare these costs with the ongoing costs of investing in other mutual funds.
The example is based on an investment of $1,000 invested at the beginning of the period and held for the entire period from July 1, 2018 to December 31, 2018. The table below shows the Fund’s expenses in two ways:
Expenses based on actual return
This section of the table provides information about actual account values and actual expenses. You may use the information in this section, together with the amount you invested, to estimate the expenses that you paid over the period. Simply divide your account value by $1,000 (for example, an $8,600 account value divided by $1,000 = 8.6), then multiply the result by the number in the section under the heading entitled “Expenses Paid During Period” to estimate the expenses you paid on your account during this period.
Expenses based on hypothetical 5% return for comparison purposes
This section of the table provides information about hypothetical account values and hypothetical expenses based on the Fund’s actual expense ratio and an assumed rate of return of 5% per year before expenses, which is not the Fund’s actual return. The hypothetical account values and expenses may not be used to estimate the actual ending account balance or expenses you paid for the period. You may use this information to compare the ongoing costs of investing in the Fund with the cost of investing in other mutual funds. To do so, compare this 5% hypothetical example with the 5% hypothetical examples that appear in the shareholder reports of the other funds.
Note that the expenses shown in the table are meant to highlight your ongoing costs only and do not reflect any transactional costs, such as sales charges (loads), redemption fees, or exchange fees. Therefore the second section is useful in comparing ongoing costs only, and will not help you determine the relative total costs of owning different funds. If these transactional costs were included, your costs would have been higher. Charges and expenses at the insurance company separate account level are not reflected in the table.
Beginning 7/1/18 | Ending Account Value 12/31/18 | Expenses Paid During Period* 7/1/18-12/31/18 | Expense Ratio During Period 7/1/18-12/31/18 | |||||||||||
| Based on Actual Return | $ 1,000.00 | $ | 932.20 | $ | 4.87 | 1.00% | ||||||||
| Based on Hypothetical Return (5% Return Before Expenses) | $ 1,000.00 | $ | 1,020.16 | $ | 5.09 | 1.00% | ||||||||
| * | Expenses are equal to the Fund’s annualized expense ratio as indicated, multiplied by the average account value over the period, multiplied by184/365 (to reflect theone-half year period). |
| 5 |
Table of Contents
SCHEDULE OF INVESTMENTS — GUARDIAN LARGE CAP FUNDAMENTAL GROWTH VIP FUND
| December 31, 2018 | Shares | Value | ||||||
| Common Stocks – 98.2% |
| |||||||
| Air Freight & Logistics – 1.5% |
| |||||||
United Parcel Service, Inc., Class B | 34,350 | $ | 3,350,156 | |||||
|
| |||||||
| 3,350,156 | ||||||||
| Beverages – 3.1% |
| |||||||
Anheuser-Busch InBev S.A., ADR | 56,320 | 3,706,419 | ||||||
The Coca-Cola Co. | 69,200 | 3,276,620 | ||||||
|
| |||||||
| 6,983,039 | ||||||||
| Biotechnology – 7.5% |
| |||||||
Alexion Pharmaceuticals, Inc.(1) | 32,310 | 3,145,702 | ||||||
Biogen, Inc.(1) | 15,500 | 4,664,260 | ||||||
BioMarin Pharmaceutical, Inc.(1) | 27,320 | 2,326,298 | ||||||
Celgene Corp.(1) | 58,040 | 3,719,783 | ||||||
Regeneron Pharmaceuticals, Inc.(1) | 7,670 | 2,864,745 | ||||||
|
| |||||||
| 16,720,788 | ||||||||
| Capital Markets – 3.6% |
| |||||||
BlackRock, Inc. | 10,040 | 3,943,913 | ||||||
The Charles Schwab Corp. | 97,020 | 4,029,240 | ||||||
|
| |||||||
| 7,973,153 | ||||||||
| Chemicals – 3.6% |
| |||||||
Ecolab, Inc. | 29,860 | 4,399,871 | ||||||
Linde PLC | 23,420 | 3,654,457 | ||||||
|
| |||||||
| 8,054,328 | ||||||||
| Consumer Finance – 1.7% |
| |||||||
American Express Co. | 38,800 | 3,698,416 | ||||||
|
| |||||||
| 3,698,416 | ||||||||
| Energy Equipment & Services – 0.9% |
| |||||||
Schlumberger Ltd. | 58,200 | 2,099,856 | ||||||
|
| |||||||
| 2,099,856 | ||||||||
| Entertainment – 2.2% |
| |||||||
The Walt Disney Co. | 45,020 | 4,936,443 | ||||||
|
| |||||||
| 4,936,443 | ||||||||
| Equity Real Estate Investment – 1.7% |
| |||||||
Equinix, Inc. REIT | 10,440 | 3,680,726 | ||||||
|
| |||||||
| 3,680,726 | ||||||||
| Food & Staples Retailing – 1.7% |
| |||||||
Costco Wholesale Corp. | 18,310 | 3,729,930 | ||||||
|
| |||||||
| 3,729,930 | ||||||||
| Food Products – 1.0% |
| |||||||
McCormick & Co., Inc. | 15,643 | 2,178,131 | ||||||
|
| |||||||
| 2,178,131 | ||||||||
| Health Care Providers & Services – 3.2% |
| |||||||
UnitedHealth Group, Inc. | 28,510 | 7,102,411 | ||||||
|
| |||||||
| 7,102,411 | ||||||||
| Hotels, Restaurants & Leisure – 3.0% |
| |||||||
Chipotle Mexican Grill, Inc.(1) | 6,640 | 2,867,086 | ||||||
Yum China Holdings, Inc. | 111,250 | 3,730,212 | ||||||
|
| |||||||
| 6,597,298 | ||||||||
| December 31, 2018 | Shares | Value | ||||||
| Industrial Conglomerates – 1.9% |
| |||||||
Honeywell International, Inc. | 32,650 | $ | 4,313,718 | |||||
|
| |||||||
| 4,313,718 | ||||||||
| Interactive Media & Services – 8.0% |
| |||||||
Alphabet, Inc., Class A(1) | 2,755 | 2,878,865 | ||||||
Alphabet, Inc., Class C(1) | 6,906 | 7,151,922 | ||||||
Facebook, Inc., Class A(1) | 60,020 | 7,868,022 | ||||||
|
| |||||||
| 17,898,809 | ||||||||
| Internet & Direct Marketing Retail – 7.2% |
| |||||||
Alibaba Group Holding Ltd., ADR(1) | 17,910 | 2,454,924 | ||||||
Amazon.com, Inc.(1) | 9,022 | 13,550,773 | ||||||
|
| |||||||
| 16,005,697 | ||||||||
| IT Services – 7.5% |
| |||||||
Akamai Technologies, Inc.(1) | 69,910 | 4,270,103 | ||||||
PayPal Holdings, Inc.(1) | 54,800 | 4,608,132 | ||||||
Visa, Inc., Class A | 60,420 | 7,971,815 | ||||||
|
| |||||||
| 16,850,050 | ||||||||
| Life Sciences Tools & Services – 2.2% |
| |||||||
Thermo Fisher Scientific, Inc. | 21,830 | 4,885,336 | ||||||
|
| |||||||
| 4,885,336 | ||||||||
| Machinery – 1.3% |
| |||||||
Caterpillar, Inc. | 23,270 | 2,956,919 | ||||||
|
| |||||||
| 2,956,919 | ||||||||
| Media – 2.0% |
| |||||||
Comcast Corp., Class A | 131,010 | 4,460,891 | ||||||
|
| |||||||
| 4,460,891 | ||||||||
| Oil, Gas & Consumable Fuels – 0.8% |
| |||||||
Pioneer Natural Resources Co. | 14,305 | 1,881,394 | ||||||
|
| |||||||
| 1,881,394 | ||||||||
| Pharmaceuticals – 3.7% |
| |||||||
Johnson & Johnson | 25,090 | 3,237,864 | ||||||
Zoetis, Inc. | 59,250 | 5,068,245 | ||||||
|
| |||||||
| 8,306,109 | ||||||||
| Professional Services – 1.3% |
| |||||||
IHS Markit Ltd.(1) | 60,857 | 2,919,310 | ||||||
|
| |||||||
| 2,919,310 | ||||||||
| Semiconductors & Semiconductor Equipment – 4.2% |
| |||||||
NVIDIA Corp. | 11,920 | 1,591,320 | ||||||
QUALCOMM, Inc. | 70,980 | 4,039,472 | ||||||
Texas Instruments, Inc. | 39,370 | 3,720,465 | ||||||
|
| |||||||
| 9,351,257 | ||||||||
| Software – 16.9% |
| |||||||
Adobe, Inc.(1) | 27,290 | 6,174,090 | ||||||
Microsoft Corp. | 98,430 | 9,997,535 | ||||||
Nutanix, Inc., Class A(1) | 58,410 | 2,429,272 | ||||||
Oracle Corp. | 105,910 | 4,781,836 | ||||||
Palo Alto Networks, Inc.(1) | 20,040 | 3,774,534 | ||||||
Red Hat, Inc.(1) | 24,320 | 4,271,565 | ||||||
Splunk, Inc.(1) | 36,150 | 3,790,328 | ||||||
VMware, Inc., Class A | 18,440 | 2,528,677 | ||||||
|
| |||||||
| 37,747,837 | ||||||||
| 6 | The accompanying notes are an integral part of these financial statements. |
Table of Contents
SCHEDULE OF INVESTMENTS — GUARDIAN LARGE CAP FUNDAMENTAL GROWTH VIP FUND
| December 31, 2018 | Shares | Value | ||||||
| Specialty Retail – 2.0% |
| |||||||
The Home Depot, Inc. | 25,520 | $ | 4,384,846 | |||||
|
| |||||||
| 4,384,846 | ||||||||
| Technology Hardware, Storage & Peripherals – 2.3% |
| |||||||
Apple, Inc. | 32,590 | 5,140,747 | ||||||
|
| |||||||
| 5,140,747 | ||||||||
| Trading Companies & Distributors – 2.2% |
| |||||||
WW Grainger, Inc. | 17,700 | 4,997,772 | ||||||
|
| |||||||
| 4,997,772 | ||||||||
| Total Common Stocks (Cost $225,939,229) |
| 219,205,367 | ||||||
| Principal Amount | Value | |||||||
| Short–Term Investment – 1.8% |
| |||||||
| Repurchase Agreements – 1.8% |
| |||||||
Fixed Income Clearing Corp., 0.50%, dated 12/31/2018, proceeds at maturity value of $4,068,113, due 1/2/2019(2) | $ | 4,068,000 | 4,068,000 | |||||
| Total Repurchase Agreements (Cost $4,068,000) |
| 4,068,000 | ||||||
| Total Investments – 100.0% (Cost $230,007,229) |
| 223,273,367 | ||||||
| Liabilities in excess of other assets – (0.0)% |
| (9,117 | ) | |||||
| Total Net Assets – 100.0% |
| $ | 223,264,250 | |||||
| (1) | Non–income–producing security. |
| (2) | The table below presents collateral for repurchase agreements. |
| Security | Coupon | Maturity Date | Principal Amount | Value | ||||||||||||
| U.S. Treasury Note | 2.875% | 7/31/2025 | $ | 4,045,000 | $ | 4,150,583 | ||||||||||
Legend:
ADR — American Depositary Receipt
REIT — Real Estate Investment Trust
The following is a summary of the inputs used as of December 31, 2018 in valuing the Fund’s investments. For more information on valuation inputs, please refer to Note 2a of the accompanying Notes to Financial Statements.
| Valuation Inputs | ||||||||||||||||
| Investments in Securities | Level 1 | Level 2 | Level 3 | Total | ||||||||||||
| Common Stocks | $ | 219,205,367 | $ | — | $ | — | $ | 219,205,367 | ||||||||
| Repurchase Agreements | — | 4,068,000 | — | 4,068,000 | ||||||||||||
| Total | $ | 219,205,367 | $ | 4,068,000 | $ | — | $ | 223,273,367 | ||||||||
| The accompanying notes are an integral part of these financial statements. | 7 |
Table of Contents
FINANCIAL INFORMATION — GUARDIAN LARGE CAP FUNDAMENTAL GROWTH VIP FUND
For the Year Ended December 31, 2018 | ||||
Investment Income | ||||
Dividends | $ | 2,402,720 | ||
Interest | 16,326 | |||
Withholding taxes on foreign dividends | (22,850 | ) | ||
|
| |||
Total Investment Income | 2,396,196 | |||
|
| |||
Expenses | ||||
Investment advisory fees | 1,124,272 | |||
Distribution fees | 476,407 | |||
Trustees’ and officers’ fees | 109,261 | |||
Professional fees | 70,419 | |||
Custodian and accounting fees | 47,424 | |||
Administrative fees | 44,750 | |||
Shareholder reports | 19,746 | |||
Transfer agent fees | 18,733 | |||
Other expenses | 28,408 | |||
|
| |||
Total Expenses | 1,939,420 | |||
Less: Fees waived | (48,706 | ) | ||
|
| |||
Net expenses before Adviser recoupment | 1,890,714 | |||
Expenses recouped by Adviser | 14,914 | |||
|
| |||
Total Expenses, Net | 1,905,628 | |||
|
| |||
Net Investment Income/(Loss) | 490,568 | |||
|
| |||
Realized Gain/(Loss) and Change in Unrealized Appreciation/(Depreciation) on Investments | ||||
Net realized gain/(loss) from investments | 6,619,884 | |||
Net change in unrealized appreciation/(depreciation) on investments | (8,867,885 | ) | ||
|
| |||
Net Loss on Investments | (2,248,001 | ) | ||
|
| |||
Net Decrease in Net Assets Resulting From Operations | $ | (1,757,433 | ) | |
|
| |||
| 8 | The accompanying notes are an integral part of these financial statements. |
Table of Contents
FINANCIAL INFORMATION — GUARDIAN LARGE CAP FUNDAMENTAL GROWTH VIP FUND
| For the Year Ended 12/31/18 | For the Year Ended 12/31/17 | |||||||
| ||||||||
Operations | ||||||||
Net investment income/(loss) | $ | 490,568 | $ | 13,841 | ||||
Net realized gain/(loss) from investments | 6,619,884 | 1,368,660 | ||||||
Net change in unrealized appreciation/(depreciation) on investments | (8,867,885 | ) | 2,012,222 | |||||
|
|
|
| |||||
Net Increase/(Decrease) in Net Assets Resulting from Operations | (1,757,433 | ) | 3,394,723 | |||||
|
|
|
| |||||
Capital Share Transactions | ||||||||
Proceeds from sales of shares | 246,910,584 | 5,559,941 | ||||||
Cost of shares redeemed | (33,834,722 | ) | (6,787,106 | ) | ||||
|
|
|
| |||||
Net Increase/(Decrease) in Net Assets Resulting from Capital Share Transactions | 213,075,862 | (1,227,165 | ) | |||||
|
|
|
| |||||
Net Increase in Net Assets | 211,318,429 | 2,167,558 | ||||||
|
|
|
| |||||
Net Assets | ||||||||
Beginning of year | 11,945,821 | 9,778,263 | ||||||
|
|
|
| |||||
End of year | $ | 223,264,250 | $ | 11,945,821 | ||||
|
|
|
| |||||
Other Information: | ||||||||
Shares | ||||||||
Sold | 19,371,482 | 518,039 | ||||||
Redeemed | (2,465,268 | ) | (540,548 | ) | ||||
|
|
|
| |||||
Net Increase/(Decrease) | 16,906,214 | (22,509 | ) | |||||
|
|
|
| |||||
| The accompanying notes are an integral part of these financial statements. | 9 |
Table of Contents
FINANCIAL INFORMATION — GUARDIAN LARGE CAP FUNDAMENTAL GROWTH VIP FUND
The Financial Highlights table is intended to help you understand the Fund’s financial performance for the past five years (or, if shorter, the period since inception). Certain information reflects financial results for a single Fund share. The total returns in the table represent the rate that an investor would have earned (or lost) on an investment in the Fund.
Financial Highlights | ||||||||||||||||||||||||
| Per Share Operating Performance | ||||||||||||||||||||||||
| Net Asset Value, Beginning of Period | Net Investment Income(1) | Net Realized | Total Operations | Net Asset Value, End of Period | Total Return(2) | |||||||||||||||||||
Year Ended 12/31/18 | $ | 12.74 | $ | 0.03 | $ | (0.26 | ) | $ | (0.23 | ) | $ | 12.51 | (1.81) | % | ||||||||||
Year Ended 12/31/17 | 10.19 | 0.01 | 2.54 | 2.55 | 12.74 | 25.02 | % | |||||||||||||||||
Period Ended 12/31/16(4) | 10.00 | 0.01 | 0.18 | 0.19 | 10.19 | 1.90 | %(5) | |||||||||||||||||
| 10 | The accompanying notes are an integral part of these financial statements. |
Table of Contents
FINANCIAL INFORMATION — GUARDIAN LARGE CAP FUNDAMENTAL GROWTH VIP FUND
| ||||||||||||||||||||||
| Ratios/Supplemental Data | ||||||||||||||||||||||
| Net Assets, End of Period (000s) | Net Ratio of Expenses to Average Net Assets(3) | Gross Ratio of Expenses to Average Net Assets | Net Ratio of Net Investment Income to Average Net Assets(3) | Gross Ratio of Net Investment Income/(Loss) to Average Net Assets | Portfolio Turnover Rate | |||||||||||||||||
| $ | 223,264 | 1.00% | 1.02% | 0.26% | 0.24 | % | 33% | |||||||||||||||
| 11,946 | 1.00% | 1.95% | 0.09% | (0.86) | % | 51% | ||||||||||||||||
| 9,778 | 1.00% | (5) | 3.08% | (5) | 0.26% | (5) | (1.82) | %(5) | 4% | (5) | ||||||||||||
| (1) | Calculated based on the average shares outstanding during the period. |
| (2) | Total returns do not reflect the effects of charges deducted pursuant to the terms of The Guardian Insurance & Annuity Company, Inc.’s variable contracts. Inclusion of such charges would reduce the total returns for all periods shown. |
| (3) | Net Ratio of Expenses to Average Net Assets and Net Ratio of Net Investment Income to Average Net Assets include the effect of fee waivers, expense limitations, and recoupments. |
| (4) | Commenced operations on September 1, 2016. |
| (5) | Ratios for periods less than one year have been annualized, except for total return and portfolio turnover rate. For the period ended December 31, 2016, certain non-recurring fees (i.e., audit fees) are not annualized. |
| The accompanying notes are an integral part of these financial statements. | 11 |
Table of Contents
NOTES TO FINANCIAL STATEMENTS — GUARDIAN LARGE CAP FUNDAMENTAL GROWTH VIP FUND
December 31, 2018
1. Organization
Guardian Variable Products Trust (the “Trust”), a Delaware statutory trust organized on January 12, 2016, is registered under the Investment Company Act of 1940, as amended (the “1940 Act”), as anopen-end management investment company. The Trust currently has sixteen series. Guardian Large Cap Fundamental Growth VIP Fund (the “Fund”) is a series of the Trust. The Fund is a diversified fund and commenced operations on September 1, 2016. The financial statements for other series of the Trust are presented in separate reports.
The Trust has authorized an unlimited number of shares of beneficial interest with no par value. Shares are bought and sold at closing net asset value (“NAV”). Shares of the Fund are only sold to certain separate accounts of The Guardian Insurance & Annuity Company, Inc. (“GIAC”) that fund certain variable annuity contracts and variable life insurance policies issued by GIAC. GIAC is a wholly-owned subsidiary of The Guardian Life Insurance Company of America (“Guardian Life”).
The Fund seeks long-term growth of capital.
2. Significant Accounting Policies
The following is a summary of significant accounting policies followed by the Fund in the preparation of its financial statements. The Fund follows the investment company accounting and reporting guidance of the Financial Accounting Standards Board (“FASB”) Accounting Standards Codification Topic 946 Financial Services — Investment Companies. The following policies are in conformity with accounting principles generally accepted in the United States of America (“GAAP”). The preparation of financial statements in accordance with GAAP requires management to make estimates and assumptions that affect the reported amounts and disclosures in the financial statements. Actual results could differ from those estimates.
a. Investment Valuations Equity securities traded on an exchange other than NASDAQ Stock Market, LLC (“NASDAQ”) are valued at the last reported sale price on the principal exchange or market on which they are traded; or, if there were no sales that day, at the mean between the closing bid and ask prices. Securities traded on the NASDAQ are generally valued at the NASDAQ official closing price, which may not be the last sale price. If the NASDAQ official closing price is not available
for a security, that security is generally valued at the mean between the closing bid and ask prices. Repurchase agreements are carried at cost, which approximates fair value (see Note 5d). Foreign securities are valued in the currencies of the markets in which they trade and then converted to U.S. dollars by the application of foreign exchange rates at the close of the New York Stock Exchange (“NYSE”). Forward foreign currency contracts, if any, are valued at the mean between the bid and ask rates for the specified time interpolated from rates for proximate time periods. Securities for which market quotations are not readily available or for which market quotations may be considered unreliable are valued at their fair values as determined in accordance with policies and procedures adopted by the Board of Trustees.
Under the policies and procedures approved by the Board of Trustees, Park Avenue Institutional Advisers LLC (“Park Avenue”), the Fund’s investment adviser, has established a Fair Valuation Committee to assist the Board of Trustees with the oversight and monitoring of the valuation of the Fund’s investments. This includes monitoring the appropriateness of fair values based on results of ongoing valuation oversight, including but not limited to consideration of security specific events, market events, and pricing vendor and broker-dealer due diligence. The Fair Valuation Committee oversees and carries out the policies for the valuation of investments held in the Fund. The Fair Valuation Committee is responsible for discussing and assessing the potential impacts to the fair values on an ongoing basis, and at least on a quarterly basis with the Board of Trustees.
Securities whose values have been materially affected by events occurring before the Fund’s valuation time but after the close of the securities’ principal exchange or market may be fair valued in accordance with policies and procedures adopted by the Board of Trustees. In addition, the values of the Fund’s investments in foreign securities are generally determined by a pricing service using pricing models designed to estimate likely changes in the values of those securities. Certain foreign equity instruments are valued by applying international fair value factors provided by approved pricing services. The factors seek to adjust the local closing price for movements of local markets post closing, but prior to the time the NAVs are calculated. Valuations reflected in this report are as of the report date. As a result, changes in valuation due to market events and/or issuer related events after the report date and prior to issuance of the report are not reflected herein.
| 12 |
Table of Contents
NOTES TO FINANCIAL STATEMENTS — GUARDIAN LARGE CAP FUNDAMENTAL GROWTH VIP FUND
Various inputs are used in determining the valuation of the Fund’s investments. These inputs are summarized in three broad levels listed below.
| • | Level 1 — unadjusted inputs using quoted prices in active markets for identical investments. |
| • | Level 2— other significant observable inputs, including, but not limited to, quoted prices for similar investments, inputs other than quoted prices that are observable for investments (such as interest rates, prepayment speeds, credit risks, etc.) or other market corroborated inputs. |
| • | Level 3 — significant unobservable inputs (including the Fund’s own assumptions in determining the fair value of investments) |
Inputs may include price information, volatility statistics, specific and broad credit data, liquidity statistics, and other factors. A financial instrument’s level within the fair value hierarchy is based on the lowest level of any input; both individually and in aggregate, that is significant to the fair value measurement. However, the determination of what constitutes “observable” requires significant judgment by the Trust. The Trust considers observable data to be that market data which is readily available, regularly distributed or updated, reliable and verifiable, and provided by independent sources that are actively involved in the relevant market. The inputs or methodology used for valuing securities are not necessarily an indication of the risk associated with investing in those securities. Changes in valuation techniques may result in transfers into or out of a financial instrument’s assigned level within the hierarchy.
The FASB requires reporting entities to make disclosures about purchases, sales, issuances and settlements of Level 3 securities on a gross basis.
The Fund’s policy is to recognize transfers between Level 1, Level 2 and Level 3 at the end of the reporting period. For the year ended December 31, 2018, there were no transfers among any levels.
In determining a financial instrument’s placement within the hierarchy, the Trust separates the Fund’s investment portfolio into two categories: investments and derivatives (e.g., futures). A summary of inputs used to value the Fund’s assets and liabilities carried at fair value as of December 31, 2018 is included in the Schedule of Investments.
InvestmentsInvestments whose values are based on quoted market prices in active markets, and are therefore classified within Level 1, include active listed
equities. Investments that trade in markets that are not considered to be active, but are valued based on quoted market prices, dealer quotations or alternative pricing sources supported by observable inputs are classified within Level 2. These include certain U.S. government and sovereign obligations, most government agency securities, investment-grade corporate bonds, certain mortgage products, state, municipal and provincial obligations, and certain foreign equity securities, including securities whose prices may have been affected by events occurring after the close of trading on their principal exchange or market and, as a result, whose values are determined by a pricing service as described above, or securities whose values are otherwise determined using fair valuation methods approved by the Fund’s Board of Trustees.
Investments classified within Level 3 have significant unobservable inputs, as they trade infrequently or not at all. Level 3 investments include, among others, private placement securities. When observable prices are not available for these securities, the Trust uses one or more valuation techniques for which sufficient and reliable data is available. The inputs used by the Trust in estimating the value of Level 3 investments include, for example, the original transaction price, recent transactions in the same or similar instruments, completed or pending third-party transactions in the underlying investment or comparable issuers, subsequent rounds of financing, recapitalizations, and other transactions across the capital structure. Level 3 investments may also be adjusted to reflect illiquidity and/ornon-transferability, with the amount of such discount estimated by the Trust in the absence of market information. Assumptions used by the Trust due to the lack of observable inputs may significantly impact the resulting fair value and therefore the Fund’s results of operations. As of December 31, 2018, the Fund had no securities classified as Level 3.
DerivativesExchange-traded derivatives, such as futures contracts, exchange-traded option contracts and certain swaps, are typically classified within Level 1 or Level 2 of the fair value hierarchy depending on whether or not they are deemed to be actively traded. Certainnon-exchange-traded derivatives, such as generic forwards, certain swaps and options, have inputs which can generally be corroborated by market data and are therefore classified within Level 2. During the year ended December 31, 2018, the Fund did not hold any derivatives.
b. Securities TransactionsSecurities transactions are accounted for on the date securities are purchased or
| 13 |
Table of Contents
NOTES TO FINANCIAL STATEMENTS — GUARDIAN LARGE CAP FUNDAMENTAL GROWTH VIP FUND
sold (trade date). Realized gains or losses on securities transactions are determined on the basis of specific identification.
c. Foreign Currency Translation The accounting records of the Fund are maintained in U.S. dollars. Investment securities and all other assets and liabilities of the Fund denominated in a foreign currency are generally translated into U.S. dollars at the exchange rates quoted at the close of the NYSE on each business day. The market value of investment securities and other assets and liabilities are translated at the exchange rate as of the valuation date. Purchases and sales of securities, income receipts, and expense payments are translated into U.S. dollars at the exchange rates in effect on the dates of the respective transactions. The Fund does not isolate the portion of the fluctuations on investments resulting from changes in foreign currency exchange rates from the fluctuations in market prices of investments held. Such fluctuations are included in the Net change in net realized and unrealized gain/(loss) from investments on the Statement of Operations.
Reported realized foreign currency gains and losses arise from the disposition of foreign currency, currency gains or losses realized between the trade and settlement dates on securities transactions, and the difference between the amounts of dividends, interest and foreign withholding taxes recorded on the Fund’s books on the transaction date and the U.S. dollar equivalent of the amounts actually received or paid. These reported realized foreign currency gains and losses, if any, are included in Net realized gain/(loss) from foreign currency transactions on the Statement of Operations. Unrealized foreign currency gains and losses arise from changes (due to changes in exchange rates) in the value of foreign currency and other assets and liabilities denominated in foreign currencies, which are held at period end, if any, and are included in Net change in unrealized appreciation/(depreciation) on translation of assets and liabilities in foreign currencies on the Statement of Operations.
d. Foreign Capital Gains Tax The Fund may be subject to foreign taxes on income, gains on investments or currency purchases/repatriation, a portion of which may be recoverable. The Fund will accrue such taxes and recoveries as applicable, based upon their current interpretation of tax rules and regulations that exist in the markets in which they invest.
e. Investment Income Dividend income net of foreign taxes withheld, if any, is generally recorded on the
ex-dividend date. Interest income, which includes amortization/accretion of premium/discount, is determined using the interest income accrual method, and is accrued and recorded daily.
f. Allocation of Income and Expenses Many of the expenses of the Trust can be directly attributed to a specific series of the Trust. Expenses that cannot be directly attributed to a specific series of the Trust are generally apportioned among all the series in the Trust, based on relative net assets. In calculating net asset value per share for each series of the Trust, investment income, realized and unrealized gains and losses, and expenses other than series-specific expenses are allocated daily to each series based upon the proportion of net assets attributable to each series.
3. Transactions with Affiliates
a. Investment Advisory Feeand Expense Limitation Under the terms of the advisory agreement, which, after its two year initial term, is reviewed and approved annually by the Board of Trustees, the Fund pays an investment advisory fee to Park Avenue. Park Avenue is a wholly-owned subsidiary of Guardian Life and receives an investment advisory fee at an annual rate of 0.62% up to $100 million, 0.57% up to $300 million, 0.52% up to $500 million, and 0.50% in excess of $500 million of the Fund’s average daily net assets. The fee is accrued daily and paid monthly.
Park Avenue has contractually agreed through April 30, 2019 to waive certain fees and/or reimburse certain expenses incurred by the Fund to the extent necessary to limit the Fund’s total annual operating expenses after fee waiver and/or expense reimbursement to 1.01% of the Fund’s average daily net assets (excluding, if applicable, any acquired fund fees and expenses, taxes, interest, transaction costs and brokerage commissions, litigation and extraordinary expenses). Prior to April 9, 2018, the expense limitation was 1.00%. The limitation may not be increased or terminated prior to this time without action by the Board of Trustees, may be terminated only upon approval of the Board of Trustees, and is subject to Park Avenue’s recoupment rights. For the year ended December 31, 2018, Park Avenue waived fees and/or paid Fund expenses in the amount of $48,706.
Park Avenue may be entitled to recoupment of previously waived fees and reimbursed expenses from the Fund for three years from the date of the waiver or reimbursement, subject to the expense limitation in effect at the time of the waiver or reimbursement and at the time of the recoupment, if any. Amounts waived or
| 14 |
Table of Contents
NOTES TO FINANCIAL STATEMENTS — GUARDIAN LARGE CAP FUNDAMENTAL GROWTH VIP FUND
reimbursed by Park Avenue pursuant to any expense limitation after April 9, 2018 will not be subject to Park Avenue’s recoupment rights. During the year ended December 31, 2018, Park Avenue recouped previous waived or reimbursed expenses in the amount of $14,914. The amount available for potential future recoupment by Park Avenue from the Fund under the Expense Limitation Agreement and the expiration schedule at December 31, 2018 are as follows:
Potential Recoupment Amounts Expiring | ||||||||||||
Total Potential Recoupment Amounts | 2021 | 2020 | 2019 | |||||||||
| $238,998 | $ | 47,223 | $ | 146,810 | $ | 44,965 | ||||||
Park Avenue has entered into aSub-Advisory Agreement with ClearBridge Investments LLC (“ClearBridge”). ClearBridge is responsible for providingday-to-day investment advisory services to the Fund, subject to the supervision of Park Avenue and the oversight of the Board of Trustees.Sub-advisory fees are paid by Park Avenue and do not represent a separate or additional expense to the Fund.
b. Compensation of Trustees and OfficersTrustees and officers who are interested persons of the Trust, as defined in the 1940 Act, receive no compensation from the Fund, except for the Chief Compliance Officer of the Trust. Trustees of the Trust who are not interested persons of the Trust, and the Chief Compliance Officer, receive compensation and reimbursement of expenses from the Trust.
c. Distribution Fees Park Avenue Securities LLC (“PAS”), a wholly-owned subsidiary of Guardian Life, is the principal underwriter of Fund shares. The Trust has entered into a distribution and service agreement with PAS, which governs the sale and distribution of shares of the Fund. Under a distribution and service plan adopted by the Trust(“12b-1 plan”), PAS is compensated for services in such capacity, including its expenses in connection with the promotion and distribution of shares of the Fund, at an annual rate of 0.25% of the Fund’s average daily net assets. For the year ended December 31, 2018, the Fund paid distribution fees in the amount of $476,407 to PAS.
PAS has directed that certain payments under the12b-1 plan be used to compensate GIAC for shareholder services provided to contract owners.
4. Federal Income Taxes
a. Distributions to Shareholders For federal income tax purposes, the Fund is treated as a disregarded entity (“DRE”). As a DRE, the Fund is not subject to an entity-level income tax; and any income, gains, losses, deductions, taxes, and credits of the Fund would instead be “passed through” directly to the separate accounts of GIAC that invest in the Fund and retain the same character for U.S. federal income tax purposes. In addition, the Fund is not required to distribute taxable income and capital gains for U.S. federal income tax purposes. Therefore, no dividends and capital gains distributions were paid by the Fund.
5. Investments
a. Investment Purchases and Sales The cost of investments purchased and the proceeds from investments sold (excluding short-term investments) amounted to $269,290,238 and $59,285,075, respectively, for the year ended December 31, 2018. During the year ended December 31, 2018, there were no purchases or sales of U.S. government securities.
b. Foreign Securities Foreign securities investments involve special risks and considerations not typically associated with U.S. investments. These risks include, but are not limited to, currency risk; adverse political, regulatory, social, and economic developments; and less reliable information about issuers. Moreover, securities of some foreign issuers may be less liquid and their prices more volatile than those of comparable U.S. issuers.
c. Industry or Sector Concentration In its normal course of business, the Fund may invest a significant portion of its assets in companies within a limited number of industries or sectors. As a result, the Fund may be subject to a greater risk of loss than that of a fund invested in a wider spectrum of industries or sectors because the stocks of many or all of the companies in the industry, group of industries, sector, or sectors may decline in value due to developments adversely affecting the industry, group of industries, sector, or sectors.
d. Repurchase Agreements The Fund may invest in repurchase agreements to maintain liquidity and earn income over periods of time as short as overnight. The collateral for repurchase agreements is either cash or fully negotiable U.S. government securities (including U.S. government agency securities). Repurchase agreements are fully collateralized (including the interest accrued thereon) and such collateral is marked
| 15 |
Table of Contents
NOTES TO FINANCIAL STATEMENTS — GUARDIAN LARGE CAP FUNDAMENTAL GROWTH VIP FUND
to market daily while the agreements remain in force. If the value of the collateral falls below the repurchase price plus accrued interest, the Fund will typically require the seller to deposit additional collateral by the next business day. If the request for additional collateral is not met, or the seller defaults, the Fund maintains the right to sell the collateral (although it may be prevented or delayed from doing so in certain circumstances) and may be required to claim any resulting loss against the seller. Park Avenue monitors the creditworthiness of the seller with which the Fund enters into repurchase agreements.
6. Temporary Borrowings
The Fund, with other funds managed by Park Avenue, is party to a $10 million committed revolving credit facility from State Street Bank and Trust Company for temporary borrowing purposes, including the meeting of redemption requests that otherwise might require the untimely disposition of securities. Interest is calculated based on the higher of the dailyone-month LIBOR rate and the Federal Funds rate plus 1.25% at the time of borrowing. In addition to the interest charged on any borrowings by the Fund, each fund pays a commitment fee of 0.30% per annum on its share of the unused portion of the credit facility. The agreement is in place until December 10, 2019. The Fund did not utilize the credit facility during the year ended December 31, 2018.
7. Indemnifications
Under the Trust’s organizational documents and, in some cases, by contract, its officers and trustees are
indemnified against certain liabilities arising out of the performance of their duties to the Fund. In addition, in the normal course of business, the Fund enters into contracts with its vendors and others that provide general indemnifications. The Fund’s maximum exposure under these arrangements is unknown as this would involve future claims that may be made against the Fund that have not yet occurred. However, based on experience, the Fund expects the risk of loss to be remote.
8. Recent Accounting Pronouncement
On August 17, 2018, the U.S. Securities and Exchange Commission (“SEC”) voted to adopt amendments to certain disclosure requirements that have become redundant, duplicative, overlapping, outdated, or superseded, in light of other SEC disclosure requirements, GAAP, or changes in the information environment. The SEC will also be referring certain SEC disclosure requirements that overlap with, but require information incremental to, GAAP to the FASB for potential incorporation into GAAP. The amendments are intended to facilitate the disclosure of information to investors and simplify compliance without significantly altering the total mix of information provided to investors. As such, the financial statements herein have been updated to conform with these new requirements, which had no effect on the Fund’s net assets or results of operations.
| 16 |
Table of Contents
REPORT OF INDEPENDENT REGISTERED PUBLIC ACCOUNTING FIRM
To the Board of Trustees of Guardian Variable Products Trust and Shareholders of
Guardian Large Cap Fundamental Growth VIP Fund
Opinion on the Financial Statements
We have audited the accompanying statement of assets and liabilities, including the schedule of investments, ofGuardian Large Cap Fundamental Growth VIP Fund(one of the funds constituting Guardian Variable Products Trust, referred to hereafter as the “Fund”) as of December 31, 2018, the related statement of operationsfor the year ended December 31, 2018, the statement of changes in net assets for each of the two years in the period ended December 31, 2018, including the related notes,and the financial highlights for each of the periods indicated therein (collectively referred to as the “financial statements”). In our opinion, the financial statements present fairly, in all material respects, the financial position of the Fund as of December 31, 2018, the results of its operations for the year then ended, the changes in its net assets for each of the two years in the period ended December 31, 2018and the financial highlights for each of the periods indicated therein in conformity with accounting principles generally accepted in the United States of America.
Basis for Opinion
These financial statements are the responsibility of the Fund’s management. Our responsibility is to express an opinion on the Fund’s financial statements based on our audits. We are a public accounting firm registered with the Public Company Accounting Oversight Board (United States) (PCAOB) and are required to be independent with respect to the Fund in accordance with the U.S. federal securities laws and the applicable rules and regulations of the Securities and Exchange Commission and the PCAOB.
We conducted our audits of these financial statements in accordance with the standards of the PCAOB. Those standards require that we plan and perform the audit to obtain reasonable assurance about whether the financial statements are free of material misstatement, whether due to error or fraud.
Our audits included performing procedures to assess the risks of material misstatement of the financial statements, whether due to error or fraud, and performing procedures that respond to those risks. Such procedures included examining, on a test basis, evidence regarding the amounts and disclosures in the financial statements. Our audits also included evaluating the accounting principles used and significant estimates made by management, as well as evaluating the overall presentation of the financial statements. Our procedures included confirmation of securities owned as of December 31, 2018 by correspondence with the custodian. We believe that our audits provide a reasonable basis for our opinion.
New York, New York
February 19, 2019
We have served as the auditor of one or more investment companies in Guardian Variable Products Trust since 2016.
| 17 |
Table of Contents
SUPPLEMENTAL INFORMATION(UNAUDITED)
Approval of Investment Advisory andSub-advisory Agreements
Section 15(c) of the Investment Company Act of 1940, as amended (the “1940 Act”), requires that a fund’s board of trustees annually review and consider the continuation of the fund’s investment advisory andsub-advisory agreements. The continuation of any such agreement must be approved by a vote of a majority of the trustees who are not parties to the agreement or “interested persons” (as defined in the 1940 Act) of a party to the agreement at anin-person meeting of the board called for the purpose of voting on such approval.
At a meeting of the Board of Trustees (the “Board”) of Guardian Variable Products Trust (the “Trust”) held on March27-28, 2018, the Board considered and unanimously voted to approve the continuation of the investment management agreement (the “Management Agreement”) between Park Avenue Institutional Advisers LLC (the “Manager”) and the Trust, on behalf of the following 11 series, Guardian Core Plus Fixed Income VIP Fund, Guardian Diversified Research VIP Fund, Guardian Growth & Income VIP Fund, Guardian Integrated Research VIP Fund, Guardian International Growth VIP Fund, Guardian International Value VIP Fund, Guardian Large Cap Disciplined Growth VIP Fund, Guardian Large Cap Disciplined Value VIP Fund, Guardian Large Cap Fundamental Growth VIP Fund, Guardian Mid Cap Relative Value VIP Fund and Guardian Mid Cap Traditional Growth VIP Fund (the “Funds”). The Board also considered and unanimously voted to approve the continuation of thesub-advisory agreements (the“Sub-advisory Agreements,” collectively with the Management Agreement, the “Agreements”) between the Manager and the following investment advisory firms serving assub-advisers to the Funds, ClearBridge Investments LLC, Wellington Management Company LLP, Massachusetts Financial Services Company, Putnam Investment Management, LLC, Boston Partners Global Investors, Inc., AllianceBernstein L.P., Janus Capital Management LLC, Wells Capital Management Incorporated, J.P. Morgan Investment Management Inc., Lazard Asset Management LLC, and Lord, Abbett & Co. LLC (the“Sub-advisers”). The continuation of the Agreements for aone-year period was unanimously approved by the Trustees who are not parties to the Agreements or “interested persons” (as defined in the 1940 Act) of a party to the Agreements (the “Independent Trustees”).
The Board is responsible for overseeing the management of each Fund. In determining whether to approve the continuation of the Agreements, the
Trustees evaluated information and factors that they considered to be relevant and appropriate through the exercise of their own business judgment. The Trustees considered certain information and factors in light of advice furnished to them by legal counsel to the Trust and, in the case of the Independent Trustees, their independent legal counsel.
In advance of the meeting held on March27-28, 2018, the Trustees received materials and information designed to assist their consideration of the Agreements, including written responses from the Manager and eachSub-adviser to a series of questions and requests for information covering a wide variety of topics provided by independent legal counsel on behalf of the Independent Trustees. Broadridge Financial Solutions, Inc. (“Broadridge”), an independent provider of investment company data, was retained to provide the Trustees with reports on how each Fund’s contractual management fees, actual management fees, overall expense ratios and investment performance compared to those of “peer funds” selected by Broadridge that are offered as investment options underlying variable contracts. The Trustees also received materials and information regarding the legal standards applicable to their consideration of the Agreements and the process and criteria used by the Manager to oversee theSub-advisers. During the course of their deliberations, the Independent Trustees met to discuss and evaluate the Agreements in executive session with their independent legal counsel, outside of the presence of the Trustees who are not Independent Trustees and representatives from Fund management, the Manager or anySub-adviser.
In reaching its decisions to approve the continuation of the Agreements, the Board took into account the materials and information described above as well as other materials and information provided to the Board and discussed with and among the Trustees, including information regarding the Funds furnished to the Board by the Manager throughout the year. Individual Trustees may have given different weight to different factors and information with respect to each Agreement, and the Trustees did not identify any single factor or information that, in isolation, would be controlling in deciding to approve the continuation of the Agreements.
The discussion below is intended to summarize the broad factors that figured prominently in the Board’s decisions to approve the continuation of the Agreements rather than to beall-inclusive. These broad factors included: (i) the nature, extent and quality of the services provided to the Funds by the Manager and the
| 18 |
Table of Contents
SUPPLEMENTAL INFORMATION(UNAUDITED)
Sub-advisers; (ii) the investment performance of the Funds; (iii) the fees charged and estimated profitability; (iv) the extent to which economies of scale may exist for a Fund, and the extent to which a Fund may benefit from economies of scale; and (v) any other benefits derived by the Manager or theSub-advisers (or their respective affiliates) from their relationships with the Funds. In addition to considering the above-referenced factors, the Board observed that there are a range of investment options available to variable contract owners who may invest in the Funds, and that these contract owners, having had the opportunity to consider other investment options, may choose to invest or remain invested in the Funds.
Nature, Extent and Quality of Services
The Trustees considered information regarding the nature, extent and quality of services provided to the Funds by the Manager. The Trustees also considered the range of investment advisory services andnon-investment advisory services provided by the Manager, notably coordinating the preparation and filing of various regulatory documents, coordinating the preparation and assembly of Board meeting materials and assisting the Board with certain valuation matters.
The Trustees considered the operation of the Funds in a“manager-of-managers” structure and the responsibilities that the Manager has under this structure, including monitoring and evaluating the performance of theSub-advisers, monitoring theSub-advisers for adherence to the stated investment objectives, strategies, policies and restrictions of the Funds and supervising theSub-advisers with respect to the services that theSub-advisers provide under the Sub-advisory Agreements. The Trustees also considered the process used by the Manager, consistent with this structure, to identify and recommendsub-advisers, and its ability to monitor and overseesub-advisers and recommend replacementsub-advisers, when necessary, and provide other services under the Management Agreement. The Trustees reviewed information regarding the experience and background of the Manager’s key personnel and the Manager’s organizational structure and resources, including investment, legal and administrative capabilities of the Manager. In this regard, the Trustees recognized that the Funds benefit from the Manager’s use of similar resources and capabilities of its affiliates in providing services to the Funds.
The Trustees considered information regarding the nature, extent and quality of services provided to the Funds by theSub-advisers. The Trustees also
considered, among other things, the range of investment advisory services provided by theSub-advisers under the oversight of the Manager. In evaluating these investment advisory services, the Trustees considered, among other things, theSub-advisers’ investment philosophies, styles and/or processes and approach to managing risk. The Trustees received and evaluated information regarding the background, education, expertise and/or experience of the investment professionals that serve as portfolio managers for the Funds and the capabilities, resources and reputations of theSub-advisers.
Based upon these considerations, the Board concluded that it was satisfied with the nature, extent and quality of services provided to the Funds by the Manager and eachSub-adviser.
Investment Performance
The Board considered the investment performance of each Fund. Among other reports, the Board reviewed the performance of the Funds for theone-year and since inception periods compared to a universe of peer funds selected by Broadridge. The Board noted that the Funds had performance records of less than two years and that the Board had reviewed longer performance records of the funds or accounts managed by theSub-advisers with similar strategies as the applicable Fund, when available, when the Board initially approved the Agreements in 2016. The Broadridge report placed the Funds in the following quintiles of the relevant peer universe for theone-year and since inception periods, respectively: Guardian Core Plus Fixed Income VIP Fund (3rd, 3rd), Guardian Diversified Research VIP Fund (2nd, 2nd), Guardian Growth & Income VIP Fund (1st, 1st), Guardian Integrated Research VIP Fund (4th, 5th), Guardian International Growth VIP Fund (3rd, 2nd), Guardian International Value VIP Fund (3rd, 5th), Guardian Large Cap Disciplined Growth VIP Fund (3rd, 4th), Guardian Large Cap Disciplined Value VIP Fund (1st, 1st), Guardian Large Cap Fundamental Growth VIP Fund (5th, 4th), Guardian Mid Cap Relative Value VIP Fund (4th, 3rd) and Guardian Mid Cap Traditional Growth VIP Fund (2nd, 2nd).
The Board considered the investment reports provided by the Manager since commencement of operations of the Funds during quarterly Board meetings. The Board also considered the Manager’s analysis ofSub-adviser performance and the steps taken by the Manager and theSub-advisers to seek to improve performance and the results of those steps.
| 19 |
Table of Contents
SUPPLEMENTAL INFORMATION(UNAUDITED)
In light of the considerations noted above, the Board concluded that it had continued confidence in the Manager’s and theSub-advisers’ overall capabilities to manage the Funds.
Costs and Profitability
The Trustees considered the management fees paid by the Funds to the Manager under the Management Agreement and evaluated the reasonableness of these fees. The Trustees received and reviewed information with respect to the management fees, including the portion of the management fees paid to eachSub-adviser, and the management fees paid by other funds offered as investment options underlying variable contracts within the applicable peer group selected by Broadridge. The Broadridge report placed the Funds in the following quintiles of the relevant expense peer group for the contractual management fees and actual management fees, respectively: Guardian Core Plus Fixed Income VIP Fund (1st, 3rd), Guardian Diversified Research VIP Fund (2nd, 3rd), Guardian Growth & Income VIP Fund (1st, 1st), Guardian Integrated Research VIP Fund (1st, 2nd), Guardian International Growth VIP Fund (1st, 2nd), Guardian International Value VIP Fund (3rd, 2nd), Guardian Large Cap Disciplined Growth VIP Fund (1st, 1st), Guardian Large Cap Disciplined Value VIP Fund (1st, 1st), Guardian Large Cap Fundamental Growth VIP Fund (1st, 1st), Guardian Mid Cap Relative Value VIP Fund (1st, 1st) and Guardian Mid Cap Traditional Growth VIP Fund (3rd, 4th).
The Trustees considered thesub-advisory fees paid under the Sub-advisory Agreements and evaluated the reasonableness of those fees. The Trustees also considered that the fees paid to theSub-advisers are paid by the Manager and not the Funds and that the Manager had negotiated the fees with theSub-advisers atarm’s-length. In addition, the Trustees considered the portion of the management fees paid to eachSub-adviser as compared to the portion retained by the Manager.
The Trustees received and reviewed information in the Broadridge report comparing each Fund’s operating expense ratio to the actual operating expense ratios of a peer group of funds selected by Broadridge. The Trustees considered the Manager’s commitment to limit each Fund’s operating expenses through an expense limitation agreement with the Trust. The Broadridge report placed the Funds in the following quintiles of the relevant expense peer group for the operating expense ratio: Guardian Core Plus Fixed Income VIP Fund (2nd), Guardian Diversified Research VIP Fund (2nd), Guardian Growth & Income VIP Fund
(2nd), Guardian Integrated Research VIP Fund (1st), Guardian International Growth VIP Fund (3rd), Guardian International Value VIP Fund (1st), Guardian Large Cap Disciplined Growth VIP Fund (1st), Guardian Large Cap Disciplined Value VIP Fund (2nd), Guardian Large Cap Fundamental Growth VIP Fund (1st), Guardian Mid Cap Relative Value VIP Fund (1st) and Guardian Mid Cap Traditional Growth VIP Fund (3rd).
Although the Board recognized that the comparisons between the management fees and anticipated operating expenses of the Funds and those of identified peer funds are imprecise, given different terms of agreements and variations in fund strategies, the Trustees found that the comparative information supported their consideration and approval of the management fees and evaluation of operating expenses.
The Trustees reviewed information regarding the Manager’s costs of sponsoring the Funds and estimated profitability of the Funds to the Manager. The Trustees noted that the information contained estimates, such as allocations of expenses. Although the Trustees did not receive specific cost and profitability information from certainSub-advisers, the Trustees primarily considered the cost and profitability information relating to the Manager because the Manager is responsible for payment of thesub-advisory fees and negotiated the fees with theSub-advisers atarm’s-length.
Based on the consideration of the information and factors summarized above, as well as other information and factors deemed relevant by the Trustees, the Trustees concluded that the management andsub-advisory fees were reasonable in light of the nature, extent and quality of services rendered to the Funds by the Manager and theSub-advisers. The Trustees also concluded that the estimated profitability of the Funds to the Manager was acceptable.
Economies of Scale
The Trustees considered the extent to which economies of scale may be shared as assets grow based on current asset levels of the Funds, anticipated asset levels over the next year, the current management andsub-advisory fee rates, the expense limitation arrangements, and any management andsub-advisory fee breakpoints, which reduce fee rates as assets increase. Based on those factors, the Board concluded that it was satisfied with the extent to which any economies of scale would be shared for the benefit of Fund shareholders. The Board noted that it would continue to monitor future growth in each Fund’s assets
| 20 |
Table of Contents
SUPPLEMENTAL INFORMATION(UNAUDITED)
and whether additional steps are required to share appropriately any economies of scale with Fund shareholders.
Ancillary Benefits
The Trustees considered the benefits, other than management fees, that the Manager and/or its affiliates receive because of the Manager’s relationship with the Funds. The Trustees acknowledged that the Funds serve as investment options under variable contracts issued by an affiliate of the Manager that receives fees under those contracts and that Park Avenue Securities LLC, an affiliate of the Manager and principal underwriter of the Funds, and an insurance company affiliated with the Manager receive fees from the Funds under a plan of distribution adopted pursuant to Rule12b-1 under the 1940 Act. The Trustees considered that the Manager and its affiliates may benefit from (i) greater efficiencies in annuity administration and operations and potential cost savings due to a reduction in the number of unaffiliated funds available as annuity contract investment options, and (ii) increased dividends-received deductions due to the Funds’ status under the
tax laws as disregarded entities. In addition, the Trustees considered the potential benefits, other thansub-advisory fees, that theSub-advisers and their affiliates receive because of their relationships with the Funds, including the potential increased ability to use soft dollars consistent with Trust policies and other benefits from increases in assets under management. The Trustees concluded that benefits that accrue to the Manager and its affiliates are reasonable and the benefits that accrue to theSub-advisers and their affiliates are consistent with those expected for asub-adviser to a mutual fund such as the applicable Fund.
Conclusion
Based on a comprehensive consideration and evaluation of all of the information and factors summarized above, among others, the Board voting as a whole, including the Independent Trustees voting separately, unanimously approved the continuation of the Agreements.
| 21 |
Table of Contents
SUPPLEMENTAL INFORMATION(UNAUDITED)
Trustees and Officers Information Table
The following table provides information about the Trustees of the Trust.
| Name and Year of Birth | Term of Office, Position(s) Held and Length of Service* | Principal During Past Five Years | Number of in Fund | Other Directorships Held by Trustee | ||||
| Independent Trustees | ||||||||
Bruce W. Ferris† (born 1955) | Trustee | Retired (since 2015); President and CEO, Prudential Annuity Distributors (2013– 2015); Director/Trustee, Advanced Series Trust, Prudential Series Fund and Prudential’s Gibraltar Fund, Inc. (2013– 2015); Senior Vice President, Prudential Annuities (2008–2015). | 16 | None. | ||||
Theda R. Haber† (born 1954) | Trustee | Adjunct Assistant Professor of Law, UC Hastings College of Law (since 2013); Member of the Board of Directors, Fairholme Trust Company, LLC (since 2015); Attorney, Law Office of Theda R. Haber (since 2014); Visiting Professor of Law, UC Davis School of Law (since 2014); Consultant, Haber & Associates LLC (financial services industry) (since 2012); Advisory Council Chair, Vice Chair, and Member, Advisory Council on Employee Welfare and Pension Benefit Plans (ERISA Advisory Council), U.S. Department of Labor (2009–2011); Managing Director and General Counsel, BlackRock Institutional Trust Company, N.A. (2009–2011); Deputy Global General Counsel, Barclays Global Investors (2006–2009); Managing Director, Barclays Global Investors (1998–2006). | 16 | None. | ||||
Marshall Lux† (born 1960) | Trustee | Senior Advisor, The Boston Consulting Group (since 2014); Senior Partner and Managing Director, The Boston Consulting Group (2009–2014). | 16 | None. | ||||
Lisa K. Polsky† (born 1956) | Trustee | Senior Risk Advisor, AQR (investment management) (since 2016); Senior Risk Advisor, Ultra Capital (venture capital) (since 2016); Board Member and Chair of Risk Committee, DeutscheBank IHC (financial services) (since May 2016); Chief Risk Officer, CIT Group Inc. (financial services) (2010–2015); Board Member and Chair of Audit Committee, Piper Jaffray (investment bank) (2007–2016). | 16 | None. | ||||
John Walters† (born 1962) | Lead Independent Trustee | Board Member, Amerilife Holdings LLC (insurance distribution) (since 2015); Board Member, Stadion Money Management LLC (investment adviser) (since 2011); President and Chief Operating Officer, Hartford Life Insurance Company (2000–2010). | 16 | None. | ||||
| 22 |
Table of Contents
SUPPLEMENTAL INFORMATION(UNAUDITED)
| Name and Year of Birth | Term of Office, Position(s) Held and Length of Service* | Principal During Past Five Years | Number of by Trustees*** | Other Directorships Held by Trustee | ||||
| Interested Trustees | ||||||||
| Gordon Dinsmore** (born 1952) | Trustee | Senior Vice President, Head of Product and President of Berkshire, The Guardian Life Insurance Company of America. | 16 | None. | ||||
| Marc Costantini** (born 1969) | Chairman and Trustee | Executive Vice President, Group and Worksite Markets, The Guardian Life Insurance Company of America (since 2017); Executive Vice President and Chief Financial Officer, The Guardian Life Insurance Company of America (2014– 2017); Executive Vice President, Manulife Financial prior thereto (various positions from 1990–2014). | 16 | None. | ||||
| * | Each Trustee except for Mr. Dinsmore began service in such capacity in 2016 and serves until his or her successor is elected and qualified or until his or her resignation, death or removal. Mr. Dinsmore has served as a Trustee since November 2017. The business address of each Trustee is 7 Hanover Square, New York, New York 10004. |
| ** | Each of Gordon Dinsmore and Marc Costantini is considered to be an “interested person” of the Trust within the meaning of the 1940 Act because of their affiliation with The Guardian Life Insurance Company of America and/or its affiliates. |
| *** | As of the date of this report, the Trust currently consists of 16 separate Funds. |
| † | Member of the Audit Committee of the Trust. |
The following table provides information about the Officers of the Trust.
| Name and Year of Birth | Position(s) Held and Length of Service* | Principal Occupation(s) During Past Five Years | ||
Gordon Dinsmore (born 1952) | President and Principal Executive Officer (Since November 2017) | Senior Vice President, Head of Product and President of Berkshire, The Guardian Life Insurance Company of America. | ||
John H. Walter (born 1962) | Senior Vice President, Treasurer, and Principal Financial and Accounting Officer | Vice President, Chief Financial Officer, Equity Profit Center, The Guardian Life Insurance Company of America. | ||
Harris Oliner (born 1971) | Senior Vice President and Secretary | Senior Vice President, Corporate Secretary, The Guardian Life Insurance Company of America (since 2015); Senior Vice President, Deputy General Counsel, Corporate Secretary, Voya Financial, Inc. (2013–2014); Managing Director, Senior Counsel, Corporate Secretary, BlackRock, Inc. prior thereto. | ||
Richard T. Potter (born 1954) | Senior Vice President and Chief Legal Officer | Vice President and Equity Counsel, The Guardian Life Insurance Company of America. | ||
Philip Stack (born 1964) | Chief Compliance Officer (Since September 2017) | Executive Director, Chief Compliance Officer, Morgan Stanley (2015–2017); Vice President, Morgan Stanley (2013–2015); Vice President, Corporate Audit Group–Compliance, Morgan Stanley prior thereto. | ||
James R. Anderson (born 1963) | Anti-Money Laundering Officer (Since November 2017) | Second Vice President, Agency and Anti-Money Laundering Compliance, The Guardian Life Insurance Company of America. | ||
Kathleen M. Moynihan (born 1966) | Senior Counsel | Senior Counsel, The Guardian Life Insurance Company of America. | ||
Maria Nydia Morrison (born 1958) | Fund Controller | Mutual Fund Controller, The Guardian Life Insurance Company of America (since 2015); Chief Financial Officer/Assistant Operating Officer, St. Francis De Assisi Montessori School (Plaridel, Bulacan), Inc. (Philippines) (2013–2015); Vice President, Bank of New York Mellon prior thereto. | ||
| 23 |
Table of Contents
SUPPLEMENTAL INFORMATION(UNAUDITED)
| Name and Year of Birth | Position(s) Held and Length of Service* | Principal Occupation(s) During Past Five Years | ||
Sonya L. Crosswell (born 1977) | Assistant Secretary | Assistant Vice President, Assistant Corporate Secretary and Secretary Pro Tem, The Guardian Life Insurance Company of America (since 2014); Vice President, Secretary and Assistant General Counsel, Carver Federal Savings Bank prior thereto. | ||
| * | Unless otherwise indicated, the Officers each began service in such capacity in 2016 and hold office for an indefinite term or until their successors shall have been elected and qualified. The business address of each Officer is 7 Hanover Square, New York, New York 10004. |
| 24 |
Table of Contents
SUPPLEMENTAL INFORMATION(UNAUDITED)
The Statement of Additional Information (“SAI”) includes additional information about the Trust’s Trustees and Officers and is available, without charge, upon request by calling toll-free1-888-GUARDIAN(1-888-482-7342) or by visiting our website at http://guardianvpt.onlineprospectus.net/GuardianVPT/Prospectuses.
Portfolio Holdings and Proxy Voting Procedures
The Fund files its complete schedule of portfolio holdings with the Securities and Exchange Commission for the first and third quarters of each fiscal year as an exhibit to its reports on Form N-Q or FormN-PORT (for filings beginning in April 2019 relating to March 31, 2019 data). The Fund’s Form N-Q orForm N-PORT reports are available on the Securities and Exchange Commission’s website at https://www.sec.gov. The Fund’s Form N-Q or FormN-PORT information is also available, without charge, upon request, by calling toll-free1-888-GUARDIAN(1-888-482-7342) or by visiting our website at http://guardianvpt.onlineprospectus.net/GuardianVPT/
Prospectuses.
Beginning in April 2019, the Fund will cease to disclose its holdings on Form N-Q and will file Form N-PORT with the Securities and Exchange Commission on a monthly
basis, with the information contained on Form N-PORT for the last month of the Fund’s fiscal quarter being made public by the Securities and Exchange Commission 60 days after the end of the Fund’s fiscal quarter.
A description of the policies and procedures that the Fund uses to determine how to vote proxies relating to portfolio securities is included in the SAI. The SAI and information regarding how the Fund voted proxies relating to portfolio securities during the most recent12-month period ended June 30 may be obtained (i) without charge, upon request, by calling toll-free1-888-GUARDIAN(1-888-482-7342) or by visiting our website at http://guardianvpt.onlineprospectus.net/GuardianVPT/
Prospectuses; and (ii) on the Securities and Exchange Commission’s website at https://www.sec.gov.
| 25 |
Table of Contents
This report is transmitted to shareholders only. It is not authorized for use as an offer of sale or a solicitation of an offer to buy shares of the Fund unless accompanied or preceded by the Fund’s current prospectus. Past performance results shown in this report should not be considered a representation of future performance. Investment returns and principal value of shares will fluctuate so that shares, when redeemed, may be worth more or less than their original cost. Statements and other information herein are as dated and are subject to change.

The Guardian Life Insurance Company of America New York, NY 10004-4025
PUB8175
Table of Contents
Guardian Variable
Products Trust
2018
Annual Report
All Data as of December 31, 2018
Guardian Large Cap Disciplined Growth VIP Fund
Important Notice
Beginning on January 1, 2021, as permitted by regulations adopted by the Securities and Exchange Commission, paper copies of the Fund’s shareholder reports will no longer be sent by mail from The Guardian Insurance & Annuity Company, Inc. (“GIAC”). Instead, GIAC will mail you a notice when copies of the shareholder reports are made available on a website. You will be notified by mail each time a report is posted and provided with a website link to access the report.
If you have already elected to receive shareholder reports electronically, you will not be affected by this change and you need not take any action. If you have not yet elected electronic delivery, at any time, you may elect to receive the Fund’s shareholder reports and certain other communications from GIAC electronically, by going to www.guardianlife.com and registering for e-delivery.
You may instead elect to receive all future shareholder reports in paper free of charge. If you wish to receive paper copies of your shareholder reports, please call GIAC’s Customer Service Office Contact Center at 1-888-GUARDIAN (1-888-482-7342). Your election to receive reports in paper will apply to all the underlying funds available.

| Not FDIC insured. May lose value. No bank guarantee. | www.guardianlife.com |
Table of Contents
Guardian Large Cap Disciplined Growth VIP Fund
Except as otherwise specifically stated, all information, including portfolio security positions, is as of December 31, 2018. The views expressed in the Fund Commentary are those of the Fund’s portfolio manager(s) as of the date of this report and are subject to change without notice. They do not necessarily represent the views of Park Avenue Institutional Advisers LLC or a sub-adviser. The Fund Commentary may contain some forward-looking statements providing expectations or forecasts of future events as of the date of this report; they do not necessarily relate to historical or current facts. There can be no guarantee that any forward-looking statement will be realized. We undertake no obligation to update forward-looking statements, whether as a result of new information, future events, or otherwise. Any discussions of specific securities should not be considered a recommendation to buy or sell those securities. Fund holdings will vary. Information contained herein has been obtained from sources believed reliable, but is not guaranteed.
Table of Contents
GUARDIAN LARGE CAP DISCIPLINED GROWTH VIP FUND
FUND COMMENTARY OF WELLINGTON MANAGEMENT COMPANY LLP,SUB-ADVISER
Highlights
| • | Guardian Large Cap Disciplined Growth VIP Fund (the “Fund”) returned-1.18% for the 12 months ended December 31, 2018, outperforming its benchmark, the Russell 1000® Growth Index1 (the “Index”). The Fund’s relative outperformance was primarily due to security selection in the information technology and communication services sectors. |
| • | The Index returned-1.51% for the period. Within the Index, the energy, communication services, and materials sectors declined the most during the period. |
Market Overview
U.S. equities, as measured by the Standard & Poor’s 500®Index2, posted negative results over the 12 months ended December 31, 2018. The U.S. Federal Reserve raised its benchmark interest rate by 25 basis points four times during 2018, in line with market expectations, albeit signaling a more dovish path heading into 2019. Bullish sentiment was exceptionally strong to start 2018, as better-than-expected corporate profits helped drive U.S. equities higher. Signs of inflation entered the market in February and led to heightened levels of volatility, a theme that continued for the remainder of the period. By the summer of 2018, talk of tariffs and trade wars had progressed to implementation, raising concerns in an otherwise strong economy. Nonetheless, positive sentiment persisted, fueled by robust earnings growth, fiscal stimulus, the announcement of a preliminary trade deal between the U.S. and Mexico, and expectations for stronger U.S. economic growth relative to other regions of the world. This changed in the final months of 2018, when concerns surrounding slowing global growth, rich valuations, rising central bank benchmark interest rates, and capricious U.S. and China trade tensions were at the forefront of investors’ minds. Returns in October and December were sharply negative, with the latter representing the largest U.S. equity market monthly decline seen this decade, culminating the first year of negative U.S. equity returns since 2008.
Portfolio Review
Stock selection was the primary driver of relative outperformance during the period. Strong selection in information technology and communication services
was only partially offset by weak selection in financials, industrials, and health care. Sector allocation, a fall out of the Fund’sbottom-up stock selection process, aided relative results. The Fund’s underweight allocation to the materials sector relative to the Index contributed to relative performance during the period while its overweight to communication services detracted from results.
Outlook
We believe that the U.S. economy remained healthy at year end, although leading indicators are suggesting some moderation in growth later in 2019. With unemployment levels low and trending lower, we still believe risks to U.S. inflation are to the upside. Many companies are facing higher labor and material costs, creating some uncertainty around profitability. While we had fretted about the possibility of higher oil prices last quarter, given the prospect of Iran sanctions, the waivers granted by the Trump administration actually resulted in oversupply and declining crude prices. We expect the recent cuts will restore supply demand balance and allow oil prices to find a firmer footing in the coming months.
Trade continues to dominate the narrative. As the calendar year began, trade representatives started conversations in China. We are hopeful that a satisfactory agreement will be reached; however, some supply chain disruption and temporary pauses in capital investment cannot be ruled out. Brexit hasre-emerged as another near-term uncertainty that we have to monitor. On the flip side, we believe the strong employment situation bodes well for the consumer and as of December 31, 2018, the U.S. government shutdown has had little economic impact.
We will be closely watching profitability trends this quarter, particularly in areas seeing inflationary pressures, to evaluate the ability for companies to pass on prices and still grow. Given the uncertainty of some of the aforementioned macro items, we do expect volatility to remain somewhat elevated despite recent declines in the market.
We remain consistent in adhering to our disciplined portfolio construction process that allows us to assess risk, weight individual positions accordingly, and in the process build a portfolio that focuses largely on stock selection.
| 1 | The Russell 1000®Growth Index (the “Index”) is an unmanaged market-capitalization-weighted index that measures the performance of those companies in the Russell 1000®Index (which consists of the 1.000 largest U.S. companies based on total market capitalization) with higherprice-to-book ratios and higher forecasted growth values. Index results assume the reinvestment of dividends paid on the stocks constituting the Index. You may not invest in the Index, and, unlike the Fund, the Index does not incur fees or expenses. |
| 2 | The Standard & Poor’s 500®Index (the “S&P 500 Index”) is an unmanaged market-capitalization-weighted index generally considered to be representative of U.S. equity market activity. The S&P 500 Index consists of 500 stocks representing leading industries of the U.S. economy. Index results assume the reinvestment of dividends paid on the stocks constituting the Index. You may not invest in the S&P 500 Index, and, unlike the Fund, the S&P 500 Index does not incur fees or expenses. |
| 1 |
Table of Contents
GUARDIAN LARGE CAP DISCIPLINED GROWTH VIP FUND
Funds in the Guardian Variable Products Trust are sold by prospectus only. You should carefully consider the investment objectives, risks, charges and expenses of the Funds before making an investment decision. The prospectus contains this and other important information. Please read it carefully before investing or sending money. Please visit our website at http://guardianvpt.onlineprospectus.net/GuardianVPT/Prospectuses or to obtain a printed copy, call 1-888-GUARDIAN (1-888-482-7342).
As with all mutual funds, the value of an investment in the Fund could decline, and you could lose money. Diversification does not guarantee profit or protect against loss, and there can be no assurance that the Fund will achieve its investment objective. The Fund invests primarily in equity securities and therefore exposes you to the general risks of investing in stock markets. Investing inlarge-capitalization companies involves risks such as having low growth rates, and slow responsiveness to competitive challenges or opportunities than in the case of smaller companies. Investments in growth companies may be highly volatile. Growth stocks may not realize their perceived growth potential and during certain periods the Fund may underperform other equity funds that employ a different style. International investing involves special risks, which include changes in currency rates, foreign taxation and differences in auditing standards and securities regulations, political uncertainty and greater volatility. Foreign securities are subject to political, regulatory, economic, andexchange-rate risks not present in domestic investments. Investing in a more limited number of issuers and sectors can be subject to greater market fluctuation. Any discussions of specific securities should not be considered a recommendation to buy or sell those securities. Fund holdings will vary.
| 2 |
Table of Contents
GUARDIAN LARGE CAP DISCIPLINED GROWTH VIP FUND
Fund Characteristics (unaudited)
| Total Net Assets: $181,144,223 |
Sector Allocation1 As of December 31, 2018 |
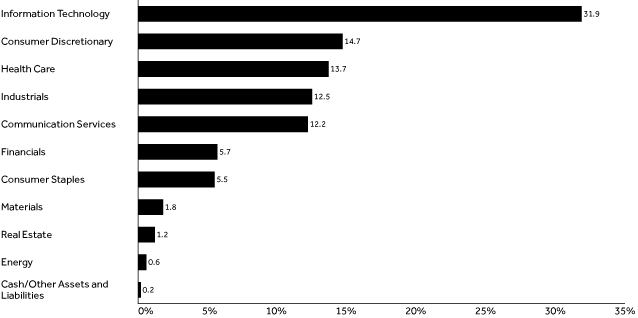 |
Top Ten Holdings2 As of December 31, 2018 | ||||
| Holding | % of Total Net Assets | |||
| Amazon.com, Inc. | 5.41% | |||
| Microsoft Corp. | 5.13% | |||
| Apple, Inc. | 5.00% | |||
| Alphabet, Inc., Class A | 4.80% | |||
| MasterCard, Inc., Class A | 2.98% | |||
| UnitedHealth Group, Inc. | 2.86% | |||
| The Boeing Co. | 2.79% | |||
| NIKE, Inc., Class B | 2.32% | |||
| Alphabet, Inc., Class C | 2.03% | |||
| Facebook, Inc., Class A | 2.03% | |||
| Total | 35.35% | |||
| 1 | The Fund’s holdings are allocated to each sector based on the MSCI Global Industry Classification Standard (GICS®). Cash includes short-term investments and net other assets and liabilities. |
| 2 | Portfolio holdings are subject to change and should not be considered a recommendation to buy or sell individual securities. |
| 3 |
Table of Contents
GUARDIAN LARGE CAP DISCIPLINED GROWTH VIP FUND
Average Annual Total Returns As of December 31, 2018 | ||||||||||||||||||||
| Inception Date | 1 Year | 5 Year | 10 Year | Since Inception | ||||||||||||||||
| Guardian Large Cap Disciplined Growth VIP Fund | 9/1/2016 | -1.18% | — | — | 10.11% | |||||||||||||||
| Russell 1000® Growth Index | -1.51% | — | — | 11.84% | ||||||||||||||||
Results of a Hypothetical $10,000 Investment As of December 31, 2018 |
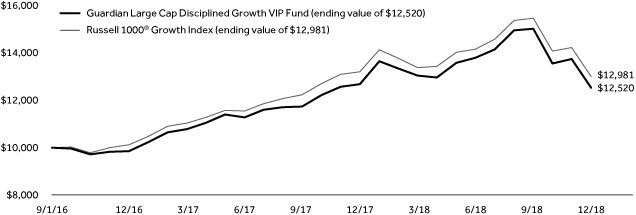 |
The chart above shows the performance of a hypothetical $10,000 investment made on inception date in Guardian Large Cap Disciplined Growth VIP Fund and the Russell 1000® Growth Index. Index returns do not include the fees and expenses of the Fund, but do include reinvestment of dividends, if any.
Performance quoted represents past performance and does not guarantee or predict future results. Investment return and principal value will fluctuate, so shares, when redeemed, may be worth more or less than their original cost. The Fund’s fees and expenses are detailed in the Financial Highlights section of this report. Fees and expenses are factored into the net asset value of Fund shares and any performance numbers we release. Total return figures include the effect of expense limitations in effect during the periods shown, if applicable; without such limitations, the performance shown would have been lower. Performance results assume the reinvestment of dividends and capital gains. The return figures shown do not reflect the deduction of taxes that a contract owner/policyholder may pay on redemption units. The actual total returns for owners of variable annuity contracts or variable life insurance policies that provide for investment in the Fund will be lower to reflect separate account and contract/policy charges. Current andmonth-end performance information, which may be lower or higher than that cited, is available by calling1-888-GUARDIAN(1-888-482-7342) and is periodically updated on our website: http://guardianlife.com.
| 4 |
Table of Contents
UNDERSTANDING YOUR FUND’S EXPENSES(UNAUDITED)
By investing in the Fund, you incur two types of costs: (1) transaction costs and (2) ongoing costs, including, as applicable, investment advisory fees, distribution and/or service(12b-1) fees and other Fund expenses. The example below is intended to help you understand your ongoing costs (in dollars) of investing in the Fund and to compare these costs with the ongoing costs of investing in other mutual funds.
The example is based on an investment of $1,000 invested at the beginning of the period and held for the entire period from July 1, 2018 to December 31, 2018. The table below shows the Fund’s expenses in two ways:
Expenses based on actual return
This section of the table provides information about actual account values and actual expenses. You may use the information in this section, together with the amount you invested, to estimate the expenses that you paid over the period. Simply divide your account value by $1,000 (for example, an $8,600 account value divided by $1,000 = 8.6), then multiply the result by the number in the section under the heading entitled “Expenses Paid During Period” to estimate the expenses you paid on your account during this period.
Expenses based on hypothetical 5% return for comparison purposes
This section of the table provides information about hypothetical account values and hypothetical expenses based on the Fund’s actual expense ratio and an assumed rate of return of 5% per year before expenses, which is not the Fund’s actual return. The hypothetical account values and expenses may not be used to estimate the actual ending account balance or expenses you paid for the period. You may use this information to compare the ongoing costs of investing in the Fund with the cost of investing in other mutual funds. To do so, compare this 5% hypothetical example with the 5% hypothetical examples that appear in the shareholder reports of the other funds.
Note that the expenses shown in the table are meant to highlight your ongoing costs only and do not reflect any transactional costs, such as sales charges (loads), redemption fees, or exchange fees. Therefore the second section is useful in comparing ongoing costs only, and will not help you determine the relative total costs of owning different funds. If these transactional costs were included, your costs would have been higher. Charges and expenses at the insurance company separate account level are not reflected in the table.
Beginning 7/1/18 | Ending Account Value 12/31/18 | Expenses Paid During Period* 7/1/18-12/31/18 | Expense Ratio During Period 7/1/18-12/31/18 | |||||||||||
| Based on Actual Return | $1,000.00 | $ | 908.60 | $ | 4.19 | 0.87% | ||||||||
| Based on Hypothetical Return (5% Return Before Expenses) | $1,000.00 | $ | 1,020.82 | $ | 4.43 | 0.87% | ||||||||
| * | Expenses are equal to the Fund’s annualized expense ratio as indicated, multiplied by the average account value over the period, multiplied by184/365 (to reflect theone-half year period). |
| 5 |
Table of Contents
SCHEDULE OF INVESTMENTS — GUARDIAN LARGE CAP DISCIPLINED GROWTH VIP FUND
| December 31, 2018 | Shares | Value | ||||||
| Common Stocks – 98.8% |
| |||||||
| Aerospace & Defense – 2.8% |
| |||||||
The Boeing Co. | 15,659 | $ | 5,050,028 | |||||
|
| |||||||
| 5,050,028 | ||||||||
| Banks – 0.6% |
| |||||||
SVB Financial Group(1) | 5,470 | 1,038,862 | ||||||
|
| |||||||
| 1,038,862 | ||||||||
| Beverages – 1.8% |
| |||||||
Constellation Brands, Inc., Class A | 7,735 | 1,243,943 | ||||||
Monster Beverage Corp.(1) | 39,323 | 1,935,478 | ||||||
|
| |||||||
| 3,179,421 | ||||||||
| Biotechnology – 2.7% |
| |||||||
Biogen, Inc.(1) | 4,661 | 1,402,588 | ||||||
Incyte Corp.(1) | 10,138 | 644,676 | ||||||
Seattle Genetics, Inc.(1) | 19,992 | 1,132,747 | ||||||
Vertex Pharmaceuticals, Inc.(1) | 10,182 | 1,687,259 | ||||||
|
| |||||||
| 4,867,270 | ||||||||
| Building Products – 0.8% |
| |||||||
Fortune Brands Home & Security, Inc. | 37,200 | 1,413,228 | ||||||
|
| |||||||
| 1,413,228 | ||||||||
| Capital Markets – 2.5% |
| |||||||
BlackRock, Inc. | 2,967 | 1,165,497 | ||||||
Intercontinental Exchange, Inc. | 25,121 | 1,892,365 | ||||||
MarketAxess Holdings, Inc. | 7,249 | 1,531,786 | ||||||
|
| |||||||
| 4,589,648 | ||||||||
| Chemicals – 1.8% |
| |||||||
PPG Industries, Inc. | 22,010 | 2,250,082 | ||||||
The Sherwin-Williams Co. | 2,760 | 1,085,950 | ||||||
|
| |||||||
| 3,336,032 | ||||||||
| Commercial Services & Supplies – 0.8% |
| |||||||
Copart, Inc.(1) | 29,931 | 1,430,103 | ||||||
|
| |||||||
| 1,430,103 | ||||||||
| Consumer Finance – 0.8% |
| |||||||
Capital One Financial Corp. | 19,239 | 1,454,276 | ||||||
|
| |||||||
| 1,454,276 | ||||||||
| Diversified Telecommunication Services – 1.5% |
| |||||||
Verizon Communications, Inc. | 48,742 | 2,740,275 | ||||||
|
| |||||||
| 2,740,275 | ||||||||
| Electrical Equipment – 1.6% |
| |||||||
AMETEK, Inc. | 25,245 | 1,709,087 | ||||||
Eaton Corp. PLC | 18,540 | 1,272,956 | ||||||
|
| |||||||
| 2,982,043 | ||||||||
| Electronic Equipment, Instruments & Components – 0.8% |
| |||||||
CDW Corp. | 18,821 | 1,525,442 | ||||||
|
| |||||||
| 1,525,442 | ||||||||
| Entertainment – 1.0% |
| |||||||
Netflix, Inc.(1) | 6,734 | 1,802,422 | ||||||
|
| |||||||
| 1,802,422 | ||||||||
| Equity Real Estate Investment – 1.2% |
| |||||||
American Tower Corp. REIT | 13,161 | 2,081,939 | ||||||
|
| |||||||
| 2,081,939 | ||||||||
| December 31, 2018 | Shares | Value | ||||||
| Food & Staples Retailing – 1.6% |
| |||||||
Costco Wholesale Corp. | 14,224 | $ | 2,897,571 | |||||
|
| |||||||
| 2,897,571 | ||||||||
| Health Care Equipment & Supplies – 4.8% |
| |||||||
Baxter International, Inc. | 41,442 | 2,727,713 | ||||||
Boston Scientific Corp.(1) | 62,258 | 2,200,198 | ||||||
Edwards Lifesciences Corp.(1) | 11,631 | 1,781,520 | ||||||
Teleflex, Inc. | 7,917 | 2,046,386 | ||||||
|
| |||||||
| 8,755,817 | ||||||||
| Health Care Providers & Services – 2.9% |
| |||||||
UnitedHealth Group, Inc. | 20,825 | 5,187,924 | ||||||
|
| |||||||
| 5,187,924 | ||||||||
| Hotels, Restaurants & Leisure – 1.1% |
| |||||||
Hilton Worldwide Holdings, Inc. | 28,247 | 2,028,135 | ||||||
|
| |||||||
| 2,028,135 | ||||||||
| Household Products – 1.3% |
| |||||||
Colgate-Palmolive Co. | 40,239 | 2,395,025 | ||||||
|
| |||||||
| 2,395,025 | ||||||||
| Insurance – 0.8% |
| |||||||
The Allstate Corp. | 18,369 | 1,517,831 | ||||||
|
| |||||||
| 1,517,831 | ||||||||
| Interactive Media & Services – 8.9% |
| |||||||
Alphabet, Inc., Class A(1) | 8,317 | 8,690,932 | ||||||
Alphabet, Inc., Class C(1) | 3,550 | 3,676,416 | ||||||
Facebook, Inc., Class A(1) | 27,983 | 3,668,291 | ||||||
|
| |||||||
| 16,035,639 | ||||||||
| Internet & Direct Marketing Retail – 7.7% |
| |||||||
Amazon.com, Inc.(1) | 6,528 | 9,804,860 | ||||||
Booking Holdings, Inc.(1) | 1,733 | 2,984,954 | ||||||
Wayfair, Inc., Class A(1) | 12,116 | 1,091,409 | ||||||
|
| |||||||
| 13,881,223 | ||||||||
| IT Services – 9.5% |
| |||||||
EPAM Systems, Inc.(1) | 12,509 | 1,451,169 | ||||||
FleetCor Technologies, Inc.(1) | 13,391 | 2,486,976 | ||||||
Global Payments, Inc. | 22,135 | 2,282,783 | ||||||
GoDaddy, Inc., Class A(1) | 45,546 | 2,988,728 | ||||||
MasterCard, Inc., Class A | 28,581 | 5,391,806 | ||||||
PayPal Holdings, Inc.(1) | 30,254 | 2,544,059 | ||||||
|
| |||||||
| 17,145,521 | ||||||||
| Life Sciences Tools & Services – 1.6% |
| |||||||
Thermo Fisher Scientific, Inc. | 12,603 | 2,820,425 | ||||||
|
| |||||||
| 2,820,425 | ||||||||
| Machinery – 3.9% |
| |||||||
Gardner Denver Holdings, Inc.(1) | 34,417 | 703,828 | ||||||
Illinois Tool Works, Inc. | 14,365 | 1,819,902 | ||||||
Nordson Corp. | 14,161 | 1,690,115 | ||||||
Snap-on, Inc. | 10,969 | 1,593,686 | ||||||
The Middleby Corp.(1) | 11,533 | 1,184,785 | ||||||
|
| |||||||
| 6,992,316 | ||||||||
| 6 | The accompanying notes are an integral part of these financial statements. |
Table of Contents
SCHEDULE OF INVESTMENTS — GUARDIAN LARGE CAP DISCIPLINED GROWTH VIP FUND
| December 31, 2018 | Shares | Value | ||||||
| Media – 0.8% |
| |||||||
Comcast Corp., Class A | 43,907 | $ | 1,495,033 | |||||
|
| |||||||
| 1,495,033 | ||||||||
| Oil, Gas & Consumable Fuels – 0.6% |
| |||||||
Continental Resources, Inc.(1) | 28,994 | 1,165,269 | ||||||
|
| |||||||
| 1,165,269 | ||||||||
| Personal Products – 0.8% |
| |||||||
The Estee Lauder Cos., Inc., Class A | 11,570 | 1,505,257 | ||||||
|
| |||||||
| 1,505,257 | ||||||||
| Pharmaceuticals – 1.7% |
| |||||||
Allergan PLC | 10,943 | 1,462,641 | ||||||
Bristol-Myers Squibb Co. | 32,354 | 1,681,761 | ||||||
|
| |||||||
| 3,144,402 | ||||||||
| Professional Services – 1.2% |
| |||||||
Equifax, Inc. | 9,835 | 915,934 | ||||||
IHS Markit Ltd.(1) | 26,493 | 1,270,869 | ||||||
|
| |||||||
| 2,186,803 | ||||||||
| Road & Rail – 1.4% |
| |||||||
JB Hunt Transport Services, Inc. | 10,364 | 964,267 | ||||||
Norfolk Southern Corp. | 10,293 | 1,539,215 | ||||||
|
| |||||||
| 2,503,482 | ||||||||
| Semiconductors & Semiconductor Equipment – 2.3% |
| |||||||
Advanced Micro Devices, Inc.(1) | 91,254 | 1,684,549 | ||||||
Micron Technology, Inc.(1) | 45,285 | 1,436,893 | ||||||
ON Semiconductor Corp.(1) | 64,159 | 1,059,265 | ||||||
|
| |||||||
| 4,180,707 | ||||||||
| Software – 13.4% |
| |||||||
Adobe, Inc.(1) | 14,025 | 3,173,016 | ||||||
Guidewire Software, Inc.(1) | 23,213 | 1,862,379 | ||||||
Microsoft Corp. | 91,563 | 9,300,054 | ||||||
salesforce.com, Inc.(1) | 26,020 | 3,563,959 | ||||||
ServiceNow, Inc.(1) | 9,937 | 1,769,283 | ||||||
SS&C Technologies Holdings, Inc. | 38,263 | 1,726,044 | ||||||
Workday, Inc., Class A(1) | 18,053 | 2,882,703 | ||||||
|
| |||||||
| 24,277,438 | ||||||||
| Specialty Retail – 1.4% |
| |||||||
The TJX Cos., Inc. | 57,141 | 2,556,488 | ||||||
|
| |||||||
| 2,556,488 | ||||||||
| December 31, 2018 | Shares | Value | ||||||
| Technology Hardware, Storage & Peripherals – 5.9% |
| |||||||
Apple, Inc. | 57,430 | $ | 9,059,008 | |||||
NetApp, Inc. | 28,391 | 1,694,091 | ||||||
|
| |||||||
| 10,753,099 | ||||||||
| Textiles, Apparel & Luxury Goods – 4.5% |
| |||||||
NIKE, Inc., Class B | 56,796 | 4,210,856 | ||||||
Under Armour, Inc., Class C(1) | 103,769 | 1,677,945 | ||||||
VF Corp. | 30,792 | 2,196,701 | ||||||
|
| |||||||
| 8,085,502 | ||||||||
| Total Common Stocks (Cost $183,003,274) |
| 179,001,896 | ||||||
| Exchange–Traded Funds – 1.0% |
| |||||||
iShares Russell 1000 Growth ETF | 13,919 | 1,822,136 | ||||||
| Total Exchange–Traded Funds (Cost $1,918,614) |
| 1,822,136 | ||||||
| Principal Amount | Value | |||||||
| Short–Term Investment – 0.3% |
| |||||||
| Repurchase Agreements – 0.3% |
| |||||||
Fixed Income Clearing Corp., 0.50%, dated 12/31/2018, proceeds at maturity value of $457,013, due 1/2/2019(2) | $ | 457,000 | 457,000 | |||||
| Total Repurchase Agreements (Cost $457,000) |
| 457,000 | ||||||
| Total Investments – 100.1% (Cost $185,378,888) |
| 181,281,032 | ||||||
| Liabilities in excess of other assets – (0.1)% |
| (136,809 | ) | |||||
| Total Net Assets – 100.0% |
| $ | 181,144,223 | |||||
| (1) | Non–income–producing security. |
| (2) | The table below presents collateral for repurchase agreements. |
| Security | Coupon | Maturity Date | Principal Amount | Value | ||||||||||||
| U.S. Treasury Note | 2.875% | 7/31/2025 | $ | 455,000 | $ | 466,876 | ||||||||||
Legend:
REIT — Real Estate Investment Trust
The following is a summary of the inputs used as of December 31, 2018 in valuing the Fund’s investments. For more information on valuation inputs, please refer to Note 2a of the accompanying Notes to Financial Statements.
| Valuation Inputs | ||||||||||||||||
| Investments in Securities | Level 1 | Level 2 | Level 3 | Total | ||||||||||||
| Common Stocks | $ | 179,001,896 | $ | — | $ | — | $ | 179,001,896 | ||||||||
| Exchange–Traded Funds | 1,822,136 | — | — | 1,822,136 | ||||||||||||
| Repurchase Agreements | — | 457,000 | — | 457,000 | ||||||||||||
| Total | $ | 180,824,032 | $ | 457,000 | $ | — | $ | 181,281,032 | ||||||||
| The accompanying notes are an integral part of these financial statements. | 7 |
Table of Contents
FINANCIAL INFORMATION — GUARDIAN LARGE CAP DISCIPLINED GROWTH VIP FUND
For the Year Ended December 31, 2018 | ||||
Investment Income | ||||
Dividends | $ | 1,299,493 | ||
Interest | 5,944 | |||
|
| |||
Total Investment Income | 1,305,437 | |||
|
| |||
Expenses | ||||
Investment advisory fees | 942,157 | |||
Distribution fees | 396,725 | |||
Trustees’ and officers’ fees | 90,729 | |||
Professional fees | 63,632 | |||
Custodian and accounting fees | 51,126 | |||
Administrative fees | 44,732 | |||
Transfer agent fees | 16,735 | |||
Shareholder reports | 14,608 | |||
Other expenses | 23,814 | |||
|
| |||
Total Expenses | 1,644,258 | |||
Less: Fees waived | (260,573 | ) | ||
|
| |||
Total Expenses, Net | 1,383,685 | |||
|
| |||
Net Investment Income/(Loss) | (78,248 | ) | ||
|
| |||
Realized Gain/(Loss) and Change in Unrealized Appreciation/(Depreciation) on Investments | ||||
Net realized gain/(loss) from investments | 4,802,346 | |||
Net change in unrealized appreciation/(depreciation) on investments | (5,628,435 | ) | ||
|
| |||
Net Loss on Investments | (826,089 | ) | ||
|
| |||
Net Decrease in Net Assets Resulting From Operations | $ | (904,337 | ) | |
|
| |||
| 8 | The accompanying notes are an integral part of these financial statements. |
Table of Contents
FINANCIAL INFORMATION — GUARDIAN LARGE CAP DISCIPLINED GROWTH VIP FUND
| For the Year Ended 12/31/18 | For the Year Ended 12/31/17 | |||||||
| ||||||||
Operations | ||||||||
Net investment income/(loss) | $ | (78,248 | ) | $ | 33,229 | |||
Net realized gain/(loss) from investments | 4,802,346 | 1,446,500 | ||||||
Net change in unrealized appreciation/(depreciation) on investments | (5,628,435 | ) | 1,553,217 | |||||
|
|
|
| |||||
Net Increase/(Decrease) in Net Assets Resulting from Operations | (904,337 | ) | 3,032,946 | |||||
|
|
|
| |||||
Capital Share Transactions | ||||||||
Proceeds from sales of shares | 215,934,389 | 3,969,855 | ||||||
Cost of shares redeemed | (42,406,621 | ) | (6,647,250 | ) | ||||
|
|
|
| |||||
Net Increase/(Decrease) in Net Assets Resulting from Capital Share Transactions | 173,527,768 | (2,677,395 | ) | |||||
|
|
|
| |||||
Net Increase in Net Assets | 172,623,431 | 355,551 | ||||||
|
|
|
| |||||
Net Assets | ||||||||
Beginning of year | 8,520,792 | 8,165,241 | ||||||
|
|
|
| |||||
End of year | $ | 181,144,223 | $ | 8,520,792 | ||||
|
|
|
| |||||
Other Information: | ||||||||
Shares | ||||||||
Sold | 16,846,940 | 375,170 | ||||||
Redeemed | (3,049,778 | ) | (531,565 | ) | ||||
|
|
|
| |||||
Net Increase/(Decrease) | 13,797,162 | (156,395 | ) | |||||
|
|
|
| |||||
| The accompanying notes are an integral part of these financial statements. | 9 |
Table of Contents
FINANCIAL INFORMATION — GUARDIAN LARGE CAP DISCIPLINED GROWTH VIP FUND
The Financial Highlights table is intended to help you understand the Fund’s financial performance for the past five years (or, if shorter, the period since inception). Certain information reflects financial results for a single Fund share. The total returns in the table represent the rate that an investor would have earned (or lost) on an investment in the Fund.
Financial Highlights | ||||||||||||||||||||||||
| Per Share Operating Performance | ||||||||||||||||||||||||
| Net Asset Value, Beginning of Period | Net Investment Income/(Loss)(1) | Net Realized and Unrealized Gain/(Loss) | Total Operations | Net Asset Value, End of Period | Total Return(2) | |||||||||||||||||||
Year Ended 12/31/18 | $ | 12.67 | $ | (0.01 | ) | $ | (0.14 | ) | $ | (0.15 | ) | $ | 12.52 | (1.18) | % | |||||||||
Year Ended 12/31/17 | 9.85 | 0.03 | 2.79 | 2.82 | 12.67 | 28.63 | % | |||||||||||||||||
Period Ended 12/31/16(4) | 10.00 | 0.01 | (0.16 | ) | (0.15 | ) | 9.85 | (1.50) | %(5) | |||||||||||||||
| 10 | The accompanying notes are an integral part of these financial statements. |
Table of Contents
FINANCIAL INFORMATION — GUARDIAN LARGE CAP DISCIPLINED GROWTH VIP FUND
| Ratios/Supplemental Data | ||||||||||||||||||||||
| Net Assets, End of Period (000s) | Net Ratio of Expenses to Average Net Assets(3) | Gross Ratio of Expenses to Average Net Assets | Net Ratio of Net Investment Income/(Loss) to Average Net Assets(3) | Gross Ratio of Net Investment Loss to Average Net Assets | Portfolio Turnover Rate | |||||||||||||||||
| $ | 181,144 | 0.87% | 1.04% | (0.05)% | (0.22)% | 47% | ||||||||||||||||
| 8,521 | 1.00% | 2.08% | 0.27% | (0.81)% | 77% | |||||||||||||||||
| 8,165 | 1.00% | (5) | 3.16% | (5) | 0.39% | (5) | (1.77)% | (5) | 42% | (5) | ||||||||||||
| (1) | Calculated based on the average shares outstanding during the period. |
| (2) | Total returns do not reflect the effects of charges deducted pursuant to the terms of The Guardian Insurance & Annuity Company, Inc.‘s variable contracts. Inclusion of such charges would reduce the total returns for all periods shown. |
| (3) | Net Ratio of Expenses to Average Net Assets and Net Ratio of Net Investment Income/(Loss) to Average Net Assets include the effect of fee waivers and expense limitations. |
| (4) | Commenced operations on September 1, 2016. |
| (5) | Ratios for periods less than one year have been annualized, except for total return and portfolio turnover rate. For the period ended December 31, 2016, certainnon-recurring fees (i.e., audit fees) are not annualized. |
| The accompanying notes are an integral part of these financial statements. | 11 |
Table of Contents
NOTES TO FINANCIAL STATEMENTS — GUARDIAN LARGE CAP DISCIPLINED GROWTH VIP FUND
December 31, 2018
1. Organization
Guardian Variable Products Trust (the “Trust”), a Delaware statutory trust organized on January 12, 2016, is registered under the Investment Company Act of 1940, as amended (the “1940 Act”), as anopen-end management investment company. The Trust currently has sixteen series. Guardian Large Cap Disciplined Growth VIP Fund (the “Fund”) is a series of the Trust. The Fund is a diversified fund and commenced operations on September 1, 2016. The financial statements for other series of the Trust are presented in separate reports.
The Trust has authorized an unlimited number of shares of beneficial interest with no par value. Shares are bought and sold at closing net asset value (“NAV”). Shares of the Fund are only sold to certain separate accounts of The Guardian Insurance & Annuity Company, Inc. (“GIAC”) that fund certain variable annuity contracts and variable life insurance policies issued by GIAC. GIAC is a wholly-owned subsidiary of The Guardian Life Insurance Company of America (“Guardian Life”).
The Fund seeks to maximize long-term growth.
2. Significant Accounting Policies
The following is a summary of significant accounting policies followed by the Fund in the preparation of its financial statements. The Fund follows the investment company accounting and reporting guidance of the Financial Accounting Standards Board (“FASB”) Accounting Standards Codification Topic 946 Financial Services – Investment Companies. The following policies are in conformity with accounting principles generally accepted in the United States of America (“GAAP”). The preparation of financial statements in accordance with GAAP requires management to make estimates and assumptions that affect the reported amounts and disclosures in the financial statements. Actual results could differ from those estimates.
a. Investment Valuations Equity securities traded on an exchange other than NASDAQ Stock Market, LLC (“NASDAQ”) are valued at the last reported sale price on the principal exchange or market on which they are traded; or, if there were no sales that day, at the mean between the closing bid and ask prices. Securities traded on the NASDAQ are generally valued at the NASDAQ official closing price, which may not be the last sale price. If the NASDAQ official closing price is not available
for a security, that security is generally valued at the mean between the closing bid and ask prices. Repurchase agreements are carried at cost, which approximates fair value (see Note 5d). Foreign securities are valued in the currencies of the markets in which they trade and then converted to U.S. dollars by the application of foreign exchange rates at the close of the New York Stock Exchange (“NYSE”). Forward foreign currency contracts, if any, are valued at the mean between the bid and ask rates for the specified time interpolated from rates for proximate time periods. Securities for which market quotations are not readily available or for which market quotations may be considered unreliable are valued at their fair values as determined in accordance with policies and procedures adopted by the Board of Trustees.
Under the policies and procedures approved by the Board of Trustees, Park Avenue Institutional Advisers LLC (“Park Avenue”), the Fund’s investment adviser, has established a Fair Valuation Committee to assist the Board of Trustees with the oversight and monitoring of the valuation of the Fund’s investments. This includes monitoring the appropriateness of fair values based on results of ongoing valuation oversight, including but not limited to consideration of security specific events, market events, and pricing vendor and broker-dealer due diligence. The Fair Valuation Committee oversees and carries out the policies for the valuation of investments held in the Fund. The Fair Valuation Committee is responsible for discussing and assessing the potential impacts to the fair values on an ongoing basis, and at least on a quarterly basis with the Board of Trustees.
Securities whose values have been materially affected by events occurring before the Fund’s valuation time but after the close of the securities’ principal exchange or market may be fair valued in accordance with policies and procedures adopted by the Board of Trustees. In addition, the values of the Fund’s investments in foreign securities are generally determined by a pricing service using pricing models designed to estimate likely changes in the values of those securities. Certain foreign equity instruments are valued by applying international fair value factors provided by approved pricing services. The factors seek to adjust the local closing price for movements of local markets post closing, but prior to the time the NAVs are calculated. Valuations reflected in this report are as of the report date. As a result, changes in valuation due to market events and/or issuer related events after the report date and prior to issuance of the report are not reflected herein.
| 12 |
Table of Contents
NOTES TO FINANCIAL STATEMENTS — GUARDIAN LARGE CAP DISCIPLINED GROWTH VIP FUND
Various inputs are used in determining the valuation of the Fund’s investments. These inputs are summarized in three broad levels listed below.
| • | Level 1 — unadjusted inputs using quoted prices in active markets for identical investments. |
| • | Level 2 — other significant observable inputs, including, but not limited to, quoted prices for similar investments, inputs other than quoted prices that are observable for investments (such as interest rates, prepayment speeds, credit risks, etc.) or other market corroborated inputs. |
| • | Level 3 — significant unobservable inputs (including the Fund’s own assumptions in determining the fair value of investments) |
Inputs may include price information, volatility statistics, specific and broad credit data, liquidity statistics, and other factors. A financial instrument’s level within the fair value hierarchy is based on the lowest level of any input; both individually and in aggregate, that is significant to the fair value measurement. However, the determination of what constitutes “observable” requires significant judgment by the Trust. The Trust considers observable data to be that market data which is readily available, regularly distributed or updated, reliable and verifiable, and provided by independent sources that are actively involved in the relevant market. The inputs or methodology used for valuing securities are not necessarily an indication of the risk associated with investing in those securities. Changes in valuation techniques may result in transfers into or out of a financial instrument’s assigned level within the hierarchy.
The FASB requires reporting entities to make disclosures about purchases, sales, issuances and settlements of Level 3 securities on a gross basis.
The Fund’s policy is to recognize transfers between Level 1, Level 2 and Level 3 at the end of the reporting period. For the year ended December 31, 2018, there were no transfers among any levels.
In determining a financial instrument’s placement within the hierarchy, the Trust separates the Fund’s investment portfolio into two categories: investments and derivatives (e.g., futures). A summary of inputs used to value the Fund’s assets and liabilities carried at fair value as of December 31, 2018 is included in the Schedule of Investments.
Investments Investments whose values are based on quoted market prices in active markets, and are
therefore classified within Level 1, include active listed equities. Investments that trade in markets that are not considered to be active, but are valued based on quoted market prices, dealer quotations or alternative pricing sources supported by observable inputs are classified within Level 2. These include certain U.S. government and sovereign obligations, most government agency securities, investment-grade corporate bonds, certain mortgage products, state, municipal and provincial obligations, and certain foreign equity securities, including securities whose prices may have been affected by events occurring after the close of trading on their principal exchange or market and, as a result, whose values are determined by a pricing service as described above, or securities whose values are otherwise determined using fair valuation methods approved by the Fund’s Board of Trustees.
Investments classified within Level 3 have significant unobservable inputs, as they trade infrequently or not at all. Level 3 investments include, among others, private placement securities. When observable prices are not available for these securities, the Trust uses one or more valuation techniques for which sufficient and reliable data is available. The inputs used by the Trust in estimating the value of Level 3 investments include, for example, the original transaction price, recent transactions in the same or similar instruments, completed or pending third-party transactions in the underlying investment or comparable issuers, subsequent rounds of financing, recapitalizations, and other transactions across the capital structure. Level 3 investments may also be adjusted to reflect illiquidity and/ornon-transferability, with the amount of such discount estimated by the Trust in the absence of market information. Assumptions used by the Trust due to the lack of observable inputs may significantly impact the resulting fair value and therefore the Fund’s results of operations. As of December 31, 2018, the Fund had no securities classified as Level 3.
Derivatives Exchange-traded derivatives, such as futures contracts, exchange-traded option contracts and certain swaps, are typically classified within Level 1 or Level 2 of the fair value hierarchy depending on whether or not they are deemed to be actively traded. Certainnon-exchange-traded derivatives, such as generic forwards, certain swaps and options, have inputs which can generally be corroborated by market data and are therefore classified within Level 2. During the year ended December 31, 2018, the Fund did not hold any derivatives.
| 13 |
Table of Contents
NOTES TO FINANCIAL STATEMENTS — GUARDIAN LARGE CAP DISCIPLINED GROWTH VIP FUND
b. Securities Transactions Securities transactions are accounted for on the date securities are purchased or sold (trade date). Realized gains or losses on securities transactions are determined on the basis of specific identification.
c. Foreign Currency Translation The accounting records of the Fund are maintained in U.S. dollars. Investment securities and all other assets and liabilities of the Fund denominated in a foreign currency are generally translated into U.S. dollars at the exchange rates quoted at the close of the NYSE on each business day. The market value of investment securities and other assets and liabilities are translated at the exchange rate as of the valuation date. Purchases and sales of securities, income receipts, and expense payments are translated into U.S. dollars at the exchange rates in effect on the dates of the respective transactions. The Fund does not isolate the portion of the fluctuations on investments resulting from changes in foreign currency exchange rates from the fluctuations in market prices of investments held. Such fluctuations are included in the Net change in net realized and unrealized gain/(loss) from investments on the Statement of Operations.
Reported realized foreign currency gains and losses arise from the disposition of foreign currency, currency gains or losses realized between the trade and settlement dates on securities transactions, and the difference between the amounts of dividends, interest and foreign withholding taxes recorded on the Fund’s books on the transaction date and the U.S. dollar equivalent of the amounts actually received or paid. These reported realized foreign currency gains and losses, if any, are included in Net realized gain/(loss) from foreign currency transactions on the Statement of Operations. Unrealized foreign currency gains and losses arise from changes (due to changes in exchange rates) in the value of foreign currency and other assets and liabilities denominated in foreign currencies, which are held at period end, if any, and are included in Net change in unrealized appreciation/(depreciation) on translation of assets and liabilities in foreign currencies on the Statement of Operations.
d. Foreign Capital Gains Tax The Fund may be subject to foreign taxes on income, gains on investments or currency purchases/repatriation, a portion of which may be recoverable. The Fund will accrue such taxes and recoveries as applicable, based upon their current interpretation of tax rules and regulations that exist in the markets in which they invest.
e. Investment Income Dividend income net of foreign taxes withheld, if any, is generally recorded on theex-dividend date. Interest income, which includes amortization/accretion of premium/discount, is determined using the interest income accrual method, and is accrued and recorded daily.
f. Allocation of Income and Expenses Many of the expenses of the Trust can be directly attributed to a specific series of the Trust. Expenses that cannot be directly attributed to a specific series of the Trust are generally apportioned among all the series in the Trust, based on relative net assets. In calculating net asset value per share for each series of the Trust, investment income, realized and unrealized gains and losses, and expenses other than series-specific expenses are allocated daily to each series based upon the proportion of net assets attributable to each series.
3. Transactions with Affiliates
a. Investment Advisory Fee and Expense Limitation Under the terms of the advisory agreement, which, after its two year initial term, is reviewed and approved annually by the Board of Trustees, the Fund pays an investment advisory fee to Park Avenue. Park Avenue is a wholly-owned subsidiary of Guardian Life and receives an investment advisory fee at an annual rate of 0.62% up to $100 million, 0.57% up to $300 million, 0.52% up to $500 million, and 0.50% in excess of $500 million of the Fund’s average daily net assets. The fee is accrued daily and paid monthly.
Park Avenue has contractually agreed through April 30, 2019 to waive certain fees and/or reimburse certain expenses incurred by the Fund to the extent necessary to limit the Fund’s total annual operating expenses after fee waiver and/or expense reimbursement to 0.87% of the Fund’s average daily net assets (excluding, if applicable, any acquired fund fees and expenses, taxes, interest, transaction costs and brokerage commissions, litigation and extraordinary expenses). Prior to April 9, 2018, the expense limitation was 1.00%. The limitation may not be increased or terminated prior to this time without action by the Board of Trustees, may be terminated only upon approval of the Board of Trustees, and is subject to Park Avenue’s recoupment rights. For the year ended December 31, 2018, Park Avenue waived fees and/or paid Fund expenses in the amount of $260,573.
Park Avenue may be entitled to recoupment of previously waived fees and reimbursed expenses from the Fund for three years from the date of the waiver or reimbursement, subject to the expense limitation in
| 14 |
Table of Contents
NOTES TO FINANCIAL STATEMENTS — GUARDIAN LARGE CAP DISCIPLINED GROWTH VIP FUND
effect at the time of the waiver or reimbursement and at the time of the recoupment, if any. Amounts waived or reimbursed by Park Avenue pursuant to any expense limitation after April 9, 2018 will not be subject to Park Avenue’s recoupment rights. The amount available for potential future recoupment by Park Avenue from the Fund under the Expense Limitation Agreement and the expiration schedule at December 31, 2018 are as follows:
| Potential Recoupment Amounts Expiring | ||||||||||||
Total Potential | 2021 | 2020 | 2019 | |||||||||
| $230,335 | $ | 38,387 | $ | 134,778 | $ | 57,170 | ||||||
Park Avenue has entered into aSub-Advisory Agreement with Wellington Management Company LLP (“Wellington”). Wellington is responsible for providingday-to-day investment advisory services to the Fund, subject to the supervision of Park Avenue and the oversight of the Board of Trustees.Sub-advisory fees are paid by Park Avenue and do not represent a separate or additional expense to the Fund.
b. Compensation of Trustees and Officers Trustees and officers who are interested persons of the Trust, as defined in the 1940 Act, receive no compensation from the Fund, except for the Chief Compliance Officer of the Trust. Trustees of the Trust who are not interested persons of the Trust, and the Chief Compliance Officer, receive compensation and reimbursement of expenses from the Trust.
c. Distribution Fees Park Avenue Securities LLC (“PAS”), a wholly-owned subsidiary of Guardian Life, is the principal underwriter of Fund shares. The Trust has entered into a distribution and service agreement with PAS, which governs the sale and distribution of shares of the Fund. Under a distribution and service plan adopted by the Trust(“12b-1 plan”), PAS is compensated for services in such capacity, including its expenses in connection with the promotion and distribution of shares of the Fund, at an annual rate of 0.25% of the Fund’s average daily net assets. For the year ended December 31, 2018, the Fund paid distribution fees in the amount of $396,725 to PAS.
PAS has directed that certain payments under the12b-1 plan be used to compensate GIAC for shareholder services provided to contract owners.
4. Federal Income Taxes
a. Distributions to Shareholders For federal income tax purposes, the Fund is treated as a disregarded entity (“DRE”). As a DRE, the Fund is not subject to an entity-level income tax; and any income, gains, losses, deductions, taxes, and credits of the Fund would instead be “passed through” directly to the separate accounts of GIAC that invest in the Fund and retain the same character for U.S. federal income tax purposes. In addition, the Fund is not required to distribute taxable income and capital gains for U.S. federal income tax purposes. Therefore, no dividends and capital gains distributions were paid by the Fund.
5. Investments
a. Investment Purchases and Sales The cost of investments purchased and the proceeds from investments sold (excluding short-term investments) amounted to $243,637,287 and $70,460,993, respectively, for the year ended December 31, 2018. During the year ended December 31, 2018, there were no purchases or sales of U.S. government securities.
b. Foreign Securities Foreign securities investments involve special risks and considerations not typically associated with U.S. investments. These risks include, but are not limited to, currency risk; adverse political, regulatory, social, and economic developments; and less reliable information about issuers. Moreover, securities of some foreign issuers may be less liquid and their prices more volatile than those of comparable U.S. issuers.
c. Industry or Sector Concentration In its normal course of business, the Fund may invest a significant portion of its assets in companies within a limited number of industries or sectors. As a result, the Fund may be subject to a greater risk of loss than that of a fund invested in a wider spectrum of industries or sectors because the stocks of many or all of the companies in the industry, group of industries, sector, or sectors may decline in value due to developments adversely affecting the industry, group of industries, sector, or sectors.
d. Repurchase Agreements The Fund may invest in repurchase agreements to maintain liquidity and earn income over periods of time as short as overnight. The collateral for repurchase agreements is either cash or fully negotiable U.S. government securities (including U.S. government agency securities). Repurchase agreements are fully collateralized (including the interest accrued thereon) and such collateral is marked
| 15 |
Table of Contents
NOTES TO FINANCIAL STATEMENTS — GUARDIAN LARGE CAP DISCIPLINED GROWTH VIP FUND
to market daily while the agreements remain in force. If the value of the collateral falls below the repurchase price plus accrued interest, the Fund will typically require the seller to deposit additional collateral by the next business day. If the request for additional collateral is not met, or the seller defaults, the Fund maintains the right to sell the collateral (although it may be prevented or delayed from doing so in certain circumstances) and may be required to claim any resulting loss against the seller. Park Avenue monitors the creditworthiness of the seller with which the Fund enters into repurchase agreements.
6. Temporary Borrowings
The Fund, with other funds managed by Park Avenue, is party to a $10 million committed revolving credit facility from State Street Bank and Trust Company for temporary borrowing purposes, including the meeting of redemption requests that otherwise might require the untimely disposition of securities. Interest is calculated based on the higher of the dailyone-month LIBOR rate and the Federal Funds rate plus 1.25% at the time of borrowing. In addition to the interest charged on any borrowings by the Fund, each fund pays a commitment fee of 0.30% per annum on its share of the unused portion of the credit facility. The agreement is in place until December 10, 2019. The Fund did not utilize the credit facility during the year ended December 31, 2018.
7. Indemnifications
Under the Trust’s organizational documents and, in some cases, by contract, its officers and trustees are
indemnified against certain liabilities arising out of the performance of their duties to the Fund. In addition, in the normal course of business, the Fund enters into contracts with its vendors and others that provide general indemnifications. The Fund’s maximum exposure under these arrangements is unknown as this would involve future claims that may be made against the Fund that have not yet occurred. However, based on experience, the Fund expects the risk of loss to be remote.
8. Recent Accounting Pronouncement
On August 17, 2018, the U.S. Securities and Exchange Commission (“SEC”) voted to adopt amendments to certain disclosure requirements that have become redundant, duplicative, overlapping, outdated, or superseded, in light of other SEC disclosure requirements, GAAP, or changes in the information environment. The SEC will also be referring certain SEC disclosure requirements that overlap with, but require information incremental to, GAAP to the FASB for potential incorporation into GAAP. The amendments are intended to facilitate the disclosure of information to investors and simplify compliance without significantly altering the total mix of information provided to investors. As such, the financial statements herein have been updated to conform with these new requirements, which had no effect on the Fund’s net assets or results of operations.
| 16 |
Table of Contents
REPORT OF INDEPENDENT REGISTERED PUBLIC ACCOUNTING FIRM
TotheBoard of Trustees ofGuardian Variable Products TrustandShareholders of Guardian Large Cap Disciplined Growth VIP Fund
Opinion on the Financial Statements
We have audited the accompanying statement of assets and liabilities, including the schedule of investments, ofGuardian Large Cap Disciplined Growth VIP Fund(one of the funds constituting Guardian Variable Products Trust, referred to hereafter as the “Fund”) as of December 31, 2018, the related statement of operations for the year ended December 31, 2018, the statement of changes in net assets for each of the two years in the period ended December 31, 2018, including the related notes,and the financial highlights for each of the periods indicated therein (collectively referred to as the “financial statements”). In our opinion, the financial statements present fairly, in all material respects, the financial position of the Fund as of December 31, 2018, the results of its operations for the year then ended, the changes in its net assets for each of the two years in the period ended December 31, 2018 and the financial highlights for each of the periods indicated therein in conformity with accounting principles generally accepted in the United States of America.
Basis for Opinion
These financial statements are the responsibility of the Fund’s management. Our responsibility is to express an opinion on the Fund’s financial statements based on our audits. We are a public accounting firm registered with the Public Company Accounting Oversight Board (United States) (PCAOB) and are required to be independent with respect to the Fund in accordance with the U.S. federal securities laws and the applicable rules and regulations of the Securities and Exchange Commission and the PCAOB.
We conducted our audits of these financial statements in accordance with the standards of the PCAOB. Those standards require that we plan and perform the audit to obtain reasonable assurance about whether the financial statements are free of material misstatement, whether due to error or fraud.
Our audits included performing procedures to assess the risks of material misstatement of the financial statements, whether due to error or fraud, and performing procedures that respond to those risks. Such procedures included examining, on a test basis, evidence regarding the amounts and disclosures in the financial statements. Our audits also included evaluating the accounting principles used and significant estimates made by management, as well as evaluating the overall presentation of the financial statements. Our procedures included confirmation of securities owned as of December 31, 2018 by correspondence with the custodian. We believe that our audits provide a reasonable basis for our opinion.
New York, New York
February 19, 2019
We have served as the auditor of one or more investment companies in Guardian Variable Products Trustsince 2016.
| 17 |
Table of Contents
SUPPLEMENTAL INFORMATION(UNAUDITED)
Approval of Investment Advisory andSub-advisory Agreements
Section 15(c) of the Investment Company Act of 1940, as amended (the “1940 Act”), requires that a fund’s board of trustees annually review and consider the continuation of the fund’s investment advisory andsub-advisory agreements. The continuation of any such agreement must be approved by a vote of a majority of the trustees who are not parties to the agreement or “interested persons” (as defined in the 1940 Act) of a party to the agreement at anin-person meeting of the board called for the purpose of voting on such approval.
At a meeting of the Board of Trustees (the “Board”) of Guardian Variable Products Trust (the “Trust”) held on March27-28, 2018, the Board considered and unanimously voted to approve the continuation of the investment management agreement (the “Management Agreement”) between Park Avenue Institutional Advisers LLC (the “Manager”) and the Trust, on behalf of the following 11 series, Guardian Core Plus Fixed Income VIP Fund, Guardian Diversified Research VIP Fund, Guardian Growth & Income VIP Fund, Guardian Integrated Research VIP Fund, Guardian International Growth VIP Fund, Guardian International Value VIP Fund, Guardian Large Cap Disciplined Growth VIP Fund, Guardian Large Cap Disciplined Value VIP Fund, Guardian Large Cap Fundamental Growth VIP Fund, Guardian Mid Cap Relative Value VIP Fund and Guardian Mid Cap Traditional Growth VIP Fund (the “Funds”). The Board also considered and unanimously voted to approve the continuation of thesub-advisory agreements (the“Sub-advisory Agreements,” collectively with the Management Agreement, the “Agreements”) between the Manager and the following investment advisory firms serving assub-advisers to the Funds, ClearBridge Investments LLC, Wellington Management Company LLP, Massachusetts Financial Services Company, Putnam Investment Management, LLC, Boston Partners Global Investors, Inc., AllianceBernstein L.P., Janus Capital Management LLC, Wells Capital Management Incorporated, J.P. Morgan Investment Management Inc., Lazard Asset Management LLC, and Lord, Abbett & Co. LLC (the“Sub-advisers”). The continuation of the Agreements for aone-year period was unanimously approved by the Trustees who are not parties to the Agreements or “interested persons” (as defined in the 1940 Act) of a party to the Agreements (the “Independent Trustees”).
The Board is responsible for overseeing the management of each Fund. In determining whether to approve the continuation of the Agreements, the
Trustees evaluated information and factors that they considered to be relevant and appropriate through the exercise of their own business judgment. The Trustees considered certain information and factors in light of advice furnished to them by legal counsel to the Trust and, in the case of the Independent Trustees, their independent legal counsel.
In advance of the meeting held on March27-28, 2018, the Trustees received materials and information designed to assist their consideration of the Agreements, including written responses from the Manager and eachSub-adviser to a series of questions and requests for information covering a wide variety of topics provided by independent legal counsel on behalf of the Independent Trustees. Broadridge Financial Solutions, Inc. (“Broadridge”), an independent provider of investment company data, was retained to provide the Trustees with reports on how each Fund’s contractual management fees, actual management fees, overall expense ratios and investment performance compared to those of “peer funds” selected by Broadridge that are offered as investment options underlying variable contracts. The Trustees also received materials and information regarding the legal standards applicable to their consideration of the Agreements and the process and criteria used by the Manager to oversee theSub-advisers. During the course of their deliberations, the Independent Trustees met to discuss and evaluate the Agreements in executive session with their independent legal counsel, outside of the presence of the Trustees who are not Independent Trustees and representatives from Fund management, the Manager or anySub-adviser.
In reaching its decisions to approve the continuation of the Agreements, the Board took into account the materials and information described above as well as other materials and information provided to the Board and discussed with and among the Trustees, including information regarding the Funds furnished to the Board by the Manager throughout the year. Individual Trustees may have given different weight to different factors and information with respect to each Agreement, and the Trustees did not identify any single factor or information that, in isolation, would be controlling in deciding to approve the continuation of the Agreements.
The discussion below is intended to summarize the broad factors that figured prominently in the Board’s decisions to approve the continuation of the Agreements rather than to beall-inclusive. These broad factors included: (i) the nature, extent and quality of the services provided to the Funds by the Manager and the
| 18 |
Table of Contents
SUPPLEMENTAL INFORMATION(UNAUDITED)
Sub-advisers; (ii) the investment performance of the Funds; (iii) the fees charged and estimated profitability; (iv) the extent to which economies of scale may exist for a Fund, and the extent to which a Fund may benefit from economies of scale; and (v) any other benefits derived by the Manager or theSub-advisers (or their respective affiliates) from their relationships with the Funds. In addition to considering the above-referenced factors, the Board observed that there are a range of investment options available to variable contract owners who may invest in the Funds, and that these contract owners, having had the opportunity to consider other investment options, may choose to invest or remain invested in the Funds.
Nature, Extent and Quality of Services
The Trustees considered information regarding the nature, extent and quality of services provided to the Funds by the Manager. The Trustees also considered the range of investment advisory services andnon-investment advisory services provided by the Manager, notably coordinating the preparation and filing of various regulatory documents, coordinating the preparation and assembly of Board meeting materials and assisting the Board with certain valuation matters.
The Trustees considered the operation of the Funds in a“manager-of-managers” structure and the responsibilities that the Manager has under this structure, including monitoring and evaluating the performance of theSub-advisers, monitoring theSub-advisers for adherence to the stated investment objectives, strategies, policies and restrictions of the Funds and supervising theSub-advisers with respect to the services that theSub-advisers provide under the Sub-advisory Agreements. The Trustees also considered the process used by the Manager, consistent with this structure, to identify and recommendsub-advisers, and its ability to monitor and overseesub-advisers and recommend replacementsub-advisers, when necessary, and provide other services under the Management Agreement. The Trustees reviewed information regarding the experience and background of the Manager’s key personnel and the Manager’s organizational structure and resources, including investment, legal and administrative capabilities of the Manager. In this regard, the Trustees recognized that the Funds benefit from the Manager’s use of similar resources and capabilities of its affiliates in providing services to the Funds.
The Trustees considered information regarding the nature, extent and quality of services provided to the Funds by theSub-advisers. The Trustees also
considered, among other things, the range of investment advisory services provided by theSub-advisers under the oversight of the Manager. In evaluating these investment advisory services, the Trustees considered, among other things, theSub-advisers’ investment philosophies, styles and/or processes and approach to managing risk. The Trustees received and evaluated information regarding the background, education, expertise and/or experience of the investment professionals that serve as portfolio managers for the Funds and the capabilities, resources and reputations of theSub-advisers.
Based upon these considerations, the Board concluded that it was satisfied with the nature, extent and quality of services provided to the Funds by the Manager and eachSub-adviser.
Investment Performance
The Board considered the investment performance of each Fund. Among other reports, the Board reviewed the performance of the Funds for theone-year and since inception periods compared to a universe of peer funds selected by Broadridge. The Board noted that the Funds had performance records of less than two years and that the Board had reviewed longer performance records of the funds or accounts managed by theSub-advisers with similar strategies as the applicable Fund, when available, when the Board initially approved the Agreements in 2016. The Broadridge report placed the Funds in the following quintiles of the relevant peer universe for theone-year and since inception periods, respectively: Guardian Core Plus Fixed Income VIP Fund (3rd, 3rd), Guardian Diversified Research VIP Fund (2nd, 2nd), Guardian Growth & Income VIP Fund (1st, 1st), Guardian Integrated Research VIP Fund (4th, 5th), Guardian International Growth VIP Fund (3rd, 2nd), Guardian International Value VIP Fund (3rd, 5th), Guardian Large Cap Disciplined Growth VIP Fund (3rd, 4th), Guardian Large Cap Disciplined Value VIP Fund (1st, 1st), Guardian Large Cap Fundamental Growth VIP Fund (5th, 4th), Guardian Mid Cap Relative Value VIP Fund (4th, 3rd) and Guardian Mid Cap Traditional Growth VIP Fund (2nd, 2nd).
The Board considered the investment reports provided by the Manager since commencement of operations of the Funds during quarterly Board meetings. The Board also considered the Manager’s analysis ofSub-adviser performance and the steps taken by the Manager and theSub-advisers to seek to improve performance and the results of those steps.
| 19 |
Table of Contents
SUPPLEMENTAL INFORMATION(UNAUDITED)
In light of the considerations noted above, the Board concluded that it had continued confidence in the Manager’s and theSub-advisers’ overall capabilities to manage the Funds.
Costs and Profitability
The Trustees considered the management fees paid by the Funds to the Manager under the Management Agreement and evaluated the reasonableness of these fees. The Trustees received and reviewed information with respect to the management fees, including the portion of the management fees paid to eachSub-adviser, and the management fees paid by other funds offered as investment options underlying variable contracts within the applicable peer group selected by Broadridge. The Broadridge report placed the Funds in the following quintiles of the relevant expense peer group for the contractual management fees and actual management fees, respectively: Guardian Core Plus Fixed Income VIP Fund (1st, 3rd), Guardian Diversified Research VIP Fund (2nd, 3rd), Guardian Growth & Income VIP Fund (1st, 1st), Guardian Integrated Research VIP Fund (1st, 2nd), Guardian International Growth VIP Fund (1st, 2nd), Guardian International Value VIP Fund (3rd, 2nd), Guardian Large Cap Disciplined Growth VIP Fund (1st, 1st), Guardian Large Cap Disciplined Value VIP Fund (1st, 1st), Guardian Large Cap Fundamental Growth VIP Fund (1st, 1st), Guardian Mid Cap Relative Value VIP Fund (1st, 1st) and Guardian Mid Cap Traditional Growth VIP Fund (3rd, 4th).
The Trustees considered thesub-advisory fees paid under the Sub-advisory Agreements and evaluated the reasonableness of those fees. The Trustees also considered that the fees paid to theSub-advisers are paid by the Manager and not the Funds and that the Manager had negotiated the fees with theSub-advisers atarm’s-length. In addition, the Trustees considered the portion of the management fees paid to eachSub-adviser as compared to the portion retained by the Manager.
The Trustees received and reviewed information in the Broadridge report comparing each Fund’s operating expense ratio to the actual operating expense ratios of a peer group of funds selected by Broadridge. The Trustees considered the Manager’s commitment to limit each Fund’s operating expenses through an expense limitation agreement with the Trust. The Broadridge report placed the Funds in the following quintiles of the relevant expense peer group for the operating expense ratio: Guardian Core Plus Fixed Income VIP Fund (2nd), Guardian Diversified Research
VIP Fund (2nd), Guardian Growth & Income VIP Fund (2nd), Guardian Integrated Research VIP Fund (1st), Guardian International Growth VIP Fund (3rd), Guardian International Value VIP Fund (1st), Guardian Large Cap Disciplined Growth VIP Fund (1st), Guardian Large Cap Disciplined Value VIP Fund (2nd), Guardian Large Cap Fundamental Growth VIP Fund (1st), Guardian Mid Cap Relative Value VIP Fund (1st) and Guardian Mid Cap Traditional Growth VIP Fund (3rd).
Although the Board recognized that the comparisons between the management fees and anticipated operating expenses of the Funds and those of identified peer funds are imprecise, given different terms of agreements and variations in fund strategies, the Trustees found that the comparative information supported their consideration and approval of the management fees and evaluation of operating expenses.
The Trustees reviewed information regarding the Manager’s costs of sponsoring the Funds and estimated profitability of the Funds to the Manager. The Trustees noted that the information contained estimates, such as allocations of expenses. Although the Trustees did not receive specific cost and profitability information from certainSub-advisers, the Trustees primarily considered the cost and profitability information relating to the Manager because the Manager is responsible for payment of thesub-advisory fees and negotiated the fees with theSub-advisers atarm’s-length.
Based on the consideration of the information and factors summarized above, as well as other information and factors deemed relevant by the Trustees, the Trustees concluded that the management andsub-advisory fees were reasonable in light of the nature, extent and quality of services rendered to the Funds by the Manager and theSub-advisers. The Trustees also concluded that the estimated profitability of the Funds to the Manager was acceptable.
Economies of Scale
The Trustees considered the extent to which economies of scale may be shared as assets grow based on current asset levels of the Funds, anticipated asset levels over the next year, the current management andsub-advisory fee rates, the expense limitation arrangements, and any management andsub-advisory fee breakpoints, which reduce fee rates as assets increase. Based on those factors, the Board concluded that it was satisfied with the extent to which any economies of scale would be shared for the benefit of
| 20 |
Table of Contents
SUPPLEMENTAL INFORMATION(UNAUDITED)
Fund shareholders. The Board noted that it would continue to monitor future growth in each Fund’s assets and whether additional steps are required to share appropriately any economies of scale with Fund shareholders.
Ancillary Benefits
The Trustees considered the benefits, other than management fees, that the Manager and/or its affiliates receive because of the Manager’s relationship with the Funds. The Trustees acknowledged that the Funds serve as investment options under variable contracts issued by an affiliate of the Manager that receives fees under those contracts and that Park Avenue Securities LLC, an affiliate of the Manager and principal underwriter of the Funds, and an insurance company affiliated with the Manager receive fees from the Funds under a plan of distribution adopted pursuant to Rule12b-1 under the 1940 Act. The Trustees considered that the Manager and its affiliates may benefit from (i) greater efficiencies in annuity administration and operations and potential cost savings due to a reduction in the number of unaffiliated funds available as annuity contract
investment options, and (ii) increased dividends-received deductions due to the Funds’ status under the tax laws as disregarded entities. In addition, the Trustees considered the potential benefits, other thansub-advisory fees, that theSub-advisers and their affiliates receive because of their relationships with the Funds, including the potential increased ability to use soft dollars consistent with Trust policies and other benefits from increases in assets under management. The Trustees concluded that benefits that accrue to the Manager and its affiliates are reasonable and the benefits that accrue to theSub-advisers and their affiliates are consistent with those expected for asub-adviser to a mutual fund such as the applicable Fund.
Conclusion
Based on a comprehensive consideration and evaluation of all of the information and factors summarized above, among others, the Board voting as a whole, including the Independent Trustees voting separately, unanimously approved the continuation of the Agreements.
| 21 |
Table of Contents
SUPPLEMENTAL INFORMATION(UNAUDITED)
Trustees and Officers Information Table
The following table provides information about the Trustees of the Trust.
| Name and Year of Birth | Term of Office, Position(s) Held and Length of Service* | Principal During Past Five Years | Number of in Fund by Trustees*** | Other Directorships Held by Trustee | ||||
| Independent Trustees | ||||||||
| Bruce W. Ferris† (born 1955) | Trustee | Retired (since 2015); President and CEO, Prudential Annuity Distributors (2013–2015); Director/Trustee, Advanced Series Trust, Prudential Series Fund and Prudential’s Gibraltar Fund, Inc. (2013–2015); Senior Vice President, Prudential Annuities (2008–2015). | 16 | None. | ||||
| Theda R. Haber† (born 1954) | Trustee | Adjunct Assistant Professor of Law, UC Hastings College of Law (since 2013); Member of the Board of Directors, Fairholme Trust Company, LLC (since 2015); Attorney, Law Office of Theda R. Haber (since 2014); Visiting Professor of Law, UC Davis School of Law (since 2014); Consultant, Haber & Associates LLC (financial services industry) (since 2012); Advisory Council Chair, Vice Chair, and Member, Advisory Council on Employee Welfare and Pension Benefit Plans (ERISA Advisory Council), U.S. Department of Labor (2009–2011); Managing Director and General Counsel, BlackRock Institutional Trust Company, N.A. (2009–2011); Deputy Global General Counsel, Barclays Global Investors (2006–2009); Managing Director, Barclays Global Investors (1998–2006). | 16 | None. | ||||
| Marshall Lux† (born 1960) | Trustee | Senior Advisor, The Boston Consulting Group (since 2014); Senior Partner and Managing Director, The Boston Consulting Group (2009–2014). | 16 | None. | ||||
| Lisa K. Polsky† (born 1956) | Trustee | Senior Risk Advisor, AQR (investment management) (since 2016); Senior Risk Advisor, Ultra Capital (venture capital) (since 2016); Board Member and Chair of Risk Committee, DeutscheBank IHC (financial services) (since May 2016); Chief Risk Officer, CIT Group Inc. (financial services) (2010–2015); Board Member and Chair of Audit Committee, Piper Jaffray (investment bank) (2007–2016). | 16 | None. | ||||
| John Walters† (born 1962) | Lead Independent Trustee | Board Member, Amerilife Holdings LLC (insurance distribution) (since 2015); Board Member, Stadion Money Management LLC (investment adviser) (since 2011); President and Chief Operating Officer, Hartford Life Insurance Company (2000–2010). | 16 | None. | ||||
| 22 |
Table of Contents
SUPPLEMENTAL INFORMATION(UNAUDITED)
| Name and Year of Birth | Term of Office, Position(s) Held and Length of Service* | Principal During Past Five Years | Number of Funds in Fund Complex Overseen by Trustees*** | Other Directorships Held by Trustee | ||||
| Interested Trustees | ||||||||
| Gordon Dinsmore** (born 1952) | Trustee | Senior Vice President, Head of Product and President of Berkshire, The Guardian Life Insurance Company of America. | 16 | None. | ||||
| Marc Costantini** (born 1969) | Chairman and Trustee | Executive Vice President, Group and Worksite Markets, The Guardian Life Insurance Company of America (since 2017); Executive Vice President and Chief Financial Officer, The Guardian Life Insurance Company of America (2014– 2017); Executive Vice President, Manulife Financial prior thereto (various positions from 1990–2014). | 16 | None. | ||||
| * | Each Trustee except for Mr. Dinsmore began service in such capacity in 2016 and serves until his or her successor is elected and qualified or until his or her resignation, death or removal. Mr. Dinsmore has served as a Trustee since November 2017. The business address of each Trustee is 7 Hanover Square, New York, New York 10004. |
| ** | Each of Gordon Dinsmore and Marc Costantini is considered to be an “interested person” of the Trust within the meaning of the 1940 Act because of their affiliation with The Guardian Life Insurance Company of America and/or its affiliates. |
| *** | As of the date of this report, the Trust currently consists of 16 separate Funds. |
| † | Member of the Audit Committee of the Trust. |
The following table provides information about the Officers of the Trust.
| Name and Year of Birth | Position(s) Held and Length of Service* | Principal Occupation(s) During Past Five Years | ||
| Gordon Dinsmore (born 1952) | President and Principal Executive Officer (Since November 2017) | Senior Vice President, Head of Product and President of Berkshire, The Guardian Life Insurance Company of America. | ||
| John H. Walter (born 1962) | Senior Vice President, Treasurer, and Principal Financial and Accounting Officer | Vice President, Chief Financial Officer, Equity Profit Center, The Guardian Life Insurance Company of America. | ||
| Harris Oliner (born 1971) | Senior Vice President and Secretary | Senior Vice President, Corporate Secretary, The Guardian Life Insurance Company of America (since 2015); Senior Vice President, Deputy General Counsel, Corporate Secretary, Voya Financial, Inc. (2013–2014); Managing Director, Senior Counsel, Corporate Secretary, BlackRock, Inc. prior thereto. | ||
| Richard T. Potter (born 1954) | Senior Vice President and Chief Legal Officer | Vice President and Equity Counsel, The Guardian Life Insurance Company of America. | ||
| Philip Stack (born 1964) | Chief Compliance Officer (Since September 2017) | Executive Director, Chief Compliance Officer, Morgan Stanley (2015–2017); Vice President, Morgan Stanley (2013–2015); Vice President, Corporate Audit Group–Compliance, Morgan Stanley prior thereto. | ||
| James R. Anderson (born 1963) | Anti-Money Laundering Officer (Since November 2017) | Second Vice President, Agency and Anti-Money Laundering Compliance, The Guardian Life Insurance Company of America. | ||
| Kathleen M. Moynihan (born 1966) | Senior Counsel | Senior Counsel, The Guardian Life Insurance Company of America. | ||
| Maria Nydia Morrison (born 1958) | Fund Controller | Mutual Fund Controller, The Guardian Life Insurance Company of America (since 2015); Chief Financial Officer/Assistant Operating Officer, St. Francis De Assisi Montessori School (Plaridel, Bulacan), Inc. (Philippines) (2013–2015); Vice President, Bank of New York Mellon prior thereto. | ||
| 23 |
Table of Contents
SUPPLEMENTAL INFORMATION(UNAUDITED)
| Name and Year of Birth | Position(s) Held and Length of Service* | Principal Occupation(s) During Past Five Years | ||
| Sonya L. Crosswell (born 1977) | Assistant Secretary | Assistant Vice President, Assistant Corporate Secretary and Secretary Pro Tem, The Guardian Life Insurance Company of America (since 2014); Vice President, Secretary and Assistant General Counsel, Carver Federal Savings Bank prior thereto. | ||
| * | Unless otherwise indicated, the Officers each began service in such capacity in 2016 and hold office for an indefinite term or until their successors shall have been elected and qualified. The business address of each Officer is 7 Hanover Square, New York, New York 10004. |
| 24 |
Table of Contents
SUPPLEMENTAL INFORMATION(UNAUDITED)
The Statement of Additional Information (“SAI”) includes additional information about the Trust’s Trustees and Officers and is available, without charge, upon request by calling toll-free1-888-GUARDIAN(1-888-482-7342) or by visiting our website at http://guardianvpt.onlineprospectus.net/GuardianVPT/Prospectuses.
Portfolio Holdings and Proxy Voting Procedures
The Fund files its complete schedule of portfolio holdings with the Securities and Exchange Commission for the first and third quarters of each fiscal year as an exhibit to its reports on Form N-Q or FormN-PORT (for filings beginning in April 2019 relating to March 31, 2019 data). The Fund’s Form N-Q or FormN-PORT reports are available on the Securities and Exchange Commission’s website at https://www.sec.gov. The Fund’s Form N-Q or FormN-PORT information is also available, without charge, upon request, by calling toll-free1-888-GUARDIAN(1-888-482-7342) or by visiting our website at http://guardianvpt.onlineprospectus.net/GuardianVPT/Prospectuses.
Beginning in April 2019, the Fund will cease to disclose its holdings on Form N-Q and will file Form N-PORT with the Securities and Exchange Commission on a monthly
basis, with the information contained on Form N-PORT for the last month of the Fund’s fiscal quarter being made public by the Securities and Exchange Commission 60 days after the end of the Fund’s fiscal quarter.
A description of the policies and procedures that the Fund uses to determine how to vote proxies relating to portfolio securities is included in the SAI. The SAI and information regarding how the Fund voted proxies relating to portfolio securities during the most recent12-month period ended June 30 may be obtained (i) without charge, upon request, by calling toll-free1-888-GUARDIAN(1-888-482-7342) or by visiting our website at http://guardianvpt.onlineprospectus.net/GuardianVPT/Prospectuses; and (ii) on the Securities and Exchange Commission’s website at https://www.sec.gov.
| 25 |
Table of Contents
This report is transmitted to shareholders only. It is not authorized for use as an offer of sale or a solicitation of an offer to buy shares of the Fund unless accompanied or preceded by the Fund’s current prospectus. Past performance results shown in this report should not be considered a representation of future performance. Investment returns and principal value of shares will fluctuate so that shares, when redeemed, may be worth more or less than their original cost. Statements and other information herein are as dated and are subject to change.

The Guardian Life Insurance Company of America New York, NY 10004-4025
PUB8173
Table of Contents
Guardian Variable
Products Trust
2018
Annual Report
All Data as of December 31, 2018
Guardian Integrated Research VIP Fund
Important Notice
Beginning on January 1, 2021, as permitted by regulations adopted by the Securities and Exchange Commission, paper copies of the Fund’s shareholder reports will no longer be sent by mail from The Guardian Insurance & Annuity Company, Inc. (“GIAC”). Instead, GIAC will mail you a notice when copies of the shareholder reports are made available on a website. You will be notified by mail each time a report is posted and provided with a website link to access the report.
If you have already elected to receive shareholder reports electronically, you will not be affected by this change and you need not take any action. If you have not yet elected electronic delivery, at any time, you may elect to receive the Fund’s shareholder reports and certain other communications from GIAC electronically, by going to www.guardianlife.com and registering for e-delivery.
You may instead elect to receive all future shareholder reports in paper free of charge. If you wish to receive paper copies of your shareholder reports, please call GIAC’s Customer Service Office Contact Center at 1-888-GUARDIAN (1-888-482-7342). Your election to receive reports in paper will apply to all the underlying funds available.

| Not FDIC insured. May lose value. No bank guarantee. | www.guardianlife.com |
Table of Contents
Guardian Integrated Research VIP Fund
Except as otherwise specifically stated, all information, including portfolio security positions, is as of December 31, 2018. The views expressed in the Fund Commentary are those of the Fund’s portfolio manager(s) as of the date of this report and are subject to change without notice. They do not necessarily represent the views of Park Avenue Institutional Advisers LLC or a sub-adviser. The Fund Commentary may contain some forward-looking statements providing expectations or forecasts of future events as of the date of this report; they do not necessarily relate to historical or current facts. There can be no guarantee that any forward-looking statement will be realized. We undertake no obligation to update forward-looking statements, whether as a result of new information, future events, or otherwise. Any discussions of specific securities should not be considered a recommendation to buy or sell those securities. Fund holdings will vary. Information contained herein has been obtained from sources believed reliable, but is not guaranteed.
Table of Contents
GUARDIAN INTEGRATED RESEARCH VIP FUND
FUND COMMENTARY OF MASSACHUSETTS FINANCIAL SERVICES COMPANY,SUB-ADVISER
Highlights
| • | The Guardian Integrated Research VIP Fund (the “Fund”) returned-8.31% for the 12 months ended December 31, 2018, underperforming its benchmark, the Standard & Poor’s 500® Index1 (the “Index”). The Fund’s underperformance relative to the Index was primarily due to stock selection in the financials sector. |
| • | The Index returned -4.38% for the year. The negative return can primarily be attributed to weak performance in the financials, communication services, industrials, energy and consumer staples sectors. To an extent, positive performance from information technology, health care and consumer discretionary stocks offset the weak performance. |
Market Overview
During the 12 months ended December 31, 2018, the U.S. Federal Reserve raised interest rates by 100 basis points, bringing the total number of rate hikes to nine since the central bank began to normalize monetary policy in late 2015. Economic growth rates in the U.S., Eurozone and Japan remained above trend, despite a slowing in global growth, particularly toward the end of the period. Inflation remained contained, particularly outside the U.S. Late in the period, the European Central Bank halted its asset purchase program but issued forward guidance that it does not expect to raise interest rates at least until after the summer of 2019. The Bank of England (once) and the Bank of Canada (three times) each raised rates during the period. The European political backdrop became a bit more volatile late in the period, spurred by concerns over cohesion in the Eurozone after the election of an anti-establishment, Eurosceptic coalition government in Italy and widespread protests over stagnant wage growth in France.
Bond yields rose in the U.S. during most of the period, but remained low by historical standards and slipped from their highs late in the period, as market volatility increased. Yields in many developed markets fell. Outside of emerging markets, where spreads and currencies came under pressure, credit spreads remained quite tight until the end of the period, when
thinner liquidity, lower oil prices and concerns over high degrees of corporate leverage emerged. Growing concern over increasing global trade friction appeared to have weighed on business sentiment during the period’s second half, especially outside the U.S. Tighter financial conditions from rising U.S. rates and a strong dollar, combined with trade uncertainty, helped expose structural weaknesses in several emerging markets in the second half of the period.
Volatility increased at the end of the period, amid signs of slowing global economic growth and increasing trade tensions, which prompted a market setback shortly after U.S. markets set record highs in September. It was the second such equity market decline during the reporting period. The correction came despite a third consecutive quarter of strong growth in U.S. earnings per share. Strong earnings growth, combined with the market decline, brought U.S. equity valuations down from elevated levels earlier in the period, to multiples more in line with long-term averages. While the U.S. economy held up better than most, global economic growth became less synchronized during the period, with Europe and China showing signs of a slowdown and some emerging markets coming under stress.
Portfolio Review
Stock selection in the financials sector was a primary detractor from performance relative to the Index. Stock selection in both the health care and consumer discretionary sectors also negatively impacted relative results.
Strong stock selection in the industrials sector was a primary contributor to performance relative to the benchmark. Stock selection in the utilities sector also benefited relative returns. The Fund’s overweight holdings in pharmaceutical companies compared to the Index also boosted relative returns.
Outlook
Looking forward, in contrast to a year ago, we believe the macro environment today is much more daunting and fraught with many risks. U.S. leading economic indicators, while not yet signaling recession, continue to soften. The U.S. Federal Reserve is on track for two more rate increases in 2019; however, we also believe the market is pricing in fewer than that. Trade tensions
| 1 | The Standard & Poor’s 500®Index (the “Index”) is an unmanaged market-capitalization-weighted index generally considered to be representative of U.S. equity market activity. The Index consists of 500 stocks representing leading industries of the U.S. economy. Index results assume the reinvestment of dividends paid on the stocks constituting the Index. You may not invest in the Index, and, unlike the Fund, the Index does not incur fees or expenses. |
| 1 |
Table of Contents
GUARDIAN INTEGRATED RESEARCH VIP FUND
remain high with negotiations ongoing with Europe, Japan and most importantly, China. In our view, a new divided Congress needs to address the renegotiated NAFTA deal and, barring an impeachment focus, could potentially find bipartisan agreement on infrastructure, minimum wage and drug price legislation.
Given the near-term policy and trade risks, coupled with the weakening economic data and earnings outlook, we believe market leadership is likely to maintain a more
defensive profile. The shift from growth to value leadership is not uncommon in this advanced part of the cycle, as investors look to more defensive characteristics like lower-beta and higher-yielding stocks. We believe that employing a multi-factor quantitative model is important, as factors such as price momentum, earnings momentum, quality and valuation, can encounter transitory performance periods when a factor can be out of favor.
Funds in the Guardian Variable Products Trust are sold by prospectus only. You should carefully consider the investment objectives, risks, charges and expenses of the Funds before making an investment decision. The prospectus contains this and other important information. Please read it carefully before investing or sending money. Please visit our website at http://guardianvpt.onlineprospectus.net/GuardianVPT/Prospectuses or to obtain a printed copy, call 1-888-GUARDIAN (1-888-482-7342).
As with all mutual funds, the value of an investment in the Fund could decline, and you could lose money. Diversification does not guarantee profit or protect against loss, and there can be no assurance that the Fund will achieve its investment objective. The Fund invests primarily in equity securities and therefore exposes you to the general risks of investing in stock markets. Investing inlarge-capitalization companies involves risks such as having low growth rates, and slow responsiveness to competitive challenges or opportunities than in the case of smaller companies. Investments in growth companies may be highly volatile. Growth stocks may not realize their perceived growth potential and during certain periods the Fund may underperform other equity funds that employ a different style. Value stocks may not realize their perceived value and during certain periods the Fund may underperform other equity funds that employ a different style. International investing involves special risks, which include changes in currency rates, foreign taxation and differences in auditing standards and securities regulations, political uncertainty and greater volatility. Foreign securities are subject to political, regulatory, economic, andexchange-rate risks not present in domestic investments. Investing in a more limited number of issuers and sectors can be subject to greater market fluctuation. Any discussions of specific securities should not be considered a recommendation to buy or sell those securities. Fund holdings will vary.
| 2 |
Table of Contents
GUARDIAN INTEGRATED RESEARCH VIP FUND
Fund Characteristics (unaudited)
| Total Net Assets: $9,814,203 |
Sector Allocation1 As of December 31, 2018 |
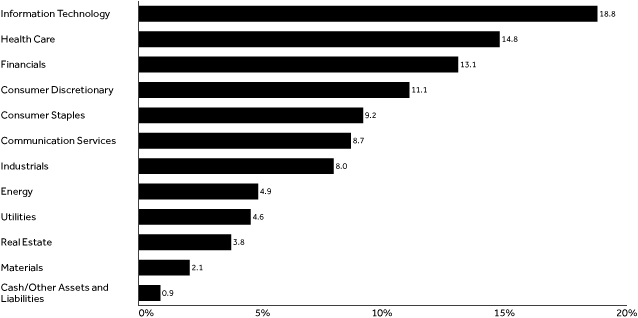 |
Top Ten Holdings2 As of December 31, 2018 |
| Holding | % of Total Net Assets | |||
| Microsoft Corp. | 5.06% | |||
| Amazon.com, Inc. | 3.61% | |||
| Johnson & Johnson | 3.09% | |||
| Apple, Inc. | 2.44% | |||
| Bank of America Corp. | 2.41% | |||
| Cisco Systems, Inc. | 2.34% | |||
| Intel Corp. | 2.32% | |||
| The Boeing Co. | 2.25% | |||
| Comcast Corp., Class A | 2.04% | |||
| Medtronic PLC | 2.03% | |||
| Total | 27.59% | |||
| 1 | The Fund’s holdings are allocated to each sector based on the MSCI Global Industry Classification Standard (GICS®). Cash includes short-term investments and net other assets and liabilities. |
| 2 | Portfolio holdings are subject to change and should not be considered a recommendation to buy or sell individual securities. |
| 3 |
Table of Contents
GUARDIAN INTEGRATED RESEARCH VIP FUND
Average Annual Total Returns As of December 31, 2018 | ||||||||||||||||||||
| Inception Date | 1 Year | 5 Year | 10 Year | Since Inception | ||||||||||||||||
| Guardian Integrated Research VIP Fund | 9/1/2016 | -8.31% | — | — | 5.22% | |||||||||||||||
| Standard & Poor’s 500® Index | -4.38% | — | — | 8.51% | ||||||||||||||||
Results of a Hypothetical $10,000 Investment As of December 31, 2018 |
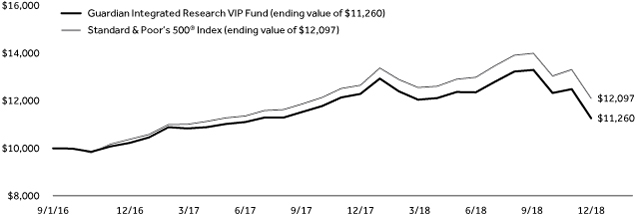 |
The chart above shows the performance of a hypothetical $10,000 investment made on inception date in Guardian Integrated Research VIP Fund and the Standard & Poor’s 500® Index. Index returns do not include the fees and expenses of the Fund, but do include reinvestment of dividends, if any.
Performance quoted represents past performance and does not guarantee or predict future results. Investment return and principal value will fluctuate, so shares, when redeemed, may be worth more or less than their original cost. The Fund’s fees and expenses are detailed in the Financial Highlights section of this report. Fees and expenses are factored into the net asset value of Fund shares and any performance numbers we release. Total return figures include the effect of expense limitations in effect during the periods shown, if applicable; without such limitations, the performance shown would have been lower. Performance results assume the reinvestment of dividends and capital gains. The return figures shown do not reflect the deduction of taxes that a contract owner/policyholder may pay on redemption units. The actual total returns for owners of variable annuity contracts or variable life insurance policies that provide for investment in the Fund will be lower to reflect separate account and contract/policy charges. Current andmonth-end performance information, which may be lower or higher than that cited, is available by calling1-888-GUARDIAN(1-888-482-7342) and is periodically updated on our website: http://guardianlife.com.
| 4 |
Table of Contents
UNDERSTANDING YOUR FUND’S EXPENSES(UNAUDITED)
By investing in the Fund, you incur two types of costs: (1) transaction costs and (2) ongoing costs, including, as applicable, investment advisory fees, distribution and/or service(12b-1) fees and other Fund expenses. The example below is intended to help you understand your ongoing costs (in dollars) of investing in the Fund and to compare these costs with the ongoing costs of investing in other mutual funds.
The example is based on an investment of $1,000 invested at the beginning of the period and held for the entire period from July 1, 2018 to December 31, 2018. The table below shows the Fund’s expenses in two ways:
Expenses based on actual return
This section of the table provides information about actual account values and actual expenses. You may use the information in this section, together with the amount you invested, to estimate the expenses that you paid over the period. Simply divide your account value by $1,000 (for example, an $8,600 account value divided by $1,000 = 8.6), then multiply the result by the number in the section under the heading entitled “Expenses Paid During Period” to estimate the expenses you paid on your account during this period.
Expenses based on hypothetical 5% return for comparison purposes
This section of the table provides information about hypothetical account values and hypothetical expenses based on the Fund’s actual expense ratio and an assumed rate of return of 5% per year before expenses, which is not the Fund’s actual return. The hypothetical account values and expenses may not be used to estimate the actual ending account balance or expenses you paid for the period. You may use this information to compare the ongoing costs of investing in the Fund with the cost of investing in other mutual funds. To do so, compare this 5% hypothetical example with the 5% hypothetical examples that appear in the shareholder reports of the other funds.
Note that the expenses shown in the table are meant to highlight your ongoing costs only and do not reflect any transactional costs, such as sales charges (loads), redemption fees, or exchange fees. Therefore the second section is useful in comparing ongoing costs only, and will not help you determine the relative total costs of owning different funds. If these transactional costs were included, your costs would have been higher. Charges and expenses at the insurance company separate account level are not reflected in the table.
Beginning 7/1/18 | Ending Account Value | Expenses Paid During Period* 7/1/18-12/31/18 | Expense Ratio During Period 7/1/18-12/31/18 | |||||||||||
| Based on Actual Return | $1,000.00 | $ | 911.70 | $ | 4.63 | 0.96% | ||||||||
| Based on Hypothetical Return (5% Return Before Expenses) | $1,000.00 | $ | 1,020.37 | $ | 4.89 | 0.96% | ||||||||
| * | Expenses are equal to the Fund’s annualized expense ratio as indicated, multiplied by the average account value over the period, multiplied by 184/365 (to reflect theone-half year period). |
| 5 |
Table of Contents
SCHEDULE OF INVESTMENTS — GUARDIAN INTEGRATED RESEARCH VIP FUND
| December 31, 2018 | Shares | Value | ||||||
| Common Stocks – 99.1% |
| |||||||
| Aerospace & Defense – 2.2% |
| |||||||
The Boeing Co. | 685 | $ | 220,912 | |||||
|
| |||||||
| 220,912 | ||||||||
| Airlines – 1.1% |
| |||||||
Delta Air Lines, Inc. | 2,241 | 111,826 | ||||||
|
| |||||||
| 111,826 | ||||||||
| Auto Components – 1.2% |
| |||||||
Lear Corp. | 950 | 116,717 | ||||||
|
| |||||||
| 116,717 | ||||||||
| Banks – 5.9% |
| |||||||
Bank of America Corp. | 9,599 | 236,520 | ||||||
Citigroup, Inc. | 1,889 | 98,341 | ||||||
JPMorgan Chase & Co. | 545 | 53,203 | ||||||
Wells Fargo & Co. | 4,065 | 187,315 | ||||||
|
| |||||||
| 575,379 | ||||||||
| Beverages – 2.6% |
| |||||||
Molson Coors Brewing Co., Class B | 2,015 | 113,162 | ||||||
PepsiCo, Inc. | 1,273 | 140,641 | ||||||
|
| |||||||
| 253,803 | ||||||||
| Biotechnology – 2.3% |
| |||||||
Biogen, Inc.(1) | 564 | 169,719 | ||||||
Celgene Corp.(1) | 898 | 57,553 | ||||||
|
| |||||||
| 227,272 | ||||||||
| Capital Markets – 1.7% |
| |||||||
Morgan Stanley | 3,625 | 143,731 | ||||||
The Goldman Sachs Group, Inc. | 130 | 21,717 | ||||||
|
| |||||||
| 165,448 | ||||||||
| Chemicals – 2.1% |
| |||||||
CF Industries Holdings, Inc. | 3,342 | 145,410 | ||||||
Eastman Chemical Co. | 868 | 63,460 | ||||||
|
| |||||||
| 208,870 | ||||||||
| Communications Equipment – 2.3% |
| |||||||
Cisco Systems, Inc. | 5,303 | 229,779 | ||||||
|
| |||||||
| 229,779 | ||||||||
| Consumer Finance – 2.0% |
| |||||||
Discover Financial Services | 1,947 | 114,834 | ||||||
Synchrony Financial | 3,314 | 77,746 | ||||||
|
| |||||||
| 192,580 | ||||||||
| Diversified Financial Services – 0.7% |
| |||||||
Berkshire Hathaway, Inc., Class B(1) | 331 | 67,584 | ||||||
|
| |||||||
| 67,584 | ||||||||
| Diversified Telecommunication Services – 1.0% |
| |||||||
CenturyLink, Inc. | 2,794 | 42,329 | ||||||
Verizon Communications, Inc. | 947 | 53,240 | ||||||
|
| |||||||
| 95,569 | ||||||||
| Electric Utilities – 1.8% |
| |||||||
Exelon Corp. | 3,973 | 179,182 | ||||||
|
| |||||||
| 179,182 | ||||||||
| December 31, 2018 | Shares | Value | ||||||
| Electrical Equipment – 1.4% |
| |||||||
Eaton Corp. PLC | 1,983 | $ | 136,153 | |||||
|
| |||||||
| 136,153 | ||||||||
| Entertainment – 1.2% |
| |||||||
Electronic Arts, Inc.(1) | 1,469 | 115,919 | ||||||
|
| |||||||
| 115,919 | ||||||||
| Equity Real Estate Investment – 3.8% |
| |||||||
EPR Properties REIT | 734 | 46,998 | ||||||
Life Storage, Inc. REIT | 755 | 70,208 | ||||||
Simon Property Group, Inc. REIT | 929 | 156,063 | ||||||
STORE Capital Corp. REIT | 3,611 | 102,227 | ||||||
|
| |||||||
| 375,496 | ||||||||
| Food & Staples Retailing – 4.0% |
| |||||||
Costco Wholesale Corp. | 750 | 152,782 | ||||||
US Foods Holding Corp.(1) | 2,294 | 72,582 | ||||||
Walgreens Boots Alliance, Inc. | 2,505 | 171,167 | ||||||
|
| |||||||
| 396,531 | ||||||||
| Food Products – 0.5% |
| |||||||
Tyson Foods, Inc., Class A | 1,002 | 53,507 | ||||||
|
| |||||||
| 53,507 | ||||||||
| Health Care Equipment & Supplies – 2.3% |
| |||||||
Boston Scientific Corp.(1) | 672 | 23,749 | ||||||
Medtronic PLC | 2,192 | 199,384 | ||||||
|
| |||||||
| 223,133 | ||||||||
| Health Care Providers & Services – 3.5% |
| |||||||
CVS Health Corp. | 1,650 | 108,108 | ||||||
HCA Healthcare, Inc. | 1,074 | 133,659 | ||||||
Humana, Inc. | 327 | 93,679 | ||||||
UnitedHealth Group, Inc. | 21 | 5,232 | ||||||
|
| |||||||
| 340,678 | ||||||||
| Hotels, Restaurants & Leisure – 3.3% |
| |||||||
Aramark | 714 | 20,685 | ||||||
Domino’s Pizza, Inc. | 76 | 18,847 | ||||||
Marriott International, Inc., Class A | 1,101 | 119,524 | ||||||
Starbucks Corp. | 2,507 | 161,451 | ||||||
|
| |||||||
| 320,507 | ||||||||
| Household Durables – 0.5% |
| |||||||
PulteGroup, Inc. | 2,002 | 52,032 | ||||||
|
| |||||||
| 52,032 | ||||||||
| Household Products – 0.4% |
| |||||||
Kimberly-Clark Corp. | 261 | 29,738 | ||||||
The Procter & Gamble Co. | 79 | 7,262 | ||||||
|
| |||||||
| 37,000 | ||||||||
| Independent Power and Renewable Electricity Producers – 2.8% |
| |||||||
AES Corp. | 8,468 | 122,447 | ||||||
NRG Energy, Inc. | 3,464 | 137,175 | ||||||
Vistra Energy Corp.(1) | 553 | 12,658 | ||||||
|
| |||||||
| 272,280 | ||||||||
| Industrial Conglomerates – 0.6% |
| |||||||
Honeywell International, Inc. | 476 | 62,889 | ||||||
|
| |||||||
| 62,889 | ||||||||
| 6 | The accompanying notes are an integral part of these financial statements. |
Table of Contents
SCHEDULE OF INVESTMENTS — GUARDIAN INTEGRATED RESEARCH VIP FUND
| December 31, 2018 | Shares | Value | ||||||
| Insurance – 2.8% |
| |||||||
MetLife, Inc. | 2,900 | $ | 119,074 | |||||
Prudential Financial, Inc. | 1,354 | 110,419 | ||||||
The Allstate Corp. | 521 | 43,050 | ||||||
|
| |||||||
| 272,543 | ||||||||
| Interactive Media & Services – 4.5% |
| |||||||
Alphabet, Inc., Class A(1) | 184 | 192,273 | ||||||
Alphabet, Inc., Class C(1) | 191 | 197,801 | ||||||
Facebook, Inc., Class A(1) | 402 | 52,698 | ||||||
|
| |||||||
| 442,772 | ||||||||
| Internet & Direct Marketing Retail – 5.2% |
| |||||||
Amazon.com, Inc.(1) | 236 | 354,465 | ||||||
Booking Holdings, Inc.(1) | 92 | 158,463 | ||||||
|
| |||||||
| 512,928 | ||||||||
| IT Services – 3.9% |
| |||||||
DXC Technology Co. | 1,698 | 90,283 | ||||||
FleetCor Technologies, Inc.(1) | 710 | 131,861 | ||||||
Global Payments, Inc. | 235 | 24,236 | ||||||
Leidos Holdings, Inc. | 842 | 44,390 | ||||||
MasterCard, Inc., Class A | 376 | 70,932 | ||||||
Visa, Inc., Class A | 159 | 20,979 | ||||||
|
| |||||||
| 382,681 | ||||||||
| Leisure Products – 0.4% |
| |||||||
Brunswick Corp. | 750 | 34,837 | ||||||
|
| |||||||
| 34,837 | ||||||||
| Machinery – 0.7% |
| |||||||
AGCO Corp. | 557 | 31,008 | ||||||
Ingersoll-Rand PLC | 456 | 41,601 | ||||||
|
| |||||||
| 72,609 | ||||||||
| Media – 2.0% |
| |||||||
Comcast Corp., Class A | 5,883 | 200,316 | ||||||
|
| |||||||
| 200,316 | ||||||||
| Oil, Gas & Consumable Fuels – 4.9% |
| |||||||
EOG Resources, Inc. | 1,407 | 122,704 | ||||||
Exxon Mobil Corp. | 535 | 36,482 | ||||||
Kinder Morgan, Inc. | 5,422 | 83,390 | ||||||
ONEOK, Inc. | 510 | 27,515 | ||||||
Phillips 66 | 1,449 | 124,831 | ||||||
Pioneer Natural Resources Co. | 109 | 14,336 | ||||||
Valero Energy Corp. | 916 | 68,673 | ||||||
|
| |||||||
| 477,931 | ||||||||
| Pharmaceuticals – 6.7% |
| |||||||
Bristol-Myers Squibb Co. | 3,167 | 164,621 | ||||||
Eli Lilly & Co. | 802 | 92,807 | ||||||
Johnson & Johnson | 2,350 | 303,268 | ||||||
Pfizer, Inc. | 2,156 | 94,109 | ||||||
|
| |||||||
| 654,805 | ||||||||
| Road & Rail – 1.8% |
| |||||||
Union Pacific Corp. | 1,296 | 179,146 | ||||||
|
| |||||||
| 179,146 | ||||||||
| December 31, 2018 | Shares | Value | ||||||
| Semiconductors & Semiconductor Equipment – 2.6% |
| |||||||
Intel Corp. | 4,854 | $ | 227,798 | |||||
Lam Research Corp. | 239 | 32,545 | ||||||
|
| |||||||
| 260,343 | ||||||||
| Software – 6.9% |
| |||||||
Adobe, Inc.(1) | 683 | 154,522 | ||||||
Microsoft Corp. | 4,886 | 496,271 | ||||||
salesforce.com, Inc.(1) | 170 | 23,285 | ||||||
|
| |||||||
| 674,078 | ||||||||
| Specialty Retail – 0.4% |
| |||||||
Urban Outfitters, Inc.(1) | 1,240 | 41,168 | ||||||
|
| |||||||
| 41,168 | ||||||||
| Technology Hardware, Storage & Peripherals – 3.1% |
| |||||||
Apple, Inc. | 1,517 | 239,291 | ||||||
Hewlett Packard Enterprise Co. | 4,609 | 60,885 | ||||||
|
| |||||||
| 300,176 | ||||||||
| Textiles, Apparel & Luxury Goods – 0.1% |
| |||||||
Lululemon Athletica, Inc.(1) | 48 | 5,837 | ||||||
|
| |||||||
| 5,837 | ||||||||
| Tobacco – 1.7% |
| |||||||
Philip Morris International, Inc. | 2,509 | 167,501 | ||||||
|
| |||||||
| 167,501 | ||||||||
| Trading Companies & Distributors – 0.2% |
| |||||||
HD Supply Holdings, Inc.(1) | 413 | 15,496 | ||||||
|
| |||||||
| 15,496 | ||||||||
| Total Common Stocks (Cost $9,673,034) |
| 9,726,213 | ||||||
| Principal Amount | Value | |||||||
| Short–Term Investment – 1.1% |
| |||||||
| Repurchase Agreements – 1.1% |
| |||||||
Fixed Income Clearing Corp., 0.50%, dated 12/31/2018, proceeds at maturity value of $104,003, due 1/2/2019(2) | $ | 104,000 | 104,000 | |||||
| Total Repurchase Agreements (Cost $104,000) |
| 104,000 | ||||||
| Total Investments – 100.2% (Cost $9,777,034) |
| 9,830,213 | ||||||
| Liabilities in excess of other assets – (0.2)% |
| (16,010 | ) | |||||
| Total Net Assets – 100.0% |
| $ | 9,814,203 | |||||
| (1) | Non–income–producing security. |
| (2) | The table below presents collateral for repurchase agreements. |
| Security | Coupon | Maturity Date | Principal Amount | Value | ||||||||||||
| U.S. Treasury Note | 2.875% | 7/31/2025 | $ | 105,000 | $ | 107,741 | ||||||||||
Legend:
REIT — Real Estate Investment Trust
| The accompanying notes are an integral part of these financial statements. | 7 |
Table of Contents
SCHEDULE OF INVESTMENTS — GUARDIAN INTEGRATED RESEARCH VIP FUND
The following is a summary of the inputs used as of December 31, 2018 in valuing the Fund’s investments. For more information on valuation inputs, please refer to Note 2a of the accompanying Notes to Financial Statements.
| Valuation Inputs | ||||||||||||||||
| Investments in Securities | Level 1 | Level 2 | Level 3 | Total | ||||||||||||
| Common Stocks | $ | 9,726,213 | $ | — | $ | — | $ | 9,726,213 | ||||||||
| Repurchase Agreements | — | 104,000 | — | 104,000 | ||||||||||||
| Total | $ | 9,726,213 | $ | 104,000 | $ | — | $ | 9,830,213 | ||||||||
| 8 | The accompanying notes are an integral part of these financial statements. |
Table of Contents
FINANCIAL INFORMATION — GUARDIAN INTEGRATED RESEARCH VIP FUND
For the Year Ended December 31, 2018 | ||||
Investment Income | ||||
Dividends | $ | 215,469 | ||
Interest | 192 | |||
|
| |||
Total Investment Income | 215,661 | |||
|
| |||
Expenses | ||||
Investment advisory fees | 62,644 | |||
Custodian and accounting fees | 57,527 | |||
Administrative fees | 44,638 | |||
Professional fees | 36,743 | |||
Trustees’ and officers’ fees | 29,450 | |||
Distribution fees | 28,475 | |||
Transfer agent fees | 11,854 | |||
Other expenses | 844 | |||
|
| |||
Total Expenses | 272,175 | |||
Less: Fees waived | (162,831 | ) | ||
|
| |||
Total Expenses, Net | 109,344 | |||
|
| |||
Net Investment Income/(Loss) | 106,317 | |||
|
| |||
Realized Gain/(Loss) and Change in Unrealized Appreciation/(Depreciation) on Investments | ||||
Net realized gain/(loss) from investments | 538,433 | |||
Net change in unrealized appreciation/(depreciation) on investments | (1,521,435) | |||
|
| |||
Net Loss on Investments | (983,002 | ) | ||
|
| |||
Net Decrease in Net Assets Resulting From Operations | $ | (876,685 | ) | |
|
| |||
| The accompanying notes are an integral part of these financial statements. | 9 |
Table of Contents
FINANCIAL INFORMATION — GUARDIAN INTEGRATED RESEARCH VIP FUND
| For the Year Ended 12/31/18 | For the Year Ended 12/31/17 | |||||||
| ||||||||
Operations | ||||||||
Net investment income/(loss) | $ | 106,317 | $ | 173,122 | ||||
Net realized gain/(loss) from investments | 538,433 | 2,237,849 | ||||||
Net change in unrealized appreciation/(depreciation) on investments | (1,521,435 | ) | 1,305,018 | |||||
|
|
|
| |||||
Net Increase/(Decrease) in Net Assets Resulting from Operations | (876,685 | ) | 3,715,989 | |||||
|
|
|
| |||||
Capital Share Transactions | ||||||||
Proceeds from sales of shares | 258,696 | 5,574,156 | ||||||
Cost of shares redeemed | (1,738,400 | ) | (12,034,790 | ) | ||||
|
|
|
| |||||
Net Decrease in Net Assets Resulting from Capital Share Transactions | (1,479,704 | ) | (6,460,634 | ) | ||||
|
|
|
| |||||
Net Decrease in Net Assets | (2,356,389 | ) | (2,744,645 | ) | ||||
|
|
|
| |||||
Net Assets | ||||||||
Beginning of year | 12,170,592 | 14,915,237 | ||||||
|
|
|
| |||||
End of year | $ | 9,814,203 | $ | 12,170,592 | ||||
|
|
|
| |||||
Other Information: | ||||||||
Shares | ||||||||
Sold | 21,136 | 519,309 | ||||||
Redeemed | (140,091 | ) | (984,873 | ) | ||||
|
|
|
| |||||
Net Decrease | (118,955 | ) | (465,564 | ) | ||||
|
|
|
| |||||
| 10 | The accompanying notes are an integral part of these financial statements. |
Table of Contents
This Page Intentionally Left Blank
| 11 |
Table of Contents
FINANCIAL INFORMATION — GUARDIAN INTEGRATED RESEARCH VIP FUND
The Financial Highlights table is intended to help you understand the Fund’s financial performance for the past five years (or, if shorter, the period since inception). Certain information reflects financial results for a single Fund share. The total returns in the table represent the rate that an investor would have earned (or lost) on an investment in the Fund.
Financial Highlights | ||||||||||||||||||||||||
| Per Share Operating Performance | ||||||||||||||||||||||||
| Net Asset Value, Beginning of Period | Net Investment Income(1) | Net Realized and Unrealized Gain/(Loss) | Total Operations | Net Asset Value, End of Period | Total Return(2) | |||||||||||||||||||
Year Ended 12/31/18 | $ | 12.28 | $ | 0.12 | $ | (1.14 | ) | $ | (1.02 | ) | $ | 11.26 | (8.31) | % | ||||||||||
Year Ended 12/31/17 | 10.24 | 0.09 | 1.95 | 2.04 | 12.28 | 19.92 | % | |||||||||||||||||
Period Ended 12/31/16(4) | 10.00 | 0.03 | 0.21 | 0.24 | 10.24 | 2.40 | %(5) | |||||||||||||||||
| 12 | The accompanying notes are an integral part of these financial statements. |
Table of Contents
FINANCIAL INFORMATION — GUARDIAN INTEGRATED RESEARCH VIP FUND
| Ratios/Supplemental Data | ||||||||||||||||||||||
| Net Assets, End of Period (000s) | Net Ratio of Expenses to Average Net Assets(3) | Gross Ratio of Expenses to Average Net Assets | Net Ratio of Net Investment Income to Average Net Assets(3) | Gross Ratio of Net Investment Loss to Average Net Assets | Portfolio Turnover Rate | |||||||||||||||||
| $ | 9,814 | 0.96% | 2.39% | 0.93% | (0.50)% | 58% | ||||||||||||||||
| 12,171 | 0.96% | 1.91% | 0.84% | (0.11)% | 80% | |||||||||||||||||
| 14,915 | 0.96% | (5) | 2.65% | (5) | 0.92% | (5) | (0.77)% | (5) | 15% | (5) | ||||||||||||
| (1) | Calculated based on the average shares outstanding during the period. |
| (2) | Total returns do not reflect the effects of charges deducted pursuant to the terms of The Guardian Insurance & Annuity Company, Inc.‘s variable contracts. Inclusion of such charges would reduce the total returns for all periods shown. |
| (3) | Net Ratio of Expenses to Average Net Assets and Net Ratio of Net Investment Income to Average Net Assets include the effect of fee waivers and expense limitations. |
| (4) | Commenced operations on September 1, 2016. |
| (5) | Ratios for periods less than one year have been annualized, except for total return and portfolio turnover rate. For the period ended December 31, 2016, certainnon-recurring fees (i.e., audit fees) are not annualized. |
| The accompanying notes are an integral part of these financial statements. | 13 |
Table of Contents
NOTES TO FINANCIAL STATEMENTS — GUARDIAN INTEGRATED RESEARCH VIP FUND
December 31, 2018
1. Organization
Guardian Variable Products Trust (the “Trust”), a Delaware statutory trust organized on January 12, 2016, is registered under the Investment Company Act of 1940, as amended (the “1940 Act”), as anopen-end management investment company. The Trust currently has sixteen series. Guardian Integrated Research VIP Fund (the “Fund”) is a series of the Trust. The Fund is a diversified fund and commenced operations on September 1, 2016. The financial statements for other series of the Trust are presented in separate reports.
The Trust has authorized an unlimited number of shares of beneficial interest with no par value. Shares are bought and sold at closing net asset value (“NAV”). Shares of the Fund are only sold to certain separate accounts of The Guardian Insurance & Annuity Company, Inc. (“GIAC”) that fund certain variable annuity contracts and variable life insurance policies issued by GIAC. GIAC is a wholly-owned subsidiary of The Guardian Life Insurance Company of America (“Guardian Life”).
The Fund seeks capital appreciation.
2. Significant Accounting Policies
The following is a summary of significant accounting policies followed by the Fund in the preparation of its financial statements. The Fund follows the investment company accounting and reporting guidance of the Financial Accounting Standards Board (“FASB”) Accounting Standards Codification Topic 946 Financial Services — Investment Companies. The following policies are in conformity with accounting principles generally accepted in the United States of America (“GAAP”). The preparation of financial statements in accordance with GAAP requires management to make estimates and assumptions that affect the reported amounts and disclosures in the financial statements. Actual results could differ from those estimates.
a. Investment Valuations Equity securities traded on an exchange other than NASDAQ Stock Market, LLC (“NASDAQ”) are valued at the last reported sale price on the principal exchange or market on which they are traded; or, if there were no sales that day, at the mean between the closing bid and ask prices. Securities traded on the NASDAQ are generally valued at the NASDAQ official closing price, which may not be the last sale price. If the NASDAQ official closing price is not available for a security, that security is generally valued at the
mean between the closing bid and ask prices. Repurchase agreements are carried at cost, which approximates fair value (see Note 5d). Foreign securities are valued in the currencies of the markets in which they trade and then converted to U.S. dollars by the application of foreign exchange rates at the close of the New York Stock Exchange (“NYSE”). Forward foreign currency contracts, if any, are valued at the mean between the bid and ask rates for the specified time interpolated from rates for proximate time periods. Securities for which market quotations are not readily available or for which market quotations may be considered unreliable are valued at their fair values as determined in accordance with policies and procedures adopted by the Board of Trustees.
Under the policies and procedures approved by the Board of Trustees, Park Avenue Institutional Advisers LLC (“Park Avenue”), the Fund’s investment adviser, has established a Fair Valuation Committee to assist the Board of Trustees with the oversight and monitoring of the valuation of the Fund’s investments. This includes monitoring the appropriateness of fair values based on results of ongoing valuation oversight, including but not limited to consideration of security specific events, market events, and pricing vendor and broker-dealer due diligence. The Fair Valuation Committee oversees and carries out the policies for the valuation of investments held in the Fund. The Fair Valuation Committee is responsible for discussing and assessing the potential impacts to the fair values on an ongoing basis, and at least on a quarterly basis with the Board of Trustees.
Securities whose values have been materially affected by events occurring before the Fund’s valuation time but after the close of the securities’ principal exchange or market may be fair valued in accordance with policies and procedures adopted by the Board of Trustees. In addition, the values of the Fund’s investments in foreign securities are generally determined by a pricing service using pricing models designed to estimate likely changes in the values of those securities. Certain foreign equity instruments are valued by applying international fair value factors provided by approved pricing services. The factors seek to adjust the local closing price for movements of local markets post closing, but prior to the time the NAVs are calculated. Valuations reflected in this report are as of the report date. As a result, changes in valuation due to market events and/or issuer related events after the report date and prior to issuance of the report are not reflected herein.
| 14 |
Table of Contents
NOTES TO FINANCIAL STATEMENTS — GUARDIAN INTEGRATED RESEARCH VIP FUND
Various inputs are used in determining the valuation of the Fund’s investments. These inputs are summarized in three broad levels listed below.
| • | Level 1 — unadjusted inputs using quoted prices in active markets for identical investments. |
| • | Level 2 — other significant observable inputs, including, but not limited to, quoted prices for similar investments, inputs other than quoted prices that are observable for investments (such as interest rates, prepayment speeds, credit risks, etc.) or other market corroborated inputs. |
| • | Level 3 — significant unobservable inputs (including the Fund’s own assumptions in determining the fair value of investments) |
Inputs may include price information, volatility statistics, specific and broad credit data, liquidity statistics, and other factors. A financial instrument’s level within the fair value hierarchy is based on the lowest level of any input; both individually and in aggregate, that is significant to the fair value measurement. However, the determination of what constitutes “observable” requires significant judgment by the Trust. The Trust considers observable data to be that market data which is readily available, regularly distributed or updated, reliable and verifiable, and provided by independent sources that are actively involved in the relevant market. The inputs or methodology used for valuing securities are not necessarily an indication of the risk associated with investing in those securities. Changes in valuation techniques may result in transfers into or out of a financial instrument’s assigned level within the hierarchy.
The FASB requires reporting entities to make disclosures about purchases, sales, issuances and settlements of Level 3 securities on a gross basis.
The Fund’s policy is to recognize transfers between Level 1, Level 2 and Level 3 at the end of the reporting period. For the year ended December 31, 2018, there were no transfers among any levels.
In determining a financial instrument’s placement within the hierarchy, the Trust separates the Fund’s investment portfolio into two categories: investments and derivatives (e.g., futures). A summary of inputs used to value the Fund’s assets and liabilities carried at fair value as of December 31, 2018 is included in the Schedule of Investments.
Investments Investments whose values are based on quoted market prices in active markets, and are
therefore classified within Level 1, include active listed equities. Investments that trade in markets that are not considered to be active, but are valued based on quoted market prices, dealer quotations or alternative pricing sources supported by observable inputs are classified within Level 2. These include certain U.S. government and sovereign obligations, most government agency securities, investment-grade corporate bonds, certain mortgage products, state, municipal and provincial obligations, and certain foreign equity securities, including securities whose prices may have been affected by events occurring after the close of trading on their principal exchange or market and, as a result, whose values are determined by a pricing service as described above, or securities whose values are otherwise determined using fair valuation methods approved by the Fund’s Board of Trustees.
Investments classified within Level 3 have significant unobservable inputs, as they trade infrequently or not at all. Level 3 investments include, among others, private placement securities. When observable prices are not available for these securities, the Trust uses one or more valuation techniques for which sufficient and reliable data is available. The inputs used by the Trust in estimating the value of Level 3 investments include, for example, the original transaction price, recent transactions in the same or similar instruments, completed or pending third-party transactions in the underlying investment or comparable issuers, subsequent rounds of financing, recapitalizations, and other transactions across the capital structure. Level 3 investments may also be adjusted to reflect illiquidity and/ornon-transferability, with the amount of such discount estimated by the Trust in the absence of market information. Assumptions used by the Trust due to the lack of observable inputs may significantly impact the resulting fair value and therefore the Fund’s results of operations. As of December 31, 2018, the Fund had no securities classified as Level 3.
Derivatives Exchange-traded derivatives, such as futures contracts, exchange-traded option contracts and certain swaps, are typically classified within Level 1 or Level 2 of the fair value hierarchy depending on whether or not they are deemed to be actively traded. Certainnon-exchange-traded derivatives, such as generic forwards, certain swaps and options, have inputs which can generally be corroborated by market data and are therefore classified within Level 2. During the year ended December 31, 2018, the Fund did not hold any derivatives.
| 15 |
Table of Contents
NOTES TO FINANCIAL STATEMENTS — GUARDIAN INTEGRATED RESEARCH VIP FUND
b. Securities Transactions Securities transactions are accounted for on the date securities are purchased or sold (trade date). Realized gains or losses on securities transactions are determined on the basis of specific identification.
c. Foreign Currency Translation The accounting records of the Fund are maintained in U.S. dollars. Investment securities and all other assets and liabilities of the Fund denominated in a foreign currency are generally translated into U.S. dollars at the exchange rates quoted at the close of the NYSE on each business day. The market value of investment securities and other assets and liabilities are translated at the exchange rate as of the valuation date. Purchases and sales of securities, income receipts, and expense payments are translated into U.S. dollars at the exchange rates in effect on the dates of the respective transactions. The Fund does not isolate the portion of the fluctuations on investments resulting from changes in foreign currency exchange rates from the fluctuations in market prices of investments held. Such fluctuations are included in the Net change in net realized and unrealized gain/(loss) from investments on the Statement of Operations.
Reported realized foreign currency gains and losses arise from the disposition of foreign currency, currency gains or losses realized between the trade and settlement dates on securities transactions, and the difference between the amounts of dividends, interest and foreign withholding taxes recorded on the Fund’s books on the transaction date and the U.S. dollar equivalent of the amounts actually received or paid. These reported realized foreign currency gains and losses, if any, are included in Net realized gain/(loss) from foreign currency transactions on the Statement of Operations. Unrealized foreign currency gains and losses arise from changes (due to changes in exchange rates) in the value of foreign currency and other assets and liabilities denominated in foreign currencies, which are held at period end, if any, and are included in Net change in unrealized appreciation/(depreciation) on translation of assets and liabilities in foreign currencies on the Statement of Operations.
d. Foreign Capital Gains Tax The Fund may be subject to foreign taxes on income, gains on investments or currency purchases/repatriation, a portion of which may be recoverable. The Fund will accrue such taxes and recoveries as applicable, based upon their current interpretation of tax rules and regulations that exist in the markets in which they invest.
e. Investment Income Dividend income net of foreign taxes withheld, if any, is generally recorded on the ex-dividend date. Interest income, which includes amortization/accretion of premium/discount, is determined using the interest income accrual method, and is accrued and recorded daily.
f. Allocation of Income and Expenses Many of the expenses of the Trust can be directly attributed to a specific series of the Trust. Expenses that cannot be directly attributed to a specific series of the Trust are generally apportioned among all the series in the Trust, based on relative net assets. In calculating net asset value per share for each series of the Trust, investment income, realized and unrealized gains and losses, and expenses other than series-specific expenses are allocated daily to each series based upon the proportion of net assets attributable to each series.
3. Transactions with Affiliates
a. Investment Advisory Fee and Expense Limitation Under the terms of the advisory agreement, which, after its two year initial term, is reviewed and approved annually by the Board of Trustees, the Fund pays an investment advisory fee to Park Avenue. Park Avenue is a wholly-owned subsidiary of Guardian Life and receives an investment advisory fee at an annual rate of 0.55% up to $100 million, 0.50% up to $300 million, and 0.40% in excess of $300 million of the Fund’s average daily net assets. The fee is accrued daily and paid monthly.
Park Avenue has contractually agreed through April 30, 2019 to waive certain fees and/or reimburse certain expenses incurred by the Fund to the extent necessary to limit the Fund’s total annual operating expenses after fee waiver and/or expense reimbursement to 0.96% of the Fund’s average daily net assets (excluding, if applicable, any acquired fund fees and expenses, taxes, interest, transaction costs and brokerage commissions, litigation and extraordinary expenses). Prior to April 9, 2018, the expense limitation was 0.96%. The limitation may not be increased or terminated prior to this time without action by the Board of Trustees, may be terminated only upon approval of the Board of Trustees, and is subject to Park Avenue’s recoupment rights. For the year ended December 31, 2018, Park Avenue waived fees and/or paid Fund expenses in the amount of $162,831.
Park Avenue may be entitled to recoupment of previously waived fees and reimbursed expenses from the Fund for three years from the date of the waiver or reimbursement, subject to the expense limitation in effect at the time of the waiver or reimbursement and at
| 16 |
Table of Contents
NOTES TO FINANCIAL STATEMENTS — GUARDIAN INTEGRATED RESEARCH VIP FUND
the time of the recoupment, if any. The amount available for potential future recoupment by Park Avenue from the Fund under the Expense Limitation Agreement and the expiration schedule at December 31, 2018 are as follows:
| Potential Recoupment Amounts Expiring | ||||||||||||
Total Potential Recoupment Amounts | 2021 | 2020 | 2019 | |||||||||
| $436,893 | $ | 162,831 | $ | 194,792 | $ | 79,270 | ||||||
Park Avenue has entered into aSub-Advisory Agreement with Massachusetts Financial Services Company (“MFS”). MFS is responsible for providingday-to-day investment advisory services to the Fund, subject to the supervision of Park Avenue and the oversight of the Board of Trustees.Sub-advisory fees are paid by Park Avenue and do not represent a separate or additional expense to the Fund.
b. Compensation of Trustees and Officers Trustees and officers who are interested persons of the Trust, as defined in the 1940 Act, receive no compensation from the Fund, except for the Chief Compliance Officer of the Trust. Trustees of the Trust who are not interested persons of the Trust, and the Chief Compliance Officer, receive compensation and reimbursement of expenses from the Trust.
c. Distribution Fees Park Avenue Securities LLC (“PAS”), a wholly-owned subsidiary of Guardian Life, is the principal underwriter of Fund shares. The Trust has entered into a distribution and service agreement with PAS, which governs the sale and distribution of shares of the Fund. Under a distribution and service plan adopted by the Trust(“12b-1 plan”), PAS is compensated for services in such capacity, including its expenses in connection with the promotion and distribution of shares of the Fund, at an annual rate of 0.25% of the Fund’s average daily net assets. For the year ended December 31, 2018, the Fund paid distribution fees in the amount of $28,475 to PAS.
PAS has directed that certain payments under the12b-1 plan be used to compensate GIAC for shareholder services provided to contract owners.
4. Federal Income Taxes
a. Distributions to Shareholders For federal income tax purposes, the Fund is treated as a disregarded entity (“DRE”). As a DRE, the Fund is not subject to an entity-level income tax; and any income, gains, losses, deductions, taxes, and credits of the Fund would instead
be “passed through” directly to the separate accounts of GIAC that invest in the Fund and retain the same character for U.S. federal income tax purposes. In addition, the Fund is not required to distribute taxable income and capital gains for U.S. federal income tax purposes. Therefore, no dividends and capital gains distributions were paid by the Fund.
5. Investments
a. Investment Purchases and Sales The cost of investments purchased and the proceeds from investments sold (excluding short-term investments) amounted to $6,548,873 and $7,928,151, respectively, for the year ended December 31, 2018. During the year ended December 31, 2018, there were no purchases or sales of U.S. government securities.
b. Foreign Securities Foreign securities investments involve special risks and considerations not typically associated with U.S. investments. These risks include, but are not limited to, currency risk; adverse political, regulatory, social, and economic developments; and less reliable information about issuers. Moreover, securities of some foreign issuers may be less liquid and their prices more volatile than those of comparable U.S. issuers.
c. Industry or Sector Concentration In its normal course of business, the Fund may invest a significant portion of its assets in companies within a limited number of industries or sectors. As a result, the Fund may be subject to a greater risk of loss than that of a fund invested in a wider spectrum of industries or sectors because the stocks of many or all of the companies in the industry, group of industries, sector, or sectors may decline in value due to developments adversely affecting the industry, group of industries, sector, or sectors.
d. Repurchase Agreements The Fund may invest in repurchase agreements to maintain liquidity and earn income over periods of time as short as overnight. The collateral for repurchase agreements is either cash or fully negotiable U.S. government securities (including U.S. government agency securities). Repurchase agreements are fully collateralized (including the interest accrued thereon) and such collateral is marked to market daily while the agreements remain in force. If the value of the collateral falls below the repurchase price plus accrued interest, the Fund will typically require the seller to deposit additional collateral by the next business day. If the request for additional collateral is not met, or the seller defaults, the Fund maintains the right to sell the collateral (although it may be prevented
| 17 |
Table of Contents
NOTES TO FINANCIAL STATEMENTS — GUARDIAN INTEGRATED RESEARCH VIP FUND
or delayed from doing so in certain circumstances) and may be required to claim any resulting loss against the seller. Park Avenue monitors the creditworthiness of the seller with which the Fund enters into repurchase agreements.
6. Temporary Borrowings
The Fund, with other funds managed by Park Avenue, is party to a $10 million committed revolving credit facility from State Street Bank and Trust Company for temporary borrowing purposes, including the meeting of redemption requests that otherwise might require the untimely disposition of securities. Interest is calculated based on the higher of the dailyone-month LIBOR rate and the Federal Funds rate plus 1.25% at the time of borrowing. In addition to the interest charged on any borrowings by the Fund, each fund pays a commitment fee of 0.30% per annum on its share of the unused portion of the credit facility. The agreement is in place until December 10, 2019. The Fund did not utilize the credit facility during the year ended December 31, 2018.
7. Indemnifications
Under the Trust’s organizational documents and, in some cases, by contract, its officers and trustees are indemnified against certain liabilities arising out of the
performance of their duties to the Fund. In addition, in the normal course of business, the Fund enters into contracts with its vendors and others that provide general indemnifications. The Fund’s maximum exposure under these arrangements is unknown as this would involve future claims that may be made against the Fund that have not yet occurred. However, based on experience, the Fund expects the risk of loss to be remote.
8. Recent Accounting Pronouncement
On August 17, 2018, the U.S. Securities and Exchange Commission (“SEC”) voted to adopt amendments to certain disclosure requirements that have become redundant, duplicative, overlapping, outdated, or superseded, in light of other SEC disclosure requirements, GAAP, or changes in the information environment. The SEC will also be referring certain SEC disclosure requirements that overlap with, but require information incremental to, GAAP to the FASB for potential incorporation into GAAP. The amendments are intended to facilitate the disclosure of information to investors and simplify compliance without significantly altering the total mix of information provided to investors. As such, the financial statements herein have been updated to conform with these new requirements, which had no effect on the Fund’s net assets or results of operations.
| 18 |
Table of Contents
REPORT OF INDEPENDENT REGISTERED PUBLIC ACCOUNTING FIRM
TotheBoard of Trustees ofGuardian Variable Products TrustandShareholders of Guardian Integrated Research VIP Fund
Opinion on the Financial Statements
We have audited the accompanying statement of assets and liabilities, including the schedule of investments, ofGuardian Integrated Research VIP Fund (one of the funds constituting Guardian Variable Products Trust, referred to hereafter as the “Fund”) as of December 31, 2018, the related statement of operations for the year ended December 31, 2018, the statement of changes in net assets for each of the two years in the period ended December 31, 2018, including the related notes,and the financial highlights for each of the periods indicated therein (collectively referred to as the “financial statements”). In our opinion, the financial statements present fairly, in all material respects, the financial position of the Fund as of December 31, 2018, the results of its operations for the year then ended, the changes in its net assets for each of the two years in the period ended December 31, 2018 and the financial highlights for each of the periods indicated therein in conformity with accounting principles generally accepted in the United States of America.
Basis for Opinion
These financial statements are the responsibility of the Fund’s management. Our responsibility is to express an opinion on the Fund’s financial statements based on our audits. We are a public accounting firm registered with the Public Company Accounting Oversight Board (United States) (PCAOB) and are required to be independent with respect to the Fund in accordance with the U.S. federal securities laws and the applicable rules and regulations of the Securities and Exchange Commission and the PCAOB.
We conducted our audits of these financial statements in accordance with the standards of the PCAOB. Those standards require that we plan and perform the audit to obtain reasonable assurance about whether the financial statements are free of material misstatement, whether due to error or fraud.
Our audits included performing procedures to assess the risks of material misstatement of the financial statements, whether due to error or fraud, and performing procedures that respond to those risks. Such procedures included examining, on a test basis, evidence regarding the amounts and disclosures in the financial statements. Our audits also included evaluating the accounting principles used and significant estimates made by management, as well as evaluating the overall presentation of the financial statements. Our procedures included confirmation of securities owned as of December 31, 2018 by correspondence with the custodian. We believe that our audits provide a reasonable basis for our opinion.
New York, New York
February 19, 2019
We have served as the auditor of one or more investment companies in Guardian Variable Products Trustsince 2016.
| 19 |
Table of Contents
SUPPLEMENTAL INFORMATION(UNAUDITED)
Approval of Investment Advisory andSub-advisory Agreements
Section 15(c) of the Investment Company Act of 1940, as amended (the “1940 Act”), requires that a fund’s board of trustees annually review and consider the continuation of the fund’s investment advisory andsub-advisory agreements. The continuation of any such agreement must be approved by a vote of a majority of the trustees who are not parties to the agreement or “interested persons” (as defined in the 1940 Act) of a party to the agreement at anin-person meeting of the board called for the purpose of voting on such approval.
At a meeting of the Board of Trustees (the “Board”) of Guardian Variable Products Trust (the “Trust”) held on March27-28, 2018, the Board considered and unanimously voted to approve the continuation of the investment management agreement (the “Management Agreement”) between Park Avenue Institutional Advisers LLC (the “Manager”) and the Trust, on behalf of the following 11 series, Guardian Core Plus Fixed Income VIP Fund, Guardian Diversified Research VIP Fund, Guardian Growth & Income VIP Fund, Guardian Integrated Research VIP Fund, Guardian International Growth VIP Fund, Guardian International Value VIP Fund, Guardian Large Cap Disciplined Growth VIP Fund, Guardian Large Cap Disciplined Value VIP Fund, Guardian Large Cap Fundamental Growth VIP Fund, Guardian Mid Cap Relative Value VIP Fund and Guardian Mid Cap Traditional Growth VIP Fund (the “Funds”). The Board also considered and unanimously voted to approve the continuation of thesub-advisory agreements (the“Sub-advisory Agreements,” collectively with the Management Agreement, the “Agreements”) between the Manager and the following investment advisory firms serving assub-advisers to the Funds, ClearBridge Investments LLC, Wellington Management Company LLP, Massachusetts Financial Services Company, Putnam Investment Management, LLC, Boston Partners Global Investors, Inc., AllianceBernstein L.P., Janus Capital Management LLC, Wells Capital Management Incorporated, J.P. Morgan Investment Management Inc., Lazard Asset Management LLC, and Lord, Abbett & Co. LLC (the“Sub-advisers”). The continuation of the Agreements for aone-year period was unanimously approved by the Trustees who are not parties to the Agreements or “interested persons” (as defined in the 1940 Act) of a party to the Agreements (the “Independent Trustees”).
The Board is responsible for overseeing the management of each Fund. In determining whether to approve the continuation of the Agreements, the Trustees evaluated information and factors that they
considered to be relevant and appropriate through the exercise of their own business judgment. The Trustees considered certain information and factors in light of advice furnished to them by legal counsel to the Trust and, in the case of the Independent Trustees, their independent legal counsel.
In advance of the meeting held on March27-28, 2018, the Trustees received materials and information designed to assist their consideration of the Agreements, including written responses from the Manager and eachSub-adviser to a series of questions and requests for information covering a wide variety of topics provided by independent legal counsel on behalf of the Independent Trustees. Broadridge Financial Solutions, Inc. (“Broadridge”), an independent provider of investment company data, was retained to provide the Trustees with reports on how each Fund’s contractual management fees, actual management fees, overall expense ratios and investment performance compared to those of “peer funds” selected by Broadridge that are offered as investment options underlying variable contracts. The Trustees also received materials and information regarding the legal standards applicable to their consideration of the Agreements and the process and criteria used by the Manager to oversee theSub-advisers. During the course of their deliberations, the Independent Trustees met to discuss and evaluate the Agreements in executive session with their independent legal counsel, outside of the presence of the Trustees who are not Independent Trustees and representatives from Fund management, the Manager or anySub-adviser.
In reaching its decisions to approve the continuation of the Agreements, the Board took into account the materials and information described above as well as other materials and information provided to the Board and discussed with and among the Trustees, including information regarding the Funds furnished to the Board by the Manager throughout the year. Individual Trustees may have given different weight to different factors and information with respect to each Agreement, and the Trustees did not identify any single factor or information that, in isolation, would be controlling in deciding to approve the continuation of the Agreements.
The discussion below is intended to summarize the broad factors that figured prominently in the Board’s decisions to approve the continuation of the Agreements rather than to beall-inclusive. These broad factors included: (i) the nature, extent and quality of the services provided to the Funds by the Manager and theSub-advisers; (ii) the investment performance of the
| 20 |
Table of Contents
SUPPLEMENTAL INFORMATION(UNAUDITED)
Funds; (iii) the fees charged and estimated profitability; (iv) the extent to which economies of scale may exist for a Fund, and the extent to which a Fund may benefit from economies of scale; and (v) any other benefits derived by the Manager or theSub-advisers (or their respective affiliates) from their relationships with the Funds. In addition to considering the above-referenced factors, the Board observed that there are a range of investment options available to variable contract owners who may invest in the Funds, and that these contract owners, having had the opportunity to consider other investment options, may choose to invest or remain invested in the Funds.
Nature, Extent and Quality of Services
The Trustees considered information regarding the nature, extent and quality of services provided to the Funds by the Manager. The Trustees also considered the range of investment advisory services andnon-investment advisory services provided by the Manager, notably coordinating the preparation and filing of various regulatory documents, coordinating the preparation and assembly of Board meeting materials and assisting the Board with certain valuation matters.
The Trustees considered the operation of the Funds in a“manager-of-managers” structure and the responsibilities that the Manager has under this structure, including monitoring and evaluating the performance of theSub-advisers, monitoring theSub-advisers for adherence to the stated investment objectives, strategies, policies and restrictions of the Funds and supervising theSub-advisers with respect to the services that theSub-advisers provide under the Sub-advisory Agreements. The Trustees also considered the process used by the Manager, consistent with this structure, to identify and recommendsub-advisers, and its ability to monitor and overseesub-advisers and recommend replacementsub-advisers, when necessary, and provide other services under the Management Agreement. The Trustees reviewed information regarding the experience and background of the Manager’s key personnel and the Manager’s organizational structure and resources, including investment, legal and administrative capabilities of the Manager. In this regard, the Trustees recognized that the Funds benefit from the Manager’s use of similar resources and capabilities of its affiliates in providing services to the Funds.
The Trustees considered information regarding the nature, extent and quality of services provided to the Funds by theSub-advisers. The Trustees also considered, among other things, the range of investment advisory
services provided by theSub-advisers under the oversight of the Manager. In evaluating these investment advisory services, the Trustees considered, among other things, theSub-advisers’ investment philosophies, styles and/or processes and approach to managing risk. The Trustees received and evaluated information regarding the background, education, expertise and/or experience of the investment professionals that serve as portfolio managers for the Funds and the capabilities, resources and reputations of theSub-advisers.
Based upon these considerations, the Board concluded that it was satisfied with the nature, extent and quality of services provided to the Funds by the Manager and eachSub-adviser.
Investment Performance
The Board considered the investment performance of each Fund. Among other reports, the Board reviewed the performance of the Funds for theone-year and since inception periods compared to a universe of peer funds selected by Broadridge. The Board noted that the Funds had performance records of less than two years and that the Board had reviewed longer performance records of the funds or accounts managed by theSub-advisers with similar strategies as the applicable Fund, when available, when the Board initially approved the Agreements in 2016. The Broadridge report placed the Funds in the following quintiles of the relevant peer universe for theone-year and since inception periods, respectively: Guardian Core Plus Fixed Income VIP Fund (3rd, 3rd), Guardian Diversified Research VIP Fund (2nd, 2nd), Guardian Growth & Income VIP Fund (1st, 1st), Guardian Integrated Research VIP Fund (4th, 5th), Guardian International Growth VIP Fund (3rd, 2nd), Guardian International Value VIP Fund (3rd, 5th), Guardian Large Cap Disciplined Growth VIP Fund (3rd, 4th), Guardian Large Cap Disciplined Value VIP Fund (1st, 1st), Guardian Large Cap Fundamental Growth VIP Fund (5th, 4th), Guardian Mid Cap Relative Value VIP Fund (4th, 3rd) and Guardian Mid Cap Traditional Growth VIP Fund (2nd, 2nd).
The Board considered the investment reports provided by the Manager since commencement of operations of the Funds during quarterly Board meetings. The Board also considered the Manager’s analysis ofSub-adviser performance and the steps taken by the Manager and theSub-advisers to seek to improve performance and the results of those steps.
In light of the considerations noted above, the Board concluded that it had continued confidence in the Manager’s and theSub-advisers’ overall capabilities to manage the Funds.
| 21 |
Table of Contents
SUPPLEMENTAL INFORMATION(UNAUDITED)
Costs and Profitability
The Trustees considered the management fees paid by the Funds to the Manager under the Management Agreement and evaluated the reasonableness of these fees. The Trustees received and reviewed information with respect to the management fees, including the portion of the management fees paid to eachSub-adviser, and the management fees paid by other funds offered as investment options underlying variable contracts within the applicable peer group selected by Broadridge. The Broadridge report placed the Funds in the following quintiles of the relevant expense peer group for the contractual management fees and actual management fees, respectively: Guardian Core Plus Fixed Income VIP Fund (1st, 3rd), Guardian Diversified Research VIP Fund (2nd, 3rd), Guardian Growth & Income VIP Fund (1st, 1st), Guardian Integrated Research VIP Fund (1st, 2nd), Guardian International Growth VIP Fund (1st, 2nd), Guardian International Value VIP Fund (3rd, 2nd), Guardian Large Cap Disciplined Growth VIP Fund (1st, 1st), Guardian Large Cap Disciplined Value VIP Fund (1st, 1st), Guardian Large Cap Fundamental Growth VIP Fund (1st, 1st), Guardian Mid Cap Relative Value VIP Fund (1st, 1st) and Guardian Mid Cap Traditional Growth VIP Fund (3rd, 4th).
The Trustees considered thesub-advisory fees paid under the Sub-advisory Agreements and evaluated the reasonableness of those fees. The Trustees also considered that the fees paid to theSub-advisers are paid by the Manager and not the Funds and that the Manager had negotiated the fees with theSub-advisers atarm’s-length. In addition, the Trustees considered the portion of the management fees paid to eachSub-adviser as compared to the portion retained by the Manager.
The Trustees received and reviewed information in the Broadridge report comparing each Fund’s operating expense ratio to the actual operating expense ratios of a peer group of funds selected by Broadridge. The Trustees considered the Manager’s commitment to limit each Fund’s operating expenses through an expense limitation agreement with the Trust. The Broadridge report placed the Funds in the following quintiles of the relevant expense peer group for the operating expense ratio: Guardian Core Plus Fixed Income VIP Fund (2nd), Guardian Diversified Research VIP Fund (2nd), Guardian Growth & Income VIP Fund (2nd), Guardian Integrated Research VIP Fund (1st), Guardian International Growth VIP Fund (3rd), Guardian International Value VIP Fund (1st), Guardian Large Cap Disciplined Growth VIP Fund (1st), Guardian Large Cap Disciplined Value VIP Fund (2nd), Guardian Large Cap
Fundamental Growth VIP Fund (1st), Guardian Mid Cap Relative Value VIP Fund (1st) and Guardian Mid Cap Traditional Growth VIP Fund (3rd).
Although the Board recognized that the comparisons between the management fees and anticipated operating expenses of the Funds and those of identified peer funds are imprecise, given different terms of agreements and variations in fund strategies, the Trustees found that the comparative information supported their consideration and approval of the management fees and evaluation of operating expenses.
The Trustees reviewed information regarding the Manager’s costs of sponsoring the Funds and estimated profitability of the Funds to the Manager. The Trustees noted that the information contained estimates, such as allocations of expenses. Although the Trustees did not receive specific cost and profitability information from certainSub-advisers, the Trustees primarily considered the cost and profitability information relating to the Manager because the Manager is responsible for payment of thesub-advisory fees and negotiated the fees with theSub-advisers atarm’s-length.
Based on the consideration of the information and factors summarized above, as well as other information and factors deemed relevant by the Trustees, the Trustees concluded that the management andsub-advisory fees were reasonable in light of the nature, extent and quality of services rendered to the Funds by the Manager and theSub-advisers. The Trustees also concluded that the estimated profitability of the Funds to the Manager was acceptable.
Economies of Scale
The Trustees considered the extent to which economies of scale may be shared as assets grow based on current asset levels of the Funds, anticipated asset levels over the next year, the current management andsub-advisory fee rates, the expense limitation arrangements, and any management andsub-advisory fee breakpoints, which reduce fee rates as assets increase. Based on those factors, the Board concluded that it was satisfied with the extent to which any economies of scale would be shared for the benefit of Fund shareholders. The Board noted that it would continue to monitor future growth in each Fund’s assets and whether additional steps are required to share appropriately any economies of scale with Fund shareholders.
| 22 |
Table of Contents
SUPPLEMENTAL INFORMATION(UNAUDITED)
Ancillary Benefits
The Trustees considered the benefits, other than management fees, that the Manager and/or its affiliates receive because of the Manager’s relationship with the Funds. The Trustees acknowledged that the Funds serve as investment options under variable contracts issued by an affiliate of the Manager that receives fees under those contracts and that Park Avenue Securities LLC, an affiliate of the Manager and principal underwriter of the Funds, and an insurance company affiliated with the Manager receive fees from the Funds under a plan of distribution adopted pursuant to Rule12b-1 under the 1940 Act. The Trustees considered that the Manager and its affiliates may benefit from (i) greater efficiencies in annuity administration and operations and potential cost savings due to a reduction in the number of unaffiliated funds available as annuity contract investment options, and (ii) increased dividends-received deductions due to the Funds’ status under the tax laws as disregarded entities. In addition, the
Trustees considered the potential benefits, other thansub-advisory fees, that theSub-advisers and their affiliates receive because of their relationships with the Funds, including the potential increased ability to use soft dollars consistent with Trust policies and other benefits from increases in assets under management. The Trustees concluded that benefits that accrue to the Manager and its affiliates are reasonable and the benefits that accrue to theSub-advisers and their affiliates are consistent with those expected for asub-adviser to a mutual fund such as the applicable Fund.
Conclusion
Based on a comprehensive consideration and evaluation of all of the information and factors summarized above, among others, the Board voting as a whole, including the Independent Trustees voting separately, unanimously approved the continuation of the Agreements.
| 23 |
Table of Contents
SUPPLEMENTAL INFORMATION(UNAUDITED)
Trustees and Officers Information Table
The following table provides information about the Trustees of the Trust.
| Name and Year of Birth | Term of Office, Position(s) Held and Length of Service* | Principal Occupation(s) During Past Five Years | Number of Funds in Fund Complex Overseen by Trustees*** | Other Directorships Held by Trustee | ||||
| Independent Trustees | ||||||||
Bruce W. Ferris† (born 1955) | Trustee | Retired (since 2015); President and CEO, Prudential Annuity Distributors (2013–2015); Director/Trustee, Advanced Series Trust, Prudential Series Fund and Prudential’s Gibraltar Fund, Inc. (2013–2015); Senior Vice President, Prudential Annuities (2008–2015). | 16 | None. | ||||
| Theda R. Haber† (born 1954) | Trustee | Adjunct Assistant Professor of Law, UC Hastings College of Law (since 2013); Member of the Board of Directors, Fairholme Trust Company, LLC (since 2015); Attorney, Law Office of Theda R. Haber (since 2014); Visiting Professor of Law, UC Davis School of Law (since 2014); Consultant, Haber & Associates LLC (financial services industry) (since 2012); Advisory Council Chair, Vice Chair, and Member, Advisory Council on Employee Welfare and Pension Benefit Plans (ERISA Advisory Council), U.S. Department of Labor (2009–2011); Managing Director and General Counsel, BlackRock Institutional Trust Company, N.A. (2009–2011); Deputy Global General Counsel, Barclays Global Investors (2006–2009); Managing Director, Barclays Global Investors (1998–2006). | 16 | None. | ||||
| Marshall Lux† (born 1960) | Trustee | Senior Advisor, The Boston Consulting Group (since 2014); Senior Partner and Managing Director, The Boston Consulting Group (2009–2014). | 16 | None. | ||||
| Lisa K. Polsky† (born 1956) | Trustee | Senior Risk Advisor, AQR (investment management) (since 2016); Senior Risk Advisor, Ultra Capital (venture capital) (since 2016); Board Member and Chair of Risk Committee, DeutscheBank IHC (financial services) (since May 2016); Chief Risk Officer, CIT Group Inc. (financial services) (2010–2015); Board Member and Chair of Audit Committee, Piper Jaffray (investment bank) (2007–2016). | 16 | None. | ||||
| John Walters† (born 1962) | Lead Independent Trustee | Board Member, Amerilife Holdings LLC (insurance distribution) (since 2015); Board Member, Stadion Money Management LLC (investment adviser) (since 2011); President and Chief Operating Officer, Hartford Life Insurance Company (2000–2010). | 16 | None. | ||||
| 24 |
Table of Contents
SUPPLEMENTAL INFORMATION(UNAUDITED)
| Name and Year of Birth | Term of Office, Position(s) Held and Length of Service* | Principal Occupation(s) During Past Five Years | Number of Funds in Fund Complex Overseen by Trustees*** | Other Directorships Held by Trustee | ||||
| Interested Trustees | ||||||||
Gordon Dinsmore** (born 1952) | Trustee | Senior Vice President, Head of Product and President of Berkshire, The Guardian Life Insurance Company of America. | 16 | None. | ||||
Marc Costantini** (born 1969) | Chairman and Trustee | Executive Vice President, Group and Worksite Markets, The Guardian Life Insurance Company of America (since 2017); Executive Vice President and Chief Financial Officer, The Guardian Life Insurance Company of America (2014–2017); Executive Vice President, Manulife Financial prior thereto (various positions from 1990–2014). | 16 | None. | ||||
| * | Each Trustee except for Mr. Dinsmore began service in such capacity in 2016 and serves until his or her successor is elected and qualified or until his or her resignation, death or removal. Mr. Dinsmore has served as a Trustee since November 2017. The business address of each Trustee is 7 Hanover Square, New York, New York 10004. |
| ** | Each of Gordon Dinsmore and Marc Costantini is considered to be an “interested person” of the Trust within the meaning of the 1940 Act because of their affiliation with The Guardian Life Insurance Company of America and/or its affiliates. |
| *** | As of the date of this report, the Trust currently consists of 16 separate Funds. |
| † | Member of the Audit Committee of the Trust. |
The following table provides information about the Officers of the Trust.
| Name and Year of Birth | Position(s) Held and Length of Service* | Principal Occupation(s) During Past Five Years | ||
Gordon Dinsmore (born 1952) | President and Principal Executive Officer (Since November 2017) | Senior Vice President, Head of Product and President of Berkshire, The Guardian Life Insurance Company of America. | ||
John H. Walter (born 1962) | Senior Vice President, Treasurer, and Principal Financial and Accounting Officer | Vice President, Chief Financial Officer, Equity Profit Center, The Guardian Life Insurance Company of America. | ||
Harris Oliner (born 1971) | Senior Vice President and Secretary | Senior Vice President, Corporate Secretary, The Guardian Life Insurance Company of America (since 2015); Senior Vice President, Deputy General Counsel, Corporate Secretary, Voya Financial, Inc. (2013–2014); Managing Director, Senior Counsel, Corporate Secretary, BlackRock, Inc. prior thereto. | ||
Richard T. Potter (born 1954) | Senior Vice President and Chief Legal Officer | Vice President and Equity Counsel, The Guardian Life Insurance Company of America. | ||
Philip Stack (born 1964) | Chief Compliance Officer (Since September 2017) | Executive Director, Chief Compliance Officer, Morgan Stanley (2015–2017); Vice President, Morgan Stanley (2013–2015); Vice President, Corporate Audit Group–Compliance, Morgan Stanley prior thereto. | ||
James R. Anderson (born 1963) | Anti-Money Laundering Officer (Since November 2017) | Second Vice President, Agency and Anti-Money Laundering Compliance, The Guardian Life Insurance Company of America. | ||
| Kathleen M. Moynihan(born 1966) | Senior Counsel | Senior Counsel, The Guardian Life Insurance Company of America. | ||
Maria Nydia Morrison (born 1958) | Fund Controller | Mutual Fund Controller, The Guardian Life Insurance Company of America (since 2015); Chief Financial Officer/Assistant Operating Officer, St. Francis De Assisi Montessori School (Plaridel, Bulacan), Inc. (Philippines) (2013–2015); Vice President, Bank of New York Mellon prior thereto. | ||
| 25 |
Table of Contents
SUPPLEMENTAL INFORMATION(UNAUDITED)
| Name and Year of Birth | Position(s) Held and Length of Service* | Principal Occupation(s) During Past Five Years | ||
Sonya L. Crosswell (born 1977) | Assistant Secretary | Assistant Vice President, Assistant Corporate Secretary and Secretary Pro Tem, The Guardian Life Insurance Company of America (since 2014); Vice President, Secretary and Assistant General Counsel, Carver Federal Savings Bank prior thereto. | ||
| * | Unless otherwise indicated, the Officers each began service in such capacity in 2016 and hold office for an indefinite term or until their successors shall have been elected and qualified. The business address of each Officer is 7 Hanover Square, New York, New York 10004. |
| 26 |
Table of Contents
SUPPLEMENTAL INFORMATION(UNAUDITED)
The Statement of Additional Information (“SAI”) includes additional information about the Trust’s Trustees and Officers and is available, without charge, upon request by calling toll-free1-888-GUARDIAN(1-888-482-7342) or by visiting our website at http://guardianvpt.onlineprospectus.net/GuardianVPT/Prospectuses.
Portfolio Holdings and Proxy Voting Procedures
The Fund files its complete schedule of portfolio holdings with the Securities and Exchange Commission for the first and third quarters of each fiscal year as an exhibit to its reports on Form N-Q or FormN-PORT (for filings beginning in April 2019 relating to March 31, 2019 data). The Fund’s Form N-Q or FormN-PORT reports are available on the Securities and Exchange Commission’s website at https://www.sec.gov. The Fund’s Form N-Q or FormN-PORT information is also available, without charge, upon request, by calling toll-free1-888-GUARDIAN(1-888-482-7342) or by visiting our website at http://guardianvpt.onlineprospectus.net/GuardianVPT/
Prospectuses.
Beginning in April 2019, the Fund will cease to disclose its holdings on Form N-Q and will file Form N-PORT with the Securities and Exchange Commission on a monthly
basis, with the information contained on Form N-PORT for the last month of the Fund’s fiscal quarter being made public by the Securities and Exchange Commission 60 days after the end of the Fund’s fiscal quarter.
A description of the policies and procedures that the Fund uses to determine how to vote proxies relating to portfolio securities is included in the SAI. The SAI and information regarding how the Fund voted proxies relating to portfolio securities during the most recent12-month period ended June 30 may be obtained (i) without charge, upon request, by calling toll-free1-888-GUARDIAN(1-888-482-7342) or by visiting our website at http://guardianvpt.onlineprospectus.net/GuardianVPT/
Prospectuses; and (ii) on the Securities and Exchange Commission’s website at https://www.sec.gov.
| 27 |
Table of Contents
This report is transmitted to shareholders only. It is not authorized for use as an offer of sale or a solicitation of an offer to buy shares of the Fund unless accompanied or preceded by the Fund’s current prospectus. Past performance results shown in this report should not be considered a representation of future performance. Investment returns and principal value of shares will fluctuate so that shares, when redeemed, may be worth more or less than their original cost. Statements and other information herein are as dated and are subject to change.

The Guardian Life Insurance Company of America New York, NY 10004-4025
PUB8170
Table of Contents
Guardian Variable
Products Trust
2018
Annual Report
All Data as of December 31, 2018
Guardian Diversified Research VIP Fund
Important Notice
Beginning on January 1, 2021, as permitted by regulations adopted by the Securities and Exchange Commission, paper copies of the Fund’s shareholder reports will no longer be sent by mail from The Guardian Insurance & Annuity Company, Inc. (“GIAC”). Instead, GIAC will mail you a notice when copies of the shareholder reports are made available on a website. You will be notified by mail each time a report is posted and provided with a website link to access the report.
If you have already elected to receive shareholder reports electronically, you will not be affected by this change and you need not take any action. If you have not yet elected electronic delivery, at any time, you may elect to receive the Fund’s shareholder reports and certain other communications from GIAC electronically, by going to www.guardianlife.com and registering fore-delivery.
You may instead elect to receive all future shareholder reports in paper free of charge. If you wish to receive paper copies of your shareholder reports, please call GIAC’s Customer Service Office Contact Center at1-888-GUARDIAN(1-888-482-7342). Your election to receive reports in paper will apply to all the underlying funds available.

| Not FDIC insured. May lose value. No bank guarantee. | www.guardianlife.com |
Table of Contents
Guardian Diversified Research VIP Fund
| 1 | ||||
| 3 | ||||
| 4 | ||||
| 5 | ||||
Financial Information | ||||
| Schedule of Investments | 6 | |||
| Statement of Assets and Liabilities | 9 | |||
| Statement of Operations | 9 | |||
| Statements of Changes in Net Assets | 10 | |||
| Financial Highlights | 12 | |||
| Notes to Financial Statements | 14 | |||
| Report of Independent Registered Public Accounting Firm | 19 | |||
Supplemental Information | ||||
| Approval of Investment Advisory andSub-advisory Agreements | 20 | |||
| Trustees and Officers Information Table | 24 | |||
| Portfolio Holdings and Proxy Voting Procedures | 27 | |||
Except as otherwise specifically stated, all information, including portfolio security positions, is as of December 31, 2018. The views expressed in the Fund Commentary are those of the Fund’s portfolio manager(s) as of the date of this report and are subject to change without notice. They do not necessarily represent the views of Park Avenue Institutional Advisers LLC or asub-adviser. The Fund Commentary may contain some forward-looking statements providing expectations or forecasts of future events as of the date of this report; they do not necessarily relate to historical or current facts. There can be no guarantee that any forward-looking statement will be realized. We undertake no obligation to update forward-looking statements, whether as a result of new information, future events, or otherwise. Any discussions of specific securities should not be considered a recommendation to buy or sell those securities. Fund holdings will vary. Information contained herein has been obtained from sources believed reliable, but is not guaranteed.
Table of Contents
GUARDIAN DIVERSIFIED RESEARCH VIP FUND
FUND COMMENTARY OF PUTNAM INVESTMENT MANAGEMENT, LLC,SUB-ADVISER
Highlights
| • | Guardian Diversified Research VIP Fund (the “Fund”) returned-6.40%, underperforming its benchmark, the Standard & Poor’s 500® Index1 (the “Index”), for the 12 months ended December 31, 2018. Although stock selection and sector allocation were modestly positive factors relative to the Index, the Fund underperformed primarily due to impacts from currency and cash exposure. Stock selection in the consumer staples, energy, industrials, consumer discretionary, utilities and health care sectors benefited relative performance. Stock selection in the information technology, financials, materials, and communication services sectors detracted from relative performance. |
| • | The Index returned-4.38% for the period. The negative return can primarily be attributed to weak performance in the financials, communication services, industrials, energy and consumer staples sectors. To an extent, positive performance from information technology, health care and consumer discretionary stocks offset the weak performance. |
Market Overview
The year started with optimism, lifted by the passage of the Tax Cuts and Jobs Act, which ushered in significant tax breaks for corporations. In February, however, a report of rising wage inflation led to a sharp market downturn. Stocks recovered, but slid again in March when President Trump proposed tariffs on aluminum and steel imports, raising concerns about a trade war with China. As a result, U.S. equities endured a turbulent first quarter. The Dow Jones Industrial Average recorded two1,000-point drops, and major indexes entered correction territory, sparking a globalsell-off.
Despite the heightened volatility, stocks rebounded during the second quarter on the back of strong U.S. economic performance and corporate earnings. However, optimism was softened by concerns about protectionist measures between the United States and its major trading partners. Despite a challenging macro-economic backdrop, the gains continued in the third quarter with the Index recording its best quarterly performance since the end of 2013. Stocks were lifted by strong economic growth and positive corporate earnings. According to an August 2018 report, the U.S.
added more jobs than expected and wages grew at the fastest pace since 2009. The final reading of second-quarter GDP was 4.2%, and a gauge of consumer sentiment also reached new highs. Still, trade policy caused some pullbacks in the markets as the United States added tariffs to $200 billion in Chinese goods, and stalled NAFTA negotiations raised concern about whether Canada would join a new pact with the United States and Mexico.
U.S. equities began the fourth quarter after notching significant year-to-date gains. However, the gains were quickly erased by a steep sell-off that resulted in all three major indexes posting their worst annual performance in a decade. The impact of escalating trade tensions between the United States and China, concerns about a global economic slowdown, and political uncertainty fueled market volatility during the final quarter. Economic data was generally positive, although the trade deficit continued to widen, import prices increased, and consumer sentiment weakened. Worries about excess oil supply and slowing global growth caused volatility in the energy market. The spread between the two- and 10-year Treasury yields narrowed the most since 2007, fueling fear that the flattening yield curve may be signaling a recession. In this environment, U.S. equities, as measured by the Index, posted a loss of -4.38% for the year.
Portfolio Review
Although stock selection and sector allocation were modestly positive factors relative to the Index, they were essentially in line with the Index’s performance. As a result, the Fund underperformed the Index due to impacts from currency and cash exposure. The Fund added value relative to the Index through stock selection in the consumer staples, energy, industrials, consumer discretionary, utilities and health care sectors. However, this was offset by unfavorable stock selection in the information technology, financials, materials, and communication services sectors. The real estate sector performed in line with the Index.
Outlook
Many U.S. equity investors greeted the new year with an array of heightened concerns. A difficult December had brought volatility, ayear-end correction, and annual losses for all three major equity indexes. Many of the issues that worried investors throughout 2018, including
| 1 | The Standard & Poor’s 500® Index (the “Index”) is an unmanaged market-capitalization-weighted index generally considered to be representative of U.S. equity market activity. The Index consists of 500 stocks representing leading industries of the U.S. economy. Index results assume the reinvestment of dividends paid on the stocks constituting the Index. You may not invest in the Index, and, unlike the Fund, the Index does not incur fees or expenses. |
| 1 |
Table of Contents
GUARDIAN DIVERSIFIED RESEARCH VIP FUND
geopolitical instability, uncertainty about monetary policy, and the U.S.–China trade dispute, contributed to the downturn.
The U.S.-China trade dispute remained among the top concerns, despite the“non-escalation” agreement in December that paused hikes in tariffs for 90 days. Higher tariffs typically undermine confidence among corporate leaders and complicate and delay investments in their businesses. Tariff hikes can also lead to inflationary pressure, reduce demand for products, and, ultimately, shrink profit margins.
Aside from tariffs, we believe a slowing economy in China — which has been such a strong engine of global growth — is another key risk to equities. Uncertainty around Brexit is a third, which could be destabilizing for the United Kingdom, with ripple effects throughout Europe. Finally, monetary policy and concerns about
continued interest-rate hikes can put pressure on global economies, particularly emerging markets.
Looking ahead, we believe the key risks weighing on equity markets may subside. We also believe that a favorable resolution of the tariff conflict is quite possible. Even if an agreement is only partial in scope, equity markets should respond positively. In terms of U.S. interest rates, we have seen that the U.S. Federal Reserve is willing to take a more dovish stance when rate hikes are taking a toll on markets. In China, we’re seeing signs of more aggressive stimulus measures, which could improve the economic outlook for both China and global markets. And of course, market downturns naturally bring opportunities in the form of more attractive valuations for companies whose fundamental prospects are strong. In addition, we believe equities remain attractive relative to other asset classes.
Funds in the Guardian Variable Products Trust are sold by prospectus only. You should carefully consider the investment objectives, risks, charges and expenses of the Funds before making an investment decision. The prospectus contains this and other important information. Please read it carefully before investing or sending money. Please visit our website at http://guardianvpt.onlineprospectus.net/GuardianVPT/Prospectuses or to obtain a printed copy, call 1-888-GUARDIAN (1-888-482-7342).
As with all mutual funds, the value of an investment in the Fund could decline, and you could lose money. Diversification does not guarantee profit or protect against loss, and there can be no assurance that the Fund will achieve its investment objective. The Fund invests primarily in equity securities and therefore exposes you to the general risks of investing in stock markets. Investing in large-capitalization companies involves risks such as having low growth rates, and slow responsiveness to competitive challenges or opportunities than in the case of smaller companies. Investments in growth companies may be highly volatile. Growth stocks may not realize their perceived growth potential and during certain periods the Fund may underperform other equity funds that employ a different style. Value stocks may not realize their perceived value and during certain periods the Fund may underperform other equity funds that employ a different style. Investing in a more limited number of issuers and sectors can be subject to greater market fluctuation. Any discussions of specific securities should not be considered a recommendation to buy or sell those securities. Fund holdings will vary.
| 2 |
Table of Contents
GUARDIAN DIVERSIFIED RESEARCH VIP FUND
Fund Characteristics (unaudited)
| Total Net Assets: $148,193,229 |
Sector Allocation1 As of December 31, 2018 | ||||
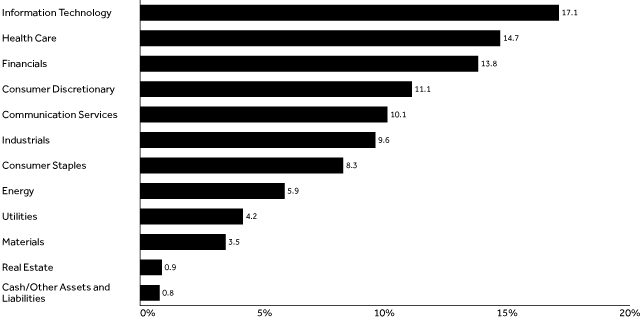 | ||||
Top Ten Holdings2 As of December 31, 2018 | ||||
| Holding | % of Total Net Assets | |||
| Microsoft Corp. | 4.02% | |||
| Alphabet, Inc., Class A | 3.07% | |||
| Amazon.com, Inc. | 2.97% | |||
| Apple, Inc. | 2.72% | |||
| Bank of America Corp. | 2.20% | |||
| The Coca-Cola Co. | 2.17% | |||
| Visa, Inc., Class A | 1.94% | |||
| The Home Depot, Inc. | 1.78% | |||
| The Procter & Gamble Co. | 1.68% | |||
| Facebook, Inc., Class A | 1.67% | |||
| Total | 24.22% | |||
| 1 | The Fund’s holdings are allocated to each sector based on the MSCI Global Industry Classification Standard (GICS®). Cash includes short-term investments and net other assets and liabilities. |
| 2 | Portfolio holdings are subject to change and should not be considered a recommendation to buy or sell individual securities. |
| 3 |
Table of Contents
GUARDIAN DIVERSIFIED RESEARCH VIP FUND
Average Annual Total Returns As of December 31, 2018 | ||||||||||||||||||||
| Inception Date | 1 Year | 5 Year | 10 Year | Since Inception | ||||||||||||||||
| Guardian Diversified Research VIP Fund | 9/1/2016 | -6.40% | — | — | 7.50% | |||||||||||||||
| Standard & Poor’s 500® Index | -4.38% | — | — | 8.51% | ||||||||||||||||
Results of a Hypothetical $10,000 Investment As of December 31, 2018 | ||||||||||
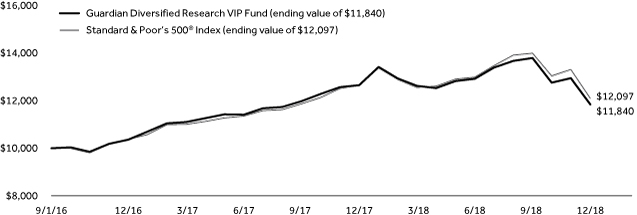 | ||||||||||
The chart above shows the performance of a hypothetical $10,000 investment made on inception date in Guardian Diversified Research VIP Fund and the Standard & Poor’s 500® Index. Index returns do not include the fees and expenses of the Fund, but do include reinvestment of dividends, if any.
Performance quoted represents past performance and does not guarantee or predict future results. Investment return and principal value will fluctuate, so shares, when redeemed, may be worth more or less than their original cost. The Fund’s fees and expenses are detailed in the Financial Highlights section of this report. Fees and expenses are factored into the net asset value of Fund shares and any performance numbers we release. Total return figures include the effect of expense limitations in effect during the periods shown, if applicable; without such limitations, the performance shown would have been lower. Performance results assume the reinvestment of dividends and capital gains. The return figures shown do not reflect the deduction of taxes that a contract owner/policyholder may pay on redemption units. The actual total returns for owners of variable annuity contracts or variable life insurance policies that provide for investment in the Fund will be lower to reflect separate account and contract/policy charges. Current andmonth-end performance information, which may be lower or higher than that cited, is available by calling1-888-GUARDIAN(1-888-482-7342) and is periodically updated on our website: http://guardianlife.com.
| 4 |
Table of Contents
UNDERSTANDING YOUR FUND’S EXPENSES(UNAUDITED)
By investing in the Fund, you incur two types of costs: (1) transaction costs and (2) ongoing costs, including, as applicable, investment advisory fees, distribution and/or service(12b-1) fees and other Fund expenses. The example below is intended to help you understand your ongoing costs (in dollars) of investing in the Fund and to compare these costs with the ongoing costs of investing in other mutual funds.
The example is based on an investment of $1,000 invested at the beginning of the period and held for the entire period from July 1, 2018 to December 31, 2018. The table below shows the Fund’s expenses in two ways:
Expenses based on actual return
This section of the table provides information about actual account values and actual expenses. You may use the information in this section, together with the amount you invested, to estimate the expenses that you paid over the period. Simply divide your account value by $1,000 (for example, an $8,600 account value divided by $1,000 = 8.6), then multiply the result by the number in the section under the heading entitled “Expenses Paid During Period” to estimate the expenses you paid on your account during this period.
Expenses based on hypothetical 5% return for comparison purposes
This section of the table provides information about hypothetical account values and hypothetical expenses based on the Fund’s actual expense ratio and an assumed rate of return of 5% per year before expenses, which is not the Fund’s actual return. The hypothetical account values and expenses may not be used to estimate the actual ending account balance or expenses you paid for the period. You may use this information to compare the ongoing costs of investing in the Fund with the cost of investing in other mutual funds. To do so, compare this 5% hypothetical example with the 5% hypothetical examples that appear in the shareholder reports of the other funds.
Note that the expenses shown in the table are meant to highlight your ongoing costs only and do not reflect any transactional costs, such as sales charges (loads), redemption fees, or exchange fees. Therefore the second section is useful in comparing ongoing costs only, and will not help you determine the relative total costs of owning different funds. If these transactional costs were included, your costs would have been higher. Charges and expenses at the insurance company separate account level are not reflected in the table.
Beginning 7/1/18 | Ending Account Value 12/31/18 | Expenses Paid During Period* 7/1/18-12/31/18 | Expense Ratio During Period 7/1/18-12/31/18 | |||||||||||
| Based on Actual Return | $1,000.00 | $ | 917.10 | $ | 4.93 | 1.02% | ||||||||
Based on Hypothetical Return (5% Return Before Expenses) | $1,000.00 | $ | 1,020.06 | $ | 5.19 | 1.02% | ||||||||
| * | Expenses are equal to the Fund’s annualized expense ratio as indicated, multiplied by the average account value over the period, multiplied by 184/365 (to reflect theone-half year period). |
| 5 |
Table of Contents
SCHEDULE OF INVESTMENTS — GUARDIAN DIVERSIFIED RESEARCH VIP FUND
| December 31, 2018 | Shares | Value | ||||||
| Common Stocks – 98.7% |
| |||||||
| Aerospace & Defense – 1.6% |
| |||||||
Textron, Inc. | 16,030 | $ | 737,220 | |||||
The Boeing Co. | 4,918 | 1,586,055 | ||||||
|
| |||||||
| 2,323,275 | ||||||||
| Automobiles – 1.2% |
| |||||||
General Motors Co. | 53,323 | 1,783,654 | ||||||
|
| |||||||
| 1,783,654 | ||||||||
| Banks – 5.5% |
| |||||||
Bank of America Corp. | 132,210 | 3,257,654 | ||||||
Citigroup, Inc. | 40,507 | 2,108,794 | ||||||
JPMorgan Chase & Co. | 15,534 | 1,516,429 | ||||||
Wells Fargo & Co. | 27,193 | 1,253,054 | ||||||
|
| |||||||
| 8,135,931 | ||||||||
| Beverages – 2.8% |
| |||||||
PepsiCo, Inc. | 8,259 | 912,454 | ||||||
The Coca-Cola Co. | 67,896 | 3,214,876 | ||||||
|
| |||||||
| 4,127,330 | ||||||||
| Biotechnology – 2.7% |
| |||||||
AbbVie, Inc. | 4,402 | 405,820 | ||||||
Amgen, Inc. | 4,400 | 856,548 | ||||||
Biogen, Inc.(1) | 2,811 | 845,886 | ||||||
Celgene Corp.(1) | 7,588 | 486,315 | ||||||
Gilead Sciences, Inc. | 7,000 | 437,850 | ||||||
Regeneron Pharmaceuticals, | 769 | 287,222 | ||||||
Vertex Pharmaceuticals, Inc.(1) | 4,541 | 752,489 | ||||||
|
| |||||||
| 4,072,130 | ||||||||
| Building Products – 0.7% |
| |||||||
Fortune Brands Home & Security, Inc. | 3,096 | 117,617 | ||||||
Johnson Controls International PLC | 28,685 | 850,510 | ||||||
|
| |||||||
| 968,127 | ||||||||
| Capital Markets – 5.0% |
| |||||||
Apollo Global Management LLC, Class A | 5,599 | 137,399 | ||||||
BlackRock, Inc. | 2,552 | 1,002,477 | ||||||
E*TRADE Financial Corp. | 26,766 | 1,174,492 | ||||||
Intercontinental Exchange, Inc. | 9,773 | 736,200 | ||||||
KKR & Co., Inc., Class A | 81,342 | 1,596,744 | ||||||
Raymond James Financial, Inc. | 15,200 | 1,131,032 | ||||||
The Goldman Sachs Group, Inc. | 9,349 | 1,561,750 | ||||||
|
| |||||||
| 7,340,094 | ||||||||
| Chemicals – 2.7% |
| |||||||
Celanese Corp. | 1,086 | 97,707 | ||||||
DowDuPont, Inc. | 30,901 | 1,652,585 | ||||||
Ecolab, Inc. | 1,187 | 174,904 | ||||||
FMC Corp. | 9,475 | 700,771 | ||||||
RPM International, Inc. | 1,674 | 98,398 | ||||||
The Sherwin-Williams Co. | 2,749 | 1,081,622 | ||||||
WR Grace & Co. | 2,646 | 171,752 | ||||||
|
| |||||||
| 3,977,739 | ||||||||
| December 31, 2018 | Shares | Value | ||||||
| Commercial Services & Supplies – 0.8% |
| |||||||
Waste Connections, Inc. | 15,994 | $ | 1,187,554 | |||||
|
| |||||||
| 1,187,554 | ||||||||
| Construction Materials – 0.3% |
| |||||||
Summit Materials, Inc., Class A(1) | 31,770 | 393,948 | ||||||
|
| |||||||
| 393,948 | ||||||||
| Containers & Packaging – 0.3% |
| |||||||
Ball Corp. | 11,195 | 514,746 | ||||||
|
| |||||||
| 514,746 | ||||||||
| Diversified Telecommunication Services – 1.5% |
| |||||||
AT&T, Inc. | 41,910 | 1,196,111 | ||||||
Verizon Communications, Inc. | 17,721 | 996,275 | ||||||
|
| |||||||
| 2,192,386 | ||||||||
| Electric Utilities – 2.9% |
| |||||||
American Electric Power Co., Inc. | 19,752 | 1,476,264 | ||||||
Duke Energy Corp. | 8,099 | 698,944 | ||||||
Edison International | 3,073 | 174,454 | ||||||
Exelon Corp. | 24,007 | 1,082,716 | ||||||
NextEra Energy, Inc. | 4,562 | 792,967 | ||||||
PG&E Corp.(1) | 2,176 | 51,680 | ||||||
|
| |||||||
| 4,277,025 | ||||||||
| Electrical Equipment – 1.1% |
| |||||||
Emerson Electric Co. | 27,897 | 1,666,846 | ||||||
|
| |||||||
| 1,666,846 | ||||||||
| Entertainment – 2.2% |
| |||||||
Activision Blizzard, Inc. | 33,925 | 1,579,887 | ||||||
Live Nation Entertainment, Inc.(1) | 11,101 | 546,724 | ||||||
Twenty-First Century Fox, Inc., Class A | 23,036 | 1,108,493 | ||||||
|
| |||||||
| 3,235,104 | ||||||||
| Equity Real Estate Investment – 0.9% |
| |||||||
Gaming and Leisure Properties, Inc. REIT | 20,758 | 670,691 | ||||||
SBA Communications Corp. REIT(1) | 4,552 | 736,923 | ||||||
|
| |||||||
| 1,407,614 | ||||||||
| Food & Staples Retailing – 2.1% |
| |||||||
BJ’s Wholesale Club Holdings, Inc.(1) | 31,553 | 699,214 | ||||||
Costco Wholesale Corp. | 3,274 | 666,947 | ||||||
Walgreens Boots Alliance, Inc. | 7,750 | 529,557 | ||||||
Walmart, Inc. | 13,757 | 1,281,465 | ||||||
|
| |||||||
| 3,177,183 | ||||||||
| Food Products – 1.2% |
| |||||||
McCormick & Co., Inc. | 5,826 | 811,212 | ||||||
The Hershey Co. | 8,818 | 945,113 | ||||||
|
| |||||||
| 1,756,325 | ||||||||
| Health Care Equipment & Supplies – 5.1% |
| |||||||
Baxter International, Inc. | 10,761 | 708,289 | ||||||
Becton Dickinson and Co. | 7,253 | 1,634,246 | ||||||
Boston Scientific Corp.(1) | 13,423 | 474,369 | ||||||
Danaher Corp. | 22,885 | 2,359,901 | ||||||
Edwards Lifesciences Corp.(1) | 2,648 | 405,594 | ||||||
ICU Medical, Inc.(1) | 2,663 | 611,505 | ||||||
| 6 | The accompanying notes are an integral part of these financial statements. |
Table of Contents
SCHEDULE OF INVESTMENTS — GUARDIAN DIVERSIFIED RESEARCH VIP FUND
| December 31, 2018 | Shares | Value | ||||||
| Health Care Equipment & Supplies(continued) |
| |||||||
Intuitive Surgical, Inc.(1) | 1,521 | $ | 728,437 | |||||
The Cooper Cos., Inc. | 2,557 | 650,757 | ||||||
|
| |||||||
| 7,573,098 | ||||||||
| Health Care Providers & Services – 2.1% |
| |||||||
Cigna Corp. | 8,485 | 1,611,471 | ||||||
UnitedHealth Group, Inc. | 6,279 | 1,564,225 | ||||||
|
| |||||||
| 3,175,696 | ||||||||
| Hotels, Restaurants & Leisure – 2.4% |
| |||||||
Chipotle Mexican Grill, Inc.(1) | 1,760 | 759,950 | ||||||
Hilton Worldwide Holdings, Inc. | 14,203 | 1,019,776 | ||||||
MGM Resorts International | 15,362 | 372,682 | ||||||
Wynn Resorts Ltd. | 6,632 | 655,971 | ||||||
Yum China Holdings, Inc. | 24,362 | 816,858 | ||||||
|
| |||||||
| 3,625,237 | ||||||||
| Household Products – 2.2% |
| |||||||
The Clorox Co. | 5,120 | 789,197 | ||||||
The Procter & Gamble Co. | 27,085 | 2,489,653 | ||||||
|
| |||||||
| 3,278,850 | ||||||||
| Independent Power and Renewable Electricity Producers – 0.7% |
| |||||||
NRG Energy, Inc. | 26,306 | 1,041,718 | ||||||
|
| |||||||
| 1,041,718 | ||||||||
| Industrial Conglomerates – 2.4% |
| |||||||
Honeywell International, Inc. | 17,200 | 2,272,464 | ||||||
Roper Technologies, Inc. | 4,940 | 1,316,609 | ||||||
|
| |||||||
| 3,589,073 | ||||||||
| Insurance – 2.8% |
| |||||||
American International Group, Inc. | 20,665 | 814,408 | ||||||
Assured Guaranty Ltd. | 34,023 | 1,302,400 | ||||||
Chubb Ltd. | 4,611 | 595,649 | ||||||
Prudential PLC (United Kingdom) | 79,338 | 1,417,537 | ||||||
|
| |||||||
| 4,129,994 | ||||||||
| Interactive Media & Services – 5.1% |
| |||||||
Alphabet, Inc., Class A(1) | 4,363 | 4,559,160 | ||||||
Facebook, Inc., Class A(1) | 18,914 | 2,479,436 | ||||||
Tencent Holdings Ltd., ADR | 12,733 | 502,572 | ||||||
|
| |||||||
| 7,541,168 | ||||||||
| Internet & Direct Marketing Retail – 3.8% |
| |||||||
Alibaba Group Holding Ltd., ADR(1) | 1,338 | 183,399 | ||||||
Amazon.com, Inc.(1) | 2,932 | 4,403,776 | ||||||
Booking Holdings, Inc.(1) | 566 | 974,890 | ||||||
|
| |||||||
| 5,562,065 | ||||||||
| IT Services – 3.9% |
| |||||||
DXC Technology Co. | 22,260 | 1,183,564 | ||||||
Fidelity National Information Services, Inc. | 6,387 | 654,987 | ||||||
First Data Corp., Class A(1) | 39,078 | 660,809 | ||||||
GoDaddy, Inc., Class A(1) | 6,462 | 424,036 | ||||||
Visa, Inc., Class A | 21,757 | 2,870,619 | ||||||
|
| |||||||
| 5,794,015 | ||||||||
| December 31, 2018 | Shares | Value | ||||||
| Life Sciences Tools & Services – 0.4% |
| |||||||
Mettler-Toledo International, Inc.(1) | 1,146 | $ | 648,155 | |||||
|
| |||||||
| 648,155 | ||||||||
| Machinery – 0.9% |
| |||||||
Deere & Co. | 3,390 | 505,686 | ||||||
Fortive Corp. | 11,784 | 797,306 | ||||||
|
| |||||||
| 1,302,992 | ||||||||
| Media – 1.3% |
| |||||||
Charter Communications, Inc., Class A(1) | 3,412 | 972,318 | ||||||
Comcast Corp., Class A | 28,983 | 986,871 | ||||||
|
| |||||||
| 1,959,189 | ||||||||
| Metals & Mining – 0.2% |
| |||||||
Alcoa Corp.(1) | 8,365 | 222,342 | ||||||
|
| |||||||
| 222,342 | ||||||||
| Multi-Utilities – 0.6% |
| |||||||
CenterPoint Energy, Inc. | 9,877 | 278,828 | ||||||
Dominion Energy, Inc. | 7,592 | 542,524 | ||||||
|
| |||||||
| 821,352 | ||||||||
| Oil, Gas & Consumable Fuels – 5.9% |
| |||||||
Anadarko Petroleum Corp. | 13,076 | 573,252 | ||||||
BP PLC (United Kingdom) | 381,734 | 2,408,521 | ||||||
Cairn Energy PLC (United Kingdom)(1) | 206,638 | 394,328 | ||||||
Cenovus Energy, Inc. (Canada) | 235,433 | 1,655,550 | ||||||
ConocoPhillips | 9,938 | 619,634 | ||||||
Enterprise Products Partners LP | 30,973 | 761,626 | ||||||
Exxon Mobil Corp. | 15,704 | 1,070,856 | ||||||
Kinder Morgan, Inc. | 67,756 | 1,042,087 | ||||||
Noble Energy, Inc. | 14,814 | 277,911 | ||||||
|
| |||||||
| 8,803,765 | ||||||||
| Pharmaceuticals – 4.4% |
| |||||||
Bristol-Myers Squibb Co. | 3,606 | 187,440 | ||||||
Eli Lilly & Co. | 8,423 | 974,710 | ||||||
Jazz Pharmaceuticals PLC(1) | 4,614 | 571,951 | ||||||
Johnson & Johnson | 10,264 | 1,324,569 | ||||||
Merck & Co., Inc. | 24,944 | 1,905,971 | ||||||
Pfizer, Inc. | 34,858 | 1,521,552 | ||||||
|
| |||||||
| 6,486,193 | ||||||||
| Road & Rail – 1.7% |
| |||||||
Norfolk Southern Corp. | 5,535 | 827,704 | ||||||
Union Pacific Corp. | 11,824 | 1,634,431 | ||||||
|
| |||||||
| 2,462,135 | ||||||||
| Semiconductors & Semiconductor Equipment – 3.8% |
| |||||||
Intel Corp. | 28,318 | 1,328,964 | ||||||
NXP Semiconductors N.V. | 18,110 | 1,327,101 | ||||||
ON Semiconductor Corp.(1) | 47,280 | 780,593 | ||||||
QUALCOMM, Inc. | 38,042 | 2,164,970 | ||||||
|
| |||||||
| 5,601,628 | ||||||||
| Software – 6.7% |
| |||||||
Adobe, Inc.(1) | 6,911 | 1,563,545 | ||||||
Everbridge, Inc.(1) | 12,425 | 705,243 | ||||||
Microsoft Corp. | 58,609 | 5,952,916 | ||||||
| The accompanying notes are an integral part of these financial statements. | 7 |
Table of Contents
SCHEDULE OF INVESTMENTS — GUARDIAN DIVERSIFIED RESEARCH VIP FUND
| December 31, 2018 | Shares | Value | ||||||
| Software(continued) |
| |||||||
salesforce.com, Inc.(1) | 12,067 | $ | 1,652,817 | |||||
|
| |||||||
| 9,874,521 | ||||||||
| Specialty Retail – 3.0% |
| |||||||
Advance Auto Parts, Inc. | 2,619 | 412,388 | ||||||
Burlington Stores, Inc.(1) | 1,957 | 318,345 | ||||||
O’Reilly Automotive, Inc.(1) | 863 | 297,157 | ||||||
The Home Depot, Inc. | 15,330 | 2,634,001 | ||||||
The TJX Cos., Inc. | 18,218 | 815,073 | ||||||
|
| |||||||
| 4,476,964 | ||||||||
| Technology Hardware, Storage & Peripherals – 2.7% |
| |||||||
Apple, Inc. | 25,585 | 4,035,778 | ||||||
|
| |||||||
| 4,035,778 | ||||||||
| Textiles, Apparel & Luxury Goods – 0.7% |
| |||||||
NIKE, Inc., Class B | 14,111 | 1,046,190 | ||||||
|
| |||||||
| 1,046,190 | ||||||||
| Trading Companies & Distributors – 0.4% |
| |||||||
Yellow Cake PLC (United Kingdom)(1)(2) | 218,884 | 638,572 | ||||||
|
| |||||||
| 638,572 | ||||||||
| Total Common Stocks (Cost $154,743,851) |
| 146,227,701 | ||||||
| Exchange–Traded Funds – 0.5% |
| |||||||
SPDR S&P 500 ETF Trust | 2,723 | 680,532 | ||||||
| Total Exchange–Traded Funds (Cost $717,007) |
| 680,532 | ||||||
| December 31, 2018 | Principal Amount | Value | ||||||
| Short–Term Investment – 0.9% |
| |||||||
| Repurchase Agreements – 0.9% |
| |||||||
Fixed Income Clearing Corp., 0.50%, dated 12/31/2018, proceeds at maturity value of $1,406,039, due 1/2/2019(3) | $ | 1,406,000 | $ | 1,406,000 | ||||
| Total Repurchase Agreements (Cost $1,406,000) |
| 1,406,000 | ||||||
| Total Investments – 100.1% (Cost $156,866,858) |
| 148,314,233 | ||||||
| Liabilities in excess of other assets – (0.1)% |
| (121,004 | ) | |||||
| Total Net Assets – 100.0% |
| $ | 148,193,229 | |||||
| (1) | Non–income–producing security. |
| (2) | Securities that may be resold in transactions, exempt from registration under Rule 144A of the Securities Act of 1933, as amended, normally to certain qualified buyers. At December 31, 2018, the aggregate market value of these securities amounted to $638,572, representing 0.4% of net assets. These securities have been deemed liquid by the investment adviser pursuant to the Fund’s liquidity procedures approved by the Board of Trustees. |
| (3) | The table below presents collateral for repurchase agreements. |
| Security | Coupon | Maturity Date | Principal Amount | Value | ||||||||||||
| U.S. Treasury Note | 2.875% | 7/31/2025 | $ | 1,400,000 | $ | 1,436,543 | ||||||||||
Legend:
ADR — American Depositary Receipt
REIT — Real Estate Investment Trust
The following is a summary of the inputs used as of December 31, 2018 in valuing the Fund’s investments. For more information on valuation inputs, please refer to Note 2a of the accompanying Notes to Financial Statements.
| Valuation Inputs | ||||||||||||||||
| Investments in Securities | Level 1 | Level 2 | Level 3 | Total | ||||||||||||
| Common Stocks | $ | 141,368,743 | $ | 4,858,958 | * | $ | — | $ | 146,227,701 | |||||||
| Exchange–Traded Funds | 680,532 | — | — | 680,532 | ||||||||||||
| Repurchase Agreements | — | 1,406,000 | — | 1,406,000 | ||||||||||||
| Total | $ | 142,049,275 | $ | 6,264,958 | $ | — | $ | 148,314,233 | ||||||||
| * | Consists of certain foreign securities whose values were determined by a pricing service using pricing models (See Note 2a in Notes to Financial Statements). These investments in securities were classified as Level 2 rather than Level 1. |
| 8 | The accompanying notes are an integral part of these financial statements. |
Table of Contents
FINANCIAL INFORMATION — GUARDIAN DIVERSIFIED RESEARCH VIP FUND
For the Year Ended December 31, 2018 | ||||
Investment Income | ||||
Dividends | $ | 2,159,636 | ||
Interest | 7,352 | |||
Withholding taxes on foreign dividends | (12,680 | ) | ||
|
| |||
Total Investment Income | 2,154,308 | |||
|
| |||
Expenses | ||||
Investment advisory fees | 759,203 | |||
Distribution fees | 316,335 | |||
Trustees’ and officers’ fees | 79,512 | |||
Custodian and accounting fees | 67,486 | |||
Professional fees | 58,226 | |||
Administrative fees | 44,746 | |||
Transfer agent fees | 17,404 | |||
Shareholder reports | 11,217 | |||
Other expenses | 19,377 | |||
|
| |||
Total Expenses | 1,373,506 | |||
Less: Fees waived | (84,844 | ) | ||
|
| |||
Total Expenses, Net | 1,288,662 | |||
|
| |||
Net Investment Income/(Loss) | 865,646 | |||
|
| |||
Realized Gain/(Loss) and Change in Unrealized Appreciation/(Depreciation) on Investments and Foreign Currency Transactions | ||||
Net realized gain/(loss) from investments | 2,287,700 | |||
Net realized gain/(loss) from foreign currency transactions | (838 | ) | ||
Net change in unrealized appreciation/(depreciation) on investments | (10,288,935 | ) | ||
Net change in unrealized appreciation/(depreciation) on translation of assets and liabilities in foreign currencies | (221 | ) | ||
|
| |||
Net Loss on Investments and Foreign Currency Transactions | (8,002,294 | ) | ||
|
| |||
Net Decrease in Net Assets Resulting From Operations | $ | (7,136,648 | ) | |
|
| |||
| �� | ||||
| The accompanying notes are an integral part of these financial statements. | 9 |
Table of Contents
FINANCIAL INFORMATION — GUARDIAN DIVERSIFIED RESEARCH VIP FUND
For the Year Ended | For the Year Ended | |||||||
| ||||||||
Operations |
| |||||||
Net investment income/(loss) | $ | 865,646 | $ | 106,484 | ||||
Net realized gain/(loss) from investments and foreign currency transactions | 2,286,862 | 1,457,659 | ||||||
Net change in unrealized appreciation/(depreciation) on investments and | (10,289,156 | ) | 1,465,012 | |||||
|
|
|
| |||||
Net Increase/(Decrease) in Net Assets Resulting from Operations | (7,136,648 | ) | 3,029,155 | |||||
|
|
|
| |||||
Capital Share Transactions |
| |||||||
Proceeds from sales of shares | 159,081,293 | 5,773,745 | ||||||
Cost of shares redeemed | (15,880,682 | ) | (6,812,524 | ) | ||||
|
|
|
| |||||
Net Increase/(Decrease) in Net Assets Resulting from Capital Share Transactions | 143,200,611 | (1,038,779 | ) | |||||
|
|
|
| |||||
Net Increase in Net Assets | 136,063,963 | 1,990,376 | ||||||
|
|
|
| |||||
Net Assets |
| |||||||
Beginning of year | 12,129,266 | 10,138,890 | ||||||
|
|
|
| |||||
End of year | $ | 148,193,229 | $ | 12,129,266 | ||||
|
|
|
| |||||
Other Information: |
| |||||||
Shares | ||||||||
Sold | 12,769,094 | 526,654 | ||||||
Redeemed | (1,214,013 | ) | (545,718 | ) | ||||
|
|
|
| |||||
Net Increase/(Decrease) | 11,555,081 | (19,064 | ) | |||||
|
|
|
| |||||
| 10 | The accompanying notes are an integral part of these financial statements. |
Table of Contents
This Page Intentionally Left Blank
| 11 |
Table of Contents
FINANCIAL INFORMATION — GUARDIAN DIVERSIFIED RESEARCH VIP FUND
The Financial Highlights table is intended to help you understand the Fund’s financial performance for the past five years (or, if shorter, the period since inception). Certain information reflects financial results for a single Fund share. The total returns in the table represent the rate that an investor would have earned (or lost) on an investment in the Fund.
| Per Share Operating Performance | ||||||||||||||||||||||||
Net Asset Value, | Net Investment Income(1) | Net Realized and Unrealized Gain/(Loss) | Total Operations | Net Asset Value, End of Period | Total Return(2) | |||||||||||||||||||
Year Ended 12/31/18 | $ | 12.65 | $ | 0.09 | $ | (0.90 | ) | $ | (0.81 | ) | $ | 11.84 | (6.40)% | |||||||||||
Year Ended 12/31/17 | 10.37 | 0.08 | 2.20 | 2.28 | 12.65 | 21.99% | ||||||||||||||||||
Period Ended 12/31/16(4) | 10.00 | 0.04 | 0.33 | 0.37 | 10.37 | 3.70% | (5) | |||||||||||||||||
| 12 | The accompanying notes are an integral part of these financial statements. |
Table of Contents
FINANCIAL INFORMATION — GUARDIAN DIVERSIFIED RESEARCH VIP FUND
| ||||||||||||||||||||||
| Ratios/Supplemental Data | ||||||||||||||||||||||
| Net Assets, End of Period (000s) | Net Ratio of Expenses to Average Net Assets(3) | Gross Ratio of Expenses to Average Net Assets | Net Ratio of Net Investment Income to Average Net Assets(3) | Gross Ratio of Net Investment Income/ (Loss) to Average Net Assets | Portfolio Turnover Rate | |||||||||||||||||
| $ | 148,193 | 1.02% | 1.09% | 0.68% | 0.61% | 88% | ||||||||||||||||
| 12,129 | 0.96% | 2.43% | 0.67% | (0.80)% | 154% | |||||||||||||||||
| 10,139 | 0.96% | (5) | 3.07% | (5) | 1.12% | (5) | (0.99)% | (5) | 61% | (5) | ||||||||||||
| (1) | Calculated based on the average shares outstanding during the period. |
| (2) | Total returns do not reflect the effects of charges deducted pursuant to the terms of The Guardian Insurance & Annuity Company, Inc.’s variable contracts. Inclusion of such charges would reduce the total returns for all periods shown. |
| (3) | Net Ratio of Expenses to Average Net Assets and Net Ratio of Net Investment Income to Average Net Assets include the effect of fee waivers and expense limitations. |
| (4) | Commenced operations on September 1, 2016. |
| (5) | Ratios for periods less than one year have been annualized, except for total return and portfolio turnover rate. For the period ended December 31, 2016, certainnon-recurring fees (i.e., audit fees) are not annualized. |
| The accompanying notes are an integral part of these financial statements. | 13 |
Table of Contents
NOTES TO FINANCIAL STATEMENTS — GUARDIAN DIVERSIFIED RESEARCH VIP FUND
December 31, 2018
1. Organization
Guardian Variable Products Trust (the “Trust”), a Delaware statutory trust organized on January 12, 2016, is registered under the Investment Company Act of 1940, as amended (the “1940 Act”), as anopen-end management investment company. The Trust currently has sixteen series. Guardian Diversified Research VIP Fund (the “Fund”) is a series of the Trust. The Fund is a diversified fund and commenced operations on September 1, 2016. The financial statements for other series of the Trust are presented in separate reports.
The Trust has authorized an unlimited number of shares of beneficial interest with no par value. Shares are bought and sold at closing net asset value (“NAV”). Shares of the Fund are only sold to certain separate accounts of The Guardian Insurance & Annuity Company, Inc. (“GIAC”) that fund certain variable annuity contracts and variable life insurance policies issued by GIAC. GIAC is a wholly-owned subsidiary of The Guardian Life Insurance Company of America (“Guardian Life”).
The Fund seeks capital appreciation.
2. Significant Accounting Policies
The following is a summary of significant accounting policies followed by the Fund in the preparation of its financial statements. The Fund follows the investment company accounting and reporting guidance of the Financial Accounting Standards Board (“FASB”) Accounting Standards Codification Topic 946 Financial Services — Investment Companies. The following policies are in conformity with accounting principles generally accepted in the United States of America (“GAAP”). The preparation of financial statements in accordance with GAAP requires management to make estimates and assumptions that affect the reported amounts and disclosures in the financial statements. Actual results could differ from those estimates.
a. Investment Valuations Equity securities traded on an exchange other than NASDAQ Stock Market, LLC (“NASDAQ”) are valued at the last reported sale price on the principal exchange or market on which they are traded; or, if there were no sales that day, at the mean between the closing bid and ask prices. Securities traded on the NASDAQ are generally valued at the NASDAQ official closing price, which may not be the last sale price. If the NASDAQ official closing price is not available for a security, that security is generally valued at the
mean between the closing bid and ask prices. Repurchase agreements are carried at cost, which approximates fair value (see Note 5d). Foreign securities are valued in the currencies of the markets in which they trade and then converted to U.S. dollars by the application of foreign exchange rates at the close of the New York Stock Exchange (“NYSE”). Forward foreign currency contracts, if any, are valued at the mean between the bid and ask rates for the specified time interpolated from rates for proximate time periods. Securities for which market quotations are not readily available or for which market quotations may be considered unreliable are valued at their fair values as determined in accordance with policies and procedures adopted by the Board of Trustees.
Under the policies and procedures approved by the Board of Trustees, Park Avenue Institutional Advisers LLC (“Park Avenue”), the Fund’s investment adviser, has established a Fair Valuation Committee to assist the Board of Trustees with the oversight and monitoring of the valuation of the Fund’s investments. This includes monitoring the appropriateness of fair values based on results of ongoing valuation oversight, including but not limited to consideration of security specific events, market events, and pricing vendor and broker-dealer due diligence. The Fair Valuation Committee oversees and carries out the policies for the valuation of investments held in the Fund. The Fair Valuation Committee is responsible for discussing and assessing the potential impacts to the fair values on an ongoing basis, and at least on a quarterly basis with the Board of Trustees.
Securities whose values have been materially affected by events occurring before the Fund’s valuation time but after the close of the securities’ principal exchange or market may be fair valued in accordance with policies and procedures adopted by the Board of Trustees. In addition, the values of the Fund’s investments in foreign securities are generally determined by a pricing service using pricing models designed to estimate likely changes in the values of those securities. Certain foreign equity instruments are valued by applying international fair value factors provided by approved pricing services. The factors seek to adjust the local closing price for movements of local markets post closing, but prior to the time the NAVs are calculated. Valuations reflected in this report are as of the report date. As a result, changes in valuation due to market events and/or issuer related events after the report date and prior to issuance of the report are not reflected herein.
| 14 |
Table of Contents
NOTES TO FINANCIAL STATEMENTS — GUARDIAN DIVERSIFIED RESEARCH VIP FUND
Various inputs are used in determining the valuation of the Fund’s investments. These inputs are summarized in three broad levels listed below.
| • | Level 1 — unadjusted inputs using quoted prices in active markets for identical investments. |
| • | Level 2— other significant observable inputs, including, but not limited to, quoted prices for similar investments, inputs other than quoted prices that are observable for investments (such as interest rates, prepayment speeds, credit risks, etc.) or other market corroborated inputs. |
| • | Level 3 — significant unobservable inputs (including the Fund’s own assumptions in determining the fair value of investments) |
Inputs may include price information, volatility statistics, specific and broad credit data, liquidity statistics, and other factors. A financial instrument’s level within the fair value hierarchy is based on the lowest level of any input; both individually and in aggregate, that is significant to the fair value measurement. However, the determination of what constitutes “observable” requires significant judgment by the Trust. The Trust considers observable data to be that market data which is readily available, regularly distributed or updated, reliable and verifiable, and provided by independent sources that are actively involved in the relevant market. The inputs or methodology used for valuing securities are not necessarily an indication of the risk associated with investing in those securities. Changes in valuation techniques may result in transfers into or out of a financial instrument’s assigned level within the hierarchy.
The FASB requires reporting entities to make disclosures about purchases, sales, issuances and settlements of Level 3 securities on a gross basis.
The Fund’s policy is to recognize transfers between Level 1, Level 2 and Level 3 at the end of the reporting period. For the year ended December 31, 2018, there were no transfers among any levels.
In determining a financial instrument’s placement within the hierarchy, the Trust separates the Fund’s investment portfolio into two categories: investments and derivatives (e.g., futures). A summary of inputs used to value the Fund’s assets and liabilities carried at fair value as of December 31, 2018 is included in the Schedule of Investments.
Investments Investments whose values are based on quoted market prices in active markets, and are therefore classified within Level 1, include active listed
equities. Investments that trade in markets that are not considered to be active, but are valued based on quoted market prices, dealer quotations or alternative pricing sources supported by observable inputs are classified within Level 2. These include certain U.S. government and sovereign obligations, most government agency securities, investment-grade corporate bonds, certain mortgage products, state, municipal and provincial obligations, and certain foreign equity securities, including securities whose prices may have been affected by events occurring after the close of trading on their principal exchange or market and, as a result, whose values are determined by a pricing service as described above, or securities whose values are otherwise determined using fair valuation methods approved by the Fund’s Board of Trustees.
Investments classified within Level 3 have significant unobservable inputs, as they trade infrequently or not at all. Level 3 investments include, among others, private placement securities. When observable prices are not available for these securities, the Trust uses one or more valuation techniques for which sufficient and reliable data is available. The inputs used by the Trust in estimating the value of Level 3 investments include, for example, the original transaction price, recent transactions in the same or similar instruments, completed or pending third-party transactions in the underlying investment or comparable issuers, subsequent rounds of financing, recapitalizations, and other transactions across the capital structure. Level 3 investments may also be adjusted to reflect illiquidity and/ornon-transferability, with the amount of such discount estimated by the Trust in the absence of market information. Assumptions used by the Trust due to the lack of observable inputs may significantly impact the resulting fair value and therefore the Fund’s results of operations. As of December 31, 2018, the Fund had no securities classified as Level 3.
Derivatives Exchange-traded derivatives, such as futures contracts, exchange-traded option contracts and certain swaps, are typically classified within Level 1 or Level 2 of the fair value hierarchy depending on whether or not they are deemed to be actively traded. Certainnon-exchange-traded derivatives, such as generic forwards, certain swaps and options, have inputs which can generally be corroborated by market data and are therefore classified within Level 2. During the year ended December 31, 2018, the Fund did not hold any derivatives.
b. Securities Transactions Securities transactions are accounted for on the date securities are purchased or
| 15 |
Table of Contents
NOTES TO FINANCIAL STATEMENTS — GUARDIAN DIVERSIFIED RESEARCH VIP FUND
sold (trade date). Realized gains or losses on securities transactions are determined on the basis of specific identification.
c. Foreign Currency Translation The accounting records of the Fund are maintained in U.S. dollars. Investment securities and all other assets and liabilities of the Fund denominated in a foreign currency are generally translated into U.S. dollars at the exchange rates quoted at the close of the NYSE on each business day. The market value of investment securities and other assets and liabilities are translated at the exchange rate as of the valuation date. Purchases and sales of securities, income receipts, and expense payments are translated into U.S. dollars at the exchange rates in effect on the dates of the respective transactions. The Fund does not isolate the portion of the fluctuations on investments resulting from changes in foreign currency exchange rates from the fluctuations in market prices of investments held. Such fluctuations are included in the Net change in net realized and unrealized gain/(loss) from investments on the Statement of Operations.
Reported realized foreign currency gains and losses arise from the disposition of foreign currency, currency gains or losses realized between the trade and settlement dates on securities transactions, and the difference between the amounts of dividends, interest and foreign withholding taxes recorded on the Fund’s books on the transaction date and the U.S. dollar equivalent of the amounts actually received or paid. These reported realized foreign currency gains and losses, if any, are included in Net realized gain/(loss) from foreign currency transactions on the Statement of Operations. Unrealized foreign currency gains and losses arise from changes (due to changes in exchange rates) in the value of foreign currency and other assets and liabilities denominated in foreign currencies, which are held at period end, if any, and are included in Net change in unrealized appreciation/(depreciation) on translation of assets and liabilities in foreign currencies on the Statement of Operations.
d. Foreign Capital Gains Tax The Fund may be subject to foreign taxes on income, gains on investments or currency purchases/repatriation, a portion of which may be recoverable. The Fund will accrue such taxes and recoveries as applicable, based upon their current interpretation of tax rules and regulations that exist in the markets in which they invest.
e. Investment IncomeDividend income net of foreign taxes withheld, if any, is generally recorded on the
ex-dividend date. Interest income, which includes amortization/accretion of premium/discount, is determined using the interest income accrual method, and is accrued and recorded daily.
f. Allocation of Income and Expenses Many of the expenses of the Trust can be directly attributed to a specific series of the Trust. Expenses that cannot be directly attributed to a specific series of the Trust are generally apportioned among all the series in the Trust, based on relative net assets. In calculating net asset value per share for each series of the Trust, investment income, realized and unrealized gains and losses, and expenses other than series-specific expenses are allocated daily to each series based upon the proportion of net assets attributable to each series.
3. Transactions with Affiliates
a. Investment Advisory Fee and Expense Limitation Under the terms of the advisory agreement, which, after its two year initial term, is reviewed and approved annually by the Board of Trustees, the Fund pays an investment advisory fee to Park Avenue. Park Avenue is a wholly-owned subsidiary of Guardian Life and receives an investment advisory fee at an annual rate of 0.60% of the Fund’s average daily net assets. The fee is accrued daily and paid monthly.
Park Avenue has contractually agreed through April 30, 2019 to waive certain fees and/or reimburse certain expenses incurred by the Fund to the extent necessary to limit the Fund’s total annual operating expenses after fee waiver and/or expense reimbursement to 1.02% of the Fund’s average daily net assets (excluding, if applicable, any acquired fund fees and expenses, taxes, interest, transaction costs and brokerage commissions, litigation and extraordinary expenses). Prior to April 9, 2018, the expense limitation was 0.96%. The limitation may not be increased or terminated prior to this time without action by the Board of Trustees, may be terminated only upon approval of the Board of Trustees, and is subject to Park Avenue’s recoupment rights. For the year ended December 31, 2018, Park Avenue waived fees and/or paid Fund expenses in the amount of $84,844.
Park Avenue may be entitled to recoupment of previously waived fees and reimbursed expenses from the Fund for three years from the date of the waiver or reimbursement, subject to the expense limitation in effect at the time of the waiver or reimbursement and at the time of the recoupment, if any. Amounts waived or reimbursed by Park Avenue pursuant to any expense limitation after April 9, 2018 will not be subject to Park
| 16 |
Table of Contents
NOTES TO FINANCIAL STATEMENTS — GUARDIAN DIVERSIFIED RESEARCH VIP FUND
Avenue’s recoupment rights. The amount available for potential future recoupment by Park Avenue from the Fund under the Expense Limitation Agreement and the expiration schedule at December 31, 2018 are as follows:
| Potential Recoupment Amounts Expiring | ||||||||||||
Total Potential Recoupment Amounts | 2021 | 2020 | 2019 | |||||||||
| $354,298 | $ | 60,975 | $ | 232,223 | $ | 61,100 | ||||||
Park Avenue has entered into aSub-Advisory Agreement with Putnam Investment Management LLC (“Putnam”). Putnam is responsible for providingday-to-day investment advisory services to the Fund, subject to the supervision of Park Avenue and the oversight of the Board of Trustees.Sub-advisory fees are paid by Park Avenue and do not represent a separate or additional expense to the Fund.
b. Compensation of Trustees and Officers Trustees and officers who are interested persons of the Trust, as defined in the 1940 Act, receive no compensation from the Fund, except for the Chief Compliance Officer of the Trust. Trustees of the Trust who are not interested persons of the Trust, and the Chief Compliance Officer, receive compensation and reimbursement of expenses from the Trust.
c. Distribution Fees Park Avenue Securities LLC (“PAS”), a wholly-owned subsidiary of Guardian Life, is the principal underwriter of Fund shares. The Trust has entered into a distribution and service agreement with PAS, which governs the sale and distribution of shares of the Fund. Under a distribution and service plan adopted by the Trust(“12b-1 plan”), PAS is compensated for services in such capacity, including its expenses in connection with the promotion and distribution of shares of the Fund, at an annual rate of 0.25% of the Fund’s average daily net assets. For the year ended December 31, 2018, the Fund paid distribution fees in the amount of $316,335 to PAS.
PAS has directed that certain payments under the12b-1 plan be used to compensate GIAC for shareholder services provided to contract owners.
4. Federal Income Taxes
a. Distributions to Shareholders For federal income tax purposes, the Fund is treated as a disregarded entity (“DRE”). As a DRE, the Fund is not subject to an entity-level income tax; and any income, gains, losses, deductions, taxes, and credits of the Fund would instead
be “passed through” directly to the separate accounts of GIAC that invest in the Fund and retain the same character for U.S. federal income tax purposes. In addition, the Fund is not required to distribute taxable income and capital gains for U.S. federal income tax purposes. Therefore, no dividends and capital gains distributions were paid by the Fund.
5. Investments
a. Investment Purchases and Sales The cost of investments purchased and the proceeds from investments sold (excluding short-term investments) amounted to $248,521,251 and $104,461,996, respectively, for the year ended December 31, 2018. During the year ended December 31, 2018, there were no purchases or sales of U.S. government securities.
b. Foreign Securities Foreign securities investments involve special risks and considerations not typically associated with U.S. investments. These risks include, but are not limited to, currency risk; adverse political, regulatory, social, and economic developments; and less reliable information about issuers. Moreover, securities of some foreign issuers may be less liquid and their prices more volatile than those of comparable U.S. issuers.
c. Industry or Sector Concentration In its normal course of business, the Fund may invest a significant portion of its assets in companies within a limited number of industries or sectors. As a result, the Fund may be subject to a greater risk of loss than that of a fund invested in a wider spectrum of industries or sectors because the stocks of many or all of the companies in the industry, group of industries, sector, or sectors may decline in value due to developments adversely affecting the industry, group of industries, sector, or sectors.
d. Repurchase Agreements The Fund may invest in repurchase agreements to maintain liquidity and earn income over periods of time as short as overnight. The collateral for repurchase agreements is either cash or fully negotiable U.S. government securities (including U.S. government agency securities). Repurchase agreements are fully collateralized (including the interest accrued thereon) and such collateral is marked to market daily while the agreements remain in force. If the value of the collateral falls below the repurchase price plus accrued interest, the Fund will typically require the seller to deposit additional collateral by the next business day. If the request for additional collateral is not met, or the seller defaults, the Fund maintains the right to sell the collateral (although it may be prevented
| 17 |
Table of Contents
NOTES TO FINANCIAL STATEMENTS — GUARDIAN DIVERSIFIED RESEARCH VIP FUND
or delayed from doing so in certain circumstances) and may be required to claim any resulting loss against the seller. Park Avenue monitors the creditworthiness of the seller with which the Fund enters into repurchase agreements.
6. Temporary Borrowings
The Fund, with other funds managed by Park Avenue, is party to a $10 million committed revolving credit facility from State Street Bank and Trust Company for temporary borrowing purposes, including the meeting of redemption requests that otherwise might require the untimely disposition of securities. Interest is calculated based on the higher of the dailyone-month LIBOR rate and the Federal Funds rate plus 1.25% at the time of borrowing. In addition to the interest charged on any borrowings by the Fund, each fund pays a commitment fee of 0.30% per annum on its share of the unused portion of the credit facility. The agreement is in place until December 10, 2019. The Fund did not utilize the credit facility during the year ended December 31, 2018.
7. Indemnifications
Under the Trust’s organizational documents and, in some cases, by contract, its officers and trustees are indemnified against certain liabilities arising out of the performance of their duties to the Fund. In addition, in
the normal course of business, the Fund enters into contracts with its vendors and others that provide general indemnifications. The Fund’s maximum exposure under these arrangements is unknown as this would involve future claims that may be made against the Fund that have not yet occurred. However, based on experience, the Fund expects the risk of loss to be remote.
8. Recent Accounting Pronouncement
On August 17, 2018, the U.S. Securities and Exchange Commission (“SEC”) voted to adopt amendments to certain disclosure requirements that have become redundant, duplicative, overlapping, outdated, or superseded, in light of other SEC disclosure requirements, GAAP, or changes in the information environment. The SEC will also be referring certain SEC disclosure requirements that overlap with, but require information incremental to, GAAP to the FASB for potential incorporation into GAAP. The amendments are intended to facilitate the disclosure of information to investors and simplify compliance without significantly altering the total mix of information provided to investors. As such, the financial statements herein have been updated to conform with these new requirements, which had no effect on the Fund’s net assets or results of operations.
| 18 |
Table of Contents
REPORT OF INDEPENDENT REGISTERED PUBLIC ACCOUNTING FIRM
TotheBoard of Trustees ofGuardian Variable Products TrustandShareholders of
Guardian Diversified Research VIP Fund
Opinion on the Financial Statements
We have audited the accompanying statement of assets and liabilities, including the schedule of investments, ofGuardian Diversified Research VIP Fund (one of the funds constituting Guardian Variable Products Trust, referred to hereafter as the “Fund”) as of December 31, 2018, the related statement of operations for the year ended December 31, 2018, the statement of changes in net assets for each of the two years in the period ended December 31, 2018, including the related notes,and the financial highlights for each of the periods indicated therein (collectively referred to as the “financial statements”). In our opinion, the financial statements present fairly, in all material respects, the financial position of the Fund as of December 31, 2018, the results of its operations for the year then ended, the changes in its net assets for each of the two years in the period ended December 31, 2018 and the financial highlights for each of the periods indicated therein in conformity with accounting principles generally accepted in the United States of America.
Basis for Opinion
These financial statements are the responsibility of the Fund’s management. Our responsibility is to express an opinion on the Fund’s financial statements based on our audits. We are a public accounting firm registered with the Public Company Accounting Oversight Board (United States) (PCAOB) and are required to be independent with respect to the Fund in accordance with the U.S. federal securities laws and the applicable rules and regulations of the Securities and Exchange Commission and the PCAOB.
We conducted our audits of these financial statements in accordance with the standards of the PCAOB. Those standards require that we plan and perform the audit to obtain reasonable assurance about whether the financial statements are free of material misstatement, whether due to error or fraud.
Our audits included performing procedures to assess the risks of material misstatement of the financial statements, whether due to error or fraud, and performing procedures that respond to those risks. Such procedures included examining, on a test basis, evidence regarding the amounts and disclosures in the financial statements. Our audits also included evaluating the accounting principles used and significant estimates made by management, as well as evaluating the overall presentation of the financial statements. Our procedures included confirmation of securities owned as of December 31, 2018 by correspondence with the custodian and brokers; when replies were not received from brokers, we performed other auditing procedures. We believe that our audits provide a reasonable basis for our opinion.
New York, New York
February 19, 2019
We have served as the auditor of one or more investment companies in Guardian Variable Products Trustsince 2016.
| 19 |
Table of Contents
SUPPLEMENTAL INFORMATION(UNAUDITED)
Approval of Investment Advisory andSub-advisory Agreements
Section 15(c) of the Investment Company Act of 1940, as amended (the “1940 Act”), requires that a fund’s board of trustees annually review and consider the continuation of the fund’s investment advisory andsub-advisory agreements. The continuation of any such agreement must be approved by a vote of a majority of the trustees who are not parties to the agreement or “interested persons” (as defined in the 1940 Act) of a party to the agreement at anin-person meeting of the board called for the purpose of voting on such approval.
At a meeting of the Board of Trustees (the “Board”) of Guardian Variable Products Trust (the “Trust”) held on March27-28, 2018, the Board considered and unanimously voted to approve the continuation of the investment management agreement (the “Management Agreement”) between Park Avenue Institutional Advisers LLC (the “Manager”) and the Trust, on behalf of the following 11 series, Guardian Core Plus Fixed Income VIP Fund, Guardian Diversified Research VIP Fund, Guardian Growth & Income VIP Fund, Guardian Integrated Research VIP Fund, Guardian International Growth VIP Fund, Guardian International Value VIP Fund, Guardian Large Cap Disciplined Growth VIP Fund, Guardian Large Cap Disciplined Value VIP Fund, Guardian Large Cap Fundamental Growth VIP Fund, Guardian Mid Cap Relative Value VIP Fund and Guardian Mid Cap Traditional Growth VIP Fund (the “Funds”). The Board also considered and unanimously voted to approve the continuation of thesub-advisory agreements (the“Sub-advisory Agreements,” collectively with the Management Agreement, the “Agreements”) between the Manager and the following investment advisory firms serving assub-advisers to the Funds, ClearBridge Investments LLC, Wellington Management Company LLP, Massachusetts Financial Services Company, Putnam Investment Management, LLC, Boston Partners Global Investors, Inc., AllianceBernstein L.P., Janus Capital Management LLC, Wells Capital Management Incorporated, J.P. Morgan Investment Management Inc., Lazard Asset Management LLC, and Lord, Abbett & Co. LLC (the“Sub-advisers”). The continuation of the Agreements for aone-year period was unanimously approved by the Trustees who are not parties to the Agreements or “interested persons” (as defined in the 1940 Act) of a party to the Agreements (the “Independent Trustees”).
The Board is responsible for overseeing the management of each Fund. In determining whether to approve the continuation of the Agreements, the Trustees evaluated information and factors that they
considered to be relevant and appropriate through the exercise of their own business judgment. The Trustees considered certain information and factors in light of advice furnished to them by legal counsel to the Trust and, in the case of the Independent Trustees, their independent legal counsel.
In advance of the meeting held on March27-28, 2018, the Trustees received materials and information designed to assist their consideration of the Agreements, including written responses from the Manager and eachSub-adviser to a series of questions and requests for information covering a wide variety of topics provided by independent legal counsel on behalf of the Independent Trustees. Broadridge Financial Solutions, Inc. (“Broadridge”), an independent provider of investment company data, was retained to provide the Trustees with reports on how each Fund’s contractual management fees, actual management fees, overall expense ratios and investment performance compared to those of “peer funds” selected by Broadridge that are offered as investment options underlying variable contracts. The Trustees also received materials and information regarding the legal standards applicable to their consideration of the Agreements and the process and criteria used by the Manager to oversee theSub-advisers. During the course of their deliberations, the Independent Trustees met to discuss and evaluate the Agreements in executive session with their independent legal counsel, outside of the presence of the Trustees who are not Independent Trustees and representatives from Fund management, the Manager or anySub-adviser.
In reaching its decisions to approve the continuation of the Agreements, the Board took into account the materials and information described above as well as other materials and information provided to the Board and discussed with and among the Trustees, including information regarding the Funds furnished to the Board by the Manager throughout the year. Individual Trustees may have given different weight to different factors and information with respect to each Agreement, and the Trustees did not identify any single factor or information that, in isolation, would be controlling in deciding to approve the continuation of the Agreements.
The discussion below is intended to summarize the broad factors that figured prominently in the Board’s decisions to approve the continuation of the Agreements rather than to beall-inclusive. These broad factors included: (i) the nature, extent and quality of the services provided to the Funds by the Manager and theSub-advisers; (ii) the investment performance of the
| 20 |
Table of Contents
SUPPLEMENTAL INFORMATION(UNAUDITED)
Funds; (iii) the fees charged and estimated profitability; (iv) the extent to which economies of scale may exist for a Fund, and the extent to which a Fund may benefit from economies of scale; and (v) any other benefits derived by the Manager or theSub-advisers (or their respective affiliates) from their relationships with the Funds. In addition to considering the above-referenced factors, the Board observed that there are a range of investment options available to variable contract owners who may invest in the Funds, and that these contract owners, having had the opportunity to consider other investment options, may choose to invest or remain invested in the Funds.
Nature, Extent and Quality of Services
The Trustees considered information regarding the nature, extent and quality of services provided to the Funds by the Manager. The Trustees also considered the range of investment advisory services andnon-investment advisory services provided by the Manager, notably coordinating the preparation and filing of various regulatory documents, coordinating the preparation and assembly of Board meeting materials and assisting the Board with certain valuation matters.
The Trustees considered the operation of the Funds in a“manager-of-managers” structure and the responsibilities that the Manager has under this structure, including monitoring and evaluating the performance of theSub-advisers, monitoring theSub-advisers for adherence to the stated investment objectives, strategies, policies and restrictions of the Funds and supervising theSub-advisers with respect to the services that theSub-advisers provide under the Sub-advisory Agreements. The Trustees also considered the process used by the Manager, consistent with this structure, to identify and recommendsub-advisers, and its ability to monitor and overseesub-advisers and recommend replacementsub-advisers, when necessary, and provide other services under the Management Agreement. The Trustees reviewed information regarding the experience and background of the Manager’s key personnel and the Manager’s organizational structure and resources, including investment, legal and administrative capabilities of the Manager. In this regard, the Trustees recognized that the Funds benefit from the Manager’s use of similar resources and capabilities of its affiliates in providing services to the Funds.
The Trustees considered information regarding the nature, extent and quality of services provided to the Funds by theSub-advisers. The Trustees also
considered, among other things, the range of investment advisory services provided by theSub-advisers under the oversight of the Manager. In evaluating these investment advisory services, the Trustees considered, among other things, theSub-advisers’ investment philosophies, styles and/or processes and approach to managing risk. The Trustees received and evaluated information regarding the background, education, expertise and/or experience of the investment professionals that serve as portfolio managers for the Funds and the capabilities, resources and reputations of theSub-advisers.
Based upon these considerations, the Board concluded that it was satisfied with the nature, extent and quality of services provided to the Funds by the Manager and eachSub-adviser.
Investment Performance
The Board considered the investment performance of each Fund. Among other reports, the Board reviewed the performance of the Funds for theone-year and since inception periods compared to a universe of peer funds selected by Broadridge. The Board noted that the Funds had performance records of less than two years and that the Board had reviewed longer performance records of the funds or accounts managed by theSub-advisers with similar strategies as the applicable Fund, when available, when the Board initially approved the Agreements in 2016. The Broadridge report placed the Funds in the following quintiles of the relevant peer universe for theone-year and since inception periods, respectively: Guardian Core Plus Fixed Income VIP Fund (3rd, 3rd), Guardian Diversified Research VIP Fund (2nd, 2nd), Guardian Growth & Income VIP Fund (1st, 1st), Guardian Integrated Research VIP Fund (4th, 5th), Guardian International Growth VIP Fund (3rd, 2nd), Guardian International Value VIP Fund (3rd, 5th), Guardian Large Cap Disciplined Growth VIP Fund (3rd, 4th), Guardian Large Cap Disciplined Value VIP Fund (1st, 1st), Guardian Large Cap Fundamental Growth VIP Fund (5th, 4th), Guardian Mid Cap Relative Value VIP Fund (4th, 3rd) and Guardian Mid Cap Traditional Growth VIP Fund (2nd, 2nd).
The Board considered the investment reports provided by the Manager since commencement of operations of the Funds during quarterly Board meetings. The Board also considered the Manager’s analysis ofSub-adviser performance and the steps taken by the Manager and theSub-advisers to seek to improve performance and the results of those steps.
| 21 |
Table of Contents
SUPPLEMENTAL INFORMATION(UNAUDITED)
In light of the considerations noted above, the Board concluded that it had continued confidence in the Manager’s and theSub-advisers’ overall capabilities to manage the Funds.
Costs and Profitability
The Trustees considered the management fees paid by the Funds to the Manager under the Management Agreement and evaluated the reasonableness of these fees. The Trustees received and reviewed information with respect to the management fees, including the portion of the management fees paid to eachSub-adviser, and the management fees paid by other funds offered as investment options underlying variable contracts within the applicable peer group selected by Broadridge. The Broadridge report placed the Funds in the following quintiles of the relevant expense peer group for the contractual management fees and actual management fees, respectively: Guardian Core Plus Fixed Income VIP Fund (1st, 3rd), Guardian Diversified Research VIP Fund (2nd, 3rd), Guardian Growth & Income VIP Fund (1st, 1st), Guardian Integrated Research VIP Fund (1st, 2nd), Guardian International Growth VIP Fund (1st, 2nd), Guardian International Value VIP Fund (3rd, 2nd), Guardian Large Cap Disciplined Growth VIP Fund (1st, 1st), Guardian Large Cap Disciplined Value VIP Fund (1st, 1st), Guardian Large Cap Fundamental Growth VIP Fund (1st, 1st), Guardian Mid Cap Relative Value VIP Fund (1st, 1st) and Guardian Mid Cap Traditional Growth VIP Fund (3rd, 4th).
The Trustees considered thesub-advisory fees paid under the Sub-advisory Agreements and evaluated the reasonableness of those fees. The Trustees also considered that the fees paid to theSub-advisers are paid by the Manager and not the Funds and that the Manager had negotiated the fees with theSub-advisers atarm’s-length. In addition, the Trustees considered the portion of the management fees paid to eachSub-adviser as compared to the portion retained by the Manager.
The Trustees received and reviewed information in the Broadridge report comparing each Fund’s operating expense ratio to the actual operating expense ratios of a peer group of funds selected by Broadridge. The Trustees considered the Manager’s commitment to limit each Fund’s operating expenses through an expense limitation agreement with the Trust. The Broadridge report placed the Funds in the following quintiles of the relevant expense peer group for the operating expense ratio: Guardian Core Plus Fixed Income VIP Fund (2nd), Guardian Diversified Research VIP Fund (2nd), Guardian Growth & Income VIP Fund
(2nd), Guardian Integrated Research VIP Fund (1st), Guardian International Growth VIP Fund (3rd), Guardian International Value VIP Fund (1st), Guardian Large Cap Disciplined Growth VIP Fund (1st), Guardian Large Cap Disciplined Value VIP Fund (2nd), Guardian Large Cap Fundamental Growth VIP Fund (1st), Guardian Mid Cap Relative Value VIP Fund (1st) and Guardian Mid Cap Traditional Growth VIP Fund (3rd).
Although the Board recognized that the comparisons between the management fees and anticipated operating expenses of the Funds and those of identified peer funds are imprecise, given different terms of agreements and variations in fund strategies, the Trustees found that the comparative information supported their consideration and approval of the management fees and evaluation of operating expenses.
The Trustees reviewed information regarding the Manager’s costs of sponsoring the Funds and estimated profitability of the Funds to the Manager. The Trustees noted that the information contained estimates, such as allocations of expenses. Although the Trustees did not receive specific cost and profitability information from certainSub-advisers, the Trustees primarily considered the cost and profitability information relating to the Manager because the Manager is responsible for payment of thesub-advisory fees and negotiated the fees with theSub-advisers atarm’s-length.
Based on the consideration of the information and factors summarized above, as well as other information and factors deemed relevant by the Trustees, the Trustees concluded that the management andsub-advisory fees were reasonable in light of the nature, extent and quality of services rendered to the Funds by the Manager and theSub-advisers. The Trustees also concluded that the estimated profitability of the Funds to the Manager was acceptable.
Economies of Scale
The Trustees considered the extent to which economies of scale may be shared as assets grow based on current asset levels of the Funds, anticipated asset levels over the next year, the current management andsub-advisory fee rates, the expense limitation arrangements, and any management andsub-advisory fee breakpoints, which reduce fee rates as assets increase. Based on those factors, the Board concluded that it was satisfied with the extent to which any economies of scale would be shared for the benefit of Fund shareholders. The Board noted that it would continue to monitor future growth in each Fund’s assets
| 22 |
Table of Contents
SUPPLEMENTAL INFORMATION(UNAUDITED)
and whether additional steps are required to share appropriately any economies of scale with Fund shareholders.
Ancillary Benefits
The Trustees considered the benefits, other than management fees, that the Manager and/or its affiliates receive because of the Manager’s relationship with the Funds. The Trustees acknowledged that the Funds serve as investment options under variable contracts issued by an affiliate of the Manager that receives fees under those contracts and that Park Avenue Securities LLC, an affiliate of the Manager and principal underwriter of the Funds, and an insurance company affiliated with the Manager receive fees from the Funds under a plan of distribution adopted pursuant to Rule12b-1 under the 1940 Act. The Trustees considered that the Manager and its affiliates may benefit from (i) greater efficiencies in annuity administration and operations and potential cost savings due to a reduction in the number of unaffiliated funds available as annuity contract investment options, and (ii) increased dividends-
received deductions due to the Funds’ status under the tax laws as disregarded entities. In addition, the Trustees considered the potential benefits, other thansub-advisory fees, that theSub-advisers and their affiliates receive because of their relationships with the Funds, including the potential increased ability to use soft dollars consistent with Trust policies and other benefits from increases in assets under management. The Trustees concluded that benefits that accrue to the Manager and its affiliates are reasonable and the benefits that accrue to theSub-advisers and their affiliates are consistent with those expected for asub-adviser to a mutual fund such as the applicable Fund.
Conclusion
Based on a comprehensive consideration and evaluation of all of the information and factors summarized above, among others, the Board voting as a whole, including the Independent Trustees voting separately, unanimously approved the continuation of the Agreements.
| 23 |
Table of Contents
SUPPLEMENTAL INFORMATION(UNAUDITED)
Trustees and Officers Information Table
The following table provides information about the Trustees of the Trust.
| Name and Year of Birth | Term of Office, Position(s) Held and Length of Service* | Principal During Past Five Years | Number of in Fund Overseen by Trustees*** | Other Directorships Held by Trustee | ||||
| Independent Trustees | ||||||||
Bruce W. Ferris† (born 1955) | Trustee | Retired (since 2015); President and CEO, Prudential Annuity Distributors (2013–2015); Director/Trustee, Advanced Series Trust, Prudential Series Fund and Prudential’s Gibraltar Fund, Inc. (2013–2015); Senior Vice President, Prudential Annuities (2008–2015). | 16 | None. | ||||
Theda R. Haber† (born 1954) | Trustee | Adjunct Assistant Professor of Law, UC Hastings College of Law (since 2013); Member of the Board of Directors, Fairholme Trust Company, LLC (since 2015); Attorney, Law Office of Theda R. Haber (since 2014); Visiting Professor of Law, UC Davis School of Law (since 2014); Consultant, Haber & Associates LLC (financial services industry) (since 2012); Advisory Council Chair, Vice Chair, and Member, Advisory Council on Employee Welfare and Pension Benefit Plans (ERISA Advisory Council), U.S. Department of Labor (2009–2011); Managing Director and General Counsel, BlackRock Institutional Trust Company, N.A. (2009–2011); Deputy Global General Counsel, Barclays Global Investors (2006–2009); Managing Director, Barclays Global Investors (1998–2006). | 16 | None. | ||||
Marshall Lux† (born 1960) | Trustee | Senior Advisor, The Boston Consulting Group (since 2014); Senior Partner and Managing Director, The Boston Consulting Group (2009–2014). | 16 | None. | ||||
| Lisa K. Polsky† (born 1956) | Trustee | Senior Risk Advisor, AQR (investment management) (since 2016); Senior Risk Advisor, Ultra Capital (venture capital) (since 2016); Board Member and Chair of Risk Committee, DeutscheBank IHC (financial services) (since May 2016); Chief Risk Officer, CIT Group Inc. (financial services) (2010–2015); Board Member and Chair of Audit Committee, Piper Jaffray (investment bank) (2007–2016). | 16 | None. | ||||
| John Walters† (born 1962) | Lead Independent Trustee | Board Member, Amerilife Holdings LLC (insurance distribution) (since 2015); Board Member, Stadion Money Management LLC (investment adviser) (since 2011); President and Chief Operating Officer, Hartford Life Insurance Company (2000–2010). | 16 | None. | ||||
| 24 |
Table of Contents
SUPPLEMENTAL INFORMATION(UNAUDITED)
| Name and Year of Birth | Term of Office, Position(s) Held and Length of Service* | Principal During Past Five Years | Number of in Fund Overseen by Trustees*** | Other Directorships Held by Trustee | ||||
| Interested Trustees | ||||||||
| Gordon Dinsmore** (born 1952) | Trustee | Senior Vice President, Head of Product and President of Berkshire, The Guardian Life Insurance Company of America. | 16 | None. | ||||
| Marc Costantini** (born 1969) | Chairman and Trustee | Executive Vice President, Group and Worksite Markets, The Guardian Life Insurance Company of America (since 2017); Executive Vice President and Chief Financial Officer, The Guardian Life Insurance Company of America (2014–2017); Executive Vice President, Manulife Financial prior thereto (various positions from 1990–2014). | 16 | None. | ||||
| * | Each Trustee except for Mr. Dinsmore began service in such capacity in 2016 and serves until his or her successor is elected and qualified or until his or her resignation, death or removal. Mr. Dinsmore has served as a Trustee since November 2017. The business address of each Trustee is 7 Hanover Square, New York, New York 10004. |
| ** | Each of Gordon Dinsmore and Marc Costantini is considered to be an “interested person” of the Trust within the meaning of the 1940 Act because of their affiliation with The Guardian Life Insurance Company of America and/or its affiliates. |
| *** | As of the date of this report, the Trust currently consists of 16 separate Funds. |
| † | Member of the Audit Committee of the Trust. |
The following table provides information about the Officers of the Trust.
| Name and Year of Birth | Position(s) Held and Length of Service* | Principal Occupation(s) During Past Five Years | ||
| Gordon Dinsmore (born 1952) | President and Principal Executive Officer (Since November 2017) | Senior Vice President, Head of Product and President of Berkshire, The Guardian Life Insurance Company of America. | ||
| John H. Walter (born 1962) | Senior Vice President, Treasurer, and Principal Financial and Accounting Officer | Vice President, Chief Financial Officer, Equity Profit Center, The Guardian Life Insurance Company of America. | ||
| Harris Oliner (born 1971) | Senior Vice President and Secretary | Senior Vice President, Corporate Secretary, The Guardian Life Insurance Company of America (since 2015); Senior Vice President, Deputy General Counsel, Corporate Secretary, Voya Financial, Inc. (2013–2014); Managing Director, Senior Counsel, Corporate Secretary, BlackRock, Inc. prior thereto. | ||
| Richard T. Potter (born 1954) | Senior Vice President and Chief Legal Officer | Vice President and Equity Counsel, The Guardian Life Insurance Company of America. | ||
| Philip Stack (born 1964) | Chief Compliance Officer (Since September 2017) | Executive Director, Chief Compliance Officer, Morgan Stanley (2015–2017); Vice President, Morgan Stanley (2013–2015); Vice President, Corporate Audit Group–Compliance, Morgan Stanley prior thereto. | ||
| James R. Anderson (born 1963) | Anti-Money Laundering Officer (Since November 2017) | Second Vice President, Agency and Anti-Money Laundering Compliance, The Guardian Life Insurance Company of America. | ||
| Kathleen M. Moynihan (born 1966) | Senior Counsel | Senior Counsel, The Guardian Life Insurance Company of America. | ||
| Maria Nydia Morrison (born 1958) | Fund Controller | Mutual Fund Controller, The Guardian Life Insurance Company of America (since 2015); Chief Financial Officer/Assistant Operating Officer, St. Francis De Assisi Montessori School (Plaridel, Bulacan), Inc. (Philippines) (2013–2015); Vice President, Bank of New York Mellon prior thereto. | ||
| 25 |
Table of Contents
SUPPLEMENTAL INFORMATION(UNAUDITED)
| Name and Year of Birth | Position(s) Held and Length of Service* | Principal Occupation(s) During Past Five Years | ||
| Sonya L. Crosswell (born 1977) | Assistant Secretary | Assistant Vice President, Assistant Corporate Secretary and Secretary Pro Tem, The Guardian Life Insurance Company of America (since 2014); Vice President, Secretary and Assistant General Counsel, Carver Federal Savings Bank prior thereto. | ||
| * | Unless otherwise indicated, the Officers each began service in such capacity in 2016 and hold office for an indefinite term or until their successors shall have been elected and qualified. The business address of each Officer is 7 Hanover Square, New York, New York 10004. |
| 26 |
Table of Contents
SUPPLEMENTAL INFORMATION(UNAUDITED)
The Statement of Additional Information (“SAI”) includes additional information about the Trust’s Trustees and Officers and is available, without charge, upon request by calling toll-free1-888-GUARDIAN(1-888-482-7342) or by visiting our website at http://guardianvpt.onlineprospectus.net/GuardianVPT/Prospectuses.
Portfolio Holdings and Proxy Voting Procedures
The Fund files its complete schedule of portfolio holdings with the Securities and Exchange Commission for the first and third quarters of each fiscal year as an exhibit to its reports on Form N-Q or FormN-PORT (for filings beginning in April 2019 relating to March 31, 2019 data). The Fund’s Form N-Q or FormN-PORT reports are available on the Securities and Exchange Commission’s website at https://www.sec.gov. The Fund’s Form N-Q or FormN-PORT information is also available, without charge, upon request, by calling toll-free1-888-GUARDIAN(1-888-482-7342) or by visiting our website at http://guardianvpt.onlineprospectus.net/GuardianVPT/
Prospectuses.
Beginning in April 2019, the Fund will cease to disclose its holdings on Form N-Q and will file Form N-PORT with the Securities and Exchange Commission on a monthly
basis, with the information contained on Form N-PORT for the last month of the Fund’s fiscal quarter being made public by the Securities and Exchange Commission 60 days after the end of the Fund’s fiscal quarter.
A description of the policies and procedures that the Fund uses to determine how to vote proxies relating to portfolio securities is included in the SAI. The SAI and information regarding how the Fund voted proxies relating to portfolio securities during the most recent12-month period ended June 30 may be obtained (i) without charge, upon request, by calling toll-free1-888-GUARDIAN(1-888-482-7342) or by visiting our website at http://guardianvpt.onlineprospectus.net/GuardianVPT/
Prospectuses; and (ii) on the Securities and Exchange Commission’s website at https://www.sec.gov.
| 27 |
Table of Contents
This report is transmitted to shareholders only. It is not authorized for use as an offer of sale or a solicitation of an offer to buy shares of the Fund unless accompanied or preceded by the Fund’s current prospectus. Past performance results shown in this report should not be considered a representation of future performance. Investment returns and principal value of shares will fluctuate so that shares, when redeemed, may be worth more or less than their original cost. Statements and other information herein are as dated and are subject to change.

The Guardian Life Insurance Company of America New York, NY 10004-4025
PUB8168
Table of Contents
Guardian Variable
Products Trust
2018
Annual Report
All Data as of December 31, 2018
Guardian Large Cap Disciplined Value VIP Fund
Important Notice
Beginning on January 1, 2021, as permitted by regulations adopted by the Securities and Exchange Commission, paper copies of the Fund’s shareholder reports will no longer be sent by mail from The Guardian Insurance & Annuity Company, Inc. (“GIAC”). Instead, GIAC will mail you a notice when copies of the shareholder reports are made available on a website. You will be notified by mail each time a report is posted and provided with a website link to access the report.
If you have already elected to receive shareholder reports electronically, you will not be affected by this change and you need not take any action. If you have not yet elected electronic delivery, at any time, you may elect to receive the Fund’s shareholder reports and certain other communications from GIAC electronically, by going to www.guardianlife.com and registering fore-delivery.
You may instead elect to receive all future shareholder reports in paper free of charge. If you wish to receive paper copies of your shareholder reports, please call GIAC’s Customer Service Office Contact Center at1-888-GUARDIAN(1-888-482-7342). Your election to receive reports in paper will apply to all the underlying funds available.

| Not FDIC insured. May lose value. No bank guarantee. | www.guardianlife.com |
Table of Contents
TABLE OF CONTENTS
Guardian Large Cap Disciplined Value VIP Fund
| 1 | ||||
| 3 | ||||
| 4 | ||||
| 5 | ||||
Financial Information | ||||
| Schedule of Investments | 6 | |||
| Statement of Assets and Liabilities | 9 | |||
| Statement of Operations | 9 | |||
| Statements of Changes in Net Assets | 10 | |||
| Financial Highlights | 12 | |||
| Notes to Financial Statements | 14 | |||
| Report of Independent Registered Public Accounting Firm | 19 | |||
Supplemental Information | ||||
| Approval of Investment Advisory andSub-advisory Agreements | 20 | |||
| Trustees and Officers Information Table | 24 | |||
| Portfolio Holdings and Proxy Voting Procedures | 27 | |||
Except as otherwise specifically stated, all information, including portfolio security positions, is as of December 31, 2018. The views expressed in the Fund Commentary are those of the Fund’s portfolio manager(s) as of the date of this report and are subject to change without notice. They do not necessarily represent the views of Park Avenue Institutional Advisers LLC or asub-adviser. The Fund Commentary may contain some forward-looking statements providing expectations or forecasts of future events as of the date of this report; they do not necessarily relate to historical or current facts. There can be no guarantee that any forward-looking statement will be realized. We undertake no obligation to update forward-looking statements, whether as a result of new information, future events, or otherwise. Any discussions of specific securities should not be considered a recommendation to buy or sell those securities. Fund holdings will vary. Information contained herein has been obtained from sources believed reliable, but is not guaranteed.
Table of Contents
GUARDIAN LARGE CAP DISCIPLINED VALUE VIP FUND
FUND COMMENTARY BY BOSTON PARTNERS GLOBAL INVESTORS, INC.,SUB-ADVISER
Highlights
| • | Guardian Large Cap Disciplined Value VIP Fund (the “Fund”) returned-10.89%, underperforming its benchmark, the Russell 1000® Value Index1 (the “Index”), for the 12 months ended December 31, 2018. The Fund’s underperformance relative to the Index was primarily due to stock selection in the health care and technology sectors. Stock selection in the energy and consumernon-durables sectors contributed to relative performance. |
| • | The Index returned-8.27% for the period. The health care and utilities sectors were two of the largest contributors to performance for the Index during the period. |
Market Overview
A combination of tightening monetary policy and increased trade tensions between the U.S. and China resulted in a spike in volatility during the end of the year, beginning with the Octobersell-off. Both the economy and the market’s underlying fundamentals were positive in 2018, with GDP on pace for its strongest growth since 2005 and an increase in the Standard & Poor’s 500® Index2 earnings growth not seen since 2010. While July through September saw no daily price moves of the S&P 500 Index in excess of 1%, the fourth quarter experienced twenty-eight such occurrences as volatility surged.
For the year, three sectors had positive returns: consumer discretionary, utilities and health care, the latter the leader with a gain of 6.47%. Energy stocks ended the year with a return of-18.1%. The momentum that had helped growth stock returns during the first three quarters of the year abruptly reversed course in the fourth quarter. Historically, in periods of weakness, large capitalization stocks have generally outperformed
small-capitalization stocks, as size has been equated with safety. This proved to be the case during the fourth quarter and the year. For the year, international markets underperformed.
Portfolio Review
For the 12 months ended December 31, 2018, the Fund underperformed the Index. The Fund’s underperformance relative to the Index was primarily due to stock selection in the health care and technology sectors. The Fund’s underweight relative to the Index in the utilities sector also detracted from relative performance. Conversely, stock selection has been positive in energy and consumernon-durables. The Fund avoided the underperforming tobacco and food industries.
Outlook
For investors to return to a comfort zone for investing in equities there will need to be a catalyst or catalysts for them to do so. Catalyst candidates could include: a resolution to the U.S.-China trade conflict, evidence that the growth scare out of Europe and China were temporary in nature, a pause in rate hikes and/or balance sheet reduction from the U.S. Federal Reserve, a reacceleration of business spending similar to levels seen earlier in the year, and proof of stability in company profit margins.
In our view, some positive conditions are already in place that could lend support to a more desirable outcome for 2019: announcements of $1.08 trillion in stock buybacks for the year, a 10% expected increase in tax refunds to individuals ($26 billion) this year versus last year, and an additional $86 billion in discretionary spending in fiscal 2019 by the U.S. government versus 2018. With price/earnings multiples experiencing their third largest decline in the last 40 years during 2018, we believe valuations are now below average levels.
| 1 | The Russell 1000® Value Index (the “Index”) is an unmanaged market-capitalization-weighted index that measures the performance of those companies in the Russell 1000® Index (which consists of the 1,000 largest U.S. companies based on total market capitalization) with lower price-to-book ratios and lower forecasted growth values. Index results assume the reinvestment of dividends paid on the stocks constituting the Index. You may not invest in the Index, and, unlike the Fund, the Index does not incur fees or expenses. |
| 2 | The Standard & Poor’s 500® Index (the “S&P 500 Index”) is an unmanaged market-capitalization-weighted index generally considered to be representative of U.S. equity market activity. The S&P 500 Index consists of 500 stocks representing leading industries of the U.S. economy. Index results assume the reinvestment of dividends paid on the stocks constituting the Index. You may not invest in the S&P 500 Index, and, unlike the Fund, the S&P 500 Index does not incur fees or expenses. |
| 1 |
Table of Contents
GUARDIAN LARGE CAP DISCIPLINED VALUE VIP FUND
Funds in the Guardian Variable Products Trust are sold by prospectus only. You should carefully consider the investment objectives, risks, charges and expenses of the Funds before making an investment decision. The prospectus contains this and other important information. Please read it carefully before investing or sending money. Please visit our website at http://guardianvpt.onlineprospectus.net/GuardianVPT/Prospectuses or to obtain a printed copy, call1-888-GUARDIAN(1-888-482-7342).
As with all mutual funds, the value of an investment in the Fund could decline, and you could lose money. Diversification does not guarantee profit or protect against loss, and there can be no assurance that the Fund will achieve its investment objective. The Fund invests primarily in equity securities and therefore exposes you to the general risks of investing in stock markets. Investing in large-capitalization companies involves risks such as having low growth rates, and slow responsiveness to competitive challenges or opportunities than in the case of smaller companies. Value stocks may not realize their perceived value and during certain periods the Fund may underperform other equity funds that employ a different style. International investing involves special risks, which include changes in currency rates, foreign taxation and differences in auditing standards and securities regulations, political uncertainty and greater volatility. Foreign securities are subject to political, regulatory, economic, and exchange-rate risks not present in domestic investments. Investing in a more limited number of issuers and sectors can be subject to greater market fluctuation. Any discussions of specific securities should not be considered a recommendation to buy or sell those securities. Fund holdings will vary.
| 2 |
Table of Contents
GUARDIAN LARGE CAP DISCIPLINED VALUE VIP FUND
Fund Characteristics (unaudited)
| Total Net Assets: $185,363,420 |
Sector Allocation1 As of December 31, 2018 |
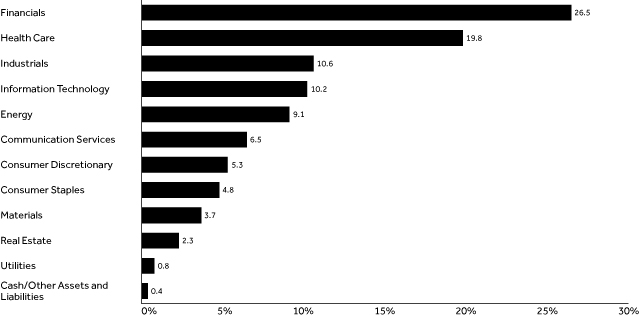 |
Top Ten Holdings2 As of December 31, 2018 |
| Holding | % of Total Net Assets | |||
| Berkshire Hathaway, Inc., Class B | 4.63% | |||
| Johnson & Johnson | 4.54% | |||
| Cisco Systems, Inc. | 3.51% | |||
| JPMorgan Chase & Co. | 3.44% | |||
| Pfizer, Inc. | 3.30% | |||
| Comcast Corp., Class A | 3.09% | |||
| Bank of America Corp. | 2.91% | |||
| The Procter & Gamble Co. | 2.89% | |||
| Chevron Corp. | 2.70% | |||
| Wells Fargo & Co. | 2.64% | |||
| Total | 33.65% | |||
| 1 | The Fund’s holdings are allocated to each sector based on the MSCI Global Industry Classification Standard (GICS®). Cash includes short-term investments and net other assets and liabilities. |
| 2 | Portfolio holdings are subject to change and should not be considered a recommendation to buy or sell individual securities. |
| 3 |
Table of Contents
GUARDIAN LARGE CAP DISCIPLINED VALUE VIP FUND
Average Annual Total Returns As of December 31, 2018 | ||||||||||||||||||||
| Inception Date | 1 Year | 5 Year | 10 Year | Since Inception | ||||||||||||||||
| Guardian Large Cap Disciplined Value VIP Fund | 9/1/2016 | -10.89% | — | — | 5.97% | |||||||||||||||
| Russell 1000® Value Index | -8.27% | — | — | 4.63% | ||||||||||||||||
Results of a Hypothetical $10,000 Investment As of December 31, 2018 | ||||||||||
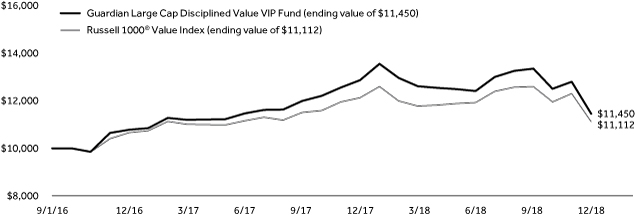 | ||||||||||
The chart above shows the performance of a hypothetical $10,000 investment made on inception date in Guardian Large Cap Disciplined Value VIP Fund and the Russell 1000® Value Index. Index returns do not include the fees and expenses of the Fund, but do include reinvestment of dividends, if any.
Performance quoted represents past performance and does not guarantee or predict future results. Investment return and principal value will fluctuate, so shares, when redeemed, may be worth more or less than their original cost. The Fund’s fees and expenses are detailed in the Financial Highlights section of this report. Fees and expenses are factored into the net asset value of Fund shares and any performance numbers we release. Total return figures include the effect of expense limitations in effect during the periods shown, if applicable; without such limitations, the performance shown would have been lower. Performance results assume the reinvestment of dividends and capital gains. The return figures shown do not reflect the deduction of taxes that a contract owner/policyholder may pay on redemption units. The actual total returns for owners of variable annuity contracts or variable life insurance policies that provide for investment in the Fund will be lower to reflect separate account and contract/policy charges. Current andmonth-end performance information, which may be lower or higher than that cited, is available by calling1-888-GUARDIAN(1-888-482-7342) and is periodically updated on our website: http://guardianlife.com.
| 4 |
Table of Contents
UNDERSTANDING YOUR FUND’S EXPENSES(UNAUDITED)
By investing in the Fund, you incur two types of costs: (1) transaction costs and (2) ongoing costs, including, as applicable, investment advisory fees, distribution and/or service(12b-1) fees and other Fund expenses. The example below is intended to help you understand your ongoing costs (in dollars) of investing in the Fund and to compare these costs with the ongoing costs of investing in other mutual funds.
The example is based on an investment of $1,000 invested at the beginning of the period and held for the entire period from July 1, 2018 to December 31, 2018. The table below shows the Fund’s expenses in two ways:
Expenses based on actual return
This section of the table provides information about actual account values and actual expenses. You may use the information in this section, together with the amount you invested, to estimate the expenses that you paid over the period. Simply divide your account value by $1,000 (for example, an $8,600 account value divided by $1,000 = 8.6), then multiply the result by the number in the section under the heading entitled “Expenses Paid During Period” to estimate the expenses you paid on your account during this period.
Expenses based on hypothetical 5% return for comparison purposes
This section of the table provides information about hypothetical account values and hypothetical expenses based on the Fund’s actual expense ratio and an assumed rate of return of 5% per year before expenses, which is not the Fund’s actual return. The hypothetical account values and expenses may not be used to estimate the actual ending account balance or expenses you paid for the period. You may use this information to compare the ongoing costs of investing in the Fund with the cost of investing in other mutual funds. To do so, compare this 5% hypothetical example with the 5% hypothetical examples that appear in the shareholder reports of the other funds.
Note that the expenses shown in the table are meant to highlight your ongoing costs only and do not reflect any transactional costs, such as sales charges (loads), redemption fees, or exchange fees. Therefore the second section is useful in comparing ongoing costs only, and will not help you determine the relative total costs of owning different funds. If these transactional costs were included, your costs would have been higher. Charges and expenses at the insurance company separate account level are not reflected in the table.
Beginning 7/1/18 | Ending Account Value | Expenses Paid During Period* 7/1/18-12/31/18 | Expense Ratio During Period 7/1/18-12/31/18 | |||||||||||
| Based on Actual Return | $1,000.00 | $ | 924.10 | $ | 4.70 | 0.97% | ||||||||
| Based on Hypothetical Return (5% Return Before Expenses) | $1,000.00 | $ | 1,020.32 | $ | 4.94 | 0.97% | ||||||||
| * | Expenses are equal to the Fund’s annualized expense ratio as indicated, multiplied by the average account value over the period, multiplied by 184/365 (to reflect theone-half year period). |
| 5 |
Table of Contents
SCHEDULE OF INVESTMENTS — GUARDIAN LARGE CAP DISCIPLINED VALUE VIP FUND
| December 31, 2018 | Shares | Value | ||||||
| Common Stocks – 99.6% |
| |||||||
| Aerospace & Defense – 3.9% |
| |||||||
The Boeing Co. | 12,843 | $ | 4,141,867 | |||||
United Technologies Corp. | 29,258 | 3,115,392 | ||||||
|
| |||||||
| 7,257,259 | ||||||||
| Air Freight & Logistics – 0.6% |
| |||||||
United Parcel Service, Inc., Class B | 11,368 | 1,108,721 | ||||||
|
| |||||||
| 1,108,721 | ||||||||
| Airlines – 2.3% |
| |||||||
Delta Air Lines, Inc. | 50,591 | 2,524,491 | ||||||
Southwest Airlines Co. | 35,793 | 1,663,659 | ||||||
|
| |||||||
| 4,188,150 | ||||||||
| Banks – 14.7% |
| |||||||
Bank of America Corp. | 218,931 | 5,394,460 | ||||||
Citigroup, Inc. | 88,019 | 4,582,269 | ||||||
Huntington Bancshares, Inc. | 154,412 | 1,840,591 | ||||||
JPMorgan Chase & Co. | 65,272 | 6,371,853 | ||||||
KeyCorp | 123,014 | 1,818,147 | ||||||
Lloyds Banking Group PLC, ADR | 341,006 | 872,975 | ||||||
Regions Financial Corp. | 105,516 | 1,411,804 | ||||||
Wells Fargo & Co. | 106,401 | 4,902,958 | ||||||
|
| |||||||
| 27,195,057 | ||||||||
| Beverages – 0.8% |
| |||||||
Coca-Cola European Partners PLC | 31,960 | 1,465,366 | ||||||
|
| |||||||
| 1,465,366 | ||||||||
| Biotechnology – 1.2% |
| |||||||
Gilead Sciences, Inc. | 35,764 | 2,237,038 | ||||||
|
| |||||||
| 2,237,038 | ||||||||
| Building Products – 0.5% |
| |||||||
Owens Corning | 22,403 | 985,284 | ||||||
|
| |||||||
| 985,284 | ||||||||
| Chemicals – 1.8% |
| |||||||
FMC Corp. | 20,422 | 1,510,411 | ||||||
Nutrien Ltd. | 22,318 | 1,048,946 | ||||||
The Mosaic Co. | 28,992 | 846,856 | ||||||
|
| |||||||
| 3,406,213 | ||||||||
| Communications Equipment – 3.5% |
| |||||||
Cisco Systems, Inc. | 150,303 | 6,512,629 | ||||||
|
| |||||||
| 6,512,629 | ||||||||
| Construction Materials – 0.9% |
| |||||||
Cemex S.A.B. de C.V., ADR(1) | 144,715 | 697,526 | ||||||
CRH PLC, ADR | 36,809 | 969,917 | ||||||
|
| |||||||
| 1,667,443 | ||||||||
| Consumer Finance – 1.6% |
| |||||||
American Express Co. | 11,438 | 1,090,270 | ||||||
Discover Financial Services | 31,315 | 1,846,959 | ||||||
|
| |||||||
| 2,937,229 | ||||||||
| Containers & Packaging – 0.5% |
| |||||||
WestRock Co. | 25,244 | 953,213 | ||||||
|
| |||||||
| 953,213 | ||||||||
| December 31, 2018 | Shares | Value | ||||||
| Diversified Financial Services – 4.6% |
| |||||||
Berkshire Hathaway, Inc., Class B(1) | 42,032 | $ | 8,582,094 | |||||
|
| |||||||
| 8,582,094 | ||||||||
| Diversified Telecommunication Services – 2.5% |
| |||||||
Verizon Communications, Inc. | 82,611 | 4,644,390 | ||||||
|
| |||||||
| 4,644,390 | ||||||||
| Electric Utilities – 0.8% |
| |||||||
Edison International | 25,782 | 1,463,644 | ||||||
|
| |||||||
| 1,463,644 | ||||||||
| Electrical Equipment – 0.8% |
| |||||||
Eaton Corp. PLC | 22,395 | 1,537,641 | ||||||
|
| |||||||
| 1,537,641 | ||||||||
| Electronic Equipment, Instruments & Components – 0.4% |
| |||||||
TE Connectivity Ltd. | 10,474 | 792,149 | ||||||
|
| |||||||
| 792,149 | ||||||||
| Energy Equipment & Services – 0.3% |
| |||||||
Apergy Corp.(1) | 17,114 | 463,447 | ||||||
|
| |||||||
| 463,447 | ||||||||
| Equity Real Estate Investment – 2.3% |
| |||||||
Equity Residential REIT | 22,132 | 1,460,933 | ||||||
Essex Property Trust, Inc. REIT | 3,902 | 956,810 | ||||||
SL Green Realty Corp. REIT | 22,592 | 1,786,575 | ||||||
|
| |||||||
| 4,204,318 | ||||||||
| Food & Staples Retailing – 0.9% |
| |||||||
Walgreens Boots Alliance, Inc. | 25,657 | 1,753,143 | ||||||
|
| |||||||
| 1,753,143 | ||||||||
| Food Products – 0.2% |
| |||||||
Tyson Foods, Inc., Class A | 6,947 | 370,970 | ||||||
|
| |||||||
| 370,970 | ||||||||
| Health Care Equipment & Supplies – 1.7% |
| |||||||
Medtronic PLC | 34,580 | 3,145,397 | ||||||
|
| |||||||
| 3,145,397 | ||||||||
| Health Care Providers & Services – 7.2% |
| |||||||
Anthem, Inc. | 11,215 | 2,945,396 | ||||||
Cigna Corp. | 17,011 | 3,230,729 | ||||||
CVS Health Corp. | 58,683 | 3,844,910 | ||||||
Laboratory Corp. of America Holdings(1) | 3,719 | 469,933 | ||||||
McKesson Corp. | 14,200 | 1,568,674 | ||||||
UnitedHealth Group, Inc. | 4,795 | 1,194,530 | ||||||
|
| |||||||
| 13,254,172 | ||||||||
| Hotels, Restaurants & Leisure – 1.5% |
| |||||||
Las Vegas Sands Corp. | 25,815 | 1,343,671 | ||||||
Wyndham Destinations, Inc. | 22,226 | 796,580 | ||||||
Wyndham Hotels & Resorts, Inc. | 16,124 | 731,546 | ||||||
|
| |||||||
| 2,871,797 | ||||||||
| Household Durables – 0.7% |
| |||||||
PulteGroup, Inc. | 20,727 | 538,695 | ||||||
Toll Brothers, Inc. | 24,165 | 795,753 | ||||||
|
| |||||||
| 1,334,448 | ||||||||
| 6 | The accompanying notes are an integral part of these financial statements. |
Table of Contents
SCHEDULE OF INVESTMENTS — GUARDIAN LARGE CAP DISCIPLINED VALUE VIP FUND
| December 31, 2018 | Shares | Value | ||||||
| Household Products – 2.9% |
| |||||||
The Procter & Gamble Co. | 58,194 | $ | 5,349,193 | |||||
|
| |||||||
| 5,349,193 | ||||||||
| Insurance – 5.6% |
| |||||||
American International Group, Inc. | 56,150 | 2,212,871 | ||||||
Aon PLC | 6,362 | 924,780 | ||||||
Chubb Ltd. | 21,751 | 2,809,794 | ||||||
Everest Re Group Ltd. | 6,981 | 1,520,183 | ||||||
The Allstate Corp. | 34,520 | 2,852,388 | ||||||
|
| |||||||
| 10,320,016 | ||||||||
| Interactive Media & Services – 0.5% |
| |||||||
Alphabet, Inc., Class A(1) | 933 | 974,948 | ||||||
|
| |||||||
| 974,948 | ||||||||
| IT Services – 1.2% |
| |||||||
DXC Technology Co. | 42,701 | 2,270,412 | ||||||
|
| |||||||
| 2,270,412 | ||||||||
| Machinery – 1.4% |
| |||||||
Cummins, Inc. | 12,008 | 1,604,749 | ||||||
Dover Corp. | 14,501 | 1,028,846 | ||||||
|
| |||||||
| 2,633,595 | ||||||||
| Media – 3.5% |
| |||||||
Comcast Corp., Class A | 168,114 | 5,724,282 | ||||||
Liberty Global PLC, Class C(1) | 40,041 | 826,446 | ||||||
|
| |||||||
| 6,550,728 | ||||||||
| Metals & Mining – 0.5% |
| |||||||
Rio Tinto PLC, ADR | 19,394 | 940,221 | ||||||
|
| |||||||
| 940,221 | ||||||||
| Multiline Retail – 1.8% |
| |||||||
Dollar Tree, Inc.(1) | 13,294 | 1,200,714 | ||||||
Nordstrom, Inc. | 11,096 | 517,185 | ||||||
Target Corp. | 23,071 | 1,524,762 | ||||||
|
| |||||||
| 3,242,661 | ||||||||
| Oil, Gas & Consumable Fuels – 8.8% |
| |||||||
Chevron Corp. | 46,023 | 5,006,842 | ||||||
Cimarex Energy Co. | 14,251 | 878,574 | ||||||
ConocoPhillips | 42,851 | 2,671,760 | ||||||
Marathon Petroleum Corp. | 49,059 | 2,894,972 | ||||||
Noble Energy, Inc. | 59,694 | 1,119,859 | ||||||
Royal Dutch Shell PLC, Class A, ADR | 63,947 | 3,726,192 | ||||||
|
| |||||||
| 16,298,199 | ||||||||
| Pharmaceuticals – 9.7% |
| |||||||
Johnson & Johnson | 65,223 | 8,417,028 | ||||||
Novartis AG, ADR | 31,285 | 2,684,566 | ||||||
Novo Nordisk A/S, ADR | 14,914 | 687,088 | ||||||
Pfizer, Inc. | 139,979 | 6,110,083 | ||||||
|
| |||||||
| 17,898,765 | ||||||||
| Road & Rail – 1.1% |
| |||||||
Union Pacific Corp. | 14,501 | 2,004,473 | ||||||
|
| |||||||
| 2,004,473 | ||||||||
| December 31, 2018 | Shares | Value | ||||||
| Software – 2.3% |
| |||||||
Microsoft Corp. | 18,254 | $ | 1,854,059 | |||||
Oracle Corp. | 54,612 | 2,465,732 | ||||||
|
| |||||||
| 4,319,791 | ||||||||
| Specialty Retail – 1.3% |
| |||||||
Lowe’s Cos., Inc. | 14,073 | 1,299,782 | ||||||
The Home Depot, Inc. | 5,947 | 1,021,814 | ||||||
|
| |||||||
| 2,321,596 | ||||||||
| Technology Hardware, Storage & Peripherals – 2.8% |
| |||||||
Apple, Inc. | 5,853 | 923,252 | ||||||
HP, Inc. | 156,065 | 3,193,090 | ||||||
NetApp, Inc. | 16,812 | 1,003,172 | ||||||
|
| |||||||
| 5,119,514 | ||||||||
| Total Common Stocks (Cost $201,547,861) |
| 184,575,324 | ||||||
| Principal Amount | Value | |||||||
| Short–Term Investment – 0.9% |
| |||||||
| Repurchase Agreements – 0.9% |
| |||||||
Fixed Income Clearing Corp., 0.50%, dated 12/31/2018, proceeds at maturity value of $1,674,047, due 1/2/2019(2) | $ | 1,674,000 | 1,674,000 | |||||
| Total Repurchase Agreements (Cost $1,674,000) |
| 1,674,000 | ||||||
| Total Investments – 100.5% (Cost $203,221,861) |
| 186,249,324 | ||||||
| Liabilities in excess of other assets – (0.5)% |
| (885,904 | ) | |||||
| Total Net Assets – 100.0% |
| $ | 185,363,420 | |||||
| (1) | Non–income–producing security. |
| (2) | The table below presents collateral for repurchase agreements. |
| Security | Coupon | Maturity Date | Principal Amount | Value | ||||||||||||
| U.S. Treasury Note | 2.875% | 7/31/2025 | $ | 1,665,000 | $ | 1,708,460 | ||||||||||
Legend:
ADR — American Depositary Receipt
REIT — Real Estate Investment Trust
| The accompanying notes are an integral part of these financial statements. | 7 |
Table of Contents
SCHEDULE OF INVESTMENTS — GUARDIAN LARGE CAP DISCIPLINED VALUE VIP FUND
The following is a summary of the inputs used as of December 31, 2018 in valuing the Fund’s investments. For more information on valuation inputs, please refer to Note 2a of the accompanying Notes to Financial Statements.
| Valuation Inputs | ||||||||||||||||
| Investments in Securities | Level 1 | Level 2 | Level 3 | Total | ||||||||||||
| Common Stocks | $ | 184,575,324 | $ | — | $ | — | $ | 184,575,324 | ||||||||
| Repurchase Agreements | — | 1,674,000 | — | 1,674,000 | ||||||||||||
| Total | $ | 184,575,324 | $ | 1,674,000 | $ | — | $ | 186,249,324 | ||||||||
| 8 | The accompanying notes are an integral part of these financial statements. |
Table of Contents
FINANCIAL INFORMATION — GUARDIAN LARGE CAP DISCIPLINED VALUE VIP FUND
For the Year Ended December 31, 2018 | ||||
Investment Income | ||||
Dividends | $ | 3,418,472 | ||
Interest | 8,997 | |||
Withholding taxes on foreign dividends | (36,148 | ) | ||
|
| |||
Total Investment Income | 3,391,321 | |||
|
| |||
Expenses | ||||
Investment advisory fees | 996,080 | |||
Distribution fees | 398,964 | |||
Trustees’ and officers’ fees | 104,466 | |||
Professional fees | 67,019 | |||
Custodian and accounting fees | 55,737 | |||
Administrative fees | 44,664 | |||
Transfer agent fees | 14,619 | |||
Shareholder reports | 14,230 | |||
Other expenses | 22,930 | |||
|
| |||
Total Expenses | 1,718,709 | |||
Less: Fees waived | (170,304 | ) | ||
|
| |||
Total Expenses, Net | 1,548,405 | |||
|
| |||
Net Investment Income/(Loss) | 1,842,916 | |||
|
| |||
Realized Gain/(Loss) and Change in Unrealized Appreciation/(Depreciation) on Investments | ||||
Net realized gain/(loss) from investments | 530,348 | |||
Net change in unrealized appreciation/(depreciation) on investments | (19,482,381 | ) | ||
|
| |||
Net Loss on Investments | (18,952,033 | ) | ||
|
| |||
Net Decrease in Net Assets Resulting From Operations | $ | (17,109,117 | ) | |
|
| |||
| The accompanying notes are an integral part of these financial statements. | 9 |
Table of Contents
FINANCIAL INFORMATION — GUARDIAN LARGE CAP DISCIPLINED VALUE VIP FUND
| For the Year Ended 12/31/18 | For the Year Ended 12/31/17 | |||||||
| ||||||||
Operations |
| |||||||
Net investment income/(loss) | $ | 1,842,916 | $ | 214,522 | ||||
Net realized gain/(loss) from investments | 530,348 | 2,523,556 | ||||||
Net change in unrealized appreciation/(depreciation) on investments | (19,482,381 | ) | 1,417,434 | |||||
|
|
|
| |||||
Net Increase/(Decrease) in Net Assets Resulting from Operations | (17,109,117 | ) | 4,155,512 | |||||
|
|
|
| |||||
Capital Share Transactions |
| |||||||
Proceeds from sales of shares | 204,091,727 | 7,437,169 | ||||||
Cost of shares redeemed | (17,523,968 | ) | (12,768,870 | ) | ||||
|
|
|
| |||||
Net Increase/(Decrease) in Net Assets Resulting from Capital Share Transactions | 186,567,759 | (5,331,701 | ) | |||||
|
|
|
| |||||
Net Increase/(Decrease) in Net Assets | 169,458,642 | (1,176,189 | ) | |||||
|
|
|
| |||||
Net Assets | ||||||||
Beginning of year | 15,904,778 | 17,080,967 | ||||||
|
|
|
| |||||
End of year | $ | 185,363,420 | $ | 15,904,778 | ||||
|
|
|
| |||||
Other Information: | ||||||||
Shares | ||||||||
Sold | 16,317,390 | 667,095 | ||||||
Redeemed | (1,371,590 | ) | (1,013,270 | ) | ||||
|
|
|
| |||||
Net Increase/(Decrease) | 14,945,800 | (346,175 | ) | |||||
|
|
|
| |||||
| 10 | The accompanying notes are an integral part of these financial statements. |
Table of Contents
This Page Intentionally Left Blank
| 11 |
Table of Contents
FINANCIAL INFORMATION — GUARDIAN LARGE CAP DISCIPLINED VALUE VIP FUND
The Financial Highlights table is intended to help you understand the Fund’s financial performance for the past five years (or, if shorter, the period since inception). Certain information reflects financial results for a single Fund share. The total returns in the table represent the rate that an investor would have earned (or lost) on an investment in the Fund.
Financial Highlights | ||||||||||||||||||||||||
| Per Share Operating Performance | ||||||||||||||||||||||||
Net Asset Value, | Net Investment Income(1) | Net Realized and Unrealized Gain/(Loss) | Total Operations | Net Asset Value, End of Period | Total Return(2) | |||||||||||||||||||
Year Ended 12/31/18 | $ | 12.85 | $ | 0.15 | $ | (1.55 | ) | $ | (1.40 | ) | $ | 11.45 | (10.89) | % | ||||||||||
Year Ended 12/31/17 | 10.78 | 0.10 | 1.97 | 2.07 | 12.85 | 19.20 | % | |||||||||||||||||
Period Ended 12/31/16(4) | 10.00 | 0.03 | 0.75 | 0.78 | 10.78 | 7.80 | %(5) | |||||||||||||||||
| 12 | The accompanying notes are an integral part of these financial statements. |
Table of Contents
FINANCIAL INFORMATION — GUARDIAN LARGE CAP DISCIPLINED VALUE VIP FUND
| Ratios/Supplemental Data | ||||||||||||||||||||||
| Net Assets, End of Period (000s) | Net Ratio of Expenses to Average Net Assets(3) | Gross Ratio of Expenses to Average Net Assets | Net Ratio of Net Investment Income to Average Net Assets(3) | Gross Ratio of Net Investment Income/(Loss) to Average Net Assets | Portfolio Turnover Rate | |||||||||||||||||
| $ | 185,363 | 0.97% | 1.08% | 1.16% | 1.05% | 56% | ||||||||||||||||
| 15,905 | 0.98% | 1.91% | 0.89% | (0.04)% | 71% | |||||||||||||||||
| 17,081 | 0.98% | (5) | 2.70% | (5) | 0.88% | (5) | (0.84)% | (5) | 19% | (5) | ||||||||||||
| (1) | Calculated based on the average shares outstanding during the period. |
| (2) | Total returns do not reflect the effects of charges deducted pursuant to the terms of The Guardian Insurance & Annuity Company, Inc.‘s variable contracts. Inclusion of such charges would reduce the total returns for all periods shown. |
| (3) | Net Ratio of Expenses to Average Net Assets and Net Ratio of Net Investment Income to Average Net Assets include the effect of fee waivers and expense limitations. |
| (4) | Commenced operations on September 1, 2016. |
| (5) | Ratios for periods less than one year have been annualized, except for total return and portfolio turnover rate. For the period ended December 31, 2016, certainnon-recurring fees (i.e., audit fees) are not annualized. |
| The accompanying notes are an integral part of these financial statements. | 13 |
Table of Contents
NOTES TO FINANCIAL STATEMENTS — GUARDIAN LARGE CAP DISCIPLINED VALUE VIP FUND
1. Organization
Guardian Variable Products Trust (the “Trust”), a Delaware statutory trust organized on January 12, 2016, is registered under the Investment Company Act of 1940, as amended (the “1940 Act”), as anopen-end management investment company. The Trust currently has sixteen series. Guardian Large Cap Disciplined Value VIP Fund (the “Fund”) is a series of the Trust. The Fund is a diversified fund and commenced operations on September 1, 2016. The financial statements for other series of the Trust are presented in separate reports.
The Trust has authorized an unlimited number of shares of beneficial interest with no par value. Shares are bought and sold at closing net asset value (“NAV”). Shares of the Fund are only sold to certain separate accounts of The Guardian Insurance & Annuity Company, Inc. (“GIAC”) that fund certain variable annuity contracts and variable life insurance policies issued by GIAC. GIAC is a wholly-owned subsidiary of The Guardian Life Insurance Company of America (“Guardian Life”).
The Fund seeks to provide long-term growth of capital primarily through investment in equity securities. Current income is a secondary objective.
2. Significant Accounting Policies
The following is a summary of significant accounting policies followed by the Fund in the preparation of its financial statements. The Fund follows the investment company accounting and reporting guidance of the Financial Accounting Standards Board (“FASB”) Accounting Standards Codification Topic 946 Financial Services – Investment Companies. The following policies are in conformity with accounting principles generally accepted in the United States of America (“GAAP”). The preparation of financial statements in accordance with GAAP requires management to make estimates and assumptions that affect the reported amounts and disclosures in the financial statements. Actual results could differ from those estimates.
a. Investment Valuations Equity securities traded on an exchange other than NASDAQ Stock Market, LLC (“NASDAQ”) are valued at the last reported sale price on the principal exchange or market on which they are traded; or, if there were no sales that day, at the mean between the closing bid and ask prices. Securities traded on the NASDAQ are generally valued at the NASDAQ official closing price, which may not be the last sale price. If the NASDAQ official closing price is not available
for a security, that security is generally valued at the mean between the closing bid and ask prices. Repurchase agreements are carried at cost, which approximates fair value (see Note 5d). Foreign securities are valued in the currencies of the markets in which they trade and then converted to U.S. dollars by the application of foreign exchange rates at the close of the New York Stock Exchange (“NYSE”). Forward foreign currency contracts, if any, are valued at the mean between the bid and ask rates for the specified time interpolated from rates for proximate time periods. Securities for which market quotations are not readily available or for which market quotations may be considered unreliable are valued at their fair values as determined in accordance with policies and procedures adopted by the Board of Trustees.
Under the policies and procedures approved by the Board of Trustees, Park Avenue Institutional Advisers LLC (“Park Avenue”), the Fund’s investment adviser, has established a Fair Valuation Committee to assist the Board of Trustees with the oversight and monitoring of the valuation of the Fund’s investments. This includes monitoring the appropriateness of fair values based on results of ongoing valuation oversight, including but not limited to consideration of security specific events, market events, and pricing vendor and broker-dealer due diligence. The Fair Valuation Committee oversees and carries out the policies for the valuation of investments held in the Fund. The Fair Valuation Committee is responsible for discussing and assessing the potential impacts to the fair values on an ongoing basis, and at least on a quarterly basis with the Board of Trustees.
Securities whose values have been materially affected by events occurring before the Fund’s valuation time but after the close of the securities’ principal exchange or market may be fair valued in accordance with policies and procedures adopted by the Board of Trustees. In addition, the values of the Fund’s investments in foreign securities are generally determined by a pricing service using pricing models designed to estimate likely changes in the values of those securities. Certain foreign equity instruments are valued by applying international fair value factors provided by approved pricing services. The factors seek to adjust the local closing price for movements of local markets post closing, but prior to the time the NAVs are calculated. Valuations reflected in this report are as of the report date. As a result, changes in valuation due to market events and/or issuer related events after the report date and prior to issuance of the report are not reflected herein.
| 14 |
Table of Contents
NOTES TO FINANCIAL STATEMENTS — GUARDIAN LARGE CAP DISCIPLINED VALUE VIP FUND
Various inputs are used in determining the valuation of the Fund’s investments. These inputs are summarized in three broad levels listed below.
| • | Level 1 — unadjusted inputs using quoted prices in active markets for identical investments. |
| • | Level 2— other significant observable inputs, including, but not limited to, quoted prices for similar investments, inputs other than quoted prices that are observable for investments (such as interest rates, prepayment speeds, credit risks, etc.) or other market corroborated inputs. |
| • | Level 3 — significant unobservable inputs (including the Fund’s own assumptions in determining the fair value of investments) |
Inputs may include price information, volatility statistics, specific and broad credit data, liquidity statistics, and other factors. A financial instrument’s level within the fair value hierarchy is based on the lowest level of any input; both individually and in aggregate, that is significant to the fair value measurement. However, the determination of what constitutes “observable” requires significant judgment by the Trust. The Trust considers observable data to be that market data which is readily available, regularly distributed or updated, reliable and verifiable, and provided by independent sources that are actively involved in the relevant market. The inputs or methodology used for valuing securities are not necessarily an indication of the risk associated with investing in those securities. Changes in valuation techniques may result in transfers into or out of a financial instrument’s assigned level within the hierarchy.
The FASB requires reporting entities to make disclosures about purchases, sales, issuances and settlements of Level 3 securities on a gross basis.
The Fund’s policy is to recognize transfers between Level 1, Level 2 and Level 3 at the end of the reporting period. For the year ended December 31, 2018, there were no transfers among any levels.
In determining a financial instrument’s placement within the hierarchy, the Trust separates the Fund’s investment portfolio into two categories: investments and derivatives (e.g., futures). A summary of inputs used to value the Fund’s assets and liabilities carried at fair value as of December 31, 2018 is included in the Schedule of Investments.
Investments Investments whose values are based on quoted market prices in active markets, and are therefore classified within Level 1, include active listed
equities. Investments that trade in markets that are not considered to be active, but are valued based on quoted market prices, dealer quotations or alternative pricing sources supported by observable inputs are classified within Level 2. These include certain U.S. government and sovereign obligations, most government agency securities, investment-grade corporate bonds, certain mortgage products, state, municipal and provincial obligations, and certain foreign equity securities, including securities whose prices may have been affected by events occurring after the close of trading on their principal exchange or market and, as a result, whose values are determined by a pricing service as described above, or securities whose values are otherwise determined using fair valuation methods approved by the Fund’s Board of Trustees.
Investments classified within Level 3 have significant unobservable inputs, as they trade infrequently or not at all. Level 3 investments include, among others, private placement securities. When observable prices are not available for these securities, the Trust uses one or more valuation techniques for which sufficient and reliable data is available. The inputs used by the Trust in estimating the value of Level 3 investments include, for example, the original transaction price, recent transactions in the same or similar instruments, completed or pending third-party transactions in the underlying investment or comparable issuers, subsequent rounds of financing, recapitalizations, and other transactions across the capital structure. Level 3 investments may also be adjusted to reflect illiquidity and/ornon-transferability, with the amount of such discount estimated by the Trust in the absence of market information. Assumptions used by the Trust due to the lack of observable inputs may significantly impact the resulting fair value and therefore the Fund’s results of operations. As of December 31, 2018, the Fund had no securities classified as Level 3.
Derivatives Exchange-traded derivatives, such as futures contracts, exchange-traded option contracts and certain swaps, are typically classified within Level 1 or Level 2 of the fair value hierarchy depending on whether or not they are deemed to be actively traded. Certainnon-exchange-traded derivatives, such as generic forwards, certain swaps and options, have inputs which can generally be corroborated by market data and are therefore classified within Level 2. During the year ended December 31, 2018, the Fund did not hold any derivatives.
b. Securities Transactions Securities transactions are accounted for on the date securities are purchased or
| 15 |
Table of Contents
NOTES TO FINANCIAL STATEMENTS — GUARDIAN LARGE CAP DISCIPLINED VALUE VIP FUND
sold (trade date). Realized gains or losses on securities transactions are determined on the basis of specific identification.
c. Foreign Currency Translation The accounting records of the Fund are maintained in U.S. dollars. Investment securities and all other assets and liabilities of the Fund denominated in a foreign currency are generally translated into U.S. dollars at the exchange rates quoted at the close of the NYSE on each business day. The market value of investment securities and other assets and liabilities are translated at the exchange rate as of the valuation date. Purchases and sales of securities, income receipts, and expense payments are translated into U.S. dollars at the exchange rates in effect on the dates of the respective transactions. The Fund does not isolate the portion of the fluctuations on investments resulting from changes in foreign currency exchange rates from the fluctuations in market prices of investments held. Such fluctuations are included in the Net change in net realized and unrealized gain/(loss) from investments on the Statement of Operations.
Reported realized foreign currency gains and losses arise from the disposition of foreign currency, currency gains or losses realized between the trade and settlement dates on securities transactions, and the difference between the amounts of dividends, interest and foreign withholding taxes recorded on the Fund’s books on the transaction date and the U.S. dollar equivalent of the amounts actually received or paid. These reported realized foreign currency gains and losses, if any, are included in Net realized gain/(loss) from foreign currency transactions on the Statement of Operations. Unrealized foreign currency gains and losses arise from changes (due to changes in exchange rates) in the value of foreign currency and other assets and liabilities denominated in foreign currencies, which are held at period end, if any, and are included in Net change in unrealized appreciation/(depreciation) on translation of assets and liabilities in foreign currencies on the Statement of Operations.
d. Foreign Capital Gains Tax The Fund may be subject to foreign taxes on income, gains on investments or currency purchases/repatriation, a portion of which may be recoverable. The Fund will accrue such taxes and recoveries as applicable, based upon their current interpretation of tax rules and regulations that exist in the markets in which they invest.
e. Investment Income Dividend income net of foreign taxes withheld, if any, is generally recorded on theex-dividend date. Interest income, which includes
amortization/accretion of premium/discount, is determined using the interest income accrual method, and is accrued and recorded daily.
f. Allocation of Income and Expenses Many of the expenses of the Trust can be directly attributed to a specific series of the Trust. Expenses that cannot be directly attributed to a specific series of the Trust are generally apportioned among all the series in the Trust, based on relative net assets. In calculating net asset value per share for each series of the Trust, investment income, realized and unrealized gains and losses, and expenses other than series-specific expenses are allocated daily to each series based upon the proportion of net assets attributable to each series.
3. Transactions with Affiliates
a. Investment Advisory Fee and Expense Limitation Under the terms of the advisory agreement, which, after its two year initial term, is reviewed and approved annually by the Board of Trustees, the Fund pays an investment advisory fee to Park Avenue. Park Avenue is a wholly-owned subsidiary of Guardian Life and receives an investment advisory fee at an annual rate of 0.65% up to $100 million, 0.60% up to $300 million, 0.55% up to $500 million, and 0.53% in excess of $500 million of the Fund’s average daily net assets. The fee is accrued daily and paid monthly.
Park Avenue has contractually agreed through April 30, 2019 to waive certain fees and/or reimburse certain expenses incurred by the Fund to the extent necessary to limit the Fund’s total annual operating expenses after fee waiver and/or expense reimbursement to 0.97% of the Fund’s average daily net assets (excluding, if applicable, any acquired fund fees and expenses, taxes, interest, transaction costs and brokerage commissions, litigation and extraordinary expenses). Prior to April 9, 2018, the expense limitation was 0.98%. The limitation may not be increased or terminated prior to this time without action by the Board of Trustees, may be terminated only upon approval of the Board of Trustees, and is subject to Park Avenue’s recoupment rights. For the year ended December 31, 2018, Park Avenue waived fees and/or paid Fund expenses in the amount of $170,304.
Park Avenue may be entitled to recoupment of previously waived fees and reimbursed expenses from the Fund for three years from the date of the waiver or reimbursement, subject to the expense limitation in effect at the time of the waiver or reimbursement and at the time of the recoupment, if any. Amounts waived or reimbursed by Park Avenue pursuant to any expense
| 16 |
Table of Contents
NOTES TO FINANCIAL STATEMENTS — GUARDIAN LARGE CAP DISCIPLINED VALUE VIP FUND
limitation after April 9, 2018 will not be subject to Park Avenue’s recoupment rights. The amount available for potential future recoupment by Park Avenue from the Fund under the Expense Limitation Agreement and the expiration schedule at December 31, 2018 are as follows:
| Potential Recoupment Amounts Expiring | ||||||||||||
Total Potential | 2021 | 2020 | 2019 | |||||||||
| $369,985 | $ | 62,448 | $ | 222,461 | $ | 85,076 | ||||||
Park Avenue has entered into aSub-Advisory Agreement with Boston Partners Global Investors, Inc. (“Boston Partners”). Boston Partners is responsible for providingday-to-day investment advisory services to the Fund, subject to the supervision of Park Avenue and the oversight of the Board of Trustees.Sub-advisory fees are paid by Park Avenue and do not represent a separate or additional expense to the Fund.
b. Compensation of Trustees and Officers Trustees and officers who are interested persons of the Trust, as defined in the 1940 Act, receive no compensation from the Fund, except for the Chief Compliance Officer of the Trust. Trustees of the Trust who are not interested persons of the Trust, and the Chief Compliance Officer, receive compensation and reimbursement of expenses from the Trust.
c. Distribution Fees Park Avenue Securities LLC (“PAS”), a wholly-owned subsidiary of Guardian Life, is the principal underwriter of Fund shares. The Trust has entered into a distribution and service agreement with PAS, which governs the sale and distribution of shares of the Fund. Under a distribution and service plan adopted by the Trust(“12b-1 plan”), PAS is compensated for services in such capacity, including its expenses in connection with the promotion and distribution of shares of the Fund, at an annual rate of 0.25% of the Fund’s average daily net assets. For the year ended December 31, 2018, the Fund paid distribution fees in the amount of $398,964 to PAS.
PAS has directed that certain payments under the12b-1 plan be used to compensate GIAC for shareholder services provided to contract owners.
4. Federal Income Taxes
a. Distributions to Shareholders For federal income tax purposes, the Fund is treated as a disregarded entity (“DRE”). As a DRE, the Fund is not subject to an entity-level income tax; and any income, gains, losses,
deductions, taxes, and credits of the Fund would instead be “passed through” directly to the separate accounts of GIAC that invest in the Fund and retain the same character for U.S. federal income tax purposes. In addition, the Fund is not required to distribute taxable income and capital gains for U.S. federal income tax purposes. Therefore, no dividends and capital gains distributions were paid by the Fund.
5. Investments
a. Investment Purchases and Sales The cost of investments purchased and the proceeds from investments sold (excluding short-term investments) amounted to $271,924,667 and $83,447,845, respectively, for the year ended December 31, 2018. During the year ended December 31, 2018, there were no purchases or sales of U.S. government securities.
b. Foreign Securities Foreign securities investments involve special risks and considerations not typically associated with U.S. investments. These risks include, but are not limited to, currency risk; adverse political, regulatory, social, and economic developments; and less reliable information about issuers. Moreover, securities of some foreign issuers may be less liquid and their prices more volatile than those of comparable U.S. issuers.
c. Industry or Sector Concentration In its normal course of business, the Fund may invest a significant portion of its assets in companies within a limited number of industries or sectors. As a result, the Fund may be subject to a greater risk of loss than that of a fund invested in a wider spectrum of industries or sectors because the stocks of many or all of the companies in the industry, group of industries, sector, or sectors may decline in value due to developments adversely affecting the industry, group of industries, sector, or sectors.
d. Repurchase Agreements The Fund may invest in repurchase agreements to maintain liquidity and earn income over periods of time as short as overnight. The collateral for repurchase agreements is either cash or fully negotiable U.S. government securities (including U.S. government agency securities). Repurchase agreements are fully collateralized (including the interest accrued thereon) and such collateral is marked to market daily while the agreements remain in force. If the value of the collateral falls below the repurchase price plus accrued interest, the Fund will typically require the seller to deposit additional collateral by the next business day. If the request for additional collateral is not met, or the seller defaults, the Fund maintains the
| 17 |
Table of Contents
NOTES TO FINANCIAL STATEMENTS — GUARDIAN LARGE CAP DISCIPLINED VALUE VIP FUND
right to sell the collateral (although it may be prevented or delayed from doing so in certain circumstances) and may be required to claim any resulting loss against the seller. Park Avenue monitors the creditworthiness of the seller with which the Fund enters into repurchase agreements.
6. Temporary Borrowings
The Fund, with other funds managed by Park Avenue, is party to a $10 million committed revolving credit facility from State Street Bank and Trust Company for temporary borrowing purposes, including the meeting of redemption requests that otherwise might require the untimely disposition of securities. Interest is calculated based on the higher of the dailyone-month LIBOR rate and the Federal Funds rate plus 1.25% at the time of borrowing. In addition to the interest charged on any borrowings by the Fund, each fund pays a commitment fee of 0.30% per annum on its share of the unused portion of the credit facility. The agreement is in place until December 10, 2019. The Fund did not utilize the credit facility during the year ended December 31, 2018.
7. Indemnifications
Under the Trust’s organizational documents and, in some cases, by contract, its officers and trustees are indemnified against certain liabilities arising out of the
performance of their duties to the Fund. In addition, in the normal course of business, the Fund enters into contracts with its vendors and others that provide general indemnifications. The Fund’s maximum exposure under these arrangements is unknown as this would involve future claims that may be made against the Fund that have not yet occurred. However, based on experience, the Fund expects the risk of loss to be remote.
8. Recent Accounting Pronouncement
On August 17, 2018, the U.S. Securities and Exchange Commission (“SEC”) voted to adopt amendments to certain disclosure requirements that have become redundant, duplicative, overlapping, outdated, or superseded, in light of other SEC disclosure requirements, GAAP, or changes in the information environment. The SEC will also be referring certain SEC disclosure requirements that overlap with, but require information incremental to, GAAP to the FASB for potential incorporation into GAAP. The amendments are intended to facilitate the disclosure of information to investors and simplify compliance without significantly altering the total mix of information provided to investors. As such, the financial statements herein have been updated to conform with these new requirements, which had no effect on the Fund’s net assets or results of operations.
| 18 |
Table of Contents
REPORT OF INDEPENDENT REGISTERED PUBLIC ACCOUNTING FIRM
TotheBoard of Trustees ofGuardian Variable Products TrustandShareholders of
Guardian Large Cap Disciplined Value VIP Fund
Opinion on the Financial Statements
We have audited the accompanying statement of assets and liabilities, including the schedule of investments, ofGuardian Large Cap Disciplined Value VIP Fund (one of the funds constituting Guardian Variable Products Trust, referred to hereafter as the “Fund”) as of December 31, 2018, the related statement of operations for the year ended December 31, 2018, the statement of changes in net assets for each of the two years in the period ended December 31, 2018, including the related notes,and the financial highlights for each of the periods indicated therein (collectively referred to as the “financial statements”). In our opinion, the financial statements present fairly, in all material respects, the financial position of the Fund as of December 31, 2018, the results of its operations for the year then ended, the changes in its net assets for each of the two years in the period ended December 31, 2018 and the financial highlights for each of the periods indicated therein in conformity with accounting principles generally accepted in the United States of America.
Basis for Opinion
These financial statements are the responsibility of the Fund’s management. Our responsibility is to express an opinion on the Fund’s financial statements based on our audits. We are a public accounting firm registered with the Public Company Accounting Oversight Board (United States) (PCAOB) and are required to be independent with respect to the Fund in accordance with the U.S. federal securities laws and the applicable rules and regulations of the Securities and Exchange Commission and the PCAOB.
We conducted our audits of these financial statements in accordance with the standards of the PCAOB. Those standards require that we plan and perform the audit to obtain reasonable assurance about whether the financial statements are free of material misstatement, whether due to error or fraud.
Our audits included performing procedures to assess the risks of material misstatement of the financial statements, whether due to error or fraud, and performing procedures that respond to those risks. Such procedures included examining, on a test basis, evidence regarding the amounts and disclosures in the financial statements. Our audits also included evaluating the accounting principles used and significant estimates made by management, as well as evaluating the overall presentation of the financial statements. Our procedures included confirmation of securities owned as of December 31, 2018 by correspondence with the custodian and brokers; when replies were not received from brokers, we performed other auditing procedures. We believe that our audits provide a reasonable basis for our opinion.
New York, New York
February 19, 2019
We have served as the auditor of one or more investment companies in Guardian Variable Products Trustsince 2016.
| 19 |
Table of Contents
SUPPLEMENTAL INFORMATION(UNAUDITED)
Approval of Investment Advisory andSub-advisory Agreements
Section 15(c) of the Investment Company Act of 1940, as amended (the “1940 Act”), requires that a fund’s board of trustees annually review and consider the continuation of the fund’s investment advisory andsub-advisory agreements. The continuation of any such agreement must be approved by a vote of a majority of the trustees who are not parties to the agreement or “interested persons” (as defined in the 1940 Act) of a party to the agreement at anin-person meeting of the board called for the purpose of voting on such approval.
At a meeting of the Board of Trustees (the “Board”) of Guardian Variable Products Trust (the “Trust”) held on March27-28, 2018, the Board considered and unanimously voted to approve the continuation of the investment management agreement (the “Management Agreement”) between Park Avenue Institutional Advisers LLC (the “Manager”) and the Trust, on behalf of the following 11 series, Guardian Core Plus Fixed Income VIP Fund, Guardian Diversified Research VIP Fund, Guardian Growth & Income VIP Fund, Guardian Integrated Research VIP Fund, Guardian International Growth VIP Fund, Guardian International Value VIP Fund, Guardian Large Cap Disciplined Growth VIP Fund, Guardian Large Cap Disciplined Value VIP Fund, Guardian Large Cap Fundamental Growth VIP Fund, Guardian Mid Cap Relative Value VIP Fund and Guardian Mid Cap Traditional Growth VIP Fund (the “Funds”). The Board also considered and unanimously voted to approve the continuation of thesub-advisory agreements (the“Sub-advisory Agreements,” collectively with the Management Agreement, the “Agreements”) between the Manager and the following investment advisory firms serving assub-advisers to the Funds, ClearBridge Investments LLC, Wellington Management Company LLP, Massachusetts Financial Services Company, Putnam Investment Management, LLC, Boston Partners Global Investors, Inc., AllianceBernstein L.P., Janus Capital Management LLC, Wells Capital Management Incorporated, J.P. Morgan Investment Management Inc., Lazard Asset Management LLC, and Lord, Abbett & Co. LLC (the“Sub-advisers”). The continuation of the Agreements for aone-year period was unanimously approved by the Trustees who are not parties to the Agreements or “interested persons” (as defined in the 1940 Act) of a party to the Agreements (the “Independent Trustees”).
The Board is responsible for overseeing the management of each Fund. In determining whether to approve the continuation of the Agreements, the
Trustees evaluated information and factors that they considered to be relevant and appropriate through the exercise of their own business judgment. The Trustees considered certain information and factors in light of advice furnished to them by legal counsel to the Trust and, in the case of the Independent Trustees, their independent legal counsel.
In advance of the meeting held on March27-28, 2018, the Trustees received materials and information designed to assist their consideration of the Agreements, including written responses from the Manager and eachSub-adviser to a series of questions and requests for information covering a wide variety of topics provided by independent legal counsel on behalf of the Independent Trustees. Broadridge Financial Solutions, Inc. (“Broadridge”), an independent provider of investment company data, was retained to provide the Trustees with reports on how each Fund’s contractual management fees, actual management fees, overall expense ratios and investment performance compared to those of “peer funds” selected by Broadridge that are offered as investment options underlying variable contracts. The Trustees also received materials and information regarding the legal standards applicable to their consideration of the Agreements and the process and criteria used by the Manager to oversee theSub-advisers. During the course of their deliberations, the Independent Trustees met to discuss and evaluate the Agreements in executive session with their independent legal counsel, outside of the presence of the Trustees who are not Independent Trustees and representatives from Fund management, the Manager or anySub-adviser.
In reaching its decisions to approve the continuation of the Agreements, the Board took into account the materials and information described above as well as other materials and information provided to the Board and discussed with and among the Trustees, including information regarding the Funds furnished to the Board by the Manager throughout the year. Individual Trustees may have given different weight to different factors and information with respect to each Agreement, and the Trustees did not identify any single factor or information that, in isolation, would be controlling in deciding to approve the continuation of the Agreements.
The discussion below is intended to summarize the broad factors that figured prominently in the Board’s decisions to approve the continuation of the Agreements rather than to beall-inclusive. These broad factors included: (i) the nature, extent and quality of the services provided to the Funds by the Manager and the
| 20 |
Table of Contents
SUPPLEMENTAL INFORMATION(UNAUDITED)
Sub-advisers; (ii) the investment performance of the Funds; (iii) the fees charged and estimated profitability; (iv) the extent to which economies of scale may exist for a Fund, and the extent to which a Fund may benefit from economies of scale; and (v) any other benefits derived by the Manager or theSub-advisers (or their respective affiliates) from their relationships with the Funds. In addition to considering the above-referenced factors, the Board observed that there are a range of investment options available to variable contract owners who may invest in the Funds, and that these contract owners, having had the opportunity to consider other investment options, may choose to invest or remain invested in the Funds.
Nature, Extent and Quality of Services
The Trustees considered information regarding the nature, extent and quality of services provided to the Funds by the Manager. The Trustees also considered the range of investment advisory services andnon-investment advisory services provided by the Manager, notably coordinating the preparation and filing of various regulatory documents, coordinating the preparation and assembly of Board meeting materials and assisting the Board with certain valuation matters.
The Trustees considered the operation of the Funds in a“manager-of-managers” structure and the responsibilities that the Manager has under this structure, including monitoring and evaluating the performance of theSub-advisers, monitoring theSub-advisers for adherence to the stated investment objectives, strategies, policies and restrictions of the Funds and supervising theSub-advisers with respect to the services that theSub-advisers provide under the Sub-advisory Agreements. The Trustees also considered the process used by the Manager, consistent with this structure, to identify and recommendsub-advisers, and its ability to monitor and overseesub-advisers and recommend replacementsub-advisers, when necessary, and provide other services under the Management Agreement. The Trustees reviewed information regarding the experience and background of the Manager’s key personnel and the Manager’s organizational structure and resources, including investment, legal and administrative capabilities of the Manager. In this regard, the Trustees recognized that the Funds benefit from the Manager’s use of similar resources and capabilities of its affiliates in providing services to the Funds.
The Trustees considered information regarding the nature, extent and quality of services provided to the Funds by theSub-advisers. The Trustees also
considered, among other things, the range of investment advisory services provided by theSub-advisers under the oversight of the Manager. In evaluating these investment advisory services, the Trustees considered, among other things, theSub-advisers’ investment philosophies, styles and/or processes and approach to managing risk. The Trustees received and evaluated information regarding the background, education, expertise and/or experience of the investment professionals that serve as portfolio managers for the Funds and the capabilities, resources and reputations of theSub-advisers.
Based upon these considerations, the Board concluded that it was satisfied with the nature, extent and quality of services provided to the Funds by the Manager and eachSub-adviser.
Investment Performance
The Board considered the investment performance of each Fund. Among other reports, the Board reviewed the performance of the Funds for theone-year and since inception periods compared to a universe of peer funds selected by Broadridge. The Board noted that the Funds had performance records of less than two years and that the Board had reviewed longer performance records of the funds or accounts managed by theSub-advisers with similar strategies as the applicable Fund, when available, when the Board initially approved the Agreements in 2016. The Broadridge report placed the Funds in the following quintiles of the relevant peer universe for theone-year and since inception periods, respectively: Guardian Core Plus Fixed Income VIP Fund (3rd, 3rd), Guardian Diversified Research VIP Fund (2nd, 2nd), Guardian Growth & Income VIP Fund (1st, 1st), Guardian Integrated Research VIP Fund (4th, 5th), Guardian International Growth VIP Fund (3rd, 2nd), Guardian International Value VIP Fund (3rd, 5th), Guardian Large Cap Disciplined Growth VIP Fund (3rd, 4th), Guardian Large Cap Disciplined Value VIP Fund (1st, 1st), Guardian Large Cap Fundamental Growth VIP Fund (5th, 4th), Guardian Mid Cap Relative Value VIP Fund (4th, 3rd) and Guardian Mid Cap Traditional Growth VIP Fund (2nd, 2nd).
The Board considered the investment reports provided by the Manager since commencement of operations of the Funds during quarterly Board meetings. The Board also considered the Manager’s analysis ofSub-adviser performance and the steps taken by the Manager and theSub-advisers to seek to improve performance and the results of those steps.
| 21 |
Table of Contents
SUPPLEMENTAL INFORMATION(UNAUDITED)
In light of the considerations noted above, the Board concluded that it had continued confidence in the Manager’s and theSub-advisers’ overall capabilities to manage the Funds.
Costs and Profitability
The Trustees considered the management fees paid by the Funds to the Manager under the Management Agreement and evaluated the reasonableness of these fees. The Trustees received and reviewed information with respect to the management fees, including the portion of the management fees paid to eachSub-adviser, and the management fees paid by other funds offered as investment options underlying variable contracts within the applicable peer group selected by Broadridge. The Broadridge report placed the Funds in the following quintiles of the relevant expense peer group for the contractual management fees and actual management fees, respectively: Guardian Core Plus Fixed Income VIP Fund (1st, 3rd), Guardian Diversified Research VIP Fund (2nd, 3rd), Guardian Growth & Income VIP Fund (1st, 1st), Guardian Integrated Research VIP Fund (1st, 2nd), Guardian International Growth VIP Fund (1st, 2nd), Guardian International Value VIP Fund (3rd, 2nd), Guardian Large Cap Disciplined Growth VIP Fund (1st, 1st), Guardian Large Cap Disciplined Value VIP Fund (1st, 1st), Guardian Large Cap Fundamental Growth VIP Fund (1st, 1st), Guardian Mid Cap Relative Value VIP Fund (1st, 1st) and Guardian Mid Cap Traditional Growth VIP Fund (3rd, 4th).
The Trustees considered thesub-advisory fees paid under the Sub-advisory Agreements and evaluated the reasonableness of those fees. The Trustees also considered that the fees paid to theSub-advisers are paid by the Manager and not the Funds and that the Manager had negotiated the fees with theSub-advisers atarm’s-length. In addition, the Trustees considered the portion of the management fees paid to eachSub-adviser as compared to the portion retained by the Manager.
The Trustees received and reviewed information in the Broadridge report comparing each Fund’s operating expense ratio to the actual operating expense ratios of a peer group of funds selected by Broadridge. The Trustees considered the Manager’s commitment to limit each Fund’s operating expenses through an expense limitation agreement with the Trust. The Broadridge report placed the Funds in the following quintiles of the relevant expense peer group for the operating expense ratio: Guardian Core Plus Fixed Income VIP Fund (2nd), Guardian Diversified Research
VIP Fund (2nd), Guardian Growth & Income VIP Fund (2nd), Guardian Integrated Research VIP Fund (1st), Guardian International Growth VIP Fund (3rd), Guardian International Value VIP Fund (1st), Guardian Large Cap Disciplined Growth VIP Fund (1st), Guardian Large Cap Disciplined Value VIP Fund (2nd), Guardian Large Cap Fundamental Growth VIP Fund (1st), Guardian Mid Cap Relative Value VIP Fund (1st) and Guardian Mid Cap Traditional Growth VIP Fund (3rd).
Although the Board recognized that the comparisons between the management fees and anticipated operating expenses of the Funds and those of identified peer funds are imprecise, given different terms of agreements and variations in fund strategies, the Trustees found that the comparative information supported their consideration and approval of the management fees and evaluation of operating expenses.
The Trustees reviewed information regarding the Manager’s costs of sponsoring the Funds and estimated profitability of the Funds to the Manager. The Trustees noted that the information contained estimates, such as allocations of expenses. Although the Trustees did not receive specific cost and profitability information from certainSub-advisers, the Trustees primarily considered the cost and profitability information relating to the Manager because the Manager is responsible for payment of thesub-advisory fees and negotiated the fees with theSub-advisers atarm’s-length.
Based on the consideration of the information and factors summarized above, as well as other information and factors deemed relevant by the Trustees, the Trustees concluded that the management andsub-advisory fees were reasonable in light of the nature, extent and quality of services rendered to the Funds by the Manager and theSub-advisers. The Trustees also concluded that the estimated profitability of the Funds to the Manager was acceptable.
Economies of Scale
The Trustees considered the extent to which economies of scale may be shared as assets grow based on current asset levels of the Funds, anticipated asset levels over the next year, the current management andsub-advisory fee rates, the expense limitation arrangements, and any management andsub-advisory fee breakpoints, which reduce fee rates as assets increase. Based on those factors, the Board concluded that it was satisfied with the extent to which any economies of scale would be shared for the benefit of
| 22 |
Table of Contents
SUPPLEMENTAL INFORMATION(UNAUDITED)
Fund shareholders. The Board noted that it would continue to monitor future growth in each Fund’s assets and whether additional steps are required to share appropriately any economies of scale with Fund shareholders.
Ancillary Benefits
The Trustees considered the benefits, other than management fees, that the Manager and/or its affiliates receive because of the Manager’s relationship with the Funds. The Trustees acknowledged that the Funds serve as investment options under variable contracts issued by an affiliate of the Manager that receives fees under those contracts and that Park Avenue Securities LLC, an affiliate of the Manager and principal underwriter of the Funds, and an insurance company affiliated with the Manager receive fees from the Funds under a plan of distribution adopted pursuant to Rule12b-1 under the 1940 Act. The Trustees considered that the Manager and its affiliates may benefit from (i) greater efficiencies in annuity administration and operations and potential cost savings due to a reduction in the number of unaffiliated funds available as annuity contract
investment options, and (ii) increased dividends-received deductions due to the Funds’ status under the tax laws as disregarded entities. In addition, the Trustees considered the potential benefits, other thansub-advisory fees, that theSub-advisers and their affiliates receive because of their relationships with the Funds, including the potential increased ability to use soft dollars consistent with Trust policies and other benefits from increases in assets under management. The Trustees concluded that benefits that accrue to the Manager and its affiliates are reasonable and the benefits that accrue to theSub-advisers and their affiliates are consistent with those expected for asub-adviser to a mutual fund such as the applicable Fund.
Conclusion
Based on a comprehensive consideration and evaluation of all of the information and factors summarized above, among others, the Board voting as a whole, including the Independent Trustees voting separately, unanimously approved the continuation of the Agreements.
| 23 |
Table of Contents
SUPPLEMENTAL INFORMATION(UNAUDITED)
Trustees and Officers Information Table
The following table provides information about the Trustees of the Trust.
| Name and Year of Birth | Term of Office, Position(s) Held and Length of Service* | Principal During Past Five Years | Number of in Fund | Other Directorships Held by Trustee | ||||
| Independent Trustees | ||||||||
| Bruce W. Ferris† (born 1955) | Trustee | Retired (since 2015); President and CEO, Prudential Annuity Distributors (2013–2015); Director/Trustee, Advanced Series Trust, Prudential Series Fund and Prudential’s Gibraltar Fund, Inc. (2013–2015); Senior Vice President, Prudential Annuities (2008–2015). | 16 | None. | ||||
| Theda R. Haber† (born 1954) | Trustee | Adjunct Assistant Professor of Law, UC Hastings College of Law (since 2013); Member of the Board of Directors, Fairholme Trust Company, LLC (since 2015); Attorney, Law Office of Theda R. Haber (since 2014); Visiting Professor of Law, UC Davis School of Law (since 2014); Consultant, Haber & Associates LLC (financial services industry) (since 2012); Advisory Council Chair, Vice Chair, and Member, Advisory Council on Employee Welfare and Pension Benefit Plans (ERISA Advisory Council), U.S. Department of Labor (2009–2011); Managing Director and General Counsel, BlackRock Institutional Trust Company, N.A. (2009–2011); Deputy Global General Counsel, Barclays Global Investors (2006-2009); Managing Director, Barclays Global Investors (1998–2006). | 16 | None. | ||||
| Marshall Lux† (born 1960) | Trustee | Senior Advisor, The Boston Consulting Group (since 2014); Senior Partner and Managing Director, The Boston Consulting Group (2009–2014). | 16 | None. | ||||
| Lisa K. Polsky† (born 1956) | Trustee | Senior Risk Advisor, AQR (investment management) (since 2016); Senior Risk Advisor, Ultra Capital (venture capital) (since 2016); Board Member and Chair of Risk Committee, DeutscheBank IHC (financial services) (since May 2016); Chief Risk Officer, CIT Group Inc. (financial services) (2010–2015); Board Member and Chair of Audit Committee, Piper Jaffray (investment bank) (2007–2016). | 16 | None. | ||||
| John Walters† (born 1962) | Lead Independent Trustee | Board Member, Amerilife Holdings LLC (insurance distribution) (since 2015); Board Member, Stadion Money Management LLC (investment adviser) (since 2011); President and Chief Operating Officer, Hartford Life Insurance Company (2000–2010). | 16 | None. | ||||
| 24 |
Table of Contents
SUPPLEMENTAL INFORMATION(UNAUDITED)
| Name and Year of Birth | Term of Office, Position(s) Held and Length of Service* | Principal During Past Five Years | Number of Overseen by Trustees*** | Other Directorships Held by Trustee | ||||
| Interested Trustees | ||||||||
| Gordon Dinsmore** (born 1952) | Trustee | Senior Vice President, Head of Product and President of Berkshire, The Guardian Life Insurance Company of America. | 16 | None. | ||||
| Marc Costantini** (born 1969) | Chairman and Trustee | Executive Vice President, Group and Worksite Markets, The Guardian Life Insurance Company of America (since 2017); Executive Vice President and Chief Financial Officer, The Guardian Life Insurance Company of America (2014–2017); Executive Vice President, Manulife Financial prior thereto (various positions from 1990–2014). | 16 | None. | ||||
| * | Each Trustee except for Mr. Dinsmore began service in such capacity in 2016 and serves until his or her successor is elected and qualified or until his or her resignation, death or removal. Mr. Dinsmore has served as a Trustee since November 2017. The business address of each Trustee is 7 Hanover Square, New York, New York 10004. |
| ** | Each of Gordon Dinsmore and Marc Costantini is considered to be an “interested person” of the Trust within the meaning of the 1940 Act because of their affiliation with The Guardian Life Insurance Company of America and/or its affiliates. |
| *** | As of the date of this report, the Trust currently consists of 16 separate Funds. |
| † | Member of the Audit Committee of the Trust. |
The following table provides information about the Officers of the Trust.
| Name and Year of Birth | Position(s) Held and Length of Service* | Principal Occupation(s) During Past Five Years | ||
| Gordon Dinsmore (born 1952) | President and Principal Executive Officer (Since November 2017) | Senior Vice President, Head of Product and President of Berkshire, The Guardian Life Insurance Company of America. | ||
| John H. Walter (born 1962) | Senior Vice President, Treasurer, and Principal Financial and Accounting Officer | Vice President, Chief Financial Officer, Equity Profit Center, The Guardian Life Insurance Company of America. | ||
| Harris Oliner (born 1971) | Senior Vice President and Secretary | Senior Vice President, Corporate Secretary, The Guardian Life Insurance Company of America (since 2015); Senior Vice President, Deputy General Counsel, Corporate Secretary, Voya Financial, Inc. (2013–2014); Managing Director, Senior Counsel, Corporate Secretary, BlackRock, Inc. prior thereto. | ||
| Richard T. Potter (born 1954) | Senior Vice President and Chief Legal Officer | Vice President and Equity Counsel, The Guardian Life Insurance Company of America. | ||
| Philip Stack (born 1964) | Chief Compliance Officer (Since September 2017) | Executive Director, Chief Compliance Officer, Morgan Stanley (2015–2017); Vice President, Morgan Stanley (2013–2015); Vice President, Corporate Audit Group–Compliance, Morgan Stanley prior thereto. | ||
| James R. Anderson (born 1963) | Anti-Money Laundering Officer (Since November 2017) | Second Vice President, Agency and Anti-Money Laundering Compliance, The Guardian Life Insurance Company of America. | ||
| Kathleen M. Moynihan (born 1966) | Senior Counsel | Senior Counsel, The Guardian Life Insurance Company of America. | ||
| Maria Nydia Morrison (born 1958) | Fund Controller | Mutual Fund Controller, The Guardian Life Insurance Company of America (since 2015); Chief Financial Officer/Assistant Operating Officer, St. Francis De Assisi Montessori School (Plaridel, Bulacan), Inc. (Philippines) (2013–2015); Vice President, Bank of New York Mellon prior thereto. | ||
| 25 |
Table of Contents
SUPPLEMENTAL INFORMATION(UNAUDITED)
| Name and Year of Birth | Position(s) Held and Length of Service* | Principal Occupation(s) During Past Five Years | ||
Sonya L. Crosswell (born 1977) | Assistant Secretary | Assistant Vice President, Assistant Corporate Secretary and Secretary Pro Tem, The Guardian Life Insurance Company of America (since 2014); Vice President, Secretary and Assistant General Counsel, Carver Federal Savings Bank prior thereto. | ||
| * | Unless otherwise indicated, the Officers each began service in such capacity in 2016 and hold office for an indefinite term or until their successors shall have been elected and qualified. The business address of each Officer is 7 Hanover Square, New York, New York 10004. |
| 26 |
Table of Contents
SUPPLEMENTAL INFORMATION(UNAUDITED)
The Statement of Additional Information (“SAI”) includes additional information about the Trust’s Trustees and Officers and is available, without charge, upon request by calling toll-free1-888-GUARDIAN(1-888-482-7342) or by visiting our website at http://guardianvpt.onlineprospectus.net/GuardianVPT/Prospectuses.
Portfolio Holdings and Proxy Voting Procedures
The Fund files its complete schedule of portfolio holdings with the Securities and Exchange Commission for the first and third quarters of each fiscal year as an exhibit to its reports on Form N-Q or FormN-PORT (for filings beginning in April 2019 relating to March 31, 2019 data). The Fund’s Form N-Q or FormN-PORT reports are available on the Securities and Exchange Commission’s website at https://www.sec.gov. The Fund’s Form N-Q or FormN-PORT information is also available, without charge, upon request, by calling toll-free1-888-GUARDIAN(1-888-482-7342) or by visiting our website at http://guardianvpt.onlineprospectus.net/GuardianVPT/
Prospectuses.
Beginning in April 2019, the Fund will cease to disclose its holdings on Form N-Q and will file Form N-PORT with the Securities and Exchange Commission on a monthly
basis, with the information contained on Form N-PORT for the last month of the Fund’s fiscal quarter being made public by the Securities and Exchange Commission 60 days after the end of the Fund’s fiscal quarter.
A description of the policies and procedures that the Fund uses to determine how to vote proxies relating to portfolio securities is included in the SAI. The SAI and information regarding how the Fund voted proxies relating to portfolio securities during the most recent12-month period ended June 30 may be obtained (i) without charge, upon request, by calling toll-free1-888-GUARDIAN(1-888-482-7342) or by visiting our website at http://guardianvpt.onlineprospectus.net/GuardianVPT/
Prospectuses; and (ii) on the Securities and Exchange Commission’s website at https://www.sec.gov.
| 27 |
Table of Contents
This report is transmitted to shareholders only. It is not authorized for use as an offer of sale or a solicitation of an offer to buy shares of the Fund unless accompanied or preceded by the Fund’s current prospectus. Past performance results shown in this report should not be considered a representation of future performance. Investment returns and principal value of shares will fluctuate so that shares, when redeemed, may be worth more or less than their original cost. Statements and other information herein are as dated and are subject to change.

The Guardian Life Insurance Company of America New York, NY 10004-4025
PUB8174
Table of Contents
Guardian Variable
Products Trust
2018
Annual Report
All Data as of December 31, 2018
Guardian Growth & Income VIP Fund
Important Notice
Beginning on January 1, 2021, as permitted by regulations adopted by the Securities and Exchange Commission, paper copies of the Fund’s shareholder reports will no longer be sent by mail from The Guardian Insurance & Annuity Company, Inc. (“GIAC”). Instead, GIAC will mail you a notice when copies of the shareholder reports are made available on a website. You will be notified by mail each time a report is posted and provided with a website link to access the report.
If you have already elected to receive shareholder reports electronically, you will not be affected by this change and you need not take any action. If you have not yet elected electronic delivery, at any time, you may elect to receive the Fund’s shareholder reports and certain other communications from GIAC electronically, by going to www.guardianlife.com and registering fore-delivery.
You may instead elect to receive all future shareholder reports in paper free of charge. If you wish to receive paper copies of your shareholder reports, please call GIAC’s Customer Service Office Contact Center at1-888-GUARDIAN(1-888-482-7342). Your election to receive reports in paper will apply to all the underlying funds available.

| Not FDIC insured. May lose value. No bank guarantee. | www.guardianlife.com |
Table of Contents
Guardian Growth & Income VIP Fund
Except as otherwise specifically stated, all information, including portfolio security positions, is as of December 31, 2018. The views expressed in the Fund Commentary are those of the Fund’s portfolio manager(s) as of the date of this report and are subject to change without notice. They do not necessarily represent the views of Park Avenue Institutional Advisers LLC or asub-adviser. The Fund Commentary may contain some forward-looking statements providing expectations or forecasts of future events as of the date of this report; they do not necessarily relate to historical or current facts. There can be no guarantee that any forward-looking statement will be realized. We undertake no obligation to update forward-looking statements, whether as a result of new information, future events, or otherwise. Any discussions of specific securities should not be considered a recommendation to buy or sell those securities. Fund holdings will vary. Information contained herein has been obtained from sources believed reliable, but is not guaranteed.
Table of Contents
GUARDIAN GROWTH & INCOME VIP FUND
FUND COMMENTARY BY ALLIANCEBERNSTEIN L.P.,SUB-ADVISER
Highlights
| • | Guardian Growth & Income VIP Fund (the “Fund”) returned-8.09%, outperforming the Russell 1000® Value Index1 (the “Index”), which is the Fund’s benchmark, for the 12 months ended December 31, 2018. Sector selection drove the Fund’s outperformance relative to the Index for the period. An underweight in the consumer staples sector and overweights to the technology and communication services sectors were notable contributors. An underweight to the defensive utilities sector and an overweight to the industrials sector detracted. Stock selection in the consumer discretionary, industrials and communication services sectors contributed to relative performance, while stock selection in the healthcare, financials and energy sectors detracted. |
| • | The Index returned -8.27% for the year. For the period, growth stocks generally outperformed their value counterparts andlarge-cap stocks generally outperformedsmall-cap stocks. |
Market Overview
Global equities ended 2018 in negative territory, marking one of the worst years for the stock market in terms of performance in a decade. Despite a relatively strong start to the year and U.S. stock indices reaching record highs, volatility spiked toward the end of the year as investors worried about the outlook for corporate earnings growth amid a more challenging global growth environment, and as the benefits of tax reform roll off. The U.S. Federal Reserve raised rates four times during 2018 as many expected, but softened its tone in December and signaled that it might slow its pace of rate hikes in 2019. An upsurge in geopolitical uncertainty regarding Brexit and budget discussions between Italy and the European Union sparked a flight to quality in the region. Slowing Chinese growth and continuing
U.S.-China trade tensions dampened investor sentiment in China toward the end of the period. In the U.S., growth stocks generally outperformed value stocks, in terms of style, andlarge-cap stocks generally outperformed theirsmall-cap peers.
Portfolio Review
Sector selection drove the Fund’s outperformance relative to the Index for the period. An underweight in the consumer staples sector compared to the Index and overweights in the technology and communication services sectors were notable contributors. An underweight to the defensive utilities sector and an overweight to the industrials sector detracted. Stock selection in the consumer discretionary, industrials and communication services sectors contributed to relative performance, while stock selection in the healthcare, financials and energy sectors detracted.
Outlook
There are some indications that economic growth is slowing as the market absorbs the impact of several years of steady monetary policy tightening. We believe the economy has been operating above potential for several quarters, and a deceleration to a more trend-like growth rate reduces the risk of overheating and of financial market imbalances. In our view, the market seems concerned that a gradual deceleration will rapidly snowball into something more significant. We believe those concerns are misplaced, as incoming data continue to paint a picture of a healthy economy, with forward momentum that we believe has the potential to sustain solid growth for several more quarters.
We seek to buy attractively valued companies that we believe are good businesses, exhibit signs of improving success, and have attractive fundamentals, high free-cash-flow yields, low earnings variability and low leverage.
| 1 |
| 1 | The Russell 1000® Value Index (the “Index”) is an unmanaged market-capitalization-weighted index that measures the performance of those companies in the Russell 1000®Index (which consists of the 1,000 largest U.S. companies based on total market capitalization) with lowerprice-to-book ratios and lower forecasted growth values. Index results assume the reinvestment of dividends paid on the stocks constituting the Index. You may not invest in the Index, and, unlike the Fund, the Index does not incur fees and expenses. |
Table of Contents
GUARDIAN GROWTH & INCOME VIP FUND
Funds in the Guardian Variable Products Trust are sold by prospectus only. You should carefully consider the investment objectives, risks, charges and expenses of the Funds before making an investment decision. The prospectus contains this and other important information. Please read it carefully before investing or sending money. Please visit our website at http://guardianvpt.onlineprospectus.net/GuardianVPT/Prospectuses or to obtain a printed copy, call 1-888-GUARDIAN(1-888-482-7342).
As with all mutual funds, the value of an investment in the Fund could decline, and you could lose money. Diversification does not guarantee profit or protect against loss, and there can be no assurance that the Fund will achieve its investment objective. The Fund invests primarily in equity securities and therefore exposes you to the general risks of investing in stock markets. Investing in large-capitalization companies involves risks such as having low growth rates, and slow responsiveness to competitive challenges or opportunities than in the case of smaller companies. Overweighting investments in certain sectors or industries increases the risk of loss due to general declines in the prices of stocks in those sectors or industries. Investing in a more limited number of issuers and sectors can be subject to greater market fluctuation. Value stocks may not realize their perceived value and during certain periods the Fund may underperform other equity funds that employ a different style. International investing involves special risks, which include changes in currency rates, foreign taxation and differences in auditing standards and securities regulations, political uncertainty and greater volatility. Foreign securities are subject to political, regulatory, economic, and exchange-rate risks not present in domestic investments. Any discussions of specific securities should not be considered a recommendation to buy or sell those securities. Fund holdings will vary.
| 2 |
Table of Contents
GUARDIAN GROWTH & INCOME VIP FUND
Fund Characteristics (unaudited)
| Total Net Assets: $ 164,861,016 |
Sector Allocation1 As of December 31, 2018 |
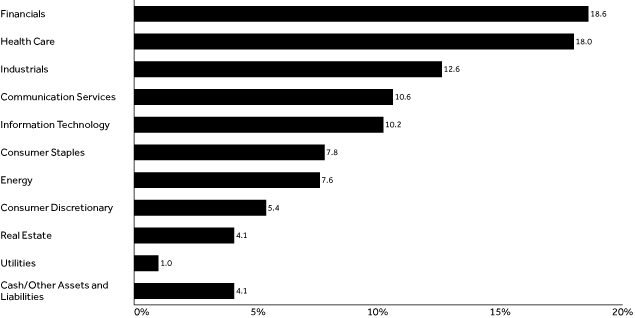 |
Top Ten Holdings2 As of December 31, 2018 | ||||
| Holding | % of Total Net Assets | |||
| Verizon Communications, Inc. | 4.00% | |||
| Berkshire Hathaway, Inc., Class B | 3.98% | |||
| Pfizer, Inc. | 3.92% | |||
| JPMorgan Chase & Co. | 3.89% | |||
| Walmart, Inc. | 3.78% | |||
| Cigna Corp. | 2.87% | |||
| DR Horton, Inc. | 2.66% | |||
| Raytheon Co. | 2.57% | |||
| Cisco Systems, Inc. | 2.48% | |||
| Comcast Corp., Class A | 2.45% | |||
| Total | 32.60% | |||
| 1 | The Fund’s holdings are allocated to each sector based on the MSCI Global Industry Classification Standard (GICS®). Cash includes short-term investments and net other assets and liabilities. |
| 2 | Portfolio holdings are subject to change and should not be considered a recommendation to buy or sell individual securities. |
| 3 |
Table of Contents
GUARDIAN GROWTH & INCOME VIP FUND
Average Annual Total Returns As of December 31, 2018 | ||||||||||||||||||||
| Inception Date | 1 Year | 5 Year | 10 Year | Since Inception | ||||||||||||||||
| Guardian Growth & Income VIP Fund | 9/1/2016 | -8.09% | — | — | 7.39% | |||||||||||||||
| Russell 1000® Value Index | -8.27% | — | — | 4.63% | ||||||||||||||||
Results of a Hypothetical $10,000 Investment As of December 31, 2018 |
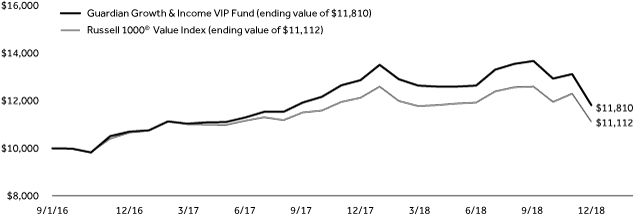 |
The chart above shows the performance of a hypothetical $10,000 investment made on inception date in Guardian Growth & Income VIP Fund and the Russell 1000® Value Index. Index returns do not include the fees and expenses of the Fund, but do include reinvestment of dividends, if any.
Performance quoted represents past performance and does not guarantee or predict future results. Investment return and principal value will fluctuate, so shares, when redeemed, may be worth more or less than their original cost. The Fund’s fees and expenses are detailed in the Financial Highlights section of this report. Fees and expenses are factored into the net asset value of Fund shares and any performance numbers we release. Total return figures include the effect of expense limitations in effect during the periods shown, if applicable; without such limitations, the performance shown would have been lower. Performance results assume the reinvestment of dividends and capital gains. The return figures shown do not reflect the deduction of taxes that a contract owner/policyholder may pay on redemption units. The actual total returns for owners of variable annuity contracts or variable life insurance policies that provide for investment in the Fund will be lower to reflect separate account and contract/policy charges. Current andmonth-end performance information, which may be lower or higher than that cited, is available by calling1-888-GUARDIAN(1-888-482-7342) and is periodically updated on our website: http://guardianlife.com.
| 4 |
Table of Contents
UNDERSTANDING YOUR FUND’S EXPENSES(UNAUDITED)
By investing in the Fund, you incur two types of costs: (1) transaction costs and (2) ongoing costs, including, as applicable, investment advisory fees, distribution and/or service(12b-1) fees and other Fund expenses. The example below is intended to help you understand your ongoing costs (in dollars) of investing in the Fund and to compare these costs with the ongoing costs of investing in other mutual funds.
The example is based on an investment of $1,000 invested at the beginning of the period and held for the entire period from July 1, 2018 to December 31, 2018. The table below shows the Fund’s expenses in two ways:
Expenses based on actual return
This section of the table provides information about actual account values and actual expenses. You may use the information in this section, together with the amount you invested, to estimate the expenses that you paid over the period. Simply divide your account value by $1,000 (for example, an $8,600 account value divided by $1,000 = 8.6), then multiply the result by the number in the section under the heading entitled “Expenses Paid During Period” to estimate the expenses you paid on your account during this period.
Expenses based on hypothetical 5% return for comparison purposes
This section of the table provides information about hypothetical account values and hypothetical expenses based on the Fund’s actual expense ratio and an assumed rate of return of 5% per year before expenses, which is not the Fund’s actual return. The hypothetical account values and expenses may not be used to estimate the actual ending account balance or expenses you paid for the period. You may use this information to compare the ongoing costs of investing in the Fund with the cost of investing in other mutual funds. To do so, compare this 5% hypothetical example with the 5% hypothetical examples that appear in the shareholder reports of the other funds.
Note that the expenses shown in the table are meant to highlight your ongoing costs only and do not reflect any transactional costs, such as sales charges (loads), redemption fees, or exchange fees. Therefore the second section is useful in comparing ongoing costs only, and will not help you determine the relative total costs of owning different funds. If these transactional costs were included, your costs would have been higher. Charges and expenses at the insurance company separate account level are not reflected in the table.
| Beginning Account Value 7/1/18 | Ending Account Value 12/31/18 | Expenses Paid During Period* 7/1/18-12/31/18 | Expense Ratio During Period 7/1/18-12/31/18 | |||||||||||
| Based on Actual Return | $1,000.00 | $ | 935.10 | $ | 4.93 | 1.01% | ||||||||
| Based on Hypothetical Return (5% Return Before Expenses) | $1,000.00 | $ | 1,020.11 | $ | 5.14 | 1.01% | ||||||||
| * | Expenses are equal to the Fund’s annualized expense ratio as indicated, multiplied by the average account value over the period, multiplied by184/365 (to reflect theone-half year period). |
| 5 |
Table of Contents
SCHEDULE OF INVESTMENTS — GUARDIAN GROWTH & INCOME VIP FUND
| December 31, 2018 | Shares | Value | ||||||
| Common Stocks – 95.9% | ||||||||
| Aerospace & Defense – 2.6% |
| |||||||
Raytheon Co. | 27,629 | $ | 4,236,907 | |||||
|
| |||||||
| 4,236,907 | ||||||||
| Airlines – 1.9% | ||||||||
Delta Air Lines, Inc. | 25,781 | 1,286,472 | ||||||
Southwest Airlines Co. | 39,804 | 1,850,090 | ||||||
|
| |||||||
| 3,136,562 | ||||||||
| Auto Components – 1.0% | ||||||||
BorgWarner, Inc. | 49,172 | 1,708,235 | ||||||
|
| |||||||
| 1,708,235 | ||||||||
| Banks – 5.9% | ||||||||
Citigroup, Inc. | 63,586 | 3,310,287 | ||||||
JPMorgan Chase & Co. | 65,680 | 6,411,682 | ||||||
|
| |||||||
| 9,721,969 | ||||||||
| Biotechnology – 3.6% | ||||||||
Biogen, Inc.(1) | 8,671 | 2,609,277 | ||||||
Celgene Corp.(1) | 23,214 | 1,487,785 | ||||||
Gilead Sciences, Inc. | 29,928 | 1,871,997 | ||||||
|
| |||||||
| 5,969,059 | ||||||||
| Capital Markets – 2.6% | ||||||||
Northern Trust Corp. | 19,362 | 1,618,470 | ||||||
The Goldman Sachs Group, Inc. | 16,358 | 2,732,604 | ||||||
|
| |||||||
| 4,351,074 | ||||||||
| Communications Equipment – 3.3% |
| |||||||
Cisco Systems, Inc. | 94,435 | 4,091,868 | ||||||
F5 Networks, Inc.(1) | 8,053 | 1,304,828 | ||||||
|
| |||||||
| 5,396,696 | ||||||||
| Construction & Engineering – 0.6% |
| |||||||
EMCOR Group, Inc. | 16,688 | 996,107 | ||||||
|
| |||||||
| 996,107 | ||||||||
| Consumer Finance – 1.0% | ||||||||
Capital One Financial Corp. | 21,729 | 1,642,495 | ||||||
|
| |||||||
| 1,642,495 | ||||||||
| Diversified Financial Services – 4.0% |
| |||||||
Berkshire Hathaway, Inc., Class B(1) | 32,137 | 6,561,733 | ||||||
|
| |||||||
| 6,561,733 | ||||||||
| Diversified Telecommunication Services – 4.9% |
| |||||||
AT&T, Inc. | 52,396 | 1,495,382 | ||||||
Verizon Communications, Inc. | 117,441 | 6,602,533 | ||||||
|
| |||||||
| 8,097,915 | ||||||||
| Electric Utilities – 1.0% | ||||||||
Exelon Corp. | 37,327 | 1,683,448 | ||||||
|
| |||||||
| 1,683,448 | ||||||||
| Electrical Equipment – 0.5% | ||||||||
Acuity Brands, Inc. | 7,592 | 872,700 | ||||||
|
| |||||||
| 872,700 | ||||||||
| Electronic Equipment, Instruments & Components – 0.8% |
| |||||||
Coherent, Inc.(1) | 4,960 | 524,321 | ||||||
Keysight Technologies, Inc.(1) | 12,834 | 796,735 | ||||||
|
| |||||||
| 1,321,056 | ||||||||
| December 31, 2018 | Shares | Value | ||||||
| Energy Equipment & Services – 0.8% |
| |||||||
Dril-Quip, Inc.(1) | 21,703 | $ | 651,741 | |||||
National Oilwell Varco, Inc. | 27,903 | 717,107 | ||||||
|
| |||||||
| 1,368,848 | ||||||||
| Entertainment – 2.3% |
| |||||||
The Walt Disney Co. | 35,260 | 3,866,259 | ||||||
|
| |||||||
| 3,866,259 | ||||||||
| Equity Real Estate Investment – 2.2% |
| |||||||
Regency Centers Corp. REIT | 62,610 | 3,673,955 | ||||||
|
| |||||||
| 3,673,955 | ||||||||
| Food & Staples Retailing – 5.8% |
| |||||||
Walgreens Boots Alliance, Inc. | 48,469 | 3,311,887 | ||||||
Walmart, Inc. | 66,891 | 6,230,896 | ||||||
|
| |||||||
| 9,542,783 | ||||||||
| Health Care Providers & Services – 6.1% |
| |||||||
Anthem, Inc. | 10,278 | 2,699,311 | ||||||
Cigna Corp. | 24,910 | 4,730,907 | ||||||
Quest Diagnostics, Inc. | 30,947 | 2,576,957 | ||||||
|
| |||||||
| 10,007,175 | ||||||||
| Household Durables – 3.4% |
| |||||||
DR Horton, Inc. | 126,580 | 4,387,263 | ||||||
Garmin Ltd. | 19,383 | 1,227,331 | ||||||
|
| |||||||
| 5,614,594 | ||||||||
| Insurance – 5.1% |
| |||||||
Aflac, Inc. | 13,497 | 614,923 | ||||||
Fidelity National Financial, Inc. | 67,811 | 2,131,978 | ||||||
Reinsurance Group of America, Inc. | 12,028 | 1,686,686 | ||||||
The Allstate Corp. | 48,682 | 4,022,594 | ||||||
|
| |||||||
| 8,456,181 | ||||||||
| Internet & Direct Marketing Retail – 0.7% |
| |||||||
Expedia Group, Inc. | 10,160 | 1,144,524 | ||||||
|
| |||||||
| 1,144,524 | ||||||||
| IT Services – 2.0% |
| |||||||
Akamai Technologies, Inc.(1) | 19,697 | 1,203,093 | ||||||
Cognizant Technology Solutions Corp., Class A | 27,302 | 1,733,131 | ||||||
Euronet Worldwide, Inc.(1) | 4,037 | 413,308 | ||||||
|
| |||||||
| 3,349,532 | ||||||||
| Machinery – 4.0% | ||||||||
Altra Industrial Motion Corp. | 44,652 | 1,122,998 | ||||||
Crane Co. | 26,952 | 1,945,395 | ||||||
PACCAR, Inc. | 23,233 | 1,327,534 | ||||||
Parker-Hannifin Corp. | 8,192 | 1,221,755 | ||||||
WABCO Holdings, Inc.(1) | 8,465 | 908,633 | ||||||
|
| |||||||
| 6,526,315 | ||||||||
| Media – 3.4% | ||||||||
Comcast Corp., Class A | 118,601 | 4,038,364 | ||||||
Discovery, Inc., Class A(1) | 64,662 | 1,599,738 | ||||||
|
| |||||||
| 5,638,102 | ||||||||
| 6 | The accompanying notes are an integral part of these financial statements. |
Table of Contents
SCHEDULE OF INVESTMENTS — GUARDIAN GROWTH & INCOME VIP FUND
| December 31, 2018 | Shares | Value | ||||||
| Oil, Gas & Consumable Fuels – 6.8% |
| |||||||
Apache Corp. | 45,437 | $ | 1,192,721 | |||||
ConocoPhillips | 55,425 | 3,455,749 | ||||||
Exxon Mobil Corp. | 36,337 | 2,477,820 | ||||||
Noble Energy, Inc. | 93,795 | 1,759,594 | ||||||
Phillips 66 | 26,730 | 2,302,790 | ||||||
|
| |||||||
| 11,188,674 | ||||||||
| Pharmaceuticals – 8.3% |
| |||||||
Eli Lilly & Co. | 29,613 | 3,426,816 | ||||||
Pfizer, Inc. | 147,921 | 6,456,752 | ||||||
Roche Holding AG, ADR | 121,940 | 3,789,895 | ||||||
|
| |||||||
| 13,673,463 | ||||||||
| Real Estate Management & Development – 1.9% |
| |||||||
CBRE Group, Inc., Class A(1) | 76,937 | 3,080,558 | ||||||
|
| |||||||
| 3,080,558 | ||||||||
| Road & Rail – 3.0% |
| |||||||
Kansas City Southern | 10,583 | 1,010,147 | ||||||
Knight-Swift Transportation Holdings, Inc. | 41,251 | 1,034,163 | ||||||
Norfolk Southern Corp. | 13,074 | 1,955,086 | ||||||
Saia, Inc.(1) | 16,025 | 894,515 | ||||||
|
| |||||||
| 4,893,911 | ||||||||
| Semiconductors & Semiconductor Equipment – 2.5% |
| |||||||
Intel Corp. | 43,345 | 2,034,181 | ||||||
QUALCOMM, Inc. | 20,616 | 1,173,257 | ||||||
Skyworks Solutions, Inc. | 13,262 | 888,819 | ||||||
|
| |||||||
| 4,096,257 | ||||||||
| Specialty Retail – 0.3% |
| |||||||
Murphy USA, Inc.(1) | 5,624 | 431,023 | ||||||
|
| |||||||
| 431,023 | ||||||||
| Technology Hardware, Storage & Peripherals – 1.6% |
| |||||||
Apple, Inc. | 11,331 | 1,787,352 | ||||||
HP, Inc. | 43,777 | 895,677 | ||||||
|
| |||||||
| 2,683,029 | ||||||||
| December 31, 2018 | Shares | Value | ||||||
| Tobacco – 2.0% |
| |||||||
Altria Group, Inc. | 38,771 | $ | 1,914,900 | |||||
Philip Morris International, Inc. | 20,416 | 1,362,972 | ||||||
|
| |||||||
| 3,277,872 | ||||||||
| Total Common Stocks (Cost $170,309,518) |
| 158,209,011 | ||||||
| Principal Amount | Value | |||||||
| Short–Term Investment – 3.9% |
| |||||||
| Repurchase Agreements – 3.9% |
| |||||||
Fixed Income Clearing Corp., 0.50%, dated 12/31/2018, proceeds at maturity value of $6,393,178, due 1/2/2019(2) | $ | 6,393,000 | 6,393,000 | |||||
| Total Repurchase Agreements (Cost $6,393,000) |
| 6,393,000 | ||||||
| Total Investments – 99.8% (Cost $176,702,518) |
| 164,602,011 | ||||||
| Assets in excess of other liabilities – 0.2% |
| 259,005 | ||||||
| Total Net Assets – 100.0% |
| $ | 164,861,016 | |||||
| (1) | Non–income–producing security. |
| (2) | The table below presents collateral for repurchase agreements. |
| Security | Coupon | Maturity Date | Principal Amount | Value | ||||||||||||
| U.S. Treasury Note | 2.875% | 7/31/2025 | $ | 6,355,000 | $ | 6,520,878 | ||||||||||
Legend:
ADR — American Depositary Receipt
REIT — Real Estate Investment Trust
The following is a summary of the inputs used as of December 31, 2018 in valuing the Fund’s investments. For more information on valuation inputs, please refer to Note 2a of the accompanying Notes to Financial Statements.
| Valuation Inputs | ||||||||||||||||
| Investments in Securities | Level 1 | Level 2 | Level 3 | Total | ||||||||||||
| Common Stocks | $ | 158,209,011 | $ | — | $ | — | $ | 158,209,011 | ||||||||
| Repurchase Agreements | — | 6,393,000 | — | 6,393,000 | ||||||||||||
| Total | $ | 158,209,011 | $ | 6,393,000 | $ | — | $ | 164,602,011 | ||||||||
| The accompanying notes are an integral part of these financial statements. | 7 |
Table of Contents
FINANCIAL INFORMATION — GUARDIAN GROWTH & INCOME VIP FUND
For the Year Ended December 31, 2018 | ||||
Investment Income | ||||
Dividends | $ | 2,741,014 | ||
Interest | 23,733 | |||
Withholding taxes on foreign dividends | (793 | ) | ||
|
| |||
Total Investment Income | 2,763,954 | |||
|
| |||
Expenses | ||||
Investment advisory fees | 886,357 | |||
Distribution fees | 353,547 | |||
Trustees’ and officers’ fees | 83,831 | |||
Professional fees | 61,046 | |||
Custodian and accounting fees | 47,301 | |||
Administrative fees | 44,739 | |||
Transfer agent fees | 17,981 | |||
Shareholder reports | 14,010 | |||
Other expenses | 21,057 | |||
|
| |||
Total Expenses | 1,529,869 | |||
Less: Fees waived | (102,381 | ) | ||
|
| |||
Total Expenses, Net | 1,427,488 | |||
|
| |||
Net Investment Income/(Loss) | 1,336,466 | |||
|
| |||
Realized Gain/(Loss) and Change in Unrealized Appreciation/(Depreciation) on Investments | ||||
Net realized gain/(loss) from investments | 3,393,124 | |||
Net change in unrealized appreciation/(depreciation) on investments | (13,699,311 | ) | ||
|
| |||
Net Loss on Investments | (10,306,187 | ) | ||
|
| |||
Net Decrease in Net Assets Resulting From Operations | $ | (8,969,721 | ) | |
|
| |||
| 8 | The accompanying notes are an integral part of these financial statements. |
Table of Contents
FINANCIAL INFORMATION — GUARDIAN GROWTH & INCOME VIP FUND
| For the Year Ended 12/31/18 | For the Year Ended 12/31/17 | |||||||
| ||||||||
Operations | ||||||||
Net investment income/(loss) | $ | 1,336,466 | $ | 113,751 | ||||
Net realized gain/(loss) from investments | 3,393,124 | 1,377,223 | ||||||
Net change in unrealized appreciation/(depreciation) on investments | (13,699,311 | ) | 1,129,781 | |||||
|
|
|
| |||||
Net Increase/(Decrease) in Net Assets Resulting from Operations | (8,969,721 | ) | 2,620,755 | |||||
|
|
|
| |||||
Capital Share Transactions | ||||||||
Proceeds from sales of shares | 183,635,093 | 5,027,525 | ||||||
Cost of shares redeemed | (20,346,714 | ) | (6,562,771 | ) | ||||
|
|
|
| |||||
Net Increase/(Decrease) in Net Assets Resulting from Capital Share Transactions | 163,288,379 | (1,535,246 | ) | |||||
|
|
|
| |||||
Net Increase in Net Assets | 154,318,658 | 1,085,509 | ||||||
|
|
|
| |||||
Net Assets | ||||||||
Beginning of year | 10,542,358 | 9,456,849 | ||||||
|
|
|
| |||||
End of year | $ | 164,861,016 | $ | 10,542,358 | ||||
|
|
|
| |||||
Other Information: | ||||||||
Shares | ||||||||
Sold | 14,707,417 | 455,605 | ||||||
Redeemed | (1,566,707 | ) | (518,800 | ) | ||||
|
|
|
| |||||
Net Increase/(Decrease) | 13,140,710 | (63,195 | ) | |||||
|
|
|
| |||||
| The accompanying notes are an integral part of these financial statements. | 9 |
Table of Contents
FINANCIAL INFORMATION — GUARDIAN GROWTH & INCOME VIP FUND
The Financial Highlights table is intended to help you understand the Fund’s financial performance for the past five years (or, if shorter, the period since inception). Certain information reflects financial results for a single Fund share. The total returns in the table represent the rate that an investor would have earned (or lost) on an investment in the Fund.
Financial Highlights | ||||||||||||||||||||||||
| Per Share Operating Performance | ||||||||||||||||||||||||
| Net Asset Value, Beginning of Period | Net Investment Income(1) | Net Realized and Unrealized Gain/(Loss) | Total Operations | Net Asset Value, End of Period | Total Return(2) | |||||||||||||||||||
Year Ended 12/31/18 | $ | 12.85 | $ | 0.12 | $ | (1.16 | ) | $ | (1.04 | ) | $ | 11.81 | (8.09) | % | ||||||||||
Year Ended 12/31/17 | 10.70 | 0.09 | 2.06 | 2.15 | 12.85 | 20.09 | % | |||||||||||||||||
Period Ended 12/31/16(4) | 10.00 | 0.04 | 0.66 | 0.70 | 10.70 | 7.00 | %(5) | |||||||||||||||||
| 10 | The accompanying notes are an integral part of these financial statements. |
Table of Contents
FINANCIAL INFORMATION — GUARDIAN GROWTH & INCOME VIP FUND
| Ratios/Supplemental Data | ||||||||||||||||||||||
| Net Assets, End of Period (000s) | Net Ratio of Expenses to Average Net Assets(3) | Gross Ratio of Expenses to Average Net Assets | Net Ratio of Net Investment Income to Average Net Assets(3) | Gross Ratio of Net Investment Income/(Loss) to Average Net Assets | Portfolio Turnover Rate | |||||||||||||||||
| $ | 164,861 | 1.01% | 1.08% | 0.94% | 0.87% | 58% | ||||||||||||||||
| 10,542 | 0.98% | 2.04% | 0.81% | (0.25)% | 85% | |||||||||||||||||
| 9,457 | 0.98% | (5) | 3.11% | (5) | 1.20% | (5) | (0.93)% | (5) | 11% | (5) | ||||||||||||
| (1) | Calculated based on the average shares outstanding during the period. |
| (2) | Total returns do not reflect the effects of charges deducted pursuant to the terms of The Guardian Insurance & Annuity Company, Inc.’s variable contracts. Inclusion of such charges would reduce the total returns for all periods shown. |
| (3) | Net Ratio of Expenses to Average Net Assets and Net Ratio of Net Investment Income to Average Net Assets include the effect of fee waivers and expense limitations. |
| (4) | Commenced operations on September 1, 2016. |
| (5) | Ratios for periods less than one year have been annualized, except for total return and portfolio turnover rate. For the period ended December 31, 2016, certainnon-recurring fees (i.e., audit fees) are not annualized. |
| The accompanying notes are an integral part of these financial statements. | 11 |
Table of Contents
NOTES TO FINANCIAL STATEMENTS — GUARDIAN GROWTH & INCOME VIP FUND
December 31, 2018
1. Organization
Guardian Variable Products Trust (the “Trust”), a Delaware statutory trust organized on January 12, 2016, is registered under the Investment Company Act of 1940, as amended (the “1940 Act”), as anopen-end management investment company. The Trust currently has sixteen series. Guardian Growth & Income VIP Fund (the “Fund”) is a series of the Trust. The Fund is a diversified fund and commenced operations on September 1, 2016. The financial statements for other series of the Trust are presented in separate reports.
The Trust has authorized an unlimited number of shares of beneficial interest with no par value. Shares are bought and sold at closing net asset value (“NAV”). Shares of the Fund are only sold to certain separate accounts of The Guardian Insurance & Annuity Company, Inc. (“GIAC”) that fund certain variable annuity contracts and variable life insurance policies issued by GIAC. GIAC is a wholly-owned subsidiary of The Guardian Life Insurance Company of America (“Guardian Life”).
The Fund seeks long-term growth of capital.
2. Significant Accounting Policies
The following is a summary of significant accounting policies followed by the Fund in the preparation of its financial statements. The Fund follows the investment company accounting and reporting guidance of the Financial Accounting Standards Board (“FASB”) Accounting Standards Codification Topic 946 Financial Services – Investment Companies. The following policies are in conformity with accounting principles generally accepted in the United States of America (“GAAP”). The preparation of financial statements in accordance with GAAP requires management to make estimates and assumptions that affect the reported amounts and disclosures in the financial statements. Actual results could differ from those estimates.
a. Investment Valuations Equity securities traded on an exchange other than NASDAQ Stock Market, LLC (“NASDAQ”) are valued at the last reported sale price on the principal exchange or market on which they are traded; or, if there were no sales that day, at the mean between the closing bid and ask prices. Securities traded on the NASDAQ are generally valued at the NASDAQ official closing price, which may not be the last sale price. If the NASDAQ official closing price is not available for a security, that security is generally valued at the
mean between the closing bid and ask prices. Repurchase agreements are carried at cost, which approximates fair value (see Note 5d). Foreign securities are valued in the currencies of the markets in which they trade and then converted to U.S. dollars by the application of foreign exchange rates at the close of the New York Stock Exchange (“NYSE”). Forward foreign currency contracts, if any, are valued at the mean between the bid and ask rates for the specified time interpolated from rates for proximate time periods. Securities for which market quotations are not readily available or for which market quotations may be considered unreliable are valued at their fair values as determined in accordance with policies and procedures adopted by the Board of Trustees.
Under the policies and procedures approved by the Board of Trustees, Park Avenue Institutional Advisers LLC (“Park Avenue”), the Fund’s investment adviser, has established a Fair Valuation Committee to assist the Board of Trustees with the oversight and monitoring of the valuation of the Fund’s investments. This includes monitoring the appropriateness of fair values based on results of ongoing valuation oversight, including but not limited to consideration of security specific events, market events, and pricing vendor and broker-dealer due diligence. The Fair Valuation Committee oversees and carries out the policies for the valuation of investments held in the Fund. The Fair Valuation Committee is responsible for discussing and assessing the potential impacts to the fair values on an ongoing basis, and at least on a quarterly basis with the Board of Trustees.
Securities whose values have been materially affected by events occurring before the Fund’s valuation time but after the close of the securities’ principal exchange or market may be fair valued in accordance with policies and procedures adopted by the Board of Trustees. In addition, the values of the Fund’s investments in foreign securities are generally determined by a pricing service using pricing models designed to estimate likely changes in the values of those securities. Certain foreign equity instruments are valued by applying international fair value factors provided by approved pricing services. The factors seek to adjust the local closing price for movements of local markets post closing, but prior to the time the NAVs are calculated. Valuations reflected in this report are as of the report date. As a result, changes in valuation due to market events and/or issuer related events after the report date and prior to issuance of the report are not reflected herein.
| 12 |
Table of Contents
NOTES TO FINANCIAL STATEMENTS — GUARDIAN GROWTH & INCOME VIP FUND
Various inputs are used in determining the valuation of the Fund’s investments. These inputs are summarized in three broad levels listed below.
| • | Level 1 — unadjusted inputs using quoted prices in active markets for identical investments. |
| • | Level 2 — other significant observable inputs, including, but not limited to, quoted prices for similar investments, inputs other than quoted prices that are observable for investments (such as interest rates, prepayment speeds, credit risks, etc.) or other market corroborated inputs. |
| • | Level 3 — significant unobservable inputs (including the Fund’s own assumptions in determining the fair value of investments) |
Inputs may include price information, volatility statistics, specific and broad credit data, liquidity statistics, and other factors. A financial instrument’s level within the fair value hierarchy is based on the lowest level of any input; both individually and in aggregate, that is significant to the fair value measurement. However, the determination of what constitutes “observable” requires significant judgment by the Trust. The Trust considers observable data to be that market data which is readily available, regularly distributed or updated, reliable and verifiable, and provided by independent sources that are actively involved in the relevant market. The inputs or methodology used for valuing securities are not necessarily an indication of the risk associated with investing in those securities. Changes in valuation techniques may result in transfers into or out of a financial instrument’s assigned level within the hierarchy.
The FASB requires reporting entities to make disclosures about purchases, sales, issuances and settlements of Level 3 securities on a gross basis.
The Fund’s policy is to recognize transfers between Level 1, Level 2 and Level 3 at the end of the reporting period. For the year ended December 31, 2018, there were no transfers among any levels.
In determining a financial instrument’s placement within the hierarchy, the Trust separates the Fund’s investment portfolio into two categories: investments and derivatives (e.g., futures). A summary of inputs used to value the Fund’s assets and liabilities carried at fair value as of December 31, 2018 is included in the Schedule of Investments.
Investments Investments whose values are based on quoted market prices in active markets, and are
therefore classified within Level 1, include active listed equities. Investments that trade in markets that are not considered to be active, but are valued based on quoted market prices, dealer quotations or alternative pricing sources supported by observable inputs are classified within Level 2. These include certain U.S. government and sovereign obligations, most government agency securities, investment-grade corporate bonds, certain mortgage products, state, municipal and provincial obligations, and certain foreign equity securities, including securities whose prices may have been affected by events occurring after the close of trading on their principal exchange or market and, as a result, whose values are determined by a pricing service as described above, or securities whose values are otherwise determined using fair valuation methods approved by the Fund’s Board of Trustees.
Investments classified within Level 3 have significant unobservable inputs, as they trade infrequently or not at all. Level 3 investments include, among others, private placement securities. When observable prices are not available for these securities, the Trust uses one or more valuation techniques for which sufficient and reliable data is available. The inputs used by the Trust in estimating the value of Level 3 investments include, for example, the original transaction price, recent transactions in the same or similar instruments, completed or pending third-party transactions in the underlying investment or comparable issuers, subsequent rounds of financing, recapitalizations, and other transactions across the capital structure. Level 3 investments may also be adjusted to reflect illiquidity and/ornon-transferability, with the amount of such discount estimated by the Trust in the absence of market information. Assumptions used by the Trust due to the lack of observable inputs may significantly impact the resulting fair value and therefore the Fund’s results of operations. As of December 31, 2018, the Fund had no securities classified as Level 3.
Derivatives Exchange-traded derivatives, such as futures contracts, exchange-traded option contracts and certain swaps, are typically classified within Level 1 or Level 2 of the fair value hierarchy depending on whether or not they are deemed to be actively traded. Certainnon-exchange-traded derivatives, such as generic forwards, certain swaps and options, have inputs which can generally be corroborated by market data and are therefore classified within Level 2. During the year ended December 31, 2018, the Fund did not hold any derivatives.
| 13 |
Table of Contents
NOTES TO FINANCIAL STATEMENTS — GUARDIAN GROWTH & INCOME VIP FUND
b. Securities Transactions Securities transactions are accounted for on the date securities are purchased or sold (trade date). Realized gains or losses on securities transactions are determined on the basis of specific identification.
c. Foreign Currency Translation The accounting records of the Fund are maintained in U.S. dollars. Investment securities and all other assets and liabilities of the Fund denominated in a foreign currency are generally translated into U.S. dollars at the exchange rates quoted at the close of the NYSE on each business day. The market value of investment securities and other assets and liabilities are translated at the exchange rate as of the valuation date. Purchases and sales of securities, income receipts, and expense payments are translated into U.S. dollars at the exchange rates in effect on the dates of the respective transactions. The Fund does not isolate the portion of the fluctuations on investments resulting from changes in foreign currency exchange rates from the fluctuations in market prices of investments held. Such fluctuations are included in the Net change in net realized and unrealized gain/(loss) from investments on the Statement of Operations.
Reported realized foreign currency gains and losses arise from the disposition of foreign currency, currency gains or losses realized between the trade and settlement dates on securities transactions, and the difference between the amounts of dividends, interest and foreign withholding taxes recorded on the Fund’s books on the transaction date and the U.S. dollar equivalent of the amounts actually received or paid. These reported realized foreign currency gains and losses, if any, are included in Net realized gain/(loss) from foreign currency transactions on the Statement of Operations. Unrealized foreign currency gains and losses arise from changes (due to changes in exchange rates) in the value of foreign currency and other assets and liabilities denominated in foreign currencies, which are held at period end, if any, and are included in Net change in unrealized appreciation/(depreciation) on translation of assets and liabilities in foreign currencies on the Statement of Operations.
d. Foreign Capital Gains Tax The Fund may be subject to foreign taxes on income, gains on investments or currency purchases/repatriation, a portion of which may be recoverable. The Fund will accrue such taxes and recoveries as applicable, based upon their current interpretation of tax rules and regulations that exist in the markets in which they invest.
e. Investment Income Dividend income net of foreign taxes withheld, if any, is generally recorded on theex-dividend date. Interest income, which includes amortization/accretion of premium/discount, is determined using the interest income accrual method, and is accrued and recorded daily.
f. Allocation of Income and Expenses Many of the expenses of the Trust can be directly attributed to a specific series of the Trust. Expenses that cannot be directly attributed to a specific series of the Trust are generally apportioned among all the series in the Trust, based on relative net assets. In calculating net asset value per share for each series of the Trust, investment income, realized and unrealized gains and losses, and expenses other than series-specific expenses are allocated daily to each series based upon the proportion of net assets attributable to each series.
3. Transactions with Affiliates
a. Investment Advisory Feeand Expense Limitation Under the terms of the advisory agreement, which, after its two year initial term, is reviewed and approved annually by the Board of Trustees, the Fund pays an investment advisory fee to Park Avenue. Park Avenue is a wholly-owned subsidiary of Guardian Life and receives an investment advisory fee at an annual rate of 0.65% up to $100 million, 0.60% up to $300 million, 0.55% up to $500 million, and 0.53% in excess of $500 million of the Fund’s average daily net assets. The fee is accrued daily and paid monthly.
Park Avenue has contractually agreed through April 30, 2019 to waive certain fees and/or reimburse certain expenses incurred by the Fund to the extent necessary to limit the Fund’s total annual operating expenses after fee waiver and/or expense reimbursement to 1.01% of the Fund’s average daily net assets (excluding, if applicable, any acquired fund fees and expenses, taxes, interest, transaction costs and brokerage commissions, litigation and extraordinary expenses). Prior to April 9, 2018, the expense limitation was 0.98%. The limitation may not be increased or terminated prior to this time without action by the Board of Trustees, may be terminated only upon approval of the Board of Trustees, and is subject to Park Avenue’s recoupment rights. For the year ended December 31, 2018, Park Avenue waived fees and/or paid Fund expenses in the amount of $102,381.
Park Avenue may be entitled to recoupment of previously waived fees and reimbursed expenses from the Fund for three years from the date of the waiver or reimbursement, subject to the expense limitation in
| 14 |
Table of Contents
NOTES TO FINANCIAL STATEMENTS — GUARDIAN GROWTH & INCOME VIP FUND
effect at the time of the waiver or reimbursement and at the time of the recoupment, if any. Amounts waived or reimbursed by Park Avenue pursuant to any expense limitation after April 9, 2018 will not be subject to Park Avenue’s recoupment rights. The amount available for potential future recoupment by Park Avenue from the Fund under the Expense Limitation Agreement and the expiration schedule at December 31, 2018 are as follows:
| Potential Recoupment Amounts Expiring | ||||||||||||
Total Potential | 2021 | 2020 | 2019 | |||||||||
| $252,225 | $ | 45,009 | $ | 147,462 | $ | 59,754 | ||||||
Park Avenue has entered into aSub-Advisory Agreement with AllianceBernstein L.P. (“AllianceBernstein”). AllianceBernstein is responsible for providingday-to-day investment advisory services to the Fund, subject to the supervision of Park Avenue and the oversight of the Board of Trustees.Sub-advisory fees are paid by Park Avenue and do not represent a separate or additional expense to the Fund.
b. Compensation of Trustees and Officers Trustees and officers who are interested persons of the Trust, as defined in the 1940 Act, receive no compensation from the Fund, except for the Chief Compliance Officer of the Trust. Trustees of the Trust who are not interested persons of the Trust, and the Chief Compliance Officer, receive compensation and reimbursement of expenses from the Trust.
c. Distribution Fees Park Avenue Securities LLC (“PAS”), a wholly-owned subsidiary of Guardian Life, is the principal underwriter of Fund shares. The Trust has entered into a distribution and service agreement with PAS, which governs the sale and distribution of shares of the Fund. Under a distribution and service plan adopted by the Trust(“12b-1 plan”), PAS is compensated for services in such capacity, including its expenses in connection with the promotion and distribution of shares of the Fund, at an annual rate of 0.25% of the Fund’s average daily net assets. For the year ended December 31, 2018, the Fund paid distribution fees in the amount of $353,547 to PAS.
PAS has directed that certain payments under the12b-1 plan be used to compensate GIAC for shareholder services provided to contract owners.
4. Federal Income Taxes
a. Distributions to Shareholders For federal income tax purposes, the Fund is treated as a disregarded entity
(“DRE”). As a DRE, the Fund is not subject to an entity-level income tax; and any income, gains, losses, deductions, taxes, and credits of the Fund would instead be “passed through” directly to the separate accounts of GIAC that invest in the Fund and retain the same character for U.S. federal income tax purposes. In addition, the Fund is not required to distribute taxable income and capital gains for U.S. federal income tax purposes. Therefore, no dividends and capital gains distributions were paid by the Fund.
5. Investments
a. Investment Purchases and Sales The cost of investments purchased and the proceeds from investments sold (excluding short-term investments) amounted to $235,861,577 and $74,381,161, respectively, for the year ended December 31, 2018. During the year ended December 31, 2018, there were no purchases or sales of U.S. government securities.
b. Foreign Securities Foreign securities investments involve special risks and considerations not typically associated with U.S. investments. These risks include, but are not limited to, currency risk; adverse political, regulatory, social, and economic developments; and less reliable information about issuers. Moreover, securities of some foreign issuers may be less liquid and their prices more volatile than those of comparable U.S. issuers.
c. Industry or Sector Concentration In its normal course of business, the Fund may invest a significant portion of its assets in companies within a limited number of industries or sectors. As a result, the Fund may be subject to a greater risk of loss than that of a fund invested in a wider spectrum of industries or sectors because the stocks of many or all of the companies in the industry, group of industries, sector, or sectors may decline in value due to developments adversely affecting the industry, group of industries, sector, or sectors.
d. Repurchase Agreements The Fund may invest in repurchase agreements to maintain liquidity and earn income over periods of time as short as overnight. The collateral for repurchase agreements is either cash or fully negotiable U.S. government securities (including U.S. government agency securities). Repurchase agreements are fully collateralized (including the interest accrued thereon) and such collateral is marked to market daily while the agreements remain in force. If the value of the collateral falls below the repurchase price plus accrued interest, the Fund will typically require
| 15 |
Table of Contents
NOTES TO FINANCIAL STATEMENTS — GUARDIAN GROWTH & INCOME VIP FUND
the seller to deposit additional collateral by the next business day. If the request for additional collateral is not met, or the seller defaults, the Fund maintains the right to sell the collateral (although it may be prevented or delayed from doing so in certain circumstances) and may be required to claim any resulting loss against the seller. Park Avenue monitors the creditworthiness of the seller with which the Fund enters into repurchase agreements.
6. Temporary Borrowings
The Fund, with other funds managed by Park Avenue, is party to a $10 million committed revolving credit facility from State Street Bank and Trust Company for temporary borrowing purposes, including the meeting of redemption requests that otherwise might require the untimely disposition of securities. Interest is calculated based on the higher of the dailyone-month LIBOR rate and the Federal Funds rate plus 1.25% at the time of borrowing. In addition to the interest charged on any borrowings by the Fund, each fund pays a commitment fee of 0.30% per annum on its share of the unused portion of the credit facility. The agreement is in place until December 10, 2019. The Fund did not utilize the credit facility during the year ended December 31, 2018.
7. Indemnifications
Under the Trust’s organizational documents and, in some cases, by contract, its officers and trustees are
indemnified against certain liabilities arising out of the performance of their duties to the Fund. In addition, in the normal course of business, the Fund enters into contracts with its vendors and others that provide general indemnifications. The Fund’s maximum exposure under these arrangements is unknown as this would involve future claims that may be made against the Fund that have not yet occurred. However, based on experience, the Fund expects the risk of loss to be remote.
8. Recent Accounting Pronouncement
On August 17, 2018, the U.S. Securities and Exchange Commission (“SEC”) voted to adopt amendments to certain disclosure requirements that have become redundant, duplicative, overlapping, outdated, or superseded, in light of other SEC disclosure requirements, GAAP, or changes in the information environment. The SEC will also be referring certain SEC disclosure requirements that overlap with, but require information incremental to, GAAP to the FASB for potential incorporation into GAAP. The amendments are intended to facilitate the disclosure of information to investors and simplify compliance without significantly altering the total mix of information provided to investors. As such, the financial statements herein have been updated to conform with these new requirements, which had no effect on the Fund’s net assets or results of operations.
| 16 |
Table of Contents
REPORT OF INDEPENDENT REGISTERED PUBLIC ACCOUNTING FIRM
TotheBoard of Trustees ofGuardian Variable Products TrustandShareholders of
Guardian Growth & Income VIP Fund
Opinion on the Financial Statements
We have audited the accompanying statement of assets and liabilities, including the schedule of investments, ofGuardian Growth & Income VIP Fund (one of the funds constituting Guardian Variable Products Trust, referred to hereafter as the “Fund”) as of December 31, 2018, the related statement of operations for the year ended December 31, 2018, the statement of changes in net assets for each of the two years in the period ended December 31, 2018, including the related notes,and the financial highlights for each of the periods indicated therein (collectively referred to as the “financial statements”). In our opinion, the financial statements present fairly, in all material respects, the financial position of the Fund as of December 31, 2018, the results of its operations for the year then ended, the changes in its net assets for each of the two years in the period ended December 31, 2018 and the financial highlights for each of the periods indicated therein in conformity with accounting principles generally accepted in the United States of America.
Basis for Opinion
These financial statements are the responsibility of the Fund’s management. Our responsibility is to express an opinion on the Fund’s financial statements based on our audits. We are a public accounting firm registered with the Public Company Accounting Oversight Board (United States) (PCAOB) and are required to be independent with respect to the Fund in accordance with the U.S. federal securities laws and the applicable rules and regulations of the Securities and Exchange Commission and the PCAOB.
We conducted our audits of these financial statements in accordance with the standards of the PCAOB. Those standards require that we plan and perform the audit to obtain reasonable assurance about whether the financial statements are free of material misstatement, whether due to error or fraud.
Our audits included performing procedures to assess the risks of material misstatement of the financial statements, whether due to error or fraud, and performing procedures that respond to those risks. Such procedures included examining, on a test basis, evidence regarding the amounts and disclosures in the financial statements. Our audits also included evaluating the accounting principles used and significant estimates made by management, as well as evaluating the overall presentation of the financial statements. Our procedures included confirmation of securities owned as of December 31, 2018 by correspondence with the custodian and brokers; when replies were not received from brokers, we performed other auditing procedures. We believe that our audits provide a reasonable basis for our opinion.
New York, New York
February 19, 2019
We have served as the auditor of one or more investment companies in Guardian Variable Products Trustsince 2016.
| 17 |
Table of Contents
SUPPLEMENTAL INFORMATION(UNAUDITED)
Approval of Investment Advisory andSub-advisory Agreements
Section 15(c) of the Investment Company Act of 1940, as amended (the “1940 Act”), requires that a fund’s board of trustees annually review and consider the continuation of the fund’s investment advisory andsub-advisory agreements. The continuation of any such agreement must be approved by a vote of a majority of the trustees who are not parties to the agreement or “interested persons” (as defined in the 1940 Act) of a party to the agreement at anin-person meeting of the board called for the purpose of voting on such approval.
At a meeting of the Board of Trustees (the “Board”) of Guardian Variable Products Trust (the “Trust”) held on March27-28, 2018, the Board considered and unanimously voted to approve the continuation of the investment management agreement (the “Management Agreement”) between Park Avenue Institutional Advisers LLC (the “Manager”) and the Trust, on behalf of the following 11 series, Guardian Core Plus Fixed Income VIP Fund, Guardian Diversified Research VIP Fund, Guardian Growth & Income VIP Fund, Guardian Integrated Research VIP Fund, Guardian International Growth VIP Fund, Guardian International Value VIP Fund, Guardian Large Cap Disciplined Growth VIP Fund, Guardian Large Cap Disciplined Value VIP Fund, Guardian Large Cap Fundamental Growth VIP Fund, Guardian Mid Cap Relative Value VIP Fund and Guardian Mid Cap Traditional Growth VIP Fund (the “Funds”). The Board also considered and unanimously voted to approve the continuation of thesub-advisory agreements (the“Sub-advisory Agreements,” collectively with the Management Agreement, the “Agreements”) between the Manager and the following investment advisory firms serving assub-advisers to the Funds, ClearBridge Investments LLC, Wellington Management Company LLP, Massachusetts Financial Services Company, Putnam Investment Management, LLC, Boston Partners Global Investors, Inc., AllianceBernstein L.P., Janus Capital Management LLC, Wells Capital Management Incorporated, J.P. Morgan Investment Management Inc., Lazard Asset Management LLC, and Lord, Abbett & Co. LLC (the“Sub-advisers”). The continuation of the Agreements for aone-year period was unanimously approved by the Trustees who are not parties to the Agreements or “interested persons” (as defined in the 1940 Act) of a party to the Agreements (the “Independent Trustees”).
The Board is responsible for overseeing the management of each Fund. In determining whether to approve the continuation of the Agreements, the
Trustees evaluated information and factors that they considered to be relevant and appropriate through the exercise of their own business judgment. The Trustees considered certain information and factors in light of advice furnished to them by legal counsel to the Trust and, in the case of the Independent Trustees, their independent legal counsel.
In advance of the meeting held on March27-28, 2018, the Trustees received materials and information designed to assist their consideration of the Agreements, including written responses from the Manager and eachSub-adviser to a series of questions and requests for information covering a wide variety of topics provided by independent legal counsel on behalf of the Independent Trustees. Broadridge Financial Solutions, Inc. (“Broadridge”), an independent provider of investment company data, was retained to provide the Trustees with reports on how each Fund’s contractual management fees, actual management fees, overall expense ratios and investment performance compared to those of “peer funds” selected by Broadridge that are offered as investment options underlying variable contracts. The Trustees also received materials and information regarding the legal standards applicable to their consideration of the Agreements and the process and criteria used by the Manager to oversee theSub-advisers. During the course of their deliberations, the Independent Trustees met to discuss and evaluate the Agreements in executive session with their independent legal counsel, outside of the presence of the Trustees who are not Independent Trustees and representatives from Fund management, the Manager or anySub-adviser.
In reaching its decisions to approve the continuation of the Agreements, the Board took into account the materials and information described above as well as other materials and information provided to the Board and discussed with and among the Trustees, including information regarding the Funds furnished to the Board by the Manager throughout the year. Individual Trustees may have given different weight to different factors and information with respect to each Agreement, and the Trustees did not identify any single factor or information that, in isolation, would be controlling in deciding to approve the continuation of the Agreements.
The discussion below is intended to summarize the broad factors that figured prominently in the Board’s decisions to approve the continuation of the Agreements rather than to beall-inclusive. These broad factors included: (i) the nature, extent and quality of the services provided to the Funds by the Manager and the
| 18 |
Table of Contents
SUPPLEMENTAL INFORMATION(UNAUDITED)
Sub-advisers; (ii) the investment performance of the Funds; (iii) the fees charged and estimated profitability; (iv) the extent to which economies of scale may exist for a Fund, and the extent to which a Fund may benefit from economies of scale; and (v) any other benefits derived by the Manager or theSub-advisers (or their respective affiliates) from their relationships with the Funds. In addition to considering the above-referenced factors, the Board observed that there are a range of investment options available to variable contract owners who may invest in the Funds, and that these contract owners, having had the opportunity to consider other investment options, may choose to invest or remain invested in the Funds.
Nature, Extent and Quality of Services
The Trustees considered information regarding the nature, extent and quality of services provided to the Funds by the Manager. The Trustees also considered the range of investment advisory services andnon-investment advisory services provided by the Manager, notably coordinating the preparation and filing of various regulatory documents, coordinating the preparation and assembly of Board meeting materials and assisting the Board with certain valuation matters.
The Trustees considered the operation of the Funds in a“manager-of-managers” structure and the responsibilities that the Manager has under this structure, including monitoring and evaluating the performance of theSub-advisers, monitoring theSub-advisers for adherence to the stated investment objectives, strategies, policies and restrictions of the Funds and supervising theSub-advisers with respect to the services that theSub-advisers provide under the Sub-advisory Agreements. The Trustees also considered the process used by the Manager, consistent with this structure, to identify and recommendsub-advisers, and its ability to monitor and overseesub-advisers and recommend replacementsub-advisers, when necessary, and provide other services under the Management Agreement. The Trustees reviewed information regarding the experience and background of the Manager’s key personnel and the Manager’s organizational structure and resources, including investment, legal and administrative capabilities of the Manager. In this regard, the Trustees recognized that the Funds benefit from the Manager’s use of similar resources and capabilities of its affiliates in providing services to the Funds.
The Trustees considered information regarding the nature, extent and quality of services provided to the
Funds by theSub-advisers. The Trustees also considered, among other things, the range of investment advisory services provided by theSub-advisers under the oversight of the Manager. In evaluating these investment advisory services, the Trustees considered, among other things, theSub-advisers’ investment philosophies, styles and/or processes and approach to managing risk. The Trustees received and evaluated information regarding the background, education, expertise and/or experience of the investment professionals that serve as portfolio managers for the Funds and the capabilities, resources and reputations of theSub-advisers.
Based upon these considerations, the Board concluded that it was satisfied with the nature, extent and quality of services provided to the Funds by the Manager and eachSub-adviser.
Investment Performance
The Board considered the investment performance of each Fund. Among other reports, the Board reviewed the performance of the Funds for theone-year and since inception periods compared to a universe of peer funds selected by Broadridge. The Board noted that the Funds had performance records of less than two years and that the Board had reviewed longer performance records of the funds or accounts managed by theSub-advisers with similar strategies as the applicable Fund, when available, when the Board initially approved the Agreements in 2016. The Broadridge report placed the Funds in the following quintiles of the relevant peer universe for theone-year and since inception periods, respectively: Guardian Core Plus Fixed Income VIP Fund (3rd, 3rd), Guardian Diversified Research VIP Fund (2nd, 2nd), Guardian Growth & Income VIP Fund (1st, 1st), Guardian Integrated Research VIP Fund (4th, 5th), Guardian International Growth VIP Fund (3rd, 2nd), Guardian International Value VIP Fund (3rd, 5th), Guardian Large Cap Disciplined Growth VIP Fund (3rd, 4th), Guardian Large Cap Disciplined Value VIP Fund (1st, 1st), Guardian Large Cap Fundamental Growth VIP Fund (5th, 4th), Guardian Mid Cap Relative Value VIP Fund (4th, 3rd) and Guardian Mid Cap Traditional Growth VIP Fund (2nd, 2nd).
The Board considered the investment reports provided by the Manager since commencement of operations of the Funds during quarterly Board meetings. The Board also considered the Manager’s analysis ofSub-adviser performance and the steps taken by the Manager and theSub-advisers to seek to improve performance and the results of those steps.
| 19 |
Table of Contents
SUPPLEMENTAL INFORMATION(UNAUDITED)
In light of the considerations noted above, the Board concluded that it had continued confidence in the Manager’s and theSub-advisers’ overall capabilities to manage the Funds.
Costs and Profitability
The Trustees considered the management fees paid by the Funds to the Manager under the Management Agreement and evaluated the reasonableness of these fees. The Trustees received and reviewed information with respect to the management fees, including the portion of the management fees paid to eachSub-adviser, and the management fees paid by other funds offered as investment options underlying variable contracts within the applicable peer group selected by Broadridge. The Broadridge report placed the Funds in the following quintiles of the relevant expense peer group for the contractual management fees and actual management fees, respectively: Guardian Core Plus Fixed Income VIP Fund (1st, 3rd), Guardian Diversified Research VIP Fund (2nd, 3rd), Guardian Growth & Income VIP Fund (1st, 1st), Guardian Integrated Research VIP Fund (1st, 2nd), Guardian International Growth VIP Fund (1st, 2nd), Guardian International Value VIP Fund (3rd, 2nd), Guardian Large Cap Disciplined Growth VIP Fund (1st, 1st), Guardian Large Cap Disciplined Value VIP Fund (1st, 1st), Guardian Large Cap Fundamental Growth VIP Fund (1st, 1st), Guardian Mid Cap Relative Value VIP Fund (1st, 1st) and Guardian Mid Cap Traditional Growth VIP Fund (3rd, 4th).
The Trustees considered thesub-advisory fees paid under the Sub-advisory Agreements and evaluated the reasonableness of those fees. The Trustees also considered that the fees paid to theSub-advisers are paid by the Manager and not the Funds and that the Manager had negotiated the fees with theSub-advisers atarm’s-length. In addition, the Trustees considered the portion of the management fees paid to eachSub-adviser as compared to the portion retained by the Manager.
The Trustees received and reviewed information in the Broadridge report comparing each Fund’s operating expense ratio to the actual operating expense ratios of a peer group of funds selected by Broadridge. The Trustees considered the Manager’s commitment to limit each Fund’s operating expenses through an expense limitation agreement with the Trust. The Broadridge report placed the Funds in the following quintiles of the relevant expense peer group for the operating expense ratio: Guardian Core Plus Fixed Income VIP Fund (2nd), Guardian Diversified Research
VIP Fund (2nd), Guardian Growth & Income VIP Fund (2nd), Guardian Integrated Research VIP Fund (1st), Guardian International Growth VIP Fund (3rd), Guardian International Value VIP Fund (1st), Guardian Large Cap Disciplined Growth VIP Fund (1st), Guardian Large Cap Disciplined Value VIP Fund (2nd), Guardian Large Cap Fundamental Growth VIP Fund (1st), Guardian Mid Cap Relative Value VIP Fund (1st) and Guardian Mid Cap Traditional Growth VIP Fund (3rd).
Although the Board recognized that the comparisons between the management fees and anticipated operating expenses of the Funds and those of identified peer funds are imprecise, given different terms of agreements and variations in fund strategies, the Trustees found that the comparative information supported their consideration and approval of the management fees and evaluation of operating expenses.
The Trustees reviewed information regarding the Manager’s costs of sponsoring the Funds and estimated profitability of the Funds to the Manager. The Trustees noted that the information contained estimates, such as allocations of expenses. Although the Trustees did not receive specific cost and profitability information from certainSub-advisers, the Trustees primarily considered the cost and profitability information relating to the Manager because the Manager is responsible for payment of thesub-advisory fees and negotiated the fees with theSub-advisers atarm’s-length.
Based on the consideration of the information and factors summarized above, as well as other information and factors deemed relevant by the Trustees, the Trustees concluded that the management andsub-advisory fees were reasonable in light of the nature, extent and quality of services rendered to the Funds by the Manager and theSub-advisers. The Trustees also concluded that the estimated profitability of the Funds to the Manager was acceptable.
Economies of Scale
The Trustees considered the extent to which economies of scale may be shared as assets grow based on current asset levels of the Funds, anticipated asset levels over the next year, the current management andsub-advisory fee rates, the expense limitation arrangements, and any management andsub-advisory fee breakpoints, which reduce fee rates as assets increase. Based on those factors, the Board concluded that it was satisfied with the extent to which any economies of scale would be shared for the benefit of
| 20 |
Table of Contents
SUPPLEMENTAL INFORMATION(UNAUDITED)
Fund shareholders. The Board noted that it would continue to monitor future growth in each Fund’s assets and whether additional steps are required to share appropriately any economies of scale with Fund shareholders.
Ancillary Benefits
The Trustees considered the benefits, other than management fees, that the Manager and/or its affiliates receive because of the Manager’s relationship with the Funds. The Trustees acknowledged that the Funds serve as investment options under variable contracts issued by an affiliate of the Manager that receives fees under those contracts and that Park Avenue Securities LLC, an affiliate of the Manager and principal underwriter of the Funds, and an insurance company affiliated with the Manager receive fees from the Funds under a plan of distribution adopted pursuant to Rule12b-1 under the 1940 Act. The Trustees considered that the Manager and its affiliates may benefit from (i) greater efficiencies in annuity administration and operations and potential cost savings due to a reduction in the number of unaffiliated funds available as annuity contract
investment options, and (ii) increased dividends-received deductions due to the Funds’ status under the tax laws as disregarded entities. In addition, the Trustees considered the potential benefits, other thansub-advisory fees, that theSub-advisers and their affiliates receive because of their relationships with the Funds, including the potential increased ability to use soft dollars consistent with Trust policies and other benefits from increases in assets under management. The Trustees concluded that benefits that accrue to the Manager and its affiliates are reasonable and the benefits that accrue to theSub-advisers and their affiliates are consistent with those expected for asub-adviser to a mutual fund such as the applicable Fund.
Conclusion
Based on a comprehensive consideration and evaluation of all of the information and factors summarized above, among others, the Board voting as a whole, including the Independent Trustees voting separately, unanimously approved the continuation of the Agreements.
| 21 |
Table of Contents
SUPPLEMENTAL INFORMATION(UNAUDITED)
Trustees and Officers Information Table
The following table provides information about the Trustees of the Trust.
| Name and Year of Birth | Term of Office, Position(s) Held and Length of Service* | Principal Occupation(s) During Past Five Years | Number of Funds in Fund Complex Overseen by Trustees*** | Other Directorships Held by Trustee | ||||
| Independent Trustees | ||||||||
| Bruce W. Ferris† (born 1955) | Trustee | Retired (since 2015); President and CEO, Prudential Annuity Distributors (2013– 2015); Director/Trustee, Advanced Series Trust, Prudential Series Fund and Prudential’s Gibraltar Fund, Inc. (2013– 2015); Senior Vice President, Prudential Annuities (2008–2015). | 16 | None. | ||||
| Theda R. Haber† (born 1954) | Trustee | Adjunct Assistant Professor of Law, UC Hastings College of Law (since 2013); Member of the Board of Directors, Fairholme Trust Company, LLC (since 2015); Attorney, Law Office of Theda R. Haber (since 2014); Visiting Professor of Law, UC Davis School of Law (since 2014); Consultant, Haber & Associates LLC (financial services industry) (since 2012); Advisory Council Chair, Vice Chair, and Member, Advisory Council on Employee Welfare and Pension Benefit Plans (ERISA Advisory Council), U.S. Department of Labor (2009–2011); Managing Director and General Counsel, BlackRock Institutional Trust Company, N.A. (2009–2011); Deputy Global General Counsel, Barclays Global Investors (2006–2009); Managing Director, Barclays Global Investors (1998–2006). | 16 | None. | ||||
| Marshall Lux† (born 1960) | Trustee | Senior Advisor, The Boston Consulting Group (since 2014); Senior Partner and Managing Director, The Boston Consulting Group (2009–2014). | 16 | None. | ||||
| Lisa K. Polsky† (born 1956) | Trustee | Senior Risk Advisor, AQR (investment management) (since 2016); Senior Risk Advisor, Ultra Capital (venture capital) (since 2016); Board Member and Chair of Risk Committee, DeutscheBank IHC (financial services) (since May 2016); Chief Risk Officer, CIT Group Inc. (financial services) (2010–2015); Board Member and Chair of Audit Committee, Piper Jaffray (investment bank) (2007–2016). | 16 | None. | ||||
| John Walters† (born 1962) | Lead Independent Trustee | Board Member, Amerilife Holdings LLC (insurance distribution) (since 2015); Board Member, Stadion Money Management LLC (investment adviser) (since 2011); President and Chief Operating Officer, Hartford Life Insurance Company (2000–2010). | 16 | None. | ||||
| 22 |
Table of Contents
SUPPLEMENTAL INFORMATION(UNAUDITED)
| Name and Year of Birth | Term of Office, Position(s) Held and Length of Service* | Principal During Past Five Years | Number of in Fund by Trustees*** | Other Directorships Held by Trustee | ||||
| Interested Trustees | ||||||||
| Gordon Dinsmore** (born 1952) | Trustee | Senior Vice President, Head of Product and President of Berkshire, The Guardian Life Insurance Company of America. | 16 | None. | ||||
| Marc Costantini** (born 1969) | Chairman and Trustee | Executive Vice President, Group and Worksite Markets, The Guardian Life Insurance Company of America (since 2017); Executive Vice President and Chief Financial Officer, The Guardian Life Insurance Company of America (2014– 2017); Executive Vice President, Manulife Financial prior thereto (various positions from 1990–2014). | 16 | None. | ||||
| * | Each Trustee except for Mr. Dinsmore began service in such capacity in 2016 and serves until his or her successor is elected and qualified or until his or her resignation, death or removal. Mr. Dinsmore has served as a Trustee since November 2017. The business address of each Trustee is 7 Hanover Square, New York, New York 10004. |
| ** | Each of Gordon Dinsmore and Marc Costantini is considered to be an “interested person” of the Trust within the meaning of the 1940 Act because of their affiliation with The Guardian Life Insurance Company of America and/or its affiliates. |
| *** | As of the date of this report, the Trust currently consists of 16 separate Funds. |
| † | Member of the Audit Committee of the Trust. |
The following table provides information about the Officers of the Trust.
| Name and Year of Birth | Position(s) Held and Length of Service* | Principal Occupation(s) During Past Five Years | ||
| Gordon Dinsmore (born 1952) | President and Principal Executive Officer (Since November 2017) | Senior Vice President, Head of Product and President of Berkshire, The Guardian Life Insurance Company of America. | ||
| John H. Walter (born 1962) | Senior Vice President, Treasurer, and Principal Financial and Accounting Officer | Vice President, Chief Financial Officer, Equity Profit Center, The Guardian Life Insurance Company of America. | ||
| Harris Oliner (born 1971) | Senior Vice President and Secretary | Senior Vice President, Corporate Secretary, The Guardian Life Insurance Company of America (since 2015); Senior Vice President, Deputy General Counsel, Corporate Secretary, Voya Financial, Inc. (2013–2014); Managing Director, Senior Counsel, Corporate Secretary, BlackRock, Inc. prior thereto. | ||
| Richard T. Potter (born 1954) | Senior Vice President and Chief Legal Officer | Vice President and Equity Counsel, The Guardian Life Insurance Company of America. | ||
| Philip Stack (born 1964) | Chief Compliance Officer (Since September 2017) | Executive Director, Chief Compliance Officer, Morgan Stanley (2015–2017); Vice President, Morgan Stanley (2013–2015); Vice President, Corporate Audit Group–Compliance, Morgan Stanley prior thereto. | ||
| James R. Anderson (born 1963) | Anti-Money Laundering Officer (Since November 2017) | Second Vice President, Agency and Anti-Money Laundering Compliance, The Guardian Life Insurance Company of America. | ||
| Kathleen M. Moynihan (born 1966) | Senior Counsel | Senior Counsel, The Guardian Life Insurance Company of America. | ||
| 23 |
Table of Contents
SUPPLEMENTAL INFORMATION(UNAUDITED)
| Name and Year of Birth | Position(s) Held and Length of Service* | Principal Occupation(s) During Past Five Years | ||
| Maria Nydia Morrison (born 1958) | Fund Controller | Mutual Fund Controller, The Guardian Life Insurance Company of America (since 2015); Chief Financial Officer/Assistant Operating Officer, St. Francis De Assisi Montessori School (Plaridel, Bulacan), Inc. (Philippines) (2013–2015); Vice President, Bank of New York Mellon prior thereto. | ||
| Sonya L. Crosswell (born 1977) | Assistant Secretary | Assistant Vice President, Assistant Corporate Secretary and Secretary Pro Tem, The Guardian Life Insurance Company of America (since 2014); Vice President, Secretary and Assistant General Counsel, Carver Federal Savings Bank prior thereto. | ||
| * | Unless otherwise indicated, the Officers each began service in such capacity in 2016 and hold office for an indefinite term or until their successors shall have been elected and qualified. The business address of each Officer is 7 Hanover Square, New York, New York 10004. |
| 24 |
Table of Contents
SUPPLEMENTAL INFORMATION(UNAUDITED)
The Statement of Additional Information (“SAI”) includes additional information about the Trust’s Trustees and Officers and is available, without charge, upon request by calling toll-free1-888-GUARDIAN(1-888-482-7342) or by visiting our website at http://guardianvpt.onlineprospectus.net/GuardianVPT/Prospectuses.
Portfolio Holdings and Proxy Voting Procedures
The Fund files its complete schedule of portfolio holdings with the Securities and Exchange Commission for the first and third quarters of each fiscal year as an exhibit to its reports on Form N-Q or FormN-PORT (for filings beginning in April 2019 relating to March 31, 2019 data). The Fund’s Form N-Q or FormN-PORT reports are available on the Securities and Exchange Commission’s website at https://www.sec.gov. The Fund’s Form N-Q or FormN-PORT information is also available, without charge, upon request, by calling toll-free1-888-GUARDIAN(1-888-482-7342) or by visiting our website at http://guardianvpt.onlineprospectus.net/GuardianVPT/
Prospectuses.
Beginning in April 2019, the Fund will cease to disclose its holdings on Form N-Q and will file Form N-PORT with the Securities and Exchange Commission on a monthly
basis, with the information contained on Form N-PORT for the last month of the Fund’s fiscal quarter being made public by the Securities and Exchange Commission 60 days after the end of the Fund’s fiscal quarter.
A description of the policies and procedures that the Fund uses to determine how to vote proxies relating to portfolio securities is included in the SAI. The SAI and information regarding how the Fund voted proxies relating to portfolio securities during the most recent12-month period ended June 30 may be obtained (i) without charge, upon request, by calling toll-free1-888-GUARDIAN(1-888-482-7342) or by visiting our website at http://guardianvpt.onlineprospectus.net/GuardianVPT/
Prospectuses; and (ii) on the Securities and Exchange Commission’s website at https://www.sec.gov.
| 25 |
Table of Contents
This report is transmitted to shareholders only. It is not authorized for use as an offer of sale or a solicitation of an offer to buy shares of the Fund unless accompanied or preceded by the Fund’s current prospectus. Past performance results shown in this report should not be considered a representation of future performance. Investment returns and principal value of shares will fluctuate so that shares, when redeemed, may be worth more or less than their original cost. Statements and other information herein are as dated and are subject to change.

The Guardian Life Insurance Company of America New York, NY 10004-4025
PUB8169
Table of Contents
Guardian Variable
Products Trust
2018
Annual Report
All Data as of December 31, 2018
Guardian Mid Cap Traditional Growth VIP Fund
Important Notice
Beginning on January 1, 2021, as permitted by regulations adopted by the Securities and Exchange Commission, paper copies of the Fund’s shareholder reports will no longer be sent by mail from The Guardian Insurance & Annuity Company, Inc. (“GIAC”). Instead, GIAC will mail you a notice when copies of the shareholder reports are made available on a website. You will be notified by mail each time a report is posted and provided with a website link to access the report.
If you have already elected to receive shareholder reports electronically, you will not be affected by this change and you need not take any action. If you have not yet elected electronic delivery, at any time, you may elect to receive the Fund’s shareholder reports and certain other communications from GIAC electronically, by going to www.guardianlife.com and registering fore-delivery.
You may instead elect to receive all future shareholder reports in paper free of charge. If you wish to receive paper copies of your shareholder reports, please call GIAC’s Customer Service Office Contact Center at1-888-GUARDIAN(1-888-482-7342). Your election to receive reports in paper will apply to all the underlying funds available.

| Not FDIC insured. May lose value. No bank guarantee. | www.guardianlife.com |
Table of Contents
Guardian Mid Cap Traditional Growth VIP Fund
Except as otherwise specifically stated, all information, including portfolio security positions, is as of December 31, 2018. The views expressed in the Fund Commentary are those of the Fund’s portfolio manager(s) as of the date of this report and are subject to change without notice. They do not necessarily represent the views of Park Avenue Institutional Advisers LLC or asub-adviser. The Fund Commentary may contain some forward-looking statements providing expectations or forecasts of future events as of the date of this report; they do not necessarily relate to historical or current facts. There can be no guarantee that any forward-looking statement will be realized. We undertake no obligation to update forward-looking statements, whether as a result of new information, future events, or otherwise. Any discussions of specific securities should not be considered a recommendation to buy or sell those securities. Fund holdings will vary. Information contained herein has been obtained from sources believed reliable, but is not guaranteed.
Table of Contents
GUARDIAN MID CAP TRADITIONAL GROWTH VIP FUND
FUND COMMENTARY OF JANUS CAPITAL MANAGEMENT LLC,SUB-ADVISER
Highlights
| • | Guardian Mid Cap Traditional Growth VIP Fund (the “Fund”) returned-3.54%, outperforming its benchmark, the Russell Midcap® Growth Index1 (the “Index”), for the 12 months ended December 31, 2018. Stock selection in the financials and health care sectors contributed to relative performance, as did the Fund’s underweight to the materials sector. |
| • | The Index returned-4.75% for the year. The materials and energy sectors were the worst-performing sectors in the Index. |
Market Overview
Mid-cap stocks were volatile and broadly lost ground during the 12 months ended December 31, 2018. While corporate earnings growth was solid, rising U.S. interest rates and global trade tensions all weighed on stocks for much of the period. In the fourth quarter, markets fell sharply as trade tensions between the U.S. and China escalated and data suggested weaker international economic growth.
Portfolio Review
The Fund outperformed the Index during the period. Stock selection in the financials and health care sectors contributed to relative performance, as did the Fund’s underweight to the materials sector. Stock selection in the industrials sector was another contributor to relative results. The Fund’s underweight to the consumer staples sector detracted from relative
performance. Stock selection in the technology sector was another detractor from relative performance.
Outlook
We believe many of the issues that roiled markets toward the end of the year — trade conflict, Brexit negotiations, uncertainty about global growth and monetary tightening — are likely to persist. As a result, we expect more volatility in the coming months. In the fourth quarter, consumer staples stocks broadly outperformed the rest of the market. As of December 31, 2018, the Fund was underweight the consumer staples sector, compared to the Index. We believe these stocks trade at high valuations relative to the market and that other trends, such as changing consumer preferences, have created further headwinds for consumer staples companies.
In recent months we have increased the Fund’s exposure to financial technology and information services companies. Another area where we see opportunity is in medical device companies. A convergence of factors, including innovation, a rising global middle class that demands better health care, and a rising aging population, all underpin strong demand, in our view. Similar to information services companies, the potentially critical impact of medical devices on patient survival removes cyclicality from their revenue streams. Both information services and medical device stocks generally trade at a slight premium to consumer staples companies, but in our view, they have similar defensive characteristics, stronger competitive advantages and greater potential for growth.
Funds in the Guardian Variable Products Trust are sold by prospectus only. You should carefully consider the investment objectives, risks, charges and expenses of the Funds before making an investment decision. The prospectus contains this and other important information. Please read it carefully before investing or sending money. Please visit our website at http://guardianvpt.onlineprospectus.net/GuardianVPT/Prospectuses or to obtain a printed copy, call 1-888-GUARDIAN(1-888-482-7342).
As with all mutual funds, the value of an investment in the Fund could decline, and you could lose money. Diversification does not guarantee profit or protect against loss, and there can be no assurance that the Fund will achieve its investment objective. The Fund invests primarily in equity securities and therefore exposes you to the general risks of investing in stock markets. Investing in mid-size companies involves risks such as having less publicly available information, higher volatility, and less liquidity than in the case of larger companies. Investments in growth companies may be highly volatile. Growth stocks may not realize their perceived growth potential and during certain periods the Fund may underperform other equity funds that employ a different style. International investing involves special risks, which include changes in currency rates, foreign taxation and differences in auditing standards and securities regulations, political uncertainty and greater volatility. Foreign securities are subject to political, regulatory, economic, and exchange-rate risks not present in domestic investments. Investing in a more limited number of issuers and sectors can be subject to greater market fluctuation. Any discussions of specific securities should not be considered a recommendation to buy or sell those securities. Fund holdings will vary.
| 1 | The Russell Midcap® Growth Index (the “Index”) is an unmanaged market-capitalization-weighted index that measures the performance of those companies in the Russell Midcap® Index with higher price-to-book ratios and higher forecasted growth values. (The Russell Midcap® Index measures the performance of the 800 smallest companies in the Russell 1000® Index, which consists of the 1,000 largest U.S. companies based on total market capitalization.) Index results assume the reinvestment of dividends paid on the stocks constituting the Index. You may not invest in the Index, and, unlike the Fund, the Index does not incur fees or expenses. |
| 1 |
Table of Contents
GUARDIAN MID CAP TRADITIONAL GROWTH VIP FUND
Fund Characteristics (unaudited)
| Total Net Assets: $110,065,187 |
Sector Allocation1 As of December 31, 2018 |
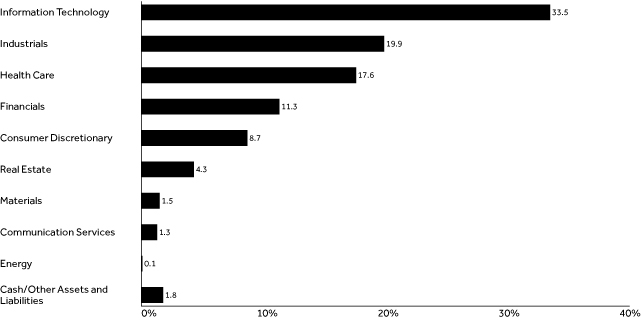 |
Top Ten Holdings2 As of December 31, 2018 | ||||
| Holding | % of Total Net Assets | |||
| Sensata Technologies Holding PLC | 2.78% | |||
| TD Ameritrade Holding Corp. | 2.75% | |||
| Boston Scientific Corp. | 2.44% | |||
| Lamar Advertising Co., Class A REIT | 2.24% | |||
| TE Connectivity Ltd. | 2.22% | |||
| WEX, Inc. | 2.20% | |||
| Constellation Software, Inc. (Canada) | 2.16% | |||
| PerkinElmer, Inc. | 2.15% | |||
| SS&C Technologies Holdings, Inc. | 2.10% | |||
| Crown Castle International Corp. REIT | 2.09% | |||
| Total | 23.13% | |||
| 1 | The Fund’s holdings are allocated to each sector based on the MSCI Global Industry Classification Standard (GICS®). Cash includes short-term investments and net other assets and liabilities. |
| 2 | Portfolio holdings are subject to change and should not be considered a recommendation to buy or sell individual securities. |
| 2 |
Table of Contents
GUARDIAN MID CAP TRADITIONAL GROWTH VIP FUND
| Average Annual Total Returns As of December 31, 2018 | ||||||||||||||||||||
| Inception Date | 1 Year | 5 Year | 10 Year | Since Inception | ||||||||||||||||
| Guardian Mid Cap Traditional Growth VIP Fund | 9/1/2016 | -3.54% | — | — | 9.16% | |||||||||||||||
| Russell Midcap® Growth Index | -4.75% | — | — | 7.95% | ||||||||||||||||
Results of a Hypothetical $10,000 Investment As of December 31, 2018 |
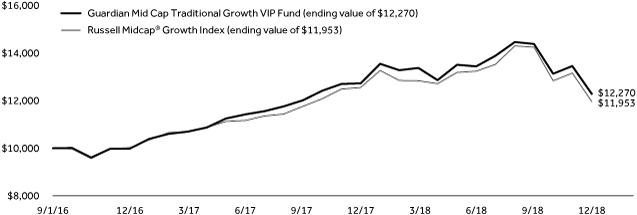 |
The chart above shows the performance of a hypothetical $10,000 investment made on inception date in Guardian Mid Cap Traditional Growth VIP Fund and the Russell Midcap® Growth Index. Index returns do not include the fees and expenses of the Fund, but do include reinvestment of dividends, if any.
Performance quoted represents past performance and does not guarantee or predict future results. Investment return and principal value will fluctuate, so shares, when redeemed, may be worth more or less than their original cost. The Fund’s fees and expenses are detailed in the Financial Highlights section of this report. Fees and expenses are factored into the net asset value of Fund shares and any performance numbers we release. Total return figures include the effect of expense limitations in effect during the periods shown, if applicable; without such limitations, the performance shown would have been lower. Performance results assume the reinvestment of dividends and capital gains. The return figures shown do not reflect the deduction of taxes that a contract owner/policyholder may pay on redemption units. The actual total returns for owners of variable annuity contracts or variable life insurance policies that provide for investment in the Fund will be lower to reflect separate account and contract/policy charges. Current andmonth-end performance information, which may be lower or higher than that cited, is available by calling1-888-GUARDIAN(1-888-482-7342) and is periodically updated on our website: http://guardianlife.com.
| 3 |
Table of Contents
UNDERSTANDING YOUR FUND’S EXPENSES(UNAUDITED)
By investing in the Fund, you incur two types of costs: (1) transaction costs and (2) ongoing costs, including, as applicable, investment advisory fees, distribution and/or service(12b-1) fees and other Fund expenses. The example below is intended to help you understand your ongoing costs (in dollars) of investing in the Fund and to compare these costs with the ongoing costs of investing in other mutual funds.
The example is based on an investment of $1,000 invested at the beginning of the period and held for the entire period from July 1, 2018 to December 31, 2018. The table below shows the Fund’s expenses in two ways:
Expenses based on actual return
This section of the table provides information about actual account values and actual expenses. You may use the information in this section, together with the amount you invested, to estimate the expenses that you paid over the period. Simply divide your account value by $1,000 (for example, an $8,600 account value divided by $1,000 = 8.6), then multiply the result by the number in the section under the heading entitled “Expenses Paid During Period” to estimate the expenses you paid on your account during this period.
Expenses based on hypothetical 5% return for comparison purposes
This section of the table provides information about hypothetical account values and hypothetical expenses based on the Fund’s actual expense ratio and an assumed rate of return of 5% per year before expenses, which is not the Fund’s actual return. The hypothetical account values and expenses may not be used to estimate the actual ending account balance or expenses you paid for the period. You may use this information to compare the ongoing costs of investing in the Fund with the cost of investing in other mutual funds. To do so, compare this 5% hypothetical example with the 5% hypothetical examples that appear in the shareholder reports of the other funds.
Note that the expenses shown in the table are meant to highlight your ongoing costs only and do not reflect any transactional costs, such as sales charges (loads), redemption fees, or exchange fees. Therefore the second section is useful in comparing ongoing costs only, and will not help you determine the relative total costs of owning different funds. If these transactional costs were included, your costs would have been higher. Charges and expenses at the insurance company separate account level are not reflected in the table.
Beginning 7/1/18 | Ending Account Value | Expenses Paid During Period* 7/1/18-12/31/18 | Expense Ratio During Period 7/1/18-12/31/18 | |||||||||||
| Based on Actual Return | $ 1,000.00 | $ | 913.60 | $ | 5.31 | 1.10% | ||||||||
| Based on Hypothetical Return (5% Return Before Expenses) | $ 1,000.00 | $ | 1,019.66 | $ | 5.60 | 1.10% | ||||||||
| * | Expenses are equal to the Fund’s annualized expense ratio as indicated, multiplied by the average account value over the period, multiplied by 184/365 (to reflect theone-half year period). |
| 4 |
Table of Contents
SCHEDULE OF INVESTMENTS — GUARDIAN MID CAP TRADITIONAL GROWTH VIP FUND
| December 31, 2018 | Shares | Value | ||||||
| Common Stocks – 98.2% |
| |||||||
| Aerospace & Defense – 2.6% |
| |||||||
Harris Corp. | 7,798 | $ | 1,050,001 | |||||
Teledyne Technologies, Inc.(1) | 8,735 | 1,808,756 | ||||||
|
| |||||||
| 2,858,757 | ||||||||
| Airlines – 0.7% |
| |||||||
Ryanair Holdings PLC, ADR(1) | 11,083 | 790,661 | ||||||
|
| |||||||
| 790,661 | ||||||||
| Auto Components – 0.3% |
| |||||||
Visteon Corp.(1) | 6,182 | 372,651 | ||||||
|
| |||||||
| 372,651 | ||||||||
| Banks – 0.6% |
| |||||||
SVB Financial Group(1) | 3,169 | 601,856 | ||||||
|
| |||||||
| 601,856 | ||||||||
| Biotechnology – 2.4% |
| |||||||
ACADIA Pharmaceuticals, Inc.(1) | 18,158 | 293,615 | ||||||
Alkermes PLC(1) | 10,615 | 313,249 | ||||||
Celgene Corp.(1) | 11,546 | 739,983 | ||||||
Neurocrine Biosciences, Inc.(1) | 12,954 | 925,045 | ||||||
Sarepta Therapeutics, Inc.(1) | 3,195 | 348,670 | ||||||
|
| |||||||
| 2,620,562 | ||||||||
| Building Products – 0.9% |
| |||||||
AO Smith Corp. | 21,790 | 930,433 | ||||||
|
| |||||||
| 930,433 | ||||||||
| Capital Markets – 5.5% |
| |||||||
LPL Financial Holdings, Inc. | 35,871 | 2,191,001 | ||||||
MSCI, Inc. | 5,553 | 818,679 | ||||||
TD Ameritrade Holding Corp. | 61,916 | 3,031,407 | ||||||
|
| |||||||
| 6,041,087 | ||||||||
| Commercial Services & Supplies – 3.4% |
| |||||||
Cimpress N.V.(1) | 14,119 | 1,460,187 | ||||||
Edenred (France) | 26,726 | 979,700 | ||||||
Ritchie Bros Auctioneers, Inc. | 40,184 | 1,314,820 | ||||||
|
| |||||||
| 3,754,707 | ||||||||
| Consumer Finance – 0.5% |
| |||||||
Synchrony Financial | 24,553 | 576,013 | ||||||
|
| |||||||
| 576,013 | ||||||||
| Containers & Packaging – 1.5% |
| |||||||
Sealed Air Corp. | 47,802 | 1,665,422 | ||||||
|
| |||||||
| 1,665,422 | ||||||||
| Diversified Consumer Services – 1.4% |
| |||||||
frontdoor, Inc.(1) | 15,793 | 420,252 | ||||||
ServiceMaster Global Holdings, Inc.(1) | 31,587 | 1,160,506 | ||||||
|
| |||||||
| 1,580,758 | ||||||||
| Electrical Equipment – 3.2% |
| |||||||
AMETEK, Inc. | 6,022 | 407,689 | ||||||
Sensata Technologies Holding PLC(1) | 68,294 | 3,062,303 | ||||||
|
| |||||||
| 3,469,992 | ||||||||
| Electronic Equipment, Instruments & Components – 6.2% |
| |||||||
Belden, Inc. | 14,484 | 604,997 | ||||||
| December 31, 2018 | Shares | Value | ||||||
| Electronic Equipment, Instruments & Components(continued) |
| |||||||
Dolby Laboratories, Inc., Class A | 16,642 | $ | 1,029,141 | |||||
Flex Ltd.(1) | 116,082 | 883,384 | ||||||
National Instruments Corp. | 39,661 | 1,799,816 | ||||||
TE Connectivity Ltd. | 32,299 | 2,442,774 | ||||||
|
| |||||||
| 6,760,112 | ||||||||
| Entertainment – 0.5% |
| |||||||
Liberty Media Corp-Liberty Formula One, Class C(1) | 18,010 | 552,907 | ||||||
|
| |||||||
| 552,907 | ||||||||
| Equity Real Estate Investment – 4.3% |
| |||||||
Crown Castle International Corp. REIT | 21,188 | 2,301,652 | ||||||
Lamar Advertising Co., Class A REIT | 35,594 | 2,462,393 | ||||||
|
| |||||||
| 4,764,045 | ||||||||
| Health Care Equipment & Supplies – 7.6% |
| |||||||
Boston Scientific Corp.(1) | 76,002 | 2,685,911 | ||||||
ICU Medical, Inc.(1) | 4,527 | 1,039,535 | ||||||
STERIS PLC | 2,059 | 220,004 | ||||||
Teleflex, Inc. | 4,128 | 1,067,005 | ||||||
The Cooper Cos., Inc. | 8,910 | 2,267,595 | ||||||
Varian Medical Systems, Inc.(1) | 9,004 | 1,020,243 | ||||||
|
| |||||||
| 8,300,293 | ||||||||
| Health Care Technology – 1.3% |
| |||||||
athenahealth, Inc.(1) | 10,800 | 1,424,844 | ||||||
|
| |||||||
| 1,424,844 | ||||||||
| Hotels, Restaurants & Leisure – 3.2% |
| |||||||
Aramark | 29,391 | 851,457 | ||||||
Dunkin’ Brands Group, Inc. | 25,265 | 1,619,992 | ||||||
Norwegian Cruise Line Holdings Ltd.(1) | 24,481 | 1,037,750 | ||||||
|
| |||||||
| 3,509,199 | ||||||||
| Industrial Conglomerates – 1.1% |
| |||||||
Carlisle Cos., Inc. | 11,869 | 1,193,072 | ||||||
|
| |||||||
| 1,193,072 | ||||||||
| Insurance – 4.7% |
| |||||||
Aon PLC | 15,146 | 2,201,623 | ||||||
Intact Financial Corp. (Canada) | 19,390 | 1,408,800 | ||||||
WR Berkley Corp. | 21,534 | 1,591,578 | ||||||
|
| |||||||
| 5,202,001 | ||||||||
| Internet & Direct Marketing Retail – 0.4% |
| |||||||
Wayfair, Inc., Class A(1) | 4,825 | 434,636 | ||||||
|
| |||||||
| 434,636 | ||||||||
| IT Services – 10.5% |
| |||||||
Amdocs Ltd. | 30,960 | 1,813,637 | ||||||
Broadridge Financial Solutions, Inc. | 10,181 | 979,921 | ||||||
Euronet Worldwide, Inc.(1) | 4,919 | 503,607 | ||||||
Fidelity National Information Services, Inc. | 16,246 | 1,666,027 | ||||||
Gartner, Inc.(1) | 9,186 | 1,174,338 | ||||||
Global Payments, Inc. | 20,459 | 2,109,937 | ||||||
GoDaddy, Inc., Class A(1) | 13,599 | 892,367 | ||||||
WEX, Inc.(1) | 17,268 | 2,418,556 | ||||||
|
| |||||||
| 11,558,390 | ||||||||
| The accompanying notes are an integral part of these financial statements. | 5 |
Table of Contents
SCHEDULE OF INVESTMENTS — GUARDIAN MID CAP TRADITIONAL GROWTH VIP FUND
| December 31, 2018 | Shares | Value | ||||||
| Life Sciences Tools & Services – 5.5% |
| |||||||
IQVIA Holdings, Inc.(1) | 16,026 | $ | 1,861,741 | |||||
PerkinElmer, Inc. | 30,164 | 2,369,382 | ||||||
Waters Corp.(1) | 9,597 | 1,810,474 | ||||||
|
| |||||||
| 6,041,597 | ||||||||
| Machinery – 2.1% |
| |||||||
Rexnord Corp.(1) | 49,436 | 1,134,556 | ||||||
The Middleby Corp.(1) | 7,638 | 784,652 | ||||||
Wabtec Corp. | 6,112 | 429,368 | ||||||
|
| |||||||
| 2,348,576 | ||||||||
| Media – 0.8% |
| |||||||
Omnicom Group, Inc. | 12,550 | 919,162 | ||||||
|
| |||||||
| 919,162 | ||||||||
| Oil, Gas & Consumable Fuels – 0.1% |
| |||||||
World Fuel Services Corp. | 7,056 | 151,069 | ||||||
|
| |||||||
| 151,069 | ||||||||
| Pharmaceuticals – 0.8% |
| |||||||
Catalent, Inc.(1) | 21,486 | 669,933 | ||||||
Elanco Animal Health, Inc.(1) | 5,292 | 166,857 | ||||||
|
| |||||||
| 836,790 | ||||||||
| Professional Services – 4.5% |
| |||||||
CoStar Group, Inc.(1) | 5,458 | 1,841,202 | ||||||
IHS Markit Ltd.(1) | 20,824 | 998,927 | ||||||
Verisk Analytics, Inc.(1) | 19,580 | 2,135,003 | ||||||
|
| |||||||
| 4,975,132 | ||||||||
| Road & Rail – 0.8% |
| |||||||
Old Dominion Freight Line, Inc. | 7,393 | 912,962 | ||||||
|
| |||||||
| 912,962 | ||||||||
| Semiconductors & Semiconductor Equipment – 7.4% |
| |||||||
KLA-Tencor Corp. | 19,598 | 1,753,825 | ||||||
Lam Research Corp. | 9,389 | 1,278,500 | ||||||
Microchip Technology, Inc. | 31,833 | 2,289,429 | ||||||
ON Semiconductor Corp.(1) | 90,746 | 1,498,217 | ||||||
Xilinx, Inc. | 14,789 | 1,259,579 | ||||||
|
| |||||||
| 8,079,550 | ||||||||
| Software – 9.4% |
| |||||||
Atlassian Corp. PLC, Class A(1) | 20,546 | 1,828,183 | ||||||
Constellation Software, Inc. (Canada) | 3,713 | 2,376,679 | ||||||
Intuit, Inc. | 3,557 | 700,195 | ||||||
Nice Ltd., ADR(1) | 17,111 | 1,851,581 | ||||||
SS&C Technologies Holdings, Inc. | 51,162 | 2,307,918 | ||||||
| December 31, 2018 | Shares | Value | ||||||
| Software(continued) |
| |||||||
The Ultimate Software Group, Inc.(1) | 5,125 | $ | 1,254,959 | |||||
|
| |||||||
| 10,319,515 | ||||||||
| Specialty Retail – 0.6% |
| |||||||
Williams-Sonoma, Inc. | 13,617 | 686,978 | ||||||
|
| |||||||
| 686,978 | ||||||||
| Textiles, Apparel & Luxury Goods – 2.8% |
| |||||||
Carter’s, Inc. | 7,845 | 640,309 | ||||||
Gildan Activewear, Inc. | 63,289 | 1,921,454 | ||||||
Lululemon Athletica, Inc.(1) | 4,518 | 549,434 | ||||||
|
| |||||||
| 3,111,197 | ||||||||
| Trading Companies & Distributors – 0.6% |
| |||||||
Ferguson PLC (United Kingdom) | 10,925 | 699,702 | ||||||
|
| |||||||
| 699,702 | ||||||||
| Total Common Stocks (Cost $116,475,715) |
| 108,044,628 | ||||||
| Principal Amount | Value | |||||||
| Short-Term Investment – 2.0% |
| |||||||
| Repurchase Agreements – 2.0% |
| |||||||
Fixed Income Clearing Corp., 0.50%, dated 12/31/2018, proceeds at maturity value of $2,215,062, due 1/2/2019(2) | $ | 2,215,000 | 2,215,000 | |||||
| Total Repurchase Agreements (Cost $2,215,000) |
| 2,215,000 | ||||||
| Total Investments – 100.2% (Cost $118,690,715) |
| 110,259,628 | ||||||
| Liabilities in excess of other assets – (0.2)% |
| (194,441 | ) | |||||
| Total Net Assets – 100.0% |
| $ | 110,065,187 | |||||
| (1) | Non–income–producing security. |
| (2) | The table below presents collateral for repurchase agreements. |
| Security | Coupon | Maturity Date | Principal Amount | Value | ||||||||||||
| U.S. Treasury Note | 2.875% | 7/31/2025 | $ | 2,205,000 | $ | 2,262,555 | ||||||||||
Legend:
ADR — American Depositary Receipt
REIT — Real Estate Investment Trust
The following is a summary of the inputs used as of December 31, 2018 in valuing the Fund’s investments. For more information on valuation inputs, please refer to Note 2a of the accompanying Notes to Financial Statements.
| Valuation Inputs | ||||||||||||||||
| Investments in Securities | Level 1 | Level 2 | Level 3 | Total | ||||||||||||
| Common Stocks | $ | 106,365,226 | $ | 1,679,402 | * | $ | — | $ | 108,044,628 | |||||||
| Repurchase Agreements | — | 2,215,000 | — | 2,215,000 | ||||||||||||
| Total | $ | 106,365,226 | $ | 3,894,402 | $ | — | $ | 110,259,628 | ||||||||
| * | Consists of certain foreign securities whose values were determined by a pricing service using pricing models (See Note 2a in Notes to Financial Statements). These investments in securities were classified as Level 2 rather than Level 1. |
| 6 | The accompanying notes are an integral part of these financial statements. |
Table of Contents
FINANCIAL INFORMATION — GUARDIAN MID CAP TRADITIONAL GROWTH VIP FUND
For the Year Ended December 31, 2018 | ||||
Investment Income | ||||
Dividends | $ | 987,070 | ||
Interest | 8,441 | |||
Withholding taxes on foreign dividends | (17,103 | ) | ||
|
| |||
Total Investment Income | 978,408 | |||
|
| |||
Expenses | ||||
Investment advisory fees | 753,294 | |||
Distribution fees | 238,360 | |||
Trustees’ and officers’ fees | 68,112 | |||
Custodian and accounting fees | 57,537 | |||
Professional fees | 53,686 | |||
Administrative fees | 44,722 | |||
Transfer agent fees | 13,460 | |||
Shareholder reports | 9,550 | |||
Other expenses | 14,056 | |||
|
| |||
Total Expenses | 1,252,777 | |||
Less: Fees waived | (204,348 | ) | ||
|
| |||
Total Expenses, Net | 1,048,429 | |||
|
| |||
Net Investment Income/(Loss) | (70,021 | ) | ||
|
| |||
Realized Gain/(Loss) and Change in Unrealized Appreciation/(Depreciation) on Investments and Foreign Currency Transactions | ||||
Net realized gain/(loss) from investments | 5,096,243 | |||
Net realized gain/(loss) from foreign currency transactions | (4,392 | ) | ||
Net change in unrealized appreciation/(depreciation) on investments | (10,889,841 | ) | ||
Net change in unrealized appreciation/(depreciation) on translation of assets and liabilities in foreign currencies | (1 | ) | ||
|
| |||
Net Loss on Investments and Foreign Currency Transactions | (5,797,991 | ) | ||
|
| |||
Net Decrease in Net Assets Resulting From Operations | $ | (5,868,012 | ) | |
|
| |||
| The accompanying notes are an integral part of these financial statements. | 7 |
Table of Contents
FINANCIAL INFORMATION — GUARDIAN MID CAP TRADITIONAL GROWTH VIP FUND
| For the Year Ended 12/31/18 | For the Year Ended 12/31/17 | |||||||
| ||||||||
Operations |
| |||||||
Net investment income/(loss) | $ | (70,021 | ) | $ | (35,939 | ) | ||
Net realized gain/(loss) from investments and foreign currency transactions | 5,091,851 | 1,871,114 | ||||||
Net change in unrealized appreciation/(depreciation) on investments and translation of assets and liabilities in foreign currencies | (10,889,842 | ) | 2,448,658 | |||||
|
|
|
| |||||
Net Increase/(Decrease) in Net Assets Resulting from Operations | (5,868,012 | ) | 4,283,833 | |||||
|
|
|
| |||||
Capital Share Transactions |
| |||||||
Proceeds from sales of shares | 120,913,855 | 4,000,864 | ||||||
Cost of shares redeemed | (17,662,081 | ) | (8,875,001 | ) | ||||
|
|
|
| |||||
Net Increase/(Decrease) in Net Assets Resulting from Capital Share Transactions | 103,251,774 | (4,874,137 | ) | |||||
|
|
|
| |||||
Net Increase/(Decrease) in Net Assets | 97,383,762 | (590,304 | ) | |||||
|
|
|
| |||||
Net Assets |
| |||||||
Beginning of year | 12,681,425 | 13,271,729 | ||||||
|
|
|
| |||||
End of year | $ | 110,065,187 | $ | 12,681,425 | ||||
|
|
|
| |||||
Other Information: |
| |||||||
Shares | ||||||||
Sold | 9,277,053 | 377,261 | ||||||
Redeemed | (1,305,053 | ) | (708,621 | ) | ||||
|
|
|
| |||||
Net Increase/(Decrease) | 7,972,000 | (331,360 | ) | |||||
|
|
|
| |||||
| 8 | The accompanying notes are an integral part of these financial statements. |
Table of Contents
This Page Intentionally Left Blank
| 9 |
Table of Contents
FINANCIAL INFORMATION — GUARDIAN MID CAP TRADITIONAL GROWTH VIP FUND
The Financial Highlights table is intended to help you understand the Fund’s financial performance for the past five years (or, if shorter, the period since inception). Certain information reflects financial results for a single Fund share. The total returns in the table represent the rate that an investor would have earned (or lost) on an investment in the Fund.
| Per Share Operating Performance | ||||||||||||||||||||||||
| Net Asset Value, Beginning of Period | Net Investment Income/(Loss)(1) | Net Realized and Unrealized Gain/(Loss) | Total Operations | Net Asset Value, End of Period | Total Return(2) | |||||||||||||||||||
Year Ended 12/31/18 | $ | 12.72 | $ | (0.01 | ) | $ | (0.44 | ) | $ | (0.45 | ) | $ | 12.27 | (3.54) | % | |||||||||
Year Ended 12/31/17 | 9.99 | (0.02 | ) | 2.75 | 2.73 | 12.72 | 27.33 | % | ||||||||||||||||
Period Ended 12/31/16(4) | 10.00 | 0.00 | (5) | (0.01 | ) | (0.01 | ) | 9.99 | (0.10) | %(6) | ||||||||||||||
| 10 | The accompanying notes are an integral part of these financial statements. |
Table of Contents
FINANCIAL INFORMATION — GUARDIAN MID CAP TRADITIONAL GROWTH VIP FUND
| Ratios/Supplemental Data | ||||||||||||||||||||||
| Net Assets, End of Period (000s) | Net Ratio of Expenses to Average Net Assets(3) | Gross Ratio of Expenses to Average Net Assets | Net Ratio of Net Investment Income/(Loss) to Average Net Assets(3) | Gross Ratio of Net Investment Loss to Average Net Assets | Portfolio Turnover Rate | |||||||||||||||||
| $ | 110,065 | 1.10% | 1.31% | (0.07) | % | (0.28 | )% | 30% | ||||||||||||||
| 12,681 | 1.09% | 2.15% | (0.20) | % | (1.26 | )% | 35% | |||||||||||||||
| 13,272 | 1.09% | (6) | 2.93% | (6) | 0.14 | %(6) | (1.70 | )%(6) | 5% | (6) | ||||||||||||
| (1) | Calculated based on the average shares outstanding during the period. |
| (2) | Total returns do not reflect the effects of charges deducted pursuant to the terms of The Guardian Insurance & Annuity Company, Inc.’s variable contracts. Inclusion of such charges would reduce the total returns for all periods shown. |
| (3) | Net Ratio of Expenses to Average Net Assets and Net Ratio of Net Investment Income/(Loss) to Average Net Assets include the effect of fee waivers and expense limitations. |
| (4) | Commenced operations on September 1, 2016. |
| (5) | Rounds to $0.00 per share. |
| (6) | Ratios for periods less than one year have been annualized, except for total return and portfolio turnover rate. For the period ended December 31, 2016, certainnon-recurring fees (i.e., audit fees) are not annualized. |
| The accompanying notes are an integral part of these financial statements. | 11 |
Table of Contents
NOTES TO FINANCIAL STATEMENTS — GUARDIAN MID CAP TRADITIONAL GROWTH VIP FUND
December 31, 2018
1. Organization
Guardian Variable Products Trust (the “Trust”), a Delaware statutory trust organized on January 12, 2016, is registered under the Investment Company Act of 1940, as amended (the “1940 Act”), as anopen-end management investment company. The Trust currently has sixteen series. Guardian Mid Cap Traditional Growth VIP Fund (the “Fund”) is a series of the Trust. The Fund is a diversified fund and commenced operations on September 1, 2016. The financial statements for other series of the Trust are presented in separate reports.
The Trust has authorized an unlimited number of shares of beneficial interest with no par value. Shares are bought and sold at closing net asset value (“NAV”). Shares of the Fund are only sold to certain separate accounts of The Guardian Insurance & Annuity Company, Inc. (“GIAC”) that fund certain variable annuity contracts and variable life insurance policies issued by GIAC. GIAC is a wholly-owned subsidiary of The Guardian Life Insurance Company of America (“Guardian Life”).
The Fund seeks long-term growth of capital.
2. Significant Accounting Policies
The following is a summary of significant accounting policies followed by the Fund in the preparation of its financial statements. The Fund follows the investment company accounting and reporting guidance of the Financial Accounting Standards Board (“FASB”) Accounting Standards Codification Topic 946 Financial Services — Investment Companies. The following policies are in conformity with accounting principles generally accepted in the United States of America (“GAAP”). The preparation of financial statements in accordance with GAAP requires management to make estimates and assumptions that affect the reported amounts and disclosures in the financial statements. Actual results could differ from those estimates.
a. Investment Valuations Equity securities traded on an exchange other than NASDAQ Stock Market, LLC (“NASDAQ”) are valued at the last reported sale price on the principal exchange or market on which they are traded; or, if there were no sales that day, at the mean between the closing bid and ask prices. Securities traded on the NASDAQ are generally valued at the NASDAQ official closing price, which may not be the last sale price. If the NASDAQ official closing price is not available
for a security, that security is generally valued at the mean between the closing bid and ask prices. Repurchase agreements are carried at cost, which approximates fair value (see Note 5d). Foreign securities are valued in the currencies of the markets in which they trade and then converted to U.S. dollars by the application of foreign exchange rates at the close of the New York Stock Exchange (“NYSE”). Forward foreign currency contracts, if any, are valued at the mean between the bid and ask rates for the specified time interpolated from rates for proximate time periods. Securities for which market quotations are not readily available or for which market quotations may be considered unreliable are valued at their fair values as determined in accordance with policies and procedures adopted by the Board of Trustees.
Under the policies and procedures approved by the Board of Trustees, Park Avenue Institutional Advisers LLC (“Park Avenue”), the Fund’s investment adviser, has established a Fair Valuation Committee to assist the Board of Trustees with the oversight and monitoring of the valuation of the Fund’s investments. This includes monitoring the appropriateness of fair values based on results of ongoing valuation oversight, including but not limited to consideration of security specific events, market events, and pricing vendor and broker-dealer due diligence. The Fair Valuation Committee oversees and carries out the policies for the valuation of investments held in the Fund. The Fair Valuation Committee is responsible for discussing and assessing the potential impacts to the fair values on an ongoing basis, and at least on a quarterly basis with the Board of Trustees.
Securities whose values have been materially affected by events occurring before the Fund’s valuation time but after the close of the securities’ principal exchange or market may be fair valued in accordance with policies and procedures adopted by the Board of Trustees. In addition, the values of the Fund’s investments in foreign securities are generally determined by a pricing service using pricing models designed to estimate likely changes in the values of those securities. Certain foreign equity instruments are valued by applying international fair value factors provided by approved pricing services. The factors seek to adjust the local closing price for movements of local markets post closing, but prior to the time the NAVs are calculated. Valuations reflected in this report are as of the report date. As a result, changes in valuation due to market events and/or issuer related events after the report date and prior to issuance of the report are not reflected herein.
| 12 |
Table of Contents
NOTES TO FINANCIAL STATEMENTS — GUARDIAN MID CAP TRADITIONAL GROWTH VIP FUND
Various inputs are used in determining the valuation of the Fund’s investments. These inputs are summarized in three broad levels listed below.
| • | Level 1 — unadjusted inputs using quoted prices in active markets for identical investments. |
| • | Level 2 — other significant observable inputs, including, but not limited to, quoted prices for similar investments, inputs other than quoted prices that are observable for investments (such as interest rates, prepayment speeds, credit risks, etc.) or other market corroborated inputs. |
| • | Level 3 — significant unobservable inputs (including the Fund’s own assumptions in determining the fair value of investments) |
Inputs may include price information, volatility statistics, specific and broad credit data, liquidity statistics, and other factors. A financial instrument’s level within the fair value hierarchy is based on the lowest level of any input; both individually and in aggregate, that is significant to the fair value measurement. However, the determination of what constitutes “observable” requires significant judgment by the Trust. The Trust considers observable data to be that market data which is readily available, regularly distributed or updated, reliable and verifiable, and provided by independent sources that are actively involved in the relevant market. The inputs or methodology used for valuing securities are not necessarily an indication of the risk associated with investing in those securities. Changes in valuation techniques may result in transfers into or out of a financial instrument’s assigned level within the hierarchy.
The FASB requires reporting entities to make disclosures about purchases, sales, issuances and settlements of Level 3 securities on a gross basis.
The Fund’s policy is to recognize transfers between Level 1, Level 2 and Level 3 at the end of the reporting period. For the year ended December 31, 2018, there were no transfers among any levels.
In determining a financial instrument’s placement within the hierarchy, the Trust separates the Fund’s investment portfolio into two categories: investments and derivatives (e.g., futures). A summary of inputs used to value the Fund’s assets and liabilities carried at fair value as of December 31, 2018 is included in the Schedule of Investments.
Investments Investments whose values are based on quoted market prices in active markets, and are
therefore classified within Level 1, include active listed equities. Investments that trade in markets that are not considered to be active, but are valued based on quoted market prices, dealer quotations or alternative pricing sources supported by observable inputs are classified within Level 2. These include certain U.S. government and sovereign obligations, most government agency securities, investment-grade corporate bonds, certain mortgage products, state, municipal and provincial obligations, and certain foreign equity securities, including securities whose prices may have been affected by events occurring after the close of trading on their principal exchange or market and, as a result, whose values are determined by a pricing service as described above, or securities whose values are otherwise determined using fair valuation methods approved by the Fund’s Board of Trustees.
Investments classified within Level 3 have significant unobservable inputs, as they trade infrequently or not at all. Level 3 investments include, among others, private placement securities. When observable prices are not available for these securities, the Trust uses one or more valuation techniques for which sufficient and reliable data is available. The inputs used by the Trust in estimating the value of Level 3 investments include, for example, the original transaction price, recent transactions in the same or similar instruments, completed or pending third-party transactions in the underlying investment or comparable issuers, subsequent rounds of financing, recapitalizations, and other transactions across the capital structure. Level 3 investments may also be adjusted to reflect illiquidity and/ornon-transferability, with the amount of such discount estimated by the Trust in the absence of market information. Assumptions used by the Trust due to the lack of observable inputs may significantly impact the resulting fair value and therefore the Fund’s results of operations. As of December 31, 2018, the Fund had no securities classified as Level 3.
Derivatives Exchange-traded derivatives, such as futures contracts, exchange-traded option contracts and certain swaps, are typically classified within Level 1 or Level 2 of the fair value hierarchy depending on whether or not they are deemed to be actively traded. Certainnon-exchange-traded derivatives, such as generic forwards, certain swaps and options, have inputs which can generally be corroborated by market data and are therefore classified within Level 2. During the year ended December 31, 2018, the Fund did not hold any derivatives.
| 13 |
Table of Contents
NOTES TO FINANCIAL STATEMENTS — GUARDIAN MID CAP TRADITIONAL GROWTH VIP FUND
b. Securities Transactions Securities transactions are accounted for on the date securities are purchased or sold (trade date). Realized gains or losses on securities transactions are determined on the basis of specific identification.
c. Foreign Currency Translation The accounting records of the Fund are maintained in U.S. dollars. Investment securities and all other assets and liabilities of the Fund denominated in a foreign currency are generally translated into U.S. dollars at the exchange rates quoted at the close of the NYSE on each business day. The market value of investment securities and other assets and liabilities are translated at the exchange rate as of the valuation date. Purchases and sales of securities, income receipts, and expense payments are translated into U.S. dollars at the exchange rates in effect on the dates of the respective transactions. The Fund does not isolate the portion of the fluctuations on investments resulting from changes in foreign currency exchange rates from the fluctuations in market prices of investments held. Such fluctuations are included in the Net change in net realized and unrealized gain/(loss) from investments on the Statement of Operations.
Reported realized foreign currency gains and losses arise from the disposition of foreign currency, currency gains or losses realized between the trade and settlement dates on securities transactions, and the difference between the amounts of dividends, interest and foreign withholding taxes recorded on the Fund’s books on the transaction date and the U.S. dollar equivalent of the amounts actually received or paid. These reported realized foreign currency gains and losses, if any, are included in Net realized gain/(loss) from foreign currency transactions on the Statement of Operations. Unrealized foreign currency gains and losses arise from changes (due to changes in exchange rates) in the value of foreign currency and other assets and liabilities denominated in foreign currencies, which are held at period end, if any, and are included in Net change in unrealized appreciation/(depreciation) on translation of assets and liabilities in foreign currencies on the Statement of Operations.
d. Foreign Capital Gains Tax The Fund may be subject to foreign taxes on income, gains on investments or currency purchases/repatriation, a portion of which may be recoverable. The Fund will accrue such taxes and recoveries as applicable, based upon their current interpretation of tax rules and regulations that exist in the markets in which they invest.
e. Investment Income Dividend income net of foreign taxes withheld, if any, is generally recorded on theex-dividend date. Interest income, which includes amortization/accretion of premium/discount, is determined using the interest income accrual method, and is accrued and recorded daily.
f. Allocation of Income and Expenses Many of the expenses of the Trust can be directly attributed to a specific series of the Trust. Expenses that cannot be directly attributed to a specific series of the Trust are generally apportioned among all the series in the Trust, based on relative net assets. In calculating net asset value per share for each series of the Trust, investment income, realized and unrealized gains and losses, and expenses other than series-specific expenses are allocated daily to each series based upon the proportion of net assets attributable to each series.
3. Transactions with Affiliates
a. Investment Advisory Fee and Expense Limitation Under the terms of the advisory agreement, which, after its two year initial term, is reviewed and approved annually by the Board of Trustees, the Fund pays an investment advisory fee to Park Avenue. Park Avenue is a wholly-owned subsidiary of Guardian Life and receives an investment advisory fee at an annual rate of 0.80% up to $100 million, 0.75% up to $300 million, and 0.73% in excess of $300 million of the Fund’s average daily net assets. The fee is accrued daily and paid monthly.
Park Avenue has contractually agreed through April 30, 2019 to waive certain fees and/or reimburse certain expenses incurred by the Fund to the extent necessary to limit the Fund’s total annual operating expenses after fee waiver and/or expense reimbursement to 1.10% of the Fund’s average daily net assets (excluding, if applicable, any acquired fund fees and expenses, taxes, interest, transaction costs and brokerage commissions, litigation and extraordinary expenses). Prior to April 9, 2018, the expense limitation was 1.09%. The limitation may not be increased or terminated prior to this time without action by the Board of Trustees, may be terminated only upon approval of the Board of Trustees, and is subject to Park Avenue’s recoupment rights. For the year ended December 31, 2018, Park Avenue waived fees and/or paid Fund expenses in the amount of $204,348.
Park Avenue may be entitled to recoupment of previously waived fees and reimbursed expenses from the Fund for three years from the date of the waiver or reimbursement, subject to the expense limitation in effect at the time of the waiver or reimbursement and at
| 14 |
Table of Contents
NOTES TO FINANCIAL STATEMENTS — GUARDIAN MID CAP TRADITIONAL GROWTH VIP FUND
the time of the recoupment, if any. Amounts waived or reimbursed by Park Avenue pursuant to any expense limitation after April 9, 2018 will not be subject to Park Avenue’s recoupment rights. The amount available for potential future recoupment by Park Avenue from the Fund under the Expense Limitation Agreement and the expiration schedule at December 31, 2018 are as follows:
| Potential Recoupment Amounts Expiring | ||||||||||||
Total Potential Recoupment Amounts | 2021 | 2020 | 2019 | |||||||||
| $328,231 | $ | 54,113 | $ | 192,946 | $ | 81,172 | ||||||
Park Avenue has entered into aSub-Advisory Agreement with Janus Capital Management LLC (“Janus Capital”). Janus Capital is responsible for providingday-to-day investment advisory services to the Fund, subject to the supervision of Park Avenue and the oversight of the Board of Trustees.Sub-advisory fees are paid by Park Avenue and do not represent a separate or additional expense to the Fund.
b. Compensation of Trustees and Officers Trustees and officers who are interested persons of the Trust, as defined in the 1940 Act, receive no compensation from the Fund, except for the Chief Compliance Officer of the Trust. Trustees of the Trust who are not interested persons of the Trust, and the Chief Compliance Officer, receive compensation and reimbursement of expenses from the Trust.
c. Distribution Fees Park Avenue Securities LLC (“PAS”), a wholly-owned subsidiary of Guardian Life, is the principal underwriter of Fund shares. The Trust has entered into a distribution and service agreement with PAS, which governs the sale and distribution of shares of the Fund. Under a distribution and service plan adopted by the Trust(“12b-1 plan”), PAS is compensated for services in such capacity, including its expenses in connection with the promotion and distribution of shares of the Fund, at an annual rate of 0.25% of the Fund’s average daily net assets. For the year ended December 31, 2018, the Fund paid distribution fees in the amount of $238,360 to PAS.
PAS has directed that certain payments under the12b-1 plan be used to compensate GIAC for shareholder services provided to contract owners.
4. Federal Income Taxes
a. Distributions to Shareholders For federal income tax purposes, the Fund is treated as a disregarded entity
(“DRE”). As a DRE, the Fund is not subject to an entity-level income tax; and any income, gains, losses, deductions, taxes, and credits of the Fund would instead be “passed through” directly to the separate accounts of GIAC that invest in the Fund and retain the same character for U.S. federal income tax purposes. In addition, the Fund is not required to distribute taxable income and capital gains for U.S. federal income tax purposes. Therefore, no dividends and capital gains distributions were paid by the Fund.
5. Investments
a. Investment Purchases and Sales The cost of investments purchased and the proceeds from investments sold (excluding short-term investments) amounted to $128,333,138 and $26,614,556, respectively, for the year ended December 31, 2018. During the year ended December 31, 2018, there were no purchases or sales of U.S. government securities.
b. Foreign Securities Foreign securities investments involve special risks and considerations not typically associated with U.S. investments. These risks include, but are not limited to, currency risk; adverse political, regulatory, social, and economic developments; and less reliable information about issuers. Moreover, securities of some foreign issuers may be less liquid and their prices more volatile than those of comparable U.S. issuers.
c. Industry or Sector Concentration In its normal course of business, the Fund may invest a significant portion of its assets in companies within a limited number of industries or sectors. As a result, the Fund may be subject to a greater risk of loss than that of a fund invested in a wider spectrum of industries or sectors because the stocks of many or all of the companies in the industry, group of industries, sector, or sectors may decline in value due to developments adversely affecting the industry, group of industries, sector, or sectors.
d. Repurchase Agreements The Fund may invest in repurchase agreements to maintain liquidity and earn income over periods of time as short as overnight. The collateral for repurchase agreements is either cash or fully negotiable U.S. government securities (including U.S. government agency securities). Repurchase agreements are fully collateralized (including the interest accrued thereon) and such collateral is marked to market daily while the agreements remain in force. If the value of the collateral falls below the repurchase price plus accrued interest, the Fund will typically require the seller to deposit additional collateral by the next
| 15 |
Table of Contents
NOTES TO FINANCIAL STATEMENTS — GUARDIAN MID CAP TRADITIONAL GROWTH VIP FUND
business day. If the request for additional collateral is not met, or the seller defaults, the Fund maintains the right to sell the collateral (although it may be prevented or delayed from doing so in certain circumstances) and may be required to claim any resulting loss against the seller. Park Avenue monitors the creditworthiness of the seller with which the Fund enters into repurchase agreements.
6. Temporary Borrowings
The Fund, with other funds managed by Park Avenue, is party to a $10 million committed revolving credit facility from State Street Bank and Trust Company for temporary borrowing purposes, including the meeting of redemption requests that otherwise might require the untimely disposition of securities. Interest is calculated based on the higher of the dailyone-month LIBOR rate and the Federal Funds rate plus 1.25% at the time of borrowing. In addition to the interest charged on any borrowings by the Fund, each fund pays a commitment fee of 0.30% per annum on its share of the unused portion of the credit facility. The agreement is in place until December 10, 2019. The Fund did not utilize the credit facility during the year ended December 31, 2018.
7. Indemnifications
Under the Trust’s organizational documents and, in some cases, by contract, its officers and trustees are
indemnified against certain liabilities arising out of the performance of their duties to the Fund. In addition, in the normal course of business, the Fund enters into contracts with its vendors and others that provide general indemnifications. The Fund’s maximum exposure under these arrangements is unknown as this would involve future claims that may be made against the Fund that have not yet occurred. However, based on experience, the Fund expects the risk of loss to be remote.
8. Recent Accounting Pronouncement
On August 17, 2018, the U.S. Securities and Exchange Commission (“SEC”) voted to adopt amendments to certain disclosure requirements that have become redundant, duplicative, overlapping, outdated, or superseded, in light of other SEC disclosure requirements, GAAP, or changes in the information environment. The SEC will also be referring certain SEC disclosure requirements that overlap with, but require information incremental to, GAAP to the FASB for potential incorporation into GAAP. The amendments are intended to facilitate the disclosure of information to investors and simplify compliance without significantly altering the total mix of information provided to investors. As such, the financial statements herein have been updated to conform with these new requirements, which had no effect on the Fund’s net assets or results of operations.
| 16 |
Table of Contents
REPORT OF INDEPENDENT REGISTERED PUBLIC ACCOUNTING FIRM
TotheBoard of Trustees ofGuardian Variable Products TrustandShareholders of
Guardian Mid Cap Traditional Growth VIP Fund
Opinion on the Financial Statements
We have audited the accompanying statement of assets and liabilities, including the schedule of investments, ofGuardian Mid Cap Traditional Growth VIP Fund (one of the funds constituting Guardian Variable Products Trust, referred to hereafter as the “Fund”) as of December 31, 2018, the related statement of operations for the year ended December 31, 2018, the statement of changes in net assets for each of the two years in the period ended December 31, 2018, including the related notes,and the financial highlights for each of the periods indicated therein (collectively referred to as the “financial statements”). In our opinion, the financial statements present fairly, in all material respects, the financial position of the Fund as of December 31, 2018, the results of its operations for the year then ended, the changes in its net assets for each of the two years in the period ended December 31, 2018 and the financial highlights for each of the periods indicated therein in conformity with accounting principles generally accepted in the United States of America.
Basis for Opinion
These financial statements are the responsibility of the Fund’s management. Our responsibility is to express an opinion on the Fund’s financial statements based on our audits. We are a public accounting firm registered with the Public Company Accounting Oversight Board (United States) (PCAOB) and are required to be independent with respect to the Fund in accordance with the U.S. federal securities laws and the applicable rules and regulations of the Securities and Exchange Commission and the PCAOB.
We conducted our audits of these financial statements in accordance with the standards of the PCAOB. Those standards require that we plan and perform the audit to obtain reasonable assurance about whether the financial statements are free of material misstatement, whether due to error or fraud.
Our audits included performing procedures to assess the risks of material misstatement of the financial statements, whether due to error or fraud, and performing procedures that respond to those risks. Such procedures included examining, on a test basis, evidence regarding the amounts and disclosures in the financial statements. Our audits also included evaluating the accounting principles used and significant estimates made by management, as well as evaluating the overall presentation of the financial statements. Our procedures included confirmation of securities owned as of December 31, 2018 by correspondence with the custodian and brokers; when replies were not received from brokers, we performed other auditing procedures. We believe that our audits provide a reasonable basis for our opinion.
New York, New York
February 19, 2019
We have served as the auditor of one or more investment companies in Guardian Variable Products Trustsince 2016.
| 17 |
Table of Contents
SUPPLEMENTAL INFORMATION(UNAUDITED)
Approval of Investment Advisory andSub-advisory Agreements
Section 15(c) of the Investment Company Act of 1940, as amended (the “1940 Act”), requires that a fund’s board of trustees annually review and consider the continuation of the fund’s investment advisory andsub-advisory agreements. The continuation of any such agreement must be approved by a vote of a majority of the trustees who are not parties to the agreement or “interested persons” (as defined in the 1940 Act) of a party to the agreement at anin-person meeting of the board called for the purpose of voting on such approval.
At a meeting of the Board of Trustees (the “Board”) of Guardian Variable Products Trust (the “Trust”) held on March27-28, 2018, the Board considered and unanimously voted to approve the continuation of the investment management agreement (the “Management Agreement”) between Park Avenue Institutional Advisers LLC (the “Manager”) and the Trust, on behalf of the following 11 series, Guardian Core Plus Fixed Income VIP Fund, Guardian Diversified Research VIP Fund, Guardian Growth & Income VIP Fund, Guardian Integrated Research VIP Fund, Guardian International Growth VIP Fund, Guardian International Value VIP Fund, Guardian Large Cap Disciplined Growth VIP Fund, Guardian Large Cap Disciplined Value VIP Fund, Guardian Large Cap Fundamental Growth VIP Fund, Guardian Mid Cap Relative Value VIP Fund and Guardian Mid Cap Traditional Growth VIP Fund (the “Funds”). The Board also considered and unanimously voted to approve the continuation of thesub-advisory agreements (the“Sub-advisory Agreements,” collectively with the Management Agreement, the “Agreements”) between the Manager and the following investment advisory firms serving assub-advisers to the Funds, ClearBridge Investments LLC, Wellington Management Company LLP, Massachusetts Financial Services Company, Putnam Investment Management, LLC, Boston Partners Global Investors, Inc., AllianceBernstein L.P., Janus Capital Management LLC, Wells Capital Management Incorporated, J.P. Morgan Investment Management Inc., Lazard Asset Management LLC, and Lord, Abbett & Co. LLC (the“Sub-advisers”). The continuation of the Agreements for aone-year period was unanimously approved by the Trustees who are not parties to the Agreements or “interested persons” (as defined in the 1940 Act) of a party to the Agreements (the “Independent Trustees”).
The Board is responsible for overseeing the management of each Fund. In determining whether to approve the continuation of the Agreements, the Trustees evaluated information and factors that they
considered to be relevant and appropriate through the exercise of their own business judgment. The Trustees considered certain information and factors in light of advice furnished to them by legal counsel to the Trust and, in the case of the Independent Trustees, their independent legal counsel.
In advance of the meeting held on March27-28, 2018, the Trustees received materials and information designed to assist their consideration of the Agreements, including written responses from the Manager and eachSub-adviser to a series of questions and requests for information covering a wide variety of topics provided by independent legal counsel on behalf of the Independent Trustees. Broadridge Financial Solutions, Inc. (“Broadridge”), an independent provider of investment company data, was retained to provide the Trustees with reports on how each Fund’s contractual management fees, actual management fees, overall expense ratios and investment performance compared to those of “peer funds” selected by Broadridge that are offered as investment options underlying variable contracts. The Trustees also received materials and information regarding the legal standards applicable to their consideration of the Agreements and the process and criteria used by the Manager to oversee theSub-advisers. During the course of their deliberations, the Independent Trustees met to discuss and evaluate the Agreements in executive session with their independent legal counsel, outside of the presence of the Trustees who are not Independent Trustees and representatives from Fund management, the Manager or anySub-adviser.
In reaching its decisions to approve the continuation of the Agreements, the Board took into account the materials and information described above as well as other materials and information provided to the Board and discussed with and among the Trustees, including information regarding the Funds furnished to the Board by the Manager throughout the year. Individual Trustees may have given different weight to different factors and information with respect to each Agreement, and the Trustees did not identify any single factor or information that, in isolation, would be controlling in deciding to approve the continuation of the Agreements.
The discussion below is intended to summarize the broad factors that figured prominently in the Board’s decisions to approve the continuation of the Agreements rather than to beall-inclusive. These broad factors included: (i) the nature, extent and quality of the services provided to the Funds by the Manager and theSub-advisers; (ii) the investment performance of the
| 18 |
Table of Contents
SUPPLEMENTAL INFORMATION(UNAUDITED)
Funds; (iii) the fees charged and estimated profitability; (iv) the extent to which economies of scale may exist for a Fund, and the extent to which a Fund may benefit from economies of scale; and (v) any other benefits derived by the Manager or theSub-advisers (or their respective affiliates) from their relationships with the Funds. In addition to considering the above-referenced factors, the Board observed that there are a range of investment options available to variable contract owners who may invest in the Funds, and that these contract owners, having had the opportunity to consider other investment options, may choose to invest or remain invested in the Funds.
Nature, Extent and Quality of Services
The Trustees considered information regarding the nature, extent and quality of services provided to the Funds by the Manager. The Trustees also considered the range of investment advisory services andnon-investment advisory services provided by the Manager, notably coordinating the preparation and filing of various regulatory documents, coordinating the preparation and assembly of Board meeting materials and assisting the Board with certain valuation matters.
The Trustees considered the operation of the Funds in a“manager-of-managers” structure and the responsibilities that the Manager has under this structure, including monitoring and evaluating the performance of theSub-advisers, monitoring theSub-advisers for adherence to the stated investment objectives, strategies, policies and restrictions of the Funds and supervising theSub-advisers with respect to the services that theSub-advisers provide under the Sub-advisory Agreements. The Trustees also considered the process used by the Manager, consistent with this structure, to identify and recommendsub-advisers, and its ability to monitor and overseesub-advisers and recommend replacementsub-advisers, when necessary, and provide other services under the Management Agreement. The Trustees reviewed information regarding the experience and background of the Manager’s key personnel and the Manager’s organizational structure and resources, including investment, legal and administrative capabilities of the Manager. In this regard, the Trustees recognized that the Funds benefit from the Manager’s use of similar resources and capabilities of its affiliates in providing services to the Funds.
The Trustees considered information regarding the nature, extent and quality of services provided to the Funds by theSub-advisers. The Trustees also
considered, among other things, the range of investment advisory services provided by theSub-advisers under the oversight of the Manager. In evaluating these investment advisory services, the Trustees considered, among other things, theSub-advisers’ investment philosophies, styles and/or processes and approach to managing risk. The Trustees received and evaluated information regarding the background, education, expertise and/or experience of the investment professionals that serve as portfolio managers for the Funds and the capabilities, resources and reputations of theSub-advisers.
Based upon these considerations, the Board concluded that it was satisfied with the nature, extent and quality of services provided to the Funds by the Manager and eachSub-adviser.
Investment Performance
The Board considered the investment performance of each Fund. Among other reports, the Board reviewed the performance of the Funds for theone-year and since inception periods compared to a universe of peer funds selected by Broadridge. The Board noted that the Funds had performance records of less than two years and that the Board had reviewed longer performance records of the funds or accounts managed by theSub-advisers with similar strategies as the applicable Fund, when available, when the Board initially approved the Agreements in 2016. The Broadridge report placed the Funds in the following quintiles of the relevant peer universe for theone-year and since inception periods, respectively: Guardian Core Plus Fixed Income VIP Fund (3rd, 3rd), Guardian Diversified Research VIP Fund (2nd, 2nd), Guardian Growth & Income VIP Fund (1st, 1st), Guardian Integrated Research VIP Fund (4th, 5th), Guardian International Growth VIP Fund (3rd, 2nd), Guardian International Value VIP Fund (3rd, 5th), Guardian Large Cap Disciplined Growth VIP Fund (3rd, 4th), Guardian Large Cap Disciplined Value VIP Fund (1st, 1st), Guardian Large Cap Fundamental Growth VIP Fund (5th, 4th), Guardian Mid Cap Relative Value VIP Fund (4th, 3rd) and Guardian Mid Cap Traditional Growth VIP Fund (2nd, 2nd).
The Board considered the investment reports provided by the Manager since commencement of operations of the Funds during quarterly Board meetings. The Board also considered the Manager’s analysis ofSub-adviser performance and the steps taken by the Manager and theSub-advisers to seek to improve performance and the results of those steps.
| 19 |
Table of Contents
SUPPLEMENTAL INFORMATION(UNAUDITED)
In light of the considerations noted above, the Board concluded that it had continued confidence in the Manager’s and theSub-advisers’ overall capabilities to manage the Funds.
Costs and Profitability
The Trustees considered the management fees paid by the Funds to the Manager under the Management Agreement and evaluated the reasonableness of these fees. The Trustees received and reviewed information with respect to the management fees, including the portion of the management fees paid to eachSub-adviser, and the management fees paid by other funds offered as investment options underlying variable contracts within the applicable peer group selected by Broadridge. The Broadridge report placed the Funds in the following quintiles of the relevant expense peer group for the contractual management fees and actual management fees, respectively: Guardian Core Plus Fixed Income VIP Fund (1st, 3rd), Guardian Diversified Research VIP Fund (2nd, 3rd), Guardian Growth & Income VIP Fund (1st, 1st), Guardian Integrated Research VIP Fund (1st, 2nd), Guardian International Growth VIP Fund (1st, 2nd), Guardian International Value VIP Fund (3rd, 2nd), Guardian Large Cap Disciplined Growth VIP Fund (1st, 1st), Guardian Large Cap Disciplined Value VIP Fund (1st, 1st), Guardian Large Cap Fundamental Growth VIP Fund (1st, 1st), Guardian Mid Cap Relative Value VIP Fund (1st, 1st) and Guardian Mid Cap Traditional Growth VIP Fund (3rd, 4th).
The Trustees considered thesub-advisory fees paid under the Sub-advisory Agreements and evaluated the reasonableness of those fees. The Trustees also considered that the fees paid to theSub-advisers are paid by the Manager and not the Funds and that the Manager had negotiated the fees with theSub-advisers atarm’s-length. In addition, the Trustees considered the portion of the management fees paid to eachSub-adviser as compared to the portion retained by the Manager.
The Trustees received and reviewed information in the Broadridge report comparing each Fund’s operating expense ratio to the actual operating expense ratios of a peer group of funds selected by Broadridge. The Trustees considered the Manager’s commitment to limit each Fund’s operating expenses through an expense limitation agreement with the Trust. The Broadridge report placed the Funds in the following quintiles of the relevant expense peer group for the operating expense ratio: Guardian Core Plus Fixed Income VIP Fund (2nd), Guardian Diversified Research VIP Fund (2nd), Guardian Growth & Income VIP Fund
(2nd), Guardian Integrated Research VIP Fund (1st), Guardian International Growth VIP Fund (3rd), Guardian International Value VIP Fund (1st), Guardian Large Cap Disciplined Growth VIP Fund (1st), Guardian Large Cap Disciplined Value VIP Fund (2nd), Guardian Large Cap Fundamental Growth VIP Fund (1st), Guardian Mid Cap Relative Value VIP Fund (1st) and Guardian Mid Cap Traditional Growth VIP Fund (3rd).
Although the Board recognized that the comparisons between the management fees and anticipated operating expenses of the Funds and those of identified peer funds are imprecise, given different terms of agreements and variations in fund strategies, the Trustees found that the comparative information supported their consideration and approval of the management fees and evaluation of operating expenses.
The Trustees reviewed information regarding the Manager’s costs of sponsoring the Funds and estimated profitability of the Funds to the Manager. The Trustees noted that the information contained estimates, such as allocations of expenses. Although the Trustees did not receive specific cost and profitability information from certainSub-advisers, the Trustees primarily considered the cost and profitability information relating to the Manager because the Manager is responsible for payment of thesub-advisory fees and negotiated the fees with theSub-advisers atarm’s-length.
Based on the consideration of the information and factors summarized above, as well as other information and factors deemed relevant by the Trustees, the Trustees concluded that the management andsub-advisory fees were reasonable in light of the nature, extent and quality of services rendered to the Funds by the Manager and theSub-advisers. The Trustees also concluded that the estimated profitability of the Funds to the Manager was acceptable.
Economies of Scale
The Trustees considered the extent to which economies of scale may be shared as assets grow based on current asset levels of the Funds, anticipated asset levels over the next year, the current management andsub-advisory fee rates, the expense limitation arrangements, and any management andsub-advisory fee breakpoints, which reduce fee rates as assets increase. Based on those factors, the Board concluded that it was satisfied with the extent to which any economies of scale would be shared for the benefit of Fund shareholders. The Board noted that it would continue to monitor future growth in each Fund’s assets
| 20 |
Table of Contents
SUPPLEMENTAL INFORMATION(UNAUDITED)
and whether additional steps are required to share appropriately any economies of scale with Fund shareholders.
Ancillary Benefits
The Trustees considered the benefits, other than management fees, that the Manager and/or its affiliates receive because of the Manager’s relationship with the Funds. The Trustees acknowledged that the Funds serve as investment options under variable contracts issued by an affiliate of the Manager that receives fees under those contracts and that Park Avenue Securities LLC, an affiliate of the Manager and principal underwriter of the Funds, and an insurance company affiliated with the Manager receive fees from the Funds under a plan of distribution adopted pursuant to Rule12b-1 under the 1940 Act. The Trustees considered that the Manager and its affiliates may benefit from (i) greater efficiencies in annuity administration and operations and potential cost savings due to a reduction in the number of unaffiliated funds available as annuity contract investment options,
and (ii) increased dividends-received deductions due to the Funds’ status under the tax laws as disregarded entities. In addition, the Trustees considered the potential benefits, other thansub-advisory fees, that theSub-advisers and their affiliates receive because of their relationships with the Funds, including the potential increased ability to use soft dollars consistent with Trust policies and other benefits from increases in assets under management. The Trustees concluded that benefits that accrue to the Manager and its affiliates are reasonable and the benefits that accrue to theSub-advisers and their affiliates are consistent with those expected for asub-adviser to a mutual fund such as the applicable Fund.
Conclusion
Based on a comprehensive consideration and evaluation of all of the information and factors summarized above, among others, the Board voting as a whole, including the Independent Trustees voting separately, unanimously approved the continuation of the Agreements.
| 21 |
Table of Contents
SUPPLEMENTAL INFORMATION(UNAUDITED)
Trustees and Officers Information Table
The following table provides information about the Trustees of the Trust.
| Name and Year of Birth | Term of Office, Position(s) Held and Length of Service* | Principal During Past Five Years | Number of in Fund by Trustees*** | Other Directorships Held by Trustee | ||||
| Independent Trustees | ||||||||
| Bruce W. Ferris† (born 1955) | Trustee | Retired (since 2015); President and CEO, Prudential Annuity Distributors (2013– 2015); Director/Trustee, Advanced Series Trust, Prudential Series Fund and Prudential’s Gibraltar Fund, Inc. (2013– 2015); Senior Vice President, Prudential Annuities (2008–2015). | 16 | None. | ||||
| Theda R. Haber† (born 1954) | Trustee | Adjunct Assistant Professor of Law, UC Hastings College of Law (since 2013); Member of the Board of Directors, Fairholme Trust Company, LLC (since 2015); Attorney, Law Office of Theda R. Haber (since 2014); Visiting Professor of Law, UC Davis School of Law (since 2014); Consultant, Haber & Associates LLC (financial services industry) (since 2012); Advisory Council Chair, Vice Chair, and Member, Advisory Council on Employee Welfare and Pension Benefit Plans (ERISA Advisory Council), U.S. Department of Labor (2009–2011); Managing Director and General Counsel, BlackRock Institutional Trust Company, N.A. (2009-2011); Deputy Global General Counsel, Barclays Global Investors (2006-2009); Managing Director, Barclays Global Investors (1998-2006). | 16 | None. | ||||
| Marshall Lux† (born 1960) | Trustee | Senior Advisor, The Boston Consulting Group (since 2014); Senior Partner and Managing Director, The Boston Consulting Group (2009–2014). | 16 | None. | ||||
| Lisa K. Polsky† (born 1956) | Trustee | Senior Risk Advisor, AQR (investment management) (since 2016); Senior Risk Advisor, Ultra Capital (venture capital) (since 2016); Board Member and Chair of Risk Committee, DeutscheBank IHC (financial services) (since May 2016); Chief Risk Officer, CIT Group Inc. (financial services) (2010–2015); Board Member and Chair of Audit Committee, Piper Jaffray (investment bank) (2007–2016). | 16 | None. | ||||
| John Walters† (born 1962) | Lead Independent Trustee | Board Member, Amerilife Holdings LLC (insurance distribution) (since 2015); Board Member, Stadion Money Management LLC (investment adviser) (since 2011); President and Chief Operating Officer, Hartford Life Insurance Company (2000–2010). | 16 | None. | ||||
| 22 |
Table of Contents
SUPPLEMENTAL INFORMATION(UNAUDITED)
| Name and Year of Birth | Term of Office, Position(s) Held and Length of Service* | Principal During Past Five Years | Number of in Fund by Trustees*** | Other Directorships Held by Trustee | ||||
| Interested Trustees | ||||||||
| Gordon Dinsmore**(born 1952) | Trustee | Senior Vice President, Head of Product and President of Berkshire, The Guardian Life Insurance Company of America. | 16 | None. | ||||
| Marc Costantini**(born 1969) | Chairman and Trustee | Executive Vice President, Group and Worksite Markets, The Guardian Life Insurance Company of America (since 2017); Executive Vice President and Chief Financial Officer, The Guardian Life Insurance Company of America (2014– 2017); Executive Vice President, Manulife Financial prior thereto (various positions from 1990–2014). | 16 | None. | ||||
| * | Each Trustee except for Mr. Dinsmore began service in such capacity in 2016 and serves until his or her successor is elected and qualified or until his or her resignation, death or removal. Mr. Dinsmore has served as a Trustee since November 2017. The business address of each Trustee is 7 Hanover Square, New York, New York 10004. |
| ** | Each of Gordon Dinsmore and Marc Costantini is considered to be an “interested person” of the Trust within the meaning of the 1940 Act because of their affiliation with The Guardian Life Insurance Company of America and/or its affiliates. |
| *** | As of the date of this report, the Trust currently consists of 16 separate Funds. |
| † | Member of the Audit Committee of the Trust. |
The following table provides information about the Officers of the Trust.
| Name and Year of Birth | Position(s) Held and Length of Service* | Principal Occupation(s) During Past Five Years | ||
| Gordon Dinsmore (born 1952) | President and Principal Executive Officer (Since November 2017) | Senior Vice President, Head of Product and President of Berkshire, The Guardian Life Insurance Company of America. | ||
| John H. Walter (born 1962) | Senior Vice President, Treasurer, and Principal Financial and Accounting Officer | Vice President, Chief Financial Officer, Equity Profit Center, The Guardian Life Insurance Company of America. | ||
| Harris Oliner (born 1971) | Senior Vice President and Secretary | Senior Vice President, Corporate Secretary, The Guardian Life Insurance Company of America (since 2015); Senior Vice President, Deputy General Counsel, Corporate Secretary, Voya Financial, Inc. (2013–2014); Managing Director, Senior Counsel, Corporate Secretary, BlackRock, Inc. prior thereto. | ||
| Richard T. Potter (born 1954) | Senior Vice President and Chief Legal Officer | Vice President and Equity Counsel, The Guardian Life Insurance Company of America. | ||
| Philip Stack (born 1964) | Chief Compliance Officer (Since September 2017) | Executive Director, Chief Compliance Officer, Morgan Stanley (2015–2017); Vice President, Morgan Stanley (2013–2015); Vice President, Corporate Audit Group–Compliance, Morgan Stanley prior thereto. | ||
| James R. Anderson (born 1963) | Anti-Money Laundering Officer (Since November 2017) | Second Vice President, Agency and Anti-Money Laundering Compliance, The Guardian Life Insurance Company of America. | ||
| Kathleen M. Moynihan (born 1966) | Senior Counsel | Senior Counsel, The Guardian Life Insurance Company of America. | ||
| Maria Nydia Morrison (born 1958) | Fund Controller | Mutual Fund Controller, The Guardian Life Insurance Company of America (since 2015); Chief Financial Officer/Assistant Operating Officer, St. Francis De Assisi Montessori School (Plaridel, Bulacan), Inc. (Philippines) (2013–2015); Vice President, Bank of New York Mellon prior thereto. | ||
| 23 |
Table of Contents
SUPPLEMENTAL INFORMATION(UNAUDITED)
| Name and Year of Birth | Position(s) Held and Length of Service* | Principal Occupation(s) During Past Five Years | ||
| Sonya L. Crosswell(born 1977) | Assistant Secretary | Assistant Vice President, Assistant Corporate Secretary and Secretary Pro Tem, The Guardian Life Insurance Company of America (since 2014); Vice President, Secretary and Assistant General Counsel, Carver Federal Savings Bank prior thereto. | ||
| * | Unless otherwise indicated, the Officers each began service in such capacity in 2016 and hold office for an indefinite term or until their successors shall have been elected and qualified. The business address of each Officer is 7 Hanover Square, New York, New York 10004. |
| 24 |
Table of Contents
SUPPLEMENTAL INFORMATION(UNAUDITED)
The Statement of Additional Information (“SAI”) includes additional information about the Trust’s Trustees and Officers and is available, without charge, upon request by calling toll-free1-888-GUARDIAN(1-888-482-7342) or by visiting our website at http://guardianvpt.onlineprospectus.net/GuardianVPT/Prospectuses.
Portfolio Holdings and Proxy Voting Procedures
The Fund files its complete schedule of portfolio holdings with the Securities and Exchange Commission for the first and third quarters of each fiscal year as an exhibit to its reports on Form N-Q or FormN-PORT (for filings beginning in April 2019 relating to March 31, 2019 data). The Fund’s Form N-Q or FormN-PORT reports are available on the Securities and Exchange Commission’s website at https://www.sec.gov. The Fund’s Form N-Q or FormN-PORT information is also available, without charge, upon request, by calling toll-free1-888-GUARDIAN(1-888-482-7342) or by visiting our website at http://guardianvpt.onlineprospectus.net/GuardianVPT/
Prospectuses.
Beginning in April 2019, the Fund will cease to disclose its holdings on Form N-Q and will file Form N-PORT with the Securities and Exchange Commission on a monthly
basis, with the information contained on Form N-PORT for the last month of the Fund’s fiscal quarter being made public by the Securities and Exchange Commission 60 days after the end of the Fund’s fiscal quarter.
A description of the policies and procedures that the Fund uses to determine how to vote proxies relating to portfolio securities is included in the SAI. The SAI and information regarding how the Fund voted proxies relating to portfolio securities during the most recent12-month period ended June 30 may be obtained (i) without charge, upon request, by calling toll-free1-888-GUARDIAN(1-888-482-7342) or by visiting our website at http://guardianvpt.onlineprospectus.net/GuardianVPT/
Prospectuses; and (ii) on the Securities and Exchange Commission’s website at https://www.sec.gov.
| 25 |
Table of Contents
This report is transmitted to shareholders only. It is not authorized for use as an offer of sale or a solicitation of an offer to buy shares of the Fund unless accompanied or preceded by the Fund’s current prospectus. Past performance results shown in this report should not be considered a representation of future performance. Investment returns and principal value of shares will fluctuate so that shares, when redeemed, may be worth more or less than their original cost. Statements and other information herein are as dated and are subject to change.

The Guardian Life Insurance Company of America New York, NY 10004-4025
PUB8177
Table of Contents
Guardian Variable
Products Trust
2018
Annual Report
All Data as of December 31, 2018
Guardian Mid Cap Relative Value VIP Fund
Important Notice
Beginning on January 1, 2021, as permitted by regulations adopted by the Securities and Exchange Commission, paper copies of the Fund’s shareholder reports will no longer be sent by mail from The Guardian Insurance & Annuity Company, Inc. (“GIAC”). Instead, GIAC will mail you a notice when copies of the shareholder reports are made available on a website. You will be notified by mail each time a report is posted and provided with a website link to access the report.
If you have already elected to receive shareholder reports electronically, you will not be affected by this change and you need not take any action. If you have not yet elected electronic delivery, at any time, you may elect to receive the Fund’s shareholder reports and certain other communications from GIAC electronically, by going to www.guardianlife.com and registering for e-delivery.
You may instead elect to receive all future shareholder reports in paper free of charge. If you wish to receive paper copies of your shareholder reports, please call GIAC’s Customer Service Office Contact Center at 1-888-GUARDIAN (1-888-482-7342). Your election to receive reports in paper will apply to all the underlying funds available.

| Not FDIC insured. May lose value. No bank guarantee. | www.guardianlife.com |
Table of Contents
TABLE OF CONTENTS
Guardian Mid Cap Relative Value VIP Fund
Except as otherwise specifically stated, all information, including portfolio security positions, is as of December 31, 2018. The views expressed in the Fund Commentary are those of the Fund’s portfolio manager(s) as of the date of this report and are subject to change without notice. They do not necessarily represent the views of Park Avenue Institutional Advisers LLC or asub-adviser. The Fund Commentary may contain some forward-looking statements providing expectations or forecasts of future events as of the date of this report; they do not necessarily relate to historical or current facts. There can be no guarantee that any forward-looking statement will be realized. We undertake no obligation to update forward-looking statements, whether as a result of new information, future events, or otherwise. Any discussions of specific securities should not be considered a recommendation to buy or sell those securities. Fund holdings will vary. Information contained herein has been obtained from sources believed reliable, but is not guaranteed.
Table of Contents
GUARDIAN MID CAP RELATIVE VALUE VIP FUND
FUND COMMENTARY OF WELLS CAPITAL MANAGEMENT INCORPORATED,SUB-ADVISER
Highlights
| • | Guardian Mid Cap Relative Value VIP Fund (the “Fund”) returned-14.48%, underperforming its benchmark, the Russell Midcap® Value Index1 (the “Index”), for the 12 months ended December 31, 2018. The Fund’s underperformance relative to the Index was primarily due to security selection in the energy, consumer staples, and materials sectors. The Fund’s security selection in the health care and financials sectors contributed to relative performance. |
| • | The Index returned-12.29% for the year. The market depreciation was broad across most sectors with energy and consumer discretionary declining the most. |
Market Overview
2018 was a tale of two very different market environments. The first nine months of the year saw growth and momentum strategies significantly outperform. The U.S. equity markets took a dramatic shift for the last three months of the year as volatility increased significantly and concerns surrounding tighter monetary policy actions, potentially peak growth/margins and continued trade tensions worried investors. Mid Cap value stocks saw some of the largest multiples
contraction of any style box during the first nine months of the year, but fared better over the last three months.
The Index sharply declined during the period. The energy, consumer discretionary, and materials sectors faced the most downward pressure, while the more defensive communication services and utilities sectors fared the best, as they were the only sectors in the Index with positive performance during the period.
Portfolio Review
The Fund’s relative performance was negatively impacted primarily by stock selection in the energy, consumer staples, and materials sectors. Security selection in the health care and financials sectors contributed to relative performance.
Outlook
As investors turn the page to 2019, headlines continue to focus on political budget debates, trade issues, and future monetary policy. Investors are also struggling with determining how much growth is left in this current economic cycle. We will continue to execute our process to seek to identify and capitalize on inefficiencies in individual stock prices. We will continue to seek companies that we believe have distinct long-term competitive advantages, flexible balance sheets, and strong, sustainable free-cash-flow generation.
Funds in the Guardian Variable Products Trust are sold by prospectus only. You should carefully consider the investment objectives, risks, charges and expenses of the Funds before making an investment decision. The prospectus contains this and other important information. Please read it carefully before investing or sending money. Please visit our website at http://guardianvpt.onlineprospectus.net/GuardianVPT/Prospectuses or to obtain a printed copy, call 1-888-GUARDIAN(1-888-482-7342).
As with all mutual funds, the value of an investment in the Fund could decline, and you could lose money. Diversification does not guarantee profit or protect against loss, and there can be no assurance that the Fund will achieve its investment objective. The Fund invests primarily in equity securities and therefore exposes you to the general risks of investing in stock markets. Investing inmid-size companies involves risks such as having less publicly available information, higher volatility, and less liquidity than in the case of larger companies. Value stocks may not realize their perceived value and during certain periods the Fund may underperform other equity funds that employ a different style. Investing in a more limited number of issuers and sectors can be subject to greater market fluctuation. Any discussions of specific securities should not be considered a recommendation to buy or sell those securities. Fund holdings will vary.
| 1 | The Russell Midcap® Value Index (the “Index”) is an unmanaged market-capitalization-weighted index that measures the performance of those companies in the Russell Midcap® Index with lowerprice-to-book ratios and lower forecasted growth values. (The Russell Midcap® Index measures the performance of the 800 smallest companies in the Russell 1000® Index, which consists of the 1,000 largest U.S. companies based on total market capitalization.) Index results assume the reinvestment of dividends paid on the stocks constituting the Index. You may not invest in the Index, and, unlike the Fund, the Index does not incur fees or expenses. |
| 1 |
Table of Contents
GUARDIAN MID CAP RELATIVE VALUE VIP FUND
Fund Characteristics (unaudited)
| Total Net Assets: $204,185,383 |
Sector Allocation1 As of December 31, 2018 |
 |
Top Ten Holdings2 As of December 31, 2018 |
| Holding | % of Total Net Assets | |||||
| Brown & Brown, Inc. | 2.96% | |||||
| Ameren Corp. | 2.92% | |||||
| American Electric Power Co., Inc. | 2.73% | |||||
| Sealed Air Corp. | 2.69% | |||||
| Kansas City Southern | 2.65% | |||||
| Fidelity National Information Services, Inc. | 2.62% | |||||
| American Water Works Co., Inc. | 2.61% | |||||
| Republic Services, Inc. | 2.56% | |||||
| Molson Coors Brewing Co., Class B | 2.55% | |||||
| Jacobs Engineering Group, Inc. | 2.52% | |||||
| Total | 26.81% | |||||
| 1 | The Fund’s holdings are allocated to each sector based on the MSCI Global Industry Classification Standard (GICS®). Cash includes short-term investments and net other assets and liabilities. |
| 2 | Portfolio holdings are subject to change and should not be considered a recommendation to buy or sell individual securities. |
| 2 |
Table of Contents
GUARDIAN MID CAP RELATIVE VALUE VIP FUND
Average Annual Total Returns As of December 31, 2018 | ||||||||||||||||||||
| Inception Date | 1 Year | 5 Year | 10 Year | Since Inception | ||||||||||||||||
| Guardian Mid Cap Relative Value VIP Fund | 9/1/2016 | -14.48% | — | — | 1.19% | |||||||||||||||
| Russell Midcap® Value Index | -12.29% | — | — | 2.33% | ||||||||||||||||
Results of a Hypothetical $10,000 Investment As of December 31, 2018 | ||||||||||
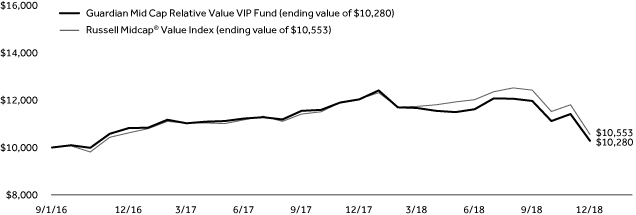 | ||||||||||
The chart above shows the performance of a hypothetical $10,000 investment made on inception date in Guardian Mid Cap Relative Value VIP Fund and the Russell Midcap® Value Index. Index returns do not include the fees and expenses of the Fund, but do include reinvestment of dividends, if any.
Performance quoted represents past performance and does not guarantee or predict future results. Investment return and principal value will fluctuate, so shares, when redeemed, may be worth more or less than their original cost. The Fund’s fees and expenses are detailed in the Financial Highlights section of this report. Fees and expenses are factored into the net asset value of Fund shares and any performance numbers we release. Total return figures include the effect of expense limitations in effect during the periods shown, if applicable; without such limitations, the performance shown would have been lower. Performance results assume the reinvestment of dividends and capital gains. The return figures shown do not reflect the deduction of taxes that a contract owner/policyholder may pay on redemption units. The actual total returns for owners of variable annuity contracts or variable life insurance policies that provide for investment in the Fund will be lower to reflect separate account and contract/policy charges. Current andmonth-end performance information, which may be lower or higher than that cited, is available by calling1-888-GUARDIAN(1-888-482-7342) and is periodically updated on our website: http://guardianlife.com.
| 3 |
Table of Contents
UNDERSTANDING YOUR FUND’S EXPENSES(UNAUDITED)
By investing in the Fund, you incur two types of costs: (1) transaction costs and (2) ongoing costs, including, as applicable, investment advisory fees, distribution and/or service(12b-1) fees and other Fund expenses. The example below is intended to help you understand your ongoing costs (in dollars) of investing in the Fund and to compare these costs with the ongoing costs of investing in other mutual funds.
The example is based on an investment of $1,000 invested at the beginning of the period and held for the entire period from July 1, 2018 to December 31, 2018. The table below shows the Fund’s expenses in two ways:
Expenses based on actual return
This section of the table provides information about actual account values and actual expenses. You may use the information in this section, together with the amount you invested, to estimate the expenses that you paid over the period. Simply divide your account value by $1,000 (for example, an $8,600 account value divided by $1,000 = 8.6), then multiply the result by the number in the section under the heading entitled “Expenses Paid During Period” to estimate the expenses you paid on your account during this period.
Expenses based on hypothetical 5% return for comparison purposes
This section of the table provides information about hypothetical account values and hypothetical expenses based on the Fund’s actual expense ratio and an assumed rate of return of 5% per year before expenses, which is not the Fund’s actual return. The hypothetical account values and expenses may not be used to estimate the actual ending account balance or expenses you paid for the period. You may use this information to compare the ongoing costs of investing in the Fund with the cost of investing in other mutual funds. To do so, compare this 5% hypothetical example with the 5% hypothetical examples that appear in the shareholder reports of the other funds.
Note that the expenses shown in the table are meant to highlight your ongoing costs only and do not reflect any transactional costs, such as sales charges (loads), redemption fees, or exchange fees. Therefore the second section is useful in comparing ongoing costs only, and will not help you determine the relative total costs of owning different funds. If these transactional costs were included, your costs would have been higher. Charges and expenses at the insurance company separate account level are not reflected in the table.
Beginning 7/1/18 | Ending Account Value | Expenses Paid 7/1/18-12/31/18 | Expense Ratio During Period 7/1/18-12/31/18 | |||||||||||
| Based on Actual Return | $1,000.00 | $ | 886.20 | $ | 4.75 | 1.00% | ||||||||
| Based on Hypothetical Return (5% Return Before Expenses) | $1,000.00 | $ | 1,020.16 | $ | 5.09 | 1.00% | ||||||||
| * | Expenses are equal to the Fund’s annualized expense ratio as indicated, multiplied by the average account value over the period, multiplied by 184/365 (to reflect theone-half year period). |
| 4 |
Table of Contents
SCHEDULE OF INVESTMENTS — GUARDIAN MID CAP RELATIVE VALUE VIP FUND
| December 31, 2018 | Shares | Value | ||||||
| Common Stocks – 97.7% |
| |||||||
| Aerospace & Defense – 1.8% |
| |||||||
Harris Corp. | 27,959 | $ | 3,764,679 | |||||
|
| |||||||
| 3,764,679 | ||||||||
| Auto Components – 0.9% |
| |||||||
Aptiv PLC | 29,702 | 1,828,752 | ||||||
|
| |||||||
| 1,828,752 | ||||||||
| Banks – 4.1% |
| |||||||
Fifth Third Bancorp | 93,804 | 2,207,208 | ||||||
PacWest Bancorp | 80,679 | 2,684,997 | ||||||
Regions Financial Corp. | 146,103 | 1,954,858 | ||||||
Zions Bancorporation N.A. | 39,750 | 1,619,415 | ||||||
|
| |||||||
| 8,466,478 | ||||||||
| Beverages – 2.5% |
| |||||||
Molson Coors Brewing Co., Class B | 92,717 | 5,206,987 | ||||||
|
| |||||||
| 5,206,987 | ||||||||
| Building Products – 1.8% |
| |||||||
AO Smith Corp. | 14,217 | 607,066 | ||||||
Owens Corning | 70,666 | 3,107,891 | ||||||
|
| |||||||
| 3,714,957 | ||||||||
| Capital Markets – 1.6% |
| |||||||
Northern Trust Corp. | 37,932 | 3,170,736 | ||||||
|
| |||||||
| 3,170,736 | ||||||||
| Chemicals – 2.2% |
| |||||||
PPG Industries, Inc. | 43,876 | 4,485,443 | ||||||
|
| |||||||
| 4,485,443 | ||||||||
| Commercial Services & Supplies – 3.5% |
| |||||||
Republic Services, Inc. | 72,449 | 5,222,848 | ||||||
Stericycle, Inc.(1) | 50,201 | 1,841,875 | ||||||
|
| |||||||
| 7,064,723 | ||||||||
| Construction & Engineering – 2.5% |
| |||||||
Jacobs Engineering Group, Inc. | 88,073 | 5,148,748 | ||||||
|
| |||||||
| 5,148,748 | ||||||||
| Construction Materials – 1.0% |
| |||||||
Eagle Materials, Inc. | 33,144 | 2,022,778 | ||||||
|
| |||||||
| 2,022,778 | ||||||||
| Containers & Packaging – 6.0% |
| |||||||
International Paper Co. | 77,636 | 3,133,389 | ||||||
Packaging Corp. of America | 42,951 | 3,584,691 | ||||||
Sealed Air Corp. | 157,986 | 5,504,232 | ||||||
|
| |||||||
| 12,222,312 | ||||||||
| Electric Utilities – 3.5% |
| |||||||
American Electric Power Co., Inc. | 74,502 | 5,568,279 | ||||||
FirstEnergy Corp. | 42,567 | 1,598,391 | ||||||
|
| |||||||
| 7,166,670 | ||||||||
| Electrical Equipment – 0.8% |
| |||||||
Acuity Brands, Inc. | 15,090 | 1,734,595 | ||||||
|
| |||||||
| 1,734,595 | ||||||||
| Energy Equipment & Services – 2.1% |
| |||||||
Baker Hughes a GE Co. | 48,271 | 1,037,827 | ||||||
| December 31, 2018 | Shares | Value | ||||||
| Energy Equipment & Services(continued) |
| |||||||
National Oilwell Varco, Inc. | 59,117 | $ | 1,519,307 | |||||
Patterson-UTI Energy, Inc. | 160,487 | 1,661,040 | ||||||
|
| |||||||
| 4,218,174 | ||||||||
| Equity Real Estate Investment – 4.7% |
| |||||||
American Campus Communities, Inc. REIT | 83,779 | 3,467,613 | ||||||
Invitation Homes, Inc. REIT | 164,759 | 3,308,360 | ||||||
Mid-America Apartment Communities, Inc. REIT | 28,604 | 2,737,403 | ||||||
|
| |||||||
| 9,513,376 | ||||||||
| Health Care Equipment & Supplies – 5.6% |
| |||||||
Hologic, Inc.(1) | 38,771 | 1,593,488 | ||||||
STERIS PLC | 25,656 | 2,741,344 | ||||||
Varian Medical Systems, Inc.(1) | 33,878 | 3,838,716 | ||||||
Zimmer Biomet Holdings, Inc. | 30,887 | 3,203,600 | ||||||
|
| |||||||
| 11,377,148 | ||||||||
| Health Care Providers & Services – 3.3% |
| |||||||
AmerisourceBergen Corp. | 18,572 | 1,381,757 | ||||||
Humana, Inc. | 12,030 | 3,446,354 | ||||||
Universal Health Services, Inc., Class B | 17,101 | 1,993,293 | ||||||
|
| |||||||
| 6,821,404 | ||||||||
| Hotels, Restaurants & Leisure – 1.3% |
| |||||||
The Wendy’s Co. | 170,017 | 2,653,965 | ||||||
|
| |||||||
| 2,653,965 | ||||||||
| Household Durables – 1.4% |
| |||||||
Mohawk Industries, Inc.(1) | 23,642 | 2,765,168 | ||||||
|
| |||||||
| 2,765,168 | ||||||||
| Household Products – 1.5% |
| |||||||
Church & Dwight Co., Inc. | 22,085 | 1,452,310 | ||||||
Spectrum Brands Holdings, Inc. | 35,974 | 1,519,901 | ||||||
|
| |||||||
| 2,972,211 | ||||||||
| Industrial Conglomerates – 1.5% |
| |||||||
Carlisle Cos., Inc. | 30,806 | 3,096,619 | ||||||
|
| |||||||
| 3,096,619 | ||||||||
| Insurance – 12.7% |
| |||||||
Arch Capital Group Ltd.(1) | 154,392 | 4,125,354 | ||||||
Brown & Brown, Inc. | 219,092 | 6,038,175 | ||||||
Fidelity National Financial, Inc. | 106,574 | 3,350,687 | ||||||
Loews Corp. | 101,198 | 4,606,533 | ||||||
The Allstate Corp. | 46,889 | 3,874,438 | ||||||
Willis Towers Watson PLC | 25,610 | 3,889,135 | ||||||
|
| |||||||
| 25,884,322 | ||||||||
| IT Services – 6.9% |
| |||||||
Amdocs Ltd. | 66,767 | 3,911,211 | ||||||
Euronet Worldwide, Inc.(1) | 35,435 | 3,627,835 | ||||||
Fidelity National Information Services, Inc. | 52,170 | 5,350,033 | ||||||
Leidos Holdings, Inc. | 24,647 | 1,299,390 | ||||||
|
| |||||||
| 14,188,469 | ||||||||
| The accompanying notes are an integral part of these financial statements. | 5 |
Table of Contents
SCHEDULE OF INVESTMENTS — GUARDIAN MID CAP RELATIVE VALUE VIP FUND
| December 31, 2018 | Shares | Value | ||||||
| Life Sciences Tools & Services – 1.7% |
| |||||||
Charles River Laboratories International, Inc.(1) | 30,458 | $ | 3,447,236 | |||||
|
| |||||||
| 3,447,236 | ||||||||
| Machinery – 3.4% |
| |||||||
Cummins, Inc. | 17,751 | 2,372,244 | ||||||
Deere & Co. | 13,510 | 2,015,287 | ||||||
Stanley Black & Decker, Inc. | 20,979 | 2,512,025 | ||||||
|
| |||||||
| 6,899,556 | ||||||||
| Multiline Retail – 1.6% |
| |||||||
Kohl’s Corp. | 50,134 | 3,325,890 | ||||||
|
| |||||||
| 3,325,890 | ||||||||
| Multi-Utilities – 2.9% |
| |||||||
Ameren Corp. | 91,464 | 5,966,197 | ||||||
|
| |||||||
| 5,966,197 | ||||||||
| Oil, Gas & Consumable Fuels – 4.2% |
| |||||||
Anadarko Petroleum Corp. | 65,434 | 2,868,627 | ||||||
Cimarex Energy Co. | 48,670 | 3,000,505 | ||||||
Hess Corp. | 48,861 | 1,978,871 | ||||||
WPX Energy, Inc.(1) | 67,355 | 764,479 | ||||||
|
| |||||||
| 8,612,482 | ||||||||
| Real Estate Management & Development – 2.1% |
| |||||||
CBRE Group, Inc., Class A(1) | 106,544 | 4,266,022 | ||||||
|
| |||||||
| 4,266,022 | ||||||||
| Road & Rail – 2.7% |
| |||||||
Kansas City Southern | 56,632 | 5,405,525 | ||||||
Ryder System, Inc. | 935 | 45,020 | ||||||
|
| |||||||
| 5,450,545 | ||||||||
| Semiconductors & Semiconductor Equipment – 1.1% |
| |||||||
Analog Devices, Inc. | 14,396 | 1,235,609 | ||||||
MKS Instruments, Inc. | 14,408 | 930,901 | ||||||
|
| |||||||
| 2,166,510 | ||||||||
| December 31, 2018 | Shares | Value | ||||||
| Software – 0.7% |
| |||||||
Check Point Software Technologies Ltd.(1) | 14,346 | $ | 1,472,617 | |||||
|
| |||||||
| 1,472,617 | ||||||||
| Technology Hardware, Storage & Peripherals – 1.5% |
| |||||||
NCR Corp.(1) | 130,881 | 3,020,733 | ||||||
|
| |||||||
| 3,020,733 | ||||||||
| Water Utilities – 2.6% |
| |||||||
American Water Works Co., Inc. | 58,675 | 5,325,930 | ||||||
|
| |||||||
| 5,325,930 | ||||||||
| Total Common Stocks (Cost $224,768,141) |
| 199,442,432 | ||||||
| Principal Amount | Value | |||||||
| Short–Term Investment – 2.3% |
| |||||||
| Repurchase Agreements – 2.3% |
| |||||||
Fixed Income Clearing Corp., 0.50%, dated 12/31/2018, proceeds at maturity value of $4,781,133, due 1/2/2019(2) | $ | 4,781,000 | 4,781,000 | |||||
| Total Repurchase Agreements (Cost $4,781,000) |
| 4,781,000 | ||||||
| Total Investments – 100.0% (Cost $229,549,141) |
| 204,223,432 | ||||||
| Liabilities in excess of other assets – (0.0)% |
| (38,049 | ) | |||||
| Total Net Assets – 100.0% |
| $ | 204,185,383 | |||||
| (1) | Non–income–producing security. |
| (2) | The table below presents collateral for repurchase agreements. |
| Security | Coupon | Maturity Date | Principal Amount | Value | ||||||||||||
| U.S. Treasury Note | 2.875% | 7/31/2025 | $ | 4,755,000 | $ | 4,879,115 | ||||||||||
Legend:
REIT — Real Estate Investment Trust
The following is a summary of the inputs used as of December 31, 2018 in valuing the Fund’s investments. For more information on valuation inputs, please refer to Note 2a of the accompanying Notes to Financial Statements.
| Valuation Inputs | ||||||||||||||||
| Investments in Securities | Level 1 | Level 2 | Level 3 | Total | ||||||||||||
| Common Stocks | $ | 199,442,432 | $ | — | $ | — | $ | 199,442,432 | ||||||||
| Repurchase Agreements | — | 4,781,000 | — | 4,781,000 | ||||||||||||
| Total | $ | 199,442,432 | $ | 4,781,000 | $ | — | $ | 204,223,432 | ||||||||
| 6 | The accompanying notes are an integral part of these financial statements. |
Table of Contents
FINANCIAL INFORMATION — GUARDIAN MID CAP RELATIVE VALUE VIP FUND
For the Year Ended December 31, 2018 | ||||
Investment Income | ||||
Dividends | $ | 2,838,983 | ||
Interest | 22,453 | |||
|
| |||
Total Investment Income | 2,861,436 | |||
|
| |||
Expenses | ||||
Investment advisory fees | 1,194,567 | |||
Distribution fees | 431,502 | |||
Trustees’ and officers’ fees | 102,742 | |||
Professional fees | 68,144 | |||
Custodian and accounting fees | 58,416 | |||
Administrative fees | 44,684 | |||
Transfer agent fees | 17,909 | |||
Shareholder reports | 16,236 | |||
Other expenses | 24,862 | |||
|
| |||
Total Expenses | 1,959,062 | |||
Less: Fees waived | (229,988 | ) | ||
|
| |||
Total Expenses, Net | 1,729,074 | |||
|
| |||
Net Investment Income/(Loss) | 1,132,362 | |||
|
| |||
Realized Gain/(Loss) and Change in Unrealized Appreciation/(Depreciation) on Investments | ||||
Net realized gain/(loss) from investments | 1,377,970 | |||
Net change in unrealized appreciation/(depreciation) on investments | (26,909,351 | ) | ||
|
| |||
Net Loss on Investments | (25,531,381 | ) | ||
|
| |||
Net Decrease in Net Assets Resulting From Operations | $ | (24,399,019 | ) | |
|
| |||
| The accompanying notes are an integral part of these financial statements. | 7 |
Table of Contents
FINANCIAL INFORMATION — GUARDIAN MID CAP RELATIVE VALUE VIP FUND
| For the Year Ended 12/31/18 | For the Year Ended 12/31/17 | |||||||
| ||||||||
Operations | ||||||||
Net investment income/(loss) | $ | 1,132,362 | $ | 167,083 | ||||
Net realized gain/(loss) from investments | 1,377,970 | 1,129,434 | ||||||
Net change in unrealized appreciation/(depreciation) on investments | (26,909,351 | ) | 740,586 | |||||
|
|
|
| |||||
Net Increase/(Decrease) in Net Assets Resulting from Operations | (24,399,019 | ) | 2,037,103 | |||||
|
|
|
| |||||
Capital Share Transactions | ||||||||
Proceeds from sales of shares | 233,892,549 | 5,163,563 | ||||||
Cost of shares redeemed | (18,104,929 | ) | (9,325,050 | ) | ||||
|
|
|
| |||||
Net Increase/(Decrease) in Net Assets Resulting from Capital Share Transactions | 215,787,620 | (4,161,487 | ) | |||||
|
|
|
| |||||
Net Increase/(Decrease) in Net Assets | 191,388,601 | (2,124,384 | ) | |||||
|
|
|
| |||||
Net Assets | ||||||||
Beginning of year | 12,796,782 | 14,921,166 | ||||||
|
|
|
| |||||
End of year | $ | 204,185,383 | $ | 12,796,782 | ||||
|
|
|
| |||||
Other Information: | ||||||||
Shares | ||||||||
Sold | 20,351,298 | 468,111 | ||||||
Redeemed | (1,562,377 | ) | (783,293 | ) | ||||
|
|
|
| |||||
Net Increase/(Decrease) | 18,788,921 | (315,182 | ) | |||||
|
|
|
| |||||
| 8 | The accompanying notes are an integral part of these financial statements. |
Table of Contents
This Page Intentionally Left Blank
| 9 |
Table of Contents
FINANCIAL INFORMATION — GUARDIAN MID CAP RELATIVE VALUE VIP FUND
The Financial Highlights table is intended to help you understand the Fund’s financial performance for the past five years (or, if shorter, the period since inception). Certain information reflects financial results for a single Fund share. The total returns in the table represent the rate that an investor would have earned (or lost) on an investment in the Fund.
Financial Highlights | ||||||||||||||||||||||||
| Per Share Operating Performance | ||||||||||||||||||||||||
| Net Asset Value, Beginning of Period | Net Investment Income(1) | Net Realized and Unrealized Gain/(Loss) | Total Operations | Net Asset Value, End of Period | Total Return(2) | |||||||||||||||||||
Year Ended 12/31/18 | $ | 12.02 | $ | 0.08 | $ | (1.82 | ) | $ | (1.74 | ) | $ | 10.28 | (14.48)% | |||||||||||
Year Ended 12/31/17 | 10.81 | 0.10 | 1.11 | 1.21 | 12.02 | 11.19% | ||||||||||||||||||
Period Ended 12/31/16(4) | 10.00 | 0.03 | 0.78 | 0.81 | 10.81 | 8.10% | (5) | |||||||||||||||||
| 10 | The accompanying notes are an integral part of these financial statements. |
Table of Contents
FINANCIAL INFORMATION — GUARDIAN MID CAP RELATIVE VALUE VIP FUND
| Ratios/Supplemental Data | ||||||||||||||||||||||
| Net Assets, End of Period (000s) | Net Ratio of Expenses to Average Net Assets(3) | Gross Ratio of Expenses to Average Net Assets | Net Ratio of Net Investment Income to Average Net Assets(3) | Gross Ratio of Net Investment Income/ (Loss) to Average Net Assets | Portfolio Turnover Rate | |||||||||||||||||
| $ | 204,185 | 1.00% | 1.14% | 0.66% | 0.52% | 31% | ||||||||||||||||
| 12,797 | 1.09% | 2.09% | 0.87% | (0.13)% | 76% | |||||||||||||||||
| 14,921 | 1.09% | (5) | 2.80% | (5) | 0.93% | (5) | (0.76)% | (5) | 14% | (5) | ||||||||||||
| (1) | Calculated based on the average shares outstanding during the period. |
| (2) | Total returns do not reflect the effects of charges deducted pursuant to the terms of The Guardian Insurance & Annuity Company, Inc.‘s variable contracts. Inclusion of such charges would reduce the total returns for all periods shown. |
| (3) | Net Ratio of Expenses to Average Net Assets and Net Ratio of Net Investment Income to Average Net Assets include the effect of fee waivers and expense limitations. |
| (4) | Commenced operations on September 1, 2016. |
| (5) | Ratios for periods less than one year have been annualized, except for total return and portfolio turnover rate. For the period ended December 31, 2016, certainnon-recurring fees (i.e., audit fees) are not annualized. |
| The accompanying notes are an integral part of these financial statements. | 11 |
Table of Contents
NOTES TO FINANCIAL STATEMENTS — GUARDIAN MID CAP RELATIVE VALUE VIP FUND
December 31, 2018
1. Organization
Guardian Variable Products Trust (the “Trust”), a Delaware statutory trust organized on January 12, 2016, is registered under the Investment Company Act of 1940, as amended (the “1940 Act”), as anopen-end management investment company. The Trust currently has sixteen series. Guardian Mid Cap Relative Value VIP Fund (the “Fund”) is a series of the Trust. The Fund is a diversified fund and commenced operations on September 1, 2016. The financial statements for other series of the Trust are presented in separate reports.
The Trust has authorized an unlimited number of shares of beneficial interest with no par value. Shares are bought and sold at closing net asset value (“NAV”). Shares of the Fund are only sold to certain separate accounts of The Guardian Insurance & Annuity Company, Inc. (“GIAC”) that fund certain variable annuity contracts and variable life insurance policies issued by GIAC. GIAC is a wholly-owned subsidiary of The Guardian Life Insurance Company of America (“Guardian Life”).
The Fund seeks long-term capital appreciation.
2. Significant Accounting Policies
The following is a summary of significant accounting policies followed by the Fund in the preparation of its financial statements. The Fund follows the investment company accounting and reporting guidance of the Financial Accounting Standards Board (“FASB”) Accounting Standards Codification Topic 946 Financial Services – Investment Companies. The following policies are in conformity with accounting principles generally accepted in the United States of America (“GAAP”). The preparation of financial statements in accordance with GAAP requires management to make estimates and assumptions that affect the reported amounts and disclosures in the financial statements. Actual results could differ from those estimates.
a. Investment Valuations Equity securities traded on an exchange other than NASDAQ Stock Market, LLC (“NASDAQ”) are valued at the last reported sale price on the principal exchange or market on which they are traded; or, if there were no sales that day, at the mean between the closing bid and ask prices. Securities traded on the NASDAQ are generally valued at the NASDAQ official closing price, which may not be the last sale price. If the NASDAQ official closing price is not available for a security, that security is generally valued at the
mean between the closing bid and ask prices. Repurchase agreements are carried at cost, which approximates fair value (see Note 5d). Foreign securities are valued in the currencies of the markets in which they trade and then converted to U.S. dollars by the application of foreign exchange rates at the close of the New York Stock Exchange (“NYSE”). Forward foreign currency contracts, if any, are valued at the mean between the bid and ask rates for the specified time interpolated from rates for proximate time periods. Securities for which market quotations are not readily available or for which market quotations may be considered unreliable are valued at their fair values as determined in accordance with policies and procedures adopted by the Board of Trustees.
Under the policies and procedures approved by the Board of Trustees, Park Avenue Institutional Advisers LLC (“Park Avenue”), the Fund’s investment adviser, has established a Fair Valuation Committee to assist the Board of Trustees with the oversight and monitoring of the valuation of the Fund’s investments. This includes monitoring the appropriateness of fair values based on results of ongoing valuation oversight, including but not limited to consideration of security specific events, market events, and pricing vendor and broker-dealer due diligence. The Fair Valuation Committee oversees and carries out the policies for the valuation of investments held in the Fund. The Fair Valuation Committee is responsible for discussing and assessing the potential impacts to the fair values on an ongoing basis, and at least on a quarterly basis with the Board of Trustees.
Securities whose values have been materially affected by events occurring before the Fund’s valuation time but after the close of the securities’ principal exchange or market may be fair valued in accordance with policies and procedures adopted by the Board of Trustees. In addition, the values of the Fund’s investments in foreign securities are generally determined by a pricing service using pricing models designed to estimate likely changes in the values of those securities. Certain foreign equity instruments are valued by applying international fair value factors provided by approved pricing services. The factors seek to adjust the local closing price for movements of local markets post closing, but prior to the time the NAVs are calculated. Valuations reflected in this report are as of the report date. As a result, changes in valuation due to market events and/or issuer related events after the report date and prior to issuance of the report are not reflected herein.
| 12 |
Table of Contents
NOTES TO FINANCIAL STATEMENTS — GUARDIAN MID CAP RELATIVE VALUE VIP FUND
Various inputs are used in determining the valuation of the Fund’s investments. These inputs are summarized in three broad levels listed below.
| • | Level 1 — unadjusted inputs using quoted prices in active markets for identical investments. |
| • | Level 2 — other significant observable inputs, including, but not limited to, quoted prices for similar investments, inputs other than quoted prices that are observable for investments (such as interest rates, prepayment speeds, credit risks, etc.) or other market corroborated inputs. |
| • | Level 3 — significant unobservable inputs (including the Fund’s own assumptions in determining the fair value of investments) |
Inputs may include price information, volatility statistics, specific and broad credit data, liquidity statistics, and other factors. A financial instrument’s level within the fair value hierarchy is based on the lowest level of any input; both individually and in aggregate, that is significant to the fair value measurement. However, the determination of what constitutes “observable” requires significant judgment by the Trust. The Trust considers observable data to be that market data which is readily available, regularly distributed or updated, reliable and verifiable, and provided by independent sources that are actively involved in the relevant market. The inputs or methodology used for valuing securities are not necessarily an indication of the risk associated with investing in those securities. Changes in valuation techniques may result in transfers into or out of a financial instrument’s assigned level within the hierarchy.
The FASB requires reporting entities to make disclosures about purchases, sales, issuances and settlements of Level 3 securities on a gross basis.
The Fund’s policy is to recognize transfers between Level 1, Level 2 and Level 3 at the end of the reporting period. For the year ended December 31, 2018, there were no transfers among any levels.
In determining a financial instrument’s placement within the hierarchy, the Trust separates the Fund’s investment portfolio into two categories: investments and derivatives (e.g., futures). A summary of inputs used to value the Fund’s assets and liabilities carried at fair value as of December 31, 2018 is included in the Schedule of Investments.
Investments Investments whose values are based on quoted market prices in active markets, and are therefore classified within Level 1, include active listed
equities. Investments that trade in markets that are not considered to be active, but are valued based on quoted market prices, dealer quotations or alternative pricing sources supported by observable inputs are classified within Level 2. These include certain U.S. government and sovereign obligations, most government agency securities, investment-grade corporate bonds, certain mortgage products, state, municipal and provincial obligations, and certain foreign equity securities, including securities whose prices may have been affected by events occurring after the close of trading on their principal exchange or market and, as a result, whose values are determined by a pricing service as described above, or securities whose values are otherwise determined using fair valuation methods approved by the Fund’s Board of Trustees.
Investments classified within Level 3 have significant unobservable inputs, as they trade infrequently or not at all. Level 3 investments include, among others, private placement securities. When observable prices are not available for these securities, the Trust uses one or more valuation techniques for which sufficient and reliable data is available. The inputs used by the Trust in estimating the value of Level 3 investments include, for example, the original transaction price, recent transactions in the same or similar instruments, completed or pending third-party transactions in the underlying investment or comparable issuers, subsequent rounds of financing, recapitalizations, and other transactions across the capital structure. Level 3 investments may also be adjusted to reflect illiquidity and/ornon-transferability, with the amount of such discount estimated by the Trust in the absence of market information. Assumptions used by the Trust due to the lack of observable inputs may significantly impact the resulting fair value and therefore the Fund’s results of operations. As of December 31, 2018, the Fund had no securities classified as Level 3.
Derivatives Exchange-traded derivatives, such as futures contracts, exchange-traded option contracts and certain swaps, are typically classified within Level 1 or Level 2 of the fair value hierarchy depending on whether or not they are deemed to be actively traded. Certainnon-exchange-traded derivatives, such as generic forwards, certain swaps and options, have inputs which can generally be corroborated by market data and are therefore classified within Level 2. During the year ended December 31, 2018, the Fund did not hold any derivatives.
b. Securities Transactions Securities transactions are accounted for on the date securities are purchased or
| 13 |
Table of Contents
NOTES TO FINANCIAL STATEMENTS — GUARDIAN MID CAP RELATIVE VALUE VIP FUND
sold (trade date). Realized gains or losses on securities transactions are determined on the basis of specific identification.
c. Foreign Currency Translation The accounting records of the Fund are maintained in U.S. dollars. Investment securities and all other assets and liabilities of the Fund denominated in a foreign currency are generally translated into U.S. dollars at the exchange rates quoted at the close of the NYSE on each business day. The market value of investment securities and other assets and liabilities are translated at the exchange rate as of the valuation date. Purchases and sales of securities, income receipts, and expense payments are translated into U.S. dollars at the exchange rates in effect on the dates of the respective transactions. The Fund does not isolate the portion of the fluctuations on investments resulting from changes in foreign currency exchange rates from the fluctuations in market prices of investments held. Such fluctuations are included in the Net change in net realized and unrealized gain/(loss) from investments on the Statement of Operations.
Reported realized foreign currency gains and losses arise from the disposition of foreign currency, currency gains or losses realized between the trade and settlement dates on securities transactions, and the difference between the amounts of dividends, interest and foreign withholding taxes recorded on the Fund’s books on the transaction date and the U.S. dollar equivalent of the amounts actually received or paid. These reported realized foreign currency gains and losses, if any, are included in Net realized gain/(loss) from foreign currency transactions on the Statement of Operations. Unrealized foreign currency gains and losses arise from changes (due to changes in exchange rates) in the value of foreign currency and other assets and liabilities denominated in foreign currencies, which are held at period end, if any, and are included in Net change in unrealized appreciation/(depreciation) on translation of assets and liabilities in foreign currencies on the Statement of Operations.
d. Foreign Capital Gains Tax The Fund may be subject to foreign taxes on income, gains on investments or currency purchases/repatriation, a portion of which may be recoverable. The Fund will accrue such taxes and recoveries as applicable, based upon their current interpretation of tax rules and regulations that exist in the markets in which they invest.
e. Investment Income Dividend income net of foreign taxes withheld, if any, is generally recorded on the
ex-dividend date. Interest income, which includes amortization/accretion of premium/discount, is determined using the interest income accrual method, and is accrued and recorded daily.
f. Allocation of Income and Expenses Many of the expenses of the Trust can be directly attributed to a specific series of the Trust. Expenses that cannot be directly attributed to a specific series of the Trust are generally apportioned among all the series in the Trust, based on relative net assets. In calculating net asset value per share for each series of the Trust, investment income, realized and unrealized gains and losses, and expenses other than series-specific expenses are allocated daily to each series based upon the proportion of net assets attributable to each series.
3. Transactions with Affiliates
a. Investment Advisory Fee and Expense Limitation Under the terms of the advisory agreement, which, after its two year initial term, is reviewed and approved annually by the Board of Trustees, the Fund pays an investment advisory fee to Park Avenue. Park Avenue is a wholly-owned subsidiary of Guardian Life and receives an investment advisory fee at an annual rate of 0.72% up to $100 million, 0.67% up to $300 million, 0.62% up to $500 million, and 0.60% in excess of $500 million of the Fund’s average daily net assets. The fee is accrued daily and paid monthly.
Park Avenue has contractually agreed through April 30, 2019 to waive certain fees and/or reimburse certain expenses incurred by the Fund to the extent necessary to limit the Fund’s total annual operating expenses after fee waiver and/or expense reimbursement to 1.00% of the Fund’s average daily net assets (excluding, if applicable, any acquired fund fees and expenses, taxes, interest, transaction costs and brokerage commissions, litigation and extraordinary expenses). Prior to April 9, 2018, the expense limitation was 1.09%. The limitation may not be increased or terminated prior to this time without action by the Board of Trustees, may be terminated only upon approval of the Board of Trustees, and is subject to Park Avenue’s recoupment rights. For the year ended December 31, 2018, Park Avenue waived fees and/or paid Fund expenses in the amount of $229,988.
Park Avenue may be entitled to recoupment of previously waived fees and reimbursed expenses from the Fund for three years from the date of the waiver or reimbursement, subject to the expense limitation in effect at the time of the waiver or reimbursement and at the time of the recoupment, if any. Amounts waived or
| 14 |
Table of Contents
NOTES TO FINANCIAL STATEMENTS — GUARDIAN MID CAP RELATIVE VALUE VIP FUND
reimbursed by Park Avenue pursuant to any expense limitation after April 9, 2018 will not be subject to Park Avenue’s recoupment rights. The amount available for potential future recoupment by Park Avenue from the Fund under the Expense Limitation Agreement and the expiration schedule at December 31, 2018 are as follows:
| Potential Recoupment Amounts Expiring | ||||||||||||
Total Potential | 2021 | 2020 | 2019 | |||||||||
| $324,090 | $ | 52,843 | $ | 191,233 | $ | 80,014 | ||||||
Park Avenue has entered into aSub-Advisory Agreement with Wells Capital Management Incorporated (“Wells Capital”). Wells Capital is responsible for providingday-to-day investment advisory services to the Fund, subject to the supervision of Park Avenue and the oversight of the Board of Trustees.Sub-advisory fees are paid by Park Avenue and do not represent a separate or additional expense to the Fund.
b. Compensation of Trustees and Officers Trustees and officers who are interested persons of the Trust, as defined in the 1940 Act, receive no compensation from the Fund, except for the Chief Compliance Officer of the Trust. Trustees of the Trust who are not interested persons of the Trust, and the Chief Compliance Officer, receive compensation and reimbursement of expenses from the Trust.
c. Distribution Fees Park Avenue Securities LLC (“PAS”), a wholly-owned subsidiary of Guardian Life, is the principal underwriter of Fund shares. The Trust has entered into a distribution and service agreement with PAS, which governs the sale and distribution of shares of the Fund. Under a distribution and service plan adopted by the Trust(“12b-1 plan”), PAS is compensated for services in such capacity, including its expenses in connection with the promotion and distribution of shares of the Fund, at an annual rate of 0.25% of the Fund’s average daily net assets. For the year ended December 31, 2018, the Fund paid distribution fees in the amount of $431,502 to PAS.
PAS has directed that certain payments under the12b-1 plan be used to compensate GIAC for shareholder services provided to contract owners.
4. Federal Income Taxes
a. Distributions to Shareholders For federal income tax purposes, the Fund is treated as a disregarded entity
(“DRE”). As a DRE, the Fund is not subject to an entity-level income tax; and any income, gains, losses, deductions, taxes, and credits of the Fund would instead be “passed through” directly to the separate accounts of GIAC that invest in the Fund and retain the same character for U.S. federal income tax purposes. In addition, the Fund is not required to distribute taxable income and capital gains for U.S. federal income tax purposes. Therefore, no dividends and capital gains distributions were paid by the Fund.
5. Investments
a. Investment Purchases and Sales The cost of investments purchased and the proceeds from investments sold (excluding short-term investments) amounted to $261,086,306 and $48,531,897, respectively, for the year ended December 31, 2018. During the year ended December 31, 2018, there were no purchases or sales of U.S. government securities.
b. Foreign Securities Foreign securities investments involve special risks and considerations not typically associated with U.S. investments. These risks include, but are not limited to, currency risk; adverse political, regulatory, social, and economic developments; and less reliable information about issuers. Moreover, securities of some foreign issuers may be less liquid and their prices more volatile than those of comparable U.S. issuers.
c. Industry or Sector Concentration In its normal course of business, the Fund may invest a significant portion of its assets in companies within a limited number of industries or sectors. As a result, the Fund may be subject to a greater risk of loss than that of a fund invested in a wider spectrum of industries or sectors because the stocks of many or all of the companies in the industry, group of industries, sector, or sectors may decline in value due to developments adversely affecting the industry, group of industries, sector, or sectors.
d. Repurchase Agreements The Fund may invest in repurchase agreements to maintain liquidity and earn income over periods of time as short as overnight. The collateral for repurchase agreements is either cash or fully negotiable U.S. government securities (including U.S. government agency securities). Repurchase agreements are fully collateralized (including the interest accrued thereon) and such collateral is marked to market daily while the agreements remain in force. If the value of the collateral falls below the repurchase price plus accrued interest, the Fund will typically require the seller to deposit additional collateral by the next
| 15 |
Table of Contents
NOTES TO FINANCIAL STATEMENTS — GUARDIAN MID CAP RELATIVE VALUE VIP FUND
business day. If the request for additional collateral is not met, or the seller defaults, the Fund maintains the right to sell the collateral (although it may be prevented or delayed from doing so in certain circumstances) and may be required to claim any resulting loss against the seller. Park Avenue monitors the creditworthiness of the seller with which the Fund enters into repurchase agreements.
6. Temporary Borrowings
The Fund, with other funds managed by Park Avenue, is party to a $10 million committed revolving credit facility from State Street Bank and Trust Company for temporary borrowing purposes, including the meeting of redemption requests that otherwise might require the untimely disposition of securities. Interest is calculated based on the higher of the dailyone-month LIBOR rate and the Federal Funds rate plus 1.25% at the time of borrowing. In addition to the interest charged on any borrowings by the Fund, each fund pays a commitment fee of 0.30% per annum on its share of the unused portion of the credit facility. The agreement is in place until December 10, 2019. The Fund did not utilize the credit facility during the year ended December 31, 2018.
7. Indemnifications
Under the Trust’s organizational documents and, in some cases, by contract, its officers and trustees are indemnified against certain liabilities arising out of the
performance of their duties to the Fund. In addition, in the normal course of business, the Fund enters into contracts with its vendors and others that provide general indemnifications. The Fund’s maximum exposure under these arrangements is unknown as this would involve future claims that may be made against the Fund that have not yet occurred. However, based on experience, the Fund expects the risk of loss to be remote.
8. Recent Accounting Pronouncement
On August 17, 2018, the U.S. Securities and Exchange Commission (“SEC”) voted to adopt amendments to certain disclosure requirements that have become redundant, duplicative, overlapping, outdated, or superseded, in light of other SEC disclosure requirements, GAAP, or changes in the information environment. The SEC will also be referring certain SEC disclosure requirements that overlap with, but require information incremental to, GAAP to the FASB for potential incorporation into GAAP. The amendments are intended to facilitate the disclosure of information to investors and simplify compliance without significantly altering the total mix of information provided to investors. As such, the financial statements herein have been updated to conform with these new requirements, which had no effect on the Fund’s net assets or results of operations.
| 16 |
Table of Contents
REPORT OF INDEPENDENT REGISTERED PUBLIC ACCOUNTING FIRM
TotheBoard of Trustees ofGuardian Variable Products TrustandShareholders of
Guardian Mid Cap Relative Value VIP Fund
Opinion on the Financial Statements
We have audited the accompanying statement of assets and liabilities, including the schedule of investments, ofGuardian Mid Cap Relative Value VIP Fund (one of the funds constituting Guardian Variable Products Trust, referred to hereafter as the “Fund”) as of December 31, 2018, the related statement of operations for the year ended December 31, 2018, the statement of changes in net assets for each of the two years in the period ended December 31, 2018, including the related notes,and the financial highlights for each of the periods indicated therein (collectively referred to as the “financial statements”). In our opinion, the financial statements present fairly, in all material respects, the financial position of the Fund as of December 31, 2018, the results of its operations for the year then ended, the changes in its net assets for each of the two years in the period ended December 31, 2018 and the financial highlights for each of the periods indicated therein in conformity with accounting principles generally accepted in the United States of America.
Basis for Opinion
These financial statements are the responsibility of the Fund’s management. Our responsibility is to express an opinion on the Fund’s financial statements based on our audits. We are a public accounting firm registered with the Public Company Accounting Oversight Board (United States) (PCAOB) and are required to be independent with respect to the Fund in accordance with the U.S. federal securities laws and the applicable rules and regulations of the Securities and Exchange Commission and the PCAOB.
We conducted our audits of these financial statements in accordance with the standards of the PCAOB. Those standards require that we plan and perform the audit to obtain reasonable assurance about whether the financial statements are free of material misstatement, whether due to error or fraud.
Our audits included performing procedures to assess the risks of material misstatement of the financial statements, whether due to error or fraud, and performing procedures that respond to those risks. Such procedures included examining, on a test basis, evidence regarding the amounts and disclosures in the financial statements. Our audits also included evaluating the accounting principles used and significant estimates made by management, as well as evaluating the overall presentation of the financial statements. Our procedures included confirmation of securities owned as of December 31, 2018 by correspondence with the custodian and brokers; when replies were not received from brokers, we performed other auditing procedures. We believe that our audits provide a reasonable basis for our opinion.
New York, New York
February 19, 2019
We have served as the auditor of one or more investment companies in Guardian Variable Products Trustsince 2016.
| 17 |
Table of Contents
SUPPLEMENTAL INFORMATION(UNAUDITED)
Approval of Investment Advisory andSub-advisory Agreements
Section 15(c) of the Investment Company Act of 1940, as amended (the “1940 Act”), requires that a fund’s board of trustees annually review and consider the continuation of the fund’s investment advisory andsub-advisory agreements. The continuation of any such agreement must be approved by a vote of a majority of the trustees who are not parties to the agreement or “interested persons” (as defined in the 1940 Act) of a party to the agreement at anin-person meeting of the board called for the purpose of voting on such approval.
At a meeting of the Board of Trustees (the “Board”) of Guardian Variable Products Trust (the “Trust”) held on March27-28, 2018, the Board considered and unanimously voted to approve the continuation of the investment management agreement (the “Management Agreement”) between Park Avenue Institutional Advisers LLC (the “Manager”) and the Trust, on behalf of the following 11 series, Guardian Core Plus Fixed Income VIP Fund, Guardian Diversified Research VIP Fund, Guardian Growth & Income VIP Fund, Guardian Integrated Research VIP Fund, Guardian International Growth VIP Fund, Guardian International Value VIP Fund, Guardian Large Cap Disciplined Growth VIP Fund, Guardian Large Cap Disciplined Value VIP Fund, Guardian Large Cap Fundamental Growth VIP Fund, Guardian Mid Cap Relative Value VIP Fund and Guardian Mid Cap Traditional Growth VIP Fund (the “Funds”). The Board also considered and unanimously voted to approve the continuation of thesub-advisory agreements (the“Sub-advisory Agreements,” collectively with the Management Agreement, the “Agreements”) between the Manager and the following investment advisory firms serving assub-advisers to the Funds, ClearBridge Investments LLC, Wellington Management Company LLP, Massachusetts Financial Services Company, Putnam Investment Management, LLC, Boston Partners Global Investors, Inc., AllianceBernstein L.P., Janus Capital Management LLC, Wells Capital Management Incorporated, J.P. Morgan Investment Management Inc., Lazard Asset Management LLC, and Lord, Abbett & Co. LLC (the“Sub-advisers”). The continuation of the Agreements for aone-year period was unanimously approved by the Trustees who are not parties to the Agreements or “interested persons” (as defined in the 1940 Act) of a party to the Agreements (the “Independent Trustees”).
The Board is responsible for overseeing the management of each Fund. In determining whether to approve the continuation of the Agreements, the Trustees evaluated information and factors that they
considered to be relevant and appropriate through the exercise of their own business judgment. The Trustees considered certain information and factors in light of advice furnished to them by legal counsel to the Trust and, in the case of the Independent Trustees, their independent legal counsel.
In advance of the meeting held on March27-28, 2018, the Trustees received materials and information designed to assist their consideration of the Agreements, including written responses from the Manager and eachSub-adviser to a series of questions and requests for information covering a wide variety of topics provided by independent legal counsel on behalf of the Independent Trustees. Broadridge Financial Solutions, Inc. (“Broadridge”), an independent provider of investment company data, was retained to provide the Trustees with reports on how each Fund’s contractual management fees, actual management fees, overall expense ratios and investment performance compared to those of “peer funds” selected by Broadridge that are offered as investment options underlying variable contracts. The Trustees also received materials and information regarding the legal standards applicable to their consideration of the Agreements and the process and criteria used by the Manager to oversee theSub-advisers. During the course of their deliberations, the Independent Trustees met to discuss and evaluate the Agreements in executive session with their independent legal counsel, outside of the presence of the Trustees who are not Independent Trustees and representatives from Fund management, the Manager or anySub-adviser.
In reaching its decisions to approve the continuation of the Agreements, the Board took into account the materials and information described above as well as other materials and information provided to the Board and discussed with and among the Trustees, including information regarding the Funds furnished to the Board by the Manager throughout the year. Individual Trustees may have given different weight to different factors and information with respect to each Agreement, and the Trustees did not identify any single factor or information that, in isolation, would be controlling in deciding to approve the continuation of the Agreements.
The discussion below is intended to summarize the broad factors that figured prominently in the Board’s decisions to approve the continuation of the Agreements rather than to beall-inclusive. These broad factors included: (i) the nature, extent and quality of the services provided to the Funds by the Manager and theSub-advisers; (ii) the investment performance of the
| 18 |
Table of Contents
SUPPLEMENTAL INFORMATION(UNAUDITED)
Funds; (iii) the fees charged and estimated profitability; (iv) the extent to which economies of scale may exist for a Fund, and the extent to which a Fund may benefit from economies of scale; and (v) any other benefits derived by the Manager or theSub-advisers (or their respective affiliates) from their relationships with the Funds. In addition to considering the above-referenced factors, the Board observed that there are a range of investment options available to variable contract owners who may invest in the Funds, and that these contract owners, having had the opportunity to consider other investment options, may choose to invest or remain invested in the Funds.
Nature, Extent and Quality of Services
The Trustees considered information regarding the nature, extent and quality of services provided to the Funds by the Manager. The Trustees also considered the range of investment advisory services andnon-investment advisory services provided by the Manager, notably coordinating the preparation and filing of various regulatory documents, coordinating the preparation and assembly of Board meeting materials and assisting the Board with certain valuation matters.
The Trustees considered the operation of the Funds in a“manager-of-managers” structure and the responsibilities that the Manager has under this structure, including monitoring and evaluating the performance of theSub-advisers, monitoring theSub-advisers for adherence to the stated investment objectives, strategies, policies and restrictions of the Funds and supervising theSub-advisers with respect to the services that theSub-advisers provide under the Sub-advisory Agreements. The Trustees also considered the process used by the Manager, consistent with this structure, to identify and recommendsub-advisers, and its ability to monitor and overseesub-advisers and recommend replacementsub-advisers, when necessary, and provide other services under the Management Agreement. The Trustees reviewed information regarding the experience and background of the Manager’s key personnel and the Manager’s organizational structure and resources, including investment, legal and administrative capabilities of the Manager. In this regard, the Trustees recognized that the Funds benefit from the Manager’s use of similar resources and capabilities of its affiliates in providing services to the Funds.
The Trustees considered information regarding the nature, extent and quality of services provided to the Funds by theSub-advisers. The Trustees also considered, among other things, the range of
investment advisory services provided by theSub-advisers under the oversight of the Manager. In evaluating these investment advisory services, the Trustees considered, among other things, theSub-advisers’ investment philosophies, styles and/or processes and approach to managing risk. The Trustees received and evaluated information regarding the background, education, expertise and/or experience of the investment professionals that serve as portfolio managers for the Funds and the capabilities, resources and reputations of theSub-advisers.
Based upon these considerations, the Board concluded that it was satisfied with the nature, extent and quality of services provided to the Funds by the Manager and eachSub-adviser.
Investment Performance
The Board considered the investment performance of each Fund. Among other reports, the Board reviewed the performance of the Funds for theone-year and since inception periods compared to a universe of peer funds selected by Broadridge. The Board noted that the Funds had performance records of less than two years and that the Board had reviewed longer performance records of the funds or accounts managed by theSub-advisers with similar strategies as the applicable Fund, when available, when the Board initially approved the Agreements in 2016. The Broadridge report placed the Funds in the following quintiles of the relevant peer universe for theone-year and since inception periods, respectively: Guardian Core Plus Fixed Income VIP Fund (3rd, 3rd), Guardian Diversified Research VIP Fund (2nd, 2nd), Guardian Growth & Income VIP Fund (1st, 1st), Guardian Integrated Research VIP Fund (4th, 5th), Guardian International Growth VIP Fund (3rd, 2nd), Guardian International Value VIP Fund (3rd, 5th), Guardian Large Cap Disciplined Growth VIP Fund (3rd, 4th), Guardian Large Cap Disciplined Value VIP Fund (1st, 1st), Guardian Large Cap Fundamental Growth VIP Fund (5th, 4th), Guardian Mid Cap Relative Value VIP Fund (4th, 3rd) and Guardian Mid Cap Traditional Growth VIP Fund (2nd, 2nd).
The Board considered the investment reports provided by the Manager since commencement of operations of the Funds during quarterly Board meetings. The Board also considered the Manager’s analysis ofSub-adviser performance and the steps taken by the Manager and theSub-advisers to seek to improve performance and the results of those steps.
| 19 |
Table of Contents
SUPPLEMENTAL INFORMATION(UNAUDITED)
In light of the considerations noted above, the Board concluded that it had continued confidence in the Manager’s and theSub-advisers’ overall capabilities to manage the Funds.
Costs and Profitability
The Trustees considered the management fees paid by the Funds to the Manager under the Management Agreement and evaluated the reasonableness of these fees. The Trustees received and reviewed information with respect to the management fees, including the portion of the management fees paid to eachSub-adviser, and the management fees paid by other funds offered as investment options underlying variable contracts within the applicable peer group selected by Broadridge. The Broadridge report placed the Funds in the following quintiles of the relevant expense peer group for the contractual management fees and actual management fees, respectively: Guardian Core Plus Fixed Income VIP Fund (1st, 3rd), Guardian Diversified Research VIP Fund (2nd, 3rd), Guardian Growth & Income VIP Fund (1st, 1st), Guardian Integrated Research VIP Fund (1st, 2nd), Guardian International Growth VIP Fund (1st, 2nd), Guardian International Value VIP Fund (3rd, 2nd), Guardian Large Cap Disciplined Growth VIP Fund (1st, 1st), Guardian Large Cap Disciplined Value VIP Fund (1st, 1st), Guardian Large Cap Fundamental Growth VIP Fund (1st, 1st), Guardian Mid Cap Relative Value VIP Fund (1st, 1st) and Guardian Mid Cap Traditional Growth VIP Fund (3rd, 4th).
The Trustees considered thesub-advisory fees paid under the Sub-advisory Agreements and evaluated the reasonableness of those fees. The Trustees also considered that the fees paid to theSub-advisers are paid by the Manager and not the Funds and that the Manager had negotiated the fees with theSub-advisers atarm’s-length. In addition, the Trustees considered the portion of the management fees paid to eachSub-adviser as compared to the portion retained by the Manager.
The Trustees received and reviewed information in the Broadridge report comparing each Fund’s operating expense ratio to the actual operating expense ratios of a peer group of funds selected by Broadridge. The Trustees considered the Manager’s commitment to limit each Fund’s operating expenses through an expense limitation agreement with the Trust. The Broadridge report placed the Funds in the following quintiles of the relevant expense peer group for the operating expense ratio: Guardian Core Plus Fixed Income VIP Fund (2nd), Guardian Diversified Research VIP Fund (2nd), Guardian Growth & Income VIP Fund
(2nd), Guardian Integrated Research VIP Fund (1st), Guardian International Growth VIP Fund (3rd), Guardian International Value VIP Fund (1st), Guardian Large Cap Disciplined Growth VIP Fund (1st), Guardian Large Cap Disciplined Value VIP Fund (2nd), Guardian Large Cap Fundamental Growth VIP Fund (1st), Guardian Mid Cap Relative Value VIP Fund (1st) and Guardian Mid Cap Traditional Growth VIP Fund (3rd).
Although the Board recognized that the comparisons between the management fees and anticipated operating expenses of the Funds and those of identified peer funds are imprecise, given different terms of agreements and variations in fund strategies, the Trustees found that the comparative information supported their consideration and approval of the management fees and evaluation of operating expenses.
The Trustees reviewed information regarding the Manager’s costs of sponsoring the Funds and estimated profitability of the Funds to the Manager. The Trustees noted that the information contained estimates, such as allocations of expenses. Although the Trustees did not receive specific cost and profitability information from certainSub-advisers, the Trustees primarily considered the cost and profitability information relating to the Manager because the Manager is responsible for payment of thesub-advisory fees and negotiated the fees with theSub-advisers atarm’s-length.
Based on the consideration of the information and factors summarized above, as well as other information and factors deemed relevant by the Trustees, the Trustees concluded that the management andsub-advisory fees were reasonable in light of the nature, extent and quality of services rendered to the Funds by the Manager and theSub-advisers. The Trustees also concluded that the estimated profitability of the Funds to the Manager was acceptable.
Economies of Scale
The Trustees considered the extent to which economies of scale may be shared as assets grow based on current asset levels of the Funds, anticipated asset levels over the next year, the current management andsub-advisory fee rates, the expense limitation arrangements, and any management andsub-advisory fee breakpoints, which reduce fee rates as assets increase. Based on those factors, the Board concluded that it was satisfied with the extent to which any economies of scale would be shared for the benefit of Fund shareholders. The Board noted that it would continue to monitor future growth in each Fund’s assets
| 20 |
Table of Contents
SUPPLEMENTAL INFORMATION(UNAUDITED)
and whether additional steps are required to share appropriately any economies of scale with Fund shareholders.
Ancillary Benefits
The Trustees considered the benefits, other than management fees, that the Manager and/or its affiliates receive because of the Manager’s relationship with the Funds. The Trustees acknowledged that the Funds serve as investment options under variable contracts issued by an affiliate of the Manager that receives fees under those contracts and that Park Avenue Securities LLC, an affiliate of the Manager and principal underwriter of the Funds, and an insurance company affiliated with the Manager receive fees from the Funds under a plan of distribution adopted pursuant to Rule12b-1 under the 1940 Act. The Trustees considered that the Manager and its affiliates may benefit from (i) greater efficiencies in annuity administration and operations and potential cost savings due to a reduction in the number of unaffiliated funds available as annuity contract investment options, and (ii) increased dividends-received deductions due to the Funds’ status under the
tax laws as disregarded entities. In addition, the Trustees considered the potential benefits, other thansub-advisory fees, that theSub-advisers and their affiliates receive because of their relationships with the Funds, including the potential increased ability to use soft dollars consistent with Trust policies and other benefits from increases in assets under management. The Trustees concluded that benefits that accrue to the Manager and its affiliates are reasonable and the benefits that accrue to theSub-advisers and their affiliates are consistent with those expected for asub-adviser to a mutual fund such as the applicable Fund.
Conclusion
Based on a comprehensive consideration and evaluation of all of the information and factors summarized above, among others, the Board voting as a whole, including the Independent Trustees voting separately, unanimously approved the continuation of the Agreements.
| 21 |
Table of Contents
SUPPLEMENTAL INFORMATION(UNAUDITED)
Trustees and Officers Information Table
The following table provides information about the Trustees of the Trust.
| Name and Year of Birth | Term of Office, Position(s) Held and Length of Service* | Principal During Past Five Years | Number of in Fund by Trustees*** | Other Directorships Held by Trustee | ||||
| Independent Trustees | ||||||||
| Bruce W. Ferris† (born 1955) | Trustee | Retired (since 2015); President and CEO, Prudential Annuity Distributors (2013–2015); Director/Trustee, Advanced Series Trust, Prudential Series Fund and Prudential’s Gibraltar Fund, Inc. (2013–2015); Senior Vice President, Prudential Annuities (2008–2015). | 16 | None. | ||||
| Theda R. Haber† (born 1954) | Trustee | Adjunct Assistant Professor of Law, UC Hastings College of Law (since 2013); Member of the Board of Directors, Fairholme Trust Company, LLC (since 2015); Attorney, Law Office of Theda R. Haber (since 2014); Visiting Professor of Law, UC Davis School of Law (since 2014); Consultant, Haber & Associates LLC (financial services industry) (since 2012); Advisory Council Chair, Vice Chair, and Member, Advisory Council on Employee Welfare and Pension Benefit Plans (ERISA Advisory Council), U.S. Department of Labor (2009–2011); Managing Director and General Counsel, BlackRock Institutional Trust Company, N.A. (2009–2011); Deputy Global General Counsel, Barclays Global Investors (2006-2009); Managing Director, Barclays Global Investors (1998–2006). | 16 | None. | ||||
| Marshall Lux† (born 1960) | Trustee | Senior Advisor, The Boston Consulting Group (since 2014); Senior Partner and Managing Director, The Boston Consulting Group (2009–2014). | 16 | None. | ||||
| Lisa K. Polsky† (born 1956) | Trustee | Senior Risk Advisor, AQR (investment management) (since 2016); Senior Risk Advisor, Ultra Capital (venture capital) (since 2016); Board Member and Chair of Risk Committee, DeutscheBank IHC (financial services) (since May 2016); Chief Risk Officer, CIT Group Inc. (financial services) (2010–2015); Board Member and Chair of Audit Committee, Piper Jaffray (investment bank) (2007–2016). | 16 | None. | ||||
| John Walters† (born 1962) | Lead Independent Trustee | Board Member, Amerilife Holdings LLC (insurance distribution) (since 2015); Board Member, Stadion Money Management LLC (investment adviser) (since 2011); President and Chief Operating Officer, Hartford Life Insurance Company (2000–2010). | 16 | None. | ||||
| 22 |
Table of Contents
SUPPLEMENTAL INFORMATION(UNAUDITED)
| Name and Year of Birth | Term of Office, Position(s) Held and Length of Service* | Principal During Past Five Years | Number of in Fund by Trustees*** | Other Directorships Held by Trustee | ||||
| Interested Trustees | ||||||||
| Gordon Dinsmore** (born 1952) | Trustee | Senior Vice President, Head of Product and President of Berkshire, The Guardian Life Insurance Company of America. | 16 | None. | ||||
| Marc Costantini** (born 1969) | Chairman and Trustee | Executive Vice President, Group and Worksite Markets, The Guardian Life Insurance Company of America (since 2017); Executive Vice President and Chief Financial Officer, The Guardian Life Insurance Company of America (2014– 2017); Executive Vice President, Manulife Financial prior thereto (various positions from 1990–2014). | 16 | None. | ||||
| * | Each Trustee except for Mr. Dinsmore began service in such capacity in 2016 and serves until his or her successor is elected and qualified or until his or her resignation, death or removal. Mr. Dinsmore has served as a Trustee since November 2017. The business address of each Trustee is 7 Hanover Square, New York, New York 10004. |
| ** | Each of Gordon Dinsmore and Marc Costantini is considered to be an “interested person” of the Trust within the meaning of the 1940 Act because of their affiliation with The Guardian Life Insurance Company of America and/or its affiliates. |
| *** | As of the date of this report, the Trust currently consists of 16 separate Funds. |
| † | Member of the Audit Committee of the Trust. |
The following table provides information about the Officers of the Trust.
| Name and Year of Birth | Position(s) Held and Length of Service* | Principal Occupation(s) During Past Five Years | ||
| Gordon Dinsmore (born 1952) | President and Principal Executive Officer (Since November 2017) | Senior Vice President, Head of Product and President of Berkshire, The Guardian Life Insurance Company of America. | ||
| John H. Walter (born 1962) | Senior Vice President, Treasurer, and Principal Financial and Accounting Officer | Vice President, Chief Financial Officer, Equity Profit Center, The Guardian Life Insurance Company of America. | ||
| Harris Oliner (born 1971) | Senior Vice President and Secretary | Senior Vice President, Corporate Secretary, The Guardian Life Insurance Company of America (since 2015); Senior Vice President, Deputy General Counsel, Corporate Secretary, Voya Financial, Inc. (2013–2014); Managing Director, Senior Counsel, Corporate Secretary, BlackRock, Inc. prior thereto. | ||
| Richard T. Potter (born 1954) | Senior Vice President and Chief Legal Officer | Vice President and Equity Counsel, The Guardian Life Insurance Company of America. | ||
| Philip Stack (born 1964) | Chief Compliance Officer (Since September 2017) | Executive Director, Chief Compliance Officer, Morgan Stanley (2015–2017); Vice President, Morgan Stanley (2013–2015); Vice President, Corporate Audit Group–Compliance, Morgan Stanley prior thereto. | ||
| James R. Anderson (born 1963) | Anti-Money Laundering Officer (Since November 2017) | Second Vice President, Agency and Anti-Money Laundering Compliance, The Guardian Life Insurance Company of America. | ||
| Kathleen M. Moynihan (born 1966) | Senior Counsel | Senior Counsel, The Guardian Life Insurance Company of America. | ||
| Maria Nydia Morrison (born 1958) | Fund Controller | Mutual Fund Controller, The Guardian Life Insurance Company of America (since 2015); Chief Financial Officer/Assistant Operating Officer, St. Francis De Assisi Montessori School (Plaridel, Bulacan), Inc. (Philippines) (2013–2015); Vice President, Bank of New York Mellon prior thereto. | ||
| 23 |
Table of Contents
SUPPLEMENTAL INFORMATION(UNAUDITED)
| Name and Year of Birth | Position(s) Held and Length of Service* | Principal Occupation(s) During Past Five Years | ||
Sonya L. Crosswell (born 1977) | Assistant Secretary | Assistant Vice President, Assistant Corporate Secretary and Secretary Pro Tem, The Guardian Life Insurance Company of America (since 2014); Vice President, Secretary and Assistant General Counsel, Carver Federal Savings Bank prior thereto. | ||
| * | Unless otherwise indicated, the Officers each began service in such capacity in 2016 and hold office for an indefinite term or until their successors shall have been elected and qualified. The business address of each Officer is 7 Hanover Square, New York, New York 10004. |
| 24 |
Table of Contents
SUPPLEMENTAL INFORMATION(UNAUDITED)
The Statement of Additional Information (“SAI”) includes additional information about the Trust’s Trustees and Officers and is available, without charge, upon request by calling toll-free1-888-GUARDIAN(1-888-482-7342) or by visiting our website at http://guardianvpt.onlineprospectus.net/GuardianVPT/Prospectuses.
Portfolio Holdings and Proxy Voting Procedures
The Fund files its complete schedule of portfolio holdings with the Securities and Exchange Commission for the first and third quarters of each fiscal year as an exhibit to its reports on Form N-Q or FormN-PORT (for filings beginning in April 2019 relating to March 31, 2019 data). The Fund’s Form N-Q or FormN-PORT reports are available on the Securities and Exchange Commission’s website at https://www.sec.gov. The Fund’s Form N-Q or FormN-PORT information is also available, without charge, upon request, by calling toll-free1-888-GUARDIAN(1-888-482-7342) or by visiting our website at http://guardianvpt.onlineprospectus.net/GuardianVPT/
Prospectuses.
Beginning in April 2019, the Fund will cease to disclose its holdings on Form N-Q and will file Form N-PORT with the Securities and Exchange Commission on a monthly
basis, with the information contained on Form N-PORT for the last month of the Fund’s fiscal quarter being made public by the Securities and Exchange Commission 60 days after the end of the Fund’s fiscal quarter.
A description of the policies and procedures that the Fund uses to determine how to vote proxies relating to portfolio securities is included in the SAI. The SAI and information regarding how the Fund voted proxies relating to portfolio securities during the most recent12-month period ended June 30 may be obtained (i) without charge, upon request, by calling toll-free1-888-GUARDIAN(1-888-482-7342) or by visiting our website at http://guardianvpt.onlineprospectus.net/GuardianVPT/
Prospectuses; and (ii) on the Securities and Exchange Commission’s website at https://www.sec.gov.
| 25 |
Table of Contents
This report is transmitted to shareholders only. It is not authorized for use as an offer of sale or a solicitation of an offer to buy shares of the Fund unless accompanied or preceded by the Fund’s current prospectus. Past performance results shown in this report should not be considered a representation of future performance. Investment returns and principal value of shares will fluctuate so that shares, when redeemed, may be worth more or less than their original cost. Statements and other information herein are as dated and are subject to change.

The Guardian Life Insurance Company of America New York, NY 10004-4025
PUB8176
Table of Contents
Guardian Variable
Products Trust
2018
Annual Report
All Data as of December 31, 2018
Guardian International Growth VIP Fund
Important Notice
Beginning on January 1, 2021, as permitted by regulations adopted by the Securities and Exchange Commission, paper copies of the Fund’s shareholder reports will no longer be sent by mail from The Guardian Insurance & Annuity Company, Inc. (“GIAC”). Instead, GIAC will mail you a notice when copies of the shareholder reports are made available on a website. You will be notified by mail each time a report is posted and provided with a website link to access the report.
If you have already elected to receive shareholder reports electronically, you will not be affected by this change and you need not take any action. If you have not yet elected electronic delivery, at any time, you may elect to receive the Fund’s shareholder reports and certain other communications from GIAC electronically, by going to www.guardianlife.com and registering fore-delivery.
You may instead elect to receive all future shareholder reports in paper free of charge. If you wish to receive paper copies of your shareholder reports, please call GIAC’s Customer Service Office Contact Center at1-888-GUARDIAN(1-888-482-7342). Your election to receive reports in paper will apply to all the underlying funds available.

| Not FDIC insured. May lose value. No bank guarantee. | www.guardianlife.com |
Table of Contents
Guardian International Growth VIP Fund
| 1 | ||||
| 3 | ||||
| 4 | ||||
| 6 | ||||
Financial Information | ||||
| Schedule of Investments | 7 | |||
| Statement of Assets and Liabilities | 9 | |||
| Statement of Operations | 9 | |||
| Statements of Changes in Net Assets | 10 | |||
| Financial Highlights | 12 | |||
| Notes to Financial Statements | 14 | |||
| Report of Independent Registered Public Accounting Firm | 19 | |||
Supplemental Information | ||||
| Approval of Investment Advisory andSub-advisory Agreements | 20 | |||
| Trustees and Officers Information Table | 24 | |||
| Portfolio Holdings and Proxy Voting Procedures | 27 | |||
Except as otherwise specifically stated, all information, including portfolio security positions, is as of December 31, 2018. The views expressed in the Fund Commentary are those of the Fund’s portfolio manager(s) as of the date of this report and are subject to change without notice. They do not necessarily represent the views of Park Avenue Institutional Advisers LLC or asub-adviser. The Fund Commentary may contain some forward-looking statements providing expectations or forecasts of future events as of the date of this report; they do not necessarily relate to historical or current facts. There can be no guarantee that any forward-looking statement will be realized. We undertake no obligation to update forward-looking statements, whether as a result of new information, future events, or otherwise. Any discussions of specific securities should not be considered a recommendation to buy or sell those securities. Fund holdings will vary. Information contained herein has been obtained from sources believed reliable, but is not guaranteed.
Table of Contents
GUARDIAN INTERNATIONAL GROWTH VIP FUND
FUND COMMENTARY OF J.P. MORGAN INVESTMENT MANAGEMENT, INC.,SUB-ADVISER
Highlights
| • | Guardian International Growth VIP Fund (the “Fund”) returned-18.79, underperforming its benchmark, the MSCI® EAFE® Growth Index1 (the “Index”), for the 12 months ended December 31, 2018. The Fund’s underperformance relative to the Index was primarily due to security selection, especially in the health care and consumer discretionary sectors. Stock selection in the financials and materials sectors were the largest contributors to the Fund’s performance. |
| • | The Index returned -12.83% for the year. This performance was held back by the materials, industrials and information technology sectors. |
Market Overview
Global equity markets struggled in 2018, as returns were negative for almost all countries and sectors, even though earnings growth was positive across all regions. After a strong start to the year, equities started to struggle outside the U.S. as the blistering pace of gross domestic product growth from 2017 started to slow, and as the U.S. dollar strengthened, which triggered funding difficulties in emerging markets and outright currency crises in Argentina and Turkey. More importantly internationally, however, was President Trump’s announcement of trade measures against the U.S.’s major partners, which had a discernible effect on trade volumes and corporate sentiment as companies struggled to plan for the impact on global supply chains. As sentiment deteriorated, investors worried about the continued tightening of short-term rates by the U.S. Federal Reserve (the “Fed”), even though in real terms rates are still near historical lows. There were also concerns that the Fed’s shrinkage of its balance sheet would cause liquidity to dry up internationally. As concerns about U.S. growth mounted, the U.S. stock market was affected by the international malaise and started to correct, with the slide accelerating as the final quarter drew to a close.
Portfolio Review
In a poor period for international equities, the Fund’s underperformance was driven primarily by stock selection. The Fund’s lack of exposure to more defensive areas of the market, such as utilities, consumer staples and communication services, also hurt performance. Throughout the period, we maintained a preference for more cyclical sectors, such as information technology and financials, where we found individual stocks with attractive valuations and strong earnings growth on a forward-looking basis.
Outlook
After falling almost 20% from the highs in September 2018 was the first negative year for equity markets in this cycle, ending one of the longest stretches of positive calendar year returns in recent history. Despite economic growth remaining above trend and strong corporate earnings growth over the year, politics, global trade tensions, tightening monetary policy and moderating economic growth dominated the market narrative. As we move into 2019, these issues still remain. Although there are signs of high levels of debt building in many parts of the U.S. corporate sector, and technological change and disruption facing many industries, we believe corporate profitability remains healthy and, although economic momentum has certainly slowed, we believe it remains broad-based enough to support earnings globally. For the first time in many years, valuations are both below historic averages and attractive relative to cash and bonds. A key risk, in our view, is that geopolitical uncertainty, which has already started to weigh on corporate investment and hiring decisions, escalates further and investors will be closely monitoring statements from company management teams in the upcoming corporate earnings season for signs of an impact.
| 1 | MSCI® EAFE® Growth Index (the “Index”), which is a subset of the MSCI® EAFE® Index. The MSCI® EAFE® Index (Europe, Australasia, and Far East) is a free float-adjusted market capitalization index that is designed to measure the equity market performance of developed markets, excluding the U.S. and Canada. Index results assume the reinvestment of dividends paid on the stocks constituting the Index. You may not invest in the Index and, unlike the Fund, the Index does not incur fees or expenses. |
| 1 |
Table of Contents
GUARDIAN INTERNATIONAL GROWTH VIP FUND
Funds in the Guardian Variable Products Trust are sold by prospectus only. You should carefully consider the investment objectives, risks, charges and expenses of the Funds before making an investment decision. The prospectus contains this and other important information. Please read it carefully before investing or sending money. Please visit our website at http://guardianvpt.onlineprospectus.net/GuardianVPT/Prospectuses or to obtain a printed copy, call1-888-GUARDIAN(1-888-482-7342).
As with all mutual funds, the value of an investment in the Fund could decline, and you could lose money. Diversification does not guarantee profit or protect against loss, and there can be no assurance that the Fund will achieve its investment objective. The Fund invests primarily in equity securities and therefore exposes you to the general risks of investing in stock markets. Investments in growth companies may be highly volatile. Growth stocks may not realize their perceived growth potential and during certain periods the Fund may underperform other equity funds that employ a different style. Investing in large-capitalization companies involves risks such as having low growth rates, and slow responsiveness to competitive challenges or opportunities than in the case of smaller companies. International investing involves special risks, which include changes in currency rates, foreign taxation and differences in auditing standards and securities regulations, political uncertainty and greater volatility. Foreign securities are subject to political, regulatory, economic, and exchange-rate risks not present in domestic investments. These risks are even greater when investing in emerging markets. Derivative transactions can create leverage and may be highly volatile. It is possible that a derivative transaction will result in a loss greater than the principal amount invested and the Fund may not be able to close out a derivative transaction at a favorable time or price. Investing in a more limited number of issuers and sectors can be subject to greater market fluctuation. Any discussions of specific securities should not be considered a recommendation to buy or sell those securities. Fund holdings will vary.
| 2 |
Table of Contents
GUARDIAN INTERNATIONAL GROWTH VIP FUND
Fund Characteristics (unaudited)
| Total Net Assets: $131,136,625 |
Geographic Region Allocation1 As of December 31, 2018 |
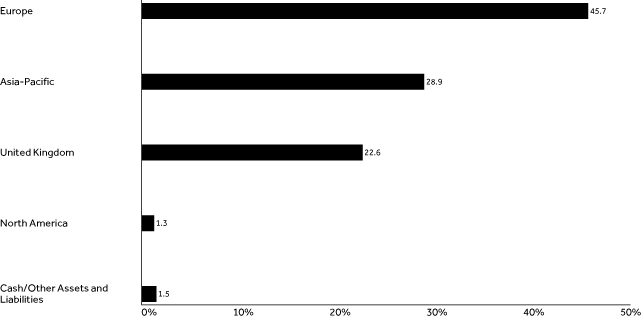 |
Sector Allocation2 As of December 31, 2018 |
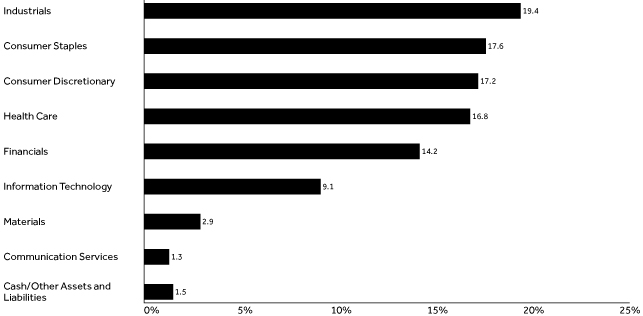 |
| 3 |
Table of Contents
GUARDIAN INTERNATIONAL GROWTH VIP FUND
Top Ten Holdings1 As of December 31, 2018 | ||||||
| Holding | Country | % of Total Net Assets | ||||
| Nestle S.A. (Reg S) | Switzerland | 4.97% | ||||
| Unilever PLC | United Kingdom | 4.70% | ||||
| Roche Holding AG | Switzerland | 4.05% | ||||
| AIA Group Ltd. | Hong Kong | 3.68% | ||||
| SAP SE | Germany | 3.08% | ||||
| Novo Nordisk A/S, Class B | Denmark | 2.88% | ||||
| Novartis AG (Reg S) | Switzerland | 2.72% | ||||
| Diageo PLC | United Kingdom | 2.67% | ||||
| AstraZeneca PLC | United Kingdom | 2.44% | ||||
| LVMH Moet Hennessy Louis Vuitton SE | France | 2.43% | ||||
| Total | 33.62% | |||||
| 1 | Portfolio holdings are subject to change and should not be considered a recommendation to buy or sell individual securities. Cash includes short-term investments and net other assets and liabilities. |
| 2 | The Fund’s holdings are allocated to each sector based on the MSCI Global Industry Classification Standard (GICS®). Cash includes short-term investments and net other assets and liabilities. |
Average Annual Total Returns As of December 31, 2018 | ||||||||||||||||||||
| Inception Date | 1 Year | 5 Year | 10 Year | Since Inception | ||||||||||||||||
| Guardian International Growth VIP Fund | 9/1/2016 | -18.79% | — | — | 1.02% | |||||||||||||||
| MSCI® EAFE® Growth Index | -12.83% | — | — | 3.01% | ||||||||||||||||
Results of a Hypothetical $10,000 Investment As of December 31, 2018 | ||||||||||
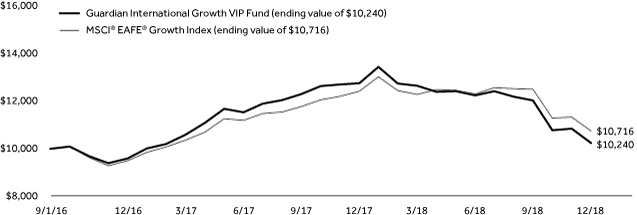 | ||||||||||
The chart above shows the performance of a hypothetical $10,000 investment made on inception date in Guardian International Growth VIP Fund and the MSCI® EAFE® Growth Index. Index returns do not include the fees and expenses of the Fund, but do include reinvestment of dividends, if any.
| 4 |
Table of Contents
GUARDIAN INTERNATIONAL GROWTH VIP FUND
Performance quoted represents past performance and does not guarantee or predict future results. Investment return and principal value will fluctuate, so shares, when redeemed, may be worth more or less than their original cost. The Fund’s fees and expenses are detailed in the Financial Highlights section of this report. Fees and expenses are factored into the net asset value of Fund shares and any performance numbers we release. Total return figures include the effect of expense limitations in effect during the periods shown, if applicable; without such limitations, the performance shown would have been lower. Performance results assume the reinvestment of dividends and capital gains. The return figures shown do not reflect the deduction of taxes that a contract owner/policyholder may pay on redemption units. The actual total returns for owners of variable annuity contracts or variable life insurance policies that provide for investment in the Fund will be lower to reflect separate account and contract/policy charges. Current andmonth-end performance information, which may be lower or higher than that cited, is available by calling1-888-GUARDIAN(1-888-482-7342) and is periodically updated on our website: http://guardianlife.com.
| 5 |
Table of Contents
UNDERSTANDING YOUR FUND’S EXPENSES(UNAUDITED)
By investing in the Fund, you incur two types of costs: (1) transaction costs and (2) ongoing costs, including, as applicable, investment advisory fees, distribution and/or service(12b-1) fees and other Fund expenses. The example below is intended to help you understand your ongoing costs (in dollars) of investing in the Fund and to compare these costs with the ongoing costs of investing in other mutual funds.
The example is based on an investment of $1,000 invested at the beginning of the period and held for the entire period from July 1, 2018 to December 31, 2018. The table below shows the Fund’s expenses in two ways:
Expenses based on actual return
This section of the table provides information about actual account values and actual expenses. You may use the information in this section, together with the amount you invested, to estimate the expenses that you paid over the period. Simply divide your account value by $1,000 (for example, an $8,600 account value divided by $1,000 = 8.6), then multiply the result by the number in the section under the heading entitled “Expenses Paid During Period” to estimate the expenses you paid on your account during this period.
Expenses based on hypothetical 5% return for comparison purposes
This section of the table provides information about hypothetical account values and hypothetical expenses based on the Fund’s actual expense ratio and an assumed rate of return of 5% per year before expenses, which is not the Fund’s actual return. The hypothetical account values and expenses may not be used to estimate the actual ending account balance or expenses you paid for the period. You may use this information to compare the ongoing costs of investing in the Fund with the cost of investing in other mutual funds. To do so, compare this 5% hypothetical example with the 5% hypothetical examples that appear in the shareholder reports of the other funds.
Note that the expenses shown in the table are meant to highlight your ongoing costs only and do not reflect any transactional costs, such as sales charges (loads), redemption fees, or exchange fees. Therefore the second section is useful in comparing ongoing costs only, and will not help you determine the relative total costs of owning different funds. If these transactional costs were included, your costs would have been higher. Charges and expenses at the insurance company separate account level are not reflected in the table.
Beginning 7/1/18 | Ending Account Value | Expenses Paid During Period* 7/1/18-12/31/18 | Expense Ratio During Period 7/1/18-12/31/18 | |||||||||||
| Based on Actual Return | $1,000.00 | $ | 844.90 | $ | 5.49 | 1.18% | ||||||||
| Based on Hypothetical Return (5% Return Before Expenses) | $1,000.00 | $ | 1,019.26 | $ | 6.01 | 1.18% | ||||||||
| * | Expenses are equal to the Fund’s annualized expense ratio as indicated, multiplied by the average account value over the period, multiplied by 184/365 (to reflect theone-half year period). |
| 6 |
Table of Contents
SCHEDULE OF INVESTMENTS — GUARDIAN INTERNATIONAL GROWTH VIP FUND
| December 31, 2018 | Shares | Value | ||||||
| Common Stocks – 98.5% |
| |||||||
| Cayman Islands – 1.3% |
| |||||||
Tencent Holdings Ltd. | 44,100 | $ | 1,748,081 | |||||
|
| |||||||
| 1,748,081 | ||||||||
| China – 1.1% |
| |||||||
Ping An Insurance Group Co. of China Ltd., Class H | 165,000 | 1,448,797 | ||||||
|
| |||||||
| 1,448,797 | ||||||||
| Denmark – 4.2% |
| |||||||
Genmab A/S(1) | 10,470 | 1,715,789 | ||||||
Novo Nordisk A/S, Class B | 82,044 | 3,771,375 | ||||||
|
| |||||||
| 5,487,164 | ||||||||
| France – 6.9% |
| |||||||
Accor S.A. | 31,808 | 1,348,907 | ||||||
EssilorLuxottica S.A. | 17,320 | 2,187,034 | ||||||
LVMH Moet Hennessy Louis Vuitton SE | 10,868 | 3,193,516 | ||||||
Safran S.A. | 19,822 | 2,381,417 | ||||||
|
| |||||||
| 9,110,874 | ||||||||
| Germany – 10.8% |
| |||||||
adidas AG | 11,090 | 2,317,488 | ||||||
Bayer AG (Reg S) | 18,359 | 1,273,034 | ||||||
Continental AG | 11,633 | 1,608,591 | ||||||
Delivery Hero SE(1)(2) | 47,348 | 1,758,422 | ||||||
Deutsche Boerse AG | 15,299 | 1,839,816 | ||||||
SAP SE | 40,506 | 4,034,790 | ||||||
Zalando SE(1)(2) | 50,470 | 1,297,025 | ||||||
|
| |||||||
| 14,129,166 | ||||||||
| Hong Kong – 3.7% |
| |||||||
AIA Group Ltd. | 586,000 | 4,820,587 | ||||||
|
| |||||||
| 4,820,587 | ||||||||
| India – 1.5% |
| |||||||
HDFC Bank Ltd., ADR | 18,951 | 1,963,134 | ||||||
|
| |||||||
| 1,963,134 | ||||||||
| Ireland – 2.3% |
| |||||||
Linde PLC(1) | 11,165 | 1,772,856 | ||||||
Ryanair Holdings PLC, ADR(1) | 17,703 | 1,262,932 | ||||||
|
| |||||||
| 3,035,788 | ||||||||
| Italy – 1.2% |
| |||||||
FinecoBank Banca Fineco S.p.A. | 152,945 | 1,539,097 | ||||||
|
| |||||||
| 1,539,097 | ||||||||
| Japan – 19.7% |
| |||||||
Asahi Group Holdings Ltd. | 52,200 | 2,038,903 | ||||||
Daikin Industries Ltd. | 18,300 | 1,925,729 | ||||||
FANUC Corp. | 9,800 | 1,473,309 | ||||||
Keyence Corp. | 6,000 | 3,023,884 | ||||||
Makita Corp. | 44,400 | 1,572,274 | ||||||
Nidec Corp. | 17,800 | 2,039,964 | ||||||
Nitori Holdings Co. Ltd. | 10,100 | 1,254,582 | ||||||
ORIX Corp. | 113,900 | 1,654,924 | ||||||
Recruit Holdings Co. Ltd. | 72,000 | 1,723,735 | ||||||
| December 31, 2018 | Shares | Value | ||||||
| Japan(continued) |
| |||||||
Shimano, Inc. | 12,900 | $ | 1,833,917 | |||||
Shin-Etsu Chemical Co. Ltd. | 27,500 | 2,118,623 | ||||||
Shiseido Co. Ltd. | 31,700 | 1,969,680 | ||||||
SMC Corp. | 5,800 | 1,732,461 | ||||||
Yamaha Motor Co. Ltd. | 75,400 | 1,467,463 | ||||||
|
| |||||||
| 25,829,448 | ||||||||
| Netherlands – 4.3% |
| |||||||
Airbus SE | 26,802 | 2,563,368 | ||||||
ASML Holding N.V. | 19,687 | 3,071,702 | ||||||
|
| |||||||
| 5,635,070 | ||||||||
| Singapore – 1.5% |
| |||||||
DBS Group Holdings Ltd. | 115,200 | 1,990,367 | ||||||
|
| |||||||
| 1,990,367 | ||||||||
| Spain – 1.6% |
| |||||||
Industria de Diseno Textil S.A. | 84,180 | 2,146,006 | ||||||
|
| |||||||
| 2,146,006 | ||||||||
| Sweden – 1.3% |
| |||||||
Atlas Copco AB, Class A | 69,985 | 1,671,981 | ||||||
|
| |||||||
| 1,671,981 | ||||||||
| Switzerland – 13.1% |
| |||||||
Lonza Group AG (Reg S)(1) | 6,976 | 1,813,599 | ||||||
Nestle S.A. (Reg S) | 80,190 | 6,519,515 | ||||||
Novartis AG (Reg S) | 41,703 | 3,571,794 | ||||||
Roche Holding AG | 21,479 | 5,311,204 | ||||||
|
| |||||||
| 17,216,112 | ||||||||
| Taiwan – 1.4% |
| |||||||
Taiwan Semiconductor Manufacturing Co. Ltd., ADR | 48,361 | 1,785,005 | ||||||
|
| |||||||
| 1,785,005 | ||||||||
| United Kingdom – 22.6% |
| |||||||
AstraZeneca PLC | 42,795 | 3,200,444 | ||||||
Burberry Group PLC | 101,423 | 2,231,419 | ||||||
Diageo PLC | 98,533 | 3,502,209 | ||||||
Ferguson PLC | 27,051 | 1,732,506 | ||||||
Intertek Group PLC | 36,086 | 2,196,914 | ||||||
London Stock Exchange Group PLC | 33,800 | 1,744,250 | ||||||
Reckitt Benckiser Group PLC | 37,747 | 2,882,588 | ||||||
RELX PLC | 145,548 | 2,996,301 | ||||||
Smith & Nephew PLC | 80,012 | 1,488,098 | ||||||
St James’s Place PLC | 125,611 | 1,505,003 | ||||||
Unilever PLC | 117,709 | 6,160,613 | ||||||
|
| |||||||
| 29,640,345 | ||||||||
| Total Common Stocks (Cost $146,957,185) |
| 129,197,022 | ||||||
| The accompanying notes are an integral part of these financial statements. | 7 |
Table of Contents
SCHEDULE OF INVESTMENTS — GUARDIAN INTERNATIONAL GROWTH VIP FUND
| December 31, 2018 | Principal Amount | Value | ||||||
| Short-Term Investment – 0.6% |
| |||||||
| Repurchase Agreements – 0.6% |
| |||||||
Fixed Income Clearing Corp., 0.50%, dated 12/31/2018, proceeds at maturity value of $773,021, due 1/2/2019(3) | $ | 773,000 | $ | 773,000 | ||||
Total Repurchase Agreements (Cost $773,000) | 773,000 | |||||||
Total Investments – 99.1% (Cost $147,730,185) | 129,970,022 | |||||||
| Assets in excess of other liabilities – 0.9% |
| 1,166,603 | ||||||
| Total Net Assets – 100.0% | $ | 131,136,625 | ||||||
| (1) | Non–income–producing security. |
| (2) | Securities that may be resold in transactions, exempt from registration under Rule 144A of the Securities Act of 1933, as amended, normally to certain qualified buyers. At December 31, 2018, the aggregate market value of these securities amounted to $3,055,447, representing 2.3% of net assets. These securities have been deemed liquid by the investment adviser pursuant to the Fund’s liquidity procedures approved by the Board of Trustees. |
| (3) | The table below presents collateral for repurchase agreements. |
| Security | Coupon | Maturity Date | Principal Amount | Value | ||||||||||||
| U.S. Treasury Note | 2.875% | 7/31/2025 | $ | 770,000 | $ | 790,099 | ||||||||||
Legend:
ADR — American Depositary Receipt
The following is a summary of the inputs used as of December 31, 2018 in valuing the Fund’s investments. For more information on valuation inputs, please refer to Note 2a of the accompanying Notes to Financial Statements.
| Valuation Inputs | ||||||||||||||||
| Investments in Securities | Level 1 | Level 2 | Level 3 | Total | ||||||||||||
| Common Stocks |
| |||||||||||||||
Cayman Islands | $ | — | $ | 1,748,081 | * | $ | — | $ | 1,748,081 | |||||||
China | — | 1,448,797 | * | — | 1,448,797 | |||||||||||
Denmark | — | 5,487,164 | * | — | 5,487,164 | |||||||||||
France | — | 9,110,874 | * | — | 9,110,874 | |||||||||||
Germany | — | 14,129,166 | * | — | 14,129,166 | |||||||||||
Hong Kong | — | 4,820,587 | * | — | 4,820,587 | |||||||||||
India | 1,963,134 | — | — | 1,963,134 | ||||||||||||
Ireland | 1,262,932 | 1,772,856 | * | — | 3,035,788 | |||||||||||
Italy | — | 1,539,097 | * | — | 1,539,097 | |||||||||||
Japan | — | 25,829,448 | * | — | 25,829,448 | |||||||||||
Netherlands | — | 5,635,070 | * | — | 5,635,070 | |||||||||||
Singapore | — | 1,990,367 | * | — | 1,990,367 | |||||||||||
Spain | — | 2,146,006 | * | — | 2,146,006 | |||||||||||
Sweden | — | 1,671,981 | * | — | 1,671,981 | |||||||||||
Switzerland | — | 17,216,112 | * | — | 17,216,112 | |||||||||||
Taiwan | 1,785,005 | — | — | 1,785,005 | ||||||||||||
United Kingdom | — | 29,640,345 | * | — | 29,640,345 | |||||||||||
| Repurchase Agreements | — | 773,000 | — | 773,000 | ||||||||||||
| Total | $ | 5,011,071 | $ | 124,958,951 | $ | — | $ | 129,970,022 | ||||||||
| * | Consists of certain foreign securities whose values were determined by a pricing service using pricing models (See Note 2a in Notes to Financial Statements). These investments in securities were classified as Level 2 rather than Level 1. |
| 8 | The accompanying notes are an integral part of these financial statements. |
Table of Contents
FINANCIAL INFORMATION — GUARDIAN INTERNATIONAL GROWTH VIP FUND
For the Year Ended December 31, 2018 | ||||
Investment Income | ||||
Dividends | $ | 2,615,561 | ||
Interest | 7,234 | |||
Withholding taxes on foreign dividends | (195,737 | ) | ||
|
| |||
Total Investment Income | 2,427,058 | |||
|
| |||
Expenses | ||||
Investment advisory fees | 846,908 | |||
Distribution fees | 269,668 | |||
Custodian and accounting fees | 95,180 | |||
Trustees’ and officers’ fees | 65,127 | |||
Professional fees | 56,601 | |||
Administrative fees | 44,710 | |||
Transfer agent fees | 14,617 | |||
Shareholder reports | 11,865 | |||
Other expenses | 15,729 | |||
|
| |||
Total Expenses | 1,420,405 | |||
Less: Fees waived | (146,400 | ) | ||
|
| |||
Total Expenses, Net | 1,274,005 | |||
|
| |||
Net Investment Income/(Loss) | 1,153,053 | |||
|
| |||
Realized Gain/(Loss) and Change in Unrealized Appreciation/(Depreciation) on Investments, Futures Contracts and Foreign Currency Transactions | ||||
Net realized gain/(loss) from investments | (8,310,743 | ) | ||
Net realized gain/(loss) from futures contracts | (273,962 | ) | ||
Net realized gain/(loss) from foreign currency transactions | (64,381 | ) | ||
Net change in unrealized appreciation/(depreciation) on investments | (19,842,682 | ) | ||
Net change in unrealized appreciation/(depreciation) on translation of assets and liabilities in foreign currencies | (1,579 | ) | ||
|
| |||
Net Loss on Investments, Futures Contracts and Foreign Currency Transactions | (28,493,347 | ) | ||
|
| |||
Net Decrease in Net Assets Resulting From Operations | $ | (27,340,294 | ) | |
|
| |||
| The accompanying notes are an integral part of these financial statements. | 9 |
Table of Contents
FINANCIAL INFORMATION — GUARDIAN INTERNATIONAL GROWTH VIP FUND
| For the Year Ended 12/31/18 | For the Year Ended 12/31/17 | |||||||
| ||||||||
Operations | ||||||||
Net investment income/(loss) | $ | 1,153,053 | $ | 108,423 | ||||
Net realized gain/(loss) from investments, futures contracts and foreign currency transactions | (8,649,086 | ) | 1,054,547 | |||||
Net change in unrealized appreciation/(depreciation) on investments and translation of assets and liabilities in foreign currencies | (19,844,261 | ) | 2,472,670 | |||||
|
|
|
| |||||
Net Increase/(Decrease) in Net Assets Resulting from Operations | (27,340,294 | ) | 3,635,640 | |||||
|
|
|
| |||||
Capital Share Transactions | ||||||||
Proceeds from sales of shares | 163,773,670 | 1,681,780 | ||||||
Cost of shares redeemed | (15,932,351 | ) | (5,662,149 | ) | ||||
|
|
|
| |||||
Net Increase/(Decrease) in Net Assets Resulting from Capital Share Transactions | 147,841,319 | (3,980,369 | ) | |||||
|
|
|
| |||||
Net Increase/(Decrease) in Net Assets | 120,501,025 | (344,729 | ) | |||||
|
|
|
| |||||
Net Assets | ||||||||
Beginning of year | 10,635,600 | 10,980,329 | ||||||
|
|
|
| |||||
End of year | $ | 131,136,625 | $ | 10,635,600 | ||||
|
|
|
| |||||
Other Information: | ||||||||
Shares | ||||||||
Sold | 13,300,264 | 163,193 | ||||||
Redeemed | (1,332,858 | ) | (461,234 | ) | ||||
|
|
|
| |||||
Net Increase/(Decrease) | 11,967,406 | (298,041 | ) | |||||
|
|
|
| |||||
| 10 | The accompanying notes are an integral part of these financial statements. |
Table of Contents
This Page Intentionally Left Blank
| 11 |
Table of Contents
FINANCIAL INFORMATION — GUARDIAN INTERNATIONAL GROWTH VIP FUND
The Financial Highlights table is intended to help you understand the Fund’s financial performance for the past five years (or, if shorter, the period since inception). Certain information reflects financial results for a single Fund share. The total returns in the table represent the rate that an investor would have earned (or lost) on an investment in the Fund.
Financial Highlights | ||||||||||||||||||||||||
| Per Share Operating Performance | ||||||||||||||||||||||||
| Net Asset Value, Beginning of Period | Net Investment Income/(Loss)(1) | Net Realized and Unrealized Gain/(Loss) | Total Operations | Net Asset Value, End of Period | Total Return(2) | |||||||||||||||||||
Year Ended 12/31/18 | $ | 12.61 | $ | 0.12 | $ | (2.49 | ) | $ | (2.37 | ) | $ | 10.24 | (18.79)% | |||||||||||
Year Ended 12/31/17 | 9.62 | 0.09 | 2.90 | 2.99 | 12.61 | 31.08% | ||||||||||||||||||
Period Ended 12/31/16(4) | 10.00 | (0.00 | )(5) | (0.38 | ) | (0.38 | ) | 9.62 | (3.80)% | (6) | ||||||||||||||
| 12 | The accompanying notes are an integral part of these financial statements. |
Table of Contents
FINANCIAL INFORMATION — GUARDIAN INTERNATIONAL GROWTH VIP FUND
| Ratios/Supplemental Data | ||||||||||||||||||||||
| Net Assets, End of Period (000s) | Net Ratio of Expenses to Average Net Assets(3) | Gross Ratio of Expenses to Average Net Assets | Net Ratio of Net Investment Income/(Loss) to Average Net Assets(3) | Gross Ratio of Net Investment Income/(Loss) to Average Net Assets | Portfolio Turnover Rate | |||||||||||||||||
| $ | 131,137 | 1.18% | 1.32% | 1.07% | 0.93% | 61% | ||||||||||||||||
| 10,636 | 1.22% | 2.49% | 0.79% | (0.48)% | 32% | |||||||||||||||||
| 10,980 | 1.22% | (6) | 3.20% | (6) | (0.06)% | (6) | (2.04)% | (6) | 8% | (6) | ||||||||||||
| (1) | Calculated based on the average shares outstanding during the period. |
| (2) | Total returns do not reflect the effects of charges deducted pursuant to the terms of The Guardian Insurance & Annuity Company, Inc.’s variable contracts. Inclusion of such charges would reduce the total returns for all periods shown. |
| (3) | Net Ratio of Expenses to Average Net Assets and Net Ratio of Net Investment Income/(Loss) to Average Net Assets include the effect of fee waivers and expense limitations. |
| (4) | Commenced operations on September 1, 2016. |
| (5) | Rounds to $(0.00) per share. |
| (6) | Ratios for periods less than one year have been annualized, except for total return and portfolio turnover rate. For the period ended December 31, 2016, certainnon-recurring fees (i.e., audit fees) are not annualized. |
| The accompanying notes are an integral part of these financial statements. | 13 |
Table of Contents
NOTES TO FINANCIAL STATEMENTS — GUARDIAN INTERNATIONAL GROWTH VIP FUND
December 31, 2018
1. Organization
Guardian Variable Products Trust (the “Trust”), a Delaware statutory trust organized on January 12, 2016, is registered under the Investment Company Act of 1940, as amended (the “1940 Act”), as anopen-end management investment company. The Trust currently has sixteen series. Guardian International Growth VIP Fund (the “Fund”) is a series of the Trust. The Fund is a diversified fund and commenced operations on September 1, 2016. The financial statements for other series of the Trust are presented in separate reports.
The Trust has authorized an unlimited number of shares of beneficial interest with no par value. Shares are bought and sold at closing net asset value (“NAV”). Shares of the Fund are only sold to certain separate accounts of The Guardian Insurance & Annuity Company, Inc. (“GIAC”) that fund certain variable annuity contracts and variable life insurance policies issued by GIAC. GIAC is a wholly-owned subsidiary of The Guardian Life Insurance Company of America (“Guardian Life”).
The Fund seeks total return consisting of long-term capital growth and current income.
2. Significant Accounting Policies
The following is a summary of significant accounting policies followed by the Fund in the preparation of its financial statements. The Fund follows the investment company accounting and reporting guidance of the Financial Accounting Standards Board (“FASB”) Accounting Standards Codification Topic 946 Financial Services — Investment Companies. The following policies are in conformity with accounting principles generally accepted in the United States of America (“GAAP”). The preparation of financial statements in accordance with GAAP requires management to make estimates and assumptions that affect the reported amounts and disclosures in the financial statements. Actual results could differ from those estimates.
a. Investment Valuations Equity securities traded on an exchange other than NASDAQ Stock Market, LLC (“NASDAQ”) are valued at the last reported sale price on the principal exchange or market on which they are traded; or, if there were no sales that day, at the mean between the closing bid and ask prices. Securities traded on the NASDAQ are generally valued at the NASDAQ official closing price, which may not be the last sale price. If the NASDAQ official closing price is not available for a security, that security is generally valued at the
mean between the closing bid and ask prices. Repurchase agreements are carried at cost, which approximates fair value (see Note 5d). Foreign securities are valued in the currencies of the markets in which they trade and then converted to U.S. dollars by the application of foreign exchange rates at the close of the New York Stock Exchange (“NYSE”). Forward foreign currency contracts, if any, are valued at the mean between the bid and ask rates for the specified time interpolated from rates for proximate time periods. Securities for which market quotations are not readily available or for which market quotations may be considered unreliable are valued at their fair values as determined in accordance with policies and procedures adopted by the Board of Trustees.
Under the policies and procedures approved by the Board of Trustees, Park Avenue Institutional Advisers LLC (“Park Avenue”), the Fund’s investment adviser, has established a Fair Valuation Committee to assist the Board of Trustees with the oversight and monitoring of the valuation of the Fund’s investments. This includes monitoring the appropriateness of fair values based on results of ongoing valuation oversight, including but not limited to consideration of security specific events, market events, and pricing vendor and broker-dealer due diligence. The Fair Valuation Committee oversees and carries out the policies for the valuation of investments held in the Fund. The Fair Valuation Committee is responsible for discussing and assessing the potential impacts to the fair values on an ongoing basis, and at least on a quarterly basis with the Board of Trustees.
Securities whose values have been materially affected by events occurring before the Fund’s valuation time but after the close of the securities’ principal exchange or market may be fair valued in accordance with policies and procedures adopted by the Board of Trustees. In addition, the values of the Fund’s investments in foreign securities are generally determined by a pricing service using pricing models designed to estimate likely changes in the values of those securities. Certain foreign equity instruments are valued by applying international fair value factors provided by approved pricing services. The factors seek to adjust the local closing price for movements of local markets post closing, but prior to the time the NAVs are calculated. Valuations reflected in this report are as of the report date. As a result, changes in valuation due to market events and/or issuer related events after the report date and prior to issuance of the report are not reflected herein.
| 14 |
Table of Contents
NOTES TO FINANCIAL STATEMENTS — GUARDIAN INTERNATIONAL GROWTH VIP FUND
Various inputs are used in determining the valuation of the Fund’s investments. These inputs are summarized in three broad levels listed below.
| • | Level 1 — unadjusted inputs using quoted prices in active markets for identical investments. |
| • | Level 2 — other significant observable inputs, including, but not limited to, quoted prices for similar investments, inputs other than quoted prices that are observable for investments (such as interest rates, prepayment speeds, credit risks, etc.) or other market corroborated inputs. |
| • | Level 3 — significant unobservable inputs (including the Fund’s own assumptions in determining the fair value of investments) |
Inputs may include price information, volatility statistics, specific and broad credit data, liquidity statistics, and other factors. A financial instrument’s level within the fair value hierarchy is based on the lowest level of any input; both individually and in aggregate, that is significant to the fair value measurement. However, the determination of what constitutes “observable” requires significant judgment by the Trust. The Trust considers observable data to be that market data which is readily available, regularly distributed or updated, reliable and verifiable, and provided by independent sources that are actively involved in the relevant market. The inputs or methodology used for valuing securities are not necessarily an indication of the risk associated with investing in those securities. Changes in valuation techniques may result in transfers into or out of a financial instrument’s assigned level within the hierarchy.
The FASB requires reporting entities to make disclosures about purchases, sales, issuances and settlements of Level 3 securities on a gross basis.
The Fund’s policy is to recognize transfers between Level 1, Level 2 and Level 3 at the end of the reporting period. For the year ended December 31, 2018, there were no transfers among any levels.
In determining a financial instrument’s placement within the hierarchy, the Trust separates the Fund’s investment portfolio into two categories: investments and derivatives (e.g., futures). A summary of inputs used to value the Fund’s assets and liabilities carried at fair value as of December 31, 2018 is included in the Schedule of Investments.
Investments Investments whose values are based on quoted market prices in active markets, and are therefore classified within Level 1, include active listed
equities. Investments that trade in markets that are not considered to be active, but are valued based on quoted market prices, dealer quotations or alternative pricing sources supported by observable inputs are classified within Level 2. These include certain U.S. government and sovereign obligations, most government agency securities, investment-grade corporate bonds, certain mortgage products, state, municipal and provincial obligations, and certain foreign equity securities, including securities whose prices may have been affected by events occurring after the close of trading on their principal exchange or market and, as a result, whose values are determined by a pricing service as described above, or securities whose values are otherwise determined using fair valuation methods approved by the Fund’s Board of Trustees.
Investments classified within Level 3 have significant unobservable inputs, as they trade infrequently or not at all. Level 3 investments include, among others, private placement securities. When observable prices are not available for these securities, the Trust uses one or more valuation techniques for which sufficient and reliable data is available. The inputs used by the Trust in estimating the value of Level 3 investments include, for example, the original transaction price, recent transactions in the same or similar instruments, completed or pending third-party transactions in the underlying investment or comparable issuers, subsequent rounds of financing, recapitalizations, and other transactions across the capital structure. Level 3 investments may also be adjusted to reflect illiquidity and/ornon-transferability, with the amount of such discount estimated by the Trust in the absence of market information. Assumptions used by the Trust due to the lack of observable inputs may significantly impact the resulting fair value and therefore the Fund’s results of operations. As of December 31, 2018, the Fund had no securities classified as Level 3.
Derivatives Exchange-traded derivatives, such as futures contracts, exchange-traded option contracts and certain swaps, are typically classified within Level 1 or Level 2 of the fair value hierarchy depending on whether or not they are deemed to be actively traded. Certainnon-exchange-traded derivatives, such as generic forwards, certain swaps and options, have inputs which can generally be corroborated by market data and are therefore classified within Level 2.
b. Securities Transactions Securities transactions are accounted for on the date securities are purchased or sold (trade date). Realized gains or losses on securities transactions are determined on the basis of specific identification.
| 15 |
Table of Contents
NOTES TO FINANCIAL STATEMENTS — GUARDIAN INTERNATIONAL GROWTH VIP FUND
c. Futures Contracts The Fund may enter into financial futures contracts. In entering into such contracts, the Fund is required to deposit with the counterparty, either in cash or securities, an amount equal to a certain percentage of the face value of the contract. Subsequent payments are received or made by the Fund each day, depending on the daily fluctuations in the values of the contracts, and are recorded for financial statement purposes as variation margin received or paid by the Fund. Daily changes in variation margin are recognized as unrealized gains or losses by the Fund. The Fund may not achieve the anticipated benefits of the financial futures contracts and may realize a loss.
d. Foreign Currency Translation The accounting records of the Fund are maintained in U.S. dollars. Investment securities and all other assets and liabilities of the Fund denominated in a foreign currency are generally translated into U.S. dollars at the exchange rates quoted at the close of the NYSE on each business day. The market value of investment securities and other assets and liabilities are translated at the exchange rate as of the valuation date. Purchases and sales of securities, income receipts, and expense payments are translated into U.S. dollars at the exchange rates in effect on the dates of the respective transactions. The Fund does not isolate the portion of the fluctuations on investments resulting from changes in foreign currency exchange rates from the fluctuations in market prices of investments held. Such fluctuations are included in the Net change in net realized and unrealized gain/(loss) from investments on the Statement of Operations.
Reported realized foreign currency gains and losses arise from the disposition of foreign currency, currency gains or losses realized between the trade and settlement dates on securities transactions, and the difference between the amounts of dividends, interest and foreign withholding taxes recorded on the Fund’s books on the transaction date and the U.S. dollar equivalent of the amounts actually received or paid. These reported realized foreign currency gains and losses, if any, are included in Net realized gain/(loss) from foreign currency transactions on the Statement of Operations. Unrealized foreign currency gains and losses arise from changes (due to changes in exchange rates) in the value of foreign currency and other assets and liabilities denominated in foreign currencies, which are held at period end, if any, and are included in Net change in unrealized appreciation/(depreciation) on translation of assets and liabilities in foreign currencies on the Statement of Operations.
e. Foreign Capital Gains Tax The Fund may be subject to foreign taxes on income, gains on investments or
currency purchases/repatriation, a portion of which may be recoverable. The Fund will accrue such taxes and recoveries as applicable, based upon their current interpretation of tax rules and regulations that exist in the markets in which they invest.
f. Investment Income Dividend income net of foreign taxes withheld, if any, is generally recorded on theex-dividend date. Interest income, which includes amortization/accretion of premium/discount, is determined using the interest income accrual method, and is accrued and recorded daily.
g. Allocation of Income and Expenses Many of the expenses of the Trust can be directly attributed to a specific series of the Trust. Expenses that cannot be directly attributed to a specific series of the Trust are generally apportioned among all the series in the Trust, based on relative net assets. In calculating net asset value per share for each series of the Trust, investment income, realized and unrealized gains and losses, and expenses other than series-specific expenses are allocated daily to each series based upon the proportion of net assets attributable to each series.
3. Transactions with Affiliates
a. Investment Advisory Fee and Expense Limitation Under the terms of the advisory agreement, which, after its two year initial term, is reviewed and approved annually by the Board of Trustees, the Fund pays an investment advisory fee to Park Avenue. Park Avenue is a wholly-owned subsidiary of Guardian Life and receives an investment advisory fee at an annual rate of 0.80% of the first $100 million, and 0.75% in excess of $100 million of the Fund’s average daily net assets. The fee is accrued daily and paid monthly.
Park Avenue has contractually agreed through April 30, 2019 to waive certain fees and/or reimburse certain expenses incurred by the Fund to the extent necessary to limit the Fund’s total annual operating expenses after fee waiver and/or expense reimbursement to 1.18% of the Fund’s average daily net assets (excluding, if applicable, any acquired fund fees and expenses, taxes, interest, transaction costs and brokerage commissions, litigation and extraordinary expenses). Prior to April 9, 2018, the expense limitation was 1.22%. The limitation may not be increased or terminated prior to this time without action by the Board of Trustees, may be terminated only upon approval of the Board of Trustees, and is subject to Park Avenue’s recoupment rights. For the year ended December 31, 2018, Park Avenue waived fees and/or paid Fund expenses in the amount of $146,400.
| 16 |
Table of Contents
NOTES TO FINANCIAL STATEMENTS — GUARDIAN INTERNATIONAL GROWTH VIP FUND
Park Avenue may be entitled to recoupment of previously waived fees and reimbursed expenses from the Fund for three years from the date of the waiver or reimbursement, subject to the expense limitation in effect at the time of the waiver or reimbursement and at the time of the recoupment, if any. Amounts waived or reimbursed by Park Avenue pursuant to any expense limitation after April 9, 2018 will not be subject to Park Avenue’s recoupment rights. The amount available for potential future recoupment by Park Avenue from the Fund under the Expense Limitation Agreement and the expiration schedule at December 31, 2018 are as follows:
Potential Recoupment Amounts Expiring | ||||||||||||
Total Potential Recoupment Amounts | 2021 | 2020 | 2019 | |||||||||
| $307,518 | $ | 48,645 | $ | 174,590 | $ | 84,283 | ||||||
Park Avenue has entered into aSub-Advisory Agreement with J.P. Morgan Investment Management Inc. (“J.P. Morgan”). J.P. Morgan is responsible for providingday-to-day investment advisory services to the Fund, subject to the supervision of Park Avenue and the oversight of the Board of Trustees.Sub-advisory fees are paid by Park Avenue and do not represent a separate or additional expense to the Fund.
b. Compensation of Trustees and Officers Trustees and officers who are interested persons of the Trust, as defined in the 1940 Act, receive no compensation from the Fund, except for the Chief Compliance Officer of the Trust. Trustees of the Trust who are not interested persons of the Trust, and the Chief Compliance Officer, receive compensation and reimbursement of expenses from the Trust.
c. Distribution Fees Park Avenue Securities LLC (“PAS”), a wholly-owned subsidiary of Guardian Life, is the principal underwriter of Fund shares. The Trust has entered into a distribution and service agreement with PAS, which governs the sale and distribution of shares of the Fund. Under a distribution and service plan adopted by the Trust(“12b-1 plan”), PAS is compensated for services in such capacity, including its expenses in connection with the promotion and distribution of shares of the Fund, at an annual rate of 0.25% of the Fund’s average daily net assets. For the year ended December 31, 2018, the Fund paid distribution fees in the amount of $269,668 to PAS.
PAS has directed that certain payments under the12b-1 plan be used to compensate GIAC for shareholder services provided to contract owners.
4. Federal Income Taxes
a. Distributions to Shareholders For federal income tax purposes, the Fund is treated as a disregarded entity (“DRE”). As a DRE, the Fund is not subject to an entity-level income tax; and any income, gains, losses, deductions, taxes, and credits of the Fund would instead be “passed through” directly to the separate accounts of GIAC that invest in the Fund and retain the same character for U.S. federal income tax purposes. In addition, the Fund is not required to distribute taxable income and capital gains for U.S. federal income tax purposes. Therefore, no dividends and capital gains distributions were paid by the Fund.
5. Investments
a. Investment Purchases and Sales The cost of investments purchased and the proceeds from investments sold (excluding short-term investments) amounted to $208,064,192 and $61,188,513, respectively, for the year ended December 31, 2018. During the year ended December 31, 2018, there were no purchases or sales of U.S. government securities.
b. Foreign Securities Foreign securities investments involve special risks and considerations not typically associated with U.S. investments. These risks include, but are not limited to, currency risk; adverse political, regulatory, social, and economic developments; and less reliable information about issuers. Moreover, securities of some foreign issuers may be less liquid and their prices more volatile than those of comparable U.S. issuers.
c. Industry or Sector Concentration In its normal course of business, the Fund may invest a significant portion of its assets in companies within a limited number of industries or sectors. As a result, the Fund may be subject to a greater risk of loss than that of a fund invested in a wider spectrum of industries or sectors because the stocks of many or all of the companies in the industry, group of industries, sector, or sectors may decline in value due to developments adversely affecting the industry, group of industries, sector, or sectors.
d. Repurchase Agreements The Fund may invest in repurchase agreements to maintain liquidity and earn income over periods of time as short as overnight. The collateral for repurchase agreements is either cash or fully negotiable U.S. government securities (including U.S. government agency securities). Repurchase agreements are fully collateralized (including the interest accrued thereon) and such collateral is marked to market daily while the agreements remain in force. If
| 17 |
Table of Contents
NOTES TO FINANCIAL STATEMENTS — GUARDIAN INTERNATIONAL GROWTH VIP FUND
the value of the collateral falls below the repurchase price plus accrued interest, the Fund will typically require the seller to deposit additional collateral by the next business day. If the request for additional collateral is not met, or the seller defaults, the Fund maintains the right to sell the collateral (although it may be prevented or delayed from doing so in certain circumstances) and may be required to claim any resulting loss against the seller. Park Avenue monitors the creditworthiness of the seller with which the Fund enters into repurchase agreements.
e. Disclosures About Derivative Instruments and Hedging Activities The Fund entered into U.S. Treasury futures contracts for the year ended December 31, 2018 to economically hedge against changes in interest rates. The Fund bears the risk of interest rates moving unexpectedly, in which case the Fund may not achieve the anticipated benefits of the futures contracts and realize a loss. There is minimal counterparty credit risk to the Funds since futures are exchange traded and the exchange’s clearinghouse, as counterparty to all exchange traded futures, guarantees futures against default.
Transactions in derivative investments for the year ended December 31, 2018 were as follows:
Interest Rate Contracts | ||||
Net Realized Gain (Loss) | ||||
| Futures Contracts1 | $ | (273,962 | ) | |
Average Number of Notional Amounts | ||||
| Futures Contracts2 | 92 | |||
| 1 | Statement of Operations location: Net realized gain/(loss) from futures contracts. |
| 2 | Amount represents number of contracts. |
6. Temporary Borrowings
The Fund, with other funds managed by Park Avenue, is party to a $10 million committed revolving credit facility from State Street Bank and Trust Company for temporary borrowing purposes, including the meeting of redemption requests that otherwise might require
the untimely disposition of securities. Interest is calculated based on the higher of the dailyone-month LIBOR rate and the Federal Funds rate plus 1.25% at the time of borrowing. In addition to the interest charged on any borrowings by the Fund, each fund pays a commitment fee of 0.30% per annum on its share of the unused portion of the credit facility. The agreement is in place until December 10, 2019. The Fund did not utilize the credit facility during the year ended December 31, 2018.
7. Indemnifications
Under the Trust’s organizational documents and, in some cases, by contract, its officers and trustees are indemnified against certain liabilities arising out of the performance of their duties to the Fund. In addition, in the normal course of business, the Fund enters into contracts with its vendors and others that provide general indemnifications. The Fund’s maximum exposure under these arrangements is unknown as this would involve future claims that may be made against the Fund that have not yet occurred. However, based on experience, the Fund expects the risk of loss to be remote.
8. Recent Accounting Pronouncement
On August 17, 2018, the U.S. Securities and Exchange Commission (“SEC”) voted to adopt amendments to certain disclosure requirements that have become redundant, duplicative, overlapping, outdated, or superseded, in light of other SEC disclosure requirements, GAAP, or changes in the information environment. The SEC will also be referring certain SEC disclosure requirements that overlap with, but require information incremental to, GAAP to the FASB for potential incorporation into GAAP. The amendments are intended to facilitate the disclosure of information to investors and simplify compliance without significantly altering the total mix of information provided to investors. As such, the financial statements herein have been updated to conform with these new requirements, which had no effect on the Fund’s net assets or results of operations.
| 18 |
Table of Contents
REPORT OF INDEPENDENT REGISTERED PUBLIC ACCOUNTING FIRM
TotheBoard of Trustees ofGuardian Variable Products TrustandShareholders of
Guardian International Growth VIP Fund
Opinion on the Financial Statements
We have audited the accompanying statement of assets and liabilities, including the schedule of investments, ofGuardian International Growth VIP Fund (one of the funds constituting Guardian Variable Products Trust, referred to hereafter as the “Fund”) as of December 31, 2018, the related statement of operations for the year ended December 31, 2018, the statement of changes in net assets for each of the two years in the period ended December 31, 2018, including the related notes,and the financial highlights for each of the periods indicated therein (collectively referred to as the “financial statements”). In our opinion, the financial statements present fairly, in all material respects, the financial position of the Fund as of December 31, 2018, the results of its operations for the year then ended, the changes in its net assets for each of the two years in the period ended December 31, 2018 and the financial highlights for each of the periods indicated therein in conformity with accounting principles generally accepted in the United States of America.
Basis for Opinion
These financial statements are the responsibility of the Fund’s management. Our responsibility is to express an opinion on the Fund’s financial statements based on our audits. We are a public accounting firm registered with the Public Company Accounting Oversight Board (United States) (PCAOB) and are required to be independent with respect to the Fund in accordance with the U.S. federal securities laws and the applicable rules and regulations of the Securities and Exchange Commission and the PCAOB.
We conducted our audits of these financial statements in accordance with the standards of the PCAOB. Those standards require that we plan and perform the audit to obtain reasonable assurance about whether the financial statements are free of material misstatement, whether due to error or fraud.
Our audits included performing procedures to assess the risks of material misstatement of the financial statements, whether due to error or fraud, and performing procedures that respond to those risks. Such procedures included examining, on a test basis, evidence regarding the amounts and disclosures in the financial statements. Our audits also included evaluating the accounting principles used and significant estimates made by management, as well as evaluating the overall presentation of the financial statements. Our procedures included confirmation of securities owned as of December 31, 2018 by correspondence with the custodian and brokers; when replies were not received from brokers, we performed other auditing procedures. We believe that our audits provide a reasonable basis for our opinion.
New York, New York
February 19, 2019
We have served as the auditor of one or more investment companies in Guardian Variable Products Trustsince 2016.
| 19 |
Table of Contents
SUPPLEMENTAL INFORMATION(UNAUDITED)
Approval of Investment Advisory andSub-advisory Agreements
Section 15(c) of the Investment Company Act of 1940, as amended (the “1940 Act”), requires that a fund’s board of trustees annually review and consider the continuation of the fund’s investment advisory andsub-advisory agreements. The continuation of any such agreement must be approved by a vote of a majority of the trustees who are not parties to the agreement or “interested persons” (as defined in the 1940 Act) of a party to the agreement at anin-person meeting of the board called for the purpose of voting on such approval.
At a meeting of the Board of Trustees (the “Board”) of Guardian Variable Products Trust (the “Trust”) held on March27-28, 2018, the Board considered and unanimously voted to approve the continuation of the investment management agreement (the “Management Agreement”) between Park Avenue Institutional Advisers LLC (the “Manager”) and the Trust, on behalf of the following 11 series, Guardian Core Plus Fixed Income VIP Fund, Guardian Diversified Research VIP Fund, Guardian Growth & Income VIP Fund, Guardian Integrated Research VIP Fund, Guardian International Growth VIP Fund, Guardian International Value VIP Fund, Guardian Large Cap Disciplined Growth VIP Fund, Guardian Large Cap Disciplined Value VIP Fund, Guardian Large Cap Fundamental Growth VIP Fund, Guardian Mid Cap Relative Value VIP Fund and Guardian Mid Cap Traditional Growth VIP Fund (the “Funds”). The Board also considered and unanimously voted to approve the continuation of thesub-advisory agreements (the“Sub-advisory Agreements,” collectively with the Management Agreement, the “Agreements”) between the Manager and the following investment advisory firms serving assub-advisers to the Funds, ClearBridge Investments LLC, Wellington Management Company LLP, Massachusetts Financial Services Company, Putnam Investment Management, LLC, Boston Partners Global Investors, Inc., AllianceBernstein L.P., Janus Capital Management LLC, Wells Capital Management Incorporated, J.P. Morgan Investment Management Inc., Lazard Asset Management LLC, and Lord, Abbett & Co. LLC (the“Sub-advisers”). The continuation of the Agreements for aone-year period was unanimously approved by the Trustees who are not parties to the Agreements or “interested persons” (as defined in the 1940 Act) of a party to the Agreements (the “Independent Trustees”).
The Board is responsible for overseeing the management of each Fund. In determining whether to approve the continuation of the Agreements, the Trustees evaluated information and factors that they
considered to be relevant and appropriate through the exercise of their own business judgment. The Trustees considered certain information and factors in light of advice furnished to them by legal counsel to the Trust and, in the case of the Independent Trustees, their independent legal counsel.
In advance of the meeting held on March27-28, 2018, the Trustees received materials and information designed to assist their consideration of the Agreements, including written responses from the Manager and eachSub-adviser to a series of questions and requests for information covering a wide variety of topics provided by independent legal counsel on behalf of the Independent Trustees. Broadridge Financial Solutions, Inc. (“Broadridge”), an independent provider of investment company data, was retained to provide the Trustees with reports on how each Fund’s contractual management fees, actual management fees, overall expense ratios and investment performance compared to those of “peer funds” selected by Broadridge that are offered as investment options underlying variable contracts. The Trustees also received materials and information regarding the legal standards applicable to their consideration of the Agreements and the process and criteria used by the Manager to oversee theSub-advisers. During the course of their deliberations, the Independent Trustees met to discuss and evaluate the Agreements in executive session with their independent legal counsel, outside of the presence of the Trustees who are not Independent Trustees and representatives from Fund management, the Manager or anySub-adviser.
In reaching its decisions to approve the continuation of the Agreements, the Board took into account the materials and information described above as well as other materials and information provided to the Board and discussed with and among the Trustees, including information regarding the Funds furnished to the Board by the Manager throughout the year. Individual Trustees may have given different weight to different factors and information with respect to each Agreement, and the Trustees did not identify any single factor or information that, in isolation, would be controlling in deciding to approve the continuation of the Agreements.
The discussion below is intended to summarize the broad factors that figured prominently in the Board’s decisions to approve the continuation of the Agreements rather than to beall-inclusive. These broad factors included: (i) the nature, extent and quality of the services provided to the Funds by the Manager and theSub-advisers; (ii) the investment performance of the Funds; (iii) the fees
| 20 |
Table of Contents
SUPPLEMENTAL INFORMATION(UNAUDITED)
charged and estimated profitability; (iv) the extent to which economies of scale may exist for a Fund, and the extent to which a Fund may benefit from economies of scale; and (v) any other benefits derived by the Manager or theSub-advisers (or their respective affiliates) from their relationships with the Funds. In addition to considering the above-referenced factors, the Board observed that there are a range of investment options available to variable contract owners who may invest in the Funds, and that these contract owners, having had the opportunity to consider other investment options, may choose to invest or remain invested in the Funds.
Nature, Extent and Quality of Services
The Trustees considered information regarding the nature, extent and quality of services provided to the Funds by the Manager. The Trustees also considered the range of investment advisory services andnon-investment advisory services provided by the Manager, notably coordinating the preparation and filing of various regulatory documents, coordinating the preparation and assembly of Board meeting materials and assisting the Board with certain valuation matters.
The Trustees considered the operation of the Funds in a“manager-of-managers” structure and the responsibilities that the Manager has under this structure, including monitoring and evaluating the performance of theSub-advisers, monitoring theSub-advisers for adherence to the stated investment objectives, strategies, policies and restrictions of the Funds and supervising theSub-advisers with respect to the services that theSub-advisers provide under the Sub-advisory Agreements. The Trustees also considered the process used by the Manager, consistent with this structure, to identify and recommendsub-advisers, and its ability to monitor and overseesub-advisers and recommend replacementsub-advisers, when necessary, and provide other services under the Management Agreement. The Trustees reviewed information regarding the experience and background of the Manager’s key personnel and the Manager’s organizational structure and resources, including investment, legal and administrative capabilities of the Manager. In this regard, the Trustees recognized that the Funds benefit from the Manager’s use of similar resources and capabilities of its affiliates in providing services to the Funds.
The Trustees considered information regarding the nature, extent and quality of services provided to the Funds by theSub-advisers. The Trustees also considered, among other things, the range of investment advisory services provided by the
Sub-advisers under the oversight of the Manager. In evaluating these investment advisory services, the Trustees considered, among other things, theSub-advisers’ investment philosophies, styles and/or processes and approach to managing risk. The Trustees received and evaluated information regarding the background, education, expertise and/or experience of the investment professionals that serve as portfolio managers for the Funds and the capabilities, resources and reputations of theSub-advisers.
Based upon these considerations, the Board concluded that it was satisfied with the nature, extent and quality of services provided to the Funds by the Manager and eachSub-adviser.
Investment Performance
The Board considered the investment performance of each Fund. Among other reports, the Board reviewed the performance of the Funds for theone-year and since inception periods compared to a universe of peer funds selected by Broadridge. The Board noted that the Funds had performance records of less than two years and that the Board had reviewed longer performance records of the funds or accounts managed by theSub-advisers with similar strategies as the applicable Fund, when available, when the Board initially approved the Agreements in 2016. The Broadridge report placed the Funds in the following quintiles of the relevant peer universe for theone-year and since inception periods, respectively: Guardian Core Plus Fixed Income VIP Fund (3rd, 3rd), Guardian Diversified Research VIP Fund (2nd, 2nd), Guardian Growth & Income VIP Fund (1st, 1st), Guardian Integrated Research VIP Fund (4th, 5th), Guardian International Growth VIP Fund (3rd, 2nd), Guardian International Value VIP Fund (3rd, 5th), Guardian Large Cap Disciplined Growth VIP Fund (3rd, 4th), Guardian Large Cap Disciplined Value VIP Fund (1st, 1st), Guardian Large Cap Fundamental Growth VIP Fund (5th, 4th), Guardian Mid Cap Relative Value VIP Fund (4th, 3rd) and Guardian Mid Cap Traditional Growth VIP Fund (2nd, 2nd).
The Board considered the investment reports provided by the Manager since commencement of operations of the Funds during quarterly Board meetings. The Board also considered the Manager’s analysis ofSub-adviser performance and the steps taken by the Manager and theSub-advisers to seek to improve performance and the results of those steps.
In light of the considerations noted above, the Board concluded that it had continued confidence in the Manager’s and theSub-advisers’ overall capabilities to manage the Funds.
| 21 |
Table of Contents
SUPPLEMENTAL INFORMATION(UNAUDITED)
Costs and Profitability
The Trustees considered the management fees paid by the Funds to the Manager under the Management Agreement and evaluated the reasonableness of these fees. The Trustees received and reviewed information with respect to the management fees, including the portion of the management fees paid to eachSub-adviser, and the management fees paid by other funds offered as investment options underlying variable contracts within the applicable peer group selected by Broadridge. The Broadridge report placed the Funds in the following quintiles of the relevant expense peer group for the contractual management fees and actual management fees, respectively: Guardian Core Plus Fixed Income VIP Fund (1st, 3rd), Guardian Diversified Research VIP Fund (2nd, 3rd), Guardian Growth & Income VIP Fund (1st, 1st), Guardian Integrated Research VIP Fund (1st, 2nd), Guardian International Growth VIP Fund (1st, 2nd), Guardian International Value VIP Fund (3rd, 2nd), Guardian Large Cap Disciplined Growth VIP Fund (1st, 1st), Guardian Large Cap Disciplined Value VIP Fund (1st, 1st), Guardian Large Cap Fundamental Growth VIP Fund (1st, 1st), Guardian Mid Cap Relative Value VIP Fund (1st, 1st) and Guardian Mid Cap Traditional Growth VIP Fund (3rd, 4th).
The Trustees considered thesub-advisory fees paid under the Sub-advisory Agreements and evaluated the reasonableness of those fees. The Trustees also considered that the fees paid to theSub-advisers are paid by the Manager and not the Funds and that the Manager had negotiated the fees with theSub-advisers atarm’s-length. In addition, the Trustees considered the portion of the management fees paid to eachSub-adviser as compared to the portion retained by the Manager.
The Trustees received and reviewed information in the Broadridge report comparing each Fund’s operating expense ratio to the actual operating expense ratios of a peer group of funds selected by Broadridge. The Trustees considered the Manager’s commitment to limit each Fund’s operating expenses through an expense limitation agreement with the Trust. The Broadridge report placed the Funds in the following quintiles of the relevant expense peer group for the operating expense ratio: Guardian Core Plus Fixed Income VIP Fund (2nd), Guardian Diversified Research VIP Fund (2nd), Guardian Growth & Income VIP Fund (2nd), Guardian Integrated Research VIP Fund (1st), Guardian International Growth VIP Fund (3rd), Guardian International Value VIP Fund (1st), Guardian Large Cap Disciplined Growth VIP Fund (1st), Guardian Large Cap Disciplined Value VIP Fund (2nd), Guardian Large Cap
Fundamental Growth VIP Fund (1st), Guardian Mid Cap Relative Value VIP Fund (1st) and Guardian Mid Cap Traditional Growth VIP Fund (3rd).
Although the Board recognized that the comparisons between the management fees and anticipated operating expenses of the Funds and those of identified peer funds are imprecise, given different terms of agreements and variations in fund strategies, the Trustees found that the comparative information supported their consideration and approval of the management fees and evaluation of operating expenses.
The Trustees reviewed information regarding the Manager’s costs of sponsoring the Funds and estimated profitability of the Funds to the Manager. The Trustees noted that the information contained estimates, such as allocations of expenses. Although the Trustees did not receive specific cost and profitability information from certainSub-advisers, the Trustees primarily considered the cost and profitability information relating to the Manager because the Manager is responsible for payment of thesub-advisory fees and negotiated the fees with theSub-advisers atarm’s-length.
Based on the consideration of the information and factors summarized above, as well as other information and factors deemed relevant by the Trustees, the Trustees concluded that the management andsub-advisory fees were reasonable in light of the nature, extent and quality of services rendered to the Funds by the Manager and theSub-advisers. The Trustees also concluded that the estimated profitability of the Funds to the Manager was acceptable.
Economies of Scale
The Trustees considered the extent to which economies of scale may be shared as assets grow based on current asset levels of the Funds, anticipated asset levels over the next year, the current management andsub-advisory fee rates, the expense limitation arrangements, and any management andsub-advisory fee breakpoints, which reduce fee rates as assets increase. Based on those factors, the Board concluded that it was satisfied with the extent to which any economies of scale would be shared for the benefit of Fund shareholders. The Board noted that it would continue to monitor future growth in each Fund’s assets and whether additional steps are required to share appropriately any economies of scale with Fund shareholders.
| 22 |
Table of Contents
SUPPLEMENTAL INFORMATION(UNAUDITED)
Ancillary Benefits
The Trustees considered the benefits, other than management fees, that the Manager and/or its affiliates receive because of the Manager’s relationship with the Funds. The Trustees acknowledged that the Funds serve as investment options under variable contracts issued by an affiliate of the Manager that receives fees under those contracts and that Park Avenue Securities LLC, an affiliate of the Manager and principal underwriter of the Funds, and an insurance company affiliated with the Manager receive fees from the Funds under a plan of distribution adopted pursuant to Rule12b-1 under the 1940 Act. The Trustees considered that the Manager and its affiliates may benefit from (i) greater efficiencies in annuity administration and operations and potential cost savings due to a reduction in the number of unaffiliated funds available as annuity contract investment options, and (ii) increased dividends-received deductions due to the Funds’ status under the tax laws as disregarded entities. In addition, the
Trustees considered the potential benefits, other thansub-advisory fees, that theSub-advisers and their affiliates receive because of their relationships with the Funds, including the potential increased ability to use soft dollars consistent with Trust policies and other benefits from increases in assets under management. The Trustees concluded that benefits that accrue to the Manager and its affiliates are reasonable and the benefits that accrue to theSub-advisers and their affiliates are consistent with those expected for asub-adviser to a mutual fund such as the applicable Fund.
Conclusion
Based on a comprehensive consideration and evaluation of all of the information and factors summarized above, among others, the Board voting as a whole, including the Independent Trustees voting separately, unanimously approved the continuation of the Agreements.
| 23 |
Table of Contents
SUPPLEMENTAL INFORMATION(UNAUDITED)
Trustees and Officers Information Table
The following table provides information about the Trustees of the Trust.
| Name and Year of Birth | Term of Office, Position(s) Held and Length of Service* | Principal During Past Five Years | Number of in Fund by Trustees*** | Other Directorships Held by Trustee | ||||
| Independent Trustees | ||||||||
| Bruce W. Ferris† (born 1955) | Trustee | Retired (since 2015); President and CEO, Prudential Annuity Distributors (2013– 2015); Director/Trustee, Advanced Series Trust, Prudential Series Fund and Prudential’s Gibraltar Fund, Inc. (2013– 2015); Senior Vice President, Prudential Annuities (2008–2015). | 16 | None. | ||||
| Theda R. Haber† (born 1954) | Trustee | Adjunct Assistant Professor of Law, UC Hastings College of Law (since 2013); Member of the Board of Directors, Fairholme Trust Company, LLC (since 2015); Attorney, Law Office of Theda R. Haber (since 2014); Visiting Professor of Law, UC Davis School of Law (since 2014); Consultant, Haber & Associates LLC (financial services industry) (since 2012); Advisory Council Chair, Vice Chair, and Member, Advisory Council on Employee Welfare and Pension Benefit Plans (ERISA Advisory Council), U.S. Department of Labor (2009–2011); Managing Director and General Counsel, BlackRock Institutional Trust Company, N.A. (2009-2011); Deputy Global General Counsel, Barclays Global Investors (2006-2009); Managing Director, Barclays Global Investors (1998-2006). | 16 | None. | ||||
| Marshall Lux† (born 1960) | Trustee | Senior Advisor, The Boston Consulting Group (since 2014); Senior Partner and Managing Director, The Boston Consulting Group (2009–2014). | 16 | None. | ||||
| Lisa K. Polsky† (born 1956) | Trustee | Senior Risk Advisor, AQR (investment management) (since 2016); Senior Risk Advisor, Ultra Capital (venture capital) (since 2016); Board Member and Chair of Risk Committee, DeutscheBank IHC (financial services) (since May 2016); Chief Risk Officer, CIT Group Inc. (financial services) (2010–2015); Board Member and Chair of Audit Committee, Piper Jaffray (investment bank) (2007–2016). | 16 | None. | ||||
| John Walters† (born 1962) | Lead Independent Trustee | Board Member, Amerilife Holdings LLC (insurance distribution) (since 2015); Board Member, Stadion Money Management LLC (investment adviser) (since 2011); President and Chief Operating Officer, Hartford Life Insurance Company (2000–2010). | 16 | None. | ||||
| 24 |
Table of Contents
SUPPLEMENTAL INFORMATION(UNAUDITED)
| Name and Year of Birth | Term of Office, Position(s) Held and Length of Service* | Principal During Past Five Years | Number of in Fund by Trustees*** | Other Directorships Held by Trustee | ||||
| Interested Trustees | ||||||||
| Gordon Dinsmore** (born 1952) | Trustee | Senior Vice President, Head of Product and President of Berkshire, The Guardian Life Insurance Company of America. | 16 | None. | ||||
| Marc Costantini** (born 1969) | Chairman and Trustee | Executive Vice President, Group and Worksite Markets, The Guardian Life Insurance Company of America (since 2017); Executive Vice President and Chief Financial Officer, The Guardian Life Insurance Company of America (2014– 2017); Executive Vice President, Manulife Financial prior thereto (various positions from 1990–2014). | 16 | None. | ||||
| * | Each Trustee except for Mr. Dinsmore began service in such capacity in 2016 and serves until his or her successor is elected and qualified or until his or her resignation, death or removal. Mr. Dinsmore has served as a Trustee since November 2017. The business address of each Trustee is 7 Hanover Square, New York, New York 10004. |
| ** | Each of Gordon Dinsmore and Marc Costantini is considered to be an “interested person” of the Trust within the meaning of the 1940 Act because of their affiliation with The Guardian Life Insurance Company of America and/or its affiliates. |
| *** | As of the date of this report, the Trust currently consists of 16 separate Funds. |
| † | Member of the Audit Committee of the Trust. |
The following table provides information about the Officers of the Trust.
| Name and Year of Birth | Position(s) Held and Length of Service* | Principal Occupation(s) During Past Five Years | ||
| Gordon Dinsmore (born 1952) | President and Principal Executive Officer (Since November 2017) | Senior Vice President, Head of Product and President of Berkshire, The Guardian Life Insurance Company of America. | ||
| John H. Walter (born 1962) | Senior Vice President, Treasurer, and Principal Financial and Accounting Officer | Vice President, Chief Financial Officer, Equity Profit Center, The Guardian Life Insurance Company of America. | ||
| Harris Oliner (born 1971) | Senior Vice President and Secretary | Senior Vice President, Corporate Secretary, The Guardian Life Insurance Company of America (since 2015); Senior Vice President, Deputy General Counsel, Corporate Secretary, Voya Financial, Inc. (2013–2014); Managing Director, Senior Counsel, Corporate Secretary, BlackRock, Inc. prior thereto. | ||
| Richard T. Potter (born 1954) | Senior Vice President and Chief Legal Officer | Vice President and Equity Counsel, The Guardian Life Insurance Company of America. | ||
| Philip Stack (born 1964) | Chief Compliance Officer (Since September 2017) | Executive Director, Chief Compliance Officer, Morgan Stanley (2015–2017); Vice President, Morgan Stanley (2013–2015); Vice President, Corporate Audit Group–Compliance, Morgan Stanley prior thereto. | ||
| James R. Anderson (born 1963) | Anti-Money Laundering Officer (Since November 2017) | Second Vice President, Agency and Anti-Money Laundering Compliance, The Guardian Life Insurance Company of America. | ||
| Kathleen M. Moynihan (born 1966) | Senior Counsel | Senior Counsel, The Guardian Life Insurance Company of America. | ||
| Maria Nydia Morrison (born 1958) | Fund Controller | Mutual Fund Controller, The Guardian Life Insurance Company of America (since 2015); Chief Financial Officer/Assistant Operating Officer, St. Francis De Assisi Montessori School (Plaridel, Bulacan), Inc. (Philippines) (2013–2015); Vice President, Bank of New York Mellon prior thereto. | ||
| 25 |
Table of Contents
SUPPLEMENTAL INFORMATION(UNAUDITED)
| Name and Year of Birth | Position(s) Held and Length of Service* | Principal Occupation(s) During Past Five Years | ||
| Sonya L. Crosswell (born 1977) | Assistant Secretary | Assistant Vice President, Assistant Corporate Secretary and Secretary Pro Tem, The Guardian Life Insurance Company of America (since 2014); Vice President, Secretary and Assistant General Counsel, Carver Federal Savings Bank prior thereto. | ||
| * | Unless otherwise indicated, the Officers each began service in such capacity in 2016 and hold office for an indefinite term or until their successors shall have been elected and qualified. The business address of each Officer is 7 Hanover Square, New York, New York 10004. |
| 26 |
Table of Contents
SUPPLEMENTAL INFORMATION(UNAUDITED)
The Statement of Additional Information (“SAI”) includes additional information about the Trust’s Trustees and Officers and is available, without charge, upon request by calling toll-free1-888-GUARDIAN(1-888-482-7342) or by visiting our website at http://guardianvpt.onlineprospectus.net/GuardianVPT/Prospectuses.
Portfolio Holdings and Proxy Voting Procedures
The Fund files its complete schedule of portfolio holdings with the Securities and Exchange Commission for the first and third quarters of each fiscal year as an exhibit to its reports on Form N-Q or FormN-PORT (for filings beginning in April 2019 relating to March 31, 2019 data). The Fund’s Form N-Q or FormN-PORT reports are available on the Securities and Exchange Commission’s website at https://www.sec.gov. The Fund’s Form N-Q orForm N-PORT information is also available, without charge, upon request, by calling toll-free1-888-GUARDIAN(1-888-482-7342) or by visiting our website at http://guardianvpt.onlineprospectus.net/GuardianVPT/
Prospectuses.
Beginning in April 2019, the Fund will cease to disclose its holdings on Form N-Q and will file Form N-PORT with the Securities and Exchange Commission on a monthly
basis, with the information contained on Form N-PORT for the last month of the Fund’s fiscal quarter being made public by the Securities and Exchange Commission 60 days after the end of the Fund’s fiscal quarter.
A description of the policies and procedures that the Fund uses to determine how to vote proxies relating to portfolio securities is included in the SAI. The SAI and information regarding how the Fund voted proxies relating to portfolio securities during the most recent12-month period ended June 30 may be obtained (i) without charge, upon request, by calling toll-free1-888-GUARDIAN(1-888-482-7342) or by visiting our website at http://guardianvpt.onlineprospectus.net/GuardianVPT/
Prospectuses; and (ii) on the Securities and Exchange Commission’s website at https://www.sec.gov.
| 27 |
Table of Contents
This report is transmitted to shareholders only. It is not authorized for use as an offer of sale or a solicitation of an offer to buy shares of the Fund unless accompanied or preceded by the Fund’s current prospectus. Past performance results shown in this report should not be considered a representation of future performance. Investment returns and principal value of shares will fluctuate so that shares, when redeemed, may be worth more or less than their original cost. Statements and other information herein are as dated and are subject to change.

The Guardian Life Insurance Company of America New York, NY 10004-4025
PUB8171
Table of Contents
Guardian Variable
Products Trust
2018
Annual Report
All Data as of December 31, 2018
Guardian International Value VIP Fund
Important Notice
Beginning on January 1, 2021, as permitted by regulations adopted by the Securities and Exchange Commission, paper copies of the Fund’s shareholder reports will no longer be sent by mail from The Guardian Insurance & Annuity Company, Inc. (“GIAC”). Instead, GIAC will mail you a notice when copies of the shareholder reports are made available on a website. You will be notified by mail each time a report is posted and provided with a website link to access the report.
If you have already elected to receive shareholder reports electronically, you will not be affected by this change and you need not take any action. If you have not yet elected electronic delivery, at any time, you may elect to receive the Fund’s shareholder reports and certain other communications from GIAC electronically, by going to www.guardianlife.com and registering fore-delivery.
You may instead elect to receive all future shareholder reports in paper free of charge. If you wish to receive paper copies of your shareholder reports, please call GIAC’s Customer Service Office Contact Center at1-888-GUARDIAN(1-888-482-7342). Your election to receive reports in paper will apply to all the underlying funds available.

| Not FDIC insured. May lose value. No bank guarantee. | www.guardianlife.com |
Table of Contents
Guardian International Value VIP Fund
| 1 | ||||
| 3 | ||||
| 4 | ||||
| 6 | ||||
Financial Information | ||||
| Schedule of Investments | 7 | |||
| Statement of Assets and Liabilities | 10 | |||
| Statement of Operations | 10 | |||
| Statements of Changes in Net Assets | 11 | |||
| Financial Highlights | 12 | |||
| Notes to Financial Statements | 14 | |||
| Report of Independent Registered Public Accounting Firm | 19 | |||
Supplemental Information | ||||
| Approval of Investment Advisory andSub-advisory Agreements | 20 | |||
| Trustees and Officers Information Table | 24 | |||
| Portfolio Holdings and Proxy Voting Procedures | 27 | |||
Except as otherwise specifically stated, all information, including portfolio security positions, is as of December 31, 2018. The views expressed in the Fund Commentary are those of the Fund’s portfolio manager(s) as of the date of this report and are subject to change without notice. They do not necessarily represent the views of Park Avenue Institutional Advisers LLC or asub-adviser. The Fund Commentary may contain some forward-looking statements providing expectations or forecasts of future events as of the date of this report; they do not necessarily relate to historical or current facts. There can be no guarantee that any forward-looking statement will be realized. We undertake no obligation to update forward-looking statements, whether as a result of new information, future events, or otherwise. Any discussions of specific securities should not be considered a recommendation to buy or sell those securities. Fund holdings will vary. Information contained herein has been obtained from sources believed reliable, but is not guaranteed.
Table of Contents
GUARDIAN INTERNATIONAL VALUE VIP FUND
FUND COMMENTARY OF LAZARD ASSET MANAGEMENT LLC,SUB-ADVISER
Highlights
| • | Guardian International Value VIP Fund (the “Fund”) returned -15.17%, underperforming its benchmark, the MSCI® EAFE® Index1 (the “Index”), for the 12 months ended December 31, 2018. Stock selection in the consumer discretionary, materials, and health care sectors, an underweight compared to the Index in the materials sector, and an overweight in the energy sector benefited the Fund’s relative performance. Stock selection in the consumer staples and energy sectors, an underweight in the health care and utilities sectors, and positioning in emerging markets detracted from relative performance. |
| • | The Index returned -13.79% for the year. |
Market Overview
Global equities declined significantly in 2018 as investor sentiment was undermined by global macroeconomic and geopolitical trends, including interest rate pressures, trade disputes, and populism. Riskier assets around the world sold off, with many generating their worst calendar-year performance since the global financial crisis a decade ago.
The Index declined, returning-13.79% in 2018. Emerging markets equities ended 2018 down 14.6%. U.S. equities joined the rout, ending the year down 4.4%. These returns are notable given the outperformance of U.S. equities over international equities over much of the past decade.
We have suggested previously that investors had not been pricing in many global risks, especially in the United States. As global economic data began to plateau and decline from peak levels earlier in 2018, markets entered the later phases of the economic cycle. International equity valuations at this point came under more pressure, bearing the brunt of investor fears about slowing global growth and geopolitical tensions.
The latest economic data shows a deceleration in global growth, with recent indicators for manufacturing in decline. In the United States, manufacturing decreased unexpectedly in December to atwo-year low. In Europe, leading indicators have fallen from elevated levels, and
the Eurozone’s 0.2% quarterly rise in GDP was the lowest since 2014. The Japanese economy contracted in the third quarter. China, in the meantime, has implemented stimulus — including liquidity injections, tax cuts, and regulatory easing — for several months as its economy slows and U.S. tariffs weigh on sentiment.
One of the main factors compressing multiples in global equity markets has been political uncertainty. In the United States, trade tensions persist, while the government shut down over funding for a physical wall on the nation’s southern border. In the United Kingdom, investor uncertainty was raised as the March 2019 deadline for a Brexit deal draws closer. Elsewhere, France, Italy and Germany are also experiencing their own political tensions.
The decline in investor confidence in 2018 was most pronounced in emerging markets equities. Most of these losses occurred earlier in the year before the decline in developed markets. Within a few months, however, U.S. economic growth, boosted by tax cuts and fiscal stimulus, appeared to diverge from the rest of the world. Relatively strong U.S. growth supported further U.S. Federal Reserve rate hikes, which in turn boosted the U.S. dollar early in the year. The rising dollar put pressure on emerging markets in general, but investors focused on countries with high current account deficits and/or significant holdings of U.S. dollar–denominated debt, significantly impacting Argentina’s and Turkey’s equity markets.
Another weight on emerging markets sentiment last year was trade. President Donald Trump in 2018 took action against trade deficits, implementing or threatening tariffs on nearly a quarter of U.S. imports. Uncertainty about trade lowered Chinese confidence just as policymakers were trying to restrict credit growth, reduce systemic risk, and deleverage the economy. Chinese equities sold off, and decelerating Chinese growth rippled through the global economy.
Portfolio Review
One of the largest detractors from the Fund’s performance during the period was the Fund’s exposure to emerging markets. In contrast, stock selection in the consumer discretionary sector was among the largest positive drivers of relative returns. Stock selection in the health care sector was also beneficial to relative returns.
| 1 | The MSCI® EAFE® Index (Europe, Australasia, and Far East) (the “Index”) is a free float-adjusted market capitalization index that is designed to measure the equity market performance of developed markets, excluding the U.S. and Canada. Index results assume the reinvestment of dividends paid on the stocks constituting the Index. You may not invest in the Index and, unlike the Fund, the Index does not incur fees or expenses. |
| 1 |
Table of Contents
GUARDIAN INTERNATIONAL VALUE VIP FUND
Outlook
The uncertainty and volatility global investors faced last year will likely continue in 2019, in our view. We see this, however, as a partly positive development. The fact that investors are pricing in risks leads us to be more constructive about markets going forward given that valuations have come down. We acknowledge challenges for growth, geopolitics, and corporate earnings, but we also note that prior market reverses
have led to more realistic pricing and, in some cases, opportunities. We believe markets will continue to exhibit higher volatility and uncertainty in 2019, which in our view can be an opportunity for fundamental equity investors. Many risks will likely resolve in the coming year and provide investors with clarity, regardless of whether the outcome is positive or negative. Market prices, in many cases, appear to reflect expectations of a negative result, and thus we believe the resolution of any prominent risk could have a positive impact.
Funds in the Guardian Variable Products Trust are sold by prospectus only. You should carefully consider the investment objectives, risks, charges and expenses of the Funds before making an investment decision. The prospectus contains this and other important information. Please read it carefully before investing or sending money. Please visit our website at http://guardianvpt.onlineprospectus.net/GuardianVPT/Prospectuses or to obtain a printed copy, call 1-888-GUARDIAN(1-888-482-7342).
As with all mutual funds, the value of an investment in the Fund could decline, and you could lose money. Diversification does not guarantee profit or protect against loss, and there can be no assurance that the Fund will achieve its investment objective. The Fund invests primarily in equity securities and therefore exposes you to the general risks of investing in stock markets. Investing inlarge-capitalization companies involves risks such as having low growth rates, and slow responsiveness to competitive challenges or opportunities than in the case of smaller companies. International investing involves special risks, which include changes in currency rates, foreign taxation and differences in auditing standards and securities regulations, political uncertainty and greater volatility. Foreign securities are subject to political, regulatory, economic, and exchange-rate risks not present in domestic investments. These risks are even greater when investing in emerging markets. Value stocks may not realize their perceived value and during certain periods the Fund may underperform other equity funds that employ a different style. Investing in a more limited number of issuers and sectors can be subject to greater market fluctuation. Any discussions of specific securities should not be considered a recommendation to buy or sell those securities. Fund holdings will vary.
| 2 |
Table of Contents
GUARDIAN INTERNATIONAL VALUE VIP FUND
Fund Characteristics (unaudited)
| Total Net Assets: $ 208,181,539 |
Geographic Region Allocation1 As of December 31, 2018 |
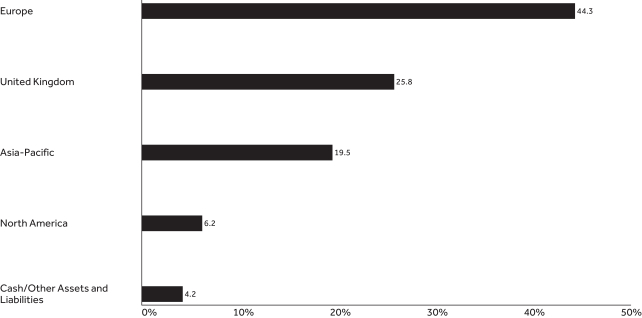 |
Sector Allocation2 As of December 31, 2018 |
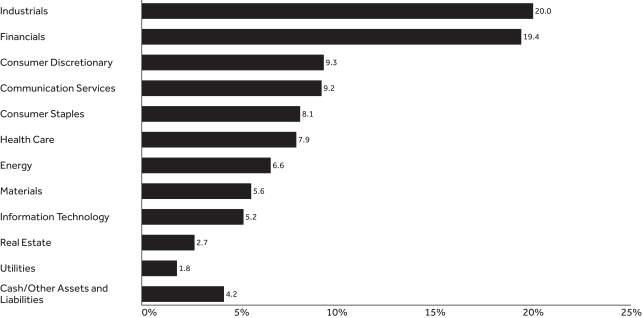 |
| 3 |
Table of Contents
GUARDIAN INTERNATIONAL VALUE VIP FUND
Top Ten Holdings1 As of December 31, 2018 | ||||||
| Holding | Country | % of Total Net Assets | ||||
| Novartis AG (Reg S) | Switzerland | 4.24% | ||||
| Royal Dutch Shell PLC, Class A | United Kingdom | 3.43% | ||||
| Prudential PLC | United Kingdom | 3.05% | ||||
| SAP SE | Germany | 3.00% | ||||
| Medtronic PLC | Ireland | 2.89% | ||||
| Daiwa House Industry Co. Ltd. | Japan | 2.69% | ||||
| Aon PLC | United Kingdom | 2.65% | ||||
| RELX PLC | United Kingdom | 2.50% | ||||
| Compass Group PLC | United Kingdom | 2.39% | ||||
| Ferguson PLC | United Kingdom | 2.35% | ||||
| Total | 29.19% | |||||
| 1 | Portfolio holdings are subject to change and should not be considered a recommendation to buy or sell individual securities. Cash includes short-term investments and net other assets and liabilities. |
| 2 | The Fund’s holdings are allocated to each sector based on the MSCI Global Industry Classification Standard (GICS®). Cash includes short-term investments and net other assets and liabilities. |
Average Annual Total Returns As of December 31, 2018 | ||||||||||||||||||||
| Inception Date | 1 Year | 5 Year | 10 Year | Since Inception | ||||||||||||||||
| Guardian International Value VIP Fund | 9/1/2016 | -15.17% | — | — | 0.04% | |||||||||||||||
| MSCI® EAFE® Index | -13.79% | — | — | 3.26% | ||||||||||||||||
Results of a Hypothetical $10,000 Investment As of December 31, 2018 |
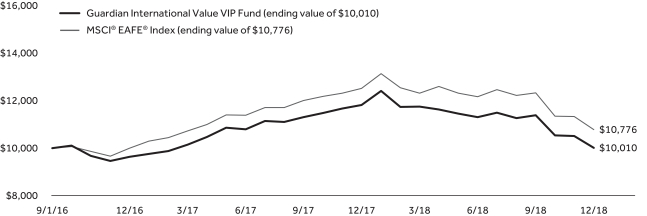 |
The chart above shows the performance of a hypothetical $10,000 investment made on inception date in Guardian International Value VIP Fund and the MSCI® EAFE® Index. Index returns do not include the fees and expenses of the Fund, but do include reinvestment of dividends, if any.
| 4 |
Table of Contents
GUARDIAN INTERNATIONAL VALUE VIP FUND
Performance quoted represents past performance and does not guarantee or predict future results. Investment return and principal value will fluctuate, so shares, when redeemed, may be worth more or less than their original cost. The Fund’s fees and expenses are detailed in the Financial Highlights section of this report. Fees and expenses are factored into the net asset value of Fund shares and any performance numbers we release. Total return figures include the effect of expense limitations in effect during the periods shown, if applicable; without such limitations, the performance shown would have been lower. Performance results assume the reinvestment of dividends and capital gains. The return figures shown do not reflect the deduction of taxes that a contract owner/policyholder may pay on redemption units. The actual total returns for owners of variable annuity contracts or variable life insurance policies that provide for investment in the Fund will be lower to reflect separate account and contract/policy charges. Current andmonth-end performance information, which may be lower or higher than that cited, is available by calling1-888-GUARDIAN(1-888-482-7342) and is periodically updated on our website: http://guardianlife.com.
| 5 |
Table of Contents
UNDERSTANDING YOUR FUND’S EXPENSES(UNAUDITED)
By investing in the Fund, you incur two types of costs: (1) transaction costs and (2) ongoing costs, including, as applicable, investment advisory fees, distribution and/or service(12b-1) fees and other Fund expenses. The example below is intended to help you understand your ongoing costs (in dollars) of investing in the Fund and to compare these costs with the ongoing costs of investing in other mutual funds.
The example is based on an investment of $1,000 invested at the beginning of the period and held for the entire period from July 1, 2018 to December 31, 2018. The table below shows the Fund’s expenses in two ways:
Expenses based on actual return
This section of the table provides information about actual account values and actual expenses. You may use the information in this section, together with the amount you invested, to estimate the expenses that you paid over the period. Simply divide your account value by $1,000 (for example, an $8,600 account value divided by $1,000 = 8.6), then multiply the result by the number in the section under the heading entitled “Expenses Paid During Period” to estimate the expenses you paid on your account during this period.
Expenses based on hypothetical 5% return for comparison purposes
This section of the table provides information about hypothetical account values and hypothetical expenses based on the Fund’s actual expense ratio and an assumed rate of return of 5% per year before expenses, which is not the Fund’s actual return. The hypothetical account values and expenses may not be used to estimate the actual ending account balance or expenses you paid for the period. You may use this information to compare the ongoing costs of investing in the Fund with the cost of investing in other mutual funds. To do so, compare this 5% hypothetical example with the 5% hypothetical examples that appear in the shareholder reports of the other funds.
Note that the expenses shown in the table are meant to highlight your ongoing costs only and do not reflect any transactional costs, such as sales charges (loads), redemption fees, or exchange fees. Therefore the second section is useful in comparing ongoing costs only, and will not help you determine the relative total costs of owning different funds. If these transactional costs were included, your costs would have been higher. Charges and expenses at the insurance company separate account level are not reflected in the table.
Beginning Account Value 7/1/18 | Ending Account Value 12/31/18 | Expenses Paid During Period* 7/1/18-12/31/18 | Expense Ratio During Period 7/1/18-12/31/18 | |||||||||||
| Based on Actual Return | $1,000.00 | $ | 885.80 | $ | 4.47 | 0.94% | ||||||||
| Based on Hypothetical Return (5% Return Before Expenses) | $1,000.00 | $ | 1,020.47 | $ | 4.79 | 0.94% | ||||||||
| * | Expenses are equal to the Fund’s annualized expense ratio as indicated, multiplied by the average account value over the period, multiplied by 184/365 (to reflect theone-half year period). |
| 6 |
Table of Contents
SCHEDULE OF INVESTMENTS — GUARDIAN INTERNATIONAL VALUE VIP FUND
| December 31, 2018 | Shares | Value | ||||||
| Common Stocks – 93.9% |
| |||||||
| Belgium – 1.8% |
| |||||||
Anheuser-Busch InBev S.A. | 55,688 | $ | 3,685,559 | |||||
|
| |||||||
| 3,685,559 | ||||||||
| Canada – 6.2% |
| |||||||
Canadian National Railway Co. | 29,447 | 2,180,916 | ||||||
National Bank of Canada | 59,649 | 2,448,964 | ||||||
Rogers Communications, Inc., Class B | 80,300 | 4,114,993 | ||||||
Suncor Energy, Inc. | 148,910 | 4,159,052 | ||||||
|
| |||||||
| 12,903,925 | ||||||||
| Denmark – 1.4% |
| |||||||
Carlsberg A/S, Class B | 27,927 | 2,971,112 | ||||||
|
| |||||||
| 2,971,112 | ||||||||
| Finland – 2.9% |
| |||||||
Nordea Bank Abp | 351,656 | 2,965,890 | ||||||
Sampo OYJ, Class A | 70,965 | 3,119,704 | ||||||
|
| |||||||
| 6,085,594 | ||||||||
| France – 11.2% |
| |||||||
Air Liquide S.A. | 26,250 | 3,249,891 | ||||||
Capgemini SE | 30,947 | 3,055,242 | ||||||
Cie de Saint-Gobain | 54,283 | 1,806,828 | ||||||
Cie Generale des Etablissements Michelin SCA | 19,223 | 1,900,563 | ||||||
Safran S.A. | 37,651 | 4,523,395 | ||||||
Societe Generale S.A. | 56,458 | 1,792,482 | ||||||
Vinci S.A. | 40,203 | 3,303,795 | ||||||
Vivendi S.A. | 156,300 | 3,797,670 | ||||||
|
| |||||||
| 23,429,866 | ||||||||
| Germany – 3.7% |
| |||||||
Fresenius SE & Co. KGaA | 31,292 | 1,512,581 | ||||||
SAP SE | 62,769 | 6,252,400 | ||||||
|
| |||||||
| 7,764,981 | ||||||||
| Hong Kong – 0.9% |
| |||||||
Techtronic Industries Co. Ltd. | 364,500 | 1,921,260 | ||||||
|
| |||||||
| 1,921,260 | ||||||||
| India – 1.4% |
| |||||||
ICICI Bank Ltd., ADR | 289,350 | 2,977,411 | ||||||
|
| |||||||
| 2,977,411 | ||||||||
| Ireland – 4.3% |
| |||||||
Medtronic PLC | 66,179 | 6,019,642 | ||||||
Ryanair Holdings PLC, ADR(1) | 40,094 | 2,860,306 | ||||||
|
| |||||||
| 8,879,948 | ||||||||
| Israel – 0.8% |
| |||||||
Bank LeumiLe-Israel BM | 267,852 | 1,621,702 | ||||||
|
| |||||||
| 1,621,702 | ||||||||
| Japan – 13.0% |
| |||||||
Daiwa House Industry Co. Ltd. | 176,112 | 5,593,240 | ||||||
Don Quijote Holdings Co. Ltd. | 61,400 | 3,809,019 | ||||||
Kao Corp. | 39,630 | 2,921,758 | ||||||
Makita Corp. | 80,200 | 2,840,008 | ||||||
Nexon Co. Ltd.(1) | 223,500 | 2,855,126 | ||||||
| December 31, 2018 | Shares | Value | ||||||
| Japan(continued) |
| |||||||
Shin-Etsu Chemical Co. Ltd. | 37,000 | $ | 2,850,510 | |||||
Sumitomo Mitsui Financial Group, Inc. | 102,900 | 3,393,316 | ||||||
Suzuki Motor Corp. | 19,300 | 976,590 | ||||||
Yamaha Corp. | 45,100 | 1,914,786 | ||||||
|
| |||||||
| 27,154,353 | ||||||||
| Netherlands – 3.5% |
| |||||||
ABN AMRO Group N.V.(2) | 104,081 | 2,437,923 | ||||||
Koninklijke DSM N.V. | 18,715 | 1,522,771 | ||||||
Wolters Kluwer N.V. | 55,995 | 3,306,689 | ||||||
|
| |||||||
| 7,267,383 | ||||||||
| Norway – 3.2% |
| |||||||
Equinor ASA | 114,323 | 2,438,075 | ||||||
Telenor ASA | 214,294 | 4,136,707 | ||||||
|
| |||||||
| 6,574,782 | ||||||||
| Republic of Korea – 0.7% |
| |||||||
Samsung Electronics Co. Ltd. | 43,050 | 1,489,559 | ||||||
|
| |||||||
| 1,489,559 | ||||||||
| Singapore – 2.7% |
| |||||||
DBS Group Holdings Ltd. | 227,680 | 3,933,739 | ||||||
NetLink NBN Trust | 2,967,700 | 1,664,299 | ||||||
|
| |||||||
| 5,598,038 | ||||||||
| Spain – 1.8% |
| |||||||
Red Electrica Corp. S.A. | 168,816 | 3,760,314 | ||||||
|
| |||||||
| 3,760,314 | ||||||||
| Sweden – 3.4% |
| |||||||
Assa Abloy AB, Class B | 231,326 | 4,135,942 | ||||||
Epiroc AB, Class A(1) | 303,521 | 2,882,521 | ||||||
|
| |||||||
| 7,018,463 | ||||||||
| Switzerland – 5.2% |
| |||||||
Julius Baer Group Ltd.(1) | 53,578 | 1,914,545 | ||||||
Novartis AG (Reg S) | 103,042 | 8,825,380 | ||||||
|
| |||||||
| 10,739,925 | ||||||||
| United Kingdom – 25.8% |
| |||||||
Aon PLC | 37,924 | 5,512,633 | ||||||
BHP Group PLC | 198,236 | 4,144,341 | ||||||
Compass Group PLC | 236,797 | 4,971,477 | ||||||
Diageo PLC | 71,820 | 2,552,735 | ||||||
Ferguson PLC | 76,236 | 4,882,604 | ||||||
Howden Joinery Group PLC | 318,881 | 1,763,601 | ||||||
Informa PLC | 299,548 | 2,401,987 | ||||||
Melrose Industries PLC | 980,181 | 2,029,704 | ||||||
Prudential PLC | 355,774 | 6,356,637 | ||||||
RELX PLC | 253,833 | 5,213,456 | ||||||
Royal Dutch Shell PLC, Class A | 243,618 | 7,150,312 | ||||||
RSA Insurance Group PLC | 319,441 | 2,084,263 | ||||||
Unilever PLC | 90,111 | 4,716,199 | ||||||
|
| |||||||
| 53,779,949 | ||||||||
| Total Common Stocks (Cost $222,747,537) |
| 195,624,124 | ||||||
| The accompanying notes are an integral part of these financial statements. | 7 |
Table of Contents
SCHEDULE OF INVESTMENTS — GUARDIAN INTERNATIONAL VALUE VIP FUND
| December 31, 2018 | Shares | Value | ||||||
| Preferred Stocks – 1.9% |
| |||||||
| Germany – 1.9% |
| |||||||
Volkswagen AG, 3.00% | 24,572 | $ | 3,910,228 | |||||
|
| |||||||
| 3,910,228 | ||||||||
| Total Preferred Stocks (Cost $4,659,939) |
| 3,910,228 | ||||||
| Principal Amount | Value | |||||||
| Short–Term Investment – 4.3% |
| |||||||
| Repurchase Agreements – 4.3% |
| |||||||
Fixed Income Clearing Corp., 0.50%, dated 12/31/2018, proceeds at maturity value of $8,916,248, due 1/2/2019(3) | $ | 8,916,000 | 8,916,000 | |||||
| Total Repurchase Agreements (Cost $8,916,000) |
| 8,916,000 | ||||||
| Total Investments – 100.1% (Cost $236,323,476) |
| 208,450,352 | ||||||
| Liabilities in excess of other assets – (0.1)% |
| (268,813 | ) | |||||
| Total Net Assets – 100.0% |
| $ | 208,181,539 | |||||
| (1) | Non–income–producing security. |
| (2) | Securities that may be resold in transactions, exempt from registration under Rule 144A of the Securities Act of 1933, as amended, normally to certain qualified buyers. At December 31, 2018, the aggregate market value of these securities amounted to $2,437,923, representing 1.2% of net assets. These securities have been deemed liquid by the investment adviser pursuant to the Fund’s liquidity procedures approved by the Board of Trustees. |
| (3) | The table below presents collateral for repurchase agreements. |
| Security | Coupon | Maturity Date | Principal Amount | Value | ||||||||||||
| U.S. Treasury Note | 2.875% | 7/31/2025 | $ | 8,865,000 | $ | 9,096,394 | ||||||||||
Legend:
ADR — American Depositary Receipt
| 8 | The accompanying notes are an integral part of these financial statements. |
Table of Contents
SCHEDULE OF INVESTMENTS — GUARDIAN INTERNATIONAL VALUE VIP FUND
The following is a summary of the inputs used as of December 31, 2018 in valuing the Fund’s investments. For more information on valuation inputs, please refer to Note 2a of the accompanying Notes to Financial Statements.
| Valuation Inputs | ||||||||||||||||
| Investments in Securities | Level 1 | Level 2 | Level 3 | Total | ||||||||||||
| Common Stocks |
| |||||||||||||||
Belgium | $ | — | $ | 3,685,559 | * | $ | — | $ | 3,685,559 | |||||||
Canada | 12,903,925 | — | — | 12,903,925 | ||||||||||||
Denmark | — | 2,971,112 | * | — | 2,971,112 | |||||||||||
Finland | — | 6,085,594 | * | — | 6,085,594 | |||||||||||
France | — | 23,429,866 | * | — | 23,429,866 | |||||||||||
Germany | — | 7,764,981 | * | — | 7,764,981 | |||||||||||
Hong Kong | — | 1,921,260 | * | — | 1,921,260 | |||||||||||
India | 2,977,411 | — | — | 2,977,411 | ||||||||||||
Ireland | 8,879,948 | — | — | 8,879,948 | ||||||||||||
Israel | — | 1,621,702 | * | — | 1,621,702 | |||||||||||
Japan | — | 27,154,353 | * | — | �� | 27,154,353 | ||||||||||
Netherlands | — | 7,267,383 | * | — | 7,267,383 | |||||||||||
Norway | — | 6,574,782 | * | — | 6,574,782 | |||||||||||
Republic of Korea | — | 1,489,559 | * | — | 1,489,559 | |||||||||||
Singapore | — | 5,598,038 | * | — | 5,598,038 | |||||||||||
Spain | — | 3,760,314 | * | — | 3,760,314 | |||||||||||
Sweden | — | 7,018,463 | * | — | 7,018,463 | |||||||||||
Switzerland | — | 10,739,925 | * | — | 10,739,925 | |||||||||||
United Kingdom | 5,512,633 | 48,267,316 | * | — | 53,779,949 | |||||||||||
| Preferred Stocks |
| |||||||||||||||
Germany | — | 3,910,228 | * | — | 3,910,228 | |||||||||||
| Repurchase Agreements | — | 8,916,000 | — | 8,916,000 | ||||||||||||
| Total | $ | 30,273,917 | $ | 178,176,435 | $ | — | $ | 208,450,352 | ||||||||
| * | Consists of certain foreign securities whose values were determined by a pricing service using pricing models (See Note 2a in Notes to Financial Statements). These investments in securities were classified as Level 2 rather than Level 1. |
| The accompanying notes are an integral part of these financial statements. | 9 |
Table of Contents
FINANCIAL INFORMATION — GUARDIAN INTERNATIONAL VALUE VIP FUND
For the Year Ended December 31, 2018 | ||||
Investment Income | ||||
Dividends | $ | 5,185,229 | ||
Interest | 21,844 | |||
Withholding taxes on foreign dividends | (524,677 | ) | ||
|
| |||
Total Investment Income | 4,682,396 | |||
|
| |||
Expenses | ||||
Investment advisory fees | 1,323,439 | |||
Distribution fees | 428,499 | |||
Trustees’ and officers’ fees | 96,004 | |||
Custodian and accounting fees | 86,381 | |||
Professional fees | 68,911 | |||
Administrative fees | 44,587 | |||
Shareholder reports | 17,116 | |||
Transfer agent fees | 16,689 | |||
Other expenses | 24,430 | |||
|
| |||
Total Expenses | 2,106,056 | |||
Less: Fees waived | (489,784 | ) | ||
|
| |||
Total Expenses, Net | 1,616,272 | |||
|
| |||
Net Investment Income/(Loss) | 3,066,124 | |||
|
| |||
Realized Gain/(Loss) and Change in Unrealized Appreciation/(Depreciation) on Investments and Foreign Currency Transactions | ||||
Net realized gain/(loss) from investments | (8,490,643 | ) | ||
Net realized gain/(loss) from foreign currency transactions | (223,882 | ) | ||
Net change in unrealized appreciation/(depreciation) on investments | (29,758,337 | ) | ||
Net change in unrealized appreciation/(depreciation) on translation of assets and liabilities in foreign currencies | (953 | ) | ||
|
| |||
Net Loss on Investments and Foreign Currency Transactions | (38,473,815 | ) | ||
|
| |||
Net Decrease in Net Assets Resulting From Operations | $ | (35,407,691 | ) | |
|
| |||
| 10 | The accompanying notes are an integral part of these financial statements. |
Table of Contents
FINANCIAL INFORMATION — GUARDIAN INTERNATIONAL VALUE VIP FUND
| For the Year Ended 12/31/18 | For the Year Ended 12/31/17 | |||||||
| ||||||||
Operations |
| |||||||
Net investment income/(loss) | $ | 3,066,124 | $ | 263,007 | ||||
Net realized gain/(loss) from investments and foreign currency transactions | (8,714,525 | ) | 1,326,229 | |||||
Net change in unrealized appreciation/(depreciation) on investments and | (29,759,290 | ) | 2,213,152 | |||||
|
|
|
| |||||
Net Increase/(Decrease) in Net Assets Resulting from Operations | (35,407,691 | ) | 3,802,388 | |||||
|
|
|
| |||||
Capital Share Transactions |
| |||||||
Proceeds from sales of shares | 252,164,387 | 5,500,620 | ||||||
Cost of shares redeemed | (19,708,380 | ) | (12,269,526 | ) | ||||
|
|
|
| |||||
Net Increase/(Decrease) in Net Assets Resulting from Capital Share Transactions | 232,456,007 | (6,768,906 | ) | |||||
|
|
|
| |||||
Net Increase/(Decrease) in Net Assets | 197,048,316 | (2,966,518 | ) | |||||
|
|
|
| |||||
Net Assets |
| |||||||
Beginning of year | 11,133,223 | 14,099,741 | ||||||
|
|
|
| |||||
End of year | $ | 208,181,539 | $ | 11,133,223 | ||||
|
|
|
| |||||
Other Information: |
| |||||||
Shares | ||||||||
Sold | 21,623,258 | 552,275 | ||||||
Redeemed | (1,774,536 | ) | (1,072,930 | ) | ||||
|
|
|
| |||||
Net Increase/(Decrease) | 19,848,722 | (520,655 | ) | |||||
|
|
|
| |||||
| The accompanying notes are an integral part of these financial statements. | 11 |
Table of Contents
FINANCIAL INFORMATION — GUARDIAN INTERNATIONAL VALUE VIP FUND
The Financial Highlights table is intended to help you understand the Fund’s financial performance for the past five years (or, if shorter, the period since inception). Certain information reflects financial results for a single Fund share. The total returns in the table represent the rate that an investor would have earned (or lost) on an investment in the Fund.
Financial Highlights | ||||||||||||||||||||||||
| Per Share Operating Performance | ||||||||||||||||||||||||
Net Asset Value, Beginning of Period | Net Investment Income(1) | Net Realized and Unrealized Gain/(Loss) | Total Operations | Net Asset Value, End of Period | Total Return(2) | |||||||||||||||||||
Year Ended 12/31/18 | $ | 11.80 | $ | 0.20 | $ | (1.99 | ) | $ | (1.79 | ) | $ | 10.01 | (15.17) | % | ||||||||||
Year Ended 12/31/17 | 9.63 | 0.15 | 2.02 | 2.17 | 11.80 | 22.53 | % | |||||||||||||||||
Period Ended 12/31/16(4) | 10.00 | 0.01 | (0.38 | ) | (0.37 | ) | 9.63 | (3.70) | %(5) | |||||||||||||||
| 12 | The accompanying notes are an integral part of these financial statements. |
Table of Contents
FINANCIAL INFORMATION — GUARDIAN INTERNATIONAL VALUE VIP FUND
| Ratios/Supplemental Data | ||||||||||||||||||||||
| Net Assets, End of Period (000s) | Net Ratio of Expenses to Average Net Assets(3) | Gross Ratio of Expenses to Average Net Assets | Net Ratio of Net Investment Income to Average Net Assets(3) | Gross Ratio of Net Investment Income/ (Loss) to Average Net Assets | Portfolio Turnover Rate | |||||||||||||||||
| $ | 208,182 | 0.94% | 1.23% | 1.79% | 1.50% | 74% | ||||||||||||||||
| 11,133 | 1.11% | 2.39% | 1.40% | 0.12% | 61% | |||||||||||||||||
| 14,100 | 1.11% | (5) | 3.11% | (5) | 0.42% | (5) | (1.58)% | (5) | 8% | (5) | ||||||||||||
| (1) | Calculated based on the average shares outstanding during the period. |
| (2) | Total returns do not reflect the effects of charges deducted pursuant to the terms of The Guardian Insurance & Annuity Company, Inc.‘s variable contracts. Inclusion of such charges would reduce the total returns for all periods shown. |
| (3) | Net Ratio of Expenses to Average Net Assets and Net Ratio of Net Investment Income to Average Net Assets include the effect of fee waivers and expense limitations. |
| (4) | Commenced operations on September 1, 2016. |
| (5) | Ratios for periods less than one year have been annualized, except for total return and portfolio turnover rate. For the period ended December 31, 2016, certainnon-recurring fees (i.e., audit fees) are not annualized. |
| The accompanying notes are an integral part of these financial statements. | 13 |
Table of Contents
NOTES TO FINANCIAL STATEMENTS — GUARDIAN INTERNATIONAL VALUE VIP FUND
December 31, 2018
1. Organization
Guardian Variable Products Trust (the “Trust”), a Delaware statutory trust organized on January 12, 2016, is registered under the Investment Company Act of 1940, as amended (the “1940 Act”), as anopen-end management investment company. The Trust currently has sixteen series. Guardian International Value VIP Fund (the “Fund”) is a series of the Trust. The Fund is a diversified fund and commenced operations on September 1, 2016. The financial statements for other series of the Trust are presented in separate reports.
The Trust has authorized an unlimited number of shares of beneficial interest with no par value. Shares are bought and sold at closing net asset value (“NAV”). Shares of the Fund are only sold to certain separate accounts of The Guardian Insurance & Annuity Company, Inc. (“GIAC”) that fund certain variable annuity contracts and variable life insurance policies issued by GIAC. GIAC is a wholly-owned subsidiary of The Guardian Life Insurance Company of America (“Guardian Life”).
The Fund seeks long-term capital appreciation.
2. Significant Accounting Policies
The following is a summary of significant accounting policies followed by the Fund in the preparation of its financial statements. The Fund follows the investment company accounting and reporting guidance of the Financial Accounting Standards Board (“FASB”) Accounting Standards Codification Topic 946 Financial Services — Investment Companies. The following policies are in conformity with accounting principles generally accepted in the United States of America (“GAAP”). The preparation of financial statements in accordance with GAAP requires management to make estimates and assumptions that affect the reported amounts and disclosures in the financial statements. Actual results could differ from those estimates.
a. Investment Valuations Equity securities traded on an exchange other than NASDAQ Stock Market, LLC (“NASDAQ”) are valued at the last reported sale price on the principal exchange or market on which they are traded; or, if there were no sales that day, at the mean between the closing bid and ask prices. Securities traded on the NASDAQ are generally valued at the NASDAQ official closing price, which may not be the last sale price. If the NASDAQ official closing price is not available for a security, that security is generally valued at the
mean between the closing bid and ask prices. Repurchase agreements are carried at cost, which approximates fair value (see Note 5d). Foreign securities are valued in the currencies of the markets in which they trade and then converted to U.S. dollars by the application of foreign exchange rates at the close of the New York Stock Exchange (“NYSE”). Forward foreign currency contracts, if any, are valued at the mean between the bid and ask rates for the specified time interpolated from rates for proximate time periods. Securities for which market quotations are not readily available or for which market quotations may be considered unreliable are valued at their fair values as determined in accordance with policies and procedures adopted by the Board of Trustees.
Under the policies and procedures approved by the Board of Trustees, Park Avenue Institutional Advisers LLC (“Park Avenue”), the Fund’s investment adviser, has established a Fair Valuation Committee to assist the Board of Trustees with the oversight and monitoring of the valuation of the Fund’s investments. This includes monitoring the appropriateness of fair values based on results of ongoing valuation oversight, including but not limited to consideration of security specific events, market events, and pricing vendor and broker-dealer due diligence. The Fair Valuation Committee oversees and carries out the policies for the valuation of investments held in the Fund. The Fair Valuation Committee is responsible for discussing and assessing the potential impacts to the fair values on an ongoing basis, and at least on a quarterly basis with the Board of Trustees.
Securities whose values have been materially affected by events occurring before the Fund’s valuation time but after the close of the securities’ principal exchange or market may be fair valued in accordance with policies and procedures adopted by the Board of Trustees. In addition, the values of the Fund’s investments in foreign securities are generally determined by a pricing service using pricing models designed to estimate likely changes in the values of those securities. Certain foreign equity instruments are valued by applying international fair value factors provided by approved pricing services. The factors seek to adjust the local closing price for movements of local markets post closing, but prior to the time the NAVs are calculated. Valuations reflected in this report are as of the report date. As a result, changes in valuation due to market events and/or issuer related events after the report date and prior to issuance of the report are not reflected herein.
| 14 |
Table of Contents
NOTES TO FINANCIAL STATEMENTS — GUARDIAN INTERNATIONAL VALUE VIP FUND
Various inputs are used in determining the valuation of the Fund’s investments. These inputs are summarized in three broad levels listed below.
| • | Level 1 — unadjusted inputs using quoted prices in active markets for identical investments. |
| • | Level 2 — other significant observable inputs, including, but not limited to, quoted prices for similar investments, inputs other than quoted prices that are observable for investments (such as interest rates, prepayment speeds, credit risks, etc.) or other market corroborated inputs. |
| • | Level 3 — significant unobservable inputs (including the Fund’s own assumptions in determining the fair value of investments) |
Inputs may include price information, volatility statistics, specific and broad credit data, liquidity statistics, and other factors. A financial instrument’s level within the fair value hierarchy is based on the lowest level of any input; both individually and in aggregate, that is significant to the fair value measurement. However, the determination of what constitutes “observable” requires significant judgment by the Trust. The Trust considers observable data to be that market data which is readily available, regularly distributed or updated, reliable and verifiable, and provided by independent sources that are actively involved in the relevant market. The inputs or methodology used for valuing securities are not necessarily an indication of the risk associated with investing in those securities. Changes in valuation techniques may result in transfers into or out of a financial instrument’s assigned level within the hierarchy.
The FASB requires reporting entities to make disclosures about purchases, sales, issuances and settlements of Level 3 securities on a gross basis.
The Fund’s policy is to recognize transfers between Level 1, Level 2 and Level 3 at the end of the reporting period. For the year ended December 31, 2018, there were no transfers among any levels.
In determining a financial instrument’s placement within the hierarchy, the Trust separates the Fund’s investment portfolio into two categories: investments and derivatives (e.g., futures). A summary of inputs used to value the Fund’s assets and liabilities carried at fair value as of December 31, 2018 is included in the Schedule of Investments.
Investments Investments whose values are based on quoted market prices in active markets, and are therefore classified within Level 1, include active listed
equities. Investments that trade in markets that are not considered to be active, but are valued based on quoted market prices, dealer quotations or alternative pricing sources supported by observable inputs are classified within Level 2. These include certain U.S. government and sovereign obligations, most government agency securities, investment-grade corporate bonds, certain mortgage products, state, municipal and provincial obligations, and certain foreign equity securities, including securities whose prices may have been affected by events occurring after the close of trading on their principal exchange or market and, as a result, whose values are determined by a pricing service as described above, or securities whose values are otherwise determined using fair valuation methods approved by the Fund’s Board of Trustees.
Investments classified within Level 3 have significant unobservable inputs, as they trade infrequently or not at all. Level 3 investments include, among others, private placement securities. When observable prices are not available for these securities, the Trust uses one or more valuation techniques for which sufficient and reliable data is available. The inputs used by the Trust in estimating the value of Level 3 investments include, for example, the original transaction price, recent transactions in the same or similar instruments, completed or pending third-party transactions in the underlying investment or comparable issuers, subsequent rounds of financing, recapitalizations, and other transactions across the capital structure. Level 3 investments may also be adjusted to reflect illiquidity and/ornon-transferability, with the amount of such discount estimated by the Trust in the absence of market information. Assumptions used by the Trust due to the lack of observable inputs may significantly impact the resulting fair value and therefore the Fund’s results of operations. As of December 31, 2018, the Fund had no securities classified as Level 3.
Derivatives Exchange-traded derivatives, such as futures contracts, exchange-traded option contracts and certain swaps, are typically classified within Level 1 or Level 2 of the fair value hierarchy depending on whether or not they are deemed to be actively traded. Certainnon-exchange-traded derivatives, such as generic forwards, certain swaps and options, have inputs which can generally be corroborated by market data and are therefore classified within Level 2. During the year ended December 31, 2018, the Fund did not hold any derivatives.
b. Securities Transactions Securities transactions are accounted for on the date securities are purchased or
| 15 |
Table of Contents
NOTES TO FINANCIAL STATEMENTS — GUARDIAN INTERNATIONAL VALUE VIP FUND
sold (trade date). Realized gains or losses on securities transactions are determined on the basis of specific identification.
c. Foreign Currency Translation The accounting records of the Fund are maintained in U.S. dollars. Investment securities and all other assets and liabilities of the Fund denominated in a foreign currency are generally translated into U.S. dollars at the exchange rates quoted at the close of the NYSE on each business day. The market value of investment securities and other assets and liabilities are translated at the exchange rate as of the valuation date. Purchases and sales of securities, income receipts, and expense payments are translated into U.S. dollars at the exchange rates in effect on the dates of the respective transactions. The Fund does not isolate the portion of the fluctuations on investments resulting from changes in foreign currency exchange rates from the fluctuations in market prices of investments held. Such fluctuations are included in the Net change in net realized and unrealized gain/(loss) from investments on the Statement of Operations.
Reported realized foreign currency gains and losses arise from the disposition of foreign currency, currency gains or losses realized between the trade and settlement dates on securities transactions, and the difference between the amounts of dividends, interest and foreign withholding taxes recorded on the Fund’s books on the transaction date and the U.S. dollar equivalent of the amounts actually received or paid. These reported realized foreign currency gains and losses, if any, are included in Net realized gain/(loss) from foreign currency transactions on the Statement of Operations. Unrealized foreign currency gains and losses arise from changes (due to changes in exchange rates) in the value of foreign currency and other assets and liabilities denominated in foreign currencies, which are held at period end, if any, and are included in Net change in unrealized appreciation/(depreciation) on translation of assets and liabilities in foreign currencies on the Statement of Operations.
d. Foreign Capital Gains Tax The Fund may be subject to foreign taxes on income, gains on investments or currency purchases/repatriation, a portion of which may be recoverable. The Fund will accrue such taxes and recoveries as applicable, based upon their current interpretation of tax rules and regulations that exist in the markets in which they invest.
e. Investment Income Dividend income net of foreign taxes withheld, if any, is generally recorded on theex-dividend date. Interest income, which includes
amortization/accretion of premium/discount, is determined using the interest income accrual method, and is accrued and recorded daily.
f. Allocation of Income and Expenses Many of the expenses of the Trust can be directly attributed to a specific series of the Trust. Expenses that cannot be directly attributed to a specific series of the Trust are generally apportioned among all the series in the Trust, based on relative net assets. In calculating net asset value per share for each series of the Trust, investment income, realized and unrealized gains and losses, and expenses other than series-specific expenses are allocated daily to each series based upon the proportion of net assets attributable to each series.
3. Transactions with Affiliates
a. Investment Advisory Fee and Expense Limitation Under the terms of the advisory agreement, which, after its two year initial term, is reviewed and approved annually by the Board of Trustees, the Fund pays an investment advisory fee to Park Avenue. Park Avenue is a wholly-owned subsidiary of Guardian Life and receives an investment advisory fee at an annual rate of 0.80% of the first $100 million, and 0.75% in excess of $100 million of the Fund’s average daily net assets. The fee is accrued daily and paid monthly.
Park Avenue has contractually agreed through April 30, 2019 to waive certain fees and/or reimburse certain expenses incurred by the Fund to the extent necessary to limit the Fund’s total annual operating expenses after fee waiver and/or expense reimbursement to 0.94% of the Fund’s average daily net assets (excluding, if applicable, any acquired fund fees and expenses, taxes, interest, transaction costs and brokerage commissions, litigation and extraordinary expenses). Prior to April 9, 2018, the expense limitation was 1.11%. The limitation may not be increased or terminated prior to this time without action by the Board of Trustees, may be terminated only upon approval of the Board of Trustees, and is subject to Park Avenue’s recoupment rights. For the year ended December 31, 2018, Park Avenue waived fees and/or paid Fund expenses in the amount of $489,784.
Park Avenue may be entitled to recoupment of previously waived fees and reimbursed expenses from the Fund for three years from the date of the waiver or reimbursement, subject to the expense limitation in effect at the time of the waiver or reimbursement and at the time of the recoupment, if any. Amounts waived or reimbursed by Park Avenue pursuant to any expense limitation after April 9, 2018 will not be subject to Park
| 16 |
Table of Contents
NOTES TO FINANCIAL STATEMENTS — GUARDIAN INTERNATIONAL VALUE VIP FUND
Avenue’s recoupment rights. The amount available for potential future recoupment by Park Avenue from the Fund under the Expense Limitation Agreement and the expiration schedule at December 31, 2018 are as follows:
| Potential Recoupment Amounts Expiring | ||||||||||||
Total Potential Recoupment Amounts | 2021 | 2020 | 2019 | |||||||||
| $388,825 | $ | 58,226 | $ | 240,766 | $ | 89,833 | ||||||
Park Avenue has entered into aSub-Advisory Agreement with Lazard Asset Management LLC (“Lazard”). Lazard is responsible for providingday-to-day investment advisory services to the Fund, subject to the supervision of Park Avenue and the oversight of the Board of Trustees.Sub-advisory fees are paid by Park Avenue and do not represent a separate or additional expense to the Fund.
b. Compensation of Trustees and Officers Trustees and officers who are interested persons of the Trust, as defined in the 1940 Act, receive no compensation from the Fund, except for the Chief Compliance Officer of the Trust. Trustees of the Trust who are not interested persons of the Trust, and the Chief Compliance Officer, receive compensation and reimbursement of expenses from the Trust.
c. Distribution Fees Park Avenue Securities LLC (“PAS”), a wholly-owned subsidiary of Guardian Life, is the principal underwriter of Fund shares. The Trust has entered into a distribution and service agreement with PAS, which governs the sale and distribution of shares of the Fund. Under a distribution and service plan adopted by the Trust(“12b-1 plan”), PAS is compensated for services in such capacity, including its expenses in connection with the promotion and distribution of shares of the Fund, at an annual rate of 0.25% of the Fund’s average daily net assets. For the year ended December 31, 2018, the Fund paid distribution fees in the amount of $428,499 to PAS.
PAS has directed that certain payments under the12b-1 plan be used to compensate GIAC for shareholder services provided to contract owners.
4. Federal Income Taxes
a. Distributions to Shareholders For federal income tax purposes, the Fund is treated as a disregarded entity (“DRE”). As a DRE, the Fund is not subject to an entity-level income tax; and any income, gains, losses, deductions, taxes, and credits of the Fund would instead
be “passed through” directly to the separate accounts of GIAC that invest in the Fund and retain the same character for U.S. federal income tax purposes. In addition, the Fund is not required to distribute taxable income and capital gains for U.S. federal income tax purposes. Therefore, no dividends and capital gains distributions were paid by the Fund.
5. Investments
a. Investment Purchases and Sales The cost of investments purchased and the proceeds from investments sold (excluding short-term investments) amounted to $343,448,711 and $116,553,472, respectively, for the year ended December 31, 2018. During the year ended December 31, 2018, there were no purchases or sales of U.S. government securities.
b. Foreign Securities Foreign securities investments involve special risks and considerations not typically associated with U.S. investments. These risks include, but are not limited to, currency risk; adverse political, regulatory, social, and economic developments; and less reliable information about issuers. Moreover, securities of some foreign issuers may be less liquid and their prices more volatile than those of comparable U.S. issuers.
c. Industry or Sector Concentration In its normal course of business, the Fund may invest a significant portion of its assets in companies within a limited number of industries or sectors. As a result, the Fund may be subject to a greater risk of loss than that of a fund invested in a wider spectrum of industries or sectors because the stocks of many or all of the companies in the industry, group of industries, sector, or sectors may decline in value due to developments adversely affecting the industry, group of industries, sector, or sectors.
d. Repurchase Agreements The Fund may invest in repurchase agreements to maintain liquidity and earn income over periods of time as short as overnight. The collateral for repurchase agreements is either cash or fully negotiable U.S. government securities (including U.S. government agency securities). Repurchase agreements are fully collateralized (including the interest accrued thereon) and such collateral is marked to market daily while the agreements remain in force. If the value of the collateral falls below the repurchase price plus accrued interest, the Fund will typically require the seller to deposit additional collateral by the next business day. If the request for additional collateral is not met, or the seller defaults, the Fund maintains the right to sell the collateral (although it may be prevented
| 17 |
Table of Contents
NOTES TO FINANCIAL STATEMENTS — GUARDIAN INTERNATIONAL VALUE VIP FUND
or delayed from doing so in certain circumstances) and may be required to claim any resulting loss against the seller. Park Avenue monitors the creditworthiness of the seller with which the Fund enters into repurchase agreements.
6. Temporary Borrowings
The Fund, with other funds managed by Park Avenue, is party to a $10 million committed revolving credit facility from State Street Bank and Trust Company for temporary borrowing purposes, including the meeting of redemption requests that otherwise might require the untimely disposition of securities. Interest is calculated based on the higher of the dailyone-month LIBOR rate and the Federal Funds rate plus 1.25% at the time of borrowing. In addition to the interest charged on any borrowings by the Fund, each fund pays a commitment fee of 0.30% per annum on its share of the unused portion of the credit facility. The agreement is in place until December 10, 2019. The Fund did not utilize the credit facility during the year ended December 31, 2018.
7. Indemnifications
Under the Trust’s organizational documents and, in some cases, by contract, its officers and trustees are indemnified against certain liabilities arising out of the performance of their duties to the Fund. In addition, in
the normal course of business, the Fund enters into contracts with its vendors and others that provide general indemnifications. The Fund’s maximum exposure under these arrangements is unknown as this would involve future claims that may be made against the Fund that have not yet occurred. However, based on experience, the Fund expects the risk of loss to be remote.
8. Recent Accounting Pronouncement
On August 17, 2018, the U.S. Securities and Exchange Commission (“SEC”) voted to adopt amendments to certain disclosure requirements that have become redundant, duplicative, overlapping, outdated, or superseded, in light of other SEC disclosure requirements, GAAP, or changes in the information environment. The SEC will also be referring certain SEC disclosure requirements that overlap with, but require information incremental to, GAAP to the FASB for potential incorporation into GAAP. The amendments are intended to facilitate the disclosure of information to investors and simplify compliance without significantly altering the total mix of information provided to investors. As such, the financial statements herein have been updated to conform with these new requirements, which had no effect on the Fund’s net assets or results of operations.
| 18 |
Table of Contents
REPORT OF INDEPENDENT REGISTERED PUBLIC ACCOUNTING FIRM
TotheBoard of Trustees ofGuardian Variable Products TrustandShareholders of Guardian International Value VIP Fund
Opinion on the Financial Statements
We have audited the accompanying statement of assets and liabilities, including the schedule of investments, ofGuardian International Value VIP Fund (one of the funds constituting Guardian Variable Products Trust, referred to hereafter as the “Fund”) as of December 31, 2018, the related statement of operations for the year ended December 31, 2018, the statement of changes in net assets for each of the two years in the period ended December 31, 2018, including the related notes,and the financial highlights for each of the periods indicated therein (collectively referred to as the “financial statements”). In our opinion, the financial statements present fairly, in all material respects, the financial position of the Fund as of December 31, 2018, the results of its operations for the year then ended, the changes in its net assets for each of the two years in the period ended December 31, 2018 and the financial highlights for each of the periods indicated therein in conformity with accounting principles generally accepted in the United States of America.
Basis for Opinion
These financial statements are the responsibility of the Fund’s management. Our responsibility is to express an opinion on the Fund’s financial statements based on our audits. We are a public accounting firm registered with the Public Company Accounting Oversight Board (United States) (PCAOB) and are required to be independent with respect to the Fund in accordance with the U.S. federal securities laws and the applicable rules and regulations of the Securities and Exchange Commission and the PCAOB.
We conducted our audits of these financial statements in accordance with the standards of the PCAOB. Those standards require that we plan and perform the audit to obtain reasonable assurance about whether the financial statements are free of material misstatement, whether due to error or fraud.
Our audits included performing procedures to assess the risks of material misstatement of the financial statements, whether due to error or fraud, and performing procedures that respond to those risks. Such procedures included examining, on a test basis, evidence regarding the amounts and disclosures in the financial statements. Our audits also included evaluating the accounting principles used and significant estimates made by management, as well as evaluating the overall presentation of the financial statements. Our procedures included confirmation of securities owned as of December 31, 2018 by correspondence with the custodian and brokers; when replies were not received from brokers, we performed other auditing procedures. We believe that our audits provide a reasonable basis for our opinion.
New York, New York
February 19, 2019
We have served as the auditor of one or more investment companies in Guardian Variable Products Trustsince 2016.
| 19 |
Table of Contents
SUPPLEMENTAL INFORMATION(UNAUDITED)
Approval of Investment Advisory andSub-advisory Agreements
Section 15(c) of the Investment Company Act of 1940, as amended (the “1940 Act”), requires that a fund’s board of trustees annually review and consider the continuation of the fund’s investment advisory andsub-advisory agreements. The continuation of any such agreement must be approved by a vote of a majority of the trustees who are not parties to the agreement or “interested persons” (as defined in the 1940 Act) of a party to the agreement at anin-person meeting of the board called for the purpose of voting on such approval.
At a meeting of the Board of Trustees (the “Board”) of Guardian Variable Products Trust (the “Trust”) held onMarch 27-28, 2018, the Board considered and unanimously voted to approve the continuation of the investment management agreement (the “Management Agreement”) between Park Avenue Institutional Advisers LLC (the “Manager”) and the Trust, on behalf of the following 11 series, Guardian Core Plus Fixed Income VIP Fund, Guardian Diversified Research VIP Fund, Guardian Growth & Income VIP Fund, Guardian Integrated Research VIP Fund, Guardian International Growth VIP Fund, Guardian International Value VIP Fund, Guardian Large Cap Disciplined Growth VIP Fund, Guardian Large Cap Disciplined Value VIP Fund, Guardian Large Cap Fundamental Growth VIP Fund, Guardian Mid Cap Relative Value VIP Fund and Guardian Mid Cap Traditional Growth VIP Fund (the “Funds”). The Board also considered and unanimously voted to approve the continuation of thesub-advisory agreements (the“Sub-advisory Agreements,” collectively with the Management Agreement, the “Agreements”) between the Manager and the following investment advisory firms serving assub-advisers to the Funds, ClearBridge Investments LLC, Wellington Management Company LLP, Massachusetts Financial Services Company, Putnam Investment Management, LLC, Boston Partners Global Investors, Inc., AllianceBernstein L.P., Janus Capital Management LLC, Wells Capital Management Incorporated, J.P. Morgan Investment Management Inc., Lazard Asset Management LLC, and Lord, Abbett & Co. LLC (the“Sub-advisers”). The continuation of the Agreements for aone-year period was unanimously approved by the Trustees who are not parties to the Agreements or “interested persons” (as defined in the 1940 Act) of a party to the Agreements (the “Independent Trustees”).
The Board is responsible for overseeing the management of each Fund. In determining whether to approve the continuation of the Agreements, the Trustees evaluated information and factors that they
considered to be relevant and appropriate through the exercise of their own business judgment. The Trustees considered certain information and factors in light of advice furnished to them by legal counsel to the Trust and, in the case of the Independent Trustees, their independent legal counsel.
In advance of the meeting held on March27-28, 2018, the Trustees received materials and information designed to assist their consideration of the Agreements, including written responses from the Manager and eachSub-adviser to a series of questions and requests for information covering a wide variety of topics provided by independent legal counsel on behalf of the Independent Trustees. Broadridge Financial Solutions, Inc. (“Broadridge”), an independent provider of investment company data, was retained to provide the Trustees with reports on how each Fund’s contractual management fees, actual management fees, overall expense ratios and investment performance compared to those of “peer funds” selected by Broadridge that are offered as investment options underlying variable contracts. The Trustees also received materials and information regarding the legal standards applicable to their consideration of the Agreements and the process and criteria used by the Manager to oversee theSub-advisers. During the course of their deliberations, the Independent Trustees met to discuss and evaluate the Agreements in executive session with their independent legal counsel, outside of the presence of the Trustees who are not Independent Trustees and representatives from Fund management, the Manager or anySub-adviser.
In reaching its decisions to approve the continuation of the Agreements, the Board took into account the materials and information described above as well as other materials and information provided to the Board and discussed with and among the Trustees, including information regarding the Funds furnished to the Board by the Manager throughout the year. Individual Trustees may have given different weight to different factors and information with respect to each Agreement, and the Trustees did not identify any single factor or information that, in isolation, would be controlling in deciding to approve the continuation of the Agreements.
The discussion below is intended to summarize the broad factors that figured prominently in the Board’s decisions to approve the continuation of the Agreements rather than to beall-inclusive. These broad factors included: (i) the nature, extent and quality of the services provided to the Funds by the Manager and theSub-advisers; (ii) the investment performance of the
| 20 |
Table of Contents
SUPPLEMENTAL INFORMATION(UNAUDITED)
Funds; (iii) the fees charged and estimated profitability; (iv) the extent to which economies of scale may exist for a Fund, and the extent to which a Fund may benefit from economies of scale; and (v) any other benefits derived by the Manager or theSub-advisers (or their respective affiliates) from their relationships with the Funds. In addition to considering the above-referenced factors, the Board observed that there are a range of investment options available to variable contract owners who may invest in the Funds, and that these contract owners, having had the opportunity to consider other investment options, may choose to invest or remain invested in the Funds.
Nature, Extent and Quality of Services
The Trustees considered information regarding the nature, extent and quality of services provided to the Funds by the Manager. The Trustees also considered the range of investment advisory services andnon-investment advisory services provided by the Manager, notably coordinating the preparation and filing of various regulatory documents, coordinating the preparation and assembly of Board meeting materials and assisting the Board with certain valuation matters.
The Trustees considered the operation of the Funds in a“manager-of-managers” structure and the responsibilities that the Manager has under this structure, including monitoring and evaluating the performance of theSub-advisers, monitoring theSub-advisers for adherence to the stated investment objectives, strategies, policies and restrictions of the Funds and supervising theSub-advisers with respect to the services that theSub-advisers provide under the Sub-advisory Agreements. The Trustees also considered the process used by the Manager, consistent with this structure, to identify and recommendsub-advisers, and its ability to monitor and overseesub-advisers and recommend replacementsub-advisers, when necessary, and provide other services under the Management Agreement. The Trustees reviewed information regarding the experience and background of the Manager’s key personnel and the Manager’s organizational structure and resources, including investment, legal and administrative capabilities of the Manager. In this regard, the Trustees recognized that the Funds benefit from the Manager’s use of similar resources and capabilities of its affiliates in providing services to the Funds.
The Trustees considered information regarding the nature, extent and quality of services provided to the Funds by theSub-advisers. The Trustees also
considered, among other things, the range of investment advisory services provided by theSub-advisers under the oversight of the Manager. In evaluating these investment advisory services, the Trustees considered, among other things, theSub-advisers’ investment philosophies, styles and/or processes and approach to managing risk. The Trustees received and evaluated information regarding the background, education, expertise and/or experience of the investment professionals that serve as portfolio managers for the Funds and the capabilities, resources and reputations of theSub-advisers.
Based upon these considerations, the Board concluded that it was satisfied with the nature, extent and quality of services provided to the Funds by the Manager and eachSub-adviser.
Investment Performance
The Board considered the investment performance of each Fund. Among other reports, the Board reviewed the performance of the Funds for theone-year and since inception periods compared to a universe of peer funds selected by Broadridge. The Board noted that the Funds had performance records of less than two years and that the Board had reviewed longer performance records of the funds or accounts managed by theSub-advisers with similar strategies as the applicable Fund, when available, when the Board initially approved the Agreements in 2016. The Broadridge report placed the Funds in the following quintiles of the relevant peer universe for theone-year and since inception periods, respectively: Guardian Core Plus Fixed Income VIP Fund (3rd, 3rd), Guardian Diversified Research VIP Fund (2nd, 2nd), Guardian Growth & Income VIP Fund (1st, 1st), Guardian Integrated Research VIP Fund (4th, 5th), Guardian International Growth VIP Fund (3rd, 2nd), Guardian International Value VIP Fund (3rd, 5th), Guardian Large Cap Disciplined Growth VIP Fund (3rd, 4th), Guardian Large Cap Disciplined Value VIP Fund (1st, 1st), Guardian Large Cap Fundamental Growth VIP Fund (5th, 4th), Guardian Mid Cap Relative Value VIP Fund (4th, 3rd) and Guardian Mid Cap Traditional Growth VIP Fund (2nd, 2nd).
The Board considered the investment reports provided by the Manager since commencement of operations of the Funds during quarterly Board meetings. The Board also considered the Manager’s analysis ofSub-adviser performance and the steps taken by the Manager and theSub-advisers to seek to improve performance and the results of those steps.
| 21 |
Table of Contents
SUPPLEMENTAL INFORMATION(UNAUDITED)
In light of the considerations noted above, the Board concluded that it had continued confidence in the Manager’s and theSub-advisers’ overall capabilities to manage the Funds.
Costs and Profitability
The Trustees considered the management fees paid by the Funds to the Manager under the Management Agreement and evaluated the reasonableness of these fees. The Trustees received and reviewed information with respect to the management fees, including the portion of the management fees paid to eachSub-adviser, and the management fees paid by other funds offered as investment options underlying variable contracts within the applicable peer group selected by Broadridge. The Broadridge report placed the Funds in the following quintiles of the relevant expense peer group for the contractual management fees and actual management fees, respectively: Guardian Core Plus Fixed Income VIP Fund (1st, 3rd), Guardian Diversified Research VIP Fund (2nd, 3rd), Guardian Growth & Income VIP Fund (1st, 1st), Guardian Integrated Research VIP Fund (1st, 2nd), Guardian International Growth VIP Fund (1st, 2nd), Guardian International Value VIP Fund (3rd, 2nd), Guardian Large Cap Disciplined Growth VIP Fund (1st, 1st), Guardian Large Cap Disciplined Value VIP Fund (1st, 1st), Guardian Large Cap Fundamental Growth VIP Fund (1st, 1st), Guardian Mid Cap Relative Value VIP Fund (1st, 1st) and Guardian Mid Cap Traditional Growth VIP Fund (3rd, 4th).
The Trustees considered thesub-advisory fees paid under the Sub-advisory Agreements and evaluated the reasonableness of those fees. The Trustees also considered that the fees paid to theSub-advisers are paid by the Manager and not the Funds and that the Manager had negotiated the fees with theSub-advisers atarm’s-length. In addition, the Trustees considered the portion of the management fees paid to eachSub-adviser as compared to the portion retained by the Manager.
The Trustees received and reviewed information in the Broadridge report comparing each Fund’s operating expense ratio to the actual operating expense ratios of a peer group of funds selected by Broadridge. The Trustees considered the Manager’s commitment to limit each Fund’s operating expenses through an expense limitation agreement with the Trust. The Broadridge report placed the Funds in the following quintiles of the relevant expense peer group for the operating expense ratio: Guardian Core Plus Fixed Income VIP Fund (2nd), Guardian Diversified Research VIP Fund (2nd), Guardian Growth & Income VIP Fund
(2nd), Guardian Integrated Research VIP Fund (1st), Guardian International Growth VIP Fund (3rd), Guardian International Value VIP Fund (1st), Guardian Large Cap Disciplined Growth VIP Fund (1st), Guardian Large Cap Disciplined Value VIP Fund (2nd), Guardian Large Cap Fundamental Growth VIP Fund (1st), Guardian Mid Cap Relative Value VIP Fund (1st) and Guardian Mid Cap Traditional Growth VIP Fund (3rd).
Although the Board recognized that the comparisons between the management fees and anticipated operating expenses of the Funds and those of identified peer funds are imprecise, given different terms of agreements and variations in fund strategies, the Trustees found that the comparative information supported their consideration and approval of the management fees and evaluation of operating expenses.
The Trustees reviewed information regarding the Manager’s costs of sponsoring the Funds and estimated profitability of the Funds to the Manager. The Trustees noted that the information contained estimates, such as allocations of expenses. Although the Trustees did not receive specific cost and profitability information from certainSub-advisers, the Trustees primarily considered the cost and profitability information relating to the Manager because the Manager is responsible for payment of thesub-advisory fees and negotiated the fees with theSub-advisers atarm’s-length.
Based on the consideration of the information and factors summarized above, as well as other information and factors deemed relevant by the Trustees, the Trustees concluded that the management andsub-advisory fees were reasonable in light of the nature, extent and quality of services rendered to the Funds by the Manager and theSub-advisers. The Trustees also concluded that the estimated profitability of the Funds to the Manager was acceptable.
Economies of Scale
The Trustees considered the extent to which economies of scale may be shared as assets grow based on current asset levels of the Funds, anticipated asset levels over the next year, the current management andsub-advisory fee rates, the expense limitation arrangements, and any management andsub-advisory fee breakpoints, which reduce fee rates as assets increase. Based on those factors, the Board concluded that it was satisfied with the extent to which any economies of scale would be shared for the benefit of Fund shareholders. The Board noted that it would continue to monitor future growth in each Fund’s assets
| 22 |
Table of Contents
SUPPLEMENTAL INFORMATION(UNAUDITED)
and whether additional steps are required to share appropriately any economies of scale with Fund shareholders.
Ancillary Benefits
The Trustees considered the benefits, other than management fees, that the Manager and/or its affiliates receive because of the Manager’s relationship with the Funds. The Trustees acknowledged that the Funds serve as investment options under variable contracts issued by an affiliate of the Manager that receives fees under those contracts and that Park Avenue Securities LLC, an affiliate of the Manager and principal underwriter of the Funds, and an insurance company affiliated with the Manager receive fees from the Funds under a plan of distribution adopted pursuant to Rule12b-1 under the 1940 Act. The Trustees considered that the Manager and its affiliates may benefit from (i) greater efficiencies in annuity administration and operations and potential cost savings due to a reduction in the number of unaffiliated funds available as annuity contract investment options,
and (ii) increased dividends-received deductions due to the Funds’ status under the tax laws as disregarded entities. In addition, the Trustees considered the potential benefits, other thansub-advisory fees, that theSub-advisers and their affiliates receive because of their relationships with the Funds, including the potential increased ability to use soft dollars consistent with Trust policies and other benefits from increases in assets under management. The Trustees concluded that benefits that accrue to the Manager and its affiliates are reasonable and the benefits that accrue to theSub-advisers and their affiliates are consistent with those expected for asub-adviser to a mutual fund such as the applicable Fund.
Conclusion
Based on a comprehensive consideration and evaluation of all of the information and factors summarized above, among others, the Board voting as a whole, including the Independent Trustees voting separately, unanimously approved the continuation of the Agreements.
| 23 |
Table of Contents
SUPPLEMENTAL INFORMATION(UNAUDITED)
Trustees and Officers Information Table
The following table provides information about the Trustees of the Trust.
Name and Year of Birth | Term of Office, Position(s) Held and Length of Service* | Principal During Past Five Years | Number of in Fund by Trustees*** | Other Directorships Held by Trustee | ||||
| Independent Trustees | ||||||||
Bruce W. Ferris† (born 1955) | Trustee | Retired (since 2015); President and CEO, Prudential Annuity Distributors (2013–2015); Director/Trustee, Advanced Series Trust, Prudential Series Fund and Prudential’s Gibraltar Fund, Inc. (2013–2015); Senior Vice President, Prudential Annuities (2008–2015). | 16 | None. | ||||
Theda R. Haber† (born 1954) | Trustee | Adjunct Assistant Professor of Law, UC Hastings College of Law (since 2013); Member of the Board of Directors, Fairholme Trust Company, LLC (since 2015); Attorney, Law Office of Theda R. Haber (since 2014); Visiting Professor of Law, UC Davis School of Law (since 2014); Consultant, Haber & Associates LLC (financial services industry) (since 2012); Advisory Council Chair, Vice Chair, and Member, Advisory Council on Employee Welfare and Pension Benefit Plans (ERISA Advisory Council), U.S. Department of Labor (2009–2011); Managing Director and General Counsel, BlackRock Institutional Trust Company, N.A. (2009–2011); Deputy Global General Counsel, Barclays Global Investors (2006-2009); Managing Director, Barclays Global Investors (1998–2006). | 16 | None. | ||||
Marshall Lux† (born 1960) | Trustee | Senior Advisor, The Boston Consulting Group (since 2014); Senior Partner and Managing Director, The Boston Consulting Group (2009–2014). | 16 | None. | ||||
Lisa K. Polsky† (born 1956) | Trustee | Senior Risk Advisor, AQR (investment management) (since 2016); Senior Risk Advisor, Ultra Capital (venture capital) (since 2016); Board Member and Chair of Risk Committee, DeutscheBank IHC (financial services) (since May 2016); Chief Risk Officer, CIT Group Inc. (financial services) (2010–2015); Board Member and Chair of Audit Committee, Piper Jaffray (investment bank) (2007–2016). | 16 | None. | ||||
John Walters† (born 1962) | Lead Independent Trustee | Board Member, Amerilife Holdings LLC (insurance distribution) (since 2015); Board Member, Stadion Money Management LLC (investment adviser) (since 2011); President and Chief Operating Officer, Hartford Life Insurance Company (2000–2010). | 16 | None. | ||||
| 24 |
Table of Contents
SUPPLEMENTAL INFORMATION(UNAUDITED)
Name and Year of Birth | Term of Office, Position(s) Held and Length of Service* | Principal During Past Five Years | Number of in Fund by Trustees*** | Other Directorships Held by Trustee | ||||
| Interested Trustees | ||||||||
Gordon Dinsmore** (born 1952) | Trustee | Senior Vice President, Head of Product and President of Berkshire, The Guardian Life Insurance Company of America. | 16 | None. | ||||
Marc Costantini** (born 1969) | Chairman and Trustee | Executive Vice President, Group and Worksite Markets, The Guardian Life Insurance Company of America (since 2017); Executive Vice President and Chief Financial Officer, The Guardian Life Insurance Company of America (2014–2017); Executive Vice President, Manulife Financial prior thereto (various positions from 1990–2014). | 16 | None. | ||||
| * | Each Trustee except for Mr. Dinsmore began service in such capacity in 2016 and serves until his or her successor is elected and qualified or until his or her resignation, death or removal. Mr. Dinsmore has served as a Trustee since November 2017. The business address of each Trustee is 7 Hanover Square, New York, New York 10004. |
| ** | Each of Gordon Dinsmore and Marc Costantini is considered to be an “interested person” of the Trust within the meaning of the 1940 Act because of their affiliation with The Guardian Life Insurance Company of America and/or its affiliates. |
| *** | As of the date of this report, the Trust currently consists of 16 separate Funds. |
| † | Member of the Audit Committee of the Trust. |
The following table provides information about the Officers of the Trust.
| Name and Year of Birth | Position(s) Held and Length of Service* | Principal Occupation(s) During Past Five Years | ||
Gordon Dinsmore (born 1952) | President and Principal Executive Officer (Since November 2017) | Senior Vice President, Head of Product and President of Berkshire, The Guardian Life Insurance Company of America. | ||
John H. Walter (born 1962) | Senior Vice President, Treasurer, and Principal Financial and Accounting Officer | Vice President, Chief Financial Officer, Equity Profit Center, The Guardian Life Insurance Company of America. | ||
Harris Oliner (born 1971) | Senior Vice President and Secretary | Senior Vice President, Corporate Secretary, The Guardian Life Insurance Company of America (since 2015); Senior Vice President, Deputy General Counsel, Corporate Secretary, Voya Financial, Inc. (2013–2014); Managing Director, Senior Counsel, Corporate Secretary, BlackRock, Inc. prior thereto. | ||
Richard T. Potter (born 1954) | Senior Vice President and Chief Legal Officer | Vice President and Equity Counsel, The Guardian Life Insurance Company of America. | ||
Philip Stack (born 1964) | Chief Compliance Officer (Since September 2017) | Executive Director, Chief Compliance Officer, Morgan Stanley (2015–2017); Vice President, Morgan Stanley (2013–2015); Vice President, Corporate Audit Group–Compliance, Morgan Stanley prior thereto. | ||
James R. Anderson (born 1963) | Anti-Money Laundering Officer (Since November 2017) | Second Vice President, Agency and Anti-Money Laundering Compliance, The Guardian Life Insurance Company of America. | ||
Kathleen M. Moynihan (born 1966) | Senior Counsel | Senior Counsel, The Guardian Life Insurance Company of America. | ||
Maria Nydia Morrison (born 1958) | Fund Controller | Mutual Fund Controller, The Guardian Life Insurance Company of America (since 2015); Chief Financial Officer/Assistant Operating Officer, St. Francis De Assisi Montessori School (Plaridel, Bulacan), Inc. (Philippines) (2013–2015); Vice President, Bank of New York Mellon prior thereto. | ||
| 25 |
Table of Contents
SUPPLEMENTAL INFORMATION(UNAUDITED)
| Name and Year of Birth | Position(s) Held and Length of Service* | Principal Occupation(s) During Past Five Years | ||
Sonya L. Crosswell (born 1977) | Assistant Secretary | Assistant Vice President, Assistant Corporate Secretary and Secretary Pro Tem, The Guardian Life Insurance Company of America (since 2014); Vice President, Secretary and Assistant General Counsel, Carver Federal Savings Bank prior thereto. | ||
| * | Unless otherwise indicated, the Officers each began service in such capacity in 2016 and hold office for an indefinite term or until their successors shall have been elected and qualified. The business address of each Officer is 7 Hanover Square, New York, New York 10004. |
| 26 |
Table of Contents
SUPPLEMENTAL INFORMATION(UNAUDITED)
The Statement of Additional Information (“SAI”) includes additional information about the Trust’s Trustees and Officers and is available, without charge, upon request by calling toll-free1-888-GUARDIAN(1-888-482-7342) or by visiting our website at http://guardianvpt.onlineprospectus.net/GuardianVPT/Prospectuses.
Portfolio Holdings and Proxy Voting Procedures
The Fund files its complete schedule of portfolio holdings with the Securities and Exchange Commission for the first and third quarters of each fiscal year as an exhibit to its reports on Form N-Q or FormN-PORT (for filings beginning in April 2019 relating to March 31, 2019 data). The Fund’s Form N-Q or FormN-PORT reports are available on the Securities and Exchange Commission’s website at https://www.sec.gov. The Fund’s Form N-Q or FormN-PORT information is also available, without charge, upon request, by calling toll-free1-888-GUARDIAN(1-888-482-7342) or by visiting our website at http://guardianvpt.onlineprospectus.net/GuardianVPT/ Prospectuses.
Beginning in April 2019, the Fund will cease to disclose its holdings on Form N-Q and will file Form N-PORT with the Securities and Exchange Commission on a monthly
basis, with the information contained on Form N-PORT for the last month of the Fund’s fiscal quarter being made public by the Securities and Exchange Commission 60 days after the end of the Fund’s fiscal quarter.
A description of the policies and procedures that the Fund uses to determine how to vote proxies relating to portfolio securities is included in the SAI. The SAI and information regarding how the Fund voted proxies relating to portfolio securities during the most recent12-month period ended June 30 may be obtained (i) without charge, upon request, by calling toll-free1-888-GUARDIAN(1-888-482-7342) or by visiting our website at http://guardianvpt.onlineprospectus.net/GuardianVPT/
Prospectuses; and (ii) on the Securities and Exchange Commission’s website at https://www.sec.gov.
| 27 |
Table of Contents
This report is transmitted to shareholders only. It is not authorized for use as an offer of sale or a solicitation of an offer to buy shares of the Fund unless accompanied or preceded by the Fund’s current prospectus. Past performance results shown in this report should not be considered a representation of future performance. Investment returns and principal value of shares will fluctuate so that shares, when redeemed, may be worth more or less than their original cost. Statements and other information herein are as dated and are subject to change.

The Guardian Life Insurance Company of America New York, NY 10004-4025
PUB8172
Table of Contents
Guardian Variable
Products Trust
2018
Annual Report
All Data as of December 31, 2018
Guardian Core Plus Fixed Income VIP Fund
Important Notice
Beginning on January 1, 2021, as permitted by regulations adopted by the Securities and Exchange Commission, paper copies of the Fund’s shareholder reports will no longer be sent by mail from The Guardian Insurance & Annuity Company, Inc. (“GIAC”). Instead, GIAC will mail you a notice when copies of the shareholder reports are made available on a website. You will be notified by mail each time a report is posted and provided with a website link to access the report.
If you have already elected to receive shareholder reports electronically, you will not be affected by this change and you need not take any action. If you have not yet elected electronic delivery, at any time, you may elect to receive the Fund’s shareholder reports and certain other communications from GIAC electronically, by going to www.guardianlife.com and registering fore-delivery.
You may instead elect to receive all future shareholder reports in paper free of charge. If you wish to receive paper copies of your shareholder reports, please call GIAC’s Customer Service Office Contact Center at1-888-GUARDIAN(1-888-482-7342). Your election to receive reports in paper will apply to all the underlying funds available.

| Not FDIC insured. May lose value. No bank guarantee. | www.guardianlife.com |
Table of Contents
Guardian Core Plus Fixed Income VIP Fund
Except as otherwise specifically stated, all information, including portfolio security positions, is as of December 31, 2018. The views expressed in the Fund Commentary are those of the Fund’s portfolio manager(s) as of the date of this report and are subject to change without notice. They do not necessarily represent the views of Park Avenue Institutional Advisers LLC or asub-adviser. The Fund Commentary may contain some forward-looking statements providing expectations or forecasts of future events as of the date of this report; they do not necessarily relate to historical or current facts. There can be no guarantee that any forward-looking statement will be realized. We undertake no obligation to update forward-looking statements, whether as a result of new information, future events, or otherwise. Any discussions of specific securities should not be considered a recommendation to buy or sell those securities. Fund holdings will vary. Information contained herein has been obtained from sources believed reliable, but is not guaranteed.
Table of Contents
GUARDIAN CORE PLUS FIXED INCOME VIP FUND
FUND COMMENTARY OF LORD, ABBETT & CO. LLC,SUB-ADVISER
Highlights
| • | Guardian Core Plus Fixed Income VIP Fund (the “Fund”) returned-1.29%, underperforming its benchmark, the Bloomberg Barclays U.S. Aggregate Bond Index1(the “Index”), for the 12 months ended December 31, 2018. The Fund’s underperformance relative to the Index was primarily due to its allocation to high yield corporate bonds. |
| • | The Index returned 0.01% for the period. |
Market Overview
During the period, there were several market-moving events. In June 2018, the White House announced its intent to impose additional tariffs on $200 billion worth of Chinese goods, on top of the $50 billion previously announced. The aggressive U.S. trade posture continued into September with trade tensions mounting between the U.S. and China. While the impact has yet to be fully realized, many corporations anticipate that the retaliatory tariffs will weigh on profits. In 2018, the U.S. Federal Reserve (the “Fed”) hiked rates at 0.25% increments at each of its March, June, September and December meetings, raising the target range to2.25%-2.50%. As the Fed continued to raise rates, the U.S. Treasury yield curve flattened through the year. The yield on10-year U.S. Treasury securities reached multi-year highs in November, and pulled back in December, asrisk-off sentiment prevailed. Amid rising concerns surrounding escalating trade tensions, slowing global growth, and increasing interest rates, the Nasdaq experienced the largest monthly drop since 2008 in October, and U.S. equity markets suffered the largest December decline since the Great Depression. Additionally, in the fourth quarter of 2018, both the investment grade and high yield markets experienced asell-off due to a number of idiosyncratic risks and concerns over slower growth and rising inflation. Despite thesell-off, the U.S. economy continued to expand by more than 2% during each quarter of the trailing12-month period, with domestic GDP growth ranging between 2.2% and 4.2% from the third quarter of 2017 to the third quarter of 2018. The 4.2% GDP growth in the second quarter marked the strongest
growth rate since the third quarter of 2014. Inflation, as measured by the Consumer Price Index (CPI), continued to rise, gaining 2.5% year over year, which was mostly pushed higher by oil prices. However, oil prices have since receded significantly due to oversupply.
Portfolio Review
For the12-month period ended December 2018, the Fund’s positioning within high yield corporates was the largest detractor to relative performance. The asset class came under pressure during the 4th quarter as spreads widened due to falling oil prices and concerns around slowing global growth. An underweight allocation to U.S. Treasuries also detracted from performance over the year due to a late rally. The asset class benefited from a flight to quality in the 4th quarter, amid increased volatility in risk assets. Security selection within mortgage-backed securities (MBS) also detracted.
The largest contributor to the Fund’s relative performance over the period was an underweight allocation to investment grade corporates compared to the Index. Corporate spread widening in the final quarter of the year had a notable negative influence on full year performance for the asset class. An overweight position to asset-backed securities (ABS) also contributed to relative performance. We continue to favor high-quality ABS where we have found strong carry opportunities relative to other high-quality assets, primarily within credit card and auto-related ABS. Lastly, an overweight to and security selection within commercial mortgage-backed securities (CMBS) contributed. Within CMBS, we favor single-asset/single-borrower deals across the credit spectrum.
Outlook
We hold the view that U.S. domestic growth will separate from global weakness. Despite the recent market volatility and downturn of some soft economic indicators, we are cautiously optimistic about the U.S. economy as the labor market remains tight. We continue to believe that inflation expectations will gradually increase, and we remain focused on domestic opportunities given the potential for increased volatility and event risk abroad.
| 1 | The Bloomberg Barclays U.S. Aggregate Bond Index (the “Index”) is an index of U.S dollar-denominated, investment-grade U.S. government and corporate securities, and mortgage pass-through securities, and asset-backed securities. You may not invest in the Index and, unlike the Fund, the Index does not incur fees or expenses. |
| 1 |
Table of Contents
GUARDIAN CORE PLUS FIXED INCOME VIP FUND
Funds in the Guardian Variable Products Trust are sold by prospectus only. You should carefully consider the investment objectives, risks, charges and expenses of the Funds before making an investment decision. The prospectus contains this and other important information. Please read it carefully before investing or sending money. Please visit our website at http://guardianvpt.onlineprospectus.net/GuardianVPT/Prospectuses or to obtain a printed copy, call 1-888-GUARDIAN (1-888-482-7342).
As with all mutual funds, the value of an investment in the Fund could decline, and you could lose money. Diversification does not guarantee profit or protect against loss, and there can be no assurance that the Fund will achieve its investment objective. Bond funds are subject to interest rate risk, credit risk, and prepayment risk. When interest rates rise, bond prices generally fall, and when interest rates fall, bond prices generally rise. In a lower interest rate environment, the risk that bond prices may fall when interest rates rise is potentially greater. Derivative transactions can create leverage and may be highly volatile. It is possible that a derivative transaction will result in a loss greater than the principal amount invested and the Fund may not be able to close out a derivative transaction at a favorable time or price. International investing involves special risks, which include changes in currency rates, foreign taxation and differences in auditing standards and securities regulations, political uncertainty and greater volatility. Foreign securities are subject to political, regulatory, economic, and exchange-rate risks not present in domestic investments. These risks are even greater when investing in emerging markets. The value of a debt security is affected by changes in interest rates and is subject to any credit risk of the issuer or guarantor of the security. Investing in a more limited number of issuers and sectors can be subject to greater market fluctuation. Any discussions of specific securities should not be considered a recommendation to buy or sell those securities. Fund holdings will vary.
| 2 |
Table of Contents
GUARDIAN CORE PLUS FIXED INCOME VIP FUND
Fund Characteristics (unaudited)
| Total Net Assets: $ 355,069,564 |
Bond Sector Allocation1 As of December 31, 2018 |
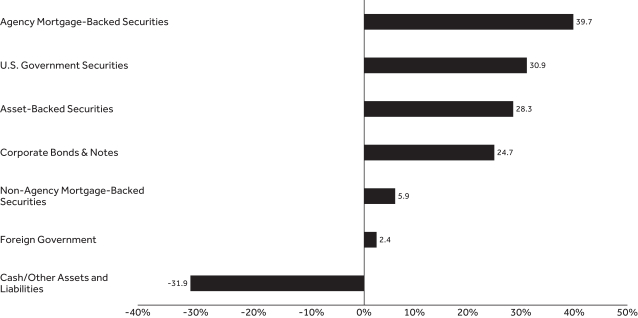 |
Bond Quality Allocation2 As of December 31, 2018 |
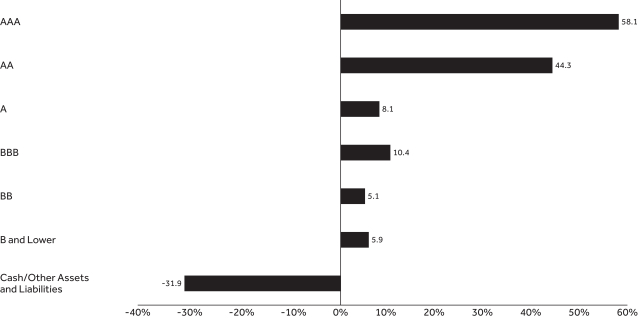 |
| 3 |
Table of Contents
GUARDIAN CORE PLUS FIXED INCOME VIP FUND
Top Ten Holdings1 As of December 31, 2018 | ||||||||||||
| Holding | Coupon Rate | Maturity Date | % of Total Net Assets | |||||||||
| Federal National Mortgage Association | 4.500% | 1/1/2049 | 22.68% | |||||||||
| U.S. Treasury Bill | 2.370% | 3/14/2019 | 14.22% | |||||||||
| Federal National Mortgage Association | 4.000% | 1/1/2049 | 11.17% | |||||||||
| U.S. Treasury Bond | 3.000% | 8/15/2048 | 4.87% | |||||||||
| U.S. Treasury Note Inflation Protected Security | 0.625% | 4/15/2023 | 4.71% | |||||||||
| U.S. Treasury Bond | 2.750% | 11/15/2042 | 3.10% | |||||||||
| Federal Home Loan Bank | 2.350% | 2/15/2019 | 2.34% | |||||||||
| Federal National Mortgage Association | 3.500% | 1/1/2049 | 1.69% | |||||||||
| U.S. Treasury Note | 3.125% | 11/15/2028 | 1.52% | |||||||||
| Federal Home Loan Bank | 2.310% | 1/31/2019 | 1.38% | |||||||||
| Total | 67.68% | |||||||||||
| 1 | Portfolio holdings are subject to change and should not be considered a recommendation to buy or sell individual securities. Cash includes short-term investments and net other assets and liabilities. |
| 2 | The Bond Quality Allocation chart displays the percentage of fund assets allocated to each rating. Rating agencies’ independent ratings of individual securities are aggregated by Barclays, and market weights are reported using Standard & Poor’s letter rating conventions. Rating methodology uses the middle rating of Moody’s Investors Service, Inc., Standard & Poor’s Ratings Services, and Fitch Ratings. When a rating from only two of the rating agencies is available, the lower rating is used. Credit quality ratings assigned by a rating agency are subject to change periodically and are not absolute standards of credit quality. Rating agencies may fail to make timely changes in credit ratings, and an issuer’s current financial condition may be better or worse than a rating indicates. In formulating investment decisions for the Fund, Lord, Abbett & Co. LLC develops its own analysis of the credit quality and risks associated with individual debt instruments, rather than relying exclusively on rating agency ratings. |
Average Annual Total Returns As of December 31, 2018 | ||||||||||||||||||||
| Inception Date | 1 Year | 5 Year | 10 Year | Since Inception | ||||||||||||||||
| Guardian Core Plus Fixed Income VIP Fund | 9/1/2016 | -1.29% | — | — | -0.21% | |||||||||||||||
| Bloomberg Barclays U.S. Aggregate Bond Index | 0.01% | — | — | 0.19% | ||||||||||||||||
| 4 |
Table of Contents
GUARDIAN CORE PLUS FIXED INCOME VIP FUND
Results of a Hypothetical $10,000 Investment As of December 31, 2018 |
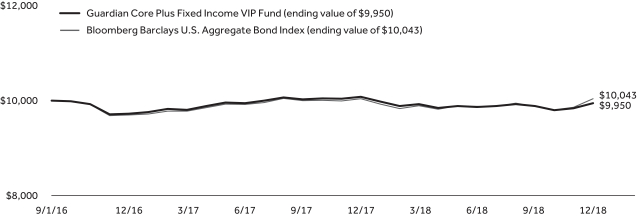 |
The chart above shows the performance of a hypothetical $10,000 investment made on inception date in Guardian Core Plus Fixed Income VIP Fund and the Bloomberg Barclays U.S. Aggregate Bond Index. Index returns do not include the fees and expenses of the Fund, but do include reinvestment of dividends, if any.
Performance quoted represents past performance and does not guarantee or predict future results. Investment return and principal value will fluctuate, so shares, when redeemed, may be worth more or less than their original cost. The Fund’s fees and expenses are detailed in the Financial Highlights section of this report. Fees and expenses are factored into the net asset value of Fund shares and any performance numbers we release. Total return figures include the effect of expense limitations in effect during the periods shown, if applicable; without such limitations, the performance shown would have been lower. Performance results assume the reinvestment of dividends and capital gains. The return figures shown do not reflect the deduction of taxes that a contract owner/policyholder may pay on redemption units. The actual total returns for owners of variable annuity contracts or variable life insurance policies that provide for investment in the Fund will be lower to reflect separate account and contract/policy charges. Current andmonth-end performance information, which may be lower or higher than that cited, is available by calling1-888-GUARDIAN(1-888-482-7342) and is periodically updated on our website: http://guardianlife.com.
| 5 |
Table of Contents
UNDERSTANDING YOUR FUND’S EXPENSES(UNAUDITED)
By investing in the Fund, you incur two types of costs: (1) transaction costs and (2) ongoing costs, including, as applicable, investment advisory fees, distribution and/or service(12b-1) fees and other Fund expenses. The example below is intended to help you understand your ongoing costs (in dollars) of investing in the Fund and to compare these costs with the ongoing costs of investing in other mutual funds.
The example is based on an investment of $1,000 invested at the beginning of the period and held for the entire period from July 1, 2018 to December 31, 2018. The table below shows the Fund’s expenses in two ways:
Expenses based on actual return
This section of the table provides information about actual account values and actual expenses. You may use the information in this section, together with the amount you invested, to estimate the expenses that you paid over the period. Simply divide your account value by $1,000 (for example, an $8,600 account value divided by $1,000 = 8.6), then multiply the result by the number in the section under the heading entitled “Expenses Paid During Period” to estimate the expenses you paid on your account during this period.
Expenses based on hypothetical 5% return for comparison purposes
This section of the table provides information about hypothetical account values and hypothetical expenses based on the Fund’s actual expense ratio and an assumed rate of return of 5% per year before expenses, which is not the Fund’s actual return. The hypothetical account values and expenses may not be used to estimate the actual ending account balance or expenses you paid for the period. You may use this information to compare the ongoing costs of investing in the Fund with the cost of investing in other mutual funds. To do so, compare this 5% hypothetical example with the 5% hypothetical examples that appear in the shareholder reports of the other funds.
Note that the expenses shown in the table are meant to highlight your ongoing costs only and do not reflect any transactional costs, such as sales charges (loads), redemption fees, or exchange fees. Therefore the second section is useful in comparing ongoing costs only, and will not help you determine the relative total costs of owning different funds. If these transactional costs were included, your costs would have been higher. Charges and expenses at the insurance company separate account level are not reflected in the table.
Beginning 7/1/18 | Ending Account Value | Expenses Paid During Period* 7/1/18-12/31/18 | Expense Ratio During Period 7/1/18-12/31/18 | |||||||||||
| Based on Actual Return | $1,000.00 | $1,008.10 | $4.00 | 0.79% | ||||||||||
| Based on Hypothetical Return (5% Return Before Expenses) | $1,000.00 | $1,021.22 | $4.02 | 0.79% | ||||||||||
| * | Expenses are equal to the Fund’s annualized expense ratio as indicated, multiplied by the average account value over the period, multiplied by184/365 (to reflect theone-half year period). |
| 6 |
Table of Contents
SCHEDULE OF INVESTMENTS — GUARDIAN CORE PLUS FIXED INCOME VIP FUND
| December 31, 2018 | Principal Amount | Value | ||||||
| Agency Mortgage–Backed Securities – 39.7% |
| |||||||
Federal Home Loan Bank | $ | 4,915,000 | $ | 4,905,578 | ||||
2.35% due 2/6/2019(1) | 1,230,000 | 1,227,130 | ||||||
2.35% due 2/15/2019(1) | 8,342,000 | 8,317,533 | ||||||
Federal Home Loan Mortgage Corp. Multifamily Structured Pass-Through Certificate | 42,000 | 42,363 | ||||||
Federal National Mortgage Association | 6,000,000 | 5,998,945 | ||||||
4.00% due 1/1/2049(2) | 38,900,000 | 39,653,688 | ||||||
4.50% due 1/1/2049(2) | 77,750,000 | 80,509,214 | ||||||
Government National Mortgage Association | 96,378 | 92,222 | ||||||
2017-41 AS | 82,588 | 78,535 | ||||||
2017-69 AS | 44,647 | 43,243 | ||||||
2017-71 AS | 28,686 | 27,565 | ||||||
2017-89 AB | 28,392 | 26,534 | ||||||
2017-90 AS | 39,862 | 38,171 | ||||||
| Total Agency Mortgage–Backed Securities (Cost $140,253,811) |
| 140,960,721 | ||||||
| Asset–Backed Securities – 28.3% |
| |||||||
ACC Trust | 230,000 | 230,247 | ||||||
Ally Auto Receivables Trust | 5,162 | 5,151 | ||||||
ALM VII Ltd. | 1,806,000 | 1,810,434 | ||||||
American Credit Acceptance Receivables Trust | 11,000 | 11,175 | ||||||
2018-1 A | 25,271 | 25,252 | ||||||
2018-4 A | 1,043,000 | 1,043,128 | ||||||
American Express Credit Account Master Trust2017-1 A | 1,000,000 | 988,173 | ||||||
2017-4 A | 2,838,000 | 2,824,746 | ||||||
AmeriCredit Automobile Receivables Trust | 884,000 | 881,486 | ||||||
| December 31, 2018 | Principal Amount | Value | ||||||
| Asset–Backed Securities(continued) |
| |||||||
2015-3 B | $ | 3,989 | $ | 3,988 | ||||
2016-3 C | 2,097,000 | 2,064,335 | ||||||
2017-2 C | 44,000 | 43,668 | ||||||
2017-3 B | 18,000 | 17,772 | ||||||
2018-3 A2A | 540,000 | 537,459 | ||||||
2018-3 A2B | 540,000 | 539,527 | ||||||
Ares XXXIII CLO Ltd. | 250,000 | 249,894 | ||||||
Ascentium Equipment Receivables Trust | 8,599 | 8,562 | ||||||
2016-2A B | 9,000 | 8,949 | ||||||
2017-1A A2 | 1,945 | 1,944 | ||||||
2017-1A A3 | 12,000 | 11,910 | ||||||
Avery Point VII CLO Ltd. | 2,000,000 | 1,999,206 | ||||||
Avis Budget Rental Car Funding AESOP LLC | 826,000 | 816,760 | ||||||
Barclays Dryrock Issuance Trust | 2,624,000 | 2,612,266 | ||||||
Benefit Street Partners CLO IV Ltd. | 500,000 | 500,048 | ||||||
2014-IVA A1R | 500,000 | 499,772 | ||||||
BlueMountain CLO Ltd. | 1,036,000 | 1,035,555 | ||||||
2016-1A BR | 822,000 | 791,266 | ||||||
BMW Vehicle Owner Trust | 54,087 | 53,910 | ||||||
California Republic Auto Receivables Trust | 9,629 | 9,607 | ||||||
| The accompanying notes are an integral part of these financial statements. | 7 |
Table of Contents
SCHEDULE OF INVESTMENTS — GUARDIAN CORE PLUS FIXED INCOME VIP FUND
| December 31, 2018 | Principal Amount | Value | ||||||
| Asset–Backed Securities(continued) |
| |||||||
2015-2 B | $ | 87,000 | $ | 86,505 | ||||
2015-3 A4 | 17,704 | 17,633 | ||||||
2015-4 A4 | 58,786 | 58,668 | ||||||
2016-2 B | 21,000 | 20,752 | ||||||
2017-1 A3 | 27,790 | 27,697 | ||||||
2018-1 A2 | 934,000 | 932,415 | ||||||
2018-1 B | 669,000 | 671,531 | ||||||
Capital Auto Receivables Asset Trust2017-1 B | 28,000 | 27,605 | ||||||
2017-1 C | 40,000 | 39,614 | ||||||
2017-1 D | 1,086,000 | 1,083,145 | ||||||
Capital One Multi-Asset Execution Trust | 627,000 | 622,173 | ||||||
2016-A4 A4 | 808,000 | 799,834 | ||||||
2017-A1 A1 | 1,000,000 | 989,005 | ||||||
CarMax Auto Owner Trust | 36,873 | 36,702 | ||||||
2018-4 B | 1,822,000 | 1,780,340 | ||||||
Cedar Funding VI CLO Ltd. | 400,000 | 389,593 | ||||||
Chase Issuance Trust | 534,000 | 529,653 | ||||||
2016-A5 A5 | 1,058,000 | 1,048,726 | ||||||
Chesapeake Funding II LLC | 84,367 | 84,163 | ||||||
2016-2A A1 | 274,375 | 273,182 | ||||||
2017-2A A1 | 355,111 | 351,389 | ||||||
2017-3A A1 | 1,583,520 | 1,563,098 | ||||||
Chrysler Capital Auto Receivables Trust | 6,000 | 6,007 | ||||||
Citibank Credit Card Issuance Trust2014-A6 A6 | 608,000 | 605,496 | ||||||
| December 31, 2018 | Principal Amount | Value | ||||||
| Asset–Backed Securities(continued) |
| |||||||
2017-A2 A2 | $ | 467,000 | $ | 466,699 | ||||
CNH Equipment Trust | 41,659 | 41,485 | ||||||
CPS Auto Receivables Trust | 827,369 | 824,385 | ||||||
2017-D A | 30,655 | 30,550 | ||||||
2017-D B | 955,000 | 947,954 | ||||||
2018-B B | 1,509,000 | 1,507,363 | ||||||
2018-B D | 750,000 | 760,682 | ||||||
CPS Auto Trust | 507,270 | 506,249 | ||||||
2018-C B | 212,000 | 212,311 | ||||||
Daimler Trucks Retail Trust | 50,151 | 50,086 | ||||||
Discover Card Execution Note Trust2012-A6 A6 | 1,942,000 | 1,929,433 | ||||||
2014-A1 A1 due 7/15/2021(4) | 200,000 | 200,023 | ||||||
2014-A4 A4 | 635,000 | 632,633 | ||||||
2016-A1 A1 | 100,000 | 99,926 | ||||||
2017-A2 A2 | 1,277,000 | 1,257,399 | ||||||
| �� | ||||||||
DLL LLC | 1,016,000 | 1,016,253 | ||||||
DLL Securitization Trust | 749,000 | 741,510 | ||||||
Drive Auto Receivables Trust | 14,835 | 14,860 | ||||||
2016-BA D | 1,329,000 | 1,337,576 | ||||||
2016-CA C | 28,445 | 28,428 | ||||||
2016-CA D | 14,000 | 14,071 | ||||||
2017-1 D | 3,156,000 | 3,167,314 | ||||||
2017-3 C | 62,000 | 61,842 | ||||||
2017-AA D | 26,000 | 26,293 | ||||||
2017-BA D | 1,499,000 | 1,501,844 | ||||||
| 8 | The accompanying notes are an integral part of these financial statements. |
Table of Contents
SCHEDULE OF INVESTMENTS — GUARDIAN CORE PLUS FIXED INCOME VIP FUND
| December 31, 2018 | Principal Amount | Value | ||||||
| Asset–Backed Securities(continued) |
| |||||||
2018-3 A2 | $ | 1,203,545 | $ | 1,202,933 | ||||
2018-3 A3 | 672,000 | 671,050 | ||||||
2018-3 B | 265,000 | 265,176 | ||||||
2018-3 C | 633,000 | 632,950 | ||||||
2018-4 A2A | 647,000 | 646,293 | ||||||
2018-4 A3 | 1,011,000 | 1,010,974 | ||||||
2018-5 A2A | 900,000 | 900,013 | ||||||
2018-5 A2B | 738,000 | 736,900 | ||||||
Engs Commercial Finance Trust | 61,240 | 61,107 | ||||||
First Investors Auto Owner Trust | 4,921 | 4,913 | ||||||
2017-2A A1 | 31,338 | 31,189 | ||||||
2017-3A A2 | 24,000 | 23,811 | ||||||
2017-3A B | 10,000 | 9,911 | ||||||
Flagship Credit Auto Trust | 1,555,264 | 1,553,221 | ||||||
2017-1 A | 8,637 | 8,617 | ||||||
2017-2 A | 13,072 | 13,011 | ||||||
2017-3 A | 16,521 | 16,421 | ||||||
2017-3 B | 20,000 | 19,757 | ||||||
2017-4 A | 16,068 | 15,949 | ||||||
2018-1 A | 28,224 | 28,074 | ||||||
2018-3 A | 1,456,495 | 1,451,443 | ||||||
2018-3 B | 479,000 | 482,303 | ||||||
Ford Credit Auto Lease Trust | 26,679 | 26,602 | ||||||
Ford Credit Auto Owner Trust | 2,000,000 | 1,950,969 | ||||||
2017-1 A | 817,000 | 805,247 | ||||||
2018-2 A | 516,000 | 522,888 | ||||||
| December 31, 2018 | Principal Amount | Value | ||||||
| Asset–Backed Securities(continued) |
| |||||||
Ford Credit Floorplan Master Owner Trust A | $ | 1,500,000 | $ | 1,477,771 | ||||
2018-4A | 450,000 | 451,134 | ||||||
Foursight Capital Automobile Receivables Trust | 25,551 | 25,492 | ||||||
2018-1 B | 100,000 | 100,322 | ||||||
GM Financial Automobile Leasing Trust | 4,235 | 4,228 | ||||||
2017-2 A2A | 4,491 | 4,480 | ||||||
GM Financial Consumer Automobile Receivables Trust | 30,195 | 30,101 | ||||||
GMF Floorplan Owner Revolving Trust | 722,000 | 718,688 | ||||||
Golden Credit Card Trust | 2,015,000 | 2,004,608 | ||||||
Halcyon Loan Advisors Funding Ltd. | 250,000 | 240,111 | ||||||
Hardee’s Funding LLC | 766,080 | 773,761 | ||||||
Honda Auto Receivables Owner Trust | 3,242 | 3,229 | ||||||
Hyundai Auto Lease Securitization Trust | 63,174 | 62,959 | ||||||
KVK CLO Ltd. | 483,000 | 477,007 | ||||||
LCM XXII Ltd. | 250,000 | 249,996 | ||||||
LCM XXIV Ltd. | 439,000 | 438,974 | ||||||
Magnetite XVIII Ltd. | 1,000,000 | 995,571 | ||||||
| The accompanying notes are an integral part of these financial statements. | 9 |
Table of Contents
SCHEDULE OF INVESTMENTS — GUARDIAN CORE PLUS FIXED INCOME VIP FUND
| December 31, 2018 | Principal Amount | Value | ||||||
| Asset–Backed Securities(continued) |
| |||||||
Master Credit Card Trust II Series | $ | 100,000 | $ | 99,651 | ||||
Mercedes-Benz Auto Lease Trust2018-A A2 | 39,055 | 38,969 | ||||||
2018-B A2 | 1,442,000 | 1,441,877 | ||||||
Mercedes-Benz Auto Receivables Trust | 11,677 | 11,585 | ||||||
MMAF Equipment Finance LLC | 1,705,000 | 1,688,997 | ||||||
Navient Private Education Refi Loan Trust | 368,000 | 370,827 | ||||||
NextGear Floorplan Master Owner Trust | 1,349,000 | 1,347,439 | ||||||
2016-2A A2 | 656,000 | 651,293 | ||||||
OHA Loan Funding Ltd. | 542,000 | 539,957 | ||||||
Orec Ltd. | 645,000 | 644,999 | ||||||
Palmer Square Loan Funding Ltd.2018-5A A1 | 671,000 | 669,322 | ||||||
2018-5A A2 | 250,000 | 249,218 | ||||||
Pennsylvania Higher Education Assistance Agency | 44,542 | 42,866 | ||||||
PFS Financing Corp. | 937,000 | 927,597 | ||||||
Regatta VI Funding Ltd. | 314,000 | 301,458 | ||||||
Riserva CLO Ltd. | 250,000 | 249,889 | ||||||
| December 31, 2018 | Principal Amount | Value | ||||||
| Asset–Backed Securities(continued) |
| |||||||
Santander Drive Auto Receivables Trust | $ | 13,068 | $ | 13,062 | ||||
2016-3 B | 6,862 | 6,844 | ||||||
2017-3 A3 | 37,181 | 37,098 | ||||||
2017-3 C | 12,000 | 11,928 | ||||||
2018-1 A2 | 16,778 | 16,755 | ||||||
2018-1 B | 46,000 | 45,726 | ||||||
2018-1 D | 35,000 | 34,764 | ||||||
2018-3 A2A | 836,730 | 835,648 | ||||||
SCF Equipment Leasing LLC | 873,000 | 871,855 | ||||||
SLC Student Loan Trust | 249,826 | 255,829 | ||||||
SoFi Professional Loan Program Trust | 1,564,933 | 1,548,051 | ||||||
2018-A A2A | 519,899 | 515,349 | ||||||
2018-B A1FX | 570,629 | 567,947 | ||||||
Sound Point CLO XI Ltd. | 370,000 | 367,583 | ||||||
SunTrust Auto Receivables Trust | 10,476 | 10,434 | ||||||
Synchrony Credit Card Master Note Trust | 100,000 | 99,797 | ||||||
2016-3 A | 561,000 | 555,477 | ||||||
2017-1 A | 1,873,000 | 1,843,526 | ||||||
2017-2 A | 2,219,000 | 2,189,812 | ||||||
TCF Auto Receivables Owner Trust | 1,049,000 | 1,050,279 | ||||||
2016-1A B | 69,000 | 67,875 | ||||||
2016-PT1A B | 30,000 | 29,793 | ||||||
| 10 | The accompanying notes are an integral part of these financial statements. |
Table of Contents
SCHEDULE OF INVESTMENTS — GUARDIAN CORE PLUS FIXED INCOME VIP FUND
| December 31, 2018 | Principal Amount | Value | ||||||
| Asset–Backed Securities(continued) |
| |||||||
TCI-Flatiron CLO Ltd. | $ | 750,000 | $ | 749,878 | ||||
TCI-Symphony CLO Ltd. | 250,000 | 252,637 | ||||||
THL Credit Wind River CLO Ltd. | 2,000,000 | 1,991,032 | ||||||
Towd Point Asset Trust | 672,570 | 666,507 | ||||||
TPG Real Estate Finance Issuer Ltd. | 658,000 | 657,999 | ||||||
Volvo Financial Equipment LLC | 14,884 | 14,869 | ||||||
Westgate Resorts LLC | 295,867 | 295,696 | ||||||
Westlake Automobile Receivables Trust | 1,695 | 1,694 | ||||||
2017-2A A2A | 10,949 | 10,925 | ||||||
Wheels SPV 2 LLC | 347,000 | 347,939 | ||||||
Wingstop Funding LLC | 532,000 | 540,418 | ||||||
World Financial Network Credit Card Master Trust | 580,000 | 579,938 | ||||||
2017-B A | 2,894,000 | 2,874,398 | ||||||
2017-C A | 1,091,000 | 1,075,762 | ||||||
2017-C M | 40,000 | 39,494 | ||||||
| Total Asset–Backed Securities (Cost $100,739,369) |
| 100,549,001 | ||||||
| Corporate Bonds & Notes – 24.7% |
| |||||||
| Aerospace & Defense – 0.6% |
| |||||||
Bombardier, Inc. | 746,000 | 703,105 | ||||||
Embraer S.A. | 15,000 | 15,413 | ||||||
| December 31, 2018 | Principal Amount | Value | ||||||
| Aerospace & Defense(continued) |
| |||||||
Kratos Defense & Security Solutions, Inc. | $ | 553,000 | $ | 562,677 | ||||
United Technologies Corp. | 766,000 | 762,999 | ||||||
|
| |||||||
| 2,044,194 | ||||||||
| Auto Manufacturers – 0.9% |
| |||||||
Daimler Finance North America LLC | 760,000 | 714,966 | ||||||
Ford Motor Co. | 1,065,000 | 1,098,041 | ||||||
General Motors Co. | 50,000 | 48,675 | ||||||
6.75% due 4/1/2046 | 1,100,000 | 1,064,914 | ||||||
Tesla, Inc. | 419,000 | 364,006 | ||||||
|
| |||||||
| 3,290,602 | ||||||||
| Beverages – 0.4% |
| |||||||
Anheuser-Busch Cos. LLC / Anheuser-Busch InBev Worldwide, Inc. | 1,003,000 | 948,385 | ||||||
4.70% due 2/1/2036(3) | 303,000 | 281,002 | ||||||
Becle S.A.B. de C.V. | 150,000 | 142,844 | ||||||
|
| |||||||
| 1,372,231 | ||||||||
| Chemicals – 0.6% |
| |||||||
Ashland LLC | 176,000 | 173,360 | ||||||
Braskem Netherlands Finance B.V. | 400,000 | 369,704 | ||||||
CNAC HK Finbridge Co. Ltd. | 380,000 | 370,451 | ||||||
Mexichem S.A.B. de C.V. | 250,000 | 251,562 | ||||||
Phosagro OAO Via Phosagro Bond Funding DAC | 300,000 | 280,740 | ||||||
Rain CII Carbon LLC / CII Carbon Corp. | 765,000 | 692,325 | ||||||
|
| |||||||
| 2,138,142 | ||||||||
| Coal – 0.2% |
| |||||||
Peabody Energy Corp. | 543,000 | 504,990 | ||||||
Warrior Met Coal, Inc. | 345,000 | 342,413 | ||||||
|
| |||||||
| 847,403 | ||||||||
| Commercial Banks – 4.6% |
| |||||||
Akbank T.A.S. | 200,000 | 196,400 | ||||||
Banco de Credito e Inversiones S.A. | 420,000 | 378,000 | ||||||
| The accompanying notes are an integral part of these financial statements. | 11 |
Table of Contents
SCHEDULE OF INVESTMENTS — GUARDIAN CORE PLUS FIXED INCOME VIP FUND
| December 31, 2018 | Principal Amount | Value | ||||||
| Commercial Banks(continued) |
| |||||||
Bank of America Corp. | $ | 756,000 | $ | 716,929 | ||||
3.95% due 4/21/2025 | 25,000 | 24,223 | ||||||
4.00% due 1/22/2025 | 577,000 | 562,082 | ||||||
4.45% due 3/3/2026 | 250,000 | 247,149 | ||||||
Citigroup, Inc. | 1,401,000 | 1,351,837 | ||||||
4.45% due 9/29/2027 | 361,000 | 347,938 | ||||||
HBOS PLC | 35,000 | 36,753 | ||||||
Intesa Sanpaolo S.p.A. | 400,000 | 341,615 | ||||||
JPMorgan Chase & Co. | 2,307,000 | 2,239,450 | ||||||
Macquarie Group Ltd. | 963,000 | 942,555 | ||||||
Morgan Stanley | 138,000 | 131,155 | ||||||
4.00% due 7/23/2025 | 790,000 | 779,375 | ||||||
Popular, Inc. | 361,000 | 358,069 | ||||||
Royal Bank of Canada | 2,033,000 | 2,054,206 | ||||||
Santander U.K. PLC | 87,000 | 102,019 | ||||||
The Goldman Sachs Group, Inc. | 490,000 | 471,570 | ||||||
6.25% due 2/1/2041 | 405,000 | 461,926 | ||||||
The Toronto-Dominion Bank | 1,074,000 | 1,017,001 | ||||||
Turkiye Garanti Bankasi A/S | 400,000 | 396,328 | ||||||
UBS AG | 522,000 | 519,390 | ||||||
7.625% due 8/17/2022 | 900,000 | 958,500 | ||||||
Wachovia Corp. | 151,000 | 178,782 | ||||||
Wells Fargo Bank N.A. | 1,250,000 | 1,545,898 | ||||||
|
| |||||||
| 16,359,150 | ||||||||
| December 31, 2018 | Principal Amount | Value | ||||||
| Commercial Services – 0.6% | ||||||||
Adani Ports & Special Economic Zone Ltd. | $ | 200,000 | $ | 178,407 | ||||
Ahern Rentals, Inc. | 762,000 | 609,600 | ||||||
The Brink’s Co. | 577,000 | 525,070 | ||||||
United Rentals North America, Inc. | 552,000 | 484,380 | ||||||
Weight Watchers International, Inc. | 507,000 | 517,140 | ||||||
|
| |||||||
| 2,314,597 | ||||||||
| Computers – 0.5% |
| |||||||
Dell International LLC / EMC Corp. | 141,000 | 143,487 | ||||||
6.02% due 6/15/2026(3) | 134,000 | 134,606 | ||||||
7.125% due 6/15/2024(3) | 660,000 | 671,550 | ||||||
8.35% due 7/15/2046(3) | 648,000 | 701,648 | ||||||
|
| |||||||
| 1,651,291 | ||||||||
| Diversified Financial Services – 1.5% |
| |||||||
Affiliated Managers Group, Inc. | 500,000 | 485,875 | ||||||
4.25% due 2/15/2024 | 25,000 | 25,506 | ||||||
Ally Financial, Inc. | 603,000 | 669,330 | ||||||
BrightSphere Investment Group PLC | 315,000 | 303,333 | ||||||
GE Capital International Funding Co. Unlimited Co. | 1,353,000 | 1,133,228 | ||||||
International Lease Finance Corp. | 880,000 | 883,589 | ||||||
5.875% due 8/15/2022 | 112,000 | 117,315 | ||||||
Navient Corp. | 938,000 | 783,230 | ||||||
Neuberger Berman Group LLC / Neuberger Berman Finance Corp. | 309,000 | 308,725 | ||||||
4.875% due 4/15/2045(3) | 198,000 | 176,505 | ||||||
SURA Asset Management S.A. | 400,000 | 371,504 | ||||||
|
| |||||||
| 5,258,140 | ||||||||
| Electric – 1.2% |
| |||||||
Ausgrid Finance Pty. Ltd. | 686,000 | 683,735 | ||||||
Berkshire Hathaway Energy Co. | 263,000 | 236,049 | ||||||
Calpine Corp. | 580,000 | 530,700 | ||||||
Electricite de France S.A. | 755,000 | 669,017 | ||||||
Entergy Louisiana LLC | 292,000 | 295,374 | ||||||
| 12 | The accompanying notes are an integral part of these financial statements. |
Table of Contents
SCHEDULE OF INVESTMENTS — GUARDIAN CORE PLUS FIXED INCOME VIP FUND
| December 31, 2018 | Principal Amount | Value | ||||||
| Electric(continued) |
| |||||||
Exelon Generation Co. LLC | $ | 49,000 | $ | 47,703 | ||||
6.25% due 10/1/2039 | 450,000 | 469,281 | ||||||
Massachusetts Electric Co. | 370,000 | 348,153 | ||||||
Minejesa Capital B.V. | 200,000 | 178,267 | ||||||
PSEG Power LLC | 228,000 | 296,028 | ||||||
South Carolina Electric & Gas Co. | 543,000 | 640,328 | ||||||
6.625% due 2/1/2032 | 15,000 | 18,187 | ||||||
|
| |||||||
| 4,412,822 | ||||||||
| Electronics – 0.0% |
| |||||||
Trimble, Inc. | 22,000 | 21,662 | ||||||
|
| |||||||
| 21,662 | ||||||||
| Engineering & Construction – 0.3% |
| |||||||
China Railway Resources Huitung Ltd. | 581,000 | 580,905 | ||||||
Indika Energy Capital III Pte Ltd. | 410,000 | 356,481 | ||||||
|
| |||||||
| 937,386 | ||||||||
| Entertainment – 0.4% |
| |||||||
Eldorado Resorts, Inc. | 714,000 | 688,753 | ||||||
Jacobs Entertainment, Inc. | 553,000 | 569,590 | ||||||
Mohegan Gaming & Entertainment | 59,000 | 55,091 | ||||||
|
| |||||||
| 1,313,434 | ||||||||
| Food – 0.4% |
| |||||||
Albertsons Cos. LLC / Safeway, Inc. / New Albertsons LP / Albertson’s LLC | 769,000 | 713,247 | ||||||
Arcor SAIC | 13,000 | 11,948 | ||||||
Campbell Soup Co. | 303,000 | 226,458 | ||||||
Lamb Weston Holdings, Inc. | 544,000 | 522,240 | ||||||
|
| |||||||
| 1,473,893 | ||||||||
| Forest Products & Paper – 0.1% |
| |||||||
Fibria Overseas Finance Ltd. | 390,000 | 367,770 | ||||||
|
| |||||||
| 367,770 | ||||||||
| Gas – 0.1% |
| |||||||
Dominion Energy Gas Holdings LLC | 430,000 | 423,942 | ||||||
|
| |||||||
| 423,942 | ||||||||
| December 31, 2018 | Principal Amount | Value | ||||||
| Hand & Machine Tools – 0.1% |
| |||||||
Kennametal, Inc. | $ | 360,000 | $ | 358,705 | ||||
|
| |||||||
| 358,705 | ||||||||
| Healthcare-Services – 1.0% |
| |||||||
Acadia Healthcare Co., Inc. | 577,000 | 546,707 | ||||||
6.50% due 3/1/2024 | 117,000 | 112,905 | ||||||
HCA, Inc. | 483,000 | 479,378 | ||||||
5.50% due 6/15/2047 | 580,000 | 549,550 | ||||||
7.50% due 11/6/2033 | 10,000 | 10,500 | ||||||
MPH Acquisition Holdings LLC | 540,000 | 503,550 | ||||||
Polaris Intermediate Corp. | 716,000 | 653,078 | ||||||
WellCare Health Plans, Inc. | 771,000 | 742,087 | ||||||
|
| |||||||
| 3,597,755 | ||||||||
| Home Builders – 0.8% |
| |||||||
Century Communities, Inc. | 599,000 | 527,120 | ||||||
PulteGroup, Inc. | 638,000 | 660,330 | ||||||
Taylor Morrison Communities, Inc. | 351,000 | 351,439 | ||||||
TRI Pointe Group, Inc. | 804,000 | 626,879 | ||||||
William Lyon Homes, Inc. | 224,000 | 190,400 | ||||||
6.00% due 9/1/2023 | 378,000 | 340,200 | ||||||
Williams Scotsman International, Inc. | 182,000 | 174,720 | ||||||
|
| |||||||
| 2,871,088 | ||||||||
| Household Products & Wares – 0.0% |
| |||||||
Kimberly-Clark de Mexico S.A.B. de C.V. | 100,000 | 97,736 | ||||||
|
| |||||||
| 97,736 | ||||||||
| Insurance – 0.2% |
| |||||||
CNO Financial Group, Inc. | 354,000 | 337,185 | ||||||
Teachers Insurance & Annuity Association of America | 253,000 | 262,341 | ||||||
Willis North America, Inc. | 50,000 | 51,147 | ||||||
|
| |||||||
| 650,673 | ||||||||
| Internet – 0.5% |
| |||||||
Alibaba Group Holding Ltd. | 400,000 | 354,662 | ||||||
Netflix, Inc. | 1,397,000 | 1,267,777 | ||||||
|
| |||||||
| 1,622,439 | ||||||||
| The accompanying notes are an integral part of these financial statements. | 13 |
Table of Contents
SCHEDULE OF INVESTMENTS — GUARDIAN CORE PLUS FIXED INCOME VIP FUND
| December 31, 2018 | Principal Amount | Value | ||||||
| Iron & Steel – 0.2% |
| |||||||
Cleveland-Cliffs, Inc. | $ | 763,000 | $ | 686,700 | ||||
Vale Overseas Ltd. | 141,000 | 162,855 | ||||||
|
| |||||||
| 849,555 | ||||||||
| Leisure Time – 0.2% |
| |||||||
Carnival PLC | 525,000 | 654,495 | ||||||
|
| |||||||
| 654,495 | ||||||||
| Machinery-Diversified – 0.6% |
| |||||||
Nvent Finance Sarl | 1,587,000 | 1,554,883 | ||||||
SPX FLOW, Inc. | 751,000 | 709,695 | ||||||
|
| |||||||
| 2,264,578 | ||||||||
| Media – 1.7% |
| |||||||
21st Century Fox America, Inc. | 320,000 | 469,824 | ||||||
AMC Networks, Inc. | 562,000 | 510,015 | ||||||
Cablevision Systems Corp. | 789,000 | 775,193 | ||||||
CCO Holdings LLC / CCO Holdings Capital Corp. | 883,000 | 865,340 | ||||||
Comcast Corp. | 449,000 | 401,340 | ||||||
Cox Communications, Inc. | 539,000 | 454,537 | ||||||
4.70% due 12/15/2042(3) | 496,000 | 436,712 | ||||||
8.375% due 3/1/2039(3) | 63,000 | 78,519 | ||||||
Myriad International Holdings B.V. | 540,000 | 543,623 | ||||||
Time Warner Cable LLC | 71,000 | 72,863 | ||||||
7.30% due 7/1/2038 | 447,000 | 484,573 | ||||||
Time Warner Entertainment Co. LP | 432,000 | 526,660 | ||||||
Warner Media LLC | 434,000 | 468,532 | ||||||
|
| |||||||
| 6,087,731 | ||||||||
| Metal Fabricate & Hardware – 0.0% |
| |||||||
Grinding Media, Inc. /Moly-Cop AltaSteel Ltd. | 9,000 | 8,708 | ||||||
|
| |||||||
| 8,708 | ||||||||
| Mining – 0.8% |
| |||||||
Anglo American Capital PLC | 1,000,000 | 904,859 | ||||||
4.75% due 4/10/2027(3) | 521,000 | 498,976 | ||||||
Barrick North America Finance LLC | 88,000 | 106,596 | ||||||
| December 31, 2018 | Principal Amount | Value | ||||||
| Mining(continued) |
| |||||||
Corp. Nacional del Cobre de Chile | $ | 450,000 | $ | 455,706 | ||||
Freeport-McMoRan, Inc. | 571,000 | 528,175 | ||||||
Glencore Finance Canada Ltd. | 429,000 | 386,151 | ||||||
|
| |||||||
| 2,880,463 | ||||||||
| Miscellaneous Manufacturing – 0.4% |
| |||||||
General Electric Co. | 448,000 | 360,669 | ||||||
6.15% due 8/7/2037 | 448,000 | 436,998 | ||||||
Siemens Financieringsmaatschappij N.V. | 500,000 | 455,533 | ||||||
|
| |||||||
| 1,253,200 | ||||||||
| Oil & Gas – 2.6% |
| |||||||
Apache Corp. | 217,000 | 196,545 | ||||||
Berry Petroleum Co. LLC | 12,000 | 10,800 | ||||||
Carrizo Oil & Gas, Inc. | 560,000 | 518,000 | ||||||
Chesapeake Energy Corp. | 365,000 | 312,075 | ||||||
Continental Resources, Inc. | 480,000 | 472,405 | ||||||
Ecopetrol S.A. | 190,000 | 179,402 | ||||||
Eni S.p.A. | 850,000 | 879,644 | ||||||
Equinor ASA | 1,500,000 | 1,788,656 | ||||||
Gazprom OAO Via Gaz Capital S.A. | 200,000 | 190,708 | ||||||
Hilcorp Energy I LP / Hilcorp Finance Co. | 563,000 | 495,440 | ||||||
Indigo Natural Resources LLC | 188,000 | 161,680 | ||||||
Kerr-McGee Corp. | 20,000 | 23,951 | ||||||
Pertamina Persero PT | 200,000 | 189,040 | ||||||
Petrobras Global Finance B.V. | 290,000 | 276,622 | ||||||
7.25% due 3/17/2044 | 560,000 | 551,886 | ||||||
Petroleos Mexicanos | 803,000 | 692,186 | ||||||
Precision Drilling Corp. | 385,000 | 319,550 | ||||||
7.75% due 12/15/2023 | 176,000 | 162,140 | ||||||
Sinopec Group Overseas Development Ltd. | 200,000 | 204,463 | ||||||
| 14 | The accompanying notes are an integral part of these financial statements. |
Table of Contents
SCHEDULE OF INVESTMENTS — GUARDIAN CORE PLUS FIXED INCOME VIP FUND
| December 31, 2018 | Principal Amount | Value | ||||||
| Oil & Gas(continued) |
| |||||||
SM Energy Co. | $ | 226,000 | $ | 200,010 | ||||
Valero Energy Corp. | 486,000 | 742,677 | ||||||
WPX Energy, Inc. | 262,000 | 237,110 | ||||||
YPF S.A. | 415,000 | 372,462 | ||||||
|
| |||||||
| 9,177,452 | ||||||||
| Oil & Gas Services – 0.4% |
| |||||||
Baker Hughes a GE Co. LLC / Baker HughesCo-Obligor, Inc. | 1,184,000 | 975,677 | ||||||
Transocean Proteus Ltd. | 321,600 | 307,932 | ||||||
|
| |||||||
| 1,283,609 | ||||||||
| Pharmaceuticals – 0.2% |
| |||||||
Bausch Health Cos., Inc. | 310,000 | 305,350 | ||||||
Bayer Corp. | 11,000 | 12,475 | ||||||
Valeant Pharmaceuticals International | 304,000 | 304,000 | ||||||
|
| |||||||
| 621,825 | ||||||||
| Pipelines – 0.6% |
| |||||||
Abu Dhabi Crude Oil Pipeline LLC | 200,000 | 195,266 | ||||||
Cheniere Corpus Christi Holdings LLC | 1,134,000 | 1,070,553 | ||||||
Colonial Pipeline Co. | 478,000 | 458,318 | ||||||
Northern Natural Gas Co. | 238,000 | 231,953 | ||||||
Peru LNG S.R.L. | 200,000 | 193,510 | ||||||
|
| |||||||
| 2,149,600 | ||||||||
| Real Estate – 0.3% |
| |||||||
China Evergrande Group | 700,000 | 588,993 | ||||||
Country Garden Holdings Co. Ltd. | 200,000 | 177,687 | ||||||
4.75% due 9/28/2023 | 200,000 | 174,200 | ||||||
Shimao Property Holdings Ltd. | 320,000 | 301,031 | ||||||
|
| |||||||
| 1,241,911 | ||||||||
| Real Estate Investment Trusts – 0.4% |
| |||||||
EPR Properties | 37,000 | 36,599 | ||||||
MGM Growth Properties Operating Partnership LP / MGP FinanceCo-Issuer, Inc. | 15,000 | 14,850 | ||||||
| December 31, 2018 | Principal Amount | Value | ||||||
| Real Estate Investment Trusts(continued) |
| |||||||
VEREIT Operating Partnership LP | $ | 1,265,000 | $ | 1,264,466 | ||||
|
| |||||||
| 1,315,915 | ||||||||
| Retail – 0.2% |
| |||||||
Conn’s, Inc. | 180,000 | 173,700 | ||||||
L Brands, Inc. | 791,000 | 676,305 | ||||||
|
| |||||||
| 850,005 | ||||||||
| Software – 0.2% |
| |||||||
Oracle Corp. | 500,000 | 600,161 | ||||||
|
| |||||||
| 600,161 | ||||||||
| Telecommunications – 0.7% |
| |||||||
AT&T, Inc. | 193,000 | 194,986 | ||||||
CenturyLink, Inc. | 527,000 | 507,896 | ||||||
Ooredoo International Finance Ltd. | 200,000 | 191,500 | ||||||
Sprint Capital Corp. | 370,000 | 349,650 | ||||||
Sprint Corp. | 676,000 | 693,745 | ||||||
T-Mobile U.S.A., Inc. | 346,000 | 352,920 | ||||||
Verizon Communications, Inc. | 297,000 | 287,980 | ||||||
|
| |||||||
| 2,578,677 | ||||||||
| Transportation – 0.2% |
| |||||||
Burlington Northern Santa Fe LLC | 120,000 | 140,528 | ||||||
Rumo Luxembourg Sarl | 400,000 | 416,960 | ||||||
|
| |||||||
| 557,488 | ||||||||
| Water – 0.0% |
| |||||||
Aquarion Co. | 25,000 | 25,390 | ||||||
|
| |||||||
| 25,390 | ||||||||
| Total Corporate Bonds & Notes (Cost $92,461,954) |
| 87,825,818 | ||||||
| Non–Agency Mortgage–Backed Securities – 5.9% |
| |||||||
Atrium Hotel Portfolio Trust | 349,000 | 348,794 | ||||||
BAMLL Commercial Mortgage Securities Trust | 3,900,000 | 3,830,794 | ||||||
BB-UBS Trust | 860,000 | 860,093 | ||||||
| The accompanying notes are an integral part of these financial statements. | 15 |
Table of Contents
SCHEDULE OF INVESTMENTS — GUARDIAN CORE PLUS FIXED INCOME VIP FUND
| December 31, 2018 | Principal Amount | Value | ||||||
| Non–Agency Mortgage–Backed Securities(continued) |
| |||||||
BX Trust | $ | 987,000 | $ | 984,831 | ||||
Caesars Palace Las Vegas Trust | 92,000 | 92,585 | ||||||
2017-VICI B | 57,000 | 57,190 | ||||||
Citigroup Commercial Mortgage Trust | 1,685,000 | 1,321,635 | ||||||
Commercial Mortgage Trust | 1,458,000 | 1,500,603 | ||||||
2015-PC1 B | 100,000 | 100,568 | ||||||
2015-PC1 D | 33,000 | 29,210 | ||||||
2016-SAVA A | 63,227 | 63,099 | ||||||
DBWF Mortgage Trust | 630,000 | 626,950 | ||||||
GS Mortgage Securities Corp. Trust | 1,273,000 | 1,261,560 | ||||||
2018-FBLU A | 631,000 | 631,104 | ||||||
2018-RIVR A | 438,000 | 436,442 | ||||||
JP Morgan Chase Commercial Mortgage Securities Corp. | 1,084,000 | 1,126,125 | ||||||
2018-LAQ A | 1,035,000 | 1,029,098 | ||||||
2018-LAQ D | 517,000 | 510,446 | ||||||
2018-MINN A | 339,000 | 338,739 | ||||||
2018-WPT AFL | 242,000 | 243,008 | ||||||
2018-WPT AFX | 676,000 | 702,498 | ||||||
2018-WPT BFL | 724,000 | 727,007 | ||||||
2018-WPT BFX | 218,000 | 226,631 | ||||||
2018-WPT CFX | 290,000 | 301,311 | ||||||
JPMBB Commercial Mortgage Securities Trust | 13,000 | 12,478 | ||||||
| December 31, 2018 | Principal Amount | Value | ||||||
| Non–Agency Mortgage–Backed Securities(continued) |
| |||||||
Morgan Stanley Capital Barclays Bank Trust | $ | 100,000 | $ | 97,912 | ||||
2016-MART XCP | 5,633,000 | 56 | ||||||
The Bancorp Commercial Mortgage Trust | 18,418 | 18,351 | ||||||
Wells Fargo Commercial Mortgage Trust | 1,500,000 | 1,296,907 | ||||||
WFLD Mortgage Trust | 2,000,000 | 2,022,087 | ||||||
| Total Non–Agency Mortgage–Backed Securities (Cost $20,745,696) |
| 20,798,112 | ||||||
| Foreign Government – 2.4% |
| |||||||
Angolan Government International Bond | USD | 200,000 | 209,988 | |||||
Argentine Republic Government International Bond | USD | 194,000 | 153,260 | |||||
5.625% due 1/26/2022 | USD | 2,292,000 | 1,933,875 | |||||
6.875% due 4/22/2021 | USD | 2,000,000 | 1,807,020 | |||||
8.28% due 12/31/2033 | USD | 501,930 | 391,505 | |||||
Bahamas Government International Bond | USD | 400,000 | 406,000 | |||||
Bermuda Government International Bond | USD | 400,000 | 380,468 | |||||
Egypt Government International Bond | USD | 200,000 | 196,216 | |||||
7.903% due 2/21/2048(3) | USD | 200,000 | 172,056 | |||||
Mexico Government International Bond | USD | 395,000 | 369,724 | |||||
4.00% due 10/2/2023 | USD | 560,000 | 557,390 | |||||
Nigeria Government International Bond | USD | 200,000 | 176,620 | |||||
Provincia de Buenos Aires Argentina | USD | 15,000 | 12,075 | |||||
Provincia de Mendoza Argentina | USD | 300,000 | 243,000 | |||||
| 16 | The accompanying notes are an integral part of these financial statements. |
Table of Contents
SCHEDULE OF INVESTMENTS — GUARDIAN CORE PLUS FIXED INCOME VIP FUND
| December 31, 2018 | Principal Amount | Value | ||||||
| Foreign Government(continued) |
| |||||||
Qatar Government International Bond | USD | 555,000 | $ | 535,966 | ||||
5.103% due 4/23/2048(3) | USD | 210,000 | 220,552 | |||||
Romanian Government International Bond | USD | 8,000 | 8,865 | |||||
Turkey Government International Bond | USD | 745,000 | 744,945 | |||||
5.75% due 3/22/2024 | USD | 200,000 | 193,258 | |||||
| Total Foreign Government (Cost $9,331,251) |
| 8,712,783 | ||||||
| U.S. Government Securities – 30.9% |
| |||||||
U.S. Treasury Bill | $ | 50,730,000 | 50,491,504 | |||||
U.S. Treasury Bond | 11,504,000 | 10,999,352 | ||||||
3.00% due 8/15/2048 | 17,368,000 | 17,285,909 | ||||||
U.S. Treasury Note | 4,754,000 | 4,833,110 | ||||||
3.125% due 11/15/2028 | 5,201,000 | 5,394,818 | ||||||
U.S. Treasury Note Inflation Protected Security | 4,203,156 | 4,011,168 | ||||||
0.625% due 4/15/2023 | 17,021,462 | 16,738,657 | ||||||
| Total U.S. Government Securities (Cost $108,106,838) |
| 109,754,518 | ||||||
| Short–Term Investment – 2.8% |
| |||||||
| Repurchase Agreements – 2.8% |
| |||||||
Fixed Income Clearing Corp., 0.50%, dated 12/31/2018, proceeds at maturity value of $9,811,273, due 1/2/2019(8) | 9,811,000 | 9,811,000 | ||||||
| Total Repurchase Agreements (Cost $9,811,000) |
| 9,811,000 | ||||||
| Total Investments(9) – 134.7% (Cost $481,449,919) |
| 478,411,953 | ||||||
| Liabilities in excess of other assets(10) – (34.7)% |
| (123,342,389 | ) | |||||
| Total Net Assets – 100.0% |
| $ | 355,069,564 | |||||
| (1) | Interest rate shown reflects the discount rate at time of purchase. |
| (2) | TBA — To be announced. |
| (3) | Securities that may be resold in transactions, exempt from registration under Rule 144A of the Securities Act of 1933, as amended, normally to certain qualified buyers. At December 31, 2018, the aggregate market value of these securities amounted to $105,150,976, representing 29.6% of net assets. These securities have been deemed liquid by the investment adviser pursuant to the Fund’s liquidity procedures approved by the Board of Trustees. |
| (4) | Variable rate securities, which may includestep-up bonds or adjustable rate mortgages. The rate shown is the rate in effect at December 31, 2018. |
| (5) | Payment–in–kind security, for which interest payments may be made in additional principal ranging from 0% to 100% of the full stated interest rate. As of December 31, 2018, interest payments had been made in cash. |
| (6) | Variable coupon rate based on weighted average interest rate of underlying mortgages. |
| (7) | Interest only security. |
| (8) | The table below presents collateral for repurchase agreements. |
| Security | Coupon | Maturity Date | Principal Amount | Value | ||||||||||||
| U.S. Treasury Note | 2.875% | 7/31/2025 | $ | 9,755,000 | $ | 10,009,625 | ||||||||||
| (9) | A portion of the securities in the Fund is segregated to cover to be announced securities (TBA). |
| The accompanying notes are an integral part of these financial statements. | 17 |
Table of Contents
SCHEDULE OF INVESTMENTS — GUARDIAN CORE PLUS FIXED INCOME VIP FUND
| (10) | Liabilities in excess of other assets include net unrealized appreciation on futures contracts as follows: |
Open futures contracts at December 31, 2018:
| Type | Expiration | Contracts | Position | Notional Amount | Notional Value | Unrealized Appreciation | ||||||||||||||||||
| U.S.2-Year Treasury Note | March 2019 | 75 | Long | $ | 15,885,335 | $ | 15,923,437 | $ | 38,102 | |||||||||||||||
| U.S.5-Year Treasury Note | March 2019 | 203 | Long | 22,937,609 | 23,281,563 | 343,954 | ||||||||||||||||||
| U.S. Long Bond | March 2019 | 257 | Long | 35,859,973 | 37,522,000 | 1,662,027 | ||||||||||||||||||
| Total |
| $ | 74,682,917 | $ | 76,727,000 | $ | 2,044,083 | |||||||||||||||||
| Type | Expiration | Contracts | Position | Notional Amount | Notional Value | Unrealized Depreciation | ||||||||||||||||||
| U.S. Ultra10-Year Treasury Note | March 2019 | 98 | Short | $ | (12,351,605 | ) | $ | (12,747,656 | ) | $ | (396,051 | ) | ||||||||||||
| U.S. Ultra Long Bond | March 2019 | 153 | Short | (23,322,355 | ) | (24,580,406 | ) | (1,258,051 | ) | |||||||||||||||
| Total |
| $ | (35,673,960 | ) | $ | (37,328,062 | ) | $ | (1,654,102 | ) | ||||||||||||||
Legend:
CLO — Collateralized Loan Obligation
LIBOR — London Interbank Offered Rate
PIK — Payment–In–Kind
USD — United States Dollar
The following is a summary of the inputs used as of December 31, 2018 in valuing the Fund’s investments. For more information on valuation inputs, please refer to Note 2a of the accompanying Notes to Financial Statements.
| Valuation Inputs | ||||||||||||||||
| Investments in Securities | Level 1 | Level 2 | Level 3 | Total | ||||||||||||
| Agency Mortgage–Backed Securities | $ | — | $ | 140,960,721 | $ | — | $ | 140,960,721 | ||||||||
| Asset–Backed Securities | — | 100,549,001 | — | 100,549,001 | ||||||||||||
| Corporate Bonds & Notes | — | 87,825,818 | — | 87,825,818 | ||||||||||||
| Non–Agency Mortgage–Backed Securities | — | 20,798,112 | — | 20,798,112 | ||||||||||||
| Foreign Government | — | 8,712,783 | — | 8,712,783 | ||||||||||||
| U.S. Government Securities | — | 109,754,518 | — | 109,754,518 | ||||||||||||
| Repurchase Agreements | — | 9,811,000 | — | 9,811,000 | ||||||||||||
| Total | $ | — | $ | 478,411,953 | $ | — | $ | 478,411,953 | ||||||||
| Other Financial Instruments | ||||||||||||||||
| Futures Contracts | ||||||||||||||||
Assets | $ | 2,044,083 | $ | — | $ | — | $ | 2,044,083 | ||||||||
Liabilities | (1,654,102) | — | — | (1,654,102 | ) | |||||||||||
| Total | $ | 389,981 | $ | — | $ | — | $ | 389,981 | ||||||||
| 18 | The accompanying notes are an integral part of these financial statements. |
Table of Contents
FINANCIAL INFORMATION — GUARDIAN CORE PLUS FIXED INCOME VIP FUND
For the Year Ended December 31, 2018 | ||||
Investment Income | ||||
Interest | $ | 9,309,309 | ||
|
| |||
Total Investment Income | 9,309,309 | |||
|
| |||
Expenses | ||||
Investment advisory fees | 1,211,961 | |||
Distribution fees | 687,195 | |||
Trustees’ and officers’ fees | 158,935 | |||
Custodian and accounting fees | 104,110 | |||
Professional fees | 95,045 | |||
Administrative fees | 44,630 | |||
Shareholder reports | 28,241 | |||
Transfer agent fees | 19,528 | |||
Other expenses | 36,861 | |||
|
| |||
Total Expenses | 2,386,506 | |||
Less: Fees waived | (213,714 | ) | ||
|
| |||
Total Expenses, Net | 2,172,792 | |||
|
| |||
Net Investment Income/(Loss) | 7,136,517 | |||
|
| |||
Realized Gain/(Loss) and Change in Unrealized Appreciation/(Depreciation) on Investments and Futures Contracts | ||||
Net realized gain/(loss) from investments | (4,618,359 | ) | ||
Net realized gain/(loss) from futures contracts | 84,263 | |||
Net change in unrealized appreciation/(depreciation) on investments | (3,123,547 | ) | ||
Net change in unrealized appreciation/(depreciation) on futures contracts | 389,981 | |||
|
| |||
Net Loss on Investments and Futures Contracts | (7,267,662 | ) | ||
|
| |||
Net Decrease in Net Assets Resulting From Operations | $ | (131,145 | ) | |
|
| |||
| The accompanying notes are an integral part of these financial statements. | 19 |
Table of Contents
FINANCIAL INFORMATION — GUARDIAN CORE PLUS FIXED INCOME VIP FUND
For the Year Ended | For the Year Ended | |||||||
| ||||||||
Operations |
| |||||||
Net investment income/(loss) | $ | 7,136,517 | $ 502,977 | |||||
Net realized gain/(loss) from investments and futures contracts | (4,534,096 | ) | 93,000 | |||||
Net change in unrealized appreciation/(depreciation) on investments and | (2,733,566 | ) | 466,851 | |||||
|
|
|
| |||||
Net Increase/(Decrease) in Net Assets Resulting from Operations | (131,145 | ) | 1,062,828 | |||||
|
|
|
| |||||
Capital Share Transactions |
| |||||||
Proceeds from sales of shares | 381,440,464 | 7,568,880 | ||||||
Cost of shares redeemed | (49,335,564 | ) | (10,423,482 | ) | ||||
|
|
|
| |||||
Net Increase/(Decrease) in Net Assets Resulting from Capital Share Transactions | 332,104,900 | (2,854,602 | ) | |||||
|
|
|
| |||||
Net Increase/(Decrease) in Net Assets | 331,973,755 | (1,791,774 | ) | |||||
|
|
|
| |||||
Net Assets |
| |||||||
Beginning of year | 23,095,809 | 24,887,583 | ||||||
|
|
|
| |||||
End of year | $ | 355,069,564 | $ | 23,095,809 | ||||
|
|
|
| |||||
Other Information: |
| |||||||
Shares | ||||||||
Sold | 38,416,835 | 771,669 | ||||||
Redeemed | (5,007,402 | ) | (1,037,312 | ) | ||||
|
|
|
| |||||
Net Increase/(Decrease) | 33,409,433 | (265,643 | ) | |||||
|
|
|
| |||||
| 20 | The accompanying notes are an integral part of these financial statements. |
Table of Contents
This Page Intentionally Left Blank
| 21 |
Table of Contents
FINANCIAL INFORMATION — GUARDIAN CORE PLUS FIXED INCOME VIP FUND
The Financial Highlights table is intended to help you understand the Fund’s financial performance for the past five years (or, if shorter, the period since inception). Certain information reflects financial results for a single Fund share. The total returns in the table represent the rate that an investor would have earned (or lost) on an investment in the Fund.
Financial Highlights | ||||||||||||||||||||||||
| Per Share Operating Performance | ||||||||||||||||||||||||
| Net Asset Value, Beginning of Period | Net Investment Income(1) | Net Realized and Unrealized Gain/(Loss) | Total Operations | Net Asset Value, End of Period | Total Return(2) | |||||||||||||||||||
Year Ended 12/31/18 | $ | 10.08 | $ | 0.26 | $ | (0.39 | ) | $ | (0.13 | ) | $ | 9.95 | (1.29) | % | ||||||||||
Year Ended 12/31/17 | 9.73 | 0.17 | 0.18 | 0.35 | 10.08 | 3.60 | % | |||||||||||||||||
Period Ended 12/31/16(4) | 10.00 | 0.04 | (0.31 | ) | (0.27 | ) | 9.73 | (2.70) | %(5) | |||||||||||||||
| 22 | The accompanying notes are an integral part of these financial statements. |
Table of Contents
FINANCIAL INFORMATION — GUARDIAN CORE PLUS FIXED INCOME VIP FUND
| Ratios/Supplemental Data | ||||||||||||||||||||||
| Net Assets, End of Period (000s) | Net Ratio of Expenses to Average Net Assets(3) | Gross Ratio of Expenses to Average Net Assets | Net Ratio of Net Investment Income to Average Net Assets(3) | Gross Ratio of Net Investment Income/(Loss) to Average Net Assets | Portfolio Turnover Rate | |||||||||||||||||
| $ | 355,070 | 0.79% | 0.87% | 2.60% | 2.52% | 543% | ||||||||||||||||
| 23,096 | 0.81% | 1.77% | 1.69% | 0.73% | 409% | |||||||||||||||||
| 24,888 | 0.81% | (5) | 2.54% | (5) | 1.18% | (5) | (0.55)% | (5) | 107% | (5) | ||||||||||||
| (1) | Calculated based on the average shares outstanding during the period. |
| (2) | Total returns do not reflect the effects of charges deducted pursuant to the terms of The Guardian Insurance & Annuity Company, Inc.‘s variable contracts. Inclusion of such charges would reduce the total returns for all periods shown. |
| (3) | Net Ratio of Expenses to Average Net Assets and Net Ratio of Net Investment Income to Average Net Assets include the effect of fee waivers and expense limitations. |
| (4) | Commenced operations on September 1, 2016. |
| (5) | Ratios for periods less than one year have been annualized, except for total return and portfolio turnover rate. For the period ended December 31, 2016, certainnon-recurring fees (i.e., audit fees) are not annualized. |
| The accompanying notes are an integral part of these financial statements. | 23 |
Table of Contents
NOTES TO FINANCIAL STATEMENTS — GUARDIAN CORE PLUS FIXED INCOME VIP FUND
December 31, 2018
1. Organization
Guardian Variable Products Trust (the “Trust”), a Delaware statutory trust organized on January 12, 2016, is registered under the Investment Company Act of 1940, as amended (the “1940 Act”), as anopen-end management investment company. The Trust currently has sixteen series. Guardian Core Plus Fixed Income VIP Fund (the “Fund”) is a series of the Trust. The Fund is a diversified fund and commenced operations on September 1, 2016. The financial statements for other series of the Trust are presented in separate reports.
The Trust has authorized an unlimited number of shares of beneficial interest with no par value. Shares are bought and sold at closing net asset value (“NAV”). Shares of the Fund are only sold to certain separate accounts of The Guardian Insurance & Annuity Company, Inc. (“GIAC”) that fund certain variable annuity contracts and variable life insurance policies issued by GIAC. GIAC is a wholly-owned subsidiary of The Guardian Life Insurance Company of America (“Guardian Life”).
The Fund seeks income and capital appreciation to produce a high total return.
2. Significant Accounting Policies
The following is a summary of significant accounting policies followed by the Fund in the preparation of its financial statements. The Fund follows the investment company accounting and reporting guidance of the Financial Accounting Standards Board (“FASB”) Accounting Standards Codification Topic 946 Financial Services – Investment Companies. The following policies are in conformity with accounting principles generally accepted in the United States of America (“GAAP”). The preparation of financial statements in accordance with GAAP requires management to make estimates and assumptions that affect the reported amounts and disclosures in the financial statements. Actual results could differ from those estimates.
a. Investment Valuations The valuations of debt securities for which quoted bid prices are readily available are valued at the bid price by independent pricing services (each, a “Service”). Debt securities for which quoted bid prices are not readily available are valued by a Service at the evaluated bid price provided by the Service or the bid price provided by an independent broker-dealer or at a calculated price based on the spread to an appropriate benchmark provided by such broker-dealer. Securities for which
market quotations are not readily available or for which market quotations may be considered unreliable or for which a Service or independent broker-dealer does not provide a valuation are valued at their fair values as determined in accordance with policies and procedures adopted by the Board of Trustees.
Under the policies and procedures approved by the Board of Trustees, Park Avenue Institutional Advisers LLC (“Park Avenue”), the Fund’s investment adviser, has established a Fair Valuation Committee to assist the Board of Trustees with the oversight and monitoring of the valuation of the Fund’s investments. This includes monitoring the appropriateness of fair values based on results of ongoing valuation oversight, including but not limited to consideration of security specific events, market events, and pricing vendor and broker-dealer due diligence. The Fair Valuation Committee oversees and carries out the policies for the valuation of investments held in the Fund. The Fair Valuation Committee is responsible for discussing and assessing the potential impacts to the fair values on an ongoing basis, and at least on a quarterly basis with the Board of Trustees.
Equity securities traded on an exchange other than NASDAQ Stock Market, LLC (“NASDAQ”) are valued at the last reported sale price on the principal exchange or market on which they are traded; or, if there were no sales that day, at the mean between the closing bid and ask prices. Securities traded on the NASDAQ are generally valued at the NASDAQ official closing price, which may not be the last sale price. If the NASDAQ official closing price is not available for a security, that security is generally valued at the mean between the closing bid and ask prices. Repurchase agreements are carried at cost, which approximates fair value (see Note 5d). Foreign securities are valued in the currencies of the markets in which they trade and then converted to U.S. dollars by the application of foreign exchange rates at the close of the New York Stock Exchange (“NYSE”).
Securities whose values have been materially affected by events occurring before the Fund’s valuation time but after the close of the securities’ principal exchange or market may be fair valued in accordance with policies and procedures adopted by the Board of Trustees. Valuations reflected in this report are as of the report date. As a result, changes in valuation due to market events and/or issuer related events after the report date and prior to issuance of the report are not reflected herein.
| 24 |
Table of Contents
NOTES TO FINANCIAL STATEMENTS — GUARDIAN CORE PLUS FIXED INCOME VIP FUND
Various inputs are used in determining the valuation of the Fund’s investments. These inputs are summarized in three broad levels listed below.
| • | Level 1 — unadjusted inputs using quoted prices in active markets for identical investments. |
| • | Level 2— other significant observable inputs, including, but not limited to, quoted prices for similar investments, inputs other than quoted prices that are observable for investments (such as interest rates, prepayment speeds, credit risks, etc.) or other market corroborated inputs. |
| • | Level 3 — significant unobservable inputs (including the Fund’s own assumptions in determining the fair value of investments) |
Inputs may include price information, volatility statistics, specific and broad credit data, liquidity statistics, and other factors. A financial instrument’s level within the fair value hierarchy is based on the lowest level of any input; both individually and in aggregate, that is significant to the fair value measurement. However, the determination of what constitutes “observable” requires significant judgment by the Trust. The Trust considers observable data to be that market data which is readily available, regularly distributed or updated, reliable and verifiable, and provided by independent sources that are actively involved in the relevant market. The inputs or methodology used for valuing securities are not necessarily an indication of the risk associated with investing in those securities. Changes in valuation techniques may result in transfers into or out of a financial instrument’s assigned level within the hierarchy.
The FASB requires reporting entities to make disclosures about purchases, sales, issuances and settlements of Level 3 securities on a gross basis.
The Fund’s policy is to recognize transfers between Level 1, Level 2 and Level 3 at the end of the reporting period. For the year ended December 31, 2018, there were no transfers among any levels.
In determining a financial instrument’s placement within the hierarchy, the Trust separates the Fund’s investment portfolio into two categories: investments and derivatives (e.g., futures). A summary of inputs used to value the Fund’s assets and liabilities carried at fair value as of December 31, 2018 is included in the Schedule of Investments.
InvestmentsInvestments whose values are based on quoted market prices in active markets, and are
therefore classified within Level 1, include active listed equities. Investments that trade in markets that are not considered to be active, but are valued based on quoted market prices, dealer quotations or alternative pricing sources supported by observable inputs are classified within Level 2. These include certain U.S. government and sovereign obligations, most government agency securities, investment-grade corporate bonds, certain mortgage products, state, municipal and provincial obligations, and certain foreign equity securities, including securities whose prices may have been affected by events occurring after the close of trading on their principal exchange or market and, as a result, whose values are determined by a pricing service as described above, or securities whose values are otherwise determined using fair valuation methods approved by the Fund’s Board of Trustees.
Investments classified within Level 3 have significant unobservable inputs, as they trade infrequently or not at all. Level 3 investments include, among others, private placement securities. When observable prices are not available for these securities, the Trust uses one or more valuation techniques for which sufficient and reliable data is available. The inputs used by the Trust in estimating the value of Level 3 investments include, for example, the original transaction price, recent transactions in the same or similar instruments, completed or pending third-party transactions in the underlying investment or comparable issuers, subsequent rounds of financing, recapitalizations, and other transactions across the capital structure. Level 3 investments may also be adjusted to reflect illiquidity and/ornon-transferability, with the amount of such discount estimated by the Trust in the absence of market information. Assumptions used by the Trust due to the lack of observable inputs may significantly impact the resulting fair value and therefore the Fund’s results of operations. As of December 31, 2018, the Fund had no securities classified as Level 3.
DerivativesExchange-traded derivatives, such as futures contracts, exchange-traded option contracts and certain swaps, are typically classified within Level 1 or Level 2 of the fair value hierarchy depending on whether or not they are deemed to be actively traded. Certainnon-exchange-traded derivatives, such as generic forwards, certain swaps and options, have inputs which can generally be corroborated by market data and are therefore classified within Level 2.
b. Securities TransactionsSecurities transactions are accounted for on the date securities are purchased or
| 25 |
Table of Contents
NOTES TO FINANCIAL STATEMENTS — GUARDIAN CORE PLUS FIXED INCOME VIP FUND
sold (trade date). Realized gains or losses on securities transactions are determined on the basis of specific identification.
c. Futures ContractsThe Fund may enter into financial futures contracts. In entering into such contracts, the Fund is required to deposit with the counterparty, either in cash or securities, an amount equal to a certain percentage of the face value of the contract. Subsequent payments are received or made by the Fund each day, depending on the daily fluctuations in the values of the contracts, and are recorded for financial statement purposes as variation margin received or paid by the Fund. Daily changes in variation margin are recognized as unrealized gains or losses by the Fund. The Fund may not achieve the anticipated benefits of the financial futures contracts and may realize a loss.
d. Credit DerivativesThe Fund may enter into credit derivatives, including credit default swaps on individual obligations or credit indices. The Fund may use these investments (i) as alternatives to direct long or short investment in a particular security or securities, (ii) to adjust the Fund’s asset allocation or risk exposure, or (iii) for hedging purposes. The use by the Fund of credit default swaps may have the effect of creating a short position in a security. Credit derivatives can create investment leverage and may create additional investment risks that may subject the Fund to greater volatility than investments in more traditional securities, as described in the Statement of Additional Information.
The Fund may enter into credit default swap agreements either as a buyer or seller. The Fund may buy protection under a credit default swap to attempt to mitigate the risk of default or credit quality deterioration in one or more individual holdings or in a segment of the fixed income securities market. The Fund may sell protection under a credit default swap in an attempt to gain exposure to an underlying issuer’s credit quality characteristics without investing directly in that issuer.
For swaps entered with an individual counterparty, the Fund bears the risk of loss of the uncollateralized amount expected to be received under a credit default swap agreement in the event of the default or bankruptcy of the counterparty. Credit default swap agreements are generally valued at a price at which the counterparty to such agreement would terminate the agreement. The Fund may also enter into cleared swaps.
In entering into swap contracts, the Fund is required to deposit with the broker (or for the benefit of the broker), either in cash or securities, an amount equal to a percentage of the notional value of the contract.
Subsequent payments are received or made by the Fund each day, depending on the daily fluctuations in the values of the contracts, and are recorded for financial statement purposes as variation margin received or paid by the Fund. Daily changes in variation margin are recognized as unrealized gains or losses by the Fund. The Fund may not achieve the anticipated benefits of the swap contracts and may realize a loss.
The Fund enters into credit default swaps primarily for asset allocation and risk exposure management. There were no credit default swaps held as of December 31, 2018.
e. Options TransactionsThe Fund can write (sell) put and call options on securities and indexes to earn premiums, for hedging purposes, for risk management purposes or otherwise as part of its investment strategies. In writing options, the Fund is required to deposit with the broker or counterparty, either in cash or securities, an amount equal to a percentage of the face value of the options. When an option is written, the premium received is recorded as an asset with an equal liability that is subsequently marked to market to reflect the market value of the written option. These liabilities, if any, are reflected as written options, at value, in the Fund’s Statement of Assets and Liabilities. Premiums received from writing options which expire unexercised are recorded on the expiration date as a realized gain. The difference between the premium received and the amount paid on effecting a closing purchase transaction, including brokerage commissions, is also treated as a realized gain, or if the premium is less than the amount paid for the closing purchased transactions, as a realized loss. If a written call option is exercised, the premium is added to the proceeds from the sale of the underlying security in determining whether there has been a realized gain or loss. If a written put option is exercised, the premium reduces the cost basis of the security. In writing an option, the Fund bears the market risk of an unfavorable change in the price of the security underlying the written option. Exercise of a written option could result in the Fund purchasing or selling a security at a price different from its current market value. There were no options transactions as of December 31, 2018.
f. Investment Income Dividend income net of foreign taxes withheld, if any, is generally recorded on theex-dividend date. Interest income, which includes amortization/accretion of premium/discount, is determined using the interest income accrual method, and is accrued and recorded daily.
| 26 |
Table of Contents
NOTES TO FINANCIAL STATEMENTS — GUARDIAN CORE PLUS FIXED INCOME VIP FUND
g. Allocation of Income and Expenses Many of the expenses of the Trust can be directly attributed to a specific series of the Trust. Expenses that cannot be directly attributed to a specific series of the Trust are generally apportioned among all the series in the Trust, based on relative net assets. In calculating net asset value per share for each series of the Trust, investment income, realized and unrealized gains and losses, and expenses other than series-specific expenses are allocated daily to each series based upon the proportion of net assets attributable to each series.
3. Transactions with Affiliates
a. Investment Advisory Feeand Expense Limitation Under the terms of the advisory agreement, which, after its two year initial term, is reviewed and approved annually by the Board of Trustees, the Fund pays an investment advisory fee to Park Avenue. Park Avenue is a wholly-owned subsidiary of Guardian Life and receives an investment advisory fee at an annual rate of 0.45% of the first $300 million, and 0.40% in excess of $300 million of the Fund’s average daily net assets. The fee is accrued daily and paid monthly.
Park Avenue has contractually agreed through April 30, 2019 to waive certain fees and/or reimburse certain expenses incurred by the Fund to the extent necessary to limit the Fund’s total annual operating expenses after fee waiver and/or expense reimbursement to 0.79% of the Fund’s average daily net assets (excluding, if applicable, any acquired fund fees and expenses, taxes, interest, transaction costs and brokerage commissions, litigation and extraordinary expenses). Prior to April 9, 2018, the expense limitation was 0.81%. The limitation may not be increased or terminated prior to this time without action by the Board of Trustees, may be terminated only upon approval of the Board of Trustees, and is subject to Park Avenue’s recoupment rights. For the year ended December 31, 2018, Park Avenue waived fees and/or paid Fund expenses in the amount of $213,714.
Park Avenue may be entitled to recoupment of previously waived fees and reimbursed expenses from the Fund for three years from the date of the waiver or reimbursement, subject to the expense limitation in effect at the time of the waiver or reimbursement and at the time of the recoupment, if any. Amounts waived or reimbursed by Park Avenue pursuant to any expense limitation after April 9, 2018 will not be subject to Park Avenue’s recoupment rights. The amount available for potential future recoupment by Park Avenue from the Fund under the Expense Limitation Agreement and the
expiration schedule at December 31, 2018 are as follows:
| Potential Recoupment Amounts Expiring | ||||||||||||
Total Potential Recoupment Amounts | 2021 | 2020 | 2019 | |||||||||
| $515,884 | $ | 86,166 | $ | 284,497 | $ | 145,221 | ||||||
Park Avenue has entered into aSub-Advisory Agreement with Lord, Abbett & Co. LLC (“Lord Abbett”). Lord Abbett is responsible for providingday-to-day investment advisory services to the Fund, subject to the supervision of Park Avenue and the oversight of the Board of Trustees.Sub-advisory fees are paid by Park Avenue and do not represent a separate or additional expense to the Fund.
b. Compensation of Trustees and Officers Trustees and officers who are interested persons of the Trust, as defined in the 1940 Act, receive no compensation from the Fund, except for the Chief Compliance Officer of the Trust. Trustees of the Trust who are not interested persons of the Trust, and the Chief Compliance Officer, receive compensation and reimbursement of expenses from the Trust.
c. Distribution Fees Park Avenue Securities LLC (“PAS”), a wholly-owned subsidiary of Guardian Life, is the principal underwriter of Fund shares. The Trust has entered into a distribution and service agreement with PAS, which governs the sale and distribution of shares of the Fund. Under a distribution and service plan adopted by the Trust(“12b-1 plan”), PAS is compensated for services in such capacity, including its expenses in connection with the promotion and distribution of shares of the Fund, at an annual rate of 0.25% of the Fund’s average daily net assets. For the year ended December 31, 2018, the Fund paid distribution fees in the amount of $687,195 to PAS.
PAS has directed that certain payments under the12b-1 plan be used to compensate GIAC for shareholder services provided to contract owners.
4. Federal Income Taxes
a. Distributions to Shareholders For federal income tax purposes, the Fund is treated as a disregarded entity (“DRE”). As a DRE, the Fund is not subject to an entity-level income tax; and any income, gains, losses, deductions, taxes, and credits of the Fund would instead be “passed through” directly to the separate accounts of GIAC that invest in the Fund and retain the same character for U.S. federal income tax purposes. In
| 27 |
Table of Contents
NOTES TO FINANCIAL STATEMENTS — GUARDIAN CORE PLUS FIXED INCOME VIP FUND
addition, the Fund is not required to distribute taxable income and capital gains for U.S. federal income tax purposes. Therefore, no dividends and capital gains distributions were paid by the Fund.
5. Investments
a. Investment Purchases and Sales The cost of investments and U.S. government agency obligations purchased and the proceeds from U.S. government agency obligations and other investments sold (excluding short-term investments and to be announced (TBA) securities) for the year ended December 31, 2018, were as follows:
| Other Investments | U.S. Government and Agency Obligations | |||||||
| Purchases | $ | 315,000,030 | $ | 1,100,418,768 | ||||
| Sales | 125,324,490 | 1,019,626,897 | ||||||
b. Foreign Securities Foreign securities investments involve special risks and considerations not typically associated with U.S. investments. These risks include, but are not limited to, currency risk; adverse political, regulatory, social, and economic developments; and less reliable information about issuers. Moreover, securities of some foreign issuers may be less liquid and their prices more volatile than those of comparable U.S. issuers.
c. Industry or Sector Concentration In its normal course of business, the Fund may invest a significant portion of its assets in companies within a limited number of industries or sectors. As a result, the Fund may be subject to a greater risk of loss than that of a fund invested in a wider spectrum of industries or sectors because the stocks of many or all of the companies in the industry, group of industries, sector, or sectors may decline in value due to developments adversely affecting the industry, group of industries, sector, or sectors.
d. Repurchase Agreements The Fund may invest in repurchase agreements to maintain liquidity and earn income over periods of time as short as overnight. The collateral for repurchase agreements is either cash or fully negotiable U.S. government securities (including U.S. government agency securities). Repurchase agreements are fully collateralized (including the interest accrued thereon) and such collateral is marked to market daily while the agreements remain in force. If the value of the collateral falls below the repurchase price plus accrued interest, the Fund will typically require the seller to deposit additional collateral by the next
business day. If the request for additional collateral is not met, or the seller defaults, the Fund maintains the right to sell the collateral (although it may be prevented or delayed from doing so in certain circumstances) and may be required to claim any resulting loss against the seller. Park Avenue monitors the creditworthiness of the seller with which the Fund enters into repurchase agreements.
e. Securities Purchased on a When-Issued or Delayed-Delivery Basis The Fund may purchase securities on a when-issued or delayed-delivery basis, with payment and delivery scheduled for a future date. These transactions are subject to market fluctuations and are subject to the risk that the value at delivery may be more or less than at the trade date purchase price. Although the Fund will generally enter into these transactions with the intention of taking delivery of the securities, it may sell the securities before the settlement date. Assets will be segregated when a fund agrees to purchase on a when-issued or delayed-delivery basis. These transactions may create investment leverage.
f. Restricted and Illiquid Securities A restricted security cannot be resold to the general public without prior registration under the Securities Act of 1933, as amended (except pursuant to an applicable exemption). The values of these securities may be highly volatile. If the security is subsequently registered and resold, the issuer would typically bear the expense of all registrations at no cost to the Fund. Restricted and illiquid securities are valued according to the policies and procedures adopted by the Trust’s Board of Trustees and are noted, if any, in the Fund’s Schedule of Investments. As of December 31, 2018, the Fund did not hold any restricted or illiquid securities.
g. Below Investment Grade Securities The Fund may invest in below investment grade securities (i.e. lower-quality, “junk” debt), which are subject to various risks. Lower-quality debt is considered to be speculative because it is less certain that the issuer will be able to pay interest or repay the principal than in the case of investment grade debt. These securities can involve a substantially greater risk of default than higher-rated securities, and their values can decline significantly over short periods of time. Lower-quality debt securities tend to be more sensitive to adverse news about their issuers, the market and the economy in general, than higher-quality debt securities. The market for these securities can be less liquid, especially during periods of recession or general market decline.
| 28 |
Table of Contents
NOTES TO FINANCIAL STATEMENTS — GUARDIAN CORE PLUS FIXED INCOME VIP FUND
h. Mortgage- and Asset-Backed Securities The values of some mortgage-related or asset-backed securities may be particularly sensitive to changes in prevailing interest rates. Early repayment of principal on some mortgage-related securities may expose the Fund to a lower rate of return upon reinvestment of principal. The values of mortgage- and asset-backed securities depend in part on the credit quality and adequacy of the underlying assets or collateral and may fluctuate in response to the market’s perception of these factors as well as current and future repayment rates. Some mortgage-backed securities are backed by the full faith and credit of the U.S. government (e.g., mortgage-backed securities issued by the Government National Mortgage Association, commonly known as “Ginnie Mae”), while other mortgage-backed securities (e.g., mortgage-backed securities issued by the Federal National Mortgage Association and the Federal Home Loan Mortgage Corporation, commonly known as “Fannie Mae” and “Freddie Mac”), are backed only by the credit of the government entity issuing them. In addition, some mortgage-backed securities are issued by private entities and, as such, are not guaranteed by the U.S. government or any agency or instrumentality of the U.S. government.
i. Treasury Inflation Protected SecuritiesTreasury inflation protected securities (“TIPS”) are debt securities issued by the U.S. Treasury whose principal and/or interest payments are adjusted for inflation, unlike debt securities that make fixed principal and interest payments. The interest rate paid by the TIPS is fixed, while the principal value rises or falls based on changes in a published Consumer Price Index (“CPI”). Thus, if inflation occurs, the principal and interest payments on TIPS are adjusted accordingly to protect investors from inflationary loss. During a deflationary period, the principal and interest payments decrease, although the TIPS principal amounts will not drop below their face amounts at maturity. In exchange for the inflation protection, the TIPS generally pay lower interest rates than typical U.S. Treasury securities. Only if inflation occurs will TIPS offer a higher real yield than a conventional Treasury bond of the same maturity.
j. Disclosures About Derivative Instruments and Hedging ActivitiesThe Fund entered into U.S. Treasury futures contracts for the year ended December 31, 2018 to economically hedge against changes in interest rates. The Fund bears the risk of interest rates moving unexpectedly, in which case the Fund may not achieve the anticipated benefits of the futures contracts and realize a loss. There is minimal counterparty credit risk to the Funds since futures are
exchange traded and the exchange’s clearinghouse, as counterparty to all exchange traded futures, guarantees futures against default.
As of December 31, 2018, the Fund had the following derivatives at fair value, grouped into appropriate risk categories that illustrate the Fund’s use of derivative instruments:
Interest Rate Contracts | ||||
Asset Derivatives | ||||
| Futures Contracts1 | $ | 2,044,083 | ||
Liability Derivatives | ||||
| Futures Contracts1 | $ | (1,654,102 | ) | |
| 1 | Statements of Assets and Liabilities location: Includes cumulative unrealized appreciation/depreciation of futures contracts as reported in the Schedule of Investments. Only current day’s variation margin is reported within the Statements of Assets and Liabilities. |
Transactions in derivative investments for the year ended December 31, 2018 were as follows:
Interest Rate Contracts | ||||
Net Realized Gain (Loss) | ||||
| Futures Contracts1 | $ | 84,263 | ||
Net Change in Unrealized Appreciation/Depreciation |
| |||
| Futures Contracts2 | $ | 389,981 | ||
Average Number of Notional Amounts | ||||
| Futures Contracts3 | 316 | |||
| 1 | Statement of Operations location: Net realized gain/(loss) from futures contracts. |
| 2 | Statements of Operations location: Net change in unrealized appreciation/(depreciation) on futures contracts. |
| 3 | Amount represents number of contracts. |
6. Temporary Borrowings
The Fund, with other funds managed by Park Avenue, is party to a $10 million committed revolving credit facility from State Street Bank and Trust Company for temporary borrowing purposes, including the meeting of redemption requests that otherwise might require the untimely disposition of securities. Interest is calculated based on the higher of the dailyone-month LIBOR rate and the Federal Funds rate plus 1.25% at the time of borrowing. In addition to the interest charged on any borrowings by the Fund, each fund pays a commitment fee of 0.30% per annum on its share of the unused portion of the credit facility. The agreement is in place until December 10, 2019. The Fund did not utilize the credit facility during the year ended December 31, 2018.
| 29 |
Table of Contents
NOTES TO FINANCIAL STATEMENTS — GUARDIAN CORE PLUS FIXED INCOME VIP FUND
7. Indemnifications
Under the Trust’s organizational documents and, in some cases, by contract, its officers and trustees are indemnified against certain liabilities arising out of the performance of their duties to the Fund. In addition, in the normal course of business, the Fund enters into contracts with its vendors and others that provide general indemnifications. The Fund’s maximum exposure under these arrangements is unknown as this would involve future claims that may be made against the Fund that have not yet occurred. However, based on experience, the Fund expects the risk of loss to be remote.
8. Recent Accounting Pronouncement
On August 17, 2018, the U.S. Securities and Exchange Commission (“SEC”) voted to adopt amendments to
certain disclosure requirements that have become redundant, duplicative, overlapping, outdated, or superseded, in light of other SEC disclosure requirements, GAAP, or changes in the information environment. The SEC will also be referring certain SEC disclosure requirements that overlap with, but require information incremental to, GAAP to the FASB for potential incorporation into GAAP. The amendments are intended to facilitate the disclosure of information to investors and simplify compliance without significantly altering the total mix of information provided to investors. As such, the financial statements herein have been updated to conform with these new requirements, which had no effect on the Fund’s net assets or results of operations.
| 30 |
Table of Contents
REPORT OF INDEPENDENT REGISTERED PUBLIC ACCOUNTING FIRM
To the Board of Trustees of Guardian Variable Products Trust and Shareholders of Guardian Core Plus Fixed Income VIP Fund
Opinion on the Financial Statements
We have audited the accompanying statement of assets and liabilities, including the schedule of investments, ofGuardian Core Plus Fixed Income VIP Fund (one of the funds constituting Guardian Variable Products Trust, referred to hereafter as the “Fund”) as of December 31, 2018, the related statement of operations for the year ended December 31, 2018, the statement of changes in net assets for each of the two years in the period ended December 31, 2018, including the related notes,and the financial highlights for each of the periods indicated therein (collectively referred to as the “financial statements”). In our opinion, the financial statements present fairly, in all material respects, the financial position of the Fund as of December 31, 2018, the results of its operations for the year then ended, the changes in its net assets for each of the two years in the period ended December 31, 2018 and the financial highlights for each of the periods indicated therein in conformity with accounting principles generally accepted in the United States of America.
Basis for Opinion
These financial statements are the responsibility of the Fund’s management. Our responsibility is to express an opinion on the Fund’s financial statements based on our audits. We are a public accounting firm registered with the Public Company Accounting Oversight Board (United States) (PCAOB) and are required to be independent with respect to the Fund in accordance with the U.S. federal securities laws and the applicable rules and regulations of the Securities and Exchange Commission and the PCAOB.
We conducted our audits of these financial statements in accordance with the standards of the PCAOB. Those standards require that we plan and perform the audit to obtain reasonable assurance about whether the financial statements are free of material misstatement, whether due to error or fraud.
Our audits included performing procedures to assess the risks of material misstatement of the financial statements, whether due to error or fraud, and performing procedures that respond to those risks. Such procedures included examining, on a test basis, evidence regarding the amounts and disclosures in the financial statements. Our audits also included evaluating the accounting principles used and significant estimates made by management, as well as evaluating the overall presentation of the financial statements. Our procedures included confirmation of securities owned as of December 31, 2018 by correspondence with the custodian and brokers; when replies were not received from brokers, we performed other auditing procedures. We believe that our audits provide a reasonable basis for our opinion.
New York, New York
February 19, 2019
We have served as the auditor of one or more investment companies in Guardian Variable Products Trustsince 2016.
| 31 |
Table of Contents
SUPPLEMENTAL INFORMATION(UNAUDITED)
Approval of Investment Advisory andSub-advisory Agreements
Section 15(c) of the Investment Company Act of 1940, as amended (the “1940 Act”), requires that a fund’s board of trustees annually review and consider the continuation of the fund’s investment advisory andsub-advisory agreements. The continuation of any such agreement must be approved by a vote of a majority of the trustees who are not parties to the agreement or “interested persons” (as defined in the 1940 Act) of a party to the agreement at anin-person meeting of the board called for the purpose of voting on such approval.
At a meeting of the Board of Trustees (the “Board”) of Guardian Variable Products Trust (the “Trust”) held on March27-28, 2018, the Board considered and unanimously voted to approve the continuation of the investment management agreement (the “Management Agreement”) between Park Avenue Institutional Advisers LLC (the “Manager”) and the Trust, on behalf of the following 11 series, Guardian Core Plus Fixed Income VIP Fund, Guardian Diversified Research VIP Fund, Guardian Growth & Income VIP Fund, Guardian Integrated Research VIP Fund, Guardian International Growth VIP Fund, Guardian International Value VIP Fund, Guardian Large Cap Disciplined Growth VIP Fund, Guardian Large Cap Disciplined Value VIP Fund, Guardian Large Cap Fundamental Growth VIP Fund, Guardian Mid Cap Relative Value VIP Fund and Guardian Mid Cap Traditional Growth VIP Fund (the “Funds”). The Board also considered and unanimously voted to approve the continuation of thesub-advisory agreements (the“Sub-advisory Agreements,” collectively with the Management Agreement, the “Agreements”) between the Manager and the following investment advisory firms serving assub-advisers to the Funds, ClearBridge Investments LLC, Wellington Management Company LLP, Massachusetts Financial Services Company, Putnam Investment Management, LLC, Boston Partners Global Investors, Inc., AllianceBernstein L.P., Janus Capital Management LLC, Wells Capital Management Incorporated, J.P. Morgan Investment Management Inc., Lazard Asset Management LLC, and Lord, Abbett & Co. LLC (the“Sub-advisers”). The continuation of the Agreements for aone-year period was unanimously approved by the Trustees who are not parties to the Agreements or “interested persons” (as defined in the 1940 Act) of a party to the Agreements (the “Independent Trustees”).
The Board is responsible for overseeing the management of each Fund. In determining whether to approve the continuation of the Agreements, the Trustees evaluated information and factors that they
considered to be relevant and appropriate through the exercise of their own business judgment. The Trustees considered certain information and factors in light of advice furnished to them by legal counsel to the Trust and, in the case of the Independent Trustees, their independent legal counsel.
In advance of the meeting held on March27-28, 2018, the Trustees received materials and information designed to assist their consideration of the Agreements, including written responses from the Manager and eachSub-adviser to a series of questions and requests for information covering a wide variety of topics provided by independent legal counsel on behalf of the Independent Trustees. Broadridge Financial Solutions, Inc. (“Broadridge”), an independent provider of investment company data, was retained to provide the Trustees with reports on how each Fund’s contractual management fees, actual management fees, overall expense ratios and investment performance compared to those of “peer funds” selected by Broadridge that are offered as investment options underlying variable contracts. The Trustees also received materials and information regarding the legal standards applicable to their consideration of the Agreements and the process and criteria used by the Manager to oversee theSub-advisers. During the course of their deliberations, the Independent Trustees met to discuss and evaluate the Agreements in executive session with their independent legal counsel, outside of the presence of the Trustees who are not Independent Trustees and representatives from Fund management, the Manager or anySub-adviser.
In reaching its decisions to approve the continuation of the Agreements, the Board took into account the materials and information described above as well as other materials and information provided to the Board and discussed with and among the Trustees, including information regarding the Funds furnished to the Board by the Manager throughout the year. Individual Trustees may have given different weight to different factors and information with respect to each Agreement, and the Trustees did not identify any single factor or information that, in isolation, would be controlling in deciding to approve the continuation of the Agreements.
The discussion below is intended to summarize the broad factors that figured prominently in the Board’s decisions to approve the continuation of the Agreements rather than to beall-inclusive. These broad factors included: (i) the nature, extent and quality of the services provided to the Funds by the Manager and theSub-advisers; (ii) the investment performance of the
| 32 |
Table of Contents
SUPPLEMENTAL INFORMATION(UNAUDITED)
Funds; (iii) the fees charged and estimated profitability; (iv) the extent to which economies of scale may exist for a Fund, and the extent to which a Fund may benefit from economies of scale; and (v) any other benefits derived by the Manager or theSub-advisers (or their respective affiliates) from their relationships with the Funds. In addition to considering the above-referenced factors, the Board observed that there are a range of investment options available to variable contract owners who may invest in the Funds, and that these contract owners, having had the opportunity to consider other investment options, may choose to invest or remain invested in the Funds.
Nature, Extent and Quality of Services
The Trustees considered information regarding the nature, extent and quality of services provided to the Funds by the Manager. The Trustees also considered the range of investment advisory services andnon-investment advisory services provided by the Manager, notably coordinating the preparation and filing of various regulatory documents, coordinating the preparation and assembly of Board meeting materials and assisting the Board with certain valuation matters.
The Trustees considered the operation of the Funds in a“manager-of-managers” structure and the responsibilities that the Manager has under this structure, including monitoring and evaluating the performance of theSub-advisers, monitoring theSub-advisers for adherence to the stated investment objectives, strategies, policies and restrictions of the Funds and supervising theSub-advisers with respect to the services that theSub-advisers provide under the Sub-advisory Agreements. The Trustees also considered the process used by the Manager, consistent with this structure, to identify and recommendsub-advisers, and its ability to monitor and overseesub-advisers and recommend replacementsub-advisers, when necessary, and provide other services under the Management Agreement. The Trustees reviewed information regarding the experience and background of the Manager’s key personnel and the Manager’s organizational structure and resources, including investment, legal and administrative capabilities of the Manager. In this regard, the Trustees recognized that the Funds benefit from the Manager’s use of similar resources and capabilities of its affiliates in providing services to the Funds.
The Trustees considered information regarding the nature, extent and quality of services provided to the Funds by theSub-advisers. The Trustees also considered, among other things, the range of investment advisory
services provided by theSub-advisers under the oversight of the Manager. In evaluating these investment advisory services, the Trustees considered, among other things, theSub-advisers’ investment philosophies, styles and/or processes and approach to managing risk. The Trustees received and evaluated information regarding the background, education, expertise and/or experience of the investment professionals that serve as portfolio managers for the Funds and the capabilities, resources and reputations of theSub-advisers.
Based upon these considerations, the Board concluded that it was satisfied with the nature, extent and quality of services provided to the Funds by the Manager and eachSub-adviser.
Investment Performance
The Board considered the investment performance of each Fund. Among other reports, the Board reviewed the performance of the Funds for theone-year and since inception periods compared to a universe of peer funds selected by Broadridge. The Board noted that the Funds had performance records of less than two years and that the Board had reviewed longer performance records of the funds or accounts managed by theSub-advisers with similar strategies as the applicable Fund, when available, when the Board initially approved the Agreements in 2016. The Broadridge report placed the Funds in the following quintiles of the relevant peer universe for theone-year and since inception periods, respectively: Guardian Core Plus Fixed Income VIP Fund (3rd, 3rd), Guardian Diversified Research VIP Fund (2nd, 2nd), Guardian Growth & Income VIP Fund (1st, 1st), Guardian Integrated Research VIP Fund (4th, 5th), Guardian International Growth VIP Fund (3rd, 2nd), Guardian International Value VIP Fund (3rd, 5th), Guardian Large Cap Disciplined Growth VIP Fund (3rd, 4th), Guardian Large Cap Disciplined Value VIP Fund (1st, 1st), Guardian Large Cap Fundamental Growth VIP Fund (5th, 4th), Guardian Mid Cap Relative Value VIP Fund (4th, 3rd) and Guardian Mid Cap Traditional Growth VIP Fund (2nd, 2nd).
The Board considered the investment reports provided by the Manager since commencement of operations of the Funds during quarterly Board meetings. The Board also considered the Manager’s analysis ofSub-adviser performance and the steps taken by the Manager and theSub-advisers to seek to improve performance and the results of those steps.
In light of the considerations noted above, the Board concluded that it had continued confidence in the Manager’s and theSub-advisers’ overall capabilities to manage the Funds.
| 33 |
Table of Contents
SUPPLEMENTAL INFORMATION(UNAUDITED)
Costs and Profitability
The Trustees considered the management fees paid by the Funds to the Manager under the Management Agreement and evaluated the reasonableness of these fees. The Trustees received and reviewed information with respect to the management fees, including the portion of the management fees paid to eachSub-adviser, and the management fees paid by other funds offered as investment options underlying variable contracts within the applicable peer group selected by Broadridge. The Broadridge report placed the Funds in the following quintiles of the relevant expense peer group for the contractual management fees and actual management fees, respectively: Guardian Core Plus Fixed Income VIP Fund (1st, 3rd), Guardian Diversified Research VIP Fund (2nd, 3rd), Guardian Growth & Income VIP Fund (1st, 1st), Guardian Integrated Research VIP Fund (1st, 2nd), Guardian International Growth VIP Fund (1st, 2nd), Guardian International Value VIP Fund (3rd, 2nd), Guardian Large Cap Disciplined Growth VIP Fund (1st, 1st), Guardian Large Cap Disciplined Value VIP Fund (1st, 1st), Guardian Large Cap Fundamental Growth VIP Fund (1st, 1st), Guardian Mid Cap Relative Value VIP Fund (1st, 1st) and Guardian Mid Cap Traditional Growth VIP Fund (3rd, 4th).
The Trustees considered thesub-advisory fees paid under the Sub-advisory Agreements and evaluated the reasonableness of those fees. The Trustees also considered that the fees paid to theSub-advisers are paid by the Manager and not the Funds and that the Manager had negotiated the fees with theSub-advisers atarm’s-length. In addition, the Trustees considered the portion of the management fees paid to eachSub-adviser as compared to the portion retained by the Manager.
The Trustees received and reviewed information in the Broadridge report comparing each Fund’s operating expense ratio to the actual operating expense ratios of a peer group of funds selected by Broadridge. The Trustees considered the Manager’s commitment to limit each Fund’s operating expenses through an expense limitation agreement with the Trust. The Broadridge report placed the Funds in the following quintiles of the relevant expense peer group for the operating expense ratio: Guardian Core Plus Fixed Income VIP Fund (2nd), Guardian Diversified Research VIP Fund (2nd), Guardian Growth & Income VIP Fund (2nd), Guardian Integrated Research VIP Fund (1st), Guardian International Growth VIP Fund (3rd), Guardian International Value VIP Fund (1st), Guardian Large Cap Disciplined Growth VIP Fund (1st), Guardian Large Cap
Disciplined Value VIP Fund (2nd), Guardian Large Cap Fundamental Growth VIP Fund (1st), Guardian Mid Cap Relative Value VIP Fund (1st) and Guardian Mid Cap Traditional Growth VIP Fund (3rd).
Although the Board recognized that the comparisons between the management fees and anticipated operating expenses of the Funds and those of identified peer funds are imprecise, given different terms of agreements and variations in fund strategies, the Trustees found that the comparative information supported their consideration and approval of the management fees and evaluation of operating expenses.
The Trustees reviewed information regarding the Manager’s costs of sponsoring the Funds and estimated profitability of the Funds to the Manager. The Trustees noted that the information contained estimates, such as allocations of expenses. Although the Trustees did not receive specific cost and profitability information from certainSub-advisers, the Trustees primarily considered the cost and profitability information relating to the Manager because the Manager is responsible for payment of thesub-advisory fees and negotiated the fees with theSub-advisers atarm’s-length.
Based on the consideration of the information and factors summarized above, as well as other information and factors deemed relevant by the Trustees, the Trustees concluded that the management andsub-advisory fees were reasonable in light of the nature, extent and quality of services rendered to the Funds by the Manager and theSub-advisers. The Trustees also concluded that the estimated profitability of the Funds to the Manager was acceptable.
Economies of Scale
The Trustees considered the extent to which economies of scale may be shared as assets grow based on current asset levels of the Funds, anticipated asset levels over the next year, the current management andsub-advisory fee rates, the expense limitation arrangements, and any management andsub-advisory fee breakpoints, which reduce fee rates as assets increase. Based on those factors, the Board concluded that it was satisfied with the extent to which any economies of scale would be shared for the benefit of Fund shareholders. The Board noted that it would continue to monitor future growth in each Fund’s assets and whether additional steps are required to share appropriately any economies of scale with Fund shareholders.
| 34 |
Table of Contents
SUPPLEMENTAL INFORMATION(UNAUDITED)
Ancillary Benefits
The Trustees considered the benefits, other than management fees, that the Manager and/or its affiliates receive because of the Manager’s relationship with the Funds. The Trustees acknowledged that the Funds serve as investment options under variable contracts issued by an affiliate of the Manager that receives fees under those contracts and that Park Avenue Securities LLC, an affiliate of the Manager and principal underwriter of the Funds, and an insurance company affiliated with the Manager receive fees from the Funds under a plan of distribution adopted pursuant to Rule12b-1 under the 1940 Act. The Trustees considered that the Manager and its affiliates may benefit from (i) greater efficiencies in annuity administration and operations and potential cost savings due to a reduction in the number of unaffiliated funds available as annuity contract investment options, and (ii) increased dividends-received deductions due to the Funds’ status under the tax laws as disregarded entities. In addition, the
Trustees considered the potential benefits, other thansub-advisory fees, that theSub-advisers and their affiliates receive because of their relationships with the Funds, including the potential increased ability to use soft dollars consistent with Trust policies and other benefits from increases in assets under management. The Trustees concluded that benefits that accrue to the Manager and its affiliates are reasonable and the benefits that accrue to theSub-advisers and their affiliates are consistent with those expected for asub-adviser to a mutual fund such as the applicable Fund.
Conclusion
Based on a comprehensive consideration and evaluation of all of the information and factors summarized above, among others, the Board voting as a whole, including the Independent Trustees voting separately, unanimously approved the continuation of the Agreements.
| 35 |
Table of Contents
SUPPLEMENTAL INFORMATION(UNAUDITED)
Trustees and Officers Information Table
The following table provides information about the Trustees of the Trust.
| Name and Year of Birth | Term of Office, Position(s) Held and Length of Service* | Principal During Past Five Years | Number of in Fund by Trustees*** | Other Directorships Held by Trustee | ||||
| Independent Trustees | ||||||||
| Bruce W. Ferris† (born 1955) | Trustee | Retired (since 2015); President and CEO, Prudential Annuity Distributors (2013–2015); Director/Trustee, Advanced Series Trust, Prudential Series Fund and Prudential’s Gibraltar Fund, Inc. (2013–2015); Senior Vice President, Prudential Annuities (2008–2015). | 16 | None. | ||||
| Theda R. Haber† (born 1954) | Trustee | Adjunct Assistant Professor of Law, UC Hastings College of Law (since 2013); Member of the Board of Directors, Fairholme Trust Company, LLC (since 2015); Attorney, Law Office of Theda R. Haber (since 2014); Visiting Professor of Law, UC Davis School of Law (since 2014); Consultant, Haber & Associates LLC (financial services industry) (since 2012); Advisory Council Chair, Vice Chair, and Member, Advisory Council on Employee Welfare and Pension Benefit Plans (ERISA Advisory Council), U.S. Department of Labor (2009–2011); Managing Director and General Counsel, BlackRock Institutional Trust Company, N.A. (2009–2011); Deputy Global General Counsel, Barclays Global Investors (2006-2009); Managing Director, Barclays Global Investors (1998–2006). | 16 | None. | ||||
| Marshall Lux† (born 1960) | Trustee | Senior Advisor, The Boston Consulting Group (since 2014); Senior Partner and Managing Director, The Boston Consulting Group (2009–2014). | 16 | None. | ||||
| Lisa K. Polsky† (born 1956) | Trustee | Senior Risk Advisor, AQR (investment management) (since 2016); Senior Risk Advisor, Ultra Capital (venture capital) (since 2016); Board Member and Chair of Risk Committee, DeutscheBank IHC (financial services) (since May 2016); Chief Risk Officer, CIT Group Inc. (financial services) (2010–2015); Board Member and Chair of Audit Committee, Piper Jaffray (investment bank) (2007–2016). | 16 | None. | ||||
| John Walters† (born 1962) | Lead Independent Trustee | Board Member, Amerilife Holdings LLC (insurance distribution) (since 2015); Board Member, Stadion Money Management LLC (investment adviser) (since 2011); President and Chief Operating Officer, Hartford Life Insurance Company (2000–2010). | 16 | None. | ||||
| 36 |
Table of Contents
SUPPLEMENTAL INFORMATION(UNAUDITED)
| Name and Year of Birth | Term of Office, Position(s) Held and Length of Service* | Principal During Past Five Years | Number of in Fund by Trustees*** | Other Directorships Held by Trustee | ||||
| Interested Trustees | ||||||||
| Gordon Dinsmore**(born 1952) | Trustee | Senior Vice President, Head of Product and President of Berkshire, The Guardian Life Insurance Company of America. | 16 | None. | ||||
Marc Costantini** (born 1969) | Chairman and Trustee | Executive Vice President, Group and Worksite Markets, The Guardian Life Insurance Company of America (since 2017); Executive Vice President and Chief Financial Officer, The Guardian Life Insurance Company of America (2014–2017); Executive Vice President, Manulife Financial prior thereto (various positions from 1990–2014). | 16 | None. | ||||
| * | Each Trustee except for Mr. Dinsmore began service in such capacity in 2016 and serves until his or her successor is elected and qualified or until his or her resignation, death or removal. Mr. Dinsmore has served as a Trustee since November 2017. The business address of each Trustee is 7 Hanover Square, New York, New York 10004. |
| ** | Each of Gordon Dinsmore and Marc Costantini is considered to be an “interested person” of the Trust within the meaning of the 1940 Act because of their affiliation with The Guardian Life Insurance Company of America and/or its affiliates. |
| *** | As of the date of this report, the Trust currently consists of 16 separate Funds. |
| † | Member of the Audit Committee of the Trust. |
The following table provides information about the Officers of the Trust.
| Name and Year of Birth | Position(s) Held and Length of Service* | Principal Occupation(s) During Past Five Years | ||
| Gordon Dinsmore (born 1952) | President and Principal Executive Officer (Since November 2017) | Senior Vice President, Head of Product and President of Berkshire, The Guardian Life Insurance Company of America. | ||
| John H. Walter (born 1962) | Senior Vice President, Treasurer, and Principal Financial and Accounting Officer | Vice President, Chief Financial Officer, Equity Profit Center, The Guardian Life Insurance Company of America. | ||
| Harris Oliner (born 1971) | Senior Vice President and Secretary | Senior Vice President, Corporate Secretary, The Guardian Life Insurance Company of America (since 2015); Senior Vice President, Deputy General Counsel, Corporate Secretary, Voya Financial, Inc. (2013–2014); Managing Director, Senior Counsel, Corporate Secretary, BlackRock, Inc. prior thereto. | ||
| Richard T. Potter (born 1954) | Senior Vice President and Chief Legal Officer | Vice President and Equity Counsel, The Guardian Life Insurance Company of America. | ||
| Philip Stack (born 1964) | Chief Compliance Officer (Since September 2017) | Executive Director, Chief Compliance Officer, Morgan Stanley (2015–2017); Vice President, Morgan Stanley (2013–2015); Vice President, Corporate Audit Group–Compliance, Morgan Stanley prior thereto. | ||
| James R. Anderson (born 1963) | Anti-Money Laundering Officer (Since November 2017) | Second Vice President, Agency and Anti-Money Laundering Compliance, The Guardian Life Insurance Company of America. | ||
| Kathleen M. Moynihan (born 1966) | Senior Counsel | Senior Counsel, The Guardian Life Insurance Company of America. | ||
| Maria Nydia Morrison (born 1958) | Fund Controller | Mutual Fund Controller, The Guardian Life Insurance Company of America (since 2015); Chief Financial Officer/Assistant Operating Officer, St. Francis De Assisi Montessori School (Plaridel, Bulacan), Inc. (Philippines) (2013–2015); Vice President, Bank of New York Mellon prior thereto. | ||
| 37 |
Table of Contents
SUPPLEMENTAL INFORMATION(UNAUDITED)
| Name and Year of Birth | Position(s) Held and Length of Service* | Principal Occupation(s) During Past Five Years | ||
| Sonya L. Crosswell (born 1977) | Assistant Secretary | Assistant Vice President, Assistant Corporate Secretary and Secretary Pro Tem, The Guardian Life Insurance Company of America (since 2014); Vice President, Secretary and Assistant General Counsel, Carver Federal Savings Bank prior thereto. | ||
| * | Unless otherwise indicated, the Officers each began service in such capacity in 2016 and hold office for an indefinite term or until their successors shall have been elected and qualified. The business address of each Officer is 7 Hanover Square, New York, New York 10004. |
| 38 |
Table of Contents
SUPPLEMENTAL INFORMATION(UNAUDITED)
The Statement of Additional Information (“SAI”) includes additional information about the Trust’s Trustees and Officers and is available, without charge, upon request by calling toll-free1-888-GUARDIAN(1-888-482-7342) or by visiting our website at http://guardianvpt.onlineprospectus.net/GuardianVPT/Prospectuses.
Portfolio Holdings and Proxy Voting Procedures
The Fund files its complete schedule of portfolio holdings with the Securities and Exchange Commission for the first and third quarters of each fiscal year as an exhibit to its reports on Form N-Q or FormN-PORT (for filings beginning in April 2019 relating to March 31, 2019 data). The Fund’s Form N-Q or FormN-PORT reports are available on the Securities and Exchange Commission’s website at https://www.sec.gov. The Fund’s Form N-Q or FormN-PORT information is also available, without charge, upon request, by calling toll-free1-888-GUARDIAN(1-888-482-7342) or by visiting our website at http://guardianvpt.onlineprospectus.net/GuardianVPT/
Prospectuses.
Beginning in April 2019, the Fund will cease to disclose its holdings on Form N-Q and will file Form N-PORT with the Securities and Exchange Commission on a monthly
basis, with the information contained on Form N-PORT for the last month of the Fund’s fiscal quarter being made public by the Securities and Exchange Commission 60 days after the end of the Fund’s fiscal quarter.
A description of the policies and procedures that the Fund uses to determine how to vote proxies relating to portfolio securities is included in the SAI. The SAI and information regarding how the Fund voted proxies relating to portfolio securities during the most recent12-month period ended June 30 may be obtained (i) without charge, upon request, by calling toll-free1-888-GUARDIAN(1-888-482-7342) or by visiting our website at http://guardianvpt.onlineprospectus.net/GuardianVPT/
Prospectuses; and (ii) on the Securities and Exchange Commission’s website at https://www.sec.gov.
| 39 |
Table of Contents
This report is transmitted to shareholders only. It is not authorized for use as an offer of sale or a solicitation of an offer to buy shares of the Fund unless accompanied or preceded by the Fund’s current prospectus. Past performance results shown in this report should not be considered a representation of future performance. Investment returns and principal value of shares will fluctuate so that shares, when redeemed, may be worth more or less than their original cost. Statements and other information herein are as dated and are subject to change.

The Guardian Life Insurance Company of America New York, NY 10004-4025
PUB8167
Table of Contents
Item 2. Code of Ethics.
The registrant, as of the end of the period covered by this report, has adopted a code of ethics, as defined in this Item 2, that applies to the registrant’s principal executive officer, principal financial officer, principal accounting officer or controller, or persons performing similar functions. There were no amendments or waivers granted with respect to the Code of Ethics during the fiscal year ended December 31, 2018.
Item 3. Audit Committee Financial Expert.
The registrant’s board of trustees has determined that Lisa Polsky is an audit committee financial expert serving on its audit committee. This individual is “independent,” as defined by this Item 3.
Item 4. Principal Accountant Fees and Services.
(a)-(d)
Fees for services rendered to the registrant by its principal accountant.
Fiscal Year Ended | Audit Fees* | Audit- Related Fees | Tax Fees | All Other Fees | ||||||||||||
December 31, 2018 | $ | 341,500 | $ | — | $ | — | $ | — | ||||||||
December 31, 2017 | $ | 338,500 | $ | — | $ | — | $ | — | ||||||||
| * | Fees are exclusive ofout-of-pocket expenses. |
(e)(1) The registrant’s Audit Committee is required to approve at least annually all audit and non-audit services that are required to bepre-approved under paragraph (c)(7) of Rule 2-01 of RegulationS-X. In addition, pursuant to the registrant’s Audit CommitteePre-Approval Procedures, the chair of the Audit Committee, or one or more designated members of the Audit Committee, is authorized topre-approve a proposednon-audit service, or a proposed material change in the nature or cost of any previously approvednon-audit service, between meetings of the Audit Committee. Any such action shall be presented for ratification by the Audit Committee not later than its next regularly scheduled meeting.
(e)(2) With respect to the services described in (b) - (d) of this item relating to the Audit-Related Fees, Tax Fees and All Other Fees disclosed above, 0% were approved by the audit committee pursuant to paragraph (c)(7)(i)(C) of Rule 2-01 of RegulationS-X.
(f) Not applicable.
(g) Not applicable.
(h) Not applicable.
Item 5. Audit Committee of Listed registrants.
Not applicable to the registrant.
Item 6. Investments.
(a) The Schedule of Investments in securities of unaffiliated issuers as of the close of the reporting period is included as part of the report to shareholders filed under Item 1 of this Form.
(b) None.
Item 7. Disclosure of Proxy Voting Policies and Procedures forClosed-End Management Investment Companies.
Not applicable to the registrant.
Item 8. Portfolio Managers ofClosed-End Management Investment Companies.
Not applicable to the registrant.
Item 9. Purchases of Equity Securities byClosed-End Management Investment Company and Affiliated Purchasers.
Not applicable to the registrant.
Table of Contents
Item 10. Submission of Matters to a Vote of Security Holders.
There have been no material changes to the procedures by which shareholders may recommend nominees to the registrant’s board of trustees, where those changes were implemented after the registrant last provided disclosure in response to the requirements of Item 407(c) (2)(iv) of RegulationS-K (as required by Item 22(b)(15) of Schedule 14A) or this Item.
Item 11. Controls and Procedures.
(a) The registrant’s principal executive and principal financial officers have concluded that the registrant’s disclosure controls and procedures (as defined in Rule 30a-3(c) under the Investment Company Act of 1940, as amended (the “1940 Act”) (17 CFR270.30a-3(c)) are effective, as of a date within 90 days of the filing date of this FormN-CSR, to provide reasonable assurance that the information required to be disclosed by the registrant on FormN-CSR is recorded, processed, summarized, and reported within the time periods specified in the Commission’s rules and forms, based on their evaluation of these disclosure controls and procedures required by Rule 30a-3(b) under the 1940 Act (17 CFR 270.30a-3(b)) and Rule 13a-15(b) or 15d-15(b) under the Securities Exchange Act of 1934 (17 CFR240.13a-15(b) or 240.15d-15(b)).
(b) There were no changes in the registrant’s internal control over financial reporting (as defined in Rule 30a-3(d) under the 1940 Act (17 CFR 270.30a-3(d)) that occurred during the period covered by this report that has materially affected, or is reasonably likely to materially affect, the registrant’s internal control over financial reporting.
Item 12. Exhibits.
(a)(1) Code of ethics that is the subject of disclosure required by Item 2 is attached hereto.
(a)(2) Certifications pursuant to Rule 30a-2(a) under the 1940 Act and Section 302 of theSarbanes-Oxley Act of 2002 are attached hereto.
(a)(3) Not applicable.
(b) Certification pursuant to Rule 30a-2(b) under the 1940 Act and Section 906 of the Sarbanes-Oxley Act of 2002 is attached hereto.
Table of Contents
SIGNATURES
Pursuant to the requirements of the Securities Exchange Act of 1934 and the Investment Company Act of 1940, the registrant has duly caused this report to be signed on its behalf by the undersigned, thereunto duly authorized.
| (Registrant) | Guardian Variable Products Trust | |
| By (Signature and Title)* | /s/ Gordon Dinsmore | |
| Gordon Dinsmore, President | ||
| (Principal Executive Officer) | ||
Date: March 6, 2019
Pursuant to the requirements of the Securities Exchange Act of 1934 and the Investment Company Act of 1940, this report has been signed below by the following persons on behalf of the registrant and in the capacities and on the dates indicated.
| By (Signature and Title)* | /s/ Gordon Dinsmore | |
| Gordon Dinsmore, President | ||
| (Principal Executive Officer) | ||
| Date: March 6, 2019 | ||
| By (Signature and Title)* | /s/ John H Walter | |
John H Walter, Treasurer | ||
| (Principal Financial and Accounting Officer) | ||
Date: March 6, 2019