UNITED STATES
SECURITIES AND EXCHANGE COMMISSION
WASHINGTON, D.C. 20549
FORM N-CSR
CERTIFIED SHAREHOLDER REPORT OF REGISTERED
MANAGEMENT INVESTMENT COMPANIES
811-23159
(Investment Company Act file number)
Griffin Institutional Access Credit Fund
(Exact name of registrant as specified in charter)
Griffin Capital Plaza
1520 E. Grand Avenue
El Segundo, CA 90245
(Address of principal executive offices) (Zip code)
ALPS Fund Services, Inc.
1290 Broadway, Suite 1100
Denver, CO 80203
(Name and address of agent for service)
Copy to:
Terrence O. Davis, Esq.
Holland & Knight
1180 West Peachtree Street, N.W.
Suite 1800
Atlanta, GA 30309
Registrant’s telephone number, including area code: (404) 817-8500
Date of fiscal year end: December 31
Date of reporting period: July 1, 2017 – December 31, 2017
Item 1. Reports to Stockholders.

Table of Contents
| Shareholder Letter | 1 |
| Portfolio Update | 6 |
| Schedule of Investments | 8 |
| Statement of Assets and Liabilities | 16 |
| Statement of Operations | 18 |
| Statements of Changes in Net Assets | 19 |
| Financial Highlights | 21 |
| Notes to Financial Statements | 26 |
| Report of Independent Registered Public Accounting Firm | 38 |
| Additional Information | 39 |
| Trustees and Officers | 40 |
| GRIFFIN INSTITUTIONAL ACCESS CREDIT FUND | ANNUAL REPORT 2017 |  |
Dear Fellow Shareholders,
We are pleased to present the annual report for Griffin Institutional Access™ Credit Fund (the “Fund”). Since the Fund launched on April 3, 2017, assets under management have grown to over $100 million. We appreciate the support of our shareholders as well as our broker-dealer partners and will remain true to our stated investment objective of generating a return comprised of both current income and capital appreciation with low volatility and low correlation1 to the broader markets.
During its first nine months of operations, the Fund’s sub-adviser—BCSF Advisors, LP, an affiliate of Bain Capital Credit, LP—continued to construct a well-diversified portfolio consisting primarily of floating rate, senior secured bank loans. The portfolio composition is ultimately determined through both fundamental quantitative and qualitative analysis to determine the optimal mix of securities across global markets with the potential to deliver the best risk-adjusted returns for investors.
Since inception, our portfolio allocation strategy delivered a total return of 4.31%, outperforming the S&P/ LSTA Leveraged Loan Index2 by 142 basis points.3 As of December 31, 2017, the Fund was diversified across 236 individual securities and 31 industries.
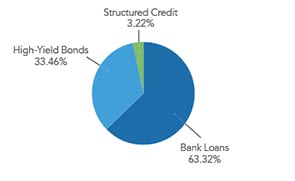
Griffin Institutional Access Credit Fund Holdings
(Based on market value of invested assets as of December 31, 2017)
| FLOATING RATE ASSETS4 66.54% | FIXED RATE ASSETS4 33.46% |
| SECTOR ANALYSIS4 | ASSET TYPE4 |
| | |
 | 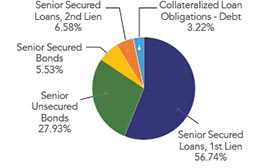 |
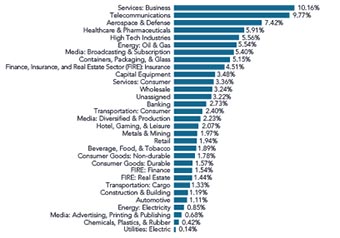
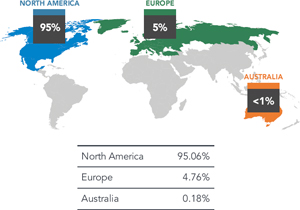
| INDUSTRY CONCENTRATION4,5 | GEOGRAPHY4 |
| | |
 |  |
| GRIFFIN INSTITUTIONAL ACCESS CREDIT FUND | ANNUAL REPORT 2017 | |
(Shareholder Letter continued)
Investment Performance
Performance during the year was driven by a combination of carry and price appreciation across high yield and bank loan positions. Bank loans were the largest contributors to Fund’s performance followed by bonds and structured products. The Fund is overweight loans relative to bonds given our preference for safety and current relative value, though we continue to monitor how loan repricing might alter this relationship. Lower-quality assets within loans and bonds outperformed higher quality mainly due to the carry advantage and recovery in spreads. While the Fund’s structured holdings (CLOs) had an attractive return on assets (ROA),6 the contribution to return was more muted given the limited allocation. We view our structured investments as a tactical alpha generation tool which we will dynamically adjust based on prevailing market conditions and relative value. Our CLO purchases to-date have been evenly split between BB debt, which has a low risk of impairment and an attractive yield profile, and equity classes. As part of our CLO equity selection process, we have focused on 2017 vintage deals with clean portfolios and long reinvestment periods. As spreads in the leveraged loan market have compressed, CLO liability funding costs have followed suit and now hover near multi-year tights, creating upside to equity classes if loan price volatility materializes over the next few years.
We continue to approach opportunities in private credit cautiously, choosing to pass on deals that do not meet our underwriting criteria or where the market has mispriced risk. Despite the competitive headwinds, the middle market still commands an attractive yield premium to broadly syndicated loans. We continue to believe that investors should approach opportunities in the middle market with discipline and that the risk/reward proposition remains attractive, although some caution is warranted.
Outside of the traditional credit asset classes, Bain Capital Credit as a firm continues to focus on European non-performing loans (NPLs) given the size of the opportunity, high barriers to entry and the attractive return profile. Within NPLs, assuming certain conditions are met, we intend to target portfolios of loans backed by hard collateral (real estate, small-to-medium sized enterprises) as a way to minimize our downside and drive value. Sourcing, underwriting and servicing NPL portfolios is a rigorous and time-consuming process that requires significant human and financial capital, limiting the competitive set to a few dedicated institutions with local market expertise and sufficient scale.7
Investment Environment
During 2017, the market environment oscillated between risk-on and risk-off, but the environment remained generally accommodative for high-yield credit. In the fourth quarter, spreads in high yield approached their post-crisis tights in response to a steady rise in oil prices, improving economic data –Q3 gross domestic product (GDP) rebounded to a 3.2% annualized pace–and solid corporate earnings, despite concerns surrounding the Gulf Coast hurricane impact. Although the fundamental backdrop for credit markets was supportive, the positive gains in high yield suffered a brief hiccup during the fourth quarter, driven by interest rate volatility, which caused the 10-year Treasury to hit a multi-month high amid uncertainty on who would succeed Janet Yellen as the next Fed Chair. Leveraged loans were the beneficiary of this move as inflows accelerated during October, causing the asset class to outperform bonds and post the second highest monthly return of 2017.8 Credit markets recovered towards the latter half amidst rallying stock and oil prices and renewed optimism related to U.S. tax reform, causing both high yield and leveraged loans to retrace most of their price declines. For companies seeking debt financing, the markets have been highly receptive, an indication that technicals remain strong and investors continue to invest cash balances in the face of limited real supply.
We are pleased with the continued build out of the portfolio and our performance to date. We believe that our ability to actively manage across credit sectors and markets will allow us to provide value to our shareholders in the form of strong risk-adjusted returns. Moving forward, the portfolio management team will continue to leverage the breadth of Bain Capital Credit, LP’s global platform to uncover investment opportunities in line with the stated investment objective of the Fund.
| GRIFFIN INSTITUTIONAL ACCESS CREDIT FUND | ANNUAL REPORT 2017 | |
(Shareholder Letter continued)
Thank you for your investment in and support of Griffin Institutional Access Credit Fund.
Sincerely,

Randy I. Anderson, Ph.D., CRE
President
Griffin Capital Asset Management Company, LLC
Griffin Institutional Access Credit Fund (the “Fund”) is a closed-end interval fund. Limited liquidity is provided to shareholders only through the Fund’s quarterly repurchase offers for no less than 5% of the Fund’s shares outstanding at net asset value. The Fund is suitable only for investors who can bear the risks associated with the limited liquidity of the Fund and should be viewed as a long-term investment.
| GRIFFIN INSTITUTIONAL ACCESS CREDIT FUND | ANNUAL REPORT 2017 | |
FUND SUB-ADVISER (unaudited)
| BCSF Advisors, LP |  |
Griffin Institutional Access Credit Fund is sub-advised by BCSF Advisors, LP, an SEC-registered investment adviser and affiliate of Bain Capital Credit, LP.
Bain Capital Credit, LP provides ongoing research, opinions and recommendations regarding the Fund’s investment portfolio. Bain Capital Credit, LP was formed in 1998 as the credit investing arm of Bain Capital, one of the world’s premier alternative investment firms, with approximately $85 billion in assets under management as of October 1, 2017. Bain Capital Credit, LP invests across the full spectrum of credit strategies, including leveraged loans, high-yield bonds, distressed debt, direct lending, structured products, non-performing loans and equities. With offices in Boston, Chicago, New York, London, Dublin, Hong Kong, Melbourne and Sydney, Bain Capital Credit, LP has a global footprint with approximately $36 billion9 in assets under management.
END NOTES
| 1 | Correlation is a statistical measure of how two securities move in relation to each other. A correlation ranges from -1 to 1. A positive correlation of 1 implies that as one security moves, either up or down, the other security will move in lockstep, in the same direction. A negative correlation of -1 indicates that the securities will move in the opposite direction. If the correlation is 0, the movements of the securities are said to have no correlation; they are completely random. |
| 2 | The S&P/LSTA Leveraged Loan Index is a daily total return index that uses mark-to-market pricing to calculate market value change. The LSTA tracks, on a real-time basis, the current outstanding balance and spread over the London Interbank Offered Rate (LIBOR) for fully funded term loans. The facilities included in the LSTA represent a broad cross section of leveraged loans syndicated in the United States, including dollar-denominated loans to overseas issuers. You cannot invest directly in an index. Index performance does not represent actual Fund or portfolio performance. A fund or portfolio may differ significantly from the securities included in the index. Index performance assumes reinvestment of dividends but does not reflect any management fees, transaction costs or other expenses that would be incurred by a fund or portfolio, or brokerage commissions on transactions in fund shares. Such fees, expenses, and commissions could reduce returns. |
| 3 | One basis point is equal to 1/100th of 1%, or 0.01%. |
| 4 | Based on market value of invested assets as of December 31, 2017. |
| 5 | Based on Moody’s 35 Industry Categories (“Moody’s 35”) . |
| 6 | Return on assets (ROA) is an indicator of how profitable a company is relative to its total assets. ROA gives a manager, investor, or analyst an idea as to how efficient a company’s management is at using its assets to generate earnings. Return on assets is expressed as a percentage that calculated by dividing the company’s net income by total assets. |
| 7 | Source: Deloitte (Deleveraging Europe 2016-2017). Data as of 12/31/16. |
| 8 | Source: JP Morgan Loan Market Monitor. Data as of 12/31/17. |
| 9 | As of October 1, 2017. Bain Capital Credit’s assets under management includes its subsidiaries and credit vehicles managed by its AIFM affiliate. |
| GRIFFIN INSTITUTIONAL ACCESS CREDIT FUND | ANNUAL REPORT 2017 | |
DISCLOSURES (unaudited)
Investors in Griffin Institutional Access Credit Fund (the “Fund”) should understand that the net asset value (“NAV”) of the Fund will fluctuate, which may result in a loss of the principal amount invested. The Fund is a closed-end interval fund, the shares have no history of public trading, nor is it intended at this time that the shares will be listed on a public exchange. No secondary market is expected to develop for the Fund’s shares, liquidity for the Fund’s shares will be provided only through quarterly repurchase offers for no less than 5% and no more than 25% of the Fund’s shares at NAV, and there is no guarantee that an investor will be able to sell all the shares that the investor desires to sell in the repurchase offer. Due to these restrictions, an investor should consider an investment in the Fund to be of limited liquidity. The Fund is suitable only for investors who can bear the risks associated with the limited liquidity of the Fund and should be viewed as a long-term investment. Investing in the Fund is speculative and involves a high degree of risk, including the risks associated with leverage.
Diversification does not assure a profit or protect against loss in a declining market.
By investing in the Fund, a shareholder will not be deemed to be an investor in any underlying fund and will not have the ability to exercise any rights attributable to an investor in any such underlying fund related to their investment.
The views and information discussed in this commentary are as of the date of publication, are subject to change, and may not reflect the writer’s current views. The views expressed represent an assessment of market conditions at a specific point in time, are opinions only and should not be relied upon as investment advice regarding a particular investment or markets in general. Such information does not constitute a recommendation to buy or sell specific securities or investment vehicles. It should not be assumed that any investment will be profitable or will equal the performance of the fund(s) or any securities or any sectors mentioned herein. The subject matter contained herein has been derived from several sources believed to be reliable and accurate at the time of compilation. Griffin Capital Securities, LLC does not accept any liability for losses either direct or consequential caused by the use of this information.
DISTRIBUTION POLICY RISK
The Fund’s distribution policy is to make quarterly distributions to shareholders. All or a portion of a distribution may consist solely of a return of capital (i.e. from your original investment) and not a return of net profit. Shareholders should not assume that the source of a distribution from the Fund is net profit. Shareholders should note that return of capital will reduce the tax basis of their shares and potentially increase the taxable gain, if any, upon disposition of their shares. Sources of distributions to shareholders for tax reporting purposes will depend upon the Fund’s investment experience during the remainder of its fiscal year and may be subject to changes based on tax regulations. Pursuant to Section 852 of the Internal Revenue Code, the taxability of distributions will be reported on Form 1099-DIV.
The Fund distribution rate is the amount, expressed as a percentage, a Fund investor would receive in distributions if the most recent Fund distribution stayed consistent going forward. It is calculated by annualizing the most recent Fund distribution yield. The percentage represents a single distribution from the Fund and does not represent the total return of the Fund.
ALPS Distributors, Inc. is the distributor of Griffin Institutional Access Credit Fund. Griffin Capital and ALPS Distributors, Inc. are not affiliated.
| Griffin Institutional Access Credit Fund | Portfolio Update |
December 31, 2017 (Unaudited)
Performance (for the period ended December 31, 2017)
| | 3 Month | Since Inception | Inception | Total Expense Ratio**** |
| Griffin Institutional Access Credit Fund - A - Without Load | 1.20% | 4.38% | 4/3/17 | 2.64% |
| Griffin Institutional Access Credit Fund - A - With Load* | -4.61% | -1.64% | 4/3/17 | |
| Griffin Institutional Access Credit Fund - C - Without Load | 1.20% | 4.37% | 4/3/17 | 3.39% |
| Griffin Institutional Access Credit Fund - C - With Load** | 0.20% | 3.37% | 4/3/17 | |
| Griffin Institutional Access Credit Fund - I - NAV | 1.20% | 4.38% | 4/3/17 | 2.39% |
| Griffin Institutional Access Credit Fund - L - Without Load | 1.20% | 1.84% | 9/5/17 | 2.89% |
| Griffin Institutional Access Credit Fund - L - With Load*** | -3.09% | -2.50% | 9/5/17 | |
| Griffin Institutional Access Credit Fund - F - NAV | 1.24% | 1.41% | 9/25/17 | 1.85% |
| S&P/LSTA Leveraged Loan Index | 1.11% | 2.89% | 4/3/17 | |
| * | Adjusted for initial maximum sales charge of 5.75%. |
| ** | Adjusted for contingent deferred sales charge of 1.00%. |
| *** | Adjusted for initial maximum sales charge of 4.25% |
| **** | Per the Fund’s most recent prospectus. Includes borrowing costs of 0.04%. |
The S&P/LSTA Leveraged Loan Index is a capitalization-weighted syndicated loan index based upon market weightings, spreads and interest payments. The S&P/LSTA Leveraged Loan Index covers the U.S. market back to 1997 and currently calculates on a daily basis.
Indexes are not actively managed and do not reflect deduction for fees, expenses or taxes. An investor cannot invest directly into an index.
The returns shown above do not reflect the deduction of taxes a shareholder would pay on Fund distributions or redemption of Fund shares.
The performance data quoted above represents past performance. Past performance is not a guarantee of future results. Investment return and value of the Fund shares will fluctuate so that an investor’s shares, when sold or redeemed, may be worth more or less than their original cost. Performance may be lower or higher than performance data quoted. Fund performance current to the most recent month-end is available by calling 1-888-926-2688 or by visiting www.griffincapital.com.
Class A shares are offered subject to a maximum sales charge of 5.75% of the offering price and Class L shares are offered subject to a maximum sales charge of 4.25% of the offering price. Class C, Class I and Class F shares are offered at net asset value per share. Class C shares may be subject to a 1.00% contingent deferred sales charge on shares redeemed during the first 365 days after their purchase. The Fund’s investment adviser has contractually agreed to waive its fees and to pay or absorb the ordinary annual operating expenses of the Fund (including offering expenses, but excluding taxes, interest, brokerage commissions, acquired fund fees and expenses and extraordinary expenses), to the extent that they exceed 2.60%, 3.35%, 2.35%, 2.85 and 1.85% per annum of the Fund’s average daily net assets attributable to Class A, Class C, Class I, Class L and Class F, respectively. The Expense Limitation Agreement will remain in effect at least until August 31, 2018, unless and until the Board approves its modification or termination. Without the waiver the expenses would be 3.06%, 3.81%, 2.81%, 3.31% and 2.81% for Class A, Class C, Class I, Class L and Class F, respectively per the Fund’s most recent prospectus. In addition to the Expense Limitation Agreement described above, the Adviser voluntarily has absorbed all of the operating expenses of the Fund since the commencement of the Fund’s operations. The Adviser will continue to bear such expenses on a going forward basis in its discretion and is under no obligation to continue to do so for any specified period of time. In the absence of the election by the Adviser to bear all of the Fund’s operating expenses, the performance of the Fund would have been reduced. Please review the Fund’s Prospectus for more details regarding the Fund’s fees and expenses. No assurances can be given that the Fund will pay a dividend in the future; or, if any such dividend is paid, the amount or rate of the dividend.
| 6 | 1.888.926.2688 | www.griffincapital.com |
| Griffin Institutional Access Credit Fund | Portfolio Update |
December 31, 2017 (Unaudited)
Performance of $10,000 Initial Investment (for the period ended December 31, 2017)

The graph shown above represents historical performance of a hypothetical investment of $10,000 in the Fund since inception. Past performance does not guarantee future results. All returns reflect reinvested dividends, but do not reflect the deduction of taxes that a shareholder would pay on Fund distributions or the redemption of Fund shares.
Industry Concentration (as a % of Net Assets)
| Services: Business | 9.61% |
| Telecommunications | 9.23% |
| Aerospace & Defense | 7.01% |
| Healthcare & Pharmaceuticals | 5.58% |
| High Tech Industries | 5.25% |
| Energy: Oil & Gas | 5.24% |
| Media: Broadcasting & Subscription | 5.10% |
| Containers, Packaging, & Glass | 4.86% |
| FIRE: Insurance | 4.26% |
| Capital Equipment | 3.28% |
| Services: Consumer | 3.18% |
| Wholesale | 3.06% |
| Unassigned | 3.04% |
| Banking | 2.58% |
| Transportation: Consumer | 2.27% |
| Media: Diversified & Production | 2.11% |
| Hotel, Gaming, & Leisure | 1.95% |
| Metals & Mining | 1.86% |
| Retail | 1.83% |
| Beverage, Food, & Tobacco | 1.78% |
| Consumer goods: non-durable | 1.69% |
| Consumer goods: durable | 1.48% |
| FIRE: Finance | 1.46% |
| FIRE: Real Estate | 1.36% |
| Transportation: Cargo | 1.26% |
| Construction & Building | 1.12% |
| Automotive | 1.05% |
| Energy: Electricity | 0.80% |
| Media: Advertising, Printing & Publishing | 0.64% |
| Chemicals, Plastics, & Rubber | 0.39% |
| Utilities: Electric | 0.14% |
| Other Assets in Excess of Liabilities | 5.53% |
| TOTAL | 100.00% |
Portfolio Composition (as a % of Net Assets)
| Bank Loans | 59.82% |
| Corporate Bonds | 31.61% |
| Collateralized Loan Obligations | 3.04% |
| Other Assets in Excess of Liabilities | 5.53% |
| TOTALS | 100.00% |
| Annual Report | December 31, 2017 | 7 |
| Griffin Institutional Access Credit Fund | Schedule of Investments |
December 31, 2017
| Description | | Currency | | | Rate | | Maturity
Date | | | Principal
Amount | | | Value
(Note 2) | |
| BANK LOANS (59.82%)(a) | | | | | | | | | | | | | | | | | | |
| | | | | | | | | | | | | | | | | | | |
| 1011778 BC ULC (New Red Finance, Inc.), Term B-3 Loan, Tranche 1 | | | USD | | | 1M US L + 2.25% | | | 02/16/24 | | | | 58,842 | | | $ | 58,906 | |
| 1011778 BC ULC (New Red Finance, Inc.), Term B-3 Loan, Tranche 2 | | | USD | | | 3M US L + 2.25% | | | 02/16/24 | | | | 37,829 | | | | 37,870 | |
| Accudyne Industries Borrower SCA/Accudyne Industries LLC, Initial Term Loan | | | USD | | | 1M US L + 3.75% | | | 08/18/24 | | | | 243,621 | | | | 245,410 | |
| Acosta, Inc., Tranche B-1 Loan | | | USD | | | 1M US L + 3.25% | | | 09/26/21 | | | | 107,110 | | | | 94,904 | |
| Advantage Sales & Marketing, Inc., Initial Term Loan (First Lien) | | | USD | | | 3M US L + 3.25% | | | 07/23/21 | | | | 373,072 | | | | 364,755 | |
| Agro Merchants North America Holdings, Inc., Effective Date Loan (First Lien) | | | USD | | | 1M US L + 3.75% | | | 12/06/24 | | | | 89,993 | | | | 90,893 | |
| A-I Parent LLC, Initial Term Loan (First Lien)(b) | | | USD | | | L + 3.25% | | | 12/01/23 | | | | 401,197 | | | | 404,707 | |
| Alliant Holdings Intermediate LLC, Initial Term Loan | | | USD | | | 1M US L + 3.25% | | | 08/12/22 | | | | 1,492,360 | | | | 1,501,910 | |
| American Tire Distributors, Inc., Initial Term Loan | | | USD | | | 1M US L + 4.25% | | | 09/01/21 | | | | 1,491,058 | | | | 1,503,546 | |
| Anaren, Inc., Term Loan (First Lien) | | | USD | | | 3M US L + 4.50% | | | 02/18/21 | | | | 209,136 | | | | 210,182 | |
| Ancestry.com Operations Inc., Term Loan (First Lien) | | | USD | | | 1M US L + 3.25% | | | 10/19/23 | | | | 598,364 | | | | 602,478 | |
| Aqgen Ascensus, Inc., Delayed Draw Term Loan(c) | | | USD | | | L + 3.50% | | | 12/05/22 | | | | 241,874 | | | | 243,689 | |
| Aristrocrat Leisure, Ltd., New 2017 Term Loan | | | USD | | | 3M US L + 2.00% | | | 10/19/24 | | | | 170,639 | | | | 171,306 | |
| Ascena Retail Group, Inc., Tranche B Term Loan | | | USD | | | 1M US L + 4.50% | | | 08/21/22 | | | | 330,000 | | | | 275,138 | |
| Ascend Performance Materials Operations LLC, Term B Loan | | | USD | | | 3M US L + 5.25% | | | 08/12/22 | | | | 227,597 | | | | 229,304 | |
| ASP MCS Acquisition Corp., Initial Term Loan | | | USD | | | 1M US L + 4.75% | | | 05/20/24 | | | | 580,713 | | | | 586,520 | |
| Asurion LLC, Amendment No.14 Replacement B-4 Term Loan | | | USD | | | 1M US L + 2.75% | | | 08/04/22 | | | | 497,500 | | | | 500,654 | |
| Asurion LLC, Replacement B-2 Term Loan (Second Lien) | | | USD | | | 1M US L + 6.00% | | | 08/04/25 | | | | 2,085,308 | | | | 2,146,997 | |
| Asurion LLC, Replacement B-5 Term Loan | | | USD | | | 1M US L + 3.00% | | | 11/03/23 | | | | 80,762 | | | | 81,231 | |
| Autodata, Inc., Initial Term Loan (First Lien)(b) | | | USD | | | 3M US L + 3.25% | | | 12/12/24 | | | | 500,000 | | | | 501,250 | |
| Autodata, Inc., Initial Term Loan (Second Lien) | | | USD | | | 3M US L + 7.25% | | | 12/12/25 | | | | 190,967 | | | | 192,638 | |
| BCP Renaissance Parent LLC, Initial Term Loan | | | USD | | | 3M US L + 4.00% | | | 10/31/24 | | | | 87,088 | | | | 88,267 | |
| Belron Finance US LLC, Initial Euro Term Loan | | | EUR | | | 3M EUR L + 2.75%, 0.01% Floor | | | 11/07/24 | | | | 125,589 | | | | 152,038 | |
| Berlin Packaging LLC, 2017 Replacement Term Loan (First Lien), Tranche 1 | | | USD | | | 1M US L + 3.25% | | | 10/01/21 | | | | 236,546 | | | | 238,296 | |
| Berlin Packaging LLC, 2017 Replacement Term Loan (First Lien), Tranche 2 | | | USD | | | 3M US L + 3.25% | | | 10/01/21 | | | | 141,513 | | | | 142,556 | |
| BioClinica Holding I, LP, Initial Term Loan (First Lien) | | | USD | | | 3M US L + 4.25% | | | 10/20/23 | | | | 507,471 | | | | 497,322 | |
| BWAY Holding Co., Initial Term Loan | | | USD | | | 3M US L + 3.25% | | | 04/03/24 | | | | 995,000 | | | | 1,000,442 | |
| Cactus Wellhead LLC, Tranche B Term Loan | | | USD | | | 3M US L + 6.00% | | | 07/31/20 | | | | 424,358 | | | | 425,419 | |
| Caelus Energy Alaska 03 LLC, Second Lien Loan | | | USD | | | 3M US L + 7.50% | | | 04/15/20 | | | | 53,937 | | | | 48,454 | |
| CB Poly Investments, LLC, Closing Date Term Loan (First Lien) | | | USD | | | 1M US L + 4.75% | | | 08/16/23 | | | | 1,011,210 | | | | 1,020,715 | |
| CDS US Intermediate Holdings, Inc., Term B Loan (First Lien) | | | USD | | | 3M US L + 3.75% | | | 07/08/22 | | | | 118,769 | | | | 118,139 | |
| CenturyLink, Inc., Initial Term B Loan | | | USD | | | 1M US L + 2.75% | | | 01/31/25 | | | | 227,505 | | | | 219,908 | |
| Ch Hold Corp., Initial Term Loan (First Lien) | | | USD | | | 1M US L + 3.00% | | | 02/01/24 | | | | 103,857 | | | | 104,636 | |
| Checkout Holding Corp., Term B Loan (First Lien) | | | USD | | | 1M US L + 3.50% | | | 04/09/21 | | | | 500,000 | | | | 399,452 | |
| Circor International, Inc., Initial Term Loan | | | USD | | | 1M US L + 3.50% | | | 12/11/24 | | | | 422,246 | | | | 421,455 | |
| Comet Bidco Ltd., Facility B | | | GBP | | | 1M GBP L + 5.25% | | | 09/30/24 | | | | 469,565 | | | | 623,550 | |
| Commercial Vehicle Group, Inc. (CVG), Term B Loan | | | USD | | | 1M US L + 6.00% | | | 04/12/23 | | | | 246,875 | | | | 248,727 | |
| Communications Sales & Leasing, Inc. (CSL Capital LLC), Shortfall Term Loan(b) | | | USD | | | 1M US L + 3.00% | | | 10/24/22 | | | | 256,398 | | | | 247,712 | |
| Compass Power Generation, LLC, Term Loan | | | USD | | | 3M US L + 3.75% | | | 12/20/24 | | | | 147,323 | | | | 148,428 | |
See Notes to Financial Statements.
| 8 | 1.888.926.2688 | www.griffincapital.com |
| Griffin Institutional Access Credit Fund | Schedule of Investments |
December 31, 2017
| Description | | Currency | | | Rate | | Maturity
Date | | | Principal
Amount | | | Value
(Note 2) | |
| CPG International LLC, New Term Loan | | | USD | | | 3M US L + 3.75% | | | 05/05/24 | | | | 364,471 | | | $ | 366,863 | |
| CVS Holdings I LP, Delayed Draw Term Loan(c)(d) | | | USD | | | 1M US L + 6.25% | | | 08/14/21 | | | | 1,200,000 | | | | 1,188,000 | |
| CVS Holdings I LP, First Incremental Term Loan(d) | | | USD | | | 1M US L + 6.25% | | | 08/16/21 | | | | 790,000 | | | | 782,100 | |
| CVS Holdings I LP, Revolver Loan(c)(d) | | | USD | | | 1M US L + 6.25% | | | 08/14/21 | | | | 43,000 | | | | 42,570 | |
| CVS Holdings I LP, Term Loan(d) | | | USD | | | 1M US L + 6.25% | | | 08/16/21 | | | | 251,335 | | | | 248,821 | |
| DAE Aviation Holdings, Inc., Initial Term Loan | | | USD | | | 1M US L + 3.75% | | | 07/07/22 | | | | 1,073,894 | | | | 1,083,962 | |
| Deep Gulf Energy II LLC, 2018 Term Loan(d)(e) | | | USD | | | 3M US L + 14.50% | | | 09/30/18 | | | | 100,000 | | | | 96,500 | |
| Deluxe Entertainment Services Group, Inc., Initial Term Loan | | | USD | | | 3M US L + 5.50% | | | 02/28/20 | | | | 194,550 | | | | 191,145 | |
| Digicert Holdings, Inc., Term Loan (First Lien) | | | USD | | | 3M US L + 4.75% | | | 10/31/24 | | | | 158,764 | | | | 161,007 | |
| Digicert Holdings, Inc., Term Loan (Second Lien) | | | USD | | | 3M US L + 8.00% | | | 10/31/25 | | | | 51,768 | | | | 52,205 | |
| Direct Chassis Acquisition, Inc., Term Loan (Second Lien)(b) | | | USD | | | L + 6.00% | | | 06/15/23 | | | | 374,252 | | | | 381,737 | |
| DXP Enterprises, Inc., Initial Term Loan | | | USD | | | 1M US L + 5.50% | | | 08/29/23 | | | | 53,590 | | | | 54,126 | |
| Envision Healthcare Corp., Initial Term Loan | | | USD | | | 1M US L + 3.00% | | | 12/01/23 | | | | 116,454 | | | | 116,891 | |
| EXC Holdings III Corp., Initial Euro Term Loan (First Lien) | | | EUR | | | 3M EUR L + 3.50% 0.00% Floor | | | 12/02/24 | | | | 22,825 | | | | 27,660 | |
| EXC Holdings III Corp., Initial USD Term Loan (Second Lien) | | | USD | | | 6M US L + 3.50% | | | 12/02/24 | | | | 158,089 | | | | 159,571 | |
| EXC Holdings III Corp., Term Loan(b) | | | USD | | | 3M US L + 7.50% | | | 12/01/25 | | | | 143,183 | | | | 145,330 | |
| Exgen Renewables IV, LLC, Term Loan | | | USD | | | 3M US L + 3.00% | | | 11/28/24 | | | | 137,680 | | | | 139,401 | |
| EZE Software Group LLC, Term B-2 Loan (First Lien), Tranche 1 | | | USD | | | 3M US L + 3.00% | | | 04/06/20 | | | | 276,125 | | | | 277,736 | |
| EZE Software Group LLC, Term B-2 Loan (First Lien), Tranche 2 | | | USD | | | 1M US L + 3.00% | | | 04/06/20 | | | | 221,288 | | | | 222,579 | |
| First Data Corp., 2024A New Dollar Term Loan | | | USD | | | 1M US L + 2.25% | | | 04/26/24 | | | | 500,000 | | | | 500,893 | |
| Flex Acquisition Co., Inc., Initial Term Loan | | | USD | | | 3M US L + 3.00% | | | 12/29/23 | | | | 127,884 | | | | 128,736 | |
| Frontier Communications Corp., Term B-1 Loan(b) | | | USD | | | 1M US L + 3.75% | | | 06/15/24 | | | | 249,373 | | | | 241,175 | |
| Go Daddy Operating Co., LLC, Tranche B-1 Term loan | | | USD | | | 1M US L + 2.25% | | | 02/15/24 | | | | 249,373 | | | | 250,377 | |
| GTT Communications, Inc. Tranche B Term Loan | | | USD | | | 1M US L + 3.25% | | | 01/09/24 | | | | 398,992 | | | | 402,484 | |
| Hargray Communications Group, Inc., Initial Term Loan | | | USD | | | 1M US L + 3.00% | | | 05/16/24 | | | | 248,750 | | | | 249,709 | |
| Hayward Industries Inc., Initial Term Loan (First Lien) | | | USD | | | 1M US L + 3.50% | | | 08/05/24 | | | | 498,750 | | | | 500,944 | |
| HD Supply Waterworks, Ltd., Initial Term Loan | | | USD | | | 3M US L + 3.00% | | | 08/01/24 | | | | 337,594 | | | | 340,126 | |
| HGC Holdings LLC, Term Loan B | | | USD | | | 3M US L + 5.50% | | | 12/20/24 | | | | 337,768 | | | | 324,399 | |
| Hub International, LTD, Initial Term Loan | | | USD | | | 3M US L + 3.00% | | | 10/02/20 | | | | 471,817 | | | | 474,472 | |
| Inc Research Holdings, Inc., Term B Loan | | | USD | | | 1M US L + 2.25% | | | 08/01/24 | | | | 158,552 | | | | 159,007 | |
| Intelsat Jackson Holdings SA, Tranche B-2 Term Loan(b) | | | USD | | | 3M US L + 2.75% | | | 06/30/19 | | | | 711,957 | | | | 715,071 | |
| Intelsat Jackson Holdings SA, Tranche B-4 Term Loan(b) | | | USD | | | L + 4.50% | | | 01/02/24 | | | | 177,721 | | | | 180,387 | |
| Intelsat Jackson Holdings SA, Tranche B-5 Term Loan(b) | | | USD | | | L + 6.63% | | | 01/02/24 | | | | 289,875 | | | | 293,638 | |
| Intralinks, Inc., Initial Term Loan (First Lien)(b) | | | USD | | | 3M US L + 4.00% | | | 11/14/24 | | | | 234,852 | | | | 233,854 | |
| Jaguar Holding Co. I LLC, 2017 Term Loan, Tranche 1 | | | USD | | | 1M US L + 2.75% | | | 08/18/22 | | | | 826,124 | | | | 828,654 | |
| Jaguar Holding Co. I LLC, 2017 Term Loan, Tranche 2 | | | USD | | | 3M US L + 2.75% | | | 08/18/22 | | | | 914,947 | | | | 917,750 | |
| Jane Street Group LLC, Dollar Term Loan | | | USD | | | 3M US L + 4.50% | | | 08/25/22 | | | | 104,544 | | | | 105,851 | |
| Jazz Acquisition, Inc., Term Loan (First Lien) | | | USD | | | 3M US L + 3.50% | | | 06/19/21 | | | | 1,301,634 | | | | 1,273,974 | |
| Kronos Acquisition Intermediate, Inc., Initial Loan | | | USD | | | 3M US L + 4.50% | | | 08/26/22 | | | | 983,049 | | | | 992,060 | |
| Kronos, Inc., Incremental Term Loan (First Lien) | | | USD | | | 3M US L + 3.50% | | | 11/01/23 | | | | 77,950 | | | | 78,557 | |
| Lakeland Tours LLC, Delayed Draw Term Loan(c) | | | USD | | | L + 4.00% | | | 12/16/24 | | | | 9,330 | | | | 9,423 | |
| Lakeland Tours LLC, Initial Term Loan(b) | | | USD | | | L + 4.00% | | | 12/16/24 | | | | 113,290 | | | | 114,423 | |
| Logix Communications LP., Term Loan(b) | | | USD | | | L + 5.75% | | | 12/22/24 | | | | 360,000 | | | | 363,375 | |
| Masergy Holdings, Inc., 2017 Replacement Term Loan (First Lien) | | | USD | | | 3M US L + 3.75% | | | 12/15/23 | | | | 8,239 | | | | 8,290 | |
| Masergy Holdings, Inc., Initial Loan (Second Lien) | | | USD | | | 3M US L + 8.50% | | | 12/16/24 | | | | 230,000 | | | | 233,307 | |
| MB Aerospace ACP Holdings III Corp., Term Loan(b) | | | USD | | | L + 3.50% | | | 12/13/24 | | | | 115,794 | | | | 115,939 | |
See Notes to Financial Statements.
| Annual Report | December 31, 2017 | 9 |
| Griffin Institutional Access Credit Fund | Schedule of Investments |
December 31, 2017
| Description | | Currency | | | Rate | | Maturity
Date | | | Principal
Amount | | | Value
(Note 2) | |
| MH Sub I LLC (Micro Holding Corp.), Amendment No. 2 Initial Term Loan (First Lien) | | | USD | | | 3M US L + 3.75% | | | 09/13/24 | | | | 743,726 | | | $ | 746,552 | |
| MH Sub I LLC (Micro Holding Corp.), Amendment No. 2 Initial Term Loan (Second Lien) | | | USD | | | 3M US L + 7.50% | | | 09/15/25 | | | | 491,828 | | | | 495,209 | |
| MRO Holdings, Inc., Initial Term Loan | | | USD | | | 3M US L + 5.25% | | | 10/25/23 | | | | 728,226 | | | | 734,598 | |
| MTN Infrastructure TopCo, Inc., Delayed Draw Term Loan(c) | | | USD | | | L + 3.25% | | | 11/15/24 | | | | 88,073 | | | | 88,476 | |
| MTN Infrastructure TopCo, Inc., Initial Term Loan | | | USD | | | 1M US L + 3.25% | | | 11/15/24 | | | | 89,927 | | | | 90,339 | |
| Murray Energy Corp., Term B-2 Loan | | | USD | | | 3M US L + 7.25% | | | 04/16/20 | | | | 1,043,754 | | | | 926,114 | |
| National Vision, Inc., New Term Loan (First Lien) | | | USD | | | 1M US L + 2.75% | | | 11/20/24 | | | | 703,525 | | | | 705,722 | |
| Netsmart, Inc., Term C-1 Loan | | | USD | | | 3M US L + 4.50% | | | 04/19/23 | | | | 282,099 | | | | 285,742 | |
| Novetta Solutions LLC, Initial Term Loan (First Lien) | | | USD | | | 3M US L + 5.00% | | | 10/17/22 | | | | 440,816 | | | | 428,418 | |
| NPC International, Inc., Bridge Loan (Second Lien)(b) | | | USD | | | L + 7.50% | | | 04/18/25 | | | | 425,238 | | | | 424,175 | |
| NPC International, Inc., Initial Term Loan (Second Lien) | | | USD | | | 1M US L + 7.50% | | | 04/18/25 | | | | 250,000 | | | | 256,250 | |
| Oeconnection LLC, Term Loan (Second Lien) | | | USD | | | 3M US L + 8.00% | | | 11/22/25 | | | | 222,772 | | | | 222,772 | |
| Optiv, Inc., Initial Term Loan (First Lien) | | | USD | | | 3M US L + 3.25% | | | 02/01/24 | | | | 89,829 | | | | 84,514 | |
| Oxbow Carbon LLC, Term Loan (Second Lien)(b) | | | USD | | | L + 7.50% | | | 01/04/24 | | | | 246,275 | | | | 247,506 | |
| Oxbow Carbon LLC, Tranche B Term Loan (First Lien)(b) | | | USD | | | L + 3.75% | | | 01/04/23 | | | | 50,856 | | | | 51,269 | |
| Packaging Coordinators Midco, Inc., Initial Term Loan | | | USD | | | 1M US L + 4.00% | | | 06/30/23 | | | | 678,118 | | | | 679,813 | |
| Packaging Coordinators Midco, Inc., Term Loan (Second Lien) | | | USD | | | 1M US L + 8.75% | | | 06/29/24 | | | | 512,500 | | | | 512,500 | |
| Paladin Brands Holdings, Inc., Term B Loan | | | USD | | | 3M US L + 5.50% | | | 08/15/22 | | | | 803,935 | | | | 809,964 | |
| Parexel International Corp., Initial Term Loan | | | USD | | | 1M US L + 3.00% | | | 09/27/24 | | | | 736,493 | | | | 740,789 | |
| Petco Animal Supplies, Inc., Term Loan | | | USD | | | 3M US L + 3.00% | | | 01/26/23 | | | | 658,325 | | | | 501,150 | |
| Playa Resorts Holding B.V., Initial Term Loan | | | USD | | | 3M US L + 3.25% | | | 04/29/24 | | | | 73,340 | | | | 73,798 | |
| Pods, LLC, Tranche B-3 Term Loan | | | USD | | | 1M US L + 3.00% | | | 12/06/24 | | | | 99,003 | | | | 99,705 | |
| Polycom Inc., Initial Term Loan (First Lien) | | | USD | | | 1M US L + 5.25% | | | 09/27/23 | | | | 454,323 | | | | 459,047 | |
| Post Holdings, Inc., Series A Incremental Term Loan | | | USD | | | 1M US L + 2.25% | | | 05/24/24 | | | | 128,061 | | | | 128,648 | |
| Press Ganey Holdings, Inc., Replacement Term Loan (First Lien)(b) | | | USD | | | 1M US L + 3.00% | | | 10/23/23 | | | | 499,078 | | | | 501,886 | |
| Prime Security Services Borrower LLC, 2016-2 Refinancing Term B-1 Loan (First Lien) | | | USD | | | 1M US L + 2.75% | | | 05/02/22 | | | | 179,841 | | | | 181,334 | |
| Project Alpha Intermediate Holding, Inc., Term Loan | | | USD | | | 3M US L + 3.50% | | | 04/26/24 | | | | 220,592 | | | | 216,180 | |
| Quest Soffware US Holdings, Inc., 2017 Incremental Term Loan (First Lien) | | | USD | | | 3M US L + 5.50% | | | 10/31/22 | | | | 996,184 | | | | 1,013,492 | |
| Rackspace Hosting, Inc., Term B Loan (First Lien) | | | USD | | | 3M US L + 3.00% | | | 11/03/23 | | | | 593,861 | | | | 594,514 | |
| Radiate Holdco LLC, Closing Date Term Loan | | | USD | | | 1M US L + 3.00% | | | 02/01/24 | | | | 1,004,937 | | | | 998,656 | |
| RP Crown Parent LLC, Initial Term Loan | | | USD | | | 1M US L + 3.00% | | | 10/12/23 | | | | 335,400 | | | | 337,182 | |
| Sally Holdings LLC, Term B-1 Loan | | | USD | | | 1M US L + 2.50% | | | 07/05/24 | | | | 55,242 | | | | 55,311 | |
| Sedgwick Claims Management Services, Inc., Initial Term Loan (First Lien) | | | USD | | | 1M US L + 2.75% | | | 03/01/21 | | | | 994,832 | | | | 995,206 | |
| Sequa Mezzanine Holdings LLC, Initial Loan (Second Lien) | | | USD | | | 3M US L + 9.00% | | | 04/28/22 | | | | 635,787 | | | | 645,324 | |
| Sequa Mezzanine Holdings LLC, Initial Term Loan ( First Lien) | | | USD | | | 3M US L + 5.00% | | | 11/28/21 | | | | 1,513,398 | | | | 1,527,272 | |
| SolarWinds Holdings, Inc., 2017 Refinancing Term loan | | | USD | | | 1M US L + 3.50% | | | 02/03/23 | | | | 1,571,554 | | | | 1,579,214 | |
| Sophia LP, Term B Loan | | | USD | | | 3M US L + 3.25% | | | 09/30/22 | | | | 984,295 | | | | 986,669 | |
| SRS Distribution Inc., Term B-2 Loan (Second Lien) | | | USD | | | 1M US L + 8.75% | | | 02/24/23 | | | | 370,000 | | | | 379,558 | |
| Sterling Midco Holdings, Inc. , Initial Term Loan (First Lien) | | | USD | | | 1M US L + 3.50% | | | 06/19/24 | | | | 34,732 | | | | 34,992 | |
| STG-Fairway Acquisitions, Inc., Term Loan (First Lien)(b) | | | USD | | | 3M US L + 5.25% | | | 06/30/22 | | | | 636,363 | | | | 629,999 | |
| Tecostar Holding, Inc., 2017 Term Loan (First Lien) | | | USD | | | 3M US L + 3.50% | | | 05/01/24 | | | | 1,088,189 | | | | 1,100,431 | |
| Tempo Acquisition LLC, Initial Term Loan | | | USD | | | 1M US L + 3.00% | | | 05/01/24 | | | | 596,271 | | | | 595,154 | |
| TMF Group Holding B.V., Term B Loan(b) | | | EUR | | | EUR L + 3.25% | | | 12/06/24 | | | | 175,143 | | | | 210,802 | |
See Notes to Financial Statements.
| 10 | 1.888.926.2688 | www.griffincapital.com |
| Griffin Institutional Access Credit Fund | Schedule of Investments |
December 31, 2017
| Description | | Currency | | | Rate | | Maturity
Date | | | Principal
Amount | | | Value
(Note 2) | |
| TMK Hawk Parent Corp., Delayed Draw Term Loan (First Lien)(c) | | | USD | | | L + 3.50% | | | 08/28/24 | | | | 35,384 | | | $ | 35,694 | |
| TMK Hawk Parent Corp., Initial Term Loan (First Lien) | | | USD | | | 3M US L + 3.50% | | | 08/28/24 | | | | 790,630 | | | | 797,587 | |
| TNS, Inc. (Transaction Network Services, Inc.), Initial Term Loan (First Lien), Tranche 1(b) | | | USD | | | 2M US L + 4.00% | | | 08/14/22 | | | | 244,427 | | | | 245,313 | |
| TNS, Inc. (Transaction Network Services, Inc.), Initial Term Loan (First Lien), Tranche 2 | | | USD | | | 1M US L + 4.00% | | | 08/14/22 | | | | 2,785 | | | | 2,795 | |
| TransDigm, Inc., New Tranche F Term Loan, Tranche 1 | | | USD | | | 1M US L + 2.75% | | | 06/09/23 | | | | 83,171 | | | | 83,414 | |
| TransDigm, Inc., New Tranche F Term Loan, Tranche 2 | | | USD | | | 3M US L + 2.75% | | | 06/09/23 | | | | 43,389 | | | | 43,515 | |
| TransDigm, Inc., Tranche G Term Loan, Tranche 1 | | | USD | | | 1M US L + 3.00% | | | 08/22/24 | | | | 71,433 | | | | 71,858 | |
| TransDigm, Inc., Tranche G Term Loan, Tranche 2 | | | USD | | | 3M US L + 3.00% | | | 08/22/24 | | | | 243,976 | | | | 245,426 | |
| Travel Leaders Group LLC, New Incremental Term Loan | | | USD | | | 3M US L + 4.50% | | | 01/25/24 | | | | 270,557 | | | | 274,954 | |
| Traverse Midstream Partners LLC, Advance(b) | | | USD | | | L + 4.00% | | | 09/27/24 | | | | 46,471 | | | | 47,151 | |
| TRC Companies, Inc., Initial Term Loan | | | USD | | | 1M US L + 3.50% | | | 06/21/24 | | | | 325,374 | | | | 326,493 | |
| TurboCombustor Technology, Inc., Initial Term Loan | | | USD | | | 3M US L + 4.50% | | | 12/02/20 | | | | 685,212 | | | | 674,934 | |
| US Anesthesia Partners, Inc., Initial Term Loan (First Lien) | | | USD | | | 1M US L + 3.25% | | | 06/23/24 | | | | 985,260 | | | | 989,004 | |
| Vantiv LLC, New Term B-4 Loan(c) | | | USD | | | L + 2.00% | | | 09/19/24 | | | | 32,973 | | | | 33,148 | |
| Vantiv LLC, New Term B-4 Loan | | | USD | | | 1M US L + 2.00% | | | 08/09/24 | | | | 117,488 | | | | 118,288 | |
| VICI Properties 1 LLC, Term B Loan(b) | | | USD | | | L + 2.25% | | | 12/20/24 | | | | 505,354 | | | | 506,248 | |
| Virgin Media Bristol LLC, K Facility | | | USD | | | 1M US L + 2.50% | | | 01/15/26 | | | | 137,770 | | | | 137,942 | |
| West Corp., Term B Loan | | | USD | | | 1M US L + 4.00% | | | 10/10/24 | | | | 177,729 | | | | 178,606 | |
| Wheels Up Partners LLC, Class A Notes | | | USD | | | 3M US L + 6.50% | | | 03/01/24 | | | | 369,511 | | | | 367,664 | |
| William Morris Endeavor Entertainment LLC (IMG Worldwide Holdings LLC), Term Loan (First Lien) | | | USD | | | 3M US L + 3.25% | | | 05/06/21 | | | | 909,902 | | | | 915,873 | |
| Windstream Services, LLC, Tranche B-6 Term Loan | | | USD | | | 1M US L + 4.00% | | | 03/29/21 | | | | 124,684 | | | | 117,437 | |
| WireCo WorldGroup, Inc. (WireCo WorldGroup Finance LP), Initial Term Loan (First Lien) | | | USD | | | 3M US L + 5.50% | | | 09/29/23 | | | | 333,244 | | | | 335,119 | |
| WP CPP Holdings, LLC, Term B-3 Loan (First Lien) | | | USD | | | 3M US L + 3.50% | | | 12/28/19 | | | | 498,688 | | | | 498,843 | |
| | | | | | | | | | | | | | | | | | | |
| TOTAL BANK LOANS | | | | | | | | | | | | | | | | | | |
| (Cost $61,143,943) | | | | | | | | | | | | | | | | | 61,388,435 | |
| | | | | | | | | | | | | | | | | | | |
| CORPORATE BONDS (31.61%)(f) | | | | | | | | | | | | | | | | | | |
| 1011778 BC ULC (New Red Finance, Inc.)(g) | | | USD | | | 4.25% | | | 05/15/24 | | | | 150,000 | | | | 150,000 | |
| 1011778 BC ULC (New Red Finance, Inc.)(g) | | | USD | | | 5.00% | | | 10/15/25 | | | | 233,000 | | | | 235,913 | |
| AECOM | | | USD | | | 5.13% | | | 03/15/27 | | | | 650,000 | | | | 663,748 | |
| Alta Mesa Holdings LP / Alta Mesa Finance Services Corp. | | | USD | | | 7.88% | | | 12/15/24 | | | | 273,000 | | | | 300,641 | |
| APTIM Corp.(g) | | | USD | | | 7.75% | | | 06/15/25 | | | | 231,000 | | | | 221,760 | |
| Ashtead Capital, Inc.(g) | | | USD | | | 4.13% | | | 08/15/25 | | | | 269,000 | | | | 272,026 | |
| Berry Global, Inc. | | | USD | | | 5.13% | | | 07/15/23 | | | | 250,000 | | | | 260,938 | |
| Berry Global, Inc. | | | USD | | | 5.50% | | | 05/15/22 | | | | 38,000 | | | | 39,188 | |
| BWAY Holding Co.(g) | | | USD | | | 5.50% | | | 04/15/24 | | | | 250,000 | | | | 260,625 | |
| BWAY Holding Co.(g) | | | USD | | | 7.25% | | | 04/15/25 | | | | 1,000,000 | | | | 1,034,999 | |
| California Resources Corp.(g) | | | USD | | | 8.00% | | | 12/15/22 | | | | 125,000 | | | | 103,594 | |
| CB Escrow Corp.(g) | | | USD | | | 8.00% | | | 10/15/25 | | | | 280,000 | | | | 285,600 | |
| CCO Holdings LLC / CCO Holdings Capital Corp.(g) | | | USD | | | 5.00% | | | 02/01/28 | | | | 596,000 | | | | 582,590 | |
| CCO Holdings LLC / CCO Holdings Capital Corp.(g) | | | USD | | | 5.75% | | | 02/15/26 | | | | 910,000 | | | | 947,538 | |
| CDW LLC / CDW Finance Corp. | | | USD | | | 5.00% | | | 09/01/25 | | | | 125,000 | | | | 130,000 | |
| Churchill Downs, Inc.(g) | | | USD | | | 4.75% | | | 01/15/28 | | | | 88,000 | | | | 87,864 | |
| Compass Minerals International, Inc.(g) | | | USD | | | 4.88% | | | 07/15/24 | | | | 177,000 | | | | 175,230 | |
| Comstock Resources, Inc. | | | USD | | | 10.00% Cash or 12.25% PIK | | | 03/15/20 | | | | 250,000 | | | | 259,063 | |
| CPG Merger Sub LLC(g) | | | USD | | | 8.00% | | | 10/01/21 | | | | 504,000 | | | | 522,900 | |
See Notes to Financial Statements.
| Annual Report | December 31, 2017 | 11 |
| Griffin Institutional Access Credit Fund | Schedule of Investments |
December 31, 2017
| Description | | Currency | | | Rate | | | Maturity
Date | | Principal
Amount | | | Value
(Note 2) | |
| CSC Holdings LLC(g) | | | USD | | | | 10.88% | | | 10/15/25 | | | 842,000 | | | $ | 1,001,979 | |
| Dell International LLC / EMC Corp.(g) | | | USD | | | | 6.02% | | | 06/15/26 | | | 130,000 | | | | 143,540 | |
| Diamondback Energy, Inc. | | | USD | | | | 4.75% | | | 11/01/24 | | | 304,000 | | | | 306,660 | |
| Eldorado Resorts, Inc. | | | USD | | | | 6.00% | | | 04/01/25 | | | 80,000 | | | | 84,000 | |
| Gates Global LLC / Gates Global Co.(g) | | | USD | | | | 6.00% | | | 07/15/22 | | | 625,000 | | | | 642,188 | |
| Genworth Holdings, Inc. | | | USD | | | | 4.80% | | | 02/15/24 | | | 229,000 | | | | 195,795 | |
| Genworth Holdings, Inc. | | | USD | | | | 4.90% | | | 08/15/23 | | | 32,000 | | | | 27,440 | |
| GTT Communications, Inc.(g) | | | USD | | | | 7.88% | | | 12/31/24 | | | 750,000 | | | | 793,124 | |
| Gulfport Energy Corp. | | | USD | | | | 6.00% | | | 10/15/24 | | | 375,000 | | | | 376,875 | |
| Gulfport Energy Corp.(g) | | | USD | | | | 6.38% | | | 01/15/26 | | | 636,000 | | | | 642,360 | |
| Hanesbrands, Inc.(g) | | | USD | | | | 4.88% | | | 05/15/26 | | | 109,000 | | | | 112,270 | |
| HCA, Inc. | | | USD | | | | 5.38% | | | 02/01/25 | | | 900,000 | | | | 933,750 | |
| Intelsat Jackson Holdings SA(g) | | | USD | | | | 9.50% | | | 09/30/22 | | | 729,000 | | | | 843,817 | |
| Intrepid Aviation Group Holdings LLC / Intrepid Finance Co.(g) | | | USD | | | | 6.88% | | | 02/15/19 | | | 945,000 | | | | 942,637 | |
| Intrum Justitia AB(g) | | | EUR | | | | 3.13% | | | 07/15/24 | | | 195,000 | | | | 235,406 | |
| Iron Mountain, Inc.(g) | | | USD | | | | 5.25% | | | 03/15/28 | | | 274,000 | | | | 274,000 | |
| Jones Energy Holdings LLC / Jones Energy Finance Corp. | | | USD | | | | 6.75% | | | 04/01/22 | | | 125,000 | | | | 94,375 | |
| KAR Auction Services, Inc.(g) | | | USD | | | | 5.13% | | | 06/01/25 | | | 103,000 | | | | 105,833 | |
| Kronos Acquisition Holdings, Inc.(g) | | | USD | | | | 9.00% | | | 08/15/23 | | | 353,000 | | | | 330,938 | |
| Level 3 Financing, Inc. | | | USD | | | | 5.38% | | | 01/15/24 | | | 410,000 | | | | 410,513 | |
| Live Nation Entertainment, Inc.(g) | | | USD | | | | 4.88% | | | 11/01/24 | | | 250,000 | | | | 256,875 | |
| MEDNAX, Inc.(g) | | | USD | | | | 5.25% | | | 12/01/23 | | | 500,000 | | | | 510,000 | |
| Multi-Color Corp.(g) | | | USD | | | | 4.88% | | | 11/01/25 | | | 610,000 | | | | 613,812 | |
| Murray Energy Corp.(g) | | | USD | | | | 11.25% | | | 04/15/21 | | | 512,000 | | | | 263,680 | |
| National CineMedia LLC | | | USD | | | | 5.75% | | | 08/15/26 | | | 500,000 | | | | 471,250 | |
| Park Aerospace Holdings, Ltd.(g) | | | USD | | | | 5.50% | | | 02/15/24 | | | 1,000,000 | | | | 994,999 | |
| Parsley Energy LLC / Parsley Finance Corp.(g) | | | USD | | | | 5.25% | | | 08/15/25 | | | 250,000 | | | | 251,875 | |
| Parsley Energy LLC / Parsley Finance Corp.(g) | | | USD | | | | 5.38% | | | 01/15/25 | | | 760,000 | | | | 771,399 | |
| Pioneer Holdings LLC / Pioneer Finance Corp.(g) | | | USD | | | | 9.00% | | | 11/01/22 | | | 253,000 | | | | 262,171 | |
| Plastipak Holdings, Inc.(g) | | | USD | | | | 6.25% | | | 10/15/25 | | | 78,000 | | | | 80,535 | |
| Post Holdings, Inc.(g) | | | USD | | | | 5.00% | | | 08/15/26 | | | 250,000 | | | | 246,563 | |
| Post Holdings, Inc.(g) | | | USD | | | | 5.75% | | | 03/01/27 | | | 121,000 | | | | 123,420 | |
| Prime Security Services Borrower LLC / Prime Finance, Inc.(g) | | | USD | | | | 9.25% | | | 05/15/23 | | | 1,375,000 | | | | 1,529,687 | |
| PVH Corp.(g) | | | EUR | | | | 3.13% | | | 12/15/27 | | | 242,000 | | | | 294,986 | |
| QEP Resources, Inc. | | | USD | | | | 5.25% | | | 05/01/23 | | | 375,000 | | | | 381,323 | |
| Range Resources Corp. | | | USD | | | | 5.00% | | | 03/15/23 | | | 500,000 | | | | 500,000 | |
| Rbs Global Inc. / Rexnord LLC(g) | | | USD | | | | 4.88% | | | 12/15/25 | | | 220,000 | | | | 222,750 | |
| Regal Entertainment Group | | | USD | | | | 5.75% | | | 02/01/25 | | | 500,000 | | | | 515,000 | |
| Sabre GLBL, Inc.(g) | | | USD | | | | 5.25% | | | 11/15/23 | | | 250,000 | | | | 256,950 | |
| Sabre GLBL, Inc.(g) | | | USD | | | | 5.38% | | | 04/15/23 | | | 250,000 | | | | 258,750 | |
| Sally Holdings LLC / Sally Capital, Inc. | | | USD | | | | 5.63% | | | 12/01/25 | | | 250,000 | | | | 250,000 | |
| SBA Communications Corp. | | | USD | | | | 4.88% | | | 09/01/24 | | | 298,000 | | | | 306,940 | |
| Service Corp. International | | | USD | | | | 4.63% | | | 12/15/27 | | | 98,000 | | | | 99,678 | |
| Sirius XM Radio, Inc.(g) | | | USD | | | | 3.88% | | | 08/01/22 | | | 76,000 | | | | 76,570 | |
| Sirius XM Radio, Inc.(g) | | | USD | | | | 5.00% | | | 08/01/27 | | | 105,000 | | | | 105,788 | |
| Six Flags Entertainment Corp.(g) | | | USD | | | | 4.88% | | | 07/31/24 | | | 250,000 | | | | 254,375 | |
| Sophia LP / Sophia Finance, Inc.(g) | | | USD | | | | 9.00% | | | 09/30/23 | | | 250,000 | | | | 265,625 | |
| Sprint Corp. | | | USD | | | | 7.88% | | | 09/15/23 | | | 250,000 | | | | 266,875 | |
| SRC Energy, Inc.(g) | | | USD | | | | 6.25% | | | 12/01/25 | | | 246,000 | | | | 252,765 | |
| Summit Materials LLC / Summit Materials Finance Corp.(g) | | | USD | | | | 5.13% | | | 06/01/25 | | | 119,000 | | | | 121,678 | |
| Tesla, Inc.(g) | | | USD | | | | 5.30% | | | 08/15/25 | | | 250,000 | | | | 239,688 | |
See Notes to Financial Statements.
| 12 | 1.888.926.2688 | www.griffincapital.com |
| Griffin Institutional Access Credit Fund | Schedule of Investments |
December 31, 2017
| Description | | Currency | | | Rate | | | Maturity
Date | | Principal
Amount | | | Value
(Note 2) | |
| T-Mobile USA, Inc. | | | USD | | | | 6.38% | | | 03/01/25 | | | 1,125,000 | | | $ | 1,206,562 | |
| T-Mobile USA, Inc. | | | USD | | | | 6.50% | | | 01/15/26 | | | 250,000 | | | | 273,438 | |
| TreeHouse Foods, Inc.(g) | | | USD | | | | 6.00% | | | 02/15/24 | | | 375,000 | | | | 391,875 | |
| TriMas Corp.(g) | | | USD | | | | 4.88% | | | 10/15/25 | | | 184,000 | | | | 185,035 | |
| Ultra Resources, Inc.(g) | | | USD | | | | 7.13% | | | 04/15/25 | | | 125,000 | | | | 125,156 | |
| United Continental Holdings, Inc. | | | USD | | | | 5.00% | | | 02/01/24 | | | 850,000 | | | | 871,250 | |
| United Rentals North America, Inc. | | | USD | | | | 4.88% | | | 01/15/28 | | | 622,000 | | | | 626,664 | |
| United Rentals North America, Inc. | | | USD | | | | 5.88% | | | 09/15/26 | | | 375,000 | | | | 402,656 | |
| ViaSat, Inc.(g) | | | USD | | | | 5.63% | | | 09/15/25 | | | 220,000 | | | | 222,750 | |
| Wabash National Corp.(g) | | | USD | | | | 5.50% | | | 10/01/25 | | | 162,000 | | | | 163,620 | |
| West Corp.(g) | | | USD | | | | 8.50% | | | 10/15/25 | | | 181,000 | | | | 179,643 | |
| Whiting Petroleum Corp. | | | USD | | | | 1.25% | | | 04/01/20 | | | 125,000 | | | | 115,625 | |
| Wildhorse Resource Development Corp. | | | USD | | | | 6.88% | | | 02/01/25 | | | 43,000 | | | | 44,280 | |
| WildHorse Resource Development Corp.(g) | | | USD | | | | 6.88% | | | 02/01/25 | | | 82,000 | | | | 83,845 | |
| Zayo Group LLC / Zayo Capital, Inc.(g) | | | USD | | | | 5.75% | | | 01/15/27 | | | 500,000 | | | | 511,250 | |
| Zayo Group LLC / Zayo Capital, Inc. | | | USD | | | | 6.00% | | | 04/01/23 | | | 410,000 | | | | 429,086 | |
| Zayo Group LLC / Zayo Capital, Inc. | | | USD | | | | 6.38% | | | 05/15/25 | | | 500,000 | | | | 530,625 | |
| TOTAL CORPORATE BONDS | | | | | | | | | | | | | | | | | | |
| (Cost $32,289,905) | | | | | | | | | | | | | | | | | 32,441,084 | |
| | | | | | | | | | | | | | | | | | | |
| COLLATERALIZED LOAN OBLIGATIONS (3.04%) | | | | | | | | | | | | | | | | | | |
| DEBT (0.89%) | | | | | | | | | | | | | | | | | | |
| OZLM, Ltd., Series 2017-19D(a)(g) | | | USD | | | | 3M US L + 6.60% | | | 11/22/30 | | | 400,000 | | | | 401,594 | |
| Sound Point CLO, Ltd., Series 2017-3A(a)(g) | | | USD | | | | 3M US L + 6.50% | | | 10/20/30 | | | 500,000 | | | | 509,856 | |
| | | | | | | | | | | | | | | | | | 911,450 | |
| EQUITY (2.15%) | | | | | | | | | | | | | | | | | | |
| Carlyle Global Market Strategies, Ltd., Series 2017-5A(g)(h) | | | USD | | | | 16.74% | | | 01/20/30 | | | 700,000 | | | | 668,857 | |
| OZLM, Ltd., Series 2017-19A(g)(h) | | | USD | | | | 17.78% | | | 11/22/30 | | | 1,100,000 | | | | 990,001 | |
| Venture CDO, Ltd., Series 2017-30A(g)(h) | | | USD | | | | 17.44% | | | 01/15/31 | | | 600,000 | | | | 550,500 | |
| | | | | | | | | | | | | | | | | | 2,209,358 | |
| TOTAL COLLATERALIZED LOAN OBLIGATIONS | | | | | | | | | | | | | | | |
| (Cost $3,106,494) | | | | | | | | | | | | | | | | | 3,120,808 | |
| | | | | | | | | | | | | | | | | | | |
| | | | | | | | | | | Expiration
Date | | | Shares | | | | Value
(Note 2) | |
| WARRANTS (0.00%) | | | | | | | | | | | | | | | | | | |
| Deep Gulf Energy II, LLC(d) | | | USD | | | | | | | 12/31/25 | | | 33 | | | | 4,000 | |
| | | | | | | | | | | | | | | | | | | |
| TOTAL WARRANTS | | | | | | | | | | | | | | | | | | |
| (Cost $–) | | | | | | | | | | | | | | | | | 4,000 | |
| | | | | | | | | | | | | | | | | | | |
| TOTAL INVESTMENTS (94.47%) | | | | | | | | | | | | | | | | | | |
| (Cost $96,540,342) | | | | | | | | | | | | | | | | $ | 96,954,327 | |
| | | | | | | | | | | | | | | | | | | |
| Other Assets In Excess Of Liabilities (5.53%) | | | | | | | | | | | | | | | | | 5,673,943 | |
| NET ASSETS (100.00%) | | | | | | | | | | | | | | | | $ | 102,628,270 | |
Libor Rates:
1M US L - 1 Month US LIBOR as of December 31, 2017 was 1.57%
2M US L - 2 Month US LIBOR as of December 31, 2017 was 1.62%
3M US L - 3 Month US LIBOR as of December 31, 2017 was 1.69%
6M US L - 6 Month US LIBOR as of December 31, 2017 was 1.84%
3M EUR L - 3 Month EURIBOR as of December 31, 2017 was -0.32%
1M GBP L - 1 Month GBP LIBOR as of December 31, 2017 was 0.50%
See Notes to Financial Statements.
| Annual Report | December 31, 2017 | 13 |
| Griffin Institutional Access Credit Fund | Schedule of Investments |
December 31, 2017
| (a) | Floating or variable rate security. The reference rate is described above. The rate in effect as of December 31, 2017 is based on the reference rate plus the displayed spread as of the security's last reset date. |
| (b) | All or a portion of this position has not settled as of December 31, 2017. The interest rate shown represents the stated spread over London Interbank Offered Rate ("LIBOR" or "L") or the applicable LIBOR floor; the Fund will not accrue interest until the settlement date, at which point LIBOR will be established. If the position is partially settled, the reference rate shown is applicable to the settled portion. |
| (c) | A portion of this position or the entire position was not funded as of December 31, 2017. The Fund had approximately $1,540,021 in unfunded commitments pursuant to a Delayed Draw Term Loan facility. The Schedule of Investments records each of these investments as fully funded and accordingly, a corresponding payable for investments purchased has also been recorded which represents the actual unfunded amount on the balance sheet date. |
| (d) | This investment is classified as a level 3 asset, and such classification was a result of unavailable quoted prices from an active market or the unavailability of other significant observable inputs. |
| (e) | 60.91% of the total coupon was PIK and 39.09% was cash. |
| (g) | Securities exempt from registration under Rule 144A of the Securities Act of 1933. These securities may be sold in the ordinary course of business in transactions exempt from registration, normally to qualified institutional buyers. As of December 31, 2017, the aggregate market value of those securities was $24,187,654, representing 23.57% of net assets. |
| (h) | CLO subordinated notes, income notes, and M notes are considered CLO equity positions. CLO equity positions are entitled to recurring distributions which are generally equal to the remaining cash flow of payments made by underlying securities less contractual payments to debt holders and fund expenses. The effective yield is estimated based upon the current projection of the amount and timing of these recurring distributions in addition to the estimated amount of terminal principal payment. Effective yields for the Fund's CLO equity positions are updated at least once a year, either on the anniversary of the formation of a CLO investment that the Fund holds in its portfolio or on a transaction such as a partial sale, add-on purchase, refinancing or reset. The estimated yield and investment cost may ultimately not be realized. |
Industry Concentration (as a % of Net Assets)
| Services: Business | | | 9.61 | % |
| Telecommunications | | | 9.23 | % |
| Aerospace & Defense | | | 7.01 | % |
| Healthcare & Pharmaceuticals | | | 5.58 | % |
| High Tech Industries | | | 5.25 | % |
| Energy: Oil & Gas | | | 5.24 | % |
| Media: Broadcasting & Subscription | | | 5.10 | % |
| Containers, Packaging, & Glass | | | 4.86 | % |
| FIRE*: Insurance | | | 4.26 | % |
| Capital Equipment | | | 3.28 | % |
| Services: Consumer | | | 3.18 | % |
| Wholesale | | | 3.06 | % |
| Unassigned | | | 3.04 | % |
| Banking | | | 2.58 | % |
| Transportation: Consumer | | | 2.27 | % |
| Media: Diversified & Production | | | 2.11 | % |
| Hotel, Gaming, & Leisure | | | 1.95 | % |
| Metals & Mining | | | 1.86 | % |
| Retail | | | 1.83 | % |
| Beverage, Food, & Tobacco | | | 1.78 | % |
| Consumer goods: non-durable | | | 1.69 | % |
| Consumer goods: durable | | | 1.48 | % |
| FIRE*: Finance | | | 1.46 | % |
| FIRE*: Real Estate | | | 1.36 | % |
| Transportation: Cargo | | | 1.26 | % |
| Construction & Building | | | 1.12 | % |
| Automotive | | | 1.05 | % |
| Energy: Electricity | | | 0.80 | % |
| Media: Advertising, Printing & Publishing | | | 0.64 | % |
| Chemicals, Plastics, & Rubber | | | 0.39 | % |
| Utilities: Electric | | | 0.14 | % |
| Other Assets in Excess of Liabilities | | | 5.53 | % |
| TOTAL | | | 100.00 | % |
| * | Finance, Insurance, and Real Estate. |
See Notes to Financial Statements.
| 14 | 1.888.926.2688 | www.griffincapital.com |
| Griffin Institutional Access Credit Fund | Schedule of Investments |
December 31, 2017
Common Abbreviations:
EURIBOR - Euro InterBank Offered Rate
LIBOR - London Interbank Offered Rate
LLC - Limited Liability Company
LP - Limited Partnerships
PIK - Payment in Kind
OUTSTANDING FORWARD FOREIGN CURRENCY CONTRACTS
| Counterparty | | Buy/Sale Currency | | Contracted Amount* | | | Purchase/Sale Contract | | Settlement Date | | Current Value(USD) | | | Unrealized Appreciation/ (Depreciation) | |
| BNY Mellon | | USD/EUR | | | 600,000 | | | Sale | | 01/19/2018 | | $ | 720,641 | | | $ | (8,441 | ) |
| BNY Mellon | | USD/GBP | | | 470,000 | | | Sale | | 01/29/2018 | | | 635,160 | | | | (4,260 | ) |
| | | | | | | | | | | | | | | | | $ | (12,701 | ) |
| * | The contracted amount is stated in the foreign currency in which the security is denominated. |
See Notes to Financial Statements.
| Annual Report | December 31, 2017 | 15 |
| Griffin Institutional Access Credit Fund | Statement of Assets and Liabilities |
December 31, 2017
| ASSETS | | |
| Investments, at value (Cost $96,540,342) | $ | 96,954,327 | |
| Cash | | 10,450,066 | |
| Foreign currency, at value (Cost $17,745) | | 17,864 | |
| Receivable for investments sold | | 1,593,255 | |
| Receivable for shares sold | | 1,403,576 | |
| Dividends and interest receivable | | 756,325 | |
| Receivable due from Adviser (Note 4) | | 308,287 | |
| Prepaid offering costs (Note 2) | | 83,178 | |
| Prepaid expenses and other assets | | 10,926 | |
| Total Assets | | 111,577,804 | |
| LIABILITIES | | | |
| Payable for investments purchased | | 7,507,684 | |
| Shareholder servicing fees payable (Note 4) | | 7,381 | |
| Unrealized depreciation on forward foreign currency contracts | | 12,701 | |
| Administration fees payable (Note 4) | | 33,959 | |
| Transfer agency fees payable (Note 4) | | 26,807 | |
| Distribution fees payable (Note 4) | | 4,144 | |
| Payable due to Adviser | | 154,832 | |
| Payable for distributions | | 996,393 | |
| Chief compliance officer fees payable (Note 4) | | 8,982 | |
| Trustees' fees payable (Note 4) | | 15,404 | |
| Legal fees payable | | 41,363 | |
| Audit and tax fees payable | | 109,898 | |
| Custody fees payable | | 17,167 | |
| Insurance fees payable | | 7,653 | |
| Accrued expenses and other liabilities | | 5,166 | |
| Total Liabilities | | 8,949,534 | |
| NET ASSETS | $ | 102,628,270 | |
| NET ASSETS CONSIST OF | | | |
| Paid-in capital | $ | 102,157,786 | |
| Accumulated net investment income | | 73,667 | |
| Accumulated net realized loss | | (574 | ) |
| Net unrealized appreciation | | 397,391 | |
| NET ASSETS | $ | 102,628,270 | |
See Notes to Financial Statements.
| 16 | 1.888.926.2688 | www.griffincapital.com |
| Griffin Institutional Access Credit Fund | Statement of Assets and Liabilities |
December 31, 2017
| PRICING OF SHARES | | |
| Class A: | | | |
| Net asset value | $ | 25.30 | |
| Net assets | $ | 14,580,527 | |
| Shares of beneficial interest outstanding (unlimited number of shares, no par value common stock authorized) | | 576,344 | |
| Maximum offering price per share ((NAV/0.9425), based on maximum sales charge of 5.75% of the offering price) | $ | 26.84 | |
| Class C: | | | |
| Net asset value and offering | $ | 25.30 | |
| Net assets | $ | 6,680,564 | |
| Shares of beneficial interest outstanding (unlimited number of shares, no par value common stock authorized) | | 264,046 | |
| Class I: | | | |
| Net asset value and offering | $ | 25.30 | |
| Net assets | $ | 42,592,584 | |
| Shares of beneficial interest outstanding (unlimited number of shares, no par value common stock authorized) | | 1,683,407 | |
| Class L:(a) | | | |
| Net asset value | $ | 25.30 | |
| Net assets | $ | 520,211 | |
| Shares of beneficial interest outstanding (unlimited number of shares, no par value common stock authorized) | | 20,563 | |
| Maximum offering price per share ((NAV/0.9575), based on maximum sales charge of 4.25% of the offering price) | $ | 26.42 | |
| Class F:(b) | | | |
| Net asset value and offering | $ | 25.30 | |
| Net assets | $ | 38,254,384 | |
| Shares of beneficial interest outstanding (unlimited number of shares, no par value common stock authorized) | | 1,511,761 | |
| (a) | The Fund's Class L shares commenced operations on September 5, 2017. |
| (b) | The Fund's Class F shares commenced operations on September 25, 2017. |
See Notes to Financial Statements.
| Annual Report | December 31, 2017 | 17 |
| Griffin Institutional Access Credit Fund | Statement of Operations |
| | For the Period April 3, 2017 (Commencement of Operations) to December 31, 2017 | |
| INVESTMENT INCOME | | | |
| Interest | $ | 1,567,613 | |
| Total Investment Income | | 1,567,613 | |
| | | | |
| EXPENSES | | | |
| Investment advisory fees (Note 4) | | 598,942 | |
| Administrative fees (Note 4) | | 136,416 | |
| Transfer Agency fees (Note 4) | | 86,777 | |
| Shareholder servicing fees: | | | |
| Class A | | 10,199 | |
| Class C | | 5,672 | |
| Class L(a) | | 412 | |
| Distribution fees: | | | |
| Class C | | 17,017 | |
| Class L(a) | | 412 | |
| Legal fees | | 79,507 | |
| Audit and tax fees | | 95,000 | |
| Reports to shareholders and printing fees | | 24,638 | |
| State registration fees | | 4,728 | |
| Insurance fees | | 56,091 | |
| Custody fees | | 31,000 | |
| Chief compliance officer fees (Note 4) | | 75,929 | |
| Organizational cost | | 80,043 | |
| Offering cost (Note 2) | | 240,202 | |
| Trustees' fees (Note 4) | | 42,279 | |
| Other expenses | | 7,395 | |
| Total Expenses | | 1,592,659 | |
| Less: Fees waived/expenses reimbursed by Adviser (Note 4) | | (1,592,659 | ) |
| Net Expenses | | – | |
| Net Investment Income | | 1,567,613 | |
| Net realized gain on investments | | 57,574 | |
| Net realized loss on forward foreign currency transactions | | (25,533 | ) |
| Net realized gain on foreign currency translation | | 5,695 | |
| Net realized gain | | 37,736 | |
| Net change in unrealized appreciation on investments | | 413,985 | |
| Net change in unrealized appreciation/(depreciation) on forward foreign currency transactions | | (12,701 | ) |
| Net change in unrealized appreciation/(depreciation) on translation of assets and liabilities denominated in foreign currencies | | (3,893 | ) |
| Net change in unrealized appreciation | | 397,391 | |
| NET REALIZED AND UNREALIZED GAIN ON INVESTMENTS | | 435,127 | |
| NET INCREASE IN NET ASSETS RESULTING FROM OPERATIONS | $ | 2,002,740 | |
| (a) | The Fund's Class L shares commenced operations on September 5, 2017. |
See Notes to Financial Statements.
| 18 | 1.888.926.2688 | www.griffincapital.com |
| Griffin Institutional Access Credit Fund | Statement of Changes in Net Assets |
| | For the Period April 3, 2017 (Commencement of Operations) to December 31, 2017 | |
| OPERATIONS: | | |
| Net investment income | $ | 1,567,613 | |
| Net realized gain on investments | | 37,736 | |
| Net change in unrealized appreciation on investments | | 397,391 | |
| Net Increase in Net Assets Resulting from Operations | | 2,002,740 | |
| | | | |
| DISTRIBUTIONS TO SHAREHOLDERS: | | | |
| Class A | | | |
| From net investment income | | (195,865 | ) |
| Class C | | | |
| From net investment income | | (104,149 | ) |
| Class I | | | |
| From net investment income | | (729,549 | ) |
| Class L(a) | | | |
| From net investment income | | (7,568 | ) |
| Class F(b) | | | |
| From net investment income | | (436,978 | ) |
| Total Distributions to Shareholders | | (1,474,109 | ) |
| | | | |
| BENEFICIAL INTEREST TRANSACTIONS, IN DOLLARS: | | | |
| Class A | | | |
| Shares sold | | 14,979,001 | |
| Distributions reinvested | | 100,857 | |
| Shares redeemed | | (36,689 | ) |
| Transferred out | | (507,511 | ) |
| Class C | | | |
| Shares sold | | 7,102,320 | |
| Distributions reinvested | | 61,626 | |
| Transferred out | | (506,599 | ) |
| Class I | | | |
| Shares sold | | 42,883,835 | |
| Distributions reinvested | | 442,561 | |
| Shares redeemed | | (916,892 | ) |
| Class L(a) | | | |
| Shares sold | | 4,334 | |
| Distributions reinvested | | 7,416 | |
| Transferred in | | 506,599 | |
| Class F(b) | | | |
| Shares sold | | 38,863,613 | |
| Distributions reinvested | | 24,326 | |
| Shares redeemed | | (1,416,669 | ) |
| Transferred in | | 507,511 | |
| Net Increase in Net Assets Derived from Beneficial Interest Transactions | | 102,099,639 | |
| | | | |
| Net increase in net assets | | 102,628,270 | |
| | | | |
| NET ASSETS: | | | |
| Beginning of period | | – | |
| End of period * | $ | 102,628,270 | |
| *Including accumulated net investment income of: | $ | 73,667 | |
See Notes to Financial Statements.
| Annual Report | December 31, 2017 | 19 |
| Griffin Institutional Access Credit Fund | Statement of Changes in Net Assets |
| | For the Period April 3, 2017 (Commencement of Operations) to December 31, 2017 | |
| Other Information | | | |
| BENEFICIAL INTEREST TRANSACTIONS, IN SHARES: | | | |
| Class A | | | |
| Beginning shares | | – | |
| Shares sold | | 593,898 | |
| Distributions reinvested | | 3,994 | |
| Shares redeemed | | (1,449 | ) |
| Transferred out | | (20,099 | ) |
| Net increase in shares outstanding | | 576,344 | |
| Ending shares | | 576,344 | |
| Class C | | | |
| Beginning shares | | – | |
| Shares sold | | 281,702 | |
| Distributions reinvested | | 2,440 | |
| Transferred out | | (20,096 | ) |
| Net increase in shares outstanding | | 264,046 | |
| Ending shares | | 264,046 | |
| Class I | | | |
| Beginning shares | | – | |
| Shares sold | | 1,702,079 | |
| Distributions reinvested | | 17,528 | |
| Shares redeemed | | (36,200 | ) |
| Net increase in shares outstanding | | 1,683,407 | |
| Ending shares | | 1,683,407 | |
| Class L(a) | | | |
| Beginning shares | | – | |
| Shares sold | | 172 | |
| Distributions reinvested | | 293 | |
| Transferred in | | 20,098 | |
| Net increase in shares outstanding | | 20,563 | |
| Ending shares | | 20,563 | |
| Class F(b) | | | |
| Beginning shares | | – | |
| Shares sold | | 1,546,583 | |
| Distributions reinvested | | 963 | |
| Shares redeemed | | (55,884 | ) |
| Transferred in | | 20,099 | |
| Net increase in shares outstanding | | 1,511,761 | |
| Ending shares | | 1,511,761 | |
| (a) | The Fund's Class L shares commenced operations on September 5, 2017. |
| (b) | The Fund's Class F shares commenced operations on September 25, 2017. |
See Notes to Financial Statements.
| 20 | 1.888.926.2688 | www.griffincapital.com |
| Griffin Institutional Access Credit Fund – Class A | Financial Highlights |
For a Share Outstanding Throughout the Period Presented
| | For the Period April 3, 2017 (Commencement of Operations) to December 31, 2017 | |
| Net asset value, beginning of period | $ | 25.00 | |
| | | | |
| INCOME FROM INVESTMENT OPERATIONS: | | | |
| Net investment income(a) | | 0.92 | |
| Net realized and unrealized gain/(loss) | | 0.16 | |
| Total from investment operations | | 1.08 | |
| | | | |
| DISTRIBUTIONS: | | | |
| From net investment income(b) | | (0.78 | ) |
| Total distributions | | (0.78 | ) |
| | | | |
| Net increase in net asset value | | 0.30 | |
| Net asset value, end of period | $ | 25.30 | |
| TOTAL RETURN(c) | | 4.38 | % |
| | | | |
| RATIOS/SUPPLEMENTAL DATA: | | | |
| Net assets, end of period (000s) | $ | 14,581 | |
| Ratios to Average Net Assets | | | |
| Ratio of expenses to average net assets excluding fee waivers and reimbursements | | 5.15 | %(d)(e) |
| Ratio of expenses to average net assets including fee waivers and reimbursements | | 0 | %(f) |
| Ratio of net investment income to average net assets | | 4.86 | %(d) |
| | | | |
| Portfolio turnover rate(g) | | 48 | % |
| (a) | Calculated using the average shares method. |
| (b) | Distributions are based on a daily accrual of net investment income, which will vary based on investment yields and daily shares outstanding. |
| (c) | Total returns are for the period indicated and have not been annualized. Total returns would have been lower had certain expenses not been waived during the period. Returns shown do not reflect the deduction of taxes that a shareholder would pay on Fund distributions or the redemption of Fund shares. |
| (e) | The gross expense ratio included non-recurring organizational costs. |
| (f) | The Adviser voluntarily has absorbed all of the operating expenses of the Fund since the commencement of the Fund's operations. The Adviser will continue to bear such expenses on a going forward basis in its discretion and is under no obligation to continue to do so for any specified period of time. In the absence of the election by the Fund's investment adviser to bear all of the Fund's operating expenses, the ratio of expenses to average net assets including fee waivers and reimbursements would have been higher. |
| (g) | Portfolio turnover rate for periods less than one full year has not been annualized and is calculated at the Fund level. |
See Notes to Financial Statements.
| Annual Report | December 31, 2017 | 21 |
| Griffin Institutional Access Credit Fund – Class C | Financial Highlights |
For a Share Outstanding Throughout the Period Presented
| | For the Period April 3, 2017 (Commencement of Operations) to December 31, 2017 | |
| Net asset value, beginning of period | $ | 25.00 | |
| | | | |
| INCOME FROM INVESTMENT OPERATIONS: | | | |
| Net investment income(a) | | 0.91 | |
| Net realized and unrealized gain/(loss) | | 0.17 | |
| Total from investment operations | | 1.08 | |
| | | | |
| DISTRIBUTIONS: | | | |
| From net investment income(b) | | (0.78 | ) |
| Total distributions | | (0.78 | ) |
| | | | |
| Net increase in net asset value | | 0.30 | |
| Net asset value, end of period | $ | 25.30 | |
| TOTAL RETURN(c) | | 4.37 | % |
| | | | |
| RATIOS/SUPPLEMENTAL DATA: | | | |
| Net assets, end of period (000s) | $ | 6,681 | |
| Ratios to Average Net Assets | | | |
| Ratio of expenses to average net assets excluding fee waivers and reimbursements | | 6.25 | %(d)(e) |
| Ratio of expenses to average net assets including fee waivers and reimbursements | | 0 | %(f) |
| Ratio of net investment income to average net assets | | 4.83 | %(d) |
| | | | |
| Portfolio turnover rate(g) | | 48 | % |
| (a) | Calculated using the average shares method. |
| (b) | Distributions are based on a daily accrual of net investment income, which will vary based on investment yields and daily shares outstanding. |
| (c) | Total returns are for the period indicated and have not been annualized. Total returns would have been lower had certain expenses not been waived during the period. Returns shown do not reflect the deduction of taxes that a shareholder would pay on Fund distributions or the redemption of Fund shares. |
| (e) | The gross expense ratio included non-recurring organizational costs. |
| (f) | The Adviser voluntarily has absorbed all of the operating expenses of the Fund since the commencement of the Fund's operations. The Adviser will continue to bear such expenses on a going forward basis in its discretion and is under no obligation to continue to do so for any specified period of time. In the absence of the election by the Fund's investment adviser to bear all of the Fund's operating expenses, the ratio of expenses to average net assets including fee waivers and reimbursements would have been higher. |
| (g) | Portfolio turnover rate for periods less than one full year has not been annualized and is calculated at the Fund level. |
See Notes to Financial Statements.
| 22 | 1.888.926.2688 | www.griffincapital.com |
| Griffin Institutional Access Credit Fund – Class I | Financial Highlights |
| | For a Share Outstanding Throughout the Period Presented |
| | For the Period April 3, 2017 (Commencement of Operations) to December 31, 2017 | |
| Net asset value, beginning of period | $ | 25.00 | |
| | | | |
| INCOME FROM INVESTMENT OPERATIONS: | | | |
| Net investment income(a) | | 0.90 | |
| Net realized and unrealized gain/(loss) | | 0.19 | |
| Total from investment operations | | 1.09 | |
| | | | |
| DISTRIBUTIONS: | | | |
| From net investment income(b) | | (0.79 | ) |
| Total distributions | | (0.79 | ) |
| | | | |
| Net increase in net asset value | | 0.30 | |
| Net asset value, end of period | $ | 25.30 | |
| TOTAL RETURN(c) | | 4.38 | % |
| | | | |
| RATIOS/SUPPLEMENTAL DATA: | | | |
| Net assets, end of period (000s) | $ | 42,593 | |
| Ratios to Average Net Assets | | | |
| Ratio of expenses to average net assets excluding fee waivers and reimbursements | | 5.62 | %(d)(e) |
| Ratio of expenses to average net assets including fee waivers and reimbursements | | 0 | %(f) |
| Ratio of net investment income to average net assets | | 4.78 | %(d) |
| | | | |
| Portfolio turnover rate(g) | | 48 | % |
| (a) | Calculated using the average shares method. |
| (b) | Distributions are based on a daily accrual of net investment income, which will vary based on investment yields and daily shares outstanding. |
| (c) | Total returns are for the period indicated and have not been annualized. Total returns would have been lower had certain expenses not been waived during the period. Returns shown do not reflect the deduction of taxes that a shareholder would pay on Fund distributions or the redemption of Fund shares. |
| (e) | The gross expense ratio included non-recurring organizational costs. |
| (f) | The Adviser voluntarily has absorbed all of the operating expenses of the Fund since the commencement of the Fund's operations. The Adviser will continue to bear such expenses on a going forward basis in its discretion and is under no obligation to continue to do so for any specified period of time. In the absence of the election by the Fund's investment adviser to bear all of the Fund's operating expenses, the ratio of expenses to average net assets including fee waivers and reimbursements would have been higher. |
| (g) | Portfolio turnover rate for periods less than one full year has not been annualized and is calculated at the Fund level. |
See Notes to Financial Statements.
| Annual Report | December 31, 2017 | 23 |
| Griffin Institutional Access Credit Fund – Class L | Financial Highlights |
| | For a Share Outstanding Throughout the Period Presented |
| | | For the Period September 5, 2017 (Commencement of Operations) to December 31, 2017 | |
| Net asset value, beginning of period | | $ | 25.21 | |
| | | | | |
| INCOME FROM INVESTMENT OPERATIONS: | | | | |
| Net investment income(a) | | | 0.40 | |
| Net realized and unrealized gain/(loss) | | | 0.06 | |
| Total from investment operations | | | 0.46 | |
| | | | | |
| DISTRIBUTIONS: | | | | |
| From net investment income(b) | | | (0.37 | ) |
| Total distributions | | | (0.37 | ) |
| | | | | |
| Net increase in net asset value | | | 0.09 | |
| Net asset value, end of period | | $ | 25.30 | |
| TOTAL RETURN(c) | | | 1.84 | % |
| | | | | |
| RATIOS/SUPPLEMENTAL DATA: | | | | |
| Net assets, end of period (000s) | | $ | 520 | |
| Ratios to Average Net Assets | | | | |
| Ratio of expenses to average net assets excluding fee waivers and reimbursements | | | 4.17 | %(d) |
| Ratio of expenses to average net assets including fee waivers and reimbursements | | | 0 | %(e) |
| Ratio of net investment income to average net assets | | | 4.88 | %(d) |
| | | | | |
| Portfolio turnover rate(f) | | | 48 | % |
| (a) | Calculated using the average shares method. |
| (b) | Distributions are based on a daily accrual of net investment income, which will vary based on investment yields and daily shares outstanding. |
| (c) | Total returns are for the period indicated and have not been annualized. Total returns would have been lower had certain expenses not been waived during the period. Returns shown do not reflect the deduction of taxes that a shareholder would pay on Fund distributions or the redemption of Fund shares. |
| (e) | The Adviser voluntarily has absorbed all of the operating expenses of the Fund since the commencement of the Fund's operations. The Adviser will continue to bear such expenses on a going forward basis in its discretion and is under no obligation to continue to do so for any specified period of time. In the absence of the election by the Fund's investment adviser to bear all of the Fund's operating expenses, the ratio of expenses to average net assets including fee waivers and reimbursements would have been higher. |
| (f) | Portfolio turnover rate for periods less than one full year has not been annualized and is calculated at the Fund level. |
See Notes to Financial Statements.
| 24 | 1.888.926.2688 | www.griffincapital.com |
| Griffin Institutional Access Credit Fund – Class F | Financial Highlights |
For a Share Outstanding Throughout the Period Presented
| | | For the Period September 25, 2017 (Commencement of Operations) to December 31, 2017 | |
| Net asset value, beginning of period | | $ | 25.25 | |
| | | | | |
| INCOME FROM INVESTMENT OPERATIONS: | | | | |
| Net investment income(a) | | | 0.32 | |
| Net realized and unrealized gain/(loss) | | | 0.03 | |
| Total from investment operations | | | 0.35 | |
| | | | | |
| DISTRIBUTIONS: | | | | |
| From net investment income(b) | | | (0.30 | ) |
| Total distributions | | | (0.30 | ) |
| | | | | |
| Net increase in net asset value | | | 0.05 | |
| Net asset value, end of period | | $ | 25.30 | |
| TOTAL RETURN(c) | | | 1.41 | % |
| | | | | |
| RATIOS/SUPPLEMENTAL DATA: | | | | |
| Net assets, end of period (000s) | | $ | 38,254 | |
| Ratios to Average Net Assets | | | | |
| Ratio of expenses to average net assets excluding fee waivers and reimbursements | | | 3.27 | %(d) |
| Ratio of expenses to average net assets including fee waivers and reimbursements | | | 0 | %(e) |
| Ratio of net investment income to average net assets | | | 4.85 | %(d) |
| | | | | |
| Portfolio turnover rate(f) | | | 48 | % |
| (a) | Calculated using the average shares method. |
| (b) | Distributions are based on a daily accrual of net investment income, which will vary based on investment yields and daily shares outstanding. |
| (c) | Total returns are for the period indicated and have not been annualized. Total returns would have been lower had certain expenses not been waived during the period. Returns shown do not reflect the deduction of taxes that a shareholder would pay on Fund distributions or the redemption of Fund shares. |
| (e) | The Adviser voluntarily has absorbed all of the operating expenses of the Fund since the commencement of the Fund's operations. The Adviser will continue to bear such expenses on a going forward basis in its discretion and is under no obligation to continue to do so for any specified period of time. In the absence of the election by the Fund's investment adviser to bear all of the Fund's operating expenses, the ratio of expenses to average net assets including fee waivers and reimbursements would have been higher. |
| (f) | Portfolio turnover rate for periods less than one full year has not been annualized and is calculated at the Fund level. |
See Notes to Financial Statements.
| Annual Report | December 31, 2017 | 25 |
| Griffin Institutional Access Credit Fund | Notes to Financial Statements |
1. ORGANIZATION
Griffin Institutional Access Credit Fund (the “Fund”) is registered with the U.S. Securities and Exchange Commission (“SEC”) under the Investment Company Act of 1940, as amended (the “1940 Act”), as a non-diversified, closed-end management investment company. The Fund engages in a continuous offering of shares and operates as an interval fund that offers quarterly repurchases of shares at net asset value. The Fund’s SEC registered investment adviser is Griffin Capital Credit Advisor, LLC (the “Adviser”). BCSF Advisors, LP, an affiliate of Bain Capital Credit, LP, (the “Sub-Adviser”) serves as the Fund’s sub-adviser. The investment objective of the Fund is to generate a return comprised of both current income and capital appreciation with an emphasis on current income with low volatility and low correlation to the broader markets. The Fund pursues its investment objective by investing in a range of secured and unsecured debt obligations which may be syndicated, consisting of U.S high yield securities, global high yield securities and other fixed-income and fixed-income related securities, including direct originated debt obligations and collateralized loan obligations.
The Fund was organized as a statutory trust on April 5, 2016 under the laws of the State of Delaware. The Fund commenced operations on April 3, 2017, and is authorized to issue an unlimited number of shares with no par value.
Effective September 29, 2017 Griffin Capital BDC Corp., formerly known as Griffin-Benefit Street Partners BDC Corp. (the “BDC”) transferred all of its assets to the Fund, in exchange for Class F shares of the Fund and the Fund assumed all of the liabilities of the BDC. Class F shares are available to investors who were stockholders of the BDC at the time of the reorganization of the BDC into the Fund. Class F shares are not otherwise available or being offered to the general public. The Reorganization (the “Reorganization”) was accomplished on a tax free basis under applicable provisions of the Internal Revenue Code.
The Fund currently offers Class A, Class C, Class I, Class L and Class F shares. Class A, Class C and Class I shares commenced operations on April 3, 2017. Class L shares commenced operations on September 5, 2017. Class F Shares commenced operations on September 25, 2017. Class A shares are offered subject to a maximum sales charge of 5.75% of the offering price and Class L shares are offered subject to a maximum sales charge of 4.25% of the offering price. Class C, Class I and Class F shares are offered at net asset value per share. Class C shares may be subject to a 1.00% contingent deferred sales charge on shares redeemed during the first 365 days after their purchase. Each class represents an interest in the same assets of the Fund and classes are identical except for differences in their sales charge structures and ongoing service and distribution charges. All classes of shares have equal voting privileges except that each class has exclusive voting rights with respect to its service and/or distribution plans. The Fund’s income, expenses (other than class specific distribution fees) and realized and unrealized gains and losses are allocated proportionately each day based upon the relative net assets of each class.
2. SIGNIFICANT ACCOUNTING POLICIES
Basis of Presentation – The following is a summary of significant accounting policies followed by the Fund in preparation of its financial statements. These policies are in conformity with accounting principles generally accepted in the United States of America (“GAAP”). The Fund is considered an investment company following accounting and reporting guidance in Accounting Standards Codification (“ASC”) Topic 946 – Financial Services – Investment Companies. The preparation of financial statements requires management to make estimates and assumptions that affect the reported amounts of assets and liabilities and disclosure of contingent assets and liabilities at the date of the financial statements and the reported amounts of income and expenses for the period. Actual results could differ from those estimates.
Security Valuation – In accordance with ASC Topic 820 – Fair Value Measurement and Disclosures, portfolio securities of the Fund are valued at their current market values determined on the basis of market quotations. If market quotations are not readily available, securities are valued at fair value as determined by the Board of Trustees (the “Trustees”). The Trustees have delegated the day to day responsibility for determining fair valuation to the Fair Value Pricing Committee in accordance with the policies approved by the Trustees. Fair valuation involves subjective judgments, and it is possible that the fair value determined for a security may differ materially from the value that could be realized upon the sale of the security. In determining the fair value of a security for which there are no readily available market quotations, the Adviser and Sub-Adviser may consider several factors, including: (1) evaluation of all relevant factors, including but not limited to, pricing history, current market level, supply and demand of the respective security; (2) comparison to the values and current pricing of securities that have comparable characteristics; (3) knowledge of historical market information with respect to the security; and (4) other factors relevant to the security which would include, but not be limited to, duration, yield, fundamental analytical data, the Treasury yield curve, and credit quality. The Adviser may also consider periodic financial statements (audited and unaudited) or other information provided by the issuer.
| 26 | | 1.888.926.2688 | www.griffincapital.com |
| Griffin Institutional Access Credit Fund | Notes to Financial Statements |
Non-dollar-denominated securities, if any, are valued as of the close of the New York Stock Exchange (“the “NYSE”) at the closing price of such securities in their principal trading market, but may be valued at fair value if subsequent events occurring before the computation of net asset value materially have affected the value of the securities. Readily marketable portfolio securities listed on the NYSE are valued at the last sale price as of the close of the NYSE on the business day as of which such value is being determined. If there has been no sale on such day, the securities are valued at the mean of the closing bid and asked prices on such day as determined by a third-party pricing service. If no bid or asked prices are quoted on such day or if market prices may be unreliable because of events occurring after the close of trading, then the security is valued by such method as the Trustees shall determine in good faith to reflect its fair market value. The Adviser and Sub-Adviser have engaged independent third-party valuation specialists to assist in valuing such securities in certain circumstances.
The Adviser will provide the Trustees with periodic reports, no less frequently than quarterly, that discuss the functioning of the valuation process, if applicable to that period, and that identify issues and valuation problems that have arisen, if any. To the extent deemed necessary by the Adviser, the Fund’s Fair Value Pricing Committee will review any securities valued by the Adviser in accordance with the Fund’s valuation policies.
Fair Value Measurements – In accordance with ASC Topic 820 – Fair Value Measurement and Disclosures, a three-tier hierarchy has been established to classify fair value measurements for disclosure purposes. Inputs refer broadly to the assumptions that market participants would use in pricing the asset or liability, including assumptions about risk. Inputs may be observable or unobservable. Observable inputs are inputs that reflect the assumptions market participants would use in pricing the asset or liability that are developed based on market data obtained from sources independent of the reporting entity. Unobservable inputs are inputs that reflect the reporting entity’s own assumptions about the assumptions market participants would use in pricing the asset or liability that are developed based on the best information available. In accordance with the authoritative guidance on fair value measurements and disclosure under GAAP, the Fund discloses fair value of its investments in a hierarchy that prioritizes the inputs to valuation techniques used to measure the fair value.
Various inputs are used in determining the value of the Fund’s investments as of the reporting period end. These inputs are categorized in the following hierarchy under applicable financial accounting standards:
| Level 1 – | Unadjusted quoted prices in active markets for identical, unrestricted assets or liabilities that the Fund has the ability to access at the measurement date; |
| Level 2 – | Quoted prices which are not active, quoted prices for similar assets or liabilities in active markets or inputs other than quoted prices that are observable (either directly or indirectly) for substantially the full term of the asset or liability at the measurement date; and |
| Level 3 – | Significant unobservable prices or inputs (including the Fund’s own assumptions in determining the fair value of investments) where there is little or no market activity for the asset or liability at the measurement date. |
The availability of observable inputs can vary from security to security and is affected by a wide variety of factors, including, for example, the type of security, whether the security is new and not yet established in the marketplace, the liquidity of markets and other characteristics particular to the security. To the extent that valuation is based on models or inputs that are less observable or unobservable in the market, the determination of fair value requires more judgment. Accordingly, the degree of judgment exercised in determining fair value is greatest for instruments categorized in Level 3.
An investment level within the fair value hierarchy is based on the lowest level input, individually or in the aggregate, that is significant to fair value measurement. The valuation techniques used by the Fund to measure fair value during the period ended December 31, 2017 maximized the use of observable inputs and minimized the use of unobservable inputs.
| Annual Report | December 31, 2017 | 27 |
| Griffin Institutional Access Credit Fund | Notes to Financial Statements |
The inputs or methodologies used for valuing securities are not necessarily an indication of the risk or liquidity associated with investing in those securities. The following is a summary of the inputs used in valuing the Fund’s investments as of December 31, 2017:
| Investments in Securities at Value | | Level 1 - Quoted Prices | | | Level 2 - Other Significant Observable Inputs | | | Level 3 - Significant Unobservable Inputs | | | Total | |
| Bank Loans | | $ | – | | | $ | 59,030,444 | | | $ | 2,357,991 | | | $ | 61,388,435 | |
| Corporate Bonds | | | – | | | | 32,441,084 | | | | – | | | | 32,441,084 | |
| Collateralized Loan Obligations | | | – | | | | 3,120,808 | | | | – | | | | 3,120,808 | |
| Warrants | | | – | | | | – | | | | 4,000 | | | | 4,000 | |
| Total | | $ | – | | | $ | 94,592,336 | | | $ | 2,361,991 | | | $ | 96,954,327 | |
| Other Financial Instruments* Liabilities: | | | | | | | | | | | | | | | | |
| Forward Foreign Currency Contracts | | $ | – | | | $ | (12,701 | ) | | $ | – | | | $ | (12,701 | ) |
| Total | | $ | – | | | $ | (12,701 | ) | | $ | – | | | $ | (12,701 | ) |
| * | Other financial instruments are derivative instruments reflected in the Statement of Investments. The derivatives shown in this table are reported at their unrealized appreciation/ (depreciation) at measurement date, which represents the change in the contract's value. |
The changes of fair value of investments for which the Fund has used Level 3 inputs to determine the fair value are as follows:
| Asset Type | | Balance as of April 3, 2017(a) | | | Accrued (Discount)/ Premium | | | Return of Capital | | | Realized Gain/(Loss) | | | Change in Unrealized Appreciation/ (Depreciation) | | | Purchases | | | Sales Proceeds | | | Transfer into Level 3 | | | Transfer Out of Level 3 | | | Balance as of December 31, 2017 | | | Net change in unrealized appreciation/ (depreciation) included in the Statements of Operations attributable to Level 3 investments held at December 31, 2017 | |
| Bank Loans | | $ | – | | | $ | 1,175 | | | $ | – | | | $ | (32 | ) | | $ | (304 | ) | | $ | 2,359,760 | | | $ | (2,608 | ) | | $ | – | | | $ | – | | | $ | 2,357,991 | | | $ | (304 | ) |
| Warrants | | | – | | | | – | | | | – | | | | – | | | | 4,000 | | | | – | | | | – | | | | – | | | | – | | | | 4,000 | | | | 4,000 | |
| | | $ | – | | | $ | 1,175 | | | $ | – | | | $ | (32 | ) | | $ | 3,696 | | | $ | 2,359,760 | | | $ | (2,608 | ) | | $ | – | | | $ | – | | | $ | 2,361,991 | | | $ | 3,696 | |
| (a) | Commencement of operations |
The table below provides additional information about the Level 3 Fair Value Measurements as of December 31, 2017:
Quantitative Information about Level 3 Fair Value Measurements
| | | | | Range | |
| Asset Class | Fair Value (USD) | Valuation Technique | Unobservable Inputs(a) | Minimum | Maximum | Weighted Average |
| Bank Loans | $2,357,991 | Market Comparable Companies | Comparative Yield | 9.00% | 20.50% | 9.47% |
| Warrants | 4,000 | Market Comparable Companies | EBITDA Multiple | 1.50 | 1.50 | 1.50 |
| (a) | A change to the unobservable input may result in a significant change to the value of the investment as follows: |
| Unobservable Input | Impact to Value if Input Increases | Impact to Value if Input Decreases |
| EBITDA Multiple | Increase | Decrease |
| Comparative Yield | Decrease | Increase |
| 28 | | 1.888.926.2688 | www.griffincapital.com |
| Griffin Institutional Access Credit Fund | Notes to Financial Statements |
It is the Fund’s policy to recognize transfers into and out of all levels at the end of the reporting period. There were no transfers between levels during the period.
Investment Transactions – Investment security transactions are accounted for on trade date. Gains and losses on securities sold are determined on a specific identification basis.
Investment Income – Interest income is accrued and recorded on a daily basis including amortization of premiums, accretion of discounts and income earned from money market funds. Interest is not accrued on securities that are in default.
Foreign Currency Translation – The books and records of the Fund are maintained in U.S. dollars. Investment valuations and other assets and liabilities initially expressed in foreign currencies are converted each business day into U.S. dollars based upon current exchange rates. Prevailing foreign exchange rates may generally be obtained at the close of the NYSE (normally, 4:00 p.m. EST).
Foreign Securities – The Fund may directly purchase securities of foreign issuers. Investing in securities of foreign issuers involves special risks not typically associated with investing in securities of U.S. issuers. The risks include possible revaluation of currencies, the ability to repatriate funds, less complete financial information about companies and possible future adverse political and economic developments. Moreover, securities of many foreign issuers and their markets may be less liquid and their prices more volatile than those of securities of comparable U.S. issuers.
Concentration of Credit Risk – The Fund places its cash with one banking institution, which is insured by Federal Deposit Insurance Corporation (“FDIC”). The FDIC limit is $250,000. At various times throughout the year, the amount on deposit may exceed the FDIC limit and subject the Fund to a credit risk. The Fund does not believe that such deposits are subject to any unusual risk associated with investment activities.
Loan Participation and Assignments – The Fund may invest in direct debt instruments which are interests in amounts owed to lenders or lending syndicates by corporate, governmental, or other borrowers. The Fund’s investments in loans may be in the form of participations in loans or assignments of all or a portion of the loans from third parties. A loan is often administered by a bank or other financial institution (the “agent”) that acts as agent for all holders. The agent administers the terms of the loan, as specified in the loan agreement. The Fund may invest in multiple series or tranches of a loan, which may have varying terms and carry different associated risks. The Fund generally has no right to enforce compliance with the terms of the loan agreement with the borrower. As a result, the Fund may be subject to the credit risk of both the borrower and the agent that is selling the loan agreement. When the Fund purchases assignments from lenders they acquire direct rights against the borrower of the loan. The Fund may enter into unfunded loan commitments, which are contractual obligations for future funding. Unfunded loan commitments represent a future obligation in full, even though a percentage of the notional loan amounts may not be utilized by the borrower. When investing in a loan participation, the Fund has the right to receive payments of principal, interest and any fees to which it is entitled only from the agent selling the loan agreement and only upon receipt of payments by the agent from the borrower. The Fund may receive a commitment fee based on the undrawn portion of the underlying line of credit portion of a floating rate loan. In certain circumstances, the Fund may receive a penalty fee upon the prepayment of a floating rate loan by a borrower. For the period ended December 31, 2017, no penalty fees were received by the Fund. Fees earned or paid are recorded as a component of interest income or interest expense, respectively, on the Statement of Operations. At December 31, 2017, the Fund had $1,540,021 in unfunded loan commitments.
Distributions to Shareholders – The Fund intends to accrue dividends daily and to distribute as of the last business day of each quarter. Distributions of net capital gains are normally accrued and distributed in December. Income and capital gains distributions are determined in accordance with income tax regulations, which may differ from GAAP.
Indemnification – The Fund indemnifies its Officers and Trustees for certain liabilities that may arise from the performance of their duties to the Fund. Additionally, in the normal course of business, the Fund enters into contracts that contain a variety of representations and warranties and which provide general indemnities. The Fund’s maximum exposure under these arrangements is unknown, as this would involve future claims that may be made against the Fund that have not yet occurred. However, based on industry experience, the Fund expects the risk of loss due to these warranties and indemnities to be remote.
Organizational and Offering Costs – Organizational costs of $80,043 were expensed as incurred and primarily consist of costs incurred in connection with the establishment of the Fund. Offering costs incurred by the Fund of $323,380 were treated as deferred charges until operations commenced and are being amortized over a 12-month period using the straight line method. Unamortized amounts are included in prepaid offering costs in the Statement of Assets and Liabilities.
| Annual Report | December 31, 2017 | 29 |
| Griffin Institutional Access Credit Fund | Notes to Financial Statements |
December 31, 2017
Federal Income Taxes – The Fund intends to continue to comply with the requirements of Subchapter M of the Internal Revenue Code applicable to regulated investment companies and will distribute all of its taxable income, if any, to shareholders. Accordingly, no provision for federal income taxes is required in the financial statements.
The Fund recognizes the tax benefits of uncertain tax positions only when the position is “more likely than not” to be sustained assuming examination by tax authorities. Management has reviewed the tax positions and has concluded that no liability for unrecognized tax benefits should be recorded related to uncertain tax positions expected to be taken in the Fund’s 2017 returns.
Commitments and Contingencies – In the normal course of business, the Fund's investment activities involve executions, settlement and financing of various transactions resulting in receivables from, and payables to, brokers, dealers and the Fund's custodian. These activities may expose the Fund to risk in the event that such parties are unable to fulfill contractual obligations. Management does not anticipate any material losses from counterparties with whom it conducts business. Consistent with standard business practice, the Fund enters into contracts that contain a variety of indemnifications, and is engaged from time to time in various legal actions. The maximum exposure of the Fund under these arrangements and activities is unknown. However, the Fund expects the risk of material loss to be remote.
Discounts and Premiums – Discounts and premiums on securities purchased are accreted/amortized over the life of the respective security using the effective interest method. The adjusted cost of investments represents the original cost adjusted for PIK interest and the accretion of discounts and amortization of premiums.
3. DERIVATIVE TRANSACTIONS
Derivative Instruments and Hedging Activities – The following discloses the Fund’s use of derivative instruments and hedging activities.
The Fund’s investment objectives allow the Fund to enter into various types of derivative contracts such as forward foreign currency contracts. In doing so, the Fund will employ strategies in differing combinations to permit it to increase, decrease, or change the level or types of exposure to market factors. Central to those strategies are features inherent to derivatives that make them more attractive for this purpose than equity or debt securities; they require little or no initial cash investment, they can focus exposure on only certain selected risk factors, and they may not require the ultimate receipt or delivery of the underlying security (or securities) to the contract. This may allow the Fund to pursue its objectives more quickly and efficiently than if it were to make direct purchases or sales of securities capable of effecting a similar response to market factors.
Market Risk Factors – In pursuit of its investment objectives, the Fund may seek to use derivatives to increase or decrease its exposure to the following market risk factors:
Foreign Exchange Rate Risk: Foreign exchange rate risk relates to the change in the U.S. dollar value of a security held that is denominated in a foreign currency. The value of a foreign currency denominated security will decrease as the dollar appreciates against the currency, while the value of the foreign currency denominated security will increase as the dollar depreciates against the currency.
Risk of Investing in Derivatives – The Fund’s use of derivatives can result in losses due to unanticipated changes in the market risk factors and the overall market.
Derivatives may have little or no initial cash investment relative to their market value exposure and therefore can produce significant gains or losses in excess of their cost. This use of embedded leverage allows the Fund to increase its market value exposure relative to its net assets and can substantially increase the volatility of the Fund’s performance.
Additional associated risks from investing in derivatives also exist and potentially could have significant effects on the valuation of the derivative and the Fund. Typically, the associated risks are not the risks that the Fund is attempting to increase or decrease exposure to, per their investment objectives, but are the additional risks from investing in derivatives.
Examples of these associated risks are liquidity risk, which is the risk that the Fund will not be able to sell the derivative in the open market in a timely manner, and counterparty credit risk, which is the risk that the counterparty will not fulfill its obligation to the Fund.
Forward Foreign Currency Contracts – The Fund engaged in currency transactions with counterparties during the period ended December 31, 2017 to hedge the value of portfolio securities denominated in particular currencies against fluctuations in relative value, to gain or reduce exposure to certain currencies, or to generate income or gains. A forward foreign currency contract is an agreement between two parties to buy and sell a currency at a set price on a future date. The contract is marked-to-market daily and the change in value is recorded by the Fund as an unrealized gain or loss. When a forward foreign currency contract is extinguished, the Fund records a realized gain or loss equal to the difference between the value of the contract at the time it was opened and the value of the contract at the time it was extinguished.
| 30 | | 1.888.926.2688 | www.griffincapital.com |
| Griffin Institutional Access Credit Fund | Notes to Financial Statements |
Forward foreign currency contracts involve elements of market risk in excess of the amounts reflected in the Statements of Assets and Liabilities. The Fund bears the risk of an unfavorable change in the foreign exchange rate underlying the forward foreign currency contract. Risks may also arise upon entering into these contracts from the potential inability of the counterparties to meet the terms of their contracts.
The tables below are a summary of the fair valuations of derivative instruments categorized by risk exposure.
Fair values of forward foreign currency contracts on the Statements of Assets and Liabilities as of December 31, 2017:
| Risk Exposure | | Statement of Assets and Liabilities Location | | Fair Value | | | Statement of Assets and Liabilities Location | | Fair Value | |
| Griffin Institutional Access Credit Fund | | | | | | | | | | | | |
| Foreign Exchange Rate Risk (Forward Foreign Currency Contracts) | | Unrealized appreciation on forward foreign currency contracts | | $ | – | | | Unrealized depreciation on forward foreign currency contracts | | $ | (12,701 | ) |
| Total | | | | $ | – | | | | | $ | (12,701 | ) |
Forward foreign currency contracts average notional value during the period ended December 31, 2017 is $320,333.
The effect of forward foreign currency contracts on the Statements of Operations for the period ended December 31, 2017:
| Risk Exposure | | Location | | Realized Gain/(Loss) on Derivatives | | | Location | | Change in Unrealized Appreciation/(Depreciation) on Derivatives Recognized in Income | |
| Griffin Institutional Access Credit Fund | | | | | | | | | | | | |
| Foreign Exchange Rate Risk (Forward Foreign Currency Contracts) | | Net realized gain/(loss) on forward foreign currency contracts | | $ | (25,533 | ) | | Change in unrealized appreciation/(depreciation) on forward foreign currency contracts | | $ | (12,701 | ) |
| Total | | | | $ | (25,533 | ) | | | | $ | (12,701 | ) |
4. ADVISORY FEES, ADMINISTRATION FEES AND OTHER AGREEMENTS
Investment Advisory
Pursuant to the Investment Advisory Agreement with the Fund (“Advisory Agreement”), the Adviser is entitled to an investment advisory fee of 1.85% of the average daily net assets of the Fund, computed daily and payable monthly.
The Adviser and the Fund have entered into an expense limitation and reimbursement agreement (the “Expense Limitation Agreement”) under which the Adviser has agreed contractually to waive its fees and to pay or absorb the ordinary annual operating expenses of the Fund (including offering expenses, but excluding taxes, interest, brokerage commissions, acquired fund fees and expenses and extraordinary expenses) at least until August 31, 2018, so that the total annual operating expenses of the Fund do not exceed 2.60% per annum of Class A average daily net assets, 3.35% per annum of Class C average daily net assets, 2.35% per annum of Class I average daily net assets, 2.85% per annum of Class L average daily net assets and 1.85% per annum of Class F average daily net assets (the “Expense Limitations”). The agreement can be extended at the discretion of the Adviser and the Trustees.
In consideration of the Adviser’s agreement to limit the Fund’s expenses, the Fund has agreed to repay the Adviser in the amount of any fees waived and Fund expenses paid or absorbed, subject to the limitations that: (1) the reimbursement for fees and expenses will be made only if payable not more than three years from the date such expenses were incurred; and (2) the reimbursement may not be made if it would cause the Expense Limitations to be exceeded. In addition to the Expense Limitation Agreement described above, the Adviser voluntarily has absorbed all of the operating expenses of the Fund since the commencement of the Fund’s operations. Fees waived and Fund expenses paid or absorbed with respect to Class F assets will not be repaid or reimbursed. The Adviser will continue to bear such expenses on a going forward basis in its discretion and is under no obligation to continue to do so for any specified period of time. Operating expenses absorbed by the Adviser during this voluntary period will be permanently waived.
| Annual Report | December 31, 2017 | 31 |
| Griffin Institutional Access Credit Fund | Notes to Financial Statements |
During the period ended December 31, 2017, the fee waiver was as follows:
| | | Fees Waived/ Reimbursed By Advisor | |
| Griffin Institutional Access Credit Fund | | $ | 1,592,659 | |
In addition to the organizational expenses included on the Statement of Operations, the Fund recorded $53,952 of organizational expenses in the Statement of Operations included in the Seed Audit Financial Statements for the period from April 5, 2016 to January 23, 2017.
Sub-advisory services are provided to the Fund pursuant to an agreement between the Fund, Adviser and Sub-Adviser. Under the terms of the investment sub-advisory agreement, the Adviser compensates the Sub-Adviser based on a portion of the Fund’s average daily net assets which they had been allocated to manage.
Fund Administration and Accounting Fees and Expenses
ALPS Fund Services, Inc. serves as the Fund’s administrator and accounting agent (the “Administrator”) and receives customary fees from the Fund for such services. The Administrator is also reimbursed by the Fund for certain out of pocket expenses.
Transfer Agent
DST Systems, Inc. serves as transfer, dividend paying and shareholder servicing agent for the Fund (the “Transfer Agent”).
Compliance Services
Cipperman Compliance Services LLC provides a Chief Compliance Officer to the Fund as well as related compliance services pursuant to a consulting agreement between Cipperman Compliance Services LLC and the Fund.
Distributor
The Fund has entered into a Distribution Agreement with ALPS Distributors, Inc. (the “Distributor”) to provide distribution services to the Fund. The Distributor serves as principal underwriter of shares of the Fund. Under the Distribution Agreement, the Class C shares and Class L shares will pay to the Distributor a Distribution Fee that will accrue at an annual rate equal to 0.75% and 0.25% of the Fund’s average daily net assets attributable to Class C shares and Class L shares, respectively, payable on a quarterly basis. For the period ended December 31, 2017, Class C shares and Class L shares incurred distribution fees of $17,017 and $412. Class A, Class I and Class F shares are not currently subject to a Distribution Fee. Under the Shareholder Services Plan, the Class A, Class C and Class L shares may pay up to 0.25% per year of their average daily net assets for such services. For the period ended December 31, 2017, Class A, Class C and Class L shares incurred shareholder servicing fees of $10,199, $5,672 and $412, respectively. Class I and Class F shares are not currently subject to a shareholder services fee.
The Distributor acts as the Fund’s principal underwriter in a continuous public offering of the Fund’s shares. The Distributor is an affiliate of the Administrator and the Transfer Agent. For the period ended December 31, 2017, the Distributor received $25,306 in underwriting commissions for sales of the Fund’s Class A shares, of which all was paid to the Fund’s dealer manager.
Officer and Trustee Compensation
Each Trustee who is not affiliated with the Fund or Adviser receives $2,500 per quarterly and special in-person meetings and $500 per special telephonic meetings, as well as reimbursement for any reasonable expenses incurred attending meetings. The chair of the Audit Committee receives an additional $500 annually. None of the executive officers receive compensation from the Fund.
Certain Trustees and officers of the Fund are also officers of the Adviser and are not paid by the Fund for serving in such capacities.
| 32 | | 1.888.926.2688 | www.griffincapital.com |
| Griffin Institutional Access Credit Fund | Notes to Financial Statements |
5. PURCHASES AND SALES OF INVESTMENT SECURITIES
The cost of purchases and proceeds from the sale of securities, other than short-term securities, for the period ended December 31, 2017 were as follows:
| | | Purchases of Securities | | | Proceeds from Sales of Securities | |
| Griffin Institutional Access Credit Fund | | $ | 117,155,692 | | | $ | 20,638,320 | |
6. TAX BASIS INFORMATION
Distributions are determined in accordance with federal income tax regulations, which differ from GAAP, and, therefore, may differ significantly in amount or character from net investment income and realized gains for financial reporting purposes. Financial reporting records are adjusted for permanent book/tax differences to reflect tax character but are not adjusted for temporary differences. The amounts and characteristics of tax basis distributions and composition of distributable earnings/(accumulated losses) are finalized at fiscal year-end.
For the period ended December 31, 2017, the following reclassifications, which had no impact on results of operations or net assets, were recorded to reflect tax character:
| | | Paid-in Capital | | | Accumulated Net Investment Income/(Loss) | | | Accumulated Net Realized Gain/(Loss) on Investments | |
| Griffin Institutional Access Credit Fund | | $ | 58,147 | | | $ | (19,837 | ) | | $ | (38,310 | ) |
The tax character of distributions paid for the period ended December 31, 2017 was as follows:
| Year | | | Ordinary Income | | | Long-Term Capital Gain | | | Return of Capital | |
| 2017 | | | $ | 1,474,109 | | | $ | – | | | $ | – | |
As of December 31, 2017 the components of accumulated earnings/(deficit) on a tax basis were as follows:
| | | Undistributed net investment income | | | Accumulated net realized loss on investments | | | Other cumulative effect of timing differences | | | Net unrealized appreciation on investments | | | Total | |
| Griffin Institutional Access Credit Fund | | $ | 150,221 | | | $ | (29,587 | ) | | $ | (55,233 | ) | | $ | 405,083 | | | $ | 470,484 | |
As of December 31, 2017, net unrealized appreciation/(depreciation) of investments based on the federal tax cost was as follows:
| | | Gross Appreciation (excess of value over tax cost) | | | Gross Depreciation (excess of tax cost over value) | | | Net Appreciation/ (Depreciation) of Foreign Currency | | | Net Unrealized Appreciation | | | Cost of Investments for Income Tax Purposes | |
| Griffin Institutional Access Credit Fund | | $ | 871,072 | | | $ | (461,977 | ) | | $ | (4,012 | ) | | $ | 405,083 | | | $ | 96,545,351 | |
The difference between book basis and tax basis net unrealized appreciation is primarily attributable to wash sales, premium amortization and forward contacts.
Capital loss carryovers used during the period ended December 31, 2017 were $21,013.
Capital losses deferred to the next tax year were as follows:
| Fund Name | | Short Term | | | Long Term | |
| Griffin Institutional Access Credit Fund | | $ | 2,851 | | | $ | 34,283 | |
| Annual Report | December 31, 2017 | 33 |
| Griffin Institutional Access Credit Fund | Notes to Financial Statements |
7. REPURCHASE OFFERS
The Fund is an interval fund and, as such, has adopted a fundamental policy to make quarterly repurchase offers, at net asset value, of no less than 5% of the Fund’s shares outstanding. There is no guarantee that shareholders will be able to sell all of the shares they desire to sell in a quarterly repurchase offer, although each shareholder will have the right to require the Fund to purchase at least 5% of such shareholder’s shares in each quarterly repurchase. Liquidity will be provided to shareholders only through the Fund’s quarterly repurchases. Shareholders will be notified in writing of each quarterly repurchase offer and the date the repurchase offer ends (the “Repurchase Request Deadline”). Shares will be repurchased at the NAV per share determined as of the close of regular trading on the NYSE no later than the 14th day after the Repurchase Request Deadline, or the next business day if the 14th day is not a business day (each a “Repurchase Pricing Date”).
During the period ended December 31, 2017, the Fund completed two quarterly repurchase offers. In these offers, the Fund offered to repurchase up to 5% of the number of its outstanding shares as of the Repurchase Pricing Dates. No repurchase offer was oversubscribed. The result of those repurchase offers were as follows:
| | Repurchase Offer #1 | Repurchase Offer #2 |
| Commencement Date | June 29, 2017 | September 28, 2017 |
| Repurchase Request Deadline | August 3, 2017 | November 6, 2017 |
| Repurchase Pricing Date | August 3, 2017 | November 6, 2017 |
| Amount Repurchased | $164,109 | $2,206,141 |
| Shares Repurchased | 6,494 | 87,039 |
8. RISK FACTORS
In the normal course of business, the Fund invests in financial instruments and enters into financial transactions where risk of potential loss exists due to such things as changes in the market (market risk) or failure or inability of the other party to a transaction to perform (credit and counterparty risk). See below for a detailed description of select principal risks. The following list is not intended to be a comprehensive listing of all of the potential risks associated with the Fund. For a more comprehensive list of potential risks the Fund may be subject to, please refer to the Fund’s Prospectus and Statement of Additional Information (“SAI”).
Debt Securities Risk When the Fund invests in debt securities, the value of your investment in the Fund will fluctuate with changes in interest rates. Typically, a rise in interest rates causes a decline in the value of debt securities. In general, the market price of debt securities with longer maturities will increase or decrease more in response to changes in interest rates than shorter-term securities. Other risk factors include credit risk (the debtor may default) and prepayment risk (the debtor may pay its obligation early, reducing the amount of interest payments). These risks could affect the value of a particular investment, possibly causing the Fund’s share price and total return to be reduced and fluctuate more than other types of investments.
Secured Debt Risk Secured debt holds the most senior position in the capital structure of a borrower. Secured debt in most circumstances is fully collateralized by assets of the borrower. Thus, it is generally repaid before unsecured bank loans, corporate bonds, subordinated debt, trade creditors, and preferred or common stockholders. Substantial increases in interest rates may cause an increase in loan defaults as borrowers may lack resources to meet higher debt service requirements. The value of the Fund’s assets may also be affected by other uncertainties such as economic developments affecting the market for senior secured term loans or affecting borrowers generally. Moreover, the security for the Fund’s investments in secured debt may not be recognized for a variety of reasons, including the failure to make required filings by lenders, trustees or other responsible parties and, as a result, the Fund may not have priority over other creditors as anticipated.
Secured debt usually includes restrictive covenants, which must be maintained by the borrower. The Fund may have an obligation with respect to certain senior secured term loan investments to make additional loans upon demand by the borrower. Such instruments, unlike certain bonds, usually do not have call protection. This means that such interests, while having a stated term, may be prepaid, often without penalty. The rate of such prepayments may be affected by, among other things, general business and economic conditions, as well as the financial status of the borrower. Prepayment would cause the actual duration of a senior loan to be shorter than its stated maturity
Secured debt typically will be secured by pledges of collateral from the borrower in the form of tangible and intangible assets. In some instances, the Fund may invest in secured debt that is secured only by stock of the borrower or its subsidiaries or affiliates. The value of the collateral may decline below the principal amount of the senior secured term loans subsequent to an investment by the Fund.
| 34 | | 1.888.926.2688 | www.griffincapital.com |
| Griffin Institutional Access Credit Fund | Notes to Financial Statements |
Subordinated and Unsecured or Partially Secured Loans Risk The Fund may invest in unsecured loans and secured subordinated loans, including second and lower lien loans. Second lien loans are generally second in line in terms of repayment priority. A second lien loan may have a claim on the same collateral pool as the first lien or it may be secured by a separate set of assets. Second lien loans generally give investors priority over general unsecured creditors in the event of an asset sale. The priority of the collateral claims of third or lower lien loans ranks below holders of second lien loans and so on. Such junior loans are subject to the same general risks inherent to any loan investment, including credit risk, market and liquidity risk, and interest rate risk. Due to their lower place in the borrower’s capital structure and possible unsecured or partially secured status, such loans involve a higher degree of overall risk than senior loans of the same borrower.
Structured Products Risk The Fund may invest in Collateralized Debt Obligations (“CDOs”) and other structured products, consisting of Collateralized Bond Obligations, Collateralized Loan Obligations (“CLOs”) and credit-linked notes. Holders of structured products bear risks of the underlying investments, index or reference obligation and are subject to counterparty risk.
The Fund may have the right to receive payments only from the structured product, and generally does not have direct rights against the issuer or the entity that sold the assets to be securitized. While certain structured products enable the investor to acquire interests in a pool of securities without the brokerage and other expenses associated with directly holding the same securities, investors in structured products generally pay their share of the structured product’s administrative and other expenses. Although it is difficult to predict whether the prices of indices and securities underlying structured products will rise or fall, these prices (and, therefore, the prices of structured products) will be influenced by the same types of political and economic events that affect issuers of securities and capital markets generally. If the issuer of a structured product uses shorter term financing to purchase longer term securities, the issuer may be forced to sell its securities at below market prices if it experiences difficulty in obtaining short-term financing, which may adversely affect the value of the structured products owned by the Fund.
Certain structured products may be thinly traded or have a limited trading market. CLOs and credit-linked notes are typically privately offered and sold.
Bank Loans Risk The Fund expects that some of its investments will consist of interests in loans originated by banks and other financial institutions. The loans invested in by the Fund may include term loans and revolving loans, may pay interest at a fixed or floating rate and may be senior or subordinated. Purchasers of bank loans are predominantly commercial banks, investment funds and investment banks. As secondary market trading volumes for bank loans increase, new bank loans are frequently adopting standardized documentation to facilitate loan trading which should improve market liquidity. The bank loan market currently, however, is facing unprecedented levels of illiquidity and volatility. There can be no assurance as to when or even if this current market illiquidity and volatility will abate or that future levels of supply and demand in bank loan trading will provide an adequate degree of liquidity, that the current period of illiquidity will not persist or worsen and that the market will not experience periods of significant illiquidity in the future. In addition, the Fund will make investments in stressed or distressed bank loans which are often less liquid than performing bank loans.
CLO Risk In addition to the general risks associated with debt securities and structured products discussed herein, CLOs carry additional risks, including, but not limited to (i) the possibility that distributions from collateral securities will not be adequate to make interest or other payments; (ii) the quality of the collateral may decline in value or default; (iii) the possibility that the investments in CLOs are subordinate to other classes or tranches thereof; and (iv) the complex structure of the security may not be fully understood at the time of investment and may produce disputes with the issuer or unexpected investment results.
CLO equity and junior debt securities that the Fund may acquire are subordinated to more senior tranches of CLO debt. CLO equity and junior debt securities are subject to increased risks of default relative to the holders of superior priority interests in the same securities. In addition, at the time of issuance, CLO equity securities are under-collateralized in that the liabilities of a CLO at inception exceed its total assets. Though not exclusively, the Fund will typically be in a first loss or subordinated position with respect to realized losses on the assets of the CLOs in which it is invested. The Fund may recognize phantom taxable income from its investments in the subordinated tranches of CLOs and structured notes. See “Tax Status” in the Fund’s SAI.
Between the closing date and the effective date of a CLO, the CLO collateral manager will generally expect to purchase additional collateral obligations for the CLO. During this period, the price and availability of these collateral obligations may be adversely affected by a number of market factors, including price volatility and availability of investments suitable for the CLO, which could hamper the ability of the collateral manager to acquire a portfolio of collateral obligations that will satisfy specified concentration limitations and allow the CLO to reach the initial par amount of collateral prior to the effective date. An inability or delay in reaching the target initial par amount of collateral may adversely affect the timing and amount of interest or principal payments received by the holders of the CLO debt securities and distributions of the CLO on equity securities and could result in early redemptions which may cause CLO debt and equity investors to receive less than face value of their investment.
| Annual Report | December 31, 2017 | 35 |
| Griffin Institutional Access Credit Fund | Notes to Financial Statements |
The failure by a CLO in which the Fund invests to satisfy financial covenants, including with respect to adequate collateralization and/or interest coverage tests, could lead to a reduction in the CLO’s payments to the Fund. In the event that a CLO fails certain tests, holders of CLO senior debt may be entitled to additional payments that would, in turn, reduce the payments the Fund would otherwise be entitled to receive. Separately, the Fund may incur expenses to the extent necessary to seek recovery upon default or to negotiate new terms, which may include the waiver of certain financial covenants, with a defaulting CLO or any other investment the Fund may make. If any of these occur, it could adversely affect the Fund’s operating results and cash flows.
The Fund’s CLO investments are exposed to leveraged credit risk. If certain minimum collateral value ratios and/or interest coverage ratios are not met by a CLO, primarily due to senior secured loan defaults, then cash flow that otherwise would have been available to pay distributions to the Fund on its CLO investments may instead be used to redeem any senior notes or to purchase additional senior secured loans, until the ratios again exceed the minimum required levels or any senior notes are repaid in full. The Fund’s CLO investments and/or the underlying senior secured loans may prepay more quickly than expected, which could have an adverse impact on the Company’s net assets.
Mezzanine Securities Risk Most of the Fund’s mezzanine securities and other investments (if any) are expected to be unsecured and made in companies whose capital structures have significant indebtedness ranking ahead of the investments, all or a significant portion of which may be secured. While the securities and other investments may benefit from the same or similar financial and other covenants as those enjoyed by the indebtedness ranking ahead of the investments and may benefit from cross-default provisions and security over the portfolio company’s assets, some or all of such terms may not be part of particular investments. Mezzanine securities and other investments generally are subject to various risks including, without limitation: (i) a subsequent characterization of an investment as a “fraudulent conveyance”; (ii) the recovery as a “preference” of liens perfected or payments made on account of a debt in the 90 days before a bankruptcy filing; (iii) equitable subordination claims by other creditors; (iv) so-called “lender liability” claims by the issuer of the obligations; and (v) environmental liabilities that may arise with respect to collateral securing the obligations.
High Yield Debt Risk A substantial portion of the high yield debt in which the Fund intends to invest are rated below investment-grade by one or more nationally recognized statistical rating organizations or are unrated but of comparable credit quality to obligations rated below investment-grade, and have greater credit and liquidity risk than more highly rated debt obligations. Lower-rated securities may include securities that have the lowest rating or are in default. High yield debt is generally unsecured and may be subordinate to other obligations of the obligor. The lower rating of high yield debt reflects a greater possibility that adverse changes in the financial condition of the obligor or in general economic conditions (including, for example, a substantial period of rising interest rates or declining earnings) or both may impair the ability of the obligor to make payment of principal and interest. Many issuers of high yield debt are highly leveraged, and their relatively high debt-to-equity ratios create increased risks that their operations might not generate sufficient cash flow to service their debt obligations. In addition, many issuers of high yield debt may be in poor financial condition, experiencing poor operating results, having substantial capital needs or negative net worth or be facing special competitive or product obsolescence problems, and may include companies involved in bankruptcy or other reorganizations or liquidation proceedings. Certain of these securities may not be publicly traded, and therefore it may be difficult to obtain information as to the true condition of the issuers. Overall declines in the below investment-grade bond and other markets may adversely affect such issuers by inhibiting their ability to refinance their debt at maturity. High yield debt is often less liquid than higher rated securities.
Credit Risk There is a risk that debt issuers will not make payments, resulting in losses to the Fund. In addition, the credit quality of securities may be lowered if an issuer’s financial condition changes. Lower credit quality may lead to greater volatility in the price of a security and in shares of the Fund. Lower credit quality also may affect liquidity and make it difficult to sell the security. Default, or the market’s perception that an issuer is likely to default, could reduce the value and liquidity of securities, thereby reducing the value of your investment in Fund shares. In addition, default may cause the Fund to incur expenses in seeking recovery of principal or interest on its portfolio holdings.
Medium and Small Capitalization Company Risk Some issuers of the Fund’s investments may be medium or small capitalization companies which may be newly formed or have limited product lines, distribution channels, and financial or managerial resources. The risks associated with these investments are generally greater than those associated with investments in the securities of larger, more-established companies. The Fund does not maintain a policy limiting its ability to invest in medium or small capitalization companies. This may cause the Fund’s NAV to be more volatile when compared to investment companies that focus only on large capitalization companies. Generally, securities of medium and small capitalization companies are more likely to experience sharper swings in market values, less liquid markets, in which it may be more difficult for the Advisor to sell at times and at prices that the Advisor believes appropriate, and generally are more volatile than those of larger companies. Compared to large companies, smaller companies are more likely to have (i) less information publicly available, (ii) more limited product lines or markets and less mature businesses, (iii) fewer capital resources, (iv) more limited management depth, and (v) shorter operating histories. Further, the equity securities of smaller companies are often traded over-the-counter and generally experience a lower trading volume than is typical for securities that are traded on a national securities exchange. Consequently, the Fund may be required to dispose of these securities over a longer period of time (and potentially at less favorable prices) than would be the case for securities of larger companies, offering greater potential for gains and losses and associated tax consequences.
| 36 | | 1.888.926.2688 | www.griffincapital.com |
| Griffin Institutional Access Credit Fund | Notes to Financial Statements |
9. FUND REORGANIZATION
On September 29, 2017, the Fund acquired all of the assets and assumed all of the liabilities of Griffin Capital BDC Corp. (“BDC”) pursuant to an Agreement and Plan of Reorganization approved by the BDC’s Board of Directors (“BDC Board”) and BDC shareholders. The acquisition was accomplished by an exchange of Class F shares of the Fund for corresponding shares then outstanding of the BDC at its net asset value on the acquisition date. The reorganization provides shareholders of the BDC access to an actively-managed, diversified, global credit strategy with the potential for attractive risk-adjusted returns across various market cycles. The reorganization qualified as a tax-free reorganization for federal income tax purposes with no gain or loss recognized to the funds or BDC shareholders. The BDC's net assets of approximately $39,072,394, including securities of approximately $37,390,945, and excluding unfunded commitments, were combined with the Fund's net assets of approximately $38,676,006 for total net assets after the acquisition of approximately $77,748,400. As of December 31, 2017, these unfunded commitments were included on the Statement of Assets and Liabilities at fair value, $1,129,590.
Assuming the acquisition had been completed on April 3, 2017 (beginning of the reporting period), the fund’s pro forma results of operations for the reporting period are as follows: Net investment income $2,751,247. Net gain on investments $38,775. Net increase in net assets resulting from operations $2,790,022. Because the combined investment portfolios have been managed as a single portfolio since the acquisition was completed, it is not practicable to separate the amounts of revenue and earnings of acquired fund that have been included in the fund’s Statement of Operations for the current fiscal period.
10. SUBSEQUENT EVENTS
Subsequent events after the date of the Statement of Assets and Liabilities have been evaluated through the date the financial statements were issued.
The Fund completed a quarterly repurchase offer on February 5, 2018, which resulted in 310,679 Fund shares being repurchased for $7,857,065. Of this amount, 74.4% was attributable to Class F shares.
As of January 17, 2018, Ryan Del Giudice was appointed as the Chief Compliance Officer (“CCO”) of the Fund for purposes of Rule 38a-1 under the 1940 Act. Mr. Del Giudice replaces Jay Haas who served as CCO pursuant to the terms of the agreement with Cipperman Compliance Services LLC described in Note 4.
Management has determined that there were no other subsequent events to report through the issuance of these financial statements.
| Annual Report | December 31, 2017 | 37 |
| | Report of Independent Registered |
| Griffin Institutional Access Credit Fund | Public Accounting Firm |
To the Board of Trustees and Shareholders of
Griffin Institutional Access Credit Fund:
Opinion on the Financial Statements
We have audited the accompanying statement of assets and liabilities, including the schedule of investments, of Griffin Institutional Access Credit Fund (the “Fund”) as of December 31, 2017, and the related statement of operations for the period then ended, the statement of changes in net assets, including the related notes, and the financial highlights for the period April 3, 2017 (commencement of operations) through December 31, 2017 (collectively referred to as the “financial statements”). In our opinion, the financial statements present fairly, in all material respects, the financial position of the Fund as of December 31, 2017, and the results of its operations, changes in its net assets, and the financial highlights for the period April 3, 2017 (commencement of operations) through December 31, 2017 in conformity with accounting principles generally accepted in the United States of America.
Basis for Opinion
These financial statements are the responsibility of the Fund’s management. Our responsibility is to express an opinion on the Fund’s financial statements based on our audit. We are a public accounting firm registered with the Public Company Accounting Oversight Board (United States) (“PCAOB”) and are required to be independent with respect to the Fund in accordance with the U.S. federal securities laws and the applicable rules and regulations of the Securities and Exchange Commission and the PCAOB.
We conducted our audit of these financial statements in accordance with the standards of the PCAOB. Those standards require that we plan and perform the audit to obtain reasonable assurance about whether the financial statements are free of material misstatement, whether due to error or fraud.
Our audit included performing procedures to assess the risks of material misstatement of the financial statements, whether due to error or fraud, and performing procedures that respond to those risks. Such procedures included examining, on a test basis, evidence regarding the amounts and disclosures in the financial statements. Our audit also included evaluating the accounting principles used and significant estimates made by management, as well as evaluating the overall presentation of the financial statements. Our procedures included confirmation of securities owned as of December 31, 2017 by correspondence with the custodian, transfer agent and brokers; when replies were not received from brokers, we performed other auditing procedures. We believe that our audit provides a reasonable basis for our opinion.

Boston, MA
February 28, 2018
We have served as the auditor of one or more investment companies in Griffin Capital Credit Advisor, LLC since 2017.
| 38 | | 1.888.926.2688 | www.griffincapital.com |
| Griffin Institutional Access Credit Fund | Additional Information |
| | December 31, 2017 (Unaudited) |
1. PROXY VOTING POLICIES AND VOTING RECORD
A description of the policies and procedures that the Fund uses to vote proxies relating to portfolio securities is available without charge upon request by calling toll-free 888-926-2688, or on the Securities and Exchange Commission’s (“SEC”) website at https://www.sec.gov. Information regarding how the Fund voted proxies relating to portfolio securities during the most recent 12-month period ended June 30th is available without charge upon request by calling toll-free 888-926-2688, or on the SEC’s website at https://www.sec.gov.
2. QUARTERLY PORTFOLIO HOLDINGS
The Fund files a complete listing of portfolio holdings for the Fund with the SEC as of the first and third quarters of each fiscal year on Form N-Q. The filings are available upon request by calling 888-926-2688. Furthermore, you may obtain a copy of the filing on the SEC’s website at https://www.sec.gov. The Fund’s Form N-Q may also be reviewed and copied at the SEC’s Public Reference Room in Washington, D.C., and information on the operation of the Public Reference Room may be obtained by calling 1-800-SEC-0330.
| Annual Report | December 31, 2017 | 39 |
| Griffin Institutional Access Credit Fund | Trustees and Officers |
December 31, 2017 (Unaudited)
The business and affairs of the Fund are managed under the direction of the Trustees. Information concerning the Trustees and officers of the Fund is set forth below. Generally, each Trustee and officer serves an indefinite term or until certain circumstances such as his resignation, death, or otherwise as specified in the Fund’s organizational documents. Any Trustee may be removed at a meeting of shareholders by a vote meeting the requirements of the Fund’s organizational documents. The Statement of Additional Information of the Fund includes additional information about the Trustees and officers and is available, without charge, upon request by calling the Fund toll-free at 888-926-2688.
INDEPENDENT TRUSTEES
Name, Address and Age | Position/Term of Office* | Principal Occupation During the Past Five Years | Number of Portfolios in Fund Complex** Overseen by Trustee | Other Directorships held by Trustee During Last Five Years |
Nathaniel Headrick
Age: 43 | Trustee Since 2017 | General Counsel, Triloma Capital (private equity firm), 2013-present; Founder and Partner, DDW Holdings LLC (due diligence software provider), 2013-present; President, Bluerock Capital Markets (public and private equity fund broker-dealer), 2013; General Counsel and Chief Compliance Officer, CNL Securities (public and private equity fund broker-dealer), 2008-2013; and General Counsel, Corporate Capital Trust (Public non- traded BDC), 2012-2013. | 2 | Class of 1938 Foundation (nonprofit), 1996-present; Orange County Regional History Center (nonprofit), 2005-2013; Junior Achievement of Florida (nonprofit), 2007-2011; Florida Children’s Hospital (nonprofit), 2007-2011; and United Cerebral Palsy of Central Florida (nonprofit), 2004-2011; Trustee, Griffin Institutional Access Real Estate Fund, 2014-present. |
Robb Chapin
Age: 55 | Trustee Since 2017 | Chief Executive Officer, ROC Senior Housing Fund Manager, LLC (real estate fund management), 2013- present; Managing Partner, Servant Investments, LLC (real estate fund management), 2005-2013; and Managing Partner, Servant Capital Group, LLC (real estate fund management), 2012-2013 | 2 | ROC Seniors Housing & Medical Properties Fund, LP (real estate fund), 2013- present; Trustee, Griffin Institutional Access Real Estate Fund, 2014-present. |
Ira Cohen
Age: 58 | Trustee Since 2017 | Executive Vice President, Recognos Financial (financial data services firm), 2015-present; Chief Executive Officer, Ira Cohen Consulting, LLC (mutual fund operations consulting firm), 2005-present. | 2 | Valued Advisers Trust (14 portfolios), 2010-present; and Angel Oak Funds Trust (2 portfolios), 2014-present; Trustee, Griffin Institutional Access Real Estate Fund, 2014-present. |
| 40 | | 1.888.926.2688 | www.griffincapital.com |
| Griffin Institutional Access Credit Fund | Trustees and Officers |
December 31, 2017 (Unaudited)
INTERESTED TRUSTEES AND OFFICERS
Name, Address and Age | Position/Term of Office* | Principal Occupation During the Past Five Years | Number of Portfolios in Fund Complex** Overseen by Trustee | Other Directorships held by Trustee During Last 5 Years |
Kevin Shields
Age: 59 | President and Trustee Since 2017 | Chairman and Chief Executive Officer, Griffin Capital Company, LLC; Chief Executive Officer, Griffin Capital Credit Advisor, LLC; Chairman and Chief Executive Officer, Griffin Capital Securities, LLC; President and Chief Executive Officer, Griffin Capital Essential Asset REIT, Inc. and Griffin Capital Essential Asset REIT II, Inc.; President and Director, Griffin Capital BDC Corp., 2014-2017. | 2 | President and Trustee, Griffin Institutional Access Real Estate Fund, 2014-present; Chairman, Griffin Capital Company, LLC, 1995- present; Director, Griffin Capital Essential Asset REIT, Inc., 2008-present; Director, Griffin Capital Essential Asset REIT II, Inc. 2014-present; Director., Griffin Capital BDC Corp., 2014-2017. |
Joseph Miller
Age: 54 | Treasurer Since 2017 | Chief Financial Officer and Chief Operating Officer, Griffin Capital Company, LLC; Chief Financial Officer, Griffin Capital BDC Corp., 2014-2017. | N/A | Treasurer, Griffin Institutional Access Real Estate Fund, 2014-present. |
Randy Anderson
Age: 49 | Executive Vice President, Secretary and Trustee Since 2017 | Chief Economist, Griffin Capital Company, LLC; Chief Investment Officer, Griffin Capital Advisor, LLC; President, Griffin Capital Asset Management Company, LLC; Howard Phillips Eminent Scholar Chair and Professor of Real Estate, University of Central Florida; President, Bluerock Real Estate LLC; President, CNL Real Estate Advisors; Chief Economist, Marcus and Millichap Company; Executive Vice President, Griffin Capital BDC Corp., 2014-2017. | 2 | Trustee, Portfolio Manager and Secretary, Griffin Institutional Access Real Estate Fund, 2014-present. |
Ryan Del Giudice
Age: 27 | Chief Compliance Officer Since 2018 | Chief Compliance Officer, Griffin Capital Advisor, LLC, 2018-present; Chief Compliance Officer, Griffin Capital Credit Advisor, LLC, 2018-present; Chief Compliance Officer, 40 Act Funds and Advisors, Griffin Capital Company, LLC, 2017-present; Vice President, Cipperman Compliance Services LLC, 2015-2017; Manager, Cipperman Compliance Services, LLC, 2013- 2015; Regulatory Administration Associate, BNY Mellon Asset Servicing, 2012-2013. | N/A | Chief Compliance Officer, Griffin Institutional Access Real Estate Fund, 2018-present. |
Pete Greenly
Age: 49 | Assistant Treasurer Since 2017 | Fund Controller, ALPS Fund Services, Inc., 2012-present. | N/A | Assistant Treasurer, Griffin Institutional Access Real Estate Fund, 2017-present. |
| Annual Report | December 31, 2017 | 41 |
| Griffin Institutional Access Credit Fund | Trustees and Officers |
December 31, 2017 (Unaudited)
INTERESTED TRUSTEES AND OFFICERS (continued)
Name, Address and Age | Position/Term of Office* | Principal Occupation During the Past Five Years | Number of Portfolios in Fund Complex** Overseen by Trustee | Other Directorships held by Trustee During Last 5 Years |
Howard S. Hirsch
Age: 51 | Vice President and Assistant Secretary Since 2017 | Vice President and General Counsel – Securities, Griffin Capital Company, LLC, 2014-present; Vice President and Secretary, Griffin Capital Essential Asset REIT II, Inc., 2014-present; Vice President and Secretary, Griffin Capital Essential Asset REIT, Inc., 2015-present; Vice President and Secretary, Griffin Capital BDC Corp., 2014-2017; Vice President, Griffin Capital BDC Advisor, LLC, 2014-2017; Shareholder, Baker Donelson, Caldwell & Berkowitz, PC, 2009-2014. | N/A | Vice President and Assistant Secretary, Griffin Institutional Access Real Estate Fund, 2015-present. |
Christopher Moore
Age: 33 | Assistant Secretary Since 2017 | Vice President and Senior Counsel, ALPS Fund Services, Inc., 2016-present; Associate, Thompson Hine LLP, 2013-2016; Corporate Counsel, DSW, Inc., 2012-2013. | N/A | Assistant Secretary, Griffin Institutional Access Real Estate Fund, 2016-present; Secretary, RiverNorth Opportunities Fund, 2017-present. |
| * | The term of office for each Trustee and officer listed above will continue indefinitely. |
| ** | The term “Fund Complex” refers to the Griffin Institutional Access Credit Fund and the Griffin Institutional Access Real Estate Fund.
|
| 42 | | 1.888.926.2688 | www.griffincapital.com |
Page Intentionally Left Blank

Item 2. Code of Ethics.
| (a) | As of the end of the period covered by this report, the registrant has adopted a code of ethics that applies to the registrant’s principal executive officer, principal financial officer, principal accounting officer or controller, or persons performing similar functions, regardless of whether these individuals are employed by the registrant or a third party. |
| (c) | During the period covered by this report, there were no amendments to the provisions of the code of ethics adopted in Item 2(a) of this report. |
| (d) | During the period covered by this report, the registrant had not granted any express or implicit waivers from the provisions of the code of ethics adopted in Item 2(a) of this report. |
| (f) | The registrant’s Code of Ethics is attached as an Exhibit hereto. |
Item 3. Audit Committee Financial Expert.
The Board of Trustees of the registrant has determined that the registrant has at least one Audit Committee Financial Expert serving on its audit committee. The Board of Trustees of the registrant has designated Mr. Ira Cohen as the registrant’s Audit Committee Financial Expert. Mr. Cohen is “independent” as defined in paragraph (a)(2) of Item 3 to Form N-CSR.
Item 4. Principal Accountant Fees and Services.
| (a) | Audit Fees: For the registrant's fiscal period ended December 31, 2017, the aggregate fees billed for professional services rendered by the principal accountant for the audit of the registrant's annual financial statements or services that are normally provided by the accountant in connection with statutory and regulatory filings or engagements were $110,000*. |
| (b) | Audit-Related Fees: For the registrant’s fiscal period ended December 31, 2017, the aggregate fees billed for assurance and related services by the principal accountant that are reasonably related to the performance of the audit of the registrant’s financial statements and not otherwise reported under paragraph (a) of Item 4 of this report were $0, respectively. |
| (c) | Tax Fees: For the registrant's fiscal period ended December 31, 2017, the aggregate fees billed for professional services rendered by the principal accountant for tax compliance, tax advice and tax planning, which were comprised of the preparation of excise filings and income tax returns for the registrant were $44,850*, respectively. |
| (d) | All Other Fees: For the registrant's fiscal period ended December 31, 2017, the aggregate fees billed for products and services other than the services reported in paragraphs (a) through (c) of Item 4 of this report, were provided by the principal accountant, $37,500, respectively. |
| (e) | (1) | The audit committee’s pre-approval policies and procedures require that all services to be performed by the registrant’s principal accountant must be pre-approved by the registrant’s audit committee. |
| (2) | No services described in paragraphs (b) through (d) of Item 4 of this report were approved by the registrant’s audit committee pursuant to paragraph (c)(7)(i)(C) of Rule 2-01 of Regulation S-X. |
| (f) | Not applicable to the registrant. |
| (g) | For the registrant's fiscal period ended December 31, 2017, the aggregate non-audit fees for services rendered to the registrant, the registrant's investment adviser (not including any sub-adviser whose role is primarily portfolio management and is subcontracted with or overseen by another investment adviser) and any entity controlling, controlled by, or under common control with the adviser that provides ongoing services to the registrant were $0, respectively. |
| (h) | The registrant’s audit committee has considered whether the provision of non-audit services to the registrant’s investment adviser (not including any sub-adviser whose role is primarily portfolio management and is subcontracted with or overseen by another investment adviser), and any entity controlling, controlled by, or under common control with the investment adviser that provides ongoing services to the registrant, that were not pre-approved pursuant to paragraph (c)(7)(ii) of Rule 2-01 of Regulation S-X, is compatible with maintaining the principal accountant’s independence. |
| * | Audit Fees and Tax Fees are based on estimated costs. |
Item 5. Audit Committee of Listed Registrants.
Not applicable.
Item 6. Investments.
| (a) | The schedule of investments is included as part of the Reports to Stockholders filed under Item 1 of this report. |
Item 7. Disclosure of Proxy Voting Policies and Procedures for Closed-End Management Investment Companies.
Policy
Griffin Capital Advisor, LLC, (the “Adviser”), as a matter of policy and as a fiduciary to its Clients, has the responsibility for voting proxies for securities consistent with the best interests of Clients. The Adviser maintains written policies and procedures as to the handling, voting and reporting of proxy voting and makes appropriate disclosures about the Adviser’s proxy policies and practices and the availability of the Adviser’s proxy voting record. The Adviser does not vote proxies regarding securities held by Underlying Funds but rather, may vote on issues regarding the Underlying Funds. In general, the Adviser does not receive proxies to be voted due to the nature of its investments on behalf of the Fund; this policy is intended to comply with Rule 206(4)-6 in the infrequent instance that the Adviser receives a proxy, or other action requiring a vote, from an Underlying Fund. The Adviser has delegated proxy voting authority to the Public Sub-Adviser of the Griffin Institutional Access Credit Fund.
Background & Description
In general, proxy voting is an important right of shareholders and reasonable care and diligence must be undertaken to ensure that such rights are properly and timely exercised.
Investment advisers registered with the SEC, and which exercise voting authority with respect to client securities, are required by Rule 206(4)-6 of the Advisers Act to (a) adopt and implement written policies and procedures that are reasonably designed to ensure that client securities are voted in the best interests of clients, which must include how an adviser addresses material conflicts that may arise between an adviser’s interests and those of its clients; (b) disclose to clients how they may obtain information from the adviser with respect to the voting of proxies for their securities; (c) describe to clients a summary of its proxy voting policies and procedures and, upon request, furnish a copy to its clients; and (d) maintain certain records relating to the adviser’s proxy voting activities when the adviser does have proxy voting authority.
The Adviser is responsible for the recommendations regarding assets on behalf of the Fund to Underlying Funds, which may include hedge funds and other alternative investment pools that are structured as limited partnerships, limited liability companies or offshore corporations. The voting rights of the Client, as holders of interests in Private Investment Funds, are generally contract rights set out in the organizational documents (e.g., the limited partnership agreement, limited liability company agreement, memorandum and articles of association of the Underlying Funds). Underlying Funds, if privately placed, generally are not subject to the regulatory scheme applicable to public companies. Because most, if not all, of the Underlying Funds are privately placed, they generally do not issue proxies. Instead, they may solicit consents from their limited partners, members or shareholders. The term “Proxies” will refer to any such consents or other action requiring a vote as well as any per se proxies.
Responsibility
The Chief Compliance Officer (“CCO”) has responsibility for implementation and monitoring of the Adviser’s proxy voting policy, practices, disclosures and record keeping, including outlining voting guidelines in its procedures.
Procedures
The Adviser has adopted procedures to implement the firm’s proxy voting policy and to monitor and ensure its policy is observed and amended or updated, as appropriate, which include the following:
Voting Procedures
| ● | In the event Adviser employees, officers, or directors receive proxy materials on behalf of the Fund, the employees, officers and directors will forward such materials to the appropriate members of the Adviser’s Investment Committee to vote the Proxy. |
| ● | The Adviser’s Investment Committee will analyze the proxy materials and determine how the Adviser should vote the Proxy in accordance with applicable voting guidelines (see below). The Adviser’s Investment Committee may consider information provided by the Underlying Fund’s personnel regarding the nature of the proxy. Additionally, the Adviser’s Investment Committee and CCO will identify if any material conflicts exist for the Adviser. A member of the Investment Committee will then provide a Proxy Voting Form, maintained separately, that the Adviser is not subject to conflicts of interest regarding the Underlying Fund or the subject of the Proxy. |
| ● | The CCO or designee, is responsible for coordinating this process in a timely and appropriate manner and delivering the Proxy to the Underlying Fund prior to the deadline. |
Proxy Voting Guidelines
| ● | In the absence of specific voting guidelines from the Fund, the Adviser will vote Proxies in the best interests of the Fund. |
| ● | Because in the context of Underlying Funds each solicited vote raises unique questions, each Proxy with respect to an Underlying Funds will be analyzed by the Investment Committee, on a case-by-case basis. |
| ● | The Adviser may determine not to vote a Proxy if doing so would not be in the Fund’s best interest, such as when the Adviser determines that the cost of voting the Proxy exceeds the expected benefit to the Fund. |
Material Conflicts of Interest in Connection with Proxy Voting
| ● | Material conflicts of interest may arise in situations that include, but are not limited to, when an Underlying Fund or an affiliate of such Underlying Fund has a relationship with the Fund or an affiliate of the Adviser and such Underlying Fund is soliciting proxies and failure to vote in a certain way may affect the Adviser’s relationship with such company and materially impact the Adviser’s business; or when a personal relationship between an Adviser officer and management of a company or other proponents of proxy proposals could impact the voting decision. |
| ● | From time to time, the Adviser will review a proxy which presents a potential material conflict. As a fiduciary to its clients, the Adviser takes these potential conflicts very seriously. While the Adviser’s primary goal in addressing any such potential conflict is to ensure that proxy votes are cast in the Fund’s best interest and are not affected by the Adviser’s potential conflict, there are a number of courses that the Adviser may take. The final decision about which course to follow shall be made by the Investment Committee. Casting a vote in the best interest of the Fund would eliminate the Adviser’s discretion on the particular issue and hence avoid the conflict. |
| ● | The Adviser will maintain a record of the analysis of any potential conflict of interest and its resolution. |
Disclosure
| ● | The Adviser will provide conspicuously displayed information in the Fund’s Registration Statement summarizing this proxy voting policy and procedures, including a statement that the Investors may request information regarding how the Adviser voted the Fund’s Proxies, and may request a copy of these policies and procedures. |
Requests for Information
| ● | All requests for information regarding proxy votes, or policies and procedures, received by any Adviser employee, officer, or director should be forwarded to the CCO. |
| ● | In response to any request from an Investor, the CCO will prepare a written response with the information requested. |
Recordkeeping
The CCO shall retain the following proxy records in accordance with the Adviser’s Recordkeeping Policy:
| ● | These policies and procedures and any amendments; |
| ● | Each Proxy statement that the Adviser receives; |
| ● | A record of each vote that the Adviser casts; |
| ● | Any document the Adviser created that was material to deciding how to vote Proxies, or that memorializes that decision; |
| ● | A copy of each written request from an Investor for information on how the Adviser voted such Proxies, and a copy of any written response. |
Item 8. Portfolio Managers of Closed-End Management Investment Companies.
Jonathan DeSimone -- Mr. DeSimone joined Bain Capital Credit in 2002. He is a Managing Director, a Credit Committee member and the Chief Investment Officer of Bain Capital Credit’s Liquid Credit business including separate accounts and dedicated funds. He serves as the Portfolio Manager for the Bain Capital Senior Loan Fund, Bain Capital High Income Partnership and Bain Capital Credit’s separate accounts in liquid credit. Prior to his current role, Mr. DeSimone covered the Enterprise Services and Chemicals industries. In addition, he opened Bain Capital Credit’s London office and served as its head from 2005 to 2009. Previously, Mr. DeSimone was a Manager at Bain & Company where he worked in the firm’s Private Equity Practice performing strategic due diligence and post-acquisition strategy assessments. Mr. DeSimone received an M.B.A. from the Amos Tuck School of Business at Dartmouth College as an Edward Tuck Scholar with Highest Distinction and a B.A. from Georgetown University.
Andrew Carlino -- Mr. Carlino joined Bain Capital Credit in 2002. He is a Managing Director and Portfolio Manager in Liquid Credit. Prior to his current role, Mr. Carlino was responsible for investments in the Airlines, Aerospace & Defense, and Homebuilding & Building Product sectors. Previously, Mr. Carlino was a consultant for The Boston Consulting Group where he worked on engagements in the Healthcare, Software and Retail Banking sectors. He also spent five years in the US Air Force as an intelligence officer. Mr. Carlino received an M.B.A. from The University of Chicago Booth Graduate School of Business and a B.S. from the United States Air Force Academy.
Jonathan DeSimone and Andrew Carlino of the Sub-Adviser are the Fund’s portfolio managers. Messrs. DeSimone and Carlino have primary responsibility for management of the Fund’s investment portfolio and have served the Fund in this capacity since it commenced operations in 2017. Messrs. DeSimone and Carlino each receive a salary, retirement plan benefits and performance-based bonus from the Sub-Adviser or its affiliates. Because the Portfolio Managers may manage assets for other pooled investment vehicles and/or other accounts (including institutional clients, pension plans and certain high net worth individuals) (collectively “Client Accounts”), or may be affiliated with such Client Accounts, there may be an incentive to favor one Client Account over another, resulting in conflicts of interest. For example, the Sub-Adviser may, directly or indirectly, receive fees from Client Accounts that are higher than the fee it receives from the Fund, or it may, directly or indirectly, receive a performance-based fee on a Client Account. In those instances, a portfolio manager may have an incentive to not favor the Fund over the Client Accounts. The Sub-Adviser has adopted trade allocation and other policies and procedures that it believes are reasonably designed to address these and other conflicts of interest.
As of December 31, 2017, Messrs. DeSimone and Carlino are responsible for the management of the following types of accounts in addition to the Fund:
Mr. DeSimone
Other Accounts By Type | Total Number of Accounts by Account Type | Total Assets By Account Type | Number of Accounts by Type Subject to a Performance Fee | Total Assets By Account Type Subject to a Performance Fee |
| Registered Investment Companies | 2 | $172,854,160 | 0 | $0 |
| Other Pooled Investment Vehicles | 9 | $5,661,257,907 | 5 | $2,834,051,188 |
| Other Accounts | 22 | $7,067,242,151 | 7 | $1,395,835,892 |
Mr. Carlino
Other Accounts By Type | Total Number
of Accounts by Account Type | Total Assets By Account Type | Number of Accounts by Type Subject to a Performance Fee | Total Assets By Account Type Subject to a Performance Fee |
| Registered Investment Companies | 2 | $172,854,160 | 0 | $0 |
| Other Pooled Investment Vehicles | 6 | $3,213,129,511 | 5 | $2,834,051,188 |
| Other Accounts | 9 | $3,574,827,043 | 6 | $1,238,889,860 |
As of December 31, 2017, Messrs. DeSimone and Carlino owned no Fund shares.
Item 9. Purchases of Equity Securities by Closed-End Management Investment Company and Affiliates Purchasers.
Not applicable.
Item 10. Submission of Matters to a Vote of Security Holders.
The registrant has not adopted procedures by which shareholders may recommend nominees to the registrant’s Board of Trustees.
Item 11. Controls and Procedures.
| (a) | Based on an evaluation of the registrant’s disclosure controls and procedures (as defined in Rule 30a-3(c) under the 1940 Act), the registrant’s principal executive officer and principal financial officer have concluded that the registrant’s disclosure controls and procedures are effective as of a date within 90 days of the filing date of this report. |
| (b) | There were no significant changes in the registrant’s internal control over financial reporting that occurred during the registrant’s last fiscal half-year that have materially affected, or are reasonably likely to materially affect, the registrant’s internal control over financial reporting. |
Item 12. Disclosure of Securities Lending Activities for Closed-End Management Investment Companies.
Not applicable.
Item 13. Exhibits.
| (a)(1) | Registrant’s Financial Officer Code of Ethics is filed herewith as Exhibit 12(a)(1). |
| (a)(2) | Certifications required by Item 13(a)(2) of Form N-CSR are filed herewith as Exhibit 99.CERT. |
| | |
| (a)(3) | Not applicable to the registrant. |
| (b) | Certifications required by Item 13(b) of Form N-CSR are filed herewith as Exhibit 99.906CERT. |
SIGNATURES
Pursuant to the requirements of the Securities Exchange Act of 1934 and the Investment Company Act of 1940, the registrant has duly caused this report to be signed on its behalf by the undersigned, thereunto duly authorized.
| GRIFFIN INSTITUTIONAL ACCESS CREDIT FUND | |
| | | |
| By: | /s/ Kevin Shields | |
| | Kevin Shields | |
| | President (Principal Executive Officer) |
| | |
| Date: | March 7, 2018 |
Pursuant to the requirements of the Securities Exchange Act of 1934 and the Investment Company Act of 1940, this report has been signed below by the following persons on behalf of the registrant and in the capacities and on the dates indicated.
By (Signature and Title)
| By: | /s/ Kevin Shields | |
| | Kevin Shields | |
| | President (Principal Executive Officer) |
| | |
| Date: | March 7, 2018 |
By (Signature and Title)
| By: | /s/ Joseph Miller | |
| | Joseph Miller | |
| | Treasurer (Principal Financial Officer) |
| | |
| Date: | March 7, 2018 |