UNITED STATES
SECURITIES AND EXCHANGE COMMISSION
WASHINGTON, D.C. 20549
FORM N-CSR
CERTIFIED SHAREHOLDER REPORT OF REGISTERED
MANAGEMENT INVESTMENT COMPANIES
811-23159
(Investment Company Act file number)
Griffin Institutional Access Credit Fund
(Exact name of registrant as specified in charter)
Griffin Capital Plaza
1520 E. Grand Avenue
El Segundo, CA 90245
(Address of principal executive offices) (Zip code)
(310) 469.6100
(Registrant's telephone number, including area code)
ALPS Fund Services, Inc.
1290 Broadway, Suite 1000
Denver, CO 80203
(Name and address of agent for service)
Copy to:
Terrence O. Davis, Esq.
Greenberg Traurig, LLP
Terminus 200
3333 Piedmont Road, NE, Suite 2500
Atlanta, GA 30305
Date of fiscal year end:December 31
Date of reporting period:January 1, 2019 – December 31, 2019
Item 1. Reports to Stockholders.
ELECTRONIC REPORTS DISCLOSURE
Beginning on January 1, 2021, as permitted by regulations adopted by the Securities and Exchange Commission, paper copies of the Fund shareholder reports will no longer be sent by mail, unless you specifically request paper copies of the reports from the Fund or from your financial intermediary (such as a broker-dealer or bank). Instead, the reports will be made available on the Fund’s website (www.griffincapital.com), and you will be notified by mail each time a report is posted and provided with a website link to access the report. You may elect to receive all future reports in paper free of charge. If you invest through a financial intermediary, you can contact your financial intermediary to request that you continue to receive paper copies of your shareholder reports. If you invest directly with the Fund, you can call the Fund toll-free at 1-888-926-2688 or submit a signed letter of instruction requesting paper reports to Griffin Institutional Access Credit Fund, c/o DST Systems, Inc., 430 W 7th St, Kansas City, MO 64105-1407. Your election to receive reports in paper will apply to all funds held in your account if you invest through your financial intermediary or all funds held with the fund complex if you invest directly with a fund. If you already elected to receive shareholder reports electronically, you will not be affected by this change and you need not take any action. You may elect to receive shareholder reports and other communications from the Fund electronically anytime by contacting your financial intermediary or, if you invest directly with the Fund, by enrolling at www.griffincapital.com.
Table of Contents
| Shareholder Letter | 2 |
| Portfolio Update | 10 |
| Consolidated Schedule of Investments | 12 |
| Consolidated Statement of Assets and Liabilities | 36 |
| Consolidated Statement of Operations | 38 |
| Consolidated Statements of Changes in Net Assets | 39 |
| Consolidated Statement of Cash Flows | 41 |
| Consolidated Financial Highlights | 42 |
| Notes to Consolidated Financial Statements | 47 |
| Report of Independent Registered Public Accounting Firm | 62 |
| Dividend Reinvestment Policy | 63 |
| Additional Information | 64 |
| Trustees and Officers | 65 |
| Service Providers | 68 |
| Privacy Notice | 69 |
Dear Fellow Shareholders,
We are pleased to present the annual report for Griffin Institutional Access® Credit Fund (the “Fund”). We greatly appreciate the support of our shareholders and will remain true to our stated investment objective of generating a return comprised of both current income and capital appreciation with low volatility and low correlation to the broader markets. From the Fund’s inception on April 3, 2017 through December 31, 2019, the Fund’s Class I shares (NASDAQ: CRDIX) generated a(n):
| ● | 11.00% total return in 20191 |
| ● | Total cumulative return of 16.87% and a 5.83% annualized return1 |
| ● | Standard Deviation of 2.89%1 |
The Fund’s sub-adviser—BCSF Advisors, LP, an affiliate of Bain Capital Credit, LP—has continued to construct a well-diversified alternative credit portfolio. The portfolio composition is ultimately determined through both fundamental quantitative and qualitative analysis to determine the optimal mix of securities across global markets with the potential to deliver strong risk-adjusted returns for investors.
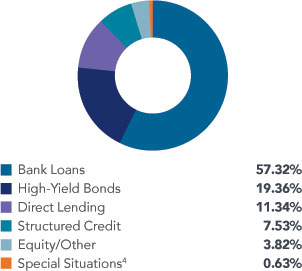
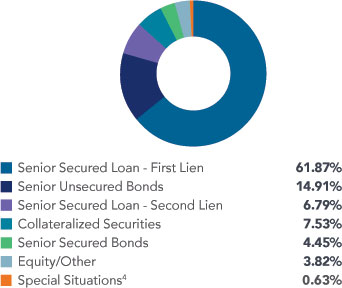
GRIFFIN INSTITUTIONAL ACCESS CREDIT FUND PORTFOLIO DIVERSIFICATION AS OF DECEMBER 31, 2019
| Floating Rate Assets2:79.23% | | Fixed Rate Assets2:20.77% |
| | | |
| | | |
| Sector Analysis3 | | Asset Type3 |
| | | |
 | |  |
Past performance is not a guarantee of future results.
2
Investment Performance
The Fund delivered strong absolute returns in 2019, driven by a wide range of asset types and industries. The largest contributors to performance during the year by asset type were bank loans5 and high-yield bonds, and to a lesser extent, structured credit. The structured credit contribution was split equally between collateralized loan obligation (CLO) debt and equity. Additionally, within the loan category, private debt was a contributor to performance during the year. By industry, our exposure to Aerospace & Defense was additive to returns, while Metals & Mining detracted from performance in the year.6
Since our inception, active management has been a critical factor in delivering strong risk-adjusted returns to our investors. During 2019, the Fund rotated its position in order to capitalize on relative value opportunities within credit markets across the globe. We reduced our exposure to high yield bonds in the second half of 2019 amidst the substantial outperformance of these securities. From a credit quality perspective, we continue to focus on the B-rated credit market, which has traded at a discount and presents what we view as interesting idiosyncratic credit opportunities. Additionally, we believe that the lack of demand for companies that were subject to negative news or reported weak earnings may provide attractive entry points.
Within structured credit, the Fund added to CLO debt throughout 2019, particularly in mezzanine tranches that were trading at what we believed to be attractive pricing. Towards the end of 2019, we began to trim a portion of these mezzanine holdings as the market started to recover. We have maintained our CLO equity position, though we are making occasional rotations in favor of the new issue market over existing shorter duration equity exposure.
Over the year, we gradually grew our direct lending exposure and remain focused on lending to high-quality businesses in less cyclical industries where we can extend senior secured financing at a spread premium relative to syndicated loan markets.
Market Overview and Outlook7
Economic growth in the US has been slow and steady. We observe that historically, in a low growth environment, high-yield bonds and loans have outperformed equities and as such we believe it is a good time to be invested in high-yield credit. We also believe valuations are reasonably attractive across credit markets, especially given pricing and low yields in the equity and investment grade bond sectors. While there are certainly market indicators suggesting we are late in the credit cycle, market fundamentals remain generally healthy and we do not anticipate rapidly increasing defaults. That being said, we feel that volatility will likely continue in the near to medium term, especially given that 2020 is an election year. In our view, it is not the time to chase yield or to overweight illiquid assets.
3
During 2019, credit markets witnessed unprecedented market behavior as the historical relationships between various securities showed uncharacteristic movements. High-yield credit performed exceedingly well with the S&P/LSTA Leveraged Loan Index and the ICE Bank of America Merrill Lynch High Yield Index up 8.6% and 14.4%, respectively. This performance would suggest a risk-on market sentiment, however the underlying story was quite the opposite. Investors generally favored the high-quality portion of the high yield market, i.e. BB-rated loans and bonds – and shunned lower rated CCC assets. Higher-quality BB bond returns significantly outperformed lower rated CCC assets, quite contrary to a risk-on market sentiment. CLOs, which generally invest in syndicated, secured loans, declined in price throughout most of the year while the S&P/LSTA Leveraged Loan Index was up over 8% in 2019. At the same time, Treasury yields collapsed as market participants sought safety. Needless to say, 2019 was a unique year which presented both opportunities and challenges for investors.
Given the current market backdrop, sector diversification and dynamic asset allocation will be key in delivering attractive risk-adjusted returns. Moving forward, we believe that some of the portfolio themes we implemented throughout the year within loans and bonds as well structured credit may continue to produce positive results. For example, discounted loans and bonds received a strong bid towards the end of the year and early in 2020. We believe selective value remains in the loan market, most notably in the B-rated debt segment. Also, the Fund has been underweight to the BB-rated debt segment of the market as we believe this segment could exhibit increased volatility during periods of stress. While B-rated debt is not immune to the same risks, we believe better value can be found in the B-rated debt segment of the market. Further, within structured credit, CLO debt which has been a consistent and growing position within the Fund, lagged the broader credit markets through most of 2019 but retraced some losses in November and December. CLO equity remains a key position in the portfolio and continues to offer double digit distribution yields and upside convexity.
We are pleased with the growth of the Fund as well as our current portfolio positioning. We believe that our ability to actively manage the portfolio across credit sectors and markets will allow us to provide value to our shareholders.
Thank you for your investment in and continued support of Griffin Institutional Access Credit Fund.
Sincerely,

Randy I. Anderson, Ph.D., CRE
President, Griffin Capital Asset Management Company, LLC
Founding Partner, Griffin Institutional Access Credit Fund
Griffin Institutional Access Credit Fund (the “Fund”) is a closed-end interval fund. Limited liquidity is provided to shareholders only through the Fund’s quarterly repurchase offers for no less than 5% and no more than 25% of the Fund’s shares outstanding at net asset value. The Fund is suitable only for investors who can bear the risks associated with the limited liquidity of the Fund and should be viewed as a long-term investment. There is no secondary market for the Fund’s shares and none is expected to develop.
4
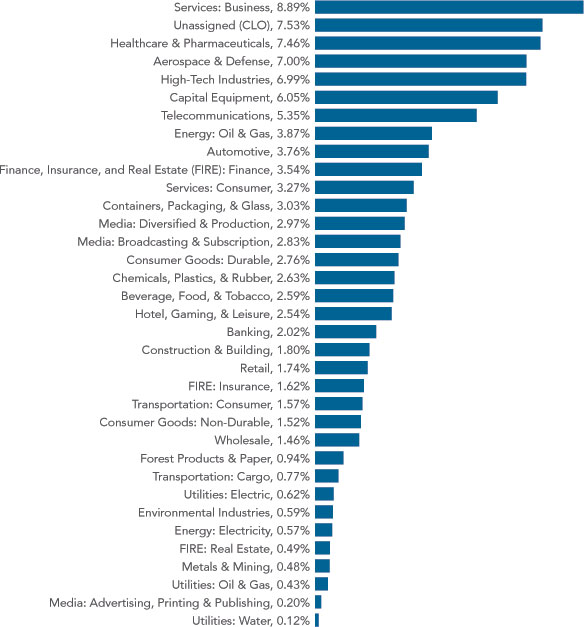
Industry Diversification3, 6
Geography3
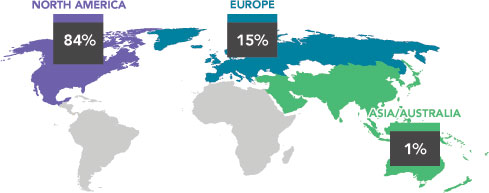
5
FUND SUB-ADVISER (UNAUDITED)
| BCSF Advisors, LP | |  |
Griffin Institutional Access Credit Fund is sub-advised by BCSF Advisors, LP, an SEC-registered investment adviser and affiliate of Bain Capital Credit, LP.
Bain Capital Credit, LP provides ongoing research, opinions and recommendations regarding the Fund’s investment portfolio. Bain Capital Credit was formed in 1998 as the credit investing arm of Bain Capital, one of the world’s premier alternative investment firms, with approximately $105 billion in assets under management.8 Bain Capital Credit invests across the full spectrum of credit strategies, including leveraged loans, high-yield bonds, distressed debt, direct lending, structured products, non-performing loans and equities. With offices in Boston, Chicago, New York, London, Dublin, Madrid, Hong Kong, Guangzhou, Seoul, Mumbai,9 Melbourne and Sydney, Bain Capital Credit has a global footprint with approximately $44 billion10 in assets under management.
ENDNOTES
| 1. | Data source: Morningstar Direct for the period of 4/3/17 – 12/31/19. Performance reflects the Fund’s Class I share (NASDAQ: CRDIX) and the reinvestment of dividends or other distributions. Performance information presented herein may differ from the Fund’s financial highlights prepared in accordance with U.S. GAAP. The S&P 500 is generally representative of the broad market and as such is used as a calculation benchmark for alpha and beta. A glossary of terms and indices can be found on page 7. |
| 2. | Based on the Fund’s total market value exposure to debt securities including exposure to debt securities gained through the Fund’s use of total return swaps. |
| 3. | Based on the Fund’s total market value exposure including exposure gained through the Fund’s use of total return swaps. |
| 4. | Previously referred to “Special Situations” as “Non-Performing Loans.” |
| 5. | The Fund gains exposure to bank loans directly and through its use of total return swaps. Total return swaps effectively add leverage to the Fund’s portfolio by providing investment exposure to underlying reference assets without owning or taking physical custody of such assets. The Fund bears the risk of changes in value in the underlying reference assets. |
| 6. | Based on Moody’s 35 Industry Categories (“Moody’s 35”). |
| 7. | Data as of December 31, 2019. Source: J.P. Morgan, unless otherwise noted. Performance represents ICE Bank of America Merrill Lynch US High Yield Index (“BAML”) for bonds and S&P/LSTA Leveraged Loan Index (“LSTA”) for loans. |
| 8. | Firm-level assets under management (AUM) for Bain Capital is estimated and is presented as of June 30, 2019. |
| 9. | Individuals in the Mumbai office are employed by IndiaRF, a joint venture between Bain Capital Credit, LP and Piramal Enterprises Ltd. |
| 10. | AUM estimated as of January 2, 2020. Bain Capital Credit’s assets under management includes its subsidiaries and credit vehicles managed by its Alternative Investment Fund Managers (AIFM) affiliate. |
6
GLOSSARY (UNAUDITED)
Alpha:A measure of risk-adjusted return implying how much a fund/manager outperformed its benchmark, given its risk profile. The S&P 500 is used as the benchmark for alpha in this report.
Annualized Return:Calculated by annualizing cumulative return (i.e., adjusting it for a period of one year). Annualized return includes capital appreciation and assumes a reinvestment of dividends and distributions.
Beta:A measure of systematic risk (volatility), or the sensitivity of a fund to movements in a benchmark. A beta of 1 implies that you can expect the movement of a fund’s return series to match that of the benchmark used to measure beta. A value of less than 1 implies that the fund is less volatile than the index. The S&P 500 is used as the benchmark for beta in this report.
Bond:A debt instrument, also considered a loan, that an investor makes to a corporation, government, federal agency or other organization (known as an issuer) in which the issuer typically agrees to pay the owner the amount of the face value of the bond on a future date, and to pay interest at a specified rate at regular intervals.
Collateralized Loan Obligation (CLO): A security backed by a pool of commercial or personal loans, structured so there are several classes of bondholders with varying maturities, called tranches.
CLO Equity: A tranche in the CLO structure with ownership interest.
Convexity:Measure of the curvature in the relationship between bond prices and bond yields that demonstrates how the duration of a bond changes as the interest rate changes.
Correlation:A statistical measure of how two securities move in relation to each other. A correlation ranges from -1 to 1. A positive correlation of 1 implies that as one security moves, either up or down, the other security will move in lockstep, in the same direction. A negative correlation of -1 indicates that the securities have moved in the opposite direction. If the correlation is 0, the movements of the securities are said to have no correlation; they are completely random.
Cumulative Return: The compound return of an investment. It includes capital appreciation and assumes a reinvestment of dividends and distributions.
High-Yield Bond: A bond issued by an issuer that is considered a credit risk by a Nationally Recognized Statistical Rating Organization, as indicated by a low bond rating (e.g., “Ba” or lower by Moody’s Investors Services, or “BB” or below by Standard & Poor’s Corporation). Because of this risk, a high-yield bond generally pays a higher return (yield) than a bond with an issuer that carries lower default risk. Also known as a “junk” bond.
ICE Bank of America Merrill Lynch US High Yield Index: Tracks the performance of US dollar denominated below investment grade corporate debt publicly issued in the US domestic market.
London Interbank Offered Rate (LIBOR): Benchmark interest rate index used to make adjustments to variable-rate loans. LIBOR is used by world banks when charging each other for short-term loans.
S&P/LSTA Leveraged Loan Index (LSTA): A daily total return index that uses mark-to-market pricing to calculate market value change. It tracks, on a real-time basis, the current outstanding balance and spread over LIBOR for fully funded term loans. The facilities included in the LSTA represent a broad cross section of leveraged loans syndicated in the United States, including dollar-denominated loans to overseas issuers.
Secured Loan: A loan that is backed or secured by collateral, which reduces the risk associated with the loan.
Sharpe Ratio: Measures risk-adjusted returns by calculating the excess return (above the risk free rate) per unit of risk (standard deviation). The higher the ratio, the better the risk-adjusted returns. The average 3 month U.S. Treasury T-bill auction was used as the risk free rate in this material.
Standard Deviation: Measures the average deviations of a return series from its mean, and is often used as a measure of volatility/risk. A large standard deviation implies that there have been large swings in the return series of the manager.
7
IMPORTANT DISCLOSURES (UNAUDITED)
This is neither an offer to sell nor a solicitation to purchase any security. Investors should carefully consider the investment objectives, risks, charges and expenses of Griffin Institutional Access Credit Fund (the “Fund”). This and other important information about the Fund is contained in the prospectus, which can be obtained by contacting your financial advisor or visiting www.griffincapital.com. Please read the prospectus carefully before investing.
All Morningstar calculations and metrics are based on monthly data. Performance reflects management fees and other expenses. Performance uses the Class I share (NASDAQ: CRDIX) of Griffin Institutional Access Credit Fund. Investors of the Class I share do not pay a front-end sales charge/load.
Past performance is not a guarantee of future results. Investing in the Fund involves risks, including the risk that you may receive little or no return on your investment or that you may lose part or all of your investment. The ability of the Fund to achieve its investment objective depends, in part, on the ability of the Adviser to allocate effectively the assets of the Fund among the various securities and investments in which the Fund invests. There can be no assurance that the actual allocations will be effective in achieving the Fund’s investment objective or delivering positive returns. The investment return and principal value of an investment will fluctuate so that an investor’s shares, when redeemed, may be worth more or less than the original cost. Current performance may be lower or higher than the performance quoted. The most recent performance is available at www.griffincapital.com or by calling 888.926.2688.
The Fund is a closed-end interval fund, the shares have no history of public trading, nor is it intended that the shares will be listed on a public exchange at this time. No secondary market is expected to develop for the Fund’s shares. Limited liquidity is provided to shareholders only through the Fund’s quarterly repurchase offers for no less than 5% and no more than 25% of the Fund’s shares outstanding at net asset value. There is no guarantee that an investor will be able to sell all the shares that the investor desires to sell in the repurchase offer. The investment return and principal value of an investment will fluctuate so that an investor’s shares, when redeemed, may be worth more or less than the original cost. Due to these restrictions, an investor should consider an investment in the Fund to be of limited liquidity. The Fund is suitable only for investors who can bear the risks associated with the limited liquidity of the Fund and should be viewed as a long-term investment. Investing in the Fund is speculative and involves a high degree of risk, including the risks associated with leverage and the risk of a substantial loss of investment. There is no guarantee that the investment strategies will work under all market conditions.
The Fund’s inception date was April 3, 2017. Per the Fund’s prospectus dated November 15, 2019, the total annual expense ratio is 2.67% for Class I. Performance data quoted represents past performance. Past performance is no guarantee of future results and investment returns and principal value of the Fund will fluctuate so that shares, when redeemed, may be worth more or less than their original cost. Current performance may be lower or higher than performance data quoted. The Adviser and Fund have entered into an expense limitation agreement until at least November 15, 2020 under which the Adviser has contractually agreed to waive its fees and to pay or absorb the ordinary annual operating expenses of the Fund (including offering expenses, but excluding taxes, interest, brokerage commissions, acquired fund fees and expenses and extraordinary expenses) to the extent that they exceed 2.35% for Class I, subject to possible recoupment from the Fund in future years. Separate of the expense limitation agreement, commencing on August 26, 2019, the Adviser voluntarily absorbs Fund expenses in excess of 1.25% and will continue to bear such expenses on a going forward basis in its discretion and is under no obligation to continue to do so for any specified period of time. Prior to August 26, 2019 and since the commencement of the operations of the Fund, the Adviser has borne all of the operating expenses of the Fund and waived its entire management fee. Without the waiver the expenses would have been higher. Fund returns would have been lower had expenses, such as management fees, not been waived during the period. The Fund return does not reflect the deduction of all fees and if the Fund return reflected the deduction of such fees, the performance would be lower.
Investors in the Fund should understand that the net asset value (“NAV”) of the Fund will fluctuate, which may result in a loss of the principal amount invested. The Fund’s investments may be negatively affected by the broad investment environment and capital markets in which the Fund invests, including the real estate market, the debt market and/or the equity securities market. The value of the Fund’s investments will increase or decrease based on changes in the prices of the investments it holds. This will cause the value of the Fund’s shares to increase or decrease. The Fund is “non-diversified” under the Investment Company Act of 1940 since changes in the financial condition or market value of a single issuer may cause a greater fluctuation in the Fund’s net asset value than in a “diversified” fund. Diversification does not eliminate the risk of experiencing investment losses. Holdings are subject to change without notice. The Fund is not intended to be a complete investment program.
When the Fund invests in debt securities, the value of your investment in the Fund will fluctuate with changes in interest rates. There is a risk that debt issuers will not make payments, resulting in losses to the Fund. The Adviser’s judgments about the attractiveness, value and potential appreciation of a particular sector and securities in which the Fund invests may prove to be incorrect and may not produce the desired results. Foreign investing involves special risks such as currency fluctuations and political uncertainty. The Fund’s use of derivative instruments involves risks different from, or possibly greater than, the risks associated with investing directly in securities and other traditional investments. Derivatives may involve certain costs and risks such as liquidity, interest rate, market, credit, management and pricing risk (i.e., derivatives may be difficult to value). Derivatives may also be leveraged and subject to counterparty risk (e.g., the risk of a counterparty’s defaulting on the obligation or bankruptcy).
8
Investing in derivatives could substantially increase the impact of adverse price movements on the Fund’s portfolio. Derivatives are also subject to non-correlation risk because they may not be perfect substitutes for the instruments they are intended to hedge or replace. It may not be possible for the Fund to liquidate a derivative position at an advantageous time or price, which may result in significant losses. These investments give the Fund investment exposure that is greater than the investment amount. There is no guarantee that the Fund’s leverage strategy will be successful.
The Fund’s distribution policy is to make quarterly distributions to shareholders. The Fund intends to declare and pay distributions from its net investment income, however, the amount of distributions that the Fund may pay, if any, is uncertain. Shareholders should not assume that the source of a distribution from the Fund is net profit. All or a portion of a distribution may consist of a return of capital (i.e. from your original investment) and not a return of net profit. Historically, distributions have not included return of capital. Please refer to the Fund’s most recent Section 19(a) notice, if applicable, at www.griffincapital.com or the Fund’s semi-annual or annual reports filed with the U.S. Securities and Exchange Commission (the “SEC”) for the sources of distributions. The Fund’s distributions may be affected by numerous factors, including but not limited to changes in realized and projected market returns, fluctuations in market interest rates, Fund performance, and other factors. There can be no assurance that a change in market conditions or other factors will not result in a change in the Fund’s distribution rate or that the rate will be sustainable in the future. The Fund intends to distribute as of the last business day of each quarter. Distributions are not guaranteed.
The Fund is advised by Griffin Capital Credit Advisor, LLC (“GCCA”). GCCA is registered as an investment adviser with the SEC pursuant to the provisions of the Investment Advisers Act of 1940, as amended (the “Advisers Act”). GCCA is an indirect majority-owned subsidiary of Griffin Capital Company, LLC. The Fund is sub-advised by BCSF Advisors, LP (“BCSF”). BCSF is registered as an investment adviser with the SEC pursuant to the provisions of the Advisers Act. BCSF is an affiliate of Bain Capital Credit, LP. Registration with the SEC does not constitute an endorsement by the SEC nor does it imply a certain level of skill or training.
This annual report may contain certain forward-looking statements. Such forward-looking statements can generally be identified by our use of forward-looking terminology such as “may,” “will,” “expect,” “intend,” “anticipate,” “estimate,” “believe,” “continue,” or other similar words. Because such statements include risks, uncertainties and contingencies, actual results may differ materially from the expectations, intentions, beliefs, plans or predictions of the future expressed or implied by such forward-looking statements. These risks, uncertainties and contingencies include, but are not limited to: uncertainties relating to changes in general economic, credit and real estate conditions; uncertainties relating to the implementation of our investment strategy; uncertainties relating to capital proceeds; and other risk factors as outlined in our prospectus, annual report and semi-annual report filed with the SEC.
This material has been distributed for informational purposes only and should not be considered as investment advice or a recommendation of any particular security, strategy or investment product or be relied upon for any other purpose. Information contained herein has been obtained from sources deemed to be reliable, but not guaranteed. This material represents views as of the date of this publication and is subject to change without notice of any kind. Griffin Capital does not accept any liability for losses either direct or consequential caused by the use of this information.
9
| Griffin Institutional Access Credit Fund | Portfolio Update |
December 31, 2019 (Unaudited)
Performance(for the period ended December 31, 2019)
| | 6 Month | 1 Year | Since Inception**** | Inception |
| Griffin Institutional Access Credit Fund - A - With Load* | -2.62% | 4.68% | 3.62% | 4/3/17 |
| Griffin Institutional Access Credit Fund - A - Without Load | 3.31% | 11.04% | 5.88% | 4/3/17 |
| Griffin Institutional Access Credit Fund - C - With Load** | 2.31% | 10.04% | 5.88% | 4/3/17 |
| Griffin Institutional Access Credit Fund - C - Without Load | 3.31% | 11.04% | 5.88% | 4/3/17 |
| Griffin Institutional Access Credit Fund - I - NAV | 3.31% | 11.04% | 5.89% | 4/3/17 |
| Griffin Institutional Access Credit Fund - L - With Load*** | -1.08% | 6.31% | 3.91% | 9/5/17 |
| Griffin Institutional Access Credit Fund - L - Without Load | 3.32% | 11.05% | 5.87% | 9/5/17 |
| Griffin Institutional Access Credit Fund - F - NAV | 3.30% | 11.06% | 5.81% | 9/25/17 |
| S&P/LSTA Leveraged Loan Index | 2.74% | 8.64% | 4.31% | 4/3/17 |
| * | Adjusted for initial maximum sales charge of 5.75%. |
| ** | Adjusted for contingent deferred sales charge of 1.00%. |
| *** | Adjusted for initial maximum sales charge of 4.25% |
| **** | Annualized |
The S&P/LSTA Leveraged Loan Index is a capitalization-weighted syndicated loan index based upon market weightings, spreads and interest payments. The S&P/LSTA Leveraged Loan Index covers the U.S. market back to 1997 and currently calculates on a daily basis.
Indexes are not actively managed and do not reflect deduction of fees, expenses or taxes. An investor cannot invest directly into an index.
The returns shown above do not reflect the deduction of taxes a shareholder would pay on Fund distributions or redemption of Fund shares.
The performance data quoted above represents past performance. Past performance is not a guarantee of future results. Investment return and value of the Fund shares will fluctuate so that an investor’s shares, when sold or redeemed, may be worth more or less than their original cost. Performance may be lower or higher than performance data quoted. Fund performance current to the most recent month-end is available by calling 1-888-926-2688 or by visiting www.griffincapital.com.
Class A shares are offered subject to a maximum sales charge of 5.75% of the offering price and Class L shares are offered subject to a maximum sales charge of 4.25% of the offering price. Class C, Class I and Class F shares are offered at net asset value per share. Class C shares may be subject to a 1.00% contingent deferred sales charge on shares redeemed during the first 365 days after their purchase. The Adviser and the Fund have entered into an expense limitation and reimbursement agreement (the “Expense Limitation Agreement”) under which the Adviser has agreed contractually to waive its fees and to pay or absorb the ordinary annual operating expenses of the Fund (including offering expenses, but excluding taxes, interest, brokerage commissions, acquired fund fees and expenses and extraordinary expenses) at least through November 15, 2020, so that the total annual operating expenses of the Fund do not exceed 2.60% per annum of Class A average daily net assets, 3.35% per annum of Class C average daily net assets, 2.35% per annum of Class I average daily net assets, 2.85% per annum of Class L average daily net assets and 1.85% per annum of Class F average daily net assets (the “Expense Limitations”). The agreement can be extended at the discretion of the Adviser and the Trustees. Without the waiver, the expenses would be 2.93%, 3.67%, 2.67%, 3.16%, and 2.66% for Class A, Class C, Class I, Class L and Class F, respectively per the Fund’s most recent prospectus. In consideration of the Adviser’s agreement to limit the Fund’s expenses, the Fund has agreed to repay the Adviser in the amount of any fees waived and Fund expenses paid or absorbed, subject to the limitations that: (1) the reimbursement for fees and expenses will be made only if payable not more than three years from the date such expenses were incurred; and (2) the reimbursement may not be made if it would cause the lesser of the Expense Limitations in place at the time of waiver or at the time of reimbursement to be exceeded. Fees waived and Fund expenses paid or absorbed with respect to Class F assets will not be repaid or reimbursed. In addition to the Expense Limitation Agreement described above, the Adviser voluntarily has waived or absorbed all of the operating expenses of the Fund since the commencement of the Fund’s operations. The Adviser will continue to bear such expenses on a going forward basis in its discretion and is under no obligation to continue to do so for any specified period of time. Operating expenses absorbed by the Adviser during this voluntary period will be permanently waived. In the absence of the election by the Adviser to bear all of the Fund’s operating expenses, the performance of the Fund would have been reduced. Please review the Fund’s Prospectus for more details regarding the Fund’s fees and expenses. No assurances can be given that the Fund will pay a distribution in the future; or, if any such distribution is paid, the amount or rate of the distribution.
| 10 | 1.888.926.2688 | www.griffincapital.com |
| Griffin Institutional Access Credit Fund | Portfolio Update |
December 31, 2019 (Unaudited)
Performance of $10,000 Initial Investment(for the period ended December 31, 2019)

The graph shown above represents historical performance of a hypothetical investment of $10,000 in the Class A Shares of the Fund since inception. Past performance does not guarantee future results. All returns reflect reinvested dividends, but do not reflect the deduction of taxes that a shareholder would pay on Fund distributions or the redemption of Fund shares.
| Annual Report | December 31, 2019 | 11 |
| Griffin Institutional Access Credit Fund | Consolidated Schedule of Investments |
December 31, 2019
| Description | | Country | | Spread
Above Index | | Rate | | Maturity
Date | | Principal
Amount | | Value
(Note 2)(a) | |
| BANK LOANS (52.60%)(b) | | | | | | | | | | | | | | | |
| | | | | | | | | | | | | | | | |
| AEROSPACE & DEFENSE (4.33%) | | | | | | | | | | | | | |
| Air Comm Corp. LLC Term Loan(c) | | United States | | 3M US L + 6.50% | | 8.45 | % | | 07/01/25 | | $ | 1,710,393 | | $ | 1,697,575 | |
| Bleriot US Bidco, Inc., First Lien B Term Loan | | United States | | 3M US L + 4.75% | | 6.69 | % | | 10/31/26 | | | 373,308 | | | 377,507 | |
| Bleriot US Bidco, Inc., First Lien Delayed Draw Term Loan(d) | | United States | | L + 4.75% | | | | 11/01/26 | | | 58,329 | | | 58,986 | |
| Bleriot US Bidco, Inc., Second Lien Initial Term Loan(c) | | United States | | 3M US L + 8.50% | | 10.44 | % | | 10/31/27 | | | 198,113 | | | 200,590 | |
| Ducommun, Inc., First Lien B Term Loan | | United States | | 3M US L + 4.00% | | 5.91 | % | | 11/21/25 | | | 265,642 | | | 266,472 | |
| Dynasty Acquisition Co., Inc., First Lien Initial B-1 Term Loan | | United States | | 3M US L + 4.00% | | 5.94 | % | | 04/06/26 | | | 537,025 | | | 541,429 | |
| Excelitas Technologies Corp., First Lien 2019 Additional USD Term Loan(c) | | United States | | 3M US L + 3.50% | | 5.44 | % | | 12/02/24 | | | 357,277 | | | 353,704 | |
| Excelitas Technologies Corp., First Lien Initial Euro Term Loan(c) | | United States | | 3M EUR L + 3.50% | | 3.50 | % | | 12/02/24 | | € | 22,368 | | | 24,746 | |
| Excelitas Technologies Corp., First Lien Initial USD Term Loan | | United States | | 3M US L + 3.50% | | 5.44 | % | | 12/02/24 | | $ | 374,905 | | | 374,672 | |
| Excelitas Technologies Corp., Second Lien Initial Term Loan | | United States | | 3M US L + 7.50% | | 9.59 | % | | 12/01/25 | | | 1,143,183 | | | 1,108,887 | |
| Forming Machining Industries Holdings LLC, First Lien Initial Term Loan(c) | | United States | | 3M US L + 4.00% | | 5.94 | % | | 10/09/25 | | | 694,096 | | | 673,273 | |
| Forming Machining Industries Holdings LLC, Second Lien Initial Term Loan(c) | | United States | | 3M US L + 8.25% | | 10.19 | % | | 10/09/26 | | | 310,000 | | | 297,600 | |
| Jazz Acquisition, Inc., First Lien Initial Term Loan | | United States | | 3M US L + 4.25% | | 6.19 | % | | 06/19/26 | | | 538,140 | | | 532,982 | |
| Jazz Acquisition, Inc., Second Lien Initial Term Loan(c) | | United States | | 3M US L + 8.00% | | 9.94 | % | | 06/18/27 | | | 1,058,702 | | | 1,021,647 | |
| Kellstrom Commercial Aerospace, Inc. - Delayed Draw Term Loan(c)(d) | | United States | | L + 5.00% | | | | 07/01/25 | | | 260,146 | | | 254,943 | |
| Kellstrom Commercial Aerospace, Inc. - Initial Term Loan(c) | | United States | | 3M US L + 5.00% | | 7.10 | % | | 07/01/25 | | | 2,306,631 | | | 2,254,833 | |
| Kellstrom Commercial Aerospace, Inc. - Revolver(c)(d) | | United States | | 3M US L + 5.00% | | 8.28 | % | | 07/01/25 | | | 433,577 | | | 424,905 | |
| MHI Holdings LLC, First Lien Initial Term Loan | | United States | | 1M US L + 5.00% | | 6.80 | % | | 09/21/26 | | | 1,011,139 | | | 1,014,930 | |
| Nordam Group LLC, First Lien Initial Term Loan(c) | | United States | | 1M US L + 5.50% | | 7.25 | % | | 04/09/26 | | | 1,122,790 | | | 1,121,386 | |
| Standard Aero Limited, First Lien Initial B-2 Term Loan | | United States | | 3M US L + 4.00% | | 5.94 | % | | 04/06/26 | | | 288,723 | | | 291,091 | |
| Turbocombustor Technology, Inc., First Lien Initial Term Loan | | United States | | 1M US L + 4.50% | | 6.30 | % | | 12/02/20 | | | 1,429,882 | | | 1,397,709 | |
| Vectra Co., First Lien Initial Term Loan | | United States | | 1M US L + 3.25% | | 5.05 | % | | 03/08/25 | | | 240,567 | | | 239,139 | |
| Wheels Up Partners LLC, First Lien Class A Notes Term Loan(c) | | United States | | 3M US L + 6.50% | | 8.41 | % | | 03/01/24 | | | 301,751 | | | 301,751 | |
| WP CPP Holdings LLC, First Lien Initial Term Loan | | United States | | 3M US L + 3.75% | | 5.68 | % | | 04/30/25 | | | 1,160,934 | | | 1,155,130 | |
| WP CPP Holdings LLC, Second Lien Initial Term Loan | | United States | | 3M US L + 7.75% | | 9.68 | % | | 04/30/26 | | | 623,597 | | | 616,195 | |
| | | | | | | | | | | | | | | 16,602,082 | |
| AUTOMOTIVE (2.36%) | | | | | | | | | | | | | | | |
| Commercial Vehicle Group, Inc., First Lien Initial Term Loan(c) | | United States | | 1M US L + 6.00% | | 7.80 | % | | 04/12/23 | | | 234,159 | | | 235,623 | |
See Notes to Consolidated Financial Statements.
| 12 | 1.888.926.2688 | www.griffincapital.com |
| Griffin Institutional Access Credit Fund | Consolidated Schedule of Investments |
December 31, 2019
| Description | | Country | | Spread
Above Index | | Rate | | | Maturity
Date | | Principal
Amount | | Value
(Note 2)(a) | |
| AUTOMOTIVE (continued) | | | | | | | | | | | | | | | | |
| CST Buyer Co, First Lien Tranche B Term Loan(c) | | United States | | 1M US L + 5.75% | | 7.55 | % | | 10/03/25 | | $ | 5,003,942 | | $ | 5,003,942 | |
| CST Buyer Co, Revolving Credit Facility Term Loan(c)(d) | | United States | | L + 0.50% | | | | | 10/03/25 | | | 233,472 | | | 233,472 | |
| Mavis Tire Express Services Corp., First Lien Closing Date Term Loan(e) | | United States | | 1M US L + 3.25% | | 5.05 | % | | 03/20/25 | | | 671,851 | | | 656,734 | |
| Mavis Tire Express Services Corp., First Lien Delayed Draw Term Loan(d)(e) | | United States | | 1M US L + 3.25% | | 3.46 | % | | 03/20/25 | | | 85,511 | | | 83,587 | |
| Midas Intermediate Holdco II LLC, First Lien 2017 Refinancing Term Loan(e) | | United States | | 3M US L + 2.75% | | 4.70 | % | | 08/18/21 | | | 924,995 | | | 912,660 | |
| OEConnection LLC, First Lien Delayed Draw Term Loan(c)(d) | | United States | | L + 2.00% | | | | | 09/25/26 | | | 29,131 | | | 29,313 | |
| OEConnection LLC, First Lien Initial Term Loan(c) | | United States | | 3M US L + 4.00% | | 5.80 | % | | 09/25/26 | | | 306,560 | | | 308,476 | |
| Project Boost Purchaser LLC, First Lien Term Loan(e) | | United States | | L + 3.50% | | | | | 06/01/26 | | | 544,662 | | | 547,982 | |
| Project Boost Purchaser LLC, Second Lien Term Loan(c)(e) | | United States | | L + 8.00% | | | | | 05/31/27 | | | 448,768 | | | 447,646 | |
| Thor Industries, Inc., First Lien Initial Euro Term Loan | | United States | | 1M EUR + 4.00% | | 4.00 | % | | 02/01/26 | | € | 223,953 | | | 252,675 | |
| Thor Industries, Inc., First Lien Initial USD Term Loan(c) | | United States | | 1M US L + 3.75% | | 5.50 | % | | 02/01/26 | | $ | 321,505 | | | 323,113 | |
| | | | | | | | | | | | | | | | 9,035,223 | |
| BANKING (0.06%) | | | | | | | | | | | | | | | | |
| TNS, Inc., First Lien Initial Term Loan(c) | | United States | | 3M US L + 4.00% | | 5.93 | % | | 08/14/22 | | | 242,179 | | | 235,822 | |
| | | | | | | | | | | | | | | | | |
| BEVERAGE, FOOD, & TOBACCO (1.38%) | | | | | | | | | | | | | | | | |
| Advantage Sales & Marketing, Inc., First Lien Initial Term Loan | | United States | | 1M US L + 3.25% | | 5.05 | % | | 07/23/21 | | | 365,360 | | | 354,810 | |
| Carrols Restaurant Group, Inc., First Lien Initial Term Loan(e) | | United States | | L + 3.25% | | | | | 04/30/26 | | | 321,719 | | | 317,731 | |
| H-Food Holdings LLC, First Lien Initial Term Loan | | United States | | 1M US L + 3.69% | | 5.49 | % | | 05/23/25 | | | 794,801 | | | 789,237 | |
| K-Mac Holdings Corp., Second Lien Initial Term Loan | | United States | | 1M US L + 6.75% | | 8.55 | % | | 03/16/26 | | | 2,255,780 | | | 2,198,258 | |
| NPC International, Inc., Second Lien Initial Term Loan | | United States | | 3M US L + 7.50% | | 9.43 | % | | 04/18/25 | | | 250,000 | | | 30,066 | |
| Quidditch Acquisition, Inc., First Lien B Term Loan(c) | | United States | | 1M US L + 7.00% | | 8.80 | % | | 03/21/25 | | | 1,577,523 | | | 1,593,298 | |
| | | | | | | | | | | | | | | | 5,283,400 | |
| CAPITAL EQUIPMENT (4.62%) | | | | | | | | | | | | | | | | |
| 10945048 Canada, Inc., Second Lien Term Loan(c) | | Canada | | 3M CDOR + 8.25% | | 10.27 | % | | 09/21/26 | | CAD | 3,020,000 | | | 2,279,158 | |
| ASP Unifrax Holdings, Inc., First Lien EUR Term Loan | | United States | | 3M EUR L + 3.75% | | 3.75 | % | | 12/12/25 | | € | 615,277 | | | 627,182 | |
| ASP Unifrax Holdings, Inc., First Lien USD Term Loan(e) | | United States | | L + 3.75% | | | | | 12/12/25 | | $ | 247,730 | | | 228,345 | |
| ASP Unifrax Holdings, Inc., Second Lien Term Loan | | United States | | 3M US L + 8.50% | | 10.39 | % | | 12/14/26 | | | 917,431 | | | 793,349 | |
| Blackbird Purchaser, Inc. Term Loan(c)(e) | | United States | | 3M US L + 8.50% | | 10.44 | % | | 04/09/27 | | | 1,418,860 | | | 1,383,389 | |
| C&D Technologies, Inc., First Lien B Term Loan | | United States | | 1M US L + 5.75% | | 7.55 | % | | 12/20/25 | | | 730,795 | | | 689,687 | |
See Notes to Consolidated Financial Statements.
| Annual Report | December 31, 2019 | 13 |
| Griffin Institutional Access Credit Fund | Consolidated Schedule of Investments |
December 31, 2019
| Description | | Country | | Spread
Above Index | | Rate | | | Maturity
Date | | Principal
Amount | | Value
(Note 2)(a) | |
| CAPITAL EQUIPMENT (continued) | | | | | | | | | | | | | | | | |
| Cohu, Inc., First Lien Initial B Term Loan(c)(e) | | United States | | 1M US L + 3.00% | | 4.80 | % | | 10/01/25 | | $ | 378,398 | | $ | 376,505 | |
| Crosby Group LLC, First Lien Initial Term Loan(e) | | United States | | 1M US L + 4.75% | | 6.54 | % | | 06/26/26 | | | 437,885 | | | 429,674 | |
| Cyxtera DC Holdings, Inc., First Lien Initial Term Loan(e) | | United States | | L + 3.00% | | | | | 05/01/24 | | | 155,008 | | | 137,764 | |
| Engineered Controls Intl, LLC Term Loan(c) | | United States | | 1M US L + 7.00% | | 8.70 | % | | 11/05/24 | | | 4,199,852 | | | 4,105,356 | |
| Erpe Bidco, Ltd., First Lien Facility B EUR Term Loan | | United Kingdom | | 3M EUR L + 4.00% | | 4.00 | % | | 10/04/24 | | € | 1,536,058 | | | 1,107,745 | |
| Granite US Holdings Corp., First Lien B Term Loan(c) | | United States | | 3M US L + 5.25% | | 7.21 | % | | 09/30/26 | | $ | 379,394 | | | 381,291 | |
| Mirion Technologies LLC, First Lien Initial Dollar Term Loan | | United States | | 3M US L + 4.00% | | 4.00 | % | | 03/06/26 | | | 670,184 | | | 676,886 | |
| Ohio Transmission Corporation, Term Loan(c) | | United States | | 3M US L + 8.50% | | 10.44 | % | | 04/09/27 | | | 1,961,592 | | | 1,912,552 | |
| Ply Gem Midco, Inc., First Lien Initial Term Loan | | United States | | 1M US L + 3.75% | | 5.49 | % | | 04/12/25 | | | 967,629 | | | 968,529 | |
| Rackspace Hosting, Inc., First Lien B Term Loan | | United States | | 3M US L + 3.00% | | 4.90 | % | | 11/03/23 | | | 313,238 | | | 305,125 | |
| WireCo WorldGroup, Inc., First Lien Initial Term Loan | | Cayman Islands | | 1M US L + 5.00% | | 6.80 | % | | 09/29/23 | | | 659,054 | | | 628,079 | |
| WireCo WorldGroup, Inc., Second Lien Initial Term Loan(c) | | Cayman Islands | | 1M US L + 9.00% | | 10.80 | % | | 09/30/24 | | | 750,000 | | | 682,500 | |
| | | | | | | | | | | | | | | | 17,713,116 | |
| CHEMICALS, PLASTICS, & RUBBER (1.45%) | | | | | | | | | | | | | | | | |
| Ascend Performance Materials Operations LLC, First Lien Initial Term Loan(c) | | United States | | 1M US L + 5.25% | | 7.19 | % | | 08/27/26 | | | 1,964,850 | | | 1,984,499 | |
| ASK Chemicals GmbH, First Lien Facility B Term Loan(c) | | Germany | | 6M EUR L + 5.25% | | 5.25 | % | | 05/12/23 | | € | 1,000,000 | | | 1,088,054 | |
| ASP Chromaflo Intermediate Holdings, Inc., First Lien Initial Tranche B-1 Term Loan(c)(e) | | United States | | L + 3.50% | | | | | 11/20/23 | | $ | 181,969 | | | 174,690 | |
| ASP Chromaflo Intermediate Holdings, Inc., First Lien Initial Tranche B-2 Term Loan(c)(e) | | United States | | L + 3.50% | | | | | 11/20/23 | | | 236,617 | | | 227,153 | |
| Colouroz Investment 1 GmbH, First Lien Initial C Term Loan | | Germany | | 3M US L + 3.00% | | 4.94 | % | | 09/07/21 | | | 10,947 | | | 9,586 | |
| Colouroz Investment 2 LLC, First Lien Initial B-2 Term Loan | | United States | | 3M US L + 3.00% | | 4.94 | % | | 09/07/21 | | | 66,220 | | | 57,990 | |
| Nouryon Finance B.V., First Lien Initial Dollar Term Loan | | Netherlands | | 1M US L + 3.25% | | 4.96 | % | | 10/01/25 | | | 581,738 | | | 582,951 | |
| Plaskolite PPC Intermediate II LLC, First Lien Initial Term Loan | | United States | | 1M US L + 4.25% | | 6.04 | % | | 12/15/25 | | | 893,263 | | | 856,416 | |
| Venator Finance SARL, First Lien Initial Term Loan(e) | | Luxembourg | | L + 3.00% | | | | | 08/08/24 | | | 570,000 | | | 567,030 | |
| | | | | | | | | | | | | | | | 5,548,369 | |
| CONSTRUCTION & BUILDING (0.59%) | | | | | | | | | | | | | | | | |
| CPG International LLC, First Lien New Term Loan | | United States | | 3M US L + 3.75% | | 5.93 | % | | 05/05/24 | | | 386,713 | | | 387,842 | |
| Crown Subsea Communications Holding, Inc., First Lien Initial Term Loan | | United States | | 1M US L + 6.00% | | 7.69 | % | | 11/02/25 | | | 195,682 | | | 195,274 | |
| KBR, Inc., First Lien B Term Loan(c) | | United States | | 1M US L + 3.75% | | 5.55 | % | | 04/25/25 | | | 708,750 | | | 715,838 | |
See Notes to Consolidated Financial Statements.
| 14 | 1.888.926.2688 | www.griffincapital.com |
| Griffin Institutional Access Credit Fund | Consolidated Schedule of Investments |
December 31, 2019
| Description | | Country | | Spread
Above Index | | Rate | | | Maturity
Date | | Principal
Amount | | Value
(Note 2)(a) | |
| CONSTRUCTION & BUILDING (continued) | | | | | | | | | | | | | | | | |
| Sequa Mezzanine Holdings LLC, First Lien Initial Term Loan | | United States | | 3M US L + 5.00% | | 6.90 | % | | 11/28/21 | | $ | 458,498 | | $ | 459,573 | |
| Wilsonart LLC, First Lien Tranche D Term Loan | | United States | | 3M US L + 3.25% | | 5.20 | % | | 12/19/23 | | | 492,424 | | | 494,579 | |
| | | | | | | | | | | | | | | | 2,253,106 | |
| CONSUMER GOODS: DURABLE (2.28%) | | | | | | | | | | | | | | | | |
| Auris Luxembourg III S.a r.l., First Lien Facility B1A Term Loan | | Denmark | | 3M EUR L + 4.00% | | 4.00 | % | | 02/27/26 | | € | 795,720 | | | 899,132 | |
| Hayward Industries, Inc., First Lien Initial Term Loan | | United States | | 1M US L + 3.50% | | 5.30 | % | | 08/05/24 | | $ | 569,853 | | | 567,004 | |
| Keter Group B.V., First Lien Facility B1 Term Loan(e) | | Israel | | 3M EUR L + 4.25% | | 5.25 | % | | 10/31/23 | | € | 397,748 | | | 392,247 | |
| New Milani Group LLC, First Lien Term Loan(c) | | United States | | 3M US L + 4.50% | | 6.44 | % | | 06/06/24 | | $ | 788,000 | | | 768,300 | |
| TGG TS Acquisition Co., First Lien B Term Loan | | United States | | 1M US L + 6.50% | | 8.24 | % | | 12/14/25 | | | 1,094,949 | | | 1,089,474 | |
| TLC Purchaser, Inc. Delayed Draw Term Loan(c)(d) | | United States | | L + 4.75% | | | | | 10/11/25 | | | 623,197 | | | 616,965 | |
| TLC Purchaser, Inc. Revolver Loan(c)(d) | | United States | | PRIME + 4.75% | | 9.50 | % | | 10/11/25 | | | 778,763 | | | 763,187 | |
| TLC Purchaser, Inc. Term Loan B(c) | | United States | | 1M US L + 5.75% | | 7.49 | % | | 10/11/25 | | | 3,737,873 | | | 3,663,116 | |
| | | | | | | | | | | | | | | | 8,759,425 | |
| CONSUMER GOODS: NON-DURABLE (0.64%) | | | | | | | | | | | | | | | | |
| Kronos Acquisition Intermediate, Inc.,First Lien Initial Term Loan | | Canada | | 1M US L + 4.00% | | 5.79 | % | | 05/15/23 | | | 1,233,049 | | | 1,213,937 | |
| Zeppelin Bidco Pty Limited(c) | | Australia | | 3M BBSW + 6.00% | | 6.90 | % | | 06/28/24 | | AUD | 1,804,348 | | | 1,228,214 | |
| | | | | | | | | | | | | | | | 2,442,151 | |
| CONTAINERS, PACKAGING, & GLASS (1.73%) | | | | | | | | | | | | | | | | |
| Automate Intermediate Holdings II SARL(c) | | Luxembourg | | 1M US L + 7.75% | | 9.56 | % | | 07/22/27 | | $ | 1,090,250 | | | 1,068,445 | |
| BWay Holding Co, First Lien Initial Term Loan | | United States | | 3M US L + 3.25% | | 5.23 | % | | 04/03/24 | | | 1,015,555 | | | 1,013,971 | |
| Flex Acquisition Co., Inc., First Lien Incremental B-2018 Term Loan(e) | | United States | | L + 3.25% | | | | | 06/29/25 | | | 523,233 | | | 520,616 | |
| Flex Acquisition Co., Inc., First Lien Initial Term Loan | | United States | | 3M US L + 3.00% | | 5.09 | % | | 12/29/23 | | | 1,103,937 | | | 1,097,727 | |
| Klockner Pentaplast of America, Inc., First Lien Euro Term Loan | | Luxembourg | | 3M EUR L + 4.75% | | 4.75 | % | | 06/30/22 | | € | 189,191 | | | 181,269 | |
| Packaging Coordinators Midco, Inc., First Lien Initial Term Loan | | United States | | 3M US L + 4.00% | | 5.95 | % | | 06/30/23 | | $ | 728,969 | | | 727,453 | |
| Packaging Coordinators Midco, Inc., Second Lien Initial Term Loan(c) | | United States | | 3M US L + 8.75% | | 10.70 | % | | 07/01/24 | | | 512,500 | | | 512,500 | |
| Pro Mach Group, Inc., First Lien Initial Term Loan(e) | | United States | | 1M US L + 2.75% | | 4.54 | % | | 03/07/25 | | | 921,191 | | | 915,148 | |
| Trident TPI Holdings, Inc., First Lien Tranche B-1 Term Loan(e) | | United States | | L + 3.25% | | | | | 10/17/24 | | | 604,665 | | | 588,998 | |
| | | | | | | | | | | | | | | | 6,626,127 | |
| ENERGY: ELECTRICITY (0.49%) | | | | | | | | | | | | | | | | |
| Infinite Electronics International, Inc., First Lien B-2 Term Loan(c) | | United States | | 1M US L + 4.00% | | 5.80 | % | | 07/02/25 | | | 1,656,791 | | | 1,644,334 | |
| Infinite Electronics International, Inc., Second Lien B-1 Term Loan(c) | | United States | | 1M US L + 8.00% | | 9.80 | % | | 07/02/26 | | | 240,000 | | | 240,000 | |
| | | | | | | | | | | | | | | | 1,884,334 | |
See Notes to Consolidated Financial Statements.
| Annual Report | December 31, 2019 | 15 |
| Griffin Institutional Access Credit Fund | Consolidated Schedule of Investments |
December 31, 2019
| Description | | Country | | Spread
Above Index | | Rate | | | Maturity
Date | | Principal
Amount | | Value
(Note 2)(a) | |
| ENERGY: OIL & GAS (1.60%) | | | | | | | | | | | | | | | | |
| BlackBrush Oil & Gas LP, First Lien Closing Date Term Loan(c) | | United States | | 3M US L + 8.00% | | 9.89 | % | | 02/09/24 | | $ | 2,151,724 | | $ | 2,130,207 | |
| California Resources Corp., First Lien Initial Term Loan(e) | | United States | | L + 4.75% | | | | | 12/31/22 | | | 184,000 | | | 165,906 | |
| California Resources Corp., First Lien Term Loan | | United States | | 1M US L + 10.38% | | 12.18 | % | | 12/31/21 | | | 870,000 | | | 657,216 | |
| Lower Cadence Holdings LLC, First Lien Initial Term Loan(e) | | United States | | 1M US L + 4.00% | | 5.80 | % | | 05/22/26 | | | 905,266 | | | 897,916 | |
| Oxbow Carbon LLC, First Lien Tranche B Term Loan | | United States | | 1M US L + 3.75% | | 5.55 | % | | 01/04/23 | | | 980,835 | | | 983,287 | |
| Prairie ECI Acquiror LP, First Lien Initial Term Loan(e) | | United States | | L + 4.75% | | | | | 03/11/26 | | | 310,252 | | | 308,701 | |
| Ultra Resources, Inc., First Lien Term Loan(f) | | United States | | 1M US L + 4.00% | | 5.80 | % | | 04/12/24 | | | 1,677,479 | | | 1,008,962 | |
| | | | | | | | | | | | | | | | 6,152,195 | |
| ENVIRONMENTAL INDUSTRIES (0.15%) | | | | | | | | | | | | | | | | |
| Filtration Group Corp., First Lien Initial Euro Term Loan | | United States | | 3M EUR L + 3.50% | | 3.50 | % | | 03/29/25 | | € | 235,695 | | | 266,473 | |
| TRC Companies, Inc., First Lien Initial Term Loan | | United States | | 1M US L + 3.50% | | 5.30 | % | | 06/21/24 | | $ | 318,850 | | | 307,690 | |
| | | | | | | | | | | | | | | | 574,163 | |
| FIRE: FINANCE (0.44%) | | | | | | | | | | | | | | | | |
| Advisor Group Holdings, Inc., First Lien Initial B Term Loan | | United States | | 1M US L + 5.00% | | 6.80 | % | | 07/31/26 | | | 1,696,270 | | | 1,686,737 | |
| | | | | | | | | | | | | | | | | |
| FIRE: INSURANCE (0.99%) | | | | | | | | | | | | | | | | |
| Asurion LLC, Second Lien Replacement B-2 Term Loan | | United States | | 1M US L + 6.50% | | 8.30 | % | | 08/04/25 | | | 1,915,308 | | | 1,943,319 | |
| Hub International, Ltd., First Lien Initial Term Loan | | United States | | 3M US L + 2.75% | | 4.69 | % | | 04/25/25 | | | 677,396 | | | 678,050 | |
| Ivy Finco Limited, Facility B Term Loan(c) | | Jersey | | 3M GBP L + 5.00% | | 5.70 | % | | 05/19/25 | | £ | 451,074 | | | 585,547 | |
| Ivy Finco Limited, Term Loan, Acquisition Facility (Original)(c)(d) | | Jersey | | 1M GBP L + 5.00% | | 5.70 | % | | 05/19/25 | | | 442,316 | | | 574,178 | |
| | | | | | | | | | | | | | | | 3,781,094 | |
| FIRE: REAL ESTATE (0.32%) | | | | | | | | | | | | | | | | |
| Strand Court Limited(c) | | United Kingdom | | 6M EUR L + 6.75% | | 7.25 | % | | 10/29/21 | | € | 214,418 | | | 238,108 | |
| Strand Court, Ltd., First Lien A-1 Term Loan(c) | | United Kingdom | | 6M EUR L + 6.75% | | 7.25 | % | | 10/30/21 | | | 268,603 | | | 298,281 | |
| Strand Court, Ltd., First Lien A-2 Term Loan(c) | | United Kingdom | | 6M EUR L + 6.75% | | 7.25 | % | | 10/30/21 | | | 604,220 | | | 670,979 | |
| | | | | | | | | | | | | | | | 1,207,368 | |
| FOREST PRODUCTS & PAPER (0.28%) | | | | | | | | | | | | | | | | |
| Solenis Holdings LLC, First Lien Initial Dollar Term Loan | | United States | | 3M US L + 4.00% | | 5.91 | % | | 06/26/25 | | $ | 536,512 | | | 532,219 | |
| Solenis Holdings LLC, Second Lien Initial Term Loan | | United States | | 3M US L + 8.50% | | 10.41 | % | | 06/26/26 | | | 604,384 | | | 553,011 | |
| | | | | | | | | | | | | | | | 1,085,230 | |
| HEALTHCARE & PHARMACEUTICALS (5.54%) | | | | | | | | | | | | | | | | |
| AEA Holdings (Luxembourg) SARL(c)(f) | | Luxembourg | | 6M US L + 9.25% | | 11.18 | % | | 11/17/24 | | | 2,379,021 | | | 2,402,811 | |
| Amneal Pharmaceuticals LLC, First Lien Initial Term Loan(e) | | United States | | 1M US L + 3.50% | | 5.31 | % | | 05/04/25 | | | 1,462,642 | | | 1,322,228 | |
| BioClinica Holding I LP, First Lien Initial Term Loan | | United States | | 1M US L + 4.25% | | 6.06 | % | | 10/20/23 | | | 574,043 | | | 559,873 | |
See Notes to Consolidated Financial Statements.
| 16 | 1.888.926.2688 | www.griffincapital.com |
| Griffin Institutional Access Credit Fund | Consolidated Schedule of Investments |
December 31, 2019
| Description | | Country | | Spread
Above Index | | Rate | | | Maturity
Date | | Principal
Amount | | Value
(Note 2)(a) | |
| HEALTHCARE & PHARMACEUTICALS (continued) | | | | | | | | | | | | | | | | |
| Chip Holdco, Ltd., First Lien B Term Loan(c) | | United Kingdom | | 6M US L + 5.00% | | 6.92 | % | | 07/11/25 | | $ | 961,318 | | $ | 961,318 | |
| Clarkson Eyecare LLC, First Lien ARC Acquisition Term Loan(c) | | United States | | 1M US L + 6.25% | | 8.05 | % | | 04/02/21 | | | 1,051,365 | | | 1,051,365 | |
| Clarkson Eyecare LLC, First Lien Nationwide Acquisition Term Loan(c) | | United States | | 1M US L + 6.25% | | 8.05 | % | | 04/02/21 | | | 695,058 | | | 695,058 | |
| Curium BidCo SARL, First Lien Facility B Term Loan | | Luxembourg | | 3M US L + 4.00% | | 5.94 | % | | 07/09/26 | | | 397,355 | | | 401,082 | |
| Envision Healthcare Corp., First Lien Initial Term Loan | | United States | | 1M US L + 3.75% | | 5.55 | % | | 10/10/25 | | | 556,875 | | | 477,751 | |
| Explorer Holdings, Inc., First Lien Term Loan(e) | | United States | | L + 4.50% | | | | | 11/20/26 | | | 1,377,912 | | | 1,390,830 | |
| Golden State Buyer, Inc., First Lien Initial Term Loan(c) | | United States | | 1M US L + 4.75% | | 6.55 | % | | 06/21/26 | | | 2,665,178 | | | 2,605,212 | |
| Mendel Bidco, Inc., Term Loan(c) | | United States | | 3M US L + 4.50% | | 6.45 | % | | 06/17/27 | | | 2,715,805 | | | 2,647,910 | |
| Mertus 522. GmbH, Acquisition/Capex Facility(c)(d) | | Germany | | 6M EUR L + 5.75% | | 5.75 | % | | 05/28/26 | | € | 467,970 | | | 523,612 | |
| Mertus 522. GmbH, Facility B(c) | | Germany | | 6M EUR L + 5.75% | | 5.75 | % | | 05/28/26 | | | 800,751 | | | 895,961 | |
| National Mentor Holdings, Inc., First Lien Initial C Term Loan | | United States | | 1M US L + 4.00% | | 5.80 | % | | 03/09/26 | | $ | 23,312 | | | 23,540 | |
| National Mentor Holdings, Inc., First Lien Initial Term Loan | | United States | | 1M US L + 4.00% | | 5.80 | % | | 03/09/26 | | | 413,706 | | | 417,739 | |
| Netsmart Technologies, Inc., First Lien D-1 Term Loan | | United States | | 1M US L + 3.75% | | 5.55 | % | | 04/19/23 | | | 204,162 | | | 203,779 | |
| Parexel International Corp., First Lien Initial Term Loan(e) | | United States | | 1M US L + 2.75% | | 4.55 | % | | 09/27/24 | | | 1,820,969 | | | 1,791,379 | |
| Soursop, Ltd., Acquisition/Capex Facility(c)(d) | | Ireland | | 3M EUR L + 5.50% | | 5.75 | % | | 11/03/25 | | € | 1,119,435 | | | 1,243,119 | |
| Soursop, Ltd., First Lien Term Loan(c) | | Ireland | | 3M EUR L + 5.50% | | 5.75 | % | | 11/03/25 | | | 432,376 | | | 480,149 | |
| U.S. Anesthesia Partners, Inc., First Lien Initial Term Loan | | United States | | 1M US L + 3.00% | | 4.80 | % | | 06/23/24 | | $ | 1,159,117 | | | 1,157,668 | |
| | | | | | | | | | | | | | | | 21,252,384 | |
| HIGH TECH INDUSTRIES (5.71%) | | | | | | | | | | | | | | | | |
| AMI US Holdings Inc. Revolver Loan(c)(d) | | United States | | 1M US L + 5.50% | | 7.30 | % | | 04/01/24 | | | 145,361 | | | 145,361 | |
| AMI US Holdings Inc. Term Loan(c) | | United States | | 1M US L + 5.50% | | 7.19 | % | | 04/01/25 | | | 1,099,191 | | | 1,096,430 | |
| CB Nike Intermediateco Ltd. Closing Date Term Loan(c) | | Israel | | 3M US L + 5.00% | | 6.93 | % | | 10/31/25 | | | 2,480,000 | | | 2,430,400 | |
| CB Nike Intermediateco Ltd. Revolver Loan(c)(d) | | Israel | | 3M US L + 5.00% | | 6.93 | % | | 10/31/25 | | | 310,000 | | | 303,800 | |
| CMI Marketing, Inc., First Lien Initial Term Loan(c) | | United States | | 1M US L + 4.50% | | 6.30 | % | | 05/24/24 | | | 866,800 | | | 866,800 | |
| CMI Marketing, Inc., First Lien Revolving Term Loan(c)(d) | | United States | | L + 4.50% | | | | | 05/24/23 | | | 120,000 | | | 120,000 | |
| Drilling Info Holdings, Inc. Delayed Draw Term Loan(c)(d) | | United States | | L + 2.00% | | | | | 07/30/25 | | | 171,330 | | | 170,474 | |
| Drilling Info Holdings, Inc., First Lien Initial Term Loan | | United States | | 1M US L + 4.25% | | 6.05 | % | | 07/30/25 | | | 1,868,223 | | | 1,858,881 | |
| Electronics for Imaging, Inc., First Lien Initial Term Loan | | United States | | 3M US L + 5.00% | | 6.94 | % | | 07/23/26 | | | 978,640 | | | 914,422 | |
| Electronics for Imaging, Inc., Second Lien Initial Term Loan(c) | | United States | | 3M US L + 9.00% | | 10.94 | % | | 07/23/27 | | | 2,227,800 | | | 2,082,993 | |
| Epicor Software Corp., First Lien B Term Loan | | United States | | 1M US L + 3.25% | | 5.05 | % | | 06/01/22 | | | 449,475 | | | 452,538 | |
See Notes to Consolidated Financial Statements.
| Annual Report | December 31, 2019 | 17 |
| Griffin Institutional Access Credit Fund | Consolidated Schedule of Investments |
December 31, 2019
| Description | | Country | | Spread
Above Index | | Rate | | | Maturity
Date | | Principal
Amount | | Value
(Note 2)(a) | |
| HIGH TECH INDUSTRIES (continued) | | | | | | | | | | | | | | | | |
| Everest Bidco SAS, First Lien Facility B Term Loan | | France | | 3M EUR L + 4.00% | | 4.00 | % | | 07/04/25 | | € | 303,237 | | $ | 332,771 | |
| Everest Bidco SAS, Second Lien Term Loan(c) | | France | | 3M GBP L + 7.50% | | 8.50 | % | | 07/03/26 | | £ | 378,378 | | | 483,661 | |
| LTI Holdings, Inc., First Lien Initial Term Loan | | United States | | 1M US L + 3.50% | | 5.30 | % | | 09/06/25 | | $ | 1,283,762 | | | 1,160,887 | |
| LTI Holdings, Inc., Second Lien Initial Term Loan | | United States | | 1M US L + 6.75% | | 8.55 | % | | 09/06/26 | | | 275,478 | | | 210,740 | |
| Utimaco Management GmbH(c) | | Germany | | 6M EUR L + 4.50% | | 4.50 | % | | 08/09/27 | | € | 2,786,275 | | | 3,109,752 | |
| Vital Holdco Limited, Facility B1(c) | | United Kingdom | | 1M US L + 5.25% | | 7.05 | % | | 05/29/26 | | $ | 2,946,432 | | | 2,946,432 | |
| Vital Holdco Limited, Facility B2(c) | | United Kingdom | | 1M US L + 5.25% | | 5.25 | % | | 05/29/26 | | € | 659,780 | | | 740,078 | |
| Zywave, Inc.(c) | | United States | | 3M US L + 5.00% | | 6.84 | % | | 11/17/22 | | $ | 2,450,000 | | | 2,450,000 | |
| | | | | | | | | | | | | | | | 21,876,420 | |
| HOTEL, GAMING, & LEISURE (0.84%) | | | | | | | | | | | | | | | | |
| Compass III, Ltd., First Lien Facility B2 Term Loan | | Netherlands | | 6M EUR L + 4.50% | | 4.50 | % | | 05/09/25 | | € | 671,493 | | | 754,569 | |
| HNVR Holdco, Ltd., First Lien Facility C Term Loan | | United Kingdom | | 6M EUR L + 4.50% | | 4.50 | % | | 09/12/25 | | | 1,353,619 | | | 1,491,949 | |
| IRB Holding Corp., First Lien B Term Loan | | United States | | 3M US L + 3.25% | | 5.22 | % | | 02/05/25 | | $ | 963,945 | | | 971,377 | |
| | | | | | | | | | | | | | | | 3,217,895 | |
| MEDIA: ADVERTISING, PRINTING & PUBLISHING (0.01%) | | | | | | | | | | | | | | | | |
| Catalina Marketing Corp., First Lien First-Out Term Loan | | United States | | 1M US L + 7.50% | | 9.29 | % | | 02/15/23 | | | 16,584 | | | 13,350 | |
| Checkout Holding Corp., First Lien Term Loan(f) | | United States | | 1M US L + 10.50% | | 12.29 | % | | 08/15/23 | | | 83,672 | | | 35,979 | |
| | | | | | | | | | | | | | | | 49,329 | |
| MEDIA: BROADCASTING & SUBSCRIPTION (0.06%) | | | | | | | | | | | | | | | | |
| Tele Columbus AG, First Lien Facility A2 Term Loan(e) | | Germany | | L + 3.00% | | | | | 10/15/24 | | € | 217,689 | | | 233,979 | |
| | | | | | | | | | | | | | | | | |
| MEDIA: DIVERSIFIED & PRODUCTION (1.46%) | | | | | | | | | | | | | | | | |
| Getty Images, Inc., First Lien Initial Euro Term Loan | | United States | | 1M EUR L + 5.00% | | 5.00 | % | | 02/19/26 | | | 312,066 | | | 346,283 | |
| International Entertainment Investments, Ltd., First Lien C1 Term Loan(c) | | United Kingdom | | 6M GBP L + 4.75% | | 5.61 | % | | 05/31/23 | | £ | 619,048 | | | 819,996 | |
| International Entertainment Investments, Ltd., First Lien C2 Term Loan(c) | | United Kingdom | | 6M GBP L + 4.75% | | 5.61 | % | | 05/31/23 | | | 380,952 | | | 504,613 | |
| MH Sub I LLC, First Lien Amendment No. 2 Initial Term Loan | | United States | | 1M US L + 3.75% | | 5.55 | % | | 09/13/24 | | $ | 643,014 | | | 645,471 | |
| MH Sub I LLC, Second Lien Amendment No. 2 Initial Term Loan | | United States | | 1M US L + 7.50% | | 9.30 | % | | 09/15/25 | | | 491,828 | | | 493,367 | |
| Technicolor S.A., First Lien Euro Term Loan | | France | | 3M EUR L + 3.50% | | 3.50 | % | | 12/06/23 | | € | 1,836,556 | | | 1,814,575 | |
| William Morris Endeavor Entertainment LLC, First Lien B-1 Term Loan | | United States | | 1M US L + 2.75% | | 4.61 | % | | 05/18/25 | | $ | 985,264 | | | 982,390 | |
| | | | | | | | | | | | | | | | 5,606,695 | |
| METALS & MINING (0.56%) | | | | | | | | | | | | | | | | |
| Hyperion Materials & Technologies, Inc., First Lien Initial Term Loan | | United States | | 1M US L + 5.50% | | 7.30 | % | | 08/28/26 | | | 917,971 | | | 908,791 | |
| Murray Energy Corp. Facility Term Loan | | United States | | 1M US L + 11.00% | | 13.00 | % | | 07/30/20 | | | 877,521 | | | 881,909 | |
| Murray Energy Corp., First Lien Superpriority B-2 Term Loan(g) | | United States | | 3M US L + 7.25% | | 9.35 | % | | 10/17/22 | | | 1,567,358 | | | 343,079 | |
| | | | | | | | | | | | | | | | 2,133,779 | |
See Notes to Consolidated Financial Statements.
| 18 | 1.888.926.2688 | www.griffincapital.com |
| Griffin Institutional Access Credit Fund | Consolidated Schedule of Investments |
December 31, 2019
| Description | | Country | | Spread
Above Index | | Rate | | | Maturity
Date | | Principal
Amount | | Value
(Note 2)(a) | |
| RETAIL (1.06%) | | | | | | | | | | | | | | |
| Ascena Retail Group, Inc., First Lien Tranche B Term Loan | | United States | | 1M US L + 4.50% | | 6.31 | % | | 08/21/22 | | $ | 1,456,070 | | $ | 997,408 | |
| Casino, Guichard-Perrachon S.A., First Lien Facility B Term Loan | | France | | 3M EUR L + 5.50% | | 5.50 | % | | 01/31/24 | | € | 321,500 | | | 365,227 | |
| CWGS Group LLC, First Lien Term Loan(e) | | United States | | 1M US L + 2.75% | | 4.44 | % | | 11/08/23 | | $ | 701,420 | | | 665,093 | |
| Kirk Beauty One GmbH, First Lien Facility B1 Term Loan | | Germany | | 3M EUR L + 3.50% | | 3.50 | % | | 08/12/22 | | € | 86,242 | | | 81,684 | |
| Kirk Beauty One GmbH, First Lien Facility B2 Term Loan | | Germany | | 3M EUR L + 3.50% | | 3.50 | % | | 08/12/22 | | | 24,198 | | | 22,919 | |
| Kirk Beauty One GmbH, First Lien Facility B3 Term Loan | | Germany | | 3M EUR L + 3.50% | | 3.50 | % | | 08/12/22 | | | 77,165 | | | 73,086 | |
| Kirk Beauty One GmbH, First Lien Facility B4 Term Loan | | France | | 3M EUR L + 3.50% | | 3.50 | % | | 08/12/22 | | | 50,869 | | | 48,181 | |
| Kirk Beauty One GmbH, First Lien Facility B5 Term Loan | | France | | 3M EUR L + 3.50% | | 3.50 | % | | 08/12/22 | | | 9,292 | | | 8,801 | |
| Kirk Beauty One GmbH, First Lien Facility B6 Term Loan | | Germany | | 3M EUR L + 3.50% | | 3.50 | % | | 08/12/22 | | | 37,779 | | | 35,782 | |
| Kirk Beauty One GmbH, First Lien Facility B7 Term Loan | | Netherlands | | 3M EUR L + 3.50% | | 3.50 | % | | 08/12/22 | | | 27,528 | | | 26,073 | |
| Kirk Beauty One GmbH, First Lien Facility B8 Term Loan | | Germany | | 3M EUR L + 3.25% | | 3.25 | % | | 08/12/22 | | | 216,743 | | | 201,705 | |
| MED ParentCo LP, First Lien Delayed Draw Term Loan(d) | | United States | | 1M US L + 4.25% | | 4.63 | % | | 08/31/26 | | $ | 167,559 | | | 167,847 | |
| MED ParentCo LP, First Lien Initial Term Loan | | United States | | 1M US L + 4.25% | | 6.05 | % | | 08/31/26 | | | 669,708 | | | 670,860 | |
| Moran Foods LLC, First Lien Term Loan(g) | | United States | | 1M US L + 6.75% | | 8.55 | % | | 12/05/23 | | | 130,795 | | | 47,904 | |
| Party City Holdings, Inc., First Lien 2018 Replacement Term Loan(e) | | United States | | 1M US L + 2.50% | | 4.30 | % | | 08/19/22 | | | 682,456 | | | 636,564 | |
| | | | | | | | | | | | | | | | 4,049,134 | |
| SERVICES: BUSINESS (6.49%) | | | | | | | | | | | | | | | | |
| Alliant Holdings Intermediate LLC, First Lien 2018 Initial Term Loan | | United States | | 1M US L + 3.00% | | 4.80 | % | | 05/09/25 | | | 1,048,383 | | | 1,050,516 | |
| AMCP Clean Acquisition Co. LLC, First Lien Delayed Draw Term Loan | | United States | | 3M US L + 4.25% | | 6.19 | % | | 06/16/25 | | | 162,121 | | | 158,473 | |
| AMCP Clean Acquisition Co. LLC, First Lien Term Loan | | United States | | 3M US L + 4.25% | | 6.19 | % | | 06/16/25 | | | 670,031 | | | 654,955 | |
| AqGen Ascensus, Inc., First Lien Replacement Term Loan | | United States | | 3M US L + 4.00% | | 5.94 | % | | 12/05/22 | | | 1,757,601 | | | 1,765,844 | |
| Baring Private Equity Asia VI Holding, Ltd., First Lien Initial Dollar Term Loan | | Netherlands | | 1M US L + 3.00% | | 4.80 | % | | 10/26/22 | | | 84,290 | | | 82,498 | |
| BBD Bidco, Ltd., First Lien B1 Term Loan | | United Kingdom | | 3M GBP L + 4.75% | | 5.54 | % | | 11/06/26 £ | | | 819,435 | | | 1,093,745 | |
| BBD Parentco, Ltd., Second Lien Facility 1 Term Loan(c) | | United Kingdom | | 3M GBP L + 8.25% | | 9.04 | % | | 09/06/27 | | | 1,445,511 | | | 1,929,096 | |
| Comet Bidco, Ltd., First Lien Facility B Term Loan | | United Kingdom | | 1M GBP L + 5.00% | | 5.70 | % | | 09/30/24 | | | 469,565 | | | 611,883 | |
| Comet Bidco, Ltd., First Lien Facility B2 Term Loan | | United Kingdom | | 3M US L + 5.00% | | 6.91 | % | | 09/30/24 | | $ | 358,937 | | | 352,655 | |
| Copernicus Group, INC., First Lien Term Loan(e) | | United States | | L + 4.00% | | | | | 12/11/26 | | | 484,045 | | | 485,256 | |
| DiscoverOrg LLC, First Lien Initial Term Loan(c) | | United States | | 1M US L + 4.50% | | 6.30 | % | | 02/02/26 | | | 1,243,750 | | | 1,249,969 | |
| DiscoverOrg LLC, Second Lien Initial Term Loan | | United States | | 1M US L + 8.50% | | 10.19 | % | | 02/01/27 | | | 1,285,714 | | | 1,292,143 | |
See Notes to Consolidated Financial Statements.
| Annual Report | December 31, 2019 | 19 |
| Griffin Institutional Access Credit Fund | Consolidated Schedule of Investments |
December 31, 2019
| Description | | Country | | Spread
Above Index | | Rate | | | Maturity
Date | | Principal
Amount | | Value
(Note 2)(a) | |
| SERVICES: BUSINESS (continued) | | | | | | | | | | | | | | | | |
| Ensemble RCM LLC, First Lien Closing Date Term Loan | | United States | | 3M US L + 3.75% | | 5.66 | % | | 08/03/26 | | $ | 365,133 | | $ | 368,557 | |
| Genuine Financial Holdings LLC, First Lien Initial Term Loan | | United States | | 1M US L + 3.75% | | 5.55 | % | | 07/11/25 | | | 493,750 | | | 491,437 | |
| Inmar, Inc., Initial Term Loan (First Lien), First Lien Initial Term Loan(e) | | United States | | L + 4.00% | | | | | 05/01/24 | | | 523,233 | | | 500,995 | |
| Marnix SAS, First Lien Facility B (EUR) Term Loan(e) | | France | | L + 3.50% | | | | | 08/03/26 | | € | 667,930 | | | 754,372 | |
| Monotype Imaging Holdings, Inc., First Lien Term Loan(c)(e) | | United States | | L + 5.50% | | | | | 10/09/26 | | $ | 1,049,683 | | | 1,012,944 | |
| MPH Acquisition Holdings LLC, First Lien Initial Term Loan(e) | | United States | | L + 2.75% | | | | | 06/07/23 | | | 1,120,000 | | | 1,106,997 | |
| Nexus Buyer LLC, First Lien B Term Loan(e) | | United States | | 1M US L + 3.75% | | 5.46 | % | | 11/09/26 | | | 554,547 | | | 559,053 | |
| Park Place Technologies LLC, Second Lien Initial Term Loan(c) | | United States | | 1M US L + 8.00% | | 9.80 | % | | 03/29/26 | | | 276,817 | | | 274,740 | |
| Research Now Group, Inc., First Lien Initial Term Loan | | United States | | 3M US L + 5.50% | | 7.41 | % | | 12/20/24 | | | 1,170,870 | | | 1,172,480 | |
| Salient CRGT, Inc., First Lien Initial Term Loan(c) | | United States | | 1M US L + 6.50% | | 8.29 | % | | 02/28/22 | | | 1,502,588 | | | 1,427,458 | |
| Sophia LP, First Lien B Term Loan | | United States | | 3M US L + 3.25% | | 5.19 | % | | 09/30/22 | | | 896,161 | | | 899,365 | |
| STG-Fairway Acquisitions, Inc., First Lien Term Loan | | United States | | 1M US L + 5.25% | | 7.05 | % | | 06/30/22 | | | 1,755,026 | | | 1,758,685 | |
| Sumup Holdings Luxembourg SARL, Facility A(c) | | Luxembourg | | 3M EUR L + 8.00% | | 9.00 | % | | 08/01/24 | | € | 1,396,226 | | | 1,562,239 | |
| Sumup Holdings Luxembourg SARL, Facility B(c)(d) | | Luxembourg | | 3M EUR L + 8.00% | | 9.00 | % | | 08/01/24 | | | 1,483,491 | | | 1,659,879 | |
| Upstream Newco, Inc., First Lien Initial Term Loan(c) | | United States | | 1M US L + 4.50% | | 6.30 | % | | 11/20/26 | | $ | 164,163 | | | 165,599 | |
| Upstream Rehabilitation, Inc., Second Lien Term Loan(c) | | United States | | 1M US L + 8.50% | | 10.30 | % | | 10/22/27 | | | 456,140 | | | 458,421 | |
| | | | | | | | | | | | | | | | 24,900,254 | |
| SERVICES: CONSUMER (1.71%) | | | | | | | | | | | | | | | | |
| Ancestry.com Operations, Inc., First Lien Extended Term Loan | | United States | | 1M US L + 4.25% | | 6.05 | % | | 08/27/26 | | | 709,105 | | | 699,135 | |
| Dentalcorp Health Services ULC, First Lien Initial Term Loan(e) | | Canada | | L + 3.75% | | | | | 06/06/25 | | | 126,402 | | | 125,981 | |
| NVA Holdings, Inc., First Lien Incremental B-4 Term Loan | | United States | | PRIME + 3.50% | | 7.25 | % | | 02/02/25 | | | 144,609 | | | 144,700 | |
| Obol France 3 SAS, First Lien Amended Facility B Term Loan(e) | | France | | L + 3.50% | | | | | 04/11/23 | | € | 444,392 | | | 428,550 | |
| Titan Acquisitionco New Zealand, Ltd., First Lien Initial Term Loan | | United States | | 3M US L + 4.25% | | 6.19 | % | | 05/01/26 | | $ | 536,454 | | | 539,137 | |
| Trafalgar Bidco, Ltd., First Lien Term Loan(c) | | United Kingdom | | 3M GBP L + 5.00% | | 5.70 | % | | 09/11/24 | | £ | 1,502,760 | | | 1,930,852 | |
| WeddingWire, Inc., Second Lien Initial Dollar Term Loan(c) | | United States | | 1M US L + 8.25% | | 10.05 | % | | 12/21/26 | | $ | 533,333 | | | 528,000 | |
| Weld North Education LLC, First Lien Initial Term Loan(c) | | United States | | 3M US L + 4.25% | | 6.20 | % | | 02/15/25 | | | 1,165,450 | | | 1,169,820 | |
| Wink Holdco, Inc., First Lien Initial Term Loan | | United States | | 1M US L + 3.00% | | 4.80 | % | | 12/02/24 | | | 986,795 | | | 989,883 | |
| | | | | | | | | | | | | | | | 6,556,058 | |
See Notes to Consolidated Financial Statements.
| 20 | 1.888.926.2688 | www.griffincapital.com |
| Griffin Institutional Access Credit Fund | Consolidated Schedule of Investments |
December 31, 2019
| Description | | Country | | Spread
Above Index | | Rate | | | Maturity
Date | | Principal
Amount | | Value
(Note 2)(a) | |
| TELECOMMUNICATIONS (3.32%) | | | | | | | | | | | | | | |
| Frontier Communications Corp., First Lien B-1 Term Loan(e) | | United States | | 1M US L + 3.75% | | 5.55 | % | | 06/15/24 | | $ | 2,738,021 | | $ | 2,757,230 | |
| Greeneden U.S. Holdings I LLC, First Lien Tranche B-3 Dollar Term Loan | | United States | | 1M US L + 3.25% | | 5.05 | % | | 12/01/23 | �� | | 991,806 | | | 996,453 | |
| GTT Communications, Inc., First Lien Closing Date U.S. Term Loan | | United States | | 1M US L + 2.75% | | 4.55 | % | | 05/31/25 | | | 912,707 | | | 767,979 | |
| Horizon Telcom, Inc., First Lien Delayed Draw Term Loan(c)(e) | | United States | | 3M US L + 4.75% | | 6.44 | % | | 06/15/23 | | | 86,865 | | | 85,997 | |
| Horizon Telcom, Inc., First Lien Revolving Term Loan(c)(d) | | United States | | L + 0.50% | | | | | 06/15/23 | | | 5,793 | | | 5,735 | |
| Horizon Telcom, Inc., First Lien Term Loan(c) | | United States | | 3M US L + 4.75% | | 6.44 | % | | 06/15/23 | | | 686,483 | | | 679,618 | |
| Intelsat Jackson Holdings S.A., First Lien Tranche B-3 Term Loan | | Luxembourg | | 3M US L + 3.75% | | 5.68 | % | | 11/27/23 | | | 177,721 | | | 178,339 | |
| Intelsat Jackson Holdings S.A., First Lien Tranche B-5 Term Loan(h) | | Luxembourg | | 6.63% | | 6.63 | % | | 01/02/24 | | | 289,875 | | | 294,380 | |
| Iridium Satellite LLC, First Lien B Term Loan | | United States | | 1M US L + 3.75% | | 5.55 | % | | 11/04/26 | | | 801,587 | | | 812,861 | |
| Logix Holding Co. LLC, First Lien Initial Term Loan(c) | | United States | | 1M US L + 5.75% | | 7.55 | % | | 12/22/24 | | | 338,400 | | | 335,016 | |
| Masergy Holdings, Inc., First Lien 2017 Replacement Term Loan | | United States | | 3M US L + 3.25% | | 5.19 | % | | 12/15/23 | | | 945,653 | | | 934,224 | |
| Masergy Holdings, Inc., Second Lien Initial Term Loan | | United States | | 3M US L + 7.50% | | 9.46 | % | | 12/16/24 | | | 462,778 | | | 453,522 | |
| Masmovil Ibercom S.A., First Lien Facility B Term Loan | | Spain | | 6M EUR L + 2.63% | | 2.63 | % | | 05/07/26 | | € | 1,130,366 | | | 1,270,714 | |
| Matterhorn Telecom S.A., First Lien Facility B Term Loan(c)(e) | | Luxembourg | | L + 3.50% | | | | | 09/10/26 | | | 389,770 | | | 441,032 | |
| Mavenir Systems, Inc., First Lien Initial Term Loan(c) | | United States | | 3M US L + 6.00% | | 7.91 | % | | 05/08/25 | | $ | 240,579 | | | 239,376 | |
| Maxar Technologies, Inc., First Lien Initial B Term Loan(e) | | United States | | L + 2.75% | | | | | 10/04/24 | | | 523,233 | | | 504,703 | |
| Pulsant Acquisitions, Ltd., Facility B Term Loan, First Lien Term Loan(c) | | United Kingdom | | 3M GBP L + 5.25% | | 6.25 | % | | 05/31/23 | | £ | 710,227 | | | 931,365 | |
| Uniti Group, Inc., First Lien Shortfall Term Loan | | United States | | 1M US L + 5.00% | | 6.80 | % | | 10/24/22 | | $ | 1,076,005 | | | 1,059,418 | |
| | | | | | | | | | | | | | | | 12,747,962 | |
| TRANSPORTATION: CARGO (0.61%) | | | | | | | | | | | | | | | | |
| Drive Chassis Holdco LLC, Second Lien B Term Loan(c) | | United States | | 3M US L + 8.25% | | 10.26 | % | | 04/10/26 | | | 918,451 | | | 847,271 | |
| Grammer Purchaser, Inc., First Lien Revolving Term Loan(c)(d) | | United States | | 1M US L + 4.50% | | 6.30 | % | | 09/30/24 | | | 90,000 | | | 89,100 | |
| Grammer Purchaser, Inc., First Lien Term Loan(c) | | United States | | 6M US L + 4.50% | | 6.31 | % | | 09/30/24 | | | 1,419,200 | | | 1,405,008 | |
| | | | | | | | | | | | | | | | 2,341,379 | |
| TRANSPORTATION: CONSUMER (0.70%) | | | | | | | | | | | | | | | | |
| Lakeland Tours LLC, First Lien Initial Term Loan | | United States | | 3M US L + 4.25% | | 6.15 | % | | 12/16/24 | | | 885,348 | | | 884,980 | |
| Safe Fleet Holdings LLC, Second Lien Initial Term Loan | | United States | | 1M US L + 6.75% | | 8.49 | % | | 02/02/26 | | | 667,223 | | | 648,877 | |
| Toro Private Holdings III, Ltd., First Lien Initial Term Loan | | United Kingdom | | 3M US L + 5.00% | | 6.94 | % | | 05/29/26 | | | 435,362 | | | 408,370 | |
See Notes to Consolidated Financial Statements.
| Annual Report | December 31, 2019 | 21 |
| Griffin Institutional Access Credit Fund | Consolidated Schedule of Investments |
December 31, 2019
| Description | | Country | | Spread
Above Index | | Rate | | Maturity
Date | | Principal
Amount | | Value
(Note 2)(a) | |
| TRANSPORTATION: CONSUMER (continued) | | | | | | | | | | | | | | | | |
| Toro Private Holdings III, Ltd., Second Lien Initial Term Loan(c) | | United Kingdom | | 3M US L + 9.00% | | 10.94 | % | | 05/28/27 | | $ | 899,835 | | $ | 760,361 | |
| | | | | | | | | | | | | | | | 2,702,588 | |
| UTILITIES: ELECTRIC (0.24%) | | | | | | | | | | | | | | | | |
| Brookfield WEC Holdings, Inc., First Lien Initial Term Loan | | Canada | | 1M US L + 3.50% | | 5.30 | % | | 08/01/25 | | | 899,076 | | | 906,660 | |
| | | | | | | | | | | | | | | | | |
| UTILITIES: OIL & GAS (0.13%) | | | | | | | | | | | | | | | | |
| Traverse Midstream Partners LLC, First Lien Advance Term Loan | | United States | | 1M US L + 4.00% | | 5.80 | % | | 09/27/24 | | | 546,561 | | | 496,277 | |
| | | | | | | | | | | | | | | | | |
| WHOLESALE (0.45%) | | | | | | | | | | | | | | | | |
| DXP Enterprises, Inc., First Lien Initial Term Loan | | United States | | 1M US L + 4.75% | | 6.55 | % | | 08/29/23 | | | 52,515 | | | 52,712 | |
| Specialty Building Products Holdings LLC, First Lien 2018 Initial Term Loan | | United States | | 1M US L + 5.75% | | 7.55 | % | | 10/01/25 | | | 675,643 | | | 674,798 | |
| SRS Distribution, Inc., First Lien Initial Term Loan | | United States | | 1M US L + 3.25% | | 5.05 | % | | 05/23/25 | | | 1,002,020 | | | 996,133 | |
| | | | | | | | | | | | | | | | 1,723,643 | |
| TOTAL BANK LOANS | | | | | | | | | | | | | | | | |
| (Cost $203,705,769) | | | | | | | | | | | | | | | 201,664,378 | |
| | | | | | | | | | | | | | | | | |
| CORPORATE BONDS (22.36%)(h) | | | | | | | | | | | | | | | | |
| AEROSPACE & DEFENSE (2.62%) | | | | | | | | | | | | | | | | |
| Avolon Holdings Funding, Ltd.(i) | | Ireland | | | | 5.50 | % | | 01/15/23 | | $ | 76,000 | | | 82,155 | |
| Bombardier, Inc.(i) | | Canada | | | | 6.13 | % | | 01/15/23 | | | 348,000 | | | 357,599 | |
| Bombardier, Inc.(i) | | Canada | | | | 7.50 | % | | 03/15/25 | | | 128,000 | | | 132,319 | |
| Bombardier, Inc.(i) | | Canada | | | | 7.88 | % | | 04/15/27 | | | 1,555,000 | | | 1,603,633 | |
| F-Brasile SpA(i) | | Italy | | | | 7.38 | % | | 08/15/26 | | | 1,745,000 | | | 1,849,700 | |
| Global Aircraft Leasing Co., Ltd.(f) (i) | | Cayman Islands | | | | 6.50% Cash & 7.25% PIK | | 09/15/24 | | | 666,000 | | | 696,603 | |
| Moog, Inc.(i) | | United States | | | | 4.25 | % | | 12/15/27 | | | 174,000 | | | 177,497 | |
| SSL Robotics LLC(i) | | United States | | | | 9.75 | % | | 12/31/23 | | | 1,078,000 | | | 1,175,020 | |
| TransDigm, Inc.(i) | | United States | | | | 5.50 | % | | 11/15/27 | | | 1,367,000 | | | 1,384,881 | |
| TransDigm, Inc.(i) | | United States | | | | 6.25 | % | | 03/15/26 | | | 825,000 | | | 894,699 | |
| TransDigm, Inc. | | United States | | | | 6.50 | % | | 07/15/24 | | | 115,000 | | | 118,845 | |
| Wolverine Escrow LLC(i) | | United States | | | | 9.00 | % | | 11/15/26 | | | 1,504,000 | | | 1,578,200 | |
| | | | | | | | | | | | | | | | 10,051,151 | |
| AUTOMOTIVE (0.98%)(i) | | | | | | | | | | | | | | | | |
| AAG FH LP | | Canada | | | | 9.75 | % | | 07/15/24 | | | 1,303,000 | | | 1,205,275 | |
| KAR Auction Services, Inc. | | United States | | | | 5.13 | % | | 06/01/25 | | | 103,000 | | | 107,335 | |
| Midas Intermediate Holdco II LLC | | United States | | | | 7.88 | % | | 10/01/22 | | | 1,519,000 | | | 1,390,359 | |
| Truck Hero, Inc. | | United States | | | | 8.50 | % | | 04/21/24 | | | 1,006,000 | | | 1,039,112 | |
| | | | | | | | | | | | | | | | 3,742,081 | |
| BEVERAGE, FOOD, & TOBACCO (1.05%)(i) | | | | | | | | | | | | | | | | |
| H-Food Holdings LLC | | United States | | | | 8.50 | % | | 06/01/26 | | | 2,322,000 | | | 2,178,550 | |
| Post Holdings, Inc. | | United States | | | | 5.75 | % | | 03/01/27 | | | 121,000 | | | 130,054 | |
| Sigma Holdco BV | | Netherlands | | | | 7.88 | % | | 05/15/26 | | | 1,718,000 | | | 1,721,264 | |
| | | | | | | | | | | | | | | | 4,029,868 | |
See Notes to Consolidated Financial Statements.
| 22 | 1.888.926.2688 | www.griffincapital.com |
| Griffin Institutional Access Credit Fund | Consolidated Schedule of Investments |
December 31, 2019
| Description | | Country | | Spread Above Index | | Rate | | | Maturity Date | | Principal Amount | | Value (Note 2)(a) | |
| CAPITAL EQUIPMENT (1.65%)(i) | | | | | | | | | | | | | | | | |
| Cleaver-Brooks, Inc. | | United States | | | | 7.88 | % | | 03/01/23 | | $ | 938,000 | | $ | 938,389 | |
| CPG Merger Sub LLC | | United States | | | | 8.00 | % | | 10/01/21 | | | 1,660,000 | | | 1,668,964 | |
| Granite Holdings US Acquisition Co. | | United States | | | | 11.00 | % | | 10/01/27 | | | 514,000 | | | 521,889 | |
| Manitowoc Co., Inc. | | United States | | | | 9.00 | % | | 04/01/26 | | | 1,347,000 | | | 1,414,178 | |
| Resideo Funding, Inc. | | United States | | | | 6.13 | % | | 11/01/26 | | | 1,570,000 | | | 1,585,739 | |
| TriMas Corp. | | United States | | | | 4.88 | % | | 10/15/25 | | | 184,000 | | | 189,865 | |
| | | | | | | | | | | | | | | | 6,319,024 | |
| CHEMICALS, PLASTICS, & RUBBER (0.81%)(i) | | | | | | | | | | | | | | | | |
| Compass Minerals International, Inc. | | United States | | | | 4.88 | % | | 07/15/24 | | | 450,000 | | | 449,624 | |
| Compass Minerals International, Inc. | | United States | | | | 6.75 | % | | 12/01/27 | | | 897,000 | | | 954,722 | |
| Neon Holdings, Inc. | | United States | | | | 10.13 | % | | 04/01/26 | | | 1,177,000 | | | 1,173,908 | |
| Venator Finance SARL | | United States | | | | 5.75 | % | | 07/15/25 | | | 551,000 | | | 509,675 | |
| | | | | | | | | | | | | | | | 3,087,929 | |
| CONSTRUCTION & BUILDING (0.28%)(i) | | | | | | | | | | | | | | | | |
| Summit Materials LLC | | United States | | | | 5.13 | % | | 06/01/25 | | | 386,000 | | | 397,740 | |
| Summit Materials LLC | | United States | | | | 6.50 | % | | 03/15/27 | | | 625,000 | | | 673,655 | |
| | | | | | | | | | | | | | | | 1,071,395 | |
| CONSUMER GOODS: NON-DURABLE (0.64%)(i) | | | | | | | | | | | | | | | | |
| Coty, Inc. | | United States | | | | 6.50 | % | | 04/15/26 | | | 435,000 | | | 458,936 | |
| Kronos Acquisition Holdings, Inc. | | Canada | | | | 9.00 | % | | 08/15/23 | | | 1,263,000 | | | 1,209,847 | |
| Mattel, Inc. | | United States | | | | 5.88 | % | | 12/15/27 | | | 740,000 | | | 781,144 | |
| | | | | | | | | | | | | | | | 2,449,927 | |
| CONTAINERS, PACKAGING, & GLASS (0.39%)(i) | | | | | | | | | | | | | | | | |
| Mauser Packaging Solutions Holding Co. | | United States | | | | 7.25 | % | | 04/15/25 | | | 750,000 | | | 742,492 | |
| Trident TPI Holdings, Inc. | | United States | | | | 9.25 | % | | 08/01/24 | | | 283,000 | | | 286,655 | |
| Trivium Packaging Finance BV | | Netherlands | | | | 8.50 | % | | 08/15/27 | | | 410,000 | | | 456,884 | |
| | | | | | | | | | | | | | | | 1,486,031 | |
| ENERGY: OIL & GAS (1.69%) | | | | | | | | | | | | | | | | |
| Alta Mesa Holdings LP(g) | | United States | | | | 7.88 | % | | 12/15/24 | | | 968,000 | | | 106,480 | |
| Bruin E&P Partners LLC(i) | | United States | | | | 8.88 | % | | 08/01/23 | | | 804,000 | | | 524,944 | |
| CNX Resources Corp.(i) | | United States | | | | 7.25 | % | | 03/14/27 | | | 444,000 | | | 389,488 | |
| Comstock Resources, Inc., Series WI | | United States | | | | 9.75 | % | | 08/15/26 | | | 365,000 | | | 332,103 | |
| Covey Park Energy LLC(i) | | United States | | | | 7.50 | % | | 05/15/25 | | | 358,000 | | | 308,924 | |
| Great Western Petroleum LLC(i) | | United States | | | | 9.00 | % | | 09/30/21 | | | 907,000 | | | 813,262 | |
| Magnolia Oil & Gas Operating LLC(i) | | United States | | | | 6.00 | % | | 08/01/26 | | | 221,000 | | | 227,154 | |
| Moss Creek Resources Holdings, Inc.(i) | | United States | | | | 7.50 | % | | 01/15/26 | | | 860,000 | | | 656,049 | |
| Parsley Energy LLC(i) | | United States | | | | 5.38 | % | | 01/15/25 | | | 231,000 | | | 238,505 | |
| QEP Resources, Inc. | | United States | | | | 5.25 | % | | 05/01/23 | | | 750,000 | | | 744,375 | |
| Range Resources Corp. | | United States | | | | 5.00 | % | | 03/15/23 | | | 500,000 | | | 461,155 | |
| SM Energy Co. | | United States | | | | 5.63 | % | | 06/01/25 | | | 625,000 | | | 595,053 | |
| Targa Resources Partners LP(i) | | United States | | | | 5.50 | % | | 03/01/30 | | | 578,000 | | | 594,617 | |
| Ultra Resources, Inc.(f) | | United States | | | | 11.00% Cash & 0.25% PIK | | 07/12/24 | | | 296,725 | | | 48,960 | |
| Vine Oil & Gas LP(i) | | United States | | | | 9.75 | % | | 04/15/23 | | | 401,000 | | | 202,505 | |
| WPX Energy, Inc. | | United States | | | | 5.25 | % | | 10/15/27 | | | 220,000 | | | 232,507 | |
| | | | | | | | | | | | | | | | 6,476,081 | |
| FIRE: FINANCE (0.71%)(i) | | | | | | | | | | | | | | | | |
| AG Merger Sub II, Inc. | | United States | | | | 10.75 | % | | 08/01/27 | | | 698,000 | | | 699,988 | |
| Credit Acceptance Corp. | | United States | | | | 5.13 | % | | 12/31/24 | | | 434,000 | | | 451,777 | |
| Credit Acceptance Corp. | | United States | | | | 6.63 | % | | 03/15/26 | | | 441,000 | | | 477,877 | |
| LPL Holdings, Inc. | | United States | | | | 4.63 | % | | 11/15/27 | | | 1,077,000 | | | 1,101,232 | |
| | | | | | | | | | | | | | | | 2,730,874 | |
See Notes to Consolidated Financial Statements.
| Annual Report | December 31, 2019 | 23 |
| Griffin Institutional Access Credit Fund | Consolidated Schedule of Investments |
December 31, 2019
| Description | | Country | | Spread Above Index | | Rate | | | Maturity Date | | Principal Amount | | Value (Note 2)(a) | |
| FIRE: REAL ESTATE (0.11%)(i) | | | | | | | | | | | | | | | | |
| VICI Properties LP | | United States | | | | 4.63 | % | | 12/01/29 | | $ | 397,000 | | $ | 415,599 | |
| | | | | | | | | | | | | | | | | |
| FOREST PRODUCTS & PAPER (0.36%)(i) | | | | | | | | | | | | | | | | |
| LABL Escrow Issuer LLC | | United States | | | | 6.75 | % | | 07/15/26 | | | 662,000 | | | 704,615 | |
| LABL Escrow Issuer LLC | | United States | | | | 10.50 | % | | 07/15/27 | | | 656,000 | | | 672,087 | |
| | | | | | | | | | | | | | | | 1,376,702 | |
| HEALTHCARE & PHARMACEUTICALS (1.81%)(i) | | | | | | | | | | | | | | | | |
| Bausch Health Americas, Inc. | | United States | | | | 8.50 | % | | 01/31/27 | | | 1,488,000 | | | 1,697,287 | |
| Bausch Health Cos., Inc. | | United States | | | | 5.25 | % | | 01/30/30 | | | 189,000 | | | 196,465 | |
| Bausch Health Cos., Inc. | | United States | | | | 5.75 | % | | 08/15/27 | | | 115,000 | | | 124,988 | |
| Bausch Health Cos., Inc. | | United States | | | | 9.00 | % | | 12/15/25 | | | 1,313,000 | | | 1,496,426 | |
| Ortho-Clinical Diagnostics, Inc. | | United States | | | | 6.63 | % | | 05/15/22 | | | 844,000 | | | 840,830 | |
| Par Pharmaceutical, Inc. | | United States | | | | 7.50 | % | | 04/01/27 | | | 1,531,000 | | | 1,527,211 | |
| Select Medical Corp. | | United States | | | | 6.25 | % | | 08/15/26 | | | 959,000 | | | 1,039,896 | |
| | | | | | | | | | | | | | | | 6,923,103 | |
| HIGH TECH INDUSTRIES (0.67%)(i) | | | | | | | | | | | | | | | | |
| Banff Merger Sub, Inc. | | United States | | | | 9.75 | % | | 09/01/26 | | | 960,000 | | | 974,424 | |
| CDK Global, Inc. | | United States | | | | 5.25 | % | | 05/15/29 | | | 836,000 | | | 897,655 | |
| Genesys Telecommunications Laboratories, Inc. | | United States | | | | 10.00 | % | | 11/30/24 | | | 655,000 | | | 709,584 | |
| | | | | | | | | | | | | | | | 2,581,663 | |
| HOTEL, GAMING, & LEISURE (1.10%)(i) | | | | | | | | | | | | | | | | |
| Boyd Gaming Corp. | | United States | | | | 4.75 | % | | 12/01/27 | | | 875,000 | | | 910,525 | |
| MGM Growth Properties Operating Partnership LP | | United States | | | | 5.75 | % | | 02/01/27 | | | 260,000 | | | 290,875 | |
| Scientific Games International, Inc. | | United States | | | | 5.00 | % | | 10/15/25 | | | 255,000 | | | 267,750 | |
| Scientific Games International, Inc. | | United States | | | | 7.00 | % | | 05/15/28 | | | 260,000 | | | 278,681 | |
| Scientific Games International, Inc. | | United States | | | | 7.25 | % | | 11/15/29 | | | 743,000 | | | 809,387 | |
| Scientific Games International, Inc. | | United States | | | | 8.25 | % | | 03/15/26 | | | 1,511,000 | | | 1,668,709 | |
| | | | | | | | | | | | | | | | 4,225,927 | |
| MEDIA: BROADCASTING & SUBSCRIPTION (1.11%)(i) | | | | | | | | | | | | | | | | |
| CCO Holdings LLC | | United States | | | | 5.00 | % | | 02/01/28 | | | 596,000 | | | 626,497 | |
| CSC Holdings LLC | | United States | | | | 5.38 | % | | 02/01/28 | | | 328,000 | | | 350,492 | |
| CSC Holdings LLC | | United States | | | | 7.50 | % | | 04/01/28 | | | 379,000 | | | 429,150 | |
| CSC Holdings LLC | | United States | | | | 10.88 | % | | 10/15/25 | | | 1,250,000 | | | 1,399,219 | |
| Cumulus Media New Holdings, Inc. | | United States | | | | 6.75 | % | | 07/01/26 | | | 209,000 | | | 224,283 | |
| Entercom Media Corp. | | United States | | | | 6.50 | % | | 05/01/27 | | | 871,000 | | | 934,450 | |
| iHeartCommunications, Inc. | | United States | | | | 5.25 | % | | 08/15/27 | | | 284,000 | | | 297,675 | |
| | | | | | | | | | | | | | | | 4,261,766 | |
| MEDIA: DIVERSIFIED & PRODUCTION (0.99%) | | | | | | | | | | | | | | | | |
| Getty Images, Inc.(i) | | United States | | | | 9.75 | % | | 03/01/27 | | | 1,140,000 | | | 1,134,696 | |
| National CineMedia LLC | | United States | | | | 5.75 | % | | 08/15/26 | | | 802,000 | | | 786,239 | |
| National CineMedia LLC(i) | | United States | | | | 5.88 | % | | 04/15/28 | | | 574,000 | | | 611,509 | |
| Sirius XM Radio, Inc.(i) | | United States | | | | 5.00 | % | | 08/01/27 | | | 625,000 | | | 660,532 | |
| Sirius XM Radio, Inc.(i) | | United States | | | | 5.50 | % | | 07/01/29 | | | 568,000 | | | 615,195 | |
| | | | | | | | | | | | | | | | 3,808,171 | |
| METALS & MINING (0.00%)(f)(g)(i)(j) | | | | | | | | | | | | | | | | |
| Murray Energy Corp. | | United States | | | | 9.00% Cash & 3.00% PIK | | 04/15/24 | | | 1,551,935 | | | 1,955 | |
| | | | | | | | | | | | | | | | | |
| RETAIL (0.39%)(i) | | | | | | | | | | | | | | | | |
| Albertsons Cos. Inc. | | United States | | | | 5.88 | % | | 02/15/28 | | | 426,000 | | | 453,413 | |
See Notes to Consolidated Financial Statements.
| 24 | 1.888.926.2688 | www.griffincapital.com |
| Griffin Institutional Access Credit Fund | Consolidated Schedule of Investments |
December 31, 2019
| Description | | Country | | Spread Above Index | | Rate | | | Maturity Date | | Principal Amount | | Value (Note 2)(a) | |
| RETAIL (continued) | | | | | | | | | | | | | | | | |
| Party City Holdings, Inc. | | United States | | | | 6.13 | % | | 08/15/23 | | $ | 57,000 | | $ | 50,041 | |
| Party City Holdings, Inc. | | United States | | | | 6.63 | % | | 08/01/26 | | | 1,428,000 | | | 1,010,057 | |
| | | | | | | | | | | | | | | | 1,513,511 | |
| SERVICES: BUSINESS (1.70%) | | | | | | | | | | | | | | | | |
| Aptim Corp.(i) | | United States | | | | 7.75 | % | | 06/15/25 | | | 472,000 | | | 284,576 | |
| Eagle Holding Co. II LLC(f)(i) | | United States | | | | 7.75% Cash & 8.50% PIK | | 05/15/22 | | | 656,000 | | | 667,257 | |
| Fair Isaac Corp.(i) | | United States | | | | 4.00 | % | | 06/15/28 | | | 230,000 | | | 232,300 | |
| Gogo Intermediate Holdings LLC(i) | | United States | | | | 9.88 | % | | 05/01/24 | | | 1,033,000 | | | 1,093,260 | |
| La Financiere Atalian SASU, Series Reg S(k) | | France | | | | 4.00 | % | | 05/15/24 | | € | 565,000 | | | 514,907 | |
| La Financiere Atalian SASU, Series Reg S(k) | | France | | | | 5.13 | % | | 05/15/25 | | | 430,000 | | | 391,775 | |
| MDC Partners, Inc.(i) | | United States | | | | 6.50 | % | | 05/01/24 | | $ | 1,953,000 | | | 1,772,348 | |
| MPH Acquisition Holdings LLC(i) | | United States | | | | 7.13 | % | | 06/01/24 | | | 972,000 | | | 942,830 | |
| Promontoria Holding 264 BV, Series | | | | | | | | | | | | | | | | |
| Reg S(b)(k) | | Netherlands | | 3M EUR L + 6.25% | | 6.25 | % | | 08/15/23 | | € | 384,000 | | | 380,511 | |
| Sophia LP(i) | | United States | | | | 9.00 | % | | 09/30/23 | | $ | 250,000 | | | 257,604 | |
| | | | | | | | | | | | | | | | 6,537,368 | |
| SERVICES: CONSUMER (0.28%) | | | | | | | | | | | | | | | | |
| Cedar Fair LP(i) | | United States | | | | 5.25 | % | | 07/15/29 | | | 421,000 | | | 454,406 | |
| Netflix, Inc.(i) | | United States | | | | 4.88 | % | | 06/15/30 | | | 105,000 | | | 106,835 | |
| Netflix, Inc. | | United States | | | | 5.88 | % | | 11/15/28 | | | 465,000 | | | 516,341 | |
| | | | | | | | | | | | | | | | 1,077,582 | |
| TELECOMMUNICATIONS (1.59%) | | | | | | | | | | | | | | | | |
| Cincinnati Bell, Inc.(i) | | United States | | | | 8.00 | % | | 10/15/25 | | | 952,000 | | | 1,011,895 | |
| Connect Finco SARL(i) | | United Kingdom | | | | 6.75 | % | | 10/01/26 | | | 641,000 | | | 683,466 | |
| Intelsat Connect Finance S.A.(i) | | Luxembourg | | | | 9.50 | % | | 02/15/23 | | | 87,000 | | | 61,092 | |
| Intelsat Jackson Holdings S.A.(i) | | Luxembourg | | | | 8.50 | % | | 10/15/24 | | | 961,000 | | | 877,311 | |
| Intelsat Jackson Holdings S.A.(i) | | Luxembourg | | | | 9.50 | % | | 09/30/22 | | | 171,000 | | | 194,032 | |
| Intelsat Luxembourg S.A. | | Luxembourg | | | | 8.13 | % | | 06/01/23 | | | 103,000 | | | 61,155 | |
| Level 3 Financing, Inc. | | United States | | | | 5.38 | % | | 01/15/24 | | | 660,000 | | | 672,649 | |
| Matterhorn Telecom S.A.(i) | | Luxembourg | | | | 3.13 | % | | 09/15/26 | | € | 482,000 | | | 560,364 | |
| Sprint Communications, Inc. | | United States | | | | 11.50 | % | | 11/15/21 | | $ | 1,720,000 | | | 1,968,230 | |
| | | | | | | | | | | | | | | | 6,090,194 | |
| TRANSPORTATION: CARGO (0.24%) | | | | | | | | | | | | | | | | |
| Flexi-Van Leasing, Inc.(i) | | United States | | | | 10.00 | % | | 02/15/23 | | | 296,000 | | | 281,940 | |
| Naviera Armas S.A., Series Reg S(b)(k) | | Spain | | 3M EUR L + 6.50% | | 6.50 | % | | 07/31/23 | | € | 732,000 | | | 640,462 | |
| | | | | | | | | | | | | | | | 922,402 | |
| TRANSPORTATION: CONSUMER (0.41%)(i) | | | | | | | | | | | | | | | | |
| VistaJet Malta Finance PLC | | Switzerland | | | | 10.50 | % | | 06/01/24 | | $ | 1,641,000 | | | 1,562,372 | |
| | | | | | | | | | | | | | | | | |
| UTILITIES: ELECTRIC (0.15%)(i) | | | | | | | | | | | | | | | | |
| Calpine Corp. | | United States | | | | 4.50 | % | | 02/15/28 | | | 578,000 | | | 583,849 | |
| | | | | | | | | | | | | | | | | |
| UTILITIES: WATER (0.07%)(i) | | | | | | | | | | | | | | | | |
| Core & Main LP | | United States | | | | 6.13 | % | | 08/15/25 | | | 240,000 | | | 249,598 | |
| | | | | | | | | | | | | | | | | |
| WHOLESALE (0.56%)(i) | | | | | | | | | | | | | | | | |
| Beacon Roofing Supply, Inc. | | United States | | | | 4.50 | % | | 11/15/26 | | | 87,000 | | | 89,719 | |
| Beacon Roofing Supply, Inc. | | United States | | | | 4.88 | % | | 11/01/25 | | | 1,250,000 | | | 1,258,856 | |
| SRS Distribution, Inc. | | United States | | | | 8.25 | % | | 07/01/26 | | | 614,000 | | | 635,703 | |
| | | | | | | | | | | | | | | | | |
See Notes to Consolidated Financial Statements.
| Annual Report | December 31, 2019 | 25 |
| Griffin Institutional Access Credit Fund | Consolidated Schedule of Investments |
December 31, 2019
| Description | | Country | | Spread Above Index | Rate | | | Maturity Date | | Principal Amount | | Value (Note 2)(a) | |
| WHOLESALE (continued) | | | | | | | | | | | | | | | | |
| TPro Acquisition Corp. | | United States | | | | 11.00 | % | | 10/15/24 | | $ | 174,000 | | $ | 179,655 | |
| | | | | | | | | | | | | | | | 2,163,933 | |
| TOTAL CORPORATE BONDS | | | | | | | | | | | | | | | | |
| (Cost $85,250,965) | | | | | | | | | | | | | | | 85,740,056 | |
| | | | | | | | | | | | | | | | | |
| CONVERTIBLE CORPORATE BONDS (0.09%)(h) | | | | | | | | | | | | | | | | |
| ENERGY: OIL & GAS (0.09%) | | | | | | | | | | | | | | | | |
| Whiting Petroleum Corp. | | United States | | | | 1.25 | % | | 04/01/20 | | | 331,000 | | | 324,740 | |
| | | | | | | | | | | | | | | | | |
| TOTAL CONVERTIBLE CORPORATE BONDS | | | | | | | | | | | | | | | | |
| (Cost $325,365) | | | | | | | | | | | | | | | 324,740 | |
| | | | | | | | | | | | | | | | | |
| COLLATERALIZED LOAN OBLIGATIONS (8.73%)(i) | | | | | | | | | | | | | | | | |
| DEBT (5.08%)(b) | | | | | | | | | | | | | | | | |
| Allegro CLO X, Ltd., Series 2019-1A | | Cayman Islands | | 3M US L + 6.88% | | 8.85 | % | | 04/20/32 | | | 400,000 | | | 392,095 | |
| AMMC CLO 18, Ltd., Series 2018-18A | | Cayman Islands | | 3M US L + 6.00% | | 7.92 | % | | 05/26/31 | | | 600,000 | | | 541,443 | |
| AMMC CLO XI, Ltd., Series 2018-11A | | Cayman Islands | | 3M US L + 5.80% | | 7.74 | % | | 04/30/31 | | | 400,000 | | | 373,278 | |
| AMMC CLO XIV, Ltd., Series 2017-14A | | Cayman Islands | | 3M US L + 6.53% | | 8.47 | % | | 07/25/29 | | | 800,000 | | | 772,423 | |
| | | | | | | | | | | | | | | | |
| Atlas Senior Loan Fund XIV, Series 2019-14A | | Cayman Islands | | 3M US L + 6.94% | | 9.34 | % | | 07/20/32 | | | 500,000 | | | 472,817 | |
| Atlas Senior Loan Fund XV, Ltd., Series 2019-15A | | Cayman Islands | | 3M US L + 7.54% | | 9.46 | % | | 10/23/32 | | | 700,000 | | | 688,040 | |
| BlueMountain CLO 2016-3, Ltd., Series 2018-3A | | Cayman Islands | | 3M US L + 5.95% | | 7.86 | % | | 11/15/30 | | | 300,000 | | | 280,420 | |
| Carlyle Global Market Strategies CLO 2013-3, Ltd., Series 2017-3A | | Cayman Islands | | 3M US L + 5.50% | | 7.50 | % | | 10/15/30 | | | 400,000 | | | 360,918 | |
| Carlyle US CLO 2017-3, Ltd., Series 2017-3A | | Cayman Islands | | 3M US L + 6.11% | | 8.08 | % | | 07/20/29 | | | 400,000 | | | 366,412 | |
| CIFC Funding 2013-I, Ltd., Series 2017-1A | | Cayman Islands | | 3M US L + 6.65% | | 8.65 | % | | 07/16/30 | | | 600,000 | | | 587,698 | |
| CIFC Funding 2013-III-R, Ltd., Series 2018-3RA | | Cayman Islands | | 3M US L + 5.90% | | 7.84 | % | | 04/24/31 | | | 500,000 | | | 476,193 | |
| CIFC Funding 2014-II-R, Ltd., Series 2018-2RA | | Cayman Islands | | 3M US L + 5.69% | | 7.63 | % | | 04/24/30 | | | 300,000 | | | 273,187 | |
| Dryden 37 Senior Loan Fund, Series 2017-37A | | Cayman Islands | | 3M US L + 5.15% | | 7.14 | % | | 01/15/31 | | | 300,000 | | | 274,426 | |
| Greenwood Park CLO, Ltd., Series 2018-1A | | Cayman Islands | | 3M US L + 4.95% | | 6.95 | % | | 04/15/31 | | | 300,000 | | | 282,431 | |
| KKR CLO 10, Ltd., Series 2017-10 | | Cayman Islands | | 3M US L + 6.50% | | 8.39 | % | | 09/15/29 | | | 800,000 | | | 762,363 | |
| KKR CLO 14, Ltd., Series 2018-14 | | Cayman Islands | | 3M US L + 6.15% | | 8.15 | % | | 07/15/31 | | | 400,000 | | | 372,316 | |
| Madison Park Funding XIII, Ltd., Series 2018-13A | | Cayman Islands | | 3M US L + 5.75% | | 7.72 | % | | 04/19/30 | | | 700,000 | | | 672,700 | |
| MidOcean Credit CLO X, Series 2019-10A | | Cayman Islands | | 3M US L + 7.44% | | 9.25 | % | | 10/23/32 | | | 1,200,000 | | | 1,110,499 | |
| Mountain View CLO 2015-9, Ltd., Series 2018-9A | | Cayman Islands | | 3M US L + 6.08% | | 8.08 | % | | 07/15/31 | | | 700,000 | | | 610,425 | |
| Mountain View CLO 2017-2 LLC, Series 2018-2A | | Cayman Islands | | 3M US L + 5.96% | | 7.96 | % | | 01/16/31 | | | 500,000 | | | 459,731 | |
| Northwoods Capital XVIII, Ltd., Series 2019-18A | | Cayman Islands | | 3M US L + 6.58% | | 8.48 | % | | 05/20/32 | | | 400,000 | | | 349,996 | |
| Oaktree CLO 2018-1, Ltd., Series 2018-1A | | Cayman Islands | | 3M US L + 6.15% | | 8.12 | % | | 10/20/30 | | | 300,000 | | | 276,702 | |
| Oaktree CLO 2019-1, Ltd., Series 2019-1A | | Cayman Islands | | 3M US L + 6.80% | | 8.75 | % | | 04/22/30 | | | 400,000 | | | 360,654 | |
| Oaktree CLO 2019-2, Ltd., Series 2019-2A | | Cayman Islands | | 3M US L + 6.77% | | 8.77 | % | | 04/15/31 | | | 500,000 | | | 465,026 | |
See Notes to Consolidated Financial Statements.
| 26 | 1.888.926.2688 | www.griffincapital.com |
| Griffin Institutional Access Credit Fund | Consolidated Schedule of Investments |
December 31, 2019
| Description | | Country | | Spread Above Index | | Rate | | | Maturity Date | | | Principal Amount | | | Value (Note 2)(a) | |
| DEBT (continued) | | | | | | | | | | | | | | | | | | | |
| OCP CLO 2014-6, Ltd., Series 2017-6A | | Cayman Islands | | 3M US L + 6.52% | | 8.52 | % | | | 10/17/30 | | | $ | 500,000 | | | $ | 489,363 | |
| OZLM Funding IV, Ltd., Series 2017-4A | | Cayman Islands | | 3M US L + 6.30% | | 8.25 | % | | | 10/22/30 | | | | 693,421 | | | | 652,220 | |
| Parallel 2019-1, Ltd., Series 2019-1A | | Cayman Islands | | 3M US L + 6.72% | | 8.84 | % | | | 07/20/32 | | | | 400,000 | | | | 389,264 | |
| Regatta XIII Funding, Ltd., Series 2018-2A | | Cayman Islands | | 3M US L + 5.95% | | 7.95 | % | | | 07/15/31 | | | | 900,000 | | | | 842,304 | |
| Regatta XIV Funding, Ltd., Series 2018-3A | | Cayman Islands | | 3M US L + 5.95% | | 7.89 | % | | | 10/25/31 | | | | 600,000 | | | | 566,292 | |
| Sound Point CLO II, Ltd., Series 2018-1A | | Cayman Islands | | 3M US L + 5.50% | | 7.44 | % | | | 01/26/31 | | | | 300,000 | | | | 263,592 | |
| Sound Point CLO XXII, Ltd., Series 2019-1A | | Cayman Islands | | 3M US L + 6.30% | | 8.27 | % | | | 01/20/32 | | | | 300,000 | | | | 278,736 | |
| Symphony CLO XV, Ltd., Series 2018-15A | | Cayman Islands | | 3M US L + 6.33% | | 8.33 | % | | | 01/17/32 | | | | 1,000,000 | | | | 948,906 | |
| TCW CLO 2019-2, Ltd., Series 2019-2A | | Cayman Islands | | 3M US L + 7.40% | | 9.30 | % | | | 10/20/32 | | | | 500,000 | | | | 496,965 | |
| Trimaran Cavu 2019-1, Ltd., Series 2019-1A | | Cayman Islands | | 3M US L + 7.04% | | 9.01 | % | | | 07/20/32 | | | | 800,000 | | | | 750,264 | |
| Venture 32 CLO, Ltd., Series 2018-32A | | Cayman Islands | | 3M US L + 5.75% | | 7.75 | % | | | 07/18/31 | | | | 300,000 | | | | 275,492 | |
| Venture 33 CLO, Ltd., Series 2018-33A | | Cayman Islands | | 3M US L + 5.95% | | 7.95 | % | | | 07/15/31 | | | | 200,000 | | | | 181,084 | |
| Venture 34 CLO, Ltd., Series 2018-34A | | Cayman Islands | | 3M US L + 6.13% | | 8.13 | % | | | 10/15/31 | | | | 200,000 | | | | 187,993 | |
| Venture 35 CLO, Ltd., Series 2018-35A | | Cayman Islands | | 3M US L + 6.20% | | 8.15 | % | | | 10/22/31 | | | | 300,000 | | | | 278,093 | |
| Venture 36 CLO, Ltd., Series 2019-36A | | Cayman Islands | | 3M US L + 6.92% | | 8.89 | % | | | 04/20/32 | | | | 300,000 | | | | 279,987 | |
| Venture XXII CLO, Ltd., Series 2015-22A | | Cayman Islands | | 3M US L + 5.65% | | 7.65 | % | | | 01/15/31 | | | | 300,000 | | | | 260,311 | |
| Venture XXX CLO, Ltd., Series 2017-30A | | Cayman Islands | | 3M US L + 6.30% | | 8.30 | % | | | 01/15/31 | | | | 200,000 | | | | 183,068 | |
| Voya CLO 2014-4, Ltd., Series 2018-4A | | Cayman Islands | | 3M US L + 5.95% | | 7.95 | % | | | 07/14/31 | | | | 300,000 | | | | 270,842 | |
| Wellfleet CLO X, Ltd., Series 2019-XA | | Cayman Islands | | 3M US L + 7.03% | | 9.00 | % | | | 04/20/32 | | | | 300,000 | | | | 289,246 | |
| | | | | | | | | | | | | | | | | | | 19,466,215 | |
| EQUITY (3.65%)(l) | | | | | | | | | | | | | | | | | | | |
| ARES XLVII CLO, Ltd., Series 2018-47A | | Cayman Islands | | | | 12.40 | % | | | 04/15/30 | | | | 800,000 | | | | 621,908 | |
| Bardot CLO, Ltd., Series 2019-2A | | Cayman Islands | | | | 8.15 | % | | | 10/22/32 | | | | 1,100,000 | | | | 1,050,792 | |
| Barings CLO, Ltd., Series 2019-3A | | Cayman Islands | | | | 6.78 | % | | | 04/20/31 | | | | 1,200,000 | | | | 1,075,377 | |
| Carlyle US CLO 2017-5, Ltd., Series 2017-5A | | Cayman Islands | | | | 11.26 | % | | | 01/20/30 | | | | 700,000 | | | | 529,599 | |
| CIFC Funding 2018-I, Ltd., Series 2018-1A | | Cayman Islands | | | | 12.09 | % | | | 04/18/31 | | | | 200,000 | | | | 164,605 | |
| CIFC Funding 2018-II, Ltd., Series 2018-2A | | Cayman Islands | | | | 11.26 | % | | | 04/20/31 | | | | 300,000 | | | | 242,593 | |
| CIFC Funding 2019-I, Ltd., Series 2019-1A | | Cayman Islands | | | | 9.32 | % | | | 04/20/32 | | | | 1,100,000 | | | | 868,455 | |
| Dryden 40 Senior Loan Fund, Series 2015-40A | | Cayman Islands | | | | 16.02 | % | | | 08/15/31 | | | | 800,000 | | | | 427,290 | |
| Dryden, Ltd., Series 2018-64A | | Cayman Islands | | | | 15.09 | % | | | 04/18/31 | | | | 900,000 | | | | 653,158 | |
| Madison Park Funding XXI, Ltd., Series 2016-21A | | Cayman Islands | | | | 4.59 | % | | | 07/25/29 | | | | 500,000 | | | | 313,710 | |
| Madison Park Funding XXVI, Ltd., Series 2017-26A | | Cayman Islands | | | | 9.17 | % | | | 07/29/47 | | | | 500,000 | | | | 254,698 | |
| Midocean Credit CLO, Ltd., Series 2018-8A | | Cayman Islands | | | | 12.64 | % | | | 02/20/31 | | | | 300,000 | | | | 198,498 | |
| Octagon Investment Partners 37, Ltd., Series 2018-2A | | Cayman Islands | | | | 12.93 | % | | | 07/25/30 | | | | 1,000,000 | | | | 794,157 | |
| OZLM XIX, Ltd., Series 2017-19A | | Cayman Islands | | | | 12.25 | % | | | 11/22/30 | | | | 1,100,000 | | | | 686,050 | |
| Parallel 2018-1, Ltd., Series 2018-1A | | Cayman Islands | | | | 11.56 | % | | | 04/20/31 | | | | 1,200,000 | | | | 839,835 | |
| RR 4, Ltd., Series 2018-4A | | Cayman Islands | | | | 13.52 | % | | | 04/15/18* | | | | 1,000,000 | | | | 889,588 | |
| Sound Point CLO XIX, Ltd., Series 2018-1A | | Cayman Islands | | | | 10.25 | % | | | 04/15/31 | | | | 400,000 | | | | 284,363 | |
| Sound Point CLO XVII, Ltd., Series 2017-3A | | Cayman Islands | | | | 13.69 | % | | | 10/20/30 | | | | 600,000 | | | | 416,334 | |
| Sound Point CLO XX, Ltd., Series 2018-2A | | Cayman Islands | | | | 11.41 | % | | | 07/26/31 | | | | 500,000 | | | | 414,772 | |
| Sound Point CLO XXI, Ltd., Series 2018-3A | | Cayman Islands | | | | 11.06 | % | | | 10/26/31 | | | | 1,200,000 | | | | 927,435 | |
| Venture CDO, Ltd., Series 2017-30A | | Cayman Islands | | | | 10.32 | % | | | 01/15/31 | | | | 600,000 | | | | 466,916 | |
| Vibrant CLO VIII, Ltd., Series 2018-8A | | Cayman Islands | | | | 14.96 | % | | | 01/20/31 | | | | 500,000 | | | | 354,262 | |
| Voya, Ltd., Series 2017-1A | | Cayman Islands | | | | 13.05 | % | | | 04/17/30 | | | | 505,000 | | | | 296,969 | |
| Voya, Ltd., Series 2018-1A | | Cayman Islands | | | | 14.39 | % | | | 04/19/31 | | | | 500,000 | | | | 369,607 | |
| * | Maturity date is April 15, 2118 |
See Notes to Consolidated Financial Statements.
| Annual Report | December 31, 2019 | 27 |
| Griffin Institutional Access Credit Fund | Consolidated Schedule of Investments |
December 31, 2019
| Description | | Country | | Spread Above Index | | Rate | | | | Maturity Date | | | Principal Amount | | | Value (Note 2)(a) | |
| EQUITY (continued) | | | | | | | | | | | | | | | | | | | |
| Wind River CLO, Ltd. | | Cayman Islands | | | | 12.40 | % | | | 01/20/31 | | | $ | 1,200,000 | | | $ | 866,432 | |
| | | | | | | | | | | | | | | | | | | 14,007,403 | |
| TOTAL COLLATERALIZED LOAN OBLIGATIONS | | | | | | | | | | | | | | | |
| (Cost $33,411,373) | | | | | | | | | | | | | | | | | | 33,473,618 | |
| | | | | | | | Shares | | | | |
| COMMON STOCKS (0.00%)(m) | | | | | | | | | | | | |
| MEDIA: ADVERTISING, PRINTING & PUBLISHING (0.00%)(j) | | | | | | | |
| PacificCo | | United States | | | | | | 1,260 | | | 7,402 | |
| | | | | | | | | | | | | |
| TOTAL COMMON STOCKS | | | | | | | | | | | | |
| (Cost $383,355) | | | | | | | | | | | 7,402 | |
| | | | | | | | | | | | | |
| EQUITY INTEREST (1.18%)(c) | | | | | | | | | | | | |
| AEROSPACE & DEFENSE (0.22%)(k) | | | | | | | | | | | | |
| GIACF Air Comm Equity Holdings, LLC - Preferred Stock (16.00% PIK)(f) | | United States | | | | | | 676,730 | | | 676,730 | |
| Kellstrom Aerospace Group, Inc.(m) | | United States | | | | | | 107 | | | 167,231 | |
| | | | | | | | | | | | 843,961 | |
| CONSTRUCTION & BUILDING (0.75%)(k)(n) | | | | | | | | | | | | |
| Bain Capital Credit CC Fund | | United States | | | | | | 2,450 | | | 2,869,923 | |
| | | | | | | | | | | | | |
| CONSUMER GOODS: DURABLE (0.03%)(m) | | | | | | | | | | | | |
| TLC Holdco LP | | United States | | | | | | 103,961 | | | 103,961 | |
| | | | | | | | | | | | | |
| HIGH TECH INDUSTRIES (0.06%)(k)(m) | | | | | | | | | | | | |
| East BCC Coinvest III, LLC | | United States | | | | | | 241,930 | | | 241,930 | |
| | | | | | | | | | | | | |
| TRANSPORTATION: CARGO (0.04%)(k) | | | | | | | | | | | | |
| GIACF Grammer Equity Holdings, LLC - Common Stock(m) | | United States | | | | | | 84,221 | | | 85,063 | |
| GIACF Grammer Equity Holdings, LLC - Preferred Stock (10.00% PIK)(f) | | United States | | | | | | 513 | | | 53,883 | |
| GIACF Grammer Equity Holdings, LLC - Warrants(m) | | United States | | | | | | 10,151 | | | 10,151 | |
| | | | | | | | | | | | 149,097 | |
| TRANSPORTATION: CONSUMER (0.08%)(k)(m) | | | | | | | | | | | | |
| Toro Private Investments LP | | United States | | | | | | 324,324 | | | 324,324 | |
| | | | | | | | | | | | | |
| TOTAL EQUITY INTEREST | | | | | | | | | | | | |
| (Cost $4,104,866) | | | | | | | | | | | 4,533,196 | |
| | | | | | | | | | | | | |
| EXCHANGE TRADED FUNDS (3.99%) | | | | | | | | | | | | |
| iShares iBoxx High Yield Corporate Bond ETF | | United States | | | | | | 84,473 | | | 7,428,556 | |
| | | | | | | | | | | | | |
| Invesco Senior Loan ETF | | United States | | | | | | 344,571 | | | 7,863,110 | |
| | | | | | | | | | | | | |
| TOTAL EXCHANGE TRADED FUNDS | | | | | | | | | | | | |
| (Cost $15,190,049) | | | | | | | | | | | 15,291,666 | |
See Notes to Consolidated Financial Statements.
| 28 | 1.888.926.2688 | www.griffincapital.com |
| Griffin Institutional Access Credit Fund | Consolidated Schedule of Investments |
December 31, 2019
| | | Value (Note 2)(a) | |
| TOTAL INVESTMENTS (88.95%) | | | | |
| (Cost $342,371,742) | | $ | 341,035,056 | |
| | | | | |
| Other Assets In Excess Of Liabilities (11.05%)(o) | | | 42,382,034 | |
| NET ASSETS (100.00%) | | $ | 383,417,090 | |
Libor Rates:
3M BBSW - 3 Month BBSW as of December 31, 2019 was 0.95%
1M US L - 1 Month US LIBOR as of December 31, 2019 was 1.76%
2M US L - 2 Month US LIBOR as of December 31, 2019 was 1.83%
3M US L - 3 Month US LIBOR as of December 31, 2019 was 1.91%
6M US L - 6 Month US LIBOR as of December 31, 2019 was 1.91%
1M EUR L - 1 Month EURIBOR as of December 31, 2019 was (0.51)%
2M EUR L - 2 Month EURIBOR as of December 31, 2019 was (0.45)%
3M EUR L - 3 Month EURIBOR as of December 31, 2019 was (0.41)%
6M EUR L - 6 Month EURIBOR as of December 31, 2019 was (0.37)%
1M GBP L - 1 Month GBP LIBOR as of December 31, 2019 was 0.70%
3M GBP L - 3 Month GBP LIBOR as of December 31, 2019 was 0.79%
6M GBP L - 6 Month GBP LIBOR as of December 31, 2019 was 0.88%
3M CDOR - 3 Month CDOR as of December 31, 2019 was 1.91%
PRIME rate as of December 31, 2019 was 4.75%
| (a) | Investment holdings denominated in foreign currencies are converted to U.S. Dollars using period end spot rates. |
| (b) | Floating or variable rate security. The reference rate is described above. The rate in effect as of December 31, 2019 is based on the reference rate plus the displayed spread as of the security's last reset date. |
| (c) | Security is classified as Level 3 in the Fund's fair value hierarchy (see Note 2). |
| (d) | A portion of this position or the entire position was not funded as of December 31, 2019. The Fund had $5,035,759 at par value in unfunded commitments pursuant to Delayed Draw Term Loan facilities and unused Revolver capacities. The Consolidated Schedule of Investments records each of these investments as fully funded. A corresponding payable for investments purchased has also been recorded which represents the actual unfunded amount on the balance sheet date. |
| Unfunded Security | | Total revolving and delayed draw loan commitments | | | Less: drawn commitments | | | Total undrawn commitments | |
| AMI US Holdings Inc. Revolver Loan | | $ | 145,361 | | | $ | 63,959 | | | $ | 81,402 | |
| Bleriot US Bidco, Inc., First Lien Delayed Draw Term Loan | | | 58,329 | | | | – | | | | 58,329 | |
| CB Nike Intermediateco Ltd. Revolver Loan | | | 310,000 | | | | 108,500 | | | | 201,500 | |
| CMI Marketing, Inc., First Lien Revolving Term Loan | | | 120,000 | | | | – | | | | 120,000 | |
| CST Buyer Co, Revolving Credit Facility Term Loan | | | 233,472 | | | | – | | | | 233,472 | |
| Drilling Info Holdings, Inc. Delayed Draw Term Loan | | | 171,330 | | | | – | | | | 171,330 | |
| Grammer Purchaser, Inc., First Lien Revolving Term Loan | | | 90,000 | | | | 4,500 | | | | 85,500 | |
| Horizon Telcom, Inc., First Lien Revolving Term Loan | | | 5,793 | | | | – | | | | 5,793 | |
| Ivy Finco Limited, Term Loan, Acquisition Facility (Original) | | | 585,896 | | | | 222,808 | | | | 363,088 | |
| Kellstrom Commercial Aerospace, Inc. - Delayed Draw Term Loan | | | 260,146 | | | | – | | | | 260,146 | |
| Kellstrom Commercial Aerospace, Inc. - Revolver | | | 433,577 | | | | 390,219 | | | | 43,358 | |
| Mavis Tire Express Services Corp., First Lien Delayed Draw Term Loan | | | 85,511 | | | | 6,264 | | | | 79,247 | |
| MED Parentco LP, First Lien Delayed Draw Term Loan | | | 167,559 | | | | 35,665 | | | | 131,894 | |
| Mertus 522. GmbH, Acquisition/Capex Facility | | | 524,924 | | | | 34,995 | | | | 489,929 | |
| OEConnection LLC, First Lien Delayed Draw Term Loan | | | 29,131 | | | | – | | | | 29,131 | |
| Soursop, Ltd., Acquisition/Capex Facility | | | 1,255,676 | | | | 563,244 | | | | 692,432 | |
| Sumup Holdings Luxembourg SARL, Facility B | | | 1,664,039 | | | | 734,135 | | | | 929,904 | |
| TLC Purchaser, Inc. Delayed Draw Term Loan | | | 623,197 | | | | – | | | | 623,197 | |
| TLC Purchaser, Inc. Revolver Loan | | | 778,763 | | | | 342,656 | | | | 436,107 | |
| Total | | $ | 7,542,704 | | | $ | 2,506,945 | | | $ | 5,035,759 | |
See Notes to Consolidated Financial Statements.
| Annual Report | December 31, 2019 | 29 |
| Griffin Institutional Access Credit Fund | Consolidated Schedule of Investments |
December 31, 2019
| (e) | All or a portion of this position has not settled as of December 31, 2019. The interest rate shown represents the stated spread over the applicable London Interbank Offered Rate ("LIBOR" or "L") or Euro Interbank Offered Rate ("EURIBOR" or "EUR L"); the Fund will not accrue interest until the settlement date at which point LIBOR or EURIBOR will be established. If the position is partially settled, the reference rate and floor shown is applicable to the settled portion. |
| (f) | Paid in kind security which may pay interest in additional par. |
| (g) | See Note 2 regarding defaulted securities. |
| (i) | Securities exempt from registration under Rule 144A of the Securities Act of 1933, as amended (the "Securities Act"). These securities may be sold in the ordinary course of business in transactions exempt from registration normally to qualified institutional buyers. As of December 31, 2019, the aggregate market value of those securities was $110,641,927, representing 28.86% of net assets. |
| (k) | Securities exempt from registration under the Securities Act, and may be deemed to be "restricted securities" under the Securities Act. As of December 31, 2019 the aggregate market value of those securities was $6,356,890 representing 1.66% of the Fund's net assets. |
| (l) | CLO subordinated notes, income notes, and Class M notes are considered CLO equity positions. CLO equity positions are entitled to recurring distributions which are generally equal to the remaining cash flow of payments made by underlying securities less contractual payments to debt holders and fund expenses. |
| (m) | Non-income producing security. |
| (n) | The Fund's interest in this investment is held through a wholly-owned subsidiary of the Fund, GIACF Alternative Holdings, LLC, a Cayman Islands company formed to effect certain non-performing loan investments for the Fund. |
| (o) | Includes cash which is being held as collateral for total return swaps. |
Common Abbreviations:
BBSW - Bank Bill Swap Rate
CDO - Collateralized Debt Obligation
CDOR - Canadian Dollar Offered Rate
CLO - Collateralized Loan Obligation
ETF - Exchange Traded Fund
EURIBOR - Euro Interbank Offered Rate
GmbH - German company with limited liability
LIBOR - London Interbank Offered Rate
LLC - Limited Liability Company
LP - Limited Partnership
Ltd - Limited Company
PIK - Payment in Kind
PLC - Public Limited Company
Reg S - Regulation S
S.A. - Société Anonyme
SARL - Société A Responsabilité Limitée
See Notes to Consolidated Financial Statements.
| 30 | 1.888.926.2688 | www.griffincapital.com |
| Griffin Institutional Access Credit Fund | Consolidated Schedule of Investments |
December 31, 2019
OUTSTANDING FORWARD FOREIGN CURRENCY CONTRACTS
| Counterparty | | Settlement Date | | Fund Receiving | | Value | | Fund Delivering | | Value | | Unrealized Appreciation/ (Depreciation) | |
| Bank of New York Mellon | | 06/15/20 | | USD | | | 4,144,430 | | EUR | | | 4,113,978 | | $ | 30,452 | |
| | | | | | | | | | | | | | | $ | 30,452 | |
| | | | | | | | | | | | | | | | | |
| Bank of New York Mellon | | 06/15/20 | | USD | | | 1,231,120 | | AUD | | | 1,239,788 | | $ | (8,668 | ) |
| Bank of New York Mellon | | 03/20/20 | | USD | | | 2,347,489 | | CAD | | | 2,395,629 | | | (48,140 | ) |
| Bank of New York Mellon | | 03/20/20 | | USD | | | 24,649,587 | | EUR | | | 24,831,120 | | | (181,533 | ) |
| Bank of New York Mellon | | 03/20/20 | | USD | | | 9,163,401 | | GBP | | | 9,305,245 | | | (141,844 | ) |
| | | | | | | | | | | | | | | $ | (380,185 | ) |
| | | | | | | | | | | | | | | $ | (349,733 | ) |
TOTAL RETURN SWAP CONTRACTS(a)
| Counterparty | | Fund Receives | | Fund Pays | | Notional Amount | | | Unrealized Appreciation/ (Depreciation) | |
| Citibank, N.A. | | Advisor Group Holdings Inc., 1M US L + 5.00%, 6.80%, 07/31/26 | | 1M US L + 1.25% | | $ | 499,245 | | | $ | 6,245 | |
| Citibank, N.A. | | Albertson's LLC, 1M US L + 2.75%, 4.55%, 11/17/25 | | 1M US L + 1.25% | | | 587,063 | | | | 7,880 | |
| Citibank, N.A. | | Alliant Holdings Intermediate LLC, 1M US L + 3.00%, 4.80%, 05/09/25 | | 1M US L + 1.25% | | | 1,178,668 | | | | 35,531 | |
| Citibank, N.A. | | Alliant Holdings Intermediate LLC, 1M US L + 3.25%, 4.99%, 05/09/25 | | 1M US L + 1.25% | | | 274,313 | | | | 3,542 | |
| Citibank, N.A. | | Altice Financing S.A., 1M US L + 2.75%, 4.49%, 07/15/25 | | 1M US L + 1.25% | | | 594,336 | | | | 33,213 | |
| Citibank, N.A. | | Altice Financing S.A., 1M US L + 2.75%, 4.51%, 01/31/26 | | 1M US L + 1.25% | | | 685,457 | | | | 17,015 | |
| Citibank, N.A. | | American Airlines Inc., 1M US L + 1.75%, 3.54%, 06/27/25 | | 1M US L + 1.25% | | | 950,032 | | | | 19,160 | |
| Citibank, N.A. | | American Axle & Manufacturing Inc., 3M US L + 2.25%, 4.08%, 04/06/24(b) | | 1M US L + 1.25% | | | 275,782 | | | | 7,163 | |
| Citibank, N.A. | | American Rock Salt Co. LLC, 1M US L + 3.75%, 5.55%, 03/21/25(b) | | 1M US L + 1.25% | | | 274,229 | | | | 2,200 | |
| Citibank, N.A. | | Asurion LLC, 1M US L + 3.00%, 4.80%, 11/03/23 | | 1M US L + 1.25% | | | 1,072,549 | | | | 7,802 | |
| Citibank, N.A. | | Athenahealth Inc., 3M US L + 4.50%, 6.40%, 02/11/26 | | 1M US L + 1.25% | | | 692,547 | | | | 8,380 | |
| Citibank, N.A. | | Auris Luxembourg III SARL, 1M US L + 3.75%, 5.55%, 02/27/26 | | 1M US L + 1.25% | | | 547,911 | | | | 2,561 | |
| Citibank, N.A. | | AVSC Holding Corp., 3M US L + 3.25%, 5.09%, 03/03/25(b) | | 1M US L + 1.25% | | | 729,609 | | | | 21,511 | |
| Citibank, N.A. | | Barracuda Networks Inc., 1M US L + 3.25%, 5.04%, 02/12/25 | | 1M US L + 1.25% | | | 547,177 | | | | 3,728 | |
| Citibank, N.A. | | Bausch Health Companies Inc., 1M US L + 2.75%, 4.49%, 11/27/25 | | 1M US L + 1.25% | | | 1,197,212 | | | | 14,222 | |
| Citibank, N.A. | | Bausch Health Companies Inc., 1M US L + 3.00%, 4.74%, 06/02/25 | | 1M US L + 1.25% | | | 655,066 | | | | 3,283 | |
| Citibank, N.A. | | Blount International Inc., 3M US L + 3.75%, 5.95%, 04/12/23 | | 1M US L + 1.25% | | | 274,307 | | | | 3,243 | |
| Citibank, N.A. | | Boxer Parent Co. Inc., 1M US L + 4.25%, 6.05%, 10/02/25 | | 1M US L + 1.25% | | | 951,321 | | | | 40,667 | |
| Citibank, N.A. | | Brookfield WEC Holdings Inc., 1M US L + 3.50%, 5.30%, 08/01/25 | | 1M US L + 1.25% | | | 501,013 | | | | 1,859 | |
| Citibank, N.A. | | BWay Holding Co, 3M US L + 3.25%, 5.23%, 04/03/24 | | 1M US L + 1.25% | | | 1,634,404 | | | | 69,075 | |
| Citibank, N.A. | | Caesars Resort Collection LLC, 1M US L + 2.75%, 4.55%, 12/23/24 | | 1M US L + 1.25% | | | 1,000,892 | | | | 17,455 | |
| Citibank, N.A. | | California Resources Corp., L + 4.75%, 12/31/22(c) | | 1M US L + 1.25% | | | 739,582 | | | | 1,287 | |
| Citibank, N.A. | | Capital Automotive LP, 1M US L + 2.50%, 4.30%, 03/25/24 | | 1M US L + 1.25% | | | 561,556 | | | | 3,335 | |
| Citibank, N.A. | | Carrols Restaurant Group Inc., 1M US L + 3.25%, 5.05%, 04/30/26(c) | | 1M US L + 1.25% | | | 687,535 | | | | 9,005 | |
| Citibank, N.A. | | Cincinnati Bell Inc., 1M US L + 3.25%, 5.05%, 10/02/24 | | 1M US L + 1.25% | | | 547,822 | | | | 9,950 | |
| Citibank, N.A. | | Citadel Securities LP, 1M US L + 3.50%, 5.30%, 02/27/26 | | 1M US L + 1.25% | | | 249,953 | | | | 855 | |
| Citibank, N.A. | | Core & Main LP, 1M US L + 2.75%, 4.53%, 08/01/24 | | 1M US L + 1.25% | | | 294,891 | | | | 644 | |
| Citibank, N.A. | | Crosby US Acquisition Corp., 1M US L + 4.75%, 6.54%, 06/26/26 | | 1M US L + 1.25% | | | 498,831 | | | | 2,049 | |
| Citibank, N.A. | | Crown Finance US Inc., 1M US L + 2.25%, 4.05%, 02/28/25 | | 1M US L + 1.25% | | | 643,872 | | | | 5,176 | |
| Citibank, N.A. | | CSC Holdings LLC, 1M US L + 2.25%, 3.99%, 07/17/25 | | 1M US L + 1.25% | | | 486,881 | | | | 6,237 | |
| Citibank, N.A. | | CSC Holdings LLC, 1M US L + 2.50%, 4.24%, 04/15/27 | | 1M US L + 1.25% | | | 1,138,958 | | | | 21,255 | |
| Citibank, N.A. | | Delek US Holdings Inc., 1M US L + 2.25%, 4.05%, 03/31/25 | | 1M US L + 1.25% | | | 745,334 | | | | 1,792 | |
| Citibank, N.A. | | Dell International LLC, 1M US L + 2.00%, 3.80%, 09/19/25 | | 1M US L + 1.25% | | | 798,577 | | | | 4,796 | |
| Citibank, N.A. | | Dentalcorp Health Services ULC, 1M US L + 3.75%, 5.55%, 06/06/25 | | 1M US L + 1.25% | | | 985,574 | | | | 9,683 | |
See Notes to Consolidated Financial Statements.
| Annual Report | December 31, 2019 | 31 |
| Griffin Institutional Access Credit Fund | Consolidated Schedule of Investments |
December 31, 2019
TOTAL RETURN SWAP CONTRACTS(a) (continued)
| Counterparty | | Fund Receives | | Fund Pays | | Notional Amount | | | Unrealized Appreciation/ (Depreciation) | |
| Citibank, N.A. | | Dynasty Acquisition Co. Inc., 3M US L + 4.00%, 5.94%, 04/06/26 | | 1M US L + 1.25% | | $ | 178,158 | | | $ | 2,795 | |
| Citibank, N.A. | | Dynasty Acquisition Co. Inc., 3M US L + 4.00%, 5.94%, 04/06/26 | | 1M US L + 1.25% | | | 95,784 | | | | 1,503 | |
| Citibank, N.A. | | Electronics for Imaging Inc., 3M US L + 5.00%, 6.94%, 07/23/26 | | 1M US L + 1.25% | | | 250,799 | | | | 1,680 | |
| Citibank, N.A. | | Entercom Media Corp Term Loan, 1M US L + 2.50%, 4.31%, 11/18/24 | | 1M US L + 1.25% | | | 890,604 | | | | 7,486 | |
| Citibank, N.A. | | Epicor Software Corp., 1M US L + 3.25%, 5.05%, 06/01/22 | | 1M US L + 1.25% | | | 547,793 | | | | 7,933 | |
| Citibank, N.A. | | Equinox Holdings Inc., 1M US L + 3.00%, 4.80%, 03/08/24 | | 1M US L + 1.25% | | | 397,592 | | | | 2,546 | |
| Citibank, N.A. | | Excelitas Technologies Corp., 3M US L + 3.50%, 5.44%, 12/02/24 | | 1M US L + 1.25% | | | 498,457 | | | | 4,547 | |
| Citibank, N.A. | | Eyemart Express LLC, 1M US L + 3.00%, 4.80%, 08/04/24 | | 1M US L + 1.25% | | | 1,092,936 | | | | 12,241 | |
| Citibank, N.A. | | Flex Acquisition Co. Inc., 3M US L + 3.00%, 5.09%, 12/29/23 | | 1M US L + 1.25% | | | 790,920 | | | | 46,976 | |
| Citibank, N.A. | | Foundation Building Materials Holding Co. LLC, 1M US L + 3.00%, 4.80%, 08/13/25 | | 1M US L + 1.25% | | | 273,591 | | | | 1,238 | |
| Citibank, N.A. | | Frontier Communications Corp., 1M US L + 3.75%, 5.55%, 06/15/24 | | 1M US L + 1.25% | | | 917,765 | | | | 23,363 | |
| Citibank, N.A. | | Genuine Financial Holdings LLC, 1M US L + 3.75%, 5.55%, 07/11/25 | | 1M US L + 1.25% | | | 633,854 | | | | 4,557 | |
| Citibank, N.A. | | GHX Ultimate Parent Corp., 3M US L + 3.25%, 5.21%, 06/28/24 | | 1M US L + 1.25% | | | 679,364 | | | | 15,313 | |
| Citibank, N.A. | | Go Daddy Operating Co. LLC, 1M US L + 1.75%, 3.55%, 02/15/24 | | 1M US L + 1.25% | | | 274,122 | | | | 1,133 | |
| Citibank, N.A. | | GOBP Holdings Inc., 1M US L + 3.50%, 5.24%, 10/22/25 | | 1M US L + 1.25% | | | 121,487 | | | | 1,303 | |
| Citibank, N.A. | | Granite Acquisition Inc., 3M US L + 3.50%, 5.44%, 12/17/21 | | 1M US L + 1.25% | | | 999,540 | | | | 10,113 | |
| Citibank, N.A. | | Greeneden U.S. Holdings I LLC, 1M US L + 3.25%, 5.05%, 12/01/23 | | 1M US L + 1.25% | | | 547,697 | | | | 6,758 | |
| Citibank, N.A. | | GYP Holdings III Corp., 1M US L + 2.75%, 4.55%, 06/01/25 | | 1M US L + 1.25% | | | 522,920 | | | | 8,733 | |
| Citibank, N.A. | | Harbor Freight Tools USA Inc., 1M US L + 2.50%, 4.30%, 08/18/23 | | 1M US L + 1.25% | | | 683,602 | | | | 20,590 | |
| Citibank, N.A. | | Hargray Communications Group Inc., 1M US L + 3.00%, 4.80%, 05/16/24 | | 1M US L + 1.25% | | | 874,498 | | | | 8,566 | |
| Citibank, N.A. | | Hayward Industries Inc., 1M US L + 3.50%, 5.30%, 08/05/24 | | 1M US L + 1.25% | | | 1,326,027 | | | | 20,722 | |
| Citibank, N.A. | | H-Food Holdings LLC, 1M US L + 3.688%, 5.49%, 05/23/25 | | 1M US L + 1.25% | | | 868,726 | | | | 11,945 | |
| Citibank, N.A. | | Hostess Brands LLC, 3M US L + 2.25%, 4.14%, 08/03/25 | | 1M US L + 1.25% | | | 498,055 | | | | 4,284 | |
| Citibank, N.A. | | Hub International Ltd., 3M US L + 2.75%, 4.69%, 04/25/25 | | 1M US L + 1.25% | | | 1,384,422 | | | | 43,216 | |
| Citibank, N.A. | | iHeartCommunications Inc., 1M US L + 4.00%, 5.69%, 05/01/26 | | 1M US L + 1.25% | | | 244,499 | | | | 1,228 | |
| Citibank, N.A. | | Inmar Inc., 3M US L + 4.00%, 5.94%, 05/01/24 | | 1M US L + 1.25% | | | 594,113 | | | | 12,089 | |
| Citibank, N.A. | | Intelsat Jackson Holdings S.A., 3M US L + 3.75%, 5.68%, 11/27/23 | | 1M US L + 1.25% | | | 1,653,715 | | | | 32,127 | |
| Citibank, N.A. | | IRB Holding Corp., 3M US L + 3.25%, 5.22%, 02/05/25 | | 1M US L + 1.25% | | | 1,284,389 | | | | 33,998 | |
| Citibank, N.A. | | Jaguar Holding Co. II, 1M US L + 2.50%, 4.30%, 08/18/22 | | 1M US L + 1.25% | | | 874,473 | | | | 8,628 | |
| Citibank, N.A. | | Jane Street Group LLC, 1M US L + 3.00%, 4.80%, 08/25/22 | | 1M US L + 1.25% | | | 893,221 | | | | 5,561 | |
| Citibank, N.A. | | Kronos Acquisition Intermediate Inc., 1M US L + 4.00%, 5.79%, 05/15/23 | | 1M US L + 1.25% | | | 1,314,218 | | | | 59,255 | |
| Citibank, N.A. | | Kronos Inc., 3M US L + 3.00%, 4.91%, 11/01/23 | | 1M US L + 1.25% | | | 549,825 | | | | 7,023 | |
| Citibank, N.A. | | LABL Inc., 1M US L + 4.50%, 6.30%, 07/01/26 | | 1M US L + 1.25% | | | 399,133 | | | | 2,167 | |
| Citibank, N.A. | | Lakeland Tours LLC, 3M US L + 4.25%, 6.15%, 12/16/24 | | 3M US L + 1.25% | | | 501,095 | | | | 496 | |
| Citibank, N.A. | | LegalZoom.com Inc., 1M US L + 4.50%, 6.30%, 11/21/24 | | 1M US L + 1.25% | | | 397,865 | | | | 3,208 | |
| Citibank, N.A. | | Level 3 Financing Inc., 1M US L + 1.75%, 3.55%, 03/01/27 | | 1M US L + 1.25% | | | 337,722 | | | | 1,651 | |
| Citibank, N.A. | | Lower Cadence Holdings LLC, 1M US L + 4.00%, 5.80%, 05/22/26 | | 1M US L + 1.25% | | | 494,527 | | | | 706 | |
| Citibank, N.A. | | MA FinanceCo. LLC, 1M US L + 2.50%, 4.30%, 06/21/24 | | 1M US L + 1.25% | | | 71,264 | | | | 998 | |
| Citibank, N.A. | | Masergy Holdings Inc., 3M US L + 3.25%, 5.19%, 12/15/23 | | 1M US L + 1.25% | | | 912,700 | | | | 7,901 | |
| Citibank, N.A. | | Mavis Tire Express Services Corp., 1M US L + 3.25%, 5.05%, 03/20/25 | | 1M US L + 1.25% | | | 649,761 | | | | 84 | |
| Citibank, N.A. | | MED ParentCo LP, 1M US L + 4.25%, 6.05%, 08/31/26 | | 1M US L + 1.25% | | | 398,462 | | | | 1,082 | |
| Citibank, N.A. | | MH Sub I LLC, 1M US L + 3.75%, 5.55%, 09/13/24 | | 1M US L + 1.25% | | | 1,632,308 | | | | 36,246 | |
| Citibank, N.A. | | Microchip Technology Inc., 1M US L + 2.00%, 3.80%, 05/29/25 | | 1M US L + 1.25% | | | 276,297 | | | | 996 | |
| Citibank, N.A. | | Midas Intermediate Holdco II LLC, 3M US L + 2.75%, 4.70%, 08/18/21 | | 1M US L + 1.25% | | | 484,604 | | | | 12,698 | |
| Citibank, N.A. | | MX Holdings US Inc., 1M US L + 2.75%, 4.55%, 07/25/25 | | 1M US L + 1.25% | | | 164,942 | | | | 708 | |
| Citibank, N.A. | | National CineMedia LLC, 1M US L + 3.00%, 4.81%, 06/20/25 | | 1M US L + 1.25% | | | 274,351 | | | | 428 | |
See Notes to Consolidated Financial Statements.
| 32 | 1.888.926.2688 | www.griffincapital.com |
| Griffin Institutional Access Credit Fund | Consolidated Schedule of Investments |
December 31, 2019
TOTAL RETURN SWAP CONTRACTS(a) (continued)
| Counterparty | | Fund Receives | | Fund Pays | | Notional Amount | | | Unrealized Appreciation/ (Depreciation) | |
| Citibank, N.A. | | Netsmart Technologies Inc., 1M US L + 3.75%, 5.55%, 04/19/23 | | 1M US L + 1.25% | | $ | 746,598 | | | $ | 6,768 | |
| Citibank, N.A. | | Nielsen Finance LLC, 1M US L + 2.00%, 3.71%, 10/04/23 | | 1M US L + 1.25% | | | 825,831 | | | | 3,242 | |
| Citibank, N.A. | | NorthRiver Midstream Finance LP, 3M US L + 3.25%, 5.35%, 10/01/25 | | 1M US L + 1.25% | | | 749,557 | | | | 9,478 | |
| Citibank, N.A. | | Nouryon Finance B.V., 1M US L + 3.25%, 4.96%, 10/01/25 | | 1M US L + 1.25% | | | 1,340,151 | | | | 23,187 | |
| Citibank, N.A. | | NVA Holdings Inc., PRIME + 2.75%, 6.50%, 02/02/25 | | 1M US L + 1.25% | | | 498,078 | | | | 1,403 | |
| Citibank, N.A. | | Oxbow Carbon LLC, 1M US L + 3.75%, 5.55%, 01/04/23 | | 1M US L + 1.25% | | | 971,834 | | | | 6,649 | |
| Citibank, N.A. | | Packaging Coordinators Midco Inc., 3M US L + 4.00%, 5.95%, 06/30/23 | | 1M US L + 1.25% | | | 920,232 | | | | 10,842 | |
| Citibank, N.A. | | Panther BF Aggregator 2 LP, 1M US L + 3.50%, 5.30%, 04/30/26 | | 1M US L + 1.25% | | | 435,841 | | | | 5,754 | |
| Citibank, N.A. | | Parexel International Corp., 1M US L + 2.75%, 4.55%, 09/27/24 | | 1M US L + 1.25% | | | 936,463 | | | | 22,758 | |
| Citibank, N.A. | | Park Place Technologies LLC, 1M US L + 4.00%, 5.80%, 03/29/25 | | 1M US L + 1.25% | | | 343,821 | | | | 1,712 | |
| Citibank, N.A. | | PetVet Care Centers LLC, 1M US L + 2.75%, 4.55%, 02/14/25 | | 1M US L + 1.25% | | | 964,525 | | | | 22,857 | |
| Citibank, N.A. | | Plaze Inc., 1M US L + 3.50%, 5.19%, 08/03/26 | | 1M US L + 1.25% | | | 500,000 | | | | 2,121 | |
| Citibank, N.A. | | Ply Gem Midco Inc., 1M US L + 3.75%, 5.49%, 04/14/25 | | 1M US L + 1.25% | | | 216,084 | | | | 7,010 | |
| Citibank, N.A. | | Prairie ECI Acquiror LP, 3M US L + 4.75%, 6.69%, 03/11/26 | | 1M US L + 1.25% | | | 855,344 | | | | 5,960 | |
| Citibank, N.A. | | Pre-Paid Legal Services Inc., 1M US L + 3.25%, 5.05%, 05/01/25 | | 1M US L + 1.25% | | | 535,098 | | | | 3,388 | |
| Citibank, N.A. | | Pro Mach Group Inc., 1M US L + 2.75%, 4.54%, 03/07/25 | | 1M US L + 1.25% | | | 1,346,692 | | | | 44,099 | |
| Citibank, N.A. | | Project Alpha Intermediate Holding Inc., 3M US L + 3.50%, 5.49%, 04/26/24 | | 1M US L + 1.25% | | | 274,945 | | | | 4,471 | |
| Citibank, N.A. | | Project Boost Purchaser LLC, 3M US L + 3.50%, 5.30%, 06/01/26 | | 1M US L + 1.25% | | | 997,500 | | | | 8,890 | |
| Citibank, N.A. | | Quest Software US Holdings Inc., 3M US L + 4.25%, 6.18%, 05/16/25 | | 1M US L + 1.25% | | | 346,159 | | | | 3,911 | |
| Citibank, N.A. | | Quikrete Holdings Inc., 1M US L + 2.75%, 4.55%, 11/15/23 | | 1M US L + 1.25% | | | 551,195 | | | | 8,569 | |
| Citibank, N.A. | | Radiate Holdco LLC, 1M US L + 3.00%, 4.80%, 02/01/24 | | 1M US L + 1.25% | | | 1,105,212 | | | | 18,041 | |
| Citibank, N.A. | | Recorded Books Inc., 1M US L + 4.50%, 6.30%, 08/29/25(b) | | 1M US L + 1.25% | | | 548,891 | | | | 2,719 | |
| Citibank, N.A. | | Research Now Group Inc., 3M US L + 5.50%, 7.41%, 12/20/24 | | 1M US L + 1.25% | | | 500,971 | | | | 2,231 | |
| Citibank, N.A. | | RP Crown Parent LLC, 1M US L + 2.75%, 4.55%, 10/12/23 | | 1M US L + 1.25% | | | 548,550 | | | | 6,456 | |
| Citibank, N.A. | | Sage Borrowco LLC, 1M US L + 4.75%, 6.55%, 06/20/26(b) | | 1M US L + 1.25% | | | 124,972 | | | | 957 | |
| Citibank, N.A. | | Scientific Games International Inc., 1M US L + 2.75%, 4.59%, 08/14/24 | | 1M US L + 1.25% | | | 878,456 | | | | 8,803 | |
| Citibank, N.A. | | Seattle SpinCo Inc., 1M US L + 2.50%, 4.30%, 06/21/24 | | 1M US L + 1.25% | | | 481,263 | | | | 6,740 | |
| Citibank, N.A. | | Seaworld Parks & Entertainment Inc., 1M US L + 3.00%, 4.80%, 04/01/24 | | 1M US L + 1.25% | | | 523,553 | | | | 3,297 | |
| Citibank, N.A. | | Select Medical Corp., 3M US L + 2.50%, 4.58%, 03/06/25 | | 1M US L + 1.25% | | | 562,944 | | | | 2,345 | |
| Citibank, N.A. | | SolarWinds Holdings Inc., 1M US L + 2.75%, 4.55%, 02/05/24 | | 1M US L + 1.25% | | | 548,203 | | | | 5,497 | |
| Citibank, N.A. | | Solenis Holdings LLC, 3M US L + 4.00%, 5.91%, 06/26/25 | | 1M US L + 1.25% | | | 1,297,861 | | | | 8,250 | |
| Citibank, N.A. | | Sophia LP, 3M US L + 3.25%, 5.19%, 09/30/22 | | 1M US L + 1.25% | | | 1,112,989 | | | | 17,841 | |
| Citibank, N.A. | | SRS Distribution Inc., 1M US L + 3.25%, 5.05%, 05/23/25 | | 1M US L + 1.25% | | | 1,634,640 | | | | 58,084 | |
| Citibank, N.A. | | SS&C Technologies Holdings Inc., 1M US L + 2.25%, 4.05%, 04/16/25 | | 1M US L + 1.25% | | | 306,611 | | | | 2,648 | |
| Citibank, N.A. | | SS&C Technologies Holdings Inc., 1M US L + 2.25%, 4.05%, 04/16/25 | | 1M US L + 1.25% | | | 442,211 | | | | 3,868 | |
| Citibank, N.A. | | STG-Fairway Acquisitions Inc., 1M US L + 5.25%, 7.05%, 06/30/22 | | 1M US L + 1.25% | | | 500,553 | | | | 2,624 | |
| Citibank, N.A. | | Sundyne US Purchaser Inc., 1M US L + 4.00%, 5.80%, 05/15/26 | | 1M US L + 1.25% | | | 237,305 | | | | 1,910 | |
| Citibank, N.A. | | Sunshine Luxembourg VII SARL, 3M US L + 4.25%, 6.19%, 10/01/26 | | 1M US L + 1.25% | | | 250,612 | | | | 4,406 | |
| Citibank, N.A. | | Telenet Financing USD LLC, 1M US L + 2.25%, 3.99%, 08/15/26 | | 1M US L + 1.25% | | | 674,850 | | | | 6,869 | |
| Citibank, N.A. | | Tempo Acquisition LLC, 1M US L + 2.75%, 4.55%, 05/01/24 | | 1M US L + 1.25% | | | 921,276 | | | | 9,063 | |
| Citibank, N.A. | | TransDigm Inc., 1M US L + 2.50%, 4.30%, 05/30/25 | | 1M US L + 1.25% | | | 493,953 | | | | 6,832 | |
| Citibank, N.A. | | TransDigm Inc., 1M US L + 2.50%, 4.30%, 06/09/23 | | 1M US L + 1.25% | | | 1,148,748 | | | | 15,082 | |
| Citibank, N.A. | | Travel Leaders Group LLC, 1M US L + 4.00%, 5.79%, 01/25/24 | | 1M US L + 1.25% | | | 284,880 | | | | 1,107 | |
See Notes to Consolidated Financial Statements.
| Annual Report | December 31, 2019 | 33 |
| Griffin Institutional Access Credit Fund | Consolidated Schedule of Investments |
December 31, 2019
TOTAL RETURN SWAP CONTRACTS(a) (continued)
| Counterparty | | Fund Receives | | Fund Pays | | Notional Amount | | | Unrealized Appreciation/ (Depreciation) | |
| Citibank, N.A. | | Travelport Finance Luxembourg SARL, 3M US L + 5.00%, 6.94%, 05/29/26 | | 1M US L + 1.25% | | $ | 427,806 | | | $ | 10,133 | |
| Citibank, N.A. | | Trident TPI Holdings Inc., 1M US L + 3.00%, 4.80%, 10/17/24 | | 1M US L + 1.25% | | | 548,943 | | | | 842 | |
| Citibank, N.A. | | Truck Hero Inc., 1M US L + 3.75%, 5.55%, 04/22/24(c) | | 1M US L + 1.25% | | | 499,628 | | | | 34,189 | |
| Citibank, N.A. | | Uber Technologies Inc., 1M US L + 4.00%, 5.74%, 04/04/25 | | 1M US L + 1.25% | | | 498,650 | | | | 1,847 | |
| Citibank, N.A. | | Vectra Co., 1M US L + 3.25%, 5.05%, 03/08/25 | | 1M US L + 1.25% | | | 720,009 | | | | 25,540 | |
| Citibank, N.A. | | Venator Finance SARL, 1M US L + 3.00%, 4.80%, 08/08/24 | | 1M US L + 1.25% | | | 686,445 | | | | 8,837 | |
| Citibank, N.A. | | WCA Waste Systems Inc., 1M US L + 2.50%, 4.30%, 08/11/23 | | 1M US L + 1.25% | | | 549,938 | | | | 3,576 | |
| Citibank, N.A. | | Weld North Education LLC, 3M US L + 4.25%, 6.20%, 02/15/25(b) | | 1M US L + 1.25% | | | 744,114 | | | | 11,191 | |
| Citibank, N.A. | | WEX Inc., 1M US L + 2.25%, 4.05%, 05/15/26 | | 1M US L + 1.25% | | | 1,071,736 | | | | 5,803 | |
| Citibank, N.A. | | Whatabrands LLC, 1M US L + 3.25%, 4.94%, 08/02/26 | | 1M US L + 1.25% | | | 125,434 | | | | 324 | |
| Citibank, N.A. | | William Morris Endeavor Entertainment LLC, 3M US L + 2.75%, 4.61%, 05/18/25 | | 1M US L + 1.25% | | | 640,726 | | | | 20,972 | |
| Citibank, N.A. | | Wilsonart LLC, 3M US L + 3.25%, 5.20%, 12/19/23 | | 1M US L + 1.25% | | | 1,278,761 | | | | 50,722 | |
| Citibank, N.A. | | Wink Holdco Inc., L + 3.00%, 12/02/24(c) | | 1M US L + 1.25% | | | 918,618 | | | | 29,591 | |
| Citibank, N.A. | | Winter Park Intermediate Inc., 1M US L + 4.75%, 6.55%, 04/04/25 | | 1M US L + 1.25% | | | 453,302 | | | | 2,212 | |
| Citibank, N.A. | | WP CPP Holdings LLC, 3M US L + 3.75%, 5.68%, 04/30/25 | | 1M US L + 1.25% | | | 499,919 | | | | 154 | |
| Citibank, N.A. | | Ziggo Secured Finance Partnership, 1M US L + 2.50%, 4.24%, 04/15/25 | | 1M US L + 1.25% | | | 1,276,923 | | | | 30,123 | |
| | | | | | | $ | 93,681,100 | | | $ | 1,535,413 | |
| | | | | | | | | | | | | |
| Citibank, N.A. | | Ancestry.com Operations Inc., 1M US L + 4.25%, 6.05%, 08/27/26 | | 1M US L + 1.25% | | $ | 1,544,109 | | | $ | (18,196 | ) |
| Citibank, N.A. | | ASP Chromaflo Intermediate Holdings Inc., 1M US L + 3.50%, 5.30%, 11/20/23(b) | | 1M US L + 1.25% | | | 108,929 | | | | (1,354 | ) |
| Citibank, N.A. | | ASP Chromaflo Intermediate Holdings Inc., 1M US L + 3.50%, 5.30%, 11/20/23(b) | | 1M US L + 1.25% | | | 141,641 | | | | (1,760 | ) |
| Citibank, N.A. | | ASP Unifrax Holdings Inc., 3M US L + 3.75%, 5.69%, 12/12/25 | | 1M US L + 1.25% | | | 239,233 | | | | (6,212 | ) |
| Citibank, N.A. | | BCP Renaissance Parent LLC, 3M US L + 3.50%, 5.44%, 10/31/24 | | 1M US L + 1.25% | | | 543,122 | | | | (45,995 | ) |
| Citibank, N.A. | | Edgewater Generation LLC, 1M US L + 3.75%, 5.55%, 12/13/25 | | 1M US L + 1.25% | | | 689,178 | | | | (18,785 | ) |
| Citibank, N.A. | | Emerald 2 Ltd., 3M US L + 3.75%, 5.69%, 07/10/26 | | 1M US L + 1.25% | | | 273,983 | | | | (620 | ) |
| Citibank, N.A. | | Keane Group Holdings LLC, 1M US L + 3.75%, 5.56%, 05/25/25 | | 1M US L + 1.25% | | | 480,084 | | | | (7,892 | ) |
| Citibank, N.A. | | Lightstone Holdco LLC, 1M US L + 3.75%, 5.55%, 01/30/24 | | 1M US L + 1.25% | | | 42,144 | | | | (2,161 | ) |
| Citibank, N.A. | | Lightstone Holdco LLC, 1M US L + 3.75%, 5.55%, 01/30/24 | | 1M US L + 1.25% | | | 747,213 | | | | (38,313 | ) |
| Citibank, N.A. | | LTI Holdings Inc., 1M US L + 3.50%, 5.30%, 09/06/25 | | 1M US L + 1.25% | | | 867,485 | | | | (38,951 | ) |
| Citibank, N.A. | | Mavis Tire Express Services Corp., 1M US L + 3.25%, 3.46%, 03/20/25(d) | | 1M US L + 1.25% | | | 82,748 | | | | (260 | ) |
| Citibank, N.A. | | MED Parentco LP, 1M US L + 4.25%, 4.63%, 08/31/26(e) | | 1M US L + 1.25% | | | 99,698 | | | | (105 | ) |
| Citibank, N.A. | | Plaskolite PPC Intermediate II LLC, 1M US L + 4.25%, 6.04%, 12/15/25 | | 1M US L + 1.25% | | | 497,740 | | | | (677 | ) |
| Citibank, N.A. | | TNS Inc., 3M US L + 4.00%, 5.93%, 08/14/22(b) | | 1M US L + 1.25% | | | 1,319,893 | | | | (10,405 | ) |
| Citibank, N.A. | | Traverse Midstream Partners LLC, 1M US L + 4.00%, 5.80%, 09/27/24 | | 1M US L + 1.25% | | | 200,963 | | | | (14,702 | ) |
| Citibank, N.A. | | TRC Companies Inc., 1M US L + 3.50%, 5.30%, 06/21/24 | | 1M US L + 1.25% | | | 499,837 | | | | (18,501 | ) |
| Citibank, N.A. | | WireCo WorldGroup Inc., 1M US L + 5.00%, 6.80%, 09/29/23 | | 1M US L + 1.25% | | | 1,311,135 | | | | (62,410 | ) |
| | | | | | | $ | 9,689,135 | | | $ | (287,299 | ) |
| Total | | | | | | $ | 103,370,235 | | | $ | 1,248,114 | |
| (a) | The Fund's interest in the total return swap transactions are held through a wholly-owned subsidiary of the Fund, CRDTX SPV I, LLC, a Delaware Limited Liability Company. |
| (b) | Security is classified as Level 3 in the Fund's fair value hierarchy (see Note 2). |
See Notes to Consolidated Financial Statements.
| 34 | 1.888.926.2688 | www.griffincapital.com |
| Griffin Institutional Access Credit Fund | Consolidated Schedule of Investments |
December 31, 2019
| (c) | Total return swap reference asset has not settled as of December 31, 2019. The interest rate shown represents the stated spread over the applicable London Interbank Offered Rate ("LIBOR" or "L"); the Fund will not accrue interest or financing charges until the settlement date at which point LIBOR will be established. |
| (d) | $65,434 of this delayed draw term loan total return swap reference asset was undrawn as of December 31, 2019. The Consolidated Schedule of Investments records this investment at the full commitment value of $84,387. A corresponding payable for investments purchased has also been recorded which represents the actual undrawn amount on the Consolidated Balance Sheet. |
| (e) | $78,284 of this delayed draw term loan total return swap reference asset was undrawn as of December 31, 2019. The Consolidated Schedule of Investments records this investment at the full commitment value of $99,453. A corresponding payable for investments purchased has also been recorded which represents the actual undrawn amount on the Consolidated Balance Sheet. |
See Notes to Consolidated Financial Statements.
| Annual Report | December 31, 2019 | 35 |
| Griffin Institutional Access Credit Fund | Consolidated Statement
of Assets and Liabilities |
December 31, 2019
| ASSETS | | | |
| Investments, at value (Cost $342,371,742) | | $ | 341,035,056 | |
| Cash collateral for total return swaps | | | 27,230,994 | |
| Cash | | | 25,455,549 | |
| Foreign currency, at value (Cost $5,578,364) | | | 5,648,661 | |
| Receivable for shares sold | | | 4,843,430 | |
| Dividend and interest receivable | | | 3,325,694 | |
| Receivable for investments sold | | | 3,230,519 | |
| Unrealized appreciation on total return swap contracts (Note 3) | | | 1,535,413 | |
| Receivable due from Adviser (Note 4) | | | 171,471 | |
| Unrealized appreciation on forward foreign currency contracts (Note 3) | | | 30,452 | |
| Receivable on total return swaps | | | 18,530 | |
| Prepaid expenses and other assets | | | 8,755 | |
| Total Assets | | | 412,534,524 | |
| LIABILITIES | | | | |
| Payable for investments purchased | | | 21,372,559 | |
| Payable for distributions to shareholders | | | 5,812,202 | |
| Unrealized depreciation on forward foreign currency contracts (Note 3) | | | 380,185 | |
| Payable for audit and tax fees | | | 374,500 | |
| Unrealized depreciation on total return swap contracts (Note 3) | | | 287,299 | |
| Payable for administration fees (Note 4) | | | 159,721 | |
| Payable to broker on total return swaps | | | 114,971 | |
| Payable for income tax expense | | | 103,617 | |
| Payable for transfer agency fees (Note 4) | | | 70,600 | |
| Payable for legal fees | | | 68,782 | |
| Payable for compliance service fees (Note 4) | | | 66,588 | |
| Payable for custody fees | | | 45,255 | |
| Payable for distribution fees (Note 4) | | | 30,698 | |
| Payable for trustees' fees (Note 4) | | | 29,684 | |
| Payable for shareholder servicing fees (Note 4) | | | 24,233 | |
| Payable for insurance fees | | | 5,640 | |
| Accrued expenses and other liabilities | | | 170,900 | |
| Total Liabilities | | | 29,117,434 | |
| NET ASSETS | | $ | 383,417,090 | |
| NET ASSETS CONSIST OF | | | | |
| Paid-in capital | | $ | 382,303,822 | |
| Total distributable earnings | | | 1,113,268 | |
| NET ASSETS | | $ | 383,417,090 | |
See Notes to Consolidated Financial Statements.
| 36 | 1.888.926.2688 | www.griffincapital.com |
| Griffin Institutional Access Credit Fund | Consolidated Statement
of Assets and Liabilities |
December 31, 2019
| PRICING OF SHARES | | | |
| Class A: | | | | |
| Net asset value | | $ | 24.89 | |
| Net assets | | $ | 65,930,200 | |
| Shares of beneficial interest outstanding (unlimited number of shares, no par value common stock authorized) | | | 2,648,784 | |
| Maximum offering price per share ((NAV/0.9425), based on maximum sales charge of 5.75% of the offering price) | | $ | 26.41 | |
| Class C: | | | | |
| Net asset value and maximum offering price | | $ | 24.89 | |
| Net assets | | $ | 49,083,445 | |
| Shares of beneficial interest outstanding (unlimited number of shares, no par value common stock authorized) | | | 1,971,838 | |
| Class I: | | | | |
| Net asset value and maximum offering price | | $ | 24.89 | |
| Net assets | | $ | 236,901,420 | |
| Shares of beneficial interest outstanding (unlimited number of shares, no par value common stock authorized) | | | 9,517,341 | |
| Class L: | | | | |
| Net asset value | | $ | 24.89 | |
| Net assets | | $ | 5,536,627 | |
| Shares of beneficial interest outstanding (unlimited number of shares, no par value common stock authorized) | | | 222,486 | |
| Maximum offering price per share ((NAV/0.9575), based on maximum sales charge of 4.25% of the offering price) | | $ | 25.99 | |
| Class F: | | | | |
| Net asset value and maximum offering price | | $ | 24.90 | |
| Net assets | | $ | 25,965,398 | |
| Shares of beneficial interest outstanding (unlimited number of shares, no par value common stock authorized) | | | 1,042,940 | |
See Notes to Consolidated Financial Statements.
| Annual Report | December 31, 2019 | 37 |
| Griffin Institutional Access Credit Fund | Consolidated Statement of Operations |
| | | For the Year Ended
December 31, 2019 | |
| INVESTMENT INCOME | | | | |
| Interest income | | $ | 19,343,813 | |
| Dividend Income | | | 382,074 | |
| Total Investment Income | | | 19,725,887 | |
| | | | | |
| EXPENSES | | | | |
| Investment advisory fees (Note 4) | | | 5,222,167 | |
| Administration fees (Note 4) | | | 534,108 | |
| Transfer agency fees (Note 4) | | | 148,400 | |
| Shareholder servicing fees (Note 4): | | | | |
| Class A | | | 120,177 | |
| Class C | | | 81,813 | |
| Class L | | | 7,858 | |
| Distribution fees (Note 4): | | | | |
| Class C | | | 245,440 | |
| Class L | | | 6,469 | |
| Legal fees | | | 511,273 | |
| Audit and tax fees | | | 302,965 | |
| Reports to shareholders and printing fees | | | 269,418 | |
| Compliance service fees (Note 4) | | | 211,494 | |
| Trustees' fees (Note 4) | | | 115,129 | |
| Income tax expense | | | 108,113 | |
| Custody fees | | | 96,979 | |
| State registration fees | | | 75,027 | |
| Insurance fees | | | 49,636 | |
| Other expenses | | | 44,408 | |
| Total Expenses | | | 8,150,874 | |
| Fees waived/expenses reimbursed by Adviser (Note 4) | | | (6,648,053 | ) |
| Net Expenses | | | 1,502,821 | |
| Net Investment Income | | | 18,223,066 | |
| NET REALIZED GAIN AND UNREALIZED APPRECIATION ON INVESTMENTS, TOTAL RETURN SWAPS, FORWARD FOREIGN CURRENCY TRANSACTIONS AND TRANSLATIONS OF ASSETS AND LIABILITIES DENOMINATED IN FOREIGN CURRENCIES | | | | |
| Net realized gain on investments | | | 162,031 | |
| Net realized gain on total return swap contracts | | | 265,468 | |
| Net realized gain on forward foreign currency transactions | | | 1,327,539 | |
| Net realized loss on foreign currency translation | | | (389,383 | ) |
| Net realized gain | | | 1,365,655 | |
| Net change in unrealized appreciation on investments | | | 7,530,087 | |
| Net change in unrealized appreciation on total return swap contracts | | | 1,248,114 | |
| Net change in unrealized depreciation on forward foreign currency transactions | | | (369,633 | ) |
| Net change in unrealized appreciation on translation of assets and liabilities denominated in foreign currencies | | | 25,168 | |
| Net change in unrealized appreciation | | | 8,433,736 | |
| NET REALIZED GAIN AND UNREALIZED APPRECIATION ON INVESTMENTS, TOTAL RETURN SWAPS, FORWARD FOREIGN CURRENCY TRANSACTIONS AND TRANSLATIONS OF ASSETS AND LIABILITIES DENOMINATED IN FOREIGN CURRENCIES | | | 9,799,391 | |
| NET INCREASE IN NET ASSETS RESULTING FROM OPERATIONS | | $ | 28,022,457 | |
See Notes to Consolidated Financial Statements.
| 38 | 1.888.926.2688 | www.griffincapital.com |
| Griffin Institutional Access Credit Fund | Consolidated Statements
of Changes in Net Assets |
| | | For the
Year Ended
December 31, 2019 | | | For the
Year Ended
December 31, 2018 | |
| OPERATIONS: | | | | | | | | |
| Net investment income | | $ | 18,223,066 | | | $ | 8,297,176 | |
| Net realized gain | | | 1,365,655 | | | | 530,731 | |
| Net change in unrealized appreciation | | | 8,433,736 | | | | (9,211,278 | ) |
| Net Increase/(Decrease) in Net Assets Resulting from Operations | | | 28,022,457 | | | | (383,371 | ) |
| DISTRIBUTIONS TO SHAREHOLDERS: | | | | | | | | |
| Class A | | | | | | | | |
| From distributable earnings | | | (3,317,970 | ) | | | (1,297,741 | ) |
| Class C | | | | | | | | |
| From distributable earnings | | | (2,252,164 | ) | | | (651,188 | ) |
| Class I | | | | | | | | |
| From distributable earnings | | | (11,833,166 | ) | | | (4,527,167 | ) |
| Class L | | | | | | | | |
| From distributable earnings | | | (219,150 | ) | | | (53,354 | ) |
| Class F | | | | | | | | |
| From distributable earnings | | | (1,850,503 | ) | | | (1,870,902 | ) |
| Total Distributions to Shareholders | | | (19,472,953 | ) | | | (8,400,352 | ) |
| BENEFICIAL INTEREST TRANSACTIONS, IN DOLLARS: | | | | | | | | |
| Class A | | | | | | | | |
| Shares sold | | | 38,038,611 | | | | 23,340,677 | |
| Distributions reinvested | | | 1,411,775 | | | | 566,653 | |
| Shares redeemed (Note 7) | | | (4,777,404 | ) | | | (4,860,061 | ) |
| Exchanged out | | | (1,458,696 | ) | | | (924,029 | ) |
| Class C | | | | | | | | |
| Shares sold | | | 30,439,390 | | | | 13,779,726 | |
| Distributions reinvested | | | 1,109,412 | | | | 355,609 | |
| Shares redeemed (Note 7) | | | (1,375,198 | ) | | | (1,978,168 | ) |
| Exchanged out | | | (107,965 | ) | | | – | |
| Class I | | | | | | | | |
| Shares sold | | | 124,903,028 | | | | 87,592,441 | |
| Distributions reinvested | | | 4,638,141 | | | | 2,019,662 | |
| Shares redeemed (Note 7) | | | (17,518,952 | ) | | | (9,893,290 | ) |
| Exchanged in | | | 1,566,661 | | | | 923,862 | |
| Class L | | | | | | | | |
| Shares sold | | | 3,529,683 | | | | 1,341,314 | |
| Distributions reinvested | | | 122,699 | | | | 43,008 | |
| Shares redeemed (Note 7) | | | (44,603 | ) | | | – | |
| Class F | | | | | | | | |
| Shares sold | | | – | | | | 5,387 | |
| Distributions reinvested | | | 351,903 | | | | 297,733 | |
| Shares redeemed (Note 7) | | | (2,194,872 | ) | | | (10,221,265 | ) |
| Exchanged in | | | – | | | | 167 | |
| Net Increase in Net Assets Derived from Beneficial Interest Transactions | | | 178,633,613 | | | | 102,389,426 | |
| | | | | | | | | |
| Net increase in net assets | | | 187,183,117 | | | | 93,605,703 | |
| | | | | | | | | |
| NET ASSETS: | | | | | | | | |
| Beginning of year | | | 196,233,973 | | | | 102,628,270 | |
| End of year | | $ | 383,417,090 | | | $ | 196,233,973 | |
See Notes to Consolidated Financial Statements.
| Annual Report | December 31, 2019 | 39 |
| Griffin Institutional Access Credit Fund | Consolidated Statements
of Changes in Net Assets |
| | | For the
Year Ended
December 31, 2019 | | | For the
Year Ended
December 31, 2018 | |
| Other Information | | | | | | | | |
| BENEFICIAL INTEREST TRANSACTIONS, IN SHARES: | | | | | | | | |
| Class A | | | | | | | | |
| Beginning shares | | | 1,305,814 | | | | 576,344 | |
| Shares sold | | | 1,538,935 | | | | 938,036 | |
| Distributions reinvested | | | 56,950 | | | | 22,989 | |
| Shares redeemed (Note 7) | | | (194,058 | ) | | | (194,627 | ) |
| Exchanged out | | | (58,857 | ) | | | (36,928 | ) |
| Net increase in shares outstanding | | | 1,342,970 | | | | 729,470 | |
| Ending shares | | | 2,648,784 | | | | 1,305,814 | |
| Class C | | | | | | | | |
| Beginning shares | | | 753,530 | | | | 264,046 | |
| Shares sold | | | 1,233,805 | | | | 554,312 | |
| Distributions reinvested | | | 44,746 | | | | 14,432 | |
| Shares redeemed (Note 7) | | | (55,885 | ) | | | (79,260 | ) |
| Exchanged out | | | (4,358 | ) | | | – | |
| Net increase in shares outstanding | | | 1,218,308 | | | | 489,484 | |
| Ending shares | | | 1,971,838 | | | | 753,530 | |
| Class I | | | | | | | | |
| Beginning shares | | | 4,919,684 | | | | 1,683,407 | |
| Shares sold | | | 5,056,931 | | | | 3,512,938 | |
| Distributions reinvested | | | 187,067 | | | | 81,941 | |
| Shares redeemed (Note 7) | | | (709,556 | ) | | | (395,516 | ) |
| Exchanged in | | | 63,215 | | | | 36,914 | |
| Net increase in shares outstanding | | | 4,597,657 | | | | 3,236,277 | |
| Ending shares | | | 9,517,341 | | | | 4,919,684 | |
| Class L | | | | | | | | |
| Beginning shares | | | 76,255 | | | | 20,563 | |
| Shares sold | | | 143,071 | | | | 53,946 | |
| Distributions reinvested | | | 4,950 | | | | 1,746 | |
| Shares redeemed (Note 7) | | | (1,790 | ) | | | – | |
| Net increase in shares outstanding | | | 146,231 | | | | 55,692 | |
| Ending shares | | | 222,486 | | | | 76,255 | |
| Class F | | | | | | | | |
| Beginning shares | | | 1,117,837 | | | | 1,511,761 | |
| Shares sold | | | – | | | | 215 | |
| Distributions reinvested | | | 14,192 | | | | 12,030 | |
| Shares redeemed (Note 7) | | | (89,089 | ) | | | (406,183 | ) |
| Exchanged in | | | – | | | | 14 | |
| Net decrease in shares outstanding | | | (74,897 | ) | | | (393,924 | ) |
| Ending shares | | | 1,042,940 | | | | 1,117,837 | |
See Notes to Consolidated Financial Statements.
| 40 | 1.888.926.2688 | www.griffincapital.com |
| Griffin Institutional Access Credit Fund | Consolidated Statement of Cash Flows |
| | | For the Year Ended
December 31, 2019 | |
| Operating Activities: | | | | |
| Net increase in net assets resulting from operations | | $ | 28,022,457 | |
| Adjustments to reconcile net increase in net assets from operations to net cash used in operating activities: | | | | |
| Purchase of investments | | | (333,260,661 | ) |
| Proceeds from sale of investments | | | 186,420,607 | |
| Net realized gain on investments | | | (162,031 | ) |
| Net unrealized appreciation on investments | | | (7,530,087 | ) |
| Net unrealized depreciation on forward foreign currency contracts | | | 369,633 | |
| Amortization and accretion of discounts and premiums, net | | | (508,486 | ) |
| PIK dividends and interest | | | (114,940 | ) |
| Change in operating assets and liabilities: | | | | |
| Dividend and interest receivables | | | (1,916,354 | ) |
| Receivable due from adviser | | | 239,527 | |
| Receivable on total return swaps | | | (18,530 | ) |
| Prepaid expenses and other assets | | | 46,477 | |
| Payable for audit and tax fees | | | 136,000 | |
| Payable for administration fees | | | 100,838 | |
| Payable to broker on total return swaps | | | 114,971 | |
| Payable for income tax expense | | | 49,396 | |
| Payable for transfer agency fees | | | 57,958 | |
| Payable for legal fees | | | 32,087 | |
| Payable for compliance service fees | | | 49,430 | |
| Payable for custody fees | | | 14,273 | |
| Payable for distribution fees | | | 19,493 | |
| Payable for trustees' fees | | | 29,684 | |
| Payable for shareholder servicing fees | | | 15,394 | |
| Payable for insurance fees | | | 5,640 | |
| Accrued expenses and other liabilities | | | 140,652 | |
| Net cash used in operating activities | | | (127,646,572 | ) |
| | | | | |
| Financing Activities: | | | | |
| Proceeds from shares sold | | | 194,400,379 | |
| Cost of shares redeemed | | | (25,911,029 | ) |
| Distributions paid to common shareholders | | | (8,785,356 | ) |
| Net cash provided by financing activities | | | 159,703,994 | |
| Effect of exchange rates on cash | | | 56,577 | |
| Net Change in Cash and Foreign Rates on Cash and Foreign Currency | | | 32,113,999 | |
| | | | | |
| Cash and cash equivalents, beginning of year | | $ | 26,221,205 | |
| Cash and cash equivalents, end of year | | $ | 58,335,204 | |
| | | | | |
| SUPPLEMENTAL DISCLOSURE OF CASH FLOW INFORMATION: | | | | |
| Non-cash financing activities not included herein consist of reinvestment of distributions of: | | $ | 7,633,930 | |
| | | | | |
| RECONCILIATION OF RESTRICTED AND UNRESTRICTED CASH AT THE BEGINNING OF YEAR TO THE STATEMENT OF ASSETS AND LIABILITIES | | | | |
| Cash | | | 26,221,205 | |
| Cash collateral for total return swaps | | | – | |
| RECONCILIATION OF RESTRICTED AND UNRESTRICTED CASH AT THE END OF YEAR TO THE STATEMENT OF ASSETS AND LIABILITIES | | | | |
| Cash | | | 31,104,210 | |
| Cash collateral for total return swaps | | | 27,230,994 | |
See Notes to Consolidated Financial Statements.
| Annual Report | December 31, 2019 | 41 |
| Griffin Institutional Access Credit Fund – Class A | Consolidated Financial Highlights |
For a Share Outstanding Throughout the Period Presented
| | | For the Year
Ended
December 31,
2019 | | | For the Year
Ended
December 31,
2018 | | | For the Period
April 3, 2017
(Commencement
of Operations) to
December 31,
2017 | |
| Net asset value, beginning of period | | $ | 24.01 | | | $ | 25.30 | | | $ | 25.00 | |
| | | | | | | | | | | | | |
| INCOME FROM INVESTMENT OPERATIONS: | | | | | | | | | | | | |
| Net investment income(a) | | | 1.59 | | | | 1.52 | | | | 0.92 | |
| Net realized and unrealized gain/(loss) | | | 1.01 | | | | (1.27 | ) | | | 0.16 | |
| Total from investment operations | | | 2.60 | | | | 0.25 | | | | 1.08 | |
| | | | | | | | | | | | | |
| DISTRIBUTIONS: | | | | | | | | | | | | |
| From net investment income(b) | | | (1.72 | ) | | | (1.54 | ) | | | (0.78 | ) |
| Total distributions | | | (1.72 | ) | | | (1.54 | ) | | | (0.78 | ) |
| | | | | | | | | | | | | |
| Net increase/(decrease) in net asset value | | | 0.88 | | | | (1.29 | ) | | | 0.30 | |
| Net asset value, end of period | | $ | 24.89 | | | $ | 24.01 | | | $ | 25.30 | |
| TOTAL RETURN(c) | | | 11.04 | % | | | 0.93 | % | | | 4.38 | % |
| | | | | | | | | | | | | |
| RATIOS/SUPPLEMENTAL DATA: | | | | | | | | | | | | |
| Net assets, end of period (000s) | | $ | 65,930 | | | $ | 31,350 | | | $ | 14,581 | |
| Ratios to Average Net Assets | | | | | | | | | | | | |
| Ratio of expenses to average net assets excluding fee waivers and reimbursements | | | 2.97 | % | | | 3.32 | % | | | 5.15 | %(d)(e) |
| Ratio of expenses to average net assets including fee waivers and reimbursements | | | 0.54 | %(f) | | | 0 | %(g) | | | 0 | %(g) |
| Ratio of net investment income to average net assets | | | 6.45 | % | | | 6.09 | % | | | 4.86 | %(d) |
| | | | | | | | | | | | | |
| Portfolio turnover rate(h) | | | 72 | % | | | 56 | % | | | 48 | % |
| (a) | Calculated using the average shares method. |
| (b) | Distributions are based on a daily accrual of net investment income which will vary based on investment yields and daily shares outstanding (see Note 6). |
| (c) | Total returns are for the period indicated and have not been annualized for periods less than a year and do not reflect the impact of sales charge. Total returns would have been lower had certain expenses not been waived during the period. Returns shown do not reflect the deduction of taxes that a shareholder would pay on Fund distributions or the redemption of Fund shares. |
| (e) | The gross expense ratio included non-recurring organizational costs. |
| (f) | For the period of January 1, 2019 to August 25, 2019 the Adviser voluntarily absorbed all of the operating expenses of the Fund. For the Period of August 26, 2019 to December 31, 2019, the Adviser voluntarily absorbed operating expenses of the Fund in excess of 1.25% of net assets. |
| (g) | The Adviser voluntarily absorbed all of the operating expenses of the Fund since the commencement of the Fund's operations. In the absence of the election by the Fund's investment adviser to bear all of the Fund's operating expenses, the ratio of expenses to average net assets including fee waivers and reimbursements would have been higher. |
| (h) | Portfolio turnover rate for periods less than one full year has not been annualized and is calculated at the Fund level. |
See Notes to Consolidated Financial Statements.
| 42 | 1.888.926.2688 | www.griffincapital.com |
| Griffin Institutional Access Credit Fund – Class C | Consolidated Financial Highlights |
For a Share Outstanding Throughout the Period Presented
| | | For the Year
Ended
December 31,
2019 | | | For the Year
Ended
December 31,
2018 | | | For the Period
April 3, 2017
(Commencement
of Operations) to
December 31,
2017 | |
| Net asset value, beginning of period | | $ | 24.01 | | | $ | 25.30 | | | $ | 25.00 | |
| | | | | | | | | | | | | |
| INCOME FROM INVESTMENT OPERATIONS: | | | | | | | | | | | | |
| Net investment income(a) | | | 1.58 | | | | 1.52 | | | | 0.91 | |
| Net realized and unrealized gain/(loss) | | | 1.02 | | | | (1.27 | ) | | | 0.17 | |
| Total from investment operations | | | 2.60 | | | | 0.25 | | | | 1.08 | |
| | | | | | | | | | | | | |
| DISTRIBUTIONS: | | | | | | | | | | | | |
| From net investment income(b) | | | (1.72 | ) | | | (1.54 | ) | | | (0.78 | ) |
| Total distributions | | | (1.72 | ) | | | (1.54 | ) | | | (0.78 | ) |
| | | | | | | | | | | | | |
| Net increase/(decrease) in net asset value | | | 0.88 | | | | (1.29 | ) | | | 0.30 | |
| Net asset value, end of period | | $ | 24.89 | | | $ | 24.01 | | | $ | 25.30 | |
| TOTAL RETURN(c) | | | 11.04 | % | | | 0.94 | % | | | 4.37 | % |
| | | | | | | | | | | | | |
| RATIOS/SUPPLEMENTAL DATA: | | | | | | | | | | | | |
| Net assets, end of period (000s) | | $ | 49,083 | | | $ | 18,091 | | | $ | 6,681 | |
| Ratios to Average Net Assets | | | | | | | | | | | | |
| Ratio of expenses to average net assets excluding fee waivers and reimbursements | | | 3.73 | % | | | 4.07 | % | | | 6.25 | %(d)(e) |
| Ratio of expenses to average net assets including fee waivers and reimbursements | | | 0.56 | %(f) | | | 0 | %(g) | | | 0 | %(g) |
| Ratio of net investment income to average net assets | | | 6.41 | % | | | 6.12 | % | | | 4.83 | %(d) |
| | | | | | | | | | | | | |
| Portfolio turnover rate(h) | | | 72 | % | | | 56 | % | | | 48 | % |
| (a) | Calculated using the average shares method. |
| (b) | Distributions are based on a daily accrual of net investment income which will vary based on investment yields and daily shares outstanding (see Note 6). |
| (c) | Total returns are for the period indicated and have not been annualized for periods less than a year and do not reflect the impact of sales charge. Total returns would have been lower had certain expenses not been waived during the period. Returns shown do not reflect the deduction of taxes that a shareholder would pay on Fund distributions or the redemption of Fund shares. |
| (e) | The gross expense ratio included non-recurring organizational costs. |
| (f) | For the period of January 1, 2019 to August 25, 2019 the Adviser voluntarily absorbed all of the operating expenses of the Fund. For the Period of August 26, 2019 to December 31, 2019, the Adviser voluntarily absorbed operating expenses of the Fund in excess of 1.25% of net assets. |
| (g) | The Adviser voluntarily absorbed all of the operating expenses of the Fund since the commencement of the Fund's operations. In the absence of the election by the Fund's investment adviser to bear all of the Fund's operating expenses, the ratio of expenses to average net assets including fee waivers and reimbursements would have been higher. |
| (h) | Portfolio turnover rate for periods less than one full year has not been annualized and is calculated at the Fund level. |
See Notes to Consolidated Financial Statements.
| Annual Report | December 31, 2019 | 43 |
| Griffin Institutional Access Credit Fund – Class I | Consolidated Financial Highlights |
For a Share Outstanding Throughout the Period Presented
| | | For the Year
Ended
December 31,
2019 | | | For the Year
Ended
December 31,
2018 | | | For the Period
April 3, 2017
(Commencement
of Operations) to
December 31,
2017 | |
| Net asset value, beginning of period | | $ | 24.01 | | | $ | 25.30 | | | $ | 25.00 | |
| | | | | | | | | | | | | |
| INCOME FROM INVESTMENT OPERATIONS: | | | | | | | | | | | | |
| Net investment income(a) | | | 1.59 | | | | 1.52 | | | | 0.90 | |
| Net realized and unrealized gain/(loss) | | | 1.01 | | | | (1.27 | ) | | | 0.19 | |
| Total from investment operations | | | 2.60 | | | | 0.25 | | | | 1.09 | |
| | | | | | | | | | | | | |
| DISTRIBUTIONS: | | | | | | | | | | | | |
| From net investment income(b) | | | (1.72 | ) | | | (1.54 | ) | | | (0.79 | ) |
| Total distributions | | | (1.72 | ) | | | (1.54 | ) | | | (0.79 | ) |
| | | | | | | | | | | | | |
| Net increase/(decrease) in net asset value | | | 0.88 | | | | (1.29 | ) | | | 0.30 | |
| Net asset value, end of period | | $ | 24.89 | | | $ | 24.01 | | | $ | 25.30 | |
| TOTAL RETURN(c) | | | 11.04 | % | | | 0.95 | % | | | 4.38 | % |
| | | | | | | | | | | | | |
| RATIOS/SUPPLEMENTAL DATA: | | | | | | | | | | | | |
| Net assets, end of period (000s) | | $ | 236,901 | | | $ | 118,119 | | | $ | 42,593 | |
| Ratios to Average Net Assets | | | | | | | | | | | | |
| Ratio of expenses to average net assets excluding fee waivers and reimbursements | | | 2.72 | % | | | 3.07 | % | | | 5.62 | %(d)(e) |
| Ratio of expenses to average net assets including fee waivers and reimbursements | | | 0.54 | %(f) | | | 0 | %(g) | | | 0 | %(g) |
| Ratio of net investment income to average net assets | | | 6.44 | % | | | 6.12 | % | | | 4.78 | %(d) |
| | | | | | | | | | | | | |
| Portfolio turnover rate(h) | | | 72 | % | | | 56 | % | | | 48 | % |
| (a) | Calculated using the average shares method. |
| (b) | Distributions are based on a daily accrual of net investment income which will vary based on investment yields and daily shares outstanding (see Note 6). |
| (c) | Total returns are for the period indicated and have not been annualized for periods less than a year and do not reflect the impact of sales charge. Total returns would have been lower had certain expenses not been waived during the period. Returns shown do not reflect the deduction of taxes that a shareholder would pay on Fund distributions or the redemption of Fund shares. |
| (e) | The gross expense ratio included non-recurring organizational costs. |
| (f) | For the period of January 1, 2019 to August 25, 2019 the Adviser voluntarily absorbed all of the operating expenses of the Fund. For the Period of August 26, 2019 to December 31, 2019, the Adviser voluntarily absorbed operating expenses of the Fund in excess of 1.25% of net assets. |
| (g) | The Adviser voluntarily absorbed all of the operating expenses of the Fund since the commencement of the Fund's operations. In the absence of the election by the Fund's investment adviser to bear all of the Fund's operating expenses, the ratio of expenses to average net assets including fee waivers and reimbursements would have been higher. |
| (h) | Portfolio turnover rate for periods less than one full year has not been annualized and is calculated at the Fund level. |
See Notes to Consolidated Financial Statements.
| 44 | 1.888.926.2688 | www.griffincapital.com |
| Griffin Institutional Access Credit Fund – Class L | Consolidated Financial Highlights |
For a Share Outstanding Throughout the Period Presented
| | | For the Year
Ended
December 31,
2019 | | | For the Year
Ended
December 31,
2018 | | | For the Period
September 5,
2017
(Commencement
of Operations) to
December 31,
2017 | |
| Net asset value, beginning of period | | $ | 24.01 | | | $ | 25.30 | | | $ | 25.21 | |
| | | | | | | | | | | | | |
| INCOME FROM INVESTMENT OPERATIONS: | | | | | | | | | | | | |
| Net investment income(a) | | | 1.57 | | | | 1.53 | | | | 0.40 | |
| Net realized and unrealized gain/(loss) | | | 1.03 | | | | (1.28 | ) | | | 0.06 | |
| Total from investment operations | | | 2.60 | | | | 0.25 | | | | 0.46 | |
| | | | | | | | | | | | | |
| DISTRIBUTIONS: | | | | | | | | | | | | |
| From net investment income(b) | | | (1.72 | ) | | | (1.54 | ) | | | (0.37 | ) |
| Total distributions | | | (1.72 | ) | | | (1.54 | ) | | | (0.37 | ) |
| | | | | | | | | | | | | |
| Net increase/(decrease) in net asset value | | | 0.88 | | | | (1.29 | ) | | | 0.09 | |
| Net asset value, end of period | | $ | 24.89 | | | $ | 24.01 | | | $ | 25.30 | |
| TOTAL RETURN(c) | | | 11.05 | % | | | 0.94 | % | | | 1.84 | % |
| | | | | | | | | | | | | |
| RATIOS/SUPPLEMENTAL DATA: | | | | | | | | | | | | |
| Net assets, end of period (000s) | | $ | 5,537 | | | $ | 1,831 | | | $ | 520 | |
| Ratios to Average Net Assets | | | | | | | | | | | | |
| Ratio of expenses to average net assets excluding fee waivers and reimbursements | | | 3.19 | % | | | 3.45 | % | | | 4.17 | %(d) |
| Ratio of expenses to average net assets including fee waivers and reimbursements | | | 0.59 | %(e) | | | 0 | %(f) | | | 0 | %(f) |
| Ratio of net investment income to average net assets | | | 6.38 | % | | | 6.14 | % | | | 4.88 | %(d) |
| | | | | | | | | | | | | |
| Portfolio turnover rate(g) | | | 72 | % | | | 56 | % | | | 48 | % |
| (a) | Calculated using the average shares method. |
| (b) | Distributions are based on a daily accrual of net investment income which will vary based on investment yields and daily shares outstanding (see Note 6). |
| (c) | Total returns are for the period indicated and have not been annualized for periods less than a year and do not reflect the impact of sales charge. Total returns would have been lower had certain expenses not been waived during the period. Returns shown do not reflect the deduction of taxes that a shareholder would pay on Fund distributions or the redemption of Fund shares. |
| (e) | For the period of January 1, 2019 to August 25, 2019 the Adviser voluntarily absorbed all of the operating expenses of the Fund. For the Period of August 26, 2019 to December 31, 2019, the Adviser voluntarily absorbed operating expenses of the Fund in excess of 1.25% of net assets. |
| (f) | The Adviser voluntarily absorbed all of the operating expenses of the Fund since the commencement of the Fund's operations. In the absence of the election by the Fund's investment adviser to bear all of the Fund's operating expenses, the ratio of expenses to average net assets including fee waivers and reimbursements would have been higher. |
| (g) | Portfolio turnover rate for periods less than one full year has not been annualized and is calculated at the Fund level. |
See Notes to Consolidated Financial Statements.
| Annual Report | December 31, 2019 | 45 |
| Griffin Institutional Access Credit Fund – Class F | Consolidated Financial Highlights |
For a Share Outstanding Throughout the Period Presented
| | | For the Year
Ended
December 31,
2019 | | | For the Year
Ended
December 31,
2018 | | | For the Period
September 25,
2017
(Commencement
of Operations) to
December 31,
2017 | |
| Net asset value, beginning of period | | $ | 24.01 | | | $ | 25.30 | | | $ | 25.25 | |
| | | | | | | | | | | | | |
| INCOME FROM INVESTMENT OPERATIONS: | | | | | | | | | | | | |
| Net investment income(a) | | | 1.63 | | | | 1.50 | | | | 0.32 | |
| Net realized and unrealized gain/(loss) | | | 0.97 | | | | (1.26 | ) | | | 0.03 | |
| Total from investment operations | | | 2.60 | | | | 0.24 | | | | 0.35 | |
| | | | | | | | | | | | | |
| DISTRIBUTIONS: | | | | | | | | | | | | |
| From net investment income(b) | | | (1.71 | ) | | | (1.53 | ) | | | (0.30 | ) |
| Total distributions | | | (1.71 | ) | | | (1.53 | ) | | | (0.30 | ) |
| | | | | | | | | | | | | |
| Net increase/(decrease) in net asset value | | | 0.89 | | | | (1.29 | ) | | | 0.05 | |
| Net asset value, end of period | | $ | 24.90 | | | $ | 24.01 | | | $ | 25.30 | |
| TOTAL RETURN(c) | | | 11.06 | % | | | 0.91 | % | | | 1.41 | % |
| | | | | | | | | | | | | |
| RATIOS/SUPPLEMENTAL DATA: | | | | | | | | | | | | |
| Net assets, end of period (000s) | | $ | 25,965 | | | $ | 26,843 | | | $ | 38,254 | |
| Ratios to Average Net Assets | | | | | | | | | | | | |
| Ratio of expenses to average net assets excluding fee waivers and reimbursements | | | 2.70 | % | | | 3.03 | % | | | 3.27 | %(d) |
| Ratio of expenses to average net assets including fee waivers and reimbursements | | | 0.43 | %(e) | | | 0 | %(f) | | | 0 | %(f) |
| Ratio of net investment income to average net assets | | | 6.58 | % | | | 5.99 | % | | | 4.85 | %(d) |
| | | | | | | | | | | | | |
| Portfolio turnover rate(g) | | | 72 | % | | | 56 | % | | | 48 | % |
| (a) | Calculated using the average shares method. |
| (b) | Distributions are based on a daily accrual of net investment income which will vary based on investment yields and daily shares outstanding (see Note 6). |
| (c) | Total returns are for the period indicated and have not been annualized for periods less than a year and do not reflect the impact of sales charge. Total returns would have been lower had certain expenses not been waived during the period. Returns shown do not reflect the deduction of taxes that a shareholder would pay on Fund distributions or the redemption of Fund shares. |
| (e) | For the period of January 1, 2019 to August 25, 2019 the Adviser voluntarily absorbed all of the operating expenses of the Fund. For the Period of August 26, 2019 to December 31, 2019, the Adviser voluntarily absorbed operating expenses of the Fund in excess of 1.25% of net assets. |
| (f) | The Adviser voluntarily absorbed all of the operating expenses of the Fund since the commencement of the Fund's operations. In the absence of the election by the Fund's investment adviser to bear all of the Fund's operating expenses, the ratio of expenses to average net assets including fee waivers and reimbursements would have been higher. |
| (g) | Portfolio turnover rate for periods less than one full year has not been annualized and is calculated at the Fund level. |
See Notes to Consolidated Financial Statements.
| 46 | 1.888.926.2688 | www.griffincapital.com |
| Griffin Institutional Access Credit Fund | Notes to Consolidated
Financial Statements |
December 31, 2019
1. ORGANIZATION
Griffin Institutional Access Credit Fund (the “Fund”) is registered with the U.S. Securities and Exchange Commission (“SEC”) under the Investment Company Act of 1940, as amended (the “1940 Act”), as a non-diversified, closed-end management investment company. The Fund engages in a continuous offering of shares and operates as an interval fund that offers quarterly repurchases of shares at net asset value. The Fund’s SEC registered investment adviser is Griffin Capital Credit Advisor, LLC (the “Adviser”). BCSF Advisors, LP (the “Sub-Adviser”), an affiliate of Bain Capital Credit, LP, serves as the Fund’s sub-adviser. The investment objective of the Fund is to generate a return comprised of both current income and capital appreciation with an emphasis on current income with low volatility and low correlation to the broader markets. The Fund pursues its investment objective by investing in a range of secured and unsecured debt obligations, which may be syndicated, consisting of U.S. high yield securities, global high yield securities, direct lending investments including direct originated debt obligations, collateralized loan obligations (“CLOs”), and other fixed-income and fixed-income related securities. The portfolio may consist of high yield bonds and bank loans, equity securities, CLOs, and direct lending investments, which may include senior direct lending (“SDL”) as well as subordinate and unitranche direct lending. The Fund may also acquire warrants and other equity interests through its direct lending activities. The portfolio may also consist of, to a lesser extent, special situations investments such as non-performing loans (“NPLs”). In pursuing its investment objective, the Fund may also directly or indirectly invest in derivative investments, such as total return swap agreements.
The Fund was organized as a statutory trust on April 5, 2016 under the laws of the State of Delaware. The Fund commenced operations on April 3, 2017 and is authorized to issue an unlimited number of shares with no par value.
The Fund currently offers Class A, Class C, Class I and Class L shares. Class A, Class C and Class I shares commenced operations on April 3, 2017. Class L shares commenced operations on September 5, 2017. Class F Shares commenced operations on September 25, 2017 and are no longer offered except for reinvestment of dividends. Class A and L shares are offered subject to a maximum sales charge of 5.75% and 4.25%, respectively, of their offering price. Class C and Class I shares are offered at net asset value per share. Class C shares may be subject to a 1.00% contingent deferred sales charge on shares redeemed during the first 365 days after their purchase. Each class represents an interest in the same assets of the Fund and classes are identical except for differences in their sales charge structures and ongoing service and distribution charges. All classes of shares have equal voting privileges except that each class has exclusive voting rights with respect to its service and/or distribution plans. The Fund’s income, expenses (other than class specific service and distribution fees) and realized and unrealized gains and losses are allocated proportionately each day based upon the relative net assets of each class. An affiliate of the Adviser owns shares in the Fund representing 2.37% of net asset value.
2. SIGNIFICANT ACCOUNTING POLICIES
Basis of Presentation– The following is a summary of significant accounting policies followed by the Fund in preparation of its consolidated financial statements. These policies are in conformity with accounting principles generally accepted in the United States of America (“GAAP”). The Fund is considered an investment company following accounting and reporting guidance inAccounting Standards Codification (“ASC”) Topic 946 – Financial Services – Investment Companies. The preparation of the consolidated financial statements requires management to make estimates and assumptions that affect the reported amounts of assets and liabilities and disclosure of contingent assets and liabilities at the date of the consolidated financial statements and the reported amounts of income and expenses for the period. Actual results could differ from those estimates.
Consolidation of GIACF Alternative Holdings, LLC –GIACF Alternative Holdings, LLC, (the “NPL Subsidiary”), a Cayman Islands exempted company and wholly-owned subsidiary of the Fund, was formed on September 18, 2018. The NPL Subsidiary acts as an investment vehicle for the Fund in order to effect certain NPL investments for the Fund. The Fund is the managing and sole member of the NPL Subsidiary pursuant to a limited liability agreement. As a wholly-owned subsidiary of the Fund, the financial statements of the NPL Subsidiary are included in the consolidated financial statements and financial highlights of the Fund. All investments held by the NPL Subsidiary are disclosed in the Consolidated Schedule of Investments. All inter-company accounts and transactions have been eliminated in consolidation.
The NPL Subsidiary has received an undertaking from the Government of the Cayman Islands exempting it from all local income, profits and capital gains taxes. No such taxes are levied in the Cayman Islands at the present time. For U.S. income tax purposes, the NPL Subsidiary is a Controlled Foreign Corporation, which generates and is allocated no income that is considered effectively connected with U.S. trade of business and, as such, is not subject to U.S. income tax. However, as a wholly-owned Controlled Foreign Corporation, the NPL Subsidiary’s net income and capital gain, to the extent of its earnings and profits, will be included each year in the Fund’s investment company taxable income.
Consolidation of CRDTX SPV I, LLC– CRDTX SPV I, LLC, (the “Swap Subsidiary”), a Delaware Limited Liability Company and wholly-owned subsidiary of the Fund, was formed on November 27, 2018. The Swap Subsidiary, on behalf of the Fund, has entered into a series of single-asset total return swaps (the “Swaps”) on individual bank loans (each a “Reference Asset”). The Fund is the managing and sole member of the Swap Subsidiary pursuant to a limited liability agreement. Further, the Fund will remain the sole member and will continue to wholly own and control the Swap Subsidiary. As a wholly-owned subsidiary of the Fund, the financial statements of the Swap Subsidiary are included in the consolidated financial statements and financial highlights of the Fund. The Swaps that the Swap Subsidiary has entered into are disclosed in the Consolidated Schedule of Investments. All inter-company accounts and transactions have been eliminated in consolidation.
| Annual Report | December 31, 2019 | 47 |
| Griffin Institutional Access Credit Fund | Notes to Consolidated
Financial Statements |
December 31, 2019
Single-Asset Subsidiaries– Certain investments of the Fund will be held in single-asset subsidiaries controlled by the Fund (the “Single-Asset Subsidiaries”). The Single-Asset Subsidiaries are generally formed as needed to hold a particular equity investment obtained in private transactions. The financial statements of the Single-Asset Subsidiaries are included in the consolidated financial statements and financial highlights of the Fund. The equity holdings of the Single-Asset Subsidiaries are disclosed in the Consolidated Schedule of Investments. All inter-company accounts and transactions have been eliminated in consolidation.
The Fund will generally consolidate any wholly-owned or controlled subsidiary. For purposes of the Fund’s investment restrictions, guidelines and limitations, the Fund will aggregate direct investments with investment exposure provided by its wholly-owned and controlled subsidiaries.
Security Valuation– In accordance withASC Topic 820 – Fair Value Measurement and Disclosures, and consistent with the Fund’s Valuation Policy, portfolio securities of the Fund are valued at their current market values determined on the basis of readily available market quotations. Market quotations are obtained from independent pricing services approved by the Board of Trustees (the “Trustees”). Forward foreign currency exchange contracts are typically valued at their quoted daily prices obtained from an independent pricing service. With respect to the Swaps, each Reference Asset is marked daily at its quoted price obtained from an independent pricing service. The collective daily value of each Swap is based on the daily value of the Reference Asset together with accrued income of the Reference Asset and the accrued expenses incurred under the Swap agreement. The aggregate settlement values and notional amounts of the forward foreign currency exchange contracts and Swaps will not be recorded in the Consolidated Statement of Assets and Liabilities. Fluctuations in the value of the forward foreign currency exchange contracts, and Swaps will be recorded in the Consolidated Statement of Assets and Liabilities as an asset or liability and in the Consolidated Statement of Operations as unrealized appreciation or depreciation until terminated. When a Swap is terminated, the Fund records a realized gain or loss in the Consolidated Statement of Operations equal to the difference between the value of the Swap at the time it was opened and the value of the Swap at the time it was terminated.
If market quotations are not readily available, securities are valued at fair value in good faith pursuant to procedures adopted by the Trustees. The Trustees have delegated the day to day responsibility for determining fair valuation to the Fair Value Pricing Committee in accordance with the Valuation Policy approved by the Trustees. There is no single standard for determining fair value of a security. Rather, in determining the fair value of a security for which there are no readily available market quotations, the Adviser and Sub-Adviser, together with the Fair Value Pricing Committee, may consider several factors as relevant, including but not limited to: (1) evaluation of all relevant factors, including but not limited to, pricing history, current market level, supply and demand of the respective security; (2) comparison to the values, yields, and current pricing of securities that have comparable characteristics; (3) knowledge of current and historical market information with respect to the security; (4) other factors relevant to the security which would include, but not be limited to, duration, yield, fundamental analytical data, including enterprise value of portfolio company, relevant credit market indices, and credit quality. The Adviser and Sub-Adviser may also consider periodic financial statements (audited and unaudited) or other information provided by the issuer. The Fair Value Pricing Committee will give consideration to all factors which might reasonably affect the fair value of an investment. The Fund has retained the services of one or more independent third-party valuation specialists to assist the Fair Value Pricing Committee in determining the fair value of certain securities for which market quotations are not available. The independent third-party valuation specialist provides the Fair Value Pricing Committee with a valuation report that includes a description of the methodology used to measure fair value and the analysis and calculations supporting its conclusion. Fair valuation involves subjective judgments, and it is possible that the fair value determined for a security may differ materially from the value that could be realized upon the sale of the security.
The Adviser will provide the Trustees with periodic reports, no less frequently than quarterly, that discuss the functioning of the valuation process, if applicable to that period, and that identify issues and valuation problems that have arisen, if any. To the extent deemed necessary by the Adviser, the Trustees will review any securities valued by the Adviser and/or the Fair Value Pricing Committee in accordance with the Fund’s Valuation Policy.
Fair Value Measurements– In accordance withASC Topic 820 – Fair Value Measurement and Disclosures, a three-tier hierarchy has been established to classify fair value measurements for disclosure purposes. Inputs refer broadly to the assumptions that market participants would use in pricing the asset or liability, including assumptions about risk. Inputs may be observable or unobservable. Observable inputs are inputs that reflect the assumptions market participants would use in pricing the asset or liability that are developed based on market data obtained from sources independent of the reporting entity. Unobservable inputs are inputs that reflect the reporting entity’s own assumptions about the assumptions market participants would use in pricing the asset or liability that are developed based on the best information available. In accordance with the authoritative guidance on fair value measurements and disclosure under GAAP, the Fund discloses fair value of its investments in a hierarchy that prioritizes the inputs to valuation techniques used to measure the fair value, as follows:
| 48 | 1.888.926.2688 | www.griffincapital.com |
| Griffin Institutional Access Credit Fund | Notes to Consolidated
Financial Statements |
December 31, 2019
| Level 1 – | Unadjusted quoted prices in active markets for identical, unrestricted assets or liabilities that the Fund has the ability to access at the measurement date; |
| Level 2 – | Quoted prices which are not active, quoted prices for similar assets or liabilities in active markets or inputs other than quoted prices that are observable (either directly or indirectly) for substantially the full term of the asset or liability at the measurement date; and |
| Level 3 – | Significant unobservable prices or inputs (including the Fund’s own assumptions in determining the fair value of investments) where there is little or no market activity for the asset or liability at the measurement date. |
The availability of observable inputs can vary from security to security and is affected by a wide variety of factors, including, for example, the type of security, whether the security is new and not yet established in the marketplace, the liquidity of markets and other characteristics particular to the security. To the extent that valuation is based on models or inputs that are less observable or unobservable in the market, the determination of fair value requires more judgment. Accordingly, the degree of judgment exercised in determining fair value is greatest for instruments categorized in Level 3.
An investment level within the fair value hierarchy is based on the lowest level input, individually or in the aggregate, that is significant to fair value measurement. The valuation techniques used by the Fund to measure fair value during the fiscal year ended December 31, 2019 maximized the use of observable inputs and minimized the use of unobservable inputs.
The inputs or methodologies used for valuing securities are not necessarily an indication of the risk or liquidity associated with investing in those securities. The following is a summary of the inputs used in valuing the Fund’s investments as of December 31, 2019:
| Investments in Securities at Value | | Level 1 -
Quoted Prices | | | Level 2 -
Other Significant
Observable Inputs | | | Level 3 -
Significant
Unobservable Inputs | | | Total | |
| Bank Loans | | $ | – | | | $ | 103,347,173 | | | $ | 98,317,205 | | | $ | 201,664,378 | |
| Corporate Bonds | | | – | | | | 85,740,056 | | | | – | | | | 85,740,056 | |
| Convertible Corporate Bonds | | | – | | | | 324,740 | | | | – | | | | 324,740 | |
| Collateralized Loan Obligations | | | – | | | | 33,473,618 | | | | – | | | | 33,473,618 | |
| Common Stocks | | | – | | | | 7,402 | | | | – | | | | 7,402 | |
| Equity Interest | | | – | | | | – | | | | 4,533,196 | | | | 4,533,196 | |
| Exchange Traded Funds | | | 15,291,666 | | | | – | | | | – | | | | 15,291,666 | |
| Total | | $ | 15,291,666 | | | $ | 222,892,989 | | | $ | 102,850,401 | | | $ | 341,035,056 | |
| Other Financial Instruments* | | | | | | | | | | | | | | | | |
| Assets: | | | | | | | | | | | | | | | | |
| Forward Foreign Currency Contracts | | $ | – | | | $ | 30,452 | | | $ | – | | | | 30,452 | |
| Total Return Swap Contracts | | | – | | | | 1,489,672 | | | | 45,741 | | | | 1,535,413 | |
| Liabilities: | | | | | | | | | | | | | | | | |
| Forward Foreign Currency Contracts | | | – | | | | (380,185 | ) | | | – | | | | (380,185 | ) |
| Total Return Swap Contracts | | | – | | | | (273,780 | ) | | | (13,519 | ) | | | (287,299 | ) |
| Total | | $ | – | | | $ | 866,159 | | | $ | 32,222 | | | $ | 898,381 | |
| * | Other financial instruments are derivative instruments reflected in the Consolidated Schedule of Investments. The derivatives shown in this table are reported at their unrealized appreciation/ (depreciation) at measurement date, which represents the change in the contracts' value. |
| Annual Report | December 31, 2019 | 49 |
| Griffin Institutional Access Credit Fund | Notes to Consolidated
Financial Statements |
December 31, 2019
The changes of fair value of investments for which the Fund has used Level 3 inputs to determine the fair value are as follows:
| | | Bank Loans | | | Equity Interest | | | Total | |
| Balance as of December 31, 2018 | | $ | 13,505,046 | | | | 2,667,450 | | | $ | 16,172,496 | |
| Accrued Discount/premium | | $ | 115,871 | | | | – | | | $ | 115,871 | |
| Realized Gain/(Loss) | | $ | 8,202 | | | | 10,516 | | | $ | 18,718 | |
| Change in Unrealized Appreciation/Depreciation | | $ | 790,845 | | | | 492,971 | | | $ | 1,283,816 | |
| Purchases | | $ | 74,652,268 | | | | 1,624,262 | | | $ | 76,276,530 | |
| Sales Proceeds | | $ | (3,026,288 | ) | | | (262,003 | ) | | $ | (3,288,291 | ) |
| Transfer into Level 3 | | $ | 12,271,261 | | | | – | | | $ | 12,271,261 | |
| Transfer Out of Level 3 | | $ | – | | | | – | | | $ | – | |
| Balance as of December 31, 2019 | | $ | 98,317,205 | | | | 4,533,196 | | | $ | 102,850,401 | |
| Net change in unrealized appreciation/(depreciation) included in the Consolidated Statements of Operations attributable to Level 3 investments held at December 31, 2019 | | $ | 813,685 | | | | 492,971 | | | $ | 1,306,656 | |
The following is a reconciliation for the year ended December 31, 2019 of the total return swap contracts for which significant unobservable inputs (Level 3) were used in determining fair value:
| | | Total Return Swaps | | | Total | |
| Balance as of December 31, 2018 | | $ | – | | | $ | – | |
| Accrued Discount/premium | | $ | – | | | $ | – | |
| Realized Gain/(Loss) | | $ | 367 | | | $ | 367 | |
| Change in Unrealized Appreciation/Depreciation | | $ | 32,222 | | | $ | 32,222 | |
| Purchases | | $ | – | | | $ | – | |
| Sales Proceeds | | $ | (367 | ) | | $ | (367 | ) |
| Transfer into Level 3 | | $ | – | | | $ | – | |
| Transfer Out of Level 3 | | $ | – | | | $ | – | |
| Balance as of December 31, 2019 | | $ | 32,222 | | | $ | 32,222 | |
| Net change in unrealized appreciation/(depreciation) included in the Consolidated Statements of Operations attributable to Level 3 investments held at December 31, 2019 | | $ | 32,222 | | | $ | 32,222 | |
The table below provides additional information about the Level 3 Fair Value Measurements as of December 31, 2019:
Quantitative Information about Level 3 Fair Value Measurements
| | | | | Range | |
| Asset Class | Fair Value | Valuation Technique | Unobservable Inputs(a) | Minimum | Maximum | Weighted Average |
| Bank Loans | $54,289,362 | Comparative Yield Analysis | Market Yield | 5.20% | 13.00% | 8.35% |
| Bank Loans | 30,398,596 | Third Party Pricing Service | Broker Quote | $84.50 | $101.25 | $98.36 |
| Bank Loans | 11,882,824(b) | Purchase Price | Purchase Price | $97.75 | $99.00 | $97.97 |
| Bank Loans | 1,746,423 | Recent Transaction | Recent Transaction Price | $100.00 | $100.00 | $100.00 |
| Equity Interest | 2,869,923 | Discounted Cash Flows | Discount Rate | 14.98% | 14.98% | 14.98% |
| Equity Interest | 1,559,312 | Enterprise Value Analysis | EBITDA Multiple | 7.3x | 10.0x | 9.0x |
| Equity Interest | 103,961(b) | Purchase Price | Purchase Price | $1.00 | $1.00 | $1.00 |
| Total | $102,850,401 | | | | | |
| Total Return Swap Contracts | $32,222 | Third Party Pricing Service | Broker Quote | $96.00 | $100.88 | $99.18 |
| 50 | 1.888.926.2688 | www.griffincapital.com |
| Griffin Institutional Access Credit Fund | Notes to Consolidated
Financial Statements |
December 31, 2019
| (a) | A change to the unobservable input may result in a significant change to the value of the investment as follows: |
| Unobservable Input | Impact to Value if Input Increases | Impact to Value if Input Decreases |
| Market Yield | Decrease | Increase |
| EBITDA Multiple | Increase | Decrease |
| Discount Rate | Decrease | Increase |
| Broker Quote | Increase | Decrease |
| Purchase Price | N/A | N/A |
| Recent Transaction Price | N/A | N/A |
| (b) | Investments acquired during the quarter ended December 31, 2019. |
The Fund utilized the comparative yield, enterprise value, and discounted cash flow techniques to determine the fair value of certain Level 3 assets as of December 31, 2019. The significant unobservable input used in the comparative yield analysis is yield. The comparative yield valuation technique measures fair value of an investment based upon an assessment of expected market yields of other businesses of similar size in the same industry. The significant unobservable input used in the enterprise value approach is the EBITDA multiple. EBITDA multiples are typically determined based upon review of market comparable transactions and publicly traded comparable companies. The multiple is used to estimate the enterprise value of the underlying investment. The discounted cash flow technique is an analysis whereby future expected cash flows of the investment are discounted to determine a present value using a discount rate.
Generally, new investments not valued by a third-party pricing service are held at purchase price initially until the investment has been held by the Fund for a full quarter. The investment is then generally transitioned to an independent third-party valuation specialist to assist the Fair Value Pricing Committee in determining the application of a valuation methodology at the next valuation date. The Fair Value Pricing Committee will convene if there has been a material change to the underlying company, industry or market between the time of investment and the valuation date.
Securities Transactions, Revenue Recognition and Expenses– The Fund records its investment transactions on a trade date basis. The Fund measures realized gains or losses by the difference between the net proceeds from the repayment or sale and the amortized cost basis of the investment, using the specified identification method. Interest income, adjusted for amortization of premium and accretion of discount, is recorded on an accrual basis. Discount and premium to par value on investments acquired are accreted and amortized, respectively, into interest income over the life of the respective investment using the effective interest method. Loan origination fees, original issue discount and market discount or premium are capitalized and amortized against or accreted into interest income using the effective interest method or straight-line method, as applicable. For the Fund’s investments in revolving bank loans, the cost basis of the investment purchased is adjusted for the cash received for the discount on the total balance committed. The fair value is also adjusted for price appreciation or depreciation on the unfunded portion. Upon prepayment of a loan or debt security, any prepayment premium is recorded as interest income.
Dividend income on preferred equity investments is recorded on an accrual basis to the extent that such amounts are payable by the portfolio company and are expected to be collected. Dividend income on common equity investments is recorded on the record date for private portfolio companies and on the ex-dividend date for publicly traded portfolio companies. Distributions received from a limited liability company or limited partnership investments are evaluated to determine if the distribution should be recorded as dividend income or a return of capital.
Income from securitization vehicles and equity investments in the equity class securities of CLO vehicles (typically income notes or subordinated notes) is recorded daily using the effective interest method in accordance with the provisions of ASC 325-40, Beneficial Interests in Securitized Financial Assets, based upon a calculation of the effective yield to the expected redemption date based on an estimate of future cash flows, including those CLO equity investments that have not made their inaugural distribution for the relevant period end. The Fund monitors the expected residual payments, and the effective yield is determined and updated quarterly.
Certain investments may have contractual payment-in-kind (“PIK”) interest or dividends. PIK represents accrued interest or accumulated dividends that are added to the loan principal of the investment on the respective interest or dividend payment dates rather than being paid in cash and generally becomes due at maturity or upon being called by the issuer. PIK is recorded as interest or dividend income, as applicable. If at any point the Fund believes PIK is not expected to be realized, the investment generating PIK will be placed on non-accrual status. Accrued PIK interest or dividends are generally reversed through interest or dividend income, respectively, when an investment is placed on non-accrual status.
Expenses are recorded on an accrual basis.
| Annual Report | December 31, 2019 | 51 |
| Griffin Institutional Access Credit Fund | Notes to Consolidated
Financial Statements |
December 31, 2019
Foreign Currency Translation– The books and records of the Fund are maintained in U.S. dollars. Investment valuations and other assets and liabilities initially expressed in foreign currencies are converted each business day into U.S. dollars based upon current exchange rates. Prevailing foreign exchange rates may generally be obtained at the close of the NYSE (normally, 4:00 p.m. EST).
Foreign Securities– The Fund may directly purchase securities of foreign issuers. Investing in securities of foreign issuers involves special risks not typically associated with investing in securities of U.S. issuers. The risks include possible revaluation of currencies, the ability to repatriate funds, less complete financial information about companies and possible future adverse political and economic developments. Moreover, securities of many foreign issuers and their markets may be less liquid and their prices more volatile than those of securities of comparable U.S. issuers.
Cash and Cash Equivalents– The Fund places its cash with one banking institution, which is insured by the Federal Deposit Insurance Corporation (“FDIC”). The FDIC limit is $250,000. At various times throughout the year, the amount on deposit may exceed the FDIC limit and subject the Fund to a credit risk. The Fund does not believe that such deposits are subject to any unusual risk associated with investment activities.
Loan Participation and Assignments– The Fund may invest in direct debt instruments, which are interests in amounts owed to lenders or lending syndicates by corporate, governmental, or other borrowers. The Fund’s investments in loans may be in the form of participations in loans or assignments of all or a portion of the loans from third parties. A loan is often administered by a bank or other financial institution (the “agent”) that acts as agent for all holders. The agent administers the terms of the loan, as specified in the loan agreement. The Fund may invest in multiple series or tranches of a loan, which may have varying terms and carry different associated risks. The Fund generally has no right to enforce compliance with the terms of the loan agreement with the borrower. As a result, the Fund may be subject to the credit risk of both the borrower and the agent that is selling the loan agreement. When the Fund purchases assignments from lenders they acquire direct rights against the borrower of the loan. The Fund may enter into unfunded loan commitments, which are contractual obligations for future funding. Unfunded loan commitments represent a future obligation in full, even though a percentage of the notional loan amounts may not be utilized by the borrower. When investing in a loan participation, the Fund has the right to receive payments of principal, interest and any fees to which it is entitled only from the agent selling the loan agreement and only upon receipt of payments by the agent from the borrower. The Fund may receive a fee based on the undrawn portion of the underlying line of credit of a floating rate loan. In certain circumstances, the Fund may receive a penalty fee upon the prepayment of a floating rate loan by a borrower. For the fiscal year ended December 31, 2019, no penalty fees were received by the Fund. Fees earned or paid are recorded as a component of interest income or interest expense, respectively, on the Consolidated Statement of Operations. At December 31, 2019, the Fund had $5,035,759 at par value in unfunded loan commitments.
Defaulted Securities –The Fund held defaulted securities and/or other securities for which the income has been deemed uncollectible. As of December 31, 2019, the aggregate value of those securities was $499,418 representing 0.13% of the Fund's net assets. The Fund no longer accrues income on securities for which income has been deemed uncollectible. Additionally, the Fund provides for losses on interest of receivable. Such securities have been identified on the accompanying Consolidated Schedule of Investments.
Distributions to Shareholders– The Fund intends to accrue dividends daily and to distribute as of the last business day of each quarter. Distributions of net capital gains are normally accrued and distributed in December. Income and capital gains distributions are determined in accordance with income tax regulations, which may differ from GAAP.
Indemnification– The Fund indemnifies its Officers and Trustees for certain liabilities that may arise from the performance of their duties to the Fund. Additionally, in the normal course of business, the Fund enters into contracts that contain a variety of representations and warranties and which provide general indemnities. The Fund’s maximum exposure under these arrangements is unknown, as this would involve future claims that may be made against the Fund that have not yet occurred. However, based on industry experience, the Fund expects the risk of loss due to these warranties and indemnities to be remote.
Federal Income Taxes– The Fund intends to continue to comply with the requirements of Subchapter M of the Internal Revenue Code applicable to regulated investment companies and will distribute all of its taxable income, if any, to shareholders. Accordingly, no provision for federal income taxes is required in the consolidated financial statements.
The Fund recognizes the tax benefits of uncertain tax positions only when the position is “more likely than not” (more than a fifty percent chance) to be sustained assuming examination by tax authorities. Management has reviewed the tax positions and has concluded that no liability for unrecognized tax benefits should be recorded related to uncertain tax positions expected to be taken in the Fund’s 2019 returns.
Commitments and Contingencies– In the normal course of business, the Fund's investment activities involve executions, settlement and financing of various transactions resulting in receivables from, and payables to, brokers, dealers and the Fund's custodian. These activities may expose the Fund to risk in the event that such parties are unable to fulfill contractual obligations. Management does not anticipate any material losses from counterparties with whom it conducts business. Consistent with standard business practice, the Fund enters into contracts that contain a variety of indemnifications, and may be engaged from time to time in various legal actions. The maximum exposure of the Fund under these arrangements and activities is unknown. However, the Fund expects the risk of material loss to be remote.
| 52 | 1.888.926.2688 | www.griffincapital.com |
| Griffin Institutional Access Credit Fund | Notes to Consolidated
Financial Statements |
December 31, 2019
3. DERIVATIVE TRANSACTIONS
The Fund’s investment objectives allow the Fund to enter into various types of derivative contracts such as total return swaps and forward foreign currency contracts. In doing so, the Fund and its Swap Subsidiary will employ strategies in differing combinations to permit it to increase, decrease, or change the level or types of exposure to market factors. Central to those strategies are features inherent to derivatives that make them more attractive for this purpose than equity or debt securities; they require little or no initial cash investment, they can focus exposure only on certain selected risk factors, and they may not require the ultimate receipt or delivery of the underlying security (or securities) to the contract. This may allow the Fund to pursue its objectives more quickly and efficiently than if it were to make direct purchases or sales of securities capable of effecting a similar response to market factors.
Risk of Investing in Derivatives– The Fund’s use of derivatives can result in losses due to unanticipated changes in the market risk factors and the overall market.
Derivatives may have little or no initial cash investment relative to their market value exposure and therefore can produce significant gains or losses in excess of their cost. This use of embedded leverage allows the Fund to increase its market value exposure relative to its net assets and can substantially increase the volatility of the Fund’s performance.
Additional associated risks from investing in derivatives also exist and potentially could have significant effects on the valuation of the derivative and the Fund. Typically, the associated risks are not the risks that the Fund is attempting to increase or decrease exposure to, per their investment objectives, but are the additional risks from investing in derivatives.
Examples of these associated risks are liquidity risk, which is the risk that the Fund will not be able to sell the derivative in the open market in a timely manner, and counterparty credit risk, which is the risk that the counterparty will not fulfill its obligation to the Fund.
Forward Foreign Currency Contracts– The Fund engaged in currency transactions with counterparties during the fiscal year ended December 31, 2019 to hedge the value of portfolio securities denominated in particular currencies against fluctuations in relative value or to gain or reduce exposure to certain currencies. A forward foreign currency contract is an agreement between two parties to buy and sell a currency at a set price on a future date. The contract is marked-to-market daily and the change in value is recorded by the Fund as an unrealized gain or loss. When a forward foreign currency contract is terminated, the Fund records a realized gain or loss equal to the difference between the value of the contract at the time it was opened and the value of the contract at the time it was extinguished.
Forward foreign currency contracts involve elements of market risk in excess of the amounts reflected in the Consolidated Statement of Assets and Liabilities. The Fund bears the risk of an unfavorable change in the foreign exchange rate underlying the forward foreign currency contract. Risks may also arise upon entering into these contracts from the potential inability of the counterparties to meet the terms of their contracts. Forward foreign currency exchange contracts are typically valued at their quoted daily prices obtained from an independent pricing service.
Total Return Swap Contracts– The Fund’s Swap Subsidiary has entered into a series of single-asset total return swaps on individual bank loans with Citibank, N.A. (“Citi”) as the counterparty. The Swaps allow the Fund to indirectly obtain exposure to the Reference Assets, each a bank loan, without owning or taking physical custody of the underlying bank loans. Each Swap is an agreement between the Swap Subsidiary and Citi in which Citi has contractually committed to make payments based on the total return (income plus realized appreciation) of each Reference Asset in exchange for a periodic payment from the Swap Subsidiary based on a floating interest rate and any realized depreciation of each Reference Asset. If the total return of the Reference Asset exceeds or falls short of the offsetting floating interest rate obligation, the Swap Subsidiary receives payment from or makes payment to Citi, respectively. Additionally, the Fund’s Swap Subsidiary posts collateral to cover its potential contractual obligations under the Swaps. Each Swap is marked-to-market daily consistent with the Fund’s Valuation Policy and changes in value are recorded by the Fund as unrealized gain or loss in the consolidated financial statements. When a Swap is terminated, the Fund records a realized gain or loss in the Consolidated Statement of Operations equal to the difference between the value of the Swap at the time it was opened and the value of the Swap at the time it was terminated.
The Swaps effectively add leverage to the Fund’s portfolio by providing investment exposure to underlying bank loans without owning or taking physical custody of such bank loans. In an effort to limit leverage risk, the Fund will earmark assets determined to be liquid to cover its obligations under the Swap agreements. The use of Swaps includes the risks associated with each Reference Asset including the risk that the underlying bank loan defaults. The Fund bears the risk of unfavorable changes in market prices of the underlying Reference Assets. Risk may also arise upon entering into these contracts from the potential inability of the counterparty to meet the terms of its contract.
| Annual Report | December 31, 2019 | 53 |
| Griffin Institutional Access Credit Fund | Notes to Consolidated
Financial Statements |
December 31, 2019
Fair values of forward foreign currency contracts and total return swap contracts on the Consolidated Statement of Assets and Liabilities as of December 31, 2019, categorized by risk exposure:
| Risk Exposure | | Consolidated
Statement of Assets
and Liabilities
Location | | Fair Value | | | Consolidated Statement of Assets and Liabilities Location | | Fair Value | |
| Foreign Exchange Rate Risk (Forward Foreign Currency Contracts) | | Unrealized appreciation on forward foreign currency contracts | | $ | 30,452 | | | Unrealized depreciation on forward foreign currency contracts | | $ | (380,185 | ) |
| Market and Credit Risk (Total Return Swap Contracts) | | Unrealized appreciation on total return swap contracts | | | 1,535,413 | | | Unrealized depreciation on total return swap contracts | | | (287,299 | ) |
| Total | | | | $ | 1,565,865 | | | | | $ | (667,484 | ) |
For the fiscal year ended December 31, 2019, the average monthly notional value of forward foreign currency contracts and total return swap contracts was $29,635,622 and $51,102,366, respectively.
The effect of forward foreign currency contracts and total return swap contracts on the Consolidated Statement of Operations for the fiscal year ended December 31, 2019:
Risk Exposure | | Consolidated
Statement of Operations
Location | | Realized
Gain/(Loss) on
Derivatives | | | Consolidated
Statement of Operations
Location | | Change in Unrealized Appreciation/(Depreciation) on Derivatives Recognized in Income | |
| Foreign Exchange Rate Risk (Forward Foreign Currency Contracts) | | Net realized gain/(loss) on forward foreign currency contracts | | $ | 1,327,539 | | | Change in unrealized appreciation/ (depreciation) on forward foreign currency contracts | | $ | (369,633 | ) |
| Market and Credit Risk (Total Return Swap Contracts) | | Net realized gain/(loss) on total return swaps | | | 265,468 | | | Change in unrealized appreciation/ (depreciation) on total return swaps | | | 1,248,114 | |
| Total | | | | $ | 1,593,007 | | | | | $ | 878,481 | |
4. ADVISORY FEES, ADMINISTRATION FEES AND OTHER AGREEMENTS
Investment Advisory
Pursuant to the Investment Advisory Agreement with the Fund (“Advisory Agreement”), the Adviser is entitled to an investment advisory fee of 1.85% of the average daily net assets of the Fund, computed daily and payable monthly. Sub-advisory services are provided to the Fund pursuant to an agreement among the Fund, Adviser and Sub-Adviser (“Sub-Advisory Agreement”). Under the terms of the investment sub-advisory agreement, the Adviser compensates the Sub-Adviser based on the Fund’s average daily net assets.
The Adviser and the Fund have entered into an expense limitation and reimbursement agreement (the “Expense Limitation Agreement”) under which the Adviser has agreed contractually to waive its fees and to pay or absorb the ordinary annual operating expenses of the Fund (including offering expenses, but excluding taxes, interest, brokerage commissions, acquired fund fees and expenses and extraordinary expenses) at least until November 15, 2020, so that the total annual operating expenses of the Fund do not exceed 2.60% per annum of Class A average daily net assets, 3.35% per annum of Class C average daily net assets, 2.35% per annum of Class I average daily net assets, 2.85% per annum of Class L average daily net assets and 1.85% per annum of Class F average daily net assets (the “Expense Limitations”). The agreement can be extended at the discretion of the Adviser and the Trustees. In consideration of the Adviser’s agreement to limit the Fund’s expenses, the Fund has agreed to repay the Adviser in the amount of any fees waived and Fund expenses paid or absorbed, subject to the limitations that: (1) the reimbursement for fees and expenses will be made only if payable not more than three years from the date such expenses were incurred; and (2) the reimbursement may not be made if it would cause the lesser of the Expense Limitations in place at the time of waiver or at the time of reimbursement to be exceeded. The operating expenses absorbed by the Adviser that limit each share class’ operating expenses to the contractual limitations provided above are recoupable except that fees waived and Fund expenses paid or absorbed with respect to Class F assets will not be repaid or reimbursed.
| 54 | 1.888.926.2688 | www.griffincapital.com |
| Griffin Institutional Access Credit Fund | Notes to Consolidated
Financial Statements |
December 31, 2019
In addition to the Expense Limitation Agreement described above, the Adviser voluntarily waived or absorbed all of the operating expenses of the Fund since the commencement of Fund operations until August 26, 2019. Operating expenses voluntarily waived or absorbed by the Adviser during this voluntary period are permanently waived. For the period of August 26, 2019 to December 31, 2019, the Adviser voluntarily waived or absorbed operating expenses of the Fund in excess of 1.25% of net assets. Operating expenses voluntarily waived or absorbed by the Adviser in excess of 1.25% of net assets and below the contractual share class expense limitations are permanently waived.
During the fiscal year ended December 31, 2019, fees waived and reimbursed expenses to the Fund by the Adviser totaled $6,648,053, of which $537,135 is subject to recoupment for a three year period from the date waived or reimbursed.
Fund Administration and Accounting Fees and Expenses
ALPS Fund Services, Inc. serves as the Fund’s administrator and accounting agent (the “Administrator”) and receives customary fees from the Fund for such services. The Administrator is also reimbursed by the Fund for certain out of pocket expenses.
Transfer Agency Fees and Expenses
DST Systems, Inc. serves as transfer, distribution paying and shareholder servicing agent for the Fund and receives customary fees from the Fund for such services.
Custody Fees and Expenses
The Bank of New York Mellon Trust Company, National Association serves as the Fund’s custodian and receives customary fees from the Fund for such services.
Distribution and Shareholder Servicing Fees and Expenses
The Fund has entered into a Distribution Agreement with ALPS Distributors, Inc. (the “Distributor”) to provide distribution services to the Fund. The Distributor serves as principal underwriter of shares of the Fund. Under the Distribution Agreement, the Class C shares and Class L shares will pay to the Distributor a Distribution Fee that will accrue at an annual rate equal to 0.75% and 0.25% of the Fund’s average daily net assets attributable to Class C shares and Class L shares, respectively, payable on a monthly basis. For the fiscal year ended December 31, 2019, Class C shares and Class L shares incurred distribution fees of $245,440 and $6,469, respectively. Class A, Class I and Class F shares are not currently subject to a Distribution Fee. Under the Shareholder Services Plan, the Class A, Class C and Class L shares may pay up to 0.25% per year of their average daily net assets for such services. For the fiscal year ended December 31, 2019, Class A, Class C and Class L shares incurred shareholder servicing fees of $120,177, $81,813, and $7,858, respectively. Class I shares are not currently subject to a shareholder services fee.
The Distributor has entered into a wholesale marketing agreement with Griffin Capital Securities, LLC (“GCS”), a registered broker-dealer and an affiliate of the Adviser. Pursuant to the terms of the wholesale marketing agreement, GCS will seek to market and otherwise promote the Fund through various wholesale distribution channels, including regional and independent retail broker-dealers, registered investment advisers, and wirehouses.
Officer and Trustee Compensation
Each “non-interested” Trustee receives $7,500 per quarter and $500 per special telephonic meetings, as well as reimbursement for any reasonable expenses incurred attending meetings. The Chair of the Fund’s Audit Committee receives an additional $10,000 annually. Prior to April 1, 2019, each “non-interested” trustee received $5,000 per quarter and $500 per special telephonic meeting, as well as reimbursement for any reasonable expenses incurred attending the meetings. The chair of the Fund’s Audit Committee received an additional $10,000 annually. None of the executive officers, with the exception of the Chief Compliance Officer, receive or received compensation from the Fund.
Certain Trustees and officers of the Fund are also officers of the Adviser and, with the exception of the Chief Compliance Officer, are not paid by the Fund for serving in such capacities.
| Annual Report | December 31, 2019 | 55 |
| | Notes to Consolidated |
| Griffin Institutional Access Credit Fund | Financial Statements |
December 31, 2019
5. PURCHASES AND SALES OF INVESTMENT SECURITIES
The cost of purchases and proceeds from the sale of securities, other than short-term securities, for the fiscal year ended December 31, 2019 were as follows:
| | | | Purchases of Securities | | | Proceeds from Sales of Securities | |
| | | | $ | 341,572,779 | | | $ | 188,906,523 | |
6. TAX BASIS INFORMATION
Distributions are determined in accordance with federal income tax regulations, which differ from GAAP, and, therefore, may differ significantly in amount or character from net investment income and realized gains for financial reporting purposes. Financial reporting records are adjusted for permanent book/tax differences to reflect tax character but are not adjusted for temporary differences. The amounts and characteristics of tax basis distributions and composition of distributable earnings/(accumulated losses) are finalized at fiscal year-end. Accordingly, tax basis balances have not been determined as of the date of the annual report.
For the fiscal year ended December 31, 2019, the following reclassifications, which had no impact on results of operations or net assets, were recorded to reflect tax character:
| | | | Paid-in Capital | | | Total Distributable Earnings | |
| | | | $ | (727,820 | ) | | $ | 727,820 | |
The reclassifications were primarily related to excise taxes paid and tax adjustments for wholly-owned subsidiaries.
The tax character of distributions paid for the fiscal years ended December 31, 2018 and December 31, 2019 were as follows:
| Year | | | Ordinary Income | | | Long-Term Capital Gain | | | Return of Capital | |
| 2019 | | | $ | 19,472,953 | | | $ | – | | | $ | – | |
| 2018 | | | | 8,400,352 | | | | – | | | | – | |
As of December 31, 2019, the components of accumulated earnings/(deficit) on a tax basis were as follows:
| | | | Undistributed net investment income | | | Accumulated net realized loss on investments | | | Other cumulative effect of timing differences | | | Net unrealized appreciation/(depreciation) on investments | | | Total | |
| | | $ | 2,313,491 | | | $ | (235,915 | ) | | $ | 267,378 | | | $ | (1,231,686 | ) | | $ | 1,113,268 | |
As of December 31, 2019, net unrealized appreciation/(depreciation) of investments based on the federal tax cost was as follows:
| | | | Gross Appreciation (excess of value over tax cost) | | | Gross Depreciation (excess of tax cost over value) | | | Net Appreciation/ (Depreciation) of Foreign Currency | | | Net Unrealized Appreciation/(Depreciation) | | | Cost of Investments for Income Tax Purposes | |
| | | | $ | 6,694,416 | | | $ | (9,206,615 | ) | | $ | 1,280,513 | | | $ | (1,231,686 | ) | | $ | 343,227,592 | |
The difference between book basis and tax basis unrealized appreciation/(depreciation) is primarily due to premium amortization, wash sales, forward contracts and passive foreign investment companies.
| 56 | 1.888.926.2688 | www.griffincapital.com |
| | Notes to Consolidated |
| Griffin Institutional Access Credit Fund | Financial Statements |
December 31, 2019
Under current law, capital losses maintain their character as short-term or long-term and are carried forward to the next tax year without expiration. As of December 31, 2019, the following amounts are available as carry forwards to the next tax year:
| Fund Name | | Short Term | | | Long Term | |
| Griffin Institutional Access Credit Fund | | $ | – | | | $ | 235,915 | |
7. REPURCHASE OFFERS
The Fund is an interval fund and, as such, has adopted a fundamental policy to make quarterly repurchase offers, at net asset value, of no less than 5% of the Fund’s shares outstanding. There is no guarantee that shareholders will be able to sell all of the shares they desire to sell in a quarterly repurchase offer. Liquidity will be provided to shareholders only through the Fund’s quarterly repurchases. Shareholders will be notified in writing of each quarterly repurchase offer and the date on which the repurchase period ends (the “Repurchase Request Deadline”). Fund Shares will be repurchased at a price equal to the net asset value as of the close of business as determined on the Repurchase Request Deadline.
During the fiscal year ended December 31, 2019, the Fund completed four quarterly repurchase offers. In which, the Fund offered to repurchase up to 5% of its outstanding shares as of each respective Repurchase Request Deadline. All shareholder repurchase requests received by the Fund in good order were honored in their full amounts for the fiscal year ended December 31, 2019. The result of the aforementioned repurchase offers were as follows:
| | Repurchase Offer #1 | Repurchase Offer #2 | Repurchase Offer #3 | Repurchase Offer #4 |
| Commencement Date | December 28, 2018 | March 29, 2019 | June 27, 2019 | September 27, 2019 |
| Repurchase Request Deadline | February 6, 2019 | May 7, 2019 | August 6, 2019 | November 5, 2019 |
| Repurchase Pricing Date | February 6, 2019 | May 7, 2019 | August 6, 2019 | November 5, 2019 |
| Amount Repurchased | $6,054,878 | $6,198,776 | $7,261,616 | $6,395,759 |
| Shares Repurchased | 246,033 | 248,648 | 293,271 | 262,426 |
8. RISK FACTORS
In the normal course of business, the Fund invests in financial instruments and enters into financial transactions where risk of potential loss exists due to such things as changes in the market (market risk) or failure or inability of the other party to a transaction to perform (credit and counterparty risk). See below for a detailed description of select principal risks. The following list is not intended to be a comprehensive listing of all of the potential risks associated with the Fund. For a more comprehensive list of potential risks the Fund may be subject to, please refer to the Fund’s Prospectus and Statement of Additional Information (“SAI”).
Bank Loans Risk The Fund expects that some of its investments will consist of interests in loans originated by banks and other financial institutions. The loans invested in by the Fund may include term loans and revolving loans, may pay interest at a fixed or floating rate and may be senior or subordinated. Purchasers of bank loans are predominantly commercial banks, investment funds and investment banks. As secondary market trading volumes for bank loans increase, new bank loans are frequently adopting standardized documentation to facilitate loan trading which should improve market liquidity. There can be no assurance as to when or even if this current market illiquidity and volatility will abate or that future levels of supply and demand in bank loan trading will provide an adequate degree of liquidity, that the current period of illiquidity will not persist or worsen and that the market will not experience periods of significant illiquidity in the future. In addition, the Fund will make investments in stressed or distressed bank loans which are often less liquid than performing bank loans. The Fund may utilize Swaps for the purpose of gaining exposure to bank loans.
CLO Risk In addition to the general risks associated with debt securities and structured products discussed herein, CLOs carry additional risks, including, but not limited to (i) the possibility that distributions from collateral securities will not be adequate to make interest or other payments; (ii) the quality of the collateral may decline in value or default; (iii) the possibility that the investments in CLOs are subordinate to other classes or tranches thereof; and (iv) the complex structure of the security may not be fully understood at the time of investment and may produce disputes with the issuer or unexpected investment results. CLO equity and junior debt securities that the Fund may acquire are subordinated to more senior tranches of CLO debt. CLO equity and junior debt securities are subject to increased risks of default relative to the holders of superior priority interests in the same securities. In addition, at the time of issuance, CLO equity securities are under-collateralized in that the liabilities of a CLO at inception exceed its total assets. Though not exclusively, the Fund will typically be in a first loss or subordinated position with respect to realized losses on the assets of the CLOs in which it is invested.
| Annual Report | December 31, 2019 | 57 |
| | Notes to Consolidated |
| Griffin Institutional Access Credit Fund | Financial Statements |
December 31, 2019
Between the closing date and the effective date of a CLO, the CLO collateral manager will generally expect to purchase additional collateral obligations for the CLO. During this period, the price and availability of these collateral obligations may be adversely affected by a number of market factors, including price volatility and availability of investments suitable for the CLO, which could hamper the ability of the collateral manager to acquire a portfolio of collateral obligations that will satisfy specified concentration limitations and allow the CLO to reach the initial par amount of collateral prior to the effective date. An inability or delay in reaching the target initial par amount of collateral may adversely affect the timing and amount of interest or principal payments received by the holders of the CLO debt securities and distributions of the CLO on equity securities and could result in early redemptions which may cause CLO debt and equity investors to receive less than face value of their investment.
The failure by a CLO in which the Fund invests to satisfy financial covenants, including with respect to adequate collateralization and/or interest coverage tests, could lead to a reduction in the CLO’s payments to the Fund. In the event that a CLO fails certain tests, holders of CLO senior debt may be entitled to additional payments that would, in turn, reduce the payments the Fund would otherwise be entitled to receive. Separately, the Fund may incur expenses to the extent necessary to seek recovery upon default or to negotiate new terms, which may include the waiver of certain financial covenants, with a defaulting CLO or any other investment the Fund may make. If any of these occur, it could adversely affect the Fund’s operating results and cash flows.
The Fund’s CLO investments are exposed to leveraged credit risk. If certain minimum collateral value ratios and/or interest coverage ratios are not met by a CLO, primarily due to senior secured loan defaults, then cash flow that otherwise would have been available to pay distributions to the Fund on its CLO investments may instead be used to redeem any senior notes or to purchase additional senior secured loans, until the ratios again exceed the minimum required levels or any senior notes are repaid in full. The Fund’s CLO investments and/or the underlying senior secured loans may prepay more quickly than expected, which could have an adverse impact on the Fund’s net assets.
Credit RiskThere is a risk that debt issuers will not make payments, resulting in losses to the Fund. In addition, the credit quality of securities may be lowered if an issuer’s financial condition changes. Lower credit quality may lead to greater volatility in the price of a security and in shares of the Fund. Lower credit quality also may affect liquidity and make it difficult to sell the security. Default, or the market’s perception that an issuer is likely to default, could reduce the value and liquidity of securities, thereby reducing the value of your investment in Fund shares. In addition, default may cause the Fund to incur expenses in seeking recovery of principal or interest on its portfolio holdings.
Cybersecurity Risk Cybersecurity refers to the combination of technologies, processes and procedures established to protect information technology systems and data from unauthorized access, attack or damage. The Fund and its affiliates and third-party service providers are subject to cybersecurity risks. Cybersecurity risks have significantly increased in recent years and the Fund could suffer such losses in the future. The Fund’s and its affiliates’ and third-party service providers’ computer systems, software and networks may be vulnerable to unauthorized access, computer viruses or other malicious code and other events that could have a security impact. If one or more of such events occur, this potentially could jeopardize confidential and other information, including nonpublic personal information and sensitive business data, processed and stored in, and transmitted through, computer systems and networks, or otherwise cause interruptions or malfunctions in the Fund’s operations or the operations of their respective affiliates and third-party service providers. This could result in significant losses, reputational damage, litigation, regulatory fines or penalties, or otherwise adversely affect the Fund’s business, financial condition or results of operations. Privacy and information security laws and regulation changes, and compliance with those changes, may result in cost increases due to system changes and the development of new administrative processes. In addition, the Fund may be required to expend significant additional resources to modify the Fund’s protective measures and to investigate and remediate vulnerabilities or other exposures arising from operational and security risks.
Debt Securities Risk When the Fund invests in debt securities, the value of your investment in the Fund will fluctuate with changes in interest rates. Typically, a rise in interest rates causes a decline in the value of debt securities. In general, the market price of debt securities with longer maturities will increase or decrease more in response to changes in interest rates than shorter-term securities. Other risk factors include credit risk (the debtor may default) and prepayment risk (the debtor may pay its obligation early, reducing the amount of interest payments). These risks could affect the value of a particular investment, possibly causing the Fund’s share price and total return to be reduced and fluctuate more than other types of investments.
Direct Origination Risk A portion of the Fund’s investment may be originated by certain affiliates of the Sub-Adviser, subject to the conditions of the Fund’s exemptive relief. The results of the Fund’s operations depend on several factors, including the availability of opportunities for the origination or acquisition of target investments, the level and volatility of interest rates, the availability of adequate short and long-term financing, conditions in the financial markets and economic conditions. Further, the Fund’s inability to raise capital and the risk of portfolio company defaults may materially and adversely affect the Fund’s investment originations, business, liquidity, financial condition, results of operations and its ability to make distributions to its shareholders. In addition, competition for originations of and investments in the Fund’s target investments may lead to the price of such assets increasing, which may further limit its ability to generate desired returns. Also, as a result of this competition, desirable investments in the Fund’s target investments may be limited in the future and the Fund may not be able to take advantage of attractive investment opportunities from time to time, as the Fund can provide no assurance that the Adviser and Sub-Adviser will be able to identify and make investments that are consistent with its investment objective. Additionally, the Fund may originate certain of its investments with the expectation of later syndicating a portion of such investment to third parties. Prior to such syndication, or if such syndication is not successful, the Fund’s exposure to the originated investment may exceed the exposure that the Adviser and Sub-Adviser intended to have over the long-term or would have had had it purchased such investment in the secondary market rather than originating it.
| 58 | 1.888.926.2688 | www.griffincapital.com |
| | Notes to Consolidated |
| Griffin Institutional Access Credit Fund | Financial Statements |
December 31, 2019
Foreign Exchange Rate RiskForeign exchange rate risk relates to the change in the U.S. dollar value of a security held that is denominated in a foreign currency. The value of a foreign currency denominated security will decrease as the dollar appreciates against the currency, while the value of the foreign currency denominated security will increase as the dollar depreciates against the currency.
High Yield Debt Risk A substantial portion of the high yield debt in which the Fund intends to invest are rated below investment-grade by one or more nationally recognized statistical rating organizations or are unrated but of comparable credit quality to obligations rated below investment-grade, and have greater credit and liquidity risk than more highly rated debt obligations. Lower-rated securities may include securities that have the lowest rating or are in default. High yield debt is generally unsecured and may be subordinate to other obligations of the obligor. The lower rating of high yield debt reflects a greater possibility that adverse changes in the financial condition of the obligor or in general economic conditions (including, for example, a substantial period of rising interest rates or declining earnings) or both may impair the ability of the obligor to make payment of principal and interest. Many issuers of high yield debt are highly leveraged, and their relatively high debt-to-equity ratios create increased risks that their operations might not generate sufficient cash flow to service their debt obligations. In addition, many issuers of high yield debt may be in poor financial condition, experiencing poor operating results, having substantial capital needs or negative net worth or be facing special competitive or product obsolescence problems, and may include companies involved in bankruptcy or other reorganizations or liquidation proceedings. Certain of these securities may not be publicly traded, and therefore it may be difficult to obtain information as to the true condition of the issuers. Overall declines in the below investment-grade bond and other markets may adversely affect such issuers by inhibiting their ability to refinance their debt at maturity. High yield debt is often less liquid than higher rated securities.
Leveraging Risk The use of leverage, such as in connection with Swaps and borrowing money to purchase securities, by the Fund will magnify the Fund’s gains or losses. Generally, the use of leverage also will cause the Fund to have higher expenses (especially interest and/or short selling related dividend expenses) than those of funds that do not use such techniques. In addition, a lender to the Fund may terminate or refuse to renew any credit facility. If the Fund is unable to access additional credit, it may be forced to sell investments at inopportune times, which may further depress the returns on the Fund. Because many derivatives have a leverage component, adverse changes in the value or level of the underlying asset, reference rate or index could result in a loss substantially greater than the amount invested in the derivative itself. When the Fund uses derivatives for leverage, investments in that Fund will tend to be more volatile, resulting in larger gains or losses in response to market changes. In an effort to limit leverage risk, the Fund will earmark assets determined to be liquid to cover its obligations under swap agreements.
Liquidity of Investments Risk The lack of an established, liquid secondary market for a certain portion of the Fund’s investments may have an adverse effect on the market value of the Fund’s investments and the Fund’s ability to dispose of them. Additionally, certain investments may be subject to certain transfer restrictions that may also contribute to illiquidity. Further, Fund assets that are typically traded in a liquid market may become illiquid if the applicable trading market tightens. Therefore, no assurance can be given that the Fund can dispose of a particular investment at its prevailing fair value. A portion of the Fund’s investments may consist of securities that are subject to restrictions on resale by the Fund because they were acquired in a "private placement" or similar transaction or because the Fund is deemed to be an affiliate of the issuer of such securities. The Fund will be able to sell such securities only under applicable securities laws, which may permit only limited sales under specified conditions or subject the Fund to additional potential liability.
Medium and Small Capitalization Company Risk Some issuers of the Fund’s investments may be medium or small capitalization companies which may be newly formed or have limited product lines, distribution channels, and financial or managerial resources. The risks associated with these investments are generally greater than those associated with investments in the securities of larger, more-established companies. The Fund does not maintain a policy limiting its ability to invest in medium or small capitalization companies. This may cause the Fund’s NAV to be more volatile when compared to investment companies that focus only on large capitalization companies. Generally, securities of medium and small capitalization companies are more likely to experience sharper swings in market values, less liquid markets, in which it may be more difficult for the Sub-Adviser to sell at times and at prices that the Sub-Adviser believes appropriate, and generally are more volatile than those of larger companies. Compared to large companies, smaller companies are more likely to have (i) less information publicly available, (ii) more limited product lines or markets and less mature businesses, (iii) fewer capital resources, (iv) more limited management depth, and (v) shorter operating histories. Further, the equity securities of smaller companies are often traded over-the-counter and generally experience a lower trading volume than is typical for securities that are traded on a national securities exchange. Consequently, the Fund may be required to dispose of these securities over a longer period of time (and potentially at less favorable prices) than would be the case for securities of larger companies, offering greater potential for gains and losses and associated tax consequences.
| Annual Report | December 31, 2019 | 59 |
| | Notes to Consolidated |
| Griffin Institutional Access Credit Fund | Financial Statements |
December 31, 2019
Mezzanine Securities Risk Most of the Fund’s mezzanine securities and other investments (if any) are expected to be unsecured and made in companies whose capital structures have significant indebtedness ranking ahead of the investments, all or a significant portion of which may be secured. While the securities and other investments may benefit from the same or similar financial and other covenants as those enjoyed by the indebtedness ranking ahead of the investments and may benefit from cross-default provisions and security over the portfolio company’s assets, some or all of such terms may not be part of particular investments. Mezzanine securities and other investments generally are subject to various risks including, without limitation: (i) a subsequent characterization of an investment as a “fraudulent conveyance”; (ii) the recovery as a “preference” of liens perfected or payments made on account of a debt in the 90 days before a bankruptcy filing; (iii) equitable subordination claims by other creditors; (iv) so-called “lender liability” claims by the issuer of the obligations; and (v) environmental liabilities that may arise with respect to collateral securing the obligations.
Non-Performing Loans Risk Fund investments in non-performing and sub-performing loans are expected to involve workout negotiations, restructuring and the possibility of foreclosure. These processes, in some cases, may be lengthy and expensive. In addition, the Fund’s investments may include securities and debt obligations of financially distressed issuers, including companies involved in bankruptcy or other reorganization and liquidation proceedings. As a result, the Fund’s investments may be subject to additional bankruptcy related risks and returns on such investments may not be realized for a considerable period of time.
Secured Debt Risk Secured debt holds the most senior position in the capital structure of a borrower. Secured debt in most circumstances is fully collateralized by assets of the borrower. Thus, it is generally repaid before unsecured bank loans, corporate bonds, subordinated debt, trade creditors, and preferred or common stockholders. Substantial increases in interest rates may cause an increase in loan defaults as borrowers may lack resources to meet higher debt service requirements. The value of the Fund’s assets may also be affected by other uncertainties such as economic developments affecting the market for senior secured term loans or affecting borrowers generally. Moreover, the security for the Fund’s investments in secured debt may not be recognized for a variety of reasons, including the failure to make required filings by lenders, trustees or other responsible parties and, as a result, the Fund may not have priority over other creditors as anticipated.
Secured debt usually includes restrictive covenants, which must be maintained by the borrower. The Fund may have an obligation with respect to certain senior secured term loan investments to make additional loans upon demand by the borrower. Such instruments, unlike certain bonds, usually do not have call protection. This means that such interests, while having a stated term, may be prepaid, often without penalty. The rate of such prepayments may be affected by, among other things, general business and economic conditions, as well as the financial status of the borrower. Prepayment would cause the actual duration of a senior loan to be shorter than its stated maturity.
Secured debt typically will be secured by pledges of collateral from the borrower in the form of tangible and intangible assets. In some instances, the Fund may invest in secured debt that is secured only by stock of the borrower or its subsidiaries or affiliates. The value of the collateral may decline below the principal amount of the senior secured term loans subsequent to an investment by the Fund.
Structured Products Risk The Fund may invest in Collateralized Debt Obligations (“CDOs”) and other structured products, consisting of Collateralized Bond Obligations, Collateralized Loan Obligations (“CLOs”) and credit-linked notes. Holders of structured products bear risks of the underlying investments, index or reference obligation and are subject to counterparty risk.
The Fund may have the right to receive payments only from the structured product, and generally does not have direct rights against the issuer or the entity that sold the assets to be securitized. While certain structured products enable the investor to acquire interests in a pool of securities without the brokerage and other expenses associated with directly holding the same securities, investors in structured products generally pay their share of the structured product’s administrative and other expenses. Although it is difficult to predict whether the prices of indices and securities underlying structured products will rise or fall, these prices (and, therefore, the prices of structured products) will be influenced by the same types of political and economic events that affect issuers of securities and capital markets generally. If the issuer of a structured product uses shorter term financing to purchase longer term securities, the issuer may be forced to sell its securities at below market prices if it experiences difficulty in obtaining short-term financing, which may adversely affect the value of the structured products owned by the Fund. Certain structured products may be thinly traded or have a limited trading market. CLOs and credit-linked notes are typically privately offered and sold.
Subordinated and Unsecured or Partially Secured Loans Risk The Fund may invest in unsecured loans and secured subordinated loans, including second and lower lien loans. Second lien loans are generally second in line in terms of repayment priority. A second lien loan may have a claim on the same collateral pool as the first lien or it may be secured by a separate set of assets. Second lien loans generally give investors priority over general unsecured creditors in the event of an asset sale. The priority of the collateral claims of third or lower lien loans ranks below holders of second lien loans and so on. Such junior loans are subject to the same general risks inherent to any loan investment, including credit risk, market and liquidity risk, and interest rate risk. Due to their lower place in the borrower’s capital structure and possible unsecured or partially secured status, such loans involve a higher degree of overall risk than senior loans of the same borrower.
| 60 | 1.888.926.2688 | www.griffincapital.com |
| | Notes to Consolidated |
| Griffin Institutional Access Credit Fund | Financial Statements |
December 31, 2019
Swaps Risk The Fund’s use of swaps involves risks different from, or possibly greater than, the risks associated with investing directly in securities and other traditional investments and exposes the Fund to the risks associated with derivative instruments described above. In a standard “swap” transaction, two parties agree to exchange the returns, differentials in rates of return or some other amount earned or realized on the “notional amount” of predetermined investments or instruments, which may be adjusted for an interest factor. Swaps can involve greater risks than direct investment in securities, because swaps may be leveraged and subject to counterparty risk (e.g., the risk of a counterparty’s defaulting on the obligation or bankruptcy), credit risk and pricing risk (i.e., swaps may be difficult to value). Swaps are also subject to non-correlation risk because they may not be perfect substitutes for the instruments they are intended to hedge or replace. Swaps may also be considered illiquid. It may not be possible for the Fund to liquidate a swap position at an advantageous time or price, which may result in significant losses.
Valuation of Private Investments While the valuation of publicly traded securities held by the Fund are more readily ascertainable, the Fund expects to make investments in loans and securities that are not publicly traded and for which no market based price quotations are available. If market quotations are not readily available, securities are valued at fair value in good faith pursuant to procedures adopted by the Trustees. The Trustees have delegated the day to day responsibility for determining fair valuation to the Fair Value Pricing Committee in accordance with the Valuation Policy approved by the Trustees. Certain of the Fund’s investments will be classified as Level 3 under Topic 820 of the U.S. Financial Accounting Standards Board’s Accounting Standards Codification, as amended, Fair Value Measurements and Disclosures. This means that the Fund’s portfolio valuations will be based on unobservable inputs and the Fund’s own assumptions about how market participants would price the asset or liability in question. The Fund expects that inputs into the determination of fair value of the Fund’s portfolio investments will require significant management judgment or estimation. The Fund has retained the services of one or more independent third-party valuation specialists to review the valuations of certain of these securities. Because such valuations, and particularly valuations of private securities and private companies, are inherently uncertain, may fluctuate over short periods of time and may be based on estimates, the Fund’s determinations of fair value may differ materially from the values that would have been used if a ready market for these securities existed. The Fund’s net asset value could be adversely affected if the determinations regarding the fair value of the Fund’s investments were materially higher than the values that the Fund ultimately realizes upon the disposal of such securities.
9. ACCOUNTING PRONOUNCEMENTS
In March 2017, the Financial Accounting Standards Board (“FASB”) issued Accounting Standards Update No. 2017-08 (“ASU 2017-08”), “Receivables—Nonrefundable Fees and Other Costs (Subtopic 310-20): Premium Amortization on Purchased Callable Debt Securities.” ASU 2017-08 changed the amortization period for certain callable debt securities held at a premium. Specifically, it required the premium to be amortized to the earliest call date. The Fund has adopted and applied ASU 2017-08 on a modified retrospective basis through a cumulative-effect adjustment as of the beginning of the period of adoption. As a result of the adoption of ASU 2017-08, as of November 13, 2019 amortized cost basis of investments was reduced by $41,033 and unrealized appreciation of investments was increased by $41,033. The adoption of ASU 2017-08 had no impact on beginning net assets, the current period results from operations, or any prior period information presented in the financial statements.
10. SUBSEQUENT EVENTS
Subsequent events after the date of the Consolidated Statement of Assets and Liabilities have been evaluated through the date the consolidated financial statements were issued.
The Fund completed a quarterly repurchase offer on February 5, 2020, which resulted in 627,140 Fund shares being repurchased for $15,602,901.
Management has determined that there were no other subsequent events to report through the issuance of these consolidated financial statements.
| Annual Report | December 31, 2019 | 61 |
| | Report of Independent Registered |
| Griffin Institutional Access Credit Fund | Public Accounting Firm |
December 31, 2019
To the Board of Trustees and Shareholders of
Griffin Institutional Access Credit Fund
Opinion on the Financial Statements
We have audited the accompanying consolidated statement of assets and liabilities, including the consolidated schedule of investments, of Griffin Institutional Access Credit Fund and its subsidiaries (the “Fund”) as of December 31, 2019, the related consolidated statements of operations and cash flows for the year ended December 31, 2019, the consolidated statements of changes in net assets for each of the two years in the period ended December 31, 2019, including the related notes, and the consolidated financial highlights for each of the periods indicated therein (collectively referred to as the “consolidated financial statements”). In our opinion, the consolidated financial statements present fairly, in all material respects, the financial position of the Fund as of December 31, 2019, the results of its operations and its cash flows for the year then ended, the changes in its net assets for each of the two years in the period ended December 31, 2019 and the financial highlights for each of the periods indicated therein in conformity with accounting principles generally accepted in the United States of America.
Basis for Opinion
These consolidated financial statements are the responsibility of the Fund’s management. Our responsibility is to express an opinion on the Fund’s consolidated financial statements based on our audits. We are a public accounting firm registered with the Public Company Accounting Oversight Board (United States) (PCAOB) and are required to be independent with respect to the Fund in accordance with the U.S. federal securities laws and the applicable rules and regulations of the Securities and Exchange Commission and the PCAOB.
We conducted our audits of these consolidated financial statements in accordance with the standards of the PCAOB. Those standards require that we plan and perform the audit to obtain reasonable assurance about whether the consolidated financial statements are free of material misstatement, whether due to error or fraud.
Our audits included performing procedures to assess the risks of material misstatement of the consolidated financial statements, whether due to error or fraud, and performing procedures that respond to those risks. Such procedures included examining, on a test basis, evidence regarding the amounts and disclosures in the consolidated financial statements. Our audits also included evaluating the accounting principles used and significant estimates made by management, as well as evaluating the overall presentation of the consolidated financial statements. Our procedures included confirmation of securities owned as of December 31, 2019 by correspondence with the custodian, transfer agent and brokers; when replies were not received from brokers, we performed other auditing procedures. We believe that our audits provide a reasonable basis for our opinion.

Boston, Massachusetts
February 28, 2020
We have served as the Fund’s auditor since 2017.
| 62 | 1.888.926.2688 | www.griffincapital.com |
| Griffin Institutional Access Credit Fund | Dividend Reinvestment Policy |
December 31, 2019 (Unaudited)
The Fund will operate under a dividend reinvestment policy administered by DST Systems, Inc. (“Transfer Agent”) Pursuant to the policy, the Fund’s income dividends or capital gains or other distributions (each, a “Distribution” and collectively, “Distributions”), net of any applicable U.S. withholding tax, are reinvested in the same class of shares of the Fund.
Shareholders automatically participate in the dividend reinvestment policy, unless and until an election is made to withdraw from the policy on behalf of such participating shareholder. Shareholders who do not wish to have Distributions automatically reinvested should notify the Transfer Agent in writing at Griffin Institutional Access Credit Fund, c/o DST Systems, Inc., 430 W 7th St, Kansas City, MO 64105-1407. Such written notice must be received by the Transfer Agent 30 days prior to the record date of the Distribution or the shareholder will receive such Distribution in shares through the dividend reinvestment policy. Under the dividend reinvestment policy, the Fund’s Distributions to shareholders are reinvested in full and fractional shares as described below.
When the Fund declares a Distribution, the Transfer Agent, on the shareholder’s behalf, will receive additional authorized shares from the Fund either newly issued or repurchased from shareholders by the Fund and held as treasury stock. The number of shares to be received when Distributions are reinvested will be determined by dividing the amount of the Distribution by the Fund’s net asset value per share.
The Transfer Agent will maintain all shareholder accounts and furnish written confirmations of all transactions in the accounts, including information needed by shareholders for personal and tax records. The Transfer Agent will hold shares in the account of the shareholders in non-certificated form in the name of the participant, and each shareholder’s proxy, if any, will include those shares purchased pursuant to the dividend reinvestment policy. Each participant, nevertheless, has the right to request certificates for whole and fractional shares owned. The Fund will issue certificates in its sole discretion. The Transfer Agent will distribute all proxy solicitation materials, if any, to participating shareholders.
In the case of shareholders, such as banks, brokers or nominees, that hold shares for others who are beneficial owners participating under the dividend reinvestment policy, the Transfer Agent will administer the dividend reinvestment policy on the basis of the number of shares certified from time to time by the record shareholder as representing the total amount of shares registered in the shareholder’s name and held for the account of beneficial owners participating under the dividend reinvestment policy.
Neither the Transfer Agent nor the Fund shall have any responsibility or liability beyond the exercise of ordinary care for any action taken or omitted pursuant to the dividend reinvestment policy, nor shall they have any duties, responsibilities or liabilities except such as expressly set forth herein. Neither shall they be liable hereunder for any act done in good faith or for any good faith omissions to act, including, without limitation, failure to terminate a participant’s account prior to receipt of written notice of his or her death or with respect to prices at which shares are purchased or sold for the participants account and the terms on which such purchases and sales are made, subject to applicable provisions of the federal securities laws.
The automatic reinvestment of Dividends will not relieve participants of any federal, state or local income tax that may be payable (or required to be withheld) on such Dividends.
The Fund reserves the right to amend or terminate the dividend reinvestment policy. There is no direct service charge to participants with regard to purchases under the dividend reinvestment policy; however, the Fund reserves the right to amend the dividend reinvestment policy to include a service charge payable by the participants.
All correspondence concerning the dividend reinvestment policy should be directed to the Transfer Agent at Griffin Institutional Access Credit Fund, c/o DST Systems, Inc., 430 W 7th St, Kansas City, MO 64105-1407. Certain transactions can be performed by calling the toll free number 1-888-926-2688.
| Annual Report | December 31, 2019 | 63 |
| Griffin Institutional Access Credit Fund | Additional Information |
December 31, 2019 (Unaudited)
1. PROXY VOTING POLICIES AND VOTING RECORD
A description of the policies and procedures that the Fund uses to vote proxies relating to portfolio securities is available without charge upon request by calling toll-free 888-926-2688, or on the Securities and Exchange Commission’s (“SEC”) website at https://www.sec.gov. Information regarding how the Fund voted proxies relating to portfolio securities during the most recent 12-month period ended June 30th is available without charge upon request by calling toll-free 888-926-2688, or on the SEC’s website at https://www.sec.gov.
2. QUARTERLY PORTFOLIO HOLDINGS
The Fund files its complete schedule of portfolio holdings with the SEC for the first and third quarters of each fiscal year as an exhibit to its reports on Form N-PORT. The Fund’s Form N-PORT reports are available on the SEC’s web site at http://www.sec.gov. Prior to May 30, 2019, the Fund filed its complete schedule of portfolio holdings with the SEC for the first and third quarters of each fiscal year on Form N-Q. The Fund's Form N-Q's are available on the SEC's website at http://www.sec.gov and may also be reviewed at the SEC's Public Reference Room in Washington D.C. Information on the operation of the Public Reference Room may be obtained by calling 1-800-SEC-0330.
| 64 | 1.888.926.2688 | www.griffincapital.com |
| Griffin Institutional Access Credit Fund | Trustees and Officers |
December 31, 2019 (Unaudited)
The business and affairs of the Fund are managed under the direction of the Trustees. Information concerning the Trustees and officers of the Fund is set forth below. Generally, each Trustee and officer serves an indefinite term or until certain circumstances such as his resignation, death, or otherwise as specified in the Fund’s organizational documents. Any Trustee may be removed at a meeting of shareholders by a vote meeting the requirements of the Fund’s organizational documents. The Statement of Additional Information of the Fund includes additional information about the Trustees and officers and is available, without charge, upon request by calling the Fund toll-free at 888-926-2688.
| INDEPENDENT TRUSTEES |
Name and Birth Year | Position/Term of Office* | Principal Occupation During the Past Five Years | Number of Portfolios in Fund Complex** Overseen by Trustee | Other Directorships held by Trustee During Last Five Years |
Nathan Headrick (1974) | Trustee Since 2017 | Managing Director, BluWater Group (financial services firm), 2019-present; Managing Director and Founder, Triloma Financial Group (private equity firm), 2013-2019; Founder and Partner, DDW Holdings LLC (due diligence software provider), 2013-2014; President, Bluerock Capital Markets (public and private equity fund broker-dealer), 2013; General Counsel and Chief Compliance Officer, CNL Securities (public and private equity fund broker-dealer), 2008-2013; and General Counsel, Corporate Capital Trust (Public non-traded BDC), 2012-2013. | 2 | Griffin Institutional Access Real Estate Fund, 2014-present; Class of 1938 Foundation (nonprofit), 1996-present. |
Robb Chapin (1962) | Trustee Since 2017 | Chief Executive Officer, Bridge Senior Housing Fund Manager, LLC (real estate fund management), 2013-present; Managing Partner, Servant Investments, LLC (real estate fund management), 2005-2013; and Managing Partner, Servant Capital Group, LLC (real estate fund management), 2012-2013. | 2 | Griffin Institutional Access Real Estate Fund, 2014-present; Bridge Seniors Housing & Medical Properties Fund, LP (real estate fund), 2013-present. |
Ira Cohen (1959) | Trustee Since 2017 | Executive Vice President, Recognos Financial (financial data services firm), 2015-present; Chief Executive Officer, Ira Cohen Consulting, LLC (mutual fund operations consulting firm), 2005-present. | 2 | Griffin Institutional Access Real Estate Fund, 2014-present; Valued Advisers Trust (for all of its series), 2010-present; Angel Oak Financial Strategies Income Term Trust, 2018 – present; Angel Oak Strategic Credit Fund, 2017 – present; and Angel Oak Funds Trust (for all of its series), 2014-present. |
| Annual Report | December 31, 2019 | 65 |
| Griffin Institutional Access Credit Fund | Trustees and Officers |
December 31, 2019 (Unaudited)
| INTERESTED TRUSTEES AND OFFICERS |
Name and Birth Year | Position/Term of Office* | Principal Occupation During the Past Five Years | Number of Portfolios in Fund Complex** Overseen by Trustee | Other Directorships held by Trustee During Last 5 Years |
Kevin Shields (1958) | President and Trustee Since 2017 | Chairman and Chief Executive Officer, Griffin Capital Company, LLC; Chief Executive Officer, Griffin Capital Credit Advisor, LLC; Chairman and Chief Executive Officer, Griffin Capital Securities, LLC; President and Director, Griffin Capital BDC Corp.; Executive Chairman, and Chief Executive Officer, Griffin Capital Essential Asset REIT, Inc. and Executive Chairman, and Chief Executive Officer, EA 1. | 2 | President and Trustee, Griffin Institutional Access Real Estate Fund, 2014-present; Chairman, Griffin Capital Company, LLC, 1995- present; Director, Griffin Capital Essential Asset REIT, Inc., 2008-2019; Director, Griffin Capital Essential Asset REIT II, Inc., 2014-2019; Director, Griffin Capital BDC Corp., 2014-2017. |
Randy Anderson (1968) | Trustee, Executive Vice President and Secretary Since 2017 | Chief Economist, Griffin Capital Company, LLC; Chief Investment Officer, Griffin Capital Advisor, LLC; President, Griffin Capital Asset Management Company, LLC; Executive Vice President and Secretary, Griffin Institutional Access Credit Fund; Executive Vice President, Griffin Capital BDC Corp; Howard Phillips Eminent Scholar Chair and Professor of Real Estate at the University of Central Florida; President, Bluerock Real Estate LLC; President, CNL Real Estate Advisors; and Chief Economist, Marcus and Millichap Company | 2 | Trustee, Executive President and Secretary, Griffin Institutional Access Real Estate Fund, 2014- present. |
Joseph Miller (1963) | Treasurer Since 2017 | Chief Financial Officer and Chief Operating Officer, Griffin Capital Company, LLC; Chief Financial Officer, Griffin Capital BDC Corp. | N/A | N/A |
Ryan Del Giudice (1990) | Chief Compliance Officer Since 2018 | Chief Compliance Officer, Griffin Capital Advisor, LLC; Chief Compliance Officer, Griffin Capital Credit Advisor, LLC; Griffin Capital Company, LLC; Vice President, Cipperman Compliance Services, LLC; Manager, Cipperman Compliance Services, LLC. | N/A | N/A |
Madeline Arment (1989) | Assistant Treasurer Since 2019 | Fund Controller, ALPS Fund Services, Inc.; Manager of Investment Operations, Shelton Capital Management; Tax Supervisor/Accountant, ALPS Fund Services, Inc. | N/A | N/A |
| 66 | 1.888.926.2688 | www.griffincapital.com |
| Griffin Institutional Access Credit Fund | Trustees and Officers |
December 31, 2019 (Unaudited)
| INTERESTED TRUSTEES AND OFFICERS (continued) |
Name and Birth Year | Position/Term of Office* | Principal Occupation During the Past Five Years | Number of Portfolios in Fund Complex** Overseen by Trustee | Other Directorships held by Trustee During Last 5 Years |
Howard S. Hirsch (1966) | Vice President and Assistant Secretary Since 2017 | Chief Legal Officer and Secretary, Vice President, Griffin Capital Essential Asset REIT Inc.; Vice President and Assistant Secretary, Griffin Institutional Access Credit Fund; Chief Legal Officer, Vice President, Secretary and Assistant Secretary, EA 1; Vice President and General Counsel – Securities, Griffin Capital Company, LLC; Vice President and Secretary, Griffin Capital BDC Corp.; and Vice President, Griffin Capital BDC Advisor, LLC | N/A | N/A |
Christopher Moore (1984) | Assistant Secretary Since 2017 | Vice President and Secretary, Boulder Growth and Income Fund; Secretary of each of: RiverNorth Opportunities Fund; ALPS Series Trust; Assistant Secretary of each of Griffin Institutional Access Real Estate Fund; RiverNorth Opportunistic Municipal Income Fund; RiverNorth Funds; RiverNorth Managed Duration Municipal Income Fund. | N/A | N/A |
| * | The term of office for each Trustee and officer listed above will continue indefinitely. |
| ** | The term “Fund Complex” refers to the Griffin Institutional Access Credit Fund and the Griffin Institutional Access Real Estate Fund. |
| Annual Report | December 31, 2019 | 67 |
| Griffin Institutional Access Credit Fund | Service Providers |
December 31, 2019 (Unaudited)
Investment Adviser
Griffin Capital Credit Advisor, LLC
Griffin Capital Plaza, 1520 East Grand Avenue, El Segundo, CA 90245
Investment Sub-Adviser
BCSF Advisors, LP
200 Clarendon Street, 37th Floor Boston, MA 02116
Administrator
ALPS Fund Services, Inc.
1290 Broadway, Suite 1000, Denver, CO 80203
Custodian
Bank of New York Mellon Trust Company, National Association
601 Travis Street, 16th Floor, Houston, TX 77002
Distributor
ALPS Distributors, Inc.
1290 Broadway, Suite 1000, Denver, CO 80203
Independent Registered Public Accounting Firm
PricewaterhouseCoopers LLP
101 Seaport Boulevard, Boston, MA 02210
Legal Counsel
Greenberg Traurig, LLP
Terminus 200, 3333 Piedmont Road NE, Suite 2500, Atlanta, GA 30305
Transfer Agent and DRIP Administrator
DST Systems, Inc.
330 W 9th Street, Kansas City, MO 64105
| 68 | 1.888.926.2688 | www.griffincapital.com |
| Griffin Institutional Access Credit Fund | Privacy Policy |
December 31, 2019 (Unaudited)
NOTICE OF PRIVACY POLICY AND PRACTICES
The Griffin Institutional Access Credit Fund (the “Fund”) is committed to maintaining the confidentiality, integrity, and security of your nonpublic personal information (“NPI”). When you provide personal information, the Fund believes that you should be aware of policies utilized to protect the confidentiality of that information. The Fund needs to share your NPI to conduct everyday business. The following information is intended to help you understand what NPI we collect, how we protect your NPI from unauthorized access and why the Fund may share your NPI with other affiliated and non-affiliated parties.
The Fund collects the following nonpublic personal information about you:
| ● | Information we receive from you on or in applications or other forms, correspondence, or conversations, including, but not limited to, your name, address, phone number, social security number, assets, income, and date of birth; and |
| ● | Information about your transactions with us, our affiliates, or others, including, but not limited to, your account number and balance, payments history, parties to transactions, cost basis information, and other financial information. |
How does the Fund protect your nonpublic personal information?
To protect your personal information from unauthorized access and use, the Fund maintains physical, electronic and procedural safeguards that comply with applicable federal and state standards to guard your NPI. These measures include computer safeguards and secured files and buildings.
What does the Fund do with your personal information?
The Fund does not permit use of your personal information for any joint marketing or non-business purpose. Further, the Fund does not permit the disclosure of your personal information to non-affiliated parties for marketing purposes. The Fund may, however, disclose your personal information to comply with regulatory requirements, court orders or other legal requirements.
Affiliated Parties
The Fund does not disclose any nonpublic personal information about our current or former shareholders to affiliated parties, except as permitted by applicable law or regulation and as described herein. The Fund may, for example, share NPI with personnel of the Fund’s investment adviser and affiliated broker-dealer which also serves as the Fund’s exclusive wholesale marketing agent. The Fund shares NPI with its affiliates for business purposes only in an effort to service your account(s) which includes, but is not limited to, assisting in processing your transactions, inquiring about your transactions and experience, sending you shareholder reports and other information about the Fund or to otherwise provide the applicable service and maintain your account(s). The Fund’s affiliated parties that receive your NPI are required to protect your NPI, provide it only to personnel who need and use it solely for the purpose for which they received it. The Fund and its affiliated parties that receive your NPI maintain physical, electronic and procedural safeguards that comply with applicable federal and state standards to guard your NPI.
Non-Affiliated Parties
The Fund does not disclose any nonpublic personal information about our current or former shareholders to non-affiliated third parties, except as permitted by applicable law or regulation and as described herein. The Fund may share NPI with non-affiliated service providers and their employees, including the Fund’s administrator, transfer agent, distributor, proxy solicitors and legal counsel, among others. The Fund shares NPI with its non-affiliated service providers to service your account(s) including, but not limited to, processing your transactions, sending you shareholder reports and other information about the Fund or to otherwise provide the applicable service and maintain your account(s). These non-affiliated service providers are required to protect your NPI and use it solely for the purpose for which they received it. The non-affiliated service providers are required to maintain physical, electronic and procedural safeguards that comply with applicable federal and state standards to guard your NPI.
| Annual Report | December 31, 2019 | 69 |

Item 2. Code of Ethics.
| (a) | The Griffin Institutional Access Credit Fund (the “Fund”) has adopted a Code of Ethics that applies to the Fund's principal executive officer and principal financial officer. |
| (c) | During the period covered by this report, there were no amendments to the Fund’s Code of Ethics. |
| (d) | During the period covered by this report, the Fund had not granted any express or implicit waivers from the Code of Ethics. |
| (f) | The Fund’s Code of Ethics is attached hereto as exhibit 13(A)(1). |
Item 3. Audit Committee Financial Expert.
The Board of Trustees (the “Board’) of the Fund has determined that the Fund has at least one audit committee financial expert serving on its Audit Committee. The Board has designated Ira Cohen as the Fund’s audit committee financial expert. Mr. Cohen is “independent” as defined in paragraph (a)(2) of Item 3 to Form N-CSR.
Item 4. Principal Accountant Fees and Services.
| (a) | Audit Fees: For the Fund’s last two fiscal years ended December 31, 2018 and December 31, 2019, the aggregate fees billed for professional services rendered by the principal accountant for the audit of the Fund’s annual financial statements or services that are normally provided by the accountant in connection with statutory and regulatory filings or engagements were $160,000 and $212,5001, respectively. |
| (b) | Audit-Related Fees: For the Fund’s last two fiscal years ended December 31, 2018 and December 31, 2019, no fees were billed for assurance and related services by the principal accountant that would otherwise be reasonably related to the performance of the audit of the Fund’s financial statements and not otherwise reported under paragraph (a) of Item 4 of this report. |
| (c) | Tax Fees: For the Fund’s last two fiscal years ended December 31, 2018 and December 31, 2019, the aggregate fees billed for professional services rendered by the principal accountant for tax compliance, tax advice and tax planning, which were comprised of the preparation of excise filings and income tax returns for the Fund were $63,500 and $86,5002, respectively. |
| (d) | All Other Fees: For the Fund’s last two fiscal years ended December 31, 2018 and December 31, 2019, there were no other fees billed for products and services other than the services reported in paragraphs (a) through (c) of Item 4 of this report, provided by the principal accountant. |
| (e) (1) | The Audit Committee’s pre-approval policies and procedures require that all services to be performed by the Fund’s principal accountant must be pre-approved by the Fund’s Audit Committee. |
| (2) | No services described in paragraphs (b) through (d) of Item 4 of this report were approved by the Fund’s Audit Committee pursuant to paragraph (c)(7)(i)(C) of Rule 2-01 of Regulation S-X. |
| (f) | Not applicable to the Fund. |
| (g) | For the Fund’s last two fiscal years ended December 31, 2018 and December 31, 2019, the aggregate fees billed for non-audit fees for services rendered by the principal accountant to the Fund, the Fund’s investment adviser and any entity controlling, controlled by, or under common control with the Fund’s investment adviser that provides ongoing services to the Fund were $2,700 and $2,7003, respectively. |
| (h) | The Fund's Audit Committee has considered whether the provision of non-audit services to the Fund's investment adviser and any entity controlling, controlled by, or under common control with the investment adviser that provides ongoing services to the Fund, that were not pre-approved pursuant to paragraph (c)(7)(ii) of Rule 2-01 of Regulation S-X, is compatible with maintaining the principal accountant's independence. |
| 1 | 2019 Audit fees are based on estimated costs. |
| 2 | 2019 Tax fees are based on estimated costs. |
| 3 | 2019 Non-audit fees are based on estimated costs. |
Item 5. Audit Committee of Listed Registrants.
The Fund is not a listed issuer as defined in Rule 10A-3 under the Securities Exchange Act of 1934, as amended.
Item 6. Investments.
| (a) | The schedule of investments is included as part of the Reports to Stockholders filed under Item 1 of this Form N-CSR. |
| (b) | Not applicable to the Fund. |
Item 7. Disclosure of Proxy Voting Policies and Procedures for Closed-End Management Investment Companies.
The proxy voting policies and procedures of the Fund’s investment adviser and investment sub-adviser are attached hereto as exhibit EX 99.Item 7.
Item 8. Portfolio Managers of Closed-End Management Investment Companies.
As of the date of this filing, Andrew Carlino, Nate Whittier, Michael Ewald and Alon Avner, each an employee of Bain Capital Credit, serve as the Fund’s portfolio managers (“Portfolio Managers”). Mr. Carlino and Mr. Whittier are primarily responsible for overseeing the day to day investment operations of the Fund. The Fund’s investment sub-adviser, BCSF Advisors, LP (the “Sub-Adviser”), an affiliate of Bain Capital Credit, has entered into a resource sharing agreement with Bain Capital Credit pursuant to which Bain Capital Credit provides the Sub-Adviser with experienced investment professionals and access to the resources of Bain Capital Credit. All references to the Sub-Adviser shall include Bain Capital Credit as applicable.
Andrew Carlino.Mr. Carlino joined Bain Capital Credit in 2002. He is a Managing Director and Portfolio Manager in Liquid Credit. Prior to his current role, Mr. Carlino was responsible for investments in the Airlines, Aerospace & Defense, and Homebuilding & Building Product sectors. Previously, Mr. Carlino was a consultant for The Boston Consulting Group where he worked on engagements in the Healthcare, Software and Retail Banking sectors. He also spent five years in the US Air Force as an intelligence officer. Mr. Carlino received an M.B.A. from The University of Chicago Booth Graduate School of Business and a B.S. from the United States Air Force Academy.
Nate Whittier. Mr. Whittier joined Bain Capital Credit in 2013. He is a Director and Portfolio Manager in Liquid Credit based in Bain Capital Credit’s Boston office. He is also responsible for risk management and portfolio analytics across the firm’s strategies. Previously, Mr. Whittier worked in the Global Portfolio Solutions Group of the Asset Management Division of Goldman Sachs. Mr. Whittier received a B.Sc. in Computer Science and Finance from Northeastern University.
Michael Ewald. Mr. Ewald joined Bain Capital Credit in 1998. He is a Managing Director, Global Head of the Private Credit Group, Portfolio Manager for the Middle Market Credit and Senior Direct Lending strategies and a Credit Committee member. He also serves as President and CEO of Bain Capital Specialty Finance, Inc., a registered business development company. He is based in Bain Capital Credit’s Boston office. Previously, Mr. Ewald was an Associate Consultant at Bain & Company and an analyst at Credit Suisse First Boston in the Regulated Industries group. Mr. Ewald received an M.B.A. from the Amos Tuck School of Business at Dartmouth College and a B.A. from Tufts University.
Alon Avner. Mr. Avner joined Bain Capital Credit in 2006. He has been the Head of Bain Capital Credit Europe since 2009 and is a Managing Director in Distressed and Special Situations and a Credit Committee member based in Bain Capital Credit’s London office. Between 2006 and 2009, Mr. Avner was responsible for Bain Capital Credit’s European Telecom and Media investments. Previously, Mr. Avner was a Manager at Bain & Company. In addition, he worked in operations and marketing roles at Comverse Technology and Creo/Scitex. Mr. Avner received an M.B.A. from INSEAD and a B.Sc. from Tel Aviv University.
Compensation:
Mr. Carlino, Mr. Whittier, Mr. Ewald and Mr. Avner each receive a salary, retirement plan benefits and performance-based bonus from the Sub-Adviser. The performance-based bonus is measured yearly based on an overall assessment of the financial performance of the Sub-Adviser, the team of which a portfolio manager is a member, and the portfolio manager’s performance in managing accounts against the account’s applicable stated benchmark.
Material Conflicts of Interest:
Bain Capital Credit employees, including the Fund’s portfolio managers, serve, or may serve, as officers, directors, members, or principals of entities that operate in the same or a related line of business as the Fund, or of investment funds, accounts, or investment vehicles managed by Bain Capital Credit and/or its affiliates. Similarly, Bain Capital Credit and its affiliates have other clients with similar, different or competing investment objectives. In serving in these multiple capacities, they have obligations to other clients or investors in those entities, the fulfillment of which may not be in the best interests of the Fund and its shareholders. For example, Bain Capital Credit has management responsibilities for other investment funds, accounts and investment vehicles (“Sub-Adviser Client Accounts”). The Sub-Adviser may, directly or indirectly, receive fees from Sub-Adviser Client Accounts that are higher than the fee it receives from the Fund, or it may, directly or indirectly, receive a performance-based fees from the Sub-Adviser Client Accounts. In those instances, a portfolio manager may have an incentive favor the Sub-Adviser Client Accounts. The Sub-Adviser has various policies and procedures that it believes are reasonably designed to address these and other conflicts of interest.
The Fund often invests on a side-by-side basis with one or more Sub-Adviser Client Accounts. In this scenario, the Fund may invest alongside Sub-Adviser Client Accounts in certain circumstances where doing so is consistent with the Fund’s investment strategy as well as exemptive relief and SEC guidance. In an order dated March 22, 2018, the SEC granted exemptive relief to the Fund, subject to the satisfaction of certain conditions, to co-invest in certain privately negotiated transactions with certain affiliates of Bain Capital Credit (“Co-Investment Program” or the “Order”). With respect to the Co-Investment Program, allocations among the Fund and other affiliated accounts managed by Bain Capital Credit or its affiliates are based on recommended amounts which generally provides that such allocations are made pro rata based on the order size of each participating account. Although the Sub-Adviser attempts to allocate investment opportunities fairly and equitably, co-investments made under the Order are subject to compliance with the conditions and other requirements contained in the Order, which could limit the Fund’s ability to participate in the Co-Investment Program. Furthermore, in situations where co-investment with Sub-Adviser Client Accounts is not permitted or appropriate, such as when there is an opportunity to invest in different securities of the same issuer or where the different investments could be expected to result in a conflict between the Fund’s interests and those of the Sub-Adviser Client Accounts, Bain Capital Credit will need to decide which client will proceed with the investment. Moreover, except in certain limited circumstances as permitted by the 1940 Act, such as when the only term being negotiated is price, the Fund will be unable to invest in any issuer in which an investment fund, account or investment vehicle managed by Bain Capital Credit has previously invested. Similar restrictions limit the Fund’s ability to transact business with its officers or directors or their affiliates. These restrictions will limit the scope of investment opportunities that would otherwise be available. In certain situations where co-investment with one or more participating accounts managed by Bain Capital Credit or its affiliates is not covered by the Co-Investment Program, the Sub-Adviser will make allocation determinations based on the Sub-Adviser’s policies and procedures, which are designed to reasonably ensure that investment opportunities are allocated fairly and equitably.
As of December 31, 2019, Mr. Carlino is responsible for the management of the following types of accounts in addition to the Fund (asset values have been estimated):
Other Accounts by Type1 | Total Number
of Accounts by
Account Type | Total Assets by
Account Type (in
millions) | Number of
Accounts by
Type Subject
to a
Performance
Fee | Total Assets by
Account Type
Subject to a
Performance Fee |
| Registered Investment Companies | 1 | $819 | 0 | - |
| Other Pooled Investment Vehicles | 4 | $3,086 | 1 | $1,107 |
| Other Accounts | 26 | $9,030 | 11 | $4,205 |
As of December 31, 2019, Mr. Whittier is responsible for the management of the following types of accounts in addition to the Fund (assets values have been estimated):
Other Accounts by Type1 | Total Number
of Accounts by
Account Type | Total Assets by
Account Type (in
millions) | Number of
Accounts by
Type Subject
to a
Performance
Fee | Total Assets by
Account Type
Subject to a
Performance Fee |
| Registered Investment Companies | 1 | $819 | 0 | - |
| Other Pooled Investment Vehicles | 4 | $3,086 | 1 | $1,107 |
| Other Accounts | 26 | $9,030 | 11 | $4,205 |
As of December 31, 2019, Mr. Ewald is responsible for the management of the following types of accounts in addition to the Fund (assets values have been estimated):
Other Accounts by Type1,2 | Total Number
of Accounts by
Account Type | Total Assets by
Account Type (in
millions) | Number of
Accounts by
Type Subject
to a
Performance
Fee | Total Assets by
Account Type
Subject to a
Performance Fee |
| Registered Investment Companies | 1 | $2,646 | 1 | $2,646 |
| Other Pooled Investment Vehicles | 2 | $529 | 2 | $529 |
| Other Accounts | 8 | $3,509 | 7 | $3,409 |
As of December 31, 2019, Mr. Avner is responsible for the management of the following types of accounts in addition to the Fund (assets values have been estimated):
Other Accounts by Type1,3 | Total Number
of Accounts by
Account Type | Total Assets by
Account Type (in
millions) | Number of
Accounts by
Type Subject
to a
Performance
Fee | Total Assets by
Account Type
Subject to a
Performance Fee |
| Registered Investment Companies | 0 | - | 0 | - |
| Other Pooled Investment Vehicles | 8 | $6,007 | 8 | $6,007 |
| Other Accounts | 12 | $3,889 | 7 | $2,164 |
| 1 | Some of the accounts noted herein have additional co-portfolio managers. |
| 2 | Mr. Ewald’s management of the Fund is related to certain SDL assets and not the Fund as a whole. |
| 3 | Mr. Avner’s management of the Fund is related to certain NPL assets and not the Fund as a whole. |
As of December 31, 2019, Andrew Carlino, Mr. Whittier, Mr. Ewald and Mr. Avner did not own shares of the Fund.
Item 9. Purchases of Equity Securities by Closed-End Management Investment Company and Affiliates Purchasers.
None.
Item 10. Submission of Matters to a Vote of Security Holders.
No changes have occurred.
Item 11. Controls and Procedures.
| (a) | Based on an evaluation of the Fund’s disclosure controls and procedures (as defined in Rule 30a-3(c) under the 1940 Act), the Fund’s principal executive officer and principal financial officer have concluded that the Fund’s disclosure controls and procedures are effective as of a date within 90 days of the filing date of this report. |
| (b) | There were no significant changes in the Fund’s internal control over financial reporting that occurred during the period covered by this report that has materially affected, or are reasonably likely to materially affect, the Fund’s internal control over financial reporting. |
Item 12. Disclosure of Securities Lending Activities for Closed-End Management Investment Companies.
None.
Item 13. Exhibits.
| (a)(1) | The Fund’s Code of Ethics, which is the subject of the disclosure required by Item 2 of Form N-CSR, is attached hereto as Exhibit 99.13(A)(1). |
| (a)(2) | Certifications required by Item 13(a)(2) of Form N-CSR are filed herewith as Exhibit 99.CERT. |
| (a)(5) | The proxy voting policies and procedures of the Fund’s investment adviser and investment sub-adviser are attached hereto in response to Item 7 of Form N-CSR as exhibit EX 99.Item7. |
| (b) | Certifications required by Item 13(b) of Form N-CSR are filed herewith as Exhibit 99.906CERT. |
SIGNATURES
Pursuant to the requirements of the Securities Exchange Act of 1934 and the Investment Company Act of 1940, the Fund has duly caused this report to be signed on its behalf by the undersigned, thereunto duly authorized.
GRIFFIN INSTITUTIONAL ACCESS CREDIT FUND
| By: | /s/ Kevin Shields | |
| | Kevin Shields | |
| | President (Principal Executive Officer) | |
Date: March 9, 2020
Pursuant to the requirements of the Securities Exchange Act of 1934 and the Investment Company Act of 1940, this report has been signed below by the following persons on behalf of the Fund and in the capacities and on the dates indicated.
By (Signature and Title)
| By: | /s/ Kevin Shields | |
| | Kevin Shields | |
| | President (Principal Executive Officer) | |
Date: March 9, 2020
By (Signature and Title)
| By: | /s/ Joseph Miller | |
| | Joseph Miller | |
| | Treasurer (Principal Financial Officer) | |
Date: March 9, 2020