UNITED STATES
SECURITIES AND EXCHANGE COMMISSION
WASHINGTON, D.C. 20549
FORM N-CSR
CERTIFIED SHAREHOLDER REPORT OF REGISTERED
MANAGEMENT INVESTMENT COMPANIES
811-23159
(Investment Company Act file number)
Griffin Institutional Access Credit Fund
(Exact name of registrant as specified in charter)
Griffin Capital Plaza
1520 E. Grand Avenue
El Segundo, CA 90245
(Address of principal executive offices) (Zip code)
(310) 469.6100
(Registrant's telephone number, including area code)
ALPS Fund Services, Inc.
1290 Broadway, Suite 1000
Denver, CO 80203
(Name and address of agent for service)
Copy to:
Terrence O. Davis, Esq.
Greenberg Traurig, LLP
Terminus 200
3333 Piedmont Road, NE, Suite 2500
Atlanta, GA 30305
Date of fiscal year end: December 31
Date of reporting period: January 1, 2021 – December 31, 2021
Item 1. Reports to Stockholders.
ELECTRONIC REPORTS DISCLOSURE
As permitted by regulations adopted by the Securities and Exchange Commission, paper copies of the Fund’s shareholder reports will no longer be sent by mail, unless you specifically request paper copies of the reports from the Fund or from your financial intermediary (such as a broker-dealer or bank). Instead, the reports will be made available on the Fund’s website (www.griffincapital.com), and you will be notified electronically or by mail, depending on your elections, each time a report is posted and provided with a website link to access the report.
You may elect to receive all future reports in paper, free of charge. If you invest directly with the Fund, you can call the Fund toll-free at 1.888.926.2688 or visit www.griffincapital.com/investor-login to inform the Fund that you wish to continue receiving paper copies of your shareholder reports. If you invest through a financial intermediary, you can contact your financial intermediary to request that you continue to receive paper copies of your shareholder reports. Please note that not all financial intermediaries may offer this service. Your election to receive reports in paper will apply to all funds held in your account if you invest through your financial intermediary or all funds held with the fund sponsor if you invest directly with a fund.
If you already elected to receive shareholder reports electronically, you will not be affected by this change and you need not take any action. You may elect to receive electronic delivery of shareholder reports and other communications by: (i) calling the Fund toll-free at 1.888.926.2688 or visiting www.griffincapital.com/investor-login, if you invest directly with the Fund, or (ii) contacting your financial intermediary, if you invest through a financial intermediary. Please note that not all financial intermediaries may offer this service.
Table of Contents
| Shareholder Letter | 2 |
| Portfolio Update | 10 |
| Consolidated Schedule of Investments | 12 |
| Consolidated Statement of Assets and Liabilities | 43 |
| Consolidated Statement of Operations | 45 |
| Consolidated Statements of Changes in Net Assets | 46 |
| Consolidated Statement of Cash Flows | 48 |
| Consolidated Financial Highlights | 50 |
| Notes to Consolidated Financial Statements | 62 |
| Report of Independent Registered Public Accounting Firm | 78 |
| Dividend Reinvestment Policy | 79 |
| Approval of Interim Investment Sub-Advisor Agreements | 80 |
| Additional Information | 81 |
| Trustees and Officers | 82 |
| Service Providers | 84 |
| Privacy Notice | 85 |
| Actively managed by |  |
Dear Fellow Shareholders,
We are pleased to present the 2021 annual report for Griffin Institutional Access® Credit Fund (the “Fund”) and greatly appreciate the support of our shareholders. As of December 31, 2021, the Fund’s Class I shares (NASDAQ: CRDIX) generated a1:
| · | One-year total return of 8.55% |
| · | Total cumulative return of 30.77% (5.81% annualized) since inception |
| · | Beta of 0.27 since inception |
The Fund’s sub-adviser—BCSF Advisors, LP, an affiliate of Bain Capital Credit, LP—has continued to construct a well-diversified alternative credit portfolio. The portfolio composition is ultimately determined through both quantitative and qualitative fundamental analysis to determine the optimal mix of securities across global markets with the potential to deliver attractive risk-adjusted returns for investors.

Randy I. Anderson,
Ph.D., CRE
Chief Executive Officer
Griffin Capital Asset
Management Company, LLC
Founding Partner
Griffin Institutional Access
Credit Fund
| Portfolio Highlights as of December 31, 2021 |
| 6.26% | $755.47M | 0.93 |
| Q4 Annualized Distribution Rate (Class I Share)2 | Total Investment Exposure3 | Average Duration (Years)4 |
Investment Performance and Positioning5
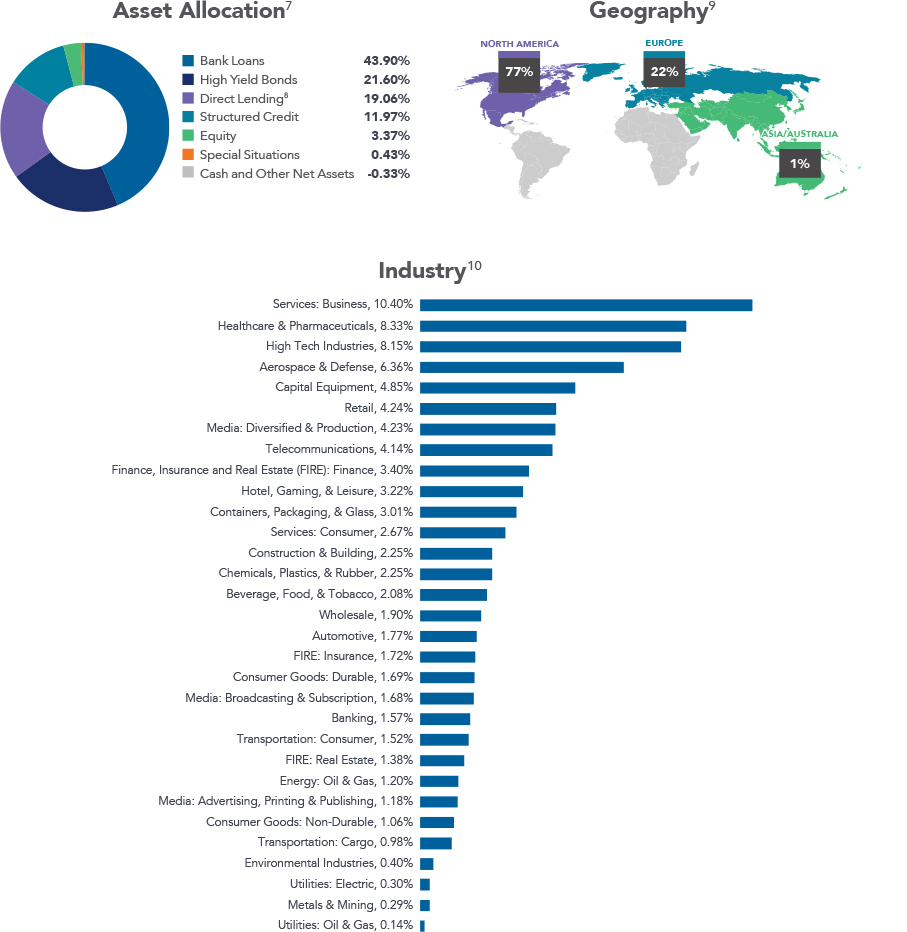
Griffin Institutional Access Credit Fund produced a total return of 8.55% in 2021, outperforming both the S&P/LSTA Leveraged Loan Index and ICE BofA U.S. High Yield Index by 3.35% and 3.19%, respectively. This outperformance was driven by active management across all segments of the portfolio and the Fund’s preference for floating rate investments, particularly allocations to direct lending investments and syndicated bank loans, both of which were top contributors to performance in 2021. High-yield bonds were also accretive to performance during the year, primarily driven by B- and CCC-rated securities. Within structured credit, CLO mezzanine debt generated strong income and was a consistent contributor to returns. The Fund’s equity holdings, primarily comprised of prior restructurings, were additive to Fund returns as risk assets performed well throughout 2021. At an industry level, Software & Enterprise Services and Aerospace & Defense were the top two contributors to Fund performance, while Utilities and Cable modestly detracted in 2021.
Past performance is not indicative of future results. Investment return and the principal value of an investment will fluctuate. Shares may be worth more or less than original cost when redeemed. Performance includes reinvestment of distributions and reflects management fees and other expenses. On a purely voluntary basis, the Adviser currently waives Fund expenses in excess of 1.50% and will continue to bear such expenses on a going forward basis in its discretion and is under no obligation to continue to do so for any specified period of time. Due to financial statement adjustments, performance information presented herein for the Fund differs from the Fund’s financial highlights which are prepared in accordance with U.S. GAAP. Such differences generally are attributable to valuation adjustments to certain of the Fund’s investments which are reflected in the financial statements. Performance based on the Class I share (NASDAQ: CRDIX) of Griffin Institutional Access Credit Fund. Investors of the Class I share do not pay a front-end sales charge/load. The Fund offers multiple different classes of shares. An investment in any share class of the Fund represents an investment in the same assets of the Fund. However, the purchase restrictions, ongoing fees, expenses, and performance for each share class are different. For more information on the differences in share classes, refer to the applicable prospectus, which can be found at www.griffincapital.com.
2
The Fund’s portfolio management team made several tactical asset allocation shifts during the year, most notably decreasing the Fund’s fixed coupon high-yield bond exposure in favor of floating rate structured credit investments. CLO mezzanine debt, in particular, became increasingly attractive on a relative basis as spreads generally compressed across liquid credit, and the Fund added to its allocation accordingly. Within the Fund’s high-yield bond portfolio, the Fund selectively trimmed CCC- and B-rated exposures as lower rated assets rallied for most of the year. Additionally, the Fund allocated to new and existing direct lending investments throughout 2021.
Market and Outlook5
The liquid alternative credit markets delivered coupon-like returns in 2021 with bank loans (represented by the S&P/ LSTA Leveraged Loan Index) and high-yield bonds (represented by the ICE BofA U.S. High Yield Index) returning 5.20% and 5.36%, respectively. Capital markets were robust in 2021 with an active new issue market in bank loans, high-yield bonds, and CLOs which allowed issuers to push out maturities. Technicals have been consistently supportive, especially in the bank loan asset class, which has benefitted from fund flows, CLO formation, and a general preference for floating-rate exposure. Default rates for bank loans and high-yield bonds ended 2021 at 0.65% and 0.29%, respectively, and forecasts generally project default rates to remain below historical averages in the near- to medium-term. Corporate credit fundamentals continued to improve in 2021, as demonstrated by improving leverage and interest coverage ratios. This has flowed through to ratings as well with a significant portion of issuers being upgraded following a wave of downgrades in 2020.
The portfolio management team is actively monitoring market risks related to inflation — a more hawkish Federal Reserve Policy and pandemic-related risks — and is making prudent asset allocation decisions accordingly. We believe the aforementioned market risks may result in pockets of volatility in the near term which we have seen materialize thus far in 2022, but we are confident the economy will remain relatively strong throughout the year. We believe the Fund is well positioned to navigate rising inflation and the likely prospect of higher rates given the Fund’s meaningful exposure to floating rate alternative credit investments and preference for senior secured credits. Importantly, as we have demonstrated in the past, volatility can create opportunities for active management in many of the Fund’s target markets. Conversely, investment grade fixed income remains challenged as yields are muted and duration is elevated. Proving to be an attractive alternative to traditional fixed income, the Fund outperformed the Bloomberg U.S. Aggregate Bond Index by 10.09% in 2021.1 For these reasons, we believe Griffin Institutional Access Credit Fund may be a compelling asset allocation solution for investors seeking enhanced income with limited duration risk. Overall, we are pleased with the Fund’s performance in 2021 and believe it is well positioned to deliver attractive risk-adjusted returns in the current environment.
Past performance is not indicative of future results. Investment return and the principal value of an investment will fluctuate. Shares may be worth more or less than original cost when redeemed.
The Fund is a closed-end interval fund. Limited liquidity is provided to shareholders only through the Fund’s quarterly repurchase offers for no less than 5% and no more than 25% of the Fund’s shares outstanding at net asset value. The Fund is suitable only for investors who can bear the risks associated with the limited liquidity of the Fund and should be viewed as a long-term investment. There is no secondary market for the Fund’s shares and none is expected to develop.
3
On behalf of the Fund’s management team, thank you for your investment and continued confidence in Griffin Institutional Access Credit Fund.
Sincerely,

Randy I. Anderson, Ph.D., CRE
Chief Executive Officer, Griffin Capital Asset Management Company, LLC
Founding Partner, Griffin Institutional Access Credit Fund
NOTE: On December 2, 2021, Apollo Global Management, Inc. (“Apollo”) announced that it entered into a definitive agreement to acquire the asset management and distribution businesses of Griffin Capital. The transaction will provide benefits in the form of enhanced resources and scale, and for this reason, we are extremely excited about our future partnership with Apollo. The Fund anticipates transitioning investment sub-adviser responsibilities to Apollo Credit Management, LLC, a wholly owned subsidiary of Apollo on April 1, 2022 pursuant to the terms of an interim sub-advisory agreement between Griffin Capital Credit Advisor, LLC and Apollo Credit Management, LLC. For more information regarding the transaction, please refer to www.griffincapital.com and the Subsequent Events note of this annual report.
4
PORTFOLIO DIVERSIFICATION AS OF DECEMBER 31, 2021
Floating Rate Assets: 76.50%6 | Fixed Rate Assets: 23.50%6 | Senior Secured: 71.12%
Past performance is not indicative of future results. Holdings and allocations are subject to change without notice. Diversification does not eliminate the risk of experiencing investment losses. Holdings and allocations, unless disclosed otherwise, are based on Total Investment Exposure and subject to change without notice.
5
SUB-ADVISER (UNAUDITED)
BCSF Advisors, LP 11 |  |
Griffin Institutional Access Credit Fund is sub-advised by BCSF Advisors, LP, an SEC-registered investment adviser and affiliate of Bain Capital Credit, LP.12
Bain Capital Credit, LP provides ongoing research, opinions and recommendations regarding the Fund’s investment portfolio. Bain Capital Credit was formed in 1998 as the alternative credit investing arm of Bain Capital, one of the world’s premier alternative investment firms, with approximately $155 billion in assets under management. Bain Capital Credit invests across the full spectrum of alternative credit strategies, including bank loans, high-yield bonds, distressed debt, direct lending, structured products, non-performing loans (special situations) and equities. With offices in Boston, Chicago, New York, London, Dublin, Lisbon, Madrid, Hong Kong, Guangzhou, Seoul, Mumbai, Melbourne, Singapore and Sydney, Bain Capital Credit has a global footprint with approximately $49 billion in assets under management.
ENDNOTES
| 1. | Past performance is not indicative of future results. Investment return and the principal value of an investment will fluctuate. Shares may be worth more or less than original cost when redeemed. Investing involves risk, including loss of principal. Data source: Morningstar Direct. Performance includes reinvestment of distributions and reflects management fees and other expenses. Fund returns would have been lower had expenses, such as management fees, not been waived during the period. The Fund return does not reflect the deduction of all fees, including any applicable Fund share class sales load, third-party brokerage commissions or third-party investment advisory fees paid by investors to a financial intermediary for brokerage services. If the deduction of such fees was reflected, the performance would be lower. Returns shown do not reflect the deduction of taxes that a shareholder would pay on Fund distributions or the redemption of Fund shares. From the Fund’s inception on 4/3/17 to 12/31/21, Griffin Institutional Access Credit Fund had an annualized return of 5.81%, the S&P/LSTA Leveraged Loan Index had an annualized return of 4.25%, the ICE BofA U.S. High Yield Index had an annualized return of 5.83%, and the Bloomberg U.S. Aggregate Bond Index had an annualized return of 3.58%. As of 12/31/21, Griffin Institutional Access Credit Fund had a one-year return of 8.55% and a three-year annualized return of 7.49%. The S&P/LSTA Leveraged Loan Index had a one-year return of 5.20% and a three-year annualized return of 5.63%. The ICE BofA U.S. High Yield Index had a one-year return of 5.36% and a three-year annualized return of 8.57%. The Bloomberg U.S. Aggregate Bond Index had a one-year return of -1.54% and a three-year annualized return of 4.79%. Beta calculation benchmark: Bloomberg U.S. Aggregate Bond Index. Assets and securities contained within indices are different than the assets and securities contained in Griffin Institutional Access Credit Fund and will therefore have different risk and reward profiles. There are limitations when comparing the Griffin Institutional Access Credit Fund to indices. Many open-end funds which track these indices offer daily liquidity, while closed-end interval funds offer liquidity on a periodic basis. Deteriorating general market conditions will reduce the value of stock securities. Fixed income risks include interest-rate and credit risk. The Fund’s investment in in lower-rated securities involves special risks in addition to the risks associated with investments in investment grade securities, including a high degree of credit risk. Lower-rated securities may be regarded as predominately speculative with respect to the issuer’s continuing ability to meet principal and interest payments. |
| 2. | Distribution rates are not performance and reflect the applicable quarter’s cumulative distribution rate when annualized. Under GAAP, the composition of the Fund’s distribution on December 31, 2021 was estimated to include a de minimis amount of return of capital and should not be confused with yield or income. Historically, Fund distributions have only included income for tax purposes. It is important to note that differences exist between the Fund’s accounting records prepared in accordance with GAAP and recordkeeping practices required under income tax regulations. Therefore, the characterization of Fund distributions for federal income tax purposes may be different from GAAP characterization estimates. The determination of what portion of each year’s distributions constitutes ordinary income, qualifying dividend income, short or long-term capital gains or return of capital is determined at year-end and reported to shareholders on Form 1099-DIV, which is mailed every year in late January. The Fund does not provide tax advice. Fund distributions would have been lower had expenses, such as management fees, not been waived during the period and the Adviser is under no obligation to continue its voluntary expense waiver for any specified period of time. |
| 3. | Total Investment Exposure is equal to the total of the Fund’s assets, including assets attributable to financial leverage, minus accrued liabilities, other than debt representing financial leverage. |
| 4. | Duration is a measure of how sensitive the price of a debt instrument (such as a bond) is to a change in interest rates and is measured in years. |
| 5. | Represents the views of Bain Capital Credit and Griffin Capital at the time of this letter and is subject to change. Data as of December 31, 2021, unless otherwise stated. Data source: JPM, unless otherwise noted. Leveraged loans are represented by the S&P/LSTA Leveraged Loan Index and high-yield bonds are represented by the ICE BofA U.S. High Yield Index. |
| 6. | Based on the Fund’s total market value exposure to debt securities. |
| 7. | Holdings and allocations, unless disclosed otherwise, are based on Total Investment Exposure and subject to change without notice. |
| 8. | The Fund executes its direct lending strategy by investing primarily in middle-market opportunities in which the Fund and Sub-Adviser generally seek to originate and negotiate loans directly to sponsor-backed companies. |
| 9. | Excludes Cash and Other Net Assets. |
| 10. | Excludes Cash and Other Net Assets and Structured Credit. Based on Moody’s 35 Industry Categories (“Moody’s 35”). |
| 11. | Firm-level AUM for Bain Capital is estimated and is presented as of September 30, 2021. Bain Capital Credit’s AUM is estimated as of March 31, 2021. Bain Capital Credit’s AUM includes its subsidiaries and credit vehicles managed by its Alternative Investment Fund Managers (AIFM) affiliate. |
| 12. | The Fund anticipates transitioning investment sub-adviser responsibilities to Apollo Credit Management, LLC, a wholly owned subsidiary of Apollo on April 1, 2022 pursuant to the terms of an interim sub-advisory agreement between Griffin Capital Credit Advisor, LLC and Apollo Credit Management, LLC. |
6
GLOSSARY (UNAUDITED)
Annualized Return: Calculated by annualizing cumulative return (i.e., adjusting it for a period of one year). Annualized return includes capital appreciation and assumes a reinvestment of dividends and distributions.
Basis Point: One basis point is equal to 1/100th of a 1%, or 0.01%.
Bloomberg U.S. Aggregate Bond Index: Measures the performance of the U.S. investment grade bond market.
Bond: A debt instrument, also considered a loan, that an investor makes to a corporation, government, federal agency or other organization (known as an issuer) in which the issuer typically agrees to pay the owner the amount of the face value of the bond on a future date, and to pay interest at a specified rate at regular intervals.
Bond Rating: A method of evaluating the quality and safety of a bond. This rating is based on an examination of the issuer’s financial strength and the likelihood that it will be able to meet scheduled repayments. Ratings range from AAA (best) to D (worst). Bonds receiving a rating of BB or below are not considered investment grade because of the relative potential for issuer default.
Collateralized Loan Obligation (CLO): A structured credit security backed by a pool of bank loans, structured so there are several classes of bondholders with varying maturities, called tranches. Debt and equity securities of CLOs are sold in tranches where each CLO tranche has a different priority on distributions, unique risk exposures, and yield expectations based on the tranche’s place in the capital structure. Distributions begin with the senior debt tranches (CLO debt) and flow down to the equity tranches (CLO equity).
Correlation: A statistical measure of how two securities move in relation to each other. A correlation ranges from -1 to 1. A positive correlation of 1 implies that as one security moves, either up or down, the other security will move in lockstep, in the same direction. A negative correlation of -1 indicates that the securities have moved in the opposite direction. If the correlation is 0, the movements of the securities are said to have no correlation; they are completely random.
Cumulative Return: The compound return of an investment. It includes capital appreciation and assumes a reinvestment of dividends and distributions.
Duration: A measure of how sensitive the price of a debt instrument (such as a bond) is to a change in interest rates and is measured in years.
High-Yield Bond: A bond issued by an issuer that is considered a credit risk by a Nationally Recognized Statistical Rating Organization, as indicated by a low bond rating (e.g., “Ba” or lower by Moody’s Investors Services, or “BB” or below by Standard & Poor’s Corporation). Because of this risk, a high-yield bond generally pays a higher return (yield) than a bond with an issuer that carries lower default risk. Also known as a “junk” bond.
Middle-Market Direct Lending: A form of lending in which non-bank lenders loan money to mid-sized or middle-market companies. Middle-market companies are typically defined as those with earnings before interest, taxes, depreciation and amortization (EBITDA) between $10 million and $150 million.
ICE BofA U.S. High Yield Index: Tracks the performance of U.S. dollar denominated below investment grade corporate debt publicly issued in the U.S. domestic market.
S&P/LSTA Leveraged Loan Index: A daily total return index that uses mark-to-market pricing to calculate market value change. It tracks, on a real-time basis, the current outstanding balance and spread over LIBOR for fully funded term loans. The facilities included in the LSTA represent a broad cross section of leveraged loans syndicated in the United States, including dollar-denominated loans to overseas issuers.
7
IMPORTANT DISCLOSURES (UNAUDITED)
This is neither an offer to sell nor a solicitation to purchase any security. Investors should carefully consider the investment objectives, risks, charges and expenses of Griffin Institutional Access Credit Fund (the “Fund”). This and other important information about the Fund is contained in the prospectus, which can be obtained by contacting your financial advisor or visiting www.griffincapital.com. Please read the prospectus carefully before investing.
Past performance is not indicative of future results. Investment return and the principal value of an investment will fluctuate. Shares may be worth more or less than original cost when redeemed. Investing involves risk, including loss of principal. Performance includes reinvestment of distributions and reflects management fees and other expenses. Fund returns would have been lower had expenses, such as management fees, not been waived during the period. The Fund return does not reflect the deduction of all fees, including any applicable Fund share class sales load, third-party brokerage commissions or third-party investment advisory fees paid by investors to a financial intermediary for brokerage services. If the deduction of such fees was reflected, the performance would be lower. Returns shown do not reflect the deduction of taxes that a shareholder would pay on Fund distributions or the redemption of Fund shares. Investing in the Fund involves risks, including the risk that you may receive little or no return on your investment or that you may lose part or all of your investment. The ability of the Fund to achieve its investment objective depends, in part, on the ability of the Adviser to allocate effectively the assets of the Fund among the various securities and investments in which the Fund invests. There can be no assurance that the actual allocations will be effective in achieving the Fund’s investment objective or delivering positive returns. Current performance may be lower or higher than the performance quoted. The most recent performance is available at www.griffincapital.com or by calling 888.926.2688.
Assets and securities contained within indices are different than the assets and securities contained in Griffin Institutional Access Credit Fund and will therefore have different risk and reward profiles. There are limitations when comparing the Griffin Institutional Access Credit Fund to indices. Many open-end funds which track these indices offer daily liquidity, while closed-end interval funds offer liquidity on a periodic basis. Deteriorating general market conditions will reduce the value of stock securities. Fixed income risks include interest-rate and credit risk, bond values fluctuate in price so the value of your investment can go down depending on market conditions. The Fund’s investment in lower-rated securities involves special risks in addition to the risks associated with investments in investment grade securities, including a high degree of credit risk. Lower-rated securities may be regarded as predominately speculative with respect to the issuer’s continuing ability to meet principal and interest payments. Analysis of the creditworthiness of issuers/issues of lower-rated securities may be more complex than for issuers/ issues of higher quality debt securities. There is a risk that issuers will not make payments, resulting in losses to the Fund. An investment cannot be made in an index, which is unmanaged and has returns that do not reflect any trading, management or other costs. Index performance does not represent actual Fund or portfolio performance, nor does it represent actual performance of the Fund’s Adviser or Sub-Adviser.
The Fund is a closed-end interval fund, the shares have no history of public trading, nor is it intended that the shares will be listed on a public exchange at this time. No secondary market is expected to develop for the Fund’s shares. Limited liquidity is provided to shareholders only through the Fund’s quarterly repurchase offers for no less than 5% and no more than 25% of the Fund’s shares outstanding at net asset value. There is no guarantee that an investor will be able to sell all the shares that the investor desires to sell in the repurchase offer. The investment return and principal value of an investment will fluctuate so that an investor’s shares, when redeemed, may be worth more or less than the original cost. Due to these restrictions, an investor should consider an investment in the Fund to be of limited liquidity. The Fund is suitable only for investors who can bear the risks associated with the limited liquidity of the Fund and should be viewed as a long-term investment. Investing in the Fund is speculative and involves a high degree of risk, including the risks associated with leverage and the risk of a substantial loss of investment. There is no guarantee that the investment strategies will work under all market conditions.
The Fund’s inception date was April 3, 2017. On a purely voluntary basis, the Adviser currently waives Fund expenses in excess of 1.50% and will continue to bear such expenses on a going forward basis in its discretion and is under no obligation to continue to do so for any specified period of time (the “Voluntary Waiver”). Previously, the Adviser had borne all of the operating expenses of the Fund and waived its entire management fee or a portion thereof. Without the Voluntary Waiver, expenses would have been higher and Fund returns would have been lower. The Voluntary Waiver is separate and apart from the contractual expense limitation and reimbursement agreement between the Adviser and the Fund that will extend until at least April 30, 2022 and under which the Adviser has contractually agreed to waive its fees and to pay or absorb the ordinary operating expenses of the Fund (including offering expenses, but excluding interest, brokerage commissions, acquired fund fees and expenses and extraordinary expenses), to the extent that such expenses exceed 2.35% for Class I shares.
Investors in the Fund should understand that the net asset value (“NAV”) of the Fund will fluctuate, which may result in a loss of the principal amount invested. All investments contain risk and may lose value The Fund’s investments may be negatively affected by the broad investment environment and capital markets in which the Fund invests, including the debt market, real estate market, and/or the equity securities market. The value of the Fund’s investments will increase or decrease based on changes in the prices of the investments it holds. This will cause the value of the Fund’s shares to increase or decrease. The use of leverage by the Fund will magnify the Fund’s gains or losses. The Fund is “diversified” under the Investment Company Act of 1940. Diversification does not eliminate the risk of experiencing investment losses. Holdings are subject to change without notice. The Fund is not intended to be a complete investment program.
8
Investing in lower-rated securities involves special risks in addition to the risks associated with investments in investment grade securities, including a high degree of credit risk. Lower-rated securities may be regarded as predominately speculative with respect to the issuer’s continuing ability to meet principal and interest payments. Analysis of the creditworthiness of issuers/issues of lower-rated securities may be more complex than for issuers/ issues of higher quality debt securities. Securities that are in the lowest rating category are considered to have extremely poor prospects of ever attaining any real investment standing, to have a current identifiable vulnerability to default and/or to be unlikely to have the capacity to pay interest and repay principal. There is a risk that issuers will not make payments, resulting in losses to the Fund. In addition, the credit quality of securities may be lowered if an issuer’s financial condition changes. Lower credit quality may lead to greater volatility in the price of a security and in shares of the Fund. Lower credit quality also may affect liquidity and make it difficult to sell the security. Default, or the market’s perception that an issuer is likely to default, could reduce the value and liquidity of securities, thereby reducing the value of your investment in Fund shares. The Adviser’s judgments about the attractiveness, value and potential appreciation of a particular sector and securities in which the Fund invests may prove to be incorrect and may not produce the desired results. Foreign investing involves special risks such as currency fluctuations and political uncertainty. The use of leverage by the Fund will magnify the Fund’s gains or losses. There is no guarantee that the Fund’s leverage strategy will be successful.
The Fund’s distribution policy is to make quarterly distributions to shareholders. Shareholders should not assume that the source of a distribution from the Fund is net profit. Please refer to the Fund’s most recent Section 19(a) notice for an estimate of the composition of the Fund’s most recent distribution, available at www.griffincapital.com, and the Fund’s semi-annual or annual reports filed with the U.S. Securities and Exchange Commission (the “SEC”) for additional information regarding the composition of distributions. The Fund’s distributions may be affected by numerous factors, including but not limited to changes in Fund expenses including the amount of expenses waived by the Fund’s Adviser, investment performance, realized and projected market returns, fluctuations in market interest rates, and other factors. Fund distributions would have been lower had expenses, such as management fees, not been waived during the period and the Adviser is under no obligation to continue its voluntary expense waiver for any specified period of time. There is no assurance that the Fund’s distribution rate will be sustainable in the future nor are distributions guaranteed.
The Fund is advised by Griffin Capital Credit Advisor, LLC (“GCCA”). GCCA is registered as an investment adviser with the SEC pursuant to the provisions of the Investment Advisers Act of 1940, as amended (the “Advisers Act”). GCCA is an indirect majority-owned subsidiary of Griffin Capital Company, LLC. The Fund is sub-advised by BCSF Advisors, LP (“BCSF”). BCSF is registered as an investment adviser with the SEC pursuant to the provisions of the Advisers Act. BCSF is an affiliate of Bain Capital Credit, LP. Registration with the SEC does not constitute an endorsement by the SEC nor does it imply a certain level of skill or training.
This annual report may contain certain forward-looking statements. Such forward-looking statements can generally be identified by our use of forward-looking terminology such as “may,” “will,” “expect,” “intend,” “anticipate,” “estimate,” “believe,” “continue,” or other similar words. Because such statements include risks, uncertainties and contingencies, actual results may differ materially from the expectations, intentions, beliefs, plans or predictions of the future expressed or implied by such forward-looking statements. These risks, uncertainties and contingencies include, but are not limited to: uncertainties relating to changes in general economic, credit and real estate conditions; uncertainties relating to the implementation of our investment strategy; uncertainties relating to capital proceeds; and other risk factors as outlined in our prospectus, annual report and semi-annual report filed with the SEC.
This material has been distributed for informational purposes only and should not be considered as investment advice or a recommendation of any particular security, strategy or investment product or be relied upon for any other purpose. The views expressed represent an assessment of market conditions at a specific point in time, are opinions only and should not be relied upon as investment advice regarding a particular investment or markets in general. Such information does not constitute a recommendation to buy or sell specific securities or investment vehicles. It should not be assumed that any investment will be profitable or will equal the performance of the fund(s) or any securities or any sectors mentioned herein. Information contained herein has been obtained from sources deemed to be reliable, but not guaranteed. Griffin Capital and its affiliates do not provide tax, legal or accounting advice. This material is not intended to provide, and should not be relied on for, tax, legal or accounting advice. You should consult your own tax, legal and accounting advisors before engaging in any transaction. This material represents views as of the date of this presentation and is subject to change without notice of any kind.
9
| Griffin Institutional Access Credit Fund | Portfolio Update |
December 31, 2021 (Unaudited)
Performance (for the period ended December 31, 2021)
| | 6 Month | 1 Year | 3 Year | Since Inception**** | Inception |
| Griffin Institutional Access Credit Fund - A - With Load* | -2.98% | 2.25% | 5.42% | 4.53% | 4/3/17 |
| Griffin Institutional Access Credit Fund - A - Without Load | 2.94% | 8.49% | 7.52% | 5.84% | 4/3/17 |
| Griffin Institutional Access Credit Fund - C - With Load** | 1.94% | 7.49% | 7.51% | 5.84% | 4/3/17 |
| Griffin Institutional Access Credit Fund - C - Without Load | 2.94% | 8.49% | 7.51% | 5.84% | 4/3/17 |
| Griffin Institutional Access Credit Fund - I - NAV | 2.94% | 8.50% | 7.52% | 5.85% | 4/3/17 |
| Griffin Institutional Access Credit Fund - M - NAV | – | – | – | 0.91% | 11/2/21 |
| Griffin Institutional Access Credit Fund - L - With Load*** | -1.43% | 3.87% | 5.96% | 4.77% | 9/5/17 |
| Griffin Institutional Access Credit Fund - L - Without Load | 2.94% | 8.49% | 7.51% | 5.83% | 9/5/17 |
| Griffin Institutional Access Credit Fund - F - NAV | 2.89% | 8.44% | 7.50% | 5.79% | 9/25/17 |
| S&P/LSTA Leveraged Loan Index | 1.86% | 5.20% | 5.63% | 4.24% | 4/3/17 |
| * | Adjusted for initial maximum sales charge of 5.75%. |
| ** | Adjusted for contingent deferred sales charge of 1.00%. |
| *** | Adjusted for initial maximum sales charge of 4.25% |
The S&P/LSTA Leveraged Loan Index is a capitalization-weighted syndicated loan index based upon market weightings, spreads and interest payments. The S&P/LSTA Leveraged Loan Index covers the U.S. market back to 1997 and currently calculates on a daily basis.
Indexes are not actively managed and do not reflect deduction of fees, expenses or taxes. An investor cannot invest directly into an index.
The returns shown above do not reflect the deduction of taxes a shareholder would pay on Fund distributions or redemption of Fund shares.
The performance data quoted above represents past performance. Past performance is not indicative of future results. Investment return and value of the Fund shares will fluctuate so that an investor’s shares, when sold or redeemed, may be worth more or less than their original cost. Performance may be lower or higher than performance data quoted. The Fund’s current performance is available by calling 1-888-926-2688 or by visiting www.griffincapital.com.
Class A shares are offered subject to a maximum sales charge of 5.75% of the offering price and Class L shares are offered subject to a maximum sales charge of 4.25% of the offering price. Class C, Class I and Class M shares are offered at net asset value per share. Class C shares may be subject to a 1.00% contingent deferred sales charge on shares redeemed during the first 365 days after their purchase. Class F Shares are no longer offered except for reinvestment of dividends at net asset value. The Adviser and the Fund have entered into an expense limitation and reimbursement agreement (the “Expense Limitation Agreement”) under which the Adviser has agreed contractually to waive its fees and to pay or absorb the ordinary annual operating expenses of the Fund (including offering expenses, but excluding taxes, interest, brokerage commissions, acquired fund fees and expenses and extraordinary expenses) (i) at least through April 30, 2023 for Class A, Class C, Class I, Class M and Class L shares, so that the total annual operating expenses of the Fund do not exceed 2.60% per annum of Class A average daily net assets, 3.35% per annum of Class C average daily net assets, 2.35% per annum of Class I average daily net assets, 3.10% per annum of Class M average daily net assets, 2.85% per annum of Class L average daily net assets and, (ii) for Class F shares, for so long as Class F shares are outstanding and the Adviser is the investment adviser to the Fund so that the total annual operating expenses of the Fund do not exceed 1.85% per annum of Class F average daily net assets (the “Expense Limitations”). The agreement can be extended at the discretion of the Adviser and the Trustees. Without the waiver, the expenses would be 2.80%, 3.55%, 2.55%, 3.06%, and 2.55% for Class A, Class C, Class I, Class L and Class F, respectively per the Fund’s most recent prospectus dated April 30, 2021. Without the waiver, the expenses would be 3.30% for Class M per the Fund’s most recent prospectus dated November 1, 2021. In consideration of the Adviser’s agreement to limit the Fund’s expenses, the Fund has agreed to repay the Adviser in the amount of any fees waived and Fund expenses paid or absorbed, subject to the limitations that: (1) the reimbursement for fees and expenses will be made only if payable not more than three years from the date such expenses were incurred; and (2) the reimbursement may not be made if it would cause the lesser of the Expense Limitations in place at the time of waiver or at the time of reimbursement to be exceeded. Fees waived and Fund expenses paid or absorbed with respect to Class F assets will not be repaid or reimbursed. As of August 16, 2021, the Adviser waives Fund expenses in excess of 1.50% on a purely voluntary basis and will continue to bear such expenses on a going forward basis in its discretion and is under no obligation to continue to do so for any specified period of time (the “Voluntary Waiver”). Previously, the Adviser had borne all of the operating expenses of the Fund and waived its entire management fee or a portion thereof. Operating expenses absorbed by the Adviser during this voluntary period will be permanently waived. Without the Voluntary Waiver, expenses would have been higher and Fund returns and distributions would have been lower. The Voluntary Waiver is separate and apart from the contractual expense limitation and reimbursement agreement between the Adviser and the Fund that will extend until at least April 30, 2023. Please review the Fund’s Prospectus for more details regarding the Fund’s fees and expenses. No assurances can be given that the Fund will pay a distribution in the future; or, if any such distribution is paid, the amount or rate of the distribution.
| 10 | 1.888.926.2688 | www.griffincapital.com |
| Griffin Institutional Access Credit Fund | Portfolio Update |
December 31, 2021 (Unaudited)
Performance of $10,000 Initial Investment (for the period ended December 31, 2021)
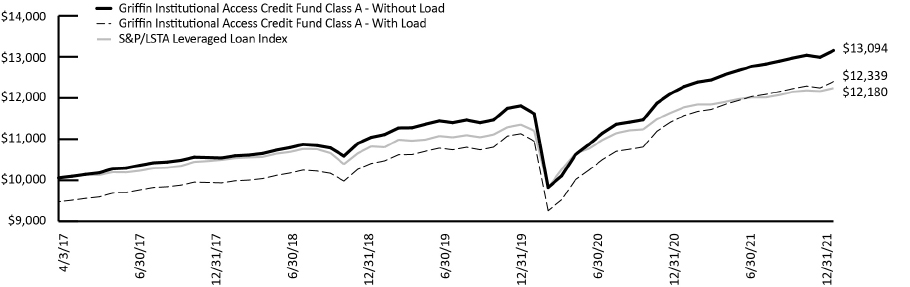
The graph shown above represents historical performance of a hypothetical investment of $10,000 in the Class A Shares of the Fund since inception. Past performance is not indicative of future results. All returns reflect reinvested distributions, but do not reflect the deduction of taxes that a shareholder would pay on Fund distributions or the redemption of Fund shares.
| Annual Report | December 31, 2021 | 11 |
| Griffin Institutional Access Credit Fund | Consolidated Schedule of Investments |
December 31, 2021
| Description | | Country | | Spread Above Index | | Rate | | | Maturity Date | | Principal Amount | | | Value
(Note 2)(a) | |
| BANK LOANS (74.11%)(b) | | | | | | | | | | | | | | | | | | |
| | | | | | | | | | | | | | | | | | | |
| AEROSPACE & DEFENSE (6.21%) | | | | | | | | | | | | | | | | | | |
| Arcline FM Holdings LLC, First Lien Initial Term Loan(c) | | United States | | 3M US L + 4.75% | | | 5.50 | % | | 06/23/28 | | $ | 992,148 | | | $ | 992,768 | |
| Cobham Ultra Us Co-Borrower LLC, First Lien Term Loan(c)(d) | | United States | | L + 3.75% | | | | | | 11/17/28 | | | 812,630 | | | | 811,870 | |
| Dynasty Acquisition Co., Inc., First Lien 2020 B-1 Term Loan | | United States | | 3M US L + 3.50% | | | 3.72 | % | | 04/06/26 | | | 956,079 | | | | 932,865 | |
| Dynasty Acquisition Co., Inc., First Lien 2020 B-2 Term Loan | | United States | | 3M US L + 3.50% | | | 3.72 | % | | 04/06/26 | | | 514,021 | | | | 501,540 | |
| Fairbanks Morse Defense, Second Lien Term Loan(d)(e) | | United States | | 6M US L + 8.25% | | | 9.00 | % | | 06/15/29 | | | 3,697,445 | | | | 3,706,689 | |
| Forming Machining Industries Holdings LLC, First Lien Initial Term Loan | | United States | | 3M US L + 4.25% | | | 4.47 | % | | 10/09/25 | | | 680,074 | | | | 632,469 | |
| Forming Machining Industries Holdings LLC, Second Lien Initial Term Loan(e) | | United States | | 3M US L + 8.25% | | | 8.47 | % | | 10/09/26 | | | 310,000 | | | | 275,900 | |
| Jazz Acquisition, Inc., First Lien Initial Term Loan | | United States | | 1M US L + 4.25% | | | 4.35 | % | | 06/19/26 | | | 797,832 | | | | 788,693 | |
| Jazz Acquisition, Inc., Second Lien Initial Term Loan | | United States | | 1M US L + 8.00% | | | 8.10 | % | | 06/18/27 | | | 1,058,702 | | | | 987,906 | |
| Kellstrom Commercial Aerospace, Inc. - Initial Term Loan(e) | | United States | | 3M US L + 5.50% | | | 6.50 | % | | 07/01/25 | | | 2,226,702 | | | | 2,093,100 | |
| Kellstrom Commercial Aerospace, Inc. - Revolver(e)(f) | | United States | | 3M PRIME + 4.50% | | | 6.50 | % | | 07/01/25 | | | 361,314 | | | | 339,635 | |
| Mach Acquisition, LLC Initial Term Loan(e)(g) | | United States | | 3M US L + 7.50% | | | 8.50 | % | | 10/18/26 | | | 3,672,000 | | | | 3,598,560 | |
| Mach Acquisition, LLC Revolving Credit Loan(e)(f)(g) | | United States | | L + 0.50% | | | | | | 10/18/26 | | | 1,130,000 | | | | 1,107,400 | |
| MB Aerospace Holdings II Corp., First Lien Initial Term Loan | | United States | | 3M US L + 3.50% | | | 4.50 | % | | 01/22/25 | | | 2,606,364 | | | | 2,436,950 | |
| Nordam Group LLC, First Lien Initial Term Loan | | United States | | 1M US L + 5.50% | | | 5.63 | % | | 04/09/26 | | | 1,100,164 | | | | 958,518 | |
| Novaria Holdings LLC, First Lien Initial Term Loan | | United States | | 3M US L + 5.50% | | | 6.50 | % | | 01/27/27 | | | 1,529,176 | | | | 1,501,941 | |
| Peraton Corp., First Lien B Term Loan(c) | | United States | | 1M US L + 3.75% | | | 4.50 | % | | 02/01/28 | | | 1,688,694 | | | | 1,692,307 | |
| Peraton Corp., Second Lien B-1 Term Loan | | United States | | 1M US L + 7.75% | | | 8.50 | % | | 02/01/29 | | | 541,097 | | | | 549,890 | |
| PICP Project Sprint Intermediate II LLC, Bridge Loan(e)(g)(h) | | United States | | | | | 26.00 | % | | 06/30/25 | | | 634,281 | | | | 174,427 | |
| Sprint Intermediate Holding I Term Loan(e)(g)(h) | | United States | | | | | 18.00 | % | | 06/30/26 | | | 2,380,261 | | | | 2,320,754 | |
| Turbocombustor Technology, Inc., First Lien Term Loan(e)(g) | | United States | | 1M US L + 10.25% | | | 11.25 | % | | 07/15/27 | | | 2,992,556 | | | | 2,992,556 | |
| Vectra Co., First Lien Initial Term Loan(c) | | United States | | 1M US L + 3.25% | | | 3.35 | % | | 03/08/25 | | | 1,220,908 | | | | 1,175,637 | |
| Vertex Aerospace Services Corp., First Lien Term Loan(c)(d) | | United States | | L + 4.00% | | | | | | 12/06/28 | | | 1,147,184 | | | | 1,146,897 | |
| Whitcraft LLC, First Lien Initial Term Loan(e) | | United States | | 3M US L + 6.00% | | | 7.00 | % | | 04/03/23 | | | 3,480,316 | | | | 3,367,206 | |
| Whitcraft LLC, First Lien Revolving Term Loan(e)(f) | | United States | | L + 0.50% | | | | | | 04/03/23 | | | 158,575 | | | | 153,421 | |
| WP CPP Holdings LLC, First Lien Initial Term Loan | | United States | | 3M US L + 3.75% | | | 4.75 | % | | 04/30/25 | | | 2,579,137 | | | | 2,479,196 | |
| WP CPP Holdings LLC, Second Lien Initial Term Loan | | United States | | 3M US L + 7.75% | | | 8.75 | % | | 04/30/26 | | | 1,267,182 | | | | 1,242,471 | |
| | | | | | | | | | | | | | | | | | 38,961,566 | |
See Notes to Consolidated Financial Statements.
| 12 | 1.888.926.2688 | www.griffincapital.com |
| Griffin Institutional Access Credit Fund | Consolidated Schedule of Investments |
December 31, 2021
| Description | | Country | | Spread Above Index | | Rate | | | Maturity Date | | Principal Amount | | | Value
(Note 2)(a) | |
| AUTOMOTIVE (1.87%) | | | | | | | | | | | | |
| BTM Comms Jersey Limited, Facility B(e) | | Israel | | 6M US L + 6.00% | | | 6.50 | % | | 05/12/28 | | $ | 1,509,000 | | | $ | 1,509,000 | |
| CST Buyer Company, First Lien Tranche B Term Loan(e) | | United States | | 3M US L + 5.50% | | | 6.50 | % | | 10/03/25 | | | 4,634,444 | | | | 4,634,444 | |
| CST Buyer Company, Revolving Credit Facility Term Loan(e)(f) | | United States | | L + 0.50% | | | | | | 10/03/25 | | | 233,472 | | | | 233,472 | |
| Mavis Tire Express Services Topco Corp., First Lien Initial Term Loan(c) | | United States | | 1M US L + 4.00% | | | 4.75 | % | | 05/04/28 | | | 1,885,372 | | | | 1,889,501 | |
| Midas Intermediate Holdco II LLC, First Lien Closing Date Term Loan(g) | | United States | | 3M US L + 6.75% | | | 7.50 | % | | 12/22/25 | | | 2,323,258 | | | | 2,223,393 | |
| Truck Hero, Inc., First Lien Initial Term Loan(c) | | United States | | 1M US L + 3.25% | | | 4.00 | % | | 01/31/28 | | | 397,416 | | | | 396,083 | |
| Wheel Pros, Inc., First Lien Initial Term Loan(c) | | United States | | 3M US L + 4.50% | | | 5.25 | % | | 05/11/28 | | | 836,402 | | | | 836,247 | |
| | | | | | | | | | | | | | | | | | 11,722,140 | |
| BANKING (0.09%) | | | | | | | | | | | | | | | | | | |
| Paysafe Group Holdings II, Ltd., First Lien Facility B1 Term Loan(c)(d) | | United States | | 1M US L + 2.75% | | | 3.25 | % | | 06/28/28 | | | 575,231 | | | | 560,672 | |
| | | | | | | | | | | | | | | | | | | |
| BEVERAGE, FOOD, & TOBACCO (1.37%) | | | | | | | | | | | | |
| CHG PPC Parent LLC, First Lien Term Loan(c) | | United States | | 1M US L + 3.00% | | | 3.50 | % | | 12/08/28 | | | 1,113,181 | | | | 1,111,094 | |
| Cookie Acquisition SAS, First Lien Facility B Term Loan(d) | | France | | L + 4.00% | | | | | | 02/15/27 | | € | 795,412 | | | | 884,326 | |
| Froneri International, Ltd., First Lien Facility B1 Term Loan | | United Kingdom | | 3M EUR L + 2.38% | | | 2.38 | % | | 01/29/27 | | | 650,024 | | | | 726,068 | |
| H-Food Holdings LLC, First Lien Initial Term Loan(c) | | United States | | 1M US L + 3.69% | | | 3.79 | % | | 05/23/25 | | $ | 1,518,745 | | | | 1,511,151 | |
| Quidditch Acquisition, Inc., First Lien B Term Loan | | United States | | 1M US L + 7.00% | | | 8.00 | % | | 03/21/25 | | | 3,475,247 | | | | 3,429,652 | |
| Sigma Holdco B.V., First Lien Facility B2 Term Loan(c) | | Netherlands | | 6M US L + 3.00% | | | 3.16 | % | | 07/02/25 | | | 974,594 | | | | 955,561 | |
| | | | | | | | | | | | | | | | | | 8,617,852 | |
| CAPITAL EQUIPMENT (3.67%) | | | | | | | | | | | | |
| 10945048 Canada, Inc., Second Lien Term Loan(e) | | Canada | | 3M CDOR + 8.00% | | | 9.00 | % | | 09/21/26 | | | CAD1,585,500 | | | | 1,253,409 | |
| ACProducts Holdings, Inc., First Lien Initial Term Loan(c) | | United States | | 3M US L + 4.25% | | | 4.75 | % | | 05/17/28 | | $ | 246,794 | | | | 243,709 | |
| ASP Unifrax Holdings, Inc., First Lien EUR Term Loan | | United States | | 3M EUR L + 3.75% | | | 3.75 | % | | 12/12/25 | | € | 615,277 | | | | 690,860 | |
| ASP Unifrax Holdings, Inc., First Lien USD Term Loan | | United States | | 3M US L + 3.75% | | | 3.97 | % | | 12/12/25 | | $ | 1,463,511 | | | | 1,447,046 | |
| Avaya, Inc., First Lien Tranche B-2 Term Loan(c) | | United States | | 3M US L + 4.00% | | | 4.11 | % | | 12/15/27 | | | 495,170 | | | | 495,574 | |
| C&D Technologies, Inc., First Lien B Term Loan | | United States | | 6M US L + 5.75% | | | 5.75 | % | | 12/20/25 | | | 1,700,200 | | | | 1,688,519 | |
| Cohu, Inc., First Lien Initial B Term Loan(c) | | United States | | 1M US L + 3.00% | | | 3.10 | % | | 10/01/25 | | | 291,349 | | | | 290,439 | |
| Crosby Group LLC, First Lien Initial Term Loan(c) | | United States | | 1M US L + 4.75% | | | 4.85 | % | | 06/26/26 | | | 866,955 | | | | 866,955 | |
| Diversitech Holdings, Inc. Delayed Draw Term Loan(c)(d)(f) | | United States | | L + 3.75% | | | | | | 12/15/28 | | | 121,852 | | | | 121,891 | |
| Diversitech Holdings, Inc. Initial Term Loan(c)(d) | | United States | | L + 3.75% | | | | | | 12/22/28 | | | 588,953 | | | | 589,139 | |
| Diversitech Holdings, Inc., Second Lien Term Loan(d) | | United States | | L + 6.75% | | | | | | 12/21/29 | | | 1,133,094 | | | | 1,138,057 | |
See Notes to Consolidated Financial Statements.
| Annual Report | December 31, 2021 | 13 |
| Griffin Institutional Access Credit Fund | Consolidated Schedule of Investments |
December 31, 2021
| Description | | Country | | Spread Above Index | | Rate | | | Maturity Date | | Principal Amount | | | Value
(Note 2)(a) | |
| CAPITAL EQUIPMENT (continued) | | | | | | | | | | | | |
| Electronics for Imaging, Inc., First Lien Initial Term Loan(e) | | United States | | 1M US L + 5.00% | | | 5.10 | % | | 07/23/26 | | $ | 1,220,728 | | | $ | 1,196,313 | |
| Electronics for Imaging, Inc., Second Lien Initial Term Loan(e) | | United States | | 1M US L + 9.00% | | | 9.10 | % | | 07/23/27 | | | 2,057,305 | | | | 1,923,580 | |
| Engineered Components and Systems LLC, First Lien Delayed Draw Term Loan(c)(e)(f) | | United States | | L + 6.50% | | | | | | 08/02/28 | | | 179,478 | | | | 178,132 | |
| Engineered Components and Systems LLC, First Lien Initial Term Loan(c)(e) | | United States | | 1M US L + 6.00% | | | 6.50 | % | | 08/02/28 | | | 603,046 | | | | 598,523 | |
| Engineered Machinery Holdings, Inc., Second Lien Incremental Amendment No. 2 Term Loan | | United States | | 3M US L + 6.50% | | | 7.25 | % | | 05/21/29 | | | 2,204,586 | | | | 2,218,364 | |
| Esdec Solar Group B.V., First Lien Initial Term Loan(c)(e) | | Netherlands | | 3M US L + 5.00% | | | 5.75 | % | | 08/30/28 | | | 623,110 | | | | 623,110 | |
| Excelitas Technologies Corp., First Lien Initial USD Term Loan(c)(e) | | United States | | 3M US L + 3.50% | | | 4.50 | % | | 12/02/24 | | | 488,284 | | | | 490,726 | |
| Financiere Storage, Second Lien Term Loan(e) | | France | | 3M EUR L + 8.25% | | | 8.25 | % | | 08/08/26 | | € | 2,387,115 | | | | 2,721,123 | |
| Logoplaste Parent SARL, First Lien Facility B Term Loan(c) | | Luxembourg | | 1M US L + 4.25% | | | 4.75 | % | | 07/07/28 | | $ | 503,543 | | | | 504,382 | |
| Maravai Intermediate Holdings LLC, First Lien Initial Term Loan(c) | | United States | | 1M US L + 3.75% | | | 4.75 | % | | 10/19/27 | | | 416,870 | | | | 419,215 | |
| Mirion Technologies, Inc., First Lien Term Loan(c) | | United States | | 6M US L + 2.75% | | | 3.25 | % | | 10/20/28 | | | 419,007 | | | | 418,707 | |
| Secure Acquisition, Inc., Delayed Draw, First Lien Term Loan(c)(e)(f) | | United States | | L + 5.00% | | | | | | 12/15/28 | | | 87,562 | | | | 87,344 | |
| Secure Acquisition, Inc., First Lien Term Loan(c)(e) | | United States | | 3M US L + 5.00% | | | 5.50 | % | | 12/15/28 | | | 589,587 | | | | 588,113 | |
| Shape Technologies Group, Inc., First Lien Initial Term Loan | | United States | | 1M US L + 3.00% | | | 3.10 | % | | 04/21/25 | | | 1,690,521 | | | | 1,603,459 | |
| Watlow Electric Manufacturing Company, First Lien Initial Term Loan(c) | | United States | | 3M US L + 3.75% | | | 4.25 | % | | 03/02/28 | | | 667,387 | | | | 667,597 | |
| | | | | | | | | | | | | | | | | | 23,064,286 | |
| CHEMICALS, PLASTICS, & RUBBER (1.92%) | | | | | | | | | | | | |
| Ascend Performance Materials Operations LLC, First Lien 2021 Refinancing Term Loan(c) | | United States | | 3M US L + 4.75% | | | 5.50 | % | | 08/27/26 | | | 1,925,701 | | | | 1,939,662 | |
| ASK Chemicals International Holding GmbH, First Lien Facility B Term Loan | | Germany | | 6M EUR L + 5.50% | | | 5.50 | % | | 05/12/23 | | € | 1,000,000 | | | | 1,091,535 | |
| CPC Acquisition Corp., Initial Term Loan(c) | | United States | | 3M US L + 3.75% | | | 4.50 | % | | 12/29/27 | | $ | 489,495 | | | | 484,600 | |
| CPC Acquisition Corp., Second Lien Initial Term Loan | | United States | | 3M US L + 7.75% | | | 8.50 | % | | 12/29/28 | | | 924,085 | | | | 912,534 | |
| LSF11 Skyscraper Holdco SARL, First Lien Facility B3 Term Loan(c) | | Luxembourg | | 3M US L + 3.50% | | | 4.25 | % | | 09/29/27 | | | 649,386 | | | | 649,792 | |
| Plaskolite PPC Intermediate II LLC, First Lien 2021-1 Refinancing Term Loan(c) | | United States | | 6M US L + 4.00% | | | 4.75 | % | | 12/15/25 | | | 673,644 | | | | 667,541 | |
| Solenis International LP, First Lien B Term Loan(c) | | United States | | 3M US L + 3.75% | | | 4.25 | % | | 11/09/28 | | | 640,820 | | | | 639,619 | |
| Sparta U.S. Holdco LLC, First Lien Initial Term Loan(c) | | United States | | 3M US L + 3.50% | | | 4.25 | % | | 08/02/28 | | | 357,582 | | | | 358,476 | |
| V Global Holdings LLC, First Lien Initial Term Loan(e) | | United States | | 1M US L + 6.00% | | | 7.00 | % | | 12/22/27 | | | 2,279,648 | | | | 2,279,649 | |
See Notes to Consolidated Financial Statements.
| 14 | 1.888.926.2688 | www.griffincapital.com |
| Griffin Institutional Access Credit Fund | Consolidated Schedule of Investments |
December 31, 2021
| Description | | Country | | Spread Above Index | | Rate | | | Maturity Date | | Principal Amount | | | Value
(Note 2)(a) | |
| CHEMICALS, PLASTICS, & RUBBER (continued) | | | | | | | | | | | | |
| V Global Holdings LLC, First Lien Term Loan(e) | | United States | | 3M US L + 5.25% | | | 6.25 | % | | 12/22/27 | | $ | 1,000,000 | | | $ | 990,000 | |
| V Global Holdings LLC, Revolving Credit, First Lien Term Loan(e)(f) | | United States | | PRIME + 5.00% | | | 8.25 | % | | 12/22/25 | | | 371,009 | | | | 371,009 | |
| Venator Finance SARL, First Lien Initial Term Loan(c) | | Luxembourg | | 1M US L + 3.00% | | | 3.10 | % | | 08/08/24 | | | 1,172,223 | | | | 1,165,635 | |
| W. R. Grace Holdings LLC, First Lien Initial Term Loan(c) | | United States | | 3M US L + 3.75% | | | 4.25 | % | | 09/22/28 | | | 480,094 | | | | 481,535 | |
| | | | | | | | | | | | | | | | | | 12,031,587 | |
| CONSTRUCTION & BUILDING (2.10%) | | | | | | | | | | | | |
| Abbey Cottages Ltd., Tranche 1(e)(f) | | Ireland | | 3M EUR L + 6.75% | | | 7.75 | % | | 10/16/23 | | € | 1,040,690 | | | | 1,149,279 | |
| Abbey Cottages Ltd., Tranche 2(e)(f) | | Ireland | | L | | | | | | 10/16/23 | | | 53,939 | | | | 59,567 | |
| Aegion Corp., First Lien Initial Term Loan(c) | | United States | | 3M US L + 4.75% | | | 5.50 | % | | 05/17/28 | | $ | 530,985 | | | | 534,080 | |
| Crown Subsea Communications Holding, Inc., First Lien Initial Term Loan(c) | | United States | | 1M US L + 4.75% | | | 5.50 | % | | 04/27/27 | | | 749,683 | | | | 755,617 | |
| LSF10 XL Bidco S.C.A., First Lien Facility B4 Term Loan | | Luxembourg | | 3M EUR L + 4.00% | | | 4.00 | % | | 04/12/28 | | € | 1,500,000 | | | | 1,712,196 | |
| Patagonia BidCo, Ltd., Facility B1 | | United Kingdom | | 3M SONIA + 5.25% | | | 5.25 | % | | 10/13/28 | | £ | 653,734 | | | | 880,767 | |
| Patagonia BidCo, Ltd., Facility B2(d)(f) | | United Kingdom | | L + 5.25% | | | | | | 10/13/28 | | | 118,861 | | | | 160,140 | |
| Playpower, Inc., First Lien Initial Term Loan(c) | | United States | | 3M US L + 5.50% | | | 5.72 | % | | 05/08/26 | | $ | 2,255,649 | | | | 2,214,303 | |
| Recess Holdings, Inc., First Lien Initial Term Loan(c) | | United States | | 3M US L + 3.75% | | | 4.75 | % | | 09/30/24 | | | 1,974,227 | | | | 1,968,669 | |
| Sequa Mezzanine Holdings LLC, First Lien Extended Term Loan | | United States | | 3M US L + 6.75% | | | 7.75 | % | | 11/28/23 | | | 2,368,041 | | | | 2,388,761 | |
| Wilsonart LLC, First Lien Tranche E Term Loan(c) | | United States | | 3M US L + 3.50% | | | 4.50 | % | | 12/31/26 | | | 1,332,635 | | | | 1,334,167 | |
| | | | | | | | | | | | | | | | | | 13,157,546 | |
| CONSUMER GOODS: DURABLE (2.03%) | | | | | | | | | | | | |
| Amer Sports Holding Oy, First Lien Facility B Term Loan | | Finland | | 6M EUR L + 4.50% | | | 4.50 | % | | 03/30/26 | | € | 812,416 | | | | 926,267 | |
| Auris Luxembourg III SARL, First Lien Facility B1A Term Loan | | Denmark | | 6M EUR L + 4.00% | | | 4.00 | % | | 02/27/26 | | | 795,720 | | | | 905,432 | |
| Auris Luxembourg III SARL, First Lien Facility B2 Term Loan(c) | | Denmark | | 1M US L + 3.75% | | | 3.85 | % | | 02/27/26 | | $ | 1,122,179 | | | | 1,115,519 | |
| Harbor Freight Tools USA, Inc., First Lien Initial (2021) Term Loan(c) | | United States | | 1M US L + 2.75% | | | 3.25 | % | | 10/19/27 | | | 2,125,738 | | | | 2,124,006 | |
| Lakeshore Learning Materials, First Lien Term Loan(c) | | United States | | 3M US L + 3.50% | | | 4.00 | % | | 09/29/28 | | | 360,352 | | | | 359,790 | |
| New Milani Group LLC, First Lien Term Loan(e) | | United States | | 3M US L + 6.50% | | | 7.50 | % | | 06/06/24 | | | 774,000 | | | | 750,780 | |
| Stanton Carpet Corp. 2L, Second Lien Term Loan(e) | | United States | | 3M US L + 9.00% | | | 10.00 | % | | 04/01/28 | | | 2,213,000 | | | | 2,168,740 | |
| TLC Purchaser, Inc. Delayed Draw Term Loan(e)(f) | | United States | | L + 4.75% | | | | | | 10/13/25 | | | 623,197 | | | | 548,413 | |
| TLC Purchaser, Inc. Revolver Loan(e)(f) | | United States | | PRIME + 5.25% | | | 8.50 | % | | 10/13/25 | | | 778,762 | | | | 685,311 | |
| TLC Purchaser, Inc. Term Loan B(e) | | United States | | 3M US L + 5.75% | | | 6.75 | % | | 10/13/25 | | | 3,602,346 | | | | 3,170,064 | |
| | | | | | | | | | | | | | | | | | 12,754,322 | |
| CONSUMER GOODS: NON-DURABLE (0.90%) | | | | | | | | | | | | |
| ABG Intermediate Holdings 2 LLC, First Lien 2021 Refinancing Term Loan(c) | | United States | | 3M US L + 3.25% | | | 4.00 | % | | 09/27/24 | | | 237,941 | | | | 237,410 | |
| ABG Intermediate Holdings 2, First Lien Tranche 1 Term Loan(c)(d)(e) | | United States | | L + 3.50% | | | | | | 12/08/28 | | | 75,234 | | | | 74,952 | |
See Notes to Consolidated Financial Statements.
| Annual Report | December 31, 2021 | 15 |
| Griffin Institutional Access Credit Fund | Consolidated Schedule of Investments |
December 31, 2021
| Description | | Country | | Spread Above Index | | Rate | | | Maturity Date | | Principal Amount | | | Value
(Note 2)(a) | |
| CONSUMER GOODS: NON-DURABLE (continued) | | | | | | | | | | | | |
| ABG Intermediate Holdings 2, First Lien Tranche 2 Term Loan(c)(d)(e)(f) | | United States | | L + 3.50% | | | | | | 12/08/28 | | $ | 479,618 | | | $ | 477,820 | |
| ABG Intermediate Holdings 2, First Lien Tranche 3 Term Loan(c)(d)(e)(f) | | United States | | L + 3.50% | | | | | | 12/08/28 | | | 75,234 | | | | 74,952 | |
| ABG Intermediate Holdings 2, Second Lien Term Loan(d)(e) | | United States | | L + 6.00% | | | | | | 01/31/30 | | | 341,398 | | | | 343,105 | |
| FL Hawk Intermediate Holdings, Inc., Second Lien Term Loan(e) | | United States | | 3M US L + 9.00% | | | 10.00 | % | | 08/22/28 | | | 924,225 | | | | 924,225 | |
| Kronos Acquisition Holdings, Inc., First Lien Tranche B-1 Term Loan(c) | | Canada | | 3M US L + 3.75% | | | 4.25 | % | | 12/22/26 | | | 663,864 | | | | 646,129 | |
| New Era Cap Co., Inc., First Lien A Term Loan(e) | | United States | | 1M US L + 6.50% | | | 7.50 | % | | 09/10/23 | | | 1,744,758 | | | | 1,744,758 | |
| Plaze, Inc., First Lien 2021-1 Term Loan(c) | | United States | | 1M US L + 3.75% | | | 4.50 | % | | 08/03/26 | | | 618,750 | | | | 614,109 | |
| Plaze, Inc., First Lien Initial Term Loan(c)(e) | | United States | | 1M US L + 3.50% | | | 3.60 | % | | 08/03/26 | | | 490,000 | | | | 480,200 | |
| | | | | | | | | | | | | | | | | | 5,617,660 | |
| CONTAINERS, PACKAGING, & GLASS (1.74%) | | | | | | | | | | | | |
| Anchor Packaging LLC, First Lien Initial Term Loan(c) | | United States | | 1M US L + 4.00% | | | 4.10 | % | | 07/18/26 | | | 506,432 | | | | 502,634 | |
| Flex Acquisition Company, Inc., First Lien 2021 Specified Refinancing Term Loan(c) | | United States | | 3M US L + 3.50% | | | 4.00 | % | | 03/02/28 | | | 28,522 | | | | 28,500 | |
| Jadex, Inc., First Lien 2021 Refinancing Term Loan(c) | | United States | | 1M US L + 4.75% | | | 5.50 | % | | 02/18/28 | | | 1,279,824 | | | | 1,270,225 | |
| Mauser Packaging Solutions Holding Company, First Lien Initial Term Loan(c) | | United States | | 1M US L + 3.25% | | | 3.35 | % | | 04/03/24 | | | 1,605,829 | | | | 1,587,619 | |
| Pactiv Evergreen Group Holdings, Inc., First Lien Tranche B-3 U.S. Term Loan(c) | | United States | | 1M US L + 3.50% | | | 4.00 | % | | 09/24/28 | | | 377,241 | | | | 377,241 | |
| Pro Mach Group, Inc., First Lien Closing Date Initial Term Loan(c) | | United States | | 3M US L + 4.00% | | | 5.00 | % | | 08/31/28 | | | 1,366,850 | | | | 1,373,302 | |
| Pro Mach Group, Inc., First Lien Delayed Draw Term Loan(c)(f) | | United States | | L + 4.00% | | | | | | 08/31/28 | | | 171,931 | | | | 172,742 | |
| ProAmpac PG Borrower LLC, First Lien 2020-1 Term Loan(c) | | United States | | 3M US L + 3.75% | | | 4.50 | % | | 11/03/25 | | | 731,181 | | | | 732,895 | |
| Technimark LLC, First Lien Initial Term Loan(c) | | United States | | 3M US L + 3.75% | | | 4.25 | % | | 07/09/28 | | | 374,647 | | | | 373,478 | |
| Tekni-Plex, Inc., First Lien Tranche B-3 Initial Term Loan(c) | | United States | | 3M US L + 4.00% | | | 4.50 | % | | 09/17/28 | | | 431,233 | | | | 431,569 | |
| Tricorbraun Holdings, Inc., First Lien Closing Date Initial Term Loan(c) | | United States | | 1M US L + 3.25% | | | 3.75 | % | | 03/03/28 | | | 1,155,467 | | | | 1,148,725 | |
| Trident TPI Holdings, Inc., First Lien Delayed Draw Tem Term Loan(c)(f) | | United States | | 3M US L + 4.00% | | | 4.50 | % | | 09/17/28 | | | 61,259 | | | | 61,307 | |
| Trident TPI Holdings, Inc., First Lien Term Loan | | United States | | 3M EUR L + 3.50% | | | 3.50 | % | | 10/17/24 | | € | 742,365 | | | | 838,183 | |
| Trident TPI Holdings, Inc., First Lien Tranche B-1 Term Loan(c) | | United States | | 3M US L + 3.25% | | | 4.25 | % | | 10/17/24 | | $ | 550,660 | | | | 551,478 | |
| Valcour Packaging, LLC, First Lien Term Loan(c)(e) | | United States | | 3M US L + 3.75% | | | 4.25 | % | | 10/04/28 | | | 406,606 | | | | 406,606 | |
| Valcour Packaging, LLC, Second Lien Term Loan(e) | | United States | | 3M US L + 7.00% | | | 7.50 | % | | 10/04/29 | | | 1,057,166 | | | | 1,057,166 | |
| | | | | | | | | | | | | | | | | | 10,913,670 | |
| ENERGY: OIL & GAS (0.52%) | | | | | | | | | | | | |
| AMH Litigation Trust Initial Loan(e)(i) | | United States | | | | | | | | 06/06/25 | | | 1,044 | | | | 1,044 | |
See Notes to Consolidated Financial Statements.
| 16 | 1.888.926.2688 | www.griffincapital.com |
| Griffin Institutional Access Credit Fund | Consolidated Schedule of Investments |
December 31, 2021
| Description | | Country | | Spread Above Index | | Rate | | | Maturity Date | | Principal Amount | | | Value
(Note 2)(a) | |
| ENERGY: OIL & GAS (continued) | | | | | | | | | | | | |
| BlackBrush Oil & Gas LP, First Lien Term Loan(e)(g) | | United States | | 3M US L + 7.00% | | | 8.00 | % | | 09/01/25 | | $ | 827,546 | | | $ | 827,546 | |
| Oryx Midstream Services Permian Basin, LLC, First Lien Term Loan(c) | | United States | | 3M US L + 3.25% | | | 3.75 | % | | 10/05/28 | | | 1,040,514 | | | | 1,035,233 | |
| Oxbow Carbon LLC, First Lien Term Loan(c) | | United States | | 1M US L + 4.25% | | | 5.00 | % | | 10/19/25 | | | 1,393,635 | | | | 1,398,165 | |
| | | | | | | | | | | | | | | | | | 3,261,988 | |
| ENVIRONMENTAL INDUSTRIES (0.29%) | | | | | | | | | | | | |
| Urbaser, S.A., First Lien Term Loan | | Luxembourg | | 6M EUR L + 4.75% | | | 4.75 | % | | 10/23/28 | | € | 1,209,650 | | | | 1,382,156 | |
| WIN Waste Innovations Holdings, Inc., First Lien Initial Term Loan(c) | | United States | | 3M US L + 2.75% | | | 3.25 | % | | 03/24/28 | | $ | 463,120 | | | | 463,004 | |
| | | | | | | | | | | | | | | | | | 1,845,160 | |
| FIRE: FINANCE (1.86%) | | | | | | | | | | | | |
| Advisor Group Holdings, Inc., First Lien B-1 Term Loan(c) | | United States | | 1M US L + 4.50% | | | 4.60 | % | | 07/31/26 | | | 1,655,819 | | | | 1,662,550 | |
| Cast & Crew Payroll LLC, First Lien Initial Term Loan(c) | | United States | | 1M US L + 3.50% | | | 3.60 | % | | 02/09/26 | | | 737,669 | | | | 738,525 | |
| Claros Mortgage Trust, Inc., First Lien Term Loan(c)(e) | | United States | | 3M US L + 4.50% | | | 5.00 | % | | 08/09/26 | | | 2,052,597 | | | | 2,062,860 | |
| DRW Holdings LLC, First Lien Initial Term Loan(c) | | United States | | 1M US L + 3.75% | | | 3.85 | % | | 03/01/28 | | | 1,123,282 | | | | 1,121,529 | |
| Helios Software Holdings, Inc., First Lien Initial Dollar (2021) Term Loan(c) | | Luxembourg | | 3M US L + 3.75% | | | 3.97 | % | | 03/11/28 | | | 1,252,594 | | | | 1,246,851 | |
| HighTower Holdings LLC, First Lien Initial Term Loan(c)(d) | | United States | | 3M US L + 4.00% | | | 4.75 | % | | 04/21/28 | | | 887,646 | | | | 888,294 | |
| Hudson River Trading LLC, First Lien Term Loan(c) | | United States | | 1M US L + 3.00% | | | 3.10 | % | | 03/20/28 | | | 1,975,338 | | | | 1,963,348 | |
| ION Trading Finance, Ltd., First Lien Initial Dollar (2021) Term Loan(c) | | Ireland | | 3M US L + 4.75% | | | 4.97 | % | | 04/01/28 | | | 1,966,623 | | | | 1,974,273 | |
| | | | | | | | | | | | | | | | | | 11,658,230 | |
| FIRE: INSURANCE (2.08%) | | | | | | | | | | | | | | | | | | |
| Hub International, Ltd., First Lien Initial Term Loan(c) | | United States | | 3M US L + 2.75% | | | 2.87 | % | | 04/25/25 | | | 1,631,690 | | | | 1,615,006 | |
| IMA Financial Group, Inc., First Lien Term Loan(c)(d) | | United States | | L + 3.75% | | | | | | 11/01/28 | | | 805,949 | | | | 804,603 | |
| MRH Trowe Beteiligungsgesellschaft mbH Acquisition Facility(e)(f) | | Germany | | L + 1.65% | | | | | | 07/26/28 | | € | 2,370,000 | | | | 2,698,241 | |
| MRH Trowe Beteiligungsgesellschaft mbH Term Loan Facility A(e) | | Germany | | 3M EUR L + 5.50% | | | 5.50 | % | | 07/26/28 | | | 1,885,000 | | | | 2,146,069 | |
| Paisley Bidco Limited, Acquisition Facility(e)(f) | | Guernsey | | L + 1.93% | | | | | | 11/26/28 | | £ | 1,687,000 | | | | 2,260,598 | |
| Paisley Bidco Limited, Facility B(e) | | Guernsey | | 1M EUR L + 5.50% | | | 5.50 | % | | 11/26/28 | | € | 849,742 | | | | 957,755 | |
| Tempo Acquisition LLC, First Lien Extended Term Loan(c) | | United States | | 1M US L + 3.25% | | | 3.35 | % | | 11/02/26 | | $ | 1,482,642 | | | | 1,486,349 | |
| World Insurance Associates, LLC, Delayed Draw Term Loan(e) | | United States | | 3M US L + 5.75% | | | 6.75 | % | | 04/01/26 | | | 731,346 | | | | 725,861 | |
| World Insurance Associates, LLC, Revolving Term Loan(e)(f) | | United States | | 1M US L + 5.75% | | | 6.75 | % | | 04/01/26 | | | 81,464 | | | | 80,853 | |
| World Insurance Associates, LLC, Term Loan(e) | | United States | | 3M US L + 5.75% | | | 6.75 | % | | 04/01/26 | | | 275,806 | | | | 273,737 | |
| | | | | | | | | | | | | | | | | | 13,049,072 | |
See Notes to Consolidated Financial Statements.
| Annual Report | December 31, 2021 | 17 |
| Griffin Institutional Access Credit Fund | Consolidated Schedule of Investments |
December 31, 2021
| Description | | Country | | Spread Above Index | | Rate | | | Maturity Date | | Principal Amount | | | Value
(Note 2)(a) | |
| FIRE: REAL ESTATE (0.23%) | | | | | | | | | | | | |
| RealPage, Inc., First Lien Initial Term Loan(c)(d) | | United States | | 1M US L + 3.25% | | | 3.75 | % | | 04/24/28 | | $ | 1,438,600 | | | $ | 1,436,132 | |
| | | | | | | | | | | | | | | | | | | |
| HEALTHCARE & PHARMACEUTICALS (7.12%) | | | | | | | | | | | | |
| Amneal Pharmaceuticals LLC, First Lien Initial Term Loan(c)(d) | | United States | | 1M US L + 3.50% | | | 3.63 | % | | 05/04/25 | | | 3,212,069 | | | | 3,184,767 | |
| athenahealth, Inc., First Lien B-1 Term Loan(c) | | United States | | 3M US L + 4.25% | | | 4.40 | % | | 02/11/26 | | | 2,157,789 | | | | 2,160,756 | |
| Bayou Intermediate II LLC, First Lien Initial Term Loan(c)(e) | | United States | | 3M US L + 4.50% | | | 5.25 | % | | 08/02/28 | | | 573,219 | | | | 576,085 | |
| Chip Holdco, Ltd., First Lien B Term Loan(e) | | United Kingdom | | 3M US L + 5.00% | | | 5.22 | % | | 07/11/25 | | | 961,318 | | | | 961,318 | |
| Confluent Health, LLC Term Loan B(c) | | United States | | 1M US L + 4.00% | | | 4.10 | % | | 11/30/28 | | | 582,169 | | | | 582,410 | |
| Confluent Health, LLC, Delayed Draw Term Loan(c)(f) | | United States | | L + 4.00% | | | | | | 11/30/28 | | | 125,198 | | | | 125,250 | |
| Curium BidCo SARL, First Lien Additional Senior Facility Term Loan(c) | | Luxembourg | | 3M US L + 4.25% | | | 5.00 | % | | 12/02/27 | | | 694,579 | | | | 697,183 | |
| Curium BidCo SARL, Second Lien Term Loan | | Luxembourg | | 3M US L + 7.75% | | | 8.50 | % | | 10/27/28 | | | 811,462 | | | | 820,591 | |
| Endo Luxembourg Finance Company I SARL, First Lien 2021 Term Loan(c) | | United States | | 3M US L + 5.00% | | | 5.75 | % | | 03/27/28 | | | 3,009,049 | | | | 2,934,395 | |
| Envision Healthcare Corp., First Lien Initial Term Loan | | United States | | 1M US L + 3.75% | | | 3.85 | % | | 10/10/25 | | | 1,332,008 | | | | 1,076,016 | |
| eResearchTechnology, Inc., Initial Term Loan(c) | | United States | | 1M US L + 4.50% | | | 5.50 | % | | 02/04/27 | | | 2,223,848 | | | | 2,234,200 | |
| Genesis Care Finance Pty, Ltd., First Lien Facility B4 Term Loan | | United States | | 3M EUR L + 4.75% | | | 4.75 | % | | 05/14/27 | | € | 561,618 | | | | 615,996 | |
| Genesis Care Finance Pty, Ltd., First Lien Facility B5 Term Loan(d) | | United States | | 3M US L + 5.00% | | | 6.00 | % | | 05/14/27 | | $ | 1,278,164 | | | | 1,229,913 | |
| Golden State Buyer, Inc., First Lien Initial Term Loan(c) | | United States | | 1M US L + 4.75% | | | 5.50 | % | | 06/21/26 | | | 2,586,239 | | | | 2,578,170 | |
| Jazz Pharmaceuticals Public, Ltd. Company, First Lien Initial Dollar Term Loan(c) | | United States | | 1M US L + 3.50% | | | 4.00 | % | | 05/05/28 | | | 812,452 | | | | 816,466 | |
| LSCS Holdings/Eversana 11/21, First Lien Term Loan(c)(d) | | United States | | L + 4.50% | | | | | | 11/23/28 | | | 1,191,077 | | | | 1,192,864 | |
| Mertus 522. GmbH, Acquisition/Capex Facility(e) | | Germany | | 6M EUR L + 6.25% | | | 6.25 | % | | 05/28/26 | | € | 467,970 | | | | 532,783 | |
| Mertus 522. GmbH, Facility B(e) | | Germany | | 6M EUR L + 6.25% | | | 6.25 | % | | 05/28/26 | | | 800,751 | | | | 911,654 | |
| Milano Acquisition Corp., First Lien B Term Loan(c) | | United States | | 3M US L + 4.00% | | | 4.75 | % | | 10/01/27 | | $ | 1,430,789 | | | | 1,436,333 | |
| Mozart Debt Merger Sub, Inc., First Lien Term Loan(c) | | United States | | 1M US L + 3.25% | | | 3.75 | % | | 10/23/28 | | | 1,544,037 | | | | 1,545,434 | |
| National Mentor Holdings, Inc., First Lien Delayed Draw Term Loan(c)(f) | | United States | | L + 3.75% | | | | | | 03/02/28 | | | 86,662 | | | | 85,850 | |
| National Mentor Holdings, Inc., First Lien Initial C Term Loan(c) | | United States | | 3M US L + 3.75% | | | 4.50 | % | | 03/02/28 | | | 57,155 | | | | 56,619 | |
| National Mentor Holdings, Inc., First Lien Initial Term Loan(c)(d) | | United States | | 3M US L + 3.75% | | | 4.50 | % | | 03/02/28 | | | 2,081,904 | | | | 2,062,386 | |
| National Mentor Holdings, Inc., Second Lien Initial Term Loan | | United States | | 3M US L + 7.25% | | | 8.00 | % | | 03/02/29 | | | 1,609,442 | | | | 1,607,430 | |
| Padagis LLC, First Lien B Term Loan | | United States | | 3M US L + 4.75% | | | 5.25 | % | | 07/06/28 | | | 1,003,740 | | | | 1,000,603 | |
| Parexel International Corp., First Lien Term Loan(c) | | United States | | 1M US L + 3.50% | | | 4.00 | % | | 11/15/28 | | | 1,450,816 | | | | 1,452,818 | |
See Notes to Consolidated Financial Statements.
| 18 | 1.888.926.2688 | www.griffincapital.com |
| Griffin Institutional Access Credit Fund | Consolidated Schedule of Investments |
December 31, 2021
| Description | | Country | | Spread Above Index | | Rate | | | Maturity Date | | Principal Amount | | | Value
(Note 2)(a) | |
| HEALTHCARE & PHARMACEUTICALS (continued) | | | | | | | | | | | | |
| Radnet Management, Inc., First Lien Initial Term Loan(c) | | United States | | 3M US L + 3.00% | | | 3.75 | % | | 04/23/28 | | $ | 654,756 | | | $ | 655,575 | |
| Revint Intermediate II LLC, First Lien Initial Term Loan(c) | | United States | | 1M US L + 4.25% | | | 4.75 | % | | 10/15/27 | | | 1,126,535 | | | | 1,129,351 | |
| RH Diagnostik & Therapie Holding GmbH, Acquisition/Capex Facility(e)(f) | | Germany | | L + 0.25% | | | | | | 09/15/28 | | € | 3,415,542 | | | | 3,888,588 | |
| Sharp Midco LLC, First Lien Term Loan(c)(d)(e) | | United States | | L + 4.00% | | | | | | 12/14/28 | | $ | 417,637 | | | | 418,159 | |
| Sunmed Group Holdings, LLC, Revolver(e)(f) | | United States | | 3M US L + 5.75% | | | 6.50 | % | | 06/16/27 | | | 137,842 | | | | 137,842 | |
| Sunmed Group Holdings, LLC, Term Loan(e) | | United States | | 3M US L + 5.75% | | | 6.50 | % | | 06/16/28 | | | 2,076,160 | | | | 2,076,160 | |
| TecoStar Holdings, Inc., First Lien Term Loan(d) | | United States | | 3M US L + 3.50% | | | 4.50 | % | | 05/01/24 | | | 927,204 | | | | 884,993 | |
| Upstream Newco, Inc., First Lien August 2021 Incremental Term Loan(c) | | United States | | 1M US L + 4.25% | | | 4.34 | % | | 11/20/26 | | | 395,230 | | | | 396,279 | |
| Upstream Rehabilitation, Inc., Second Lien Term Loan(e) | | United States | | 1M US L + 8.50% | | | 8.60 | % | | 10/24/27 | | | 456,140 | | | | 451,579 | |
| US Radiology Specialists, Inc., First Lien Closing Date Term Loan(c)(d) | | United States | | 3M US L + 5.50% | | | 6.25 | % | | 12/15/27 | | | 2,082,982 | | | | 2,084,607 | |
| Verscend Holding Corp., First Lien B-1 Term Loan(c) | | United States | | 1M US L + 4.00% | | | 4.09 | % | | 08/27/25 | | | 106,776 | | | | 106,882 | |
| | | | | | | | | | | | | | | | | | 44,708,305 | |
| HIGH TECH INDUSTRIES (8.91%) | | | | | | | | | | | | |
| AMI US Holdings Inc. Revolver Loan(e)(f) | | United States | | 1M US L + 5.25% | | | 5.35 | % | | 04/01/24 | | | 145,361 | | | | 145,361 | |
| AMI US Holdings Inc. Term Loan(e) | | United States | | 1M US L + 5.50% | | | 6.50 | % | | 04/01/25 | | | 1,077,097 | | | | 1,077,097 | |
| AppLovin Corp., First Lien Initial Term Loan(c) | | United States | | 1M US L + 3.25% | | | 3.35 | % | | 08/15/25 | | | 1,456,467 | | | | 1,455,557 | |
| AppLovin Corp., First Lien Term Loan(c) | | United States | | 1M US L + 3.00% | | | 3.50 | % | | 10/25/28 | | | 977,878 | | | | 977,570 | |
| Appriss Health LLC, First Lien Initial Term Loan(e) | | United States | | 3M US L + 7.25% | | | 8.25 | % | | 05/06/27 | | | 988,075 | | | | 978,194 | |
| Appriss Health LLC, First Lien Revolving Credit Term Loan(e)(f) | | United States | | L + 0.50% | | | | | | 05/06/27 | | | 65,875 | | | | 65,216 | |
| Astra Acquisition Corp., First Lien Term Loan | | United States | | 1M US L + 5.25% | | | 5.75 | % | | 10/25/28 | | | 1,304,808 | | | | 1,284,153 | |
| Australian Technology LTD, 2021 Term Loan(e) | | Australia | | 3M BBSY + 5.75% | | | 6.75 | % | | 09/12/24 | | | AUD3,502,021 | | | | 2,547,888 | |
| Barracuda Networks, Inc., Second Lien 2nd Lien Term Loan | | United States | | 3M US L + 6.75% | | | 7.50 | % | | 10/30/28 | | $ | 532,670 | | | | 537,831 | |
| BMC Software, Inc., Second Lien 2nd Lien Term Loan | | United States | | 3M US L + 5.50% | | | 6.00 | % | | 03/23/26 | | | 431,682 | | | | 436,627 | |
| Boxer Parent Company, Inc., First Lien 2021 Replacement Dollar Term Loan(c) | | United States | | 3M US L + 3.75% | | | 3.97 | % | | 10/02/25 | | | 1,916,774 | | | | 1,907,190 | |
| Cardinal Parent, Inc., First Lien Initial Term Loan(c) | | United States | | 3M US L + 4.50% | | | 5.25 | % | | 11/12/27 | | | 748,295 | | | | 748,381 | |
| CB Nike Intermediateco Ltd. Closing Date Term Loan(e) | | Israel | | 3M US L + 4.75% | | | 5.75 | % | | 10/31/25 | | | 2,430,400 | | | | 2,430,400 | |
| CB Nike Intermediateco Ltd. Revolver Loan(e) | | Israel | | 3M US L + 4.75% | | | 5.75 | % | | 10/31/25 | | | 310,000 | | | | 310,000 | |
| Cloudera, Inc., First Lien Term Loan(c) | | United States | | 1M US L + 3.75% | | | 4.25 | % | | 10/08/28 | | | 939,539 | | | | 938,219 | |
| Cloudera, Inc., Second Lien Term Loan(e) | | United States | | 1M US L + 6.00% | | | 6.50 | % | | 10/08/29 | | | 1,038,558 | | | | 1,041,155 | |
| Cornerstone OnDemand, Inc., First Lien Initial Term Loan(c) | | United States | | 3M US L + 3.75% | | | 4.25 | % | | 10/15/28 | | | 1,120,552 | | | | 1,118,748 | |
| Creation Technologies, Inc., First Lien Term Loan(c)(e) | | United States | | 3M US L + 5.50% | | | 6.00 | % | | 10/05/28 | | | 1,072,292 | | | | 1,065,591 | |
See Notes to Consolidated Financial Statements.
| Annual Report | December 31, 2021 | 19 |
| Griffin Institutional Access Credit Fund | Consolidated Schedule of Investments |
December 31, 2021
| Description | | Country | | Spread Above Index | | Rate | | | Maturity Date | | Principal Amount | | | Value
(Note 2)(a) | |
| HIGH TECH INDUSTRIES (continued) | | | | | | | | | | | | |
| DCert Buyer, Inc., First Lien Initial Term Loan(c) | | United States | | 1M US L + 4.00% | | | 4.10 | % | | 10/16/26 | | $ | 682,492 | | | $ | 682,066 | |
| DCert Buyer, Inc., Second Lien First Amendment Refinancing Term Loan | | United States | | 1M US L + 7.00% | | | 7.10 | % | | 02/19/29 | | | 1,403,693 | | | | 1,409,539 | |
| Digital Media Solutions LLC, First Lien Initial Term Loan | | United States | | 1M US L + 5.00% | | | 5.75 | % | | 05/25/26 | | | 851,584 | | | | 846,794 | |
| Drilling Info Holdings, Inc., First Lien Initial Term Loan(e) | | United States | | 1M US L + 4.25% | | | 4.35 | % | | 07/30/25 | | | 1,999,683 | | | | 1,979,686 | |
| Endurance International Group Holdings, Inc., First Lien Initial Term Loan(c) | | United States | | 3M US L + 3.50% | | | 4.25 | % | | 02/10/28 | | | 564,541 | | | | 560,572 | |
| Ensemble RCM LLC, First Lien Closing Date Term Loan(c) | | United States | | 3M US L + 3.75% | | | 3.88 | % | | 08/03/26 | | | 1,229,081 | | | | 1,230,230 | |
| EP Purchaser, LLC, First Lien Term Loan(c) | | United States | | 3M US L + 3.50% | | | 4.00 | % | | 11/06/28 | | | 372,005 | | | | 372,610 | |
| Epicor Software Corp., First Lien C Term Loan(c) | | United States | | 1M US L + 3.25% | | | 4.00 | % | | 07/30/27 | | | 1,035,995 | | | | 1,036,528 | |
| Epicor Software Corp., Second Lien Initial Term Loan | | United States | | 1M US L + 7.75% | | | 8.75 | % | | 07/31/28 | | | 352,503 | | | | 361,610 | |
| IGT Holding IV AB, First Lien Facility B2 Term Loan(c) | | Sweden | | 3M US L + 3.50% | | | 4.00 | % | | 03/31/28 | | | 963,592 | | | | 962,995 | |
| Instructure Holdings, Inc., First Lien Term Loan(c) | | United States | | 1M US L + 2.75% | | | 3.25 | % | | 10/30/28 | | | 295,175 | | | | 294,437 | |
| Ivanti Software, Inc., First Lien First Amendment Term Loan(c) | | United States | | 3M US L + 4.00% | | | 4.75 | % | | 12/01/27 | | | 553,356 | | | | 551,397 | |
| Ivanti Software, Inc., First Lien Term Loan(c) | | United States | | 3M US L + 4.25% | | | 5.00 | % | | 12/01/27 | | | 964,998 | | | | 967,709 | |
| LTI Holdings, Inc., First Lien Initial Term Loan(c) | | United States | | 1M US L + 3.50% | | | 3.60 | % | | 09/06/25 | | | 2,954,225 | | | | 2,923,871 | |
| Magenta Buyer LLC, First Lien Initial Term Loan(c) | | United States | | 3M US L + 5.00% | | | 5.75 | % | | 07/27/28 | | | 1,472,951 | | | | 1,471,338 | |
| Marnix SAS, First Lien Facility B (EUR) Term Loan | | France | | 3M EUR L + 3.00% | | | 3.00 | % | | 11/19/26 | | € | 464,705 | | | | 522,219 | |
| Medassets Software Intermediate Hldgs., Inc., Second Lien Term Loan(d) | | United States | | L + 6.75% | | | | | | 11/19/29 | | $ | 702,969 | | | | 702,747 | |
| MRI Software LLC, Delayed Draw Term Loan(e)(g) | | United States | | 3M US L + 5.50% | | | 6.50 | % | | 02/10/26 | | | 4,678 | | | | 4,678 | |
| MRI Software LLC, First Lien Closing Date Term Loan(e)(g) | | United States | | 3M US L + 5.50% | | | 6.50 | % | | 02/10/26 | | | 2,269,573 | | | | 2,269,573 | |
| MRI Software LLC, First Lien Revolving Term Loan(e)(f) | | United States | | L + 0.50% | | | | | | 02/10/26 | | | 155,944 | | | | 155,944 | |
| Oneshield, Inc., Revolver Loan(e)(f) | | United States | | L + 0.50% | | | | | | 09/09/26 | | | 115,942 | | | | 115,942 | |
| Oneshield, Inc., Term Note(e) | | United States | | 3M US L + 9.00% | | | 10.00 | % | | 09/09/26 | | | 1,300,272 | | | | 1,300,272 | |
| Orchid Merger Sub II, LLC, First Lien Term Loan(d)(e) | | United States | | L + 4.75% | | | | | | 05/12/27 | | | 2,219,208 | | | | 2,130,440 | |
| Project Alpha Intermediate Holding, Inc., First Lien 2021 Refinancing Term Loan(c) | | United States | | 1M US L + 5.00% | | | 5.00 | % | | 04/26/24 | | | 270,033 | | | | 270,793 | |
| Project Boost Purchaser LLC, First Lien Term Loan(c) | | United States | | 6M US L + 4.00% | | | 4.50 | % | | 11/18/28 | | | 626,766 | | | | 627,744 | |
| Proofpoint, Inc., First Lien Initial Term Loan(c) | | United States | | 3M US L + 3.25% | | | 3.75 | % | | 08/31/28 | | | 1,014,610 | | | | 1,011,998 | |
| Red Planet Borrower LLC, First Lien Initial Term Loan(c) | | United States | | 3M US L + 3.75% | | | 4.25 | % | | 09/30/28 | | | 2,076,775 | | | | 2,068,468 | |
| Revalize, Inc., Additional Revolver(e)(f) | | United States | | L + 0.50% | | | | | | 04/15/27 | | | 100,000 | | | | 99,000 | |
See Notes to Consolidated Financial Statements.
| 20 | 1.888.926.2688 | www.griffincapital.com |
| Griffin Institutional Access Credit Fund | Consolidated Schedule of Investments |
December 31, 2021
| Description | | Country | | Spread Above Index | | Rate | | | Maturity Date | | Principal Amount | | | Value
(Note 2)(a) | |
| HIGH TECH INDUSTRIES (continued) | | | | | | | | | | | | |
| Revalize, Inc., Tranche 3 Delayed Draw Term Loan(e) | | United States | | 3M US L + 5.25% | | | 6.25 | % | | 04/15/27 | | $ | 385,000 | | | $ | 381,150 | |
| Revalize, Inc., Tranche 4 Delayed Draw Term Loan(e)(f) | | United States | | L + 0.50% | | | | | | 04/15/27 | | | 1,005,000 | | | | 994,950 | |
| SolarWinds Holdings, Inc., First Lien 2018 Refinancing Term Loan(c) | | United States | | 1M US L + 2.75% | | | 2.85 | % | | 02/05/24 | | | 1,978,242 | | | | 1,953,959 | |
| Sovos Compliance LLC, First Lien Initial Term Loan(c) | | United States | | 1M US L + 4.50% | | | 5.00 | % | | 08/12/28 | | | 480,898 | | | | 482,740 | |
| Sovos Compliance LLC, First Lien Term Loan(c)(f) | | United States | | L + 4.50% | | | | | | 08/12/28 | | | 83,047 | | | | 83,365 | |
| Surf Holdings SARL, First Lien Dollar Tranche Term Loan(c) | | United States | | 3M US L + 3.50% | | | 3.69 | % | | 03/05/27 | | | 313,823 | | | | 311,862 | |
| Symplr Software, Inc., First Lien Initial Term Loan(c) | | United States | | 3M US L + 4.50% | | | 5.25 | % | | 12/22/27 | | | 886,236 | | | | 888,868 | |
| UKG, Inc., First Lien Term Loan(c) | | United States | | 3M US L + 3.25% | | | 3.75 | % | | 05/03/26 | | | 130,479 | | | | 130,016 | |
| Ultimate Software, 2021 Incremental Term Loan (Second Lien) | | United States | | 1M US L + 5.25% | | | 5.75 | % | | 05/03/27 | | | 716,586 | | | | 720,918 | |
| Utimaco Management GmbH, Facility C1(e) | | Germany | | 3M EUR L + 4.00% | | | 4.00 | % | | 08/09/27 | | € | 2,786,275 | | | | 3,172,169 | |
| Vision Solutions, Inc., First Lien Term Loan(c) | | United States | | 3M US L + 4.00% | | | 4.00 | % | | 05/28/28 | | $ | 812,443 | | | | 812,443 | |
| | | | | | | | | | | | | | | | | | 55,928,818 | |
| HOTEL, GAMING, & LEISURE (2.22%) | | | | | | | | | | | | |
| Aimbridge Acquisition Co., Inc., First Lien 2021 Term Loan(e) | | United States | | 1M US L + 4.75% | | | 5.50 | % | | 02/02/26 | | | 140,192 | | | | 139,842 | |
| Aimbridge Acquisition Co., Inc., First Lien Initial (2019) Term Loan | | United States | | 1M US L + 3.75% | | | 3.85 | % | | 02/02/26 | | | 1,180,399 | | | | 1,156,791 | |
| Aristocrat Leisure, Ltd., First Lien Initial Term Loan(c) | | Australia | | 3M US L + 3.75% | | | 4.75 | % | | 10/19/24 | | | 277,660 | | | | 279,310 | |
| Compass III, Ltd., First Lien Facility B2 Term Loan | | Netherlands | | 6M EUR L + 4.00% | | | 4.00 | % | | 05/09/25 | | € | 671,493 | | | | 764,834 | |
| HNVR Holdco, Ltd., First Lien Facility C Term Loan | | United Kingdom | | 6M EUR L + 4.50% | | | 4.50 | % | | 09/12/27 | | | 1,353,619 | | | | 1,379,278 | |
| Hurtigruten Group AS, First Lien Term Loan(d) | | Norway | | 6M EUR L + 8.00% | | | 8.00 | % | | 06/11/23 | | | 1,334,140 | | | | 1,519,554 | |
| Hurtigruten Group AS, Term Loan(d) | | Norway | | L + 8.00% | | | | | | 06/11/23 | | | 2,235,572 | | | | 2,548,376 | |
| IRB Holding Corp., First Lien 2020 Replacement B Term Loan(c) | | United States | | 3M US L + 2.75% | | | 3.75 | % | | 02/05/25 | | $ | 1,170,233 | | | | 1,169,899 | |
| J & J Ventures Gaming LLC, First Lien Initial Term Loan(c)(e) | | United States | | 1M US L + 4.00% | | | 4.75 | % | | 04/26/28 | | | 498,079 | | | | 499,325 | |
| OVG Business Services, LLC, First Lien Term Loan(e) | | United States | | 3M US L + 6.25% | | | 7.25 | % | | 11/20/28 | | | 3,044,912 | | | | 3,014,463 | |
| Playa Resorts Holding, First Lien Initial Term Loan | | United States | | 1M US L + 2.75% | | | 3.75 | % | | 04/27/24 | | | 75,858 | | | | 74,048 | |
| Raptor Acquisition Corp., First Lien B Term Loan(c) | | Canada | | 3M US L + 4.00% | | | 4.75 | % | | 11/01/26 | | | 249,457 | | | | 250,315 | |
| Stonegate Pub Company Bidco Holdings, Ltd., Second Lien Facility Term Loan(d) | | United Kingdom | | L + 8.50% | | | | | | 03/06/28 | | £ | 871,287 | | | | 1,161,638 | |
| | | | | | | | | | | | | | | | | | 13,957,673 | |
| MEDIA: ADVERTISING, PRINTING & PUBLISHING (0.76%) | | | | | | | | | | | | |
| Castle US Holding Corp., First Lien Initial Dollar Term Loan(c) | | United States | | 3M US L + 3.75% | | | 3.97 | % | | 01/29/27 | | $ | 987,474 | | | | 980,068 | |
| Cimpress plc, First Lien Tranche B-1 Term Loan(c) | | Ireland | | 1M US L + 3.50% | | | 4.00 | % | | 05/17/28 | | | 523,167 | | | | 523,821 | |
See Notes to Consolidated Financial Statements.
| Annual Report | December 31, 2021 | 21 |
| Griffin Institutional Access Credit Fund | Consolidated Schedule of Investments |
December 31, 2021
| Description | | Country | | Spread Above Index | | Rate | | | Maturity Date | | Principal Amount | | | Value
(Note 2)(a) | |
| MEDIA: ADVERTISING, PRINTING & PUBLISHING (continued) | | | | | | | | |
| CMI Marketing, Inc., First Lien Term Loan(c)(e) | | United States | | 3M US L + 4.25% | | | 4.75 | % | | 03/23/28 | | $ | 1,245,886 | | | $ | 1,259,902 | |
| Constant Contact, Inc., First Lien Initial Term Loan(c) | | United States | | 6M US L + 4.00% | | | 4.75 | % | | 02/10/28 | | | 1,990,916 | | | | 1,992,161 | |
| | | | | | | | | | | | | | | | | | 4,755,952 | |
| MEDIA: BROADCASTING & SUBSCRIPTION (1.66%) | | | | | | | | |
| Altice Financing S.A., First Lien March 2017 Refinancing Term Loan(c) | | Luxembourg | | 3M US L + 2.75% | | | 2.87 | % | | 07/15/25 | | | 953,629 | | | | 943,158 | |
| Altice Financing S.A., First Lien October 2017 USD Term Loan(c) | | Luxembourg | | 3M US L + 2.75% | | | 2.87 | % | | 01/31/26 | | | 687,471 | | | | 681,050 | |
| Lightning Finco Limited, Facility B1 Term Loan(e) | | United Kingdom | | 6M US L + 5.75% | | | 6.50 | % | | 07/14/28 | | | 2,127,719 | | | | 2,127,719 | |
| Lightning Finco Limited, Facility B2 Term Loan(e) | | United Kingdom | | 6M US L + 5.75% | | | 6.50 | % | | 07/14/28 | | | 284,281 | | | | 284,281 | |
| Radiate Holdco LLC, First Lien Term Loan(c) | | United States | | 1M US L + 3.25% | | | 4.00 | % | | 09/25/26 | | | 2,366,445 | | | | 2,361,522 | |
| Univision Communications, Inc., First Lien B Term Loan(c)(d) | | United States | | L + 3.25% | | | | | | 05/05/28 | | | 823,293 | | | | 823,145 | |
| Virgin Media Ireland, Ltd., First Lien Facility B1 Term Loan | | Ireland | | 3M EUR L + 3.50% | | | 3.50 | % | | 07/15/29 | | € | 893,224 | | | | 1,014,814 | |
| Walker Edison Furniture Company LLC, First Lien Term Loan(e) | | United States | | 3M US L + 5.75% | | | 6.75 | % | | 08/05/27 | | $ | 1,127,218 | | | | 1,082,129 | |
| WideOpenWest 12/21 Cov-Lite, First Lien Term Loan(c) | | United States | | 1M SOFR + 3.00% | | | 3.50 | % | | 12/08/28 | | | 1,119,499 | | | | 1,119,729 | |
| | | | | | | | | | | | | | | | | | 10,437,547 | |
| MEDIA: DIVERSIFIED & PRODUCTION (3.56%) | | | | | | | | |
| 9 Story Media Group Inc. CAD, First Lien Term Loan(e) | | Canada | | 3M CDOR + 5.50% | | | 6.25 | % | | 04/30/26 | | | CAD1,718,765 | | | | 1,358,761 | |
| 9 Story Media Group Inc. Euro, First Lien Term Loan(e) | | Canada | | 3M EUR L + 5.25% | | | 5.25 | % | | 04/30/26 | | € | 768,697 | | | | 875,160 | |
| 9 Story Media Group Inc. Revolver(e)(f) | | Canada | | 2M CDOR + 5.25% | | | 6.25 | % | | 04/30/26 | | | CAD 895,604 | | | | 708,015 | |
| Aptus 1724. GmbH Capex and Acquisition Facility(e) | | Germany | | 3M US L + 6.25% | | | 6.50 | % | | 02/23/28 | | $ | 941,323 | | | | 941,323 | |
| Aptus 1724. GmbH Facility B(e) | | Germany | | 3M EUR L + 6.00% | | | 6.25 | % | | 02/23/28 | | € | 2,462,373 | | | | 2,803,407 | |
| Crown Finance US, Inc., First Lien Initial B-1 Term Loan(g)(h) | | United Kingdom | | | | | 15.25 | % | | 05/23/24 | | $ | 278,178 | | | | 333,640 | |
| Crown Finance US, Inc., First Lien Initial Dollar Tranche Term Loan(g)(j) | | United Kingdom | | 3M US L + 2.50% | | | 3.50 | % | | 02/28/25 | | | 4,057 | | | | 3,152 | |
| Crown Finance US, Inc., First Lien Partially Priming Incremental Term Loan | | United Kingdom | | 3M US L + 8.25% | | | 9.25 | % | | 05/23/24 | | | 74,173 | | | | 79,551 | |
| Getty Images, Inc., First Lien Initial Dollar Term Loan(c) | | United States | | 1M US L + 4.50% | | | 4.63 | % | | 02/19/26 | | | 984,606 | | | | 987,275 | |
| Getty Images, Inc., First Lien Initial Euro Term Loan | | United States | | 1M EUR L + 5.00% | | | 5.00 | % | | 02/19/26 | | € | 290,568 | | | | 331,462 | |
| Indy US Bidco LLC, First Lien Term Loan(c) | | United States | | 3M US L + 3.75% | | | 3.84 | % | | 03/05/28 | | $ | 657,856 | | | | 658,063 | |
| International Entertainment Investments, Ltd., First Lien C1 Term Loan(e)(g) | | United Kingdom | | 6M GBP L + 4.75% | | | 4.85 | % | | 05/31/23 | | £ | 620,998 | | | | 840,550 | |
| International Entertainment Investments, Ltd., First Lien C2 Term Loan(e)(g) | | United Kingdom | | 6M GBP L + 4.75% | | | 5.06 | % | | 05/31/23 | | | 382,153 | | | | 517,261 | |
| MH Sub I LLC, First Lien 2020 June New Term Loan(c) | | United States | | 1M US L + 3.75% | | | 4.75 | % | | 09/13/24 | | $ | 305,540 | | | | 306,559 | |
| MH Sub I LLC, First Lien Amendment No. 2 Initial Term Loan(c) | | United States | | 1M US L + 3.50% | | | 3.60 | % | | 09/13/24 | | | 1,668,954 | | | | 1,663,012 | |
See Notes to Consolidated Financial Statements.
| 22 | 1.888.926.2688 | www.griffincapital.com |
| Griffin Institutional Access Credit Fund | Consolidated Schedule of Investments |
December 31, 2021
| Description | | Country | | Spread Above Index | | Rate | | | Maturity Date | | Principal Amount | | | Value
(Note 2)(a) | |
| MEDIA: DIVERSIFIED & PRODUCTION (continued) | | | | | | | | |
| MH Sub I LLC, Second Lien 2021 Replacement Term Loan | | United States | | 1M US L + 6.25% | | | 6.35 | % | | 02/23/29 | | $ | 1,465,563 | | | $ | 1,478,386 | |
| National CineMedia LLC, First Lien Initial Term Loan | | United States | | 1M US L + 4.00% | | | 5.00 | % | | 06/20/25 | | | 1,199,466 | | | | 1,085,331 | |
| National CineMedia LLC, First Lien New Incremental Term Loan(e) | | United States | | 1M US L + 8.00% | | | 9.00 | % | | 12/20/24 | | | 1,628,881 | | | | 1,571,870 | |
| Recorded Books, Inc., First Lien 2021 Replacement Term Loan(c) | | United States | | 1M US L + 4.00% | | | 4.10 | % | | 08/29/25 | | | 1,891,096 | | | | 1,892,108 | |
| Tech 6, First Lien Tranche 1(g) | | France | | 6M EUR L + 6.00% | | | 6.00 | % | | 06/30/24 | | € | 299,698 | | | | 364,664 | |
| Tech 6, First Lien Tranche 2(e)(g) | | France | | 6M EUR L + 6.00% | | | 6.00 | % | | 06/30/24 | | | 352,807 | | | | 427,297 | |
| Technicolor USA, Inc., First Lien Tranche 1 Term Loan(g) | | France | | 6M EUR L + 3.00% | | | 3.00 | % | | 12/31/24 | | | 880,390 | | | | 978,518 | |
| Technicolor USA, Inc., US New Money Loan(g) | | France | | 6M US L + 12.00% | | | 12.15 | % | | 06/30/24 | | $ | 249,887 | | | | 266,833 | |
| William Morris Endeavor Entertainment LLC, First Lien B-1 Term Loan | | United States | | 1M US L + 2.75% | | | 2.86 | % | | 05/18/25 | | | 1,925,882 | | | | 1,889,050 | |
| | | | | | | | | | | | | | | | | | 22,361,248 | |
| METALS & MINING (0.19%) | | | | | | | | |
| American Consolidated Natural Resources, Inc., First Priority Term Loan(g) | | United States | | 3M US L + 16.00% | | | 17.00 | % | | 09/16/25 | | | 502,741 | | | | 516,147 | |
| Hyperion Materials & Technologies, Inc., First Lien Initial Term Loan(c) | | United States | | 3M US L + 4.50% | | | 5.00 | % | | 08/30/28 | | | 677,666 | | | | 679,645 | |
| | | | | | | | | | | | | | | | | | 1,195,792 | |
| RETAIL (3.28%) | | | | | | | | | | | | | | | | | | |
| Ascena Retail Group, Inc., First Lien Tranche B Term Loan(j) | | United States | | 1M US L + 4.50% | | | 5.25 | % | | 08/21/22 | | | 1,435,369 | | | | 10,586 | |
| Calceus Acquisition, Inc., First Lien Initial Term Loan(d) | | United States | | L + 5.50% | | | | | | 02/12/25 | | | 610,362 | | | | 577,809 | |
| Eyemart Express LLC, First Lien B-1 Term Loan(c)(e) | | United States | | 3M US L + 3.00% | | | 4.00 | % | | 08/31/27 | | | 1,678,304 | | | | 1,678,304 | |
| Financiere Abra SAS, Second Lien Facility Term Loan | | France | | 3M EUR L + 8.00% | | | 8.00 | % | | 10/23/26 | | € | 500,000 | | | | 570,908 | |
| Hunkemoller B.V., First Lien Term Loan(d)(e) | | Netherlands | | 3M EUR L + 3.75% | | | 3.75 | % | | 02/10/23 | | | 2,269,445 | | | | 2,467,490 | |
| L1R HB Finance, Ltd., First Lien Facility B1 Term Loan(d) | | United Kingdom | | 3M SONIA + 5.25% | | | 5.53 | % | | 09/02/24 | | £ | 3,000,000 | | | | 3,785,084 | |
| Mattress Firm, Inc., First Lien -2021 Term Loan(c) | | United States | | 3M US L + 4.25% | | | 5.00 | % | | 09/24/28 | | $ | 1,305,116 | | | | 1,297,775 | |
| MED ParentCo LP, First Lien Initial Term Loan(c) | | United States | | 1M US L + 4.25% | | | 4.35 | % | | 08/31/26 | | | 1,348,973 | | | | 1,349,344 | |
| New Look Vision Group, Inc., First Lien Canadian Delayed Draw Term Loan(e)(f) | | Canada | | 3M US L + 5.25% | | | 6.25 | % | | 05/26/28 | | | CAD 985,074 | | | | 778,746 | |
| New Look Vision Group, Inc., First Lien Canadian Revolving Term Loan(e)(f) | | Canada | | 3M CDOR + 5.50% | | | 6.25 | % | | 05/26/26 | | | 338,000 | | | | 267,204 | |
| New Look Vision Group, Inc., First Lien Initial Term Loan(e) | | Canada | | 3M CDOR + 5.25% | | | 6.25 | % | | 05/26/28 | | | 2,484,773 | | | | 1,964,325 | |
| Runner Buyer, Inc., First Lien Term Loan(c) | | United States | | 3M US L + 5.50% | | | 6.25 | % | | 10/21/28 | | $ | 1,288,668 | | | | 1,275,781 | |
| RVR Dealership Holdings LLC, First Lien B Term Loan(c) | | United States | | 3M US L + 4.00% | | | 4.75 | % | | 02/08/28 | | | 1,001,504 | | | | 1,000,883 | |
| Thrasio, LLC, Initial Term Loan(e) | | United States | | 3M US L + 7.00% | | | 8.00 | % | | 12/18/26 | | | 2,835,523 | | | | 2,835,523 | |
| Tory Burch LLC, First Lien Initial B Term Loan(c) | | United States | | 1M US L + 3.00% | | | 3.50 | % | | 04/16/28 | | | 759,290 | | | | 759,290 | |
| | | | | | | | | | | | | | | | | | 20,619,052 | |
See Notes to Consolidated Financial Statements.
| Annual Report | December 31, 2021 | 23 |
| Griffin Institutional Access Credit Fund | Consolidated Schedule of Investments |
December 31, 2021
| Description | | Country | | Spread Above Index | | Rate | | | Maturity Date | | Principal Amount | | | Value
(Note 2)(a) | |
| SERVICES: BUSINESS (10.56%) | | | | | | | | |
| Acuris Finance US, Inc., First Lien Initial Dollar Term Loan(c) | | United States | | 3M US L + 4.00% | | | 4.50 | % | | 02/16/28 | | $ | 294,980 | | | $ | 296,402 | |
| AEA International Holdings SARL, First Lien Initial Term Loan(c) | | Luxembourg | | 3M US L + 3.75% | | | 4.25 | % | | 09/07/28 | | | 1,079,331 | | | | 1,082,029 | |
| Alliant Holdings Intermediate LLC, First Lien 2018 Initial Term Loan(c) | | United States | | 1M US L + 3.25% | | | 3.35 | % | | 05/09/25 | | | 1,182,307 | | | | 1,172,027 | |
| Alliant Holdings Intermediate LLC, First Lien 2019 New Term Loan(c) | | United States | | 1M US L + 3.25% | | | 3.35 | % | | 05/09/25 | | | 762,499 | | | | 756,239 | |
| AMCP Clean Acquisition Company LLC, First Lien Delayed Draw Term Loan | | United States | | 1M US L + 4.25% | | | 4.35 | % | | 07/10/25 | | | 158,855 | | | | 132,744 | |
| AMCP Clean Acquisition Company LLC, First Lien Term Loan | | United States | | 1M US L + 4.25% | | | 4.35 | % | | 07/10/25 | | | 656,463 | | | | 548,557 | |
| Atlas CC Acquisition Corp., First Lien B Term Loan(c) | | United States | | 3M US L + 4.25% | | | 5.00 | % | | 05/25/28 | | | 709,305 | | | | 711,798 | |
| Atlas CC Acquisition Corp., First Lien C Term Loan(c) | | United States | | 3M US L + 4.25% | | | 5.00 | % | | 05/25/28 | | | 144,265 | | | | 144,773 | |
| AVSC Holding Corp., First Lien 2020 B-1 Term Loan(g) | | United States | | 3M US L + 3.50% | | | 4.50 | % | | 03/03/25 | | | 2,377,306 | | | | 2,195,442 | |
| AVSC Holding Corp., First Lien 2020 B-3 Term Loan(g)(h) | | United States | | | | | 15.00 | % | | 10/15/26 | | | 1,991,702 | | | | 2,330,790 | |
| Brook Bidco I Limited, CA Facility 1(d)(e)(g) | | Ireland | | 3M US L + 6.00% | | | 6.75 | % | | 07/07/28 | | £ | 630,000 | | | | 852,734 | |
| Brook Bidco I Limited, CA Facility 2(d)(e)(g) | | Ireland | | 3M US L + 6.00% | | | 6.75 | % | | 07/07/28 | | | 470,000 | | | | 636,167 | |
| Brook Bidco I Limited, Facility B(e)(g) | | Ireland | | 3M US L + 6.00% | | | 6.09 | % | | 07/07/28 | | | 1,754,383 | | | | 2,374,639 | |
| Brown Group Holdings LLC, First Lien Initial Term Loan(c) | | United States | | 3M US L + 2.50% | | | 3.00 | % | | 06/07/28 | | $ | 1,066,137 | | | | 1,065,471 | |
| Chamber Bidco Limited, Facility B Term Loan(e) | | United Kingdom | | 3M US L + 6.00% | | | 6.50 | % | | 06/07/28 | | | 4,870,000 | | | | 4,870,000 | |
| Comet Bidco, Ltd., First Lien Facility B Term Loan | | United Kingdom | | 6M GBP L + 5.25% | | | 5.42 | % | | 09/27/24 | | £ | 469,565 | | | | 590,115 | |
| Comet Bidco, Ltd., First Lien Facility B2 Term Loan | | United Kingdom | | 6M US L + 5.00% | | | 6.00 | % | | 09/30/24 | | $ | 2,228,275 | | | | 2,112,962 | |
| Constellation Automotive Ltd, Term Loan | | United Kingdom | | 3M SONIA + 7.50% | | | 7.50 | % | | 07/16/29 | | £ | 379,158 | | | | 521,065 | |
| ENC Parent Corp., First Lien Delayed Draw Term Loan(c)(f) | | United States | | L + 4.25% | | | | | | 08/19/28 | | $ | 74,568 | | | | 74,288 | |
| ENC Parent Corp., First Lien Initial Term Loan(c) | | United States | | 3M US L + 4.25% | | | 5.00 | % | | 08/19/28 | | | 836,794 | | | | 833,656 | |
| Genuine Financial Holdings LLC, First Lien Initial Term Loan(c) | | United States | | 1M US L + 3.75% | | | 3.85 | % | | 07/11/25 | | | 987,474 | | | | 985,499 | |
| GHX Ultimate Parent Corp., First Lien Initial Term Loan(c) | | United States | | 3M US L + 3.25% | | | 4.25 | % | | 06/28/24 | | | 671,304 | | | | 670,885 | |
| Global Business Travel Holdings, Ltd., First Lien Initial Term Loan(d) | | United States | | 1M US L + 2.50% | | | 2.60 | % | | 08/13/25 | | | 570,032 | | | | 555,781 | |
| Gluware, Inc., First Lien Term Loan(e)(g) | | United States | | | | | 12.50 | % | | 10/15/25 | | | 1,641,000 | | | | 1,608,180 | |
| Hunter Holdco 3, Ltd., First Lien Initial Dollar Term Loan(c) | | United Kingdom | | 3M US L + 4.25% | | | 4.75 | % | | 08/19/28 | | | 901,095 | | | | 903,915 | |
| Inmar, Inc., First Lien Term Loan(c) | | United States | | 3M US L + 4.00% | | | 5.00 | % | | 05/01/24 | | | 609,056 | | | | 609,376 | |
| Mercury Borrower, Inc., First Lien Term Loan(c)(d) | | United States | | L + 3.50% | | | | | | 08/02/28 | | | 155,666 | | | | 155,277 | |
| Mercury Borrower, Inc., Second Lien Term Loan(d) | | United States | | L + 6.50% | | | | | | 08/02/29 | | | 809,091 | | | | 813,391 | |
| Midcap Invest UK Acquisition Facility(e)(f)(g) | | United Kingdom | | L + 1.50% | | | | | | 05/05/28 | | £ | 1,123,000 | | | | 1,520,032 | |
| Midcap Invest UK Facility B(e)(g) | | United Kingdom | | 12M SONIA + 5.50% | | | 5.83 | % | | 05/05/28 | | | 2,527,000 | | | | 3,420,411 | |
See Notes to Consolidated Financial Statements.
| 24 | 1.888.926.2688 | www.griffincapital.com |
| Griffin Institutional Access Credit Fund | Consolidated Schedule of Investments |
December 31, 2021
| Description | | Country | | Spread Above Index | | Rate | | | Maturity Date | | Principal Amount | | | Value
(Note 2)(a) | |
| SERVICES: BUSINESS (continued) | | | | | | | | |
| Mitchell International, Inc., First Lien Term Loan(c) | | United States | | 3M US L + 3.75% | | | 4.25 | % | | 10/15/28 | | $ | 1,060,526 | | | $ | 1,055,886 | |
| Monotype Imaging 11/21 Cov-Lite, First Lien Term Loan(d) | | United States | | 3M US L + 5.00% | | | 5.75 | % | | 10/31/26 | | | 2,483,486 | | | | 2,489,695 | |
| Osmose Utilities Services, Inc., First Lien Initial Term Loan(c) | | United States | | 1M US L + 3.25% | | | 3.75 | % | | 06/22/28 | | | 788,329 | | | | 784,978 | |
| PECF USS Intermediate Holding III Corporation, Initial Term Loan(c) | | United States | | 3M US L + 4.25% | | | 4.75 | % | | 11/19/28 | | | 1,270,690 | | | | 1,273,644 | |
| Project Boost Purchaser LLC, First Lien Tranche 1 Term Loan(c) | | United States | | 1M US L + 3.50% | | | 3.60 | % | | 06/01/26 | | | 1,420,500 | | | | 1,421,388 | |
| Project Boost Purchaser LLC, Second Lien Term Loan(e) | | United States | | 1M US L + 8.00% | | | 8.10 | % | | 05/31/27 | | | 448,768 | | | | 447,646 | |
| Refine Intermediate, Inc., Facility B Term Loan(e) | | United States | | 3M US L + 4.50% | | | 5.50 | % | | 03/03/27 | | | 1,915,751 | | | | 1,915,751 | |
| Refine Intermediate, Inc., Revolving Facility Term Loan(e)(f) | | United States | | L + 0.50% | | | | | | 09/03/26 | | | 467,256 | | | | 467,256 | |
| Research Now Group, Inc., First Lien Initial Term Loan(c) | | United States | | 3M US L + 5.50% | | | 6.50 | % | | 12/20/24 | | | 2,748,896 | | | | 2,718,260 | |
| Research Now Group, Inc., Second Lien Term Loan | | United States | | 3M US L + 9.50% | | | 10.50 | % | | 12/20/25 | | | 2,177,805 | | | | 2,159,653 | |
| Smartronix Initial Term Loan(e) | | United States | | 3M US L + 6.00% | | | 7.00 | % | | 11/23/28 | | | 4,161,000 | | | | 4,077,780 | |
| Smartronix Revolving Loan(e)(f) | | United States | | L + 0.50% | | | | | | 11/23/27 | | | 711,000 | | | | 696,780 | |
| Sophia LP, First Lien Term Loan(c) | | United States | | 3M US L + 3.75% | | | 4.25 | % | | 10/07/27 | | | 1,436,504 | | | | 1,437,761 | |
| SumUp Holdings Midco SARL Delayed Draw(e) | | Luxembourg | | 3M EUR L + 8.50% | | | 10.00 | % | | 02/17/26 | | € | 3,299,189 | | | | 3,756,121 | |
| Trader Interactive LLC, First Lien Initial Term Loan(c)(e) | | United States | | 6M US L + 4.00% | | | 4.50 | % | | 07/28/28 | | $ | 381,369 | | | | 380,892 | |
| USIC Holdings, Inc., First Lien Initial Term Loan(c) | | United States | | 1M US L + 3.50% | | | 4.25 | % | | 05/12/28 | | | 1,540,675 | | | | 1,540,675 | |
| USIC Holdings, Inc., Second Lien Initial Term Loan | | United States | | 1M US L + 6.50% | | | 7.25 | % | | 05/14/29 | | | 764,488 | | | | 772,324 | |
| Venga Finance SARL, First Lien Term Loan(c)(d) | | Luxembourg | | L + 4.75% | | | | | | 11/03/28 | | | 1,055,084 | | | | 1,037,285 | |
| WCI-Gigawatt Purchaser, LLC, Initial Delayed Draw Term Loan(e)(f) | | United States | | 3M US L + 5.75% | | | 6.75 | % | | 11/19/27 | | | 543,000 | | | | 530,782 | |
| WCI-Gigawatt Purchaser, LLC, Initial Term Loan(e) | | United States | | 3M US L + 5.75% | | | 6.75 | % | | 11/19/27 | | | 2,509,000 | | | | 2,452,548 | |
| WCI-Gigawatt Purchaser, LLC, Revolving Loan(e)(f) | | United States | | L + 0.50% | | | | | | 11/19/27 | | | 362,000 | | | | 353,855 | |
| | | | | | | | | | | | | | | | | | 66,315,605 | |
| SERVICES: CONSUMER (2.72%) | | | | | | | | |
| Arches Buyer, Inc., First Lien Refinancing Term Loan(c) | | United States | | 1M US L + 3.25% | | | 3.75 | % | | 12/06/27 | | | 1,414,286 | | | | 1,406,691 | |
| Foundational Education Group, Inc., Second Lien Initial Term Loan | | United States | | 3M US L + 6.50% | | | 7.00 | % | | 08/31/29 | | | 1,333,333 | | | | 1,333,333 | |
| MZR Buyer, LLC, Initial Term Loan(e) | | United States | | 3M US L + 6.75% | | | 7.75 | % | | 12/21/26 | | | 2,640,569 | | | | 2,640,569 | |
| MZR Buyer, LLC, Revolving Loan(e)(f) | | United States | | L + 0.50% | | | | | | 12/21/26 | | | 341,954 | | | | 341,954 | |
| Pack-A-Punch Bidco Limited Acquisition Facility(e)(f) | | United Kingdom | | 3M SONIA + 5.75% | | | 5.92 | % | | 07/15/28 | | £ | 580,000 | | | | 781,132 | |
| Pack-A-Punch Bidco Limited Facility B(e) | | United Kingdom | | 3M SONIA + 5.75% | | | 5.80 | % | | 07/15/28 | | | 1,095,000 | | | | 1,474,722 | |
| Pathway Vet Alliance LLC, First Lien 2021 Replacement Term Loan(c) | | United States | | 1M US L + 3.75% | | | 3.85 | % | | 03/31/27 | | $ | 732,200 | | | | 730,827 | |
See Notes to Consolidated Financial Statements.
| Annual Report | December 31, 2021 | 25 |
| Griffin Institutional Access Credit Fund | Consolidated Schedule of Investments |
December 31, 2021
| Description | | Country | | Spread Above Index | | Rate | | | Maturity Date | | Principal Amount | | | Value
(Note 2)(a) | |
| SERVICES: CONSUMER (continued) | | | | | | | | |
| Pearl Intermediate Parent LLC, First Lien Initial Term Loan(c) | | United States | | 1M US L + 2.75% | | | 2.85 | % | | 02/14/25 | | $ | 1,459,612 | | | $ | 1,445,243 | |
| Refficiency Holdings LLC, Delayed Draw Term loan(c)(f) | | United States | | L + 3.75% | | | | | | 12/16/27 | | | 69,332 | | | | 69,375 | |
| Refficiency Holdings LLC, First Lien Term Loan(c) | | United States | | 1M US L + 3.25% | | | 4.00 | % | | 12/16/27 | | | 356,926 | | | | 357,151 | |
| The Knot Worldwide, Inc., Second Lien Initial Dollar Term Loan | | United States | | 3M US L + 8.25% | | | 8.38 | % | | 12/21/26 | | | 533,333 | | | | 528,000 | |
| Titan Acquisitionco New Zealand Ltd., First Lien Term Loan(c) | | United States | | 3M US L + 4.00% | | | 4.50 | % | | 10/18/28 | | | 922,040 | | | | 921,270 | |
| Travel Leaders Group LLC, First Lien 2018 Refinancing Term Loan | | United States | | 1M US L + 4.00% | | | 4.10 | % | | 01/25/24 | | | 3,313,091 | | | | 3,039,429 | |
| Viad Corp, First Lien Initial Term Loan(c) | | United States | | 1M US L + 5.00% | | | 5.50 | % | | 07/30/28 | | | 712,500 | | | | 712,058 | |
| Zeppelin Bidco Pty Limited, Facility B(e) | | Australia | | 6M BBSY + 6.00% | | | 6.12 | % | | 06/28/24 | | | AUD1,804,348 | | | | 1,312,750 | |
| | | | | | | | | | | | | | | | | | 17,094,504 | |
| TELECOMMUNICATIONS (2.74%) | | | | | | | | |
| Cincinnati Bell Inc., First Lien Term Loan(c) | | United States | | 3M SOFR + 3.25% | | | 3.75 | % | | 11/17/28 | | $ | 691,123 | | | | 691,900 | |
| Connect Finco SARL, First Lien Amendment No. 1 Refinancing Term Loan(c) | | United Kingdom | | 1M US L + 3.50% | | | 4.50 | % | | 12/11/26 | | | 1,474,981 | | | | 1,476,950 | |
| DC Blox Inc., Initial Advance(e)(f)(g) | | United States | | 1M US L + 8.00% | | | 9.00 | % | | 03/22/26 | | | 4,722,770 | | | | 4,722,770 | |
| GTT Communications BV, First Lien Closing Date EMEA Term Loan(d)(g) | | United States | | 3M EUR L + 5.25% | | | 5.25 | % | | 05/31/25 | | € | 1,885,584 | | | | 1,929,378 | |
| GTT Communications, Inc., First Lien Closing Date U.S. Term Loan(d)(g) | | United States | | 3M US L + 4.75% | | | 4.88 | % | | 05/31/25 | | $ | 2,081,174 | | | | 1,872,516 | |
| Horizon Telcom, Inc., First Lien Delayed Draw Term Loan(e) | | United States | | 3M US L + 5.00% | | | 6.00 | % | | 06/15/23 | | | 44,513 | | | | 44,513 | |
| Horizon Telcom, Inc., First Lien Revolving Term Loan(e) | | United States | | 3M US L + 5.00% | | | 6.00 | % | | 06/15/23 | | | 5,793 | | | | 5,793 | |
| Horizon Telcom, Inc., First Lien Term Loan(e) | | United States | | 3M US L + 5.00% | | | 6.00 | % | | 06/15/23 | | | 646,510 | | | | 646,510 | |
| Intelsat Jackson Holdings SA, DIP Facility (2021)(f) | | Luxembourg | | 3M US L + 4.75% | | | 5.75 | % | | 07/13/22 | | | 107,609 | | | | 107,778 | |
| LOGIX Holding Company LLC, First Lien Initial Term Loan | | United States | | 1M US L + 5.75% | | | 6.75 | % | | 12/22/24 | | | 331,200 | | | | 312,984 | |
| Mavenir Systems, Inc., First Lien Initial Term Loan(c) | | United States | | 3M US L + 4.75% | | | 5.25 | % | | 08/18/28 | | | 849,422 | | | | 850,837 | |
| MetroNet Systems Holdings LLC, First Lien 2021 Term Loan(c) | | United States | | 1M US L + 3.75% | | | 4.50 | % | | 06/02/28 | | | 501,514 | | | | 502,392 | |
| Northwest Fiber LLC, First Lien B-2 Term Loan(c) | | United States | | 1M US L + 3.75% | | | 3.85 | % | | 04/30/27 | | | 940,518 | | | | 938,754 | |
| UPC Financing Partnership, First Lien Facility AX Term Loan(c) | | United States | | 1M US L + 3.00% | | | 3.11 | % | | 01/31/29 | | | 1,113,586 | | | | 1,111,147 | |
| Voyage Australia Pty, Ltd., First Lien Initial U.S. Term Loan(c) | | Australia | | 3M US L + 3.50% | | | 4.00 | % | | 07/20/28 | | | 641,040 | | | | 642,242 | |
| Zayo Group Holdings, Inc., First Lien Initial Dollar Term Loan(c) | | United States | | 1M US L + 3.00% | | | 3.10 | % | | 03/09/27 | | | 1,337,300 | | | | 1,321,560 | |
| | | | | | | | | | | | | | | | | | 17,178,024 | |
| TRANSPORTATION: CARGO (0.94%) | | | | | | | | |
| AIT Worldwide Logistics Holdings, Inc., First Lien Initial Term Loan(c) | | United States | | 3M US L + 4.75% | | | 5.50 | % | | 04/06/28 | | | 1,339,854 | | | | 1,341,548 | |
| Drive Chassis Holdco LLC, Second Lien 2021 Refinancing B Term Loan | | United States | | 3M US L + 6.75% | | | 6.87 | % | | 04/10/26 | | | 1,652,745 | | | | 1,663,075 | |
See Notes to Consolidated Financial Statements.
| 26 | 1.888.926.2688 | www.griffincapital.com |
| Griffin Institutional Access Credit Fund | Consolidated Schedule of Investments |
December 31, 2021
| Description | | Country | | Spread Above Index | | Rate | | | Maturity Date | | Principal Amount | | | Value
(Note 2)(a) | |
| TRANSPORTATION: CARGO (continued) | | | | | | | | |
| Grammer Purchaser, Inc., First Lien Revolving Term Loan(e)(f) | | United States | | L + 0.50% | | | | | | 09/30/24 | | $ | 90,000 | | | $ | 90,000 | |
| Grammer Purchaser, Inc., First Lien Term Loan(e) | | United States | | 3M US L + 4.50% | | | 5.50 | % | | 09/30/24 | | | 1,017,714 | | | | 1,017,714 | |
| Naviera Armas S.A. Facility A(e)(g) | | Spain | | 1M EUR L + 10.00% | | | 10.00 | % | | 01/12/22 | | € | 153,317 | | | | 174,551 | |
| Naviera Armas S.A. Facility B(e)(g) | | Spain | | 1M EUR L + 10.00% | | | 10.00 | % | | 01/12/22 | | | 35,700 | | | | 40,645 | |
| Naviera Armas S.A. Facility B2(e)(g) | | Spain | | 1M EUR L + 10.00% | | | 10.00 | % | | 01/12/22 | | | 64,803 | | | | 73,777 | |
| Naviera Armas S.A., Facility C(e)(g) | | Spain | | 1M EUR L + 10.00% | | | 10.00 | % | | 01/12/22 | | | 245,358 | | | | 279,339 | |
| PODS LLC, First Lien Initial Term Loan(c) | | United States | | 1M US L + 3.00% | | | 3.75 | % | | 03/31/28 | | $ | 648,745 | | | | 647,347 | |
| PS Holdco LLC, First Lien B Term Loan(c)(e) | | United States | | 1M US L + 4.25% | | | 5.00 | % | | 09/23/28 | | | 576,133 | | | | 577,213 | |
| | | | | | | | | | | | | | | | | | 5,905,209 | |
| TRANSPORTATION: CONSUMER (1.05%) | | | | | | | | |
| Air Canada, First Lien B Term Loan(c) | | Canada | | 3M US L + 3.50% | | | 4.25 | % | | 08/11/28 | | | 308,973 | | | | 309,138 | |
| Grab Holdings, Inc., First Lien Initial Term Loan(c) | | Singapore | | 6M US L + 4.50% | | | 5.50 | % | | 01/29/26 | | | 922,102 | | | | 927,095 | |
| Lakeland Holdings LLC, Holdco First Lien Term Loan(g)(h)(j) | | United States | | | | | 13.25 | % | | 09/25/27 | | | 672,867 | | | | 464,278 | |
| Lakeland Tours LLC, Priority Exit (New Money DIP) Term Loan(g) | | United States | | 3M US L + 12.00% | | | 13.25 | % | | 09/25/23 | | | 261,049 | | | | 263,009 | |
| Lakeland Tours LLC, Second Out Term Loan(e)(g) | | United States | | 3M US L + 7.50% | | | 8.75 | % | | 09/25/25 | | | 487,772 | | | | 485,333 | |
| Lakeland Tours LLC, Third Out Term Loan(g) | | United States | | 3M US L + 7.50% | | | 8.75 | % | | 09/25/25 | | | 612,325 | | | | 545,735 | |
| Safe Fleet Holdings LLC, Second Lien Initial Term Loan | | United States | | 1M US L + 6.75% | | | 7.75 | % | | 02/02/26 | | | 667,223 | | | | 665,141 | |
| Toro Private Holdings III, Ltd., First Lien Initial (Super Priority) Term Loan(g)(j) | | Luxembourg | | 3M US L + 8.00% | | | 9.00 | % | | 02/28/25 | | | 505,622 | | | | 521,138 | |
| Uber Technologies, Inc., First Lien 2021 Incremental Term Loan(c) | | United States | | 1M US L + 3.50% | | | 3.60 | % | | 04/04/25 | | | 1,746,264 | | | | 1,749,416 | |
| United AirLines, Inc., First Lien Class B Term Loan(c) | | United States | | 3M US L + 3.75% | | | 4.50 | % | | 04/21/28 | | | 638,043 | | | | 641,775 | |
| | | | | | | | | | | | | | | | | | 6,572,058 | |
| UTILITIES: ELECTRIC (0.24%) | | | | | | | | |
| New Frontera Holdings LLC, First Lien Term Loan(e) | | United States | | 3M US L + 13.00% | | | 14.00 | % | | 07/28/26 | | | 917,547 | | | | 981,776 | |
| New Frontera Holdings LLC, Second Lien Term Loan(e) | | United States | | 3M US L + 1.50% | | | 2.50 | % | | 07/28/28 | | | 888,345 | | | | 533,007 | |
| | | | | | | | | | | | | | | | | | 1,514,783 | |
| UTILITIES: OIL & GAS (0.17%) | | | | | | | | |
| BCP Renaissance Parent LLC, First Lien Initial Term Loan(c) | | United States | | 3M US L + 3.50% | | | 4.50 | % | | 10/31/24 | | | 10,326 | | | | 10,318 | |
| Delek US Holdings, Inc., First Lien Initial Term Loan(c) | | United States | | 1M US L + 2.25% | | | 2.35 | % | | 03/31/25 | | | 1,106,330 | | | | 1,076,846 | |
| | | | | | | | | | | | | | | | | | 1,087,164 | |
| WHOLESALE (1.11%) | | | | | | | | | | | | | | | | | | |
| Foundation Building Materials, Inc., First Lien Initial Term Loan(c) | | United States | | 3M US L + 3.25% | | | 3.75 | % | | 01/31/28 | | | 753,126 | | | | 748,890 | |
| Infinite Bidco LLC, First Lien Initial Term Loan(c) | | United States | | 1M US L + 3.75% | | | 4.25 | % | | 03/02/28 | | | 540,288 | | | | 539,445 | |
| Infinite Bidco LLC, Second Lien Initial Term Loan(d) | | United States | | 1M US L + 7.00% | | | 7.50 | % | | 03/02/29 | | | 1,403,935 | | | | 1,412,710 | |
| Specialty Building Products Holdings, LLC, First Lien Term Loan(c) | | United States | | 3M US L + 3.75% | | | 4.25 | % | | 10/15/28 | | | 1,170,458 | | | | 1,169,363 | |
See Notes to Consolidated Financial Statements.
| Annual Report | December 31, 2021 | 27 |
| Griffin Institutional Access Credit Fund | Consolidated Schedule of Investments |
December 31, 2021
| Description | | Country | | Spread Above Index | | Rate | | | Maturity Date | | Principal Amount | | | Value
(Note 2)(a) | |
| WHOLESALE (continued) | | | | | | | | |
| SRS Distribution, Inc., First Lien 2021 Refinancing Term Loan(c) | | United States | | 6M US L + 3.75% | | | 4.25 | % | | 06/02/28 | | $ | 1,162,893 | | | $ | 1,162,009 | |
| Staples, Inc., First Lien Term Loan | | United States | | 3M US L + 5.00% | | | 5.13 | % | | 04/16/26 | | | 742,081 | | | | 718,810 | |
| WSP Midco LLC Initial Term Loan(e) | | United States | | 1M US L + 6.25% | | | 7.25 | % | | 04/27/27 | | | 1,072,734 | | | | 1,053,961 | |
| WSP Midco LLC, Delayed Draw Term Loan(e)(f) | | United States | | L + 0.50% | | | | | | 04/27/23 | | | 158,380 | | | | 155,609 | |
| WSP Midco LLC, Revolving Loan(e)(f) | | United States | | 1M US L + 6.25% | | | 6.25 | % | | 04/27/27 | | | 38,602 | | | | 37,926 | |
| | | | | | | | | | | | | | | | | | 6,998,723 | |
| TOTAL BANK LOANS | | | | | | | | | | | | | | | | | | |
| (Cost $464,557,035) | | | | | | | | | | | | | | | | | 465,282,340 | |
| | | | | | | | | | | | | | | | | | | |
| CORPORATE BONDS (25.80%)(h) | | | | | | | | |
| AEROSPACE & DEFENSE (1.31%) | | | | | | | | |
| F-Brasile SpA(k) | | Italy | | | | | 7.38 | % | | 08/15/26 | | $ | 2,331,000 | | | | 2,321,769 | |
| Global Aircraft Leasing Co., Ltd., Series 2021(e)(g)(k) | | Cayman Islands | | | | | 6.50 | % | | 09/15/24 | | | 860,000 | | | | 805,059 | |
| Rolls-Royce PLC(k) | | United Kingdom | | | | | 5.75 | % | | 10/15/27 | | | 419,000 | | | | 463,791 | |
| Spirit AeroSystems, Inc.(k) | | United States | | | | | 7.50 | % | | 04/15/25 | | | 1,265,000 | | | | 1,328,231 | |
| TransDigm, Inc. | | United States | | | | | 4.63 | % | | 01/15/29 | | | 1,171,000 | | | | 1,169,232 | |
| TransDigm, Inc.(k) | | United States | | | | | 8.00 | % | | 12/15/25 | | | 150,000 | | | | 158,435 | |
| Wolverine Escrow LLC(k) | | United States | | | | | 8.50 | % | | 11/15/24 | | | 473,000 | | | | 439,200 | |
| Wolverine Escrow LLC(k) | | United States | | | | | 9.00 | % | | 11/15/26 | | | 1,601,000 | | | | 1,522,735 | |
| | | | | | | | | | | | | | | | | | 8,208,452 | |
| AUTOMOTIVE (0.26%)(k) | | | | | | | | |
| AAG FH LP | | Canada | | | | | 9.75 | % | | 07/15/24 | | | 1,303,000 | | | | 1,294,837 | |
| Wheel Pros, Inc. | | United States | | | | | 6.50 | % | | 05/15/29 | | | 380,000 | | | | 365,334 | |
| | | | | | | | | | | | | | | | | | 1,660,171 | |
| BANKING (0.08%)(k) | | | | | | | | | | | | | | | | | | |
| Paysafe Finance PLC | | United States | | | | | 4.00 | % | | 06/15/29 | | | 570,000 | | | | 529,507 | |
| | | | | | | | | | | | | | | | | | | |
| BEVERAGE, FOOD, & TOBACCO (1.13%)(k) | | | | | | | | |
| Carrols Restaurant Group, Inc. | | United States | | | | | 5.88 | % | | 07/01/29 | | | 975,000 | | | | 878,870 | |
| H-Food Holdings LLC | | United States | | | | | 8.50 | % | | 06/01/26 | | | 1,379,000 | | | | 1,380,434 | |
| Ocado Group PLC | | United Kingdom | | | | | 3.88 | % | | 10/08/26 | | £ | 573,000 | | | | 757,584 | |
| Post Holdings, Inc. | | United States | | | | | 4.50 | % | | 09/15/31 | | $ | 1,044,000 | | | | 1,037,861 | |
| Post Holdings, Inc. | | United States | | | | | 5.50 | % | | 12/15/29 | | | 500,000 | | | | 526,145 | |
| Punch Finance PLC | | United Kingdom | | | | | 6.13 | % | | 06/30/26 | | £ | 492,000 | | | | 666,456 | |
| Quidditch Acquisition, Inc.(e) | | United States | | | | | 11.25 | % | | 03/21/25 | | $ | 1,750,000 | | | | 1,863,624 | |
| | | | | | | | | | | | | | | | | | 7,110,974 | |
| CAPITAL EQUIPMENT (1.35%)(k) | | | | | | | | |
| Avaya, Inc. | | United States | | | | | 6.13 | % | | 09/15/28 | | | 909,000 | | | | 965,108 | |
| Manitowoc Co., Inc. | | United States | | | | | 9.00 | % | | 04/01/26 | | | 1,347,000 | | | | 1,419,307 | |
| Sensata Technologies BV | | United States | | | | | 4.00 | % | | 04/15/29 | | | 576,000 | | | | 589,236 | |
| Standard Industries, Inc. | | United States | | | | | 4.75 | % | | 01/15/28 | | | 1,738,000 | | | | 1,797,639 | |
| Unifrax Escrow Issuer Corp. | | United States | | | | | 5.25 | % | | 09/30/28 | | | 968,000 | | | | 980,294 | |
| Unifrax Escrow Issuer Corp. | | United States | | | | | 7.50 | % | | 09/30/29 | | | 318,000 | | | | 321,631 | |
| Victors Merger Corp. | | United States | | | | | 6.38 | % | | 05/15/29 | | | 750,000 | | | | 706,054 | |
| Wabash National Corp. | | United States | | | | | 4.50 | % | | 10/15/28 | | | 1,670,000 | | | | 1,688,788 | |
| | | | | | | | | | | | | | | | | | 8,468,057 | |
| CHEMICALS, PLASTICS, & RUBBER (0.80%)(k) | | | | | | | | |
| Olympus Water US Holding Corp. | | United States | | | | | 6.25 | % | | 10/01/29 | | | 1,119,000 | | | | 1,092,597 | |
| Venator Finance SARL | | United States | | | | | 5.75 | % | | 07/15/25 | | | 1,906,000 | | | | 1,831,742 | |
| Venator Finance SARL | | United States | | | | | 9.50 | % | | 07/01/25 | | | 1,269,000 | | | | 1,388,553 | |
See Notes to Consolidated Financial Statements.
| 28 | 1.888.926.2688 | www.griffincapital.com |
| Griffin Institutional Access Credit Fund | Consolidated Schedule of Investments |
December 31, 2021
| Description | | Country | | Spread Above Index | | Rate | | | Maturity Date | | Principal Amount | | | Value
(Note 2)(a) | |
| CHEMICALS, PLASTICS, & RUBBER (continued) | | | | | | | | |
| WR Grace Holdings LLC | | United States | | | | | 5.63 | % | | 08/15/29 | | $ | 669,000 | | | $ | 686,561 | |
| | | | | | | | | | | | | | | | | | 4,999,453 | |
| CONSTRUCTION & BUILDING (0.10%)(k) | | | | | | | | |
| New Enterprise Stone & Lime Co., Inc. | | United States | | | | | 5.25 | % | | 07/15/28 | | | 598,000 | | | | 607,272 | |
| | | | | | | | | | | | | | | | | | | |
| CONSUMER GOODS: NON-DURABLE (0.36%)(k) | | | | | | | | |
| Coty, Inc./HFC Prestige Products Inc | | United States | | | | | 4.75 | % | | 01/15/29 | | | 1,897,000 | | | | 1,930,728 | |
| Energizer Holdings, Inc. | | United States | | | | | 4.75 | % | | 06/15/28 | | | 356,000 | | | | 364,110 | |
| | | | | | | | | | | | | | | | | | 2,294,838 | |
| CONTAINERS, PACKAGING, & GLASS (1.89%) | | | | | | | | |
| Ardagh Metal Packaging Finance USA LLC(k) | | United States | | | | | 3.25 | % | | 09/01/28 | | | 855,000 | | | | 846,630 | |
| Ardagh Metal Packaging Finance USA LLC(k) | | United States | | | | | 4.00 | % | | 09/01/29 | | | 1,580,000 | | | | 1,567,889 | |
| Ball Corp. | | United States | | | | | 3.13 | % | | 09/15/31 | | | 1,488,000 | | | | 1,471,580 | |
| Intelligent Packaging, Ltd. Finco, Inc.(k) | | Canada | | | | | 6.00 | % | | 09/15/28 | | | 594,000 | | | | 611,820 | |
| Kleopatra Holdings 2 SCA | | Luxembourg | | | | | 6.50 | % | | 09/01/26 | | € | 1,309,000 | | | | 1,371,458 | |
| LABL, Inc.(k) | | United States | | | | | 5.88 | % | | 11/01/28 | | $ | 379,000 | | | | 391,318 | |
| LABL, Inc.(k) | | United States | | | | | 8.25 | % | | 11/01/29 | | | 906,000 | | | | 912,727 | |
| Pactiv Evergreen Group Issuer LLC(k) | | United States | | | | | 4.38 | % | | 10/15/28 | | | 896,000 | | | | 890,637 | |
| Titan Holdings II BV(k) | | Netherlands | | | | | 5.13 | % | | 07/15/29 | | € | 442,000 | | | | 501,719 | |
| Titan Holdings II BV | | Netherlands | | | | | 5.13 | % | | 07/15/29 | | | 852,000 | | | | 967,115 | |
| Trivium Packaging Finance BV(k) | | Netherlands | | | | | 8.50 | % | | 08/15/27 | | $ | 2,195,000 | | | | 2,323,408 | |
| | | | | | | | | | | | | | | | | | 11,856,301 | |
| ENERGY: OIL & GAS (0.23%) | | | | | | | | |
| Alta Mesa Holdings LP(e)(j) | | United States | | | | | 7.88 | % | | 12/15/24 | | | 968,000 | | | | 1,936 | |
| Magnolia Oil & Gas Operating LLC(k) | | United States | | | | | 6.00 | % | | 08/01/26 | | | 221,000 | | | | 226,808 | |
| New Fortress Energy, Inc.(c)(k) | | United States | | | | | 6.50 | % | | 09/30/26 | | | 1,206,000 | | | | 1,198,306 | |
| | | | | | | | | | | | | | | | | | 1,427,050 | |
| ENVIRONMENTAL INDUSTRIES (0.19%)(k) | | | | | | | | |
| GFL Environmental, Inc. | | Canada | | | | | 4.00 | % | | 08/01/28 | | | 1,202,000 | | | | 1,179,997 | |
| | | | | | | | | | | | | | | | | | | |
| FIRE: FINANCE (2.23%)(k) | | | | | | | | |
| Advisor Group Holdings, Inc. | | United States | | | | | 10.75 | % | | 08/01/27 | | | 305,000 | | | | 338,995 | |
| AG Issuer LLC(c) | | United States | | | | | 6.25 | % | | 03/01/28 | | | 1,446,000 | | | | 1,502,271 | |
| Aretec Escrow Issuer, Inc. | | United States | | | | | 7.50 | % | | 04/01/29 | | | 2,487,000 | | | | 2,554,796 | |
| Cobra AcquisitionCo LLC | | United States | | | | | 6.38 | % | | 11/01/29 | | | 1,869,000 | | | | 1,848,264 | |
| Encore Capital Group, Inc. | | United States | | | | | 4.25 | % | | 06/01/28 | | £ | 672,000 | | | | 900,542 | |
| HighTower Holding LLC | | United States | | | | | 6.75 | % | | 04/15/29 | | $ | 1,059,000 | | | | 1,089,293 | |
| Jane Street Group | | United States | | | | | 4.50 | % | | 11/15/29 | | | 763,000 | | | | 771,881 | |
| Jefferson Capital Holdings LLC | | United States | | | | | 6.00 | % | | 08/15/26 | | | 1,181,000 | | | | 1,196,979 | |
| LPL Holdings, Inc. | | United States | | | | | 4.00 | % | | 03/15/29 | | | 402,000 | | | | 412,217 | |
| LPL Holdings, Inc. | | United States | | | | | 4.38 | % | | 05/15/31 | | | 312,000 | | | | 319,600 | |
| Midcap Financial Issuer Trust | | United States | | | | | 5.63 | % | | 01/15/30 | | | 559,000 | | | | 561,303 | |
| Midcap Financial Issuer Trust | | United States | | | | | 6.50 | % | | 05/01/28 | | | 1,106,000 | | | | 1,154,896 | |
| StoneX Group, Inc. | | United States | | | | | 8.63 | % | | 06/15/25 | | | 1,275,000 | | | | 1,355,688 | |
| | | | | | | | | | | | | | | | | | 14,006,725 | |
| FIRE: REAL ESTATE (0.94%)(k) | | | | | | | | |
| Blackstone Mortgage Trust, Inc. | | United States | | | | | 3.75 | % | | 01/15/27 | | | 760,000 | | | | 758,389 | |
| Iron Mountain, Inc. | | United States | | | | | 5.25 | % | | 03/15/28 | | | 1,163,000 | | | | 1,211,520 | |
| Ladder Capital Finance Holdings LLLP | | United States | | | | | 4.25 | % | | 02/01/27 | | | 1,125,000 | | | | 1,133,629 | |
| Ladder Capital Finance Holdings LLLP | | United States | | | | | 4.75 | % | | 06/15/29 | | | 448,000 | | | | 459,964 | |
| PennyMac Financial Services, Inc. | | United States | | | | | 4.25 | % | | 02/15/29 | | | 948,000 | | | | 912,843 | |
| PennyMac Financial Services, Inc. | | United States | | | | | 5.75 | % | | 09/15/31 | | | 814,000 | | | | 823,284 | |
See Notes to Consolidated Financial Statements.
| Annual Report | December 31, 2021 | 29 |
| Griffin Institutional Access Credit Fund | Consolidated Schedule of Investments |
December 31, 2021
| Description | | Country | | Spread Above Index | | Rate | | | Maturity Date | | Principal Amount | | | Value
(Note 2)(a) | |
| FIRE: REAL ESTATE (continued) | | | | | | | | |
| United Wholesale Mortgage LLC | | United States | | | | | 5.50 | % | | 04/15/29 | | $ | 619,000 | | | $ | 608,263 | |
| | | | | | | | | | | | | | | | | | 5,907,892 | |
| HEALTHCARE & PHARMACEUTICALS (2.47%)(k) | | | | | | | | |
| Acadia Healthcare Co., Inc. | | United States | | | | | 5.00 | % | | 04/15/29 | | | 222,000 | | | | 228,442 | |
| Acadia Healthcare Co., Inc. | | United States | | | | | 5.50 | % | | 07/01/28 | | | 325,000 | | | | 342,076 | |
| AHP Health Partners, Inc. | | United States | | | | | 5.75 | % | | 07/15/29 | | | 1,933,000 | | | | 1,918,889 | |
| Bausch Health Cos., Inc. | | United States | | | | | 5.25 | % | | 01/30/30 | | | 894,000 | | | | 788,106 | |
| Bausch Health Cos., Inc. | | United States | | | | | 5.25 | % | | 02/15/31 | | | 1,109,000 | | | | 976,253 | |
| Bausch Health Cos., Inc. | | United States | | | | | 6.25 | % | | 02/15/29 | | | 486,000 | | | | 462,613 | |
| Cheplapharm Arzneimittel GmbH | | Germany | | | | | 5.50 | % | | 01/15/28 | | | 1,180,000 | | | | 1,196,426 | |
| Endo Luxembourg Finance Co. I SARL | | United States | | | | | 6.13 | % | | 04/01/29 | | | 18,000 | | | | 17,675 | |
| Jazz Securities DAC | | United States | | | | | 4.38 | % | | 01/15/29 | | | 1,475,000 | | | | 1,529,826 | |
| Mozart Debt Merger Sub, Inc. | | United States | | | | | 5.25 | % | | 10/01/29 | | | 1,809,000 | | | | 1,837,437 | |
| Option Care Health, Inc. | | United States | | | | | 4.38 | % | | 10/31/29 | | | 632,000 | | | | 634,547 | |
| Organon & Co. | | United States | | | | | 4.13 | % | | 04/30/28 | | | 1,720,000 | | | | 1,750,926 | |
| Organon & Co. | | United States | | | | | 5.13 | % | | 04/30/31 | | | 2,022,000 | | | | 2,115,972 | |
| Select Medical Corp. | | United States | | | | | 6.25 | % | | 08/15/26 | | | 1,609,000 | | | | 1,706,377 | |
| | | | | | | | | | | | | | | | | | 15,505,565 | |
| HIGH TECH INDUSTRIES (0.44%)(k) | | | | | | | | |
| Endure Digital, Inc. | | United States | | | | | 6.00 | % | | 02/15/29 | | | 955,000 | | | | 889,492 | |
| International Game Technology PLC | | United States | | | | | 5.25 | % | | 01/15/29 | | | 997,000 | | | | 1,057,961 | |
| ZoomInfo Technologies LLC | | United States | | | | | 3.88 | % | | 02/01/29 | | | 826,000 | | | | 820,115 | |
| | | | | | | | | | | | | | | | | | 2,767,568 | |
| HOTEL, GAMING, & LEISURE (1.66%) | | | | | | | | |
| Cinemark USA, Inc.(k) | | United States | | | | | 5.25 | % | | 07/15/28 | | | 1,541,000 | | | | 1,505,110 | |
| Gamma Bidco SpA(k) | | Italy | | | | | 5.13 | % | | 07/15/25 | | € | 483,000 | | | | 555,296 | |
| Premier Entertainment Sub LLC(k) | | United States | | | | | 5.63 | % | | 09/01/29 | | $ | 2,018,000 | | | | 2,005,075 | |
| Premier Entertainment Sub LLC(k) | | United States | | | | | 5.88 | % | | 09/01/31 | | | 2,018,000 | | | | 2,028,090 | |
| Raptor Acquisition Corp.(k) | | Canada | | | | | 4.88 | % | | 11/01/26 | | | 280,000 | | | | 283,150 | |
| Station Casinos LLC(k) | | United States | | | | | 4.63 | % | | 12/01/31 | | | 1,492,000 | | | | 1,506,778 | |
| Stonegate Pub Co. Financing 2019 PLC | | United Kingdom | | | | | 8.00 | % | | 07/13/25 | | £ | 833,000 | | | | 1,149,631 | |
| Stonegate Pub Co. Financing 2019 PLC(k) | | United Kingdom | | | | | 8.25 | % | | 07/31/25 | | | 734,000 | | | | 1,011,997 | |
| Stonegate Pub Co. Financing 2019 PLC | | United Kingdom | | | | | 8.25 | % | | 07/31/25 | | | 256,000 | | | | 352,958 | |
| | | | | | | | | | | | | | | | | | 10,398,085 | |
| MEDIA: ADVERTISING, PRINTING & PUBLISHING (0.66%)(k) | | | | | | | | |
| Castle US Holding Corp. | | United States | | | | | 9.50 | % | | 02/15/28 | | $ | 932,000 | | | | 972,929 | |
| Cimpress PLC | | Ireland | | | | | 7.00 | % | | 06/15/26 | | | 875,000 | | | | 909,816 | |
| Midas OpCo Holdings LLC | | United States | | | | | 5.63 | % | | 08/15/29 | | | 2,185,000 | | | | 2,240,357 | |
| | | | | | | | | | | | | | | | | | 4,123,102 | |
| MEDIA: BROADCASTING & SUBSCRIPTION (0.36%)(k) | | | | | | | | |
| CSC Holdings LLC | | United States | | | | | 4.63 | % | | 12/01/30 | | | 716,000 | | | | 678,725 | |
| IPD 3 BV | | France | | | | | 5.50 | % | | 12/01/25 | | € | 494,000 | | | | 579,769 | |
| Townsquare Media, Inc.(c) | | United States | | | | | 6.88 | % | | 02/01/26 | | $ | 929,000 | | | | 986,867 | |
| | | | | | | | | | | | | | | | | | 2,245,361 | |
| MEDIA: DIVERSIFIED & PRODUCTION (1.36%) | | | | | | | | |
| Getty Images, Inc.(k) | | United States | | | | | 9.75 | % | | 03/01/27 | | | 2,310,000 | | | | 2,449,177 | |
| Lions Gate Capital Holdings LLC(k) | | United States | | | | | 5.50 | % | | 04/15/29 | | | 984,000 | | | | 1,002,967 | |
| National CineMedia LLC | | United States | | | | | 5.75 | % | | 08/15/26 | | | 3,117,000 | | | | 2,425,836 | |
| National CineMedia LLC(k) | | United States | | | | | 5.88 | % | | 04/15/28 | | | 817,000 | | | | 734,414 | |
| Sirius XM Radio, Inc.(k) | | United States | | | | | 4.13 | % | | 07/01/30 | | | 1,374,000 | | | | 1,376,439 | |
| Sirius XM Radio, Inc.(k) | | United States | | | | | 5.50 | % | | 07/01/29 | | | 500,000 | | | | 539,590 | |
| | | | | | | | | | | | | | | | | | 8,528,423 | |
See Notes to Consolidated Financial Statements.
| 30 | 1.888.926.2688 | www.griffincapital.com |
| Griffin Institutional Access Credit Fund | Consolidated Schedule of Investments |
December 31, 2021
| Description | | Country | | Spread Above Index | | Rate | | | Maturity Date | | Principal Amount | | | Value
(Note 2)(a) | |
| RETAIL (1.82%) | | | | | | | | | | | | | | | | | | |
| Asbury Automotive Group, Inc. | | United States | | | | | 4.50 | % | | 03/01/28 | | $ | 294,000 | | | $ | 300,302 | |
| Asbury Automotive Group, Inc.(k) | | United States | | | | | 4.63 | % | | 11/15/29 | | | 873,000 | | | | 890,827 | |
| Asbury Automotive Group, Inc. | | United States | | | | | 4.75 | % | | 03/01/30 | | | 810,000 | | | | 824,389 | |
| Douglas GmbH(k) | | Germany | | | | | 6.00 | % | | 04/08/26 | | € | 961,000 | | | | 1,095,875 | |
| Gap, Inc.(k) | | United States | | | | | 3.63 | % | | 10/01/29 | | $ | 538,000 | | | | 532,972 | |
| Gap, Inc.(k) | | United States | | | | | 3.88 | % | | 10/01/31 | | | 538,000 | | | | 531,485 | |
| Group 1 Automotive, Inc.(k) | | United States | | | | | 4.00 | % | | 08/15/28 | | | 707,000 | | | | 705,526 | |
| Kirk Beauty SUN GmbH(g)(k) | | Germany | | | | | 8.25 | % | | 10/01/26 | | € | 965,000 | | | | 1,054,935 | |
| LCM Investments Holdings II LLC(k) | | United States | | | | | 4.88 | % | | 05/01/29 | | $ | 1,016,000 | | | | 1,045,743 | |
| Lithia Motors, Inc.(k) | | United States | | | | | 4.38 | % | | 01/15/31 | | | 1,554,000 | | | | 1,661,125 | |
| Maxeda DIY Holding BV(k) | | Netherlands | | | | | 5.88 | % | | 10/01/26 | | € | 414,000 | | | | 482,405 | |
| Penske Automotive Group, Inc. | | United States | | | | | 3.75 | % | | 06/15/29 | | $ | 2,334,000 | | | | 2,316,927 | |
| | | | | | | | | | | | | | | | | | 11,442,511 | |
| SERVICES: BUSINESS (1.49%) | | | | | | | | |
| Alliant Holdings Intermediate LLC(k) | | United States | | | | | 5.88 | % | | 11/01/29 | | | 755,000 | | | | 769,209 | |
| Constellation Automotive Financing PLC(k) | | United Kingdom | | | | | 4.88 | % | | 07/15/27 | | £ | 961,000 | | | | 1,284,466 | |
| Constellation Automotive Financing PLC | | United Kingdom | | | | | 4.88 | % | | 07/15/27 | | | 728,000 | | | | 973,040 | |
| NESCO Holdings II, Inc.(k) | | United States | | | | | 5.50 | % | | 04/15/29 | | $ | 617,000 | | | | 638,148 | |
| PECF USS Intermediate Holding III Corp.(k) | | United States | | | | | 8.00 | % | | 11/15/29 | | | 453,000 | | | | 469,779 | |
| Syneos Health, Inc.(k) | | United States | | | | | 3.63 | % | | 01/15/29 | | | 2,548,000 | | | | 2,519,806 | |
| US Acute Care Solutions LLC(c)(k) | | United States | | | | | 6.38 | % | | 03/01/26 | | | 2,572,000 | | | | 2,696,845 | |
| | | | | | | | | | | | | | | | | | 9,351,293 | |
| SERVICES: CONSUMER (0.42%)(k) | | | | | | | | |
| Paganini Bidco SpA(b) | | Italy | | 3M EUR L + 4.25% | | | 4.25 | % | | 10/30/28 | | € | 884,000 | | | | 1,013,629 | |
| WW International, Inc. | | United States | | | | | 4.50 | % | | 04/15/29 | | $ | 1,664,000 | | | | 1,595,293 | |
| | | | | | | | | | | | | | | | | | 2,608,922 | |
| TELECOMMUNICATIONS (2.16%)(k) | | | | | | | | |
| Altice France SA | | France | | | | | 5.50 | % | | 10/15/29 | | | 2,971,000 | | | | 2,931,501 | |
| Cablevision Lightpath LLC | | United States | | | | | 5.63 | % | | 09/15/28 | | | 320,000 | | | | 315,909 | |
| CommScope Technologies LLC | | United States | | | | | 5.00 | % | | 03/15/27 | | | 610,000 | | | | 570,960 | |
| CommScope Technologies LLC | | United States | | | | | 6.00 | % | | 06/15/25 | | | 549,000 | | | | 549,612 | |
| Connect Finco SARL(c) | | United Kingdom | | | | | 6.75 | % | | 10/01/26 | | | 937,000 | | | | 986,286 | |
| Frontier Communications Holdings LLC | | United States | | | | | 6.00 | % | | 01/15/30 | | | 407,000 | | | | 409,735 | |
| Frontier Communications Holdings LLC | | United States | | | | | 6.75 | % | | 05/01/29 | | | 1,207,000 | | | | 1,257,127 | |
| Iliad Holding SASU | | France | | | | | 6.50 | % | | 10/15/26 | | | 1,103,000 | | | | 1,160,455 | |
| Iliad Holding SASU | | France | | | | | 7.00 | % | | 10/15/28 | | | 1,103,000 | | | | 1,161,768 | |
| Kaixo Bondco Telecom SA | | Spain | | | | | 5.13 | % | | 09/30/29 | | € | 876,000 | | | | 1,007,481 | |
| Northwest Fiber LLC | | United States | | | | | 6.00 | % | | 02/15/28 | | $ | 124,000 | | | | 121,719 | |
| Northwest Fiber LLC | | United States | | | | | 10.75 | % | | 06/01/28 | | | 1,331,000 | | | | 1,452,673 | |
| United Group BV | | Netherlands | | | | | 3.13 | % | | 02/15/26 | | € | 475,000 | | | | 526,537 | |
| United Group BV | | Netherlands | | | | | 3.63 | % | | 02/15/28 | | | 707,000 | | | | 783,403 | |
| United Group BV(b) | | Netherlands | | 3M EUR L + 3.25% | | | 3.25 | % | | 02/15/26 | | | 309,000 | | | | 347,838 | |
| | | | | | | | | | | | | | | | | | 13,583,004 | |
| TRANSPORTATION: CARGO (0.17%)(b)(j) | | | | | | | | |
| Naviera Armas S.A., Series Reg S | | Spain | | 3M EUR L + 4.25% | | | 4.25 | % | | 11/15/24 | | | 497,000 | | | | 440,784 | |
| Naviera Armas S.A., Series Reg S | | Spain | | 3M EUR L + 6.50% | | | 6.50 | % | | 07/31/23 | | | 732,000 | | | | 660,038 | |
| | | | | | | | | | | | | | | | | | 1,100,822 | |
| TRANSPORTATION: CONSUMER (0.78%)(k) | | | | | | | | |
| First Student Bidco, Inc. | | United States | | | | | 4.00 | % | | 07/31/29 | | $ | 1,417,000 | | | | 1,379,471 | |
| Uber Technologies, Inc. | | United States | | | | | 4.50 | % | | 08/15/29 | | | 932,000 | | | | 950,840 | |
| VistaJet Malta Finance PLC | | Switzerland | | | | | 10.50 | % | | 06/01/24 | | | 2,390,000 | | | | 2,559,786 | |
| | | | | | | | | | | | | | | | | | 4,890,097 | |
See Notes to Consolidated Financial Statements.
| Annual Report | December 31, 2021 | 31 |
| Griffin Institutional Access Credit Fund | Consolidated Schedule of Investments |
December 31, 2021
| Description | | Country | | Spread Above Index | | Rate | | | Maturity Date | | Principal Amount | | | Value
(Note 2)(a) | |
| WHOLESALE (1.14%)(k) | | | | | | | | | | | | | | | | | | |
| Beacon Roofing Supply, Inc. | | United States | | | | | 4.13 | % | | 05/15/29 | | $ | 1,500,000 | | | $ | 1,501,477 | |
| Beacon Roofing Supply, Inc. | | United States | | | | | 4.50 | % | | 11/15/26 | | | 87,000 | | | | 90,171 | |
| GYP Holdings III Corp. | | United States | | | | | 4.63 | % | | 05/01/29 | | | 1,399,000 | | | | 1,404,638 | |
| Specialty Building Products Holdings LLC(c) | | United States | | | | | 6.38 | % | | 09/30/26 | | | 1,449,000 | | | | 1,520,124 | |
| SRS Distribution, Inc. | | United States | | | | | 4.63 | % | | 07/01/28 | | | 622,000 | | | | 625,284 | |
| SRS Distribution, Inc. | | United States | | | | | 6.00 | % | | 12/01/29 | | | 283,000 | | | | 284,858 | |
| SRS Distribution, Inc. | | United States | | | | | 6.13 | % | | 07/01/29 | | | 659,000 | | | | 672,536 | |
| Staples, Inc. | | United States | | | | | 7.50 | % | | 04/15/26 | | | 743,000 | | | | 764,399 | |
| TPro Acquisition Corp. | | United States | | | | | 11.00 | % | | 10/15/24 | | | 251,000 | | | | 274,067 | |
| | | | | | | | | | | | | | | | | | 7,137,554 | |
| TOTAL CORPORATE BONDS | | | | | | | | |
| (Cost $161,716,802) | | | | | | | | | | | | | | | | | 161,938,996 | |
| | | | | | | | | | | | | | | | | | | |
| CONVERTIBLE CORPORATE BONDS (0.20%)(h) | | | | | | | | |
| FIRE: REAL ESTATE (0.20%) | | | | | | | | |
| Apollo Commercial Real Estate Finance, Inc. | | United States | | | | | 5.38 | % | | 10/15/23 | | $ | 1,216,000 | | | | 1,243,360 | |
| | | | | | | | | | | | | | | | | | | |
| TOTAL CONVERTIBLE CORPORATE BONDS | | | | | | | | | | | | | | | | | | |
| (Cost $968,344) | | | | | | | | | | | | | | | | | 1,243,360 | |
| Description | | Country | | Spread Above Index | | Rate | | | Maturity Date | | Principal Amount | | | Value
(Note 2)(a) | |
| COLLATERALIZED LOAN OBLIGATIONS (14.40%)(b)(k) | | | | | | | | |
| DEBT (14.26%) | | | | | | | | | | | | | | | | | | |
| Adagio IV CLO, Ltd., Series 2021-A | | Ireland | | 3M EUR L + 8.52% | | | 8.52 | % | | 04/15/34 | | € | 250,000 | | | | 275,465 | |
| Allegro CLO VII, Ltd., Series 2018-1A | | Cayman Islands | | 3M US L + 5.75% | | | 5.87 | % | | 06/13/31 | | $ | 250,000 | | | | 229,361 | |
| Allegro CLO X, Ltd., Series 2019-1A | | Cayman Islands | | 3M US L + 6.88% | | | 7.01 | % | | 04/20/32 | | | 400,000 | | | | 388,421 | |
| AMMC CLO XI, Ltd., Series 2018-11A | | Cayman Islands | | 3M US L + 5.80% | | | 5.93 | % | | 04/30/31 | | | 400,000 | | | | 376,633 | |
| AMMC CLO XVIII, Ltd., Series 2018-18A | | Cayman Islands | | 3M US L + 6.00% | | | 6.12 | % | | 05/26/31 | | | 700,000 | | | | 646,369 | |
| Anchorage Credit Funding 13, Ltd., Series 2021-13A(h) | | Cayman Islands | | 6.92% | | | 6.92 | % | | 07/27/39 | | | 2,300,000 | | | | 2,142,595 | |
| Anchorage Credit Funding 14, Ltd., Series 2021-14A(h) | | Cayman Islands | | 7.45% | | | 7.45 | % | | 01/21/40 | | | 850,000 | | | | 810,252 | |
| Anchorage Credit Funding Ltd., Series 2021-13A(h) | | Cayman Islands | | 6.84% | | | 6.84 | % | | 07/27/39 | | | 350,000 | | | | 324,450 | |
| Apex Credit CLO 2018-I, Ltd., Series 2018- 1A | | Cayman Islands | | 3M US L + 5.65% | | | 5.77 | % | | 04/25/31 | | | 300,000 | | | | 269,286 | |
| Apex Credit CLO 2019, Ltd., Series 2019-1A | | Cayman Islands | | 3M US L + 7.10% | | | 7.23 | % | | 04/18/32 | | | 400,000 | | | | 387,622 | |
| Arbour CLO II DAC, Series 2021-2A | | Ireland | | 3M EUR L + 8.30% | | | 8.30 | % | | 04/15/34 | | € | 500,000 | | | | 560,903 | |
| Atlas Senior Loan Fund VII, Ltd., Series 2018-7A | | Cayman Islands | | 3M US L + 6.40% | | | 6.58 | % | | 11/27/31 | | $ | 300,000 | | | | 277,767 | |
| Atlas Senior Loan Fund X, Ltd., Series 2018- 10A | | Cayman Islands | | 3M US L + 5.70% | | | 5.82 | % | | 01/15/31 | | | 300,000 | | | | 266,014 | |
| Atlas Senior Loan Fund XI, Ltd., Series 2018-11A | | Cayman Islands | | 3M US L + 5.75% | | | 5.87 | % | | 07/26/31 | | | 250,000 | | | | 223,008 | |
| Atlas Senior Loan Fund XII, Ltd., Series 2018-12A | | Cayman Islands | | 3M US L + 5.95% | | | 6.07 | % | | 10/24/31 | | | 100,000 | | | | 89,715 | |
| Atlas Senior Loan Fund XIII, Series 2019- 13A | | Cayman Islands | | 3M US L + 6.95% | | | 7.08 | % | | 04/22/31 | | | 400,000 | | | | 368,932 | |
| Atlas Senior Loan Fund XIV, Series 2019- 14A | | Cayman Islands | | 3M US L + 6.94% | | | 7.07 | % | | 07/20/32 | | | 650,000 | �� | | | 599,739 | |
See Notes to Consolidated Financial Statements.
| 32 | 1.888.926.2688 | www.griffincapital.com |
| Griffin Institutional Access Credit Fund | Consolidated Schedule of Investments |
December 31, 2021
| Description | | Country | | Spread Above Index | | Rate | | | Maturity Date | | Principal Amount | | | Value
(Note 2)(a) | |
| DEBT (continued) | | | | | | | | | | | | | | | | | | |
| Atlas Senior Loan Fund, Ltd., Series 2021- 18A | | Cayman Islands | | 3M US L + 7.16% | | | 7.40 | % | | 01/18/35 | | $ | 600,000 | | | $ | 592,768 | |
| Barings Euro CLO 2018-3 DAC, Series 2018- 3A | | Netherlands | | 3M EUR L + 7.93% | | | 7.93 | % | | 07/27/31 | | € | 400,000 | | | | 438,518 | |
| Barings Euro CLO 2019-2 DAC, Series 2020- 2A | | Ireland | | 3M EUR L + 8.78% | | | 8.78 | % | | 07/24/32 | | | 400,000 | | | | 439,810 | |
| Barings Euro CLO 2020-1 DAC, Series 2021- 1A | | Ireland | | 3M EUR L + 8.78% | | | 8.78 | % | | 10/21/34 | | | 675,000 | | | | 755,866 | |
| Barings Euro CLO 2021-2 DAC, Series 2021- 2A | | Ireland | | 3M EUR L + 8.99% | | | 8.99 | % | | 10/15/34 | | | 700,000 | | | | 769,017 | |
| Blackrock European CLO III Designated Activity Co., Series 2021-3A | | Ireland | | 3M EUR L + 8.56% | | | 8.56 | % | | 07/19/35 | | | 675,000 | | | | 744,930 | |
| BlueMountain CLO 2016-3, Ltd., Series 2018-3A | | Cayman Islands | | 3M US L + 2.20% | | | 2.36 | % | | 11/15/30 | | $ | 300,000 | | | | 298,569 | |
| BlueMountain CLO 2016-3, Ltd., Series 2018-3A | | Cayman Islands | | 3M US L + 5.95% | | | 6.11 | % | | 11/15/30 | | | 300,000 | | | | 281,598 | |
| BlueMountain CLO 2018-1, Ltd., Series 2018-1A | | Cayman Islands | | 3M US L + 5.95% | | | 6.08 | % | | 07/30/30 | | | 400,000 | | | | 376,575 | |
| BlueMountain CLO 2018-3, Ltd., Series 2018-3A | | Cayman Islands | | 3M US L + 5.95% | | | 6.07 | % | | 10/25/30 | | | 2,400,000 | | | | 2,275,291 | |
| Cairn CLO XIII DAC, Series 2021-13A | | Netherlands | | 3M EUR L + 8.44% | | | 8.44 | % | | 10/20/33 | | € | 700,000 | | | | 774,826 | |
| Carlyle Euro CLO 2017-1 DAC, Series 2021- 1A | | Ireland | | 3M EUR L + 8.89% | | | 8.89 | % | | 07/15/34 | | | 450,000 | | | | 493,788 | |
| Carlyle Euro CLO 2021-1 DAC, Series 2021- 1A | | Ireland | | 3M EUR L + 8.49% | | | 8.49 | % | | 01/15/34 | | | 700,000 | | | | 774,100 | |
| Carlyle Euro CLO 2021-2 DAC, Series 2021- 2A | | Ireland | | 3M EUR L + 8.77% | | | 8.77 | % | | 10/15/35 | | | 1,100,000 | | | | 1,219,580 | |
| Carlyle Global Market Strategies CLO 2012- 4, Ltd., Series 2019-4A | | United States | | 3M US L + 7.29% | | | 7.43 | % | | 04/22/32 | | $ | 1,300,000 | | | | 1,285,355 | |
| Carlyle Global Market Strategies CLO 2013- 3, Ltd., Series 2017-3A | | Cayman Islands | | 3M US L + 1.70% | | | 1.82 | % | | 10/15/30 | | | 300,000 | | | | 297,291 | |
| Carlyle Global Market Strategies CLO 2013- 3, Ltd., Series 2017-3A | | Cayman Islands | | 3M US L + 5.50% | | | 5.62 | % | | 10/15/30 | | | 400,000 | | | | 354,958 | |
| Carlyle Global Market Strategies CLO 2014- 4-R, Ltd., Series 2018-4RA | | Cayman Islands | | 3M US L + 2.90% | | | 3.02 | % | | 07/15/30 | | | 500,000 | | | | 472,850 | |
| Carlyle Global Market Strategies CLO 2015- 5, Ltd., Series 2019-5A | | Cayman Islands | | 3M US L + 6.70% | | | 6.83 | % | | 01/20/32 | | | 400,000 | | | | 378,627 | |
| Carlyle Global Market Strategies CLO 2017- 3, Ltd., Series 2017-3A | | Cayman Islands | | 3M US L + 6.11% | | | 6.24 | % | | 07/20/29 | | | 400,000 | | | | 375,913 | |
| Carlyle US CLO 2017-1, Ltd., Series 2017- 1A | | Cayman Islands | | 3M US L + 6.00% | | | 6.13 | % | | 04/20/31 | | | 400,000 | | | | 373,720 | |
| CarVal CLO II, Ltd., Series 2021-1A | | Cayman Islands | | 3M US L + 6.57% | | | 6.70 | % | | 04/20/32 | | | 2,000,000 | | | | 1,963,754 | |
| Cathedral Lake VIII, Ltd., Series 2021-8A | | Cayman Islands | | 3M US L + 7.49% | | | 7.59 | % | | 01/20/35 | | | 200,000 | | | | 190,870 | |
| CBAM 2017-2, Ltd., Series 2021-2A | | Cayman Islands | | 3M US L + 7.10% | | | 7.23 | % | | 07/17/34 | | | 500,000 | | | | 497,445 | |
| Cedar Funding IV CLO, Ltd., Series 2021-4A | | Cayman Islands | | 3M US L + 6.61% | | | 6.75 | % | | 07/23/34 | | | 650,000 | | | | 642,973 | |
| CIFC European Funding CLO II DAC, Series 2020-2A | | Ireland | | 3M EUR L + 7.70% | | | 7.70 | % | | 04/15/33 | | € | 400,000 | | | | 434,859 | |
| CIFC Funding 2013-III-R, Ltd., Series 2018- 3RA | | Cayman Islands | | 3M US L + 5.90% | | | 6.02 | % | | 04/24/31 | | $ | 500,000 | | | | 481,414 | |
| CIFC Funding 2014-II-R, Ltd., Series 2018- 2RA | | Cayman Islands | | 3M US L + 5.69% | | | 5.81 | % | | 04/24/30 | | | 300,000 | | | | 286,975 | |
| Clarinda Park CLO DAC, Series 2021-1A | | Ireland | | 3M EUR L + 7.62% | | | 7.62 | % | | 02/15/34 | | € | 400,000 | | | | 428,326 | |
See Notes to Consolidated Financial Statements.
| Annual Report | December 31, 2021 | 33 |
| Griffin Institutional Access Credit Fund | Consolidated Schedule of Investments |
December 31, 2021
| Description | | Country | | Spread Above Index | | Rate | | | Maturity Date | | Principal Amount | | | Value
(Note 2)(a) | |
| DEBT (continued) | | | | | | | | | | | | | | | | | | |
| Columbia Cent CLO 29, Ltd., Series 2021- 29A | | Cayman Islands | | 3M US L + 6.86% | | | 7.01 | % | | 10/20/34 | | $ | 300,000 | | | $ | 297,001 | |
| Columbia Cent CLO 31, Ltd., Series 2021- 31A | | Cayman Islands | | 3M US L + 6.55% | | | 6.68 | % | | 04/20/34 | | | 400,000 | | | | 379,741 | |
| Crestline Denali CLO XIV, Ltd., Series 2018- 1A | | Cayman Islands | | 3M US L + 6.35% | | | 6.47 | % | | 10/23/31 | | | 250,000 | | | | 228,352 | |
| Crestline Denali CLO XVII, Ltd., Series 2018- 1A | | Cayman Islands | | 3M US L + 3.25% | | | 3.37 | % | | 10/15/31 | | | 400,000 | | | | 390,704 | |
| Crown Point CLO 7, Ltd., Series 2018-7A | | Cayman Islands | | 3M US L + 6.30% | | | 6.43 | % | | 10/20/31 | | | 250,000 | | | | 230,918 | |
| Crown Point CLO IV, Ltd., Series 2018-4A | | Cayman Islands | | 3M US L + 5.50% | | | 5.63 | % | | 04/20/31 | | | 300,000 | | | | 268,012 | |
| CVC Cordatus Loan Fund VIII DAC, Series 2021-8A | | Ireland | | 3M EUR L + 8.37% | | | 8.37 | % | | 07/15/34 | | € | 700,000 | | | | 772,102 | |
| CVC Cordatus Loan Fund XVII DAC, Series 2021-17A | | Ireland | | 3M EUR L + 8.56% | | | 8.56 | % | | 11/18/33 | | | 600,000 | | | | 661,569 | |
| CVC Cordatus Loan Fund XX DAC, Series 2021-20A | | Ireland | | 3M EUR L + 8.33% | | | 8.33 | % | | 06/22/34 | | | 600,000 | | | | 664,532 | |
| Dartry Park CLO DAC, Series 2021-1A | | Ireland | | 3M EUR L + 7.67% | | | 7.67 | % | | 01/28/34 | | | 2,250,000 | | | | 2,510,975 | |
| Dryden 68 CLO, Ltd., Series 2021-68A | | Cayman Islands | | 3M US L + 6.75% | | | 6.87 | % | | 07/15/35 | | $ | 3,950,000 | | | | 3,933,517 | |
| Dryden Euro CLO, Series 2021-88A | | Netherlands | | 3M EUR L + 8.38% | | | 8.38 | % | | 07/20/34 | | € | 250,000 | | | | 276,244 | |
| Elevation CLO 2018-9, Ltd., Series 2018-9A | | Cayman Islands | | 3M US L + 6.30% | | | 6.42 | % | | 07/15/31 | | $ | 550,000 | | | | 513,591 | |
| Euro-Galaxy IV CLO BV, Series 2021-4A | | Netherlands | | 3M EUR L + 8.88% | | | 8.88 | % | | 07/30/34 | | € | 450,000 | | | | 498,941 | |
| GoldenTree Loan Management EUR CLO 3 DAC, Series 2019-3A | | Ireland | | 3M EUR L + 8.32% | | | 8.32 | % | | 01/20/32 | | | 300,000 | | | | 327,130 | |
| GoldenTree Loan Management EUR CLO 4 DAC, Series 2021-4A | | Ireland | | 3M EUR L + 8.58% | | | 8.58 | % | | 07/20/34 | | | 500,000 | | | | 552,577 | |
| Greywolf CLO V, Ltd., Series 2018-1A | | Cayman Islands | | 3M US L + 5.85% | | | 5.97 | % | | 01/27/31 | | $ | 1,625,000 | | | | 1,573,767 | |
| Harvest CLO XXVI DAC, Series 2021-26A | | Ireland | | 3M EUR L + 8.55% | | | 8.55 | % | | 01/15/34 | | € | 750,000 | | | | 824,290 | |
| Hayfin Emerald CLO II DAC, Series 2021-2A | | Ireland | | 3M EUR L + 8.43% | | | 8.43 | % | | 05/27/34 | | | 1,050,000 | | | | 1,155,053 | |
| Hayfin Emerald CLO III DAC, Series 2021- 3A | | Ireland | | 3M EUR L + 8.88% | | | 8.88 | % | | 01/15/35 | | | 300,000 | | | | 333,348 | |
| Hayfin Emerald CLO VII DAC, Series 2021- 7A | | Ireland | | 3M EUR L + 8.65% | | | 8.65 | % | | 04/15/34 | | | 300,000 | | | | 327,255 | |
| Hayfin US XII, Ltd., Series 2018-9A | | Cayman Islands | | 3M US L + 6.15% | | | 6.29 | % | | 04/28/31 | | $ | 300,000 | | | | 282,203 | |
| ICG US CLO 2014-2, Ltd., Series 2018-2A | | Cayman Islands | | 3M US L + 5.20% | | | 5.32 | % | | 01/15/31 | | | 250,000 | | | | 223,625 | |
| ICG US CLO 2015-2R, Ltd., Series 2020-2RA | | Cayman Islands | | 3M US L + 6.99% | | | 7.12 | % | | 01/16/33 | | | 600,000 | | | | 571,802 | |
| ICG US CLO 2016-1, Ltd., Series 2021-1A | | Cayman Islands | | 3M US L + 7.44% | | | 7.57 | % | | 04/29/34 | | | 1,050,000 | | | | 1,031,752 | |
| ICG US CLO 2017-1, Ltd., Series 2021-1A | | Cayman Islands | | 3M US L + 7.36% | | | 7.49 | % | | 07/28/34 | | | 650,000 | | | | 637,972 | |
| Invesco Euro CLO, Series 2021-6A | | Ireland | | 3M EUR L + 8.58% | | | 8.58 | % | | 07/15/34 | | € | 500,000 | | | | 548,502 | |
| Jamestown CLO XI, Ltd., Series 2018-11A | | Cayman Islands | | 3M US L + 6.02% | | | 6.15 | % | | 07/14/31 | | $ | 350,000 | | | | 328,046 | |
| Jubilee CLO 2013-X DAC, Series 2021-10A | | Netherlands | | 3M EUR L + 8.55% | | | 8.55 | % | | 07/15/34 | | € | 600,000 | | | | 658,755 | |
| KKR CLO 14, Ltd., Series 2018-14 | | Cayman Islands | | 3M US L + 6.15% | | | 6.27 | % | | 07/15/31 | | $ | 400,000 | | | | 384,371 | |
| KKR CLO 15, Ltd., Series 2018-15 | | Cayman Islands | | 3M US L + 6.44% | | | 6.56 | % | | 01/18/32 | | | 250,000 | | | | 240,705 | |
| KKR CLO 25, Ltd., Series 2021-25 | | Cayman Islands | | 3M US L + 6.72% | | | 6.85 | % | | 07/15/34 | | | 625,000 | | | | 618,012 | |
| Madison Park Euro Funding XII DAC, Series 2018-12A | | Ireland | | 3M EUR L + 6.90% | | | 6.90 | % | | 10/15/31 | | € | 1,200,000 | | | | 1,287,951 | |
| Madison Park Euro Funding XVI DAC, Series 2021-16A | | Ireland | | 3M EUR L + 8.39% | | | 8.39 | % | | 05/25/34 | | | 1,300,000 | | | | 1,430,866 | |
| Madison Park Euro Funding XVII DAC, Series 2021-17A | | Ireland | | 3M EUR L + 8.62% | | | 8.62 | % | | 07/27/34 | | | 550,000 | | | | 598,197 | |
| Marble Point CLO XII, Ltd., Series 2018-1A | | Cayman Islands | | 3M US L + 3.00% | | | 3.12 | % | | 07/16/31 | | $ | 550,000 | | | | 515,534 | |
| Marble Point CLO XVI, Ltd., Series 2021-2A | | Cayman Islands | | 3M US L + 7.01% | | | 7.13 | % | | 11/16/34 | | | 500,000 | | | | 493,269 | |
| Midocean Credit CLO IX, Series 2018-9A | | Cayman Islands | | 3M US L + 3.30% | | | 3.43 | % | | 07/20/31 | | | 300,000 | | | | 291,127 | |
| Milltown Park CLO DAC, Series 2018-1A | | Ireland | | 3M EUR L + 6.40% | | | 6.40 | % | | 01/15/31 | | € | 600,000 | | | | 647,420 | |
See Notes to Consolidated Financial Statements.
| 34 | 1.888.926.2688 | www.griffincapital.com |
| Griffin Institutional Access Credit Fund | Consolidated Schedule of Investments |
December 31, 2021
| Description | | Country | | Spread Above Index | | Rate | | | Maturity Date | | Principal Amount | | | Value
(Note 2)(a) | |
| DEBT (continued) | | | | | | | | | | | | | | | | | | |
| Mountain View CLO 2017-2 LLC, Series 2018-2A | | Cayman Islands | | 3M US L + 5.96% | | | 6.08 | % | | 01/16/31 | | $ | 900,000 | | | $ | 836,357 | |
| Mountain View CLO IX, Ltd., Series 2018- 9A | | Cayman Islands | | 3M US L + 6.08% | | | 6.20 | % | | 07/15/31 | | | 700,000 | | | | 627,756 | |
| Northwoods Capital XI-B, Ltd., Series 2018- 11BA | | Cayman Islands | | 3M US L + 5.80% | | | 5.92 | % | | 04/19/31 | | | 250,000 | | | | 229,515 | |
| Northwoods Capital XII-B, Ltd., Series 2018-12BA | | Cayman Islands | | 3M US L + 3.15% | | | 3.35 | % | | 06/15/31 | | | 300,000 | | | | 284,581 | |
| Northwoods Capital XII-B, Ltd., Series 2018-12BA | | Cayman Islands | | 3M US L + 5.79% | | | 5.99 | % | | 06/15/31 | | | 250,000 | | | | 226,542 | |
| Northwoods Capital XVII, Ltd., Series 2018- 17A | | Cayman Islands | | 3M US L + 5.65% | | | 5.79 | % | | 04/22/31 | | | 600,000 | | | | 545,506 | |
| Northwoods Capital XVIII, Ltd., Series 2019-18A | | Cayman Islands | | 3M US L + 6.58% | | | 6.74 | % | | 05/20/32 | | | 400,000 | | | | 381,924 | |
| OAK Hill European Credit Partners V Designated Activity Co., Series 2021-5A | | Cayman Islands | | 3M EUR L + 8.87% | | | 8.87 | % | | 01/21/35 | | € | 650,000 | | | | 724,210 | |
| Oaktree CLO 2018-1, Ltd., Series 2018-1A | | Cayman Islands | | 3M US L + 6.15% | | | 6.28 | % | | 10/20/30 | | $ | 300,000 | | | | 279,564 | |
| Oaktree CLO 2019-1, Ltd., Series 2019-1A | | Cayman Islands | | 3M US L + 6.80% | | | 6.93 | % | | 04/22/30 | | | 650,000 | | | | 610,550 | |
| Oaktree CLO 2019-2, Ltd., Series 2019-2A | | Cayman Islands | | 3M US L + 6.77% | | | 6.89 | % | | 04/15/31 | | | 800,000 | | | | 768,356 | |
| Oaktree CLO 2020-1, Ltd., Series 2021-1A | | Cayman Islands | | 3M US L + 6.51% | | | 6.64 | % | | 07/15/34 | | | 1,050,000 | | | | 1,030,999 | |
| Ocean Trails CLO V, Series 2018-5A | | Cayman Islands | | 3M US L + 3.45% | | | 3.57 | % | | 10/13/31 | | | 650,000 | | | | 611,929 | |
| Ocean Trails CLO V, Series 2018-5A | | Cayman Islands | | 3M US L + 6.50% | | | 6.62 | % | | 10/13/31 | | | 150,000 | | | | 136,484 | |
| OZLM Funding IV, Ltd., Series 2017-4A | | Cayman Islands | | 3M US L + 6.30% | | | 6.43 | % | | 10/22/30 | | | 693,421 | | | | 659,934 | |
| OZLM IX, Ltd., Series 2018-9A | | Cayman Islands | | 3M US L + 6.12% | | | 6.25 | % | | 10/20/31 | | | 850,000 | | | | 794,747 | |
| OZLM VI, Ltd., Series 2018-6A | | Cayman Islands | | 3M US L + 6.05% | | | 6.17 | % | | 04/17/31 | | | 250,000 | | | | 233,251 | |
| OZLM XIV, Ltd., Series 2021-14A | | Cayman Islands | | 3M US L + 7.01% | | | 7.14 | % | | 07/15/34 | | | 5,300,000 | | | | 5,146,634 | |
| OZLM XXI, Ltd., Series 2018-21A | | Cayman Islands | | 3M US L + 5.54% | | | 5.67 | % | | 01/20/31 | | | 300,000 | | | | 280,482 | |
| OZLM XXII, Ltd., Series 2018-22A | | Cayman Islands | | 3M US L + 5.30% | | | 5.42 | % | | 01/17/31 | | | 250,000 | | | | 227,289 | |
| Parallel 2018-1, Ltd., Series 2018-1A | | Cayman Islands | | 3M US L + 5.25% | | | 5.38 | % | | 04/20/31 | | | 300,000 | | | | 258,034 | |
| Penta CLO 10 DAC, Series 2021-10A | | Ireland | | 3M EUR L + 8.80% | | | 8.80 | % | | 11/20/34 | | € | 650,000 | | | | 720,736 | |
| Penta CLO 6 DAC, Series 2021-6A | | Ireland | | 3M EUR L + 9.35% | | | 9.35 | % | | 07/25/34 | | | 500,000 | | | | 555,800 | |
| Penta CLO 9 DAC, Series 2021-9A | | Ireland | | 3M EUR L + 8.74% | | | 8.74 | % | | 07/25/36 | | | 550,000 | | | | 605,569 | |
| Pikes Peak CLO 2, Series 2021-2A | | Cayman Islands | | 3M US L + 6.66% | | | 6.87 | % | | 10/18/34 | | $ | 400,000 | | | | 385,832 | |
| Regatta XIII Funding, Ltd., Series 2018-2A | | Cayman Islands | | 3M US L + 5.95% | | | 6.07 | % | | 07/15/31 | | | 900,000 | | | | 848,860 | |
| Romark CLO V, Ltd., Series 2021-5A | | Cayman Islands | | 3M US L + 7.05% | | | 7.14 | % | | 01/15/35 | | | 500,000 | | | | 482,049 | |
| Saranac CLO VIII, Ltd., Series 2020-8A | | United States | | 3M US L + 8.12% | | | 8.25 | % | | 02/20/33 | | | 100,000 | | | | 97,668 | |
| Sculptor European CLO II DAC, Series 2021- 2A | | Ireland | | 3M EUR L + 8.28% | | | 8.28 | % | | 04/15/34 | | € | 700,000 | | | | 772,576 | |
| Shackleton 2014-V-R CLO, Ltd., Series 2018-5RA | | Cayman Islands | | 3M US L + 6.15% | | | 6.28 | % | | 05/07/31 | | $ | 650,000 | | | | 604,532 | |
| Shackleton 2015-VII-R CLO, Ltd., Series 2018-7RA | | Cayman Islands | | 3M US L + 6.20% | | | 6.32 | % | | 07/15/31 | | | 250,000 | | | | 231,270 | |
| Sound Point CLO II, Ltd., Series 2018-1A | | Cayman Islands | | 3M US L + 5.50% | | | 5.62 | % | | 01/26/31 | | | 300,000 | | | | 272,993 | |
| Sound Point CLO VII-R, Ltd., Series 2018- 3RA | | Cayman Islands | | 3M US L + 6.12% | | | 6.24 | % | | 10/23/31 | | | 300,000 | | | | 273,367 | |
| Sound Point CLO V-R, Ltd., Series 2018-1RA | | Cayman Islands | | 3M US L + 3.10% | | | 3.22 | % | | 07/18/31 | | | 450,000 | | | | 429,110 | |
| Sound Point CLO V-R, Ltd., Series 2018-1RA | | Cayman Islands | | 3M US L + 6.10% | | | 6.22 | % | | 07/18/31 | | | 300,000 | | | | 276,792 | |
| Sound Point CLO XXII, Ltd., Series 2019-1A | | Cayman Islands | | 3M US L + 6.30% | | | 6.43 | % | | 01/20/32 | | | 300,000 | | | | 289,116 | |
| Sound Point CLO XXIII, Series 2021-2A | | Cayman Islands | | 3M US L + 6.47% | | | 6.59 | % | | 07/15/34 | | | 1,200,000 | | | | 1,163,404 | |
| Sounds Point CLO IV-R, Ltd., Series 2018- 3RA | | Cayman Islands | | 3M US L + 3.25% | | | 3.37 | % | | 04/18/31 | | | 300,000 | | | | 285,033 | |
| St Pauls CLO II DAC, Series 2021-2A | | Ireland | | 3M EUR L + 8.88% | | | 8.88 | % | | 10/25/35 | | € | 400,000 | | | | 449,112 | |
See Notes to Consolidated Financial Statements.
| Annual Report | December 31, 2021 | 35 |
| Griffin Institutional Access Credit Fund | Consolidated Schedule of Investments |
December 31, 2021
| Description | | Country | | Spread Above Index | | Rate | | | Maturity Date | | Principal Amount | | | Value
(Note 2)(a) | |
| DEBT (continued) | | | | | | | | | | | | | �� | | | | | |
| St Paul’s CLO VII DAC, Series 2021-7A | | Ireland | | 3M EUR L + 8.55% | | | 8.55 | % | | 07/18/34 | | € | 750,000 | | | $ | 828,102 | |
| Steele Creek CLO 2017-1, Ltd., Series 2017- 1A | | Cayman Islands | | 3M US L + 6.20% | | | 6.32 | % | | 10/15/30 | | $ | 250,000 | | | | 232,496 | |
| Symphony CLO XV, Ltd., Series 2018-15A | | Cayman Islands | | 3M US L + 6.33% | | | 6.45 | % | | 01/17/32 | | | 1,000,000 | | | | 946,109 | |
| TCW CLO 2017-1A, Ltd., Series 2021-1A | | Cayman Islands | | 3M US L + 6.78% | | | 6.78 | % | | 10/29/34 | | | 500,000 | | | | 487,927 | |
| THL Credit Wind River 2013-2 CLO, Ltd., Series 2017-2A | | Cayman Islands | | 3M US L + 2.95% | | | 3.07 | % | | 10/18/30 | | | 250,000 | | | | 240,010 | |
| THL Credit Wind River 2014-2 CLO, Ltd., Series 2018-2A | | Cayman Islands | | 3M US L + 2.90% | | | 3.02 | % | | 01/15/31 | | | 450,000 | | | | 431,883 | |
| THL Credit Wind River 2014-3K CLO, Ltd., Series 2018-3KRA | | Cayman Islands | | 3M US L + 6.09% | | | 6.21 | % | | 10/15/30 | | | 400,000 | | | | 365,378 | |
| Tikehau CLO, Series 2021-2A | | Netherlands | | 3M EUR L + 8.95% | | | 8.95 | % | | 09/07/35 | | € | 700,000 | | | | 786,045 | |
| Trinitas CLO IV, Ltd., Series 2018-4A | | Cayman Islands | | 3M US L + 6.30% | | | 6.42 | % | | 10/18/31 | | $ | 350,000 | | | | 323,379 | |
| Venture 28A CLO, Ltd., Series 2021-28AA | | Cayman Islands | | 3M US L + 7.32% | | | 7.32 | % | | 10/20/34 | | | 750,000 | | | | 746,849 | |
| Venture 44 CLO, Ltd., Series 2021-44A | | Cayman Islands | | 3M US L + 6.53% | | | 6.65 | % | | 10/20/34 | | | 1,500,000 | | | | 1,415,424 | |
| Venture XXII CLO, Ltd., Series 2018-22A | | Cayman Islands | | 3M US L + 5.65% | | | 5.77 | % | | 01/15/31 | | | 300,000 | | | | 263,654 | |
| Venture XXX CLO, Ltd., Series 2017-30A | | Cayman Islands | | 3M US L + 6.30% | | | 6.42 | % | | 01/15/31 | | | 200,000 | | | | 185,168 | |
| Venture XXXII CLO, Ltd., Series 2018-32A | | Cayman Islands | | 3M US L + 5.75% | | | 5.87 | % | | 07/18/31 | | | 300,000 | | | | 270,519 | |
| Venture XXXIII CLO, Ltd., Series 2018-33A | | Cayman Islands | | 3M US L + 5.95% | | | 6.07 | % | | 07/15/31 | | | 200,000 | | | | 178,571 | |
| Venture XXXIV CLO, Ltd., Series 2018-34A | | Cayman Islands | | 3M US L + 6.13% | | | 6.25 | % | | 10/15/31 | | | 200,000 | | | | 186,358 | |
| Venture XXXV CLO, Ltd., Series 2018-35A | | Cayman Islands | | 3M US L + 6.20% | | | 6.33 | % | | 10/22/31 | | | 300,000 | | | | 271,012 | |
| Venture XXXVI CLO, Ltd., Series 2019-36A | | Cayman Islands | | 3M US L + 6.92% | | | 7.05 | % | | 04/20/32 | | | 300,000 | | | | 279,954 | |
| Vibrant CLO 1X, Ltd., Series 2018-9A | | Cayman Islands | | 3M US L + 3.20% | | | 3.33 | % | | 07/20/31 | | | 300,000 | | | | 287,668 | |
| Voya CLO 2016-3, Ltd., Series 2018-3A | | Cayman Islands | | 3M US L + 6.08% | | | 6.20 | % | | 10/18/31 | | | 250,000 | | | | 230,531 | |
| Wellfleet CLO X, Ltd., Series 2021-XA | | Cayman Islands | | 3M US L + 6.61% | | | 6.78 | % | | 07/20/32 | | | 1,300,000 | | | | 1,280,408 | |
| Wind River 2014-1 CLO, Ltd., Series 2018- 1A | | Cayman Islands | | 3M US L + 6.30% | | | 6.42 | % | | 07/18/31 | | | 1,050,000 | | | | 981,776 | |
| Wind River 2014-3 CLO, Ltd., Series 2018- 3A | | Cayman Islands | | 3M US L + 6.22% | | | 6.35 | % | | 10/22/31 | | | 250,000 | | | | 236,398 | |
| | | | | | | | | | | | | | | | | | 89,540,908 | |
| EQUITY (0.14%)(l) | | | | | | | | | | | | | | | | | | |
| Anchorage Credit Funding 13, Ltd., Series 2021-13A(h) | | Cayman Islands | | | | | 8.72 | % | | 07/27/39 | | $ | 850,000 | | | | 885,798 | |
| | | | | | | | | | | | | | | | | | 885,798 | |
| TOTAL COLLATERALIZED LOAN OBLIGATIONS | | | | | | | | |
| (Cost $90,962,621) | | | | | | | | | | | | | | | | | 90,426,706 | |
| | | | | | | | | | | | | | | | | | | |
| | | | | | | | | | | | | | Shares | | | | Value | |
| EQUITY INTEREST (2.72%)(m) | | | | | | | | |
| AEROSPACE & DEFENSE (0.06%)(e)(i) | | | | | | | | |
| Kellstrom Aerospace Group, Inc. | | United States | | | | | | | | | | | 107 | | | | 79,921 | |
| Meggitt-USA, Inc., Class A | | United States | | | | | | | | | | | 7,000 | | | | 313,460 | |
| | | | | | | | | | | | | | | | | | 393,381 | |
| CAPITAL EQUIPMENT (0.03%)(e)(i) | | | | | | | | |
| East BCC Coinvest III, LLC | | United States | | | | | | | | | | | 241,930 | | | | 181,498 | |
| | | | | | | | | | | | | | | | | | | |
| CONSTRUCTION & BUILDING (0.52%)(e)(i)(n) | | | | | | | | |
| Bain Capital Credit CC Fund | | United States | | | | | | | | | | | 1,940 | | | | 3,268,248 | |
| | | | | | | | | | | | | | | | | | | |
| CONSUMER GOODS: DURABLE (0.01%)(e)(i) | | | | | | | | |
| TLC Holdco LP | | United States | | | | | | | | | | | 103,961 | | | | 37,744 | |
See Notes to Consolidated Financial Statements.
| 36 | 1.888.926.2688 | www.griffincapital.com |
| Griffin Institutional Access Credit Fund | Consolidated Schedule of Investments |
December 31, 2021
| | | | | | | | | | | | | Shares | | | Value | |
| EQUITY INTEREST (continued) | | | | | | | | |
| CONSUMER GOODS: NON-DURABLE (0.01%)(e)(i) | | | | | | | | |
| FineLine Parent Holdings, LP, Class A | | United States | | | | | | | | | | | 41,077 | | | $ | 54,315 | |
| | | | | | | | | | | | | | | | | | | |
| ENERGY: OIL & GAS (0.51%)(i) | | | | | | | | |
| Blackbrush Oil & Gas LP - Common(e) | | United States | | | | | | | | | | | 75,310 | | | | – | |
| Blackbrush Oil & Gas LP - Preferred(e) | | United States | | | | | | | | | | | 2,420,690 | | | | 1,322,892 | |
| Bruin Blocker LLC(e) | | United States | | | | | | | | | | | 27,864 | | | | – | |
| PureWest LLC Common, Class A | | United States | | | | | | | | | | | 72,777 | | | | 1,883,105 | |
| | | | | | | | | | | | | | | | | | 3,205,997 | |
| HIGH TECH INDUSTRIES (0.51%)(e)(i) | | | | | | | | |
| AQ Software Corporation | | United States | | | | | | | | | | | 79 | | | | 77,192 | |
| AQ Software Corporation | | United States | | | | | | | | | | | 131 | | | | 128,608 | |
| OneShield Partners LP | | United States | | | | | | | | | | | 2,487,653 | | | | 2,864,317 | |
| Red Cypress Co-Investment Partners LP, Interests | | United States | | | | | | | | | | | 186,900 | | | | 135,745 | |
| | | | | | | | | | | | | | | | | | 3,205,862 | |
| MEDIA: ADVERTISING, PRINTING & PUBLISHING (0.00%)(i)(o) | | | | | | | | |
| PacificCo | | United States | | | | | | | | | | | 1,260 | | | | 3,937 | |
| | | | | | | | | | | | | | | | | | | |
| MEDIA: DIVERSIFIED & PRODUCTION (0.16%) | | | | | | | | |
| Cineworld Group PLC Warrant, Strike Price $41.49(i) | | United Kingdom | | | | | | | | | | | 84,898 | | | | 45,965 | |
| Technicolor USA, Inc. | | France | | | | | | | | | | | 303,315 | | | | 977,957 | |
| | | | | | | | | | | | | | | | | | 1,023,922 | |
| METALS & MINING (0.15%)(i) | | | | | | | | |
| American Consolidated Natural Resources, Inc. | | United States | | | | | | | | | | | 2,639 | | | | 122,934 | |
| American Consolidated Natural Resources, Inc. Preferred | | United States | | | | | | | | | | | 2,507 | | | | 795,972 | |
| | | | | | | | | | | | | | | | | | 918,906 | |
| SERVICES: BUSINESS (0.42%)(e)(i) | | | | | | | | |
| Astorg Co-invest Opus 2 | | Luxembourg | | | | | | | | | | | 1,160,000 | | | | 1,932,031 | |
| Gluware, Inc. Warrant Strike Price $0.00 | | United States | | | | | | | | | | | 291,144 | | | | – | |
| Marlin-Stark Aggregator, L.P. | | Cayman Islands | | | | | | | | | | | 494,227 | | | | 688,906 | |
| | | | | | | | | | | | | | | | | | 2,620,937 | |
| SERVICES: CONSUMER (0.10%)(e)(i) | | | | | | | | |
| MZR Aggregator, LLC | | United States | | | | | | | | | | | 52 | | | | 52,395 | |
| Pack-a-Punch Lux Topco SARL | | Luxembourg | | | | | | | | | | | 252,000 | | | | 341,094 | |
| WSP Midco LLC Series A | | United States | | | | | | | | | | | 254,000 | | | | 247,990 | |
| | | | | | | | | | | | | | | | | | 641,479 | |
| TELECOMMUNICATIONS (0.08%)(e)(i) | | | | | | | | |
| ACM dcBLOX LLC Warrant, Strike Price $0.01 | | United States | | | | | | | | | | | 28,120 | | | | – | |
| ACM dcBLOX LLC, Series A Preferred | | United States | | | | | | | | | | | 463,328 | | | | 500,649 | |
| | | | | | | | | | | | | | | | | | 500,649 | |
| TRANSPORTATION: CARGO (0.05%)(e)(i) | | | | | | | | |
| GIACF Grammer Equity Holdings, LLC - Common Stock(i) | | United States | | | | | | | | | | | 84,221 | | | | 87,977 | |
| GIACF Grammer Equity Holdings, LLC - Preferred Stock (10.00% PIK)(g) | | United States | | | | | | | | | | | 625 | | | | 65,687 | |
| GIACF Grammer Equity Holdings, LLC - Warrant, Strike Price $9.00(i) | | United States | | | | | | | | | | | 10,151 | | | | 10,502 | |
| Toro Private Investments LP(i) | | United States | | | | | | | | | | | 324,324 | | | | 142,039 | |
| | | | | | | | | | | | | | | | | | 306,205 | |
See Notes to Consolidated Financial Statements.
| Annual Report | December 31, 2021 | 37 |
| Griffin Institutional Access Credit Fund | Consolidated Schedule of Investments |
December 31, 2021
| | | | | | | | | | | | | Shares | | | Value | |
| EQUITY INTEREST (continued) | | | | | | | | |
| UTILITIES: ELECTRIC (0.11%)(e) | | | | | | | | |
| New Frontera Holdings Warrant, Strike Price $9.00 | | United States | | | | | | | | | | | 65,038 | | | $ | 715,418 | |
| | | | | | | | | | | | | | | | | | | |
| TOTAL EQUITY INTEREST | | | | | | | | |
| (Cost $11,793,780) | | | | | | | | | | | | | | | | | 17,078,498 | |
| | | | | | | | | | | | | | | | | | | |
| EXCHANGE TRADED FUNDS (1.72%) | | | | | | | | |
| Invesco Senior Loan ETF | | | | | | | | | | | | | 245,287 | | | | 5,420,843 | |
| iShares® iBoxx High Yield Corporate Bond ETF | | | | | | | | | | | | | 30,915 | | | | 2,689,914 | |
| SPDR® Bloomberg High Yield Bond ETF | | | | | | | | | | | | | 24,762 | | | | 2,688,410 | |
| | | | | | | | | | | | | | | | | | | |
| TOTAL EXCHANGE TRADED FUNDS | | | | | | | | |
| (Cost $10,801,124) | | | | | | | | | | | | | | | | | 10,799,167 | |
| | | | | | | | | | | | | | | | | | | |
| TOTAL INVESTMENTS (118.95%) | | | | | | | | |
| (Cost $740,799,706) | | | | | | | | | | | | | | | | $ | 746,769,067 | |
| | | | | | | | | | | | | | | | | | | |
| Liabilities in Excess of Other Assets (-18.95%)(p) | | | | | | | (118,972,104 | ) |
| NET ASSETS (100.00%) | | | | | | | | | | | | | | | | $ | 627,796,963 | |
| (a) | Investment holdings denominated in foreign currencies are converted to U.S. Dollars using period end spot rates. |
| (b) | Floating or variable rate security. The reference rate is described above. The rate in effect as of December 31, 2021 is based on the reference rate plus the displayed spread as of the security’s last reset date. |
| (c) | Security or portion thereof pledged as collateral under the secured revolving credit facility entered into by CRDTX SPV I, LLC and Citibank N.A.. |
| (d) | Investment or portion thereof has not settled as of December 31, 2021. The interest rate shown represents the stated spread over the applicable London Interbank Offered Rate (“LIBOR” or “L”) or Euro Interbank Offered Rate (“EURIBOR” or “EUR L”); the Fund will not accrue interest until the settlement date at which point LIBOR or EURIBOR will be established. If the position is partially settled, the reference rate and floor shown is applicable to the settled portion. |
| (e) | Security is classified as Level 3 in the Fund’s fair value hierarchy (see Note 2). |
See Notes to Consolidated Financial Statements.
| 38 | 1.888.926.2688 | www.griffincapital.com |
| Griffin Institutional Access Credit Fund | Consolidated Schedule of Investments |
December 31, 2021
| (f) | Investment or portion thereof was not funded as of December 31, 2021. The Fund had $23,934,723 at par value in unfunded commitments pursuant to Delayed Draw Term Loan facilities and unused Revolver capacities. The Consolidated Schedule of Investments records each of these investments as fully funded. A corresponding payable for investments purchased has also been recorded which represents the actual unfunded amount on the balance sheet date. |
| Unfunded Security | | Total revolving and delayed draw loan commitments | | | Less: drawn commitments | | | Total undrawn commitments | |
| 9 Story Media Group Inc. Revolver | | $ | 708,015 | | | $ | 75,431 | | | $ | 632,584 | |
| Abbey Cottages Ltd., Tranche 1 | | | 1,184,823 | | | | 149,263 | | | | 1,035,560 | |
| Abbey Cottages Ltd., Tranche 2 | | | 61,409 | | | | – | | | | 61,409 | |
| ABG Intermediate Holdings 2, First Lien Tranche 2 Term Loan | | | 479,618 | | | | – | | | | 479,618 | |
| ABG Intermediate Holdings 2, First Lien Tranche 3 Term Loan | | | 75,234 | | | | – | | | | 75,234 | |
| AMI US Holdings Inc. Revolver Loan | | | 145,361 | | | | 58,144 | | | | 87,217 | |
| Appriss Health LLC, First Lien Revolving Credit Term Loan | | | 65,875 | | | | – | | | | 65,875 | |
| Confluent Health, LLC, Delayed Draw Term Loan | | | 125,198 | | | | – | | | | 125,198 | |
| CST Buyer Company, Revolving Credit Facility Term Loan | | | 233,472 | | | | – | | | | 233,472 | |
| DC Blox Inc., Initial Advance | | | 4,722,770 | | | | 2,695,712 | | | | 2,027,058 | |
| Diversitech Holdings, Inc. Delayed Draw Term Loan | | | 121,852 | | | | – | | | | 121,852 | |
| ENC Parent Corp., First Lien Delayed Draw Term Loan | | | 74,568 | | | | – | | | | 74,568 | |
| Engineered Components and Systems LLC, First Lien Delayed Draw Term Loan | | | 179,478 | | | | – | | | | 179,478 | |
| Grammer Purchaser, Inc., First Lien Revolving Term Loan | | | 90,000 | | | | – | | | | 90,000 | |
| Intelsat Jackson Holdings SA, DIP Facility (2021) | | | 107,609 | | | | 89,674 | | | | 17,935 | |
| Kellstrom Commercial Aerospace, Inc. - Revolver | | | 361,314 | | | | 158,978 | | | | 202,336 | |
| Mach Acquisition, LLC Revolving Credit Loan | | | 1,130,000 | | | | – | | | | 1,130,000 | |
| Midcap Invest UK Acquisition Facility | | | 1,520,032 | | | | – | | | | 1,520,032 | |
| MRH Trowe Beteiligungsgesellschaft mbH Acquisition Facility | | | 2,698,241 | | | | – | | | | 2,698,241 | |
| MRI Software LLC, First Lien Revolving Term Loan | | | 155,944 | | | | – | | | | 155,944 | |
| MZR Buyer, LLC, Revolving Loan | | | 341,954 | | | | – | | | | 341,954 | |
| National Mentor Holdings, Inc., First Lien Delayed Draw Term Loan | | | 86,662 | | | | – | | | | 86,662 | |
| New Look Vision Group, Inc., First Lien Canadian Delayed Draw Term Loan | | | 778,746 | | | | 258,085 | | | | 520,661 | |
| New Look Vision Group, Inc., First Lien Canadian Revolving Term Loan | | | 267,204 | | | | 34,008 | | | | 233,196 | |
| Oneshield, Inc., Revolver Loan | | | 115,942 | | | | – | | | | 115,942 | |
| Pack-A-Punch Bidco Limited Acquisition Facility | | | 785,057 | | | | 458,126 | | | | 326,931 | |
| Paisley Bidco Limited, Acquisition Facility | | | 2,283,433 | | | | – | | | | 2,283,433 | |
| Patagonia BidCo, Ltd., Facility B2 | | | 160,884 | | | | – | | | | 160,884 | |
| Pro Mach Group, Inc., First Lien Delayed Draw Term Loan | | | 171,931 | | | | – | | | | 171,931 | |
| Refficiency Holdings LLC, Delayed Draw Term loan | | | 69,332 | | | | – | | | | 69,332 | |
| Refine Intermediate, Inc., Revolving Facility Term Loan | | | 467,256 | | | | – | | | | 467,256 | |
| Revalize, Inc., Additional Revolver | | | 100,000 | | | | – | | | | 100,000 | |
| Revalize, Inc., Tranche 4 Delayed Draw Term Loan | | | 1,005,000 | | | | – | | | | 1,005,000 | |
| RH Diagnostik & Therapie Holding GmbH, Acquisition/Capex Facility | | | 3,888,588 | | | | – | | | | 3,888,588 | |
| Secure Acquisition, Inc., Delayed Draw, First Lien Term Loan | | | 87,562 | | | | – | | | | 87,562 | |
| Smartronix Revolving Loan | | | 711,000 | | | | – | | | | 711,000 | |
| Sovos Compliance LLC, First Lien Term Loan | | | 83,047 | | | | – | | | | 83,047 | |
| Sunmed Group Holdings, LLC, Revolver | | | 137,842 | | | | 22,054 | | | | 115,788 | |
| TLC Purchaser, Inc. Delayed Draw Term Loan | | | 623,197 | | | | – | | | | 623,197 | |
| TLC Purchaser, Inc. Revolver Loan | | | 778,762 | | | | 560,708 | | | | 218,054 | |
| Trident TPI Holdings, Inc., First Lien Delayed Draw Tem Term Loan | | | 61,259 | | | | 24,650 | | | | 36,609 | |
| V Global Holdings LLC, Revolving Credit, First Lien Term Loan | | | 371,009 | | | | 66,782 | | | | 304,227 | |
| WCI-Gigawatt Purchaser, LLC, Initial Delayed Draw Term Loan | | | 543,000 | | | | 362,000 | | | | 181,000 | |
| WCI-Gigawatt Purchaser, LLC, Revolving Loan | | | 362,000 | | | | – | | | | 362,000 | |
| Whitcraft LLC, First Lien Revolving Term Loan | | | 158,575 | | | | – | | | | 158,575 | |
| World Insurance Associates, LLC, Revolving Term Loan | | | 81,464 | | | | 6,110 | | | | 75,354 | |
| WSP Midco LLC, Delayed Draw Term Loan | | | 158,380 | | | | – | | | | 158,380 | |
| WSP Midco LLC, Revolving Loan | | | 38,602 | | | | 4,053 | | | | 34,549 | |
| Total | | $ | 28,958,501 | | | $ | 5,023,778 | | | $ | 23,934,723 | |
See Notes to Consolidated Financial Statements.
| Annual Report | December 31, 2021 | 39 |
| Griffin Institutional Access Credit Fund | Consolidated Schedule of Investments |
December 31, 2021
| (g) | Paid in kind security which may pay interest in additional par. |
| (h) | Fixed rate security. (i) Non-income producing security. |
| (j) | See Note 2 regarding defaulted securities. |
| (k) | Securities exempt from registration under Rule 144A of the Securities Act of 1933, as amended (the “Securities Act”) and Regulation S of the Securities Act. These securities may be sold in the ordinary course of business in transactions exempt from registration normally to qualified institutional buyers. As of December 31, 2021, the aggregate market value of such securities was $237,054,678, representing 37.73% of net assets. |
| (l) | CLO subordinated notes, income notes, and Class M notes are considered CLO equity positions. CLO equity positions are entitled to recurring distributions which are generally equal to the remaining cash flow of payments made by underlying securities less contractual payments to debt holders and fund expenses. |
See Notes to Consolidated Financial Statements.
| 40 | 1.888.926.2688 | www.griffincapital.com |
| Griffin Institutional Access Credit Fund | Consolidated Schedule of Investments |
| | December 31, 2021 |
| (m) | Securities may be deemed to be “restricted securities” under the Securities Act. As of December 31, 2021, the restricted securities were as follows: |
| Restricted | | Acquisition Date | | Cost | | | Value December 31, 2021 | | | Value as Percentage of Net Assets Applicable to Common Stockholders December 31, 2021 | |
| ACM dcBLOX LLC Warrant | | 03/22/2021 | | $ | 281 | | | $ | – | | | | – | % |
| ACM dcBLOX LLC, Series A Preferred | | 03/22/2021 | | | 463,328 | | | | 500,649 | | | | 0.08 | % |
| American Consolidated Natural Resources, Inc. | | 09/16/2020 - 05/19/2021 | | | 30,349 | | | | 122,934 | | | | 0.02 | % |
| American Consolidated Natural Resources, Inc. Preferred | | 09/16/2020 | | | 37,605 | | | | 795,972 | | | | 0.13 | % |
| AQ Software Corporation | | 12/10/2021 | | | 77,192 | | | | 77,192 | | | | 0.01 | % |
| AQ Software Corporation | | 12/10/2021 | | | 128,608 | | | | 128,608 | | | | 0.02 | % |
| Astorg Co-invest Opus 2 | | 06/15/2021 09/05/2018 - | | | 1,406,725 | | | | 1,932,031 | | | | 0.31 | % |
| Bain Capital Credit CC Fund | | 06/29/2021 | | | 2,315,570 | | | | 3,268,248 | | | | 0.52 | % |
| Blackbrush Oil & Gas LP - Common | | 09/21/2020 | | | – | | | | – | | | | –% | |
| Blackbrush Oil & Gas LP - Preferred | | 09/30/2020 | | | 677,793 | | | | 1,322,892 | | | | 0.21 | % |
| Bruin Blocker LLC | | 08/31/2020 | | | – | | | | – | | | | –% | |
| Cineworld Group PLC Warrant | | 11/23/2020 | | | – | | | | 45,965 | | | | 0.01 | % |
| East BCC Coinvest III, LLC | | 07/23/2019 | | | 241,930 | | | | 181,498 | | | | 0.03 | % |
| FineLine Parent Holdings, LP, Class A | | 02/22/2021 | | | 41,077 | | | | 54,315 | | | | 0.01 | % |
| GIACF Grammer Equity Holdings, LLC - Common Stock | | 10/01/2018 - 04/02/2019 | | | 84,221 | | | | 87,977 | | | | 0.02 | % |
| GIACF Grammer Equity Holdings, LLC - Preferred Stock (10.00% PIK) | | 10/01/2018 - 01/01/2021 | | | 62,992 | | | | 65,687 | | | | 0.01 | % |
| GIACF Grammer Equity Holdings, LLC - Warrant | | 10/01/2018 | | | – | | | | 10,502 | | | | 0.00 | % |
| Gluware, Inc. Warrant | | 10/15/2021 07/09/2019 - | | | – | | | | – | | | | –% | |
| Kellstrom Aerospace Group, Inc. | | 07/10/2019 7/8/2021 - | | | 171,782 | | | | 79,921 | | | | 0.01 | % |
| Marlin-Stark Aggregator, L.P. | | 12/23/2021 | | | 678,362 | | | | 688,906 | | | | 0.11 | % |
| Meggitt-USA, Inc., Class A | | 06/30/2020 | | | 700,000 | | | | 313,460 | | | | 0.05 | % |
| MZR Aggregator, LLC | | 12/31/2020 | | | 52,379 | | | | 52,395 | | | | 0.01 | % |
| New Frontera Holdings Warrant | | 08/06/2021 | | | 715,418 | | | | 715,418 | | | | 0.11 | % |
| OneShield Partners LP | | 09/09/2020- 10/29/2021 | | | 1,072,883 | | | | 2,864,317 | | | | 0.46 | % |
| PacificCo | | 03/05/2019 | | | 383,355 | | | | 3,937 | | | | 0.00 | %(o) |
| Pack-a-Punch Lux Topco SARL | | 07/15/2021 | | | 348,364 | | | | 341,094 | | | | 0.05 | % |
| PureWest LLC Common, Class A | | 09/28/2020 | | | 426,107 | | | | 1,883,105 | | | | 0.30 | % |
| Red Cypress Co-Investment Partners LP, Interests | | 05/03/2021 | | | 140,526 | | | | 135,745 | | | | 0.02 | % |
| Technicolor USA, Inc. | | 09/22/2020 - 12/14/2020 | | | 854,648 | | | | 977,957 | | | | 0.15 | % |
| TLC Holdco LP | | 10/11/2019 | | | 103,961 | | | | 37,744 | | | | 0.01 | % |
| Toro Private Investments LP | | 03/19/2019 | | | 324,324 | | | | 142,039 | | | | 0.02 | % |
| Ultra Petroleum Corp | | 09/11/2020 | | | – | | | | – | | | | –% | |
| WSP Midco LLC Series A | | 8/31/2021 | | | 254,000 | | | | 247,990 | | | | 0.04 | % |
| Total | | | | $ | 11,793,780 | | | $ | 17,078,498 | | | | 2.72 | % |
| (n) | The Fund's interest in this investment is held through a wholly-owned subsidiary of the Fund, GIACF Alternative Holdings, LLC, a Cayman Islands company formed to effect certain non-performing loan investments for the Fund. |
| See Notes to Consolidated Financial Statements. | |
| Annual Report | December 31, 2021 | 41 |
| Griffin Institutional Access Credit Fund | Consolidated Schedule of Investments |
| | December 31, 2021 |
| (p) | Includes cash pledged as collateral under the secured revolving credit facility entered into by CRDTX SPV I, LLC and Citibank N.A.. |
| (o) | Less than 0.005%. |
Common Abbreviations:
BBSY - Bank Bill Swap Bid Rate
CDOR - Canadian Dollar Offered Rate
CLO - Collateralized Loan Obligation
GmbH - German Company with limited liability
LIBOR - London Interbank Offered Rate
LLC - Limited Liability Company
LLLP - Limited Liability Limited Partnership
LP - Limited Partnership
Ltd - Limited Company
PIK - Payment in Kind
PLC - Public Limited Company
Reg S - Regulation S
S.A. - Société Anonyme
SARL - Société A Responsabilité Limitée
SONIA - Sterling Overnight Index Average
OUTSTANDING FORWARD FOREIGN CURRENCY CONTRACTS
| Counterparty | | Settlement Date | | Fund Receiving | | | Value | | | Fund Delivering | | | Value | | | Unrealized Appreciation/ (Depreciation) | |
| Bank of New York Mellon | | 03/10/22 | | | USD | | | | 4,071,700 | | | | AUD | | | | 4,067,634 | | | $ | 4,066 | |
| Bank of New York Mellon | | 09/02/22 | | | USD | | | | 5,046,237 | | | | CAD | | | | 5,043,136 | | | | 3,101 | |
| Bank of New York Mellon | | 04/06/22 | | | USD | | | | 62,208,729 | | | | EUR | | | | 60,984,893 | | | | 1,223,836 | |
| Bank of New York Mellon | | 09/02/22 | | | USD | | | | 10,392,651 | | | | EUR | | | | 9,948,697 | | | | 443,954 | |
| Bank of New York Mellon | | 04/06/22 | | | USD | | | | 17,986,049 | | | | GBP | | | | 17,872,788 | | | | 113,261 | |
| | | | | | | | | | | | | | | | | | | | | $ | 1,788,218 | |
| Bank of New York Mellon | | 04/06/22 | | | USD | | | | 7,345,786 | | | | EUR | | | | 7,346,478 | | | $ | (692 | ) |
| | | | | | | | | | | | | | | | | | | | | $ | (692 | ) |
| See Notes to Consolidated Financial Statements. | |
| 42 | 1.888.926.2688 | www.griffincapital.com |
| Griffin Institutional Access Credit Fund | Consolidated Statement of Assets and Liabilities |
| | December 31, 2021 |
| ASSETS | | | |
| Investments, at fair value (Cost $740,799,706) | | $ | 746,769,067 | |
| Cash | | | 46,685,650 | |
| Receivable for investments sold | | | 12,075,897 | |
| Receivable for shares sold | | | 6,292,690 | |
| Interest receivable | | | 5,901,981 | |
| Cash collateral for credit facility | | | 3,315,321 | |
| Foreign currency, at value (Cost $3,056,477) | | | 3,073,577 | |
| Unrealized appreciation on forward foreign currency contracts (Note 3) | | | 1,788,218 | |
| Amortization of debt issuance costs (Note 7) | | | 435,388 | |
| Prepaid expenses and other assets | | | 89,239 | |
| Total Assets | | | 826,427,028 | |
| LIABILITIES | | | | |
| Payable for lines of credit (Note 7) | | | 133,945,324 | |
| Payable for investments purchased | | | 53,358,376 | |
| Payable for distributions to shareholders | | | 9,138,098 | |
| Payable for lines of credit interest (Note 7) | | | 499,816 | |
| Payable for investment advisory fees (Note 4) | | | 394,901 | |
| Payable for audit and tax fees | | | 353,000 | |
| Payable for administration fees (Note 4) | | | 328,609 | |
| Payable for custody fees | | | 93,228 | |
| Payable for legal fees | | | 62,705 | |
| Payable for transfer agency fees (Note 4) | | | 54,328 | |
| Payable for compliance service fees (Note 4) | | | 52,153 | |
| Payable for distribution fees (Note 4) | | | 51,459 | |
| Payable for shareholder servicing fees (Note 4) | | | 33,879 | |
| Payable for trustees' fees (Note 4) | | | 33,750 | |
| Payable for credit facility unfunded commitment fee (Note 7) | | | 9,726 | |
| Unrealized depreciation on forward foreign currency contracts (Note 3) | | | 692 | |
| Accrued expenses and other liabilities | | | 220,021 | |
| Total Liabilities | | | 198,630,065 | |
| NET ASSETS | | $ | 627,796,963 | |
| NET ASSETS CONSIST OF | | | | |
| Paid-in capital | | $ | 627,904,462 | |
| Total accumulated deficit | | | (107,499 | ) |
| NET ASSETS | | $ | 627,796,963 | |
| See Notes to Consolidated Financial Statements. | |
| Annual Report | December 31, 2021 | 43 |
| Griffin Institutional Access Credit Fund | Consolidated Statement of Assets and Liabilities |
| | December 31, 2021 |
| PRICING OF SHARES | | | |
| Class A: | | | |
| Net asset value | | $ | 24.53 | |
| Net assets | | $ | 72,119,667 | |
| Shares of beneficial interest outstanding (unlimited number of shares, no par value common stock authorized) | | | 2,940,435 | |
| Maximum offering price per share ((NAV/0.9425), based on maximum sales charge of 5.75% of the offering price) | | $ | 26.03 | |
| Class C: | | | | |
| Net asset value and maximum offering price | | $ | 24.53 | |
| Net assets | | $ | 77,619,282 | |
| Shares of beneficial interest outstanding (unlimited number of shares, no par value common stock authorized) | | | 3,164,548 | |
| Class I: | | | | |
| Net asset value and maximum offering price | | $ | 24.53 | |
| Net assets | | $ | 442,765,434 | |
| Shares of beneficial interest outstanding (unlimited number of shares, no par value common stock authorized) | | | 18,051,828 | |
| Class M: | | | | |
| Net asset value and maximum offering price | | $ | 24.53 | |
| Net assets | | $ | 245,243 | |
| Shares of beneficial interest outstanding (unlimited number of shares, no par value common stock authorized) | | | 9,999 | |
| Class L: | | | | |
| Net asset value | | $ | 24.52 | |
| Net assets | | $ | 13,710,739 | |
| Shares of beneficial interest outstanding (unlimited number of shares, no par value common stock authorized) | | | 559,179 | |
| Maximum offering price per share ((NAV/0.9575), based on maximum sales charge of 4.25% of the offering price) | | $ | 25.61 | |
| Class F: | | | | |
| Net asset value and maximum offering price | | $ | 24.53 | |
| Net assets | | $ | 21,336,598 | |
| Shares of beneficial interest outstanding (unlimited number of shares, no par value common stock authorized) | | | 869,758 | |
| See Notes to Consolidated Financial Statements. | |
| 44 | 1.888.926.2688 | www.griffincapital.com |
| Griffin Institutional Access Credit Fund | Consolidated Statement of Operations |
| | | For the Year Ended December 31, 2021 | |
| INVESTMENT INCOME | | | |
| Interest income | | $ | 40,902,639 | |
| Dividend Income | | | 1,032,902 | |
| Total Investment Income | | | 41,935,541 | |
| | | | | |
| EXPENSES | | | | |
| Investment advisory fees (Note 4) | | | 9,735,698 | |
| Administration fees (Note 4) | | | 878,132 | |
| Transfer agency fees (Note 4) | | | 261,198 | |
| Shareholder servicing fees (Note 4): | | | | |
| Class A | | | 199,200 | |
| Class C | | | 172,596 | |
| Class L | | | 29,009 | |
| Distribution fees (Note 4): | | | | |
| Class C | | | 517,789 | |
| Class M | | | 302 | |
| Class L | | | 29,109 | |
| Credit facility interest expense (Note 7) | | | 1,743,256 | |
| Legal fees | | | 623,743 | |
| Audit and tax fees | | | 297,450 | |
| Reports to shareholders and printing fees | | | 227,137 | |
| Compliance service fees (Note 4) | | | 197,776 | |
| Credit facility unfunded commitment fee (Note 7) | | | 159,948 | |
| Trustees' fees (Note 4) | | | 141,412 | |
| Custody fees | | | 83,418 | |
| State registration fees | | | 76,677 | |
| Insurance fees | | | 57,034 | |
| Credit facility fees (Note 7) | | | 33,113 | |
| Other expenses | | | 435,900 | |
| Total Expenses | | | 15,899,897 | |
| Fees waived/expenses reimbursed by Adviser (Note 4) | | | (6,806,375 | ) |
| Net Expenses | | | 9,093,522 | |
| Net Investment Income | | | 32,842,019 | |
| NET REALIZED GAIN AND UNREALIZED DEPRECIATION ON INVESTMENTS, TOTAL RETURN SWAPS, FORWARD | | | | |
| FOREIGN CURRENCY TRANSACTIONS AND TRANSLATIONS OF ASSETS AND LIABILITIES DENOMINATED IN FOREIGN CURRENCIES | | | | |
| Net realized gain on investments | | | 6,792,920 | |
| Net realized gain on total return swap contracts | | | 3,623,537 | |
| Net realized gain on forward foreign currency transactions | | | 2,544,549 | |
| Net realized gain on foreign currency translation | | | 22,180 | |
| Net realized gain | | | 12,983,186 | |
| Net change in unrealized depreciation on investments | | | (5,347,763 | ) |
| Net change in unrealized depreciation on total return swap contracts | | | (1,740,340 | ) |
| Net change in unrealized appreciation on forward foreign currency transactions | | | 2,912,899 | |
| Net change in unrealized appreciation on translation of assets and liabilities denominated in foreign currencies | | | 451,296 | |
| Net change in unrealized depreciation | | | (3,723,908 | ) |
| NET REALIZED GAIN AND UNREALIZED DEPRECIATION ON INVESTMENTS, TOTAL RETURN SWAPS, FORWARD | | | | |
| FOREIGN CURRENCY TRANSACTIONS AND TRANSLATIONS OF ASSETS AND LIABILITIES DENOMINATED IN | | | | |
| FOREIGN CURRENCIES | | | 9,259,278 | |
| NET INCREASE IN NET ASSETS RESULTING FROM OPERATIONS | | $ | 42,101,297 | |
| See Notes to Consolidated Financial Statements. | |
| Annual Report | December 31, 2021 | 45 |
| Griffin Institutional Access Credit Fund | Consolidated Statements of Changes in Net Assets |
| | | For the Year Ended December 31, 2021 | | | For the Year Ended December 31, 2020 | |
| OPERATIONS: | | | | | | |
| Net investment income | | $ | 32,842,019 | | | $ | 22,642,906 | |
| Net realized gain/(loss) | | | 12,983,186 | | | | (20,339,270 | ) |
| Net change in unrealized appreciation/(depreciation) | | | (3,723,908 | ) | | | 12,271,384 | |
| Net Increase in Net Assets Resulting from Operations | | | 42,101,297 | | | | 14,575,020 | |
| | | | | | | | | |
| DISTRIBUTIONS TO SHAREHOLDERS: | | | | | | | | |
| Class A | | | | | | | | |
| From distributable earnings | | | (4,998,279 | ) | | | (4,548,252 | ) |
| Class C | | | | | | | | |
| From distributable earnings | | | (4,324,803 | ) | | | (3,514,776 | ) |
| Class I | | | | | | | | |
| From distributable earnings | | | (21,469,720 | ) | | | (15,797,435 | ) |
| Class M(a) | | | | | | | | |
| From distributable earnings | | | (2,451 | ) | | | – | |
| Class L | | | | | | | | |
| From distributable earnings | | | (789,338 | ) | | | (506,895 | ) |
| Class F | | | | | | | | |
| From distributable earnings | | | (1,370,013 | ) | | | (1,464,078 | ) |
| Total Distributions to Shareholders | | | (32,954,604 | ) | | | (25,831,436 | ) |
| | | | | | | | | |
| BENEFICIAL INTEREST TRANSACTIONS, IN DOLLARS: | | | | | | | | |
| Class A | | | | | | | | |
| Shares sold | | | 22,012,675 | | | | 24,252,680 | |
| Distributions reinvested | | | 2,666,052 | | | | 2,250,493 | |
| Shares redeemed (Note 8) | | | (16,828,116 | ) | | | (6,875,941 | ) |
| Exchanged out | | | (19,101,663 | ) | | | (1,996,649 | ) |
| Class C | | | | | | | | |
| Shares sold | | | 20,002,671 | | | | 17,286,912 | |
| Distributions reinvested | | | 1,838,229 | | | | 1,565,614 | |
| Shares redeemed (Note 8) | | | (5,676,030 | ) | | | (3,387,260 | ) |
| Exchanged out | | | (2,661,643 | ) | | | (695,624 | ) |
| Class I | | | | | | | | |
| Shares sold | | | 182,728,016 | | | | 106,478,079 | |
| Distributions reinvested | | | 9,298,483 | | | | 6,223,157 | |
| Shares redeemed (Note 8) | | | (56,169,488 | ) | | | (65,399,571 | ) |
| Exchanged in | | | 21,877,697 | | | | 2,823,458 | |
| Class M(a) | | | | | | | | |
| Exchanged in | | | 245,500 | | | | – | |
| Class L | | | | | | | | |
| Shares sold | | | 2,579,103 | | | | 5,929,447 | |
| Distributions reinvested | | | 384,122 | | | | 262,833 | |
| Shares redeemed (Note 8) | | | (826,279 | ) | | | (59,546 | ) |
| Exchanged out | | | (260,501 | ) | | | (131,185 | ) |
| Class F | | | | | | | | |
| Distributions reinvested | | | 120,807 | | | | 206,017 | |
| Shares redeemed (Note 8) | | | (2,122,011 | ) | | | (2,251,552 | ) |
| Exchanged out | | | (99,390 | ) | | | – | |
| Net Increase in Net Assets Derived from Beneficial Interest Transactions | | | 160,008,234 | | | | 86,481,362 | |
| | | | | | | | | |
| Net increase in net assets | | | 169,154,927 | | | | 75,224,946 | |
| | | | | | | | | |
| NET ASSETS: | | | | | | | | |
| Beginning of year | | | 458,642,036 | | | | 383,417,090 | |
| End of year | | $ | 627,796,963 | | | $ | 458,642,036 | |
| See Notes to Consolidated Financial Statements. | |
| 46 | 1.888.926.2688 | www.griffincapital.com |
| Griffin Institutional Access Credit Fund | Consolidated Statements of Changes in Net Assets |
| | | For the
Year Ended
December 31, 2021 | | | For the
Year Ended
December 31, 2020 | |
| Other Information | | | | | | |
| BENEFICIAL INTEREST TRANSACTIONS, IN SHARES: | | | | | | |
| Class A | | | | | | |
| Beginning shares | | | 3,398,258 | | | | 2,648,784 | |
| Shares sold | | | 900,426 | | | | 1,035,770 | |
| Distributions reinvested | | | 108,899 | | | | 99,688 | |
| Shares redeemed (Note 8) | | | (689,806 | ) | | | (298,718 | ) |
| Exchanged out | | | (777,342 | ) | | | (87,266 | ) |
| Net increase/(decrease) in shares outstanding | | | (457,823 | ) | | | 749,474 | |
| Ending shares | | | 2,940,435 | | | | 3,398,258 | |
| Class C | | | | | | | | |
| Beginning shares | | | 2,613,584 | | | | 1,971,838 | |
| Shares sold | | | 816,545 | | | | 749,031 | |
| Distributions reinvested | | | 75,076 | | | | 70,005 | |
| Shares redeemed (Note 8) | | | (231,854 | ) | | | (146,721 | ) |
| Exchanged out | | | (108,803 | ) | | | (30,569 | ) |
| Net increase in shares outstanding | | | 550,964 | | | | 641,746 | |
| Ending shares | | | 3,164,548 | | | | 2,613,584 | |
| Class I | | | | | | | | |
| Beginning shares | | | 11,610,519 | | | | 9,517,341 | |
| Shares sold | | | 7,469,463 | | | | 4,568,601 | |
| Distributions reinvested | | | 379,687 | | | | 276,586 | |
| Shares redeemed (Note 8) | | | (2,298,739 | ) | | | (2,875,615 | ) |
| Exchanged in | | | 890,898 | | | | 123,606 | |
| Net increase in shares outstanding | | | 6,441,309 | | | | 2,093,178 | |
| Ending shares | | | 18,051,828 | | | | 11,610,519 | |
| Class M(a) | | | | | | | | |
| Beginning shares | | | – | | | | – | |
| Exchanged in | | | 9,999 | | | | – | |
| Net increase in shares outstanding | | | 9,999 | | | | – | |
| Ending shares | | | 9,999 | | | | – | |
| Class L | | | | | | | | |
| Beginning shares | | | 482,514 | | | | 222,486 | |
| Shares sold | | | 105,389 | | | | 256,706 | |
| Distributions reinvested | | | 15,689 | | | | 11,677 | |
| Shares redeemed (Note 8) | | | (33,715 | ) | | | (2,584 | ) |
| Exchanged out | | | (10,698 | ) | | | (5,771 | ) |
| Net increase in shares outstanding | | | 76,665 | | | | 260,028 | |
| Ending shares | | | 559,179 | | | | 482,514 | |
| Class F | | | | | | | | |
| Beginning shares | | | 955,874 | | | | 1,042,940 | |
| Distributions reinvested | | | 4,940 | | | | 9,472 | |
| Shares redeemed (Note 8) | | | (86,997 | ) | | | (96,538 | ) |
| Exchanged out | | | (4,059 | ) | | | – | |
| Net decrease in shares outstanding | | | (86,116 | ) | | | (87,066 | ) |
| Ending shares | | | 869,758 | | | | 955,874 | |
| (a) | Class M shares commenced operations on November 2, 2021. |
| See Notes to Consolidated Financial Statements. | |
| Annual Report | December 31, 2021 | 47 |
| Griffin Institutional Access Credit Fund | Consolidated Statement of Cash Flows |
| | | For the Year Ended December 31, 2021 | |
| Operating Activities: | | | |
| Net increase in net assets resulting from operations | | $ | 42,101,297 | |
| Adjustments to reconcile net increase in net assets resulting from operations to net cash used in operating activities: | | | | |
| Purchase of investments | | | (769,094,320 | ) |
| Proceeds from sale of investments | | | 468,643,763 | |
| Net realized gain on investments | | | (6,792,920 | ) |
| Net realized gain on foreign currency transactions | | | (2,544,549 | ) |
| Net change in unrealized appreciation on investments | | | 5,347,763 | |
| Net unrealized depreciation on total return swap contracts | | | 1,740,340 | |
| Net unrealized depreciation on forward foreign currency contracts | | | (2,912,899 | ) |
| Amortization and accretion of discounts and premiums, net | | | (2,381,253 | ) |
| Change in operating assets and liabilities: | | | | |
| Interest receivables | | | (1,567,768 | ) |
| Amortization of debt issuance costs | | | 128,211 | |
| Prepaid expenses and other assets | | | (25,983 | ) |
| Payable for investment advisory fees | | | 325,426 | |
| Payable for distribution fees | | | 10,001 | |
| Payable for shareholder servicing fees | | | 1,770 | |
| Payable for transfer agency fees | | | 27,303 | |
| Payable for lines of credit interest | | | 499,816 | |
| Payable for administration fees | | | 173,963 | |
| Payable for legal fees | | | 48,148 | |
| Payable for audit and tax fees | | | 49,500 | |
| Payable for custody fees | | | 29,893 | |
| Payable for compliance service fees | | | (31,177 | ) |
| Payable to broker on total return swaps | | | (105,706 | ) |
| Payable for income tax expense | | | (63,113 | ) |
| Payable for credit facility unfunded commitment fee | | | 9,726 | |
| Accrued expenses and other liabilities | | | (78,358 | ) |
| Net cash used in operating activities | | | (266,461,126 | ) |
| | | | | |
| Financing Activities: | | | | |
| Cash provided by lines of credit | | | 133,945,324 | |
| Proceeds from shares sold | | | 223,899,204 | |
| Cost of shares redeemed | | | (81,621,924 | ) |
| Distributions paid to shareholders | | | (16,401,733 | ) |
| Deferred debt issuance cost | | | (563,599 | ) |
| Net cash provided by financing activities | | | 259,257,272 | |
| Effect of exchange rates on cash | | | 9,216 | |
| | | | | |
| Cash and cash equivalents, beginning of year | | $ | 60,269,186 | |
| Cash and cash equivalents, end of year | | $ | 53,074,548 | |
| | | | | |
| SUPPLEMENTAL DISCLOSURE OF CASH FLOW INFORMATION: | | | | |
| Non-cash financing activities not included herein consist of reinvestment of distributions of: | | $ | 14,307,693 | |
| Cash paid during the year for interest from bank borrowing: | | $ | 1,115,229 | |
| Taxes paid: | | $ | 63,113 | |
| See Notes to Consolidated Financial Statements. | |
| 48 | 1.888.926.2688 | www.griffincapital.com |
| Griffin Institutional Access Credit Fund | Consolidated Statement of Cash Flows |
| | | For the Year Ended December 31, 2021 | |
| RECONCILIATION OF RESTRICTED AND UNRESTRICTED CASH AT THE BEGINNING OF YEAR TO THE STATEMENT OF ASSETS AND LIABILITIES | | | |
| Cash | | $ | 27,954,679 | |
| Cash collateral for total return swaps | | | 32,314,507 | |
| RECONCILIATION OF RESTRICTED AND UNRESTRICTED CASH AT THE END OF YEAR TO THE STATEMENT OF ASSETS AND LIABILITIES | | | | |
| Cash | | | 49,759,227 | |
| Cash collateral for credit facility | | | 3,315,321 | |
| See Notes to Consolidated Financial Statements. | |
| Annual Report | December 31, 2021 | 49 |
| Griffin Institutional Access Credit Fund – Class A | Consolidated Financial Highlights |
| | For a Share Outstanding Throughout the Period Presented |
| | | For the Year Ended December 31, 2021 | | | For the Year Ended December 31, 2020 | | | For the Year Ended December 31, 2019 | | | For the Year Ended December 31, 2018 | | | For the Period April 3, 2017 (Commencement of Operations) to December 31, 2017 | |
| Net asset value, beginning of year | | $ | 24.06 | | | $ | 24.89 | | | $ | 24.01 | | | $ | 25.30 | | | $ | 25.00 | |
| | | | | | | | | | | | | | | | | | | | | |
| INCOME FROM INVESTMENT OPERATIONS: | | | | | | | | | | | | | | | | | | | | |
| Net investment income(a) | | | 1.53 | | | | 1.28 | | | | 1.59 | | | | 1.52 | | | | 0.92 | |
| Net realized and unrealized gain/(loss) | | | 0.47 | | | | (0.65 | ) | | | 1.01 | | | | (1.27 | ) | | | 0.16 | |
| Total from investment operations | | | 2.00 | | | | 0.63 | | | | 2.60 | | | | 0.25 | | | | 1.08 | |
| | | | | | | | | | | | | | | | | | | | | |
| DISTRIBUTIONS: | | | | | | | | | | | | | | | | | | | | |
| From net investment income(b) | | | (1.53 | ) | | | (1.46 | ) | | | (1.72 | ) | | | (1.54 | ) | | | (0.78 | ) |
| Total distributions | | | (1.53 | ) | | | (1.46 | ) | | | (1.72 | ) | | | (1.54 | ) | | | (0.78 | ) |
| | | | | | | | | | | | | | | | | | | | | |
| Net increase/(decrease) in net asset value | | | 0.47 | | | | (0.83 | ) | | | 0.88 | | | | (1.29 | ) | | | 0.30 | |
| Net asset value, end of year | | $ | 24.53 | | | $ | 24.06 | | | $ | 24.89 | | | $ | 24.01 | | | $ | 25.30 | |
| TOTAL RETURN(c) | | | 8.49 | % | | | 3.16 | % | | | 11.04 | % | | | 0.93 | % | | | 4.38 | % |
| | | | | | | | | | | | | | | | | | | | | |
| RATIOS/SUPPLEMENTAL DATA: | | | | | | | | | | | | | | | | | | | | |
| Net assets, end of period (000s) | | $ | 72,120 | | | $ | 81,766 | | | $ | 65,930 | | | $ | 31,350 | | | $ | 14,581 | |
| Ratios to Average Net Assets (including interest expense) | | | | | | | | | | | | | | | | | | | | |
| Ratio of expenses to average net assets excluding fee waivers and reimbursements | | | 3.10 | % | | | 2.79 | % | | | 2.97 | % | | | 3.32 | % | | | 5.15 | %(d)(e) |
| Ratio of expenses to average net assets including fee waivers and reimbursements | | | 1.72 | %(f) | | | 1.25 | %(f) | | | 0.54 | %(f) | | | 0 | %(g) | | | 0 | %(g) |
| Ratio of net investment income to average net assets | | | 6.26 | % | | | 5.59 | % | | | 6.45 | % | | | 6.09 | % | | | 4.86 | %(d) |
| | | | | | | | | | | | | | | | | | | | | |
| Ratios to Average Net Assets (excluding interest expense) | | | | | | | | | | | | | | | | | | | | |
| Ratio of expenses to average net assets excluding fee waivers and reimbursements | | | 2.76 | % | | | 2.79 | % | | | 2.97 | % | | | 3.32 | % | | | 5.15 | %(d)(e) |
| Ratio of expenses to average net assets including fee waivers and reimbursements | | | 1.38 | %(f) | | | 1.25 | %(f) | | | 0.54 | %(f) | | | 0 | %(g) | | | 0 | %(g) |
| | | | | | | | | | | | | | | | | | | | | |
| Portfolio turnover rate(h) | | | 73 | % | | | 98 | % | | | 72 | % | | | 56 | % | | | 48 | % |
| See Notes to Consolidated Financial Statements. | |
| 50 | 1.888.926.2688 | www.griffincapital.com |
| Griffin Institutional Access Credit Fund – Class A | Consolidated Financial Highlights |
| | For a Share Outstanding Throughout the Period Presented |
| (a) | Calculated using the average shares method. |
| (b) | Distributions are based on a daily accrual of net investment income which will vary based on underlying investment yields and daily shares outstanding (see Note 6). |
| (c) | Total returns are for the year indicated and do not reflect the impact of the applicable sales charge. Total returns would have been lower had certain expenses not been waived or recouped by the Adviser during the year. Returns shown do not reflect the deduction of taxes that a shareholder would pay on Fund distributions or the redemption of Fund shares. |
| (e) | The gross expense ratio included non-recurring organizational costs. |
| (f) | For the period of January 1, 2019 to August 25, 2019 the Adviser voluntarily absorbed all of the operating expenses of the Fund. For the period of August 26, 2019 to April 30, 2021, the Adviser voluntarily absorbed operating expenses of the Fund in excess of 1.25% of net assets. For the period of May 1, 2021 to August 15, 2021, the Adviser voluntarily absorbed operating expenses of the Fund in excess of 1.375% of net assets. For the period of August 16, 2021 to December 31, 2021, the Adviser has voluntarily waived or absorbed operating expenses of the Fund in excess of 1.50% of net assets. In the absence of the election by the Fund's investment adviser to bear certain of the Fund's operating expenses, the ratio of expenses to average net assets including fee waivers and reimbursements would have been higher. |
| (g) | The Adviser voluntarily absorbed all of the operating expenses of the Fund during the period. In the absence of the election by the Fund's investment adviser to bear all of the Fund's operating expenses, the ratio of expenses to average net assets including fee waivers and reimbursements would have been higher. |
| (h) | Portfolio turnover rate for periods less than one full year has not been annualized and is calculated at the Fund level. |
| See Notes to Consolidated Financial Statements. | |
| Annual Report | December 31, 2021 | 51 |
| Griffin Institutional Access Credit Fund – Class C | Consolidated Financial Highlights |
| | For a Share Outstanding Throughout the Period Presented |
| | | For the Year Ended December 31, 2021 | | | For the Year Ended December 31, 2020 | | | For the Year Ended December 31, 2019 | | | For the Year Ended December 31, 2018 | | | For the Period April 3, 2017 (Commencement of Operations) to December 31, 2017 | |
| Net asset value, beginning of year | | $ | 24.06 | | | $ | 24.89 | | | $ | 24.01 | | | $ | 25.30 | | | $ | 25.00 | |
| | | | | | | | | | | | | | | | | | | | | |
| INCOME FROM INVESTMENT OPERATIONS: | | | | | | | | | | | | | | | | | | | | |
| Net investment income(a) | | | 1.53 | | | | 1.28 | | | | 1.58 | | | | 1.52 | | | | 0.91 | |
| Net realized and unrealized gain/(loss) | | | 0.47 | | | | (0.65 | ) | | | 1.02 | | | | (1.27 | ) | | | 0.17 | |
| Total from investment operations | | | 2.00 | | | | 0.63 | | | | 2.60 | | | | 0.25 | | | | 1.08 | |
| | | | | | | | | | | | | | | | | | | | | |
| DISTRIBUTIONS: | | | | | | | | | | | | | | | | | | | | |
| From net investment income(b) | | | (1.53 | ) | | | (1.46 | ) | | | (1.72 | ) | | | (1.54 | ) | | | (0.78 | ) |
| Total distributions | | | (1.53 | ) | | | (1.46 | ) | | | (1.72 | ) | | | (1.54 | ) | | | (0.78 | ) |
| | | | | | | | | | | | | | | | | | | | | |
| Net increase/(decrease) in net asset value | | | 0.47 | | | | (0.83 | ) | | | 0.88 | | | | (1.29 | ) | | | 0.30 | |
| Net asset value, end of year | | $ | 24.53 | | | $ | 24.06 | | | $ | 24.89 | | | $ | 24.01 | | | $ | 25.30 | |
| TOTAL RETURN(c) | | | 8.49 | % | | | 3.16 | % | | | 11.04 | % | | | 0.94 | % | | | 4.37 | % |
| | | | | | | | | | | | | | | | | | | | | |
| RATIOS/SUPPLEMENTAL DATA: | | | | | | | | | | | | | | | | | | | | |
| Net assets, end of period (000s) | | $ | 77,619 | | | $ | 62,889 | | | $ | 49,083 | | | $ | 18,091 | | | $ | 6,681 | |
| Ratios to Average Net Assets (including interest expense) | | | | | | | | | | | | | | | | | | | | |
| Ratio of expenses to average net assets excluding fee waivers and reimbursements | | | 3.84 | % | | | 3.54 | % | | | 3.73 | % | | | 4.07 | % | | | 6.25 | %(d)(e) |
| Ratio of expenses to average net assets including fee waivers and reimbursements | | | 1.73 | %(f) | | | 1.25 | %(f) | | | 0.56 | %(f) | | | 0 | %(g) | | | 0 | %(g) |
| Ratio of net investment income to average net assets | | | 6.25 | % | | | 5.59 | % | | | 6.41 | % | | | 6.12 | % | | | 4.83 | %(d) |
| | | | | | | | | | | | | | | | | | | | | |
| Ratios to Average Net Assets (excluding interest expense) | | | | | | | | | | | | | | | | | | | | |
| Ratio of expenses to average net assets excluding fee waivers and reimbursements | | | 3.50 | % | | | 3.54 | % | | | 3.73 | % | | | 4.07 | % | | | 6.25 | %(d)(e) |
| Ratio of expenses to average net assets including fee waivers and reimbursements | | | 1.39 | %(f) | | | 1.25 | %(f) | | | 0.56 | %(f) | | | 0 | %(g) | | | 0 | %(g) |
| | | | | | | | | | | | | | | | | | | | | |
| Portfolio turnover rate(h) | | | 73 | % | | | 98 | % | | | 72 | % | | | 56 | % | | | 48 | % |
| See Notes to Consolidated Financial Statements. | |
| 52 | 1.888.926.2688 | www.griffincapital.com |
| Griffin Institutional Access Credit Fund – Class C | Consolidated Financial Highlights |
| | For a Share Outstanding Throughout the Period Presented |
| (a) | Calculated using the average shares method. |
| (b) | Distributions are based on a daily accrual of net investment income which will vary based on underlying investment yields and daily shares outstanding (see Note 6). |
| (c) | Total returns are for the year indicated and do not reflect the impact of the applicable sales charge. Total returns would have been lower had certain expenses not been waived or recouped by the Adviser during the year. Returns shown do not reflect the deduction of taxes that a shareholder would pay on Fund distributions or the redemption of Fund shares. |
| (e) | The gross expense ratio included non-recurring organizational costs. |
| (f) | For the period of January 1, 2019 to August 25, 2019 the Adviser voluntarily absorbed all of the operating expenses of the Fund. For the period of August 26, 2019 to April 30, 2021, the Adviser voluntarily absorbed operating expenses of the Fund in excess of 1.25% of net assets. For the period of May 1, 2021 to August 15, 2021, the Adviser voluntarily absorbed operating expenses of the Fund in excess of 1.375% of net assets. For the period of August 16, 2021 to December 31, 2021, the Adviser has voluntarily waived or absorbed operating expenses of the Fund in excess of 1.50% of net assets. In the absence of the election by the Fund's investment adviser to bear certain of the Fund's operating expenses, the ratio of expenses to average net assets including fee waivers and reimbursements would have been higher. |
| (g) | The Adviser voluntarily absorbed all of the operating expenses of the Fund during the period. In the absence of the election by the Fund's investment adviser to bear all of the Fund's operating expenses, the ratio of expenses to average net assets including fee waivers and reimbursements would have been higher. |
| (h) | Portfolio turnover rate for periods less than one full year has not been annualized and is calculated at the Fund level. |
| See Notes to Consolidated Financial Statements. | |
| Annual Report | December 31, 2021 | 53 |
| Griffin Institutional Access Credit Fund – Class I | Consolidated Financial Highlights |
| | For a Share Outstanding Throughout the Period Presented |
| | | For the Year Ended December 31, 2021 | | | For the Year Ended December 31, 2020 | | | For the Year Ended December 31, 2019 | | | For the Year Ended December 31, 2018 | | | For the Period April 3, 2017 (Commencement of Operations) to December 31, 2017 | |
| Net asset value, beginning of year | | $ | 24.06 | | | $ | 24.89 | | | $ | 24.01 | | | $ | 25.30 | | | $ | 25.00 | |
| | | | | | | | | | | | | | | | | | | | | |
| INCOME FROM INVESTMENT OPERATIONS: | | | | | | | | | | | | | | | | | | | | |
| Net investment income(a) | | | 1.52 | | | | 1.28 | | | | 1.59 | | | | 1.52 | | | | 0.90 | |
| Net realized and unrealized gain/(loss) | | | 0.49 | | | | (0.65 | ) | | | 1.01 | | | | (1.27 | ) | | | 0.19 | |
| Total from investment operations | | | 2.01 | | | | 0.63 | | | | 2.60 | | | | 0.25 | | | | 1.09 | |
| | | | | | | | | | | | | | | | | | | | | |
| DISTRIBUTIONS: | | | | | | | | | | | | | | | | | | | | |
| From net investment income(b) | | | (1.54 | ) | | | (1.46 | ) | | | (1.72 | ) | | | (1.54 | ) | | | (0.79 | ) |
| Total distributions | | | (1.54 | ) | | | (1.46 | ) | | | (1.72 | ) | | | (1.54 | ) | | | (0.79 | ) |
| | | | | | | | | | | | | | | | | | | | | |
| Net increase/(decrease) in net asset value | | | 0.47 | | | | (0.83 | ) | | | 0.88 | | | | (1.29 | ) | | | 0.30 | |
| Net asset value, end of year | | $ | 24.53 | | | $ | 24.06 | | | $ | 24.89 | | | $ | 24.01 | | | $ | 25.30 | |
| TOTAL RETURN(c) | | | 8.50 | % | | | 3.16 | % | | | 11.04 | % | | | 0.95 | % | | | 4.38 | % |
| | | | | | | | | | | | | | | | | | | | | |
| RATIOS/SUPPLEMENTAL DATA: | | | | | | | | | | | | | | | | | | | | |
| Net assets, end of period (000s) | | $ | 442,765 | | | $ | 279,376 | | | $ | 236,901 | | | $ | 118,119 | | | $ | 42,593 | |
| Ratios to Average Net Assets (including interest expense) | | | | | | | | | | | | | | | | | | | | |
| Ratio of expenses to average net assets excluding fee waivers and reimbursements | | | 2.84 | % | | | 2.54 | % | | | 2.72 | % | | | 3.07 | % | | | 5.62 | %(d)(e) |
| Ratio of expenses to average net assets including fee waivers and reimbursements | | | 1.73 | %(f) | | | 1.25 | %(f) | | | 0.54 | %(f) | | | 0 | %(g) | | | 0 | %(g) |
| Ratio of net investment income to average net assets | | | 6.24 | % | | | 5.60 | % | | | 6.44 | % | | | 6.12 | % | | | 4.78 | %(d) |
| | | | | | | | | | | | | | | | | | | | | |
| Ratios to Average Net Assets (excluding interest expense) | | | | | | | | | | | | | | | | | | | | |
| Ratio of expenses to average net assets excluding fee waivers and reimbursements | | | 2.50 | % | | | 2.54 | % | | | 2.72 | % | | | 3.07 | % | | | 5.62 | %(d)(e) |
| Ratio of expenses to average net assets including fee waivers and reimbursements | | | 1.39 | %(f) | | | 1.25 | %(f) | | | 0.54 | %(f) | | | 0 | %(g) | | | 0 | %(g) |
| | | | | | | | | | | | | | | | | | | | | |
| Portfolio turnover rate(h) | | | 73 | % | | | 98 | % | | | 72 | % | | | 56 | % | | | 48 | % |
| See Notes to Consolidated Financial Statements. | |
| 54 | 1.888.926.2688 | www.griffincapital.com |
| Griffin Institutional Access Credit Fund – Class I | Consolidated Financial Highlights |
| | For a Share Outstanding Throughout the Period Presented |
| (a) | Calculated using the average shares method. |
| (b) | Distributions are based on a daily accrual of net investment income which will vary based on underlying investment yields and daily shares outstanding (see Note 6). |
| (c) | Total returns are for the year indicated and do not reflect the impact of the applicable sales charge. Total returns would have been lower had certain expenses not been waived or recouped by the Adviser during the year. Returns shown do not reflect the deduction of taxes that a shareholder would pay on Fund distributions or the redemption of Fund shares. |
| (e) | The gross expense ratio included non-recurring organizational costs. |
| (f) | For the period of January 1, 2019 to August 25, 2019 the Adviser voluntarily absorbed all of the operating expenses of the Fund. For the period of August 26, 2019 to April 30, 2021, the Adviser voluntarily absorbed operating expenses of the Fund in excess of 1.25% of net assets. For the period of May 1, 2021 to August 15, 2021, the Adviser voluntarily absorbed operating expenses of the Fund in excess of 1.375% of net assets. For the period of August 16, 2021 to December 31, 2021, the Adviser has voluntarily waived or absorbed operating expenses of the Fund in excess of 1.50% of net assets. In the absence of the election by the Fund's investment adviser to bear certain of the Fund's operating expenses, the ratio of expenses to average net assets including fee waivers and reimbursements would have been higher. |
| (g) | The Adviser voluntarily absorbed all of the operating expenses of the Fund during the period. In the absence of the election by the Fund's investment adviser to bear all of the Fund's operating expenses, the ratio of expenses to average net assets including fee waivers and reimbursements would have been higher. |
| (h) | Portfolio turnover rate for periods less than one full year has not been annualized and is calculated at the Fund level. |
| See Notes to Consolidated Financial Statements. | |
| Annual Report | December 31, 2021 | 55 |
| Griffin Institutional Access Credit Fund – Class M | Consolidated Financial Highlights |
| | For a Share Outstanding Throughout the Period Presented |
| | | For the Period November 2, 2021 (Commencement of Operations) to December 31, 2021 | |
| Net asset value, beginning of period | | $ | 24.55 | |
| | | | | |
| INCOME FROM INVESTMENT OPERATIONS: | | | | |
| Net investment income(a) | | | 0.23 | |
| Total from investment operations | | | 0.23 | |
| | | | | |
| DISTRIBUTIONS: | | | | |
| From net investment income(b) | | | (0.25 | ) |
| Total distributions | | | (0.25 | ) |
| | | | | |
| Net (decrease) in net asset value | | | (0.02 | ) |
| Net asset value, end of period | | $ | 24.53 | |
| TOTAL RETURN(c) | | | 0.91 | % |
| | | | | |
| RATIOS/SUPPLEMENTAL DATA: | | | | |
| Net assets, end of period (000s) | | $ | 245 | |
| Ratios to Average Net Assets (including interest expense) | | | | |
| Ratio of expenses to average net assets excluding fee waivers and reimbursements | | | 3.57 | %(d)(e) |
| Ratio of expenses to average net assets including fee waivers and reimbursements | | | 1.85 | %(d) |
| Ratio of net investment income to average net assets | | | 5.82 | %(d) |
| | | | | |
| Ratios to Average Net Assets (excluding interest expense) | | | | |
| Ratio of expenses to average net assets excluding fee waivers and reimbursements | | | 3.22 | %(d)(e) |
| Ratio of expenses to average net assets including fee waivers and reimbursements | | | 1.50 | %(d) |
| | | | | |
| Portfolio turnover rate(f) | | | 73 | % |
| (a) | Calculated using the average shares method. |
| (b) | Distributions are based on a daily accrual of net investment income which will vary based on underlying investment yields and daily shares outstanding (see Note 6). |
| (c) | Total returns are for the year indicated and do not reflect the impact of the applicable sales charge. Total returns would have been lower had certain expenses not been waived or recouped by the Adviser during the year. Returns shown do not reflect the deduction of taxes that a shareholder would pay on Fund distributions or the redemption of Fund shares. |
| (e) | For the period the Adviser has voluntarily waived or absorbed operating expenses of the Fund in excess of 1.50% of net assets. In the absence of the election by the Fund's investment adviser to bear certain of the Fund's operating expenses, the ratio of expenses to average net assets including fee waivers and reimbursements would have been higher. |
| (f) | Portfolio turnover rate for periods less than one full year has not been annualized and is calculated at the Fund level. |
| See Notes to Consolidated Financial Statements. | |
| 56 | 1.888.926.2688 | www.griffincapital.com |
| Griffin Institutional Access Credit Fund – Class L | Consolidated Financial Highlights |
| | For a Share Outstanding Throughout the Period Presented |
| | | For the Year Ended December 31, 2021 | | | For the Year Ended December 31, 2020 | | | For the Year Ended December 31, 2019 | | | For the Year Ended December 31, 2018 | | | For the Period September 5, 2017 (Commencement of Operations) to December 31, 2017 | |
| Net asset value, beginning of year | | $ | 24.05 | | | $ | 24.89 | | | $ | 24.01 | | | $ | 25.30 | | | $ | 25.21 | |
| | | | | | | | | | | | | | | | | | | | | |
| INCOME FROM INVESTMENT OPERATIONS: | | | | | | | | | | | | | | | | | | | | |
| Net investment income(a) | | | 1.53 | | | | 1.28 | | | | 1.57 | | | | 1.53 | | | | 0.40 | |
| Net realized and unrealized gain/(loss) | | | 0.47 | | | | (0.66 | ) | | | 1.03 | | | | (1.28 | ) | | | 0.06 | |
| Total from investment operations | | | 2.00 | | | | 0.62 | | | | 2.60 | | | | 0.25 | | | | 0.46 | |
| | | | | | | | | | | | | | | | | | | | | |
| DISTRIBUTIONS: | | | | | | | | | | | | | | | | | | | | |
| From net investment income(b) | | | (1.53 | ) | | | (1.46 | ) | | | (1.72 | ) | | | (1.54 | ) | | | (0.37 | ) |
| Total distributions | | | (1.53 | ) | | | (1.46 | ) | | | (1.72 | ) | | | (1.54 | ) | | | (0.37 | ) |
| | | | | | | | | | | | | | | | | | | | | |
| Net increase/(decrease) in net asset value | | | 0.47 | | | | (0.84 | ) | | | 0.88 | | | | (1.29 | ) | | | 0.09 | |
| Net asset value, end of year | | $ | 24.52 | | | $ | 24.05 | | | $ | 24.89 | | | $ | 24.01 | | | $ | 25.30 | |
| TOTAL RETURN(c) | | | 8.49 | % | | | 3.13 | % | | | 11.05 | % | | | 0.94 | % | | | 1.84 | % |
| | | | | | | | | | | | | | | | | | | | | |
| RATIOS/SUPPLEMENTAL DATA: | | | | | | | | | | | | | | | | | | | | |
| Net assets, end of period (000s) | | $ | 13,711 | | | $ | 11,606 | | | $ | 5,537 | | | $ | 1,831 | | | $ | 520 | |
| Ratios to Average Net Assets (including interest expense) | | | | | | | | | | | | | | | | | | | | |
| Ratio of expenses to average net assets excluding fee waivers and reimbursements | | | 3.31 | % | | | 3.05 | % | | | 3.19 | % | | | 3.45 | % | | | 4.17 | %(d) |
| Ratio of expenses to average net assets including fee waivers and reimbursements | | | 1.73 | %(e) | | | 1.25 | %(e) | | | 0.59 | %(e) | | | 0 | %(f) | | | 0 | %(f) |
| Ratio of net investment income to average net assets | | | 6.25 | % | | | 5.58 | % | | | 6.38 | % | | | 6.14 | % | | | 4.88 | %(d) |
| | | | | | | | | | | | | | | | | | | | | |
| Ratios to Average Net Assets (excluding interest expense) | | | | | | | | | | | | | | | | | | | | |
| Ratio of expenses to average net assets excluding fee waivers and reimbursements | | | 2.97 | % | | | 3.05 | % | | | 3.19 | % | | | 3.45 | % | | | 4.17 | %(d) |
| Ratio of expenses to average net assets including fee waivers and reimbursements | | | 1.39 | %(e) | | | 1.25 | %(e) | | | 0.59 | %(e) | | | 0 | %(f) | | | 0 | %(f) |
| | | | | | | | | | | | | | | | | | | | | |
| Portfolio turnover rate(g) | | | 73 | % | | | 98 | % | | | 72 | % | | | 56 | % | | | 48 | % |
| See Notes to Consolidated Financial Statements. | |
| Annual Report | December 31, 2021 | 57 |
| Griffin Institutional Access Credit Fund – Class L | Consolidated Financial Highlights |
| | For a Share Outstanding Throughout the Period Presented |
| (a) | Calculated using the average shares method. |
| (b) | Distributions are based on a daily accrual of net investment income which will vary based on underlying investment yields and daily shares outstanding (see Note 6). |
| (c) | Total returns are for the year indicated and do not reflect the impact of the applicable sales charge. Total returns would have been lower had certain expenses not been waived or recouped by the Adviser during the year. Returns shown do not reflect the deduction of taxes that a shareholder would pay on Fund distributions or the redemption of Fund shares. |
| (e) | For the period of January 1, 2019 to August 25, 2019 the Adviser voluntarily absorbed all of the operating expenses of the Fund. For the period of August 26, 2019 to April 30, 2021, the Adviser voluntarily absorbed operating expenses of the Fund in excess of 1.25% of net assets. For the period of May 1, 2021 to August 15, 2021, the Adviser voluntarily absorbed operating expenses of the Fund in excess of 1.375% of net assets. |
For the period of August 16, 2021 to December 31, 2021, the Adviser has voluntarily waived or absorbed operating expenses of the Fund in excess of 1.50% of net assets. In the absence of the election by the Fund's investment adviser to bear certain of the Fund's operating expenses, the ratio of expenses to average net assets including fee waivers and reimbursements would have been higher.
| (f) | The Adviser voluntarily absorbed all of the operating expenses of the Fund during the period. In the absence of the election by the Fund's investment adviser to bear all of the Fund's operating expenses, the ratio of expenses to average net assets including fee waivers and reimbursements would have been higher. |
| (g) | Portfolio turnover rate for periods less than one full year has not been annualized and is calculated at the Fund level. |
| See Notes to Consolidated Financial Statements. | |
| 58 | 1.888.926.2688 | www.griffincapital.com |
| Griffin Institutional Access Credit Fund – Class F | Consolidated Financial Highlights |
| | For a Share Outstanding Throughout the Period Presented |
| | | For the Year Ended December 31, 2021 | | | For the Year Ended December 31, 2020 | | | For the Year Ended December 31, 2019 | | | For the Year Ended December 31, 2018 | | | For the Period September 25, 2017 (Commencement of Operations) to December 31, 2017 | |
| Net asset value, beginning of year | | $ | 24.07 | | | $ | 24.90 | | | $ | 24.01 | | | $ | 25.30 | | | $ | 25.25 | |
| | | | | | | | | | | | | | | | | | | | | |
| INCOME FROM INVESTMENT OPERATIONS: | | | | | | | | | | | | | | | | | | | | |
| Net investment income(a) | | | 1.53 | | | | 1.28 | | | | 1.63 | | | | 1.50 | | | | 0.32 | |
| Net realized and unrealized gain/(loss) | | | 0.46 | | | | (0.65 | ) | | | 0.97 | | | | (1.26 | ) | | | 0.03 | |
| Total from investment operations | | | 1.99 | | | | 0.63 | | | | 2.60 | | | | 0.24 | | | | 0.35 | |
| | | | | | | | | | | | | | | | | | | | | |
| DISTRIBUTIONS: | | | | | | | | | | | | | | | | | | | | |
| From net investment income(b) | | | (1.53 | ) | | | (1.46 | ) | | | (1.71 | ) | | | (1.53 | ) | | | (0.30 | ) |
| Total distributions | | | (1.53 | ) | | | (1.46 | ) | | | (1.71 | ) | | | (1.53 | ) | | | (0.30 | ) |
| | | | | | | | | | | | | | | | | | | | | |
| Net increase/(decrease) in net asset value | | | 0.46 | | | | (0.83 | ) | | | 0.89 | | | | (1.29 | ) | | | 0.05 | |
| Net asset value, end of year | | $ | 24.53 | | | $ | 24.07 | | | $ | 24.90 | | | $ | 24.01 | | | $ | 25.30 | |
| TOTAL RETURN(c) | | | 8.44 | % | | | 3.15 | % | | | 11.06 | % | | | 0.91 | % | | | 1.41 | % |
| | | | | | | | | | | | | | | | | | | | | |
| RATIOS/SUPPLEMENTAL DATA: | | | | | | | | | | | | | | | | | | | | |
| Net assets, end of period (000s) | | $ | 21,337 | | | $ | 23,004 | | | $ | 25,965 | | | $ | 26,843 | | | $ | 38,254 | |
| Ratios to Average Net Assets (including interest expense) | | | | | | | | | | | | | | | | | | | | |
| Ratio of expenses to average net assets excluding fee waivers and reimbursements | | | 2.84 | % | | | 2.54 | % | | | 2.70 | % | | | 3.03 | % | | | 3.27 | %(d) |
| Ratio of expenses to average net assets including fee waivers and reimbursements | | | 1.72 | %(e) | | | 1.25 | %(e) | | | 0.43 | %(e) | | | 0 | %(f) | | | 0 | %(f) |
| Ratio of net investment income to average net assets | | | 6.27 | % | | | 5.60 | % | | | 6.58 | % | | | 5.99 | % | | | 4.85 | %(d) |
| | | | | | | | | | | | | | | | | | | | | |
| Ratios to Average Net Assets (excluding interest expense) | | | | | | | | | | | | | | | | | | | | |
| Ratio of expenses to average net assets excluding fee waivers and reimbursements | | | 2.50 | % | | | 2.54 | % | | | 2.70 | % | | | 3.03 | % | | | 3.27 | %(d) |
| Ratio of expenses to average net assets including fee waivers and reimbursements | | | 1.38 | %(e) | | | 1.25 | %(e) | | | 0.43 | %(e) | | | 0 | %(f) | | | 0 | %(f) |
| | | | | | | | | | | | | | | | | | | | | |
| Portfolio turnover rate(g) | | | 73 | % | | | 98 | % | | | 72 | % | | | 56 | % | | | 48 | % |
| See Notes to Consolidated Financial Statements. | |
| Annual Report | December 31, 2021 | 59 |
| Griffin Institutional Access Credit Fund – Class F | Consolidated Financial Highlights |
| | For a Share Outstanding Throughout the Period Presented |
| (a) | Calculated using the average shares method. |
| (b) | Distributions are based on a daily accrual of net investment income which will vary based on underlying investment yields and daily shares outstanding (see Note 6). |
| (c) | Total returns are for the year indicated. Total returns would have been lower had certain expenses not been waived or recouped by the Adviser during the year. Returns shown do not reflect the deduction of taxes that a shareholder would pay on Fund distributions or the redemption of Fund shares. |
| (e) | For the period of January 1, 2019 to August 25, 2019 the Adviser voluntarily absorbed all of the operating expenses of the Fund. For the period of August 26, 2019 to April 30, 2021, the Adviser voluntarily absorbed operating expenses of the Fund in excess of 1.25% of net assets. For the period of May 1, 2021 to August 15, 2021, the Adviser voluntarily absorbed operating expenses of the Fund in excess of 1.375% of net assets. |
For the period of August 16, 2021 to December 31, 2021, the Adviser has voluntarily waived or absorbed operating expenses of the Fund in excess of 1.50% of net assets. In the absence of the election by the Fund's investment adviser to bear certain of the Fund's operating expenses, the ratio of expenses to average net assets including fee waivers and reimbursements would have been higher.
| (f) | The Adviser voluntarily absorbed all of the operating expenses of the Fund during the period. In the absence of the election by the Fund's investment adviser to bear all of the Fund's operating expenses, the ratio of expenses to average net assets including fee waivers and reimbursements would have been higher. |
| (g) | Portfolio turnover rate for periods less than one full year has not been annualized and is calculated at the Fund level. |
| See Notes to Consolidated Financial Statements. | |
| 60 | 1.888.926.2688 | www.griffincapital.com |
| Griffin Institutional Access Credit Fund | Consolidated Financial Highlights |
| | For a Share Outstanding Throughout the Period Presented |
Information about the Fund's senior securities is shown in the following table:
| | | For the Year Ended December 31, 2021 | | | For the Year Ended December 31, 2020 | | | For the Year Ended December 31, 2019 | | | For the Year Ended December 31, 2018 | | | For the Period April 3, 2017 (Commencement of Operations) to December 31, 2017 | |
| Lines of Credit Total Amount Outstanding (000's) | | $ | 133,945 | | | | N/A | | | | N/A | | | | N/A | | | | N/A | |
| Asset Coverage Per $1,000 of Citi Credit Facility Outstanding(a) | | $ | 5,691 | | | | N/A | | | | N/A | | | | N/A | | | | N/A | |
| (a) | Calculated by subtracting the Fund’s consolidated total liabilities (excluding the indebtedness represented by the Lines of Credit) from the Fund’s total assets and dividing by the total amount outstanding on the Lines of Credit. The Asset Coverage ratio is then multiplied by $1,000 to determine the "Asset Coverage Per $1,000 of Lines of Credit Outstanding." |
| See Notes to Consolidated Financial Statements. | |
| Annual Report | December 31, 2021 | 61 |
| Griffin Institutional Access Credit Fund | Notes to Consolidated Financial Statements |
| | December 31, 2021 |
1. ORGANIZATION
Griffin Institutional Access Credit Fund (the “Fund”) is registered with the U.S. Securities and Exchange Commission (“SEC”) under the Investment Company Act of 1940, as amended (the “1940 Act”), as a diversified, closed-end management investment company. The Fund was organized as a statutory trust on April 5, 2016 under the laws of the State of Delaware. The Fund commenced operations on April 3, 2017 and is authorized to issue an unlimited number of shares with no par value. The Fund engages in a continuous offering of shares and operates as an interval fund that offers quarterly repurchases of shares at net asset value. The Fund’s investment adviser is Griffin Capital Credit Advisor, LLC (the “Adviser”), and BCSF Advisors, LP (the “Sub-Adviser”), an affiliate of Bain Capital Credit, LP, serves as the Fund’s sub-adviser. Both the Adviser and Sub-Adviser are registered as investment advisers with the SEC pursuant to the provisions of the Investment Advisers Act of 1940, as amended. The investment objective of the Fund is to generate a return comprised of both current income and capital appreciation with an emphasis on current income with low volatility and low correlation to the broader markets. The Fund pursues its investment objective by investing in a range of secured and unsecured debt obligations, which may be syndicated, consisting of U.S. high yield securities, global high yield securities, direct lending investments including direct originated debt obligations, collateralized loan obligations (“CLOs”), and other fixed-income and fixed-income related securities. The portfolio may consist of high yield bonds, bank loans, equity securities, CLOs, and direct lending investments, which may include senior direct lending (“SDL”) as well as subordinate and unitranche direct lending. The Fund may also acquire warrants and other equity interests through its direct lending activities. The portfolio may also consist of, to a lesser extent, special situations investments such as non-performing loans (“NPLs”). In pursuing its investment objective, the Fund may also directly or indirectly invest in derivative investments.
The Fund currently offers Class A, Class C, Class I, Class L and Class M shares. Class A, Class C and Class I shares commenced operations on April 3, 2017. Class L shares commenced operations on September 5, 2017. Class F shares commenced operations on September 25, 2017 and are no longer offered except for reinvestment of dividends. Class M shares commenced operations on November 2, 2021. Class A and Class L shares are offered subject to a maximum sales charge of 5.75% and 4.25%, respectively, of their offering price. Class C, Class I, and Class M shares are offered at net asset value per share. Class C shares may be subject to a 1.00% contingent deferred sales charge on shares redeemed during the first 365 days after their purchase. Each class represents an interest in the same assets of the Fund and classes are identical except for differences in their sales charge structures and ongoing service and distribution charges. All classes of shares have equal voting privileges except that each class has exclusive voting rights with respect to its service and/or distribution plans. The Fund’s income, expenses (other than class specific service and distribution fees), and realized and unrealized gains and losses are allocated proportionately each day based upon the relative net assets of each class. An affiliate of the Adviser owns shares in the Fund representing 1.48% of net asset value as of December 31, 2021.
2. SIGNIFICANT ACCOUNTING POLICIES
Basis of Presentation – The following is a summary of significant accounting policies followed by the Fund in preparation of its consolidated financial statements. These policies are in conformity with accounting principles generally accepted in the United States of America (“GAAP”). The Fund is considered an investment company following accounting and reporting guidance in Accounting Standards Codification (“ASC”) Topic 946 – Financial Services – Investment Companies. The preparation of the consolidated financial statements requires management to make estimates and assumptions that affect the reported amounts of assets and liabilities and disclosure of contingent assets and liabilities at the date of the consolidated financial statements and the reported amounts of income and expenses for the period. Actual results could differ from those estimates.
Consolidation of GIACF Alternative Holdings, LLC – GIACF Alternative Holdings, LLC, (the “NPL Subsidiary”), a Cayman Islands exempted company and wholly-owned subsidiary of the Fund, was formed on September 18, 2018. The NPL Subsidiary acts as an investment vehicle for the Fund in order to effect certain NPL investments for the Fund. The Fund is the managing and sole member of the NPL Subsidiary pursuant to a limited liability company operating agreement. As a wholly-owned subsidiary of the Fund, the financial results of the NPL Subsidiary are included in the consolidated financial statements and financial highlights of the Fund. All investments held by the NPL Subsidiary are disclosed in the Consolidated Schedule of Investments. All inter-company accounts and transactions have been eliminated in consolidation.
The NPL Subsidiary has received an undertaking from the Government of the Cayman Islands exempting it from all local income, profits and capital gains taxes. No such taxes are levied in the Cayman Islands at the present time. For U.S. income tax purposes, the NPL Subsidiary is a Controlled Foreign Corporation, which generates and is allocated no income that is considered effectively connected with U.S. trade of business and, as such, is not subject to U.S. income tax. However, as a wholly-owned Controlled Foreign Corporation, the NPL Subsidiary’s net income and capital gain, to the extent of its earnings and profits, will be included each year in the Fund’s investment company taxable income.
Consolidation of CRDTX SPV I, LLC – CRDTX SPV I, LLC (the "Financing Subsidiary"), a Delaware Limited Liability Company and wholly-owned subsidiary of the Fund, was formed on November 27, 2018. Previously, CRDTX SPV I, LLC, on behalf of the Fund, entered into a series of single-asset total return swaps on individual bank loans (the "Swaps") with Citibank, N.A. as counterparty. CRDTX SPV I, LLC terminated the Swaps on March 30, 2021 and concurrently entered into a secured revolving credit facility with Citibank, N.A. The Fund is the managing and sole member of CRDTX SPV I, LLC pursuant to a limited liability company operating agreement and the Fund will remain the sole member and will continue to wholly own and control CRDTX SPV I, LLC. As a wholly-owned subsidiary of the Fund, the financial results of CRDTX SPV I, LLC are included in the consolidated financial statements and financial highlights of the Fund. Assets pledged as collateral by CRDTX SPV I, LLC under the secured revolving credit facility are disclosed in the Consolidated Schedule of Investments. All inter-company accounts and transactions have been eliminated in consolidation.
| 62 | 1.888.926.2688 | www.griffincapital.com |
| Griffin Institutional Access Credit Fund | Notes to Consolidated Financial Statements |
| | December 31, 2021 |
Single-Asset Subsidiaries – Certain investments of the Fund will be held in single-asset subsidiaries controlled by the Fund (the “Single-Asset Subsidiaries”). The Single-Asset Subsidiaries are generally formed as needed to hold a particular equity investment obtained in private transactions. The financial statements of the Single-Asset Subsidiaries are included in the consolidated financial statements and financial highlights of the Fund. The equity holdings of the Single-Asset Subsidiaries are disclosed in the Consolidated Schedule of Investments. All inter-company accounts and transactions have been eliminated in consolidation.
The Fund will generally consolidate any wholly-owned or controlled subsidiary. For purposes of the Fund’s investment restrictions, guidelines and limitations, the Fund will aggregate direct investments with investment exposure provided by its wholly-owned and controlled subsidiaries.
Security Valuation – Portfolio securities held by the Fund are valued at their current market values determined on the basis of market or dealer quotations from independent pricing services approved by the Board. If market or dealer quotations are not readily available or deemed unreliable, the Board will determine in good faith, the fair value of such securities. For securities that are fair valued in the ordinary course of Fund operations, the Board has delegated the day-to-day responsibility for determining fair valuation to the Fair Value Pricing Committee in accordance with the policies approved by the Board. In determining the fair value of a security for which there are no readily available market or dealer quotations, the Adviser and Sub-Adviser, together with the Fair Value Pricing Committee, will take into account all reasonably available information that may be relevant to a particular security including, but not limited to: pricing history, current market level, supply and demand of the respective security; the enterprise value of the portfolio company; the portfolio company’s ability to make payments and its earnings and discounted cash flow, comparison to the values and current pricing of publicly traded securities that have comparable characteristics; comparison to publicly traded securities including factors such as yield, maturity, and credit quality; knowledge of historical market information with respect to the security; fundamental analytical data, such as periodic financial statements, and other factors or information relevant to the security, issuer, or market. The Fund has also retained the services of third-party valuation firms to review valuations of certain securities for which market or dealer quotations are unavailable or deemed unreliable and to assist in determining fair value where applicable, however, the ultimate determination of fair value will be made by the Board and not by such third-party valuation firm. Fair valuation involves subjective judgments, and it is possible that the fair value determined for a security may differ materially from the value that could be realized upon the sale of the security.
Forward foreign currency exchange contracts are typically valued at their quoted daily prices obtained from an independent pricing service. The aggregate settlement values and notional amounts of the forward foreign currency exchange contracts and total return swaps will not be recorded in the Consolidated Statement of Assets and Liabilities. However, fluctuations in the value of the forward foreign currency exchange contracts and total return swaps will be recorded in the Consolidated Statement of Assets and Liabilities as an asset or liability and in the Consolidated Statement of Operations as unrealized appreciation or depreciation until terminated. When a total return swap is terminated, the Fund records a realized gain or loss in the Consolidated Statement of Operations equal to the difference between the value of the total return swap at the time it was opened and the value of the total return swap at the time it was terminated. The Fund terminated its total return swaps on March 30, 2021.
Fair Value Measurements – In accordance with ASC Topic 820 – Fair Value Measurement and Disclosures, a three-tier hierarchy has been established to classify fair value measurements for disclosure purposes. Inputs refer broadly to the assumptions that market participants would use in pricing the asset or liability, including assumptions about risk. Inputs may be observable or unobservable. Observable inputs are inputs that reflect the assumptions market participants would use in pricing the asset or liability that are developed based on market data obtained from sources independent of the reporting entity. Unobservable inputs are inputs that reflect the reporting entity’s own assumptions about the assumptions market participants would use in pricing the asset or liability that are developed based on the best information available. In accordance with the authoritative guidance on fair value measurements and disclosure under GAAP, the Fund discloses fair value of its investments in a hierarchy that prioritizes the inputs to valuation techniques used to measure the fair value, as follows:
| Level 1 – | Unadjusted quoted prices in active markets for identical, unrestricted assets or liabilities that the Fund has the ability to access at the measurement date; |
| Level 2 – | Quoted prices which are not active, quoted prices for similar assets or liabilities in active markets or inputs other than quoted prices that are observable (either directly or indirectly) for substantially the full term of the asset or liability at the measurement date; and |
| Level 3 – | Significant unobservable prices or inputs (including the Fund’s own assumptions in determining the fair value of investments) where there is little or no market activity for the asset or liability at the measurement date. |
| Annual Report | December 31, 2021 | 63 |
| Griffin Institutional Access Credit Fund | Notes to Consolidated Financial Statements |
| | December 31, 2021 |
The availability of observable inputs can vary from security to security and is affected by a wide variety of factors, including, for example, the type of security, whether the security is new and not yet established in the marketplace, the liquidity of markets and other characteristics particular to the security. To the extent that valuation is based on models or inputs that are less observable or unobservable in the market, the determination of fair value requires more judgment. Accordingly, the degree of judgment exercised in determining fair value is greatest for instruments categorized in Level 3.
An investment level within the fair value hierarchy is based on the lowest level input, individually or in the aggregate, that is significant to fair value measurement. The valuation techniques used by the Fund to measure fair value during the fiscal year ended December 31, 2021 maximized the use of observable inputs and minimized the use of unobservable inputs.
The inputs or methodologies used for valuing securities are not necessarily an indication of the risk or liquidity associated with investing in those securities. The following is a summary of the inputs used in valuing the Fund’s investments as of December 31, 2021:
| Investments in Securities at Value | | Level 1 - Quoted Prices | | | Level 2 -Other Significant Observable Inputs | | | Level 3 - Significant Unobservable Inputs | | | Total | |
| Bank Loans | | $ | – | | | $ | 290,829,334 | | | $ | 174,453,006 | | | $ | 465,282,340 | |
| Corporate Bonds | | | – | | | | 159,268,377 | | | | 2,670,619 | | | | 161,938,996 | |
| Convertible Corporate Bonds | | | – | | | | 1,243,360 | | | | – | | | | 1,243,360 | |
| Collateralized Loan Obligations | | | – | | | | 90,426,706 | | | | – | | | | 90,426,706 | |
| Equity Interest | | | 977,957 | | | | 2,851,913 | | | | 13,248,628 | | | | 17,078,498 | |
| Exchange Traded Funds | | | 10,799,167 | | | | – | | | | – | | | | 10,799,167 | |
| Total | | $ | 11,777,124 | | | $ | 544,619,690 | | | $ | 190,372,253 | | | $ | 746,769,067 | |
| Other Financial Instruments* | | | | | | | | | | | | | | | | |
| Assets: | | | | | | | | | | | | | | | | |
| Forward Foreign Currency Contracts | | $ | – | | | $ | 1,788,218 | | | $ | – | | | $ | 1,788,218 | |
| Liabilities: | | | | | | | | | | | | | | | | |
| Forward Foreign Currency Contracts | | | – | | | | (692 | ) | | | – | | | | (692 | ) |
| Total | | $ | – | | | $ | 1,787,526 | | | $ | – | | | $ | 1,787,526 | |
| * | Other financial instruments are derivative instruments reflected in the Consolidated Schedule of Investments. The derivatives shown in this table are reported at their unrealized appreciation/ (depreciation) at measurement date, which represents the change in the contracts' value. |
| 64 | 1.888.926.2688 | www.griffincapital.com |
| Griffin Institutional Access Credit Fund | Notes to Consolidated Financial Statements |
| | December 31, 2021 |
The changes of fair value of investments for which the Fund has used Level 3 inputs to determine the fair value are as follows:
| | | Bank Loans | | | Corporate Bonds | | | Collateralized Loan Obligations | | | Equity Interest | | | Total | |
| Balance as of December 31, 2020 | | $ | 100,972,457 | | | $ | 1,914,601 | | | $ | 712,500 | | | $ | 7,054,491 | | | $ | 110,654,049 | |
| Accrued discount/premium | | | 620,859 | | | | 15,200 | | | | 71 | | | | – | | | | 636,130 | |
| Return of Capital | | | – | | | | – | | | | – | | | | – | | | | – | |
| Realized Gain | | | 1,313,029 | | | | – | | | | 40,504 | | | | 106,544 | | | | 1,460,077 | |
| Change in Unrealized Appreciation/(Depreciation) | | | (2,180,993 | ) | | | (66,177 | ) | | | – | | | | 2,759,637 | | | | 512,467 | |
| Purchases | | | 130,221,925 | | | | – | | | | – | | | | 5,859,653 | | | | 136,081,578 | |
| Sales Proceeds | | | (53,375,778 | ) | | | – | | | | (753,075 | ) | | | (1,731,787 | ) | | | (55,860,640 | ) |
| Transfer into Level 3 | | | 6,447,482 | | | | 806,995 | | | | – | | | | – | | | | 7,254,477 | |
| Transfer out of Level 3 | | | (9,565,975 | ) | | | – | | | | – | | | | (799,910 | ) | | | (10,365,885 | ) |
| Balance as of December 31, 2021 | | $ | 174,453,006 | | | $ | 2,670,619 | | | $ | – | | | $ | 13,248,628 | | | $ | 190,372,253 | |
| Net change in unrealized appreciation/(depreciation) included in the Consolidated Statements of Operations attributable to Level 3 investments held at December 31, 2021 | | $ | (1,076,095 | ) | | $ | (65,693 | ) | | $ | – | | | $ | 460,771 | | | $ | (681,017 | ) |
The following is a reconciliation for the fiscal year ended December 31, 2021 of the total return swap contracts for which significant unobservable inputs (Level 3) were used in determining fair value:
| | | Total Return Swap Contracts | |
| Balance as of December 31, 2020 | | $ | 95,095 | |
| Change in Unrealized Appreciation/(Depreciation) | | | (95,095 | ) |
| Realized Gain | | | 70,043 | |
| Sales Proceeds | | | (70,043 | ) |
| Transfers Out of Level 3 | | | – | |
| Balance as of December 31, 2021 | | $ | – | |
| Net change in unrealized appreciation/(depreciation) included in the Consolidated Statements of Operations attributable to Level 3 investments held at December 31, 2021 | | $ | – | |
The table below provides additional information about the Level 3 Fair Value Measurements as of December 31, 2021:
Quantitative Information about Level 3 Fair Value Measurements
| Asset Class | Fair Value | Valuation Technique | Unobservable Inputs | Minimum | Maximum | Weighted Average |
| Bank Loans | 108,367,194 | Yield Analysis | Market Yield | 4.29% | 18.32% | 8.21% |
| Bank Loans | 35,780,006(b) | Third Party Pricing Service | Broker Quote(a) | $95.50 | $106.38 | $99.21 |
| Bank Loans | 24,012,750(c) | Purchase Price | Purchase Price(a) | $60.00 | $107.00 | $97.63 |
| Bank Loans | 5,724,743 | Enterprise Value Analysis | EBITDA Multiple | 5.50x | 9.00x | 5.74x |
| Bank Loans | 568,313 | Pending Transaction | Redemption Price(a) | $100.00 | $100.00 | $100.00 |
| Corporate Bond | 1,863,624 | Discounted Cash Flows | Discount Rate | 8.58% | 8.58% | 8.58% |
| Corporate Bond | 806,995 | Third Party Pricing Service | Broker Quote(a) | $0.28 | $93.61 | $93.39 |
| Equity Interests | 3,268,248 | Discounted Cash Flows | Discount Rate | 14.85% | 14.85% | 14.85% |
| Equity Interests | 9,059,162 | Enterprise Value Analysis | EBITDA Multiple | 4.63x | 24.50x | 14.34x |
| Equity Interests | 921,218(c) | Purchase Price | Purchase Price(a) | $0.00 | $980.00 | $227.47 |
| Total | $190,372,253 | | | | | |
| Annual Report | December 31, 2021 | 65 |
| Griffin Institutional Access Credit Fund | Notes to Consolidated Financial Statements |
| | December 31, 2021 |
| Unobservable Input | Impact to Value if Input Increases | Impact to Value if Input Decreases |
| Market Yield | Decrease | Increase |
| EBITDA Multiple | Increase | Decrease |
| Discount Rate | Decrease | Increase |
| Broker Quote | Increase | Decrease |
| (a) | The Fund did not develop the unobservable inputs for the determination of fair value (examples include single broker quotations from pricing services and prior or pending transactions) |
| (b) | Includes investments held at CRDTX SPV I, LLC, a wholly-owned subsidiary of the Fund, pledged as collateral for a secured revolving credit facility |
| (c) | Investments acquired during the quarter ended December 31, 2021 |
The Fund used valuation techniques consistent with the income approach and market approach to determine the fair value of certain Level 3 assets as of December 31, 2021. The valuation techniques utilized by the Fund included enterprise value analysis, discounted cash flows analysis, and yield analysis. The enterprise value analysis measures fair value of a portfolio company based upon an assessment of multiples such as Earnings Before Interest Tax Depreciation and Amortization or revenue that are typically determined through review of market comparable transactions and publicly traded comparable companies. Such multiples are subsequently applied to the underlying portfolio company financial multiple, generally EBITDA or revenue, to estimate enterprise value. Total enterprise value is first allocated to the debt holders and then allocated across the capital structure reflecting applicable rights and preferences of the remaining equity securities to determine fair value of certain of the Fund’s equity interests. The significant unobservable input used in the enterprise value analysis is generally the EBITDA or revenue multiple. The Fund also utilized the discounted cash flows analysis to measure fair value of certain of the Fund’s equity and debt investments. The discounted cash flows analysis is a technique whereby future expected cash flows of the underlying investment are discounted to determine a present value using a discount rate. The significant unobservable input used in the discounted cash flows analysis is the discount rate. The yield analysis technique measures fair value of an investment based upon an assessment of expected market yields of other businesses of similar size in the same industry which are used to establish a discount rate. Future cash flows are then discounted back to present value using the discount rate to determine fair value of certain of the Fund’s debt investments. The significant unobservable input used in the yield analysis is yield.
Generally, new investments not valued by a third-party pricing service are held at purchase price initially until the investment has been held by the Fund for a full quarter. The Fair Value Pricing Committee subsequently determines the application of a fair value methodology at the next valuation date. The Fair Value Pricing Committee will convene if there has been a material change to the applicable portfolio company between the time of investment and the next valuation date.
The carrying and fair value of the Fund's debt obligation as of December 31, 2021 for which the Fund has determined would be categorized as Level 2 in the fair value hierarchy was $133,945,324.
Securities Transactions, Revenue Recognition and Expenses – The Fund records its investment transactions on a trade date basis. The Fund measures realized gains or losses by the difference between the net proceeds from the repayment or sale and the amortized cost basis of the investment, using the specified identification method. Interest income, adjusted for amortization of premium and accretion of discount, is recorded on an accrual basis. Discount and premium to par value on investments acquired are accreted and amortized, respectively, into interest income over the life of the respective investment using the effective interest method. Loan origination fees, original issue discount and market discount or premium are capitalized and amortized against or accreted into interest income using the effective interest method or straight-line method, as applicable. For the Fund’s investments in revolving bank loans, the cost basis of the investment purchased is adjusted for the cash received for the discount on the total balance committed. The fair value is also adjusted for price appreciation or depreciation on the unfunded portion. Upon prepayment of a loan or debt security, any prepayment premium is recorded as interest income.
Dividend income on preferred equity investments is recorded on an accrual basis to the extent that such amounts are payable by the portfolio company and are expected to be collected. Dividend income on common equity investments is recorded on the record date for private portfolio companies and on the ex-dividend date for publicly traded portfolio companies. Distributions received from a limited liability company or limited partnership investments are evaluated to determine if the distribution should be recorded as dividend income or a return of capital.
Income from securitization vehicles and investments in the equity class securities of CLO vehicles (typically income notes or subordinated notes) is recorded daily using the effective interest method in accordance with the provisions of ASC 325-40, Beneficial Interests in Securitized Financial Assets, based upon a calculation of the effective yield to the expected redemption date based on an estimate of future cash flows, including those CLO equity investments that have not made their inaugural distribution for the relevant period end. The Fund monitors the expected residual payments, and the effective yield is determined and updated quarterly.
| 66 | 1.888.926.2688 | www.griffincapital.com |
| Griffin Institutional Access Credit Fund | Notes to Consolidated Financial Statements |
| | December 31, 2021 |
Certain investments may have contractual payment-in-kind (“PIK”) interest or dividends. PIK represents accrued interest or accumulated dividends that are added to the loan principal of the investment on the respective interest or dividend payment dates rather than being paid in cash and generally becomes due at maturity or upon being called by the issuer. PIK is recorded as interest or dividend income, as applicable. If at any point the Fund believes PIK is not expected to be realized, the investment generating PIK will be placed on non-accrual status. Accrued PIK interest or dividends are generally reversed through interest or dividend income, respectively, when an investment is placed on non-accrual status.
Expenses are recorded on an accrual basis.
Foreign Currency Translation – The books and records of the Fund are maintained in U.S. dollars. Investment valuations and other assets and liabilities initially expressed in foreign currencies are converted each business day into U.S. dollars based upon current exchange rates. Prevailing foreign exchange rates may generally be obtained at the close of the NYSE (normally, 4:00 p.m. EST).
Foreign Securities – The Fund may directly purchase securities of foreign issuers. Investing in securities of foreign issuers involves special risks not typically associated with investing in securities of U.S. issuers. The risks include possible revaluation of currencies, the ability to repatriate funds, less complete financial information about companies and possible future adverse political and economic developments. Moreover, securities of many foreign issuers and their markets may be less liquid and their prices more volatile than those of securities of comparable U.S. issuers.
Cash and Cash Equivalents – The Fund places its cash with one banking institution, which is insured by the Federal Deposit Insurance Corporation (“FDIC”). The FDIC limit is $250,000. At various times throughout the year, the amount on deposit may exceed the FDIC limit and subject the Fund to a credit risk. The Fund does not believe that such deposits are subject to any unusual risk associated with investment activities.
Loan Participation and Assignments – The Fund may invest in direct debt instruments, which are interests in amounts owed to lenders or lending syndicates by corporate, governmental, or other borrowers. The Fund’s investments in loans may be in the form of participations in loans or assignments of all or a portion of the loans from third parties. A loan is often administered by a bank or other financial institution (the “agent”) that acts as agent for all holders. The agent administers the terms of the loan, as specified in the loan agreement. The Fund may invest in multiple series or tranches of a loan, which may have varying terms and carry different associated risks. The Fund generally has no right to enforce compliance with the terms of the loan agreement with the borrower. As a result, the Fund may be subject to the credit risk of both the borrower and the agent that is selling the loan agreement. When the Fund purchases assignments from lenders they acquire direct rights against the borrower of the loan. The Fund may enter into unfunded loan commitments, which are contractual obligations for future funding. Unfunded loan commitments represent a future obligation in full, even though a percentage of the notional loan amounts may not be utilized by the borrower. When investing in a loan participation, the Fund has the right to receive payments of principal, interest and any fees to which it is entitled only from the agent selling the loan agreement and only upon receipt of payments by the agent from the borrower. The Fund may receive a fee based on the undrawn portion of the underlying line of credit of a floating rate loan. In certain circumstances, the Fund may receive a penalty fee upon the prepayment of a floating rate loan by a borrower. For the fiscal year ended December 31, 2021, no penalty fees were received by the Fund. Fees earned or paid are recorded as a component of interest income or interest expense, respectively, on the Consolidated Statement of Operations. At December 31, 2021, the Fund had $23,934,723 at par value in unfunded loan commitments.
Defaulted Securities – The Fund held defaulted securities and/or other securities for which the income has been deemed uncollectible. As of December 31, 2021, the aggregate value of those securities was $2,101,912 representing 0.33% of the Fund's net assets. The Fund doesn't accrue income on securities for which income has been deemed uncollectible. Additionally, the Fund provides for losses on interest receivable. Such securities have been identified on the accompanying Consolidated Schedule of Investments.
Distributions to Shareholders – The Fund intends to accrue dividends daily and to distribute as of the last business day of each quarter. Distributions of net capital gains are normally accrued and distributed in December. Income and capital gains distributions are determined in accordance with income tax regulations, which may differ from GAAP.
Indemnification – The Fund indemnifies its Officers and Trustees for certain liabilities that may arise from the performance of their duties to the Fund. Additionally, in the normal course of business, the Fund enters into contracts that contain a variety of representations and warranties and which provide general indemnities. The Fund’s maximum exposure under these arrangements is unknown, as this would involve future claims that may be made against the Fund that have not yet occurred. However, based on industry experience, the Fund expects the risk of loss due to these warranties and indemnities to be remote.
| Annual Report | December 31, 2021 | 67 |
| Griffin Institutional Access Credit Fund | Notes to Consolidated Financial Statements |
| | December 31, 2021 |
Federal Income Taxes – The Fund intends to continue to comply with the requirements of Subchapter M of the Internal Revenue Code applicable to regulated investment companies and will distribute all of its taxable income, if any, to shareholders. Accordingly, no provision for federal income taxes is required in the consolidated financial statements.
The Fund recognizes the tax benefits of uncertain tax positions only when the position is “more likely than not” (more than a fifty percent chance) to be sustained assuming examination by tax authorities. Management has reviewed the tax positions and has concluded that no liability for unrecognized tax benefits should be recorded related to uncertain tax positions expected to be taken in the Fund’s 2021 returns.
Commitments and Contingencies – In the normal course of business, the Fund's investment activities involve executions, settlement and financing of various transactions resulting in receivables from, and payables to, brokers, dealers and the Fund's custodian. These activities may expose the Fund to risk in the event that such parties are unable to fulfill contractual obligations. Management does not anticipate any material losses from counterparties with whom it conducts business. Consistent with standard business practice, the Fund enters into contracts that contain a variety of indemnifications, and may be engaged from time to time in various legal actions. The maximum exposure of the Fund under these arrangements and activities is unknown. However, the Fund expects the risk of material loss to be remote.
3. DERIVATIVE TRANSACTIONS
The Fund’s investment objectives allow the Fund to enter into various types of derivative contracts such as forward foreign currency contracts. Forward foreign currency contracts involve elements of market risk in excess of the amounts reflected in the Consolidated Statement of Assets and Liabilities. The Fund bears the risk of an unfavorable change in the foreign exchange rate underlying the forward foreign currency contract. Risks may also arise upon entering into these contracts from the potential inability of the counterparties to meet the terms of their contracts. Forward foreign currency exchange contracts are typically valued at their quoted daily prices obtained from an independent pricing service.
Risk of Investing in Derivatives – The Fund’s use of derivatives can result in losses due to unanticipated changes in the market risk factors and the overall market. Derivatives may have little or no initial cash investment relative to their market value exposure and therefore can produce significant gains or losses in excess of their cost. This use of embedded leverage allows the Fund to increase its market value exposure relative to its net assets and can substantially increase the volatility of the Fund’s performance. Additional associated risks from investing in derivatives also exist and potentially could have significant effects on the valuation of the derivative and the Fund. Typically, the associated risks are not the risks that the Fund is attempting to increase or decrease exposure to, per their investment objectives, but are the additional risks from investing in derivatives. Examples of these associated risks are liquidity risk, which is the risk that the Fund will not be able to sell the derivative in the open market in a timely manner, and counterparty credit risk, which is the risk that the counterparty will not fulfill its obligation to the Fund.
Forward Foreign Currency Contracts – The Fund engaged in currency transactions with counterparties during the fiscal year ended December 31, 2021 to hedge the value of portfolio securities denominated in particular currencies against fluctuations in relative value or to gain or reduce exposure to certain currencies. A forward foreign currency contract is an agreement between two parties to buy and sell a currency at a set price on a future date. The contract is marked-to-market daily and the change in value is recorded by the Fund as an unrealized gain or loss. When a forward foreign currency contract is terminated, the Fund records a realized gain or loss equal to the difference between the value of the contract at the time it was opened and the value of the contract at the time it was extinguished.
Fair values of forward foreign currency contracts on the Consolidated Statement of Assets and Liabilities as of December 31, 2021, categorized by risk exposure:
| Risk Exposure | | Consolidated Statement of Assets and Liabilities Location | | Fair Value | | | Consolidated Statement of Assets and Liabilities Location | | Fair Value | |
| Foreign Exchange Rate Risk (Forward Foreign Currency Contracts) | | Unrealized appreciation on forward foreign currency contracts | | $ | 1,788,218 | | | Unrealized depreciation on forward foreign currency contracts | | $ | (692 | ) |
| Total | | | | $ | 1,788,218 | | | | | $ | (692 | ) |
For the fiscal year ended December 31, 2021, the average monthly notional value of forward foreign currency contracts and total return swap contracts was $83,684,302 and $22,412,928, respectively.
| 68 | 1.888.926.2688 | www.griffincapital.com |
| Griffin Institutional Access Credit Fund | Notes to Consolidated Financial Statements |
| | December 31, 2021 |
The effect of forward foreign currency contracts and total return swap contracts on the Consolidated Statement of Operations for the fiscal year ended December 31, 2021:
| Risk Exposure | | Consolidated Statement of Operations Location | | Realized Gain/(Loss) on Derivatives | | Consolidated Statement of Operations Location | | Change in Unrealized Appreciation/(Depreciation) on Derivatives Recognized in Income |
| Foreign Exchange Rate Risk (Forward Foreign Currency Contracts) | | Net realized gain/(loss) on forward foreign currency contracts | | $ | 2,544,549 | | | Change in unrealized appreciation/(depreciation) on forward foreign currency contracts | | $ | 2,912,899 | |
| Market and Credit Risk (Total Return Swap Contracts) | | Net realized gain/(loss) on total return swaps | | | 3,623,537 | | | Change in unrealized appreciation/(depreciation) on total return swaps | | | (1,740,340 | ) |
| Total | | | | $ | 6,168,086 | | | | | $ | 1,172,559 | |
4. ADVISORY FEES, ADMINISTRATION FEES AND OTHER AGREEMENTS
Investment Advisory
Pursuant to the Investment Advisory Agreement with the Fund (“Advisory Agreement”), the Adviser is entitled to an investment advisory fee of 1.85% of the average daily net assets of the Fund, computed daily and payable monthly. Sub-advisory services are provided to the Fund pursuant to an agreement among the Fund, Adviser and Sub-Adviser ("Sub-Advisory Agreement"). The Adviser has agreed to pay the Sub-Adviser as compensation under the Investment Sub-Advisory Agreement a quarterly fee computed at the annual rate of the daily net assets as set forth below. The Sub-Adviser is compensated by the Adviser out of advisory fees paid by the Fund to the Adviser; the Fund does not compensate the Sub-Adviser.
| Annual Sub-Advisory Fee Rate as a Percentage of Average Daily Net Assets |
| $0 to $250M | | | 0.75 | % |
| $250M to $500M | | | 0.65 | % |
| $500M to $1B | | | 0.60 | % |
| Over $1B | | | 0.55 | % |
The Adviser and the Fund have entered into an expense limitation and reimbursement agreement (the “Expense Limitation Agreement”) under which the Adviser has agreed contractually to waive its fees and to pay or absorb the ordinary annual operating expenses of the Fund (including offering expenses, but excluding taxes, interest, brokerage commissions, acquired fund fees and expenses and extraordinary expenses) at least until April 30, 2023, so that the total annual operating expenses of the Fund do not exceed 2.60% per annum of Class A average daily net assets, 3.35% per annum of Class C average daily net assets, 2.35% per annum of Class I average daily net assets, 2.85% per annum of Class L average daily net assets,1.85% per annum of Class F average daily net assets and 3.10% per annum of Class M average daily net assets (the “Expense Limitations”). The agreement can be extended at the discretion of the Adviser and the Trustees. In consideration of the Adviser’s agreement to limit the Fund’s expenses, the Fund has agreed to repay the Adviser in the amount of any fees waived and Fund expenses paid or absorbed, subject to the limitations that: (1) the reimbursement for fees and expenses will be made only if payable not more than three years from the date such expenses were incurred; and (2) the reimbursement may not be made if it would cause the lesser of the Expense Limitations in place at the time of waiver or at the time of reimbursement to be exceeded. The operating expenses absorbed by the Adviser that limit each share class’ operating expenses to the contractual limitations provided above are recoupable except that fees waived and Fund expenses paid or absorbed with respect to Class F assets will not be repaid or reimbursed.
In addition to the Expense Limitation Agreement described above, the Adviser voluntarily waived or absorbed all of the operating expenses of the Fund from the commencement of Fund operations until August 25, 2019. Operating expenses voluntarily waived or absorbed by the Adviser during the aforementioned period are not subject to recoupment by the Adviser. For the period of August 26, 2019 to April 30, 2021, the Adviser voluntarily waived or absorbed operating expenses of the Fund in excess of 1.25% of net assets. For the period of May 1, 2021 to August 15, 2021, the Adviser voluntarily waived or absorbed operating expenses of the Fund in excess of 1.375% of net assets. For the period of August 16, 2021 to December 31, 2021, the Adviser voluntarily waived or absorbed operating expenses of the Fund in excess of 1.50% of net assets. For these periods, operating expenses voluntarily waived or absorbed by the Adviser in excess of the voluntary waiver in effect, and below the contractual share class expense limitations are not subject to recoupment by the Adviser. The Adviser will continue to bear such expenses on a going forward basis in its discretion and is under no obligation to continue to do so for any specified period of time.
| Annual Report | December 31, 2021 | 69 |
| Griffin Institutional Access Credit Fund | Notes to Consolidated Financial Statements |
| | December 31, 2021 |
During the fiscal year ended December 31, 2021, fees waived and reimbursed expenses to the Fund by the Adviser totaled $6,806,375. The balance of recoupable expenses for the fund was as follows:
| | | Expires December 31, 2022 | | Expires December 31, 2023 | | Expires December 31, 2024 |
| | $ | 537,135 | | | $ | 731,841 | | | $ | 769,689 | |
Fund Administration and Accounting Fees and Expenses
ALPS Fund Services, Inc. serves as the Fund’s administrator and accounting agent (the “Administrator”) and receives customary fees from the Fund for such services. The Administrator is also reimbursed by the Fund for certain out of pocket expenses.
Transfer Agency Fees and Expenses
DST Systems, Inc. serves as transfer, distribution paying and shareholder servicing agent for the Fund and receives customary fees from the Fund for such services.
Custody Fees and Expenses
The Bank of New York Mellon Trust Company, National Association serves as the Fund’s custodian and receives customary fees from the Fund for such services.
Distribution and Shareholder Servicing Fees and Expenses
The Fund has entered into a Distribution Agreement with ALPS Distributors, Inc. (the “Distributor”) to provide distribution services to the Fund. The Distributor serves as principal underwriter of shares of the Fund. Under the Distribution Agreement, the Class C shares, Class L shares and Class M shares will pay to the Distributor a Distribution Fee that will accrue at an annual rate equal to 0.75%, 0.25% and 0.75% of the Fund’s average daily net assets attributable to Class C shares, Class L shares and Class M shares, respectively, payable on a monthly basis. For the fiscal year ended December 31, 2021, Class C shares, Class L shares and Class M shares incurred distribution fees of $517,789, $29,109 and $302, respectively. Class A, Class I and Class F shares are not currently subject to a Distribution Fee. Under the Shareholder Services Plan, the Class A, Class C and Class L shares may pay up to 0.25% per year of their average daily net assets for such services. For the fiscal year ended December 31, 2021, Class A, Class C and Class L shares incurred shareholder servicing fees of $199,200, $172,596, and $29,009, respectively. Class I shares and Class M shares are not currently subject to a shareholder services fee.
The Distributor has entered into a wholesale marketing agreement with Griffin Capital Securities, LLC (“GCS”), a registered broker-dealer and an affiliate of the Adviser. Pursuant to the terms of the wholesale marketing agreement, GCS will seek to market and otherwise promote the Fund through various wholesale distribution channels, including regional and independent retail broker-dealers, registered investment advisers, and wirehouses.
Officer and Trustee Compensation
Each "non-interested" Trustee receives an annual retainer of $42,000, paid quarterly, as well as reimbursement for any reasonable expenses incurred attending meetings and $2,000 per each special meeting (exclusive of two special audit committee meetings per year). The Chair of the Fund's Audit Committee receives an additional $15,750 annually. None of the executive officers, with the exception of the Chief Compliance Officer, receive compensation from the Fund.
Certain Trustees and officers of the Fund are also officers of the Adviser and, with the exception of the Chief Compliance Officer, are not paid by the Fund for serving in such capacities.
5. PURCHASES AND SALES OF INVESTMENT SECURITIES
The cost of purchases and proceeds from the sale of securities, other than short-term securities, for the fiscal year ended December 31, 2021 were as follows:
| | | Purchases of Securities | | Proceeds from Sales of Securities |
| | $ | 798,128,782 | | | $ | 466,557,114 | |
| 70 | 1.888.926.2688 | www.griffincapital.com |
| Griffin Institutional Access Credit Fund | Notes to Consolidated Financial Statements |
| | December 31, 2021 |
6. TAX BASIS INFORMATION
Distributions are determined in accordance with federal income tax regulations, which differ from GAAP, and, therefore, may differ significantly in amount or character from net investment income and realized gains for financial reporting purposes. Financial reporting records are adjusted for permanent book/tax differences to reflect tax character but are not adjusted for temporary differences. The amounts and characteristics of tax basis distributions and composition of distributable earnings/(accumulated losses) are finalized at fiscal year-end.
For the fiscal year ended December 31, 2021, the following reclassifications, which had no impact on results of operations of net assets, were recorded to reflect tax character:
| | | Paid-in Capital | | Total Distributable Earnings |
| | $ | (58,355 | ) | | $ | 58,355 | |
The reclassifications were primarily related to excise taxes paid and tax adjustments for wholly-owned subsidiaries.
The tax character of distributions paid for the fiscal years ended December 31, 2020 and December 31, 2021 were as follows:
| Year | | Ordinary Income | | Long-Term Capital Gain | | Return of Capital |
| 2021 | | $ | 32,954,604 | | | $ | – | | | $ | – | |
| 2020 | | | 25,831,436 | | | | – | | | | – | |
As of December 31, 2021, the components of accumulated earnings/(deficit) on a tax basis were as follows:
| | | Undistributed net investment income | | Accumulated net realized loss on investments | | Other cumulative effect of timing differences | | Net unrealized appreciation/(depreciation) on investments | | Total |
| | $ | 5,294,636 | | | $ | (10,329,828 | ) | | $ | (1,842,163 | ) | | $ | 6,769,856 | | | $ | (107,499 | ) |
As of December 31, 2021, net unrealized appreciation/(depreciation) of investments based on the federal tax cost was as follows:
| Gross Appreciation (excess of value over tax cost) | | Gross Depreciation (excess of tax cost over value) | | Net Appreciation/(Depreciation) of Foreign Currency | | Net Unrealized Appreciation/(Depreciation) | | Cost of Investments for Income Tax Purposes |
| $ | 17,251,191 | | | $ | (10,896,088 | ) | | $ | 414,753 | | | $ | 6,769,856 | | | $ | 742,201,491 | |
The difference between book basis and tax basis unrealized appreciation/(depreciation) is primarily due to premium amortization, wash sales, forward contracts and passive foreign investment companies.
Under current law, capital losses maintain their character as short-term or long-term and are carried forward to the next tax year without expiration. As of December 31, 2021, the following amounts are available as carry forwards to the next tax year:
| | | Short Term | | Long Term |
| | $ | 1,727,569 | | | $ | 8,602,259 | |
Capital Loss carryovers used during the year ending December 31, 2021 were $8,430,794.
7. CREDIT FACILITY
The Fund and the Fund's consolidated subsidiary, CRDTX SPV I, LLC, are party to a secured revolving credit facility with Citibank, N.A. ("Citi Credit Facility") subject to the limitations of the 1940 Act for borrowings with a maturity date of March 30, 2024. The Citi Credit Facility allows the Financing Subsidiary to borrow up to $150 million and is secured by all of the assets held by the Financing Subsidiary.
| Annual Report | December 31, 2021 | 71 |
| Griffin Institutional Access Credit Fund | Notes to Consolidated Financial Statements |
| | December 31, 2021 |
Amounts available to borrow under the Citi Credit Facility are subject to a borrowing base that applies different advance rates to different types of assets held by the Financing Subsidiary. Assets securing the Citi Credit Facility held by the Financing Subsidiary are subject to initial and ongoing eligibility criteria including restrictions on asset types and domicile, credit rating minimums, payment frequency and rate requirements, and collateral and maturity terms, among other criteria. The Fund and the Financing Subsidiary are also required to comply with various covenants, reporting requirements and other customary requirements. As of December 31, 2021, the Fund and the Financing Subsidiary were in compliance in all material respects with the terms of the Citi Credit Facility.
As of December 31, 2021, there was $133,945,324 outstanding under the Citi Credit Facility. The interest rate charged on the Citi Credit Facility is based on an applicable LIBOR rate (subject to a floor of 0%) plus spread ranging from 1.45% to 2.95% based on the applicable weighted average discount margin. The Citi Credit Facility also requires a commitment fee of between 0.35% and 1.75% per annum based on the unused portion.
For the fiscal year ended December 31, 2021, the components of interest and unused commitment fees expense, average stated interest rates (i.e., rate in effect plus the spread) and average outstanding balance for the Citi Credit Facility were as follows:
| | | For the Fiscal Year Ended December 31, 2021 |
| Credit facility interest expense | | $ | 1,615,045 | |
| Credit facility unfunded commitment fee | | | 159,948 | |
| Credit facility fees | | | 33,113 | |
| Amortization of debt issuance costs | | | 128,211 | * |
| Total credit facility expense | | $ | 1,936,317 | |
| Average stated interest rate % | | | 1.80 | % |
| Average outstanding balance | | $ | 123,737,688 | |
| * | The Fund is amortizing over a three year period $563,599 of debt issuance costs ending March 30, 2024. |
8. REPURCHASE OFFERS
As a continuously offered, closed-end interval fund, the Fund has adopted a fundamental policy in which it offers to repurchase at net asset value no less than 5% of the outstanding shares of the Fund once each quarter. It is possible that a repurchase offer may be oversubscribed and as such there is no guarantee that shareholders will be able to sell all of the shares they desire to sell in a quarterly repurchase offer, although each shareholder will have the right to require the Fund to purchase at least 5% of such shareholder’s shares in each quarterly repurchase. Liquidity will be provided to shareholders only through the Fund’s quarterly repurchase offers. Shareholders will receive written notice of each quarterly repurchase offer ("Repurchase Offer Notice") that includes the date the repurchase offer period ends ("Repurchase Request Deadline") and the date the repurchase price will be determined ("Repurchase Pricing Date"). Shares will be repurchased at the NAV per share determined on the Repurchase Pricing Date.
During the fiscal year ended December 31, 2021, the Fund completed four quarterly repurchase offers in which the Fund offered to repurchase up to 5% of its outstanding shares as of each respective Repurchase Request Deadline. All shareholder repurchase requests received by the Fund in good order were honored in their full amounts for the fiscal year ended December 31, 2021. The result of the aforementioned repurchase offers were as follows:
| | Repurchase Offer #1 | Repurchase Offer #2 | Repurchase Offer #3 | Repurchase Offer #4 |
| Commencement Date | December 29, 2020 | March 29, 2021 | June 29, 2021 | September 28, 2021 |
| Repurchase Request Deadline | February 9, 2021 | May 6, 2021 | August 5, 2021 | November 4, 2021 |
| Repurchase Pricing Date | February 9, 2021 | May 6, 2021 | August 5, 2021 | November 4, 2021 |
| Dollars Repurchased | $32,352,377 | $17,334,484 | $14,534,612 | $17,400,451 |
| Shares Repurchased | 1,330,826 | 709,553 | 592,817 | 707,915 |
9. PRINCIPAL RISK FACTORS
In the normal course of business, the Fund invests in financial instruments and enters into financial transactions where risk of potential loss exists due to such things as changes in the market (market risk) or failure or inability of the other party to a transaction to perform (credit and counterparty risk). See below for a detailed description of select principal risks. The following list is not intended to be a comprehensive listing of all of the potential risks associated with the Fund. For a more comprehensive list of potential risks the Fund may be subject to, please refer to the Fund’s Prospectus and Statement of Additional Information (“SAI”).
| 72 | 1.888.926.2688 | www.griffincapital.com |
| Griffin Institutional Access Credit Fund | Notes to Consolidated Financial Statements |
| | December 31, 2021 |
Bank Loans Risk The Fund expects that some of its investments will consist of interests in loans originated by banks and other financial institutions. The loans invested in by the Fund may include term loans and revolving loans, may pay interest at a fixed or floating rate and may be senior or subordinated. Purchasers of bank loans are predominantly commercial banks, investment funds and investment banks. As secondary market trading volumes for bank loans increase, new bank loans are frequently adopting standardized documentation to facilitate loan trading which should improve market liquidity. There can be no assurance as to when or even if this current market illiquidity and volatility will abate or that future levels of supply and demand in bank loan trading will provide an adequate degree of liquidity, that the current period of illiquidity will not persist or worsen and that the market will not experience periods of significant illiquidity in the future. In addition, the Fund will make investments in stressed or distressed bank loans which are often less liquid than performing bank loans. The Fund may utilize total return swaps for the purpose of gaining exposure to bank loans.
CLO Risk In addition to the general risks associated with debt securities and structured products discussed herein, CLOs carry additional risks, including, but not limited to (i) the possibility that distributions from collateral securities will not be adequate to make interest or other payments; (ii) the quality of the collateral may decline in value or default; (iii) the possibility that the investments in CLOs are subordinate to other classes or tranches thereof; and (iv) the complex structure of the security may not be fully understood at the time of investment and may produce disputes with the issuer or unexpected investment results. CLO equity and junior debt securities that the Fund may acquire are subordinated to more senior tranches of CLO debt. CLO equity and junior debt securities are subject to increased risks of default relative to the holders of superior priority interests in the same securities. In addition, at the time of issuance, CLO equity securities are under-collateralized in that the liabilities of a CLO at inception exceed its total assets. Though not exclusively, the Fund will typically be in a first loss or subordinated position with respect to realized losses on the assets of the CLOs in which it is invested.
Between the closing date and the effective date of a CLO, the CLO collateral manager will generally expect to purchase additional collateral obligations for the CLO. During this period, the price and availability of these collateral obligations may be adversely affected by a number of market factors, including price volatility and availability of investments suitable for the CLO, which could hamper the ability of the collateral manager to acquire a portfolio of collateral obligations that will satisfy specified concentration limitations and allow the CLO to reach the initial par amount of collateral prior to the effective date. An inability or delay in reaching the target initial par amount of collateral may adversely affect the timing and amount of interest or principal payments received by the holders of the CLO debt securities and distributions of the CLO on equity securities and could result in early redemptions which may cause CLO debt and equity investors to receive less than face value of their investment.
The failure by a CLO in which the Fund invests to satisfy financial covenants, including with respect to adequate collateralization and/or interest coverage tests, could lead to a reduction in the CLO’s payments to the Fund. In the event that a CLO fails certain tests, holders of CLO senior debt may be entitled to additional payments that would, in turn, reduce the payments the Fund would otherwise be entitled to receive. Separately, the Fund may incur expenses to the extent necessary to seek recovery upon default or to negotiate new terms, which may include the waiver of certain financial covenants, with a defaulting CLO or any other investment the Fund may make. If any of these occur, it could adversely affect the Fund’s operating results and cash flows.
The Fund’s CLO investments are exposed to leveraged credit risk. If certain minimum collateral value ratios and/or interest coverage ratios are not met by a CLO, primarily due to senior secured loan defaults, then cash flow that otherwise would have been available to pay distributions to the Fund on its CLO investments may instead be used to redeem any senior notes or to purchase additional senior secured loans, until the ratios again exceed the minimum required levels or any senior notes are repaid in full. The Fund’s CLO investments and/or the underlying senior secured loans may prepay more quickly than expected, which could have an adverse impact on the Fund’s net assets.
Credit Risk There is a risk that debt issuers will not make payments, resulting in losses to the Fund. In addition, the credit quality of securities may be lowered if an issuer’s financial condition changes. Lower credit quality may lead to greater volatility in the price of a security and in shares of the Fund. Lower credit quality also may affect liquidity and make it difficult to sell the security. Default, or the market’s perception that an issuer is likely to default, could reduce the value and liquidity of securities, thereby reducing the value of your investment in Fund shares. In addition, default may cause the Fund to incur expenses in seeking recovery of principal or interest on its portfolio holdings.
Cybersecurity Risk Cybersecurity refers to the combination of technologies, processes and procedures established to protect information technology systems and data from unauthorized access, attack or damage. The Fund and its affiliates and third-party service providers are subject to cybersecurity risks. Cybersecurity risks have significantly increased in recent years and the Fund could suffer such losses in the future. The Fund’s and its affiliates’ and third-party service providers’ computer systems, software and networks may be vulnerable to unauthorized access, computer viruses or other malicious code and other events that could have a security impact. If one or more of such events occur, this potentially could jeopardize confidential and other information, including nonpublic personal information and sensitive business data, processed and stored in, and transmitted through, computer systems and networks, or otherwise cause interruptions or malfunctions in the Fund’s operations or the operations of their respective affiliates and third-party service providers. This could result in significant losses, reputational damage, litigation, regulatory fines or penalties, or otherwise adversely affect the Fund’s business, financial condition or results of operations. Privacy and information security laws and regulation changes, and compliance with those changes, may result in cost increases due to system changes and the development of new administrative processes. In addition, the Fund may be required to expend significant additional resources to modify the Fund’s protective measures and to investigate and remediate vulnerabilities or other exposures arising from operational and security risks.
| Annual Report | December 31, 2021 | 73 |
| Griffin Institutional Access Credit Fund | Notes to Consolidated Financial Statements |
| | December 31, 2021 |
Debt Securities Risk When the Fund invests in debt securities, the value of your investment in the Fund will fluctuate with changes in interest rates. Typically, a rise in interest rates causes a decline in the value of debt securities. In general, the market price of debt securities with longer maturities will increase or decrease more in response to changes in interest rates than shorter-term securities. Other risk factors include credit risk (the debtor may default) and prepayment risk (the debtor may pay its obligation early, reducing the amount of interest payments). These risks could affect the value of a particular investment, possibly causing the Fund’s share price and total return to be reduced and fluctuate more than other types of investments.
Direct Origination Risk A portion of the Fund’s investment may be originated by certain affiliates of the Sub-Adviser, subject to the conditions of the Fund’s exemptive relief. The results of the Fund’s operations depend on several factors, including the availability of opportunities for the origination or acquisition of target investments, the level and volatility of interest rates, the availability of adequate short and long-term financing, conditions in the financial markets and economic conditions. Further, the Fund’s inability to raise capital and the risk of portfolio company defaults may materially and adversely affect the Fund’s investment originations, business, liquidity, financial condition, results of operations and its ability to make distributions to its shareholders. In addition, competition for originations of and investments in the Fund’s target investments may lead to the price of such assets increasing, which may further limit its ability to generate desired returns. Also, as a result of this competition, desirable investments in the Fund’s target investments may be limited in the future and the Fund may not be able to take advantage of attractive investment opportunities from time to time, as the Fund can provide no assurance that the Adviser and Sub-Adviser will be able to identify and make investments that are consistent with its investment objective. Additionally, the Fund may originate certain of its investments with the expectation of later syndicating a portion of such investment to third parties. Prior to such syndication, or if such syndication is not successful, the Fund’s exposure to the originated investment may exceed the exposure that the Adviser and Sub-Adviser intended to have over the long-term or would have had had it purchased such investment in the secondary market rather than originating it.
Foreign Exchange Rate Risk Foreign exchange rate risk relates to the change in the U.S. dollar value of a security held that is denominated in a foreign currency. The value of a foreign currency denominated security will decrease as the dollar appreciates against the currency, while the value of the foreign currency denominated security will increase as the dollar depreciates against the currency.
High Yield Debt Risk A substantial portion of the high yield debt in which the Fund intends to invest are rated below investment-grade by one or more nationally recognized statistical rating organizations or are unrated but of comparable credit quality to obligations rated below investment-grade, and have greater credit and liquidity risk than more highly rated debt obligations. Lower-rated securities may include securities that have the lowest rating or are in default. High yield debt is generally unsecured and may be subordinate to other obligations of the obligor. The lower rating of high yield debt reflects a greater possibility that adverse changes in the financial condition of the obligor or in general economic conditions (including, for example, a substantial period of rising interest rates or declining earnings) or both may impair the ability of the obligor to make payment of principal and interest. Many issuers of high yield debt are highly leveraged, and their relatively high debt-to-equity ratios create increased risks that their operations might not generate sufficient cash flow to service their debt obligations. In addition, many issuers of high yield debt may be in poor financial condition, experiencing poor operating results, having substantial capital needs or negative net worth or be facing special competitive or product obsolescence problems, and may include companies involved in bankruptcy or other reorganizations or liquidation proceedings. Certain of these securities may not be publicly traded, and therefore it may be difficult to obtain information as to the true condition of the issuers. Overall declines in the below investment-grade bond and other markets may adversely affect such issuers by inhibiting their ability to refinance their debt at maturity. High yield debt is often less liquid than higher rated securities.
Leveraging Risk The use of leverage, such as in connection with derivatives and borrowing money to purchase securities, by the Fund will magnify the Fund’s gains or losses. Generally, the use of leverage also will cause the Fund to have higher expenses (especially interest and/or short selling related dividend expenses) than those of funds that do not use such techniques. In addition, a lender to the Fund may terminate or refuse to renew any credit facility. If the Fund is unable to access additional credit, it may be forced to sell investments at inopportune times, which may further depress the returns on the Fund. Because many derivatives have a leverage component, adverse changes in the value or level of the underlying asset, reference rate or index could result in a loss substantially greater than the amount invested in the derivative itself. When the Fund uses derivatives for leverage, investments in that Fund will tend to be more volatile, resulting in larger gains or losses in response to market changes. In an effort to limit leverage risk, the Fund will earmark assets determined to be liquid to cover its obligations under swap agreements.
LIBOR Risk Certain of the Fund’s underlying investments and the Citi Credit Facility are based on floating rates, such as LIBOR. The London Interbank Offered Rate, or LIBOR, is a benchmark that dictates daily interest rates on loans and financial instruments globally. Plans are underway to phase out the use of LIBOR which indicates the continuation of LIBOR and other reference rates on the current basis cannot and will not be guaranteed after 2023. Any replacement rate chosen may be less favorable than the current rates. Until the announcement of the replacement rate, the Fund may continue to invest in assets that may reference LIBOR or otherwise use LIBOR. There remains uncertainty regarding the nature of any replacement rate and the impact of the transition from LIBOR on the Fund’s transactions and the financial markets generally. Further, while the Citi Credit Facility contemplates a replacement of LIBOR, it is uncertain how such replacement will affect the Fund's payment obligations, among other terms. As such, the potential effect of a transition away from LIBOR on the Fund’s investments cannot yet be determined.
| 74 | 1.888.926.2688 | www.griffincapital.com |
| | |
| Griffin Institutional Access Credit Fund | Notes to Consolidated Financial Statements |
| | December 31, 2021 |
Liquidity of Investments Risk The lack of an established, liquid secondary market for a certain portion of the Fund’s investments may have an adverse effect on the market value of the Fund’s investments and the Fund’s ability to dispose of them. Additionally, certain investments may be subject to certain transfer restrictions that may also contribute to illiquidity. Further, Fund assets that are typically traded in a liquid market may become illiquid if the applicable trading market tightens. Therefore, no assurance can be given that the Fund can dispose of a particular investment at its prevailing fair value. A portion of the Fund’s investments may consist of securities that are subject to restrictions on resale by the Fund because they were acquired in a "private placement" or similar transaction or because the Fund is deemed to be an affiliate of the issuer of such securities. The Fund will be able to sell such securities only under applicable securities laws, which may permit only limited sales under specified conditions or subject the Fund to additional potential liability.
Medium and Small Capitalization Company Risk Some issuers of the Fund’s investments may be medium or small capitalization companies which may be newly formed or have limited product lines, distribution channels, and financial or managerial resources. The risks associated with these investments are generally greater than those associated with investments in the securities of larger, more-established companies. The Fund does not maintain a policy limiting its ability to invest in medium or small capitalization companies. This may cause the Fund’s NAV to be more volatile when compared to investment companies that focus only on large capitalization companies. Generally, securities of medium and small capitalization companies are more likely to experience sharper swings in market values, less liquid markets, in which it may be more difficult for the Sub-Adviser to sell at times and at prices that the Sub-Adviser believes appropriate, and generally are more volatile than those of larger companies. Compared to large companies, smaller companies are more likely to have (i) less information publicly available, (ii) more limited product lines or markets and less mature businesses, (iii) fewer capital resources, (iv) more limited management depth, and (v) shorter operating histories. Further, the equity securities of smaller companies are often traded over-the-counter and generally experience a lower trading volume than is typical for securities that are traded on a national securities exchange. Consequently, the Fund may be required to dispose of these securities over a longer period of time (and potentially at less favorable prices) than would be the case for securities of larger companies, offering greater potential for gains and losses and associated tax consequences.
Mezzanine Securities Risk Most of the Fund’s mezzanine securities and other investments (if any) are expected to be unsecured and made in companies whose capital structures have significant indebtedness ranking ahead of the investments, all or a significant portion of which may be secured. While the securities and other investments may benefit from the same or similar financial and other covenants as those enjoyed by the indebtedness ranking ahead of the investments and may benefit from cross-default provisions and security over the portfolio company’s assets, some or all of such terms may not be part of particular investments. Mezzanine securities and other investments generally are subject to various risks including, without limitation: (i) a subsequent characterization of an investment as a “fraudulent conveyance”; (ii) the recovery as a “preference” of liens perfected or payments made on account of a debt in the 90 days before a bankruptcy filing; (iii) equitable subordination claims by other creditors; (iv) so-called “lender liability” claims by the issuer of the obligations; and (v) environmental liabilities that may arise with respect to collateral securing the obligations.
Non-Performing Loans Risk The Fund’s investments are expected to include investments in non-performing and sub-performing loans which often involve workout negotiations, restructuring and the possibility of foreclosure. These processes are often lengthy and expensive. In addition, the Fund’s investments may include securities and debt obligations of financially distressed issuers, including companies involved in bankruptcy or other reorganization and liquidation proceedings. As a result, the Fund’s investments may be subject to additional bankruptcy related risks, and returns on such investments may not be realized for a considerable period of time.
Pandemic Risk The novel coronavirus COVID-19 continues to cause disruptions in the global economy and the financial markets. As the pandemic has evolved, the impact across countries and markets has varied based on the spread of the virus, regulation and public response. Further, the pandemic and the responses thereto have caused various disruptions to the global supply chain, affecting wide swaths of manufacturing, automotive and consumer goods, among other sectors. While the health and economic outlook may improve in the short-term in some markets, such improvements may be uncertain and short-lived due to the rise of potential new variants and increased cases and hospitalizations, as well as potential increased restrictions in the response thereto. Further, the negative economic consequences, including to the global supply chain, caused by the pandemic may be prolonged and take years to resolve, if ever. Further, issuers that operate in the hospitality, healthcare, travel and entertainment industries may continue to face adverse market conditions due to future restrictions, which could result in adverse performance and potentially bankruptcy. Further, the disruptions caused by the pandemic have contributed to the global and U.S. rise in inflation, which may further increase in the future. Changes in the nature of the pandemic, including any increases in virality and/or lethality, may have negative consequences for the Fund, its service providers and issuers. While the Adviser is actively monitoring the course of the pandemic and its consequences, the uncertainty triggered by the pandemic is likely to continue and may have chilling effects on the overall market and the Fund’s performance.
| Annual Report | December 31, 2021 | 75 |
| Griffin Institutional Access Credit Fund | Notes to Consolidated Financial Statements |
| | December 31, 2021 |
Secured Debt Risk Secured debt holds the most senior position in the capital structure of a borrower. Secured debt in most circumstances is fully collateralized by assets of the borrower. Thus, it is generally repaid before unsecured bank loans, corporate bonds, subordinated debt, trade creditors, and preferred or common stockholders. Substantial increases in interest rates may cause an increase in loan defaults as borrowers may lack resources to meet higher debt service requirements. The value of the Fund’s assets may also be affected by other uncertainties such as economic developments affecting the market for senior secured term loans or affecting borrowers generally. Moreover, the security for the Fund’s investments in secured debt may not be recognized for a variety of reasons, including the failure to make required filings by lenders, trustees or other responsible parties and, as a result, the Fund may not have priority over other creditors as anticipated.
Secured debt usually includes restrictive covenants, which must be maintained by the borrower. The Fund may have an obligation with respect to certain senior secured term loan investments to make additional loans upon demand by the borrower. Such instruments, unlike certain bonds, usually do not have call protection. This means that such interests, while having a stated term, may be prepaid, often without penalty. The rate of such prepayments may be affected by, among other things, general business and economic conditions, as well as the financial status of the borrower. Prepayment would cause the actual duration of a senior loan to be shorter than its stated maturity.
Secured debt typically will be secured by pledges of collateral from the borrower in the form of tangible and intangible assets. In some instances, the Fund may invest in secured debt that is secured only by stock of the borrower or its subsidiaries or affiliates. The value of the collateral may decline below the principal amount of the senior secured term loans subsequent to an investment by the Fund.
Structured Products Risk The Fund may invest in Collateralized Debt Obligations (“CDOs”) and other structured products, consisting of Collateralized Bond Obligations, Collateralized Loan Obligations (“CLOs”) and credit-linked notes. Holders of structured products bear risks of the underlying investments, index or reference obligation and are subject to counterparty risk.
The Fund may have the right to receive payments only from the structured product, and generally does not have direct rights against the issuer or the entity that sold the assets to be securitized. While certain structured products enable the investor to acquire interests in a pool of securities without the brokerage and other expenses associated with directly holding the same securities, investors in structured products generally pay their share of the structured product’s administrative and other expenses. Although it is difficult to predict whether the prices of indices and securities underlying structured products will rise or fall, these prices (and, therefore, the prices of structured products) will be influenced by the same types of political and economic events that affect issuers of securities and capital markets generally. If the issuer of a structured product uses shorter term financing to purchase longer term securities, the issuer may be forced to sell its securities at below market prices if it experiences difficulty in obtaining short-term financing, which may adversely affect the value of the structured products owned by the Fund. Certain structured products may be thinly traded or have a limited trading market. CLOs and credit-linked notes are typically privately offered and sold.
Subordinated and Unsecured or Partially Secured Loans Risk The Fund may invest in unsecured loans and secured subordinated loans, including second and lower lien loans. Second lien loans are generally second in line in terms of repayment priority. A second lien loan may have a claim on the same collateral pool as the first lien or it may be secured by a separate set of assets. Second lien loans generally give investors priority over general unsecured creditors in the event of an asset sale. The priority of the collateral claims of third or lower lien loans ranks below holders of second lien loans and so on. Such junior loans are subject to the same general risks inherent to any loan investment, including credit risk, market and liquidity risk, and interest rate risk. Due to their lower place in the borrower’s capital structure and possible unsecured or partially secured status, such loans involve a higher degree of overall risk than senior loans of the same borrower.
Unitranche Debt Risk Unitranche debt will be structured as senior secured debt, including first priority liens on an issuer's assets. Unitranche debt typically provides for moderate loan amortization in the initial years of the facility, with the majority of the principal payment deferred until loan maturity. Since unitranche debt generally allows the borrower to make a large lump sum payment of principal at the end of the loan term, there is a risk of loss if the borrower is unable to pay the lump sum or refinance the amount owed at maturity. In some cases, the Fund will be the sole lender, or the Fund together with its affiliates will be the sole lender, of unitranche debt, which can provide the Fund with more influence interacting with a borrower in terms of monitoring and, if necessary, remediation in the event of underperformance.
Valuation of Private Investments Risk While the valuation of the Fund’s publicly-traded securities are more readily ascertainable, the Fund’s ownership interest in private investments (including Private Corporate Debt Investments) are not publicly traded. The fair value of loans, securities and other investments that are not publicly traded may not be readily determinable, and the Fund will value these investments at fair value as determined in good faith by the Board, including to reflect significant events affecting the value of the Fund’s investments. Many of the Fund’s investments, including certain Private Corporate Debt Investments, will be classified as Level 3 under Topic 820 of the U.S. Financial Accounting Standards Board’s Accounting Standards Codification, as amended, Fair Value Measurements and Disclosures (“ASC Topic 820”). This means that the Fund’s portfolio valuations will be based on unobservable inputs and the Fund’s own assumptions about how market participants would price the asset or liability in question. The Fund expects that inputs into the determination of fair value of the Fund’s portfolio investments will require significant management judgment or estimation. Even if observable market data are available, such information may be the result of consensus pricing information or broker quotes, which include a disclaimer that the broker would not be held to such a price in an actual transaction. The non-binding nature of consensus pricing and/or quotes accompanied by disclaimers materially reduces the reliability of such information. In connection with fair value determinations, the Adviser and Sub-Adviser, together with the Fair Value Pricing Committee, may provide the Board with valuations based upon certain inputs that take into account all reasonably available information that may be relevant to a particular security including, but not limited to: pricing history, current market level, supply and demand of the respective security; the enterprise value of the portfolio company; the portfolio company’s ability to make payments and its earnings and discounted cash flow, comparison to the values and current pricing of publicly traded securities that have comparable characteristics; comparison to publicly traded securities including factors such as yield, maturity, and credit quality; knowledge of historical market information with respect to the security; fundamental analytical data, such as periodic financial statements, and other factors or information relevant to the security, issuer, or market. The Fund has also retained the services of third-party valuation firms to review valuations of certain securities for which market or dealer quotations are unavailable or deemed unreliable and to assist in determining fair value where applicable, however, the ultimate determination of fair value will be made by the Board and not by such third-party valuation firm. Because such valuations, and particularly valuations of private securities and private companies, are inherently uncertain, may fluctuate over short periods of time and may be based on estimates, the Fund’s determinations of fair value may differ materially from the values that would have been used if a ready market for these securities existed. The Fund’s net asset value could be adversely affected if the Board’s determinations regarding the fair value of the Fund’s investments were materially higher than the values that the Fund ultimately realizes upon the disposal of such securities.
| 76 | 1.888.926.2688 | www.griffincapital.com |
| Griffin Institutional Access Credit Fund | Notes to Consolidated Financial Statements |
| | December 31, 2021 |
10. SUBSEQUENT EVENTS
Subsequent events after the date of the Consolidated Statement of Assets and Liabilities have been evaluated through the date the consolidated financial statements were issued.
As outlined in the Fund's Quarterly Repurchase Offer Notice dated December 29, 2021, the Fund offered to repurchase up to 5% of its outstanding shares (the "Repurchase Offer") at the net asset value of such shares on February 8, 2022 (the "Repurchase Date"). The repurchase requests received by the Fund by the Repurchase Date exceeded the number of shares subject to the Repurchase Offer and as such, the Fund increased the Repurchase Offer to 7% of its outstanding shares and repurchased shares on a pro rata basis. Accordingly, the Fund repurchased approximately 56% of the total number of shares tendered for repurchase which resulted in 1,852,872 repurchased shares for $44,913,541.
On December 2, 2021, Griffin Capital, LLC (“Griffin Capital”), the indirect parent of the Adviser and Apollo Global Management, Inc. (“AGMI”) announced that they agreed that AGMI will acquire the US wealth distribution and asset management businesses of Griffin Capital in an all-stock transaction and had entered into a definitive agreement with respect to the Transaction (the “Transaction Agreement”). AGMI and Griffin Capital intend to close the acquisition of the asset management businesses of Griffin Capital (the “Transaction”) in the first half of 2022 (such closing time, the “Effective Date”). The Transaction will result in a change in control of the Adviser, which may be deemed an “assignment” under the Investment Company Act of 1940, as amended (the “1940 Act”), that results in an automatic termination of the Fund’s previous Management Agreement with the Adviser (the “Prior Management Agreement”) on the Effective Date. The prior investment sub-advisory agreement for the Fund between the Adviser and BCSF Advisors, LP (“BCSF”) (the “Prior Sub-Advisory Agreement” and, together with the Prior Management Agreement, the “Prior Agreements”) also will terminate on the Effective Date as a result of the termination of the Prior Management Agreement. To that end, the Adviser and BCSF agreed, subject to the approval of the Board of Trustees of the Fund (the “Board”), that it was in the best interests of the Fund and its shareholders for BCSF to resign as the investment sub-adviser to the Fund effective as of the close of business on March 31, 2022. The Fund anticipates transitioning such investment sub-adviser responsibilities to Apollo Credit Management, LLC, a wholly-owned subsidiary of AGMI, (“Apollo”) on April 1, 2022 pursuant to the terms of an interim sub-advisory agreement between the Adviser and Apollo (the “First Interim Sub-Advisory Agreement”) that unanimously was approved by the Board, including the trustees who are not “interested persons” (as defined under the 1940 Act) of the Fund, the Adviser, or the Fund’s distributor, at a meeting held on December 28, 2021. The First Interim Sub-Advisory Agreement will terminate upon the sooner to occur of 150 days from April 1, 2022 or the Effective Date.
Over the course of several meetings commencing on December 14, 2021, the Board received and reviewed information from the Adviser, Griffin Capital, Apollo, and AGMI regarding the Transaction. At a special meeting of the Board held on January 13, 2022, the Board reviewed and considered information provided by the Adviser, Griffin Capital, Apollo, and AGMI that it had requested regarding a proposed new management agreement (the “New Management Agreement”) with the Adviser as the investment adviser to the Fund. At the January 13, 2022 meeting, the Board, after meeting in executive session with counsel and further discussion with representatives of the Adviser and Griffin Capital, approved the New Management Agreement, subject to shareholder approval, in order for the Adviser to continue to provide services to the Fund without disruption. Also on January 13, 2022, the Board considered and approved a new sub-advisory agreement (the “New Sub-Advisory Agreement” and, together with the New Management Agreement, the “New Agreements”) between the Adviser and Apollo, subject to shareholder approval. Under the 1940 Act, a new advisory agreement or sub-advisory agreement generally requires approval by a majority of such investment company’s outstanding voting securities, as defined in the 1940 Act, before it can go into effect. Therefore, the Board has called a special meeting of the Fund’s shareholders (the “Special Meeting”) to seek shareholder approval of the New Agreements in order to ensure that the Adviser and Apollo can provide service as the adviser and sub-adviser, respectively, to the Fund after the Effective Date.
Management has determined that there were no other subsequent events to report through the issuance of these consolidated financial statements.
| Annual Report | December 31, 2021 | 77 |
| | Report of Independent Registered |
| Griffin Institutional Access Credit Fund | Public Accounting Firm |
| | December 31, 2021 |
To the Board of Trustees and Shareholders of Griffin Institutional Access Credit Fund
Opinion on the Financial Statements
We have audited the accompanying consolidated statement of assets and liabilities, including the consolidated schedule of investments, of Griffin Institutional Access Credit Fund and its subsidiaries (the “Fund”) as of December 31, 2021, the related consolidated statements of operations and cash flows for the year ended December 31, 2021, the consolidated statements of changes in net assets for each of the two years in the period ended December 31, 2021, including the related notes, and the consolidated financial highlights for each of the periods indicated therein (collectively referred to as the “consolidated financial statements”). In our opinion, the consolidated financial statements present fairly, in all material respects, the financial position of the Fund as of December 31, 2021, the results of its operations and its cash flows for the year then ended, the changes in its net assets for each of the two years in the period ended December 31, 2021 and the consolidated financial highlights for each of the periods indicated therein in conformity with accounting principles generally accepted in the United States of America.
Basis for Opinion
These consolidated financial statements are the responsibility of the Fund’s management. Our responsibility is to express an opinion on the Fund’s consolidated financial statements based on our audits. We are a public accounting firm registered with the Public Company Accounting Oversight Board (United States) (PCAOB) and are required to be independent with respect to the Fund in accordance with the U.S. federal securities laws and the applicable rules and regulations of the Securities and Exchange Commission and the PCAOB.
We conducted our audits of these consolidated financial statements in accordance with the standards of the PCAOB. Those standards require that we plan and perform the audit to obtain reasonable assurance about whether the consolidated financial statements are free of material misstatement, whether due to error or fraud.
Our audits included performing procedures to assess the risks of material misstatement of the consolidated financial statements, whether due to error or fraud, and performing procedures that respond to those risks. Such procedures included examining, on a test basis, evidence regarding the amounts and disclosures in the consolidated financial statements. Our audits also included evaluating the accounting principles used and significant estimates made by management, as well as evaluating the overall presentation of the consolidated financial statements. Our procedures included confirmation of securities owned as of December 31, 2021 by correspondence with the custodian, transfer agent and brokers; when replies were not received from brokers, we performed other auditing procedures. We believe that our audits provide a reasonable basis for our opinion.
Boston, Massachusetts
February 28, 2022
We have served as the Fund’s auditor since 2017.
| 78 | 1.888.926.2688 | www.griffincapital.com |
| Griffin Institutional Access Credit Fund | Dividend Reinvestment Policy |
| | December 31, 2021 (Unaudited) |
The Fund will operate under a dividend reinvestment policy administered by DST Systems, Inc. (“Transfer Agent”) Pursuant to the policy, the Fund’s income dividends or capital gains or other distributions (each, a “Distribution” and collectively, “Distributions”), net of any applicable U.S. withholding tax, are reinvested in the same class of shares of the Fund.
Shareholders automatically participate in the dividend reinvestment policy, unless and until an election is made to withdraw from the policy on behalf of such participating shareholder. Shareholders who do not wish to have Distributions automatically reinvested should notify the Transfer Agent in writing at Griffin Institutional Access Credit Fund, c/o DST Systems, Inc., 430 W 7th St, Kansas City, MO 64105-1407. Such written notice must be received by the Transfer Agent 30 days prior to the record date of the Distribution or the shareholder will receive such Distribution in shares through the dividend reinvestment policy. Under the dividend reinvestment policy, the Fund’s Distributions to shareholders are reinvested in full and fractional shares as described below.
When the Fund declares a Distribution, the Transfer Agent, on the shareholder’s behalf, will receive additional authorized shares from the Fund either newly issued or repurchased from shareholders by the Fund and held as treasury stock. The number of shares to be received when Distributions are reinvested will be determined by dividing the amount of the Distribution by the Fund’s net asset value per share.
The Transfer Agent will maintain all shareholder accounts and furnish written confirmations of all transactions in the accounts, including information needed by shareholders for personal and tax records. The Transfer Agent will hold shares in the account of the shareholders in non-certificated form in the name of the participant, and each shareholder’s proxy, if any, will include those shares purchased pursuant to the dividend reinvestment policy. Each participant, nevertheless, has the right to request certificates for whole and fractional shares owned. The Fund will issue certificates in its sole discretion. The Transfer Agent will distribute all proxy solicitation materials, if any, to participating shareholders.
In the case of shareholders, such as banks, brokers or nominees, that hold shares for others who are beneficial owners participating under the dividend reinvestment policy, the Transfer Agent will administer the dividend reinvestment policy on the basis of the number of shares certified from time to time by the record shareholder as representing the total amount of shares registered in the shareholder’s name and held for the account of beneficial owners participating under the dividend reinvestment policy.
Neither the Transfer Agent nor the Fund shall have any responsibility or liability beyond the exercise of ordinary care for any action taken or omitted pursuant to the dividend reinvestment policy, nor shall they have any duties, responsibilities or liabilities except such as expressly set forth herein. Neither shall they be liable hereunder for any act done in good faith or for any good faith omissions to act, including, without limitation, failure to terminate a participant’s account prior to receipt of written notice of his or her death or with respect to prices at which shares are purchased or sold for the participants account and the terms on which such purchases and sales are made, subject to applicable provisions of the federal securities laws.
The automatic reinvestment of Dividends will not relieve participants of any federal, state or local income tax that may be payable (or required to be withheld) on such Dividends.
The Fund reserves the right to amend or terminate the dividend reinvestment policy. There is no direct service charge to participants with regard to purchases under the dividend reinvestment policy; however, the Fund reserves the right to amend the dividend reinvestment policy to include a service charge payable by the participants.
All correspondence concerning the dividend reinvestment policy should be directed to the Transfer Agent at Griffin Institutional Access Credit Fund, c/o DST Systems, Inc., 430 W 7th St, Kansas City, MO 64105-1407. Certain transactions can be performed by calling the toll free number 1-888-926-2688.
| Annual Report | December 31, 2021 | 79 |
| | Approval of Interim Investment |
| Griffin Institutional Access Credit Fund | Sub-Advisor Agreements |
| | December 31, 2021 (Unaudited) |
Trustees Consideration and Approval of Interim Investment Sub-Advisory Agreement with Apollo Credit Management, LLC
As stated above, the Fund anticipates transitioning such investment sub-adviser responsibilities to Apollo on April 1, 2022 pursuant to the terms of the First Interim Sub-Advisory Agreement that unanimously was approved by the Board, including the trustees who are not “interested persons” (as defined under the 1940 Act) of the Fund, the Adviser, or the Fund’s distributor, at a meeting held on December 28, 2021. The First Interim Sub-Advisory Agreement will terminate upon the sooner to occur of 150 days from April 1, 2022 or the Effective Date. In deciding on whether to approve the First Interim Sub-Advisory Agreement, the Trustees considered numerous factors, including:
(i) The nature, extent, and quality of the services to be provided by Apollo. The Board received and considered information regarding the fact that the nature, extent and quality of services to be provided to the Fund by Apollo under the First Interim Sub-Advisory Agreement are substantially same as under the Prior Sub-Advisory Agreement by the prior sub-adviser. The Trustees considered the responsibilities of Apollo under the First Interim Sub-Advisory Agreement and reviewed the services to be provided to the Fund including, without limitation, Apollo’s procedures for formulating investment recommendations and assuring compliance with the Fund’s investment objectives and limitations, and efforts to promote the Fund, grow the Fund’s assets, and assist in the distribution of Fund shares. The Trustees noted that Apollo will assist the Adviser in seeking to achieve the Fund’s investment objective to generate a return comprised of both current income and capital appreciation with an emphasis on current income with low volatility and low correlation to the broader markets. The Board concluded that the Fund would benefit from the quality and experience of Apollo’s investment professionals that will provide services to the Fund after the Transaction. After reviewing the foregoing information and further information in the memorandum from Apollo (e.g., Apollo’s Form ADV and descriptions of the firm’s business and compliance program), the Board concluded that the nature, extent, and quality of the services provided by Apollo would be satisfactory and appropriate for the Fund.
(ii) The investment performance of the Fund and Apollo. The Trustees discussed Apollo’s performance with respect to accounts with similar investment strategies to the Fund as well as the performance of other registered closed-end investment companies managed by Apollo. The Trustees noted that Apollo’s performance with respect to accounts with similar investment strategies to the Fund was strong, as was the performance of other registered closed-end investment companies managed by Apollo. After reviewing these considerations, the Board concluded that the investment performance of Apollo would be satisfactory.
(iii) The costs of the services to be provided by Apollo. The Trustees evaluated the overall expenses of the Fund, including the nature and frequency of advisory and sub-advisory fee payments. The Trustees then compared the fees and expenses of the Fund (including the management fee) to other peer funds comparable in terms of the type of fund, the nature of its investment strategy, and its style of investment management, among other factors. The Trustees determined that the base management fee was higher than other funds, but noted that other funds had externalized certain services that the Adviser provided as part of its management fee, and agreed that it was important to consider the entire expense ratio in the comparison. In that regard, they noted that the net expense ratio was below the average of the peer group. The Trustees noted that some funds in the peer group also charged a performance fee in addition to their management fee, which would likely make the aggregate fee paid to the investment adviser higher than that paid by the Fund in certain circumstances. The Board considered that certain other peer funds also utilized less laborious strategies. The Trustees noted that the Adviser had agreed to an Expense Limitation Agreement, which limits the Fund’s annual operating expenses, was still in effect. They further noted that Fund expenses have continued to exceed the limitation amount and, thus, the Adviser has continued to waive some of its management fee. The Trustees also considered potential benefits for the Adviser in managing the Fund. Further, the Trustees noted that, to date, the Adviser had absorbed most of the Fund’s operating expenses, the majority of which could not be recouped.
(iv) The profits to be realized by Apollo and its affiliates from the relationship with the Fund. The Trustees reviewed the Adviser’s profitability analysis in connection with its management of the Fund, and noted that the Adviser had not earned a profit and had paid most of the Fund’s operating expenses and also noted that Apollo was not expected to earn a profit under the First Interim Sub-Advisory Agreement. The Board concluded that Apollo’s profitability was not excessive.
(v) The extent to which economies of scale would be realized as the Fund grows and whether the advisory fee levels reflect these economies of scale for benefit of the Fund’s investors. The Trustees considered that the Fund’s fee arrangements with the Adviser involved both the management fee and an Expense Limitation Agreement. The Trustees noted that, while the management fee remains the same at all asset levels, the Fund’s shareholders have benefitted from the Fund’s expense limitation arrangement over time. The Trustees further noted that prior fee waivers and expense reimbursements borne by the Adviser have aided the Fund’s growth since its inception. The Trustees also noted that the Fund’s shareholders would benefit from economies of scale under the Fund’s agreements with service providers other than the Adviser. Following further discussion of the Fund’s current and projected asset levels, expectations for growth, and fee levels, the Board determined that the Fund’s fee arrangements were fair and reasonable in relation to the nature and quality of the services provided by the Adviser and that the Expense Limitation Agreement has provided savings for the benefit of the Fund’s investors.
Based upon all of the foregoing considerations, the Board of Trustees, including a majority of the Independent Trustees, approved the Interim Investment Sub-Advisory Agreement with Apollo.
| 80 | 1.888.926.2688 | www.griffincapital.com |
| Griffin Institutional Access Credit Fund | Additional Information |
| | December 31, 2021 (Unaudited) |
| 1. | PROXY VOTING POLICIES AND VOTING RECORD |
A description of the policies and procedures that the Fund uses to vote proxies relating to portfolio securities is available without charge upon request by calling toll-free 888-926-2688, or on the Securities and Exchange Commission’s (“SEC”) website at https://www.sec.gov. Information regarding how the Fund voted proxies relating to portfolio securities during the most recent 12-month period ended June 30th is available without charge upon request by calling toll-free 888-926-2688, or on the SEC’s website at https://www.sec.gov.
| 2. | QUARTERLY PORTFOLIO HOLDINGS |
The Fund files its complete schedule of portfolio holdings with the SEC for the first and third quarters of each fiscal year as an exhibit to its reports on Form N-PORT. The Fund’s Form N-PORT reports are available on the SEC’s web site at http://www.sec.gov. Information on the operation of the Public Reference Room may be obtained by calling 1-800-SEC-0330.
| Annual Report | December 31, 2021 | 81 |
| Griffin Institutional Access Credit Fund | Trustees and Officers |
| | December 31, 2021 (Unaudited) |
The business and affairs of the Fund are managed under the direction of the Trustees. Information concerning the Trustees and officers of the Fund is set forth below. Generally, each Trustee and officer serves an indefinite term or until certain circumstances such as his resignation, death, or otherwise as specified in the Fund’s organizational documents. Any Trustee may be removed at a meeting of shareholders by a vote meeting the requirements of the Fund’s organizational documents. The Statement of Additional Information of the Fund includes additional information about the Trustees and officers and is available, without charge, upon request by calling the Fund toll-free at 888-926-2688.
| INDEPENDENT TRUSTEES |
| Name and Year of Birth | Position/Term of Office* | Principal Occupation During the Past Five Years | Number of Portfolios in Fund Complex** Overseen by Trustee | Other Directorships held by Trustee During Last Five Years |
| Nathan Headrick (1974) | Trustee Since 2017 | Managing Director, BluWater Group (financial services firm), 2019 - present; Managing Director and Founder, Triloma Financial Group (private equity firm), 2013 - 2019. | 2 | Griffin Institutional Access Real Estate Fund, 2014 -present. |
| Robb Chapin (1962) | Trustee Since 2017 | Chief Executive Officer and Co-Chief Investment Officer, Bridge Senior Housing Fund Manager, LLC (real estate fund management), 2013 - present. | 2 | Griffin Institutional Access Real Estate Fund, 2014 -present; Bridge Seniors Housing & Medical Properties Fund, LP (real estate fund), 2013 - present. |
| Ira Cohen (1959) | Trustee Since 2017 | Executive Vice President, Recognos Financial (financial data services firm), 2015 - present; Chief Executive Officer, Ira Cohen Consulting, LLC (mutual fund operations consulting firm), 2005 - present. | 2 | Griffin Institutional Access Real Estate Fund, 2014 -present; Valued Advisers Trust (for all of its series), 2010 -present; Angel Oak Financial Strategies Income Term Trust, 2018- present; Angel Oak Strategic Credit Fund, 2017-present; and Angel Oak Funds Trust (for all of its series), 2014 -present. |
| 82 | 1.888.926.2688 | www.griffincapital.com |
| Griffin Institutional Access Credit Fund | Trustees and Officers |
| | December 31, 2021 (Unaudited) |
| INTERESTED TRUSTEES AND OFFICERS |
| Name and Year of Birth | Position/Term of Office* | Principal Occupation During the Past Five Years | Number of Portfolios in Fund Complex** Overseen by Trustee | Other Directorships held by Trustee During Last 5 Years |
| Kevin Shields (1958) | President and Trustee Since 2017 | Chairman and Chief Executive Officer, Griffin Capital Company, LLC, 1995 - present; Chief Executive Officer, Griffin Capital Credit Advisor, LLC, 2017 - present; Chairman and Chief Executive Officer, Griffin Capital Securities, LLC, 1995 - present; President and Director, Griffin Capital BDC Corp., 2014 - 2017; Executive Chairman, 2019 - present, Chairman of the Board of Directors, 2013 - present, and Chief Executive Officer, 2013 – 2019; Griffin Capital Essential Asset REIT, Inc. and Executive Chairman, 2018 - 2019, and Chief Executive Officer, 2008 - 2018, EA 1. | 2 | President and Trustee, Griffin Institutional Access Real Estate Fund, 2014 - present; Chairman, Griffin Capital Company, LLC, 1995 - present; Director, EA 1, 2008 - 2018; Director, Griffin Capital Essential Asset REIT, Inc., 2013 -present; Director, Griffin Capital BDC Corp., 2014 -2017. |
| Randy Anderson (1968) | Chairman, Secretary and Trustee Since 2017 | Chief Economist, Griffin Capital Company, LLC, 2014 - present; Chief Executive Officer, Griffin Capital Asset Management Company, LLC, 2021 - present; Chief Investment Officer, Griffin Capital Advisor, LLC, 2014 - present; Chief Investment Officer, Griffin Capital Credit Advisor, LLC, 2017 - present; President, Griffin Capital Asset Management Company, LLC, 2014 - present. | 2 | Chairman, Secretary and Trustee, Griffin Institutional Access Real Estate Fund, 2014 - present; Executive Vice President, Griffin Capital BDC Corp., 2014 - 2017. |
| Joseph Miller (1963) | Treasurer Since 2017 | Chief Financial Officer and Chief Operating Officer, Griffin Capital Company, LLC, 2007 - present; Treasurer, Griffin Institutional Access Real Estate Fund, 2014 - present; and Chief Financial Officer, Griffin Capital BDC Corp., 2014 - 2017. | N/A | N/A |
| Ryan Del Giudice (1990) | Chief Compliance Officer Since 2018, Vice President and Assistant Secretary Since 2020 | Chief Compliance Officer, Griffin Capital Advisor, LLC, 2018 - present; Chief Compliance Officer, Griffin Capital Credit Advisor, LLC, 2018 - present; Chief Compliance Officer, Griffin Institutional Access Real Estate Fund, 2018 - present; Vice President, Cipperman Compliance Services, LLC, 2015 - 2017. | N/A | N/A |
| Madeline Arment (1989) | Assistant Treasurer Since 2019 | Assistant Treasurer, Griffin Institutional Access Real Estate Fund; Fund Controller, ALPS Fund Services, Inc., 2018 - present; Manager of Investment Operations, Shelton Capital Management, 2016 - 2018. | N/A | N/A |
| * | The term of office for each Trustee and officer listed above will continue indefinitely. |
| ** | The term “Fund Complex” refers to the Griffin Institutional Access Credit Fund and the Griffin Institutional Access Real Estate Fund. |
| Annual Report | December 31, 2021 | 83 |
| Griffin Institutional Access Credit Fund | Service Providers |
| | December 31, 2021 (Unaudited) |
Investment Adviser
Griffin Capital Credit Advisor, LLC
Griffin Capital Plaza, 1520 East Grand Avenue, El Segundo, CA 90245
Investment Sub-Adviser
BCSF Advisors, LP
200 Clarendon Street, 37th Floor Boston, MA 02116
Administrator
ALPS Fund Services, Inc.
1290 Broadway, Suite 1000, Denver, CO 80203
Custodian
Bank of New York Mellon Trust Company, National Association
601 Travis Street, 16th Floor, Houston, TX 77002
Distributor
ALPS Distributors, Inc.
1290 Broadway, Suite 1000, Denver, CO 80203
Independent Registered Public Accounting Firm
PricewaterhouseCoopers LLP
101 Seaport Boulevard, Boston, MA 02210
Legal Counsel
Greenberg Traurig, LLP
Terminus 200, 3333 Piedmont Road NE, Suite 2500, Atlanta, GA 30305
Transfer Agent and DRIP Administrator
DST Systems, Inc.
330 W 9th Street, Kansas City, MO 64105
| 84 | 1.888.926.2688 | www.griffincapital.com |
| Griffin Institutional Access Credit Fund | Privacy Notice |
| | December 31, 2021 (Unaudited) |
NOTICE OF PRIVACY POLICY AND PRACTICES
The Griffin Institutional Access Credit Fund (the “Fund”) is committed to maintaining the confidentiality, integrity, and security of your nonpublic personal information (“NPI”). When you provide personal information, the Fund believes that you should be aware of policies utilized to protect the confidentiality of that information. The Fund needs to share your NPI to conduct everyday business. The following information is intended to help you understand what NPI we collect, how we protect your NPI from unauthorized access and why the Fund may share your NPI with other affiliated and non-affiliated parties.
The Fund collects the following nonpublic personal information about you:
| · | Information we receive from you on or in applications or other forms, correspondence, or conversations, including, but not limited to, your name, address, phone number, social security number, assets, income, and date of birth; and |
| · | Information about your transactions with us, our affiliates, or others, including, but not limited to, your account number and balance, payments history, parties to transactions, cost basis information, and other financial information. |
How does the Fund protect your nonpublic personal information?
To protect your personal information from unauthorized access and use, the Fund maintains physical, electronic and procedural safeguards that comply with applicable federal and state standards to guard your NPI. These measures include computer safeguards and secured files and buildings.
What does the Fund do with your personal information?
The Fund does not permit use of your personal information for any joint marketing or non-business purpose. Further, the Fund does not permit the disclosure of your personal information to non-affiliated parties for marketing purposes. The Fund may, however, disclose your personal information to comply with regulatory requirements, court orders or other legal requirements.
Affiliated Parties
The Fund does not disclose any nonpublic personal information about our current or former shareholders to affiliated parties, except as permitted by applicable law or regulation and as described herein. The Fund may, for example, share NPI with personnel of the Fund’s investment adviser and affiliated broker-dealer which also serves as the Fund’s exclusive wholesale marketing agent. The Fund shares NPI with its affiliates for business purposes only in an effort to service your account(s) which includes, but is not limited to, assisting in processing your transactions, inquiring about your transactions and experience, sending you shareholder reports and other information about the Fund or to otherwise provide the applicable service and maintain your account(s). The Fund’s affiliated parties that receive your NPI are required to protect your NPI, provide it only to personnel who need and use it solely for the purpose for which they received it. The Fund and its affiliated parties that receive your NPI maintain physical, electronic and procedural safeguards that comply with applicable federal and state standards to guard your NPI.
Non-Affiliated Parties
The Fund does not disclose any nonpublic personal information about our current or former shareholders to non-affiliated third parties, except as permitted by applicable law or regulation and as described herein. The Fund may share NPI with non-affiliated service providers and their employees, including the Fund’s administrator, transfer agent, distributor, proxy solicitors and legal counsel, among others. The Fund shares NPI with its non-affiliated service providers to service your account(s) including, but not limited to, processing your transactions, sending you shareholder reports and other information about the Fund or to otherwise provide the applicable service and maintain your account(s). These non-affiliated service providers are required to protect your NPI and use it solely for the purpose for which they received it. The non-affiliated service providers are required to maintain physical, electronic and procedural safeguards that comply with applicable federal and state standards to guard your NPI.
| Annual Report | December 31, 2021 | 85 |

Item 2. Code of Ethics.
| (a) | The Griffin Institutional Access Credit Fund (the “Fund”) has adopted a Code of Ethics that applies to the Fund's principal executive officer and principal financial officer. |
| (c) | During the period covered by this report, there were no amendments to the Fund’s Code of Ethics. |
| (d) | During the period covered by this report, the Fund had not granted any express or implicit waivers from the Code of Ethics. |
| (f) | The Fund’s Code of Ethics is attached hereto as exhibit 13(A)(1). |
Item 3. Audit Committee Financial Expert.
The Board of Trustees (the “Board’) of the Fund has determined that the Fund has at least one audit committee financial expert serving on its Audit Committee. The Board has designated Ira Cohen as the Fund’s audit committee financial expert. Mr. Cohen is “independent” as defined in paragraph (a)(2) of Item 3 to Form N-CSR.
Item 4. Principal Accountant Fees and Services.
| (a) | Audit Fees: For the Fund’s last two fiscal years ended December 31, 2020 and December 31, 2021, the aggregate fees billed for professional services rendered by the principal accountant for the audit of the Fund’s annual financial statements or services that are normally provided by the accountant in connection with statutory and regulatory filings or engagements were $231,950 and $250,0001 respectively. |
| (b) | Audit-Related Fees: For the Fund’s last two fiscal years ended December 31, 2020 and December 31, 2021, no fees were billed for assurance and related services by the principal accountant that would otherwise be reasonably related to the performance of the audit of the Fund’s financial statements and not otherwise reported under paragraph (a) of Item 4 of this report. |
| (c) | Tax Fees: For the Fund’s last two fiscal years ended December 31, 2020 and December 31, 2021, the aggregate fees billed for professional services rendered by the principal accountant for tax compliance, tax advice and tax planning, which were comprised of the preparation of excise filings and income tax returns for the Fund were $86,000 and $81,0001 respectively. |
| (d) | All Other Fees: For the Fund’s last two fiscal years ended December 31, 2020 and December 31, 2021, there were no other fees billed for products and services other than the services reported in paragraphs (a) through (c) of Item 4 of this report, provided by the principal accountant. |
| (e) (1) | The Audit Committee’s pre-approval policies and procedures require that all services to be performed by the Fund’s principal accountant must be pre-approved by the Fund’s audit committee. |
| (2) | No services described in paragraphs (b) through (d) of Item 4 of this report were approved by the Fund’s Audit Committee pursuant to paragraph (c)(7)(i)(C) of Rule 2-01 of Regulation S-X. |
| (f) | Not applicable to the Fund. |
| (g) | For the Fund’s last two fiscal years ended December 31, 2020 and December 31, 2021, the aggregate fees billed for non-audit fees for services rendered by the principal accountant to the Fund, the Fund’s investment adviser and any entity controlling, controlled by, or under common control with the Fund’s investment adviser that provides ongoing services to the Fund were $2,700 and $9001, respectively. |
| (h) | The Fund's Audit Committee has considered whether the provision of non-audit services to the Fund's investment adviser and any entity controlling, controlled by, or under common control with the investment adviser that provides ongoing services to the Fund, that were not pre-approved pursuant to paragraph (c)(7)(ii) of Rule 2-01 of Regulation S-X, is compatible with maintaining the principal accountant's independence. |
| 1 | 2021 fees are based on estimated costs. |
Item 5. Audit Committee of Listed Registrants.
The Fund is not a listed issuer as defined in Rule 10A-3 under the Securities Exchange Act of 1934, as amended.
Item 6. Investments.
| (a) | The schedule of investments is included as part of the Reports to Stockholders filed under Item 1 of this Form N-CSR. |
| (b) | Not applicable to the Fund. |
Item 7. Disclosure of Proxy Voting Policies and Procedures for Closed-End Management Investment Companies.
The proxy voting policies and procedures of Griffin Capital Credit Advisor, LLC and BCSF Advisors, LP are attached hereto as exhibit EX 99.Item7.
Item 8. Portfolio Managers of Closed-End Management Investment Companies.
As of the date of this filing, Andrew Carlino, Nate Whittier, Michael Ewald and Alon Avner, each an employee of Bain Capital Credit, serve as the Fund’s portfolio managers (“Portfolio Managers”). Mr. Carlino and Mr. Whittier are primarily responsible for overseeing the day to day investment operations of the Fund. The Fund’s investment sub-adviser, BCSF Advisors, LP (the “Sub-Adviser”), an affiliate of Bain Capital Credit, has entered into a resource sharing agreement with Bain Capital Credit pursuant to which Bain Capital Credit provides the Sub-Adviser with experienced investment professionals and access to the resources of Bain Capital Credit. All references to the Sub-Adviser shall include Bain Capital Credit as applicable.
Andrew Carlino. Mr. Carlino joined Bain Capital Credit in 2002. He is a Managing Director based in Bain Capital Credit’s Boston office. He is a Portfolio Manager and Co-Head of North American Liquid and Structured Credit. Prior to his current role, Mr. Carlino was responsible for investments in the Airlines, Aerospace & Defense, and Homebuilding & Building Product sectors. Previously, Mr. Carlino was a consultant for The Boston Consulting Group and an intelligence officer in the US Air Force. Mr. Carlino received an M.B.A. from The University of Chicago Booth Graduate School of Business and a B.S. from the United States Air Force Academy.
Nate Whittier. Mr. Whittier joined Bain Capital Credit in 2013. He is a Director, a Risk & Oversight Committee member, and Portfolio Manager in Liquid and Structured Credit based in Bain Capital Credit’s Boston office. He is also responsible for risk management and portfolio analytics across the Firm’s strategies. Previously, Mr. Whittier worked in the Global Portfolio Solutions Group of the Asset Management Division and the Equity Derivatives Group of Goldman Sachs. Mr. Whittier received a B.S. from Northeastern University.
Michael A. Ewald. Mr. Ewald joined Bain Capital Credit in 1998. He is a Managing Director, Global Head of the Private Credit Group, Portfolio Manager for the Middle Market Credit and Senior Direct Lending strategies and a Credit Committee member. He also serves as CEO of Bain Capital Specialty Finance, Inc., a registered business development company. He is based in Bain Capital Credit’s Boston office. Previously, Mr. Ewald was an Associate Consultant at Bain & Company and an analyst at Credit Suisse First Boston in the Regulated Industries group. Mr. Ewald received an M.B.A. from the Amos Tuck School of Business at Dartmouth College and a B.A. from Tufts University.
Alon Avner. Mr. Avner joined Bain Capital in 2006. He has been the Head of Bain Capital Credit Europe since 2009, Portfolio Manager of the Special Situations Europe fund, a Managing Director in the Special Situations Group, and an Investment Committee member based in Bain Capital’s London office. Between 2006 and 2009, Mr. Avner was responsible for Bain Capital Credit's European Telecom and Media investments. Previously, Mr. Avner was a Manager at Bain & Company. In addition, he worked in operations and marketing roles at Comverse Technology and Creo/Scitex. Mr. Avner received an M.B.A. from INSEAD and a B.Sc. from Tel Aviv University.
Compensation:
Mr. Carlino, Mr. Whittier, Mr. Ewald and Mr. Avner each receive a salary, retirement plan benefits and performance-based bonus from the Sub-Adviser. The performance-based bonus is measured yearly based on an overall assessment of the financial performance of the Sub-Adviser, the team of which a portfolio manager is a member, and the portfolio manager’s performance in managing accounts against the account’s applicable stated benchmark.
Material Conflicts of Interest:
Bain Capital Credit employees, including the Fund’s portfolio managers, serve, or may serve, as officers, directors, members, or principals of entities that operate in the same or a related line of business as the Fund, or of investment funds, accounts, or investment vehicles managed by Bain Capital Credit and/or its affiliates. Similarly, Bain Capital Credit and its affiliates have other clients with similar, different or competing investment objectives. In serving in these multiple capacities, they have obligations to other clients or investors in those entities, the fulfillment of which may not be in the best interests of the Fund and its shareholders. For example, Bain Capital Credit has management responsibilities for other investment funds, accounts and investment vehicles (“Sub-Adviser Client Accounts”). The Sub-Adviser may, directly or indirectly, receive fees from Sub-Adviser Client Accounts that are higher than the fee it receives from the Fund, or it may, directly or indirectly, receive a performance-based fees from the Sub-Adviser Client Accounts. In those instances, a portfolio manager may have an incentive favor the Sub-Adviser Client Accounts. The Sub-Adviser has various policies and procedures that it believes are reasonably designed to address these and other conflicts of interest.
The Fund often invests on a side-by-side basis with one or more Sub-Adviser Client Accounts. In this scenario, the Fund may invest alongside Sub-Adviser’s Client Accounts in certain circumstances where doing so is consistent with the Fund’s investment strategy as well as exemptive relief and SEC guidance. In an order dated March 22, 2018 the SEC granted exemptive relief to the Fund, subject to the satisfaction of certain conditions, to co-invest in certain privately negotiated transactions with certain affiliates of Bain Capital Credit (“Co-Investment Program” or the “Order”). With respect to the Co-Investment Program, allocations among the Fund and other affiliated accounts managed by Bain Capital Credit or its affiliates are based on recommended amounts which generally provides that such allocations are made pro rata based on the order size of each participating account. Although the Sub-Adviser attempts to allocate investment opportunities fairly and equitably, co-investments made under the Order are subject to compliance with the conditions and other requirements contained in the Order, which could limit the Fund’s ability to participate in the Co-Investment Program. Furthermore, in situations where co-investment with Sub-Adviser Client Accounts is not permitted or appropriate, such as when there is an opportunity to invest in different securities of the same issuer or where the different investments could be expected to result in a conflict between the Fund’s interests and those of the Sub-Adviser Client Accounts, Bain Capital Credit will need to decide which client will proceed with the investment. Moreover, except in certain limited circumstances as permitted by the 1940 Act, such as when the only term being negotiated is price, the Fund will be unable to invest in any issuer in which an investment fund, account or investment vehicle managed by Bain Capital Credit has previously invested. Similar restrictions limit the Fund’s ability to transact business with its officers or directors or their affiliates. These restrictions will limit the scope of investment opportunities that would otherwise be available. In certain situations where co-investment with one or more participating accounts managed by Bain Capital Credit or its affiliates is not covered by the Co-Investment Program, the Sub-Adviser will make allocation determinations based on the Sub-Adviser’s policies and procedures, which are designed to reasonably ensure that investment opportunities are allocated fairly and equitably.
As of December 31, 2021, Mr. Carlino is responsible for the management of the following types of accounts in addition to the Fund (asset values have been estimated):
| Other Accounts by Type1 | Total Number of Accounts by Account Type | Total Assets by Account Type (in millions) | Number of Accounts by Type Subject to a Performance Fee | Total Assets by Account Type Subject to a Performance Fee (in millions) |
| Registered Investment Companies | 1 | $1,866 | 0 | - |
| Other Pooled Investment Vehicles | 5 | $3,658 | 2 | $1,282 |
| Other Accounts | 22 | $8,842 | 9 | $4,445 |
As of December 31, 2021, Mr. Whittier is responsible for the management of the following types of accounts in addition to the Fund (assets values have been estimated):
| Other Accounts by Type1 | Total Number of Accounts by Account Type | Total Assets by Account Type (in millions) | Number of Accounts by Type Subject to a Performance Fee | Total Assets by Account Type Subject to a Performance Fee (in millions) |
| Registered Investment Companies | 1 | $1,866 | 0 | - |
| Other Pooled Investment Vehicles | 5 | $3,658 | 2 | $1,282 |
| Other Accounts | 22 | $8,842 | 9 | $4,445 |
As of December 31, 2021, Mr. Ewald is responsible for the management of the following types of accounts in addition to the Fund (assets values have been estimated):
| Other Accounts by Type1,2 | Total Number of Accounts by Account Type | Total Assets by Account Type (in millions) | Number of Accounts by Type Subject to a Performance Fee | Total Assets by Account Type Subject to a Performance Fee (in millions) |
| Registered Investment Companies | 1 | $2,406 | 1 | $2,406 |
| Other Pooled Investment Vehicles | 5 | $1,579 | 4 | $1,477 |
| Other Accounts | 10 | $4,735 | 10 | $4,735 |
As of December 31, 2021, Mr. Avner is responsible for the management of the following types of accounts in addition to the Fund (assets values have been estimated):
| Other Accounts by Type1,3 | Total Number of Accounts by Account Type | Total Assets by Account Type (in millions) | Number of Accounts by Type Subject to a Performance Fee | Total Assets by Account Type Subject to a Performance Fee (in millions) |
| Registered Investment Companies | 0 | - | 0 | - |
| Other Pooled Investment Vehicles | 7 | $8,944 | 7 | $8,944 |
| Other Accounts | 5 | $2.095 | 5 | $2,095 |
| 1 | Some of the accounts noted herein have additional co-portfolio managers. |
| 2 | Mr. Ewald’s management of the Fund is related to certain SDL assets and not the Fund as a whole. |
| 3 | Mr. Avner’s management of the Fund is related to certain NPL assets and not the Fund as a whole. |
As of December 31, 2021, Andrew Carlino, Mr. Whittier, Mr. Ewald and Mr. Avner did not own shares of the Fund.
Item 9. Purchases of Equity Securities by Closed-End Management Investment Company and Affiliates Purchasers.
None.
Item 10. Submission of Matters to a Vote of Security Holders.
No changes have occurred.
Item 11. Controls and Procedures.
| (a) | Based on an evaluation of the Fund’s disclosure controls and procedures (as defined in Rule 30a-3(c) under the 1940 Act), the Fund’s principal executive officer and principal financial officer have concluded that the Fund’s disclosure controls and procedures are effective as of a date within 90 days of the filing date of this report. |
| (b) | There were no significant changes in the Fund’s internal control over financial reporting that occurred during the period covered by this report that has materially affected, or are reasonably likely to materially affect, the Fund’s internal control over financial reporting. |
Item 12. Disclosure of Securities Lending Activities for Closed-End Management Investment Companies.
None.
Item 13. Exhibits.
SIGNATURES
Pursuant to the requirements of the Securities Exchange Act of 1934 and the Investment Company Act of 1940, the Registrant has duly caused this report to be signed on its behalf by the undersigned, thereunto duly authorized.
GRIFFIN INSTITUTIONAL ACCESS CREDIT FUND
| By: | /s/ Kevin Shields | |
| | Kevin Shields | |
| | President (Principal Executive Officer) | |
| | | |
| Date: | March 8, 2022 | |
Pursuant to the requirements of the Securities Exchange Act of 1934 and the Investment Company Act of 1940, this report has been signed below by the following persons on behalf of the Registrant and in the capacities and on the dates indicated.
| By: | /s/ Kevin Shields | |
| | Kevin Shields | |
| | President (Principal Executive Officer) | |
| | | |
| Date: | March 8, 2022 | |
| | | |
| By: | /s/ Joseph Miller | |
| | Joseph Miller | |
| | Treasurer (Principal Financial Officer) | |
| | | |
| Date: | March 8, 2022 | |