UNITED STATES
SECURITIES AND EXCHANGE COMMISSION
WASHINGTON, D.C. 20549
FORM N-CSR
CERTIFIED SHAREHOLDER REPORT OF REGISTERED
MANAGEMENT INVESTMENT COMPANIES
811-23159
(Investment Company Act file number)
Apollo Diversified Credit Fund
(Exact name of registrant as specified in charter)
9 West 57th Street, New York
New York 10019
(Address of principal executive offices)
212-515-3200
(Registrant's telephone number, including area code)
ALPS Fund Services, Inc.
1290 Broadway, Suite 1000
Denver, CO 80203
(Name and address of agent for service)
Copy to:
Ryan P. Brizek
Simpson Thacher & Bartlett LLP
900 G Street, N.W.
Washington, D.C. 20001
Date of fiscal year end: December 31
Date of reporting period: January 1, 2023 – December 31, 2023
Item 1. Reports to Stockholders.
Table of Contents
| Shareholder Letter (Unaudited) | 1 |
| Portfolio Update (Unaudited) | 14 |
| Consolidated Schedule of Investments | 16 |
| Consolidated Statement of Assets and Liabilities | 28 |
| Consolidated Statement of Operations | 30 |
| Consolidated Statements of Changes in Net Assets | 31 |
| Consolidated Statement of Cash Flows | 33 |
| Consolidated Financial Highlights | 35 |
| Notes to Consolidated Financial Statements | 47 |
| Report of Independent Registered Public Accounting Firm | 66 |
| Dividend Reinvestment Policy | 67 |
| Additional Information | 68 |
| Trustees and Officers | 69 |
| Service Providers | 71 |
| Privacy Notice | 72 |
APOLLO DIVERSIFIED CREDIT FUND
Shareholder Letter (Unaudited)
Dear Valued Shareholders,
We are pleased to present an update for Apollo Diversified Credit Fund (the “Fund”) for the fiscal year ended December 31, 2023. We will also share our perspective regarding the investment environment and potential opportunities for the Fund.
Market Overview
Markets rallied in December after Federal Reserve (the “Fed”) Chair Jerome Powell held rates steady on December 13 for the third straight meeting and signaled that the central bank is ready to pivot from its aggressive interest rate hiking campaign and is cautiously teeing up three interest rate cuts for 2024.
The surprising announcement came after nearly two years in which policymakers used higher interest rates to slow the economy and drive inflation closer to the Fed’s 2% target without causing a significant downturn or unemployment. The enthusiasm for the “Fed Pivot” spurred a sweeping rally across major financial markets in the U.S. and overseas with traders largely declaring “mission accomplished” on Powell’s bid to tame the post-pandemic rise in inflation and engineer a soft landing in 2024.
While Powell expressed caution about prematurely declaring victory against inflation and said the Federal Open Market Committee hasn’t ruled out the possibility of another interest rate hike if the data call for it, markets embraced his more dovish tone and are now pricing in an interest rate cut in March 2024. Financial markets latched onto the dovishness, with the 10-year treasury yield declining 45 basis points (bps) in December, dropping below 4% for the first time since July 2023, while the U.S. High Yield and Leveraged Loan indices rallied to end the year at 13.51% and 13.17%, respectively.1, 2
Outlook
As we look ahead to 2024, we remain cautious on the near-term outlook and still see upside risks to inflation and downside risks to growth. Despite what we believe to be recent indications that the Fed is willing to pivot from its aggressive interest rate hiking campaign amid signs of disinflation and traders’ projections for six cuts in 2024, we expect rates to remain elevated for 2024. We continue to see risks amid geopolitical instability and a wave of elections in more than 50 countries, including the U.S. We remain defensive in our positioning and are focused on credit selection, predominately on the top of the capital structure, senior secured capital in industries that have what we believe to be recession-resistant characteristics.
| Fund Snapshot | |
| Structure | 1940 Act Closed-End Interval Fund |
| Inception Date | April 3, 2017 |
| Apollo Inception Date3 | May 2, 2022 |
| Management Fee | 1.5% on NAV |
| Pricing | Daily NAV |
| Subscription Frequency | Daily |
| Repurchase Frequency | Quarterly (5% of Fund shares outstanding) |
| Distribution Frequency | Quarterly |
| Tax Reporting | 1099-DIV |
| Fund Summary Stats | |
| Managed Assets4 | $962.7 million |
| Leverage5 | 18.3% |
| Portfolio Companies | 120 |
| Average Duration (Years)6 | 0.7 |
| Q4 2023 Annualized Distribution Rate (Class I Share)7 | 10.45% |
| Last Twelve Months’ Distribution Rate (Class I Share)7 | 10.14% |
| Portfolio Weighted Average Yield8 | 9.9% |
| Floating Rate Exposure9 | 79.2% |
| Senior Secured | 86.6% |
| North America/Europe/Other10, 11 | 71% / 22% / 2% |
Past performance is not indicative of future results. Holdings and allocations are subject to change without notice. Diversification does not eliminate the risk of experiencing investment losses. Source: Apollo Analysts. The views expressed here are Apollo’s own, unless otherwise noted. Holdings and allocations, unless disclosed otherwise, are based on Managed Assets. The Fund is actively managed and its characteristics will vary. Active portfolio management could result in underperformance. For discussion purposes only. The expected allocations are subject to a variety of factors, including Apollo’s analysis of investment opportunities, and is subject to change at any time without notice. There is no guarantee these expected allocations will occur.
01
APOLLO DIVERSIFIED CREDIT FUND
Fund Performance3
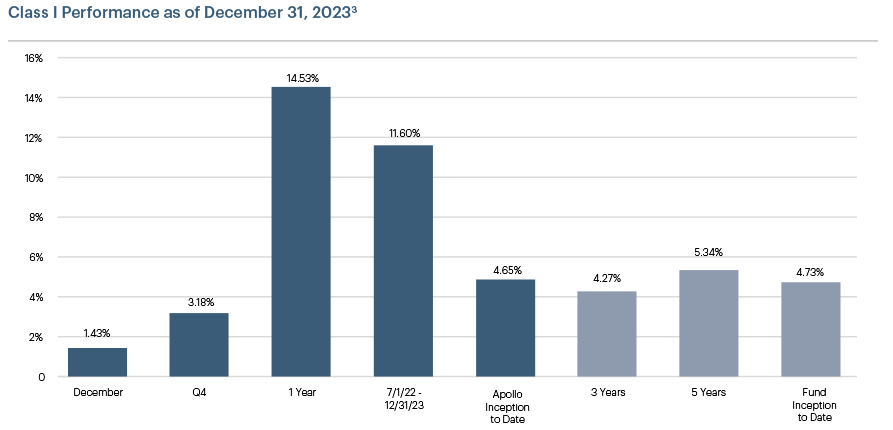
For the month ended December 31, 2023, Apollo Diversified Credit Fund’s (the “Fund”) Class I share (NASDAQ: CRDIX) returned 1.43%, bringing the one-year total return to 14.53%.12
The Fund produced positive performance across all five of its strategy pillars in December, with the highest contributions coming from Corporate Direct Lending and Performing Credit. The Fund’s private credit strategy continued to perform well as the higher interest rate environment supports income generation from the Fund’s floating rate, senior secured loans.
The Fund’s Class I shares produced a fourth quarter distribution of $0.547 per share which equates to an annualized distribution rate of 10.45% as of December 31, 2023.7 This represents an increase of 66 bps compared to the third quarter annualized distribution rate and is reflective of the Fund’s continued earnings growth and portfolio rotation into private credit.
Apollo Diversified Credit Fund is a closed-end management investment company that is operated as an interval fund. Limited liquidity is provided to shareholders only through the Fund’s quarterly repurchase offers for no less than 5% and no more than 25% of the Fund’s shares outstanding at net asset value. The Fund is only suitable for investors who can bear the risks associated with the limited liquidity of the Fund and should be viewed as a long-term investment. There is no secondary market for the Fund’s shares and none is expected to develop. Please see the Fund’s current prospectus for further information on the Fund’s objective, strategy and risk factors.
Past performance is not indicative of future results. Investment return and the principal value of an investment will fluctuate. Shares may be worth more or less than original cost when redeemed. Investing involves risk, including loss of principal. Performance includes reinvestment of distributions and is net of management fees and other expenses. Fund returns greater than one year are annualized. Fund returns would have been lower had expenses not been waived during the period. The Fund return does not reflect the deduction of all fees, including any applicable Fund share class sales load, third-party brokerage commissions or third-party investment advisory fees paid by investors to a financial intermediary for such services. If the deduction of such fees was reflected, the performance would be lower. Returns shown do not reflect the deduction of taxes that a shareholder would pay on Fund distributions or the redemption of Fund shares. Investing in the Fund involves risks, including the risk that you may receive little or no return on your investment or that you may lose part or all of your investment. The ability of the Fund to achieve its investment objective depends, in part, on the ability of the Adviser to allocate effectively the assets of the Fund among the various securities and investments in which the Fund invests. There can be no assurance that the actual allocations will be effective in achieving the Fund’s investment objective or delivering positive returns. The Fund offers multiple different classes of shares. An investment in any share class of the Fund represents an investment in the same assets of the Fund. However, the purchase restrictions, ongoing fees, expenses, distributions, and performance for each share class are different. For more information on the differences in share classes, refer to the applicable prospectus, which can be found at www.apollo.com.
The views expressed here are Apollo’s own, unless otherwise noted.
02
APOLLO DIVERSIFIED CREDIT FUND
Private Credit
As of December 31, 2023
Private Credit Overview
The pressures in the traditional banking system that were observed in the first half of the year continued, as higher rates meant potentially steep losses for banks that own sovereign and corporate debt on their balance sheet, considering the higher duration risk associated with fixed rate securities compared to floating rate.
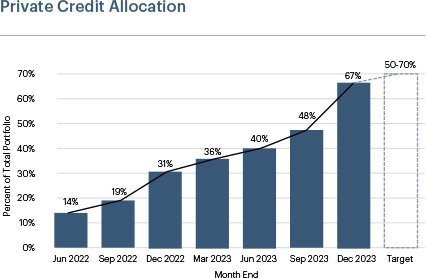
Given tightening credit conditions and stalling loan growth for U.S. banks, we believe that the trend of private credit capital providers stepping in as a senior lender across a range of uses including buyouts, add-on acquisitions, recapitalizations and dividends – areas once occupied by banks or the syndicated loan market, will continue.
Leveraged Commentary and Data estimates that new issue volume for private equity backed borrowers financed via directly originated loans will total $128 billion in 2023. Additionally, data for the fourth quarter of 2023 showed that, based on issuer count, private credit remained the financing of choice of private equity sponsors for leveraged buyouts (“LBOs”), with 33 out of 38 deals financed by private credit. In 2023, 179 out of 208 deals, or 86%, were financed by private credit, compared to 83% in 2022. Additionally, private credit outpaced syndicated loans for non-LBOs as well, accounting for approximately 54% and 57% of deals in the fourth quarter and 2023, respectively.13 We believe the benefits of private credit relative to broadly syndicated loans continue to drive deals as sponsors prefer the certainty of execution, speed, and customization that private credit offers.
Past performance is not indicative of future results. Holdings and allocations are subject to change without notice. Diversification does not eliminate the risk of experiencing investment losses. Source: Apollo Analysts. The views expressed here are Apollo’s own, unless otherwise noted. Holdings and allocations, unless disclosed otherwise, are based on Managed Assets. The Fund is actively managed and its characteristics will vary. Active portfolio management could result in underperformance. For discussion purposes only. The expected allocations are subject to a variety of factors, including Apollo’s analysis of investment opportunities, and is subject to change at any time without notice. There is no guarantee these expected allocations will occur.
03
APOLLO DIVERSIFIED CREDIT FUND
Corporate Direct Lending
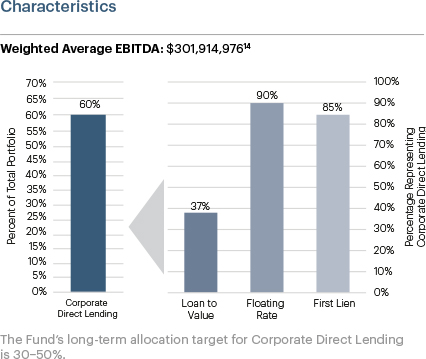
The Fund’s Corporate Direct Lending strategy targets large scale corporate originations and sponsor-backed issuers, utilizing Apollo’s proprietary sourcing channel.
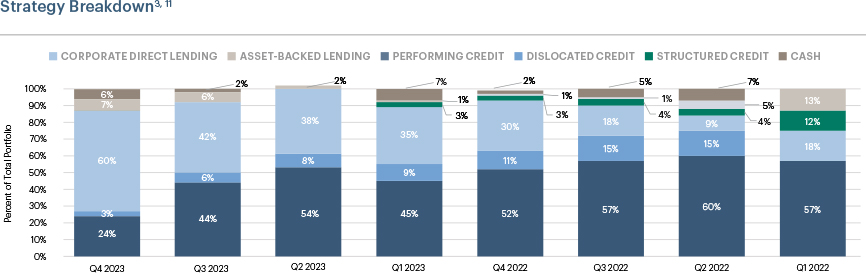
Throughout 2023, the Fund increased Corporate Direct Lending exposure from 30% to 60%, deploying capital during one of the most attractive investment vintages, in our view. New originations were across 14 different sectors, with a weighted average spread of 6.24% and weighted average EBITDA of $320mm.
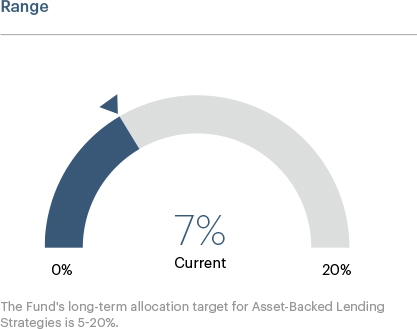
Asset-Backed Lending
The Fund’s Asset-Backed Lending strategy focuses on agile deployment of capital into origination and proprietary sourcing channels across a broad mandate of asset-backed investments, with a focus on investments collateralized by tangible investments.
As of December 31, 2023, the Fund’s exposure to asset-backed lending was approximately 7% across 11 issuers with a weighted average yield of approximately 7.5%. The asset-backed investments provide exposure to diversified collateral pools across U.S. private student loans, U.S. conduit commercial mortgage-backed securities (“CMBS”) and collateralized loan obligations (“CLOs”). In our opinion, all of these investments are attractive, given the diversity of collateral, embedded structural security and stable, predictable cashflows, resulting in lower correlation to credit performance of traditional corporate credit portfolio.
Past performance is not indicative of future results. Holdings and allocations are subject to change without notice. Diversification does not eliminate the risk of experiencing investment losses. Source: Apollo Analysts. The views expressed here are Apollo’s own, unless otherwise noted. Holdings and allocations, unless disclosed otherwise, are based on Managed Assets. The Fund is actively managed and its characteristics will vary. Active portfolio management could result in underperformance. For discussion purposes only. The expected allocations are subject to a variety of factors, including Apollo’s analysis of investment opportunities, and is subject to change at any time without notice. There is no guarantee these expected allocations will occur.
04
APOLLO DIVERSIFIED CREDIT FUND
Public Credit
As of December 31, 2023
Public Credit Overview
Leveraged loans, as represented by the J.P. Morgan Leveraged Loan Index, were up 1.61% in December, bringing one-year performance of the index to 13.17% as of December 31, 2023. Leveraged loan yields and spreads decreased 66 bps and 22 bps in December to 8.60% and 500 bps, respectively. Year-to-date as of December 31, 2023, leveraged loan yields and spreads are down 137 bps and 92 bps, respectively.2
High-yield bonds, as represented by the J.P. Morgan High Yield Bond Index, were up 3.63% in December, bringing one-year performance of the index to 13.51% as of December 31, 2023. High-yield bond yields and spreads decreased 76 bps and 36 bps in December to 7.82% and 377 bps, respectively. Year-to-date as of December 31, 2023, high-yield bond yields and spreads are down 122 bps and 113 bps, respectively.2
As of the end of December, the par weighted U.S. high-yield bond default rate decreased 4 bps to approximately 2.84% and the leveraged loan default rate increased 3 bps month-over-month, at approximately 3.15%.2, 15
Leveraged loan issuance in December was the second highest volume month since November 2021, with 84% of such issuance attributable to refinancings. High-yield bond issuance volume totaled $13.3 billion in December, bringing the 2023 issuance total to $175.9 billion, compared to $106.5 billion in 2022. Leveraged loan issuance volume totaled $52.5 billion in December, bringing the 2023 total to $370.1 billion, compared to $252.5 billion in 2022. Despite issuance volume increasing year-over-year, leveraged loan and high-yield bond issuance still lagged the issuance volume observed in 2020 and 2021.2
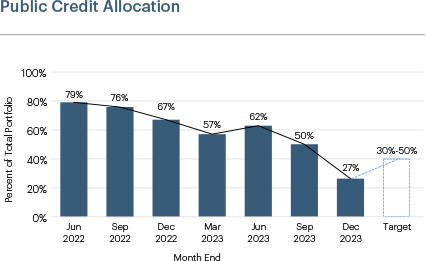
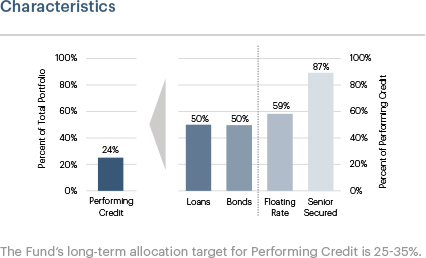
Performing Credit
The Fund’s Performing Credit strategy primarily pursues liquid, performing senior secured corporate credits to generate total return.
The Fund’s exposure within this strategy is predominately focused on senior secured positions across industries with resilient business models that we believe may continue to generate strong cash flow across various economic environments. The Fund’s portfolio allocation is currently tilted towards floating rate assets over fixed rate assets, consistent with our views of a higher for longer interest rate environment.
Past performance is not indicative of future results. Holdings and allocations are subject to change without notice. Diversification does not eliminate the risk of experiencing investment losses. Source: Apollo Analysts. The views expressed here are Apollo’s own, unless otherwise noted. Holdings and allocations, unless disclosed otherwise, are based on Managed Assets. The Fund is actively managed and its characteristics will vary. Active portfolio management could result in underperformance. For discussion purposes only. The expected allocations are subject to a variety of factors, including Apollo’s analysis of investment opportunities, and is subject to change at any time without notice. There is no guarantee these expected allocations will occur.
05
APOLLO DIVERSIFIED CREDIT FUND
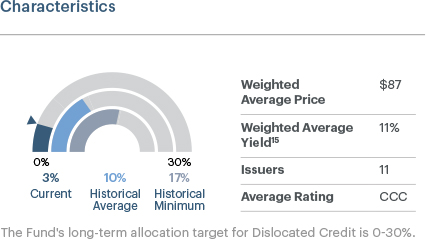
Dislocated Credit
The Fund’s Dislocated Credit strategy seeks to use contingent capital to tactically pursue “dislocated” credit opportunities (e.g., stressed, performing assets across the credit spectrum that sell-off due to technical and/or non-fundamental reasons) in between traditional, passive investment mandates and “distressed-for-control” investment mandates.
As we allocate additional capital to private credit given the relative risk-reward in this market environment, we continue to pare back our exposure in the Dislocated Credit strategy as credit spreads tighten and prices trend higher. The strategy’s weighted average price moved higher from $84 to $87 and the weighted average yield dropped 67 bps, as our positions continued to benefit from a price perspective.
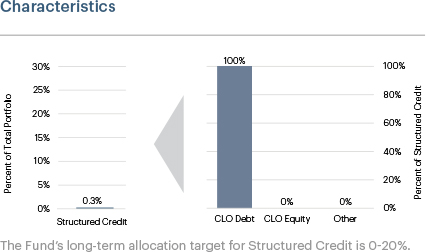
Structured Credit
The Fund’s Structured Credit strategy seeks out high-quality structured credit opportunities of various asset types, vintages, maturities, jurisdictions, and capital structure priorities, including debt and equity tranches of CLOs, commercial and residential mortgage-backed securities, consumer and commercial asset-backed securities, whole loans and regulatory capital relief transactions.
While a smaller part of the Fund’s portfolio, we believe there are likely to be increased instances of market dislocations, and we stand ready to deploy capital as opportunities present themselves.
Past performance is not indicative of future results. Holdings and allocations are subject to change without notice. Diversification does not eliminate the risk of experiencing investment losses. Source: Apollo Analysts. The views expressed here are Apollo’s own, unless otherwise noted. Holdings and allocations, unless disclosed otherwise, are based on Managed Assets. The Fund is actively managed and its characteristics will vary. Active portfolio management could result in underperformance. For discussion purposes only. The expected allocations are subject to a variety of factors, including Apollo’s analysis of investment opportunities, and is subject to change at any time without notice. There is no guarantee these expected allocations will occur.
06
APOLLO DIVERSIFIED CREDIT FUND
Portfolio Detail
As of December 31, 2023
| Attribution by Strategy | | | | |
| | December (bps) | Q4 (bps) | 1 Year (bps) | 7/1/22 - 12/31/23 (bps) | Apollo Inception to Date3 (bps) |
| Private Credit | 97 | 278 | 727 | 528 | 439 |
| Corporate Direct Lending | 85 | 258 | 682 | 524 | – |
| Asset-Backed Lending | 12 | 20 | 45 | 4 | – |
| Public Credit | 98 | 208 | 1,146 | 986 | 333 |
| Performing Credit | 74 | 164 | 864 | 780 | – |
| Dislocated Credit | 22 | 40 | 253 | 168 | – |
| Structured Credit | 2 | 4 | 29 | 38 | – |
| Currency Hedge | -30 | -92 | -51 | -42 | -23 |
| Residual17 | -6 | -29 | -174 | -148 | -136 |
| Fees & Expenses | -16 | -47 | -195 | -164 | -148 |
| Total (Net) | 143 | 318 | 1,453 | 1,160 | 465 |
| Top 10 Holdings as Percentage of Portfolio18 | |
| | | |
| Issuer | Industry19 | Percent of Allocation |
| Bellis Acquisition Company PLC/ASDA | Consumer Staples Distribution & Retail | 2.6% |
| BDO USA, P.A. | Commercial Services & Supplies | 2.5% |
| Insight XI Aggregator, L.P. | Financial Services | 2.2% |
| Avalara, Inc. | Software | 2.1% |
| K. Hovnanian Enterprises Inc. | Household Durables | 2.1% |
| Hyperion Refinance SarlSarl/Howden | Insurance | 1.9% |
| Energy Transfer LP | Oil, Gas & Consumable Fuels | 1.8% |
| Zendesk, Inc. | Software | 1.8% |
| EG Global Finance PLC | Specialty Retail | 1.8% |
| GBT Group Services B.V. | Consumer Finance | 1.8% |
| Total | | 20.6% |
Past performance is not indicative of future results. Holdings and allocations are subject to change without notice and may not be representative of current or future allocations. Diversification does not eliminate the risk of experiencing investment losses. Source: Apollo Analysts. For discussion purposes only. Attribution for periods greater than one year are annualized. The Fund pursues its investment objective through a “multi-asset” approach centered around five key strategy pillars, as described above: (1) corporate direct lending, (2) asset-backed lending, (3) performing credit, (4) dislocated credit and (5) structured credit. “Attribution by Strategy” is intended to show characters of the portfolio and provide an estimate as to which strategy pillars within the Fund contributed (positively or negatively) to the Fund’s overall performance during the period represented. Such attribution analysis should not be relied upon for investment decisions. Strategy and asset classification prior to Apollo Inception (May 2, 2022) was generated by the previous management team of the Fund’s investment adviser and as such Apollo Inception to Date attribution is only summarized for Private Credit, Public Credit, Currency Hedge, Residual, and Fees & Expenses. Total (Net) performance reflects the Fund’s Class I share and includes reinvestment of distributions and reflects management fees and other expenses charged during the period. Total (Net) performance of Fund’s Class I shares would have been lower had fees not been waived during the period. The Fund’s share classes also incur additional expenses not deducted herein, such as sales load, third-party brokerage commissions, third-party investment advisory fees paid by investors to a financial intermediary for brokerage services, or the deduction of taxes that a shareholder would pay on Fund distributions or the redemption of Fund shares.
07
APOLLO DIVERSIFIED CREDIT FUND
Correlation Summary20
| As of 12/31/23 | Correlation to Fund: Last 3 Months | Correlation to Fund: Since Apollo Inception (5/2/22)3 |
Bloomberg US Aggregate Bond Index | 0.55 | 0.37 |
Bloomberg Municipal Bond Index | 0.75 | 0.44 |
Bloomberg US Corporate Bond Index | 0.59 | 0.47 |
Morningstar LSTA US Leveraged Loan Index | 0.84 | 0.75 |
ICE BofA US High Yield Index | 0.76 | 0.87 |
Past performance is not indicative of future results. Holdings and allocations are subject to change without notice. Diversification does not eliminate the risk of experiencing investment losses. Source: Apollo Analysts. Holdings and allocations, unless disclosed otherwise, are based on Managed Assets. The Fund is actively managed and its characteristics will vary. Active portfolio management could result in underperformance.
Fund Sub-Adviser
Apollo Diversified Credit Fund is sub-advised by Apollo Credit Management, LLC. Apollo Credit Management, LLC is an affiliate of Apollo Global Management, Inc. and its consolidated subsidiaries (“Apollo”).
Apollo has built one of the world’s largest alternative credit platforms, managing $444 billion in institutional and private assets.21 We draw on 30+ years of experience, seeking to provide excess returns across the risk spectrum through our proprietary origination, an extensive credit toolkit, and a flexible capital base that can respond to the changing needs of borrowers. We offer solutions designed to align with investors’ needs for return — at what we believe to be the appropriate level of risk and liquidity. Apollo Diversified Credit Fund builds on Apollo’s global credit platform, our differentiated sourcing engine, and our status as a preferred lending partner.
| | $444B | | 300+ | |
| | in assets under management 22 | | dedicated credit investment professionals | |
The views expressed here are Apollo’s own, unless otherwise noted.
08
APOLLO DIVERSIFIED CREDIT FUND
Glossary
Annualized Return: Calculated by annualizing cumulative return (i.e., adjusting it for a period of one year). Annualized return includes capital appreciation and assumes a reinvestment of dividends and distributions.
Attribution: An assessment of the performance of a portfolio or its investments.
Asset-Backed Securities (ABS): Financial securities backed by income-generating assets.
Basis Point (bps): A unit of measure used to describe the percentage change. One basis point is equivalent to 0.01% (1/100th of a percent) or 0.0001 in decimal form.
Bloomberg Municipal Bond Index: Measures the performance of US investment grade general obligation and revenue bonds with maturities from one to 30 years.
Bloomberg US Aggregate Bond Index: Measures the performance of the US investment grade bond market.
Bloomberg US Corporate Bond Index: Measures the performance of the investment grade, fixed-rate, taxable corporate bond market. It includes US dollar-denominated securities issued by US and non-US industrial, utility and financial firms.
Bond: A debt instrument, also considered a loan, that an investor makes to a corporation, government, federal agency or other organization (known as an issuer) in which the issuer typically agrees to pay the owner the amount of the face value of the bond on a future date, and to pay interest at a specified rate at regular intervals.
Bond Rating: A method of evaluating the quality and safety of a bond. This rating is based on an examination of the issuer’s financial strength and the likelihood that it will be able to meet scheduled repayments. Ratings range from AAA (best) to D (worst). Bonds receiving a rating of BB or below are not considered investment grade because of the relative potential for issuer default.
Capital Relief Transactions: A transaction that seeks to provide credit protection on a portfolio of loans.
Collateralized Loan Obligation (CLO): A structured credit security backed by a pool of bank loans, structured so there are several classes of bondholders with varying maturities, called tranches. Debt and equity securities of CLOs are sold in tranches where each CLO tranche has a different priority on distributions, unique risk exposures, and yield expectations based on the tranche’s place in the capital structure. Distributions begin with the senior debt tranches (CLO debt) and flow down to the equity tranches (CLO equity).
Commercial Mortgage-Backed Securities (CMBS): Investment products that are backed by mortgages on commercial properties.
Cumulative Return: The compound return of an investment. It includes capital appreciation and assumes a reinvestment of dividends and distributions.
Earnings Before Interest, Taxes, Depreciation, and Amortization (EBITDA): A statistic used to assess operating performance and profitability.
ICE BofA US High Yield Index: Tracks the performance of US dollar denominated below investment grade corporate debt publicly issued in the US domestic market.
Internal Rate of Return (IRR): An investment’s anticipated annual growth rate.
J.P. Morgan High Yield Bond Index: Designed to mirror the investible universe of US dollar high-yield corporate debt market, including domestic and international issues.
J.P. Morgan Leveraged Loan Index: Designed to mirror the investable universe of US Dollar-denominated institutional leveraged loans, including US and international borrowers.
Leveraged Buyout (LBO): Purchase of a controlling share in a company using outside capital.
Loan-to-Value (LTV) Ratio: An assessment of lending risk that financial institutions and other lenders examine before lending to a company.
Morningstar LSTA US Leveraged Loan Index: Designed to deliver comprehensive coverage of the US leveraged loan market using PitchBook LCD data to monitor the performance, activity, and key characteristics of the market.
Mortgage-Backed Securities: Investment products that are backed by mortgages on commercial or residential properties.
Net Asset Value (NAV): Represents a fund’s per-share price. NAV is calculated by dividing a fund’s total net assets by its number of shares outstanding.
Secured Overnight Financing Rate (SOFR): A broad measure of the cost of borrowing cash overnight collateralized by Treasury securities. The SOFR is a benchmark interest rate for dollar-denominated derivatives and loans.
Whole Loan: A single loan issued to a borrower.
09
APOLLO DIVERSIFIED CREDIT FUND
Risk Disclosures and Other Important Information (Unaudited)
This material is neither an offer to sell nor a solicitation to purchase any security. Investors should carefully consider the investment objectives, risks, charges and expenses of Apollo Diversified Credit Fund (the “Fund”). This information and other important details about the Fund are contained in the prospectus, which can be obtained by visiting www.apollo.com. Please read the prospectus carefully before investing.
Past performance is not indicative of future results. Investment return and the principal value of an investment will fluctuate. Shares may be worth more or less than original cost when redeemed. Investing involves risk, including loss of principal. Performance includes reinvestment of distributions and is net of management fees and other expenses. Fund returns would have been lower had expenses not been waived during the period. The Fund return does not reflect the deduction of all fees, including any applicable Fund share class sales load, third-party brokerage commissions or third-party investment advisory fees paid by investors to a financial intermediary for brokerage services. If the deduction of such fees was reflected, the performance would be lower. Returns shown do not reflect the deduction of taxes that a shareholder would pay on Fund distributions or the redemption of Fund shares. Investing in the Fund involves risks, including the risk that you may receive little or no return on your investment or that you may lose part or all of your investment. The ability of the Fund to achieve its investment objective depends, in part, on the ability of the Adviser to allocate effectively the assets of the Fund among the various securities and investments in which the Fund invests. There can be no assurance that the actual allocations will be effective in achieving the Fund’s investment objective or delivering positive returns. The most recent performance is available at www.apollo.com or by calling 888.926.2688.
The Fund is a closed-end management investment company that is operated as an interval fund. The shares have no history of public trading, nor is it intended that the shares will be listed on a public exchange at this time. No secondary market is expected to develop for the Fund’s shares. Limited liquidity is provided to shareholders only through the Fund’s quarterly repurchase offers for no less than 5% and no more than 25% of the Fund’s shares outstanding at net asset value. There is no guarantee that an investor will be able to sell all the shares that the investor desires to sell in the repurchase offer. The investment return and principal value of an investment will fluctuate so that an investor’s shares, when redeemed, may be worth more or less than the original cost. Due to these restrictions, an investor should consider an investment in the Fund to be of limited liquidity. The Fund is suitable only for investors who can bear the risks associated with the limited liquidity of the Fund and should be viewed as a long-term investment. Investing in the Fund is speculative and involves a high degree of risk, including the risks associated with leverage and the risk of a substantial loss of investment. There is no guarantee that the investment strategies will work under all market conditions.
The Adviser and the Fund have entered into an expense limitation and reimbursement agreement with respect to Class F shares (the “Class F Expense Limitation Agreement”) and a separate agreement with respect to all other classes of shares (the “Multi-Class Expense Limitation Agreement” and together with the Class F Expense Limitation Agreement, the “Expense Limitation Agreements”). Pursuant to the Class F Expense Limitation Agreement, the Adviser has contractually agreed to waive its fees and/or to reimburse the Fund for expenses the Fund incurs to the extent necessary to maintain the Fund’s total annual operating expenses after fee waivers and/or reimbursements (including taxes, interest, brokerage commissions, acquired fund fees and expenses, and extraordinary expenses, such as litigation or reorganization costs and organizational costs and offering costs) to the extent that they exceed, per annum, 1.50% of the Fund’s average daily net assets attributable to Class F shares. Pursuant to the Multi-Class Expense Limitation Agreement, the Adviser has contractually agreed to waive its fees and/or reimburse the Fund for expenses the Fund incurs, but only to the extent necessary to maintain the Fund’s total annual operating expenses after fee waivers and/or reimbursement (exclusive of any taxes, interest, brokerage commissions, acquired fund fees and expenses, and extraordinary expenses, such as litigation or reorganization costs, but inclusive of organizational costs and offering costs) to the extent that such expenses exceed, per annum, 2.25% of Class A average daily net assets, 3.00% of Class C average daily net assets, 2.00% of Class I average daily net assets, 2.50% of Class L average daily net assets and 2.75% of Class M average daily net assets (the “Expense Limitations”). The Expense Limitation Agreements will remain in effect at least through April 30, 2024, unless and until the Fund’s board approved its modification or termination. Per the Fund’s prospectus dated April 8, 2023, as amended August 31, 2023, the total annual expense ratio is 3.36% for Class A shares, 4.11% for Class C shares, 1.50% for Class F shares, 3.11% for Class I shares, 3.61% for Class L, and 3.86% for Class M shares. Prior to January 1, 2023, the Adviser voluntarily waived or absorbed certain of the operating expenses of the Fund since the commencement of the Fund’s operations.
The Fund’s distribution policy is to make quarterly distributions to shareholders. Shareholders should not assume that the source of a distribution from the Fund is net profit. Please refer to the Fund’s most recent Section 19(a) notice for an estimate of the composition of the Fund’s most recent distribution, available at www.apollo.com, and the Fund’s semi-annual or annual reports filed with the U.S. Securities and Exchange Commission (the “SEC”) and available on the Fund’s website for additional information regarding the composition of distributions. The Fund’s distributions may be affected by numerous factors, including but not limited to changes in Fund expenses including the amount of expenses waived by the Fund’s Adviser, investment performance, realized and projected market returns, fluctuations in market interest rates, and other factors. There is no assurance that the Fund’s distribution rate will be sustainable in the future nor are distributions guaranteed.
Investors in the Fund should understand that the net asset value (“NAV”) of the Fund will fluctuate, which may result in a loss of the principal amount invested. All investments contain risk and may lose value. The Fund’s investments may be negatively affected by the broad investment environment and capital markets in which the Fund invests, including the debt market, real estate market, and/or the equity securities market. The value of the Fund’s investments will increase or decrease based on changes in the prices of the investments it holds. This will cause the value of the Fund’s shares to increase or decrease. The use of leverage by the Fund will magnify the Fund’s gains or losses. The Fund is “diversified” under the Investment Company Act of 1940. Diversification does not eliminate the risk of experiencing investment losses. Holdings are subject to change without notice. The Fund is not intended to be a complete investment program.
Investing in lower-rated securities involves special risks in addition to the risks associated with investments in investment grade securities, including a high degree of credit risk. Lower-rated securities may be regarded as predominately speculative with respect to the issuer’s continuing ability to meet principal and interest payments. Analysis of the creditworthiness of issuers/issues of lower-rated securities may be more complex than for issuers/issues of higher quality debt securities. Securities that are in the lowest rating category are considered to have extremely poor prospects of ever attaining any real investment standing, to have a current identifiable vulnerability to default and/or to be unlikely to have the capacity to pay interest and repay principal. There is a risk that issuers will not make payments, resulting in losses to the Fund. In addition, the credit quality of securities may be lowered if an issuer’s financial condition changes. Lower credit quality may lead to greater volatility in the price of a security and in shares of the Fund. Lower credit quality also may affect liquidity and make it difficult to sell the security. Default, or the market’s perception that an issuer is likely to default, could reduce the value and liquidity of securities, thereby reducing the value of your investment in Fund shares. The Adviser’s judgments about the attractiveness, value and potential appreciation of a particular sector and securities in which the Fund invests may prove to be incorrect and may not produce the desired results. Foreign investing involves special risks such as currency fluctuations and political uncertainty. The use of leverage by the Fund will magnify the Fund’s gains or losses. There is no guarantee that the Fund’s leverage strategy will be successful.
10
APOLLO DIVERSIFIED CREDIT FUND
This material may contain certain forward-looking statements. Such forward-looking statements can generally be identified by our use of forward-looking terminology such as “may,” “will,” “expect,” “intend,” “anticipate,” “estimate,” “believe,” “continue,” or other similar words. Because such statements include risks, uncertainties and contingencies, actual results may differ materially from the expectations, intentions, beliefs, plans or predictions of the future expressed or implied by such forward-looking statements. As a result, investors should not rely on such forward-looking statements. These risks, uncertainties and contingencies include, but are not limited to: uncertainties relating to changes in general economic and real estate conditions; uncertainties relating to the implementation of our investment strategy; uncertainties relating to capital proceeds; and other risk factors as outlined in the Fund’s prospectus, statement of additional information, annual report and semi-annual report filed with the SEC.
The Fund is advised by Apollo Capital Credit Adviser, LLC (“ACCA”). ACCA is registered as an investment adviser with the SEC pursuant to the provisions of the Investment Advisers Act of 1940, as amended (the “Advisers Act”). The Fund is sub-advised by Apollo Credit Management, LLC (“ACM”). ACM is registered as an investment adviser with the SEC pursuant to the provisions of the Advisers Act. ACM and ACCA are affiliates of Apollo Global Management, Inc. and its consolidated subsidiaries. ACCA was acquired by Apollo Global Management, Inc., on May 2, 2022. Performance prior to May 2, 2022 was generated under the previous management team of the Fund’s former investment adviser, which was not affiliated with ACM. The current management team of ACCA is responsible for performance on and after May 2, 2022. Registration with the SEC does not constitute an endorsement by the SEC nor does it imply a certain level of skill or training.
This material may not be distributed, transmitted or otherwise communicated to others, in whole or in part, without the express written consent of Apollo Global Management, Inc. (together with its subsidiaries, “Apollo”).
This material has been distributed for informational purposes only and should not be considered as investment advice or a recommendation of any particular security, strategy or investment product or be relied upon for any other purpose. The views expressed represent an assessment of market conditions at a specific point in time, are opinions only and should not be relied upon as investment advice regarding a particular investment or markets in general. Such information does not constitute a recommendation to buy or sell specific securities or investment vehicles. It should not be assumed that any investment will be profitable or will equal the performance of the fund(s) or any securities or any sectors mentioned herein. Information contained herein has been obtained from sources deemed to be reliable, but not guaranteed. Apollo Global Management, Inc. and its affiliates do not provide tax, legal or accounting advice. This material is not intended to provide, and should not be relied on for, tax, legal or accounting advice. You should consult your own tax, legal and accounting advisors before engaging in any transaction. This material represents views as of the date of this presentation and is subject to change without notice of any kind.
11
APOLLO DIVERSIFIED CREDIT FUND
Endnotes
| 2. | J.P. Morgan – North America Credit Research, January 2023. Leveraged Loans are represented by J.P. Morgan Leveraged Loan Index. High yield is represented by the J.P. Morgan High Yield Bond Index. |
| 3. | Apollo Capital Credit Adviser, LLC, f/k/a Griffin Capital Credit Advisor, LLC (hereinafter “ACCA,” and together with ACCA’s affiliated registered investment advisers directly and indirectly owned by Apollo Global Management, Inc., “Apollo”) was acquired by Apollo Global Management, Inc., on May 2, 2022. Performance prior to May 2, 2022 was generated under the previous management team of the Fund’s former investment adviser, which was not affiliated with Apollo. The current management team of ACCA is responsible for performance on and after May 2, 2022. |
| 4. | Managed Assets are equal to the total of the Fund’s assets, including assets attributable to financial leverage, minus accrued liabilities, other than debt representing financial leverage. Holdings and allocations, unless disclosed otherwise, are based on Managed Assets. |
| 5. | Leverage is equal to consolidated Fund borrowings divided by total managed assets. The use of leverage by the Fund will magnify the Fund’s gains or losses. There is no guarantee that the Fund’s leverage strategy will be successful. |
| 6. | Duration is a measure of how sensitive the price of a debt instrument (such as a bond) is to a change in interest rates and is measured in years. |
| 7. | As of December 31, 2023. The annualized distribution rate for the Fund’s Class A, C, L, M and F shares were 10.15%, 9.34%, 9.87%, 9.62% and 13.58%, respectively. Distribution rates are not performance and reflect the applicable quarter’s cumulative distribution rate when annualized. Under GAAP, the composition of the Fund’s distribution on December 29, 2023 was estimated to include a de minimis amount of return of capital and should not be confused with yield or income. It is important to note that differences exist between the Fund’s accounting records prepared in accordance with GAAP and recordkeeping practices required under income tax regulations. Therefore, the characterization of Fund distributions for federal income tax purposes may be different from GAAP characterization estimates. The determination of what portion of each year’s distributions constitutes ordinary income, qualifying dividend income, short or long-term capital gains or return of capital is determined at year-end and reported to shareholders on Form 1099-DIV, which is mailed every year in late January. The Fund does not provide tax advice. Fund distributions would have been lower had expenses, such as management fees, not been waived during the period and the Adviser is under no obligation to continue the fee waiver for any specified period of time. |
| 8. | Represents the Fund’s weighted average yield to worst at current market value of the Fund’s underlying holdings, excluding cash. Yield to worst is an estimate of the lowest yield expected from a debt investment, absent a default. |
| 9. | Based on the Fund’s total market value exposure to debt securities. |
| 10. | Excludes Cash and Other Net Assets. |
| 11. | Totals may not sum due to rounding. |
| 12. | As of December 31, 2023. The one-year return of the Fund’s Class A (with max sales load), C, L (with max sales load), M and F shares were 7.63%, 13.41% , 9.08%, 13.68% and 17.66%, respectively. The Fund offers multiple different classes of shares. An investment in any share class of the Fund represents an investment in the same assets of the Fund. However, the purchase restrictions, ongoing fees and expenses are different, and, as such, performance and distributions for the Fund’s Class A, C, L, M and F shares will be different when compared to the Fund’s Class I shares. For more information on the differences in share classes, refer to the applicable prospectus. |
| 13. | Leveraged Commentary and Data (LCD) – U.S. Private Credit & Middle Market Quarterly Wrap (January 3, 2023). |
| 14. | Represents weighted average EBITDA of the Fund’s directly originated debt investments based on latest information tracked on our portfolio companies and excludes certain portfolio companies for which these metrics are not meaningful (for instance, portfolio companies with negative EBTIDA). |
| 15. | Includes distressed exchanges. |
| 16. | Weighted average yield is represented by yield-to-worst, which is an estimate of the lowest yield that you can expect to earn from a debt investment, absent a default. |
| 17. | Represents cash and other net assets including positions not categorized within the strategies described in the “Attribution by Strategy” table. |
| 18. | Based on the market value of the funded amount. |
| 19. | Based on the Global Industry Classification Standard (GICS). |
| 20. | Past correlations are not indicative of future correlations, which may vary. Correlation is a statistical measure of how two securities move in relation to each other. A correlation ranges from -1 to 1. A positive correlation of 1 implies that as one security moves, either up or down, the other security will move in lockstep, in the same direction. A negative correlation of -1 indicates that the securities have moved in the opposite direction. If the correlation is 0, the movements of the securities are said to have no correlation; they are completely random. Data source: Morningstar using daily data. Assets and securities contained within indices and peer funds may be different than the assets and securities contained in Apollo Diversified Credit Fund and will therefore have different risk and reward profiles. An investment cannot be made in an index, which is unmanaged and has returns that do not reflect any trading, management, or other costs. Please see the glossary for descriptions of indices. |
| 21. | Apollo’s AUM measure includes Assets Under Management for which Apollo charges either nominal or zero fees. Apollo’s AUM measure also includes assets for which Apollo does not have investment discretion, including certain assets for which Apollo earns only investment-related service fees, rather than management or advisory fees. Apollo’s definition of AUM is not based on any definition of Assets Under Management contained in its governing documents or in any management agreements of the funds Apollo manages. Apollo considers multiple factors for determining what should be included in its definition of AUM. Such factors include but are not limited to (1) Apollo’s ability to influence the investment decisions for existing and available assets; (2) Apollo’s ability to generate income from the underlying assets in the funds it manages; and (3) the AUM measures that Apollo uses internally or believes are used by other investment managers. Given the differences in the investment strategies and structures among other alternative investment managers, Apollo’s calculation of AUM may differ from the calculations employed by other investment managers and, as a result, this measure may not be directly comparable to similar measures presented by other investment managers. Apollo’s calculation also differs from the manner in which its affiliates registered with the SEC report “Regulatory Assets Under Management” on Form ADV and Form PF in various ways. Apollo uses AUM, gross capital deployment and dry powder as performance measurements of its investment activities, as well as to monitor fund size in relation to professional resource and infrastructure needs. |
12
APOLLO DIVERSIFIED CREDIT FUND
| 22. | As of September 30, 2023. Assets under management (AUM) refers to the assets of the funds, partnerships and accounts to which Apollo provides investment management, advisory, or certain other investment-related services, including, without limitation, capital that such funds, partnerships and accounts have the right to call from investors pursuant to capital commitments. Our AUM equals the sum of: (1) the NAV, plus used or available leverage and/or capital commitments, or gross assets plus capital commitments, of the yield and certain hybrid funds, partnerships and accounts for which we provide investment management or advisory services, other than certain CLOs, CDOs, and certain perpetual capital vehicles, which have a fee-generating basis other than the mark-to-market value of the underlying assets; for certain perpetual capital vehicles in yield, gross asset value plus available financing capacity; (2) the fair value of the investments of the equity and certain hybrid funds, partnerships and accounts Apollo manages or advises, plus the capital that such funds, partnerships and accounts are entitled to call from investors pursuant to capital commitments, plus portfolio level financings; (3) the gross asset value associated with the reinsurance investments of the portfolio company assets Apollo manages or advises; and (4) the fair value of any other assets that Apollo manages or advises for the funds, partnerships and accounts to which Apollo provides investment management, advisory, or certain other investment-related services, plus unused credit facilities, including capital commitments to such funds, partnerships and accounts for investments that may require pre-qualification or other conditions before investment plus any other capital commitments to such funds, partnerships and accounts available for investment that are not otherwise included in the clauses above. |
13
| Apollo Diversified Credit Fund | Portfolio Update |
| | December 31, 2023 (Unaudited) |
Performance (for the period ended December 31, 2023)
| | 6 Month | 1 Year | 3 Year**** | 5 Year**** | Since Inception**** | Inception |
| Apollo Diversified Credit Fund - A - With Load* | 0.00%***** | 7.88% | 2.14% | 4.08% | 3.80% | 4/3/17 |
| Apollo Diversified Credit Fund - A - Without Load | 6.09% | 14.46% | 4.18% | 5.31% | 4.72% | 4/3/17 |
| Apollo Diversified Credit Fund - C - With Load** | 4.75% | 12.62% | 3.93% | 5.16% | 4.60% | 4/3/17 |
| Apollo Diversified Credit Fund - C - Without Load | 5.75% | 13.62% | 3.93% | 5.16% | 4.60% | 4/3/17 |
| Apollo Diversified Credit Fund - I - NAV | 6.28% | 14.74% | 4.28% | 5.37% | 4.76% | 4/3/17 |
| Apollo Diversified Credit Fund - M - NAV | 5.83% | 13.89% | – | – | 2.12% | 11/2/21 |
| Apollo Diversified Credit Fund - L - With Load*** | 1.43% | 9.33% | 2.59% | 4.34% | 3.87% | 9/5/17 |
| Apollo Diversified Credit Fund - L - Without Load | 5.95% | 14.17% | 4.09% | 5.25% | 4.59% | 9/5/17 |
| Apollo Diversified Credit Fund - F - NAV | 7.67% | 17.94% | 5.43% | 6.07% | 5.20% | 9/25/17 |
| S&P/LSTA Leveraged Loan Index | 7.05% | 13.33% | 3.92% | 5.54% | 4.51% | 4/3/17 |
| * | Adjusted for initial maximum sales charge of 5.75% |
| ** | Adjusted for contingent deferred sales charge of 1.00% on shares repurchased during the first 365 days after their purchase |
| *** | Adjusted for initial maximum sales charge of 4.25% |
| **** | Annualized |
| ***** | Rounded |
The S&P/LSTA Leveraged Loan Index is a capitalization-weighted syndicated loan index based upon market weightings, spreads and interest payments. The S&P/LSTA Leveraged Loan Index covers the U.S. market back to 1997 and currently calculates on a daily basis.
Indexes are not actively managed and do not reflect deduction of fees, expenses or taxes. An investor cannot invest directly into an index. The returns shown above do not reflect the deduction of taxes a shareholder would pay on Fund distributions or redemption of Fund shares. The performance data quoted above represents past performance. Past performance is not indicative of future results. Investment return and value of the Fund shares will fluctuate so that an investor’s shares, when sold or redeemed, may be worth more or less than their original cost. Performance may be lower or higher than performance data quoted. The Fund's current performance is available by calling 1-888-926-2688 or by visiting www.apollodiversifiedcreditfund.com. Apollo Capital Credit Adviser, LLC (formerly, Griffin Capital Credit Advisor, LLC) was acquired by Apollo Global Management, Inc., an affiliate of the Fund’s sub-adviser, on May 2, 2022. Performance prior to May 2, 2022 was generated under the previous management team of the Fund’s investment adviser. The current management team of the Fund’s investment adviser is responsible for performance on and after May 2, 2022.
Class A shares are offered subject to a maximum sales charge of 5.75% of the offering price and Class L shares are offered subject to a maximum sales charge of 4.25% of the offering price. Class C, Class I and Class M shares are offered at net asset value per share. Class C shares may be subject to a 1.00% contingent deferred sales charge on shares redeemed during the first 365 days after their purchase. Class F Shares are no longer offered except for reinvestment of dividends at net asset value. The Adviser and the Fund have entered into an expense limitation and reimbursement agreement with respect to Class F shares (the “Class F Expense Limitation Agreement”) and a separate agreement with respect to all other classes of shares (the “Multi-Class Expense Limitation Agreement” and together with the Class F Expense Limitation Agreement, the “Expense Limitation Agreements”). Pursuant to the Class F Expense Limitation Agreement, the Adviser has contractually agreed to waive its fees and/or to reimburse the Fund for expenses the Fund incurs to the extent necessary to maintain the Fund’s total annual operating expenses after fee waivers and/or reimbursements (including taxes, interest, brokerage commissions, acquired fund fees and expenses, and extraordinary expenses, such as litigation or reorganization costs and organizational costs and offering costs) to the extent that they exceed, per annum, 1.50% of the Fund’s average daily net assets attributable to Class F shares. Pursuant to the Multi-Class Expense Limitation Agreement, the Adviser has contractually agreed to waive its fees and/or reimburse the Fund for expenses the Fund incurs, but only to the extent necessary to maintain the Fund’s total annual operating expenses after fee waivers and/or reimbursement (exclusive of any taxes, interest, brokerage commissions, acquired fund fees and expenses, and extraordinary expenses, such as litigation or reorganization costs, but inclusive of organizational costs and offering costs) to the extent that such expenses exceed, per annum, 2.25% of Class A average daily net assets, 3.00% of Class C average daily net assets, 2.00% of Class I average daily net assets, 2.50% of Class L average daily net assets and 2.75% of Class M average daily net assets (the “Expense Limitations”). In consideration of the Adviser’s agreement to limit the Fund’s expenses, the Fund has agreed to repay the Adviser (or any successor thereto) in the amount of any fees waived and reimbursed, subject to the limitations that: (1) the reimbursement for fees and expenses will be made only if payable not more than three years from the date on which they were incurred; and (2) the reimbursement may not be made if it would cause the lesser of the Expense Limitation applicable to such Class in place at the time of waiver or at the time of reimbursement to be exceeded. In addition, pursuant to the Multi-Class Expense Limitation Agreement, any such repayment must be approved by the Fund's Board of Trustees (the "Board" or the "Trustees"). The Expense Limitation Agreements will remain in effect at least through April 30, 2024. The Multi-Class Expense Limitation Agreement may then be renewed for consecutive twelve-month periods provided that the Adviser specifically approves such continuance at least annually. The Class F Expense Limitation Agreement shall continue in effect so long as Class F shares are outstanding. The Expense Limitation Agreements may be terminated only by the Board on written notice to the Adviser and will automatically terminate at such time as the Management Agreement between the Adviser and the Fund terminates. Total annual expenses after fee waivers were 2.95%, 3.70%, 2.70%, 3.20%, 1.85%, and 3.45% for Class A, Class C, Class I, Class L, Class F, and Class M, for the period ended December 31, 2022. For the period of August 16, 2021 to March 31, 2022, the Adviser voluntarily waived or absorbed operating expenses (excluding interest, brokerage commissions, acquired fund fees and expenses and extraordinary expenses) of the Fund in excess of 1.50% of net assets. For the period April 1, 2022 to September 30, 2022, the Adviser voluntarily waived or absorbed operating expenses (excluding interest, brokerage commissions, acquired fund fees and expenses and extraordinary expenses) of the Fund in excess of 1.00% of net assets. For the period October 1, 2022 to December 31, 2022, the Adviser voluntarily waived or absorbed operating expenses (excluding interest, brokerage commissions, acquired fund fees and expenses and extraordinary expenses) of the Fund in excess of 1.25% of net assets. In the absence of the election by the Fund's investment adviser to bear certain of the Fund's operating expenses, the ratio of expenses to average net assets including fee waivers and The voluntary waiver is separate and apart from the contractual waiver. Please review the Fund’s Prospectus for more details regarding the Fund’s fees and expenses. No assurances can be given that the Fund will pay a distribution in the future; or, if any such distribution is paid, the amount or rate of the distribution.
| 14 | 1.888.926.2688 | www.apollo.com |
| Apollo Diversified Credit Fund | Portfolio Update |
| | December 31, 2023 (Unaudited) |
Performance of $10,000 Initial Investment (for the period ended December 31, 2023)

The graph shown above represents historical performance of a hypothetical investment of $10,000 in the Class A Shares of the Fund since inception. Past performance is not indicative of future results. All returns reflect reinvested distributions, but do not reflect the deduction of taxes that a shareholder would pay on Fund distributions or the redemption of Fund shares.
Apollo Capital Credit Adviser, LLC (formerly, Griffin Capital Credit Advisor, LLC) was acquired by Apollo Global Management, Inc., an affiliate of the Fund’s sub-adviser, on May 2, 2022. Performance prior to May 2, 2022 was generated under the previous management team of the Fund’s investment adviser. The current management team of the Fund’s investment adviser is responsible for performance on and after May 2, 2022.
| Annual Report | December 31, 2023 | 15 |
| Apollo Diversified Credit Fund | Consolidated Schedule of Investments |
| | December 31, 2023 |
| Description | | Country | | Spread Above Index | | Rate | | | Maturity Date | | Principal Amount | | | Value (Note 2)(a) | |
| BANK LOANS (80.69%)(c) | | | | | | | | | | | | | | | |
| | | | | | | | | | | | | | | | |
| AEROSPACE & DEFENSE (1.24%)(b) | | | | | | | | | | | | | | | |
| Forming Machining Industries Holdings LLC, Second Lien Initial Term Loan | | United States | | 1M SOFR + 1.51% | | | 6.89 | % | | 10/09/26 | | $ | 310,775 | | | $ | 225,312 | |
| MRO Holdings, Inc., First Lien Term Loan (d)(e) | | United States | | 3M SOFR + 5.50% | | | 11.14 | % | | 12/18/28 | | | 9,672,131 | | | | 9,696,311 | |
| | | | | | | | | | | | | | | | | | 9,921,623 | |
| AUTOMOTIVE (1.31%) | | | | | | | | | | | | | | | | | | |
| Dodge Construction Network LLC, Second Lien Term Loan(b) | | United States | | 3M SOFR + 8.25% | | | 13.75 | % | | 02/25/30 | | | 1,513,158 | | | | 703,618 | |
| Neutron Holding, First Lien Term Loan (d)(g) | | United States | | | | | 10.00 | % | | 09/30/26 | | | 10,000,000 | | | | 9,800,000 | |
| | | | | | | | | | | | | | | | | | 10,503,618 | |
| BANKING, FINANCE, INSURANCE & REAL ESTATE (13.80%)(b)(d) | | | | | | | | | | | | | | | | | | |
| HIG Finance 2 Ltd., First Lien Term Loan (e) | | United Kingdom | | 3M SOFR + 5.25% | | | 10.61 | % | | 11/12/27 | | | 16,297,143 | | | | 16,297,143 | |
| Higginbotham Insurance Agency, Inc., Delayed Draw, First Lien Term Loan, AMD1 | | United States | | 3M SOFR + 5.50% | | | 10.96 | % | | 11/25/26 | | | 623,874 | | | | 623,874 | |
| Higginbotham Insurance Agency, Inc., Delayed Draw, First Lien Term Loan, AMD3 (h) | | United States | | 3M SOFR + 5.50% | | | 10.96 | % | | 11/24/28 | | | 2,218,522 | | | | 2,218,559 | |
| Higginbotham Insurance Agency, Inc., First Lien Term Loan, AMD1 (e) | | United States | | 3M SOFR + 5.50% | | | 10.96 | % | | 11/24/28 | | | 2,139,831 | | | | 2,139,831 | |
| Insight XI, First Lien Term Loan, (4.35% PIK) (i) | | Cayman Islands | | 3M SOFR + 3.85% | | | 6.75 | % | | 08/28/24 | | | 18,796,778 | | | | 18,796,778 | |
| Paisley Bidco Ltd., Delayed Draw, First Lien Term Loan (h) | | United Kingdom | | 3M SONIA + 7.00% | | | 10.70 | % | | 03/17/28 | | £ | 7,500,000 | | | | 9,392,566 | |
| Patrimonio, First Lien Term Loan (g) | | Colombia | | | | | 17.66 | % | | 06/30/28 | | COP$ | 40,050,600,000 | | | | 10,529,025 | |
| Project Antelope B1 Delayed Draw (6.88% PIK) (i) | | France | | 6M EUR L + 6.50% | | | 10.43 | % | | 04/18/30 | | € | 4,473,333 | | | | 4,851,905 | |
| Project Antelope B2 Delayed Draw (6.88% PIK) (h)(i) | | France | | EUR L + 6.50% | | | | | | 04/18/30 | | | 526,667 | | | | 571,238 | |
| Project Antelope B3 Delayed Draw (6.63% PIK) (h)(i) | | France | | EUR L + 6.25% | | | | | | 04/18/30 | | | 1,243,611 | | | | 1,348,856 | |
| Redfin Corp, Delayed Draw, First Lien Term Loan (h) | | United States | | SOFR + 5.75% | | | | | | 10/20/28 | | $ | 8,500,000 | | | | 8,245,000 | |
| Redfin Corp, Term Loan, First Lien Term Loan | | United States | | 3M SOFR + 5.75% | | | 11.24 | % | | 10/20/28 | | | 8,478,750 | | | | 8,224,370 | |
| Safe-Guard Incremental, First Lien Term Loan (e) | | United States | | 3M SOFR + 6.00% | | | 11.48 | % | | 01/27/27 | | | 8,594,521 | | | | 8,465,603 | |
| Safe-Guard, First Lien Term Loan (e) | | United States | | 3M SOFR + 6.00% | | | 11.48 | % | | 01/27/27 | | | 952,660 | | | | 938,370 | |
| Stretto, Inc., First Lien Term Loan | | United States | | 3M SOFR + 6.00% | | | 11.39% | | | 10/13/28 | | | 15,000,000 | | | | 14,700,000 | |
| VEPF VII Holdings, LP, First Lien Term Loan, (9.89% PIK) (i) | | United States | | 3M SOFR + 4.50% | | | 9.89 | % | | 02/28/28 | | | 3,215,687 | | | | 3,217,616 | |
| | | | | | | | | | | | | | | | | | 110,560,734 | |
| BEVERAGE, FOOD & TOBACCO (0.66%)(b) | | | | | | | | | | | | | | | | | | |
| Market Bidco Ltd., First Lien Term Loan | | United Kingdom | | 6M EUR L + 4.75% | | | 8.75 | % | | 11/04/27 | | € | 5,000,000 | | | | 5,256,695 | |
| | | | | | | | | | | | | | | | | | | |
| CAPITAL EQUIPMENT (4.00%)(b)(d) | | | | | | | | | | | | | | | | | | |
| Cube Industrials, Inc., Revolver, First Lien Term Loan (h) | | United States | | SOFR + 6.00% | | | | | | 10/18/29 | | $ | 1,137,931 | | | | 1,109,483 | |
| See Notes to Consolidated Financial Statements. | |
| 16 | 1.888.926.2688 | www.apollo.com |
| Apollo Diversified Credit Fund | Consolidated Schedule of Investments |
| | December 31, 2023 |
| Description | | Country | | Spread Above Index | | Rate | | | Maturity Date | | Principal Amount | | | Value (Note 2)(a) | |
| CAPITAL EQUIPMENT (continued) | | | | | | | | | | | | | | | |
| Cube Industrials, Inc., First Lien Term Loan (e) | | United States | | 3M SOFR + 6.00% | | | 11.40 | % | | 10/18/30 | | $ | 9,862,069 | | | $ | 9,615,517 | |
| Enstall Group B.V., First Lien Term Loan | | Netherlands | | 3M EUR L + 6.00% | | | 9.97 | % | | 08/30/28 | | € | 5,985,000 | | | | 6,474,687 | |
| Esdec Solar Group B.V., Delayed Draw, First Lien Term Loan (h) | | Netherlands | | EUR L + 6.00% | | | | | | 08/30/28 | | | 2,000,000 | | | | 2,163,738 | |
| JPW Industries, Term Loan, First Lien Term Loan | | United States | | 3M SOFR + 5.88% | | | 11.25 | % | | 11/22/28 | | $ | 8,000,000 | | | | 7,800,000 | |
| LSF12 Donnelly Bidco, LLC, First Lien Term Loan (e) | | United States | | 3M SOFR + 6.50% | | | 11.86 | % | | 10/02/29 | | | 4,987,500 | | | | 4,862,804 | |
| | | | | | | | | | | | | | | | | | 32,026,229 | |
| CHEMICALS, PLASTICS, & RUBBER (1.51%)(b) | | | | | | | | | | | | | | | | | | |
| Deccan Holdings B.V. (7.16% PIK), First Lien Term Loan (d)(i) | | India | | 3M SOFR + 1.75% | | | 12.63 | % | | 09/16/25 | | | 3,427,311 | | | | 3,453,015 | |
| Heubach, Term Loan PIK, First Lien Term Loan, (2.00% PIK) (d)(i) | | United States | | 3M SOFR + 10.00% | | | 15.65 | % | | 04/30/24 | | | 659,358 | | | | 548,862 | |
| LSF11 A5 HoldCo LLC, First Lien Term Loan (e) | | United States | | 3M SOFR + 4.25% | | | 9.71 | % | | 10/15/28 | | | 6,417,325 | | | | 6,446,748 | |
| Neptune Husky US Bidco, LLC, First Lien Term Loan (e)(f)(j) | | Luxembourg | | 3M SOFR + 5.00% | | | 10.43 | % | | 01/03/29 | | | 3,816,066 | | | | 1,668,346 | |
| | | | | | | | | | | | | | | | | | 12,116,971 | |
| CONSTRUCTION & BUILDING (0.39%)(b) | | | | | | | | | | | | | | | | | | |
| K Hovnanian Enterprises, Inc., Revolver, First Lien Term Loan (d)(h) | | United States | | SOFR + 4.50% | | | | | | 06/30/26 | | | 2,000,000 | | | | 1,880,000 | |
| LSF10 XL Bidco S.C.A., First Lien Facility B4 Term Loan | | Luxembourg | | 6M EUR L + 4.18% | | | 8.10 | % | | 04/12/28 | | € | 1,280,206 | | | | 1,250,272 | |
| | | | | | | | | | | | | | | | | | 3,130,272 | |
| CONSUMER GOODS: DURABLE (0.20%)(b) | | | | | | | | | | | | | | | | | | |
| Varsity Brands Holding Co., Inc., First Lien Term Loan (e) | | United States | | 3M SOFR + 5.00% | | | 10.47 | % | | 12/15/26 | | $ | 1,599,830 | | | | 1,593,587 | |
| | | | | | | | | | | | | | | | | | | |
| CONSUMER GOODS: NON-DURABLE (5.50%)(b) | | | | | | | | | | | | | | | | | | |
| ABG Intermediate Holdings 2, First Lien Term Loan (e) | | United States | | 3M SOFR + 3.50% | | | 8.96 | % | | 12/21/28 | | | 7,502,499 | | | | 7,546,764 | |
| Altern Marketing Revolver, First Lien Term Loan (d)(h) | | United States | | SOFR + 6.00% | | | | | | 06/13/28 | | | 1,134,454 | | | | 1,120,273 | |
| Altern Marketing, First Lien Term Loan (d)(e) | | United States | | 3M SOFR + 6.00% | | | 11.38 | % | | 06/13/28 | | | 7,570,588 | | | | 7,457,030 | |
| Iconix, First Lien Incremental Term Loan (d) | | United States | | 3M SOFR + 6.00% | | | 11.50 | % | | 08/22/29 | | | 9,030,163 | | | | 8,939,861 | |
| Iconix, First Lien Term Loan (d) | | United States | | 3M SOFR + 6.00% | | | 11.50 | % | | 08/22/29 | | | 2,384,615 | | | | 2,360,946 | |
| KDC US Holdings, Inc., First Lien Term Loan (e) | | Canada | | 3M SOFR + 5.00% | | | 10.36 | % | | 08/15/28 | | | 6,831,298 | | | | 6,785,187 | |
| Revlon, Revolver, First Lien Term Loan (d)(h) | | United States | | 3M SOFR + 4.50% | | | 11.50 | % | | 05/02/26 | | | 10,000,000 | | | | 9,875,000 | |
| | | | | | | | | | | | | | | | | | 44,085,061 | |
| CONTAINERS, PACKAGING & GLASS (1.17%)(b)(e) | | | | | | | | | | | | | | | | | | |
| Tekni-Plex, Inc., First Lien Term | | United States | | 3M SOFR + 5.25% | | | 10.60 | % | | 09/15/28 | | | 1,234,833 | | | | 1,240,859 | |
| Trident TPI Holdings, Inc., First Lien 2018 Dollar Term Loan | | United States | | 3M SOFR + 4.50% | | | 9.85 | % | | 09/15/28 | | | 8,081,669 | | | | 8,102,361 | |
| | | | | | | | | | | | | | | | | | 9,343,220 | |
| ENERGY: OIL & GAS (0.00%)(d)(f) | | | | | | | | | | | | | | | | | | |
| AMH Litigation Trust, First Lien Delayed Draw, Term Loan | | United States | | | | | | | | 06/08/25 | | | 1,118 | | | | – | |
| See Notes to Consolidated Financial Statements. | |
| Annual Report | December 31, 2023 | 17 |
| Apollo Diversified Credit Fund | Consolidated Schedule of Investments |
| | December 31, 2023 |
| Description | | Country | | Spread Above Index | | Rate | | | Maturity
Date | | Principal
Amount | | | Value (Note 2)(a) | |
| ENERGY: OIL & GAS (continued) | | | | | | | | | | | | | | | |
| AMH Litigation Trust, First Lien Delayed Draw, Term Loan | | United States | | | | | | | | 06/06/25 | | $ | 1,044 | | | $ | – | |
| | | | | | | | | | | | | | | | | | – | |
| ENVIRONMENTAL INDUSTRIES (0.94%)(b)(d) | | | | | | | | | | | | | | | | | | |
| Ruler BidCo B1, First Lien Term Loan | | Luxembourg | | 6M EUR L + 6.50% | | | 10.43 | % | | 05/02/30 | | € | 3,951,573 | | | | 4,253,271 | |
| Ruler BidCo B2, First Lien Term Loan | | Luxembourg | | 6M SOFR + 6.50% | | | 11.85 | % | | 05/02/30 | | $ | 1,618,319 | | | | 1,585,953 | |
| Ruler BidCo Delayed Draw, First Lien Term Loan (h) | | Luxembourg | | 6M EUR L + 6.50% | | | 10.42 | % | | 05/02/30 | | € | 1,568,000 | | | | 1,687,715 | |
| | | | | | | | | | | | | | | | | | 7,526,939 | |
| HEALTHCARE & PHARMACEUTICALS (12.22%)(b) | | | | | | | | | | | | | | | | | | |
| Advarra Holdings, Inc., First Lien Delayed Draw, Term Loan (d)(e)(h) | | United States | | SOFR + 5.25% | | | | | | 08/24/29 | | $ | 1,243,180 | | | | 1,236,965 | |
| Advarra Holdings, Inc., First Lien Term Loan (d)(e) | | United States | | 3M SOFR + 5.25% | | | 10.61 | % | | 08/24/29 | | | 13,619,251 | | | | 13,551,501 | |
| Allied Benefit Systems Intermediate LLC, First Lien Term Loan (d)(e) | | United States | | 3M SOFR + 5.25% | | | 10.63 | % | | 10/31/30 | | | 8,453,608 | | | | 8,326,804 | |
| Allied Benefit Systems Intermediate LLC, Delayed Draw, First Lien Term Loan (d)(h) | | United States | | SOFR + 5.25% | | | | | | 10/31/30 | | | 1,546,392 | | | | 1,523,196 | |
| Bausch Health Americas, Inc., First Lien Term Loan (e) | | United States | | 3M SOFR + 5.25% | | | 10.67 | % | | 02/01/27 | | | 5,189,977 | | | | 4,231,649 | |
| Corpuls, First Lien Term Loan (d) | | Germany | | 6M EUR L + 7.00% | | | 10.93 | % | | 06/28/30 | | € | 4,000,000 | | | | 4,360,593 | |
| Exactcare Parent, Revolver, First Lien Term Loan (d)(h) | | United States | | SOFR + 6.50% | | | | | | 11/03/29 | | $ | 491,803 | | | | 478,279 | |
| Exactcare Parent, First Lien Term Loan (d) | | United States | | 3M SOFR + 6.50% | | | 11.89 | % | | 11/03/29 | | | 4,508,197 | | | | 4,384,221 | |
| Inovalon, First Lien Term Loan, (2.75% PIK) (d)(e)(i) | | United States | | 3M SOFR + 3.50% | | | 8.97 | % | | 11/24/28 | | | 10,354,006 | | | | 10,224,581 | |
| Inovalon, Second Lien Term Loan (15.96% PIK) (d)(i) | | United States | | 3M SOFR + 10.50% | | | 15.97 | % | | 11/25/33 | | | 122,741 | | | | 120,248 | |
| Keystone Acquisition, Revolver, First Lien Term Loan (d)(h) | | United States | | 3M SOFR + 6.50% | | | 11.84 | % | | 12/17/27 | | | 1,000,000 | | | | 980,000 | |
| Keystone Acquisition, First Lien Term Loan (d)(e) | | United States | | 3M SOFR + 6.50% | | | 11.85 | % | | 12/15/28 | | | 8,910,000 | | | | 8,732,038 | |
| Milano Acquisition Corp., First Lien B Term Loan (e) | | United States | | 3M SOFR + 4.00% | | | 9.45 | % | | 10/01/27 | | | 6,824,544 | | | | 6,653,931 | |
| OMH-HealthEdge Holdings, LLC Revolver, First Lien Term Loan (d)(h) | | United States | | SOFR + 6.00% | | | | | | 10/08/29 | | | 1,563,910 | | | | 1,524,812 | |
| OMH-HealthEdge Holdings, LLC, First Lien Term Loan (d)(e) | | United States | | 3M SOFR + 6.00% | | | 11.35 | % | | 10/08/29 | | | 14,436,090 | | | | 14,075,188 | |
| Project Dolphin, First Lien Term Loan (d) | | United Kingdom | | 3M SONIA + 6.25% | | | 11.47 | % | | 11/02/29 | | £ | 5,000,000 | | | | 6,325,443 | |
| Tivity Health, Inc., First Lien Term Loan (d) | | United States | | 3M SOFR + 6.00% | | | 11.35 | % | | 06/28/29 | | $ | 7,406,250 | | | | 7,313,672 | |
| Zest Acquisition Corp., First Lien Term Loan (e) | | United States | | 3M SOFR + 5.50% | | | 10.86 | % | | 02/08/28 | | | 3,960,000 | | | | 3,883,513 | |
| | | | | | | | | | | | | | | | | | 97,926,634 | |
| HIGH TECH INDUSTRIES (12.44%)(b) | | | | | | | | | | | | | | | | | | |
| Access Group, First Lien Delayed Draw, Term Loan, (4.00% PIK) (d)(i) | | United Kingdom | | 3M SONIA + 5.25% | | | 10.44 | % | | 06/28/29 | | £ | 2,057,000 | | | | 2,576,068 | |
| Access Group, First Lien Term Loan, (4.00% PIK) (d)(i) | | United Kingdom | | 3M SONIA + 5.25% | | | 10.44 | % | | 06/28/29 | | | 3,943,000 | | | | 4,937,985 | |
| Anaplan Inc., First Lien Term Loan (d)(e) | | United States | | 3M SOFR + 6.50% | | | 11.85 | % | | 06/21/29 | | $ | 9,417,548 | | | | 9,464,636 | |
| See Notes to Consolidated Financial Statements. | |
| 18 | 1.888.926.2688 | www.apollo.com |
| Apollo Diversified Credit Fund | Consolidated Schedule of Investments |
| | December 31, 2023 |
| Description | | Country | | Spread Above Index | | Rate | | | Maturity
Date | | Principal Amount | | | Value (Note 2)(a) | |
| HIGH TECH INDUSTRIES (continued) | | | | | | | | | | | | | | | |
| Anaplan Inc., Revolver, First Lien Term Loan (d)(h) | | United States | | SOFR + 6.50% | | | | | | 06/21/28 | | $ | 582,452 | | | $ | 585,364 | |
| Auctane, Inc., First Lien Term Loan (d)(e) | | United States | | 3M SOFR + 5.75% | | | 11.23 | % | | 10/05/28 | | | 9,874,372 | | | | 9,874,372 | |
| Avalara Inc., First Lien Term Loan (d) | | United States | | 3M SOFR + 7.25% | | | 12.60 | % | | 10/19/28 | | | 18,181,818 | | | | 18,272,727 | |
| Avalara Inc., Revolver, First Lien Term Loan (d)(h) | | United States | | SOFR + 7.25% | | | | | | 10/19/28 | | | 1,818,182 | | | | 1,827,273 | |
| Certinia, First Lien Term Loan (d)(e) | | United States | | 3M SOFR + 7.25% | | | 12.68 | % | | 08/03/29 | | | 3,529,412 | | | | 3,423,529 | |
| Certinia, Revolver, First Lien Term Loan (d)(h) | | United States | | SOFR + 7.25% | | | | | | 08/04/29 | | | 470,588 | | | | 456,471 | |
| Coupa Holdings LLC, Delayed Draw, First Lien Term Loan (d)(h) | | United States | | SOFR + 7.50% | | | | | | 02/27/30 | | | 539,886 | | | | 531,788 | |
| Coupa Holdings LLC, First Lien Term Loan (d)(e) | | United States | | 3M SOFR + 7.50% | | | 12.86 | % | | 02/27/30 | | | 6,046,728 | | | | 5,956,027 | |
| Coupa Holdings LLC, Revolver, First Lien Term Loan (d)(h) | | United States | | SOFR + 7.50% | | | | | | 02/27/29 | | | 413,386 | | | | 405,118 | |
| Crewline Buyer, Inc., Revolver, First Lien Term Loan (d)(h) | | United States | | SOFR + 6.75% | | | | | | 11/08/30 | | | 471,698 | | | | 459,906 | |
| Crewline Buyer, Inc., First Lien Term Loan (d) | | United States | | 3M SOFR + 6.75% | | | 12.10 | % | | 11/08/30 | | | 4,528,302 | | | | 4,415,094 | |
| Falcon, First Lien Term Loan (d)(e) | | United States | | 3M SOFR + 6.00% | | | 11.35 | % | | 09/30/30 | | | 9,906,832 | | | | 9,659,162 | |
| Falcon, Revolver, First Lien Term Loan (d)(h) | | United States | | SOFR + 6.00% | | | | | | 10/01/29 | | | 1,093,168 | | | | 1,065,839 | |
| Flexera Software LLC, First Lien Term Loan (e) | | United States | | 3M SOFR + 3.75% | | | 9.22 | % | | 03/03/28 | | | 5,387,747 | | | | 5,391,620 | |
| Zendesk Delayed Draw, First Lien Term Loan, (3.00% PIK) (d)(h)(i) | | United States | | SOFR + 6.50% | | | | | | 11/22/28 | | | 3,695,652 | | | | 3,695,652 | |
| Zendesk Revolver, First Lien Term Loan (d)(h) | | United States | | SOFR + 6.50% | | | | | | 11/22/28 | | | 1,521,739 | | | | 1,521,739 | |
| Zendesk, First Lien Term Loan (3.50% PIK) (d)(e)(i) | | United States | | 3M SOFR + 6.25% | | | 11.61 | % | | 11/22/28 | | | 15,167,685 | | | | 15,167,685 | |
| | | | | | | | | | | | | | | | | | 99,688,055 | |
| HOTEL, GAMING & LEISURE (2.19%)(b) | | | | | | | | | | | | | | | | | | |
| CircusTrix LLC, Delayed Draw, First Lien Term Loan (d)(h) | | United States | | SOFR + 6.75% | | | | | | 07/18/28 | | | 537,634 | | | | 529,570 | |
| CircusTrix LLC, First Lien Term Loan (d) | | United States | | 3M SOFR + 6.75% | | | 12.11 | % | | 07/18/28 | | | 4,183,065 | | | | 4,120,406 | |
| CircusTrix LLC, Revolver, First Lien Term Loan (d)(h) | | United States | | SOFR + 6.75% | | | | | | 07/18/28 | | | 268,817 | | | | 264,785 | |
| Life Time, Inc., First Lien Term Loan (e) | | United States | | 1M SOFR + 4.25% | | | 10.11 | % | | 01/15/26 | | | 7,000,000 | | | | 7,056,000 | |
| NCL Corporation Ltd., Backstop Notes Bridge, First Lien Term Loan (d)(f)(h) | | United States | | | | | | | | 02/22/24 | | | 2,080,000 | | | | 2,080,000 | |
| NCL Corporation Ltd., First Lien B Term Loan (d)(f)(h) | | United States | | | | | | | | 02/22/24 | | | 3,460,000 | | | | 3,460,000 | |
| | | | | | | | | | | | | | | | | | 17,510,761 | |
| MEDIA: ADVERTISING, PRINTING & PUBLISHING (2.75%)(b) | | | | | | | | | | | | | | | | | | |
| Associations Inc., First Lien Term Loan (2.50% PIK) (d)(i) | | United States | | 3M SOFR + 4.00% | | | 12.09 | % | | 07/02/27 | | | 359,999 | | | | 359,999 | |
| Associations Inc., First Lien Term Loan A, (2.50% PIK) (d)(i) | | United States | | 1M SOFR + 4.00% | | | 12.09 | % | | 07/02/27 | | | 3,115,992 | | | | 3,115,992 | |
| McGraw-Hill Education, Inc., First Lien Term Loan (e) | | United States | | 1M SOFR + 4.75% | | | 10.22 | % | | 07/28/28 | | | 6,124,206 | | | | 6,126,135 | |
| R.R. Donnelley & Sons Company, First Lien B Term Loan | | United States | | 3M SOFR + 7.25% | | | 12.71 | % | | 03/17/28 | | | 12,391,968 | | | | 12,422,483 | |
| | | | | | | | | | | | | | | | | | 22,024,609 | |
| See Notes to Consolidated Financial Statements. | |
| Annual Report | December 31, 2023 | 19 |
| Apollo Diversified Credit Fund | Consolidated Schedule of Investments |
| | December 31, 2023 |
| Description | | Country | | Spread Above Index | | Rate | | | Maturity Date | | Principal Amount | | | Value (Note 2)(a) | |
| MEDIA: BROADCASTING & SUBSCRIPTION (1.26%) | | | | | | | | | | | | | | | |
| CSC Holdings LLC, First Lien March 2017 Refinancing Term Loan (e) | | United States | | 3M US SL + 2.25% | | | 7.73 | % | | 07/17/25 | | $ | 6,723,272 | | | $ | 6,630,861 | |
| CSC Holdings LLC, First Lien Term Loan | | United States | | 3M SOFR + 4.50% | | | 9.86 | % | | 01/18/28 | | | 3,617,000 | | | | 3,502,847 | |
| | | | | | | | | | | | | | | | | | 10,133,708 | |
| RETAIL (2.81%)(b) | | | | | | | | | | | | | | | | | | |
| ASDA, First Lien Term Loan (d) | | United Kingdom | | 3M SONIA + 6.75% | | | 12.00 | % | | 10/26/29 | | £ | 12,000,000 | | | | 14,726,732 | |
| Bellis Acquisition Company PLC, First | | | | | | | | | | | | | | | | | | |
| Lien B Term Loan | | United Kingdom | | 6M EUR L + 2.75% | | | 6.88 | % | | 02/16/26 | | € | 3,000,000 | | | | 3,298,264 | |
| EG Group Ltd., First Lien Term Loan | | United Kingdom | | 3M EUR L + 5.50% | | | 9.48 | % | | 02/07/28 | | | 4,131,177 | | | | 4,439,544 | |
| Mahwah Bergen Retail Group, Inc., First | | | | | | | | | | | | | | | | | | |
| Lien Tranche B Term Loan (f)(j) | | United States | | 3M US SL + 4.50% | | | 5.25 | % | | 08/21/22 | | $ | 1,435,369 | | | | 7,177 | |
| | | | | | | | | | | | | | | | | | 22,471,717 | |
| SERVICES: BUSINESS (11.68%) | | | | | | | | | | | | | | | | | | |
| Acuity, First Lien Delayed Draw, Term Loan (b)(d) | | United Kingdom | | 3M SOFR + 5.25% | | | 10.42 | % | | 06/07/29 | | | 1,137,500 | | | | 1,128,969 | |
| Acuity, First Lien Term Loan (b)(d) | | United Kingdom | | 3M SOFR + 5.25% | | | 10.42 | % | | 06/07/29 | | | 6,362,500 | | | | 6,314,781 | |
| BDO USA, Term Loan, First Lien Term Loan (b)(d)(e) | | United States | | 3M SOFR + 6.00% | | | 11.36 | % | | 08/31/28 | | | 21,945,000 | | | | 21,506,045 | |
| Coretrust, First Lien Delayed Draw, Term Loan (b)(d)(h) | | United States | | SOFR + 6.75% | | | | | | 10/01/29 | | | 789,474 | | | | 765,790 | |
| Coretrust, First Lien Revolver Term Loan (b)(d)(h) | | United States | | SOFR + 6.75% | | | | | | 10/01/29 | | | 789,474 | | | | 765,789 | |
| Coretrust, First Lien Term Loan (b)(d)(e) | | United States | | 3M SOFR + 6.75% | | | 12.11 | % | | 10/01/29 | | | 5,366,842 | | | | 5,205,837 | |
| eResearchTechnology, Inc., First Lien Initial Term Loan (b)(e) | | United States | | 1M SOFR + 4.50% | | | 9.97 | % | | 02/04/27 | | | 4,314,356 | | | | 4,315,919 | |
| GBT Group Services B.V., First Lien Term Loan, (4.00% PIK) (b)(i) | | Netherlands | | 3M SOFR + 6.00% | | | 11.48 | % | | 12/16/26 | | | 15,000,000 | | | | 15,037,500 | |
| Ichnaea, First Lien Term Loan B(b)(d) | | United Kingdom | | 3M SONIA + 6.00% | | | 11.26 | % | | 10/05/29 | | £ | 5,000,000 | | | | 6,182,045 | |
| Planet US Buyer LLC, First Lien Term Loan (b)(d)(e) | | United States | | 3M SOFR + 6.75% | | | 12.13 | % | | 02/01/30 | | $ | 6,432,870 | | | | 6,272,049 | |
| Planet US Buyer LLC, Revolver, First Lien Term Loan (b)(d)(h) | | United States | | SOFR + 6.75% | | | | | | 02/01/28 | | | 518,519 | | | | 505,556 | |
| Polaris Newco LLC, First Lien Term Loan (b)(e) | | United States | | 3M SOFR + 4.00% | | | 9.47 | % | | 06/02/28 | | | 4,896,052 | | | | 4,836,687 | |
| Project Harrier, First Lien Term Loan (6.25% PIK) (d)(g)(i) | | United Kingdom | | | | | 12.50 | % | | 11/22/29 | | £ | 5,000,000 | | | | 6,150,179 | |
| Valor, Inc., EUR, First Lien Term Loan, (1.73% PIK) (b)(d)(i) | | United Kingdom | | 6M EUR L + 5.40% | | | 9.33 | % | | 07/11/29 | | € | 1,410,281 | | | | 1,541,308 | |
| Valor, Inc., First Lien Delayed Draw, Term Loan, (1.73% PIK) (b)(d)(i) | | United Kingdom | | 6M EUR L + 5.75% | | | 10.59 | % | | 07/11/29 | | | 1,750,000 | | | | 1,912,589 | |
| Valor, Inc., First Lien Delayed Draw, Term Loan, Add-On (1.73% PIK) (b)(d)(h)(i) | | United Kingdom | | EUR L + 6.25% | | | | | | 07/11/29 | | | 3,000,000 | | | | 3,278,725 | |
| Valor, Inc., GBP, First Lien Term Loan, (1.73% PIK) (b)(d)(i) | | United Kingdom | | 3M SONIA + 5.40% | | | 10.59 | % | | 07/11/29 | | £ | 2,295,636 | | | | 2,896,867 | |
| Wellsky, First Lien Term Loan (b)(d) | | United States | | 3M SOFR + 5.75% | | | 11.22 | % | | 03/10/28 | | $ | 4,937,500 | | | | 4,937,802 | |
| | | | | | | | | | | | | | | | | | 93,554,437 | |
| SERVICES: CONSUMER (0.63%)(b)(e) | | | | | | | | | | | | | | | | | | |
| Delivery Hero SE, First Lien Term Loan | | Korea, South | | 3M SOFR + 5.75% | | | 11.17 | % | | 08/12/27 | | | 5,024,647 | | | | 5,051,881 | |
| See Notes to Consolidated Financial Statements. | |
| 20 | 1.888.926.2688 | www.apollo.com |
| Apollo Diversified Credit Fund | Consolidated Schedule of Investments |
| | December 31, 2023 |
| Description | | Country | | Spread Above Index | | Rate | | | Maturity Date | | Principal Amount | | | Value (Note 2)(a) | |
| TELECOMMUNICATIONS (1.92%)(b) | | | | | | | | | | | | | | | |
| CommScope, Inc., First Lien Term Loan (e) | | United States | | 3M SOFR + 3.25% | | | 8.72 | % | | 04/06/26 | | $ | 15,699,736 | | | $ | 14,078,386 | |
| TDC Net A, First Lien Term Loan | | Denmark | | 6M EUR L + 1.50% | | | 5.46 | % | | 01/31/24 | | € | 529,081 | | | | 559,254 | |
| TDC Net B, First Lien Term Loan | | Denmark | | 6M EUR L + 1.50% | | | 5.46 | % | | 01/29/27 | | | 695,143 | | | | 734,787 | |
| | | | | | | | | | | | | | | | | | 15,372,427 | |
| TRANSPORTATION: CARGO (2.07%)(b)(d) | | | | | | | | | | | | | | | | | | |
| Channelside Inc., Delayed Draw, 2023-A, First Lien Term Loan (e)(h) | | United States | | SOFR + 6.75% | | | | | | 06/30/28 | | $ | 93,333 | | | | 91,933 | |
| Channelside Inc., Delayed Draw, 2023-B, First Lien Term Loan (h) | | United States | | SOFR + 5.50% | | | | | | 06/30/28 | | | 845,238 | | | | 832,560 | |
| Channelside Inc., Revolver, First Lien Term Loan (e)(h) | | United States | | SOFR + 6.75% | | | | | | 07/01/26 | | | 333,333 | | | | 328,333 | |
| Channelside Inc., First Lien Term Loan (e) | | United States | | 3M SOFR + 6.75% | | | 12.11 | % | | 06/30/28 | | | 3,547,428 | | | | 3,494,217 | |
| Swissport, First Lien Term Loan | | Luxembourg | | 6M EUR L + 7.25% | | | 11.18 | % | | 09/30/27 | | € | 11,000,000 | | | | 11,870,198 | |
| | | | | | | | | | | | | | | | | | 16,617,241 | |
| TOTAL BANK LOANS | | | | | | | | | | | | | | | | | | |
| (Cost $641,187,679) | | | | | | | | | | | | | | | | | 646,416,419 | |
| | | | | | | | | | | | | | | | | | | |
| CORPORATE BONDS (27.97%) | | | | | | | | | | | | | | | | | | |
| AUTOMOTIVE (0.90%)(g)(i)(k) | | | | | | | | | | | | | | | | | | |
| Carvana Co., (12.00% PIK) | | United States | | | | | 12.00 | % | | 12/01/28 | | $ | 2,969,000 | | | | 2,528,326 | |
| Carvana Co., (13.00% PIK) | | United States | | | | | 13.00 | % | | 06/01/30 | | | 2,557,000 | | | | 2,159,067 | |
| Carvana Co., (14.00% PIK) | | United States | | | | | 14.00 | % | | 06/01/31 | | | 2,986,000 | | | | 2,558,256 | |
| | | | | | | | | | | | | | | | | | 7,245,649 | |
| BANKING, FINANCE, INSURANCE & REAL ESTATE (1.96%) | | | | | | | | | | | | | | | | | | |
| Encore Capital Group, Inc. (g)(k) | | United States | | | | | 4.25 | % | | 06/01/28 | | £ | 672,000 | | | | 735,853 | |
| Kane Bidco, Ltd.(d)(k) | | United Kingdom | | 3M SONIA + 6.25% | | | 11.48 | % | | 02/15/28 | | | 10,000,000 | | | | 12,714,619 | |
| Kane Bidco, Ltd., Series REGs (g) | | United Kingdom | | | | | 5.00 | % | | 02/15/27 | | € | 1,000,000 | | | | 1,064,964 | |
| Kane Bidco, Ltd. (g) | | United Kingdom | | | | | 6.50 | % | | 02/15/27 | | £ | 1,000,000 | | | | 1,194,983 | |
| | | | | | | | | | | | | | | | | | 15,710,419 | |
| BEVERAGE, FOOD & TOBACCO (0.69%)(g)(k) | | | | | | | | | | | | | | | | | | |
| Market Bidco Finco PLC | | United Kingdom | | | | | 5.50 | % | | 11/04/27 | | | 4,870,000 | | | | 5,501,431 | |
| | | | | | | | | | | | | | | | | | | |
| CHEMICALS, PLASTICS, & RUBBER (0.47%)(e)(g)(k) | | | | | | | | | | | | | | | | | | |
| Olympus Water US Holding Corp. | | United States | | | | | 7.13 | % | | 10/01/27 | | $ | 3,750,000 | | | | 3,750,637 | |
| | | | | | | | | | | | | | | | | | | |
| CONSTRUCTION & BUILDING (2.21%)(d)(g)(k) | | | | | | | | | | | | | | | | | | |
| K Hovnanian Enterprises, Inc. | | United States | | | | | 8.00 | % | | 09/30/28 | | | 10,000,000 | | | | 9,900,000 | |
| K Hovnanian Enterprises, Inc. | | United States | | | | | 11.75 | % | | 09/30/29 | | | 8,000,000 | | | | 7,780,000 | |
| | | | | | | | | | | | | | | | | | 17,680,000 | |
| CONSUMER GOODS: DURABLE (1.84%)(b)(d)(k) | | | | | | | | | | | | | | | | | | |
| Hercules Achievement, Inc. / Varsity Brands Holding Co., Inc. | | United States | | 3M SOFR + 6.50% | | | 11.83 | % | | 12/15/26 | | | 15,000,000 | | | | 14,775,000 | |
| | | | | | | | | | | | | | | | | | | |
| CONSUMER GOODS: NON-DURABLE (1.47%)(b)(d)(i) | | | | | | | | | | | | | | | | | | |
| Grupo Florence Series A | | Italy | | 3M EUR L + 6.75% | | | 10.64 | % | | 10/17/30 | | € | 4,820,870 | | | | 5,162,328 | |
| Grupo Florence Series B | | Italy | | 3M EUR L + 6.75% | | | 10.64 | % | | 10/17/30 | | | 6,179,130 | | | | 6,616,794 | |
| | | | | | | | | | | | | | | | | | 11,779,122 | |
| See Notes to Consolidated Financial Statements. | |
| Annual Report | December 31, 2023 | 21 |
| Apollo Diversified Credit Fund | Consolidated Schedule of Investments |
| | December 31, 2023 |
| Description | | Country | | Spread Above Index | | Rate | | | Maturity Date | | Principal Amount | | | Value (Note 2)(a) | |
| ENERGY: OIL & GAS (4.16%) | | | | | | | | | | | | | | | |
| Alta Mesa Holdings LP / Alta Mesa Finance Services Corp.(f)(g)(j) | | United States | | | | | | | | 12/15/24 | | $ | 968,000 | | | $ | 1,258 | |
| Energy Transfer LP, Series A(b) | | United States | | 3M US SL + 4.03% | | | 9.67 | % | | 02/15/72 | | | 3,774,000 | | | | 3,635,938 | |
| Energy Transfer LP, Series H(b) | | United States | | 5Y US T + 5.69% | | | 6.50 | % | | 11/15/72 | | | 12,458,000 | | | | 11,896,954 | |
| Moss Creek Resources Holdings, Inc. (g)(k) | | United States | | | | | 10.50 | % | | 05/15/27 | | | 10,000,000 | | | | 10,265,625 | |
| Venture Global LNG, Inc.(e)(g)(k) | | United States | | | | | 8.13 | % | | 06/01/28 | | | 7,500,000 | | | | 7,566,938 | |
| | | | | | | | | | | | | | | | | | 33,366,713 | |
| HEALTHCARE & PHARMACEUTICALS (0.53%)(g)(k) | | | | | | | | | | | | | | | | | | |
| Bausch Health Companies, Inc. | | United States | | | | | 5.50 | % | | 11/01/25 | | | 4,410,000 | | | | 4,036,782 | |
| US Acute Care Solutions LLC | | United States | | | | | 6.38 | % | | 03/01/26 | | | 266,000 | | | | 223,589 | |
| | | | | | | | | | | | | | | | | | 4,260,371 | |
| HIGH TECH INDUSTRIES (2.09%)(g)(k) | | | | | | | | | | | | | | | | | | |
| CA Magnum Holdings(e) | | India | | | | | 5.38 | % | | 10/31/26 | | | 3,399,000 | | | | 3,182,946 | |
| Wolfspeed, Inc.(d) | | United States | | | | | 9.88 | % | | 06/23/30 | | | 14,000,000 | | | | 13,528,200 | |
| | | | | | | | | | | | | | | | | | 16,711,146 | |
| HOTEL, GAMING & LEISURE (0.46%)(d)(g)(k) | | | | | | | | | | | | | | | | | | |
| NCL Corporation Ltd., Series A | | United States | | | | | 9.75 | % | | 02/22/28 | | | 3,460,000 | | | | 3,675,558 | |
| | | | | | | | | | | | | | | | | | | |
| MEDIA: ADVERTISING, PRINTING & PUBLISHING | | (1.60%)(e)(g)(k) | | | | | | | | | | | | | | | | |
| Gannett Holdings LLC | | United States | | | | | 6.00 | % | | 11/01/26 | | | 7,500,000 | | | | 6,673,828 | |
| McGraw-Hill Education, Inc. | | United States | | | | | 5.75 | % | | 08/01/28 | | | 6,367,000 | | | | 6,140,558 | |
| | | | | | | | | | | | | | | | | | 12,814,386 | |
| MEDIA: BROADCASTING & SUBSCRIPTION (0.94%)(g)(k) | | | | | | | | | | | | | | | | | | |
| Clear Channel Outdoor Holdings, Inc.(e) | | United States | | | | | 5.13 | % | | 08/15/27 | | | 2,810,000 | | | | 2,681,501 | |
| CSC Holdings LLC | | United States | | | | | 5.50 | % | | 04/15/27 | | | 5,238,000 | | | | 4,840,383 | |
| | | | | | | | | | | | | | | | | | 7,521,884 | |
| RETAIL (3.46%) | | | | | | | | | | | | | | | | | | |
| Bellis Acquisition Company PLC(g) | | United Kingdom | | | | | 3.25 | % | | 02/16/26 | | £ | 3,822,000 | | | | 4,531,122 | |
| Douglas GmbH(g) | | Germany | | | | | 6.00 | % | | 04/08/26 | | € | 1,100,000 | | | | 1,205,910 | |
| eG Global Finance PLC(g)(k) | | United Kingdom | | | | | 12.00 | % | | 11/30/28 | | $ | 2,734,000 | | | | 2,913,439 | |
| eG Global Finance PLC (3.75% PIK)(b)(d)(i)(k) | | United Kingdom | | 3M SOFR + 7.50% | | | 12.85 | % | | 11/30/28 | | | 11,000,000 | | | | 10,560,000 | |
| eG Global Finance PLC, Series REGs(g) | | United Kingdom | | | | | 11.00 | % | | 11/30/28 | | € | 1,379,000 | | | | 1,622,680 | |
| Guitar Center, Inc.(e)(g)(k) | | United States | | | | | 8.50 | % | | 01/15/26 | | $ | 7,765,000 | | | | 6,856,353 | |
| | | | | | | | | | | | | | | | | | 27,689,504 | |
| SERVICES: BUSINESS (1.93%)(e)(g)(k) | | | | | | | | | | | | | | | | | | |
| Advantage Sales & Marketing, Inc. | | United States | | | | | 6.50 | % | | 11/15/28 | | | 7,357,000 | | | | 6,773,774 | |
| Allied Universal Holdco LLC/Allied Universal Finance Corp./Atlas Luxco 4 SARL | | United States | | | | | 4.63 | % | | 06/01/28 | | | 9,500,000 | | | | 8,734,062 | |
| | | | | | | | | | | | | | | | | | 15,507,836 | |
| TELECOMMUNICATIONS (1.80%)(e)(g)(k) | | | | | | | | | | | | | | | | | | |
| Uniti Group LP / Uniti Group Finance, Inc. / CSL Capital LLC | | United States | | | | | 10.50 | % | | 02/15/28 | | | 14,211,000 | | | | 14,399,509 | |
| | | | | | | | | | | | | | | | | | | |
| TRANSPORTATION: CONSUMER (0.35%)(g)(k) | | | | | | | | | | | | | | | | | | |
| Hertz Corp. | | United States | | | | | 4.63 | % | | 12/01/26 | | | 3,118,000 | | | | 2,807,603 | |
| See Notes to Consolidated Financial Statements. | |
| 22 | 1.888.926.2688 | www.apollo.com |
| Apollo Diversified Credit Fund | Consolidated Schedule of Investments |
| | December 31, 2023 |
| UTILITIES: ELECTRIC (1.11%)(b) | | | | | | | | | | | | | | | |
| Edison International | | United States | | 5Y US T + 3.86% | | | 8.13 | % | | 06/15/53 | | | 8,711,000 | | | | 8,918,844 | |
| | | | | | | | | | | | | | | | | | | |
| TOTAL CORPORATE BONDS | | | | | | | | | | | | | | | | | | |
| (Cost $222,538,318) | | | | | | | | | | | | | | | | | 224,115,612 | |
| Description | | Country | | Spread Above Index | | Rate | | | Maturity Date | | Principal Amount | | | Value (Note 2)(a) | |
| CONVERTIBLE CORPORATE BONDS (0.58%)(d)(g)(k) | | | | | | | | | | | | | | | |
| | | | | | | | | | | | | | | | |
| MEDIA: ADVERTISING, PRINTING & PUBLISHING (0.58%) | | | | | | | | | | | | | | | |
| Gannett Co., Inc. | | United States | | | | | 6.00 | % | | 12/01/27 | | $ | 5,000,000 | | | $ | 4,667,649 | |
| | | | | | | | | | | | | | | | | | | |
| TOTAL CONVERTIBLE CORPORATE BONDS (Cost $5,156,314) | | | | | | | | | | | | | | | | | 4,667,649 | |
| Description | | Country | | Spread Above Index | | Rate | | | Maturity Date | | Principal Amount | | | Value (Note 2)(a) | |
| COLLATERALIZED LOAN OBLIGATIONS (1.20%) | | | | | | | | | | | | | | | |
| DEBT (0.36%)(b)(k) | | | | | | | | | | | | | | | |
| Anchorage Credit Funding 13, Ltd., Series 2021-13A | | Cayman Islands | | | | | 6.84 | % | | 07/27/39 | | $ | 350,000 | | | | 290,197 | |
| Anchorage Credit Funding 13, Ltd., Series 2021-13A | | Cayman Islands | | | | | 6.92 | % | | 07/27/39 | | | 2,300,000 | | | | 1,888,139 | |
| Anchorage Credit Funding 14, Ltd., Series 2021-14A | | Cayman Islands | | | | | 7.45 | % | | 01/21/40 | | | 850,000 | | | | 719,863 | |
| | | | | | | | | | | | | | | | | | 2,898,199 | |
| EQUITY (0.84%)(d)(k)(l) | | | | | | | | | | | | | | | | | | |
| NSLT 2021-A R | | United States | | | | | | | | 04/20/62 | | $ | 10,080 | | | | 3,042,436 | |
| NSLT 2021-BA R | | United States | | | | | | | | 04/20/62 | | | 10,080 | | | | 1,474,149 | |
| NSLT 2021-CA R | | United States | | | | | | | | 04/20/62 | | | 10,080 | | | | 1,163,696 | |
| NSLT 2021-DA R | | United States | | | | | | | | 04/20/62 | | | 10,080 | | | | 997,154 | |
| | | | | | | | | | | | | | | | | | 6,677,435 | |
TOTAL COLLATERALIZED LOAN OBLIGATIONS
(Cost $9,735,479) | | | | | | | | | | | | | | | | | 9,575,634 | |
| | | | | | | | | | | | | | | | | | | |
| COMMERCIAL REAL ESTATE LOANS (3.68%)(b)(k) | | | | | | | | | | | | | | | | | | |
| | | | | | | | | | | | | | | | | | | |
| AREIT 2023-CRE8 LLC, Class C, Series 2023-CRE8 | | Bermuda | | 1M SOFR + 4.02% | | | 9.38 | % | | 08/17/41 | | | 7,000,000 | | | | 6,980,316 | |
| MF1 2022-B1 LLC, Class A, Series 2022-B1 | | United States | | 1M SOFR + 2.40% | | | 7.75 | % | | 11/17/37 | | | 8,000,000 | | | | 8,051,752 | |
| MF1 2022-B1 LLC, Class B, Series 2022-B1 | | United States | | 1M SOFR + 3.28% | | | 8.63 | % | | 11/17/37 | | | 100,000 | | | | 99,947 | |
| MF1 2022-B1 LLC, Class C, Series 2022-B1 | | United States | | 1M SOFR + 4.03% | | | 9.38 | % | | 11/17/37 | | | 1,034,000 | | | | 1,026,351 | |
| MF1 2022-B1 LLC, Class D, Series 2022-B1 | | United States | | 1M SOFR + 4.53% | | | 9.88 | % | | 11/17/37 | | | 142,000 | | | | 137,754 | |
| MF1 2022-B1 LLC, Class E, Series 2022-B1 | | United States | | 1M SOFR + 5.38% | | | 10.73 | % | | 11/17/37 | | | 724,000 | | | | 698,318 | |
| PFP 2023-10, Ltd., Class C, Series 2023-10 | | Bermuda | | 1M SOFR + 4.12% | | | 9.48 | % | | 09/16/38 | | | 2,500,000 | | | | 2,495,807 | |
| VMC Finance 2023-PV1 LLC, Class A, Series 2023-PV1 | | United States | | 1M SOFR + 2.77% | | | 8.12 | % | | 01/19/40 | | | 6,850,000 | | | | 6,828,538 | |
| See Notes to Consolidated Financial Statements. | |
| Annual Report | December 31, 2023 | 23 |
| Apollo Diversified Credit Fund | Consolidated Schedule of Investments |
| | December 31, 2023 |
| VMC Finance 2023-PV1 LLC, Class AS, Series 2023-PV1 | | United States | | 1M SOFR + 3.18% | | | 8.53 | % | | 01/19/40 | | | 1,050,000 | | | | 1,047,269 | |
| VMC Finance 2023-PV1 LLC, Class B, Series 2023-PV1 | | United States | | 1M SOFR + 3.58% | | | 8.93 | % | | 01/19/40 | | | 800,000 | | | | 797,862 | |
| VMC Finance 2023-PV1 LLC, Class C, Series 2023-PV1 | | United States | | 1M SOFR + 4.63% | | | 9.98 | % | | 01/19/40 | | | 800,000 | | | | 797,869 | |
| Description | | Country | | Spread Above Index | | Rate | | | Maturity Date | | Principal Amount | | | Value (Note 2)(a) | |
| COMMERCIAL REAL ESTATE LOANS (continued) | | | | | | | | | | | | | | | |
| VMC Finance 2023-PV1 LLC, Class D, Series 2023-PV1 | | United States | | 1M SOFR + 6.78% | | | 12.13 | % | | 01/19/40 | | $ | 500,000 | | | $ | 498,685 | |
| | | | | | | | | | | | | | | | | | 29,460,468 | |
TOTAL COMMERCIAL REAL ESTATE LOANS
(Cost $29,292,279) | | | | | | | | | | | | | | | | | 29,460,468 | |
| | | | | | | | | | | | Shares | | | Value | |
| EQUITY INTEREST (0.00%)(d)(f)(m) | | | | | | | | | | | | | | | |
| ENERGY: OIL & GAS (0.00%) | | | | | | | | | | | | | | | |
| Bruin Blocker LLC | | United States | | | | | | | | | | | 27,864 | | | | – | |
| | | | | | | | | | | | | | | | | | | |
| HOTEL, GAMING & LEISURE (0.00%) | | | | | | | | | | | | | | | | | | |
| Cineworld Group PLC Warrant, Strike Price $41.49 | | United States | | | | | | | | | | | 84,898 | | | | – | |
| | | | | | | | | | | | | | | | | | | |
| TRANSPORTATION: CONSUMER (0.00%) | | | | | | | | | | | | | | | | | | |
| Bahia De Las Isletas A2 | | Spain | | | | | | | | | | | 1,696 | | | | – | |
| Bahia De Las Isletas A3 | | Spain | | | | | | | | | | | 294 | | | | – | |
| Bahia De Las Isletas B2 | | Spain | | | | | | | | | | | 2,162 | | | | – | |
| Bahia De Las Isletas B3 | | Spain | | | | | | | | | | | 375 | | | | – | |
| | | | | | | | | | | | | | | | | | – | |
| TOTAL EQUITY INTEREST (Cost $38,001) | | | | | | | | | | | | | | | | | – | |
| | | 7-Day Yield | | | Shares | | | Value (Note 2)(a) | |
| SHORT TERM INVESTMENT (10.60%) | | | | | | | | | |
| Goldman Sachs Financial Square Government Fund | | | 5.25 | % | | | 84,947,743 | | | | 84,947,743 | |
| | | | | | | | | | | | | |
TOTAL SHORT TERM INVESTMENT
(Cost $84,947,743) | | | | | | | | | | | 84,947,743 | |
| | | | | | | | | | | | | |
| TOTAL INVESTMENTS (124.72%) | | | | | | | | | | | | |
| (Cost $992,895,813) | | | | | | | | | | $ | 999,183,525 | |
| | | | | | | | | | | | | |
| Liabilities in Excess of Other Assets (-24.72%) | | | | | | | | | | | (198,052,533 | ) |
| NET ASSETS (100.00%) | | | | | | | | | | $ | 801,130,992 | |
Reference Rates:
3M US SL - 3 Month US Synthetic LIBOR as of December 31, 2023 was 5.59%
3M EUR L - 3 Month EURIBOR as of December 31, 2023 was 3.91%
6M EUR L - 6 Month EURIBOR as of December 31, 2023 was 3.86%
1M US SOFR – 1 Month US SOFR as of December 31, 2023 was 5.35%
3M US SOFR – 3 Month US SOFR as of December 31, 2023 was 5.33%
3M SONIA - 3 Month SONIA as of December 31, 2023 was 5.22%
6M SONIA - 6 Month SONIA as of December 31, 2023 was 5.13%
| See Notes to Consolidated Financial Statements. | |
| 24 | 1.888.926.2688 | www.apollo.com |
| Apollo Diversified Credit Fund | Consolidated Schedule of Investments |
| | December 31, 2023 |
5Y US T - 5 Year US Treasury rate as of December 31, 2023 was 3.93%
| (a) | Investment holdings denominated in foreign currencies are converted to U.S. Dollars using period end spot rates. |
| (b) | Floating or variable rate security. The reference rate is described above. The rate in effect as of December 31, 2023 is based on the reference rate plus the displayed spread as of the security's last reset date. |
| (c) | “Bank Loans” are senior, secured loans made to companies whose debt is below investment grade as well as investments with similar economic characteristics. Senior Loans typically hold a first lien priority and, unless otherwise indicated, are required to pay interest at floating rates that are periodically reset by reference to a base lending rate plus a spread. In some instances, the rates shown represent the weighted average rate as of December 31, 2023. Senior Loans are generally not registered under the Securities Act of 1933 (the “1933 Act”) and often incorporate certain restrictions on resale and cannot be sold publicly. Senior Loans often require prepayments from excess cash flow or permit the borrower to repay at its election. The degree to which borrowers repay, whether as a contractual requirement or at their election, cannot be predicted with accuracy. As a result, the actual maturity may be substantially less than the stated maturity. |
| (d) | Security is classified as Level 3 in the Fund's fair value hierarchy (see Note 2). |
| (e) | Security or portion thereof pledge as collateral under the secured revolving credit facility entered into by CRDTX SPV I, LLC and Citibank N.A. |
| (f) | Non-income producing security. |
| See Notes to Consolidated Financial Statements. | |
| Annual Report | December 31, 2023 | 25 |
| Apollo Diversified Credit Fund | Consolidated Schedule of Investments |
| | December 31, 2023 |
| (h) | Investment was not funded as of December 31, 2023. The Fund had $61,728,241 at par value in unfunded commitments pursuant to Delayed Draw Term Loan facilities and unused Revolver capacities. The Consolidated Schedule of Investments records each of these investments as fully funded. A corresponding payable for investments purchased has also been recorded which represents the actual unfunded amount on the balance sheet date. |
| Unfunded Security | | Total revolving and delayed
draw loan commitments | | | Less: drawn
commitments | | | Total undrawn
commitments | |
| Advarra Holdings, Inc., First Lien Delayed Draw Term Loan | | $ | 1,243,180 | | | $ | – | | | $ | 1,243,180 | |
| Allied Benefit Systems Intermediate LLC, Delayed Draw, First Lien Term Loan | | | 1,546,392 | | | | – | | | | 1,546,392 | |
| Altern Marketing Revolver, First Lien Term Loan | | | 1,134,454 | | | | – | | | | 1,134,454 | |
| Anaplan Inc., Revolver, First Lien Term Loan | | | 582,452 | | | | – | | | | 582,452 | |
| Avalara Inc., Revolver, First Lien Term Loan | | | 1,818,182 | | | | – | | | | 1,818,182 | |
| Certinia, Revolver, First Lien Term Loan | | | 470,588 | | | | – | | | | 470,588 | |
| Channelside LLC, Delayed Draw, 2023-A, First Lien Term Loan | | | 93,333 | | | | – | | | | 93,333 | |
| Channelside LLC, Delayed Draw, 2023-B, First Lien Term Loan | | | 845,238 | | | | – | | | | 845,238 | |
| Channelside LLC, Revolver, First Lien Term Loan | | | 333,333 | | | | – | | | | 333,333 | |
| CircusTrix LLC, Delayed Draw, First Lien Term Loan | | | 537,634 | | | | – | | | | 537,634 | |
| CircusTrix LLC, Revolver, First Lien Term Loan | | | 268,817 | | | | – | | | | 268,817 | |
| Coretrust, First Lien Delayed Draw Term Loan | | | 789,474 | | | | – | | | | 789,474 | |
| Coretrust, First Lien Revolver Loan Term Loan | | | 789,474 | | | | – | | | | 789,474 | |
| Coupa Holdings LLC, Delayed Draw, First Lien Term Loan | | | 539,886 | | | | – | | | | 539,886 | |
| Coupa Holdings LLC, Revolver, First Lien Term Loan | | | 413,386 | | | | – | | | | 413,386 | |
| Crewline Buyer, Inc., Revolver, First Lien Term Loan | | | 471,698 | | | | – | | | | 471,698 | |
| Cube Industrials, Inc., Revolver, First Lien Term Loan | | | 1,137,931 | | | | – | | | | 1,137,931 | |
| Esdec Solar Group B.V., Delayed Draw, First Lien Term Loan | | | 2,207,895 | | | | – | | | | 2,207,895 | |
| Exactcare Parent, Revolver, First Lien Term Loan | | | 491,803 | | | | – | | | | 491,803 | |
| Falcon, Revolver, First Lien Term Loan | | | 1,093,168 | | | | – | | | | 1,093,168 | |
| Higginbotham Insurance Agency, Inc., Delayed Draw, First Lien Term Loan | | | 2,218,522 | | | | 1,476,300 | | | | 742,222 | |
| K Hovnanian Enterprises, Inc., Revolver, First Lien Term Loan | | | 2,000,000 | | | | – | | | | 2,000,000 | |
| Keystone Acquisition, First Lien Term Loan | | | 1,000,000 | | | | 366,667 | | | | 633,333 | |
| NCL Corporation Ltd., Backstop Notes Bridge, First Lien Term Loan | | | 2,080,000 | | | | – | | | | 2,080,000 | |
| NCL Corporation Ltd., First Lien B Term Loan | | | 3,460,000 | | | | – | | | | 3,460,000 | |
| OMH-HealthEdge Holdings, LLC Revolver, First Lien Term Loan | | | 1,563,910 | | | | – | | | | 1,563,910 | |
| Paisley Bidco Ltd., Delayed Draw, First Lien Term Loan | | | 9,559,864 | | | | 5,112,526 | | | | 4,447,338 | |
| Planet US Buyer LLC, Revolver, First Lien Term Loan | | | 518,519 | | | | – | | | | 518,519 | |
| Project Antelope B2 Delayed Draw (3.75% PIK) | | | 581,412 | | | | – | | | | 581,412 | |
| Project Antelope B3 Delayed Draw (3.75% PIK) | | | 1,372,882 | | | | – | | | | 1,372,882 | |
| Redfin Corp, Delayed Draw, First Lien Term Loan | | | 8,500,000 | | | | – | | | | 8,500,000 | |
| Revlon, Revolver, First Lien Term Loan | | | 10,000,000 | | | | 584,615 | | | | 9,415,385 | |
| Ruler BidCo Delayed Draw, First Lien Term Loan | | | 1,730,990 | | | | 655,303 | | | | 1,075,687 | |
| Valor, Inc., First Lien Delayed Draw Term Loan | | | 3,311,843 | | | | – | | | | 3,311,843 | |
| Zendesk Delayed Draw, First Lien Term Loan | | | 3,695,652 | | | | – | | | | 3,695,652 | |
| Zendesk Revolver, First Lien Term Loan | | | 1,521,739 | | | | – | | | | 1,521,739 | |
| Total | | $ | 69,923,651 | | | $ | 8,195,410 | | | $ | 61,728,241 | |
| (i) | Paid in kind security which may pay interest in additional par. |
| (j) | See Note 2 regarding defaulted securities. |
| (k) | Securities exempt from registration under Rule 144A of the Securities Act of 1933, as amended (the "Securities Act") and Regulation S of the Securities Act. These securities may be sold in the ordinary course of business in transactions exempt from registration normally to qualified institutional buyers. As of December 31, 2023, the aggregate market value of such securities was $221,967,588, representing 27.71% of net assets. |
| (l) | CLO subordinated notes, income notes, and Class M notes are considered CLO equity positions. CLO equity positions are entitled to recurring distributions which are generally equal to the remaining cash flow of payments made by underlying securities less contractual payments to debt holders and fund expenses. |
| See Notes to Consolidated Financial Statements. | |
| 26 | 1.888.926.2688 | www.apollo.com |
| Apollo Diversified Credit Fund | Consolidated Schedule of Investments |
| | December 31, 2023 |
| (m) | Securities may be deemed to be “restricted securities” under the Securities Act. As of December 31, 2023, the restricted securities were as follows: |
| Restricted | | Acquisition Date | | Cost | | | Value December 31, 2023 | | | Value as Percentage of Net Assets Applicable to Common Stockholders December 31, 2023 | |
| Bahia De Las Isletas A2 | | 02/17/2022 | | $ | – | | | $ | – | | | | –% | |
| Bahia De Las Isletas A3 | | 02/17/2022 | | | 16,700 | | | | – | | | | – | |
| Bahia De Las Isletas B2 | | 02/17/2022 | | | – | | | | – | | | | – | |
| Bahia De Las Isletas B3 | | 02/17/2022 | | | 21,301 | | | | – | | | | – | |
| Bruin Blocker LLC | | 08/31/2020 | | | – | | | | 0 | | | | – | |
| Cineworld Group PLC Warrant | | 11/23/2020 | | | – | | | | 0 | | | | – | |
| Total | | | | $ | 38,001 | | | $ | 0 | | | | – | % |
Common Abbreviations:
B.V. - Besloten Vennootshap
CLO - Collateralized Loan Obligation
Co. - Company
EUR L or EURIBOR - Euro Interbank Offered Rate
GmbH - German Company with limited liability
L or LIBOR - London Interbank Offered Rate
LLC - Limited Liability Company
LLLP - Limited Liability Limited Partnership
LP - Limited Partnership Ltd - Limited Company
PIK - Payment in Kind PLC - Public Limited Company Reg S - Regulation S
SARL - Société A Responsabilité Limitée
S.C.A - Société en Commandite par actions
SONIA - Sterling Overnight Index Average
SOFR - Secured Overnight Financing Rate
OUTSTANDING FORWARD FOREIGN CURRENCY CONTRACTS
| Counterparty | | Settlement Date | | Fund Receiving | | Value | | | Fund Delivering | | Value | | | Unrealized Appreciation/ (Depreciation) | |
| Bank of New York Mellon | | 03/20/24 | | USD | | | 94,916,461 | | | EUR | | | 97,237,619 | | | $ | (2,321,158 | ) |
| Bank of New York Mellon | | 03/20/24 | | USD | | | 77,217,387 | | | GBP | | | 78,347,014 | | | | (1,129,627 | ) |
| | | | | | | | | | | | | | | | | $ | (3,450,785 | ) |
CROSS CURRENCY SWAP CONTRACTS
| Counterparty | | Settlement Date | | Fund Receiving | | Value | | | Fund Delivering | | Value | | | Unrealized (Depreciation) | |
| Nomura Global Financial Products, Inc. | | 06/30/28 | | COP | | | 10,000,000 | | | USD | | | (10,628,273 | ) | | $ | (628,273 | ) |
| | | | | | | | | | | | | | | | | $ | (628,273 | ) |
| See Notes to Consolidated Financial Statements. | |
| Annual Report | December 31, 2023 | 27 |
| Apollo Diversified Credit Fund | Consolidated Statement of Assets and Liabilities |
| | December 31, 2023 |
| ASSETS | | | |
| Investments, at fair value (Cost $907,948,070) | | $ | 914,235,782 | |
| Short term investments (Cost 84,947,743) | | | 84,947,743 | |
| Cash | | | 4,550,565 | |
| Foreign currency, at value (Cost $32,761,406) | | | 33,045,509 | |
| Cash collateral for cross currency swaps | | | 790,000 | |
| Receivable for investments sold | | | 34,312,194 | |
| Receivable for shares sold | | | 14,434,922 | |
| Interest receivable | | | 9,160,279 | |
| Unamortized debt issuance costs | | | 1,199,634 | |
| Prepaid expenses and other assets | | | 27,372 | |
| Total Assets | | | 1,096,704,000 | |
| LIABILITIES | | | | |
| Payable for lines of credit (Note 7) | | | 175,800,000 | |
| Payable for investments purchased | | | 92,314,075 | |
| Payable for distributions to shareholders | | | 18,744,625 | |
| Payable for lines of credit interest expense (Note 7) | | | 3,649,966 | |
| Unrealized depreciation on forward foreign currency contracts (Note 3) | | | 3,450,784 | |
| Unrealized depreciation on cross currency swaps | | | 628,273 | |
| Payable for investment advisory fees (Note 4) | | | 439,974 | |
| Payable for administration fees (Note 4) | | | 79,566 | |
| Payable for credit facility unfunded commitment fee (Note 7) | | | 73,735 | |
| Payable for credit facility fees (Note 7) | | | 72,727 | |
| Payable for distribution fees (Note 4) | | | 62,487 | |
| Payable for custody fees | | | 62,477 | |
| Payable for transfer agency fees (Note 4) | | | 57,206 | |
| Payable for audit and tax fees | | | 51,275 | |
| Payable for shareholder servicing fees (Note 4) | | | 39,548 | |
| Payable for printing fees | | | 8,834 | |
| Payable for trustees' fees (Note 4) | | | 1,463 | |
| Accrued expenses and other liabilities | | | 35,993 | |
| Total Liabilities | | | 295,573,008 | |
| NET ASSETS | | $ | 801,130,992 | |
| NET ASSETS CONSIST OF | | | | |
| Paid-in capital | | $ | 866,804,571 | |
| Total accumulated deficit | | | (65,673,579 | ) |
| NET ASSETS | | $ | 801,130,992 | |
| See Notes to Consolidated Financial Statements. | |
| 28 | 1.888.926.2688 | www.apollo.com |
| | Consolidated Statement |
| Apollo Diversified Credit Fund | of Assets and Liabilities |
| | December 31, 2023 |
| PRICING OF SHARES | | | |
| Class A: | | | |
| Net asset value | | $ | 21.79 | |
| Net assets | | $ | 81,233,642 | |
| Shares of beneficial interest outstanding (unlimited number of shares, no par value common stock authorized) | | | 3,727,529 | |
| Maximum offering price per share ((NAV/0.9425), based on maximum sales charge of 5.75% of the offering price) | | $ | 23.12 | |
| Class C: | | | | |
| Net asset value and maximum offering price | | $ | 21.79 | |
| Net assets | | $ | 95,968,396 | |
| Shares of beneficial interest outstanding (unlimited number of shares, no par value common stock authorized) | | | 4,404,519 | |
| Class I: | | | | |
| Net asset value and maximum offering price | | $ | 21.79 | |
| Net assets | | $ | 595,909,282 | |
| Shares of beneficial interest outstanding (unlimited number of shares, no par value common stock authorized) | | | 27,349,710 | |
| Class M: | | | | |
| Net asset value and maximum offering price | | $ | 21.79 | |
| Net assets | | $ | 21,041 | |
| Shares of beneficial interest outstanding (unlimited number of shares, no par value common stock authorized) | | | 966 | |
| Class L: | | | | |
| Net asset value | | $ | 21.78 | |
| Net assets | | $ | 14,977,743 | |
| Shares of beneficial interest outstanding (unlimited number of shares, no par value common stock authorized) | | | 687,610 | |
| Maximum offering price per share ((NAV/0.9575), based on maximum sales charge of 4.25% of the offering price) | | $ | 22.75 | |
| Class F: | | | | |
| Net asset value and maximum offering price | | $ | 21.79 | |
| Net assets | | $ | 13,020,888 | |
| Shares of beneficial interest outstanding (unlimited number of shares, no par value common stock authorized) | | | 597,491 | |
| See Notes to Consolidated Financial Statements. | |
| Annual Report | December 31, 2023 | 29 |
| Apollo Diversified Credit Fund | Consolidated Statement of Operations |
| | | For the Year Ended December 31, 2023 | |
| INVESTMENT INCOME | | | |
| Interest income | | | 86,438,416 | |
| Dividend Income (Note 2) | | $ | 2,220,228 | |
| Total Investment Income | | | 88,658,644 | |
| | | | | |
| EXPENSES | | | | |
| Investment advisory fees (Note 4) | | | 9,922,080 | |
| Administration fees (Note 4) | | | 644,295 | |
| Transfer agency fees (Note 4) | | | 481,357 | |
| Shareholder servicing fees (Note 4) | | | | |
| Class A | | | 175,420 | |
| Class C | | | 216,196 | |
| Class L | | | 32,977 | |
| Distribution fees (Note 4) | | | | |
| Class C | | | 648,589 | |
| Class L | | | 32,677 | |
| Lines of Credit interest expense (Note 7) | | | 15,200,381 | |
| Legal fees | | | 1,668,499 | |
| Reports to shareholders and printing fees | | | 517,434 | |
| Amortization of debt issuance costs (Note 7) | | | 428,530 | |
| Credit facility unfunded commitment fee (Note 7) | | | 425,920 | |
| Income tax expense | | | 298,967 | |
| Audit and tax fees | | | 286,499 | |
| Insurance fees | | | 235,445 | |
| Trustees' fees (Note 4) | | | 185,213 | |
| Compliance fees (Note 4) | | | 153,284 | |
| State registration fees | | | 105,215 | |
| Credit facility fees (Note 7) | | | 74,606 | |
| Other expenses | | | 5,060 | |
| Total Expenses | | | 31,738,644 | |
| Fees waived/expenses reimbursed by Adviser (Note 4) | | | (2,158,851 | ) |
| Net Expenses | | | 29,579,793 | |
| Net Investment Income | | | 59,078,851 | |
| NET REALIZED LOSS AND UNREALIZED APPRECIATION ON INVESTMENTS, FORWARD FOREIGN CURRENCY TRANSACTIONS AND TRANSLATIONS OF ASSETS AND LIABILITIES DENOMINATED IN FOREIGN CURRENCIES | | | | |
| Net realized loss on investments | | | (7,561,987 | ) |
| Net realized gain on cross currency swap contracts | | | 55,498 | |
| Net realized loss on forward foreign currency transactions | | | (202,678 | ) |
| Net realized gain on foreign currency translation | | | 867,991 | |
| Net realized loss | | | (6,841,176 | ) |
| Net change in unrealized appreciation on investments | | | 42,412,135 | |
| Net change in unrealized depreciation on forward foreign currency transactions | | | (3,736,910 | ) |
| Net change in unrealized depreciation on cross currency swaps | | | (628,273 | ) |
| Net change in unrealized appreciation on translation of assets and liabilities denominated in foreign currencies | | | 121,320 | |
| Net change in unrealized appreciation on investments | | | 38,168,272 | |
| NET REALIZED LOSS AND UNREALIZED APPRECIATION ON INVESTMENTS, FORWARD FOREIGN CURRENCY TRANSACTIONS AND TRANSLATIONS OF ASSETS AND LIABILITIES DENOMINATED IN FOREIGN CURRENCIES | | | 31,327,096 | |
| NET INCREASE IN NET ASSETS RESULTING FROM OPERATIONS | | $ | 90,405,947 | |
| See Notes to Consolidated Financial Statements. | |
| 30 | 1.888.926.2688 | www.apollo.com |
| | Consolidated Statements |
| Apollo Diversified Credit Fund | of Changes in Net Assets |
| | | For the Year Ended December 31, 2023 | | | For the Year Ended December 31, 2022 | |
| OPERATIONS: | | | | | | |
| Net investment income | | $ | 59,078,851 | | | $ | 38,622,794 | |
| Net realized loss | | | (6,841,176 | ) | | | (50,505,844 | ) |
| Net change in unrealized appreciation/(depreciation) | | | 38,168,272 | | | | (43,878,888 | ) |
| Net Increase/(Decrease) in Net Assets Resulting from Operations | | | 90,405,947 | | | | (55,761,938 | ) |
| | | | | | | | | |
| DISTRIBUTIONS TO SHAREHOLDERS: | | | | | | | | |
| Class A | | | | | | | | |
| From distributable earnings | | | (6,525,744 | ) | | | (4,392,503 | ) |
| Class C | | | | | | | | |
| From distributable earnings | | | (7,230,896 | ) | | | (5,263,453 | ) |
| Class I | | | | | | | | |
| From distributable earnings | | | (44,638,370 | ) | | | (27,621,960 | ) |
| Class M | | | | | | | | |
| From distributable earnings | | | (6,934 | ) | | | (15,213 | ) |
| Class L | | | | | | | | |
| From distributable earnings | | | (1,213,927 | ) | | | (870,816 | ) |
| Class F | | | | | | | | |
| From distributable earnings | | | (1,754,580 | ) | | | (1,369,818 | ) |
| Total Distributions to Shareholders | | | (61,370,451 | ) | | | (39,533,763 | ) |
| | | | | | | | | |
| BENEFICIAL INTEREST TRANSACTIONS, IN DOLLARS: | | | | | | | | |
| Class A | | | | | | | | |
| Shares sold | | | 22,437,370 | | | | 12,818,961 | |
| Distributions reinvested | | | 2,942,946 | | | | 2,186,960 | |
| Shares redeemed (Note 8) | | | (7,662,356 | ) | | | (13,808,534 | ) |
| Exchanged out | | | (1,129,351 | ) | | | (1,224,719 | ) |
| Class C | | | | | | | | |
| Shares sold | | | 26,579,057 | | | | 17,249,489 | |
| Distributions reinvested | | | 3,364,850 | | | | 2,325,849 | |
| Shares redeemed (Note 8) | | | (9,060,979 | ) | | | (5,403,887 | ) |
| Exchanged out | | | (5,805,529 | ) | | | (2,148,188 | ) |
| Class I | | | | | | | | |
| Shares sold | | | 284,250,842 | | | | 123,386,368 | |
| Distributions reinvested | | | 20,981,723 | | | | 12,703,107 | |
| Shares redeemed (Note 8) | | | (128,944,583 | ) | | | (123,507,966 | ) |
| Exchanged in | | | 6,988,356 | | | | 3,425,049 | |
| Class M | | | | | | | | |
| Shares sold | | | 10,000 | | | | – | |
| Shares redeemed (Note 8) | | | (204,435 | ) | | | – | |
| Class L | | | | | | | | |
| Shares sold | | | 2,539,617 | | | | 539,865 | |
| Distributions reinvested | | | 655,439 | | | | 478,244 | |
| Shares redeemed (Note 8) | | | (959,143 | ) | | | (401,199 | ) |
| Exchanged out | | | (53,476 | ) | | | (30,049 | ) |
| Class F | | | | | | | | |
| Distributions reinvested | | | 279,495 | | | | 145,121 | |
| Shares redeemed (Note 8) | | | (4,748,211 | ) | | | (1,579,776 | ) |
| Exchanged out | | | – | | | | (22,093 | ) |
| Net Increase in Net Assets Derived from Beneficial Interest Transactions | | | 212,461,632 | | | | 27,132,602 | |
| Net increase/(decrease) in net assets | | | 241,497,128 | | | | (68,163,099 | ) |
| NET ASSETS: | | | | | | | | |
| Beginning of year | | | 559,633,864 | | | | 627,796,963 | |
| End of year | | $ | 801,130,992 | | | $ | 559,633,864 | |
| See Notes to Consolidated Financial Statements. | |
| Annual Report | December 31, 2023 | 31 |
| | Consolidated Statements |
| Apollo Diversified Credit Fund | of Changes in Net Assets |
| | | For the Year Ended December 31, 2023 | | | For the Year Ended December 31, 2022 | |
| Other Information | | | | | | |
| BENEFICIAL INTEREST TRANSACTIONS, IN SHARES: | | | | | | |
| Class A | | | | | | |
| Beginning shares | | | 2,953,556 | | | | 2,940,435 | |
| Shares sold | | | 1,046,670 | | | | 575,620 | |
| Distributions reinvested | | | 136,504 | | | | 101,850 | |
| Shares redeemed (Note 8) | | | (356,451 | ) | | | (607,302 | ) |
| Exchanged out | | | (52,748 | ) | | | (57,047 | ) |
| Net increase in shares outstanding | | | 773,975 | | | | 13,121 | |
| Ending shares | | | 3,727,531 | | | | 2,953,556 | |
| Class C | | | | | | | | |
| Beginning shares | | | 3,702,725 | | | | 3,164,548 | |
| Shares sold | | | 1,238,585 | | | | 770,977 | |
| Distributions reinvested | | | 156,029 | | | | 108,768 | |
| Shares redeemed (Note 8) | | | (421,742 | ) | | | (243,665 | ) |
| Exchanged out | | | (271,078 | ) | | | (97,903 | ) |
| Net increase in shares outstanding | | | 701,794 | | | | 538,177 | |
| Ending shares | | | 4,404,519 | | | | 3,702,725 | |
| Class I | | | | | | | | |
| Beginning shares | | | 18,823,239 | | | | 18,051,828 | |
| Shares sold | | | 13,228,237 | | | | 5,493,448 | |
| Distributions reinvested | | | 973,116 | | | | 593,328 | |
| Shares redeemed (Note 8) | | | (6,001,200 | ) | | | (5,472,599 | ) |
| Exchanged in | | | 326,318 | | | | 157,234 | |
| Net increase in shares outstanding | | | 8,526,471 | | | | 771,411 | |
| Ending shares | | | 27,349,710 | | | | 18,823,239 | |
| Class M | | | | | | | | |
| Beginning shares | | | 9,999 | | | | 9,999 | |
| Shares sold | | | 469 | | | | – | |
| Shares redeemed (Note 8) | | | (9,502 | ) | | | – | |
| Net decrease in shares outstanding | | | (9,033 | ) | | | – | |
| Ending shares | | | 966 | | | | 9,999 | |
| Class L | | | | | | | | |
| Beginning shares | | | 585,707 | | | | 559,179 | |
| Shares sold | | | 118,603 | | | | 22,757 | |
| Distributions reinvested | | | 30,393 | | | | 22,303 | |
| Shares redeemed (Note 8) | | | (44,601 | ) | | | (17,308 | ) |
| Exchanged out | | | (2,492 | ) | | | (1,224 | ) |
| Net increase in shares outstanding | | | 101,903 | | | | 26,528 | |
| Ending shares | | | 687,610 | | | | 585,707 | |
| Class F | | | | | | | | |
| Beginning shares | | | 805,274 | | | | 869,758 | |
| Distributions reinvested | | | 12,969 | | | | 6,818 | |
| Shares redeemed (Note 8) | | | (220,751 | ) | | | (70,263 | ) |
| Exchanged out | | | – | | | | (1,039 | ) |
| Net decrease in shares outstanding | | | (207,782 | ) | | | (64,484 | ) |
| Ending shares | | | 597,492 | | | | 805,274 | |
| See Notes to Consolidated Financial Statements. | |
| 32 | 1.888.926.2688 | www.apollo.com |
| Apollo Diversified Credit Fund | Consolidated Statement of Cash Flows |
| | | For the Year Ended December 31, 2023 | |
| Operating Activities: | | | |
| Net increase in net assets resulting from operations | | $ | 90,405,947 | |
| Adjustments to reconcile net decrease in net assets resulting from operations to net cash provided by operating activities: | | | | |
| Purchase of investments | | | (959,951,951 | ) |
| Proceeds from sale of investments | | | 856,631,243 | |
| Net purchases of short-term investments | | | (68,134,892 | ) |
| Net realized loss on investments | | | 7,561,987 | |
| Net realized gain on cross currency swaps transactions | | | (55,498 | ) |
| Net realized loss on foreign currency transactions | | | 202,678 | |
| Net realized gain on foreign currency translation | | | (867,991 | ) |
| Net change in unrealized appreciation on investments | | | (42,412,135 | ) |
| Net change in unrealized depreciation on cross currency swaps transactions | | | 628,273 | |
| Net unrealized depreciation on forward foreign currency contracts | | | 3,736,910 | |
| Net change in unrealized appreciation on translation of assets and liabilities denominated in foreign currencies | | | (121,320 | ) |
| Amortization and accretion of discounts and premiums, net | | | (4,429,665 | ) |
| Change in operating assets and liabilities: | | | | |
| Interest receivables | | | (2,339,035 | ) |
| Receivable due from adviser | | | 69,097 | |
| Cash collateral for cross currency swaps | | | (790,000 | ) |
| Prepaid expenses and other assets | | | 208,455 | |
| Payable for investment advisory fees | | | 439,974 | |
| Payable for distribution fees | | | 10,029 | |
| Payable for shareholder servicing fees | | | 6,875 | |
| Payable for transfer agency fees | | | 52,742 | |
| Payable for lines of credit interest expense | | | 1,018,681 | |
| Payable for administration fees | | | (78,115 | ) |
| Payable for trustees' fees | | | 1,463 | |
| Payable for audit and tax fees | | | (80,976 | ) |
| Payable for custody fees | | | (123,522 | ) |
| Payable for compliance fees | | | (10,261 | ) |
| Payable for printing fees | | | (77,841 | ) |
| Payable for credit facility fees | | | 32,440 | |
| Payable for credit facility unfunded commitment fee | | | 33,380 | |
| Accrued expenses and other liabilities | | | (84,760 | ) |
| Net cash used in operating activities | | | (118,517,788 | ) |
| | | | | |
| Financing Activities: | | | | |
| Cash payments to lines of credit | | | (45,700,000 | ) |
| Proceeds from shares sold | | | 327,157,016 | |
| Payment of shares redeemed | | | (151,579,707 | ) |
| Distributions paid to shareholders | | | (26,337,285 | ) |
| Debt issuance costs | | | (758,235 | ) |
| Amortization of debt issuance costs | | | 428,530 | |
| Net cash provided by financing activities | | | 103,210,319 | |
| Net Decrease in cash during the year | | | (15,307,469 | ) |
| Effect of foreign exchange rates changes on cash | | | 842,131 | |
| Net Change in Cash and Foreign Currency | | | (14,465,338 | ) |
| | | | | |
| Cash and cash equivalents, beginning of year | | $ | 52,061,412 | |
| Cash and cash equivalents, end of year | | $ | 37,596,074 | |
| | | | | |
| SUPPLEMENTAL DISCLOSURE OF CASH FLOW INFORMATION: | | | | |
| Non-cash financing activities not included herein consist of reinvestment of distributions of: | | $ | 28,224,453 | |
| Cash paid during the period for interest from bank borrowing: | | $ | 14,181,700 | |
| See Notes to Consolidated Financial Statements. | |
| Annual Report | December 31, 2023 | 33 |
| Apollo Diversified Credit Fund | Consolidated Statement of Cash Flows |
| | | For the Year Ended December 31, 2023 | |
| Cash paid for taxes | | | 161,868 | |
| | | | | |
| RECONCILIATION OF RESTRICTED AND UNRESTRICTED CASH AT THE BEGINNING OF YEAR TO THE STATEMENT OF ASSETS AND LIABILITIES | | | | |
| Cash | | | 51,394,318 | |
| Foreign Currency at Value | | | 667,094 | |
| RECONCILIATION OF RESTRICTED AND UNRESTRICTED CASH AT THE END OF YEAR TO THE STATEMENT OF ASSETS AND LIABILITIES | | | | |
| Cash | | | 4,550,565 | |
| Foreign Currency at Value | | | 33,045,509 | |
| Cash collateral for cross currency swaps | | | 790,000 | |
| See Notes to Consolidated Financial Statements. | |
| 34 | 1.888.926.2688 | www.apollo.com |
| | Consolidated |
| Apollo Diversified Credit Fund – Class A | Financial Highlights |
| | For a Share Outstanding Throughout the Period Presented |
| | | For the Year Ended December 31, 2023 | | | For the Year Ended December 31, 2022 | | | For the Year Ended December 31, 2021 | | | For the Year Ended December 31, 2020 | | | For the Year Ended December 31, 2019 | |
| Net asset value, beginning of year | | $ | 20.82 | | | $ | 24.53 | | | $ | 24.06 | | | $ | 24.89 | | | $ | 24.01 | |
| | | | | | | | | | | | | | | | | | | | | |
| INCOME FROM INVESTMENT OPERATIONS: | | | | | | | | | | | | | | | | | | | | |
| Net investment income(a) | | | 1.88 | | | | 1.49 | | | | 1.53 | | | | 1.28 | | | | 1.59 | |
| Net realized and unrealized gain/(loss) | | | 1.04 | | | | (3.68 | ) | | | 0.47 | | | | (0.65 | ) | | | 1.01 | |
| Total from investment operations | | | 2.92 | | | | (2.19 | ) | | | 2.00 | | | | 0.63 | | | | 2.60 | |
| | | | | | | | | | | | | | | | | | | | | |
| DISTRIBUTIONS: | | | | | | | | | | | | | | | | | | | | |
| From net investment income(b) | | | (1.95 | ) | | | (1.52 | ) | | | (1.53 | ) | | | (1.46 | ) | | | (1.72 | ) |
| Total distributions | | | (1.95 | ) | | | (1.52 | ) | | | (1.53 | ) | | | (1.46 | ) | | | (1.72 | ) |
| | | | | | | | | | | | | | | | | | | | | |
| Net increase/(decrease) in net asset value | | | 0.97 | | | | (3.71 | ) | | | 0.47 | | | | (0.83 | ) | | | 0.88 | |
| Net asset value, end of year | | $ | 21.79 | | | $ | 20.82 | | | $ | 24.53 | | | $ | 24.06 | | | $ | 24.89 | |
| TOTAL RETURN(c) | | | 14.46 | % | | | (8.93 | )% | | | 8.49 | % | | | 3.16 | % | | | 11.04 | % |
| | | | | | | | | | | | | | | | | | | | | |
| RATIOS/SUPPLEMENTAL DATA: | | | | | | | | | | | | | | | | | | | | |
| Net assets, end of period (000s) | | $ | 81,234 | | | $ | 61,500 | | | $ | 72,120 | | | $ | 81,766 | | | $ | 65,930 | |
| Ratios to Average Net Assets (including interest expense) | | | | | | | | | | | | | | | | | | | | |
| Ratio of expenses to average net assets excluding fee waivers and reimbursements | | | 4.86 | % | | | 3.75 | % | | | 3.10 | % | | | 2.79 | % | | | 2.97 | % |
| Ratio of expenses to average net assets including fee waivers and reimbursements | | | 4.61 | % | | | 2.32 | %(d) | | | 1.72 | %(d) | | | 1.25 | %(d) | | | 0.54 | %(d) |
| Ratio of net investment income to average net assets | | | 8.76 | % | | | 6.69 | % | | | 6.26 | % | | | 5.59 | % | | | 6.45 | % |
| | | | | | | | | | | | | | | | | | | | | |
| Ratios to Average Net Assets (excluding interest expense) | | | | | | | | | | | | | | | | | | | | |
| Ratio of expenses to average net assets excluding fee waivers and reimbursements | | | 2.50 | % | | | 2.64 | % | | | 2.76 | % | | | 2.79 | % | | | 2.97 | % |
| Ratio of expenses to average net assets including fee waivers and reimbursements | | | 2.25 | % | | | 1.21 | %(d) | | | 1.38 | %(d) | | | 1.25 | %(d) | | | 0.54 | %(d) |
| | | | | | | | | | | | | | | | | | | | | |
| Portfolio turnover rate | | | 105 | % | | | 148 | % | | | 73 | % | | | 98 | % | | | 72 | % |
| (a) | Calculated using the average shares method. |
| (b) | Distributions are based on a daily accrual of net investment income which will vary based on underlying investment yields and daily shares outstanding (see Note 6). |
| (c) | Total returns are for the period indicated and do not reflect the impact of the applicable sales charge. Total returns would have been lower had certain expenses not been waived or recouped by the Adviser during the years ended September 30, 2019 and September 30, 2020. Returns shown do not reflect the deduction of taxes that a shareholder would pay on Fund distributions or the redemption of Fund shares. |
| See Notes to Consolidated Financial Statements. | |
| Annual Report | December 31, 2023 | 35 |
| | Consolidated |
| Apollo Diversified Credit Fund – Class A | Financial Highlights |
| | For a Share Outstanding Throughout the Period Presented |
| (d) | For the period of January 1, 2019 to August 25, 2019 the Adviser voluntarily absorbed all of the operating expenses of the Fund. For the period of August 26, 2019 to April 30, 2021, the Adviser voluntarily absorbed operating expenses of the Fund in excess of 1.25% of net assets. For the period of May 1, 2021 to August 15, 2021, the Adviser voluntarily absorbed operating expenses of the Fund in excess of 1.375% of net assets. For the period of August 16, 2021 to March 31, 2022, the Adviser voluntarily waived or absorbed operating expenses of the Fund in excess of 1.50% of net assets. For the period April 1, 2022 to December 31, 2022, the Adviser voluntarily waived or absorbed operating expenses of the Fund in excess of 1.00% of net assets. For the period October 1, 2022 to December 31, 2022, the Adviser voluntarily waived or absorbed operating expenses (excluding interest, brokerage commissions, acquired fund fees and expenses and extraordinary expenses) of the Fund in excess of 1.25% of net assets. In the absence of the election by the Fund's investment adviser to bear certain of the Fund's operating expenses, the ratio of expenses to average net assets including fee waivers and reimbursements would have been higher. |
| See Notes to Consolidated Financial Statements. | |
| 36 | 1.888.926.2688 | www.apollo.com |
| | Consolidated |
| Apollo Diversified Credit Fund – Class C | Financial Highlights |
| | For a Share Outstanding Throughout the Period Presented |
| | | For the Year Ended December 31, 2023 | | | For the Year Ended December 31, 2022 | | | For the Year Ended December 31, 2021 | | | For the Year Ended December 31, 2020 | | | For the Year Ended December 31, 2019 | |
| Net asset value, beginning of year | | $ | 20.82 | | | $ | 24.53 | | | $ | 24.06 | | | $ | 24.89 | | | $ | 24.01 | |
| | | | | | | | | | | | | | | | | | | | | |
| INCOME FROM INVESTMENT OPERATIONS: | | | | | | | | | | | | | | | | | | | | |
| Net investment income(a) | | | 1.72 | | | | 1.49 | | | | 1.53 | | | | 1.28 | | | | 1.58 | |
| Net realized and unrealized gain/(loss) | | | 1.04 | | | | (3.68 | ) | | | 0.47 | | | | (0.65 | ) | | | 1.02 | |
| Total from investment operations | | | 2.76 | | | | (2.19 | ) | | | 2.00 | | | | 0.63 | | | | 2.60 | |
| | | | | | | | | | | | | | | | | | | | | |
| DISTRIBUTIONS: | | | | | | | | | | | | | | | | | | | | |
| From net investment income(b) | | | (1.79 | ) | | | (1.52 | ) | | | (1.53 | ) | | | (1.46 | ) | | | (1.72 | ) |
| Total distributions | | | (1.79 | ) | | | (1.52 | ) | | | (1.53 | ) | | | (1.46 | ) | | | (1.72 | ) |
| | | | | | | | | | | | | | | | | | | | | |
| Net increase/(decrease) in net asset value | | | 0.97 | | | | (3.71 | ) | | | 0.47 | | | | (0.83 | ) | | | 0.88 | |
| Net asset value, end of year | | $ | 21.79 | | | $ | 20.82 | | | $ | 24.53 | | | $ | 24.06 | | | $ | 24.89 | |
| TOTAL RETURN(c) | | | 13.62 | % | | | (8.93 | )% | | | 8.49 | % | | | 3.16 | % | | | 11.04 | % |
| | | | | | | | | | | | | | | | | | | | | |
| RATIOS/SUPPLEMENTAL DATA: | | | | | | | | | | | | | | | | | | | | |
| Net assets, end of period (000s) | | $ | 95,968 | | | $ | 77,088 | | | $ | 77,619 | | | $ | 62,889 | | | $ | 49,083 | |
| Ratios to Average Net Assets (including interest expense) | | | | | | | | | | | | | | | | | | | | |
| Ratio of expenses to average net assets excluding fee waivers and reimbursements | | | 5.61 | % | | | 4.50 | % | | | 3.84 | % | | | 3.54 | % | | | 3.73 | % |
| Ratio of expenses to average net assets including fee waivers and reimbursements | | | 5.36 | % | | | 2.32 | %(d) | | | 1.73 | %(d) | | | 1.25 | %(d) | | | 0.56 | %(d) |
| Ratio of net investment income to average net assets | | | 8.01 | % | | | 6.71 | % | | | 6.25 | % | | | 5.59 | % | | | 6.41 | % |
| | | | | | | | | | | | | | | | | | | | | |
| Ratios to Average Net Assets (excluding interest expense) | | | | | | | | | | | | | | | | | | | | |
| Ratio of expenses to average net assets excluding fee waivers and reimbursements | | | 3.25 | % | | | 3.39 | % | | | 3.50 | % | | | 3.54 | % | | | 3.73 | % |
| Ratio of expenses to average net assets including fee waivers and reimbursements | | | 3.00 | % | | | 1.21 | %(d) | | | 1.39 | %(d) | | | 1.25 | %(d) | | | 0.56 | %(d) |
| | | | | | | | | | | | | | | | | | | | | |
| Portfolio turnover rate | | | 105 | % | | | 148 | % | | | 73 | % | | | 98 | % | | | 72 | % |
| (a) | Calculated using the average shares method. |
| (b) | Distributions are based on a daily accrual of net investment income which will vary based on underlying investment yields and daily shares outstanding (see Note 6). |
| (c) | Total returns are for the period indicated and do not reflect the impact of the applicable sales charge. Total returns would have been lower had certain expenses not been waived or recouped by the Adviser during the years ended September 30, 2019 and September 30, 2020. Returns shown do not reflect the deduction of taxes that a shareholder would pay on Fund distributions or the redemption of Fund shares. |
| See Notes to Consolidated Financial Statements. | |
| Annual Report | December 31, 2023 | 37 |
| | Consolidated |
| Apollo Diversified Credit Fund – Class C | Financial Highlights |
| | For a Share Outstanding Throughout the Period Presented |
| (d) | For the period of January 1, 2019 to August 25, 2019 the Adviser voluntarily absorbed all of the operating expenses of the Fund. For the period of August 26, 2019 to April 30, 2021, the Adviser voluntarily absorbed operating expenses of the Fund in excess of 1.25% of net assets. For the period of May 1, 2021 to August 15, 2021, the Adviser voluntarily absorbed operating expenses of the Fund in excess of 1.375% of net assets. For the period of August 16, 2021 to March 31, 2022, the Adviser voluntarily waived or absorbed operating expenses of the Fund in excess of 1.50% of net assets. For the period April 1, 2022 to December 31, 2022, the Adviser voluntarily waived or absorbed operating expenses of the Fund in excess of 1.00% of net assets. For the period October 1, 2022 to December 31, 2022, the Adviser voluntarily waived or absorbed operating expenses (excluding interest, brokerage commissions, acquired fund fees and expenses and extraordinary expenses) of the Fund in excess of 1.25% of net assets. In the absence of the election by the Fund's investment adviser to bear certain of the Fund's operating expenses, the ratio of expenses to average net assets including fee waivers and reimbursements would have been higher. |
| See Notes to Consolidated Financial Statements. | |
| 38 | 1.888.926.2688 | www.apollo.com |
| | Consolidated |
| Apollo Diversified Credit Fund – Class I | Financial Highlights |
| | For a Share Outstanding Throughout the Period Presented |
| | | For the Year Ended December 31, 2023 | | | For the Year Ended December 31, 2022 | | | For the Year Ended December 31, 2021 | | | For the Year Ended December 31, 2020 | | | For the Year Ended December 31, 2019 | |
| Net asset value, beginning of year | | $ | 20.82 | | | $ | 24.53 | | | $ | 24.06 | | | $ | 24.89 | | | $ | 24.01 | |
| | | | | | | | | | | | | | | | | | | | | |
| INCOME FROM INVESTMENT OPERATIONS: | | | | | | | | | | | | | | | | | | | | |
| Net investment income(a) | | | 1.94 | | | | 1.49 | | | | 1.52 | | | | 1.28 | | | | 1.59 | |
| Net realized and unrealized gain/(loss) | | | 1.03 | | | | (3.68 | ) | | | 0.49 | | | | (0.65 | ) | | | 1.01 | |
| Total from investment operations | | | 2.97 | | | | (2.19 | ) | | | 2.01 | | | | 0.63 | | | | 2.60 | |
| | | | | | | | | | | | | | | | | | | | | |
| DISTRIBUTIONS: | | | | | | | | | | | | | | | | | | | | |
| From net investment income(b) | | | (2.00 | ) | | | (1.52 | ) | | | (1.54 | ) | | | (1.46 | ) | | | (1.72 | ) |
| Total distributions | | | (2.00 | ) | | | (1.52 | ) | | | (1.54 | ) | | | (1.46 | ) | | | (1.72 | ) |
| | | | | | | | | | | | | | | | | | | | | |
| Net increase/(decrease) in net asset value | | | 0.97 | | | | (3.71 | ) | | | 0.47 | | | | (0.83 | ) | | | 0.88 | |
| Net asset value, end of year | | $ | 21.79 | | | $ | 20.82 | | | $ | 24.53 | | | $ | 24.06 | | | $ | 24.89 | |
| TOTAL RETURN(c) | | | 14.74 | % | | | (8.93 | )% | | | 8.50 | % | | | 3.16 | % | | | 11.04 | % |
| | | | | | | | | | | | | | | | | | | | | |
| RATIOS/SUPPLEMENTAL DATA: | | | | | | | | | | | | | | | | | | | | |
| Net assets, end of period (000s) | | $ | 595,909 | | | $ | 391,881 | | | $ | 442,765 | | | $ | 279,376 | | | $ | 236,901 | |
| Ratios to Average Net Assets (including interest expense) | | | | | | | | | | | | | | | | | | | | |
| Ratio of expenses to average net assets excluding fee waivers and reimbursements | | | 4.63 | % | | | 3.50 | % | | | 2.84 | % | | | 2.54 | % | | | 2.72 | % |
| Ratio of expenses to average net assets including fee waivers and reimbursements | | | 4.36 | % | | | 2.32 | %(d) | | | 1.73 | %(d) | | | 1.25 | %(d) | | | 0.54 | %(d) |
| Ratio of net investment income to average net assets | | | 9.03 | % | | | 6.69 | % | | | 6.24 | % | | | 5.60 | % | | | 6.44 | % |
| | | | | | | | | | | | | | | | | | | | | |
| Ratios to Average Net Assets (excluding interest expense) | | | | | | | | | | | | | | | | | | | | |
| Ratio of expenses to average net assets excluding fee waivers and reimbursements | | �� | 2.27 | % | | | 2.39 | % | | | 2.50 | % | | | 2.54 | % | | | 2.72 | % |
| Ratio of expenses to average net assets including fee waivers and reimbursements | | | 2.00 | % | | | 1.21 | %(d) | | | 1.39 | %(d) | | | 1.25 | %(d) | | | 0.54 | %(d) |
| | | | | | | | | | | | | | | | | | | | | |
| Portfolio turnover rate | | | 105 | % | | | 148 | % | | | 73 | % | | | 98 | % | | | 72 | % |
| (a) | Calculated using the average shares method. |
| (b) | Distributions are based on a daily accrual of net investment income which will vary based on underlying investment yields and daily shares outstanding (see Note 6). |
| (c) | Total returns are for the period indicated and do not reflect the impact of the applicable sales charge. Total returns would have been lower had certain expenses not been waived or recouped by the Adviser during the years ended September 30, 2019 and September 30, 2020. Returns shown do not reflect the deduction of taxes that a shareholder would pay on Fund distributions or the redemption of Fund shares. |
| See Notes to Consolidated Financial Statements. | |
| Annual Report | December 31, 2023 | 39 |
| | Consolidated |
| Apollo Diversified Credit Fund – Class I | Financial Highlights |
| | For a Share Outstanding Throughout the Period Presented |
| | |
| (d) | For the period of January 1, 2019 to August 25, 2019 the Adviser voluntarily absorbed all of the operating expenses of the Fund. For the period of August 26, 2019 to April 30, 2021, the Adviser voluntarily absorbed operating expenses of the Fund in excess of 1.25% of net assets. For the period of May 1, 2021 to August 15, 2021, the Adviser voluntarily absorbed operating expenses of the Fund in excess of 1.375% of net assets. For the period of August 16, 2021 to March 31, 2022, the Adviser voluntarily waived or absorbed operating expenses of the Fund in excess of 1.50% of net assets. For the period April 1, 2022 to December 31, 2022, the Adviser voluntarily waived or absorbed operating expenses of the Fund in excess of 1.00% of net assets. For the period October 1, 2022 to December 31, 2022, the Adviser voluntarily waived or absorbed operating expenses (excluding interest, brokerage commissions, acquired fund fees and expenses and extraordinary expenses) of the Fund in excess of 1.25% of net assets. In the absence of the election by the Fund's investment adviser to bear certain of the Fund's operating expenses, the ratio of expenses to average net assets including fee waivers and reimbursements would have been higher. |
| See Notes to Consolidated Financial Statements. | |
| 40 | 1.888.926.2688 | www.apollo.com |
| | Consolidated |
| Apollo Diversified Credit Fund – Class M | Financial Highlights |
| | For a Share Outstanding Throughout the Period Presented |
| | | For the Year Ended December 31,
2023 | | | For the Year Ended December 31,
2022 | | | For the Period November 2, 2021 (Commencement of Operations) to December 31, 2021 | |
| Net asset value, beginning of year | | $ | 20.82 | | | $ | 24.53 | | | $ | 24.55 | |
| | | | | | | | | | | | | |
| INCOME FROM INVESTMENT OPERATIONS: | | | | | | | | | | | | |
| Net investment income(a) | | | 1.70 | | | | 1.49 | | | | 0.23 | |
| Net realized and unrealized gain/(loss) | | | 1.11 | | | | (3.68 | ) | | | – | |
| Total from investment operations | | | 2.81 | | | | (2.19 | ) | | | 0.23 | |
| | | | | | | | | | | | | |
| DISTRIBUTIONS: | | | | | | | | | | | | |
| From net investment income(b) | | | (1.84 | ) | | | (1.52 | ) | | | (0.25 | ) |
| Total distributions | | | (1.84 | ) | | | (1.52 | ) | | | (0.25 | ) |
| | | | | | | | | | | | | |
| Net increase/(decrease) in net asset value | | | 0.97 | | | | (3.71 | ) | | | (0.02 | ) |
| Net asset value, end of year | | $ | 21.79 | | | $ | 20.82 | | | $ | 24.53 | |
| TOTAL RETURN(c) | | | 13.89 | % | | | (8.94 | )% | | | 0.91 | % |
| | | | | | | | | | | | | |
| RATIOS/SUPPLEMENTAL DATA: | | | | | | | | | | | | |
| Net assets, end of year (000s) | | $ | 21 | | | $ | 208 | | | $ | 245 | |
| Ratios to Average Net Assets (including interest expense) | | | | | | | | | | | | |
| Ratio of expenses to average net assets excluding fee waivers and reimbursements | | | 3.46 | % | | | 3.98 | % | | | 3.57 | %(d) |
| Ratio of expenses to average net assets including fee waivers and reimbursements | | | 5.11 | % | | | 2.32 | %(e) | | | 1.85 | %(d)(e) |
| Ratio of net investment income to average net assets | | | 7.96 | % | | | 6.68 | % | | | 5.82 | %(d) |
| | | | | | | | | | | | | |
| Ratios to Average Net Assets (excluding interest expense) | | | | | | | | | | | | |
| Ratio of expenses to average net assets excluding fee waivers and reimbursements | | | 1.10 | % | | | 2.87 | % | | | 3.22 | %(d) |
| Ratio of expenses to average net assets including fee waivers and reimbursements | | | 2.75 | % | | | 1.21 | %(e) | | | 1.50 | %(d)(e) |
| | | | | | | | | | | | | |
| Portfolio turnover rate(f) | | | 105 | % | | | 148 | % | | | 73 | % |
| (a) | Calculated using the average shares method. |
| (b) | Distributions are based on a daily accrual of net investment income which will vary based on underlying investment yields and daily shares outstanding (see Note 6). |
| (c) | Total returns are for the period indicated and do not reflect the impact of the applicable sales charge. Total returns would have been lower had certain expenses not been waived or recouped by the Adviser during the years ended September 30, 2019 and September 30, 2020. Returns shown do not reflect the deduction of taxes that a shareholder would pay on Fund distributions or the redemption of Fund shares. |
| (e) | For the period November 2, 2021 to March 31, 2022 the Adviser voluntarily waived or absorbed operating expenses (excluding interest, brokerage commissions, acquired fund fees and expenses and extraordinary expenses) of the Fund in excess of 1.50% of net assets. For the period April 1, 2022 to September 30, 2022, the Adviser voluntarily waived or absorbed operating expenses (excluding interest, brokerage commissions, acquired fund fees and expenses and extraordinary expenses) of the Fund in excess of 1.00% of net assets. In the absence of the election by the Fund's investment adviser to bear certain of the Fund's operating expenses, the ratio of expenses to average net assets including fee waivers and reimbursements would have been higher. |
| (f) | Portfolio turnover rate for periods less than one full year has not been annualized and is calculated at the Fund level. |
| See Notes to Consolidated Financial Statements. | |
| Annual Report | December 31, 2023 | 41 |
| | Consolidated |
| Apollo Diversified Credit Fund – Class L | Financial Highlights |
| | For a Share Outstanding Throughout the Period Presented |
| | | For the Year Ended December 31, 2023 | | | For the Year Ended December 31, 2022 | | | For the Year Ended December 31, 2021 | | | For the Year Ended December 31, 2020 | | | For the Year Ended December 31, 2019 | |
| Net asset value, beginning of year | | $ | 20.81 | | | $ | 24.52 | | | $ | 24.05 | | | $ | 24.89 | | | $ | 24.01 | |
| | | | | | | | | | | | | | | | | | | | | |
| INCOME FROM INVESTMENT OPERATIONS: | | | | | | | | | | | | | | | | | | | | |
| Net investment income(a) | | | 1.82 | | | | 1.49 | | | | 1.53 | | | | 1.28 | | | | 1.57 | |
| Net realized and unrealized gain/(loss) | | | 1.04 | | | | (3.68 | ) | | | 0.47 | | | | (0.66 | ) | | | 1.03 | |
| Total from investment operations | | | 2.86 | | | | (2.19 | ) | | | 2.00 | | | | 0.62 | | | | 2.60 | |
| | | | | | | | | | | | | | | | | | | | | |
| DISTRIBUTIONS: | | | | | | | | | | | | | | | | | | | | |
| From net investment income(b) | | | (1.89 | ) | | | (1.52 | ) | | | (1.53 | ) | | | (1.46 | ) | | | (1.72 | ) |
| Total distributions | | | (1.89 | ) | | | (1.52 | ) | | | (1.53 | ) | | | (1.46 | ) | | | (1.72 | ) |
| | | | | | | | | | | | | | | | | | | | | |
| Net increase/(decrease) in net asset value | | | 0.97 | | | | (3.71 | ) | | | 0.47 | | | | (0.84 | ) | | | 0.88 | |
| Net asset value, end of year | | $ | 21.78 | | | $ | 20.81 | | | $ | 24.52 | | | $ | 24.05 | | | $ | 24.89 | |
| TOTAL RETURN(c) | | | 14.17 | % | | | (8.95 | )% | | | 8.49 | % | | | 3.13 | % | | | 11.05 | % |
| | | | | | | | | | | | | | | | | | | | | |
| RATIOS/SUPPLEMENTAL DATA: | | | | | | | | | | | | | | | | | | | | |
| Net assets, end of period (000s) | | $ | 14,978 | | | $ | 12,190 | | | $ | 13,711 | | | $ | 11,606 | | | $ | 5,537 | |
| Ratios to Average Net Assets (including interest expense) | | | | | | | | | | | | | | | | | | | | |
| Ratio of expenses to average net assets excluding fee waivers and reimbursements | | | 5.09 | % | | | 3.98 | % | | | 3.31 | % | | | 3.05 | % | | | 3.19 | % |
| Ratio of expenses to average net assets including fee waivers and reimbursements | | | 4.86 | % | | | 2.32 | %(d) | | | 1.73 | %(d) | | | 1.25 | %(d) | | | 0.59 | %(d) |
| Ratio of net investment income to average net assets | | | 8.50 | % | | | 6.69 | % | | | 6.25 | % | | | 5.58 | % | | | 6.38 | % |
| | | | | | | | | | | | | | | | | | | | | |
| Ratios to Average Net Assets (excluding interest expense) | | | | | | | | | | | | | | | | | | | | |
| Ratio of expenses to average net assets excluding fee waivers and reimbursements | | | 2.73 | % | | | 2.87 | % | | | 2.97 | % | | | 3.05 | % | | | 3.19 | % |
| Ratio of expenses to average net assets including fee waivers and reimbursements | | | 2.50 | % | | | 1.21 | %(d) | | | 1.39 | %(d) | | | 1.25 | %(d) | | | 0.59 | %(d) |
| | | | | | | | | | | | | | | | | | | | | |
| Portfolio turnover rate | | | 105 | % | | | 148 | % | | | 73 | % | | | 98 | % | | | 72 | % |
| (a) | Calculated using the average shares method. |
| (b) | Distributions are based on a daily accrual of net investment income which will vary based on underlying investment yields and daily shares outstanding (see Note 6). |
| (c) | Total returns are for the period indicated and do not reflect the impact of the applicable sales charge. Total returns would have been lower had certain expenses not been waived or recouped by the Adviser during the years ended September 30, 2019 and September 30, 2020. Returns shown do not reflect the deduction of taxes that a shareholder would pay on Fund distributions or the redemption of Fund shares. |
| See Notes to Consolidated Financial Statements. | |
| 42 | 1.888.926.2688 | www.apollo.com |
| | Consolidated |
| Apollo Diversified Credit Fund – Class L | Financial Highlights |
| | For a Share Outstanding Throughout the Period Presented |
| (d) | For the period of January 1, 2019 to August 25, 2019 the Adviser voluntarily absorbed all of the operating expenses of the Fund. For the period of August 26, 2019 to April 30, 2021, the Adviser voluntarily absorbed operating expenses of the Fund in excess of 1.25% of net assets. For the period of May 1, 2021 to August 15, 2021, the Adviser voluntarily absorbed operating expenses of the Fund in excess of 1.375% of net assets. For the period of August 16, 2021 to March 31, 2022, the Adviser voluntarily waived or absorbed operating expenses of the Fund in excess of 1.50% of net assets. For the period April 1, 2022 to December 31, 2022, the Adviser voluntarily waived or absorbed operating expenses of the Fund in excess of 1.00% of net assets. For the period October 1, 2022 to December 31, 2022, the Adviser voluntarily waived or absorbed operating expenses (excluding interest, brokerage commissions, acquired fund fees and expenses and extraordinary expenses) of the Fund in excess of 1.25% of net assets. In the absence of the election by the Fund's investment adviser to bear certain of the Fund's operating expenses, the ratio of expenses to average net assets including fee waivers and reimbursements would have been higher. |
| See Notes to Consolidated Financial Statements. | |
| Annual Report | December 31, 2023 | 43 |
| | Consolidated |
| Apollo Diversified Credit Fund – Class F | Financial Highlights |
| | For a Share Outstanding Throughout the Period Presented |
| | | For the Year Ended December 31, 2023 | | | For the Year Ended December 31, 2022 | | | For the Year Ended December 31, 2021 | | | For the Year Ended December 31, 2020 | | | For the Year Ended December 31, 2019 | |
| Net asset value, beginning of year | | $ | 20.82 | | | $ | 24.53 | | | $ | 24.07 | | | $ | 24.90 | | | $ | 24.01 | |
| | | | | | | | | | | | | | | | | | | | | |
| INCOME FROM INVESTMENT OPERATIONS: | | | | | | | | | | | | | | | | | | | | |
| Net investment income(a) | | | 2.53 | | | | 1.61 | | | | 1.53 | | | | 1.28 | | | | 1.63 | |
| Net realized and unrealized gain/(loss) | | | 1.05 | | | | (3.67 | ) | | | 0.46 | | | | (0.65 | ) | | | 0.97 | |
| Total from investment operations | | | 3.58 | | | | (2.06 | ) | | | 1.99 | | | | 0.63 | | | | 2.60 | |
| | | | | | | | | | | | | | | | | | | | | |
| DISTRIBUTIONS: | | | | | | | | | | | | | | | | | | | | |
| From net investment income(b) | | | (2.61 | ) | | | (1.65 | ) | | | (1.53 | ) | | | (1.46 | ) | | | (1.71 | ) |
| Total distributions | | | (2.61 | ) | | | (1.65 | ) | | | (1.53 | ) | | | (1.46 | ) | | | (1.71 | ) |
| | | | | | | | | | | | | | | | | | | | | |
| Net increase/(decrease) in net asset value | | | 0.97 | | | | (3.71 | ) | | | 0.46 | | | | (0.83 | ) | | | 0.89 | |
| Net asset value, end of year | | $ | 21.79 | | | $ | 20.82 | | | $ | 24.53 | | | $ | 24.07 | | | $ | 24.90 | |
| TOTAL RETURN(c) | | | 17.94 | % | | | (8.38 | )% | | | 8.44 | % | | | 3.15 | % | | | 11.06 | % |
| | | | | | | | | | | | | | | | | | | | | |
| RATIOS/SUPPLEMENTAL DATA: | | | | | | | | | | | | | | | | | | | | |
| Net assets, end of period (000s) | | $ | 13,021 | | | $ | 16,767 | | | $ | 21,337 | | | $ | 23,004 | | | $ | 25,965 | |
| Ratios to Average Net Assets (including interest expense) | | | | | | | | | | | | | | | | | | | | |
| Ratio of expenses to average net assets excluding fee waivers and reimbursements | | | 4.57 | % | | | 3.50 | % | | | 2.84 | % | | | 2.54 | % | | | 2.70 | % |
| Ratio of expenses to average net assets including fee waivers and reimbursements | | | 1.50 | % | | | 1.76 | %(d) | | | 1.72 | %(d) | | | 1.25 | %(d) | | | 0.43 | %(d) |
| Ratio of net investment income to average net assets | | | 11.80 | % | | | 7.24 | % | | | 6.27 | % | | | 5.60 | % | | | 6.58 | % |
| | | | | | | | | | | | | | | | | | | | | |
| Ratios to Average Net Assets (excluding interest expense) | | | | | | | | | | | | | | | | | | | | |
| Ratio of expenses to average net assets excluding fee waivers and reimbursements | | | 4.57 | %(e) | | | 2.39 | % | | | 2.50 | % | | | 2.54 | % | | | 2.70 | % |
| Ratio of expenses to average net assets including fee waivers and reimbursements | | | 1.50 | %(e) | | | 0.65 | %(d) | | | 1.38 | %(d) | | | 1.25 | %(d) | | | 0.43 | %(d) |
| | | | | | | | | | | | | | | | | | | | | |
| Portfolio turnover rate | | | 105 | % | | | 148 | % | | | 73 | % | | | 98 | % | | | 72 | % |
| (a) | Calculated using the average shares method. |
| (b) | Distributions are based on a daily accrual of net investment income which will vary based on underlying investment yields and daily shares outstanding (see Note 6). |
| (c) | Total returns are for the period indicated. Total returns would have been lower had certain expenses not been waived or recouped by the Adviser during the years ended September 30, 2019 and September 30, 2020. Returns shown do not reflect the deduction of taxes that a shareholder would pay on Fund distributions or the redemption of Fund shares. |
| See Notes to Consolidated Financial Statements. | |
| 44 | 1.888.926.2688 | www.apollo.com |
| | Consolidated |
| Apollo Diversified Credit Fund – Class F | Financial Highlights |
| | For a Share Outstanding Throughout the Period Presented |
| (d) | For the period of January 1, 2019 to August 25, 2019 the Adviser voluntarily absorbed all of the operating expenses of the Fund. For the period of August 26, 2019 to April 30, 2021, the Adviser voluntarily absorbed operating expenses of the Fund in excess of 1.25% of net assets. For the period of May 1, 2021 to August 15, 2021, the Adviser voluntarily absorbed operating expenses of the Fund in excess of 1.375% of net assets. For the period of August 16, 2021 to March 31, 2022, the Adviser voluntarily waived or absorbed operating expenses of the Fund in excess of 1.50% of net assets. For the period April 1, 2022 to December 31, 2022, the Adviser voluntarily waived or absorbed operating expenses of the Fund in excess of 1.00% of net assets. For the period October 1, 2022 to December 31, 2022, the Adviser voluntarily waived or absorbed operating expenses (excluding interest, brokerage commissions, acquired fund fees and expenses and extraordinary expenses) of the Fund in excess of 1.25% of net assets. In the absence of the election by the Fund's investment adviser to bear certain of the Fund's operating expenses, the ratio of expenses to average net assets including fee waivers and reimbursements would have been higher. |
| (e) | Ratio excludes expense waiver related to interest expense. |
| See Notes to Consolidated Financial Statements. | |
| Annual Report | December 31, 2023 | 45 |
| | Consolidated |
| Apollo Diversified Credit Fund | Financial Highlights |
| | For a Share Outstanding Throughout the Period Presented |
Information about the Fund's senior securities is shown in the following table:
| | | For the Year Ended December 31,
2023 | | | For the Year Ended December 31,
2022 | | | For the Year Ended December 31,
2021 | | | For the Year Ended December 31,
2020(a) | | For the Year Ended December 31,
2019(a) |
| Lines of Credit Total Amount Outstanding (000's) | | $ | 175,800 | | | $ | 221,500 | | | $ | 133,945 | | | N/A | | N/A |
| Asset Coverage Per $1,000 of Lines of Credit Outstanding(b) | | $ | 5,557 | | | $ | 3,527 | | | $ | 5,691 | | | N/A | | N/A |
| (a) | The Fund did not have a Line of Credit during this period. |
| (b) | Calculated by subtracting the Fund’s consolidated total liabilities (excluding the indebtedness represented by the Lines of Credit) from the Fund’s total assets and dividing by the total amount outstanding on the Lines of Credit. The Asset Coverage ratio is then multiplied by $1,000 to determine the "Asset Coverage Per $1,000 of Lines of Credit Outstanding." |
| See Notes to Consolidated Financial Statements. | |
| 46 | 1.888.926.2688 | www.apollo.com |
| Apollo Diversified Credit Fund | Notes to Consolidated Financial Statements |
| | December 31, 2023 |
1. ORGANIZATION
Apollo Diversified Credit Fund (the “Fund”) is registered with the U.S. Securities and Exchange Commission (“SEC”) under the Investment Company Act of 1940, as amended (the “1940 Act”), as a diversified, closed-end management investment company. The Fund was organized as a statutory trust on April 5, 2016 under the laws of the State of Delaware. The Fund commenced operations on April 3, 2017 and is authorized to issue an unlimited number of shares with no par value. The Fund engages in a continuous offering of shares and operates as an interval fund that offers quarterly repurchases of shares at net asset value (“NAV”). The Fund’s investment adviser is Apollo Capital Credit Adviser, LLC (formerly, Griffin Capital Credit Advisor, LLC) (the “Adviser”). The Fund's investment sub-adviser is Apollo Credit Management, LLC (the "Sub-Adviser"). Both the Adviser and Sub-Adviser are affiliates of Apollo Global Management, Inc. and its consolidated subsidiaries. Both the Adviser and Sub-Adviser are registered as investment advisers with the SEC pursuant to the provisions of the Investment Advisers Act of 1940, as amended.
The Fund’s investment objective is to generate a return comprised of both current income and capital appreciation with an emphasis on current income with low volatility and low correlation to the broader markets. The Fund pursues its investment objective through a “multi-asset” approach centered around five key strategy pillars: (1) levered performing credit, (2) dislocated credit, (3) large scale origination, (4) structured credit and (5) other private credit strategies. The levered performing credit pillar primarily pursues liquid, performing senior secured corporate credit to generate total return. The dislocated credit pillar seeks to use contingent capital to pursue “dislocated” credit opportunities (e.g., stressed, performing assets across the credit spectrum that sell-off due to technical and/or non-fundamental reasons) in between traditional, passive investment mandates and “distressed-for-control” investment mandates. The large scale origination pillar targets large corporate and sponsor-backed issuers utilizing Apollo’s proprietary sourcing channel, primarily focused on first lien and unitranche loans. The structured credit pillar seeks out high-quality structured credit opportunities of various asset types, vintages, maturities, jurisdictions and capital structure priorities, including debt and equity tranches of collateralized loan obligations (“CLO”), commercial mortgage backed securities (“CMBS"), residential mortgage backed securities (“RMBS”), consumer and commercial asset backed securities (“ABS”), whole loans and regulatory capital relief transactions. The other private credit strategies pillar is expected to enable agile deployment into origination and propriety sourcing channels across the balance of sector and credit asset class expertise resident within the Apollo credit platform that may not be captured by the above pillars. This may include opportunities within asset classes covered by Apollo including, but not limited to, asset backed lending, special purpose acquisition companies (“SPACs”), aviation finance and credit secondaries. The Fund will invest, under normal market conditions, at least 80% of its net assets plus the amount of any borrowings and the liquidation preference of any preferred shares that may be outstanding ("Managed Assets") in debt securities, including, but not limited to, credit related investments such as fixed income securities (investment grade debt and high-yield-debt), floating rate securities (senior loans or structured credit) and other debt instruments and in derivatives (futures, forward contracts, foreign currency exchange contracts, call and put options, selling or purchasing credit default swaps, and total return swaps) and other instruments that have economic characteristics similar to such securities or investments.
The Fund currently offers Class A, Class C, Class I, Class L and Class M shares. Class A, Class C and Class I shares commenced operations on April 3, 2017. Class L shares commenced operations on September 5, 2017. Class F shares commenced operations on September 25, 2017 and are no longer offered except for reinvestment of dividends. Class M shares commenced operations on November 2, 2021. Class A and Class L shares are offered subject to a maximum sales charge of 5.75% and 4.25%, respectively, of their offering price. Class C, Class I, and Class M shares are offered at net asset value per share. Class C shares may be subject to a 1.00% contingent deferred sales charge on shares redeemed during the first 365 days after their purchase. Each class represents an interest in the same assets of the Fund and classes are identical except for differences in their sales charge structures and ongoing service and distribution charges. All classes of shares have equal voting privileges except that each class has exclusive voting rights with respect to its service and/or distribution plans. The Fund’s income, expenses (other than class specific service and distribution fees), and realized and unrealized gains and losses are allocated proportionately each day based upon the relative net assets of each class.
2. SIGNIFICANT ACCOUNTING POLICIES
Basis of Presentation – The following is a summary of significant accounting policies followed by the Fund in preparation of its consolidated financial statements. These policies are in conformity with accounting principles generally accepted in the United States of America (“GAAP”). The Fund is considered an investment company following accounting and reporting guidance in Accounting Standards Codification (“ASC”) Topic 946 – Financial Services – Investment Companies. The preparation of the consolidated financial statements requires management to make estimates and assumptions that affect the reported amounts of assets and liabilities and disclosure of contingent assets and liabilities at the date of the consolidated financial statements and the reported amounts of income and expenses for the period. Actual results could differ from those estimates.
Fund Subsidiaries – During the period, certain investments of the Fund were held through wholly-owned subsidiaries. The Fund has a 100% ownership interest, consolidates, and has control over significant operating, financial, and monetary decisions of ADCF Alpine SPV, LLC (“Alpine SPV”), ADCF Zorro SPV, LLC (“Zorro SPV”), ADCF Lender, LLC (“ADCF Lender”), ADCF Mantle SPV, LLC (“Mantle SPV”), ADCF Germantown SPV, LLC (“Germantown SPV”), ADCF Titan SPV, LLC (f/k/a ADCF Certinia SPV, LLC) (“Titan SPV”), ADCF Newark SPV, LLC (“Newark SPV”), ADCF Lemon SPV, LLC (“Lemon SPV”), ADCF Ostrich SPV, LLC (“Ostrich SPV”), CRDTX SPV I, LLC (“Financing Subsidiary”), and GIACF Alternative Holdings, LLC (“Cayman SPV”) (together, the “Subsidiaries”). The primary purpose of the Subsidiaries is to facilitate the holding of certain investments of the Fund. For purposes of the Fund’s investment restrictions, guidelines and limitations, the Fund will aggregate direct investments with investment exposure provided by its Subsidiaries. The financial results of the Subsidiaries are included in the consolidated financial statements and financial highlights of the Fund and all investments held by the Subsidiaries are disclosed in the Consolidated Schedule of Investments. All accounts and transactions between the Fund and its Subsidiaries have been eliminated in consolidation.
| Annual Report | December 31, 2023 | 47 |
| Apollo Diversified Credit Fund | Notes to Consolidated Financial Statements |
| | December 31, 2023 |
Alpine SPV is a Limited Liability Company formed in accordance with the laws of the State of Delaware on June 3, 2022. The Fund is the managing and sole member of Alpine SPV pursuant to a limited liability company operating agreement. Alpine SPV, in accordance with the laws of the State of Delaware, was dissolved on March 15, 2023.
Zorro SPV is a Limited Liability Company formed in accordance with the laws of the State of Delaware on July 25, 2022. The Fund is the managing and sole member of Zorro SPV pursuant to a limited liability company operating agreement. Zorro SPV, in accordance with the laws of the State of Delaware, was dissolved on March 15, 2023.
ADCF Lender is a Limited Liability Company formed in accordance with the laws of the State of Delaware on July 28, 2022. The Fund is the managing and sole member of ADCF Lender pursuant to a limited liability company operating agreement.
Mantle SPV is a Limited Liability Company formed in accordance with the laws of the State of Delaware on December 14, 2022. The Fund is the managing and sole member of Mantle SPV pursuant to a limited liability company operating agreement. Mantle SPV, in accordance with the laws of the State of Delaware, was dissolved on April 27, 2023.
Germantown SPV is a Limited Liability Company formed in accordance with the laws of the State of Delaware on May 16, 2023. The Fund is the managing and sole member of Germantown SPV pursuant to a limited liability company operating agreement.
Titan SPV is a Limited Liability Company formed in accordance with the laws of the State of Delaware on July 13, 2023. The Fund is the managing and sole member of Titan SPV pursuant to a limited liability company operating agreement.
Newark SPV is a Limited Liability Company formed in accordance with the laws of the State of Delaware on August 2, 2023. The Fund is the managing and sole member of Newark SPV pursuant to a limited liability company operating agreement.
Lemon SPV is a Limited Liability Company formed in accordance with the laws of the State of Delaware on September 12, 2023. The Fund is the managing and sole member of Lemon SPV pursuant to a limited liability company operating agreement.
Ostrich SPV is a Limited Liability Company formed in accordance with the laws of the State of Delaware on December 4, 2023. The Fund is the managing and sole member of Ostrich SPV pursuant to a limited liability company operating agreement.
The Financing Subsidiary, a Delaware Limited Liability Company, was formed on November 27, 2018. The Fund and CRDTX SPV I, LLC, are party to a secured revolving credit facility with Citibank, N.A. The Fund is the managing and sole member of CRDTX SPV I, LLC pursuant to a limited liability company operating agreement and the Fund will remain the sole member and will continue to wholly own and control CRDTX SPV I, LLC. Assets pledged as collateral by CRDTX SPV I, LLC under the secured revolving credit facility with Citibank, N.A. are disclosed in the Consolidated Schedule of investments.
The Cayman SPV, a Cayman Islands exempted company, was formed on September 18, 2018. The Fund is the managing and sole member of the Cayman SPV pursuant to a limited liability company operating agreement. The Cayman SPV has received an undertaking from the Government of the Cayman Islands exempting it from all local income, profits and capital gains taxes. No such taxes are levied in the Cayman Islands at the present time. For U.S. income tax purposes, the Cayman SPV is a Controlled Foreign Corporation, which generates and is allocated no income that is considered effectively connected with U.S. trade of business and, as such, is not subject to U.S. income tax. However, as a wholly-owned Controlled Foreign Corporation, the Cayman SPV’s net income and capital gain, to the extent of its earnings and profits, will be included each year in the Fund’s investment company taxable income.
For purposes of the Fund’s investment restrictions, guidelines and limitations, the Fund will aggregate direct investments with investment exposure provided by its Subsidiaries.
Fund Valuation – The net asset value per share for the Fund is determined following the close of regular trading on the New York Stock Exchange (“NYSE”), generally 4:00 p.m. Eastern time, on each day the NYSE is open for trading. Each of the Fund’s share classes will be offered at net asset value plus the applicable sales load, if any. The Fund’s net asset value per share is calculated, on a class-specific basis, by dividing the value of the Fund’s net assets by the total number of shares outstanding. The Fund’s net asset value per share is calculated, on a class-specific basis, by dividing the value of the Fund’s total assets (the value of the securities the Fund holds plus cash or other assets, including interest accrued but not yet received), less accrued expenses and other liabilities of the Fund, by the total number of shares outstanding.
| 48 | 1.888.926.2688 | www.apollo.com |
| Apollo Diversified Credit Fund | Notes to Consolidated Financial Statements |
| | December 31, 2023 |
Security Valuation – The Fund’s Board has adopted procedures pursuant to which the Fund will value its investments (the “Valuation Policy and Procedures”). In accordance with the Valuation Policy and Procedures, the Fund’s portfolio investments for which market quotations are readily available are valued at market value. Investments for which market quotations are not readily available or are deemed to be unreliable are valued at fair value as determined in good faith pursuant to Rule 2a-5 under the 1940 Act. As permitted by Rule 2a-5 under the 1940 Act, the Board has designated the Adviser as the Fund’s valuation designee (“Valuation Designee”) to perform fair value determinations relating to all portfolio investments. The Adviser carries out its designated responsibilities as Valuation Designee through various teams pursuant to the Valuation Policy and Procedures which govern the Valuation Designee’s selection and application of methodologies and independent pricing services for determining and calculating the fair value of portfolio investments. The Valuation Designee will fair value portfolio investments utilizing inputs from various external and internal sources including, but not limited to, independent pricing services, dealer quotation reporting systems, independent third-party valuation firms and proprietary models and information. When determining the fair value of an investment, one or more fair value methodologies may be used. Fair value determinations will be based upon all available factors that the Valuation Designee deems relevant at the time of the determination. Fair valuation involves subjective judgments, and it is possible that the fair value determined for a security may differ materially from the value that could be realized upon the sale of the security.
Forward foreign currency exchange contracts and cross currency swaps are typically valued at their quoted daily prices obtained from an independent pricing service. The aggregate settlement values and notional amounts of the forward foreign currency exchange contracts and cross currency swaps will not be recorded in the Consolidated Statement of Assets and Liabilities. However, fluctuations in the value of the forward foreign currency exchange contracts will be recorded in the Consolidated Statement of Assets and Liabilities as an asset or liability and in the Consolidated Statement of Operations as unrealized appreciation or depreciation until terminated.
Fair Value Measurements – In accordance with ASC Topic 820 – Fair Value Measurement and Disclosures, a three-tier hierarchy has been established to classify fair value measurements for disclosure purposes. Inputs refer broadly to the assumptions that market participants would use in pricing the asset or liability, including assumptions about risk. Inputs may be observable or unobservable. Observable inputs are inputs that reflect the assumptions market participants would use in pricing the asset or liability that are developed based on market data obtained from sources independent of the reporting entity. Unobservable inputs are inputs that reflect the reporting entity’s own assumptions about the assumptions market participants would use in pricing the asset or liability that are developed based on the best information available. In accordance with the authoritative guidance on fair value measurements and disclosure under GAAP, the Fund discloses fair value of its investments in a hierarchy that prioritizes the inputs to valuation techniques used to measure the fair value, as follows:
Level 1 – Unadjusted quoted prices in active markets for identical, unrestricted assets or liabilities that the Fund has the ability to access at the measurement date;
Level 2 – Quoted prices which are not active, quoted prices for similar assets or liabilities in active markets or inputs other than quoted prices that are observable (either directly or indirectly) for substantially the full term of the asset or liability at the measurement date; and
Level 3 – Significant unobservable prices or inputs (including the Fund’s own assumptions in determining the fair value of investments) where there is little or no market activity for the asset or liability at the measurement date.
The availability of observable inputs can vary from security to security and is affected by a wide variety of factors, including, for example, the type of security, whether the security is new and not yet established in the marketplace, the liquidity of markets and other characteristics particular to the security. To the extent that valuation is based on models or inputs that are less observable or unobservable in the market, the determination of fair value requires more judgment. Accordingly, the degree of judgment exercised in determining fair value is greatest for instruments categorized in Level 3.
An investment level within the fair value hierarchy is based on the lowest level input, individually or in the aggregate, that is significant to fair value measurement. The valuation techniques used by the Fund to measure fair value during the year ended December 31, 2023 maximized the use of observable inputs and minimized the use of unobservable inputs.
| Annual Report | December 31, 2023 | 49 |
| Apollo Diversified Credit Fund | Notes to Consolidated Financial Statements |
| | December 31, 2023 |
The inputs or methodologies used for valuing securities are not necessarily an indication of the risk or liquidity associated with investing in those securities. The following is a summary of the inputs used in valuing the Fund’s investments as of December 31, 2023:
| Investments in Securities at Value | | Level 1 – Quoted Prices | | | Level 2 – Other Significant Observable Inputs | | | Level 3 – Significant Unobservable Inputs | | | Total | |
| Bank Loans | | $ | – | | | $ | 149,078,187 | | | $ | 497,338,232 | | | $ | 646,416,419 | |
| Corporate Bonds | | | – | | | | 139,403,113 | | | | 84,712,499 | | | | 224,115,612 | |
| Convertible Corporate Bonds | | | – | | | | – | | | | 4,667,649 | | | | 4,667,649 | |
| Collateralized Loan Obligations | | | – | | | | 2,898,199 | | | | 6,677,435 | | | | 9,575,634 | |
| Commercial Real Estate Loans | | | – | | | | 29,460,468 | | | | – | | | | 29,460,468 | |
| Short Term Investment | | | 84,947,743 | | | | – | | | | – | | | | 84,947,743 | |
| Total | | $ | 84,947,743 | | | $ | 320,839,967 | | | $ | 593,395,815 | | | $ | 999,183,525 | |
| Other Financial Instruments* | | | | | | | | | | | | | | | | |
| Liabilities: | | | | | | | | | | | | | | | | |
| Cross Currency Swap Contract | | | – | | | | (628,273 | ) | | | – | | | | (628,273 | ) |
| Forward Foreign Currency Contracts | | | – | | | | (3,450,785 | ) | | | – | | | | (3,450,785 | ) |
| Total | | $ | – | | | $ | (4,079,058 | ) | | $ | – | | | $ | (4,079,058 | ) |
| * | Other financial instruments are derivative instruments reflected in the Consolidated Schedule of Investments. The derivatives shown in this table are reported at their unrealized appreciation/ (depreciation) at measurement date, which represents the change in the contracts' value. |
The changes of fair value of investments for which the Fund has used Level 3 inputs to determine the fair value are as follows:
| | | Bank Loans | | | Corporate Bonds | | | Equity Interest | | | Convertible Corporate Bonds | | | Collateralized Loan Obligations | | | Total | |
| Balance as of December 31, 2022 | | $ | 216,629,877 | | | $ | – | | | $ | 5,132 | | | $ | 4,359,597 | | | $ | – | | | $ | 220,994,606 | |
| Accrued discount/ premium | | | 364,658 | | | | 81,237 | | | | – | | | | (35,199 | ) | | | (311,940 | ) | | | 98,756 | |
| Realized Gain/(Loss) | | | 351,628 | | | | – | | | | – | | | | – | | | | – | | | | 351,628 | |
| Change in Unrealized Appreciation/(Depreciation) | | | 6,021,366 | | | | 960,924 | | | | (5,132 | ) | | | 343,251 | | | | 286,842 | | | | 7,607,251 | |
| Purchases | | | 234,196,711 | | | | 83,670,338 | | | | – | | | | – | | | | 6,702,533 | | | | 324,569,582 | |
| Sales Proceeds | | | (88,954,118 | ) | | | – | | | | – | | | | – | | | | – | | | | (88,954,118 | ) |
| Transfer into Level 3(a) | | | 128,960,599 | | | | – | | | | – | | | | – | | | | – | | | | 128,960,599 | |
| Transfer out of Level 3(a) | | | (232,489 | ) | | | – | | | | – | | | | – | | | | – | | | | (232,489 | ) |
| Balance as of December 31, 2023 | | $ | 497,338,232 | | | $ | 84,712,499 | | | $ | – | | | $ | 4,667,649 | | | $ | 6,677,435 | | | $ | 593,395,815 | |
| Net change in unrealized appreciation/(depreciation) included in the Statements of Operations attributable to Level 3 investments held at December 31, 2023 | | $ | 6,006,616 | | | $ | 960,924 | | | $ | – | | | $ | 343,249 | | | $ | 286,842 | | | $ | 7,597,631 | |
| (a) | Assets were transferred from Level 2 to Level 3 or from Level 3 to Level 2 as a result of changes in levels of liquid market observability when subject to various criteria as discussed above. |
| 50 | 1.888.926.2688 | www.apollo.com |
| Apollo Diversified Credit Fund | Notes to Consolidated Financial Statements |
| | December 31, 2023 |
The table below provides additional information about the Level 3 Fair Value Measurements as of December 31, 2023:
Quantitative Information about Level 3 Fair Value Measurements
| Asset Class | | Fair Value | | | Valuation Technique(s) | | Unobservable Input(s) | | Minimum | | | Maximum | | | Weighted Average | |
| Bank Loans | | | 336,912,716 | | | Discounted Cash Flow | | Discount Rate | | | 8.52 | % | | | 15.54 | % | | | 10.47 | % |
| Bank Loans | | | 128,390,445 | (a) | | Transaction Approach | | Cost(b) | | $ | 83.24 | | | $ | 100.00 | | | $ | 97.41 | |
| Corporate Bond | | | 54,794,122 | (a) | | Transaction Approach | | Cost(b) | | $ | 96.00 | | | $ | 99.00 | | | $ | 97.61 | |
| Corporate Bond | | | 29,918,377 | | | Discounted Cash Flow | | Discount Rate | | | 6.92 | % | | | 12.19 | % | | | 10.54 | % |
| Bank Loans | | | 21,506,045 | (a) | | Transaction Approach | | Recent Transaction(b) | | $ | 98.00 | | | $ | 98.00 | | | $ | 98.00 | |
| Bank Loans | | | 10,529,025 | | | Independent pricing service and/or broker quotes | | Vendor and/or broker quotes(b) | | $ | 101.88 | | | $ | 101.88 | | | $ | 101.88 | |
| Collateralized | | | | | | | | | | | | | | | | | | | | |
| Loan Obligations | | | 6,677,436 | | | Discounted Cash Flow | | Discount Rate | | | 13.50 | % | | | 13.50 | % | | | 13.50 | % |
| Convertible | | | | | | | | | | | | | | | | | | | | |
| Corporate Bond | | | 4,667,649 | | | Discounted Cash Flow | | Discount Rate | | | 12.90 | % | | | 12.90 | % | | | 12.90 | % |
| | | | | | | Option Model | | Volatility | | | 63.00 | % | | | 63.00 | % | | | 63.00 | % |
| Bank Loans | | | – | | | Recoverability | | Estimated Proceeds | | $ | – | | | $ | – | | | $ | – | |
| Equity Interests | | | – | | | Recoverability | | Estimated Proceeds | | $ | – | | | $ | – | | | $ | – | |
| Total | | $ | 593,395,815 | | | | | | | | | | | | | | | | | |
| Unobservable Input | Impact to Value if Input Increases | Impact to Value if Input Decreases |
| Discount Rate | Decrease | Increase |
| Volatility | Increase | Decrease |
| Estimated Proceeds | Increase | Decrease |
| Vendor and/or broker quote | Increase | Decrease |
| Recent Transaction | Increase | Decrease |
| (a) | The Fund utilized a recent transaction, specifically purchase price, to fair value this security |
| (b) | The Fund did not develop the unobservable inputs for the determination of fair value (examples include broker quotations from pricing services and prior or recent transactions) |
The Fund used valuation techniques consistent with the income approach and market approach to determine the fair value of certain Level 3 assets as of December 31, 2023. The valuation techniques utilized by the Fund included discounted cash flows analysis, recoverability, and the option model. The Fund utilized the discounted cash flow analysis to measure fair value of certain of the Fund’s equity and debt investments. The discounted cash flows analysis is a technique whereby future expected cash flows of the underlying investment are discounted to determine a present value using a discount rate. The significant unobservable input used in the discounted cash flows analysis is the discount rate. The Fund also utilized a recoverability approach to measure fair value of certain of the Fund’s equity and debt investments, specifically a liquidation analysis. There are various, company specific inputs used in the valuation analysis that relate to the liquidation value of a company’s assets. The significant unobservable input used in the valuation model was estimated proceeds. For certain investments, the Fund used an option model, of which the applicable method is the Black-Scholes Option Pricing Method (“BSM”), to perform valuations. The BSM is a model of price variation over time of financial instruments, such as equity, that is used to determine the price of call or put options. Various inputs are required but the primary unobservable input into the BSM model is the underlying asset volatility.
Generally, new investments not valued by an independent pricing service are held at purchase price initially until the investment has been held by the Fund for a full quarter. Absent a material change to the applicable investment, the Valuation Designee subsequently determines the application of a fair value methodology at the next valuation date.
The carrying and fair value of the Fund's debt obligation as of December 31, 2023, for which the Fund has determined would be categorized as Level 2 in the fair value hierarchy, was $175,800,000.
Securities Transactions, Revenue Recognition and Expenses – The Fund records its investment transactions on a trade date basis. The Fund measures realized gains or losses by the difference between the net proceeds from the repayment or sale and the amortized cost basis of the investment, using the specified identification method. Interest income, adjusted for amortization of premium and accretion of discount, is recorded on an accrual basis.
| Annual Report | December 31, 2023 | 51 |
| Apollo Diversified Credit Fund | Notes to Consolidated Financial Statements |
| | December 31, 2023 |
Discount and premium to par value on investments acquired are accreted and amortized, respectively, into interest income over the life of the respective investment using the effective interest method. Loan origination fees, original issue discount and market discount or premium are capitalized and amortized against or accreted into interest income using the effective interest method or straight-line method, as applicable. For the Fund’s investments in revolving bank loans, the cost basis of the investment purchased is adjusted for the cash received for the discount on the total balance committed. The fair value is also adjusted for price appreciation or depreciation on the unfunded portion.
Dividend income on preferred equity investments is recorded on an accrual basis to the extent that such amounts are payable by the portfolio company and are expected to be collected. Dividend income on common equity investments is recorded on the record date for private portfolio companies and on the ex-dividend date for publicly traded portfolio companies. Distributions received from a limited liability company or limited partnership investments are evaluated to determine if the distribution should be recorded as dividend income or a return of capital.
Income from securitization vehicles and investments in the equity class securities of CLO vehicles (typically income notes or subordinated notes) is recorded daily using the effective interest method in accordance with the provisions of ASC 325-40, Beneficial Interests in Securitized Financial Assets, based upon a calculation of the effective yield to the expected redemption date based on an estimate of future cash flows, including those CLO equity investments that have not made their inaugural distribution for the relevant period end. The Fund monitors the expected residual payments, and the effective yield is determined and updated quarterly.
Certain investments may have contractual payment-in-kind (“PIK”) interest or dividends. PIK represents accrued interest or accumulated dividends that are added to the loan principal of the investment on the respective interest or dividend payment dates rather than being paid in cash and generally becomes due at maturity or upon being called by the issuer. PIK is recorded as interest or dividend income, as applicable. If at any point the Fund believes PIK is not expected to be realized, the investment generating PIK will be placed on non-accrual status. Accrued PIK interest or dividends are generally reversed through interest or dividend income, respectively, when an investment is placed on non-accrual status.
Expenses are recorded on an accrual basis.
Foreign Currency Translation – The books and records of the Fund are maintained in U.S. dollars. Investment valuations and other assets and liabilities initially expressed in foreign currencies are converted each business day into U.S. dollars based upon current exchange rates. Prevailing foreign exchange rates may generally be obtained at the close of the NYSE (normally, 4:00 p.m. EST).
Foreign Securities – The Fund may directly purchase securities of foreign issuers. Investing in securities of foreign issuers involves special risks not typically associated with investing in securities of U.S. issuers. The risks include possible revaluation of currencies, the ability to repatriate funds, less complete financial information about companies and possible future adverse political and economic developments. Moreover, securities of many foreign issuers and their markets may be less liquid and their prices more volatile than those of securities of comparable U.S. issuers.
Cash and Cash Equivalents – The Fund places its cash with one banking institution, which is insured by the Federal Deposit Insurance Corporation (“FDIC”). The FDIC limit is $250,000. At various times throughout the year, the amount on deposit may exceed the FDIC limit and subject the Fund to a credit risk. The Fund does not believe that such deposits are subject to any unusual risk associated with investment activities.
Loan Participation and Assignments – The Fund may invest in direct debt instruments, which are interests in amounts owed to lenders or lending syndicates by corporate, governmental, or other borrowers. The Fund’s investments in loans may be in the form of participations in loans or assignments of all or a portion of the loans from third parties. A loan is often administered by a bank or other financial institution (the “agent”) that acts as agent for all holders. The agent administers the terms of the loan, as specified in the loan agreement. The Fund may invest in multiple series or tranches of a loan, which may have varying terms and carry different associated risks. The Fund generally has no right to enforce compliance with the terms of the loan agreement with the borrower. As a result, the Fund may be subject to the credit risk of both the borrower and the agent that is selling the loan agreement. When the Fund purchases assignments from lenders they acquire direct rights against the borrower of the loan. The Fund may enter into unfunded loan commitments, which are contractual obligations for future funding. Unfunded loan commitments represent a future obligation in full, even though a percentage of the notional loan amounts may not be utilized by the borrower. The Fund will rely on an exemption in Rule 18f-4(e) when entering into unfunded commitment agreements, which includes any commitment to make a loan to a company, including term loans, delayed draw term loans, and revolvers, or to invest equity in a company. When investing in a loan participation, the Fund has the right to receive payments of principal, interest and any fees to which it is entitled only from the agent selling the loan agreement and only upon receipt of payments by the agent from the borrower. The Fund may receive a fee based on the undrawn portion of the underlying line of credit of a floating rate loan. In certain circumstances, the Fund may receive a penalty fee upon the prepayment of a floating rate loan by a borrower. For the year ended December 31, 2023, no penalty fees were received by the Fund. Fees earned or paid are recorded as a component of interest income or interest expense, respectively, on the Consolidated Statement of Operations. As of December 31, 2023, the Fund had $61,728,241 at par value in unfunded loan commitments.
| 52 | 1.888.926.2688 | www.apollo.com |
| Apollo Diversified Credit Fund | Notes to Consolidated Financial Statements |
| | December 31, 2023 |
Defaulted Securities – The Fund held defaulted securities and/or other securities for which the income has been deemed uncollectible. As of December 31, 2023, the aggregate value of those securities was $1,676,781 representing 0.21% of the Fund's net assets. The Fund doesn't accrue income on securities for which income has been deemed uncollectible. Additionally, the Fund provides for losses on interest receivable. Such securities have been identified on the accompanying Consolidated Schedule of Investments.
Distributions to Shareholders – The Fund intends to accrue dividends daily and to distribute as of the last business day of each quarter. Distributions of net capital gains are normally accrued and distributed in December 2023. Income and capital gains distributions are determined in accordance with income tax regulations, which may differ from GAAP.
Indemnification – The Fund indemnifies its Officers and Trustees for certain liabilities that may arise from the performance of their duties to the Fund. Additionally, in the normal course of business, the Fund enters into contracts that contain a variety of representations and warranties and which provide general indemnities. The Fund’s maximum exposure under these arrangements is unknown, as this would involve future claims that may be made against the Fund that have not yet occurred. However, based on industry experience, the Fund expects the risk of loss due to these warranties and indemnities to be remote.
Federal Income Taxes – The Fund intends to continue to comply with the requirements of Subchapter M of the Internal Revenue Code applicable to regulated investment companies and will distribute all of its taxable income, if any, to shareholders. Accordingly, no provision for federal income taxes is required in the consolidated financial statements.
The Fund recognizes the tax benefits of uncertain tax positions only when the position is “more likely than not” (more than a fifty percent chance) to be sustained assuming examination by tax authorities. Management has reviewed the tax positions and has concluded that no liability for unrecognized tax benefits should be recorded related to uncertain tax positions expected to be taken in the Fund’s 2023 returns.
Commitments and Contingencies – In the normal course of business, the Fund's investment activities involve executions, settlement and financing of various transactions resulting in receivables from, and payables to, brokers, dealers and the Fund's custodian. These activities may expose the Fund to risk in the event that such parties are unable to fulfill contractual obligations. Management does not anticipate any material losses from counterparties with whom it conducts business. Consistent with standard business practice, the Fund enters into contracts that contain a variety of indemnifications, and may be engaged from time to time in various legal actions. The maximum exposure of the Fund under these arrangements and activities is unknown. However, the Fund expects the risk of material loss to be remote.
Additionally, from time to time, the Adviser and its affiliates may commit to an investment on behalf of the funds it manages, including the Fund. Certain terms of these investments are not finalized at the time of the commitment and each respective fund's allocation may change prior to the date of funding. In this regard, the Fund may have to fund additional commitments in the future that it is currently not obligated to but may be at a future point in time.
3. DERIVATIVE TRANSACTIONS
The Fund’s investment objectives allow the Fund to enter into various types of derivative contracts such as forward foreign currency contracts. Forward foreign currency contracts involve elements of market risk in excess of the amounts reflected in the Consolidated Statement of Assets and Liabilities. The Fund bears the risk of an unfavorable change in the foreign exchange rate underlying the forward foreign currency contract. Risks may also arise upon entering into these contracts from the potential inability of the counterparties to meet the terms of their contracts. Forward foreign currency exchange contracts are typically valued at their quoted daily prices obtained from an independent pricing service.
The Fund relies on certain exemptions in Rule 18f-4 to enter into derivatives transactions and certain other transactions notwithstanding the restrictions on the issuance of “senior securities” under Sections 18 of the 1940 Act. Under Rule 18f-4, “derivatives transactions” include the following: (1) any swap, security-based swap, futures contract, forward contract, option (excluding purchased options), any combination of the foregoing, or any similar instrument, under which the Fund is or may be required to make any payment or delivery of cash or other assets during the life of the instrument or at maturity or early termination, whether as margin or settlement payment or otherwise; (2) any short sale borrowing; and (3) if the Fund relies on the exemption in Rule 18f-4(d)(1)(ii), reverse repurchase agreements and similar financing transactions. The Fund will rely on an exemption in Rule 18f-4(f) when purchasing when-issued or forward-settling securities (e.g., firm and standby commitments, including to-be-announced (“TBA”) commitments, and dollar rolls) and non-standard settlement cycle securities, if certain conditions are met.
The Fund intends to operate as a “limited derivatives user” for purposes of the derivatives transactions exemption in Rule 18f-4. To qualify as a limited derivatives user, the Fund’s “derivatives exposure” is limited to 10% of its net assets subject to exclusions for certain currency or interest rate hedging transactions (as calculated in accordance with Rule 18f-4). If the Fund ceases to qualify as a “limited derivatives user” as defined in Rule 18f-4, the rule would, among other things, require the Fund to establish a comprehensive derivatives risk management program, to comply with certain value-at-risk based leverage limits, to appoint a derivatives risk manager and to provide additional disclosure both publicly and to the SEC regarding its derivatives positions.
| Annual Report | December 31, 2023 | 53 |
| Apollo Diversified Credit Fund | Notes to Consolidated Financial Statements |
| | December 31, 2023 |
Foreign Currency Derivatives – The Fund engaged in currency transactions with counterparties during the year ended December 31, 2023 to hedge the value of portfolio securities denominated in particular currencies against fluctuations in relative value or to gain or reduce exposure to certain currencies. A forward foreign currency contract is an agreement between two parties to buy and sell a currency at a set price on a future date. A cross currency swap is an agreement between two parties to exchange cash flows in certain currencies at future dates. The forward foreign currency contracts and cross currency swaps are marked-to-market daily and the change in value is recorded by the Fund as an unrealized gain or loss. When a forward foreign currency contract or cross currency swap is terminated, the Fund records a realized gain or loss equal to the difference between the value of the arrangement at the time it was opened and the value of the arrangement at the time it was extinguished. As noted in the Consolidated Statement of Assets and Liabilities, the Fund has pledged $790,000 as cash collateral in accordance with the terms of the cross currency swap agreement.
Fair values of forward foreign currency contracts and cross currency swaps on the Consolidated Statement of Assets and Liabilities as of December 31, 2023, categorized by risk exposure:
| Risk Exposure | | Derivatives | | Consolidated Statement of Assets and Liabilities Location | | Fair Value | | | Consolidated Statement of Assets and Liabilities Location | | Fair Value | |
| Foreign Exchange Rate Risk | | Forward Foreign Currency Contracts | | Unrealized appreciation on forward foreign currency contracts | | $ | – | | | Unrealized depreciation on forward foreign currency contracts | | $ | (3,450,784 | ) |
| Foreign Exchange Rate Risk | | Cross Currency Swaps | | Unrealized appreciation on cross currency swaps | | | – | | | Unrealized depreciation on cross currency swaps | | | (628,273 | ) |
| Total | | | | | | $ | – | | | | | $ | (4,079,057 | ) |
For the year ended December 31, 2023, the average monthly notional value of forward foreign currency contracts and cross currency swaps were $113,044,672 and $1,538,462 respectively.
The effect of forward foreign currency contracts and cross currency swaps on the Consolidated Statement of Operations for the year ended December 31, 2023, categorized by risk exposure:
| Risk Exposure | | Derivatives | | Consolidated Statement of Operations Location | | Realized Gain/(Loss) on Derivatives | | | Consolidated Statement of Operations Location | | Change in Unrealized Appreciation/(Depreciation) on Derivatives Recognized in Income | |
| Foreign Exchange Rate Risk | | Forward Foreign Currency Contracts | | Net realized gain/(loss) on forward foreign currency contracts | | $ | (202,678 | ) | | Net Change in unrealized appreciation/ (depreciation) on forward foreign currency contracts | | $ | (3,736,910 | ) |
| | | | | Net realized gain on | | | | | | Net change in unrealized | | | | |
| Foreign Exchange Rate Risk | | Cross Currency Swaps | | cross currency swaps transactions | | | 55,498 | | | depreciation on cross currency swaps transactions | | | (628,273 | ) |
| Total | | | | | | $ | (147,180 | ) | | | | $ | (4,365,183 | ) |
Offsetting Assets and Liabilities
The Fund has elected not to offset assets and liabilities that may be received or paid as part of collateral arrangements in the accompanying Consolidated Statement of Assets and Liabilities, even when an enforceable master netting arrangement or other agreement is in place that provides the Fund, in the event of counterparty default, the right to liquidate collateral and the right to offset a counterparty’s rights and obligations. Therefore, all qualifying transactions are presented on a gross basis in the Consolidated Statement of Assets and Liabilities.
| 54 | 1.888.926.2688 | www.apollo.com |
| Apollo Diversified Credit Fund | Notes to Consolidated Financial Statements |
| | December 31, 2023 |
The following tables present the offsetting of financial and derivative assets and liabilities as of December 31, 2023:
| | | Amounts Presented in the accompanying Consolidated Statement of Assets and Liabilities | | | Gross Amounts Not Offset in the Accompanying Consolidated Statement of Assets and Liabilities Collateral Pledged | | | Net Amount | |
| Liabilities | | | | | | | | | | | | |
| Derivatives, at fair value | | | (628,273 | ) | | | 628,273 | | | | – | |
| | | $ | (628,273 | ) | | $ | 628,273 | | | $ | – | |
Amounts in the preceding table have been limited to the liability balance, and accordingly, do not include any excess collateral pledged.
The gross amounts of derivative liabilities, presented in the accompanying Consolidated Statement of Assets and Liabilities in the amount of $3,450,784, are not subject to an enforceable master netting agreement.
4. ADVISORY FEES, ADMINISTRATION FEES AND OTHER AGREEMENTS WITH AFFILIATES
Investment Advisory
Pursuant to the Investment Advisory Agreement with the Fund (“Advisory Agreement”), the Adviser is entitled to an investment advisory fee of 1.50%, of the average daily net assets of the Fund, computed daily and payable monthly. Sub-advisory services are provided to the Fund pursuant to an agreement among the Fund, Adviser and Sub-Adviser ("Sub-Advisory Agreement"). The Adviser has agreed to pay the Sub-Adviser as compensation under the Investment Sub-Advisory Agreement a quarterly fee computed at the annual rate of the daily net assets as set forth below. The Sub-Adviser is compensated by the Adviser out of advisory fees paid by the Fund to the Adviser; the Fund does not compensate the Sub-Adviser.
| Annual Sub-Advisory Fee Rate as a Percentage of Average Daily Net Assets |
| $0 to $250M | 0.40% |
| $250M to $500M | 0.30% |
| $500M to $1B | 0.25% |
| Over $1B | 0.20% |
The Adviser and the Fund have entered into an expense limitation and reimbursement agreement with respect to Class F shares (the “Class F Expense Limitation Agreement”) and a separate agreement with respect to all other classes of shares (the “Multi-Class Expense Limitation Agreement” and together with the Class F Expense Limitation Agreement, the “Expense Limitation Agreements”). Pursuant to the Class F Expense Limitation Agreement, the Adviser has contractually agreed to waive its fees and/or to reimburse the Fund for expenses the Fund incurs to the extent necessary to maintain the Fund’s total annual operating expenses after fee waivers and/or reimbursements (including taxes, interest, brokerage commissions, acquired fund fees and expenses, and extraordinary expenses, such as litigation or reorganization costs and organizational costs and offering costs) to the extent that they exceed, per annum, 1.50% of the Fund’s average daily net assets attributable to Class F shares. Pursuant to the Multi-Class Expense Limitation Agreement, the Adviser has contractually agreed to waive its fees and/or reimburse the Fund for expenses the Fund incurs, but only to the extent necessary to maintain the Fund’s total annual operating expenses after fee waivers and/or reimbursement (exclusive of any taxes, interest, brokerage commissions, acquired fund fees and expenses, and extraordinary expenses, such as litigation or reorganization costs, but inclusive of organizational costs and offering costs) to the extent that such expenses exceed, per annum, 2.25% of Class A average daily net assets, 3.00% of Class C average daily net assets, 2.00% of Class I average daily net assets, 2.50% of Class L average daily net assets and 2.75% of Class M average daily net assets (the “Expense Limitations”). In consideration of the Adviser’s agreement to limit the Fund’s expenses, the Fund has agreed to repay the Adviser (or any successor thereto) in the amount of any fees waived and reimbursed, subject to the limitations that: (1) the reimbursement for fees and expenses will be made only if payable not more than three years from the date on which they were incurred; and (2) the reimbursement may not be made if it would cause the lesser of the Expense Limitation applicable to such Class in place at the time of waiver or at the time of reimbursement to be exceeded. In addition, pursuant to the Multi-Class Expense Limitation Agreement, any such repayment must be approved by the Board. The Expense Limitation Agreements will remain in effect at least through April 30, 2024. The Multi-Class Expense Limitation Agreement may then be renewed for consecutive twelve-month periods provided that the Adviser specifically approves such continuance at least annually. The Class F Expense Limitation Agreement shall continue in effect so long as Class F shares are outstanding. The Expense Limitation Agreements may be terminated only by the Board on written notice to the Adviser and will automatically terminate at such time as the Management Agreement for the Fund is terminated. Prior to January 1, 2023, the Adviser voluntarily waived or absorbed certain of the operating expenses of the Fund since the commencement of the Fund’s operations.
| Annual Report | December 31, 2023 | 55 |
| Apollo Diversified Credit Fund | Notes to Consolidated Financial Statements |
| | December 31, 2023 |
During the year ended December 31, 2023, fees waived and reimbursed expenses to the Fund by the Adviser totaled $2,158,851. The balance of recoupable expenses for the fund was as follows:
| Expires December 31, | | | Expires December 31, | | | Expires December 31, | |
| 2024 | | | 2025 | | | 2026 | |
| $ | 769,649 | | | $ | 788,879 | | | $ | 2,139,824 | |
During the year ended December 31, 2023, previously recoupable expenses totaling $731,841 expired.
Fund Administration and Accounting Fees and Expenses
ALPS Fund Services, Inc. serves as the Fund’s administrator and accounting agent (the “Administrator”) and receives customary fees from the Fund for such services. The Administrator is also reimbursed by the Fund for certain out of pocket expenses.
Transfer Agency Fees and Expenses
SS&C GIDS, Inc. (formerly known as DST Systems, Inc.) serves as transfer, distribution paying and shareholder servicing agent for the Fund and receives customary fees from the Fund for such services.
Custody Fees and Expenses
The Bank of New York Mellon Trust Company, National Association serves as the Fund’s custodian and receives customary fees from the Fund for such services.
Distribution and Shareholder Servicing Fees and Expenses
The Fund has entered into a Distribution Agreement with ALPS Distributors, Inc. (the “Distributor”) to provide distribution services to the Fund. The Distributor serves as principal underwriter of shares of the Fund. Under the Distribution Agreement, the Class C shares, Class L shares and Class M shares will pay to the Distributor a Distribution Fee that will accrue at an annual rate equal to 0.75%, 0.25% and 0.75% of the Fund’s average daily net assets attributable to Class C shares, Class L shares and Class M shares, respectively, payable on a monthly basis. For the year ended December 31, 2023, Class C shares and Class L shares incurred distribution fees of $648,589 and $32,677, respectively. For the year ended December 31, 2023, Class M shares did not incur distribution fees. Class A, Class I and Class F shares are not currently subject to a Distribution Fee. Under the Shareholder Services Plan, the Class A, Class C and Class L shares may pay up to 0.25% per year of their average daily net assets for such services. For the year ended December 31, 2023, Class A, Class C and Class L shares incurred shareholder servicing fees of $175,420, $216,196 and $32,977, respectively. Class F shares, Class I shares and Class M shares are not currently subject to a shareholder services fee.
The Distributor has entered into a wholesale marketing agreement with Griffin Capital Securities, LLC (“GCS”), a registered broker-dealer and an affiliate of the Adviser and Sub-Adviser. Pursuant to the terms of the wholesale marketing agreement, GCS will seek to market and otherwise promote the Fund through various wholesale distribution channels, including regional and independent retail broker-dealers, registered investment advisers, and wirehouses.
Officer and Trustee Compensation
Each Independent Trustee receives an annual retainer of $42,000, paid quarterly, as well as reimbursement for any reasonable expenses incurred attending the meetings and $500 per Independent Trustee per each special telephonic meeting (exclusive of one special telephonic meeting per year). The Chair of the Audit Committee receives an additional $15,750 annually. None of the executive officers, with the exception of the Chief Compliance Officer, receive compensation from the Fund. Certain Trustees and officers of the Fund are also officers of the Adviser and, with the exception of the Chief Compliance Officer, are not paid by the Fund for serving in such capacities.
Agreements with Affiliates
From time-to-time various affiliates of the Adviser (collectively, “Affiliates”) are involved in transactions whereby certain fees, including but not limited to, structuring, underwriting, arrangement, placement, syndication, advisory or similar services (collectively, “Capital Solution” services) are earned and in certain circumstances are rebated back to the Fund in whole or in part. For the year ended December 31, 2023, the Fund received fee rebates for Capital Solution services from certain Affiliates in the amounts of $339,980, £135,107, and €54,583.
| 56 | 1.888.926.2688 | www.apollo.com |
| Apollo Diversified Credit Fund | Notes to Consolidated Financial Statements |
| | December 31, 2023 |
5. PURCHASES AND SALES OF INVESTMENT SECURITIES
The cost of purchases and proceeds from the sale of securities, other than short-term securities, for the year ended December 31, 2023 were as follows:
| | | Purchases of Securities | | | Proceeds from Sales of Securities | |
| | | $ | 989,206,426 | | | $ | 872,941,410 | |
The Fund is permitted to purchase and sell securities (“Cross-Trade”) from and to other Apollo entities pursuant to procedures approved by the Board in compliance with Rule 17a-7 under the Investment Company Act (the “Rule”). Each Cross-Trade is executed at a fair market price in compliance with the provisions of the Rule. For the year ended December 31, 2023, there was no Cross-Trade activities.
6. TAX BASIS INFORMATION
Distributions are determined in accordance with federal income tax regulations, which differ from GAAP, and, therefore, may differ significantly in amount or character from net investment income and realized gains for financial reporting purposes. Financial reporting records are adjusted for permanent book/tax differences to reflect tax character but are not adjusted for temporary differences. The amounts and characteristics of tax basis distributions and composition of distributable earnings/(accumulated losses) are finalized at fiscal year-end.
For the fiscal year ended December 31, 2023, the following reclassifications, which had no impact on results of operations of net assets, were recorded to reflect tax character:
| | | Paid-in Capital | | | Total Distributable Earnings | |
| | $ | (399,762 | ) | | $ | 399,762 | |
The reclassifications were primarily related to excise taxes paid and tax adjustments for wholly-owned subsidiaries.
The tax character of distributions paid for the fiscal year ended December 31, 2023 was as follows:
| Year | | Ordinary Income | | | Long-Term Capital Gain | | | Return of Capital | |
| 2023 | | $ | 61,370,451 | | | $ | – | | | $ | – | |
| 2022 | | | 39,533,763 | | | | – | | | | – | |
As of December 31, 2023, the components of accumulated earnings/(deficit) on a tax basis were as follows:
| | | | Undistributed net investment income | | | Accumulated net realized loss on investments | | | Other cumulative effect of timing differences | | | Net unrealized appreciation/(depreciation) on investments | | | Total | |
| | | | | $ | 5,735,360 | | | $ | (68,154,047 | ) | | $ | – | | | $ | (3,254,892 | ) | | $ | (65,673,579 | ) |
As of December 31, 2023, net unrealized appreciation/(depreciation) of investments based on the federal tax cost was as follows:
| | | | Gross Appreciation (excess of value over tax cost) | | | Gross Depreciation (excess of tax cost over value) | | | Net Appreciation/ (Depreciation) of Foreign Currency | | | Net Unrealized Appreciation/(Depreciation) | | | Cost of Investments for Income Tax Purposes | |
| | | | | $ | 11,548,718 | | | $ | (15,055,979 | ) | | $ | 252,369 | | | $ | (3,254,892 | ) | | $ | 997,165,634 | |
The difference between book basis and tax basis unrealized appreciation/(depreciation) is primarily due to premium amortization, defaulted income, wash sales, forward contracts and passive foreign investment companies.
| Annual Report | December 31, 2023 | 57 |
| Apollo Diversified Credit Fund | Notes to Consolidated Financial Statements |
| | December 31, 2023 |
Under current law, capital losses maintain their character as short-term or long-term and are carried forward to the next tax year without expiration. As of December 31,2023, the following amounts are available as carry forwards to the next tax year:
| | | Short Term | | | Long Term | |
| | $ | 37,225,884 | | | $ | 30,928,163 | |
There were no capital loss carryovers used during the year ended December 31, 2023.
7. CREDIT FACILITY
The Fund and the Fund's consolidated subsidiary, CRDTX SPV I, LLC, are party to a secured revolving credit facility with Citibank, N.A. ("Citi Credit Facility") subject to the limitations of the 1940 Act for borrowings. Amounts available to borrow under the Citi Credit Facility are subject to a borrowing base that applies different advance rates to different types of assets held by the Financing Subsidiary. Assets securing the Citi Credit Facility held by the Financing Subsidiary are subject to initial and ongoing eligibility criteria including restrictions on asset types and domicile, credit rating minimums, payment frequency and rate requirements, and collateral and maturity terms, among other criteria. The Fund and the Financing Subsidiary are also required to comply with various covenants, reporting requirements and other customary requirements. As of December 31, 2023, the Fund and the Financing Subsidiary were in compliance in all material respects with the terms of the Citi Credit Facility.
For the period January 1, 2023, to March 26, 2023, the Citi Credit Facility bore interest at applicable SOFR plus spread ranging from 1.80% to 3.30% based on the applicable weighted average discount margin and was subject to an unused commitment fee ranging from 0% to 1.60% per annum. On March 27, 2023, the Citi Credit Facility was amended pursuant to which certain changes were made including, but not limited to, increasing the amount of the facility from $270 million to $300 million. For the period March 27, 2023, to December 31, 2023, the Citi Credit Facility bore interest at SOFR plus spread ranging from 2.00% to 4.00% based on the applicable weighted average discount margin and was subject to an unused commitment fee ranging from 0% to 1.60% per annum. As of December 31, 2023, there was $175.8 million outstanding under the Citi Credit Facility.
For the year ended December 31, 2023, the components of interest and unused commitment fees expense, average stated interest rates (i.e., rate in effect plus the spread) and average outstanding balance for the Citi Credit Facility were as follows:
| | | For the Year Ended December 31, 2023 | |
| Credit facility interest expense | | $ | 15,200,381 | |
| Credit facility unfunded commitment fee | | | 425,920 | |
| Credit facility fees | | | 74,606 | |
| Amortization of debt issuance costs | | | 428,530 | * |
| Total credit facility expense | | $ | 16,129,437 | |
| Average stated interest rate % | | | 7.51 | % |
| Average outstanding balance | | $ | 202,288,493 | |
| * | The Fund is amortizing debt issuance costs of $1,420,363, over a three-year period ended March 27, 2026. |
8. REPURCHASE OFFERS
As a continuously offered, closed-end interval fund, the Fund has adopted a fundamental policy in which it offers to repurchase at net asset value no less than 5% of the outstanding shares of the Fund once each quarter. It is possible that a repurchase offer may be oversubscribed and as such there is no guarantee that shareholders will be able to sell all of the shares they desire to sell in a quarterly repurchase offer, although each shareholder will have the right to require the Fund to purchase at least 5% of such shareholder’s shares in each quarterly repurchase. Liquidity will be provided to shareholders only through the Fund’s quarterly repurchase offers. Shareholders will receive written notice of each quarterly repurchase offer ("Repurchase Offer Notice") that includes the date the repurchase offer period ends ("Repurchase Request Deadline") and the date the repurchase price will be determined ("Repurchase Pricing Date"). Shares will be repurchased at the NAV per share determined on the Repurchase Pricing Date. During the year ended December 31, 2023, the Fund completed four quarterly repurchase offers in which the Fund offered to repurchase up to 5% of its outstanding shares as of each respective Repurchase Request Deadline. The shareholder repurchase requests received by the Fund in good order by the February 7, 2023, May 9, 2023, August 8, 2023 and November 7, 2023. Repurchase Request Deadlines exceeded the number of shares of the Fund subject to each repurchase offer and as such, the Fund determined to repurchase shares on a pro rata basis. Accordingly, the Fund repurchased approximately 60% of the total number of shares tendered for repurchase on February 7, 2023, approximately 41% of the total number of shares tendered for repurchase on May 9, 2023, approximately 47% of the total number of shares tendered for repurchase on August 8, 2023 and approximately 76% of the total number of shares tendered for repurchase on November 7, 2023. The result of the aforementioned repurchase offers were as follows:
| 58 | 1.888.926.2688 | www.apollo.com |
| Apollo Diversified Credit Fund | Notes to Consolidated Financial Statements |
| | December 31, 2023 |
| | Repurchase Offer #1 | Repurchase Offer #2 | Repurchase Offer #3 | Repurchase Offer #4 |
| Commencement Date | December 28, 2022 | March 30, 2023 | June 15, 2023 | September 14, 2023 |
| Repurchase Request Deadline | February 7, 2023 | May 9, 2023 | August 8, 2023 | November 7, 2023 |
| Repurchase Pricing Date | February 7, 2023 | May 9, 2023 | August 8, 2023 | November 7, 2023 |
| Dollars Repurchased | $30,278,695 | $32,168,917 | $35,705,339 | $53,426,756 |
| Shares Repurchased | 1,408,868 | 1,507,447 | 1,653,028 | 2,484,904 |
In addition to making quarterly repurchase offers, the Fund offers limited rights to a shareholder’s descendants to redeem shares in the event of such shareholder’s death pursuant to certain conditions and restrictions. If a shareholder would like to submit a repurchase request due to shareholder death, they can call the Fund at 1-888-926-2688 or contact the financial intermediary, financial adviser or broker/dealer through which the shares are owned. Requests due to death are intended for natural persons and will require additional supporting documents.
9. PRINCIPAL RISK FACTORS
In the normal course of business, the Fund invests in financial instruments and enters into financial transactions where risk of potential loss exists due to such things as changes in the market (market risk) or failure or inability of the other party to a transaction to perform (credit and counterparty risk). See below for a detailed description of select principal risks. The following list is not intended to be a comprehensive listing of all of the potential risks associated with the Fund. For a more comprehensive list of potential risks the Fund may be subject to, please refer to the Fund’s Prospectus and Statement of Additional Information (“SAI”).
Risks Related to an Investment in the Fund
Investment and Market Risk. An investment in the Fund’s common shares is subject to investment risk, including the possible loss of the entire principal amount invested. An investment in the Fund’s common shares represents an indirect investment in the Fund’s portfolio of debt instruments, other securities, and derivative investments, and the value of these investments may fluctuate, sometimes rapidly and unpredictably. At any point in time an investment in the Fund’s common shares may be worth less than the original amount invested, even after taking into account distributions paid by the Fund and the ability of shareholders to reinvest dividends. The Fund may also use leverage, which would magnify the Fund’s investment, market and certain other risks.
All investments involve risks, including the risk that the entire amount invested may be lost. No guarantee or representation is made that the Fund’s investment objectives will be achieved. The Fund may utilize investment techniques, such as leverage and swaps, which can in certain circumstances increase the adverse impact to which the Fund’s investment portfolio may be subject.
Repurchase Offers Risks. The Fund is an interval fund and, in order to provide liquidity to shareholders, the Fund, subject to applicable law, will conduct repurchase offers of the Fund’s outstanding common shares at NAV, subject to approval of the Board. The Fund believes that these repurchase offers are generally beneficial to the Fund’s shareholders, and repurchases generally will be funded from available cash, cash from the sale of shares or sales of portfolio securities. However, repurchase offers and the need to fund repurchase obligations may affect the ability of the Fund to be fully invested or force the Fund to maintain a higher percentage of its assets in liquid investments, which may harm the Fund’s investment performance.
General Market Conditions Risk. Various sectors of the global financial markets have been experiencing an extended period of adverse conditions. Market uncertainty has increased dramatically, particularly in the United States and Europe, and adverse market conditions have expanded to other markets. These conditions have resulted in disruption of the global credit markets, periods of reduced liquidity, greater volatility, general volatility of credit spreads, an acute contraction in the availability of credit and a lack of price transparency. These volatile and often difficult global credit market conditions have episodically adversely affected the market values of equity, fixed-income and other securities and this volatility may continue and conditions could even deteriorate further. Some of the largest banks and companies across many sectors of the economy in the United States and Europe have declared bankruptcy, entered into insolvency, administration or similar proceedings, been nationalized by government authorities, and/or agreed to merge with or be acquired by other banks or companies that had been considered their peers. The long-term impact of these events is uncertain, but could continue to have a material effect on general economic conditions, consumer and business confidence and market liquidity.
Major public health issues, such as COVID-19, have at times, and may in the future impact the Fund. The COVID-19 pandemic caused substantial market volatility and global business disruption and impacted the global economy in significant and unforeseen ways. Any public health emergency, including the COVID-19 pandemic or any outbreak of other existing or new epidemic diseases or the threat thereof, and the resulting financial and economic market uncertainty, could have a material adverse impact on the Fund or its investments. Moreover, changes in interest rates, travel advisories, quarantines and restrictions, disrupted supply chains and industries, impact on labor markets, reduced liquidity or a slowdown in U.S. or global economic conditions resulting from a future public health crisis may also adversely affect the Fund or its investments. COVID-19, or any other health crisis and the current or any resulting financial, economic and capital markets environment, and future developments in these and other areas present uncertainty and risk with respect to the Fund’s NAV, performance, financial condition, results of operations, ability to pay distributions, make share repurchases and portfolio liquidity, among other factors.
| Annual Report | December 31, 2023 | 59 |
| Apollo Diversified Credit Fund | Notes to Consolidated Financial Statements |
| | December 31, 2023 |
Anti-Takeover Provisions. The Fund’s Declaration of Trust includes provisions that could limit the ability of other entities or persons to acquire control of the Fund or convert the Fund to open-end status.
Market Disruptions. The Fund may incur major losses in the event of market disruptions and other extraordinary events in which historical pricing relationships (on which the Sub-Adviser bases a number of its trading positions) become materially distorted. The risk of loss from pricing distortions is compounded by the fact that in disrupted markets many positions become illiquid, making it difficult or impossible to close out positions against which the markets are moving. Market disruptions caused by unexpected political, military and terrorist events may from time to time cause dramatic losses for the Fund and such events can result in otherwise historically low-risk strategies performing with unprecedented volatility and risk.
Highly Volatile Markets. The prices of financial instruments in which the Fund may invest can be highly volatile. The prices of instruments in which the Fund may invest are influenced by numerous factors, including interest rates, currency rates, default rates, governmental policies and political and economic events (both domestic and global). Moreover, political or economic crises, or other events may occur that can be highly disruptive to the markets in which the Fund may invest. In addition, governments from time to time intervene (directly and by regulation), which intervention may adversely affect the performance of the Fund and its investment activities. The Fund is also subject to the risk of a temporary or permanent failure of the exchanges and other markets on which its investments may trade. Sustained market turmoil and periods of heightened market volatility make it more difficult to produce positive trading results, and there can be no assurance that the Fund’s strategies will be successful in such markets.
Credit Facilities. In the event we default under a credit facility or other borrowings, our business could be adversely affected as we may be forced to sell a portion of our investments quickly and prematurely at what may be disadvantageous prices to us in order to meet our outstanding payment obligations and/or support working capital requirements under such borrowing facility, any of which would have a material adverse effect on our business, financial condition, results of operations and cash flows. In addition, following any such default, the agent for the lenders under such borrowing facility could assume control of the disposition of any or all of our assets, including the selection of such assets to be disposed and the timing of such disposition, which would have a material adverse effect on our business, financial condition, results of operations and cash flows.
Shareholders May Experience Dilution. All distributions declared in cash payable to shareholders that are participants in our distribution reinvestment plan will generally be automatically reinvested in our shares. As a result, shareholders that do not participate in our distribution reinvestment plan may experience dilution over time.
Limitation on Liability of Trustees and Officers; Indemnification and Advance of Expenses. Delaware law permits a Delaware statutory trust to include in its declaration of trust a provision to indemnify and hold harmless any trustee or beneficial owner or other person from and against any and all claims and demands whatsoever. Our Declaration of Trust provides that our Trustees will not be liable to us or our shareholders for monetary damages for breach of fiduciary duty as a trustee to the fullest extent permitted by Delaware law. Our Declaration of Trust provides for the indemnification of any person to the full extent permitted, and in the manner provided, by Delaware law. In accordance with the 1940 Act, we will not indemnify certain persons for any liability to which such persons would be subject by reason of such person’s willful misfeasance, bad faith, gross negligence or reckless disregard of the duties involved in the conduct of his office.
Operational Risk. The Fund depends on the Sub-Adviser to develop the appropriate systems and procedures to control operational risk. Operational risks arising from mistakes made in the confirmation or settlement of transactions, from transactions not being properly booked, evaluated or accounted for or other similar disruption in the Fund’s operations, can cause the Fund to suffer financial loss, the disruption of its business, liability to clients or third parties, regulatory intervention or reputational damage. The Fund’s business is highly dependent on its ability to process, on a daily basis, a large number of transactions across numerous and diverse markets. Consequently, the Fund relies heavily on its financial, accounting and other data processing systems. The ability of its systems to accommodate an increasing volume of transactions could also constrain the Fund’s abilities to properly manage its portfolios. Shareholders are generally not notified of the occurrence of an error or the resolution of any error. Generally, the Sub-Adviser and its affiliates will not be held accountable for such errors, and the Fund may bear losses resulting from such errors.
Allocation Risk. The ability of the Fund to achieve its investment objective depends, in part, on the ability of the Sub-Adviser to allocate effectively the Fund’s assets among the various asset types in which the Fund invests and, with respect to each such asset class, among debt securities. There can be no assurance that the actual allocations will be effective in achieving the Fund’s investment objective or delivering positive returns.
| 60 | 1.888.926.2688 | www.apollo.com |
| Apollo Diversified Credit Fund | Notes to Consolidated Financial Statements |
| | December 31, 2023 |
Issuer Risk. The value of a specific security can be more volatile than the market as a whole and can perform differently from the value of the market as a whole. The value of an issuer’s securities that are held in the Fund’s portfolio may decline for a number of reasons, which directly relate to the issuer, such as management performance, financial leverage and reduced demand for the issuer’s goods and services.
Management Risk. The net asset value of the Fund changes daily based on the performance of the securities in which it invests. The Sub-Adviser’s judgments about the attractiveness, value and potential appreciation of a particular sector and securities in which the Fund invests may prove to be incorrect and may not produce the desired results.
Correlation Risk. The Fund seeks to produce returns that are less correlated to the broader financial markets. Although the prices of equity securities and fixed-income securities, as well as other asset classes, often rise and fall at different times so that a fall in the price of one may be offset by a rise in the price of the other, in down markets the prices of these securities and asset classes can also fall in tandem. Because the Fund allocates its investments among different asset classes, the Fund is subject to correlation risk.
Distribution Policy Risk. The Fund’s distribution policy is to make quarterly distributions to shareholders. All or a portion of a distribution may consist solely of a return of capital (i.e. from your original investment) and not a return of net profit. Shareholders should not assume that the source of a distribution from the Fund is net profit. Shareholders should note that return of capital will reduce the tax basis of their shares and potentially increase the taxable gain, if any, upon disposition of their shares.
Risks Related to the Fund’s Investments
Loans Risk. Under normal market conditions, the Fund will invest in loans. The loans that the Fund may invest in include loans that are first lien, second lien, third lien or that are unsecured. In addition, the loans the Fund will invest in will usually be rated below investment grade or may also be unrated. Loans are subject to a number of risks described elsewhere in this Prospectus, including credit risk, liquidity risk, below investment grade instruments risk and management risk.
Investments in Bank Loans and Participations. The investment portfolio of the Fund may include bank loans and participations. The special risks associated with investing in these obligations include: (i) the possible invalidation of an investment transaction as a fraudulent conveyance under relevant creditors’ rights laws; (ii) environmental liabilities that may arise with respect to collateral securing the obligations; (iii) adverse consequences resulting from participating in such instruments with other institutions with lower credit quality; (iv) limitations on the ability of the Fund or the Sub- Adviser to directly enforce any of their respective rights with respect to participations; and (v) generation of income that is subject to U.S. federal income taxation as income effectively connected with a U.S. trade or business.
Senior Loans Risk. Senior secured loans are usually rated below investment-grade or may also be unrated. As a result, the risks associated with senior secured loans are similar to the risks of below investment-grade fixed income instruments, although senior secured loans are senior and secured in contrast to other below investment-grade fixed income instruments, which are often subordinated or unsecured. Investment in senior secured loans rated below investment-grade is considered speculative because of the credit risk of their issuers. There may be less readily available and reliable information about most senior secured loans than is the case for many other types of securities. As a result, the Sub-Adviser will rely primarily on its own evaluation of a borrower’s credit quality rather than on any available independent sources. Therefore, the Fund will be particularly dependent on the analytical abilities of the Sub-Adviser.
In general, the secondary trading market for senior secured loans is not well developed. No active trading market may exist for certain senior secured loans, which may make it difficult to value them. Illiquidity and adverse market conditions may mean that the Fund may not be able to sell senior secured loans quickly or at a fair price. To the extent that a secondary market does exist for certain senior secured loans, the market for them may be subject to irregular trading activity, wide bid/ask spreads and extended trade settlement periods.
Subordinated Loans or Securities. Certain of the Fund’s investments may consist of loans or securities, or interests in pools of securities that are subordinated or may be subordinated in right of payment and ranked junior to other securities issued by, or loans made to obligors. If an obligor experiences financial difficulty, holders of its more senior securities will be entitled to payments in priority to the Fund. Some of the Fund’s asset-backed investments may also have structural features that divert payments of interest and/or principal to more senior classes of loans or securities backed by the same assets when loss rates or delinquency exceeds certain levels. This may interrupt the income the Fund receives from its investments, which may lead to the Fund having less income to distribute to investors.
In addition, many of the obligors are highly leveraged and many of the Fund’s investments will be in securities which are unrated or rated below investment-grade. Such investments are subject to additional risks, including an increased risk of default during periods of economic downturn, the possibility that the obligor may not be able to meet its debt payments and limited secondary market support, among other risks.
| Annual Report | December 31, 2023 | 61 |
| Apollo Diversified Credit Fund | Notes to Consolidated Financial Statements |
| | December 31, 2023 |
Loans to Private Companies. Loans to private and middle-market companies involves risks that may not exist in the case of large, more established and/or publicly traded companies.
Below Investment Grade, or High-Yield, Instruments Risk. The Fund anticipates that it may invest substantially all of its assets in instruments that are rated below investment grade. Below investment grade instruments are commonly referred to as “junk” or high-yield instruments and are regarded as predominantly speculative with respect to the issuer’s capacity to pay interest and repay principal. Lower grade instruments may be particularly susceptible to economic downturns, which could adversely affect the ability of the issuers of such instruments to repay principal and pay interest thereon, increase the incidence of default for such instruments and severely disrupt the market value of such instruments.
Valuation Risk. Unlike publicly traded common stock which trades on national exchanges, there is no central place or exchange for most of the Fund’s investments to trade. The Fund’s investments generally trade on an “over-the-counter” market which may be anywhere in the world where the buyer and seller can settle on a price. Due to the lack of centralized information and trading, the valuation of loans or fixed-income instruments may carry more risk than that of common stock. Uncertainties in the conditions of the financial market, unreliable reference data, lack of transparency and inconsistency of valuation models and processes may lead to inaccurate asset pricing. In addition, other market participants may value securities differently than the Fund. As a result, the Fund may be subject to the risk that when an instrument is sold in the market, the amount received by the Fund is less than the value of such loans or fixed-income instruments carried on the Fund’s books.
Liquidity Risk. To the extent consistent with the applicable liquidity requirements for interval funds under Rule 23c-3 of the 1940 Act, the Fund may invest in securities that, at the time of investment, are illiquid (determined using the SEC’s standard applicable to registered investment companies, i.e., securities that cannot be disposed of by the Fund within seven days in the ordinary course of business at approximately the amount at which the Fund has valued the securities). However, securities that cannot be disposed of within seven days due solely to applicable laws or the Sub-Adviser’s compliance policies and procedures will not be subject to the limitations set forth above. The Fund may also invest in restricted securities. Investments in restricted securities could have the effect of increasing the amount of the Fund’s assets invested in illiquid securities if qualified institutional buyers are unwilling to purchase these securities.
Failure of Financial Institutions and Sustained Financial Market Illiquidity. The failure of certain financial institutions, namely banks, may increase the possibility of a sustained deterioration of financial market liquidity, or illiquidity at clearing, cash management and/or custodial financial institutions. The failure of a bank (or banks) with which we and/or our portfolio companies have a commercial relationship could adversely affect, among other things, our and/or our portfolio companies’ ability to pursue key strategic initiatives, including by affecting our ability to borrow from financial institutions on favorable terms. Our direct origination platform generally focuses on mature companies backed by well-funded large sponsors (e.g., private equity firms), typically with significant equity capital invested. In the event a portfolio company, or potential portfolio company, has a commercial relationship with a bank that has failed or is otherwise distressed, such portfolio company may experience delays or other issues in meeting certain obligations or consummating transactions.
Temporary Defensive Strategies. From time to time, the Fund may temporarily depart from its principal investment strategies as a defensive measure when the Sub-Adviser anticipates unusual market or other conditions. When a temporary defensive posture is believed by the Sub-Adviser to be warranted (“temporary defensive periods”), the Fund may without limitation hold cash or invest its Managed Assets in money market instruments and repurchase agreements in respect of those instruments. The money market instruments in which the Fund may invest are obligations of the U.S. government, its agencies or instrumentalities; commercial paper rated A-1 or higher by S&P or Prime-1 by Moody’s; and certificates of deposit and bankers’ acceptances issued by domestic branches of U.S. banks that are members of the Federal Deposit Insurance Corporation. During temporary defensive periods, the Fund may also invest to the extent permitted by applicable law in shares of money market mutual funds. Money market mutual funds are investment companies and the investments in those companies by the Fund are in some cases subject to applicable law. To the extent that the Fund invests defensively, it may not achieve its investment objective.
Credit Risk. Credit risk is the risk that one or more loans in the Fund’s portfolio will decline in price or fail to pay interest or principal when due because the issuer of the instrument experiences a decline in its financial status. While a senior position in the capital structure of a borrower or issuer may provide some protection with respect to the Fund’s investments in certain loans, losses may still occur because the market value of loans is affected by the creditworthiness of borrowers or issuers and by general economic and specific industry conditions and the Fund’s other investments will often be subordinate to other debt in the issuer’s capital structure. To the extent the Fund invests in below investment grade instruments, it will be exposed to a greater amount of credit risk than a fund which invests in investment grade securities. The prices of lower grade instruments are more sensitive to negative developments, such as a decline in the issuer’s revenues or a general economic downturn, than are the prices of higher grade instruments. Instruments of below investment grade quality are predominantly speculative with respect to the issuer’s capacity to pay interest and repay principal when due and therefore involve a greater risk of default. In addition, the Fund may enter into credit derivatives which may expose it to additional risk in the event that the instruments underlying the derivatives default.
| 62 | 1.888.926.2688 | www.apollo.com |
| Apollo Diversified Credit Fund | Notes to Consolidated Financial Statements |
| | December 31, 2023 |
Interest Rate Risk. The fixed-income instruments that the Fund may invest in are subject to the risk that market values of such securities will decline as interest rates increase. These changes in interest rates have a more pronounced effect on securities with longer durations. Typically, the impact of changes in interest rates on the market value of an instrument will be more pronounced for fixed-rate instruments, such as most corporate bonds, than it will for floating rate instruments. Fluctuations in the value of portfolio securities will not affect interest income on existing portfolio securities but will be reflected in the Fund’s NAV. After a period of historically low interest rates, the Federal Reserve has raised, and has indicated its intent to continue raising, certain benchmark interest rates. It cannot be predicted with certainty when, or how, these policies will change, but actions by the Federal Reserve and other central bankers may have a significant effect on interest rates and on the U.S. and world economies generally. Market volatility, rising interest rates, uncertainty around interest rates and/or unfavorable economic conditions could adversely affect our business.
U.S. Debt Ceiling and Budget Deficit Risks. U.S. debt ceiling and budget deficit concerns have increased the possibility of additional credit-rating downgrades and economic slowdowns, or a recession in the United States. Although U.S. lawmakers have historically passed legislation to raise the federal debt ceiling on multiple occasions, ratings agencies have lowered or threatened to lower the long-term sovereign credit rating on the United States. In August 2023, Fitch Ratings Inc., downgraded the U.S. credit rating to AA+ from AAA, citing fiscal deterioration over the next three years and close encounters with default due to ongoing political dysfunction. The impact of a U.S. default on its obligations or any further downgrades to the U.S. government’s sovereign credit rating or its perceived creditworthiness could adversely affect the U.S. and global financial markets and economic conditions. These developments could cause interest rates and borrowing costs to rise, which may negatively impact the ability to access the debt markets on favorable terms. In addition, disagreement over the federal budget has caused the U.S. federal government to shut down for periods of time. Continued adverse political and economic conditions could have a material adverse effect on the Fund’s business, financial condition and results of operations.
Transition from LIBOR Risk. Although the London Interbank Offered Rate (“LIBOR”) is no longer published as of June 30, 2023, certain securities and financial instruments that the Fund may hold may include a synthetic LIBOR reference rate. The Financial Conduct Authority (the "FCA") has announced that it will require the publication of synthetic LIBOR for the one-month, three-month and six-month USD LIBOR settings through at least September 30, 2024 on the basis of a changed methodology (the "synthetic LIBOR"). However, the synthetic LIBOR has been designated by the FCA as unrepresentative of the underlying market that it seeks to measure and is solely available for use in legacy transactions. No assurances can be given that the use of such a synthetic LIBOR reference rate will have the intended effects.
The elimination of LIBOR and transition to other reference rates, or any other changes or reforms to the determination or supervision of reference rates, could have an adverse impact on the market for, or value of, any securities or payments linked to those reference rates, which may adversely affect Fund performance and/or NAV. Uncertainty and risk still remain regarding the willingness and ability of issuers and lenders to include revised provisions in new and existing contracts or instruments. Consequently, the transition away from LIBOR to other reference rates may still lead to increased volatility and illiquidity in markets that have historically been tied to LIBOR, fluctuations in values of LIBOR-related investments or investments in issuers that utilize LIBOR, increased difficulty in borrowing or refinancing and diminished effectiveness of hedging strategies, potentially adversely affecting Fund performance. Furthermore, the risks associated with the discontinuation of LIBOR and transition to alternative rates may be exacerbated if the work necessary to effect an orderly transition to an alternative reference rate is not completed in a timely manner. The ultimate impact of the discontinuance of LIBOR on the Fund remains uncertain and may result in losses to the Fund.
The U.S. Federal Reserve, based on the recommendations of the New York Federal Reserve’s Alternative Reference Rate Committee (comprised of major derivative market participants and their regulators), has begun publishing the Secured Overnight Financing Rate (referred to as “SOFR”), which is their preferred alternative rate for U.S. dollar LIBOR. Proposals for alternative reference rates for other currencies have also been announced or have already begun publication. Markets are in the process of developing in response to these new rates. Although financial regulators and industry working groups have suggested alternative reference rates, such as the European Interbank Offer Rate, the Sterling Overnight Interbank Average Rate and SOFR, there has been no global consensus as to an alternative rate and the process for amending existing contracts or instruments to transition away from LIBOR remains incomplete.
Structured Products Risk. The Fund may invest up to 30% of its Managed Assets in structured products, including CLOs, floating rate mortgage-backed securities and credit linked notes. Holders of structured products bear risks of the underlying investments, index or reference obligation and are subject to counterparty risk.
Covenant-Lite Loans Risk. Covenant-lite loans contain fewer maintenance covenants than other types of loans, or no maintenance covenants, and may not include terms that allow the lender to monitor the performance of the borrower and declare a default if certain criteria are breached. Covenant-lite loans may carry more risk than traditional loans as they allow individuals and corporations to engage in activities that would otherwise be difficult or impossible under a covenant-heavy loan agreement. In the event of default, covenant-lite loans may exhibit diminished recovery values as the lender may not have the opportunity to negotiate with the borrower prior to default.
| Annual Report | December 31, 2023 | 63 |
| Apollo Diversified Credit Fund | Notes to Consolidated Financial Statements |
| | December 31, 2023 |
CDO Securities. Collateralized debt obligation (“CDO”) securities generally are limited-recourse obligations of the issuer thereof payable solely from the underlying securities of such issuer or proceeds thereof. Consequently, holders of CDO securities must rely solely on distributions on the underlying securities or proceeds thereof for payment in respect thereof. If distributions on the underlying securities are insufficient to make payments on the CDO securities, no other assets will be available for payment of the deficiency and following realization of the underlying assets, the obligations of such issuer to pay such deficiency will be extinguished. Such underlying securities may consist of high-yield debt securities, loans, structured finance securities and other debt instruments, generally rated below investment-grade (or of equivalent credit quality) except for structured finance securities. High-yield debt securities are generally unsecured (and loans may be unsecured) and may be subordinated to certain other obligations of the issuer thereof. The lower rating of high-yield debt securities and below investment-grade loans reflects a greater possibility that adverse changes in the financial condition of an issuer or in general economic conditions or both may impair the ability of the issuer to make payments of principal or interest. Such investments may be speculative.
Privacy and Data Security Laws. Many jurisdictions in which the Fund and its portfolio companies operate have laws and regulations relating to data privacy, cyber security and protection of personal information, including the General Data Protection Regulation (“GDPR”) in the European Union that went into effect in May 2018 and the California Consumer Privacy Act (“CCPA”) that took effect in January 2020 and provides for enhanced consumer protections for California residents, a private right of action for data breaches and statutory fines for data breaches or other CCPA violations. If the Fund or the Sub-Adviser fail to comply with the relevant laws and regulations, it could result in regulatory investigations and penalties, which could lead to negative publicity and may cause investors and clients to lose confidence in the effectiveness of the Fund’s security measures.
Leverage Risk. Under current market conditions, the Fund generally intends to utilize leverage in an amount up to 33 1/3% of the Fund’s Managed Assets principally through borrowings. In the future, the Fund may elect to utilize leverage in an amount up to 50% of the Fund’s total assets through the issuance of preferred shares. Leverage may result in greater volatility of the net asset value and distributions on the common shares because changes in the value of the Fund’s portfolio investments, including investments purchased with the proceeds from borrowings or the issuance of preferred shares, if any, are borne entirely by common shareholders.
Derivatives Risk. The use of derivative instruments involves risks different from, or possibly greater than, the risks associated with investing directly in securities and other traditional investments. Derivatives are subject to a number of risks, such as liquidity risk (which may be heightened for highly-customized derivatives), interest rate risk, market risk, credit risk, leveraging risk, counterparty risk, tax risk, and management risk, as well as risks arising from changes in applicable requirements. They also involve the risk of mispricing, the risk of unfavorable or ambiguous documentation and the risk that changes in the value of the derivative may not correlate perfectly with the underlying asset, rate or index. The Fund’s use of derivatives may increase or accelerate the amount of taxes payable by common shareholders.
The Fund relies on certain exemptions in Rule 18f-4 to enter into derivatives transactions and certain other transactions notwithstanding the restrictions on the issuance of “senior securities” under Section 18 of the 1940 Act. Under Rule 18f-4, “derivatives transactions” include the following: (1) any swap, security-based swap, futures contract, forward contract, option (excluding purchased options), any combination of the foregoing, or any similar instrument, under which the Fund is or may be required to make any payment or delivery of cash or other assets during the life of the instrument or at maturity or early termination, whether as margin or settlement payment or otherwise; (2) any short sale borrowing; and (3) if the Fund relies on the exemption in Rule 18f-4(d)(1)(ii), reverse repurchase agreements and similar financing transactions. The Fund will rely on a separate exemption in Rule 18f-4(e) when entering into unfunded commitment agreements, which includes any commitment to make a loan to a company, including term loans, delayed draw term loans, and revolvers, or to invest equity in a company. To rely on the unfunded commitment agreements exemption, the Fund must reasonably believe, at the time it enters into such agreement, that it will have sufficient cash and cash the equivalents to meet its obligations with respect to all of its unfunded commitment agreements, in each case as they come due. The Fund will rely on the exemption in Rule 18f-4(f) when purchasing when-issued or forward-settling securities (e.g., firm and standby commitments, including TBA commitments, and dollar rolls) and non-standard settlement cycle securities, if certain conditions are met.
The Fund intends to operate as a “limited derivatives user” for purposes of the derivatives transactions exemption in Rule 18f-4. To qualify as a limited derivatives user, the Fund’s “derivatives exposure” is limited to 10% of its net assets subject to exclusions for certain currency or interest rate hedging transactions (as calculated in accordance with Rule 18f-4). Unless the Fund qualifies as a “limited derivatives user” as defined in Rule 18f-4, the rule would, among other things, require the Fund to establish a comprehensive derivatives risk management program, to comply with certain value-at-risk based leverage limits, to appoint a derivatives risk manager and to provide additional disclosure both publicly and to the SEC regarding its derivatives positions.
Inflation/Deflation Risk. Inflation risk is the risk that the value of certain assets or income from the Fund’s investments will be worth less in the future as inflation decreases the value of money. As inflation increases, the real value of the shares and distributions on the shares can decline.
In addition, during any periods of rising inflation, the dividend rates or borrowing costs associated with the Fund’s use of leverage would likely increase, which would tend to further reduce returns to shareholders. Deflation risk is the risk that prices throughout the economy decline over time—the opposite of inflation. Deflation may have an adverse effect on the creditworthiness of issuers and may make issuer defaults more likely, which may result in a decline in the value of the Fund’s portfolio.
| 64 | 1.888.926.2688 | www.apollo.com |
| Apollo Diversified Credit Fund | Notes to Consolidated Financial Statements |
| | December 31, 2023 |
Due to global supply chain disruptions, a rise in energy prices, strong consumer demand as economies continue to reopen and other factors, inflation has accelerated in the U.S. and globally. Recent inflationary pressures have increased the costs of labor, energy and raw materials and have adversely affected consumer spending, economic growth and portfolio companies’ operations. If such portfolio companies are unable to pass any increases in their costs of operations along to their customers, it could adversely affect their operating results and impact their ability to pay interest and principal on their loans, particularly if interest rates rise in response to inflation. In addition, any projected future decreases in a portfolio companies’ operating results due to inflation could adversely impact the fair value of those investments. Any decreases in the fair value of our investments could result in future realized or unrealized losses and therefore reduce our net assets resulting from operations.
Additionally, the Federal Reserve has raised, and has indicated its intent to continue raising, certain benchmark interest rates in an effort to combat inflation. As such, inflation may continue in the near to medium-term, particularly in the U.S., with the possibility that monetary policy may tighten in response.
Non-U.S. Instruments Risk. The Fund may invest in non-U.S. Instruments. Non-U.S. investments involve certain risks not typically associated with investing in the United States. Generally, there is less readily available and reliable information about non-U.S. issuers or Borrowers due to less rigorous disclosure or accounting standards and regulatory practices. The cost of servicing external debt will also generally be adversely affected by rising international interest rates, as many external debt obligations bear interest at rates which are adjusted based upon international interest rates. Because non-U.S. Instruments may trade on days when the Fund’s common shares are not priced, the Fund’s NAV may change at times when common shares cannot be sold.
Foreign Currency Risk. Because the Fund may invest its Managed Assets in securities or other instruments denominated or quoted in currencies other than the U.S. dollar, changes in foreign currency exchange rates may affect the value of instruments held by the Fund and the unrealized appreciation or depreciation of investments. Currencies of certain countries may be volatile and therefore may affect the value of instruments denominated in such currencies, which means that the Fund’s NAV could decline as a result of changes in the exchange rates between foreign currencies and the U.S. dollar. The Sub-Adviser may, but is not required to, elect for the Fund to seek to protect itself from changes in currency exchange rates through hedging transactions depending on market conditions. The Fund may incur costs in connection with the conversions between various currencies. In addition, certain countries may impose foreign currency exchange controls or other restrictions on the repatriation, transferability or convertibility of currency.
10. SUBSEQUENT EVENTS
Subsequent events after the date of the Consolidated Statement of Assets and Liabilities have been evaluated through the date the consolidated financial statements were issued.
The Fund completed a quarterly repurchase offer on February 6, 2024, which resulted in 1,675,793 repurchased shares for $36,568,770. All shareholder repurchase requests received by the Fund in good order were honored in their full amounts.
Management has determined that there were no other subsequent events to report through the issuance of these consolidated financial statements.
| Annual Report | December 31, 2023 | 65 |
| | Report of Independent Registered |
| Apollo Diversified Credit Fund | Public Accounting Firm |
| | December 31, 2023 |
To the Shareholders and Boards of Trustees of Apollo Diversified Credit Fund
Opinion on the Financial Statements and Financial Highlights
We have audited the accompanying consolidated statement of assets and liabilities of Apollo Diversified Credit Fund (the “Fund”), including the consolidated schedule of investments, as of December 31, 2023, the related consolidated statements of operations and cash flows for the year then ended, the consolidated statements of changes in net assets for each of the two years in the period then ended, the consolidated financial highlights for each of the two years in the period then ended, and the related notes. In our opinion, the consolidated financial statements and consolidated financial highlights present fairly, in all material respects, the financial position of the Fund as of December 31, 2023, and the results of its operations and its cash flows for the year then ended, the changes in its net assets for each of the two years in the period then ended, and the consolidated financial highlights for each of the two years in the period then ended in conformity with accounting principles generally accepted in the United States of America. The consolidated financial highlights for the years or periods ended December 31, 2021, 2020, and 2019 were audited by other auditors whose report, dated February 28, 2022, expressed an unqualified opinion on those consolidated financial highlights.
Basis for Opinion
These consolidated financial statements and consolidated financial highlights are the responsibility of the Fund’s management. Our responsibility is to express an opinion on the Fund’s consolidated financial statements and consolidated financial highlights based on our audit. We are a public accounting firm registered with the Public Company Accounting Oversight Board (United States) (PCAOB) and are required to be independent with respect to the Fund in accordance with the U.S. federal securities laws and the applicable rules and regulations of the Securities and Exchange Commission and the PCAOB.
We conducted our audit in accordance with the standards of the PCAOB. Those standards require that we plan and perform the audit to obtain reasonable assurance about whether the consolidated financial statements and consolidated financial highlights are free of material misstatement, whether due to error or fraud. The Fund is not required to have, nor were we engaged to perform, an audit of its internal control over financial reporting. As part of our audit, we are required to obtain an understanding of internal control over financial reporting but not for the purpose of expressing an opinion on the effectiveness of the Fund’s internal control over financial reporting. Accordingly, we express no such opinion.
Our audit included performing procedures to assess the risks of material misstatement of the consolidated financial statements and consolidated financial highlights, whether due to error or fraud, and performing procedures that respond to those risks. Such procedures included examining, on a test basis, evidence regarding the amounts and disclosures in the consolidated financial statements and consolidated financial highlights. Our audit also included evaluating the accounting principles used and significant estimates made by management, as well as evaluating the overall presentation of the consolidated financial statements and consolidated financial highlights. Our procedures included confirmation of securities owned as of December 31, 2023, by correspondence with the custodian, brokers and selling or agent banks; when replies were not received from brokers and selling or agent banks, we performed other auditing procedures. We believe that our audit provides a reasonable basis for our opinion.
/s/ Deloitte & Touche LLP
New York, New
York February 23, 2024
We have served as the auditor of one or more Apollo Investment Companies since 2011.
| 66 | 1.888.926.2688 | www.apollo.com |
| Apollo Diversified Credit Fund | Dividend Reinvestment Policy |
| | December 31, 2023 (Unaudited) |
The Fund will operate under a dividend reinvestment plan administered by SS&C GIDS, Inc. (“Transfer Agent”) Pursuant to the policy, the Fund’s income dividends or capital gains or other distributions (each, a “Distribution” and collectively, “Distributions”), net of any applicable U.S. withholding tax, are reinvested in the same class of shares of the Fund.
Shareholders automatically participate in the dividend reinvestment plan, unless and until an election is made to withdraw from the policy on behalf of such participating shareholder. Shareholders who do not wish to have Distributions automatically reinvested should so notify the Transfer Agent in writing at Apollo Diversified Credit Fund, c/o SS&C GIDS, Inc. 430 W 7th St, Kansas City, MO 64105-1407. Such written notice must be received by the Transfer Agent 30 days prior to the record date of the Distribution or the shareholder will receive such Distribution in shares through the dividend reinvestment plan. Under the dividend reinvestment plan, the Fund’s Distributions to shareholders are reinvested in full and fractional shares as described below.
When the Fund declares a Distribution, the Transfer Agent, on the shareholder’s behalf, will receive additional authorized shares from the Fund either newly issued or repurchased from shareholders by the Fund and held as treasury stock. The number of shares to be received when Distributions are reinvested will be determined by dividing the amount of the Distribution by the Fund’s net asset value per share.
The Transfer Agent will maintain all shareholder accounts and furnish written confirmations of all transactions in the accounts, including information needed by shareholders for personal and tax records. The Transfer Agent will hold shares in the account of the shareholders in non-certificated form in the name of the participant, and each shareholder’s proxy, if any, will include those shares purchased pursuant to the dividend reinvestment plan. Each participant, nevertheless, has the right to request certificates for whole and fractional shares owned. The Fund will issue certificates in its sole discretion. The Transfer Agent will distribute all proxy solicitation materials, if any, to participating shareholders.
In the case of shareholders, such as banks, brokers or nominees, that hold shares for others who are beneficial owners participating under the dividend reinvestment plan, the Transfer Agent will administer the dividend reinvestment plan on the basis of the number of shares certified from time to time by the record shareholder as representing the total amount of shares registered in the shareholder’s name and held for the account of beneficial owners participating under the dividend reinvestment plan.
Neither the Transfer Agent nor the Fund shall have any responsibility or liability beyond the exercise of ordinary care for any action taken or omitted pursuant to the dividend reinvestment plan, nor shall they have any duties, responsibilities or liabilities except such as expressly set forth herein. Neither shall they be liable hereunder for any act done in good faith or for any good faith omissions to act, including, without limitation, failure to terminate a participant’s account prior to receipt of written notice of his or her death or with respect to prices at which shares are purchased or sold for the participants account and the terms on which such purchases and sales are made, subject to applicable provisions of the federal securities laws.
The automatic reinvestment of Distributions will not relieve participants of any federal, state or local income tax that may be payable (or required to be withheld) on such Distributions.
The Fund reserves the right to amend or terminate the dividend reinvestment plan. There is no direct service charge to participants with regard to purchases under the dividend reinvestment plan; however, the Fund reserves the right to amend the dividend reinvestment plan to include a service charge payable by the participants.
All correspondence concerning the dividend reinvestment plan should be directed to the Transfer Agent at Apollo Diversified Credit Fund, c/o SS&C GIDS, Inc. 430 W 7th St, Kansas City, MO 64105-1407. Certain transactions can be performed by calling the toll free number 1-888-926-2688.
| Annual Report | December 31, 2023 | 67 |
| Apollo Diversified Credit Fund | Additional Information |
| | December 31, 2023 (Unaudited) |
1. PROXY VOTING POLICIES AND VOTING RECORD
A description of the policies and procedures that the Fund uses to vote proxies relating to portfolio securities is available without charge upon request by calling toll-free 888-926-2688, or on the Securities and Exchange Commission’s (“SEC”) website at https://www.sec.gov. Information regarding how the Fund voted proxies relating to portfolio securities during the most recent 12-month period ended June 30th is available without charge upon request by calling toll-free 888-926-2688, or on the SEC’s website at https://www.sec.gov.
2. QUARTERLY PORTFOLIO HOLDINGS
The Fund files its complete schedule of portfolio holdings with the SEC for the first and third quarters of each fiscal year as an exhibit to its reports on Form N-PORT. The Fund’s Form N-PORT reports are available on the SEC’s web site at http://www.sec.gov. Information on the operation of the Public Reference Room may be obtained by calling 1-800-SEC-0330.
| 68 | 1.888.926.2688 | www.apollo.com |
| Apollo Diversified Credit Fund | Trustees and Officers |
| | December 31, 2023 (Unaudited) |
The business and affairs of the Fund are managed under the direction of the Trustees. Information concerning the Trustees and officers of the Fund is set forth below. Generally, each Trustee and officer serves an indefinite term or until certain circumstances such as his resignation, death, or otherwise as specified in the Fund’s organizational documents. Any Trustee may be removed at a meeting of shareholders by a vote meeting the requirements of the Fund’s organizational documents. The Statement of Additional Information of the Fund includes additional information about the Trustees and officers and is available, without charge, upon request by calling the Fund toll-free at 888-926-2688.
INDEPENDENT TRUSTEES
Name and Year of Birth | Position/Term of Office* | Principal Occupation During the Past Five Years | Number of Portfolios in Fund Complex** Overseen by Trustee | Other Directorships held by Trustee During Last Five Years |
Meredith Coffey (1968) | Trustee Since 2022 | From August 2008 to present, Ms. Coffey serves as Head of Research and the Co-Head of Public Policy for the Loan & Syndications Trading Association. | 1 | Director, Apollo S3 Private Markets Fund (2023-present); Director, Apollo Senior Floating Rate Fund Inc. (2023-present); Director, Apollo Tactical Income Fund Inc. (2023- present); Director, Apollo Debt Solutions, BDC (2021-present). |
Christine Gallagher (1985) | Trustee Since 2022 | From March 2021 to present, Ms. Gallagher serves as a Community Engagement Manager at Leidos, a company that provides information technology, engineering and science services for government and commercial contractors. Ms. Gallagher also serves as president of Military Quality of Life Consulting, LLC, a military support company she founded in 2015. From 2015 to 2019, she served as an agile IT project manager for BAM Technologies, LLC. | 1 | Director, Apollo S3 Private Markets Fund (2023-present); Director, Apollo Debt Solutions, BDC (2021-present). |
Michael Porter (1983) | Trustee Since 2022 | From December 2014 to present, Mr. Porter has worked at Netflix in Corporate Development and Strategy. In December 2020, Mr. Porter was appointed to the Board of Directors of Ednovate Charter School. | 1 | Director, Apollo S3 Private Markets Fund (2023-present); Director, Apollo Debt Solutions, BDC (2021-present). |
Carl J. Rickertsen (1960) | Trustee Since 2022 | From 2015 to present, Mr. Rickertsen has served as managing partner of Pine Creek Partners, a private equity investment firm. | 1 | Director, Apollo S3 Private Markets Fund (2023-present); Director, MicroStrategy Inc. (2002-present); Director, Apollo Senior Floating Rate Fund Inc. (2011-2023); Director, Apollo Tactical Income Fund Inc. (2013-2023); Director, Berry Global Inc. (2013-present); Director, Apollo Debt Solutions, BDC (2021-present). |
| Annual Report | December 31, 2023 | 69 |
| Apollo Diversified Credit Fund | Trustees and Officers |
| | December 31, 2023 (Unaudited) |
INTERESTED TRUSTEES AND OFFICERS
Name and Year of Birth | Position/Term of Office* | Principal Occupation During the Past Five Years | Number of Portfolios in Fund Complex** Overseen by Trustee | Other Directorships held by Trustee During Last 5 Years |
Earl Hunt (1981) | Chairman, Trustee, and President Since 2022 | Mr. Hunt joined Apollo Global Management, Inc. and its consolidated subsidiaries in 2021. From 2015 to 2021, Mr. Hunt served as a Partner in the Global Markets division at Goldman Sachs. He also was a member of Goldman Sach’s Partnership Committee, Global Markets Operating Committee and was co-chair of the Global Markets Inclusion and Diversity Committee. | 1 | Director, Apollo Debt Solutions, BDC (2021-present). |
Kenneth Seifert (1978) | Treasurer and Chief Financial Officer Since 2022 | Controller, Principal and Director, Apollo Global Management, Inc. and affiliates since 2021 and 2017, respectively. Treasurer and Chief Financial Officer of Apollo Senior Floating Rate Fund and Apollo Tactical Income Fund since 2021, Controller 2017 to 2021. Treasurer and Chief Financial Officer of Apollo Diversified Real Estate Fund since 2022. Treasurer, Chief Financial Officer and Principal Financial Officer of Apollo S3 Private Markets Fund, 2023 to present. | N/A | N/A |
Kristin Hester (1980) | Chief Legal Officer and Secretary Since 2022 | Managing Director, General Counsel-Regulated Funds, Apollo Global Management, Inc., 2015 to present; Chief Legal Officer, MidCap Financial Investment Corporation, Apollo Debt Solutions BDC, Apollo Tactical Income Fund Inc., Apollo Senior Floating Rate Fund Inc., and Redding Ridge Asset Management LLC, 2022 to present. Chief Legal Officer and Secretary of Apollo S3 Private Markets Fund, 2023 to present. | N/A | N/A |
Ryan Del Giudice (1990) | Chief Compliance Officer Since 2018, Vice President and Assistant Secretary Since 2020 | Principal, Apollo Global Management, Inc., 2022 to present; Chief Compliance Officer, Apollo Diversified Real Estate Fund, 2018 to present; Chief Compliance Officer, MidCap Financial Investment Corporation, Apollo Debt Solutions BDC, Apollo Tactical Income Fund Inc. and Apollo Senior Floating Rate Fund Inc. and Apollo S3 Private Markets Fund., 2023 to present; Chief Compliance Officer, Griffin Capital Asset Management Company, LLC, 2017 to 2022. | N/A | N/A |
| * | The term of office for each Trustee and officer listed above will continue indefinitely. |
| ** | The term “Fund Complex” refers to the Apollo Diversified Credit Fund and Apollo Diversified Real Estate Fund. |
| 70 | 1.888.926.2688 | www.apollo.com |
| Apollo Diversified Credit Fund | Service Providers |
| | December 31, 2023 (Unaudited) |
Investment Adviser
Apollo Capital Credit Adviser, LLC
9 W 57th Street, New York, NY 10019
Investment Sub-Adviser
Apollo Credit Management, LLC
9 W 57th St, New York, NY 10019
Administrator
ALPS Fund Services, Inc.
1290 Broadway, Suite 1000, Denver, CO 80203
Custodian
Bank of New York Mellon Trust Company, National Association 601 Travis Street, 16th Floor, Houston, TX 77002
Distributor
ALPS Distributors, Inc.
1290 Broadway, Suite 1000, Denver, CO 80203
Independent Registered Public Accounting Firm
Deloitte & Touche LLP
30 Rockefeller Plaza, New York, NY 10112
Legal Counsel
Simpson Thacher & Bartlett LLP
900 G Street, NW, Washington, D.C. 20001
Transfer Agent and DRIP Administrator
SS&C GIDS, Inc.
330 W 9th Street, Kansas City, MO 64105
| Annual Report | December 31, 2023 | 71 |
| Apollo Diversified Credit Fund | Privacy Notice |
| | December 31, 2023 (Unaudited) |
DATA PRIVACY NOTICE
What Information Do We Have About You?
We may have collected your personal information in connection with your investment in Apollo Diversified Credit Fund. Additionally, we may collect nonpublic personal information about you via our website, including any information captured through the use of our “cookies.”
With Whom Do We Share Your Personal Information?
We may share the information we collect with our affiliates and nonaffiliated third parties for our everyday business purposes, such as to process your transactions, maintain your investments in the Fund, and to respond to court orders and legal investigations. We also provide such information to our affiliates, attorneys, banks, auditors, securities brokers and service providers as may be necessary to facilitate the acceptance and management of your account or your investments in the Funds and to enable them to perform services on our behalf. We do not sell your personal information to third parties for their independent use.
Protecting the Confidentiality of Our Investor Information
Apollo takes our responsibility to protect the privacy and confidentiality of your personal information very seriously. As such, we maintain physical, electronic and procedural safeguards that comply with federal standards to guard your nonpublic personal information, although you should be aware that data protection cannot be guaranteed. We restrict access to nonpublic personal information about you to our employees and agents who need to know such information to provide products or services to you. Our control policies, for example, authorize access to investor information only by individuals who need such access to do their work.
Opt-Out Notice
We reserve the right to disclose nonpublic personal information about you to a nonaffiliated third party as discussed above. If you wish to limit the distribution of your personal information with our affiliates and nonaffiliated third parties, as described herein, you may do so by:
| • | Calling (877) 864-4834; or |
| • | Writing us at the following address: |
c/o: Apollo Diversified Credit Fund
9 West 57th Street, New York, NY 10019
Attn: Ryan DelGiudice
The ability to opt out of disclosure of nonpublic personal information about you may not apply to arrangements necessary to effect or administer a transaction in shares of a Fund or maintain or service your account.
If you choose to write or call us, your request should include your name, address, telephone number and account number(s) to which the opt-out applies and the extent to which your personal information shall be withheld. If you are a joint account owner, we will apply those instructions to the entire account. If you have accounts or relationships with our affiliates, you may receive multiple privacy policies from them, and will need to separately notify those companies of your privacy choices for those accounts or relationships.
Please understand that if you limit our sharing or our affiliated companies’ use of personal information, you and any joint account holder(s) may not receive information about our affiliated companies’ products and services, including products or services that could help you manage your financial resources and achieve your investment objectives.
If your shares are held in “street name” at a bank or brokerage, we do not have access to your personal information, and you should refer to your bank’s or broker’s privacy policies for a statement of the treatment of your personal information.
If you have any questions regarding this policy, please feel free to contact privacy@apollo.com.
| 72 | 1.888.926.2688 | www.apollo.com |
 | 9 West 57th Street, 42nd Floor | 212.515.3200 |
| New York, NY 10019 | www.apollo.com |
| Not a deposit | May lose value | No bank guarantee |
| | | |
| Not insured by the FDIC, NCUA or any other government agency |
This material must be accompanied or preceded by a prospectus.
Apollo Global Securities, LLC (“AGS”) and Griffin Capital Securities, LLC (“GCS”), Members of FINRA and SIPC, are subsidiaries of Apollo Global Management, Inc. AGS conducts Apollo’s capital markets business and certain of its fund marketing and distribution and GCS is a wholesale marketing agent for Apollo sponsored products. ALPS Distributors, Inc. (1290 Broadway, Suite 1000, Denver, CO 80203, Member FINRA) is the distributor of Apollo Diversified Credit Fund. Apollo Global Management, Inc. and ALPS Distributors, Inc. are not affiliated.
| GCC000848 | Exp. 01.31.25 | ADCF-IU395330-0124A |
Item 2. Code of Ethics.
| (a) | Apollo Diversified Credit Fund (the “Fund”) has adopted a Code of Ethics that applies to the Fund's principal executive officer, principal financial officer, principal accounting officer or controller or any persons performing similar functions on behalf of the Fund. |
| (c) | During the period covered by this report, there were no amendments to the Fund’s Code of Ethics. |
| (d) | During the period covered by this report, the Fund had not granted any express or implicit waivers from the Code of Ethics. |
| (f) | The Fund’s Code of Ethics is attached hereto as Exhibit 14(a)(1). |
Item 3. Audit Committee Financial Expert.
The Board of Trustees (the “Board”) of the Fund has determined that the Fund has at least one audit committee financial expert serving on its audit committee of the board (“Audit Committee”). The Board has designated Carl J. Rickertsen as the Fund’s audit committee financial expert. Mr. Rickertsen is “independent” as defined in paragraph (a)(2) of Item 3 to Form N-CSR.
Item 4. Principal Accountant Fees and Services.
| (a) | | Audit Fees: For the Fund’s last two fiscal years ended December 31, 2022 and December 31, 2023, the aggregate fees billed for professional services rendered by the principal accountant for the audit of the Fund’s annual financial statements or services that are normally provided by the accountant in connection with statutory and regulatory filings or engagements were $250,000 and $250,000, respectively. |
| (b) | | Audit-Related Fees: For the Fund’s last two fiscal years ended December 31, 2022 and December 31, 2023, no fees were billed for assurance and related services by the principal accountant that would otherwise be reasonably related to the performance of the audit of the Fund’s financial statements and not otherwise reported under paragraph (a) of Item 4 of this report. |
| (c) | | Tax Fees: For the Fund’s last two fiscal years ended December 31, 2022 and December 31, 2023, the aggregate fees billed for professional services rendered by the principal accountant for tax compliance, tax advice and tax planning, which were comprised of the preparation of excise filings and income tax returns for the Fund were $50,500 and $12,000, respectively. |
| (d) | | All Other Fees: For the Fund’s last two fiscal years ended December 31, 2022 and December 31, 2023, the fees billed for products and services provided by the principal accountant, other than the services reported in paragraphs (a) through (c) of Item 4 of this report, were $0 and $10,000, respectively. |
| (e) | (1) | The Audit Committee’s pre-approval policies and procedures require that all services to be performed by the Fund’s principal accountant must be pre-approved by the Fund’s audit committee. |
| (2) | No services described in paragraphs (b) through (d) of Item 4 of this report were approved or required to be approved by the Fund’s Audit Committee pursuant to paragraph (c)(7)(i)(C) of Rule 2-01 of Regulation S-X. |
| (f) | | Not applicable to the Fund. |
| (g) | | For the Fund’s last two fiscal years ended December 31, 2022 and December 31, 2023, the aggregate fees billed for non-audit fees for services rendered by the principal accountant to the Fund, the Fund’s investment adviser and any entity controlling, controlled by, or under common control with the Fund’s investment adviser that provides ongoing services to the Fund were $50,500 and $22,000, respectively. |
| (h) | | The Fund’s Audit Committee has considered whether the provision of non-audit services to the Fund’s investment adviser and any entity controlling, controlled by, or under common control with the investment adviser that provides ongoing services to the Fund, that were not pre-approved pursuant to paragraph (c)(7)(ii) of Rule 2-01 of Regulation S-X, is compatible with maintaining the principal accountant's independence. All non-audit services provided to the Fund’s investment adviser and any entity controlling, controlled by, or under common control with the investment adviser, which were required to be pre-approved, were pre-approved as required. |
| (i) | | Not applicable to the Fund. |
| (j) | | Not applicable to the Fund. |
Item 5. Audit Committee of Listed Registrants.
The Fund is not a listed issuer as defined in Rule 10A-3 under the Securities Exchange Act of 1934, as amended.
Item 6. Investments.
| (a) | The schedule of investments is included as part of the Reports to Stockholders filed under Item 1 of this Form N-CSR. |
| (b) | Not applicable to the Fund. |
Item 7. Disclosure of Proxy Voting Policies and Procedures for Closed-End Management Investment Companies.
The proxy voting policies and procedures of Apollo Capital Credit Adviser, LLC (the “Adviser”) and Apollo Credit Management, LLC (the “Sub-Adviser”) are attached hereto as Exhibit 99.14(a)(5).
Item 8. Portfolio Managers of Closed-End Management Investment Companies.
(a)(1) As of the date of this filing, Earl Hunt, Christopher Lahoud and James Vanek, each an employee of Apollo Credit Management, LLC (the “Sub-Adviser”), serve as the Fund’s portfolio managers. Messrs. Hunt, Lahoud and Vanek are jointly and primarily responsible for overseeing the day to day investment operations of the Fund.
Earl Hunt — Partner, Credit at Apollo, and Co-Head of Credit Secondaries. Prior to joining in 2021, Mr. Hunt was Partner in the Global Markets division at Goldman Sachs where he was responsible for strategic client coverage. He also served as a member of the Goldman Sachs's Partnership Committee and Global Markets Operating Committee. Previously, Mr. Hunt was Co-Head of US Distressed & Par Loan sales at Goldman Sachs. Before that, Mr. Hunt worked at Citi as a director in Leveraged Finance sales. Mr. Hunt earned a BA in Economics from Brown University and is a member of the Brown University Board of Trustees. Mr. Hunt has served as portfolio manager to the Fund since April 1, 2022.
Christopher Lahoud — Partner, Credit at Apollo. Prior to joining in 2018, Mr. Lahoud was Head of the Distressed Product Group at Deutsche Bank managing a team of 15 individuals. He began his career with Citigroup in 2006 as a credit trader and currently serves on the Board of Moxe Health and Hertz Corporation. Mr. Lahoud graduated from the University of Richmond with a degree in Accounting, Economics and Finance. Mr. Lahoud has served as portfolio manager to the Fund since April 1, 2022.
James Vanek — Partner, Credit at Apollo, and Co-Head of Global Performing Credit. Prior to joining Apollo in 2008, Mr. Vanek was an Associate Director, Loan Sales & Trading in the Leveraged Finance Group at Bear Stearns. He is a board member of the Loan Syndications and Trading Association, a leading advocate for the US syndicated loan market. Mr. Vanek received his MBA from Columbia Business School and graduated from Duke University with a Bachelor of Science in Economics and a Bachelor of Arts in Computer Science. Mr. Vanek has served as portfolio manager to the Fund since April 1, 2022.
(a)(2) As of December 31, 2023, Mr. Hunt is also primarily responsible for the management of the following types of accounts in addition to the Fund (asset values have been estimated):
Other Accounts by Type | Total Number of Accounts | Total Assets (in millions) | Number of Accounts Subject to a Performance Fee | Total Assets Subject to a Performance Fee (in millions) |
| Registered Investment Companies | 1 | $8,834 | 1 | $6,784 |
| Other Pooled Investment Vehicles | 0 | $0 | 0 | $0 |
| Other Accounts | 0 | $0 | 0 | $0 |
As of December 31, 2023, Mr. Lahoud is also primarily responsible for the management of the following types of accounts in addition to the Fund (asset values have been estimated):
Other Accounts by Type | Total
Number of Accounts | Total Assets (in millions) | Number of Accounts Subject to a Performance Fee | Total Assets Subject to a Performance Fee (in millions) |
| Registered Investment Companies | 0 | $0 | 0 | $0 |
| Other Pooled Investment Vehicles | 7 | $8,098 | 7 | $3,961 |
| Other Accounts | 7 | $3,736 | 6 | $2,974 |
As of December 31, 2023, Mr. Vanek is also primarily responsible for the management of the following types of accounts in addition to the Fund (asset values have been estimated):
Other Accounts by Type | Total Number of Accounts | Total Assets (in millions) | Number of Accounts Subject to a Performance Fee | Total Assets Subject to a Performance Fee (in millions) |
| Registered Investment Companies | 3 | $9,558 | 1 | $7,483 |
| Other Pooled Investment Vehicles | 4 | $7,084 | 3 | $3,128 |
| Other Accounts | 2 | $709 | 1 | $376 |
Material Conflicts of Interest:
As a general matter, certain conflicts of interest may arise in connection with a portfolio manager’s management of a fund’s investments, on the one hand, and the investments of other accounts for which the portfolio manager is responsible, on the other. For example, it is possible that the various accounts managed could have different investment strategies that, at times, might conflict with one another to the possible detriment of the Fund. Alternatively, to the extent that the same investment opportunities might be desirable for more than one account, possible conflicts could arise in determining how to allocate them. Other potential conflicts might include conflicts created by specific portfolio manager compensation arrangements, and conflicts relating to selection of brokers or dealers to execute Fund portfolio trades and/or specific uses of commissions from Fund portfolio trades (for example, research, or “soft dollars,” if any). The Sub-Adviser has adopted policies and procedures and has structured its portfolio managers’ compensation in a manner reasonably designed to safeguard the Fund from being negatively affected as a result of any such potential conflicts. In addition, certain conflicts of interest may arise from the Sub-Adviser’s arrangements with affiliated investment advisers.
(a)(3) Portfolio Manager Compensation as of December 31, 2023:
Apollo’s financial arrangements with its portfolio managers, its competitive compensation and its career path emphasis at all levels reflect the value senior management places on key resources. Compensation may include a variety of components and may vary from year to year based on a number of factors. The principal components of compensation include base compensation and discretionary compensation.
Base Compensation. Generally, portfolio managers receive an annual salary that is consistent with the market rate of annual salaries paid to similarly situated investment professionals.
Discretionary Compensation. Portfolio managers also receive discretionary compensation generally consisting of two components: an annual bonus and carried interest.
Annual Bonus. Generally, a portfolio manager receives an annual bonus based on such person’s individual performance, operational performance for the Apollo-advised accounts for which such person serves as a portfolio manager, and such portfolio manager’s impact on the overall operating performance and potential to contribute to long-term value and growth. A portion of each annual bonus may be deferred and, at the discretion of Apollo, may be in the form of cash or equity of an Apollo affiliated entity, such as restricted stock units of Apollo Global Management, Inc.
Carried Interest. Generally, a portfolio manager receives carried interests with respect to the Apollo-advised accounts for which such person serves as a portfolio manager, subject to standard terms and conditions, including vesting.
(a)(4) The following table indicates the dollar range of equity securities that each portfolio manager beneficially owned in the Fund as of December 31, 2023.
| Name of Portfolio Manager | | Dollar Range of Equity Securities in the Fund(1) |
| Earl Hunt | | None |
| Christopher Lahoud | | None |
| James Vanek | | $50,001–$100,000 |
| (1) | Dollar ranges are as follows: $1–$10,000, $10,001–$50,000, $50,001–$100,000, $100,001–$500,000, $500,001–$1,000,000 or over $1,000,000 |
Item 9. Purchases of Equity Securities by Closed-End Management Investment Company and Affiliated Purchasers.
None.
Item 10. Submission of Matters to a Vote of Security Holders.
No changes have occurred.
Item 11. Controls and Procedures.
| (a) | Based on an evaluation of the Fund’s disclosure controls and procedures (as defined in Rule 30a-3(c) under the 1940 Act), the Fund’s principal executive officer and principal financial officer have concluded that the Fund’s disclosure controls and procedures are effective as of a date within 90 days of the filing date of this report. |
| (b) | There were no changes in the Fund’s internal control over financial reporting that occurred during the period covered by this report that has materially affected, or are reasonably likely to materially affect, the Fund’s internal control over financial reporting. |
Item 12. Disclosure of Securities Lending Activities for Closed-End Management Investment Companies.
None.
Item 13. Recovery of Erroneously Awarded Compensation.
Not Applicable.
Item 14. Exhibits.
| (a)(3) | Not applicable to Registrant |
SIGNATURES
Pursuant to the requirements of the Securities Exchange Act of 1934 and the Investment Company Act of 1940, the Registrant has duly caused this report to be signed on its behalf by the undersigned, thereunto duly authorized.
APOLLO DIVERSIFIED CREDIT FUND
| By: | /s/ Earl Hunt | |
| | Earl Hunt | |
| | President (Principal Executive Officer) | |
| | | |
| Date: | March 6, 2024 | |
Pursuant to the requirements of the Securities Exchange Act of 1934 and the Investment Company Act of 1940, this report has been signed below by the following persons on behalf of the Registrant and in the capacities and on the dates indicated.
| By: | /s/ Earl Hunt | |
| | Earl Hunt | |
| | President (Principal Executive Officer) | |
| | | |
| Date: | March 6, 2024 | |
| By: | /s/ Kenneth Seifert | |
| | Kenneth Seifert | |
| | Treasurer (Principal Financial Officer) | |
| | | |
| Date: | March 6, 2024 | |