UNITED STATES
SECURITIES AND EXCHANGE COMMISSION
Washington, D.C. 20549
FORM N-CSR
CERTIFIED SHAREHOLDER REPORT OF REGISTERED
MANAGEMENT INVESTMENT COMPANIES
Investment Company Act file number: 811-23166
RiverNorth/DoubleLine Strategic Opportunity Fund, Inc.
(Exact name of registrant as specified in charter)
325 North LaSalle Street, Suite 645, Chicago, Illinois 60654
(Address of principal executive offices) (Zip code)
Marcus L. Collins, Esq.
RiverNorth Capital Management, LLC
325 North LaSalle Street, Suite 645
Chicago, Illinois 60654
(Name and address of agent for service)
(312)832-1440
Registrant's telephone number, including area code
Date of fiscal year end: June 30, 2018
Date of reporting period: December 31, 2017
Item 1. Reports to Stockholders.
| RiverNorth/DoubleLine Strategic Opportunity Fund, Inc. | Table of Contents |
| | |
| Asset Allocation | 2 |
| Schedule of Investments | 3 |
| Statement of Assets and Liabilities | 10 |
| Statement of Operations | 11 |
| Statements of Changes in Net Assets | 12 |
| Statement of Cash Flows | 13 |
| Financial Highlights | 14 |
| Notes to Financial Statements | 15 |
| Additional Information | 23 |
| RiverNorth/DoubleLine Strategic Opportunity Fund, Inc. |
| Asset Allocation | December 31, 2017 (Unaudited) |
ASSET ALLOCATION as of December 31, 2017
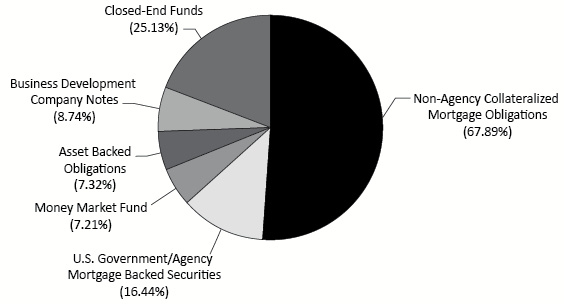
Percentages are based on total net assets of the Fund.
| 2 | (888) 848-7569 | www.rivernorth.com |
| RiverNorth/DoubleLine Strategic Opportunity Fund, Inc. |
| Schedule of Investments | December 31, 2017 (Unaudited) |
| Principal Amount/Description | | Rate | | | Maturity | | | Value | |
| ASSET BACKED OBLIGATIONS - 7.32%(a) | |
| | 2,828,125 | | | Blackbird Capital Aircraft(b)(c) | | | 5.68 | % | | | 12/16/2041 | | | $ | 2,865,855 | |
| | 1,990,000 | | | Coinstar Funding, LLC(b) | | | 5.22 | % | | | 4/25/2047 | | | | 2,068,872 | |
| | 3,000,000 | | | InSite Issuer LLC(b) | | | 6.41 | % | | | 11/15/2046 | | | | 3,074,395 | |
| | 2,828,125 | | | Labrador Aviation Finance Limited(b) | | | 5.68 | % | | | 1/15/2042 | | | | 2,805,234 | |
| | 5,792,078 | | | Morgan Stanley Capital Inc (1 Month LIBOR USD + 0.20%)(b)(c) | | | 1.75 | % | | | 5/25/2037 | | | | 4,100,527 | |
| | 1,000,000 | | | SOFI Consumer Loan Program Trust(b)(d) | | | 4.73 | % | | | 1/26/2026 | | | | 1,034,729 | |
| | | | | | | | | | | | | | | | | |
| TOTAL ASSET BACKED OBLIGATIONS | | | | | | | | | | | | |
| (Cost $15,812,086) | | | | | | | | | | | 15,949,612 | |
| Shares/Description | | Rate | | | Maturity | | | Value | |
| BUSINESS DEVELOPMENT COMPANY NOTES - 8.74%(a) | |
| | 9,425 | | | Capitala Finance Corp | | | 5.75 | % | | | 5/31/2022 | | | | 234,588 | |
| | 39,541 | | | Capital Southwest Corp | | | 5.95 | % | | | 12/15/2022 | | | | 1,023,519 | |
| | 25,512 | | | Harvest Capital Credit Corporation | | | 6.13 | % | | | 9/15/2022 | | | | 649,280 | |
| | 24,710 | | | Hercules Capital, Inc. | | | 6.25 | % | | | 7/30/2024 | | | | 633,070 | |
| | 82,869 | | | KCAP Financial Inc | | | 7.38 | % | | | 9/30/2019 | | | | 2,088,299 | |
| | 42,611 | | | MVC Capital Corp | | | 6.25 | % | | | 11/30/2022 | | | | 1,101,068 | |
| | 19,165 | | | Saratoga Investment Corp | | | 6.75 | % | | | 12/30/2023 | | | | 495,799 | |
| | 30,193 | | | Stellus Capital Investment Corporation | | | 5.75 | % | | | 9/15/2022 | | | | 763,883 | |
| | 160,200 | | | THL Credit, Inc. | | | 6.75 | % | | | 12/30/2022 | | | | 4,146,777 | |
| | 841 | | | THL Credit, Inc. | | | 6.75 | % | | | 11/15/2021 | | | | 21,201 | |
| | 230,209 | | | TICC Capital Corp. | | | 6.50 | % | | | 3/30/2024 | | | | 5,950,903 | |
| | 31,062 | | | Triangle Capital Corp | | | 6.38 | % | | | 12/15/2022 | | | | 780,899 | |
| | 2,800 | | | Triangle Capital Corp | | | 6.38 | % | | | 3/15/2022 | | | | 70,560 | |
| | 41,359 | | | TriplePoint Venture Growth BDC Corp | | | 5.75 | % | | | 7/15/2022 | | | | 1,070,371 | |
| | | | | | | | | | | | | | | | | |
| TOTAL BUSINESS DEVELOPMENT COMPANY NOTES | | | | | | | | | | | | |
| (Cost $18,561,347) | | | | | | | | | | | 19,030,217 | |
| Shares/Description | | | Value | |
| CLOSED-END FUNDS - 25.13%(a) |
| | 102,476 | | | Ares Capital Corporation | | | 1,610,923 | |
| | 570,511 | | | BlackRock Corporate High Yield Fund, Inc. | | | 6,241,390 | |
| | 387,576 | | | BlackRock Credit Allocation Income Trust | | | 5,162,512 | |
| | 43,736 | | | BlackRock Debt Strategies Fund, Inc. | | | 511,711 | |
| | 62,336 | | | Corporate Capital Trust, Inc. | | | 996,129 | |
| | 299,226 | | | Eaton Vance Limited Duration Income Fund | | | 4,084,435 | |
See Notes to Financial Statements.
| Semi-Annual Report | December 31, 2017 | 3 |
| RiverNorth/DoubleLine Strategic Opportunity Fund, Inc. |
| Schedule of Investments | December 31, 2017 (Unaudited) |
| Shares/Description | | | Value | |
| | 67,202 | | | Eaton Vance Senior Income Trust | | $ | 438,157 | |
| | 85,483 | | | FS Investment Corporation | | | 628,300 | |
| | 475,258 | | | Invesco Senior Income Trust | | | 2,086,383 | |
| | 343,175 | | | Legg Mason BW Global Income Opportunities Fund Inc | | | 4,382,345 | |
| | 85,008 | | | NexPoint Credit Strategies Fund | | | 2,149,852 | |
| | 99,410 | | | Nuveen AMT-Free Quality Municipal Income Fund | | | 1,366,887 | |
| | 517,060 | | | Nuveen Credit Strategies Income Fund | | | 4,250,233 | |
| | 72,166 | | | Nuveen Quality Municipal Income Fund | | | 1,014,654 | |
| | 48,820 | | | Pimco Dynamic Credit and Mortgage Income Fund | | | 1,095,521 | |
| | 26,882 | | | Pimco High Income Fund | | | 200,540 | |
| | 160,041 | | | Prudential Global Short Duration High Yield Fund | | | 2,306,191 | |
| | 46,604 | | | Templeton Emerging Markets Income Fund | | | 520,567 | |
| | 300,734 | | | Wells Fargo Income Opportunities Fund | | | 2,526,166 | |
| | 251,493 | | | Western Asset Emerging Markets Debt Fund Inc. | | | 3,910,716 | |
| | 354,969 | | | Western Asset Global High Income Fund Inc. | | | 3,627,783 | |
| | 1,108,985 | | | Western Asset Global High Income Opportunity Fund Inc. | | | 5,622,554 | |
| | | | | | | | | |
| TOTAL CLOSED-END FUNDS | | | | |
| (Cost $53,575,816) | | | | | | 54,733,949 | |
| Principal Amount/Description | | Rate | | | Maturity | | | Value | |
| NON-AGENCY COLLATERALIZED MORTGAGE OBLIGATIONS - 67.89%(a) | |
| | | | Bank of America Alternative Loan Trust | | | | | | | | | |
| | 2,610,524 | | | Series 2004-12 | | | 6.00 | % | | | 1/25/2035 | | | | 2,579,369 | |
| | | | | Banc of America Funding Corporation | | | | | | | | | | | | |
| | 2,773,656 | | | Series 2006-D(d) | | | 3.34 | % | | | 5/20/2036 | | | | 2,468,058 | |
| | | | | Banc of America Mortgage Securities Inc. | | | | | | | | | | | | |
| | 3,159,013 | | | Series 2007-3 | | | 6.00 | % | | | 9/25/2037 | | | | 3,079,260 | |
| | | | | BB-UBS Trust | | | | | | | | | | | | |
| | 500,000 | | | Series 2012 - TFT(b)(d) | | | 3.56 | % | | | 6/7/2030 | | | | 453,070 | |
| | | | | BCAP LLC Trust | | | | | | | | | | | | |
| | 2,825,236 | | | Series 2011-RR4(b)(d) | | | 6.00 | % | | | 8/26/2037 | | | | 2,772,230 | |
| | 2,655,671 | | | Series 2011-RR4(b)(d) | | | 6.00 | % | | | 8/26/2037 | | | | 2,602,246 | |
| | | | | Bear Stearns Alt-A Trust | | | | | | | | | | | | |
| | 2,765,743 | | | Series 2005-10(d) | | | 3.55 | % | | | 1/25/2036 | | | | 2,608,317 | |
| | | | | Bear Stearns Adjustable Rate Mortgage Trust | | | | | | | | | | | | |
| | 2,276,272 | | | Series 2006-2(d) | | | 3.65 | % | | | 7/25/2036 | | | | 2,272,388 | |
| | | | | Chase Mortgage Finance Corporation | | | | | | | | | | | | |
| | 4,118,360 | | | Series 2007-S4 (1 Month LIBOR USD + 0.60%) | | | 2.15 | % | | | 6/25/2037 | | | | 2,453,914 | |
See Notes to Financial Statements.
| 4 | (888) 848-7569 | www.rivernorth.com |
| RiverNorth/DoubleLine Strategic Opportunity Fund, Inc. |
| Schedule of Investments | December 31, 2017 (Unaudited) |
| Principal Amount/Description | | Rate | | | Maturity | | | Value | |
| | | | ChaseFlex Trust | | | | | | | | | |
| | 3,481,229 | | | Series 2007-1 | | | 6.50 | % | | | 2/25/2037 | | | $ | 2,657,370 | |
| | | | | CIM Trust | | | | | | | | | | | | |
| | 3,720,000 | | | Series 2017-3RR-B2(b)(d) | | | 16.78 | % | | | 1/29/2057 | | | | 4,147,607 | |
| | | | | Citigroup Mortgage Loan Trust Inc. | | | | | | | | | | | | |
| | 171,000 | | | Series 2015-GC27 D(b)(d) | | | 4.43 | % | | | 2/12/2048 | | | | 146,039 | |
| | 2,878,654 | | | Series 2005-5(d) | | | 3.32 | % | | | 10/25/2035 | | | | 2,262,354 | |
| | 2,357,011 | | | Series 2007-AR5(d) | | | 3.76 | % | | | 4/25/2037 | | | | 2,235,566 | |
| | 399,000 | | | Series 2016-GC36 D(b) | | | 2.85 | % | | | 2/10/2049 | | | | 304,323 | |
| | | | | Commercial Mortgage Trust | | | | | | | | | | | | |
| | 500,000 | | | Series 2012-CR4(b)(d) | | | 4.57 | % | | | 10/17/2045 | | | | 415,205 | |
| | 537,000 | | | Series 2012-CR4(b)(d) | | | 4.57 | % | | | 10/17/2045 | | | | 395,243 | |
| | 500,000 | | | Series 2013-LC13(b)(d) | | | 5.04 | % | | | 8/10/2046 | | | | 492,762 | |
| | | | | Countrywide Alternative Loan Trust | | | | | | | | | | | | |
| | 1,210,971 | | | Series 2005-48T1 | | | 5.50 | % | | | 11/25/2035 | | | | 1,100,236 | |
| | 2,180,204 | | | Series 2005-63(d) | | | 3.44 | % | | | 12/25/2035 | | | | 2,010,890 | |
| | 4,074,341 | | | Series 2005-64CB | | | 5.50 | % | | | 12/25/2035 | | | | 3,606,600 | |
| | 1,649,347 | | | Series 2006-26CB | | | 6.50 | % | | | 9/25/2036 | | | | 1,389,004 | |
| | 4,688,193 | | | Series 2006-32CB | | | 6.00 | % | | | 11/25/2036 | | | | 4,245,497 | |
| | 3,491,755 | | | Series 2007-14T2 | | | 6.00 | % | | | 7/25/2037 | | | | 2,706,829 | |
| | 3,654,802 | | | Series 2007-2CB | | | 5.75 | % | | | 3/25/2037 | | | | 3,171,147 | |
| | 2,920,508 | | | Series 2007-16CB | | | 6.25 | % | | | 8/25/2037 | | | | 2,563,211 | |
| | | | | Countrywide Home Loans | | | | | | | | | | | | |
| | 2,815,145 | | | Series 2005-HYB1 (1 Month LIBOR USD + 0.30%)(c) | | | 1.85 | % | | | 3/25/2035 | | | | 2,647,366 | |
| | 3,484,513 | | | Series 2007-9 | | | 5.75 | % | | | 7/25/2037 | | | | 3,226,735 | |
| | 2,864,328 | | | Series 2007-HYB1(d) | | | 3.11 | % | | | 3/25/2037 | | | | 2,636,442 | |
| | | | | Credit Suisse First Boston Mortgage Securities Corp. | | | | | | | | | | | | |
| | 2,228,853 | | | Series 2005-9 | | | 5.50 | % | | | 10/25/2035 | | | | 2,101,784 | |
| | | | | Credit Suisse Mortgage Trust | | | | | | | | | | | | |
| | 2,887,044 | | | Series 2006-7 | | | 6.75 | % | | | 8/25/2036 | | | | 2,621,726 | |
| | 2,634,884 | | | Series 2007-1 | | | 6.00 | % | | | 2/25/2037 | | | | 2,395,143 | |
| | 569,000 | | | Series 2017-PFHP (b) | | | 7.45 | % | | | 12/16/2030 | | | | 556,112 | |
| | | | | First Horizon Alternative Mortgage Securities Trust | | | | | | | | | | | | |
| | 1,129,452 | | | Series 2005-AA8(d) | | | 3.17 | % | | | 10/25/2035 | | | | 1,049,914 | |
| | | | | FREMF Mortgage Trust | | | | | | | | | | | | |
| | 336,096 | | | Series 2016-KF22 (1 Month LIBOR USD + 5.05%)(b) | | | 6.42 | % | | | 7/25/2023 | | | | 355,828 | |
See Notes to Financial Statements.
| Semi-Annual Report | December 31, 2017 | 5 |
| RiverNorth/DoubleLine Strategic Opportunity Fund, Inc. |
| Schedule of Investments | December 31, 2017 (Unaudited) |
| Principal Amount/Description | | Rate | | | Maturity | | | Value | |
| | | | GMAC Commercial Mortgage Securities Inc. | | | | | | | | | |
| | 500,000 | | | Series 2004-C3(b)(d) | | | 5.14 | % | | | 12/10/2041 | | | $ | 493,893 | |
| | | | | Greenpoint Mortgage Securities Trust | | | | | | | | | | | | |
| | 4,795,224 | | | Series 2007-AR2 (c) | | | 1.79 | % | | | 4/25/2047 | | | | 4,447,941 | |
| | | | | GS Mortgage Securities Trust | | | | | | | | | | | | |
| | 500,000 | | | Series 2013-GC13(b)(d) | | | 4.09 | % | | | 7/12/2046 | | | | 464,084 | |
| | 604,000 | | | Series 2014-GC26(b)(d) | | | 4.51 | % | | | 11/13/2047 | | | | 529,536 | |
| | 500,000 | | | Series 2015-GC28(b)(d) | | | 4.33 | % | | | 2/12/2048 | | | | 402,765 | |
| | | | | Harborview Mortgage Loan Trust | | | | | | | | | | | | |
| | 2,343,966 | | | Series 2004-2 (1 Month LIBOR USD + 0.52%)(c) | | | 2.02 | % | | | 6/19/2034 | | | | 2,311,325 | |
| | | | | IndyMac INDX Mortgage Loan Trust | | | | | | | | | | | | |
| | 2,038,866 | | | Series 2004-AR4(d) | | | 3.58 | % | | | 8/25/2034 | | | | 2,026,503 | |
| | 3,920,985 | | | Series 2007-FLX6 (1 Month LIBOR USD + 0.25%)(c) | | | 1.58 | % | | | 9/25/2037 | | | | 3,778,279 | |
| | | | | JP Morgan Chase Commercial Mortgage Securities Corp. | | | | | | | | | | | | |
| | 499,000 | | | Series 2006-LDP9 | | | 5.34 | % | | | 5/15/2047 | | | | 499,927 | |
| | 152,860 | | | Series 2007-LDPX(d) | | | 5.46 | % | | | 1/15/2049 | | | | 153,466 | |
| | 332,834 | | | Series 2007-C1(d) | | | 5.95 | % | | | 2/15/2051 | | | | 332,279 | |
| | 500,000 | | | Series 2016-WIKI(b)(d) | | | 4.01 | % | | | 10/5/2031 | | | | 493,687 | |
| | 500,000 | | | Series 2016-WPT (1 Month LIBOR USD + 5.00%)(b)(c) | | | 6.48 | % | | | 10/17/2033 | | | | 506,256 | |
| | | | | JPMBB Commercial Mortgage Securities Trust | | | | | | | | | | | | |
| | 9,475,000 | | | Series 2013-C14(b)(d)(f) | | | 0.97 | % | | | 8/17/2046 | | | | 448,523 | |
| | 500,000 | | | Series 2013-C15(b)(d) | | | 5.08 | % | | | 11/17/2045 | | | | 491,456 | |
| | 1,000,000 | | | Series 2013-C17(b)(d) | | | 3.87 | % | | | 1/15/2047 | | | | 731,943 | |
| | 632,000 | | | Series 2015-C27(b)(d) | | | 3.84 | % | | | 2/15/2048 | | | | 511,048 | |
| | 549,000 | | | Series 2015-JP1(b)(d) | | | 4.74 | % | | | 1/15/2049 | | | | 393,153 | |
| | | | | Luminent Mortgage Trust | | | | | | | | | | | | |
| | 3,362,386 | | | Series 06-3-11A1 (1 Month LIBOR USD + 0.20%)(c) | | | 1.75 | % | | | 5/25/2036 | | | | 3,335,134 | |
| | 3,151,246 | | | Series 06-3-12A1 (1 Month LIBOR USD + 0.21%)(c) | | | 1.76 | % | | | 5/25/2036 | | | | 2,810,162 | |
| | | | | Morgan Stanley BAML Trust | | | | | | | | | | | | |
| | 656,000 | | | Series 2015-C20(b) | | | 3.07 | % | | | 2/15/2048 | | | | 511,742 | |
| | | | | New Century Home Equity Loan Trust | | | | | | | | | | | | |
| | 3,312,600 | | | Series 2006-1-A2B (1 Month LIBOR USD + 0.18%)(c) | | | 1.73 | % | | | 5/25/2036 | | | | 3,106,714 | |
See Notes to Financial Statements.
| 6 | (888) 848-7569 | www.rivernorth.com |
| RiverNorth/DoubleLine Strategic Opportunity Fund, Inc. |
| Schedule of Investments | December 31, 2017 (Unaudited) |
| Principal Amount/Description | | Rate | | | Maturity | | | Value | |
| | | | Nomura Asset Acceptance Corporation | | | | | | | | | |
| | 2,692,375 | | | Series 2005-AP3(c) | | | 5.19 | % | | | 8/25/2035 | | | $ | 1,906,258 | |
| | | | | PR Mortgage Loan Trust | | | | | | | | | | | | |
| | 2,919,589 | | | Series 2014-1(b)(d) | | | 5.91 | % | | | 10/25/2049 | | | | 2,903,980 | |
| | | | | Residential Accredit Loans, Inc. | | | | | | | | | | | | |
| | 5,454,135 | | | Series 2006-QO5 (1 Month LIBOR USD + 0.19%)(c) | | | 1.74 | % | | | 5/25/2046 | | | | 4,824,171 | |
| | 2,837,608 | | | Series 2007-QA5(d) | | | 5.67 | % | | | 9/25/2037 | | | | 2,579,428 | |
| | | | | Residential Asset Securitization Trust | | | | | | | | | | | | |
| | 3,125,250 | | | Series 2005-A15 | | | 5.75 | % | | | 2/25/2036 | | | | 2,440,000 | |
| | 3,055,724 | | | Series 2007-A5 | | | 6.00 | % | | | 5/25/2037 | | | | 2,692,452 | |
| | | | | Residential Funding Mortgage Securities I Trust | | | | | | | | | | | | |
| | 1,874,277 | | | Series 2005-SA2(d) | | | 3.71 | % | | | 6/25/2035 | | | | 1,683,902 | |
| | 3,778,252 | | | Series 2006-S8 | | | 6.00 | % | | | 9/25/2036 | | | | 3,585,026 | |
| | | | | RMAT | | | | | | | | | | | | |
| | 1,630,924 | | | Series 2015-PR2(b)(c) | | | 8.85 | % | | | 11/25/2035 | | | | 1,580,733 | |
| | | | | Structured Adjustable Rate Mortgage Loan Trust | | | | | | | | | | | | |
| | 2,422,915 | | | Series 2005-22(d) | | | 3.73 | % | | | 12/25/2035 | | | | 2,332,392 | |
| | 3,451,653 | | | Series 2007-08(d) | | | 3.75 | % | | | 9/25/2037 | | | | 3,409,873 | |
| | | | | Structured Asset Mortgage Investments Inc. | | | | | | | | | | | | |
| | 1,001,136 | | | Series 2005-AR7 (12 Month US Treasury Average + 1.05%) | | | 2.11 | % | | | 3/25/2046 | | | | 958,073 | |
| | | | | UBS-Barclays Commercial Mortgage Trust | | | | | | | | | | | | |
| | 500,000 | | | Series 2013-C5(b)(d) | | | 4.08 | % | | | 3/10/2046 | | | | 375,041 | |
| | | | | Wachovia Bank Commercial Mortgage Trust | | | | | | | | | | | | |
| | 78,179 | | | Series 2006-C26(d) | | | 6.00 | % | | | 6/15/2045 | | | | 78,602 | |
| | 271,202 | | | Series 2007-C30(d) | | | 5.41 | % | | | 12/15/2043 | | | | 276,976 | |
| | | | | Washington Mutual Mortgage Pass-Through Certificates Trust | | | | | | | | | | | | |
| | 2,321,253 | | | Series 2005-8 | | | 5.50 | % | | | 10/25/2035 | | | | 2,222,216 | |
| | 2,280,197 | | | Series 2006-AR6(d) | | | 3.37 | % | | | 8/25/2036 | | | | 2,212,944 | |
| | 2,921,905 | | | Series 2006-AR10(d) | | | 3.30 | % | | | 8/25/2046 | | | | 2,835,730 | |
| | 1,925,163 | | | Series 2006-2 | | | 6.00 | % | | | 3/25/2036 | | | | 1,961,413 | |
| | 2,711,343 | | | Series 2007-HY3(d) | | | 3.20 | % | | | 3/25/2037 | | | | 2,549,811 | |
See Notes to Financial Statements.
| Semi-Annual Report | December 31, 2017 | 7 |
| RiverNorth/DoubleLine Strategic Opportunity Fund, Inc. |
| Schedule of Investments | December 31, 2017 (Unaudited) |
| Principal Amount/Description | | Rate | | | Maturity | | | Value | |
| | | Wells Fargo Mortgage Backed Securities | | | | | | | | | | | | |
| 2,949,262 | | Series 2006-9 | | | 6.00 | % | | | 8/25/2036 | | | $ | 2,939,237 | |
| | | | | | | | | | | | | | | |
| TOTAL NON-AGENCY COLLATERALIZED MORTGAGE OBLIGATIONS | | | | | | | | | | | | |
| (Cost $146,802,359) | | | | | | | | | | | 147,857,859 | |
| Principal Amount/Description | | Rate | | | Maturity | | | Value | |
| U.S. GOVERNMENT/AGENCY MORTGAGE BACKED SECURITIES - 16.44%(a) | |
| | | | | Federal Home Loan Mortgage Corporation | | | | | | | | | | | | |
| | 3,967,542 | | | Series 3770 | | | 4.00 | % | | | 12/15/2040 | | | | 4,221,788 | |
| | 3,482,649 | | | Series 3806(e)(f) | | | 4.97 | % | | | 12/15/2037 | | | | 142,800 | |
| | 8,919,629 | | | Series 3966(e)(f) | | | 4.42 | % | | | 12/15/2041 | | | | 1,201,810 | |
| | 4,396,855 | | | Series 4605 | | | 3.00 | % | | | 8/15/2046 | | | | 4,017,498 | |
| | 4,613,774 | | | Series 4657 | | | 3.00 | % | | | 2/15/2047 | | | | 4,263,919 | |
| | 4,094,272 | | | Series 4686 | | | 4.00 | % | | | 3/15/2047 | | | | 4,335,786 | |
| | | | | Federal National Mortgage Association | | | | | | | | | | | | |
| | 6,889,263 | | | Series 2011-101(e)(f) | | | 4.35 | % | | | 10/25/2041 | | | | 995,644 | |
| | 6,369,551 | | | Series 2011-124(e)(f) | | | 4.95 | % | | | 12/25/2041 | | | | 1,032,549 | |
| | 7,188,798 | | | Series 2012-20(e)(f) | | | 4.90 | % | | | 3/25/2042 | | | | 1,099,108 | |
| | 6,000,000 | | | Series 2013-109(g) | | | 0.00 | % | | | 7/25/2043 | | | | 4,038,071 | |
| | 2,776,413 | | | Series 2014-38 | | | 3.00 | % | | | 9/25/2043 | | | | 2,596,477 | |
| | 3,975,592 | | | Series 2016-75 | | | 3.00 | % | | | 10/25/2046 | | | | 3,587,829 | |
| | | | | Government National Mortgage Association | | | | | | | | | | | | |
| | 4,302,765 | | | Series 2017-17 | | | 3.50 | % | | | 2/20/2047 | | | | 4,286,528 | |
| | | | | | | | | | | | | | | | | |
| TOTAL U.S. GOVERNMENT/AGENCY MORTGAGE BACKED SECURITIES | | | | | | | | | | | | |
| (Cost $36,076,877) | | | | | | | | | | | 35,819,807 | |
See Notes to Financial Statements.
| 8 | (888) 848-7569 | www.rivernorth.com |
| RiverNorth/DoubleLine Strategic Opportunity Fund, Inc. |
| Schedule of Investments | December 31, 2017 (Unaudited) |
| Shares/Description | | Value | |
| SHORT-TERM INVESTMENTS - 7.21%(a) |
| Money Market Fund | | | |
| 15,701,677 | | Fidelity Institutional Government Portfolio(d) (7 Day Yield 1.14%) | | $ | 15,701,677 | |
| | | | | | | |
| TOTAL SHORT-TERM INVESTMENTS | | | | |
| (Cost $15,701,677) | | | 15,701,677 | |
| | | | | | | |
| TOTAL INVESTMENTS - 132.73% | | | | |
| (Cost $286,530,162) | | | 289,093,121 | |
| LIABILITIES IN EXCESS OF OTHER ASSETS (32.73)% | | | (71,294,154 | ) |
| NET ASSETS - 100.00% | | $ | 217,798,967 | |
| (a) | All or a portion of the security has been pledged as collateral in connection with an open credit agreement. At December 31, 2017, the value of securities pledged amounted to $289,093,121, which represents approximately 132.73% of net assets. |
| (b) | Security exempt from registration under Rule 144A of the Securities Act of 1933. These securities have been deemed liquid under procedures approved by the Fund’s Board of Directors and may normally be sold to qualified institutional buyers in transactions exempt from registration. Total fair value of Rule 144A securities amounts to $39,428,117 which represents approximately 18.10% of net assets as of December 31, 2017. |
| (c) | Step-up bond; the interest rate shown is the rate in effect as of December 31, 2017. |
| (d) | Variable rate security. Coupon is based on weighted average coupon of underlying collateral. Rate disclosed as of December 31, 2017. |
| (e) | Includes inverse floating rate securities whose interest rate moves in the opposite direction of reference interest rates. Reference interest rates are typically based on a negative multiplier or slope. Interest rate may also be subject to a cap or floor. |
| (f) | Interest only security. |
| (g) | Denotes zero-coupon bonds. |
See Notes to Financial Statements.
| Semi-Annual Report | December 31, 2017 | 9 |
| RiverNorth/DoubleLine Strategic Opportunity Fund, Inc. |
| Statement of Assets and Liabilities | December 31, 2017 (Unaudited) |
| ASSETS: | | | |
| Investment in securities: | | | |
| At cost | | $ | 286,530,162 | |
| At value | | $ | 289,093,121 | |
| Receivable for fund investments sold | | | 1,091,416 | |
| Interest receivable | | | 762,872 | |
| Dividends receivable | | | 154,387 | |
| Prepaid expenses and other assets | | | 25,632 | |
| Total Assets | | | 291,127,428 | |
| | | | | |
| LIABILITIES: | | | | |
| Payable for fund investments purchased | | | 873,101 | |
| Facility loan payable | | | 71,500,000 | |
| Interest payable on facility loan | | | 178,805 | |
| Payable for distributions | | | 63,061 | |
| Payable to Adviser | | | 245,648 | |
| Payable for fund accounting, administration and transfer agent fees | | | 96,223 | |
| Payable for audit fees | | | 9,003 | |
| Payable for custodian fees | | | 4,213 | |
| Other accrued expenses | | | 358,407 | |
| Total Liabilities | | | 73,328,461 | |
| Net Assets | | $ | 217,798,967 | |
| | | | | |
| NET ASSETS CONSIST OF: | | | | |
| Paid-in capital undistributed | | | 215,450,019 | |
| Distributions in excess of net investment income | | | (961,695 | ) |
| Accumulated net realized gain on investments | | | 747,684 | |
| Net unrealized appreciation on investments | | | 2,562,959 | |
| Net Assets | | $ | 217,798,967 | |
| | | | | |
| PRICING OF SHARES: | | | | |
| Shares of common stock outstanding (50,000,000 shares authorized, $0.0001 par value) | | | 11,013,787 | |
| Net Asset Value Per Share | | $ | 19.78 | |
See Notes to Financial Statements.
| 10 | (888) 848-7569 | www.rivernorth.com |
| RiverNorth/DoubleLine Strategic Opportunity Fund, Inc. |
| Statement of Operations | For the Period from July 1, 2017 through
December 31, 2017 (Unaudited) |
| INVESTMENT INCOME: | | | |
| Interest income | | $ | 6,838,333 | |
| Dividend income | | | 2,741,798 | |
| Total Investment Income | | | 9,580,131 | |
| | | | | |
| EXPENSES: | | | | |
| Investment Adviser fee | | | 1,469,793 | |
| Interest expense on facility loan | | | 856,113 | |
| Fund accounting, administration and transfer agent fees | | | 297,509 | |
| Legal expenses | | | 55,030 | |
| Director expenses | | | 49,512 | |
| Facility loan fees | | | 42,277 | |
| Registration expenses | | | 18,211 | |
| Audit expenses | | | 18,102 | |
| Printing expenses | | | 13,714 | |
| Custodian expenses | | | 11,357 | |
| Insurance fees | | | 3,268 | |
| Other expenses | | | 19,304 | |
| Total Expenses | | | 2,854,190 | |
| Net Investment Income | | | 6,725,941 | |
| | | | | |
| REALIZED AND UNREALIZED GAIN/(LOSS): | | | | |
| Net realized gain on: | | | | |
| Investments | | | 783,024 | |
| Net change in unrealized depreciation on: | | | | |
| Investments | | | (1,557,141 | ) |
| Net Realized and Unrealized Loss on Investments | | $ | (774,117 | ) |
| Net Increase in Net Assets Resulting from Operations | | $ | 5,951,824 | |
See Notes to Financial Statements.
| Semi-Annual Report | December 31, 2017 | 11 |
| RiverNorth/DoubleLine Strategic Opportunity Fund, Inc. |
| Statements of Changes in Net Assets | |
| | | Period from
July 1, 2017
through
December 31, 2017
(Unaudited) | | | Period from
September 28, 2016(1)
through
June 30, 2017 | |
| NET INCREASE/(DECREASE) IN NET ASSETS FROM OPERATIONS: |
| Net investment income | | $ | 6,725,941 | | | $ | 8,675,404 | |
| Net realized gain on investments and long-term capital gains from other investment companies | | | 783,024 | | | | 2,655,454 | |
| Net change in unrealized appreciation (depreciation) on investments | | | (1,557,141 | ) | | | 4,120,100 | |
| Net increase in net assets resulting from operations | | | 5,951,824 | | | | 15,450,958 | |
| | | | | | | | | |
| DISTRIBUTIONS TO SHAREHOLDERS: | | | | | | | | |
| From net investment income | | | (7,971,779 | ) | | | (10,132,666 | ) |
| From net realized gains on investments | | | (949,389 | ) | | | — | |
| Net decrease in net assets from distributions to shareholders | | | (8,921,168 | ) | | | (10,132,666 | ) |
| | | | | | | | | |
| CAPITAL SHARE TRANSACTIONS: | | | | | | | | |
| Proceeds from issuance of common shares, net of offering costs | | | — | | | | 215,346,768 | |
| Reinvestment of distributions | | | — | | | | 3,251 | |
| Net increase in net assets from capital share transactions | | | — | | | | 215,350,019 | |
| Net Increase (Decrease) in Net Assets | | | (2,969,344 | ) | | | 220,668,311 | |
| | | | | | | | | |
| NET ASSETS: | | | | | | | | |
| Beginning of period | | | 220,768,311 | | | | 100,000 | |
| End of period (including distributions in excess of net investment income of $(961,695) and accumulated undistributed net investment income of $284,143) | | $ | 217,798,967 | | | $ | 220,768,311 | |
| | | | | | | | | |
| SHARE TRANSACTIONS: | | | | | | | | |
| Shares sold | | | — | | | | 11,008,519 | |
| Shares issued in reinvestment of distributions | | | — | | | | 166 | |
| Beginning of period | | | — | | | | 5,102 | |
| End of period | | | — | | | | 11,013,787 | |
| (1) | Commencement of operations. |
See Notes to Financial Statements.
| 12 | (888) 848-7569 | www.rivernorth.com |
| RiverNorth/DoubleLine Strategic Opportunity Fund, Inc. |
| Statement of Cash Flows | For the Period from July 1, 2017 through
December 31, 2017 (Unaudited) |
| CASH FLOWS USED IN OPERATING ACTIVITIES: |
| Net increase in net assets resulting from operations | | $ | 5,951,824 | |
| Adjustments to reconcile the change in net assets from operations to net cash used in operating activities: | | | | |
| Purchases of long term investments | | | (36,519,711 | ) |
| Proceeds from sale of long term investments | | | 35,623,862 | |
| Net sales of short-term investments | | | 4,929,103 | |
| Net accretion of premiums/discounts | | | (1,888,251 | ) |
| Net realized gain on investments and long-term capital gains from other investment companies | | | (783,024 | ) |
| Net change in unrealized appreciation on investments | | | 1,557,141 | |
| Net realized paydown gain | | | (1,339,993 | ) |
| Interest-only bond amortization | | | 806,020 | |
| (Increase) and decrease in: | | | | |
| Interest and dividends receivable | | | 103,298 | |
| Prepaid expenses and other assets | | | 27,683 | |
| Receivable for fund investments sold | | | (778,533 | ) |
| Increase and (decrease) in: | | | | |
| Payable for fund investments purchased | | | 873,101 | |
| Payable to Adviser | | | 3,897 | |
| Interest payable on facility loan | | | 6,016 | |
| Other accrued expenses | | | 341,783 | |
| Fund accounting, administration and transfer agent fees payable | | | (2,213 | ) |
| Custodian fees payable | | | 407 | |
| Audit fees payable | | | (12,898 | ) |
| Net cash used in operating activities | | | 8,899,512 | |
| | | | | |
| CASH FLOWS PROVIDED BY FINANCING ACTIVITIES: | | | | |
| Cash dividends paid to common stockholders | | | (8,899,512 | ) |
| Net cash provided by financing activities | | | (8,899,512 | ) |
| | | | | |
| NET CHANGE IN CASH: | | | — | |
| Cash at beginning of period | | | — | |
| Cash at end of period | | $ | — | |
| | | | | |
| SUPPLEMENTAL DISCLOSURE OF CASH FLOW AND NON-CASH INFORMATION: |
| Non-cash financing activities - distributions reinvested | | $ | — | |
| Payable for distributions | | | 63,061 | |
| Cash paid for interest on facility loan | | | 792,806 | |
See Notes to Financial Statements.
| Semi-Annual Report | December 31, 2017 | 13 |
| RiverNorth/DoubleLine Strategic Opportunity Fund, Inc. |
| Financial Highlights | |
| | | Period from
July 1, 2017
through
December 31, 2017
(Unaudited) | | | Period from
September 28, 2016(a)
through
June 30, 2017 | |
| Net asset value - beginning of period | | $ | 20.04 | | | $ | 19.60 | |
| Income from investment operations: | | | | | | | | |
| Net investment income | | | 0.64 | | | | 0.94 | |
| Net realized and unrealized gain on investments | | | (0.09 | ) | | | 0.46 | |
| Total income from investment operations | | | 0.55 | | | | 1.40 | |
| | | | | | | | | |
| Less distributions: | | | | | | | | |
| From net investment income | | | (0.72 | ) | | | (0.92 | ) |
| From net realized gain on investments | | | (0.09 | ) | | | — | |
| Total distributions | | | (0.81 | ) | | | (0.92 | ) |
| Offering costs on issuance of common stock | | | — | | | | (0.04 | ) |
| Net increase in net asset value | | | (0.26 | ) | | | 0.44 | |
| Net asset value - end of period | | $ | 19.78 | | | | 20.04 | |
| Per common share market value - end of period | | $ | 18.38 | | | | 19.54 | |
| | | | | | | | | |
| Total return based on net asset value(b) | | | 2.64 | % | | | 7.10 | % |
| | | | | | | | | |
| Total return based on market value(b) | | | (1.83 | )% | | | 2.50 | % |
| | | | | | | | | |
| Ratios/Supplemental Data: | | | | | | | | |
| Net assets, end of period (in thousands) | | $ | 217,799 | | | $ | 220,768 | |
| Ratio of expenses to average net assets(c)(d) | | | 2.57 | % | | | 2.14 | % |
| Ratio of net investment income to average net assets(c) | | | 6.06 | % | | | 5.28 | % |
| Portfolio turnover rate(e) | | | 13 | % | | | 35 | % |
| Facility loan payable (in thousands) | | $ | 71,500 | | | $ | 71,500 | |
| Asset coverage per $1,000 of facility loan payable(f) | | $ | 4,049 | | | $ | 4,090 | |
| (a) | Commencement of operations. |
| (b) | Not annualized. Total return in the above table represents the rate that the investor would have earned or lost on an investment in the Fund, assuming reinvestment of dividends. The net asset value and market price returns will differ depending upon the level of any discount from or premium to net asset value at which the Fund’s shares traded during the period. Total return based on market value does not reflect sales load. |
| (d) | Includes interest expenses of 0.77%(c) for the period from July 1, 2017 through December 31, 2017 and 0.46%(c) for the period from September 28, 2016 (commencement of operations) June 30, 2017, respectively. |
| (f) | Calculated by subtracting the Fund’s total liabilities (excluding the facility loan and accumulated unpaid interest on facility loan) from the Fund’s total assets and dividing by the outstanding facility loan balance. |
See Notes to Financial Statements.
| 14 | (888) 848-7569 | www.rivernorth.com |
| RiverNorth/DoubleLine Strategic Opportunity Fund, Inc. |
| Notes To Financial Statements | December 31, 2017 (Unaudited) |
1. ORGANIZATION
RiverNorth/DoubleLine Strategic Opportunity Fund, Inc. (the “Fund”) is a closed end management investment company that was organized as a Maryland corporation on June 22, 2016, and commenced investment operations on September 28, 2016. The investment adviser to the Fund is RiverNorth Capital Management, LLC (the “Adviser”). The Fund’s sub-adviser is DoubleLine Capital, LP (“Sub-Adviser”). The Fund is a diversified investment company with an investment objective to seek current income and overall total return.
The Fund seeks to achieve its investment objective by allocating its Managed Assets among two principal strategies; under normal market conditions, the Fund may allocate between 10% and 35% of its Managed Assets to the Tactical Closed-End Fund Income Strategy and 65% to 90% of its Managed Assets to the Opportunistic Income Strategy. The Adviser will determine the portion of the Fund’s Managed Assets to allocate to each strategy and may, from time to time, adjust the allocations.
For more information regarding the Fund’s investment strategies and risk see the Fund’s prospectus and statement of additional information.
2. SIGNIFICANT ACCOUNTING POLICIES
The following is a summary of significant accounting policies followed by the Fund. These policies are in conformity with accounting principles generally accepted in the United States of America (“GAAP”). The preparation of financial statements in accordance with GAAP requires management to make estimates and assumptions that affect the reported amounts and disclosures in the financial statements during the reporting period. Management believes the estimates and security valuations are appropriate; however, actual results may differ from those estimates, and the security valuations reflected in the financial statements may differ from the value the Fund ultimately realizes upon sale of the securities. The Fund is considered an investment company for financial reporting purposes under GAAP and follows the accounting and reporting guidance applicable to investment companies as codified in Accounting Standards Codification (“ASC”) 946 – Investment Companies.
Security Valuation: The Fund’s assets and other financial instruments are generally valued at their market value using market quotations. If a market quotation is unavailable, a security may be valued at its estimated fair value as described in Note 3.
Security Transactions and Related Income: The Fund follows industry practice and records security transactions on the trade date basis. The specific identification costs basis method is used for determining gains or losses for financial statements and income tax purposes. Dividend income is recorded on the ex-dividend date or for certain foreign securities, when the information becomes available to the Fund and interest income and expenses are recorded on an accrual basis. Discounts and premiums on securities purchased are amortized or accreted using the effective interest method.
Other: The Fund holds certain investments which pay dividends to their shareholders based upon available funds from operations. It is possible for these dividends to exceed the underlying investments’ taxable earnings and profits resulting in the excess portion of such dividends being designated as a return of capital. Distributions received from investments in securities that represent a return of capital or capital gains are recorded as a reduction of the cost of investments or as a realized gain, respectively.
| Semi-Annual Report | December 31, 2017 | 15 |
| RiverNorth/DoubleLine Strategic Opportunity Fund, Inc. |
| Notes To Financial Statements | December 31, 2017 (Unaudited) |
Share Valuation: The net asset value (the “NAV”) is generally calculated as of the close of trading on the New York Stock Exchange (“the Exchange”) (normally 4:00 p.m. Eastern time) every day the Exchange is open. The NAV is calculated by dividing the value of all of the securities and other assets of the Fund, less the liabilities (including accrued expenses and indebtedness), by the total number of common shares outstanding.
Federal Income Taxes: The Fund intends to elect to be treated as, and to qualify each year for special tax treatment afforded to, a regulated investment company (“RIC”) under Subchapter M of the Internal Revenue Code (“IRC”). In order to qualify as a RIC, the Fund must, among other things, satisfy income, asset diversification and distribution requirements. As long as it so qualifies, the Fund will not be subject to U.S. federal income tax to the extent that it distributes annually its investment company taxable income and its “net capital gain”. If the Fund retains any investment company taxable income or net capital gain, it will be subject to U.S. federal income tax on the retained amount at regular corporate tax rates. In addition, if the Fund fails to qualify as a RIC for any taxable year, it will be subject to U.S. federal income tax on all of its income and gains at regular corporate tax rates.
Distributions to Shareholders: Distributions to shareholders, which are determined in accordance with income tax regulations, are recorded on the ex-dividend date. The treatment for financial reporting purposes of distributions made to shareholders during the year from net investment income or net realized capital gains may differ from their ultimate treatment for federal income tax purposes. These differences are caused primarily by differences in the timing of recognition of certain components of income, expense, or realized capital gain for federal income tax purposes. Where such differences are permanent in nature, they are reclassified in the components of the net assets based on their ultimate characterization for federal income tax purposes. Any such reclassification will have no effect on net assets, results of operations, or net asset values per share of the Fund.
The Fund maintains a level distribution policy. The Fund distributes to shareholders regular monthly cash distributions of its net investment income. In addition, the Fund distributes its net realized capital gains, if any, at least annually.
At times, to maintain a stable level of distributions, the Fund may pay out less than all of its net investment income or pay out accumulated undistributed income, or return capital, in addition to current net investment income. Any distribution that is treated as a return of capital generally will reduce a shareholder’s basis in his or her shares, which may increase the capital gain or reduce the capital loss realized upon the sale of such shares. Any amounts received in excess of a shareholder’s basis are generally treated as capital gain, assuming the shares are held as capital assets.
The Board of Directors (“Board”) approved the adoption of a managed distribution plan in accordance with Section 19(b) exemptive order whereby the Fund makes monthly distributions to common shareholders set at a fixed monthly rate of $0.15 per common share
| 16 | (888) 848-7569 | www.rivernorth.com |
| RiverNorth/DoubleLine Strategic Opportunity Fund, Inc. |
| Notes To Financial Statements | December 31, 2017 (Unaudited) |
3. SECURITIES VALUATION AND FAIR VALUE MEASUREMENTS
Fair value is defined as the price that a Fund might reasonably expect to receive upon selling an investment in a timely transaction to an independent buyer in the principal or most advantageous market of the investment. GAAP establishes a three-tier hierarchy to maximize the use of observable market data and minimize the use of unobservable inputs and to establish classification of fair value measurements for disclosure purposes.
Inputs refer broadly to the assumptions that market participants would use in pricing the asset or liability. This includes assumptions about risk, such as the risk inherent in a particular valuation technique used to measure fair value including using such a pricing model and/or the risk inherent in the inputs to the valuation technique. Inputs may be observable or unobservable. Observable inputs are inputs that reflect the assumptions market participants would use in pricing the asset or liability developed based on market data obtained from sources independent of the reporting entity. Unobservable inputs are inputs that reflect the reporting entity’s own assumptions about the assumptions market participants would use in pricing the asset or liability developed based on the best information available in the circumstances.
Various inputs are used in determining the value of the Fund’s investments. These inputs are summarized in the three broad levels listed below.
| | ● | Level 1 – Unadjusted quoted prices in active markets for identical, unrestricted assets or liabilities that the Fund has the ability to access at the measurement date; |
| | ● | Level 2 – Quoted prices which are not active, quoted prices for similar assets or liabilities in active markets or inputs other than quoted prices that are observable (either directly or indirectly) for substantially the full term of the asset or liability; and |
| | ● | Level 3 – Significant unobservable prices or inputs (including the Fund’s own assumptions in determining the fair value of investments) where there is little or no market activity for the asset or liability at the measurement date. |
The inputs used to measure fair value may fall into different levels of the fair value hierarchy. In such cases, for disclosure purposes, the level in the fair value hierarchy within which the fair value measurement falls in its entirety, is determined based on the lowest level input that is significant to the fair value measurement in its entirety.
Equity securities, including closed-end funds and business development company notes, are generally valued by using market quotations, but may be valued on the basis of prices furnished by a pricing service when the Adviser or Sub-Adviser believes such prices more accurately reflect the fair market value of such securities. Securities that are traded on any stock exchange are generally valued by the pricing service at the last quoted sale price. Lacking a last sale price, an exchange traded security is generally valued by the pricing service at its last bid price. Securities traded in the NASDAQ over-the-counter market are generally valued by the pricing service at the NASDAQ Official Closing Price.
Investments in mutual funds, including money market mutual funds, are generally priced at the ending net asset value (NAV) provided by the service agent of the funds. These securities will be categorized as Level 1 securities.
| Semi-Annual Report | December 31, 2017 | 17 |
| RiverNorth/DoubleLine Strategic Opportunity Fund, Inc. |
| Notes To Financial Statements | December 31, 2017 (Unaudited) |
Fair values for long-term debt securities, including asset-backed obligations, non-agency collateralized mortgage obligations, and U.S. government/agency mortgage-backed securities are normally determined on the basis of the mean valuations provided by independent pricing services. Vendors typically value such securities based on one or more inputs, including but not limited to benchmark yields, transactions, bids, offers, quotations from dealers and trading systems, new issues, spreads and other relationships observed in the markets among comparable securities, and pricing models such as yield measurers calculated using factors such as cash flows, financial or collateral performance and other reference data. In addition to these inputs, mortgage-backed and asset-backed obligations may utilize cash flows, prepayment information, default rates, delinquency and loss assumptions, collateral characteristics, credit enhancements, and specific deal information. Securities that use similar valuation techniques and inputs are categorized as Level 2 of the fair value hierarchy. To the extent the significant inputs are unobservable, the values generally would be categorized as Level 3.
Short-term investments in fixed income securities, with maturities of less than 60 days when acquired, or which subsequently are within 60 days of maturity, are valued by using the amortized cost method of valuation, which the Board has determined will represent fair value. These securities will be classified as Level 2 securities.
In accordance with the Fund’s good faith pricing guidelines, the Adviser, Sub-Adviser, or Valuation Committee is required to consider all appropriate factors relevant to the value of securities for which it has determined other pricing sources are not available or reliable as described above. No single standard exists for determining fair value, because fair value depends upon the circumstances of each individual case. As a general principle, the current fair value of an issue of securities being valued by the Adviser, Sub-Adviser, or Valuation Committee would appear to be the amount which the owner might reasonably expect to receive for them upon their current sale. Methods which are in accordance with this principle may, for example, be based on (i) a multiple of earnings; (ii) a discount from market of a similar freely traded security (including a derivative security or a basket of securities traded on other markets, exchanges or among dealers); or (iii) yield to maturity with respect to debt issues, or a combination of these and other methods. Good faith pricing is permitted if, in the Adviser’s, Sub-Adviser’s, or the Valuation Committee’s opinion, the validity of market quotations appears to be questionable based on factors such as evidence of a thin market in the security based on a small number of quotations, a significant event occurs after the close of a market but before the Fund’s NAV calculation that may affect a security’s value, or the Adviser, Sub-Adviser or Valuation Committee is aware of any other data that calls into question the reliability of market quotations.
Good faith pricing may also be used in instances when the bonds the Fund invests in default or otherwise cease to have market quotations readily available. Investments in foreign securities, junk bonds or other thinly traded securities are more likely to trigger good faith pricing than other securities.
| 18 | (888) 848-7569 | www.rivernorth.com |
| RiverNorth/DoubleLine Strategic Opportunity Fund, Inc. |
| Notes To Financial Statements | December 31, 2017 (Unaudited) |
The following is a summary of the inputs used at December 31, 2017 involving the Fund’s assets and liabilities:
| | | Valuation Inputs | | | | |
| Investments in Securities at Value* | | Level 1 | | | Level 2 | | | Level 3 | | | Total | |
| Asset Backed Obligations | | $ | — | | | $ | 15,949,612 | | | $ | — | | | $ | 15,949,612 | |
| Business Development Company Notes | | | 13,096,038 | | | | 5,934,179 | | | | — | | | | 19,030,217 | |
| Closed-End Funds | | | 54,733,949 | | | | — | | | | — | | | | 54,733,949 | |
| Non-Agency Collateralized Mortgage Obligations | | | — | | | | 147,857,859 | | | | — | | | | 147,857,859 | |
| U.S. Government/Agency Mortgage Backed Securities | | | — | | | | 35,819,807 | | | | — | | | | 35,819,807 | |
| Short-Term Investments | | | 15,701,677 | | | | — | | | | — | | | | 15,701,677 | |
| Total | | $ | 83,531,664 | | | $ | 205,561,457 | | | $ | — | | | $ | 289,093,121 | |
| * | Refer to the Fund’s Schedule of Investments for a listing of securities by type. |
It is the Fund’s policy to recognize transfers into and out of all levels at the end of the reporting period.
The Fund did not hold any Level 3 securities at the end of the reporting period.
At the period ended December 31, 2017, investments with a total aggregate value of $4,910,660 were transferred from Level 1 to Level 2. At the period ended December 31, 2017, investments with a total aggregate value of $21,201 were transferred from Level 2 to Level 1.
4. INVESTMENT ADVISORY FEE AND OTHER TRANSACTIONS WITH AFFILIATES
The Adviser serves as the investment adviser to the Fund. Under the terms of the management agreement (the “Agreement”), the Adviser, subject to the supervision of the Board, provides or arranges to be provided to the Fund such investment advice as it deems advisable and will furnish or arrange to be furnished a continuous investment program for the Fund consistent with the Fund’s investment objectives and policies. As compensation for its management services, the Fund is obligated to pay the Adviser a fee computed and accrued daily and paid monthly in arrears at an annual rate of 1.00% of the average daily managed assets of the Fund.
DoubleLine Capital, LP is the investment sub-adviser to the Fund. Under the terms of the sub-advisory agreement, the Sub-Adviser, subject to the supervision of the Adviser and the Board, provides or arranges to be provided to the Fund such investment advice as deemed advisable and will furnish or arrange to be furnished a continuous investment program for the portion of assets managed in the Fund consistent with the Fund’s investment objective and policies. As compensation for its sub-advisory services, the Adviser is obligated to pay the Sub-Adviser a fee computed and accrued daily and paid monthly in arrears based on an annual rate of 0.50% of the average daily managed assets of the Fund.
| Semi-Annual Report | December 31, 2017 | 19 |
| RiverNorth/DoubleLine Strategic Opportunity Fund, Inc. |
| Notes To Financial Statements | December 31, 2017 (Unaudited) |
U.S. Bancorp Fund Services, LLC (“USBFS”) provides the Fund with fund administration and fund accounting services. USBFS also serves as transfer, dividend paying and shareholder servicing agent for the Fund (“Transfer Agent”). As compensation for its services to the Fund, USBFS receives an annual fee based on the Fund’s average daily managed assets, subject to certain minimums.
Officers of the Fund and Directors who are “interested persons” of the Fund or the Adviser receive no salary or fees from the Fund. Each Director who is not an “interested person” receive a fee of $16,500 per year plus $1,500 per meeting attended. In addition, the lead Independent Director receives $250 annually, the Chair of the Audit Committee receives $500 annually, and the Chair of the Nominating and Corporate Governance Committee receives $250 annually. The Fund reimburses each Director and Officer for his or her travel and other expenses relating to the attendance at such meetings. Certain officers and/or interested directors of the Fund are also officers of the Adviser (and Chief Compliance Officer).
5. FEDERAL INCOME TAXES
It is the Fund’s policy to meet the requirements of the Internal Revenue Code applicable to regulated investment companies, and to distribute all of their taxable net income to their shareholders. In addition, the Fund intends to pay distributions as required to avoid imposition of excise tax. Therefore, no federal income tax provision is required.
Tax Basis of Distributions to Shareholders: The character of distributions made during the year from net investment income or net realized gains may differ from its ultimate characterization for federal income tax purposes. Also, due to the timing of dividend distributions, the fiscal year in which amounts are distributed may differ from the fiscal year in which the income or realized gain were recorded by the Fund.
The tax character of distributions paid by the Fund during the fiscal year ended June 30, 2017, was as follows:
Ordinary
Income | Net Long Term
Capital Gains | Return of
Capital | Total |
| $10,132,666 | $— | $— | $10,132,666 |
Components of Distributable Earnings on a Tax Basis: The tax components of distributable earnings are determined in accordance with income tax regulations which may differ from the composition of net assets reported under GAAP. Accordingly, for the year ended June 30, 2017, certain differences were reclassified. These differences were primarily due to book/tax distribution differences and to the different tax treatment of certain other investments; the amounts reclassified did not affect net assets. The reclassifications were as follows:
| Paid-in Capital | Accumulated Net
Investment Income/(Loss) | Accumulated Net
Realized Gain/(Loss) |
| $— | $1,741,405 | $(1,741,405) |
| 20 | (888) 848-7569 | www.rivernorth.com |
| RiverNorth/DoubleLine Strategic Opportunity Fund, Inc. |
| Notes To Financial Statements | December 31, 2017 (Unaudited) |
At June 30, 2017, the components of distributable earnings on a tax basis for the Fund was as follows:
| Undistributed Ordinary Income | Undistributed Long Term Gain | Total |
| $1,202,858 | $13,596 | $1,216,454 |
Unrealized Appreciation and Depreciation on Investments: As of June 30, 2017, net unrealized appreciation (depreciation) of investments based on federal tax costs was as follows:
Gross Appreciation
(excess of value over tax) | Gross Depreciation
(excess of tax cost
over value) | Net Unrealized
Appreciation/
(Depreciation) | Cost of Investments for
Income Tax Purposes |
| $6,136,669 | $2,034,831 | $4,101,838 | $287,376,430 |
The difference between book and tax basis unrealized appreciation/(depreciation) for the Fund is attributable to wash sales.
The Fund recognizes the tax benefits of uncertain tax positions only where the position is “more likely than not” to be sustained assuming examination by tax authorities. Management has analyzed the Fund’s tax positions, and has concluded that no liability for unrecognized tax benefits should be recorded related to uncertain tax positions taken on U.S. tax returns and state tax returns filed since inception of the Fund. No income tax returns are currently under examination. All tax years since commencement of operations remain subject to examination by the tax authorities in the United States. The Fund is not aware of any tax positions for which it is reasonably possible that the total amounts of unrecognized tax benefits will change materially in the next 12 months.
6. INVESTMENT TRANSACTIONS
Investment transactions for the period ended December 31, 2017, excluding short-term investments, were as follows:
| Purchases of Securities | Proceeds from Sales of Securities |
| $36,519,711 | $35,623,862 |
7. REVOLVING LINE OF CREDIT
On December 16, 2016, the Fund entered into a $75,000,000 secured, revolving, evergreen credit facility with U.S. Bank National Association (“U.S. Bank”). The Fund incurred a $75,000 administrative fee upon entering into the credit facility. The credit facility has a variable annual interest rate equal to one-month LIBOR plus 0.95 percent. The credit facility will accrue a commitment fee equal to an annual rate of 0.10 percent on $75,000,000.
The average principal balance and interest rate for the period during which the credit facility was utilized for the period from July 1, 2017 through December 31, 2017 was approximately $71,500,000 and 2.06 percent, respectively. At December 31, 2017, the principal balance outstanding was $71,500,000 at an interest rate of 2.51 percent. The maximum amount outstanding for the period from July 1, 2017 through December 31, 2017 was $71,500,000. Securities that have been pledged as collateral for the borrowings are indicated in the Schedule of Investments.
| Semi-Annual Report | December 31, 2017 | 21 |
| RiverNorth/DoubleLine Strategic Opportunity Fund, Inc. |
| Notes To Financial Statements | December 31, 2017 (Unaudited) |
8. INDEMNIFICATIONS
Under the Fund’s organizational documents, its officers and Directors are indemnified against certain liability arising out of the performance of their duties to the Fund. Additionally, in the normal course of business, the Fund enters into contracts with service providers that may contain general indemnification clauses. The Fund’s maximum exposure under these arrangements is unknown, as this would involve future claims that may be made against the Fund that have not yet occurred.
9. CAPITAL SHARE TRANSACTIONS
The Fund’s authorized capital stock consists of 50,000,000 shares of common stock, $0.0001 par value per share, all of which is initially classified as common shares. Under the rules of the NYSE applicable to listed companies, the Fund is required to hold an annual meeting of stockholders in each year.
On September 28, 2016, the Fund completed the initial public offering of 10,500,000 shares of common stock. These common shares were issued at $20.00 per share before the underwriting discount $0.40 per share. Proceeds paid to the Fund amounted to $205,800,000 after the deduction of underwriting commissions of $4,200,000.
On November 16, 2016, the Fund completed a subsequent offering in connection with the underwriter’s over-allotment option of 508,519 shares of common stock. These common shares were issued at $20.00 per share before the underwriting discount $0.40 per share. Proceeds paid to the Fund amounted to $9,966,972 after the deduction of underwriting commissions of $203,400.
Offering costs of $420,204 (representing approximately $0.04 per share) were offset against the proceeds of the offering and over-allotment option and have been charged to paid-in capital in excess of par.
During the period from September 28, 2016 (commencement of operations) through June 30, 2017, the Fund issued 166 shares of common stock for the reinvestment of dividends and distributions in an amount of $3,251.
10. SUBSEQUENT EVENTS
On January 31, 2017, the Fund paid a distribution in the amount of $0.15 per share, for a total of $1,652,068. Of this total, the dividend reinvestment amounted to $64,612.
On February 28, 2017, the Fund paid a distribution in the amount of $0.15 per share, for a total of $1,652,068. Of this total, the dividend reinvestment amounted to $64,173.
The Fund has performed an evaluation of subsequent events through the date the financial statements were issued and has determined that no additional items require recognition or disclosure.
| 22 | (888) 848-7569 | www.rivernorth.com |
| RiverNorth/DoubleLine Strategic Opportunity Fund, Inc. |
| Additional Information | December 31, 2017 (Unaudited) |
BOARD APPROVAL OF INVESTMENT MANAGEMENT AGREEMENT
At an in-person meeting of the Board, held on November 15, 2017 and called expressly for that purpose, the Board, including a majority of the Trustees who are not “interested persons” (as defined in the 1940 Act (the “Independent Trustees”)), considered the approval of the Management Agreement between the Adviser and the Fund. The Board received materials compiled by the Adviser and the Fund’s administrator including a copy of the Management Agreement, the Adviser’s response to a questionnaire regarding the Adviser’s profitability, management and operations, a copy of the Adviser’s Form ADV, and certifications regarding the Adviser’s compliance programs. In its consideration of the Management Agreement, the Board considered information and materials furnished by the Adviser in advance of and at the meeting and was afforded the opportunity to request additional information and to ask questions of the Adviser to obtain information that it believed to be reasonably necessary to evaluate the terms of the Management Agreement. The Board considered the following factors, among others, in reaching its determination to renew the Management Agreement: (i) the investment performance of the Fund and the investment performance of the Adviser, (ii) the nature, extent and quality of the services provided by the Adviser to the Fund, (iii) the experience and qualifications of the personnel providing such services (iv) the costs of the services provided and the profits to be realized by the Adviser and any of its affiliates from the relationship with the Fund, (v) the extent to which economies of scale will be realized by the Fund as it grows, and (vi) whether the Fund’s fee levels reflected the economies of scale to the benefit of the Fund’s shareholders.
The Board did not consider any single factor as controlling in determining whether or not to approve the Management Agreement.
The Board reviewed the performance of the Fund for the three months, one-year, and since inception periods ended September 30, 2017. These returns were compared to the returns of mutual funds in FUSE Research Network, LLC’s (“FUSE”) Multisector Bond fund universe. The Directors also reviewed the Fund’s performance relative to other funds managed by the Adviser. The Board concluded that the NAV performance of the Fund was slightly below the median to the Multisector Bond fund universe averages for each of the periods.
The Directors considered the management and the other fees paid by the Fund and compared those to the management and other fees paid by funds in the relative peer group determined by FUSE and the Multisector Bond fund universe. The Board noted that the Fund’s annual net expense ratio of 1.28% was lower than the Multisector Bond fund peer group median of 1.53%.
The Board also noted that the gross annual management fee of 1.18% for the Fund was below the 1.32% median paid by the peer group. The Board, including the Independent Directors, determined that the fees were reasonable given the nature of the services provided by the Adviser.
As to the nature, extent and quality of the services to be provided by the Adviser to the Fund, the Board considered that under the terms of the Management Agreement, the Adviser would, subject to the supervision of the Board, provide or arrange to be provided to the Fund such investment advice as the Adviser, in its discretion, deems advisable and will furnish or arrange to be furnished a continuous investment program for the Fund consistent with the Fund’s investment objective and policies. The Board reviewed the Adviser’s Form ADV, which was previously provided to the Board and which provided details regarding the experience of each of the Adviser’s personnel. The Adviser
| Semi-Annual Report | December 31, 2017 | 23 |
| RiverNorth/DoubleLine Strategic Opportunity Fund, Inc. |
| Additional Information | December 31, 2017 (Unaudited) |
also provided additional information regarding its experience managing other investment accounts. Based on the foregoing information, the Board, including the Independent Directors, concluded that the Adviser had provided quality services and would continue to do so for the Fund.
As to the cost of the services to be provided and to the profits to be realized by the Adviser, the Board reviewed the Adviser’s estimates of its profitability and its financial condition. The Board reviewed the Adviser’s financial statements and noted the Adviser’s financial condition is stable as income from its asset management operations have contributed to higher revenues for the Adviser. In response to a question from the Directors, the Adviser noted that the Adviser’s management fees were comparable to those charged to other mutual funds to which the Adviser provides sub-advisory services. The Board, including the Independent Directors, determined that the Management Agreement, with respect to the Fund was not overly profitable to the Adviser and the financial condition of the Adviser was adequate.
Consideration of Investment Sub-Advisory Agreement with DoubleLine Capital, LP
At an in-person meeting of the Board, held on November 15, 2017 and called expressly for that purpose, the Board, including the Independent Trustees, considered the approval of the sub-advisory agreement (the “Sub-Advisory Agreement”) between the Adviser and DoubleLine Capital, LP. In its consideration of the Sub-Advisory Agreement, the Board considered information and materials furnished by the Adviser and the Sub-Adviser in advance of and at the meeting and was afforded the opportunity to request additional information and to ask questions of the Adviser to obtain information that it believed to be reasonably necessary to evaluate the terms of the Sub-Advisory Agreement. The Board received materials compiled by the Sub-Adviser including a copy of the Sub-Advisory Agreement, the Sub-Adviser’s response to a questionnaire regarding its profitability, management and operations, a copy of the Sub-Adviser’s Form ADV, and certifications regarding the Sub-Adviser’s compliance programs. The Board considered the following factors, among others, in reaching its determination to renew the Sub-Advisory Agreement: (i) the investment performance of the Fund and the investment performance of the Sub-Adviser, (ii) the nature, extent and quality of the services provided by Sub-Adviser to the Fund, (iii) the experience and qualifications of the personnel providing such services, (iv) the costs of the services provided and the profits to be realized by the Sub-Adviser and any of its affiliates from the relationship with the Fund, (v) the extent to which economies of scale will be realized by the Fund as it grows, and (vi) whether the fee level of the Fund reflected the economies of scale to the benefit of the Fund’s shareholders.
The Board reviewed the performance of the portion of the Fund managed by DoubleLine relative to relevant securities indices, and to other accounts managed by DoubleLine. The Board, including the Independent Directors, concluded that the performance was in line with the universe averages and outperformed the returns of the relative benchmark index.
As to the comparative fees and expenses, the Board considered the management fee paid by the Fund to the Adviser, and noted that the Adviser pays the Sub-Adviser from its fee, which the Board had previously determined was reasonable. The Board noted that the sub-advisory fee paid by the Adviser to the Sub-Adviser was reasonable as well given the fees the Sub-Adviser charges other clients to manage similar strategies.
As to the nature, extent and quality of the services to be provided by the Sub-Adviser, the Board considered that under the terms of the Sub-Advisory Agreement, the Sub-Adviser would, subject to the supervision of the Board, provide to the Funds such investment advice as the Sub-Adviser, in
| 24 | (888) 848-7569 | www.rivernorth.com |
| RiverNorth/DoubleLine Strategic Opportunity Fund, Inc. |
| Additional Information | December 31, 2017 (Unaudited) |
their discretion, deem advisable and will furnish or arrange to be furnished a continuous investment program for the Fund consistent with the Fund’s investment objective and policies. The Board reviewed the Form ADV of the Sub-Adviser, which provided details regarding the experience of the Sub-Adviser’s investment personnel. The Sub-Adviser also provided additional information regarding their operations and experience managing other investment accounts. Based on the foregoing information, the Board, including the Independent Directors, concluded that the Sub-Adviser had provided quality services and would continue to do so for the Fund.
As to the cost of the services to be provided and to the profits to be realized by the Sub-Adviser, the Board reviewed the Sub-Adviser’s financial condition. The Board noted that financial condition of the Sub-Adviser was stable. The Board, including the Independent Directors determined that the Sub-Advisory Agreement and the compensation to the Sub-Adviser was reasonable and the financial condition of the Sub-Adviser was adequate. The Board noted that the Sub-Adviser had no affiliations with the Fund’s transfer agent, fund accountant, custodian, or distributor and therefore does not derive any benefits from the relationships these parties may have with the Fund.
PROXY VOTING POLICY
The Board of Directors of the Fund has delegated the voting of proxies for Fund securities to the Adviser pursuant to the Adviser’s proxy voting policies and procedures. Under these policies and procedures, the Adviser will vote proxies related to Fund securities in the best interest of the Fund and its shareholders.
A description of the policies and procedures the Fund used to determine how to vote proxies relating to portfolio securities owned by the Fund is available without charge upon request by calling the Fund at (888) 848-7569. Information regarding how the Fund voted the proxies related to the portfolio of securities during the period ended June 30, 2017 is available without charge by accessing this information on the SEC’s web site at www.sec.gov.
PORTFOLIO HOLDINGS DISCLOSURE POLICY
The Fund files a complete schedule of investments with the SEC for the first and third quarter of each fiscal year on Form N-Q. The Fund’s first and third quarters end on March 31 and September 30. The Form N-Q filing must be made within 60 days of the end of the quarter, and the Fund’s most recent Form N-Q was filed with the SEC on November 29, 2017. The Fund’s Form N-Q are available on the SEC’s website at www.sec.gov, or they may be reviewed and copied at the SEC’s Public Reference Room in Washington, DC (call 1-800-732-0330 for information on the operations of the Public Reference Room). You may also obtain copies by calling the Fund at 1-888-848-7569.
CERTIFICATIONS
The Fund’s President submitted to the New York Stock Exchange the initial CEO/CFO certification as required by Section 303A.12(a) of the NYSE listed Fund Manual.
| Semi-Annual Report | December 31, 2017 | 25 |
| RiverNorth/DoubleLine Strategic Opportunity Fund, Inc. |
| Additional Information | December 31, 2017 (Unaudited) |
TAX INFORMATION
The Fund designated 6.83% of its ordinary income distribution for the year ended June 30, 2017 as qualified dividend income and 4.60% of the dividends paid from net ordinary income qualify for the dividends received deduction available to corporate stock holders.
DIVIDEND REINVESTMENT PLAN
The Fund has a dividend reinvestment plan (the “Plan”) commonly referred to as an “opt out” plan. Each Common Shareholder who participates in the Plan will have all distributions of dividends and capital gains automatically reinvested in additional Common Shares. The automatic reinvestment of dividends and distributions in Common Shares will not relieve participants of any federal, state or local income tax that may be payable (or required to be withheld) on such dividends and distributions, even though such participants have not received any cash with which to pay the resulting tax. Common Shareholders who elect not to participate in the Plan will receive all distributions in cash. All correspondence or questions concerning the Plan, including how a Common Shareholder may opt out of the Plan, should be directed to U.S. Bancorp Fund Services, LLC, (855) 862-6092, 615 East Michigan Street, Milwaukee, Wisconsin 53202 (the “Plan Administrator”). Beneficial owners of Common Shares who hold their Common Shares in the name of a broker or nominee should contact the broker or nominee to determine whether and how they may participate in, or opt out of, the Plan.
PRIVACY POLICY
The Fund is committed to ensuring your financial privacy. This notice is being sent to comply with privacy regulations of the Securities and Exchange Commission. The Fund has in effect the following policy with respect to nonpublic personal information about its customers:
| | ● | Only such information received from you, through application forms or otherwise, and information about your Fund transactions will be collected. |
| | ● | None of such information about you (or former customers) will be disclosed to anyone, except as permitted by law (which includes disclosure to employees necessary to service your account). |
| | ● | Policies and procedures (including physical, electronic and procedural safeguards) are in place that are designed to protect the confidentiality of such information. |
| | ● | The Fund does not currently obtain consumer information. If the Fund were to obtain consumer information at any time in the future, it would employ appropriate procedural safeguards that comply with federal standards to protect against unauthorized access to and properly dispose of consumer information. For more information about the Fund’s privacy policies call (855) 830 1222 (toll free). |
| 26 | (888) 848-7569 | www.rivernorth.com |
This page intentionally left blank.
This page intentionally left blank.

RiverNorth Capital Management, LLC
325 N. LaSalle Street, Suite 645
Chicago, IL 60654
rivernorth.com
Item 2. Code of Ethics.
Not applicable for semi-annual reports.
Item 3. Audit Committee Financial Expert.
Not applicable for semi-annual reports.
Item 4. Principal Accountant Fees and Services.
Not applicable for semi-annual reports.
Item 5. Audit Committee of Listed Registrants.
Not applicable for semi-annual reports.
Item 6. Investments.
| (a) | Schedule of Investments is included as part of the report to shareholders filed under Item 1 of this Form. |
Item 7. Disclosure of Proxy Voting Policies and Procedures for Closed-End Management Investment Companies.
Not applicable for semi-annual reports.
Item 8. Portfolio Managers of Closed-End Management Investment Companies.
Not applicable for semi-annual reports.
Item 9. Purchases of Equity Securities by Closed-End Management Investment Company and Affiliated Purchasers.
| Period | (a)
Total Number of Shares
(or Units) Purchased | (b)
Average Price Paid
per Share (or Unit) | (c)
Total Number of Shares
(or Units) Purchased as Part
of Publicly Announced
Plans or Programs | (d)
Maximum Number (or Approximate Dollar Value)
of Shares (or Units) that
May Yet Be Purchased
Under the Plans or Programs |
Month #1 7/1/17 – 7/31/17 | 0 | 0 | 0 | 0 |
Month #2 8/1/17 – 8/31/17 | 0 | 0 | 0 | 0 |
Month #3 9/1/17 – 9/30/17 | 0 | 0 | 0 | 0 |
Month #4 10/1/17 – 10/31/17 | 0 | 0 | 0 | 0 |
Month #5 11/1/17 – 11/30/17 | 0 | 0 | 0 | 0 |
Month #6 12/1/17 – 12/31/17 | 0 | 0 | 0 | 0 |
| Total | 0 | 0 | 0 | 0 |
| * | Footnote the date each plan or program was announced, the dollar amount (or share or unit amount) approved, the expiration date (if any) of each plan or program, each plan or program that expired during the covered period, each plan or program registrant plans to terminate or let expire. |
Item 10. Submission of Matters to a Vote of Security Holders.
None.
Item 11. Controls and Procedures.
| (a) | The Registrant’s President and Chief Financial Officer have reviewed the Registrant's disclosure controls and procedures (as defined in Rule 30a-3(c) under the Investment Company Act of 1940 (the “Act”)) as of a date within 90 days of the filing of this report, as required by Rule 30a-3(b) under the Act and Rules 13a-15(b) or 15d-15(b) under the Securities Exchange Act of 1934. Based on their review, such officers have concluded that the disclosure controls and procedures are effective in ensuring that information required to be disclosed in this report is appropriately recorded, processed, summarized and reported and made known to them by others within the Registrant and by the Registrant’s service provider. |
| (b) | There were no changes in the Registrant's internal control over financial reporting (as defined in Rule 30a-3(d) under the Act) that occurred during the second fiscal quarter of the period covered by this report that have materially affected, or are reasonably likely to materially affect, the Registrant's internal control over financial reporting. |
Item 12. Disclosure of Securities Lending Activities for Closed-End Management Investment Companies
The registrant did not engage in securities lending activities during the fiscal year reported on this Form N-CSR.
Item 13. Exhibits.
| (a) | (1) Any code of ethics or amendment thereto, that is the subject of the disclosure required by Item 2, to the extent that the Registrant intends to satisfy Item 2 requirements through filing of an exhibit. Filed herewith. |
(2) Certifications pursuant to Section 302 of the Sarbanes-Oxley Act of 2002. Filed herewith.
(3) Any written solicitation to purchase securities under Rule 23c-1 under the Act sent or given during the period covered by the report by or on behalf of the Registrant to 10 or more persons. None.
| (b) | Certification pursuant to Section 906 of the Sarbanes-Oxley Act of 2002. Furnished herewith. |
SIGNATURES
Pursuant to the requirements of the Securities Exchange Act of 1934 and the Investment Company Act of 1940, the registrant has duly caused this report to be signed on its behalf by the undersigned, thereunto duly authorized.
| | (Registrant) | RiverNorth/DoubleLine Strategic Opportunity Fund, Inc. | |
| | | | |
| | By (Signature and Title) | /s/ Patrick W. Galley | |
| | | Patrick W. Galley, President | |
| | | | |
| | Date | March 12, 2018 | |
Pursuant to the requirements of the Securities Exchange Act of 1934 and the Investment Company Act of 1940, this report has been signed below by the following persons on behalf of the registrant and in the capacities and on the dates indicated.
| | By (Signature and Title) | /s/ Patrick W. Galley | |
| | | Patrick W. Galley, President | |
| | | | |
| | Date | March 12, 2018 | |
| | | | |
| | By (Signature and Title) | /s/ Jonathan M. Mohrhardt | |
| | | Jonathan M. Mohrhardt, Chief Financial Officer | |
| | | | |
| | Date | March 12, 2018 | |