UNITED STATES
SECURITIES AND EXCHANGE COMMISSION
Washington, D.C. 20549
FORM N-CSR
CERTIFIED SHAREHOLDER REPORT OF REGISTERED
MANAGEMENT INVESTMENT COMPANIES
811-23166
(Investment Company Act File Number)
RiverNorth/DoubleLine Strategic Opportunity Fund, Inc.
(Exact Name of Registrant as Specified in Charter)
325 North LaSalle Street, Suite 645
Chicago, Illinois 60654
(Address of Principal Executive Offices)
Marcus L. Collins, Esq.
RiverNorth Capital Management, LLC
325 North LaSalle Street, Suite 645
Chicago, Illinois 60654
(Name and Address of Agent for Service)
(312) 832-1440
(Registrant’s Telephone Number)
Date of Fiscal Year End:June 30
Date of Reporting Period:December 31, 2019
| Item 1. | Reports to Stockholders. |
Beginning on January 1, 2021, as permitted by regulations adopted by the U.S. Securities and Exchange Commission, paper copies of the Fund’s annual and semi-annual shareholder reports will no longer be sent by mail, unless you specifically request paper copies of the reports. Instead, the reports will be made available on the Fund’s website at www.RiverNorth.com and you will be notified by mail each time a report is posted and provided with a website link to access the report.
You may, notwithstanding the availability of shareholder reports online, elect to receive all future shareholder reports in paper free of charge. If you invest through a financial intermediary, you can contact your financial intermediary to request that you continue to receive paper copies of your shareholder reports. If you invest directly with a Fund, you can call 1-888-848-7569 to let the Fund know you wish to continue receiving paper copies of your shareholder reports.
If you already elected to receive shareholder reports electronically, you will not be affected by this change and you need not take any action. You may elect to receive shareholder reports and other communications from the Fund electronically anytime by contacting your financial intermediary (such as a broker-dealer or bank) or, if you are a direct investor, by enrolling at www.RiverNorth.com.
RiverNorth/DoubleLine Strategic Opportunity Fund, Inc.
Table of Contents
| Performance Overview | 2 |
| Schedule of Investments | 5 |
| Statement of Assets and Liabilities | 21 |
| Statement of Operations | 22 |
| Statements of Changes in Net Assets | 23 |
| Statement of Cash Flows | 24 |
| Financial Highlights | 26 |
| Notes to Financial Statements | 29 |
| Dividend Reinvestment Plan | 38 |
| Additional Information | 40 |
| Consideration and Approval of Advisory and Sub-Advisory Agreements | 41 |
RiverNorth/DoubleLine Strategic Opportunity Fund, Inc.
| Performance Overview | December 31, 2019 (Unaudited) |
WHAT IS THE FUND’S INVESTMENT STRATEGY?
RiverNorth/DoubleLine Strategic Opportunity Fund, Inc. (the "Fund") seeks to achieve its investment objective by allocating its Managed Assets among the two principal investment strategies described below:
Tactical Closed-End Fund Income Strategy (10% - 35% of Managed Assets): This strategy seeks to (i) generate returns through investments in closed-end funds, exchange-traded funds and business development companies (collectively, the “Underlying Funds”) that invest primarily in income-producing securities, and (ii) derive value from the discount and premium spreads associated with closed-end funds.
Opportunistic Income Strategy (65% - 90% of Managed Assets): This strategy seeks to generate attractive risk-adjusted returns through investments in fixed income instruments and other investments, including agency and non-agency residential mortgage-backed and other asset-backed securities, corporate bonds, municipal bonds, and real estate investment trusts. At least 50% of the Managed Assets allocated to this strategy is invested in mortgage-backed securities.
HOW DID THE FUND PERFORM RELATIVE TO ITS BENCHMARK DURING THE REPORTING PERIOD?
PERFORMANCEas of December 31, 2019
| TOTAL RETURN(1) | 6 Months | 1 Year | 3 Years(3) | Since
Inception(2)(3) |
| RiverNorth/DoubleLine StrategicOpportunity Fund, Inc. – NAV(4) | 1.68% | 10.64% | 5.67% | 5.71% |
| RiverNorth/DoubleLine StrategicOpportunity Fund, Inc. – Market(5) | 2.52% | 14.45% | 6.20% | 3.45% |
| Bloomberg Barclays U.S. AggregateBond Index(6) | 2.45% | 8.72% | 4.03% | 2.68% |
| (1) | Total returns assume reinvestment of all distributions |
| (2) | The Fund commenced operations on September 28, 2016. |
| (4) | Performance returns are net of management fees and other Fund expenses. |
| (5) | Market price is the value at which the Fund trades on an exchange. This market price can be more or less than its net asset value ("NAV"). |
| (6) | The Bloomberg Barclays U.S. Aggregate Bond Index is an unmanaged index of investment grade fixed-rate debt issues with maturities of at least one year. The index cannot be invested in directly and does not reflect fees and expenses. |
The total annual expense ratio as a percentage of net assets attributable to common shares as of December 31, 2019 is 1.91% (excluding interest on facility loan payable). Including interest on facility loan payable, the expense ratio is 3.04%.
Performance data quoted represents past performance, which is not a guarantee of future results. Current performance may be lower or higher than the performance quoted. The principal value and investment return of an investment will fluctuate so that your shares may be worth more or less than their original cost. You can obtain performance data current to the most recent month end by calling (844) 569-4750. Total return measures net investment income and capital gain or loss from portfolio investments. All performance shown assumes reinvestment of dividends and capital gains distributions.
| 2 | (888) 848-7569 | www.rivernorth.com |
RiverNorth/DoubleLine Strategic Opportunity Fund, Inc.
| Performance Overview | December 31, 2019 (Unaudited) |
GROWTH OF A HYPOTHETICAL $10,000 INVESTMENT
The graph below illustrates the growth of a hypothetical $10,000 investment assuming the purchase of common shares at the closing market price (NYSE: OPP) of $20.00 on September 28, 2016 (commencement of operations) and tracking its progress through December 31, 2019.
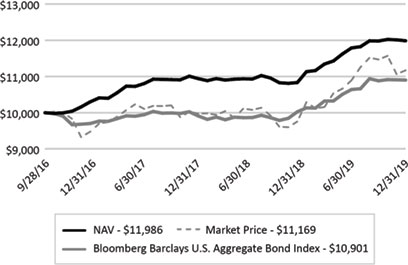
Past performance does not guarantee future results. Performance will fluctuate with changes in market conditions. Current performance may be lower or higher than the performance data shown. Performance information does not reflect the deduction of taxes that shareholders would pay on Fund distributions or the sale of Fund shares. An investment in the Fund involves risk, including loss of principal.
TOP TEN HOLDINGS*as of December 31, 2019
| | % of Net Assets |
| Fannie Mae REMICS | 2.79% |
| Western Asset High Income Opportunity Fund, Inc. | 2.53% |
| Oxford Square Capital Corp. | 2.50% |
| Freddie Mac REMICS | 2.14% |
| Government National Mortgage Association | 2.07% |
| Federal Home Loan Mortgage Corp. REMICS | 2.06% |
| Freddie Mac REMICS | 2.04% |
| Freddie Mac REMICS | 1.93% |
| Fannie Mae REMICS | 1.89% |
| Fannie Mae REMICS | 1.85% |
| | 21.80% |
| * | Holdings are subject to change and exclude short-term investments. |
| Semi-Annual Report | December 31, 2019 | 3 |
RiverNorth/DoubleLine Strategic Opportunity Fund, Inc.
| Performance Overview | December 31, 2019 (Unaudited) |
ASSET ALLOCATIONas of December 31, 2019^
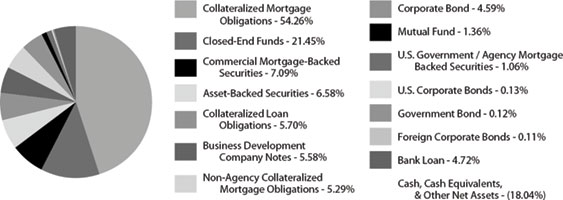
| ^ | Holdings are subject to change. |
| | Percentages are based on net assets of the Fund and do not include derivatives. |
| 4 | (888) 848-7569 | www.rivernorth.com |
| RiverNorth/DoubleLine Strategic Opportunity Fund, Inc. | |
| Schedule of Investments | December 31, 2019 (Unaudited) |
| Shares/Description | | Value | |
| CLOSED-END FUNDS - 22.81%(a) | | | | |
| | 13,000 | | AllianceBernstein Global High Income Fund, Inc. | | $ | 157,690 | |
| | 44,363 | | Ares Dynamic Credit Allocation Fund, Inc. | | | 680,972 | |
| | 27,215 | | Barings Global Short Duration High Yield Fund | | | 477,079 | |
| | 289,650 | | BlackRock Credit Allocation Income Trust | | | 4,049,306 | |
| | 66,196 | | BlackRock Floating Rate Income Trust | | | 851,943 | |
| | 296,982 | | BrandywineGLOBAL - Global Income Opportunities Fund, Inc. | | | 3,750,883 | |
| | 75,103 | | Brookfield Real Assets Income Fund, Inc. | | | 1,603,449 | |
| | 295,065 | | Eaton Vance Limited Duration Income Fund | | | 3,909,611 | |
| | 63,684 | | First Trust High Income Long/Short Fund | | | 1,003,023 | |
| | 49,045 | | First Trust Senior Floating Rate Income Fund II | | | 615,515 | |
| | 88,855 | | Highland Global Allocation Fund | | | 829,906 | |
| | 278,606 | | Highland Income Fund | | | 3,463,073 | |
| | 102,709 | | Invesco Dynamic Credit Opportunities Fund | | | 1,165,747 | |
| | 38,981 | | Invesco High Income Trust II | | | 556,649 | |
| | 667,219 | | Invesco Senior Income Trust | | | 2,862,370 | |
| | 97,813 | | NexPoint Credit Strategies Fund | | | 1,732,268 | |
| | 452,364 | | Nuveen Credit Strategies Income Fund | | | 3,469,632 | |
| | 190,920 | | PGIM Global High Yield Fund, Inc. | | | 2,867,618 | |
| | 152,444 | | PGIM High Yield Bond Fund, Inc. | | | 2,347,638 | |
| | 140,149 | | PIMCO Energy & Tactical Credit Opportunities Fund | | | 2,312,458 | |
| | 220,291 | | Western Asset Emerging Markets Debt Fund, Inc. | | | 3,143,553 | |
| | 290,706 | | Western Asset Global High Income Fund, Inc. | | | 2,912,874 | |
| | 318,995 | | Western Asset High Income Fund II, Inc. | | | 2,150,026 | |
| | 1,152,337 | | Western Asset High Income Opportunity Fund, Inc. | | | 5,842,348 | |
| | | | | | | | |
| TOTAL CLOSED-END FUNDS | | | | |
| (Cost $52,119,309) | | | 52,755,631 | |
| | | | | | | | |
| COMMON STOCKS-0.00%(a)(b) | | | | |
| | 705 | | McDermott International, Inc.(c) | | | 477 | |
| | | | | | | | |
| TOTAL COMMON STOCKS | | | | |
| (Cost $0) | | | 477 | |
| Shares/Description | | Rate | | Maturity | | | Value | |
| BUSINESS DEVELOPMENT COMPANY NOTES-5.58%(a) | | | | | | |
| United States - 5.58% | | | | | | | | | |
| | 38,563 | | Capital Southwest Corp. | 5.95 | % | | 12/15/2022 | | | | 1,007,281 | |
| | 227,236 | | Oxford Square Capital Corp. | 6.50 | % | | 03/30/2024 | | | | 5,789,951 | |
| | 33,285 | | Portman Ridge Finance Corp. | 6.13 | % | | 09/30/2022 | | | | 839,281 | |
| | 29,898 | | Stellus Capital Investment Corp. | 5.75 | % | | 09/15/2022 | | | | 760,306 | |
| | 120,261 | | THL Credit, Inc. | 6.75 | % | | 12/30/2022 | | | | 3,042,603 | |
| | 21,044 | | THL Credit, Inc. | 6.13 | % | | 10/30/2023 | | | | 552,195 | |
| See Notes to Financial Statements. | |
| Semi-Annual Report | December 31, 2019 | 5 |
| RiverNorth/DoubleLine Strategic Opportunity Fund, Inc. | |
| Schedule of Investments | December 31, 2019 (Unaudited) |
| Shares/Description | | Rate | | Maturity | | | Value | |
| | 35,926 | | TriplePoint Venture Growth BDC Corp. | 5.75 | % | | 07/15/2022 | | | $ | 912,682 | |
| | | | | | | | | | | | 12,904,299 | |
| | | | | | | | | | | | | |
| TOTAL BUSINESS DEVELOPMENT COMPANY NOTES | | | | | | | | | |
| (Cost $12,682,445) | | | | | | | | 12,904,299 | |
| Principal Amount/Description | Rate | | | Maturity | | | Value | |
| FOREIGN CORPORATE BONDS-4.42%(a) | | | | | | | | |
| Argentina - 0.28% | | | | | | | | | |
| $ | 150,000 | | Banco Macro SA(d)(e) | 6.75 | % | | 11/04/2026 | | | | 121,927 | |
| | 250,000 | | Cia General de Combustibles SA(e) | 9.50 | % | | 11/07/2021 | | | | 209,475 | |
| | 200,000 | | Telecom Argentina SA(f) | 8.00 | % | | 07/18/2026 | | | | 192,627 | |
| | 150,000 | | YPF SA(e) | 8.50 | % | | 07/28/2025 | | | | 141,439 | |
| | | | | | | | | | | | 665,468 | |
| Austria - 0.12% | | | | | | | | | |
| | 250,000 | | Klabin Austria GmbH(e) | 7.00 | % | | 04/03/2049 | | | | 273,875 | |
| | | | | | | | | | | | | |
| Brazil - 0.23% | | | | | | | | |
| | 250,000 | | Banco do Brasil SA(d)(e)(g) | 6.25 | % | | Perpetual Maturity | | | | 254,128 | |
| | | | | | | | | | | | | |
| | 300,000 | | CSN Islands XII Corp.(e)(g) | 7.00 | % | | Perpetual Maturity | | | | 276,658 | |
| | | | | | | | | | | | 530,786 | |
| British Virgin Islands - 0.09% | | | | | | | | | |
| | 200,000 | | C10 Capital SPV, Ltd.(d)(e)(g) | 3M US L + 4.71% | | | Perpetual Maturity | | | | 198,000 | |
| | | | | | | | | | | | | |
| Canada - 0.22% | | | | | | | | | |
| | 250,000 | | Canacol Energy, Ltd.(e) | 7.25 | % | | 05/03/2025 | | | | 264,232 | |
| | 250,000 | | Gran Tierra Energy, Inc.(f) | 7.75 | % | | 05/23/2027 | | | | 234,464 | |
| | | | | | | | | | | | 498,696 | |
| Cayman Islands - 0.36% | | | | | | | | | |
| | 250,000 | | Banco BTG Pactual SA(d)(e) | 7.75 | % | | 02/15/2029 | | | | 265,152 | |
| | 250,000 | | Banco Mercantil del Norte SA/Grand Cayman(d)(e)(g) | 7.63 | % | | Perpetual Maturity | | | | 267,634 | |
| | 250,000 | | Latam Finance, Ltd.(e) | 7.00 | % | | 03/01/2026 | | | | 271,086 | |
| | | | | | | | | | | | 803,872 | |
| Chile - 0.33% | | | | | | | | | |
| | 250,000 | | AES Gener SA(d)(e) | 7.13 | % | | 03/26/2079 | | | | 262,823 | |
| | 250,000 | | Geopark, Ltd.(e) | 6.50 | % | | 09/21/2024 | | | | 261,356 | |
| | 250,000 | | VTR Finance BV(e) | 6.88 | % | | 01/15/2024 | | | | 256,146 | |
| | | | | | | | | | | | 780,325 | |
| See Notes to Financial Statements. | |
| 6 | (888) 848-7569 | www.rivernorth.com |
| RiverNorth/DoubleLine Strategic Opportunity Fund, Inc. | |
| Schedule of Investments | December 31, 2019 (Unaudited) |
| Principal Amount/Description | | Rate | | | Maturity | | Value | |
| China - 0.09% | | | | | | | | | | | |
| $ | 200,000 | | | Agile Group Holdings, Ltd.(d)(g) | | | 6.88 | % | | Perpetual Maturity | | $ | 200,071 | |
| | | | | | | | | | | | | | | |
| Colombia - 0.11% | | | | | | | | | | |
| | 250,000 | | | Gilex Holding Sarl(e) | | | 8.50 | % | | 05/02/2023 | | | 269,168 | |
| | | | | | | | | | | | | | | |
| Dominican Republic - 0.12% | | | | | | | | | | |
| | 250,000 | | | Aeropuertos Dominicanos Siglo XXI SA(e) | | | 6.75 | % | | 03/30/2029 | | | 276,964 | |
| | | | | | | | | | | | | | | |
| Great Britain -0.11% | | | | | | | | | | |
| | 250,000 | | | Vedanta Resources Finance II PLC(f) | | | 9.25 | % | | 04/23/2026 | | | 248,709 | |
| | | | | | | | | | | | | | | |
| Guatemala - 0.11% | | | | | | | | | | |
| | 250,000 | | | Energuate Trust(e) | | | 5.88 | % | | 05/03/2027 | | | 258,837 | |
| | | | | | | | | | | | | | | |
| Hong Kong - 0.08% | | | | | | | | | | |
| | 200,000 | | | RKP Overseas Finance, Ltd.(g) | | | 7.95 | % | | Perpetual Maturity | | | 192,547 | |
| | | | | | | | | | | | | | | |
| India - 0.11% | | | | | | | | | | |
| | 250,000 | | | Network i2i, Ltd.(d)(f)(g) | | | 5.65 | % | | Perpetual Maturity | | | 247,375 | |
| | | | | | | | | | | | | | | |
| Indonesia - 0.11% | | | | | | | | | | |
| | 230,000 | | | Star Energy Geothermal Wayang Windu, Ltd.(e) | | | 6.75 | % | | 04/24/2033 | | | 243,906 | |
| | | | | | | | | | | | | | | |
| Ireland - 0.12% | | | | | | | | | | |
| | 250,000 | | | C&W Senior Financing DAC(e) | | | 6.88 | % | | 09/15/2027 | | | 267,913 | |
| | | | | | | | | | | | | | | |
| Luxembourg -0.32% | | | | | | | | | | |
| | 200,000 | | | JSL Europe SA(e) | | | 7.75 | % | | 07/26/2024 | | | 216,119 | |
| | 250,000 | | | Millicom International Cellular SA(e) | | | 6.25 | % | | 03/25/2029 | | | 276,210 | |
| | 250,000 | | | Minerva Luxembourg SA(e) | | | 5.88 | % | | 01/19/2028 | | | 262,965 | |
| | | | | | | | | | | | | | 755,294 | |
| Mexico - 0.94% | | | | | | | | | | |
| | 200,000 | | | Banco Santander Mexico SA Institucion de Banca Multiple Grupo Financiero Santand(d)(g) | | | 8.50 | % | | Perpetual Maturity | | | 212,187 | |
| | 250,000 | | | BBVA Bancomer SA(d)(e) | | | 5.13 | % | | 01/18/2033 | | | 252,821 | |
| | 200,000 | | | Braskem Idesa SAPI(f) | | | 7.45 | % | | 11/15/2029 | | | 213,452 | |
| | 242,250 | | | Cometa Energia SA de CV(e) | | | 6.38 | % | | 04/24/2035 | | | 264,279 | |
| See Notes to Financial Statements. | |
| Semi-Annual Report | December 31, 2019 | 7 |
| RiverNorth/DoubleLine Strategic Opportunity Fund, Inc. | |
| Schedule of Investments | December 31, 2019 (Unaudited) |
| Principal Amount/Description | | Rate | | | Maturity | | Value | |
| $ | 250,000 | | | Credito Real SAB de CV SOFOM ER(d)(e)(g) | | | 9.13 | % | | Perpetual Maturity | | $ | 263,674 | |
| | 250,000 | | | Docuformas SAPI de CV(f) | | | 10.25 | % | | 07/24/2024 | | | 254,169 | |
| | 262,403 | | | Fermaca Enterprises S RL(e) | | | 6.38 | % | | 03/30/2038 | | | 286,267 | |
| | 250,000 | | | Financiera Independencia SAB de CV SOFOM ENR(e) | | | 8.00 | % | | 07/19/2024 | | | 233,856 | |
| | 250,000 | | | Unifin Financiera SAB de CV(d)(e)(g) | | | 8.88 | % | | PerpetualMaturity | | | 230,483 | |
| | | | | | | | | | | | | | 2,211,188 | |
| Netherlands - 0.34% | | | | | | | | | | |
| | 250,000 | | | AES Andres BV / Dominican Power Partners / Empresa Generadora de Electricidad It(e) | | | 7.95 | % | | 05/11/2026 | | | 266,027 | |
| | 200,000 | | | Metinvest BV(e) | | | 7.75 | % | | 10/17/2029 | | | 205,201 | |
| | 250,000 | | | Petrobras Global Finance BV | | | 6.90 | % | | 03/19/2049 | | | 293,694 | |
| | | | | | | | | | | | | | 764,922 | |
| Singapore - 0.11% | | | | | | | | | | |
| | 250,000 | | | Medco Oak Tree Pte, Ltd.(e) | | | 7.38 | % | | 05/14/2026 | | | 255,147 | |
| | | | | | | | | | | | | | | |
| Spain - 0.12% | | | | | | | | | | |
| | 250,000 | | | AI Candelaria Spain SLU(f) | | | 7.50 | % | | 12/15/2028 | | | 281,024 | |
| | | | | | | | | | | | | | | |
| TOTAL FOREIGN CORPORATE BONDS | | | | | | | | | | |
| (Cost $9,865,739) | | | | | | | | | 10,224,087 | |
| | | | | | | | | | | | | | | |
| U.S. CORPORATE BONDS - 0.41%(a) | | | | | | | | | | |
| Food - 0.12% | | | | | | | | | | |
| | 250,000 | | | NBM US Holdings, Inc.(f) | | | 7.00 | % | | 05/14/2026 | | | 271,346 | |
| Mining - 0.13% | | | | | | | | | | |
| | 300,000 | | | Freeport-McMoRan, Inc. | | | 5.45 | % | | 03/15/2043 | | | 311,280 | |
| Telecommunications - 0.16% | | | | | | | | | | |
| | 410,000 | | | Intelsat Jackson Holdings SA(f) | | | 8.50 | % | | 10/15/2024 | | | 374,295 | |
| | | | | | | | | | | | | | | |
| TOTAL U.S. CORPORATE BONDS | | | | | | | | |
| (Cost $867,228) | | | | | | | | | 956,921 | |
| | | | | | | | | | | | | | | |
| FOREIGN GOVERNMENT BONDS AND NOTES, SUPRANATIONALS AND FOREIGN AGENCIES - 0.12%(a) |
| | 250,000 | | | Dominican Republic International Bond(f) | | | 6.40 | % | | 06/05/2049 | | | 274,921 | |
| TOTAL FOREIGN GOVERNMENT BONDS AND NOTES, SUPRANATIONALS AND FOREIGN AGENCIES |
| (Cost $254,223) | | | | | | | | | 274,921 | |
| See Notes to Financial Statements. | |
| 8 | (888) 848-7569 | www.rivernorth.com |
| RiverNorth/DoubleLine Strategic Opportunity Fund, Inc. | |
| Schedule of Investments | December 31, 2019 (Unaudited) |
| Principal Amount/Description | | Rate | | Maturity | | | Value | |
| BANK LOANS - 4.72%(a)(d) | | | | | | | | | | |
| Canada - 0.07% | | | | | | | | | | |
| $ | 165,000 | | | Kronos Acquisition Intermediate, Inc., First Lien - Initial Term Loan | | 1M US L + 4.00%, 1.00% Floor | | | 05/15/2023 | | | $ | 162,443 | |
| | | | | | | | | | | | | | | |
| Ireland - 0.07% | | | | | | | | | | |
| | 175,000 | | | ION Trading Technologies S.A.R.L., First Lien - 2018 Initial Dollar Term Loan(h) | | 3M US L + 4.00%, 1.00% Floor | | | 11/21/2024 | | | | 168,000 | |
| | | | | | | | | | | | | | | |
| Jersey - 0.09% | | | | | | | | | | |
| | 206,639 | | | Capri Acquisitions BidCo, Ltd., First Lien - Initial Dollar Term Loan | | 3M US L + 3.00% | | | 11/01/2024 | | | | 205,063 | |
| | | | | | | | | | | | | | | |
| Luxembourg - 0.10% | | | | | | | | | | |
| | 239,400 | | | Travelport Finance Luxembourg Sarl, First Lien - Initial Term Loan | | 3M US L + 5.00% | | | 05/29/2026 | | | | 224,557 | |
| | | | | | | | | | | | | | | |
| United Kingdom -0.05% | | | | | | | | | | |
| | 105,000 | | | Connect Finco SARL, First Lien - B Term Loan | | 1M US L + 4.50%, 1.00% Floor | | | 12/11/2026 | | | | 105,779 | |
| | | | | | | | | | | | | | | |
| United States - 4.34% | | | | | | | | | | |
| | 199,999 | | | Acrisure LLC, First Lien - 2017-2 Refinancing Term Loan | | 3M US L + 4.25%, 1.00% Floor | | | 11/22/2023 | | | | 200,874 | |
| | 120,000 | | | Air Medical Group Holdings, Inc., First Lien - 2018 New Term Loan | | L + 4.25%, 1.00% Floor | | | 03/14/2025 | | | | 116,700 | |
| | 522,474 | | | Air Methods Corp., First Lien - Initial Term Loan | | 3M US L + 3.50%, 1.00% Floor | | | 04/22/2024 | | | | 459,234 | |
| | 572,123 | | | American Tire Distributors, Inc., First Lien - Initial Term Loan | | 1M US L + 7.50%, 1.00% Floor | | | 09/02/2024 | | | | 513,481 | |
| | 215,547 | | | Applied Systems, Inc., First Lien - Closing Date Term Loan(h) | | 3M US L + 3.25%, 1.00% Floor | | | 09/19/2024 | | | | 216,606 | |
| | 207,759 | | | AssuredPartners, Inc., First Lien - 2017 September Refinancing Term Loan | | 1M US L + 3.50% | | | 10/22/2024 | | | | 208,720 | |
| | 124,063 | | | Athenahealth, Inc., First Lien - B Term Loan | | 3M US L + 4.50% | | | 02/11/2026 | | | | 124,889 | |
| See Notes to Financial Statements. | |
| Semi-Annual Report | December 31, 2019 | 9 |
| RiverNorth/DoubleLine Strategic Opportunity Fund, Inc. | |
| Schedule of Investments | December 31, 2019 (Unaudited) |
| Principal Amount/Description | | Rate | | Maturity | | | Value | |
| $ | 230,000 | | | Avaya, Inc., First Lien -Tranche B Term Loan | | 1M US L + 4.25% | | | 12/15/2024 | | | $ | 226,377 | |
| | 19,396 | | | Aventiv Technologies LLC, First Lien - Initial Term Loan | | 1M US L + 4.50%, 1.00% Floor | | | 11/01/2024 | | | | 14,534 | |
| | 125,000 | | | BellRing Brands LLC, First Lien - B Term Loan | | 1M US L + 5.00%, 1.00% Floor | | | 10/21/2024 | | | | 126,641 | |
| | 349,114 | | | BI-LO LLC, First Lien - Initial Term Loan | | 3M US L + 8.00%, 1.00% Floor | | | 05/31/2024 | | | | 323,659 | |
| | 64,347 | | | Blackhawk Network Holdings, Inc., First Lien Term Loan | | 1M US L + 3.00% | | | 06/15/2025 | | | | 64,467 | |
| | 323,325 | | | Cengage Learning, Inc., First Lien - 2016 Refinancing Term Loan | | 1M US L + 4.25%, 1.00% Floor | | | 06/07/2023 | | | | 310,017 | |
| | 208,108 | | | CHG Healthcare Services, Inc., First Lien - 2017 New Term Loan | | 1M US L + 3.00%, 1.00% Floor | | | 06/07/2023 | | | | 209,799 | |
| | 203,931 | | | Cvent, Inc., First Lien Term Loan | | 1M US L + 3.75%, 1.00% Floor | | | 11/29/2024 | | | | 204,084 | |
| | 214,020 | | | Cyxtera DC Holdings, Inc., First Lien - Initial Term Loan | | 1M US L + 3.00%, 1.00% Floor | | | 05/01/2024 | | | | 190,211 | |
| | 229,418 | | | Dhanani Group, Inc., First Lien Term Loan | | 1M US L + 3.75% | | | 07/20/2025 | | | | 223,682 | |
| | 213,919 | | | Equinox Holdings, Inc., First Lien - Incremental B-1 Term Loan | | 1M US L + 3.00%, 1.00% Floor | | | 03/08/2024 | | | | 215,103 | |
| | 198,541 | | | Filtration Group Corp., First Lien - Initial Dollar Term Loan | | 1M US L + 3.00% | | | 03/29/2025 | | | | 199,617 | |
| | 285,000 | | | Flex Acquisition Co., Inc., First Lien - Incremental B-2018 Term Loan(h) | | L + 3.25% | | | 06/29/2025 | | | | 283,575 | |
| | 200,000 | | | Granite US Holdings Corp., First Lien - B Term Loan | | 3M US L + 5.25% | | | 09/30/2026 | | | | 201,000 | |
| | 207,282 | | | Greeneden U.S. Holdings I LLC, First Lien - Tranche B-3 Dollar Term Loan | | 1M US L + 3.25% | | | 12/01/2023 | | | | 208,254 | |
| | 518,696 | | | Gulf Finance LLC, First Lien - Tranche B Term Loan | | 1M US L + 5.25%, 1.00% Floor | | | 08/25/2023 | | | | 408,519 | |
| | 202,163 | | | Hayward Industries, Inc., First Lien - Initial Term Loan | | 1M US L + 3.50% | | | 08/05/2024 | | | | 201,152 | |
| See Notes to Financial Statements. | |
| 10 | (888) 848-7569 | www.rivernorth.com |
RiverNorth/DoubleLine Strategic Opportunity Fund, Inc.
| Schedule of Investments | December 31, 2019 (Unaudited) |
| Principal Amount/Description | | Rate | | Maturity | | | Value | |
| $ | 203,523 | | | Hyland Software, Inc., First Lien - 2018 Refinancing Term Loan | | 1M US L + 3.50%, 0.75%Floor | | | 07/01/2024 | | | $ | 204,970 | |
| | 196,976 | | | Informatica LLC, First Lien -Dollar B-1Term Loan | | 1M US L + 3.25% | | | 08/05/2022 | | | | 198,067 | |
| | 113,555 | | | IRB Holding Corp., First Lien | | 3M US L + 3.25%, 1.00% Floor | | | 02/05/2025 | | | | 114,431 | |
| | 139,643 | | | Klockner Pentaplast of America, Inc., First Lien - Dollar Term Loan | | 3M US L + 4.25%, 1.00% Floor | | | 06/30/2022 | | | | 126,272 | |
| | 129,350 | | | Lower Cadence Holdings LLC, First Lien - Initial Term Loan | | 1M US L + 4.00% | | | 05/22/2026 | | | | 128,300 | |
| | 71,431 | | | McDermott International, Inc., First Lien - Facility Term Loan(h) | | 3M US L + 10.00%, 1.00% Floor | | | 10/21/2021 | | | | 73,127 | |
| | 188,987 | | | McDermott International, Inc., First Lien Term Loan | | 3M US L + 5.00%, 1.00% Floor | | | 05/09/2025 | | | | 112,259 | |
| | 373,120 | | | Minotaur Acquisition, Inc., First Lien - B Term Loan | | 1M US L + 5.00% | | | 03/27/2026 | | | | 368,457 | |
| | 210,174 | | | Misys, Ltd., First Lien - Dollar Term Loan | | 3M US L + 3.50%, 1.00% Floor | | | 06/13/2024 | | | | 209,153 | |
| | 74,058 | | | Mitchell International, Inc., First Lien - Initial Term Loan | | 1M US L + 3.25% | | | 11/29/2024 | | | | 73,607 | |
| | 205,463 | | | MLN US HoldCo LLC, First Lien -B Term Loan | | 1M US L + 4.50% 3M US L + | | | 11/30/2025 | | | | 195,018 | |
| | 406,765 | | | MPH Acquisition Holdings LLC, First Lien - Initial Term Loan | | 2.75%, 1.00% Floor | | | 06/07/2023 | | | | 402,042 | |
| | 45,000 | | | Parexel International (West Street Merger), First Lien - Initial Term Loan | | 1M US L + 2.75% | | | 09/27/2024 | | | | 44,269 | |
| | 445,000 | | | Peak 10 Holding Corp., First Lien - Initial Term Loan(h) | | 3M US L + 3.50% | | | 08/01/2024 | | | | 372,289 | |
| | 133,308 | | | Ply Gem Midco, Inc., First Lien -Initial Term Loan | | 1M US L + 3.75% 3M US L + | | | 04/12/2025 | | | | 133,432 | |
| | 158,188 | | | Project Alpha Intermediate Holding, Inc., First Lien Term Loan | | 3.50%, 1.00% Floor | | | 04/26/2024 | | | | 158,782 | |
| | 224,198 | | | Radiology Partners, Inc., First Lien -B Term Loan | | 3M US L + 4.75% | | | 07/09/2025 | | | | 225,694 | |
| | 178,750 | | | Refinitiv US Holdings, Inc., First Lien - Initial Dollar Term Loan | | 1M US L + 3.25% | | | 10/01/2025 | | | | 180,492 | |
See Notes to Financial Statements.
| Semi-Annual Report | December 31, 2019 | 11 |
RiverNorth/DoubleLine Strategic Opportunity Fund, Inc.
| Schedule of Investments | December 31, 2019 (Unaudited) |
| Principal Amount/Description | Rate | | Maturity | | | Value | |
| $ | 230,000 | | | Solenis Holdings LLC, First Lien - Initial Dollar Term Loan | | 3M US L + 4.00% | | | 06/26/2025 | | | $ | 228,160 | |
| | 191,981 | | | Sophia LP, First Lien - B Term Loan | | 3M US L + 3.25%, 1.00% Floor | | | 09/30/2022 | | | | 192,668 | |
| | 390,000 | | | Team Health Holdings, Inc., First Lien - Initial Term Loan(h) | | 1M US L + 2.75%, 1.00% Floor | | | 02/06/2024 | | | | 317,606 | |
| | 204,799 | | | United Natural Foods, Inc., First Lien - Initial Term Loan | | 1M US L + 4.25% | | | 10/22/2025 | | | | 175,999 | |
| | 118,500 | | | Verscend Holding Corp., First Lien - B Term Loan | | 1M US L + 4.50% | | | 08/27/2025 | | | | 119,586 | |
| | 179,651 | | | Vertafore, Inc., First Lien -Initial Term Loan | | 1M US L + 3.25% | | | 07/02/2025 | | | | 177,966 | |
| | 70,000 | | | Zelis Cost Management Buyer, Inc., First Lien - B Term Loan | | 1M US L + 4.75% | | | 09/30/2026 | | | | 70,474 | |
| | | | | | | | | | | | | | 10,054,315 | |
| | | | | | | | | | | | | | | |
| TOTAL BANK LOANS | | | | | | | | | | |
| (Cost $10,945,299) | | | | | | | | | 10,920,157 | |
| COLLATERALIZED LOAN OBLIGATIONS - 3.25%(a) | | | | | | | | | |
| | | | | Apidos CLO XXI | | | | | | | | | | |
| | 500,000 | | | Series 2018-21A(d)(f) | | 3M US L + 8.25% | | | 07/18/2027 | | | | 453,630 | |
| | | | | Apidos CLO XXIV | | | | | | | | | | |
| | 500,000 | | | Series 2018-24A(d)(f) | | 3M US L + 5.80% | | | 10/20/2030 | | | | 482,829 | |
| | | | | Apidos CLO XXXII | | | | | | | | | | |
| | 500,000 | | | Series 2020-32A(d)(f) | | 3M US L + 6.75% | | | 01/20/2033 | | | | 500,000 | |
| | | | | Barings CLO, Ltd. | | | | | | | | | | |
| | 500,000 | | | Series 2018-4A(d)(f) | | 3M US L + 5.82% | | | 10/15/2030 | | | | 479,039 | |
| | | | | Canyon Capital CLO, Ltd. | | | | | | | | | | |
| | 500,000 | | | Series 2018-1A(d)(f) | | 3M US L + 5.75% | | | 07/15/2031 | | | | 459,838 | |
| | | | | Carlyle Global Market Strategies CLO, Ltd. | | | | | | | | | | |
| | 500,000 | | | Series 2017-3A(d)(f) | | 3M US L + 5.50% | | | 10/15/2030 | | | | 443,590 | |
| | 500,000 | | | Series 2018-2RA(d)(f) | | 3M US L + 5.35% | | | 05/15/2031 | | | | 433,596 | |
| | | | | Chenango Park CLO, Ltd. | | | | | | | | | | |
| | 500,000 | | | Series 2018-1A(d)(f) | | 3M US L + 5.80% | | | 04/15/2030 | | | | 485,249 | |
| | | | | Dorchester Park CLO DAC | | | | | | | | | | |
| | 500,000 | | | Series 2018-1A(d)(f) | | 3M US L + 5.00% | | | 04/20/2028 | | | | 483,598 | |
| | | | | Fillmore Park CLO, Ltd. | | | | | | | | | | |
| | 500,000 | | | Series 2018-1A(d)(f) | | 3M US L + 5.40% | | | 07/15/2030 | | | | 472,527 | |
| | | | | Gilbert Park CLO, Ltd. | | | | | | | | | | |
| | 500,000 | | | Series 2017-1A(d)(f) | | 3M US L + 6.40% | | | 10/15/2030 | | | | 503,733 | |
See Notes to Financial Statements.
| 12 | (888) 848-7569 | www.rivernorth.com |
RiverNorth/DoubleLine Strategic Opportunity Fund, Inc.
| Schedule of Investments | December 31, 2019 (Unaudited) |
| Principal Amount/Description | | Rate | | Maturity | | | Value | |
| | | | | Myers Park CLO, Ltd. | | | | | | | | | |
| $ | 500,000 | | | Series 2018-1A(d)(f) | | 3M US L + 5.50% | | | 10/20/2030 | | $ | 470,285 | |
| | | | | Neuberger Berman CLO XXIII, Ltd. | | | | | | | | | |
| | 500,000 | | | Series 2018-23A(d)(f) | | 3M US L + 5.75% | | | 10/17/2027 | | | 490,559 | |
| | | | | THL Credit Wind River CLO, Ltd. | | | | | | | | | |
| | 500,000 | | | Series 2018-2A(d)(f) | | 3M US L + 5.75% | | | 07/15/2030 | | | 449,654 | |
| | | | | Voya CLO, Ltd. | | | | | | | | | |
| | 500,000 | | | Series 2018-2A(d)(f) | | 3M US L + 5.25% | | | 07/15/2031 | | | 467,771 | |
| | | | | Webster Park CLO, Ltd. | | | | | | | | | |
| | 500,000 | | | Series 2018-1A(d)(f) | | 3M US L + 5.50% | | | 07/20/2030 | | | 473,847 | |
| | | | | | | | | | |
| TOTAL COLLATERALIZED LOAN OBLIGATIONS | | | | | | | | | |
| (Cost $7,999,332) | | | | | | | | 7,549,745 | |
| NON-AGENCY COLLATERALIZED MORTGAGE OBLIGATIONS -21.41%(a) | |
| | | | | AmeriHome GMSR Issuer Trust | | | | | | | | |
| | 2,500,000 | | | Series 2019-GT1(f) | | 4.68% | | 11/25/2026 | | | 2,460,685 | |
| | | | | AREIT Trust | | | | | | | | |
| | 538,000 | | | Series 2019-CRE3(d)(f) | | 1M US L + 2.65% | | 07/14/2022 | | | 539,750 | |
| | | | | Atrium Hotel Portfolio Trust | | | | | | | | |
| | 433,000 | | | Series 2018-ATRM(d)(f) | | 1M US L + 3.40% | | 06/15/2021 | | | 435,487 | |
| | | | | Atrium XIII | | | | | | | | |
| | 500,000 | | | Series 2017-13A(d)(f) | | 3M US L + 6.05% | | 11/21/2030 | | | 491,963 | |
| | | | | Atrium XIV LLC | | | | | | | | |
| | 500,000 | | | Series 2018-14A(d)(f) | | 3M US L + 5.65% | | 08/23/2030 | | | 480,373 | |
| | | | | BAMLL Commercial Mortgage Securities Trust | | | | | | | | |
| | 730,000 | | | Series 2019-AHT(d)(f) | | 4.24% | | 03/15/2021 | | | 733,691 | |
| | | | | Bancorp Commercial Mortgage Trust | | | | | | | | |
| | 631,000 | | | Series 2019-CRE5(d)(f) | | 1M US L + 2.35% | | 02/15/2022 | | | 632,557 | |
| | | | | BBCMS Trust | | | | | | | | |
| | 682,000 | | | Series 2018-CBM(d)(f) | | 1M US L + 3.15% | | 07/15/2020 | | | 686,707 | |
| | | | | BB-UBS Trust | | | | | | | | |
| | 500,000 | | | Series 2012-TFT(d)(f) | | 3.56% | | 06/05/2020 | | | 491,653 | |
| | | | | BF Mortgage Trust | | | | | | | | |
| | 315,000 | | | Series 2019-NYT(d)(f) | | 1M US L + 3.00% | | 12/15/2020 | | | 317,683 | |
| | | | | BFLD | | | | | | | | |
| | 326,000 | | | Series 2019-DPLO(d)(f) | | 1M US L + 3.19% | | 10/15/2021 | | | 326,673 | |
| | | | | Blackbird Capital Aircraft Lease Securitization, Ltd. | | | | | | | | |
| | 2,453,125 | | | Series 2016-1A(f)(i) | | 5.68% | | 12/15/2024 | | | 2,548,280 | |
| | | | | Braemar Hotels & Resorts Trust | | | | | | | | |
| | 402,000 | | | Series 2018-PRME(d)(f) | | 1M US L + 2.90% | | 06/15/2035 | | | 403,549 | |
See Notes to Financial Statements.
| Semi-Annual Report | December 31, 2019 | 13 |
RiverNorth/DoubleLine Strategic Opportunity Fund, Inc.
| Schedule of Investments | December 31, 2019 (Unaudited) |
| Principal Amount/Description | Rate | | Maturity | | | Value | |
| | | | | BX Commercial Mortgage Trust | | | | | | | | | | |
| $ | 321,000 | | | Series 2019-IMC(d)(f) | | 1M US L + 1.90% | | | 04/15/2021 | | | $ | 322,569 | |
| | | | | Carbon Capital VI Commercial Mortgage Trust | | | | | | | | | | |
| | 316,000 | | | Series 2019-FL2(d)(f) | | 1M US L + 2.85% | | | 11/15/2021 | | | | 318,519 | |
| | | | | Castlelake Aircraft Securitization Trust | | | | | | | | | | |
| | 370,561 | | | Series 2018-1(f) | | 6.63% | | | 06/15/2025 | | | | 372,240 | |
| | | | | Castlelake Aircraft Structured Trust | | | | | | | | | | |
| | 1,250,000 | | | Series 2019-1A(f)(j)(k) | | 0.00% | | | 04/15/2039 | | | | 1,234,375 | |
| | | | | CIM Trust | | | | | | | | | | |
| | 3,720,000 | | | Series 2016-3RR B2(d)(f) | | 11.09% | | | 01/27/2057 | | | | 3,827,322 | |
| | | | | Citigroup Commercial Mortgage Trust | | | | | | | | | | |
| | 196,000 | | | Series 2015-GC27(d)(f) | | 4.43% | | | 01/10/2025 | | | | 186,211 | |
| | 192,000 | | | Series 2016-GC36(f) | | 2.85% | | | 01/10/2026 | | | | 166,514 | |
| | 319,000 | | | Series 2018-TBR(d)(f) | | 1M US L +3.65% | | | 12/15/2019 | | | | 322,037 | |
| | | | | COMM Mortgage Trust | | | | | | | | | | |
| | 878,000 | | | Series 2018-HCLV(d)(f) | | 1M US L + 2.18% | | | 09/15/2020 | | | | 876,443 | |
| | | | | Commercial Mortgage Trust | | | | | | | | | | |
| | 500,000 | | | Series 2012-CR4(d)(f) | | 4.59% | | | 11/15/2022 | | | | 209,744 | |
| | | | | Dryden 37 Senior Loan Fund | | | | | | | | | | |
| | 500,000 | | | Series 2017-37A(d)(f) | | 3M US L + 5.15% | | | 01/15/2031 | | | | 450,903 | |
| | | | | Dryden 40 Senior Loan Fund | | | | | | | | | | |
| | 500,000 | | | Series 2018-40A(d)(f) | | 3M US L + 5.75% | | | 08/15/2031 | | | | 478,903 | |
| | | | | Fontainebleau Miami Beach Trust | | | | | | | | | | |
| | 660,000 | | | Series 2019-FBLU(d)(f) | | 4.10% | | | 12/10/2024 | | | | 618,178 | |
| | | | | FREMF Mortgage Trust | | | | | | | | | | |
| | 108,722 | | | Series 2016-KF22(d)(f) | | 1M US L + 5.05% | | | 07/25/2023 | | | | 111,638 | |
| | | | | GMAC Commercial Mortgage Securities, Inc. Trust | | | | | | | | | | |
| | 141,741 | | | Series 2004-C3(d)(f) | | 5.14% | | | 12/10/2041 | | | | 142,585 | |
| | | | | Government National Mortgage Association | | | | | | | | | | |
| | 16,928,037 | | | Series 2013-155(d)(l)(l) | | 0.17% | | | 09/16/2053 | | | | 268,976 | |
| | | | | GPMT, Ltd. | | | | | | | | | | |
| | 999,000 | | | Series 2018-FL1(d)(f) | | 1M US L + 2.95% | | | 04/19/2021 | | | | 1,003,824 | |
| | | | | Great Wolf Trust | | | | | | | | | | |
| | 1,100,000 | | | Series 2019-WOLF(d)(f)(j) | | 1M US L + 3.13% | | | 12/15/2024 | | | | 1,099,662 | |
| | | | | GS Mortgage Securities Trust | | | | | | | | | | |
| | 1,776,000 | | | Series 2014-GC26(d)(f) | | 4.51% | | | 11/10/2047 | | | | 1,556,016 | |
| | 655,000 | | | Series 2018-TWR(d)(f) | | 1M US L + 3.92% | | | 07/15/2021 | | | | 660,872 | |
| | | | | Hawaii Hotel Trust | | | | | | | | | | |
| | 230,000 | | | Series 2019-MAUI(d)(f) | | 1M US L + 2.75% | | | 05/15/2021 | | | | 230,683 | |
| | | | | HPLY Trust | | | | | | | | | | |
| | 214,236 | | | Series 2019-HIT(d)(f) | | 1M US L + 3.90% | | | 11/15/2021 | | | | 214,503 | |
See Notes to Financial Statements.
| 14 | (888) 848-7569 | www.rivernorth.com |
RiverNorth/DoubleLine Strategic Opportunity Fund, Inc.
| Schedule of Investments | December 31, 2019 (Unaudited) |
| Principal Amount/Description | Rate | | Maturity | | | Value | |
| | | | | InSite Issuer LLC | | | | | | | | | | | |
| $ | 3,000,000 | | | Series 2016-1A(f) | | | 6.41% | | | 11/15/2046 | | | $ | 3,118,448 | |
| | | | | J.P. Morgan Chase Commercial Mortgage Securities Trust | | | | | | | | | | | |
| | 500,000 | | | Series 2016-WIKI(d)(f) | | | 4.01% | | | 10/05/2021 | | | | 504,249 | |
| | | | | JP Morgan BB Commercial Mortgage Securities Trust | | | | | | | | | | | |
| | 1,062,000 | | | Series 2014-C23(d)(f) | | | 3.36% | | | 10/15/2024 | | | | 904,276 | |
| | 632,000 | | | Series 2015-C27(d)(f) | | | 3.81% | | | 02/15/2025 | | | | 611,977 | |
| | | | | JP Morgan Chase Commercial Mortgage Securities Trust | | | | | | | | | | | |
| | 107,519 | | | Series 2006-LDP9 | | | 5.34% | | | 05/15/2047 | | | | 100,764 | |
| | 411,000 | | | Series 2011-C3(d)(f) | | | 5.66% | | | 03/15/2021 | | | | 399,911 | |
| | 130,000 | | | Series 2014-C20(d)(f) | | | 4.60% | | | 06/15/2024 | | | | 121,477 | |
| | 320,000 | | | Series 2019-MFP(d)(f) | | | 1M US L + 3.00% | | | 07/15/2021 | | | | 321,301 | |
| | 109,000 | | | Series 2019-UES(f) | | | 4.34% | | | 05/05/2024 | | | | 114,872 | |
| | 525,000 | | | Series 2019-UES(d)(f) | | | 4.45% | | | 05/05/2024 | | | | 528,456 | |
| | | | | JPMBB Commercial Mortgage Securities Trust | | | | | | | | | | | |
| | 9,475,000 | | | Series 2013-C14(d)(f)(l)(l) | | | 1.10% | | | 08/15/2023 | | | | 321,629 | |
| | | | | LCM Loan Income Fund I Income Note Issuer, Ltd. | | | | | | | | | | | |
| | 500,000 | | | Series 2018-27A(d)(f) | | | 3M US L + 5.60% | | | 07/16/2031 | | | | 459,541 | |
| | | | | LCM XIV LP | | | | | | | | | | | |
| | 500,000 | | | Series 2018-14A(d)(f) | | | 3M US L + 5.50% | | | 07/20/2031 | | | | 444,886 | |
| | | | | LCM XVII LP | | | | | | | | | | | |
| | 500,000 | | | Series 2018-17A(d)(f) | | | 3M US L + 6.00% | | | 10/15/2031 | | | | 436,110 | |
| | | | | Mello Warehouse Securitization Trust | | | | | | | | | | | |
| | 3,000,000 | | | Series 2019-1(d)(f) | | | 1M US L + 5.50% | | | 05/14/2021 | | | | 3,011,320 | |
| | | | | Morgan Stanley Bank of America Merrill Lynch Trust | | | | | | | | | | | |
| | 119,000 | | | Series 2015-C20(f) | | | 3.07% | | | 01/15/2025 | | | | 110,852 | |
| | | | | Morgan Stanley Capital I Trust | | | | | | | | | | | |
| | 330,000 | | | Series 2017-ASHF(d)(f) | | | 1M US L + 4.35% | | | 11/15/2019 | | | | 332,080 | |
| | 350,000 | | | Series 2018-SUN(d)(f) | | | 1M US L + 3.05% | | | 07/15/2020 | | | | 351,200 | |
| | | | | MSCG Trust | | | | | | | | | | | |
| | 555,000 | | | Series 2018-SELF(d)(f) | | | 1M US L + 3.05% | | | 10/15/2020 | | | | 556,993 | |
| | | | | New Century Home Equity Loan Trust | | | | | | | | | | | |
| | 2,275,571 | | | Series 2006-1(d) | | | 1M US L + 0.18% | | | 05/25/2036 | | | | 2,163,412 | |
| | | | | Octagon Investment Partners 26, Ltd. | | | | | | | | | | | |
| | 500,000 | | | Series 2018-1A(d)(f) | | | 3M US L + 8.09% | | | 07/15/2030 | | | | 434,592 | |
| | | | | Octagon Investment Partners 45, Ltd. | | | | | | | | | | | |
| | 500,000 | | | Series 2019-1A(d)(f) | | | 3M US L + 7.69% | | | 10/15/2032 | | | | 503,335 | |
See Notes to Financial Statements.
| Semi-Annual Report | December 31, 2019 | 15 |
RiverNorth/DoubleLine Strategic Opportunity Fund, Inc.
| Schedule of Investments | December 31, 2019 (Unaudited) |
| Principal Amount/Description | | Rate | | | Maturity | | | Value | |
| | | | | Octagon Investment Partners XVI, Ltd. | | | | | | | | | | | | |
| $ | 500,000 | | | Series 2018-1A(d)(f) | | | 3M US L + 5.75% | | | | 07/17/2030 | | | $ | 456,559 | |
| | | | | Octagon Investment Partners XXI, Ltd. | | | | | | | | | | | | |
| | 500,000 | | | Series 2019-1A(d)(f) | | | 3M US L + 7.00% | | | | 02/14/2031 | | | | 497,636 | |
| | | | | One Market Plaza Trust | | | | | | | | | | | | |
| | 319,000 | | | Series 2017-1MKT(f) | | | 4.14% | | | | 02/10/2024 | | | | 319,966 | |
| | | | | PR Mortgage Loan Trust | | | | | | | | | | | | |
| | 2,354,435 | | | Series 2014-1(d)(f) | | | 5.90% | | | | 09/25/2047 | | | | 2,288,127 | |
| | | | | RMAT LLC | | | | | | | | | | | | |
| | 778,353 | | | Series 2015-PR2(f)(i) | | | 9.85% | | | | 11/25/2035 | | | | 765,624 | |
| | | | | Sofi Consumer Loan Program LLC | | | | | | | | | | | | |
| | 1,000,000 | | | Series 2017-1(d)(f) | | | 4.73% | | | | 01/26/2026 | | | | 1,024,840 | |
| | | | | SoFi Professional Loan Program, LLC | | | | | | | | | | | | |
| | 28,380 | | | Series 2019-B(f)(j) | | | 0.00% | | | | 08/17/2048 | | | | 1,049,255 | |
| | | | | Trimaran CAVU, Ltd. | | | | | | | | | | | | |
| | 500,000 | | | Series 2019-2A(d)(f) | | | 3M US L + 4.72% | | | | 11/26/2032 | | | | 499,985 | |
| | | | | UBS-Barclays Commercial Mortgage Trust | | | | | | | | | | | | |
| | 233,000 | | | Series 2013-C5(d)(f) | | | 4.08% | | | | 02/10/2023 | | | | 223,662 | |
| | | | | VMC Finance LLC | | | | | | | | | | | | |
| | 492,691 | | | Series 2019-FL3(d)(f) | | | 1M US L + 2.65% | | | | 09/15/2036 | | | | 493,916 | |
| | | | | WAVE LLC | | | | | | | | | | | | |
| | 484,400 | | | Series 2019-1(f) | | | 6.41% | | | | 09/15/2027 | | | | 481,494 | |
| | | | | Wells Fargo Commercial Mortgage Trust | | | | | | | | | | | | |
| | 332,000 | | | Series 2016-C33(f) | | | 3.12% | | | | 03/15/2059 | | | | 306,336 | |
| | | | | | | | | | | | | | | | | |
| TOTAL NON-AGENCY COLLATERALIZED MORTGAGE OBLIGATIONS | | | | | | | | | | | | |
| (Cost $49,939,008) | | | | | | | | | | | 49,480,849 | |
| | | | | | | | | | | | | | | | | |
| U.S. GOVERNMENT / AGENCY MORTGAGE BACKED SECURITIES - 55.33%(a) | |
| | | | | Alternative Loan Trust | | | | | | | | | | | | |
| | 937,258 | | | Series 2005-48T1 | | | 5.50% | | | | 11/25/2035 | | | | 826,346 | |
| | 876,024 | | | Series 2005-63(d) | | | 3.71% | | | | 12/25/2035 | | | | 838,720 | |
| | 2,806,403 | | | Series 2005-64CB | | | 5.50% | | | | 12/25/2035 | | | | 2,518,692 | |
| | 1,310,395 | | | Series 2006-26CB | | | 6.50% | | | | 09/25/2036 | | | | 1,048,006 | |
| | 2,793,728 | | | Series 2007-14T2 | | | 6.00% | | | | 07/25/2037 | | | | 2,034,879 | |
| | 2,405,159 | | | Series 2007-16CB | | | 6.25% | | | | 08/25/2037 | | | | 2,019,939 | |
| | 2,737,921 | | | Series 2007-2CB | | | 5.75% | | | | 03/25/2037 | | | | 2,343,134 | |
| | | | | Banc of America Funding Trust | | | | | | | | | | | | |
| | 2,273,447 | | | Series 2006-D(d) | | | 3.52% | | | | 05/20/2036 | | | | 2,048,671 | |
| | | | | Banc of America Mortgage Trust | | | | | | | | | | | | |
| | 1,948,416 | | | Series 2007-3 | | | 6.00% | | | | 09/25/2037 | | | | 1,890,662 | |
| See Notes to Financial Statements. | |
| 16 | (888) 848-7569 | www.rivernorth.com |
| RiverNorth/DoubleLine Strategic Opportunity Fund, Inc. |
| Schedule of Investments | December 31, 2019 (Unaudited) |
| Principal Amount/Description | | Rate | | | Maturity | | | Value | |
| | | | | Bear Stearns ALT-A Trust | | | | | | | | | | | | |
| $ | 1,873,494 | | | Series 2005-10(d) | | | 4.07% | | | | 01/25/2036 | | | $ | 1,757,926 | |
| | | | | Bear Stearns ARM Trust | | | | | | | | | �� | | | |
| | 1,410,417 | | | Series 2006-2(d) | | | 4.24% | | | | 07/25/2036 | | | | 1,341,342 | |
| | | | | Chase Mortgage Finance Trust Series | | | | | | | | | | | | |
| | 3,490,590 | | | Series 2007-S4(d) | | | 1M US L + 0.60% | | | | 06/25/2037 | | | | 1,695,400 | |
| | | | | ChaseFlex Trust Series 2007-1 | | | | | | | | | | | | |
| | 2,823,736 | | | Series 2007-1 | | | 6.50% | | | | 02/25/2037 | | | | 1,603,905 | |
| | | | | CHL GMSR Issuer Trust | | | | | | | | | | | | |
| | 3,930,000 | | | Series 2018-GT1(d)(f) | | | 1M US L + 2.75% | | | | 05/25/2023 | | | | 3,945,434 | |
| | | | | CHL Mortgage Pass-Through Trust | | | | | | | | | | | | |
| | 2,102,275 | | | Series 2005-HYB1(d) | | | 1M US L + 0.60% | | | | 03/25/2035 | | | | 2,016,694 | |
| | 2,596,496 | | | Series 2007-9 | | | 5.75% | | | | 07/25/2037 | | | | 2,137,566 | |
| | 2,218,097 | | | Series 2007-HYB1(d) | | | 3.46% | | | | 03/25/2037 | | | | 2,096,888 | |
| | | | | Citigroup Mortgage Loan Trust | | | | | | | | | | | | |
| | 1,034,870 | | | Series 2007-AR5(d) | | | 4.10% | | | | 04/25/2037 | | | | 996,296 | |
| | | | | Citigroup Mortgage Loan Trust, Inc. | | | | | | | | | | | | |
| | 1,775,157 | | | Series 2005-5(d) | | | 3.83% | | | | 10/25/2035 | | | | 1,311,152 | |
| | | | | CSFB Mortgage-Backed Pass-Through Certificates | | | | | | | | | | | | |
| | 1,371,882 | | | Series 2005-9 | | | 5.50% | | | | 10/25/2035 | | | | 1,171,794 | |
| | | | | CSMC Mortgage-Backed Trust | | | | | | | | | | | | |
| | 2,115,394 | | | Series 2006-7 | | | 6.75% | | | | 08/25/2036 | | | | 1,784,303 | |
| | 2,117,031 | | | Series 2007-1 | | | 6.00% | | | | 02/25/2037 | | | | 1,843,010 | |
| | | | | Fannie Mae REMICS | | | | | | | | | | | | |
| | 4,549,046 | | | Series 2011-101(d)(l) | | | 5.90% - 1M US L | | | | 10/25/2041 | | | | 701,525 | |
| | 4,112,609 | | | Series 2011-124(d)(l) | | | 6.50% - 1M US L | | | | 12/25/2041 | | | | 688,054 | |
| | 4,820,237 | | | Series 2012-20(d)(l) | | | 6.45% - 1M US L | | | | 03/25/2042 | | | | 803,205 | |
| | 6,000,000 | | | Series 2013-109 | | | 0.00% | | | | 07/25/2043 | | | | 4,281,716 | |
| | 4,284,527 | | | Series 2013-36 | | | 3.00% | | | | 04/25/2043 | | | | 4,360,731 | |
| | 2,947,876 | | | Series 2014-38 | | | 3.00% | | | | 09/25/2043 | | | | 2,856,764 | |
| | 6,453,021 | | | Series 2014-58 | | | 3.00% | | | | 09/25/2044 | | | | 6,453,418 | |
| | 1,130,548 | | | Series 2016-26(d) | | | 7.62% - 1M US L | | | | 11/25/2042 | | | | 1,069,761 | |
| | | | | Federal Home Loan Mortgage Corp. | | | | | | | | | | | | |
| | | | | Multifamily Structured Pass-Through Certificates | | | | | | | | | | | | |
| | 5,500,000 | | | Series 2013-K713(f)(l) | | | 0.10% | | | | 05/20/2020 | | | | 166 | |
| | 2,500,000 | | | Series 2013-K713(f)(k) | | | 0.00% | | | | 05/25/2020 | | | | 2,454,297 | |
| | | | | Federal Home Loan Mortgage Corp. | | | | | | | | | | | | |
| | | | | REMICS | | | | | | | | | | | | |
| | 2,391,349 | | | Series 2013-4170(d) | | | 4.05% - 1M US L | | | | 01/15/2033 | | | | 2,341,407 | |
| | 4,434,682 | | | Series 2017-4686 | | | 4.00% | | | | 03/15/2047 | | | | 4,755,569 | |
| See Notes to Financial Statements. | |
| Semi-Annual Report | December 31, 2019 | 17 |
| RiverNorth/DoubleLine Strategic Opportunity Fund, Inc. |
| Schedule of Investments | December 31, 2019 (Unaudited) |
| Principal Amount/Description | | Rate | | | Maturity | | | Value | |
| | | | | First Horizon Alternative Mortgage Securities Trust | | | | | | | | | | | | |
| $ | 732,098 | | | Series 2005-AA8(d) | | | 3.63% | | | | 10/25/2035 | | | $ | 680,459 | |
| | | | | FMC GMSR Issuer Trust | | | | | | | | | | | | |
| | 3,000,000 | | | Series 2019-GT1(d)(f) | | | 5.66% | | | | 05/25/2024 | | | | 3,073,799 | |
| | | | | Freddie Mac REMICS | | | | | | | | | | | | |
| | 4,297,415 | | | Series 2010-3770 | | | 4.00% | | | | 12/15/2040 | | | | 4,710,457 | |
| | 6,138,269 | | | Series 2011-3966(d)(l) | | | 5.90% - 1M US L | | | | 12/15/2041 | | | | 962,960 | |
| | 4,668,392 | | | Series 2016-4605 | | | 3.00% | | | | 08/15/2046 | | | | 4,464,922 | |
| | 4,898,707 | | | Series 2017-4657 | | | 3.00% | | | | 02/15/2047 | | | | 4,939,571 | |
| | | | | Government National Mortgage Association | | | | | | | | | | | | |
| | 4,614,281 | | | Series 2017-17 | | | 3.50% | | | | 02/20/2047 | | | | 4,781,103 | |
| | | | | IndyMac INDX Mortgage Loan Trust | | | | | | | | | | | | |
| | 1,341,344 | | | Series 2004-AR4(d) | | | 4.20% | | | | 08/25/2034 | | | | 1,346,007 | |
| | 2,738,367 | | | Series 2007-FLX6(d) | | | 1M US L + 0.25% | | | | 01/25/2016 | | | | 2,749,472 | |
| | | | | Luminent Mortgage Trust | | | | | | | | | | | | |
| | 1,924,261 | | | Series 2006-3(d) | | | 1M US L + 0.20% | | | | 05/25/2036 | | | | 1,815,765 | |
| | 1,813,087 | | | Series 2006-3(d) | | | 1M US L + 0.21% | | | | 05/25/2036 | | | | 1,743,082 | |
| | | | | Nomura Asset Acceptance Corp. Alternative Loan Trust | | | | | | | | | | | | |
| | 2,194,325 | | | Series 2005-AP3(i) | | | 5.19% | | | | 08/25/2035 | | | | 1,443,148 | |
| | 9,155,617 | | | Series 2006-AR1(d) | | | 1M US L + 0.54% | | | | 02/25/2036 | | | | 2,981,210 | |
| | | | | RALI Series Trust | | | | | | | | | | | | |
| | 2,181,654 | | | Series 2007-QA5(d) | | | 5.94% | | | | 09/25/2037 | | | | 2,073,576 | |
| | | | | Residential Asset Securitization Trust | | | | | | | | | | | | |
| | 2,593,695 | | | Series 2005-A15 | | | 5.75% | | | | 02/25/2036 | | | | 1,773,035 | |
| | 2,492,666 | | | Series 2007-A5 | | | 6.00% | | | | 05/25/2037 | | | | 2,110,332 | |
| | | | | RFMSI Trust | | | | | | | | | | | | |
| | 1,452,018 | | | Series 2005-SA2(d) | | | 4.69% | | | | 06/25/2035 | | | | 1,277,481 | |
| | 2,891,073 | | | Series 2006-S8 | | | 6.00% | | | | 09/25/2036 | | | | 2,691,700 | |
| | | | | Structured Adjustable Rate Mortgage Loan Trust | | | | | | | | | | | | |
| | 1,097,101 | | | Series 2005-22(d) | | | 4.04% | | | | 12/25/2035 | | | | 1,056,435 | |
| | 2,340,022 | | | Series 2007-8(d) | | | 4.26% | | | | 09/25/2015 | | | | 2,290,345 | |
| | | | | Structured Asset Mortgage Investments II Trust | | | | | | | | | | | | |
| | 645,402 | | | Series 2005-AR7(d) | | | 3.29% | | | | 03/25/2046 | | | | 751,472 | |
| | | | | WaMu Mortgage Pass-Through Certificates Trust | | | | | | | | | | | | |
| | 1,851,705 | | | Series 2006-AR10(d) | | | 3.84% | | | | 08/25/2046 | | | | 1,812,607 | |
| | 1,596,767 | | | Series 2006-AR6(d) | | | 3.82% | | | | 08/25/2036 | | | | 1,524,184 | |
| | 1,828,829 | | | Series 2007-HY3(d) | | | 3.87% | | | | 03/25/2037 | | | | 1,779,087 | |
| See Notes to Financial Statements. | |
| 18 | (888) 848-7569 | www.rivernorth.com |
| RiverNorth/DoubleLine Strategic Opportunity Fund, Inc. |
| Schedule of Investments | December 31, 2019 (Unaudited) |
| Principal Amount/Description | | Rate | | | Maturity | | | Value | |
| | | | | Washington Mutual Mortgage Pass-Through Certificates WMALT Trust | | | | | | | | | | | | |
| $ | 1,677,230 | | | Series 2005-8 | | | 5.50% | | | | 10/25/2035 | | | $ | 1,671,701 | |
| | 1,370,399 | | | Series 2006-2 | | | 6.00% | | | | 03/25/2036 | | | | 1,397,250 | |
| | | | | | | | | | | | | | | | | |
| TOTAL U.S. GOVERNMENT / AGENCY MORTGAGE BACKED SECURITIES | | | | | |
| (Cost $129,800,049) | | | | | | | | | | 127,938,532 | |
| Shares/Description | | Value | |
| SHORT-TERM INVESTMENTS -15.32%(a) | | | | |
| Money Market Fund - 15.32% | | | | |
| | 35,440,641 | | | State Street Institutional Trust (7 Day Yield 1.54%)(m) | | | 35,440,641 | |
| | | | | |
| TOTAL SHORT-TERM INVESTMENTS | | | | |
| (Cost $35,440,641) | | | 35,440,641 | |
| | | | | |
| TOTAL INVESTMENTS - 133.37% | | | | |
| (Cost $309,913,273) | | | 308,446,260 | |
| LIABILITIES IN EXCESS OF OTHER ASSETS - (33.37)% | | | (77,168,229 | ) |
| NET ASSETS - 100.00% | | $ | 231,278,031 | |
| | | | | |
| Investment Abbreviations: | | | | |
| LIBOR - London Interbank Offered Rate | | | | |
| | | | | |
| Libor Rates: | | | | |
| 1M US L - 1 Month LIBOR as of December 31, 2019 was 1.76% | | | | |
| 3M US L - 3 Month LIBOR as of December 31, 2019 was 1.91% | | | | |
| (a) | All or a portion of the security has been pledged as collateral in connection with an open credit agreement. At December 31, 2019, the value of securities pledged amounted to $308,446,260, which represents approximately 133.37% of net assets. |
| (c) | Non-income producing security. |
| (d) | Variable rate investment. Interest rates reset periodically. Interest rate shown reflects the rate in effect at December 31, 2019. For securities based on a published reference rate and spread, the reference rate and spread are indicated in the description above. Certain variable rate securities are not based on a published reference rate and spread but are determined by the issuer or agent and are based on current market conditions. These securities do not indicate a reference rate and spread in their description above. |
| See Notes to Financial Statements. | |
| Semi-Annual Report | December 31, 2019 | 19 |
| RiverNorth/DoubleLine Strategic Opportunity Fund, Inc. |
| Schedule of Investments | December 31, 2019 (Unaudited) |
| (e) | Securities were purchased pursuant to Regulation S under the Securities Act of 1933, which exempts securities offered and sold outside of the United States from registration. Such securities cannot be sold in the United States without either an effective registration statement filed pursuant to the Securities Act of 1933, or pursuant to an exemption from registration. These securities have been deemed liquid under procedures approved by the Fund's Board of Directors (The "Board"). As of December 31, 2019, the aggregate fair value of those securities was $7,653,768, representing 3.31% of net assets. |
| (f) | Security exempt from registration under Rule 144A of the Securities Act of 1933. These securities have been deemed liquid under procedures approved by the Fund's Board of Directors and may normally be sold to qualified institutional buyers in transactions exempt from registration. Total fair value of Rule 144A securities amounts to $66,563,520, which represents approximately 28.78% of net assets as of December 31, 2019. |
| (g) | Security has no contractual maturity date, is not redeemable and contractually pays an indefinite stream of interest. |
| (h) | All or a portion of this position has not settled as of December 31, 2019. The interest rate shown represents the stated spread over the London Interbank Offered Rate ("LIBOR" or "L") or the Euro Interbank Offered Rate ("EURIBOR" or "E") or the applicable LIBOR/EURIBOR floor; the Fund will not accrue interest until the settlement date, at which point LIBOR/EURIBOR will be established. |
| (i) | Step bond. Coupon changes periodically based upon a predetermined schedule. Interest rate disclosed is that which is in effect at December 31, 2019. |
| (j) | The Level 3 assets were a result of unavailable quoted prices from an active market or the unavailability of other significant observable inputs. |
| (k) | Issued with a zero coupon. Income is recognized through the accretion of discount. |
| (l) | Interest only securities. |
| (m) | Seven-day yield as of December 31, 2019. |
| See Notes to Financial Statements. | |
| 20 | (888) 848-7569 | www.rivernorth.com |
| RiverNorth/DoubleLine Strategic Opportunity Fund, Inc. |
| Statement of Assets and Liabilities | December 31, 2019 (Unaudited) |
| ASSETS: | | | |
| Investment in securities: | | | | |
| At cost | | $ | 309,913,273 | |
| At value | | $ | 308,446,260 | |
| | | | | |
| Cash | | | 175,836 | |
| Receivable for fund investments sold | | | 1,953,750 | |
| Interest receivable | | | 1,100,701 | |
| Dividends receivable | | | 133,372 | |
| Prepaid offering costs | | | 22,940 | |
| Prepaid expenses and other assets | | | 69,999 | |
| Total Assets | | | 311,902,858 | |
| LIABILITIES: | | | | |
| Facility loan payable | | | 73,500,000 | |
| Interest payable on facility loan | | | 214,345 | |
| Facility loan fee payable | | | 22,289 | |
| Payable for fund investments purchased | | | 6,528,222 | |
| Payable to Adviser | | | 244,067 | |
| Payable for fund accounting and administration fees | | | 72,079 | |
| Payable for shareholder servicing | | | 13,296 | |
| Payable for custodian fees | | | 4,193 | |
| Payable for audit fees | | | 13,423 | |
| Payable to transfer agent | | | 1,174 | |
| Payable to Chief Compliance Officer | | | 8,851 | |
| Payable to Directors | | | 596 | |
| Other accrued expenses | | | 2,292 | |
| Total Liabilities | | | 80,624,827 | |
| Net Assets | | $ | 231,278,031 | |
| NET ASSETS CONSIST OF: | | | | |
| Paid-in capital | | $ | 241,039,933 | |
| Total distributable earnings/(accumulated deficit) | | | (9,761,902 | ) |
| Net Assets | | $ | 231,278,031 | |
| PRICING OF SHARES: | | | | |
| Net Assets | | $ | 231,278,031 | |
| Shares of common stock outstanding | | | | |
| (unlimited number of shares, $0.0001 par value) | | | 13,384,868 | |
| Net Asset Value Per Share, Offering and Redemption Price Per Share | | $ | 17.28 | |
See Notes to Financial Statements.
| Semi-Annual Report | December 31, 2019 | 21 |
| RiverNorth/DoubleLine Strategic Opportunity Fund, Inc. |
| Statement of Operations | For the Six Months Ended December 31, 2019 (Unaudited) |
| INVESTMENT INCOME: | | | |
| Dividend income | | $ | 2,137,701 | |
| Interest income | | | 7,036,971 | |
| Foreign taxes withheld | | | (1,830 | ) |
| Total Investment Income | | | 9,172,842 | |
| | | | | |
| EXPENSES: | | | | |
| Investment Adviser fee | | | 1,372,521 | |
| Interest expense on facility loan | | | 1,136,438 | |
| Accounting and administration fee | | | 278,630 | |
| Director expenses | | | 61,859 | |
| Printing expenses | | | 42,701 | |
| Facility loan fee | | | 38,333 | |
| Legal expenses | | | 36,271 | |
| Chief compliance officer | | | 18,738 | |
| Audit expenses | | | 15,631 | |
| Custodian expenses | | | 14,341 | |
| Offering costs | | | 13,307 | |
| Shareholder servicing expenses | | | 13,296 | |
| Registration expenses | | | 11,913 | |
| Insurance expenses | | | 2,203 | |
| Transfer agent expenses | | | 1,174 | |
| Miscellaneous expenses | | | 997 | |
| Total Expenses | | | 3,058,353 | |
| Net Investment Income | | | 6,114,489 | |
| | | | | |
| REALIZED AND UNREALIZED GAIN/(LOSS): | | | | |
| Net realized gain/(loss) on: | | | | |
| Investments | | | 742,841 | |
| Net realized gain | | | 742,841 | |
| Net change in unrealized appreciation/depreciation on: | | | | |
| Investments | | | (1,015,818 | ) |
| Net change in unrealized appreciation/depreciation | | | (1,015,818 | ) |
| Net Realized and Unrealized Loss on Investments | | | (272,977 | ) |
| Net Increase in Net Assets Resulting from Operations | | $ | 5,841,512 | |
See Notes to Financial Statements.
| 22 | (888) 848-7569 | www.rivernorth.com |
RiverNorth/DoubleLine Strategic Opportunity Fund, Inc.
Statements of Changes in Net Assets
| | | For the Six Months Ended December 31, 2019 (Unaudited) | | | For the Year Ended June 30, 2019 | |
| NET INCREASE/(DECREASE) IN NET ASSETS FROM OPERATIONS: | | | | | | | | |
| Net investment income | | $ | 6,114,489 | | | $ | 10,300,601 | |
| Net realized gain on investments and long-term capital gains from other investment companies | | | 742,841 | | | | 204,255 | |
| Net change in unrealized appreciation/depreciation on investments | | | (1,015,818 | ) | | | 4,172,754 | |
| Net increase in net assets resulting from operations | | | 5,841,512 | | | | 14,677,610 | |
| | | | | | | | | |
| DISTRIBUTIONS TO SHAREHOLDERS: | | | | | | | | |
| From distributable earnings | | | (12,112,963 | ) | | | (12,942,505 | ) |
| From tax return of capital | | | | | | | (9,082,869 | ) |
| Net decrease in net assets from distributions to shareholders | | | (12,112,963 | ) | | | (22,025,374 | ) |
| | | | | | | | | |
| CAPITAL SHARE TRANSACTIONS: | | | | | | | | |
| Proceeds from sale of shares, net of offering costs | | | 38,336,473 | | | | – | |
| Reinvestment of distributions | | | – | | | | – | |
| Net increase in net assets from capital share transactions | | | 38,336,473 | | | | – | |
| Net Increase/(Decrease) in Net Assets | | | 32,065,022 | | | | (7,347,764 | ) |
| | | | | | | | | |
| NET ASSETS: | | | | | | | | |
| Beginning of period | | $ | 199,213,009 | | | $ | 206,560,773 | |
| End of period | | | 231,278,031 | | | | 199,213,009 | |
| | | | | | | | | |
| Share Transactions: | | | | | | | | |
| Shares sold | | | 2,371,081 | | | | – | |
| Beginning of period | | | 11,013,787 | | | | 11,013,787 | |
| End of period | | | 13,384,868 | | | | 11,013,787 | |
See Notes to Financial Statements.
| Semi-Annual Report | December 31, 2019 | 23 |
RiverNorth/DoubleLine Strategic Opportunity Fund, Inc.
| Statement of Cash Flows | For the Six Months Ended December 31, 2019 (Unaudited) |
| CASH FLOWS FROM OPERATING ACTIVITIES: | | | |
| Net increase in net assets resulting from operations | | $ | 5,841,512 | |
| Adjustments to reconcile net increase in net assets from operations to net cash used in operating activities: | | | | |
| Purchase of investment securities | | | (39,293,022 | ) |
| Proceeds from disposition of long-term investment securities | | | 25,105,656 | |
| Net proceeds from short-term investment securities | | | (17,179,975 | ) |
| Net realized gain from investment securities | | | (742,841 | ) |
| Net change in unrealized depreciation on investment securities | | | 1,015,818 | |
| Amortization of premium and accretion of discount on investments | | | (1,057,211 | ) |
| (Increase)/Decrease in assets: | | | | |
| Interest receivable | | | 40,332 | |
| Dividends receivable | | | 257,995 | |
| Prepaid expenses and other assets | | | (65,674 | ) |
| Prepaid offering costs | | | (22,940 | ) |
| Increase/(Decrease) in liabilities: | | | | |
| Payable for interest due on facility loan | | | 169,725 | |
| Facility loan fee payable | | | 22,289 | |
| Payable for shareholder servicing | | | (75,977 | ) |
| Payable to Adviser | | | 20,307 | |
| Payable for fund accounting, administration and transfer agent fees | | | (76,966 | ) |
| Payable for audit fees | | | (17,469 | ) |
| Payable for custodian fees | | | (2,544 | ) |
| Payable to Chief Compliance Officer | | | 7,705 | |
| Payable to Directors | | | 596 | |
| Other accrued expenses | | | (29,064 | ) |
| Net cash used in operating activities | | | (26,081,748 | ) |
| | | | | |
| CASH FLOWS FROM FINANCING ACTIVITIES: | | | | |
| Proceeds from sales of shares | | | 38,336,473 | |
| Cash distributions paid to common shareholders | | | (12,112,963 | ) |
| Net cash provided by financing activities | | | 26,223,510 | |
| | | | | |
| Net increase in cash | | | 141,762 | |
| | | | | |
| Cash and foreign currency, beginning balance | | $ | 34,074 | |
| Cash and foreign currency, ending balance | | $ | 175,836 | |
| | | | | |
| SUPPLEMENTAL DISCLOSURE OF CASH FLOW INFORMATION: | | | | |
| Cash paid during the period for interest from bank borrowing: | | $ | 966,713 | |
See Notes to Financial Statements.
| 24 | (888) 848-7569 | www.rivernorth.com |
Page Intentionally Left Blank
RiverNorth/DoubleLine Strategic Opportunity Fund, Inc.
| Financial Highlights | For a share outstanding throughout the periods presented |
| Net asset value - beginning of period |
| Income from investment operations: |
| Net investment income(b) |
| Net realized and unrealized gain/(loss) on investments |
| Total income from investment operations |
| |
| Less distributions: |
| From net investment income |
| From tax return of capital |
| Total distributions |
| Capital share transactions: |
| Dilutuive effect of rights offering |
| Common share offering costs charged to paid-in capital |
| Total capital share transactions |
| Net increase/(decrease) in net asset value |
| Net asset value - end of period |
| Per common share market value - end of period |
| |
| Total Return based on net asset value(e) |
| |
| Total Return based on market value(e) |
| |
| Ratios/Supplemental Data: |
| Net assets, end of period (in thousands) |
| Ratio of expenses to average net assets(g)(h) |
| Ratio of net investment income to average net assets(b) |
| Portfolio turnover rate |
| Facility loan payable (in thousands) |
| Asset coverage per $1,000 of facility loan payable(j) |
See Notes to Financial Statements.
| 26 | (888) 848-7569 | www.rivernorth.com |
RiverNorth/DoubleLine Strategic Opportunity Fund, Inc.
| Financial Highlights | For a share outstanding throughout the periods presented |
For the Six Months Ended December 31, 2019 (Unaudited) | | | For the Year Ended June 30, 2019 | | | For the Year Ended June 30, 2018 | | | For the Period Ended June 30, 2017(a) | |
| $ | 18.09 | | | $ | 18.75 | | | $ | 20.04 | | | $ | 19.60 | |
| | | | | | | | | | | | | | | |
| | 0.54 | | | | 0.94 | | | | 1.06 | | | | 0.94 | |
| | (0.05 | ) | | | 0.40 | | | | (0.64 | ) | | | 0.46 | |
| | 0.49 | | | | 1.34 | | | | 0.42 | | | | 1.40 | |
| | | | | | | | | | | | | | | |
| | | | | | | | | | | | | | | |
| | (1.10 | ) | | | (1.18 | ) | | | (1.40 | )(c) | | | (0.92 | ) |
| | – | | | | (0.82 | ) | | | (0.31 | ) | | | – | |
| | (1.10 | ) | | | (2.00 | ) | | | (1.71 | ) | | | (0.92 | ) |
| | | | | | | | | | | | | | | |
| | (0.19 | )(d) | | | – | | | | – | | | | – | |
| | (0.01 | ) | | | – | | | | – | | | | – | |
| | (0.20 | ) | | | – | | | | – | | | | – | |
| | (0.81 | ) | | | (0.66 | ) | | | (1.29 | ) | | | 0.44 | |
| $ | 17.28 | | | $ | 18.09 | | | $ | 18.75 | | | $ | 20.04 | |
| $ | 16.43 | | | $ | 17.06 | | | $ | 17.69 | | | $ | 19.54 | |
| | | | | | | | | | | | | | | |
| | 1.68 | %(f) | | | 7.78 | % | | | 2.12 | % | | | 7.10 | %(f) |
| | | | | | | | | | | | | | | |
| | 2.52 | %(f) | | | 8.50 | % | | | (0.65 | %) | | | 2.50 | %(f) |
| | | | | | | | | | | | | | | |
| | | | | | | | | | | | | | | |
| $ | 231,278 | | | $ | 199,213 | | | $ | 206,561 | | | $ | 220,768 | |
| | 3.04 | %(i) | | | 3.16 | % | | | 2.67 | % | | | 2.14 | %(i) |
| | 6.08 | %(i) | | | 5.17 | % | | | 5.42 | % | | | 5.28 | %(i) |
| | 10 | %(f) | | | 27 | % | | | 23 | % | | | 35 | %(f) |
| $ | 73,500 | | | $ | 73,500 | | | $ | 73,500 | | | $ | 71,500 | |
| $ | 4,147 | | | $ | 3,711 | | | $ | 3,811 | | | $ | 4,090 | |
| (a) | Commenced operations on September 28, 2016. |
| (b) | Recognition of net investment income by the Fund is affected by the timing of the declarations of dividends by the underlying closed-end funds in which the Fund invests. The ratio does not include net investment income of the closed-end funds in which the Fund invests. |
| (c) | Includes net realized gain distributions of (0.09) |
See Notes to Financial Statements.
| Semi-Annual Report | December 31, 2019 | 27 |
RiverNorth/DoubleLine Strategic Opportunity Fund, Inc.
| Financial Highlights | For a share outstanding throughout the periods presented |
| (d) | Represents the impact of the Fund's rights offering of 2,371,081 shares in December 2019 at a subscription price per share based on a formula. For more details please refer to Note 8 of the Notes to Financial Statements. |
| (e) | Total return in the above table represents the rate that the investor would have earned or lost on an investment in the Fund, assuming reinvestment of dividends. The net asset value and market price returns will differ depending upon the level of any discount from or premium to net asset value at which the Fund's shares traded during the period. Total return based on market value does not reflect sales load. |
| (g) | Includes interest expenses of 1.13% for the six months ended December 31, 2019, 1.23% for the year ended June 30, 2019, 0.87% for the year ended June 30, 2018 and 0.46% |
| (f) | for the period from September 28, 2016 (commencement of operations) through June 30, 2017. |
| (h) | Does not include expenses of the closed-end funds in which the Fund invests. |
| (j) | Calculated by subtracting the Fund's total liabilities (excluding the facility loan and accumulated unpaid interest on facility loan) from the Fund's total assets and dividing by the outstanding facility loan balance. |
See Notes to Financial Statements.
| 28 | (888) 848-7569 | www.rivernorth.com |
RiverNorth/DoubleLine Strategic Opportunity Fund, Inc.
| Notes to Financial Statements | December 31, 2019 (Unaudited) |
1. ORGANIZATION
RiverNorth/DoubleLine Strategic Opportunity Fund, Inc. (the “Fund”) is a closed-end management investment company that was organized as a Maryland corporation on June 22, 2016, and commenced investment operations on September 28, 2016. The investment adviser to the Fund is RiverNorth Capital Management, LLC (the “Adviser”). The Fund’s sub-adviser is DoubleLine Capital, LP (“Sub-Adviser”). The Fund is a diversified investment company with an investment objective to seek current income and overall total return.
The Fund seeks to achieve its investment objective by allocating its Managed Assets among two principal strategies; under normal market conditions, the Fund may allocate between 10% and 35% of its Managed Assets to the Tactical Closed-End Fund Income Strategy and 65% to 90% of its Managed Assets to the Opportunistic Income Strategy. The Adviser will determine the portion of the Fund’s Managed Assets to allocate to each strategy and may, from time to time, adjust the allocations.
2. SIGNIFICANT ACCOUNTING POLICIES
The following is a summary of significant accounting policies followed by the Fund. These policies are in conformity with generally accepted accounting principles in the United States of America (“GAAP”). The financial statements are prepared in accordance with GAAP, which requires management to make estimates and assumptions that affect the reported amounts and disclosures, including the disclosure of contingent assets and liabilities, in the financial statements during the reporting period. Management believes the estimates and security valuations are appropriate; however, actual results may differ from those estimates, and the security valuations reflected in the financial statements may differ from the value the Fund ultimately realizes upon sale of the securities. The Fund is considered an investment company for financial reporting purposes under GAAP and follows the accounting and reporting guidance applicable to investment companies as codified in Accounting Standards Codification (“ASC”) 946 – Investment Companies. The financial statements have been prepared as of the close of the New York Stock Exchange (“NYSE”) on December 31, 2019.
Security Valuation:The Fund’s investments are generally valued at their fair value using market quotations. If a market value quotation is unavailable a security may be valued at its estimated fair value as described in Note 3.
Security Transactions and Related Income: The Fund follows industry practice and records security transactions on the trade date basis. The specific identification method is used for determining gains or losses for financial statements and income tax purposes. Dividend income is recorded on the ex-dividend date or for certain foreign securities, when the information becomes available to the Fund and interest income and expenses are recorded on an accrual basis. Discounts and premiums on securities purchased are amortized or accreted using the effective interest method. Paydown gains and losses on mortgage-related and other asset-backed securities are recorded as components of interest income on the Statement of Operations. Withholding taxes on foreign dividends have been provided for in accordance with the Fund’s understanding of the applicable country’s tax rules and rates. The ability of issuers of debt securities held by the Fund to meet their obligations may be affected by economic and political developments in a specific country or region. Settlement on bank loans transactions may be in excess of seven business days. Interest only stripped mortgage backed securities (“IO Strips”) are securities that receive only interest payments from a pool of mortgage loans. Little to no principal will be received by the Fund upon maturity of an IO Strip. Periodic adjustments are recorded to reduce the cost of the security until maturity, which are included in interest income.
| Semi-Annual Report | December 31, 2019 | 29 |
RiverNorth/DoubleLine Strategic Opportunity Fund, Inc.
| Notes to Financial Statements | December 31, 2019 (Unaudited) |
Other:The Fund holds certain investments which pay dividends to their shareholders based upon available funds from operations. It is possible for these dividends to exceed the underlying investments’ taxable earnings and profits resulting in the excess portion of such dividends being designated as a return of capital. Distributions received from investments in securities that represent a return of capital or long-term capital gains are recorded as a reduction of the cost of investments or as a realized gain, respectively.
Share Valuation:The NAV is generally calculated as of the close of trading on the New York Stock Exchange (“the Exchange”) (normally 4:00 p.m. Eastern time) every day the Exchange is open. The NAV is calculated by dividing the value of all of the securities and other assets of the Fund, less the liabilities (including accrued expenses and indebtedness), by the total number of common shares outstanding.
Federal Income Taxes: The Fund has been treated as, and intends to qualify each year for special tax treatment afforded to, a regulated investment company (“RIC”) under Subchapter M of the Internal Revenue Code, as amended (“IRC”). In order to qualify as a RIC, the Fund must, among other things, satisfy income, asset diversification and distribution requirements. As long as it so qualifies, the Fund will not be subject to U.S. federal income tax to the extent that it distributes annually its investment company taxable income and its “net capital gain”. If the Fund retains any investment company taxable income or net capital gain, it will be subject to U.S. federal income tax on the retained amount at regular corporate tax rates. In addition, if the Fund fails to qualify as a RIC for any taxable year, it will be subject to U.S. federal income tax on all of its income and gains at regular corporate tax rates.
Distributions to Shareholders:Distributions to shareholders, which are determined in accordance with income tax regulations, are recorded on the ex-dividend date. The treatment for financial reporting purposes of distributions made to shareholders during the year from net investment income or net realized capital gains may differ from their ultimate treatment for federal income tax purposes. These differences are caused primarily by differences in the timing of recognition of certain components of income, expense, or realized capital gain for federal income tax purposes. Where such differences are permanent in nature, they are reclassified in the components of the net assets based on their ultimate characterization for federal income tax purposes. Any such reclassification will have no effect on net assets, results of operations, or net asset values per share of the Fund.
The Fund maintains a level distribution policy. The Fund distributes to shareholders regular monthly cash distributions of its net investment income. In addition, the Fund distributes its net realized capital gains, if any, at least annually.
At times, to maintain a stable level of distributions, the Fund may pay out less than all of its net investment income or pay out accumulated undistributed income, or return capital, in addition to current net investment income. Any distribution that is treated as a return of capital generally will reduce a shareholder’s basis in his or her shares, which may increase the capital gain or reduce the capital loss realized upon the sale of such shares. Any amounts received in excess of a shareholder’s basis are generally treated as capital gain, assuming the shares are held as capital assets.
| 30 | (888) 848-7569 | www.rivernorth.com |
RiverNorth/DoubleLine Strategic Opportunity Fund, Inc.
| Notes to Financial Statements | December 31, 2019 (Unaudited) |
The Board approved the implementation of the level distribution policy to make monthly cash distributions to common shareholders, stated in terms of a rate equal to 12.5 % of the average of the Fund’s NAV per share for the final five trading days of 2018, which amounted to $17.60. The Fund makes monthly distributions to common shareholders set at a level monthly rate of $0.18 per common share.
Previously the Board approved the adoption of a managed distribution plan in accordance with a Section 19(b) exemptive order whereby the Fund made monthly distributions to common shareholders set at a fixed monthly rate of $0.15 per common share.
The amount of the Fund’s distributions pursuant to the managed distribution plan are not related to the Fund’s performance and, therefore, investors should not make any conclusions about the Fund’s investment performance from the amount of the Fund’s distributions or from the terms of the Fund’s managed distribution plan. The Board may amend, suspend or terminate the managed distribution plan at any time without notice to shareholders.
3. SECURITIES VALUATION AND FAIR VALUE MEASUREMENTS
Fair value is defined as the price that the Fund might reasonably expect to receive upon selling an investment in a timely transaction to an independent buyer in the principal or most advantageous market of the investment. GAAP establishes a three-tier hierarchy to maximize the use of observable market data and minimize the use of unobservable inputs and to establish classification of fair value measurements for disclosure purposes.
Inputs refer broadly to the assumptions that market participants would use in pricing the asset or liability, including assumptions about risk, for example, the risk inherent in a particular valuation technique used to measure fair value including using such a pricing model and/or the risk inherent in the inputs to the valuation technique. Inputs may be observable or unobservable. Observable inputs are inputs that reflect the assumptions market participants would use in pricing the asset or liability developed based on market data obtained from sources independent of the reporting entity. Unobservable inputs are inputs that reflect the reporting entity’s own assumptions about the assumptions market participants would use in pricing the asset or liability developed based on the best information available in the circumstances.
Various inputs are used in determining the value of the Fund’s investments. These inputs are summarized in the three broad levels listed below.
| ● | Level 1 – Unadjusted quoted prices in active markets for identical, unrestricted assets or liabilities that a Fund has the ability to access at the measurement date; |
| ● | Level 2 – Quoted prices which are not active, quoted prices for similar assets or liabilities in active markets or inputs other than quoted prices that are observable (either directly or indirectly) for substantially the full term of the asset or liability; and |
| Semi-Annual Report | December 31, 2019 | 31 |
RiverNorth/DoubleLine Strategic Opportunity Fund, Inc.
| Notes to Financial Statements | December 31, 2019 (Unaudited) |
| ● | Level 3 – Significant unobservable prices or inputs (including the Fund’s own assumptions in determining the fair value of investments) where there is little or no market activity for the asset or liability at the measurement date. |
The inputs used to measure fair value may fall into different levels of the fair value hierarchy. In such cases, for disclosure purposes, the level in the fair value hierarchy within which the fair value measurement falls in its entirety is determined based on the lowest level input that is significant to the fair value measurement in its entirety.
Equity securities, including closed-end funds and business development company notes, are generally valued by using market quotations, but may be valued on the basis of prices furnished by a pricing service when the Adviser or the Sub-Adviser believes such prices more accurately reflect the fair market value of such securities. Securities that are traded on any stock exchange are generally valued by the pricing service at the last quoted sale price. Lacking a last sale price, an exchange traded security is generally valued by the pricing service at its last bid price. Securities traded in the NASDAQ over-the-counter market are generally valued by the pricing service at the NASDAQ Official Closing Price. When using the market quotations or close prices provided by the pricing service and when the market is considered active, the security will be classified as a Level 1 security. Sometimes, an equity security owned by the Fund will be valued by the pricing service with factors other than market quotations or when the market is considered inactive. When this happens, the security will be classified as a Level 2 security. When market quotations are not readily available, when the Adviser or the Sub-Adviser determines that the market quotation or the price provided by the pricing service does not accurately reflect the current fair value, or when restricted or illiquid securities are being valued, such securities are valued as determined in good faith by the Adviser, Sub-Adviser, or Valuation Committee in conformity with guidelines adopted by and subject to review by the Board. These securities will be categorized as Level 3 securities.
Investments in mutual funds, including short term investments, are generally priced at the ending NAV provided by the service agent of the funds. These securities will be classified as Level 1 securities.
Domestic and foreign fixed income securities, including foreign and U.S. corporate bonds, foreign government bonds and notes, supranationals and foreign agencies, asset backed obligations, non- agency collateralized mortgage obligations, U.S. Government/Agency mortgage backed securities, bank loans, and collateralized loan obligations are normally valued on the basis of quotes obtained from brokers and dealers or independent pricing services. Foreign currency positions, including forward foreign currency contracts, are priced at the mean between the closing bid and asked prices at 4:00 p.m. Eastern Time. Prices obtained from independent pricing services typically use information provided by market makers or estimates of market values obtained from yield data relating to investments or securities with similar characteristics. Data used to establish quotes includes analysis of cash flows, pre-payment speeds, default rates, delinquency assumptions and assumptions regarding collateral and loss assumptions. These securities will be classified as Level 2 securities.
Short-term investments in fixed income securities, excluding money market funds, with maturities of less than 60 days when acquired, or which subsequently are within 60 days of maturity, are valued by using the amortized cost method of valuation, which the Board has determined will represent fair value. These securities will be classified as Level 2 securities.
| 32 | (888) 848-7569 | www.rivernorth.com |
RiverNorth/DoubleLine Strategic Opportunity Fund, Inc.
| Notes to Financial Statements | December 31, 2019 (Unaudited) |
In accordance with the Fund’s good faith pricing guidelines, the Adviser, Sub-Adviser, or Valuation Committee is required to consider all appropriate factors relevant to the value of securities for which it has determined other pricing sources are not available or reliable as described above. No single standard exists for determining fair value, because fair value depends upon the circumstances of each individual case. As a general principle, the current fair value of an issue of securities being valued by the Adviser, Sub-Adviser, or valuation committee would appear to be the amount which the owner might reasonably expect to receive for them upon their current sale. Methods which are in accordance with this principle may, for example, be based on (i) a multiple of earnings; (ii) discounted cash flow models; (iii) weighted average cost or weighted average price; (iv) a discount from market of a similar freely traded security (including a derivative security or a basket of securities traded on other markets, exchanges or among dealers); or (v) yield to maturity with respect to debt issues, or a combination of these and other methods. Good faith pricing is permitted if, in the Adviser’s, a Sub-Adviser’s, or the Valuation Committee’s opinion, the validity of market quotations appears to be questionable based on factors such as evidence of a thin market in the security based on a small number of quotations, a significant event occurs after the close of a market but before a Fund’s NAV calculation that may affect a security’s value, or the Adviser or a Sub-Adviser is aware of any other data that calls into question the reliability of market quotations.
Good faith pricing may also be used in instances when the bonds in which the Fund invests default or otherwise cease to have market quotations readily available.
The following is a summary of the inputs used at December 31, 2019 in valuing the Fund’s assets:
| | | Valuation Inputs | | | | |
| Investments in Securities at | | | | | | | | | | | | |
| Value* | | Level 1 | | | Level 2 | | | Level 3 | | | Total | |
| Closed-End Funds | | $ | 52,755,631 | | | $ | – | | | $ | – | | | $ | 52,755,631 | |
| Common Stocks | | | 477 | | | | – | | | | – | | | | 477 | |
| Business Development | | | | | | | | | | | | | | | | |
| Company Notes | | | 12,904,299 | | | | – | | | | – | | | | 12,904,299 | |
| Foreign Corporate Bonds | | | – | | | | 10,224,087 | | | | – | | | | 10,224,087 | |
| U.S. Corporate Bonds | | | – | | | | 956,921 | | | | – | | | | 956,921 | |
| Foreign Government Bonds and | | | | | | | | | | | | | | | | |
| Notes, Supranationals and | | | | | | | | | | | | | | | | |
| Foreign Agencies | | | – | | | | 274,921 | | | | – | | | | 274,921 | |
| Bank Loans | | | – | | | | 10,920,157 | | | | – | | | | 10,920,157 | |
| Collateralized Loan Obligations | | | – | | | | 7,549,745 | | | | – | | | | 7,549,745 | |
| Non-Agency Collateralized | | | | | | | | | | | | | | | | |
| Mortgage Obligations | | | – | | | | 46,097,557 | | | | 3,383,292 | | | | 49,480,849 | |
| U.S. Government / Agency | | | | | | | | | | | | | | | | |
| Mortgage Backed Securities | | | – | | | | 127,938,532 | | | | – | | | | 127,938,532 | |
| Short-Term Investments | | | 35,440,641 | | | | – | | | | – | | | | 35,440,641 | |
| Total | | $ | 101,101,048 | | | $ | 203,961,920 | | | $ | 3,383,292 | | | $ | 308,446,260 | |
| * | Refer to the Fund’s Schedule of Investments for a listing of securities by type. |
| Semi-Annual Report | December 31, 2019 | 33 |
RiverNorth/DoubleLine Strategic Opportunity Fund, Inc.
| Notes to Financial Statements | December 31, 2019 (Unaudited) |
The changes of the fair value of investments for which the Fund has used Level 3 inputs to determine the fair value are as follows:
| Asset Type | | Balance
as of
June 30, 2019 | | | Change in
Unrealized
Appreciation/
Depreciation | | | Purchases | | | Sales
Proceeds | | | Transfer
into
Level 3 | | | Transfer
Out of
Level 3 | | | Balance
as of
December 31, 2019 | | | Net change in
unrealized appreciation/
depreciation included
in the Statements
of Operations
attributable to Level 3
investments held at
December 31, 2019 | |
Non-Agency
Collateralized
Mortgage
Obligations | | $ | – | | | $ | 2,412 | | | $ | 1,097,250 | | | $ | – | | | $ | 2,283,630 | | | $ | – | | | $ | 3,383,292 | | | $ | 42,217 | |
| | | $ | – | | | $ | 2,412 | | | $ | 1,097,250 | | | $ | – | | | $ | 2,283,630 | | | $ | – | | | $ | 3,383,292 | | | $ | 42,217 | |
The table below provides additional information about the Level 3 Fair Value Measurements as of December 31, 2019:
Quantitative Information about Level 3 Fair Value Measurements
| Asset Class | Fair Value (USD) | Valuation
Technique | Unobservable
Inputs(a) | Value/Range
(Weighted Average) |
| Non-Agency Collateralized Mortgage Obligations | $3,383,292 | Third-party vendor pricing service | Broker Quote | N/A |
| (a) | A change to the unobservable input may result in a significant change to the value of the investment as follows: |
| Unobservable Inputs | Impact to Value if Input Increases | Impact to Value if Input Decreases |
| Broker Quote | Increase | Decrease |
4. INVESTMENT ADVISORY FEE AND OTHER TRANSACTIONS WITH AFFILIATES
The Adviser serves as the investment adviser to the Fund. Under the terms of the management agreement (the “Agreement”), the Adviser, subject to the supervision of the Board, provides or arranges to be provided to the Fund such investment advice as it deems advisable and will furnish or arrange to be furnished a continuous investment program for the Fund consistent with the Fund’s investment objectives and policies. As compensation for its management services, the Fund is obligated to pay the Adviser a fee computed and accrued daily and paid monthly in arrears at an annual rate of 1.00% of the average daily managed assets of the Fund. Managed assets are defined as the total assets of the Fund, including assets attributable to leverage, minus liabilities.
DoubleLine Capital, LP is the investment sub-adviser to the Fund. Under the terms of the sub- advisory agreement, the Sub-Adviser, subject to the supervision of the Adviser and the Board, provides or arranges to be provided to the Fund such investment advice as deemed advisable and will furnish or arrange to be furnished a continuous investment program for the portion of assets managed in the Fund consistent with the Fund’s investment objective and policies. As compensation for its sub-advisory services, the Adviser is obligated to pay the Sub-Adviser a fee computed and accrued daily and paid monthly in arrears based on an annual rate of 0.50% of the average daily managed assets of the Fund.
| 34 | (888) 848-7569 | www.rivernorth.com |
RiverNorth/DoubleLine Strategic Opportunity Fund, Inc.
| Notes to Financial Statements | December 31, 2019 (Unaudited) |
ALPS Fund Services, Inc. (“ALPS”) provides the Fund with fund administration and fund accounting services. As compensation for its services to the Fund, ALPS receives an annual fee based on the Fund’s average daily net assets, subject to certain minimums.
State Street Bank & Trust, Co. serves as the Fund’s custodian.
DST Systems, Inc. (“DST”), the parent company of ALPS, serves as the Transfer Agent to the Fund. Under the Transfer Agency Agreement, DST is responsible for maintaining all shareholder records of the Fund. DST is a wholly-owned subsidiary of SS&C Technologies Holdings, Inc. (“SS&C”), a publicly traded company listed on the NASDAQ Global Select Market.
Prior to December 16, 2019, U.S. Bancorp Fund Services, LLC, d/b/a U.S. Bank Global Fund Services provided fund administration and fund accounting, transfer agent, and custodial services to the Fund.
Officers of the Fund and Directors who are “interested persons” of the Fund or the Adviser receive no salary or fees from the Fund, except the Chief Compliance Officer. Each Director who is not an “interested person” receive a fee of $16,500 per year plus $1,500 per meeting attended. In addition, the lead Independent Director receives $250 annually, the Chair of the Audit Committee receives $500 annually, and the Chair of the Nominating and Corporate Governance Committee receives $250 annually. The Fund reimburses each Director and Officer for his or her travel and other expenses relating to the attendance at such meetings. Certain officers and/or interested directors of the Fund are also officers of the Adviser.
5. FEDERAL INCOME TAXES
It is the Fund’s policy to meet the requirements of the IRC applicable to regulated investment companies, and to distribute all of its taxable net income to its shareholders. In addition, the Fund intends to pay distributions as required to avoid imposition of excise tax. Therefore, no federal income tax provision is required.
Tax Basis of Distributions to Shareholders: The character of distributions made during the year from net investment income or net realized gains may differ from its ultimate characterization for federal income tax purposes. Also, due to the timing of dividend distributions, the fiscal year in which amounts are distributed may differ from the fiscal year in which the income or realized gain were recorded by the Fund.
The tax character of the distributions paid by the Fund during the fiscal year ended June 30, 2019, was as follows:
| | | June 30, 2019 | |
| Ordinary Income | | $ | 12,942,505 | |
| Return of Capital | | | 9,082,869 | |
| Total | | $ | 22,025,374 | |
| Semi-Annual Report | December 31, 2019 | 35 |
RiverNorth/DoubleLine Strategic Opportunity Fund, Inc.
| Notes to Financial Statements | December 31, 2019 (Unaudited) |
Unrealized Appreciation and Depreciation on Investments: As of June 30, 2019, net unrealized appreciation/(depreciation) of investments based on federal tax costs was as follows:
| Cost of investments for income tax purposes | | $ | 309,994,837 | |
| Gross appreciation on investments (excess of value over tax cost) | | | 7,029,410 | |
| Gross depreciation on investments (excess of tax cost over value) | | | (8,577,987 | ) |
| Net unrealized depreciation on investments | | $ | (1,548,577 | ) |
6. INVESTMENT TRANSACTIONS
Investment transactions for the six months ended December 31, 2019, excluding short-term investments, were as follows:
| | | Purchases | | | Sales | |
| | | $ | 44,811,277 | | | $ | 26,995,787 | |
7. REVOLVING CREDIT FACILITY
The Fund may borrow money and/or issue preferred stock, notes or debt securities for investment purposes. These practices are known as leveraging. The Fund may use leverage through borrowings or the issuance of preferred stock, in an aggregate amount of up to 33 1/3% of the Fund’s Total Assets immediately after such borrowings or issuance.
On December 16, 2016, the Fund entered into a $75,000,000 secured, revolving, evergreen credit facility with U.S. Bank National Association (“U.S. Bank”). The Fund incurred a $75,000 administrative fee upon entering into the credit facility. The credit facility has a variable annual interest rate equal to one-month LIBOR plus 0.95 percent. The credit facility will accrue a commitment fee equal to an annual rate of 0.10 percent on $75,000,000.
The average principal balance and interest rate for the period during which the credit facility was utilized for the six months ended December 31, 2019 was approximately $73,500,000 and 3.067%, respectively. At December 31, 2019, the principal balance outstanding was $73,500,000 at an interest rate of 2.7625%. As of and for the six months ended December 31, 2019, the Fund reached its maximum amount outstanding of $73,500,000. Securities that have been pledged as collateral for the borrowings are indicated in the Schedule of Investments.
8. CAPITAL SHARE TRANSACTIONS
The Fund’s authorized capital stock consists of 50,000,000 shares of common stock, $0.0001 par value per share, all of which is initially classified as common shares. Under the rules of the NYSE applicable to listed companies, the Fund is required to hold an annual meeting of stockholders in each year.
On November 1, 2019, the Board approved a rights offering to participating shareholders of record as of November 12, 2019 (the “Record Date”) who were allowed to subscribe for new common shares of the Fund (the “Primary Subscription”). Record Date Shareholders received one right for each common share held on the Record Date (“Right”). For every three Rights held, a holder of the Rights was entitled to buy one new common share of the Fund. Record Date Shareholders who fully exercised all Rights initially issued to them in the Primary Subscription were entitled to buy those common shares that were not purchased by other Record Date Shareholders. The Fund issued 2,371,081 new shares of common stock as a result of the rights offering which closed on December 10, 2019 (the “Expiration Date”). The subscription price of $16.21 per share was established on the Expiration Date, which represented 92.5% of the reported net asset value on the Expiration Date. The offering costs of $98,750 were charged to paid-in-capital upon the exercise of the rights.
| 36 | (888) 848-7569 | www.rivernorth.com |
RiverNorth/DoubleLine Strategic Opportunity Fund, Inc.
| Notes to Financial Statements | December 31, 2019 (Unaudited) |
Additional shares of the Fund may be issued under certain circumstances, including pursuant to the Fund’s Automatic Dividend Reinvestment Plan, as defined within the Fund’s organizational documents. Additional information concerning the Automatic Dividend Reinvestment Plan is included within this report.
9. INDEMNIFICATIONS
Under the Fund’s organizational documents, its Officers and Directors are indemnified against certain liabilities arising out of the performance of their duties to the Fund. Additionally, in the normal course of business, the Fund enters into contracts with service providers that may contain general indemnification clauses. The Fund’s maximum exposure under those arrangements is unknown, as this would involve future claims that may be made against the Fund that have not yet occurred.
10. ACCOUNTING PRONOUNCEMENTS
In August 2018, the Financial Accounting Standards Board (“FASB”) issued Accounting Standards Update (“ASU”) 2018-13, Fair Value Measurement (Topic 820): Disclosure Framework – changes to the Disclosure Requirements for Fair Value Measurements, which amended guidance on the disclosure requirements for fair value measurement. The update to Topic 820 includes added, eliminated, and modified disclosure requirements for investments measured at fair value. ASU 2018-13 is effective for fiscal years beginning after December 15, 2019, including interim periods. Early adoption is permitted for any eliminated or modified disclosures. The impact of the amended guidance on the Fund was the removal of the requirements to disclose (a) amounts of and reasons for transfers between Level 1 and 2 fair value measurements, (b) the valuation process for Level 3 fair value measurements, and (c) the policy for timing of transfers between levels. Management has evaluated the impact of this ASU and has adopted eliminated and modified disclosures.
11. SUBSEQUENT EVENTS
Subsequent to December 31, 2019, the Fund paid the following distributions:
| Ex-Date | Record Date | Payable Date | Rate (per share) |
| January 16, 2020 | January 17, 2020 | January 31, 2020 | $0.0917 |
| February 13, 2020 | February 14, 2020 | February 28, 2020 | $0.0917 |
| Semi-Annual Report | December 31, 2019 | 37 |
RiverNorth/DoubleLine Strategic Opportunity Fund, Inc.
| Dividend Reinvestment Plan | December 31, 2019 (Unaudited) |
The Fund has an automatic dividend reinvestment plan commonly referred to as an “opt-out” plan. Unless the registered owner of Common Shares elects to receive cash by contacting DST Systems, Inc. (the “Plan Administrator”), all dividends declared on Common Shares will be automatically reinvested by the Plan Administrator for shareholders in the Fund’s Automatic Dividend Reinvestment Plan (the “Plan”), in additional Common Shares. Common Shareholders who elect not to participate in the Plan will receive all dividends and other distributions in cash paid by check mailed directly to the shareholder of record (or, if the Common Shares are held in street or other nominee name, then to such nominee) by the Plan Administrator as dividend disbursing agent. Participation in the Plan is completely voluntary and may be terminated or resumed at any time without penalty by notice if received and processed by the Plan Administrator prior to the dividend record date; otherwise such termination or resumption will be effective with respect to any subsequently declared dividend or other distribution. Such notice will be effective with respect to a particular dividend or other distribution (together, a “Dividend”). Some brokers may automatically elect to receive cash on behalf of Common Shareholders and may re-invest that cash in additional Common Shares. Reinvested Dividends will increase the Fund’s Managed Assets on which the management fee is payable to the Adviser (and by the Adviser to the Sub-Adviser).
Whenever the Fund declares a Dividend payable in cash, non-participants in the Plan will receive cash and participants in the Plan will receive the equivalent in Common Shares. The Common Shares will be acquired by the Plan Administrator for the participants’ accounts, depending upon the circumstances described below, either (i) through receipt of additional unissued but authorized Common Shares from the Fund (“Newly Issued Common Shares”) or (ii) by purchase of outstanding Common Shares on the open market (“Open-Market Purchases”) on the NYSE or elsewhere. If, on the payment date for any Dividend, the closing market price plus estimated brokerage commissions per Common Share is equal to or greater than the NAV per Common Share, the Plan Administrator will invest the Dividend amount in Newly Issued Common Shares on behalf of the participants. The number of Newly Issued Common Shares to be credited to each participant’s account will be determined by dividing the dollar amount of the Dividend by the Fund’s NAV per Common Share on the payment date. If, on the payment date for any Dividend, the NAV per Common Share is greater than the closing market value plus estimated brokerage commissions (i.e., the Fund’s Common Shares are trading at a discount), the Plan Administrator will invest the Dividend amount in Common Shares acquired on behalf of the participants in Open-Market Purchases.
In the event of a market discount on the payment date for any Dividend, the Plan Administrator will have until the last business day before the next date on which the Common Shares trade on an “ex-dividend” basis or 30 days after the payment date for such Dividend, whichever is sooner (the “Last Purchase Date”), to invest the Dividend amount in Common Shares acquired in Open-Market Purchases. It is contemplated that the Fund will pay monthly income Dividends. If, before the Plan Administrator has completed its Open-Market Purchases, the market price per Common Share exceeds the NAV per Common Share, the average per Common Share purchase price paid by the Plan Administrator may exceed the NAV of the Common Shares, resulting in the acquisition of fewer Common Shares than if the Dividend had been paid in Newly Issued Common Shares on the Dividend payment date. Because of the foregoing difficulty with respect to Open-Market Purchases, the Plan provides that if the Plan Administrator is unable to invest the full Dividend amount in Open-Market Purchases during the purchase period or if the market discount shifts to a market premium during the purchase period, the Plan Administrator may cease making Open-Market Purchases and may invest the uninvested portion of the Dividend amount in Newly Issued Common Shares at the NAV per Common Share at the close of business on the Last Purchase Date.
| 38 | (888) 848-7569 | www.rivernorth.com |
RiverNorth/DoubleLine Strategic Opportunity Fund, Inc.
| Dividend Reinvestment Plan | December 31, 2019 (Unaudited) |
The Plan Administrator maintains all shareholders’ accounts in the Plan and furnishes written confirmation of all transactions in the accounts, including information needed by shareholders for tax records. Common Shares in the account of each Plan participant will be held by the Plan Administrator on behalf of the Plan participant, and each shareholder proxy will include those shares purchased or received pursuant to the Plan. The Plan Administrator will forward all proxy solicitation materials to participants and vote proxies for shares held under the Plan in accordance with the instructions of the participants.
Beneficial owners of Common Shares who hold their Common Shares in the name of a broker or nominee should contact the broker or nominee to determine whether and how they may participate in the Plan. In the case of Common Shareholders such as banks, brokers or nominees which hold shares for others who are the beneficial owners, the Plan Administrator will administer the Plan on the basis of the number of Common Shares certified from time to time by the record shareholder’s name and held for the account of beneficial owners who participate in the Plan.
There will be no brokerage charges with respect to Common Shares issued directly by the Fund. However, each participant will pay a pro rata share of brokerage commissions incurred in connection with Open-Market Purchases. The automatic reinvestment of Dividends will not relieve participants of any federal, state or local income tax that may be payable (or required to be withheld) on such Dividends, even though such participants have not received any cash with which to pay the resulting tax. See “U.S. Federal Income Tax Matters” below. Participants that request a sale of Common Shares through the Plan Administrator are subject to brokerage commissions.
The Fund reserves the right to amend or terminate the Plan. There is no direct service charge to participants with regard to purchases in the Plan; however, the Fund reserves the right to amend the Plan to include a service charge payable by the participants. All correspondence or questions concerning the Plan should be directed to the Plan Administrator at (844) 569-4750.
| Semi-Annual Report | December 31, 2019 | 39 |
RiverNorth/DoubleLine Strategic Opportunity Fund, Inc.
| Additional Information | December 31, 2019 (Unaudited) |
PROXY VOTING GUIDELINES
A description of the policies and procedures that the Fund used to determine how to vote proxies relating to portfolio securities and information regarding how the Fund voted proxies during the most recent 12-month period ended June 30, are available without charge upon request by (1) calling the Fund at (888) 848-7569 and (2) from Form N-PX filed by the Fund with the SEC on the SEC’s website at www.sec.gov.
PORTFOLIO HOLDINGS DISCLOSURE POLICY
The Fund files a complete schedule of investments with the SEC for the first and third quarter of the fiscal year on Part F of Form N-PORT. The Fund’s first and third fiscal quarters end of September 30 and March 31. The Form N-PORT filing must be made within 60 days of the end of the quarter. The Fund’s Form N-PORT (and its predecessor Form, Form N-Q) are available on the SEC’s website at www.sec.gov. You may also obtain copies by calling the Fund at 1-888-848-7569.
| 40 | (888) 848-7569 | www.rivernorth.com |
RiverNorth/DoubleLine Strategic Opportunity Fund, Inc.
| Consideration and Approval of Advisory and Sub-Advisory Agreements | December 31, 2019 (Unaudited) |
Consideration of Investment Advisory Agreement with RiverNorth Capital Management, LLC,
At an in-person meeting of the Board, held on November 12, 2019 and called expressly for that purpose, the Board, including a majority of the Trustees who are not “interested persons” (as defined in the 1940 Act (the “Independent Trustees”)), considered the approval of the Management Agreement between the Adviser and the Fund. The Board received materials compiled by the Adviser and the Fund’s administrator including a copy of the Management Agreement, the Adviser’s response to a questionnaire regarding the Adviser’s profitability, management and operations, a copy of the Adviser’s Form ADV, and certifications regarding the Adviser’s compliance programs. In its consideration of the Management Agreement, the Board considered information and materials furnished by the Adviser in advance of and at the meeting and was afforded the opportunity to request additional information and to ask questions of the Adviser to obtain information that it believed to be reasonably necessary to evaluate the terms of the Management Agreement. The Board considered the following factors, among others, in reaching its determination to renew the Management Agreement: (i) the investment performance of the Fund and the investment performance of the Adviser, (ii) the nature, extent and quality of the services provided by the Adviser to the Fund, (iii) the experience and qualifications of the personnel providing such services (iv) the costs of the services provided and the profits to be realized by the Adviser and any of its affiliates from the relationship with the Fund, (v) the extent to which economies of scale will be realized by the Fund as it grows, and (vi) whether the Fund’s fee levels reflected the economies of scale to the benefit of the Fund’s shareholders.
The Board did not consider any single factor as controlling in determining whether or not to approve the Management Agreement.
The Board reviewed the performance of the Fund for the three months, one-year, and since inception periods ended June 30, 2019. These returns were compared to the returns of mutual funds in FUSE Research Network, LLC’s (“FUSE”) Multisector Bond fund peer group. The Board noted in its review of the performance that the Fund’s performance was slightly below the median for its peer group for the one-year and since inception periods, and slightly above the median for its peer group for the three-month period. The Directors also noted that the Fund had underperformed its benchmark index for the three-month and one-year periods but overperformed since its inception. The Directors also reviewed the Fund’s performance relative to other funds managed by the Adviser. The Adviser noted the peer group is not entirely reflective of the Fund due to its unique investment structure. In consideration of each item noted, the Board agreed that the Fund’s performance was adequate.
As to the comparative fee and expenses, the Directors considered the management and the other fees paid by the Fund and compared those to the management and other fees paid by funds in the relative peer group determined by FUSE and the Multisector Bond fund universe. The Board noted that the Fund’s annual net expense ratio of 1.88% was higher than the Multisector Bond fund peer group median of 1.14%, which the Adviser noted was attributed to the sub-advisory relationship and the uniqueness of the Fund’s investment strategy. The Board noted that the highest expense ratio in the peer group was 1.88%, while the lowest was 0.80%.
| Semi-Annual Report | December 31, 2019 | 41 |
RiverNorth/DoubleLine Strategic Opportunity Fund, Inc.
| Consideration and Approval of Advisory and Sub-Advisory Agreements | December 31, 2019 (Unaudited) |
The Board also noted that the annual management fee of 1.37% for the Fund was slightly above the 1.02% median paid by the peer group. The Directors also reviewed the Fund’s fees relative to other funds managed by the Adviser. The Board, including the Independent Directors, determined that the fees were reasonable given the nature of the Fund’s investment strategy, the capabilities of the Adviser and the Sub-Adviser, and the nature of the services provided to the Fund.
As to the nature, extent and quality of the services to be provided by the Adviser to the Fund, the Board considered that under the terms of the Management Agreement, the Adviser would, subject to the supervision of the Board, provide or arrange to be provided to the Fund such investment advice as the Adviser, in its discretion, deems advisable and will furnish or arrange to be furnished a continuous investment program for the Fund consistent with the Fund’s investment objective and policies. The Board reviewed the Adviser’s Form ADV, which was previously provided to the Board and that provided details regarding the experience of each of the Adviser’s personnel. The Adviser also provided additional information regarding its experience managing other investment accounts. Based on the foregoing information, the Board, including the Independent Directors, concluded that the Adviser had provided quality services and would continue to do so for the Fund.
As to the cost of the services to be provided and to the profits to be realized by the Adviser, the Board reviewed the Adviser’s estimates of its profitability and its financial condition. The Board reviewed the Adviser’s financial statements and noted the Adviser’s financial condition is stable as income from its asset management operations have contributed to higher revenues for the Adviser. The Board acknowledged the Adviser’s management fees were comparable to those charged to other mutual funds to which the Adviser provides advisory or sub-advisory services. The Board, including the Independent Directors, determined that the Management Agreement, with respect to the Fund was not overly profitable to the Adviser and the financial condition of the Adviser was adequate.
The Board noted that the Adviser has no affiliations with the Fund’s transfer agent, fund accountant, custodian, or distributor and therefore does not derive any benefits from the relationships these parties may have with the Fund.
Consideration of Investment Sub-Advisory Agreement with DoubleLine Capital, LP
At an in-person meeting of the Board, held on November 12, 2019 and called expressly for that purpose, the Board, including the Independent Trustees, considered the approval of the sub-advisory agreement (the “Sub-Advisory Agreement”) between the Adviser and DoubleLine Capital, LP (“Sub-Adviser”). In its consideration of the Sub-Advisory Agreement, the Board considered information and materials furnished by the Adviser and the Sub-Adviser in advance of and at the meeting and was afforded the opportunity to request additional information and to ask questions of the Adviser to obtain information that it believed to be reasonably necessary to evaluate the terms of the Sub-Advisory Agreement. The Board received materials compiled by the Sub-Adviser including a copy of the Sub-Advisory Agreement, the Sub-Adviser’s response to a questionnaire regarding its profitability, management and operations, a copy of the Sub-Adviser’s Form ADV, and certifications regarding the Sub-Adviser’s compliance programs. The Board considered the following factors, among others, in reaching its determination to renew the Sub-Advisory Agreement: (i) the investment performance of the Fund and the investment performance of the Sub-Adviser, (ii) the nature, extent and quality of the services provided by Sub-Adviser to the Fund, (iii) the experience and qualifications of the personnel providing such services, (iv) the costs of the services provided and the profits to be realized by the Sub-Adviser and any of its affiliates from the relationship with the Fund, (v) the extent to which economies of scale will be realized by the Fund as it grows, and (vi) whether the fee level of the Fund reflected the economies of scale to the benefit of the Fund’s shareholders.
| 42 | (888) 848-7569 | www.rivernorth.com |
RiverNorth/DoubleLine Strategic Opportunity Fund, Inc.
| Consideration and Approval of Advisory and Sub-Advisory Agreements | December 31, 2019 (Unaudited) |
The Board reviewed the performance of the portion of the Fund managed by DoubleLine relative to relevant securities indices, and to other accounts managed by DoubleLine. The Board recalled its deliberations regarding the Fund’s performance while considering the renewal of the Management Agreement. The Board, including the Independent Directors, concluded that the performance was adequate.
As to the comparative fees and expenses, the Board considered the management fee paid by the Fund to the Adviser and noted that the Adviser pays the Sub-Adviser from its fee, which the Board had previously determined was reasonable. The Board noted that the sub-advisory fee paid by the Adviser to the Sub-Adviser was reasonable as well, given the fees the Sub-Adviser charges other clients to manage similar strategies.
As to the nature, extent and quality of the services to be provided by the Sub-Adviser, the Board considered that under the terms of the Sub-Advisory Agreement, the Sub-Adviser would, subject to the supervision of the Board, provide to the Funds such investment advice as the Sub-Adviser, in its discretion, deems advisable and will furnish or arrange to be furnished a continuous investment program for the Fund consistent with the Fund’s investment objective and policies. The Board reviewed the Form ADV of the Sub-Adviser, which provided details regarding the experience of the Sub-Adviser’s investment personnel. The Sub-Adviser also provided additional information regarding its operations and experience managing other investment accounts. Based on the foregoing information, the Board, including the Independent Directors, concluded that the Sub-Adviser had provided quality services and would continue to do so for the Fund.
As to the cost of the services to be provided and to the profits to be realized by the Sub-Adviser, the Board reviewed the Sub-Adviser’s financial condition. The Board noted that the financial condition of the Sub-Adviser was stable. The Board, including the Independent Directors determined that the Sub-Advisory Agreement and the compensation to the Sub-Adviser was reasonable and the financial condition of the Sub-Adviser was adequate. The Board noted that the Sub-Adviser had no affiliations with the Fund’s transfer agent, fund accountant, custodian, or distributor and therefore does not derive any benefits from the relationships these parties may have with the Fund.
| Semi-Annual Report | December 31, 2019 | 43 |
Board of Directors
Patrick W. Galley, CFA, Chairman
John K. Carter
John S. Oakes
J. Wayne Hutchens
David M. Swanson
Jerry R. Raio
Investment Adviser
RiverNorth Capital Management, LLC
Sub Adviser
DoubleLine Capital LP
Fund Administrator
ALPS Fund Services, Inc.
Transfer Agent and
Dividend Disbursing Agent
DST Systems, Inc.
Custodian
State Street Bank and Trust Company
Independent Registered
Public Accounting Firm
Cohen & Company, Ltd.

RiverNorth Capital Management, LLC
325 N. LaSalle Street, Suite 645
Chicago, IL 60654
Secondary market support provided to the Fund by ALPS Fund Services, Inc.’s
affiliate ALPS Distributors, Inc., a FINRA member.
This report is provided for the general information of the shareholders of the
RiverNorth/DoubleLine Strategic Opportunity Fund, Inc. This report is
not intended for distribution to prospective investors in the Fund,
unless preceded or accompanied by an effective prospectus.
Not applicable to semi-annual report.
| Item 3. | Audit Committee Financial Expert. |
Not applicable to semi-annual report.
| Item 4. | Principal Accountant Fees and Services. |
Not applicable to semi-annual report.
| Item 5. | Audit Committee of Listed Registrants. |
Not applicable to semi-annual report.
| Item 6. | Schedule of Investments. |
| (a) | Schedule of Investments is included as part of the Report to Stockholders filed under Item 1 of this form. |
| (b) | Not applicable to the Registrant. |
| Item 7. | Disclosure of Proxy Voting Policies and Procedures for Closed-End Management Investment Companies. |
Not applicable to semi-annual report.
| Item 8. | Portfolio Managers of Closed-End Management Investment Companies. |
| (a) | Not applicable to semi-annual report. |
| Item 9. | Purchases of Equity Securities by Closed-End Management Company and Affiliated Purchasers. |
Not applicable.
| Item 10. | Submission of Matters to a Vote of Security Holders. |
There have been no material changes to the procedures by which shareholders may recommend nominees to the Board of Directors of the Registrant.
| Item 11. | Controls and Procedures. |
| (a) | The Registrant’s principal executive officer and principal financial officer have concluded that the Registrant’s disclosure controls and procedures (as defined in Rule 30a-3(c) under the Investment Company Act of 1940, as amended) are effective based on their evaluation of these controls and procedures as of a date within 90 days of the filing date of this document. |
| (b) | There were no significant changes in the Registrant's internal control over financial reporting (as defined in Rule 30a-3(d) under the Investment Company Act of 1940, as amended) during the second fiscal quarter of the period covered by this report that has materially affected, or is reasonably likely to materially affect, the Registrant's internal control over financial reporting. |
| Item 12. | Disclosure of Securities Lending Activities for Closed-End Management Investment Companies. |
None.
| (a)(1) | Not applicable to semi-annual report. |
| (a)(2) | The certifications required by Rule 30a-2(a) of the Investment Company Act of 1940, as amended, and Section 302 of the Sarbanes-Oxley Act of 2002 are attached hereto as EX-99.CERT. |
| (b) | A certification for the Registrant’s Principal Executive Officer and Principal Financial Officer, as required by Rule 30a-2(b) of the Investment Company Act of 1940, as amended, and Section 906 of the Sarbanes-Oxley Act of 2002 are attached hereto as EX-99.906CERT. |
SIGNATURES
Pursuant to the requirements of the Securities Exchange Act of 1934 and the Investment Company Act of 1940, the registrant has duly caused this report to be signed on its behalf by the undersigned, thereunto duly authorized.
Registrant:RiverNorth/DoubleLine Strategic Opportunity Fund, Inc.
| By: | /s/ Patrick W. Galley | |
| Name: | Patrick W. Galley | |
| Title: | President | |
| | | |
| Date: | March 10, 2020 | |
Pursuant to the requirements of the Securities Exchange Act of 1934 and the Investment Company Act of 1940, this report has been signed below by the following persons on behalf of the registrant and in the capacities and on the dates indicated.
| By: | /s/ Patrick W. Galley | |
| Name: | Patrick W. Galley | |
| Title: | President | |
| | | |
| Date: | March 10, 2020 | |
| By: | /s/ Jonathan M. Mohrhardt | |
| Name: | Jonathan M. Mohrhardt | |
| Title: | Treasurer and Chief Financial Officer | |
| | | |
| Date: | March 10, 2020 | |