UNITED STATES
SECURITIES AND EXCHANGE COMMISSION
Washington, D.C. 20549
FORM N-CSR
CERTIFIED SHAREHOLDER REPORT OF REGISTERED
MANAGEMENT INVESTMENT COMPANIES
811-23166
(Investment Company Act File Number)
RiverNorth/DoubleLine Strategic Opportunity Fund, Inc.
(Exact Name of Registrant as Specified in Charter)
325 North LaSalle Street, Suite 645
Chicago, Illinois 60654
(Address of Principal Executive Offices)
Marcus L. Collins, Esq.
RiverNorth Capital Management, LLC
325 North LaSalle Street, Suite 645
Chicago, Illinois 60654
(Name and Address of Agent for Service)
(312) 832-1440
(Registrant’s Telephone Number)
Date of Fiscal Year End: June 30
Date of Reporting Period: December 31, 2020
| Item 1. | Reports to Stockholders. |
(a)
Beginning on January 1, 2021, as permitted by regulations adopted by the U.S. Securities and Exchange Commission, paper copies of the Fund’s annual and semi-annual shareholder reports will no longer be sent by mail, unless you specifically request paper copies of the reports. Instead, the reports will be made available on the Fund’s website at www.RiverNorth.com and you will be notified by mail each time a report is posted and provided with a website link to access the report.
You may, notwithstanding the availability of shareholder reports online, elect to receive all future shareholder reports in paper free of charge. If you invest through a financial intermediary, you can contact your financial intermediary to request that you continue to receive paper copies of your shareholder reports. If you invest directly with a Fund, you can call 1-888-848-7569 to let the Fund know you wish to continue receiving paper copies of your shareholder reports.
If you already elected to receive shareholder reports electronically, you will not be affected by this change and you need not take any action. You may elect to receive shareholder reports and other communications from the Fund electronically anytime by contacting your financial intermediary (such as a broker-dealer or bank) or, if you are a direct investor, by enrolling at www.RiverNorth.com.
RiverNorth/DoubleLine Strategic Opportunity Fund, Inc.
Table of Contents
| Performance Overview | 2 |
| Schedule of Investments | 5 |
| Statement of Assets and Liabilities | 24 |
| Statement of Operations | 25 |
| Statements of Changes in Net Assets | 26 |
| Statement of Cash Flows | 27 |
| Financial Highlights | 28 |
| Notes to Financial Statements | 31 |
| Dividend Reinvestment Plan | 43 |
| Additional Information | 45 |
| Consideration and Approval of Advisory and Sub-Advisory Agreements | 47 |
RiverNorth/DoubleLine Strategic Opportunity Fund, Inc.
| Performance Overview | December 31, 2020 (Unaudited) |
WHAT IS THE FUND’S INVESTMENT STRATEGY?
RiverNorth/DoubleLine Strategic Opportunity Fund, Inc. (the "Fund") seeks to achieve its investment objective by allocating its Managed Assets among the two principal investment strategies described below:
Tactical Closed-End Fund Income Strategy (10% - 35% of Managed Assets): This strategy seeks to (i) generate returns through investments in closed-end funds, exchange-traded funds and business development companies (collectively, the “Underlying Funds”) that invest primarily in income-producing securities, and (ii) derive value from the discount and premium spreads associated with closed-end funds.
Opportunistic Income Strategy (65% - 90% of Managed Assets): This strategy seeks to generate attractive risk-adjusted returns through investments in fixed income instruments and other investments, including agency and non-agency residential mortgage-backed and other asset-backed securities, corporate bonds, municipal bonds, and real estate investment trusts. At least 50% of the Managed Assets allocated to this strategy is invested in mortgage-backed securities.
HOW DID THE FUND PERFORM RELATIVE TO ITS BENCHMARK
DURING THE REPORTING PERIOD?
PERFORMANCE as of December 31, 2020
| | Cummulative | Annualized |
| TOTAL RETURN(1) | 6 Months | 1 Year | 3 Years(3) | Since
Inception(2)(3) |
| RiverNorth/DoubleLine Strategic Opportunity Fund, Inc. – NAV(4) | 10.35% | 1.74% | 3.45% | 4.75% |
| RiverNorth/DoubleLine Strategic Opportunity Fund, Inc. – Market(5) | 11.07% | 1.34% | 4.54% | 3.33% |
| Bloomberg Barclays U.S. Aggregate Bond Index(6) | 1.29% | 7.51% | 5.34% | 3.79% |
| (1) | Total returns assume reinvestment of all distributions. |
| (2) | The Fund commenced operations on September 28, 2016. |
| (4) | Performance returns are net of management fees and other Fund expenses. |
| (5) | Market price is the value at which the Fund trades on an exchange. This market price can be more or less than its net asset value ("NAV"). |
| (6) | The Bloomberg Barclays U.S. Aggregate Bond Index is an unmanaged index of investment grade fixed-rate debt issues with maturities of at least one year. The index cannot be invested in directly and does not reflect fees and expenses. |
The total annual expense ratio as a percentage of net assets attributable to common shares as of December 31, 2020 is 1.92% (excluding interest on facility loan payable and dividends to redeemable preferred stock). Including interest on facility loan payable and dividends to redeemable preferred stock, the expense ratio is 2.70%.
Performance data quoted represents past performance, which is not a guarantee of future results. Current performance may be lower or higher than the performance quoted. The principal value and investment return of an investment will fluctuate so that your shares may be worth more or less than their original cost. You can obtain performance data current to the most recent month end by calling (844) 569-4750. Total return measures net investment income and capital gain or loss from portfolio investments. All performance shown assumes reinvestment of dividends and capital gains distributions.
| 2 | (888) 848-7569 | www.rivernorth.com |
RiverNorth/DoubleLine Strategic Opportunity Fund, Inc.
| Performance Overview | December 31, 2020 (Unaudited) |
GROWTH OF A HYPOTHETICAL $10,000 INVESTMENT
The graph below illustrates the growth of a hypothetical $10,000 investment assuming the purchase of common shares at the closing market price (NYSE: OPP) of $20.00 on September 28, 2016 (commencement of operations) and tracking its progress through December 31, 2020.

Past performance does not guarantee future results. Performance will fluctuate with changes in market conditions. Current performance may be lower or higher than the performance data shown. Performance information does not reflect the deduction of taxes that shareholders would pay on Fund distributions or the sale of Fund shares. An investment in the Fund involves risk, including loss of principal.
TOP TEN HOLDINGS* as of December 31, 2020
| | % of Net Assets |
| Legacy Mortgage Asset Trust, 4.25%, 04/25/2059 | 2.91% |
| Legacy Mortgage Asset Trust, 4.50%, 11/25/2059 | 2.79% |
| Oxford Square Capital Corp., 0.00%, 03/30/2024 | 2.78% |
| Freddie Mac REMICS, 3.00%, 02/15/2047 | 2.52% |
| Government National Mortgage Association, 3.50%, 02/20/2047 | 2.45% |
| Freddie Mac REMICS, 4.00%, 12/15/2040 | 2.38% |
| Fannie Mae REMICS, 0.00%, 07/25/2043 | 2.31% |
| Fannie Mae REMICS, 3.00%, 04/25/2043 | 2.29% |
| PRPM LLC, 3.97%, 02/25/2023 | 1.88% |
| CHL GMSR Issuer Trust, 2.90%, 05/25/2023 | 1.84% |
| | 24.15% |
| * | Holdings are subject to change and exclude short-term investments. |
| Semi-Annual Report | December 31, 2020 | 3 |
RiverNorth/DoubleLine Strategic Opportunity Fund, Inc.
| Performance Overview | December 31, 2020 (Unaudited) |
ASSET ALLOCATION as of December 31, 2020^
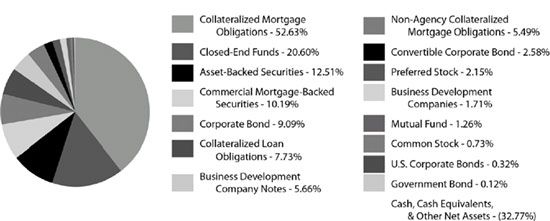
| ^ | Holdings are subject to change. |
Percentages are based on net assets of the Fund and do not include derivatives.
| 4 | (888) 848-7569 | www.rivernorth.com |
RiverNorth/DoubleLine Strategic Opportunity Fund, Inc.
| Schedule of Investments | December 31, 2020 (Unaudited) |
| Shares/Description | | | Value | |
| CLOSED-END FUNDS - 21.86%(a) | | | | |
| | 140,726 | | | AllianceBernstein Global High Income Fund, Inc. | | $ | 1,656,345 | |
| | 93,166 | | | AllianzGI Convertible & Income Fund | | | 534,773 | |
| | 29,830 | | | Angel Oak Dynamic Financial Strategies Income Term Trust | | | 557,523 | |
| | 73,797 | | | Ares Dynamic Credit Allocation Fund, Inc. | | | 1,054,559 | |
| | 220,895 | | | Barings Global Short Duration High Yield Fund | | | 3,333,305 | |
| | 59,183 | | | BlackRock 2022 Global Income Opportunity Trust | | | 535,014 | |
| | 49,562 | | | BlackRock Debt Strategies Fund, Inc. | | | 517,923 | |
| | 131,534 | | | BlackRock Floating Rate Income Strategies Fund, Inc. | | | 1,592,877 | |
| | 28,972 | | | BlackRock Multi-Sector Income Trust | | | 508,169 | |
| | 168,548 | | | Blackstone / GSO Strategic Credit Fund | | | 2,103,479 | |
| | 39,240 | | | Blackstone/GSO Long-Short Credit Income Fund | | | 526,601 | |
| | 699,746 | | | BNY Mellon High Yield Strategic Fund | | | 2,099,238 | |
| | 132,443 | | | BrandywineGLOBAL - Global Income Opportunities Fund, Inc. | | | 1,654,213 | |
| | 29,913 | | | Brookfield Real Assets Income Fund, Inc. | | | 533,349 | |
| | 89,140 | | | Calamos Convertible and High Income Fund | | | 1,272,919 | |
| | 259,419 | | | Eaton Vance, Ltd. Duration Income Fund | | | 3,250,519 | |
| | 144,726 | | | First Trust High Income Long/Short Fund | | | 2,137,603 | |
| | 249,624 | | | Invesco Dynamic Credit Opportunities Fund | | | 2,680,962 | |
| | 107,145 | | | Invesco High Income Trust II | | | 1,456,101 | |
| | 800,994 | | | Invesco Senior Income Trust | | | 3,187,956 | |
| | 175,578 | | | Morgan Stanley Emerging Markets Domestic Debt Fund, Inc. | | | 1,104,386 | |
| | 170,583 | | | NexPoint Credit Strategies Fund | | | 1,794,533 | |
| | 424,511 | | | Nuveen Credit Strategies Income Fund | | | 2,687,155 | |
| | 76,750 | | | Nuveen Floating Rate Income Fund | | | 670,795 | |
| | 65,390 | | | Nuveen Floating Rate Income Opportunity Fund | | | 566,277 | |
| | 46,304 | | | Nuveen Mortgage Opportunity Term Fund | | | 915,430 | |
| | 190,841 | | | PGIM Global High Yield Fund, Inc. | | | 2,772,920 | |
| | 107,386 | | | PGIM High Yield Bond Fund, Inc. | | | 1,610,790 | |
| | 90,583 | | | The New America High Income Fund, Inc. | | | 786,260 | |
| | 195,475 | | | Wells Fargo Income Opportunities Fund | | | 1,595,076 | |
| | 102,129 | | | Western Asset High Income Opportunity Fund, Inc. | | | 505,539 | |
| | | | | | | | | |
| TOTAL CLOSED-END FUNDS | | | | |
| (Cost $46,355,402) | | | 46,202,589 | |
| | | | | | | | | |
| BUSINESS DEVELOPMENT COMPANIES - 1.71%(a) | | | | |
| | 126,984 | | | Bain Capital Specialty Finance, Inc. | | | 1,540,316 | |
| | 371,130 | | | Oaktree Specialty Lending Corp. | | | 2,067,194 | |
| | | | | | | | | |
| TOTAL BUSINESS DEVELOPMENT COMPANIES | | | | |
| (Cost $3,200,038) | | | | 3,607,510 | |
| | | | | | | | | |
| COMMON STOCKS - 0.73%(a) | | | | | |
| | 13,637 | | | McDermott International, Ltd.(b) | | | 11,046 | |
See Notes to Financial Statements.
| Semi-Annual Report | December 31, 2020 | 5 |
RiverNorth/DoubleLine Strategic Opportunity Fund, Inc.
| Schedule of Investments | December 31, 2020 (Unaudited) |
| Shares/Description | | | Value | |
| | 121,591 | | | Owl Rock Capital Corp. | | $ | 1,539,342 | |
| | | | | | | | | |
| TOTAL COMMON STOCKS | | | | |
| (Cost $1,611,465) | | | | | | 1,550,388 | |
| | | | | | | | | |
| PREFERRED STOCKS - 2.15%(a) | | | | |
| | 131,056 | | | First Eagle Alternative Capital BDC, Inc., 6.750%, 12/30/2022 | | | 3,311,313 | |
| | 48,198 | | | First Eagle Alternative Capital BDC, Inc., 6.125%, 10/30/2023 | | | 1,223,468 | |
| | | | | | | | | |
| TOTAL PREFERRED STOCKS | | |
| (Cost $4,391,523) | | | | | 4,534,781 | |
| Shares/Description | | | Rate | | | Maturity | | | Value | |
| BUSINESS DEVELOPMENT COMPANY NOTES - 5.66%(a) | | | | | | | |
| United States - 5.66% | | | | | | | | | | | | |
| | 2,000,000 | | | Bain Capital Specialty Finance, Inc.(c) | | | 8.50 | % | | | 06/10/2023 | | | | 2,059,900 | |
| | 13,606 | | | Capital Southwest Corp. | | | 5.95 | % | | | 12/15/2022 | | | | 341,511 | |
| | 235,511 | | | Oxford Square Capital Corp. | | | 6.50 | % | | | 03/30/2024 | | | | 5,885,420 | |
| | 86,240 | | | Portman Ridge Finance Corp. | | | 6.13 | % | | | 09/30/2022 | | | | 2,163,762 | |
| | 29,532 | | | Stellus Capital Investment Corp. | | | 5.75 | % | | | 09/15/2022 | | | | 742,434 | |
| | | | | TriplePoint Venture Growth BDC | | | | | | | | | | | | |
| | 30,626 | | | Corp. | | | 5.75 | % | | | 07/15/2022 | | | | 772,081 | |
| | | | | | | | | | | | | | | | | |
| TOTAL BUSINESS DEVELOPMENT COMPANY NOTES | | | | | | | | | |
| (Cost $11,580,913) | | | | | | | | | | | 11,965,108 | |
| Principal Amount/Description | | | Rate | | | Maturity | | | Value | |
| FOREIGN CORPORATE BONDS - 6.42%(a) | | | | | | | | | |
| Argentina - 0.09% | | | | | | | | | | |
| $ | 150,000 | | | Banco Macro SA(d)(e) | | | 6.75 | % | | | 11/04/2026 | | | | 130,127 | |
| | 80,000 | | | Capex SA(e) | | | 6.88 | % | | | 05/15/2024 | | | | 70,401 | |
| | | | | | | | | | | | | | | | 200,528 | |
| Brazil - 0.37% | | | | | | | | | | | | |
| | 300,000 | | | CSN Islands XII Corp.(e)(f) | | | 7.00 | % | | | Perpetual Maturity | | | | 298,028 | |
| | 250,000 | | | Oi SA(g) | | | 10.00% (4.00%) | | | | 07/27/2025 | | | | 266,253 | |
| | 200,000 | | | Unigel Luxembourg SA(e) | | | 8.75 | % | | | 10/01/2026 | | | | 216,002 | |
| | | | | | | | | | | | | | | | 780,283 | |
| British Virgin Islands - 0.09% | | | | | | | | | | | |
| | 200,000 | | | C10 Capital SPV, Ltd.(d)(e)(f) | | | 3M US L + 4.71% | | | | Perpetual Maturity | | | | 189,000 | |
| | | | | | | | | | | | | | | | | |
| Canada - 0.43% | | | | | | | | | | | | |
| | 250,000 | | | Canacol Energy, Ltd.(e) | | | 7.25 | % | | | 05/03/2025 | | | | 268,284 | |
See Notes to Financial Statements.
| 6 | (888) 848-7569 | www.rivernorth.com |
RiverNorth/DoubleLine Strategic Opportunity Fund, Inc.
| Schedule of Investments | December 31, 2020 (Unaudited) |
| Principal Amount/Description | | | Rate | | | Maturity | | | Value | |
| $ | 165,000 | | | Garda World Security Corp.(h) | | | 8.75 | % | | | 05/15/2025 | | | | 172,114 | |
| | 250,000 | | | Gran Tierra Energy, Inc.(h) | | | 7.75 | % | | | 05/23/2027 | | | | 172,503 | |
| | 80,000 | | | Kronos Acquisition Holdings, Inc. / KIK Custom Products, Inc.(h) | | | 7.00 | % | | | 12/31/2027 | | | | 83,912 | |
| | 200,000 | | | Tervita Corp.(h) | | | 11.00 | % | | | 12/01/2025 | | | | 215,862 | |
| | | | | | | | | | | | | | | | 912,675 | |
| Cayman Islands - 0.50% | | | | | | | | | | | | |
| | 250,000 | | | Banco BTG Pactual SA(d)(e) | | | 7.75 | % | | | 02/15/2029 | | | | 273,593 | |
| | 250,000 | | | Banco Mercantil del Norte SA/Grand Cayman(d)(e)(f) | | | 7.63 | % | | | Maturity | | | | 284,065 | |
| | 350,000 | | | Itau Unibanco Holding SA Island(d)(e)(f) | | | 5Y US TI + 3.222% | | | | Maturity | | | | 343,878 | |
| | 250,000 | | | Latam Finance, Ltd.(e)(i) | | | 7.00 | % | | | 03/01/2026 | | | | 126,688 | |
| | | | | | | | | | | | | | | | 1,028,224 | |
| Chile - 0.34% | | | | | | | | | | | | |
| | 250,000 | | | AES Gener SA(d)(e) | | | 7.13 | % | | | 03/26/2079 | | | | 278,124 | |
| | 200,000 | | | Empresa Electrica Guacolda SA(e) | | | 4.56 | % | | | 04/30/2025 | | | | 180,510 | |
| | 250,000 | | | Geopark, Ltd.(e) | | | 6.50 | % | | | 09/21/2024 | | | | 260,000 | |
| | | | | | | | | | | | | | | | 718,634 | |
| China - 0.52% | | | | | | | | | | | | |
| | 200,000 | | | Agile Group Holdings, Ltd.(d)(f) | | | 6.88 | % | | | Perpetual Maturity | | | | 206,007 | |
| | 200,000 | | | Central China Real Estate, Ltd. | | | 7.25 | % | | | 07/16/2024 | | | | 202,003 | |
| | 250,000 | | | CIFI Holdings Group Co., Ltd.(d)(f) | | | 5.38 | % | | | Perpetual Maturity | | | | 254,380 | |
| | 200,000 | | | Ronshine China Holdings, Ltd. | | | 6.75 | % | | | 08/05/2024 | | | | 200,500 | |
| | 200,000 | | | Yuzhou Group Holdings Co., Ltd. | | | 8.30 | % | | | 05/27/2025 | | | | 217,625 | |
| | | | | | | | | | | | | | | | 1,080,515 | |
| Colombia - 0.33% | | | | | | | | | | | |
| | 200,000 | | | Credivalores-Crediservicios SAS(h) | | | 8.88 | % | | | 02/07/2025 | | | | 150,500 | |
| | 250,000 | | | Gilex Holding Sarl(e) | | | 8.50 | % | | | 05/02/2023 | | | | 261,096 | |
| | 259,000 | | | Tecnoglass, Inc.(e) | | | 8.20 | % | | | 01/31/2022 | | | | 270,921 | |
| | | | | | | | | | | | | | | | 682,517 | |
| Dominican Republic - 0.12% | | | | | | | | | | | | |
| | 250,000 | | | Aeropuertos Dominicanos Siglo XXI SA(e) | | | 6.75 | % | | | 03/30/2029 | | | | 260,265 | |
| | | | | | | | | | | | | | | | | |
| Great Britain -0.09% | | | | | | | | | | | | |
| | 250,000 | | | Vedanta Resources Finance II PLC(h) | | | 9.25 | % | | | 04/23/2026 | | | | 190,000 | |
| | | | | | | | | | | | | | | | | |
| Hong Kong - 0.25% | | | | | | | | | | | | |
| | 300,000 | | | Bangkok Bank PCL(d)(f)(h) | | | 5Y US TI + 4.729% | | | | Perpetual Maturity | | | | 314,414 | |
See Notes to Financial Statements.
| Semi-Annual Report | December 31, 2020 | 7 |
RiverNorth/DoubleLine Strategic Opportunity Fund, Inc.
| Schedule of Investments | December 31, 2020 (Unaudited) |
| Principal Amount/Description | | | Rate | | | Maturity | | | Value | |
| $ | 200,000 | | | RKP Overseas Finance, Ltd.(f) | | | 7.95 | % | | | Perpetual Maturity | | | | 200,318 | |
| | | | | | | | | | | | | | | | 514,732 | |
| India - 0.13% | | | | | | | | | | | | |
| | 250,000 | | | Network i2i, Ltd.(d)(f)(h) | | | 5.65 | % | | | Perpetual Maturity | | | | 266,375 | |
| | | | | | | | | | | | | | | | | |
| Indonesia - 0.30% | | | | | | | | | | | | |
| | 200,000 | | | ABM Investama Tbk PT(e) | | | 7.13 | % | | | 08/01/2022 | | | | 177,750 | |
| | 200,000 | | | Bayan Resources Tbk PT(e) | | | 6.13 | % | | | 01/24/2023 | | | | 205,615 | |
| | 226,750 | | | Star Energy Geothermal Wayang Windu, Ltd.(e) | | | 6.75 | % | | | 04/24/2033 | | | | 257,120 | |
| | | | | | | | | | | | | | | | 640,485 | |
| Ireland - 0.13% | | | | | | | | | | | | |
| | 250,000 | | | C&W Senior Financing DAC(e) | | | 6.88 | % | | | 09/15/2027 | | | | 270,343 | |
| | | | | | | | | | | | | | | | | |
| Luxembourg - 0.19% | | | | | | | | | | | | |
| | 200,000 | | | FS Luxembourg Sarl(h) | | | 10.00 | % | | | 12/15/2025 | | | | 216,850 | |
| | 200,000 | | | Puma International Financing SA(e) | | | 5.00 | % | | | 01/24/2026 | | | | 194,000 | |
| | | | | | | | | | | | | | | | 410,850 | |
| Mauritius - 0.09% | | | | | | | | | | | | |
| | 200,000 | | | UPL Corp., Ltd.(d)(f) | | | 5.25 | % | | | Perpetual Maturity | | | | 197,970 | |
| | | | | | | | | | | | | | | | | |
| Mexico - 0.89% | | | | | | | | | | | | |
| | 300,000 | | | Alpha Holding SA de CV(h) | | | 9.00 | % | | | 02/10/2025 | | | | 221,550 | |
| | 200,000 | | | Banco Santander Mexico SA Institucion de Banca Multiple Grupo Financiero Santand(d)(f) | | | 8.50 | % | | | Perpetual Maturity | | | | 211,500 | |
| | 200,000 | | | Braskem Idesa SAPI(h) | | | 7.45 | % | | | 11/15/2029 | | | | 188,000 | |
| | 250,000 | | | Credito Real SAB de CV SOFOM ER(d)(e)(f) | | | 9.13 | % | | | Perpetual Maturity | | | | 241,878 | |
| | 254,202 | | | Fermaca Enterprises S RL | | | 6.38 | % | | | 03/30/2038 | | | | 296,526 | |
| | 250,000 | | | Mexarrend SAPI de CV(h) | | | 10.25 | % | | | 07/24/2024 | | | | 228,440 | |
| | 200,000 | | | Operadora de Servicios Mega SA de CV Sofom ER(h) | | | 8.25 | % | | | 02/11/2025 | | | | 208,875 | |
| | 200,000 | | | TV Azteca SAB de CV | | | 8.25 | % | | | 08/09/2024 | | | | 113,229 | |
| | 250,000 | | | Unifin Financiera SAB de CV(d)(e)(f) | | | 8.88 | % | | | Perpetual Maturity | | | | 191,878 | |
| | | | | | | | | | | | | | | | 1,901,876 | |
| Netherlands -0.47% | | | | | | | | | | | | |
| | 250,000 | | | AES Andres BV / Dominican Power Partners / Empresa Generadora de Electricidad It(e) | | | 7.95 | % | | | 05/11/2026 | | | | 259,063 | |
| | 200,000 | | | Braskem Netherlands Finance BV(e) | | | 5.88 | % | | | 01/31/2050 | | | | 207,152 | |
See Notes to Financial Statements.
| 8 | (888) 848-7569 | www.rivernorth.com |
RiverNorth/DoubleLine Strategic Opportunity Fund, Inc.
| Schedule of Investments | December 31, 2020 (Unaudited) |
| Principal Amount/Description | | | Rate | | | Maturity | | | Value | |
| $ | 200,000 | | | Metinvest BV(e) | | | 7.75 | % | | | 10/17/2029 | | | | 219,712 | |
| | 250,000 | | | Petrobras Global Finance BV | | | 6.90 | % | | | 03/19/2049 | | | | 317,500 | |
| | | | | | | | | | | | | | | | 1,003,427 | |
| Panama - 0.10% | | | | | | | | | | | | |
| | 200,000 | | | UEP Penonome II SA(h) | | | 6.50 | % | | | 10/01/2038 | | | | 208,854 | |
| | | | | | | | | | | | | | | | | |
| Peru - 0.33% | | | | | | | | | | | | |
| | 150,000 | | | Camposol SA(h) | | | 6.00 | % | | | 02/03/2027 | | | | 158,730 | |
| | 250,000 | | | Hunt Oil Co. of Peru LLC Sucursal Del Peru(e) | | | 6.38 | % | | | 06/01/2028 | | | | 277,624 | |
| | 300,000 | | | Peru LNG Srl(e) | | | 5.38 | % | | | 03/22/2030 | | | | 268,050 | |
| | | | | | | | | | | | | | | | 704,404 | |
| Singapore - 0.32% | | | | | | | | | | | | |
| | 200,000 | | | Indika Energy Capital III Pte, Ltd.(e) | | | 5.88 | % | | | 11/09/2024 | | | | 206,000 | |
| | 250,000 | | | Medco Oak Tree Pte, Ltd.(e) | | | 7.38 | % | | | 05/14/2026 | | | | 269,394 | |
| | 200,000 | | | TBLA International Pte, Ltd. | | | 7.00 | % | | | 01/24/2023 | | | | 202,490 | |
| | | | | | | | | | | | | | | | 677,884 | |
| Switzerland - 0.10% | | | | | | | | | | | | |
| | 200,000 | | | Walnut Bidco PLC(e) | | | 9.13 | % | | | 08/01/2024 | | | | 212,322 | |
| | | | | | | | | | | | | | | | | |
| Thailand - 0.09% | | | | | | | | | | | | |
| | 200,000 | | | TMB Bank PCL(d)(f) | | | 5Y US TI + 3.256% | | | | Perpetual Maturity | | | | 195,500 | |
| | | | | | | | | | | | | | | | | |
| Trinidad and Tobago - 0.15% | | | | | | | | | | | | |
| | 300,000 | | | Telecommunications Services of Trinidad & Tobago, Ltd.(e) | | | 8.88 | % | | | 10/18/2029 | | | | 308,250 | |
| | | | | | | | | | | | | | | | | |
| TOTAL FOREIGN CORPORATE BONDS | | | | | | | | | | | | |
| (Cost $12,944,268) | | | | | | | | | | | 13,555,913 | |
| | | | | | | | | | | | | | | | | |
| U.S. CORPORATE BONDS - 2.99%(a) | | | | | | | | | | | | |
| Aerospace/Defense - 0.21% | | | | | | | | | | | | |
| | 365,000 | | | Triumph Group, Inc.(h) | | | 6.25 | % | | | 09/15/2024 | | | | 362,719 | |
| | 90,000 | | | Triumph Group, Inc. | | | 7.75 | % | | | 08/15/2025 | | | | 82,575 | |
| | | | | | | | | | | | | | | | 445,294 | |
| Agriculture - 0.05% | | | | | | | | | | | | |
| | 127,656 | | | Pyxus Holdings, Inc. | | | 10.00 | % | | | 08/24/2024 | | | | 104,997 | |
| Airlines - 0.48% | | | | | | | | | | | | |
| | 944,339 | | | JetBlue 2019-1 Class B Pass Through Trust | | | 8.00 | % | | | 11/15/2027 | | | | 1,014,329 | |
| Auto Parts & Equipment - 0.16% | | | | | | | | | | | | |
| | 330,000 | | | Dealer Tire LLC / DT Issuer LLC(h) | | | 8.00 | % | | | 02/01/2028 | | | | 348,505 | |
See Notes to Financial Statements.
| Semi-Annual Report | December 31, 2020 | 9 |
RiverNorth/DoubleLine Strategic Opportunity Fund, Inc.
| Schedule of Investments | December 31, 2020 (Unaudited) |
| Principal Amount/Description | | | Rate | | | Maturity | | | Value | |
| Chemicals - 0.24% | | | | | | | | | | |
| $ | 260,000 | | | Illuminate Buyer LLC / Illuminate Holdings IV, Inc.(h) | | | 9.00 | % | | | 07/01/2028 | | | $ | 286,325 | |
| | 200,000 | | | Sasol Financing USA LLC | | | 5.88 | % | | | 03/27/2024 | | | | 213,050 | |
| | | | | | | | | | | | | | | | 499,375 | |
| Commercial Services - 0.06% | | | | | | | | | | | | |
| | 110,000 | | | Sabre GLBL, Inc.(h) | | | 7.38 | % | | | 09/01/2025 | | | | 119,515 | |
| Computers - 0.34% | | | | | | | | | | | | |
| | 175,000 | | | Austin BidCo, Inc.(h) | | | 7.13 | % | | | 12/15/2028 | | | | 182,984 | |
| | 175,000 | | | Dell International LLC / EMC Corp.(h) | | | 6.10 | % | | | 07/15/2027 | | | | 217,621 | |
| | 305,000 | | | Flexential Intermediate Corp.(h) | | | 11.25 | % | | | 08/01/2024 | | | | 319,678 | |
| | | | | | | | | | | | | | | | 720,283 | |
| Distribution/Wholesale - 0.03% | | | | | | | | | | | | |
| | 60,000 | | | Wolverine Escrow LLC(h) | | | 9.00 | % | | | 11/15/2026 | | | | 56,906 | |
| Engineering & Construction - 0.10% | | | | | | | | | | | | |
| | 195,000 | | | PowerTeam Services LLC(h) | | | 9.03 | % | | | 12/04/2025 | | | | 217,446 | |
| Healthcare-Products - 0.10% | | | | | | | | | | | | |
| | | | | Ortho-Clinical Diagnostics, Inc. / | | | | | | | | | | | | |
| | 45,000 | | | Ortho-Clinical Diagnostics SA(h) | | | 7.38 | % | | | 06/01/2025 | | | | 48,009 | |
| | | | | Ortho-Clinical Diagnostics, Inc. / | | | | | | | | | | | | |
| | 145,000 | | | Ortho-Clinical Diagnostics SA(h) | | | 7.25 | % | | | 02/01/2028 | | | | 153,247 | |
| | | | | | | | | | | | | | | | 201,256 | |
| Healthcare-Services - 0.23% | | | | | | | | | | | | |
| | 80,000 | | | CHS/Community Health Systems, Inc.(h) | | | 6.00 | % | | | 01/15/2029 | | | | 86,521 | |
| | 305,000 | | | Radiology Partners, Inc.(h) | | | 9.25 | % | | | 02/01/2028 | | | | 343,979 | |
| | 70,000 | | | RP Escrow Issuer LLC(h) | | | 5.25 | % | | | 12/15/2025 | | | | 73,302 | |
| | | | | | | | | | | | | | | | 503,802 | |
| Internet - 0.10% | | | | | | | | | | | | |
| | 30,000 | | | Arches Buyer, Inc.(h) | | | 6.13 | % | | | 12/01/2028 | | | | 31,037 | |
| | 165,000 | | | Uber Technologies, Inc.(h) | | | 6.25 | % | | | 01/15/2028 | | | | 179,644 | |
| | | | | | | | | | | | | | | | 210,681 | |
| Leisure Time - 0.02% | | | | | | | | | | | | |
| | 45,000 | | | Carnival Corp.(h) | | | 7.63 | % | | | 03/01/2026 | | | | 49,111 | |
| Oil & Gas - 0.16% | | | | | | | | | | | | |
| | 250,000 | | | Kosmos Energy, Ltd.(e) | | | 7.13 | % | | | 04/04/2026 | | | | 243,085 | |
| | 85,000 | | | PBF Holding Co. LLC / PBF Finance Corp.(h) | | | 9.25 | % | | | 05/15/2025 | | | | 83,481 | |
| | | | | | | | | | | | | | | | 326,566 | |
| Telecommunications - 0.71% | | | | | | | | | | | | |
| | 545,000 | | | Embarq Corp Eq 7.995 06/01/36 | | | 8.00 | % | | | 06/01/2036 | | | | 673,252 | |
| | 90,000 | | | Frontier Communications Corp.(h) | | | 6.75 | % | | | 05/01/2029 | | | | 96,469 | |
| | 410,000 | | | Gogo Intermediate Holdings LLC / Gogo Finance Co., Inc.(h) | | | 9.88 | % | | | 05/01/2024 | | | | 439,771 | |
See Notes to Financial Statements.
| 10 | (888) 848-7569 | www.rivernorth.com |
RiverNorth/DoubleLine Strategic Opportunity Fund, Inc.
| Schedule of Investments | December 31, 2020 (Unaudited) |
| Principal Amount/Description | | | Rate | | | Maturity | | | Value | |
| $ | 435,000 | | | Intelsat Jackson Holdings SA(h)(i) | | | 8.50 | % | | | 10/15/2024 | | | $ | 312,069 | |
| | | | | | | | | | | | | | | | 1,521,561 | |
| | | | | | | | | | | | | | | | | |
| TOTAL U.S. CORPORATE BONDS | | | | | | | | | | | | |
| (Cost $6,000,052) | | | | | | | | | | | 6,339,627 | |
| | | | | | | | | | | | | | | | | |
| CONVERTIBLE CORPORATE BONDS -2.58% (a) | | | | | | | | | | | | |
| | 1,724,093 | | | BlackRock Capital Investment Corp. | | | 5.00 | % | | | 06/15/2022 | | | | 1,710,984 | |
| | 997,837 | | | BlackRock TCP Capital Corp. | | | 4.63 | % | | | 03/01/2022 | | | | 1,002,948 | |
| | 500,000 | | | Goldman Sachs BDC, Inc. | | | 4.50 | % | | | 04/01/2022 | | | | 515,650 | |
| | 500,000 | | | Hercules Capital, Inc. | | | 4.38 | % | | | 02/01/2022 | | | | 514,632 | |
| | 1,648,448 | | | New Mountain Finance Corp. | | | 5.75 | % | | | 08/15/2023 | | | | 1,699,962 | |
| | | | | | | | | | | | | | | | | |
| TOTAL CONVERTIBLE CORPORATE BONDS | | | | | | | | | | | | |
| (Cost $4,788,576) | | | | | | | | | | | 5,444,176 | |
| | | | | | | | | | | | | | | | | |
| FOREIGN GOVERNMENT BONDS AND NOTES, SUPRANATIONALS AND FOREIGN AGENCIES - 0.12%(a) | | | | | |
| | 200,000 | | | Mexico Government International Bond | | | 5.00 | % | | | 04/27/2051 | | | | 249,700 | |
| | | | | | | | | | | | | | | | | |
| TOTAL FOREIGN GOVERNMENT BONDS AND NOTES, SUPRANATIONALS AND FOREIGN AGENCIES |
| (Cost $185,327) | | | | | | | | | | | 249,700 | |
| | | | | | | | | | | | | | | | | |
| BANK LOANS - 4.82%(a)(d) | | | | | | | | | | | | |
| Canada - 0.12% | | | | | | | | | | | | |
| | 85,000 | | | Kronos Acquisition Holdings, Inc., First Lien - Initial (2020) Term Loan(j) | | | L + 4.50%, 0.75% Floor | | | | 12/22/2026 | | | | 85,299 | |
| | 169,324 | | | Titan Acquisition, Ltd., First Lien - Initial Term Loan | | | 3M US L + 3.00% | | | | 03/28/2025 | | | | 165,582 | |
| | | | | | | | | | | | | | | | 250,881 | |
| Ireland - 0.08% | | | | | | | | | | | | |
| | 172,741 | | | ION Trading Technologies S.A.R.L., First Lien - 2018 Initial Dollar Term Loan | | | 3M US L + 4.00%, 1.00% Floor | | | | 11/21/2024 | | | | 172,680 | |
| | | | | | | | | | | | | | | | | |
| Israel - 0.08% | | | | | | | | | | | | |
| | 176,713 | | | Playtika Holding Corp., First Lien - B Term Loan | | | 3M US L + 6.00%, 1.00% Floor | | | | 12/10/2024 | | | | 178,130 | |
See Notes to Financial Statements.
| Semi-Annual Report | December 31, 2020 | 11 |
RiverNorth/DoubleLine Strategic Opportunity Fund, Inc.
| Schedule of Investments | December 31, 2020 (Unaudited) |
| Principal Amount/Description | | | Rate | | Maturity | | | Value | |
| Luxembourg - 0.31% | | | | | | | | | |
| $ | 230,000 | | | Curium BidCo S.a r.l., Second Lien - 2nd lien TL Term Loan(j) | | L + 7.75% | | | 10/27/2028 | | | $ | 230,575 | |
| | 323,459 | | | Travelport Finance S.à r.l., First Lien - Initial (Priority) Term Loan(j) | | L + 8.00%, 1.00% Floor | | | 02/28/2025 | | | | 319,921 | |
| | | | | Travelport Finance S.à r.l., First | | | | | | | | | | |
| | 139,769 | | | Lien - Initial Term Loan | | 3M US L + 5.00% | | | 05/29/2026 | | | | 95,859 | |
| | | | | | | | | | | | | | 646,355 | |
| Netherlands - 0.12% | | | | | | | | | | |
| | 410,000 | | | Bright Bidco B.V., First Lien -2018 Refinancing B Term Loan(j) | | L + 3.50%, 1.00% Floor | | | 06/30/2024 | | | | 237,843 | |
| | 2,433 | | | Lealand Finance Company B.V., First Lien - Make-Whole Term Loan | | 1M US L + 3.00% | | | 06/28/2024 | | | | 2,008 | |
| | | | | Lealand Finance Company B.V., | | | | | | | | | | |
| | 30,999 | | | First Lien - Take-Back Term Loan | | 1M US L + 4.00% | | | 06/30/2025 | | | | 20,846 | |
| | | | | | | | | | | | | | 260,697 | |
| United States - 4.11% | | | | | | | | | | |
| | 517,115 | | | Air Methods Corp., First Lien - Initial Term Loan | | 3M US L + 3.50%, 1.00% Floor | | | 04/22/2024 | | | | 500,826 | |
| | 566,370 | | | American Tire Distributors, Inc., First Lien - Initial Term Loan | | 3M US L + 7.50%, 1.00% Floor | | | 09/02/2024 | | | | 543,148 | |
| | 102,576 | | | Avaya, Inc., First Lien -Tranche B Term Loan | | 1M US L + 4.25% | | | 12/15/2024 | | | | 103,317 | |
| | 127,424 | | | Avaya, Inc., First Lien -Tranche B-1Term Loan | | 1M US L + 4.25% | | | 12/15/2027 | | | | 127,689 | |
| | 248,438 | | | Castle US Holding Corp., First Lien - Initial Dollar Term Loan | | 3M US L + 3.75% | | | 01/29/2027 | | | | 244,477 | |
| | 319,974 | | | Cengage Learning, Inc., First Lien - 2016 Refinancing Term Loan | | 3M US L + 4.25%, 1.00% Floor | | | 06/07/2023 | | | | 307,793 | |
| | 710,344 | | | Cvent, Inc., First Lien Term Loan | | 1M US L + 3.75% | | | 11/29/2024 | | | | 685,482 | |
| | 211,830 | | | Cyxtera DC Holdings, Inc., First Lien - Initial Term Loan | | 3M US L + 3.00%, 1.00% Floor | | | 05/01/2024 | | | | 198,937 | |
| | 48,916 | | | Dhanani Group, Inc., First Lien Term Loan | | 1M US L + 3.75% | | | 07/20/2025 | | | | 48,121 | |
| | 229,415 | | | Envision Healthcare Corp., First Lien - Initial Term Loan | | 1M US L + 3.75% | | | 10/10/2025 | | | | 192,394 | |
| | 118,473 | | | Global Medical Response, Inc., First Lien - 2018 New Term Loan | | 3M US L + 4.25%, 1.00% Floor | | | 03/14/2025 | | | | 117,585 | |
| | 243,933 | | | Golden Nugget, Inc., First Lien - Initial B Term Loan | | 2M US L + 2.50%, 0.75% Floor | | | 10/04/2023 | | | | 236,300 | |
| | 197,500 | | | Granite US Holdings Corp., First Lien - B Term Loan | | 3M US L + 5.25% | | | 09/30/2026 | | | | 197,994 | |
| | 323,140 | | | Gulf Finance LLC, First Lien - Tranche B Term Loan | | 1M US L + 5.25%, 1.00% Floor | | | 08/25/2023 | | | | 246,626 | |
See Notes to Financial Statements.
| 12 | (888) 848-7569 | www.rivernorth.com |
RiverNorth/DoubleLine Strategic Opportunity Fund, Inc.
| Schedule of Investments | December 31, 2020 (Unaudited) |
| Principal Amount/Description | | | Rate | | Maturity | | | Value | |
| $ | 150,000 | | | Ivanti Software, Inc., First Lien - Initial Term Loan | | 1M US L + 4.75%, 1.00% Floor | | | 12/01/2027 | | | $ | 149,906 | |
| | 38,792 | | | Klockner Pentaplast of America, Inc., First Lien - Dollar Term Loan | | 3M US L + 4.25%, 1.00% Floor | | | 06/30/2022 | | | | 38,768 | |
| | 128,375 | | | Lower Cadence Holdings LLC, First Lien - Initial Term Loan | | 1M US L + 4.00% | | | 05/22/2026 | | | | 125,687 | |
| | 105,000 | | | Milano Acquisition Corp., First Lien - B Term Loan | | 3M US L + 4.00%, 0.75% Floor | | | 10/01/2027 | | | | 105,240 | |
| | 369,361 | | | Minotaur Acquisition, Inc., First Lien - B Term Loan | | 1M US L + 5.00% | | | 03/27/2026 | | | | 363,359 | |
| | 207,911 | | | Misys, Ltd., First Lien -Dollar Term Loan | | 3M US L + 3.50%, 1.00% Floor | | | 06/13/2024 | | | | 204,186 | |
| | 230,000 | | | Misys, Ltd., Second Lien -Dollar Term Loan | | 3M US L + 7.25%, 1.00% Floor | | | 06/13/2025 | | | | 231,561 | |
| | 445,000 | | | Mitchell International, Inc., Second Lien - Initial Term Loan | | 1M US L + 7.25% | | | 12/01/2025 | | | | 431,929 | |
| | 203,387 | | | MLN US HoldCo LLC, First Lien -B Term Loan | | 1M US L + 4.50% | | | 11/30/2025 | | | | 185,384 | |
| | 351,379 | | | MPH Acquisition Holdings LLC, First Lien - Initial Term Loan | | 3M US L + 2.75%, 1.00% Floor | | | 06/07/2023 | | | | 350,419 | |
| | 40,879 | | | Onedigital Borrower LLC Delayed Tl(j) | | L + 4.50% | | | 11/16/2027 | | | | 41,032 | |
| | 414,121 | | | OneDigital Borrower LLC, First Lien - Initial Term Loan | | 3M US L + 4.50%, 0.75% Floor | | | 11/16/2027 | | | | 415,674 | |
| | 439,324 | | | Peak 10 Holding Corp., First Lien - Initial Term Loan | | 3M US L + 3.50% | | | 08/01/2024 | | | | 394,994 | |
| | 215,778 | | | Radiology Partners, Inc., First Lien - B Term Loan | | 3M US L + 4.25% | | | 07/09/2025 | | | | 212,721 | |
| | 225,730 | | | Solenis Holdings LLC, First Lien - Initial Dollar Term Loan | | 3M US L + 4.00% | | | 06/26/2025 | | | | 225,786 | |
| | 90,000 | | | Solenis Holdings LLC, Second Lien - Initial Term Loan | | 3M US L + 8.50% | | | 06/26/2026 | | | | 89,925 | |
| | 385,000 | | | Team Health Holdings, Inc., First Lien - Initial Term Loan | | 1M US L + 2.75%, 1.00% Floor | | | 02/06/2024 | | | | 344,783 | |
| | 220,000 | | | TIBCO Software, Inc., Second Lien | | 1M US L + 7.25% | | | 03/03/2028 | | | | 222,933 | |
| | 484,724 | | | Vantage Specialty Chemicals, Inc., First Lien - Closing Date Term Loan(j) | | L + 3.50%, 1.00% Floor | | | 10/28/2024 | | | | 462,408 | |
| | | | | Web.com Group, Inc., Second | | | | | | | | | | |
| | 354,722 | | | Lien - Initial Term Loan | | 1M US L + 7.75% | | | 10/09/2026 | | | | 340,385 | |
| | | | | | | | | | | | | | 8,687,769 | |
| | | | | | | | | | | | | | | |
| TOTAL BANK LOANS | | | | | | | | | | |
| (Cost $10,065,769) | | | | | | | | | 10,196,512 | |
See Notes to Financial Statements.
| Semi-Annual Report | December 31, 2020 | 13 |
RiverNorth/DoubleLine Strategic Opportunity Fund, Inc.
| Schedule of Investments | December 31, 2020 (Unaudited) |
| Principal Amount/Description | | | Rate | | Maturity | | | Value | |
| COLLATERALIZED LOAN OBLIGATIONS -3.98%(a) | | | | | | | | | | |
| | | | | Apidos CLO XXI | | | | | | | | | | |
| $ | 500,000 | | | Series 2018-21A(d)(h) | | 3M US L + 8.25% | | | 07/18/2027 | | | $ | 407,715 | |
| | | | | Apidos CLO XXIV | | | | | | | | | | |
| | 500,000 | | | Series 2018-24A(d)(h) | | 3M US L + 5.80% | | | 10/20/2030 | | | | 465,483 | |
| | | | | Apidos CLO XXXII | | | | | | | | | | |
| | 500,000 | | | Series 2020-32A(d)(h) | | 3M US L + 6.75% | | | 01/20/2033 | | | | 496,539 | |
| | | | | Apres Static CLO 2, Ltd. | | | | | | | | | | |
| | 500,000 | | | Series 2020-1A(d)(h) | | 3M US L + 4.85% | | | 04/15/2028 | | | | 501,956 | |
| | | | | Barings CLO, Ltd. | | | | | | | | | | |
| | 500,000 | | | Series 2018-4A(d)(h) | | 3M US L + 5.82% | | | 10/15/2030 | | | | 476,152 | |
| | | | | Canyon Capital CLO, Ltd. | | | | | | | | | | |
| | 500,000 | | | Series 2018-1A(d)(h) | | 3M US L + 5.75% | | | 07/15/2031 | | | | 460,413 | |
| | | | | Carlyle Global Market Strategies CLO, Ltd. | | | | | | | | | | |
| | 500,000 | | | Series 2017-3A(d)(h) | | 3M US L + 5.50% | | | 10/15/2030 | | | | 441,905 | |
| | 500,000 | | | Series 2018-2RA(d)(h) | | 3M US L + 5.35% | | | 05/15/2031 | | | | 436,594 | |
| | | | | Chenango Park CLO, Ltd. | | | | | | | | | | |
| | 500,000 | | | Series 2018-1A(d)(h) | | 3M US L + 5.80% | | | 04/15/2030 | | | | 479,903 | |
| | | | | Dorchester Park CLO DAC | | | | | | | | | | |
| | 500,000 | | | Series 2018-1A(d)(h) | | 3M US L + 5.00% | | | 04/20/2028 | | | | 480,562 | |
| | | | | Fillmore Park CLO, Ltd. | | | | | | | | | | |
| | 500,000 | | | Series 2018-1A(d)(h) | | 3M US L + 5.40% | | | 07/15/2030 | | | | 466,804 | |
| | | | | Goldentree Loan Management US Clo 3, Ltd. | | | | | | | | | | |
| | 500,000 | | | Series 2018-3A(d)(h) | | 3M US L + 2.85% | | | 04/20/2030 | | | | 483,698 | |
| | | | | Myers Park CLO, Ltd. | | | | | | | | | | |
| | 500,000 | | | Series 2018-1A(d)(h) | | 3M US L + 5.50% | | | 10/20/2030 | | | | 468,661 | |
| | | | | Neuberger Berman CLO XXIII, Ltd. | | | | | | | | | | |
| | 500,000 | | | Series 2018-23A(d)(h) | | 3M US L + 5.75% | | | 10/17/2027 | | | | 486,460 | |
| | | | | THL Credit Wind River CLO, Ltd. | | | | | | | | | | |
| | 500,000 | | | Series 2018-2A(d)(h) | | 3M US L + 5.75% | | | 07/15/2030 | | | | 455,349 | |
| | | | | Voya CLO, Ltd. | | | | | | | | | | |
| | 500,000 | | | Series 2018-2A(d)(h) | | 3M US L + 5.25% | | | 07/15/2031 | | | | 465,244 | |
| | 500,000 | | | Series 2018-4A(d)(h) | | 3M US L + 5.95% | | | 07/14/2031 | | | | 441,231 | |
| | | | | Webster Park CLO, Ltd. | | | | | | | | | | |
| | 500,000 | | | Series 2018-1A(d)(h) | | 3M US L + 5.50% | | | 07/20/2030 | | | | 480,904 | |
| | | | | | | | | | | | | | | |
| TOTAL COLLATERALIZED LOAN OBLIGATIONS | | | | | | | | | | |
| (Cost $8,847,811) | | | | | | | | | 8,395,573 | |
| | | | | | | | | | | | | | | |
| NON-AGENCY COLLATERALIZED MORTGAGE OBLIGATIONS -31.94%(a) | | | | | | | | | | |
| | | | | AmeriHome GMSR Issuer Trust | | | | | | | | | | |
| | 2,500,000 | | | Series 2019-GT1(h) | | 4.68% | | | 11/25/2026 | | | | 2,270,487 | |
See Notes to Financial Statements.
| 14 | (888) 848-7569 | www.rivernorth.com |
RiverNorth/DoubleLine Strategic Opportunity Fund, Inc.
| Schedule of Investments | December 31, 2020 (Unaudited) |
| Principal Amount/Description | | | Rate | | | Maturity | | | Value | |
| | | | | AREIT Trust | | | | | | | | | | | | |
| $ | 538,000 | | | Series 2019-CRE3(d)(h) | | | 1M US L + 2.65% | | | | 07/14/2022 | | | $ | 515,235 | |
| | | | | Atrium Hotel Portfolio Trust | | | | | | | | | | | | |
| | 433,000 | | | Series 2018-ATRM(d)(h) | | | 1M US L + 3.40% | | | | 06/15/2021 | | | | 381,502 | |
| | | | | Atrium XIII | | | | | | | | | | | | |
| | 500,000 | | | Series 2017-13A(d)(h) | | | 3M US L + 6.05% | | | | 11/21/2030 | | | | 470,431 | |
| | | | | Atrium XIV LLC | | | | | | | | | | | | |
| | 500,000 | | | Series 2018-14A(d)(h) | | | 3M US L + 5.65% | | | | 08/23/2030 | | | | 477,922 | |
| | | | | BAMLL Commercial Mortgage | | | | | | | | | | | | |
| | | | | Securities Trust | | | | | | | | | | | | |
| | 730,000 | | | Series 2019-AHT(d)(h) | | | 2.68 | % | | | 03/15/2021 | | | | 691,368 | |
| | | | | Bancorp Commercial Mortgage Trust | | | | | | | | | | | | |
| | 631,000 | | | Series 2019-CRE5(d)(h) | | | 1M US L + 2.35% | | | | 02/15/2022 | | | | 601,424 | |
| | | | | BBCMS Trust | | | | | | | | | | | | |
| | 682,000 | | | Series 2018-CBM(d)(h) | | | 1M US L + 3.55% | | | | 07/15/2037 | | | | 618,327 | |
| | | | | BB-UBS Trust | | | | | | | | | | | | |
| | 500,000 | | | Series 2012-TFT(d)(h) | | | 3.56 | % | | | 06/05/2030 | | | | 438,225 | |
| | | | | Benchmark 2018-B4 Mortgage Trust | | | | | | | | | | | | |
| | 498,000 | | | Series 2018-B4(d)(h) | | | 2.81 | % | | | 07/15/2028 | | | | 444,020 | |
| | | | | BF Mortgage Trust | | | | | | | | | | | | |
| | 315,000 | | | Series 2019-NYT(d)(h) | | | 1M US L + 3.00% | | | | 12/15/2020 | | | | 304,926 | |
| | | | | Blackbird Capital Aircraft Lease Securitization, Ltd. | | | | | | | | | | | | |
| | 2,281,250 | | | Series 2016-1A(h)(k) | | | 5.68 | % | | | 12/15/2024 | | | | 1,992,918 | |
| | | | | BX Commercial Mortgage Trust | | | | | | | | | | | | |
| | 321,000 | | | Series 2019-IMC(d)(h) | | | 1M US L + 1.90% | | | | 04/15/2021 | | | | 301,398 | |
| | | | | BX Trust | | | | | | | | | | | | |
| | 325,000 | | | Series 2019-OC11(d)(h) | | | 4.08 | % | | | 12/09/2029 | | | | 323,984 | |
| | | | | Carbon Capital VI Commercial Mortgage Trust | | | | | | | | | | | | |
| | 316,000 | | | Series 2019-FL2(d)(h) | | | 1M US L + 2.85% | | | | 11/15/2021 | | | | 279,772 | |
| | | | | Castlelake Aircraft Securitization Trust | | | | | | | | | | | | |
| | 376,851 | | | Series 2018-1(h) | | | 6.63 | % | | | 06/15/2025 | | | | 172,535 | |
| | 1,250,000 | | | Castlelake Aircraft Structured Trust Series 2019-1A(h) | | | 0.00 | % | | | 04/15/2039 | | | | 248,427 | |
| | | | | CIM Trust | | | | | | | | | | | | |
| | 3,720,000 | | | Series 2016-3RR B2(d)(h) | | | 10.69 | % | | | 01/27/2057 | | | | 3,550,606 | |
| | | | | Citigroup Commercial Mortgage Trust | | | | | | | | | | | | |
| | 196,000 | | | Series 2015-GC27(d)(h) | | | 4.42 | % | | | 01/10/2025 | | | | 175,459 | |
| | 138,000 | | | Series 2016-GC36(h) | | | 2.85 | % | | | 01/10/2026 | | | | 99,298 | |
| | 319,000 | | | Series 2018-TBR(d)(h) | | | 1M US L + 3.65% | | | | 12/15/2036 | | | | 278,578 | |
See Notes to Financial Statements.
| Semi-Annual Report | December 31, 2020 | 15 |
RiverNorth/DoubleLine Strategic Opportunity Fund, Inc.
| Schedule of Investments | December 31, 2020 (Unaudited) |
| Principal Amount/Description | | | Rate | | | Maturity | | Value | |
| $ | 375,000 | | | Series 2020-555(d)(h) | | | 3.62 | % | | 12/10/2029 | | $ | 284,675 | |
| | | | | Citigroup COmmercial Mortgage Trust 2019-SMRT | | | | | | | | | | |
| | 320,000 | | | Series 2019-SMRT(d)(h) | | | 4.75 | % | | 01/10/2024 | | | 324,617 | |
| | | | | CLNC 2019-FL1, Ltd. | | | | | | | | | | |
| | 326,000 | | | Series 2019-FL1(d)(h) | | | 1M US L + 1.55% | | | 12/19/2025 | | | 321,669 | |
| | | | | COMM Mortgage Trust | | | | | | | | | | |
| | 878,000 | | | Series 2018-HCLV(d)(h) | | | 1M US L + 2.18% | | | 09/15/2033 | | | 785,756 | |
| | | | | Commercial Mortgage Pass-Through Certificates | | | | | | | | | | |
| | 286,000 | | | Series 2015-CR25(d) | | | 4.54 | % | | 08/10/2025 | | | 297,214 | |
| | | | | CSAIL 2016-C6 Commercial Mortgage Trust | | | | | | | | | | |
| | 428,000 | | | Series 2016-C6(d)(h) | | | 4.95 | % | | 05/15/2026 | | | 405,256 | |
| | | | | DBGS 2018-BIOD Mortgage Trust | | | | | | | | | | |
| | 269,160 | | | Series 2018-BIOD(d)(h) | | | 1M US L + 2.00% | | | 05/15/2035 | | | 269,043 | |
| | | | | DBJPM 16-C1 Mortgage Trust | | | | | | | | | | |
| | 416,000 | | | Series 2016-C1(d) | | | 3.35 | % | | 03/10/2026 | | | 392,244 | |
| | | | | Dryden 37 Senior Loan Fund | | | | | | | | | | |
| | 500,000 | | | Series 2017-37A(d)(h) | | | 3M US L + 5.15% | | | 01/15/2031 | | | 438,792 | |
| | | | | Dryden 38 Senior Loan Fund | | | | | | | | | | |
| | 500,000 | | | Series 2018-38A(d)(h) | | | 3M US L + 5.60% | | | 07/15/2030 | | | 459,649 | |
| | | | | Dryden 40 Senior Loan Fund | | | | | | | | | | |
| | 500,000 | | | Series 2018-40A(d)(h) | | | 3M US L + 5.75% | | | 08/15/2031 | | | 466,114 | |
| | | | | Fannie Mae-Aces | | | | | | | | | | |
| | 5,495,951 | | | Series 2019-M24(d)(l) | | | 1.15 | % | | 03/25/2031 | | | 542,420 | |
| | 18,974,356 | | | Series 2020-M10(d)(l) | | | 0.87 | % | | 07/25/2032 | | | 1,459,719 | |
| | 5,486,243 | | | Series 2020-M13(d)(l) | | | 1.30 | % | | 09/25/2030 | | | 508,763 | |
| | | | | FirstKey Homes 2020-SFR1 Trust | | | | | | | | | | |
| | 700,000 | | | Series 2020-SFR1(h) | | | 4.28 | % | | 09/17/2025 | | | 727,927 | |
| | | | | Fontainebleau Miami Beach Trust | | | | | | | | | | |
| | 546,000 | | | Series 2019-FBLU(d)(h) | | | 3.96 | % | | 12/10/2024 | | | 503,606 | |
| | | | | FREMF 2015-KF07 Mortgage Trust | | | | | | | | | | |
| | 270,544 | | | Series 2015-KF07(d)(h) | | | 1M US L + 4.95% | | | 02/25/2025 | | | 272,699 | |
| | | | | FREMF 2016-KF19 Mortgage Trust | | | | | | | | | | |
| | 299,980 | | | Series 2016-KF19(d)(h) | | | 1M US L + 5.50% | | | 06/25/2023 | | | 299,811 | |
| | | | | FREMF 2016-KF25 Mortgage Trust | | | | | | | | | | |
| | 296,494 | | | Series 2016-KF25(d)(h) | | | 1M US L + 5.00% | | | 10/25/2023 | | | 294,698 | |
| | | | | FREMF Mortgage Trust | | | | | | | | | | |
| | 394,367 | | | Series 2016-KF22(d)(h) | | | 1M US L + 5.05% | | | 07/25/2023 | | | 401,051 | |
| | | | | Government National Mortgage Association | | | | | | | | | | |
| | 11,665,531 | | | Series 2013-155(d)(l) | | | 0.05 | % | | 09/16/2053 | | | 81,901 | |
| | 6,307,612 | | | Series 2020-168(d)(l) | | | 0.99 | % | | 12/16/2062 | | | 561,006 | |
See Notes to Financial Statements.
| 16 | (888) 848-7569 | www.rivernorth.com |
RiverNorth/DoubleLine Strategic Opportunity Fund, Inc.
| Schedule of Investments | December 31, 2020 (Unaudited) |
| Principal Amount/Description | | | Rate | | | Maturity | | Value | |
| | | | | GPMT, Ltd. | | | | | | | | | | |
| $ | 999,000 | | | Series 2018-FL1(d)(h) | | | 1M US L + 2.95% | | | 04/19/2021 | | $ | 954,288 | |
| | | | | Great Wolf Trust | | | | | | | | | | |
| | 1,100,000 | | | Series 2019-WOLF(d)(h) | | | 1M US L + 3.13% | | | 12/15/2024 | | | 978,301 | |
| | | | | GS Mortgage Securities Corp. Trust 2018-RIVR | | | | | | | | | | |
| | 300,000 | | | Series 2018-RIVR(d)(h) | | | 1M US L + 1.55% | | | 07/15/2035 | | | 262,443 | |
| | | | | GS Mortgage Securities Trust | | | | | | | | | | |
| | 1,776,000 | | | Series 2014-GC26(d)(h) | | | 4.51 | % | | 11/10/2047 | | | 1,335,085 | |
| | 655,000 | | | Series 2018-TWR(d)(h) | | | 1M US L + 3.92% | | | 07/15/2021 | | | 559,816 | |
| | | | | Hawaii Hotel Trust | | | | | | | | | | |
| | 230,000 | | | Series 2019-MAUI(d)(h) | | | 1M US L + 2.75% | | | 05/15/2021 | | | 214,132 | |
| | | | | Highbridge Loan Management 4-2014, Ltd. | | | | | | | | | | |
| | 500,000 | | | Series 2018-2014(d)(h) | | | 3M US L + 5.55% | | | 01/28/2030 | | | 465,300 | |
| | | | | Highbridge Loan Management, Ltd. | | | | | | | | | | |
| | 500,000 | | | Series 2018-2015(d)(h) | | | 3M US L + 5.10% | | | 02/05/2031 | | | 446,799 | |
| | | | | HPLY Trust | | | | | | | | | | |
| | 187,113 | | | Series 2019-HIT(d)(h) | | | 1M US L + 3.90% | | | 11/15/2021 | | | 161,865 | |
| | | | | InSite Issuer LLC | | | | | | | | | | |
| | 3,000,000 | | | Series 2016-1A(h) | | | 6.41 | % | | 11/15/2023 | | | 3,235,206 | |
| | | | | J.P. Morgan Chase Commercial Mortgage Securities Trust | | | | | | | | | | |
| | 500,000 | | | Series 2016-WIKI(d)(h) | | | 4.01 | % | | 10/05/2021 | | | 457,133 | |
| | | | | JP Morgan BB Commercial Mortgage Securities Trust | | | | | | | | | | |
| | 1,062,000 | | | Series 2014-C23(d)(h) | | | 3.36 | % | | 10/15/2024 | | | 695,300 | |
| | 632,000 | | | Series 2015-C27(d)(h) | | | 3.81 | % | | 02/15/2025 | | | 516,734 | |
| | 290,000 | | | Series 2015-C28 | | | 3.99 | % | | 03/15/2025 | | | 309,668 | |
| | | | | JP Morgan Chase Commercial Mortgage Securities Trust | | | | | | | | | | |
| | 83,909 | | | Series 2006-LDP9 | | | 5.34 | % | | 05/15/2047 | | | 74,260 | |
| | 411,000 | | | Series 2011-C3(d)(h) | | | 5.70 | % | | 03/15/2021 | | | 125,726 | |
| | 320,000 | | | Series 2019-MFP(d)(h) | | | 1M US L + 3.00% | | | 07/15/2021 | | | 298,593 | |
| | 109,000 | | | Series 2019-UES(h) | | | 4.34 | % | | 05/05/2024 | | | 109,581 | |
| | 525,000 | | | Series 2019-UES(d)(h) | | | 4.45 | % | | 05/05/2024 | | | 495,084 | |
| | | | | JPMBB Commercial Mortgage Securities Trust | | | | | | | | | | |
| | 9,475,000 | | | Series 2013-C14(d)(h)(l) | | | 1.10 | % | | 08/15/2023 | | | 246,530 | |
| | | | | LCM Loan Income Fund I Income Note Issuer, Ltd. | | | | | | | | | | |
| | 500,000 | | | Series 2018-27A(d)(h) | | | 3M US L + 5.60% | | | 07/16/2031 | | | 440,475 | |
| | | | | LCM XIV LP | | | | | | | | | | |
| | 500,000 | | | Series 2018-14A(d)(h) | | | 3M US L + 5.50% | | | 07/20/2031 | | | 434,250 | |
See Notes to Financial Statements.
| Semi-Annual Report | December 31, 2020 | 17 |
RiverNorth/DoubleLine Strategic Opportunity Fund, Inc.
| Schedule of Investments | December 31, 2020 (Unaudited) |
| Principal Amount/Description | | | Rate | | Maturity | | Value | |
| | | | | LCM XVII LP | | | | | | | | |
| $ | 500,000 | | | Series 2018-17A(d)(h) | | 3M US L + 6.00% | | 10/15/2031 | | $ | 451,835 | |
| | | | | Legacy Mortgage Asset Trust | | | | | | | | |
| | 6,200,000 | | | Series 2019-GS3(h)(k) | | 4.25% | | 04/25/2059 | | | 6,150,420 | |
| | | | | Mello Warehouse Securitization Trust | | | | | | | | |
| | 3,250,000 | | | Series 2019-1(d)(h) | | 1M US L + 5.50% | | 05/14/2021 | | | 3,249,734 | |
| | | | | MFT Trust 2020-ABC | | | | | | | | |
| | 365,000 | | | Series 2020-ABC(d)(h) | | 3.48% | | 02/10/2030 | | | 322,693 | |
| | | | | Morgan Stanley Capital Barclays Bank Trust 2016-MART | | | | | | | | |
| | 302,000 | | | Series 2016-MART(h) | | 3.31% | | 09/13/2021 | | | 296,768 | |
| | | | | Morgan Stanley Capital I Trust | | | | | | | | |
| | 363,000 | | | Series 2007-IQ15(d)(h) | | 6.15% | | 06/11/2049 | | | 349,443 | |
| | 210,000 | | | Series 2017-ASHF(d)(h) | | 1M US L + 4.35% | | 11/15/2034 | | | 174,675 | |
| | 350,000 | | | Series 2018-SUN(d)(h) | | 1M US L + 3.05% | | 07/15/2035 | | | 326,408 | |
| | | | | Mosaic Solar Loan Trust 2020-1 | | | | | | | | |
| | 2,900,000 | | | Series 2020-1A(h) | | 0.00% | | 04/20/2046 | | | 1,114,096 | |
| | | | | Motel 6 Trust 2017-MTL6 | | | | | | | | |
| | 297,708 | | | Series 2017-MTL6(d)(h) | | 1M US L + 4.25% | | 08/15/2034 | | | 293,362 | |
| | | | | New Century Home Equity Loan Trust | | | | | | | | |
| | 1,907,509 | | | Series 2006-1(d) | | 1M US L + 0.18% | | 05/25/2036 | | | 1,808,540 | |
| | | | | Octagon Investment Partners 26, Ltd. | | | | | | | | |
| | 500,000 | | | Series 2018-1A(d)(h) | | 3M US L + 8.09% | | 07/15/2030 | | | 421,440 | |
| | | | | Octagon Investment Partners 29, Ltd. | | | | | | | | |
| | 500,000 | | | Series 2020-1A(d)(h) | | 3M US L + 7.25% | | 01/24/2033 | | | 499,997 | |
| | | | | Octagon Investment Partners 45, | | | | | | | | |
| | | | | Ltd. | | | | | | | | |
| | 500,000 | | | Series 2019-1A(d)(h) | | 3M US L + 7.69% | | 10/15/2032 | | | 504,417 | |
| | | | | Octagon Investment Partners XVI, Ltd. | | | | | | | | |
| | 500,000 | | | Series 2018-1A(d)(h) | | 3M US L + 5.75% | | 07/17/2030 | | | 470,053 | |
| | | | | Octagon Investment Partners XXI, Ltd. | | | | | | | | |
| | 500,000 | | | Series 2019-1A(d)(h) | | 3M US L + 7.00% | | 02/14/2031 | | | 500,321 | |
| | | | | Octagon Investment Partners XXII, Ltd. | | | | | | | | |
| | 500,000 | | | Series 2018-1A(d)(h) | | 3M US L + 1.90% | | 01/22/2030 | | | 492,453 | |
| | | | | One Market Plaza Trust | | | | | | | | |
| | 319,000 | | | Series 2017-1MKT(h) | | 4.14% | | 02/10/2024 | | | 325,091 | |
| | | | | PR Mortgage Loan Trust | | | | | | | | |
| | 2,112,665 | | | Series 2014-1(d)(h) | | 5.91% | | 09/25/2047 | | | 2,090,360 | |
See Notes to Financial Statements.
| 18 | (888) 848-7569 | www.rivernorth.com |
RiverNorth/DoubleLine Strategic Opportunity Fund, Inc.
| Schedule of Investments | December 31, 2020 (Unaudited) |
| Principal Amount/Description | | | Rate | | | Maturity | | Value | |
| | | | | PRPM LLC | | | | | | | | | | |
| $ | 4,000,000 | | | Series 2020-1A(h)(k) | | | 3.97 | % | | 02/25/2023 | | $ | 3,974,122 | |
| | | | | RMAT LLC | | | | | | | | | | |
| | 482,057 | | | Series 2015-PR2(h)(k) | | | 9.85 | % | | 11/25/2035 | | | 481,776 | |
| | | | | Sofi Professional Loan Program 2018-C Trust | | | | | | | | | | |
| | 50,000 | | | Series 2018-C(h) | | | 0.00 | % | | 01/25/2048 | | | 1,608,611 | |
| | | | | SoFi Professional Loan Program Trust | | | | | | | | | | |
| | 20,000 | | | Series 2020-A(h) | | | 0.00 | % | | 05/15/2046 | | | 1,246,582 | |
| | | | | SoFi Professional Loan Program, LLC | | | | | | | | | | |
| | 28,017 | | | Series 2019-B(h) | | | 0.00 | % | | 08/17/2048 | | | 795,742 | |
| | | | | Trimaran CAVU, Ltd. | | | | | | | | | | |
| | 500,000 | | | Series 2019-2A(d)(h) | | | 3M US L + 4.72% | | | 11/26/2032 | | | 505,111 | |
| | | | | UBS-Barclays Commercial Mortgage Trust | | | | | | | | | | |
| | 333,000 | | | Series 2013-C5(d)(h) | | | 4.10 | % | | 02/10/2023 | | | 209,894 | |
| | | | | UBS-Barclays Commercial Mortgage Trust 2013-C5 | | | | | | | | | | |
| | 300,000 | | | Series 2013-C5(d)(h) | | | 4.10 | % | | 02/10/2023 | | | 288,239 | |
| | | | | VMC Finance LLC | | | | | | | | | | |
| | 457,988 | | | Series 2019-FL3(d)(h) | | | 1M US L + 2.65% | | | 09/15/2036 | | | 427,104 | |
| | | | | WAVE LLC | | | | | | | | | | |
| | 491,751 | | | Series 2019-1(h) | | | 6.41 | % | | 09/15/2027 | | | 302,554 | |
| | | | | Wells Fargo Commercial Mortgage Trust | | | | | | | | | | |
| | 332,000 | | | Series 2016-C33(h) | | | 3.12 | % | | 03/15/2059 | | | 299,153 | |
| | | | | | | | | | | | | | | |
| TOTAL NON -AGENCY COLLATERALIZED MORTGAGE OBLIGATIONS | | | | | | | | | | |
| (Cost $71,711,619) | | | | | | | | | 67,533,035 | |
| | | | | | | | | | | | | | | |
| U.S. GOVERNMENT / AGENCY MORTGAGE BACKED SECURITIES -52.64%(a) | | | | |
| | | | | Alternative Loan Trust | | | | | | | | | | |
| | 728,779 | | | Series 2005-48T1 | | | 5.50 | % | | 11/25/2035 | | | 592,829 | |
| | 464,626 | | | Series 2005-63(d) | | | 3.24 | % | | 12/25/2035 | | | 447,152 | |
| | 2,613,088 | | | Series 2005-64CB | | | 5.50 | % | | 12/25/2035 | | | 2,318,329 | |
| | 1,155,363 | | | Series 2006-26CB | | | 6.50 | % | | 09/25/2036 | | | 859,543 | |
| | 2,632,854 | | | Series 2007-14T2 | | | 6.00 | % | | 07/25/2037 | | | 1,883,604 | |
| | 2,238,135 | | | Series 2007-16CB | | | 6.25 | % | | 08/25/2037 | | | 1,744,201 | |
| | 2,359,176 | | | Series 2007-2CB | | | 5.75 | % | | 03/25/2037 | | | 1,867,150 | |
| | | | | Banc of America Funding Trust | | | | | | | | | | |
| | 1,934,861 | | | Series 2006-D(d) | | | 3.08 | % | | 05/20/2036 | | | 1,714,104 | |
| | | | | Banc of America Mortgage Trust | | | | | | | | | | |
| | 1,547,096 | | | Series 2007-3 | | | 6.00 | % | | 09/25/2037 | | | 1,555,390 | |
See Notes to Financial Statements.
| Semi-Annual Report | December 31, 2020 | 19 |
RiverNorth/DoubleLine Strategic Opportunity Fund, Inc.
| Schedule of Investments | December 31, 2020 (Unaudited) |
| Principal Amount/Description | | | Rate | | | Maturity | | Value | |
| | | | | Bear Stearns ALT-A Trust | | | | | | | | | | |
| $ | 1,607,113 | | | Series 2005-10(d) | | | 3.02 | % | | 01/25/2036 | | $ | 1,536,693 | |
| | | | | Bear Stearns ARM Trust | | | | | | | | | | |
| | 1,059,276 | | | Series 2006-2(d) | | | 3.45 | % | | 07/25/2036 | | | 1,009,763 | |
| | | | | Chase Mortgage Finance Trust Series | | | | | | | | | | |
| | 3,054,060 | | | Series 2007-S4(d) | | | 1M US L + 0.60% | | | 06/25/2037 | | | 971,675 | |
| | | | | ChaseFlex Trust Series 2007-1 | | | | | | | | | | |
| | 2,580,731 | | | Series 2007-1 | | | 6.50 | % | | 02/25/2037 | | | 1,407,777 | |
| | | | | CHL GMSR Issuer Trust | | | | | | | | | | |
| | 3,930,000 | | | Series 2018-GT1(d)(h) | | | 1M US L + 2.75% | | | 05/25/2023 | | | 3,881,706 | |
| | | | | CHL Mortgage Pass-Through Trust | | | | | | | | | | |
| | 1,848,704 | | | Series 2005-HYB1(d) | | | 1M US L + 0.60% | | | 03/25/2035 | | | 1,777,681 | |
| | 2,069,088 | | | Series 2007-9 | | | 5.75 | % | | 07/25/2037 | | | 1,574,223 | |
| | 1,935,756 | | | Series 2007-HYB1(d) | | | 3.03 | % | | 03/25/2037 | | | 1,793,561 | |
| | | | | Citigroup Mortgage Loan Trust | | | | | | | | | | |
| | 774,651 | | | Series 2007-AR5(d) | | | 2.90 | % | | 04/25/2037 | | | 740,099 | |
| | | | | Citigroup Mortgage Loan Trust, Inc. | | | | | | | | | | |
| | 1,590,170 | | | Series 2005-5(d) | | | 2.98 | % | | 10/25/2035 | | | 1,121,198 | |
| | | | | CSFB Mortgage-Backed Pass-Through Certificates | | | | | | | | | | |
| | 915,450 | | | Series 2005-9 | | | 5.50 | % | | 10/25/2035 | | | 688,570 | |
| | | | | CSMC Mortgage-Backed Trust | | | | | | | | | | |
| | 1,946,634 | | | Series 2006-7 | | | 6.75 | % | | 08/25/2036 | | | 1,560,674 | |
| | 1,893,919 | | | Series 2007-1 | | | 6.00 | % | | 02/25/2037 | | | 1,696,129 | |
| | | | | Fannie Mae REMICS | | | | | | | | | | |
| | 3,121,075 | | | Series 2011-101(d)(l) | | | 5.90% - 1M US L | | | 10/25/2041 | | | 571,507 | |
| | 2,624,628 | | | Series 2011-124(d)(l) | | | 6.50% - 1M US L | | | 12/25/2041 | | | 493,621 | |
| | 3,186,277 | | | Series 2012-20(d)(l) | | | 6.45% - 1M US L | | | 03/25/2042 | | | 517,279 | |
| | 5,524,657 | | | Series 2013-109(m) | | | 0.00 | % | | 07/25/2043 | | | 4,877,197 | |
| | 4,414,845 | | | Series 2013-36 | | | 3.00 | % | | 04/25/2043 | | | 4,833,460 | |
| | 3,037,538 | | | Series 2014-38 | | | 3.00 | % | | 09/25/2043 | | | 3,046,716 | |
| | 936,740 | | | Series 2016-26(d) | | | 7.62% - 1M US L | | | 11/25/2042 | | | 1,051,480 | |
| | | | | Federal Home Loan Mortgage Corp. REMICS | | | | | | | | | | |
| | 1,744,079 | | | Series 2013-4170(d) | | | 4.05% - 1M US L | | | 01/15/2033 | | | 1,816,683 | |
| | | | | First Horizon Alternative Mortgage Securities Trust | | | | | | | | | | |
| | 477,583 | | | Series 2005-AA8(d) | | | 2.85 | % | | 10/25/2035 | | | 449,636 | |
| | | | | FMC GMSR Issuer Trust | | | | | | | | | | |
| | 3,000,000 | | | Series 2019-GT1(d)(h) | | | 5.66 | % | | 05/25/2024 | | | 2,909,161 | |
| | | | | Freddie Mac REMICS | | | | | | | | | | |
| | 4,472,498 | | | Series 2010-3770 | | | 4.00 | % | | 12/15/2040 | | | 5,027,851 | |
| | 5,469,128 | | | Series 2011-3966(d)(l) | | | 5.90% - 1M US L | | | 12/15/2041 | | | 931,554 | |
See Notes to Financial Statements.
| 20 | (888) 848-7569 | www.rivernorth.com |
RiverNorth/DoubleLine Strategic Opportunity Fund, Inc.
| Schedule of Investments | December 31, 2020 (Unaudited) |
| Principal Amount/Description | | | Rate | | | Maturity | | Value | |
| $ | 5,047,706 | | | Series 2017-4657 | | | 3.00 | % | | 02/15/2047 | | $ | 5,326,236 | |
| | 15,575,180 | | | Series 2020-5041(l) | | | 2.00 | % | | 11/25/2050 | | | 1,255,612 | |
| | | | | Government National Mortgage Association | | | | | | | | | | |
| | 4,778,397 | | | Series 2017-17 | | | 3.50 | % | | 02/20/2047 | | | 5,176,065 | |
| | 4,980,460 | | | Series 2020-146(d)(l) | | | 6.30% - 1M US L | | | 10/20/2050 | | | 1,022,610 | |
| | 6,244,464 | | | Series 2020-47(d)(l) | | | 6.00% - 1M US L | | | 05/20/2044 | | | 1,200,461 | |
| | 13,820,472 | | | Series 2020-47(d)(l) | | | 5.37% - 1M US L | | | 07/20/2044 | | | 2,398,051 | |
| | | | | Homeward Opportunities Fund Trust 2020-BPL1 | | | | | | | | | | |
| | 1,000,000 | | | Series 2020-BPL1(h)(k) | | | 5.44 | % | | 08/25/2025 | | | 1,007,769 | |
| | | | | IndyMac INDX Mortgage Loan Trust | | | | | | | | | | |
| | 2,352,620 | | | Series 2007-FLX6(d) | | | 1M US L + 0.25% | | | 09/25/2037 | | | 2,007,889 | |
| | | | | Legacy Mortgage Asset Trust | | | | | | | | | | |
| | 5,900,000 | | | Series 2019-GS7(h)(k) | | | 4.50 | % | | 11/25/2059 | | | 5,901,281 | |
| | | | | Luminent Mortgage Trust | | | | | | | | | | |
| | 1,794,877 | | | Series 2006-3(d) | | | 1M US L + 0.40% | | | 05/25/2036 | | | 1,629,979 | |
| | 1,520,375 | | | Series 2006-3(d) | | | 1M US L + 0.42% | | | 05/25/2036 | | | 1,418,537 | |
| | | | | Mello Warehouse Securitization Trust | | | | | | | | | | |
| | 400,000 | | | Series 2019-2(d)(h) | | | 1M US L + 3.25% | | | 10/25/2021 | | | 400,268 | |
| | | | | Nomura Asset Acceptance Corp. Alternative Loan Trust | | | | | | | | | | |
| | 1,951,551 | | | Series 2005-AP3(k) | | | 5.69 | % | | 08/25/2035 | | | 1,294,892 | |
| | 8,698,662 | | | Series 2006-AR1(d) | | | 1M US L + 0.54% | | | 02/25/2036 | | | 2,369,286 | |
| | | | | RALI Series Trust | | | | | | | | | | |
| | 1,720,790 | | | Series 2007-QA5(d) | | | 5.34 | % | | 09/25/2037 | | | 1,651,118 | |
| | | | | Residential Asset Securitization Trust | | | | | | | | | | |
| | 2,386,405 | | | Series 2005-A15 | | | 5.75 | % | | 02/25/2036 | | | 1,599,743 | |
| | 2,253,955 | | | Series 2007-A5 | | | 6.00 | % | | 05/25/2037 | | | 1,838,368 | |
| | | | | RFMSI Trust | | | | | | | | | | |
| | 1,145,312 | | | Series 2005-SA2(d) | | | 3.52 | % | | 06/25/2035 | | | 939,496 | |
| | 2,264,411 | | | Series 2006-S8 | | | 6.00 | % | | 09/25/2036 | | | 2,125,719 | |
| | | | | Spruce Hill Mortgage Loan Trust 2020-SH1 | | | | | | | | | | |
| | 1,936,000 | | | Series 2020-SH1(d)(h) | | | 4.68 | % | | 01/28/2050 | | | 1,962,191 | |
| | | | | Structured Adjustable Rate Mortgage Loan Trust | | | | | | | | | | |
| | 783,351 | | | Series 2005-22(d) | | | 3.23 | % | | 12/25/2035 | | | 750,560 | |
| | 1,900,289 | | | Series 2007-8(d) | | | 3.60 | % | | 09/25/2037 | | | 1,831,111 | |
| | | | | Structured Asset Mortgage Investments II Trust | | | | | | | | | | |
| | 378,630 | | | Series 2005-AR7(d) | | | 2.55 | % | | 03/25/2046 | | | 385,512 | |
See Notes to Financial Statements.
| Semi-Annual Report | December 31, 2020 | 21 |
RiverNorth/DoubleLine Strategic Opportunity Fund, Inc.
| Schedule of Investments | December 31, 2020 (Unaudited) |
| Principal Amount/Description | | | Rate | | | Maturity | | | Value | |
| | | | | WaMu Mortgage Pass-Through Certificates Trust | | | | | | | | | | | | |
| $ | 1,428,434 | | | Series 2006-AR10(d) | | | 3.16 | % | | | 08/25/2046 | | | $ | 1,349,022 | |
| | 1,194,725 | | | Series 2006-AR6(d) | | | 3.15 | % | | | 08/25/2036 | | | | 1,123,618 | |
| | 1,489,393 | | | Series 2007-HY3(d) | | | 3.59 | % | | | 03/25/2037 | | | | 1,437,015 | |
| | | | | Washington Mutual Mortgage Pass-Through Certificates WMALT Trust | | | | | | | | | | | | |
| | 1,354,124 | | | Series 2005-8 | | | 5.50 | % | | | 10/25/2035 | | | | 1,371,272 | |
| | 1,174,286 | | | Series 2006-2 | | | 6.00 | % | | | 03/25/2036 | | | | 1,211,748 | |
| | | | | | | | | | | | | | | | | |
| TOTAL U.S. GOVERNMENT / AGENCY MORTGAGE BACKED SECURITIES | | | | | | | | | | | | |
| (Cost $114,664,034) | | | | | | | | | | | 111,253,625 | |
| Shares/Description | | Value | |
| SHORT-TERM INVESTMENTS -3.92%(a) | | | | |
| Money Market Fund - 3.92% | | | | |
| 8,284,945 | | | State Street Institutional Trust (7 Day Yield 0.01%)(n) | | | 8,284,945 | |
| | | | | |
| TOTAL SHORT-TERM INVESTMENTS | | | | |
| (Cost $8,284,945) | | | 8,284,945 | |
| | | | | |
| TOTAL INVESTMENTS - 141.52% | | | | |
| (Cost $304,631,742) | | $ | 299,113,482 | |
| LIABILITIES IN EXCESS OF OTHER ASSETS -(41.52)% | | | (87,753,011 | ) |
| NET ASSETS - 100.00% | | $ | 211,360,471 | |
Investment Abbreviations:
LIBOR - London Interbank Offered Rate
Reference Rates:
1M US L - 1 Month LIBOR as of December 31, 2020 was 0.14%
2M US L - 2 Month LIBOR as of December 31, 2020 was 0.19%
3M US L - 3 Month LIBOR as of December 31, 2020 was 0.24%
5Y US TI - 5 Year US Treasury Index as of December 31, 2020 was 0.36%
| (a) | All or a portion of the security has been pledged as collateral in connection with an open credit agreement. At December 31, 2020, the value of securities pledged amounted to $299,113,482, which represents approximately 141.52% of net assets. |
| (b) | Non-income producing security. |
| (c) | The Level 3 assets were a result of unavailable quoted prices from an active market or the unavailability of other significant observable inputs. |
See Notes to Financial Statements.
| 22 | (888) 848-7569 | www.rivernorth.com |
RiverNorth/DoubleLine Strategic Opportunity Fund, Inc.
| Schedule of Investments | December 31, 2020 (Unaudited) |
| (d) | Variable rate investment. Interest rates reset periodically. Interest rate shown reflects the rate in effect at December 31, 2020. For securities based on a published reference rate and spread, the reference rate and spread are indicated in the description above. Certain variable rate securities are not based on a published reference rate and spread but are determined by the issuer or agent and are based on current market conditions. These securities do not indicate a reference rate and spread in their description above. |
| (e) | Securities were purchased pursuant to Regulation S under the Securities Act of 1933, which exempts securities offered and sold outside of the United States from registration. Such securities cannot be sold in the United States without either an effective registration statement filed pursuant to the Securities Act of 1933, or pursuant to an exemption from registration. These securities have been deemed liquid under procedures approved by the Fund's Board of Directors (The "Board"). As of December 31, 2020, the aggregate fair value of those securities was $7,720,217, representing 3.65% of net assets. |
| (f) | Security has no contractual maturity date, is not redeemable and contractually pays an indefinite stream of interest. |
| (g) | Pay-in-kind securities. Rate paid in-kind is shown in parenthesis. |
| (h) | Security exempt from registration under Rule 144A of the Securities Act of 1933. These securities have been deemed liquid under procedures approved by the Fund's Board of Directors and may normally be sold to qualified institutional buyers in transactions exempt from registration. Total fair value of Rule 144A securities amounts to $92,960,567, which represents approximately 43.98% of net assets as of December 31, 2020. |
| (i) | Security is currently in default. |
| (j) | All or a portion of this position has not settled as of December 31, 2020. The interest rate shown represents the stated spread over the London Interbank Offered Rate ("LIBOR" or "L") or the Euro Interbank Offered Rate ("EURIBOR" or "E") or the applicable LIBOR/EURIBOR floor; the Fund will not accrue interest until the settlement date, at which point LIBOR/EURIBOR will be established. |
| (k) | Step up bond. Coupon changes periodically based upon a predetermined schedule. Interest rate disclosed is that which is in effect at December 31, 2020. |
| (l) | Interest only securities. |
| (m) | Issued with a zero coupon. Income is recognized through the accretion of discount. |
| (n) | Seven-day yield as of December 31, 2020. |
See Notes to Financial Statements.
| Semi-Annual Report | December 31, 2020 | 23 |
RiverNorth/DoubleLine Strategic Opportunity Fund, Inc.
| Statement of Assets and Liabilities | December 31, 2020 (Unaudited) |
| ASSETS: | | | |
| Investment in securities: | | | | |
| At cost | | $ | 304,631,742 | |
| At value | | $ | 299,113,482 | |
| | | | | |
| Interest receivable | | | 1,250,542 | |
| Receivable for fund investments sold | | | 736,305 | |
| Prepaid offering costs | | | 567,325 | |
| Dividends receivable | | | 262,264 | |
| Prepaid expenses and other assets | | | 1,702 | |
| Total Assets | | | 301,931,620 | |
| LIABILITIES: | | | | |
| Series A Cumulative Preferred Stock, net of unamortized deferred issuance costs (Liquidation Preference $60,000,000) (See Note 8) | | | 58,167,647 | |
| Facility loan payable | | | 30,000,000 | |
| Dividend payable - redeemable preferred stock | | | 328,125 | |
| Interest payable on facility loan | | | 12,073 | |
| Payable for fund investments purchased | | | 1,607,631 | |
| Payable to Adviser | | | 255,692 | |
| Payable for fund accounting and administration fees | | | 76,553 | |
| Payable for shareholder servicing | | | 25,569 | |
| Payable for custodian fees | | | 13,806 | |
| Payable for audit fees | | | 10,339 | |
| Payable to transfer agent | | | 3,780 | |
| Payable for Compliance fees | | | 10,503 | |
| Payable to Trustees | | | 3,307 | |
| Other accrued expenses | | | 56,124 | |
| Total Liabilities | | | 90,571,149 | |
| Net Assets Attributable to Common Shareholders | | $ | 211,360,471 | |
| NET ASSETS ATTRIBUTABLE TO COMMON SHAREHOLDERS CONSIST OF: | | | | |
| Paid-in capital | | $ | 233,036,511 | |
| Total distributable earnings/(accumulated deficit) | | | (21,676,040 | ) |
| Net Assets Attributable to Common Shareholders | | $ | 211,360,471 | |
| PRICING OF SHARES: | | | | |
| Net Assets Attributable to Common Shareholders | | $ | 211,360,471 | |
| Shares of common stock outstanding | | | | |
| (unlimited number of shares, $0.0001 par value) | | | 13,857,863 | |
| Net Asset Value Per Common Share | | $ | 15.25 | |
See Notes to Financial Statements.
| 24 | (888) 848-7569 | www.rivernorth.com |
RiverNorth/DoubleLine Strategic Opportunity Fund, Inc.
| Statement of Operations | For the Six Months Ended December 31, 2020 (Unaudited) |
| INVESTMENT INCOME: | | | |
| Dividend income | | $ | 2,067,134 | |
| Interest income | | | 6,908,801 | |
| Total Investment Income | | | 8,975,935 | |
| | | | | |
| EXPENSES: | | | | |
| Investment Adviser fee | | | 1,406,396 | |
| Dividends to redeemable preferred stock | | | 488,541 | |
| Interest expense on facility loan | | | 309,730 | |
| Shareholder servicing expenses | | | 140,325 | |
| Accounting and administration fee | | | 116,832 | |
| Director expenses | | | 60,057 | |
| Facility loan fees | | | 55,560 | |
| Printing expenses | | | 51,279 | |
| Legal expenses | | | 41,231 | |
| Compliance expense | | | 20,919 | |
| Audit expenses | | | 18,434 | |
| Listing expense | | | 17,621 | |
| Transfer agent expenses | | | 11,280 | |
| Custodian expenses | | | 6,945 | |
| Insurance expenses | | | 2,464 | |
| SEC expense | | | 1,204 | |
| Miscellaneous expenses | | | 27,954 | |
| Total Expenses | | | 2,776,772 | |
| Net Investment Income | | | 6,199,163 | |
| | | | | |
| REALIZED AND UNREALIZED GAIN/(LOSS): | | | | |
| Net realized gain/(loss) on: | | | | |
| Investments | | | (3,464,066 | ) |
| Net realized loss | | | (3,464,066 | ) |
| Net change in unrealized appreciation/depreciation on: | | | | |
| Investments | | | 17,384,261 | |
| Net change in unrealized appreciation/depreciation | | | 17,384,261 | |
| Net Realized and Unrealized Gain on Investments | | | 13,920,195 | |
| Net Increase in Net Assets Resulting from Operations | | $ | 20,119,358 | |
See Notes to Financial Statements.
| Semi-Annual Report | December 31, 2020 | 25 |
RiverNorth/DoubleLine Strategic Opportunity Fund, Inc.
Statements of Changes in Net Assets
| | | For the Six
Months Ended
December 31, 2020
(Unaudited) | | | For the
Year Ended
June 30, 2020 | |
| NET INCREASE/(DECREASE) IN NET ASSETS FROM OPERATIONS ATTRIBUTABLE TO COMMON SHAREHOLDERS: | | | | | | | | |
| Net investment income | | $ | 6,199,163 | | | $ | 11,654,381 | |
| Net realized loss on investments and long-term capital gains from other investment companies | | | (3,464,066 | ) | | | (652,168 | ) |
| Net change in unrealized appreciation/depreciation on investments | | | 17,384,261 | | | | (22,451,326 | ) |
| Net increase/(decrease) in net assets resulting from operations | | | 20,119,358 | | | | (11,449,113 | ) |
| | | | | | | | | |
| DISTRIBUTIONS TO COMMON SHAREHOLDERS: | | | | | | | | |
| From distributable earnings | | | (14,711,075 | ) | | | (12,194,880 | ) |
| From tax return of capital | | | – | | | | (14,373,741 | ) |
| Net decrease in net assets from distributions to common shareholders | | | (14,711,075 | ) | | | (26,568,621 | ) |
| | | | | | | | | |
| CAPITAL SHARE TRANSACTIONS: | | | | | | | | |
| Proceeds from sale of common shares, net of offering costs | | | 6,442,626 | | | | 38,314,287 | |
| Net increase in net assets from capital share transactions | | | 6,442,626 | | | | 38,314,287 | |
| Net Increase in Net Assets Attributable to Common Shareholders | | | 11,850,909 | | | | 296,553 | |
| | | | | | | | | |
| NET ASSETS ATTRIBUTABLE TO COMMON SHAREHOLDERS: | | | | | | | | |
| Beginning of period | | | 199,509,562 | | | | 199,213,009 | |
| End of period | | $ | 211,360,471 | | | $ | 199,509,562 | |
| | | | | | | | | |
| Share Transactions: | | | | | | | | |
| Shares sold | | | 472,995 | | | | 2,371,081 | |
| Beginning of period | | | 13,384,868 | | | | 11,013,787 | |
| End of period | | | 13,857,863 | | | | 13,384,868 | |
See Notes to Financial Statements.
| 26 | (888) 848-7569 | www.rivernorth.com |
RiverNorth/DoubleLine Strategic Opportunity Fund, Inc.
| Statement of Cash Flows | For the Six Months Ended December 31, 2020 (Unaudited) |
| CASH FLOWS FROM OPERATING ACTIVITIES: | | | |
| Net increase in net assets resulting from operations | | $ | 20,119,358 | |
| Adjustments to reconcile net decrease in net assets attributable to common shareholders from operations to net Cash used in operating activities: | | | | |
| Purchase of investment securities | | | (56,541,484 | ) |
| Proceeds from disposition of long-term investment securities | | | 35,633,426 | |
| Net proceeds from short-term investment securities | | | 76,098 | |
| Net realized loss from investment securities | | | 3,464,066 | |
| Net change in unrealized appreciation on investment securities | | | (17,384,261 | ) |
| Amortization of premium and accretion of discount on investments | | | 176,975 | |
| (Increase)/Decrease in assets: | | | | |
| Interest receivable | | | 9,916 | |
| Dividends receivable | | | (29,151 | ) |
| Prepaid expenses and other assets | | | 29,964 | |
| Prepaid offering costs | | | (414,353 | ) |
| Increase/(Decrease) in liabilities: | | | | |
| Interest payable on facility loan | | | (8,655 | ) |
| Facility loan fee payable | | | (41,246 | ) |
| Dividend payable - redeemable preferred stock | | | 328,125 | |
| Payable for shareholder servicing | | | 3,992 | |
| Payable to Adviser | | | 39,926 | |
| Payable for fund accounting, administration and transfer agent fees | | | 12,152 | |
| Payable for audit fees | | | (14,661 | ) |
| Payable for custodian fees | | | 6,945 | |
| Payable for compliance fees | | | 8,420 | |
| Payable to Directors | | | 3,307 | |
| Other accrued expenses | | | 22,726 | |
| Net cash used in operating activities | | | (14,498,415 | ) |
| | | | | |
| CASH FLOWS FROM FINANCING ACTIVITIES: | | | | |
| Cash used by facility loan | | | (35,500,000 | ) |
| Issuance of Series A Cumulative Preferred Stock, net of unamortized deferred issuance costs | | | 58,167,647 | |
| Proceeds from sales of common shares, net of offering costs | | | 6,442,626 | |
| Cash distributions paid to common shareholders | | | (14,711,075 | ) |
| Net cash provided by financing activities | | | 14,399,198 | |
| | | | | |
| Net decrease in cash | | | (99,217 | ) |
| | | | | |
| Cash, beginning balance | | $ | 99,217 | |
| Cash, ending balance | | $ | – | |
| | | | | |
| SUPPLEMENTAL DISCLOSURE OF CASH FLOW INFORMATION: | | | | |
| Cash paid during the period for interest from bank borrowing: | | $ | 318,385 | |
See Notes to Financial Statements.
| Semi-Annual Report | December 31, 2020 | 27 |
RiverNorth/DoubleLine Strategic Opportunity Fund, Inc.
| Financial Highlights | For a common share outstanding throughout the periods presented |
| Net asset value - beginning of period |
| Income/(loss) from investment operations: |
| Net investment income |
| Net realized and unrealized gain/(loss) on investments |
| Total income/(loss) from investment operations |
| |
| Less distributions: |
| From net investment income |
| From tax return of capital |
| Total distributions |
| Capital share transactions: |
| Dilutive effect of rights offering |
| Common share offering costs charged to paid-in capital |
| Total capital share transactions |
| Net increase/(decrease) in net asset value |
| Net asset value - end of period |
| Per common share market value - end of period |
| |
| Total Return based on net asset value(f) |
| |
| Total Return based on market value(f) |
| |
| Ratios/Supplemental Data: |
| Net assets, end of period (in thousands) |
| Ratio of expenses to average net assets(h)(i) |
| Ratio of net investment income to average net assets(c) |
| Portfolio turnover rate |
| Facility loan payable (in thousands) |
| Redeemable preferred stock, end of period (in thousands) |
| Asset coverage per $1,000 of redeemable preferred stock(k) |
| Asset coverage per $1,000 of facility loan payable(k) |
See Notes to Financial Statements.
| 28 | (888) 848-7569 | www.rivernorth.com |
RiverNorth/DoubleLine Strategic Opportunity Fund, Inc.
| Financial Highlights | For a common share outstanding throughout the periods presented |
For the
Six Months Ended
December 31, 2020
(Unaudited) | | | For the
Year Ended
June 30, 2020 | | | For the
Year Ended
June 30, 2019 | | | For the
Year Ended
June 30, 2018 | | | For the
Period Ended
June 30, 2017 (a) | |
| $ | 14.91 | | | $ | 18.09 | | | $ | 18.75 | | | $ | 20.04 | | | $ | 19.60 | |
| | | | | | | | | | | | | | | | | | | |
| | 0.46 | (b) | | | 0.95 | (b) | | | 0.94 | (c) | | | 1.06 | (c) | | | 0.94 | (c) |
| | 1.02 | | | | (1.72 | ) | | | 0.40 | | | | (0.64 | ) | | | 0.46 | |
| | 1.48 | | | | (0.77 | ) | | | 1.34 | | | | 0.42 | | | | 1.40 | |
| | | | | | | | | | | | | | | | | | | |
| | | | | | | | | | | | | | | | | | | |
| | (1.08 | ) | | | (1.11 | ) | | | (1.18 | ) | | | (1.40 | )(d) | | | (0.92 | ) |
| | – | | | | (1.07 | ) | | | (0.82 | ) | | | (0.31 | ) | | | – | |
| | (1.08 | ) | | | (2.18 | ) | | | (2.00 | ) | | | (1.71 | ) | | | (0.92 | ) |
| | | | | | | | | | | | | | | | | | | |
| | (0.05 | )(e) | | | (0.22 | )(e) | | | – | | | | – | | | | – | |
| | (0.01 | ) | | | (0.01 | ) | | | – | | | | – | | | | – | |
| | (0.06 | ) | | | (0.23 | ) | | | – | | | | – | | | | – | |
| | 0.34 | | | | (3.18 | ) | | | (0.66 | ) | | | (1.29 | ) | | | 0.44 | |
| $ | 15.25 | | | $ | 14.91 | | | $ | 18.09 | | | $ | 18.75 | | | $ | 20.04 | |
| $ | 14.32 | | | $ | 13.91 | | | $ | 17.06 | | | $ | 17.69 | | | $ | 19.54 | |
| | | | | | | | | | | | | | | | | | | |
| | 10.35 | %(g) | | | (5.31 | %) | | | 7.78 | % | | | 2.12 | % | | | 7.10 | %(g) |
| | | | | | | | | | | | | | | | | | | |
| | 11.07 | %(g) | | | (6.33 | %) | | | 8.50 | % | | | (0.65 | %) | | | 2.50 | %(g) |
| | | | | | | | | | | | | | | | | | | |
| | | | | | | | | | | | | | | | | | | |
| $ | 211,360 | | | $ | 199,510 | | | $ | 199,213 | | | $ | 206,561 | | | $ | 220,768 | |
| | 2.70 | % | | | 2.84 | % | | | 3.16 | % | | | 2.67 | % | | | 2.14 | %(j) |
| | 6.02 | % | | | 5.73 | % | | | 5.17 | % | | | 5.42 | % | | | 5.28 | %(j) |
| | 14 | % | | | 43 | % | | | 27 | % | | | 23 | % | | | 35 | %(g) |
| $ | 30,000 | | | $ | 65,500 | | | $ | 73,500 | | | $ | 73,500 | | | $ | 71,500 | |
| $ | 58,168 | | | $ | – | | | $ | – | | | $ | – | | | $ | – | |
| $ | 4,528 | | | $ | – | | | $ | – | | | $ | – | | | $ | – | |
| $ | 8,046 | | | $ | 4,046 | | | $ | 3,711 | | | $ | 3,811 | | | $ | 4,090 | |
| (a) | Commenced operations on September 28, 2016. |
| (b) | Based on average shares outstanding during the period. |
| (c) | Recognition of net investment income by the Fund is affected by the timing of the declarations of dividends by the underlying closed-end funds in which the Fund invests. The ratio does not include net investment income of the closed-end funds in which the Fund invests. |
See Notes to Financial Statements.
| Semi-Annual Report | December 31, 2020 | 29 |
RiverNorth/DoubleLine Strategic Opportunity Fund, Inc.
| Financial Highlights | For a common share outstanding throughout the periods presented |
| (d) | Includes net realized gain distributions of (0.09) |
| (e) | Represents the impact of the Fund's rights offering of 472,995 shares in October 2020 and 2,371,081 shares in December 2019 at a subscription price per share based on a formula. For more details please refer to Note 9 of the Notes to Financial Statements. |
| (f) | Total return in the above table represents the rate that the investor would have earned or lost on an investment in the Fund, assuming reinvestment of dividends. The net asset value and market price returns will differ depending upon the level of any discount from or premium to net asset value at which the Fund's shares traded during the period. Total return based on market value does not reflect sales load. |
| (h) | Includes interest expenses and dividends to redeemable preferred stock, as applicable, of 0.78% for the six months ended December 31, 2020, 0.91% for the year ended June 30, 2020, 1.23% for the year ended June 30, 2019, 0.87% for the year ended June 30, 2018 and 0.46% for the period from September 28, 2016 (commencement of operations) through June 30, 2017. |
| (i) | Does not include expenses of the closed-end funds in which the Fund invests. |
| (k) | Calculated by subtracting the Fund's total liabilities (excluding the debt balance and accumulated unpaid interest and dividends) from the Fund's total assets and dividing by the outstanding debt balance. |
See Notes to Financial Statements.
| 30 | (888) 848-7569 | www.rivernorth.com |
RiverNorth/DoubleLine Strategic Opportunity Fund, Inc.
| Notes to Financial Statements | December 31, 2020 (Unaudited) |
1. ORGANIZATION
RiverNorth/DoubleLine Strategic Opportunity Fund, Inc. (the “Fund”) is a closed-end management investment company that was organized as a Maryland corporation on June 22, 2016, and commenced investment operations on September 28, 2016. The investment adviser to the Fund is RiverNorth Capital Management, LLC (the “Adviser”). The Fund’s sub-adviser is DoubleLine Capital, LP (“Sub-Adviser”). The Fund is a diversified investment company with an investment objective to seek current income and overall total return.
The Fund seeks to achieve its investment objective by allocating its Managed Assets among two principal strategies; under normal market conditions, the Fund may allocate between 10% and 35% of its Managed Assets to the Tactical Closed-End Fund Income Strategy and 65% to 90% of its Managed Assets to the Opportunistic Income Strategy. The Adviser will determine the portion of the Fund’s Managed Assets to allocate to each strategy and may, from time to time, adjust the allocations.
2. SIGNIFICANT ACCOUNTING POLICIES
The following is a summary of significant accounting policies followed by the Fund. These policies are in conformity with generally accepted accounting principles in the United States of America (“GAAP”). The financial statements are prepared in accordance with GAAP, which requires management to make estimates and assumptions that affect the reported amounts and disclosures, including the disclosure of contingent assets and liabilities, in the financial statements during the reporting period. Management believes the estimates and security valuations are appropriate; however, actual results may differ from those estimates, and the security valuations reflected in the financial statements may differ from the value the Fund ultimately realizes upon sale of the securities. The Fund is considered an investment company for financial reporting purposes under GAAP and follows the accounting and reporting guidance applicable to investment companies as codified in Accounting Standards Codification (“ASC”) 946 – Investment Companies. The financial statements have been prepared as of the close of the New York Stock Exchange (“NYSE”) on December 31, 2020.
Security Valuation: The Fund’s investments are generally valued at their fair value using market quotations. If a market value quotation is unavailable a security may be valued at its estimated fair value as described in Note 3.
Security Transactions and Related Income: The Fund follows industry practice and records security transactions on the trade date basis. The specific identification method is used for determining gains or losses for financial statements and income tax purposes. Dividend income is recorded on the ex-dividend date or for certain foreign securities, when the information becomes available to the Fund and interest income and expenses are recorded on an accrual basis. Discounts and premiums on securities purchased are amortized or accreted using the effective interest method. Paydown gains and losses on mortgage-related and other asset-backed securities are recorded as components of interest income on the Statement of Operations. Withholding taxes on foreign dividends have been provided for in accordance with the Fund’s understanding of the applicable country’s tax rules and rates. The ability of issuers of debt securities held by the Fund to meet their obligations may be affected by economic and political developments in a specific country or region. Settlement on bank loans transactions may be in excess of seven business days. Interest only stripped mortgage backed securities (“IO Strips”) are securities that receive only interest payments from a pool of mortgage loans. Little to no principal will be received by the Fund upon maturity of an IO Strip. Periodic adjustments are recorded to reduce the cost of the security until maturity, which are included in interest income.
| Semi-Annual Report | December 31, 2020 | 31 |
RiverNorth/DoubleLine Strategic Opportunity Fund, Inc.
| Notes to Financial Statements | December 31, 2020 (Unaudited) |
Foreign Currency Translation: The books and records of the Funds are maintained in U.S. dollars. Investment valuations and other assets and liabilities initially expressed in foreign currencies are converted each business day into U.S. dollars based upon current exchange rates. Prevailing foreign exchange rates may generally be obtained at the close of the NYSE (normally, 4:00 p.m. Eastern time). The portion of realized and unrealized gains or losses on investments due to fluctuations in foreign currency exchange rates is not separately disclosed and is included in realized and unrealized gains or losses on investments, when applicable.
Preferred Stock: The Company carries its mandatorily redeemable preferred stock at accreted cost on the Statement of Assets and Liabilities, and not fair value. Refer to “Note 8. Redeemable Preferred Stock” for further details. In accordance with ASC 480-10-25, the Company's redeemable preferred stock has been classified as a liability on the Statement of Assets and Liabilities. Dividend payments relating to the redeemable preferred stock are included in preferred dividend payable on the Statement of Assets and Liabilities and preferred dividend expense on the Statement of Operations. Issuance costs are amortized and included in interest expense in the Fund's Statement of Operations. Upon early termination of preferred stock, the remaining balance of unamortized fees related to such debt is accelerated into realized gain/loss on preferred stock on the Statement of Operations. Deferred issuance costs are included on the Statement of Assets and Liabilities as a reduction to Series A Cumulative Preferred Stock.
Other: The Fund holds certain investments which pay dividends to their shareholders based upon available funds from operations. It is possible for these dividends to exceed the underlying investments’ taxable earnings and profits resulting in the excess portion of such dividends being designated as a return of capital. Distributions received from investments in securities that represent a return of capital or long-term capital gains are recorded as a reduction of the cost of investments or as a realized gain, respectively.
Share Valuation: The NAV is generally calculated as of the close of trading on the New York Stock Exchange (“the Exchange”) (normally 4:00 p.m. Eastern time) every day the Exchange is open. The NAV is calculated by dividing the value of all of the securities and other assets of the Fund, less the liabilities (including accrued expenses and indebtedness), by the total number of common shares outstanding.
Federal Income Taxes: The Fund has been treated as, and intends to qualify each year for special tax treatment afforded to, a regulated investment company (“RIC”) under Subchapter M of the Internal Revenue Code, as amended (“IRC”). In order to qualify as a RIC, the Fund must, among other things, satisfy income, asset diversification and distribution requirements. As long as it so qualifies, the Fund will not be subject to U.S. federal income tax to the extent that it distributes annually its investment company taxable income and its “net capital gain”. If the Fund retains any investment company taxable income or net capital gain, it will be subject to U.S. federal income tax on the retained amount at regular corporate tax rates. In addition, if the Fund fails to qualify as a RIC for any taxable year, it will be subject to U.S. federal income tax on all of its income and gains at regular corporate tax rates.
| 32 | (888) 848-7569 | www.rivernorth.com |
RiverNorth/DoubleLine Strategic Opportunity Fund, Inc.
| Notes to Financial Statements | December 31, 2020 (Unaudited) |
Distributions to Shareholders: Distributions to shareholders, which are determined in accordance with income tax regulations, are recorded on the ex-dividend date. The treatment for financial reporting purposes of distributions made to shareholders during the year from net investment income or net realized capital gains may differ from their ultimate treatment for federal income tax purposes. These differences are caused primarily by differences in the timing of recognition of certain components of income, expense, or realized capital gain for federal income tax purposes. Where such differences are permanent in nature, they are reclassified in the components of the net assets based on their ultimate characterization for federal income tax purposes. Any such reclassification will have no effect on net assets, results of operations, or net asset values per share of the Fund.
The Fund maintains a level distribution policy. The Fund distributes to shareholders regular monthly cash distributions of its net investment income. In addition, the Fund distributes its net realized capital gains, if any, at least annually.
At times, to maintain a stable level of distributions, the Fund may pay out less than all of its net investment income or pay out accumulated undistributed income, or return of capital, in addition to current net investment income. Any distribution that is treated as a return of capital generally will reduce a shareholder’s basis in his or her shares, which may increase the capital gain or reduce the capital loss realized upon the sale of such shares. Any amounts received in excess of a shareholder’s basis are generally treated as capital gain, assuming the shares are held as capital assets.
The Board approved the implementation of the level distribution policy to make monthly cash distributions to common shareholders, stated in terms of a rate equal to 12.5% of the average of the Fund’s NAV per share for the final five trading days of the previous calendar year. The Fund made monthly distributions to common shareholders set at a level monthly rate of $0.18 per common share for the period ended December 31, 2020.
Previously, the Board approved the adoption of a managed distribution plan in accordance with a Section 19(b) exemptive order whereby the Fund made monthly distributions to common shareholders set at a fixed monthly rate of $0.15 per common share.
The amount of the Fund’s distributions pursuant to the managed distribution plan are not related to the Fund’s performance and, therefore, investors should not make any conclusions about the Fund’s investment performance from the amount of the Fund’s distributions or from the terms of the Fund’s managed distribution plan. The Board may amend, suspend or terminate the managed distribution plan at any time without notice to shareholders.
Distributions to holders of redeemable preferred stock are accrued on a daily basis as described in Note 8 and are treated as an operating expense as required by U.S. GAAP. For tax purposes, the payments made to the holders of the Fund’s redeemable preferred stock are treated as dividends or distributions. The character of distributions to the holders of the Fund's redeemable preferred stock made during the year may differ from their ultimate characterization for federal income tax purposes.
| Semi-Annual Report | December 31, 2020 | 33 |
RiverNorth/DoubleLine Strategic Opportunity Fund, Inc.
| Notes to Financial Statements | December 31, 2020 (Unaudited) |
3. SECURITIES VALUATION AND FAIR VALUE MEASUREMENTS
Fair value is defined as the price that the Fund might reasonably expect to receive upon selling an investment in a timely transaction to an independent buyer in the principal or most advantageous market of the investment. GAAP establishes a three-tier hierarchy to maximize the use of observable market data and minimize the use of unobservable inputs and to establish classification of fair value measurements for disclosure purposes.
Inputs refer broadly to the assumptions that market participants would use in pricing the asset or liability, including assumptions about risk, for example, the risk inherent in a particular valuation technique used to measure fair value including using such a pricing model and/or the risk inherent in the inputs to the valuation technique. Inputs may be observable or unobservable. Observable inputs are inputs that reflect the assumptions market participants would use in pricing the asset or liability developed based on market data obtained from sources independent of the reporting entity. Unobservable inputs are inputs that reflect the reporting entity’s own assumptions about the assumptions market participants would use in pricing the asset or liability developed based on the best information available in the circumstances.
Various inputs are used in determining the value of the Fund’s investments. These inputs are summarized in the three broad levels listed below.
| Level 1 – Unadjusted quoted prices in active markets for identical, unrestricted assets or liabilities that a Fund has the ability to access at the measurement date; |
| Level 2 – Quoted prices which are not active, quoted prices for similar assets or liabilities in active markets or inputs other than quoted prices that are observable (either directly or indirectly) for substantially the full term of the asset or liability; and |
|
| Level 3 – Significant unobservable prices or inputs (including the Fund’s own assumptions in determining the fair value of investments) where there is little or no market activity for the asset or liability at the measurement date. |
The inputs used to measure fair value may fall into different levels of the fair value hierarchy. In such cases, for disclosure purposes, the level in the fair value hierarchy within which the fair value measurement falls in its entirety is determined based on the lowest level input that is significant to the fair value measurement in its entirety.
Equity securities, including closed-end funds and business development company notes, are generally valued by using market quotations, but may be valued on the basis of prices furnished by a pricing service when the Adviser or the Sub-Adviser believes such prices more accurately reflect the fair market value of such securities. Securities that are traded on any stock exchange are generally valued by the pricing service at the last quoted sale price. Lacking a last sale price, an exchange traded security is generally valued by the pricing service at its last bid price. Securities traded in the NASDAQ over-the-counter market are generally valued by the pricing service at the NASDAQ Official Closing Price. When using the market quotations or close prices provided by the pricing service and when the market is considered active, the security will be classified as a Level 1 security. Sometimes, an equity security owned by the Fund will be valued by the pricing service with factors other than market quotations or when the market is considered inactive. When this happens, the security will be classified as a Level 2 security. When market quotations are not readily available, when the Adviser or the Sub-Adviser determines that the market quotation or the price provided by the pricing service does not accurately reflect the current fair value, or when restricted or illiquid securities are being valued, such securities are valued as determined in good faith by the Adviser, Sub-Adviser, or Valuation Committee in conformity with guidelines adopted by and subject to review by the Board. These securities will be categorized as Level 3 securities.
| 34 | (888) 848-7569 | www.rivernorth.com |
RiverNorth/DoubleLine Strategic Opportunity Fund, Inc.
| Notes to Financial Statements | December 31, 2020 (Unaudited) |
Investments in mutual funds, including short term investments, are generally priced at the ending NAV provided by the service agent of the funds. These securities will be classified as Level 1 securities.
Domestic and foreign fixed income securities, including foreign and U.S. corporate bonds, foreign government bonds and notes, supranationals and foreign agencies, asset backed obligations, non-agency collateralized mortgage obligations, U.S. Government/Agency mortgage backed securities, bank loans, and collateralized loan obligations are normally valued on the basis of quotes obtained from brokers and dealers or independent pricing services. Foreign currency positions, including forward foreign currency contracts, are priced at the mean between the closing bid and asked prices at 4:00 p.m. Eastern Time. Prices obtained from independent pricing services typically use information provided by market makers or estimates of market values obtained from yield data relating to investments or securities with similar characteristics. Data used to establish quotes includes analysis of cash flows , pre-payment speeds, default rates, delinquency assumptions and assumptions regarding collateral and loss assumptions. These securities will be classified as Level 2 securities.
Short-term investments in fixed income securities, excluding money market funds, with maturities of less than 60 days when acquired, or which subsequently are within 60 days of maturity, are valued by using the amortized cost method of valuation, which the Board has determined will represent fair value. These securities will be classified as Level 2 securities.
In accordance with the Fund’s good faith pricing guidelines, the Adviser, Sub-Adviser, or Valuation Committee is required to consider all appropriate factors relevant to the value of securities for which it has determined other pricing sources are not available or reliable as described above. No single standard exists for determining fair value, because fair value depends upon the circumstances of each individual case. As a general principle, the current fair value of an issue of securities being valued by the Adviser, Sub-Adviser, or valuation committee would appear to be the amount which the owner might reasonably expect to receive for them upon their current sale. Methods which are in accordance with this principle may, for example, be based on (i) a multiple of earnings; (ii) discounted cash flow models; (iii) weighted average cost or weighted average price; (iv) a discount from market of a similar freely traded security (including a derivative security or a basket of securities traded on other markets, exchanges or among dealers); or (v) yield to maturity with respect to debt issues, or a combination of these and other methods. Good faith pricing is permitted if, in the Adviser’s, a Sub-Adviser’s, or the Valuation Committee’s opinion, the validity of market quotations appears to be questionable based on factors such as evidence of a thin market in the security based on a small number of quotations, a significant event occurs after the close of a market but before a Fund’s NAV calculation that may affect a security’s value, or the Adviser or a Sub-Adviser is aware of any other data that calls into question the reliability of market quotations.
Good faith pricing may also be used in instances when the bonds in which the Fund invests default or otherwise cease to have market quotations readily available.
| Semi-Annual Report | December 31, 2020 | 35 |
RiverNorth/DoubleLine Strategic Opportunity Fund, Inc.
| Notes to Financial Statements | December 31, 2020 (Unaudited) |
The following is a summary of the inputs used at December 31, 2020 in valuing the Fund’s assets and liabilities:
| | | Valuation Inputs | | | | |
| Investments in Securities at Value* | | Level 1 | | | Level 2 | | | Level 3 | | | Total | |
| Closed-End Funds | | $ | 46,202,589 | | | $ | – | | | $ | – | | | $ | 46,202,589 | |
| Business Development Companies | | | 5,146,852 | | | | – | | | | – | | | | 5,146,852 | |
| Common Stocks | | | 11,046 | | | | – | | | | – | | | | 11,046 | |
| Preferred Stocks | | | 4,534,781 | | | | – | | | | – | | | | 4,534,781 | |
| Business Development Company Notes | | | 9,905,208 | | | | – | | | | 2,059,900 | | | | 11,965,108 | |
| Foreign Corporate Bonds | | | – | | | | 13,555,913 | | | | – | | | | 13,555,913 | |
| U.S. Corporate Bonds | | | – | | | | 6,339,627 | | | | – | | | | 6,339,627 | |
| Convertible Corporate Bonds | | | – | | | | 5,444,176 | | | | – | | | | 5,444,176 | |
| Foreign Government Bonds and Notes, Supranationals and Foreign Agencies | | | – | | | | 249,700 | | | | – | | | | 249,700 | |
| Bank Loans | | | – | | | | 10,196,512 | | | | – | | | | 10,196,512 | |
| Collateralized Loan Obligations | | | – | | | | 8,395,573 | | | | – | | | | 8,395,573 | |
| Non-Agency Collateralized Mortgage Obligations | | | – | | | | 67,533,035 | | | | – | | | | 67,533,035 | |
| U.S. Government / Agency Mortgage Backed Securities | | | – | | | | 111,253,625 | | | | – | | | | 111,253,625 | |
| Short-Term Investments | | | 8,284,945 | | | | – | | | | – | | | | 8,284,945 | |
| Total | | $ | 74,085,421 | | | $ | 222,968,161 | | | $ | 2,059,900 | | | $ | 299,113,482 | |
| 36 | (888) 848-7569 | www.rivernorth.com |
RiverNorth/DoubleLine Strategic Opportunity Fund, Inc.
| Notes to Financial Statements | December 31, 2020 (Unaudited) |
The changes of the fair value of investments for which the Fund has used Level 3 inputs to determine the fair value are as follows:
| Asset Type | | Balance as of June 30, 2020 | | | Accrued Discount/ premium | | | Return of Capital | | | Realized Gain/(Loss) | | | Change in Unrealized Appreciation/ Depreciation | | | Purchases | | Sales Proceeds | | | Transfer into Level 3 | | | Transfer Out of Level 3 | | | Balance as of December 31, 2020 | | | Net change in unrealized appreciation/ (depreciation) included in the Statements of Operations attributable to Level 3 investments held at December 31,2020 | |
| Business Development Company Notes | | $ | 1,991,000 | | | $ | 2,928 | | | $ | – | | | $ | – | | | $ | 65,972 | | | $ | – | | $ | – | | | $ | – | | | $ | – | | | $ | 2,059,900 | | | $ | 65,972 | |
| | | $ | 1,991,000 | | | $ | 2,928 | | | $ | – | | | $ | – | | | $ | 65,972 | | | $ | – | | $ | – | | | $ | – | | | $ | – | | | $ | 2,059,900 | | | $ | 65,972 | |
The table below provides additional information about the Level 3 Fair Value Measurements as of December 31, 2020:
Quantitative Information about Level 3 Fair Value Measurements
| Asset Class | Fair Value (USD) | Valuation
Technique | Unobservable
Inputs(a) | Value/Range
(Weighted Average) |
| Business Development Company Notes | $2,059,900 | Comparable Analysis | Comparable Spreads | 700-850 bps |
| (a) | A change to the unobservable input may result in a significant change to the value of the investment as follows: |
| Unobservable Inputs | Impact to Value if Input Increases | Impact to Value if Input Decreases |
| Comparable spreads | Decrease | Increase |
4. INVESTMENT ADVISORY FEE AND OTHER TRANSACTIONS WITH AFFILIATES
The Adviser serves as the investment adviser to the Fund. Under the terms of the management agreement (the “Agreement”), the Adviser, subject to the supervision of the Board, provides or arranges to be provided to the Fund such investment advice as it deems advisable and will furnish or arrange to be furnished a continuous investment program for the Fund consistent with the Fund’s investment objectives and policies. As compensation for its management services, the Fund is obligated to pay the Adviser a fee computed and accrued daily and paid monthly in arrears at an annual rate of 1.00% of the average daily managed assets of the Fund. Managed assets are defined as the total assets of the Fund, including assets attributable to leverage, minus liabilities other than debt representing leverage and any preferred stock that may be outstanding.
| Semi-Annual Report | December 31, 2020 | 37 |
RiverNorth/DoubleLine Strategic Opportunity Fund, Inc.
| Notes to Financial Statements | December 31, 2020 (Unaudited) |
DoubleLine Capital, LP is the investment sub-adviser to the Fund. Under the terms of the sub-advisory agreement, the Sub-Adviser, subject to the supervision of the Adviser and the Board, provides or arranges to be provided to the Fund such investment advice as deemed advisable and will furnish or arrange to be furnished a continuous investment program for the portion of assets managed in the Fund consistent with the Fund’s investment objective and policies. As compensation for its sub-advisory services, the Adviser is obligated to pay the Sub-Adviser a fee computed and accrued daily and paid monthly in arrears based on an annual rate of 0.50% of the average daily managed assets of the Fund.
ALPS Fund Services, Inc. (“ALPS”) provides the Fund with fund administration and fund accounting services. As compensation for its services to the Fund, ALPS receives an annual fee based on the Fund’s average daily net assets, subject to certain minimums.
State Street Bank & Trust, Co. serves as the Fund’s custodian.
DST Systems, Inc. (“DST”), the parent company of ALPS, serves as the Transfer Agent to the Fund. Under the Transfer Agency Agreement, DST is responsible for maintaining all shareholder records of the Fund. DST is a wholly-owned subsidiary of SS&C Technologies Holdings, Inc. (“SS&C”), a publicly traded company listed on the NASDAQ Global Select Market.
The Fund pays no salaries or compensation to its officers or to any interested Director affiliated with the Adviser or Sub-Adviser, and the Fund has no employees. For their services, the Directors of the Fund who are not affiliated with the Adviser or Sub-Adviser, receive an annual retainer in the amount of $16,500, and an additional $1,500 for attending each quarterly meeting of the Board. In addition, the lead Independent Director receives $250 annually, the Chair of the Audit Committee receives $500 annually and the Chair of the Nominating and Corporate Governance Committee receives $250 annually. The Directors not affiliated with the Adviser or Sub-Adviser are also reimbursed for all reasonable out-of-pocket expenses relating to attendance at meetings of the Board.
The Chief Compliance Officer (“CCO”) of the Fund is an employee of the Adviser. The Fund reimburses the Adviser for certain compliance costs related to the Fund, including a portion of the CCO's compensation.
5. FEDERAL INCOME TAXES
It is the Fund’s policy to meet the requirements of the IRC applicable to regulated investment companies, and to distribute all of its taxable net income to its shareholders. In addition, the Fund intends to pay distributions as required to avoid imposition of excise tax. Therefore, no federal income tax provision is required.
Tax Basis of Distributions to Shareholders: The character of distributions made during the year from net investment income or net realized gains may differ from its ultimate characterization for federal income tax purposes. Also, due to the timing of dividend distributions, the fiscal year in which amounts are distributed may differ from the fiscal year in which the income or realized gains were recorded by the Fund.
| 38 | (888) 848-7569 | www.rivernorth.com |
RiverNorth/DoubleLine Strategic Opportunity Fund, Inc.
| Notes to Financial Statements | December 31, 2020 (Unaudited) |
The tax character of the distributions paid by the Fund during the fiscal years ended June 30, 2020, was as follows:
| | | June 30, 2020 | |
| Ordinary Income | | $ | 12,194,880 | |
| Return of Capital | | | 14,373,741 | |
| Total | | $ | 26,568,621 | |
Unrealized Appreciation and Depreciation on Investments: As of December 31, 2020, net unrealized appreciation/(depreciation) of investments based on federal tax costs was as follows:
| Cost of investments for income tax purposes | | $ | 305,165,620 | |
| Gross appreciation on investments (excess of value over tax cost) | | | 11,381,659 | |
| Gross depreciation on investments (excess of tax cost over value) | | | (17,433,797 | ) |
| Net unrealized depreciation on investments | | $ | (6,052,138 | ) |
The difference between book and tax basis unrealized appreciation/(depreciation) for the Fund is primarily attributable to wash sales.
The Fund recognizes the tax benefits of uncertain tax positions only where the position is “more likely than not” to be sustained assuming examination by tax authorities. Management has analyzed the Fund’s tax positions, and has concluded that no liability for unrecognized tax benefits should be recorded related to uncertain tax positions taken on U.S. tax returns and state tax returns filed since inception of the Fund. No income tax returns are currently under examination. All tax years since commencement of operations remain subject to examination by the tax authorities in the United States. The Fund is not aware of any tax positions for which it is reasonably possible that the total amounts of unrecognized tax benefits will change materially in the next 12 months.
6. INVESTMENT TRANSACTIONS
Investment transactions for the period ended December 31, 2020, excluding short-term investments, were as follows:
| | Purchases | Sales |
| | $58,024,115 | $36,111,952 |
7. REVOLVING CREDIT FACILITY
The Fund may borrow money and/or issue preferred stock, notes or debt securities for investment purposes. These practices are known as leveraging. The Fund may use leverage through borrowings or the issuance of preferred stock, in an aggregate amount of up to 33 1/3% of the Fund’s Total Assets immediately after such borrowings or issuance.
| Semi-Annual Report | December 31, 2020 | 39 |
RiverNorth/DoubleLine Strategic Opportunity Fund, Inc.
| Notes to Financial Statements | December 31, 2020 (Unaudited) |
On December 16, 2016, the Fund entered into a $75,000,000 secured, revolving, evergreen credit facility with U.S. Bank National Association (“U.S. Bank”). The Fund incurred a $75,000 administrative fee upon entering into the credit facility. The credit facility has a variable annual interest rate equal to one-month LIBOR plus 0.95 percent. The credit facility will accrue a commitment fee equal to an annual rate of 0.10 percent on $75,000,000.
The average principal balance and interest rate for the period during which the credit facility was utilized for the six months ended December 31, 2020 was approximately $51,994,565 and 1.18%, respectively. At December 31, 2020 the principal balance outstanding was $30,000,000 at an interest rate of 1.14%. Securities that have been pledged as collateral for the borrowings are indicated in the Schedule of Investments.
8. REDEEMABLE PREFERRED STOCK
At December 31, 2020, the Fund had issued and outstanding 2,400,000 shares of Series A Preferred Stock, listed under trading symbol OPPPRA on the NYSE, with a par value of $0.0001 per share and a liquidation preference of $25.00 per share plus accrued and unpaid dividends (whether or not declared). The Fund issued 2,400,000 shares of Series A Preferred Stock on October 23, 2020. The Series A Preferred Stock is entitled to a dividend at a rate of 4.375% per year, paid quarterly, based on the $25.00 liquidation preference before the common stock is entitled to receive any dividends. The Series A Preferred Stock is generally not redeemable at the Fund’s option prior to November 15, 2025, and is subject to mandatory redemption by the Fund in certain circumstances. On or after November 15, 2025, the Fund may redeem in whole, or from time to time in part, outstanding Series A Preferred Stock at a redemption price per share equal to the per share liquidation preference of $25.00 per share, plus accumulated and unpaid dividends, if any, through the date of redemption. Issuance costs related to Series A Preferred Stock of $1,890,000 are deferred and amortized over the period the Series A Preferred Stock is outstanding.
| Series | First
Redemption Date | Fixed Rate | Shares
Outstanding | Aggregate
Liquidation
Preference | Estimated
Fair Value |
| Series A | November 15, 2025 | 4.375% | 2,400,000 | $ 60,000,000 | $ 59,952,000 |
9. CAPITAL SHARE TRANSACTIONS
The Fund’s authorized capital stock consists of 50,000,000 shares of common stock, $0.0001 par value per share, all of which is initially classified as common shares. Under the rules of the NYSE applicable to listed companies, the Fund is required to hold an annual meeting of stockholders in each year.
On November 1, 2019 and August 12-13, 2020, the Board approved rights two offerings to participating shareholders of record who were allowed to subscribe for new common shares of the Fund (the “Primary Subscription”). Record Date Shareholders received one right for each common share held on the Record Date ("Right"). For every three Rights held, a holder of the Rights was entitled to buy one new common share of the Fund. Record Date Shareholders who fully exercised all Rights initially issued to them in the Primary Subscription were entitled to buy those common shares that were not purchased by other Record Date Shareholders. The Fund issued new shares of common stock at a subscription price that represented 92.5% of the reported net asset value on the expiration date of each rights offering. Offering costs were charged to paid-in-capital upon the exercise of the Rights.
| 40 | (888) 848-7569 | www.rivernorth.com |
RiverNorth/DoubleLine Strategic Opportunity Fund, Inc.
| Notes to Financial Statements | December 31, 2020 (Unaudited) |
The shares of common stock issued, subscription price, and offering costs for the rights offerings were as follows:
| Record Date | Expiration Date | Shares of
Common Stock
Issued | Subscription
Price | Offering
Costs |
| November 12, 2019 | December 10, 2019 | 2,371,081 | $16.21 | $120,935 |
| September 3, 2020 | October 1, 2020 | 472,995 | $13.88 | $122,545 |
The Fund has issued and outstanding 13,857,863 shares of common stock at December 31, 2020.
Additional shares of the Fund may be issued under certain circumstances, including pursuant to the Fund’s Automatic Dividend Reinvestment Plan, as defined within the Fund’s organizational documents. Additional information concerning the Automatic Dividend Reinvestment Plan is included within this report.
10. INDEMNIFICATIONS
Under the Fund’s organizational documents, its officers and Directors are indemnified against certain liabilities arising out of the performance of their duties to the Fund. Additionally, in the normal course of business, the Fund enters into contracts with service providers that may contain general indemnification clauses. The Fund’s maximum exposure under those arrangements is unknown, as this would involve future claims that may be made against the Fund that have not yet occurred.
11. CORONAVIRUS (COVID-19) PANDEMIC
A recent outbreak of respiratory disease caused by a novel coronavirus was first detected in December 2019 and has spread internationally. The outbreak and efforts to contain its spread have resulted in closing borders and quarantines, restricting international and domestic travel, enhanced health screenings, cancelations, disrupted supply chains and customer activity, responses by businesses (including changes to operations and reducing staff), and have produced general concern and uncertainty. The impact of the coronavirus pandemic, and other epidemics and pandemics that may arise in the future could adversely affect national and global economies, individual companies and the market in general in a manner and for a period of time that cannot be foreseen at the present time and may adversely affect the value, volatility and liquidity of dividend and interest paying securities. In the event of a pandemic or an outbreak, there can be no assurance that the Fund and its service providers will be able to maintain normal business operations for an extended period of time or will not lose the services of key personnel on a temporary or long-term basis due to illness or other reasons, and could otherwise disrupt the ability of the Fund's service providers to perform essential services. Certain economic and market conditions arising out of a pandemic or outbreak could result in a Fund's inability to achieve its investment objectives, cause the postponement of reconstitution or rebalance dates for benchmark indices, adversely affect the prices and liquidity of the securities and other instruments in which a Fund invests, negatively impact a Fund's performance, and cause losses on your investment in a Fund. Management is monitoring the development of the pandemic, which was ongoing as of the date of the financial statements, and is evaluating its impact on the financial position and operating results of the Fund.
| Semi-Annual Report | December 31, 2020 | 41 |
RiverNorth/DoubleLine Strategic Opportunity Fund, Inc.
| Notes to Financial Statements | December 31, 2020 (Unaudited) |
12. LIBOR TRANSITION
Certain of the Fund's investments, payment obligations and financing terms may be based on floating rates, such as LIBOR, Euro Interbank Offered Rate and other similar types of reference rates (each, a “Reference Rate”). On July 27, 2017, the Chief Executive of the UK Financial Conduct Authority (“FCA”), which regulates LIBOR, announced that the FCA will no longer persuade nor compel banks to submit rates for the calculation of LIBOR and certain other Reference Rates after 2021. Such announcement indicates that the continuation of LIBOR and other Reference Rates on the current basis cannot and will not be guaranteed after 2021. The transition away from Reference Rates may lead to increased volatility and illiquidity in markets that are tied to such Reference Rates and reduced values of Reference Rate-related instruments. This announcement and any additional regulatory or market changes that occur as a result of the transition away from Reference Rates may have an adverse impact on a Fund’s investments, performance or financial condition.
13. SUBSEQUENT EVENTS
Subsequent to December 31, 2020, the Fund paid the following distributions:
| Ex-Date | Record Date | Payable Date | Rate (per share) |
| January 14, 2021 | January 15, 2021 | January 29, 2021 | $0.158 |
| February 10, 2021 | February 11, 2021 | February 26, 2021 | $0.158 |
| 42 | (888) 848-7569 | www.rivernorth.com |
RiverNorth/DoubleLine Strategic Opportunity Fund, Inc.
| Dividend Reinvestment Plan | December 31, 2020 (Unaudited) |
The Fund has an automatic dividend reinvestment plan commonly referred to as an “opt-out” plan. Unless the registered owner of Common Shares elects to receive cash by contacting DST Systems, Inc. (the “Plan Administrator”), all dividends declared on Common Shares will be automatically reinvested by the Plan Administrator for shareholders in the Fund’s Automatic Dividend Reinvestment Plan (the “Plan”), in additional Common Shares. Common Shareholders who elect not to participate in the Plan will receive all dividends and other distributions in cash paid by check mailed directly to the shareholder of record (or, if the Common Shares are held in street or other nominee name, then to such nominee) by the Plan Administrator as dividend disbursing agent. Participation in the Plan is completely voluntary and may be terminated or resumed at any time without penalty by notice if received and processed by the Plan Administrator prior to the dividend record date; otherwise such termination or resumption will be effective with respect to any subsequently declared dividend or other distribution. Such notice will be effective with respect to a particular dividend or other distribution (together, a “Dividend”). Some brokers may automatically elect to receive cash on behalf of Common Shareholders and may re-invest that cash in additional Common Shares. Reinvested Dividends will increase the Fund’s Managed Assets on which the management fee is payable to the Adviser (and by the Adviser to the Sub-Adviser).
Whenever the Fund declares a Dividend payable in cash, non-participants in the Plan will receive cash and participants in the Plan will receive the equivalent in Common Shares. The Common Shares will be acquired by the Plan Administrator for the participants’ accounts, depending upon the circumstances described below, either (i) through receipt of additional unissued but authorized Common Shares from the Fund (“Newly Issued Common Shares”) or (ii) by purchase of outstanding Common Shares on the open market (“Open-Market Purchases”) on the NYSE or elsewhere. If, on the payment date for any Dividend, the closing market price plus estimated brokerage commissions per Common Share is equal to or greater than the NAV per Common Share, the Plan Administrator will invest the Dividend amount in Newly Issued Common Shares on behalf of the participants. The number of Newly Issued Common Shares to be credited to each participant’s account will be determined by dividing the dollar amount of the Dividend by the Fund’s NAV per Common Share on the payment date. If, on the payment date for any Dividend, the NAV per Common Share is greater than the closing market value plus estimated brokerage commissions (i.e., the Fund’s Common Shares are trading at a discount), the Plan Administrator will invest the Dividend amount in Common Shares acquired on behalf of the participants in Open-Market Purchases.
In the event of a market discount on the payment date for any Dividend, the Plan Administrator will have until the last business day before the next date on which the Common Shares trade on an “ex-dividend” basis or 30 days after the payment date for such Dividend, whichever is sooner (the “Last Purchase Date”), to invest the Dividend amount in Common Shares acquired in Open-Market Purchases. It is contemplated that the Fund will pay monthly income Dividends. If, before the Plan Administrator has completed its Open-Market Purchases, the market price per Common Share exceeds the NAV per Common Share, the average per Common Share purchase price paid by the Plan Administrator may exceed the NAV of the Common Shares, resulting in the acquisition of fewer Common Shares than if the Dividend had been paid in Newly Issued Common Shares on the Dividend payment date. Because of the foregoing difficulty with respect to Open-Market Purchases, the Plan provides that if the Plan Administrator is unable to invest the full Dividend amount in Open-Market Purchases during the purchase period or if the market discount shifts to a market premium during the purchase period, the Plan Administrator may cease making Open-Market Purchases and may invest the uninvested portion of the Dividend amount in Newly Issued Common Shares at the NAV per Common Share at the close of business on the Last Purchase Date.
| Semi-Annual Report | December 31, 2020 | 43 |
RiverNorth/DoubleLine Strategic Opportunity Fund, Inc.
| Dividend Reinvestment Plan | December 31, 2020 (Unaudited) |
The Plan Administrator maintains all shareholders’ accounts in the Plan and furnishes written confirmation of all transactions in the accounts, including information needed by shareholders for tax records. Common Shares in the account of each Plan participant will be held by the Plan Administrator on behalf of the Plan participant, and each shareholder proxy will include those shares purchased or received pursuant to the Plan. The Plan Administrator will forward all proxy solicitation materials to participants and vote proxies for shares held under the Plan in accordance with the instructions of the participants.
Beneficial owners of Common Shares who hold their Common Shares in the name of a broker or nominee should contact the broker or nominee to determine whether and how they may participate in the Plan. In the case of Common Shareholders such as banks, brokers or nominees which hold shares for others who are the beneficial owners, the Plan Administrator will administer the Plan on the basis of the number of Common Shares certified from time to time by the record shareholder’s name and held for the account of beneficial owners who participate in the Plan.
There will be no brokerage charges with respect to Common Shares issued directly by the Fund. However, each participant will pay a pro rata share of brokerage commissions incurred in connection with Open-Market Purchases. The automatic reinvestment of Dividends will not relieve participants of any federal, state or local income tax that may be payable (or required to be withheld) on such Dividends, even though such participants have not received any cash with which to pay the resulting tax. See “U.S. Federal Income Tax Matters” below. Participants that request a sale of Common Shares through the Plan Administrator are subject to brokerage commissions.
The Fund reserves the right to amend or terminate the Plan. There is no direct service charge to participants with regard to purchases in the Plan; however, the Fund reserves the right to amend the Plan to include a service charge payable by the participants. All correspondence or questions concerning the Plan should be directed to the Plan Administrator at (844) 569-4750.
| 44 | (888) 848-7569 | www.rivernorth.com |
RiverNorth/DoubleLine Strategic Opportunity Fund, Inc.
| Additional Information | December 31, 2020 (Unaudited) |
PROXY VOTING GUIDELINES
A description of the policies and procedures that the Fund used to determine how to vote proxies relating to portfolio securities and information regarding how the Fund voted proxies during the most recent 12-month period ended June 30, are available without charge upon request by (1) calling the Fund at (888) 848-7569 and (2) from Form N-PX filed by the Fund with the SEC on the SEC’s website at www.sec.gov.
PORTFOLIO HOLDINGS DISCLOSURE POLICY
The Fund files a complete schedule of investments with the SEC for the first and third quarter of the fiscal year on Part F of Form N-PORT. The Fund’s first and third fiscal quarters end on September 30 and March 31. The Form N-PORT filing must be filed within 60 days of the end of the quarter. The Fund's Form N-PORT are available on the SEC's website at www.sec.gov. You may also obtain copies by calling the Fund at 1-888-848-7569.
STOCKHOLDER MEETING RESULTS
On October 15, 2020, the Fund held a Meeting of Stockholders to consider the proposal set forth below. The following votes were recorded:
Election of Patrick W. Galley as a Director of the Fund to a three-year term to expire at the Fund’s 2023 Annual Meeting of Stockholders or until his successor is duly elected and qualified.
| | Shares Voted | % of Shares Voted |
| For | 10,822,194 | 97.93% |
| Withheld | 229,002 | 2.07% |
| Total | 11,051,196 | 100.00% |
Election of Jerry R. Raio as a Director of the Fund to a three-year term to expire at the Fund’s 2023 Annual Meeting of Stockholders or until his successor is duly elected and qualified.
| | Shares Voted | % of Shares Voted |
| For | 10,684,523 | 96.68% |
| Withheld | 366,673 | 3.32% |
| Total | 11,051,196 | 100.00% |
| Semi-Annual Report | December 31, 2020 | 45 |
RiverNorth/DoubleLine Strategic Opportunity Fund, Inc.
| Additional Information | December 31, 2020 (Unaudited) |
UNAUDITED TAX INFORMATION
Of the distributions paid by the Fund from ordinary income for the calendar year ended December 31, 2019, the following percentages met the requirements to be treated as qualifying for the corporate dividends received deduction and qualified dividend income:
| | Dividend Received Deduction | Qualified Dividend Income |
| RiverNorth/DoubleLine Strategic Opportunity Fund | 0.00% | 0.72% |
In early 2020, if applicable, shareholders of record received this information for the distributions paid to them by the Fund during the calendar year 2019 via Form 1099. The Fund will notify shareholders in early 2021 of amounts paid to them by the Fund, if any, during the calendar year 2020.
| 46 | (888) 848-7569 | www.rivernorth.com |
RiverNorth/DoubleLine Strategic Opportunity Fund, Inc.
| Consideration and Approval of Advisory and Sub-Advisory Agreements | December 31, 2020 (Unaudited) |
Consideration of the Management Agreement
At a meeting (the “Meeting”) of the Board held on November 11, 2020 and called expressly for that purpose, the Board, including a majority of the Directors who are not “interested persons” (as defined in the 1940 Act (the “Independent Directors”)), considered the renewal of the Management Agreement between the Adviser and the Fund.1 In its consideration of the Management Agreement, the Board considered information and materials furnished by the Adviser in advance of and at the Meeting and was afforded the opportunity to request additional information and to ask questions of the Adviser to obtain information that it believed to be reasonably necessary to evaluate the terms of the Management Agreement. The Board received materials compiled by the Adviser and the Fund’s administrator including a copy of the Management Agreement, the Adviser’s response to a questionnaire regarding the Adviser’s profitability, management and operations, a copy of the Adviser’s Form ADV, and certifications regarding the Adviser’s compliance programs. The Board considered the following factors, among others, in reaching its determination to renew the Management Agreement: (i) the investment performance of the Fund and the investment performance of the Adviser, (ii) the nature, extent and quality of the services provided by the Adviser to the Fund, (iii) the experience and qualifications of the personnel providing such services (iv) the costs of the services provided and the profits to be realized by the Adviser and any of its affiliates from the relationship with the Fund, (v) the extent to which economies of scale will be realized by the Fund as it grows, and (vi) whether the Fund’s fee levels reflected the economies of scale to the benefit of the Fund’s shareholders.
The Directors relied upon the advice of independent legal counsel and their own business judgment in determining the material factors to be considered in evaluating the Management Agreement and the weight to be given to each such factor. The Directors’ conclusions were based on an evaluation of all of the information provided and were not the result of any one factor. Moreover, each Director may have afforded different weight to the various factors in reaching conclusions with respect to the Management Agreement. Although not meant to be all-inclusive, the following discussion summarizes the factors considered and conclusions reached by the Directors at the Meeting, including during an executive session with their independent legal counsel, in determining to renew the Management Agreement.
Performance, Fees and Expenses
The Board reviewed the performance of the Fund for the three months, one-year, three-year and since inception periods ended September 30, 2020. These returns were compared to the returns of mutual funds in FUSE Research Network, LLC’s (“FUSE”) Multisector Bond fund peer group. The Board noted in its review of the performance that the Fund’s performance was below the median for its peer group for three-month, one-year, three-year and since inception periods. The Directors also noted that the Fund had underperformed its benchmark index for the three-month, one-year, three-year and since-inception periods. The Directors also reviewed the Fund’s performance relative to other funds managed by the Adviser. The Adviser noted the peer group is not entirely reflective of the Fund due to its unique investment structure. In consideration of each item noted, the Board agreed that the Fund’s performance was adequate.
As to the comparative fees and expenses, the Directors considered the management and the other fees paid by the Fund and compared those to the management and other fees paid by funds in the relative peer group determined by FUSE and the Multisector Bond fund universe. The Board noted that the Fund’s annual net expense ratio was higher than the Multisector Bond fund peer group median which the Adviser noted was attributed to the sub-advisory relationship and the uniqueness of the Fund’s investment strategy.
| Semi-Annual Report | December 31, 2020 | 47 |
RiverNorth/DoubleLine Strategic Opportunity Fund, Inc.
| Consideration and Approval of Advisory and Sub-Advisory Agreements | December 31, 2020 (Unaudited) |
The Board also noted that the annual management fee for the Fund was slightly above the median paid by the peer group but within the range of the fees paid by the peer funds The Directors also reviewed the Fund’s fees relative to other funds managed by the Adviser. The Board, including the Independent Directors, determined that the fees were reasonable given the nature of the Fund’s investment strategy, the capabilities of the Adviser and the Sub-Adviser, and the nature of the services provided to the Fund.
Nature, Extent and Quality of Services
As to the nature, extent and quality of the services to be provided by the Adviser to the Fund, the Board considered that under the terms of the Management Agreement, the Adviser would, subject to the supervision of the Board, provide or arrange to be provided to the Fund such investment advice as the Adviser, in its discretion, deems advisable and will furnish or arrange to be furnished a continuous investment program for the Fund consistent with the Fund’s investment objective and policies. The Board reviewed the Adviser’s Form ADV, which was previously provided to the Board and that provided details regarding the experience of each of the Adviser’s personnel. The Adviser also provided additional information regarding its experience managing other investment accounts. Based on the foregoing information, the Board, including the Independent Directors, concluded that the Adviser had provided quality services and would continue to do so for the Fund.
Profitability and Other Benefits
As to the cost of the services to be provided and to the profits to be realized by the Adviser, the Board reviewed the Adviser’s estimates of its profitability and its financial condition. The Board reviewed the Adviser’s financial statements and noted the Adviser’s financial condition is stable as income from its asset management operations have contributed to higher revenues for the Adviser. The Board acknowledged the Adviser’s management fees were comparable to those charged to other mutual funds to which the Adviser provides advisory or sub-advisory services. It was noted that, when launching a closed-end fund, such as the Fund, RiverNorth covers the underwriting costs, which is a significant investment. The Board, including the Independent Directors, determined that the Management Agreement, with respect to the Fund was not overly profitable to the Adviser and the financial condition of the Adviser was adequate.
The Board noted that the Adviser has no affiliations with the Fund’s transfer agent, fund accountant, custodian, or distributor and therefore does not derive any benefits from the relationships these parties may have with the Fund.
Conclusion
Having requested and received such information from the Adviser as the Board believed to be reasonably necessary to evaluate the terms of the Management Agreement, and as assisted by the advice of independent counsel, the Board, including the Independent Directors, concluded that renewal of the Management Agreement was in the best interests of the Fund and its shareholders.
| 48 | (888) 848-7569 | www.rivernorth.com |
RiverNorth/DoubleLine Strategic Opportunity Fund, Inc.
| Consideration and Approval of Advisory and Sub-Advisory Agreements | December 31, 2020 (Unaudited) |
Consideration of the Sub-Advisory Agreement
At the Meeting, the Board, including the Independent Directors, also considered the renewal of the sub-advisory agreement (the “Sub-Advisory Agreement”) between the Adviser and the Sub-Adviser. In its consideration of the Sub-Advisory Agreement, the Board considered information and materials furnished by the Adviser and the Sub-Adviser in advance of and at the meeting and was afforded the opportunity to request additional information and to ask questions of the Adviser and Sub-Adviser to obtain information that it believed to be reasonably necessary to evaluate the terms of the Sub-Advisory Agreement. The Board received materials compiled by the Sub-Adviser including a copy of the Sub-Advisory Agreement, the Sub-Adviser’s response to a questionnaire regarding its profitability, management and operations, a copy of the Sub-Adviser’s Form ADV, and certifications regarding the Sub-Adviser’s compliance programs. The Board considered the following factors, among others, in reaching its determination to renew the Sub-Advisory Agreement: (i) the investment performance of the Fund and the investment performance of the Sub-Adviser, (ii) the nature, extent and quality of the services provided by Sub-Adviser to the Fund, (iii) the experience and qualifications of the personnel providing such services, (iv) the costs of the services provided and the profits to be realized by the Sub-Adviser and any of its affiliates from the relationship with the Fund, (v) the extent to which economies of scale will be realized by the Fund as it grows, and (vi) whether the fee level of the Fund reflected the economies of scale to the benefit of the Fund’s shareholders.
The Directors relied upon the advice of independent legal counsel and their own business judgment in determining the material factors to be considered in evaluating the Sub-Advisory Agreement and the weight to be given to each such factor. The Directors’ conclusions were based on an evaluation of all of the information provided and were not the result of any one factor. Moreover, each Director may have afforded different weight to the various factors in reaching conclusions with respect to the Sub-Advisory Agreement. Although not meant to be all-inclusive, the following discussion summarizes the factors considered and conclusions reached by the Directors in the executive session and at the Meeting in determining to renew the Sub-Advisory Agreement.
Performance, Fees and Expenses
The Board reviewed the performance of the portion of the Fund managed by the Sub-Adviser relative to relevant securities indices, and to other accounts managed by the Sub-Adviser. The Board recalled its deliberations regarding the Fund’s performance while considering the renewal of the Management Agreement. The Board, including the Independent Directors, concluded that the performance was adequate.
As to the comparative fees and expenses, the Board considered the management fee paid by the Fund to the Adviser and noted that the Adviser pays the Sub-Adviser from its fee, which the Board had previously determined was reasonable. The Board noted that the sub-advisory fee paid by the Adviser to the Sub-Adviser was reasonable as well, given the fees the Sub-Adviser charges other clients to manage similar strategies.
Nature, Extent and Quality of Services
As to the nature, extent and quality of the services to be provided by the Sub-Adviser, the Board considered that under the terms of the Sub-Advisory Agreement, the Sub-Adviser would, subject to the supervision of the Board, provide to the Fund such investment advice as the Sub-Adviser, in its discretion, deems advisable and will furnish or arrange to be furnished a continuous investment program for the Fund consistent with the Fund’s investment objective and policies. The Board reviewed the Form ADV of the Sub-Adviser, which provided details regarding the experience of the Sub-Adviser’s investment personnel. The Sub-Adviser also provided additional information regarding its operations and experience managing other investment accounts. Based on the foregoing information, the Board, including the Independent Directors, concluded that the Sub-Adviser had provided quality services and would continue to do so for the Fund.
| Semi-Annual Report | December 31, 2020 | 49 |
RiverNorth/DoubleLine Strategic Opportunity Fund, Inc.
| Consideration and Approval of Advisory and Sub-Advisory Agreements | December 31, 2020 (Unaudited) |
Profitability and Other Benefits
As to the cost of the services to be provided and to the profits to be realized by the Sub-Adviser, the Board reviewed the Sub-Adviser’s financial condition. The Board noted that the financial condition of the Sub-Adviser was stable. The Board, including the Independent Directors determined that the Sub-Advisory Agreement and the compensation to the Sub-Adviser was reasonable and the financial condition of the Sub-Adviser was adequate. The Board noted that the Sub-Adviser had no affiliations with the Fund’s transfer agent, fund accountant, custodian, or distributor and therefore does not derive any benefits from the relationships these parties may have with the Fund.
Conclusion
Having requested and received such information from the Adviser and Sub-Advisor as the Board believed to be reasonably necessary to evaluate the terms of the Sub-Advisory Agreement, and as assisted by the advice of independent counsel, the Board, including the Independent Directors, concluded that renewal of the Sub-Advisory Agreement was in the best interests of the Fund and its shareholders.
| 1 | Pursuant to relief granted by the U.S. Securities and Exchange Commission (the “SEC”) in light of the COVID-19 pandemic (the “Relief”) and a determination by the Board that reliance on the Relief was appropriate due to circumstances related to the current and potential effects of COVID-19, the Meeting was held telephonically. |
| 50 | (888) 848-7569 | www.rivernorth.com |
Intentionally Left Blank
Board of Directors
Patrick W. Galley, CFA, Chairman
John K. Carter
John S. Oakes
J. Wayne Hutchens
David M. Swanson
Jerry R. Raio
Investment Adviser
RiverNorth Capital Management, LLC
Sub Adviser
DoubleLine Capital LP
Fund Administrator
ALPS Fund Services, Inc.
Transfer Agent and
Dividend Disbursing Agent
DST Systems, Inc.
Custodian
State Street Bank and Trust Company
Independent Registered
Public Accounting Firm
Cohen & Company, Ltd.

RiverNorth Capital Management, LLC
325 N. LaSalle Street, Suite 645
Chicago, IL 60654
Secondary market support provided to the Fund by ALPS Fund Services, Inc.’s affiliate ALPS Distributors, Inc., a FINRA member.
This report is provided for the general information of the shareholders of the RiverNorth/DoubleLine Strategic Opportunity Fund, Inc. This report is not intended for distribution to prospective investors in the Fund, unless preceded or accompanied by an effective prospectus.
Not applicable to semi-annual report.
| Item 3. | Audit Committee Financial Expert. |
Not applicable to semi-annual report.
| Item 4. | Principal Accountant Fees and Services. |
Not applicable to semi-annual report.
| Item 5. | Audit Committee of Listed Registrants. |
Not applicable to semi-annual report.
| Item 6. | Schedule of Investments. |
| (a) | Schedule of Investments is included as part of the Report to Stockholders filed under Item 1 of this form. |
| (b) | Not applicable to the Registrant. |
| Item 7. | Disclosure of Proxy Voting Policies and Procedures for Closed-End Management Investment Companies. |
Not applicable to semi-annual report.
| Item 8. | Portfolio Managers of Closed-End Management Investment Companies. |
| (a) | Not applicable to semi-annual report. |
| Item 9. | Purchases of Equity Securities by Closed-End Management Company and Affiliated Purchasers. |
None.
| Item 10. | Submission of Matters to a Vote of Security Holders. |
There have been no material changes to the procedures by which shareholders may recommend nominees to the Board of Directors of the Registrant.
| Item 11. | Controls and Procedures. |
| (a) | The Registrant’s principal executive officer and principal financial officer have concluded that the Registrant’s disclosure controls and procedures (as defined in Rule 30a-3(c) under the Investment Company Act of 1940, as amended) are effective based on their evaluation of these controls and procedures as of a date within 90 days of the filing date of this document. |
| (b) | There were no significant changes in the Registrant’s internal control over financial reporting (as defined in Rule 30a-3(d) under the Investment Company Act of 1940, as amended) during the period covered by this report that has materially affected, or is reasonably likely to materially affect, the Registrant’s internal control over financial reporting. |
| Item 12. | Disclosure of Securities Lending Activities for Closed-End Management Investment Companies. |
None.
Items 13. Exhibits.
| (a)(1) | Not applicable to semi-annual report. |
SIGNATURES
Pursuant to the requirements of the Securities Exchange Act of 1934 and the Investment Company Act of 1940, the registrant has duly caused this report to be signed on its behalf by the undersigned, thereunto duly authorized.
Registrant: RiverNorth/DoubleLine Strategic Opportunity Fund, Inc.
| By: | /s/ Patrick W. Galley | |
| Name: | Patrick W. Galley | |
| Title: | President | |
| | | |
| Date: | March 5, 2021 | |
Pursuant to the requirements of the Securities Exchange Act of 1934 and the Investment Company Act of 1940, this report has been signed below by the following persons on behalf of the registrant and in the capacities and on the dates indicated.
| By: | /s/ Patrick W. Galley | |
| Name: | Patrick W. Galley | |
| Title: | President | |
| | | |
| Date: | March 5, 2021 | |
| By: | /s/ Jonathan M. Mohrhardt | |
| Name: | Jonathan M. Mohrhardt | |
| Title: | Treasurer and Chief Financial Officer | |
| | | |
| Date: | March 5, 2021 | |