Supplemental Information Fourth Quarter 2016 February 28, 2017 399 Park Avenue, 18th Floor, New York, NY 10022 | 212.547.2600
Cautionary Statement Regarding Forward- Looking Statements This presentation may contain forward-looking statements within the meaning of the federal securities laws. Forward-looking statements relate to expectations, beliefs, projections, future plans and strategies, anticipated events or trends and similar expressions concerning matters that are not historical facts. In some cases, you can identify forward-looking statements by the use of forward-looking terminology such as “may,” “will,” “should,” “expects,” “intends,” “plans,” “anticipates,” “believes,” “estimates,” “predicts,” or “potential” or the negative of these words and phrases or similar words or phrases which are predictions of or indicate future events or trends and which do not relate solely to historical matters. Forward-looking statements involve known and unknown risks, uncertainties, assumptions and contingencies, many of which are beyond our control, and may cause actual results to differ significantly from those expressed in any forward-looking statement. Factors that might cause such a difference include, without limitation, our failure to achieve anticipated synergies in the completed merger among NorthStar Asset Management Group Inc., Colony Capital, Inc. and NorthStar Realty Finance Corp., Colony NorthStar’s liquidity, including its ability to complete identified monetization transactions and other potential sales of non-core investments, the timing of and ability to deploy available capital, the timing of and ability to complete repurchases of Colony NorthStar’s stock, Colony NorthStar’s ability perform on the RMZ, Colony NorthStar’s leverage, including the timing and amount of borrowings under its credit facility, increased interest rates and operating costs, adverse economic or real estate developments in Colony NorthStar’s markets, Colony NorthStar’s failure to successfully operate or lease acquired properties, decreased rental rates, increased vacancy rates or failure to renew or replace expiring leases, defaults on or non-renewal of leases by tenants, the impact of economic conditions on the borrowers of Colony NorthStar’s commercial real estate debt investments and the commercial mortgage loans underlying its commercial mortgage backed securities, adverse general and local economic conditions, an unfavorable capital market environment, decreased leasing activity or lease renewals, and other risks and uncertainties detailed in our filings with the Securities and Exchange Commission (“SEC”). All forward-looking statements reflect the Colony NorthStar’s good faith beliefs, assumptions and expectations, but they are not guarantees of future performance. Additional information about these and other factors can be found in Colony NorthStar’s reports filed from time to time with the SEC. Colony NorthStar cautions investors not to unduly rely on any forward-looking statements. The forward-looking statements speak only as of the date of this presentation. Colony NorthStar is under no duty to update any of these forward-looking statements after the date of this presentation, nor to conform prior statements to actual results or revised expectations, and Colony NorthStar does not intend to do so. This presentation may contain statistics and other data that has been obtained or compiled from information made available by third-party service providers. Colony NorthStar has not independently verified such statistics or data. This presentation is for informational purposes only and does not constitute an offer to sell or a solicitation of an offer to buy any securities of the Colony NorthStar. This information is not intended to be indicative of future results. Actual performance of Colony NorthStar may vary materially. The endnotes herein contain important information that is material to an understanding of this presentation and you should read this presentation only with and in context of the endnotes.
2 Table of Contents I. CLNS Merger Update II. NRF Fourth Quarter Highlights III. Financial Statements • Balance Sheet • Income Statement • CAD Reconciliation IV. Capitalization V. Real Estate Financing Overview Real Estate Portfolio VI. Real Estate Fourth Quarter and Full Year 2016 NOI / EBITDA Summary VII. Real Estate – Healthcare VIII. Real Estate – Hotel IX. Real Estate – Net Lease X. Real Estate PE Investments XI. Real Estate Debt Investments XII. Repurchased NorthStar Realty CDO Bonds XIII. CDO Real Estate Investments Appendix Presentation Endnotes Q4 2016 and Full Year 2016 NOI / EBITDA Reconciliation
3 CLNS Merger Update Completed largest real estate merger announced in 2016 to create Colony NorthStar, Inc. (“CLNS”), a global, diversified equity REIT with $56 billion of assets under management Merger integration substantially complete with greater than 75% of the originally identified $115 million of annualized synergies and greater than 65% of the estimated $80 million of annualized cash synergies achieved to date with the balance expected to be achieved by year end on a run rate basis CLNS declared a quarterly cash dividend of $0.27 per CLNS common share of Class A and Class B common stock for the first quarter of 2017, which will be prorated to $0.24 per share for the period from January 11, 2017 to March 31, 2017 In January 2017, former Colony and NRF stockholders received stub dividends for the period from January 1, 2017 through January 10, 2017 and former NSAM stockholders received a one-time special dividend of $1.16 per NSAM common share Significant liquidity of approximately $1.2 billion, including $615 million expected from the sale of the manufactured housing communities portfolio, and more than $1 billion of additional liquidity expected throughout 2017 from future monetizations of existing non-core investments available for deployment in core verticals and other real estate investments, stock repurchases and/or debt paydowns Repaid $921 million of term loans at NSAM and NRF CLNS increased revolving credit facility to $1.0 billion from $850 million CLNS Board of Directors authorized $300 million common stock repurchase program CLNS added to the MSCI U.S. REIT Index (RMZ) as a top quartile constituent by equity market capitalization

4 NRF Fourth Quarter Highlights Because the merger closed after December 31, 2016, results in this presentation reflect the pre-merger, stand-alone results for NRF U.S. GAAP net income of $0.34 per basic share Cash available for distribution (“CAD”) of $0.26 per share Completed or under contract asset monetizations include the following: Completed a $783 million sale of a portfolio of medical office buildings, at an approximate 5.6% cap rate, resulting in net proceeds of $81 million; Completed a sale of an 18.7% preferred joint venture interest in the Company’s healthcare portfolio resulting in net proceeds of $340 million, representing an implied 6.1% cap rate; and Under contract for the sale of entire manufactured housing communities portfolio for $2.0 billion, which is expected to generate net proceeds of $615 million
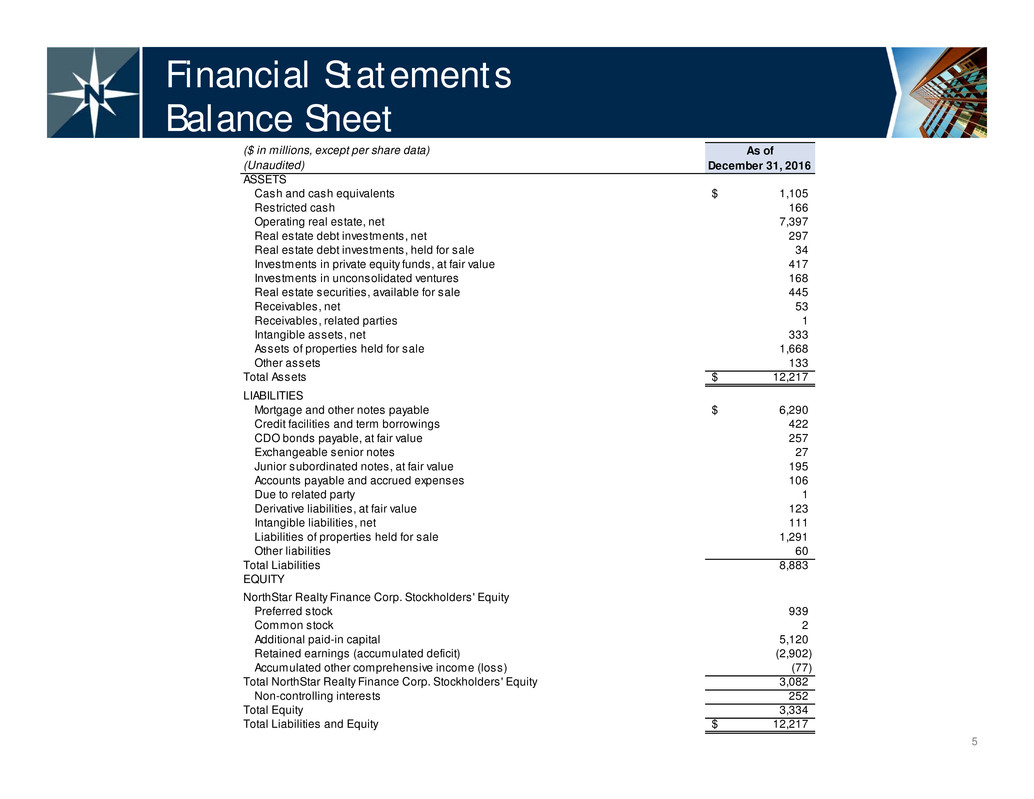
As of December 31, 2016 ASSETS Cash and cash equivalents 1,105$ Restricted cash 166 Operating real estate, net 7,397 Real estate debt investments, net 297 Real estate debt investments, held for sale 34 Investments in private equity funds, at fair value 417 Investments in unconsolidated ventures 168 Real estate securities, available for sale 445 Receivables, net 53 Receivables, related parties 1 Intangible assets, net 333 Assets of properties held for sale 1,668 Other assets 133 Total Assets 12,217$ LIABILITIES Mortgage and other notes payable 6,290$ Credit facilities and term borrowings 422 CDO bonds payable, at fair value 257 Exchangeable senior notes 27 Junior subordinated notes, at fair value 195 Accounts payable and accrued expenses 106 Due to related party 1 Derivative liabilities, at fair value 123 Intangible liabilities, net 111 Liabilities of properties held for sale 1,291 Other liabilities 60 Total Liabilities 8,883 EQUITY NorthStar Realty Finance Corp. Stockholders' Equity Preferred stock 939 Common stock 2 Additional paid-in capital 5,120 Retained earnings (accumulated deficit) (2,902) Accumulated other comprehensive income (loss) (77) Total NorthStar Realty Finance Corp. Stockholders' Equity 3,082 Non-controlling interests 252 Total Equity 3,334 Total Liabilities and Equity 12,217$ ($ in millions, except per share data) (Unaudited) 5 Financial Statements Balance Sheet
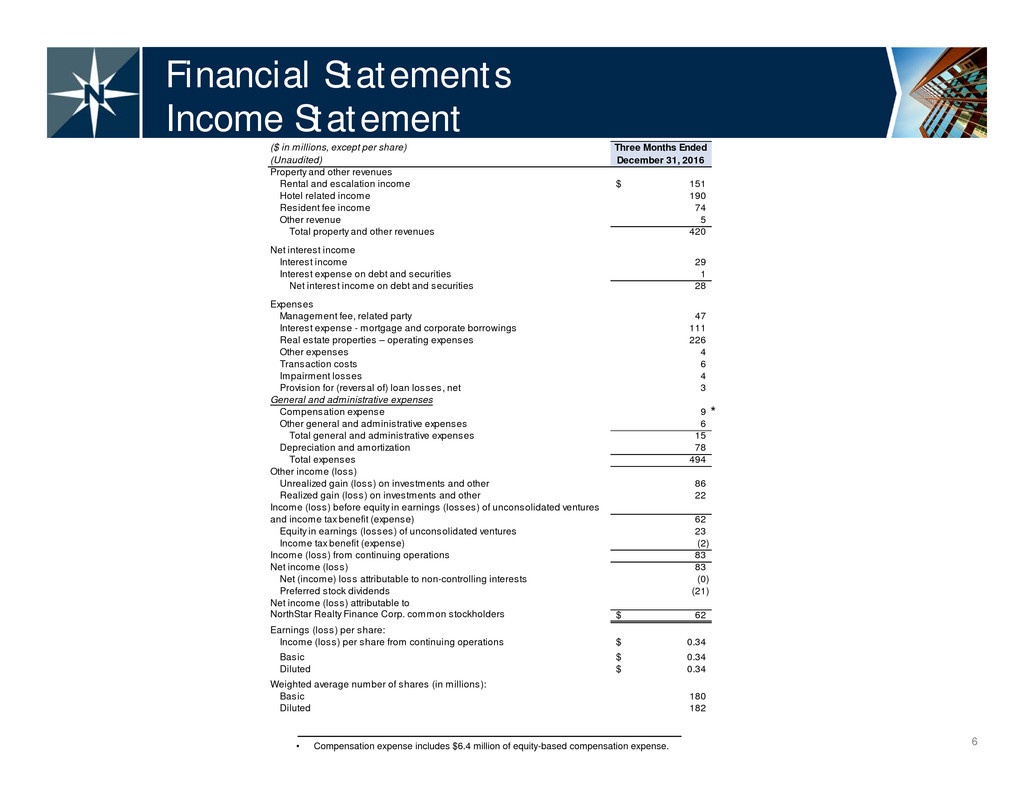
Three Months Ended December 31, 2016 Property and other revenues Rental and escalation income 151$ Hotel related income 190 Resident fee income 74 Other revenue 5 Total property and other revenues 420 Net interest income Interest income 29 Interest expense on debt and securities 1 Net interest income on debt and securities 28 Expenses Management fee, related party 47 Interest expense - mortgage and corporate borrowings 111 Real estate properties – operating expenses 226 Other expenses 4 Transaction costs 6 Impairment losses 4 Provision for (reversal of) loan losses, net 3 General and administrative expenses Compensation expense 9 Other general and administrative expenses 6 Total general and administrative expenses 15 Depreciation and amortization 78 Total expenses 494 Other income (loss) Unrealized gain (loss) on investments and other 86 Realized gain (loss) on investments and other 22 Income (loss) before equity in earnings (losses) of unconsolidated ventures and income tax benefit (expense) 62 Equity in earnings (losses) of unconsolidated ventures 23 Income tax benefit (expense) (2) Income (loss) from continuing operations 83 Net income (loss) 83 Net (income) loss attributable to non-controlling interests (0) Preferred stock dividends (21) Net income (loss) attributable to NorthStar Realty Finance Corp. common stockholders 62$ Earnings (loss) per share: Income (loss) per share from continuing operations 0.34$ Basic 0.34$ Diluted 0.34$ Weighted average number of shares (in millions): Basic 180 Diluted 182 ($ in millions, except per share) (Unaudited) 6 Financial Statements Income Statement • Compensation expense includes $6.4 million of equity-based compensation expense. *
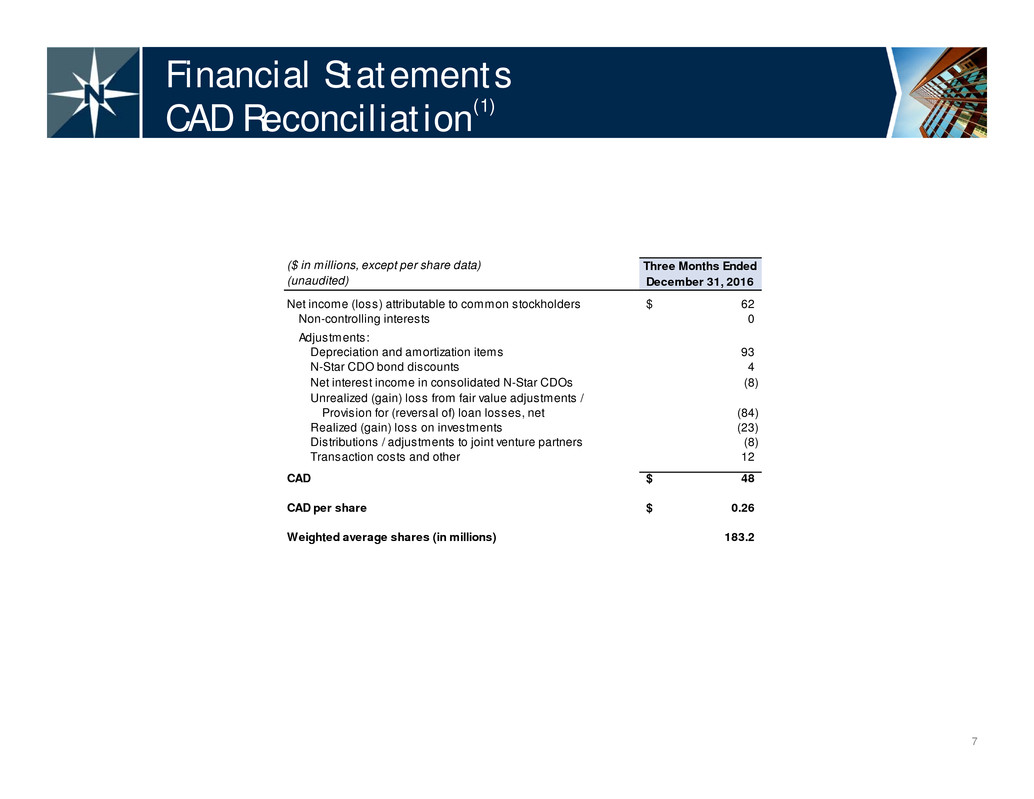
Three Months Ended December 31, 2016 Net income (loss) attributable to common stockholders 62$ Non-controlling interests 0 Adjustments: Depreciation and amortization items 93 N-Star CDO bond discounts 4 Net interest income in consolidated N-Star CDOs (8) Unrealized (gain) loss from fair value adjustments / Provision for (reversal of) loan losses, net (84) Realized (gain) loss on investments (23) Distributions / adjustments to joint venture partners (8) Transaction costs and other 12 CAD 48$ CAD per share 0.26$ Weighted average shares (in millions) 183.2 ($ in millions, except per share data) (unaudited) 7 Financial Statements CAD Reconciliation(1)
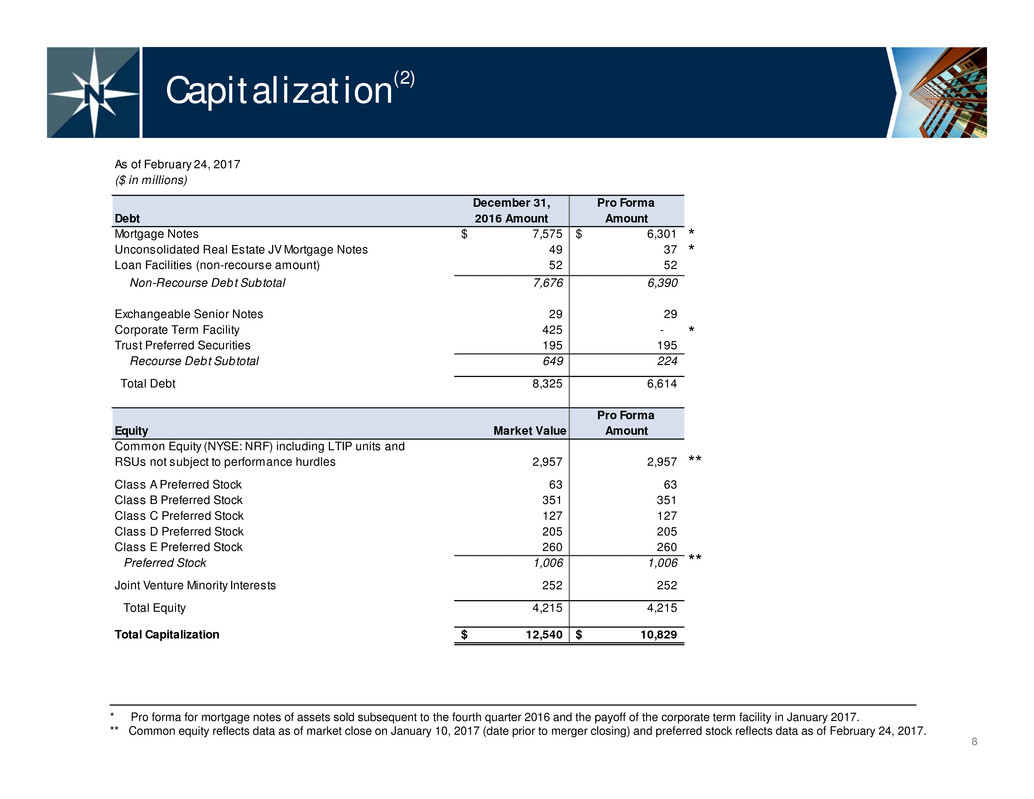
As of February 24, 2017 ($ in millions) Debt Mortgage Notes 7,575$ 6,301$ Unconsolidated Real Estate JV Mortgage Notes 49 37 Loan Facilities (non-recourse amount) 52 52 Non-Recourse Debt Subtotal 7,676 6,390 Exchangeable Senior Notes 29 29 Corporate Term Facility 425 - Trust Preferred Securities 195 195 Recourse Debt Subtotal 649 224 Total Debt 8,325 6,614 Equity Common Equity (NYSE: NRF) including LTIP units and RSUs not subject to performance hurdles 2,957 2,957 Class A Preferred Stock 63 63 Class B Preferred Stock 351 351 Class C Preferred Stock 127 127 Class D Preferred Stock 205 205 Class E Preferred Stock 260 260 Preferred Stock 1,006 1,006 Joint Venture Minority Interests 252 252 Total Equity 4,215 4,215 Total Capitalization 12,540$ 10,829$ Market Value December 31, 2016 Amount Pro Forma Amount Pro Forma Amount 8 Capitalization(2) * Pro forma for mortgage notes of assets sold subsequent to the fourth quarter 2016 and the payoff of the corporate term facility in January 2017. ** Common equity reflects data as of market close on January 10, 2017 (date prior to merger closing) and preferred stock reflects data as of February 24, 2017. * ** ** * *
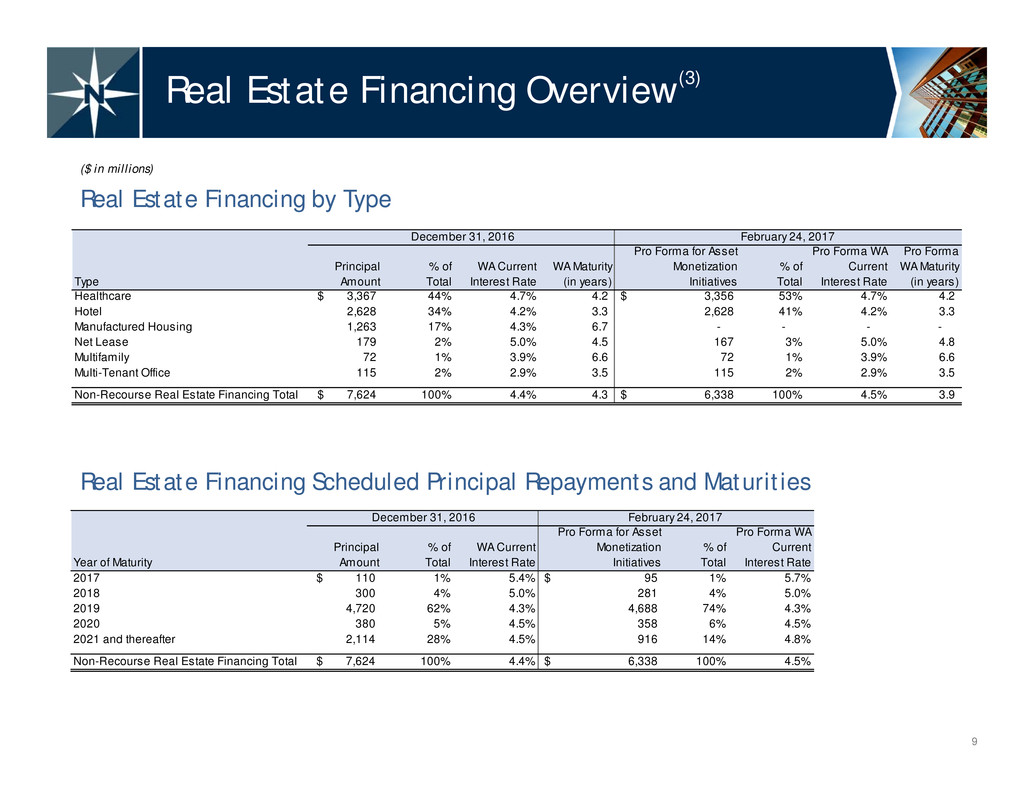
Type Principal Amount % of Total WA Current Interest Rate WA Maturity (in years) Pro Forma for Asset Monetization Initiatives % of Total Pro Forma WA Current Interest Rate Pro Forma WA Maturity (in years) Healthcare 3,367$ 44% 4.7% 4.2 3,356$ 53% 4.7% 4.2 Hotel 2,628 34% 4.2% 3.3 2,628 41% 4.2% 3.3 Manufactured Housing 1,263 17% 4.3% 6.7 - - - - Net Lease 179 2% 5.0% 4.5 167 3% 5.0% 4.8 Multifamily 72 1% 3.9% 6.6 72 1% 3.9% 6.6 Multi-Tenant Office 115 2% 2.9% 3.5 115 2% 2.9% 3.5 Non-Recourse Real Estate Financing Total 7,624$ 100% 4.4% 4.3 6,338$ 100% 4.5% 3.9 December 31, 2016 February 24, 2017 Year of Maturity Principal Amount % of Total WA Current Interest Rate Pro Forma for Asset Monetization Initiatives % of Total Pro Forma WA Current Interest Rate 2017 110$ 1% 5.4% 95$ 1% 5.7% 2018 300 4% 5.0% 281 4% 5.0% 2019 4,720 62% 4.3% 4,688 74% 4.3% 2020 380 5% 4.5% 358 6% 4.5% 2021 and thereafter 2,114 28% 4.5% 916 14% 4.8% Non-Recourse Real Estate Financing Total 7,624$ 100% 4.4% 6,338$ 100% 4.5% February 24, 2017December 31, 2016 9 Real Estate Financing Overview(3) ($ in millions) Real Estate Financing by Type Real Estate Financing Scheduled Principal Repayments and Maturities
10 Real Estate Portfolio
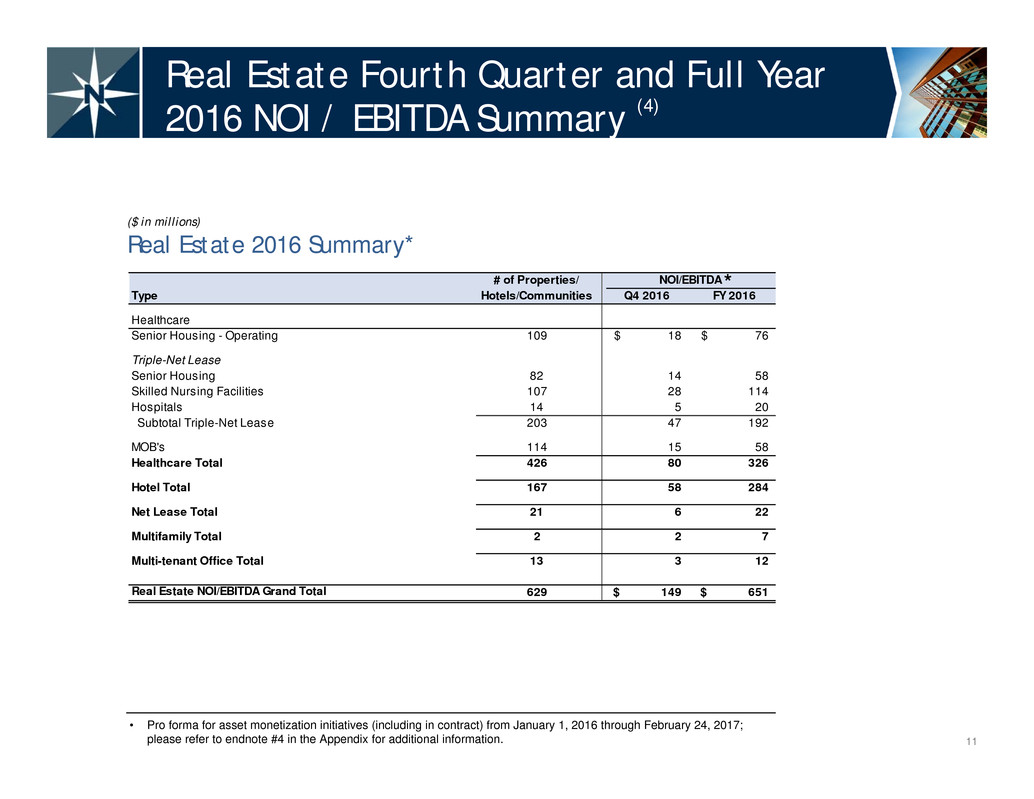
# of Properties/ NOI/EBITDA Type Hotels/Communities Q4 2016 FY 2016 Healthcare Senior Housing - Operating 109 18$ 76$ Triple-Net Lease Senior Housing 82 14 58 Skilled Nursing Facilities 107 28 114 Hospitals 14 5 20 Subtotal Triple-Net Lease 203 47 192 MOB's 114 15 58 Healthcare Total 426 80 326 Hotel Total 167 58 284 Net Lease Total 21 6 22 Multifamily Total 2 2 7 Multi-tenant Office Total 13 3 12 Real Estate NOI/EBITDA Grand Total 629 149$ 651$ 11 Real Estate Fourth Quarter and Full Year 2016 NOI / EBITDA Summary (4) Real Estate 2016 Summary* ($ in millions) • Pro forma for asset monetization initiatives (including in contract) from January 1, 2016 through February 24, 2017; please refer to endnote #4 in the Appendix for additional information. *
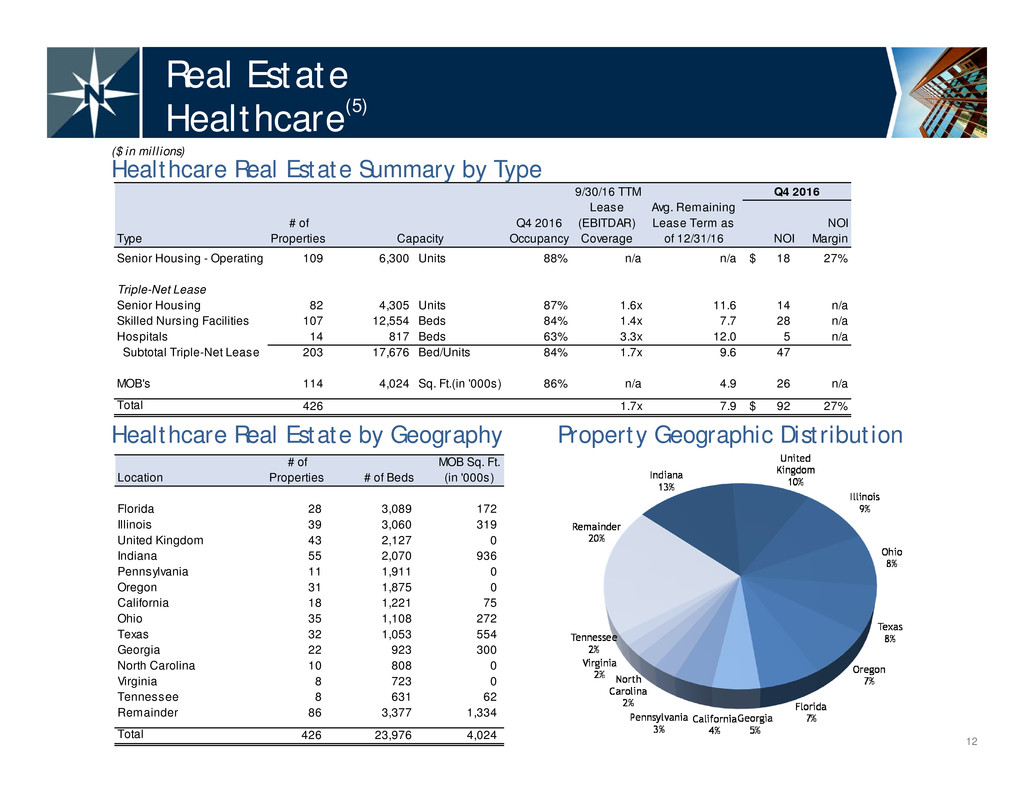
9/30/16 TTM Type # of Properties Q4 2016 Occupancy Lease (EBITDAR) Coverage Avg. Remaining Lease Term as of 12/31/16 NOI NOI Margin Senior Housing - Operating 109 6,300 Units 88% n/a n/a 18$ 27% Triple-Net Lease Senior Housing 82 4,305 Units 87% 1.6x 11.6 14 n/a Skilled Nursing Facilities 107 12,554 Beds 84% 1.4x 7.7 28 n/a Hospitals 14 817 Beds 63% 3.3x 12.0 5 n/a Subtotal Triple-Net Lease 203 17,676 Bed/Units 84% 1.7x 9.6 47 MOB's 114 4,024 Sq. Ft.(in '000s) 86% n/a 4.9 26 n/a Total 426 1.7x 7.9 92$ 27% Q4 2016 Capacity Location # of Properties # of Beds MOB Sq. Ft. (in '000s) Florida 28 3,089 172 Illinois 39 3,060 319 United Kingdom 43 2,127 0 Indiana 55 2,070 936 Pennsylvania 11 1,911 0 Oregon 31 1,875 0 California 18 1,221 75 Ohio 35 1,108 272 Texas 32 1,053 554 Georgia 22 923 300 North Carolina 10 808 0 Virginia 8 723 0 Tennessee 8 631 62 Remainder 86 3,377 1,334 Total 426 23,976 4,024 12 Real Estate Healthcare(5) Healthcare Real Estate Summary by Type ($ in millions) Healthcare Real Estate by Geography Property Geographic Distribution
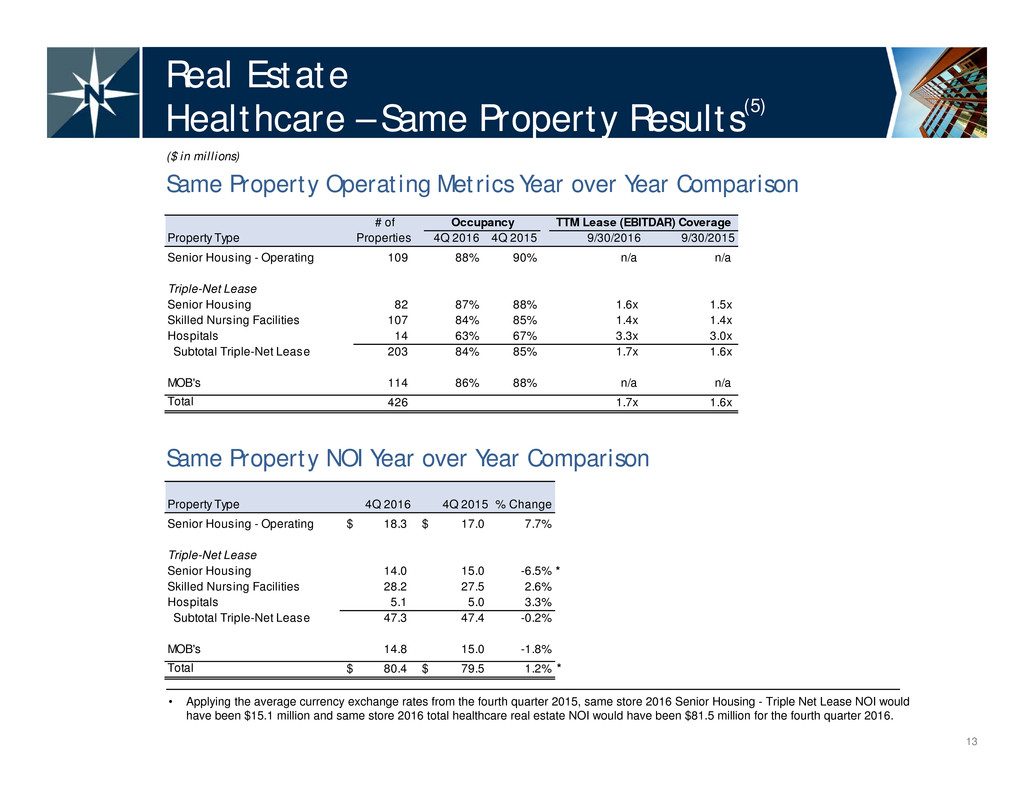
# of Property Type Properties 4Q 2016 4Q 2015 9/30/2016 9/30/2015 Senior Housing - Operating 109 88% 90% n/a n/a Triple-Net Lease Senior Housing 82 87% 88% 1.6x 1.5x Skilled Nursing Facilities 107 84% 85% 1.4x 1.4x Hospitals 14 63% 67% 3.3x 3.0x Subtotal Triple-Net Lease 203 84% 85% 1.7x 1.6x MOB's 114 86% 88% n/a n/a Total 426 1.7x 1.6x Occupancy TTM Lease (EBITDAR) Coverage Property Type 4Q 2016 4Q 2015 % Change Senior Housing - Operating 18.3$ 17.0$ 7.7% Triple-Net Lease Senior Housing 14.0 15.0 -6.5% Skilled Nursing Facilities 28.2 27.5 2.6% Hospitals 5.1 5.0 3.3% Subtotal Triple-Net Lease 47.3 47.4 -0.2% MOB's 14.8 15.0 -1.8% Total 80.4$ 79.5$ 1.2% 13 Real Estate Healthcare – Same Property Results(5) Same Property NOI Year over Year Comparison ($ in millions) Same Property Operating Metrics Year over Year Comparison • Applying the average currency exchange rates from the fourth quarter 2015, same store 2016 Senior Housing - Triple Net Lease NOI would have been $15.1 million and same store 2016 total healthcare real estate NOI would have been $81.5 million for the fourth quarter 2016. * *
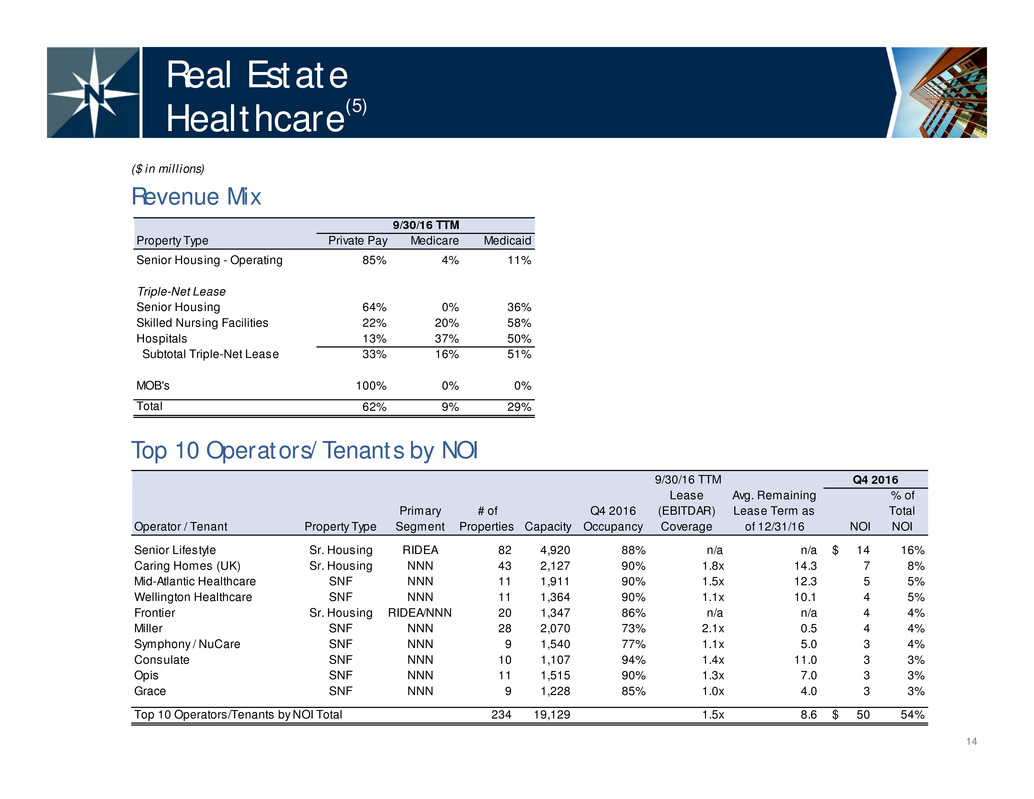
9/30/16 TTM Operator / Tenant Property Type Primary Segment # of Properties Capacity Q4 2016 Occupancy Lease (EBITDAR) Coverage Avg. Remaining Lease Term as of 12/31/16 NOI % of Total NOI Senior Lifestyle Sr. Housing RIDEA 82 4,920 88% n/a n/a 14$ 16% Caring Homes (UK) Sr. Housing NNN 43 2,127 90% 1.8x 14.3 7 8% Mid-Atlantic Healthcare SNF NNN 11 1,911 90% 1.5x 12.3 5 5% Wellington Healthcare SNF NNN 11 1,364 90% 1.1x 10.1 4 5% Frontier Sr. Housing RIDEA/NNN 20 1,347 86% n/a n/a 4 4% Miller SNF NNN 28 2,070 73% 2.1x 0.5 4 4% Symphony / NuCare SNF NNN 9 1,540 77% 1.1x 5.0 3 4% Consulate SNF NNN 10 1,107 94% 1.4x 11.0 3 3% Opis SNF NNN 11 1,515 90% 1.3x 7.0 3 3% Grace SNF NNN 9 1,228 85% 1.0x 4.0 3 3% Top 10 Operators/Tenants by NOI Total 234 19,129 1.5x 8.6 50$ 54% Q4 2016 Property Type Private Pay Medicare Medicaid Senior Housing - Operating 85% 4% 11% Triple-Net Lease Senior Housing 64% 0% 36% Skilled Nursing Facilities 22% 20% 58% Hospitals 13% 37% 50% Subtotal Triple-Net Lease 33% 16% 51% MOB's 100% 0% 0% Total 62% 9% 29% 9/30/16 TTM 14 Real Estate Healthcare(5) ($ in millions) Top 10 Operators/Tenants by NOI Revenue Mix
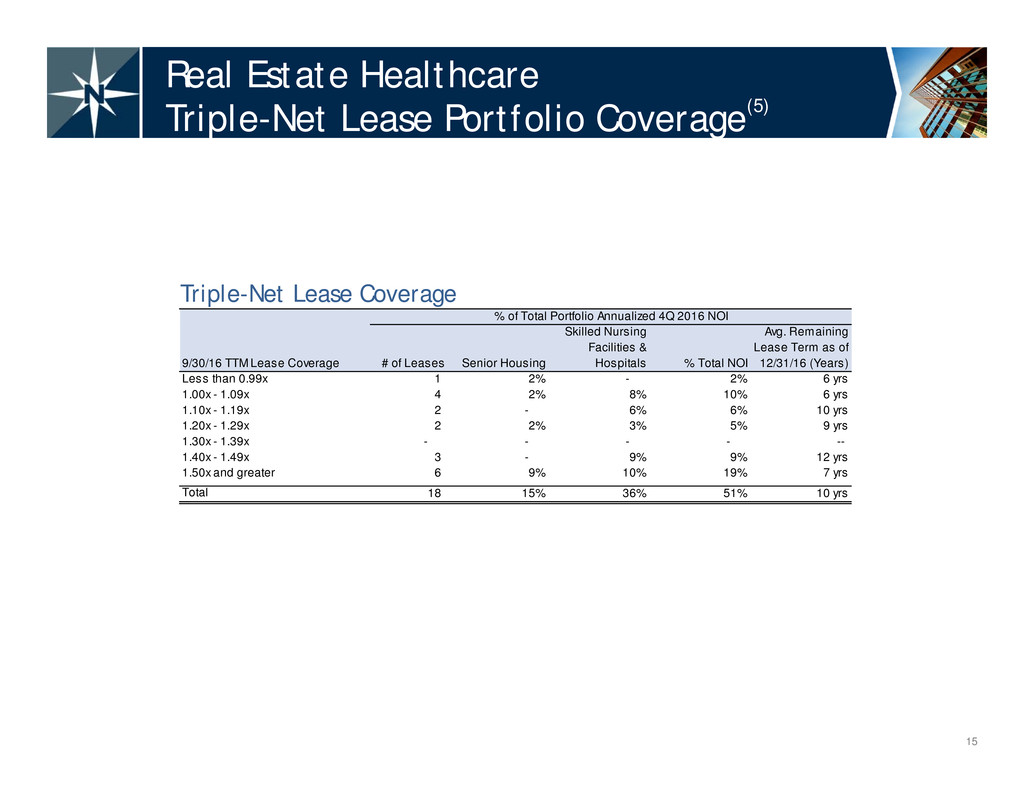
9/30/16 TTM Lease Coverage # of Leases Senior Housing Skilled Nursing Facilities & Hospitals % Total NOI Avg. Remaining Lease Term as of 12/31/16 (Years) Less than 0.99x 1 2% - 2% 6 yrs 1.00x - 1.09x 4 2% 8% 10% 6 yrs 1.10x - 1.19x 2 - 6% 6% 10 yrs 1.20x - 1.29x 2 2% 3% 5% 9 yrs 1.30x - 1.39x - - - - -- 1.40x - 1.49x 3 - 9% 9% 12 yrs 1.50x and greater 6 9% 10% 19% 7 yrs Total 18 15% 36% 51% 10 yrs % of Total Portfolio Annualized 4Q 2016 NOI 15 Real Estate Healthcare Triple-Net Lease Portfolio Coverage(5) Triple-Net Lease Coverage
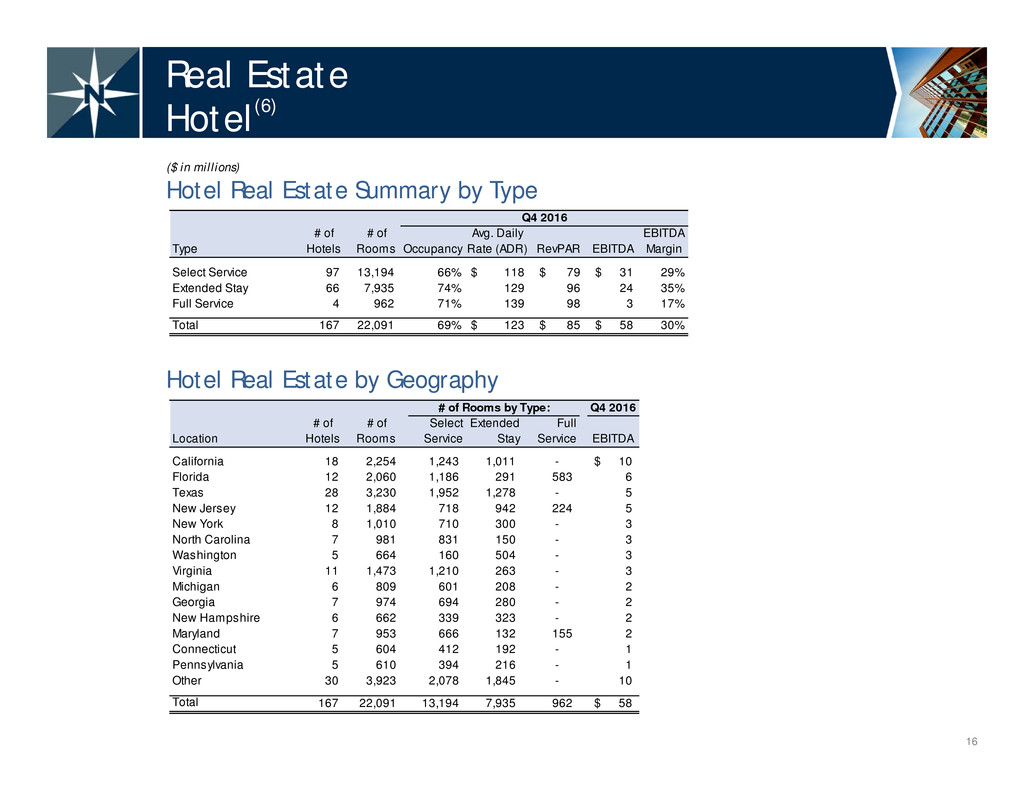
Q4 2016 Location # of Hotels # of Rooms Select Service Extended Stay Full Service EBITDA California 18 2,254 1,243 1,011 - 10$ Florida 12 2,060 1,186 291 583 6 Texas 28 3,230 1,952 1,278 - 5 New Jersey 12 1,884 718 942 224 5 New York 8 1,010 710 300 - 3 North Carolina 7 981 831 150 - 3 Washington 5 664 160 504 - 3 Virginia 11 1,473 1,210 263 - 3 Michigan 6 809 601 208 - 2 Georgia 7 974 694 280 - 2 New Hampshire 6 662 339 323 - 2 Maryland 7 953 666 132 155 2 Connecticut 5 604 412 192 - 1 Pennsylvania 5 610 394 216 - 1 Other 30 3,923 2,078 1,845 - 10 Total 167 22,091 13,194 7,935 962 58$ # of Rooms by Type: Type # of Hotels # of Rooms Occupancy Avg. Daily Rate (ADR) RevPAR EBITDA EBITDA Margin Select Service 97 13,194 66% 118$ 79$ 31$ 29% Extended Stay 66 7,935 74% 129 96 24 35% Full Service 4 962 71% 139 98 3 17% Total 167 22,091 69% 123$ 85$ 58$ 30% Q4 2016 16 Real Estate Hotel(6) Hotel Real Estate Summary by Type ($ in millions) Hotel Real Estate by Geography
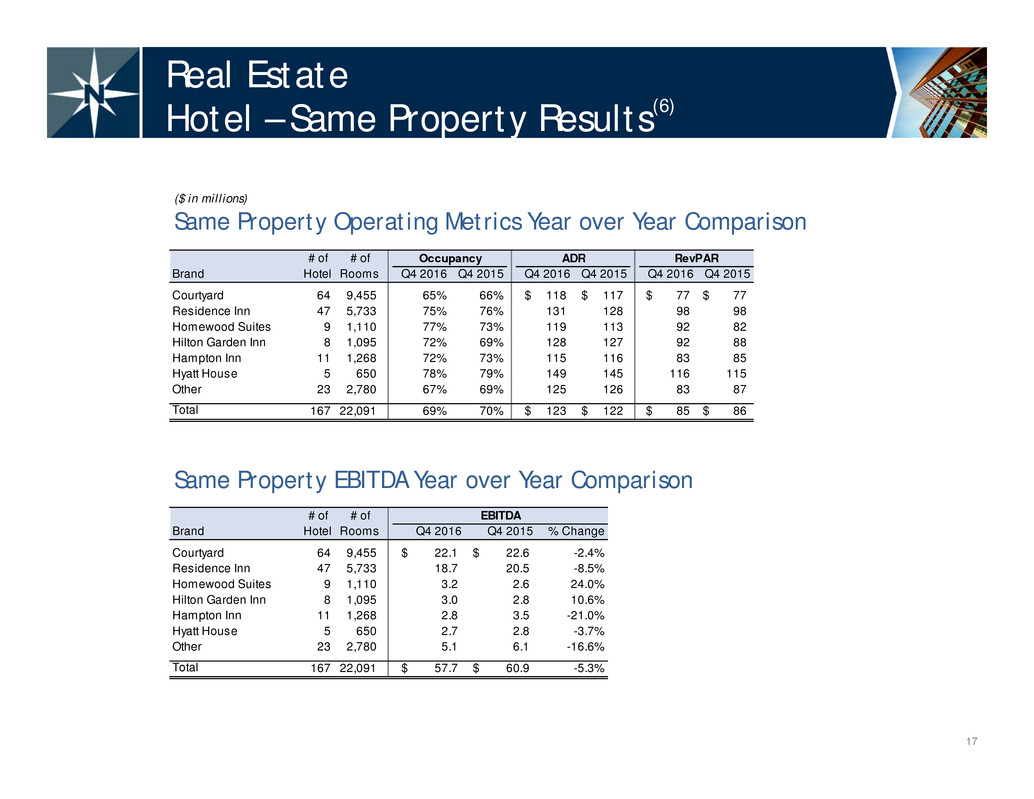
# of # of Brand Hotel Rooms Q4 2016 Q4 2015 % Change Courtyard 64 9,455 22.1$ 22.6$ -2.4% Residence Inn 47 5,733 18.7 20.5 -8.5% Homewood Suites 9 1,110 3.2 2.6 24.0% Hilton Garden Inn 8 1,095 3.0 2.8 10.6% Hampton Inn 11 1,268 2.8 3.5 -21.0% Hyatt House 5 650 2.7 2.8 -3.7% Other 23 2,780 5.1 6.1 -16.6% Total 167 22,091 57.7$ 60.9$ -5.3% EBITDA # of # of Brand Hotel Rooms Q4 2016 Q4 2015 Q4 2016 Q4 2015 Q4 2016 Q4 2015 Courtyard 64 9,455 65% 66% 118$ 117$ 77$ 77$ Residence Inn 47 5,733 75% 76% 131 128 98 98 Homewood Suites 9 1,110 77% 73% 119 113 92 82 Hilton Garden Inn 8 1,095 72% 69% 128 127 92 88 Hampton Inn 11 1,268 72% 73% 115 116 83 85 Hyatt House 5 650 78% 79% 149 145 116 115 Other 23 2,780 67% 69% 125 126 83 87 Total 167 22,091 69% 70% 123$ 122$ 85$ 86$ Occupancy ADR RevPAR 17 Real Estate Hotel – Same Property Results(6) ($ in millions) Same Property Operating Metrics Year over Year Comparison Same Property EBITDA Year over Year Comparison
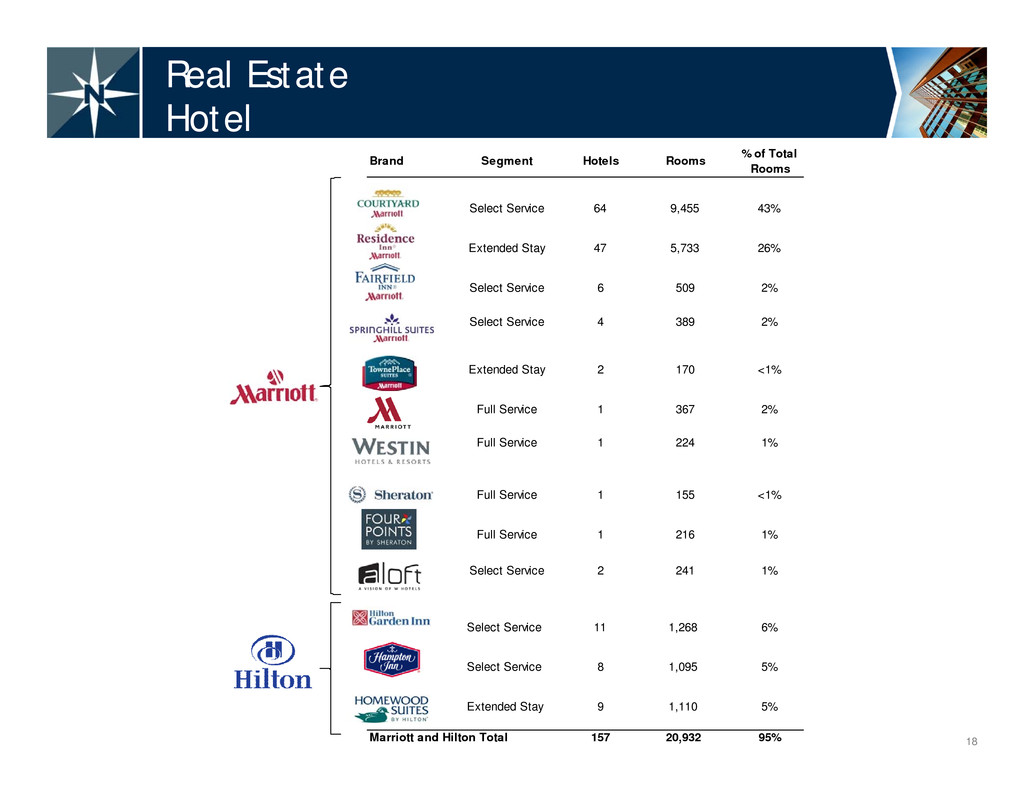
Brand Segment Hotels Rooms % of Total Rooms Select Service 64 9,455 43% Extended Stay 47 5,733 26% Select Service 6 509 2% Select Service 4 389 2% Full Service 1 367 2% Full Service 1 224 1% 4ps Full Service 1 216 1% Select Service 2 241 1% Select Service 11 1,268 6% Select Service 8 1,095 5% Extended Stay 9 1,110 5% Marriott and Hilton Total 157 20,932 95% Full Service 1 155 <1% Extended Stay 2 170 <1% 18 Real Estate Hotel
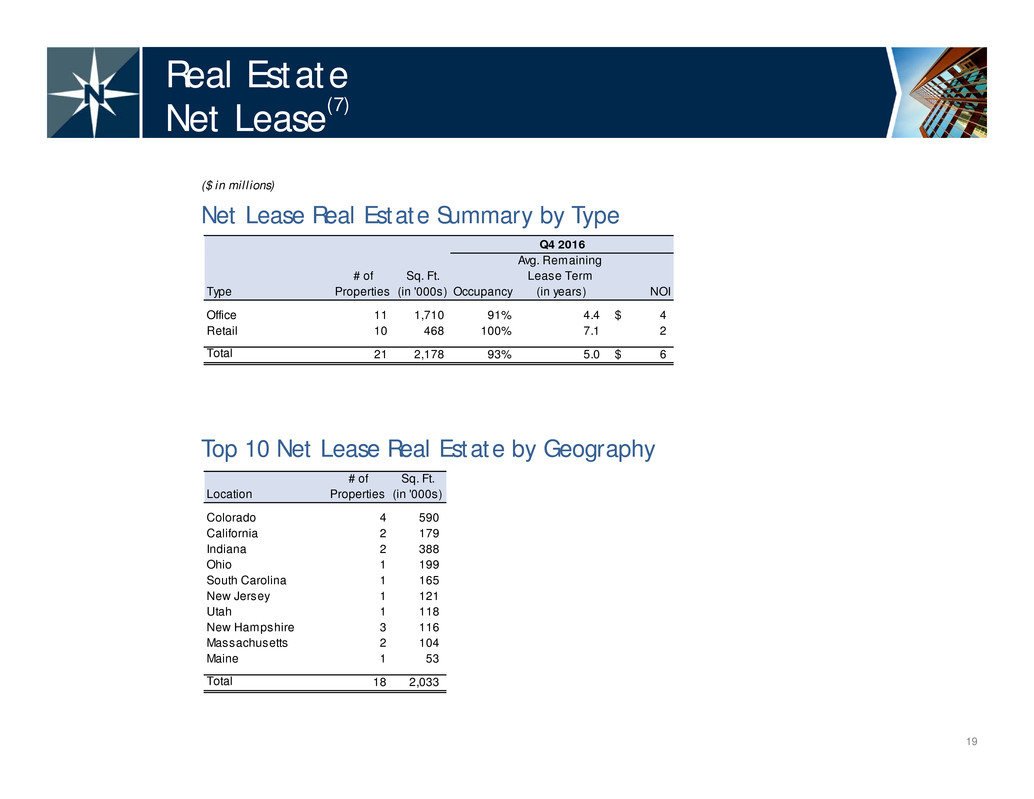
Type # of Properties Sq. Ft. (in '000s) Occupancy Avg. Remaining Lease Term (in years) NOI Office 11 1,710 91% 4.4 4$ Retail 10 468 100% 7.1 2 Total 21 2,178 93% 5.0 6$ Q4 2016 Location # of Properties Sq. Ft. (in '000s) Colorado 4 590 California 2 179 Indiana 2 388 Ohio 1 199 South Carolina 1 165 New Jersey 1 121 Utah 1 118 New Hampshire 3 116 Massachusetts 2 104 Maine 1 53 Total 18 2,033 19 Real Estate Net Lease(7) ($ in millions) Net Lease Real Estate Summary by Type Top 10 Net Lease Real Estate by Geography

Tenant # of Properties Sq. Ft. (in '000s) Avg. Remaining Lease Term (in years) NOI Dick's Sporting Goods, Inc. / PetSmart, Inc. 10 468 7.1 1$ Northrop Grumman Space & Mission Systems Corp. 1 184 5.9 <1 Credence Systems Corp. 2 179 0.2 <1 Covance, Inc. 1 338 9.0 <1 Alliance Data Systems Corp. 1 199 0.9 <1 CitiFinancial 1 165 3.8 <1 GSA 1 118 2.1 <1 Quantum 3 406 4.0 <1 Party City 1 121 6.1 <1 Top Tenants by NOI Total 21 2,178 5.0 6$ Q4 2016 Q4 2016 Q4 2015 % Change Occupancy 93.0% 96.4% -3.5% Avg. Remaining Lease Term (in years) 5.0 5.1 -1.3% NOI 5.7$ 6.2$ -8.3% 20 Real Estate Net Lease(7) ($ in millions) Top Tenants by NOI Same Property Operating Metrics/NOI Year over Year Comparison • Excluding rent concessions provided to a tenant that renewed its lease during 2016, fourth quarter 2016 NOI would have been $6.1 million. *
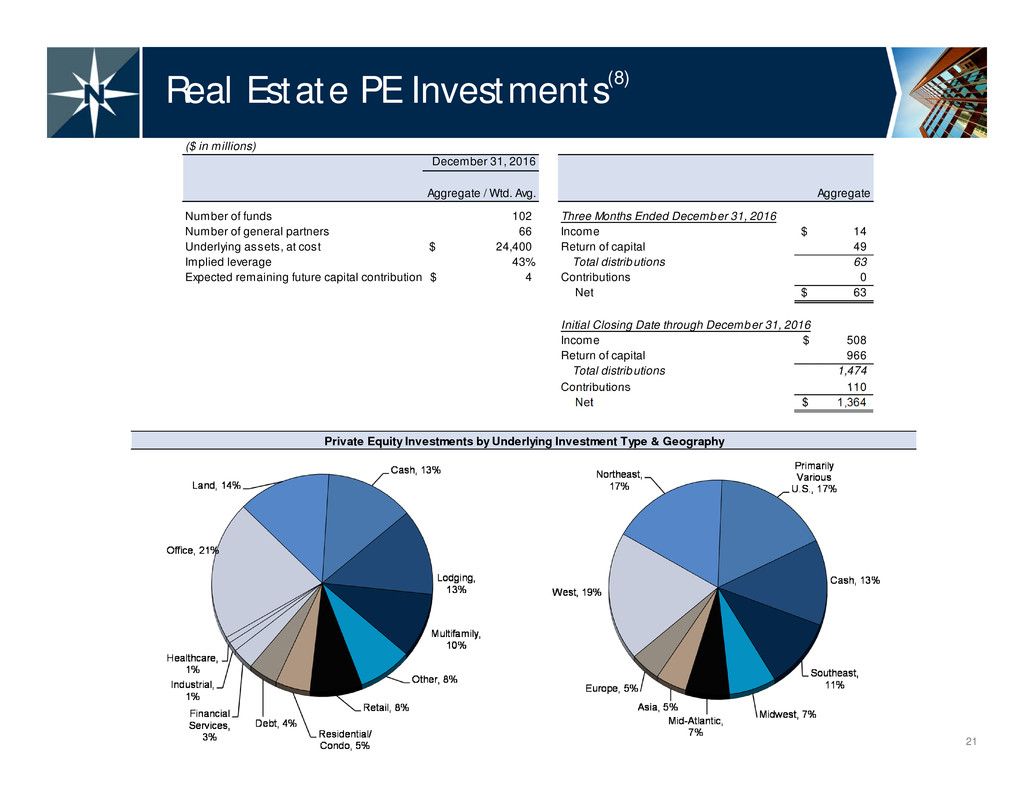
($ in millions) December 31, 2016 Aggregate / Wtd. Avg. Aggregate Number of funds 102 Three Months Ended December 31, 2016 Number of general partners 66 Income 14$ Underlying assets, at cost 24,400$ Return of capital 49 Implied leverage 43% Total distributions 63 Expected remaining future capital contribution 4$ Contributions 0 Net 63$ Initial Closing Date through December 31, 2016 Income 508$ Return of capital 966 Total distributions 1,474 Contributions 110 Net 1,364$ 21 Real Estate PE Investments(8) Private Equity Investments by Underlying Investment Type & Geography
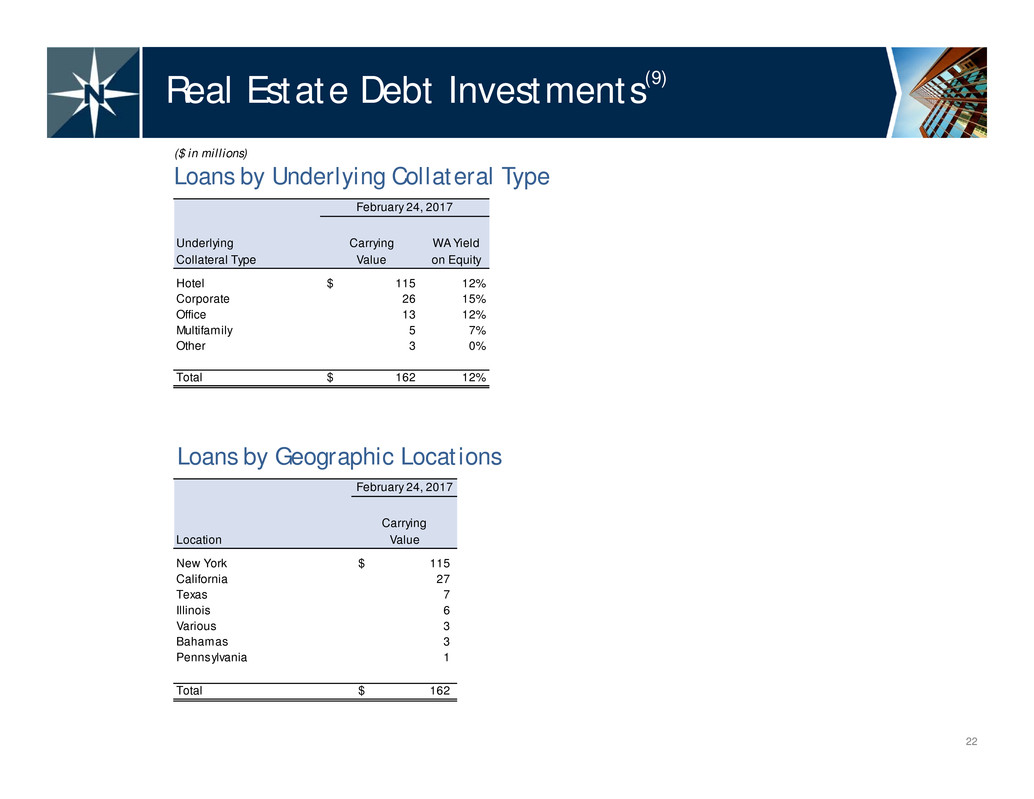
February 24, 2017 Carrying Location Value New York 115$ California 27 Texas 7 Illinois 6 Various 3 Bahamas 3 Pennsylvania 1 Total 162$ Underlying Carrying WA Yield Collateral Type Value on Equity Hotel 115$ 12% Corporate 26 15% Office 13 12% Multifamily 5 7% Other 3 0% Total 162$ 12% February 24, 2017 22 Real Estate Debt Investments(9) Loans by Underlying Collateral Type ($ in millions) Loans by Geographic Locations

Owned CDO Bonds and Other Securities: (excluding CDO bonds eliminated in consolidation) Principal Principal amount 430$ Amortized cost basis 201 Weighted average yield 18% Owned CDO Bonds Eliminated in Consolidation Principal amount 139$ Owned CDO Bonds: Based on original credit rating: AAA 109$ AA through BBB 241 Below investment grade 160 Total Owned NorthStar Realty CDO Bonds 510$ Total Repurchased NorthStar Realty CDO Bonds 376$ Weighted average original credit rating of repurchased CDO bonds A / A2 Weighted average purchase price of repurchased CDO bonds 37% 23 Repurchased NorthStar Realty CDO Bond and Other Securities(10) Balance Sheet Holdings of NorthStar Realty CDO Bonds and Other Securities as of February 24, 2017 ($ in millions)
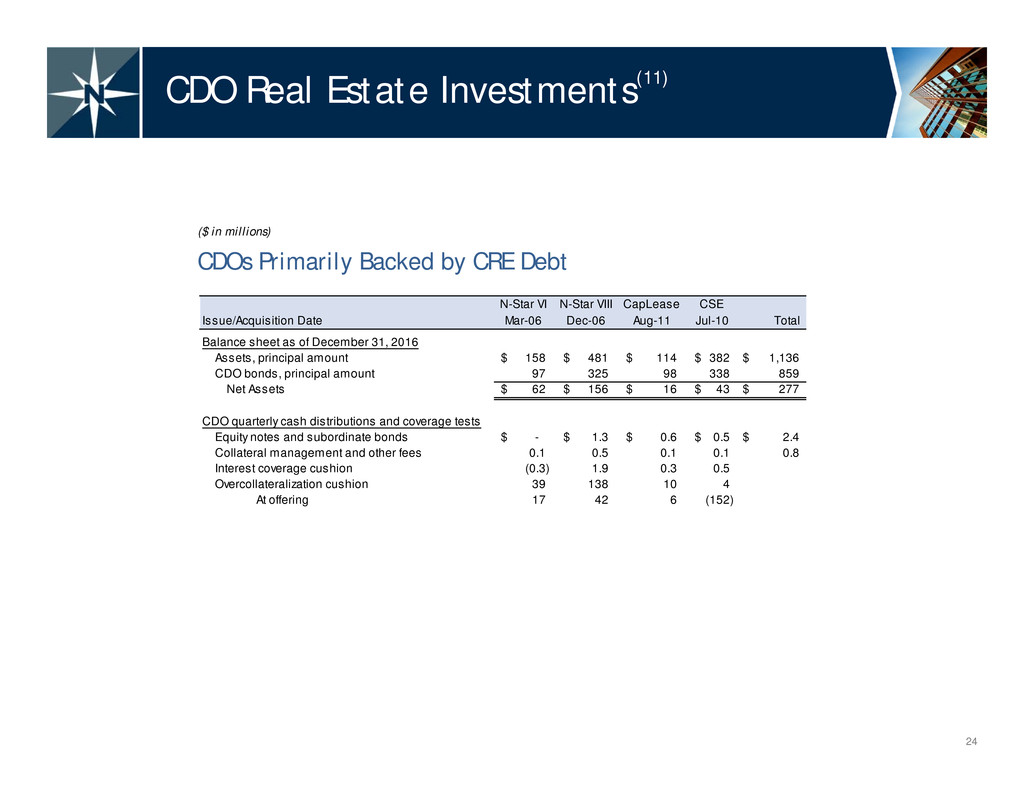
N-Star VI N-Star VIII CapLease CSE Issue/Acquisition Date Mar-06 Dec-06 Aug-11 Jul-10 Total Balance sheet as of December 31, 2016 Assets, principal amount 158$ 481$ 114$ 382$ 1,136$ CDO bonds, principal amount 97 325 98 338 859 Net Assets 62$ 156$ 16$ 43$ 277$ CDO quarterly cash distributions and coverage tests Equity notes and subordinate bonds -$ 1.3$ 0.6$ 0.5$ 2.4$ Collateral management and other fees 0.1 0.5 0.1 0.1 0.8 Interest coverage cushion (0.3) 1.9 0.3 0.5 Overcollateralization cushion 39 138 10 4 At offering 17 42 6 (152) 24 CDO Real Estate Investments(11) CDOs Primarily Backed by CRE Debt ($ in millions)
25 Appendix
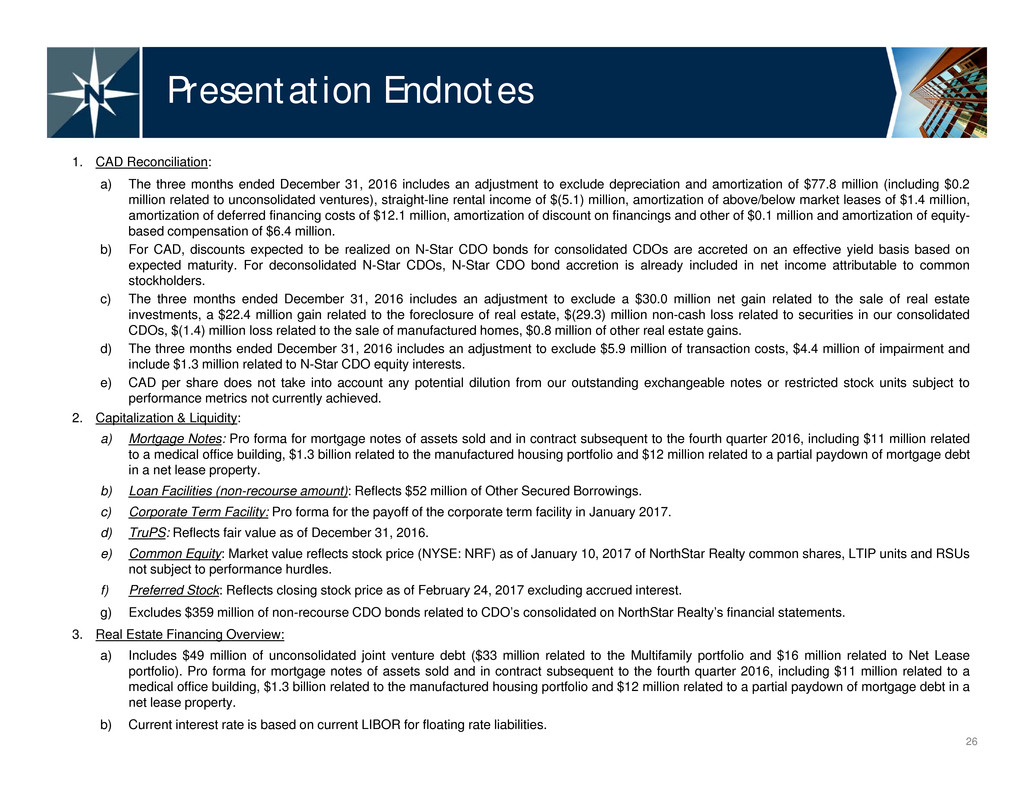
26 Presentation Endnotes 1. CAD Reconciliation: a) The three months ended December 31, 2016 includes an adjustment to exclude depreciation and amortization of $77.8 million (including $0.2 million related to unconsolidated ventures), straight-line rental income of $(5.1) million, amortization of above/below market leases of $1.4 million, amortization of deferred financing costs of $12.1 million, amortization of discount on financings and other of $0.1 million and amortization of equity- based compensation of $6.4 million. b) For CAD, discounts expected to be realized on N-Star CDO bonds for consolidated CDOs are accreted on an effective yield basis based on expected maturity. For deconsolidated N-Star CDOs, N-Star CDO bond accretion is already included in net income attributable to common stockholders. c) The three months ended December 31, 2016 includes an adjustment to exclude a $30.0 million net gain related to the sale of real estate investments, a $22.4 million gain related to the foreclosure of real estate, $(29.3) million non-cash loss related to securities in our consolidated CDOs, $(1.4) million loss related to the sale of manufactured homes, $0.8 million of other real estate gains. d) The three months ended December 31, 2016 includes an adjustment to exclude $5.9 million of transaction costs, $4.4 million of impairment and include $1.3 million related to N-Star CDO equity interests. e) CAD per share does not take into account any potential dilution from our outstanding exchangeable notes or restricted stock units subject to performance metrics not currently achieved. 2. Capitalization & Liquidity: a) Mortgage Notes: Pro forma for mortgage notes of assets sold and in contract subsequent to the fourth quarter 2016, including $11 million related to a medical office building, $1.3 billion related to the manufactured housing portfolio and $12 million related to a partial paydown of mortgage debt in a net lease property. b) Loan Facilities (non-recourse amount): Reflects $52 million of Other Secured Borrowings. c) Corporate Term Facility: Pro forma for the payoff of the corporate term facility in January 2017. d) TruPS: Reflects fair value as of December 31, 2016. e) Common Equity: Market value reflects stock price (NYSE: NRF) as of January 10, 2017 of NorthStar Realty common shares, LTIP units and RSUs not subject to performance hurdles. f) Preferred Stock: Reflects closing stock price as of February 24, 2017 excluding accrued interest. g) Excludes $359 million of non-recourse CDO bonds related to CDO’s consolidated on NorthStar Realty’s financial statements. 3. Real Estate Financing Overview: a) Includes $49 million of unconsolidated joint venture debt ($33 million related to the Multifamily portfolio and $16 million related to Net Lease portfolio). Pro forma for mortgage notes of assets sold and in contract subsequent to the fourth quarter 2016, including $11 million related to a medical office building, $1.3 billion related to the manufactured housing portfolio and $12 million related to a partial paydown of mortgage debt in a net lease property. b) Current interest rate is based on current LIBOR for floating rate liabilities.
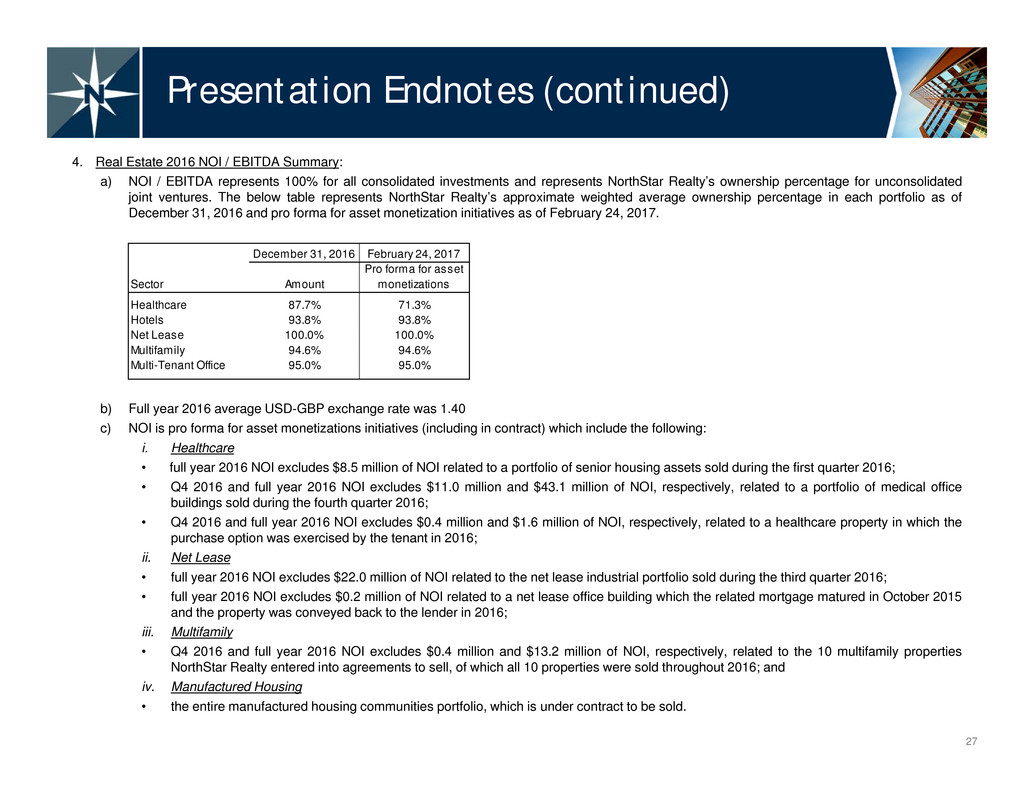
4. Real Estate 2016 NOI / EBITDA Summary: a) NOI / EBITDA represents 100% for all consolidated investments and represents NorthStar Realty’s ownership percentage for unconsolidated joint ventures. The below table represents NorthStar Realty’s approximate weighted average ownership percentage in each portfolio as of December 31, 2016 and pro forma for asset monetization initiatives as of February 24, 2017. b) Full year 2016 average USD-GBP exchange rate was 1.40 c) NOI is pro forma for asset monetizations initiatives (including in contract) which include the following: i. Healthcare • full year 2016 NOI excludes $8.5 million of NOI related to a portfolio of senior housing assets sold during the first quarter 2016; • Q4 2016 and full year 2016 NOI excludes $11.0 million and $43.1 million of NOI, respectively, related to a portfolio of medical office buildings sold during the fourth quarter 2016; • Q4 2016 and full year 2016 NOI excludes $0.4 million and $1.6 million of NOI, respectively, related to a healthcare property in which the purchase option was exercised by the tenant in 2016; ii. Net Lease • full year 2016 NOI excludes $22.0 million of NOI related to the net lease industrial portfolio sold during the third quarter 2016; • full year 2016 NOI excludes $0.2 million of NOI related to a net lease office building which the related mortgage matured in October 2015 and the property was conveyed back to the lender in 2016; iii. Multifamily • Q4 2016 and full year 2016 NOI excludes $0.4 million and $13.2 million of NOI, respectively, related to the 10 multifamily properties NorthStar Realty entered into agreements to sell, of which all 10 properties were sold throughout 2016; and iv. Manufactured Housing • the entire manufactured housing communities portfolio, which is under contract to be sold. 27 Presentation Endnotes (continued) December 31, 2016 February 24, 2017 Sector Amount Pro forma for asset monetizations Healthcare 87.7% 71.3% Hotels 93.8% 93.8% Net Lease 100.0% 100.0% Multifamily 94.6% 94.6% Multi-Tenant Office 95.0% 95.0%
28 Presentation Endnotes (continued) 5. Real Estate – Healthcare: a) Q4 2016 occupancy metrics for Senior Housing - Operating represents average fourth quarter 2016, MOB’s is as of December 31, 2016 and for Triple-Net Lease represents average third quarter 2016. Q4 2015 occupancy metrics for Senior Housing - Operating represents average fourth quarter 2015, MOB’s is as of December 31, 2015 and for Triple-Net Lease represents average third quarter 2015. Occupancy represents real estate property operator’s patient occupancy for all types except MOB. b) Q4 2016 NOI includes $1.4 million related to interest earned from healthcare real estate development loans that are recorded in the Interest Income line item on NorthStar Realty’s financial statements. c) Fourth quarter 2016 and 2015 average USD-GBP exchange rates were 1.36 and 1.53, respectively. d) Revenue Mix: Represents percentage of revenues derived from private, Medicare and Medicaid payor sources. The payor source percentages for the hospital category excludes two operating partners, whom do not track or report payor source data and totals approximately one-third of NOI in the hospital category. Overall percentages are weighted by NOI exposure in each category. e) Top 10 Operators/Tenants by NOI: Caring Homes (U.K.) lease (EBITDAR) coverage includes additional collateral provided by the operator. f) Triple-Net Lease Coverage: Coverage reflects the ratio of EBITDAR to cash rent on a trailing 12 month basis, as of September 30, 2016. Represents leases with EBITDAR coverage in each listed range. Excludes interest income associated with triple-net lease senior housing and hospital types. Caring Homes (U.K.) lease (EBITDAR) coverage includes additional collateral provided by the operator. 6. Real Estate - Hotel: Q4 2016 EBITDA excludes FF&E reserve amounts of $8 million. a) Occupancy metrics represent average occupancy during the reported quarter. 7. Real Estate – Net Lease: a) Occupancy metrics represent occupancy as of the last day in the reported quarter. b) Excludes one office building which the related mortgage matured in October 2015 and the property was conveyed back to the lender in 2016 and the net lease real estate industrial portfolio sold during the third quarter 2016. 8. Real Estate PE Investments: a) Amounts presented exclude a minimal economic interest retained in a real estate private equity fund portfolio which NorthStar Realty sold in the fourth quarter 2015. b) Number of General Partners: Includes 12 funds and 16 general partners held across multiple PE Investments. c) Implied Leverage: Represents implied leverage for funds with investment-level financing, calculated as debt divided by assets at fair value. d) Expected Remaining Future Capital Contributions: Represents the estimated amount of expected future capital contributions to funds as of December 31, 2016.
29 Presentation Endnotes (continued) 9. Real Estate Debt Investments: Based on December 31, 2016 carrying value of $297 million, less $4 million of debt investments in consolidated CDOs, $79 million of real estate development loans related to our healthcare real estate portfolio and $52 million of assets associated with secured borrowing. WA yield on equity calculation excludes debt investments in consolidated CDOs, real estate development loans related to our healthcare real estate portfolio, debt investments held for sale and assets associated with secured borrowings. 10. Repurchased NorthStar Realty CDO Bonds: a) Owned CDO bonds total principal amount represents the maximum amount of principal proceeds that could be received. There is no assurance we will receive the maximum amount of principal proceeds. b) Other Securities reflects $59 million principal amount of CMBS and other securities as of December 31, 2016. c) $139 million of total principal amount of owned CDO bonds are eliminated in the consolidated financial statements. 11. CDO Real Estate Investments: a) Data based on remittance report issued on date nearest to December 31, 2016. b) Includes all outstanding CDO bonds payable to third parties and all CDO bonds owned by us. c) IC and OC coverage to the most constrained class. d) CapLease OC at Offering: Based on trustee report as of August 31, 2011, closest to the date of acquisition. e) CSE OC at Offering: Based on trustee report as of June 24, 2010, closest to the date of acquisition. 12. Q4 2016 and Full Year 2016 NOI Reconciliation: a) Full Year 2016 NOI is pro forma for asset monetizations which include the following: a portfolio of senior housing assets sold during the first quarter 2016; a portfolio of medical office buildings sold during the fourth quarter 2016; the net lease industrial portfolio sold during the third quarter 2016; 10 multifamily properties sold throughout 2016; and a net lease office building which the related mortgage matured in October 2015 and the property was conveyed back to the lender in 2016. b) Certain other revenue earned is not included as part of NOI, including collateral management fees for administrative services in our N-Star CDOs, that are not part of our real estate segment. c) Primarily represents interest income earned from notes receivable on manufactured homes and loans in our healthcare portfolio. d) Includes an adjustment related to our interest in an unconsolidated joint venture in a net lease and multifamily property. e) Primarily includes amortization of straight-line rental income, amortization of above/below market leases and non-recurring bad debt. f) We consider NOI for hotels to be a proxy for earnings before interest, tax, depreciation & amortization (EBITDA). g) During 2016, we entered into definitive agreements to sell certain of our real estate portfolios, including ten multifamily properties of which all ten properties were sold as of December 31, 2016, our manufactured housing portfolio and a portion of our medical office building portfolio of which 34 properties were sold as of December 31, 2016. h) Represents the net income (loss) of our remaining segments to reconcile to total net income (loss).
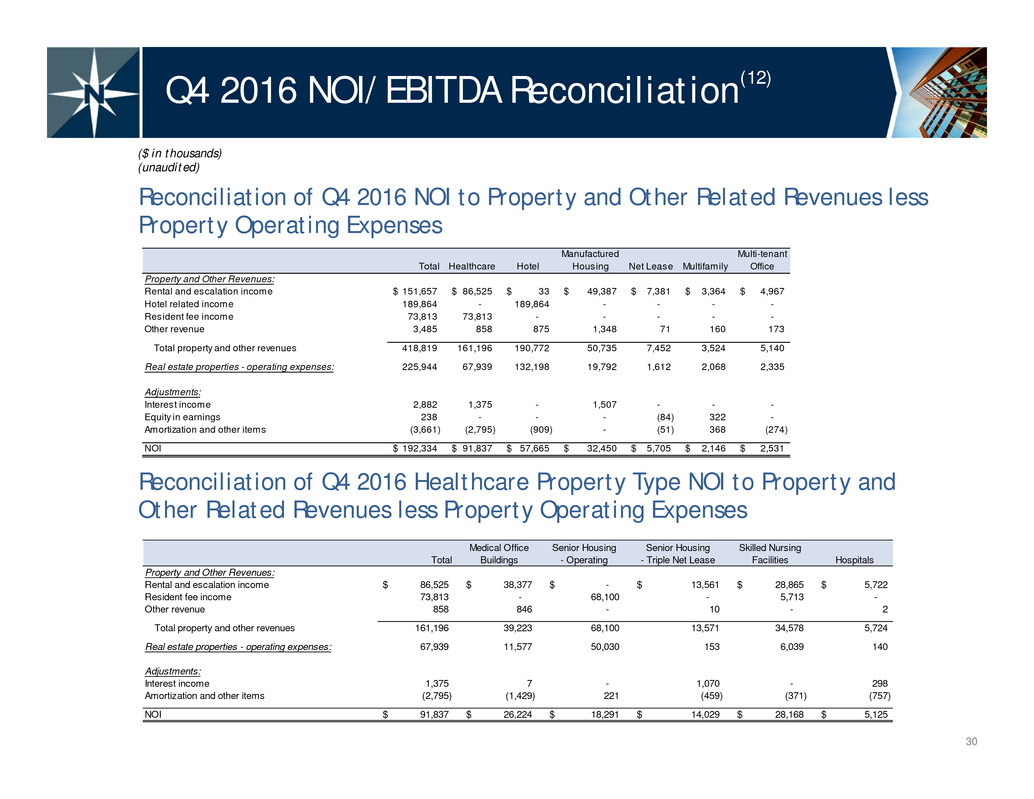
Total Healthcare Hotel Manufactured Housing Net Lease Multifamily Multi-tenant Office Property and Other Revenues: Rental and escalation income 151,657$ 86,525$ 33$ 49,387$ 7,381$ 3,364$ 4,967$ Hotel related income 189,864 - 189,864 - - - - Resident fee income 73,813 73,813 - - - - - Other revenue 3,485 858 875 1,348 71 160 173 Total property and other revenues 418,819 161,196 190,772 50,735 7,452 3,524 5,140 Real estate properties - operating expenses: 225,944 67,939 132,198 19,792 1,612 2,068 2,335 Adjustments: Interest income 2,882 1,375 - 1,507 - - - Equity in earnings 238 - - - (84) 322 - Amortization and other items (3,661) (2,795) (909) - (51) 368 (274) NOI 192,334$ 91,837$ 57,665$ 32,450$ 5,705$ 2,146$ 2,531$ Total Medical Office Buildings Senior Housing - Operating Senior Housing - Triple Net Lease Skilled Nursing Facilities Hospitals Property and Other Revenues: Rental and escalation income 86,525$ 38,377$ -$ 13,561$ 28,865$ 5,722$ Resident fee income 73,813 - 68,100 - 5,713 - Other revenue 858 846 - 10 - 2 Total property and other revenues 161,196 39,223 68,100 13,571 34,578 5,724 Real estate properties - operating expenses: 67,939 11,577 50,030 153 6,039 140 Adjustments: Interest income 1,375 7 - 1,070 - 298 Amortization and other items (2,795) (1,429) 221 (459) (371) (757) NOI 91,837$ 26,224$ 18,291$ 14,029$ 28,168$ 5,125$ 30 Q4 2016 NOI/EBITDA Reconciliation(12) Reconciliation of Q4 2016 NOI to Property and Other Related Revenues less Property Operating Expenses ($ in thousands) (unaudited) Reconciliation of Q4 2016 Healthcare Property Type NOI to Property and Other Related Revenues less Property Operating Expenses
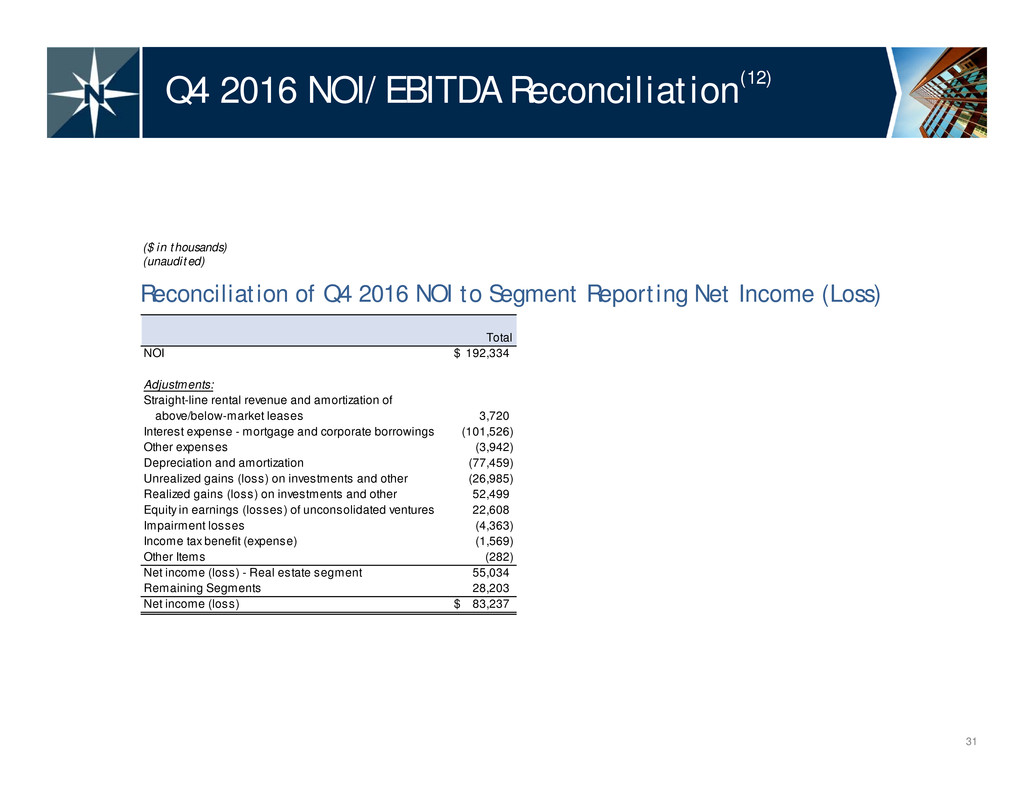
Total NOI 192,334$ Adjustments: Straight-line rental revenue and amortization of above/below-market leases 3,720 Interest expense - mortgage and corporate borrowings (101,526) Other expenses (3,942) Depreciation and amortization (77,459) Unrealized gains (loss) on investments and other (26,985) Realized gains (loss) on investments and other 52,499 Equity in earnings (losses) of unconsolidated ventures 22,608 Impairment losses (4,363) Income tax benefit (expense) (1,569) Other Items (282) Net income (loss) - Real estate segment 55,034 Remaining Segments 28,203 Net income (loss) 83,237$ 31 Q4 2016 NOI/EBITDA Reconciliation(12) Reconciliation of Q4 2016 NOI to Segment Reporting Net Income (Loss) ($ in thousands) (unaudited)
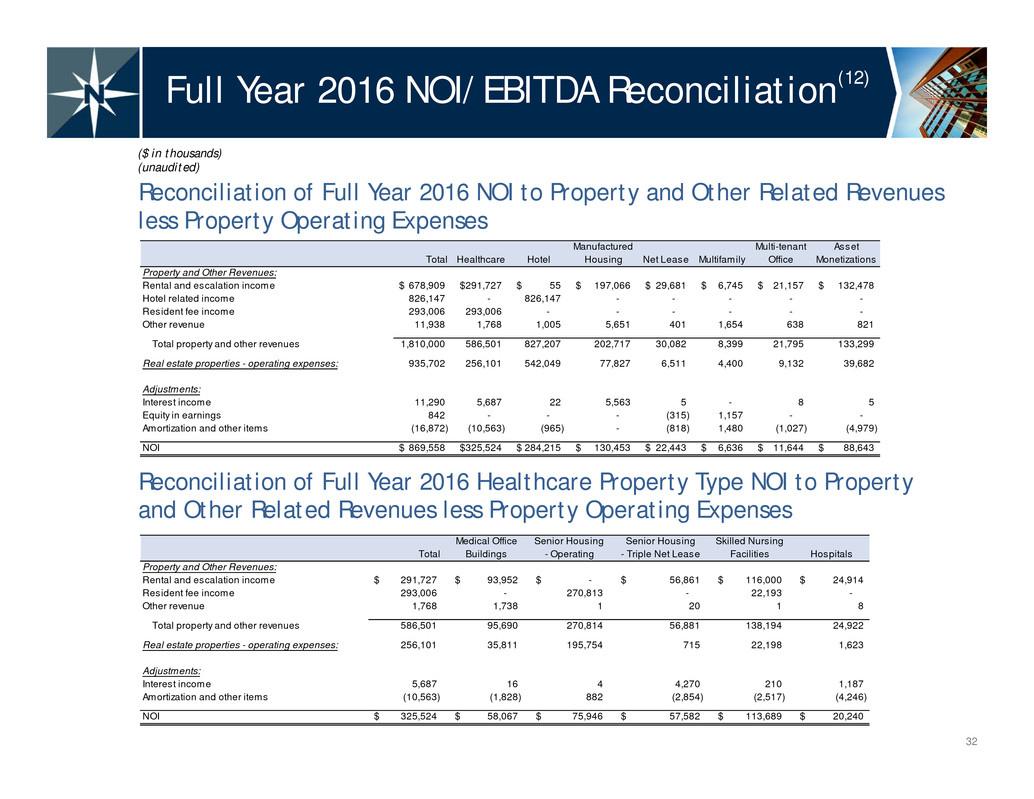
Total Healthcare Hotel Manufactured Housing Net Lease Multifamily Multi-tenant Office Asset Monetizations Property and Other Revenues: Rental and escalation income 678,909$ 291,727$ 55$ 197,066$ 29,681$ 6,745$ 21,157$ 132,478$ Hotel related income 826,147 - 826,147 - - - - - Resident fee income 293,006 293,006 - - - - - - Other revenue 11,938 1,768 1,005 5,651 401 1,654 638 821 Total property and other revenues 1,810,000 586,501 827,207 202,717 30,082 8,399 21,795 133,299 Real estate properties - operating expenses: 935,702 256,101 542,049 77,827 6,511 4,400 9,132 39,682 Adjustments: Interest income 11,290 5,687 22 5,563 5 - 8 5 Equity in earnings 842 - - - (315) 1,157 - - Amortization and other items (16,872) (10,563) (965) - (818) 1,480 (1,027) (4,979) NOI 869,558$ 325,524$ 284,215$ 130,453$ 22,443$ 6,636$ 11,644$ 88,643$ 32 Full Year 2016 NOI/EBITDA Reconciliation(12) Reconciliation of Full Year 2016 NOI to Property and Other Related Revenues less Property Operating Expenses ($ in thousands) (unaudited) Reconciliation of Full Year 2016 Healthcare Property Type NOI to Property and Other Related Revenues less Property Operating Expenses Total Medical Office Buildings Senior Housing - Operating Senior Housing - Triple Net Lease Skilled Nursing Facilities Hospitals Property and Other Revenues: Rental and escalation income 291,727$ 93,952$ -$ 56,861$ 116,000$ 24,914$ Resident fee income 293,006 - 270,813 - 22,193 - Other revenue 1,768 1,738 1 20 1 8 Total property and other revenues 586,501 95,690 270,814 56,881 138,194 24,922 Real estate properties - operating expenses: 256,101 35,811 195,754 715 22,198 1,623 Adjustments: Interest income 5,687 16 4 4,270 210 1,187 Amortization and other items (10,563) (1,828) 882 (2,854) (2,517) (4,246) NOI 325,524$ 58,067$ 75,946$ 57,582$ 113,689$ 20,240$
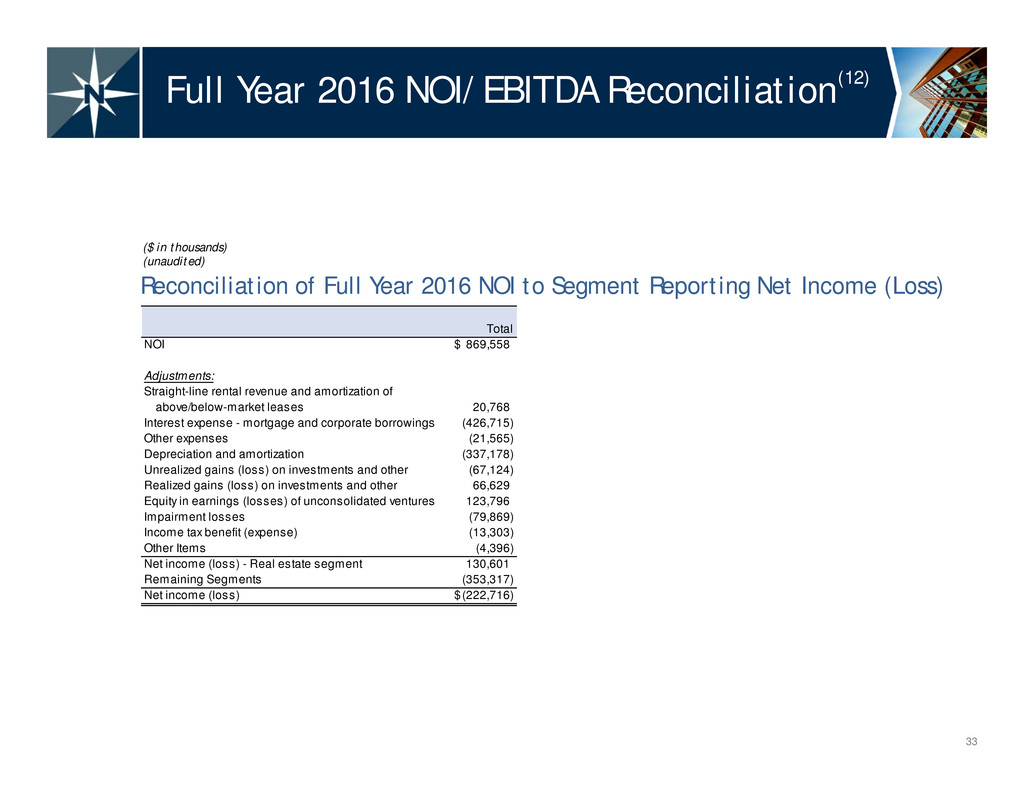
Total NOI 869,558$ Adjustments: Straight-line rental revenue and amortization of above/below-market leases 20,768 Interest expense - mortgage and corporate borrowings (426,715) Other expenses (21,565) Depreciation and amortization (337,178) Unrealized gains (loss) on investments and other (67,124) Realized gains (loss) on investments and other 66,629 Equity in earnings (losses) of unconsolidated ventures 123,796 Impairment losses (79,869) Income tax benefit (expense) (13,303) Other Items (4,396) Net income (loss) - Real estate segment 130,601 Remaining Segments (353,317) Net income (loss) (222,716)$ 33 Full Year 2016 NOI/EBITDA Reconciliation(12) Reconciliation of Full Year 2016 NOI to Segment Reporting Net Income (Loss) ($ in thousands) (unaudited)
34 399 Park Avenue, 18th Floor, New York, NY 10022 | 212.547.2600


