
Investor Presentation March 1, 2017 NYSE: CLNS | A Diversified Equity REIT
Colony NorthStar, Inc. 1 Cautionary Statement Regarding Forward-Looking Statements This presentation may contain forward-looking statements within the meaning of the federal securities laws. Forward-looking statements relate to expectations, beliefs, projections, future plans and strategies, anticipated events or trends and similar expressions concerning matters that are not historical facts. In some cases, you can identify forward-looking statements by the use of forward-looking terminology such as “may,” “will,” “should,” “expects,” “intends,” “plans,” “anticipates,” “believes,” “estimates,” “predicts,” or “potential” or the negative of these words and phrases or similar words or phrases which are predictions of or indicate future events or trends and which do not relate solely to historical matters. Forward-looking statements involve known and unknown risks, uncertainties, assumptions and contingencies, many of which are beyond our control, and may cause actual results to differ significantly from those expressed in any forward-looking statement. Factors that might cause such a difference include, without limitation, our failure to achieve anticipated synergies in the completed merger among NorthStar Asset Management Group Inc., Colony Capital, Inc. and NorthStar Realty Finance Corp., Colony NorthStar’s liquidity, including its ability to complete identified monetization transactions and other potential sales of non-core investments, the timing of and ability to deploy available capital, the timing of and ability to complete repurchases of Colony NorthStar’s stock, Colony NorthStar’s ability perform on the RMZ, Colony NorthStar’s leverage, including the timing and amount of borrowings under its credit facility, increased interest rates and operating costs, adverse economic or real estate developments in Colony NorthStar’s markets, Colony NorthStar’s failure to successfully operate or lease acquired properties, decreased rental rates, increased vacancy rates or failure to renew or replace expiring leases, defaults on or non-renewal of leases by tenants, the impact of economic conditions on the borrowers of Colony NorthStar’s commercial real estate debt investments and the commercial mortgage loans underlying its commercial mortgage backed securities, adverse general and local economic conditions, an unfavorable capital market environment, decreased leasing activity or lease renewals, and other risks and uncertainties detailed in our filings with the Securities and Exchange Commission (“SEC”). All forward-looking statements reflect the Colony NorthStar’s good faith beliefs, assumptions and expectations, but they are not guarantees of future performance. Additional information about these and other factors can be found in Colony NorthStar’s reports filed from time to time with the SEC. Colony NorthStar cautions investors not to unduly rely on any forward-looking statements. The forward-looking statements speak only as of the date of this presentation. Colony NorthStar is under no duty to update any of these forward-looking statements after the date of this presentation, nor to conform prior statements to actual results or revised expectations, and Colony NorthStar does not intend to do so. This presentation may contain statistics and other data that has been obtained or compiled from information made available by third-party service providers. Colony NorthStar has not independently verified such statistics or data. This presentation is for informational purposes only and does not constitute an offer to sell or a solicitation of an offer to buy any securities of the Colony NorthStar. This information is not intended to be indicative of future results. Actual performance of Colony NorthStar may vary materially. The endnotes herein contain important information that is material to an understanding of this presentation and you should read this presentation only with and in context of the endnotes. Forward Looking Statements
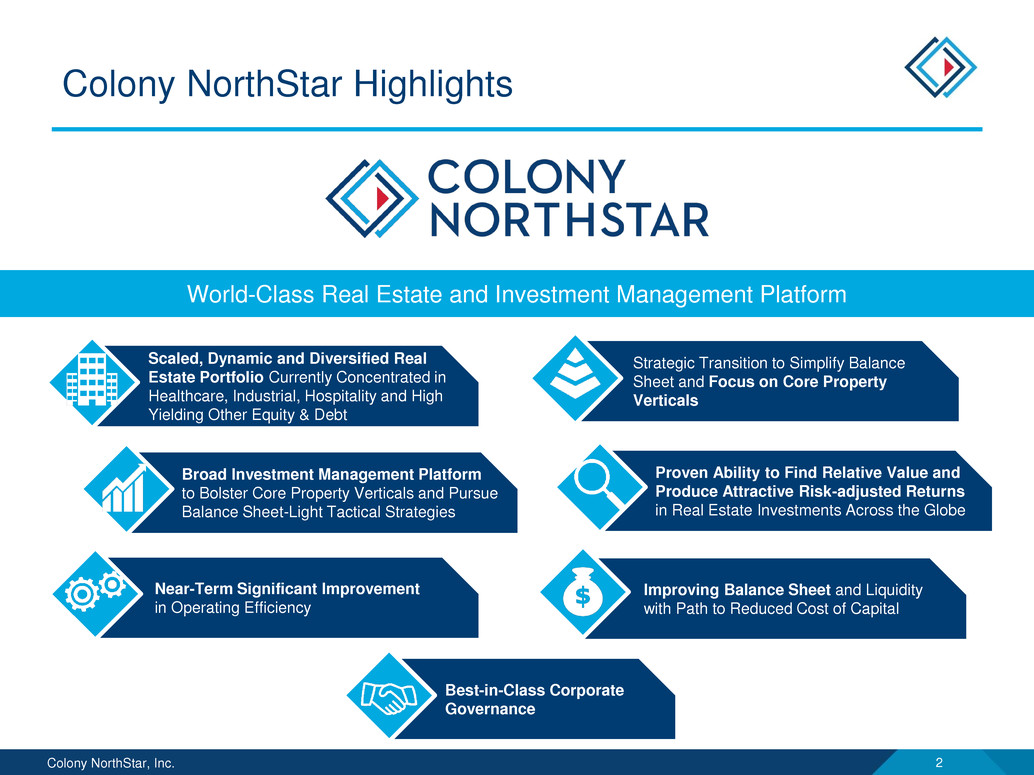
Colony NorthStar, Inc. 2 Colony NorthStar Highlights World-Class Real Estate and Investment Management Platform Improving Balance Sheet and Liquidity with Path to Reduced Cost of Capital Strategic Transition to Simplify Balance Sheet and Focus on Core Property Verticals Scaled, Dynamic and Diversified Real Estate Portfolio Currently Concentrated in Healthcare, Industrial, Hospitality and High Yielding Other Equity & Debt Near-Term Significant Improvement in Operating Efficiency Proven Ability to Find Relative Value and Produce Attractive Risk-adjusted Returns in Real Estate Investments Across the Globe Broad Investment Management Platform to Bolster Core Property Verticals and Pursue Balance Sheet-Light Tactical Strategies Best-in-Class Corporate Governance
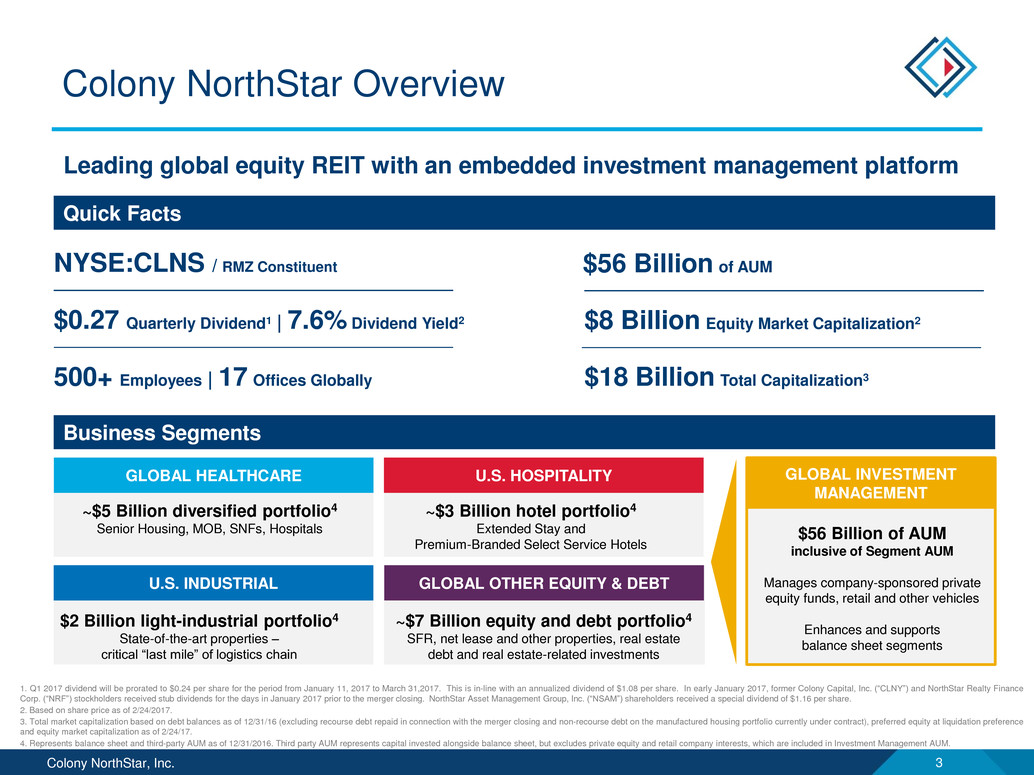
Colony NorthStar, Inc. 3 Colony NorthStar Overview Leading global equity REIT with an embedded investment management platform NYSE:CLNS / RMZ Constituent $56 Billion of AUM 500+ Employees | 17 Offices Globally $18 Billion Total Capitalization3 $8 Billion Equity Market Capitalization2 Quick Facts Business Segments $0.27 Quarterly Dividend1 | 7.6% Dividend Yield2 1. Q1 2017 dividend will be prorated to $0.24 per share for the period from January 11, 2017 to March 31,2017. This is in-line with an annualized dividend of $1.08 per share. In early January 2017, former Colony Capital, Inc. (“CLNY”) and NorthStar Realty Finance Corp. (“NRF”) stockholders received stub dividends for the days in January 2017 prior to the merger closing. NorthStar Asset Management Group, Inc. (“NSAM”) shareholders received a special dividend of $1.16 per share. 2. Based on share price as of 2/24/2017. 3. Total market capitalization based on debt balances as of 12/31/16 (excluding recourse debt repaid in connection with the merger closing and non-recourse debt on the manufactured housing portfolio currently under contract), preferred equity at liquidation preference and equity market capitalization as of 2/24/17. 4. Represents balance sheet and third-party AUM as of 12/31/2016. Third party AUM represents capital invested alongside balance sheet, but excludes private equity and retail company interests, which are included in Investment Management AUM. U.S. HOSPITALITYGLOBAL HEALTHCARE GLOBAL INVESTMENT MANAGEMENT ~$5 Billion diversified portfolio4 Senior Housing, MOB, SNFs, Hospitals ~$3 Billion hotel portfolio4 Extended Stay and Premium-Branded Select Service Hotels GLOBAL OTHER EQUITY & DEBTU.S. INDUSTRIAL $2 Billion light-industrial portfolio4 State-of-the-art properties – critical “last mile” of logistics chain ~$7 Billion equity and debt portfolio4 SFR, net lease and other properties, real estate debt and real estate-related investments $56 Billion of AUM inclusive of Segment AUM Manages company-sponsored private equity funds, retail and other vehicles Enhances and supports balance sheet segments
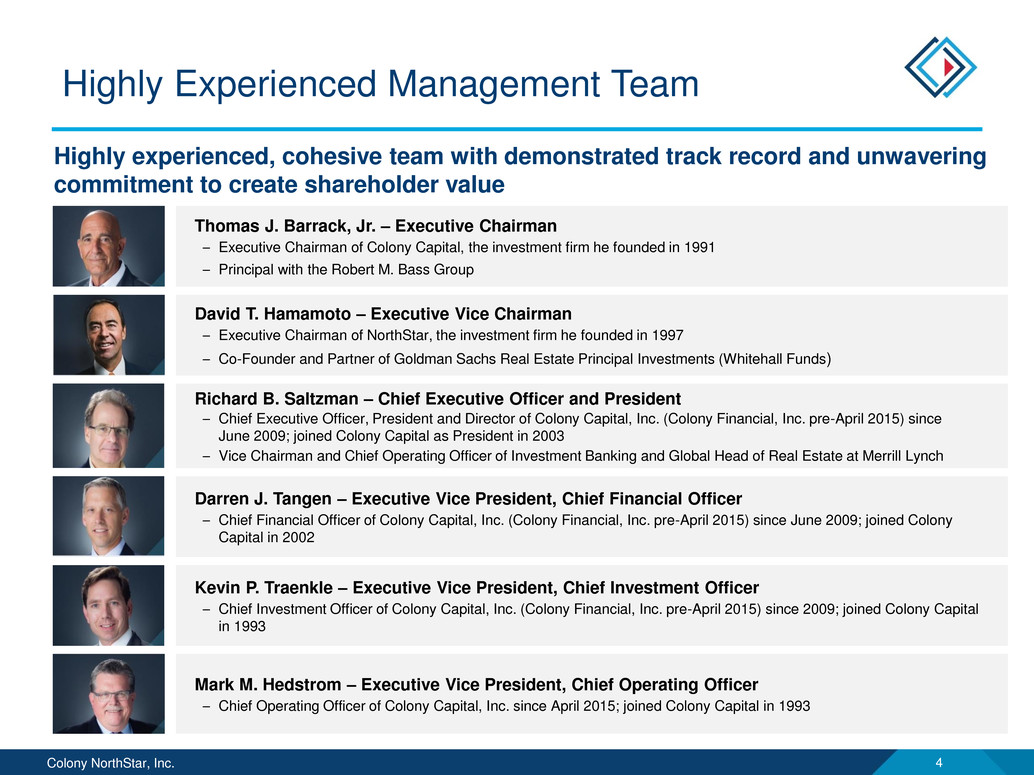
Colony NorthStar, Inc. 4 Highly experienced, cohesive team with demonstrated track record and unwavering commitment to create shareholder value Highly Experienced Management Team Thomas J. Barrack, Jr. – Executive Chairman – Executive Chairman of Colony Capital, the investment firm he founded in 1991 – Principal with the Robert M. Bass Group David T. Hamamoto – Executive Vice Chairman – Executive Chairman of NorthStar, the investment firm he founded in 1997 – Co-Founder and Partner of Goldman Sachs Real Estate Principal Investments (Whitehall Funds) Richard B. Saltzman – Chief Executive Officer and President – Chief Executive Officer, President and Director of Colony Capital, Inc. (Colony Financial, Inc. pre-April 2015) since June 2009; joined Colony Capital as President in 2003 – Vice Chairman and Chief Operating Officer of Investment Banking and Global Head of Real Estate at Merrill Lynch Darren J. Tangen – Executive Vice President, Chief Financial Officer – Chief Financial Officer of Colony Capital, Inc. (Colony Financial, Inc. pre-April 2015) since June 2009; joined Colony Capital in 2002 Mark M. Hedstrom – Executive Vice President, Chief Operating Officer – Chief Operating Officer of Colony Capital, Inc. since April 2015; joined Colony Capital in 1993 Kevin P. Traenkle – Executive Vice President, Chief Investment Officer – Chief Investment Officer of Colony Capital, Inc. (Colony Financial, Inc. pre-April 2015) since 2009; joined Colony Capital in 1993
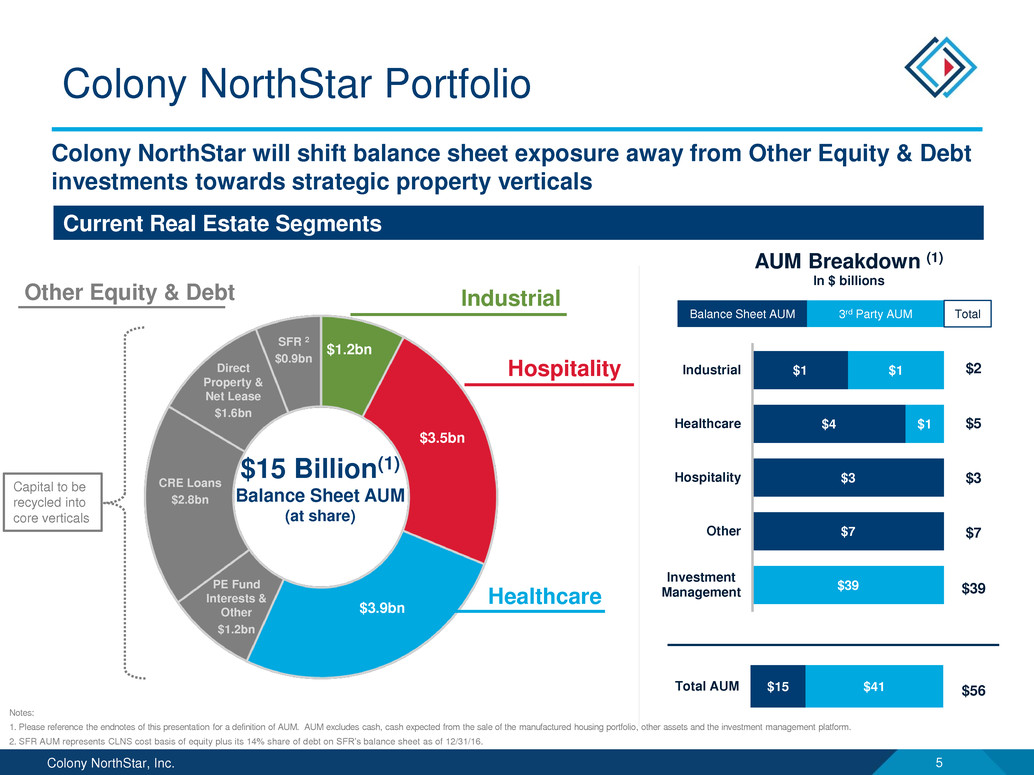
Colony NorthStar, Inc. 5 $7 $3 $4 $1 $39 $1 $1 Investment Management Other Hospitality Healthcare Industrial AUM Breakdown (1) In $ billions $15 $41Total AUM $15 Billion(1) Balance Sheet AUM (at share) Colony NorthStar Portfolio Notes: 1. Please reference the endnotes of this presentation for a definition of AUM. AUM excludes cash, cash expected from the sale of the manufactured housing portfolio, other assets and the investment management platform. 2. SFR AUM represents CLNS cost basis of equity plus its 14% share of debt on SFR’s balance sheet as of 12/31/16. Colony NorthStar will shift balance sheet exposure away from Other Equity & Debt investments towards strategic property verticals Current Real Estate Segments Other Equity & Debt Hospitality Industrial Healthcare Capital to be recycled into core verticals Balance Sheet AUM 3rd Party AUM $2 $5 $3 $7 $39 $56 Total Direct Property & Net Lease $1.6bn CRE Loans $2.8bn PE Fund Interests & Other $1.2bn SFR 2 $0.9bn $3.9bn $3.5bn $1.2bn
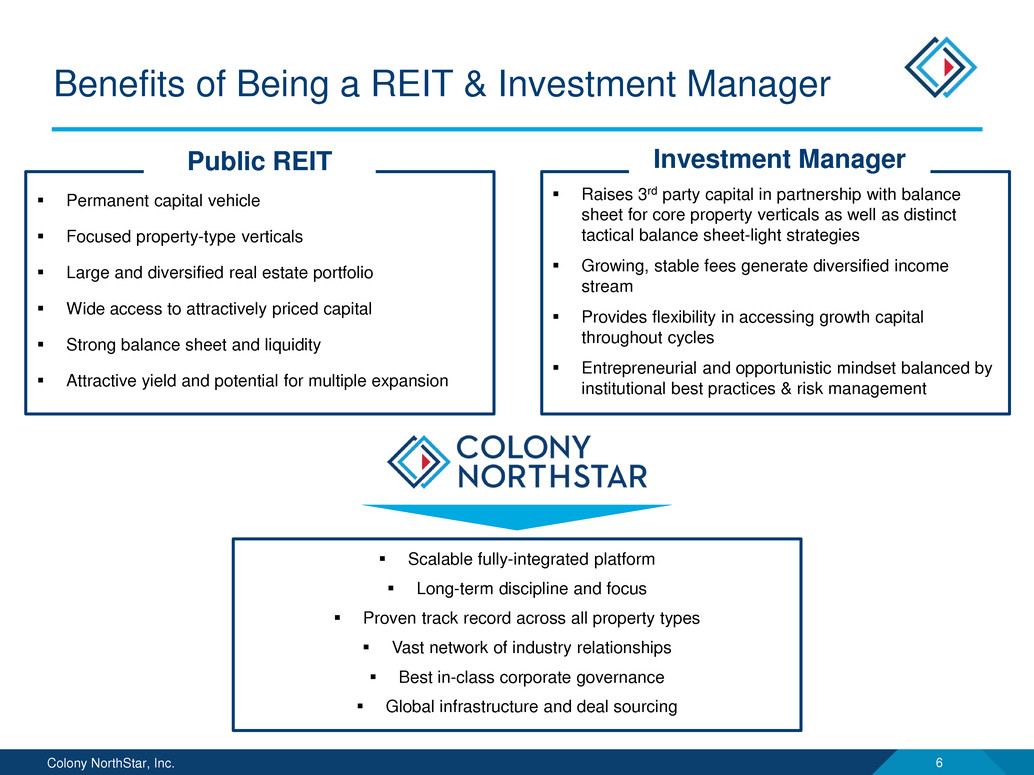
Colony NorthStar, Inc. 6 Raises 3rd party capital in partnership with balance sheet for core property verticals as well as distinct tactical balance sheet-light strategies Growing, stable fees generate diversified income stream Provides flexibility in accessing growth capital throughout cycles Entrepreneurial and opportunistic mindset balanced by institutional best practices & risk management Scalable fully-integrated platform Long-term discipline and focus Proven track record across all property types Vast network of industry relationships Best in-class corporate governance Global infrastructure and deal sourcing Benefits of Being a REIT & Investment Manager Permanent capital vehicle Focused property-type verticals Large and diversified real estate portfolio Wide access to attractively priced capital Strong balance sheet and liquidity Attractive yield and potential for multiple expansion Public REIT Investment Manager
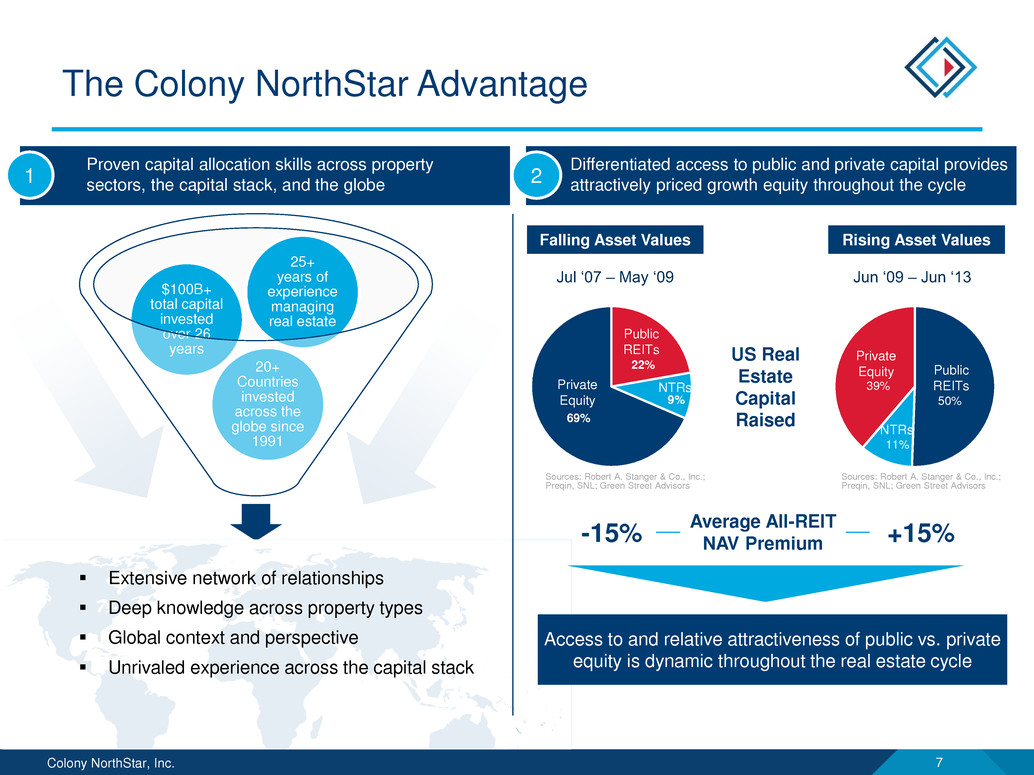
Colony NorthStar, Inc. 7 20+ Countries invested across the globe since 1991 $100B+ total capital invested over 26 years 25+ years of experience managing real estate The Colony NorthStar Advantage Differentiated access to public and private capital provides attractively priced growth equity throughout the cycle Proven capital allocation skills across property sectors, the capital stack, and the globe1 2 22% 9% 69% 50% 11% 39% US Real Estate Capital Raised Average All-REIT NAV Premium-15% +15% Private Equity Public REITs NTRs Private Equity Public REITs NTRs Falling Asset Values Jul ‘07 – May ‘09 Jun ‘09 – Jun ‘13 Rising Asset Values Sources: Robert A. Stanger & Co., Inc.; Preqin, SNL; Green Street Advisors Sources: Robert A. Stanger & Co., Inc.; Preqin, SNL; Green Street Advisors Extensive network of relationships Deep knowledge across property types Global context and perspective Unrivaled experience across the capital stack Access to and relative attractiveness of public vs. private equity is dynamic throughout the real estate cycle
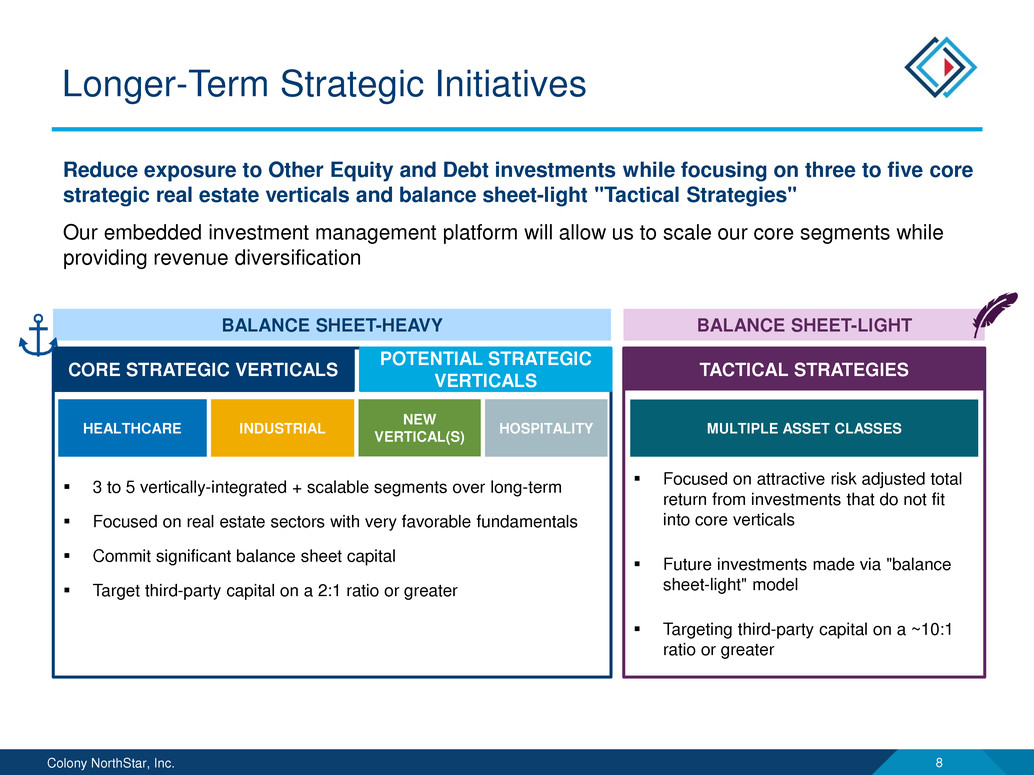
Colony NorthStar, Inc. 8 BALANCE SHEET-LIGHTBALANCE SHEET-HEAVY Longer-Term Strategic Initiatives CORE STRATEGIC VERTICALS MULTIPLE ASSET CLASSES TACTICAL STRATEGIES HOSPITALITYHEALTHCARE NEW VERTICAL(S) INDUSTRIAL 3 to 5 vertically-integrated + scalable segments over long-term Focused on real estate sectors with very favorable fundamentals Commit significant balance sheet capital Target third-party capital on a 2:1 ratio or greater Focused on attractive risk adjusted total return from investments that do not fit into core verticals Future investments made via "balance sheet-light" model Targeting third-party capital on a ~10:1 ratio or greater Reduce exposure to Other Equity and Debt investments while focusing on three to five core strategic real estate verticals and balance sheet-light "Tactical Strategies" Our embedded investment management platform will allow us to scale our core segments while providing revenue diversification POTENTIAL STRATEGIC VERTICALS
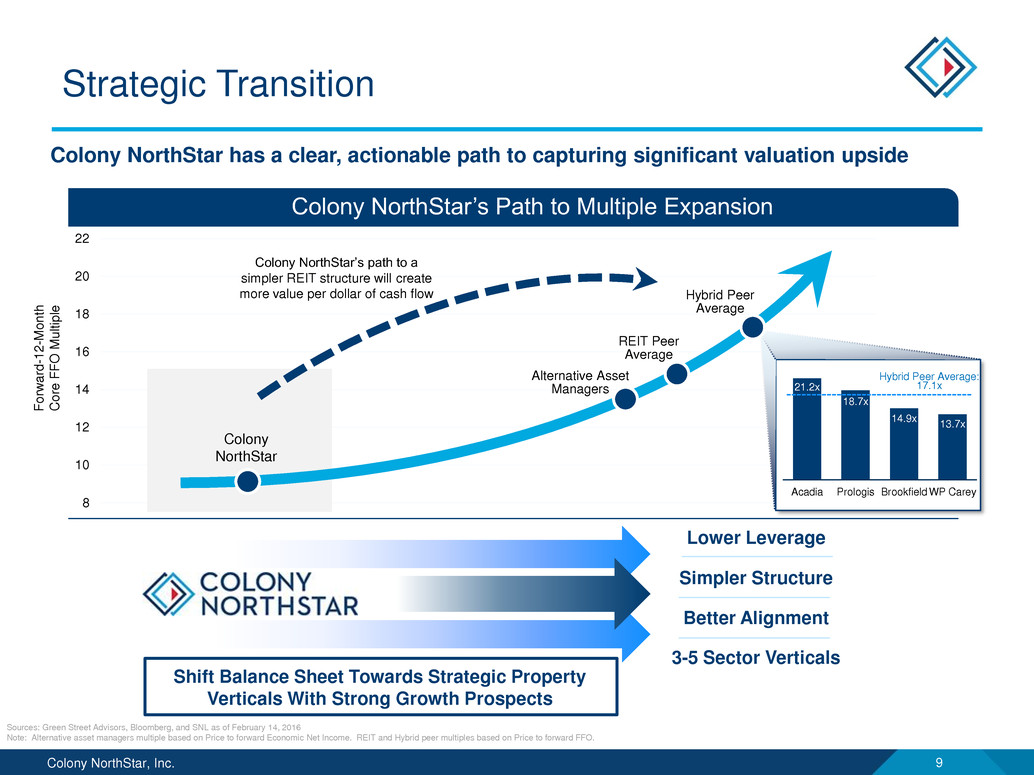
Colony NorthStar, Inc. 9 8 10 12 14 16 18 20 22 Strategic Transition Colony NorthStar has a clear, actionable path to capturing significant valuation upside Colony NorthStar Alternative Asset Managers Colony NorthStar’s Path to Multiple Expansion Colony NorthStar’s path to a simpler REIT structure will create more value per dollar of cash flow F or w ar d -1 2 -M o n th Co re F F O M u lt ip le REIT Peer Average Hybrid Peer Average Sources: Green Street Advisors, Bloomberg, and SNL as of February 14, 2016 Note: Alternative asset managers multiple based on Price to forward Economic Net Income. REIT and Hybrid peer multiples based on Price to forward FFO. 21.2x 18.7x 14.9x 13.7x Acadia Prologis Brookfield WP Carey Hybrid Peer Average: 17.1x Lower Leverage Simpler Structure Better Alignment 3-5 Sector Verticals Shift Balance Sheet Towards Strategic Property Verticals With Strong Growth Prospects
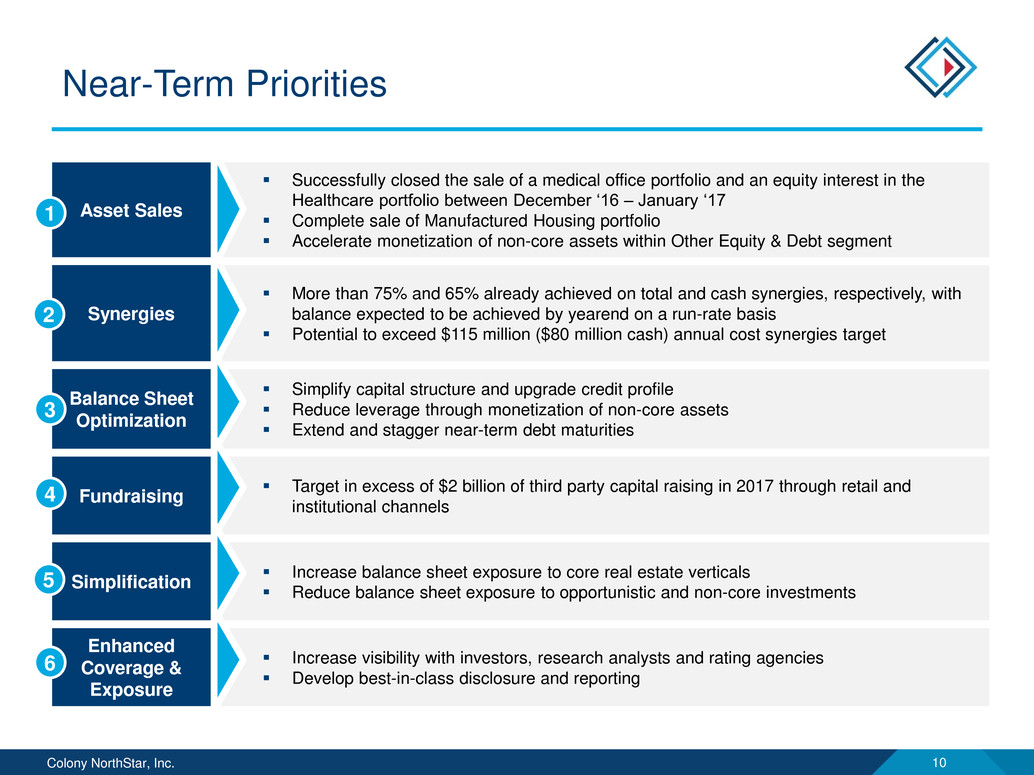
Colony NorthStar, Inc. 10 Near-Term Priorities Asset Sales Successfully closed the sale of a medical office portfolio and an equity interest in the Healthcare portfolio between December ‘16 – January ‘17 Complete sale of Manufactured Housing portfolio Accelerate monetization of non-core assets within Other Equity & Debt segment Synergies More than 75% and 65% already achieved on total and cash synergies, respectively, with balance expected to be achieved by yearend on a run-rate basis Potential to exceed $115 million ($80 million cash) annual cost synergies target Balance Sheet Optimization Simplify capital structure and upgrade credit profile Reduce leverage through monetization of non-core assets Extend and stagger near-term debt maturities Fundraising Target in excess of $2 billion of third party capital raising in 2017 through retail and institutional channels Simplification Increase balance sheet exposure to core real estate verticals Reduce balance sheet exposure to opportunistic and non-core investments Enhanced Coverage & Exposure Increase visibility with investors, research analysts and rating agencies Develop best-in-class disclosure and reporting 1 2 3 4 5 6

Colony NorthStar, Inc. 11 Senior Housing 40% SNF 35% MOB 19% Hospital 6% <1.0x 3% 1.0x - 1.5x 59% >1.5x 38%Private Pay 62% Medicaid 29% Medicare 9% Platform and Strategy Overview Diversified portfolio across senior housing facilities (operating and triple net), medical office buildings, skilled nursing facilities and hospitals Approximately 43% of senior housing facilities and all skilled nursing facilities and hospitals are net leased to over 25 highly experienced third party operators Recently completed the sale of a 19% preferred joint venture interest in the Company’s share of the healthcare portfolio to a top tier global financial institution Attractive and Scaled Portfolio $5+ billion consolidated portfolio spread across 33 states in the U.S. and U.K. Healthcare business is scaled with best in class acquisitions and operating infrastructure Manages a healthcare focused non-traded REIT with $3+ billion of AUM Healthcare Portfolio Overview Sub-Sector Composition 4 Revenue Mix 5 NNN Rent Coverage 2 Note: Data as of December 31, 2016 unless otherwise noted. 1. Senior housing operating metrics represents average fourth quarter 2016 occupancy. 2. Coverage reflects the ratio of EBITDAR to cash rent on a trailing 12 month basis, as of 9/30/16. 3. Consolidated NOI at 100% share, current CLNS share is approximately 71%. 2016 full-year NOI is pro forma for asset sales completed during the year. 4. Portfolio composition based on NOI for the quarter ended 12/31/2016, excluding the medical office building portfolio sold in Q4 2016. 5. Overall percentages are weighted by 9/30/16 trailing twelve month NOI exposure in each category. Key Stats Property Count 426 Beds / Units ~24,000 MOB Total SF (MM) 4.0 Occupancy (Operating Facilities Only) 1 88.1% NNN WALT (years) 9.6 NNN Rent Coverage 2 1.7x 2016A NOI 3 $326M Approximately 43% of senior housing facilities are net leased
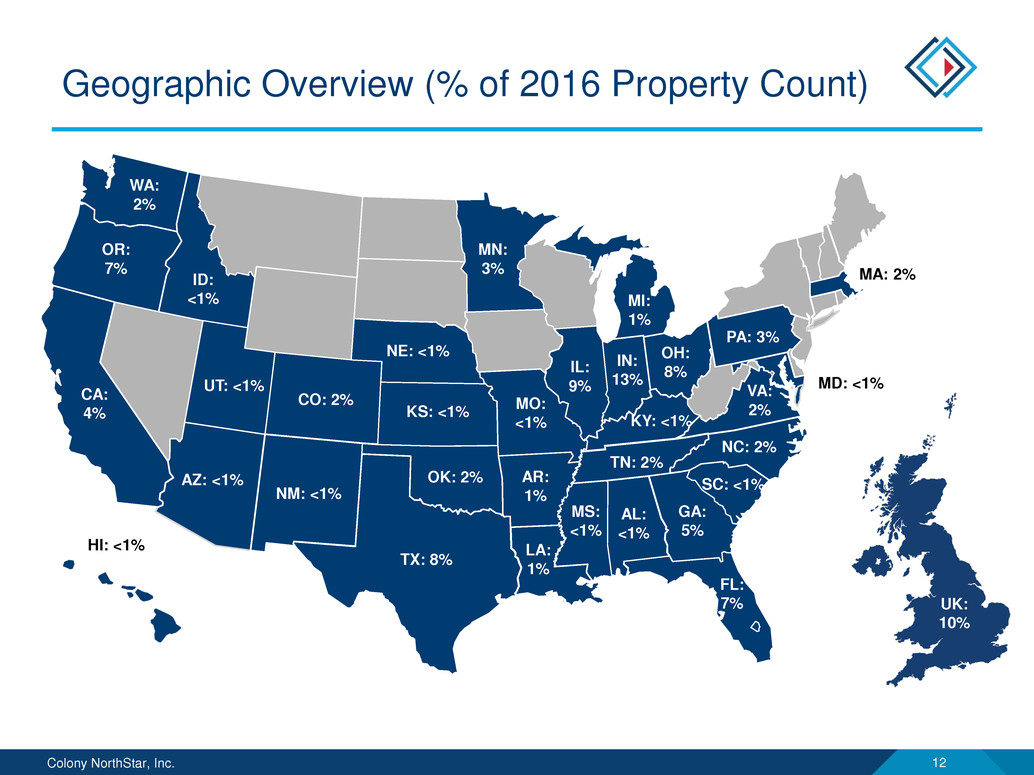
Colony NorthStar, Inc. 12 Geographic Overview (% of 2016 Property Count) PA: 3% KY: <1% TX: 8% CO: 2% WA: 2% GA: 5% IL: 9% MI: 1% MD: <1% NC: 2% AL: <1% TN: 2% OH: 8% NM: <1% AZ: <1% MA: 2% VA: 2% UT: <1% SC: <1% OR: 7% OK: 2% NE: <1% MO: <1% MS: <1% MN: 3% KS: <1% IN: 13% ID: <1% FL: 7% CA: 4% AR: 1% HI: <1% UK: 10% LA: 1%
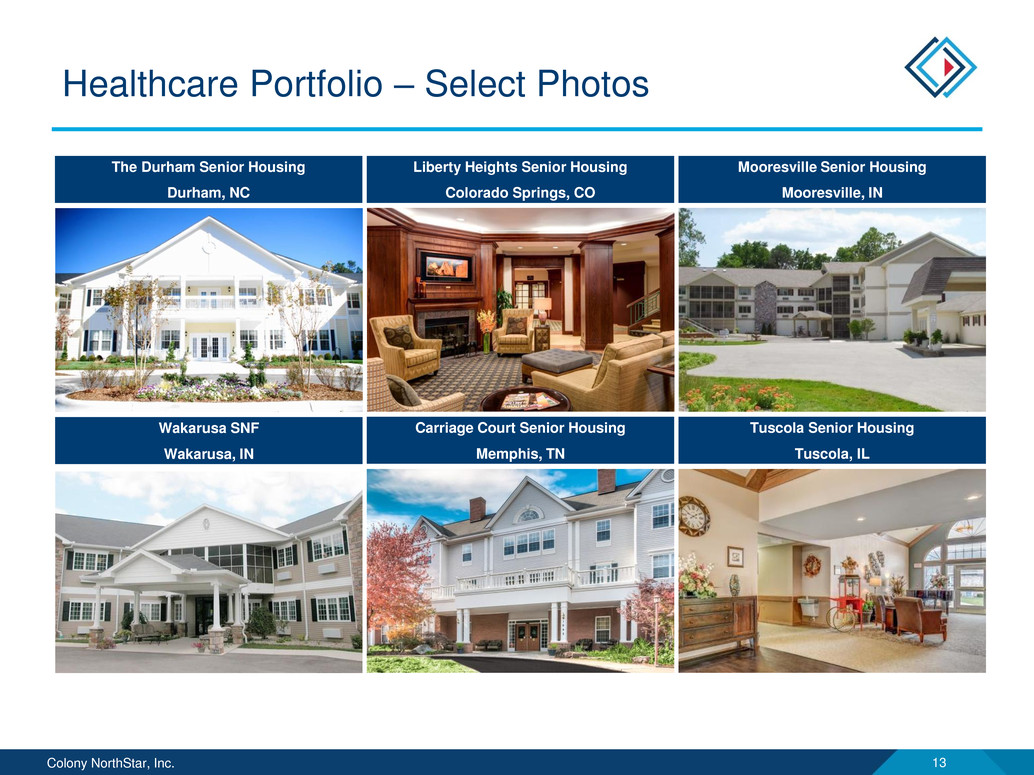
Colony NorthStar, Inc. 13 Healthcare Portfolio – Select Photos Carriage Court Senior Housing Memphis, TN The Durham Senior Housing Durham, NC Liberty Heights Senior Housing Colorado Springs, CO Mooresville Senior Housing Mooresville, IN Wakarusa SNF Wakarusa, IN Tuscola Senior Housing Tuscola, IL
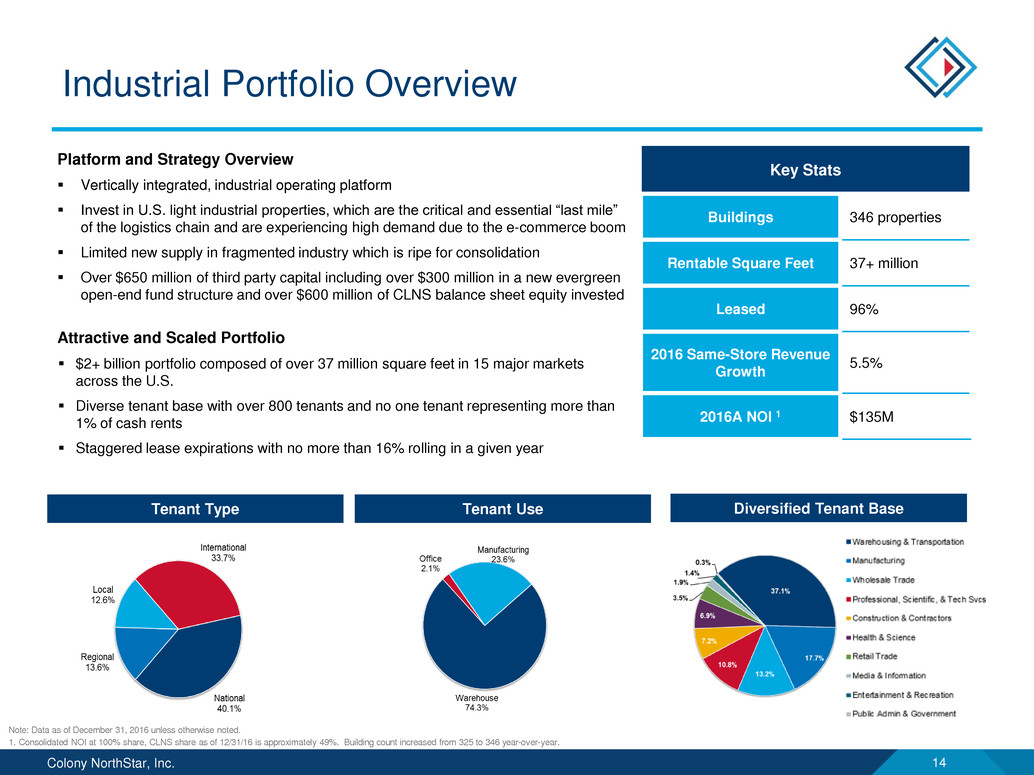
Colony NorthStar, Inc. 14 Industrial Portfolio Overview Platform and Strategy Overview Vertically integrated, industrial operating platform Invest in U.S. light industrial properties, which are the critical and essential “last mile” of the logistics chain and are experiencing high demand due to the e-commerce boom Limited new supply in fragmented industry which is ripe for consolidation Over $650 million of third party capital including over $300 million in a new evergreen open-end fund structure and over $600 million of CLNS balance sheet equity invested Attractive and Scaled Portfolio $2+ billion portfolio composed of over 37 million square feet in 15 major markets across the U.S. Diverse tenant base with over 800 tenants and no one tenant representing more than 1% of cash rents Staggered lease expirations with no more than 16% rolling in a given year Tenant Type Tenant Use Diversified Tenant Base Key Stats Buildings 346 properties Rentable Square Feet 37+ million Leased 96% 2016 Same-Store Revenue Growth 5.5% 2016A NOI 1 $135M Note: Data as of December 31, 2016 unless otherwise noted. 1. Consolidated NOI at 100% share, CLNS share as of 12/31/16 is approximately 49%. Building count increased from 325 to 346 year-over-year.
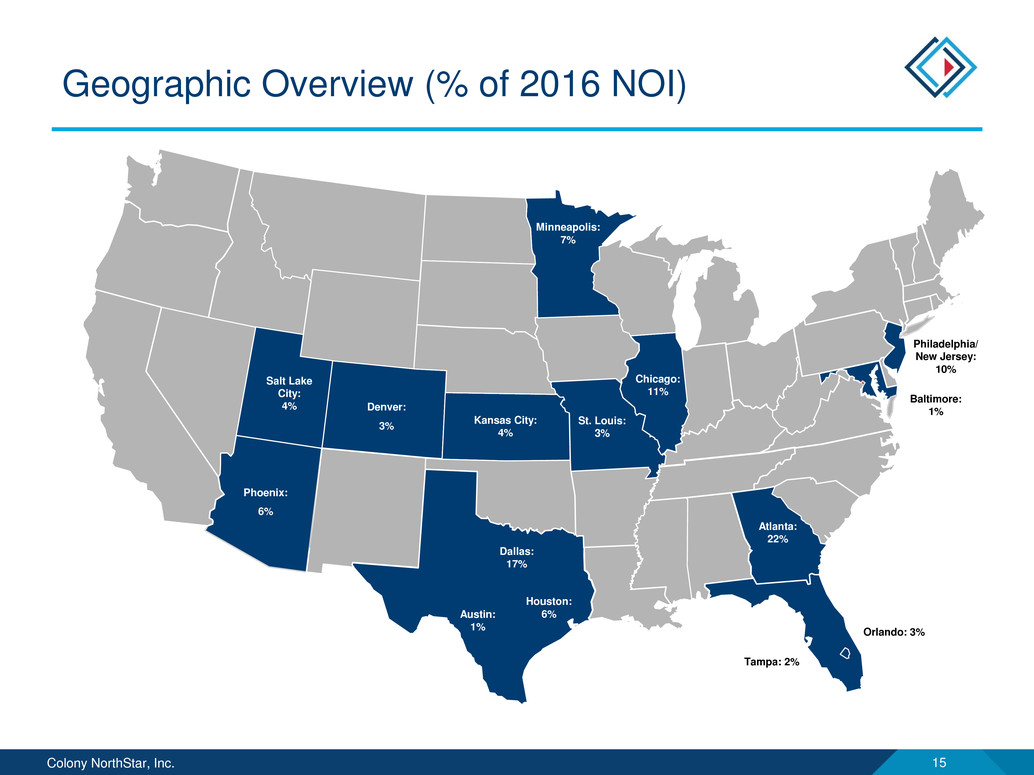
Colony NorthStar, Inc. 15 Geographic Overview (% of 2016 NOI) Philadelphia/ New Jersey: 10% Denver: 3% Atlanta: 22% Baltimore: 1% Phoenix: 6% Austin: 1% Salt Lake City: 4% Kansas City: 4% St. Louis: 3% Minneapolis: 7% Chicago: 11% Houston: 6% Dallas: 17% Orlando: 3% Tampa: 2%
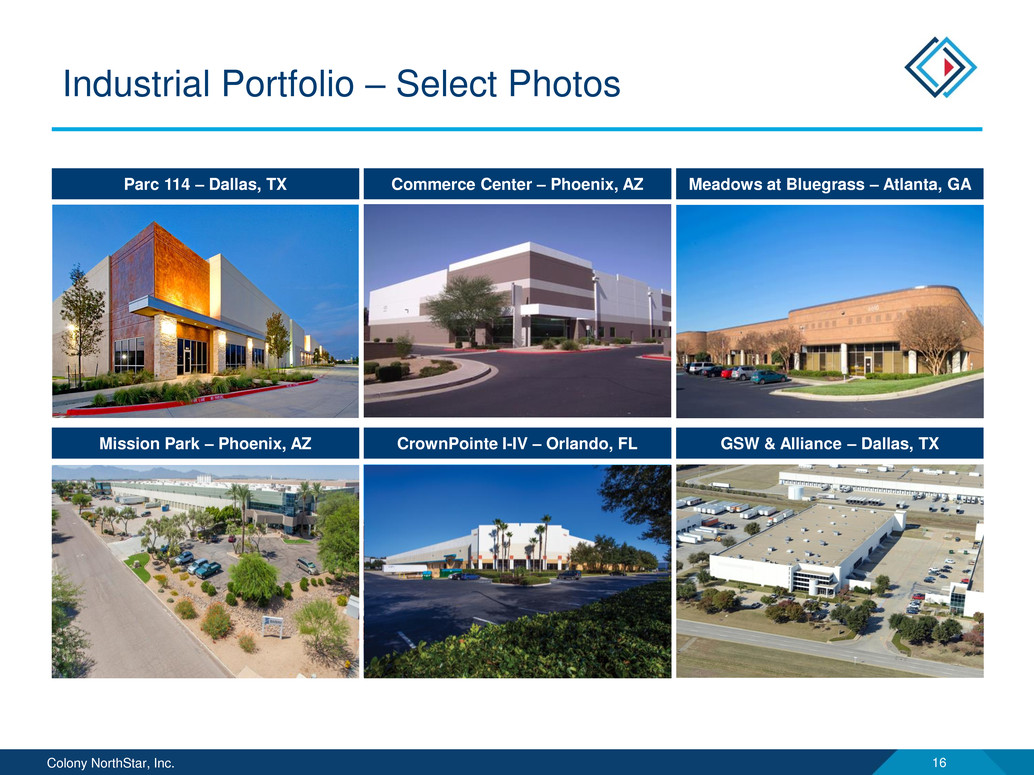
Colony NorthStar, Inc. 16 Industrial Portfolio – Select Photos Parc 114 – Dallas, TX Commerce Center – Phoenix, AZ Meadows at Bluegrass – Atlanta, GA Mission Park – Phoenix, AZ CrownPointe I-IV – Orlando, FL GSW & Alliance – Dallas, TX
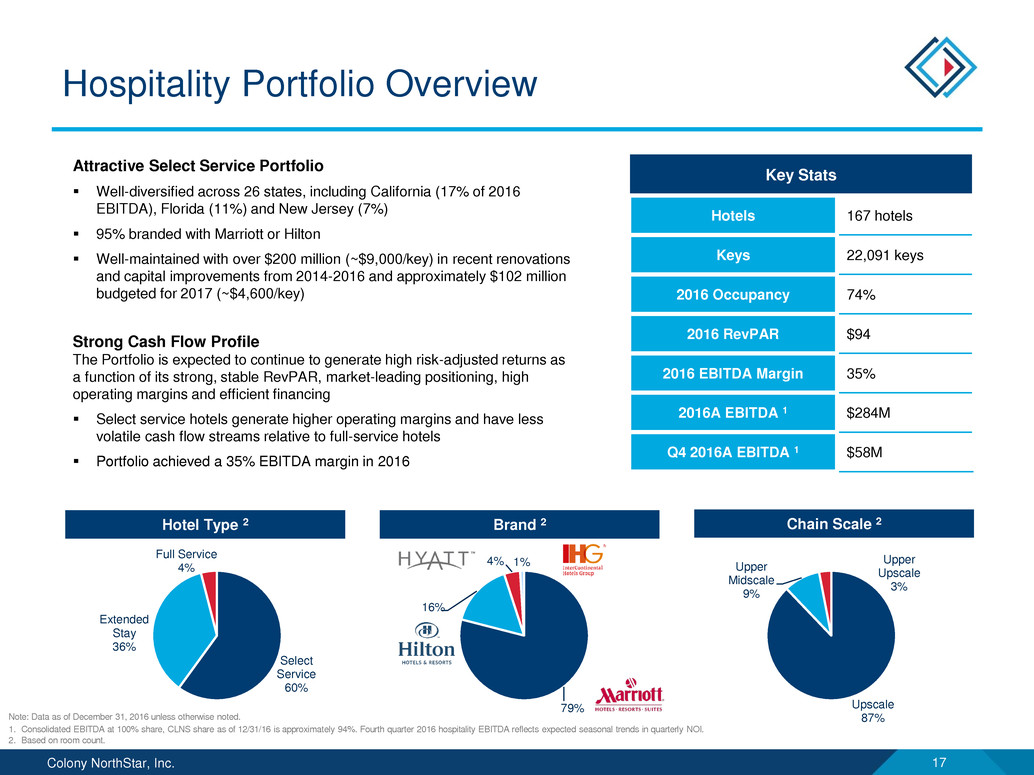
Colony NorthStar, Inc. 17 Hospitality Portfolio Overview Attractive Select Service Portfolio Well-diversified across 26 states, including California (17% of 2016 EBITDA), Florida (11%) and New Jersey (7%) 95% branded with Marriott or Hilton Well-maintained with over $200 million (~$9,000/key) in recent renovations and capital improvements from 2014-2016 and approximately $102 million budgeted for 2017 (~$4,600/key) Strong Cash Flow Profile The Portfolio is expected to continue to generate high risk-adjusted returns as a function of its strong, stable RevPAR, market-leading positioning, high operating margins and efficient financing Select service hotels generate higher operating margins and have less volatile cash flow streams relative to full-service hotels Portfolio achieved a 35% EBITDA margin in 2016 Hotel Type 2 Brand 2 Chain Scale 2 Key Stats Hotels 167 hotels Keys 22,091 keys 2016 Occupancy 74% 2016 RevPAR $94 2016 EBITDA Margin 35% 2016A EBITDA 1 $284M Q4 2016A EBITDA 1 $58M Note: Data as of December 31, 2016 unless otherwise noted. 1. Consolidated EBITDA at 100% share, CLNS share as of 12/31/16 is approximately 94%. Fourth quarter 2016 hospitality EBITDA reflects expected seasonal trends in quarterly NOI. 2. Based on room count. Select Service 60% Extended Stay 36% Full Service 4% 79% 16% 4% 1% Upscale 87% Upper Midscale 9% Upper Upscale 3%
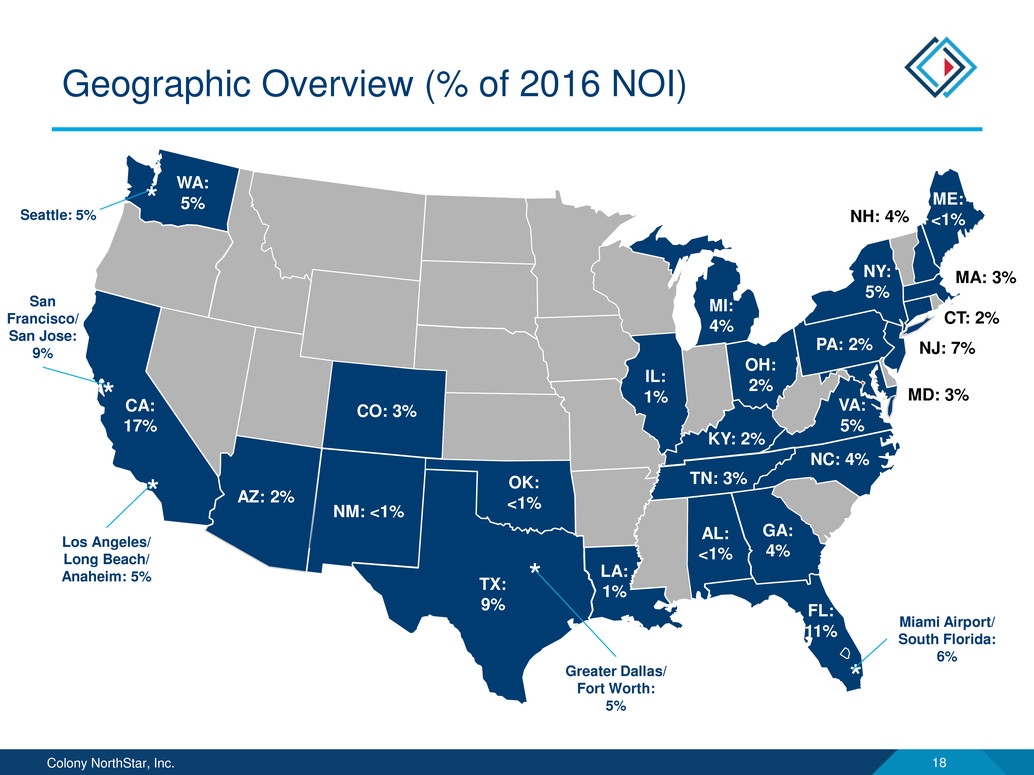
Colony NorthStar, Inc. 18 Geographic Overview (% of 2016 NOI) NJ: 7% NY: 5% PA: 2% KY: 2% CO: 3% GA: 4% IL: 1% MI: 4% San Francisco/ San Jose: 9% CT: 2% MD: 3% NC: 4% AL: <1% TN: 3% OH: 2% NM: <1% AZ: 2% NH: 4% MA: 3% CA: 17% WA: 5% FL: 11% TX: 9% LA: 1% VA: 5% ME: <1% * Los Angeles/ Long Beach/ Anaheim: 5% * Seattle: 5% * Miami Airport/ South Florida: 6% *Greater Dallas/Fort Worth: 5% * OK: <1%
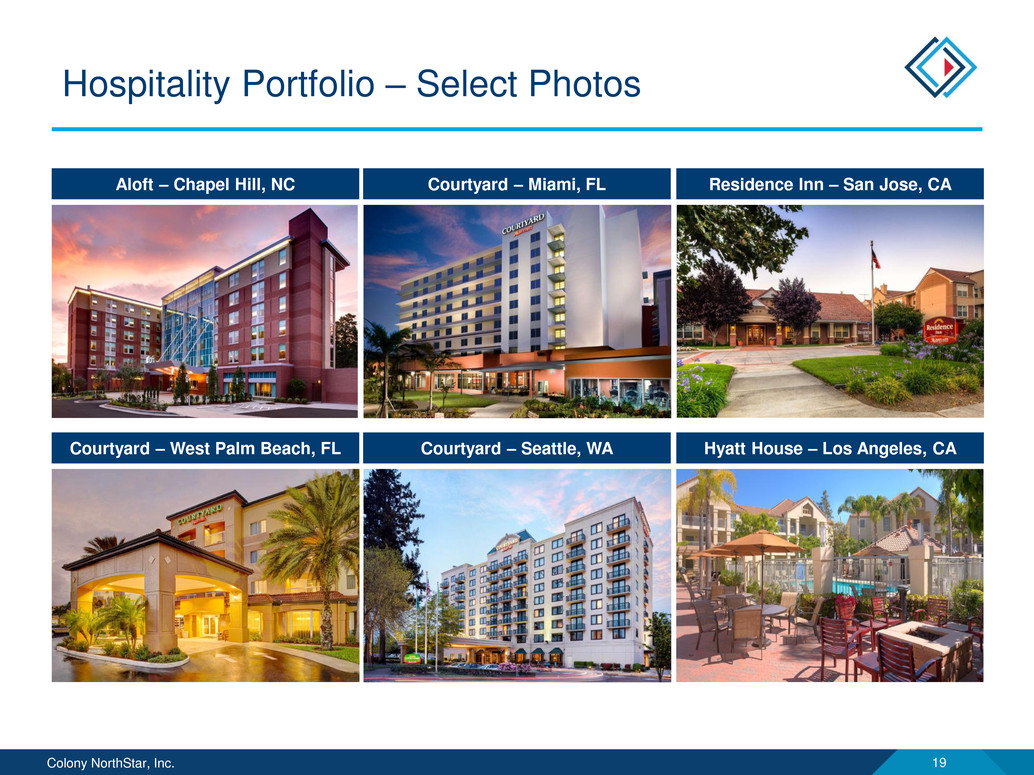
Colony NorthStar, Inc. 19 Hospitality Portfolio – Select Photos Aloft – Chapel Hill, NC Courtyard – Miami, FL Residence Inn – San Jose, CA Courtyard – West Palm Beach, FL Courtyard – Seattle, WA Hyatt House – Los Angeles, CA
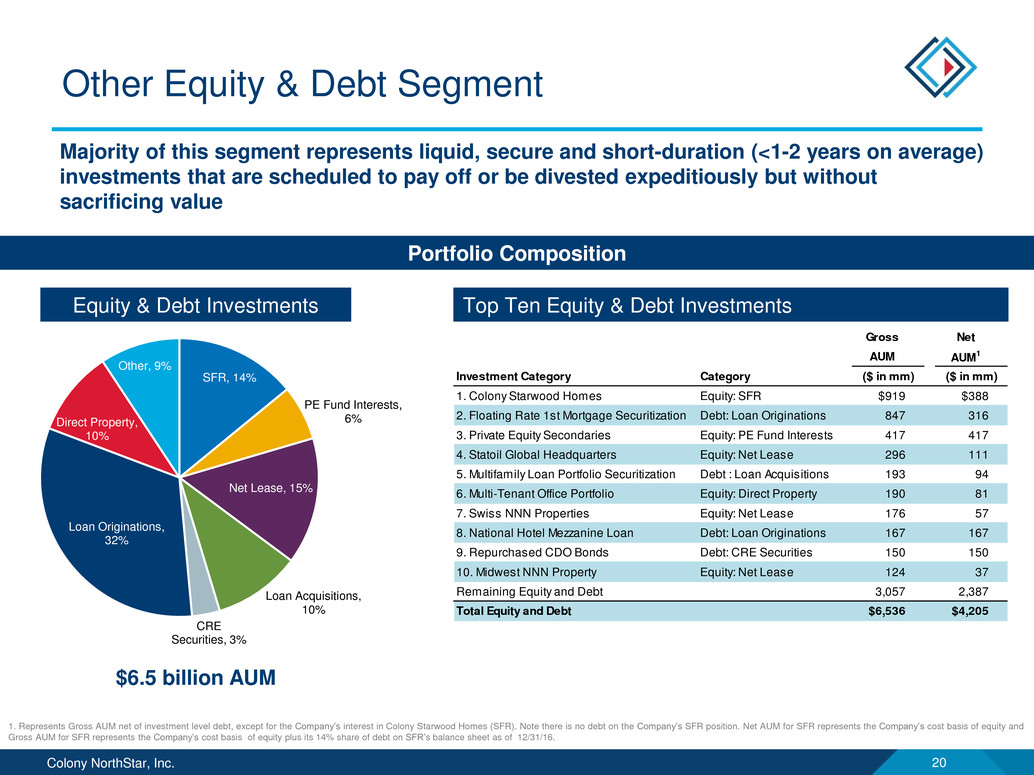
Colony NorthStar, Inc. 20 Gross Net AUM AUM 1 Investment Category Category ($ in mm) ($ in mm) 1. Colony Starwood Homes Equity: SFR $919 $388 2. Floating Rate 1st Mortgage Securitization Debt: Loan Originations 847 316 3. Private Equity Secondaries Equity: PE Fund Interests 417 417 4. Statoil Global Headquarters Equity: Net Lease 296 111 5. Multifamily Loan Portfolio Securitization Debt : Loan Acquisitions 193 94 6. Multi-Tenant Office Portfolio Equity: Direct Property 190 81 7. Swiss NNN Properties Equity: Net Lease 176 57 8. National Hotel Mezzanine Loan Debt: Loan Originations 167 167 9. Repurchased CDO Bonds Debt: CRE Securities 150 150 10. Midwest NNN Property Equity: Net Lease 124 37 Remaining Equity and Debt 3,057 2,387 Total Equity and Debt $6,536 $4,205 SFR, 14% PE Fund Interests, 6% Net Lease, 15% Loan Acquisitions, 10% CRE Securities, 3% Loan Originations, 32% Direct Property, 10% Other, 9% Top Ten Equity & Debt Investments Other Equity & Debt Segment Portfolio Composition Majority of this segment represents liquid, secure and short-duration (<1-2 years on average) investments that are scheduled to pay off or be divested expeditiously but without sacrificing value 1. Represents Gross AUM net of investment level debt, except for the Company’s interest in Colony Starwood Homes (SFR). Note there is no debt on the Company’s SFR position. Net AUM for SFR represents the Company’s cost basis of equity and Gross AUM for SFR represents the Company’s cost basis of equity plus its 14% share of debt on SFR’s balance sheet as of 12/31/16. Equity & Debt Investments $6.5 billion AUM
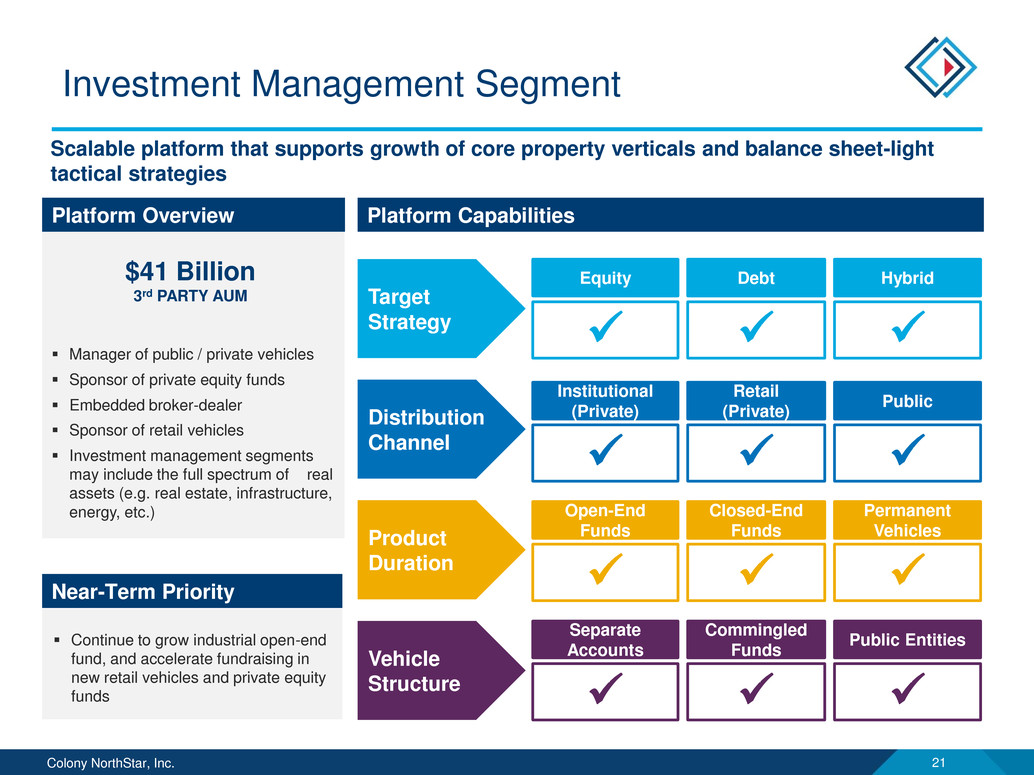
Colony NorthStar, Inc. 21 Manager of public / private vehicles Sponsor of private equity funds Embedded broker-dealer Sponsor of retail vehicles Investment management segments may include the full spectrum of real assets (e.g. real estate, infrastructure, energy, etc.) $41 Billion 3rd PARTY AUM Investment Management Segment Target Strategy DebtEquity Hybrid Distribution Channel Retail (Private) Institutional (Private) Public Product Duration Closed-End Funds Open-End Funds Permanent Vehicles Vehicle Structure Commingled Funds Separate Accounts Public Entities Platform CapabilitiesPlatform Overview Scalable platform that supports growth of core property verticals and balance sheet-light tactical strategies Near-Term Priority Continue to grow industrial open-end fund, and accelerate fundraising in new retail vehicles and private equity funds

Colony NorthStar, Inc. 22 12/31/2016 Segment Products AUM ($bn) Description Institutional Funds ● Credit funds ● Core plus / value-added ● Opportunistic ● Colony Industrial open-end fund ● Other special accounts and co- investment vehicles 11.0 ● 25 years of institutional investment management experience ● Sponsorship of private equity funds and vehicles earnings asset management fees and performance fees ● More than 300 investor relationships ● $10 billion of private equity capital raised since the beginning of 2008; $24 billion of private equity capital raised since inception Retail Companies ● NorthStar Income I ● NorthStar Healthcare ● NorthStar Income II ● NorthStar/RXR NY Metro Real Estate ● NorthStar Real Estate Capital Income ● NorthStar/Townsend Institutional Real Estate Fund 6.8 ● Wholly-owned broker-deal subsidiary engaged as dealer- manager for all retail product offerings ● Over $4 billion of capital raised to date with over $5 billion of effective products ● Manage public non-traded vehicles earning asset management, performance, acquisition and disposition fees Public Company ● NorthStar Realty Europe Corp. 2.0 ● Manage NYSE-listed European equity REIT ● Earns base management fee with potential for incentive fees Townsend ● Segregrated Mandates ● Commingled Funds ● Advisory Services 14.6 ● 84% investment in The Townsend Group ● Manage custom portfolios and fund-of-funds primary invested in direct real estate funds ● Source co-investments and joint ventures alongside GPs ● Fees comprised of recurring investment management fees, recurring advisory fees, and performance fees Pro Rata Corporate Investments ● RXR Realty, LLC ● American Healthcare Investors ● Steelwave ● Hamburg Trust ● Other Joint Ventures 6.6 ● CLNS recognizes at-share earnings from underlying pro rata corporate investments ● 27% investment in RXR Realty, a real estate owner, developer and investment management company with over $12 billion of AUM ● 43% investment in American Healthcare Investors, a healthcare investment management firm and sponsor of non-traded vehicles with $2.5 billion of AUM Total $41.0 Investment Management Segment (cont’d)
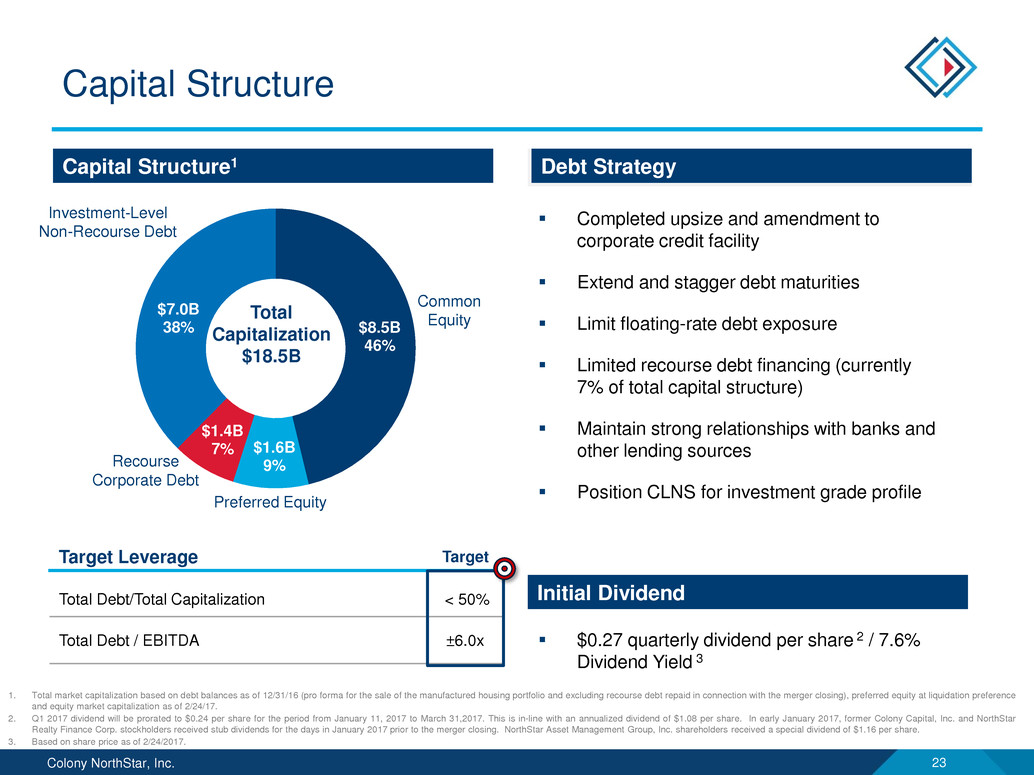
Colony NorthStar, Inc. 23 Initial Dividend Capital Structure1 Capital Structure 1. Total market capitalization based on debt balances as of 12/31/16 (pro forma for the sale of the manufactured housing portfolio and excluding recourse debt repaid in connection with the merger closing), preferred equity at liquidation preference and equity market capitalization as of 2/24/17. 2. Q1 2017 dividend will be prorated to $0.24 per share for the period from January 11, 2017 to March 31,2017. This is in-line with an annualized dividend of $1.08 per share. In early January 2017, former Colony Capital, Inc. and NorthStar Realty Finance Corp. stockholders received stub dividends for the days in January 2017 prior to the merger closing. NorthStar Asset Management Group, Inc. shareholders received a special dividend of $1.16 per share. 3. Based on share price as of 2/24/2017. Proactive Near-Term Debt Strategy Completed upsize and amendment to corporate credit facility Extend and stagger debt maturities Limit floating-rate debt exposure Limited recourse debt financing (currently 7% of total capital structure) Maintain strong relationships with banks and other lending sources Position CLNS for investment grade profile $0.27 quarterly dividend per share 2 / 7.6% Dividend Yield 3 Total Debt/Total Capitalization < 50% Total Debt / EBITDA ±6.0x Target Leverage $8.5B 46% $1.6B 9% $1.4B 7% $7.0B 38% Total Capitalization $18.5B Common Equity Preferred Equity Recourse Corporate Debt Investment-Level Non-Recourse Debt Debt Strategy Target
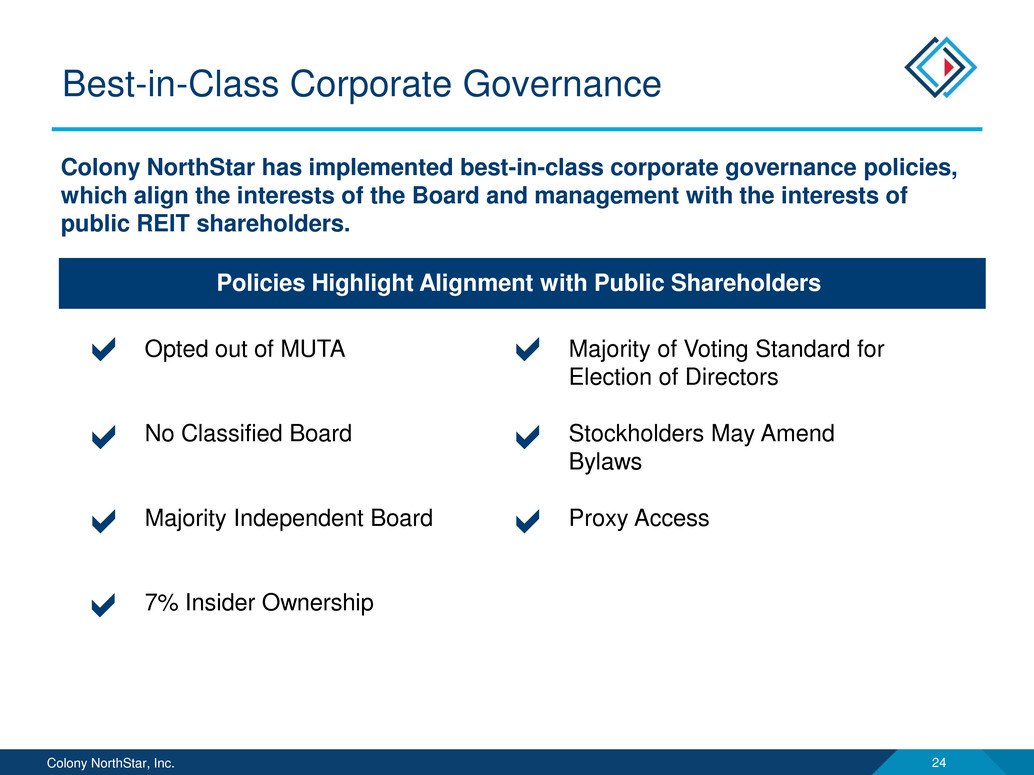
Colony NorthStar, Inc. 24 Best-in-Class Corporate Governance Colony NorthStar has implemented best-in-class corporate governance policies, which align the interests of the Board and management with the interests of public REIT shareholders. Policies Highlight Alignment with Public Shareholders Opted out of MUTA No Classified Board Majority Independent Board 7% Insider Ownership a a a Majority of Voting Standard for Election of Directors Stockholders May Amend Bylaws Proxy Access a a a a
APPENDIX

Colony NorthStar, Inc. 26 Attractive Sector Fundamentals Strong Demand – Light Industrial properties are the critical “last mile” and an essential part of the logistics chain Smaller infill locations are vital for e-commerce and other tenants that require increasingly quick delivery times Limited New Supply – As of 12/31/16, annual deliveries of new light industrial development is ~1% of inventory (compared to ~5% for Bulk Industrial) and is well below its peak over the past 15 years1 Long-Term, 3rd Party Capital Alongside Significant Balance Sheet Investment Third Party Capital – Successfully launched evergreen open-end fund in Q3 2016, providing channel for additional third-party institutional fundraising to continue growth of platform Closed on $311 million of commitments to date in open-end fund, bringing total third party capital in the platform to $669 million CLNS ownership reduced to ~49% from 62%; targeting ~25% through additional fundraising over time Significant Balance Sheet Investment – Over $618 million of balance sheet capital invested Potential to increase balance sheet investment to $1 to 2 billion as the platform grows over time Scalable, Vertically Integrated Business Large Market – Accounts for 63% of U.S. industrial market1 Fragmented Industry – Fragmented ownership of light industrial universe ripe for consolidation with limited competition from institutional investors Demonstrated Acquisition Capability – Portfolio scaled to over 37 million sf, including over 7 million sf acquired since Colony’s initial entrance to the business Vertically Integrated – Internally managed by Colony Industrial team Led by Lew Friedland, who founded Colony Industrial’s predecessor and assembled the portfolio over the past 14 years Core Property Vertical Case Study – Colony Industrial Source: Company filings as of 12/31/16. 1) CoStar Q4 2016 industrial data Colony Industrial serves as the template for execution of Colony NorthStar’s strategy for Core Strategic Real Estate Verticals
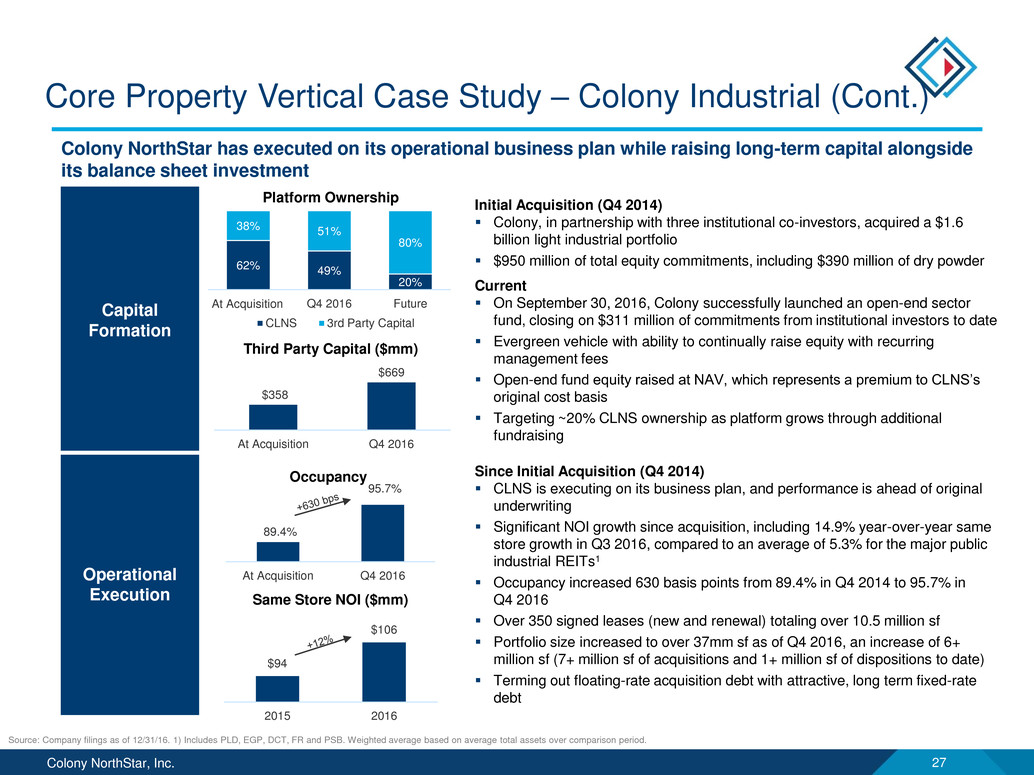
Colony NorthStar, Inc. 27 Capital Formation Initial Acquisition (Q4 2014) Colony, in partnership with three institutional co-investors, acquired a $1.6 billion light industrial portfolio $950 million of total equity commitments, including $390 million of dry powder Current On September 30, 2016, Colony successfully launched an open-end sector fund, closing on $311 million of commitments from institutional investors to date Evergreen vehicle with ability to continually raise equity with recurring management fees Open-end fund equity raised at NAV, which represents a premium to CLNS’s original cost basis Targeting ~20% CLNS ownership as platform grows through additional fundraising Operational Execution Since Initial Acquisition (Q4 2014) CLNS is executing on its business plan, and performance is ahead of original underwriting Significant NOI growth since acquisition, including 14.9% year-over-year same store growth in Q3 2016, compared to an average of 5.3% for the major public industrial REITs1 Occupancy increased 630 basis points from 89.4% in Q4 2014 to 95.7% in Q4 2016 Over 350 signed leases (new and renewal) totaling over 10.5 million sf Portfolio size increased to over 37mm sf as of Q4 2016, an increase of 6+ million sf (7+ million sf of acquisitions and 1+ million sf of dispositions to date) Terming out floating-rate acquisition debt with attractive, long term fixed-rate debt Core Property Vertical Case Study – Colony Industrial (Cont.) Colony NorthStar has executed on its operational business plan while raising long-term capital alongside its balance sheet investment 62% 49% 20% 38% 51% 80% Q4 2016 Future CLNS 3rd Party Capital At Acquisition Platform Ownership $358 $669 At Acquisition Q4 2016 Third Party Capital ($mm) 89.4% 95.7% At Acquisition Q4 2016 Occupancy $94 $106 2015 2016 Same Store NOI ($mm) Source: Company filings as of 12/31/16. 1) Includes PLD, EGP, DCT, FR and PSB. Weighted average based on average total assets over comparison period.

Colony NorthStar, Inc. 28 Core Property Vertical Case Study – Colony Starwood Homes Colony Starwood Homes is the successful culmination of building a platform/vertical from the “ground up” including capital formation, management team recruitment and property aggregation Thesis Colony American Homes (“CAH”) launched in March 2012 Generational mispricing opportunity – Historic housing price decline following Global Financial Crisis; homes priced at significant discount to replacement cost Highly fragmented sector – 16+ million single family homes for rent with <1% institutional ownership Strong fundamentals – Demographic / economic conditions encouraging increased rentership; limited new supply Successful Capital Formation Successful Capital Formation – $550 million of balance sheet (Colony Financial, Inc.) committed at the time alongside $1.7 billion of new limited partner capital - ~3:1 third party to balance sheet ratio Quick Execution – Final closing occurred in May 2013, which was approximately one year from initial capital raise launch Evolution Ground-up Operations – Built a vertically-integrated platform from the “ground up”, including acquisitions, construction management, leasing, property management and IT with experienced management team in place SFR Lending Platform – Created Colony American Finance, a lending platform that provides loans to single family home for rent investors Scaled Portfolio – Scaled portfolio to over 19,000 homes owned and managed prior to merging with SWAY Merger with SWAY – Merged CAH with SWAY and internalized SWAY’s external manager in January 2016, forming a combined company with $7.7 billion of asset value and over 30,000 homes
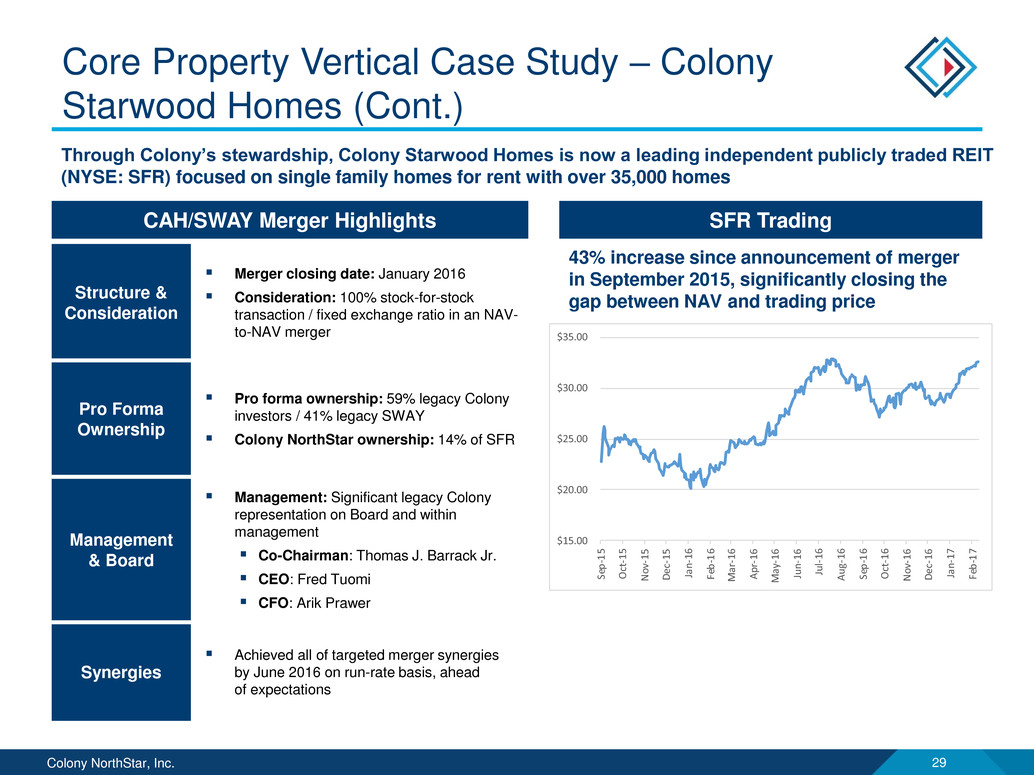
Colony NorthStar, Inc. 29 Core Property Vertical Case Study – Colony Starwood Homes (Cont.) Through Colony’s stewardship, Colony Starwood Homes is now a leading independent publicly traded REIT (NYSE: SFR) focused on single family homes for rent with over 35,000 homes Structure & Consideration Merger closing date: January 2016 Consideration: 100% stock-for-stock transaction / fixed exchange ratio in an NAV- to-NAV merger Pro Forma Ownership Pro forma ownership: 59% legacy Colony investors / 41% legacy SWAY Colony NorthStar ownership: 14% of SFR Management & Board Management: Significant legacy Colony representation on Board and within management Co-Chairman: Thomas J. Barrack Jr. CEO: Fred Tuomi CFO: Arik Prawer Synergies Achieved all of targeted merger synergies by June 2016 on run-rate basis, ahead of expectations SFR Trading 43% increase since announcement of merger in September 2015, significantly closing the gap between NAV and trading price CAH/SWAY Merger Highlights $15.00 $20.00 $25.00 $30.00 $35.00 Se p- 15 Oc t-1 5 No v-1 5 De c-1 5 Ja n- 16 Fe b- 16 M ar -1 6 Ap r-1 6 M ay -1 6 Ju n- 16 Ju l-1 6 Au g- 16 Se p- 16 Oc t-1 6 No v-1 6 De c-1 6 Ja n- 17 Fe b- 17
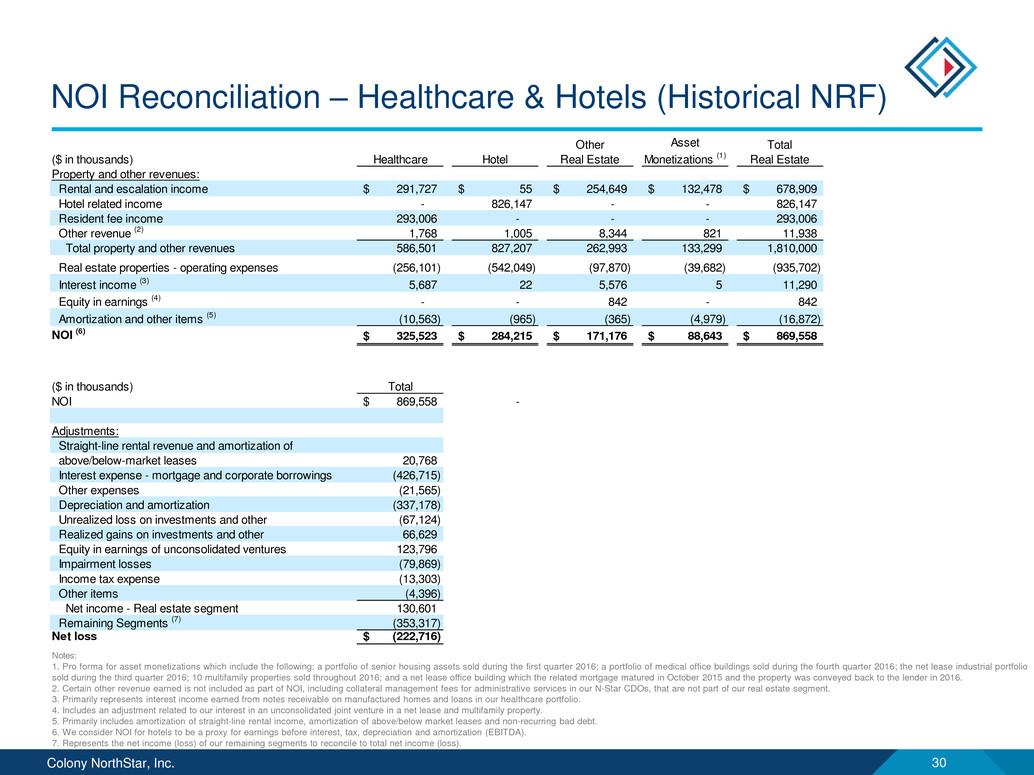
Colony NorthStar, Inc. 30 Notes: 1. Pro forma for asset monetizations which include the following: a portfolio of senior housing assets sold during the first quarter 2016; a portfolio of medical office buildings sold during the fourth quarter 2016; the net lease industrial portfolio sold during the third quarter 2016; 10 multifamily properties sold throughout 2016; and a net lease office building which the related mortgage matured in October 2015 and the property was conveyed back to the lender in 2016. 2. Certain other revenue earned is not included as part of NOI, including collateral management fees for administrative services in our N-Star CDOs, that are not part of our real estate segment. 3. Primarily represents interest income earned from notes receivable on manufactured homes and loans in our healthcare portfolio. 4. Includes an adjustment related to our interest in an unconsolidated joint venture in a net lease and multifamily property. 5. Primarily includes amortization of straight-line rental income, amortization of above/below market leases and non-recurring bad debt. 6. We consider NOI for hotels to be a proxy for earnings before interest, tax, depreciation and amortization (EBITDA). 7. Represents the net income (loss) of our remaining segments to reconcile to total net income (loss). NOI Reconciliation – Healthcare & Hotels (Historical NRF) ($ in thousands) Healthcare Hotel Other Real Estate Asset Monetizations (1) Total Real Estate Property and other revenues: Rental and escalation income 291,727$ 55$ 254,649$ 132,478$ 678,909$ Hotel related income - 826,147 - - 826,147 Resident fee income 293,006 - - - 293,006 Other revenue (2) 1,768 1,005 8,344 821 11,938 Total property and other revenues 586,501 827,207 262,993 133,299 1,810,000 Real estate properties - operating expenses (256,101) (542,049) (97,870) (39,682) (935,702) Interest income (3) 5,687 22 5,576 5 11,290 Equity in earnings (4) - - 842 - 842 Amortization and other items (5) (10,563) (965) (365) (4,979) (16,872) NOI (6) 325,523$ 284,215$ 171,176$ 88,643$ 869,558$ ($ in thousands) Total NOI 869,558$ - Adjustments: Straight-line rental revenue and amortization of above/below-market leases 20,768 Interest expense - mortgage and corporate borrowings (426,715) Other expenses (21,565) Depreciation and amortization (337,178) Unrealized loss on investments and other (67,124) Realized gains on investments and other 66,629 Equity in earnings of unconsolidated ventures 123,796 Impairment losses (79,869) Income tax expense (13,303) Other items (4,396) Net income - Real estate segment 130,601 Remaining Segments (7) (353,317) Net loss (222,716)$
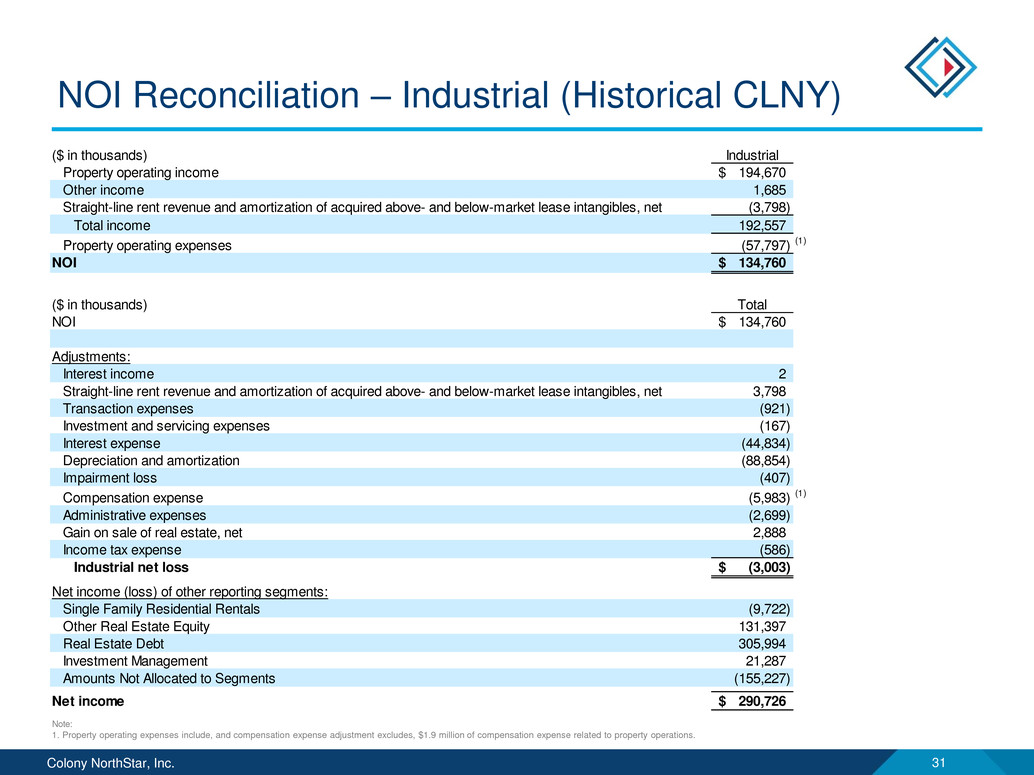
Colony NorthStar, Inc. 31 NOI Reconciliation – Industrial (Historical CLNY) ($ in thousands) Industrial Property operating income 194,670$ Other income 1,685 Straight-line rent revenue and amortization of acquired above- and below-market lease intangibles, net (3,798) Total income 192,557 Property operating expenses (57,797) (1) NOI 134,760$ ($ in thousands) Total NOI 134,760$ Adjustments: Interest income 2 Straight-line rent revenue and amortization of acquired above- and below-market lease intangibles, net 3,798 Transaction expenses (921) Investment and servicing expenses (167) Interest expense (44,834) Depreciation and amortization (88,854) Impairment loss (407) Compensation expense (5,983) (1) Administrative expenses (2,699) Gain on sale of real estate, net 2,888 Income tax expense (586) Industrial net loss (3,003)$ Net income (loss) of other reporting segments: Single Family Residential Rentals (9,722) Other Real Estate Equity 131,397 Real Estate Debt 305,994 Investment Management 21,287 Amounts Not Allocated to Segments (155,227) Net income 290,726$ Note: 1. Property operating expenses include, and compensation expense adjustment excludes, $1.9 million of compensation expense related to property operations.

Colony NorthStar, Inc. 32 Presentation Endnotes Assets Under Management (“AUM”): Refers to assets which the Company and its affiliates provides investment management services, including assets for which the Company may or may not charge management fees and/or performance allocations. AUM is generally based on reported gross carrying value or cost basis of managed investments as reported by each underlying vehicle at December 31, 2016, proforma for NRF asset monetizations, while legacy NRF real estate assets are based on preliminary merger purchase price accounting figures and for retail companies and NorthStar Realty Europe presented as of February 24, 2017. AUM further includes a) uncalled capital commitments and b) for corporate investments in affiliates with asset and investment management functions, includes the Company’s pro-rata share assets of each affiliate as presented and calculated by the affiliate. Affiliates include RXR Realty LLC, SteelWave, LLC, American Healthcare Investors and Hamburg Trust. The Company's calculations of AUM may differ materially from the calculations of other asset managers, and as a result, this measure may not be comparable to similar measures presented by other asset managers.


