Exhibit 99.62
Feasibility Study
NI 43-101 Technical Report on the Camino Rojo Gold Project
Municipality of Mazapil, Zacatecas, Mexico
Prepared for:

202 – 595 Howe Street
Vancouver, BC, V6C 2T5
Canada
Prepared by:
 | Kappes, Cassiday & Associates
7950 Security Circle
Reno, NV 89506 |
Report Effective Date: 25 June 2019
Mineral Reserve Effective Date: 24 June 2019
Authors:
Carl Defilippi, Kappes, Cassiday & Associates, RM SME
Michael Hester, Independent Mining Consultants, Inc., FAusIMM
Dr. Matthew Gray, Resource Geosciences Incorporated, CPG
David Hawkins, Barranca Group, LLC, CPG
| Camino Rojo Project Feasibility Study NI 43-101 Technical Report |
|
Contents
| 1.0 SUMMARY | 1-1 |
| | |
| 1.1 Introduction and Overview | 1-1 |
| 1.2 Property Description and Ownership | 1-1 |
| 1.3 Geology & Mineralization | 1-2 |
| 1.4 Exploration and Drilling | 1-3 |
| 1.5 Metallurgical Test Work | 1-4 |
| 1.6 Mineral Resource Estimate | 1-5 |
| 1.7 Mineral Reserve Estimate | 1-8 |
| 1.8 Mining Methods | 1-11 |
| 1.9 Recovery Methods | 1-11 |
| 1.10 Infrastructure | 1-12 |
| 1.11 Environmental Studies, Permitting and Social or Community Impact | 1-13 |
| 1.12 Capital and Operating Costs | 1-15 |
| 1.13 Cautionary Statements | 1-17 |
| 1.13.1 Forward Looking Information | 1-17 |
| 1.13.2 Non-IFRS Measures | 1-18 |
| 1.14 Economic Analysis | 1-19 |
| 1.15 Interpretations and Conclusions | 1-22 |
| 1.15.1 Conclusions | 1-22 |
| 1.15.2 Opportunities | 1-22 |
| 1.15.3 Risks | 1-23 |
| 1.15.3.1 Mining | 1-23 |
| 1.15.3.2 Metallurgy and Process | 1-24 |
| 1.15.3.3 Access, Title and Permitting | 1-24 |
| 1.15.3.4 Other Risks | 1-25 |
| 1.16 Recommendations | 1-26 |
| 1.16.1 KCA Recommendations | 1-26 |
| 1.16.2 RGI Recommendations | 1-26 |
| 1.16.3 Barranca Recommendations | 1-26 |
| | |
| 2.0 INTRODUCTION | 2-1 |
| | |
| 2.1 Introduction and Overview | 2-1 |
| 2.2 Project Scope and Terms of Reference | 2-1 |
| 2.2.1 Scope of Work | 2-1 |
| 2.2.2 Terms of Reference | 2-3 |
| 2.3 Sources of Information | 2-3 |
| 2.4 Qualified Persons and Site Visits | 2-4 |
| 2.5 Frequently Used Acronyms, Abbreviations, Definitions and Units of Measure | 2-6 |
Kappes, Cassiday & Associates June, 2019 | | Contents Page 1 |
| Camino Rojo Project Feasibility Study NI 43-101 Technical Report |
|
| 3.0 RELIANCE ON OTHER EXPERTS | 3-1 |
| | |
| 4.0 PROPERTY DESCRIPTION AND LOCATION | 4-1 |
| | |
| 4.1 Area and Location | 4-1 |
| 4.2 Claims and Title | 4-2 |
| 4.2.1 Orla Control of Mining Concessions via Acquisition from Minera Peñasquito SA de CV | 4-6 |
| 4.2.2 Pending Concession Reductions | 4-7 |
| 4.3 Surface Rights | 4-7 |
| 4.4 Environmental Liability | 4-10 |
| 4.5 Permits | 4-11 |
| 4.6 Access, Title, Permit and Security Risks | 4-11 |
| 4.6.1 Access Risks | 4-11 |
| 4.6.2 Title Risks | 4-11 |
| 4.6.3 Permit Risks | 4-12 |
| 4.6.4 Security Risks | 4-13 |
| 4.7 Royalties | 4-13 |
| | |
| 5.0 ACCESSIBILITY, CLIMATE, LOCAL RESOURCES, AND PHYSIOGRAPHY | 5-1 |
| | |
| 5.1 Accessibility | 5-1 |
| 5.2 Physiography, Climate and Vegetation | 5-3 |
| 5.3 Local Resources and Infrastructure | 5-4 |
| | |
| 6.0 HISTORY | 6-1 |
| | |
| 6.1 Prior Ownership | 6-1 |
| 6.2 Prior Exploration | 6-1 |
| 6.3 Historical Metallurgical Studies | 6-4 |
| 6.4 Historical Resource Estimates | 6-4 |
| 6.4.1 Canplats | 6-4 |
| 6.4.2 Goldcorp | 6-4 |
| 6.5 Prior Production | 6-4 |
| | |
| 7.0 GEOLOGICAL SETTING AND MINERALIZATION | 7-1 |
| | |
| 7.1 Sources of Information | 7-1 |
| 7.2 Regional Geology | 7-1 |
| 7.3 Local Geology | 7-4 |
| 7.3.1 General Deposit Geology | 7-4 |
| 7.3.2 Structural Setting | 7-7 |
| 7.3.3 Mineralized Zones | 7-7 |
| 7.3.4 Alteration | 7-11 |
| 7.4 Oxidation | 7-11 |
| 7.5 Conclusions | 7-13 |
Kappes, Cassiday & Associates June, 2019 | | Contents Page 2 |
| Camino Rojo Project Feasibility Study NI 43-101 Technical Report |
|
| 8.0 DEPOSIT TYPES | 8-1 |
| | |
| 9.0 EXPLORATION | 9-1 |
| | |
| 10.0 DRILLING | 10-1 |
| | |
| 10.1 General | 10-1 |
| 10.2 Canplats Drilling | 10-2 |
| 10.3 Goldcorp Drilling | 10-3 |
| 10.4 Orla Drilling | 10-4 |
| 10.5 Sampling | 10-5 |
| 10.5.1 Canplats and Goldcorp Sampling | 10-5 |
| 10.5.2 Orla Sampling | 10-6 |
| 10.6 Conclusions | 10-6 |
| 10.6.1 IMC Conclusion | 10-6 |
| 10.6.2 RGI Conclusion | 10-6 |
| | |
| 11.0 SAMPLE PREPARATION, ANALYSES AND SECURITY | 11-1 |
| | |
| 11.1 Sample Preparation | 11-1 |
| 11.2 Analyses | 11-1 |
| 11.3 QA/QC Programs | 11-2 |
| 11.3.1 Canplats QA/QC Program | 11-2 |
| 11.3.2 Goldcorp QA/QC Program | 11-2 |
| 11.3.3 Orla QA/QC Program | 11-4 |
| 11.4 Sample Security | 11-6 |
| 11.4.1 Canplats and Goldcorp Sample Security | 11-6 |
| 11.4.2 Orla Sample Security | 11-6 |
| | |
| 12.0 DATA VERIFICATION | 12-1 |
| | |
| 12.1 Resource Model Data | 12-1 |
| 12.1.1 Canplats and Goldcorp Drill Data | 12-1 |
| 12.1.1.1 Assay Data | 12-1 |
| 12.1.1.2 Collar Locations | 12-1 |
| 12.1.1.3 Canplats RC Data | 12-2 |
| 12.1.2 Orla Drill Data | 12-3 |
| 12.1.3 Historical Data Reviews | 12-3 |
| 12.1.3.1 Canplats | 12-3 |
| 12.1.3.2 Goldcorp | 12-3 |
| 12.2 Metallurgical Test Data | 12-4 |
| 12.3 Site Visits by Qualified Persons | 12-4 |
Kappes, Cassiday & Associates June, 2019 | | Contents Page 3 |
| Camino Rojo Project Feasibility Study NI 43-101 Technical Report |
|
| 13.0 MINERAL PROCESSING AND METALLURGICAL TESTING | 13-1 |
| | |
| 13.1 Canplats (2009 & 2010) | 13-3 |
| 13.1.1 SGS Mineral Services (2009) | 13-3 |
| 13.1.1.1 SGS Mineral Services 2009 – Column Leach Tests | 13-3 |
| 13.1.1.2 SGS Mineral Services 2009 – Bottle Roll Leach Tests | 13-5 |
| 13.1.1.3 SGS Mineral Services 2009 – Flotation Tests | 13-7 |
| 13.1.2 Kappes, Cassiday & Associates (2010) | 13-8 |
| 13.1.2.1 Kappes, Cassiday & Associates (2010) – Head Analyses and Cyanide Shake Tests | 13-8 |
| 13.1.2.2 Kappes, Cassiday & Associates (2010) – Column Leach Tests | 13-11 |
| 13.2 Goldcorp (2012-2015) | 13-12 |
| 13.2.1 Kappes, Cassiday & Associates (2012) | 13-13 |
| 13.2.1.1 Kappes, Cassiday & Associates (2012) - Head Analyses | 13-13 |
| 13.2.1.2 Kappes, Cassiday & Associates (2012) – Bottle Roll Leach Tests | 13-15 |
| 13.2.1.3 Kappes, Cassiday & Associates (2012) – Column Leach Test Work | 13-19 |
| 13.2.2 Blue Coast Research Metallurgy (2012-2013) | 13-21 |
| 13.2.3 Hazen Research (2014) | 13-22 |
| 13.2.4 Comminution Testing | 13-22 |
| 13.2.5 Kappes, Cassiday & Associates (2014 & 2015) | 13-23 |
| 13.2.5.1 Kappes, Cassiday & Associates (2015) – Head Analyses | 13-26 |
| 13.2.5.2 Kappes, Cassiday & Associates (2014 & 2015) – Bottle Roll Leach Tests | 13-29 |
| 13.2.5.3 Kappes, Cassiday & Associates (2015) – Column Leach Test Work | 13-31 |
| 13.3 Orla (2019) | 13-32 |
| 13.3.1 Kappes, Cassiday & Associates (2019) | 13-33 |
| 13.3.1.1 Kappes, Cassiday & Associates (2019) – Head Analyses & Physical Characterization | 13-37 |
| 13.3.1.2 Kappes, Cassiday & Associates (2019) – Bottle Roll Leach Tests | 13-41 |
| 13.3.1.3 Kappes, Cassiday & Associates (2019) – Agglomeration Test Work | 13-42 |
| 13.3.1.4 Kappes, Cassiday & Associates (2019) – Column Leach Test Work | 13-42 |
| 13.3.1.5 Kappes, Cassiday & Associates (2019) – Diagnostic Leach Test Work | 13-47 |
| 13.4 Conclusions from Metallurgical Programs | 13-48 |
| 13.4.1 Crush Size and Recovery | 13-50 |
| 13.4.2 Leach Cycle | 13-53 |
| 13.4.3 Reagent Consumption Projection | 13-53 |
| 13.4.3.1 Cyanide | 13-53 |
| 13.4.3.2 Lime | 13-54 |
| 13.5 Preg Robbing Discussion | 13-54 |
| 13.6 Sulphide Mineralization Discussion | 13-58 |
Kappes, Cassiday & Associates June, 2019 | | Contents Page 4 |
| Camino Rojo Project Feasibility Study NI 43-101 Technical Report |
|
| 14.0 MINERAL RESOURCE ESTIMATES | 14-1 |
| | |
| 14.1 Mineral Resource | 14-1 |
| 14.1.1 Metal Prices for Mineral Resources | 14-3 |
| 14.1.2 Cost and Recovery Estimates for Mineral Resources | 14-3 |
| 14.1.3 Parameters for Mill Material | 14-6 |
| 14.1.4 Additional Information | 14-7 |
| 14.2 Description of the Block Model | 14-10 |
| 14.2.1 General | 14-10 |
| 14.2.2 Geological Controls | 14-10 |
| 14.2.3 Potentially Contaminated RC Samples | 14-20 |
| 14.2.4 Cap Grades and Compositing | 14-20 |
| 14.2.5 Variograms | 14-27 |
| 14.2.5.1 Northeast Domain | 14-27 |
| 14.2.5.2 Southwest Domain | 14-27 |
| 14.2.6 Block Grade Estimation | 14-33 |
| 14.2.7 Resource Classification | 14-38 |
| 14.2.8 Bulk Density | 14-45 |
| 14.2.9 Mineral Resource Reconciliation | 14-46 |
| 14.2.9.1 Leach Material | 14-46 |
| 14.2.9.2 Mill Material | 14-47 |
| 14.2.9.3 Total Leach Plus Mill Material | 14-47 |
| | |
| 15.0 MINERAL RESERVE ESTIMATE | 15-1 |
| | |
| 15.1 Mineral Reserve | 15-1 |
| 15.2 Economic Parameters | 15-4 |
| | |
| 16.0 MINING METHODS | 16-1 |
| | |
| 16.1 Operating Parameters and Criteria | 16-1 |
| 16.2 Slope Angles | 16-1 |
| 16.3 Final Pit Design | 16-4 |
| 16.4 Mine Production Schedule | 16-6 |
| 16.5 Waste Storage Area and Stockpile | 16-11 |
| 16.6 Mining Equipment | 16-22 |
| | |
| 17.0 RECOVERY METHODS | 17-1 |
| | |
| 17.1 Process Design Basis | 17-1 |
| 17.2 Process Summary | 17-2 |
| 17.3 Crushing | 17-6 |
| 17.4 Reclamation and Conveyor Stacking | 17-7 |
| 17.5 Leach Pad Design | 17-8 |
| 17.6 Solution Application & Storage | 17-12 |
Kappes, Cassiday & Associates June, 2019 | | Contents Page 5 |
| Camino Rojo Project Feasibility Study NI 43-101 Technical Report |
|
| 17.7 Process Water Balance | 17-16 |
| 17.7.1 Precipitation Data | 17-16 |
| 17.7.2 Water Balance | 17-18 |
| 17.8 Merrill-Crowe Recovery Plant | 17-22 |
| 17.8.1 Refinery | 17-25 |
| 17.8.2 Process Reagents and Consumables | 17-26 |
| 17.8.2.1 Lime | 17-27 |
| 17.8.2.2 Sodium Cyanide | 17-27 |
| 17.8.2.3 Zinc | 17-30 |
| 17.8.2.4 Lead Nitrate | 17-30 |
| 17.8.2.5 Diatomaceous Earth | 17-30 |
| 17.8.2.6 Antiscalant | 17-30 |
| 17.8.2.7 Fluxes | 17-30 |
| | |
| 18.0 PROJECT INFRASTRUCTURE | 18-1 |
| | |
| 18.1 Infrastructure | 18-1 |
| 18.1.1 Existing Installations | 18-1 |
| 18.1.2 Site Roads | 18-1 |
| 18.1.3 Mine Haulage Road | 18-1 |
| 18.1.4 Project Buildings | 18-2 |
| 18.1.5 Administrative Offices | 18-2 |
| 18.1.6 Mine Camp Facilities | 18-2 |
| 18.1.7 Merrill-Crowe Process Facility | 18-4 |
| 18.1.8 Refinery | 18-4 |
| 18.1.9 Laboratory | 18-5 |
| 18.1.10 Process Maintenance Workshop | 18-5 |
| 18.1.11 Reagent Storage | 18-5 |
| 18.1.12 Mine Truck Shop | 18-5 |
| 18.1.13 Light Duty Truck Shop | 18-6 |
| 18.1.14 Fuel Storage and Dispensing | 18-6 |
| 18.1.15 Warehouse and Fenced Laydown Yard | 18-6 |
| 18.1.16 Magazine Site | 18-6 |
| 18.1.17 Guard Shack and Security | 18-7 |
| 18.1.18 Medical Clinic | 18-7 |
| 18.1.19 Fenced Areas | 18-7 |
| 18.1.20 Airstrip | 18-8 |
| 18.2 Power Supply, Communication Systems & IT | 18-8 |
| 18.2.1 Power Supply | 18-8 |
| 18.2.2 Site Distribution | 18-9 |
| 18.2.3 Estimated Electric Power Consumption | 18-9 |
| 18.2.4 Emergency Power | 18-10 |
| 18.2.5 Communications | 18-10 |
Kappes, Cassiday & Associates June, 2019 | | Contents Page 6 |
| Camino Rojo Project Feasibility Study NI 43-101 Technical Report |
|
| 18.3 Water | 18-10 |
| 18.3.1 Water Supply | 18-10 |
| 18.3.2 Potable and Domestic Water | 18-11 |
| 18.3.3 Fire Water and Protection | 18-11 |
| 18.3.4 Surface Water Management | 18-12 |
| 18.4 Sewage | 18-12 |
| | |
| 19.0 MARKET STUDIES AND CONTRACTS | 19-1 |
| | |
| 20.0 ENVIRONMENTAL STUDIES, PERMITTING AND SOCIAL OR COMMUNITY IMPACT | 20-1 |
| | |
| 20.1 Environmental Studies | 20-1 |
| 20.1.1 Project Area Description | 20-1 |
| 20.1.1.1 Climate | 20-1 |
| 20.1.1.2 Soils | 20-1 |
| 20.1.1.3 Hydrology | 20-1 |
| 20.1.1.4 Physiography | 20-2 |
| 20.1.1.5 Seismicity | 20-2 |
| 20.1.1.6 Vegetation | 20-2 |
| 20.1.1.7 Fauna | 20-3 |
| 20.1.2 Environmental Management Plans | 20-3 |
| 20.1.2.1 Surface Water Management | 20-3 |
| 20.1.2.2 Ground Water Management | 20-4 |
| 20.1.2.3 Air Quality Management | 20-5 |
| 20.1.2.4 Wildlife Management | 20-5 |
| 20.1.2.5 Cyanide Management Plan | 20-5 |
| 20.1.3 Waste Handling | 20-5 |
| 20.1.3.1 Hazardous Wastes | 20-5 |
| 20.1.3.2 Non-hazardous Wastes | 20-5 |
| 20.1.3.3 Putrescible (Domestic) Waste Disposal | 20-6 |
| 20.1.3.4 Boneyard Storage | 20-6 |
| 20.1.3.5 On-site BioRemediation Cell | 20-6 |
| 20.1.3.6 Waste Water (Sewage) Disposal | 20-6 |
| 20.1.4 Reclamation | 20-6 |
| 20.1.4.1 Soil Handling | 20-8 |
| 20.1.4.2 Camp | 20-8 |
| 20.1.4.3 Central Operating Area | 20-8 |
| 20.1.4.4 Mine Pits | 20-8 |
| 20.1.4.5 Waste Rock Storage Facility (Mine Waste Dumps) | 20-9 |
| 20.1.4.6 Roads | 20-11 |
Kappes, Cassiday & Associates June, 2019 | | Contents Page 7 |
| Camino Rojo Project Feasibility Study NI 43-101 Technical Report |
|
| 20.1.5 Closure Activities – Heap Leach Facilities | 20-13 |
| 20.1.5.1 Chemistry | 20-13 |
| 20.1.5.2 Permanent Surface Water Diversion Works | 20-14 |
| 20.1.5.3 Permanent Slope Stabilization | 20-14 |
| 20.1.5.4 Final Engineering and Monitoring Plans | 20-15 |
| 20.1.5.5 Heap Rinsing, Neutralization and Solution Management of HLP Seepage | 20-15 |
| 20.1.5.6 Heap Slope Grooming and Slope Stabilization | 20-16 |
| 20.1.5.7 Cover, Topsoil Placement and Revegetation of Heap and Surrounding Areas | 20-16 |
| 20.1.5.8 Ponds and Pump Stations | 20-16 |
| 20.1.5.9 Physical and Mobile Equipment | 20-16 |
| 20.1.5.10 Roads, Diversion Works and Erosion Controls | 20-17 |
| 20.1.5.11 Fencing | 20-17 |
| 20.1.6 Post Closure Activities | 20-17 |
| 20.1.6.1 Physical Monitoring and Maintenance | 20-17 |
| 20.1.6.2 Geochemical Monitoring and Maintenance | 20-17 |
| 20.1.6.3 Biological Monitoring and Maintenance | 20-18 |
| 20.1.6.4 Surplus Water Management | 20-18 |
| 20.1.7 Closure Cost Estimates – Heap Leach Facilities | 20-19 |
| 20.2 Permitting | 20-20 |
| 20.3 Social and Community Impact | 20-25 |
| 20.3.1 Background | 20-25 |
| 20.3.2 Population and Demographics | 20-26 |
| 20.3.2.1 Indigenous Communities | 20-26 |
| 20.3.2.2 Inhabitants, Age and Gender | 20-26 |
| 20.3.2.3 Education | 20-28 |
| 20.3.3 Infrastructure and Public Services | 20-29 |
| 20.3.4 Government and Community | 20-31 |
| 20.3.5 Economic Activity, Income, Marginalization | 20-33 |
| 20.3.6 Social Management System and Mitigation of Negative Impacts | 20-35 |
| | |
| 21.0 CAPITAL AND OPERATING COSTS | 21-1 |
| | |
| 21.1 Capital Expenditures | 21-2 |
| 21.1.1 Mining Capital Costs | 21-4 |
| 21.1.1.1 Mining Contractor Mobilization and Demobilization | 21-4 |
| 21.1.1.2 Mining Owner Equipment | 21-4 |
| 21.1.1.3 Mine Development (Preproduction) | 21-6 |
Kappes, Cassiday & Associates June, 2019 | | Contents Page 8 |
| Camino Rojo Project Feasibility Study NI 43-101 Technical Report |
|
| 21.1.2 Process and Infrastructure Capital Cost Estimate | 21-7 |
| 21.1.2.1 Process and Infrastructure Capital Cost Basis | 21-7 |
| 21.1.2.2 Major Earthworks and Liner | 21-8 |
| 21.1.2.3 Civils | 21-9 |
| 21.1.2.4 Structural Steel | 21-9 |
| 21.1.2.5 Platework | 21-9 |
| 21.1.2.6 Mechanical Equipment | 21-9 |
| 21.1.2.7 Piping | 21-10 |
| 21.1.2.8 Electrical | 21-10 |
| 21.1.2.9 Instrumentation | 21-11 |
| 21.1.2.10 Infrastructure & Buildings | 21-11 |
| 21.1.2.11 Supplier Engineering and Installation Supervision / Commissioning | 21-12 |
| 21.1.2.12 Process Mobile Equipment | 21-12 |
| 21.1.2.13 Spare Parts | 21-12 |
| 21.1.2.14 Process & Infrastructure Contingency | 21-12 |
| 21.1.2.15 Process & Infrastructure Sustaining Capital | 21-13 |
| 21.1.3 Construction Indirect Costs | 21-13 |
| 21.1.4 Other Owner’s Construction Costs | 21-14 |
| 21.1.5 Initial Fills Inventory | 21-15 |
| 21.1.6 Engineering, Procurement & Construction Management | 21-16 |
| 21.1.7 Working Capital | 21-17 |
| 21.1.8 IVA | 21-17 |
| 21.1.9 Exclusions | 21-17 |
| 21.2 Operating Costs | 21-17 |
| 21.2.1 Mining Operating Costs | 21-18 |
| 21.2.1.1 Contract Mining Cost Basis | 21-20 |
| 21.2.1.2 Blasting & Mine Technical Services Costs | 21-20 |
| 21.2.1.3 Pit Wall Support Costs | 21-20 |
| 21.2.1.4 Presplitting for Wall Control | 21-21 |
| 21.2.2 Process and G&A Operating Costs | 21-25 |
| 21.2.2.1 Personnel and Staffing | 21-27 |
| 21.2.2.2 Power | 21-27 |
| 21.2.2.3 Consumable Items | 21-28 |
| 21.2.2.4 Heap Leach Consumables | 21-28 |
| 21.2.2.5 Recovery Plant Consumables | 21-29 |
| 21.2.2.6 Laboratory | 21-29 |
| 21.2.2.7 Fuel | 21-29 |
| 21.2.2.8 Miscellaneous Operating & Maintenance Supplies | 21-29 |
| 21.2.2.9 Mobile / Support Equipment | 21-30 |
| 21.2.2.10 G&A Expenses | 21-30 |
| 21.3 Reclamation & Closure Costs | 21-32 |
Kappes, Cassiday & Associates June, 2019 | | Contents Page 9 |
| Camino Rojo Project Feasibility Study NI 43-101 Technical Report |
|
| 22.0 ECONOMIC ANALYSIS | 22-1 |
| | |
| 22.1 Summary | 22-1 |
| 22.2 Methodology | 22-4 |
| 22.2.1 General Assumptions | 22-4 |
| 22.3 Capital Expenditures | 22-6 |
| 22.4 Metal Production | 22-8 |
| 22.5 Royalties | 22-9 |
| 22.6 Operating Costs | 22-9 |
| 22.7 Closure Costs | 22-9 |
| 22.8 Taxation | 22-9 |
| 22.8.1 Value Added Tax (IVA) | 22-9 |
| 22.8.2 Federal Income Tax | 22-10 |
| 22.8.3 Special Mining Tax | 22-10 |
| 22.8.4 Zacatecas Environmental “Green Tax” | 22-10 |
| 22.8.5 Depreciation | 22-10 |
| 22.8.6 Loss Carry Forward | 22-11 |
| 22.9 Economic Model & Cash Flow | 22-11 |
| 22.10 Sensitivity | 22-14 |
| | |
| 23.0 ADJACENT PROPERTIES | 23-1 |
| | |
| 24.0 OTHER RELEVANT DATA AND INFORMATION | 24-1 |
| | |
| 24.1 Project Implementation | 24-1 |
| 24.1.1 Project Development | 24-1 |
| 24.1.2 Project Controls | 24-1 |
| 24.1.3 Procurement and Logistics | 24-2 |
| 24.1.4 Construction | 24-2 |
| 24.1.5 Construction Schedule | 24-3 |
| 24.2 Site Geotechnical Analyses | 24-5 |
| 24.2.1 Heap Leach Pad Stability | 24-5 |
| 24.3 Hydrogeology | 24-5 |
| 24.3.1 Occurrence and Movement of Groundwater | 24-6 |
| 24.3.2 Groundwater Quality | 24-8 |
| 24.3.3 Drilling and Aquifer Testing | 24-11 |
| 24.3.4 Computer Modeling of Effects of Proposed Groundwater Withdrawal | 24-12 |
| 24.3.4.1 Summary of Computer Modeling | 24-12 |
| 24.3.5 Model Limitations | 24-16 |
| 24.4 Sulphides | 24-16 |
Kappes, Cassiday & Associates June, 2019 | | Contents Page 10 |
| Camino Rojo Project Feasibility Study NI 43-101 Technical Report |
|
| 25.0 INTERPRETATIONS AND CONCLUSIONS | 25-1 |
| | |
| 25.1 Conclusions | 25-1 |
| 25.1.1 Mining | 25-1 |
| 25.1.2 Metallurgy and Process | 25-1 |
| 25.1.3 Environmental and Permitting | 25-2 |
| 25.2 Opportunities | 25-3 |
| 25.2.1 Mining | 25-3 |
| 25.2.2 Mineral Resource | 25-3 |
| 25.2.3 Metallurgy and Process | 25-3 |
| 25.2.4 New Mineral Zones | 25-4 |
| 25.3 Risks | 25-4 |
| 25.3.1 Mining | 25-4 |
| 25.3.2 Metallurgy and Process | 25-5 |
| 25.3.3 Access, Title and Permitting | 25-5 |
| 25.3.4 Other Risks | 25-6 |
| | |
| 26.0 RECOMMENDATIONS | 26-1 |
| | |
| 26.1 KCA Recommendations | 26-1 |
| 26.2 RGI Recommendations | 26-1 |
| 26.3 Barranca Recommendations | 26-2 |
| | |
| 27.0 REFERENCES | 27-1 |
| | |
| 28.0 DATE AND SIGNATURE PAGE | 28-1 |
Kappes, Cassiday & Associates June, 2019 | | Contents Page 11 |
| Camino Rojo Project Feasibility Study NI 43-101 Technical Report |
|
FIGURES
| Figure 1-1 After-Tax IRR vs. Gold Price, Capital Cost, Operating Cost & Exchange Rate | 1-21 |
| Figure 1-2 NPV @ 5% vs. Gold Price, Capital Cost, Operating Cost & Exchange Rate | 1-21 |
| Figure 4-1 Location Map, Camino Rojo Project | 4-2 |
| Figure 4-2 Mining Concessions, Camino Rojo Property | 4-5 |
| Figure 4-3 Surface rights in Project Area | 4-8 |
| Figure 5-1 Project Location and Regional Infrastructure | 5-2 |
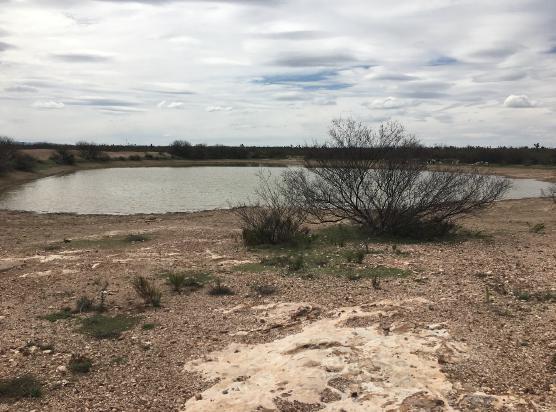
| Figure 5-2 View of Typical Topography and Vegetation at Camino Rojo | 5-3 |
| Figure 6-1 Historical Drillhole Locations and Project Claim Boundaries | 6-3 |
| Figure 7-1 Regional Geologic Map (Servicio Geológico Mexicano, 2000) | 7-3 |
| Figure 7-2 Local Geology, Camino Rojo Deposit (Servicio Geológico Mexicano, 2014) | 7-5 |
| Figure 7-3 Drillcore from CR12-345D, 818m | 7-6 |
| Figure 7-4 Drillcore from CR12-345D, 254m | 7-6 |
| Figure 7-5 Drillcore from CR12-345D, 993m | 7-7 |
| Figure 7-6 Drillcore from CR12 345D, 395m | 7-9 |
| Figure 7-7 Drillcore from CR12 345D, 727m | 7-9 |
| Figure 7-8 Drillcore from CR11 267D, 490m | 7-10 |
| Figure 7-9 Drillcore from CR11 267D, 473m | 7-10 |
| Figure 7-10 Drillcore from CR11 258D, 256m | 7-12 |
| Figure 7-11 Drillcore from CR11 258D, 257m | 7-12 |
| Figure 9-1 Chargeability Features, 300m to 400m, from Orla’s 2018 and 2019 IP Survey | 9-1 |
| Figure 10-1 Drilling by Type, IMC 2019 | 10-7 |
| Figure 10-2 Drilling by Company, IMC 2019 | 10-8 |
| Figure 13-1 Column Leach Test Sample Locations (Orla, 2019) | 13-2 |
| Figure 13-2 Preg-Robbing Percentage vs. CIL & Direct Bottle Roll Leach Test Recoveries – KCA 2014 | 13-29 |
| Figure 13-3 Preg-Robbing Percentage vs. CIL & Direct Bottle Roll Leach Test Recoveries – KCA 2015 | 13-30 |
| Figure 13-4 CIL-Direct Bottle Roll Au Extraction Difference vs. Organic Carbon Content – KCA 2015 | 13-31 |
| Figure 13-5 Sample Drill Hole Locations for KCA 2019 Test Program | 13-34 |
| Figure 13-6 Water Wash Summary | 13-46 |
| Figure 13-7 Detoxification Summary, INCO SO2 | 13-46 |
| Figure 13-8 Diagnostic Leach Results Summary – KCA 2019 | 13-48 |
| Figure 13-9 Kp Oxide Recovery vs. Crush Size | 13-50 |
| Figure 13-10 Ki Oxide Recovery vs. Crush Size | 13-51 |
| Figure 13-11 Trans-Hi Recovery vs. Crush Size | 13-51 |
| Figure 13-12 Trans-Lo Recovery vs. Crush Size | 13-52 |
| Figure 13-13 Organic Carbon Versus Preg-Robbing | 13-56 |
Kappes, Cassiday & Associates June, 2019 | | Contents Page 12 |
| Camino Rojo Project Feasibility Study NI 43-101 Technical Report |
|
| Figure 13-14 Areas with +10% Preg-Robbing Test Results | 13-57 |
| Figure 13-15 Recovery Versus Preg-Robbing | 13-57 |
| Figure 14-1 Mineral Resource Constraining Cone Shell, IMC 2019 | 14-9 |
| Figure 14-2 Hole and Cross Section Locations, IMC 2019 | 14-11 |
| Figure 14-3 Lithology on Section L112, IMC 2019 | 14-12 |
| Figure 14-4 Alteration on Section L112, IMC 2019 | 14-15 |
| Figure 14-5 Alteration on Section 18, IMC 2019 | 14-16 |
| Figure 14-6 Alteration on Section 29, IMC 2019 | 14-17 |
| Figure 14-7 Oxidation Zones on Section 29, IMC 2019 | 14-18 |
| Figure 14-8 Estimation Domains on Section L112, IMC 2019 | 14-19 |
| Figure 14-9 Probability Plot of Gold Assays by Alteration Type – NE Domain | 14-24 |
| Figure 14-10 Probability Plot of Gold 5m Composites by Alteration Type – NE Domain | 14-24 |
| Figure 14-11 Probability Plot of Gold Assays by Alteration Type – SW Domain | 14-25 |
| Figure 14-12 Probability Plot of Gold 5m Composites by Alteration Type – SW Domain | 14-25 |
| Figure 14-13 Probability Plot of Gold Assays by Alteration Type – Indidura | 14-26 |
| Figure 14-14 Probability Plot of Gold 5m Composites by Alteration Type – Indidura | 14-26 |
| Figure 14-15 NE Domain Gold Variogram – Primary Axis | 14-28 |
| Figure 14-16 NE Domain Gold Variogram – Secondary Axis | 14-29 |
| Figure 14-17 NE Domain Gold Variogram – Tertiary Axis | 14-30 |
| Figure 14-18 SW Domain Gold Variogram – Primary Axis | 14-31 |
| Figure 14-19 SW Domain Gold Variogram – Down Hole Variogram | 14-32 |
| Figure 14-20 Gold Grades on Section 29, IMC 2019 | 14-35 |
| Figure 14-21 Gold Grades on Section 18, IMC 2019 | 14-36 |
| Figure 14-22 Gold Grades on Section L112, IMC 2019 | 14-37 |
| Figure 14-23 Average Distance to Nearest 3 & 4 Holes – NE Kp & Ki Domains | 14-40 |
| Figure 14-24 Average Distance to Nearest 3 & 4 Holes – SW Kp & Ki Domains | 14-41 |
| Figure 14-25 Average Distance to Nearest 3 & 4 Holes – Indidura Kp & Ki Domains | 14-42 |
| Figure 14-26 Resource Categories on Section 18, IMC 2019 | 14-43 |
| Figure 14-27 Resource Categories on Section 29, IMC 2019 | 14-44 |
| Figure 16-1 Slope Angle Recommendations, Piteau 2019 | 16-3 |
| Figure 16-2 Final Pit, IMC 2019 | 16-5 |
| Figure 16-3 End of Preproduction, IMC 2019 | 16-13 |
| Figure 16-4 End of Year 1, IMC 2019 | 16-14 |
| Figure 16-5 End of Year 2, IMC 2019 | 16-15 |
| Figure 16-6 End of Year 3, IMC 2019 | 16-16 |
| Figure 16-7 End of Year 4, IMC 2019 | 16-17 |
| Figure 16-8 End of Year 5, IMC 2019 | 16-18 |
| Figure 16-9 End of Year 6, IMC 2019 | 16-19 |
| Figure 16-10 Year 7 – End of Mining, IMC 2019 | 16-20 |
| Figure 16-11 Year 7 – End of Waste Storage Capping & Low Grade Reclaim, IMC 2019 | 16-21 |
Kappes, Cassiday & Associates June, 2019 | | Contents Page 13 |
| Camino Rojo Project Feasibility Study NI 43-101 Technical Report |
|
| Figure 17-1 Process Overall Flowsheet | 17-4 |
| Figure 17-2 Project General Arrangement | 17-5 |
| Figure 17-3 Average Year Water Balance Diagram | 17-19 |
| Figure 17-4 Wet Year Water Balance Diagram | 17-20 |
| Figure 17-5 Dry Year Water Balance Diagram | 17-21 |
| Figure 17-6 Merrill-Crowe Recovery Plant & Refinery Layout | 17-23 |
| Figure 17-7 NaCN Mix & Storage Area Layout | 17-29 |
| Figure 20-1 Camino Rojo Project Closure Schedule | 20-12 |
| Figure 20-2 Permitting Process Flowsheet | 20-24 |
| Figure 20-3 Medical Clinic in San Tiburcio – ERM 2018. | 20-30 |
| Figure 20-4 Home in El Berrendo – ERM 2018 | 20-32 |
| Figure 20-5 Unoccupied Home in San Francisco de los Quijano – ERM 2018. | 20-32 |
| Figure 20-6 Town Plaza in San Tiburcio – ERM 2018. | 20-33 |
| Figure 20-7 Public Plaza in La Fabrica (part of San Tiburcio) – ERM 2018. | 20-33 |
| Figure 22-1 Annual Gold Production | 22-8 |
| Figure 22-2 Annual Silver Production | 22-8 |
| Figure 22-3 After Tax Sensitivity – IRR | 22-15 |
| Figure 22-4 After Tax Sensitivity – NPV @ 5% | 22-15 |
| Figure 24-1 Project Development & Implementation Schedule | 24-4 |
| Figure 24-2 Groundwater Elevation Contours Camino Rojo Project, Zacatecas | 24-7 |
| Figure 24-3 Total Dissolved Solids in Groundwater | 24-11 |
| Figure 24-4 Simulated Dewatering Rates from Open Pit | 24-14 |
| Figure 24-5 Maximum Extent of 1 Metre Drawdown Contour for Nominal Case | 24-15 |
| Figure 24-6 Maximum Extent of 1 Metre Drawdown Contour for Low K Case | 24-15 |
Kappes, Cassiday & Associates June, 2019 | | Contents Page 14 |
| Camino Rojo Project Feasibility Study NI 43-101 Technical Report |
|
TABLES
| Table 1-1 Mineral Resource (Inclusive of Mineral Reserve) | 1-8 |
| Table 1-2 Mineral Resource – Lead and Zinc | 1-8 |
| Table 1-3 Mineral Reserve | 1-10 |
| Table 1-4 Capital Cost Summary | 1-16 |
| Table 1-5 Operating Cost Summary | 1-16 |
| Table 1-6 Economic Analysis Summary | 1-20 |
| Table 4-1 Listing of Mining Concessions | 4-4 |
| Table 10-1 Summary of Camino Rojo Drilling, 2007-2018 | 10-1 |
| Table 10-2 Drillholes by Orla Included in Mineral Resource Model Database | 10-4 |
| Table 10-3 Non-Resource Drilling Completed by Orla, 2018 and 2019 | 10-5 |
| Table 13-1 Oxide Column Test Results - SGS Mineral Services 2009 | 13-4 |
| Table 13-2 Transition Column Test Results - SGS Mineral Services 2009 | 13-5 |
| Table 13-3 Bottle Roll Test Results CRM 06 Composites - SGS Mineral Services 2009 | 13-5 |
| Table 13-4 Bottle Roll Test Results CRM 14 Composites - SGS Mineral Services 2009 | 13-6 |
| Table 13-5 Bottle Roll Test Results CRM 20 Composites - SGS Mineral Services 2009 | 13-6 |
| Table 13-6 Transition & Sulphide Samples for Flotation Tests - SGS Mineral Services 2009 | 13-7 |
| Table 13-7 Head Analysis Gold & Silver – KCA 2010 | 13-9 |
| Table 13-8 Carbon & Sulphur Summary – KCA 2010 | 13-9 |
| Table 13-9 Mercury & Copper Summary – KCA 2010 | 13-10 |
| Table 13-10 Composite Cyanide Shake Tests Results Summary – KCA 2010 | 13-11 |
| Table 13-11 Column Leach Test Results on Composites – KCA 2010 | 13-12 |
| Table 13-12 Head Analysis Gold & Silver– KCA 2012 | 13-14 |
| Table 13-13 Head Analysis Carbon & Sulphur– KCA 2012 | 13-14 |
| Table 13-14 Head Analysis Mercury & Copper– KCA 2012 | 13-15 |
| Table 13-15 Bottle Roll Leach Tests Summary, Gold– KCA 2012 | 13-17 |
| Table 13-16 Bottle Roll Leach Tests Summary, Silver– KCA 2012 | 13-18 |
| Table 13-17 KCA 2012 Summary of Column Leach Test Results by Material Type | 13-20 |
| Table 13-18 Summary of Flotation Composite Feed Grades | 13-22 |
| Table 13-19 Lead Flotation Concentrate Grades | 13-22 |
| Table 13-20 Zinc Flotation Concentrate Grades | 13-22 |
| Table 13-21 Comminution Test Results Summary | 13-23 |
| Table 13-22 Comminution Test Results by Alteration Type | 13-23 |
| Table 13-23 Description of Received Material– KCA 2014 | 13-25 |
| Table 13-24 Description of Received Material– KCA 2015 | 13-26 |
| Table 13-25 Head Analyses, Gold & Silver– KCA 2015 | 13-27 |
| Table 13-26 Head Analyses Carbon & Sulphur– KCA 2015 | 13-27 |
| Table 13-27 Head Analyses Mercury & Copper– KCA 2015 | 13-28 |
Kappes, Cassiday & Associates June, 2019 | | Contents Page 15 |
| Camino Rojo Project Feasibility Study NI 43-101 Technical Report |
|
| Table 13-28 KCA 2015 Column Leach Test Results by Lithology | 13-32 |
| Table 13-29 Description of Received Material – KCA 2019 | 13-35 |
| Table 13-30 Composite Generation Information – KCA 2019 | 13-36 |
| Table 13-31 Head Analyses Gold & Silver – KCA 2019 | 13-37 |
| Table 13-32 Head Analyses Carbon & Sulphur – KCA 2019 | 13-37 |
| Table 13-33 Head Analyses Mercury & Copper – KCA 2019 | 13-38 |
| Table 13-34 Head Analyses Lead & Zinc – KCA 2019 | 13-38 |
| Table 13-35 Head Analyses Multi-Element Analysis – KCA 2019 | 13-39 |
| Table 13-36 Head Analyses Whole Rock Analysis – KCA 2019 | 13-40 |
| Table 13-37 Phisical Characterization Test Work Summary – KCA 2019 | 13-41 |
| Table 13-38 Bottle Roll Leach Test Summary, Gold – KCA 2019 | 13-41 |
| Table 13-39 Bottle Roll Leach Test Summary, Silver – KCA 2019 | 13-42 |
| Table 13-40 Column Leach Tests Results Summary, Gold – KCA 2019 | 13-44 |
| Table 13-41 Column Leach Tests Results Summary, Silver – KCA 2019 | 13-45 |
| Table 13-42 Diagnostic Leach Test Summary – KCA 2019 | 13-47 |
| Table 13-43 Estimated Recoveries by Material Type for P80 28mm Crush Size | 13-52 |
| Table 13-44 Projected Field Cyanide Consumptions by Material Type | 13-53 |
| Table 13-45 Projected Field Lime Consumptions by Material Type | 13-54 |
| Table 13-46 Distribution of Metals to Various Sulphide Products | 13-58 |
| Table 14-1 Mineral Resource | 14-2 |
| Table 14-2 Mineral Resource – Lead and Zinc | 14-3 |
| Table 14-3 Economic Parameters for Mineral Resource Estimate | 14-5 |
| Table 14-4 Treatment Costs for Lead and Zinc Concentrates | 14-6 |
| Table 14-5 Camino Rojo Model Rock Types (lith) | 14-10 |
| Table 14-6 Camino Rojo Alteration Types (alt) | 14-13 |
| Table 14-7 Camino Rojo Oxide-Sulphide Model (oxide) | 14-13 |
| Table 14-8 Camino Rojo Estimation Domains (domain) | 14-14 |
| Table 14-9 Cap Grades and Number of Assays Capped | 14-21 |
| Table 14-10 Summary Statistics of Assays | 14-22 |
| Table 14-11 Summary Statistics of 5m Composites | 14-23 |
| Table 14-12 Specific Gravity and Bulk Density | 14-45 |
| Table 14-13 Reconciliation of 2018 versus 2019 Mineral Resource - Leach Material | 14-48 |
| Table 14-14 Reconciliation of 2018 versus 2019 Mineral Resource - Mill Material | 14-48 |
| Table 14-15 Reconciliation of 2018 versus 2019 Mineral Resource - Leach & Mill Material | 14-49 |
| Table 15-1 Mineral Reserve | 15-3 |
| Table 15-2 Economic Parameters for Mine Design | 15-6 |
| Table 16-1 Mine Production Schedule - 6,570 KTPY | 16-8 |
| Table 16-2 Proposed Plant Production Schedule - 6,570 KTPY | 16-9 |
| Table 16-3 Proposed Plant Production Schedule by Material Type - 6,570 KTPY | 16-10 |
Kappes, Cassiday & Associates June, 2019 | | Contents Page 16 |
| Camino Rojo Project Feasibility Study NI 43-101 Technical Report |
|
| Table 16-4 Mine Waste by Material Type | 16-11 |
| Table 16-5 Mine Major Equipment Fleet Requirement | 16-22 |
| Table 17-1 Processing Design Criteria Summary | 17-2 |
| Table 17-2 Heap Leach Design Parameters | 17-11 |
| Table 17-3 Phase 1 Process Pond Storage Requirements | 17-15 |
| Table 17-4 Phase 2 Process Pond Storage Requirements | 17-15 |
| Table 17-5 Average Monthly Precipitation – San Tiburcio Weather Station | 17-16 |
| Table 17-6 24-h Storm Event Estimations – NewFields | 17-17 |
| Table 17-7 Average Monthly Evaporation Data – Conception del Oro Weather Station | 17-17 |
| Table 17-8 Average Make-up Water Requirements | 17-18 |
| Table 17-9 Projected Annual Reagents and Consumables | 17-27 |
| Table 18-1 Camp Capacity | 18-4 |
| Table 18-2 Power Demand | 18-9 |
| Table 20-1 Summary of Camino Rojo Closure Costs | 20-20 |
| Table 20-2 Permits Required for Mine Construction | 20-22 |
| Table 20-3 Permits Required for Mine Operation and Closure | 20-23 |
| Table 20-4 Populations of Communities in Area of Influence of Project | 20-27 |
| Table 20-5 Marginalization by Community | 20-34 |
| Table 21-1 Capital Cost Summary | 21-1 |
| Table 21-2 LOM Operating Cost Summary | 21-1 |
| Table 21-3 Summary of Pre-Production Capital Costs by Area | 21-3 |
| Table 21-4 LOM Mining Capital Costs | 21-4 |
| Table 21-5 Owner Mining Equipment Capital Costs | 21-6 |
| Table 21-6 Mine Development Capital Costs | 21-6 |
| Table 21-7 Summary of Process & Infrastructure Pre-Production Capital Costs by Discipline | 21-8 |
| Table 21-8 Process Mobile Equipment | 21-12 |
| Table 21-9 Process & Infrastructure Contingency | 21-13 |
| Table 21-10 Construction Indirect Costs | 21-14 |
| Table 21-11 Other Owner’s Construction Costs | 21-15 |
| Table 21-12 Initial Fills | 21-16 |
| Table 21-13 Contract Mining Cost Summary | 21-19 |
| Table 21-14 Contract Mining Costs Based on Unit Rates | 21-22 |
| Table 21-15 Contract Blasting Costs Based on Unit Rates | 21-22 |
| Table 21-16 Owner Mine Personnel & Technical Services | 21-23 |
| Table 21-17 Pit Wall Support Costs | 21-24 |
| Table 21-18 Wall Control Drilling Costs | 21-24 |
| Table 21-19 Average Process, Support & G&A Operating Cost | 21-25 |
| Table 21-20 Personnel & Staffing Summary | 21-27 |
| Table 21-21 Support Equipment Operating Costs | 21-30 |
Kappes, Cassiday & Associates June, 2019 | | Contents Page 17 |
| Camino Rojo Project Feasibility Study NI 43-101 Technical Report |
|
| Table 21-22 Fixed G&A Expenses | 21-31 |
| Table 21-23 G&A Expenses by Year | 21-32 |
| Table 21-24 Reclamation and Closure Cost Summary | 21-33 |
| Table 22-1 Key Economic Parameters | 22-2 |
| Table 22-2 Economic Analysis Summary | 22-3 |
| Table 22-3 Capital Expenditures Summary | 22-7 |
| Table 22-4 LOM Operating Costs | 22-9 |
| Table 22-5 Depreciation and Pre-Production Tax Pools | 22-11 |
| Table 22-6 Cashflow Model Summary | 22-12 |
| Table 22-7 After-Tax Sensitivity Analysis Results | 22-14 |
| Table 24-1 Summary of Groundwater Quality Analyses from On-Site (COPE) Wells | 24-9 |
Kappes, Cassiday & Associates June, 2019 | | Contents Page 18 |
| Camino Rojo Project Feasibility Study NI 43-101 Technical Report |
|
| 1.1 | Introduction and Overview |
The Camino Rojo property, located in Zacatecas State, Mexico, is 100% owned by Orla Mining Ltd. (Orla) through its Mexican subsidiary Minera Camino Rojo S.A. de C.V. (MCR). At the request of Orla, this Report was prepared by Kappes, Cassiday and Associates (KCA), Independent Mining Consultants, Inc. (IMC), Resource Geosciences Incorporated (RGI) and Barranca Group, LLC (Barranca) with input from other consultant groups.
This Technical Report is a summary of a Feasibility Study (FS) on the Camino Rojo Project and has been prepared in accordance with disclosure and reporting requirements set forth in the Canadian Securities Administrators’ current “Standards of Disclosure for Mineral Projects” under the provisions of National Instrument 43-101 (NI 43-101), Companion Policy 43-101 CP and Form 43-101F1 and supersedes a Technical Report prepared by KCA dated 19 June 2018 and amended 11 March 2019, “Preliminary Economic Assessment - Amended NI 43-101 Technical Report on the Camino Rojo Gold Project Municipality of Mazapil, Zacatecas, Mexico”.
The Camino Rojo Project considers open pit mining of approximately 44 million tonnes of ore with an estimated grade of 0.73 grams per tonne (g/t) gold and 14.2 g/t silver. Ore from the pit will be crushed to 80% passing 28mm, conveyor stacked onto a heap leach pad and leached using a low concentration sodium cyanide solution. Pregnant solution from the heap leach will be processed in a Merrill-Crowe recovery plant where gold and silver will be precipitated from deaerated pregnant solution with ultra-fine zinc. The resulting precious metal sludge will be filtered and dried in a mercury retort, and then smelted to produce the final doré product.
The average processing throughput for the Camino Rojo Project is 18,000 tonnes of ore per day (tpd). The Project will be developed in two stages with expansion of the leach pad and addition of conveying equipment occurring in Year 2 of operation. Pit dewatering equipment including pumps and evaporators will be required in Year 4 of operation. The scope of the FS includes a mine production schedule, as well as costing for all process components and infrastructure required for the operation. This report is based on the oxide and transitional portion of the Measured and Indicated Mineral Resource on the Property.
| 1.2 | Property Description and Ownership |
The Camino Rojo property is located in the Municipality of Mazapil, State of Zacatecas, near the village of San Tiburcio. The property lies 190 kilometres (km) NE of the city of Zacatecas, 48km S-SW of the town of Concepcion del Oro, Zacatecas, and 54km S-SE of Newmont Goldcorp Corporation’s (Newmont) Peñasquito Mine. The Project area is centred at approximately 244150E 2675900N UTM NAD27 Zone 14N.
| Kappes, Cassiday & Associates | 1.0 Summary |
| June, 2019 | Page 1-1 |
| Camino Rojo Project Feasibility Study NI 43-101 Technical Report |
|
The property mineral rights are held by Orla’s Mexican subsidiary MCR in 8 mining concessions covering approximately 2,059 km2. Currently, ongoing exploration programs are identifying the most prospective areas surrounding the Camino Rojo deposit, and Orla, through its Mexican subsidiary MCR, plans to reduce its mineral concession holdings to 1,631 km2 by relinquishing mineral rights to the least prospective ground. Surface rights are held by the Ejido San Tiburcio, a communal agrarian cooperative. Exploration has been carried out under the authority of agreements between the project operators and the Ejido San Tiburcio. There is a temporary occupation with right to expropriate agreement in place with the Ejido San Tiburcio that covers all the area of the Mineral Resource and Mineral Reserve estimate as well as the area of potential development described in this report. MCR has water rights for sufficient volumes of water to develop the Project.
| 1.3 | Geology & Mineralization |
The Camino Rojo deposit comprises intrusive related, clastic sedimentary strata hosted, polymetallic gold, silver, arsenic, zinc and lead mineralization.
Mineralization is hosted by Cretaceous submarine sedimentary strata, dominantly clastic. The most important host is the Caracol Formation, a rhythmically interbedded sequence of weakly calcareous turbiditic sandstones, siltstones and shales. The underlying Indidura Formation, comprised of regularly bedded reduced siltstones and shales, and the Cuesta del Cura limestone, now recrystallized to white fine-grained marble, host a minor amount of sulphide mineralization, but are inconsequential hosts of oxide mineralization. The gold-silver-lead-zinc deposit is situated above, and extends down into, a zone of feldspathic hornfels developed in the sedimentary strata, and variably mineralized dacitic dikes. The mineralized zones correspond to zones of sheeted sulphidic veins and veinlet networks, creating a bulk-mineable style of gold mineralization. Skarn mineralization has been encountered in the deeper portions of the system. The observed geologic and geochemical characteristics of the gold-silver-lead-zinc deposit at Camino Rojo are consistent with those of a distal oxidized gold skarn deposit. The metal suite and style of mineralization at Camino Rojo are similar to the intrusion-related deposits in the Caracol Formation and underlying carbonate rocks adjacent to the diatremes at the Peñasquito mine.
For purposes of this Report, only the economic potential of the oxide and partially oxidized transitional mineralization amenable to gold and silver recovery via standard cyanide heap leach processing, was evaluated.
| Kappes, Cassiday & Associates | 1.0 Summary |
| June, 2019 | Page 1-2 |
| Camino Rojo Project Feasibility Study NI 43-101 Technical Report |
|
| 1.4 | Exploration and Drilling |
The Camino Rojo deposit was discovered in mid-2007 and was originally entirely concealed beneath post-mineral cover in a broad, low relief alluvial valley adjacent to the western flank of the Sierra Madre Oriental. Mineralized road ballast placed on a dirt road near San Tiburcio, Zacatecas, was traced to its source by geologists Perry Durning and Bud Hillemeyer from La Cuesta International, working under contract to Canplats Resources Corporation (Canplats). A shallow pit excavated through a thin veneer of alluvium, located adjacent to a stock pond (represa) was the discovery exposure of the deposit. Canplats began concurrent programs of surface geophysics and reverse-circulation (RC) drilling in late 2007, which continued into 2008.
The initial drilling was focused on a 450 x 600 metre gold-in-rock geochemical anomaly named the Represa zone. Core drilling began in 2008. The geophysical survey defined two principal areas of high chargeability: one centred on the Represa zone and another 1 km to the west named the Don Julio zone. The elevated chargeability zones were interpreted as large volumes of sulphide mineralized rocks. Drilling by Canplats, and later drilling by Goldcorp Inc. (Goldcorp), confirmed the presence of extensive sulphide mineralization at depth in the Represa zone, and much lower quantities of sulphide minerals at Don Julio, which is an extension of the Represa zone mineralization.
By August of 2008, Canplats drilled a total of 92 RC, and 30 diamond-core holes, for a total of 23,988 and 16,044 metres respectively, mainly focused in the Represa zone.
Canplats was acquired by Goldcorp in early 2010. Validation, infill, condemnation, and expansion drilling began in January 2011. By the end of 2015, a total of 279,788 metres of new core drilling in 415 drillholes and 20,569 metres of new RC drilling in 96 drillholes was completed in the Represa and Don Julio zones and their immediate surroundings. An additional 31,286 metres of shallow rotary air blast (RAB)-style, RC drilling in 306 drillholes was completed, with most of the RAB drilling testing other exploration targets within the concession. Airborne gravity, magnetic and TEM surveys were also carried out. As of the end of 2015 a total of 295,832 metres in 445 diamond core holes, 44,557 metres in 188 RC drillholes, and 31,286 metres of RAB drilling had been completed.
Orla acquired the property from Goldcorp in 2017 and through the effective date of this report, Orla has completed: 2,228.5 metres of additional drilling in 14 diamond core holes for metallurgical sampling; 5,340.5 metres of drilling in 16 reverse circulation holes testing for water; 803.1 metres of RC holes as resource infill drillholes; 1,767.8 metres of drilling in 7 RC holes as condemnation holes; 1,261.0 metres of drilling in 6 deep diamond core holes as condemnation and infrastructure geotechnical holes; 323.4 metres of drilling in 19 shallow diamond core holes as geotechnical tests of the substrate in the areas of proposed mine infrastructure; 726.0 metres of drilling in diamond core holes as pit slope stability geotechnical holes, 56 metres of drilling in 5 diamond core holes evaluating clay sources for pond liner material; and 197.4 metres of RC drilling to construct 3 monitoring wells. Orla has not yet conducted any drilling to explore for new mineralized zones.
| Kappes, Cassiday & Associates | 1.0 Summary |
| June, 2019 | Page 1-3 |
| Camino Rojo Project Feasibility Study NI 43-101 Technical Report |
|
| 1.5 | Metallurgical Test Work |
Historical metallurgical test work programs on the Camino Rojo property were commissioned by the prior operators of the Project between 2010 and 2015. A confirmatory metallurgical test program was commissioned by Orla in 2018 to confirm the results and conclusions from the previous campaigns. In total, 107 column leach tests (85 on representative samples for the material types and pit area) and 164 bottle roll tests have been completed to date on the Camino Rojo ore body as well as physical characterization and preliminary flotation test work.
Based on the metallurgical tests completed on the deposit, key design parameters for the Project include:
| · | Crush size of 100% passing 38mm (P80 28mm). |
| · | Estimated gold recoveries (including 2% field deduction) of: |
| · | Estimated silver recoveries (including 3% field deduction) of: |
| · | Design leach cycle of 80 days. |
| · | Agglomeration with cement not required for permeability or stability. |
| · | Average cyanide consumption of 0.35 kilograms per tonne (kg/t) ore. |
| · | Average lime consumption of 1.25 kg/t ore. |
The key design parameters are based on a substantial number of metallurgical tests including 85 column leach tests on samples representative of domains in the current deposit model. These 85 representative samples from documented drillholes with good spatial distribution in the proposed pit include 41 columns tests on Kp Oxide material, 7 column tests on Ki Oxide material, 16 column tests on Trans-Hi material and 21 column tests on Trans-Lo material. The 22 non-representative columns were excluded based on the following criteria:
| Kappes, Cassiday & Associates | 1.0 Summary |
| June, 2019 | Page 1-4 |
| Camino Rojo Project Feasibility Study NI 43-101 Technical Report |
|
| · | Columns on Trans-S or sulphide material that were not considered in the Mineral Reserve. |
| · | Mix of Tran-S or other material types. |
| · | Samples taken from outside of the proposed pit area. |
An additional 54 bottle roll leach tests with direct correlations with the column tests have been included as part of the evaluation to support these results and conclusions.
In general, the Camino Rojo deposit shows variability in gold and silver recoveries based on material type and geological domain with preg-robbing organic carbon being the only significant deleterious element identified, which is primarily associated with the transition material at depth along the outer edges of the deposit. Recoveries for the oxide material are good and will yield acceptable results using conventional heap leaching methods with cyanide. Recoveries for the transition material are lower compared with the oxide material for conventional leaching with some areas of transition showing reasonably high recoveries. Reagent consumptions for all material types are reasonably low.
Preg robbing, a phenomenon where gold and gold-cyanide complexes are preferentially absorbed by carbonaceous, and to a lesser extent, other material within the orebody; presents a low risk to the overall Project. A significant investigation by Orla into the preg robbing material indicates that potentially preg robbing material represents a small percentage of the total material to be processed and will not be encountered until later in the Project life and can be mitigated by proper ore control.
| 1.6 | Mineral Resource Estimate |
Table 1-1 presents the gold and silver Mineral Resource estimation for the Camino Rojo property. Measured and Indicated Mineral Resources amount to 353.4 million tonnes at 0.83 g/t gold and 8.8 g/t silver. Contained metal amounts to 9.46 million ounces gold and 100.4 million ounces of silver for the Measured and Indicated Mineral Resources. Inferred Mineral Resource is an additional 60.9 million tonnes at 0.87 g/t gold and 7.4 g/t silver. Contained metal amounts to 1.70 million ounces of gold and 14.5 million ounces of silver for the Inferred Mineral Resource.
The gold and silver Mineral Resource includes material amenable to heap leach recovery methods (leach material) and material amenable to mill and flotation concentration methods (mill material). For the leach material, Measured and Indicated Mineral Resources amount to 94.6 million tonnes at 0.71 g/t gold and 12.7 g/t silver. Contained metal amounts to 2.16 million ounces gold and 38.8 million ounces of silver for the Measured and Indicated Mineral Resources. Inferred Mineral Resource is an additional 4.4 million tonnes at 0.86 g/t gold and 5.8 g/t silver. Contained metal amounts to 119,800 ounces of gold and 805,000 ounces of silver for the Inferred Mineral Resource amenable to heap leach methods. The resources amenable to heap leach methods are oxide dominant and are the emphasis of the Feasibility Study.
| Kappes, Cassiday & Associates | 1.0 Summary |
| June, 2019 | Page 1-5 |
| Camino Rojo Project Feasibility Study NI 43-101 Technical Report |
|
For the gold and silver resource in mill material, the Measured and Indicated Mineral Resources amount to 258.8 million tonnes at 0.88 g/t gold and 7.4 g/t silver. Contained metal amounts to 7.30 million ounces gold and 61.6 million ounces of silver for the Measured and Indicated Mineral Resources. Inferred Mineral Resource is an additional 56.6 million tonnes at 0.87 g/t gold, 7.5 g/t silver. Contained metal amounts to 1.58 million ounces of gold and 13.7 million ounces of silver for the Inferred Mineral Resource in mill material.
Table 1-2 presents the lead and zinc Mineral Resources for the Camino Rojo Project. The lead and zinc Mineral Resources are in sulphide dominant material and are recovered along with the gold and silver in the mill material. Lead and zinc Measured and Indicated Mineral Resources amount to 258.8 million tonnes at 0.07% lead and 0.26% zinc. Contained metal amounts to 413.6 million pounds of lead, and 1.50 billion pounds of zinc for the Measured and Indicated Mineral Resource. Inferred Mineral Resource is an additional 56.6 million tonnes at 0.05% lead and 0.23% zinc. Contained metal amounts to 63.1 million pounds of lead and 290.4 million pounds of zinc for the Inferred Mineral Resource category.
The Mineral Resources from the leach material are reported inclusive of those Mineral Resources that were converted to Mineral Reserves presented in Section 1.7. The Mineral Resources from the mill material were excluded from the mine design in the Feasibility Study.
The Mineral Resources are based on a block model developed by IMC during January and February 2019. This updated model incorporated the 2018 Orla drilling and updated geologic models.
The Measured, Indicated, and Inferred Mineral Resources reported herein are constrained within a floating cone pit shell to demonstrate “reasonable prospects for eventual economic extraction” to meet the definition of Mineral Resources in NI 43-101.
| Kappes, Cassiday & Associates | 1.0 Summary |
| June, 2019 | Page 1-6 |
| Camino Rojo Project Feasibility Study NI 43-101 Technical Report |
|
All of the mineralization comprised in the Mineral Resource estimate with respect to the Camino Rojo Project is contained on mineral titles controlled by Orla. However, the Mineral Resource estimate assumes that the north wall of the conceptual floating pit cone used to demonstrate reasonable prospects for eventual economic extraction extends onto lands where mineral title is held by the owner of the adjacent property (Adjacent Owner), that waste would be mined on the Adjacent Owner’s mineral titles, and an assumption that an agreement will be negotiated to allow a push-back of the pit onto the Adjacent Owner’s mineral titles to gain access to the mineral resources on Orla’s mineral properties. Any potential development of the Camino Rojo property that includes an open pit encompassing the entire Mineral Resource estimate would be dependent on obtaining an agreement with the Adjacent Owner. It is estimated that approximately two-thirds of the Mineral Resource estimate is dependent on an agreement being obtained with the Adjacent Owner. The Mineral Resource estimate has been prepared based on the Qualified Person’s reasoned judgment, in accordance with Canadian Institute of Mining, metallurgy and Petroleum (CIM) Best Practices Guidelines and his professional standards of competence, that there is a reasonable expectation that all necessary permits, agreements and approvals will be obtained and maintained, including an agreement with the Adjacent Owner to allow mining of waste material on its mineral concessions. In particular, when determining the prospects for eventual economic extraction, consideration was given to industry practice, including the past practices of the Adjacent Owner in entering similar agreements on commercially reasonable terms, and a timeframe of 10-15 years.
Delays in, or failure to obtain, such agreement would affect the development of a significant portion of the Mineral Resources of the Camino Rojo property that are not included in the Feasibility Study, in particular by limiting access to significant mineralized material at depth. There can be no assurance that Orla will be able to negotiate such agreement on terms that are satisfactory to Orla or that there will not be delays in obtaining the necessary agreement.
| Kappes, Cassiday & Associates | 1.0 Summary |
| June, 2019 | Page 1-7 |
| Camino Rojo Project Feasibility Study NI 43-101 Technical Report |
|
Table 1-1
Mineral Resource (Inclusive of Mineral Reserve)
| | | | NSR Cut-off | | Gold | Silver | Gold | Silver |
| Resource Type | ($/t) | Kt | (g/t) | (g/t) | (koz) | (koz) |
| Leach Resource: | | | | | | |
| | Measured Mineral Resource | 4.73 | 19,391 | 0.77 | 14.9 | 482.3 | 9,305 |
| | Indicated Mineral Resource | 4.73 | 75,249 | 0.70 | 12.2 | 1,680.7 | 29,471 |
| | Meas/Ind Mineral Resource | 4.73 | 94,640 | 0.71 | 12.7 | 2,163.0 | 38,776 |
| | Inferred Mineral Resource | 4.73 | 4,355 | 0.86 | 5.8 | 119.8 | 805 |
| | | | | | | | | |
| Mill Resource: | | | | | | |
| | Measured Mineral Resource | 13.71 | 3,358 | 0.69 | 9.2 | 74.2 | 997 |
| | Indicated Mineral Resource | 13.71 | 255,445 | 0.88 | 7.4 | 7,221.4 | 60,606 |
| | Meas/Ind Mineral Resource | 13.71 | 258,803 | 0.88 | 7.4 | 7,295.6 | 61,603 |
| | Inferred Mineral Resource | 13.71 | 56,564 | 0.87 | 7.5 | 1,576.9 | 13,713 |
| | | | | | | | | |
| Total Mineral Resource | | | | | | |
| | Measured Mineral Resource | | 22,749 | 0.76 | 14.1 | 556.5 | 10,302 |
| | Indicated Mineral Resource | | 330,694 | 0.84 | 8.5 | 8,902.1 | 90,078 |
| | Meas/Ind Mineral Resource | | 353,443 | 0.83 | 8.8 | 9,458.6 | 100,379 |
| | Inferred Mineral Resource | | 60,919 | 0.87 | 7.4 | 1,696.7 | 14,518 |
| | | | | | | | | |
Table 1-2
Mineral Resource – Lead and Zinc
| | | NSR Cut off | | NSR | Lead | Zinc | Lead | Zinc |
| Resource Type | ($/t) | Kt | ($/t) | (%) | (%) | (Mlb) | (Mlb) |
| Mill Resource: | | | | | | | |
| | Measured Mineral Resource | 13.71 | 3,358 | 35.04 | 0.13 | 0.38 | 9.3 | 28.2 |
| | Indicated Mineral Resource | 13.71 | 255,445 | 39.33 | 0.07 | 0.26 | 404.3 | 1,468.7 |
| | Meas/Ind Mineral Resource | 13.71 | 258,803 | 39.27 | 0.07 | 0.26 | 413.6 | 1,496.8 |
| | Inferred Mineral Resource | 13.71 | 56,564 | 38.4 | 0.05 | 0.23 | 63.1 | 290.4 |
| | | | | | | | | |
Notes:
1. The Mineral Resource has an effective date of June 7, 2019 and the estimate was prepared using the CIM Definition Standards (May 10, 2014).
2. All figures are rounded to reflect the relative accuracy of the estimate and therefore numbers may not appear to add precisely.
3. Mineral Resources that are not Mineral Reserves do not have demonstrated economic viability.
4. Mineral Resources for leach material are based on prices of $1400/oz gold and $20/oz silver.
5. Mineral Resources for mill material are based on prices of $1400/oz gold, $20/oz silver, $1.05/lb lead, and $1.20/lb zinc.
6. Mineral Resources are based on NSR cut-off of $4.73/t for leach material and $13.71/t for mill material.
7. NSR value for leach material is as follows:
Kp Oxide: NSR ($/t) = 30.77 x gold (g/t) + 0.068 x silver (g/t), based on gold recovery of 70% and silver recovery of 11%
Ki Oxide: NSR ($/t) = 24.61 x gold (g/t) + 0.092 x silver (g/t), based on gold recovery of 56% and silver recovery of 15%
Tran-Hi: NSR ($/t) = 26.37 x gold (g/t) + 0.166 x silver (g/t), based on gold recovery of 60% and silver recovery of 27%
Tran-Lo: NSR ($/t) = 17.58 x gold (g/t) + 0.209 x silver (g/t), based on gold recovery of 40% and silver recovery of 34%
8. NSR value for mill material is 36.75 x gold (g/t) + 0.429 x silver (g/t) + 10.75 x lead (%) + 11.77 x zinc (%), based on recoveries of 86% gold, 76% silver, 60% lead, and 64% zinc.
9. Table 14-3 accompanies this Mineral Resource statement and shows all relevant parameters.
10. Mineral Resources are constrained within a conceptual pit shell in order to demonstrate reasonable prospects for eventual economic extraction, to meet the definition of Mineral Resource in NI 43-101; mineralization lying outside of the pit shell is not reported as a Mineral Resource.
11. The Mineral Resource estimate requires the floating pit cone used to demonstrate reasonable prospects for eventual economic extraction to extend onto land held by the Adjacent Owner. Any potential development of the Camino Rojo property that includes an open pit encompassing the entire Mineral Resource estimate would be dependent on obtaining an agreement with the Adjacent Owner.
12. The Mineral Resources in the leach material is inclusive of those Mineral Resources that were converted to Mineral Reserves.
| 1.7 | Mineral Reserve Estimate |
Table 1-3 presents the Mineral Reserve estimation for the Camino Rojo Project. The Proven and Probable Mineral Reserve amounts to 44.0 million tonnes at 0.73 g/t Au and 14.2 g/t Ag for 1.03 million contained gold ounces and 20.1 million contained silver ounces. Direct feed material in the Mineral Reserve is material that will be processed the same year it is mined. The low-grade stockpile material will be processed after the open pit is completed. The effective date of this Mineral Reserve estimation is 24 June 2019.
| Kappes, Cassiday & Associates | 1.0 Summary |
| June, 2019 | Page 1-8 |
| Camino Rojo Project Feasibility Study NI 43-101 Technical Report |
|
The Mineral Reserve estimation is based on an open pit mine plan and mine production schedule developed by IMC. Processing is based on crushing and heap leaching to recover gold and silver. Table 1-3 shows the parameters used for economic and cut-off calculations. The Mineral Reserve is based on a gold price of US$1250 per ounce and a silver price of US$17.00 per ounce. Measured Mineral Resource in the mine production schedule was converted to proven Mineral Reserve and indicated Mineral Resource in the schedule was converted to probable Mineral Reserve.
The Mineral Reserves are classified in accordance with the “CIM Definition Standards – For Mineral Resources and Mineral Reserves” adopted by the CIM Council (as amended, the “CIM Definition Standards”) in accordance with the requirements of NI 43-101. Mineral Reserve estimates reflect the reasonable expectation that all necessary permits and approvals will be obtained and maintained.
IMC does not believe that there are significant risks to the Mineral Reserve estimate based on metallurgical or infrastructure factors. There has been a significant amount of metallurgical testing and the infrastructure requirements are relatively straightforward compared to many operations. However, recoveries lower than forecast would result is loss of revenue for the project. There has also been some potential preg-robbing material identified in the deposit, as discussed in Section 13.5 and 25.3.2, but this does not appear to represent a significant risk.
There is risk to the Mineral Reserve based on mining factors. As discussed in Section 16.2 and 25.3.1, the slope angle assumptions are based on careful application of wall control blasting, and the north and west wall slope angles are also based on significant mechanical support. Failure of these systems to perform as expected would result in less ore available for the process plant and potentially a shorter project life. Also, slope stability issues on the north wall of the pit could be difficult to mitigate due to lack of access to the ground north of the pit.
Other risks to the Mineral Reserve are related to economic parameters such as prices lower than forecast or costs higher than the current estimates. The impact of these is modeled in the sensitivity study with the economic analysis in Section 22.10.
All of the mineralization comprised in the Mineral Reserve estimate with respect to the Camino Rojo Project is contained on mineral titles controlled by Orla as is all the proposed development and mining and processing activities.
| Kappes, Cassiday & Associates | 1.0 Summary |
| June, 2019 | Page 1-9 |
| Camino Rojo Project Feasibility Study NI 43-101 Technical Report |
|
Table 1-3
Mineral Reserve
| | | | | | | | | Cont. | Cont. |
| | | | | | NSR | Gold | Silver | Gold | Silver |
| Reserve Class | Ktonnes | ($/t) | (g/t) | (g/t) | (koz) | (koz) |
| Proven Mineral Reserve | | | | | | | |
| | Direct Feed | | 13,331 | 22.87 | 0.84 | 15.6 | 358.8 | 6,698 |
| | Low Grade Stockpile | | 1,264 | 7.19 | 0.27 | 10.0 | 10.9 | 406 |
| | Total Proven Mineral Reserve | 14,595 | 21.51 | 0.79 | 15.1 | 369.7 | 7,104 |
| Probable Mineral Reserve | | | | | | |
| | Direct Feed | | 25,939 | 20.27 | 0.76 | 14.4 | 629.8 | 12,029 |
| | Low Grade Stockpile | | 3,485 | 7.05 | 0.28 | 8.6 | 31.3 | 962 |
| | Total Probable Mineral Reserve | 29,424 | 18.70 | 0.70 | 13.7 | 661.1 | 12,991 |
| Probable/Probable Mineral Reserve | | | | | | |
| | Direct Feed | | 39,270 | 21.15 | 0.78 | 14.8 | 988.6 | 18,726 |
| | Low Grade Stockpile | | 4,749 | 7.09 | 0.28 | 9.0 | 42.3 | 1,368 |
| | Total Probable/Probable Reserve | 44,019 | 19.63 | 0.73 | 14.2 | 1,030.9 | 20,095 |
Notes:
1. The Mineral Reserve estimate has an effective date of June 24, 2019 and was prepared using the CIM Definition Standards (10 May 2014).
2. Columns may not sum exactly due to rounding.
3. Mineral Reserves are based on prices of $1250/oz gold and $17/oz silver.
4. Mineral Reserves are based on NSR cut-offs that vary by time period to balance mine and plant production capacities (see Section 16). They range from a low of $4.73/t to a high of $9.00/t.
5. NSR value for leach material is as follows:
Kp Oxide: NSR ($/t) = 27.46 x gold (g/t) + 0.057 x silver (g/t), based on gold recovery of 70% and silver recovery of 11%
Ki Oxide: NSR ($/t) = 21.97 x gold (g/t) + 0.078 x silver (g/t), based on gold recovery of 56% and silver recovery of 15%
Tran-Hi: NSR ($/t) = 23.54 x gold (g/t) + 0.140 x silver (g/t), based on gold recovery of 60% and silver recovery of 27%
Tran-Lo: NSR ($/t) = 15.69 x gold (g/t) + 0.177 x silver (g/t), based on gold recovery of 40% and silver recovery of 34%
6. Table 15-2 accompanies this Mineral Reserve estimate and shows all relevant parameters
| Kappes, Cassiday & Associates | 1.0 Summary |
| June, 2019 | Page 1-10 |
| Camino Rojo Project Feasibility Study NI 43-101 Technical Report |
|
The Camino Rojo Feasibility Study is based on a conventional open pit mine. Mine operations will consist of drilling medium diameter blast holes (approximately 17cm), blasting with explosive emulsions or ANFO (ammonium nitrate/fuel oil) depending on water conditions, and loading into large off-road trucks with hydraulic shovels and wheel loaders. Ore will be delivered to the primary crusher and waste to the waste storage facility southeast of the pit. There will also be a low-grade stockpile facility to store marginal ore for processing at the end of commercial pit operations. There will be a fleet of track dozers, rubber-tired dozers, motor graders and water trucks to maintain the working areas of the pit, waste storage areas, and haul roads.
A mine plan was developed to supply ore to a conventional crushing and heap leach facility with the capacity to process 18,000 tpd (6,570 ktpy). The mine is scheduled to operate two 10-hour shifts per day for 365 days per year.
The mine plan is constrained by the Adjacent Owner concession boundary on the north side of the pit, i.e. the FS is based on the assumption that no mining activities, including waste stripping, would occur on the Adjacent Owner’s mineral titles. Accordingly, delays in, or failure to obtain, an agreement with the Adjacent Owner to conduct mining operations on its mineral titles would have no impact on the timetable or cost of development of the potential mine modelled in this technical report.
Eventually, mining will be conducted below the water table, probably during Year 4 of commercial operation. Estimates of pit dewatering requirements have been prepared for cost estimation purposes, but additional hydrogeological studies will be required to better estimate the requirements.
Test work results developed by KCA and others have indicated that part of the Camino Rojo Mineral Resource is amenable to heap leaching for the recovery of gold and silver. Based on a Mineral Reserve of 44.0 million tonnes and established processing rate of 18,000 tonnes per day of ore, the Project has an estimated mine life of approximately 6.8 years.
Ore will be mined using standard open pit mining methods and delivered to the crushing circuit using haul trucks which will direct-dump into a dump hopper; front-end loaders will feed material to the dump hopper as needed from a run of mine (ROM) stockpile located near the primary crusher. Ore will be crushed to a final product size of 80% passing 28mm (100% passing 38mm) using a two-stage closed crushing circuit. The crushing circuit will operate 7 days/week, 24 hours/day with an overall estimated availability of 75%.
Kappes, Cassiday & Associates June, 2019 | | 1.0 Summary Page 1-11 |
| Camino Rojo Project Feasibility Study NI 43-101 Technical Report |
|
The crushed product will be stockpiled using a fixed stacker, reclaimed by belt feeders to a reclaim conveyor, and conveyed to the heap stacking system by an overland conveyor system. Pebble lime will be added to the reclaim conveyor belt for pH control; agglomeration with cement is not needed.
Stacked ore will be leached using a drip irrigation system for solution application; sprinkler irrigation will be used beginning in Year 4 of operations to increase evaporation rates and reduce water treatment requirements from pit dewatering. After percolating through the ore, the gold and silver bearing pregnant leach solution will drain by gravity to a pregnant solution pond where it will be collected and pumped to a Merrill-Crowe recovery plant. Pregnant solution will be pumped through clarification filter presses to remove any suspended solids before being deaerated in a vacuum tower to remove oxygen. Ultra-fine zinc dust will be added to the deaerated pregnant solution to precipitate gold and silver values, which will be collected by precipitate filter presses. Barren leach solution leaving the precipitate filter presses will flow to a barren solution tank and will then be pumped to the heap for further leaching. High strength cyanide solution will be injected into the barren solution to maintain the cyanide concentration in the leach solutions at the desired levels.
The precipitate from the Merrill-Crowe recovery plant will be processed in the refinery. Precipitate will be treated by an electric mercury retort with a fume collection system for drying and removal of mercury before being mixed with fluxes and smelted using an induction smelting furnace to produce the final doré product.
An event pond is included to collect contact solution from storm events. Solution collected will be returned to the process as soon as practical. Evaporators will be installed in the event pond beginning in Year 3 of operation to remove excess water generated by pit dewatering.
Existing infrastructure for the Camino Rojo Project includes a 20-man exploration camp and dirt and gravel roads throughout the Project site. Internet and limited cellular communications are currently available, though these systems will need to be expanded for operations.
Access to the Project site is by the paved four lane Mexican Highway 54 and Route 62, a secondary paved highway that passes through San Tiburcio. This is approximately 260 km southwest of Monterrey and 190 km northeast of Zacatecas. A private road will enter into the mine property approximately 250 metres northeast of the intersection between highway 54 and 62. This road will provide access to the camps, offices, mine, process plant and other Project facilities. Site access roads will be constructed during pre-production and will include approximately 24 km of dirt and gravel roads.
Kappes, Cassiday & Associates June, 2019 | | 1.0 Summary Page 1-12 |
| Camino Rojo Project Feasibility Study NI 43-101 Technical Report |
|
The onsite operations camp will be arranged to lodge up to 408 people and will be under maximum occupancy during the construction phase (multiple bunks in rooms that will be single rooms during operations).
Power supply to the Camino Rojo Project will initially be generated on site using two each 2500 ekW diesel generator units operating, with an additional unit on standby, as well as by the existing power line which services the surrounding area. Power will be generated at 4160 V, 3 phase, 60 Hz and stepped up to 13.8 kV by a transformer for site distribution. The generator system has been sized to meet both the average power demand of 4.8 MW as well as the peak estimated demand of 6 MW based on detailed electrical loads with estimated utilization and demand factors. The existing power line has a reported 1 MW of capacity which will be used to supply power to dedicated loads (man camp, site buildings, water supply). The existing power line will be stepped down from 34.5 kV to 13.8 kV.
It is assumed that in Year 2 of operations, power supply will be available by connecting to the national grid and power generation at site will no longer be needed. Overhead power lines will connect 34.5 kV, three phase and 60 Hz power system, pending Centro Nacional de Control de Energía (CENACE) approval, to a metering and switching substation. This main substation will be located at approximately NAD27 245609E, 2674826N. Power from the main substation will be stepped down to 13.8 kV and connected to the existing switch gear for site distribution. The temporary generators and associated fuel tanks will be removed once line power is available.
Total Project water supply will be sourced from production wells located within the property boundary. Process make-up water will also be supplied during pit dewatering activities starting in about Year 4. Total water consumption for the Project will average 24 liters per second (L/s) with a peak water demand of 33 L/s.
Project buildings will primarily be prefabricated steel buildings or concrete masonry unit buildings and include an administration building, mine truck shop, warehouse, laboratory, guard house, clinic, refinery and motor control centres (MCC).
| 1.11 | Environmental Studies, Permitting and Social or Community Impact |
Exploration and mining activities in Mexico are subject to control by the Federal agency of the Secretaria del Medio Ambiente y Recursos Naturales (Secretary of the Environment and Natural Resources), known by its acronym SEMARNAT, which has authority over the 2 principal Federal permits:
| i. | A Manifesto de Impacto Ambiental (Environmental Impact Statement), known by its acronym as an MIA accompanied by an Estudio de Riesgo (Risk Study, hereafter referred to as ER); and |
| | | |
Kappes, Cassiday & Associates June, 2019 | | 1.0 Summary Page 1-13 |
| Camino Rojo Project Feasibility Study NI 43-101 Technical Report |
|
| ii. | A Cambio de Uso de Suelo (Land Use Change) permit, known by its acronym as a CUS, supported by an Estudio Tecnico Justificativo (Technical Justification Study, known by its acronym ETJ). |
Thus far exploration work at Camino Rojo has been conducted under the auspices of two separate MIA permits and corresponding CUS permits. These permits allow for extensive exploration drilling but are not sufficient for mine construction or operation.
Baseline environmental studies required for permitting were commissioned by Orla on April 2018 and were completed in May 2019 by independent consultants. The Project area includes five flora species with legally protected status and nine fauna species that are listed as threatened or protected. In accordance with Federal laws, 100% of the protected plants will be rescued and transplanted prior to construction and qualified biologists will survey the areas to be disturbed to identify nesting areas, dens and lairs of animals present. Any animals not naturally prone to leave the area that are found will be relocated to suitable habitats elsewhere in the property area. Current and ongoing environmental investigations are still in progress. Submission of MIA and CUS permitting documents to SEMARNAT is anticipated in the 3rd Quarter 2019.
The Project is not located in an area with any special Federal environmental protection designation and no factors have been identified that would be expected to hinder authorization of required Federal and State environmental permits. The legislated timelines for review of properly prepared MIA and Change of Land Use applications and mine operating permits for a project that does not affect Federally protected biospheres or ecological reserves are 120 calendar days and 105 working days, respectively, which can be completed concurrently.
The Peñasquito mine, a large scale, open pit mine, presently operated by Newmont, is in the same Municipality and the mine encountered no impediments to receipt of needed permits. Should construction and operation permits be solicited for the Camino Rojo Project, no obstacles to obtaining them are anticipated provided that Orla design and mitigation criteria meet all applicable standards.
In April 2018, Orla commissioned Environmental Resources Management (ERM), a global provider of environmental, health, safety, risk, social consulting and sustainability related services group to conduct an independent assessment of social and community impacts of the development of the Camino Rojo Project, and to provide guidance on actions and policies needed to ensure that Orla obtains and maintains social license to operate. The study was completed in May 2019 (ERM, 2019) and salient results are being incorporated into the project development and permitting plans. Key points are summarized as follows:
Kappes, Cassiday & Associates June, 2019 | | 1.0 Summary Page 1-14 |
| Camino Rojo Project Feasibility Study NI 43-101 Technical Report |
|
Principal concerns of affected stakeholders in surrounding communities are:
| i. | Employment of community members |
| ii. | Community benefits from improved public services and investment in community development |
| iii. | Environmental contamination |
| iv. | Increased community population and strain on public services |
Principal concerns of Ejido members whose land is affected are:
i. Just economic compensation
ii. Assistance in obtaining title to informally owned parcels
Principal concerns of local and State government authorities are:
i. Generation of employment
ii. Improvement of local infrastructure
iii. Service contracts to local businesses
iv. Environmental contamination
ERM identified the principal social and community impacts of the Project and opined that the Project does not put at risk the social environment of the nearby communities because the impacts can be mitigated or made positive with the implementation of a Social Management System (SMS). ERM has designed this SMS based on International Association of Impact Assessment best practices.
| 1.12 | Capital and Operating Costs |
Capital and operating costs for the process and general and administration components of the Camino Rojo Project were estimated by KCA. Costs for the mining components were provided by IMC. The estimated costs are considered to have an accuracy of +/-15%.
The total Life of Mine (LOM) capital cost for the Project is US$153.7 million, including US$10.1 million in working capital and not including reclamation and closure costs which have been estimated at US$19.8 million, IVA (value added tax) or other taxes; all IVA is applied to all costs at 16% and is assumed to be fully refundable. Table 1-4 presents the capital requirements for the Camino Rojo Project. A total contingency of US$18.6 million or 12% of the total LOM capital costs is included in this summary.
Kappes, Cassiday & Associates June, 2019 | | 1.0 Summary Page 1-15 |
| Camino Rojo Project Feasibility Study NI 43-101 Technical Report |
|
Table 1-4
Capital Cost Summary
| Description | Cost (US$) |
| Pre-Production Capital | $ 123,114,000 |
| Working Capital & Initial Fills | $ 10,187,000 |
| Sustaining Capital – Mine & Process | $ 20,424,000 |
| Total excluding IVA | $ 153,725,000 |
A majority of the costs presented have been estimated primarily by KCA with input from IMC on owner mining and mining contractor mobilization costs. Material take-offs for earthworks, concrete and major piping have been estimated by KCA. All equipment and material requirements are based on design information described in this report. Capital costs have been made primarily using budgetary supplier quotes for all major and most minor equipment as well as contractor quotes for major construction contracts. Multiple quotes were received for all major packages (three or more in most cases). Where project specific quotes were not available a reasonable estimate or allowance was made based on recent quotes in KCA/IMC’s files. In total, more than 90% of the Project direct costs are based on supplier and contractor quotes.
The average LOM operating cost for the Project is US$8.43 per tonne of ore processed. Table 1-5 presents the LOM operating cost requirements for the Camino Rojo Project.
Table 1-5
Operating Cost Summary
| Description | LOM Cost
(US$/t) |
| Mine | $3.30 |
| Process & Support Services | $3.38 |
| Site G & A | $1.75 |
| Total | $8.43 |
Mining costs were provided by IMC at US$2.14 per tonne mined (LOM US$3.30 per tonne of ore) and are based on quotes for contract mining with estimated owner’s mining costs.
Process operating costs have been estimated by KCA from first principles. Labour costs were estimated using project specific staffing, salary and wage and benefit requirements. Unit consumptions of materials, supplies, power, water and delivered supply costs were also estimated. LOM average processing costs are estimated at US$3.38 per tonne ore.
Kappes, Cassiday & Associates June, 2019 | | 1.0 Summary Page 1-16 |
| Camino Rojo Project Feasibility Study NI 43-101 Technical Report |
|
General administrative costs (G&A) have been estimated by KCA with input from Orla. G&A costs include project specific labour and salary requirements and operating expenses, including social contributions, land access and water rights. G&A costs are estimated at US$1.75 per tonne ore.
Operating costs were estimated based on 1st quarter 2019 US dollars and are presented with no added contingency based upon the design and operating criteria present in this report. IVA is not included in the operating cost estimate.
The operating costs presented are based upon the ownership of all process production equipment and site facilities, including the onsite laboratory. The owner will employ and direct all process operations, maintenance and support personnel for all site activities.
| 1.13 | Cautionary Statements |
| 1.13.1 | Forward Looking Information |
This document contains “forward-looking information” as defined in applicable securities laws. Forward looking information includes, but is not limited to, statements with respect to the FS, including but not limited to future production, costs and expenses of the Project; estimates of Mineral Reserves and Mineral Resources; commodity prices and exchange rates; mine production plans; projected mining and process recovery rates; mining dilution assumptions; sustaining costs and operating costs; interpretations and assumptions regarding joint venture and potential contract terms; closure costs and requirements; the ability to reach agreement with the Adjacent Owner; government regulations and permitting timelines; requirements for additional capital; environmental, permitting and social risks; and general business and economic conditions. Often, but not always, forward-looking information can be identified by the use of words such as “plans”, “expects”, “is expected”, “budget”, “scheduled”, “estimates”, “continues”, “forecasts”, “projects”, “predicts”, “intends”, “anticipates” or “believes”, or variations of, or the negatives of, such words and phrases, or statements that certain actions, events or results “may”, “could”, “would”, “should”, “might” or “will” be taken, occur or be achieved.
Kappes, Cassiday & Associates June, 2019 | | 1.0 Summary Page 1-17 |
| Camino Rojo Project Feasibility Study NI 43-101 Technical Report |
|
Forward-looking information is based on a number of assumptions which may prove to be incorrect, including, but not limited to, the availability of financing for production, development and exploration activities; the timelines for exploration and development activities on the Project; the availability of certain consumables and services; assumptions made in mineral resource and mineral reserve estimates, including geological interpretation grade, recovery rates, price assumption, and operational costs; and general business and economic conditions. Forward-looking information involves known and unknown risks, uncertainties and other factors which may cause the actual results, performance or achievements to be materially different from any of the future results, performance or achievements expressed or implied by the forward-looking information. These risks, uncertainties and other factors include, but are not limited to, the assumptions underlying the production estimates not being realized, changes to the cost of production, variations in quantity of mineralized material, grade or recovery rates, geotechnical or hydrogeological considerations during mining differing from what has been assumed, failure of plant, equipment or processes, changes to availability of power or the power rates used in the cost estimates, changes to salvage values, ability to maintain social license, changes to interest or tax rates, decrease of future gold prices, cost of labour, supplies, fuel and equipment rising, the availability of financing on attractive terms, actual results of current exploration, changes in project parameters, exchange rate fluctuations, delays and costs inherent to consulting and accommodating rights of local communities, environmental risks, reclamation expenses, title risks, regulatory risks and uncertainties with respect to obtaining necessary permits or delays in obtaining same, and other risks involved in the gold production, development and exploration industry, as well as those risk factors discussed in Orla’s latest Annual Information Form and its other SEDAR filings from time to time.
All forward-looking information herein is qualified by this cautionary statement. Accordingly, readers should not place undue reliance on forward-looking information. Orla and the authors of this Technical Report undertake no obligation to update publicly or otherwise revise any forward-looking information whether as a result of new information or future events or otherwise, except as may be required by applicable law.
Orla has included certain non-International Financial Reporting Standards (IFRS) performance measures as detailed below. In the gold mining industry, these are common performance measures but may not be comparable to similar measures presented by other issuers and the non-IFRS measures do not have any standardized meaning. Accordingly, it is intended to provide additional information and should not be considered in isolation or as a substitute for measures of performance prepared in accordance with IFRS.
Cash Costs per Ounce – Orla calculated cash costs per ounce by dividing the sum of operating costs, royalty costs, production taxes, refining and shipping costs, net of by-product silver credits, by payable gold ounces. While there is no standardized meaning of the measure across the industry, Orla believes that this measure will be useful to external users in assessing operating performance.
All-In Sustaining Costs (“AISC”) – Orla has disclosed an AISC performance measure that reflects all of the expenditures that are required to produce an ounce of gold from operations. While there is no standardized meaning of the measure across the industry, Orla’s definition conforms to the all-in sustaining cost definition as set out by the World Gold Council in its guidance dated 27 June 2013. Orla believes that this measure will be useful to external users in assessing operating performance and the ability to generate free cash flow from current operations.
Kappes, Cassiday & Associates June, 2019 | | 1.0 Summary Page 1-18 |
| Camino Rojo Project Feasibility Study NI 43-101 Technical Report |
|
Based on the estimated production schedule, capital costs and operating costs, a cash flow model was prepared by KCA for the economic analysis of the Camino Rojo Project. All of the information used in this economic evaluation has been taken from work completed by KCA and other consultants working on this Project.
The project economics were evaluated using a discounted cash flow (DCF) method, which measures the Net Present Value (NPV) of future cash flow streams. The final economic model was based on the following assumptions:
| · | The mine production schedule from IMC. |
| · | Period of analysis of twelve years including two years of investment and pre-production, seven years of production and three years for reclamation and closure. |
| · | Gold price of US$1,250/oz. |
| · | Silver prize of US$17/oz. |
| · | Processing rate of 18,000 tpd. |
| · | Overall recoveries of 64% for gold and 17% for silver. |
| · | An exchange rate of 19.3 MXN$ to US$ 1 |
| · | Capital and operating costs as developed in Section 21.0 of this report. |
The Project economics based on these criteria from the cash flow model are summarized in Table 1-6.
Kappes, Cassiday & Associates June, 2019 | | 1.0 Summary Page 1-19 |
Table 1-6
Economic Analysis Summary
| Production Data | | |
| Life of Mine | 6.8 | Years |
| Mine Throughput per day | 18,000 | Tonnes Ore /day |
| Mine Throughput per year | 6,570,000 | Tonnes Ore /year |
| Total Tonnes to Crusher | 44,020,000 | Tonnes Ore |
| Grade Au (Avg.) | 0.73 | g/t |
| Grade Ag (Avg.) | 14.2 | g/t |
| Contained Au oz | 1,031,000 | Ounces |
| Contained Ag oz | 20,093,000 | Ounces |
| Metallurgical Recovery Au (Overall) | 64% | |
| Metallurgical Recovery Ag (Overall) | 17% | |
| Average Annual Gold Production | 97,000 | Ounces |
| Average Annual Silver Production | 511,000 | Ounces |
| Total Gold Produced | 662,000 | Ounces |
| Total Silver Produced | 3,479,000 | Ounces |
| LOM Strip Ratio (W:O) | 0.54 | |
| Operating Costs (Average LOM) | | |
| Mining | $2.14 | /Tonne mined |
| Mining (processed) | $3.30 | /Tonne Ore processed |
| Processing & Support | $3.38 | /Tonne Ore processed |
| G&A | $1.75 | /Tonne Ore processed |
| Total Operating Cost | $8.43 | /Tonne Ore processed |
| Total By-Product Cash Cost | $515 | /Ounce Au |
| All-in Sustaining Cost | $576 | /Ounce Au |
| Capital Costs (Excluding IVA and Closure) | | |
| Initial Capital | $123 | million |
| LOM Sustaining Capital | $20 | million |
| Total LOM Capital | $144 | million |
| Working Capital & Initial Fills | $10 | million |
| Reclamation & Closure | $20 | million |
| Financial Analysis | | |
| Gold Price Assumption | $1,250 | /Ounce |
| Silver Price Assumption | $17 | /Ounce |
| Average Annual Cashflow (Pre-Tax) | $72 | million |
| Average Annual Cashflow (After-Tax) | $56 | million |
| Internal Rate of Return (IRR), Pre-Tax | 38.6% | |
| Internal Rate of Return (IRR), After-Tax | 28.7% | |
| NPV @ 5% (Pre-Tax) | $227 | million |
| NPV @ 5% (After-Tax) | $142 | million |
| Pay-Back Period (Rears based on After-Tax) | 3.0 | Years |
Kappes, Cassiday & Associates June, 2019 | | 1.0 Summary Page 1-20 |
| Camino Rojo Project Feasibility Study NI 43-101 Technical Report |
|
A sensitivity analysis was performed on the project economics. Figure 1-1 and Figure 1-2 are charts showing the relative sensitivity to a number of parameters.

Figure 1-1 After-Tax IRR vs. Gold Price, Capital Cost, Operating Cost & Exchange Rate
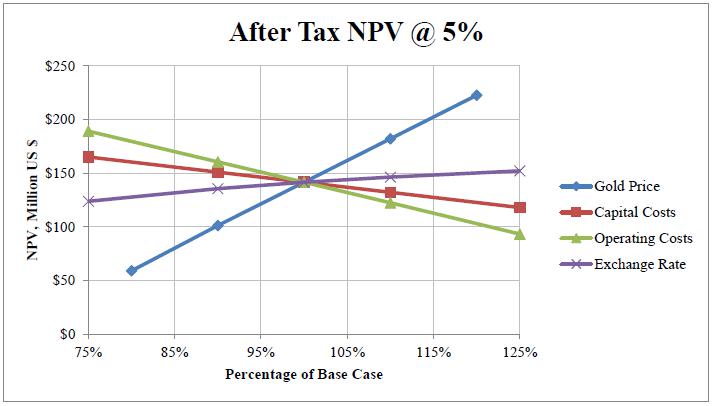
Figure 1-2 NPV @ 5% vs. Gold Price, Capital Cost, Operating Cost & Exchange Rate
Kappes, Cassiday & Associates June, 2019 | | 1.0 Summary Page 1-21 |
| Camino Rojo Project Feasibility Study NI 43-101 Technical Report |
|
| 1.15 | Interpretations and Conclusions |
The work that has been completed to date has demonstrated that the Camino Rojo open pit mine and heap leach facility is a technically feasible and economically viable project. The property is conveniently located with access via Mexican highway 54 which connects the major cities of Zacatecas and Saltillo. The project terrain is predominately flat with sufficient water for operations available from wells located at the project site. Required mineral, surface and water rights have been secured.
The Project has been designed as an open-pit mine with heap leach for recovery of gold and silver from oxide and transition material with a LOM production of 44.0 million tonnes with an average grade of 0.73 g/t Au and 14.2 g/t Ag which amounts to 1.03 million contained ounces of gold and 20.1 million contained ounces of silver. Metallurgical test work on the material to date shows acceptable recoveries for gold and silver with low to moderate reagent consumptions. Cement agglomeration is not required for stability or permeability for heap heights up to 80 metres.
Ore will be crushed to P80 28mm, stockpiled, reclaimed and conveyor stacked onto the heap leach pad at an average rate of 18,000 tpd. Stacked material will be leached using low grade sodium cyanide solution and the resulting pregnant leach solution will be processed in a Merrill-Crowe plant for the recovery of gold and silver by zinc cementation followed by drying and smelting to produce the final doré product. The Project has an estimated mine life of 6.8 years.
Key opportunities for the Camino Rojo project include:
| · | If an agreement can be made with the Adjacent Owner, additional material amendable to heap leaching could be accessed which represents an opportunity for mine expansion in the future. |
| · | In addition to the leachable oxide Mineral Resource, this report has identified Measured and Indicated Mineral Resources of 258.8 million tonnes at 0.88 g/t gold and 7.4 g/t silver that is sulphide and amenable to mill processing and flotation concentration. This amounts to 7.3 million contained ounces of gold and 61.6 million contained ounces of silver. Additional metallurgical studies will be required to evaluate potential recoveries for this material. This Mineral Resource is contained on Orla property, was not included in the Feasibility Study, and an agreement with the Adjacent Owner will be required to exploit this Mineral Resource by open pit methods. |
Kappes, Cassiday & Associates June, 2019 | | 1.0 Summary Page 1-22 |
| Camino Rojo Project Feasibility Study NI 43-101 Technical Report |
|
| · | During Year 4 of operation, the pit depth will intersect the local water table. This will require pit dewatering for the remaining LOM of the Project. Preliminary estimates placed maximum required dewatering rates of the Oxide Pit between 49 L/s and up to 99 L/s. Recent investigations suggest that the actual maximum dewatering rate will be closer to the lower estimated value, which would reduce both the capital and operating costs to pump and evaporate excess pit water not utilized in mining and processing activities. |
| · | Leaching cycles have been designed for 80 days, but laboratory results have shown that silver recoveries benefit from cyanide solution application beyond the 80-day period. With subsequent lifts, drain down from active lifts will result in extended leaching times on previously leached lifts. As a result of this, silver recoveries are expected to increase over the LOM of the Project. |
| · | Due to the uniform topography of the Camino Rojo property, earthworks quantities needed for elevating the haul roads to meet the required height of the primary crusher incur large capital costs. Utilizing a decoupled system (a conveyor at lower elevation to feed the crusher) would decrease initial earthworks quantities as well as fuel requirements from truck haulage throughout the life of the Project. |
| · | The Camino Rojo deposit occurs within a mineralized district that is highly prospective for discovery of additional deposits. New discoveries of Mineral Resources in the vicinity of the proposed mine may be accretive to the Project. |
| | | |
Risks for the Camino Rojo project include:
| · | Camino Rojo considers contract mining. There is a risk that the selected mining contractor may require financial assistance from the owner, which may increase costs. Contract mining is common in Mexico and this risk can be minimized by careful evaluation of potential contractors. |
| · | Mining operations will eventually be conducted below the water table. Estimates of pit dewatering requirements have been prepared for cost purposes, but additional hydrogeological studies need to be conducted. There is a risk that the estimated pit dewatering costs may change as a result of these studies. |
| · | There is geotechnical risk associated with the base case mine plan that is constrained by the property boundary. Mitigation of any slope failures of the north wall could prove difficult due to lack of access to the ground to the north. The design slope angles on the north and west walls are relatively steep and assume aggressive slope reinforcement. The slope angles will be flatter than design if this system fails to work as expected. This could reduce the amount of material mined and the amount of ore available for processing. |
Kappes, Cassiday & Associates June, 2019 | | 1.0 Summary Page 1-23 |
| Camino Rojo Project Feasibility Study NI 43-101 Technical Report |
|
| 1.15.3.2 | Metallurgy and Process |
| · | Carbonaceous material with preg-robbing characteristics has been identified, which may reduce overall heap performance and metal recovery if processed. With regard to gold and silver recovery the Camino Rojo deposit shows preg-robbing organic carbon as being the only significant deleterious element identified, which is primarily associated with the transition material at depth along the outer edges of the deposit. Preg robbing presents a low risk to the overall Project. A significant investigation by Orla into the preg robbing material which was reviewed by KCA indicates that preg robbing material will most likely not be encountered until later in the Project life and can be mitigated by proper ore control. |
| · | There is a risk that Merrill-Crowe efficiencies may be poor, particularly during initial operations due to low pregnant solution concentrations of gold and silver. This may result in increased zinc consumption and delayed metal recoveries. |
| · | Evaporators for pit dewatering require a minimum operating depth in the pond for operation which is assumed to be approximately 1.5 metres, or approximately 46,500 m3 of solution. Based on the pond sizing criteria there is sufficient capacity in the event pond to accommodate this additional solution for the planned heap without any changes. However, evaporation rates of water from the pit may not consistently be as estimated which may lead to some periodic short-term loss of pond storage. |
| | | |
| 1.15.3.3 | Access, Title and Permitting |
| · | The Project is subject to normal risks regarding access, title, permitting, and security. The Project has had a productive relationship with the surface owners and no extraordinary risks to project access were discerned. Conditional upon continued compliance with annual requirements, no risk to validity of title was discerned. Conditional upon compliance with applicable regulations, permits for normal exploration activities, mine construction, and mine operation are expected to be attainable. Drug related violence, propagated by members of criminal cartels and directed against other members of criminal cartels, has occurred in the region and has affected local communities. The aggression is not directed at mining companies operating in the region and has not affected the ability of Orla or previous operators to explore the Camino Rojo property. |
| · | There is a risk due to a possible Federal designation of a protected biological-ecological reserve known as “Zacatecas Semiarid Desert” as a Natural Protected Area (ANP). If a designation of this ANP by the government includes the surface of the mining concession areas or ancillary work areas such as possible water well fields of Camino Rojo, this could limit the growth and continuity of the Project. Mining activities (including both exploration and exploitation), depending on the corresponding sub-zone may be carried out provided they are authorized by CONANP (National Commission on Protected Natural Areas), without prejudice of other authorizations required for their execution. Goldcorp, the prior operator of the Project, engaged in forums with government and community stakeholders, and submitted an official opinion regarding this ANP declaration to the government, with the objective of ensuring that if an ANP was created, the Camino Rojo Project would not be restricted from development. Since the time that the idea of creating an ANP was first proposed there has been no formal movement on the proposal. Because the State and Municipal governments affected by the Camino Rojo project have formally expressed opposition to creation of the ANP in the area of the Camino Rojo Project, the authors believe the permitting risk is similar to that of any mining project of similar scope in North America. |
Kappes, Cassiday & Associates June, 2019 | | 1.0 Summary Page 1-24 |
| Camino Rojo Project Feasibility Study NI 43-101 Technical Report |
|
| · | The Project considers running a powerline from Conception Del Oro to the Project site, approximately 55 km, early in the Project life. The application for the powerline requires an investigation by CENACE to determine where the Project is allowed to connect to the national grid, followed by approval from the Mexican Federal Electric Commission (CFE) to construct and energize the powerline. It is estimated that in Year 2 of operations power supply will be available by connecting to the national commercial grid and power generation at site will no longer be needed. There is a possibility that connection to the national grid will occur later than Year 2 and will require an extended time period of diesel power generation. This delay in access to line power would incur additional operating costs for any duration beyond the expected date of connection to the commercial power grid. At this time, Orla is well underway with the application process and is currently waiting on results from the CENACE investigation. |
| · | The primary Project production well (PW-1) underwent a 10,000-minute pumping test and a sustained flow of 32 L/s was maintained. However, there is a risk that the fracture system in the limestone has limited potential to provide water and that flow to the well could decrease over the life of the Project. Development of additional wells will mitigate this risk. |
| · | An ecological tax implemented by the state Congress of Zacatecas in 2017 could have a significant impact on the economics of the Project. This tax is applied to cubic metres of material extracted during mining, square metres of material impacted by dangerous substances, tonnes of carbon dioxide produced during mining processes and tonnes of waste stored in landfills. Due to the uncertainty of application of this tax and turbulence between active mining companies and the State of Zacatecas, the long-term effects and implementation of this ecological tax are currently unknown and are not considered in this report. |
Kappes, Cassiday & Associates June, 2019 | | 1.0 Summary Page 1-25 |
| Camino Rojo Project Feasibility Study NI 43-101 Technical Report |
|
| 1.16.1 | KCA Recommendations |
This Report presents an economically robust project. Based on these results, the following future work is recommended by KCA:
| · | Application and approval for the power line to the project site should continue to be advanced. Estimated costs for this are approximately US$130,000 and are included in the cost estimates of the Report. |
| · | Engage with Adjacent Property Owner to reach an agreement allowing expansion of the proposed mine pit and Mineral Resource. |
| | | |
| 1.16.2 | RGI Recommendations |
RGI recommends a phased exploration program. Phase 1, at a total cost of US$3.25 million, consists of:
| · | 950 line-km of induced polarization (IP) geophysical surveys to seek additional mineralized zones concealed by colluvium. |
| · | A 5,000m core drill program to evaluate the sulphide resource underlying and adjacent to the oxide and transition mineralization that is the focus of the FS. |
| · | A 5,000m RC drill program to test IP anomalies already identified. |
Phase 2, at a total cost of US$1.8 million, is conditional upon identification of new IP anomalies, and comprises:
| · | A 5,000m RC drill program to test newly identified IP anomalies. |
| · | A 5,000m core drilling program to evaluate the mineralized zones thus discovered. |
| | | |
| 1.16.3 | Barranca Recommendations |
Barranca recommends the following at a total estimated cost of approximately US$1.1 million which is included in the report cost estimates in this Report:
| · | Additional RC test drilling leading to the construction of one or more back-up reserve production wells which should have a pump-tested sustainable capacity of at least 15 to 20 L/s. |
| · | Drilling and construction of all five proposed monitor wells during the 2019 calendar year or early 2020 in order to define the direction of groundwater movement as well as baseline water quality. |
Kappes, Cassiday & Associates June, 2019 | | 1.0 Summary Page 1-26 |
| Camino Rojo Project Feasibility Study NI 43-101 Technical Report |
|
| 2.1 | Introduction and Overview |
This NI 43-101 Technical Report is a summary of the Feasibility Study on the Camino Rojo Project and is in compliance with disclosure and reporting requirements set forth in the Canadian Securities Administrators’ current “Standards of Disclosure for Mineral Projects” under the provisions of NI 43-101, Companion Policy NI 43-101 CP and Form NI 43-101F1 and supersedes a National Instrument 43-101 Technical Report prepared by KCA dated 19 June 2018 and amended 11 March 2019 titled, “Preliminary Economic Assessment – Amended 43-101 Technical Report on the Camino Rojo Gold Project - Municipality of Mazapil, Zacatecas, Mexico”.
This Technical Report is issued to Orla. Orla is listed on the TSX Exchange (TSX: OLA) and holds a 100% interest in the Camino Rojo deposit through its Mexican subsidiary MCR. This report was prepared by KCA, IMC, RGI and Barranca with input from other consultant groups.
The Feasibility Study commenced during July 2018 and was completed during June 2019.
| 2.2 | Project Scope and Terms of Reference |
Orla commissioned KCA to evaluate the Camino Rojo Project to Feasibility Study standards. This Report is led by KCA and incorporates work from other groups including IMC for mine development and costs, RGI for the property descriptions and geology, Barranca for water supply, pit dewatering and ground water modeling, HydroGeoLogica Inc. (HydroGeoLogica) for heap leach pad and waste dump runoff models, Piteau Associates (Piteau) for geotechnical investigations and RGI for the property descriptions and geology. A more detailed scope description for each group is included below.
KCA’s scope of work for the project is summarized as follows:
| · | Review of new and historical metallurgical tests and interpretation, |
| · | Process design and recovery methods, |
| · | Infrastructure and process capital and operating costs, |
| · | General and administrative (G&A) costs with input from Orla mining. |
| · | Overall report preparation and compilation. |
Kappes, Cassiday & Associates June, 2019 | | 2.0 Introduction Page 2-1 |
| Camino Rojo Project Feasibility Study NI 43-101 Technical Report |
|
IMC’s scope of work for the project is summarized as follows:
| · | Audit the drill hole database for the Camino Rojo deposit, |
| · | Develop the Mineral Resource block model for the deposit, |
| · | Estimate Mineral Resource, |
| · | Estimate Mineral Reserve, |
| · | Develop an operational mine plan for the open pit, and |
| · | Mining capital and operating costs including evaluation of contract mining quotes. |
RGI’s scope of the work for the project is summarized as follows:
| · | Property description, including reporting on exploration work completed by Orla, geology and mineralization, environmental liabilities, location, access, physiography, infrastructure, claim ownership, and surface rights ownership, |
| · | Assessment of regulatory requirements and description of the steps required to obtain construction and operating permits for the mine plan described in this report, |
| · | Assess risks to project development related to access, title, permits, and security. |
Barranca’s scope of the work for the project is summarized as follows:
| · | Production well location and development. |
HydroGeoLogica’s scope of the work for the project is summarized as follows:
| · | Heap rinsing and drain down, |
| · | Acid rock drainage and metal leaching potential, |
| · | Heap and waste rock facility closure plans, and |
Piteau’s scope of the work for the project is summarized as follows:
| · | Geotechnical investigations and analysis for the mine pit, waste rock dump and heap leach facilities. |
The scope of this report also includes a study of information obtained from public documents; other literature sources cited; and cost information from public documents and recent estimates from previous studies conducted by KCA.
Kappes, Cassiday & Associates June, 2019 | | 2.0 Introduction Page 2-2 |
| Camino Rojo Project Feasibility Study NI 43-101 Technical Report |
|
This Technical Report is intended to provide the project’s economics and to give guidance for the implementation of the Camino Rojo project.
The purpose of this Report is to disclose Mineral Reserves for the Camino Rojo property, summarize the Feasibility Study completed on the property and disclose an updated Mineral Resource estimate for the property. This report supports information disclosed in a press release dated 25 June 2019.
The units of measure presented in this report, unless noted otherwise, are in the metric system. The currency used for all costs is presented in US Dollars (US$ or $), unless specified otherwise. The costs were estimated based on quotes and cost data as of 1st Quarter 2019. For all major equipment packages, construction contracts and infrastructure items multiple quotes were obtained.
The economic evaluation of the Project has been conducted on a constant dollar basis (Q1 2019) with a gold price of US$1,250 per ounce and a silver price of US$17 per ounce for the Base Case. Economic evaluation is done on a Project basis and from the point of view of a private investor, after deductions for royalties, income taxes, and various mining taxes and duties paid to the government of Mexico. An exchange ratio of 19.3 Mexican pesos = US$1 was used for any costs converted from Mexican currency.
| 2.3 | Sources of Information |
KCA has taken all reasonable care in producing the information contained in this report. The information, conclusions and estimates contained in this report are consistent with information available at the time of preparation, the data supplied by outside sources and assumptions, conditions and qualifications set forth in this report. The authors of this report are Carl Defilippi, Michael G. Hester, Dr. Matthew Gray and David Hawkins, each of whom is a Qualified Person as defined under NI 43-101.
The information in this report is not a substitute for independent professional advice before making any investment decisions. Any information in this report cannot be modified without the express written permission from KCA.
The primary sources of information used for this technical report are set out in Section 27, References, and include:
| · | The 24 June 2019 Feasibility Report titled “Project Feasibility Study on the Camino Rojo Gold Project Municipality of Mazapil, Zacatecas, Mexico” and accompanying appendices. |
Kappes, Cassiday & Associates June, 2019 | | 2.0 Introduction Page 2-3 |
| Camino Rojo Project Feasibility Study NI 43-101 Technical Report |
|
| · | The digital drillhole database. This includes work developed during the Canplats, Goldcorp and Orla tenures. |
| · | The original assay certificates for the holes. |
| · | Various geologic solids that were developed (interpreted) by Orla geologists. |
| · | Various reports, including previous reports on sampling methodology, quality control and quality assurance (QA/QC), resource modeling, geotechnical and slope stability, mine planning, and economic evaluations. These were developed by Canplats, Goldcorp, and various consultants. |
| · | Various new reports for water production and supply and site geotechnical evaluations. |
| · | Various reports on metallurgical testing, process recovery, and mineral processing that were developed by Canplats, Goldcorp, Orla and various consultants. |
| · | Published reports on Mexican taxes and duties. |
KCA, IMC, RGI and Barranca reviewed the data and only used data that were deemed reliable for this Report.
| 2.4 | Qualified Persons and Site Visits |
The processing studies, cost estimations, and financial analysis and review of current and historical metallurgical data were conducted by KCA under the auspices of Carl Defilippi, RM SME, of Reno, NV. Mr. Defilippi is an independent Qualified Person under NI 43-101 and is responsible for Sections 1.1, 1.5, 1.9, 1.10, 1.12, 1.13, 1.14, 1.15.1, 1.15.2, 1.15.3.2, 1.15.3.4, 1.16.1, 2, 3, 12.2, 12.3, 13, 17, 18, 19, 20.1.7, 21.0, 21.1, 21.1.2, 21.1.3 through 21.1.9, 21.2, 21.2.2, 21.3, 22, 24.1, 24.2, 25.1, 25.1.2, 25.2.3, 25.3.2, 25.3.4, 26.1, 27 and 28 of the Report. Mr. Defilippi visited the site on 20 and 21 of February 2018 and on 17 and 18 of January 2019. On these dates, Mr. Defilippi inspected the Project site and proposed locations for the process facilities and site infrastructure, examined drill core, and discussed geology and site conditions with Orla personnel.
Michael G. Hester, FAusIMM, Vice President and Principal Mining Engineer for IMC, is an independent Qualified Person under NI 43-101 and is responsible for Sections 1.6, 1.7, 1.8, 1.15.3.1, 10.1, 10.2, 10.3, 10.5.1, 10.6.1, 11.1, 11.2, 11.3.1, 11.3.2, 11.4.1, 12.1.1, 12.1.3, 14, 15, 16, 21.1.1, 21.2.1, 24.4, 25.1.1, 25.2.1, 25.2.2 and 25.3.1 of the Report. Mr. Hester is responsible for drilling, sample analysis, security and data verification, Mineral Resource and Mineral Reserve estimates, the mine plan used for the FS, and the mine capital and operating cost estimates. Mr. Hester visited the site on 20 and 21 February 2018. The purpose of the site visit was to examine site conditions, examine drill core, discuss project geology with Orla personnel, discuss the drilling database and sample and analytical procedures and to discuss previous work on the Project by Canplats and Goldcorp.
Kappes, Cassiday & Associates June, 2019 | | 2.0 Introduction Page 2-4 |
| Camino Rojo Project Feasibility Study NI 43-101 Technical Report |
|
Matthew D. Gray, Ph.D., C.P.G, the Qualified Person responsible for Sections 1.2, 1.3, 1.4, 1.11, 1.15.3.3, 1.16.2, 4, 5, 6, 7, 8, 9, 10.4, 10.5.2, 10.6.2, 11.3.3, 11.4.2, 12.1.2, 20 exclusive of 20.1.7, 23, 25.1.3, 25.2.4, 25.3.3, and 26.2 of this Report, conducted field visits to the Camino Rojo Gold Project, Zacatecas, Mexico, during the period 12 to 13 December 2016 as part of Orla’s due diligence review of the project, which at the time was owned and operated by Goldcorp. During his visit, Dr. Gray reviewed drill core, the geologic and resource model created by Goldcorp, assay and geologic data, and site infrastructure. In 2018, Dr Gray visited again during the periods 19 to 22 February, 18 to 20 July, and 20 to 24 August. Additional site visits were made in 2019 in the periods 17 to 18 January and 8 to 12 April. During the 2018 and 2019 site visits, Dr. Gray: designed and implemented drill program QA QC protocols; reviewed new drill core; verified 2018 and 2019 drill data; checked the new geologic and resource model for consistency with drillhole data; met with, and reviewed the work of consultants preparing environmental baseline studies and permitting documents; met with Orla’s Mexican legal counsel to discuss status of land, mineral, and water rights agreements; and reviewed the results of regional exploration programs. Dr. Gray is an independent Qualified Person under National Instrument 43-101.
David B. Hawkins, CPG, AIPG of Barranca Group LLC is an independent Qualified Person responsible for Sections 1.16.3, 24.3, and 26.3 of the Report. Mr. Hawkins is responsible for the ground water model. Mr. Hawkins has spent significant portions of time at the Project site for water supply development between 2018 and 2019. During his time at the Project Mr. Hawkins has conducted regional groundwater reconnaissance including visits to local groundwater wells. In addition, he has directly supervised exploration drilling activities, and he has directly supervised the test pumping of wells PW-1, PW-2, and CR-01.
There is no affiliation between Mr. Defilippi, Mr. Hester, Dr. Gray and Mr. Hawkins and Orla, except that of an independent consultant / client relationship.
The effective date of the Mineral Resource is 7 June 2019. The effective date of the Mineral Reserve is 24 June 2019. The effective date of this Technical Report is 25 June 2019.
Kappes, Cassiday & Associates June, 2019 | | 2.0 Introduction Page 2-5 |
| Camino Rojo Project Feasibility Study NI 43-101 Technical Report |
|
| 2.5 | Frequently Used Acronyms, Abbreviations, Definitions and Units of Measure |
All costs are presented in United States dollars. Units of measurement are metric. Only common and standard abbreviations were used wherever possible. A list of abbreviations used is as follows:
| Distances: | mm | – millimetre |
| | cm | – centimetre |
| | m | – metre |
| | km | – kilometre |
| | mbgl | – metres below ground level |
| | masl | – metres above sea level |
| Areas: | m2 or sqm | – square metre |
| | ha | – hectare |
| | km2 | – square kilometre |
| Weights: | oz | – troy ounces |
| | Koz | – 1,000 troy ounces |
| | Moz | – 1,000,000 troy ounces |
| | g | – grams |
| | kg | – kilograms |
| | T or t | – tonne (1000 kg) |
| | Kt | – 1,000 tonnes |
| | Mt | – 1,000,000 tonnes |
| Time: | min | – minute |
| | h or hr | – hour |
| | op hr | – operating hour |
| | d | – day |
| | yr | – year |
| | Ma | – Mega-annum (one million years) |
| Volume/Flow: | m3 or cu m | – cubic metre |
| | m3/h | – cubic metres per hour |
| | L/s | – litres per second |
| Assay/Grade: | g/t | – grams per tonne |
| | kg/t | – kilograms per tonne |
| | g/t Au | – grams gold per tonne |
| | g/t Ag | – grams silver per tonne |
| | ppm | – parts per million; |
| | ppb | – parts per billion |
Kappes, Cassiday & Associates June, 2019 | | 2.0 Introduction Page 2-6 |
| Camino Rojo Project Feasibility Study NI 43-101 Technical Report |
|
| Other: | TPD or tpd | – metric tonnes per day |
| | ktpy | – 1,000 tonnes per year |
| | kph | – kilometres per hour |
| | m3/h/m2 | – cubic metres per hour per square metre |
| | Lph/m2 | – litres per hour per square metre |
| | L/s/km2 | – litres per second per square kilometres |
| | g/L | – grams per litre |
| | Ag | – silver |
| | As | – arsenic |
| | Au | – gold |
| | Ba | – barium |
| | Hg | – mercury |
| | Pb | – lead |
| | Sb | – antimony |
| | Zn | – zinc |
| | US$ or $ | – United States dollar |
| | MXN$ | – Mexican Peso |
| | NaCN | – sodium cyanide |
| | TSS | – total suspended solids |
| | TDS | – total dissolved solids |
| | DDH | – diamond drill boreholes |
| | LOM | – life of mine |
| | RAB | – rotary air blast |
| | ROM | – run of mine |
| | RC | – reverse circulation |
| | RQD | - rock quality data |
| | Preg | – pregnant solution |
| | kWh | – kilowatt-hours |
| | V | – volts |
| | kVa | – kilo-volt-ampere |
| | TEM | – transient electromagnetic |
| | P80 | – 80% passing |
| | P100 | – 100% passing |
| | KN | – kilonewton |
| | CMU | – concrete masonry unit |
| | HLP | – heap leach pad |
| | TSX | – Toronto Stock Exchange |
| | Owner | – Orla Mining LTD. |
| | Adjacent Owner | – Fresnillo PLC |
| | NAD27 | – North American Datum of 1927 coordinates |
| | WGS84 | – World Geodetic System (1984) coordinates |
Kappes, Cassiday & Associates June, 2019 | | 2.0 Introduction Page 2-7 |
| Camino Rojo Project Feasibility Study NI 43-101 Technical Report |
|
| 3.0 | RELIANCE ON OTHER EXPERTS |
All of the work summarized above was prepared under the supervision of a Qualified Person or has been reviewed and approved by a Qualified Person. The authors would like to acknowledge those who assisted in the study as “non-Qualified Persons” and their respective inputs are listed:
| · | James Hogarth and Chris Wattam, Piteau Associates, Vancouver BC (geotechnical investigations for pit slope stability, heap leach facility and waste rock dump stability) (Piteau, 2019). |
| · | Jake Waples and Brent Johnson, HydroGeoLogica, Golden CO (heap and waste rock dump closure, pit lake model geochemistry) (HydroGeoLogica, 2019). |
The authors are not experts in Mexican legal, civil, environmental or tax matters and accordingly for Items 4.2, 4.3, 4.5, and 4.6 the authors have relied upon:
| · | For legal matters regarding mining concession title, opinion was provided by Lic. Mauricio Heiras, Mexican legal counsel for Orla on 28 June 2017 (Heiras, 2017) and in reports dated 6 January 2018 (Heiras, 2018) and 18 June 2019 (Heiras, 2019). |
| · | For legal matters regarding surface rights, land access agreement summaries were provided by Lic. Mauricio Heiras, Mexican legal counsel for Orla in a report dated 28 June 2017(Heiras, 2017) and reports dated 6 January 2018 (Heiras, 2018) and 18 June 2019 (Heiras, 2019). |
| · | For legal matters on environmental permitting, reports were prepared by Lic. Mauricio Heiras, Mexican legal counsel for Orla, dated 28 June 2017 (Heiras, 2017) and 18 June 2019 (Heiras, 2019). |
| · | For the 24-hour storm event for different periods, the report prepared by NewFields Servicios de Mexico dated 1 February 2019 titled "Diseno Conceptual de Manejo de Aguas Pluviales y Control de Sedimentacion, Proyecto Minero Camino Rojo, San Tiburcio, Zacatecas, Mexico" (NewFields, 2019). |
| · | For an independent assessment of social and community impacts of development of the Camino Rojo project, and to provide guidance on actions and policies needed to insure that Orla obtains and maintains social licence to operate the project, the conclusions and data contained in a report prepared by Environmental Resources Management (ERM), a global provider of environmental, health, safety, risk, social consulting services and sustainability related services, titled “Estudio de Impacto Social para el Proyecto Minero “Camino Rojo”, Marzo 2019 Proyecto No.: 0460594” (ERM, 2019). |
Except for the purposes legislated under provincial securities laws, any use of this report by any third party is at that party’s sole risk.
Kappes, Cassiday & Associates June, 2019 | | 3.0 Reliance on Other Experts Page 3-1 |
| Camino Rojo Project Feasibility Study NI 43-101 Technical Report |
|
| 4.0 | PROPERTY DESCRIPTION AND LOCATION |
The Camino Rojo property is located in the Municipality of Mazapil, State of Zacatecas, Mexico near the village of San Tiburcio. The property lies 190km NE of the city of Zacatecas, 48km S-SW of the town of Concepcion del Oro, and 54km S-SE of Newmont’s Peñasquito Mine (Figure 4-1). The Project area is centred at approximately 244150E 2675900N UTM NAD27 Zone 14N.
All geographic references in this report utilize UTM Zone 14N datum NAD27 unless otherwise stated.
Kappes, Cassiday & Associates June, 2019 | | 4.0 Property Description and Location Page 4-1 |
| Camino Rojo Project Feasibility Study NI 43-101 Technical Report |
|
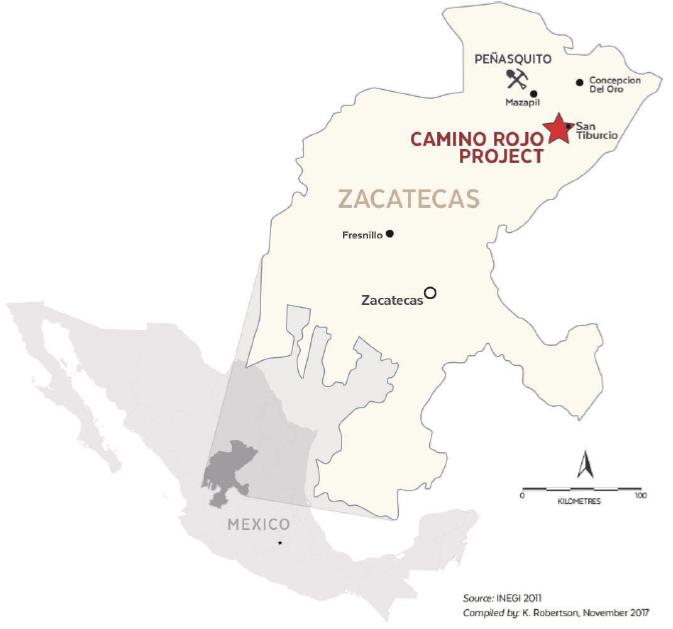
Figure 4-1 Location Map, Camino Rojo Project
The author is not an expert in Mexican mining law. The author has relied upon Orla’s legal counsel in Mexico, Lic. Mauricio Heiras of Chihuahua, Chihuahua for a review of the concession titles and legal framework, as shown in Table 4-1. Lic. Heiras verified that the concessions are in good standing and ownership of all eight concessions has been registered to Minera Camino Rojo SA de CV, (Heiras, 2017), (Heiras, 2018), (Heiras, 2019).
All minerals rights in Mexico are the property of the government of Mexico and may be exploited by private entities under concessions granted by the Mexican federal government. The process was defined under the Mexican Mining Law of 1992 and excludes petroleum and nuclear resources from consideration. The Mexican mining law also requires that non-Mexican entities must either establish a Mexican corporation, or partner with a Mexican entity.
Kappes, Cassiday & Associates June, 2019 | | 4.0 Property Description and Location Page 4-2 |
| Camino Rojo Project Feasibility Study NI 43-101 Technical Report |
|
Under current Mexican mining law, amended 29 April 2005, the Direccion General de Minas (‘DGM’) grants concessions for a period of 50 years, provided the concession is maintained in good standing. There is no distinction between mineral exploration and exploitation concessions. As part of the requirements to maintain a concession in good standing, bi-annual fees must be paid based upon a per-hectare escalating fee, work expenditures must be incurred in amounts determined on the basis of concession size and age, and applicable environmental regulations must be respected.
The northern edge of the Camino Rojo deposit identified in this technical report extends onto mining concessions controlled by the Adjacent Owner that are not part of the Project holdings. However, all interpretations, conclusions, and recommendations contained in this report relate exclusively to the mining concessions that comprise the Camino Rojo property.
All of the mineralization comprised in the Mineral Resource estimate with respect to the Camino Rojo Project is contained on mineral titles controlled by Orla. However, the Mineral Resource estimate assumes that the north wall of the conceptual floating pit cone used to constrain the Mineral Resource and demonstrate reasonable prospects for eventual economic extraction extends onto lands where mineral title is held by the Adjacent Owner and that material would be mined on the Adjacent Owner’s mineral titles to access the deeper parts of the Mineral Resource estimate. Any potential development of the Camino Rojo Project that includes an open pit encompassing the entire Mineral Resource estimate would be dependent on obtaining an agreement with the Adjacent Owner.
The Feasibility Study is based on only a portion of the total Mineral Resource estimate and was prepared on the assumption that no mining activities would occur on the Adjacent Owner’s mineral titles. Accordingly, delays in, or failure to obtain, an agreement with the Adjacent Owner to conduct mining operations on its mineral titles would have no impact on the timetable or cost of development of the proposed mine plan in the Report. However, delays in, or failure to obtain, such agreement would affect the development of a significant portion of the Mineral Resources of the Camino Rojo Project that are not included in the Feasibility Study, in particular by limiting access to significant mineralized material at depth. Orla intends to seek an agreement with the Adjacent Owner in order to maximize the potential to develop a mine that exploits the full Mineral Resource. There can be no assurance that Orla will be able to negotiate such agreement on terms that are satisfactory to Orla or that there will not be delays in obtaining the necessary agreement.
Kappes, Cassiday & Associates June, 2019 | | 4.0 Property Description and Location Page 4-3 |
| Camino Rojo Project Feasibility Study NI 43-101 Technical Report |
|
The Camino Rojo property consists of eight concessions covering in aggregate 205,936.867 hectares. The Los Cardos concession was originally staked and titled to Explominerals SA de CV whereas all other concessions were staked and titled to Canplats de Mexico SA de CV, whose legal name was subsequently changed to Camino Rojo SA de CV. The concession rights of Explominerals were transferred to Camino Rojo SA de CV. Camino Rojo SA de CV subsequently ceded all mining claims to Minera Peñasquito SA de CV, who in turn sold the mining claims to MCR.
Concession information is summarized in Table 4-1, and the concessions are shown in Figure 4-2.
Table 4-1
Listing of Mining Concessions
| Concession Name | File Number
(Expediente) | Title
Number | Validity | Area |
Title Issued
Date | Expiration
Date | Hectares |
| Camino Rojo | 093/28336 | 230914 | 06/11/2007 | 05/11/2057 | 8,340.7905 |
| Camino Rojo 1 | 093/28349 | 231922 | 16/05/2008 | 15/05/2058 | 88,897.3255 |
| Camino Rojo 1 Frac. A | 093/28349 | 231923 | 16/05/2008 | 15/05/2058 | 96.8888 |
| Camino Rojo 3 | 093/28425 | 232014 | 03/06/2008 | 02/06/2058 | 30,050.0000 |
| Camino Rojo 2 | 093/28417 | 232076 | 10/06/2008 | 09/06/2058 | 17,847.4398 |
| Camino Rojo 4 | 093/28465 | 232644 | 02/10/2008 | 01/10/2058 | 9,701.0000 |
| Camino Rojo 5 | 093/28534 | 232647 | 02/10/2008 | 01/10/2058 | 33,018.4718 |
| Los Cardos | 093/28561 | 232652 | 02/10/2008 | 01/10/2058 | 17,984.9513 |
Kappes, Cassiday & Associates June, 2019 | | 4.0 Property Description and Location Page 4-4 |
| Camino Rojo Project Feasibility Study NI 43-101 Technical Report |
|

Figure 4-2 Mining Concessions, Camino Rojo Property
Kappes, Cassiday & Associates June, 2019 | | 4.0 Property Description and Location Page 4-5 |
| Camino Rojo Project Feasibility Study NI 43-101 Technical Report |
|
The legal standing of these claims and the ownership of surface rights have been verified by Lic. Mauricio Heiras. Prior to entering into purchase option agreements for the concessions, Orla requested a title opinion for the concessions from Orla’s legal counsel in Mexico, Lic. Mauricio Heiras of Chihuahua, Chihuahua, who investigated the concession status and reported that the claims were valid. Subsequent to Orla’s acquisition of the Project, and as of the effective date of this Report, Lic. Heiras has confirmed that MCR has maintained the concessions in good standing and all concessions are current with respect to payment of mining taxes and filing of assessment reports (Heiras, 2019).
| 4.2.1 | Orla Control of Mining Concessions via Acquisition from Minera Peñasquito SA de CV |
The claims are controlled by Orla by means of its ownership of Minera Camino Rojo SA de CV, which acquired the concessions from Newmont’s Mexican subsidiary, Minera Peñasquito SA de CV. A summary of Orla’s and Newmont’s rights and obligations under the terms of the acquisition agreement is as follows:
| · | Goldcorp, a subsidiary company to Newmont, was granted a 2% NSR on all metal production from the Project, except for metals produced under the sulphide joint venture option stipulated in the acquisition agreement. |
| · | Orla is the operator of the Camino Rojo Project and has full rights to explore, evaluate, and exploit the property. |
| · | In the event that a sulphide project is defined through a positive Pre-Feasibility Study outlining one of the development scenarios a) or b) contained herein, Newmont may, at its option, enter into a joint venture for the purpose of future exploration, advancement, construction, and exploitation of the sulphide project. |
| o | Scenario a): A sulphide project where material from the Camino Rojo Project is processed using the existing infrastructure of the Peñasquito Mine, Mill and Concentrator facilities. In such circumstances, the sulphide project would be operated by Newmont, who would earn a 70% interest in the sulphide project, with Orla owning 30%. |
| o | Scenario b): A standalone sulphide project with a mine plan containing at least 500 million tonnes of Proven and Probable Mineral Reserves using standalone facilities not associated with Peñasquito. Under this scenario, the sulphide project would be operated by Newmont, who would earn a 60% interest in the sulphide project, with Orla owning 40%. |
| · | Following exercise of its option, if Newmont elects to sell its portion of the sulphide project, in whole or in part, then Orla would retain a right of first refusal on the sale of the sulphide project. |
Kappes, Cassiday & Associates June, 2019 | | 4.0 Property Description and Location Page 4-6 |
| Camino Rojo Project Feasibility Study NI 43-101 Technical Report |
|
| · | For as long as Newmont maintains ownership of at least 10% of Orla common shares, Newmont has the right to nominate one director to the board of Orla and to participate in all future equity offerings to maintain its prorated ownership. |
| · | Orla will retain a right of first refusal on Newmont’s NSR, Newmont’s portion of the sulphide project, following the exercise of its option, and certain claims retained by Newmont. |
| · | Carry forward of assessment work credits will be applied to the Camino Rojo property concessions thus no expenditures are immediately required to meet assessment work requirements. |
| | | |
| 4.2.2 | Pending Concession Reductions |
Currently, ongoing exploration programs are identifying the most prospective areas surrounding the Camino Rojo deposit, and Orla, through its Mexican subsidiary MCR plans to reduce its mineral concession holdings to 1,631 km2 by relinquishing mineral rights to the least prospective ground. Newmont retains the right to re-acquire the mineral rights to any lands released by MCR. If Newmont does not elect to exercise its rights, the released mineral concessions will revert to Federal control.
The author is not an expert in Mexican legal surface rights or contract law. The author has relied upon Orla’s legal counsel in Mexico, Lic. Mauricio Heiras of Chihuahua, Chihuahua for a review of the Project surface rights (Heiras, 2017), (Heiras, 2018), (Heiras,2019) as discussed in Section 3.0 of this report.
Surface rights in the Project area are owned by several Ejidos, which are federally defined agrarian communities. The land which includes the Mineral Resource at Camino Rojo is controlled by the San Tiburcio Ejido, comprised of 400 voting members who collectively control 37,154 hectares. The legal ownership of surface rights verification and the information contained herein comes from summary reports prepared by Orla’s legal counsel in Mexico, Lic. Mauricio Heiras.
Areas for which MCR controls surface rights include both areas with and without mineral rights, with the latter being maintained for possible infrastructure purposes. Surface rights controlled are shown in Figure 4-3.
Kappes, Cassiday & Associates June, 2019 | | 4.0 Property Description and Location Page 4-7 |
| Camino Rojo Project Feasibility Study NI 43-101 Technical Report |
|
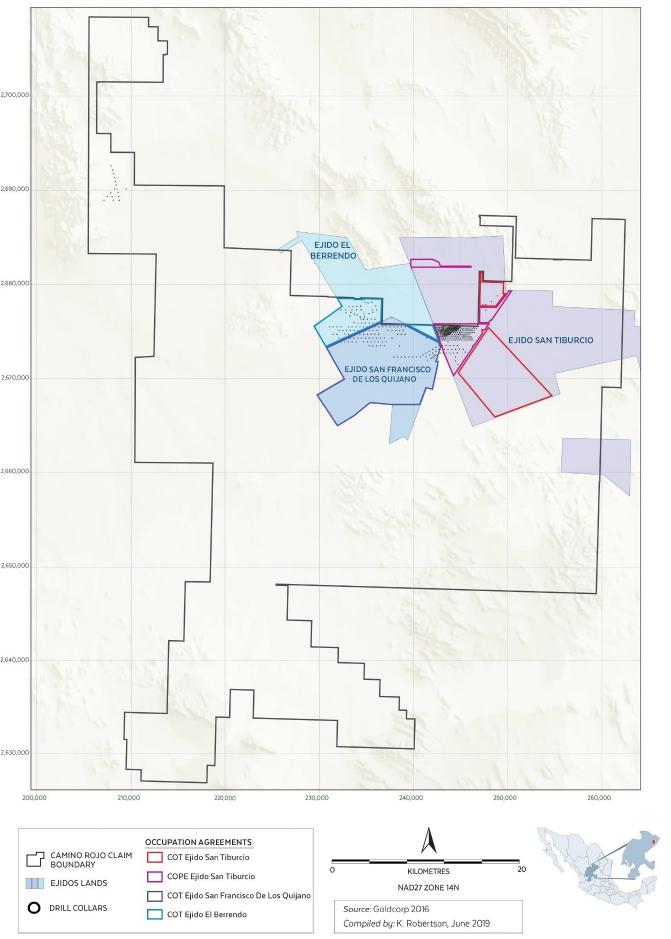
Figure 4-3 Surface rights in Project Area
Kappes, Cassiday & Associates June, 2019 | | 4.0 Property Description and Location Page 4-8 |
| Camino Rojo Project Feasibility Study NI 43-101 Technical Report |
|
Exploration work at the Project has been carried out under the terms of surface access agreements negotiated with the Ejido San Tiburcio and executed on 26 February 2013 and 31 October 2018. Camino Rojo SA de CV (a Goldcorp subsidiary) executed agreements with the Ejido that cover the Camino Rojo Mineral Resource. Camino Rojo SA de CV subsequently passed the rights and obligations of these agreements to Minera Peñasquito SA de CV (a Goldcorp subsidiary), who subsequently transferred the rights and obligations to Minera Camino Rojo SA de CV. The three agreements currently in effect with Ejido San Tiburcio are:
| i. | Previous to Expropriation Occupation Agreement (COPE), executed on 26 February 2013 by and between Camino Rojo SA de CV, in its position of “occupant”, and Ejido San Tiburcio, as the owner, with regards to a surface of 2,497.30 hectares. The rights and obligations of this agreement were passed to Minera Camino Rojo SA de CV and the agreement stipulates that the Ejido expressly and voluntarily accepts the expropriation of Ejido lands by Minera Camino Rojo SA de CV, in effect converting the Ejido land to fee simple private land titled to Minera Camino Rojo SA de CV. In the event that the Federal agency responsible for the expropriation process, the Secretario de Desarollo Agrario Territorial y Urbano, denies the petition to cede the Ejido lands to Minera Camino Rojo SA de CV, the agreement automatically converts to a 30-year temporary occupation agreement. Payment in full was made at the date of signing and no further payments are due. This agreement is valid and expires in 2043 and covers the area of the Mineral Resource discussed in this report. |
| ii. | Temporary Occupation Agreement (COT), executed on 30 October 2018 by and between Minera Camino Rojo SA de CV, in its position of occupant, and Ejido San Tiburcio, as owner, with regards to a surface of 5,850 hectares (the “TOA”). This agreement allows Minera Camino Rojo SA de CV to explore 5,850 hectares of Ejido lands over a 5-year period, while the expropriation process is executed. Payments of 10,000,000 Pesos on signing, 5,000,000 Pesos on 15 December 2019, 5,000,000 Pesos on 15 December 2020, and 5,000,000 Pesos on 15 December 2021 are required to maintain the agreement in force. The 10,000,000 Peso payment was made at the date of signing and no further payments are due until 15 December 2019. |
| iii. | Collaboration and Social Responsibility Agreement (CSRA), executed on 26 February 2013 by and between Camino Rojo SA de CV, in its position of “collaborator”, and Ejido San Tiburcio, as “beneficiary”, with regards to certain social contributions to be provided in favour of this last CSRA. The rights and obligations of this agreement were passed to Minera Camino Rojo SA de CV and the agreement stipulates that Minera Camino Rojo SA de CV will contribute 10,000,000 Pesos annually to the Ejido to be used to promote and execute diverse social and economic development programs to benefit the Ejido. Additionally, at its discretion, Minera Camino Rojo SA de CV will provide support for adult education, career training, business development assistance, and cultural programs, and scholastic scholarships. The agreement expires when exploration or exploitation activities at the Camino Rojo Project end. Annual payments are due on the 29th of June each year. This agreement is valid and remains in effect until mine closure or project cancellation. |
Kappes, Cassiday & Associates June, 2019 | | 4.0 Property Description and Location Page 4-9 |
| Camino Rojo Project Feasibility Study NI 43-101 Technical Report |
|
Camino Rojo SA de CV executed a surface rights agreement with Ejido Francisco de los Quijano. The rights and obligations of this agreement were passed to Minera Camino Rojo SA de CV. This agreement, executed on 22 December 2014, is a Temporary Occupation Agreement (COT) that allows Minera Camino Rojo SA de CV to conduct exploration activities on 7,666 Ha, as shown in Figure 4-3. The agreement expires on 21 December 2019. None of the Mineral Resources or Mineral Reserves discussed in this report, nor proposed infrastructure is located on Ejido Francisco de los Quijano land. Annual payments of 9,134,749 Pesos are required to keep the agreement in good standing. Simultaneously with the execution of the COT, Camino Rojo SA de CV executed a Collaboration and Social Responsibility Agreement with the Ejido which obligates Minera Camino Rojo SA de CV to: provide 19,000 Pesos in monthly scholarships to the Ejido; complete electrification of an Ejido water well and rehabilitate/reconstruct the community cistern; assist Ejido members with finding appropriate employment opportunities with Minera Camino Rojo SA de CV and its contractors; and to provide basic food rations to community members in need. The CSRA expires on 21 December 2019.
Minera Camino Rojo SA de CV executed a surface rights agreement with Ejido El Berrendo on 4 March 2019. None of the Mineral Resources or Mineral Reserves discussed in this report, nor proposed infrastructure, is located on Ejido El Berrendo land. This Temporary Occupation Agreement (COT) allows Minera Camino Rojo SA de CV to conduct exploration activities on 2,631 Ha, as shown in Figure 4-3. The agreement expires on 24 February 2024. A payment on signing and annual payments of $2,284,787 Pesos are required to keep the agreement in good standing. The next payment is due on 24 February 2020.
| 4.4 | Environmental Liability |
No environmental liabilities are apparent. The property does not contain active or historic mines or prospects, there are no plant facilities present within the Project area, nor are tailings piles present, and all exploration work has been carried out by prior operators in accordance with Mexican environmental standards.
Kappes, Cassiday & Associates June, 2019 | | 4.0 Property Description and Location Page 4-10 |
| Camino Rojo Project Feasibility Study NI 43-101 Technical Report |
|
The author is not an expert in Mexican environmental law. The author has relied upon Orla’s legal counsel in Mexico, Lic. Mauricio Heiras of Chihuahua, Chihuahua for a summary review of the Project environmental permits (Heiras, Legal opinion letter, 2017), (Heiras, 2019) and a public domain Federal report (CONANP, 2014) for a review of permitting risks discussed in this report.
The Ley de Desarrollo Forestal Sustentable (Sustainable Development Forest Law) and the Ley General del Equilibrio Ecológico y Protección al Ambiente (General Law of Ecologic Equilibrium and Environmental Protection) regulate all direct exploration activities carried out at Camino Rojo (reverse circulation drilling, core drilling, trenching, road construction, etc.). Surface disturbances caused by exploration activities require a Cambio de Uso de Suelo (CUS, Land Use Change) authorization and approval of an Environmental Impact Assessment (MIA).
The National Water Law regulates all water use in Mexico under the responsibility of Comisión Nacional del Agua (CONAGUA). Applications are submitted to CONAGUA indicating the annual water needs for mining activities and the source of water to be used. CONAGUA grants water concessions according to stipulated water availability in the source area. Minera Camino Rojo is the title holder of subsurface water rights totaling 9,695,900 cubic metres per annum for industrial use (Heiras, 2019).
Current exploration work at the Project is being conducted under the approval of two MIA and CUS permits.
Construction and operation of a mine at Camino Rojo will require various Federal, State, and Municipal permits as discussed in Section 20.2 of this report.
| 4.6 | Access, Title, Permit and Security Risks |
The Project has had a productive relationship with the surface owners and no extraordinary risks to Project access were discerned. A valid surface access agreement allows Orla, through its Mexican subsidiary Minera Camino Rojo SA de CV, to explore and develop the Project described for the Feasibility Study base case summarized herein.
Prior operators and Minera Camino Rojo have met legal requirements to maintain in good standing the mining concession titles. Conditional upon continued compliance with annual requirements, no risk to validity of title was discerned.
Kappes, Cassiday & Associates June, 2019 | | 4.0 Property Description and Location Page 4-11 |
| Camino Rojo Project Feasibility Study NI 43-101 Technical Report |
|
Prior operators and Minera Camino Rojo have been compliant with Mexican environmental regulations and conditional upon continued compliance, permits for normal exploration activities are expected to be readily attainable.
The chief Project permitting risk is that of a possible Federal designation of a protected biological-ecological reserve that could affect the Project. On 23 June 2014 SEMARNAT published a public notice in the Official Gazette of the Federation requesting public consultation and comments on the possible designation of an area known as “Zacatecas Semiarid Desert” as a Natural Protected Area (ANP). The proposed area for designation is located in the Municipalities of General Francisco Murguía, Villa de Cos, El Salvador, Melchor Ocampo, Concepción de Oro and Mazapil, in the State of Zacatecas (CONANP, 2014). The proposal for the ANP was created by the Comisión Nacional de Áreas Naturales Protegidas (CONANP). CONANP does not have legal authority to designate the ANP, this power being reserved for the Executive branch of Mexican Federal government. Public reaction to the ANP proposal has been mixed, with the Zacatecas State government, affected Municipalities, and private and public Mexican companies publicly and formally opposing the designation of an ANP in areas of current mining and exploration activity.
Goldcorp, the prior operator of the Project, engaged in forums with government and community stakeholders, and submitted an official opinion regarding this ANP declaration to the government, with the objective of ensuring that if an ANP was created, the Camino Rojo Project would not be restricted from development. Since the time that the proposal to create this ANP was first published in the Official Gazette of the Federation, there has been no formal Federal actions regarding the proposal. On 12 June 2018 the Comisión Legislativa de Ecología y Medio Ambiente (Legislative Commission on Ecology and Environment) of the Zacatecas State Legislature voted 15 to 10 against approval of a resolution exhorting the Federal Executive branch to approve the ANP (Gaceta Parlamentaria, 2018; El Sol, 2018). The Zacatecas State Governor and the Municipal Presidents (Mayors) of Mazapil, Francisco R. Murguía, Melchor Ocampo, Concepción del Oro, El Salvador and Villa de Cos formally communicated their opposition to the resolution and creation of the ANP. If a designation of this ANP by the government includes the surface of the mining concession areas or ancillary work areas such as possible water well fields of Camino Rojo, this could limit the growth and continuity of the Project.
ANPs are generally divided into sub-zones in which the execution of different activities is allowed or prohibited in accordance with the sub-zone's characteristics. “Core zones” are established with the objective of preserving the present ecosystems in the long term and may be controlled through designation of restricted use or through special protections.
Kappes, Cassiday & Associates June, 2019 | | 4.0 Property Description and Location Page 4-12 |
| Camino Rojo Project Feasibility Study NI 43-101 Technical Report |
|
“Buffer zones” are intended to regulate exploitation activities under a sustainable development scheme through different uses such as human settlement or sustainable natural resources exploitation (the ANPs may include other sub-zones for different land uses, agricultural, recreational, restoration, among others).
Mining activities (including both exploration and exploitation), depending on the corresponding sub-zone may be carried out provided they are authorized by CONANP (National Commission on Protected Natural Areas), without prejudice of other authorizations required for their execution.
Creation of the proposed ANP is within the authority of the Federal branch of government, however local government opinions from both State and Municipal levels have political influence on the Federal decision. Because the State and Municipal governments affected by the Camino Rojo Project have formally expressed opposition to creation of the ANP in the area of the Camino Rojo Project, the author believes the permitting risk is similar to that of any mining project of similar scope in North America.
Drug related violence, propagated by members of criminal cartels and directed against other members of criminal cartels, has occurred in the region and has affected local communities. The aggression is not directed at mining companies operating in the region and has not affected the ability of Orla or previous operators to explore the Camino Rojo Project.
Newmont has a 2% NSR on all metal production from the Camino Rojo Project, except for metals produced under the sulphide joint venture option stipulated in the acquisition agreement.
A 0.5% royalty is payable to the Mexican government as an Extraordinary Mining Duty, mandated by Federal Law.
Kappes, Cassiday & Associates June, 2019 | | 4.0 Property Description and Location Page 4-13 |
| Camino Rojo Project Feasibility Study NI 43-101 Technical Report |
|
| 5.0 | ACCESSIBILITY, CLIMATE, LOCAL RESOURCES, AND PHYSIOGRAPHY |
The Camino Rojo project is located in the Municipality of Mazapil, State of Zacatecas, Mexico, situated along a wide, flat valley near the village of San Tiburcio on Mexican Highway 54, a well-maintained, paved highway providing southbound access to the major city of Zacatecas in Zacatecas State, a distance of 203km, as well as northbound towards Monterrey in Nuevo Leon, a distance of 261km (Figure 5-1). Both of these cities have airports with regularly scheduled flights south to Mexico City or north to the U.S.A. The Project is located 48 km S-SW of the nearest population center with basic services, the town of Concepcion del Oro, and 54 km S-SE of Newmont’s Peñasquito Mine.
There are numerous gravel roads within the property linking the surrounding countryside with the two highways, Highways 54 and 62, which transect the property. There are very few locations within the property that are not readily accessible by four-wheel drive vehicle.
The project area is centered at approximately 244150E 2675900N UTM NAD27 Zone 14N.
All geographic references in this report utilize UTM Zone 14N datum NAD27 unless otherwise stated.
Kappes, Cassiday & Associates June, 2019 | | 5.0 Accessibility, Climate, Local Resources, and Physiography Page 5-1 |
| Camino Rojo Project Feasibility Study NI 43-101 Technical Report |
|
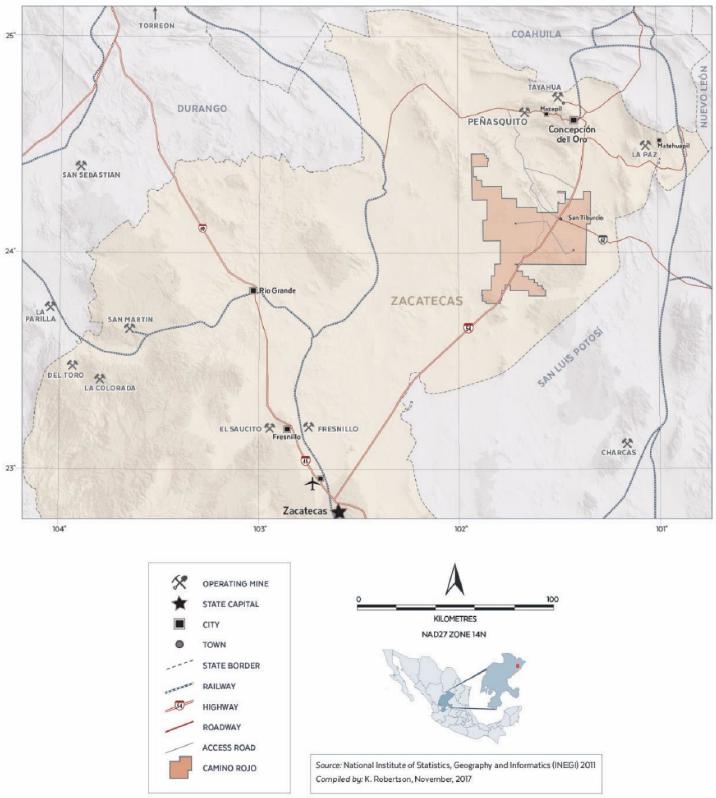
Figure 5-1 Project Location and Regional Infrastructure
Kappes, Cassiday & Associates June, 2019 | | 5.0 Accessibility, Climate, Local Resources, and Physiography Page 5-2 |
| Camino Rojo Project Feasibility Study NI 43-101 Technical Report |
|
| 5.2 | Physiography, Climate and Vegetation |
The broad valley around San Tiburcio is bounded to the north by the low rolling hills of Sierra La Arracada and Sierra El Barros, to the east by Sierra La Cucaracha, and to the south by the Sierra Los Colgados. The terrain is generally flat. Bedrock exposures are rare, limited to road cuts, borrow pits or creek beds. The elevations within the property range from approximately 1,850 to 2,460 masl and relief is low.
The climate is typical of the high-altitude Mesa Central, dry and semi-arid. Annual precipitation for the area is approximately 337mm, mostly during the rainy season in July, August, and September. Temperatures commonly range from +30° to 12°C in the summer and 24° to -6°C in the winter. Exploration and production activities can be conducted year-round.
The vegetation is dominated by the scrub bushes creosote bush and tar bush, with lesser cacti, maguey, sage and coarse grasses with rare yucca (Figure 5-2). The natural vegetation is used to locally graze domestic livestock, principally goats. Wild fauna is not abundant but several varieties of birds, rabbits, coyote, lizards, and snakes inhabit the area.
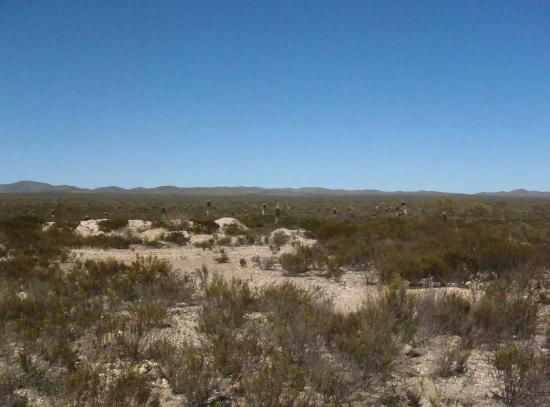
Figure 5-2 View of Typical Topography and Vegetation at Camino Rojo
Kappes, Cassiday & Associates June, 2019 | | 5.0 Accessibility, Climate, Local Resources, and Physiography Page 5-3 |
| Camino Rojo Project Feasibility Study NI 43-101 Technical Report |
|
| 5.3 | Local Resources and Infrastructure |
There is a good network of road and rail services in the region. Road access to most of the property is possible via numerous gravel roads from both Highways 54 and 62. In addition, there is a railway approximately 40 km east of San Tiburcio that crosses both highways (Figure 5-1). There is a high voltage power line transecting the property near San Tiburcio. MCR has requested CENACE to study the availability of power from the national grid and to advise the company as to where a connection to the grid may be permitted.
The Project site is generally flat with adequate space for development of mining and processing facilities. Surface rights over the Project area are subject to a Previous to Expropriation Occupation Agreement (COPE), as described in Section 4.0. This agreement provides the surface rights required to develop the Project, including access from the adjoining highway.
Prior operators purchased ground water from owners of local wells and trucked the water to site for drilling needs. On 24 February 2015 Camino Rojo SA de CV acquired subsurface water rights totaling 9,695,900 m3 per annum for industrial use. These water rights were subsequently transferred to Minera Peñasquito SA de CV and then assigned to MCR. Registration of the water rights titles in the name of MCR is in process with the Federal water authority (CONAGUA). The water rights acquired by Minera Camino Rojo grant permission to construct and extract water from 26 wells in the Project area. Four water wells were constructed by prior operators of the Project. Pump test results from well CR-01 were indicative that significant water production is feasible from structural zones within the Caracol Formation, but additional test borings in 2018 and 2019 failed to encounter significant water in the Caracol Formation. In 2019 MCR constructed and tested two additional wells, one of which was highly productive, producing water from the Cuesta del Cura Formation. Orla’s hydrogeologic consultants believe that the wells built in 2019 are adequate to meet projected Project water needs of 24 L/s average demand (Barranca Group, 2019).
Most exploration and operating supplies may be purchased in the nearby historic mining cities of Zacatecas, Fresnillo and Saltillo. Experienced mining personnel are available locally and from nearby mining towns of Concepciòn del Oro and Mazapil.
Potential waste disposal areas, heap leach pad areas, process plant sites and infrastructure facilities are discussed in Sections 16.0, 17.0 and 18.0.
Kappes, Cassiday & Associates June, 2019 | | 5.0 Accessibility, Climate, Local Resources, and Physiography Page 5-4 |
| Camino Rojo Project Feasibility Study NI 43-101 Technical Report |
|
The mining concessions comprising the Camino Rojo property were originally staked to the benefit of Canplats de Mexico, S.A. de C.V., a subsidiary of Canplats Resources Corporation (Canplats), in 2007. In 2010, Goldcorp acquired 100% of the concession rights from Canplats. Orla acquired the Project from Goldcorp in 2017.
The Camino Rojo gold-silver-lead-zinc deposit was discovered in mid-2007, approximately 45 km southwest of Concepcion del Oro, and was originally entirely concealed beneath post-mineral cover in a broad, low relief alluvial valley adjacent to the western flank of the Sierra Madre Oriental. Mineralized road ballast, placed on a dirt road near San Tiburcio, Zacatecas, was traced to its source by geologists Perry Durning and Bud Hillemeyer from La Cuesta International, working under contract to Canplats. A shallow pit excavated through a thin veneer of alluvium, located adjacent to a stock pond (Represa), was the discovery exposure of the deposit. Following a rapid program of surface pitting and trenching for geochemical samples, Canplats Resources began concurrent programs of surface geophysics (resistivity and induced polarization) and RC drilling in late 2007, which continued into 2008.
The initial drilling was focused on a 450m x 600m gold in rock geochemical anomaly named the Represa zone. Core drilling began in 2008. The geophysical survey defined two principal areas of high chargeability: one centred on the Represa zone and another 1km to the west named the Don Julio zone. The elevated chargeability zones were interpreted as large volumes of sulphide mineralized rocks. Drilling by Canplats, and later drilling by Goldcorp, confirmed the presence of extensive sulphide mineralization at depth in the Represa zone, and much lower quantities of sulphide minerals at Don Julio.
By August of 2008, Canplats drilled a total of 92 RC, and 30 diamond-core holes, for a total of 23,988 and 16,044 metres respectively, mainly focused in the Represa zone. The surface access and permission to continue drilling were cancelled in early August 2008, by the ejido of San Tiburcio, Zacatecas. Nevertheless, in November 2008, Canplats published an independent Mineral Resource estimate for the Represa zone, as discussed in Section 6.4 of this report.
In October 2009 Canplats publicly released a Preliminary Economic Assessment of the Project (Blanchflower K. K., 2009) which has been superseded by later work and technical studies, and is no longer current and accordingly should not be relied upon.
Kappes, Cassiday & Associates June, 2019 | | 5.0 Accessibility, Climate, Local Resources, and Physiography Page 6-1 |
| Camino Rojo Project Feasibility Study NI 43-101 Technical Report |
|
Canplats was acquired by Goldcorp in early 2010. Validation, infill, condemnation, and expansion drilling began in January 2011. By the end of 2015, a total of 279,788 metres of new core drilling in 415 drillholes and 20,569 metres of new RC drilling in 96 drillholes was completed in the Represa and Don Julio zones and their immediate surroundings. An additional 31,286 metres of shallow RAB-style, RC drilling in 306 drillholes was completed, with most of the RAB drilling testing other exploration targets within the concession. Airborne gravity, magnetic and TEM surveys were also carried out, the results of which are in the archives of Minera Camino Rojo.
As of the end of 2015 a total of 295,832 metres in 445 diamond core holes, 44,557 metres in 188 RC drillholes, and 31,286 metres of RAB drilling had been completed.
Locations of historical drillholes and the Project claim boundaries are summarized in Figure 6-1.
Kappes, Cassiday & Associates June, 2019 | | 5.0 Accessibility, Climate, Local Resources, and Physiography Page 6-2 |
| Camino Rojo Project Feasibility Study NI 43-101 Technical Report |
|

Figure 6-1 Historical Drillhole Locations and Project Claim Boundaries
Mineral Reserve and Mineral Resource tabulations for Camino Rojo were publicly disclosed by Goldcorp as recently as 30 June 2016, as discussed in Section 6.4 of this report. The methodology of Goldcorp’s Mineral Resource estimations has not been disclosed and Dr. Gray has not confirmed the validity of the estimate, thus the Goldcorp estimates are regarded as historical estimates only, as discussed in Section 6.4 of this report and have since been replaced by current Mineral Resource estimates.
Kappes, Cassiday & Associates June, 2019 | | 5.0 Accessibility, Climate, Local Resources, and Physiography Page 6-3 |
| Camino Rojo Project Feasibility Study NI 43-101 Technical Report |
|
| 6.3 | Historical Metallurgical Studies |
Canplats and Goldcorp conducted metallurgical tests which are discussed in Section 13.0 of this report.
| 6.4 | Historical Resource Estimates |
Minorex Consulting Ltd. prepared a Mineral Resource estimate for Canplats in 2009 (Blanchflower J., 2009) that was publicly disclosed in a Technical Report prepared in accordance with the disclosure standards of NI 43-101. However, since the effective date of the Mineral Resource estimate, significant additional drillhole data has become available, rendering the 2009 estimate obsolete. The 2009 resource estimate is historical in nature, has not been verified by the authors and should not be relied upon. Orla is not treating the historical estimate as a current estimate.
Goldcorp publicly disclosed Mineral Reserve and Mineral Resources on Camino Rojo with an effective date of 30 June 2016 (Goldcorp, 2017) which is no longer current. The key assumptions, parameters, and methods used by Goldcorp to prepare the historical estimate are unknown. The 2016 reserve and resource estimates are historical in nature, have not been verified by the author, and should not be relied upon. Orla is not treating these historical estimates as current estimates.
Current Mineral Resource and Mineral Reserve estimates are reported in Sections 14 and 15, respectively, in this Technical Report.
There has been no recorded mineral production from the property. Surface gravels have been used for road material and a shallow excavation made for gravel extraction created the discovery exposure of the Camino Rojo deposit.
Kappes, Cassiday & Associates June, 2019 | | 5.0 Accessibility, Climate, Local Resources, and Physiography Page 6-4 |
| Camino Rojo Project Feasibility Study NI 43-101 Technical Report |
|
| 7.0 | GEOLOGICAL SETTING AND MINERALIZATION |
| 7.1 | Sources of Information |
The following geological discussion is derived from a variety of peer-reviewed professional papers focused on the regional geology (Mitre-Salazar, 1989) (Centeno-Gracia, 2005) (Aranda-Gomez, 2006) (Nieto-Samaniego, 2007) (Loza-Aguirre I. N., 2008) (Tristán-González, 2009) (Barboza-Gudiño, 2010) (Weiss, 2010) (Ortega-Flores, 2015) (Cruz-Gámez, 2017), a Master’s of Science thesis from the University of Nevada-Reno that details the deposit geology (Sanchez, 2017), geologic maps published by the Servicio Geologico Mexicano, field and diamond drill core observations by Dr. Matthew Gray (Gray M. D., 2016) (Gray M. D., 2018) and Dr. Anthony Longo (Longo, 2017) (Longo, A.A., Edwards, J., 2017), and regional stratigraphy from previously published Technical Reports (Blanchflower K. K., 2009).
The Camino Rojo deposit is located beneath a broad pediment of Tertiary and Quaternary alluvium (Figure 7-1) along the boundary between the Mesa Central physiographic province and the Sierra Madre Oriental fold and thrust belt near the pre-Laramide continental-margin. Oldest rocks are Triassic metamorphic continental rocks overlain by Early to Middle Jurassic red beds. Upper Jurassic to Upper Cretaceous marine facies rocks overlie the red beds at a disconformity and comprise a package of shelf carbonate rocks comprising the Zuloaga to Cuesta del Cura Formations and the basin-filling flysch sediments of the Indidura and Caracol Formations (Nieto-Samaniego, 2007), (Ortega-Flores, 2015). The deposit lies within the southern extent of the northwest striking San Tiburcio fault zone (Weiss, 2010).
A Permo-Triassic tectono-volcanic arc in the eastern Sierra Madre Oriental represents the first Pacific-directed subduction and tectonism in Central Mexico (Centeno-Gracia, 2005). Erosion of the eastern Triassic highlands shed siliciclastic material westward and turbidites off the continental shelf into the Triassic basin plains. These marine clastic rocks, the Triassic Zacatecas and El Alamar Formations (Cruz-Gámez, 2017) were subsequently metamorphosed to phyllites and schists (Nieto-Samaniego, 2007) then eroded before continental siliciclastic rocks or red beds were deposited atop an angular unconformity in Early Jurassic (Nazas Formation and later La Joya Formation) (Barboza-Gudiño, 2010). A disconformity atop Lower Jurassic continental rocks preceded deposition of marine carbonate rocks belonging to the Zuloaga and La Caja Formations in Late Jurassic. Following a cessation of volcanism, arc magmatism flared up in the west along the Guerrero arc and continued through Late Cretaceous. Deposition of the shelf carbonate rocks progressed into Early Cretaceous with Taraises, Cupido, La Peña and Cuesta del Cura Formations. Upper Cretaceous flysch sediments derived from the erosion of the western Guerrero arc were deposited in the back-arc basin atop the carbonate rocks. The Mesozoic marine sediments were deformed during the Laramide orogeny from Late Cretaceous to Paleocene forming the Sierra Madre Oriental fold and thrust belt (Nieto-Samaniego, 2007).
Kappes, Cassiday & Associates June, 2019 | | 7.0 Geological Setting and Mineralization Page 7-1 |
| Camino Rojo Project Feasibility Study NI 43-101 Technical Report |
|
By late Paleocene, northeast of Mesa Central, a flexural bend in the fold and thrust belt deflected the Mesozoic strata into a series of west- and northwest-trending fold axes and faults (Tristán-González, 2009). South of the westward deflection, the fold belt strikes south to southeast. By early Eocene, the initial pulse of extensional tectonics produced north-northeast to north-northwest normal and strike-slip faults that bound mountain ranges (Matehuala fault zone) and deformed the southeast-trending fold belt along the eastern boundary of Mesa Central (Loza-Aguirre I. N., 2008). By middle Eocene, ranges in the fold and thrust belt were displaced and truncated by northwest-striking high angle faults that translated through the Mesa Central and feature both normal and strike-slip displacement (Nieto-Samaniego, 2007) (Tristán-González, 2009). Subsequent pulses of extension occurred from early Oligocene to Miocene and Pliocene to Quaternary that reactivated existing faults in conjunction with basaltic fissure volcanism and isolated monogenetic basaltic cinder cones (Aranda-Gomez, 2006).
The northwest faults include two major fault systems that localized middle Eocene to Oligocene magmatic activity and define the southern and northern boundaries of Mesa Central. The southern fault zone known as the San Luis-Tepehuanes fault system separates the Sierra Madre Occidental from Mesa Central and localizes numerous mineral deposits (Nieto-Samaniego, 2007) (Loza-Aguirre I. N., 2008). The northern fault zone known as the San Tiburcio lineament and fault zone extends for more than 185km and features both left-lateral strike-slip and normal displacement (Mitre-Salazar, 1989). The fault truncates west-trending anticlinal axes in the flexural bend of the Sierra Madre Oriental and may crosscut the NNE-trending Matehuala fault zone that bounds the eastern Mesa Central. Anticlinal fold axes and faults parallel the San Tiburcio fault zone, and granitic intrusive rocks and dacitic to andesitic dikes are localized along portions of its extensive strike length.
Mineralization styles in the region include polymetallic and copper-gold skarn and limestone manto (replacement) silver-lead-zinc sulphide ores. The nearest significant producing mines or past producers are Newmont’s Peñasquito mine, located 53km N-NW of Camino Rojo, and various mines of the Concepcion del Oro district, 47km N-NE of Camino Rojo. The Peñasquito mine exploits gold-silver-lead-zinc mineralization hosted in igneous diatreme-breccia and the surrounding Caracol Formation. Peñasquito mineralization gives way at depth to copper-gold sulphide breccias in garnet skarn, within limestone beneath the Caracol Formation (Rocha-Rocha, 2016). Concepcion del Oro mines produced from polymetallic and copper-gold skarn deposits and limestone-hosted manto (replacement) silver-lead-zinc sulphide deposits adjacent to Late Eocene igneous intrusions (Buseck, 1966). Dr. Gray has not verified this information and the mineralization described for the mines and mineral deposits in this section is not necessarily indicative of the mineralization at the Camino Rojo, Zacatecas property.
Kappes, Cassiday & Associates June, 2019 | | 7.0 Geological Setting and Mineralization Page 7-2 |
| Camino Rojo Project Feasibility Study NI 43-101 Technical Report |
|

Figure 7- 1 Regional Geologic Map (Servicio Geológico Mexicano, 2000)
Kappes, Cassiday & Associates June, 2019 | | 7.0 Geological Setting and Mineralization Page 7-3 |
| Camino Rojo Project Feasibility Study NI 43-101 Technical Report |
|
| 7.3.1 | General Deposit Geology |
Camino Rojo is a gold-silver-zinc-lead deposit concealed below shallow (<1 to 3 m) alluvial cover in a large pediment along the southwest border of the Sierra Madre Oriental (Weiss, 2010). Small water storage pits and trenches expose a portion of the oxide deposit in the discovery area known as the Represa zone (i.e., water reservoir). The Late Cretaceous Caracol Formation is the primary host to mineralization, and at depth, the upper Indidura Formation is a minor host near the Caracol contact. The local geology is summarized in Figure 7-2. The deposit stratigraphy, known from current diamond drilling, is discussed below from oldest to youngest.
Early Cretaceous Cuesta del Cura Formation features thin- to medium-bedded grey limestone with wavy laminations and locally discontinuous layers of black shale and chert. Polymetallic replacement manto-type occurrences are typically found in Cuesta del Cura elsewhere in the region. No significant mineralization has been found in these limestones at Camino Rojo. Late Cretaceous Indidura Formation features thin-bedded calcareous shale, grey shaley limestone and siltstone with estimated thicknesses that range from 100 to 220 metres (Figure 7-3). Atop the Indidura, the Caracol Formation consists of thinly interlayered carbonaceous and calcareous siltstones, silty mudstones, and fine-grained calcareous sandstone, and thicknesses range from 600 to 800 metres (Figure 7-4). Sandstone layers typically display cross-laminations, and the lowest occurrence of sandstone is considered the Indidura contact (Sanchez, 2017). Camino Rojo vein-style mineralization has not been found to extend below the Indidura into the Cuesta del Cura Formation, although drilling is sparse. The few drill holes that have penetrated below Indidura discovered marbleized limestone and slight calc-silicate hornfels alteration in the Cuesta del Cura Formation (Figure 7-5).
Three genetically different types of igneous dikes intruded the Cretaceous marine sediments at Camino Rojo. Type 1 dikes are medium- to coarse-grained porphyritic hornblende-biotite-feldspar porphyry. Type 2 dikes are fine-grained with rare quartz phenocrysts (1-2mm diameter). Type 3 dikes have coarse-grained hornblende with plagioclase (Sanchez, 2017). The dikes consistently display hydrothermal alteration so the actual petrologic and chemical compositions are unknown. They are assumed as intermediate composition igneous dikes (Sanchez, 2017). Drill-supported models created by Orla show dikes are oriented in two parallel subvertical northeast-trending planes spatially associated with the deposit shape. Ore stage IS veins crosscut the dikes and feature bleached halos of sericite alteration.
Kappes, Cassiday & Associates June, 2019 | | 7.0 Geological Setting and Mineralization Page 7-4 |
| Camino Rojo Project Feasibility Study NI 43-101 Technical Report |
|
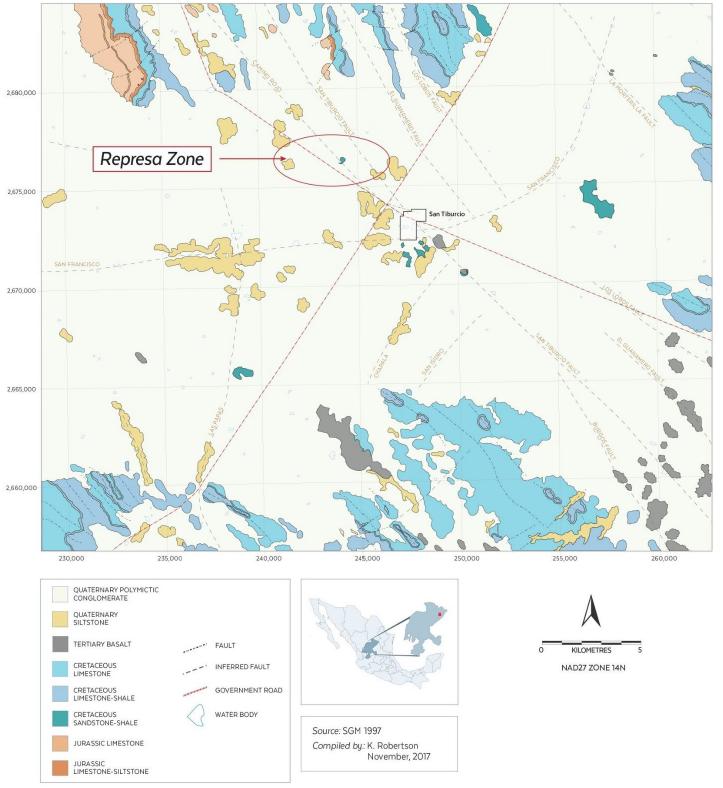
Figure 7- 2 Local Geology, Camino Rojo Deposit (Servicio Geológico Mexicano, 2014)
Kappes, Cassiday & Associates June, 2019 | | 7.0 Geological Setting and Mineralization Page 7-5 |
| Camino Rojo Project Feasibility Study NI 43-101 Technical Report |
|
Figure 7-3 shows relatively uniform nature of siltstone and shale beds in Indidura Formation, stratigraphically below Caracol Formation. Indidura is distinguished from Caracol by the absence of rhythmic sandstone-shale beds. Interval from 817.5 to 819.0m assayed 18 ppb Au.
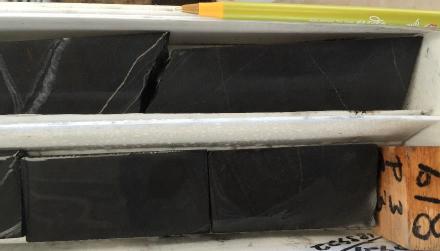
Figure 7-3 Drillcore from CR12-345D, 818m
Figure 7-4 shows typical and diagnostic interbedded centimetre scale sandstone, siltstone, and shale beds, fining upward turbiditic sequence, in unoxidized Caracol Formation. Sample assayed less than 5 ppb Au. Stratigraphic top is to right.

Figure 7-4 Drillcore from CR12-345D, 254m
Kappes, Cassiday & Associates June, 2019 | | 7.0 Geological Setting and Mineralization Page 7-6 |
| Camino Rojo Project Feasibility Study NI 43-101 Technical Report |
|
Figure 7-5 shows marbleized Cuesta del Cura limestone, stratigraphically below the Indidura Formation. Interval from 991.5 to 993.0m assayed 44 ppb Au.
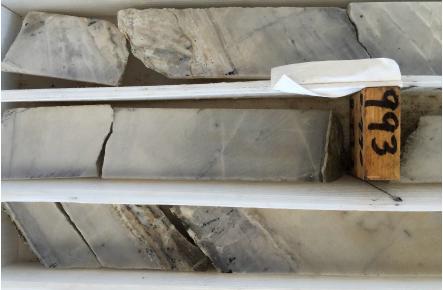
Figure 7-5 Drillcore from CR12-345D, 993m
The Camino Rojo deposit is situated within the northwest-striking San Tiburcio fault zone that features both left-lateral strike-slip and normal displacement (Mitre-Salazar, 1989) (Weiss, 2010). Anticlinal fold axes and faults parallel the San Tiburcio fault zone lending credence to a possible 15 km wide zone, encompassing Camino Rojo, which experienced extensional deformation. The deposit has a northeast trend that plunges southwest. Intermediate composition dikes localized within the deposit also strike northeast.
Three stages of mineralization have been observed in the Camino Rojo deposit, and two types of high-grade mineralization (Longo, 2017) (Longo, A.A., Edwards, J., 2017).
Stage 1 K-metasomatism (adularia?)-pyrite - K-metasomatism with disseminated pyrite replaced the mudstone, siltstone and fine-grained sandstones in the Caracol. Mineralization is typically low grade gold with 0.1-0.4 g/t (Figure 7-6, Figure 7-7).
Stage 2 Intermediate Sulphidation (IS) veins – IS veins with pyrite-arsenopyrite-sphalerite±galena, calcite and minor quartz. Moderate to high grade gold (0.4 to +4.0 g/t), high zinc grades (0.5 to >2.0% Zn) and high values of As, Pb and Ba, with variable Ag. Sanchez (2017) reports electrum and acanthite in Stage 2.
Kappes, Cassiday & Associates June, 2019 | | 7.0 Geological Setting and Mineralization Page 7-7 |
| Camino Rojo Project Feasibility Study NI 43-101 Technical Report |
|
IS Type 1 are pyrite-sphalerite-calcite veins with high values of Au-Zn-Ba, and low to moderate values of As, low Sb, and moderate to high Pb (Figure 7-8).
IS Type 2 – IS veins with pyrite-arsenopyrite-quartz ±calcite and sphalerite-sulphosalts, high gold (up to 60 g/t), Ag, As, Sb.
Stage 3 LS veins – colloform banded quartz veins, drusy-coxcomb quartz veins, and quartz-cemented, polymictic hydrothermal breccia with pyrite-galena-sulphosalts, adularia and electrum. Moderate to high gold grades (2.0 to 15.0 g/t) with high silver (100 to 500 g/t), and high As and Sb values, but variable to low Zn, Pb, and Ba values.
At hand specimen scale, mineralization is controlled by bedding and fractures. The sandy and silty beds of the turbidite sequences of the Caracol Formation are preferentially mineralized, with pyrite disseminations and semi-massive stringers hosted within them, presumably due to higher porosity and permeability relative to the enclosing shale beds. Basal layers of the turbiditic sandstone beds are often preferentially mineralized (Figure 7-6, Figure 7-7). Bedding discordant open space filling fractures and structurally controlled breccia zones host banded sulphide veins and sulphide matrix breccias (Figure 7-8, Figure 7-9). Some higher-grade vein and breccia zones are localized along the margins of dikes of intermediate composition.
Dr. Gray observed mineralization in drill core over vertical intervals greater than 400 metres, with mineralization occurring in a broad NE-SW trending elongate zone as much as 300m wide and 700m long.
Figure 7-6 displays pyrite concentrations developed in basal sandy layer of fining upward sandstone-siltstone-shale/mudstone turbiditic sequence of Caracol Formation. Note textbook turbiditic sequence comprised of cross bedded sandstone above laminar basal sand, and scour marks of basal sand into black pelagic sediments that mark top of lower and base of upper turbidite sequence. Stratigraphic up is to right of photo. Interval from 394.5 to 396.0m assayed 0.211 g/t Au, 8 g/t Ag, 101 ppm Pb, 128 ppm Zn, and 245 ppm As.
Kappes, Cassiday & Associates June, 2019 | | 7.0 Geological Setting and Mineralization Page 7-8 |
| Camino Rojo Project Feasibility Study NI 43-101 Technical Report |
|
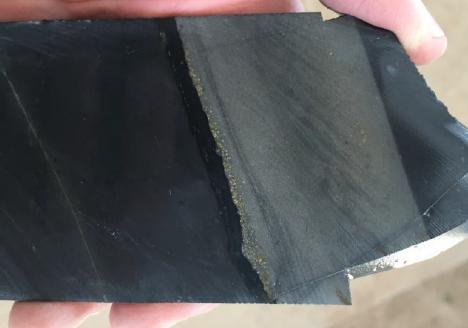
Figure 7-6 Drillcore from CR12 345D, 395m
Figure 7-7 shows pyrite concentrations developed in silty and sandy beds of turbiditic sequence of Caracol Formation. Stratigraphic up is to right of photo. Interval from 726.0 to 727.5m assayed 0.109 g/t Au, 1 g/t Ag, 19 ppm Pb, 56 ppm Zn, and 114 ppm As.
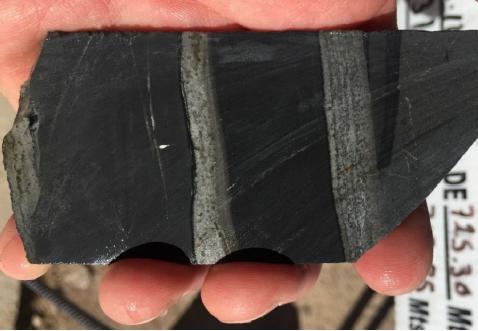
Figure 7-7 Drillcore from CR12 345D, 727m
Kappes, Cassiday & Associates June, 2019 | | 7.0 Geological Setting and Mineralization Page 7-9 |
| Camino Rojo Project Feasibility Study NI 43-101 Technical Report |
|
Figure 7-8 displays banded pyrite-marmatite (Fe rich sphalerite) carbonate veinlet. Interval from 489.5 to 491m assayed 4.76 g/t Au, 22 g/t Ag, 572 ppm Pb, 16850 ppm Zn, and 7240 ppm As. Surrounding sample intervals without discordant sulphide veinlets assayed only 0.79 and 0.28 g/t Au. Note that sulphide veinlet is nearly parallel to core axis.
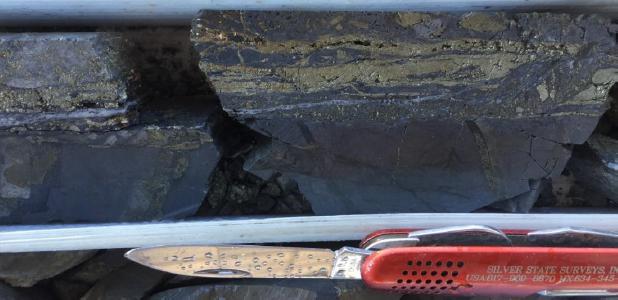
Figure 7-8 Drillcore from CR11 267D, 490m
Figure 7-9 illustrates pyrite-marmatite (Fe rich sphalerite) matrix bedding discordant breccia. Interval from 471.5 to 473.0m assayed 1.71 g/t Au, 14 g/t Ag, 411 ppm Pb, 3050 ppm Zn, and 4290 ppm As. Surrounding sample intervals without discordant sulphide veinlets assayed only 0.19 and 0.31 g/t Au.
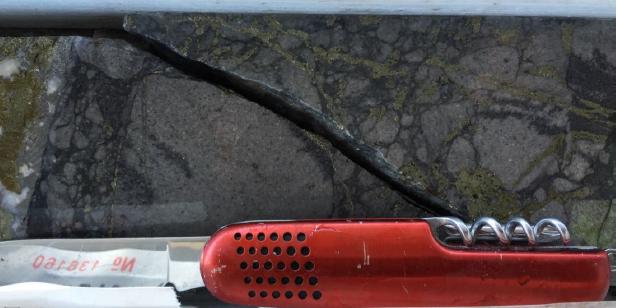
Figure 7-9 Drillcore from CR11 267D, 473m
Kappes, Cassiday & Associates June, 2019 | | 7.0 Geological Setting and Mineralization Page 7-10 |
| Camino Rojo Project Feasibility Study NI 43-101 Technical Report |
|
Distinct alteration styles accompanied each stage of mineralization (Longo, 2017) (Longo, A.A., Edwards, J., 2017):
Stage 1 K-metasomatism (adularia? flooding), decarbonization and sulphidation (forming fine-grained pyrite). This alteration assemblage is typically associated with low metal concentrations, except where cut by IS veins, then grades increase. Temperature of this event is unknown and likely not a high temperature (>400 to 700⁰C) event characteristic of K-silicate alteration in porphyry Cu deposits.
Stage 2 sericite-calcite ±pyrite-quartz overprints Stage 1 and is associated with pyrite-arsenopyrite and pyrite-sphalerite-galena ore stage veins (Sanchez, 2017). Veins that crosscut the igneous dikes display prominent alteration halos. Sericitic halos to ore stage veins are not visually obvious in the sedimentary rocks with intense K-metasomatism.
Oxidation was observed to range from complete oxidation in the uppermost portions of the deposit, generally underlain or surrounded by a zone of mixed oxide and sulphide mineralization where oxidation is complete along fracture zones and within permeable strata, but lacking in the remainder of the rock, which then is generally underlain by a sulphide zone in which no oxidation is observed.
Oxidation is ~100%, generally extending from surface to depths of 100m to 150m, and to depths of as much as 400m along fracture zones. The underlying transitional zone of mixed oxide/sulphide extends over a vertical interval in excess of 100m and is characterized by partial oxidation controlled by bedding and structures.
The sandy layers of the turbiditic sequence are preferentially oxidized, creating a stratigraphically interlayered sequence of oxide and sulphide material at the centimetre scale (Figure 7-10), with oxidation along structures affecting all strata (Figure 7-11). The partial oxidation of the Caracol Formation preferentially oxidizes the mineralized strata thus incomplete oxidation in the transition zone may result in nearly complete oxidation of the gold bearing portion of the rock, thus the metallurgical characteristics of mixed oxide/sulphide may vary greatly, with some material exhibiting characteristics similar to oxide material.
Figure 7-10 displays partially oxidized mineralized Caracol Formation. Note that oxidation is controlled by both bedding and structures. Sandy turbiditic beds are preferentially oxidized in the oxide/sulphide transition zone, whereas interlayered mudstone and shale beds are unoxidized. Oxidation affects all beds adjacent to structures.
Kappes, Cassiday & Associates June, 2019 | | 7.0 Geological Setting and Mineralization Page 7-11 |
| Camino Rojo Project Feasibility Study NI 43-101 Technical Report |
|
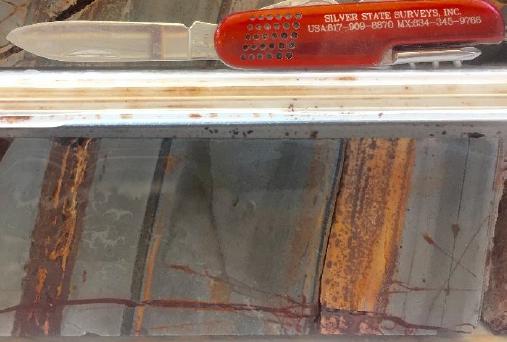
Figure 7-10 Drillcore from CR11 258D, 256m
Figure 7-11 shows oxidized Caracol Formation. Interval from 256.5 to 258.0m assayed 3.52 g/t Au, 33 g/t Ag, 6070 ppm Pb, 6060 ppm Zn, and 2590 ppm As. Note the oxidized sulphide veinlet crosscutting bedding, seen below the knife.
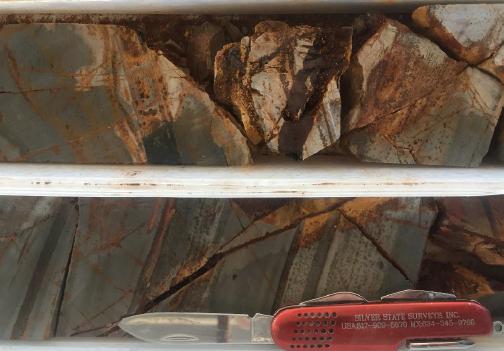
Figure 7-11 Drillcore from CR11 258D, 257m
Kappes, Cassiday & Associates June, 2019 | | 7.0 Geological Setting and Mineralization Page 7-12 |
| Camino Rojo Project Feasibility Study NI 43-101 Technical Report |
|
The distribution of mineralization at Camino Rojo is controlled by both primary bedding and discordant structures. Pervasive, near surface oxidation extends to depths in excess of 100m, and extends to greater depths along structurally controlled zones of fracturing and permeability.
Kappes, Cassiday & Associates June, 2019 | | 7.0 Geological Setting and Mineralization Page 7-13 |
| Camino Rojo Project Feasibility Study NI 43-101 Technical Report |
|
The observed geological and geochemical characteristics of the gold-silver-lead-zinc deposit at Camino Rojo are consistent with those of a distal oxidized gold skarn deposit. Characteristics of these deposits (Meinert, L.D., Dipple, G.M., and Nicolescu, S., 2005) are summarized as:
| · | Typically found in lithologies containing some limestone, but deposits not restricted to limestones. |
| · | Formed by regional or contact metamorphic processes by metasomatic fluids, often of magmatic origin. |
| · | Typically zoned deposits with a general pattern of garnet and pyroxene minerals proximal to the mineralizing heat and fluid source, and distal zones of bleaching. |
| · | Low total sulphide content. |
| · | Sulphide mineralogy comprised of pyrite, pyrrhotite, chalcopyrite, sphalerite, and galena. |
| · | Highest gold grades are associated with late, relatively lower temperature mineralizing events, often with potassium feldspar and quartz gangue. |
| · | May be transitional to epithermal deposits. |
The near surface portion of the Camino Rojo deposit has characteristics consistent with those of the distal skarn zone, transitional to epithermal mineralization, and overlies garnet bearing skarn mineralization encountered in the deeper portions of the system.
Skarn deposits often exhibit predictable patterns of mineral zoning and metal zoning. Application of skarn zoning models to exploration allows for inferences about the possible lateral and depth extents of the mineralized system at the Camino Rojo deposit and can be used to guide further exploration drill programs.
Kappes, Cassiday & Associates June, 2019 | | 8.0 Deposit Types Page 8-1 |
| Camino Rojo Project Feasibility Study NI 43-101 Technical Report |
|
Orla has conducted reconnaissance geological evaluations of portions of its mining concessions. Exploration activities completed include: geologic mapping; rock chip and soil geochemical sampling; and induced polarization geophysical surveys. As of the effective date of this report, 291.3 line-km of induced polarization geophysical surveys have been completed in 4 separate grids over the known area of mineralization, over the proposed area of infrastructure development, and to the west and south of the resource area. All grids were designed with 400m line separation and stations every 100m. Dipole spacing was selected to search for features at depths greater than 100 to 200m. Chargeability anomalies with some similarities to the Camino Rojo deposit have been identified but not yet drill tested (Figure 9-1).
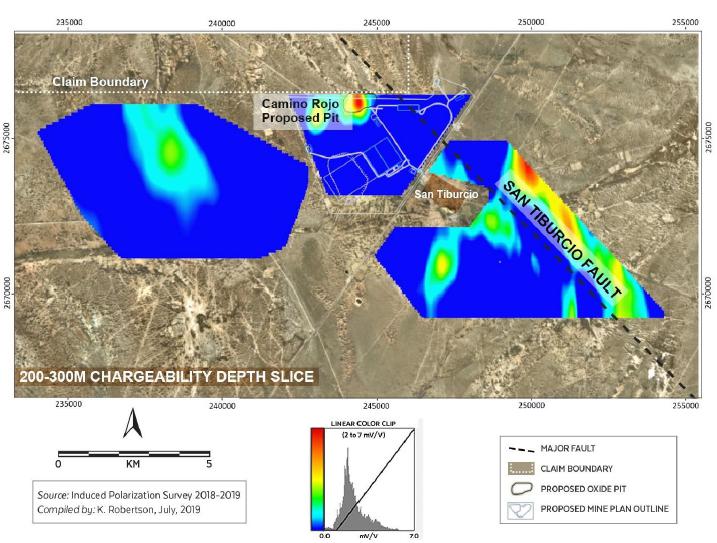
Figure 9-1 Chargeability Features, 300m to 400m, from Orla’s 2018 and 2019 IP Survey
Kappes, Cassiday & Associates June, 2019 | | 9.0 Exploration Page 9-1 |
| Camino Rojo Project Feasibility Study NI 43-101 Technical Report |
|
A small orientation soil survey has been conducted over the resource area and 66 soil samples were collected. Results from the orientation soil survey over the known deposit area to test for any characteristic signature indicates the geochemical “halo” over the deposit is tightly restricted to sub/outcrop. Anomalous gold (>0.2 g/t) is most closely associated with elevated arsenic (>100 ppm) and zinc (>300ppm). A total of 944 rock chip samples were collected from throughout the mining concessions comprising the Project. Thus far no significant rock chip gold anomalies have been identified.
Rock samples collected during the regional exploration are sent to the ALS Minerals (ALS) sample preparation facility in Zacatecas, Mexico. Sample analysis is performed in the ALS laboratory in Vancouver, British Columbia. All gold results are obtained by ALS using fire assay fusion and an atomic absorption spectroscopy finish (Au-AA23). All samples are also analysed for multi-elements, including silver, copper, lead, and zinc, using an Aqua Regia (ME-ICP41) digestion.
Regional exploration continues to field check interpreted targets, consisting of coincident historical geochemical, airborne geophysical and satellite imagery anomalies. Eight areas of alteration of sedimentary strata have been identified, and although no significant geochemical results have been returned from them to date, they are considered of interest as possible distal alteration zones to mineralized areas. The eight target areas are shown on Figure 9-2 and are: 1) Hacheros, where Indidura Formation limestones and siltstones are bleached and highly fractured with Fe-oxides and carbonate veinlets along fractures; 2) Guanamero, which lies northeast of the Represa Zone, along the trend of mineralization, and hosts recrystallized limestones of the Cuesta del Cura Formation; 3) Chapala, located south of the Represa Zone, where bleached Caracol Formation and recrystallized Indidura Formation is exposed; 4) Pozo de San Juan, which hosts old mining prospects that expose traces of Ag-Pb-Zn mineralization in recrystallized limestones of the Cupido Formation; 5) Majoma, where a polymictic hydrothermal breccia and hematized Caracol Formation are observed; 6) La Lomita, defined by a zone of stockwork fractured and weakly brecciated and hematized Caracol Formation; 7) Puerto de Sigala, where recrystallization and local silicification of Cretaceous limestones is present; and 8) Las Miserias, a zone of structural intersections, cut by intermediate composition dikes, with jasperoid developed in Cretaceous limestones.
Kappes, Cassiday & Associates June, 2019 | | 9.0 Exploration Page 9-2 |
| Camino Rojo Project Feasibility Study NI 43-101 Technical Report |
|
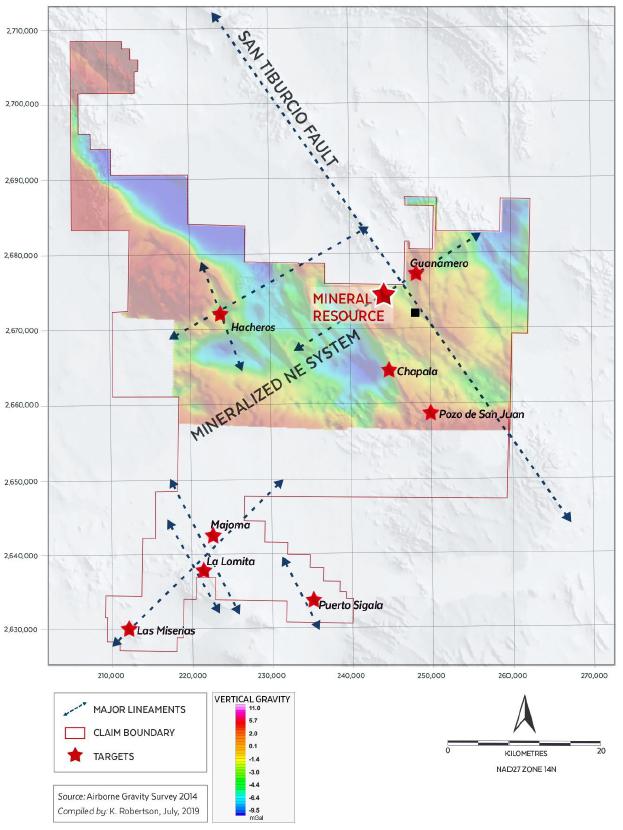
Figure 9-2 Regional Exploration Targets
Kappes, Cassiday & Associates June, 2019 | | 9.0 Exploration Page 9-3 |
| Camino Rojo Project Feasibility Study NI 43-101 Technical Report |
|
The drillhole database used for the Feasibility Study contains 911 drillholes and 370,566m of drilling. Table 10-1 summarizes the drilling by company, date, and type of drilling. During 2007 and 2008 Canplats drilled 121 holes for 39,831m of drilling, about 11% of the drilling by metres. This was 92 RC holes and 29 core holes. Between 2011 and 2015 Goldcorp drilled 779 holes for 328,587m of drilling. These were 95 RC holes, 306 RAB holes, and 378 core holes. The 2015 holes and some of the late 2014 holes were drilled for geotechnical investigations.
Orla drilling included in the resource estimate was conducted during 2018 and consisted of 6 RC holes for 803m of drilling and 5 core holes for 1,345m of drilling, totalling Orla drilling amounted to 11 holes and 2,148m of drilling.
Compared with the drilling reported in Section 6.2 of this report, Table 10-1 reports one less Canplats core hole, one less Goldcorp RC hole, and 37 less Goldcorp core holes. It is known that some of the historical drilling in Section 6.2 is well outside the current Project area. The remainder of the historical drilling is included in the current database for the purposes of the Feasibility Study.
Table 10-1
Summary of Camino Rojo Drilling, 2007-2018
| Year | Company | RC Holes | RAB Holes | Core Holes | Total Holes |
| Holes | Metres | Holes | Metres | Holes | Metres | Holes | Metres |
| | | | | | | | | | |
| 2007 | Canplats | 12 | 2,367 | | | | | 12 | 2,367 |
| 2008 | Canplats | 80 | 21,621 | | | 29 | 15,843 | 109 | 37,464 |
| 2007-08 | Canplats | 92 | 23,988 | | | 29 | 15,843 | 121 | 39,831 |
| 2011 | Goldcorp | 91 | 18,447 | 138 | 10,008 | 124 | 54,249 | 353 | 82,704 |
| 2012 | Goldcorp | 4 | 1,116 | 160 | 18,514 | 38 | 35,606 | 202 | 55,236 |
| 2013 | Goldcorp | | | | | 134 | 110,305 | 134 | 110,305 |
| 2014 | Goldcorp | | | 8 | 2,764 | 79 | 75,478 | 87 | 78,242 |
| 2015 | Goldcorp | | | | | 3 | 2,100 | 3 | 2,100 |
| 2011-15 | Goldcorp | 95 | 19,563 | 306 | 31,286 | 378 | 277,738 | 779 | 328,587 |
| 2018 | Orla | 6 | 803 | | | 5 | 1,345 | 11 | 2,148 |
| ALL | | 193 | 44,354 | 306 | 31,286 | 412 | 294,926 | 911 | 370,566 |
Note: Quantity of drillholes is less than the historical record in Section 6.2. It is known that some of the historical drilling in Section 6.2 is well outside the current Project area. The remainder of the historic drilling is included in the current database.
Kappes, Cassiday & Associates June, 2019 | | 10.0 Drilling Page 10-1 |
| Camino Rojo Project Feasibility Study NI 43-101 Technical Report |
|
Figure 10-1 shows the drillhole locations by drilling type and Figure 10-2 shows the drilling by company. Note that the RAB holes are mostly peripheral to the main mineral deposit area. The denser drilling in the northeast portion of the deposit is the area of interest for the FS. This material is relatively close to the surface and oxidized. To the southwest the mineralization is deeper with higher amounts of sulphide.
The Canplats drilling was conducted during 2007 and 2008. It is reported the RC holes were drilled by Tiger Drilling de Mexico, S.A. de C.V. and Layne de Mexico, S.A. de C.V. (Layne). The rigs used drilled holes of either 4.75in or 5.5in (12cm or 14cm) diameter. Most of the core holes are HQ (63.5mm) and drilled by Major Drilling International Inc. Four PQ (85.0mm) holes were drilled to collect metallurgical samples, but only three of them are in the IMC database. Metallurgical holes CRM-006, CRM-014 and CRM-020 included assays for individual sample intervals in the database. CRM-038 was not in the assay database provided to IMC and it is not certain individual assays were available for this hole. Often metallurgical holes are consumed in their entirety for testing purposes.
It was reported that Canplats did not do downhole surveys for the RC holes. However, Goldcorp was able to re-enter most of the holes and do the surveys. Most of the Canplats RC holes currently have detailed downhole survey information.
Core and RC logging procedures for Canplats drilling were described by Blanchflower (2009). For RC drilling, Canplats sampling personnel extracted spoon size splits from each drill interval at the rig’s cyclone splitter, washed away the fine fraction with a strainer, and placed the washed splits into divided plastic chip trays. Canplats geologists subsequently logged the RC cuttings in the office and storage building, describing each interval on paper log forms with codes for lithology, alteration, mineralization and fracturing. The logged information was later captured into electronic spreadsheet files.
Core was logged prior to hydraulic splitting and sampling. Canplats geologists used paper logging forms to record descriptions of colour, lithology, alteration, mineralization, bedding, and fracture and fault angles to the core axis. Descriptions used a combination of alpha-numeric codes and normal text, and included hand-drawn graphic sketches. The logged information was later captured into electronic spreadsheet files for importation in the database.
The Canplats drilling discovered and partially delineated the oxide mineral deposit that occurs at the northeast end of the Camino Rojo deposit, in the Represa zone. The drilling also discovered the deeper sulphide deposit to the southwest, in the Don Julio zone. This data was used to develop a Mineral Resource and PEA level study for the Represa zone by Canplats during 2009.
Kappes, Cassiday & Associates June, 2019 | | 10.0 Drilling Page 10-2 |
| Camino Rojo Project Feasibility Study NI 43-101 Technical Report |
|
The Goldcorp drilling was conducted from 2011 to 2015. The RC drilling was conducted by Layne and G4 Drilling. The RC holes were 4.75in to 5.125in in diameter (12cm to 13cm). The core holes were drilled by Layne, BD Drilling, and Boart-Longyear and were generally HQ core. In addition to the core and RC holes, 306 RAB holes were drilled. The average depth of these holes was only about 100m and they were mostly peripheral to the main deposit area. Downhole surveys were conducted for the core and RC drilling, but not for the RAB holes. They were assumed vertical.
Most of the holes are orientated north with an approximate 60° north plunge. This is an optimal orientation for the bedding, which dips moderately to the south/southeast. This direction is less optimal for steep north dipping structures and intercepts with narrow veins at low to very low angles to the core axis have been observed in many holes. There are two sections with holes directed to the south drilled by Goldcorp. However, it would be desirable to drill more holes directed south with a 45 to 60° south plunge to intersect structures with a similar attitude as the dike, southwest to northeast trending with a steep north dip. However, these holes require access to ground controlled by the Adjacent Owner.
Goldcorp RC chip logging was recorded on paper log forms by Goldcorp geologists at the RC drill sites, concurrent with drilling. Washed fines and chips from each interval were examined and logged, and a spoon-sized split was placed into divided chip trays for future reference. As of the date of this Report, the chip trays are available for inspection. The Goldcorp geologists described and recorded the lithology, alteration, fracture/fault zones, oxidation class, percent oxidation by volume, estimated percent and type of iron oxides, estimated percent sphalerite, galena, pyrite, and other sulphides, calcite, other veins, and colour. Descriptive text and a graphic sketch column were also recorded. These data were later captured into electronic spreadsheet files for importation into the database.
Core logging by Goldcorp was carried out on whole core, prior to any core cutting or sampling. All core was brought by Goldcorp personnel to the core logging shelter, rinsed with water, and measured from run blocks to determine core depths contained in each core box. Goldcorp geologists logged lithology, alteration, fracture/fault zones, oxidation class, and percent oxidation by volume. Graphic sketch columns for lithology, bedding, fracture and fault angles to core axes, and mineralization were also recorded. Estimated percentages of sulphide and gangue minerals, as well as their mode of occurrence were recorded as text. Logged information was later captured into electronic spreadsheet files for importation into the database. Core was also photographed prior to splitting. In 2012, the logging was modified to include fields for estimated percentages of various sulphide minerals. During 2010, Goldcorp geologists re-logged the Canplats RC drill cuttings to determine the degree of oxidation of each drill interval in terms of percent oxidation of the rock by volume. The Goldcorp drilling further delineated both the oxide and sulphide Mineral Resources. The oxide portion of the deposit has sufficient drilling to conduct studies at the Feasibility Study level. The sulphide deposit has sufficient drilling to conduct studies at the PEA or Preliminary Feasibility level of study. More drilling would be required for a Feasibility level study.
Kappes, Cassiday & Associates June, 2019 | | 10.0 Drilling Page 10-3 |
| Camino Rojo Project Feasibility Study NI 43-101 Technical Report |
|
BD Drilling of Guadalajara, Jalisco, Mexico drilled 5 HQ diameter diamond core holes totaling 1,345m. Three holes were drilled for geotechnical investigations and two were drilled to test a possible higher-grade structure proximal to the main resource area. All holes were sampled. Core logging by Orla personnel was conducted on unsplit whole core. Lithology, structure, alteration, oxidation, and mineralization data was recorded on paper drill logs, then transcribed into an electronic database. RQD and core recovery information was similarly captured. Drillcore was photographed prior to sampling.
Layne of Hermosillo, Sonora, Mexico drilled 6 RC holes totaling 803.1m. A 5 ¼” (13.34 cm) diameter face return bit with shroud was used. RC chips were logged by Orla geologists. Lithology, alteration, oxidation, and mineralization data was recorded on paper drill logs, then transcribed into an electronic database. Drill cuttings were sampled by splitting the sample at the drill rig with a cyclone, or in the case of wet samples, with a rotary splitter. Depending on recovery, a ½ or ¼ split was sent for assay and the remaining sample preserved and stored in warehouses in San Tiburcio.
Gyroscopic downhole surveys were completed for both diamond core and reverse circulation drillholes by Silver State Surveys Inc., supported by their Concepcion del Oro, Zacatecas office. The Orla drilling included in the resource model database, as of the effective date of this report, was conducted in 2018 and is summarized in Table 10-2.
Table 10-2
Drillholes by Orla Included in Mineral Resource Model Database
| Drillhole | Type | Core Size | Depth (m) | Azimuth | Inclination | E UTM NAD27 | N UTM NAD27 | Elevation (m) | Start Date | Finish Date | Drill Contractor |
| CRDH18-001 | DDH | HQ | 250.00 | 160 | -45 | 243402.68 | 2675882.93 | 1955.37 | 20180804 | 20180812 | BD Drilling |
| CRDH18-002 | DDH | HQ | 369.00 | 155 | -50 | 243695.74 | 2676093.77 | 1952.46 | 20180809 | 20180812 | BD Drilling |
| CRGT18-001 | DDH | HQ | 250.00 | 135 | -65 | 244145.55 | 2676170.38 | 1946.56 | 20180705 | 20181711 | BD Drilling |
| CRGT18-002 | DDH | HQ | 240.00 | 205 | -70 | 244342.02 | 2676141.77 | 1948.36 | 20180712 | 20180718 | BD Drilling |
| CRGT18-003 | DDH | HQ | 236.00 | 50 | -80 | 244534.84 | 2676143.32 | 1944.52 | 20180719 | 20180726 | BD Drilling |
| CRI18-01 | RC | | 100.58 | 0 | -90 | 244142.42 | 2676045.35 | 1944.57 | 20180822 | 20180822 | BD Drilling |
| CRI18-02 | RC | | 100.58 | 180 | -50 | 244142.24 | 2676043.36 | 1944.58 | 20180822 | 20180823 | Layne |
| CRI18-03 | RC | | 100.58 | 180 | -70 | 244081.44 | 2676021.81 | 1945.36 | 20180823 | 20180824 | Layne |
| CRI18-04 | RC | | 100.58 | 0 | -50 | 244046.99 | 2676178.62 | 1946.97 | 20180824 | 20180825 | Layne |
| CRI18-05 | RC | | 100.58 | 0 | -90 | 244098.29 | 2676239.08 | 1947.77 | 20180825 | 20180825 | Layne |
| CRI18-06 | RC | | 300.23 | 180 | -70 | 244203.57 | 2676197.94 | 1947.18 | 20180826 | 20180827 | Layne |
Kappes, Cassiday & Associates June, 2019 | | 10.0 Drilling Page 10-4 |
| Camino Rojo Project Feasibility Study NI 43-101 Technical Report |
|
In addition to Orla drilling used in the Mineral Resource model database, through the effective date of this report, Orla has completed geotechnical, metallurgical, condemnation and water exploration and development drilling totalling 11,331 metres as summarized in Table 10-3. Orla has not yet conducted any drilling to explore for new mineralized zones.
Table 10-3
Non-Resource Drilling Completed by Orla, 2018 and 2019
| Purpose | Drillhole Type | Total Number of Holes | Total m |
| Clay Exploration | DDH | 5 | 56.00 |
| Condemnation | RC | 7 | 1,767.85 |
| Geotech Infrastructure Substrate | DDH | 19 | 323.35 |
| Geotech/Condemnation | DDH | 4 | 642.00 |
| Metallurgy | DDH | 14 | 2,288.50 |
| Monitoring Wells | RC/rotary | 3 | 197.41 |
| Water Exploration | RC | 16 | 5,340.51 |
| Water Production | RC/rotary | 2 | 715.60 |
| | Total | 70 | 11,331.22 |
The clay exploration drilling indicated that clay required for leach pad and pond construction is present in adequate amounts. The condemnation holes verified that the proposed sites for Project infrastructure will not impede development of Mineral Resources. The geotechnical holes provided the information necessary to determine pit slope stabilities and design criteria for the process plant, leach pad, waste dumps, and ponds, and confirmed that the proposed locations for each are suitable. Metallurgical drillholes provided material for testing as described in Section 13.0 of this report. The water exploration, monitoring, and development drilling provided information needed for hydrologic modeling as described in Section 24.3 of this report and indicated that wells at the Project site can provide an adequate water supply to the Project as described in Section 18.3.1 of this report.
| 10.5.1 | Canplats and Goldcorp Sampling |
Goldcorp sample intervals were consistently 1.5m for core, RC, and RAB drilling. For Canplats RC drilling about 20% of the sample intervals were 1.0m and 80% 2.0m intervals. Canplats core samples tended to be 2.0m intervals, but about 30% of the intervals were shorter and of random length. According to the Canplats 2009 Technical Report, the geologist could adjust the sample intervals to correspond with geologic contacts.
Kappes, Cassiday & Associates June, 2019 | | 10.0 Drilling Page 10-5 |
| Camino Rojo Project Feasibility Study NI 43-101 Technical Report |
|
For the RC drilling by Canplats and Goldcorp a splitter was used at the drill rig and the sample collected in the field. For drillcore, both Canplats and Goldcorp split the samples at secure facilities and bagged them for shipment to the sample preparation laboratories.
There is no recovery information for Canplats drilling or for any of the RC or RAB drilling. The recovery for Goldcorp core was very high, generally above 90% and the overall average was about 96%.
Drillcore was sampled by cutting the core with a diamond disk saw and sending ½ of the core for assay and maintaining ½ of the core in the core box for archive. Sample intervals were generally 1.5m long, except where geologic contacts or lack of recovery required a different sample length. Sampling was conducted in secure facilities at the Project core logging facility in San Tiburcio.
For reverse circulation drilling, imperial unit drill rods were used, thus sample intervals were 1.524m long (5 feet). Sampling was conducted at the drill rig, and samples then transported to secure warehouse facilities in San Tiburcio.
It is the opinion of IMC that the drilling and sampling procedures for Camino Rojo drill samples by Canplats and Goldcorp are reasonable and adequate for the purposes of the FS. IMC does not know of any drilling, sampling, or recovery factors that would materially impact the accuracy and reliability of the results that are included in the database used for Mineral Resource estimation.
Analytical work comparing various drilling campaigns and drilling types indicates potential down hole contamination in some of the wet Canplats RC drilling. This is discussed in more detail in Section 12.1.1.3. The suspect sample intervals were not used for the resource modeling for this report. This impacted about 2100m, or about 5%, of the Canplats drilling.
It is the opinion of RGI that the 2018 drilling and sampling procedures for Camino Rojo drill samples by Orla are reasonable and adequate for the purposes of the FS. RGI does not know of any drilling, sampling, or recovery factors related to 2018 drilling that would materially impact the accuracy and reliability of results that are included in the database used for Mineral Resource estimation.
Kappes, Cassiday & Associates June, 2019 | | 10.0 Drilling Page 10-6 |
| Camino Rojo Project Feasibility Study NI 43-101 Technical Report |
|

Figure 10-1 Drilling by Type, IMC 2019
Kappes, Cassiday & Associates June, 2019 | | 10.0 Drilling Page 10-7 |
| Camino Rojo Project Feasibility Study NI 43-101 Technical Report |
|
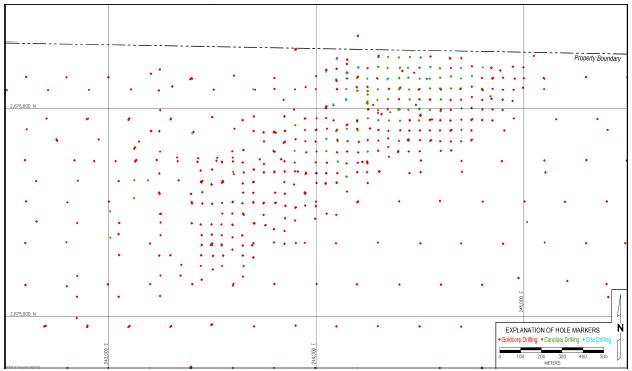
Figure 10-2 Drilling by Company, IMC 2019
Kappes, Cassiday & Associates June, 2019 | | 10.0 Drilling Page 10-8 |
| Camino Rojo Project Feasibility Study NI 43-101 Technical Report |
|
| 11.0 | SAMPLE PREPARATION, ANALYSES AND SECURITY |
The sampling and analysis were supervised by the geological staff of Canplats for 2007 and 2008 drilling, by Goldcorp for 2011 through 2014 drilling, and by Orla for 2018 drilling.
ALS Chemex has been the primary assay laboratory used for the routine assaying of surface and drill samples for the Canplats, Goldcorp, and Orla drilling/sampling programs. All of the assays have been done at the ALS Chemex laboratory in North Vancouver, British Columbia, certified under ISO 9001: 2000, and 2008, and accredited under ISO 17025:2005. ALS Chemex is independent of each of Canplats, Goldcorp, and Orla.
The Canplats samples were prepared for assaying at the ALS Chemex sample preparation laboratory in Guadalajara, Mexico. Most of the Goldcorp samples were prepared at the ALS Chemex sample preparation laboratory in Zacatecas, Mexico. However, during 2013 and 2014 samples were also sent to the ALS Chihuahua facility and the ALS Guadalajara preparation lab as well as the Zacatecas facility. Orla samples were prepared at the ALS Chemex facility in Zacatecas.
Upon receipt at the sample preparation labs the samples were dried, crushed in their entirety to >70% passing a 2mm screen. The crushed material was riffle split to extract an approximate 250-gram sub-sample that was pulverized to >85% passing 75 microns in a disc pulveriser. This sample preparation procedure is the standard ALS Chemex “PREP-31” procedure. Each of the 250-gram pulps were riffle split into two sealed paper sample envelopes, with one split air-shipped to the ALS Chemex assay facility in North Vancouver. The second split was returned to the property for storage. The same sample preparation procedure was used for core and RC chips.
The core and RC samples collected by Canplats and Goldcorp, and Orla, as well as the surface pit and trench samples collected by Canplats, were assayed with the same analytical methods and at the same laboratory, the ALS Chemex facility in North Vancouver, British Columbia. For gold, all were assayed using the Au-AA23 30-gram fire assay fusion, with Atomic Absorption finish. A total of 33 other elements were determined by four-acid sample digestion followed by Inductively Coupled Plasma Atomic Emission Spectrometry (ICP-AES). This is ALS Chemex method code ME-ICP61. The elements assayed by ICP-AES are Ag, Al, As, Ba, Be, Bi, Ca, Cd, Co, Cr, Cu, Fe, Ga, K, La, Mg, Mn, Mo, Na, Ni, P, Pb, S, Sb, Sc, Sr, Th, Ti, Tl, U, V, W, and Zn.
Over-limits for gold were automatically re-assayed with 30-gram fire assay fusion with gravimetric finish (method code Au-GRA21). Over-limits for silver, copper, lead and zinc were automatically performed by four acid digestion of the sample followed by analysis by ICP-AES. This is ALS Chemex method code ME-OG62 for ore grade samples.
Kappes, Cassiday & Associates June, 2019 | | 11.0 Sample Preparation, Analysis and Security Page 11-1 |
| Camino Rojo Project Feasibility Study NI 43-101 Technical Report |
|
RAB-style RC samples from 2011 to 2014 were analysed at ALS Chemex using method code ME-MS61m, which employs the same four-acid digestion, and a combination of ICP-AES, mass-spectrometry, and cold-vapour Atomic Absorption to determine 48 elements plus mercury. Most of the RAB holes are peripheral to the main deposit area.
| 11.3.1 | Canplats QA/QC Program |
It is reported that the Canplats Quality Control/Quality Assurance (QA/QC) program was based on the insertion of control samples at a target rate of 5% to the assay laboratory (Blanchflower, 2009). A quality control sample was to be inserted randomly within every 20 consecutive samples, alternating between standard, blank or duplicate samples. The standard and blank samples were inserted into the sample sequence as the sample shipment was being readied. Duplicate samples were inserted into the sample sequence at the time of collection (Blanchflower, 2009). As reported by Blanchflower (2009) the final, compiled database for 2007 and 2008 drilling included 2,165 blanks and standards, and 1,078 field duplicates. However, relatively few of the Canplats QA/QC samples (about three holes) are included in the current database. IMC believes the Canplats drilling is adequately verified by the Goldcorp drilling results. Based on 5m composite there are 673 Canplats composites in 51 different holes that also have Goldcorp composites within 10m. The distributions of the gold values are comparable. This analysis is after the removal of potentially contaminated Canplats RC samples discussed in Section 12.1.1.3.
| 11.3.2 | Goldcorp QA/QC Program |
Goldcorp’s QA/QC program included the use of blanks, standards and field duplicates for all drilling to monitor potential sample numbering issues and contamination during sample preparation, as well as analytical accuracy and precision. The control sample insertion rate was originally targeted at 7%, and Goldcorp personnel inserted all QA/QC samples during sample collection, prior to placing the samples in the storage area for shipment to the laboratory. A blank was inserted every 25 samples and consisted of fragments of unaltered calcareous siltstone and sandstone of the Caracol Formation, from a borrow pit near Tanque Nuevo, Zacatecas, approximately 60km northeast of Camino Rojo. For RC blanks the Caracol material was hand-crushed to coarse gravel size, and for core drilling blanks the material was broken into fragments similar to drill core size. Standards were inserted every 50 samples usually immediately following the blanks. Standards have included the commercial standards CDN-ME-15 and CDN-ME-16, from CDN Resource Laboratories in Vancouver, B.C., and three in-house reference materials, PEN1850OX, PEN1850T and STDCR14-01, all prepared at SGS Minerales in Durango. The first two were prepared from bulk samples of oxide and mixed oxide-sulphide ore from Peñasquito and the latter from Camino Rojo drill core. Field duplicates were inserted every 100th sample, labelled with a “B” suffix to the original sample number. Field duplicates were two ¼’s of the same ½ piece of sawn core. A total of 10,583 control samples were inserted in 2011 through 2013, for a realized control insertion rate of just below 8%.
Kappes, Cassiday & Associates June, 2019 | | 11.0 Sample Preparation, Analysis and Security Page 11-2 |
| Camino Rojo Project Feasibility Study NI 43-101 Technical Report |
|
A comprehensive compilation and review of Goldcorp’s QA/QC program by Hamilton (2014c) determined that while adequate, the program had several aspects that could be significantly improved through a few simple and easy to implement changes including:
| · | At 8% the overall insertion rate was considered low and that a higher proportion of QA/QC samples, distributed more evenly, were needed. |
| · | Over significant periods of time only a single standard had been used and that several standards should be used on a rotation basis. |
| · | The ¼ core duplicate could not assess variability in the regular samples properly and that the full second half of core should be used instead. |
Early in 2014 a new QA/QC protocol was adopted where a QA/QC material would be inserted every 10th sample for an improved insertion rate of 10%. Three standards were used in a rotation, alternating with blanks and duplicates such that every 80 samples two blanks, two ½ core duplicates and 4 standards were inserted into the sample sequence.
Goldcorp implemented procedures in 2012 for improved follow-up of QA/QC analytical data (Ristorcelli and Ronning, 2012). The project database manager was to review blank and standard assay results as new data was received and loaded into the project master assay table. Standards more than three deviations from the expected values and blanks with gold values greater than 0.020 g/t, or silver values greater than to 1.5 g/t, were reported to the project exploration manager and via email to ALS Chemex for investigation. The exploration manager, database manager and ALS Chemex QA/QC staff communicated to identify the cause of the elevated blank or unexpected standard result. Depending on the cause, the exploration manager ordered appropriate steps as necessary for re-assays, or submission of remaining sample splits for new assays, and instructed the database manager on any changes needed to the assay database.
The Goldcorp QA/QC samples were included in the database provided to IMC. IMC has reviewed this data, including developing some independent control charts. It is the opinion of IMC that the Goldcorp QA/QC program met or exceeded industry standards.
Kappes, Cassiday & Associates June, 2019 | | 11.0 Sample Preparation, Analysis and Security Page 11-3 |
| Camino Rojo Project Feasibility Study NI 43-101 Technical Report |
|
Throughout the 2018 drilling campaign Orla implemented a quality assurance and quality control program appropriate for an exploration and resource evaluation program. Orla’s QA/QC program included training of project geologists and drillers on proper sampling methods at the drill rig, field visits by the responsible Qualified Person, systematic insertion into the sample stream and assay of blank samples, standards, and duplicate samples.
Blank samples were of crushed unmineralized post-mineral volcanic rocks. During the 2018 drill program project geologists inserted blank samples into the sample stream at an interval of one blank sample every 50 samples on regular intervals. A total of 29 blanks were inserted into the sample stream and 19 of the blanks were preceded by a sample containing detectable gold. In 2 of these 19 cases, the blank sample also returned a detectable gold assay. The blank sample that was immediately preceded by the highest-grade drill sample, 5.57 ppm, yielded the highest measured gold concentration of 0.16 ppm. If it is assumed that the blank samples truly are “blank” and do not contain gold above the 0.005 ppm detection limit, then these data are consistent with a slight and immaterial amount of contamination during sample preparation. This possible error is not considered significant.
Standards were inserted into the sample stream every 50 samples. Five different standards of different gold grades were used. The standards were prepared and certified by CDN Resource Laboratories Ltd. of Canada and Rocklabs Ltd. of New Zealand. The standards were in the form of pulps and were inserted into the sample stream after the laboratory had completed its sample preparation. Standards ME1401, ME1414, OXC145, OXD127, and OXI121 were used. A comparison of standard assay results from ALS Chemex to the certified assay means for the standards indicates that the assays obtained during the 2018 drilling program are reliable.
Field duplicates were inserted into the sample stream at a ratio of one duplicate every 50 samples. Field duplicates consist of a ¼ rig split of the RC drilling chips collected from the same ½ split that yields the sample sent to the lab, or a ¼ sawn split of drill core. Field duplicates were submitted blind to the laboratory, i.e. the lab could not distinguish which samples were field duplicates. Duplicates were submitted as the 5th sample immediately following the original sample. A total of 31 field duplicates were analysed. The field duplicates show high variation compared to originals for both Au and Ag and 10% of rig split duplicates have greater than 60% absolute relative difference in Au assay and 47% absolute relative difference in Ag assay from originals. The variance in gold was further examined by segregating data by drilling method. Both RC and drillcore samples exhibit the same variances of Au.
The precision demonstrated by the rig split duplicates is outside of normal ranges observed for disseminated gold deposits. The data indicates the gold and silver distribution is heterogeneous at a local scale. The assay data is adequate for resource estimation purposes, but the estimate of grade at any specific location or particular block within the model will be moderately uncertain, although the global estimate will be reliable.
Kappes, Cassiday & Associates June, 2019 | | 11.0 Sample Preparation, Analysis and Security Page 11-4 |
| Camino Rojo Project Feasibility Study NI 43-101 Technical Report |
|
Preparation duplicates are inserted into the sample stream at a ratio of one duplicate every 100 samples. A total of 15 preparation duplicates were analysed. Preparation duplicates have a low variation compared to originals. 90% of sample preparation duplicates have less than 22% absolute relative difference Au and less than 20% absolute relative difference Ag from originals. The precision demonstrated by the coarse reject duplicates is within normal ranges observed for gold deposits and the data indicates the sampling is reliable and adequate for resource estimation purposes.
Assay (lab) duplicates were inserted into the sample stream at a ratio of one duplicate every 100 samples. A total of 12 lab duplicates were analysed. Lab duplicates consist of a repeat analysis of an already prepared and analysed sample pulp. The pulp re-assays show low variance compared to the original assay for both Au and Ag and 90% of laboratory pulp duplicates have less than 13% absolute relative difference Au and less than 10% absolute relative difference Ag from originals. The precision demonstrated by the pulp re-assays is within normal ranges observed for gold deposits and the data indicates the sampling is reliable and adequate for resource estimation purposes.
Check assays from an independent lab of the same pulp assayed by ALS have not yet been performed. Bureau Veritas (BV) labs has performed independent assays on a second pulp prepared by ALS and sent out for independent assay for 64 samples. BV gold assays yielded a mean 11.9% higher than the ALS assays. Because the BV assays are of a second pulp, not the same pulp assayed by ALS, no conclusions can be drawn about the repeatability of assays between the labs. It is recommended that 3% of pulps assayed by ALS Chemex are sent to and assayed by another independent laboratory to verify results.
It is the opinion of RGI that Orla’s QA/QC program was appropriate for a resource development drill program and the QA/QC program met or exceeded industry standards. Results of analyses of blank, standard, and duplicate samples verify that the analytical results of the 2018 drilling program are reliable and it is the opinion of RGI that the 2018 drillhole assay database is suitable for use for resource estimation.
Kappes, Cassiday & Associates June, 2019 | | 11.0 Sample Preparation, Analysis and Security Page 11-5 |
| Camino Rojo Project Feasibility Study NI 43-101 Technical Report |
|
| 11.4.1 | Canplats and Goldcorp Sample Security |
After collection in the field, the Canplats core and RC samples were transported by truck to a secure warehouse in San Tiburcio, a distance of about 5km. After each drill core sample was split in half by sawing and bagged, the sample bags were tied shut with non-slip plastic ties. The sample bags were then moved to a locked storage area in the core logging and storage facility controlled by the company geologists. Prior to shipping, several sample bags were placed into large woven nylon ‘rice’ bags, their contents were marked on each bag, and each bag was securely sealed.
The sample bags were delivered directly to the ALS Chemex assay laboratory in Guadalajara, Jalisco State, Mexico by company personnel.
During the Goldcorp tenure samples were transported from the field to a secure warehouse and logging area in San Tiburcio, usually twice a day, morning and late afternoon. Sealed individual sample bags of sawn core were loaded into numbered rice sacks which were tied closed and placed in the secure storage building each afternoon. Once or twice a week the sealed sacks were loaded into a delivery truck operated under contract to ALS Chemex and delivered to the preparation labs.
Orla took possession of the Goldcorp facility in San Tiburcio. As of this writing the core, many of the assay pulps, and the RC chip trays are stored at this facility. The facility is walled with locked gates.
It is the opinion of IMC that the sample preparation, analysis, QA/QC programs and sample security were adequate to ensure the reliability of the drilling database.
| 11.4.2 | Orla Sample Security |
During the 2018 drill campaign, at the end of each drill shift, Orla personnel moved RC cutting samples and drill core to Orla’s secure, locked storage facilities in San Tiburcio. Samples for assay were packaged in shipping sacks and delivered directly to the ALS sample preparation facility in Zacatecas.
It is the opinion of RGI that the sample preparation, analysis, QA/QC programs and sample security were adequate to ensure the reliability of the 2018 drilling database.
Kappes, Cassiday & Associates June, 2019 | | 11.0 Sample Preparation, Analysis and Security Page 11-6 |
| Camino Rojo Project Feasibility Study NI 43-101 Technical Report |
|
| 12.1.1 | Canplats and Goldcorp Drill Data |
IMC selected 20 holes at random from the Camino Rojo database and compared the database with original assay certificates. The holes were:
| CR13-459D | | | | CR11-289D | | | | CR12-344D | | | | CR11-332D | |
| CR13-380D | | | | CR13-428D | | | | CR13-390D | | | | CR13-422D | |
| BCR-006 | | | | BCR-044 | | | | BCR-066 | | | | CR13-424D | |
| CR11-266D | | | | BCR-078 | | | | CRD-021 | | | | CR11-284D | |
| BCR-011 | | | | BCR-019 | | | | CR11-305D | | | | CR13-497D | |
The gold, silver, lead, and zinc assays in the database were compared with the certificates. The checked data amounted to about 7,623 assay intervals.
For gold there were minor discrepancies in the certificates versus the database for nine intervals; one in CR11-266D and eight in CR13-380D. The database and certificate values were similar, so the discrepancies are not material. There were also eight discrepancies for silver and zinc and seven discrepancies for lead in hole CR13-380D, generally in the same records as gold. This is an indication that a section of hole CR13-380D might have been re-assayed.
There were also 10 discrepancies for silver, lead, and zinc in hole BCR-019. They were the same 10 assay intervals. Again, the certificate and database values were similar, so the discrepancies are not material.
Based on the comparisons IMC concluded the database assay values are reliable.
IMC also compared collar elevations of the drillholes with topography. The elevations were in very good agreement with the exception of 15 holes, mostly on one drill fence, at the south end of the drilling. The holes are not in the resource area and are not material for the present study.
Minera Camino Rojo personnel have also re-surveyed many of the drillhole collars to verify the original surveys. IMC believes the collar coordinates of the drillholes are accurate.
Kappes, Cassiday & Associates June, 2019 | | 12.0 Data Verification Page 12-1 |
| Camino Rojo Project Feasibility Study NI 43-101 Technical Report |
|
A review of the RC drilling was done. In particular, a report by Mine Development Associates (MDA) dated June 8, 2011 and titled “Camino Rojo – A Comparison of Goldcorp and Canplats Drill Results” indicated potential issues with the Canplats RC drilling. The report concluded that a portion of the RC drilling that was considered wet was probably contaminated and should not be used for Mineral Resource estimates. Contamination in RC drilling occurs when material from higher in the hole falls downward and mixes with samples extracted from lower in the hole.
IMC conducted a comparison of the following four population sets based on pairing 5m composites:
| · | Goldcorp core versus all Canplats RC |
| · | Goldcorp core versus dry Canplats RC |
| · | Goldcorp core versus wet Canplats RC |
| · | Canplats dry versus wet RC |
There was a variable in the database (wet_rc) that classified the RC drilling into dry, humid, and wet. For the Canplats data there were 11,074 assay intervals classified as dry, 375 classified as humid, and 1,638 classified as wet. Humid and wet are lumped for this analysis. Generally, portions of holes are classified as humid or wet, not the entire hole. Also, the wet samples tend to be deeper in the holes for most occurrences. Based on a review of cross sections, most of the wet RC drilling is not in the constrained oxide pit developed for this report.
Additional analysis was done with decay analysis and visual review of the assays in the holes. Based on the analysis IMC decided the assay intervals marked as wet or humid for the following 16 holes are potentially contaminated and should not be used for resource modeling:
| BCR-031 | | | | BCR-039 | | | | BCR-040 | | | | BCR-052 | |
| BCR-069 | | | | BCR-080 | | | | BCR-010 | | | | BCR-028 | |
| BCR-030 | | | | BCR-032 | | | | BCR-035 | | | | BCR-044 | |
| BCR-057 | | | | BCR-074 | | | | BCR-084 | | | | BCR-085 | |
This impacted about 2100m, or about 5%, of the Canplats drilling.
It is noted that Goldcorp also drilled several RC holes, but they tend to be outside of the Mineral Resource area of interest for the FS.
Kappes, Cassiday & Associates June, 2019 | | 12.0 Data Verification Page 12-2 |
| Camino Rojo Project Feasibility Study NI 43-101 Technical Report |
|
IMC is of the opinion that the Camino Rojo drillhole database is acceptable for Preliminary Economic Analysis, Prefeasibility and Feasibility level studies, after the deletion of the potentially contaminated RC samples.
RGI conducted field reviews during the 2018 drill program to verify drilling and sampling techniques and drillhole collar locations. RGI reviewed: drill methods; drill core; Orla’s drill logs; Orla’s geologic and oxidation database; and Orla’s geological interpretations and model. No discrepancies, inconsistencies, or geologically implausible interpretations were noted. RGI independently evaluated the drill sample assay data, including a comparison of the Project drillhole database against original assay certificates from the 2018 drill program. No unresolved discrepancies were noted and it is the opinion of RGI that the 2018 geologic and drillhole assay database is suitable for use in resource and reserve estimation and for the purpose of the FS.
| 12.1.3 | Historical Data Reviews |
Canplats Resource Corporation issued a Technical Report titled “Preliminary Assessment based on Report Titled ‘Technical Assessment of Camino Rojo Project – Zacatecas Mexico’” with an amended date of November 30, 2009. The report was prepared by Minorex Consulting Ltd., an independent, qualified, consulting group. In Sections 11.0 (Drilling) and 14.0 (Verification) Minorex states that they were responsible for the compilation of the drilling database and that the data included in the database was verified by them.
Section 14.0 of the Canplats report also includes detailed description of the QA/QC program for the 2007/8 drilling campaign. In particular, GeoSparks Consulting based in Nanaimo, British Columbia, an independent consulting company, was retained to compile and review all the 2007 and 2008 QA/QC results. This review also included sending 152 samples to another laboratory for check assays. The GeoSparks report concluded that the final assay results for the 2007 and 2008 drilling were of high quality.
During August 2012, M3 Engineering of Tucson, Arizona (M3) prepared a Pre-Feasibility Study report for the Camino Rojo Project for Goldcorp. The report was titled “Camino Rojo Project – Technical Report – Pre-Feasibility Study – Zacatecas, Mexico”, dated August 17, 2012. This report was prepared in NI 43-101 format but it does not appear it was filed on SEDAR; Camino Rojo was probably not considered a material property for Goldcorp.
Kappes, Cassiday & Associates June, 2019 | | 12.0 Data Verification Page 12-3 |
| Camino Rojo Project Feasibility Study NI 43-101 Technical Report |
|
The resource block model for the M3 study was developed by Mine Development Associates (MDA) of Reno, Nevada. It is reported that MDA did a detailed audit of several aspects of the drilling data including collar locations, downhole deviation surveys, checks of the specific gravity measurements conducted by Goldcorp, and the analytical data. The report notes that MDA checked all the Canplats and Goldcorp assays against original assay certificates for gold, silver, copper, lead and zinc. It is also reported that very few discrepancies were noted in the data.
As discussed in Section 12.1.1.3, MDA also did analysis that indicated potential downhole contamination in some of the Canplats wet RC drilling.
In addition to IMC’s and RGI’s reviews, there has been considerable review of the Camino Rojo drilling data by companies that were independent of the owners. IMC is of the opinion that the Camino Rojo drillhole database is acceptable for Preliminary Economic Analysis, Prefeasibility and Feasibility level studies.
| 12.2 | Metallurgical Test Data |
KCA checked the metallurgical test procedures and results to ensure they met industry standards. Metallurgical sample locations were reviewed to ensure that there was material from throughout the resource area and that the samples were reasonably representative with regards to material type and grade with the material planned to be processed so as to support the selected process method and assumptions regarding recoveries and costs.
| 12.3 | Site Visits by Qualified Persons |
As detailed in Section 2.4, each of the Qualified Persons for this Report visited the Camino Rojo property and, in regards to data verification, were provided the opportunity to review current and past drill programs, property details and other miscellaneous items in relation to the Camino Rojo Project.
Kappes, Cassiday & Associates June, 2019 | | 12.0 Data Verification Page 12-4 |
| Camino Rojo Project Feasibility Study NI 43-101 Technical Report |
|
| 13.0 | MINERAL PROCESSING AND METALLURGICAL TESTING |
Historical metallurgical test work programs on the Camino Rojo Project were commissioned by the prior operators of the Project: Canplats (SGS, 2009; KCA 2010) and Goldcorp (KCA, 2012; KCA 2014, KCA, 2015; Blue Coast 2012, Hazen, 2014; SGS Vancouver, 2015). A confirmatory metallurgical test program was commissioned by Orla (KCA, 2019) to confirm the results and conclusions from the previous campaigns. In total 107 column leach tests (85 on representative samples for the material types and pit area) and 164 bottle roll tests have been completed to date on the Camino Rojo ore body as well as physical characterization and preliminary flotation test work.
Selected test work and results from the programs carried out to-date for the Camino Rojo Project are summarized chronologically below and are referenced in this report. Although condensed, for the sake of completeness, as much relevant data as practical are presented here, as a significant amount of metallurgical work has been done. Sample locations for all column test work are presented in Figure 13-1.
Kappes, Cassiday & Associates June, 2019 | | 13.0 Mineral Processing & Metallurgical Testing Page 13-1 |
| Camino Rojo Project Feasibility Study NI 43-101 Technical Report |
|
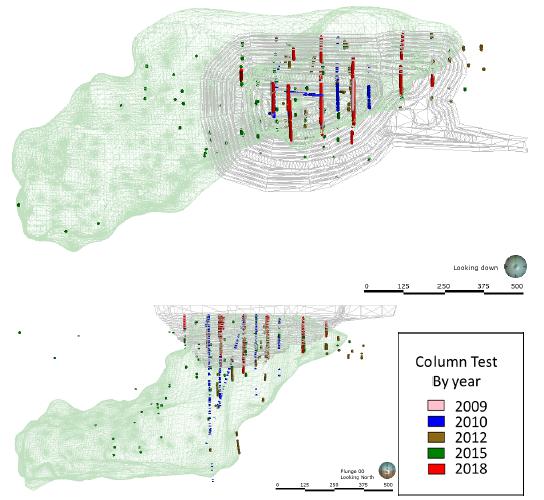
Figure 13-1 Column Leach Test Sample Locations (Orla, 2019)
Kappes, Cassiday & Associates June, 2019 | | 13.0 Mineral Processing & Metallurgical Testing Page 13-2 |
| Camino Rojo Project Feasibility Study NI 43-101 Technical Report |
|
| 13.1 | Canplats (2009 & 2010) |
Canplats commissioned SGS Mineral Services Minerals in Durango, Mexico to conduct bottle roll, column leach, and flotation tests in two programs on Camino Rojo drill core samples and in 2009 publicly disclosed results of 18 column leach tests, 61 bottle roll tests, and 35 flotation tests.
In 2010, Mine and Quarry Engineering Services, on behalf of Canplats, commissioned KCA to perform additional metallurgical test work based on material mineralization according to the geological and mineral interpretations at the time. Test work performed included cyanide shake tests on 569 individual samples and 16 composites, 16 column leach tests, as well as percolation and agglomeration tests.
| 13.1.1 | SGS Mineral Services (2009) |
Results for the 2009 SGS test program summarized herein are extracted from the Canplats 2009 technical report (Blanchflower, K.D., Kaye, C., and Steidtmann, H., 2009).
Composite samples for the first program by SGS were obtained from diamond drill cores of oxide and transition material. Tests performed during the first program included bottle roll, column leach and flotation. The second program used samples from diamond drill cores of oxide, sulphide and transition materials. Material from the second program was used for bottle roll and flotation tests. No mineralogy, bond work index and crusher abrasion index tests were performed.
| 13.1.1.1 | SGS Mineral Services 2009 – Column Leach Tests |
Column leach tests results are summarized in Table 13-1 and Table 13-2 for oxide and transition composites, respectively, and indicate that variations in crush sizes between 37mm and 9.5mm for oxide material have a negligible effect on gold recovery. Silver recoveries tended to increase as the crush size was reduced to 9.5mm. The effect of crush size on transition material was only evaluated on 2 samples and there were insufficient data to show any meaningful trends. In general, gold recovery was higher for oxide material than transition material. Silver recoveries were consistently higher in transition samples than in oxide samples. Ultimate gold and silver recoveries for oxide material were achieved between 40 and 50 days. Different recovery trends for gold and silver based on material classification (oxide or transition) were evident. At a 19mm crush size, modeling of recovery versus head grades indicated that at a 0.7 g/t Au head grade, a gold recovery of approximately 74% for oxide material and 69% for transition material was predicted. At a 14 g/t Ag head grade, column test results indicated a silver recovery of approximately 23% for oxide material and 28% for transition material.
Kappes, Cassiday & Associates June, 2019 | | 13.0 Mineral Processing & Metallurgical Testing Page 13-3 |
| Camino Rojo Project Feasibility Study NI 43-101 Technical Report |
|
Table 13-1
Oxide Column Test Results - SGS Mineral Services 2009
| Column | Crush
Size
(mm) | Calculated Head Grade | Extraction | Consumption |
Gold
(g/t) | Silver
(g/t) | Gold
(%) | Silver
(%) | NaCN
(kg/T) | CaO
(kg/T) |
| CRM-06-1 | 38 | 0.672 | 8.27 | 72.59 | 12.84 | 0.66 | 2.29 |
| | 19 | 0.603 | 9.36 | 73.31 | 14.91 | 0.87 | 3.34 |
| | 9.5 | 0.537 | 9.00 | 73.65 | 19.02 | 0.81 | 4.28 |
| | | | | | | | |
| CRM-06-2/3 | 38 | 1.952 | 10.63 | 83.66 | 12.05 | 0.79 | 2.36 |
| | 19 | 1.794 | 11.51 | 86.60 | 21.23 | 0.99 | 2.81 |
| | 9.5 | 1.795 | 11.58 | 86.49 | 25.27 | 1.23 | 4.60 |
| | | | | | | | |
| CRM-14-1 | 38 | 0.508 | 19.24 | 62.14 | 30.39 | 0.78 | 3.00 |
| | 19 | 0.486 | 18.01 | 64.14 | 32.29 | 0.62 | 3.30 |
| | 9.5 | 0.486 | 18.01 | 61.81 | 28.06 | 0.91 | 4.30 |
| | | | | | | | |
| CRM-20-1 | 38 | 0.369 | 14.09 | 65.15 | 23.16 | 0.58 | 2.63 |
| | 19 | 0.338 | 17.94 | 78.08 | 23.21 | 0.55 | 2.31 |
| | 9.5 | 0.359 | 15.26 | 74.81 | 30.88 | 0.71 | 3.55 |
Kappes, Cassiday & Associates June, 2019 | | 13.0 Mineral Processing & Metallurgical Testing Page 13-4 |
| Camino Rojo Project Feasibility Study NI 43-101 Technical Report |
|
Table 13-2
Transition Column Test Results - SGS Mineral Services 2009
| Column | Crush
Size
(mm) | Calculated Head Grade | Extraction | Consumption |
Gold
(g/t) | Silver
(g/t) | Gold
(%) | Silver
(%) | NaCN
(kg/T) | CaO
(kg/T) |
| CRM-14-2 | 38 | 0.431 | 15.51 | 34.74 | 33.71 | 0.67 | 1.59 |
| | 19 | 0.446 | 13.63 | 36.35 | 38.95 | 0.61 | 1.44 |
| | 9.5 | 0.387 | 15.33 | 33.13 | 44.15 | 0.81 | 2.53 |
| | | | | | | | |
| CRM-20-2 | 38 | 0.593 | 21.51 | 55.2 | 30.54 | 0.54 | 1.55 |
| | 19 | 0.585 | 28.58 | 62.39 | 31.74 | 0.47 | 1.48 |
| | 9.5 | 0.589 | 22.35 | 60.51 | 50.87 | 0.84 | 2.83 |
| 13.1.1.2 | SGS Mineral Services 2009 – Bottle Roll Leach Tests |
Coarse bottle roll tests at -25mm (1”), -12.5mm (1/2”) and -6.25mm (1/4”) along with finely ground bottle rolls at -70 Mesh and -140 Mesh were conducted on samples from CRM 06 Composites 1, 2 and 3, CRM 14-1 (oxide) and 14-2 (transition) composites and CRM 20-1 (oxide) and 20-2 (transition). Results from the bottle roll tests for CRM 06, CRM 14 and CRM 20 composites are presented in Table 13-3, Table 13-4 and Table 13-5, respectively.
Table 13-3
Bottle Roll Test Results CRM 06 Composites - SGS Mineral Services 2009
| Composite | Size | Head Assay | Residue | Extraction |
| Au g/t | Ag g/t | Au g/t | Ag g/t | Au % | Ag % |
| 1 | 25 mm | 0.68 | 9.3 | 0.21 | 7.8 | 74% | 14% |
| 12.5 mm" | 0.22 | 8.2 | 72% | 17% |
| 6.25 mm" | 0.26 | 7.2 | 64% | 20% |
| 70 Mesh | 0.11 | 8 | 84% | 44% |
| 140 Mesh | 0.06 | 3 | 89% | 67% |
| 2 | 25 mm | 2.64 | 20.7 | 0.39 | 15.2 | 77% | 16% |
| 12.5 mm" | 0.34 | 15.2 | 82% | 25% |
| 6.25 mm" | 0.26 | 13.3 | 85% | 27% |
| 70 Mesh | 0.21 | 11 | 87% | 43% |
| 140 Mesh | 0.18 | 10 | 89% | 51% |
| 3 | 25 mm | 1.68 | 8.7 | 0.39 | 14.7 | 79% | 5% |
| 12.5 mm" | 0.35 | 10.5 | 83% | 10% |
| 6.25 mm" | 0.32 | 10.1 | 83% | 11% |
| 70 Mesh | 0.11 | 8 | 91% | 44% |
| 140 Mesh | 0.06 | | 96% | |
Kappes, Cassiday & Associates June, 2019 | | 13.0 Mineral Processing & Metallurgical Testing Page 13-5 |
| Camino Rojo Project Feasibility Study NI 43-101 Technical Report |
|
Table 13-4
Bottle Roll Test Results CRM 14 Composites - SGS Mineral Services 2009
| Composite | Size | Head Assay | Residue | Extraction |
| Au g/t | Ag g/t | Au g/t | Ag g/t | Au % | Ag % |
| 1 | 25 mm | 0.48 | 20 | 0.17 | 14.4 | 65.3% | 29.0% |
| 12.5 mm" | 0.16 | 16.1 | 67.4% | 31.6% |
| 6.25 mm" | 0.17 | 12.2 | 67.7% | 41.1% |
| 70 Mesh | 0.12 | 7.0 | 72.3% | 59.5% |
| 140 Mesh | 0.17 | 11.0 | 70.2% | 53.3% |
| 2 | 25 mm | 0.50 | 14.0 | 0.26 | 7.4 | 32.5% | 37.8% |
| 12.5 mm" | 0.29 | 8.6 | 32.7% | 39.2% |
| 6.25 mm" | 0.34 | 4.5 | 26.1% | 59.6% |
| 70 Mesh | 0.35 | 3.0 | 39.5% | 76.8% |
| 140 Mesh | 0.28 | 3.0 | 50.1% | 79.9% |
Table 13-5
Bottle Roll Test Results CRM 20 Composites - SGS Mineral Services 2009
| Composite | Size | Head Assay | Residue | Extraction |
| Au g/t | Ag g/t | Au g/t | Ag g/t | Au % | Ag % |
| 1 | 25 mm | 0.39 | 19.7 | 0.16 | 16.0 | 62.6% | 22.3% |
| 12.5 mm" | 0.12 | 15.0 | 69.3% | 23.4% |
| 6.25 mm" | 0.12 | 13.0 | 71.2% | 32.0% |
| 70 Mesh | 0.13 | 8.0 | 70.1% | 60.7% |
| 140 Mesh | 0.09 | 8.0 | 81.5% | 60.9% |
| 2 | 25 mm | 0.50 | 14.0 | 0.28 | 15.0 | 57.1% | 33.8% |
| 12.5 mm" | 0.24 | 13.0 | 62.4% | 45.1% |
| 6.25 mm" | 0.26 | 11.0 | 63.1% | 55.6% |
| 70 Mesh | 0.19 | 3.0 | 68.1% | 86.7% |
| 140 Mesh | 0.15 | 3.0 | 74.2% | 85.8% |
Bottle roll tests results show slightly increasing recoveries with finer crushing for all material types with silver recoveries being more sensitive to crush size than gold. Additionally, observed gold recoveries were significantly higher for the oxide composites compared to the transition composites and higher silver recoveries were observed in the transition composites compared to the oxide composites. Dissolution of gold and silver for the bottle roll tests was essentially complete after 48 hours.
Kappes, Cassiday & Associates June, 2019 | | 13.0 Mineral Processing & Metallurgical Testing Page 13-6 |
| Camino Rojo Project Feasibility Study NI 43-101 Technical Report |
|
| 13.1.1.3 | SGS Mineral Services 2009 – Flotation Tests |
Flotation tests were completed on CRM06 composites 1, 2 and 3, CRM14 composites 1 and 2 and CRM20 composites 1 and 2 at grind sizes of 65% -200 Mesh and 75% -200 Mesh as well as additional tests with a sulphidizing reagent Na2S added. Additional Pb/Zn flotation tests were performed on 14 transition and sulphide composites from Camino Rojo drill holes CRD-005, CRD-009, CRD-012, CRD-013, CRD-015, CRD-022 and CRD-023 at grind sizes of 80% - 200 Mesh. A summary of the additional transition and sulphide samples is presented in Table 13-6.
Table 13-6
Transition & Sulphide Samples for Flotation Tests - SGS Mineral Services 2009
| Hole Number | Metres | Samples Number | Composite
Label | Comments |
| from | to | from | to |
| CRD-005 | 168 | 198 | 707003 | 707022 | CRD-005-A | Transition |
| CRD-005 | 218 | 248 | 707036 | 707062 | CRD-005-B | Transition |
| CRD-009 | 532 | 560 | 710714 | 710733 | CRD-009-A | Sulphide |
| CRD-009 | 674 | 700 | 710808 | 710827 | CRD-009-B | Sulphide |
| CRD-012 | 290 | 320 | 712263 | 712279 | CRD-012-A | Sulphide |
| CRD-012 | 360 | 390 | 712306 | 712323 | CRD-012-B | Sulphide |
| CRD-012 | 522 | 556 | 712407 | 712426 | CRD-012-C | Sulphide |
| CRD-013 | 260 | 288 | 711343 | 711359 | CRD-013-A | Transition |
| CRD-013 | 316 | 348 | 711378 | 711397 | CRD-013-B | Sulphide |
| CRD-015 | 164 | 194 | 712819 | 712838 | CRD-015-A | Transition |
| CRD-015 | 220 | 250 | 712859 | 712876 | CRD-015-B | Transition |
| CRD-015 | 296 | 326 | 712906 | 712925 | CRD-015-C | Sulphide |
| CRD-022 | 180 | 210 | 534479 | 534499 | CRD-022-A | Transition |
| CRD-023 | 312 | 346 | 537533 | 537554 | CRD-023-A | Sulphide |
Results from the flotation test work indicated that the oxide material is not amenable to treatment by flotation and sulphidization did not improve the metallurgical response of this material. Flotation tests on sulphide samples produced some encouraging results for recoveries of base metals. Three tests recorded recoveries of lead to a lead rougher concentrate in excess of 85% while two others indicated recoveries in excess of 70%. Apart from these tests, however, lead grades were mostly low and considerable upgrading would be required to produce a marketable lead concentrate. Recoveries of zinc to a zinc rougher concentrate were mostly modest although two tests recorded recoveries in excess of 75%. Results indicated considerable upgrading of both lead and zinc rougher concentrates would be required to produce a marketable concentrate. Recoveries of gold and silver to the lead rougher concentrate ranged between 5% and 67% for gold and 7% and 78% for silver.
Kappes, Cassiday & Associates
June, 2019 | | 13.0 Mineral Processing & Metallurgical Testing
Page 13-7 |
| Camino Rojo Project Feasibility Study NI 43-101 Technical Report |
|
| 13.1.2 | Kappes, Cassiday & Associates (2010) |
Results for the 2010 KCA test program summarized herein are extracted from the KCA laboratory report titled “Camino Rojo Project Report on Metallurgical Test Work, April 2010” (KCA, 2010).
The 2010 metallurgical program was commissioned by Mine and Quarry Engineering Services (MQes) on behalf of Canplats to investigate:
| · | The metallurgical response of the Camino Rojo material based on geological classifications (oxide, transition and sulphide); |
| · | Spatial distribution within the known resource boundary; |
| · | Effect of head grade on metallurgical recoveries; and |
| · | The development of a geo-metallurgical model for the resource. |
A total of 1,477 kg of sample material consisting of 569 individual ¼ to ½ split core interval samples were submitted for test work. The individual core samples were crushed to a nominal -38mm and then used to prepare 16 composite samples.
Metallurgical testing included cyanide shake tests on portions of the 569 individual core samples as well as the 16 composite samples, head analyses on the 16 composite samples including semi-quantitative multi-element and whole rock analysis and assays for carbon, sulphur, mercury, gold and silver, percolation and agglomeration test work and column leach test work.
| 13.1.2.1 | Kappes, Cassiday & Associates (2010) – Head Analyses and Cyanide Shake Tests |
Composite samples were prepared by combining sample intervals as specified by MQes to generate 16 composite samples. Head analyses were completed for each composite sample and are presented in Table 13-7, Table 13-8 and Table 13-9 for gold and silver, carbon and sulphur and mercury and copper, respectively. Multi-element and whole rock analyses were also performed on each composite sample. Multi-element analysis shows arsenic concentrations ranging from 184 to 1031 ppm as well as elevated concentrations of lead and zinc.
Kappes, Cassiday & Associates
June, 2019 | | 13.0 Mineral Processing & Metallurgical Testing
Page 13-8 |
| Camino Rojo Project Feasibility Study NI 43-101 Technical Report |
|
Table 13-7
Head Analysis Gold & Silver – KCA 2010
KCA
Sample No. | Composite | Average Assay,
g/t Au | Average Assay,
g/t Ag |
| 42433 | 1 | 0.31 | 11.8 |
| 42434 | 2 | 0.83 | 18.5 |
| 42435 | 3 | 0.91 | 23.5 |
| 42436 | 4 | 0.37 | 8.7 |
| 42437 | 5 | 0.64 | 15.7 |
| 42438 | 6 | 0.98 | 23.8 |
| 42439 | 7 | 0.73 | 12.7 |
| 42440 | 9 | 0.61 | 18.5 |
| 42441 | 10 | 0.81 | 36.0 |
| 42442 | 11 | 0.55 | 12.7 |
| 42443 | 12 | 0.59 | 19.2 |
| 42444 | 14 | 0.59 | 16.2 |
| 42445 | 16 | 0.59 | 14.7 |
| 42446 | 17 | 0.72 | 27.1 |
| 42447 | 18 | 0.30 | 8.9 |
| 42448 | 21 | 0.24 | 11.1 |
| Note: Silver analyses by 4-acid digestion with FAAS finish. |
| Note: Detection limit for silver by 4-acid digestion with FAAS finish is 0.2 g/t Au. |
Table 13-8
Carbon & Sulphur Summary – KCA 2010
KCA
Sample No. | Composite | Total
Carbon,
% | Total
Sulphur,
% | Sulphide
Sulphur,
% | Sulphate
Sulphur,
% |
| 42433 | 1 | 0.86 | 0.13 | 0.01 | 0.12 |
| 42434 | 2 | 0.73 | 0.32 | 0.03 | 0.30 |
| 42435 | 3 | 0.35 | 0.32 | 0.05 | 0.28 |
| 42436 | 4 | 1.17 | 1.88 | 1.35 | 0.54 |
| 42437 | 5 | 1.06 | 2.42 | 1.81 | 0.62 |
| 42438 | 6 | 0.49 | 1.65 | 1.21 | 0.44 |
| 42439 | 7 | 1.60 | 3.61 | 2.91 | 0.70 |
| 42440 | 9 | 0.23 | 0.14 | 0.02 | 0.13 |
| 42441 | 10 | 0.08 | 0.24 | 0.02 | 0.21 |
| 42442 | 11 | 0.78 | 2.56 | 2.11 | 0.45 |
| 42443 | 12 | 0.44 | 2.01 | 1.52 | 0.49 |
| 42444 | 14 | 2.47 | 5.07 | 4.06 | 1.01 |
| 42445 | 16 | 0.40 | 0.16 | 0.01 | 0.15 |
| 42446 | 17 | 0.22 | 0.26 | 0.04 | 0.22 |
| 42447 | 18 | 1.48 | 3.22 | 2.52 | 0.70 |
| 42448 | 21 | 1.43 | 3.99 | 3.29 | 0.70 |
| Note: The detection limit for carbon and sulphur by LECO analysis is 0.01% |
Kappes, Cassiday & Associates
June, 2019 | | 13.0 Mineral Processing & Metallurgical Testing
Page 13-9 |
| Camino Rojo Project Feasibility Study NI 43-101 Technical Report |
|
Table 13-9
Mercury & Copper Summary – KCA 2010
KCA
Sample No. | Composite | Total Mercury,
mg/kg | Total Copper, mg/kg | Cyanide Soluble Copper, mg/kg | Cyanide Soluble Copper,
% |
| 42433 | 1 | <0.05 | 65 | 28 | 43% |
| 42434 | 2 | <0.05 | 80 | 20 | 25% |
| 42435 | 3 | <0.05 | 114 | 31 | 27% |
| 42436 | 4 | <0.05 | 95 | 82 | 86% |
| 42437 | 5 | <0.05 | 89 | 68 | 76% |
| 42438 | 6 | <0.05 | 98 | 56 | 57% |
| 42439 | 7 | <0.05 | 150 | 86 | 57% |
| 42440 | 9 | <0.05 | 92 | 10 | 11% |
| 42441 | 10 | <0.05 | 118 | 28 | 24% |
| 42442 | 11 | <0.05 | 34 | 27 | 79% |
| 42443 | 12 | <0.05 | 80 | 62 | 78% |
| 42444 | 14 | <0.05 | 53 | 32 | 60% |
| 42445 | 16 | <0.05 | 65 | 21 | 32% |
| 42446 | 17 | <0.05 | 113 | 36 | 32% |
| 42447 | 18 | <0.05 | 72 | 56 | 78% |
| 42448 | 21 | <0.05 | 116 | 68 | 59% |
Based on the head analysis, material grades ranged from 0.3 to 0.98 g/t Au and 8.7 to 36.0 g/t Ag. The composites did not show significant mercury or cyanide soluble copper.
Cyanide shake tests were conducted on portions of the 569 individual samples and the sixteen composite samples generated. Samples were pulverized to 80% passing 0.075mm and agitated with 5 g/L NaCN solution for 24 hours. Results from the cyanide shake tests the composite samples are presented in Table 13-10.
Kappes, Cassiday & Associates
June, 2019 | | 13.0 Mineral Processing & Metallurgical Testing
Page 13-10 |
| Camino Rojo Project Feasibility Study NI 43-101 Technical Report |
|
Table 13-10
Composite Cyanide Shake Tests Results Summary – KCA 2010
| KCA Sample No. | Composite | Type | Weighted Avg Calculated Head, g/t Au | Weighted Avg Calculated Head, g/t Ag | Weighted Avg Au Recov, % | Weighted Avg Ag Recov, % |
| 42433 | 1 | Oxide | 0.35 | 9.13 | 61% | 61% |
| 42434 | 2 | Oxide | 0.86 | 13.33 | 77% | 64% |
| 42435 | 3 | Oxide | 1.25 | 21.19 | 75% | 71% |
| 42436 | 4 | Transition | 0.48 | 10.17 | 64% | 56% |
| 42437 | 5 | Transition | 0.75 | 17.64 | 66% | 69% |
| 42438 | 6 | Transition | 0.94 | 21.59 | 73% | 80% |
| 42439 | 7 | Sulphide | 0.49 | 16.27 | 53% | 46% |
| 42440 | 9 | Oxide | 0.73 | 16.25 | 70% | 66% |
| 42441 | 10 | Oxide | 0.88 | 24.91 | 77% | 74% |
| 42442 | 11 | Trans / Sulphide | 0.38 | 11.69 | 48% | 67% |
| 42443 | 12 | Transition | 0.54 | 17.60 | 50% | 73% |
| 42444 | 14 | Sulphide | 0.40 | 6.48 | 24% | 38% |
| 42445 | 16 | Oxide | 0.62 | 11.02 | 78% | 60% |
| 42446 | 17 | Oxide | 0.82 | 25.02 | 77% | 67% |
| 42447 | 18 | Trans / Sulphide | 0.29 | 7.06 | 52% | 54% |
| 42448 | 21 | Sulphide | 0.23 | 7.48 | 54% | 41% |
The cyanide shake tests show there is significant variability in metal recoveries with regards to material type with generally higher recoveries with oxide material.
| 13.1.2.2 | Kappes, Cassiday & Associates (2010) – Column Leach Tests |
Column leach tests were conducted on material from composites 1, 2, 3, 4, 5, 6, 9, 10, 11, 12, 16, 17 and 18 at -19mm with additional tests at -9.5mm on material from composites 2, 9 and 16. Results from the column tests are presented in Table 13-11.
Gold recoveries ranged from 36% to 80% with higher observed recoveries on oxide material and significantly lower recoveries on the transition/sulphide mix material. Only minor recovery improvements with finer crush size (-9.5mm vs. -19mm) were observed based on test results on the same composite at different crush sizes. Reagent consumptions were low to moderate with NaCN consumption ranging between 0.77 to 1.30 kg/t and lime consumptions around 1.0 kg/t.
Kappes, Cassiday & Associates
June, 2019 | | 13.0 Mineral Processing & Metallurgical Testing
Page 13-11 |
| Camino Rojo Project Feasibility Study NI 43-101 Technical Report |
|
Table 13-11
Column Leach Test Results on Composites – KCA 2010
| Composite | Type | Crush Size,
mm | Calculated Head,
g/t Au | Extracted,
% Au | Consumption NaCN,
kg/t | Hydrated Lime Addition,
kg/t |
| 1 | Oxide | 19.0 | 0.33 | 63% | 1.30 | 1.01 |
| 2 | Oxide | 19.0 | 0.77 | 70% | 1.10 | 1.00 |
| 2 | Oxide | 9.5 | 0.78 | 73% | 1.07 | 1.00 |
| 3 | Oxide | 19.0 | 0.96 | 75% | 0.95 | 1.01 |
| 4 | Transition | 19.0 | 0.37 | 49% | 0.95 | 1.00 |
| 5 | Transition | 19.0 | 0.64 | 57% | 1.06 | 1.01 |
| 6 | Transition | 19.0 | 0.95 | 67% | 1.06 | 1.01 |
| 9 | Oxide | 19.0 | 0.59 | 74% | 1.16 | 1.01 |
| 9 | Oxide | 9.5 | 0.61 | 79% | 1.34 | 1.01 |
| 10 | Oxide | 19.0 | 0.81 | 78% | 1.30 | 1.01 |
| 11 | Trans / Sulphide | 19.0 | 0.44 | 36% | 1.01 | 1.01 |
| 12 | Transition | 19.0 | 0.57 | 51% | 1.28 | 1.01 |
| 16 | Oxide | 19.0 | 0.60 | 78% | 1.08 | 1.01 |
| 16 | Oxide | 9.5 | 0.58 | 79% | 0.98 | 1.01 |
| 17 | Oxide | 19.0 | 0.83 | 80% | 0.77 | 1.00 |
| 18 | Trans / Sulphide | 19.0 | 0.27 | 41% | 0.90 | 1.00 |
| Average | | 19 | 0.63 | 63% | 1.07 | 1.01 |
| Average | | 9.5 | 0.66 | 77% | 1.13 | 1.01 |
Between 2012 and 2015, Goldcorp carried out several metallurgical programs on oxide, sulphide and transition material. This work was performed by several different metallurgical testing groups including KCA, Blue Coast Research Metallurgy in Parksville, B.C., and Hazen Research in Golden, CO.
KCA completed three separate test programs for Goldcorp between 2012 and 2015 including column leach tests, agglomeration and percolation tests, bottle roll tests and cyanide shake tests.
The column tests were completed on composite samples of split core by material types and lithologies. The 2012 program included 28 column tests on 14 different composites by pit oxidation level and material type. The 2014 program included 68 direct and carbon in leach (CIL) bottle leach tests on cut and broken core intervals. The 2015 program included 26 column tests on 13 different composites by lithology.
Kappes, Cassiday & Associates
June, 2019 | | 13.0 Mineral Processing & Metallurgical Testing
Page 13-12 |
| Camino Rojo Project Feasibility Study NI 43-101 Technical Report |
|
The Blue Coast Research Metallurgy program consisted of a variability study, small scale gravity tests, and a flotation flowsheet development. The variability program subjected 98 samples to small-scale bench flotation, small-scale leach testing, and small-scale gravity recovery tests. Flotation flowsheet development testing was conducted on three bulk sulphide composites: one from the Represa zone and two from the West Extension.
The Hazen Research test program included grinding, flotation, and cyanide leaching studies of sulphide and transitional material on some 112 composites.
| 13.2.1 | Kappes, Cassiday & Associates (2012) |
Results for the 2012 KCA test program summarized herein are extracted from the KCA laboratory report titled “Camino Rojo Project Report on Metallurgical Test Work, May 2012” (KCA, 2012).
The 2012 KCA test program was conducted on half split HQ core material which was used to generate 14 composite samples. Core intervals received were sorted according to zone and oxidation class as requested by Goldcorp. Each composite was utilized for head analyses, bottle roll leach testing, agglomeration testing and column leach testing.
| 13.2.1.1 | Kappes, Cassiday & Associates (2012) - Head Analyses |
Head analyses were completed on each composite sample. Assays for gold and silver are presented in Table 13-12. Quantitative assays for carbon and sulphur and mercury and copper were also completed and are presented in Table 13-13 and Table 13-14, respectively. Semi-quantitative assays by means of ICAP-OES for multi-element and whole rock analyses were performed.
Kappes, Cassiday & Associates June, 2019 | | 13.0 Mineral Processing & Metallurgical Testing Page 13-13 |
| Camino Rojo Project Feasibility Study NI 43-101 Technical Report |
|
Table 13-12
Head Analysis Gold & Silver– KCA 2012
KCA
Sample No. | Description | Average
Assay,
g Au/MT | Average
Assay,
g/t Ag | Weighted
Avg. Head Assay1,
g Au/MT | Weighted
Avg. Head
Assay1,
g/t Ag |
| 62401 | Composite 1, Central-Oxide | 0.350 | 13.75 | 0.361 | 13.38 |
| 62402 | Composite 6, East-Oxide | 0.490 | 9.29 | 0.510 | 9.21 |
| 62403 | Composite 10, West-Oxide | 1.875 | 11.65 | 2.551 | 11.38 |
| 62404 | Composite 2, Central-Transition | 0.468 | 13.71 | 0.508 | 12.05 |
| 62405 | Composite 3, Central-Transition | 0.501 | 21.00 | 0.489 | 18.53 |
| 62406 | Composite 4, Central-Transition | 0.950 | 25.41 | 0.991 | 22.67 |
| 62407 | Composite 7, East-Transition | 0.459 | 14.30 | 0.538 | 13.69 |
| 62408 | Composite 8, East-Transition | 0.799 | 25.51 | 0.818 | 22.59 |
| 62409 | Composite 9, East-Transition | 0.566 | 9.39 | 0.582 | 8.69 |
| 62410 | Composite 11, West-Transition | 0.655 | 10.01 | 0.641 | 8.62 |
| 62411 | Composite 12, West-Transition | 0.345 | 17.31 | 0.420 | 14.77 |
| 62412 | Composite 13, West-Transition | 0.492 | 12.60 | 0.517 | 12.40 |
| 62413 | Composite 5, Central-Sulphide | 0.434 | 5.90 | 0.406 | 5.47 |
| 62414 | Composite 14, West-Sulphide | 0.405 | 8.14 | 0.387 | 6.80 |
Table 13-13
Head Analysis Carbon & Sulphur– KCA 2012
KCA
Sample No. | Description | Total
Carbon, % | Total
Sulphur,
% | Sulphide
Sulphur,
% | Sulphate
Sulphur, % |
| 62401 | Composite 1, Central-Oxide | 0.32 | 0.18 | 0.01 | 0.17 |
| 62402 | Composite 6, East-Oxide | 0.76 | 0.22 | 0.01 | 0.21 |
| 62403 | Composite 10, West-Oxide | 0.51 | 0.25 | 0.01 | 0.24 |
| 62404 | Composite 2, Central-Transition | 1.09 | 1.93 | 1.42 | 0.51 |
| 62405 | Composite 3, Central-Transition | 1.03 | 4.42 | 3.48 | 0.93 |
| 62406 | Composite 4, Central-Transition | 0.34 | 1.77 | 1.37 | 0.40 |
| 62407 | Composite 7, East-Transition | 1.44 | 0.62 | 0.23 | 0.39 |
| 62408 | Composite 8, East-Transition | 0.86 | 1.33 | 0.90 | 0.43 |
| 62409 | Composite 9, East-Transition | 2.02 | 0.88 | 0.47 | 0.41 |
| 62410 | Composite 11, West-Transition | 1.05 | 3.22 | 2.55 | 0.67 |
| 62411 | Composite 12, West-Transition | 1.19 | 2.41 | 1.83 | 0.58 |
| 62412 | Composite 13, West-Transition | 1.15 | 0.52 | 0.22 | 0.31 |
| 62413 | Composite 5, Central-Sulphide | 1.69 | 3.55 | 2.87 | 0.69 |
| 62414 | Composite 14, West-Sulphide | 1.55 | 3.78 | 2.78 | 0.99 |
Kappes, Cassiday & Associates June, 2019 | | 13.0 Mineral Processing & Metallurgical Testing Page 13-14 |
| Camino Rojo Project Feasibility Study NI 43-101 Technical Report |
|
Table 13-14
Head Analysis Mercury & Copper– KCA 2012
KCA
Sample
No. | Description | Total
Mercury,
mg/kg | Total
Copper,
mg/kg | Cyanide
Soluble
Copper*,
mg/kg | Cyanide
Soluble
Copper,
% |
| 62401 | Composite 1, Central-Oxide | <0.05 | 161 | 8.13 | 5% |
| 62402 | Composite 6, East-Oxide | <0.05 | 165 | 3.33 | 2% |
| 62403 | Composite 10, West-Oxide | <0.05 | 99 | 7.46 | 8% |
| 62404 | Composite 2, Central-Transition | <0.05 | 115 | 69.05 | 60% |
| 62405 | Composite 3, Central-Transition | <0.05 | 153 | 82.85 | 54% |
| 62406 | Composite 4, Central-Transition | <0.05 | 102 | 46.20 | 45% |
| 62407 | Composite 7, East-Transition | <0.05 | 97 | 47.30 | 49% |
| 62408 | Composite 8, East-Transition | <0.05 | 69 | 51.70 | 75% |
| 62409 | Composite 9, East-Transition | <0.05 | 78 | 41.70 | 53% |
| 62410 | Composite 11, West-Transition | <0.05 | 97 | 58.35 | 60% |
| 62411 | Composite 12, West-Transition | <0.05 | 132 | 74.75 | 57% |
| 62412 | Composite 13, West-Transition | <0.05 | 103 | 51.50 | 50% |
| 62413 | Composite 5, Central-Sulphide | <0.05 | 77 | 32.30 | 42% |
| 62414 | Composite 14, West-Sulphide | <0.05 | 75 | 30.45 | 41% |
| | | | | | |
| *Note: Average of two (2) splits | | | | |
| 13.2.1.2 | Kappes, Cassiday & Associates (2012) – Bottle Roll Leach Tests |
Cyanide bottle roll tests at 80% passing 0.075mm were performed on a portion of each sample and were run for 96 hours. Sodium cyanide was maintained at 1.0 g/L solution and a pH of 11.0 was maintained by adding hydrated lime.
Additional bottle roll tests were then completed on each composite which had an initial gold extraction of less than 20% including composites 2, 7, 9 and 12. These additional tests were performed with the same parameters with increased sodium cyanide concentrations of 5.0 g/L solution.
Bottle roll leach test results are presented in Table 13-15 for gold and Table 13-16 for silver.
Based on the bottle roll test results, oxide sample recoveries ranged between 71% and 91% for gold and 18% and 61% for silver. Transition recoveries ranged between 0% and 77% for gold and 37% to 93% for silver. Sulphide recoveries ranged between 0% and 16% for gold and 28% to 40% for silver.
Kappes, Cassiday & Associates June, 2019 | | 13.0 Mineral Processing & Metallurgical Testing Page 13-15 |
| Camino Rojo Project Feasibility Study NI 43-101 Technical Report |
|
The bottle roll test results indicate that the oxide samples are amenable to cyanide leaching for recovery of gold with lower recoveries for silver. Recoveries for transition material are highly variable for gold with good recoveries for silver. Sulphide samples are not amenable to cyanide leaching for the recovery of gold and leaching of sulphides results in relatively low recoveries for silver. Increased cyanide concentrations resulted in higher cyanide consumptions with minor to no recovery improvements for gold ranging from 0% to 4% and silver recovery improvements ranging from 0% to 11%.
Kappes, Cassiday & Associates June, 2019 | | 13.0 Mineral Processing & Metallurgical Testing Page 13-16 |
| Camino Rojo Project Feasibility Study NI 43-101 Technical Report |
|
Table 13-15
Bottle Roll Leach Tests Summary, Gold– KCA 2012
KCA
Sample No. | Description | Target
NaCN,
g/L | Calculated
Head,
g/t Au | Extracted,
g/t Au | Avg.
Tails,
g/t Au | Bottle Roll Au
Extracted,
% | Leach
Time,
hours | Consumption
NaCN,
kg/t | Addition Ca(OH)2,
kg/t |
| 62401 | Composite 1, Central-Oxide | 1 | 0.363 | 0.259 | 0.104 | 71% | 96 | 0.33 | 2.50 |
| 62402 | Composite 6, East-Oxide | 1 | 0.505 | 0.387 | 0.118 | 77% | 96 | 0.19 | 2.00 |
| 62403 | Composite 10, West-Oxide | 1 | 1.851 | 1.680 | 0.171 | 91% | 96 | 0.33 | 2.00 |
| 62404 | Composite 2, Central-Transition | 1 | 0.458 | 0.016 | 0.442 | 4% | 96 | 0.66 | 1.50 |
| 62404 | Composite 2, Central-Transition | 1 | 0.519 | 0.047 | 0.472 | 9% | 96 | 0.74 | 1.50 |
| 62404 | Composite 2, Central-Transition | 5 | 0.535 | 0.062 | 0.473 | 12% | 96 | 1.47 | 1.50 |
| 62405 | Composite 3, Central-Transition | 1 | 0.516 | 0.113 | 0.403 | 22% | 96 | 1.21 | 2.00 |
| 62406 | Composite 4, Central-Transition | 1 | 0.741 | 0.503 | 0.238 | 68% | 96 | 0.54 | 2.00 |
| 62407 | Composite 7, East-Transition | 1 | 0.425 | 0.000 | 0.425 | 0% | 96 | 0.52 | 2.00 |
| 62407 | Composite 7, East-Transition | 1 | 0.523 | 0.016 | 0.507 | 3% | 96 | 0.48 | 2.00 |
| 62407 | Composite 7, East-Transition | 5 | 0.514 | 0.031 | 0.483 | 6% | 96 | 1.08 | 2.00 |
| 62408 | Composite 8, East-Transition | 1 | 0.656 | 0.047 | 0.609 | 7% | 96 | 0.73 | 2.00 |
| 62409 | Composite 9, East-Transition | 1 | 0.564 | 0.000 | 0.564 | 0% | 96 | 0.66 | 2.00 |
| 62409 | Composite 9, East-Transition | 1 | 0.575 | 0.032 | 0.543 | 6% | 96 | 0.46 | 2.00 |
| 62409 | Composite 9, East-Transition | 5 | 0.572 | 0.032 | 0.540 | 6% | 96 | 0.84 | 2.00 |
| 62410 | Composite 11, West-Transition | 1 | 0.582 | 0.130 | 0.453 | 22% | 96 | 0.57 | 1.50 |
| 62411 | Composite 12, West-Transition | 1 | 0.322 | 0.000 | 0.322 | 0% | 96 | 0.91 | 2.50 |
| 62411 | Composite 12, West-Transition | 1 | 0.407 | 0.016 | 0.391 | 4% | 96 | 1.20 | 2.50 |
| 62411 | Composite 12, West-Transition | 5 | 0.400 | 0.016 | 0.384 | 4% | 96 | 1.96 | 2.00 |
| 62412 | Composite 13, West-Transition | 1 | 0.486 | 0.373 | 0.112 | 77% | 96 | 0.30 | 1.50 |
| 62413 | Composite 5, Central-Sulphide | 1 | 0.435 | 0.047 | 0.387 | 11% | 96 | 0.75 | 2.50 |
| 62413 | Composite 5, Central-Sulphide | 1 | 0.525 | 0.062 | 0.463 | 12% | 96 | 0.72 | 2.00 |
| 62413 | Composite 5, Central-Sulphide | 5 | 0.504 | 0.079 | 0.425 | 16% | 96 | 1.99 | 2.00 |
| 62414 | Composite 14, West-Sulphide | 1 | 0.362 | 0.000 | 0.362 | 0% | 96 | 0.98 | 1.50 |
| 62414 | Composite 14, West-Sulphide | 1 | 0.381 | 0.000 | 0.381 | 0% | 96 | 0.85 | 1.50 |
| 62414 | Composite 14, West-Sulphide | 5 | 0.399 | 0.000 | 0.399 | 0% | 96 | 2.34 | 1.50 |
Kappes, Cassiday & Associates June, 2019 | | 13.0 Mineral Processing & Metallurgical Testing Page 13-17 |
| Camino Rojo Project Feasibility Study NI 43-101 Technical Report |
|
Table 13-16
Bottle Roll Leach Tests Summary, Silver– KCA 2012
KCA
Sample No. | Description | Target
NaCN,
g/L | Calculated
Head,
g/t Ag | Extracted,
g/t Ag | Avg.
Tails,
g/t Ag | Ag
Extracted,
% | Leach
Time,
hours | Consumption
NaCN,
kg/t | Addition
Ca(OH)2,
kg/t |
| 62401 | Composite 1, Central-Oxide | 1 | 11.91 | 7.21 | 4.70 | 61% | 96 | 0.33 | 2.50 |
| 62402 | Composite 6, East-Oxide | 1 | 10.09 | 1.8 | 8.30 | 18% | 96 | 0.19 | 2.00 |
| 62403 | Composite 10, West-Oxide | 1 | 10.06 | 3.17 | 6.89 | 32% | 96 | 0.33 | 2.00 |
| 62404 | Composite 2, Central-Transition | 1 | 8.79 | 7.69 | 1.10 | 88% | 96 | 0.66 | 1.50 |
| 62404 | Composite 2, Central-Transition | 1 | 12.55 | 9.00 | 3.55 | 72% | 96 | 0.74 | 1.50 |
| 62404 | Composite 2, Central-Transition | 5 | 13.92 | 10.01 | 3.91 | 72% | 96 | 1.47 | 1.50 |
| 62405 | Composite 3, Central-Transition | 1 | 19.33 | 14.84 | 4.49 | 77% | 96 | 1.21 | 2.00 |
| 62406 | Composite 4, Central-Transition | 1 | 26.68 | 24.78 | 1.90 | 93% | 96 | 0.54 | 2.00 |
| 62407 | Composite 7, East-Transition | 1 | 12.31 | 8.20 | 4.11 | 67% | 96 | 0.52 | 2.00 |
| 62407 | Composite 7, East-Transition | 1 | 14.15 | 8.35 | 5.79 | 59% | 96 | 0.48 | 2.00 |
| 62407 | Composite 7, East-Transition | 5 | 13.46 | 9.27 | 4.00 | 70% | 96 | 1.08 | 2.00 |
| 62408 | Composite 8, East-Transition | 1 | 17.49 | 15.29 | 2.19 | 87% | 96 | 0.73 | 2.00 |
| 62409 | Composite 9, East-Transition | 1 | 6.97 | 2.57 | 4.41 | 37% | 96 | 0.66 | 2.00 |
| 62409 | Composite 9, East-Transition | 1 | 6.85 | 2.76 | 4.10 | 40% | 96 | 0.46 | 2.00 |
| 62409 | Composite 9, East-Transition | 5 | 7.27 | 3.57 | 3.70 | 49% | 96 | 0.84 | 2.00 |
| 62410 | Composite 11, West-Transition | 1 | 8.28 | 5.98 | 2.30 | 72% | 96 | 0.57 | 1.50 |
| 62411 | Composite 12, West-Transition | 1 | 13.54 | 9.32 | 4.22 | 69% | 96 | 0.91 | 2.50 |
| 62411 | Composite 12, West-Transition | 1 | 16.12 | 11.40 | 4.71 | 71% | 96 | 1.20 | 2.50 |
| 62411 | Composite 12, West-Transition | 5 | 17.15 | 13.03 | 4.11 | 76% | 96 | 1.96 | 2.00 |
| 62412 | Composite 13, West-Transition | 1 | 11.91 | 9.93 | 1.99 | 83% | 96 | 0.30 | 1.50 |
| 62413 | Composite 5, Central-Sulphide | 1 | 4.64 | 1.44 | 3.21 | 31% | 96 | 0.75 | 2.50 |
| 62413 | Composite 5, Central-Sulphide | 1 | 5.67 | 2.07 | 3.60 | 37% | 96 | 0.72 | 2.00 |
| 62413 | Composite 5, Central-Sulphide | 5 | 6.33 | 2.44 | 3.89 | 39% | 96 | 1.99 | 2.00 |
| 62414 | Composite 14, West-Sulphide | 1 | 7.09 | 1.98 | 5.11 | 28% | 96 | 0.98 | 1.50 |
| 62414 | Composite 14, West-Sulphide | 1 | 7.49 | 2.59 | 4.90 | 35% | 96 | 0.85 | 1.50 |
| 62414 | Composite 14, West-Sulphide | 5 | 8.40 | 3.40 | 5.01 | 40% | 96 | 2.34 | 1.50 |
Kappes, Cassiday & Associates June, 2019 | | 13.0 Mineral Processing & Metallurgical Testing Page 13-18 |
| Camino Rojo Project Feasibility Study NI 43-101 Technical Report |
|
| 13.2.1.3 | Kappes, Cassiday & Associates (2012) – Column Leach Test Work |
Column leach tests were conducted on each composite at crush sizes of 100% passing 25mm and 12.5mm. Columns were leached for 113 days using a dilute sodium cyanide solution. Column leach test results are presented in Table 13-17.
For the oxide material the column tests showed that an average of 71% of the contained gold could be extracted from the material when crushed to 100% passing 25 millimetres with no additional extraction at 100% passing 12.5mm. The transition material showed an average recovery of 31% of the contained gold at 100% passing 25 millimetres and 30% at 100% passing 12.5 millimetres. Sulphide material recoveries ranged between 6% and 17% of the contained gold with very little recovery difference at 100% passing 25 millimetres and 100% passing 12.5 millimetres. Silver recoveries were generally higher with finer crushing. Reagent consumptions were low to moderate with an overall average NaCN consumption of 0.77 kg/t material and lime consumption of 2.03 kg/t material.
Kappes, Cassiday & Associates June, 2019 | | 13.0 Mineral Processing & Metallurgical Testing Page 13-19 |
| Camino Rojo Project Feasibility Study NI 43-101 Technical Report |
|
Table 13-17
KCA 2012 Summary of Column Leach Test Results by Material Type
| Description | Crush Size,
mm | Calculated
Head,
g/t Au | Extracted,
% Au | Calculated
Head,
g/t Ag | Extracted,
% Ag | Calculated
Tail P80
Size, mm | Consumption
NaCN,
kg/t | Addition
Hydrated
Lime,
kg/t |
| Composite 1, Central-Oxide | 25.0 | 0.376 | 67% | 13.07 | 15% | 19.0 | 1.41 | 2.04 |
| Composite 1, Central-Oxide | 12.5 | 0.390 | 68% | 15.37 | 19% | 9.19 | 1.23 | 2.04 |
| Composite 6, East-Oxide | 25.0 | 0.573 | 62% | 11.20 | 1% | 17.8 | 1.08 | 2.01 |
| Composite 6, East-Oxide | 12.5 | 0.527 | 61% | 13.62 | 2% | 9.04 | 1.05 | 2.04 |
| Composite 10, West-Oxide | 25.0 | 2.031 | 83% | 10.74 | 3% | 17.8 | 0.18 | 2.03 |
| Composite 10, West-Oxide | 12.5 | 2.130 | 84% | 13.24 | 2% | 9.47 | 0.41 | 2.02 |
| Composite 2, Central-Transition | 25.0 | 0.484 | 28% | 13.14 | 36% | 18.5 | 0.44 | 2.03 |
| Composite 2, Central-Transition | 12.5 | 0.482 | 23% | 15.03 | 41% | 9.75 | 0.57 | 2.02 |
| Composite 3, Central-Transition | 25.0 | 0.484 | 26% | 16.98 | 37% | 17.9 | 0.56 | 2.03 |
| Composite 3, Central-Transition | 12.5 | 0.479 | 30% | 18.26 | 45% | 9.37 | 0.54 | 2.03 |
| Composite 4, Central-Transition | 25.0 | 1.448 | 40% | 26.62 | 37% | 18.5 | 0.59 | 2.02 |
| Composite 4, Central-Transition | 12.5 | 1.263 | 51% | 29.05 | 49% | 9.19 | 0.77 | 2.03 |
| Composite 7, East-Transition | 25.0 | 0.518 | 25% | 14.63 | 43% | 16.0 | 0.76 | 2.04 |
| Composite 7, East-Transition | 12.5 | 0.553 | 15% | 16.97 | 46% | 8.87 | 0.67 | 2.04 |
| Composite 8, East-Transition | 25.0 | 0.867 | 28% | 21.07 | 42% | 18.2 | 0.62 | 2.03 |
| Composite 8, East-Transition | 12.5 | 0.821 | 26% | 23.74 | 52% | 9.25 | 0.58 | 2.04 |
| Composite 9, East-Transition | 25.0 | 0.592 | 12% | 11.36 | 29% | 17.1 | 0.68 | 2.03 |
| Composite 9, East-Transition | 12.5 | 0.679 | 9% | 11.07 | 33% | 8.91 | 1.00 | 2.03 |
| Composite 11, West-Transition | 25.0 | 0.652 | 33% | 10.02 | 36% | 17.3 | 0.75 | 2.03 |
| Composite 11, West-Transition | 12.5 | 0.658 | 30% | 11.17 | 35% | 9.26 | 0.79 | 2.04 |
| Composite 12, West-Transition | 25.0 | 0.454 | 17% | 19.37 | 41% | 17.6 | 0.94 | 2.04 |
| Composite 12, West-Transition | 12.5 | 0.401 | 18% | 19.70 | 41% | 9.73 | 1.30 | 2.04 |
| Composite 13, West-Transition | 25.0 | 0.532 | 70% | 10.21 | 22% | 17.1 | 0.65 | 2.04 |
| Composite 13, West-Transition | 12.5 | 0.575 | 70% | 15.46 | 26% | 8.38 | 0.87 | 2.03 |
| Composite 5, Central-Sulphide | 25.0 | 0.446 | 8% | 8.25 | 11% | 17.8 | 0.86 | 2.02 |
| Composite 5, Central-Sulphide | 12.5 | 0.410 | 6% | 6.42 | 17% | 9.56 | 0.69 | 2.03 |
| Composite 14, West-Sulphide | 25.0 | 0.429 | 17% | 5.31 | 14% | 17.6 | 0.81 | 2.03 |
| Composite 14, West-Sulphide | 12.5 | 0.421 | 18% | 4.62 | 18% | 9.15 | 0.64 | 2.04 |
| Average, Oxide | 25.0 | 0.993 | 71% | 14.50 | 6% | 18.2 | 0.89 | 2.03 |
| Average, Oxide | 12.5 | 1.016 | 71% | 11.67 | 8% | 9.2 | 0.90 | 2.03 |
| Average, Transition | 25.0 | 0.670 | 31% | 17.58 | 36% | 17.6 | 0.67 | 2.03 |
| Average, Transition | 12.5 | 0.657 | 30% | 15.93 | 41% | 9.2 | 0.79 | 2.03 |
| Average, Sulphide | 25.0 | 0.438 | 13% | 10.94 | 17% | 17.7 | 0.84 | 2.03 |
| Average, Sulphide | 12.5 | 0.416 | 12% | 6.78 | 18% | 9.4 | 0.67 | 2.04 |
Kappes, Cassiday & Associates June, 2019 | | 13.0 Mineral Processing & Metallurgical Testing Page 13-20 |
| Camino Rojo Project Feasibility Study NI 43-101 Technical Report |
|
| 13.2.2 | Blue Coast Research Metallurgy (2012-2013) |
Results for the 2014 Blue Coast test program summarized herein are extracted from the Blue Coast Research report titled “Camino Rojo Final Report, March 2014” (Blue Coast, 2014).
A test work program was undertaken in 2012/2013 at Blue Coast Research Metallurgy (“Blue Coast Research”) in Parksville, B.C. This program consisted of a variability study, a small gravity program, and a flotation flowsheet development component (Blue Coast Research Ltd., 2014). Tests were completed using four samples selected to obtain information from a high oxidation and low oxidation sample from both the west and east zones of the deposit.
The variability program subjected 98 samples to small-scale bench flotation, small-scale leach testing, and small-scale gravity recovery tests. Flotation flowsheet development testing was conducted on three bulk sulphide composites: one from the central part of the deposit and two from the western part.
Blue Coast Research performed nine single-pass gravity recoverable gold (“GRG”) tests on different samples from various locations in the Camino Rojo deposit, both in the Represa and in the West Extension areas. A single extended GRG test was performed on a sulphide sample from the western part of the deposit (WE MC1). The results of these tests demonstrated gold recoveries greater than 20% at nominal primary grind feed sizes with mass pulls averaging 2%. These results suggest that concentration of gold by an initial gravity process is a viable option for sulphide material. No subsequent gravity work has been conducted to date.
Very little transitional material was tested at Blue Coast Research; the majority of the test work completed was performed on sulphide material from the western part of the deposit. Flowsheet development work conducted at Blue Coast Research formed the basis for understanding the processing options for the Camino Rojo sulphide deposit.
A full mineralogical analysis was performed on several samples during the FS. The results of the QEMSCAN sulphide mineralogy indicated that the sphalerite was relatively coarse-grained, being well-liberated (having a 40% release size) well above 100 microns. Galena appeared finer-grained, being well-liberated at 90 microns.
Gold mineralogy was undertaken using both optical and D-SIMS techniques. Results indicated that gold was significantly linked to both pyrite and arsenopyrite. Higher gold values were associated with higher arsenic values.
Kappes, Cassiday & Associates
June, 2019 | | 13.0 Mineral Processing & Metallurgical Testing
Page 13-21 |
| Camino Rojo Project Feasibility Study NI 43-101 Technical Report |
|
Results from the Blue Coast Research Tests are presented in Table 13-18, Table 13-19 and Table 13-20.
Table 13-18
Summary of Flotation Composite Feed Grades
| Composite | Au
(g/t) | Ag
(g/t) | Zn% | Pb% |
| WE MC1 | 1.19 | 10.8 | 0.31 | 0.10 |
| WE MC2 | 0.89 | 8.6 | 0.26 | 0.08 |
Table 13-19
Lead Flotation Concentrate Grades
| Composite | Au
(g/t) | Ag
(g/t) | Zn% | Pb% |
| WE MC1 | 185 | 2062 | 0.3 | 28.00 |
| WE MC2 | 236 | 2094 | 9 | 36 |
Table 13-20
Zinc Flotation Concentrate Grades
| Composite | Au
(g/t) | Ag
(g/t) | Zn% | Pb% |
| WE MC1 | 17 | 112 | 41 | 0.50 |
| WE MC2 | 9 | 125 | 43 | 0.7 |
| 13.2.3 | Hazen Research (2014) |
Results for the 2014 Hazen Research test program summarized herein are extracted from the Hazen report titled “Camino Rojo Variability, May 2014” (Hazen, 2014).
Hazen Research was commissioned to conduct grinding, flotation, and cyanide leaching studies of sulphide and transitional material. Some 112 composites were tested. Standard flotation methods yielded recoveries of ~90% Au, 74% to 81% Ag, 83% to 90% Zn, and 82% to 91% Pb for sulphide material, and recoveries of 60% to 67% Au, 56% to 63% Ag, 35% Zn, and 48% Pb for transition material (Hazen Research Inc., 2014).
Kappes, Cassiday & Associates
June, 2019 | | 13.0 Mineral Processing & Metallurgical Testing
Page 13-22 |
| Camino Rojo Project Feasibility Study NI 43-101 Technical Report |
|
| 13.2.4 | Comminution Testing |
Comminution testing occurred at SGS Vancouver in 2015 (SGS Canada Inc., 2015). Material for testing was sourced from the Camino Rojo site directly as well as from an existing stockpile of samples being stored at Hazen. From these two sources, a total of 23 half HQ composites and 2 full PQ composites were selected for testing. The HQ samples were selected based on 4 spatial quadrants, alteration, and oxidation. The PQ samples were selected based on their respective oxidation levels which included one near sulphide composite and one highly oxidized composite. JK Drop Weight (Axb), SMC, Abrasion Index (Ai), Crusher Work Index (CWI), Bond Ball Work Index (BWi), Bond Rod Work Index (RWi), SPI, Point Load Index, and Unconfined Compressive Strength (UCS) tests were performed. It should be noted that only two relevant crusher work indices were obtained from testing data as shown in the summary of results in Table 13-21 below.
Table 13-21
Comminution Test Results Summary
| | Axb | SPI
(min) | Ai
(g) | CWi* (kWh/t) | BWi (kWh/t) | RWi (kWh/t) | UCS* (kN) | IS50
(Mpa) |
| Mean | 38.9 | 99.8 | 0.123 | | 14.4 | 15.9 | | 7.48 |
| Min | 25.6 | 34.4 | 0.017 | 9.4 | 8.5 | 10.8 | 251.3 | 3.82 |
| Max | 68.2 | 145.9 | 0.276 | 10.5 | 19.4 | 19.3 | 522.3 | 15.35 |
| RSD% | 21.8 | 29.2 | 73.7 | | 21.2 | 15.0 | | 43.9 |
Additionally, comminution results are provided by alteration type in Table 13-22. These alterations are: Pyrite-Carbonate (PC), Incipient Potassic Hornfels (IH), and Potassic Hornfels (HF). As indicated in the table, “S” represents Sulphide and “T” represents Transition.
Table 13-22
Comminution Test Results by Alteration Type
| | Axb | SPI
(min) | Ai
(g) | BWi (kWh/t) | RWi (kWh/t) | IS50
(Mpa) |
| PC (S) | 41.6 | 93.0 | 0.061 | 12.8 | 14.4 | 6.07 |
| PC (T) | 50.5 | 57.2 | 0.024 | 9.6 | 12.1 | 4.78 |
| IH (S) | 29.7 | 141.2 | 0.136 | 16.8 | 18.6 | 7.93 |
| IH (T) | 40.7 | 92.0 | 0.061 | 13.2 | 15.3 | 5.18 |
| HF (S) | 32.1 | 120.1 | 0.233 | 17.6 | 18.2 | 13.46 |
| HF (T) | 39.1 | 99.4 | 0.200 | 16.2 | 16.7 | 6.89 |
| 13.2.5 | Kappes, Cassiday & Associates (2014 & 2015) |
Results for the 2014 and 2015 KCA test programs summarized herein are extracted from the KCA laboratory reports titled “Camino Rojo Project Report of Metallurgical Test Work, October 2014” (KCA,2014) and “Camino Rojo Project Report on Metallurgical Test Work, August 2015” (KCA, 2015).
Kappes, Cassiday & Associates
June, 2019 | | 13.0 Mineral Processing & Metallurgical Testing
Page 13-23 |
| Camino Rojo Project Feasibility Study NI 43-101 Technical Report |
|
The 2014 KCA program was conducted on 34 cut and broken core intervals from eight drill holes that were utilized for direct and CIL bottle roll leach tests. The 2015 KCA test program was conducted on cut and broken HQ core material from 469 sample bags, each labelled with a lithology and client sample ID which were used to generate thirteen composite samples. Each composite was utilized for head analyses (including preg-rob test work), direct and carbon in leach (CIL) bottle roll leach tests, and column leach tests.
A summary of the material as received is presented in Table 13-23 for the 2014 program and Table 13-24 for the 2015 program.
Results from the 2014 test program are discussed in this section where applicable.
Kappes, Cassiday & Associates
June, 2019 | | 13.0 Mineral Processing & Metallurgical Testing
Page 13-24 |
| Camino Rojo Project Feasibility Study NI 43-101 Technical Report |
|
Table 13-23
Description of Received Material– KCA 2014
KCA
Sample No. | Drill
Hole
I.D. | Interval, meters | %
Ox | Received Weight,
kilograms | |
| From | To | |
| |
| 62949 | CR13-379DB | 549.5 | 551 | 90 | 6.15 | |
| 62950 | CR13-380D | 749.5 | 751 | 90 | 6.07 | |
| 62951 | CR13-380D | 751 | 752.5 | 90 | 5.85 | |
| 62952 | CR13-390D | 581 | 582.5 | 98 | 5.87 | |
| 62953 | CR13-390D | 582.5 | 584 | 98 | 5.39 | |
| 62954 | CR13-390D | 584 | 585.5 | 98 | 5.73 | |
| 62955 | CR13-390D | 675.5 | 677 | 80 | 4.43 | |
| 62956 | CR13-390D | 677 | 678.5 | 80 | 4.59 | |
| 62957 | CR13-390D | 681.5 | 683 | 80 | 5.29 | |
| 62958 | CR13-390D | 684.5 | 686 | 80 | 4.92 | |
| 62959 | CR13-390D | 687.5 | 689 | 70 | 5.46 | |
| 62960 | CR13-390D | 689 | 690.5 | 80 | 4.42 | |
| 62961 | CR13-400D | 421.5 | 423 | 80 | 6.14 | |
| 62962 | CR13-400D | 423 | 424.5 | 80 | 5.70 | |
| 62963 | CR13-400D | 424.5 | 426 | 80 | 5.99 | |
| 62964 | CR13-410DB | 19.5 | 21 | 100 | 4.71 | |
| 62965 | CR13-410DB | 67.5 | 69 | 100 | 5.30 | |
| 62966 | CR13-410DB | 175.5 | 177 | 80 | 8.59 | |
| 62967 | CR13-410DB | 193.5 | 195 | 70 | 5.62 | |
| 62968 | CR13-410DB | 195 | 196.5 | 70 | 5.46 | |
| 62969 | CR13-410DB | 196.5 | 198 | 70 | 4.70 | |
| 62970 | CR13-418D | 33.5 | 35 | 100 | 4.44 | |
| 62971 | CR13-418D | 63.5 | 65 | 100 | 5.01 | |
| 62972 | CR13-418D | 72.5 | 74 | 100 | 5.15 | |
| 62973 | CR13-418D | 77 | 78.5 | 100 | 4.96 | |
| 62974 | CR13-418D | 98 | 99.5 | 100 | 4.28 | |
| 62975 | CR13-418D | 134 | 135.5 | 80 | 5.34 | |
| 62976 | CR13-419D | 40.5 | 42 | 100 | 5.35 | |
| 62977 | CR13-419D | 84 | 85.5 | 100 | 4.99 | |
| 62978 | CR13-419D | 96 | 97.5 | 100 | 5.23 | |
| 62979 | CR13-466D | 639.5 | 641 | 70 | 5.28 | |
| 62980 | CR13-466D | 647 | 648.5 | 90 | 4.49 | |
| 62981 | CR13-466D | 648.5 | 650 | 90 | 4.68 | |
| 62982 | CR13-466D | 675.5 | 677 | 70 | 5.52 | |
Kappes, Cassiday & Associates
June, 2019 | | 13.0 Mineral Processing & Metallurgical Testing
Page 13-25 |
| Camino Rojo Project Feasibility Study NI 43-101 Technical Report |
|
Table 13-24
Description of Received Material– KCA 2015
KCA
Sample No. | Material
I.D. | Total
Weight, kg |
| 71815 A | HF - Ox 11 | 208.12 |
| 71816 A | HFT - Hi 2 | 184.00 |
| 71817 A | IHT-Hi 4 | 163.60 |
| 71818 A | HFT - Hi 8 | 189.06 |
| 71819 A | HFT - Lo 1 | 196.00 |
| 71820 A | HFT - Lo 7 | 219.80 |
| 71821 A | IH - Ox 12 | 133.04 |
| 71822 A | IHT - Lo 3 | 155.90 |
| 71823 A | OX - Ox 10 | 163.40 |
| 71824 A | OX - Ox 9 | 126.24 |
| 71825 A | PC - Ox 13 | 150.84 |
| 71826 A | PCT - Hi 6 | 169.88 |
| 71827 A | PCT - Lo 5 | 160.36 |
| Total - | | 2220.24 |
| 13.2.5.1 | Kappes, Cassiday & Associates (2015) – Head Analyses |
Head analyses for gold and silver were completed by standard fire assay and wet chemistry methods for each composite and are presented in Table 13-25. Each composite was assayed quantitatively for carbon and sulphur and mercury and copper and are presented in Table 13-26 and Table 13-27. Semi-quantitative analyses for additional elements for whole rock constituents were also completed.
The head analyses show gold grades ranging between 0.29 and 1.65 g/t and silver grades ranging between 9.3 and 54.5 g/t. Organic carbon is present at relatively low percentages. Mercury and copper quantities were low and would not be expected to be problematic for cyanide leaching.
From the multi element analyses, arsenic (As), lead (Pb) and zinc (Zn) were elevated as is typically seen in association with high silver ores. Barium was elevated but does not generally present a problem in leaching.
Kappes, Cassiday & Associates
June, 2019 | | 13.0 Mineral Processing & Metallurgical Testing
Page 13-26 |
| Camino Rojo Project Feasibility Study NI 43-101 Technical Report |
|
Table 13-25
Head Analyses, Gold & Silver– KCA 2015
KCA
Sample
No. | Description | Average
Assay,
g/t Au | Average
Assay,
g/t Ag |
| 71815 B | HF - Ox 11 | 1.128 | 17.95 |
| 71816 B | HFT - Hi 2 | 1.378 | 27.70 |
| 71817 B | IHT - Hi 4 | 0.890 | 26.19 |
| 71818 B | HFT - Hi 8 | 1.649 | 12.41 |
| 71819 B | HFT - Lo 1 | 0.979 | 13.90 |
| 71820 B | HFT - Lo 7 | 1.029 | 9.29 |
| 71821 B | IH - Ox 12 | 0.559 | 23.21 |
| 71822 B | IHT - Lo 3 | 0.847 | 28.06 |
| 71823 B | OX - Ox 9 | 0.291 | 11.61 |
| 71824 B | OX - Ox 10 | 0.785 | 13.30 |
| 71825 B | PC - Ox 13 | 0.618 | 14.81 |
| 71826 B | PCT - Hi 6 | 1.165 | 12.89 |
| 71827 B | PCT - Lo 5 | 0.991 | 54.51 |
| Note - The detection limit for silver with FAAS finish is 0.21 g/t Ag. |
| Note - For the purpose of calculation a value of 1/2 the detection limit is utilized for assays less than the detection limit. |
Table 13-26
Head Analyses Carbon & Sulphur– KCA 2015
KCA
Sample
No. | Description | Total
Carbon,
% | Organic
Carbon,
% | Inorganic
Carbon,
% | Total
Sulphur,
% | Sulphide
Sulphur,
% | Sulphate
Sulphur,
% |
| 71815 B | HF - Ox 11 | 0.67 | 0.13 | 0.54 | 0.32 | 0.01 | 0.31 |
| 71816 B | HFT - Hi 2 | 0.27 | 0.10 | 0.17 | 0.82 | 0.46 | 0.35 |
| 71817 B | IHT - Hi 4 | 0.81 | 0.13 | 0.68 | 0.55 | 0.20 | 0.34 |
| 71818 B | HFT - Hi 8 | 1.17 | 0.19 | 0.97 | 1.80 | 1.29 | 0.52 |
| 71819 B | HFT - Lo 1 | 0.62 | 0.18 | 0.43 | 1.66 | 1.19 | 0.47 |
| 71820 B | HFT - Lo 7 | 1.39 | 0.20 | 1.19 | 1.71 | 1.21 | 0.50 |
| 71821 B | IH - Ox 12 | 0.43 | 0.11 | 0.32 | 0.40 | 0.11 | 0.29 |
| 71822 B | IHT - Lo 3 | 1.31 | 0.25 | 1.06 | 0.93 | 0.52 | 0.42 |
| 71823 B | OX - Ox 9 | 0.28 | 0.05 | 0.23 | 0.25 | <0.01 | 0.25 |
| 71824 B | OX - Ox 10 | 0.76 | 0.08 | 0.69 | 0.17 | <0.01 | 0.17 |
| 71825 B | PC - Ox 13 | 1.54 | 0.16 | 1.38 | 0.34 | <0.01 | 0.34 |
| 71826 B | PCT - Hi 6 | 1.69 | 0.18 | 1.51 | 0.10 | <0.01 | 0.10 |
| 71827 B | PCT - Lo 5 | 1.82 | 0.37 | 1.45 | 0.84 | 0.46 | 0.38 |
Kappes, Cassiday & Associates June, 2019 | | 13.0 Mineral Processing & Metallurgical Testing Page 13-27 |
| Camino Rojo Project Feasibility Study NI 43-101 Technical Report |
|
Table 13-27
Head Analyses Mercury & Copper– KCA 2015
KCA
Sample
No. | Description | Total
Mercury,
mg/kg | Total
Copper,
mg/kg | Cyanide1 Soluble
Copper,
mg/kg | Cyanide Soluble
Copper,
% |
| 71815 B | HF - Ox 11 | <0.02 | 118 | 30.4 | 26% |
| 71816 B | HFT - Hi 2 | <0.02 | 125 | 58.1 | 46% |
| 71817 B | IHT - Hi 4 | <0.02 | 80.2 | 15.3 | 19% |
| 71818 B | HFT - Hi 8 | <0.02 | 183 | 87.2 | 48% |
| 71819 B | HFT - Lo 1 | <0.02 | 168 | 55.8 | 33% |
| 71820 B | HFT - Lo 7 | <0.02 | 145 | 80.1 | 55% |
| 71821 B | IH - Ox 12 | <0.02 | 91.1 | 17.8 | 19% |
| 71822 B | IHT - Lo 3 | <0.02 | 102 | 50.0 | 49% |
| 71823 B | OX - Ox 9 | <0.02 | 74.2 | 3.51 | 5% |
| 71824 B | OX - Ox 10 | <0.02 | 94.2 | 3.01 | 3% |
| 71825 B | PC - Ox 13 | <0.02 | 71.4 | 9.30 | 13% |
| 71826 B | PCT - Hi 6 | <0.02 | 57.5 | 6.67 | 12% |
| 71827 B | PCT - Lo 5 | <0.02 | 66.1 | 33.5 | 51% |
| Note (1): Average assay from cyanide shake tests. | | | |
In addition to the head analyses, direct cyanide shake tests as well as cyanide shake tests with an added gold spike were conducted on each sample to evaluate the material for preg-robbing tendencies.
For the preg-rob cyanide shake tests, preg-robbing tendencies are determined by comparing the spiked shake test extraction and the original shake test extraction to determine a % preg-rob. Typically, % preg-robbing greater than 10% indicates preg-robbing tendencies. The cyanide shake test results suggest little or no preg-robbing tendencies with the oxide material and high preg-robbing tendencies with the transition samples, especially with the Trans-Lo material.
Kappes, Cassiday & Associates June, 2019 | | 13.0 Mineral Processing & Metallurgical Testing Page 13-28 |
| Camino Rojo Project Feasibility Study NI 43-101 Technical Report |
|
| 13.2.5.2 | Kappes, Cassiday & Associates (2014 & 2015) – Bottle Roll Leach Tests |
Direct and CIL (Carbon-In-Leach) bottle roll leach tests were conducted as part of the 2014 and 2015 test campaigns on portions of each sample or composite sample at 80% passing 0.125mm. Results from the bottle roll leach tests for the 2014 and 2015 programs are presented in Figure 13-2 and Figure 13-3 for gold, respectively. The direct-CIL bottle roll recovery difference vs. organic carbon percent for the 2015 program is presented in Figure 13-4.
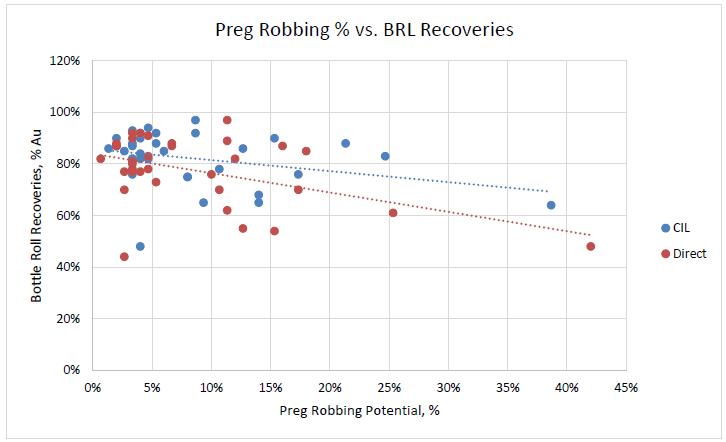
Figure 13-2 Preg-Robbing Percentage vs. CIL & Direct Bottle Roll Leach Test Recoveries – KCA 2014
Kappes, Cassiday & Associates June, 2019 | | 13.0 Mineral Processing & Metallurgical Testing Page 13-29 |
| Camino Rojo Project Feasibility Study NI 43-101 Technical Report |
|
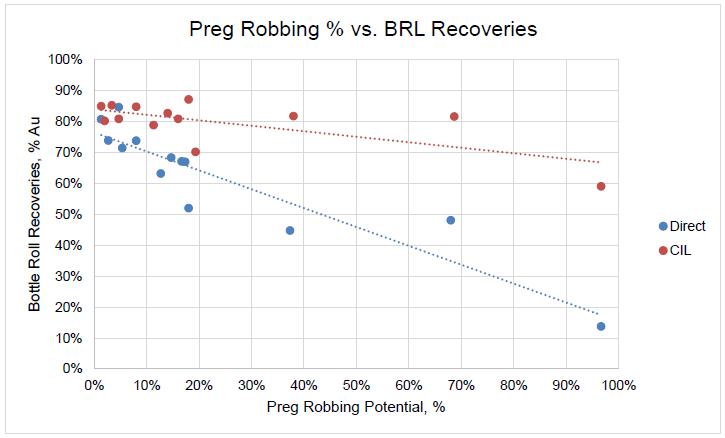
Figure 13-3 Preg-Robbing Percentage vs. CIL & Direct Bottle Roll Leach Test Recoveries – KCA 2015
Kappes, Cassiday & Associates June, 2019 | | 13.0 Mineral Processing & Metallurgical Testing Page 13-30 |
| Camino Rojo Project Feasibility Study NI 43-101 Technical Report |
|
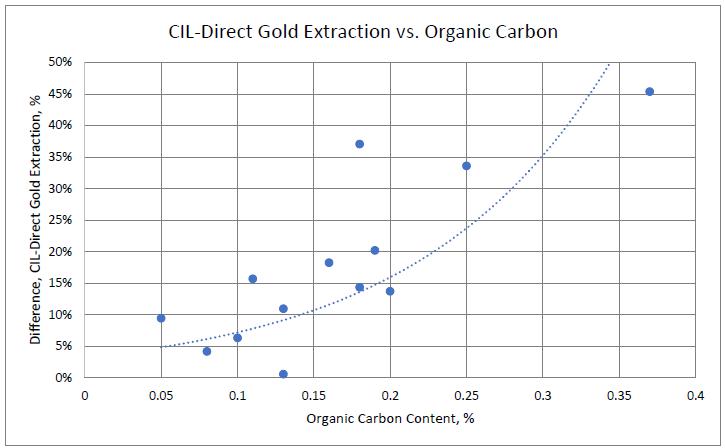
Figure 13-4 CIL-Direct Bottle Roll Au Extraction Difference vs. Organic Carbon Content – KCA 2015
Calculated leach preg robbing values based on the difference between CIL and direct bottle roll test recoveries ranged from 0% to 34% with higher preg-robbing tendencies associated with the transition composites. Based on KCA’s experience, a difference greater than 3% indicates the material could be preg-robbing.
Preg-robbing test work performed on the head material did not prove to be an indication of preg-robbing during leaching. Samples that exhibited preg-robbing characteristics during the preg-robbing test work did not necessarily show the same characteristics during direct and CIL bottle roll leach tests. Additionally, no one individual drillhole exhibited any more tendency toward preg-robbing than another. No strong correlations were observed between sulphide sulphur content and preg-rob values, or between organic carbon content and preg-rob values. The bottle roll tests also did not show a strong correlation between percent gold recovery and sulphide content.
| 13.2.5.3 | Kappes, Cassiday & Associates (2015) – Column Leach Test Work |
Column leach tests were conducted on each sample at crush sizes of 100% passing 25mm and 100% passing 12.5mm and were leached for 90 days. Results from the column leach tests for gold and silver are presented in Table 13-28.
Kappes, Cassiday & Associates June, 2019 | | 13.0 Mineral Processing & Metallurgical Testing Page 13-31 |
| Camino Rojo Project Feasibility Study NI 43-101 Technical Report |
|
Column test results on material crushed to 100% passing 25mm and 12.5mm show only minor recovery improvements with finer crushing with the exception of oxide and transitional material logged as hornfels and incipient hornfels, which benefitted from a 3% to 5% recovery increase for oxide material and 4% to 10% increase for transition material with finer crush size.
Table 13-28
KCA 2015 Column Leach Test Results by Lithology
| Description | Crush
Size,
mm | Calculated
Head,
g/t Au | Extracted,
% Au | | Calculated
Head,
g/t Ag | Extracted,
% Ag | | Calculated
Tail P80
Size,
mm | Consumption
NaCN,
kg/t | Addition
Hydrated
Lime,
kg/t |
| HF - Ox 11 | 25 | 1.060 | 78% | | 14.09 | 21% | | 16.52 | 1.39 | 1.00 |
| HF - Ox 11 | 12.5 | 1.033 | 81% | | 13.28 | 32% | | 9.27 | 1.42 | 1.01 |
| HFT - Hi 2 | 25 | 0.834 | 72% | | 23.67 | 31% | | 17.71 | 1.49 | 1.00 |
| HFT - Hi 2 | 12.5 | 0.855 | 75% | | 22.74 | 46% | | 9.93 | 1.37 | 1.00 |
| IHT - Hi 4 | 25 | 0.812 | 68% | | 17.90 | 25% | | 18.29 | 1.35 | 1.00 |
| IHT - Hi 4 | 12.5 | 0.858 | 73% | | 17.33 | 38% | | 9.92 | 1.37 | 1.00 |
| HFT - Hi 8 | 25 | 1.095 | 72% | | 10.51 | 44% | | 18.32 | 1.44 | 1.01 |
| HFT - Hi 8 | 12.5 | 0.973 | 74% | | 10.50 | 54% | | 10.16 | 1.52 | 1.02 |
| HFT - Lo 1 | 25 | 0.817 | 61% | | 10.91 | 35% | | 18.06 | 1.51 | 0.95 |
| HFT - Lo 1 | 12.5 | 0.788 | 63% | | 10.82 | 51% | | 9.51 | 1.33 | 0.95 |
| HFT - Lo 7 | 25 | 0.880 | 63% | | 5.32 | 41% | | 17.58 | 1.30 | 0.99 |
| HFT - Lo 7 | 12.5 | 0.912 | 70% | | 4.97 | 62% | | 9.84 | 1.79 | 0.99 |
| IH - Ox 12 | 25 | 0.610 | 59% | | 16.22 | 22% | | 18.75 | 1.22 | 1.01 |
| IH - Ox 12 | 12.5 | 0.589 | 63% | | 15.98 | 40% | | 9.90 | 1.59 | 1.01 |
| IHT - Lo 3 | 25 | 0.911 | 57% | | 23.25 | 33% | | 18.26 | 1.47 | 1.01 |
| IHT - Lo 3 | 12.5 | 0.932 | 58% | | 22.04 | 49% | | 9.74 | 1.45 | 1.01 |
| OX - Ox 9 | 25 | 0.269 | 73% | | 9.79 | 12% | | 18.66 | 1.41 | 1.01 |
| OX - Ox 9 | 12.5 | 0.281 | 74% | | 9.58 | 22% | | 9.77 | 1.54 | 1.01 |
| OX - Ox 10 | 25 | 0.729 | 78% | | 11.55 | 2% | | 17.66 | 0.89 | 1.01 |
| OX - Ox 10 | 12.5 | 0.765 | 79% | | 10.95 | 4% | | 10.01 | 0.76 | 1.01 |
| PC - Ox 13 | 25 | 0.557 | 60% | | 14.35 | 30% | | 18.10 | 1.24 | 0.93 |
| PC - Ox 13 | 12.5 | 0.554 | 55% | | 14.56 | 36% | | 13.661 | 1.25 | 0.93 |
| PCT - Hi 6 | 25 | 1.069 | 72% | | 11.87 | 37% | | 17.64 | 1.52 | 1.01 |
| PCT - Hi 6 | 12.5 | 1.087 | 69% | | 11.33 | 45% | | 9.51 | 1.24 | 1.04 |
| PCT - Lo 5 | 25 | 0.922 | 37% | | 43.26 | 50% | | 18.19 | 1.56 | 1.01 |
| PCT - Lo 5 | 12.5 | 0.989 | 26% | | 49.68 | 56% | | 9.06 | 1.54 | 1.01 |
Kappes, Cassiday & Associates June, 2019 | | 13.0 Mineral Processing & Metallurgical Testing Page 13-32 |
| Camino Rojo Project Feasibility Study NI 43-101 Technical Report |
|
Orla commissioned KCA in 2018 to perform confirmatory test work on the Camino Rojo ore. The Camino Rojo ore body contains three basic material types which include Oxide, Sulphide, and Transition material. The test work included column leach and bottle roll leach tests on each of the primary ore types (Kp Oxide, Ki Oxide, Transition Hi and Transition Lo) as well as physical characterization and cyanide neutralization test work. These material types have been further defined into distinct groups beyond the basic classifications. Oxide material has been classified relative to the material’s K alteration values from ICP testing and include the Kp (pervasive) and Ki (incipient) oxides. Transition material has been classified based on oxidation level via qualitative indicators which include Transition-Hi (60 to 90% oxidized), Transition-Lo (30 to 60% oxidized), and Transition-S (Sulphide, <30% oxidized). Transition-S material is not included in the Mineral Resource for the Camino Rojo Project.
| 13.3.1 | Kappes, Cassiday & Associates (2019) |
Results for the 2019 KCA test program summarized herein are extracted from the KCA laboratory report titled “Camino Rojo Project Kp, Ki, TrSx(H), TrHi and TrLo Composites Report on Metallurgical Test Work, June 2019” (KCA, 2019).
The 2019 KCA test program was conducted on PQ core material which was used to generate seven composites based on material types. Figure 13-5 presents the location of the drill holes for the samples and a description of material received is presented in Table 13-29. Details on the composite generation are presented in Table 13-30.
Kappes, Cassiday & Associates June, 2019 | | 13.0 Mineral Processing & Metallurgical Testing Page 13-33 |
| Camino Rojo Project Feasibility Study NI 43-101 Technical Report |
|
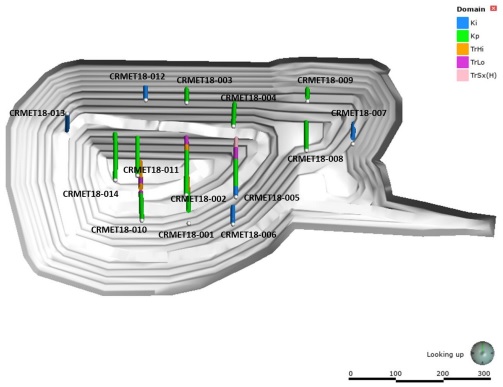
Figure 13-5 Sample Drill Hole Locations for KCA 2019 Test Program
Kappes, Cassiday & Associates
June, 2019 | | 13.0 Mineral Processing & Metallurgical Testing
Page 13-34 |
| Camino Rojo Project Feasibility Study NI 43-101 Technical Report |
|
Table 13-29
Description of Received Material – KCA 2019
KCA
Sample
No. | Client I.D. | Received
Weight,
kg | |
| |
| 82401 A | CRMET18-001, 54 to 135 metres | 1,030.0 | |
| 82402 A | CRMET18-002, 2 to 143 metres | 1,472.5 | |
| 82403 A | CRMET18-003, 2 to 106 metres | 1,037.5 | |
| 82417 A | CRMET18-010, 3 to 84 metres | 909.5 | |
| 82418 A | CRMET18-010, 84 to 108 metres | 258.5 | |
| 82419 A | CRMET18-011, 2 to 75 metres | 745.5 | |
| 82420 A | CRMET18-011, 75 to 126 metres | 511.0 | |
| 82457 A | CRMET18-014, 2 to 160 metres | 1,550.5 | |
| 82421 A | CRMET18-004, 2 to 129.5 metres | 1,278.1 | |
| 82422 A | CRMET18-005, 31 to 122 metres | 954.0 | |
| 82423 A | CRMET18-008, 4 to 126 metres | 1,386.5 | |
| 82424 A | CRMET18-009, 14 to 134 metres | 1,449.0 | |
| 82425 A | CRMET18-005, 4 to 31 metres | 293.1 | |
| 82426 A | CRMET18-006, 2 to 75 metres | 886.3 | |
| 82427 A | CRMET18-007, 26 to 100 metres | 897.2 | |
| 82428 A | CRMET18-012, 3 to 75.5 metres | 863.5 | |
| 82429 A | CRMET18-013, 2 to 70 metres | 807.5 | |
| 82430 A | CRMET18-001, 135 to 212 metres | 973.0 | |
| 82431 A | CRMET18-002, 143 to 162 metres | 264.3 | |
| 82432 A | CRMET18-003, 106 to 117 metres | 148.9 | |
| 82433 A | CRMET18-008, 126 to 142 metres | 214.6 | |
| 82434 A | CRMET18-009, 165 to 170 metres | 66.0 | |
| 82435 A | CRMET18-010, 135 to 149 metres | 1,088.4 | |
| 82436 A | CRMET18-010, 175 to 250 metres | |
| 82437 A | CRMET18-001, 212 to 245 metres | 459.4 | |
| 82438 A | CRMET18-002, 162 to 255 metres | 1,185.4 | |
| 82439 A | CRMET18-003, 117 to 127 metres | 126.8 | |
| 82440 A | CRMET18-003, 139 to 160 metres | 292.3 | |
| 82441 A | CRMET18-005, 122 to 162 metres | 530.0 | |
| 82442 A | CRMET18-005, 196 to 227 metres | 409.0 | |
| 82443 A | CRMET18-008, 142 to 180 metres | 488.0 | |
| 82444 A | CRMET18-009, 148 to 165 metres | 219.0 | |
| 82445 A | CRMET18-010, 108 to 120 metres | 179.0 | |
| 82446 A | CRMET18-010, 149 to 175 metres | 380.0 | |
| 82447 A | CRMET18-001, 245 to 279 metres | 493.5 | |
| 82448 A | CRMET18-005, 162 to 196 metres | 445.0 | |
| 82449 A | CRMET18-005, 227 to 237.5 metres | 138.4 | |
| 82550 A | CRMET18-009, 134 to 148 metres | 184.5 | |
Kappes, Cassiday & Associates
June, 2019 | | 13.0 Mineral Processing & Metallurgical Testing
Page 13-35 |
| Camino Rojo Project Feasibility Study NI 43-101 Technical Report |
|
Table 13-30
Composite Generation Information – KCA 2019
KCA Composite
No. | KCA Sample
No. | Description | Client I.D. | Weight to Composite, kg | |
| |
| 82404 A | 82401 A | Kp 4400 Composite | CRMET18-001, 54 to 135 metres | 300.0 | |
| 82402 A | CRMET18-002, 2 to 143 metres | 300.0 | |
| 82403 A | CRMET18-003, 2 to 106 metres | 600.0 | |
| Total Weight, kg | 1,200.0 | |
| | | | | | |
| 82451 A | 82417 A | Kp 4300 Composite | CRMET18-010, 3 to 84 metres | 139.3 | |
| 82418 A | CRMET18-010, 84 to 108 metres | 158.4 | |
| 82419 A | CRMET18-011, 2 to 75 metres | 114.2 | |
| 82420 A | CRMET18-011, 75 to 126 metres | 313.1 | |
| 82457 A | CRMET18-014, 2 to 160 metres | 475.0 | |
| Total Weight, kg | 1,200.0 | |
| | | | | | |
| 82452 A | 82421 A | Kp 4500/4650 Composite | CRMET18-004, 2 to 129.5 metres | 689.2 | |
| 82422 A | CRMET18-005, 31 to 122 metres | 128.6 | |
| 82423 A | CRMET18-008, 4 to 126 metres | 186.9 | |
| 82424 A | CRMET18-009, 14 to 134 metres | 195.3 | |
| Total Weight, kg | 1,200.0 | |
| | | | | | |
| 82453 A | 82425 A | Ki Composite | CRMET18-005, 4 to 31 metres | 55.7 | |
| 82426 A | CRMET18-006, 2 to 75 metres | 168.4 | |
| 82427 A | CRMET18-007, 26 to 100 metres | 341.0 | |
| 82428 A | CRMET18-012, 3 to 75.5 metres | 328.1 | |
| 82429 A | CRMET18-013, 2 to 70 metres | 306.8 | |
| Total Weight, kg | 1,200.0 | |
| | | | | | |
| 82454 A | 82430 A | TrHi Composite | CRMET18-001, 135 to 212 metres | 423.8 | |
| 82431 A | CRMET18-002, 143 to 162 metres | 115.1 | |
| 82432 A | CRMET18-003, 106 to 117 metres | 64.9 | |
| 82433 A | CRMET18-008, 126 to 142 metres | 93.5 | |
| 82434 A | CRMET18-009, 165 to 170 metres | 28.8 | |
| 82435 A | CRMET18-010, 135 to 149 metres | 474.0 | |
| 82436 A | CRMET18-010, 175 to 250 metres | |
| Total Weight, kg | 1,200.0 | |
| | | | | | |
| 82455 A | 82437 A | TrLo Composite | CRMET18-001, 212 to 245 metres | 129.1 | |
| 82438 A | CRMET18-002, 162 to 255 metres | 333.2 | |
| 82439 A | CRMET18-003, 117 to 127 metres | 35.7 | |
| 82440 A | CRMET18-003, 139 to 160 metres | 82.2 | |
| 82441 A | CRMET18-005, 122 to 162 metres | 149.0 | |
| 82442 A | CRMET18-005, 196 to 227 metres | 115.0 | |
| 82443 A | CRMET18-008, 142 to 180 metres | 137.2 | |
| 82444 A | CRMET18-009, 148 to 165 metres | 61.6 | |
| 82445 A | CRMET18-010, 108 to 120 metres | 50.3 | |
| 82446 A | CRMET18-010, 149 to 175 metres | 106.8 | |
| Total Weight, kg | 1,200.0 | |
| | | | | | |
| 82556 A | 82447 A | TrSx(H) Composite | CRMET18-001, 245 to 279 metres | 195.6 | |
| 82448 A | CRMET18-005, 162 to 196 metres | 176.4 | |
| 82449 A | CRMET18-005, 227 to 237.5 metres | 54.9 | |
| 82550 A | CRMET18-009, 134 to 148 metres | 73.1 | |
| Total Weight, kg | 500.0 | |
Kappes, Cassiday & Associates
June, 2019 | | 13.0 Mineral Processing & Metallurgical Testing
Page 13-36 |
| Camino Rojo Project Feasibility Study NI 43-101 Technical Report |
|
| 13.3.1.1 | Kappes, Cassiday & Associates (2019) – Head Analyses & Physical Characterization |
Material from each composite was assayed for gold and silver content by standard fire assay and wet chemistry methods and results are presented in Table 13-31 along with the expected / target grade based on previous drill results. Gold grades ranged between 0.26 and 1.5 g/t and were generally slightly lower than the expected grades. Silver grades ranged between 6.8 and 27.9 g/t and were typically close to the expected grades with the exception of the Trans-Lo and Trans-Sx composites which were significantly higher than expected.
Composite samples were also assayed by quantitative methods for carbon and sulphur, copper and mercury and lead and zinc which are presented in Table 13-32, Table 13-33 and Table 13-34, respectively. Based on these results, the material does show some organic carbon with higher percentages associated with the transition and sulphide composites. Mercury is present in most of the samples and will require treatment for recovery during operations. Copper concentrations are low and are not expected to present any issues with cyanide leaching. Semi-quantitative multi-element analyses for whole rock constituents were also performed and are presented in Table 13-35 and Table 13-36.
Table 13-31
Head Analyses Gold & Silver – KCA 2019
KCA
Sample
No. | Description | Client
Expected
Grade,
g/t Au | Average
Assay,
g/t Au | Client
Expected
Grade,
g/t Ag | Average
Assay,
g/t Ag |
| 82404 C | Kp 4400 Composite | 0.77 | 0.550 | 14.4 | 12.51 |
| 82451 C | Kp 4300 Composite | 1.07 | 0.820 | 12.4 | 11.69 |
| 82452 C | Kp 4500/4650 Composite | 0.63 | 0.537 | 14.6 | 16.54 |
| 82453 C | Ki Composite | 0.35 | 0.264 | 7.3 | 6.79 |
| 82454 C | TrHi Composite | 0.97 | 0.983 | 25.3 | 30.39 |
| 82455 C | TrLo Composite | 0.85 | 0.749 | 16.2 | 37.90 |
| 82456 C | TrSx(H) Composite | 0.98 | 1.524 | 15.2 | 28.90 |
| Note - The detection limit for silver with FAAS finish is 0.21 g/t. |
| Note - For the purpose of calculation a value of 1/2 the detection limit is utilized for assays less than the detection limit. |
Table 13-32
Head Analyses Carbon & Sulphur – KCA 2019
KCA
Sample
No. | Description | Total
Carbon,
% | Organic
Carbon,
% | Inorganic
Carbon,
% | Total
Sulphur,
% | Sulphide
Sulphur,
% | Sulphate
Sulphur,
% |
| 82404 C | Kp 4400 Composite | 0.85 | 0.03 | 0.81 | 0.07 | 0.02 | 0.05 |
| 82451 C | Kp 4300 Composite | 0.44 | 0.06 | 0.37 | 0.27 | 0.01 | 0.26 |
| 82452 C | Kp 4500/4650 Composite | 0.40 | 0.04 | 0.36 | 0.13 | <0.01 | 0.13 |
| 82453 C | Ki Composite | 1.23 | 0.03 | 1.20 | 0.04 | <0.01 | 0.03 |
| 82454 C | TrHi Composite | 0.33 | 0.13 | 0.20 | 0.67 | 0.35 | 0.33 |
| 82455 C | TrLo Composite | 0.54 | 0.18 | 0.36 | 1.82 | 1.34 | 0.48 |
| 82456 C | TrSx(H) Composite | 0.77 | 0.22 | 0.55 | 5.50 | 4.60 | 0.90 |
Kappes, Cassiday & Associates
June, 2019 | | 13.0 Mineral Processing & Metallurgical Testing
Page 13-37 |
| Camino Rojo Project Feasibility Study NI 43-101 Technical Report |
|
Table 13-33
Head Analyses Mercury & Copper – KCA 2019
KCA
Sample No. | Description | Total Mercury,
mg/kg | Total Copper,
mg/kg | Cyanide Soluble Copper,
mg/kg | Cyanide Soluble Copper,
% |
| 82404 C | Kp 4400 Composite | 0.02 | 97 | 6.91 | 7% |
| 82451 C | Kp 4300 Composite | <0.02 | 114 | 6.41 | 6% |
| 82452 C | Kp 4500/4650 Composite | 0.03 | 88 | 5.92 | 7% |
| 82453 C | Ki Composite | 0.08 | 45 | 1.99 | 4% |
| 82454 C | TrHi Composite | 0.04 | 122 | 67.65 | 55% |
| 82455 C | TrLo Composite | 0.05 | 83 | 64.55 | 78% |
| 82456 C | TrSx(H) Composite | 0.05 | 85 | 57.30 | 67% |
| Note - The cyanide soluble copper is an average of two cyanide shake analyses. | |
Table 13-34
Head Analyses Lead & Zinc – KCA 2019
KCA
Sample No. | Description | Lead,
mg/kg | Zinc,
mg/kg |
| 82404 C | Kp 4400 Composite | 2010 | 2470 |
| 82451 C | Kp 4300 Composite | 4210 | 3140 |
| 82452 C | Kp 4500/4650 Composite | 3630 | 4720 |
| 82453 C | Ki Composite | 1460 | 1980 |
| 82454 C | TrHi Composite | 2480 | 6250 |
| 82455 C | TrLo Composite | 2100 | 5950 |
| 82456 C | TrSx(H) Composite | 2060 | 8030 |
Kappes, Cassiday & Associates
June, 2019 | | 13.0 Mineral Processing & Metallurgical Testing
Page 13-38 |
| Camino Rojo Project Feasibility Study NI 43-101 Technical Report |
|
Table 13-35
Head Analyses Multi-Element Analysis – KCA 2019
| Constituent | Unit | Kp 4400 Composite
82404 C | Kp 4300 Composite
82451 C | Kp 4500/4650 Composite
82452 C | Ki Composite
82453 C | TrHi Composite
82454 C | TrLo Composite
82455 C | TrSx(H) Composite
82456 C |
| Al | % | 7.31 | 7.16 | 7.05 | 6.40 | 7.09 | 6.69 | 6.31 |
| As | mg/kg | 660 | 811 | 547 | 523 | 630 | 503 | 585 |
| Ba | mg/kg | 7.81 | 1040 | 1060 | 497 | 1220 | 1190 | 1130 |
| Bi | mg/kg | 27 | 11 | 3 | 3 | 8 | 5 | 12 |
| C(total) | % | 0.85 | 0.44 | 0.40 | 1.23 | 0.33 | 0.54 | 0.77 |
| C(organic) | % | 0.03 | 0.06 | 0.04 | 0.03 | 0.13 | 0.18 | 0.22 |
| C(inorganic) | % | 0.81 | 0.37 | 0.36 | 1.20 | 0.20 | 0.36 | 0.55 |
| Ca | % | 2.87 | 1.44 | 1.37 | 3.97 | 1.14 | 1.59 | 1.91 |
| Cd | mg/kg | 35 | 36 | 37 | 37 | 75 | 91 | 96 |
| Co | mg/kg | 18 | 16 | 14 | 14 | 11 | 11 | 17 |
| Cr | mg/kg | 68 | 76 | 77 | 64 | 79 | 75 | 80 |
| Cu(total) | mg/kg | 97 | 114 | 88 | 45 | 122 | 83 | 85 |
| Cu(cyanide soluble) | mg/kg | 6.91 | 6.41 | 5.92 | 1.99 | 67.65 | 64.55 | 57.30 |
| Fe | % | 4.91 | 5.69 | 4.96 | 3.54 | 5.82 | 4.70 | 6.09 |
| Hg | mg/kg | 0.02 | <0.02 | 0.03 | 0.08 | 0.04 | 0.05 | 0.05 |
| K | % | 4.61 | 6.19 | 5.88 | 2.99 | 7.20 | 6.75 | 7.14 |
| Mg | % | 0.83 | 0.65 | 0.63 | 1.15 | 0.41 | 0.37 | 0.59 |
| Mn | mg/kg | 1130 | 775 | 958 | 836 | 223 | 362 | 511 |
| Mo | mg/kg | 2 | 4 | <1 | <1 | <1 | <1 | <1 |
| Na | % | 0.33 | 0.44 | 0.21 | 0.64 | 0.20 | 0.19 | 0.16 |
| Ni | mg/kg | 53 | 47 | 53 | 53 | 40 | 37 | 46 |
| Pb | mg/kg | 2010 | 4210 | 3630 | 1460 | 2480 | 2100 | 2060 |
| S(total) | % | 0.07 | 0.27 | 0.13 | 0.04 | 0.67 | 1.82 | 5.50 |
| S(sulphide) | % | 0.02 | 0.01 | <0.01 | <0.01 | 0.35 | 1.34 | 4.60 |
| S(sulphate) | % | 0.05 | 0.26 | 0.13 | 0.03 | 0.33 | 0.48 | 0.90 |
| Sb | mg/kg | 30 | 37 | 24 | 13 | 22 | 16 | 11 |
| Se | mg/kg | 12 | 13 | 13 | 11 | 48 | 39 | 29 |
| Sr | mg/kg | 184 | 271 | 208 | 151 | 190 | 212 | 197 |
| Te | mg/kg | 14 | 18 | 11 | 8 | 17 | 15 | 21 |
| Ti | % | 0.32 | 0.21 | 0.20 | 0.29 | 0.21 | 0.21 | 0.19 |
| V | mg/kg | 177 | 173 | 182 | 175 | 150 | 133 | 130 |
| W | mg/kg | 33 | 39 | 54 | 23 | 69 | 68 | 100 |
| Zn | mg/kg | 2470 | 3140 | 4720 | 1980 | 6250 | 5950 | 8030 |
Kappes, Cassiday & Associates
June, 2019 | | 13.0 Mineral Processing & Metallurgical Testing
Page 13-39 |
| Camino Rojo Project Feasibility Study NI 43-101 Technical Report |
|
Table 13-36
Head Analyses Whole Rock Analysis – KCA 2019
| Constituent | Unit | Kp 4400 Composite
82404 C | Kp 4300 Composite
82451 C | Kp 4500/4650 Composite
82452 C | Ki Composite
82453 C | TrHi Composite
82454 C |
| SiO2 | % | 59.5 | | 58.4 | | 61.68 | | 58.35 | | 60.0 | |
| Si | % | | 27.82 | | 27.30 | | 28.84 | | 27.28 | | 28.05 |
| Al2O3 | % | 14.3 | | 14.7 | | 13.82 | | 13.83 | | 14.4 | |
| Al | % | | 7.57 | | 7.78 | | 7.32 | | 7.32 | | 7.62 |
| Fe2O3 | % | 6.92 | | 7.65 | | 7.06 | | 5.17 | | 9.20 | |
| Fe | % | | 4.84 | | 5.35 | | 4.94 | | 3.62 | | 6.43 |
| CaO | % | 3.98 | | 1.95 | | 2.07 | | 6.03 | | 1.73 | |
| Ca | % | | 2.84 | | 1.39 | | 1.48 | | 4.31 | | 1.24 |
| MgO | % | 1.48 | | 1.12 | | 1.04 | | 2.09 | | 0.91 | |
| Mg | % | | 0.89 | | 0.68 | | 0.63 | | 1.26 | | 0.55 |
| Na2O | % | 0.39 | | 0.34 | | 0.32 | | 0.97 | | 0.30 | |
| Na | % | | 0.29 | | 0.25 | | 0.24 | | 0.72 | | 0.22 |
| K2O | % | 5.72 | | 8.08 | | 7.37 | | 4.02 | | 7.85 | |
| K | % | | 4.75 | | 6.71 | | 6.12 | | 3.34 | | 6.51 |
| TiO2 | % | 0.71 | | 0.76 | | 0.74 | | 0.65 | | 0.73 | |
| Ti | % | | 0.43 | | 0.46 | | 0.44 | | 0.39 | | 0.44 |
| MnO | % | 0.15 | | 0.11 | | 0.12 | | 0.11 | | 0.03 | |
| Mn | % | | 0.12 | | 0.09 | | 0.09 | | 0.09 | | 0.02 |
| SrO | % | 0.01 | | 0.02 | | 0.01 | | 0.01 | | 0.01 | |
| Sr | % | | 0.01 | | 0.02 | | 0.01 | | 0.01 | | 0.01 |
| BaO | % | 0.08 | | 0.12 | | 0.11 | | 0.05 | | 0.14 | |
| Ba | % | | 0.07 | | 0.11 | | 0.10 | | 0.04 | | 0.13 |
| Cr2O3 | % | 0.01 | | 0.01 | | 0.01 | | 0.01 | | 0.01 | |
| Cr | % | | 0.01 | | 0.01 | | 0.01 | | 0.01 | | 0.01 |
| P2O5 | % | 0.17 | | 0.21 | | 0.14 | | 0.16 | | 0.19 | |
| P | % | | 0.07 | | 0.09 | | 0.06 | | 0.07 | | 0.08 |
| LOI1090°C | % | 6.13 | | 5.04 | | 4.69 | | 8.14 | | 4.55 | |
| SUM | % | 99.55 | | 98.51 | | 99.18 | | 99.59 | | 100.05 | |
Note: The SUM is the total of the oxide constituents and the loss on ignition.
Note - For the purpose of calculation a value of 1/2 the detection limit is utilized for assays less than the detection limit.
Cyanide shakes tests were conducted to evaluate preg-robbing tendencies in the different material composites. Direct and spiked cyanide shake tests were performed with preg-robbing tendencies being determined by comparing the spiked shake test extraction and the direct shake test extractions to determine a % preg-rob.
Typically, % preg-robbing greater than 10% indicates preg-robbing tendencies. The results indicate no preg-robbing tendencies for the oxide composites with observed moderate preg-robbing tendencies with all of the transition and sulphide samples. The preg-robbing results show a general trend of increased preg robbing tendencies with increased organic carbon content.
A portion of each of the composites were submitted to Hazen Research in Golden, Colorado for comminution testing. Comminution test results are presented in Table 13-37.
Kappes, Cassiday & Associates
June, 2019 | | 13.0 Mineral Processing & Metallurgical Testing
Page 13-40 |
| Camino Rojo Project Feasibility Study NI 43-101 Technical Report |
|
Table 13-37
Phisical Characterization Test Work Summary – KCA 2019
KCA
Sample No. | Client
I.D. | Crusher Work Index | Abrasion Index | |
| kWh/short ton | kWh/metric
tonne | Ai, g | |
| |
| 82405 A | Kp 4400 | 10.8 | 11.9 | 0.0286 | |
| 82458 A | Ki | 10.4 | 11.5 | 0.0262 | |
| 82459 A | TriHi | 10.5 | 11.6 | 0.1764 | |
| 82460 A | TriLo | 10.1 | 11.2 | 0.2286 | |
| 82461 A | TrSx(H) | 10.6 | 11.7 | 0.2164 | |
The results indicate average hardness with low to moderate abrasion.
| 13.3.1.2 | Kappes, Cassiday & Associates (2019) – Bottle Roll Leach Tests |
Bottle roll leach testing was conducted on material from each composite (Kp 4400 Composite, Kp 4300 Composite, Kp 4500/4650 Composite, Ki Composite, TrHi Composite, TrLo Composite and TrSx(H) Composite). A 1,000-gram portion of head material was pulverized to a target of 100% passing 0.15mm. Results from the bottle roll tests are presented in Table 13-38 and Table 13-39 for gold and silver, respectively.
Table 13-38
Bottle Roll Leach Test Summary, Gold – KCA 2019
KCA
Sample
No. | Description | Target
P80
Size,
mm | Calculated
Head,
g/t Au | Extracted,
g/t Au | Avg.
Tails,
g/t
Au | Au
Extracted,
% | Leach
Time,
hours | Consumption
NaCN,
kg/t | Addition
Ca(OH)2,
kg/t |
| 82404 C | Kp 4400 Composite | 0.075 | 0.569 | 0.494 | 0.075 | 87% | 96 | 0.09 | 2.00 |
| 82451 C | Kp 4300 Composite | 0.075 | 1.020 | 0.933 | 0.087 | 92% | 96 | 0.33 | 1.75 |
| 82452 C | Kp 4500/4650 Composite | 0.075 | 0.494 | 0.409 | 0.086 | 83% | 96 | 0.33 | 1.75 |
| 82453 C | Ki Composite | 0.075 | 0.170 | 0.124 | 0.046 | 73% | 96 | 0.19 | 1.75 |
| 82454 C | TrHi Composite | 0.075 | 0.976 | 0.751 | 0.225 | 77% | 96 | 0.81 | 1.75 |
| 82454 C | TrHi Composite | 0.075 | 0.878 | 0.647 | 0.231 | 74% | 96 | 0.64 | 1.25 |
| | Average: | | 0.927 | 0.699 | 0.228 | 76% | | | |
| 82455 C | TrLo Composite | 0.075 | 0.683 | 0.161 | 0.523 | 23% | 96 | 0.75 | 1.50 |
| 82456 C | TrSx(H) Composite | 0.075 | 2.337 | 1.138 | 1.198 | 49% | 96 | 1.34 | 1.50 |
| 82456 C | TrSx(H) Composite | 0.075 | 3.742 | 2.216 | 1.526 | 59% | 96 | 1.99 | 1.00 |
| | Average: | | 3.039 | 1.677 | 1.362 | 54% | | | |
Kappes, Cassiday & Associates June, 2019 | | 13.0 Mineral Processing & Metallurgical Testing Page 13-41 |
| Camino Rojo Project Feasibility Study NI 43-101 Technical Report |
|
Table 13-39
Bottle Roll Leach Test Summary, Silver – KCA 2019
KCA
Sample
No. | Description | Target
P80
Size,
mm | Calculated
Head,
g/t Ag | Extracted,
g/t Ag | Avg.
Tails,
g/t
Ag | Ag
Extracted,
% | Leach
Time,
hours | Consumption
NaCN,
kg/t | Addition
Ca(OH)2,
kg/t |
| 82404 C | Kp 4400 Composite | 0.075 | 12.80 | 6.49 | 6.31 | 51% | 96 | 0.09 | 2.00 |
| 82451 C | Kp 4300 Composite | 0.075 | 12.21 | 6.05 | 6.15 | 50% | 96 | 0.33 | 1.75 |
| 82452 C | Kp 4500/4650 Composite | 0.075 | 17.30 | 8.09 | 9.21 | 47% | 96 | 0.33 | 1.75 |
| 82453 C | Ki Composite | 0.075 | 6.67 | 1.57 | 5.11 | 23% | 96 | 0.19 | 1.75 |
| 82454 C | TrHi Composite | 0.075 | 29.53 | 22.02 | 7.51 | 75% | 96 | 0.81 | 1.75 |
| 82454 C | TrHi Composite | 0.075 | 31.50 | 23.79 | 7.71 | 76% | 96 | 0.64 | 1.25 |
| | Average: | | 30.52 | 22.91 | 7.61 | 75% | | | |
| 82455 C | TrLo Composite | 0.075 | 36.34 | 15.44 | 20.90 | 42% | 96 | 0.75 | 1.50 |
| 82456 C | TrSx(H) Composite | 0.075 | 29.74 | 20.78 | 8.96 | 70% | 96 | 1.34 | 1.50 |
| 82456 C | TrSx(H) Composite | 0.075 | 36.22 | 32.31 | 3.91 | 89% | 96 | 1.99 | 1.00 |
| | Average: | | 32.98 | 26.55 | 6.43 | 80% | | | |
For the pulverized composite material, gold extractions ranged from 23% to 92% based on calculated heads and silver extractions ranged between 23% and 89%. The results indicate that the oxide composites are amenable to cyanide leaching. Transition material recoveries for gold were lower compared to the oxide.
| 13.3.1.3 | Kappes, Cassiday & Associates (2019) – Agglomeration Test Work |
Preliminary agglomeration test work and compacted permeability test work were conducted on portions of each composite. Agglomeration tests were conducted utilizing portions of the material at a crushed size of 100% passing 12.5 millimetres and agglomerated with 0, 2, 4 and 8 kilograms of cement per tonne of material. Based on KCA’s criteria, all samples passed up to an effective heap height of 90m and cement agglomeration would not be required for material crushed to 12.5mm or coarser.
| 13.3.1.4 | Kappes, Cassiday & Associates (2019) – Column Leach Test Work |
Column leach tests were conducted utilizing material crushed to 100% passing 150, 50 and 12.5mm for each composite (Kp 4400 Composite, Kp 4300 Composite, Kp 4500/4650 Composite, Ki Composite, TrHi Composite and TrLo Composite) and 50mm for the TrSx(H) Composite. During testing, the material was leached for 82, 85, 95 and 114 days with a sodium cyanide solution.
The column leach test results are presented in Table 13-40 and Table 13-41 for gold and silver, respectively.
Kappes, Cassiday & Associates June, 2019 | | 13.0 Mineral Processing & Metallurgical Testing Page 13-42 |
| Camino Rojo Project Feasibility Study NI 43-101 Technical Report |
|
Results indicate gold recoveries for the Kp oxide material ranging between 44% and 82% with results for the Kp 4500/4650 being generally lower than the other Kp oxide results and silver recoveries being between 3 to 24%. Ki gold recoveries were lower and ranged from 47 to 64% with silver extractions between 1 to 5 %. Metal extractions for TrHi ranged between 44 to 64% gold and 5 to 49 % for silver. TrLo metal recoveries ranged between 30 to 41% for gold and 10 to 58 % for silver. Gold recoveries for the TrSx(H) Composite were low at 33%, indicating that the sulphide material is not amenable to direct leaching and supports the mine modelling treating all Tr(Sx) as waste.
In general, recoveries improved with finer crushing with silver recoveries being more sensitive to crush size than gold. Recovery improvements were more significant for 150mm to 50mm than 50mm to 12.5mm. Tests indicate there is not a strong correlation between head grade and metal recovery for gold; however, silver recoveries appear to improve with higher head grades.
After completion of leaching, columns were allowed to drain for 168 hours. After draining, select columns at the 50mm crush size were utilized for water rinsing or chemical neutralization using the INCO SO2 method. Results are presented in Figure 13-6 for water rinsing and Figure 13-7 for chemical neutralization.
Kappes, Cassiday & Associates June, 2019 | | 13.0 Mineral Processing & Metallurgical Testing Page 13-43 |
| Camino Rojo Project Feasibility Study NI 43-101 Technical Report |
|
Table 13-40
Column Leach Tests Results Summary, Gold – KCA 2019
KCA
Sample
No. | Description | Crush
Size,
mm | Calculated
Head,
g Au/MT | Extracted,
g Au/MT | Weighted
Avg. Tail
Screen,
g Au/MT | Extracted,
% Au | Days of
Leach | Days of
Wash/Detox | Consumption
NaCN,
kg/t | Addition
Hydrated
Lime,
kg/t | Addition
Cement,
kg/t |
| 82404 A | Kp 4400 Composite | 150 | 0.538 | 0.357 | 0.181 | 66% | 114 | -- | 0.98 | 1.51 | 0.00 |
| 82404 B | Kp 4400 Composite | 50 | 0.583 | 0.427 | 0.156 | 73% | 114 | 31w | 0.82 | 2.00 | 0.00 |
| 82404 C | Kp 4400 Composite | 12.5 | 0.619 | 0.497 | 0.122 | 80% | 114 | -- | 0.99 | 2.37 | 0.00 |
| Avg. | | | 0.580 | | | | | | | | |
| Std. Dev. | | | 0.041 | | | | | | | | |
| RSD, % | | | 7% | | | | | | | | |
| | | | | | | | | | | | |
| 82451 A | Kp 4300 Composite | 150 | 1.003 | 0.687 | 0.316 | 69% | 82 | -- | 0.38 | 1.80 | 0.00 |
| 82451 B | Kp 4300 Composite | 50 | 0.877 | 0.711 | 0.166 | 81% | 95 | 21d | 1.09 | 1.76 | 0.00 |
| 82451 C | Kp 4300 Composite | 12.5 | 0.849 | 0.694 | 0.155 | 82% | 85 | -- | 0.97 | 1.77 | 0.00 |
| Avg. | | | 0.910 | | | | | | | | |
| Std. Dev. | | | 0.082 | | | | | | | | |
| RSD, % | | | 9% | | | | | | | | |
| | | | | | | | | | | | |
| 82452 A | Kp 4500/4650 Composite | 150 | 0.547 | 0.241 | 0.306 | 44% | 82 | -- | 0.39 | 1.68 | 0.00 |
| 82452 B | Kp 4500/4650 Composite | 50 | 0.526 | 0.310 | 0.216 | 59% | 95 | -- | 0.79 | 1.76 | 0.00 |
| 82452 C | Kp 4500/4650 Composite | 12.5 | 0.542 | 0.371 | 0.171 | 68% | 85 | -- | 0.97 | 1.76 | 0.00 |
| Avg. | | | 0.538 | | | | | | | | |
| Std. Dev. | | | 0.011 | | | | | | | | |
| RSD, % | | | 2% | | | | | | | | |
| | | | | | | | | | | | |
| 82453 A | Ki Composite | 150 | 0.333 | 0.155 | 0.178 | 47% | 82 | -- | 0.50 | 1.73 | 0.00 |
| 82453 B | Ki Composite | 50 | 0.306 | 0.189 | 0.117 | 62% | 95 | 21w | 0.77 | 1.77 | 0.00 |
| 82453 C | Ki Composite | 12.5 | 0.279 | 0.178 | 0.101 | 64% | 85 | -- | 0.95 | 1.77 | 0.00 |
| Avg. | | | 0.306 | | | | | | | | |
| Std. Dev. | | | 0.027 | | | | | | | | |
| RSD, % | | | 9% | | | | | | | | |
| | | | | | | | | | | | |
| 82454 A | TrHi Composite | 150 | 0.881 | 0.385 | 0.496 | 44% | 82 | -- | 0.32 | 1.72 | 0.00 |
| 82454 B | TrHi Composite | 50 | 1.225 | 0.565 | 0.660 | 46% | 95 | 39d | 0.61 | 1.63 | 0.00 |
| 82454 C | TrHi Composite | 12.5 | 1.042 | 0.662 | 0.380 | 64% | 85 | -- | 0.75 | 1.77 | 0.00 |
| Avg. | | | 1.049 | | | | | | | | |
| Std. Dev. | | | 0.172 | | | | | | | | |
| RSD, % | | | 16% | | | | | | | | |
| | | | | | | | | | | | |
| 82455 A | TrLo Composite | 150 | 0.843 | 0.257 | 0.586 | 30% | 82 | -- | 0.39 | 1.72 | 0.00 |
| 82455 B | TrLo Composite | 50 | 0.856 | 0.347 | 0.509 | 41% | 95 | 25d | 0.88 | 1.63 | 0.00 |
| 82455 C | TrLo Composite | 12.5 | 0.749 | 0.304 | 0.445 | 41% | 85 | -- | 0.95 | 1.52 | 0.00 |
| Avg. | | | 0.816 | | | | | | | | |
| Std. Dev. | | | 0.058 | | | | | | | | |
| RSD, % | | | 7% | | | | | | | | |
| | | | | | | | | | | | |
| 82456 A | TrSx(H) Composite | 50 | 1.277 | 0.423 | 0.854 | 33% | 95 | 21w | 0.48 | 1.78 | 0.00 |
Kappes, Cassiday & Associates June, 2019 | | 13.0 Mineral Processing & Metallurgical Testing Page 13-44 |
| Camino Rojo Project Feasibility Study NI 43-101 Technical Report |
|
Table 13-41
Column Leach Tests Results Summary, Silver – KCA 2019
KCA
Sample
No. | Description | Crush
Size,
mm | Calculated
Head,
g/t Ag | Extracted,
g/t Ag | Weighted
Avg. Tail
Screen,
g/t Ag | Extracted,
% Ag | Days of
Leach | Days of
Wash/Deto
x | Consumption
NaCN,
kg/t | Addition
Hydrated
Lime,
kg/t | Addition
Cement,
kg/t |
| 82404 A | Kp 4400 Composite | 150 | 9.44 | 0.47 | 8.97 | 5% | 114 | -- | 0.98 | 1.51 | 0.00 |
| 82404 B | Kp 4400 Composite | 50 | 10.75 | 1.00 | 9.75 | 9% | 114 | 31w | 0.82 | 2.00 | 0.00 |
| 82404 C | Kp 4400 Composite | 12.5 | 11.58 | 2.16 | 9.42 | 19% | 114 | -- | 0.99 | 2.37 | 0.00 |
| Avg. | | | 10.59 | | | | | | | | |
| Std. Dev. | | | 1.08 | | | | | | | | |
| RSD, % | | | 10% | | | | | | | | |
| | | | | | | | | | | | |
| 82451 A | Kp 4300 Composite | 150 | 10.31 | 0.35 | 9.96 | 3% | 82 | -- | 0.38 | 1.80 | 0.00 |
| 82451 B | Kp 4300 Composite | 50 | 11.62 | 0.67 | 10.95 | 6% | 95 | 21d | 1.09 | 1.76 | 0.00 |
| 82451 C | Kp 4300 Composite | 12.5 | 9.32 | 1.24 | 8.08 | 13% | 85 | -- | 0.97 | 1.77 | 0.00 |
| Avg. | | | 10.42 | | | | | | | | |
| Std. Dev. | | | 1.15 | | | | | | | | |
| RSD, % | | | 11% | | | | | | | | |
| | | | | | | | | | | | |
| 82452 A | Kp 4500/4650 Composite | 150 | 15.32 | 0.70 | 14.62 | 5% | 82 | -- | 0.39 | 1.68 | 0.00 |
| 82452 B | Kp 4500/4650 Composite | 50 | 16.50 | 1.31 | 15.19 | 8% | 95 | -- | 0.79 | 1.76 | 0.00 |
| 82452 C | Kp 4500/4650 Composite | 12.5 | 16.86 | 4.09 | 12.77 | 24% | 85 | -- | 0.97 | 1.76 | 0.00 |
| Avg. | | | 16.23 | | | | | | | | |
| Std. Dev. | | | 0.81 | | | | | | | | |
| RSD, % | | | 5% | | | | | | | | |
| | | | | | | | | | | | |
| 82453 A | Ki Composite | 150 | 5.06 | 0.07 | 4.99 | 1% | 82 | -- | 0.50 | 1.73 | 0.00 |
| 82453 B | Ki Composite | 50 | 7.17 | 0.28 | 6.89 | 4% | 95 | 21w | 0.77 | 1.77 | 0.00 |
| 82453 C | Ki Composite | 12.5 | 6.52 | 0.33 | 6.19 | 5% | 85 | -- | 0.95 | 1.77 | 0.00 |
| Avg. | | | 6.25 | | | | | | | | |
| Std. Dev. | | | 1.08 | | | | | | | | |
| RSD, % | | | 17% | | | | | | | | |
| | | | | | | | | | | | |
| 82454 A | TrHi Composite | 150 | 27.79 | 1.36 | 26.31 | 5% | 82 | -- | 0.32 | 1.72 | 0.00 |
| 82454 B | TrHi Composite | 50 | 29.71 | 4.69 | 25.02 | 16% | 95 | 39d | 0.61 | 1.63 | 0.00 |
| 82454 C | TrHi Composite | 12.5 | 23.36 | 11.35 | 12.01 | 49% | 85 | -- | 0.75 | 1.77 | 0.00 |
| Avg. | | | 26.95 | | | | | | | | |
| Std. Dev. | | | 3.26 | | | | | | | | |
| RSD, % | | | 12% | | | | | | | | |
| | | | | | | | | | | | |
| 82455 A | TrLo Composite | 150 | 18.92 | 1.95 | 16.97 | 10% | 82 | -- | 0.39 | 1.72 | 0.00 |
| 82455 B | TrLo Composite | 50 | 16.67 | 4.63 | 12.04 | 28% | 95 | 25d | 0.88 | 1.63 | 0.00 |
| 82455 C | TrLo Composite | 12.5 | 16.12 | 9.38 | 6.74 | 58% | 85 | -- | 0.95 | 1.52 | 0.00 |
| Avg. | | | 17.24 | | | | | | | | |
| Std. Dev. | | | 1.48 | | | | | | | | |
| RSD, % | | | 9% | | | | | | | | |
| | | | | | | | | | | | |
| 82456 A | TrSx(H) Composite | 50 | 20.67 | 6.43 | 14.24 | 31% | 95 | 21w | 0.48 | 1.78 | 0.00 |
Kappes, Cassiday & Associates June, 2019 | | 13.0 Mineral Processing & Metallurgical Testing Page 13-45 |
| Camino Rojo Project Feasibility Study NI 43-101 Technical Report |
|
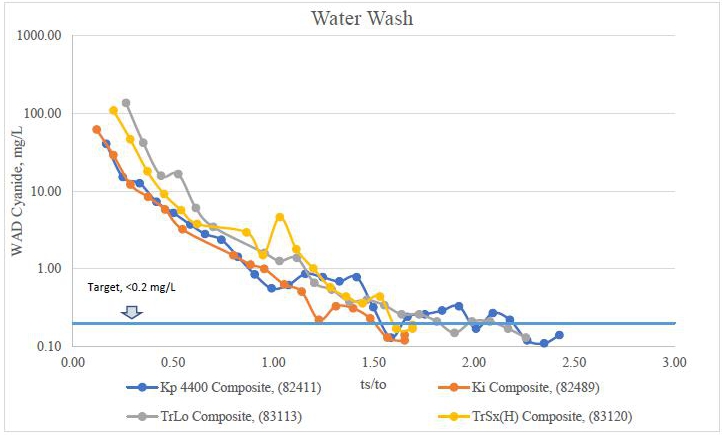
Figure 13-6 Water Wash Summary
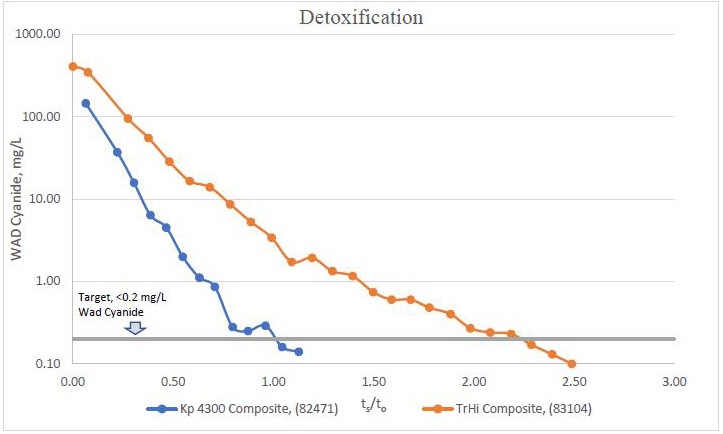
Figure 13-7 Detoxification Summary, INCO SO2
Kappes, Cassiday & Associates June, 2019 | | 13.0 Mineral Processing & Metallurgical Testing Page 13-46 |
| Camino Rojo Project Feasibility Study NI 43-101 Technical Report |
|
| 13.3.1.5 | Kappes, Cassiday & Associates (2019) – Diagnostic Leach Test Work |
Diagnostic leach testing was utilized to determine the metal association within the column tailings material for composites Kp 4500/4650 and Ki by leaching the material in five (5) sequential stages with various pre-treatments. A 1,000-gram portion of the column tailings material was pulverized to a target size of 80% passing 0.075 millimetres and utilized for the initial agitated leaching stage. For each additional sequential stage, the entire tails residue was utilized.
The results of the diagnostic leach testing for gold and silver extraction are summarized in Table 13-42. A chart summarizing the extractions from the individual phases of leaching is presented in Figure 13-8.
Table 13-42
Diagnostic Leach Test Summary – KCA 2019
| Kp 4500/4650 Composite - Column Tail Assay 0.171 g/t Au |
KCA
Sample
No. | KCA
Test No. | Metal Association | Calculated
Head,
g/t Au | Au
Extracted,
% | Cumulative
Extracted,
% |
| 82483 | 83183 A | Direct Cyanide Soluble Gold | 0.179 | 63% | 63% |
| | 83184 A, C | Calcite | 0.067 | 4% | 66% |
| | 83185 A, C | Dolomite and Iron Oxide | 0.060 | 11% | 78% |
| | 83186 A, C | Pyrites and Sulphides | 0.040 | 2% | 80% |
| | 83187 A | Carbonaceous | 0.036 | 0% | 80% |
| | -- | Encapsulated Gold | -- | 20% | 100% |
| | Overall | -- | 0.179 | 100% | -- |
| | | | | | |
| Ki Composite - Column Tail Assay 0.101 g/t Au | | | |
KCA
Sample
No. | KCA
Test No. | Metal Association | Calculated
Head,
g/t Au | Au
Extracted,
% | Cumulative
Extracted,
% |
| 82492 | 83183 B | Direct Cyanide Soluble Gold | 0.131 | 54% | 54% |
| | 83184 B, D | Calcite | 0.060 | 10% | 64% |
| | 83185 B, D | Dolomite and Iron Oxide | 0.047 | 20% | 86% |
| | 83186 B, D | Pyrites and Sulphides | 0.021 | 2% | 88% |
| | 83187 B | Carbonaceous | 0.019 | 0% | 88% |
| | -- | Encapsulated Gold | -- | 15% | 100% |
| | Overall | -- | 0.131 | 100% | -- |
Kappes, Cassiday & Associates June, 2019 | | 13.0 Mineral Processing & Metallurgical Testing Page 13-47 |
| Camino Rojo Project Feasibility Study NI 43-101 Technical Report |
|
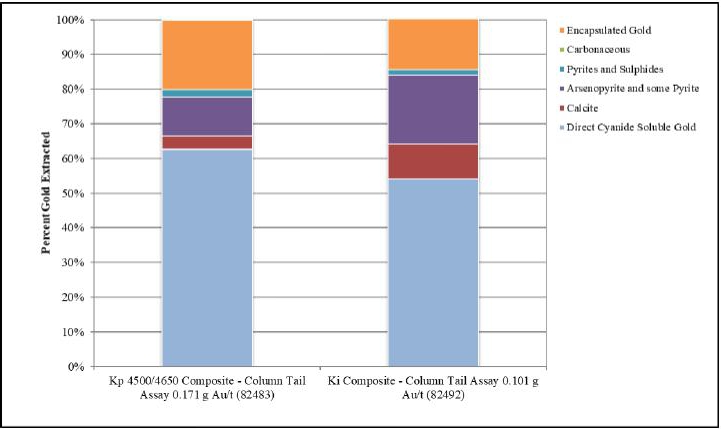
Figure 13-8 Diagnostic Leach Results Summary – KCA 2019
The diagnostic leaching indicates that the majority of the reduced recovery is associated with encapsulation of the metals and none associated with carbonaceous material.
| 13.4 | Conclusions from Metallurgical Programs |
Based on the metallurgical tests completed on the Project, key design parameters for the Project include:
| · | Crush size of 100% passing 38mm (P80 28mm). |
| · | Estimated gold recoveries (including 2% field deduction) of: |
| · | Estimated silver recoveries (including 3% field deduction) of: |
| · | Design leach cycle of 80 days. |
Kappes, Cassiday & Associates June, 2019 | | 13.0 Mineral Processing & Metallurgical Testing Page 13-48 |
| Camino Rojo Project Feasibility Study NI 43-101 Technical Report |
|
| · | Agglomeration with cement not required for permeability or stability. |
| · | Average cyanide consumption of 0.35 kg/t ore. |
| · | Average lime consumption of 1.25 kg/t ore. |
The key design parameters are based on a substantial number of metallurgical tests including 107 column leach tests with 85 of the columns being performed on samples representative of domains in the current deposit model. These 85 representative samples from documented drill holes with good spatial distribution in the proposed pit include 41 columns tests on Kp Oxide material, 7 column tests on Ki Oxide material, 16 column tests on Trans-Hi material and 21 column tests on Trans-Lo material. The 22 non-representative columns were excluded based on the following criteria:
| · | Column on Trans-S or sulphide material which is not considered in the Mineral Reserve. |
| · | Mix of Tran-S or other material types. |
| · | Samples taken from outside of the proposed pit area. |
An additional 54 bottle roll leach tests with direct correlations with the column tests have been included as part of the evaluation to support these results and conclusions, which are detailed in the following sections.
In general, the Camino Rojo deposit shows variability in gold and silver recoveries based on material type and geological domain with preg-robbing organic carbon being the only significant deleterious element identified, which is primarily associated with the transition material at depth along the outer edges of the deposit. Recoveries for the oxide material are good and will yield acceptable results using conventional heap leaching methods with cyanide. Recoveries for the transition material are lower compared with the oxide material for conventional leaching with some areas of transition showing reasonably high recoveries. Reagent consumptions for all material types are reasonably low.
Preg robbing presents a low to moderate risk to the overall Project; however, a significant investigation by Orla into the preg robbing material as well as preg-robbing test work completed by KCA indicates that preg robbing material will most likely not be encountered until later in the Project life and can be mitigated by proper ore control.
Kappes, Cassiday & Associates June, 2019 | | 13.0 Mineral Processing & Metallurgical Testing Page 13-49 |
| Camino Rojo Project Feasibility Study NI 43-101 Technical Report |
|
| 13.4.1 | Crush Size and Recovery |
The column leach recovery by crush size was analysed to determine the effect of crush size on recovery for each material type. Column tests were conducted on crushed product sizes ranging from a P80 of 7mm to a P80 of nearly 118mm (P80 sizes were estimated for the SGS data set). These data were aggregated and plotted against recoveries for both gold and silver for each material classification type. Trend lines were then used to establish projected recoveries. Crushed product size vs. recovery results are presented in Figure 13-9 through Figure 13-12 for Kp Oxide, Ki Oxide, Trans-Hi and Trans-Lo material types, respectively.
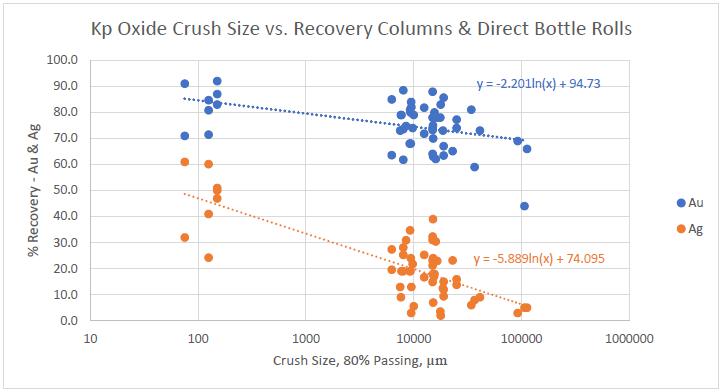
Figure 13-9 Kp Oxide Recovery vs. Crush Size
Kappes, Cassiday & Associates June, 2019 | | 13.0 Mineral Processing & Metallurgical Testing Page 13-50 |
| Camino Rojo Project Feasibility Study NI 43-101 Technical Report |
|
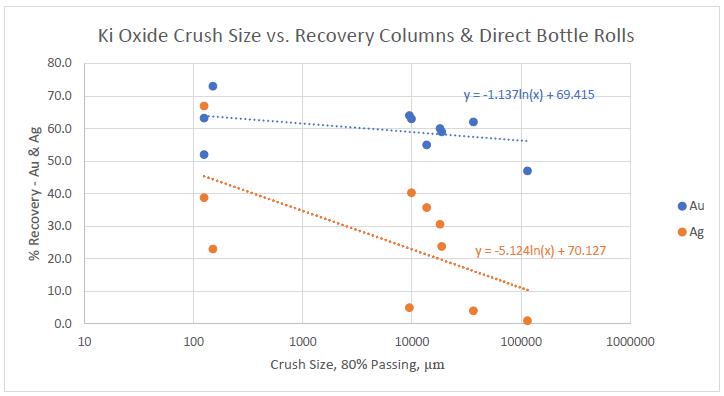
Figure 13-10 Ki Oxide Recovery vs. Crush Size

Figure 13-11 Trans-Hi Recovery vs. Crush Size
Kappes, Cassiday & Associates June, 2019 | | 13.0 Mineral Processing & Metallurgical Testing Page 13-51 |
| Camino Rojo Project Feasibility Study NI 43-101 Technical Report |
|
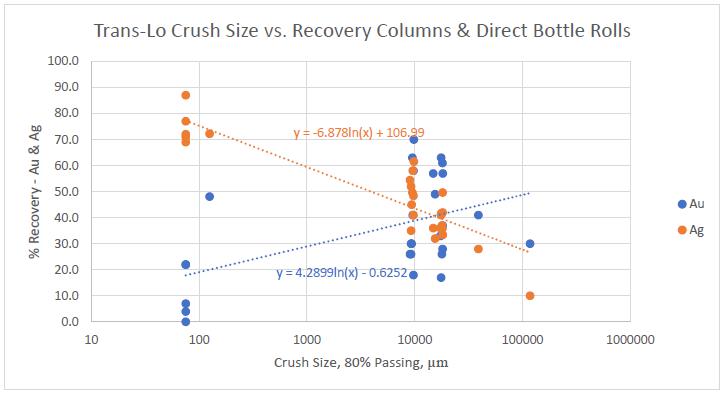
Figure 13-12 Trans-Lo Recovery vs. Crush Size
Results from the test work generally show improved recoveries with finer crushing with decreasing recovery improvements for gold at crush sizes finer that P80 25mm. Silver recoveries were significantly more sensitive to crush size than gold recoveries.
Based on the metallurgical test data, KCA recommends a crushed product size of 100% passing 38mm (P80 ~28mm) in order to minimize crushing requirements and recover most of the recoverable gold and silver. Estimated recoveries by material type at P80 28mm, including a 2% field deduction for gold and 3% field deduction for silver, are presented in Table 13-43.
Table 13-43
Estimated Recoveries by Material Type for P80 28mm Crush Size
| Material Type | Au | Ag |
| Kp Oxide | 70% | 11% |
| Ki Oxide | 56% | 15% |
| Transition-hi | 60% | 27% |
| Transition-lo | 40% | 34% |
Kappes, Cassiday & Associates June, 2019 | | 13.0 Mineral Processing & Metallurgical Testing Page 13-52 |
| Camino Rojo Project Feasibility Study NI 43-101 Technical Report |
|
The Camino Rojo leach cycle has been estimated based on the column test work completed by evaluating the leach curves for gold and silver. The leach cycle considers tonnes of solution per tonne of material as well as total time required to reach the ultimate recovery in the column leach tests. Based on this data, the estimated leach cycle for the Camino Rojo material is 80 days. The expected tonnes of solutions per tonne of ore after the 80-day leach cycle is approximately 1.32. The recommended leach cycle is primarily based on the time required to leach and recover gold. The column tests indicate that silver leaches slower and increased silver recoveries would be expected with longer leach cycles.
| 13.4.3 | Reagent Consumption Projection |
The column leach test cyanide consumptions were studied by material type and adjusted to provide a basis for the expected field cyanide consumptions. In KCA’s experience, field cyanide consumptions are typically 25% to 50% of observed lab consumptions and have been estimated at 35% of the lab consumptions for the FS. The projected field consumptions by material type are shown in the Table 13-44.
Table 13-44
Projected Field Cyanide Consumptions by Material Type
Material
Type | NaCN Cons.
kg/t |
| Kp Ox | 0.32 |
| Ki Ox | 0.38 |
| Trans-Hi | 0.37 |
| Trans-Lo | 0.37 |
| Wt. Avg., All | 0.35 |
For the purposes of the FS, the weighted average NaCN consumption based on total tonnes of ore is estimated 0.35 kg/t ore.
Kappes, Cassiday & Associates
June, 2019 | | 13.0 Mineral Processing & Metallurgical Testing
Page 13-53 |
| Camino Rojo Project Feasibility Study NI 43-101 Technical Report |
|
Lime is required for pH control during leaching. Because hydrated lime was utilized in the lab leach tests, the laboratory lime consumptions are adjusted to accurately predict consumptions of quicklime (pebble lime, CaO) in the field. Estimated quicklime consumptions by material type are presented in Table 13-45.
Table 13-45
Projected Field Lime Consumptions by Material Type
Material
Type | Quicklime Cons.
kg/t |
| Kp Ox | 1.26 |
| Ki Ox | 1.16 |
| Trans-Hi | 1.24 |
| Trans-Lo | 1.32 |
| Wt. Avg. All | 1.25 |
To ensure that proper pH is maintained throughout the heap, a lime consumption of 1.25 kg/t ore has been selected.
| 13.5 | Preg Robbing Discussion |
Preg robbing is a phenomenon where gold and gold-cyanide complexes are preferentially absorbed by carbonaceous, and to a lesser extent, other material. In addition to the direct vs. CIL bottle roll tests and cyanide shake tests completed by KCA to evaluate the potential for preg-robbing, an extensive campaign was completed by Orla and reviewed by KCA to further understand the preg robbing mechanism and affected material types and areas. The program included 828 tests completed on samples from drillhole intercepts in 2018 and 2019 which were evaluated for Au (CN) recovery, preg-robbing and organic carbon. Another 3,960 composite core samples tested by Goldcorp for organic carbon and preg-robbing were used as reference, though the majority of these were from the sulphide portion of the deposit.
Key observations from the preg robbing test work include:
| · | Overall, no strong correlation between organic carbon content and preg-robbing material. The correlation is more pronounced in less oxidized material. |
| · | Preg robbing not strongly associated with Oxide material with less than 3% of tests showing preg rob values above 10%. Most of these are on samples taken from areas of waste in the current mine model. |
| · | Higher preg rob values generally associated with the Trans-Lo material. |
Kappes, Cassiday & Associates
June, 2019 | | 13.0 Mineral Processing & Metallurgical Testing
Page 13-54 |
| Camino Rojo Project Feasibility Study NI 43-101 Technical Report |
|
| · | Preg robbing appears to be primarily at depth in the transition material along the outer margins of the deposit. |
| · | Approximately 2% of the recovered gold in the feasibility production model comes from areas with more than 10% preg-robbing test results. Material from these areas will be mined starting in year 4, with the bulk coming in years 6 and 7. |
| · | 65% of the material from areas with greater than 10% preg-robbing test results that is planned to go to the heap is Trans-Lo. |
Interbedded shale and sandstone layers of the Caracol Formation that host the Camino Rojo deposit contain variable amounts of organic carbon derived from the sediments that formed the rocks. During the alteration and mineralizing events that formed the deposit, the carbon was mobilized and depleted in the core of the deposit. Carbonate was similarly depleted, while potassium was increased through metasomatism, resulting in a high potassium, low carbonate and low carbon core to the deposit. In the outer parts of the deposit, and peripheral to it, organic carbon is still present. It typically occurs as grey/black, wispy, flattened, millimetre sized clots, lenses or layers in darker shale horizons. It is locally sub-graphitic and weakly sheared along mm-cm calcite rich bedding planes.
Spatial plots of organic carbon (OC) content confirm that higher organic carbon contents occur in the outer part of the deposit with an OC depleted zone in the centre. The Kp domain, which forms the central part of the deposit, is therefore generally lower in organic carbon than the Ki domain that surrounds it.
Overall, data shows a weak positive correlation between organic carbon and preg-robbing, but with significant variability (Figure 13-13). When results are divided by oxidation level, it is evident that in oxide material organic carbon most commonly does not cause preg-robbing conditions. This is postulated to be because the carbon has already been neutralized by absorbing other elements during the weathering process. In Trans_ Lo and Trans_sx material, there is a much stronger correlation between organic carbon and preg-robbing. Carbon, when present, is still available to absorb the gold. Correlation in Transition_Hi is between oxide and Transition_Lo as would be expected.
Kappes, Cassiday & Associates
June, 2019 | | 13.0 Mineral Processing & Metallurgical Testing
Page 13-55 |
| Camino Rojo Project Feasibility Study NI 43-101 Technical Report |
|

Figure 13-13 Organic Carbon Versus Preg-Robbing
KCA considers preg-robbing values greater than 10% to be potentially problematic. Spatial analysis of the preg-robbing test results was undertaken and areas where most samples have greater than 10% preg-robbing results outlined. This indicates approximately 1.5 million tonnes, or 3.5%, of the 44.0 million tonnes of material going to the heap leach pad in the Feasibility Study mine schedule comes from areas with potential preg-robbing issues. The average grade is 0.59 g/t Au, representing 3% of the total contained gold ounces in the schedule. However, 65% of this material is Trans_Lo which has a lower recovery than other material. Therefore, estimated recovered gold from areas with greater than 10% preg-robbing is 2% of the total. Material that is potentially problematic does not come into the mine plan until year 4. Figure 13-14 shows areas with +10% peg-robbing test results.
Not all of the material with greater than 10% preg-robbing test results is expected to actually be preg-robbing. In the 2015 column test program, preg-robbing testing was performed on the composite material and material with 40 to 60% preg-robbing results had 55 to 72% Au recovery. See Figure 13-15. These results show that higher preg-robbing results do not necessarily indicate recovery problems.
Kappes, Cassiday & Associates
June, 2019 | | 13.0 Mineral Processing & Metallurgical Testing
Page 13-56 |
| Camino Rojo Project Feasibility Study NI 43-101 Technical Report |
|
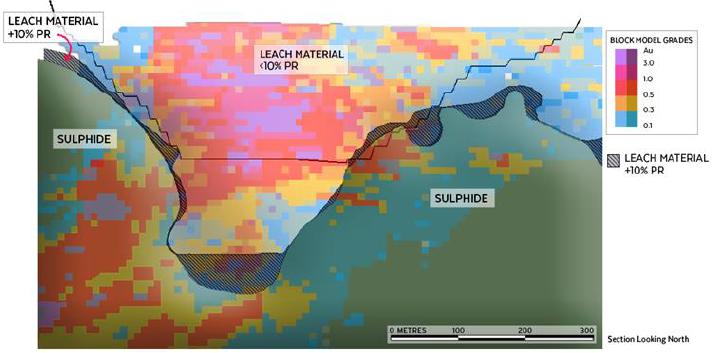
Figure 13-14 Areas with +10% Preg-Robbing Test Results
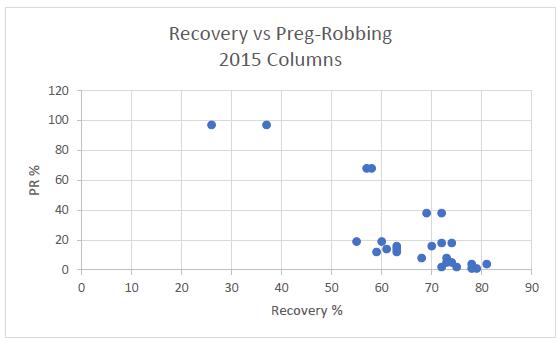
Figure 13-15 Recovery Versus Preg-Robbing
Because the correlation between preg-robbing tests and actual recovery problems is not certain and tests show that at least some material with high preg-robbing results will still get good recoveries, further testing of the material identified as potentially preg-robbing is recommended before this material is mined. This should include column testing.
Kappes, Cassiday & Associates
June, 2019 | | 13.0 Mineral Processing & Metallurgical Testing
Page 13-57 |
| Camino Rojo Project Feasibility Study NI 43-101 Technical Report |
|
If there is still uncertainty during mining, potentially preg-robbing material should be stockpiled separately and tested further. If additional test work confirms the material is preg-robbing, it should either be put in the waste pile or on the top of the heap at the end of mine life.
| 13.6 | Sulphide Mineralization Discussion |
Metallurgical testing on the sulphide resource (Trans-S) has indicated that the material is not amenable to direct cyanide leaching with average gold recoveries of less than 25% and silver recoveries around 26%; however, the mineralization has demonstrated that gold, silver, lead and zinc can be recovered into concentrates that are of potentially marketable grade.
A possible process flowsheet for a sequential flotation process consists of an initial pre-flotation to remove organic carbon followed by lead flotation, zinc flotation, and pyrite/arsenopyrite flotation to recover additional precious metals. The pyrite/arsenopyrite concentrate would be oxidized to recover additional gold and silver by cyanide leaching. Payable products would be the Lead Concentrate, Zinc Concentrate, and Gold Silver doré recovered from the cyanide leaching of the pyrite/arsenopyrite concentrate. It is assumed that after oxidation 90% of the gold and silver can be recovered from the oxidized pyrite concentrate. Waste products would be the pre-flotation concentrate, the flotation tailings, and the leached residue of the pyrite/arsenopyrite concentrate. Table 13-46 presents the distribution of metals to the various products based on preliminary test work.
Note that the sulphide material is not included as part of the Mineral Reserve for the FS and these numbers are only presented to provide guidance as to whether material could potentially be a Mineral Resource. The process flowsheet described above is based on commonly used metal recovery methods and the metallurgical test work to date is too preliminary to confirm these recoveries can be achieved or to determine the economic viability of the material.
Table 13-46
Distribution of Metals to Various Sulphide ProductsBased on Preliminary Test Work
| Product | Wt % | Distribution % |
| | | Pb | Zn | Au | Ag |
| Flotation Feed | 100 | 100 | 100 | 100 | 100 |
| Lead Concentrate | 0.3 | 60 | 1 | 49 | 44 |
| Zinc Concentrate | 0.6 | 1 | 64 | 2 | 7 |
| Pyrite Concentrate | 19.6 | (15) | (19) | (39) | (28) |
| Dore from leaching Pyrite Con | NA | NA | NA | 35 | 25 |
| | | | | | |
| Total Recovery for resource estimate | | 60% | 64% | 86% | 76% |
| | | | | | |
| Pre-flotation Concentrate | 4.4 | 14 | 6 | 6 | 16 |
| Pyrite Leach Residue | 19.6 | 15 | 19 | 4 | 3 |
| Flotation Tailings | 75.1 | 10 | 10 | 4 | 5 |
Kappes, Cassiday & Associates
June, 2019 | | 13.0 Mineral Processing & Metallurgical Testing
Page 13-58 |
| Camino Rojo Project Feasibility Study NI 43-101 Technical Report |
|
| 14.0 | MINERAL RESOURCE ESTIMATES |
Table 14-1 presents the gold and silver Mineral Resource for the Camino Rojo Project. Measured and Indicated Mineral Resources amount to 353.4 million tonnes at 0.832 g/t gold and 8.83 g/t silver. Contained metal amounts to 9.46 million ounces gold and 100.4 million ounces of silver for Measured and Indicated Mineral Resources. Inferred Mineral Resource is an additional 60.9 million tonnes at 0.866 g/t gold and 7.41 g/t silver. Contained metal amounts to 1.70 million ounces of gold and 14.5 million ounces of silver for the inferred Mineral Resource.
The gold and silver Mineral Resource includes material amenable to heap leach recovery methods (leach material) and material amenable mill and flotation concentration methods (mill material). For the leach material, Measured and Indicated Mineral Resources amount to 94.6 million tonnes at 0.71 g/t gold and 12.7 g/t silver and contained metal amounts to 2.16 million ounces gold and 38.8 million ounces of silver. Inferred Mineral Resource is an additional 4.4 million tonnes at 0.86 g/t gold and 5.8 g/t silver and contained metal amounts to 119,800 ounces of gold and 805,000 ounces of silver for the Inferred Mineral Resource in leach material. The leach Mineral Resources are oxide dominant and are the focus of the Feasibility Study.
For the gold and silver resource in mill material, Measured and Indicated Mineral Resources amount to 258.8 million tonnes at 0.88 g/t gold and 7.4 g/t silver and contained metal amounts to 7.30 million ounces gold and 61.6 million ounces of silver. Inferred Mineral Resource is an additional 56.6 million tonnes at 0.87 g/t gold and 7.5 g/t silver and contained metal amounts to 1.58 million ounces of gold and 13.7 million ounces of silver for the Inferred Mineral Resource in mill material.
Table 14-2 presents the lead and zinc Mineral Resources for the Camino Rojo Project. The lead and zinc Mineral Resources are in sulphide dominant material and are recovered along with the gold and silver in the mill material. Lead and zinc Measured and Indicated Mineral Resources amount to 258.8 million tonnes at 0.07% lead and 0.26% zinc. Contained metal amounts to 413.6 million pounds of lead, and 1.50 billion pounds of zinc for Measured and Indicated Mineral Resources. Inferred Mineral Resource is an additional 56.6 million tonnes at 0.05% lead and 0.23% zinc. Contained metal amounts to 63.1 million pounds of lead and 290.4 million pounds of zinc for the Inferred Mineral Resource category.
The Mineral Resources from the leach material are reported inclusive of those Mineral Resources that were converted to Mineral Reserves presented in Section 15.0. The Mineral Resources from the mill material were excluded from the mine design in the Feasibility Study.
Kappes, Cassiday & Associates
June, 2019 | | 14.0 Mineral Resource Estimate
Page 14-1 |
| Camino Rojo Project Feasibility Study NI 43-101 Technical Report |
|
The Mineral Resources are based on a block model developed by IMC during January and February 2019. This updated model incorporated the 2018 Orla drilling and updated geologic models.
The Measured, Indicated, and Inferred Mineral Resources reported herein are contained within a floating cone pit shell to demonstrate “reasonable prospects for eventual economic extraction” to meet the definition of Mineral Resources in NI 43-101.
Figure 14-1 shows the constraining pit shell that is based on Measured, Indicated, and Inferred Mineral Resource.
Table 14-1
Mineral Resource
| | | NSR Cut-off | | Gold | Silver | Gold | Silver |
| Resource Type | ($/t) | Kt | (g/t) | (g/t) | (koz) | (koz) |
| Leach Resource: | | | | | | |
| | Measured Mineral Resource | 4.73 | 19,391 | 0.77 | 14.9 | 482.3 | 9,305 |
| | Indicated Mineral Resource | 4.73 | 75,249 | 0.70 | 12.2 | 1,680.7 | 29,471 |
| | Meas/Ind Mineral Resource | 4.73 | 94,640 | 0.71 | 12.7 | 2,163.0 | 38,776 |
| | Inferred Mineral Resource | 4.73 | 4,355 | 0.86 | 5.8 | 119.8 | 805 |
| | | | | | | | |
| Mill Resource: | | | | | | |
| | Measured Mineral Resource | 13.71 | 3,358 | 0.69 | 9.2 | 74.2 | 997 |
| | Indicated Mineral Resource | 13.71 | 255,445 | 0.88 | 7.4 | 7,221.4 | 60,606 |
| | Meas/Ind Mineral Resource | 13.71 | 258,803 | 0.88 | 7.4 | 7,295.6 | 61,603 |
| | Inferred Mineral Resource | 13.71 | 56,564 | 0.87 | 7.5 | 1,576.9 | 13,713 |
| | | | | | | | |
| Total Mineral Resource | | | | | | |
| | Measured Mineral Resource | | 22,749 | 0.76 | 14.1 | 556.5 | 10,302 |
| | Indicated Mineral Resource | | 330,694 | 0.84 | 8.5 | 8,902.1 | 90,078 |
| | Meas/Ind Mineral Resource | | 353,443 | 0.83 | 8.8 | 9,458.6 | 100,379 |
| | Inferred Mineral Resource | | 60,919 | 0.87 | 7.4 | 1,696.7 | 14,518 |
| | | | | | | | |
Kappes, Cassiday & Associates
June, 2019 | | 14.0 Mineral Resource Estimate
Page 14-2 |
| Camino Rojo Project Feasibility Study NI 43-101 Technical Report |
|
Table 14-2
Mineral Resource – Lead and Zinc
| | | NSR Cut-off | | Lead | Zinc | Lead | Zinc |
| Resource Type | ($/t) | Kt | (%) | (%) | (Mlb) | (Mlb) |
| Mill Resource: | | | | | | |
| | Measured Mineral Resource | 13.71 | 3,358 | 0.13 | 0.38 | 9.3 | 28.2 |
| | Indicated Mineral Resource | 13.71 | 255,445 | 0.07 | 0.26 | 404.3 | 1,468.7 |
| | Meas/Ind Mineral Resource | 13.71 | 258,803 | 0.07 | 0.26 | 413.6 | 1,496.8 |
| | Inferred Mineral Resource | 13.71 | 56,564 | 0.05 | 0.23 | 63.1 | 290.4 |
| | | | | | | | |
Notes:
1. The Mineral Resources have an effective date of 7 June 2019 and the estimate was prepared using the definitions in CIM Definition Standards (10 May 2014).
2. All figures are rounded to reflect the relative accuracy of the estimate and therefore numbers may not appear to add precisely.
3. Mineral Resources that are not Mineral Reserves do not have demonstrated economic viability.
4. Mineral Resources for leach material are based on prices of $1400/oz gold and $20/oz silver.
5. Mineral Resources for mill material are based on prices of $1400/oz gold, $20/oz silver, $1.05/lb lead, and $1.20/lb zinc.
6. Mineral Resources are based on NSR cut-off of $4.73/t for leach material and $13.71/t for mill material.
7. NSR value for leach material is as follows:
Kp Oxide: NSR ($/t) = 30.77 x gold (g/t) + 0.068 x silver (g/t), based on gold recovery of 70% and silver recovery of 11%
Ki Oxide: NSR ($/t) = 24.61 x gold (g/t) + 0.092 x silver (g/t), based on gold recovery of 56% and silver recovery of 15%
Tran-Hi: NSR ($/t) = 26.37 x gold (g/t) + 0.166 x silver (g/t), based on gold recovery of 60% and silver recovery of 27%
Tran-Lo: NSR ($/t) = 17.58 x gold (g/t) + 0.209 x silver (g/t), based on gold recovery of 40% and silver recovery of 34%
8. NSR value for mill material is 36.75 x gold (g/t) + 0.429 x silver (g/t) + 10.75 x lead (%) + 11.77 x zinc (%), based on recoveries of 86% gold, 76% silver, 60% lead, and 64% zinc.
9. Table 14-3 accompanies this Mineral Resource statement and shows all relevant parameters.
10. Mineral Resources are reported in relation to a conceptual constraining pit shell in order to demonstrate reasonable prospects for eventual economic extraction, as required by the definition of Mineral Resource in NI 43-101; mineralization lying outside of the pit shell is excluded from the Mineral Resource.
11. The Mineral Resource estimate assumes that the floating pit cone used to constrain the estimate extends onto land held by the Adjacent Owner. Any potential development of the Camino Rojo Project that includes an open pit encompassing the entire Mineral Resource estimate would be dependent on obtaining an agreement with the Adjacent Owner.
12. The Mineral Resources in the leach material are inclusive of those Mineral Resources that were converted to Mineral Reserves.
| 14.1.1 | Metal Prices for Mineral Resources |
Table 14-3 shows the economic and recovery parameters for the Mineral Resource estimate. Metal prices for the Mineral Resource estimate are US$1400 per ounce gold, US$20 per ounce silver, US$1.05 per pound lead, and US$1.20 per pound zinc. IMC believes these prices to be reasonable based on: 1) historical 3-year trailing averages, 2) prices used by other companies for comparable projects, and 3) long range consensus price forecasts prepared by various bank economists.
| 14.1.2 | Cost and Recovery Estimates for Mineral Resources |
The mining cost is estimated at US$1.65 per total tonne. This was estimated by IMC and is based on owner operation of the mining fleet. This includes an allowance of US$0.05 per tonne for pit dewatering.
Table 14-3 shows parameters for six material types. Note that costs used for the resource estimation vary somewhat from the costs estimated in the Feasibility Study because the resource was done earlier and the Feasibility Study does not consider the sulphide material. The costs used in the Mineral Resource estimation were only used to demonstrate “reasonable prospects for eventual economic extraction”. For the first four materials, Kp Oxide, Ki Oxide, Transitional High Oxide, and Transitional Low Oxide, it is assumed that processing will be by crushing and heap leaching. The processing and G&A costs of US$3.413 and US$1.319 per processed tonne respectively were provided by KCA and are based on a process production rate of 18,000 tonnes per day or about 6.57 million tonnes per year.
Kappes, Cassiday & Associates
June, 2019 | | 14.0 Mineral Resource Estimate
Page 14-3 |
| Camino Rojo Project Feasibility Study NI 43-101 Technical Report |
|
KCA provided the recovery estimates for gold and silver shown in Table 14-3. These estimates consider both the historical and recent metallurgical testing data.
IMC assumed 100% refinery payables for this case. The gold and silver refining costs are also IMC estimates. The leach material is also subject to a 2% NSR royalty. Lead and zinc do not contribute to economics for leach material.
Due to two products, and also variable recoveries by material type, an NSR value was calculated for each block to tabulate proposed quantities of mineralized material. The gold and silver NSR factors for Kp Oxide are calculated as follows:
Gold NSR Factor = ($1400 – $5.00) x 0.70 x 1.00 x 0.98 / 31.103 = $30.768/t
Silver NSR Factor = ($20 – $0.50) x 0.11 x 1.00 x 0.98 / 31.103 = $0.0676/t
The units are US$ per gram per tonne. The 0.98 constant represents an allowance for the royalty cost.
The NSR value for a block is calculated as:
NSR = $30.768 x gold grade + $0.0676 x silver grade
The breakeven NSR cut-off is US$6.38 per tonne, the mining + process + G&A cost. The internal NSR cut-off is US$4.73 per tonne, the process + G&A cost. Internal cut-off applies to blocks that have to be removed from the pit, so mining is a sunk cost. Note the NSR cut-off does not vary by material type for the heap leach materials, so is convenient for mine planning and scheduling.
The parameters and cut-offs for the other material types are also shown in Table 14-3.
Kappes, Cassiday & Associates
June, 2019 | | 14.0 Mineral Resource Estimate
Page 14-4 |
| Camino Rojo Project Feasibility Study NI 43-101 Technical Report |
|
Table 14-3
Economic Parameters for Mineral Resource Estimate
| Material Type | Units | Kp Oxide | Ki Oxide | Tran-Hi | Tran-Low | Tran-S | Sulphide | Waste |
| Commodity Prices | | | | | | | | | |
| | Gold Price Per Ounce | | (US$) | 1400 | 1400 | 1400 | 1400 | 1400 | 1400 | |
| | Silver Price Per Ounce | | (US$) | 20.00 | 20.00 | 20.00 | 20.00 | 20.00 | 20.00 | |
| | Lead Price Per Pound | | (US$) | 1.05 | 1.05 | 1.05 | 1.05 | 1.05 | 1.05 | |
| | Zinc Price Per Pound | | (US$) | 1.20 | 1.20 | 1.20 | 1.20 | 1.20 | 1.20 | |
| Plant Production Rate | | (ktpy) | 6,570 | 6,570 | 6,570 | 6,570 | 9,125 | 9,125 | |
| Mining Cost Per Tonne | | | | | | | | | |
| | Owner Mining Cost | | (US$) | 1.600 | 1.600 | 1.600 | 1.600 | 1.600 | 1.600 | 1.600 |
| | Allowance for Pit Dewatering | (US$) | 0.050 | 0.050 | 0.050 | 0.050 | 0.050 | 0.050 | 0.050 |
| | Total Mining Cost | | (US$) | 1.650 | 1.650 | 1.650 | 1.650 | 1.650 | 1.650 | 1.650 |
| Process and G&A Cost Per Ore Tonne | | | | | | | | |
| | Processing | | | (US$) | 3.413 | 3.413 | 3.413 | 3.413 | 12.500 | 12.500 | |
| | G&A | | | (US$) | 1.319 | 1.319 | 1.319 | 1.319 | 1.205 | 1.205 | |
| | Total Process and G&A | | (US$) | 4.732 | 4.732 | 4.732 | 4.732 | 13.705 | 13.705 | |
| Plant Recovery | | | | | | | | | |
| | Gold | | | (%) | 70% | 56% | 60% | 40% | 86% | 86% | |
| | Silver | | | (%) | 11% | 15% | 27% | 34% | 76% | 76% | |
| | Lead | | | (%) | 0% | 0% | 0% | 0% | 60% | 60% | |
| | Zinc | | | (%) | 0% | 0% | 0% | 0% | 64% | 64% | |
| Smelting/Refining Payables and Costs | | | | | | | | |
| | Gold Refinery Payable | | (%) | 100% | 100% | 100% | 100% | 95% | 95% | |
| | Silver Refinery Payable | | (%) | 100% | 100% | 100% | 100% | 95% | 95% | |
| | Lead Smelter Payable | | (%) | 0% | 0% | 0% | 0% | 95% | 95% | |
| | Zinc Smelter Payable | | (%) | 0% | 0% | 0% | 0% | 85% | 85% | |
| | Gold Refining Per Ounce | (US$) | 5.00 | 5.00 | 5.00 | 5.00 | 1.00 | 1.00 | |
| | Silver Refining Per Ounce | (US$) | 0.50 | 0.50 | 0.50 | 0.50 | 1.50 | 1.50 | |
| | Lead Treatment Per Pound | (US$) | 0.00 | 0.00 | 0.00 | 0.00 | 0.194 | 0.194 | |
| | Zinc Treatment Per Pound | (US$) | 0.00 | 0.00 | 0.00 | 0.00 | 0.219 | 0.219 | |
| Royalties | | | | | | | | | | |
| | Royalty | | | (%) | 2% | 2% | 2% | 2% | 0% | 0% | |
| NSR Factors | | | | | | | | | | |
| | Gold NSR Factor | | ($/g) | 30.768 | 24.614 | 26.372 | 17.582 | 36.748 | 36.748 | |
| | Silver NSR Factor | | ($/g) | 0.0676 | 0.0922 | 0.1659 | 0.2089 | 0.4294 | 0.4294 | |
| | Lead NSR Factor | | ($/%) | 0.00 | 0.00 | 0.00 | 0.00 | 10.753 | 10.753 | |
| | Zinc NSR Factor | | ($/%) | 0.00 | 0.00 | 0.00 | 0.00 | 11.770 | 11.770 | |
| NSR Cut-offs | | | | | | | | | |
| | Breakeven NSR Cut-off | ($/t) | 6.38 | 6.38 | 6.38 | 6.38 | 15.36 | 15.36 | |
| | Internal NSR Cut-off | ($/t) | 4.73 | 4.73 | 4.73 | 4.73 | 13.71 | 13.71 | |
Note: Economic parameters used for the Mineral Resource vary slightly from the Feasibility Study economic model as they were done before the final economic analysis.
Kappes, Cassiday & Associates
June, 2019 | | 14.0 Mineral Resource Estimate
Page 14-5 |
| Camino Rojo Project Feasibility Study NI 43-101 Technical Report |
|
| 14.1.3 | Parameters for Mill Material |
The processing cost for the Transition Sulphide and Sulphide material types is estimated at US$12.50 per tonne based on grinding and differential flotation to produce a lead, zinc, and a pyrite concentrate. The plant production rate is assumed to be 25,000 tpd or 9.12 million tonnes per year. The overall recoveries for gold and silver are based on the oxidation and cyanide leaching of the pyrite concentrate. The cost for this is included in the process cost estimate. It is assumed the lead and zinc will be recovered as concentrates that will be shipped to conventional smelters. Preliminary estimates of plant recoveries for gold, silver, lead, and zinc are shown in Table 14-3.
Table 14-4 shows typical treatment terms for lead and zinc concentrates, and is the basis for the payable amounts of lead and zinc and treatment charges shown in Table 14-3. Typical concentrate grades are assumed for the calculation but more testing is required.
The NSR factors for each metal are shown in Table 14-3 and are calculated as follows:
Gold NSR Factor = ($1400 – $1.00) x 0.86 x 0.95 / 31.103 = $36.748/t
Silver NSR Factor = ($20 – $1.50) x 0.76 x 0.95 / 31.103 = $0.4294/t
Lead NSR Factor = ($1.05 - $0.194) x 0.60 x 0.95 x 22.046 = $10.753/t
Zinc NSR Factor = ($1.20 - $0.219) x 0.64 x 0.85 x 22.046 = $11.770/t
Table 14-4
Treatment Costs for Lead and Zinc Concentrates
| Parameter | | Units | Lead | Zinc |
| Concentrate Grade | | (%) | 60% | 53% |
| Moisture Content | | (%) | 8.5% | 8.5% |
| Concentrate Loss | | (%) | 0.0% | 0.0% |
| Payable Percentage | | (%) | 95% | 85% |
| Payable Lbs/Tonne | | (lbs) | 1,257 | 993 |
| Treatment Cost Per DMT | (US$) | 217.00 | 190.00 |
| Freight Per WMT | | (US$) | 25.00 | 25.00 |
| Treatment Cost Per Pound | (US$) | 0.173 | 0.191 |
| Transport Cost Per Pound | (US$) | 0.022 | 0.027 |
| Total Cost Per Pound | (US$) | 0.194 | 0.219 |
Kappes, Cassiday & Associates
June, 2019 | | 14.0 Mineral Resource Estimate
Page 14-6 |
| Camino Rojo Project Feasibility Study NI 43-101 Technical Report |
|
Total NSR is calculated by multiplying each factor times the mineral grade; the lead and zinc grades are assumed to be in percent (ppm/10000). The breakeven NSR cut-off is US$15.36 per tonne; internal NSR cut-off is US$13.71 per tonne. The Mineral Resources on Table 14-1 and Table 14-2 are based on internal NSR cut-off for all material types. There are no royalties applied to the mill material.
| 14.1.4 | Additional Information |
The Mineral Resources are classified in accordance with the Canadian Institute of Mining, Metallurgy and Petroleum (“CIM”) “CIM Definition Standards – For Mineral Resources and Mineral Reserves” adopted by the CIM Council (as amended, the “CIM Definition Standards”) in accordance with the requirements of NI 43-101. Mineral Reserve and Mineral Resource estimates reflect the reasonable expectation that all necessary permits and approvals will be obtained and maintained.
There is no guarantee that any of the Mineral Resources will be converted to Mineral Reserve. The Inferred Mineral Resources included in this Technical Report meet the current definition of Inferred Mineral Resources. The quantity and grade of Inferred Mineral Resources are uncertain in nature and there has been insufficient exploration to define these inferred Mineral Resources as an Indicated Mineral Resource. It is, however, expected that the majority of Inferred Mineral Resource could be upgraded to Indicated Mineral Resource with continued exploration.
IMC does not believe that there are significant risks to the Mineral Resource estimates based on environmental, permitting, legal, title, taxation, socio-economic, marketing, or political factors. The Project is in a jurisdiction friendly to mining. The most significant risks to the Mineral Resource are related to economic parameters such as prices lower than forecast, recoveries lower than forecast, or costs higher than the current estimates.
Kappes, Cassiday & Associates
June, 2019 | | 14.0 Mineral Resource Estimate
Page 14-7 |
| Camino Rojo Project Feasibility Study NI 43-101 Technical Report |
|
All of the mineralization comprised in the Mineral Resource estimate with respect to the Camino Rojo Project is contained on mineral titles controlled by Orla. However, the Mineral Resource estimate assumes that the north wall of the conceptual floating pit cone used to demonstrate reasonable prospects for eventual economic extraction extends onto lands where mineral title is held by the Adjacent Owner and that waste would be mined on the Adjacent Owner’s mineral titles. Any potential development of the Camino Rojo Project that includes an open pit encompassing the entire Mineral Resource estimate would be dependent on obtaining an agreement with the Adjacent Owner. It is estimated that approximately two-thirds of the Mineral Resource estimate is dependent on an agreement being obtained with the Adjacent Owner. The Mineral Resource estimate has been prepared based on the Qualified Person’s reasoned judgment, in accordance with CIM Best Practices Guidelines and his professional standards of competence, that there is a reasonable expectation that all necessary permits, agreements and approvals will be obtained and maintained, including an agreement with the Adjacent Owner to allow mining of waste material on its mineral concessions. In particular, in considering the prospects for eventual economic extraction, consideration was given to industry practice, including the past practices of the Adjacent Owner in entering similar agreements on commercially reasonable terms, and a timeframe of 10-15 years.
Delays in, or failure to obtain, such agreement would affect the development of a significant portion of the Mineral Resources of the Camino Rojo Project that are not included in the Feasibility Study, in particular by limiting access to significant mineralized material at depth. There can be no assurance that Orla will be able to negotiate such agreement on terms that are satisfactory to Orla or that there will not be delays in obtaining the necessary agreement.
Kappes, Cassiday & Associates
June, 2019 | | 14.0 Mineral Resource Estimate
Page 14-8 |
| Camino Rojo Project Feasibility Study NI 43-101 Technical Report |
|
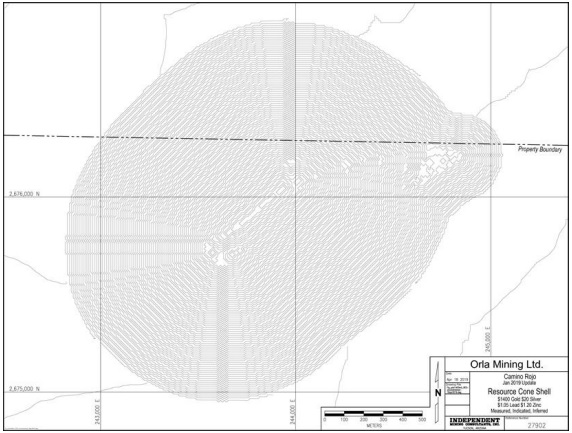
Figure 14-1 Mineral Resource Constraining Cone Shell, IMC 2019
Kappes, Cassiday & Associates
June, 2019 | | 14.0 Mineral Resource Estimate
Page 14-9 |
| Camino Rojo Project Feasibility Study NI 43-101 Technical Report |
|
| 14.2 | Description of the Block Model |
The Camino Rojo Mineral Resource is based on a block model developed by IMC during January and February 2019. The model is based on 10m by 10m by 10m high blocks. The model is not rotated. The main changes since the April 2018 model are:
| · | The Orla 2018 drilling data is incorporated into the model. |
| · | The alteration and oxidation geological models have been updated. |
| · | Portions of Canplats wet RC drilling has been designated as potentially contaminated and excluded from the model. |
| 14.2.2 | Geological Controls |
Orla personnel developed various geological models as follows:
| · | A solid to define the post mineral lithologic unit and a surface to represent the contact between the Caracol and Indidura units. |
| · | Solids to represent higher and lower amounts of potassium alteration in the Caracol and Indidura units; these were termed Potassium Pervasive (Kp) and Potassium Incipient (Ki) alteration zones. |
| · | Solids to represent several levels of oxidation. |
| · | A solid interpretation of a dike that runs through the deposit from southwest to northeast. |
IMC reviewed these solids and incorporated them in the model. The lithology model, variable “lith”, is defined as follows:
Table 14-5
Camino Rojo Model Rock Types (lith)
| Rock Code | Unit | Description |
| 10 | PM | Post Mineral |
| 20 | Car | Caracol |
| 30 | Ind | Indidura |
The lithology code was assigned to the nearest whole block, i.e. the block was assigned if more than 50% of the block was inside the solid. Figure 14-2 shows the drillhole locations and the location of cross sections referenced in this section. Figure 14-3 shows the lithology on Section L112 along the long axis of the deposit (southwest to northeast). The Caracol unit is the main resource host.
Kappes, Cassiday & Associates
June, 2019 | | 14.0 Mineral Resource Estimate
Page 14-10 |
| Camino Rojo Project Feasibility Study NI 43-101 Technical Report |
|
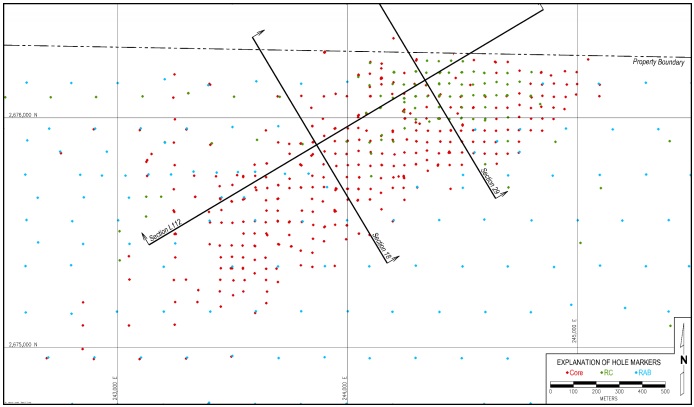
Figure 14-2
Hole and Cross Section Locations, IMC 2019
Kappes, Cassiday & Associates
June, 2019 | | 14.0 Mineral Resource Estimate
Page 14-11 |
| Camino Rojo Project Feasibility Study NI 43-101 Technical Report |
|
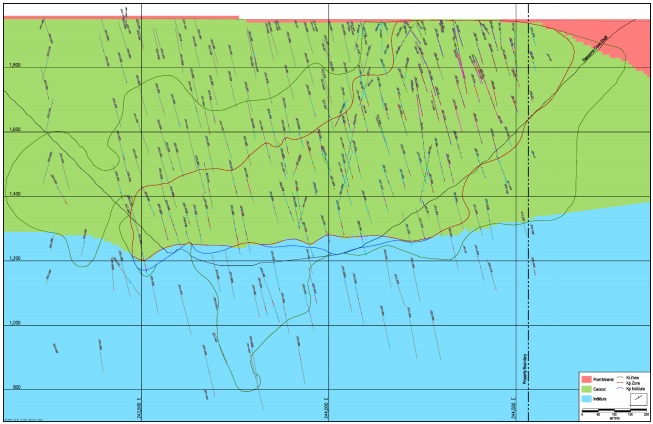
Figure 14-3 Lithology on Section L112, IMC 2019
Kappes, Cassiday & Associates
June, 2019 | | 14.0 Mineral Resource Estimate
Page 14-12 |
| Camino Rojo Project Feasibility Study NI 43-101 Technical Report |
|
The main control for grade estimation is based on the level of potassium alteration and is based on geological logging and ICP assays of potassium. The alteration model, variable “alt”, is defined as follows:
Table 14-6
Camino Rojo Alteration Types (alt)
| Alteration Code | Alteration | Description |
| 10 | Kp | Potassium Pervasive – Caracol |
| 20 | Ki | Potassium Incipient – Caracol/Indidura |
| 30 | Ind | Potassium Pervasive - Indidura |
The Kp (Potassium Pervasive) alteration tends to be pervasive potassium flooding and potassium content in ICP results are consistently above 3% throughout the zone. It is efficient in defining the area of higher gold assays. The Ki (Potassium Incipient) alteration has potassium flooding localized in bands associated with structures and potassium in ICP results are variable, with the altered portions having greater than 3% and the unaltered <1 to 3% potassium. Figure 14-4 through Figure 14-6 are sections of the alteration. Figure 14-4 is long Section L112. Figure 14-5 and Figure 14-6 are in the southwest and northeast portions of the deposit respectively.
The oxide model, variable “oxide” is defined as follows:
Table 14-7
Camino Rojo Oxide-Sulphide Model (oxide)
| Oxide Code | Type | Description |
| 10 | Ox | Oxide |
| 20 | TrH | Transition 60-90% Oxide |
| 30 | TrL | Transition 30-60% Oxide |
| 40 | TrS | Transition 10-30% Oxide |
| 50 | Slf | Sulphide |
The solids were developed based on % oxide in the drillhole database as logged by Goldcorp. Orla geologists logged holes on several sections to verify the Goldcorp loggings. Figure 14-7 shows a cross section of the oxide model in the northeast portion of the deposit. The southwest portion of the deposit is mostly sulphide.
Kappes, Cassiday & Associates
June, 2019 | | 14.0 Mineral Resource Estimate
Page 14-13 |
| Camino Rojo Project Feasibility Study NI 43-101 Technical Report |
|
In addition to the above geologic controls, IMC also included a domain code in the model. This was due to perceived differences in the orientation of the mineralization in the higher elevation northeast portion of the Caracol versus the deeper southwest portion. These are described in Table 14-8. Figure 14-8 shows a long section of the domains.
Table 14- 8
Camino Rojo Estimation Domains (domain)
| Domain Code | Domain | Description |
| 10 | NEKp | Kp in the NE |
| 15 | NEKi | Ki in the NE |
| 20 | SWKp | Kp in the SW |
| 25 | SWKi | Ki in the SW |
| 30 | INKp | Kp in Indidura |
| 35 | INKi | Ki in Indidura |
Kappes, Cassiday & Associates
June, 2019 | | 14.0 Mineral Resource Estimate
Page 14-14 |
| Camino Rojo Project Feasibility Study NI 43-101 Technical Report |
|
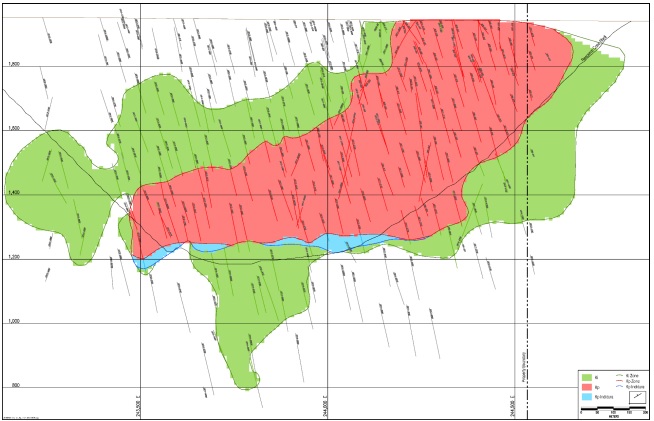
Figure 14-4 Alteration on Section L112, IMC 2019
Kappes, Cassiday & Associates
June, 2019 | | 14.0 Mineral Resource Estimate
Page 14-15 |
| Camino Rojo Project Feasibility Study NI 43-101 Technical Report |
|
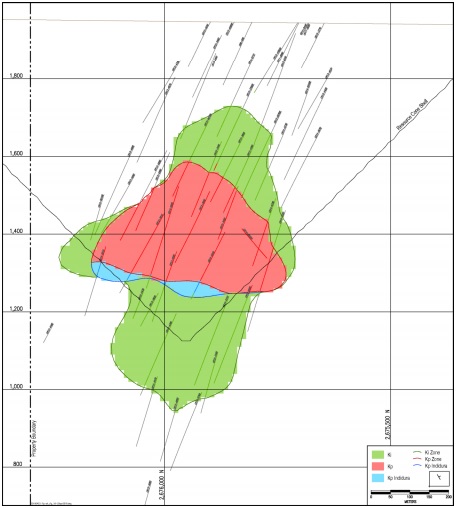
Figure 14-5 Alteration on Section 18, IMC 2019
Kappes, Cassiday & Associates
June, 2019 | | 14.0 Mineral Resource Estimate
Page 14-16 |
| Camino Rojo Project Feasibility Study NI 43-101 Technical Report |
|
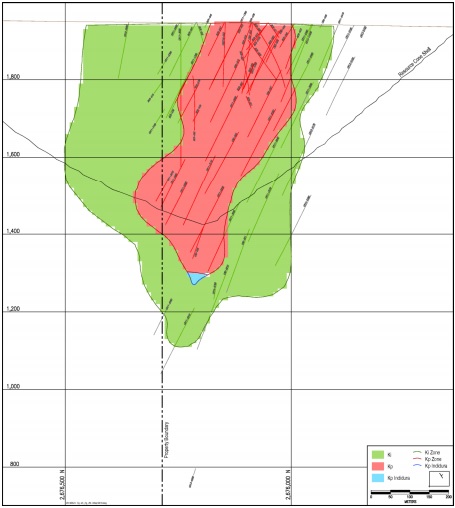
Figure 14-6 Alteration on Section 29, IMC 2019
Kappes, Cassiday & Associates
June, 2019 | | 14.0 Mineral Resource Estimate
Page 14-17 |
| Camino Rojo Project Feasibility Study NI 43-101 Technical Report |
|
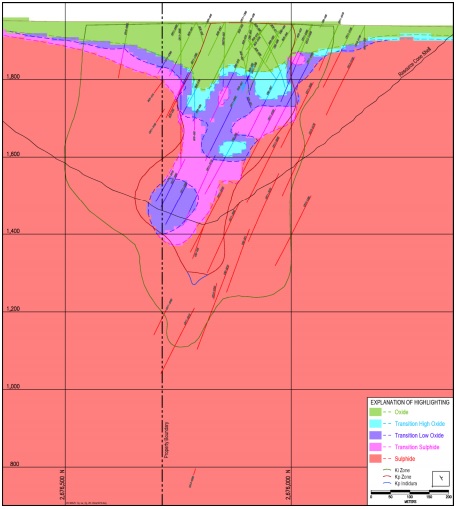
Figure 14- 7 Oxidation Zones on Section 29, IMC 2019
Kappes, Cassiday & Associates
June, 2019 | | 14.0 Mineral Resource Estimate
Page 14-18 |
| Camino Rojo Project Feasibility Study NI 43-101 Technical Report |
|

Figure 14- 8 Estimation Domains on Section L112, IMC 2019
Kappes, Cassiday & Associates
June, 2019 | | 14.0 Mineral Resource Estimate
Page 14-19 |
| Camino Rojo Project Feasibility Study NI 43-101 Technical Report |
|
| 14.2.3 | Potentially Contaminated RC Samples |
As discussed in Section 12.0, IMC conducted a review of the Canplats RC drilling results, particularly portions of the holes that were deemed wet. Based on the analysis IMC determined that the assay intervals marked as wet or humid for the following 16 holes are potentially contaminated and they were not used for resource modeling:
| BCR-031 | BCR-039 | BCR-040 | BCR-052 |
| BCR-069 | BCR-080 | BCR-010 | BCR-028 |
| BCR-030 | BCR-032 | BCR-035 | BCR-044 |
| BCR-057 | BCR-074 | BCR-084 | BCR-085 |
| 14.2.4 | Cap Grades and Compositing |
IMC reviewed the distribution of assays for gold, silver, lead, and zinc, by six different populations and applied cap grades as shown in Figure 14-9. The top part of the table shows the cap grades and the bottom shows the number of assays capped. The cap grades were generally derived by reviewing probability plots and sorted lists of the assays to find breaks in the distributions. The cap grades are at the 99.8 percentile of the distributions for gold and silver and at the 99.9 percentile for lead and zinc; they would not generally be considered very aggressive capping.
Kappes, Cassiday & Associates
June, 2019 | | 14.0 Mineral Resource Estimate
Page 14-20 |
| Camino Rojo Project Feasibility Study NI 43-101 Technical Report |
|
Table 14-9
Cap Grades and Number of Assays Capped
| | | Northeast | Southwest | Indidura |
| Metal | Units | Kp | Ki | Kp | Ki | Kp | Ki |
| | | | | | | | |
| Gold | (g/t) | 11 | 5.4 | 27 | 6.8 | 18.5 | 15 |
| | | | | | | | |
| Silver | (g/t) | 108 | 79 | 145 | 263 | 103 | 73 |
| | | | | | | | |
| Lead | (%) | 1.9 | 1.4 | 2.7 | 2.2 | 1.0 | 0.75 |
| | | | | | | | |
| Zinc | (%) | 3.1 | 2.4 | 4.7 | 3.2 | 5.2 | 7.5 |
| | | | | | | | |
| Number of Assays Capped | | | | | |
| | | Northeast | Southwest | Indidura |
| Metal | Units | Kp | Ki | Kp | Ki | Kp | Ki |
| | | | | | | | |
| Gold | (none) | 27 | 18 | 59 | 63 | 4 | 18 |
| | | | | | | | |
| Silver | (none) | 28 | 18 | 61 | 62 | 4 | 18 |
| | | | | | | | |
| Lead | (none) | 17 | 10 | 31 | 33 | 2 | 9 |
| | | | | | | | |
| Zinc | (none) | 15 | 10 | 31 | 29 | 2 | 9 |
| | | | | | | | |
Figure 14-9 and Figure 14-10 show probability plots of gold assays and gold composites respectively for the NE domain. The plots show original and capped values for the Kp and Ki alterations types. Figure 14-11 and Figure 14-12 show the probability plots for gold for the SW domain and Figure 14-13 and Figure 14-14 are for Indidura.
The lithology and alteration codes were assigned to the drillhole database by back-assignment from the solids. The domain codes were assigned to the database by back-assignment from the model.
The drillhole database was composited to regular 5m downhole composites, though the current model is based on 10m blocks. This was to avoid blurring the rock type and alteration contacts. Table 14-10 and Table 14-11 show basic descriptive statistics for the assays and 5m composites respectively. Results are shown for gold, silver, lead, and zinc and are by the various estimation domain populations. The left side of the table shows results for uncapped values and the right side shows capped values.
Kappes, Cassiday & Associates
June, 2019 | | 14.0 Mineral Resource Estimate
Page 14-21 |
| Camino Rojo Project Feasibility Study NI 43-101 Technical Report |
|
Table 14-10
Summary Statistics of Assays
| | | Not Capped | | | | | Capped | | |
| | No. of | Mean | Std Dev | Max | Min | No. of | Mean | Std Dev | Max | Min |
| Metal/Domain | Samples | (g/t) | (g/t) | (g/t) | (g/t) | Samples | (g/t) | (g/t) | (g/t) | (g/t) |
| Gold: | 92,564 | 0.56 | 2.18 | 290.0 | 0.002 | 92,564 | 0.54 | 1.51 | 27.0 | 0.002 |
| Northeast Domain: | 21,784 | 0.57 | 1.12 | 51.3 | 0.002 | 21,784 | 0.56 | 0.91 | 11.0 | 0.002 |
| Kp Alteration | 12,934 | 0.79 | 1.31 | 51.3 | 0.002 | 12,934 | 0.77 | 1.05 | 11.0 | 0.002 |
| Ki Alteration | 8,850 | 0.25 | 0.61 | 22.3 | 0.002 | 8,850 | 0.24 | 0.50 | 5.4 | 0.002 |
| Southwest Domain: | 60,483 | 0.58 | 2.50 | 290.0 | 0.002 | 60,483 | 0.55 | 1.71 | 27.0 | 0.002 |
| Kp Alteration | 29,691 | 1.01 | 3.42 | 290.0 | 0.002 | 29,691 | 0.96 | 2.30 | 27.0 | 0.002 |
| Ki Alteration | 30,792 | 0.17 | 0.81 | 48.0 | 0.002 | 30,792 | 0.16 | 0.56 | 6.8 | 0.002 |
| All Caracol | 82,267 | 0.58 | 2.22 | 290.0 | 0.002 | 82,267 | 0.56 | 1.54 | 27.0 | 0.002 |
| Kp Alteration | 42,625 | 0.94 | 2.95 | 290.0 | 0.002 | 42,625 | 0.90 | 2.01 | 27.0 | 0.002 |
| Ki Alteration | 39,642 | 0.19 | 0.77 | 48.0 | 0.002 | 39,642 | 0.18 | 0.54 | 6.8 | 0.002 |
| Indidura | 10,297 | 0.42 | 1.81 | 63.8 | 0.002 | 10,297 | 0.38 | 1.20 | 18.5 | 0.002 |
| Kp Alteration | 1,652 | 0.80 | 1.81 | 27.1 | 0.002 | 1,652 | 0.79 | 1.68 | 18.5 | 0.002 |
| Ki Alteration | 8,645 | 0.34 | 1.80 | 63.8 | 0.002 | 8,645 | 0.31 | 1.07 | 15.0 | 0.002 |
| | No. of | Mean | Std Dev | Max | Min | No. of | Mean | Std Dev | Max | Min |
| Metal/Domain | Samples | (g/t) | (g/t) | (g/t) | (g/t) | Samples | (g/t) | (g/t) | (g/t) | (g/t) |
| Silver: | 92,564 | 6.8 | 24.8 | 4870 | 0.14 | 92,564 | 6.5 | 14.6 | 263 | 0.14 |
| Northeast Domain: | 21,784 | 11.7 | 35.9 | 4870 | 0.25 | 21,784 | 11.3 | 12.7 | 108 | 0.25 |
| Kp Alteration | 12,934 | 15.5 | 45.5 | 4870 | 0.25 | 12,934 | 15.0 | 13.9 | 108 | 0.25 |
| Ki Alteration | 8,850 | 6.0 | 9.2 | 338 | 0.25 | 8,850 | 5.9 | 8.1 | 79 | 0.25 |
| Southwest Domain: | 60,483 | 5.6 | 21.2 | 1310 | 0.14 | 60,483 | 5.4 | 15.7 | 263 | 0.14 |
| Kp Alteration | 29,691 | 6.8 | 15.9 | 804 | 0.25 | 29,691 | 6.7 | 13.2 | 145 | 0.25 |
| Ki Alteration | 30,792 | 4.4 | 25.2 | 1310 | 0.14 | 30,792 | 4.1 | 17.8 | 263 | 0.14 |
| All Caracol | 82,267 | 7.2 | 26.0 | 4870 | 0.14 | 82,267 | 6.9 | 15.2 | 263 | 0.14 |
| Kp Alteration | 42,625 | 9.5 | 28.6 | 4870 | 0.25 | 42,625 | 9.2 | 14.0 | 145 | 0.25 |
| Ki Alteration | 39,642 | 4.8 | 22.6 | 1310 | 0.14 | 39,642 | 4.5 | 16.1 | 263 | 0.14 |
| Indidura | 10,297 | 3.3 | 10.5 | 421 | 0.25 | 10,297 | 3.2 | 7.9 | 103 | 0.25 |
| Kp Alteration | 1,652 | 6.4 | 15.4 | 421 | 0.25 | 1,652 | 6.2 | 11.5 | 103 | 0.25 |
| Ki Alteration | 8,645 | 2.8 | 9.1 | 290 | 0.25 | 8,645 | 2.6 | 6.8 | 73 | 0.25 |
| | No. of | Mean | Std Dev | Max | Min | No. of | Mean | Std Dev | Max | Min |
| Metal/Domain | Samples | (%) | (%) | (%) | (%) | Samples | (%) | (%) | (%) | (%) |
| Lead: | 92,564 | 0.080 | 0.213 | 12.85 | 0.00 | 92,564 | 0.079 | 0.186 | 2.70 | 0.00 |
| Northeast Domain: | 21,784 | 0.195 | 0.237 | 8.85 | 0.00 | 21,784 | 0.194 | 0.226 | 1.90 | 0.00 |
| Kp Alteration | 12,934 | 0.265 | 0.245 | 3.53 | 0.00 | 12,934 | 0.264 | 0.242 | 1.90 | 0.00 |
| Ki Alteration | 8,850 | 0.092 | 0.180 | 8.85 | 0.00 | 8,850 | 0.091 | 0.149 | 1.40 | 0.00 |
| Southwest Domain: | 60,483 | 0.051 | 0.206 | 12.85 | 0.00 | 60,483 | 0.049 | 0.167 | 2.70 | 0.00 |
| Kp Alteration | 29,691 | 0.069 | 0.234 | 12.85 | 0.00 | 29,691 | 0.067 | 0.189 | 2.70 | 0.00 |
| Ki Alteration | 30,792 | 0.034 | 0.173 | 7.90 | 0.00 | 30,792 | 0.032 | 0.139 | 2.20 | 0.00 |
| All Caracol | 82,267 | 0.089 | 0.224 | 12.85 | 0.00 | 82,267 | 0.087 | 0.195 | 2.70 | 0.00 |
| Kp Alteration | 42,625 | 0.128 | 0.254 | 12.85 | 0.00 | 42,625 | 0.127 | 0.226 | 2.70 | 0.00 |
| Ki Alteration | 39,642 | 0.047 | 0.176 | 8.85 | 0.00 | 39,642 | 0.045 | 0.144 | 2.20 | 0.00 |
| Indidura | 10,297 | 0.011 | 0.061 | 2.69 | 0.00 | 10,297 | 0.010 | 0.046 | 1.00 | 0.00 |
| Kp Alteration | 1,652 | 0.022 | 0.091 | 2.69 | 0.00 | 1,652 | 0.021 | 0.066 | 1.00 | 0.00 |
| Ki Alteration | 8,645 | 0.008 | 0.054 | 2.09 | 0.00 | 8,645 | 0.008 | 0.040 | 0.75 | 0.00 |
| | No. of | Mean | Std Dev | Max | Min | No. of | Mean | Std Dev | Max | Min |
| Metal/Domain | Samples | (%) | (%) | (%) | (%) | Samples | (%) | (%) | (%) | (%) |
| Zinc: | 92,562 | 0.204 | 0.400 | 13.00 | 0.00 | 92,562 | 0.202 | 0.384 | 7.50 | 0.00 |
| Northeast Domain: | 21,784 | 0.330 | 0.319 | 5.44 | 0.00 | 21,784 | 0.329 | 0.312 | 3.10 | 0.00 |
| Kp Alteration | 12,934 | 0.431 | 0.341 | 4.41 | 0.00 | 12,934 | 0.431 | 0.337 | 3.10 | 0.00 |
| Ki Alteration | 8,850 | 0.181 | 0.209 | 5.44 | 0.00 | 8,850 | 0.180 | 0.191 | 2.40 | 0.00 |
| Southwest Domain: | 60,482 | 0.161 | 0.372 | 13.00 | 0.00 | 60,482 | 0.160 | 0.353 | 4.70 | 0.00 |
| Kp Alteration | 29,690 | 0.254 | 0.453 | 13.00 | 0.00 | 29,690 | 0.253 | 0.432 | 4.70 | 0.00 |
| Ki Alteration | 30,792 | 0.071 | 0.239 | 7.81 | 0.00 | 30,792 | 0.070 | 0.219 | 3.20 | 0.00 |
| All Caracol | 82,266 | 0.206 | 0.366 | 13.00 | 0.00 | 82,266 | 0.205 | 0.351 | 4.70 | 0.00 |
| Kp Alteration | 42,624 | 0.308 | 0.430 | 13.00 | 0.00 | 42,624 | 0.307 | 0.414 | 4.70 | 0.00 |
| Ki Alteration | 39,642 | 0.095 | 0.237 | 7.81 | 0.00 | 39,642 | 0.094 | 0.218 | 3.20 | 0.00 |
| Indidura | 10,296 | 0.187 | 0.607 | 13.00 | 0.00 | 10,296 | 0.185 | 0.586 | 7.50 | 0.00 |
| Kp Alteration | 1,652 | 0.291 | 0.567 | 6.21 | 0.00 | 1,652 | 0.290 | 0.559 | 5.20 | 0.00 |
| Ki Alteration | 8,644 | 0.167 | 0.612 | 13.00 | 0.00 | 8,644 | 0.165 | 0.589 | 7.50 | 0.00 |
Kappes, Cassiday & Associates
June, 2019 | | 14.0 Mineral Resource Estimate
Page 14-22 |
| Camino Rojo Project Feasibility Study NI 43-101 Technical Report |
|
Table 14-11
Summary Statistics of 5m Composites
| | | Not Capped | | | | | Capped | | |
| | No. of | Mean | Std Dev | Max | Min | No. of | Mean | Std Dev | Max | Min |
| Metal/Domain | Samples | (g/t) | (g/t) | (g/t) | (g/t) | Samples | (g/t) | (g/t) | (g/t) | (g/t) |
| Gold: | 28,761 | 0.56 | 1.37 | 89.1 | 0.002 | 28,761 | 0.54 | 1.02 | 24.2 | 0.002 |
| Northeast Domain: | 7,142 | 0.57 | 0.81 | 22.3 | 0.002 | 7,142 | 0.56 | 0.69 | 8.0 | 0.002 |
| Kp Alteration | 4,282 | 0.79 | 0.93 | 22.3 | 0.002 | 4,282 | 0.77 | 0.77 | 8.0 | 0.002 |
| Ki Alteration | 2,860 | 0.26 | 0.42 | 7.0 | 0.002 | 2,860 | 0.25 | 0.38 | 4.0 | 0.002 |
| Southwest Domain: | 18,524 | 0.58 | 1.57 | 89.1 | 0.002 | 18,524 | 0.55 | 1.15 | 24.2 | 0.002 |
| Kp Alteration | 9,138 | 1.00 | 2.09 | 89.1 | 0.002 | 9,138 | 0.95 | 1.49 | 24.2 | 0.002 |
| Ki Alteration | 9,386 | 0.17 | 0.53 | 19.7 | 0.002 | 9,386 | 0.16 | 0.38 | 6.0 | 0.002 |
| All Caracol | 25,666 | 0.58 | 1.40 | 89.1 | 0.002 | 25,666 | 0.55 | 1.04 | 24.2 | 0.002 |
| Kp Alteration | 13,420 | 0.93 | 1.80 | 89.1 | 0.002 | 13,420 | 0.89 | 1.31 | 24.2 | 0.002 |
| Ki Alteration | 12,246 | 0.19 | 0.51 | 19.7 | 0.002 | 12,246 | 0.18 | 0.38 | 6.0 | 0.002 |
| Indidura | 3,095 | 0.42 | 1.09 | 21.6 | 0.002 | 3,095 | 0.39 | 0.77 | 7.9 | 0.002 |
| Kp Alteration | 500 | 0.80 | 1.11 | 9.7 | 0.004 | 500 | 0.79 | 1.04 | 7.9 | 0.004 |
| Ki Alteration | 2,595 | 0.35 | 1.07 | 21.6 | 0.002 | 2,595 | 0.31 | 0.68 | 7.8 | 0.002 |
| | No. of | Mean | Std Dev | Max | Min | No. of | Mean | Std Dev | Max | Min |
| Metal/Domain | Samples | (g/t) | (g/t) | (g/t) | (g/t) | Samples | (g/t) | (g/t) | (g/t) | (g/t) |
| Silver: | 28,761 | 6.9 | 17.2 | 1961 | 0.25 | 28,761 | 6.6 | 10.4 | 211 | 0.25 |
| Northeast Domain: | 7,142 | 11.8 | 25.5 | 1961 | 0.25 | 7,142 | 11.4 | 10.2 | 89 | 0.25 |
| Kp Alteration | 4,282 | 15.6 | 31.9 | 1961 | 0.25 | 4,282 | 15.0 | 10.8 | 89 | 0.25 |
| Ki Alteration | 2,860 | 6.1 | 6.5 | 115 | 0.25 | 2,860 | 6.0 | 6.1 | 58 | 0.25 |
| Southwest Domain: | 18,524 | 5.6 | 13.7 | 531 | 0.25 | 18,524 | 5.3 | 10.5 | 211 | 0.25 |
| Kp Alteration | 9,138 | 6.8 | 10.4 | 252 | 0.25 | 9,138 | 6.7 | 9.0 | 128 | 0.25 |
| Ki Alteration | 9,386 | 4.4 | 16.3 | 531 | 0.25 | 9,386 | 4.1 | 11.7 | 211 | 0.25 |
| All Caracol | 25,666 | 7.3 | 18.0 | 1961 | 0.25 | 25,666 | 7.0 | 10.8 | 211 | 0.25 |
| Kp Alteration | 13,420 | 9.6 | 20.4 | 1961 | 0.25 | 13,420 | 9.3 | 10.4 | 128 | 0.25 |
| Ki Alteration | 12,246 | 4.8 | 14.6 | 531 | 0.25 | 12,246 | 4.5 | 10.7 | 211 | 0.25 |
| Indidura | 3,095 | 3.4 | 7.3 | 181 | 0.25 | 3,095 | 3.2 | 5.6 | 85 | 0.25 |
| Kp Alteration | 500 | 6.4 | 10.3 | 140 | 0.25 | 500 | 6.2 | 8.3 | 85 | 0.25 |
| Ki Alteration | 2,595 | 2.8 | 6.4 | 181 | 0.25 | 2,595 | 2.7 | 4.8 | 59 | 0.25 |
| | No. of | Mean | Std Dev | Max | Min | No. of | Mean | Std Dev | Max | Min |
| Metal/Domain | Samples | (%) | (%) | (%) | (%) | Samples | (%) | (%) | (%) | (%) |
| Lead: | 28,761 | 0.083 | 0.159 | 4.61 | 0.00 | 28,761 | 0.081 | 0.147 | 1.92 | 0.00 |
| Northeast Domain: | 7,142 | 0.196 | 0.193 | 2.99 | 0.00 | 7,142 | 0.195 | 0.189 | 1.43 | 0.00 |
| Kp Alteration | 4,282 | 0.263 | 0.201 | 1.56 | 0.00 | 4,282 | 0.263 | 0.199 | 1.43 | 0.00 |
| Ki Alteration | 2,860 | 0.094 | 0.126 | 2.99 | 0.00 | 2,860 | 0.093 | 0.112 | 0.93 | 0.00 |
| Southwest Domain: | 18,524 | 0.051 | 0.133 | 4.61 | 0.00 | 18,524 | 0.049 | 0.112 | 1.92 | 0.00 |
| Kp Alteration | 9,138 | 0.069 | 0.151 | 4.61 | 0.00 | 9,138 | 0.067 | 0.129 | 1.92 | 0.00 |
| Ki Alteration | 9,386 | 0.034 | 0.110 | 3.62 | 0.00 | 9,386 | 0.032 | 0.090 | 1.46 | 0.00 |
| All Caracol | 25,666 | 0.091 | 0.166 | 4.61 | 0.00 | 25,666 | 0.090 | 0.153 | 1.92 | 0.00 |
| Kp Alteration | 13,420 | 0.131 | 0.192 | 4.61 | 0.00 | 13,420 | 0.129 | 0.180 | 1.92 | 0.00 |
| Ki Alteration | 12,246 | 0.048 | 0.117 | 3.62 | 0.00 | 12,246 | 0.046 | 0.099 | 1.46 | 0.00 |
| Indidura | 3,095 | 0.011 | 0.041 | 1.01 | 0.00 | 3,095 | 0.010 | 0.032 | 0.63 | 0.00 |
| Kp Alteration | 500 | 0.023 | 0.068 | 1.01 | 0.00 | 500 | 0.021 | 0.050 | 0.51 | 0.00 |
| Ki Alteration | 2,595 | 0.008 | 0.033 | 0.77 | 0.00 | 2,595 | 0.008 | 0.026 | 0.63 | 0.00 |
| | No. of | Mean | Std Dev | Max | Min | No. of | Mean | Std Dev | Max | Min |
| Metal/Domain | Samples | (%) | (%) | (%) | (%) | Samples | (%) | (%) | (%) | (%) |
| Zinc: | 28,761 | 0.207 | 0.289 | 5.58 | 0.00 | 28,761 | 0.206 | 0.281 | 5.24 | 0.00 |
| Northeast Domain: | 7,142 | 0.332 | 0.267 | 3.23 | 0.01 | 7,142 | 0.331 | 0.263 | 2.96 | 0.01 |
| Kp Alteration | 4,282 | 0.432 | 0.277 | 3.23 | 0.01 | 4,282 | 0.431 | 0.275 | 2.96 | 0.01 |
| Ki Alteration | 2,860 | 0.183 | 0.161 | 2.95 | 0.01 | 2,860 | 0.182 | 0.149 | 1.48 | 0.01 |
| Southwest Domain: | 18,524 | 0.161 | 0.258 | 3.96 | 0.00 | 18,524 | 0.160 | 0.249 | 3.25 | 0.00 |
| Kp Alteration | 9,138 | 0.254 | 0.305 | 3.96 | 0.00 | 9,138 | 0.253 | 0.296 | 3.25 | 0.00 |
| Ki Alteration | 9,386 | 0.071 | 0.155 | 2.55 | 0.00 | 9,386 | 0.070 | 0.144 | 2.14 | 0.00 |
| All Caracol | 25,666 | 0.209 | 0.271 | 3.96 | 0.00 | 25,666 | 0.208 | 0.264 | 3.25 | 0.00 |
| Kp Alteration | 13,420 | 0.311 | 0.308 | 3.96 | 0.00 | 13,420 | 0.310 | 0.301 | 3.25 | 0.00 |
| Ki Alteration | 12,246 | 0.097 | 0.163 | 2.95 | 0.00 | 12,246 | 0.096 | 0.153 | 2.14 | 0.00 |
| Indidura | 3,095 | 0.188 | 0.404 | 5.58 | 0.00 | 3,095 | 0.186 | 0.389 | 5.24 | 0.00 |
| Kp Alteration | 500 | 0.291 | 0.369 | 3.62 | 0.00 | 500 | 0.290 | 0.362 | 3.20 | 0.00 |
| Ki Alteration | 2,595 | 0.168 | 0.407 | 5.58 | 0.00 | 2,595 | 0.166 | 0.391 | 5.24 | 0.00 |
Kappes, Cassiday & Associates
June, 2019 | | 14.0 Mineral Resource Estimate
Page 14-23 |
| Camino Rojo Project Feasibility Study NI 43-101 Technical Report |
|
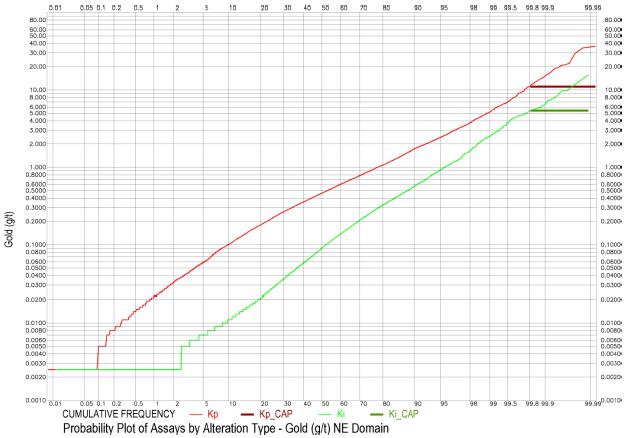
Figure 14-9 Probability Plot of Gold Assays by Alteration Type – NE Domain

Figure 14-10 Probability Plot of Gold 5m Composites by Alteration Type – NE Domain
Kappes, Cassiday & Associates
June, 2019 | | 14.0 Mineral Resource Estimate
Page 14-24 |
| Camino Rojo Project Feasibility Study NI 43-101 Technical Report |
|
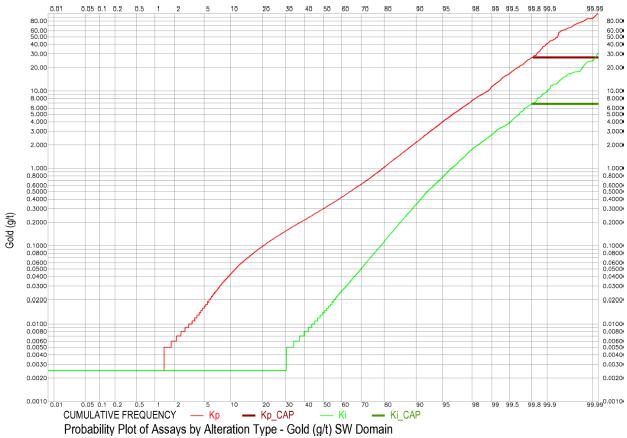
Figure 14-11 Probability Plot of Gold Assays by Alteration Type – SW Domain
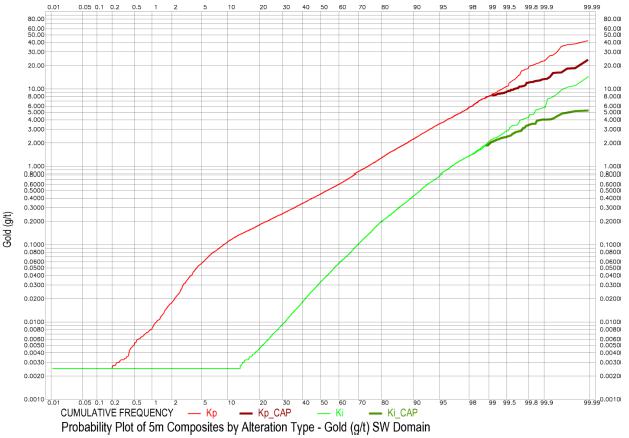
Figure 14-12 Probability Plot of Gold 5m Composites by Alteration Type – SW Domain
Kappes, Cassiday & Associates
June, 2019 | | 14.0 Mineral Resource Estimate
Page 14-25 |
| Camino Rojo Project Feasibility Study NI 43-101 Technical Report |
|
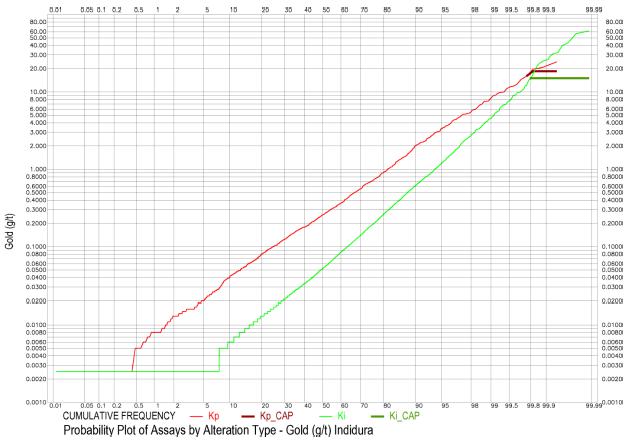
Figure 14-13 Probability Plot of Gold Assays by Alteration Type – Indidura
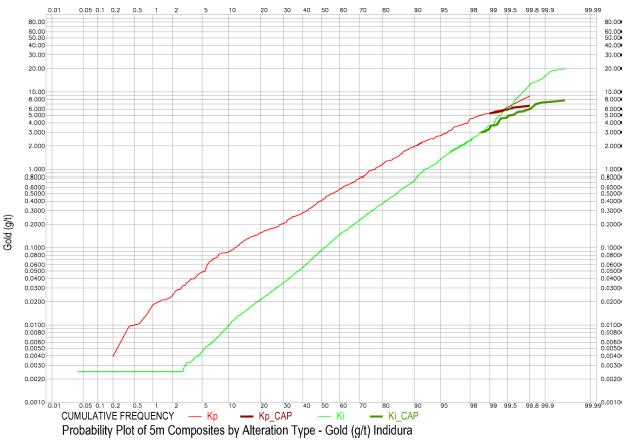
Figure 14-14 Probability Plot of Gold 5m Composites by Alteration Type – Indidura
Kappes, Cassiday & Associates
June, 2019 | | 14.0 Mineral Resource Estimate
Page 14-26 |
| Camino Rojo Project Feasibility Study NI 43-101 Technical Report |
|
IMC conducted a variogram analysis of gold in the Kp alteration type for the NE domain. The analysis was based on the 5m composites. Figure 14-15 shows the variogram in the N60°E direction with no dip. This is a good variogram in terms of clarity and has a range of about 135m. This direction is assumed as the major axis for the variogram model. Figure 14-16 shows the variogram in the S30°E direction with a dip of 15°. This is also a good variogram in terms of clarity with ranges of 85 and 160m for the two structures fit to it. It is noted that the primary and secondary directions conform to the strike and dip of the bedding.
Figure 14-17 shows the variogram in the north direction with a 60° dip. This is approximately, but not exactly, the tertiary direction to the previous variograms. This direction represents the approximate downhole direction for much of the drilling, so is a convenient direction for calculation. The variogram is of good clarity, but relatively short range. The range of the first structure fit to the variogram is about 32m and about 90% of the total variability in this variogram takes place within about this distance.
Figure 14-18 shows the variogram in the S60°W direction with a 25° dip for the SW domain. This is assumed to be the primary axis, and it appears evident on cross sections. The variogram has good clarity with a range of about 100m.
Figure 14-19 shows the variogram in the north direction with a 60° dip. As previously mentioned, this is the approximate downhole direction for much of the drilling. Orla geological personnel propose that a primary control of mineralization is related to structures trending about N60°E with a steep NNW dip. This variogram is approximately in that direction. It can be seen however that the range of the variogram is quite short, about 8m for the first structure and 31m for the second structure. However, IMC could not find any direction perpendicular to the major axis that produced good variogram results. Based on this, it was determined to assume the secondary and tertiary directions were the same, and about half the range of the primary direction.
IMC did not run variograms for Indidura; there is not sufficient drilling. Indidura grade estimations are the same as for the SW domain. IMC also did not run variograms for the lower grade Ki alteration zones. The Ki searches are assumed to be the same as for Kp alteration.
Kappes, Cassiday & Associates
June, 2019 | | 14.0 Mineral Resource Estimate
Page 14-27 |
| Camino Rojo Project Feasibility Study NI 43-101 Technical Report |
|
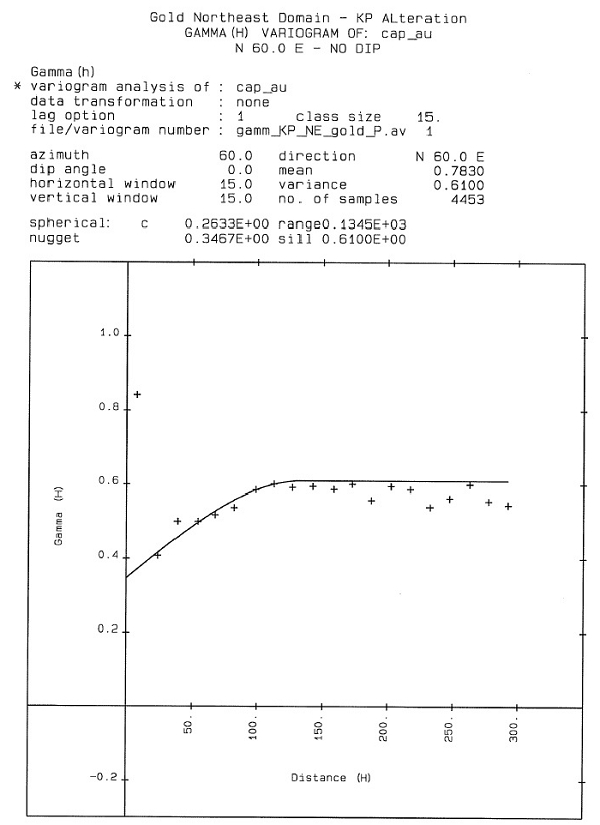
Figure 14-15 NE Domain Gold Variogram – Primary Axis
Kappes, Cassiday & Associates
June, 2019 | | 14.0 Mineral Resource Estimate
Page 14-28 |
| Camino Rojo Project Feasibility Study NI 43-101 Technical Report |
|

Figure 14-16 NE Domain Gold Variogram – Secondary Axis
Kappes, Cassiday & Associates
June, 2019 | | 14.0 Mineral Resource Estimate
Page 14-29 |
| Camino Rojo Project Feasibility Study NI 43-101 Technical Report |
|
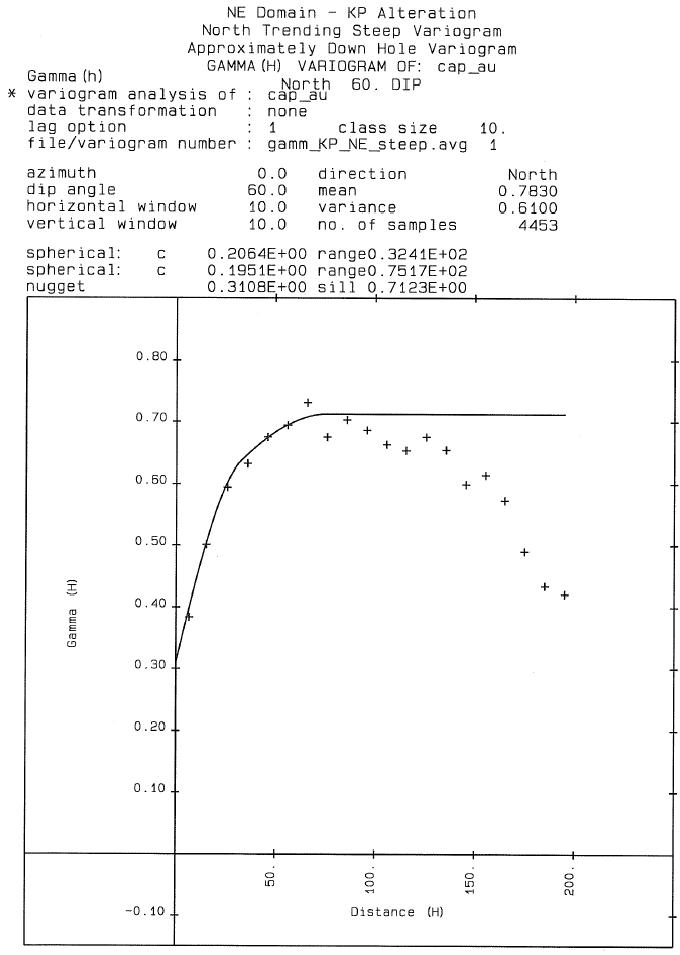
Figure 14-17 NE Domain Gold Variogram – Tertiary Axis
Kappes, Cassiday & Associates
June, 2019 | | 14.0 Mineral Resource Estimate
Page 14-30 |
| Camino Rojo Project Feasibility Study NI 43-101 Technical Report |
|
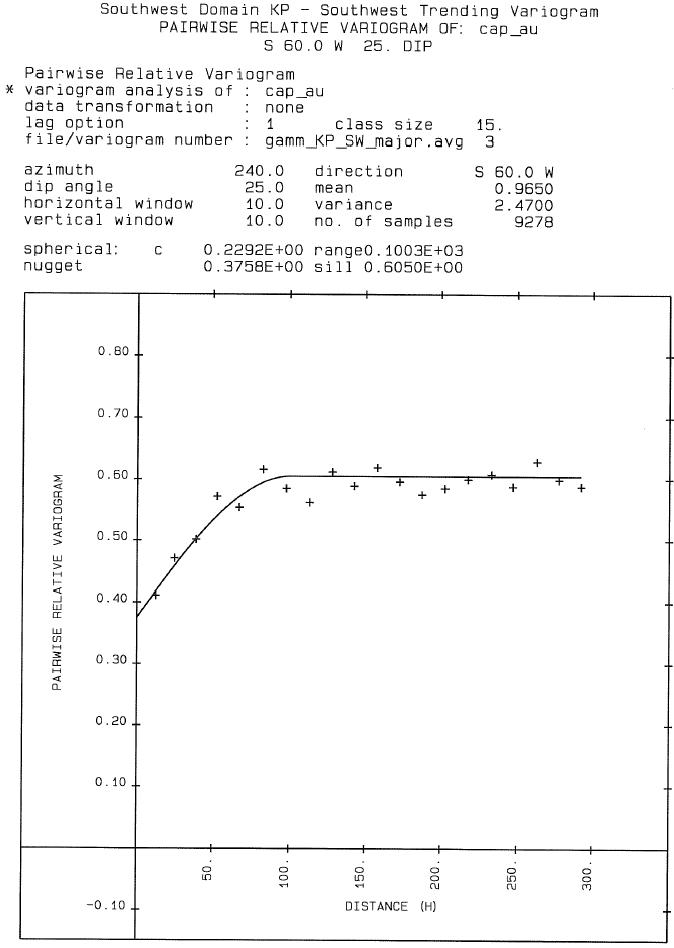
Figure 14-18 SW Domain Gold Variogram – Primary Axis
Kappes, Cassiday & Associates
June, 2019 | | 14.0 Mineral Resource Estimate
Page 14-31 |
| Camino Rojo Project Feasibility Study NI 43-101 Technical Report |
|
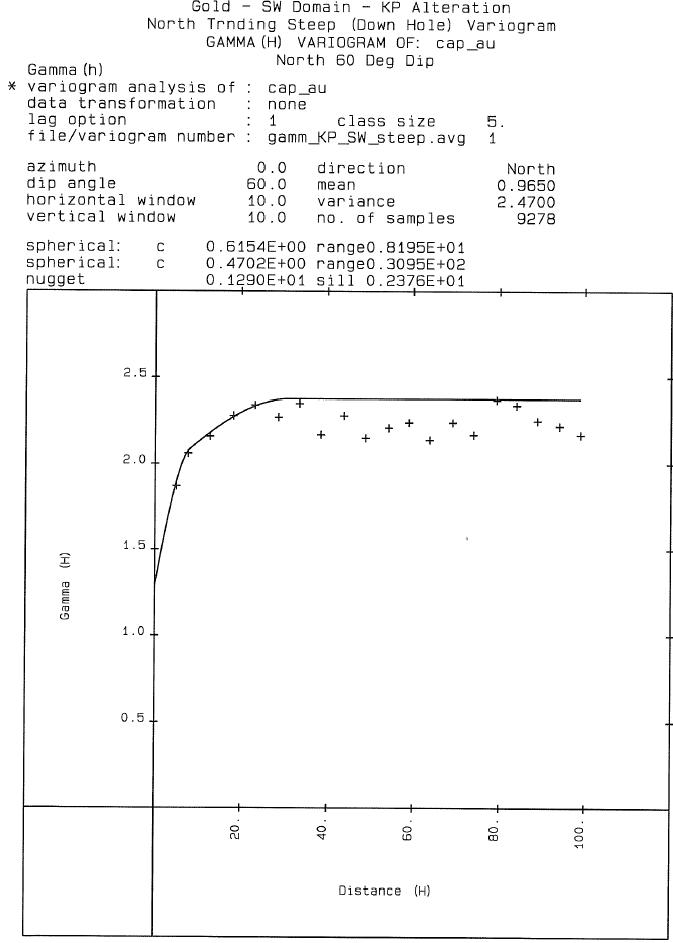
Figure 14-19 SW Domain Gold Variogram – Down Hole Variogram
Kappes, Cassiday & Associates
June, 2019 | | 14.0 Mineral Resource Estimate
Page 14-32 |
| Camino Rojo Project Feasibility Study NI 43-101 Technical Report |
|
| 14.2.6 | Block Grade Estimation |
The Kp versus Ki alteration types were treated as a hard boundary for estimation purposes. Kp blocks were only estimated with Kp composites, etc. The Indidura/Caracol boundary was also a hard boundary. As was depicted on Table 14-7 there are six domains for grade estimation for gold, silver, lead, and zinc:
The NE and SW domains were not a hard boundary for estimation, but were used to control search orientation. For the NE Caracol (Kp and Ki), the primary axis of the search ellipse had a dip direction and dip of 60° (N60°E) and 0° respectively and the secondary axis had a dip direction and dip of 150° (S30°E) and 15° (down) respectively. The search radii were 100m along the primary and secondary directions and 30m in the tertiary direction.
IMC estimated grades for gold, silver, lead, and zinc using inverse distance with a power weight of 2 (ID2). A maximum of 15 composites, a minimum of three and a maximum of three composites per hole was used. The effect of inverse distance weighting along with a relatively low number of composites should produce relatively unsmoothed estimates of block grades. Also recall that 5m composites were used to estimate the grades of the 10m blocks. Figure 14-20 shows a cross section of the gold grades in the NE domain.
For the SW Caracol (again Kp and Ki), and also the Indidura domains, the primary axis of the search ellipse had a dip direction and dip of 240° (S60°W) and 25° (down). The search radii were 100m along the major axis and 50m, circular, perpendicular to the primary axis.
A maximum of 24 composites, a minimum of four and a maximum of eight composites per hole was used. This is more composites, and more per hole, than was used for the NE domain, but is necessary since there is not as much clarity on the secondary versus tertiary direction in the SW domain. Figure 14-21 shows a cross section of gold grades in the SW domain. Figure 14-22 shows the gold grades on the long section.
Arsenic grades were also estimated and incorporated into the resource model. The estimate was done using the same domains and parameters as gold, silver, lead, and zinc. The estimate was based on the multi-element data in the database. The upper detection limit for the arsenic assays was 10,000 ppm.
| | | |
Kappes, Cassiday & Associates June, 2019 | | 14.0 Mineral Resource Estimate Page 14-33 |
| Camino Rojo Project Feasibility Study NI 43-101 Technical Report |
|
Sulphur grades were also estimated and incorporated into the model. For sulphur, the oxidation types, oxide, transition high, transition low, transition sulphide, and sulphide, were used as hard boundaries for estimation. The Kp and Ki boundaries were also hard boundaries; there tended to be significant breaks in the sulphur grades across these boundaries. The sulphur estimates were also based on multi-element data in the database. The upper detection limit for sulphur was 10%.
Grade estimates for lead, zinc, arsenic and sulphur were also estimated into the waste zones outside of the established resource domains for waste characterization purposes. This also included the post mineral rock type. These estimates were also by Inverse Distance Squared (ID2) with a 100m by 100m by 30m vertical flat search.
| | | |
Kappes, Cassiday & Associates June, 2019 | | 14.0 Mineral Resource Estimate Page 14-34 |
| Camino Rojo Project Feasibility Study NI 43-101 Technical Report |
|
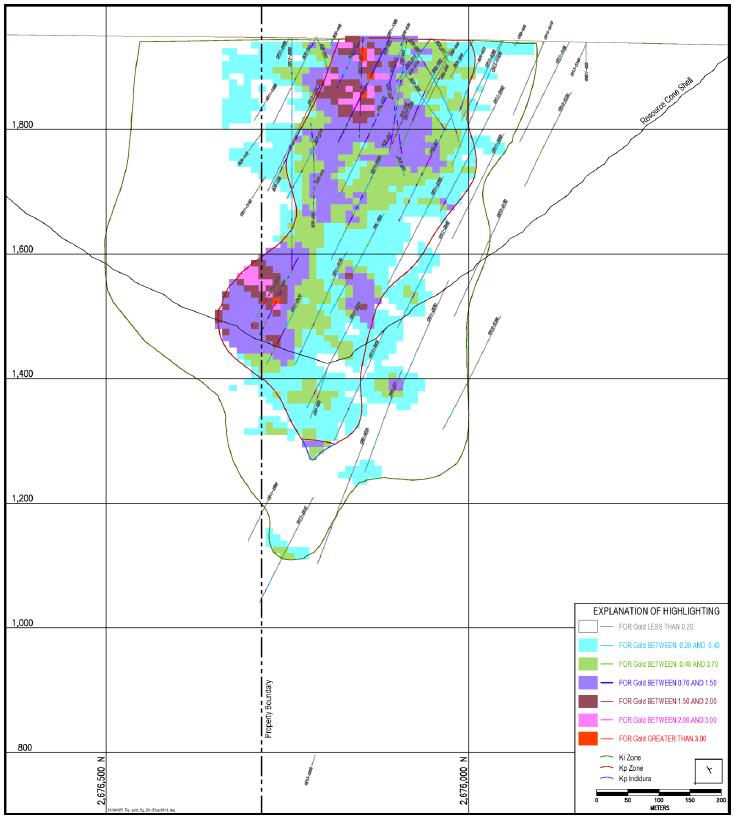
Figure 14-20 Gold Grades on Section 29, IMC 2019
| | | |
Kappes, Cassiday & Associates June, 2019 | | 14.0 Mineral Resource Estimate Page 14-35 |
| Camino Rojo Project Feasibility Study NI 43-101 Technical Report |
|
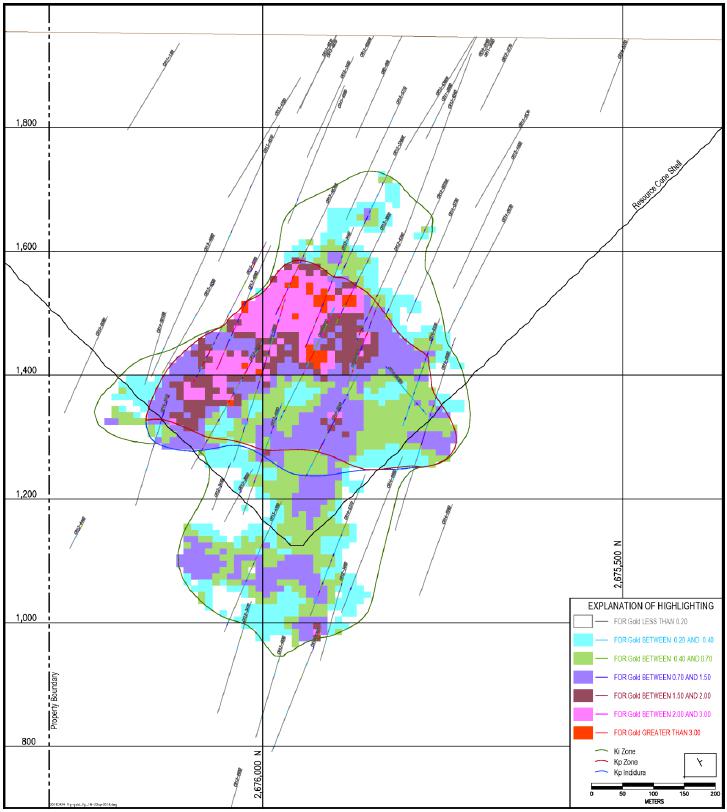
Figure 14-21 Gold Grades on Section 18, IMC 2019
| | | |
Kappes, Cassiday & Associates June, 2019 | | 14.0 Mineral Resource Estimate Page 14-36 |
| Camino Rojo Project Feasibility Study NI 43-101 Technical Report |
|
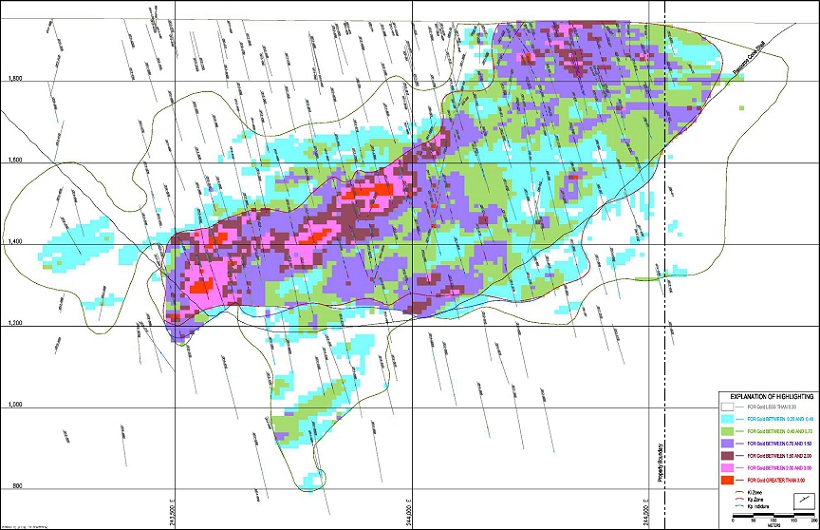
Figure 14-22 Gold Grades on Section L112, IMC 2019
| | | |
Kappes, Cassiday & Associates June, 2019 | | 14.0 Mineral Resource Estimate Page 14-37 |
| Camino Rojo Project Feasibility Study NI 43-101 Technical Report |
|
| 14.2.7 | Resource Classification |
For the purpose of classifying the Mineral Resources, two additional block estimates were done. They were based on the same search orientations and search radii as the grade estimates. The first estimate was based on a maximum of four composites, a minimum of four, and a maximum of one composite per hole. The second estimate was based on a maximum of three composites, a minimum of three, and a maximum of one composite per hole. These estimates provide the average distance to the nearest three and four holes to each block and were put into the block model. Note the grade from this estimate was not used. Also, the Kp/Ki contact was not used as a hard boundary for these estimations.
Blocks with an average distance to four holes less than or equal to 25m were assigned as Measured Mineral Resource. Blocks with an average distance to the nearest three holes less than 45m, but greater than 25m from the nearest four holes, were assigned as Indicated Mineral Resource. Blocks with an average distance to three holes greater than 45m were assigned to Inferred Mineral Resource. The distribution of drilling at Camino Rojo is quite variable. Generally (not specific to Camino Rojo) an average distance to the nearest four holes of 25m corresponds to an average drill spacing of 30m to 33m. An average distance to the nearest three holes of 45m corresponds to an average drill spacing of about 60m. These estimates are approximate.
After setting classification codes as discussed above, there was some minor reclassification between the Measured and Indicated Mineral Resource categories to do some smoothing and orphan removal using the following procedure:
| · | First, Indicated blocks with edge contacts with two or more Measured blocks were reclassified as Measured. This is a minor smoothing operation that removed some orphan Indicated blocks and, in some cases, joined up some separate pods of Measured blocks. |
| · | Second, Measured blocks with 0 or 1 edge with other Measured blocks were reclassified as indicated. |
| · | Third, all Measured blocks on the 1640 bench and below were reclassified as Indicated blocks. At depth the Measured blocks are formed into fairly small pods of mostly transition sulphide or sulphide material. It is preferred to not classify this as Measured Mineral Resource. |
| | | |
Kappes, Cassiday & Associates June, 2019 | | 14.0 Mineral Resource Estimate Page 14-38 |
| Camino Rojo Project Feasibility Study NI 43-101 Technical Report |
|
Figure 14-23, Figure 14-24 and Figure 14-25 show the probability plots for these average distances for the NE, SW, and Indidura domains respectively. The approximate percent of blocks in each resource category are:
| | Measured | Indicated | Inferred |
| | | | |
| Northeast | 11.9% | 74.9% | 13.2% |
| | | | |
| Southwest | 1.9% | 60.2% | 37.9% |
| | | | |
| Indidura | 0.8% | 34.7% | 64.5% |
Figure 14-26 and Figure 14-27 show the resource categories on cross sections.
| | | |
Kappes, Cassiday & Associates June, 2019 | | 14.0 Mineral Resource Estimate Page 14-39 |
| Camino Rojo Project Feasibility Study NI 43-101 Technical Report |
|
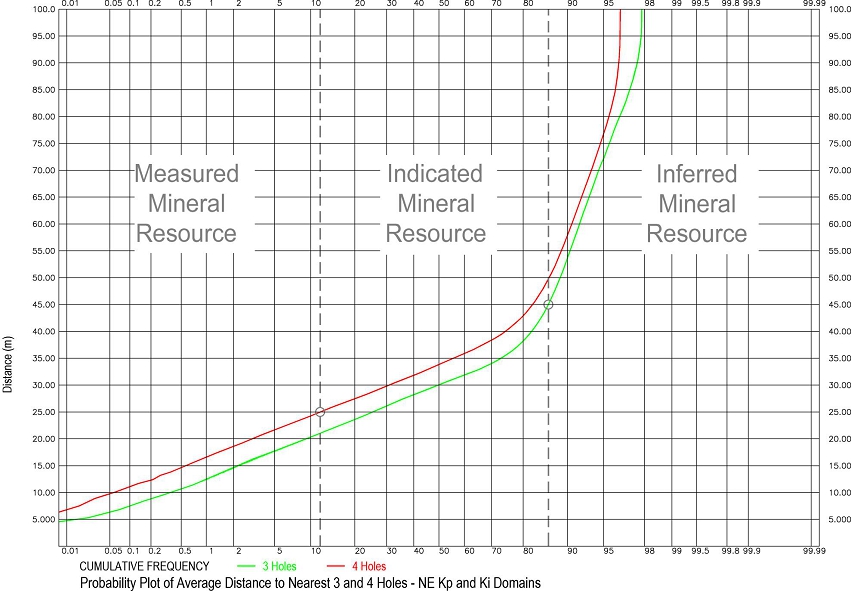
Figure 14-23 Average Distance to Nearest 3 & 4 Holes – NE Kp & Ki Domains
| | | |
Kappes, Cassiday & Associates June, 2019 | | 14.0 Mineral Resource Estimate Page 14-40 |
| Camino Rojo Project Feasibility Study NI 43-101 Technical Report |
|

Figure 14-24 Average Distance to Nearest 3 & 4 Holes – SW Kp & Ki Domains
| | | |
Kappes, Cassiday & Associates June, 2019 | | 14.0 Mineral Resource Estimate Page 14-41 |
| Camino Rojo Project Feasibility Study NI 43-101 Technical Report |
|
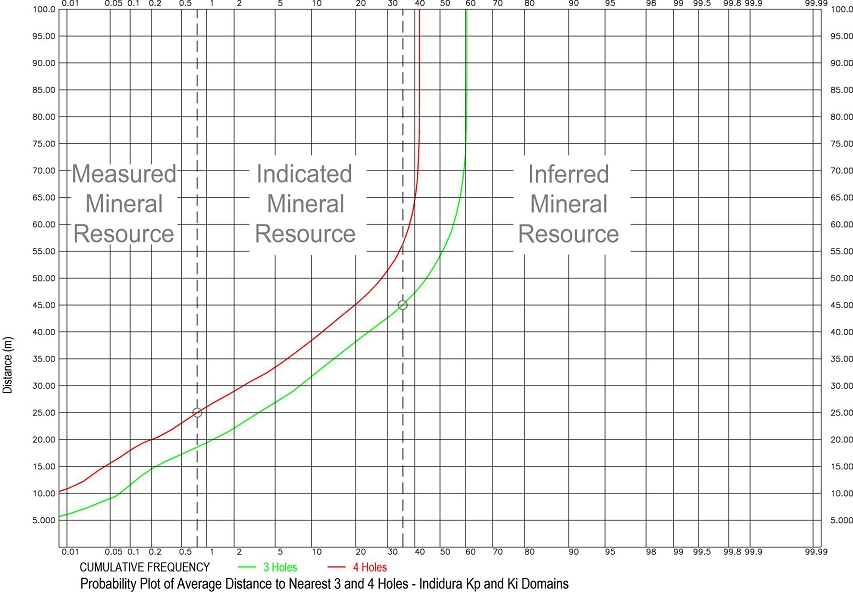
Figure 14-25 Average Distance to Nearest 3 & 4 Holes – Indidura Kp & Ki Domains
| | | |
Kappes, Cassiday & Associates June, 2019 | | 14.0 Mineral Resource Estimate Page 14-42 |
| Camino Rojo Project Feasibility Study NI 43-101 Technical Report |
|
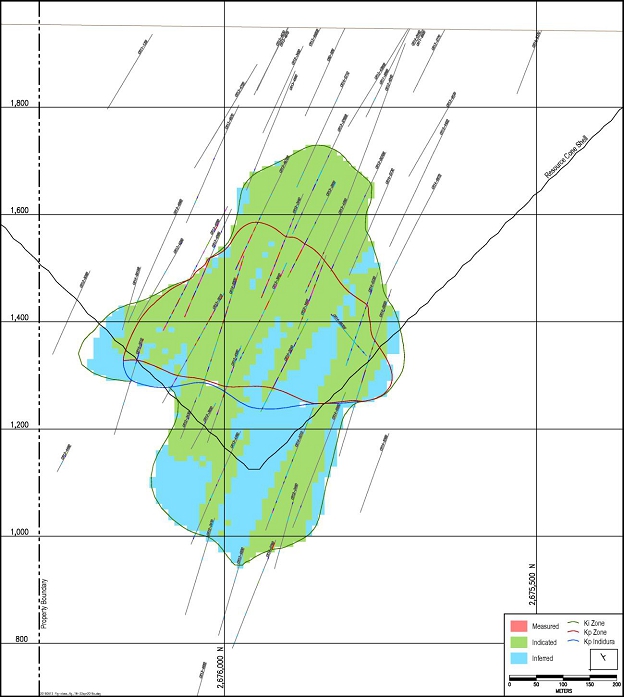
Figure 14-26 Resource Categories on Section 18, IMC 2019
| | | |
Kappes, Cassiday & Associates June, 2019 | | 14.0 Mineral Resource Estimate Page 14-43 |
| Camino Rojo Project Feasibility Study NI 43-101 Technical Report |
|
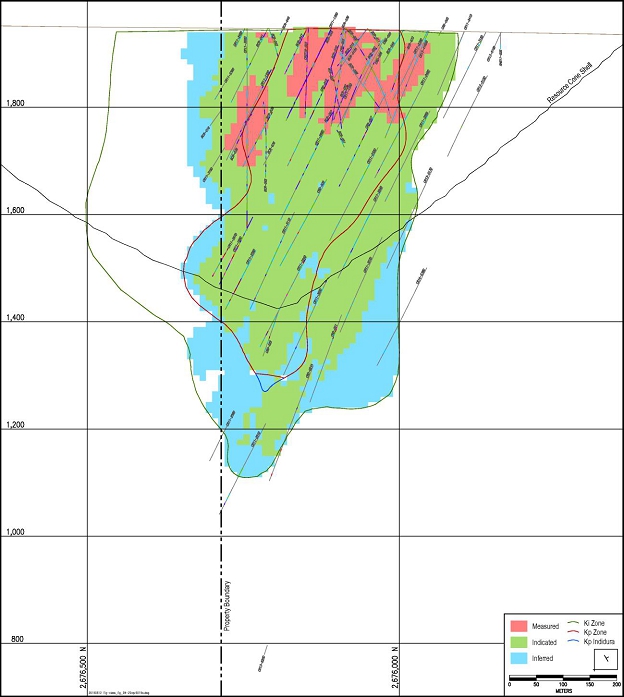
Figure 14-27 Resource Categories on Section 29, IMC 2019
| | | |
Kappes, Cassiday & Associates June, 2019 | | 14.0 Mineral Resource Estimate Page 14-44 |
| Camino Rojo Project Feasibility Study NI 43-101 Technical Report |
|
The database included about 10,000 specific gravity and density tests conducted on core. Some were based on the wax immersion method, but most were based on cutting whole core to obtain small cylinders and measuring them to obtain the volume; they were then weighed.
IMC examined this data by rock type and oxidation type. Table 14-12 shows the results.
Table 14-12
Specific Gravity and Bulk Density
| | | No. of | Specific | Bulk | Bulk | Ktonnes/ |
| Lithology | Oxidation | Samples | Gravity | Factor | Density | Block |
| | | | | | | |
| Post Min | Ox | 183 | 1.994 | 0.98 | 1.954 | 1.954 |
| | | | | | | |
| Caracol | Ox, TrH | 703 | 2.458 | 0.98 | 2.409 | 2.409 |
| | | | | | | |
| Caracol | TrL, TrS | 778 | 2.550 | 0.98 | 2.499 | 2.499 |
| | | | | | | |
| Caracol | Slf | 6450 | 2.618 | 0.98 | 2.566 | 2.566 |
| | | | | | | |
| Indura | TrS, Slf | 1915 | 2.664 | 0.98 | 2.611 | 2.611 |
| | | | | | | |
The post mineral rock types averaged about 2.0. For the Caracol unit there were measurable differences based on the level of oxidation. The oxide and TrH material averaged about 2.46, The TrL and TrS material about 2.55, and the sulphide about 2.62. The Indidura unit averaged about 2.66.
The average specific gravity was reduced 2% to obtain an estimate of bulk density. This is to allow for voids in the rock mass at a larger scale than what could be captured in the small core samples.
| | | |
Kappes, Cassiday & Associates June, 2019 | | 14.0 Mineral Resource Estimate Page 14-45 |
| Camino Rojo Project Feasibility Study NI 43-101 Technical Report |
|
| 14.2.9 | Mineral Resource Reconciliation |
A reconciliation of the current Mineral Resource, dated June 7, 2019, with the April 27, 2018 Mineral Resource, developed for the PEA study, was conducted. The Mineral Resource includes material amenable to heap leach recovery methods (leach material) and material amenable to mill and flotation concentration methods (mill material).
Table 14-13 shows the results for leach material. The portion of the April 27, 2018 Measured and Indicated Mineral Resource that was potentially leachable amounted to 100.8 million tonnes at 0.734 g/t gold and 12.67 g/t silver for 2.38 million contained gold ounces and 41.1 million contained silver ounces.
For the current Measured and Indicated Mineral Resource, the material that is potentially leachable amounts to 94.6 million tonnes at 0.711 g/t gold and 12.74 g/t silver for 2.16 million contained gold ounces and 38.8 million contained silver ounces. This amounts to 6.1% less tonnes at a 3.2% lower gold grade, a 0.5% higher silver grade for 9.2% less contained gold ounces and 5.6% less contained silver ounces for Measured and Indicated Mineral Resource.
The difference in Measured and Indicated Mineral Resource tonnes amounts to 6.2 million tonnes and is primarily due to differences in the interpretation of the oxide domains. There was a decrease in oxide and trans-low material and an increase of trans-sulf and sulfide (mill material) in the new resource model, i.e. there is a net transfer of material from leach material to mill material.
The main contributor to the 3.2% lower gold grade is the elimination of the potentially contaminated wet RC samples. It does not appear the new Orla drilling or revised geologic interpretations were significant contributors to the gold grade change.
There was also a net transfer of Mineral Resource from the Indicated to the Measured category for the leach material. This is due to some revisions in the classification methods described in Section 14.2.7 compared to the April 27, 2018 Mineral Resource. There was not much net change in classification due to drilling; the new Orla drilling and the elimination of potentially contaminated RC samples about balanced each other in terms of drilling density.
It is also noted that the differences in Mineral Resources are almost exclusively due to model differences. The cone shell used to define the Mineral Resource was about the same for both cases and the changes due to economic parameters and cutoff grades are not significant.
| | | |
Kappes, Cassiday & Associates June, 2019 | | 14.0 Mineral Resource Estimate Page 14-46 |
| Camino Rojo Project Feasibility Study NI 43-101 Technical Report |
|
Table 14-14 shows the reconciliation for mill material. The portion of the April 27, 2018 Measured and Indicated Mineral Resource that was potential mill material amounted to 254.1 million tonnes at 0.889 g/t gold and 7.50 g/t silver for 7.26 million ounces of contained gold and 61.3 million contained silver ounces.
For the current Measured and Indicated Mineral Resource, the material that is potentially millable amounts to 258.8 million tonnes at 0.877 g/t gold and 7.40 g/t silver for 7.30 million contained gold ounces and 61.6 million contained silver ounces. This amounts to 1.9% more tonnes at a 1.4% lower gold grade, a 1.3% lower silver grade for 0.4% more contained gold ounces and 0.5% more contained silver ounces for Measured and Indicated Mineral Resource.
The 4.7 million tonne increase in Measured and Indicated Mineral Resources is due primarily to the difference in the interpretation of the oxide domains, as discussed in the previous section. The gold and silver grade changes are minimal, but are due mostly to exclusion of the potentially contaminated RC samples.
The amount of Measured Mineral Resource in the potential mill material is minimal, but there has been a net transfer of material from the Measured to Indicated category for this material. As described in Section 14.2.7, Measured Mineral Resource below the 1640 bench were reclassified as Indicated Mineral Resource for the current Mineral Resource.
| 14.2.9.3 | Total Leach Plus Mill Material |
Table 14-15 shows the reconciliation for the Mineral Resource, including the leach and mill material. For Measured and Indicated Mineral Resource the current Mineral Resource has 0.4% less tonnes at a 1.5% lower gold grade and 1.5% lower silver grade for 1.9% less contained gold ounces and 2.0% less contained silver ounces. There is virtually no change to the overall Mineral Resource estimate.
| | | |
Kappes, Cassiday & Associates June, 2019 | | 14.0 Mineral Resource Estimate Page 14-47 |
| Camino Rojo Project Feasibility Study NI 43-101 Technical Report |
|
Table 14-13
Reconciliation of 2018 versus 2019 Mineral Resource - Leach Material
| | | | Gold | Silver | Gold | Silver |
| Resource Model | Kt | (g/t) | (g/t) | (koz) | (koz) |
| April 27, 2018 Mineral Resource | | | | | |
| | Measured Mineral Resource | 16,147 | 0.79 | 15.4 | 412.1 | 8,014 |
| | Indicated Mineral Resource | 84,692 | 0.72 | 12.1 | 1,969.3 | 33,076 |
| | Meas/Ind Mineral Resource | 100,839 | 0.73 | 12.7 | 2,381.3 | 41,091 |
| | Inferred Mineral Resource | 4,858 | 0.77 | 5.6 | 120.6 | 874 |
| | | | | | | |
| Current Mineral Resource - June 7, 2019 | | | | | |
| | Measured Mineral Resource | 19,391 | 0.77 | 14.9 | 482.3 | 9,305 |
| | Indicated Mineral Resource | 75,249 | 0.69 | 12.2 | 1,680.7 | 29,471 |
| | Meas/Ind Mineral Resource | 94,640 | 0.71 | 12.7 | 2,163.0 | 38,776 |
| | Inferred Mineral Resource | 4,355 | 0.86 | 5.8 | 119.8 | 805 |
| | | | | | | |
| Percent Difference | | | | | |
| | Measured Mineral Resource | 20.1% | -2.5% | -3.3% | 17.1% | 16.1% |
| | Indicated Mineral Resource | -11.1% | -3.9% | 0.3% | -14.7% | -10.9% |
| | Meas/Ind Mineral Resource | -6.1% | -3.2% | 0.5% | -9.2% | -5.6% |
| | Inferred Mineral Resource | -10.4% | 10.9% | 2.8% | -0.6% | -7.9% |
| | | | | | | |
Table 14-14
Reconciliation of 2018 versus 2019 Mineral Resource - Mill Material
| | | | Gold | Silver | Gold | Silver |
| Resource Model | Kt | (g/t) | (g/t) | (koz) | (koz) |
| April 27, 2018 Mineral Resource | | | | | |
| | Measured Mineral Resource | 9,818 | 0.86 | 7.5 | 272.6 | 2,352 |
| | Indicated Mineral Resource | 244,251 | 0.89 | 7.5 | 6,992.2 | 58,934 |
| | Meas/Ind Mineral Resource | 254,069 | 0.89 | 7.5 | 7,264.8 | 61,286 |
| | Inferred Mineral Resource | 60,342 | 0.87 | 7.9 | 1,696.9 | 15,334 |
| | | | | | | |
| Current Mineral Resource - June 7, 2019 | | | | | |
| | Measured Mineral Resource | 3,358 | 0.69 | 9.2 | 74.2 | 997 |
| | Indicated Mineral Resource | 255,445 | 0.88 | 7.4 | 7,221.4 | 60,606 |
| | Meas/Ind Mineral Resource | 258,803 | 0.88 | 7.4 | 7,295.6 | 61,603 |
| | Inferred Mineral Resource | 56,564 | 0.87 | 7.5 | 1,576.9 | 13,713 |
| | | | | | | |
| Percent Difference | | | | | |
| | Measured Mineral Resource | -65.8% | -20.5% | 23.9% | -72.8% | -57.6% |
| | Indicated Mineral Resource | 4.6% | -1.2% | -1.7% | 3.3% | 2.8% |
| | Meas/Ind Mineral Resource | 1.9% | -1.4% | -1.3% | 0.4% | 0.5% |
| | Inferred Mineral Resource | -6.3% | -0.9% | -4.6% | -7.1% | -10.6% |
| | | | | | | |
| | | |
Kappes, Cassiday & Associates June, 2019 | | 14.0 Mineral Resource Estimate Page 14-48 |
| Camino Rojo Project Feasibility Study NI 43-101 Technical Report |
|
Table 14-15
Reconciliation of 2018 versus 2019 Mineral Resource - Leach & Mill Material
| | | | Gold | Silver | Gold | Silver |
| Resource Model | Kt | (g/t) | (g/t) | (koz) | (koz) |
| April 27, 2018 Mineral Resource | | | | | |
| | Measured Mineral Resource | 25,965 | 0.82 | 12.4 | 684.6 | 10,367 |
| | Indicated Mineral Resource | 328,943 | 0.85 | 8.7 | 8,961.5 | 92,010 |
| | Meas/Ind Mineral Resource | 354,908 | 0.85 | 9.0 | 9,646.1 | 102,377 |
| | Inferred Mineral Resource | 65,200 | 0.87 | 7.7 | 1,817.5 | 16,208 |
| | | | | | | |
| Current Mineral Resource - June 7, 2019 | | | | | |
| | Measured Mineral Resource | 22,749 | 0.76 | 14.1 | 556.5 | 10,302 |
| | Indicated Mineral Resource | 330,694 | 0.84 | 8.5 | 8,902.1 | 90,078 |
| | Meas/Ind Mineral Resource | 353,443 | 0.83 | 8.8 | 9,458.6 | 100,379 |
| | Inferred Mineral Resource | 60,919 | 0.87 | 7.4 | 1,696.7 | 14,518 |
| | | | | | | |
| Percent Difference | | | | | |
| | Measured Mineral Resource | -12.4% | -7.2% | 13.4% | -18.7% | -0.6% |
| | Indicated Mineral Resource | 0.5% | -1.2% | -2.6% | -0.7% | -2.1% |
| | Meas/Ind Mineral Resource | -0.4% | -1.5% | -1.5% | -1.9% | -2.0% |
| | Inferred Mineral Resource | -6.6% | -0.1% | -4.1% | -6.6% | -10.4% |
| | | | | | | |
| | | |
Kappes, Cassiday & Associates June, 2019 | | 14.0 Mineral Resource Estimate Page 14-49 |
| Camino Rojo Project Feasibility Study NI 43-101 Technical Report |
|
| 15.0 | MINERAL RESERVE ESTIMATE |
Table 15-1 presents the Mineral Reserve for the Camino Rojo Project. The Proven and Probable Mineral Reserve amounts to 44.0 million tonnes at 0.73 g/t Au and 14.2 g/t Ag for 1.03 million contained gold ounces and 20.1 million contained silver ounces. Direct feed material in the Mineral Reserve is material that will be processed the same year it is mined. The low- grade stockpile material will be processed after the open pit is depleted. The effective date of this Mineral Reserve is 24 June 2019.
The Mineral Reserve is based on an open pit mine plan and mine production schedule developed by IMC. Processing is based on crushing and heap leaching to recover gold and silver. Table 15-2 shows the parameters used for economic and cut-off calculations. The Mineral Reserve is based on a gold price of US$1250 per ounce and a silver price of US$17.00 per ounce. Measured Mineral Resource in the mine production schedule was converted to Proven Mineral Reserve and Indicated Mineral Resource in the schedule was converted to Probable Mineral Reserve.
The Mineral Reserves are classified in accordance with the “CIM Definition Standards – For Mineral Resources and Mineral Reserves” adopted by the CIM Council (as amended, the “CIM Definition Standards”) in accordance with the requirements of NI 43-101. Mineral Reserve estimates reflect the reasonable expectation that all necessary permits and approvals will be obtained and maintained. The Project is in a jurisdiction friendly to mining.
IMC does not believe that there are significant risks to the Mineral Reserve estimate based on metallurgical or infrastructure factors. There has been a significant amount of metallurgical testing and the infrastructure requirements are relatively straightforward compared to many operations. However, recoveries lower than forecast would result is loss of revenue for the project. There has also been some potential preg-robbing material identified in the deposit, as discussed in Section 13.5 and 25.3.2, but this does not appear to represent a significant risk.
There is risk to the Mineral Reserve based on mining factors. As discussed in Section 16.2 and 25.3.1, the slope angle assumptions are based on careful application of wall control blasting, and the north and west wall slope angles are also based on significant mechanical support. Failure of these systems to perform as expected would result in less ore available for the process plant and potentially a shorter project life. Also, slope stability issues on the north wall of the pit could be difficult to mitigate due to lack of access to the ground north of the pit.
| | | |
Kappes, Cassiday & Associates June, 2019 | | 15.0 Mineral Reserve Estimate Page 15-1 |
| Camino Rojo Project Feasibility Study NI 43-101 Technical Report |
|
Other risks to the Mineral Reserve are related to economic parameters such as prices lower than forecast or costs higher than the current estimates. The impact of these is modeled in the sensitivity study with the economic analysis in Section 22.10.
All of the mineralization comprised in the Mineral Reserve estimate with respect to the Camino Rojo Project is contained on mineral titles controlled by Orla as is all the proposed development and mining and processing activities.
| | | |
Kappes, Cassiday & Associates June, 2019 | | 15.0 Mineral Reserve Estimate Page 15-2 |
| Camino Rojo Project Feasibility Study NI 43-101 Technical Report |
|
Table 15-1
Mineral Reserve
| | | | | | | | | Cont. | Cont. |
| | | | | | NSR | Gold | Silver | Gold | Silver |
| Reserve Class | Ktonnes | ($/t) | (g/t) | (g/t) | (koz) | (koz) |
| Proven Mineral Reserve | | | | | | | |
| | Direct Feed | | 13,331 | 22.87 | 0.84 | 15.6 | 358.8 | 6,698 |
| | Low Grade Stockpile | | 1,264 | 7.19 | 0.27 | 10.0 | 10.9 | 406 |
| | Total Proven Mineral Reserve | 14,595 | 21.51 | 0.79 | 15.1 | 369.7 | 7,104 |
| Probable Mineral Reserve | | | | | | |
| | Direct Feed | | 25,939 | 20.27 | 0.76 | 14.4 | 629.8 | 12,029 |
| | Low Grade Stockpile | | 3,485 | 7.05 | 0.28 | 8.6 | 31.3 | 962 |
| | Total Probable Mineral Reserve | 29,424 | 18.70 | 0.70 | 13.7 | 661.1 | 12,991 |
| Probable/Probable Mineral Reserve | | | | | | |
| | Direct Feed | | 39,270 | 21.15 | 0.78 | 14.8 | 988.6 | 18,726 |
| | Low Grade Stockpile | | 4,749 | 7.09 | 0.28 | 9.0 | 42.3 | 1,368 |
| | Total Probable/Probable Reserve | 44,019 | 19.63 | 0.73 | 14.2 | 1,030.9 | 20,095 |
Notes:
1. The Mineral Reserve estimate has an effective date of 24 June 2019 and was prepared using the CIM Definition Standards (10 May 2014).
2. Columns may not sum exactly due to rounding.
3. Mineral Reserves are based on prices of $1250/oz gold and $17/oz silver.
4. Mineral Reserves are based on NSR cut-offs that vary by time period to balance mine and plant production capacities (see Section 16). They range from a low of $4.73/t to a high of $9.00/t.
5. NSR value for leach material is as follows:
Kp Oxide: NSR ($/t) = 27.46 x gold (g/t) + 0.057 x silver (g/t), based on gold recovery of 70% and silver recovery of 11%
Ki Oxide: NSR ($/t) = 21.97 x gold (g/t) + 0.078 x silver (g/t), based on gold recovery of 56% and silver recovery of 15%
Tran-Hi: NSR ($/t) = 23.54 x gold (g/t) + 0.140 x silver (g/t), based on gold recovery of 60% and silver recovery of 27%
Tran-Lo: NSR ($/t) = 15.69 x gold (g/t) + 0.177 x silver (g/t), based on gold recovery of 40% and silver recovery of 34%
6. Table 15-2 accompanies this Mineral Reserve estimate and shows all relevant parameters
| | | |
Kappes, Cassiday & Associates June, 2019 | | 15.0 Mineral Reserve Estimate Page 15-3 |
| Camino Rojo Project Feasibility Study NI 43-101 Technical Report |
|
Table 15-2 shows the parameters for pit design. Only gold and silver are produced for this plan and the only material types considered are the Kp Oxide, Ki Oxide, Transitional Hi, and Transitional Low.
Gold and silver prices are US$1250/oz and US$17/oz respectively. IMC believes these prices to be reasonable based on: 1) Historical 3-year trailing averages, 2) prices used by other companies for comparable projects, and 3) long range consensus price forecasts prepared by various bank economists.
For mine design, the base mining cost was estimated at US$1.85 per total tonne as previously developed for the PEA study on the Project. This was estimated based on a calculated owner mining cost plus an allowance for equipment depreciation and contractor profit. A cost of US$0.03 per total tonne for wall stabilization is based on a cost estimate developed by Piteau. An allowance of US$0.05 per tonne for pit dewatering has also been included to bring the total mining cost, for design purposes, to US$1.941 per total tonne. The unit costs for mining, processing, and G&A shown on Table 15-2 are preliminary estimates used for design. These differ from the final cost estimates developed by this report that were developed using the design mine plan. The final cost estimates used for the economic analysis are presented in Section 21.
Processing is by crushing and heap leaching at a rate of 18,000 tonnes per day or about 6.57 million tonnes per year. The gold and silver recoveries presented on the table were provided by KCA in March 2019 and are based on historical metallurgical testing and the new testing conducted during 2018 and 2019.
The processing and G&A costs of US$3.413 and US$1.319 respectively per processed tonne were provided by KCA and are based also based on the updated metallurgical testing.
IMC assumed 100% refinery payables for this case. The gold and silver refining costs are also IMC estimates. The oxide material is subject to a 2% NSR royalty.
Due to two products, and also variable recoveries by material type, an NSR value was used to tabulate proposed quantities of Mineral Reserves. The gold and silver NSR factors for Kp Oxide are calculated as follows:
Gold NSR Factor = ($1250 – $5.00) x 0.70 x 1.00 x 0.98 / 31.103 = US$27.459/t
Silver NSR Factor = ($17 – $0.50) x 0.11 x 1.00 x 0.98 / 31.103 = US$0.0572/t
| | | |
Kappes, Cassiday & Associates June, 2019 | | 15.0 Mineral Reserve Estimate Page 15-4 |
| Camino Rojo Project Feasibility Study NI 43-101 Technical Report |
|
The units are US$ per gram per tonne. The 0.98 constant represents an allowance for the royalty cost.
The NSR value for a block is calculated as:
NSR = US$27.459 x gold grade + US$0.0572 x silver grade
The breakeven NSR cut-off is US$6.67 per tonne, the mining + process + G&A. The internal NSR cut-off is US$4.73 per tonne, the process + G&A cost. Internal cut-off applies to blocks that have to be removed from the pit, so mining is a sunk cost. Note the NSR cut-off does not vary by material type, so is convenient for mine planning and scheduling. The NSR factors and cut-offs for the other material types are also shown in the table
The Mineral Reserves are based on NSR cutoffs that vary by time period to balance mine and plant production capacities. They range from a low of US$4.73/t to a high of US$9.00/t.
The Mineral Reserves include allowances for mining dilution and ore loss. IMC believes that reasonable amounts of dilution and loss were incorporated into the block model used for the FS. Compositing assays into composites and estimating blocks with multiple composites introduces some smoothing of model grades that are analogous to dilution and ore loss effects.
Only Measured and Indicated Mineral Resource are allowed to contribute to the economics for the Feasibility Study and be converted to Mineral Reserves. Inferred Mineral Resource is treated as waste for the FS.
| | | |
Kappes, Cassiday & Associates June, 2019 | | 15.0 Mineral Reserve Estimate Page 15-5 |
| Camino Rojo Project Feasibility Study NI 43-101 Technical Report |
|
Table 15-2
Economic Parameters for Mine Design
| Parameter/Material Type | Units | Kp Oxide | Ki Oxide | Tran-Hi | Tran-Low | Waste |
| Commodity Prices | | | | | | | | |
| | Gold Price Per Ounce | | (US$) | 1250 | 1250 | 1250 | 1250 | |
| | Silver Price Per Ounce | | (US$) | 17.00 | 17.00 | 17.00 | 17.00 | |
| Mining Cost Per Tonne | | | | | | | |
| | Contract Mining Cost | | (US$) | 1.859 | 1.859 | 1.859 | 1.859 | 1.859 |
| | Allowance for Wall Stabilization | (US$) | 0.032 | 0.032 | 0.032 | 0.032 | 0.032 |
| | Allowance for Pit Dewatering | (US$) | 0.050 | 0.050 | 0.050 | 0.050 | 0.050 |
| | Total Mining Cost | | (US$) | 1.941 | 1.941 | 1.941 | 1.941 | 1.941 |
| Process and G&A Cost Per Ore Tonne | | | | | | |
| | Processing | | | (US$) | 3.413 | 3.413 | 3.413 | 3.413 | |
| | G&A | | | | (US$) | 1.319 | 1.319 | 1.319 | 1.319 | |
| | Total Process and G&A | | (US$) | 4.732 | 4.732 | 4.732 | 4.732 | |
| Plant Recovery | | | | | | | | |
| | Gold | | | | (%) | 70% | 56% | 60% | 40% | |
| | Silver | | | | (%) | 11% | 15% | 27% | 34% | |
| Refinery Payables and Costs | | | | | | | |
| | Gold Refinery Payable | | (%) | 100% | 100% | 100% | 100% | |
| | Silver Refinery Payable | | (%) | 100% | 100% | 100% | 100% | |
| | Gold Refining Per Ounce | | (US$) | 5.00 | 5.00 | 5.00 | 5.00 | |
| | Silver Refining Per Ounce | | (US$) | 0.50 | 0.50 | 0.50 | 0.50 | |
| Royalties | | | | | | | | | |
| | Royalty | | | | (%) | 2% | 2% | 2% | 2% | |
| NSR Factors | | | | | | | | |
| | Gold NSR Factor | | | ($/g) | 27.459 | 21.968 | 23.537 | 15.691 | |
| | Silver NSR Factor | | ($/g) | 0.0572 | 0.0780 | 0.1404 | 0.1768 | |
| NSR Cut-offs | | | | | | | | |
| | Breakeven NSR Cut-off | ($/t) | 6.67 | 6.67 | 6.67 | 6.67 | |
| | Internal NSR Cut-off | ($/t) | 4.73 | 4.73 | 4.73 | 4.73 | |
| | | |
Kappes, Cassiday & Associates June, 2019 | | 15.0 Mineral Reserve Estimate Page 15-6 |
| Camino Rojo Project Feasibility Study NI 43-101 Technical Report |
|
| 16.1 | Operating Parameters and Criteria |
The Feasibility Study is based on a conventional open pit mine. Mine operations will consist of drilling medium diameter blast holes (approximately 17 cm), blasting with explosive emulsions or ANFO (ammonium nitrate/fuel oil) depending on water conditions, and loading into large off-road trucks with hydraulic shovels and wheel loaders. Resource will be delivered to the primary crusher and waste to the waste storage facility southeast of the pit. There will also be a low-grade stockpile facility to store marginally economic Mineral Reserves for processing at the end of commercial pit operations. There will be a fleet of track dozers, rubber-tired dozers, motor graders and water trucks to maintain the working areas of the pit, waste storage areas, and haul roads.
A mine plan was developed to supply Mineral Reserves to a conventional crushing and heap leach plant with the capacity to process 18,000 tpd (6,570 ktpy). The mine is scheduled to operate two 10-hour shifts per day for 365 days per year.
The mine plan is constrained by the Adjacent Owner concession boundary on the north side of the pit, i.e. the report is based on the assumption that no mining activities, including waste stripping, would occur on the Adjacent Owner’s mineral titles. Accordingly, delays in, or failure to obtain, an agreement with the Adjacent Owner to conduct mining operations on its mineral titles would have no impact on the timetable or cost of development of the potential mine modelled in this FS.
The geotechnical parameters relevant to the mine plan are discussed in Section 16.2 and are adequate for this FS.
Eventually, mining will be conducted below the water table, probably during Year 4 of commercial operation. Estimates of pit dewatering requirements have been prepared for cost estimation purposes. These are based on the median expected water in-flows. Additional hydrogeological studies underway will allow a better estimate of the pit dewatering requirements.
Several evaluations of slope angles have been conducted for Camino Rojo, all by Piteau. The slope angle design for this FS is based on the report “Recommended Geotechnical Slope Designs Incorporating Reinforcement for the Camino Rojo “Constrained” Pit Feasibility Study”. Figure 16-1 shows the inter-ramp (IR) slope angle recommendations from that report.
Kappes, Cassiday & Associates June, 2019 | | 16.0 Mining Methods Page 16-1 |
| Camino Rojo Project Feasibility Study NI 43-101 Technical Report |
|
The recommended slope design is based on a 38° IR angle for the post mineral rocks on the east side of the pit. The south wall is designed at a 53° IR angle based on double benching 10m benches. Lithology is dipping into the wall on the south side so it is expected to be relatively stable. It is assumed the controlled blasting, such as pre-splitting, will be required to maintain the bench face angles and catch benches.
The north and west walls are based on single benching (10m) at a 43° IR angle for the upper 50m of the wall and double benching below that at a 53° IR angle. This design is based on significant support for much of the north and west walls, consisting of drilling holes near the pit edge, insertion of rebar, and grouting with cement. The hole diameter is about 100mm and recommended spacing between holes is 1.7m for the 10m single benches and 0.6m for the 20m double benching. Number 10 rebar is assumed for the support. This is the design basis for the final pit for the FS. Pre-splitting is also assumed to maintain the face angles and catch benches.
Kappes, Cassiday & Associates June, 2019 | | 16.0 Mining Methods Page 16-2 |
| Camino Rojo Project Feasibility Study NI 43-101 Technical Report |
|
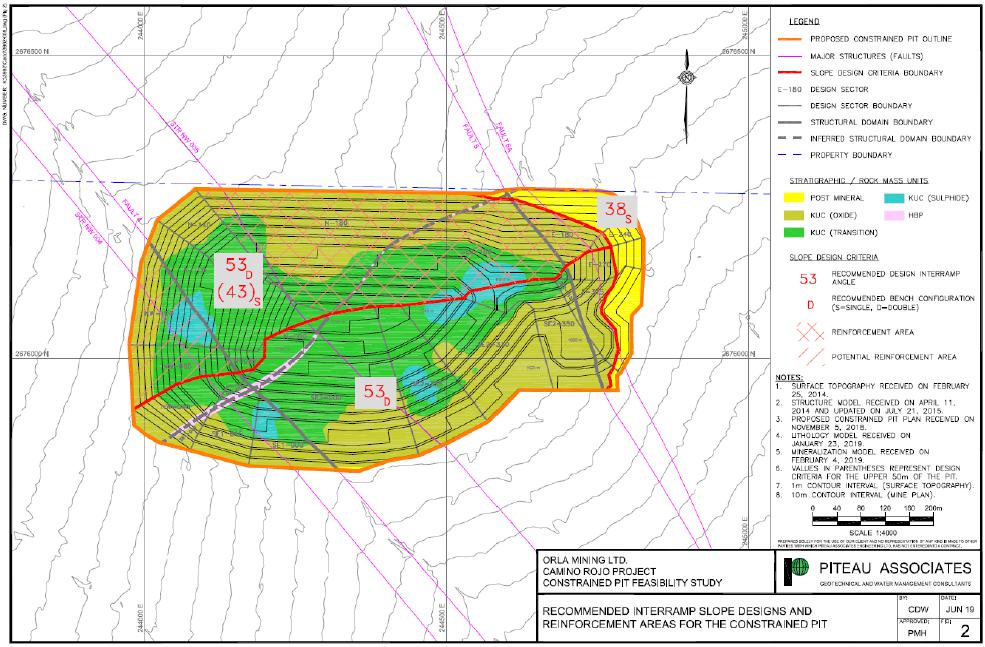
Figure 16-1 Slope Angle Recommendations, Piteau 2019
Kappes, Cassiday & Associates June, 2019 | | 16.0 Mining Methods Page 16-3 |
| Camino Rojo Project Feasibility Study NI 43-101 Technical Report |
|
The final pit design is based on the results of a floating cone analysis using the parameters discussed in the previous section. Figure 16-2 shows the final pit design. Due to space limitations there is only one mining phase, the final pit. The design includes the haul road and sufficient working room for the equipment. The road is 21m wide at a maximum grade of 10%. This will accommodate trucks of approximately 53 to 61 tonne capacity such as Caterpillar 773 or 775 class trucks.
Kappes, Cassiday & Associates June, 2019 | | 16.0 Mining Methods Page 16-4 |
| Camino Rojo Project Feasibility Study NI 43-101 Technical Report |
|
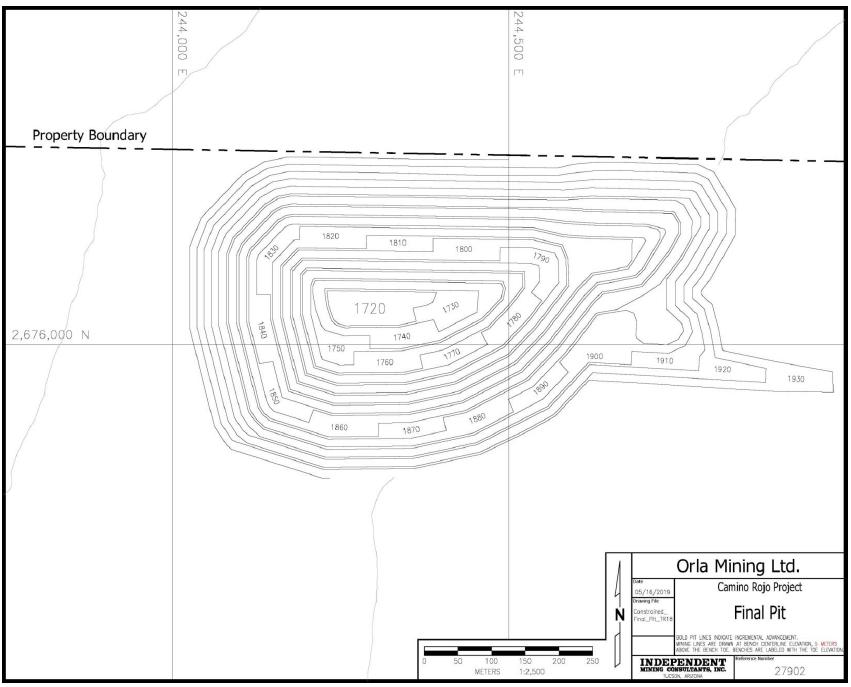
Figure 16-2 Final Pit, IMC 2019
Kappes, Cassiday & Associates June, 2019 | | 16.0 Mining Methods Page 16-5 |
| Camino Rojo Project Feasibility Study NI 43-101 Technical Report |
|
| 16.4 | Mine Production Schedule |
The schedule is based on processing the resource by crushing and heap leaching at a production rate of 18,000 tpd, or 6,570 ktpy. Table 16-1 shows the schedule. Preproduction and Year 1 are by months, Year 2 by quarters, and the rest of the schedule is by years.
The upper section of the table shows direct crusher feed material by time period. This is material that is processed during the same time period it is mined and amounts to 39.3 million tonnes at 0.78 g/t gold and 14.8 g/t silver. This produces about 988,600 ounces of contained gold and 637,400 ounces of recoverable gold for an average recovery of 64.5%. Contained and recoverable silver amounts to 18.7 and 3.28 million ounces respectively for an average recovery of 17.5%. As discussed, due to two products, gold and silver, and different recoveries for the different material types, an NSR cut-off was used to classify Mineral Reserves and waste for scheduling. The internal NSR cut-off is US$4.73, but this is only used for Years 6 and 7. For the other periods the cut-off varies by period to balance the mine and plant production capacities.
Low grade is material between an NSR cut-off of US$5.50 per tonne and the operating cut-off for the year. This amounts to 4.75 million tonnes at 0.28 g/t gold and 9.0 g/t silver. The US$5.50 per tonne low grade stockpile cut-off is the internal cut-off of US$4.73 per tonne and an allowance of US$0.77 per tonne for re-handle costs. This material is processed at the end of commercial pit production during Years 6 and 7.
The bottom of Table 16-1 shows that preproduction is 600,000 tonnes of total material. The schedule also shows 100kt of Reserve produced during the final month of preproduction. 63kt of the Reserve is designated as leach pad overliner to be crushed and placed during the final month of preproduction. The remaining 37kt will be placed on the pad during the first month of Year 1. Year 1 Q1 mine production is 822kt, about 50% of plant capacity. Total mine production ramps up during the first quarter of Year 1 to a rate of about 1,100 ktonnes per month or 3,300kt per quarter for Years 1 through 3; the peak material movement is 13.2 million tonnes during Year 2. Total material is 67.7 million tonnes. Waste, net of the low grade, is 23.7 million tonnes for an average waste strip ratio of 0.54 to 1.
Table 16-2 shows a proposed plant production schedule, including the direct feed material and the low grade stockpile. As previously discussed, the 100kt of preproduction Reserves is distributed between preproduction month 3 pad overliner (63kt), and 37kt added to Year 1 month 1 production. The low grade stockpile material is processed during Years 6 and 7. Total processed Reserve is 44.0 million tonnes at 0.73 g/t gold and 14.2 g/t silver. This amounts to 1.03 million ounces of contained gold and 20.1 million ounces of contained silver respectively. Recoverable gold and silver are 662,300 ounces and 3.48 million ounces respectively for average recoveries of 64% for gold and 17% for silver. The commercial Project life, including the low-grade stockpile, is about 6¾ years.
Kappes, Cassiday & Associates June, 2019 | | 16.0 Mining Methods Page 16-6 |
| Camino Rojo Project Feasibility Study NI 43-101 Technical Report |
|
Table 16-3 shows the proposed plant schedule by material type.
Figure 16-3 though Figure 16-11 show the pit, waste storage, and low-grade stockpile at the end of each mining year. There are two figures for Year 7, one showing end of mining, and the other showing the end of capping the waste storage facility and low-grade stockpile reclaim.
The mine production schedule includes allowances for mining dilution and ore loss. IMC believes that reasonable amounts of dilution and loss were incorporated into the block model used for the FS. Compositing assays into composites and estimating blocks with multiple composites introduces some smoothing of model grades that are analogous to dilution and ore loss effects.
Kappes, Cassiday & Associates June, 2019 | | 16.0 Mining Methods Page 16-7 |
| Camino Rojo Project Feasibility Study NI 43-101 Technical Report |
|
Table 16-1
Mine Production Schedule - 6,570 KTPY
| MINE PRODUCTION SCHEDULE: | (Units) | TOTAL | PP
M1 | PP
M2 | PP
M3 | Yr1
M1 | Yr1
M2 | Yr1
M3 | Yr1
M4 | Yr1
M5 | Yr1
M6 | Yr1
M7 | Yr1
M8 | Yr1
M9 | Yr1
M10 | Yr1
M11 | Yr1
M12 | Yr2
Q1 | Yr2
Q2 | Yr2
Q3 | Yr2
Q4 | Year
3 | Year
4 | Year
5 | Year
6 | Year
7 |
| LEACH RESERVE: | | | | | | | | | | | | | | | | | | | | | | | | | | |
| NSR Cut-off | ($/t) | | 8.75 | 8.75 | 8.75 | 8.75 | 8.75 | 8.75 | 5.00 | 5.00 | 5.00 | 5.00 | 5.00 | 5.00 | 7.00 | 7.00 | 7.00 | 6.00 | 7.00 | 7.25 | 7.50 | 9.00 | 9.00 | 9.00 | 4.73 | 4.73 |
| Ktonnes | (kt) | 39,272 | 0 | 0 | 100 | 100 | 212 | 510 | 548 | 549 | 548 | 546 | 548 | 548 | 548 | 547 | 549 | 1,643 | 1,645 | 1,642 | 1,642 | 6,569 | 6,570 | 6,570 | 6,215 | 923 |
| NSR | ($/t) | 21.15 | 0.00 | 0.00 | 20.30 | 30.32 | 26.88 | 21.19 | 16.81 | 17.28 | 25.02 | 18.47 | 14.43 | 10.77 | 12.49 | 19.37 | 25.86 | 16.23 | 20.46 | 18.35 | 22.84 | 21.27 | 24.16 | 23.54 | 19.74 | 18.88 |
| Gold | (g/t) | 0.78 | 0.00 | 0.00 | 0.72 | 1.08 | 0.97 | 0.79 | 0.59 | 0.63 | 0.95 | 0.68 | 0.51 | 0.40 | 0.46 | 0.69 | 0.94 | 0.60 | 0.74 | 0.66 | 0.82 | 0.76 | 0.86 | 0.87 | 0.81 | 0.80 |
| Silver | (g/t) | 14.8 | 0.0 | 0.0 | 11.7 | 11.6 | 10.6 | 9.8 | 12.7 | 10.4 | 9.2 | 8.6 | 9.7 | 9.6 | 11.2 | 11.7 | 10.3 | 9.7 | 12.0 | 10.6 | 12.0 | 12.9 | 15.5 | 17.3 | 20.8 | 21.2 |
| Lead | (%) | 0.27 | 0.00 | 0.00 | 0.42 | 0.37 | 0.35 | 0.30 | 0.31 | 0.29 | 0.30 | 0.25 | 0.33 | 0.26 | 0.25 | 0.31 | 0.33 | 0.25 | 0.28 | 0.33 | 0.31 | 0.31 | 0.28 | 0.27 | 0.19 | 0.18 |
| Zinc | (%) | 0.38 | 0.00 | 0.00 | 0.40 | 0.29 | 0.27 | 0.29 | 0.32 | 0.27 | 0.25 | 0.24 | 0.31 | 0.28 | 0.36 | 0.34 | 0.28 | 0.27 | 0.33 | 0.31 | 0.34 | 0.34 | 0.33 | 0.44 | 0.52 | 0.49 |
| Arsenic | (ppm) | 734 | 0 | 0 | 944 | 1,024 | 1,029 | 888 | 562 | 665 | 906 | 889 | 910 | 635 | 583 | 657 | 880 | 663 | 667 | 757 | 780 | 814 | 746 | 731 | 636 | 643 |
| Sulphur | (%) | 0.494 | 0.000 | 0.000 | 0.587 | 0.563 | 0.654 | 0.407 | 0.178 | 0.299 | 0.381 | 0.337 | 0.309 | 0.192 | 0.161 | 0.209 | 0.347 | 0.184 | 0.160 | 0.268 | 0.164 | 0.183 | 0.236 | 0.760 | 1.214 | 1.124 |
| Recovered Gold | (g/t) | 0.50 | 0.00 | 0.00 | 0.50 | 0.76 | 0.67 | 0.52 | 0.41 | 0.42 | 0.62 | 0.46 | 0.35 | 0.26 | 0.30 | 0.48 | 0.64 | 0.40 | 0.50 | 0.45 | 0.56 | 0.52 | 0.59 | 0.56 | 0.43 | 0.40 |
| Recovered Silver | (g/t) | 2.6 | 0.0 | 0.0 | 1.3 | 1.3 | 1.2 | 1.2 | 1.4 | 1.3 | 1.2 | 1.0 | 1.1 | 1.2 | 1.3 | 1.3 | 1.2 | 1.2 | 1.4 | 1.2 | 1.4 | 1.4 | 1.9 | 3.4 | 5.8 | 6.5 |
| Contained Gold | (koz) | 988.6 | 0.0 | 0.0 | 2.3 | 3.5 | 6.6 | 13.0 | 10.3 | 11.2 | 16.7 | 12.0 | 9.1 | 7.0 | 8.1 | 12.2 | 16.6 | 31.5 | 39.2 | 35.0 | 43.3 | 160.0 | 181.9 | 184.3 | 161.3 | 23.8 |
| Recoverable Gold | (koz) | 637.4 | 0.0 | 0.0 | 1.6 | 2.4 | 4.6 | 8.6 | 7.2 | 7.5 | 11.0 | 8.0 | 6.2 | 4.5 | 5.3 | 8.4 | 11.3 | 21.0 | 26.6 | 23.9 | 29.8 | 110.5 | 124.8 | 117.3 | 85.1 | 11.7 |
| Contained Silver | (koz) | 18,725 | 0 | 0 | 38 | 37 | 72 | 161 | 224 | 184 | 163 | 152 | 171 | 170 | 198 | 206 | 182 | 511 | 634 | 559 | 633 | 2,716 | 3,284 | 3,651 | 4,150 | 629 |
| Recoverable Silver | (koz) | 3,275 | 0 | 0 | 4 | 4 | 8 | 19 | 25 | 23 | 21 | 18 | 20 | 22 | 24 | 23 | 21 | 62 | 74 | 65 | 73 | 305 | 395 | 716 | 1,161 | 192 |
| Gold Recovery | (%) | 64.5% | 0.0% | 0.0% | 69.9% | 69.8% | 68.9% | 66.0% | 69.8% | 66.9% | 65.7% | 66.9% | 68.6% | 64.9% | 65.8% | 68.8% | 68.2% | 66.8% | 68.0% | 68.2% | 68.8% | 69.1% | 68.6% | 63.7% | 52.8% | 49.3% |
| Silver Recovery | (%) | 17.5% | 0.0% | 0.0% | 11.0% | 11.1% | 11.4% | 12.0% | 11.1% | 12.3% | 12.7% | 12.1% | 11.5% | 12.7% | 12.0% | 11.4% | 11.7% | 12.1% | 11.6% | 11.6% | 11.5% | 11.2% | 12.0% | 19.6% | 28.0% | 30.6% |
| LOW GRADE STOCKPILE: | | | | | | | | | | | | | | | | | | | | | | | | | | |
| NSR Cut-off | ($/t) | | 5.50 | 5.50 | 5.50 | 5.50 | 5.50 | 5.50 | 5.50 | 5.50 | 5.50 | 5.50 | 5.50 | 5.50 | 5.50 | 5.50 | 5.50 | 5.50 | 5.50 | 5.50 | 5.50 | 5.50 | 5.50 | 5.50 | 5.50 | 5.50 |
| Ktonnes | (kt) | 4,748 | 0 | 0 | 3 | 1 | 65 | 121 | 0 | 0 | 0 | 0 | 0 | 0 | 103 | 142 | 67 | 69 | 129 | 248 | 136 | 1,738 | 1,266 | 660 | 0 | 0 |
| NSR | ($/t) | 7.09 | 0.00 | 0.00 | 6.88 | 8.61 | 6.63 | 7.15 | 0.00 | 0.00 | 0.00 | 0.00 | 0.00 | 0.00 | 6.39 | 6.31 | 6.41 | 5.74 | 6.19 | 6.35 | 6.50 | 7.24 | 7.38 | 7.24 | 0.00 | 0.00 |
| Gold | (g/t) | 0.28 | 0.00 | 0.00 | 0.23 | 0.30 | 0.28 | 0.28 | 0.00 | 0.00 | 0.00 | 0.00 | 0.00 | 0.00 | 0.24 | 0.26 | 0.26 | 0.23 | 0.26 | 0.25 | 0.26 | 0.28 | 0.28 | 0.31 | 0.00 | 0.00 |
| Silver | (g/t) | 9.0 | 0.0 | 0.0 | 11.5 | 5.1 | 7.2 | 8.3 | 0.0 | 0.0 | 0.0 | 0.0 | 0.0 | 0.0 | 9.3 | 7.0 | 6.9 | 6.8 | 6.4 | 7.8 | 7.1 | 9.2 | 9.4 | 10.0 | 0.0 | 0.0 |
| Lead | (%) | 0.14 | 0.00 | 0.00 | 0.56 | 0.05 | 0.16 | 0.18 | 0.00 | 0.00 | 0.00 | 0.00 | 0.00 | 0.00 | 0.22 | 0.18 | 0.15 | 0.12 | 0.11 | 0.18 | 0.09 | 0.16 | 0.12 | 0.14 | 0.00 | 0.00 |
| Zinc | (%) | 0.24 | 0.00 | 0.00 | 0.33 | 0.19 | 0.19 | 0.25 | 0.00 | 0.00 | 0.00 | 0.00 | 0.00 | 0.00 | 0.30 | 0.27 | 0.21 | 0.23 | 0.25 | 0.25 | 0.20 | 0.24 | 0.22 | 0.28 | 0.00 | 0.00 |
| Arsenic | (ppm) | 456 | 0 | 0 | 1,299 | 530 | 433 | 530 | 0 | 0 | 0 | 0 | 0 | 0 | 586 | 506 | 523 | 348 | 384 | 452 | 356 | 459 | 441 | 467 | 0 | 0 |
| Sulphur | (%) | 0.227 | 0.000 | 0.000 | 0.839 | 0.485 | 0.469 | 0.342 | 0.000 | 0.000 | 0.000 | 0.000 | 0.000 | 0.000 | 0.225 | 0.101 | 0.156 | 0.057 | 0.047 | 0.124 | 0.043 | 0.080 | 0.199 | 0.784 | 0.000 | 0.000 |
| Recovered Gold | (g/t) | 0.16 | 0.00 | 0.00 | 0.16 | 0.21 | 0.15 | 0.17 | 0.00 | 0.00 | 0.00 | 0.00 | 0.00 | 0.00 | 0.15 | 0.15 | 0.15 | 0.13 | 0.15 | 0.15 | 0.15 | 0.17 | 0.17 | 0.16 | 0.00 | 0.00 |
| Recovered Silver | (g/t) | 1.3 | 0.0 | 0.0 | 1.3 | 0.6 | 1.1 | 1.1 | 0.0 | 0.0 | 0.0 | 0.0 | 0.0 | 0.0 | 1.2 | 1.0 | 1.0 | 1.0 | 0.9 | 1.1 | 1.0 | 1.2 | 1.3 | 2.2 | 0.0 | 0.0 |
| Contained Gold | (koz) | 42.3 | 0.0 | 0.0 | 0.0 | 0.0 | 0.6 | 1.1 | 0.0 | 0.0 | 0.0 | 0.0 | 0.0 | 0.0 | 0.8 | 1.2 | 0.6 | 0.5 | 1.1 | 2.0 | 1.2 | 15.4 | 11.5 | 6.5 | 0.0 | 0.0 |
| Recoverable Gold | (koz) | 24.9 | 0.0 | 0.0 | 0.0 | 0.0 | 0.3 | 0.7 | 0.0 | 0.0 | 0.0 | 0.0 | 0.0 | 0.0 | 0.5 | 0.7 | 0.3 | 0.3 | 0.6 | 1.2 | 0.7 | 9.4 | 7.0 | 3.3 | 0.0 | 0.0 |
| Contained Silver | (koz) | 1,368 | 0 | 0 | 1 | 0 | 15 | 32 | 0 | 0 | 0 | 0 | 0 | 0 | 31 | 32 | 15 | 15 | 27 | 62 | 31 | 513 | 383 | 211 | 0 | 0 |
| Recoverable Silver | (koz) | 203 | 0 | 0 | 0 | 0 | 2 | 4 | 0 | 0 | 0 | 0 | 0 | 0 | 4 | 5 | 2 | 2 | 4 | 8 | 4 | 67 | 53 | 47 | 0 | 0 |
| Gold Recovery | (%) | 58.8% | 0.0% | 0.0% | 70.0% | 70.0% | 56.2% | 61.0% | 0.0% | 0.0% | 0.0% | 0.0% | 0.0% | 0.0% | 61.6% | 56.8% | 58.3% | 57.1% | 56.5% | 59.8% | 57.9% | 61.2% | 60.4% | 50.8% | 0.0% | 0.0% |
| Silver Recovery | (%) | 14.8% | 0.0% | 0.0% | 11.0% | 11.0% | 14.9% | 13.1% | 0.0% | 0.0% | 0.0% | 0.0% | 0.0% | 0.0% | 12.7% | 14.5% | 14.3% | 14.2% | 14.6% | 13.6% | 14.2% | 13.1% | 13.8% | 22.3% | 0.0% | 0.0% |
| TOTAL MATERIAL AND WASTE: | | | | | | | | | | | | | | | | | | | | | | | | | | |
| Total Material | (kt) | 67,748 | 100 | 200 | 300 | 587 | 1,000 | 1,093 | 1,100 | 1,101 | 1,099 | 1,100 | 1,099 | 1,097 | 1,100 | 1,100 | 1,100 | 3,300 | 3,301 | 3,299 | 3,301 | 12,778 | 10,273 | 9,134 | 8,198 | 988 |
| Waste (Net of Low Grade) | (kt) | 23,728 | 100 | 200 | 197 | 486 | 723 | 462 | 552 | 552 | 551 | 554 | 551 | 549 | 449 | 411 | 484 | 1,588 | 1,527 | 1,409 | 1,523 | 4,471 | 2,437 | 1,904 | 1,983 | 65 |
| Waste Ratio | (none) | 0.54 | 0.00 | 0.00 | 1.91 | 4.81 | 2.61 | 0.73 | 1.01 | 1.01 | 1.01 | 1.01 | 1.01 | 1.00 | 0.69 | 0.60 | 0.79 | 0.93 | 0.86 | 0.75 | 0.86 | 0.54 | 0.31 | 0.26 | 0.32 | 0.07 |
Kappes, Cassiday & Associates June, 2019 | | 16.0 Mining Methods Page 16-8 |
| Camino Rojo Project Feasibility Study NI 43-101 Technical Report |
|
Table 16-2
Proposed Plant Production Schedule - 6,570 KTPY
| PLANT PRODUCTION SCHEDULE: | (Units) | TOTAL | PP
M1 | PP
M2 | PP
M3 | Yr1
M1 | Yr1
M2 | Yr1 M3 | Yr1
M4 | Yr1
M5 | Yr1
M6 | Yr1
M7 | Yr1
M8 | Yr1
M9 | Yr1
M10 | Yr1
M11 | Yr1
M12 | Yr2
Q1 | Yr2
Q2 | Yr2
Q3 | Yr2
Q4 | Year
3 | Year
4 | Year
5 | Year
6 | Year
7 |
| LEACH RESOURCE: | | | | | | | | | | | | | | | | | | | | | | | | | | |
| NSR Cut-off | ($/t) | | 8.75 | 8.75 | 8.75 | 8.75 | 8.75 | 8.75 | 5.00 | 5.00 | 5.00 | 5.00 | 5.00 | 5.00 | 7.00 | 7.00 | 7.00 | 6.00 | 7.00 | 7.25 | 7.50 | 9.00 | 9.00 | 9.00 | 4.73 | 4.73 |
| Ktonnes | (kt) | 44,020 | 0 | 0 | 63 | 137 | 212 | 510 | 548 | 549 | 548 | 546 | 548 | 548 | 548 | 547 | 549 | 1,643 | 1,645 | 1,642 | 1,642 | 6,569 | 6,570 | 6,570 | 6,570 | 5,316 |
| NSR | ($/t) | 19.63 | 0.00 | 0.00 | 20.30 | 27.61 | 26.88 | 21.19 | 16.81 | 17.28 | 25.02 | 18.47 | 14.43 | 10.77 | 12.49 | 19.37 | 25.86 | 16.23 | 20.46 | 18.35 | 22.84 | 21.27 | 24.16 | 23.54 | 19.07 | 9.12 |
| Gold | (g/t) | 0.73 | 0.00 | 0.00 | 0.72 | 0.98 | 0.97 | 0.79 | 0.59 | 0.63 | 0.95 | 0.68 | 0.51 | 0.40 | 0.46 | 0.69 | 0.94 | 0.60 | 0.74 | 0.66 | 0.82 | 0.76 | 0.86 | 0.87 | 0.78 | 0.36 |
| Silver | (g/t) | 14.2 | 0.0 | 0.0 | 11.7 | 11.6 | 10.6 | 9.8 | 12.7 | 10.4 | 9.2 | 8.6 | 9.7 | 9.6 | 11.2 | 11.7 | 10.3 | 9.7 | 12.0 | 10.6 | 12.0 | 12.9 | 15.5 | 17.3 | 20.1 | 11.1 |
| Lead | (%) | 0.26 | 0.00 | 0.00 | 0.42 | 0.38 | 0.35 | 0.30 | 0.31 | 0.29 | 0.30 | 0.25 | 0.33 | 0.26 | 0.25 | 0.31 | 0.33 | 0.25 | 0.28 | 0.33 | 0.31 | 0.31 | 0.28 | 0.27 | 0.19 | 0.15 |
| Zinc | (%) | 0.36 | 0.00 | 0.00 | 0.40 | 0.32 | 0.27 | 0.29 | 0.32 | 0.27 | 0.25 | 0.24 | 0.31 | 0.28 | 0.36 | 0.34 | 0.28 | 0.27 | 0.33 | 0.31 | 0.34 | 0.34 | 0.33 | 0.44 | 0.51 | 0.28 |
| Arsenic | (ppm) | 704 | 0 | 0 | 944 | 1003 | 1029 | 888 | 562 | 665 | 906 | 889 | 910 | 635 | 583 | 657 | 880 | 663 | 667 | 757 | 780 | 814 | 746 | 731 | 627 | 487 |
| Sulphur | (%) | 0.465 | 0.000 | 0.000 | 0.587 | 0.569 | 0.654 | 0.407 | 0.178 | 0.299 | 0.381 | 0.337 | 0.309 | 0.192 | 0.161 | 0.209 | 0.347 | 0.184 | 0.160 | 0.268 | 0.164 | 0.183 | 0.236 | 0.760 | 1.218 | 0.312 |
| Recovered Gold | (g/t) | 0.47 | 0.00 | 0.00 | 0.50 | 0.69 | 0.67 | 0.52 | 0.41 | 0.42 | 0.62 | 0.46 | 0.35 | 0.26 | 0.30 | 0.48 | 0.64 | 0.40 | 0.50 | 0.45 | 0.56 | 0.52 | 0.59 | 0.56 | 0.41 | 0.20 |
| Recovered Silver | (g/t) | 2.5 | 0.0 | 0.0 | 1.3 | 1.3 | 1.2 | 1.2 | 1.4 | 1.3 | 1.2 | 1.0 | 1.1 | 1.2 | 1.3 | 1.3 | 1.2 | 1.2 | 1.4 | 1.2 | 1.4 | 1.4 | 1.9 | 3.4 | 5.7 | 2.1 |
| Contained Gold | (koz) | 1,030.9 | 0.0 | 0.0 | 1.4 | 4.3 | 6.6 | 13.0 | 10.3 | 11.2 | 16.7 | 12.0 | 9.1 | 7.0 | 8.1 | 12.2 | 16.6 | 31.5 | 39.2 | 35.0 | 43.3 | 160.0 | 181.9 | 184.3 | 165.2 | 62.2 |
| Recoverable Gold | (koz) | 662.3 | 0.0 | 0.0 | 1.0 | 3.0 | 4.6 | 8.6 | 7.2 | 7.5 | 11.0 | 8.0 | 6.2 | 4.5 | 5.3 | 8.4 | 11.3 | 21.0 | 26.6 | 23.9 | 29.8 | 110.5 | 124.8 | 117.3 | 86.8 | 34.9 |
| Contained Silver | (koz) | 20,093 | 0 | 0 | 24 | 51 | 72 | 161 | 224 | 184 | 163 | 152 | 171 | 170 | 198 | 206 | 182 | 511 | 634 | 559 | 633 | 2,716 | 3,284 | 3,651 | 4,250 | 1,897 |
| Recoverable Silver | (koz) | 3,478 | 0 | 0 | 3 | 6 | 8 | 19 | 25 | 23 | 21 | 18 | 20 | 22 | 24 | 23 | 21 | 62 | 74 | 65 | 73 | 305 | 395 | 716 | 1,193 | 363 |
| Gold Recovery | (%) | 64.2% | 0.0% | 0.0% | 69.9% | 69.8% | 68.9% | 66.0% | 69.8% | 66.9% | 65.7% | 66.9% | 68.6% | 64.9% | 65.8% | 68.8% | 68.2% | 66.8% | 68.0% | 68.2% | 68.8% | 69.1% | 68.6% | 63.7% | 52.6% | 56.2% |
| Silver Recovery | (%) | 17.3% | 0.0% | 0.0% | 11.0% | 11.1% | 11.4% | 12.0% | 11.1% | 12.3% | 12.7% | 12.1% | 11.5% | 12.7% | 12.0% | 11.4% | 11.7% | 12.1% | 11.6% | 11.6% | 11.5% | 11.2% | 12.0% | 19.6% | 28.1% | 19.1% |
Kappes, Cassiday & Associates June, 2019 | | 16.0 Mining Methods Page 16-9 |
| Camino Rojo Project Feasibility Study NI 43-101 Technical Report |
|
Table 16-3
Proposed Plant Production Schedule by Material Type - 6,570 KTPY
| MATERIAL TYPE: | (Units) | TOTAL | PP
M1 | PP
M2 | PP
M3 | Yr1
M1 | Yr1
M2 | Yr1
M3 | Yr1
M4 | Yr1
M5 | Yr1
M6 | Yr1
M7 | Yr1
M8 | Yr1
M9 | Yr1
M10 | Yr1
M11 | Yr1
M12 | Yr2
Q1 | Yr2
Q2 | Yr2
Q3 | Yr2
Q4 | Year
3 | Year
4 | Year
5 | Year
6 | Year
7 |
| KP Oxide: | | | | | | | | | | | | | | | | | | | | | | | | | | |
| Ktonnes | (kt) | 27,154 | 0 | 0 | 63 | 134 | 182 | 369 | 530 | 319 | 290 | 379 | 470 | 288 | 372 | 452 | 433 | 1,127 | 1,306 | 1,350 | 1,376 | 6,034 | 5,685 | 3,769 | 608 | 1,618 |
| NSR | ($/t) | 22.32 | 0 | 0 | 20.3 | 27.92 | 29.35 | 22.2 | 17.14 | 24.11 | 34.65 | 21.59 | 15.41 | 14 | 13.62 | 21.75 | 29.39 | 19.03 | 22.57 | 19.88 | 25.25 | 21.77 | 25.41 | 25.45 | 28.44 | 7.44 |
| Gold | (g/t) | 0.78 | 0 | 0 | 0.72 | 0.99 | 1.05 | 0.79 | 0.6 | 0.85 | 1.24 | 0.77 | 0.54 | 0.49 | 0.47 | 0.77 | 1.05 | 0.67 | 0.8 | 0.7 | 0.89 | 0.77 | 0.89 | 0.89 | 0.99 | 0.25 |
| Silver | (g/t) | 13.7 | 0 | 0 | 11.7 | 11.7 | 11.1 | 10.4 | 12.9 | 11.9 | 10.1 | 9.1 | 9.9 | 10.6 | 12.5 | 12.6 | 10.8 | 10.3 | 12.9 | 11.1 | 12.8 | 13.2 | 16.2 | 15.6 | 21.9 | 11.4 |
| Lead | (%) | 0.31 | 0 | 0 | 0.42 | 0.39 | 0.38 | 0.36 | 0.31 | 0.33 | 0.42 | 0.31 | 0.36 | 0.36 | 0.31 | 0.33 | 0.38 | 0.3 | 0.32 | 0.37 | 0.35 | 0.32 | 0.3 | 0.27 | 0.2 | 0.22 |
| Zinc | (%) | 0.35 | 0 | 0 | 0.4 | 0.32 | 0.28 | 0.31 | 0.32 | 0.29 | 0.27 | 0.25 | 0.33 | 0.35 | 0.43 | 0.35 | 0.28 | 0.29 | 0.36 | 0.34 | 0.37 | 0.35 | 0.35 | 0.38 | 0.43 | 0.31 |
| Arsenic | (ppm) | 788 | 0 | 0 | 944 | 1013 | 1067 | 967 | 559 | 768 | 1040 | 1024 | 960 | 868 | 630 | 692 | 948 | 772 | 700 | 842 | 849 | 836 | 780 | 761 | 637 | 581 |
| Sulphur | (%) | 0.232 | 0 | 0 | 0.587 | 0.575 | 0.568 | 0.428 | 0.18 | 0.346 | 0.617 | 0.357 | 0.338 | 0.325 | 0.137 | 0.222 | 0.418 | 0.249 | 0.179 | 0.32 | 0.187 | 0.192 | 0.21 | 0.21 | 0.264 | 0.187 |
| Recovered Gold | (g/t) | 0.55 | 0 | 0 | 0.5 | 0.69 | 0.73 | 0.55 | 0.42 | 0.6 | 0.87 | 0.54 | 0.38 | 0.34 | 0.33 | 0.54 | 0.73 | 0.47 | 0.56 | 0.49 | 0.63 | 0.54 | 0.62 | 0.63 | 0.69 | 0.17 |
| Recovered Silver | (g/t) | 1.5 | 0 | 0 | 1.3 | 1.3 | 1.2 | 1.2 | 1.4 | 1.3 | 1.1 | 1 | 1.1 | 1.2 | 1.4 | 1.4 | 1.2 | 1.1 | 1.4 | 1.2 | 1.4 | 1.5 | 1.8 | 1.7 | 2.4 | 1.3 |
| KI Oxide: | | | | | | | | | | | | | | | | | | | | | | | | | | |
| Ktonnes | (kt) | 6,757 | 0 | 0 | 0 | 3 | 30 | 141 | 18 | 230 | 258 | 167 | 78 | 260 | 176 | 95 | 116 | 516 | 339 | 292 | 266 | 505 | 542 | 48 | 37 | 2,640 |
| NSR | ($/t) | 9.92 | 0 | 0 | 0 | 14.1 | 11.91 | 18.55 | 7.19 | 7.81 | 14.2 | 11.39 | 8.51 | 7.2 | 10.11 | 8.03 | 12.69 | 10.13 | 12.31 | 11.28 | 10.39 | 15.8 | 14.11 | 12.97 | 5.45 | 6.84 |
| Gold | (g/t) | 0.42 | 0 | 0 | 0 | 0.61 | 0.51 | 0.82 | 0.3 | 0.33 | 0.62 | 0.49 | 0.36 | 0.3 | 0.43 | 0.34 | 0.55 | 0.43 | 0.53 | 0.48 | 0.45 | 0.69 | 0.61 | 0.56 | 0.21 | 0.28 |
| Silver | (g/t) | 8.1 | 0 | 0 | 0 | 7.8 | 7.9 | 8.3 | 7.8 | 8.4 | 8.3 | 7.6 | 8.3 | 8.5 | 8.6 | 7.5 | 8.6 | 8.4 | 8.5 | 8.3 | 7.9 | 8.8 | 8.1 | 10 | 11 | 7.6 |
| Lead | (%) | 0.13 | 0 | 0 | 0 | 0.09 | 0.19 | 0.16 | 0.23 | 0.23 | 0.17 | 0.11 | 0.15 | 0.14 | 0.13 | 0.21 | 0.14 | 0.13 | 0.14 | 0.15 | 0.1 | 0.16 | 0.1 | 0.1 | 0.09 | 0.1 |
| Zinc | (%) | 0.21 | 0 | 0 | 0 | 0.22 | 0.22 | 0.25 | 0.25 | 0.24 | 0.23 | 0.21 | 0.21 | 0.2 | 0.22 | 0.27 | 0.26 | 0.22 | 0.23 | 0.19 | 0.21 | 0.23 | 0.17 | 0.22 | 0.24 | 0.2 |
| Arsenic | (ppm) | 458 | 0 | 0 | 0 | 547 | 799 | 683 | 653 | 523 | 756 | 582 | 608 | 377 | 484 | 490 | 628 | 425 | 539 | 362 | 423 | 561 | 472 | 497 | 364 | 378 |
| Sulphur | (%) | 0.107 | 0 | 0 | 0 | 0.29 | 1.179 | 0.351 | 0.109 | 0.233 | 0.116 | 0.291 | 0.137 | 0.045 | 0.213 | 0.145 | 0.083 | 0.041 | 0.089 | 0.026 | 0.048 | 0.082 | 0.079 | 0.072 | 0.211 | 0.096 |
| Recovered Gold | (g/t) | 0.24 | 0 | 0 | 0 | 0.34 | 0.29 | 0.46 | 0.17 | 0.18 | 0.35 | 0.28 | 0.2 | 0.17 | 0.24 | 0.19 | 0.31 | 0.24 | 0.3 | 0.27 | 0.25 | 0.39 | 0.34 | 0.31 | 0.12 | 0.16 |
| Recovered Silver | (g/t) | 1.2 | 0 | 0 | 0 | 1.2 | 1.2 | 1.3 | 1.2 | 1.3 | 1.3 | 1.1 | 1.2 | 1.3 | 1.3 | 1.1 | 1.3 | 1.3 | 1.3 | 1.3 | 1.2 | 1.3 | 1.2 | 1.5 | 1.7 | 1.1 |
| Transitional High: | | | | | | | | | | | | | | | | | | | | | | | | | | |
| Ktonnes | (kt) | 5,746 | 0 | 0 | 0 | 0 | 0 | 0 | 0 | 0 | 0 | 0 | 0 | 0 | 0 | 0 | 0 | 0 | 0 | 0 | 0 | 30 | 318 | 2,012 | 2,949 | 437 |
| NSR | ($/t) | 21.95 | 0 | 0 | 0 | 0 | 0 | 0 | 0 | 0 | 0 | 0 | 0 | 0 | 0 | 0 | 0 | 0 | 0 | 0 | 0 | 12.07 | 19.83 | 22.58 | 21.71 | 22.82 |
| Gold | (g/t) | 0.81 | 0 | 0 | 0 | 0 | 0 | 0 | 0 | 0 | 0 | 0 | 0 | 0 | 0 | 0 | 0 | 0 | 0 | 0 | 0 | 0.46 | 0.74 | 0.84 | 0.79 | 0.83 |
| Silver | (g/t) | 21.2 | 0 | 0 | 0 | 0 | 0 | 0 | 0 | 0 | 0 | 0 | 0 | 0 | 0 | 0 | 0 | 0 | 0 | 0 | 0 | 8.3 | 17.3 | 19.5 | 22.6 | 23.1 |
| Lead | (%) | 0.23 | 0 | 0 | 0 | 0 | 0 | 0 | 0 | 0 | 0 | 0 | 0 | 0 | 0 | 0 | 0 | 0 | 0 | 0 | 0 | 0.07 | 0.25 | 0.29 | 0.19 | 0.19 |
| Zinc | (%) | 0.49 | 0 | 0 | 0 | 0 | 0 | 0 | 0 | 0 | 0 | 0 | 0 | 0 | 0 | 0 | 0 | 0 | 0 | 0 | 0 | 0.13 | 0.36 | 0.5 | 0.5 | 0.43 |
| Arsenic | (ppm) | 661 | 0 | 0 | 0 | 0 | 0 | 0 | 0 | 0 | 0 | 0 | 0 | 0 | 0 | 0 | 0 | 0 | 0 | 0 | 0 | 605 | 628 | 698 | 635 | 690 |
| Sulphur | (%) | 0.807 | 0 | 0 | 0 | 0 | 0 | 0 | 0 | 0 | 0 | 0 | 0 | 0 | 0 | 0 | 0 | 0 | 0 | 0 | 0 | 0.014 | 0.972 | 1.117 | 0.615 | 0.606 |
| Recovered Gold | (g/t) | 0.48 | 0 | 0 | 0 | 0 | 0 | 0 | 0 | 0 | 0 | 0 | 0 | 0 | 0 | 0 | 0 | 0 | 0 | 0 | 0 | 0.28 | 0.44 | 0.51 | 0.47 | 0.5 |
| Recovered Silver | (g/t) | 5.7 | 0 | 0 | 0 | 0 | 0 | 0 | 0 | 0 | 0 | 0 | 0 | 0 | 0 | 0 | 0 | 0 | 0 | 0 | 0 | 2.2 | 4.7 | 5.3 | 6.1 | 6.2 |
| Transitional Low: | | | | | | | | | | | | | | | | | | | | | | | | | | |
| Ktonnes | (kt) | 4,363 | 0 | 0 | 0 | 0 | 0 | 0 | 0 | 0 | 0 | 0 | 0 | 0 | 0 | 0 | 0 | 0 | 0 | 0 | 0 | 0 | 25 | 741 | 2,976 | 621 |
| NSR | ($/t) | 14.94 | 0 | 0 | 0 | 0 | 0 | 0 | 0 | 0 | 0 | 0 | 0 | 0 | 0 | 0 | 0 | 0 | 0 | 0 | 0 | 0 | 11.77 | 17.12 | 14.71 | 13.56 |
| Gold | (g/t) | 0.75 | 0 | 0 | 0 | 0 | 0 | 0 | 0 | 0 | 0 | 0 | 0 | 0 | 0 | 0 | 0 | 0 | 0 | 0 | 0 | 0 | 0.7 | 0.86 | 0.74 | 0.68 |
| Silver | (g/t) | 17.7 | 0 | 0 | 0 | 0 | 0 | 0 | 0 | 0 | 0 | 0 | 0 | 0 | 0 | 0 | 0 | 0 | 0 | 0 | 0 | 0 | 4.6 | 20.3 | 17.4 | 16.7 |
| Lead | (%) | 0.19 | 0 | 0 | 0 | 0 | 0 | 0 | 0 | 0 | 0 | 0 | 0 | 0 | 0 | 0 | 0 | 0 | 0 | 0 | 0 | 0 | 0.04 | 0.27 | 0.19 | 0.15 |
| Zinc | (%) | 0.53 | 0 | 0 | 0 | 0 | 0 | 0 | 0 | 0 | 0 | 0 | 0 | 0 | 0 | 0 | 0 | 0 | 0 | 0 | 0 | 0 | 0.1 | 0.58 | 0.54 | 0.46 |
| Arsenic | (ppm) | 622 | 0 | 0 | 0 | 0 | 0 | 0 | 0 | 0 | 0 | 0 | 0 | 0 | 0 | 0 | 0 | 0 | 0 | 0 | 0 | 0 | 367 | 687 | 620 | 562 |
| Sulphur | (%) | 2.021 | 0 | 0 | 0 | 0 | 0 | 0 | 0 | 0 | 0 | 0 | 0 | 0 | 0 | 0 | 0 | 0 | 0 | 0 | 0 | 0 | 0.223 | 2.636 | 2.022 | 1.353 |
| Recovered Gold | (g/t) | 0.3 | 0 | 0 | 0 | 0 | 0 | 0 | 0 | 0 | 0 | 0 | 0 | 0 | 0 | 0 | 0 | 0 | 0 | 0 | 0 | 0 | 0.28 | 0.35 | 0.3 | 0.27 |
| Recovered Silver | (g/t) | 6 | 0 | 0 | 0 | 0 | 0 | 0 | 0 | 0 | 0 | 0 | 0 | 0 | 0 | 0 | 0 | 0 | 0 | 0 | 0 | 0 | 1.6 | 6.9 | 5.9 | 5.7 |
Kappes, Cassiday & Associates June, 2019 | | 16.0 Mining Methods Page 16-10 |
| Camino Rojo Project Feasibility Study NI 43-101 Technical Report |
|
| 16.5 | Waste Storage Area and Stockpile |
A waste rock storage area was designed southeast of the pit to hold the waste rock for the pit. Table 16-4 shows a summary of total mine waste by waste type. Waste for each combination of lithology (post mineral or Caracol), alteration type (Kp, Ki, or none), and oxidation type is shown. The lead, zinc, arsenic, and sulphur grades are also reported by waste type.
Table 16-4
Mine Waste by Material Type
| | Waste | Lead | Zinc | Arsenic | Sulphur |
| Waste Type | Ktonnes | (%) | (%) | (ppm) | (%) |
| Post Mineral: | 3,485 | 0.04 | 0.05 | 128 | 0.107 |
| Caracol Kp Oxide: | 208 | 0.23 | 0.28 | 625 | 0.258 |
| Caracol Kp TrH: | 2 | 0.21 | 0.43 | 617 | 0.423 |
| Caracol Kp TrL: | 83 | 0.08 | 0.25 | 317 | 0.734 |
| Caracol Kp TrS: | 519 | 0.16 | 0.48 | 599 | 3.209 |
| Caracol Kp Slf: | 396 | 0.20 | 0.72 | 620 | 4.801 |
| Caracol Ki Oxide: | 8,358 | 0.06 | 0.15 | 274 | 0.145 |
| Caracol Ki TrH: | 207 | 0.04 | 0.11 | 236 | 0.427 |
| Caracol Ki TrL: | 696 | 0.05 | 0.14 | 253 | 1.181 |
| Caracol Ki TrS: | 137 | 0.06 | 0.28 | 299 | 2.185 |
| Caracol Ki Slf: | 21 | 0.06 | 0.17 | 248 | 1.591 |
| Caracol None Oxide: | 7,017 | 0.03 | 0.07 | 147 | 0.060 |
| Caracol None TrH: | 58 | 0.01 | 0.07 | 144 | 0.119 |
| Caracol None TrL: | 931 | 0.01 | 0.07 | 123 | 0.246 |
| Caracol None TrS: | 1,396 | 0.02 | 0.08 | 121 | 0.763 |
| Caracol None Slf: | 214 | 0.01 | 0.05 | 86 | 0.692 |
| TOTAL: | 23,728 | 0.05 | 0.12 | 213 | 0.353 |
Guidance for the design of the waste storage area was provided by HydroGeoLogica in the memo report “Camino Rojo – Waste Rock Management Plan” dated 28 June 2019 as summarized herein. It was recommended that transition and sulphide material be blended with, or encapsulated by, post mineral or oxide materials. It is expected that this will provide excess neutralization potential (NP) for neutralization of localized acidic conditions in the waste storage facility. It was also recommended a minimum of 5m of post mineral or oxide waste be developed as a base layer prior to placement of transition and sulphide waste and also that transition or sulphide waste be encapsulated with a minimum of 3m of post mineral or oxide waste on top or on the side slopes of the facility. The current design exceeds this amount on the top and side slopes.
Total waste amounts to 23.7 million tonnes. Of this, about 4.7 million tonnes is transition or sulphide material to be encapsulated. Average in-situ bulk density of the waste is estimated at 2.35 tonnes per cubic metre. The waste storage design assumes 30% swell, so average density of the placed waste is about 1.81 tonnes per cubic metre.
Kappes, Cassiday & Assocites
June, 2019 | | 16.0 Mining Methods
Page 16-11 |
| Camino Rojo Project Feasibility Study NI 43-101 Technical Report |
|
Preproduction and Year 1 produce 6.8 million tonnes of waste, and none of the waste is transition or sulphide. This is shown in Figure 16-4. The main part of the facility is raised to the 1940 level, but a hole or sink has been developed in which to place sulphide waste.
Year 2 produces about 6 million tonnes of waste, again all oxide. See Figure 16-5. The facility is extended to the southeast for the 1940 lift and a 1960 lift has been started.
Year 3 produces about 4.5 million tonnes of waste of which 450 ktonnes are transition or sulphide. The transition/sulphide is placed in the hole and the clean waste raises most of the facility to the 1950 level and extends the 1960 lift to the east. The placement of new transition and sulphide material is shown in red on Figure 16-6.
Year 4 produces about 2.4 million tonnes of waste and about 1.1 million tonnes is transition or sulphide waste. Figure 16-7 shows placement of the transition and sulphide material in the hole. Clean waste is used to raise the facility to the 1970 lift in the north and east.
Year 5 produces 1.9 million tonnes of waste and 1.2 million is transition or sulphide material. Figure 16-8 shows the sulphide placed in the centre of the facility on the 1950 and 1955 lifts. The oxide waste is stacked around it on those lifts, mostly on the 1955 lift.
Year 6 produces about 2.0 million tonnes of waste and 1.8 million tonnes are transition or sulphide. This raises the facility to the 1965 lift in the centre, with oxide waste stacked around it on the 1955 level as shown on Figure 16-9.
Year 7 waste is only 64 ktonnes, all transition or sulphide. Its’ placement is shown in Figure 16-10 which shows the pit and waste storage area at the end of mining.
At the end of mining about 1.65 million tonnes will be re-handled to cap the transition and sulphide material. Figure 16-11 shows the final facility with the transition and sulphide waste encapsulated.
The stability of the waste storage facility was analysed by Piteau. This is documented in the memo report “Waste Rock Facility and Heap Leach Pad – Preliminary Stability Analyses” dated 18 April 2019 as summarized herein. It was concluded that there are no short term or long-term risks of significant instability for the facility.
The mine plan also produces about 5 million tonnes of low-grade material that will be stockpiled and processed at the end of commercial pit production. This is also shown on the various maps.
Kappes, Cassiday & Assocites
June, 2019 | | 16.0 Mining Methods
Page 16-12 |
| Camino Rojo Project Feasibility Study NI 43-101 Technical Report |
|
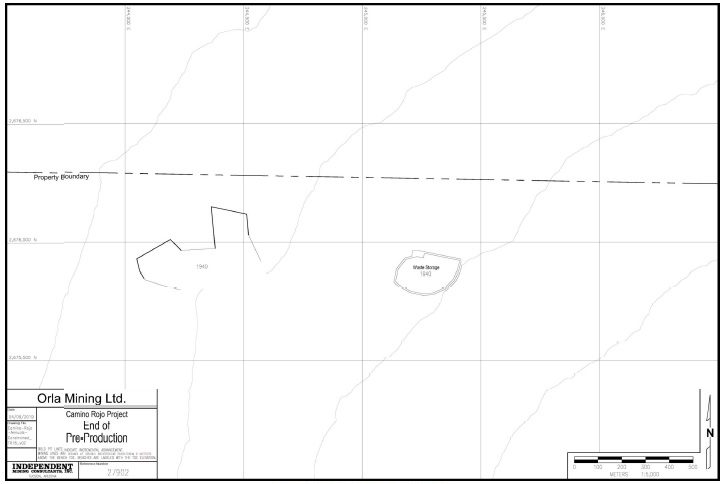
Figure 16-3 End of Preproduction, IMC 2019
Kappes, Cassiday & Assocites
June, 2019 | | 16.0 Mining Methods
Page 16-13 |
| Camino Rojo Project Feasibility Study NI 43-101 Technical Report |
|
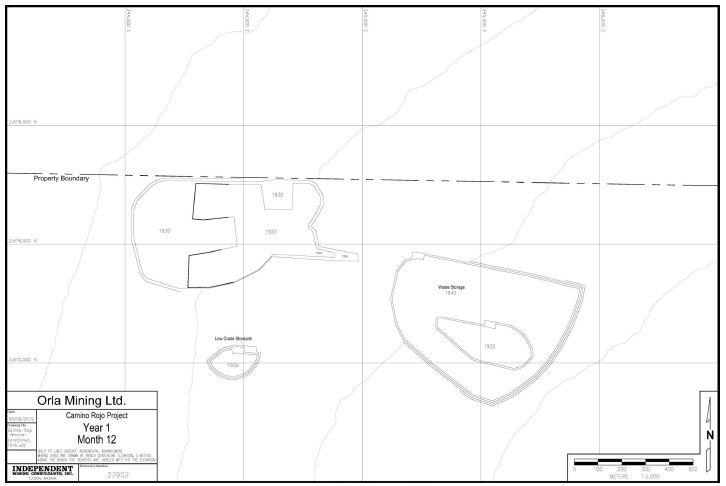
Figure 16-4 End of Year 1, IMC 2019
Kappes, Cassiday & Assocites
June, 2019 | | 16.0 Mining Methods
Page 16-14 |
| Camino Rojo Project Feasibility Study NI 43-101 Technical Report |
|
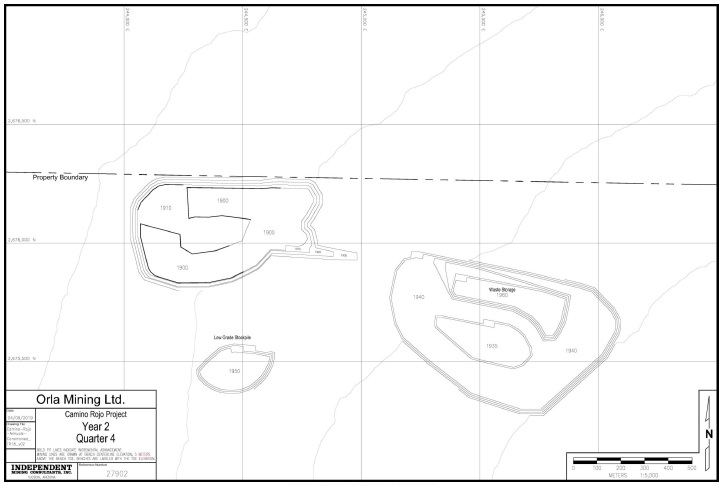
Figure 16-5 End of Year 2, IMC 2019
Kappes, Cassiday & Assocites
June, 2019 | | 16.0 Mining Methods
Page 16-15 |
| Camino Rojo Project Feasibility Study NI 43-101 Technical Report |
|
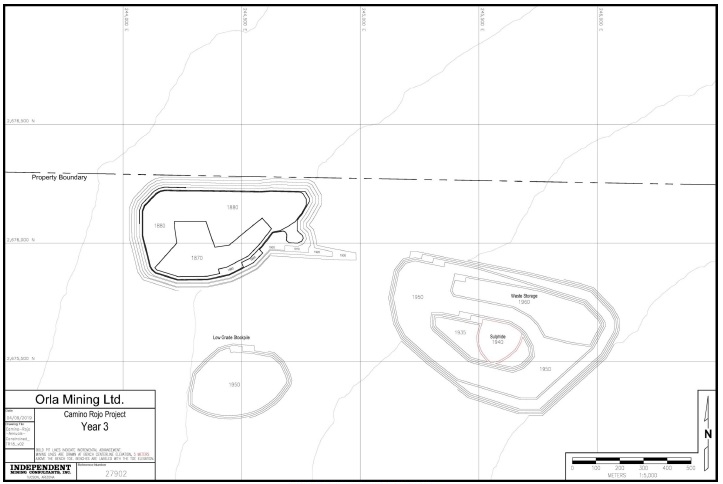
Figure 16-6 End of Year 3, IMC 2019
Kappes, Cassiday & Assocites
June, 2019 | | 16.0 Mining Methods
Page 16-16 |
| Camino Rojo Project Feasibility Study NI 43-101 Technical Report |
|
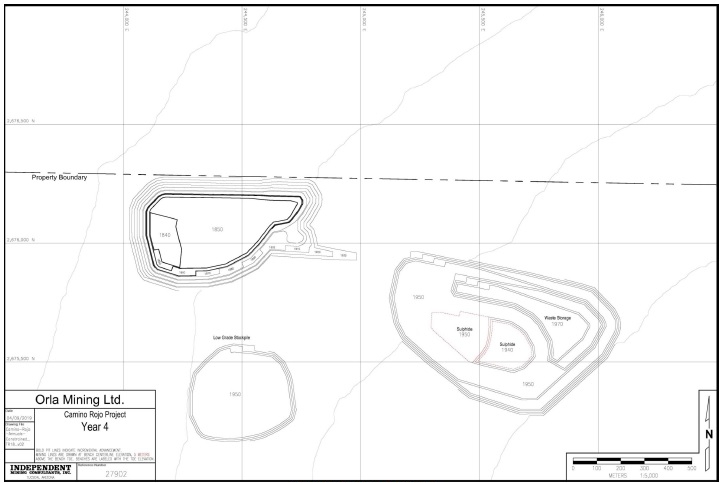
Figure 16-7 End of Year 4, IMC 2019
Kappes, Cassiday & Assocites
June, 2019 | | 16.0 Mining Methods
Page 16-17 |
| Camino Rojo Project Feasibility Study NI 43-101 Technical Report |
|

Figure 16-8 End of Year 5, IMC 2019
Kappes, Cassiday & Assocites
June, 2019 | | 16.0 Mining Methods
Page 16-18 |
| Camino Rojo Project Feasibility Study NI 43-101 Technical Report |
|
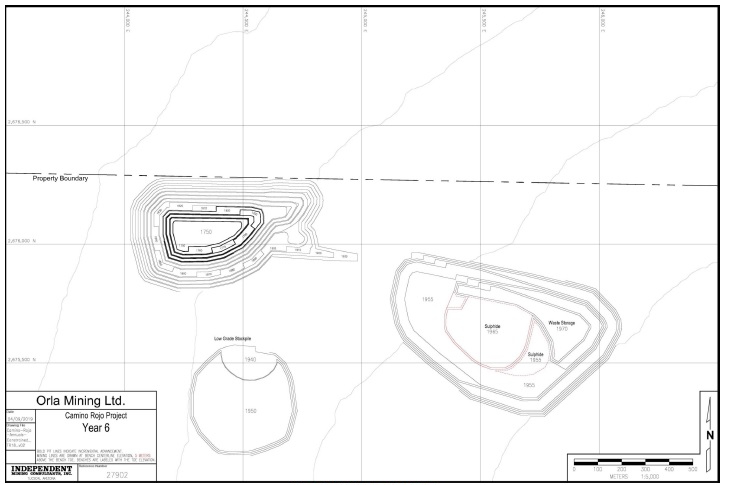
Figure 16-9 End of Year 6, IMC 2019
Kappes, Cassiday & Assocites
June, 2019 | | 16.0 Mining Methods
Page 16-19 |
| Camino Rojo Project Feasibility Study NI 43-101 Technical Report |
|

Figure 16-10 Year 7 – End of Mining, IMC 2019
Kappes, Cassiday & Assocites
June, 2019 | | 16.0 Mining Methods
Page 16-20 |
| Camino Rojo Project Feasibility Study NI 43-101 Technical Report |
|
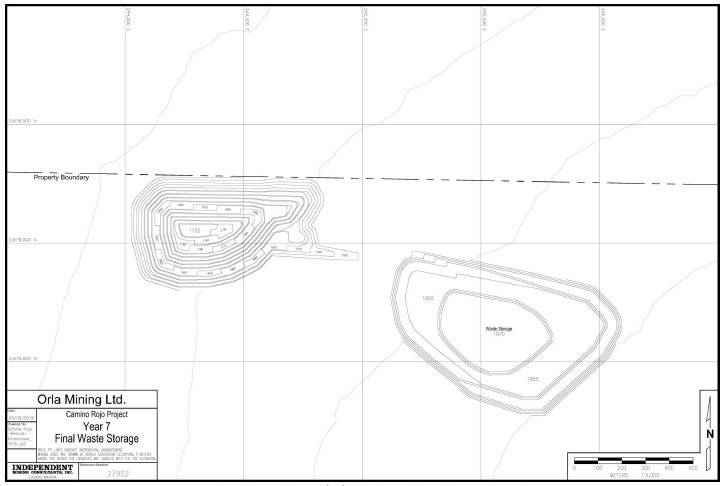
Figure 16-11 Year 7 – End of Waste Storage Capping & Low Grade Reclaim, IMC 2019
Kappes, Cassiday & Assocites
June, 2019 | | 16.0 Mining Methods
Page 16-21 |
| Camino Rojo Project Feasibility Study NI 43-101 Technical Report |
|
Mine major equipment requirements were sized and estimated on a first principles basis based on the mine production schedule, the mine work schedule, and estimated equipment productivity rates. The mine equipment estimate is based on contract-miner operation and assumes a well-managed mining operation with a well-trained labour pool.
Table 16-5 shows major equipment requirements by year. This table represents the equipment required to perform the following duties:
| · | Developing access roads from the mine to the crusher, waste storage area, and the low-grade stockpile, |
| · | Mining and transporting resource to the crusher or low-grade stockpile, |
| · | Mining and transporting waste to the waste storage facility, |
| · | Maintaining the haul roads and waste storage areas. |
Table 16-5
Mine Major Equipment Fleet Requirement
| | Capacity/ | Time Period |
| Equipment Type | Power | PP | Y1Q1 | Y1Q2 | Y1Q3 | Y1Q4 | 2 | 3 | 4 | 5 | 6 | 7 |
| Atlas Copco DM30 II Drill | (171 mm) | 1 | 2 | 3 | 3 | 3 | 3 | 3 | 2 | 2 | 2 | 0 |
| Caterpillar 6018FS Hyd Shovel | (10 cu m) | 1 | 2 | 2 | 2 | 2 | 2 | 2 | 2 | 2 | 2 | 1 |
| Caterpillar 992K Wheel Loader | (11.5 cu m) | 1 | 1 | 1 | 1 | 1 | 1 | 1 | 1 | 1 | 1 | 1 |
| Caterpillar 773G Truck | (53 t) | 2 | 7 | 9 | 10 | 10 | 10 | 12 | 11 | 12 | 11 | 4 |
| Caterpillar D9T Track Dozer | (306 kw) | 3 | 3 | 3 | 3 | 3 | 3 | 3 | 3 | 3 | 2 | 1 |
| Caterpillar 824H Wheel Dozer | (264 kw) | 2 | 2 | 2 | 2 | 2 | 2 | 2 | 2 | 2 | 1 | 1 |
| Caterpillar 14M Motor Grader | (193 kw) | 2 | 2 | 2 | 2 | 2 | 2 | 2 | 2 | 2 | 1 | 1 |
| Water Truck - 14,000 gal | (53,000 l) | 2 | 2 | 2 | 2 | 2 | 2 | 2 | 2 | 2 | 1 | 1 |
| Caterpillar 319DL Excavator | (1.13 cu m) | 1 | 1 | 1 | 1 | 1 | 1 | 1 | 1 | 1 | 1 | 0 |
| Sandvik DX680 TH Drill | (102 mm) | 1 | 1 | 1 | 1 | 1 | 1 | 1 | 1 | 1 | 1 | 0 |
| TOTAL | | 16 | 23 | 26 | 27 | 27 | 27 | 29 | 27 | 28 | 23 | 10 |
Note: Equipment in the table above was used for mine cost estimations. Actual equipment will vary by contractor.
Kappes, Cassiday & Associates June, 2019 | | 16.0 Mining Methods Page 16-22 |
| Camino Rojo Project Feasibility Study NI 43-101 Technical Report |
|
Test work results developed by KCA and others have indicated that the Camino Rojo Mineral Reserve is amenable to heap leaching for the recovery of gold and silver. Based on the Mineral Reserve of 44.0 million tonnes and established processing rate of 18,000 tpd of ore, the Project has an estimated mine life of approximately 6.8 years.
This report models a scenario where ore is mined by standard open pit mining methods. Ore will be crushed at a rate of 18,000 tonnes per day to 80% passing 28mm using a two-stage closed crushing circuit and conveyor stacked on the leach pad in 10-metre lifts. Lime will be added to the material for pH control before being stacked and leached with a dilute cyanide solution. Pregnant solution will flow by gravity to a pregnant solution pond before being pumped to a Merrill-Crowe plant for metal recovery. Gold and silver will be precipitated from the pregnant solution via zinc cementation. The precious metal precipitate will be dewatered using filters, dried in a mercury retort to remove mercury values, and smelted to produce the final doré product.
A summary of the processing design criteria is presented in Table 17-1. A detailed process design criteria document is referenced in Section 27 of this report.
Kappes, Cassiday & Associates June, 2019 | | 17.0 Recovery Methods Page 17-1 |
| Camino Rojo Project Feasibility Study NI 43-101 Technical Report |
|
Table 17-1
Processing Design Criteria Summary
| ITEM | DESIGN CRITERIA |
| Annual Tonnage Processed | 6,570,000 tonnes |
| Crushing Production Rate | 18,000 tonnes/day average |
| Crushing Operation | 8 hours/shift, 3 shifts/day, 7 days/week |
| Crusher Availability | 75% |
| Crushing Product Size | 80% -28mm |
| Conveyor Stacking System Availability | 80% |
| Leaching Cycle, days (Total) | 80 |
| Average Sodium Cyanide Consumption, kg/t | 0.35 |
| Average Lime Consumption, kg/t | 1.25 |
| Average Oxide Gold Recovery, Kp | 70% |
| Average Oxide Gold Recovery, Ki | 56% |
| Average Transition-Hi Gold Recovery | 60% |
| Average Transition-Lo Gold Recovery | 40% |
| Overall Gold Recovery | 64% |
| Average Oxide Silver Recovery, Kp | 11% |
| Average Oxide Silver Recovery, Ki | 15% |
| Average Transition-Hi Silver Recovery | 27% |
| Average Transition-Lo Silver Recovery | 34% |
| Overall Silver Recovery | 17% |
Ore will be mined using standard open pit mining methods and delivered to the crushing circuit using haul trucks which will direct-dump into a dump hopper; front-end loaders will feed material to the dump hopper as needed from a ROM stockpile located near the primary crusher. Ore will be crushed at a rate of 18,000 tonnes per day to a final product size of 80% passing 28mm (100% passing 38mm) using a two-stage closed crushing circuit. The crushing circuit will operate 7 days/week, 24 hours/day with an overall estimated availability of 75%.
The crushed product will be stockpiled using a fixed stacker, reclaimed by belt feeders to a reclaim conveyor, and conveyed to the heap stacking system by an overland conveyor system. Pebble lime will be added to the reclaim conveyor belt for pH control; agglomeration with cement is not needed.
Stacked ore will be leached using a drip irrigation system for solution application; sprinkler irrigation will be used beginning in Year 4 of operations to increase evaporation rates and reduce water treatment requirements from pit dewatering. After percolating through the ore, the gold and silver bearing pregnant leach solution drains by gravity to a pregnant solution pond where it will be collected and pumped to a Merrill-Crowe recovery plant. Pregnant solution will then be pumped through clarification filter presses to remove any suspended solids before being deaerated in a vacuum tower to remove oxygen. Ultra-fine zinc will be added to the deaerated pregnant solution to precipitate gold and silver values, which will be collected by precipitate filter presses. Barren leach solution leaving the precipitate filter presses will flow to a barren solution tank and will then be pumped to the heap for further leaching. High strength cyanide solution will be injected into the barren solution to maintain the cyanide concentration in the leach solutions at the desired levels.
Kappes, Cassiday & Associates June, 2019 | | 17.0 Recovery Methods Page 17-2 |
| Camino Rojo Project Feasibility Study NI 43-101 Technical Report |
|
The precipitate from the Merrill-Crowe recovery plant will be processed in the refinery. Precipitate will be treated by an electric mercury retort with a fume collection system for drying and removal of mercury before being mixed with fluxes and smelted using an induction smelting furnace to produce the final doré product.
An event pond is included to collect contact solution from storm events. Solution collected will be returned to the process as soon as practical. Evaporators will be installed in the event pond in Year 3 of operation to treat excess solution generated by pit dewatering.
Figure 17-1 shows the overall process flowsheet and Figure 17-2 shows the general arrangement of the mine site.
All selected processes and equipment are established technologies used in gold and silver processing plants.
The overall plant site has been arranged to allow for possible future expansion.
Kappes, Cassiday & Associates June, 2019 | | 17.0 Recovery Methods Page 17-3 |
| Camino Rojo Project Feasibility Study NI 43-101 Technical Report |
|
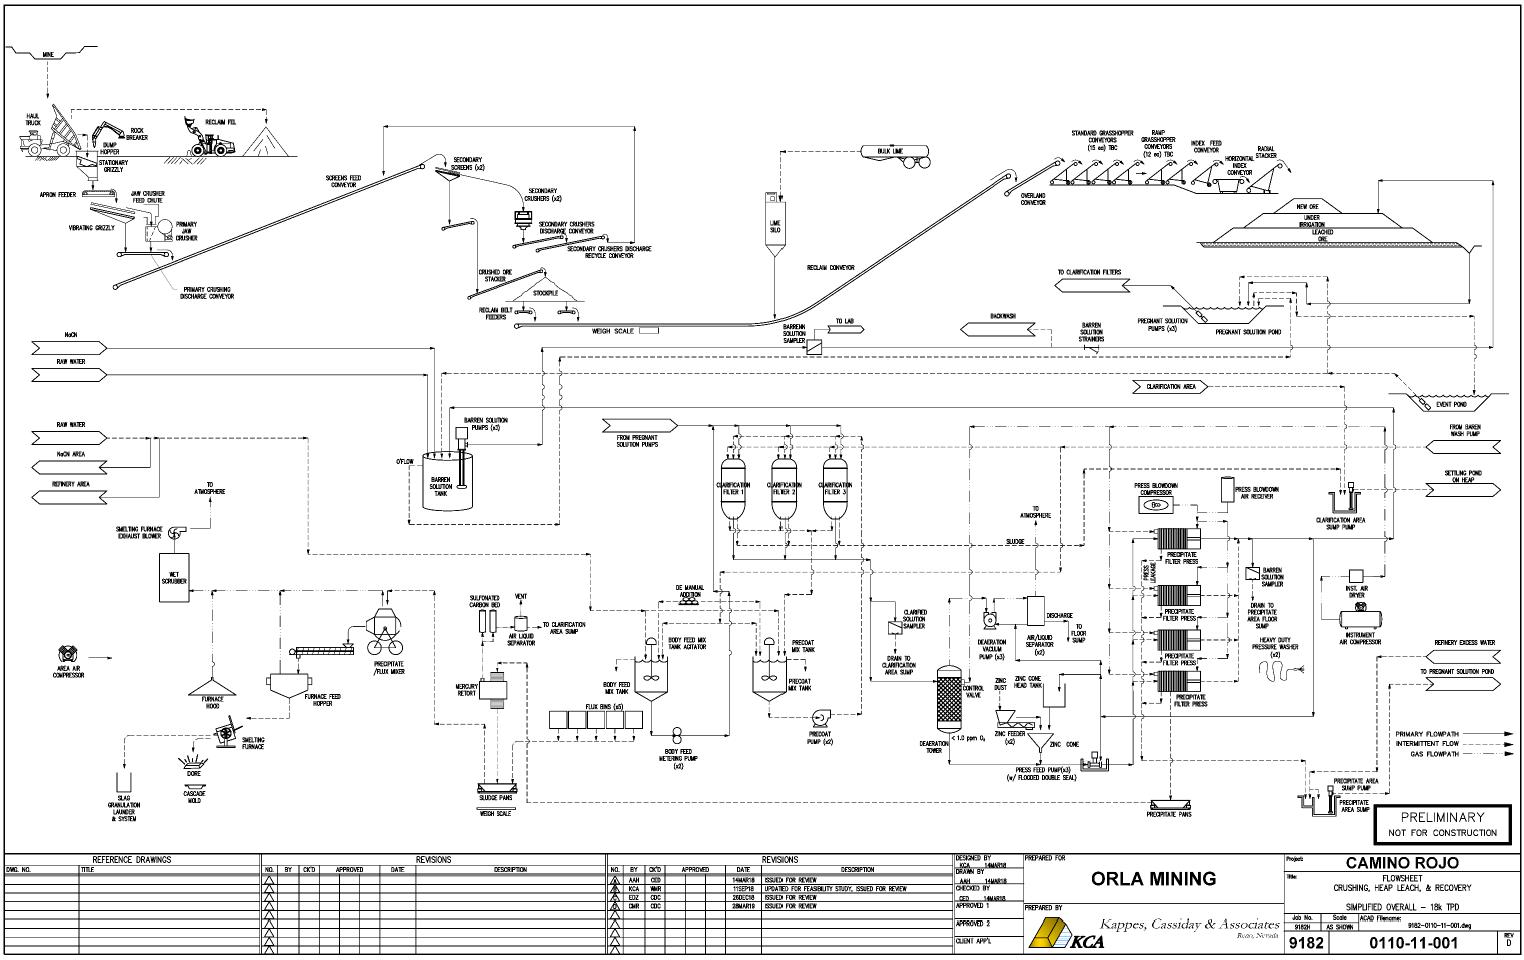
Figure 17-1 Process Overall Flowsheet
Kappes, Cassiday & Associates June, 2019 | | 17.0 Recovery Methods Page 17-4 |
| Camino Rojo Project Feasibility Study NI 43-101 Technical Report |
|

Figure 17-2 Project General Arrangement
Kappes, Cassiday & Associates June, 2019 | | 17.0 Recovery Methods Page 17-5 |
| Camino Rojo Project Feasibility Study NI 43-101 Technical Report |
|
The following major components are included in the crushing facility:
| · | 200-tonne ROM Dump hopper with static grizzly; |
| · | 2,134mm x 7.32m Apron feeder; |
| · | 1.52m x 3.05m Vibrating grizzly feeder; |
| · | 1500mm x 2000mm Primary jaw crusher; |
| · | Two each 2.4m x 7.3m Double deck vibrating screens; |
| · | Two each 500 HP Standard cone crushers; and |
| · | Associated transfer conveyors, chutes and instruments. |
ROM ore will be transported from the mine pit in 53-tonne surface haul trucks and will either be directly dumped into the crusher dump hopper or stockpiled in a ROM stockpile; approximately 4.4 million tonnes of low-grade material from the pit will be stockpiled in a low-grade stockpile and processed at the end of the mine life. Stockpiled ore from the ROM stockpile will be reclaimed by a 992 front-end loader and fed to the dump hopper as needed, primarily for the daily four-hour period when mining operations are suspended. Oversized rocks or large lumps will be broken using a rock breaker. The crushing plant will process an average of 18,000 tonnes of ore per day.
Ore will be fed from the ROM dump hopper to a vibrating grizzly feeder via an apron feeder. The vibrating grizzly feeder will have parallel bars spaced 175mm apart with grizzly oversize being fed to the primary jaw crusher and the grizzly undersize being recombined with the jaw crusher product on the primary crusher discharge conveyor. The primary jaw crusher will operate with a 175mm discharge setting and has been oversized to allow for increased throughput for potential future expansion. The primary crusher discharge conveyor transfers primary crushed ore to the screen feed conveyor, which feeds the secondary screens. A tramp metal electromagnet and metal detector will be installed on the primary crusher discharge conveyor to protect the secondary crushers.
Primary crushed ore will be fed to a splitter chute by the secondary screen feed conveyor which directly feeds the two secondary screens. The secondary screens splitter chute will be equipped with an adjustable gate to allow for control and accurate split of the crushed material between the screens. The secondary screening circuit includes two double-deck vibrating screens with 100mm and 38mm top and bottom deck openings, respectively. Oversize material (+38mm) will be fed to the secondary cone crushers and undersize (-38mm) will be transferred to the crushed product stockpile stacker by the secondary screen undersize conveyor. Oversize material will be crushed by the secondary standard cone crushers which will operate with a 38mm closed side setting and will discharge onto the secondary crushers discharge conveyor. The secondary crushing circuit will be operated in closed circuit with the secondary crusher discharge conveyor feeding a recycle conveyor which recycles the cone product to the secondary screen feed conveyor.
Kappes, Cassiday & Associates June, 2019 | | 17.0 Recovery Methods Page 17-6 |
| Camino Rojo Project Feasibility Study NI 43-101 Technical Report |
|
The secondary screen undersize (crushed product) will be 80% passing 28mm (100% passing 38mm). Crushed product will be transferred to the crushed product stockpile stacker by the screen undersize conveyor located beneath the secondary screens. The crushed product will be stockpiled in a conical stockpile which will be reclaimed using belt feeders and conveyed to the leach pad for stacking. The crushed product stockpile is approximately 60m in diameter and has an estimated live capacity of 6,000 tonnes, or about 8 hours of operation.
A modular motor control centre will be located in a container near the secondary crushing circuit. A PLC control unit will be located in a central control room which will control and monitor all crushing equipment, as well as monitor the conveyor stacking equipment. All of the conveyors will be interlocked so that if one conveyor trips out, all upstream conveyors and the vibrating grizzly feeder will also trip. This interlocking is designed to prevent large spills and equipment damage. Both of these features are considered necessary to meet the design utilization for the system.
Water sprays will be located at all material transfer points to reduce dust generation by the crushing circuit.
| 17.4 | Reclamation and Conveyor Stacking |
The following major components are included in the reclamation and conveyor stacking system:
| · | Two each 1524mm x 6m reclaim belt feeders |
| · | 120-tonne lime silo with associated dust control and feeding equipment |
| · | 1067mm x 348m overland conveyor |
| · | Four each 1067mm x 35m standard grasshopper transfer conveyors |
| · | Three each 1067mm x 205m overland transfer conveyor |
| · | 12 each 1067mm x 35m grasshopper ramp conveyors |
| · | 15 each standard grasshopper conveyors |
| · | 1067mm x 18m index feed conveyor |
| · | 1067mm x 35m horizontal index conveyor |
| · | 1067mm x 41m radial stacker with 5m extendable stinger conveyor |
Kappes, Cassiday & Associates June, 2019 | | 17.0 Recovery Methods Page 17-7 |
| Camino Rojo Project Feasibility Study NI 43-101 Technical Report |
|
The crushed product stockpile is sized to accommodate a total capacity of approximately 33,000 tonnes (live capacity of approximately 6,000 tonnes). Crushed ore will be reclaimed from the stockpile by two belt feeders to a reclaim conveyor in a tunnel below the stockpile. Pebble lime (CaO) for pH control will be added to the reclaim tunnel conveyor at an average rate of 1.25 kg per tonne of ore from a 120-tonne silo equipped with a bin activator, variable speed rotary feeder, screw conveyor and dust collector. The reclaim conveyor discharges to an overland conveyor which transfers ore to the heap stacking circuit. The heap is divided into four primary stacking zones which are separated by grasshopper transfer conveyors and short overland conveyors. Transfer grasshoppers and connecting overland conveyors will be moved and operated as required based on the active heap stacking zone.
The heap will be constructed in 10-metre-high lifts, in cells 80 metres wide, using a mobile conveyor stacking system. The first lift will be stacked so that the toe of the heap is 10 metres from the inside toe of the perimeter berm. The effective overall slope of the heap will be approximately 2.5H:1V.
The heap stacking system consists of three each transfer overland conveyors (1067mm x 205m), four each grasshopper transfer conveyors (1067mm x 35m), 12 each ramp grasshopper conveyors (1067mm x 35m), 15 each standard grasshopper conveyors (1067mm x 35m), an index feed conveyor (1067mm x 18m), horizontal index conveyor (1067mm x 35m) and a radial stacker (1067mm x 41m). The transfer overland conveyors and transfer grasshoppers feed material to the grasshopper conveyors in the active stacking zone, which transfer the material to the conveyor stacking system. The conveyor stacking system includes the index feed conveyor, horizontal index, and radial stacker conveyors. The horizontal index and radial stacker are able to retreat and stack ore onto the heap. The number of grasshopper conveyors required varies depending on the area of the heap being stacked with a maximum of 27 grasshopper conveyors being required, not including the transfer grasshopper conveyors.
Once a lift of cells has finished leaching and is sufficiently drained, a new lift can be stacked over the top of the old lift. The old lift will be cross-ripped prior to stacking new material on top of any old heap area or access road/ramp to break up any compacted or cemented sections.
Stacked lifts will progress in a stair-step manner. The maximum planned heap height is 60m over the composite leach pad liner system with a design maximum height of 80m. The planned leach pad will have a total of six lifts with the maximum design of eight lifts to allow for potential future expansion.
The final location for the leach pad and ponds was selected considering the available area within the Camino Rojo property, suitable pad foundation and the location of other project facilities. The leach pad location also allows for the development of future resources, without moving the pad. The leach pad will be a single-use, multi-lift type leach pad and has been designed with a lining system in accordance with International Cyanide Code requirements and meets or exceeds the North American standards and practices for lining systems, piping systems and process ponds to minimize the environmental risk of the facilities impacting local soils, surface water and ground water in and around the site.
Kappes, Cassiday & Associates June, 2019 | | 17.0 Recovery Methods Page 17-8 |
| Camino Rojo Project Feasibility Study NI 43-101 Technical Report |
|
The leach pad area will be constructed by clearing the pad area and stripping vegetation and growth medium. Only minor grading of the leach pad area will be required as the natural slopes are within the required range for solution drainage and stability.
The leach pad liner will be composed of the following lining system from top to bottom:
| · | Overliner consisting of 600mm of crushed and screened material (-19mm, + 0.43mm). |
| · | 2mm smooth Linear Low Density Polyethylene (LLDPE) geomembrane. |
| · | 300mm of compacted soil liner with a minimum permeability of 1x10⁻⁶ cm/sec. |
| · | Leak detection system under the primary solution collection pipes which route solution to a monitoring sump tank. |
Clay borrow sources have been identified around the Project site for use as soil liner. These borrow sources will be amended with bentonite as needed to meet the 1x10⁻⁶ cm/sec permeability requirement.
The first phase of the heap leach pad will be constructed in Year -1 and includes 440,000 m2 of lined area and will contain approximately two years’ worth of ore production. Phase 2 of the leach pad will be constructed in Year 2 and includes 360,000 m2 of lined area and has been sized to contain the ultimate cumulative ore capacity. A berm will be constructed during Phase 1 separating the Phase 1 area from the Phase 2 Area. The phase separation berm includes temporary sections which will be removed during Phase 2 to allow solution collection pipes for Phase 2 to connect with existing solution collection pipes from Phase 1.
Gravity solution collection pipes will be installed on top of the geomembrane liner and covered with overliner material. The pipes are sized to operate at 50% full to contain the design production flows from the upgradient tributary area, allowing additional capacity to accommodate excess solution from storm events.
The gravity solution collection pipes will consist of 100mm diameter perforated corrugated polyethylene (PCPE) tertiary pipes spaced on 8-metre centres flowing into larger double walled PCPE secondary pipes of 450mm in diameter. The secondary solution collection pipes will flow into primary solution collection pipes composed of double-walled 600mm PCPE pipe that will run along the toe of the southern and eastern heap perimeter berms. The primary solution collection pipes will exit the heap through a concrete weir to the solution collection channel. The pipes will be solid walled as they enter the solution collection channel that flows into the pregnant pond.
Kappes, Cassiday & Associates June, 2019 | | 17.0 Recovery Methods Page 17-9 |
| Camino Rojo Project Feasibility Study NI 43-101 Technical Report |
|
Should solution flows exceed the capacity of the heap outlet pipes, solution head will build at the leach pad discharge area, causing excess solution to overflow the concrete weir into the solution collection channel.
The overliner material will act as a protective layer that resides above the LLDPE geomembrane. The main purpose of this material is to protect the composite liner system and solution collection piping from damage during material placement
The leak detection system will consist of 50mm perforated Polyvinyl Chloride (PVC) pipe which will be installed under the main solution collection pipes. The leak detection pipes will discharge to 200 L monitoring sump tanks outside of the heap perimeter berm. At the perimeter berm the perforated PVC pipe will transition to solid pipe and will pass through a 1000mm bentonite plug to ensure solutions are contained. The monitoring sumps will be checked daily to ensure no leaks are present. A single roll width of Geosynthetic Clay Liner (GCL) is installed over the leak detection trenches due to the increased solution flows at the primary solution collection piping.
Kappes, Cassiday & Associates June, 2019 | | 17.0 Recovery Methods Page 17-10 |
| Camino Rojo Project Feasibility Study NI 43-101 Technical Report |
|
Table 17-2
Heap Leach Design Parameters
| ITEM | DESIGN CRITERIA |
| Ore Feed Rate, tpd | 18,000 |
| Total Capacity, t | |
| Planned Heap | 44.0 Million |
| Design Provision | 75 Million |
| Lift Height, m | 10 |
| Quantity of Lifts | |
| Planned Heap | 6 |
| Design Provision | 8 |
| Maximum stacking height, m | |
| Planned Heap | 60 |
| Design Provision | 80 |
| Stacked Ore Density, t/m3 | 1.45 |
| Front of Heap Slope, H:V | 2.5 |
| Side and Back Slopes of Heap, H:V | 2.5 |
| Setback Between Lifts, m | 11.7 |
| Angle of Repose, º | 37 |
| Leaching Cycle, d | 80 |
| Number of Leach Cycles | 1 |
| Leaching Schedule | |
| d/a | 365 |
| h/d | 24 |
| Tonnes Under Leach, t | 1.4 Million |
| Active Leach Area, m2 | 99,300 |
| Solution Application Method | Buried Driplines or Wobbler Sprinklers |
| Solution Application Rate, Nominal, L/h/m2 | 10 |
| Heap Irrigation Rate, Nominal, m3/h | |
| Planned Heap | 1,000 |
| Design Provision | 1,379 |
| Heap Leach Ore Moisture Retention, % of Total Ore Weight | 7.8 |
Kappes, Cassiday & Associates June, 2019 | | 17.0 Recovery Methods Page 17-11 |
| Camino Rojo Project Feasibility Study NI 43-101 Technical Report |
|
| 17.6 | Solution Application & Storage |
The Camino Rojo Project will utilize a pregnant solution pond, barren solution tank and event solution pond for solution management. An emergency pond will also be constructed down gradient from the Merrill-Crowe facility to catch any solutions resulting from a catastrophic containment failure, such as a burst pipe.
Solution management for the Camino Rojo Project is fairly simple. The pregnant solution pond should be maintained in the mid-to lower range of its working capacity. The event pond should normally be maintained empty or at low levels whenever possible. It is important that the event pond be at minimum levels at the start of the wet season to ensure that it has the required capacity to contain both shorter and longer-term extreme precipitation events during the wet season. During Years 4 through the end of the Project life, water levels in the event pond should be maintained at the minimum allowable level for safe operation of the barge mounted evaporator units. Solution diverted to the event pond should be returned to the system as make-up water as soon as practical with every effort made to avoid storing excess solution over a long period of time.
Ore will be leached in a single stage using barren solution consisting of a dilute sodium cyanide solution. Additional residual leaching of ore will occur as leach solution from higher lifts percolates downward. Barren solution will be pumped from the barren solution tank to the active leach site using a dedicated set of vertical turbine pumps (two operating, one standby) and will be applied to the heap by a system of drip emitters. Drip emitters will be used as they generate less evaporation than sprinklers and will minimize the make-up water requirements. Wobbler Sprinklers will be used during Years 4 through the end of the Project life to help eliminate excess water from pit dewatering. Barren solution will be applied to the heap at an average rate of 10 L/h/m2. Based on metallurgical test work results, a leach cycle of 80 days has been estimated. Concentrated cyanide will be added to the barren solution tank by metering pumps to maintain the cyanide in solution at 300-500 ppm NaCN. The barren solution tank is sized for 5 minutes of residence time at the Merrill-Crowe plant design flow rate of 1,200 m3/h. Antiscalant polymer will continuously be added to the leach solutions at an average rate of 10 ppm to reduce the potential for scaling problems within the irrigation system.
Pregnant solution containing gold and silver values from the heap drains by gravity to a pregnant solution pond from the heap. PCPE pipes will be placed on the geomembrane liner to facilitate the collection and transport of pregnant leach solution to the pregnant pond. An emergency backup generator is included and has been sized to run the Merrill-Crowe and solution pumping systems in the event of a power outage. The emergency generator is equipped with a day tank sized to supply fuel to the engine for 12 hours at full load.
Kappes, Cassiday & Associates June, 2019 | | 17.0 Recovery Methods Page 17-12 |
| Camino Rojo Project Feasibility Study NI 43-101 Technical Report |
|
The pregnant pond has a total volume of 94,000 m3 and has been sized based on the following criteria being contained within the pregnant pond:
| · | Working volume for 24 hours at 1379 m3/h of solution, based on potential for additional ore sources |
| · | A 12-hour heap draindown volume of the leach solution (due to an event such as loss of power or pump) also at the solution application rate of 1379 m3/h |
| · | Accumulation of solution resulting from a 24-hour precipitation event of 33mm over the entire lined area |
| · | Dead storage volume assuming 1 metre of slimes at the bottom of the pond |
| · | Freeboard of 1 metre below the top of the containment berm |
The pregnant pond will be equipped with three submersible high flow pumps (two operating, one standby) and three horizontal centrifugal booster pumps which will pump solution to the Merrill-Crowe recovery circuit. The submersible pumps will be mounted on pump slides on the pond side walls to facilitate the placement and extraction of the pumps in the pond. An additional textured protective liner panel and conveyor belting will be installed on the pond sidewalls in the area the pump slide is located to protect the pond liner.
Gold and silver will be precipitated from the pregnant solution by zinc cementation in the Merrill-Crowe facility and the resulting barren solution is returned to the barren solution tank. The pregnant solution pond will be constructed using the following composite liner system from top to bottom:
| · | 2mm smooth High Density Polyethylene (HDPE) primary liner |
| · | geonet or double sided geocomposite |
| · | 1.5mm smooth HDPE secondary liner |
| · | geosynthetic clay liner (GCL) |
Leak detection pipes will be provided beneath the primary pond liner to allow for monitoring and pumping of solutions from within the leak detection sumps.
An event pond is included with a total volume of 313,000 m3 and has been sized based on the following criteria being contained within the event pond:
| · | A 12-hour heap draindown volume of leach solution at the design application rate of 1379 m3/h |
| · | Accumulation of solution resulting from a 100-year, 24-h precipitation event of 130mm (113mm 100-year event plus 15%), less the 33mm of storm capacity accounted for in the pregnant pond |
Kappes, Cassiday & Associates June, 2019 | | 17.0 Recovery Methods Page 17-13 |
| Camino Rojo Project Feasibility Study NI 43-101 Technical Report |
|
| · | Accumulation of solution resulting from wettest recorded monthly precipitation of 287mm |
| · | Dead storage volume assuming 0.5m of slimes at the bottom of the pond |
| · | Freeboard of 1m below the top of the containment berm |
The event pond will be constructed using the following composite liner system from top to bottom:
| · | 2mm smooth HDPE primary liner |
| · | geonet or double sided geocomposite |
| · | 1.5mm smooth HDPE secondary liner |
| · | geosynthetic clay liner (GCL) |
Leak detection pipes will be provided beneath the primary pond liner to allow for monitoring and pumping of solutions from within the leak detection sumps.
The Event Pond will include a submersible pump mounted on a pump slide on the ponds side slope to return solution to the active leach circuit.
By incorporating normal working solution and drain down volumes in the Pregnant Solution Pond, it ensures that the Event Solution Pond will be used very infrequently, if at all during the first two years of operation. During typical operations, normal rainfall events can be accommodated in the Pregnant Pond as long as a significant heap drain down event does not occur at the same time. The solution storage system has been designed so that the barren solution tank overflows to the pregnant solution pond, and the pregnant solution pond overflows to the event pond in case of an emergency or significant storm event.
In Year 3 of operations, barge mounted evaporators will be installed in the event pond to facilitate the removal of excess solution from pit dewatering. An estimated 50 evaporator units will be installed and will evaporate solution generated from pit dewatering.
The emergency pond has been sized based on the following criteria being contained within the emergency pond:
| · | Working volume for 16 hours at the design application rate of 1379 m3/h of solution (in the case of a pipe burst) |
| · | Accumulation of solution resulting from a 100-year 24-hour precipitation event of 113mm from the process facilities catchment area |
Based on the emergency pond conditions, the capacity of the pond is approximately 36,000 m3. The emergency pond is expected to never contain any process solutions, only minor quantities of surface water from storm events.
Kappes, Cassiday & Associates June, 2019 | | 17.0 Recovery Methods Page 17-14 |
| Camino Rojo Project Feasibility Study NI 43-101 Technical Report |
|
Minimum pond storage requirements for Phases 1 and 2 are detailed Table 17-2 and Table 17-3, respectively.
Table 17-3
Phase 1 Process Pond Storage Requirements
| | Pregnant | Event | Total |
| | Pond (m3) | Pond (m3) | (m3) |
| Dead Storage | 8,748 | 16,331 | 25,079 |
| Working Solution | 33,103 | | 33,103 |
| Heap Draindown | 16,552 | 16,552 | 33,103 |
| Storm Precipitation | 15,475 | 51,479 | 66,953 |
| Wet Season Accum. | | 57,939 | 57,939 |
| Total Work Vol. required | 65,130 | 125,969 | 191,099 |
| Total Vol. Incl. Dead | 73,878 | 142,300 | 216,178 |
Pond sizing for phase 1 is based on a 900m x 504m lined heap area with the solution accumulations described above.
Table 17-4
Phase 2 Process Pond Storage Requirements
| | Pregnant | Event | Total |
| | Pond (m3) | Pond (m3) | (m3) |
| Dead Storage | 8,748 | 16,331 | 25,079 |
| Working Solution | 33,103 | | 33,103 |
| Heap Draindown | 16,552 | 16,552 | 33,103 |
| Storm Precipitation | 35,031 | 108,933 | 143,965 |
| Wet Season Accum. | | 170,738 | 170,738 |
| Total Work Vol. required | 84,687 | 296,223 | 380,909 |
| Total Vol. Incl. Dead | 93,435 | 312,554 | 405,989 |
Pond sizing for phase 2 is based on a 900m x 1200m lined heap area with the solution accumulations described above. This heap size includes area for potential future expansion. Ponds will be constructed for the phase 2 design requirements at the start of the Project.
Kappes, Cassiday & Associates June, 2019 | | 17.0 Recovery Methods Page 17-15 |
| Camino Rojo Project Feasibility Study NI 43-101 Technical Report |
|
| 17.7 | Process Water Balance |
The Camino Rojo Project area is in a relatively dry region which makes solution management fairly simple. Due to the very limited site rainfall, precipitation event control will be based upon the volume needed to store a sudden major storm event, using the pregnant and event ponds.
Precipitation data has been collected from several weather stations around the Project site. Average precipitation is based on the precipitation data from the San Tiburcio weather station which is approximately four kilometres from the Project. Average precipitation by month is presented in Table 17-5.
Table 17-5
Average Monthly Precipitation – San Tiburcio Weather Station
| Month | Jan | Feb | Mar | Apr | May | Jun | |
Average Rainfall (mm) | 13.3 | 10.4 | 6.4 | 17.4 | 37 | 32.9 | |
| Month | Jul | Aug | Sep | Oct | Nov | Dec | Annual |
Average Rainfall (mm) | 54.1 | 55 | 60 | 24.2 | 11.9 | 14 | 336.6 |
The 24-hr storm events based on different periods were estimated by NewFields and are presented in Table 17-6 and have been derived from the NewFields report titled “Diseño Conceptual de Manejo de Aguas Pluviales y Control de Sedimentacion, Proyecto Minero Camino Rojo, San Tiburcio, Zacatecas, Mexico” dated January, 2019 and referenced in Section 27 of this report.
Kappes, Cassiday & Associates June, 2019 | | 17.0 Recovery Methods Page 17-16 |
| Camino Rojo Project Feasibility Study NI 43-101 Technical Report |
|
Table 17-6
24-h Storm Event Estimations – NewFields
Period
(Years) | Max 24 h
(mm) |
| 2 | 42.71 |
| 5 | 57.99 |
| 10 | 68.04 |
| 25 | 80.68 |
| 50 | 90.07 |
| 100 | 100.47 |
| 500 | 121.54 |
| 1000 | 131.41 |
| 5000 | 154.03 |
| 10000 | 164.89 |
Based on the NewFields report, the estimated 24-h storm event would be approximately 100.5mm. For the water balance analysis and pond sizing, a conservative 24-hr 100-year storm event of 113mm was used plus an additional 15% to account for climate change, making the design storm event of 130mm similar to the estimated 1000-year event.
Pan evaporation data for the water model are based on data from the Conception del Oro weather station and are summarized in Table 17-7. Pan evaporation was not monitored at the San Tiburcio weather station.
Table 17-7
Average Monthly Evaporation Data – Conception del Oro Weather Station
| Month | Jan | Feb | Mar | Apr | May | Jun | |
Average Evap. (mm) | 103.2 | 118.6 | 182.1 | 207.2 | 225.8 | 212.8 | |
| Month | Jul | Aug | Sep | Oct | Nov | Dec | Annual |
Average Evap. (mm) | 203.2 | 190.0 | 158.5 | 140.1 | 115.0 | 95.0 | 1928.7 |
Kappes, Cassiday & Associates June, 2019 | | 17.0 Recovery Methods Page 17-17 |
| Camino Rojo Project Feasibility Study NI 43-101 Technical Report |
|
Based on the preceding rainfall and pan evaporation data, active water balances were calculated based on the requirement for the full processing tonnage of 18,000 tpd. Water balance diagrams for an average year, wet year, and dry year and are presented in Figure 17-3, Figure 17-4 and Figure 17-5, respectively. For all scenarios, it was determined that the Camino Rojo Project will be in a water deficit and makeup water will be required. Makeup water requirements vary minimally between average, wet, and dry years due to the minimal overall precipitation at the Project site. Average Make-up water requirements in cubic metres per hour are summarized in Table 17-8. Pit dewatering influences on the water balance are not included.
Table 17-8
Average Make-up Water Requirements
| Description | Value | Comments |
| Crusher Dust Control | 11.3 | From Water Balance Diagram |
| Heap Leach Usage | 48.2 | From Water Balance "Dry Year Diagram" |
| Road Dust Control | 15.0 | Allowance |
| Truck Shop Wash Down | 1.0 | 2.3 m3/h for 45 minutes, 7 times a day = ~0.4 m3/h. Assume 1 m3/h (6400 gal/day) allowance. |
| Camp Usage | 2.6 | 0.25 m3/day per person, assume 250 permanent design population |
| Buildings | | |
| - Admin | 0.5 | allowance for bathroom / potable water |
| - Plant Shop & Warehouse | 0.5 | allowance for misc. usage / spillage / clean-up |
| - Mine Shop & Warehouse | 1.0 | allowance for misc. usage / spillage / clean-up |
| - Laboratory | 1.0 | allowance for misc. usage / clean-up |
| - Merrill-Crowe | 5.0 | allowance for misc. usage / spillage / clean-up |
| - Refinery | 0.5 | allowance for misc. usage / spillage / clean-up |
| | | |
| TOTAL Water Required | 86.6 | m3/h |
| or | 24 | L/s |
Kappes, Cassiday & Associates June, 2019 | | 17.0 Recovery Methods Page 17-18 |
| Camino Rojo Project Feasibility Study NI 43-101 Technical Report |
|
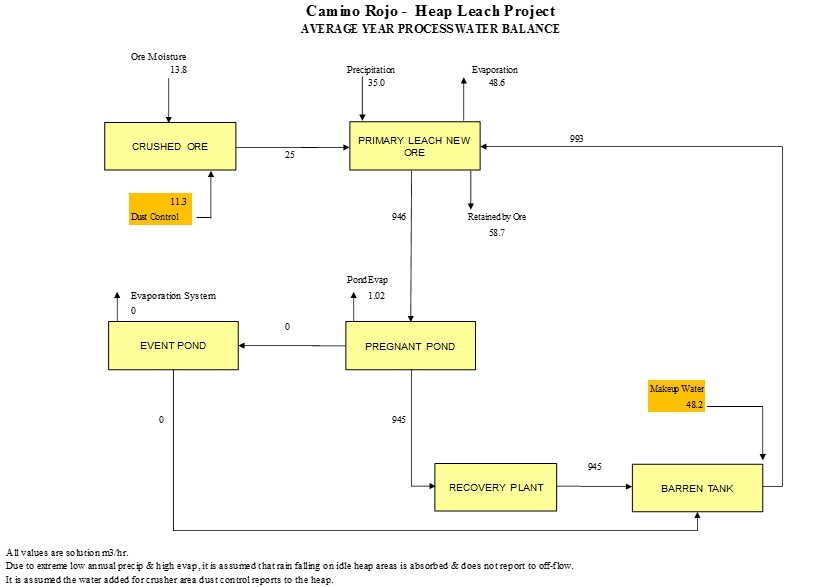
Figure 17-3 Average Year Water Balance Diagram
Kappes, Cassiday & Associates June, 2019 | | 17.0 Recovery Methods Page 17-19 |
| Camino Rojo Project Feasibility Study NI 43-101 Technical Report |
|
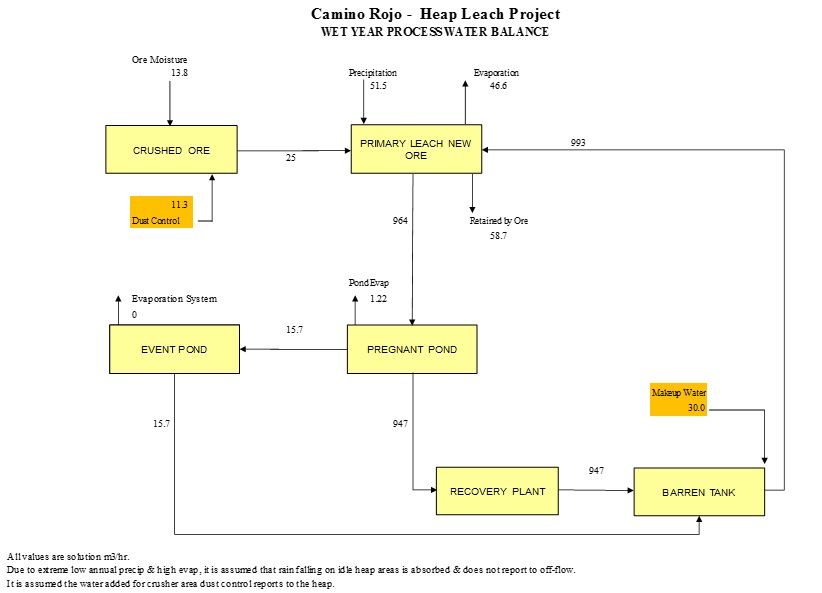
Figure 17-4 Wet Year Water Balance Diagram
Kappes, Cassiday & Associates June, 2019 | | 17.0 Recovery Methods Page 17-20 |
| Camino Rojo Project Feasibility Study NI 43-101 Technical Report |
|
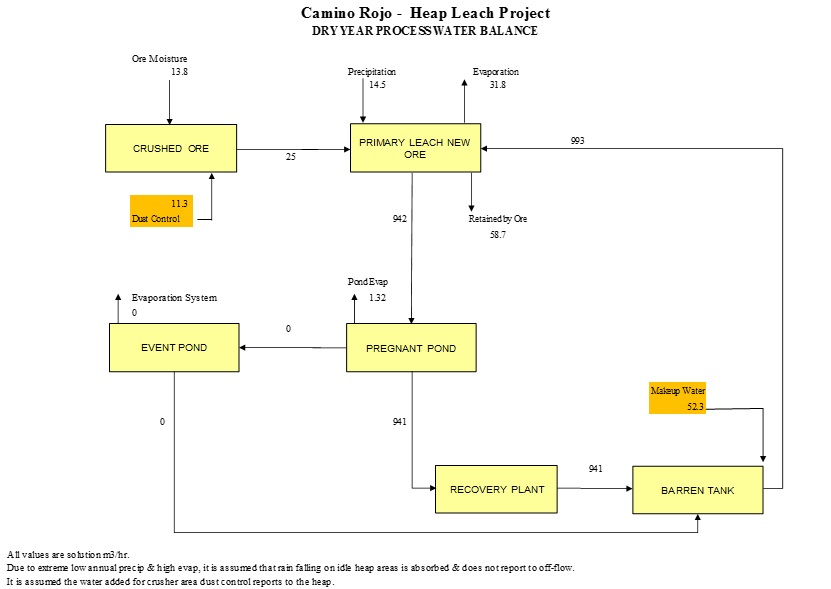
Figure 17-5 Dry Year Water Balance Diagram
Kappes, Cassiday & Associates June, 2019 | | 17.0 Recovery Methods Page 17-21 |
| Camino Rojo Project Feasibility Study NI 43-101 Technical Report |
|
| 17.8 | Merrill-Crowe Recovery Plant |
A Merrill-Crowe recovery plant is designed to recover gold and silver values from pregnant solution by zinc precipitation. The recovery plant will be constructed on a concrete containment slab located outdoors. The zinc addition and filter pre-coat circuits will be fully enclosed inside a steel building. Precipitation filtration and smelting operations will be located in a separate enclosed, secure building. The motor control centre will be housed in a separate room proximal to the recovery plant area.
The Merrill-Crowe recovery plant and refinery layouts are presented in Figure 17-6.
Kappes, Cassiday & Associates June, 2019 | | 17.0 Recovery Methods Page 17-22 |
| Camino Rojo Project Feasibility Study NI 43-101 Technical Report |
|
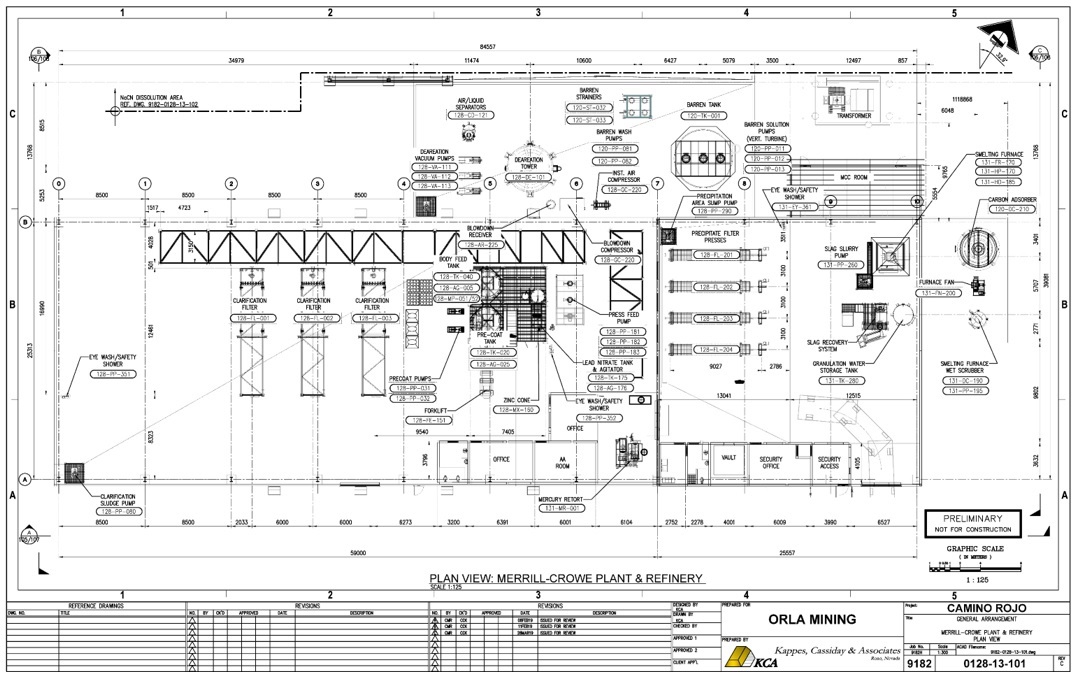
Figure 17-6 Merrill-Crowe Recovery Plant & Refinery Layout
Kappes, Cassiday & Associates June, 2019 | | 17.0 Recovery Methods Page 17-23 |
| Camino Rojo Project Feasibility Study NI 43-101 Technical Report |
|
The following major plant components are included in the Merrill-Crowe facility:
| · | Three each 280 m2 parallel pressure leaf clarification filters, (2 operating); |
| · | Diatomaceous earth filter pre-coat and body feed systems; |
| · | 4.6m dia. x 10m tall Deaeration tower; |
| · | Four each 231 m2 plate and frame precipitate filter presses (3 operating, 1 standby); and |
The Merrill-Crowe plant will be semi-automatic with local Human Machine Interface (HMI) panels displaying unit functions and controlling primary flow streams. Non-primary or batch flow streams, such as precoating, clarifier draining, washing and cleaning, etc. will be controlled manually. All local sensors will provide a signal for monitoring from the master PLC which will control the Merrill-Crowe circuit based on level or solution flow set point for the pregnant solution pumps by controlling pump VFDs.
Pregnant solution at the nominal rate of 1,000 m3/h (1,200 m3/h design) will be pumped to two of the three pressure leaf type clarification filters (two operating, one on backwash/clean/precoat cycle) with a design input pressure of 517 kPag (75 psig). The clarification filters are designed to remove suspended solids down to levels of less than 1 mg/L before removal of oxygen in the deaeration tower. Diatomaceous Earth (DE) for the clarification filters will be prepared in a body feed mix tank and transferred to a pre-coat mix tank. DE from the pre-coat mix tank will be used to precoat the clarification filters. A portion of body feed solution will be metered into the pregnant feed solution to the clarification filters during operation. It is assumed that the clarification filters will require pre-coating once each day.
The clear pregnant solution from the clarification circuit will be sent to the deaeration tower for removal of oxygen. Clear pregnant solution then flows into the deaeration tower and passes through a bed of high surface area packing material. Liquid seal ring vacuum pumps (two operating, one standby) with a design flow of 1400 m3/h each at 24 kPa absolute provide sufficient degassing capacity to maintain oxygen levels in solution of less than 1 ppm.
Deaerated clarified pregnant solution then discharges from the tower and is pumped to three of four precipitate filter presses. Ultra-fine zinc will be added at the press feed pump suction to precipitate gold and silver from the deaerated pregnant solution. Lead Nitrate (PbNO3) may be mixed and metered into the zinc cone as needed to improve Merrill-Crowe efficiencies by forming cathodically charged areas of lead with negatively charged gold cyanide ions being reduced preferentially at these polarized regions. Zinc precipitation is performed at ambient temperatures. Precipitated gold and silver from the ultra-fine zinc will be collected in the precipitate filter presses which have a design operating pressure of 689 kPag (100 psig). A release coat of DE is added to the precipitate filter presses before each filter is brought online for collecting precipitated metals from solution. A portion of body feed solution will be metered into the deaerated pregnant feed solution to the precipitate filters during operation.
Kappes, Cassiday & Associates June, 2019 | | 17.0 Recovery Methods Page 17-24 |
| Camino Rojo Project Feasibility Study NI 43-101 Technical Report |
|
Solution discharging from the filter presses will be stripped of gold and silver and is termed barren solution. The barren solution will be returned to the barren solution tank, which acts as a surge tank and a head tank for miscellaneous uses of barren solution within the facility (gland water, wash down, fresh cyanide solution make-up, etc.) as well as irrigation solution for the heap.
Precipitate from the Merrill-Crowe circuit will be processed in the refinery to produce a doré bar. The refinery circuit includes the following major components:
| · | A 0.28 m3 electric mercury retort; |
| · | A 100 L Induction smelting furnace; |
| · | A smelting furnace hood and off-gas extraction blower; |
| · | A smelting furnace off-gas scrubber system; and |
| · | A slag granulation and handling circuit |
Periodically, one of the precipitate presses will be taken off-line and the empty pre-coated press will be put on line. The press taken off-line will then be put on a compressed air blow cycle to dry the filtered precipitate. After a four-hour blow dry, the press will be opened and the precipitate, with a moisture content ranging from 15 to 20 percent, drops into pans below the press. The pans will be loaded into an electric mercury retort with a fume collection system for drying and removal of mercury before being mixed with fluxes in preparation for smelting. The mercury retort will operate at temperatures up to 650 °C under vacuum. Condensers cool the retort gas stream, condensing most of the mercury which has been vaporised which is collected while the final gas stream is further cooled by aftercoolers and then pass through sulphonated carbon columns before being discharged to ensure there is no remaining mercury in the emissions stream. Recovered mercury is considered as a hazardous waste and will be transported off site for disposal.
The mixed precipitate and fluxes will be fed to the tilting induction furnace by a screw conveyor. The induction furnace is designed to operate at temperatures up to 1260 °C to melt the metal values present. After melting, slag will be poured off into cascading cast iron moulds until the remaining molten furnace charge is mostly molten metal (doré). Doré will be poured off into 40 kg bar moulds, cooled, cleaned, and stored in a vault pending shipment to a third-party refiner. The doré poured from the furnace will represent the final product of the processing circuit.
Kappes, Cassiday & Associates June, 2019 | | 17.0 Recovery Methods Page 17-25 |
| Camino Rojo Project Feasibility Study NI 43-101 Technical Report |
|
Slag will be processed through a granulation circuit, milled, and tabled to remove metal droplets called prills. The classified slag will then be recycled to the heap leach pad via the crushing circuit.
A hood will collect the furnace fumes which will pass through a series of scrubbers including a multi-cone baghouse to remove zinc oxide particles, a wet scrubbing system to remove particulates and a sulphonated carbon scrubber to remove any remaining mercury vapour. The system will be designed to remove over 98% of the particulates present in the exhaust fumes.
The refinery will require detailed inspections of all persons entering and leaving through the guard shack, including management personnel. Doré will be poured and loaded in an area under constant video surveillance. For added security, the security contractor will be present starting from the point where the doré is removed from the storage facility and thereafter accompany the vehicle to the airstrip or the armored truck to the main gate.
| 17.8.2 | Process Reagents and Consumables |
The reagent handling systems includes all equipment required to mix and or store reagents required for the Camino Rojo Project.
Average estimated annual reagent and consumable consumption quantities for the process area are shown in Table 17-9.
Kappes, Cassiday & Associates June, 2019 | | 17.0 Recovery Methods Page 17-26 |
| Camino Rojo Project Feasibility Study NI 43-101 Technical Report |
|
Table 17-9
Projected Annual Reagents and Consumables
| Item | Form | Storage Capacity | Average Annual
Consumption |
| Sodium Cyanide | SLS Cyanide mix system, ~20 tonne shipments, briquettes in 1000 kg super sacks for emergency use | 10 days | 2,300 tonnes |
| Lime (CaO) | Bulk Delivery (20 tonne) | 5.3 days | 8,200 tonnes |
| Antiscalant | Liquid Tote 1 m3 Bins | 1 Month | 175 m3 |
| Zinc | Dry Powder, 50kg canisters | 1 Month | 50.5 tonnes |
| Lead Nitrate | Dry Powder, 25 kg bags | 1 Month | 5.1 tonnes |
| Diatomaceous Earth | Dry Powder, 454 kg supersacks | 1 Month | 530 tonnes |
| Silica | Dry Solid Sacks | 1 Month | 2.1 tonnes |
| Borax | Dry Solid Sacks | 1 Month | 11.7 tonnes |
| Niter | Dry Solid Sacks | 1 Month | 4.4 tonnes |
| Soda Ash | Dry Solid Sacks | 1 Month | 8.2 tonnes |
Pebble lime (CaO) will be delivered in 20-tonne pneumatic trucks. Storage will be provided in one 120-tonne silo and the estimated consumption is 1.25 kg/tonne material which will be metered onto the crushed product reclaim conveyor using a rotary feeder and screw conveyor.
Cyanide used for leaching and other process applications will be mixed in 18 to 20-tonne batches onsite using an SLS (Solid to Liquid) Cyanide mix system. Cyanide will be delivered in certified iso-containers in solid form. At site, process solution will be added to a 95 m3 NaCN dissolution tank and circulated through the delivery container back to the dissolution at ambient temperatures and a design pressure of 147 kPa (15m TDH). Once the cyanide is completely dissolved, the connecting hoses and pipes are cleared pneumatically to ensure there is no remaining cyanide solution in the delivery container or piping. The concentrated cyanide solution (25% NaCN by weight) is then transferred to a 95 m3 Cyanide storage tank for delivery to the process by metering pumps.
An extra SLS cyanide container is planned to be stored on site in the event of a delay in delivery. In the event of a significant delay in delivery, an emergency cyanide mix system will be available to mix briquettes delivered in 1,000 kg bulk bags. Emergency cyanide in bulk bags will be stored on a concrete slab with drainage controls in a secure, fenced, and completely enclosed area.
Kappes, Cassiday & Associates June, 2019 | | 17.0 Recovery Methods Page 17-27 |
| Camino Rojo Project Feasibility Study NI 43-101 Technical Report |
|
The Cyanide dissolution tank, cyanide storage tank, and emergency cyanide mix tank are all in concrete containment sized to hold 110% of the largest tank volume. The concrete containment will have appropriate water stops to ensure containment of solutions.
Cyanide consumption for the process is approximately 0.35 kg/tonne of ore processed.
The cyanide mix and storage area layout is presented in Figure 17-7.
Kappes, Cassiday & Associates June, 2019 | | 17.0 Recovery Methods Page 17-28 |
| Camino Rojo Project Feasibility Study NI 43-101 Technical Report |
|
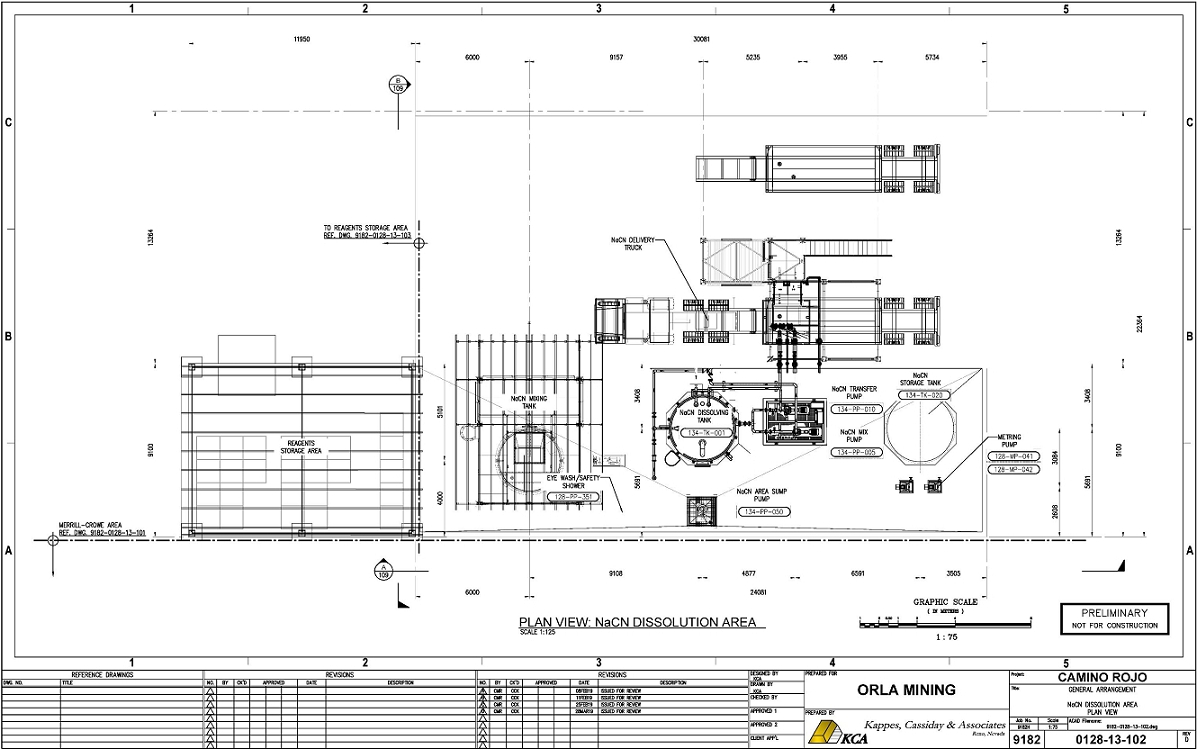
Figure 17-7 NaCN Mix & Storage Area Layout
Kappes, Cassiday & Associates June, 2019 | | 17.0 Recovery Methods Page 17-29 |
| Camino Rojo Project Feasibility Study NI 43-101 Technical Report |
|
Ultra-fine zinc will be added to the zinc cone every shift and consumption will be approximately 150 kg/day at an assumed rate of three times the metal precipitated. An inventory of 90 canisters of 50 kg each will be stored onsite (approximately a 30-day supply).
Lead Nitrate will be delivered in 25 kg sacks, mixed at site and metered to the zinc cone at a rate of 10% of the zinc addition rate if needed. Lead nitrate is consumed at an average rate of 15 kg/day. A 30-day supply will be stored at the Merrill-Crowe plant.
| 17.8.2.5 | Diatomaceous Earth |
Diatomaceous earth will be consumed at an average rate of 1.4 tonnes per day for pre-coating the filters in the Merrill Crowe plant. A one-month reserve supply will be kept onsite in case of supply interruptions and will be stored in an enclosed reagent storage building.
Antiscalant agents will be used to prevent the build-up of scale in the process solution and heap irrigation lines. Antiscalant agent will normally be added to the process pump intakes, or directly into pipelines. Consumption varies depending on the concentration of scale-forming species in the process stream. Delivery will be in liquid form in 1 m3 (1-tonne) bulk containers.
Antiscalant will be added directly from the supplier bulk containers into the pregnant and barren pumping systems using variable speed, chemical-metering pumps. On average, antiscalant consumption is expected to be about 10 kilograms per 1,000 m³ (10 ppm) of process solution to be treated (pregnant and barren), or approximately 500 Litres per day.
Various fluxes will be used in the smelting process to remove impurities from the bullion in the form of a glass slag. The normal flux components will be a mix of silica sand, niter, borax, and sodium carbonate (soda ash). The flux mix composition is variable and will be adjusted to meet individual project smelting needs. Dry fluxes will be delivered in 25-kg or 50-kg bags. Average consumption of fluxes has been estimated at 1.75 kilograms per kg of gold and silver produced.
Kappes, Cassiday & Associates June, 2019 | | 17.0 Recovery Methods Page 17-30 |
| Camino Rojo Project Feasibility Study NI 43-101 Technical Report |
|
| 18.0 | PROJECT INFRASTRUCTURE |
| 18.1.1 | Existing Installations |
Existing infrastructure at the Camino Rojo Project includes an exploration camp in the town of San Tiburcio capable of housing approximately 30 people and dirt and gravel roads throughout the property. Internet and limited cellular communications are currently available, though these systems will need to be expanded for operations.
Access to the Project site is by the paved four lane Mexican Highway 54 and Route 62, a secondary paved highway that passes through San Tiburcio. The Project is approximately 260 km southwest of Monterrey and 190 km northeast of Zacatecas. A private road will enter into the mine property approximately 250 metres northeast of the intersection of Highway 54 and Route 62. This road will provide access to the camps, offices, mine, process plant and other Project facilities. The entrance to the property will be located at NAD27 246493E, 2673864N, Zone 14. Site access roads will be constructed during pre-production and will include approximately 24 km of dirt and gravel roads.
At the existing intersection, an unpaved road and accompanying powerline continue to the town of El Berrendo, approximately 6.5 km northwest of the Project. Both the road and powerline will intersect critical mining facilities, therefore rerouting them will be necessary. The intersection will remain intact, but the road and powerline to El Berrendo will be diverted along the western boundary of the Camino Rojo property until they intersect the existing road and powerline on the north end of the property. This 7.8 km access road will be paved with asphalt and constructed within the Camino Rojo property boundary. Both the existing intersection and the mine entrance will have acceleration and deceleration lanes on both northbound and southbound directions.
The main production haul road will be finished during the construction phase to support pre-stripping and pre-production activities. There will be multiple branches off the main haul road from the pit, including access to the mine truck shop, waste rock dump and low-grade stockpile. Approximately 2.6 km of haul roads will be constructed from the top of the pit ramp to all associated haul truck destinations.
Kappes, Cassiday & Associates June, 2019 | | 18.0 Project Infrastructure Page 18-1 |
| Camino Rojo Project Feasibility Study NI 43-101 Technical Report |
|
Site buildings for the Camino Rojo Project will primarily be prefabricated steel buildings or concrete masonry unit buildings. Site buildings include:
| · | Administration Building; |
| · | Merrill-Crowe Process Facility; |
| · | Process Maintenance Workshop; |
| · | Reagent Storage Building; |
| · | Contractor Mine Office Building; |
| 18.1.5 | Administrative Offices |
A 600 m2 administration building will be constructed with Concrete Masonry Units (CMU) brick with stucco finish and will include permanent office space for approximately 30 employees and additional offices for temporary use. Two entrances, two emergency exits, men and women’s washrooms, a coffee area, a server room and a meeting room will also be included. This facility will include potable and fire water supply along with septic holding tanks sized for service on a weekly basis. The administration building will also include a 75 m2 room designated for training of personnel.
| 18.1.6 | Mine Camp Facilities |
The Project has an existing camp in San Tiburcio with single and multi-room layouts that can house approximately 30 people. The existing camp will be expanded on a nearby property at the beginning of construction. The expansion will include 12 modular housing units each able to accommodate four workers. Additional modular units will be installed and equipped with toilets, urinals and showers. The associated sewage treatment systems in these modular units will be able to treat the amount of waste generated.
Kappes, Cassiday & Associates June, 2019 | | 18.0 Project Infrastructure Page 18-2 |
| Camino Rojo Project Feasibility Study NI 43-101 Technical Report |
|
A significant portion of the work force is planned to be local and will be transported by bus from Conception del Oro and surrounding towns. An onsite operations camp for workers who are not local will be arranged to lodge up to 408 people and will be under maximum occupancy during the construction phase (multiple bunks in rooms that will be single rooms during operations). The camp will be located towards the northeastern portion of the property boundary.
There are two different types of camp accommodations: “A” camp and “B” camp units. The “A” camp unit consist of single rooms with accommodation for 6 single beds or double bunks. During construction, double bunks will be used to maximize camp capacity and will be reduced to single beds during operations. Each “A” camp building covers an area of 36 m2 (7.5 metres x 4.8 metres). The “B” camp unit consists of 4 private bedrooms with private entrances and private bathrooms per unit. Each “B” camp building covers an area of 72 m2 (9.6 metres x 7.4 metres). The total camp occupancy is summarized in Table 18-1 for both construction and operations.
Men and women’s privy units will be constructed and will include toilets, shower stalls, and hand washing stations sufficient for the maximum camp occupancy. A laundry building is also considered and will contain washer and dryer units for cleaning clothes and linens for the camp operations.
Kappes, Cassiday & Associates June, 2019 | | 18.0 Project Infrastructure Page 18-3 |
| Camino Rojo Project Feasibility Study NI 43-101 Technical Report |
|
Table 18-1
Camp Capacity
| Description | Unit Qty | Capacity
(Construction) | Occupancy
(Construction) | Capacity
(Operations) | Occupancy
(Operations) |
| Type A Dorm | 32 | 12 | 384 | 6 | 192 |
| Type B Dorm | 12 | 2 | 24 | 2 | 24 |
| Total | | | 408 | | 216 |
A pre-engineered steel building for cooking and dining facilities will be constructed near the camp to cater for approximately 460 workers and construction personnel. This insulated, steel walled building will include all storage areas for dry and refrigerated food, cooking equipment and serving stations for catering as well as seating and tables for personnel.
A pre-engineered recreation building will be constructed and includes areas for a full gym, multiple TV viewing areas, men’s and women’s wash room and areas for game tables. The recreation building is approximately 324 m2.
| 18.1.7 | Merrill-Crowe Process Facility |
Pregnant solution from the heap leach will be processed in a Merrill-Crowe recovery plant where gold and silver will be precipitated from deaerated pregnant solution with ultra-fine zinc. A 1,500 m2 uninsulated steel walled building with an eave height of 10 metres will contain the clarification filters, pre-coat systems and zinc feed systems for the Merrill-Crowe process facility. This building will have a rollup door, two man-doors, washroom, two offices, an atomic adsorption room for solution analysis and all other associated equipment for the Merrill-Crowe process. Liquid samples such as PLS, barren solution and other solutions from the process will be assayed using the atomic adsorption unit in the Merrill-Crowe building for gold and silver. The facility will include all necessary eyewash/safety shower water and firewater provisions.
Precipitate from the Merrill-Crowe circuit will be processed in the refinery to produce doré bars. A secure, barbwire fenced, 8-metre tall CMU brick building adjacent to the Merrill-Crowe facility will house the refinery and have secure access for personnel and armored trucks. This building will house the precipitate filter presses, flux mixing system, mercury retort and smelting furnace and will include secured entry room, washroom, laundry room, mercury retort room, security office and vault. This will be a CMU brick building of approximately 650 m2. Adjacent to the refinery will be a sulphonated carbon column and wet scrubber for Merrill-Crowe and refinery exhausts.
Kappes, Cassiday & Associates June, 2019 | | 18.0 Project Infrastructure Page 18-4 |
| Camino Rojo Project Feasibility Study NI 43-101 Technical Report |
|
A laboratory facility will be constructed near the Merrill-Crowe plant and will process samples from the mine and process. Chemical and fire assays for full support to the operation will be provided and operated by the owner. This insulated, steel walled facility will include a wet lab, atomic adsorption and fire assay capabilities to have the capacity for 150 assays per day. Doré samples will be assayed at the onsite lab and then later by a third party at an external lab. The laboratory will include all necessary eyewash/safety shower water and firewater distribution.
| 18.1.10 | Process Maintenance Workshop |
Process equipment will be repaired and maintained in a process maintenance workshop. A three-sided, steel walled, uninsulated 330 m2 facility will be located near the Merrill-Crowe building. This will include an open shop area, men and women’s washrooms, a break room and two offices. The work shop will be equipped with air supply and distribution, welding plug sockets, wash water and firewater supply and distribution.
A steel walled reagent storage building will be adjacent to the Merrill-Crowe process facility and will be approximately 100 m2. This will include room for 10 pallets of diatomaceous earth, 10 super sacks of NaCN and 5 bins of antiscalant. Concrete containment will have the capacity for 110% of the largest container within the reagent storage building and includes appropriate water stops to meet the international cyanide code.
The major mining equipment consists of approximately 10 Caterpillar 773G 50-tonne trucks, two Caterpillar 6018FS hydraulic shovels, one Caterpillar 319DL excavator, three Caterpillar 992K loaders, two Caterpillar 824H wheel dozers, three D9T dozers, a Caterpillar D6 dozer, two Caterpillar 14M graders and a Caterpillar 416E backhoe. The truck shop is designed with a semi-open arrangement to include repair bays for small trucks, ancillary equipment, light vehicles, wash and welding areas.
An uninsulated steel-sided 600 m2 mine truck shop with three bays will be utilized for fleet maintenance. An office, lunch room, men and women’s washrooms, a storage area and firewater supply and distribution will also be included. The height of the mine truck shop will be approximately 16 metres. An attached 200 m2 wash bay will be used for washing mine equipment. Adjacent to the wash bay will be an oil skimmer to collect the oil in the wash water from the wash bay.
Kappes, Cassiday & Associates June, 2019 | | 18.0 Project Infrastructure Page 18-5 |
| Camino Rojo Project Feasibility Study NI 43-101 Technical Report |
|
Crane work will be conducted within the mine truck shop with a 10-tonne overhead crane. Maintenance fluids will be distributed to each bay by the means of lubrication stations, each with a supply of compressed air, clean water, grease oils and lubricants. Fuel for the mining fleet will be handled and stored at a fuel station adjacent to the mine truck shop which will include two 100 m3 horizontal diesel storage tanks.
| 18.1.13 | Light Duty Truck Shop |
Approximately 45 vehicles and light duty pieces of equipment will require repair and maintenance. An uninsulated, three-sided steel walled shop of approximately 330 m2 will be utilized for light duty vehicles and will include one vehicle service bay, a lunchroom, a washroom and an office. The eave height of the light duty shop will be approximately 6 metres.
| 18.1.14 | Fuel Storage and Dispensing |
The main diesel storage facility will consist of one project owned 100 m3 storage tank. This facility will be complete with fuel dispensing systems and will be located near the mine truck shop. An additional fuel station with a 15 m3 storage tank will be centrally located to supply gasoline for light duty vehicles. Fuel will be delivered to the mine site via tanker trucks. All storage tanks will be placed in a 110% capacity concrete containment to assure no fuel is leaked to the environment.
| 18.1.15 | Warehouse and Fenced Laydown Yard |
A warehouse and laydown yard for storage of miscellaneous equipment, piping and supplies will be located near the entrance to the property. A 330 m2 uninsulated, steel walled warehouse will have two rollup doors and include a washroom, a break room, two offices and all required firewater supply systems. The building has an open storage area for racking shelves and bins. An attached 260 m2 fenced laydown yard will be adjacent to the warehouse. An additional 1-hectare unfenced area behind the warehouse is designated for additional laydown capacity.
Within a two-metre high bermed and fenced area for explosives, there will be three ventilated silos and two CMU brick explosive magazines, two silos designated for ANFO storage and one silo for emulsion. The explosive storage silos will have a combined capacity of approximately 200 tonnes of explosives. Two silos of approximately 62 m3 and a third silo of approximately 33.5 m3 will be used to store ammonium nitrate and emulsion, separately. Depending on the seasonal conditions, emulsion and ammonium nitrate storage will vary from silo to silo.
A 550 m2 CMU brick powder magazine will be used to store accessories and low explosive products, such as ANFO, emulsion packaging, boosters and detonation cord. A smaller 60 m2 magazine will be used to store the detonators and will have a berm that separates it from the silos and the larger magazine.
Kappes, Cassiday & Associates June, 2019 | | 18.0 Project Infrastructure Page 18-6 |
| Camino Rojo Project Feasibility Study NI 43-101 Technical Report |
|
Approximate distances from notable infrastructure are as follows:
| · | 800 metres northwest of the heap leach boundary |
| · | 1000 metres west of the nearest occupied facility (primary crusher) |
| · | 1100 metres southwest of the main haulage road |
| · | 1200 metres west of the waste rock dump |
| · | 1300 metres east of the El Berrendo access road |
All of the above distances exceed the minimum safety distance requirements of the explosive regulations established by Secretaría de la Defensa Nacional (SEDENA) based on the amount of explosives to be stored in the explosives’ facilities.
Security of the explosives’ magazine will be conducted by strict authorization and documentation of all personnel entering the storage area for supply or removal of materials within the facility.
| 18.1.17 | Guard Shack and Security |
Access to the Camino Rojo Project will be limited to one main gate to access process and camp areas, ensuring only authorized employees, contractors and visitors are allowed onto the property or inside the critical facilities. The entrance will be manned 24 hours a day, 7 days a week for identification control, random checks, drug and alcohol monitoring and vehicle check-in/out. A security contractor will be used for general site security and protection of mine assets.
A 75 m2 insulated CMU brick and stucco finished medical clinic and ambulance will be present onsite, near the administrative buildings. Emergency medical staff on site include one physician, one paramedic, one nurse and one driver/rescue person. Medical treatment will be limited to the attendance of minor accidents and stabilization of patients that have received minor trauma. In the event high level medical care is needed, the ambulance is equipped and prepared for emergency transport to Saltillo or Zacatecas.
Approximately 6 kilometres of usable fencing around the property is already constructed. An additional 30 kilometres of fencing is required to isolate the Project and ensure safety and security. Chain-link fence and gated entry will be utilized around the explosives’ magazines and process ponds area. Chain link fencing will be constructed around fenced laydown yards, sample storage areas and the camp facilities.
Kappes, Cassiday & Associates June, 2019 | | 18.0 Project Infrastructure Page 18-7 |
| Camino Rojo Project Feasibility Study NI 43-101 Technical Report |
|
The Project infrastructure includes a one-kilometre by 30 metre air strip to allow for small passenger planes to land and take off at the Project site. The air strip will be constructed by grading and compacting the existing surface and is located south of the heap leach pad. The air strip does not include any infrastructure or provisions for fueling or maintenance of planes or other aircraft. The air strip will be located approximately 700 meters south of the event pond.
| 18.2 | Power Supply, Communication Systems & IT |
Power supply to the Camino Rojo Project will initially be generated on site using two each 2500 ekW diesel generator units with one additional generator on standby as well as by the existing power line which services the surrounding area. Power will be generated at 4160 V, 3 phase, 60 Hz and stepped up to 13.8 kV by a transformer for site distribution. The generator system has been sized to meet both the average power demand of 4.8 MW as well as the peak estimated demand of 6 MW based on detailed electrical loads with estimated utilization and demand factors. The existing power line has a reported 1 MW of capacity which will be used to supply power to dedicated loads (man camp, site buildings, water supply). The existing power line will be stepped down from 34.5 kV to 13.8 kV.
The general operating philosophy for the temporary site power plant will be that three of the generators will normally be running with one on standby. As loads routinely fluctuate (for example when the stacking conveyors are down for a new stacking arrangement) the generators will automatically switch to fewer generators operating as required to maintain maximum efficiency.
Adjacent to the generator machines there will be a central containerized switchgear with all of the synchronization, control panels, disconnects, circuit breakers, instrumentation, data logging, and 1,200 amp bus.
Each genset will have a fuel day tank with 15,000 L capacity and horizontal air coolers. Two each 100 m3 horizontal diesel storage tanks are also included to ensure adequate fuel supply is available to operate the generators.
An existing 34.5 kV powerline with concrete poles from San Tiburcio to El Berrendo accompanies the existing dirt road access to El Berrendo. This powerline and accompanying poles will be removed once new lined power is completed along the new El Berrendo access road around the Camino Rojo property. The new powerline from San Tiburcio to El Berrendo will be 34.5 kV, three phase and 60 Hz and will be constructed with concrete poles.
Kappes, Cassiday & Associates June, 2019 | | 18.0 Project Infrastructure Page 18-8 |
| Camino Rojo Project Feasibility Study NI 43-101 Technical Report |
|
It is estimated that in Year 2 of operations power supply will be available by connecting to the national commercial grid and power generation at site will no longer be needed. Overhead power lines will connect the 34.5 kV, three phase and 60 Hz power system (pending CENACE approval), to a metering and switching substation. This main substation will be located at approximately NAD27 245609E, 2674826N. Power from the main substation will be stepped down to 13.8 kV and connected to the existing switch gear for site distribution. The temporary generators and associated fuel tanks will be removed once line power is available.
Power distribution around the process plant and facilities will be by overhead powerlines at 13.8 kV, 3 phase, 60 Hz and will be stepped down to 4,160 V, 460 V, 220 V and 110 V as required. Power will primarily be supplied at 460 V or 220/110 V to motor control centres or distribution panels in their respective areas. Power to the conveying stacking system will be supplied at 4160 V and stepped down to 460 V using on board transformers for each conveyor. All overhead distribution power lines will be connected to the main switchgear.
| 18.2.3 | Estimated Electric Power Consumption |
The estimated electrical power demand for the life of the Project is presented in Table 18-2, not including pit dewatering. Attached power for pit dewatering is estimated at 410 kW with demand varying based on pit dewatering requirements.
Table 18-2
Power Demand
| | Year 1 | Year 3 |
| Area / Description | Attached Power (kW) | Average Demand (kW) | Attached Power (kW) | Average Demand (kW) |
| Area 110 - General | 410 | 231 | 410 | 231 |
| Area 113 - Crushing | 2189 | 1286 | 2189 | 1286 |
| Area 115 - Heap Leach Stacking | 2268 | 1361 | 2554 | 1480 |
| Area 120 - Heap Leach Pad & Ponds | 1141 | 810 | 1141 | 810 |
| Area 128 - Merrill-Crowe | 460 | 322 | 460 | 322 |
| Area 131 - Refining | 365 | 149 | 365 | 149 |
| Area 134 - Reagents | 42 | 24 | 42 | 24 |
| Area 360 - Power | 10 | 6 | 10 | 6 |
| Area 362 - Water Supply & Distribution | 399 | 161.2 | 641 | 266 |
| Area 365 - Laboratory | 470 | 264 | 470 | 264 |
| Total | 7,759 | 4,617 | 8,333 | 4,902 |
Note: Minor Difference in Totals Due to Rounding
Kappes, Cassiday & Associates June, 2019 | | 18.0 Project Infrastructure Page 18-9 |
| Camino Rojo Project Feasibility Study NI 43-101 Technical Report |
|
In the event of a power failure or power interruption, diesel-fired backup generators will be used to supply emergency power for project safety and security. Backup electric power will be supplied to the following facilities:
| · | Critical process equipment |
| · | Raw Water Pumping System |
In order to maintain critical solution balances in the solution handling systems during power outages, a 2,000 kW generator is required for the Pond/Merrill Crowe area for the critical pumps. This emergency generator will be located next to the Merrill Crowe recovery plant. A fuel tank will be provided for the generator to maintain a 24-hr fuel supply. The fuel storage system will also include a concrete containment area sized for 110% of the capacity of the tank(s).
Emergency power for the mine camp and raw water pumping systems will be by small local generators located at the facilities.
Communications systems required to support mining, processing and general administration activities will require multiple transmission modes for fail-safe redundancy. Internal communications will be by radio frequency. External communications will be through a mix of landline, cellular and VOIP. Primary communications and any required equipment will be located within the server room in the administration building.
Camino Rojo will require water for the following uses:
| · | Dust control for mining and crushing activities |
| · | Makeup water for the heap leach |
| · | Process plant and laboratory activities |
| · | Man camp and administration uses |
Kappes, Cassiday & Associates June, 2019 | | 18.0 Project Infrastructure Page 18-10 |
| Camino Rojo Project Feasibility Study NI 43-101 Technical Report |
|
Total project water supply will be sourced from production wells located within the property boundary. Total water consumption for the Project will average 24 L/s with a peak water demand of 33 L/s.
A production well designated CRPW-01 has been drilled approximately 2.7 km from the raw water tank. A seven-day pump test of PW-1 concluded that the well could produce at 24 L/s, without significant draw down and potentially up to 32 L/s. This is enough to supply water for operations in a normal year. Work is currently in progress to locate an additional production well to supplement water production at PW-1.
Water demand from production wells will decrease once the water table is reached in the pit. Inflow of groundwater to the pit is expected to exceed water demands for process and mine operations. Eventually, excess pit water will need to be evaporated by implementing additional dust suppression as well as installing evaporators in the event pond.
The design basis for water supply for the average case are presented in Section 17.
| 18.3.2 | Potable and Domestic Water |
Potable water will be treated by a reverse osmosis water treatment system from the raw water tank and stored in an HDPE or lined storage tank to ensure that the water remains acceptable for domestic uses. Water will then be distributed by pumps to the camp and other facilities.
| 18.3.3 | Fire Water and Protection |
Throughout the property, hydrants and sprinkler systems will be installed at appropriate locations. The fire water supply will be a designated portion of the raw water tank located near the camp facilities. The fire water pumps will be a pair of 100% duty pumps, one electrically driven and the other diesel driven, which automatically comes into operation when the electrical driven pump is either being maintained or there is a power failure. To ensure a constant pressure in the main, an electrically driven jockey pump will also be utilized.
The entire system will be automated and provided with signals and alarms to communicate with the main control room. Fire alarm detection systems will be provided for all process areas, camp, warehouses, offices, workshops and electrical/control rooms. The fire detection system will consist of addressable intelligent automatic detectors, manual alarm stations and alarm bells within each facility tied to a central monitoring panel or to a local fire alarm panel with remote reporting to the central monitoring panel in the security office.
Kappes, Cassiday & Associates June, 2019 | | 18.0 Project Infrastructure Page 18-11 |
| Camino Rojo Project Feasibility Study NI 43-101 Technical Report |
|
An underground network of HDPE pipe will feed fire hydrants located in proximity to all facilities and processing areas. Fire hose stations will be installed in the mine workshop, process plant workshop and in proximity to all major process areas.
| 18.3.4 | Surface Water Management |
Water runoff from upstream of developed property will be diverted around the mine operations and allowed to return to natural drainage locations on the southern boundary of the property. The details of this water diversion channel are outlined in the NewFields’ report “Diseño Conceptual de Manejo de Aguas Pluviales y Control de Sedimentación”. An emergency pond will collect water runoff from areas near the process facility through a series of diversion ditches. Ditches around ponds, stockpiles, buildings and roads will collect water runoff from developed portions of the property which will be conveyed to the channel detailed in the NewFields’ report which is referenced in Section 27 of this report.
A sewage treatment plant of 40 m3/day capacity will be constructed early in the construction phase next to the operations camp. This plant will handle the sewage from all camp rooms, kitchens and laundry rooms. Sludge volume generated in the treatment plant will be collected and utilized for compost production to be sent to the growth media stockpiles while the treated water will be utilized for dust suppression.
Waste from the septic systems of the process area, administrative buildings and laboratory will be collected in septic holding tanks and removed from the site by sanitary services. Septic tanks designated for the administration and contractor office buildings will be 20 m3 and all other associated tanks will be 10 m3 all of which will be serviced on a weekly basis.
Kappes, Cassiday & Associates June, 2019 | | 18.0 Project Infrastructure Page 18-12 |
| Camino Rojo Project Feasibility Study NI 43-101 Technical Report |
|
| 19.0 | MARKET STUDIES AND CONTRACTS |
No market studies were completed and no contracts are in place in support of this Technical Report. Gold and silver production can generally be sold to any of a number of financial institutions or refining houses and therefore no market studies are required.
It is assumed that the doré produced at Camino Rojo will be of a specification comparable with other gold and silver producers and as such, acceptable to all refineries.
Gold and silver produced by the Camino Rojo Project would be sold to refineries or other financial institutions and the settlement price would be based on the then-current spot price for gold and silver on public markets. There would be no direct marketing of the metal. The base case financial model for the Camino Rojo Project utilizes a gold price of US$1,250/oz and a silver price of US$17/oz.
The FS assumes that mining operations will be conducted by contractors working under the supervision of the chief mining engineer. The required contracts are:
| · | A general mining contractor, |
| · | A blasting agent/high explosives manufacturer that will also be responsible for delivering the blasting products to the site, loading the blast holes and detonating the blasts, |
| · | A specialty drilling contractor to drill small diameter holes for pre-splitting final pit walls and drilling holes for slope reinforcement if the general mining contractor cannot perform these tasks. |
Quotations for these services have been received and were used to estimate costs for the Feasibility Study, but no contracts are currently in place.
Kappes, Cassiday & Associates June, 2019 | | 19.0 Market Studies and Contracts Page 19-1 |
| Camino Rojo Project Feasibility Study NI 43-101 Technical Report |
|
| 20.0 | ENVIRONMENTAL STUDIES, PERMITTING AND SOCIAL OR COMMUNITY IMPACT |
| 20.1 | Environmental Studies |
Some baseline environmental studies were completed by previous operators of the Project. In April 2018, Orla commissioned independent consultants to conduct more complete baseline environmental studies over the Project area. The studies required to support permitting were completed in May 2019. Periodic sampling of some parameters such as groundwater and air quality is ongoing.
| 20.1.1 | Project Area Description |
The description of the Camino Rojo Environmental System (Sistema Ambiental) presented in this report has been summarized from the Technical Justification Study for Change of Land Use (ETJ, Estudio Tecnico Justificativo para Cambio de Uso de Suelo) prepared for submission to the Federal environmental permitting authority SEMARNAT.
The climate is typical of the high altitude Mesa Central, dry and semi-arid. Temperatures commonly range from +30° to 12 °C in the summer and 24° to -6° C in the winter. The median annual temperature is 17.1 °C. The average annual precipitation of 337mm falls mostly during the rainy season in July, August, and September. The average annual evaporation is approximately 1,900mm. Wind speeds are variable with maximum wind speeds of 130 to 160 kph during extreme events. Average wind speed is 5 kph.
Soils are dominantly calcisols (soils with high carbonate component) and leptosols (shallow soil over carbonate rock). These soils are not very suitable for agriculture.
The Project is located in Hydrologic Administrative Region III, North Central Basins, in Hydrologic Region Number 37 El Salado, within the RH37C Sierra de Rodriguez Basin, within sub basin RH37Ca San Tiburico and micro-basin 37-158-04-007 San Tiburcio, characterized by open dendritic drainages.
Kappes, Cassiday & Associates June, 2019
| | 20.0 Environmental Studies, Permitting and
Social or Community ImpactPage 20-1 |
| Camino Rojo Project Feasibility Study NI 43-101 Technical Report |
|
The Project is located in the Mesa Central physiographic province, dominated by gently sloping valley floor lowlands in basins separated by low hills and/or moderate relief mountains.
The site is in Seismic Zone A, nil to very low seismic activity: It is characterized by zero reported historic seismic events and expected temblor-caused soil accelerations of no more than 10% of the acceleration of gravity
The vegetation is dominantly creosote bush and tar bush, with cacti, maguey, sage and coarse grasses with rare yucca, and is classified as matorral desértico micrófilo (small leaved and/or thorny desert scrub less than 4m high) which covers >95% of the Project area, and matorral desiertico rosetofilo (desert scrub less than 4m high with rosette shaped leaves) which covers <5% of the Project area).
Five flora species with legally protected status are present: biznaga (beehive cactus - Coryphantha delicata); biznaga burra (giant barrel cactus - Echinocactus platyacanthus); biznaga barril de lima (Mexican fire barrel cactus - Ferocactus pilosus); biznaga bola uncinada (Chihuahuan fishhook cactus - Glandulicactus uncinatus ssp. Uncinatus); and amole cenizo (Manfreda potosina).
In addition to the protected species, the independent biologists contracted to conduct the flora survey recommended that eleven flora species be considered of biological interest and included in a flora rescue/protection plan.
In accordance with Federal laws and permit conditions, 100% of protected plants will be rescued and transplanted prior to construction. The planned program of flora rescue and transplant anticipates the collection and transplantation of 3,801 plants of protected species. Additionally, 10% of the plants of biological interest will be rescued and transplanted prior to construction. The total number of plants of biological interest to be rescued and transplanted is estimated at 8,502. A nursery will be constructed on site to safely store rescued plants prior to their re-planting, and native vegetation seeds will be collected and germinated in the nursery to provide plant stock for post-closure reclamation plantings.
Kappes, Cassiday & Associates June, 2019
| | 20.0 Environmental Studies, Permitting and
Social or Community ImpactPage 20-2 |
| Camino Rojo Project Feasibility Study NI 43-101 Technical Report |
|
Seventy-eight vertebrate species were identified in the Project area, 57 bird species, 9 mammals, 8 reptiles, and 4 amphibians. Nine species identified in the Project area are listed as threatened or protected species, and thus require special consideration: sapo verde (North American green toad - Anaxyrus debilis); cascabel de diamantes (Western diamondback rattlesnake - Crotalus atrox); vibora de cascabel gris (rock rattlesnake - Crotalus Lepidus); víbora de cascabel cola negra (black tailed rattlesnake - Crotalus molossus); chirrionerra (coachwhip snake - Masticophis flagellum); culebra sorda Mexicana (Mexican bull snake – Pituophis deppei); lagartija espinosa de mezquite (mesquite lizard - Sceloporus grammicus); zorra norteña (kit fox - Vulpes macrotis); and the aguililla rojinegra (Harris hawk - Parabuteo unicinctus harrisi).
In accordance with Federal laws and permit conditions, prior to construction qualified biologists will survey areas to be disturbed to identify nesting areas, dens, and lairs of animals present. Any animals not naturally prone to leave the area that are found will then be relocated to suitable habitats elsewhere in the property area.
| 20.1.2 | Environmental Management Plans |
A key objective is to design and build the Project in such a way that it does not cause significant adverse effects during construction, operation, closure and post-closure. To aid this objective, a number of Environmental Management Plans will be developed. An outline of some of the key plans is given in this section. These plans will need to be developed further before construction begins. They will also need to be reviewed and revised during the life of the Project.
Costs for environmental monitoring, management plans and environmental protection measures are included in the FS.
| 20.1.2.1 | Surface Water Management |
Surface waters in the Project area are exclusively ephemeral streams with water flow only during storm events, and small retaining ponds built along the drainages as sources of water for livestock and agriculture. As part of Project environmental baseline studies, water from retention ponds was sampled. Sampling of surface waters draining the Project area will be continued through the life of the mine, including reclamation period and post-closure until it has been determined that reclamation has been successful in preventing long-term effects on surface waters.
Water diversion structures will be constructed to keep surface water from flowing into the heap leach pad, mine pits, waste dumps and other operational areas. Surface drainage from disturbed areas which have no potential to produce chemical or metal contamination will be directed into small ponds to allow sediments to settle out before discharging to the environment.
| Kappes, Cassiday & Associates | 20.0 Environmental Studies, Permitting and |
| | Social or Community Impact |
| June, 2019 | Page 20-3 |
| Camino Rojo Project Feasibility Study NI 43-101 Technical Report |
|
Independent consultants have completed a detailed investigation of Acid Rock Drainage (ARD) and metal leaching potential. Over 80% of the mineralized and unmineralized material that would be moved or processed under the plans described in the Feasibility Study are categorized as Non-Acid Generating, the remaining material is categorized as Potentially Acid Generating. The waste rock storage facility and the heap leach pad are expected to be net neutralizing. A full report of the ARD study by HydroGeoLogica is referenced in Section 27 of this report. A preliminary waste rock management plan has been developed by HydroGeoLogica and includes encapsulating potential acid forming materials in the centre of the waste rock storage facility to limit the possible generation or release of ARD as described in Section 16.6.
| 20.1.2.2 | Ground Water Management |
Groundwater in the area of the proposed pit and waste rock storage facility (WRSF) is present at approximately 110 metres (m) below ground surface (bgs), indicating a significant unsaturated zone is present underneath the WRSF. Groundwater in the vicinity of the WRSF, based on water quality samples collected from long-term pumping test of well CR-01 in January 2019, has a near neutral pH, but high total dissolved solids (TDS) in the range of 5,000 to 6,000 mg/L, as well as elevated concentrations of other constituents. However, there may also be a perched zone of ground water below part of the heap leach pad (HLP) at a depth of approximately 12 to 27m bgs; the extent of this perched zone (vertical and horizontal distribution) is still being evaluated.
Groundwater is not currently used as water supply in the vicinity of the Project and the groundwater quality precludes its use for drinking water as concentrations of several constituents are above drinking water standards. Additionally, water from CR-01 had an arsenic concentration of 0.27 mg/L in one of the January 2019 samples, greater than standards applicable to the Project (average monthly discharge standards for agriculture presented in NOM-001-SEMARNAT-1996).
Groundwater quality degradation could potentially come from the heap leach pad and associated ponds (if the liners leak) and from the waste rock dump. Therefore, monitoring wells will be constructed down-gradient of the heap leach pad, mine and waste rock dumps. A systematic sampling program will be developed to ensure any effects the operation has on groundwater are detected and appropriate changes to the operation can be made to negate these effects.
Hydrologic models of the proposed mine area indicate that post closure, the mined pit would become a pit lake with evaporation exceeding inflows, thus the pit would become a hydrologic sink relative to lateral groundwater flow and groundwater in the vicinity of the pit would flow towards the pit, thus minimizing the potential for affecting groundwater quality outside of the immediate mine area. Depending on vertical head gradients and permeabilities, there is a possibility that groundwater in the pit lake could flow downward into underlying units.
| Kappes, Cassiday & Associates | 20.0 Environmental Studies, Permitting and |
| | Social or Community Impact |
| June, 2019 | Page 20-4 |
| Camino Rojo Project Feasibility Study NI 43-101 Technical Report |
|
| 20.1.2.3 | Air Quality Management |
The primary potential effect on air quality will be because of dust. Costs for watering the road and for dust control in the crushing circuit have been included in this Report. The Company has an ongoing air quality monitoring program in local communities. An air quality monitoring program will be initiated to ensure worker health and the environment are not adversely affected by air quality.
| 20.1.2.4 | Wildlife Management |
All protected species of fauna will be rescued and relocated to suitable habitats prior to commencement of operations. All operational areas will be fenced to keep animals out. A no hunting policy will be enforced amongst workers. Waterfowl are not common in the area. However, if required, a system to keep birds from landing in the operational ponds will be devised.
| 20.1.2.5 | Cyanide Management Plan |
Orla will develop a cyanide management plan which will include measures to prevent interaction of wildlife with heap leach solutions. All lining and containment systems will be designed to meet International Cyanide Code requirements and will be constructed according to North American standards.
Special wastes such as waste oil, glycol coolant, solvent fluids, used oil filters, used batteries, and contaminated fuel, will be handled, stored, transported, and disposed of in accordance with appropriate Hazardous Waste Regulations. A certified transport and disposal company will collect all waste to transport offsite for final disposal.
The fenced temporary storage facility for hazardous waste will be approximately 1,375 m2. Approximate 7.5 m2 of steel roofed storage area will be designated for used batteries and 50 m2 of storage for used lubricants, coolant and other miscellaneous fluids. Approximately 730 m2 within the fenced area is designated for used tires. This area is sized for a year of replaced haul truck tire storage stacked one tire high, providing additional storage if tires are stacked in multiples.
| 20.1.3.2 | Non-hazardous Wastes |
A site for temporary storage of recyclable materials will be established at the laydown Area. Such items as scrap metal, tires, glass, recyclable plastics and drink containers will be separated, containerized as appropriate, and temporarily stored in the lay down area until sufficient volumes are available for shipment to a recycling point. Non-recyclable and non-hazardous waste will be buried in an on-site fenced landfill of approximately 12,000 m2. The landfill will have the capacity for approximately 15,000 m3 or 4,500 tonnes worth of waste material based on a compaction of 300 kg/m3, the minimum landfill compaction outlined in NOM 083.
| Kappes, Cassiday & Associates | 20.0 Environmental Studies, Permitting and |
| | Social or Community Impact |
| June, 2019 | Page 20-5 |
| Camino Rojo Project Feasibility Study NI 43-101 Technical Report |
|
| 20.1.3.3 | Putrescible (Domestic) Waste Disposal |
Non-hazardous putrescible organic food wastes generated from the camp accommodation facilities will be composted and used as an organic enrichment to stockpiled soil, or if not suitable for composting, will be buried in the landfill site along with other inert non-recyclable materials.
A location on the mine site will be designated as an outdoor storage or ‘boneyard’ area for placement of items that are not yet ready for disposal, but which may still be of use for spare parts. These items are likely to include equipment parts, vehicles, and pieces of equipment, and metal components. As much of this material as possible, will be utilized during the mine life. Materials remaining in the boneyard at the end of mine life will either be shipped off site for salvage value, recycled, or disposed of in the landfill if they meet the criteria for disposal at that location.
| 20.1.3.5 | On-site BioRemediation Cell |
“Land farming” is a commonly used method of soil remediation for hydrocarbon contaminated soil that relies on natural breakdown of hydrocarbons by microbial action. This is done by spreading a shallow layer of contaminated soil onto a lined "bermed" area referred to as a biocell. In the event of a minor hydrocarbon spill on site, the contaminated materials will be treated using a biocell as authorized in the Hazardous Waste Regulation.
| 20.1.3.6 | Waste Water (Sewage) Disposal |
The wastewater disposal systems for the camp and office areas will be engineered, constructed, and maintained under the direction of a qualified professional and will comprise separate septic systems for the office and housing facilities as described in Section 18.0.
| Kappes, Cassiday & Associates | 20.0 Environmental Studies, Permitting and |
| | Social or Community Impact |
| June, 2019 | Page 20-6 |
| Camino Rojo Project Feasibility Study NI 43-101 Technical Report |
|
Reclamation will be undertaken during mining activities where possible, but the majority of work will occur after the completion of mining and final gold recovery. The reclamation land use objective will be to return the land to its traditional use as a grazing area for goats and wildlife habitat. Closure objectives include securing the site to assure physical safety of people, protecting wildlife, protecting surface and groundwater quality and quantity, minimizing erosion and controlling fugitive dust. To accomplish these objectives, the following key elements will be included in the reclamation plan:
| 1. | Chemical stabilization, accomplished through rinsing of the heap leach pad solutions, encapsulation of potentially acid generating rock in the waste rock storage facility and development of a pit lake; |
| 2. | Physical stabilization, accomplished through slope grooming, and the application of topsoil and revegetation; |
| 3. | Control of surface waters; and |
| 4. | Monitoring effluent chemistry from the pad and water draining the mine waste and pit areas. |
Closure will be accomplished in three stages:
| 1. | Concurrent: measures implemented during the operating life of the Project; |
| 2. | Final: measures implemented after cessation of operations; and, |
| 3. | Post-closure: provides for short-term maintenance and long-term monitoring of the closed facilities. |
An outline of the key components of the closure and reclamation plan is given in this section. Further detailing of these components will be required before construction commences. During operation, the closure and reclamation plan will be revised further.
| Kappes, Cassiday & Associates | 20.0 Environmental Studies, Permitting and |
| | Social or Community Impact |
| June, 2019 | Page 20-7 |
| Camino Rojo Project Feasibility Study NI 43-101 Technical Report |
|
All topsoil harvested during construction will be stockpiled for future use. However, the site is expected to be deficient of organic matter and other soils to support revegetation. Therefore, during operations topsoil will be created. This will be done by combining compostable materials with suitable native soils and natural topsoil. The produced topsoil will be stockpiled for future use; this process must start early since green wastes require time to compost before they are suitable to use as soil amendments.
Possible sources for organic matter include:
| · | Chipped wood, bark and brush from site clearing activities (from the entire site including the mine and waste dumps), beginning with the initial site clearing and including subsequent phases of expansion of the heap, waste dumps and open pits; |
| · | Composted organic fractions from solid wastes (especially food wastes) from the camp and canteen; and, |
| · | Composted sewage sludge from the on-site disposal systems (ideally composted with the solid waste organic fraction). |
All camp buildings will be removed upon completion of the operation and the area graded and seeded.
| 20.1.4.3 | Central Operating Area |
Prior to reclamation, all hazardous material will be removed from site. All equipment and building in the central operating area, including the office and warehouse, mine truck shop, Merrill-Crowe plant, generators and fuel handling facility will be dismantled and removed, and the area graded and seeded.
Closure of the pit will include restricting access to the pit and allowing the pit to naturally fill with groundwater to form a pit lake. In order to prevent the inflow of natural water runoff, the catchment berm preventing upstream flow into the pit will be retained after closure.
Hydrogeologic and geochemical modeling to predict pit filling and pit lake water levels and pit lake chemistry during the post-closure period was performed by HydroGeoLogica and is presented in the report titled “Camino Rojo Pit Lake Evaluation”. The pit lake is expected to fill to a steady-state elevation within 30 to 40 years. The steady-state pit lake is predicted to be approximately 100m deep with a lake surface 110m below the rim; discharge to surface water will not occur. The pit lake water balance indicates that the pit will function as a hydraulic sink in the base case scenario and most sensitivity scenarios evaluated. For a high groundwater inflow scenario, the pit lake water balance predicts a downward outflow from the pit lake, though the pit lake seepage flow rate to groundwater is low, limiting potential effects to groundwater. The pit lake chemistry is expected to initially have a near-neutral to alkaline pH and a total dissolved solids concentration (TDS) that is elevated, but similar to that of groundwater (approximately 5000 mg/L). The pit lake is predicted to remain alkaline in the post closure period as potentially acid generating materials in the pit walls will largely be submerged. As the pit lake is expected to function as a hydraulic sink, overconcentration of the pit lake water will occur with time and the TDS concentrations will increase throughout the post closure period. Concentrations of arsenic and cadmium are predicted to eventually be elevated.
| Kappes, Cassiday & Associates | 20.0 Environmental Studies, Permitting and |
| | Social or Community Impact |
| June, 2019 | Page 20-8 |
| Camino Rojo Project Feasibility Study NI 43-101 Technical Report |
|
Water inflow and quality in the pit and surrounding areas will be monitored for 10 years after the notice to SEMARNAT of restoration compliance.
Finally, the pit will be enclosed by a perimeter fence in order to restrict the access of individuals and wildlife in the area.
| 20.1.4.5 | Waste Rock Storage Facility (Mine Waste Dumps) |
The WRSF and associated roads will be reclaimed post mining. Mine roads and waste dumps will be re-sloped, with slopes re-contoured to 2.5:1 horizontal to vertical grade, have topsoil added, and be re-seeded.
Short and longer term monitoring of slope stabilities will be provided until deemed stable.
Sulphide oxidation is a potential issue for all mineral deposits containing sulphides that are exposed to air and water through the process of mining. Sulphide oxidation produces acidity that can result in acid rock drainage (ARD) if there is an absence of sufficient neutralization potential and if there is sufficient flushing to mobilize this acidity. However, if sufficient neutralizing minerals, specifically carbonate minerals such as calcite, are present and available, then acidic conditions may not occur even in the presence of sulphide oxidation.
Geochemical characterization and modeling studies completed by HydroGeoLogica Inc. demonstrate that the Camino Rojo deposit has abundant neutralization potential throughout the deposit, with an average content of approximately 140 tCaCO3/kt for all material types. Additionally, the post-mineral and the oxide zones of the deposit have limited to no sulphide minerals, though the transition and sulphide zones of the deposits have low sulphide mineral contents, primarily as pyrite, with average contents of approximately 1 wt% and 3 wt%, for the transition and sulphide materials, respectively. These average sulphide contents correspond to acid generation potentials (AGPs) of approximately 30 to 100 tCaCO3/kt, respectively, less than the average neutralizing potential.
| Kappes, Cassiday & Associates | 20.0 Environmental Studies, Permitting and |
| | Social or Community Impact |
| June, 2019 | Page 20-9 |
| Camino Rojo Project Feasibility Study NI 43-101 Technical Report |
|
Based on the overall average ABA characteristics of the waste rock, HydroGeoLogica determined that the waste rock storage facility is expected to be net neutralizing. Using the neutralization potentials and sulphide mineral contents above, and tonnages of the respective materials in the waste rock dump, there is more than five times the required neutralization potential to maintain overall neutral conditions, or an equivalent overall neutralization potential ratio of 5 (NPR, defined as neutralization potential over acid generation potential). Per Mexican regulations, NPR values greater than 3 are classified as non-acid generating.
A waste rock characterization and handling plan was developed by HydroGeoLogica, independent consultants to Orla, (reference Hydrogeologic report), key components of which are:
| · | Minimum 5-metre thick base of oxide/post-mineral. This practise will: a) prevent direct infiltration of seepage from transition and sulphide materials to the vadose zone and groundwater, b) prevent surface water and/or groundwater moving along the waste rock-ground surface contact to interact with transition and sulphide materials, and c) provide a layer of material with excess neutralization potential at the base of the WRSF, which will provide attenuation capacity for any acidic seepage generated within the WRSF. |
| · | Final surface of 3-m layer of post-mineral/oxide material. This will prevent long-term exposure of transition and sulphide materials and limit development of potential localized zones of acidic conditions. |
Given that the current Project mine plan does not include mining appreciable tonnages of post-mineral or oxide materials in the final two years of the mine plan, the WRSF is designed such that post-mineral and oxide materials may be easily pushed or placed over the transition and sulphide materials upon completion of mining.
Additional components of the waste rock management in anticipation of closure and reclamation include: a water shedding design, including grading and sloping of lifts, benches and top surfaces, to limit infiltration and prevent ponding, and water management structures to divert non-contact water around the waste rock storage facility. Runoff from the waste rock storage facility will be contained in retention or sediment control basins, as appropriate.
| Kappes, Cassiday & Associates | 20.0 Environmental Studies, Permitting and |
| | Social or Community Impact |
| June, 2019 | Page 20-10 |
| Camino Rojo Project Feasibility Study NI 43-101 Technical Report |
|
During reclamation, steep slopes on roads will be stabilized and any culverts removed. Drainage bars will be constructed to keep water from flowing down the road bed. Except for the access road, surfaces will be scarified and seeded.
| Kappes, Cassiday & Associates | 20.0 Environmental Studies, Permitting and |
| | Social or Community Impact |
| June, 2019 | Page 20-11 |
| Camino Rojo Project Feasibility Study NI 43-101 Technical Report |
|
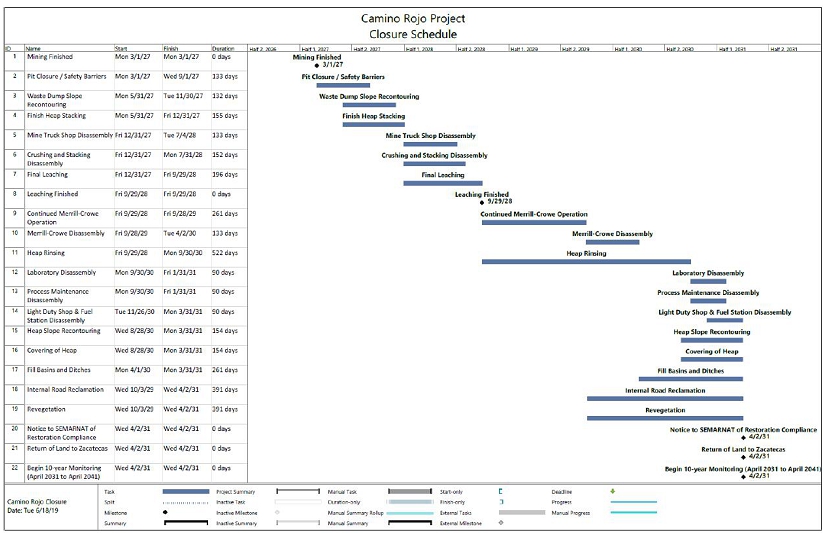
Figure 20-1 Camino Rojo Project Closure Schedule
| Kappes, Cassiday & Associates | 20.0 Environmental Studies, Permitting and |
| | Social or Community Impact |
| June, 2019 | Page 20-12 |
| Camino Rojo Project Feasibility Study NI 43-101 Technical Report |
|
| 20.1.5 | Closure Activities – Heap Leach Facilities |
The following activities will be completed during the operating life of the Project, beginning in year 3 of operations and continuing until the cessation of operations:
Analysis of results from geochemical and metallurgical laboratory testing to investigate heap neutralization and long-term chemical and physical stability of the heap leach has been completed by KCA and HydroGeoLogica Inc., and the results of these studies are herein summarized.
The HLP will contain oxide ore and transitional ore (TrH and TrL); as such, development of acid rock drainage (ARD) in the HLP during operations or the post-closure period is not expected. The environmental geochemical behaviour of the oxide and transitional materials for the deposit has been evaluated by several geochemical characterization programs, as summarized by HGL (2019a). The oxide materials are non-acid forming, with low sulphide content and abundant acid neutralization potential (NP). The transitional materials are also considered overall non-acid forming due to their abundant NP. However, the transitional materials have variable sulphide mineral content due to the variability of oxidation in the deposit, resulting in a potential acid-forming classification for approximately 30% of the transitional samples (HGL 2019a) based on Mexican standards.
The sulphide mineral content of the ore is important from a metallurgical standpoint because it affects cyanide leaching, and from an environmental standpoint, because it determines the environmental behaviour with respect to ARD potential (HGL 2019a). The predicted annual average total sulphur content of the ore, based on assay data and the block model, was included in the mine schedule IMC (2019). Given that the majority of the ore is oxide, the overall sulphur content is relatively low at 0.47 wt.%. In contrast, the average neutralization potential for the oxide and transitional ore samples as presented in HGL (2019a) was 72 tonnes of calcium carbonate per kiloton (tCaCO3/kt), ranging from 19 to 163 tCaCO3/kt.
The resulting net neutralization potential (NNP, defined as the NP minus the AGP from sulphur content as pyrite), considering respective tonnages of oxide and transitional ores, is positive, with an excess of 2.5 million tCaCO3, due to the relatively elevated ANP of all materials and the abundance of low-sulphur oxide materials.
Mexican regulations (NOM-157-SEMARNAT-2009) use the neutralization potential ratio (NPR; ANP/AGP) for classification of waste materials, with NPR values less than 3 designated as potentially acid forming. Weighted annual average NPR values were calculated for the overall ore. The NPR values are greater than 3 except for the final two years of mining when the ore is mostly transitional ore; however, this only represents approximately 15% of the overall ore based on the mine plan. Using the bulk ANP and AGP for the HLP, the overall HLP is classified as non-acid forming with an NPR of 5.
| Kappes, Cassiday & Associates | 20.0 Environmental Studies, Permitting and |
| | Social or Community Impact |
| June, 2019 | Page 20-13 |
| Camino Rojo Project Feasibility Study NI 43-101 Technical Report |
|
The metals leaching behaviour of the oxide and transitional leached ore from an environmental standpoint was evaluated by rinsing column tests completed as a part of metallurgical testing and through the synthetic precipitation leaching procedure (SPLP). The metallurgical column test rinsing included chemical analysis of rinse leachates over time from free-draining columns containing approximately 200-kilogram (kg) samples. Six of the columns were rinsed by drip irrigation with water or with a detoxified barren solution with the equivalent of 5 to 8 pore volumes of rinse solution.
Concentrations of metals and cyanide decreased with rinsing, and by pore volumes 5 to 8, concentrations of all metals and cyanide, with the exception of arsenic, were below standards applicable to the site as presented in NOM-001-SEMARNAT-1996 (metals limits for discharge for agricultural use) and NOM-155-SEMARNAT-2007 (cyanide limits for heap leach mining).
Arsenic concentrations were also elevated in the SPLP tests (though not relative to the standard applicable to the tests, NOM-157-SEMARNAT-2009, for determination of hazardous materials), as well as in one of the humidity cell tests on the oxide waste rock (HGL 2019a). The combination of these results imply that the source of the arsenic is not due to cyanide leaching, but rather weathering of the oxide and transitional ore. Given this, the elevated concentrations of arsenic observed in the rinsing are expected to persist long term in the post-closure period. Consistent with this evaluation, arsenic is also elevated in the natural groundwater based on sample testing of well CR-01 in the pit area (Section 20.1.2.2). Designs and procedures developed to ensure the elevated arsenic does not result in environmental degradation are given in the following sections.
| 20.1.5.2 | Permanent Surface Water Diversion Works |
As the leach pad expands the lower portions of the surface water diversion systems will be in their final locations, and then they will be upgraded to meet permanent standards for erosion and storm size appropriate for the post-closure period to limit maintenance. This will also apply to the outlet structures and any associated erosion works.
| 20.1.5.3 | Permanent Slope Stabilization |
Once heap slopes are in their permanent configuration and leaching has ceased, final grooming, capping and revegetation of these slopes, along with associated surface water and erosion controls, will be implemented.
| Kappes, Cassiday & Associates | 20.0 Environmental Studies, Permitting and |
| | Social or Community Impact |
| June, 2019 | Page 20-14 |
| Camino Rojo Project Feasibility Study NI 43-101 Technical Report |
|
| 20.1.5.4 | Final Engineering and Monitoring Plans |
The plans developed during concurrent closure will require final revisions to accommodate both lessons learned and the final configuration of the heap and roads. This will also include final as-built surveys of the facilities.
| 20.1.5.5 | Heap Rinsing, Neutralization and Solution Management of HLP Seepage |
The heap rinsing process consists primarily of recirculating cleaner water through the heap. Initially the recirculated solutions will be process solutions, diluted by normal rainfall, with pH buffered to normal leaching levels to allow complete extraction of gold, silver and other metals. Individual areas of the heap, simulating approximately the normal leach areas, will be rinsed so that the capacity of the drainage system and plant are properly utilized. Once the target levels for the controlled constituents (pH, metals and CN) are reached, the heap will be allowed to sit idle through at least one wet season and the effluent chemistry monitored to ensure the targets are maintained. If any of the constituents exceed the targets, then rinsing will be repeated.
Following rinsing, the HLP may be regraded as needed and a cover will be placed on the HLP to reduce infiltration and subsequent seepage that may require management. The HLP will initially have a high moisture content from residual rinsing and leaching solutions. During initial drain down of these solutions, flows will be similar to that of operations, but will decrease rapidly as the coarser zones are drained. Following the bulk of draindown, seepage rates will approach those of a long-term, steady-state seepage. Long-term seepage rates will be governed by precipitation, evaporation and the cover system.
Geochemical testing of residual samples from column leach tests indicate that leached material is not prone to acid production and the potential for metal leaching is generally low. Long-term seepage chemistry is expected to be is expected to be similar to that of the final rinses from the metallurgical columns, near-neutral to alkaline with low concentrations of metals with the exception of arsenic. The long-term seepage is expected to be low with the use of a cover, less than 0.1 L/s, but will likely persist in perpetuity and may be sporadic. The long-term seepage can be managed using the operational solution collection system and directed to an evaporation pond constructed by the conversion of the operational ponds, eliminating the need for discharge.
In the first years of operation detailed closure and monitoring plans will be developed considering the as-built facilities and the projected as-stacked heap. These plans will be of sufficient detail to allow the start of concurrent closure activities as well as planning for final closure.
Laboratory and field data will be collected on an ongoing basis to support geochemical and heap neutralization modeling and to allow accurate prediction of both the neutralization process and effluent chemistry following closure. Laboratory testing may include leach columns and kinetic testing to simulate long-term geochemistry. Field testing may include testing either pilot heaps or cells created inside the commercial heap to verify the laboratory data. Geochemical modeling will allow predictive modeling of effluent quality from the closed heap.
| Kappes, Cassiday & Associates | 20.0 Environmental Studies, Permitting and |
| | Social or Community Impact |
| June, 2019 | Page 20-15 |
| Camino Rojo Project Feasibility Study NI 43-101 Technical Report |
|
| 20.1.5.6 | Heap Slope Grooming and Slope Stabilization |
After the heaps have been rinsed and neutralized, the slopes will be graded to a smoothed contour with 2.5:1 horizontal to vertical grade, with appropriate grading to promote proper drainage and to accommodate the cover. In some cases where slope stability has been an issue during operations, some flattening of the slopes may be required as part of final closure. The required final slopes will be determined based on testing and analysis. Some areas may be graded to allow creation of permanent access roads or other features. The lower portions of the entire perimeter of the heap will be graded so that all exposed liner is covered but such that the liner will still capture draindown and seepage solutions for short term and long-term water management.
| 20.1.5.7 | Cover, Topsoil Placement and Revegetation of Heap and Surrounding Areas |
The heap, as well as any disturbed ground in the vicinity (except roads and diversions to remain) will be covered with an evapotranspiration cover of native soil, growth media (topsoil), supplemental nutrients as needed, and then seeded. The cover will provide for protection of surface water runoff quality, limit infiltration into the HLP, reducing post-closure water management requirements, and promote vegetation growth. For high-erosion prone areas some rapid growing, annual species of exotics may be used but the revegetation plan will emphasize the use of locally harvested native species. Experience has shown that locally harvested seeds have the highest survival rates and are the best suited to local soil and climate factors. Over the heap non-food species will be preferred to avoid accumulation of any metals in the food chain. The cost estimate includes harvesting and purchasing seed and purchasing fertilizer annually for the first three years; afterwards the maturing vegetation will generate sufficient seed and organic mass to support robust growth.
| 20.1.5.8 | Ponds and Pump Stations |
The solution and emergency ponds and pump stations will remain in place and in service for the first few years after operations cease to allow management of heap effluents. Upon determination they are no longer necessary, they will be removed.
| 20.1.5.9 | Physical and Mobile Equipment |
Except for a handful of light mobile equipment (truck, backhoe, bulldozer), no equipment form mining activities will remain on-site. Most of the removed equipment will be in serviceable condition and thus will probably be sold at a profit (i.e., sales proceeds exceed decommissioning costs). Equipment not saleable as functioning equipment will be recycled, sold for scrap, or suitably disposed of.
| Kappes, Cassiday & Associates | 20.0 Environmental Studies, Permitting and |
| | Social or Community Impact |
| June, 2019 | Page 20-16 |
| Camino Rojo Project Feasibility Study NI 43-101 Technical Report |
|
| 20.1.5.10 | Roads, Diversion Works and Erosion Controls |
Roads and diversion works that are to remain in service post-closure will be upgraded to meet the closure design. Generally, this will mean that the surfacing will be more robust and that the dimensions of drainage facilities will be enlarged to meet a larger design storm. Culverts will be replaced with surface crossings since culverts are only serviceable for 10-20 years.
All fencing around the pad and pond areas will be removed as the land is intended to return to grazing and wildlife habitat. Permanent fences will remain around the pit and the evaporation pond.
Fencing will be removed to allow for grazing wildlife habitat. However, fencing will be maintained around the pit to prevent access to the pit and around evaporation ponds near the HLP.
| 20.1.6 | Post Closure Activities |
| 20.1.6.1 | Physical Monitoring and Maintenance |
After the completion of final closure, the site will require regular maintenance for the first approximately 10 years post-closure or until there is no further signs of changing conditions. During this period, the site will be inspected every calendar quarter (3 months) and maintenance activities will be planned immediately following each wet season and following any unseasonal major storm events. The purpose of this is to ensure the drainage and erosion control measures are working as planned, and to allow the recently revegetated areas to mature and properly take hold. Maintenance work will consist of light manual labour (ditch tending, rubble removal, and so forth), and light equipment (backhoe and bulldozer) work to regrade or groom any areas showing signs of distress or erosion.
Once the site stops showing signs of seasonal distress and the functionality of the facilities has been field proofed, and when the geochemical performance matches predictive modeling, periodic inspection and maintenance activities can be reduced in frequency; initially to annually and eventually to only after unusually high rainfall periods.
| 20.1.6.2 | Geochemical Monitoring and Maintenance |
The quality of the water draining from the heap will require monitoring and comparison to the predicted chemistry and discharge standards. If the measured water quality significantly varies from that predicted, in an unfavourable manner, then the geochemical model will be revised and new forecasts prepared. In the extreme case additional rinsing and neutralization of the heap may be required. More likely it will only be required to extend the short-term maintenance period.
| Kappes, Cassiday & Associates | 20.0 Environmental Studies, Permitting and |
| | Social or Community Impact |
| June, 2019 | Page 20-17 |
| Camino Rojo Project Feasibility Study NI 43-101 Technical Report |
|
During the initial, short-term draindown period, the ponds will remain in service for water management. Water collected in the ponds will be tested with each inspection cycle and if the water quality does not meet discharge standards then that water will be recirculated to the heap and/or evaporated. No discharge of solutions are expected. The ponds will likely accumulate sediments and precipitates as water accumulates and evaporates. These sediments will require periodic removal and can be buried within the heap. This will probably continue for at least one-year post-closure and may be needed for up to five years, depending upon the effectiveness of the erosion control measures and re-vegetation efforts.
In the long term, the ponds will be used for evaporation of HLP seepage as described in Section 20.1.6.4 for surplus water management. No discharge of solutions are expected. Sediments and evaporative precipitates will accumulate and require periodic removal and disposal on the HLP.
| 20.1.6.3 | Biological Monitoring and Maintenance |
Maintaining a healthy, robust biological system will improve both the physical and geochemical performance of the closed heap. Thus, the periodic inspections will pay special attention to the biological environment, the health of the vegetated areas as well as the health of the down-stream habitats and surrounding vegetative areas. Reseeding will be planned annually for the first approximately 3 years, or as needed. Biological monitoring will continue as long as physical monitoring does, and at least until all habitat and vegetative areas have been stable for multiple years and through extreme wet and dry seasons
| 20.1.6.4 | Surplus Water Management |
During draindown periods when the water cannot be effectively evaporated in an evaporation pond, solutions will be pumped on top of the heap as irrigation water for the revegetated areas and evaporated on top of the HLP. Alternatively, draindown solutions may be pumped to the developing pit lake if water quality is adequate and is not predicted to affect the pit lake water quality. Costs for this program will principally be pump maintenance and provision of electrical power (i.e., diesel fuel) from the generating station.
If the geochemistry of the heap effluent supports closing the ponds, then they will be decommissioned and closed at such time. The liners will be perforated and the ponds backfilled with permeable waste rock or rinsed leached material.
| Kappes, Cassiday & Associates | 20.0 Environmental Studies, Permitting and |
| | Social or Community Impact |
| June, 2019 | Page 20-18 |
| Camino Rojo Project Feasibility Study NI 43-101 Technical Report |
|
If the long-term HLP seepage does not meet standards, the seepage will be managed by evaporation ponds, constructed by converting the HLP solution management ponds to evaporation ponds. Initial draindown modeling by HydroGeoLogica indicates, with a cover, the long-term seepage rate is expected to be low enough for effective management by evaporation over the long term.
| 20.1.7 | Closure Cost Estimates – Heap Leach Facilities |
Costs for concurrent reclamation and closure, including G&A, have been estimated at US$0.65 per tonne of ore processed, or approximately US$29.9 million over the life of the Project (including US$8.8 million for G&A costs during closure). These costs are in addition to any reclamation and closure costs considered in the normal operating and sustaining cost estimates.
Costs for concurrent reclamation are considered to begin during Year 6 of production and continue throughout the life of the mine, including a three-year closure period.
Estimated closure costs by year are presented in Table 20-1 below, not including G&A:
| Kappes, Cassiday & Associates | 20.0 Environmental Studies, Permitting and |
| | Social or Community Impact |
| June, 2019 | Page 20-19 |
| Camino Rojo Project Feasibility Study NI 43-101 Technical Report |
|
Table 20-1
Summary of Camino Rojo Closure Costs
| Description | Year 6 | Year 7 | Year 8 | Year 9 | Year 10 | Total |
| Closure Plan (Regulatory Approval) | $100,000 | $0 | $0 | $0 | $0 | $100,000 |
| Topsoil/Revegetation of Preg/Excess Pond (Haulage/Placement) | $0 | $0 | $0 | $76,000 | $25,000 | $101,000 |
| Topsoil/Revegetation of Waste Dump | $334,000 | $37,000 | $0 | $0 | $0 | $371,000 |
| Topsoil/Revegetation of Heap Leach Pad | $0 | $0 | $0 | $143,000 | $143,000 | $287,000 |
| Regrade of Heap Leach Pad | $0 | $0 | $0 | $217,000 | $217,000 | $434,000 |
| Leach Pad Waste Cover | $0 | $0 | $0 | $574,000 | $574,000 | $1,148,000 |
| Water Control Infrastructure | $0 | $0 | $50,000 | $0 | $0 | $50,000 |
| Pregnant Pond Partial Fill | $0 | $0 | $0 | $102,000 | $0 | $102,000 |
| Excess Pond Partial Fill | $0 | $0 | $0 | $251,000 | $84,000 | $335,000 |
| Pond Drainage Revision | $0 | $0 | $0 | $0 | $100,000 | $100,000 |
| Demolish/Removal Mine Infrastructure and Camp | $0 | $0 | $0 | $0 | $0 | $0 |
| Building Slabs (Bury In-Place or to Heap/Ponds) | $0 | $0 | $25,000 | $25,000 | $0 | $50,000 |
| Crushers / MC plant | $0 | $352,000 | $0 | $220,000 | $0 | $572,000 |
| Remediation of disturbed areas | $0 | $0 | $54,000 | $27,000 | $9,000 | $89,000 |
| Remediation of hydrocarbon affected areas | $0 | $0 | $0 | $12,000 | $0 | $12,000 |
| Hazardous Waste Removal | $0 | $0 | $0 | $10,000 | $0 | $10,000 |
| Remediation of Chemical Affected Areas | $0 | $0 | $0 | $59,000 | $20,000 | $79,000 |
| Reclaim Tunnel Closure | $0 | $50,000 | $0 | $0 | $0 | $50,000 |
| Access Road Closure to Restricted Areas | $0 | $0 | $0 | $0 | $66,000 | $66,000 |
| Removal of Haul Road | $0 | $0 | $0 | $0 | $508,000 | $508,000 |
| Monitoring of Mine for 10 years | $0 | $0 | $0 | $0 | $100,000 | $100,000 |
| Labor | $121,000 | $241,000 | $1,207,000 | $483,000 | $362,000 | $2,414,000 |
| Heap Rinsing & Neutralization | $0 | $1,464,000 | $4,881,000 | $2,441,000 | $976,000 | $9,763,000 |
| Support Services | $0 | $98,000 | $196,000 | $98,000 | $98,000 | $489,000 |
| Contingency (15%) | $83,000 | $336,000 | $962,000 | $711,000 | $492,000 | $2,584,000 |
| | | | | | | |
| Total (Excluding G&A) | $638,000 | $2,579,000 | $7,375,000 | $5,448,000 | $3,774,000 | $19,813,000 |
Exploration and mining activities in Mexico are subject to control by SEMARNAT, which has authority over the two principal Federal permits:
| i. | | A MIA, accompanied by an ER; and |
| ii. | | A CUS, supported by an ETJ. |
| Kappes, Cassiday & Associates | 20.0 Environmental Studies, Permitting and |
| | Social or Community Impact |
| June, 2019 | Page 20-20 |
| Camino Rojo Project Feasibility Study NI 43-101 Technical Report |
|
Thus far exploration work at Camino Rojo has been conducted under the auspices of two separate MIA permits and corresponding CUS permits. These permits allow for extensive exploration drilling but are not sufficient for mine construction or operation.
In April 2018, Orla hired independent environmental permitting consultants to design and implement baseline environmental studies of the Camino Rojo Project, and to work with Orla’s consultant engineers to collect the data required for obtaining a Manifesto de Impacto Ambiental (Environmental Impact Statement) and Cambio de Uso de Suelo (Land Use Change) permit, and to prepare the documents needed to solicit and obtain the MIA and CUS permits necessary for mine construction and operation. Submission of MIA and CUS permitting documents to SEMARNAT is anticipated in the 3rd Quarter 2019.
The Project is not located in an area with a special Federal environmental protection designation and no factors have been identified that would be expected to hinder authorization of required Federal and State environmental permits. The legislated timelines for review of properly prepared MIA and Change of Land Use applications and mine operating permits for a project that does not affect Federally protected biospheres or ecological reserves are 120 calendar days and 105 working days, respectively, which can be completed concurrently.
The Peñasquito mine, a large scale, open pit mine, presently operated by Newmont, is in the same Municipality and the mine encountered no impediments to receipt of needed permits. Should construction and operation permits be solicited for the Camino Rojo Project, no obstacles to obtaining them are anticipated provided that Orla design and mitigation criteria meet all applicable standards.
Table 20-2 summarizes the Federal, State, and Municipal permits required for mine construction, and Table 20-3 for mine operation and closure. Figure 20-2 summarizes the permitting flow chart.
| Kappes, Cassiday & Associates | 20.0 Environmental Studies, Permitting and |
| | Social or Community Impact |
| June, 2019 | Page 20-21 |
| Camino Rojo Project Feasibility Study NI 43-101 Technical Report |
|
Table 20-2
Permits Required for Mine Construction
| Mining Stage | Required formality | Agency | Response time (Aprox.) | Comments |
CONSTRUCTION | OPTION 1 | Environmental Impact Manifest (MIA) | SEMARNAT | 3-6 months | Baseline studies should be conducted to support the MIA. A comprehensive environmental manifest shall be prepared and submitted to SEMARNAT for evalutation and authorization. |
| Land Use Change Study (ETJ) | SEMARNAT | 2-3 months | A detailed forestry inventory and a technical study shall be prepared and submitted to SEMARNAT for evaluation and authorization. |
| Risk Analysis Study (ER) | SEMARNAT | 3-6 months | A risk analysis shall be prepared and submitted and will be evaluated together with the MIA, when high risk substances such as cyanide is used in the process. |
| OPTION 2 | Documento Técnico Unificado (DTU) | SEMARNAT | 3-6 months | A comprehensive technical document that integrates information of the MIA, ER and ETJ should be prepared and submited to SEMARNAT for evaluation and authorization. |
| Land Use/construction Licence | Municipality | 1 month | An application letter shall be submitted to the municipal authorities to obtain the authoriztion letter. |
| Permit for disposal of non-hazardous residues | Municipality | 1 month | An application letter needs to be submitted to the municipal authorities, specifying the expected type and amount of non-hazardous waste from the mine construction and operation. |
| Explosive handling | SEDENA, Municipality and State Government of Sonora | 3 months | An application letter shall be submitted to SEDENA. Also an endorsement letter shall be obtained from the State Government and the Municipality. |
| Archeological clearance | INAH | 1 to 8 months | A request letter should be submitted to INAH. A survey will be done by INAH personnel and if there is some archeological interest a rescue and documenting program will be performed. |
| Water use concessions | CONAGUA | 3 months | An application should be submitted to CONAGUA requesting a water use concession, specifying the volume of water to use per year. If the aquifer has no availabiltiy, water rights need to be purchased. The volume of water to be used in the mining activities should be measured and paid. |
| Kappes, Cassiday & Associates | 20.0 Environmental Studies, Permitting and |
| | Social or Community Impact |
| June, 2019 | Page 20-22 |
| Camino Rojo Project Feasibility Study NI 43-101 Technical Report |
|
Table 20-3
Permits Required for Mine Operation and Closure
| Mining Stage | Required formality | Agency | Response time (Aprox.) | Comments |
| OPERATION | Water discharge permit | CONAGUA | 3 months | An application needs to be filed before CONAGUA with estimated annual volume and the quality of the discharge. This may include the sannitary service water discharge or any other water discharge to septic tanks or natural environment. |
| Operation licence | SEMARNAT | 2 to 4 months | Needs to do an inventory of all air emissions, water discharges and solid wastes. |
| Accident prevention plan | SEMARNAT | None | Based on the risk analysis, it is necessary to establish a plan and procedures to prevent and respond to emergencies and accidental events. SEMARNAT will register this plan. |
| Mining residues managament plan | SEMARNAT | None | Need to prepare this plan according to NOM-157-SEMARNAT-2009. SEMARNAT will register this plan |
| Hazardous waste generator registry | SEMARNAT | None | It is required to keep records of any hazardous waste movement at the mine facilities and deliveries to an authorized external company. |
| ABANDONMENT | Closure and reclamation plan | SEMARNAT | Not specified | Need to submit a comprehensive closure and reclamation plan, as early as possible before the closure of the mine. |
| Kappes, Cassiday & Associates | 20.0 Environmental Studies, Permitting and |
| | Social or Community Impact |
| June, 2019 | Page 20-23 |
| Camino Rojo Project Feasibility Study NI 43-101 Technical Report |
|

Figure 20-2 Permitting Process Flowsheet
| Kappes, Cassiday & Associates | 20.0 Environmental Studies, Permitting and |
| | Social or Community Impact |
| June, 2019 | Page 20-24 |
| Camino Rojo Project Feasibility Study NI 43-101 Technical Report |
|
| 20.3 | Social and Community Impact |
The Project has a long association with the local communities, including Community and Social Responsibility Agreements as described in Section 4.3 of this report. Minera Camino Rojo has a fulltime community and social relations department working on site in San Tiburcio, and has enjoyed a pacific and mutually beneficial relationship with the local communities.
In April 2018, Orla commissioned ERM, a global provider of environmental, health, safety, risk, social consulting services and sustainability related services, to conduct an independent assessment of social and community impacts of development of the Camino Rojo Project, and to provide guidance on actions and policies needed to ensure that Orla obtains and maintains social licence to operate. The study was completed in May 2019 (ERM, 2019) and salient results are being incorporated into the project development and permitting plans. Key points are summarized as follows:
Principal concerns of affected stakeholders in surrounding communities are:
| i. | | Employment of community members |
| ii. | | Community benefits from improved public services and investment in community development |
| iii. | | Environmental contamination |
| iv. | | Increased community population and strain on public services |
Principal concerns of Ejido members whose land is affected are:
| i. | | Just economic compensation |
| ii. | | Assistance in obtaining title to informally owned parcels |
Principal concerns of local and State government authorities are:
| i. | | Generation of employment |
| ii. | | Improvement of local infrastructure |
| iii. | | Service contracts to local businesses |
| iv. | | Environmental contamination |
ERM identified the principal social and community impacts of the Project and concluded that the Project does not put at risk the social environment of the nearby communities because the impacts can be mitigated or made positive with the implementation of a Social Management System (SMS). ERM has designed a SMS based on International Association of Impact Assessment best practices.
| Kappes, Cassiday & Associates | 20.0 Environmental Studies, Permitting and |
| | Social or Community Impact |
| June, 2019 | Page 20-25 |
| Camino Rojo Project Feasibility Study NI 43-101 Technical Report |
|
Population, demographic, and local infrastructure information presented in Sections 20.3.1 through 20.3.4 are derived from Instituto Nacional de Estadística, Geografía e Informática (INEGI - National Institute of Statistics and Geography) and a social and community impact report prepared by ERM de Mexico SA de CV (ERM, 2019).
| 20.3.2 | Population and Demographics |
| 20.3.2.1 | Indigenous Communities |
According to census data from the Comisión Nacional para el Desarrollo de los Pueblos Indígenas (CDI – National Commission for the Development of Indigenous Communities) the localities are not categorized as indigenous localities. ERM’s field visit corroborated that there is no indigenous presence in the CAI.
| 20.3.2.2 | Inhabitants, Age and Gender |
ERM defined the Core Area of Influence (CAI) of the Project and a broader Area of Direct Influence (ADI) of the Project according to IAIA and International Finance Commission criteria. The communities nearest to the Project, San Tiburcio, San Francisco de los Quijano, and El Berrendo have a combined population estimated at 1,209 persons. An additional 2,072 persons live in the communities that comprise the broader area of direct influence. Population by community is summarized in Table 20-4.
| Kappes, Cassiday & Associates | 20.0 Environmental Studies, Permitting and |
| | Social or Community Impact |
| June, 2019 | Page 20-26 |
| Camino Rojo Project Feasibility Study NI 43-101 Technical Report |
|
Table 20-4
Populations of Communities in Area of Influence of Project
Area of Influence
Category | Locality | Population,
INEGI Data,
2010 Census | Population,
2018 Camino
Rojo Census |
| Core Area of Influence (CAI) | El Berrendo | 149 | 152 |
| Core Area of Influence (CAI) | San Francisco de los Quijano | 45 | 52 |
| Core Area of Influence (CAI) | San Tiburcio | 548 | 1005 |
| | | | |
| | Total | 742 | 1209 |
| | | | |
| Area of Direct Influence (ADI) | Banderita Dos | 118 | N/A |
| Area of Direct Influence (ADI) | El Calabazal | 36 | N/A |
| Area of Direct Influence (ADI) | Tanque de los Hacheros (Hacheros) | 90 | N/A |
| Area of Direct Influence (ADI) | Majoma | 334 | N/A |
| Area of Direct Influence (ADI) | La Pardita | 207 | N/A |
| Area of Direct Influence (ADI) | Pozo de San Juan | 225 | N/A |
| Area of Direct Influence (ADI) | Presa del Junco | 245 | N/A |
| Area of Direct Influence (ADI) | Cardona (Rancho Nuevo) | 294 | N/A |
| Area of Direct Influence (ADI) | Salto de San Juan | 130 | N/A |
| Area of Direct Influence (ADI) | San Benito (El Salitrillo) | 21 | N/A |
| Area of Direct Influence (ADI) | San Elías da la Cardona | 214 | N/A |
| Area of Direct Influence (ADI) | Tanquecillos | 158 | N/A |
| | | | |
| | Total | 2072 | |
According to the 2010 INEGI census, in all three localities of the CAI area, the male population presented a slight majority, however the 2018 census by Minera Camino Rojo showed that the communities of El Berrendo and San Tiburcio had slight female majorities.
| Kappes, Cassiday & Associates | 20.0 Environmental Studies, Permitting and |
| | Social or Community Impact |
| June, 2019 | Page 20-27 |
| Camino Rojo Project Feasibility Study NI 43-101 Technical Report |
|
The 12 localities that comprise the ADI all have a greater proportion of men than of women in a range of 50% to 57.4%, with the exception of El Calabazal, where 63.9% of its inhabitants are men and 36.1% are women. As a consequence, the proportion of women is below the state average of 51.2%.
In El Berrendo and San Tiburcio, the largest age group comprising approximately 60% is the population 15 to 64 years of age, which INEGI defines as the working age population, followed by the population between 0 to 14 years of age (~30%) and the age group 65 years old or older that represents approximately 10% of the population. The only town that presents a different distribution is San Francisco de los Quijano, where the second largest age group is the population over 65 years of age equivalent to 31.1% of the population and 8.9% of the population ranging from 0 to 14 years.
The majority age group is the population between 15 and 64 years old, followed by the group between 0 and 14 years and finally, the over 64 years old population. In all communities of the ADI the trend repeats itself.
San Tiburcio has a kindergarten, primary school, secondary school, and preparatory (high) school.
The illiteracy rate in the three localities of the CAI is greater than the percentage at the state level (4%) however there are significant differences. In El Berrendo and San Tiburcio between 7% and 6% of the population aged 15 and over is illiterate. In San Francisco de los Quijano, almost a quarter of the population is illiterate (22%).
The percentage of the population greater than 15 years old that has completed a primary school education varies significantly depending on the locality. In San Francisco de los Quijano the percentage of the population that has completed primary education is 44%, in San Tiburcio it is 14%, and in El Berrendo it is 11%.
In El Berrendo, 21% of the population aged 15 or older has completed high school, a percentage higher than the State average of 16%. In comparison with the locality of El Berrendo, both the localities of San Francisco de los Quijano as San Tiburcio, show lower percentages of completion of secondary education, 11% and 16% respectively.
At the state level, the average level of education completed is 7.9 years. In general, the Zacatecasn population finished primary school, but not secondary school. In the case of localities of the CAI, the best average educated level is in San Tiburcio which has an average of 7.05 years of schooling, followed by El Berrendo with 6.33 and San Francisco de los Quijano with 3.51.
Similar to the educational data for the CAI, the population of the ADI likewise has relatively low educational level compared to State averages.
| Kappes, Cassiday & Associates | 20.0 Environmental Studies, Permitting and |
| | Social or Community Impact |
| June, 2019 | Page 20-28 |
| Camino Rojo Project Feasibility Study NI 43-101 Technical Report |
|
| 20.3.3 | Infrastructure and Public Services |
The locality in the CAI that has the best provision of public services, surpassing even the state average, is San Tiburcio. There, 91% of homes have electricity, in contrast to the state average which is 73%. In addition, 89% of homes have access to piped water, 87.5% have a toilet and 74% have drainage in their homes. In the case of El Berrendo and San Francisco de los Quijano, access to public services is lower. Both locations have similar percentages of houses with sanitary drainage (60% and 59% respectively), homes with a toilet (67% and 77% respectively), and homes with access to the electricity network (72% and 77% respectively). The biggest difference is the percentage of homes with access to piped water. In El Berrendo 72% of the houses have piped water, while in San Francisco de los Quijano only 5% of homes have access to water.
El Berrendo has a water purification plant that represents the only significant economic and commercial activity for the community beyond very small-scale agriculture. The water treatment plant attracts people from other nearby localities that obtain their drinking water from this government subsidized plant.
The town with greatest access to public services is Salto de San Juan, there at least 80% of the houses have piped water, drainage, toilet and electricity. On the other extreme is El Calabazal, where 100% of its homes lack drinking water and drainage. In addition, in 5 of the 12 localities that make up the ADI no houses with access to drinking water were identified. Except for Salto de San Juan, the percentage of homes with drainage is below the state average.
Access to media and communications is dominated by television in the three localities of the CAI. In both El Berrendo and in San Tiburcio, over 90% of homes have television (93.6% and 93.6% respectively) while San Francisco de los Quijano, 76.5% of the housing has television. Radio is available in 58.1% of homes in El Berrendo, 70.6% in San Francisco Los Quijano and 48.8% in San Tiburcio. All three locations are below the state average of 82.2%. San Tiburcio is the locality where more houses have a computer (23.2%), even above the state average of 22.5%. In El Berrendo and San Francisco de los Quijano, the percentage of homes with a computer is minimal. All three communities have minimal access (San Tiburcio) or no internet access (El Berrendo and San Francisco de los Quijano).
| Kappes, Cassiday & Associates | 20.0 Environmental Studies, Permitting and |
| | Social or Community Impact |
| June, 2019 | Page 20-29 |
| Camino Rojo Project Feasibility Study NI 43-101 Technical Report |
|
All communities in the ADI have access to television and radio. However, only in San Benito (El Salitrillo) the percentage of dwellings that have television is higher than the state average. In the case of radio, El Calabazal has the highest number of houses with radios. None of the 12 locations have access to the internet while access to computers and cell phones is limited. In 8 of 12 localities the percentage of homes with computers does not exceed 10% and half of the locations do not have cell phones. As in the CAI, television is the main means of communication to which the inhabitants they have access. The internet and the computer are the mediums with the least coverage.
Health services are insufficient in the CAI. At the state level, 68% of the population has rights to public health services, 35% is affiliated with Popular Insurance, 25% is entitled to the Mexican Insurance Institute Social Security (IMSS) and 7% to the Institute of Security and Social Services of State Workers (ISSSTE). The community within the CAI with the highest percentage of population with access rights to medical service is San Francisco de los Quijano with 98%, followed by El Berrendo with 74% and San Tiburcio with 49%. Both in San Francisco de los Quijano and in San Tiburcio, the population with access to medical services is affiliated with IMSS, while, in El Berrendo, 48% is affiliated with the Seguro Popula.
ERM’s field surveys indicate that the health services in the three communities of the CAI are insufficient. Both the inhabitants of El Berrendo and those of San Francisco de los Quijano, (including those from the La Fábrica neighbourhood) attend the San Tiburcio health centre (Figure 20-3). The current clinic does not cover the needs of the population. There are State and Municipal plans to construct a new medical clinic in San Tiburcio. Local residents communicated that when services are not available in San Tiburcio, patients must travel to Concepción del Oro.
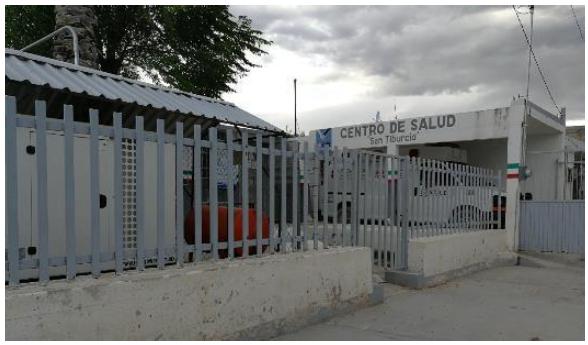
Figure 20-3 Medical Clinic in San Tiburcio – ERM 2018.
Kappes, Cassiday & Associates June, 2019 | 20.0 Environmental Studies, Permitting and Social or Community Impact Page 20-30 |
| Camino Rojo Project Feasibility Study NI 43-101 Technical Report |
|
In the ADI, in 8 of the 12 communities the percentage of the population with rights to medical care exceeds the state average (68%). The best served communities are Presa del Junco and Salto de San Juan where 94% of the population has access to public health services. In contrast, the localities with the lowest percentage of population with access to medical services are: San Benito (El Salitrillo), where less than half of its population has access (43%), Majoma, with 26% and La Pardita where 94% of its population is not a beneficiary of either of IMSS, ISSSTE, nor Popular Insurance coverage. The medical service that has the highest percentage of affiliates in the ADI is IMSS, followed by ISSSTE and Popular Insurance.
| 20.3.4 | Government and Community |
All communities in the CAI are part of the Municipality of Mazapil, governed by an elected Mayor (Presidente Municipal). As discussed in Section 4.3 of this report, three Ejidos, self-governing agricultural cooperatives, are part of the CAI and while subject to governance of the Municipality, the Ejidos have rights over the use of Ejidal lands.
ERM conducted field surveys of the three localities that comprise the CAI. In all three localities, the predominance of houses were built with concrete block and vault ceilings (Figure 20-4), however, some houses built with sheet or cardboard were also observed. Most houses have a water tank, since the water service is insufficient. Particularly in the town of San Francisco de los Quijano, many dwellings were observed uninhabited and abandoned (Figure 20-5). Many dwellings in the CAI have chicken coops, solar panels, orchards, and other self-sustainable features. The Ministry of Agriculture, Livestock, Rural Development, Fisheries and Food (SAGARPA) implemented both in El Berrendo and in San Francisco de los Quijano and San Tiburcio, a program called "Strategic Project of Food Security" (PESA) with the objective of supporting family food production in rural localities of high and very high marginalization. Based on the information collected through focus groups, it was found that particularly in El Berrendo there is a very positive perception about the PESA program.
Kappes, Cassiday & Associates June, 2019 | 20.0 Environmental Studies, Permitting and Social or Community Impact Page 20-31 |
| Camino Rojo Project Feasibility Study NI 43-101 Technical Report |
|
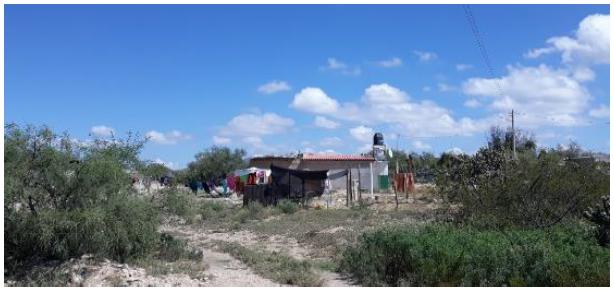
Figure 20-4 Home in El Berrendo – ERM 2018
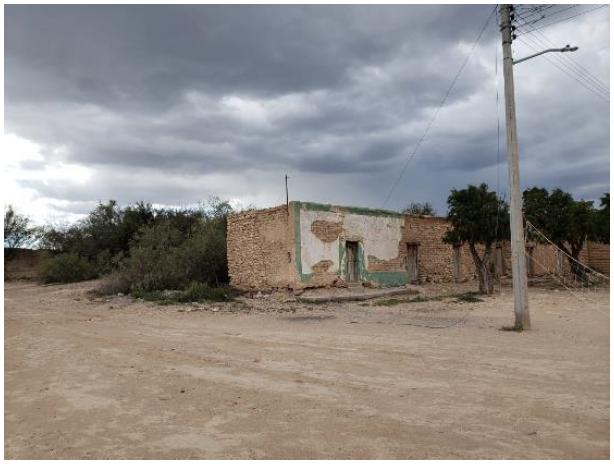
Figure 20-5 Unoccupied Home in San Francisco de los Quijano – ERM 2018.
Public space infrastructure is scarce. San Tiburcio is the community with the most significant public spaces, including a town square with a kiosk, public lighting, benches and fencing (Figure 20-5). The neighbourhood of La Fábrica, although it is part of the ejido de San Tiburcio, has less infrastructure in its public spaces (Figure 20-6). All three communities of the CAI have ejidal community buildings, which are commonly used for meetings of the Ejidal Comisariado. The ejido community room of El Berrendo was funded by Goldcorp and is in good condition.
Kappes, Cassiday & Associates June, 2019 | 20.0 Environmental Studies, Permitting and Social or Community Impact Page 20-32 |
| Camino Rojo Project Feasibility Study NI 43-101 Technical Report |
|
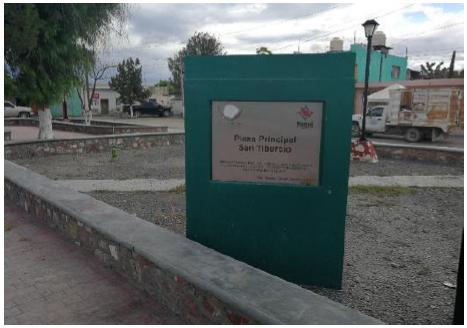
Figure 20-6 Town Plaza in San Tiburcio – ERM 2018.
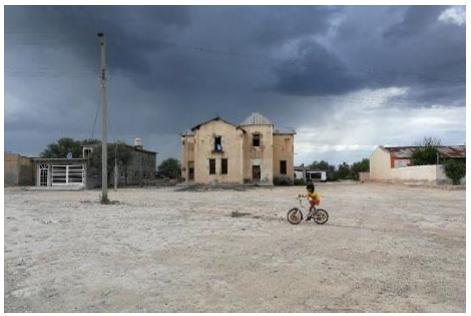
Figure 20-7 Public Plaza in La Fabrica (part of San Tiburcio) – ERM 2018.
| 20.3.5 | Economic Activity, Income, Marginalization |
The main economic activities in the area are agriculture and livestock, although a large part of the production of these sectors is used for self-consumption. The mining industry in the area, a tortillería, the Mahoma solar energy park 40km south of the Project area, and small businesses and restaurants in San Tiburcio and along Federal Highway 54 are the main sources of employment in the CAI. Minera Camino Rojo and its subcontractors are a significant local employer, with approximately 40 local community members employed.
Kappes, Cassiday & Associates June, 2019 | 20.0 Environmental Studies, Permitting and Social or Community Impact Page 20-33 |
| Camino Rojo Project Feasibility Study NI 43-101 Technical Report |
|
The Consejo Nacional de Población (CONAPO - National Population Council) has developed metrics to quantify the marginalization of communities in Mexico. The degree of marginalization is a summary measurement allowing differentiation of communities according to the impact of the deficiencies that the population suffers as a result of the lack of access to education, lack of adequate housing, and lack of goods and services. Marginalization is also expressed in the unequal distribution of progress and exclusion of various social groups. CONAPO has determined that two of the three communities in the CAI, El Berrendo and San Francisco de los Quijano, have a high degree of marginalization, while San Tiburcio has a moderate degree of marginalization. (Table 20-5)
Table 20-5
Marginalization by Community
| Community | Marginalization Index
(CONAPO, 2010) | Degree of
Marginalization |
| El Berrendo | -0.789659188 | High |
| San Francisco de los Quijano | -0.148593057 | High |
| San Tiburcio | -1.047676631 | Medium |
The Consejo Nacional de Evaluacion de la Politica de Desarrollo Social (CONEVAL – National Council for Evaluation of Social Development Policy) for 2010, in the municipality of Mazapil, of which the CAI communities are part of and which has a total population of 18,603, determined that 67.8% of the inhabitants of the municipality lived in poverty (12,247 inhabitants). 5.5% of the population (999 people) was considered economically vulnerable due to low income, while 73.4% (13,246 inhabitants) had income below the level required for basic well-being, of which 6,357 inhabitants (35.2% of total population) had income below the level required for minimum well-being.
The Economically Active Population (EAP) in a community is defined as the total population 15 years and older who have a job or who, not having work, are looking for work. At the state level, 35.5% is in the EAP. In San Francisco de los Quijano 42.2% is within that category, followed by the towns of San Tiburcio and El Berrendo with 33.4% and 32.2% respectively. The inactive population refers to pensioners or retired people, students, people dedicated to the home, or people who have some permanent physical or mental limitation that prevents them from working. In the CAI, all communities have percentages of inactive population above the state percentage of 38.6%. The town that has the highest percentage of non-economically active population is San Francisco de los Quijano with 48.9%, followed by the town of El Berrendo with 47.7% and finally, San Tiburcio with a 40.5%. The employed population corresponds to those over 15 years of age who practise some activity in the production of goods and services, which is remunerated. Of the localities of the CAI only one, San Francisco de los Quijano, is above the Zacatecas state average (33.7%) with 42.4%. Both El Berrendo (32.3%) and San Tiburcio (32.5%) are slightly below the state average. The willfully inactive population refers to people over 15 years of age who by choice do not participate in paid productive activities, for example, students, housewives, pensioners, retirees, etc. This category is exceeded by all others in all three communities in the CAI.
Kappes, Cassiday & Associates June, 2019 | 20.0 Environmental Studies, Permitting and Social or Community Impact Page 20-34 |
| Camino Rojo Project Feasibility Study NI 43-101 Technical Report |
|
| 20.3.6 | Social Management System and Mitigation of Negative Impacts |
The social and community impact study completed by ERM identified 19 significant concerns and impacts of the Project to the local communities and stakeholders. Each impact or concern is categorized as potentially positive (P), potentially negative (N), or neutral and are as follows:
| i. | | Economic development (P) |
| ii. | | Creation of technical capabilities in communities (P) |
| iii. | | Economic displacement due to land use and road diversion (N) |
| iv. | | Increase in the payment of taxes at Municipal, State and Federal level by the Project (P) |
| v. | | Restoration of site after closure (neutral) |
| vi. | | Social investment in the communities (P) |
| vii. | | Induced migration (N) |
| ix. | | Increase in the cost of living (N) |
| x. | | Construction of new infrastructure that benefits community (P) |
| xi. | | Pressure on public services from Project employees (N) |
| xii. | | Re-routing of roads (neutral) |
| xiv. | | Traffic issues due to increased Project related traffic (N) |
| xvi. | | Noise and dust generation (N) |
| xvii. | | Environmental contamination and degradation of natural resources (N) |
| xviii. | | Accidents and emergencies (N) |
| xix. | | Occupational injuries and diseases (N) |
The impacts incurred during the exploration and development stage are generally positive, and the potentially negative impacts will be mitigated. The concern of economic displacement due to land use and road diversion will be mitigated through implementation of a development plan that ensures the correct compensation (economic or in-kind services, or a mixture) of the persons correctly identified as affected, such a plan includes investments in projects that improve the quality of life of the people of the ADI. Such a strategy is already in place as part of Orla’s Collaboration and Social Responsibility Agreements with the local Ejidal communities.
Kappes, Cassiday & Associates June, 2019 | 20.0 Environmental Studies, Permitting and Social or Community Impact Page 20-35 |
| Camino Rojo Project Feasibility Study NI 43-101 Technical Report |
|
Significant impacts during the construction phase can be reduced through mitigation measures, including community consultations and agreements on the criteria used to on decide on the deviation of traditional roads, and development of strategic alliances with Government entities to mitigate the impact of demand on public infrastructure and services by project workers. Environmental and social monitoring systems will be implemented to monitor noise and dust levels to ensure that they do not exceed the levels established by the Mexican regulations.
The environmental impacts during the operation and production stage will be mitigated through implementation of the operation and closure plans described in this report, particularly those designed to minimize the long-term impact to the local environment. During the closure and remediation stage the Project will enact the mitigation measures included in the environmental studies and permitting reports prepared for the Project, and such measures will meet Mexican regulations and meet or exceed industry best practices. The company will communicate these measures in an efficient and transparent manner.
ERM concluded that the Project does not put at risk the social environment of the neighbouring communities, given that social impacts and risks can be prevented, mitigated or if positive, expanded, through the implementation of a Social Management System (SGS). The SGS for the Project was designed based on the best practices and guidelines of the International Association for Social Impact Assessment (IAIA) and is supported by Orla’s Corporate Social Responsibility Policy and Environment & Sustainability, Health & Safety Policy. Orla plans to develop the Camino Rojo Project in accordance with International Finance Corporation Performance Standards, as well as the International Council on Mining and Metals principles.
When MCR has submitted construction and operation permit applications, SEMARNAT will require a bond, insurance or guarantee, for the estimated cost of reclamation required by law. The amount will be determined based on a technical study of the required reclamation, and bonding is required in stages, proportional to the pending reclamation work created by Project development.
Kappes, Cassiday & Associates June, 2019 | 20.0 Environmental Studies, Permitting and Social or Community Impact Page 20-36 |
| Camino Rojo Project Feasibility Study NI 43-101 Technical Report |
|
| 21.0 | CAPITAL AND OPERATING COSTS |
Capital and operating costs for the process and general and administration components of the Camino Rojo Project were estimated by KCA. Costs for the mining components were provided by IMC. The estimated costs are considered to have an accuracy of +/-15% and are discussed in greater detail in this Section.
The total Life of Mine (LOM) capital cost for the Project is US$153.7 million, including US$10.1 million in working capital and not including reclamation and closure costs which are estimated at US$19.8 million, IVA (value added tax) or other taxes; all IVA is applied to all capital costs at 16% and is assumed to be fully refundable. Table 21-1 presents the capital requirements for the Camino Rojo Project.
Table 21-1
Capital Cost Summary
| Description | Cost (US$) |
| Pre-Production Capital | $123,114,000 |
| Working Capital & Initial Fills | $10,187,000 |
| Sustaining Capital – Mine & Process | $20,424,000 |
| Total excluding IVA | $153,725,000 |
The average life of mine operating cost for the Project is US$8.43 per tonne of ore processed. Table 21-2 presents the LOM operating cost requirements for the Camino Rojo Project.
Table 21-2
LOM Operating Cost Summary
| Description | LOM Cost
(US$/t) |
| Mine | $3.30 |
| Process & Support Services | $3.38 |
| Site G & A | $1.75 |
| Total | $8.43 |
IVA is not included in the operating costs.
Kappes, Cassiday & Associates June, 2019 | 21.0 Capital & Operating Costs Page 21-1 |
| Camino Rojo Project Feasibility Study NI 43-101 Technical Report |
|
The required capital cost estimates have been based on the design outlined in this report. The scope of these costs includes all expenditures for process facilities, infrastructure, construction indirect costs, mine contactor mobilization and owner mining capital costs for the Project.
The costs presented have primarily been estimated by KCA with input from IMC on owner mining and mining contractor mobilization costs. Material take-offs for earthworks, concrete and major piping have been estimated by KCA. All equipment and material requirements are based on design information described in previous sections of this Report. Capital costs estimates have been made primarily using budgetary supplier quotes for all major and most minor equipment as well as contractor quotes for major construction contracts. Multiple quotes were received for all major packages (three or more in most cases). Where Project specific quotes were not available a reasonable estimate or allowance was made based on recent quotes in KCA/IMC’s files. In total, more than 90% of the Project direct costs are based on supplier and contractor quotes.
All capital cost estimates are based on the purchase of equipment quoted new from the manufacturer or estimated to be fabricated new.
The total pre-production capital cost estimate for the Camino Rojo Project is estimated at US$133.3 million, including all process equipment and infrastructure, construction indirect costs, mine contractor mobilization and working capital. All costs are presented in first quarter 2019 US dollars. Where prices were quoted in Mexican Pesos and an exchange rate of 19.3 MXN:1 US$ was used.
Pre-production capital costs required for the Camino Rojo Project by area are presented in Table 21-3.
Kappes, Cassiday & Associates June, 2019 | 21.0 Capital & Operating Costs Page 21-2 |
| Camino Rojo Project Feasibility Study NI 43-101 Technical Report |
|
Table 21-3
Summary of Pre-Production Capital Costs by Area
| Plant Totals Direct Costs | Total Supply
Cost | Install | Grand Total |
| | US$ | US$ | US$ |
| Area 110 - General | $12,406,000 | $3,059,000 | $15,466,000 |
| Area 113 - Crushing | $11,202,000 | $6,372,000 | $17,574,000 |
| Area 115 - Heap Leach Stacking | $6,637,000 | $747,000 | $7,384,000 |
| Area 120 - Heap Leach Pad & Ponds | $5,805,000 | $8,404,000 | $14,209,000 |
| Area 128 - Merrill-Crowe | $7,832,000 | $3,174,000 | $11,006,000 |
| Area 131 - Refining (incl. Area 128) | $0 | $0 | $0 |
| Area 134 - Reagents | $285,000 | $31,000 | $316,000 |
| Area 360 - Power | $1,812,000 | $268,000 | $2,081,000 |
| Area 362 - Water Supply & Distribution | $2,846,000 | $1,123,000 | $3,969,000 |
| Area 365 - Laboratory | $1,626,000 | $126,000 | $1,752,000 |
| Area 367 - Mobile Equipment | $4,834,000 | $0 | $4,834,000 |
| | | | |
| Total Direct Costs | $55,286,000 | $23,305,000 | $78,591,000 |
| | | | |
| Spare Parts | $1,640,000 | | $1,640,000 |
| | | | |
| Sub Total with Spare Parts | | | $80,231,000 |
| | | | |
| Contingency | $12,638,000 | | $12,638,000 |
| | | | |
| Total Direct Costs with Contingency | | | $92,869,000 |
| | | | |
| Mining Costs | | | $3,022,000 |
| | | | |
| Indirect Costs | | | $9,174,000 |
| | | | |
| Other Owner's Costs | | | $9,506,000 |
| | | | |
| Initial Fills | | | $806,000 |
| | | | |
| EPCM | | | $8,544,000 |
| | | | |
| Sub Total Costs before Working Capital | | | $123,921,000 |
| | | | |
| Working Capital (60 days) | | | $9,381,000 |
| | | | |
| TOTAL COSTS (excluding IVA) | | | $133,301,000 |
Kappes, Cassiday & Associates June, 2019 | 21.0 Capital & Operating Costs Page 21-3 |
| Camino Rojo Project Feasibility Study NI 43-101 Technical Report |
|
| 21.1.1 | Mining Capital Costs |
IMC has developed an estimate of contract mining costs for the Camino Rojo Project. The estimated mining cost is based on 18,000 tpd of ore production.
Overall, mining capital costs amount to a total of US$4.02 million, including US$1.13 million for contractor mobilization, US$1.89 million for mine preproduction and owner equipment and US$995,000 for sustaining capital (contractor demobilization). Mine Capital Costs are presented in Table 21-4.
Table 21-4
LOM Mining Capital Costs
MINE CAPITAL
COSTS | Units | PP | Yr1
Q1 | Yr1
Q2 | Yr1
Q3 | Yr1
Q4 | Year
2 | Year
3 | Year
4 | Year
5 | Year
6 | Year
7 | TOTAL |
| Contractor Mobilization | ($x1000) | 1,130 | 0 | 0 | 0 | 0 | 0 | 0 | 0 | 0 | 0 | 0 | 1,130 |
| Contractor Demobilization | ($x1000) | 0 | 0 | 0 | 0 | 0 | 0 | 0 | 0 | 0 | 0 | 995 | 995 |
| Owner Equipment | ($x1000) | 525 | 0 | 0 | 0 | 0 | 0 | 0 | 0 | 0 | 0 | 0 | 525 |
| Mine Development | ($x1000) | 1,366 | 0 | 0 | 0 | 0 | 0 | 0 | 0 | 0 | 0 | 0 | 1,366 |
| Mine Infrastructure | | | | | | | | | | | | 0 | 0 |
| TOTAL MINE CAPITAL COST | ($x1000) | 3,022 | 0 | 0 | 0 | 0 | 0 | 0 | 0 | 0 | 0 | 995 | 4,017 |
| 21.1.1.1 | Mining Contractor Mobilization and Demobilization |
Mine contractor mobilization has been quoted at US$1.13 million. Demobilization costs are quoted at US$995,000 and will occur in Year 7 of the Project.
| 21.1.1.2 | Mining Owner Equipment |
Owner mining equipment includes the equipment required for mine engineering, geology, and surveying personnel and has been estimated at US$525,400 by IMC. The estimate includes four pickup trucks at US$52,500 each. This is a list price from a Tucson dealer. Surveying equipment is based on a supplier quote and includes a fixed ground station and two hand held data collection units, and required software.
The estimate includes nine computer workstations at US$4,000 per computer. This covers the computer, one or two monitors each and typical operating system and office product licences. This estimate assumes the main G&A budget includes the major file servers, firewall servers, and internet access equipment. Printers and large format plotter cost estimates are based on recent purchases by IMC.
The initial subscription cost for two MineSight software licences has been quoted at US$175,000 for one basic and one extended licence. Additional software such as Leapfrog and AutoCAD are licenced as annual subscription fees and are incorporated in the operating costs.
Also included in the overall estimate is a 10% allowance/contingency for smaller items that might be needed. Note that IMC has not shown any replacements for the equipment. With a mine life of just over six years, equipment replacement may not be necessary and therefore, not contemplated.
Owner mining equipment costs are summarized in Table 21-5.
Kappes, Cassiday & Associates June, 2019 | 21.0 Capital & Operating Costs Page 21-4 |
| Camino Rojo Project Feasibility Study NI 43-101 Technical Report |
|
Table 21-5
Owner Mining Equipment Capital Costs
| | | | | | Units | Total |
| EQUIPMENT PURCHASE SCHEDULE: | | | |
| Pickup Trucks | | | | (none) | 4 |
| Surveying Equipment | | | | (none) | 1 |
| Computer Workstations | | | (none) | 9 |
| Printer/Scanner/Copier | | | (none) | 2 |
| Large Format Plotters | | | (none) | 1 |
| Software Licence Fees | | | (none) | 2 |
| Total Major Equipment Purchases | | (none) | 19 |
| EQUIPMENT CAPITAL COST: | | Unit Price | | |
| | | | | ($x1000) | | |
| Pickup Trucks | | | 52.5 | ($x1000) | 210.0 |
| Surveying Equipment | | | 30.8 | ($x1000) | 30.8 |
| Computer Workstations | | 4.0 | ($x1000) | 36.0 |
| Printer/Scanner/Copier | | 7.9 | ($x1000) | 15.8 |
| Large Format Plotters | | 10.0 | ($x1000) | 10.0 |
| Software Licence Fees | | 87.5 | ($x1000) | 175.0 |
| OWNER EQUIPMENT CAPITAL COST | | ($x1000) | 477.6 |
| CONTINGENCY/MISC @ | 10.00% | | ($x1000) | 47.8 |
| TOTAL EQUIPMENT COST | | | ($x1000) | 525.4 |
| 21.1.1.3 | Mine Development (Preproduction) |
Mine development or preproduction estimated at US$1.37 million is the estimated operating cost to mine 600,000 tonnes of material during the three-month preproduction period based on the contractor mining quote. The mine development cost is presented in Table 21-6.
Table 21-6
Mine Development Capital Costs
| Description | | | | | Units | Total |
| Mining Contractor | | | ($x1000) | 1,026 |
| Blasting Contract | | | ($x1000) | 214 |
| Technical Services Personnel | | ($x1000) | 81 |
| Technical Services Supplies | | | ($x1000) | 45 |
| Waste Storage Cover | | | ($x1000) | |
| Allowance for Controlled Blasting | | ($x1000) | |
| TOTAL COST - Development | ($x1000) | 1,366 |
Kappes, Cassiday & Associates June, 2019 | | 21.0 Capital & Operating Costs Page 21-6 |
| Camino Rojo Project Feasibility Study NI 43-101 Technical Report |
|
| 21.1.2 | Process and Infrastructure Capital Cost Estimate |
| 21.1.2.1 | Process and Infrastructure Capital Cost Basis |
Process and infrastructure costs have been estimated by KCA. All equipment and material requirements are based on the design information described in previous sections of this Report. Budgetary capital costs have been estimated primarily based on Project specific quotes for all major and most minor equipment as well as contractor quotes for all major construction contracts. Multiple quotes were received for all major packages (three or more in most cases). Supplier and contractor quotes used in the cost estimates were selected based on a combination of factors including price, completeness of proposal and capabilities of the vendor. Where Project specific quotes were not available a reasonable estimate or allowance was made based on recent quotes in KCA’s files. All capital cost estimates are based on the purchase of equipment quoted new from the manufacturer or to be fabricated new.
Each area in the process cost build-up has been separated into the following disciplines, as applicable:
| · | Major earthworks & liner; |
| · | Infrastructure & Buildings; |
| · | Supplier Engineering; and |
| · | Commissioning & Supervision. |
Pre-production process and infrastructure costs by discipline are presented in Table 21-7.
Kappes, Cassiday & Associates June, 2019 | | 21.0 Capital & Operating Costs Page 21-7 |
| Camino Rojo Project Feasibility Study NI 43-101 Technical Report |
|
Table 21-7
Summary of Process & Infrastructure Pre-Production Capital Costs by Discipline
| Discipline Totals | Cost @ Source | Freight | Customs Fees & Duties | Total Supply Cost | Install | Grand Total |
| | US$ | US$ | US$ | US$ | US$ | US$ |
| Major Earthworks | | | | $3,781,000 | $11,823,000 | $15,604,000 |
| Civils (Supply & Install) | $358,000 | | | $358,000 | $1,019,000 | $1,377,000 |
| Structural Steelwork (Supply & Install) | $850,000 | | | $850,000 | $0 | $850,000 |
| Platework (Supply & Install) | $1,500,000 | | | $1,500,000 | $225,000 | $1,725,000 |
| Mechanical Equipment | $29,181,000 | $4,897,000 | $34,078,000 | $29,181,000 | $4,897,000 | $34,078,000 |
| Piping | $2,955,000 | $1,972,000 | $4,927,000 | $2,955,000 | $1,972,000 | $4,927,000 |
| Electrical | $2,829,000 | $500,000 | $3,329,000 | $2,829,000 | $500,000 | $3,329,000 |
| Instrumentation | $817,000 | $119,000 | $936,000 | $817,000 | $119,000 | $936,000 |
| Infrastructure & Buildings | $13,015,000 | $0 | $0 | $13,015,000 | $22,000 | $13,036,000 |
| Supplier Engineering | | | | | $2,117,000 | $2,117,000 |
| Commissioning & Supervision | | | | | $612,000 | $612,000 |
| Spare Parts | | | | $1,640,000 | | $1,640,000 |
| Contingency | | | | $12,638,000 | | $12,638,000 |
| | | | | | | |
| Total Direct Costs | $51,505,000 | $7,488,000 | $43,270,000 | $69,564,000 | $23,306,000 | $92,869,000 |
Freight, customs fees and duties, and installation costs are also considered for each discipline. Freight costs are based on loads as bulk freight and have been estimated at 10% of the equipment cost. Where applicable, supplier quoted freight cost estimates for equipment were used in place of estimated freight. Quoted freight accounts for approximately 35% of the total freight costs.
Installation costs are based on the contractor quotes based on a detailed equipment list and estimated equipment weights or included in turn-key supplier packages. Quoted contractor costs include all labour, tools and support equipment required for proper placement and installation of equipment.
Where not directly quoted, installation is based an hourly installation rate of US$39.11 which is derived from the contractor quote and estimated installation hours based on supply costs.
Engineering, procurement, and construction management (EPCM), indirect costs, and initial fills inventory are also considered as part of the capital cost estimate.
| 21.1.2.2 | Major Earthworks and Liner |
Earthworks and liner quantities for the Project have been estimated by KCA for all Project areas. Earthworks and liner supply and installation will be performed by contractors with imported fill being supplied by the mining contractor. Unit rates for site earthworks and liner supply and installation are based on contractor quotes. The earthworks and liner discipline also includes cost for materials to construct the crushing retaining wall.
Kappes, Cassiday & Associates June, 2019 | | 21.0 Capital & Operating Costs Page 21-8 |
| Camino Rojo Project Feasibility Study NI 43-101 Technical Report |
|
Total preproduction earthworks costs are estimated at US$15.6 million including an allowance of US$2.8 million for pad cover production and placement, which is based on an estimated cost of US$12.00 per cubic meter of pad cover produced.
Civils include detailed earthworks and concrete. Concrete quantities have been estimated by KCA based on layouts, similar equipment installations, vibrating equipment, major equipment weights and on slab areas. Unit costs for concrete supply, which include production (supply of aggregates, water and cement, batching and mixing), and delivery of concrete have and concrete installation which include all excavations, formwork, rebar, placement and curing are based on contractor quotes. Total costs for concrete are estimated at US$1.4 million.
Costs for structural steel, including steel grating, structural steel, and handrails are primarily quoted by suppliers as part of equipment supply packages or included in supplier turnkey proposals.
Total costs for structural steel not included in equipment package supply costs are estimated at US$850,000, which is the quoted crushing plant structural steel requirements.
The platework discipline includes costs for the supply and installation of steel tanks, bins, and chutes. Platework costs have been primarily quoted as part of complete equipment supply packages.
Total platework costs not included in the mechanical equipment supply costs are estimated at US$1.7 million including the quoted crushing circuit platework costs and quoted field erected raw water tank.
| 21.1.2.6 | Mechanical Equipment |
Costs for mechanical equipment are based on a detailed equipment list developed of all major equipment for the process. Costs for all major and most minor equipment items are based on budgetary quotes from suppliers. Where Project specific supplier quotes were not available, reasonable allowances were made based on recent quotes from KCA’s files. All costs assume equipment purchased new from the manufacturer or to be fabricated new.
Kappes, Cassiday & Associates June, 2019 | | 21.0 Capital & Operating Costs Page 21-9 |
| Camino Rojo Project Feasibility Study NI 43-101 Technical Report |
|
The mechanical equipment costs consider a complete turn-key bid for the Merrill-Crowe, Refinery and Cyanide dissolution system, complete engineering design and supply package for the crushing and reclaim systems and various equipment supply packages by several different suppliers. Installation costs for mechanical equipment are based on contractor quotes or are included as part of turn-key vendor packages.
The total installed mechanical equipment cost is estimated at US$34.1 million.
Major piping, including heap irrigation and gravity solution collection pipes and water distribution pipes (raw water and fire water) are based on material take-offs and supplier quotes. Piping for the Merrill-Crowe and cyanide dissolution systems are included in the turn-key vendor supply package and are included in the mechanical equipment costs. Additional ancillary piping, fittings, and valve costs have been estimated on a percentage basis of the mechanical equipment supply costs by area ranging from 0% to 5%.
Installation costs for major piping is based on contractor quotes. Installation of ancillary piping has been estimated based on unit installation rates from the installation contractor and estimated installation hours based on the material supply costs. The total installed piping cost is estimated at US$4.9 million.
Major electrical equipment including transformers, substations, site powerlines, motor control centres and VFDs have been considered in the electrical equipment list and have been costed based on supplier / contractor quotes or have been included as part of turn-key or complete vendor supply packages. Also considered in electrical is the cost to relocate the electrical power line which services the town of El Berrendo.
Miscellaneous electrical costs have been estimated as percentages of the mechanical equipment supply cost for each process area and range between 0 and 25%. Costs for the power supply line to the Project site are assumed to occur during Year 1 of operations and have been costed based on a contractor quote and assumed connection point and distribution voltage. The distribution power line to site is currently pending CFE review and decision on the final connection point.
Kappes, Cassiday & Associates June, 2019 | | 21.0 Capital & Operating Costs Page 21-10 |
| Camino Rojo Project Feasibility Study NI 43-101 Technical Report |
|
Installation of electrical equipment and ancillary electrical items not included in turn-key vendor packages have been estimated based on unit installation rates from the installation contractor quote and estimated installation hours based on the material supply costs. Supply and installation of the distribution powerline is based on a contractor quote.
The total installed electrical cost is estimated at US$3.3 million.
Instrumentation costs are primarily included as part of turn-key or complete vendor supply packages. Minor miscellaneous instrumentation costs have been estimated as percentages of the mechanical equipment supply cost for each process area and range between 0 and 3%. An allowance of US$350,000 has been included for communication equipment.
The total installed instrumentation cost is estimated at US$936,000.
| 21.1.2.10 | Infrastructure & Buildings |
Infrastructure and buildings for the Camino Rojo Project include the construction of a 250-person man camp for operations and construction, an administration building, mine truck shop, mine contractor offices, warehouse, guard house, on-site clinic, powder magazine, and light vehicle workshop. Process buildings including the laboratory, process workshop, reagents storage building, Merrill-Crowe plant and refinery are also included. Costs for the man camp and site buildings have been quoted by contractors or are included as part of the vendor supply package.
Water supply to the main water tank will be by production wells. One production well is in place. An additional two production wells will be developed to provide redundancy. The production wells consider 200mm cased wells in 350mm boreholes and have an estimated cost of US$350,000 each, including the cost of the well pump, discharge pipe and cabling. An allowance of US$375,000 is also included for five monitoring wells based on costs of wells drilled on the property.
An allowance of US$5.60 per meter of barb wire fencing for the site perimeter has been included as well as US$500,000 for modifications to the existing highway for safer access to the Project site.
The total infrastructure and buildings cost is estimated at US$13.0 million.
Kappes, Cassiday & Associates June, 2019 | | 21.0 Capital & Operating Costs Page 21-11 |
| Camino Rojo Project Feasibility Study NI 43-101 Technical Report |
|
| 21.1.2.11 | Supplier Engineering and Installation Supervision / Commissioning |
Supplier engineering costs have been quoted for the crushing system as well as the recovery plant and include the costs for detailed engineering for the complete or turn-key supply packages. The total cost for supplier engineering is estimated at US$2.1 million.
Costs for installation and commissioning supervision has been quoted by suppliers as either a fixed cost or cost per time period and are considered for all major equipment items. Total cost for installation and commissioning supervision are estimated at US$600,000.
| 21.1.2.12 | Process Mobile Equipment |
Mobile equipment included in the capital cost estimate are detailed in Table 21-8.
Table 21-8
Process Mobile Equipment
| Description | Quantity |
| CAT 992 Loader or Equiv. | 1 |
| CAT D6 Dozer or Equiv. | 1 |
| Mechanical Service Truck | 1 |
| Forklift, 2.5 ton | 3 |
| Telehandler, 4 ton | 1 |
| Pickup Truck, ¾ ton | 7 |
| Backhoe w/ Fork Attachment, 1.1 cu. yd. | 1 |
| Boom Truck, 10 ton | 1 |
| Crane, 50 ton | 1 |
| Bobcat | 1 |
Costs for process mobile equipment are based on cost guides or other published data. Mobile equipment costs are considered in the mechanical equipment cost estimate.
Spare parts costs are estimated at 6% of the mechanical equipment supply costs. Total spare parts costs are estimated at US$1.6 million.
| 21.1.2.14 | Process & Infrastructure Contingency |
Contingency for the process and infrastructure has been applied to the total direct costs by discipline. Contingency has been applied ranging from 15% to 20% as detailed in Table 21-9. The overall contingency for process and infrastructure is estimated at 16.1% of the direct costs.
Kappes, Cassiday & Associates June, 2019 | | 21.0 Capital & Operating Costs Page 21-12 |
| Camino Rojo Project Feasibility Study NI 43-101 Technical Report |
|
Table 21-9
Process & Infrastructure Contingency
| Direct Costs Contingency | % | Total (US$) |
| Major Earthworks | 20% | $3,121,000 |
| Civils (Supply & Install) | 20% | $275,000 |
| Structural Steelwork | 15% | $128,000 |
| Platework | 15% | $259,000 |
| Mechanical Equipment | 15% | $5,112,000 |
| Piping | 15% | $739,000 |
| Electrical | 15% | $499,000 |
| Instrumentation | 15% | $140,000 |
| Infrastructure & Buildings | 15% | $1,955,000 |
| Supplier Engineering | 15% | $317,000 |
| Commissioning & Supervision | 15% | $92,000 |
| | | |
| Total Contingency on Direct Costs | 16.1% | $12,638,000 |
| 21.1.2.15 | Process & Infrastructure Sustaining Capital |
Sustaining capital for process and infrastructure includes the costs for constructing a powerline to the Project site in Year 1 of operations, the expansion of the heap leach pad and addition of an overland conveying equipment in Year 2 of operation, the addition of 5 each pit dewatering wells pumps and evaporators for pit dewatering in Year 3 and the replacement of some of the process mobile equipment. Total sustaining capital is estimated at US$20.4 million including contingency.
| 21.1.3 | Construction Indirect Costs |
Indirect field costs include temporary construction facilities, construction services, quality control, survey support, warehouse and fenced yards, support equipment, etc. These costs have been estimated based on 16 months of field construction, contractor quotes, and reasonable allowances based on KCA’s recent experience. Construction indirect costs are summarized in Table 21-10. A 20% contingency has been applied to the estimated construction indirect costs.
Kappes, Cassiday & Associates June, 2019 | | 21.0 Capital & Operating Costs Page 21-13 |
| Camino Rojo Project Feasibility Study NI 43-101 Technical Report |
|
Table 21-10
Construction Indirect Costs
| Indirect Field Costs | Basis | Total (US$) |
| Misc. Hotels, etc. | $150/night, avg. 3 rooms per month | $216,000 |
| QA/QC Earthworks, Liner and Concrete | Contractor Quote | $607,000 |
| Surveying | Contractor Quote | $186,000 |
| Temporary Construction Camp Set-Up | Allowance | $500,000 |
| Camp Operations | Contractor Quote | $3,437,000 |
| Construction Equipment Rentals & Operating Costs | $40k / month Allowance | $640,000 |
| Office Equipment (copiers, Printers, Computers, Plotter) | Allowance | $100,000 |
| Construction Vehicle O&M (6 Pickups + Flatbed) | 50 km /day ea. @ $1.48/km | $249,000 |
| Construction Tools | Allowance | $150,000 |
| Construction Phone / Internet | $5000/month Allowance | $80,000 |
| Construction Power Opex and Rental | $8000/month genset rental, 2 generators / ~2,100 L/day diesel consumption | $1,051,000 |
| Portable Toilet Service | $15k/month Allowance | $240,000 |
| Outside Consultants / Vendor Reps | Allowance | $100,000 |
| Construction Office Trailers / Containers (Purchase & set-up) | Allowance (3 ea. @ $30k/trailer) | $90,000 |
| | | |
| Sub Total Indirect Costs | | $7,645,000 |
| | | |
| Indirect Contingency | 20% | $1,529,000 |
| | | |
| Total Indirect Costs | | $9,174,000 |
| 21.1.4 | Other Owner’s Construction Costs |
Other Owner’s construction costs are intended to cover the following items:
| · | Owner’s costs for labour, offices, home office support, vehicles, travel and consultants during construction. |
| · | Subscriptions, licence fees, etc. |
| · | Work place health and safety costs during construction. |
Other Owner’s construction costs are estimated based on 16 months of site construction and are summarized in Table 21-11. A 20% contingency has been applied to the estimated Other Owner’s construction costs.
Kappes, Cassiday & Associates June, 2019 | | 21.0 Capital & Operating Costs Page 21-14 |
| Camino Rojo Project Feasibility Study NI 43-101 Technical Report |
|
Table 21-11
Other Owner’s Construction Costs
| Other Owner's Costs | Basis | Total (US$) |
| Labor | 2/3 G&A labor for 16 months | $2,277, 000 |
| Office Supplies/Subscriptions | Allowance | $250,000 |
| Vehicles | 1 ea. 3/4 ton and 11 ea. Light duty pickup trucks | $430,000 |
| Vehicle OPEX | 12 @ 100 km/day @ $0.63/km, 16 months | $367,920 |
| Off-Site Office | Allowance | $230,000 |
| Public Relations Expense | Allowance | $500,000 |
| Communications | $75k/year allowance, 16 months | $100,000 |
| Insurance | Allowance | $200,000 |
| Safety Supplies | Allowance | $33,000 |
| Training & Training Supplies | Allowance | $250,000 |
| Travel | Allowance | $86,250 |
| Legal | Allowance | $150,000 |
| IT, Internet, Software, computers | Allowance | $150,000 |
| Waste Management | Allowance | $150,000 |
| Medical Supplies | Allowance | $50,000 |
| Land Use Change | 3182.4 Ha equivalents @ MXN 14002.49 / Ha | $2,309,000 |
| Cactus Relocation | | $259,000 |
| CENACE Study | MXN 2,000,000 - CENACE | $104,000 |
| CENACE Consultant | Contractor Quote | $26,000 |
| | | |
| Sub Total Other Owner's Costs | | $7,922,000 |
| | | |
| Other Owner's Costs Contingency | 20% | $1,584,000 |
| | | |
| Total Other Owner's Costs | | $9,506,000 |
| 21.1.5 | Initial Fills Inventory |
The initial fills consist of consumable items stored on site at the outset of operations, which includes sodium cyanide (NaCN), lime, zinc, diatomaceous earth (DE), antiscalant, lead nitrate and fluxes. Initial fills are summarized in Table 21-12.
Kappes, Cassiday & Associates June, 2019 | | 21.0 Capital & Operating Costs Page 21-15 |
| Camino Rojo Project Feasibility Study NI 43-101 Technical Report |
|
Table 21-12
Initial Fills
| Item | Basis | Needed
Weight | Truckloads | Quantity to
Order | Unit
Price | Total Cost
(Excluding
IVA) |
| | | kg or l | | kg or l | US$ | US$ |
| | | | | | | |
| NaCN | 30 Days | 262,500 | 13.1 | 260,000 | 2.50 | $650,000 |
| | | | | | | |
| Zinc | 31 days | 4,000 | 0.2 | 4,000 | 5.26 | $21,000 |
| Diatomaceous Earth (D.E.) | 30 days | 54,810 | 2.7 | 60,000 | 1.16 | $70,000 |
| Antiscalant | 4 weeks | 11,500 | 0.6 | 11,500 | 3.19 | $37,000 |
| Lime (CaO) | full silo | 120,000 | 6.0 | 120,000 | 0.15 | $18,000 |
| | | | | | | |
| Flux | | | | | | |
| SiO2 | | 2,000 | 0.1 | 2,000 | 0.50 | $1,000 |
| Borax | | 2,000 | 0.1 | 2,000 | 0.98 | $2,000 |
| Niter | | 2,000 | 0.1 | 2,000 | 1.75 | $3,500 |
| Soda Ash | | 2,000 | 0.1 | 2,000 | 1.70 | $3,400 |
| | | | | | | |
| TOTAL | $806,000 |
| 21.1.6 | Engineering, Procurement & Construction Management |
The estimated costs for engineering, procurement and construction management (EPCM) for the development, construction, and commissioning are based on a percentage of the direct capital cost. The total EPCM cost is estimated at US$8.5 million, or 9.2% of the process and infrastructure direct costs.
The EPCM costs cover services and expenses for the following areas:
| · | Construction Management. |
For some major equipment packages, costs associated with detailed engineering, commissioning, and installation supervision have been included in the vendor’s quotes; these costs are reflected in the supplier engineering estimate of the capital costs and have been considered when estimating the EPCM costs and are not included in this estimate.
Kappes, Cassiday & Associates June, 2019 | | 21.0 Capital & Operating Costs Page 21-16 |
| Camino Rojo Project Feasibility Study NI 43-101 Technical Report |
|
Working capital is money that is used to cover operating costs from start-up until a positive cash flow is achieved. Once a positive cash flow is attained, Project expenses will be paid from earnings. Working capital for the Project is estimated to be US$9.4 million based on 60 days of operation and includes all mine, process and G&A operating costs as well as process pre-production costs.
IVA is a value added tax which is applied at 16% to all goods and services in Mexico. IVA is not considered in the capital and operating costs; however, is included as part of the economic model. IVA is assumed to be completely refundable within one calendar year.
The following capital cost considerations have been excluded from the scope of supply and estimate:
| · | Finance charges and interest during construction. |
| · | Currency exchange fluctuations. |
| | | |
Process operating costs for the Camino Rojo Project have been estimated based on information presented in earlier sections of this Report. Mining costs were provided by IMC at US$2.14 per tonne mined (LOM US$3.30 per tonne of ore) and are based on quotes for contract mining with estimated owner’s mining costs.
Process operating costs have been estimated by KCA from first principles. Labour costs were estimated using project specific staffing, salary and wage and benefit requirements. Unit consumptions of materials, supplies, power, water and delivered supply costs were also estimated. LOM average processing costs are estimated at US$3.38 per tonne ore
General administrative costs (G&A) have been estimated by KCA with input from Orla mining. G&A costs include project specific labour and salary requirements and operating expenses including social contributions and land and water rights. G&A costs are estimated at US$1.75 per tonne ore.
Kappes, Cassiday & Associates June, 2019 | | 21.0 Capital & Operating Costs Page 21-17 |
| Camino Rojo Project Feasibility Study NI 43-101 Technical Report |
|
Operating costs were estimated based on 1st quarter 2019 US dollars and are presented with no added contingency based upon the design and operating criteria present in this report. IVA is not included in the operating cost estimate.
The operating costs presented are based upon the ownership of all process production equipment and site facilities, including the onsite laboratory. The owner will employ and direct all operating maintenance and support personnel for all site activities.
Operating costs estimates have been based upon information obtained from the following sources:
| · | Contractor mining quotes and owner mining costs from IMC; |
| · | G&A costs estimated by KCA with input from Orla; |
| · | Project metallurgical test work and process engineering; |
| · | Supplier quotes for reagents and fuel |
| · | Recent KCA project file data; and |
| · | Experience of KCA staff with other similar operations. |
Where specific data do not exist, cost allowances have been based upon consumption and operating requirements from other similar properties for which reliable data exist. Freight costs have been estimated where delivered prices were not available.
| 21.2.1 | Mining Operating Costs |
Mine operating costs are based on contractor quotes, owner mining personnel from first principles and estimated supplies and support services. Costs for pit wall supports have been estimated by Piteau Associates. Costs for pit dewatering have been estimated by KCA based on pumping volumes estimated by Barranca and are included in the process operating cost. Total mine operating cost during commercial production is estimated at US$145.2 million. This amounts to US$2.14 per tonne of material mined and US$3.30 per ore tonne. LOM mining operating costs are presented in Table 21-13.
There are some specific risks related to contract mining. There is risk that the contractor may need financial assistance from the owner either in terms of cash, or loan guarantees, to procure some equipment, increasing the capital cost. Contract mining is common in Mexico and risks can be reduced by careful selection of the contractor.
At the end of mining about 1.65 million tonnes of clean waste will be re-handled to cover transition and sulphide waste exposed in the centre of the facility. The estimated cost for this is US$1.46 million. This estimate was prepared by IMC and is included in the cost estimate.
Kappes, Cassiday & Associates June, 2019 | | 21.0 Capital & Operating Costs Page 21-18 |
| Camino Rojo Project Feasibility Study NI 43-101 Technical Report |
|
Table 21-13
Contract Mining Cost Summary
| MINE OPERATING COSTS: | Units | PP | Yr1
Q1 | Yr1
Q2 | Yr1
Q3 | Yr1
Q4 | Year 2 | Year 3 | Year 4 | Year 5 | Year 6 | Year 7 | TOTAL |
| Mining Contractor | ($x1000) | 1,026 | 4,687 | 5,633 | 5,626 | 5,633 | 22,534 | 21,812 | 17,536 | 15,592 | 14,391 | 6,598 | 121,068 |
| Blasting Contract | ($x1000) | 214 | 563 | 668 | 667 | 668 | 2,670 | 2,599 | 2,179 | 1,987 | 1,830 | 279 | 14,324 |
| Technical Services Personnel | ($x1000) | 81 | 122 | 128 | 128 | 128 | 513 | 513 | 513 | 513 | 374 | 175 | 3,189 |
| Technical Services Supplies | ($x1000) | 45 | 65 | 68 | 68 | 77 | 308 | 308 | 308 | 308 | 238 | 113 | 1,905 |
| Pit Stabilization | ($x1000) | 0 | 60 | 35 | 30 | 34 | 175 | 419 | 450 | 591 | 633 | 250 | 2,679 |
| Pit Dewatering | ($x1000) | 0 | 0 | 0 | 0 | 0 | 0 | 0 | 0 | 0 | 0 | 0 | 0 |
| Waste Storage Cover | ($x1000) | | | | | | | | | | | 1,462 | 1,462 |
| Allowance for Controlled Blasting | ($x1000) | | 12 | 62 | 17 | 0 | 89 | 414 | 438 | 359 | 485 | 88 | 1,965 |
| TOTAL OPERATING COST - Commercial | ($x1000) | | 5,510 | 6,594 | 6,536 | 6,540 | 26,289 | 26,065 | 21,424 | 19,351 | 17,951 | 8,965 | 145,225 |
| TOTAL OPERATING COST - Development | ($x1000) | 1,366 | | | | | | | | | | | 1,366 |
| Total Material (Ex-Pit Only) | (kt) | 601 | 2,680 | 3,300 | 3,296 | 3,300 | 13,201 | 12,778 | 10,273 | 9,134 | 8,198 | 988 | 67,749 |
| Total Ore | (kt) | 0 | 922 | 1,645 | 1,642 | 1,644 | 6,572 | 6,569 | 6,570 | 6,570 | 6,570 | 5,316 | 44,020 |
| Cost Per Total Tonne | (US$/t) | | 2.056 | 1.998 | 1.983 | 1.982 | 1.991 | 2.040 | 2.085 | 2.119 | 2.190 | 9.074 | 2.144 |
| Cost Per Ore Tonne | (US$/t) | 0.000 | 5.976 | 4.009 | 3.981 | 3.978 | 4.000 | 3.968 | 3.261 | 2.945 | 2.732 | 1.686 | 3.299 |
Kappes, Cassiday & Associates June, 2019 | | 21.0 Capital & Operating Costs Page 21-19 |
| Camino Rojo Project Feasibility Study NI 43-101 Technical Report |
|
| 21.2.1.1 | Contract Mining Cost Basis |
Contract mining costs are based on contractor quotes and are summarized in Table 21-14. The quoted contract mining rate is US$1.707 per total tonne and was not broken out by material type or destination; however, separate estimates for drilling, loading, hauling, and auxiliary equipment are included. A US$1.118 per tonne rehandle cost was estimated by IMC based on loading, hauling, and 50% of the auxiliary equipment from the contractor quote. The contract mining cost estimate is based on 74.2 million total tonnes moved. This includes 4.85 million tonnes of ore rehandle from stockpiles and 1.65 million tonnes of waste rehandle in Year 7 to cap sulphide and transition waste in the waste storage facility. Waste rehandle is not included in the contractor quote; IMC has prepared a separate estimate for this cost. The contractor quote includes diesel fuel, but does not include blasting. The life of mine estimate for mining contract cost is US$121.1 million or about US$1.67 per total tonne.
| 21.2.1.2 | Blasting & Mine Technical Services Costs |
Costs for blasting are based on contractor quotes and are summarized in Table 21-15. The blasting agents and services contract includes costs to load and detonate the blast holes. The quotation is based on a cost of US$0.168 per tonne for blasting supplies and a fixed cost of 728,102 pesos per month for services. At an exchange rate of 19.3 pesos to the US dollar the services amount to US$37,725 per month. The life of mine estimate for blasting amounts to about US$0.211 per total tonne blasted.
Mine technical services and supplies includes the cost for engineering, geology, surveying and grade control personnel, and an allowance for supplies and is summarized in Table 21-16 by time period. It is assumed that the chief engineer will be the primary contact for the mining and blasting contractors. The estimate also includes an allowance of 50% of the personnel costs for supplies and consumables. This is to cover office supplies, fuel and repairs for the pickups, repair and maintenance costs for office equipment, training, conventions, consultant reviews, etc.
There is also a separate line item for major software support. MineSight support has been quoted at 20% of the initial purchase price per year. The first-year subscription is included in the purchase price, so this charge does not start until the 4th quarter of Year 1. The subscription cost for one Leapfrog key is US$13,000 per year and two AutoCAD seats are about US$3,000 per year (US$1,500 each). These are US$16,000 per year or US$4,000 per quarter. Personnel plus supplies costs amount to US$5.10 million over the Project life.
| 21.2.1.3 | Pit Wall Support Costs |
Wall support costs are based on information provided by Piteau and are estimated at US$2.68 million over the mine life as detailed in Table 21-17. Linear metres of new final wall for 10m single benches and 20m double benches are shown by year. These are for areas in the north and west wall specified by Piteau for support to steepen the slope angles. Drilling costs for the 10m and 20m holes are based on US$6.81 per meter based on a quotation provided for wall control drilling. Cost estimates for support dowels were provided by Piteau. For single benches 1.7m spacing between dowels was proposed at a cost of US$85.75 per dowel. For double benches 0.6m spacing between dowels was proposed at a cost of US$159.50 per dowel. The cost per dowel includes #10 rebar inserted in the hole, and the hole filled with concrete.
Kappes, Cassiday & Associates June, 2019 | | 21.0 Capital & Operating Costs Page 21-20 |
| Camino Rojo Project Feasibility Study NI 43-101 Technical Report |
|
| 21.2.1.4 | Presplitting for Wall Control |
This estimate assumes that all the 20m high, double-benched, walls will require presplitting. These are assumed to be 102mm (4 inch) diameter holes drilled at an angle of 72 degrees with about 0.5m of subgrade drilling so each hole is about 21.5m long. The spacing between holes is estimated at 1.25m. Table 21-18 shows a cost estimate. The top line on the table is meters of double-benched, final wall, developed each year. The estimates of the number of holes per year and meters drilled are derived from this data. The estimated cost for this drilling is US$6.81 per meter, based on a contractor quotation. Powder loading for presplit blasting is relatively low at about 1kg per square meter of wall. Required explosives per hole are one 25kg packaged charge at US$43.48 and a detonator at about US$9.74 for about US$53.22 per hole. It is assumed that hole loading and detonation is included in the fixed monthly cost for the blasting contractor services discussed with blasting agents and services above. Total cost, life of mine, is about US$1.96 million or US$0.027 per total tonne. This comes to about US$200 per hole.
Kappes, Cassiday & Associates June, 2019 | | 21.0 Capital & Operating Costs Page 21-21 |
| Camino Rojo Project Feasibility Study NI 43-101 Technical Report |
|
Table 21-14
Contract Mining Costs Based on Unit Rates
| Material Type | Unit Cost | Units | PP | Yr1
Q1 | Yr1
Q2 | Yr1
Q3 | Yr1
Q4 | Year 2 | Year 3 | Year 4 | Year 5 | Year 6 | Year 7 | TOTAL |
| Leach | | 1.707 | ($x1000) | 171 | 1,403 | 2,808 | 2,803 | 2,806 | 11,218 | 11,213 | 11,215 | 11,215 | 10,609 | 1,576 | 67,037 |
| Low Grade | 1.707 | ($x1000) | 5 | 319 | 0 | 0 | 533 | 993 | 2,967 | 2,161 | 1,127 | 0 | 0 | 8,105 |
| Overburden | 1.707 | ($x1000) | 850 | 2,059 | 1,425 | 239 | 548 | 777 | 51 | 0 | 0 | 0 | 0 | 5,949 |
| Waste | | 1.707 | ($x1000) | 0 | 794 | 1,400 | 2,584 | 1,746 | 9,546 | 7,581 | 4,160 | 3,250 | 3,385 | 111 | 34,557 |
| Rehandle | | 1.118 | ($x1000) | 0 | 112 | 0 | 0 | 0 | 0 | 0 | 0 | 0 | 397 | 4,911 | 5,420 |
| Waste Rehandle | 0 | ($x1000) | 0 | 0 | 0 | 0 | 0 | 0 | 0 | 0 | 0 | 0 | 0 | 0 |
| Total Cost | | | ($x1000) | 1,026 | 4,687 | 5,633 | 5,626 | 5,633 | 22,534 | 21,812 | 17,536 | 15,592 | 14,391 | 6,598 | 121,068 |
| Cost Per Ore Tonne | | (US$) | 0.000 | 5.083 | 3.424 | 3.426 | 3.426 | 3.429 | 3.320 | 2.669 | 2.373 | 2.190 | 1.241 | 2.750 |
| Cost Per Total Tonne | | (US$) | 1.707 | 1.686 | 1.707 | 1.707 | 1.707 | 1.707 | 1.707 | 1.707 | 1.707 | 1.683 | 1.226 | 1.668 |
Table 21-15
Contract Blasting Costs Based on Unit Rates
| Description | | | Units | PP | Yr1
Q1 | Yr1
Q2 | Yr1
Q3 | Yr1
Q4 | Year 2 | Year 3 | Year 4 | Year 5 | Year 6 | Year 7 | TOTAL |
| Ex-Pit Ktonnes | | | ($x1000) | 601 | 2,680 | 3,300 | 3,296 | 3,300 | 13,201 | 12,778 | 10,273 | 9,134 | 8,198 | 988 | 67,749 |
| Blasting Supplies @ | 0.168 | /tonne | ($x1000) | 101 | 450 | 554 | 554 | 554 | 2,218 | 2,147 | 1,726 | 1,535 | 1,377 | 166 | 11,382 |
| Months/Period | | | ($x1000) | 3 | 3 | 3 | 3 | 3 | 12 | 12 | 12 | 12 | 12 | 3 | 78 |
| Services @ pesos | 728,102 | /month | (MXNx1000) | 2,184 | 2,184 | 2,184 | 2,184 | 2,184 | 8,737 | 8,737 | 8,737 | 8,737 | 8,737 | 2,184 | 56,792 |
| Services @ | 19.3 | Pesos/$ | ($x1000) | 113 | 113 | 113 | 113 | 113 | 453 | 453 | 453 | 453 | 453 | 113 | 2,943 |
| Total Cost | | | | ($x1000) | 214 | 563 | 668 | 667 | 668 | 2,670 | 2,599 | 2,179 | 1,987 | 1,830 | 279 | 14,324 |
| Cost Per Ex-Pit Tonne | | (US$) | 0.356 | 0.210 | 0.202 | 0.202 | 0.202 | 0.202 | 0.203 | 0.212 | 0.218 | 0.223 | 0.283 | 0.211 |
Kappes, Cassiday & Associates June, 2019 | | 21.0 Capital & Operating Costs Page 21-22 |
| Camino Rojo Project Feasibility Study NI 43-101 Technical Report |
|
Table 21-16
Owner Mine Personnel & Technical Services
| | | Year | |
| JOB DESCRIPTION | Unit | PP | Y1Q1 | Y1Q2 | Y1Q3 | Y1Q4 | 2 | 3 | 4 | 5 | 6 | 7 | TOTAL |
| TECHNICAL SERVICES: | | | | | | | | | | | | | |
| Chief Mining Engineer | persons | 1 | 1 | 1 | 1 | 1 | 1 | 1 | 1 | 1 | 1 | 1 | |
| Mining Engineer | persons | 1 | 2 | 2 | 2 | 2 | 2 | 2 | 2 | 2 | 1 | 1 | |
| Chief Geologist | persons | 0 | 0 | 0 | 0 | 0 | 0 | 0 | 0 | 0 | 0 | 0 | |
| Geologist | persons | 1 | 2 | 2 | 2 | 2 | 2 | 2 | 2 | 2 | 1 | 1 | |
| Chief Surveyor | persons | 1 | 1 | 1 | 1 | 1 | 1 | 1 | 1 | 1 | 1 | 1 | |
| Technicians | persons | 1 | 2 | 3 | 3 | 3 | 3 | 3 | 3 | 3 | 3 | 2 | |
| TOTAL PERSONNEL | persons | 5.0 | 8.0 | 9.0 | 9.0 | 9.0 | 9.0 | 9.0 | 9.0 | 9.0 | 7.0 | 6.0 | |
| Mine Technical Services Total | ($x1000) | 81.4 | 122.3 | 128.3 | 128.3 | 128.3 | 513.1 | 513.1 | 513.1 | 513.1 | 373.6 | 174.8 | 3,189 |
| Supplies/Consumables @ | 50% | 40.7 | 61.1 | 64.1 | 64.1 | 64.1 | 256.6 | 256.6 | 256.6 | 256.6 | 186.8 | 87.4 | 1,595 |
| Software Support | | 4.0 | 4.0 | 4.0 | 4.0 | 12.8 | 51.2 | 51.2 | 51.2 | 51.2 | 51.2 | 25.6 | 310 |
| TOTAL | | 126.1 | 187.4 | 196.4 | 196.4 | 205.2 | 820.9 | 820.9 | 820.9 | 820.9 | 611.6 | 287.8 | 5,095 |
Kappes, Cassiday & Associates June, 2019 | | 21.0 Capital & Operating Costs Page 21-23 |
| Camino Rojo Project Feasibility Study NI 43-101 Technical Report |
|
Table 21-17
Pit Wall Support Costs
| Wall Support Requirements | | | Units | PP | Yr1
Q1 | Yr1
Q2 | Yr1
Q3 | Yr1
Q4 | Year 2 | Year 3 | Year 4 | Year 5 | Year 6 | Year 7 | TOTAL |
| 10m Benches: | | | | | | | | | | | | | | | | |
| | New Final Wall Length | | | (m) | | 668 | 384 | 329 | 380 | 1,932 | 222 | | | | | 3,915 |
| | Number of Dowels @ | 1.7 | m spacing | (none) | | 393 | 226 | 194 | 224 | 1,136 | 131 | | | | | 2,303 |
| | Meters of Drilling @ | 10 | m/hole | (m) | | 3,929 | 2,259 | 1,935 | 2,235 | 11,365 | 1,306 | | | | | 23,029 |
| | Drilling Cost @ | $6.81 | / meter | ($x1000) | | 27 | 15 | 13 | 15 | 77 | 9 | | | | | 157 |
| | Rebar and Grouting @ | $85.75 | / dowel | ($x1000) | | 34 | 19 | 17 | 19 | 97 | 11 | | | | | 197 |
| | Total Cost | | | | ($x1000) | | 60 | 35 | 30 | 34 | 175 | 20 | | | | | 354 |
| 20m Benches: | | | | | | | | | | | | | | | | |
| | New Final Wall Length | | | (m) | | | | | | | 810 | 913 | 1,200 | 1,285 | 508 | 4,716 |
| | Number of Dowels @ | 0.6 | m spacing | (none) | | | | | | | 1,350 | 1,522 | 2,000 | 2,142 | 847 | 7,860 |
| | Meters of Drilling @ | 20 | m/hole | (m) | | | | | | | 27,000 | 30,433 | 40,000 | 42,833 | 16,933 | 157,200 |
| | Drilling Cost @ | $6.81 | / meter | ($x1000) | | | | | | | 184 | 207 | 272 | 292 | 115 | 1,071 |
| | Rebar and Grouting @ | $159.50 | / dowel | ($x1000) | | | | | | | 215 | 243 | 319 | 342 | 135 | 1,254 |
| | Total Cost | | | | ($x1000) | | | | | | | 399 | 450 | 591 | 633 | 250 | 2,324 |
| Total Wall Support Cost | | | ($x1000) | | 60 | 35 | 30 | 34 | 175 | 419 | 450 | 591 | 633 | 250 | 2,679 |
Table 21-18
Wall Control Drilling Costs
| Wall Presplitting Requirements | | Units | PP | Yr1
Q1 | Yr1
Q2 | Yr1
Q3 | Yr1
Q4 | Year 2 | Year 3 | Year 4 | Year 5 | Year 6 | Year 7 | TOTAL |
| Drilling Requirements: | | | | | | | | | | | | | | | |
| | New Final Wall Length (20m Benches) | (m) | | 74 | 390 | 105 | 0 | 557 | 2,590 | 2,745 | 2,250 | 3,040 | 550 | 12,301 |
| | Number of Holes @ | 1.25 | m spacing | (none) | | 59 | 312 | 84 | 0 | 446 | 2,072 | 2,196 | 1,800 | 2,432 | 440 | 9,841 |
| | Meters Drilled @ | 21.5 | / hole | (m) | | 1,273 | 6,708 | 1,806 | 0 | 9,580 | 44,546 | 47,212 | 38,699 | 52,286 | 9,460 | 211,570 |
| Costs: | | | | | | | | | | | | | | | | |
| | Drilling @ | | 6.81 | / m | (US$) | | 8,667 | 45,680 | 12,298 | 0 | 65,240 | 303,361 | 321,516 | 263,538 | 356,069 | 64,420 | 1,440,790 |
| | Explosives/Supplies @ | 53.22 | / hole | (US$) | | 3,151 | 16,605 | 4,470 | 0 | 23,715 | 110,272 | 116,871 | 95,796 | 129,431 | 23,417 | 523,727 |
| | Loading and Detonating Included | | (US$) | | | | | | | | | | | | |
| Total Presplitting Cost | | | (US$) | | 11,818 | 62,284 | 16,769 | 0 | 88,955 | 413,633 | 438,387 | 359,334 | 485,500 | 87,837 | 1,964,517 |
| Total Tonnes - Commercial Production | | (kt) | | 2,780 | 3,300 | 3,296 | 3,300 | 13,201 | 12,778 | 10,273 | 9,134 | 8,553 | 7,031 | 73,646 |
| Cost Per Total Tonne | | | (US$) | | 0.004 | 0.019 | 0.005 | 0.000 | 0.007 | 0.032 | 0.043 | 0.039 | 0.057 | 0.012 | 0.027 |
Kappes, Cassiday & Associates June, 2019 | | 21.0 Capital & Operating Costs Page 21-24 |
| Camino Rojo Project Feasibility Study NI 43-101 Technical Report |
|
| 21.2.2 | Process and G&A Operating Costs |
Average annual process and G&A operating costs are presented in Table 21-19.
Table 21-19
Average Process, Support & G&A Operating Cost
| | | | | Unit | Annual | US$ per |
| | Units | Cost Type | Qty | Costs, US$ | Costs, US$ | Tonne Ore |
| | | | | | | |
| Labor | | | | | | |
| Process | ea | Fixed | 123 | | $2,494,543 | $0.43 |
| Laboratory | ea | Fixed | 18 | | $353,642 | $0.06 |
| SUBTOTAL | | | | | $2,848,184 | $0.45 |
| | | | | | | |
| Crushing | | | | | | |
| Power | kWh/year | Variable | 10805619 | $0.125 | $1,352,588 | $0.22 |
| 992 Loader | h/mo | Fixed | 414 | $172.37 | $856,811 | $0.14 |
| Wear | | Variable | | | $1,257,714 | $0.20 |
| Overhaul & Maintenance | | Variable | | | $628,857 | $0.10 |
| SUBTOTAL | | | | | $4,095,970 | $0.65 |
| | | | | | | |
| Reclaim & Convey/Stacking | | | | | | |
| Power | kWh/year | Variable | 12284447 | $0.125 | $1,537,700 | $0.26 |
| D-6 Dozer | h/mo | Fixed | 480 | $48.38 | $278,644 | $0.04 |
| Maintenance Supplies | lot | Variable | | | $314,429 | $0.05 |
| SUBTOTAL | | | | | $2,130,772 | $0.34 |
| | | | | | | |
| Heap Leach Systems | | | | | | |
| Power | kWh/year | Variable | 6796789 | $0.125 | $850,785 | $0.14 |
| Piping | lot | Variable | | | $188,657 | $0.03 |
| Maintenance Supplies | lot | Variable | | | $62,886 | $0.01 |
| SUBTOTAL | | | | | $1,102,328 | $0.18 |
| | | | | | | |
| Merrill-Crowe | | | | | | |
| Power | kWh/year | Variable | 1962094 | $0.125 | $245,604 | $0.04 |
| DE | kg/year | Variable | 504,944 | $1.165 | $588,127 | $0.09 |
| Zinc | kg/yr | Variable | 55,198 | $5.26 | $290,233 | $0.05 |
| Lead Nitrate | kg/yr | Variable | 5,520 | $5.76 | $31,783 | $0.01 |
| Filter Cloths (Press) | sets/year | Fixed | 12 | $8,000.00 | $96,000 | $0.01 |
| Filter Cloths (Clarifier) | sets/year | Fixed | 4 | $8,000.00 | $32,000 | $0.01 |
| Misc. Operating Supplies | lot | Variable | | | $125,771 | $0.02 |
| SUBTOTAL | | | | | $1,409,519 | $0.22 |
| | | | | | | |
| Refinery | | | | | | |
| Power | kWh/year | Variable | 1032608 | $0.125 | $129,256 | $0.02 |
| Misc. Operating Supplies | lot | Variable | | | $125,771 | $0.02 |
| Maintenance Supplies | lot | Variable | | | $62,886 | $0.01 |
| SUBTOTAL | | | | | $317,913 | $0.05 |
| | | | | | | |
| Reagents | | | | | | |
| Power | kWh/year | Variable | 147616 | $0.125 | $18,478 | $0.00 |
| Lime | kg/t | Variable | 1.250 | $0.153 | $1,202,689 | $0.19 |
| Cyanide (Ore) | kg/t | Variable | 0.35 | $2.50 | $5,502,500 | $0.88 |
| Antiscalant | L/year | Variable | 167,695 | $3.19 | $534,411 | $0.09 |
| Fluxes | kg/oz | Variable | 0.054 | $1.85 | $59,092 | $0.01 |
| Maintenance Supplies | lot | Variable | | | $62,886 | $0.01 |
Kappes, Cassiday & Associates June, 2019 | | 21.0 Capital & Operating Costs Page 21-25 |
| Camino Rojo Project Feasibility Study NI 43-101 Technical Report |
|
| | | | | Unit | Annual | US$ per |
| | Units | Cost Type | Qty | Costs, US$ | Costs, US$ | Tonne Ore |
| SUBTOTAL | | | | | $7,380,056 | $1.174 |
| | | | | | | |
| Water Supply & Distribution | | | | | | |
| Power | kWh/year | Variable | 1333333 | $0.125 | $166,899 | $0.03 |
| Pit Dewatering Treatment | kWh/year | Variable | 873,399 | $0.125 | $85,647 | $0.01 |
| Maintenance Supplies | lot | Variable | | | $125,771 | $0.02 |
| SUBTOTAL | | | | | $378,318 | $0.06 |
| | | | | | | |
| Laboratory | | | | | | |
| Power | kWh/year | Variable | 2228991 | $0.125 | $279,013 | $0.04 |
| Assays, Solids | No/d | Fixed | 150 | $7.00 | $383,250 | $0.06 |
| Assays, Solutions | No/d | Fixed | 100 | $3.00 | $109,500 | $0.02 |
| Misc. Supplies | lot | Variable | | | $125,771 | $0.02 |
| SUBTOTAL | | | | | $897,534 | $0.14 |
| | | | | | | |
| Support Services / Facilities | | | | | | |
| Power | kWh/year | Variable | 1968151 | $0.125 | $246,362 | $0.04 |
| Fork Lift, 2.5 t | h/mo | Fixed | 180 | $6.55 | $14,159 | $0.00 |
| Telehandler | h/mo | Fixed | 120 | $22.95 | $33,051 | $0.01 |
| Boom Truck 10 t | h/mo | Fixed | 90 | $13.90 | $15,011 | $0.00 |
| Backhoe/loader | h/mo | Fixed | 180 | $22.15 | $47,846 | $0.01 |
| Pickup Trucks (7) | km/d | Fixed | 350 | $1.51 | $192,512 | $0.03 |
| Maintenance Truck | km/d | Fixed | 100 | $0.82 | $29,878 | $0.01 |
| Crane - Rough Terrain | h/mo | Fixed | 24 | $36.97 | $10,649 | $0.00 |
| Bobcat | h/mo | Fixed | 180 | $8.00 | $17,280 | $0.00 |
| Maintenance Supplies | lot | Variable | | | $125,771 | $0.00 |
| SUBTOTAL | | | | | $732,519 | $0.12 |
| | | | | | | |
| TOTAL COST (w/o contingency) | | | | | $21,293,114 | $3.38 |
| | | | | | | |
| Contingency | | | | | $0 | $0.000 |
| | | | | | | |
| Sub-TOTAL COST (process only excluding IVA) | | | | | $21,293,114 | $3.38 |
| | | | | | | |
| IVA (16% of materials costs) | | | | | $1,545,190 | $0.25 |
| | | | | | | |
| TOTAL COST (process only including IVA) | | | | | $22,838,304 | $3.63 |
| | | | | | | |
| G&A | | | | | | |
| G&A Labor | ea | | 126 | | $2,561,477 | $0.41 |
| G&A Expenses | | | | | $5,770,746 | $0.92 |
| San Tiburcio Social Contribution | | | | | $790,440 | $0.13 |
| Other Social Commitments | | | | | $50,624 | $0.01 |
| Land Access Agreements | | | | | $0 | $0.000 |
| Water Rights | | | | | $456,557 | $0.07 |
| Concessions | | | | | $142,784 | $0.02 |
| TOTAL COST G&A* | | | | | $9,772,628 | $1.55 |
| | | | | | | |
| TOTAL COST (excluding IVA) | | | | | $31,065,743 | $4.94 |
| | | | | | | |
*Note: Average G&A does not include G&A costs during the reclamation and closure period.
Kappes, Cassiday & Associates June, 2019 | | 21.0 Capital & Operating Costs Page 21-26 |
| Camino Rojo Project Feasibility Study NI 43-101 Technical Report |
|
| 21.2.2.1 | Personnel and Staffing |
Staffing requirements for process and administration personnel have been estimated by KCA based on experience with similar sized operations with input from Orla on wages and salary information. Staffing will be primarily by Mexican nationals with an emphasis of hiring as many workers from the local community as possible. Total process personnel are estimated at 143 persons including 18 laboratory workers. G&A labour is estimated at 126 persons plus an additional 17 support personnel included in the mine cost estimate. Mining labour will be provided by the mining contractor and is considered in the mining cost estimate.
Personnel requirements and costs are estimated at US$5.4 million per year and are summarized in Table 21-20.
Table 21-20
Personnel & Staffing Summary
| Description | Number of Workers | Cost US$/yr |
| Process Supervision | 13 | $822,275 |
| Crushing & Reclaim | 17 | $236,021 |
| Heap Leach | 28 | $366,298 |
| Recovery Plant | 26 | $364,790 |
| Maintenance | 41 | $727.365 |
| Subtotal Process | 125 | $2,516,748 |
| Laboratory | 18 | $361,985 |
| Subtotal Laboratory | 18 | $361,985 |
| G&A | 126 | $2,561,477 |
| Subtotal G&A | 126 | $2,561,477 |
| TOTAL | 269 | $5,440,211 |
Power usage for the process and process-related infrastructure was derived from estimated connected loads assigned to powered equipment from the mechanical equipment list. Equipment power demands under normal operation were assigned and coupled with estimated on-stream times to determine the average energy usage and cost. Power requirements for the Project are presented in Table 18-2 in Section 18 of this report excluding pit dewatering power requirements. Attached power for pit dewatering is estimated at 410 kW with demand varying based on pit dewatering requirements.
The total attached power for the process and infrastructure is estimated at 7.7 MW, with an average draw of 4.6 MW at start up increasing to 8.0 MW attached with a demand of 4.8 MW in Year 3 of operations (not including pit dewatering). The total consumed power for these areas is approximately 5.95 kWh/t ore processed increasing to 6.15 kWh/t ore processed in Year 3. Power will initially be supplied by temporary leased generators as well as an existing powerline that runs along the highway adjacent to the Project site with capacity to supply as estimated 1MW of power to select project areas. The approximate power cost at start-up is estimated at US$0.29/kWh and is based on 1 MW of line power from the existing power line at US$0.10 per kWh and generated power at US$0.34 per kWh. Generated power costs are based on the following:
Kappes, Cassiday & Associates June, 2019 | | 21.0 Capital & Operating Costs Page 21-27 |
| Camino Rojo Project Feasibility Study NI 43-101 Technical Report |
|
| · | US$340,000 per month lease / maintenance rate based on supplier quote |
| · | Fuel consumption of 0.33 L diesel/kWh |
| · | Diesel price of US$0.88/L not including IVA |
In Year 2 power is expected to be supplied to the Project site by an overhead power line with an average estimated cost of US$0.10/kWh. Orla is currently working with CFE and CENACE for approval of the power line and final transmission rate costs.
Operating supplies have been estimated based upon unit costs and consumption rates predicted by metallurgical tests and have been broken down by area. Freight costs are included in all operating supply and reagent estimates. Reagent consumptions have been derived from test work and from design criteria considerations. Other consumable items have been estimated by KCA based on KCA’s experience with other similar operations.
Operating costs for consumable items have been distributed based on tonnage and gold/silver production or smelting batches, as appropriate.
| 21.2.2.4 | Heap Leach Consumables |
Pipes, Fittings and Emitters – The heap pipe costs include expenses for broken pipe, fittings and valves, and abandoned tubing. The heap pipe costs are estimated to be US$0.03/t ore, and are based on previous detailed studies conducted by KCA on similar projects.
Sodium Cyanide (NaCN) – Delivered sodium cyanide is quoted at US$2.50/kg. Cyanide is primarily consumed in the heap leach at 0.35 kg/t ore.
Pebble Lime (CaO) – Pebble lime is consumed at an average rate pf 1.25 kg/t ore for pH control at the heap. A delivered price of US$153/t has been quoted.
Antiscale Agent (Scale Inhibitor) – Antiscalant consumption is based on a dosage range of 0 to 20 ppm to the suctions of the barren and pregnant pumps. A delivered price of US$2.48/kg has been used based on recent supplier quotes in KCA’s files.
Kappes, Cassiday & Associates June, 2019 | | 21.0 Capital & Operating Costs Page 21-28 |
| Camino Rojo Project Feasibility Study NI 43-101 Technical Report |
|
| 21.2.2.5 | Recovery Plant Consumables |
Filter Cloths – Filter cloths for the clarification and precipitation filter presses must be replaced periodically. It is assumed that filter cloths will be replaced three times per year for the clarification filters and once per year for the precipitation filter presses. An allowance of US$8,000 per set of filter cloths has been used for the FS based on recent information in KCA’s files.
Zinc – Ultra-fine zinc dust will be consumed in the recovery plant at an assumed rate of 3 kg zinc per kg of metal in solution which will vary based on recovery plant efficiencies. Merrillite zinc is quoted at US$5.00 per kg. A US$0.258/kg allowance has been added for delivery to the Project site.
Lead Nitrate – Lead nitrate is used to improve Merrill-Crowe recovery efficiency and is consumed at approximately 10% of the zinc consumption if required. Lead nitrate has been quoted at US$5.50/ kg. A US$0.258/kg allowance has been added for delivery to the Project site.
Diatomaceous Earth – Diatomaceous earth (DE) is used as a filter media in the recovery plant. DE consumption is based on one precoat per day for each of the clarification and precipitation filter presses as well as body feed to each of the filter systems. Diatomaceous earth has been quoted at US$0.91/kg. A US$0.258/kg allowance has been added for delivery to the Project site.
Smelting Fluxes - It has been estimated that 0.054 kg of mixed fluxes per troy ounce of precious metal produced will be required. The estimated delivered cost of these fluxes, which includes borax, silica, niter, and soda ash, is US$1.85/kg, which is based on quoted costs and assumed flux composition. A US$0.258/kg allowance has been added for delivery to the Project site.
Fire assaying and solution assaying of samples will be conducted in the on-site laboratory. It is estimated that approximately 150 solids assays and 100 solutions assays at US$7 and US$3 per assay, respectively, will need to be performed each day.
Diesel fuel will be required for heavy equipment operation, vehicles and power generation at the start of the Project. Diesel is quoted at US$0.88/L, not including IVA.
| 21.2.2.8 | Miscellaneous Operating & Maintenance Supplies |
Overhaul and maintenance of equipment along with miscellaneous operating supplies for each area have been estimated as allowances based on tonnes of ore processed. The allowances for each area were developed based on published data as well as KCA’s experience with similar operations.
Kappes, Cassiday & Associates June, 2019 | | 21.0 Capital & Operating Costs Page 21-29 |
| Camino Rojo Project Feasibility Study NI 43-101 Technical Report |
|
Maintenance and operating supplies costs are estimated at US$0.480 per tonne ore processed.
| 21.2.2.9 | Mobile / Support Equipment |
Mobile and support equipment are required for the process and include three fork lifts, one 4-t telehandler with boom extension, one 10-t boom truck, one backhoe, seven pickup trucks, one maintenance truck, one 50-t rough terrain crane and an ambulance. The costs to operate and maintain each piece of equipment have been estimated primarily using published information and project specific fuel costs. Where published information was not available, allowances were made based on KCA’s experience from similar operations.
Support equipment annual operating costs are estimated at US$360,000 or US$0.055 per tonne of ore. Support equipment operating costs are presented in Table 21-21.
Table 21-21
Support Equipment Operating Costs
| Description | Unit | Qty. | Unit Cost | Annual Cost, US$ |
| Fork Lift, 2.5 t | h/mo | 180 | $6.55 | $14,200 |
| Telehandler | h/mo | 120 | $22.95 | $33,000 |
| Boom Truck 10 t | h/mo | 90 | $13.90 | $15,000 |
| Backhoe/loader | h/mo | 180 | $22.15 | $47,900 |
| Pickup Trucks (7) | km/d | 350 | $1.48 | $192,500 |
| Maintenance Truck | km/d | 100 | $0.82 | $29,900 |
| Crane - Rough Terrain | h/mo | 24 | $36.97 | $10,600 |
| Bobcat | h/mo | 180 | $8.00 | $17,300 |
| TOTAL | | | | $360,400 |
General and administrative expenses are expected to average US$5.8 million per year and include costs for water and land access rights, concessions, offsite offices, insurance, office supplies, communications, environmental and social management, health and safety supplies, security, travel and camp operations. For the cost estimate G&A expenses are represented primarily as fixed costs or have been structured based on existing agreements between Orla and the surrounding communities. Fixed G&A expenses are presented in Table 21-22. Total G&A expenses by year are presented in Table 21-23.
Kappes, Cassiday & Associates June, 2019 | | 21.0 Capital & Operating Costs Page 21-30 |
| Camino Rojo Project Feasibility Study NI 43-101 Technical Report |
|
Table 21-22
Fixed G&A Expenses
| Description | Basis | Total Annual Cost, US$ | |
| |
| Maintenance Supplies | 5% of G&A Staff / Labor | $128,000 | |
| Office Supplies/Subscriptions | 7.5% of G&A Staff / Labor | $192,000 | |
| Transportation | 12 x $10000/month | $120,000 | |
| Vehicles | Replace 1 Vehicles/Year | $45,000 | |
| Vehicle OPEX | 12 @ 100 km/day @ $0.63/km | $276,000 | |
| Mancamp | CH Lunch Quote, 200 persons | $2,905,400 | |
| Crew Rotations | Included above | | |
| Off Site Office | Allowance | $120,000 | |
| Public Relations Expense | 12% of G&A Staff / Labor | $307,000 | |
| Communications | 3% of G&A Staff / Labor | $77,000 | |
| Insurance | Allowance | $150,000 | |
| Safety Supplies | Allowance | $25,000 | |
| Environmental Monitoring / Reporting, Permits | Allowance | $200,000 | |
| Training Supplies | Allowance | $25,000 | |
| Outside Audit (Accounting, Metallurgy, etc.) | Allowance | $75,000 | |
| Travel | 15 Trips @ $3000/Trip | $45,000 | |
| Legal | Allowance | $150,000 | |
| CSR Budget | | $385,000 | |
| CSR Annual Report | | $75,000 | |
| IT, Internet, Software, computers | Allowance | $100,000 | |
| Access Road Maintenance | Allowance | $25,000 | |
| Waste Management | Allowance | $100,000 | |
| Equipment Rentals | Allowance | $25,000 | |
| Medical Supplies | Allowance | $20,000 | |
| Property Tax | Allowance | | |
| Miscellaneous | Allowance | $200,000 | |
| Sub-Total | | $5,771, 000 | |
Kappes, Cassiday & Associates June, 2019 | | 21.0 Capital & Operating Costs Page 21-31 |
| Camino Rojo Project Feasibility Study NI 43-101 Technical Report |
|
Table 21-23
G&A Expenses by Year
| | Y1 | Y2 | Y3 | Y4 | Y5 | Y6 | Y7 |
| Fixed Expenses | $5,771,000 | $5,771,000 | $5,771,000 | $5,771,000 | $5,771,000 | $5,771,000 | $5,771,000 |
| San Tiburcio Social Contribution | $680,000 | $714,000 | $749,000 | $787,000 | $826,000 | $867,000 | $911,000 |
| Other Social Commitments | $44,000 | $46,000 | $48,000 | $50,000 | $53,000 | $56,000 | $58,000 |
| Water Rights | $848,000 | $500,000 | $848,000 | $500,000 | $0 | $500,000 | $0 |
| Water Usage | $121,000 | $121,000 | $121,000 | $121,000 | $121,000 | $121,000 | $121,000 |
| Concessions | $143,000 | $143,000 | $143,000 | $143,000 | $143,000 | $143,000 | $143,000 |
| Total | $7,606,000 | $7,294,000 | $7,680,000 | $7,372,000 | $6,914,000 | $7,458,000 | $7,004,000 |
| 21.3 | Reclamation & Closure Costs |
A cost estimate for reclamation and closure was made by KCA with input from IMC. Costs for reclamation and closure are based on a 3-year closure period (plus on going monitoring) and are summarized in Table 21-24 and includes work to be conducted from the closure of the mine, end of operation activities and concurrent rehabilitation work, excluding G&A costs during closure. G&A costs during closure are estimated at US$8.8 million and are included in the operating costs estimate.
The main objectives of the reclamation and closure plan include:
| · | Progressive rehabilitation to allow rapid recovery of the vegetation cover and early recovery of the ecosystem; |
| · | Sustainability of rehabilitation work including water and wind erosion; |
| · | Recovery of land uses; and |
| · | Implementation of a post-closure monitoring program. |
Activities included as part of reclamation and closure are described in Section 20 of this Report.
| Kappes, Cassiday & Associates | 21.0 Capital & Operating Costs |
| June, 2019 | Page 21-32 |
| Camino Rojo Project Feasibility Study NI 43-101 Technical Report |
|
Table 21-24
Reclamation and Closure Cost Summary
| Description | Year 6 | Year 7 | Year 8 | Year 9 | Year 10 | Total |
| Closure Plan (Regulatory Approval) | $100,000 | $0 | $0 | $0 | $0 | $100,000 |
| Topsoil/Revegetation of Preg/Excess Pond (Haulage/Placement) | $0 | $0 | $0 | $76,000 | $25,000 | $101,000 |
| Topsoil/Revegetation of Waste Dump | $334,000 | $37,000 | $0 | $0 | $0 | $371,000 |
| Topsoil/Revegetation of Heap Leach Pad | $0 | $0 | $0 | $143,000 | $143,000 | $287,000 |
| Regrade of Heap Leach Pad | $0 | $0 | $0 | $217,000 | $217,000 | $434,000 |
| Leach Pad Waste Cover | $0 | $0 | $0 | $574,000 | $574,000 | $1,148,000 |
| Water Control Infrastructure | $0 | $0 | $50,000 | $0 | $0 | $50,000 |
| Pregnant Pond Partial Fill | $0 | $0 | $0 | $102,000 | $0 | $102,000 |
| Excess Pond Partial Fill | $0 | $0 | $0 | $251,000 | $84,000 | $335,000 |
| Pond Drainage Revision | $0 | $0 | $0 | $0 | $100,000 | $100,000 |
| Demolish/Removal Mine Infrastructure and Camp | $0 | $0 | $0 | $0 | $0 | $0 |
| Building Slabs (Bury In-Place or to Heap/Ponds) | $0 | $0 | $25,000 | $25,000 | $0 | $50,000 |
| Crushers / MC plant | $0 | $352,000 | $0 | $220,000 | $0 | $572,000 |
| Remediation of disturbed areas | $0 | $0 | $54,000 | $27,000 | $9,000 | $89,000 |
| Remediation of hydrocarbon affected areas | $0 | $0 | $0 | $12,000 | $0 | $12,000 |
| Hazardous Waste Removal | $0 | $0 | $0 | $10,000 | $0 | $10,000 |
| Remediation of Chemical Affected Areas | $0 | $0 | $0 | $59,000 | $20,000 | $79,000 |
| Reclaim Tunnel Closure | $0 | $50,000 | $0 | $0 | $0 | $50,000 |
| Access Road Closure to Restricted Areas | $0 | $0 | $0 | $0 | $66,000 | $66,000 |
| Removal of Haul Road | $0 | $0 | $0 | $0 | $508,000 | $508,000 |
| Monitoring of Mine for 10 years | $0 | $0 | $0 | $0 | $100,000 | $100,000 |
| Labor | $121,000 | $241,000 | $1,207,000 | $483,000 | $362,000 | $2,414,000 |
| Heap Rinsing & Neutralization | $0 | $1,464,000 | $4,881,000 | $2,441,000 | $976,000 | $9,763,000 |
| Support Services | $0 | $98,000 | $196,000 | $98,000 | $98,000 | $489,000 |
| Contingency (15%) | $83,000 | $336,000 | $962,000 | $711,000 | $492,000 | $2,584,000 |
| | | | | | | |
| Total (excluding G&A) | $638,000 | $2,579,000 | $7,375,000 | $5,448,000 | $3,774,000 | $19,813,000 |
| Kappes, Cassiday & Associates | 21.0 Capital & Operating Costs |
| June, 2019 | Page 21-33 |
| Camino Rojo Project Feasibility Study NI 43-101 Technical Report |
|
Based on the estimated production schedule, capital costs and operating costs, a cash flow model was prepared by KCA for the economic analysis of the Project. All of the information used in this economic evaluation has been taken from work completed by KCA and other consultants working on this Project as described in previous sections of this Report.
The Project economics were evaluated using a discounted cash flow (DCF) method, which measures the Net Present Value (NPV) of future cash flow streams. The results of the economic analyses represent forward-looking information as defined under Canadian securities law. The results depend on inputs that are subject to a number of known and unknown risks, uncertainties and other factors that may cause actual results to differ materially from those presented here.
The final economic model was developed by KCA based on the following assumptions:
| · | The cash flow model is based on the mine production schedule from IMC. |
| · | The period of analysis is twelve years including two year of investment and pre-production, seven years of production and three years for reclamation and closure. |
| · | Gold price of US$1,250/oz. |
| · | Silver prize of US$17/oz. |
| · | Processing rate of 18,000 tpd. |
| · | Overall recoveries of 64% for gold and 17% for silver. |
| · | Capital and operating costs as developed in Section 21.0 of this Report. |
The key economic parameters are presented in Table 22-1 and the economic summary is presented in Table 22-2.
Kappes, Cassiday & Associates June, 2019 | | 22.0 Economic Analysis Page 22-1 |
| Camino Rojo Project Feasibility Study NI 43-101 Technical Report |
|
Table 22-1
Key Economic Parameters
| Item | Value | unit |
| Au Price | 1,250 | US$/oz |
| Ag Price | 17 | US$/oz |
| Au Avg. Recovery | 64 | % |
| Ag Avg. Recovery | 17 | % |
| Treatment Rate | 18,000 | tpd |
| Refining & Transportation Cost, Au | 1. 40 | US$/oz |
| Refining & Transportation Cost, Ag | 1.20 | US$/oz |
| Payable Factor, Au | 99.9 | % |
| Payable Factor, Ag | 98.0 | % |
| | | |
| Annual Produced Au, Avg. | 97 | koz |
| Annual Produced Ag, Avg. | 511 | koz |
| Income & Corporate Tax Rate | 30 | % |
| Special Mining Tax Rate | 7.5 | % |
| Royalties | | |
| Mine Claim (Newmont) | 2.0 | % |
| Extraordinary Mining Duty | 0.5 | % |
Kappes, Cassiday & Associates June, 2019 | | 22.0 Economic Analysis Page 22-2 |
| Camino Rojo Project Feasibility Study NI 43-101 Technical Report |
|
Table 22-2
Economic Analysis Summary
| Production Data | | |
| Life of Mine | 6.8 | Years |
| Mine Throughput per day | 18,000 | Tonnes Ore /day |
| Mine Throughput per year | 6,570,000 | Tonnes Ore /year |
| Total Tonnes to Crusher | 44,020,000 | Tonnes Ore |
| Grade Au (Avg.) | 0.73 | g/t |
| Grade Ag (Avg.) | 14.2 | g/t |
| Contained Au oz | 1,031,000 | Ounces |
| Contained Ag oz | 20,093,000 | Ounces |
| Metallurgical Recovery Au (Overall) | 64% | |
| Metallurgical Recovery Ag (Overall) | 17% | |
| Average Annual Gold Production | 97,000 | Ounces |
| Average Annual Silver Production | 511,000 | Ounces |
| Total Gold Produced | 662,000 | Ounces |
| Total Silver Produced | 3,479,000 | Ounces |
| LOM Strip Ratio (W:O) | 0.54 | |
| Operating Costs (Average LOM) | | |
| Mining | $2.14 | /Tonne mined |
| Mining (processed) | $3.30 | /Tonne Ore processed |
| Processing & Support | $3.38 | /Tonne Ore processed |
| G&A | $1.75 | /Tonne Ore processed |
| Total Operating Cost | $8.43 | /Tonne Ore processed |
| Total By-Product Cash Cost | $515 | /Ounce Au |
| All-in Sustaining Cost | $576 | /Ounce Au |
| Capital Costs (Excluding IVA and Closure) | | |
| Initial Capital | $123 | million |
| LOM Sustaining Capital | $20 | million |
| Total LOM Capital | $144 | million |
| Working Capital & Initial Fills | $10 | million |
| Closure Costs | $20 | million |
| Financial Analysis | | |
| Gold Price Assumption | $1,250 | /Ounce |
| Silver Price Assumption | $17 | /Ounce |
| Average Annual Cashflow (Pre-Tax) | $72 | million |
| Average Annual Cashflow (After-Tax) | $56 | million |
| Internal Rate of Return (IRR), Pre-Tax | 38.6% | |
| Internal Rate of Return (IRR), After-Tax | 28.7% | |
| NPV @ 5% (Pre-Tax) | $227 | million |
| NPV @ 5% (After-Tax) | $142 | million |
| Pay-Back Period (Years based on After-Tax) | 3.0 | Years |
Kappes, Cassiday & Associates June, 2019 | | 22.0 Economic Analysis Page 22-3 |
| Camino Rojo Project Feasibility Study NI 43-101 Technical Report |
|
The Camino Rojo Project economics are evaluated using a discounted cash flow method. The DCF method requires that annual cash inflows and outflows are projected, from which the resulting net annual cash flows are discounted back to the Project evaluation date. Considerations for this analysis include the following:
| · | The cash flow model has been developed by KCA with input from Orla. |
| · | The cash flow model is based on the mine production schedule from IMC. |
| · | Gold and silver production and revenue in the model are delayed from the time ore is stacked based on the mine production schedule and leach curves to account for time required for metal values to be recovered from the heap. |
| · | The period of analysis is twelve years including two years of investment and pre-production, seven years of production and three years for reclamation and closure. |
| · | All cash flow amounts are in US dollars (US$). All costs are considered to be 1st quarter 2019 costs. Inflation is not considered in this model with the exception of inflationary adjustment on depreciation pool balances as permitted under Mexican law. |
| · | The Internal Rate of Return (IRR) is calculated as the discount rate that yields a zero Net Present Value (NPV). |
| · | The NPV is calculated by discounting the annual cash back to Year -2 at different discount rates. All annual cash flows are assumed to occur at the end of each respective year. |
| · | The payback period is the amount of time, in years, required to recover the initial construction capital cost. |
| · | Working capital and initial fills are considered in this model and includes mining, processing and general administrative operating costs. The model assumes working capital and initial fills are recovered during the final two years of operation. |
| · | Royalties and government taxes are included in the model. |
| · | The model is built on an unlevered basis. |
| · | Salvage value for process equipment is considered and is applied at the end of the Project. |
| · | Reclamation and closure costs are included. |
The economic analysis is performed on a before and after-tax basis in constant dollar terms, with the cash flows estimated on a project basis.
Kappes, Cassiday & Associates June, 2019 | | 22.0 Economic Analysis Page 22-4 |
| Camino Rojo Project Feasibility Study NI 43-101 Technical Report |
|
| 22.2.1 | General Assumptions |
General assumptions for the model, including cost inputs, parameters, royalties and taxes are as follows:
| · | Basic and detailed engineering begins fourth quarter 2019 with site construction beginning 1st quarter 2020. |
| · | First gold pour occurs second quarter 2021. |
| · | Gold price of US$1,250/oz is used as the base case commodity price. |
| · | Silver prize of US$17/oz as the base commodity price. |
| · | Gold and silver production and revenue in the model are delayed from the time material is stacked based on the mine production schedule and material leach curves to account for time required for gold to be recovered from the heap. An additional month of delay is added beginning in Year 5 to reflect additional delays from higher lifts. |
| · | LOM average operating costs of US$8.43/t ore including a mining cost of US$3.30/t ore (US$2.14/ tonne mined), processing cost of US$3.38/t ore and G&A cost of US$1.75/t ore. |
| · | Pre-production capital costs for the Project are spent entirely in Years -2 and -1. Sustaining capital for the site power line is spent in Year 1. Sustaining capital for the heap leach pad expansion is spent in Year 2. Sustaining capital for evaporators for treatment of pit water is spent in Year 3. Sustaining capital for replacement of some process mobile equipment is spent in Year 4. Sustaining costs for the mine is spent in Year 7 for contractor demobilization. |
| · | Working capital equal to 60 days of operating costs during the pre-production and ramp up period is included for mining, process and G&A costs as well as initial fills for process reagents and consumables. The assumption is made that all working capital and initial fills can be recovered in the final years of operation and the effective sum of working capital and initial fills over the life of mine is zero. |
| · | Depreciation allowances for eligible items are included in the model based on straight line depreciation schedules including 3% annual inflation adjustment on depreciation pool balances. |
| · | IVA is applied at 16% to all capital costs as a part of this model and is assumed to be 100% refundable the following year. IVA is not applied to operating costs. |
| · | A 2% NSR is included for royalty agreements with mining claim owners. |
| · | A 0.5% NSR is included and payable to the government as an “extraordinary mining duty”. |
| · | An income tax of 30% is considered. |
| · | A 7.5% mining tax is included and is based on EBITDA less exploration and deductible earthworks costs. |
| · | Possibly forthcoming Zacatecas Environmental “Green Tax” is not considered. |
| · | A refinery and transportation cost of US$1.40/oz for gold and US$1.20/oz for silver is used in the model, including insurance. Gold and silver are assumed to be 99.9% and 98% payable, respectively. |
| · | A loss carry forward of US$252,100 (MXN$4.9 million) which includes expenses for the Project to date, but excludes current assets and inventories is included. |
Kappes, Cassiday & Associates June, 2019 | | 22.0 Economic Analysis Page 22-5 |
| Camino Rojo Project Feasibility Study NI 43-101 Technical Report |
|
| · | Pre-production exploration costs of US$49.1 million are considered, which includes US$24 million for the acquisition of the mining concessions. Pre-production exploration costs are assumed to be depreciable using the straight-line method over a 10-year period. |
| · | By-product cash operating costs per payable ounce represent the mine site operating costs including mining, processing, metal transport, refining, administration costs and royalties with a credit for silver produced. Operating costs are presented in greater detail in Section 21 of this report. |
| · | All in sustaining costs per payable ounce represent the mine site operating costs including mining, processing, metal transport, refining, administration costs and royalties with a credit for silver produced as well as the LOM sustaining capital and reclamation and closure costs. |
| · | The cash flow analysis evaluates the Project on a stand-alone basis. No withholding taxes or dividends are included. No head office or overheads for the parent company are included. |
| | | |
Capital expenditures include initial capital (pre-production or construction costs), sustaining capital and working capital. The capital expenditures are presented in detail in Section 21 of this Report.
The capital expenditures for the Project are summarized in Table 22-3.
Kappes, Cassiday & Associates June, 2019 | | 22.0 Economic Analysis Page 22-6 |
| Camino Rojo Project Feasibility Study NI 43-101 Technical Report |
|
Table 22-3
Capital Expenditures Summary
| Capital Item | LOM Cost (US$) |
| Contractor Mobilization | $1,130,000 |
| Contractor Demobilization | $995,000 |
| Pre-Production Stripping | $1,366,000 |
| Owner Equipment | $525,000 |
| | |
| Major Earthworks | $9,943,000 |
| Liner / Materials (Supply & Install) | $11,884,000 |
| Civils (Supply & Install) | $1,377,000 |
| Structural Steel (Supply & Install) | $850,000 |
| Platework (Supply) | $1,500,000 |
| Platework (Install) | $225,000 |
| Mechanical Equipment (Supply) | $33,582,000 |
| Mechanical Equipment (Install) | $5,072,000 |
| Piping (Supply & Install) | $4,927,000 |
| Electrical (Supply) | $8,654,000 |
| Electrical (Install) | $500,000 |
| Instrumentation (Supply & Install) | $936,000 |
| Infrastructure (Supply & Install) | $13,036,000 |
| Spare Parts | $1,640,000 |
| Freight & Duties | incl |
| | |
| Process Contingency | $15,442,000 |
| EPCM | $8,544,000 |
| Commissioning & Supervision | $612,000 |
| Supplier Engineering | $2,117,000 |
| Indirect Costs (incl. contingency) | $9,174,000 |
| Owner's Costs (incl. contingency) | $9,506,000 |
| | |
| Subtotal | $143,538,000 |
| Working Capital (Initial Fills) | $806,000 |
| Working Capital (60 days) | $9,106,000 |
| Process Preproduction | $275,000 |
| | |
| TOTAL (Excluding IVA) | $153,725,000 |
The economic model assumes working capital and initial fills will be recovered at the end of the operation and are applied as credits against the capital cost. Working capital and initial fills are assumed to be recovered during Years 6 and 7. Salvage value for equipment is considered as taxable income and is applied during Years 8 through 10 after equipment items are no longer in service. Costs presented in Table 22-3 do not include the recovery of working capital or salvage income.
Kappes, Cassiday & Associates June, 2019 | | 22.0 Economic Analysis Page 22-7 |
| Camino Rojo Project Feasibility Study NI 43-101 Technical Report |
|
Total metal production for the Camino Rojo oxide deposit is estimated at 662,000 ounces of recovered gold and 3.5 million ounces of recovered silver. Annual production profiles for gold and silver are presented in Figure 22-1 and Figure 22-2, respectively with 97,000 ounces of gold and 511,000 ounces being recovered annually on average.
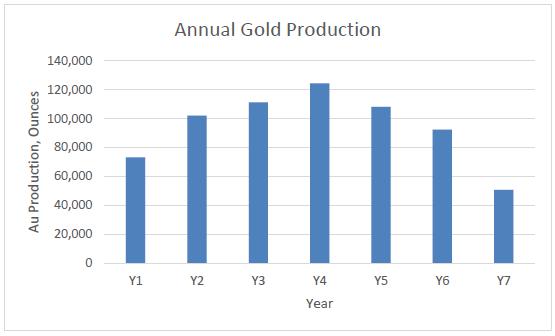
Figure 22-1 Annual Gold Production
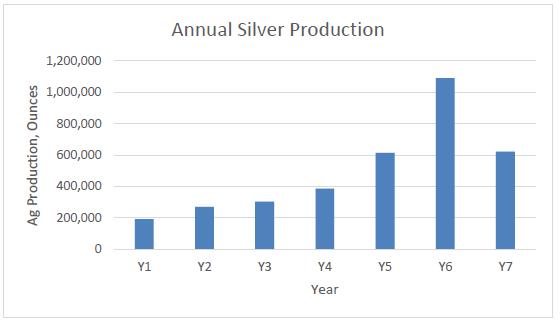
Figure 22-2 Annual Silver Production
Kappes, Cassiday & Associates June, 2019 | | 22.0 Economic Analysis Page 22-8 |
| Camino Rojo Project Feasibility Study NI 43-101 Technical Report |
|
Royalties payable for the Camino Rojo include a 2% royalty on the mining claims to Newmont (formerly Goldcorp Inc.) and a 0.5% royalty due to the Mexican government as an “Extraordinary Mining Duty. The 2% mining claims royalty represents US$17.6 million over the life of the mine and the 0.5% extraordinary mining duty represents US$4.4 million.
Operating costs were estimated by KCA for all process and support services. G&A operating costs were estimated by KCA with input from Orla. Mining costs were estimated by IMC. LOM operating costs for the Camino Rojo Project are summarized in Table 22-4. A detailed description of the operating cost build-up is included in Section 21.0 of this report.
Table 22-4
LOM Operating Costs
| Description | LOM Cost (US$/t Ore) |
| Mine | $3.30 |
| Process & Support Services | $3.38 |
| Site G & A | $1.75 |
| Total | $8.43 |
Reclamation and closure include costs for works to be conducted for the closure of the mine at the end of operations and have been estimated primarily by KCA with input from IMC for encapsulation of transition and sulphide material in the waste rock dump. The estimated LOM reclamation and closure costs is US$19.8 million, not including G&A, or US$0.45 per tonne ore processed based on a closure period of three years after the completion of operations. Reclamation and closure activities are summarized in Section 20.0 of this report and costs are summarized in Section 21.0.
| 22.8.1 | Value Added Tax (IVA) |
The “Impuesto al Valor Agregado” (IVA) is a 16% value added tax applied to all goods and services and is considered to be fully refundable. For the economic model, a 16% IVA is applied to all capital costs in the year in which they occur with the IVA refund or credit being applied in the following year. IVA is not considered in the operating cost estimate as it is assumed that once in operation IVA paid vs. IVA credits will be a net zero value during the period in which they occur.
Kappes, Cassiday & Associates June, 2019 | | 22.0 Economic Analysis Page 22-9 |
| Camino Rojo Project Feasibility Study NI 43-101 Technical Report |
|
Federal income tax is applied at 30% of the Project income after deductions of eligible expenses including depreciation of assets, earthworks and indirect construction costs, exploration costs, special mining tax, extraordinary mining duty and any losses carried forward.
The special mining duty is applied at 7.5% of the Project income after deduction of eligible exploration, earthworks and indirect costs expenses. Income subject to the special mining tax does not allow deductions for depreciation or allow losses carried forward.
| 22.8.4 | Zacatecas Environmental “Green Tax” |
A “Green Tax” was approved for the state of Zacatecas in 2017 which considers taxation of operations in order to increase tax revenue and reduce environmental impact for industrial activities. The tax is, as proposed, to be applied based on four categories:
| · | Environmental Remediation Tax on the Extraction of Materials |
| · | Tax on Gas Emissions to the Atmosphere |
| · | Tax on Emissions of Pollutants to the Soil, Subsoil and Water |
| · | Tax on Disposal of Wastes |
The environmental tax has been very controversial and is currently subject to several law suits by various existing operating companies. Further, although a proposed tax rate for each item has been proposed, it is unclear in the law how these taxes would be applied.
For the purposes of the Camino Rojo economic evaluation the “Green Tax” has not been included at this time as the extent to which this tax applies is unclear.
Depreciation of assets has been estimated based on a straight-line method with eligible cost items being depreciated at 10% or 12% per year based on the depreciation schedule for the specific item, including pooled costs for exploration and pre-production development of the Project. In addition to the base depreciation value, Mexican tax law allows for adjustments to the remaining depreciation pool balance for inflation. A 3% annual inflation adjustment for these tax pool balances is considered in the economic model.
Kappes, Cassiday & Associates June, 2019 | | 22.0 Economic Analysis Page 22-10 |
| Camino Rojo Project Feasibility Study NI 43-101 Technical Report |
|
All earthworks and indirect construction costs are assumed to be 100% depreciable in the year in which the expense occurred.
Salvage value is not considered for the depreciation value of capital items, as salvage is considered as taxable income in the model
A detailed list of items considered for the depreciation and tax pools is presented in Table 22-5.
Table 22-5
Depreciation and Pre-Production Tax Pools
| | MXN | USD |
| Category | Total | Total |
| Mine Concession acquisition costs | 462,834,000 | 23,981000 |
| Royalty acquisition cost | 207,266,000 | 10,739,000 |
| Project exploration costs & expected 2019 spending | 484,494,000 | 25,103,000 |
| Operating tax loss carry fwd. | 4,866,000 | 252,000 |
| Subtotal | 1,159,460, 000 | 60,076,000 |
| VAT | 105,850,000 | 5,484,000 |
| Total | 1,265,310,000 | 65,560,000 |
The Mexican tax law allows for the carry-forward of operating losses for the development of a property. The loss carry-forward is estimated at US$252,100 (MXN$4.9 million) which is based on the 2018 and estimated 2019 tax return for Minera Camino Rojo and are included in Table 22-5.
| 22.9 | Economic Model & Cash Flow |
The discounted cash flow model for the Camino Rojo Project is presented in Table 22-6 and is based on the inputs and assumptions detailed in this Section.
| Kappes, Cassiday & Associates | 22.0 Economic Analysis |
| June, 2019 | Page 22-11 |
| Camino Rojo Project Feasibility Study NI 43-101 Technical Report |
|
Table 22-6
Cashflow Model Summary
| | | | | | Year 1 | Year 2 | | | | | | | | |
| ITEM | UNITS | TOTAL | Year -2 | Year -1 | Q1 | Q2 | Q3 | Q4 | Q1 | Q2 | Q3 | Q4 | Year 3 | Year 4 | Year 5 | Year 6 | Year 7 | Year 8 | Year 9 | Year 10 |
| TOTAL MINED | | | | | | | | | | | | | | | | | | | | |
| Leachable Tonnes | | 44,020,000 | | 103,000 | 1,009,000 | 1,645,000 | 1,642,000 | 1,956,000 | 1,712,000 | 1,774,000 | 1,890,000 | 1,778,000 | 8,307,000 | 7,836,000 | 7,230,000 | 6,215,000 | 923,000 | | | |
| Au, g/t | | 0.73 | | 0.70 | 0.76 | 0.72 | 0.53 | 0.63 | 0.58 | 0.71 | 0.61 | 0.78 | 0.66 | 0.77 | 0.82 | 0.81 | 0.80 | | | |
| Ag, g/t | | 14.20 | | 11.66 | 9.81 | 10.80 | 9.32 | 10.56 | 9.56 | 11.58 | 10.22 | 11.62 | 12.09 | 14.55 | 16.62 | 20.77 | 21.19 | | | |
| Waste Mined | | 23,728,000 | | 497,000 | 1,671,000 | 1,655,000 | 1,654,000 | 1,344,000 | 1,588,000 | 1,527,000 | 1,409,000 | 1,523,000 | 4,471,000 | 2,437,000 | 1,904,000 | 1,983,000 | 65,000 | | | |
| Total Mined | | 67,748,000 | | 600,000 | 2,680,000 | 3,300,000 | 3,296,000 | 3,300,000 | 3,300,000 | 3,301,000 | 3,299,000 | 3,301,000 | 12,778,000 | 10,273,000 | 9,134,000 | 8,198,000 | 988,000 | | | |
| Strip Ratio (W:O) | | 0.54 | | 4.83 | 1.66 | 1.01 | 1.01 | 0.69 | | | | 0.86 | 0.54 | 0.31 | 0.26 | 0.32 | 0.07 | | | |
| Ore Processed to Heap Leach | 44,020,000 | | 63,000 | 859,000 | 1,645,000 | 1,642,000 | 1,644,000 | 1,643,000 | 1,645,000 | 1,642,000 | 1,642,000 | 6,569,000 | 6,570,000 | 6,570,000 | 6,570,000 | 5,316,000 | | | |
| Au grade | 0.73 | | 0.72 | 0.87 | 0.72 | 0.53 | 0.70 | 0.60 | 0.74 | 0.66 | 0.82 | 0.76 | 0.86 | 0.87 | 0.78 | 0.36 | | | |
| Ag grade | 14.20 | | 11.67 | 10.31 | 10.80 | 9.32 | 11.09 | 9.67 | 11.99 | 10.58 | 11.99 | 12.86 | 15.55 | 17.28 | 20.12 | 11.10 | | | |
| | cont oz Au | 1,031,000 | | 1,400 | 24,000 | 38,200 | 28,000 | 36,900 | 31,500 | 39,200 | 35,000 | 43,300 | 160,000 | 181,900 | 184,300 | 165,200 | 62,200 | | | |
| | cont oz Ag | 20,092,735 | | 23,600 | 284,800 | 571,300 | 492,100 | 586,200 | 510,900 | 633,900 | 558,800 | 633,200 | 2,715,600 | 3,284,000 | 3,651,000 | 4,250,300 | 1,896,900 | | | |
| Total Ore Processed, kt | 44,020 | | 63 | 859 | 1,645 | 1,642 | 1,644 | 1,643 | 1,645 | 1,642 | 1,642 | 6,569 | 6,570 | 6,570 | 6,570 | 5,316 | | | |
| Au, g/t | 0.73 | | 0.72 | 0.87 | 0.72 | 0.53 | 0.70 | 0.60 | 0.74 | 0.66 | 0.82 | 0.76 | 0.86 | 0.87 | 0.78 | 0.36 | | | |
| Ag, g/t | 14.20 | | 11.67 | 10.31 | 10.80 | 9.32 | 11.09 | 9.67 | 11.99 | 10.58 | 11.99 | 12.86 | 15.55 | 17.28 | 20.12 | 11.10 | | | |
| contained Au, kg | 32,065 | | 45 | 746 | 1,188 | 872 | 1,146 | 980 | 1,218 | 1,088 | 1,347 | 4,977 | 5,656 | 5,731 | 5,137 | 1,934 | | | |
| contained Ag, kg | 624,944 | | 735 | 8,857 | 17,770 | 15,307 | 18,232 | 15,891 | 19,716 | 17,380 | 19,695 | 84,462 | 102,143 | 113,558 | 132,198 | 59,001 | | | |
| Recoverable Gold, kg | 20,598 | | 32 | 504 | 798 | 584 | 778 | 655 | 827 | 742 | 926 | 3,434 | 3,884 | 3,647 | 2,701 | 1,086 | | | |
| Total Recoverable Gold, kg | 20,598 | | 32 | 504 | 798 | 584 | 778 | 655 | 827 | 742 | 926 | 3,434 | 3,884 | 3,647 | 2,701 | 1,086 | | | |
| Total Recoverable Gold, koz | 662 | | 1.0 | 16.2 | 25.7 | 18.8 | 25.0 | 21.0 | 26.6 | 23.8 | 29.8 | 110.4 | 124.9 | 117.2 | 86.8 | 34.9 | | | |
| Ultimate Recovery, Au | | 64% | | 70% | 68% | 67% | 67% | 68% | 67% | 68% | 68% | 69% | 69% | 69% | 64% | 53% | 56% | | | |
| Recoverable Silver, kg | 108,198 | | 81 | 1,032 | 2,123 | 1,849 | 2,134 | 1,922 | 2,285 | 2,009 | 2,251 | 9,508 | 12,316 | 22,256 | 37,143 | 11,290 | | | |
| Total Recoverable Silver, kg | 108,198 | | 81 | 1,032 | 2,123 | 1,849 | 2,134 | 1,922 | 2,285 | 2,009 | 2,251 | 9,508 | 12,316 | 22,256 | 37,143 | 11,290 | | | |
| Total Recoverable Silver, koz | 3,479 | | 2.6 | 33.2 | 68.3 | 59.4 | 68.6 | 61.8 | 73.5 | 64.6 | 72.4 | 305.7 | 396.0 | 715.6 | 1,194.2 | 363.0 | | | |
| Ultimate Recovery, Ag | | 17% | | 11% | 12% | 12% | 12% | 12% | 12% | 12% | 12% | 11% | 11% | 12% | 20% | 28% | 19% | | | |
| Recoverable Gold Delayed, oz | | | 1,000 | 9,800 | 13,100 | 6,400 | 13,400 | 8,900 | 11,300 | 10,200 | 12,700 | 11,800 | 12,300 | 21,300 | 15,800 | | 0 | 0 | 0 |
| Recoverable Silver Delayed, oz | | | | 2,600 | 24,500 | 38,900 | 36,600 | 39,600 | 38,100 | 43,000 | 37,700 | 41,600 | 42,800 | 52,900 | 155,100 | 258,900 | | 0 | 0 | 0 |
| Total Gold Produced, oz | 662,000 | | 0 | 7,400 | 22,400 | 25,500 | 18,000 | 25,600 | 24,200 | 25,000 | 27,200 | 111,300 | 124,400 | 108,200 | 92,400 | 50,700 | 0 | 0 | 0 |
| Total Silver Produced, oz | 3,479,000 | | 0 | 11,300 | 53,800 | 61,800 | 65,600 | 63,300 | 68,600 | 69,900 | 68,500 | 304,500 | 385,900 | 613,300 | 1,090,400 | 621,900 | 0 | 0 | 0 |
| Realized Recovery, Au | | | | 0% | 29% | 47% | 60% | 57% | 62% | 62% | 63% | 63% | 65% | 65% | 64% | 63% | 64% | 64% | 64% | 64% |
| Realized Recovery, Ag | | | | 0% | 4% | 7% | 9% | 10% | 10% | 10% | 11% | 11% | 11% | 11% | 12% | 15% | 16% | 16% | 16% | 16% |
| TOTAL EQUIVALENT Au oz PRODUCED | 710,000 | | 0 | 7,600 | 23,100 | 26,300 | 18,800 | 26,400 | 25,100 | 26,000 | 28,200 | 115,500 | 129,600 | 116,600 | 107,200 | 59,200 | 0 | 0 | 0 |
| Gold payable, oz | 662,000 | | 0 | 7,400 | 22,400 | 25,500 | 17,900 | 25,500 | 24,200 | 25,000 | 27,200 | 111,300 | 124,300 | 108,100 | 92,300 | 50,700 | 0 | 0 | 0 |
| silver payable, oz | 3,409,000 | | 0 | 11,100 | 52,700 | 60,500 | 64,300 | 62,000 | 67,200 | 68,500 | 67,100 | 298,400 | 378,200 | 601,000 | 1,068,600 | 609,500 | 0 | 0 | 0 |
| equivalent Au payable oz | 708,000 | | 0 | 7,600 | 23,100 | 26,300 | 18,800 | 26,400 | 25,100 | 25,900 | 28,100 | 115,300 | 129,400 | 116,300 | 106,800 | 59,000 | 0 | 0 | 0 |
| Refining & Transportation Charge | 5,902,146 | | $0 | $24,000 | $95,900 | $109,800 | $103,800 | $111,800 | $116,100 | $118,900 | $120,300 | $521,300 | $637,300 | $887,500 | $1,437,800 | $817,300 | $0 | $0 | $0 |
| NET REVENUE | | $880,045,000 | $0 | $0 | $9,426,000 | $28,775,000 | $32,737,000 | $23,410,000 | $32,878,000 | $31,258,000 | $32,283,000 | $35,031,000 | $143,616,000 | $161,139,000 | $144,513,000 | $132,096,000 | $72,883,000 | $0 | $0 | $0 |
| OPERATING COSTS | | | | | | | | | | | | | | | | | | | | |
| Mining Cost | $3.30 | $145,225,000 | $0 | $0 | $5,510,000 | $6,594,000 | $6,536,000 | $6,540,000 | $6,572,000 | $6,572,000 | $6,572,000 | $6,572,000 | $26,065,000 | $21,424,000 | $19,351,000 | $17,951,000 | $8,965,000 | $0 | $0 | $0 |
| Processing Cost | $3.38 | $148,728,000 | $0 | $0 | $4,272,000 | $7,032,000 | $7,022,000 | $7,029,000 | $5,176,000 | $5,181,000 | $5,174,000 | $5,174,000 | $20,949,000 | $21,097,000 | $21,320,000 | $21,700,000 | $17,604,000 | $0 | $0 | $0 |
| G&A Cost | $1.75 | $77,202,000 | $0 | $0 | $2,511,000 | $2,511,000 | $2,511,000 | $2,511,000 | $2,434,000 | $2,434,000 | $2,434,000 | $2,434,000 | $10,120,000 | $9,812,000 | $9,354,000 | $9,898,000 | $9,444,000 | $3,476,000 | $2,659,000 | $2,659,000 |
| TOTAL OPERATING COSTS | | $371,155,000 | $0 | $0 | $12,293,000 | $16,138,000 | $16,069,000 | $16,080,000 | $14,182,000 | $14,187,000 | $14,180,000 | $14,180,000 | $57,134,000 | $52,333,000 | $50,025,000 | $49,549,000 | $36,013,000 | $3,476,000 | $2,659,000 | $2,659,000 |
| TAXES | | | | | | | | | | | | | | | | | | | | |
| Specialty Mining Tax | | $37,107,000 | $0 | $0 | -$229,000 | $905,000 | $1,201,000 | $515,000 | $1,353,000 | $1,233,000 | $1,309,000 | $1,353,000 | $6,271,000 | $7,919,000 | $6,870,000 | $5,945,000 | $2,463,000 | $0 | $0 | $0 |
| Income Tax Payable | | $78,478,000 | $0 | $0 | $0 | $0 | $0 | $0 | $0 | $0 | $2,149,000 | $3,464,000 | $16,738,000 | $22,609,000 | $18,560,000 | $14,957,000 | $0 | $0 | $0 | $0 |
| Kappes, Cassiday & Associates | 22.0 Economic Analysis |
| June, 2019 | Page 22-12 |
| Camino Rojo Project Feasibility Study NI 43-101 Technical Report |
|
| TOTAL TAXES | | $115,584,000 | $0 | $0 | -$229,000 | $905,000 | $1,201,000 | $515,000 | $1,353,000 | $1,233,000 | $3,458,000 | $4,818,000 | $23,008,000 | $30,528,000 | $25,430,000 | $20,902,000 | $2,463,000 | $0 | $0 | $0 |
| CAPITAL COSTS | | | | | | | | | | | | | | | | | | | | |
| Mine Costs | | $4,017,000 | $0 | $3,022,000 | $0 | $0 | $0 | $0 | $0 | $0 | $0 | $0 | $0 | $0 | $0 | $0 | $995,000 | $0 | $0 | $0 |
| Major Earthworks | | $9,943,000 | $3,093,000 | $5,093,000 | $0 | $0 | $0 | $0 | $0 | $0 | $0 | $1,756,000 | $0 | $0 | $0 | $0 | $0 | $0 | $0 | $0 |
| Liner / Materials (Supply & Install) | | $11,884,000 | $0 | $7,417,000 | $0 | $0 | $0 | $0 | $0 | $0 | $0 | $4,467,000 | $0 | $0 | $0 | $0 | $0 | $0 | $0 | $0 |
| Civils (Supply & Install) | | $1,377,000 | $0 | $1,377,000 | $0 | $0 | $0 | $0 | $0 | $0 | $0 | $0 | $0 | $0 | $0 | $0 | $0 | $0 | $0 | $0 |
| Structural Steel (Supply & Install) | | $850,000 | $0 | $850,000 | $0 | $0 | $0 | $0 | $0 | $0 | $0 | $0 | $0 | $0 | $0 | $0 | $0 | $0 | $0 | $0 |
| Platework (Supply) | | $1,500,000 | $0 | $1,500,000 | $0 | $0 | $0 | $0 | $0 | $0 | $0 | $0 | $0 | $0 | $0 | $0 | $0 | $0 | $0 | $0 |
| Platework (Install) | | $225,000 | $0 | $225,000 | $0 | $0 | $0 | $0 | $0 | $0 | $0 | $0 | $0 | $0 | $0 | $0 | $0 | $0 | $0 | $0 |
| Mechanical Equipment (Supply) | | $33,582,000 | $2,144,000 | $27,037,000 | $0 | $0 | $0 | $0 | $0 | $0 | $0 | $1,473,000 | $2,635,000 | $294,000 | $0 | $0 | $0 | $0 | $0 | $0 |
| Mechanical Equipment (Install) | | $5,072,000 | $0 | $4,897,000 | $0 | $0 | $0 | $0 | $0 | $0 | $0 | $175,000 | $0 | $0 | $0 | $0 | $0 | $0 | $0 | $0 |
| Piping (Supply & Install) | | $4,927,000 | $0 | $4,927,000 | $0 | $0 | $0 | $0 | $0 | $0 | $0 | $0 | $0 | $0 | $0 | $0 | $0 | $0 | $0 | $0 |
| Electrical (Supply) | | $8,654,000 | $0 | $2,829,000 | $0 | $5,825,000 | $0 | $0 | $0 | $0 | $0 | $0 | $0 | $0 | $0 | $0 | $0 | $0 | $0 | $0 |
| Electrical (Install) | | $500,000 | $0 | $500,000 | $0 | $0 | $0 | $0 | $0 | $0 | $0 | $0 | $0 | $0 | $0 | $0 | $0 | $0 | $0 | $0 |
| Instrumentation (Supply & Install) | | $936,000 | $0 | $936,000 | $0 | $0 | $0 | $0 | $0 | $0 | $0 | $0 | $0 | $0 | $0 | $0 | $0 | $0 | $0 | $0 |
| Infrastructure (Supply & Install) | | $13,036,000 | $1,760,000 | $11,277,000 | $0 | $0 | $0 | $0 | $0 | $0 | $0 | $0 | $0 | $0 | $0 | $0 | $0 | $0 | $0 | $0 |
| Spare Parts | | $1,640,000 | $0 | $1,640,000 | $0 | $0 | $0 | $0 | $0 | $0 | $0 | $0 | $0 | $0 | $0 | $0 | $0 | $0 | $0 | $0 |
| Process Contingency | | $15,442,000 | $0 | $12,638,000 | $0 | $874,000 | $0 | $0 | $0 | $0 | $0 | $1,492,000 | $395,000 | $44,000 | $0 | $0 | $0 | $0 | $0 | $0 |
| EPCM | | $8,544,000 | $1,709,000 | $6,835,000 | $0 | $0 | $0 | $0 | $0 | $0 | $0 | $0 | $0 | $0 | $0 | $0 | $0 | $0 | $0 | $0 |
| Commissioning & Supervision | | $612,000 | $0 | $612,000 | $0 | $0 | $0 | $0 | $0 | $0 | $0 | $0 | $0 | $0 | $0 | $0 | $0 | $0 | $0 | $0 |
| Supplier Engineering | | $2,117,000 | $0 | $2,117,000 | $0 | $0 | $0 | $0 | $0 | $0 | $0 | $0 | $0 | $0 | $0 | $0 | $0 | $0 | $0 | $0 |
| Indirect Costs (incl. contingency) | | $9,174,000 | $1,835,000 | $7,339,000 | $0 | $0 | $0 | $0 | $0 | $0 | $0 | $0 | $0 | $0 | $0 | $0 | $0 | $0 | $0 | $0 |
| Owner's Costs (incl. contingency) | | $9,506,000 | $1,901,000 | $7,605,000 | $0 | $0 | $0 | $0 | $0 | $0 | $0 | $0 | $0 | $0 | $0 | $0 | $0 | $0 | $0 | $0 |
| Subtotal | | $143,538,000 | $12,442,000 | $110,673,000 | $0 | $6,699,000 | $0 | $0 | $0 | $0 | $0 | $9,362,000 | $3,030,000 | $338,000 | $0 | $0 | $995,000 | $0 | $0 | $0 |
| Working Capital (Initial Fills) | | $806,000 | $0 | $806,000 | $0 | $0 | $0 | $0 | $0 | $0 | $0 | $0 | $0 | $0 | $0 | $0 | $0 | $0 | $0 | $0 |
| Working Capital (60 days) | | $9,106,000 | $0 | $9,106,000 | $0 | $0 | $0 | $0 | $0 | $0 | $0 | $0 | $0 | $0 | $0 | $0 | $0 | $0 | $0 | $0 |
| Process Preproduction | | $275,000 | $0 | $275,000 | $0 | $0 | $0 | $0 | $0 | $0 | $0 | $0 | $0 | $0 | $0 | $0 | $0 | $0 | $0 | $0 |
| Less: Working Capital Recovery | | $10,187,000 | $0 | $0 | $0 | $0 | $0 | $0 | $0 | $0 | $0 | $0 | $0 | $0 | $0 | $3,396,000 | $6,791,000 | $0 | $0 | $0 |
| Net Working Capital | | $0 | $0 | $10,187,000 | $0 | $0 | $0 | $0 | $0 | $0 | $0 | $0 | $0 | $0 | $0 | -$3,396,000 | -$6,791,000 | $0 | $0 | $0 |
| Subtotal | | $143,538,000 | $12,442,000 | $120,860,000 | $0 | $6,699,000 | $0 | $0 | $0 | $0 | $0 | $9,362,000 | $3,030,000 | $338,000 | $0 | -$3,396,000 | -$5,796,000 | $0 | $0 | $0 |
| IVA | 16% | $22,966,000 | $1,991,000 | $17,708,000 | $0 | $1,072,000 | $0 | $0 | $0 | $0 | $0 | $1,498,000 | $485,000 | $54,000 | $0 | $0 | $159,000 | $0 | $0 | $0 |
| Less: IVA (Rebate) | | $22,966,000 | $0 | $1,991,000 | $0 | $0 | $0 | $17,708,000 | $0 | $0 | $0 | $1,072,000 | $1,498,000 | $485,000 | $54,000 | $0 | $0 | $159,000 | $0 | $0 |
| Net IVA | | $0 | $1,991,000 | $15,717,000 | $0 | $1,072,000 | $0 | -$17,708,000 | $0 | $0 | $0 | $426,000 | -$1,013,000 | -$431,000 | -$54,000 | $0 | $159,000 | -$159,000 | $0 | $0 |
| Subtotal | | $143,538,000 | $14,432,000 | $136,577,000 | $0 | $7,771,000 | $0 | -$17,708,000 | $0 | $0 | $0 | $9,788,000 | $2,017,000 | -$93,000 | -$54,000 | -$3,396,000 | -$5,637,000 | -$159,000 | $0 | $0 |
| Reclamation & Closure | $0.45 | $19,813,000 | $0 | $0 | $0 | $0 | $0 | $0 | $0 | $0 | $0 | $0 | $0 | $0 | $0 | $638,000 | $2,579,000 | $7,375,000 | $5,448,000 | $3,774,000 |
| TOTAL CAPITAL | | $163,351,000 | $14,432,000 | $136,577,000 | $0 | $7,771,000 | $0 | ($17,708,000) | $0 | $0 | $0 | $9,788,000 | $2,017,000 | ($93,000) | ($54,000) | ($2,758,000) | ($3,058,000) | $7,216,000 | $5,448,000 | $3,774,000 |
| PRE-TAX NET CASH FLOW | | Total | Year -2 | Year -1 | Q1 | Q2 | Q3 | Q4 | Q1 | Q2 | Q3 | Q4 | Year 3 | Year 4 | Year 5 | Year 6 | Year 7 | Year 8 | Year 9 | Year 10 |
| Pre-tax Net Cash Flow | | $345,538,000 | -$14,432,000 | -$136,577,000 | -$2,867,000 | $4,866,000 | $16,668,000 | $25,037,000 | $18,696,000 | $17,071,000 | $18,104,000 | $11,063,000 | $84,465,000 | $108,899,000 | $94,542,000 | $85,304,000 | $39,929,000 | -$10,692,000 | -$8,106,000 | -$6,432,000 |
| Royalty Payable | 2.00% | $17,601,000 | $0 | $0 | $189,000 | $575,000 | $655,000 | $468,000 | $658,000 | $625,000 | $646,000 | $701,000 | $2,872,000 | $3,223,000 | $2,890,000 | $2,642,000 | $1,458,000 | $0 | $0 | $0 |
| Extraordinary Mining Duty | 0.50% | $4,400,000 | $0 | $0 | $47,000 | $144,000 | $164,000 | $117,000 | $164,000 | $156,000 | $161,000 | $175,000 | $718,000 | $806,000 | $723,000 | $660,000 | $364,000 | $0 | $0 | $0 |
| Salvage Value | | $3,791,000 | $0 | $0 | $0 | $0 | $0 | $0 | $0 | $0 | $0 | $0 | $0 | $0 | $0 | $0 | $0 | $1,007,000 | $2,015,000 | $769,000 |
| IVA Refund (Project Purchase + Pre-Prod. Exploration) | $5,484,000 | $0 | $0 | $0 | $0 | $0 | $5,484,000 | $0 | $0 | $0 | $0 | $0 | $0 | $0 | $0 | $0 | $0 | $0 | $0 |
| Pre-tax Net Cash Flow | | $332,812,000 | -$14,432,000 | -$136,577,000 | -$3,103,000 | $4,147,000 | $15,850,000 | $29,936,000 | $17,874,000 | $16,290,000 | $17,297,000 | $10,187,000 | $80,875,000 | $104,870,000 | $90,929,000 | $82,002,000 | $38,106,000 | -$9,684,000 | -$6,092,000 | -$5,664,000 |
| | | $332,812,000 | -$14,432,000 | -$136,577,000 | $46,830,000 | $61,648,000 | $80,875,000 | $104,870,000 | $90,929,000 | $82,002,000 | $38,106,000 | -$9,684,000 | -$6,092,000 | -$5,664,000 |
| Cumulative | | | -$14,432,000 | -$151,009,000 | -$154,112,000 | -$149,965,000 | -$134,116,000 | -$104,179,000 | -$86,305,000 | -$70,015,000 | -$52,719,000 | -$42,531,000 | $38,344,000 | $143,214,000 | $234,143,000 | $316,145,000 | $354,252,000 | $344,568,000 | $338,476,000 | $332,812,000 |
| AFTER-TAX NET CASH FLOW | | | | | | | | | | | | | | | | | | | | |
| Income & Other Taxes | | $115,584,000 | $0 | $0 | -$229,000 | $905,000 | $1,201,000 | $515,000 | $1,353,000 | $1,233,000 | $3,458,000 | $4,818,000 | $23,008,000 | $30,528,000 | $25,430,000 | $20,902,000 | $2,463,000 | $0 | $0 | $0 |
| After-Tax net annual Cash Flow, $ | | $217,228,000 | -$14,432,000 | -$136,577,000 | -$2,874,000 | $3,242,000 | $14,649,000 | $29,422,000 | $16,521,000 | $15,056,000 | $13,838,000 | $5,370,000 | $57,867,000 | $74,342,000 | $65,500,000 | $61,100,000 | $35,644,000 | -$9,684,000 | -$6,092,000 | -$5,664,000 |
| | | $217,228,000 | -$14,432,000 | -$136,577,000 | $44,439,000 | $50,786,000 | $57,867,000 | $74,342,000 | $65,500,000 | $61,100,000 | $35,644,000 | -$9,684,000 | -$6,092,000 | -$5,664,000 |
| TOTAL CUMULATIVE | | | -$14,432,000 | -$151,009,000 | -$153,883,000 | -$150,641,000 | -$135,992,000 | -$106,570,000 | -$90,049,000 | -$74,993,000 | -$61,154,000 | -$55,784,000 | $2,082,000 | $76,424,000 | $141,924,000 | $203,024,000 | $238,668,000 | $228,984,000 | $222,892,000 | $217,228,000 |
| Kappes, Cassiday & Associates | 22.0 Economic Analysis |
| June, 2019 | Page 22-13 |
| Camino Rojo Project Feasibility Study NI 43-101 Technical Report |
|
The Camino Rojo cash flows are net of royalties and taxes. The Project yields an after-tax internal rate of return of 28.7%.
To estimate the relative economic strength of the Project, base case sensitivity analyses have been completed analyzing the economic sensitivity to several parameters including changes in gold price, capital costs, average operating cash cost per tonne of ore processed and exchange rate. The sensitivities are based on +/- 25% of the base case for capital costs, operating costs and exchange rate and select gold prices. The after-tax analysis is presented in Table 22-7. Figure 22-3 and Figure 22-4 present graphical representations of the after-tax sensitivities. Variations in gold price, ore grades and recovery rates have the largest influence on the sensitivity of the Project. From these sensitivities it can be seen that the Project is economically robust.
The economic indicators chosen for sensitivity evaluation are the internal rate of return (IRR) and NPV at 5% discount rate.
Table 22-7
After-Tax Sensitivity Analysis Results
| | | | NPV |
| | Variation | IRR | 5% | 10% |
| Gold Price | | | | |
| | $1,000 | 15.9% | $59,068,000 | $25,895,000 |
| | $1,125 | 22.8% | $101,241,000 | $58,528,000 |
| | $1,250 | 28.7% | $141,580,000 | $89,534,000 |
| | $1,375 | 34.3% | $182,146,000 | $120,710,000 |
| | $1,500 | 39.7% | $222,711,000 | $151,886,000 |
| | | | | |
| Capital Costs | | | | |
| 75% | $130,013,659 | 38.7% | $165,153,000 | $112,375,000 |
| 90% | $150,016,306 | 32.2% | $151,009,000 | $98,671,000 |
| 100% | $163,351,404 | 28.7% | $141,580,000 | $89,534,000 |
| 110% | $176,686,502 | 25.7% | $132,151,000 | $80,398,000 |
| 125% | $196,689,149 | 21.9% | $118,008,000 | $66,694,000 |
| | | | | |
| Operating Costs | | | | |
| 75% | $278,366,386 | 35.5% | $189,191,000 | $126,195,000 |
| 90% | $334,039,663 | 31.5% | $160,625,000 | $104,198,000 |
| 100% | $371,155,181 | 28.7% | $141,580,000 | $89,534,000 |
| 110% | $408,270,699 | 25.9% | $122,536,000 | $74,870,000 |
| 125% | $463,943,977 | 21.4% | $93,317,000 | $52,279,000 |
| | | | | |
| Exchange Rate | | | | |
| 75% | 14.475 | 25.2% | $123,861,000 | $74,932,000 |
| 90% | 17.37 | 27.5% | $135,673,000 | $84,666,000 |
| 100% | 19.3 | 28.7% | $141,580,000 | $89,534,000 |
| 110% | 21.23 | 29.7% | $146,412,000 | $93,516,000 |
| 125% | 24.125 | 31.0% | $152,208,000 | $98,292,000 |
Kappes, Cassiday & Associates June, 2019 | | 22.0 Economic Analysis Page 22-14 |
| Camino Rojo Project Feasibility Study NI 43-101 Technical Report |
|
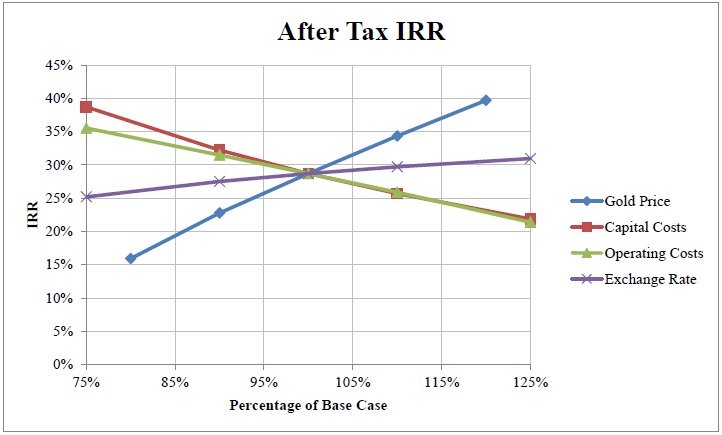
Figure 22-3 After Tax Sensitivity – IRR
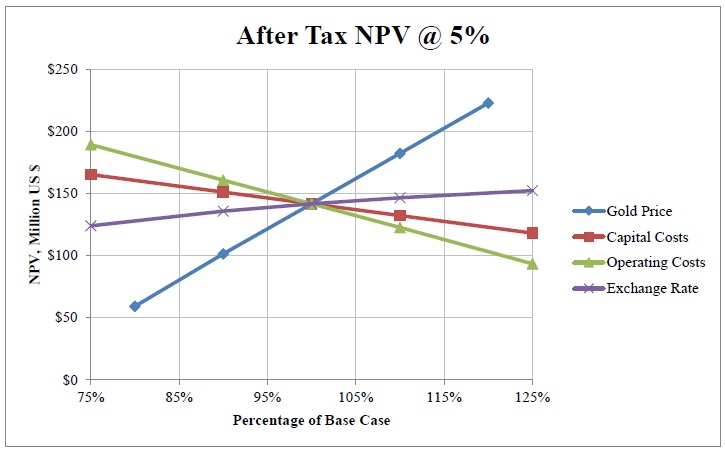
Figure 22-4 After Tax Sensitivity – NPV @ 5%
Kappes, Cassiday & Associates June, 2019 | | 22.0 Economic Analysis Page 22-15 |
| Camino Rojo Project Feasibility Study NI 43-101 Technical Report |
|
There are no active exploration properties or producing mines immediately adjacent to the Camino Rojo Project.
The Adjacent Owner controls a mining concession adjacent to the Camino Rojo concessions that abuts the northern limit of the Represa Zone. Drillpads and drillroads were observed on this claim during Dr. Gray’s site visit, but the drilling results were unavailable to the author. Notwithstanding, the absence of confirmed information, on this basis, it is reasonable to assume that the Represa mineralized zone extends onto the Adjacent Owner’s claim, however, all interpretations, conclusions, and recommendations contained in this report relate exclusively to the mining concessions that comprise the Camino Rojo Project.
Kappes, Cassiday & Associates June, 2019 | | 23.0 Adjacent Properties Page 23-1 |
| Camino Rojo Project Feasibility Study NI 43-101 Technical Report |
|
| 24.0 | OTHER RELEVANT DATA AND INFORMATION |
| 24.1 | Project Implementation |
| 24.1.1 | Project Development |
The development philosophy for the Project assumes that Orla will hire an EPCM Project Management Company (PMC) to act on behalf of the owner to complete the detail engineering and project implementation. The PMC will manage and supervise the engineering consultants.
The PMC will also execute the following responsibilities:
| · | Procurement tasks for all equipment and supplies |
| · | Process all accounts payable documentation |
Standard project controls will be used during the implementation of the Camino Rojo Project. Multiple software packages are normally used to control various aspects of the following:
| · | Tech specifications and manuals |
| · | Expediting and logistics |
| · | Bidding process and tracking |
| · | Receiving / warehousing and materials management |
| · | Construction job cost system and interface with the accounting system |
| · | Tracking and forecasting costs estimates to completion (“ETC”) |
Kappes, Cassiday & Associates June, 2019 | | 24.0 Other Relevant Data and Information Page 24-1 |
| Camino Rojo Project Feasibility Study NI 43-101 Technical Report |
|
A project server will be dedicated to storage and there will be controlled access to all project relevant documents.
Weekly progress reports and monthly cost reports of project status will be prepared and distributed.
| 24.1.3 | Procurement and Logistics |
The PMC will purchase all material for the Project on behalf of the Owner. This enables direct control over the procurement budget and schedule. The team performs equipment technical reviews and negotiations, analyses the total delivery cost, issues recommendations and produces the purchase orders or contractual documents upon owner’s approval. The team coordinates logistics and assists suppliers. Freight forwarding is managed dynamically to minimize the freight transit times and avoid transportation issues. A weekly expediting report is also generated showing the status of purchase orders and latest estimate of delivery dates for each purchase with latest status of customs clearances, etc.
The PMC will provide the site construction management team and supplement the site staff with resources as required. Personnel that are planned to be kept after the preproduction period and become operations key personnel will be directly hired by the owner. Lump sum contracts will be considered when practical and cost reimbursable contracts will be awarded when preferable. Early in the Project, mobile equipment will be purchased by the owner for use during the construction phase that will be turned over to the operations group shortly after commissioning. This equipment includes:
This equipment will be purchased new over the course of the Project as the need for each arises.
For the FS, quotations were received that considered all contractors bringing their own cranes. In practise, it is usually more efficient and less expensive if the owner purchases one crane and rents sufficient additional cranes for each phase of the Project. The owner can then globally manage and allocate cranes to each contractor’s activities on an as-needed basis.
Kappes, Cassiday & Associates June, 2019 | | 24.0 Other Relevant Data and Information Page 24-2 |
| Camino Rojo Project Feasibility Study NI 43-101 Technical Report |
|
The owner will contract one concrete batch plant for the site. All concrete requirements for the Project will be supplied at the owner’s cost and delivered to the various contractors.
The owner will provide sanitary services, domestic water and general services supply throughout the Project site at no cost to the contractors.
| 24.1.5 | Construction Schedule |
Assuming permits are awarded on schedule and there are no significant issues or set-backs, it is envisioned for the Project construction to begin in the first quarter of 2020 and commissioning and initial production to start during the first quarter of 2021 with first gold pour in the second quarter of 2021. It is expected to take approximately 17 months from the beginning of site construction to the pouring of the first doré bar. The first six of these months will include:
| · | Conclusion of detailed engineering; |
| · | Detailed execution plan implementation; |
| · | Camp and warehouse construction; |
| · | Final orders for long lead-time equipment items; |
| · | Earthworks contractor mobilization; |
| · | Roads, culverts and building pads; and |
| · | El Berrendo access road and powerline relocation. |
A proposed project development and implementation schedule is presented in Figure 24-1.
Kappes, Cassiday & Associates June, 2019 | | 24.0 Other Relevant Data and Information Page 24-3 |
| Camino Rojo Project Feasibility Study NI 43-101 Technical Report |
|

Figure 24-1 Project Development & Implementation Schedule
Kappes, Cassiday & Associates June, 2019 | | 24.0 Other Relevant Data and Information Page 24-4 |
| Camino Rojo Project Feasibility Study NI 43-101 Technical Report |
|
| 24.2 | Site Geotechnical Analyses |
Piteau conducted a number of geotechnical studies for the Project including slope stability assessments for the heap, waste dumps and pit slopes. The foundation conditions in the vicinity of the heap leach pad and the waste rock dump are based on the results of site investigation programs carried out by Piteau across the Project site in 2014, 2018 and 2019. These investigations included 74 test pits and 19 drillholes. The pit slope design is based on the results of site investigation programs carried out by Piteau in 2014, 2015 and 2018. These investigations included an additional 21 drillholes.
| 24.2.1 | Heap Leach Pad Stability |
The geometry of the heap leach pad is proposed to be developed in six lifts; each superior lift with a height of 10 metres above the underlying lift and with each lift sloping at an angle similar to the foundation. The repose angle slope of each lift of the heap material was assumed to be 39°, the assumed angle of internal friction of the ore. To allow pregnant solution to be collected, an LLDPE liner will be installed at the base of the HLP. To form a foundation for the liner and help minimize seepage into the foundation in the event of a leak in the LLDPE liner, a 30cm layer of low permeability material will be placed and compacted across the entire footprint of the HLP.
The details of the heap stability design can be seen in the report “Feasibility Geotechnical Assessment of the Waste Dump, Heap Leach Pad and Site Infrastructure” and is referenced is Section 27 of this report.
The results of the heap stability analyses indicate a stable facility at the design heights and slope angles.
Hydrogeological and groundwater investigations have been carried out at the Project site and are detailed in the following technical documents and reports:
| · | “Technical Memo – Camino Rojo Project Pump Test Summary, Well CR-01, January 2019” |
| · | “Camino Rojo Project Production Well PW-1, April 2019” |
| · | “Camino Rojo Project Heap Leach Area Monitor Wells, June 2019” |
| · | “Camino Rojo Project Well Summary Report PW-2, June 2019” |
| · | “Groundwater Flow Modeling for Projected Camino Rojo Mine Project, San Tiburcio, State of Zacatecas Mexico, June 2019” |
| · | “Estudios Ambientales de Línea Base para el proyecto Camino Rojo” |
Kappes, Cassiday & Associates June, 2019 | | 24.0 Other Relevant Data and Information Page 24-5 |
| Camino Rojo Project Feasibility Study NI 43-101 Technical Report |
|
The scope of work for the hydrogeological investigations was primarily focused on locating a viable water source and modeling the water level impacts from mining. Results and conclusions are based on information in the above studies which are referenced in Section 27 of this report.
| 24.3.1 | Occurrence and Movement of Groundwater |
Groundwater in the vicinity of the proposed mine occurs in the Caracol, Indidura and Cuesta del Cura Formations. The rock matrix for all of these formations has very low permeability and groundwater flow is dominated by fracture flow, or possibly flow in solution cavities in limestone units. There is little, if any, surficial evidence for karst formation in the carbonate formations such as the Cuesta del Cura Formation, however, there may be solution features at depth related to faulting.
In general, groundwater flow direction is often a subdued expression of topography. However, the groundwater flow pattern(s) in the vicinity of the Project and the village of San Tiburcio is complex.
A groundwater elevation contour map based on water levels measured in wells in and near the Project in November 2018 or later is presented in Figure 24-2. Water level elevations represent a “steady state” condition, as there was no pumping going on when water levels were measured. Water level elevations in the immediate vicinity of the proposed mine pit are low relative to wells further to the south. As depicted, groundwater flows from the village of San Tiburcio area north towards the pit area.
Kappes, Cassiday & Associates June, 2019 | | 24.0 Other Relevant Data and Information Page 24-6 |
| Camino Rojo Project Feasibility Study NI 43-101 Technical Report |
|

Figure 24-2 Groundwater Elevation Contours Camino Rojo Project, Zacatecas
Monitor well construction in the vicinity of the proposed heap encountered water at depths as shallow as 20m (Barranca, 2019). Although these shallow depths could be indicative of a “perched zone,” water quality from shallow wells is similar to wells completed deeper in the Caracol Formation (Figure 24-3 and Table 24-1). Additional monitor well construction is planned in the vicinity of the proposed heap which should resolve whether there is a “perched zone” beneath the proposed heap or a steep gradient between this area and the proposed pit area.
Kappes, Cassiday & Associates June, 2019 | | 24.0 Other Relevant Data and Information Page 24-7 |
| Camino Rojo Project Feasibility Study NI 43-101 Technical Report |
|
Information from the coring and packer testing program conducted by Piteau indicates that there may be a vertical downward groundwater head gradient in the vicinity of the proposed pit (Piteau, 2014). The water level contours, as currently shown in Figure 24-2, are indicative of groundwater flow toward the proposed pit area from the south. One explanation for this phenomenon could be that vertical fracturing in the pit area, in combination with a downward gradient, is transmitting water downward into the Cuesta del Cura Formation along vertical fractures that could be related to either the mineralizing system or possibly the San Tiburcio Fault.
| 24.3.2 | Groundwater Quality |
Water quality analytical results for samples collected from wells on or near the COPE are summarized in Table 24-1. All chemical analyses were conducted by ALS Indequim SA de CV, of Monterey, N.L. The water quality from samples taken from wells completed in the Caracol Formation in the Project area are poor, with concentrations of Total Dissolved Solids (TDS) generally exceeding 4,000 mg/l and sulphate concentrations generally above 1500 mg/l. The constituent concentrations in Table 24-1 that exceed the Mexican Regulatory potable water limit (NOM-127-SSA1-2002) are colored orange. TDS concentrations in samples from well CR-04 have generally exceeded 12,000 mg/l (Figure 24-3).
Because groundwater quality is poor in the region, and generally non-potable due to elevated naturally-occurring total dissolved solids, generally exceeding 2,000 mg/l (Estudios Ambientales, 2019), the local residents make extensive use of small impoundments to collect groundwater from precipitation events. These small impoundments are an important source of water for livestock. There is a small surface impoundment within the COPE along the western margin of the proposed open pit area.
In the village of Berrendo a relatively shallow well has been constructed at the toe of such an impoundment. Fresh water seeping from the impoundment into the groundwater is collected by the well, and is provided as a municipal supply. There is also a small reverse-osmosis plant in the village of Berrendo to treat water to potable levels. In other nearby villages, people reportedly drink bottled water
The water samples collected from PW-1, which derives groundwater from the Cuesta del Cura Formation, had TDS concentrations just over 1000 mg/l and sulphate concentrations between 300 and 350 mg/l. The Mexican Norm for potable water (NOM-127-SSA1-2002) for these constituents is 1000 mg/l and 400 mg/l, respectively. This indicates water quality in the Cuesta del Cura is distinctive from the water quality in the Caracol. The initial water samples from the monitor wells near the proposed heap (MP-1 and MP-2) also had high TDS concentrations.
Kappes, Cassiday & Associates June, 2019 | | 24.0 Other Relevant Data and Information Page 24-8 |
| Camino Rojo Project Feasibility Study NI 43-101 Technical Report |
|
Table 24-1
Summary of Groundwater Quality Analyses from On-Site (COPE) Wells
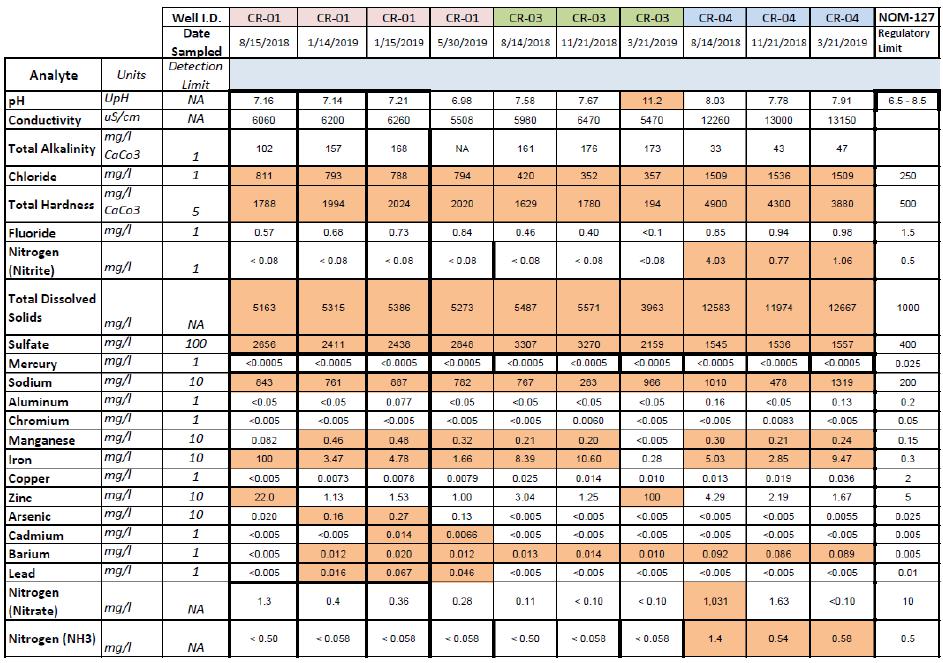
Kappes, Cassiday & Associates June, 2019 | | 24.0 Other Relevant Data and Information Page 24-9 |
| Camino Rojo Project Feasibility Study NI 43-101 Technical Report |
|
Summary of Groundwater Quality Analyses from On-Site (COPE) Wells cont.
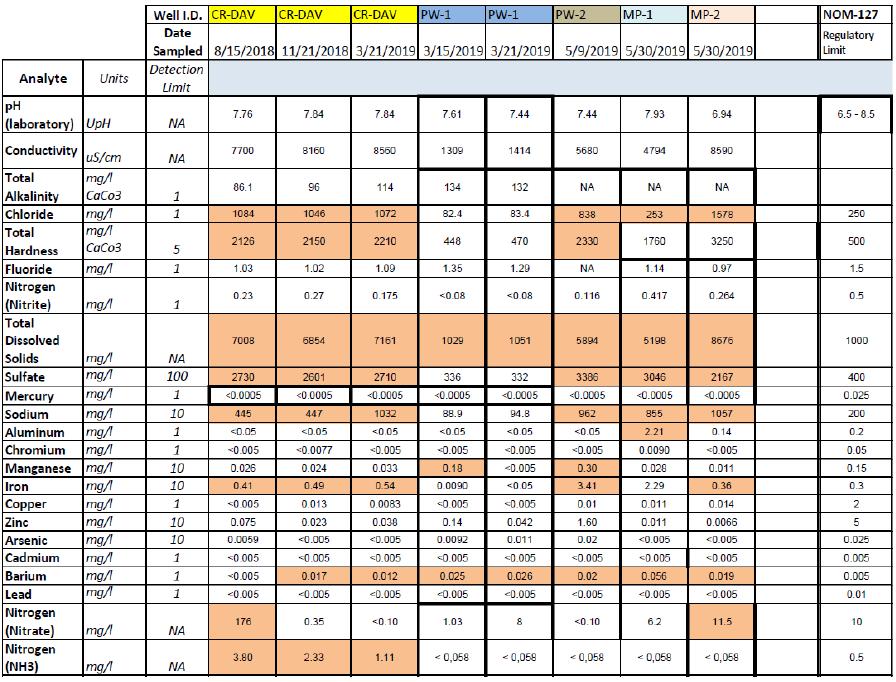
Kappes, Cassiday & Associates June, 2019 | | 24.0 Other Relevant Data and Information Page 24-10 |
| Camino Rojo Project Feasibility Study NI 43-101 Technical Report |
|
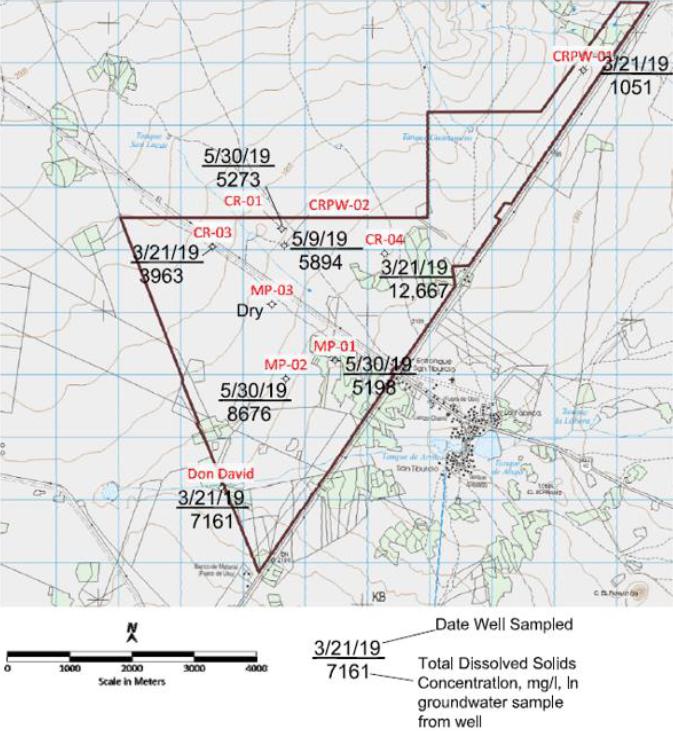
Figure 24-3 Total Dissolved Solids in Groundwater
| 24.3.3 | Drilling and Aquifer Testing |
A test drilling program was undertaken in order to identify possible location(s) for construction of water supply well(s). The test drilling program included the drilling of 14 test borings in the COPE, using the reverse-circulation air (RC) drilling method. In general, the drilling results from boreholes drilled in the Caracol Formation were not encouraging, excepting for CR-01 drilled by Goldcorp. An aquifer test of this hole (completed in the Caracol Formation within the boundary of the proposed pit) indicated that significant quantities of water could be withdrawn from wells in fractured portions of the Caracol (Barranca, 2019).
Kappes, Cassiday & Associates June, 2019 | | 24.0 Other Relevant Data and Information Page 24-11 |
| Camino Rojo Project Feasibility Study NI 43-101 Technical Report |
|
A number of holes were drilled in the vicinity of CR-01, in an attempt to intersect the fracture systems that may be supplying water to this hole. Water production from these holes was not encouraging, suggesting that major water bearing structures in the Caracol Formation may be concentrated in the deposit.
A test boring in the extreme northeast of the COPE (CRW18-13) encountered the Cuesta del Cura Formation at a relatively shallow depth, and there appeared to be significant water production from this formation. It was decided to drill and construct a test production well at this location (Barranca, 2019). The seven-day pumping test conducted at PW-1 indicated that the well will be capable of delivering the 24 L/s of water needed for the Project. Based on the pumping test results, the maximum long-term production at PW-1 is approximately 32 L/s.
Even though PW-1 has been determined to be able to provide a sufficient water supply for the project, additional back up well capacity will need to be developed.
| 24.3.4 | Computer Modeling of Effects of Proposed Groundwater Withdrawal |
John Ward of Tucson Arizona (AIPG Certified Professional Geologist) was engaged to model the effects of proposed groundwater withdrawal (Ward, 2019). Specifically, the computer model was used to simulate:
| · | The water level change due to withdrawal of groundwater to be used by the proposed mining operation for process water, dust control, etc.; |
| · | The effects of withdrawing groundwater from the pit as it advances to greater depth; and, |
| · | The long-term impact of groundwater forming a pit-lake in the bottom of the pit after mining has ceased. |
| 24.3.4.1 | Summary of Computer Modeling |
Current mining plans call for excavation of an open pit within the Caracol Formation to a depth of approximately 230 meters over an active mining period of 6.8 years. During the fourth year of pit excavation, groundwater will likely be encountered at a depth of about 110 meters, and mine pit dewatering will be required for the final three years of active mining.
The groundwater model was developed encompassing approximately 1,200 square kilometers of the Cretaceous aquifer within portions of the El Cardito and Guadalupe Garzarón administrative basins. The simulation of groundwater flow assumed that the aquifer is currently in equilibrium with respect to recharge and discharge, as groundwater development appears to be minimal.
Kappes, Cassiday & Associates June, 2019 | | 24.0 Other Relevant Data and Information Page 24-12 |
| Camino Rojo Project Feasibility Study NI 43-101 Technical Report |
|
Many of the wells in the area are shallow dug or drilled wells. Within the modeled area groundwater normally flows both easterly into a groundwater sink in the Guadalupe Garzarón basin; and northwesterly in the El Cardito basin. At the Project site groundwater has a more northerly component; piezometers installed at various depths at the proposed pit site indicate a downward hydraulic gradient.
Model calibration to regional conditions was based on published groundwater levels, aquifer test results, and groundwater flow estimates. Project site test results were used to help define the aquifer properties and constrain the dewatering simulations. The overall calibration is considered reasonable.
Two dewatering scenarios were developed that would encompass the known range of measured Project site hydrologic properties. The “nominal” case modeled dewatering based on regionally averaged aquifer conditions. The “low K” case modeled the same dewatering using lower hydraulic conductivity in the vicinity of the mine pit, based on results of additional Project site testing which indicated areas of lower hydraulic conductivity. Both cases simulated 3-½ years of active dewatering and more than 100 years of pit recovery. Simulated maximum mine pit dewatering ranged from 49 to 99 liters/second for the low K and nominal cases, respectively during the final half-year of mining. Simulated dewatering rates over the life of mine are shown for both cases in Figure 24-4.
Kappes, Cassiday & Associates June, 2019 | | 24.0 Other Relevant Data and Information Page 24-13 |
| Camino Rojo Project Feasibility Study NI 43-101 Technical Report |
|
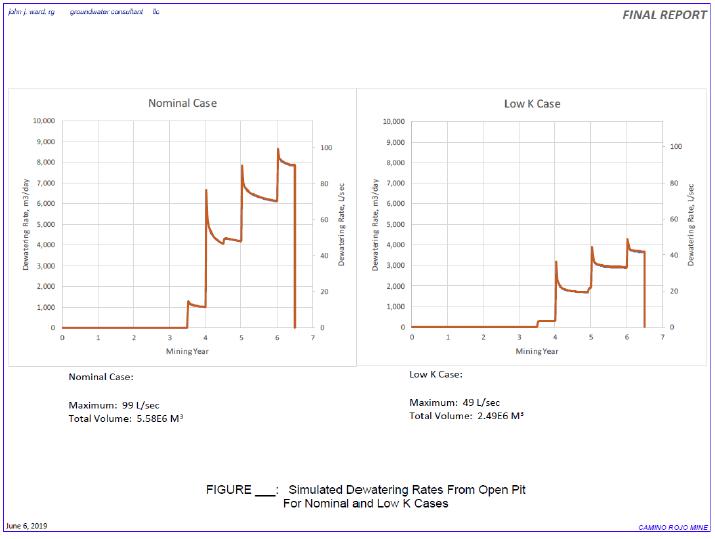
Figure 24-4 Simulated Dewatering Rates from Open Pit
The impacts to the regional aquifer were evaluated by comparing the extent of the 1-metre decline (drawdown) in water levels due to mine dewatering. For the nominal case, the maximum extent of 1-metre drawdown averaged 8 kilometres from the mine pit, occurring about 20 years after cessation of mining, as shown in Figure 24-5. By year 50 the 1-metre drawdown extent extended only an average of 5 kilometres from the mine pit. For the low K case, the maximum extent averaged 5 kilometres from the mine pit, as shown in Figure 24-6. By year 25, the 1-metre drawdown extent averaged 2 kilometres from the mine pit.
Kappes, Cassiday & Associates June, 2019 | | 24.0 Other Relevant Data and Information Page 24-14 |
| Camino Rojo Project Feasibility Study NI 43-101 Technical Report |
|

Figure 24-5 Maximum Extent of 1 Metre Drawdown Contour for Nominal Case
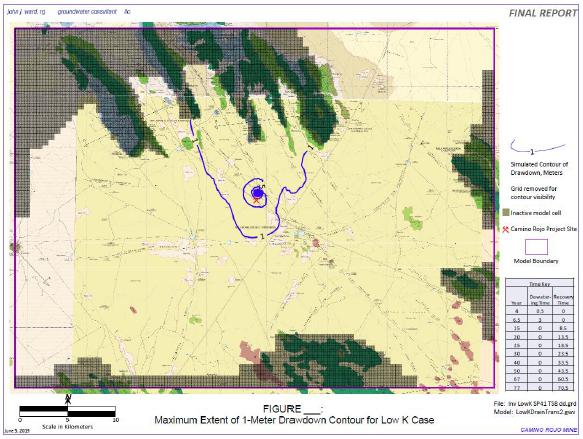
Figure 24-6 Maximum Extent of 1 Metre Drawdown Contour for Low K Case
Kappes, Cassiday & Associates June, 2019 | | 24.0 Other Relevant Data and Information Page 24-15 |
| Camino Rojo Project Feasibility Study NI 43-101 Technical Report |
|
Recovery of groundwater levels after cessation of dewatering was simulated for both cases. Simulated pit lake water levels stabilized approximately 30 years after dewatering ceased. Regionally, the simulated stabilized water levels showed the pit lake to be a groundwater sink in terms of lateral groundwater flow. However, in some high precipitation scenarios, there is a potential for movement of low volumes of water from the pit lake into underlying units (HGL, 2019).
The groundwater model presented herein is based on current data available. The natural variability associated with fractured hydrogeologic media preclude making definitive statements about areas not directly associated with the constructed and tested wells. Actual conditions may vary from model predictions, but are expected to be in the range described. Additional modelling should be undertaken by qualified professional as more groundwater information becomes available.
The oxide and transition material that is the subject of the FS is underlain by sulphide material that is amendable to milling and flotation concentration methods. The Measured and Indicated Mineral Resources amendable to milling and flotation total 258.8 million tonnes at 0.88 g/t Au, 7.4 g/t Ag, 0.07% lead, and 0.26% zinc. Contained metal amounts to 7.30 million ounces gold, 61.6 million ounces of silver, 409.2 million pounds of lead, and 1.49 billion pounds of zinc. No part of this resource is considered in the Feasibility Study. However, the heap leach pad and mine waste rock dump were placed such that they would not need to be moved should a large open pit be developed to mine the sulphide material.
A possible process flowsheet for the sulphide material is a sequential flotation process consisting of an initial pre-flotation to remove organic carbon followed by lead flotation, zinc flotation, and pyrite/arsenopyrite flotation to recover additional precious metals. The pyrite/arsenopyrite concentrate would be oxidized to recover additional gold and silver by cyanide leaching. Payable products would be the lead concentrate, zinc concentrate, and gold/silver doré recovered from the cyanide leaching of the pyrite/arsenopyrite concentrate.
Kappes, Cassiday & Associates June, 2019 | | 24.0 Other Relevant Data and Information Page 24-16 |
| Camino Rojo Project Feasibility Study NI 43-101 Technical Report |
|
| 25.0 | INTERPRETATIONS AND CONCLUSIONS |
The work that has been completed to date has demonstrated that the Camino Rojo open pit mine and heap leach is a technically feasible and economically viable project. The Project is conveniently located with access via Mexican highway 54 which connects the major cities of Zacatecas and Saltillo. The Project terrain is predominately flat and sufficient water for operations is available from wells located at the Project site. Required mineral, surface and water rights have been secured.
More specific and detailed conclusions are presented in the Sections below.
The Camino Rojo mine will be a conventional open pit mine. The mine plan developed as the base case for the FS has identified 44.0 million tonnes of ore at an average grade of 0.73 g/t Au and 14.2 g/t Ag. This amounts to 1.03 million contained ounces of gold and 20.1 million contained ounces of silver. The mine life is about 6.8 years and the life of mine strip ratio is 0.54 to 1, a relatively low ratio for a precious metal pit.
Pit operation should be relatively simple compared to most projects in Mexico. The ground in the deposit area is flat, and the haul distances to the proposed crusher and waste storage areas are only about 500m and a kilometre from the pit rim respectively.
| 25.1.2 | Metallurgy and Process |
The Project has been designed as an open-pit mine with heap leach for recovery of gold and silver from oxide and transition material. Ore will be crushed to P80 28mm, stockpiled, reclaimed and conveyor stacked onto the heap leach pad at an average rate of 18,000 tonnes/day. Stacked material will be leached using low grade sodium cyanide solution and the resulting pregnant leach solution will be processed in a Merrill-Crowe plant for the recovery of gold and silver by zinc cementation followed by drying and smelting to produce the final doré product.
Metallurgical test work completed indicates that the material is amenable to cyanide leaching for the recovery of precious metals with overall recoveries of 64% for gold and 17% for silver with low to moderate reagent consumptions and will produce an estimated 662,000 ounces of gold and 3.5 million ounces of silver. Cement agglomeration is not required for heap heights up to 80m with only lime being required for pH control.
Kappes, Cassiday & Associates June, 2019 | | 25.0 Interpretations and Conclusions Page 25-1 |
| Camino Rojo Project Feasibility Study NI 43-101 Technical Report |
|
Potentially preg-robbing material has been identified within the Camino Rojo ore body. A significant campaign was carried out to identify the material associated with preg-robbing with results indicating that the potentially preg-rob material is only a minor component of the total material and is found primarily at depth and is associated with the transition material with almost none of the oxide showing preg-robbing tendencies. Deleterious effects from preg-robbing should be able to be mitigated with proper ore control toward the end of the project life.
| 25.1.3 | Environmental and Permitting |
Site investigations and works completed as part of the FS are intended to support and advance the permitting process for the Camino Rojo mine. Baseline environmental studies required for permitting have been completed with continued and ongoing monitoring in progress. Submission of MIA and CUS permitting documents to SEMARNAT is anticipated in the 3rd Quarter 2019. The Project is not located in an area with any special Federal environmental protection designation and no factors have been identified that would be expected to hinder authorization of required Federal and State environmental permits.
The Project area includes five flora species with legally protected status and nine fauna species are listed as threatened or protected. In accordance with Federal laws, 100% of the protected plants will be rescued and transplanted prior to construction and qualified biologists will survey the areas to be disturbed to identify nesting areas, dens and lairs of animals present. Any animals not naturally prone to leave the area that are found will be relocated to suitable habitats elsewhere in the property area.
Based on the Mineral Reserves developed for this Project and results from environmental test work, the heap leach Project material has an overall neutralization potential ratio of 5 and is classified as non-acid forming, Tests completed by rinsing leached material with water indicate concentrations of metals and cyanide decreased with rinsing, and were within standards applicable to the site as presented in NOM-001-SEMARNAT-1996 (metals limits for discharge for agricultural use) and NOM-155-SEMARNAT-2007 (cyanide limits for heap leach mining) for all metals with the exception of arsenic. Results from SPLP and humidity cell tests imply that the source of the arsenic is not due to cyanide leaching, but rather weathering of the oxide and transitional ore. Consistent with this evaluation, arsenic is also elevated in the natural groundwater based on sample testing of well CR-01 in the pit area (Section 20.1.2.2). The Project considers designs and procedures to ensure that the elevated arsenic levels do not result in environmental degradation around the Project site.
Based on an independent assessment of social and community impacts of development of the Project completed by ERM, the Project does not put at risk the social environment of the nearby communities because the impacts can be mitigated or made positive with the implementation of a Social Management System (SMS). Orla plans to develop the Project in accordance with International Finance Corporation Performance Standards, as well as the International Council on Mining and Metals principles.
Kappes, Cassiday & Associates June, 2019 | | 25.0 Interpretations and Conclusions Page 25-2 |
| Camino Rojo Project Feasibility Study NI 43-101 Technical Report |
|
Baseline environmental studies and social and community impact investigations are ongoing. Based on the information and conclusions available, there are no environmental or social reasons preventing the development of the Project.
If an agreement with the Adjacent Owner can be reached there is additional Measured and Indicated Mineral Resource that is amendable to heap leaching that could potentially be exploited by open pit mining and processed in the facilities proposed for this Project.
In addition to the Mineral Resource amenable to heap leaching, the FS has identified a Measured and Indicated Mineral Resource of sulphide material that is amenable to milling and flotation concentration of 258.8 million tonnes at 0.88 g/t Au and 7.4 g/t Ag. This amounts to 7.3 million contained ounces of gold and 61.6 million contained ounces of silver. Additional metallurgical studies will be required to support the estimated metallurgical recoveries for this material. This deeper sulphide Mineral Resource is contained on Orla property, but an agreement with the Adjacent Owner will be required to exploit this by open pit mining methods. The selected heap leach pad and mine waste dump location have been situated to allow an open pit to be developed on the sulphides without requiring them to be moved.
| 25.2.3 | Metallurgy and Process |
Due to the uniform topography of the Camino Rojo property, earthworks quantities needed for elevating the haul roads to meet the required height of the primary crusher incur large capital costs. Utilizing a decoupled system (a conveyor at lower elevation to feed the crusher) would decrease initial earthworks quantities as well as fuel requirements from truck haulage throughout the life of the Project.
During Year 4 of operation, the pit depth will intersect the local water table. This will require pit dewatering for the remaining LOM of the Project. Recent investigation results suggest that the actual maximum dewatering rate will be lower than the estimated rate considered in this report, which would reduce both the capital and operating costs required for dewatering and for evaporation of excess pit water not utilized in mining and processing activities.
Kappes, Cassiday & Associates June, 2019 | | 25.0 Interpretations and Conclusions Page 25-3 |
| Camino Rojo Project Feasibility Study NI 43-101 Technical Report |
|
Leaching cycles have been designed for 80 days, but laboratory results have shown that silver recoveries benefit from cyanide solution application beyond the 80-day period. With subsequent lifts, draindown from active lifts will result in extended leaching times on previously leached lifts. As a result of this, silver recoveries are expected to increase over the LOM of the Project.
The Camino Rojo deposit occurs within a mineralized district that is highly prospective for discovery of additional deposits. New discoveries of Mineral Resources in the vicinity of the proposed mine may be accretive to project value.
The Project uses contract mining as part of the base case study. There are some specific risks related to contract mining. There is risk that the contractor may need financial assistance from the owner either in terms of cash, or loan guarantees, to procure some equipment, increasing the capital cost. Contract mining is common in Mexico and this risk can be minimized by careful evaluation of potential contractors.
Mining operations will eventually be conducted below the water table, probably during Year 4 of commercial operations. Estimates of pit dewatering requirements have been prepared for cost estimation purposes, but additional hydrogeological studies need to be conducted to evaluate the amount of pit inflow and the potential to keep the water from entering the pit by lowering the water table with external wells. There is a risk that the estimated pit dewatering costs may change as a result of these studies.
There is geotechnical risk associated with the base case mine plan that is constrained by the property boundary. Mitigation of any slope failures of the north wall could prove difficult due to lack of access to the ground to the north. The design slope angles on the north and west wall are relatively steep and assume aggressive slope reinforcement utilizing closely spaced cemented rebar dowels along the pit wall. The slope angles will be flatter than design if this system fails to work as expected. The slope angle design also assumes much of the wall will be pre-split using lightly loaded, approximate 100mm diameter blast holes, spaced 1m to 1.2m along the final pit wall. This is to maintain bench face angles of about 72o and allow safe catch bench widths. If this does not work as anticipated, or it is decided not to utilize this in some areas, the slope angles will be flatter than design. These geotechnical risks could reduce the amount of material mined and the amount of ore available for processing.
Kappes, Cassiday & Associates June, 2019 | | 25.0 Interpretations and Conclusions Page 25-4 |
| Camino Rojo Project Feasibility Study NI 43-101 Technical Report |
|
| 25.3.2 | Metallurgy and Process |
Carbonaceous material with preg-robbing characteristics has been identified, which may reduce overall heap performance and metal recovery if processed. In regards to gold and silver recovery the Camino Rojo deposit shows preg-robbing organic carbon as being the only significant deleterious element identified, which is primarily associated with the transition material at depth along the outer edges of the deposit. Preg robbing presents a low risk to the overall Project. A significant investigation by Orla into the preg robbing material which was reviewed by KCA indicates that preg robbing material will most likely not be encountered until later in the Project life and can be mitigated by proper ore control.
Evaporators for pit dewatering require a minimum operating depth in the pond for operation which is assumed to be approximately 1.5 metres, or approximately 46,500 m3 of solution. Based on the pond sizing criteria there is sufficient capacity in the event pond to accommodate this additional solution for the planned heap without any changes. However, evaporation rates of water from the pit may not consistently be as estimated which may lead to some periodic loss of pond storage.
There is a risk that Merrill-Crowe efficiencies may be poor, particularly during initial operations due to low pregnant solution concentrations. This may result in increased zinc consumption and delayed metal recoveries.
| 25.3.3 | Access, Title and Permitting |
The Project is subject to normal risks regarding access, title, permitting, and security. The Project has had a productive relationship with the surface owners and no extraordinary risks to Project access were discerned. Conditional upon continued compliance with annual requirements, no risk to validity of title was discerned. Conditional upon compliance with applicable regulations, permits for normal exploration activities, mine construction, and mine operation are expected to be attainable. Drug related violence, propagated by members of criminal cartels and directed against other members of criminal cartels, has occurred in the region and has affected local communities. The aggression is not directed at mining companies operating in the region and has not affected the ability of Orla or previous operators to explore the Camino Rojo property.
There is a risk due to a possible Federal designation of a protected biological-ecological reserve known as “Zacatecas Semiarid Desert” as a Natural Protected Area (ANP). If a designation of this ANP by the government includes the surface of the mining concession areas or ancillary work areas such as possible water well fields of Camino Rojo, this could limit the growth and continuity of the Project. Mining activities (including both exploration and exploitation), depending on the corresponding sub-zone may be carried out provided they are authorized by CONANP (National Commission on Protected Natural Areas), without prejudice of other authorizations required for their execution. Goldcorp, the prior operator of the Project, engaged in forums with government and community stakeholders, and submitted an official opinion regarding this ANP declaration to the government, with the objective of ensuring that if an ANP was created, the Camino Rojo Project would not be restricted from development. Since the time that the idea of creating an ANP was proposed there has been no formal movement on the proposal. Because the State and Municipal governments affected by the Camino Rojo Project have formally expressed opposition to creation of the ANP in the area of the Camino Rojo Project, the author believes the permitting risk is similar to that of any mining project of similar scope in North America.
Kappes, Cassiday & Associates June, 2019 | | 25.0 Interpretations and Conclusions Page 25-5 |
| Camino Rojo Project Feasibility Study NI 43-101 Technical Report |
|
The Project considers running a powerline from Conception Del Oro, approximately 55km from the Project site, to provide power to site early in the Project life. The application for the power line requires an investigation by CENACE to determine where the Project is allowed to connect to the grid, followed by approval from the Mexican CFE to construct the powerline. It is assumed that by Year 2 of operations power supply will be available by connecting to the national commercial grid and power generation at site will no longer be needed. There is a possibility that connection to the national grid will occur later than Year 2 and will require an extended time period of diesel power generation. This delay in access to lined power would incur additional operating costs for any duration beyond the expected date of connection to the commercial power grid. The estimated operating costs for generated power is approximately 37% more than line power.
An ecological tax implemented by the state Congress of Zacatecas in 2017 could have a significant impact on the economics of the Project. This tax is applied to cubic metres of material extracted during mining, square metres of material impacted by dangerous substances, tonnes of carbon dioxide produced during mining processes and tonnes of waste stored in landfills. Due to the uncertainty of application of this tax and turbulence between active mining companies and the State of Zacatecas, the long term affects and implementation of this ecological tax are currently unknown.
The primary Project production well (PW-1) underwent a 10,000-minute pumping test and a sustained flow of 32 L/s was maintained. However, there is a risk that the fracture system in the limestone has limited potential to provide water and that flow to the well could decrease over the life of the Project. Development of additional wells will mitigate this risk.
Kappes, Cassiday & Associates June, 2019 | | 25.0 Interpretations and Conclusions Page 25-6 |
| Camino Rojo Project Feasibility Study NI 43-101 Technical Report |
|
This Report presents an economically robust project. Based on these results, KCA recommends the following future work in regards to process and infrastructure development:
| · | Application and approval for the power line to the project site should continue to be advanced. Estimated costs for this are approximately US$130,000 and are included in the cost estimates of the Report. |
| · | Engage with Adjacent Property Owner to reach an agreement allowing expansion of the proposed mine pit and mineral resource. |
| | | |
In addition to the continuing the exploration work already underway, RGI recommends a phased exploration program. Phase 1 consists of:
| · | 950 line-km of induced polarization (IP) geophysical surveys to seek additional mineralized zones concealed by colluvium. |
| · | A 5,000m core drill program to evaluate the sulphide resource underlying and adjacent to the oxide and transition mineralization that is the focus of the FS, with the goal of defining mineralization that may be economically processed through a mill and flotation plant. |
| · | A 5,000m RC drill program to test IP anomalies already identified. |
Phase 2, which is conditional upon identification of new IP anomalies, comprises:
| · | A 5,000m RC drill program to test newly defined IP anomalies. |
| · | A 5,000m core drilling program to evaluate the mineralized zones thus discovered. |
The total estimated cost to complete the first phase of recommended exploration work is US$3.25 million. Conditional upon positive results from the first phase, the second phase of recommended work is estimated to cost US$1.80 million.
Kappes, Cassiday & Associates June, 2019 | | 26.0 Recommendations Page 26-1 |
| Camino Rojo Project Feasibility Study NI 43-101 Technical Report |
|
| 26.3 | Barranca Recommendations |
Barranca Group LLC recommends the following:
| · | Additional RC test drilling leading to the construction of one or more back up or reserve production wells which should have a pump-tested sustainable capacity of at least 15 to 20 L/s; and, |
| · | Drilling and construction of all 5 proposed monitor wells during calendar 2019 or early 2020 in order to define the direction of groundwater movement as well as baseline water quality. |
The estimated cost for the proposed water well drilling and development is approximately US$1.1 million and is included in the capital cost estimate of this report.
Kappes, Cassiday & Associates June, 2019 | | 26.0 Recommendations Page 26-2 |
| Camino Rojo Project Feasibility Study NI 43-101 Technical Report |
|
Aguayo, P., (2019), Estudios Ambientales de Línea Base para el proyecto Camino Rojo.
Aranda-Gomez, J. L.-M.-C., 2006, El volcanismo tipo intraplaca del Cenozoico tardío en el centro y norte de México: Una revision. Boletín De La Sociedad Geológica Mexicana, 187-225.
Barboza-Gudiño, J. Z.-M.-R.-N., 2010, Late Triassic stratigraphy and facies from northeastern Mexico: Tectonic setting and provenance. Geosphere, 621-640.
Barranca Group, LLC, 2019 (January), Technical Memo – Camino Rojo Project – Pump Test Summary – Well Cr-01 – January 2019.
Barranca Group, LLC, 2019 (April), Camino Rojo Project – Production Well Pw-1 – April 2019.
Barranca Group, LLC, 2019 (June), Camino Rojo Project – Heap Leach Area Monitor Wells – June 2019.
Barranca Group, LLC, 2019 (June), Camino Rojo Project – Well Summary Report Pw-2 – June 2019.
Barrett, M., 2019 (January), Laboratory Test Results for Orla Mining Ltd Project – Camino Rojo.
Blanchflower, J. (2009, January 15). Technical Report on the Mineral Resources of the Camino Rojo Property. Technical report posted by the Canplats on SEDAR, January 15, 2009, 70 p: Minorex Consulting.
Blanchflower, K. K. (2009). Technical Report Preliminary Assessment based on Report Titled "Technical Assessment of Camino Rojo Project, Zacatecas, Mexico", prepared by Minorex Consulting Mine and Quarry Engineering Services Inc. for Canplats Resources Corporation, October 16, 2009.
Blue Coast Research, Ltd., 2013 (September), PJ5119 – Goldcorp Camino Rojo Represa Transition Sample Summary, Prepared for Goldcorp.
Buseck, P. R., 1966, Contact metamorphism and ore deposition, Concepcion del Oro, Mexico. Economic Geology, 61(1), p 97-136.
Kappes, Cassiday & Associates June, 2019 | | 27.0 References Page 27-1 |
| Camino Rojo Project Feasibility Study NI 43-101 Technical Report |
|
Centeno-Garcia, E., 2005, Review of Upper Paleozoic and Lower Mesozoic stratigraphy and depositional environments of central and west Mexico: Constraints on terrane analysis and paleogeography. The Mojave-Sonora megashear hypothesis: Development, assessment, and alternatives: Geological Society of America Special Paper 393, Anderson, T.H., Nourse, J.A., McKee, J.W., and Steiner, M.B., eds., 233-258.
CONANP., 2014, Estudio previo justificativo para la declaratoria como Area Natural Protegida Reserva de la Biosfera Desierto Semiarido de Zacatecas. Mexico City, Mexico: Comision Nacional de Areas Naturales Protegidas.
Cruz-Gámez, E. V.-T.-F.-S.-D., 2017, Volcanic sequence in Late Triassic – Jurassic siliciclastic and evaporitic rocks from Galeana, NE Mexico. Geologica Acta: an international earth science journal, 89-106.
Ernst & Young, 2017, (May), Metals Tax Summary, Mexico - Mining and Metals Tax Guide.
Goldcorp, 2016 (September), Pre-Feasibility Study Report, Camino Rojo Project, San Tiburcio, Zacatecas, Mexico.
Goldcorp Inc., 2017, (March), Goldcorp Annual Information Form for the Financial Year Ending 31 December 2016.
Gray, M. D., 2016 (December), Site Visit Report, Camino Rojo Gold Project (Goldcorp), Zacatecas, Mexico, Prepared for Orla Mining Ltd. Rio Rico, Arizona, USA: Resource Geosciences Inc.
Gray, M. D, 2018, CSA NI43-101 Technical Report on the Camino Rojo Gold Project, Municipio of Mazapil, Zacatecas, Mexico. Rio Rico, AZ: Resource Geosciences Inc.
Hawkins, D., 2018, Groundwater Conditions – Camino Rojo Project. Tucson, Arizona: Barranca Group LLC.
Hazen Research Inc., 2014, Camino Rojo Project Variability Study. Golden, Colorado: Hazen Research Inc.
Heiras, M., 2017 (June), Legal opinion letter. Chihuahua, Chihuahua, Mexico: Heiras y Asociados S.C. Abogados.
Heiras, M., 2018 (January), Letter report, Camino Rojo permitting for exploration and Ejido relations. Chihuahua, Chihuahua, Mexico: Heiras y Asociados S.C., Abogados.
Kappes, Cassiday & Associates June, 2019 | | 27.0 References Page 27-2 |
| Camino Rojo Project Feasibility Study NI 43-101 Technical Report |
|
Heiras, M., 2019 (July), Legal opinion letter. Chihuahua, Chihuahua, Mexico: Heiras y Asociados S.C. Abogados.
Huss, C., M3, 2012 (August), Camino Rojo Project Technical Report Prefeasibility Study, Zacatecas, Mexico, Document No. M3-PN100113, Prepared for Goldcorp.
HydroGeoLogica Incorporated, 2019 (January), Final Sampling and Analysis Plan for Supplemental Geochemical Characterization, Camino Rojo Project.
HydroGeoLogica Incorporated, 2019 (April), Camino Rojo Supplemental Geochemical Characterization Program – Interim Report.
HydroGeoLogica Incorporated, 2019 (June), Preliminary Closure Plan for the Camino Rojo Heap Leach Pad.
HydroGeoLogica Incorporated, 2019 (June), Draft – Camino Rojo Pit Lake Evaluation Report.
Independent Mining Consultants, Inc., 2018 (December), Core versus RC Drilling Memo.
Independent Mining Consultants, Inc., 2018 (April), Camino Rojo Mine Production Schedule – Constrained Case.
Independent Mining Consultants, Inc., 2018 (April), Waste Details – 18,000 TPD Constrained Schedule.
Kappes, Cassiday & Associates, 2010 (April), Camino Rojo Project Report of Metallurgical Test Work, Prepared for Mine and Quarry Engineering Services, Inc.
Kappes, Cassiday & Associates, 2012 (May), Camino Rojo Project Report of Metallurgical Test Work, Prepared for Goldcorp.
Kappes, Cassiday & Associates, 2014 (October), Camino Rojo Project Report of Metallurgical Test Work, Prepared for Goldcorp.
Kappes, Cassiday & Associates, 2015 (August), Camino Rojo Project Report of Metallurgical Test Work, Prepared for Goldcorp.
Kappes, Cassiday & Associates, 2019 (June), Camino Rojo Project Feasibility Capital Cost Details.
Kappes, Cassiday & Associates June, 2019 | | 27.0 References Page 27-3 |
| Camino Rojo Project Feasibility Study NI 43-101 Technical Report |
|
Kappes, Cassiday & Associates, 2019 (June), Camino Rojo Project Feasibility Study Equipment List.
Kappes, Cassiday & Associates, 2019 (June), Camino Rojo Project Feasibility Study Process Design Criteria.
Kappes, Cassiday & Associates, 2019 (June), Camino Rojo Project Kp, Ki, TrSx(H), TrHi and TrLo Composites Report of Metallurgical Test Work.
Kappes, Cassiday & Associates, 2019 (June), Project Feasibility Study on the Camino Rojo Gold Project Municipality of Mazapil, Zacatecas, Mexico
Longo, A., 2017, Review of the exploration data for Camino Rojo, Orla Mining Ltd., private company report. Reno, NV.
Longo, A.A., Edwards, J., 2017, Camino Rojo: Observations leading to a new geologic model, and breccia modelling issues, private company report, Prepared for Orla Mining Ltd. Reno, NV.
Loza-Aguirre, I. N., 2008, Relaciones estratigráfico-estructurales en la intersección del sistema de fallas San Luis-Tepehuanes y el graben de Aguascalientes, México central, pp. 533-548.
Loza-Aguirre, I. N.-S.-Á.-O., 2012, Cenozoic volcanism and extension in northwestern Mesa Central, Durango, México. Boletín De La Sociedad Geológica Mexicana, 243-263.
Meinert, L.D., Dipple, G.M., and Nicolescu, S., 2005, World Skarn Deposits. In J. T. Hedenquist, Economic Geology One Hundredth Anniversary Volume 1905 - 2005. (p. 1136). Littleton, CO: Society of Economic Geologists, Inc.
Mine Development Associates, 2011 (June), Camino Rojo - A Comparison of Goldcorp and Canplats Drill Results.
Mitre-Salazar, L., 1989, La megafalla Laramídica de San Tiburcio, estado de Zacatecas. Univ. Nacional Autón. México, Inst. Geologia Revista, 47-51.
NewFields Servicios de México, 2019 (February), Diseño Conceptual de Manejo de Aguas Pluviales y Control de Sedimentacion Proyecto Minero Camino Rojo San Tiburcio, Zacatecas Mexico.
Kappes, Cassiday & Associates June, 2019 | | 27.0 References Page 27-4 |
| Camino Rojo Project Feasibility Study NI 43-101 Technical Report |
|
NewFields Servicios de México, 2019 (February), Ingeniería Conceptual Para Manejo de Aguas Pluviales y Control de Sedimentación Proyecto Minero Camino Rojo.
NewFields Servicios de México, 2019 (February), Revision y Calculo de Precipitacion Pluvial del Proyecto Camino Rojo Proyecto Minero Camino Rojo San Tiburcio, Zacatecas Mexico.
Nieto-Samaniego, A. A.-Á., 2007, Mesa Central of México: Stratigraphy, structure, and Cenozoic tectonic evolution. Geology of México: Celebrating the Centenary of the Geological Society of México: Geological Society of America, Special Paper 422, Álvarez, S.A., and Nieto-Samaniego, Á.F., eds., 41-70.
Ortega-Flores, B. S.-A., 2015, The Mesozoic successions of western Sierra de Zacatecas, Central Mexico: provenance and tectonic implications. Geology Magazine, 1-22.
Piteau Associates Engineering Ltd., 2016 (May), Goldcorp Inc. Camino Rojo Project Prefeasibility Pit Slope Design Study, Geotechnical Investigations and Slope Design Recommendations for the Proposed Oxide and Sulphide Open Pits, Prepared for Goldcorp.
Piteau Associates Engineering Ltd., 2018 (October), Waste Rock Facility and Heap Leach Pad - Preliminary Stability Analyses.
Piteau Associates Engineering Ltd., 2019 (April), Slope Stability Assessments and Slope Steepening Using Reinforcement for the North and West Walls of the Camino Rojo: Constrained: Mine Plan.
Piteau Associates Engineering Ltd., 2019 (April), Waste Rock Facility and Heap Leach Pad - Preliminary Stability Analyses.
Resource Geosciences Incorporated, 2018 (December), 2018 Drill Program QA QC Report Camino Rojo Project, Municipio of Mazapil, Zacatecas, Mexico.
Rocha-Rocha, M., 2016 (May), Metallogenesis of the Peñasquito polymetallic deposit: A contribution to the understanding of the magmatic ore system. Doctoral dissertation. Reno, Nevada, USA: University of Nevada Reno.
Sanchez, S., 2017 (May), The Mineralogy, Paragenesis And Alteration Of The Camino Rojo Deposit, Zacatecas, Mexico. Master of Science Thesis. Reno, Nevada, USA: University of Nevada, Reno.
Kappes, Cassiday & Associates June, 2019 | | 27.0 References Page 27-5 |
| Camino Rojo Project Feasibility Study NI 43-101 Technical Report |
|
SEMARNAT, Delegacion en el Estado De Zacatecas, Subdelegación de Gestión para la Protección Ambiental y Recursos Naturales., 2013, Oficio No DFZ152-203/13/1675. Zacatecas, Zacatecas: Secretaria de Medio Ambiente y Recursos Naturales, Mexico.
Servicio Geológico Mexicano, 2000, Carta Geológico-Minero Concepcion del Oro G14-10. Pachuca, Hidalgo, Mexico: Servicio Geológico Mexicano.
Servicio Geológico Mexicano, 2014, Carta Geológico-Minero San Tiburcio G14C82. Pachuca, Hidalgo, Mexico: Servicio Geologico Mexicano.
SGS Minerals Services, 2009 (August), Progress Report 1, Evaluation of the Amenability of Camino Rojo Drill Hole Samples to Cyanide Leaching and Flotation Processes, Report SGS 54-08, Prepared for Canplats de México, S.A. de C.V.
SGS Minerals Services, 2009 (August), An Investigation into the Amenability of 21 Camino Rojo Samples to Leaching and Flotation Processes, Report SGS-09-09, Progress Report 2, Prepared for Canplats de México, S.A. de C.V.
Tristán-González, M. A.-D.-H.-H., 2009, Post-Laramide and pre-Basin and Range deformation and implications for Paleogene (55–25 Ma) volcanism in central Mexico: A geological basis for a volcano-tectonic stress model. Tectonophysics, 136-152.
Ward, J., 2019 (June), Groundwater Flow Modeling for Projected Camino Rojo Mine Project.
Weiss, S. I.-V.-D.-C.,2010, Geologic Setting and Polymetallic Style of Gold Mineralization, Camino Rojo Deposit, Northern Zacatecas, Mexico. Gold and Base Metal Deposits in the Mexican Altiplano, States of Zacatecas and San Luis Potosi, Central Mexico, Society of Economic Geologists Guidebook series, V. 40, 97-102.
Kappes, Cassiday & Associates June, 2019 | | 27.0 References Page 27-6 |
| Camino Rojo Project Feasibility Study NI 43-101 Technical Report |
|
| 28.0 | DATE AND SIGNATURE PAGE |
This report, entitled Feasibility Study NI 43-101 Technical Report on the Camino Rojo Gold Project, Municipality of Mazapil, Zacatecas, Mexico has the following report dates:
| Report Date is: | 25 June 2019 |
| | |
| Mineral Resource Effective Date is: | 7 June 2019 |
| | |
| Mineral Reserve Effective Date is: | 24 June 2019 |
| | |
The report was prepared as per the following signed Qualified Persons’ Certificates.
Kappes, Cassiday & Associates June, 2019 | | 28.0 Date & Signature Page 28-1 |
CERTIFICATE OF QUALIFIED PERSON
I, Carl Defilippi, RM SME, of Reno, Nevada, USA, Sr. Project Engineer at Kappes, Cassiday & Associates, as an author of this report entitled “Feasibility Study - NI 43-101 Technical Report on the Camino Rojo Gold Project - Municipality of Mazapil, Zacatecas, Mexico” dated June 25, 2019, prepared for Orla Mining Ltd. (the “Issuer”) do hereby certify that:
| 1. | I am employed as a Sr. Project Engineer at Kappes, Cassiday & Associates, an independent metallurgical consulting firm, whose address is 7950 Security Circle, Reno, Nevada 89506. |
| 2. | This certificate applies to the technical report “Feasibility Study - NI 43-101 Technical Report on the Camino Rojo Gold Project - Municipality of Mazapil, Zacatecas, Mexico”, dated June 25, 2019 (the “Technical Report”). |
| 3. | I am a registered member with the Society of Mining, Metallurgy and Exploration (SME) since 2011 and my qualifications include experience applicable to the subject matter of the Technical Report. In particular, I am a graduate of the University of Nevada with a B.S. in Chemical Engineering (1978) and a M.S. in Metallurgical Engineer (1981). I have practiced my profession continuously since 1982. Most of my professional practice has focused on the development of gold-silver leaching projects. I have successfully managed numerous studies at all levels on various cyanidation projects. |
| 4. | I am familiar with National Instrument 43-101 – Standards of Disclosure for Mineral Projects (“NI 43-101”) and by reason of education, experience and professional registration I fulfill the requirements of a “qualified person” as defined in NI 43-101. |
| 5. | I visited the Camino Rojo property for a total of four days on January 17-18, 2019 and on 20-21 February, 2018. |
| 6. | I am responsible for Sections 1.1, 1.5, 1.9, 1.10, 1.12, 1.13, 1.14, 1.15.1, 1.15.2, 1.15.3.2, 1.15.3.4, 1.16.1, 2, 3, 12.2, 12.3, 13, 17, 18, 19, 20.1.7, 21.0, 21.1, 21.1.2, 21.1.3 through 21.1.9, 21.2, 21.2.2, 21.3, 22, 24.1, 24.2, 25.1, 25.1.2, 25.2.3, 25.3.2, 25.3.4, 26.1, 27 and 28 of the Technical Report. |
| 7. | I am independent of the Issuer as described in section 1.5 of NI 43-101. |
| 8. | I have had no prior involvement with the property that is the subject of the Technical Report, other than as an author of the previous technical reports entitled “Preliminary Economic Assessment – Amended NI 43-101 Technical Report on the Camino Rojo Gold Project – Municipality of Mazapil, Zacatecas, Mexico” dated June 19, 2018 and amended March 11, 2019 and “CSA NI43-101 Technical Report on the Camino Rojo Gold Project, Municipio of Mazapil, Zacatecas, Mexico”, dated 24 January 2018. |
| 9. | I have read NI 43-101 and the Technical Report has been prepared in compliance with NI 43-101. |
| 10. | As of the effective date of the Technical Report, to the best of my knowledge, information and belief, the Technical Report contains all scientific and technical information that is required to be disclosed to make the Technical Report not misleading. |
Dated this 6th day of August, 2019
| | |
| “Carl E. Defilippi” | |
Carl Defilippi, RM SME Sr. Project Engineer at Kappes, Cassiday & Associates | |
CERTIFICATE OF QUALIFIED PERSON
I, Michael G. Hester, FAusIMM, of Tucson, Arizona, USA, Vice President and Principal Mining Engineer at Independent Mining Consultants, Inc., as an author of this report entitled “Feasibility Study - NI 43-101 Technical Report on the Camino Rojo Gold Project - Municipality of Mazapil, Zacatecas, Mexico” dated June 25, 2019, prepared for Orla Mining Ltd. (the “Issuer”) do hereby certify that:
| 1. | I am employed as a Vice President and Principal Mining Engineer at Independent Mining Consultants, Inc., an independent mining consulting firm, whose address is 3560 East Gas Road, Tucson, Arizona, 85714, USA, phone number (520) 294-9861. |
| 2. | This certificate applies to the technical report “Feasibility Study - NI 43-101 Technical Report on the Camino Rojo Gold Project - Municipality of Mazapil, Zacatecas, Mexico”, dated June 25, 2019 (the “Technical Report”). |
| 3. | I hold the following academic qualifications: |
B.S. (Mining Engineering) University of Arizona 1979
M.S. (Mining Engineering) University of Arizona 1982
| 4. | I am a Fellow of the Australian Institute of Mining and Metallurgy (FAusIMM #221108), a professional association as defined by National Instrument 43-101 – Standards of Disclosure for Mineral Projects (“NI 43-101”). As well, I am a member in good standing of the following technical associations and societies: |
Society for Mining, Metallurgy, and Exploration, Inc. (SME Member # 1423200)
Member of Resources and Reserves Committee of the Society of Mining, Metallurgy, and Exploration.
The Canadian Institute of Mining, Metallurgy and Petroleum (CIM Member #100809)
| 5. | I have worked in the minerals industry as an engineer continuously since 1979, a period of 40 years. I am a founding partner, Vice President, and Principal Mining Engineer for Independent Mining Consultants, Inc., a position I have held since 1983. I have been employed as an Adjunct Lecturer at the University of Arizona (1997-1998) where I taught classes in open pit mine planning and mine economic analysis. I am also a member of the Resources and Reserves Committee of the Society of Mining, Metallurgy, and Exploration since March 2012. I was employed as a staff engineer for Pincock, Allen & Holt, Inc. from 1979 to 1983. During my career I have had extensive experience reviewing and auditing deposit sampling methods, analytical procedures, and QA/QC analysis. I also have many years of experience developing mineral resource models, developing open pit mine plans and production schedules, calculating equipment requirements for open pit mining operations, developing mine capital and operating cost estimates, performing economic analysis of mining operations and managing various preliminary economic assessments, Pre-Feasibility, and Feasibility Studies. |
| 6. | I am familiar with NI 43-101 and by reason of education, experience and professional registration I fulfill the requirements of a “qualified person” as defined in NI 43-101. |
| 7. | I visited the Camino Rojo property for two days from February 20-21, 2018. |
| 8. | I am responsible for Sections 1.6, 1.7, 1.8, 1.15.3.1, 10.1, 10.2, 10.3, 10.5.1, 10.6.1, 11.1, 11.2, 11.3.1, 11.3.2, 11.4.1, 12.1.1, 12.1.3, 14, 15, 16, 21.1.1, 21.2.1, 24.4, 25.1.1, 25.2.1, 25.2.2, and 25.3.1. |
| 9. | I am independent of the Issuer as described in section 1.5 of NI 43-101. |
| 10. | I have had no prior involvement with the property that is the subject of the Technical Report, other than as an author of the previous technical report entitled “Preliminary Economic Assessment – Amended NI 43-101 Technical Report on the Camino Rojo Gold Project – Municipality of Mazapil, Zacatecas, Mexico” dated June 19, 2018 and amended March 11, 2019. |
| 11. | I have read NI 43-101 and the Technical Report has been prepared in compliance with NI 43-101. |
| 12. | As of the effective date of the Technical Report, to the best of my knowledge, information and belief, the Technical Report contains all scientific and technical information that is required to be disclosed to make the Technical Report not misleading. |
Dated this 6th day of August, 2019
| | |
| “Michael G. Hester” | |
Michael G. Hester, FAusIMM Vice President and Principal Mining Engineer Independent Mining Consultants, Inc. | |
CERTIFICATE OF QUALIFIED PERSON
I, Dr. Matthew Gray, Ph.D., C.P.G. #10688, of Rio Rico, Arizona, USA, Geologist at Resource Geosciences Incorporated, as an author of this report entitled “Feasibility Study - NI 43-101 Technical Report on the Camino Rojo Gold Project - Municipality of Mazapil, Zacatecas, Mexico” dated June 25, 2019, prepared for Orla Mining Ltd. (the “Issuer”) do hereby certify that:
| 1. | I am employed as a geologist at Resource Geosciences Incorporated, an independent consulting geosciences firm, whose address is 765A Dorotea Ct, Rio Rico, Arizona, 85648 USA. |
| 2. | This certificate applies to the technical report “Feasibility Study - NI 43-101 Technical Report on the Camino Rojo Gold Project - Municipality of Mazapil, Zacatecas, Mexico”, dated June 25, 2019 (the “Technical Report”). |
| 3. | I am a Certified Professional Geologist (#10688) with the American Institute of Professional Geologists since 2003, a Member and Fellow of the Society of Economic Geologists since 1987, and my qualifications include experience applicable to the subject matter of the Technical Report. In particular, I am a graduate of the Colorado School of Mines (Ph.D., Geology with Minor in Mineral Economics, 1994; B.Sc., Geological Engineering, 1985) and the University of Arizona (M.Sc., Geosciences, 1988) and I have practiced my profession continuously since 1988. Most of my professional practice has focused on exploration for metallic mineral deposits, the creation of resource models, and the economic development of gold and copper deposits. I successfully managed mine permitting, water rights, and community relocation issues related to development of the Piedras Verdes copper mine, a large scale open pit mine in Sonora, Mexico. |
| 4. | I am familiar with National Instrument 43-101 – Standards of Disclosure for Mineral Projects (“NI 43-101”) and by reason of education, experience and professional registration I fulfill the requirements of a “qualified person” as defined in NI 43-101. |
| 5. | I visited the Camino Rojo property for a total of 21 days during the periods 12-13 December 2016, 19 to 22 February, 18 to 20 July, and 20 to 24 August 2018, and 17 to 18 January and 8 to 12 April 2019. |
| 6. | I am responsible for Sections 1.2, 1.3, 1.4, 1.11, 1.15.3.3, 1.16.2, 4, 5, 6, 7, 8, 9, 10.4, 10.5.2, 10.6.2, 11.3.3, 11.4.2, 12.1.2, 20 exclusive of 20.1.7, 23, 25.1.3, 25.2.4, 25.3.3, and 26.2. |
| 7. | I am independent of the Issuer as described in section 1.5 of NI 43-101. |
| 8. | I have had no prior involvement with the property that is the subject of the Technical Report, other than as an author of the previous technical reports entitled “Preliminary Economic Assessment – Amended NI 43-101 Technical Report on the Camino Rojo Gold Project – Municipality of Mazapil, Zacatecas, Mexico” dated June 19, 2018 and amended March 11, 2019, and “CSA NI43-101 Technical Report on the Camino Rojo Gold Project, Municipio of Mazapil, Zacatecas, Mexico”, dated 24 January 2018. |
| 9. | I have read NI 43-101 and the Technical Report has been prepared in compliance with NI 43-101. |
| 10. | As of the effective date of the Technical Report, to the best of my knowledge, information and belief, the Technical Report contains all scientific and technical information that is required to be disclosed to make the Technical Report not misleading. |
Dated this 6th day of August, 2019
| | |
| “Matthew D. Gray” | |
Dr. Matthew Gray, Ph.D., C.P.G. #10688 Geologist
Resource Geosciences Incorporated | |
CERTIFICATE OF QUALIFIED PERSON
I, David Hawkins, C.P.G., of Tuscon, Arizona, USA, Owner and Principal Hydrogeologist at Barranca Group, LLC, as an author of this report entitled “Feasibility Study - NI 43-101 Technical Report on the Camino Rojo Gold Project - Municipality of Mazapil, Zacatecas, Mexico” dated June 25, 2019, prepared for Orla Mining Ltd. (the “Issuer”) do hereby certify that:
| 11. | I am Owner and Principal Hydrogeologist at Barranca Group, LLC, and independent groundwater hydrogeology consulting firm whose address is 2954 N. Campbell Ave., No. 149, Tucson, AZ 85719. |
| 12. | This certificate applies to the technical report “Feasibility Study - NI 43-101 Technical Report on the Camino Rojo Gold Project - Municipality of Mazapil, Zacatecas, Mexico”, dated June 25, 2019 (the “Technical Report”). |
| 13. | I am a Certified Professional Geologist (CPG-11613) with the American Institute of Professional Geologists since May 28, 2013. My qualifications include experience applicable to the subject matter of the Technical Report. In particular, I am a graduate of the University of Arizona, Northern Arizona University, and New Mexico Institute of Mining and Technology, and I have practiced my profession continuously since 1981. Most of my professional practice has focused on water supply development investigations and groundwater quality investigations. |
| 14. | I am familiar with National Instrument 43-101 – Standards of Disclosure for Mineral Projects (“NI 43-101”) and by reason of education, experience and professional registration I fulfill the requirements of a “qualified person” as defined in NI 43-101. |
| 15. | I most recently visited the Camino Rojo property May 7 through 11, 2019 to supervise the test pumping of well PW-2. |
| 16. | I am responsible for Sections 1.16.3, 24.3, and 26.3 of the Technical Report. |
| 17. | I am independent of the Issuer as described in section 1.5 of NI 43-101. |
| 18. | Prior to being contracted by Orla Mining Ltd. In 2018 to work on groundwater-related aspects of the project I had no prior involvement with the property. I have read NI 43-101 and the Technical Report has been prepared in compliance with NI 43-101. |
| 19. | As of the effective date of the Technical Report, to the best of my knowledge, information and belief, the Technical Report contains all scientific and technical information that is required to be disclosed to make the Technical Report not misleading. |
Dated this 6th day of August, 2019
| | |
| “David B. Hawkins” | |
David Hawkins, CPG [Owner and Principal Hydrogeologist]
Barranca Group, LLC | |