Exhibit 99.88
AMENDED AND RESTATED
| Camino Rojo Preliminary Economic Assessment | | NI 43-101 Technical Report |
Preliminary Economic Assessment
Amended NI 43-101 Technical Report on the Camino Rojo Gold Project
Municipality of Mazapil, Zacatecas, Mexico
Prepared for:

1240 – 1140 West Pender Street
Vancouver, BC, V6E 4G1
Canada
Prepared by:
| |  | Kappes, Cassiday & Associates 7950 Security Circle Reno, NV 89506 | |
Report Date: June 19, 2018 Mineral Resource Effective Date: April 27, 2018
Amended: March 11, 2019 | Authors: Carl Defilippi, KCA, RM SME Dr. Matthew Gray, RGI, CPG Michael Hester, IMC, FAusIMM |
Kappes, Cassiday & Associates June 19, 2018
| Page 1-1 |
| AMENDED AND RESTATED |
| Camino Rojo Preliminary Economic Assessment | NI 43-101 Technical Report |
TABLE OF CONTENTS
| | 1.1 | Introduction and Overview | 1-1 |
| | | | |
| | 1.2 | Property Description and Ownership | 1-2 |
| | | | |
| | 1.3 | Geology & Mineralization | 1-2 |
| | | | |
| | 1.4 | Exploration and Drilling | 1-3 |
| | | | |
| | 1.5 | Metallurgical Testwork | 1-4 |
| | | | |
| | 1.6 | Mineral Resource Estimate | 1-4 |
| | | | |
| | 1.7 | Mining Methods | 1-6 |
| | | | |
| | 1.8 | Recovery Methods | 1-7 |
| | | | |
| | 1.9 | Infrastructure | 1-7 |
| | | | |
| | 1.10 | Environmental Studies, Permitting and Social or Community Impact | 1-8 |
| | | | |
| | 1.11 | Capital and Operating Costs | 1-9 |
| | | | |
| | 1.12 | Economic Analysis | 1-10 |
| | | | |
| | 1.13 | Interpretations and Conclusions | 1-13 |
| | 1.13.1 | Conclusions | 1-13 |
| | | | |
| | 1.13.2 | Opportunities | 1-14 |
| | | | |
| | 1.13.3 | Risks | 1-14 |
| | 2.1 | Introduction and Overview | 2-1 |
| | | | |
| | 2.2 | Project Scope and Terms of Reference | 2-2 |
| | 2.2.1 | Scope of Work | 2-2 |
| | | | |
| | 2.2.2 | Terms of Reference | 2-3 |
| | 2.3 | Sources of Information | 2-4 |
| | | | |
| | 2.4 | Qualified Persons and Site Visits | 2-4 |
| | | | |
| | 2.5 | Forward Looking Information | 2-5 |
| | | | |
| | 2.6 | Frequently Used Acronyms, Abbreviations, Definitions and Units of Measure | 2-8 |
| | 3.0 | RELIANCE ON OTHER EXPERTS | 3-1 |
| | | | |
| | 4.0 | PROPERTY DESCRIPTION AND LOCATION | 4-1 |
| | 4.1 | Area and Location | 4-1 |
| | | | |
| | 4.2 | Claims and Title | 4-2 |
| | 4.2.1 | Orla Control of Mining Concessions via Acquisition from Minera Peñasquito SA de CV | 4-6 |
Kappes, Cassiday & Associates June 19, 2018
| Page 1-2 |
| AMENDED AND RESTATED |
| Camino Rojo Preliminary Economic Assessment | NI 43-101 Technical Report |
| | 4.3 | Surface Rights | 4-7 |
| | | | |
| | 4.4 | Environmental Liability | 4-11 |
| | | | |
| | 4.5 | Permits | 4-11 |
| | | | |
| | 4.6 | Access, Title, Permit and Security Risks | 4-12 |
| | 4.6.1 | Access Risks | 4-12 |
| | | | |
| | 4.6.2 | Title Risks | 4-12 |
| | | | |
| | 4.6.3 | Permit Risks | 4-12 |
| | | | |
| | 4.6.4 | Security Risks | 4-13 |
| | 5.0 | ACCESSIBILITY, CLIMATE, LOCAL RESOURCES AND PHYSIOGRAPHY | 5-1 |
| | 5.1 | Accessibility | 5-1 |
| | | | |
| | 5.2 | Physiography, Climate and Vegetation | 5-3 |
| | | | |
| | 5.3 | Local Resources and Infrastructure | 5-4 |
| | 6.1 | Prior Ownership | 6-1 |
| | | | |
| | 6.2 | Prior Exploration | 6-1 |
| | | | |
| | 6.3 | Historical Metallurgical Studies | 6-3 |
| | | | |
| | 6.4 | Historical Resource Estimates | 6-4 |
| | 6.4.1 | Canplats | 6-4 |
| | | | |
| | 6.4.2 | Goldcorp | 6-4 |
| | 7.0 | GEOLOGICAL HISTORY AND MINERALIZATION | 7-1 |
| | 7.1 | Sources of Information | 7-1 |
| | | | |
| | 7.2 | Regional Geology | 7-1 |
| | | | |
| | 7.3 | Local and Property Geology | 7-4 |
| | 7.3.1 | General Deposit Geology | 7-4 |
| | | | |
| | 7.3.2 | Structural Setting | 7-7 |
| | | | |
| | 7.3.3 | Mineralized Zones | 7-7 |
| | | | |
| | 7.3.4 | Alteration | 7-11 |
| | 7.4 | Oxidation | 7-11 |
| | | | |
| | 7.5 | Conclusions | 7-14 |
| | 8.0 | DEPOSIT TYPES | 8-1 |
| | | | |
| | 9.0 | EXPLORATION | 9-1 |
| | | | |
| | 10.0 | DRILLING | 10-1 |
Kappes, Cassiday & Associates June 19, 2018
| Page 1-3 |
| AMENDED AND RESTATED |
| Camino Rojo Preliminary Economic Assessment | NI 43-101 Technical Report |
| | 10.1 | General | 10-1 |
| | | | |
| | 10.2 | Canplats Drilling | 10-2 |
| | | | |
| | 10.3 | Goldcorp Drilling | 10-2 |
| | | | |
| | 10.4 | Sampling | 10-4 |
| | | | |
| | 10.5 | Conclusions | 10-4 |
| | 11.0 | SAMPLE PREPARATION, ANALYSES AND SECURITY | 11-1 |
| | 11.1 | Sample Preparation | 11-1 |
| | | | |
| | 11.2 | Analyses | 11-1 |
| | | | |
| | 11.3 | QA/QC Programs | 11-2 |
| | 11.3.1 | Canplats QA/QC Program | 11-2 |
| | | | |
| | 11.3.2 | Goldcorp QA/QC Program | 11-2 |
| | 12.0 | DATA VERIFICATION | 12-1 |
| | | | |
| | 13.0 | MINERAL PROCESSING AND METALLURGICAL TESTING | 13-1 |
| | 13.1 | Canplats (2009) | 13-1 |
| | | | |
| | 13.2 | Goldcorp (2010-2015) | 13-3 |
| | 13.2.1 | Kappes, Cassiday & Associates (2010-2015) | 13-3 |
| | | | |
| | 13.2.2 | Blue Coast Research Metallurgy (2012-2013) | 13-10 |
| | | | |
| | 13.2.3 | Hazen Research (2014) | 13-11 |
| | | | |
| | 13.2.4 | Comminution Testing | 13-12 |
| | 13.3 | Conclusions from Metallurgical Programs | 13-13 |
| | 13.3.1 | Crush Size and Recovery | 13-13 |
| | | | |
| | 13.3.2 | Leach Cycle | 13-16 |
| | | | |
| | 13.3.3 | Reagent Consumption Projection | 13-16 |
| | | | |
| | 13.3.4 | Conclusions and Key Design Parameters | 13-17 |
| | 13.4 | Sulphide Mineralization Discussion | 13-18 |
| | 14.0 | MINERAL RESOURCE ESTIMATES | 14-1 |
| | 14.1.1 | Metal Prices for Mineral Resources | 14-4 |
| | | | |
| | 14.1.2 | Cost and Recovery Estimates for Mineral Resources | 14-4 |
| | | | |
| | 14.1.3 | Parameters for Mill Material | 14-7 |
| | | | |
| | 14.1.4 | Additional Information | 14-8 |
| | 14.2 | Description of the Block Model | 14-11 |
Kappes, Cassiday & Associates June 19, 2018
| Page 1-4 |
| AMENDED AND RESTATED |
| Camino Rojo Preliminary Economic Assessment | NI 43-101 Technical Report |
| | 14.2.2 | Geologic Controls | 14-11 |
| | | | |
| | 14.2.3 | Cap Grades and Compositing | 14-21 |
| | | | |
| | 14.2.4 | Variograms | 14-28 |
| | | | |
| | 14.2.5 | Block Grade Estimation | 14-35 |
| | | | |
| | 14.2.6 | Resource Classification | 14-39 |
| | | | |
| | 14.2.7 | Bulk Density | 14-45 |
| | 15.0 | MINERAL RESERVE ESTIMATE | 15-1 |
| | | | |
| | 16.0 | MINING METHODS | 16-1 |
| | 16.1 | Operating Parameters and Criteria | 16-1 |
| | | | |
| | 16.2 | Slope Angles | 16-2 |
| | | | |
| | 16.3 | Economic Parameters | 16-4 |
| | | | |
| | 16.4 | Final Pit Design | 16-6 |
| | | | |
| | 16.5 | Mine Production Schedule | 16-7 |
| | | | |
| | 16.6 | Waste Storage Area and Stockpile | 16-18 |
| | | | |
| | 16.7 | Mining Equipment | 16-20 |
| | 17.1 | Process Design Basis | 17-1 |
| | | | |
| | 17.2 | Crushing | 17-5 |
| | | | |
| | 17.3 | Reclamation and Stacking | 17-5 |
| | | | |
| | 17.4 | Leach Pad Design | 17-8 |
| | | | |
| | 17.5 | Solution Application and Storage | 17-10 |
| | | | |
| | 17.6 | Process Water Balance | 17-11 |
| | | | |
| | 17.7 | Merrill-Crowe Recovery Plant | 17-13 |
| | 17.7.1 | Refinery | 17-14 |
| | | | |
| | 17.7.2 | Process Reagents and Consumables | 17-15 |
| | 18.0 | PROJECT INFRASTRUCTURE | 18-1 |
| | 18.1.1 | Existing Installations | 18-1 |
| | | | |
| | 18.1.2 | Site Roads | 18-1 |
| | | | |
| | 18.1.3 | Mine Haulage Road | 18-1 |
| | | | |
| | 18.1.4 | Project Buildings | 18-1 |
| | | | |
| | 18.1.5 | Mine Camp | 18-4 |
| | | | |
| | 18.1.6 | Laboratory | 18-4 |
| | | | |
| | 18.1.7 | Fuel Storage and Dispensing | 18-4 |
Kappes, Cassiday & Associates June 19, 2018
| Page 1-5 |
| AMENDED AND RESTATED |
| Camino Rojo Preliminary Economic Assessment | NI 43-101 Technical Report |
| | 18.2 | Power Supply, Communication Systems & IT | 18-6 |
| | 18.2.1 | Power Supply | 18-6 |
| | | | |
| | 18.2.2 | Site Power Distribution | 18-6 |
| | | | |
| | 18.2.3 | Communication Systems & IT | 18-6 |
| | 18.3.1 | Water Balance | 18-6 |
| | | | |
| | 18.3.2 | Potable and Domestic Water | 18-7 |
| | | | |
| | 18.3.3 | Fire Water and Protection | 18-7 |
| | 19.0 | MARKET STUDIES AND CONTRACTS | 19-1 |
| | | | |
| | 20.0 | ENVIRONMENTAL STUDIES, PERMITTING AND SOCIAL OR COMMUNITY IMPACT | 20-1 |
| | 20.1 | Environmental Studies | 20-1 |
| | 20.1.1 | Project Area Description | 20-1 |
| | | | |
| | 20.1.2 | Environmental Management Plans | 20-2 |
| | | | |
| | 20.1.3 | Waste Handling | 20-4 |
| | | | |
| | 20.1.4 | Reclamation | 20-5 |
| | | | |
| | 20.1.5 | Closure Activities – Heap Leach Facilities | 20-7 |
| | | | |
| | 20.1.6 | Post Closure Activities | 20-10 |
| | 20.2 | Permitting | 20-12 |
| | | | |
| | 20.3 | Social and Community Impact | 20-16 |
| | 21.0 | CAPITAL AND OPERATING COSTS | 21-1 |
| | 21.1 | Capital Expenditures | 21-2 |
| | 21.1.1 | Mining Capital Costs | 21-4 |
| | | | |
| | 21.1.2 | Process and Infrastructure Capital Cost Estimate | 21-6 |
| | | | |
| | 21.1.3 | Construction Indirect and Other Owner’s Costs | 21-11 |
| | | | |
| | 21.1.4 | Initial Fills Inventory | 21-11 |
| | | | |
| | 21.1.5 | Contingency | 21-11 |
| | | | |
| | 21.1.6 | Working Capital | 21-11 |
| | | | |
| | 21.1.7 | Sustaining Capital | 21-12 |
| | 21.2.1 | Mining Operating Costs | 21-13 |
| | | | |
| | 21.2.2 | Process and G&A Operating Costs | 21-18 |
| | 21.3 | Reclamation & Closure Costs | 21-21 |
Kappes, Cassiday & Associates June 19, 2018
| Page 1-6 |
| AMENDED AND RESTATED |
| Camino Rojo Preliminary Economic Assessment | NI 43-101 Technical Report |
| | 22.0 | ECONOMIC ANALYSIS | 22-1 |
| | 22.1 | Summary | 22-1 |
| | | | |
| | 22.2 | Sensitivity | 22-10 |
| | 23.0 | ADJACENT PROPERTIES | 23-1 |
| | | | |
| | 24.0 | OTHER RELEVANT DATA AND INFORMATION | 24-1 |
| | | | |
| | 24.1 | Project Implementation | 24-1 |
| | 24.2 | Sulphides | 24-3 |
| | | | |
| | 24.3 | Other Cases | 24-3 |
| | 25.0 | INTERPRETATIONS AND CONCLUSIONS | 25-1 |
| | 25.1.1 | Mining | 25-1 |
| | | | |
| | 25.1.2 | Metallurgy and Process | 25-1 |
| | 25.2.1 | Mineral Resource | 25-2 |
| | | | |
| | 25.2.2 | Mining | 25-2 |
| | | | |
| | 25.2.3 | Metallurgy and Process | 25-2 |
| | | | |
| | 25.2.4 | New Mineral Zones | 25-2 |
| | 25.3.1 | Mineral Resource | 25-3 |
| | | | |
| | 25.3.2 | Mining | 25-3 |
| | | | |
| | 25.3.3 | Metallurgy and Process | 25-4 |
| | | | |
| | 25.3.4 | Other Risks | 25-4 |
| | 26.0 | RECOMMENDATIONS | 26-1 |
| | | | |
| | 27.0 | REFERENCES | 27-1 |
| | | | |
| | 28.0 | DATE AND SIGNATURE PAGE | 28-1 |
Kappes, Cassiday & Associates June 19, 2018
| Page 1-7 |
| AMENDED AND RESTATED |
| Camino Rojo Preliminary Economic Assessment | NI 43-101 Technical Report |
LIST OF FIGURES
| Figure 1-1 After-Tax IRR vs. Gold Price, Capital Cost, and Operating Cost | 1-13 |
| | |
| Figure 1-2 NPV @ 5% vs. Gold Price, Capital Cost, and Operating Cost | 1-13 |
| | |
| Figure 4-1 Location Map, Camino Rojo Project | 4-2 |
| | |
| Figure 4-2 Mining Concessions, Camino Rojo Project | 4-5 |
| | |
| Figure 4-3 Surface Rights in Project Area | 4-8 |
| | |
| Figure 5-1 Project Location and Regional Infrastructure | 5-2 |
| | |
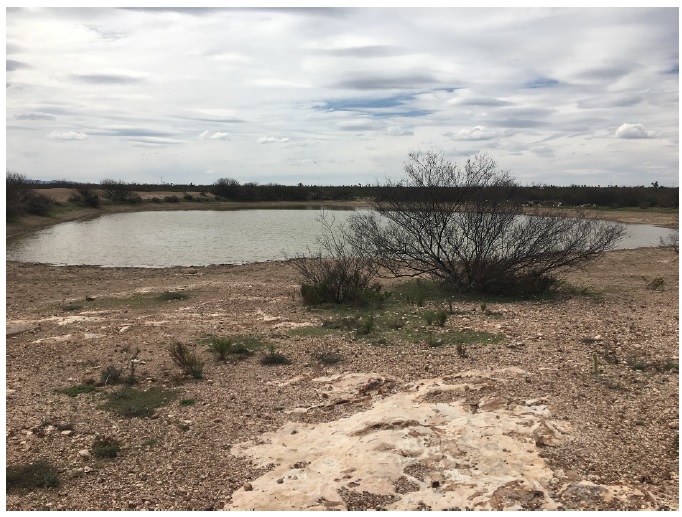
| Figure 5-2 View of Typical Topography and Vegetation at Camino Rojo | 5-3 |
| | |
| Figure 6-1 Historical Drillhole Locations and Project Claim Boundaries | 6-3 |
| | |
| Figure 7-1 Regional Geologic Map (Servicio Geologico Mexicano, 2000) | 7-3 |
| | |
| Figure 7-2 Local Geology, Camino Rojo Deposit (Servicio Geologico Mexicano, 2014) | 7-5 |
| | |
| Figure 7-3 Drillcore from CR12-345D, 818m | 7-6 |
| | |
| Figure 7-4 Drillcore from CR12-345D, 254m | 7-6 |
| | |
| Figure 7-5 Drillcore from CR12-345D, 993m | 7-7 |
| | |
| Figure 7-6 Drillcore from CR12 345D, 395m | 7-9 |
| | |
| Figure 7-7 Drillcore from CR12 345D, 727m | 7-10 |
| | |
| Figure 7-8 Drillcore from CR11 267D, 490m | 7-10 |
| | |
| Figure 7-9 Drillcore from CR11 267D, 473m | 7-11 |
| | |
| Figure 7-10 Drillcore from CR11 258D, 256m | 7-13 |
| | |
| Figure 7-11 Drillcore from CR11 258D, 257m | 7-13 |
| | |
| Figure 10-1 Drilling by Type, IMC 2018 | 10-5 |
| | |
| Figure 10-2 Drilling by Company, IMC 2018 | 10-6 |
| | |
| Figure 13-1 Preg-Robbing Percentage vs. CIL and Direct Bottle Roll Leach Test Recoveries | 13-8 |
| | |
| Figure 13-2 Preg-Robbing from Leach Percentage vs. Sulphide Content | 13-9 |
| | |
| Figure 13-3 Preg-Robbing from Leach Percentage vs. Organic Carbon Content | 13-9 |
| | |
| Figure 13-4 Preg-Robbing from Leach Percentage vs. Organic Carbon Content | 13-10 |
| | |
| Figure 13-5 Oxide Recovery vs. Crush Size | 13-14 |
| | |
| Figure 13-6 Transition Recovery vs. Crush Size | 13-15 |
| | |
| Figure 14-1 Mineral Resource Cone Shell, IMC 2018 | 14-10 |
| | |
| Figure 14-2 Hole and Cross Section Locations, IMC 2018 | 14-13 |
| | |
| Figure 14-3 Lithology on Section L112, IMC 2018 | 14-14 |
| | |
| Figure 14-4 Alteration on Section L112, IMC 2018 | 14-16 |
| | |
| Figure 14-5 Alteration on Section 18, IMC 2018 | 14-17 |
| | |
| Figure 14-6 Alteration on Section 29, IMC 2018 | 14-18 |
| | |
| Figure 14-7 Oxidation Zones on Section 29, IMC 2018 | 14-19 |
| | |
| Figure 14-8 Estimation Domains on Section L112, IMC 2018 | 14-20 |
Kappes, Cassiday & Associates June 19, 2018
| Page 1-8 |
| AMENDED AND RESTATED |
| Camino Rojo Preliminary Economic Assessment | NI 43-101 Technical Report |
| Figure 14-9 Probability Plot of Gold Assays by Alteration Type – NE Domain | 14-25 |
| | |
| Figure 14-10 Probability Plot of Gold 5m Composites by Alteration Type – NE Domain | 14-25 |
| | |
| Figure 14-11 Probability Plot of Gold Assays by Alteration Type – SW Domain | 14-26 |
| | |
| Figure 14-12 Probability Plot of Gold 5m Composites by Alteration Type – SW Domain | 14-26 |
| | |
| Figure 14-13 Probability Plot of Gold Assays by Alteration Type – Indidura | 14-27 |
| | |
| Figure 14-14 Probability Plot of Gold 5m Composites by Alteration Type – Indidura | 14-28 |
| | |
| Figure 14-15 NE Domain Gold Variogram – Primary Axis | 14-30 |
| | |
| Figure 14-16 NE Domain Gold Variogram – Secondary Axis | 14-31 |
| | |
| Figure 14-17 NE Domain Gold Variogram – Tertiary Axis | 14-32 |
| | |
| Figure 14-18 SW Domain Gold Variogram – Primary Axis | 14-33 |
| | |
| Figure 14-19 SW Domain Gold Variogram – Down Hole Variogram | 14-34 |
| | |
| Figure 14-20 Gold Grades on Section 29, IMC 2018 | 14-36 |
| | |
| Figure 14-21 Gold Grades on Section 18, IMC 2018 | 14-37 |
| | |
| Figure 14-22 Gold Grades on Section L112, IMC 2018 | 14-38 |
| | |
| Figure 14-23 Average Distance to Nearest 3 and 4 Holes – NE Domain | 14-40 |
| | |
| Figure 14-24 Average Distance to Nearest 3 and 4 Holes – SW Domain | 14-41 |
| | |
| Figure 14-25 Average Distance to Nearest 3 and 4 Holes – Indidura | 14-42 |
| | |
| Figure 14-26 Resource Class on Section 18, IMC 2018 | 14-43 |
| | |
| Figure 14-27 Resource Class on Section 29, IMC 2018 | 14-44 |
| | |
| Figure 16-1 Slope Angle Recommendations, Piteau 2016 | 16-3 |
| | |
| Figure 16-2 Final Pit, IMC 2018 | 16-8 |
| | |
| Figure 16-3 End of Year 1, IMC 2018 | 16-12 |
| | |
| Figure 16-4 End of Year 2, IMC 2018 | 16-13 |
| | |
| Figure 16-5 End of Year 3, IMC 2018 | 16-14 |
| | |
| Figure 16-6 End of Year 4, IMC 2018 | 16-15 |
| | |
| Figure 16-7 End of Year 5, IMC 2018 | 16-16 |
| | |
| Figure 16-8 End of Year 6, IMC 2018 | 16-17 |
| | |
| Figure 16-9 Mine Waste Storage Area, IMC 2018 | 16-19 |
| | |
| Figure 17-1 Mine Process Overall Flowsheet | 17-3 |
| | |
| Figure 17-2 Mine General Arrangement | 17-4 |
| | |
| Figure 17-3 Crushing & Reclaim | 17-7 |
| | |
| Figure 17-4 Heap Leach Pad | 17-9 |
| | |
| Figure 17-5 Merrill-Crowe Recovery Plant | 17-17 |
| | |
| Figure 18-1 Mine Truck Shop | 18-2 |
| | |
| Figure 18-2 Lab, Warehouse and Administration Buildings | 18-3 |
| | |
| Figure 18-3 Explosives Magazine Site | 18-5 |
| | |
| Figure 20-1 Permitting Process Flowsheet | 20-15 |
Kappes, Cassiday & Associates June 19, 2018
| Page 1-9 |
| AMENDED AND RESTATED |
| Camino Rojo Preliminary Economic Assessment | NI 43-101 Technical Report |
| Figure 22-1 After Tax Sensitivity – IRR | 22-11 |
| | |
| Figure 22-2 After Tax Sensitivity – NPV @ 0% | 22-11 |
| | |
| Figure 22-3 After Tax Sensitivity – NPV @ 5% | 22-12 |
| | |
| Figure 24-1 Project Development & Implementation Schedule | 24-2 |
Kappes, Cassiday & Associates June 19, 2018
| Page 1-10 |
| AMENDED AND RESTATED |
| Camino Rojo Preliminary Economic Assessment | NI 43-101 Technical Report |
LIST OF TABLES
| Table 1-1 Resource Summary | 1-5 |
| | |
| Table 1-2 Capital Cost Summary | 1-9 |
| | |
| Table 1-3 Operating Cost Summary | 1-10 |
| | |
| Table 1-4 Economic Analysis Summary | 1-12 |
| | |
| Table 2-1 Table of Responsibilities by Section | 2-7 |
| | |
| Table 4-1 Listing of Mining Concessions | 4-4 |
| | |
| Table 6-1 2016 Camino Rojo Historical Proven and Probable Mineral Reserve Estimate | 6-5 |
| | |
| Table 6-2 2016 Camino Rojo Historical Measured and Indicated Mineral Resource Estimate | 6-5 |
| | |
| Table 6-3 2016 Camino Rojo Historical Inferred Mineral Resource Estimate | 6-5 |
| | |
| Table 10-1 Summary of Camino Rojo Drilling, 2007-2015 | 10-1 |
| | |
| Table 13-1 Oxide Column Test Results SGS Mineral Services Minerals | 13-2 |
| | |
| Table 13-2 Transition Column Test Results SGS Mineral Services Minerals | 13-2 |
| | |
| Table 13-3 KCA 2010 Column Leach Test Results on Composites | 13-4 |
| | |
| Table 13-4 KCA 2012 Summary of Column Leach Test Results by Material Type | 13-5 |
| | |
| Table 13-5 KCA 2015 Column Leach Test Results by Lithology | 13-6 |
| | |
| Table 13-6 Preg-Robbing Data Comparison for Camino Rojo | 13-7 |
| | |
| Table 13-7 Summary of Flotation Composite Feed Grades | 13-11 |
| | |
| Table 13-8 Lead Flotation Concentrate Grades | 13-11 |
| | |
| Table 13-9 Zinc Flotation Concentrate Grades | 13-11 |
| | |
| Table 13-10 Comminution Test Results Summary | 13-12 |
| | |
| Table 13-11 Comminution Test Results by Alteration Type | 13-13 |
| | |
| Table 13-12 Estimated Recoveries by Material Type for P80 38mm Crush Size | 13-16 |
| | |
| Table 13-13 Projected Field Cyanide Consumptions by Material Type | 13-17 |
| | |
| Table 13-14 Projected Field Lime Consumptions by Material Type | 13-17 |
| | |
| Table 13-15 Distribution of Metals to Various Sulphide Products | 13-19 |
| | |
| Table 14-1 Mineral Resource | 14-3 |
| | |
| Table 14-2 Economic Parameters for Mineral Resource Estimate | 14-6 |
| | |
| Table 14-3 Treatment Costs for Lead and Zinc Concentrates | 14-8 |
| | |
| Table 14-4 Camino Rojo Model Rock Types (lith) | 14-11 |
| | |
| Table 14-5 Camino Rojo Alteration Types (alt) | 14-12 |
| | |
| Table 14-6 Camino Rojo Oxide-Sulphide Model (oxide) | 14-15 |
| | |
| Table 14-7 Camino Rojo Estimation Domains (domain) | 14-15 |
| | |
| Table 14-8 Cap Grades and Number of Assays Capped | 14-21 |
| | |
| Table 14-9 Summary Statistics of Assays | 14-23 |
| | |
| Table 14-10 Summary Statistics of 5m Composites | 14-24 |
Kappes, Cassiday & Associates June 19, 2018
| Page 1-11 |
| AMENDED AND RESTATED |
| Camino Rojo Preliminary Economic Assessment | NI 43-101 Technical Report |
| Table 14-11 Specific Gravity and Bulk Density | 14-45 |
| | |
| Table 16-1 Economic Parameters for Mine Design | 16-6 |
| | |
| Table 16-2 Mine Production Schedule | 16-9 |
| | |
| Table 16-3 Proposed Plant Production Schedule | 16-10 |
| | |
| Table 16-4 Proposed Plant Production Schedule by Material Type | 16-11 |
| | |
| Table 16-5 Mine Major Equipment Fleet Requirement | 16-20 |
| | |
| Table 17-1 Processing Design Criteria Summary | 17-2 |
| | |
| Table 17-2 Site-Wide Average Year Water Requirements | 17-12 |
| | |
| Table 17-3 Projected Annual Reagents and Consumables | 17-15 |
| | |
| Table 20-1 Permits Required for Mine Construction | 20-13 |
| | |
| Table 20-2 Permits Required for Mine Operation and Closure | 20-14 |
| | |
| Table 21-1 Capital Cost Summary | 21-1 |
| | |
| Table 21-2 LOM Operating Cost Summary | 21-1 |
| | |
| Table 21-3 Summary of Pre-Production Capital Costs by Area | 21-3 |
| | |
| Table 21-4 Mining Capital Costs | 21-5 |
| | |
| Table 21-5 Summary of Pre-Production Capital Costs by Discipline | 21-8 |
| | |
| Table 21-6 Process Mobile Equipment | 21-10 |
| | |
| Table 21-7 Contract Mining Cost Summary | 21-14 |
| | |
| Table 21-8 Contract Mining Equipment Depreciation | 21-17 |
| | |
| Table 21-9 Contractor Equipment Depreciation | 21-18 |
| | |
| Table 21-10 Process, Support & G&A Operating Cost | 21-19 |
| | |
| Table 22-1 Key Economic Parameters | 22-3 |
| | |
| Table 22-2 Economic Analysis Summary | 22-4 |
| | |
| Table 22-3 Cash Flow Model | 22-5 |
| | |
| Table 22-4 Sensitivity Analysis Results | 22-10 |
| | |
| Table 26-1 Recommendations | 26-3 |
Kappes, Cassiday & Associates June 19, 2018
| Page 1-12 |
| AMENDED AND RESTATED |
| Camino Rojo Preliminary Economic Assessment | NI 43-101 Technical Report |
1.0 EXECUTIVE SUMMARY
1.1 Introduction and Overview
The Camino Rojo project, located in Zacatecas State, Mexico, is 100% owned by Orla Mining Limited (Orla). At the request of Orla, this report was prepared by Kappes, Cassiday and Associates (KCA), Independent Mining Consultants, Inc. (IMC), and Resource Geosciences Incorporated (RGI).
The purposes of this Technical Report are as follows:
| · | Develop an NI 43-101 compliant Mineral Resource for the Camino Rojo deposit, |
| · | Present the results of a Preliminary Economic Analysis (PEA) for the implementation of open pit mining and heap leaching to recover the gold and silver mineralization, and |
| · | Propose additional work required for Preliminary Feasibility or Feasibility level studies. |
This PEA is preliminary in nature and it includes inferred mineral resources that are considered too speculative geologically to have the economic considerations applied to them that would enable them to be categorized as mineral reserves and there is no certainty that the PEA will be realized. The project considers open pit mining of approximately 42.5 million tonnes of material with an estimated grade of 0.71 g/t gold and 13.6 g/t silver. Material from the pit will be crushed to 80% passing 38mm (100% passing 66mm), conveyor stacked onto a heap leach pad and leached using a low concentration sodium cyanide solution. Pregnant solution from the heap leach will be processed in a Merrill-Crowe recovery plant where gold and silver will be precipitated from deaerated pregnant solution with zinc dust. The resulting precious metal sludge will be filtered and dried in a mercury retort to produce the final doré product.
The average processing throughput for the Camino Rojo project is 18,000 tonnes of material per day. The project will be developed in two stages with expansion of the leach pad and addition of conveying equipment occurring in Year 2 of operation. The scope of this study includes a mine production schedule, as well as costing for all process components and infrastructure required for the operation. This report also presents a mineral resource estimate. The PEA is based on the oxide and transitional portion of this resource.
Kappes, Cassiday & Associates June 19, 2018
| Page 1-1 |
| AMENDED AND RESTATED |
| Camino Rojo Preliminary Economic Assessment | NI 43-101 Technical Report |
1.2 Property Description and Ownership
The Camino Rojo project is located in the Municipality of Mazapil, State of Zacatecas, near the village of San Tiburcio. The project lies 190 km NE of the city of Zacatecas, 48 km S-SW of the town of Concepcion del Oro, Zacatecas, and 54 km S-SE of Goldcorp’s Peñasquito Mine. The project area is centered at approximately 244150E 2675900N UTM NAD27 Zone 14N.
The project mineral rights are held by Orla’s Mexican subsidiary Minera Camino Rojo S.A. de C.V. (MCR) in 8 mining concessions covering approximately 2,059 square kilometers. Surface rights are held by the Ejido San Tiburcio, a communal agrarian cooperative. Exploration has been carried out under the authority of agreements between the project operators and the Ejido San Tiburcio. There is a temporary occupation with right to expropriate agreement in place with the Ejido San Tiburcio that covers all the area of the resource and area of potential development described in this report. MCR has water rights for sufficient volumes of water to develop the project.
1.3 Geology & Mineralization
The Camino Rojo project comprises intrusive related, clastic sedimentary strata hosted, polymetallic Au, Ag, As, Zn, and Pb mineralization.
The Camino Rojo deposit is hosted by Cretaceous submarine sedimentary strata, dominantly clastic. The most important mineralization host is the Caracol Formation, a rhythmically interbedded sequence of weakly calcareous turbiditic sandstones, siltstones and shales. The underlying Indidura Formation, comprised of regularly bedded reduced siltstones and shales, and the Cuesta del Cura limestone, now recrystallized to white fine grained marble, host a minor amount of sulphide mineralization, but are inconsequential hosts of oxide mineralization. The gold-silver-lead-zinc deposit is situated above, and extends down into, a zone of feldspathic hornfels developed in the sedimentary strata, and variably mineralized dacitic dikes. The mineralized zones correspond to zones of sheeted sulfidic veins and veinlet networks, creating a bulk-mineable style of gold mineralization. Skarn mineralization has been encountered in the deeper portions of the system. The observed geologic and geochemical characteristics of the gold-silver-lead-zinc deposit at Camino Rojo are consistent with those of a distal oxidized gold skarn deposit. The metal suite and style of mineralization at Camino Rojo are similar to the intrusion-related deposits in the Caracol Formation and underlying carbonate rocks adjacent to the diatremes at Peñasquito.
For purposes of this study, only the economic potential of the oxide and partially oxidized transitional mineralization amenable to Au and Ag recovery via standard cyanide heap leach processing, is evaluated.
Kappes, Cassiday & Associates June 19, 2018
| Page 1-2 |
| | AMENDED AND RESTATED |
| Camino Rojo Preliminary Economic Assessment | NI 43-101 Technical Report |
1.4 Exploration and Drilling
The Camino Rojo deposit was discovered in mid-2007 and was originally entirely concealed beneath post-mineral cover in a broad, low relief alluvial valley adjacent to the western flank of the Sierra Madre Oriental. Mineralized road ballast placed on a dirt road near San Tiburcio, Zacatecas, was traced to its source by geologists Perry Durning and Bud Hillemeyer from La Cuesta International, working under contract to Canplats Resources Corporation (Canplats). A shallow pit excavated through a thin veneer of alluvium, located adjacent to a stock pond (represa) was the discovery exposure of the deposit. Canplats began concurrent programs of surface geophysics and reverse-circulation drilling in late 2007, which continued into 2008.
The initial drilling was focused on a 450m x 600m gold in rock geochemical anomaly named the Represa zone. Core drilling began in 2008. The geophysical survey defined two principal areas of high chargeability: one centered on the Represa zone and another 1 km to the west named the Don Julio zone. The elevated chargeability zones were interpreted as large volumes of sulphide mineralized rocks. Drilling by Canplats, and later drilling by Goldcorp Inc. (Goldcorp), confirmed the presence of extensive sulphide mineralization at depth in the Represa zone, and much lower quantities of sulphide minerals at Don Julio.
By August of 2008, Canplats drilled a total of 92 reverse-circulation, and 30 diamond-core holes, for a total of 23,988m and 16,044m respectively, mainly focused in the Represa zone.
Canplats was acquired by Goldcorp in early 2010. Validation, infill, condemnation, and expansion drilling began in January 2011. By the end of 2015, a total of 279,788m of new core drilling in 415 drillholes and 20,569m of new RC drilling in 96 drillholes was completed in the Represa and Don Julio zones and their immediate surroundings. An additional 31,286m of shallow RAB-style, RC drilling in 306 drillholes was completed, with most of the RAB drilling testing other exploration targets within the concession. Airborne gravity, magnetic and TEM surveys were also carried out.
As of the end of 2015 a total of 295,832m in 445 diamond core holes, 44,557m in 188 RC drillholes, and 31,286m of RAB drilling had been completed. Orla acquired the project from Goldcorp in 2017 and through the effective date of this report, has completed approximately 1,850m of additional drilling in 10 diamond core holes for metallurgical sampling and 1,900m of drilling in 6 reverse circulation holes testing for water.
Kappes, Cassiday & Associates June 19, 2018
| Page 1-3 |
| | AMENDED AND RESTATED |
| Camino Rojo Preliminary Economic Assessment | NI 43-101 Technical Report |
1.5 Metallurgical Testwork
Metallurgical test work programs on the Camino Rojo project were commissioned by the prior operators of the project, Canplats Mexico and Goldcorp, and are considered as historical data. No metallurgical studies have been conducted by Orla at this time.
Based on the metallurgical data available, the Camino Rojo deposit shows significant variability in gold recoveries based on material type and geological domain with preg-robbing organic carbon being the only significant deleterious element identified. In general, recoveries for gold and silver are good and will yield acceptable results using conventional heap leaching methods with cyanide.
Key design parameters from the metallurgical test work are summarized below:
| · | Crush size of 80% passing 38mm. |
| · | Estimated gold recoveries (including 2% field deduction) of 70%, 58%, 60% and 49% for Kp Oxide, Ki Oxide, Transition-hi and Transition-lo materials, respectively. |
| · | Estimated silver recoveries (including 3% field deduction) of 13%, 20%, 17% and 20% for Kp Oxide, Ki Oxide, Transition-hi and Transition-lo materials, respectively. |
| · | Design leach cycle of 80 days. |
| · | Average cyanide consumption of 0.35 kg/t material. |
| · | Average lime consumption of 1.25 kg/t material. |
Additional column leach tests should be conducted to confirm recoveries at coarser crush sizes, especially for the Ki material type which has very little data available, in an effort to mitigate any associated risk.
1.6 Mineral Resource Estimate
The mineral resource includes potential mill resources and the potential heap leach resources, which are oxide dominant and are the emphasis of this PEA study.
Kappes, Cassiday & Associates June 19, 2018
| Page 1-4 |
| | AMENDED AND RESTATED |
| Camino Rojo Preliminary Economic Assessment | NI 43-101 Technical Report |
For the leach resource, measured and indicated mineral resources amount to 100.8 million tonnes at 0.734 g/t gold, 12.67 g/t silver, 0.21% lead, and 0.37% zinc. Contained metal amounts to 2.38 million ounces gold, 41.1 million ounces of silver, 455.8 million pounds of lead, and 814.8 million pounds of zinc. Inferred mineral resource is an additional 4.9 million tonnes at 0.772 g/t gold, 5.60 g/t silver, 0.07% lead, and 0.24% zinc. Contained metal amounts to 120,600 ounces of gold, 874,000 ounces of silver, 7.0 million pounds of lead, and 25.9 million pounds of zinc for the inferred mineral resource.
For the mill resource, measured and indicated mineral resources amount to 254.1 million tonnes at 0.889 g/t gold, 7.50 g/t silver, 0.07% lead, and 0.26% zinc. Contained metal amounts to 7.3 million ounces gold, 61.3 million ounces of silver, 402.0 million pounds of lead, and 1.46 billion pounds of zinc. Inferred mineral resource is an additional 60.3 million tonnes at 0.875 g/t gold, 7.90 g/t silver, 0.05% lead, and 0.23% zinc. Contained metal amounts to 1.7 million ounces of gold, 15.3 million ounces of silver, 68.1 million pounds of lead, and 310.8 million pounds of zinc for the inferred mineral resource. Table 1-1 presents a summary of the resource.
Table 1-1
Resource Summary
| Re source Type | | NSR Cog
($/t) | | | Kt | | | NSR
($/t) | | | Gold
(g/t) | | | Silver (g/t) | | | Lead
(%) | | | Zinc
(%) | | | Gold
(koz) | | | Silver
(koz) | | | Lead
(mlb) | | | Zinc
(mlb) | |
| Leach Resource: | | | | | | | | | | | | | | | | | | | | | | | | | | | | | | | | | | | | | | | | | | | | |
| Measured Mineral Resource | | | 5.06 | | | | 16,147 | | | | 23.65 | | | | 0.794 | | | | 15.44 | | | | 0.26 | | | | 0.39 | | | | 412.1 | | | | 8,014 | | | | 92.1 | | | | 140.6 | |
| Indicated Mineral Resource | | | 5.06 | | | | 84,692 | | | | 20.07 | | | | 0.723 | | | | 12.15 | | | | 0.19 | | | | 0.36 | | | | 1,969.3 | | | | 33,076 | | | | 363.7 | | | | 674.3 | |
| Meas/Ind Mineral Resource | | | 5.06 | | | | 100,839 | | | | 20.64 | | | | 0.734 | | | | 12.67 | | | | 0.21 | | | | 0.37 | | | | 2,381.3 | | | | 41,091 | | | | 455.8 | | | | 814.8 | |
| Inferred Mineral Resource | | | 5.06 | | | | 4,858 | | | | 18.13 | | | | 0.772 | | | | 5.60 | | | | 0.07 | | | | 0.24 | | | | 120.6 | | | | 874 | | | | 7.0 | | | | 25.9 | |
| | | | | | | | | | | | | | | | | | | | | | | | | | | | | | | | | | | | | | | | | | | | | |
| Mill Resource: | | | | | | | | | | | | | | | | | | | | | | | | | | | | | | | | | | | | | | | | | | | | |
| Measured Mineral Resource | | | 13.72 | | | | 9,818 | | | | 39.27 | | | | 0.864 | | | | 7.45 | | | | 0.08 | | | | 0.28 | | | | 272.6 | | | | 2,352 | | | | 16.4 | | | | 60.1 | |
| Indicated Mineral Resource | | | 13.72 | | | | 244251 | | | | 39.98 | | | | 0.890 | | | | 7.50 | | | | 0.07 | | | | 0.26 | | | | 6,992.2 | | | | 58,934 | | | | 385.6 | | | | 1,398.2 | |
| Meas/Ind Mineral Resource | | | 13.72 | | | | 254,069 | | | | 39.95 | | | | 0.889 | | | | 7.50 | | | | 0.07 | | | | 0.26 | | | | 7,264.8 | | | | 61,286 | | | | 402.0 | | | | 1,458.3 | |
| Inferred Mineral Resource | | | 13.72 | | | | 60,342 | | | | 39.04 | | | | 0.875 | | | | 7.90 | | | | 0.05 | | | | 0.23 | | | | 1,696.9 | | | | 15,334 | | | | 68.1 | | | | 310.8 | |
| | | | | | | | | | | | | | | | | | | | | | | | | | | | | | | | | | | | | | | | | | | | | |
| Total Mineral Re source | | | | | | | | | | | | | | | | | | | | | | | | | | | | | | | | | | | | | | | | | | | | |
| Measured Mineral Resource | | | | | | | 25,965 | | | | 29.55 | | | | 0.820 | | | | 12.42 | | | | 0.19 | | | | 0.35 | | | | 684.6 | | | | 10,367 | | | | 108.5 | | | | 200.7 | |
| Indicated Mineral Resource | | | | | | | 328,943 | | | | 34.86 | | | | 0.847 | | | | 8.70 | | | | 0.10 | | | | 0.29 | | | | 8,961.5 | | | | 92,010 | | | | 749.3 | | | | 2,072.5 | |
| Meas/Ind Mineral Resource | | | | | | | 354,908 | | | | 34.47 | | | | 0.845 | | | | 8.97 | | | | 0.11 | | | | 0.29 | | | | 9,646.1 | | | | 102,377 | | | | 857.8 | | | | 2,273.2 | |
| Inferred Mineral Resource | | | | | | | 65,200 | | | | 37.49 | | | | 0.867 | | | | 7.73 | | | | 0.05 | | | | 0.23 | | | | 1,817.5 | | | | 16,208 | | | | 75.2 | | | | 336.8 | |
Notes:
| (1) | The mineral resource is effective as of April 27, 2018. |
| (2) | Columns may not sum exactly due to rounding. |
| (3) | Mineral resources that are not mineral reserves do not have demonstrated economic viability. |
| (4) | Mineral resources for leach material are based on prices of $1400/oz gold and $20/oz silver. |
| (5) | Mineral resources for mill material are based on prices of $1400/oz gold, $20/oz silver, $1.05/lb lead, and $1.25/lb zinc. |
| (6) | Mineral resources are based on NSR cut-off grades of $5.06/t for leach material and $13.72/t for mill material. |
| (7) | NSR value for leach material is as follows: |
Kp Oxide: NSR ($/t) = 30.77 x gold (g/t) + 0.080 x silver (g/t), based on gold recovery of 70% and silver recovery of 13%
Ki Oxide: NSR ($/t) = 25.49 x gold (g/t) + 0.123 x silver (g/t), based on gold recovery of 58% and silver recovery of 20%
Tran-Hi: NSR ($/t) = 26.37 x gold (g/t) + 0.104 x silver (g/t), based on gold recovery of 60% and silver recovery of 17%
Tran-Lo: NSR ($/t) = 21.54 x gold (g/t) + 0.123 x silver (g/t), based on gold recovery of 49% and silver recovery of 20%
Kappes, Cassiday & Associates June 19, 2018
| Page 1-5 |
| | AMENDED AND RESTATED |
| Camino Rojo Preliminary Economic Assessment | NI 43-101 Technical Report |
| (8) | NSR value for mill material is 36.75 x gold (g/t) + 0.429 x silver (g/t) + 10.75 x lead (%) + 12.37 x zinc (%), based on recoveries of 86% gold, 76% silver, 60% lead, and 64% zinc. |
| (9) | Table 14-2 accompanies this Mineral Resource statement and shows all relevant parameters. |
| (10) | The mineral resource estimate assumes that the floating pit cone used to demonstrate reasonable prospects for eventual economic extraction extends onto land held by the Adjacent Owner (as defined herein). Any potential development of the Camino Rojo Project that includes an open pit encompassing the entire mineral resource estimate would be dependent on obtaining an agreement with the Adjacent Owner. |
All of the mineralization comprised in the mineral resource estimate with respect to the Camino Rojo Project is contained on mineral titles controlled by Orla. However, the mineral resource estimate assumes that the north wall of the conceptual floating pit cone used to demonstrate reasonable prospects for eventual economic extraction extends onto lands where mineral title is held by Fresnillo PLC (the “Adjacent Owner”) and that waste would be mined on the Adjacent Owner’s mineral titles. Any potential development of the Camino Rojo Project that includes an open pit encompassing the entire mineral resource estimate would be dependent on obtaining an agreement with the Adjacent Owner. It is estimated that approximately two-thirds of the mineral resource estimate is dependent on an agreement being obtained with the Adjacent Owner. Delays in, or failure to obtain, an agreement with the Adjacent Owner to conduct mining operations on its mineral titles would affect the development of a significant portion of the mineral resources of the Camino Rojo Project that are not included in the PEA, in particular by limiting access to significant mineralized material at depth. Orla intends to seek an agreement with the Adjacent Owner in order to maximize the potential to develop a mine that exploits the full mineral resource. There can be no assurance that Orla will be able to negotiate such agreement on terms that are satisfactory to Orla or that there will not be delays in obtaining the necessary agreement.
1.7 Mining Methods
The Camino Rojo mine will be a conventional open pit mine. Mine operations will consist of drilling medium diameter blast holes (approximately 17cm), blasting with either explosive slurries or ANFO (ammonium nitrate/fuel oil) depending on water conditions, and loading into large off-road trucks with hydraulic shovels and wheel loaders.
Resource will be delivered to the primary crusher and waste to the waste storage facility southeast of the pit. There will also be a low-grade stockpile facility to store marginal resource for processing at the end of commercial pit operations. There will be a fleet of track dozers, rubber tired dozers, motor graders and water trucks to maintain the working areas of the pit, waste storage areas, and haul roads. The mine is scheduled to operate two 10 hour shifts per day for 365 days per year.
Kappes, Cassiday & Associates June 19, 2018
| Page 1-6 |
| | AMENDED AND RESTATED |
| Camino Rojo Preliminary Economic Assessment | NI 43-101 Technical Report |
Due to space limitations there is only one mining phase, the final pit. The final pit design is based on the results of a floating cone analysis using the parameters discussed in the mineral resource estimate.
The mine plan is constrained by the Adjacent Owner concession boundary on the north side of the pit. The PEA is based on only a portion of the total mineral resource estimate and was prepared on the assumption that no mining activities would occur on the Adjacent Owner’s mineral titles. Accordingly, delays in, or failure to obtain, an agreement with the Adjacent Owner to conduct mining operations on its mineral titles would have no impact on the timetable or cost of development of the potential mine modelled in the PEA.
1.8 Recovery Methods
Test work results developed by KCA and others have indicated that the Camino Rojo mineral is amenable to heap leaching for the recovery of gold and silver. The material will be mined by standard open pit mining methods and crushed at a rate of 18,000 tpd to 80% passing 38mm (100% passing 66mm) using a two-stage closed crushing circuit and conveyor stacked on the leach pad in 10m lifts. Lime will be added to the material for pH control before being stacked and leached with a dilute sodium cyanide solution. Pregnant solution will flow by gravity to a pregnant solution pond before being pumped to a Merrill-Crowe plant for metal recovery. Gold and silver will be precipitated from the pregnant solution via zinc cementation. The precious metal precipitate is dewatered using filters, dried in a mercury retort to remove mercury values, and smelted to produce the final doré product.
The process has been designed to process 6.57 million tonnes per year at an average processing rate of 18,000 tpd. The project has an estimated mine life of 6.6 years.
Electric power will be provided by line power to all elements of the process.
An event pond is included to collect contact solution from storm events. Solution collected will be returned to the process as soon as practical.
1.9 Infrastructure
Existing infrastructure for the Camino Rojo project includes a 20-person exploration camp and dirt and gravel roads throughout the project site. Internet and limited cellular communications are currently available, though these systems will need to be expanded for operations.
Kappes, Cassiday & Associates June 19, 2018
| Page 1-7 |
| | AMENDED AND RESTATED |
| Camino Rojo Preliminary Economic Assessment | NI 43-101 Technical Report |
Primary access to the project site is by the paved four-lane Mexican Highway 54 which runs along the project site. An additional 8.4 km of site roads will be constructed to allow access to all project facilities for maintenance, transportation of personnel, deliveries, and hauling of material.
Power will be supplied by a 115 kVA overhead power line and distributed at 4160 V. Power will be stepped down as needed to 460 V or 110/220 V. Emergency power will be provided by two diesel-fired generators, which are sized to supply power to the process solution pumping systems and other critical process equipment.
Water for operations will be provided by water wells. Average make-up water required is estimated at 112 m3/h.
Project buildings will primarily be prefabricated steel buildings or concrete masonry unit buildings and include an administration building, mine truck shop, warehouse, laboratory, guard house, clinic, refinery and MCCs (motor control centers).
1.10 Environmental Studies, Permitting and Social or Community Impact
Exploration and mining activities in Mexico are subject to control by the Federal agency of the Secretaria del Medio Ambiente y Recursos Naturales (Secretary of the Environment and Natural Resources), known by its acronym SEMARNAT, which has authority over the two principal Federal permits:
| i. | A Manifesto de Impacto Ambiental (Environmental Impact Statement), known by its acronym as an MIA accompanied by a Estudio de Riesgo (Risk Study, hereafter referred to as ER) and: |
| ii. | A Cambio de Uso de Suelo (Land Used Change) permit, known by its acronym as a CUS, supported by an Estudio Tecnico Justificativo (Technical Justification Study, known by its acronym ETJ). |
Thus far exploration work at Camino Rojo has been conducted under the auspices of two separate MIA permits and corresponding CUS permits. These permits allow for extensive exploration drilling but are not sufficient for mine construction or operation. In April 2018, Orla hired independent environmental permitting consultants to design and implement baseline environmental studies of the Camino Rojo project, and to work with Orla’s consultant engineers to collect the data required for obtaining a Manifesto de Impacto Ambiental (Environmental Impact Statement) and Cambio de Uso de Suelo (Land Use Change) permit.
Kappes, Cassiday & Associates June 19, 2018
| Page 1-8 |
| | AMENDED AND RESTATED |
| Camino Rojo Preliminary Economic Assessment | NI 43-101 Technical Report |
The project is not located in an area with any special Federal environmental protection designation and no factors have been identified that would be expected to hinder authorization of required Federal and State environmental permits. Properly prepared MIA and CUS applications and mine operating permits for a project that does not affect federally protected biospheres or ecological reserves can usually be approved in 12 months.
In April 2018, Orla commissioned independent consultants to work with Minera Camino Rojo community relations staff to assess social and community impacts of development of the Camino Rojo project. The project has a long association with the local communities, including Community and Social Responsibility Agreements as described in Section 4.3 of this report.
1.11 Capital and Operating Costs
Capital and operating costs for the process and general administration components of the Camino Rojo project PEA were estimated by KCA. Costs for the mining components were provided by IMC. All costs are presented in first quarter 2018 US dollars. Estimated costs are considered to have an accuracy of +/-25% for capital costs and +/-20% for operating costs.
The total capital cost for the Project is US$153.8 million, including US$13.8 million in working capital and not including reclamation and closure costs, IVA (value added tax) or other taxes; all IVA is assumed to be fully refundable. Table 1-2 presents the capital requirements for the Camino Project.
Table 1-2
Capital Cost Summary
| Description | | Cost (US$) | |
| Pre-Production Capital | | $ | 120,199,000 | |
| Working Capital & Initial Fills | | $ | 13,789,000 | |
| Mining Contractor Mobilization & Preproduction | | $ | 4,926,000 | |
| Sustaining Capital – Mine & Process | | $ | 14,871,000 | |
| Total excluding IVA | | $ | 153,785,000 | |
Kappes, Cassiday & Associates June 19, 2018
| Page 1-9 |
| | AMENDED AND RESTATED |
| Camino Rojo Preliminary Economic Assessment | NI 43-101 Technical Report |
All equipment and material requirements are based on the design information described in this report. Budgetary capital costs for process related components have been estimated primarily based on quotes from similar projects in KCA’s database and cost guide data at the time this report was initially completed in June 2018. Where quotes were not available at the time, reasonable cost estimates or allowances were made. All capital cost estimates are based on the purchase of equipment quoted new from the manufacturer or to be fabricated new.
The average life of mine operating cost for the Project is US$8.02 per tonne of material processed. Table 1-3 presents the operating cost requirements for the Camino Rojo Project.
Table 1-3
Operating Cost Summary
| Description | | LOM Cost (US$/t) | |
| Mine | | $ | 3.05 | |
| Process & Support Services | | $ | 3.20 | |
| Site G & A | | $ | 1.77 | |
| Total | | $ | 8.02 | |
Mining operating costs have been estimated by IMC and are based on contract mining at US$1.81 per tonne of material moved. Process operating costs have been estimated from first principles. Labor costs were estimated using project specific staffing, salary and wage and benefit requirements. Unit consumptions of materials, supplies, power, water and delivered supply costs were also estimated.
The process operating costs presented are based upon the ownership of all process production equipment and site facilities. The owner will employ and direct all operating maintenance and support personnel for all site activities.
IVA is not included in the operating costs.
1.12 Economic Analysis
Based on the estimated production parameters, capital costs, and operating costs, a cash flow model was prepared by KCA for the economic analysis of the Camino Rojo project. The project economics were evaluated using a discounted cash flow (DCF) method, which measures the Net Present Value (NPV) of future cash flow streams.
Kappes, Cassiday & Associates June 19, 2018
| Page 1-10 |
| | AMENDED AND RESTATED |
| Camino Rojo Preliminary Economic Assessment | NI 43-101 Technical Report |
The final economic model was developed by KCA, with input from Orla, using the following assumptions:
| · | Period of Analysis of nine years (includes one year of pre-production and investment, seven years of production and one year for reclamation and closure). |
| · | Gold price of US$1,250/oz and silver price of US$17/oz. |
| · | Processing rate of 18,000 tonnes per day material. |
| · | Gold and silver recoveries as discussed in Section 13.0. |
| · | Capital and operating costs as developed in Section 21.0. |
The project economics based on these criteria from the cash flow model are summarized in Table 1-4.
Kappes, Cassiday & Associates June 19, 2018
| Page 1-11 |
| | AMENDED AND RESTATED |
| Camino Rojo Preliminary Economic Assessment | NI 43-101 Technical Report |
Table 1-4
Economic Analysis Summary
| Economic Analysis | | | | | |
| Internal Rate of Return (IRR), Pre-Tax | | | 38.1 | % | | |
| Internal Rate of Return (IRR), After-Tax | | | 24.5 | % | | |
| Average Annual Cashflow (Pre-Tax) | | $ | 60 | | | M |
| NPV @ 5% (Pre-Tax) | | $ | 231 | | | M |
| Average Annual Cashflow (After-Tax) | | $ | 43 | | | M |
| NPV @ 5% (After-Tax) | | $ | 121 | | | M |
| Gold Price Assumption | | $ | 1,250 | | | /Ounce |
| Silver Price Assumption | | $ | 17 | | | /Ounce |
| Pay-Back Period (Rears based on After-Tax) | | | 3.3 | | | Years |
| | | | | | | |
| Capital Costs (Excluding IVA) | | | | | | |
| Initial Capital | | $ | 125 | | | M |
| Working Capital & Initial Fills | | $ | 14 | | | M |
| LOM Sustaining Capital | | $ | 15 | | | M |
| | | | | | | |
| Operating Costs (Average LOM) | | | | | | |
| Mining | | $ | 3.05 | | | /Tonne processed |
| Processing & Support | | $ | 3.20 | | | /Tonne processed |
| G&A | | $ | 1.77 | | | /Tonne processed |
| Total Operating Cost | | $ | 8.02 | | | /Tonne processed |
| Total By-Product Cash Cost | | $ | 499 | | | /Ounce Au |
| All-in Sustaining Cost | | $ | 555 | | | /Ounce Au |
| | | | | | | |
| Production Data | | | | | | |
| Life of Mine | | | 6.6 | | | Years |
| Total Tonnes to Crusher | | | 42,477,000 | | | Tonnes |
| Grade Au (Avg.) | | | 0.71 | | | g/t |
| Grade Ag (Avg.) | | | 13.56 | | | g/t |
| Contained Au oz | | | 966,000 | | | Ounces |
| Contained Ag oz | | | 18,517,000 | | | Ounces |
| Mine Throughput per day | | | 18,000 | | | Tonnes/day |
| Mine Throughput per year | | | 6,570,000 | | | Tonnes/year |
| Metallurgical Recovery Au (Overall) | | | 67 | % | | |
| Metallurgical Recovery Ag (Overall) | | | 15 | % | | |
| Average Annual Gold Production | | | 97,472 | | | Ounces |
| Average Annual Silver Production | | | 415,981 | | | Ounces |
| Total Gold Produced | | | 642,382 | | | Ounces |
| Total Silver Produced | | | 2,741,485 | | | Ounces |
| LOM Strip Ratio | | | 0.58:1 | | | |
A sensitivity analysis was performed on the project economics. Figure 1-1 and Figure 1-2 are charts showing the relative sensitivity to a number of parameters.
Kappes, Cassiday & Associates June 19, 2018
| Page 1-12 |
| | AMENDED AND RESTATED |
| Camino Rojo Preliminary Economic Assessment | NI 43-101 Technical Report |

Figure 1-1
After-Tax IRR vs. Gold Price, Capital Cost, and Operating Cost
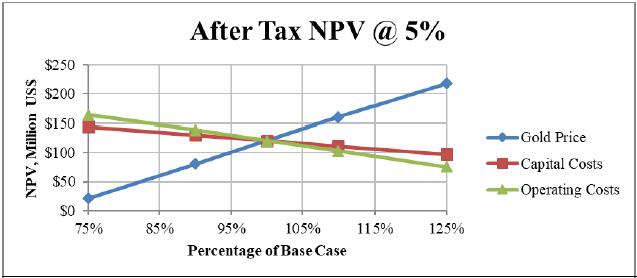
Figure 1-2
NPV @ 5% vs. Gold Price, Capital Cost, and Operating Cost
1.13 Interpretations and Conclusions
1.13.1 Conclusions
The work that has been completed to date has demonstrated that Camino Rojo is potentially a technically and economically viable project and justifies additional work, including a pre-feasibility or feasibility study.
Kappes, Cassiday & Associates June 19, 2018
| Page 1-13 |
| | AMENDED AND RESTATED |
| Camino Rojo Preliminary Economic Assessment | NI 43-101 Technical Report |
The project has been designed as an open-pit mine with heap leach for recovery of gold and silver from oxide and transition material with a life of mine production of 42.5 million tonnes with an average grade of 0.71 g/t Au and 13.6 g/t Ag. Metallurgical test work on the material to date shows acceptable recoveries for gold and silver with low to moderate reagent consumptions. Cement agglomeration does not appear to be required.
Leachable material will be crushed to P80 38mm, stockpiled, reclaimed and conveyor stacked onto the heap leach pad at an average rate of 18,000 tpd. Stacked material will be leached using low grade sodium cyanide solution and the resulting pregnant leach solution will be processed in a Merrill-Crowe plant for the recovery of gold and silver by zinc cementation.
1.13.2 Opportunities
Key opportunities for the Camino Rojo project include:
| · | Based on test work to date, metal recoveries are relatively insensitive to crush size and the same results may be achievable at coarser material sizes, which would result in lower capital and operating costs. |
| · | If an agreement can be achieved with the owner of the adjoining claim, there would be an increase in the amount of material that could potentially be mined and processed with the same general mine and process plan as the PEA is based upon. This would be positive for the project economics. |
1.13.3 Risks
Risks for the Camino Rojo project include:
| · | Camino Rojo considers contract mining. There is a risk that the selected mining contractor may require financial assistance from the owner, which may increase costs. |
| · | Metallurgical results for the Camino Rojo project are based on information and data that have been extrapolated from results from historical test work and are speculative due to lack of direct confirmatory test work. There is a risk that the results may be overstated. |
| · | Carbonaceous material with preg-robbing characteristics has been identified, which may reduce overall heap performance and metal recovery if processed. |
| · | Additional studies on the proposed power line to site, including approval from the Mexican CFE, is required to confirm the proposed power line is feasible. Based on the results of these studies, an alternative power supply method may be required which may increase project costs. |
Kappes, Cassiday & Associates June 19, 2018
| Page 1-14 |
| | AMENDED AND RESTATED |
| Camino Rojo Preliminary Economic Assessment | NI 43-101 Technical Report |
1.14 Recommendations
Based on the results of the PEA, KCA and IMC recommend the following additional work:
| · | The project should proceed to the prefeasibility or feasibility study level; |
| · | Additional studies and cost estimates for delivery of line power to the project site should be completed; |
| · | Confirmatory metallurgical test work should be completed on representative samples for each mineral type, specifically column leach tests on coarse crushed material; |
| · | Perform geotechnical and hydrogeological studies at the proposed heap, pit and processing areas; |
RGI recommends drilling an additional 5,000m to further evaluate the known sulphide resource, and implementation of an exploration program, including 7,500m of drilling, to seek additional resources within the project concessions.
The total estimated cost to complete the recommended work is US$7.5 million.
Kappes, Cassiday & Associates June 19, 2018
| Page 1-15 |
| | AMENDED AND RESTATED |
| Camino Rojo Preliminary Economic Assessment | NI 43-101 Technical Report |
2.0 INTRODUCTION
2.1 Introduction and Overview
This Technical Report is issued to Orla Mining Ltd. (Orla). Orla is listed on the TSX Venture Exchange (TSX VENTURE: OLA) and holds a 100% interest in the Camino Rojo deposit through its Mexican subsidiary Minera Camino Rojo S.A. de C.V (MCR). This report was prepared by Kappes, Cassiday and Associates (KCA), Resource Geosciences Incorporated (RGI) and Independent Mining Consultants, Inc. (IMC).
This Technical Report was amended on March 11, 2019 to address certain comments from the British Columbia Securities Commission in connection with Orla’s filing of a preliminary base shelf prospectus. There has been no change to the Mineral Resource estimate or the PEA (as defined below)
The purposes of this Technical Report are as follows:
| | · | Develop an NI 43-101 compliant Mineral Resource for the Camino Rojo deposit, |
| | · | Present the results of a Preliminary Economic Analysis (PEA) for the implementation of open pit mining and heap leaching to recover the gold and silver mineralization, and |
| | · | Propose additional work required for Preliminary Feasibility or Feasibility level studies. |
The project considers open pit mining of approximately 42.5 million tonnes of material with an estimated grade of 0.71 g/t gold and 13.6 g/t silver. Material from the pit will be crushed to 80% passing 38mm (100% passing 66mm), conveyor stacked onto a heap leach pad and leached using a low concentration sodium cyanide solution. Pregnant solution from the heap leach will be processed in a Merrill-Crowe recovery plant where gold and silver will be precipitated from deaerated pregnant solution with zinc dust. The resulting precious metal sludge will be filtered and dried in a mercury retort to produce the final doré product.
The average processing throughput for the Camino Rojo project is 18,000 tonnes of material per day and will be developed in two stages with expansion of the leach pad and addition of conveying equipment occurring in Year 2 of operation. The scope of this study includes development of a preliminary mine production schedule, as well as preliminary-level costing for all process components and infrastructure required for the operation.
Kappes, Cassiday & Associates June 19, 2018
| Page 2-1 |
| | AMENDED AND RESTATED |
| Camino Rojo Preliminary Economic Assessment | NI 43-101 Technical Report |
This study considers the potential viability of mineral resources for the proposed development option and includes:
| | · | a mineral resource estimate; |
| | · | historical exploration work, description of the property, geology and nature of mineralization; |
| | · | evaluations of processing options and plant throughputs; |
| | · | analysis of infrastructure and logistic strategies; |
| | · | new costing studies; and |
| | · | a preliminary economic model based upon the results of those studies. |
The property description, including reporting on historical exploration work, geology and mineralization, environmental review and assessment of regulatory requirements and adjacent properties have previously been published by RGI by Matthew Gray in a report with a 13 January 2018 effective date titled, “CSA NI43-101 Technical Report on the Camino Rojo Project, Municipio of Mazapil, Zacatecas, Mexico.” (the January Report). The report was written in compliance with disclosure and reporting requirements set forth in National Instrument “Standards of Disclosure for Mineral Projects” (NI 43-101).
This Technical Report supersedes the January Report.
2.2 Project Scope and Terms of Reference
2.2.1 Scope of Work
The purpose of this Technical Report is to provide a mineral resource estimate for the Camino Rojo deposit and a preliminary economic analysis of a conceptual mining and processing project treating the oxide and transition materials detailed in the mineral resource estimate.
KCA’s scope of work for the project is summarized as follows:
| | · | Review of historical metallurgical tests and interpretation, |
| | · | Plant design and recovery methods, |
| | · | Infrastructure process capital and operating costs, |
| | · | Overall report preparation and compilation. |
Kappes, Cassiday & Associates June 19, 2018
| Page 2-2 |
| | AMENDED AND RESTATED |
| Camino Rojo Preliminary Economic Assessment | NI 43-101 Technical Report |
IMC’s scope of work for the project is summarized as follows:
| | · | Audit the drillhole database for the Camino Rojo deposit, |
| | · | Develop the mineral resource block model for the deposit, |
| | · | Estimate NI 43-101 compliant mineral resource, |
| | · | Develop an operational mine plan for the open pit, and |
| | · | Estimate mine equipment requirements, mine capital costs, mine operating costs, and contract mining costs for the project. |
RGI’s scope of the work for the project is summarized as follows:
| | · | Create a property description, including reporting on historical exploration work, geology and mineralization, environmental liabilities, location, access, physiography, infrastructure, claim ownership, and surface rights ownership, |
| | · | Assessment of regulatory requirements and description of the steps required to obtain construction and operating permits for the mine plan described in this report, |
| | · | Assess risks to project development related to access, title, permits, and security. |
The scope of this report also includes a study of information obtained from public documents; other literature sources cited; review of historical metallurgical tests and programs conducted to date; cost information from public documents and recent estimates from previous studies conducted by KCA.
This PEA is intended to provide the project’s preliminary economics and to give guidance for the implementation of the Camino Rojo project.
2.2.2 Terms of Reference
The units of measure presented in this report, unless noted otherwise, are in the metric system. The currency used for all costs is presented in US dollars (US$), unless specified otherwise. The costs were estimated based on quotes and cost data as of 1st quarter 2018.
The economic evaluation of the Project has been conducted on a constant dollar basis (Q1 2018) with a gold price of US$1,250/oz and a silver price of US$17/oz for the Base Case. Economic evaluation is done on a Project-basis and from the point of view of a private investor, after deductions for royalties, income taxes, and various mining taxes and duties paid to the government of Mexico. An exchange ratio of 18 pesos = 1.00 US$ was used for any costs converted from Mexican currency.
Kappes, Cassiday & Associates June 19, 2018
| Page 2-3 |
| | AMENDED AND RESTATED |
| Camino Rojo Preliminary Economic Assessment | NI 43-101 Technical Report |
2.3 Sources of Information
The primary sources of information used for this study include:
| | · | The digital drillhole database. This was developed during the Canplats and Goldcorp tenure. |
| | · | The original assay certificates for the holes. |
| | · | Various geologic solids that were developed (interpreted) by Orla geologists. |
| | · | Various reports, including previous technical reports, on sampling methodology, quality control and quality assurance (QA/QC), resource modeling, geotechnical and slope stability, mine planning, and economic evaluations. These were developed by Canplats, Goldcorp, and various consultants. |
| | · | Various reports on metallurgical testing, process recovery, and mineral processing that were developed by Canplats, Goldcorp, and other consultants. |
| | · | Published reports on Mexican taxes and duties. |
KCA, IMC, and RGI reviewed the data and only used data that were deemed reliable for this report.
2.4 Qualified Persons and Site Visits
Table 2-1 shows QP’s responsible for each section of this Technical Report.
The new processing studies, cost estimations, and financial analysis and review of historical metallurgical data were conducted by KCA under the auspices of Carl Defilippi, of Reno, NV. Mr. Defilippi is an independent qualified person under NI 43-101, and last visited the site on 20 and 21 of February 2018.
Matthew D. Gray, Ph.D., C.P.G, the Qualified Person responsible for Sections 4 through 9, Section 20 and Section 23 of this report, conducted field visits to the Camino Rojo Gold Project, Zacatecas, Mexico, during the period 12 to 13 December 2016 as part of Orla’s due diligence review of the project, which at the time was owned and operated by Goldcorp, and visited again during the period 19 to 22 February 2018.
Kappes, Cassiday & Associates June 19, 2018
| Page 2-4 |
| | AMENDED AND RESTATED |
| Camino Rojo Preliminary Economic Assessment | NI 43-101 Technical Report |
Prior to the field visit and data review conducted for the purposes of this Technical Report, Dr. Gray had been directly involved in mineral exploration programs in the region but had not conducted examinations of the Camino Rojo project.
Michael G. Hester, Vice President and Principal Mining Engineer for IMC, is an independent Qualified Person. Mr. Hester is responsible for the mineral resource estimate, the mine plan used for the PEA study, and the mine capital and operating cost estimates. Mr. Hester visited the site on 20 and 21 February 2018 for two days.
There is no affiliation between Mr. Defilippi, Dr. Gray and Mr. Hester and Orla except that of an independent consultant / client relationship and each author is considered to be independent of Orla as described in Section 1.5 of NI 43-101.
The effective date of the mineral resource is April 27, 2018. The effective date of this PEA is June 19, 2018.
2.5 Forward Looking Information
The results of the PEA, and the mineral resource estimates represent forward-looking information that is subject to a number of known and unknown risks, uncertainties and other factors that may cause actual results to differ materially from those presented here. Forward-looking statements in this technical report include, but are not limited to, statements with respect to future metal prices, exchange rates; taxation; smelter and refinery terms; assumed mining and metallurgical recovery factors; net present value; internal rate of return; sensitivities on parameters; the estimation of mineral resources; the realization of estimates; the timing and amount of estimated future production, costs of production; capital expenditures; operating costs; technological changes to the mining, processing and waste disposal activities outlined; permitting time lines; requirements for additional capital; government regulation of mining operations; environmental risks; ability to retain social license for operations; unanticipated reclamation expenses; title disputes or claims; upside opportunities, pit wall angles, larger crush size and increase in the recoveries; ability to reach agreement with the Adjacent Owner; and limitations on insurance coverage.
Kappes, Cassiday & Associates June 19, 2018
| Page 2-5 |
| | AMENDED AND RESTATED |
| Camino Rojo Preliminary Economic Assessment | NI 43-101 Technical Report |
Forward-looking statements are based on the beliefs, estimates and opinions on the date the statements are made. Certain material assumptions regarding such forward-looking statements are discussed in this report. Forward-looking statements involve significant known and unknown risks and uncertainties, which could cause actual results to differ materially from those anticipated. These risks include, but are not limited to: risks related to uncertainties inherent in the preparation of preliminary economic assessments, drill results and the estimation of mineral resources, including changes in the economic parameters; changes in Project parameters as mine, process and closure plans continue to be refined, possible variations in mineral resources, grade, dilution, or recovery rates; geotechnical and hydrogeological considerations during mining; failure of plant, equipment or processes to operate as anticipated; shipping delays and regulations; accidents, labor disputes and other risks of the mining industry; and delays in obtaining governmental approvals; risks relating to not securing agreements with third parties or not receiving required permits.
Kappes, Cassiday & Associates June 19, 2018
| Page 2-6 |
| | AMENDED AND RESTATED |
| Camino Rojo Preliminary Economic Assessment | NI 43-101 Technical Report |
Table 2-1
Table of Responsibilities by Section
| Section | Section Title | QP |
| 1 | Summary | All |
| 2 | Introduction | C. Defilippi, KCA |
| 3 | Reliance on Other Experts | C. Defilippi, KCA |
| 4 | Property Description and Location | M. Gray, RGI |
| 5 | Accessibility, Climate, Local Resources, Infrastructure and Physiography | M. Gray, RGI |
| 6 | History | M. Gray, RGI |
| 7 | Geological Setting and Mineralization | M. Gray, RGI |
| 8 | Deposit Types | M. Gray, RGI |
| 9 | Exploration | M. Gray, RGI |
| 10 | Drilling | M. Hester, IMC |
| 11 | Sample Preparation, Analyses and Security | M. Hester, IMC |
| 12 | Data Verification | M. Hester, IMC |
| 13 | Mineral Processing and Metallurgical Testing | C. Defilippi, KCA |
| 14 | Mineral Resource Estimates | M. Hester, IMC |
| 15 | Mineral Reserve Estimates | N/A |
| 16 | Mining Methods | M. Hester, IMC |
| 17 | Recovery Methods | C. Defilippi, KCA |
| 18 | Project Infrastructure | C. Defilippi, KCA |
| 19 | Market Studies and Contracts | C. Defilippi, KCA |
| 20 | Environmental Studies, Permitting and Social or Community Impact | M. Gray, RGI |
| 21 | Capital and Operating Costs | C. Defilippi (KCA) / M. Hester (IMC) |
| 22 | Economic Analyses | C. Defilippi, KCA |
| 23 | Adjacent Properties | M. Gray, RGI |
| 24 | Other Relevant Data and Information | All |
| 25 | Interpretation and Conclusions | All |
| 26 | Recommendations | All |
| 27 | References | All |
Kappes, Cassiday & Associates June 19, 2018
| Page 2-7 |
| | AMENDED AND RESTATED |
| Camino Rojo Preliminary Economic Assessment | NI 43-101 Technical Report |
2.6 Frequently Used Acronyms, Abbreviations, Definitions and Units of Measure
All costs are presented in United States dollars. Units of measurement are metric. Only common and standard abbreviations were used wherever possible. A list of abbreviations used is as follows:
| Distances: | mm | – millimeter |
| | cm | – centimeter |
| | m | – meter |
| | km | – kilometer |
| | mbgl | – meters below ground level |
| Areas: | m2 or sqm | – square meter |
| | ha | – hectare |
| | km2 | – square kilometer |
| Weights: | oz | – troy ounces |
| | Koz | – 1,000 troy ounces |
| | mlb | – million pounds (imperial) |
| | g | – grams |
| | kg | – kilograms |
| | T or t | – tonne (1000 kg) |
| | Kt | – 1,000 tonnes |
| | Mt | – 1,000,000 tonnes |
| Time: | min | – minute |
| | h or hr | – hour |
| | op hr | – operating hour |
| | d | – day |
| | yr | – year |
| | Ma | – Mega-annum (one million years) |
| Volume/Flow: | m3 or cu m | – cubic meter |
| | m3/h | – cubic meters per hour |
| | L/s | – liters per second |
| Assay/Grade: | g/t | – grams per tonne |
| | g Au/t | – grams gold per tonne |
| | g Ag/t | – grams silver per tonne |
| | g Cu/t | – grams copper per tonne |
| | ppm | – parts per million |
Kappes, Cassiday & Associates June 19, 2018
| Page 2-8 |
| | AMENDED AND RESTATED |
| Camino Rojo Preliminary Economic Assessment | NI 43-101 Technical Report |
| | ppb | – parts per billion |
| Other: | TPD or tpd | – metric tonnes per day |
| | ktpy | – 1000 tonnes per year |
| | m3/h/m2 | – cubic meters per hour per square meter |
| | Lph/m2 | – liters per hour per square meter |
| | L/s/km2 | – liters per second per square kilometers |
| | g/L | – grams per liter |
| | kph | – kilometers per hour |
| | Ag | – silver |
| | Au | – gold |
| | Hg | – mercury |
| | US$ or $ | – United States dollar |
| | MXN | – Mexican Peso |
| | NaCN | – sodium cyanide |
| | TSS | – total suspended solids |
| | TDS | – total dissolved solids |
| | RAB | – rotary air blast |
| | RC | – reverse circulation |
| | TEM | – transient electromagnetic |
| | DDH | – diamond drill boreholes |
| | LOM | – Life of Mine |
| | kWh | – Kilowatt-hours |
| | kN | – Kilonewton |
| | P80 | – 80% passing |
Kappes, Cassiday & Associates June 19, 2018
| Page 2-9 |
| | AMENDED AND RESTATED |
| Camino Rojo Preliminary Economic Assessment | NI 43-101 Technical Report |
| 3.0 | RELIANCE ON OTHER EXPERTS |
KCA, RGI and IMC have taken all reasonable care in producing the information contained in this report. The information, conclusions and estimates contained in this report are consistent with the industry best practice guidelines, based on information available at the time of preparation and assumptions, conditions and qualifications set forth in this report.
The authors of this Technical Report are not experts in Mexican legal or environmental matters. Accordingly, for certain information pertaining solely to legal and environmental matters contained in Sections 4.2, 4.3, 4.5 and 4.6 the authors have relied upon:
| · | Mining concession title opinion provided by Lic. Mauricio Heiras, Mexican legal counsel for Orla on 28 June 2017 (Heiras, 2017) and in a report dated 6 January 2018 (Heiras, 2018). |
| · | Land access agreement summaries provided by Lic. Mauricio Heiras, Mexican legal counsel for Orla in a report dated 28 June 2017 (Heiras, 2017) and a report dated 6 January 2018 (Heiras, 2018). |
| · | Environmental permitting information contained in a report prepared by Lic. Mauricio Heiras, Mexican legal counsel for Orla, dated 28 June 2017 (Heiras, 2017) and a public domain Federal report (CONANP, 2014). |
KCA, RGI and IMC have taken appropriate steps in their professional judgment to confirm that all information outlined above as having been supplied by non-Qualified Persons to prepare this Technical Report is reliable, but it must be recognized that the authors are relying on the accuracy of the above noted opinions.
All reports, publications, exhibits, documentation, conclusions, and other work products obtained or developed by KCA, RGI and IMC during completion of this Technical Report shall be and remain the property of KCA, RGI and IMC.
This Technical Report was prepared specifically for the purpose of complying with NI 43-101 and may be distributed to third parties and published without prior consent of the Authors if the Technical Report is presented in its entirety without omissions or modifications, subject to the regulations of NI 43-101.
Kappes, Cassiday & Associates June 19, 2018
| Page 3-1 |
| | AMENDED AND RESTATED |
| Camino Rojo Preliminary Economic Assessment | NI 43-101 Technical Report |
| 4.0 | PROPERTY DESCRIPTION AND LOCATION |
The Camino Rojo project is located in the Municipality of Mazapil, State of Zacatecas, Mexico near the village of San Tiburcio. The project lies 190 km NE of the city of Zacatecas, 48 km S-SW of the town of Concepcion del Oro, and 54 km S-SE of Goldcorp’s Peñasquito Mine (Figure 4-1). The project area is centered at approximately 244150E 2675900N UTM NAD27 Zone 14N.
All geographic references in this report utilize UTM Zone 14N datum NAD27 unless otherwise stated.
Kappes, Cassiday & Associates June 19, 2018
| Page 4-1 |
| | AMENDED AND RESTATED |
| Camino Rojo Preliminary Economic Assessment | NI 43-101 Technical Report |
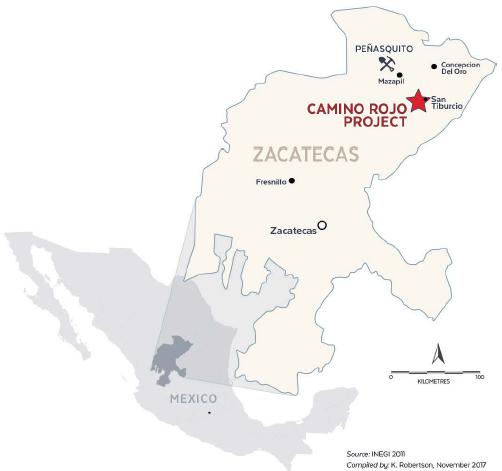
Figure 4-1
Location Map, Camino Rojo Project
The author is not an expert in Mexican mining law. The author has relied upon Orla’s legal counsel in Mexico, Lic. Mauricio Heiras of Chihuahua, Chihuahua for a review of the concession titles and legal framework, as shown in Table 4-1. Lic. Heiras verified that the concessions are in good standing and ownership of all eight concessions has been registered to Minera Camino Rojo SA de CV, (Heiras, 2017), (Heiras, 2018).
Kappes, Cassiday & Associates June 19, 2018
| Page 4-2 |
| | AMENDED AND RESTATED |
| Camino Rojo Preliminary Economic Assessment | NI 43-101 Technical Report |
All minerals rights in Mexico are the property of the government of Mexico and may be exploited by private entities under concessions granted by the Mexican federal government. The process was defined under the Mexican Mining Law of 1992 and excludes petroleum and nuclear resources from consideration. The Mining Law also requires that non-Mexican entities must either establish a Mexican corporation, or partner with a Mexican entity.
Under current Mexican mining law, amended 29 April 2005, the Direccion General de Minas (‘DGM’) grants concessions for a period of 50 years, provided the concession is maintained in good standing. There is no distinction between mineral exploration and exploitation concessions. As part of the requirements to maintain a concession in good standing, bi-annual fees must be paid based upon a per-hectare escalating fee, work expenditures must be incurred in amounts determined on the basis of concession size and age, and applicable environmental regulations must be respected.
The northern edge of the Camino Rojo deposit identified in this technical report extends onto mining concessions controlled by the Adjacent Owner that are not part of the project holdings. Drillpads and drillroads have been observed on the Adjacent Owner’s concessions and the Adjacent Owner has a publicly available resource with respect to the adjacent mining concessions. However, all interpretations, conclusions, and recommendations contained in this report relate exclusively to the mining concessions that comprise the Camino Rojo project.
All of the mineralization comprised in the mineral resource estimate with respect to the Camino Rojo Project is contained on mineral titles controlled by Orla. However, the mineral resource estimate assumes that the north wall of the conceptual floating pit cone used to demonstrate reasonable prospects for eventual economic extraction extends onto lands where mineral title is held by the Adjacent Owner and that waste would be mined on the Adjacent Owner’s mineral titles. Any potential development of the Camino Rojo Project that includes an open pit encompassing the entire mineral resource estimate would be dependent on obtaining an agreement with the Adjacent Owner.
The PEA is based on only a portion of the total mineral resource estimate and was prepared on the assumption that no mining activities would occur on the Adjacent Owner’s mineral titles. Accordingly, delays in, or failure to obtain, an agreement with the Adjacent Owner to conduct mining operations on its mineral titles would have no impact on the timetable or cost of development of the potential mine modelled in the PEA. However, delays in, or failure to obtain, such agreement would affect the development of a significant portion of the mineral resources of the Camino Rojo Project that are not included in the PEA, in particular by limiting access to significant mineralized material at depth. Orla intends to seek an agreement with the Adjacent Owner in order to maximize the potential to develop a mine that exploits the full mineral resource. There can be no assurance that Orla will be able to negotiate such agreement on terms that are satisfactory to Orla or that there will not be delays in obtaining the necessary agreement.
Kappes, Cassiday & Associates June 19, 2018
| Page 4-3 |
| | AMENDED AND RESTATED |
| Camino Rojo Preliminary Economic Assessment | NI 43-101 Technical Report |
The Camino Rojo project consists of eight concessions covering in aggregate 205,936.867 Has. The Los Cardos concession was originally staked and titled to Explominerals SA de CV whereas all other concessions were staked and titled to Canplats de Mexico SA de CV, whose legal name was subsequently changed to Camino Rojo SA de CV. The concession rights of Explominerals were transferred to Camino Rojo SA de CV. Camino Rojo SA de CV subsequently ceded all mining claims to Minera Peñasquito SA de CV, who in turn sold the mining claims to Minera Camino Rojo SA de CV, a subsidiary of Orla.
Concession information is summarized in Table 4-1, and the concessions are shown in Figure 4-2.
Table 4-1
Listing of Mining Concessions
| | | | | | | Validity | | Area |
| Concession Name | | File Number
(Expediente) | | Title
Number | | Title Issued
Date | | Expiration
Date | | Has. |
| Camino Rojo | | 093/28336 | | 230914 | | 06/11/2007 | | 05/11/2057 | | 8,340.7905 |
| Camino Rojo 1 | | 093/28349 | | 231922 | | 16/05/2008 | | 15/05/2058 | | 88,897.3255 |
| Camino Rojo 1 Frac. A | | 093/28349 | | 231923 | | 16/05/2008 | | 15/05/2058 | | 96.8888 |
| Camino Rojo 3 | | 093/28425 | | 232014 | | 03/06/2008 | | 02/06/2058 | | 30,050.0000 |
| Camino Rojo 2 | | 093/28417 | | 232076 | | 10/06/2008 | | 09/06/2058 | | 17,847.4398 |
| Camino Rojo 4 | | 093/28465 | | 232644 | | 02/10/2008 | | 01/10/2058 | | 9,701.0000 |
| Camino Rojo 5 | | 093/28534 | | 232647 | | 02/10/2008 | | 01/10/2058 | | 33,018.4718 |
| Los Cardos | | 093/28561 | | 232652 | | 02/10/2008 | | 01/10/2058 | | 17,984.9513 |
Kappes, Cassiday & Associates June 19, 2018
| Page 4-4 |
| | AMENDED AND RESTATED |
| Camino Rojo Preliminary Economic Assessment | NI 43-101 Technical Report |
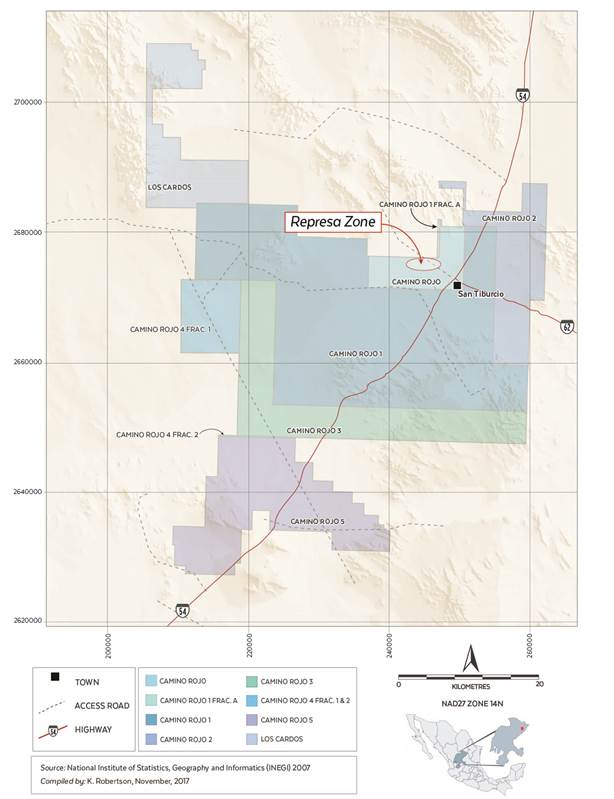
Figure 4-2
Mining Concessions, Camino Rojo Project
Kappes, Cassiday & Associates June 19, 2018
| Page 4-5 |
| | AMENDED AND RESTATED |
| Camino Rojo Preliminary Economic Assessment | NI 43-101 Technical Report |
The legal standing of these claims and the ownership of surface rights have not been verified by Dr. Gray or RGI. Prior to entering into purchase option agreements for the concessions, Orla requested a title opinion for the concessions from Orla’s legal counsel in Mexico, Lic. Mauricio Heiras of Chihuahua, Chihuahua, who investigated the concession status and reported that the claims were valid.
| 4.2.1 | Orla Control of Mining Concessions via Acquisition from Minera Peñasquito SA de CV |
The claims are controlled by Orla by means of its ownership of Minera Camino Rojo SA de CV, which acquired the concessions from Goldcorp’s Mexican subsidiary, Minera Peñasquito SA de CV. A summary of Orla’s and Goldcorp’s rights and obligations under the terms of the acquisition agreement is as follows:
| · | Goldcorp was granted a 2% NSR on all metal production from the project, except for metals produced under the sulphide joint venture option stipulated in the acquisition agreement. |
| · | Orla is the operator of the Camino Rojo project and has full rights to explore, evaluate, and exploit the property. |
| · | In the event that a sulphide project is defined through a positive Pre-Feasibility Study outlining one of the development scenarios a) or b) contained herein, Goldcorp may, at its option, enter into a joint venture for the purpose of future exploration, advancement, construction, and exploitation of the sulphide project. |
| o | Scenario a): A sulphide project where material from Camino Rojo is processed using the existing infrastructure of the Peñasquito Mine, Mill and Concentrator facilities. In such circumstances, the sulphide project would be operated by Goldcorp, who would earn a 70% interest in the sulphide project, with Orla owning 30%. |
| o | Scenario b): A standalone sulphide project with a mine plan containing at least 500 million tonnes of Proven and Probable Mineral Reserves using standalone facilities not associated with Peñasquito. Under this scenario, the sulphide project would be operated by Goldcorp, who would earn a 60% interest in the sulphide project, with Orla owning 40%. |
| · | Following exercise of its option, if Goldcorp elects to sell its portion of the sulphide project, in whole or in part, the Orla would retain a right of first refusal on the sale of the sulphide project. |
Kappes, Cassiday & Associates June 19, 2018
| Page 4-6 |
| | AMENDED AND RESTATED |
| Camino Rojo Preliminary Economic Assessment | NI 43-101 Technical Report |
| · | For as long as Goldcorp maintains ownership of at least 10% of Orla common shares, Goldcorp has the right to nominate one director to the board of Orla and to participate in all future equity offerings to maintain its prorated ownership. |
| · | Orla will retain a right of first refusal on Goldcorp’s NSR, Goldcorp’s portion of the sulphide project, following the exercise of its option, and certain claims retained by Goldcorp. |
| · | Carry forward of assessment work credits will be applied to the Camino Rojo project concessions thus no expenditures are immediately required to meet assessment work requirements |
The author is not an expert in Mexican surface rights or contract law. The author has relied upon Orla’s legal counsel in Mexico, Lic. Mauricio Heiras of Chihuahua, Chihuahua for a review of the project surface rights (Heiras, 2017), (Heiras, 2018) as discussed in Section 3.0 of this report.
Surface rights in the project area are owned by several Ejidos, which are federally defined agrarian communities. The land which includes the resource at Camino Rojo is controlled by the San Tiburcio Ejido, comprised of 400 voting members who collectively control 37,154 Has. The legal ownership of surface rights has not been verified by Dr. Gray or RGI, and the information contained herein comes from summary reports prepared by Orla’s legal counsel in Mexico, Lic. Mauricio Heiras.
Areas for which Minera Camino Rojo SA de CV controls surface rights include both areas with and without mineral rights, with the latter being maintained for possible infrastructure purposes. Surface rights controlled are shown in Figure 4-3.
Kappes, Cassiday & Associates June 19, 2018
| Page 4-7 |
| | AMENDED AND RESTATED |
| Camino Rojo Preliminary Economic Assessment | NI 43-101 Technical Report |
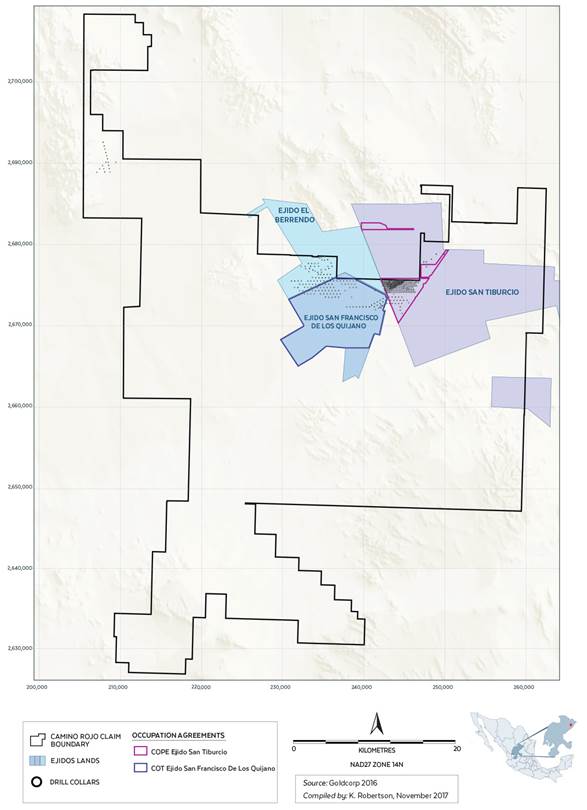
Figure 4-3
Surface Rights in Project Area
Kappes, Cassiday & Associates June 19, 2018
| Page 4-8 |
| | AMENDED AND RESTATED |
| Camino Rojo Preliminary Economic Assessment | NI 43-101 Technical Report |
Exploration work at the project has been carried out under the terms of surface access agreements negotiated with the Ejido and executed on 26 February 2013. Camino Rojo SA de CV (a Goldcorp subsidiary) executed three agreements with the Ejido that cover the Camino Rojo resource. Camino Rojo SA de CV subsequently passed the rights and obligations of these agreements to Minera Peñasquito SA de CV (a Goldcorp subsidiary), who subsequently transferred the rights and obligations to Minera Camino Rojo SA de CV. The three agreements are:
| 1. | Previous to Expropriation Occupation Agreement (COPE), executed on 26 February 2013 by and between Camino Rojo SA de CV, in its position of “occupant”, and Ejido San Tiburcio, as the owner, with regards to a surface of 2,497.30 Has. This agreement stipulates that the Ejido expressly and voluntarily accepts the expropriation of Ejido lands by Camino Rojo SA de CV, in effect converting the Ejido land to fee simple private land titled to Camino Rojo SA de CV. In the event that the Federal agency responsible for the expropriation process, the Secretario de Desarollo Agrario Territorial y Urbano, denies the petition to cede the Ejido lands to Camino Rojo SA de CV, the agreement automatically converts to a 30-year temporary occupation agreement, extendable for another 30-year period of requested by the Company. Payment in full was made at the date of signing and no further payments are due. This agreement is valid and expires in 2043 and covers the area of the mineral resource discussed in this report. |
| 2. | Temporary Occupation Agreement (COT), executed on 26 February 2013 by and between Camino Rojo SA de CV, in its position of occupant, and Ejido San Tiburcio, as owner, with regards to a surface of 2,500 Has (the “TOA”). This agreement allows Camino Rojo SA de CV to explore 2,500 Has of Ejido lands over a 5-year period, while the expropriation process is executed. Payment in full was made at the date of signing and no further payments are due. This agreement expired in February 2018 and Minera Camino Rojo is currently negotiating with Ejido San Tiburcio a new COT. |
| 3. | Collaboration and Social Responsibility Agreement (CSRA), executed on 26 February 2013 by and between Camino Rojo SA de CV, in its position of “collaborator”, and Ejido San Tiburcio, as “beneficiary”, with regards to certain social contributions to be provided in favor of this last CSRA. The agreement stipulates that Camino Rojo SA de CV will contribute $10,000,000 Pesos annually to the Ejido to be used to promote and execute diverse social and economic development programs to benefit the Ejido. Additionally, at its discretion, Camino Rojo SA de CV will provide support for adult education, career training, business development assistance, and cultural programs, and scholastic scholarships. The agreement expires when exploration or exploitation activities at the Camino Rojo project end. Annual payments are due on the 29th of June each year. This agreement is valid and remains in effect until mine closure or project cancellation. |
Kappes, Cassiday & Associates June 19, 2018
| Page 4-9 |
| | AMENDED AND RESTATED |
| Camino Rojo Preliminary Economic Assessment | NI 43-101 Technical Report |
Camino Rojo SA de CV executed a surface rights agreement with Ejido Francisco de los Quijano. This agreement, executed on 22 December 2014, is a Temporary Occupation Agreement (COT) that allows Camino Rojo SA de CV to conduct exploration activities on 7,666 Has, as shown in Figure 4-3. The agreement expires on 21 December 2019. Annual payments of $9,134,749 Pesos are required to keep the agreement in good standing. Simultaneously with the execution of the COT, Camino Rojo SA de CV executed a Collaboration and Social Responsibility Agreement with the Ejido which obligates Camino Rojo SA de CV to: provide $19,000 Pesos in monthly scholastic scholarships to the Ejido; complete electrification of an Ejido water well and rehabilitate/reconstruct the community cistern; assist Ejido members with finding appropriate employment opportunities with Camino Rojo SA de CV and its contractors; and to provide basic food rations to community members in need. The CSRA expires on 21 December 2019.
Camino Rojo executed a surface rights agreements with Ejido El Berrendo. This agreement, executed on 22 December 2014 was a Temporary Occupation Agreement (COT) that allowed Camino Rojo SA de CV to conduct exploration activities on 4,201 Has, as shown in Figure 4-3. Annual payments of $4,467,530 Pesos were required to keep the agreement in good standing. The COT agreement expired on 21 December 2017. Minera Camino Rojo is currently negotiating a new COT agreement with the Ejido.
Simultaneously with the execution of the 2014 COT agreement, Camino Rojo SA de CV executed a Collaboration and Social Responsibility Agreement with the Ejido El Berrendo which obligated Camino Rojo SA de CV to: provide $26,000 Pesos in monthly scholastic scholarships to the Ejido; complete electrification of the Ejido community building; rehabilitate Ejido roads; provide materials needed for construction of a community health center and water well; rehabilitate/reconstruct the community cistern; assist Ejido members with finding appropriate employment opportunities with Camino Rojo SA de CV and its contractors; and to provide basic food rations to community members in need. The CSRA expired on 21 December 2017. Minera Camino Rojo is currently negotiating a new CSRA agreement with the Ejido.
Kappes, Cassiday & Associates June 19, 2018
| Page 4-10 |
| | AMENDED AND RESTATED |
| Camino Rojo Preliminary Economic Assessment | NI 43-101 Technical Report |
| 4.4 | Environmental Liability |
No environmental liabilities are apparent. The property does not contain active or historic mines or prospects, there are no plant facilities present within the project area, nor are tailings piles present, and all exploration work has been carried out by prior operators in accordance with Mexican environmental standards.
The author is not an expert in Mexican environmental law. The author has relied upon Orla’s legal counsel in Mexico, Lic. Mauricio Heiras of Chihuahua, Chihuahua for a summary review of the project environmental permits (Heiras, Legal opinion letter, 2017) and a public domain Federal report (CONANP, 2014) for a review of permitting risks discussed in this report.
The Ley de Desarrollo Forestal Sustentable (Sustainable Development Forest Law) and the Ley General del Equilibrio Ecológico y Protección al Ambiente (General Law of Ecologic Equilibrium and Environmental Protection) regulate all direct exploration activities carried out at Camino Rojo (reverse circulation drilling, core drilling, trenching, road construction, etc.). Surface disturbances caused by exploration activities require a Cambio de Uso de Suelo (CUS, Land Use Change) authorization and approval of an Environmental Impact Assessment (MIA).
The National Water Law regulates all water use in Mexico under the responsibility of Comisión Nacional del Agua (CONAGUA). Applications are submitted to CONAGUA indicating the annual water needs for mining activities and the source of water to be used. CONAGUA grants water concessions according to stipulated water availability in the source area.
Current exploration work at the project is being conducted under the approval of two MIA and CUS permits.
Construction and operation of a mine at Camino Rojo will require various Federal, State, and Municipal permits as discussed in Section 20.2 of this report.
Kappes, Cassiday & Associates June 19, 2018
| Page 4-11 |
| | AMENDED AND RESTATED |
| Camino Rojo Preliminary Economic Assessment | NI 43-101 Technical Report |
| 4.6 | Access, Title, Permit and Security Risks |
The project has had a productive relationship with the surface owners and no extraordinary risks to project access were discerned. A valid surface access agreement allows Orla, through its Mexican subsidiary Minera Camino Rojo SA de CV, to explore and develop the project modelled for the PEA base case described herein.
Prior operators have met legal requirements to maintain in good standing mining concession titles. Conditional upon continued compliance with annual requirements, no risk to validity of title was discerned.
Prior operators have been compliant with Mexican environmental regulations and conditional upon continued compliance, permits for normal exploration activities are expected to be readily attainable.
The chief project risk identified by previous operators is that of a possible Federal designation of a protected biological-ecological reserve that could affect the project. SEMARNAT published a public notice in the Official Gazette of the Federation requesting public consultation and comments on the possible designation of an area known as “Zacatecas Semiarid Desert” as a Natural Protected Area (ANP). If a designation of this ANP by the government includes the surface of the mining concession areas or ancillary work areas such as possible water well fields of Camino Rojo, this could limit the growth and continuity of the project.
The proposed area for designation is located in the Municipalities of General Francisco Murguía, Villa de Cos, El Salvador, Melchor Ocampo, Concepción de Oro and Mazapil, in the State of Zacatecas (CONANP, 2014).
ANPs are generally divided into sub-zones in which the execution of different activities are allowed or prohibited in accordance with the sub-zone's characteristics. “Core zones” are established with the objective of preserving the present ecosystems in the long term and may be controlled through designation of restricted use or through special protections.
Kappes, Cassiday & Associates June 19, 2018
| Page 4-12 |
| | AMENDED AND RESTATED |
| Camino Rojo Preliminary Economic Assessment | NI 43-101 Technical Report |
“Buffer zones” are intended to regulate exploitation activities under a sustainable development scheme through different uses such as human settlement or sustainable natural resources exploitation (the ANPs may include other sub-zones for different land uses, agricultural, recreational, restoration, among others).
Mining activities (including both exploration and exploitation), depending on the corresponding sub-zone may be carried out provided they are authorized by CONANP (National Commission on Protected Natural Areas), without prejudice of other authorizations required for their execution.
Goldcorp, the prior operator of the project, engaged in forums with government and community stakeholders, and submitted an official opinion regarding this ANP declaration to the government, with the objective of ensuring that if an ANP was created, the Camino Rojo project would not be restricted from development. Since the time that the idea of creating an ANP was first proposed there has been no formal movement on the proposal. The State government has opposed the declaration of an ANP in the region.
Drug related violence, propagated by members of criminal cartels and directed against other members of criminal cartels, has occurred in the region and has affected local communities. The aggression is not directed at mining companies operating in the region and has not affected the ability of Orla or previous operators to explore the Camino Rojo project.
| Kappes, Cassiday & Associates | | |
| June 19, 2018 | | Page 4-13 |
| | AMENDED AND RESTATED |
| Camino Rojo Preliminary Economic Assessment | NI 43-101 Technical Report |
| 5.0 | ACCESSIBILITY, CLIMATE, LOCAL RESOURCES AND PHYSIOGRAPHY |
The property is dominantly situated along a wide, flat valley near the town of San Tiburcio. San Tiburcio is situated on Mexican highway 54, a well-maintained, paved highway linking the major city of Zacatecas in Zacatecas State with Saltillo in Coahuila State (Figure 5-1). The project lies 190 km NE of the city of Zacatecas. Both of these cities have airports with regularly scheduled flights south to Mexico City or north to the U.S.A.
There are numerous gravel roads within the property linking the surrounding countryside with the two highways, Highways 54 and 62, which transect the property. There are very few locations within the property that are not readily accessible by four-wheel drive vehicles.
| Kappes, Cassiday & Associates | | |
| June 19, 2018 | | Page 5-1 |
| AMENDED AND RESTATED |
| Camino Rojo Preliminary Economic Assessment | NI 43-101 Technical Report |
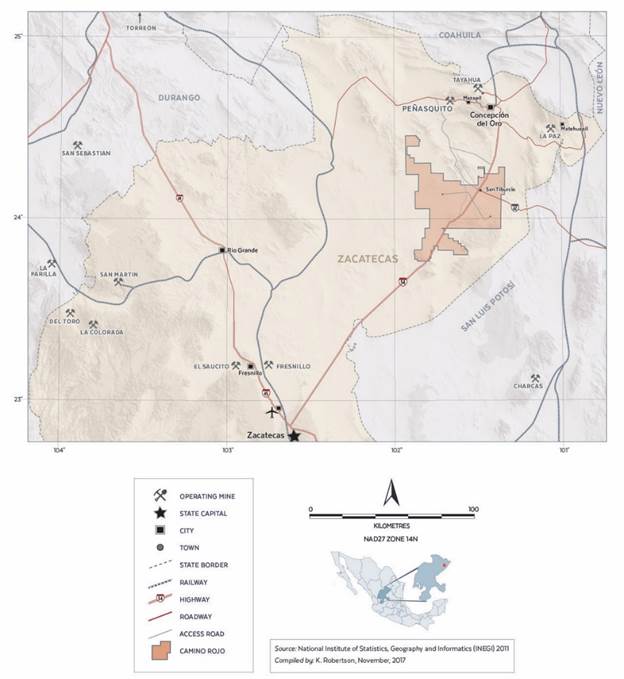
Figure 5-1
Project Location and Regional Infrastructure
| Kappes, Cassiday & Associates | | |
| June 19, 2018 | | Page 5-2 |
| | AMENDED AND RESTATED |
| Camino Rojo Preliminary Economic Assessment | NI 43-101 Technical Report |
| 5.2 | Physiography, Climate and Vegetation |
The broad valley around San Tiburcio is bounded to the north by the low rolling hills of Sierra La Arracada and Sierra El Barros, to the east by Sierra La Cucaracha, and to the south by the Sierra Los Colgados. The terrain is generally flat. Bedrock exposures are rare, limited to road cuts, borrow pits or creek beds. The elevations within the property range from approximately 1,850m to 2,460m AMSL and relief is low.
The climate is typical of the high altitude Mesa Central, dry and semi-arid. Annual precipitation for the area is approximately 337mm, mostly during the rainy season in June and July. Temperatures commonly range from +30o to 20oC in the summer and 15o to 0o C in the winter. Exploration and production activities can be conducted year-round.
The vegetation is dominantly scrub bushes with cacti, maguey, sage and coarse grasses with rare yucca (Figure 5-2). The natural grasses are used to locally graze domestic livestock. Wild fauna is not abundant but several varieties of birds, rabbits, coyote, lizards, snakes and deer reportedly inhabit the area.
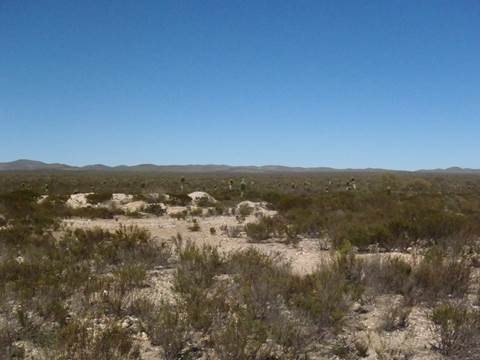
Figure 5-2
View of Typical Topography and Vegetation at Camino Rojo
| Kappes, Cassiday & Associates | | |
| June 19, 2018 | | Page 5-3 |
| | AMENDED AND RESTATED |
| Camino Rojo Preliminary Economic Assessment | NI 43-101 Technical Report |
| 5.3 | Local Resources and Infrastructure |
There is a good network of road and rail services in the region. Road access to most of the property is possible via numerous gravel roads from both Highways 54 and 62. In addition, there is a railway approximately 40 km east of San Tiburcio that crosses both highways (Figure 5-1). There is a high voltage power line transecting the property near San Tiburcio. However, preliminary indications are that a connection may not be possible close to site and power will have to be brought from a switching yard 70 km away because the current local grid does not have sufficient capacity to meet the power demands for the project.
The project site is generally flat with adequate space for any future development of mining and processing facilities. Surface rights over the PEA base case project area are subject to a Previous to Expropriation Occupation Agreement (COPE), as described in Section 3.0. This agreement provides the surface rights required to develop the project, including access from the adjoining highway.
Prior operators purchased ground water from owners of local wells and trucked the water to site for drilling needs. On 24 February 2015 Camino Rojo SA de CV acquired subsurface water rights totalling 9,695,900 cubic meters per annum for industrial use. These water rights were subsequently transferred to Minera Peñasquito SA de CV and then assigned to Minera Camino Rojo SA de CV. Registration of the water rights titles in the name of Minera Camino Rojo SA de CV is in process with the Federal water authority (CONAGUA). The water rights acquired by Minera Camino Rojo grant permission to construct and extract water from 26 wells in the project area. Thus far, four water wells have been constructed for testing purposes. Pump testing of these wells was conducted by prior operators of the project. Pump test results from well CR-01 were indicative that significant water production is feasible from structural zones within the Caracol Formation. Orla’s hydrogeologic consultants believe that the most prospective targets for water production for the project are structural zones with significant secondary permeability developed in the Caracol Formation (Hawkins, 2018). Orla believes it will be possible and practical to develop a subsurface water supply for the project, and in April 2018, Orla initiated a review of existing groundwater information and tested the wells completed to date in order to develop a program of water well exploration, construction, and testing, to define a water supply adequate for project development.
Most exploration supplies may be purchased in the nearby historic mining cities of Zacatecas, Fresnillo and Saltillo. Experienced mining personnel are available locally and from nearby mining towns of Concepciòn del Oro and Mazapil.
| Kappes, Cassiday & Associates | | |
| June 19, 2018 | | Page 5-4 |
| | AMENDED AND RESTATED |
| Camino Rojo Preliminary Economic Assessment | NI 43-101 Technical Report |
The mining concessions comprising the Camino Rojo project were originally staked to the benefit of Canplats Mexico, a subsidiary of Canplats Resources Corporation (Canplats), in 2007. In 2010 Goldcorp acquired 100% of the concession rights from Canplats. Orla acquired the project from Goldcorp in 2017.
The Camino Rojo gold-silver-lead-zinc deposit was discovered in mid-2007, approximately 45 km southwest of Concepcion del Oro, and was originally entirely concealed beneath post-mineral cover in a broad, low relief alluvial valley adjacent to the western flank of the Sierra Madre Oriental. Mineralized road ballast, placed on a dirt road near San Tiburcio, Zacatecas, was traced to its source by geologists Perry Durning and Bud Hillemeyer from La Cuesta International, working under contract to Canplats. A shallow pit excavated through a thin veneer of alluvium, located adjacent to a stock pond (Represa), was the discovery exposure of the deposit. Following a rapid program of surface pitting and trenching for geochemical samples, Canplats began concurrent programs of surface geophysics (resistivity and induced potential) and reverse-circulation drilling in late 2007, which continued into 2008.
The initial drilling was focused on a 450m x 600m gold in rock geochemical anomaly named the Represa zone. Core drilling began in 2008. The geophysical survey defined two principal areas of high chargeability: one centered on the Represa zone and another 1 km to the west named the Don Julio zone. The elevated chargeability zones were interpreted as large volumes of sulphide mineralized rocks. Drilling by Canplats, and later drilling by Goldcorp, confirmed the presence of extensive sulphide mineralization at depth in the Represa zone, and much lower quantities of sulphide minerals at Don Julio.
By August of 2008, Canplats drilled a total of 92 reverse-circulation, and 30 diamond-core holes, for a total of 23,988m and 16,044m respectively, mainly focused in the Represa zone. The surface access and permission to continue drilling were cancelled in early August 2008, by the ejido of San Tiburcio, Zacatecas. Nevertheless, in November 2008, Canplats published an independent Mineral Resource estimate for the Represa zone, as discussed in Section 6.4 of this report.
| Kappes, Cassiday & Associates | | |
| June 19, 2018 | | Page 6-1 |
| | AMENDED AND RESTATED |
| Camino Rojo Preliminary Economic Assessment | NI 43-101 Technical Report |
In October 2009 Canplats publicly released a Preliminary Economic Assessment of the project (Blanchflower K. K., 2009). The preliminary economic assessment is historical in nature and should not be relied upon. The conclusions and recommendations of the historical Canplats assessment do not form the basis for the recommendations contained in this technical report.
Canplats was acquired by Goldcorp in early 2010. Validation, infill, condemnation, and expansion drilling began in January 2011. By the end of 2015, a total of 279,788m of new core drilling in 415 drillholes and 20,569m of new RC drilling in 96 drillholes was completed in the Represa and Don Julio zones and their immediate surroundings. An additional 31,286m of shallow RAB-style, RC drilling in 306 drillholes was completed, with most of the RAB drilling testing other exploration targets within the concession. Airborne gravity, magnetic and TEM surveys were also carried out, the results of which are in the archives of Minera Camino Rojo.
As of the end of 2015 a total of 295,832m in 445 diamond core holes, 44,557m in 188 RC drillholes, and 31,286m of RAB drilling had been completed.
Locations of historical drillholes and the project claim boundaries are summarized in Figure 6-1.
| Kappes, Cassiday & Associates | | |
| June 19, 2018 | | Page 6-2 |
| | AMENDED AND RESTATED |
| Camino Rojo Preliminary Economic Assessment | NI 43-101 Technical Report |

Figure 6-1
Historical Drillhole Locations and Project Claim Boundaries
Mineral Reserve and Mineral Resource tabulations for Camino Rojo were publicly disclosed by Goldcorp as recently as 30 June 2016, as discussed in Section 6.4 of this report. The methodology of Goldcorp’s Mineral Resource estimations has not been disclosed and Dr. Gray has not confirmed the validity of the estimate, thus the Goldcorp estimates are regarded as historic estimates only, as discussed in Section 6.4 of this report.
| 6.3 | Historical Metallurgical Studies |
Canplats and Goldcorp conducted metallurgical tests which are discussed in Section 13.0 of this report.
| Kappes, Cassiday & Associates | | |
| June 19, 2018 | | Page 6-3 |
| | AMENDED AND RESTATED |
| Camino Rojo Preliminary Economic Assessment | NI 43-101 Technical Report |
| 6.4 | Historical Resource Estimates |
The resource estimates discussed herein were prepared prior to Orla having acquired the project and neither Dr. Gray, Mr. Defilippi, Mr. Hester, nor Orla have verified these estimates and they are considered historical estimates and should not be relied upon. A Qualified Person has not done sufficient work to classify the historical estimates as current Mineral Resources or Mineral Reserves and Orla is not treating these historical estimates as current estimates. A Current Mineral Resource is detailed in Section 14.0 of this report.
Minorex Consulting prepared a resource estimate for Canplats in 2009 (Blanchflower J. , 2009) that was publicly disclosed in a Technical Report prepared in accordance with the disclosure standards of NI43-101. However, since the effective date of the resource estimate, significant additional drillhole data has become available, rendering the 2009 estimate obsolete. The 2009 resource estimate is historical in nature, has not been verified by the author, and should not be relied upon. Orla is not treating the historical estimate as a current estimate.
Goldcorp publicly disclosed a Mineral Reserve and Mineral Resources report with information on Camino Rojo with an effective date of 30 June 2016 (Goldcorp Inc., 2017). Goldcorp’s historic Proven and Probable Mineral Reserve estimate for Camino Rojo was 75.52 Mt @ 0.70 gpt Au for 1.70M oz. contained gold, calculated at a gold price of $1,200 US$/oz and a silver price of $18.00 US$/oz. Goldcorp’s historic Measured and Indicated Mineral Resource estimate for Camino Rojo, exclusive of Reserves, was 223.08 Mt @ 1.05 gpt Au containing 7.50M oz. contained gold (Goldcorp Inc., 2017) calculated at a gold price of $1,400 US$/oz and silver price of $20.00 US$/oz. Goldcorp’s historic Inferred Mineral Resource estimate for Camino Rojo, exclusive of Reserves, was 17.16 Mt @ 0.88 gpt Au for 0.49M oz. contained gold, calculated at a gold price of $1,400 US$/oz and silver price of $20.00 US$/oz. Goldcorp’s historic estimates are summarized in Table 6-1, Table 6-2, and Table 6-3. The key assumptions, parameters, and methods used by Goldcorp to prepare the historical estimate are unknown. The 2016 reserve and resource estimates are historical in nature, have not been verified by the author, and should not be relied upon. Orla is not treating these historical estimates as current estimates.
| Kappes, Cassiday & Associates | | |
| June 19, 2018 | | Page 6-4 |
| | AMENDED AND RESTATED |
| Camino Rojo Preliminary Economic Assessment | NI 43-101 Technical Report |
Table 6-1
2016 Camino Rojo Historical Proven and Probable Mineral Reserve Estimate by Goldcorp, $1,200 US$/oz. gold price and $18.00 US$/oz. silver price assumed
| Category | Tonnes x 106 | Grade Au gpt | Grade Ag gpt | Contained
Ounces Au x 106 | Contained
Ounces Ag x 106 |
| Proven | - | - | - | - | - |
| Probable | 75.52 | 0.70 | 14.22 | 1.70 | 34.53 |
Proven +
Probable | 75.52 | 0.70 | 14.22 | 1.70 | 34.53 |
Table 6-2
2016 Camino Rojo Historical Measured and Indicated Mineral Resource Estimate by Goldcorp, $1,400 US$/oz. gold price and $20.00 US$/oz. silver price assumed.
| Category | Tonnes x 106 | Grade Au gpt | Grade Ag gpt | Contained
Ounces Au x 106 | Contained
Ounces Ag x 106 |
| Measured | - | - | - | - | - |
| Indicated | 223.08 | 1.05 | 9.02 | 7.50 | 64.72 |
Measured +
Indicated | 223.08 | 1.05 | 9.02 | 7.50 | 64.72 |
Table 6-3
2016 Camino Rojo Historical Inferred Mineral Resource Estimate by Goldcorp, $1,400 US$/oz. gold price and $20.00 US$/oz. silver price assumed.
| Category | Tonnes x 106 | Grade Au gpt | Grade Ag gpt | Contained
Ounces Au x 106 | Contained
Ounces Ag x 106 |
| Inferred | 17.16 | 0.88 | 9.06 | 0.49 | 5.00 |
| Kappes, Cassiday & Associates | | |
| June 19, 2018 | | Page 6-5 |
| | AMENDED AND RESTATED |
| Camino Rojo Preliminary Economic Assessment | NI 43-101 Technical Report |
There has been no recorded mineral production from the property. Surface gravels have been used for road material and a shallow excavation made for gravel extraction created the discovery exposure of the Camino Rojo deposit.
| Kappes, Cassiday & Associates | | |
| June 19, 2018 | | Page 6-6 |
| | AMENDED AND RESTATED |
| Camino Rojo Preliminary Economic Assessment | NI 43-101 Technical Report |
| 7.0 | GEOLOGICAL HISTORY AND MINERALIZATION |
| 7.1 | Sources of Information |
The following geologic discussion is derived from a variety of peer-reviewed professional papers focused on the regional geology (Mitre-Salazar, 1989) (Centeno-Gracia, 2005) (Aranda-Gomez, 2006) (Nieto-Samaniego, 2007) (Loza-Aguirre I. N., 2008) (Tristán-González, 2009) (Barboza-Gudiño, 2010) (Weiss, 2010) (Ortega-Flores, 2015) (Cruz-Gámez, 2017), a Master’s of Science thesis from the University of Nevada-Reno that details the deposit geology (Sanchez, 2017), geologic maps published by the Servicio Geologico Mexicano, field and diamond drill core observations by Dr. Matthew Gray (Gray M. D., 2016) (Gray M. D., 2018) and Dr. Anthony Longo (Longo, 2017) (Longo, A.A., Edwards, J., 2017), and regional stratigraphy from previously published Technical Reports (Blanchflower K. K., 2009).
The Camino Rojo deposit is located beneath a broad pediment of Tertiary and Quaternary alluvium (Figure 1-1) along the boundary between the Mesa Central physiographic province and the Sierra Madre Oriental fold and thrust belt near the pre-Laramide continental-margin. Oldest rocks are Triassic metamorphic continental rocks overlain by Early to Middle Jurassic red beds. Upper Jurassic to Upper Cretaceous marine facies rocks overlie the red beds at a disconformity and comprise a package of shelf carbonate rocks comprising the Zuloaga to Cuesta del Cura Formations and the basin-filling flysch sediments of the Indidura and Caracol Formations (Nieto-Samaniego, 2007), (Ortega-Flores, 2015). The deposit lies within the southern extent of the northwest striking San Tiburcio fault zone (Weiss, 2010).
| Kappes, Cassiday & Associates | | |
| June 19, 2018 | | Page 7-1 |
| | AMENDED AND RESTATED |
| Camino Rojo Preliminary Economic Assessment | NI 43-101 Technical Report |
A Permo-Triassic tectono-volcanic arc in the eastern Sierra Madre Oriental represents the first Pacific-directed subduction and tectonism in Central Mexico (Centeno-Gracia, 2005). Erosion of the eastern Triassic highlands shed siliciclastic material westward and turbidites off the continental shelf into the Triassic basin plains. These marine clastic rocks, the Triassic Zacatecas and El Alamar Formations (Cruz-Gámez, 2017) were subsequently metamorphosed to phyllites and schists (Nieto-Samaniego, 2007) then eroded before continental siliciclastic rocks or red beds were deposited atop an angular unconformity in Early Jurassic (Nazas Formation and later La Joya Formation (Barboza-Gudiño, 2010). A disconformity atop Lower Jurassic continental rocks preceded deposition of marine carbonate rocks belonging to the Zuloaga and La Caja Formations in Late Jurassic. Following a cessation of volcanism, arc magmatism flared up in the west along the Guerrero arc and continued through Late Cretaceous. Deposition of the shelf carbonate rocks progressed into Early Cretaceous with Taraises, Cupido, La Peña and Cuesta del Cura Formations. Upper Cretaceous flysch sediments derived from the erosion of the western Guerrero arc were deposited in the back-arc basin atop the carbonate rocks. The Mesozoic marine sediments were deformed during the Laramide orogeny from Late Cretaceous to Paleocene forming the Sierra Madre Oriental fold and thrust belt (Nieto-Samaniego, 2007). By late Paleocene, northeast of Mesa Central, a flexural bend in the fold and thrust belt deflected the Mesozoic strata into a series of west- and northwest-trending fold axes and faults (Tristán-González, 2009). South of the westward deflection, the fold belt strikes south to southeast. By early Eocene, the initial pulse of extensional tectonics produced north-northeast to north-northwest normal and strike-slip faults that bound mountain ranges (Matehuala fault zone) and deformed the southeast-trending fold belt along the eastern boundary of Mesa Central (Loza-Aguirre I. N., 2008). By middle Eocene, ranges in the fold and thrust belt were displaced and truncated by northwest-striking high angle faults that translated through the Mesa Central and feature both normal and strike-slip displacement (Nieto-Samaniego, 2007) (Tristán-González, 2009). Subsequent pulses of extension occurred from early Oligocene to Miocene and Pliocene to Quaternary that reactivated existing faults in conjunction with basaltic fissure volcanism and isolated monogenetic basaltic cinder cones (Aranda-Gomez, 2006).
The northwest faults include two major fault systems that localized middle Eocene to Oligocene magmatic activity and define the southern and northern boundaries of Mesa Central. The southern fault zone known as the San Luis-Tepehuanes fault system separates the Sierra Madre Occidental from Mesa Central and localizes numerous mineral deposits (Nieto-Samaniego, 2007) (Loza-Aguirre I. N., 2008). The northern fault zone known as the San Tiburcio lineament and fault zone extends for more than 185 km and features both left-lateral strike-slip and normal displacement (Mitre-Salazar, 1989). The fault truncates west-trending anticlinal axes in the flexural bend of the Sierra Madre Oriental and may crosscut the NNE-trending Matehuala fault zone that bounds the eastern Mesa Central. Anticlinal fold axes and faults parallel the San Tiburcio fault zone, and granitic intrusive rocks and dacitic to andesitic dikes are localized along portions of its extensive strike length.
Mineralization styles in the region include polymetallic and copper-gold skarn and limestone manto (replacement) silver-lead-zinc sulphide material in the Concepcion del Oro District, 50 km north of Camino Rojo (Buseck, 1966), and gold-silver-lead-zinc mineralized igneous diatreme-breccia, and sulphide-sulfosalt-carbonate veinlets and fracture fillings in the Caracol Formation at the Peñasquito mine (Rocha-Rocha, 2016).
| Kappes, Cassiday & Associates | | |
| June 19, 2018 | | Page 7-2 |
| | AMENDED AND RESTATED |
| Camino Rojo Preliminary Economic Assessment | NI 43-101 Technical Report |
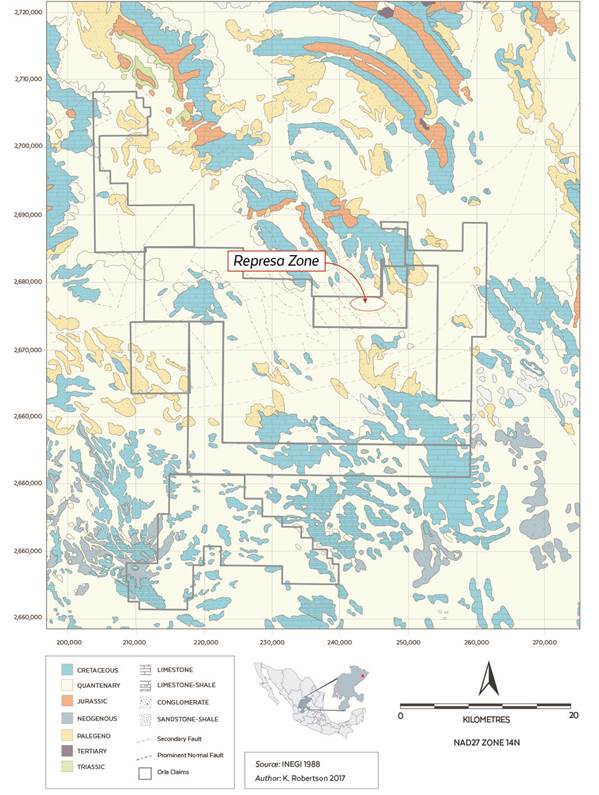
Figure 7-1
Regional Geologic Map (Servicio Geologico Mexicano, 2000)
| Kappes, Cassiday & Associates | | |
| June 19, 2018 | | Page 7-3 |
| | AMENDED AND RESTATED |
| Camino Rojo Preliminary Economic Assessment | NI 43-101 Technical Report |
| 7.3 | Local and Property Geology |
| 7.3.1 | General Deposit Geology |
Camino Rojo is a gold-silver-zinc-lead deposit concealed below shallow (<1m to 3 m) alluvial cover in a large pediment along the southwest border of the Sierra Madre Oriental (Weiss, 2010). Small water storage pits and trenches expose a portion of the oxide deposit in the discovery area known as Represa zone (i.e. water reservoir). The Late Cretaceous Caracol Formation is the primary mineralization host, and at depth, the upper Indidura Formation is a minor mineralization host along the Caracol contact. The local geology is summarized in Figure 7-2. The deposit stratigraphy, known from current diamond drilling, is discussed below from oldest to youngest.
Early Cretaceous Cuesta del Cura Formation features thin- to medium-bedded gray limestone with wavy laminations and locally discontinuous layers of black shale and chert. Polymetallic replacement manto-type occurrences are typically found in Cuesta del Cura elsewhere in the region. No significant mineralization has been found in these limestones at Camino Rojo. Late Cretaceous Indidura Formation features thin-bedded calcareous shale, gray shaley limestone and siltstone with estimated thicknesses that range from 100m to 220m (Figure 7-3). Atop the Indidura, the Caracol Formation consists of thinly interlayered carbonaceous and calcareous siltstones, silty mudstones, and fine-grained calcareous sandstone, and thicknesses range from 600m to 800m (Figure 7-4). Sandstone layers typically display cross-laminations, and the lowest occurrence of sandstone is considered the Indidura contact (Sanchez, 2017). Camino Rojo vein-style mineralization has not been found to extend below the Indidura into the Cuesta del Cura Formation, although drilling is sparse. The few drill holes that have penetrated below Indidura discovered marbleized limestone and slight calc-silicate hornfels alteration in the Cuesta del Cura Formation (Figure 7-5).
Three genetically different types of igneous dikes intruded the Cretaceous marine sediments at Camino Rojo. Type 1 dikes are medium- to coarse-grained porphyritic hornblende-biotite-feldspar porphyry. Type 2 dikes are fine-grained with rare quartz phenocyrsts (1-2mm dia.). Type 3 dikes have coarse-grained hornblende with plagioclase (Sanchez, 2017). The dikes consistently display hydrothermal alteration so the actual petrologic and chemical compositions are unknown. They are assumed as intermediate composition igneous dikes (Sanchez, 2017). Drill-supported models created by Orla show dikes are oriented in two parallel subvertical northeast-trending planes spatially associated with the deposit shape. Mineralization stage IS veins crosscut the dikes and feature bleached halos of sericite alteration.
| Kappes, Cassiday & Associates | | |
| June 19, 2018 | | Page 7-4 |
| | AMENDED AND RESTATED |
| Camino Rojo Preliminary Economic Assessment | NI 43-101 Technical Report |
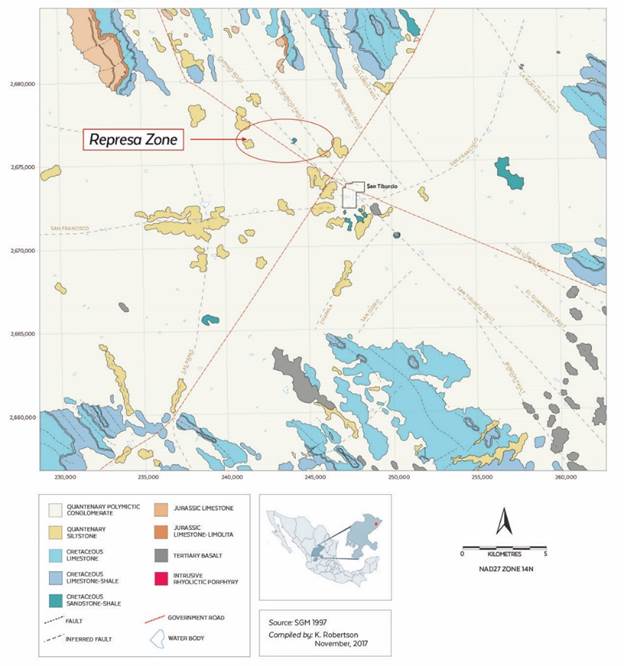
Figure 7-2
Local Geology, Camino Rojo Deposit (Servicio Geologico Mexicano, 2014)
| Kappes, Cassiday & Associates | | |
| June 19, 2018 | | Page 7-5 |
| | AMENDED AND RESTATED |
| Camino Rojo Preliminary Economic Assessment | NI 43-101 Technical Report |
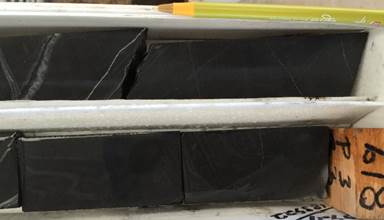
Figure 7-3
Drillcore from CR12-345D, 818m, showing relatively uniform nature of siltstone and shale beds in Indidura Formation, stratigraphically below Caracol Formation. Indidura is distinguished from Caracol by the absence of rhythmic sandstone-shale beds. Interval from 817.5m to 819.0m assayed 18 ppb Au.
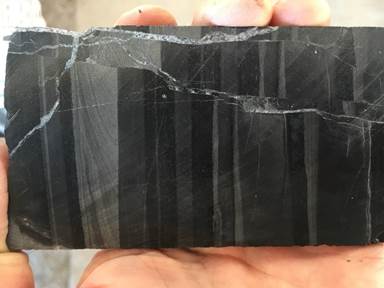
Figure 7-4
Drillcore from CR12-345D, 254m , showing typical and diagnostic interbedded centimeter scale sandstone, siltstone, and shale beds, fining upward turbiditic sequence, in unoxidized Caracol Formation. Sample assayed less than 5 ppb Au. Stratigraphic top is to right.
| Kappes, Cassiday & Associates | | |
| June 19, 2018 | | Page 7-6 |
| | AMENDED AND RESTATED |
| Camino Rojo Preliminary Economic Assessment | NI 43-101 Technical Report |
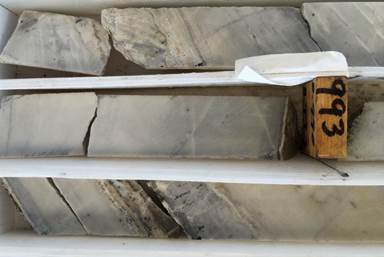
Figure 7-5
Drillcore from CR12-345D, 993m , showing marbleized Cuesta del Cura limestone, stratigraphically below Indidura Formation. Interval from 991.5m to 993.0m assayed 44 ppb Au.
The Camino Rojo deposit is situated within the northwest-striking San Tiburcio fault zone that features both left-lateral strike-slip and normal displacement (Mitre-Salazar, 1989) (Weiss, 2010). Anticlinal fold axes and faults parallel the San Tiburcio fault zone lend credence to a possible 15 km wide zone encompassing Camino Rojo that experienced extensional deformation. None the less, the deposit shape features a northeast trend that plunges southwest. Intermediate composition dikes localized within the deposit also strike northeast.
Three stages of mineralization have been observed in the Camino Rojo deposit, and two types of high-grade material (Longo, 2017) (Longo, A.A., Edwards, J., 2017).
Stage 1 K-metasomatism (adularia?)-pyrite - K-metasomatism with disseminated pyrite replaced the mudstone, siltstone and fine-grained sandstones in the Caracol. Mineralization is typically low grade gold with 0.1-0.4 grams gold (Figure 7-6, Figure 7-7).
Stage 2 Intermediate Sulfidation (IS) veins – IS veins with pyrite-arsenopyrite-sphalerite±galena, calcite and minor quartz. Moderate to high grade gold (0.4 to +4.0 grams/tonne), high zinc grades (0.5 to >2.0% Zn) and high values of As, Pb and Ba, with variable Ag. Sanchez (2017) reports electrum and acanthite in Stage 2.
| Kappes, Cassiday & Associates | | |
| June 19, 2018 | | Page 7-7 |
| | AMENDED AND RESTATED |
| Camino Rojo Preliminary Economic Assessment | NI 43-101 Technical Report |
IS Type 1 are pyrite-sphalerite-calcite veins with high values of Au-Zn-Ba, and low to moderate values of As, low Sb, and moderate to high Pb (Figure 7-8).
IS Type 2 – IS veins with pyrite-arsenopyrite-quartz ±calcite and sphalerite-sulfosalts?, high gold (up to 60 g/t Au), Ag, As, Sb.
Stage 3 LS veins – colloform banded quartz veins, drusy-coxcomb quartz veins, and quartz-cemented, polymict hydrothermal breccia with pyrite-galena-sulfosalts, adularia? and electrum?. Moderate to high gold grades (2.0 to 15.0 grams/tonne Au) with high Ag (100 to 500 grams/tonne), and high As and Sb values, but variable to low Zn, Pb, and Ba values.
At hand specimen scale, mineralization is controlled by bedding and fractures. The sandy and silty beds of the turbidite sequences of the Caracol Formation are preferentially mineralized, with pyrite disseminations and semi-massive stringers hosted within them, presumably due to higher porosity and permeability relative to the enclosing shale beds. Basal layers of the turbiditic sandstone beds are often preferentially mineralized (Figure 7-6, Figure 7-7). Bedding discordant open space filling fractures and structurally controlled breccia zones host banded sulphide veins and sulphide matrix breccias (Figure 7-8, Figure 7-9). Some higher grade vein and breccia zones are localized along the margins of dikes of intermediate composition.
Dr. Gray observed mineralization in drill core over vertical intervals greater than 400m, with mineralization occurring in a broad NE-SW trending elongate zone as much as 300m wide and 700m long.
| Kappes, Cassiday & Associates | | |
| June 19, 2018 | | Page 7-8 |
| | AMENDED AND RESTATED |
| Camino Rojo Preliminary Economic Assessment | NI 43-101 Technical Report |
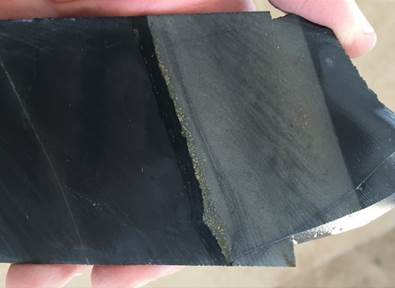
Figure 7-6
Drillcore from CR12 345D, 395m , pyrite concentrations developed in basal sandy layer of fining upward sandstone-siltstone-shale/mudstone turbiditic sequence of Caracol Formation. Note textbook turbiditic sequence comprised of cross bedded sandstone above laminar basal sand, and scour marks of basal sand into black pelagic sediments that mark top of lower and base of upper turbidite sequence. Stratigraphic up is to right of photo. Interval from 394.5m to 396.0m assayed 0.211 gpt Au, 8 gpt Ag, 101 ppm Pb, 128 ppm Zn, and 245 ppm As.
| Kappes, Cassiday & Associates | | |
| June 19, 2018 | | Page 7-9 |
| | AMENDED AND RESTATED |
| Camino Rojo Preliminary Economic Assessment | NI 43-101 Technical Report |
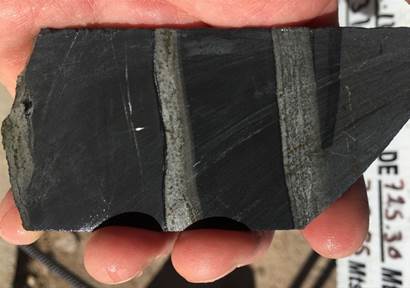
Figure 7-7
Drillcore from CR12 345D, 727m , pyrite concentrations developed in silty and sandy beds of turbiditic sequence of Caracol Formation. Stratigraphic up is to right of photo. Interval from 726.0m to 727.5m assayed 0.109 gpt Au, 1 ppm Ag, 19 ppm Pb, 56 ppm Zn, and 114 ppm As.
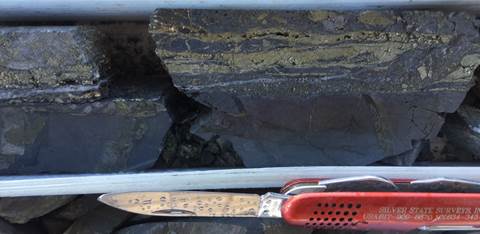
Figure 7-8
Drillcore from CR11 267D, 490m , banded pyrite-marmatite (Fe rich sphalerite) carbonate veinlet. Interval from 489.5m to 491m assayed 4.76 gpt Au, 22 gpt Ag, 572 ppm Pb, 16850 ppm Zn, and 7240 ppm As. Surrounding sample intervals without discordant sulfide veinlets assayed only 0.793 and 0.279 gpt Au. Note that sulfide veinlet is nearly parallel to core axis.
| Kappes, Cassiday & Associates | | |
| June 19, 2018 | | Page 7-10 |
| AMENDED AND RESTATED |
| Camino Rojo Preliminary Economic Assessment | | NI 43-101 Technical Report |
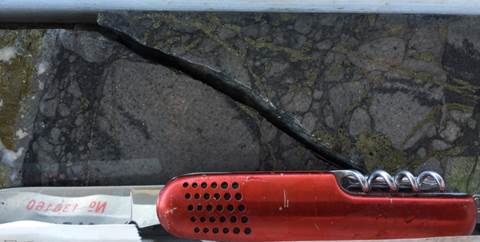
Figure 7-9
Drillcore from CR11 267D, 473m, pyrite-marmatite (Fe rich sphalerite) matrix bedding discordant breccia. Interval from 471.5m to 473.0m assayed 1.710 gpt Au, 14 gpt Ag, 411 ppm Pb, 3050 ppm Zn, and 4290 ppm As. Surrounding sample intervals without discordant sulfide veinlets assayed only 0.188 and 0.310 gpt Au.
Distinct alteration styles accompanied each stage of mineralization (Longo, 2017) (Longo, A.A., Edwards, J., 2017):
Stage 1 - K-metasomatism (adularia? flooding), decarbonization and sulfidation (forming fine-grained pyrite). This alteration assemblage is typically associated with low metal concentrations, except where cut by IS veins, then grades increase. Temperature of this event is unknown and likely not a high temperature (>400 to 700⁰C) event characteristic of K-silicate alteration in porphyry Cu deposits.
Stage 2 - sericite-calcite ±pyrite-quartz overprints Stage 1 and is associated with pyrite-arsenopyrite and pyrite-sphalerite-galena mineral stage veins (Sanchez, 2017). Veins that crosscut the igneous dikes display prominent alteration halos. Sericitic halos to mineral stage veins are not visually obvious in the sediments with intense K-metasomatism.
Oxidation was observed to range from complete oxidation in the uppermost portions of the deposit, generally underlain or surrounded by a zone of mixed oxide and sulphide mineralization where oxidation is complete along fracture zones and within permeable strata, but lacking in the remainder of the rock, which then is generally underlain by a sulphide zone in which no oxidation is observed.
| Kappes, Cassiday & Associates | | |
| June 19, 2018 | | Page 7-11 |
| AMENDED AND RESTATED |
| Camino Rojo Preliminary Economic Assessment | | NI 43-101 Technical Report |
Oxidation of the deposit is ~100%, extending from surface to depths of 100m to 150m. The underlying transitional zone of mixed oxide/sulphide extends over a vertical interval in excess of 100m, and is characterized by partial oxidation controlled by bedding and structures.
The sandy layers of the turbiditic sequence are preferentially oxidized, creating a stratigraphically interlayered sequence of oxide and sulphide material at the cm scale (Figure 7-10), with oxidation along structures affecting all strata (Figure 7-11). The partial oxidation of the Caracol Formation preferentially oxidizes the mineralized strata thus incomplete oxidation in the transition zone may result in nearly complete oxidation of the gold bearing portion of the rock, thus the metallurgical characteristics of mixed oxide/sulphide may vary greatly, with some material exhibiting characteristics similar to oxide material.
| Kappes, Cassiday & Associates | | |
| June 19, 2018 | | Page 7-12 |
| AMENDED AND RESTATED |
| Camino Rojo Preliminary Economic Assessment | | NI 43-101 Technical Report |

Figure 7-10
Drillcore from CR11 258D, 256m, partially oxidized mineralized Caracol Formation. Note that oxidation is controlled by both bedding and structures. Sandy turbiditic beds are preferentially oxidized in the oxide/sulfide transition zone, whereas interlayered mudstone and shale beds are unoxidized. Oxidation affects all beds adjacent to structures.
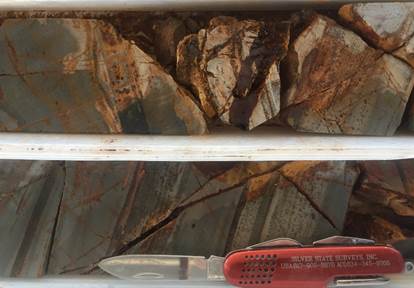
Figure 7-11
Drillcore from CR11 258D, 257m, oxidized Caracol Formation. Interval from 256.5m to 258.0m assayed 3.52 gpt Au, 33 gpt Ag, 6070 ppm Pb, 6060 ppm Zn, and 2590 ppm As. Note oxidized sulfide veinlet crosscutting bedding, seen below the knife.
| Kappes, Cassiday & Associates | | |
| June 19, 2018 | | Page 7-13 |
| AMENDED AND RESTATED |
| Camino Rojo Preliminary Economic Assessment | | NI 43-101 Technical Report |
The distribution of mineralization at Camino Rojo is controlled by both primary bedding and discordant structures. Near surface oxidation extends to depths in excess of 100m, and extends to greater depths along structurally controlled zones of fracturing and permeability.
| Kappes, Cassiday & Associates | | |
| June 19, 2018 | | Page 7-14 |
| AMENDED AND RESTATED |
| Camino Rojo Preliminary Economic Assessment | | NI 43-101 Technical Report |
The observed geologic and geochemical characteristics of the gold-silver-lead-zinc deposit at Camino Rojo are consistent with those of a distal oxidized gold skarn deposit. Characteristics of these deposits (Meinert, L.D., Dipple, G.M., and Nicolescu, S., 2005) are summarized as:
| · | Typically found in lithologies containing some limestone, but deposits not restricted to limestones. |
| · | Formed by regional or contact metamorphic processes by metasomatic fluids, often of magmatic origin. |
| · | Typically zoned deposits with a general pattern of garnet and pyroxene minerals proximal to the mineralizing heat and fluid source, and distal zones of bleaching. |
| · | Low total sulphide content. |
| · | Sulphide mineralogy comprised of pyrite, pyrrhotite, chalcopyrite, sphalerite, and galena. |
| · | Highest gold grades are associated with late relatively lower temperature mineralizing events, often with potassium feldspar and quartz gangue. |
| · | May be transitional to epithermal deposits. |
The near surface portion of the Camino Rojo deposit has characteristics consistent with those of the distal skarn zone, transitional to epithermal mineralization, and overlies garnet bearing skarn mineralization encountered in the deeper portions of the system.
Skarn deposits often exhibit predictable patterns of mineral zoning and metal zoning. Application of skarn zoning models to exploration allows for inferences about the possible lateral and depth extents of the mineralized system at the Camino Rojo deposit and can be used to guide further exploration drill programs.
| Kappes, Cassiday & Associates | | |
| June 19, 2018 | | Page 8-1 |
| AMENDED AND RESTATED |
| Camino Rojo Preliminary Economic Assessment | | NI 43-101 Technical Report |
Orla has conducted reconnaissance geologic evaluations of portions of its mining concessions. As of the effective date of this report, an induced polarization geophysical survey is in process over the known area of mineralization, over the proposed area of infrastructure development and to the west of these areas. It is not yet complete. A small orientation soil survey has been conducted over the resource area. A 2,200m HQ core drill program to obtain samples for additional metallurgical studies is underway, as is a 3,000m Reverse Circulation drill program testing for potential water well locations. Orla has not yet conducted any drilling to explore for new mineralized zones. Historic exploration by prior operators is summarized in Section 6.0 of this report.
Through the effective date of this report, Orla has completed approximately 1,850m of additional drilling in 10 diamond core holes for metallurgical sampling and 1,900m of drilling in 6 reverse circulation holes testing for water. In addition, approximately 100 line-km of Induced Polarization geophysical survey have been completed and 325 rock and soil samples have been collected.
Rock samples are sent to the ALS Minerals (ALS) sample preparation facility in Zacatecas, Mexico. Sample analysis is performed in the ALS laboratory in Vancouver, British Columbia. All gold results are obtained by ALS using fire assay fusion and an atomic absorption spectroscopy finish (Au-AA23). All samples are also analyzed for multi-elements, including silver and copper, using an Aqua Regia (ME-ICP41).
Regional exploration continues to field check interpreted targets, consisting of coincident historic geochemical, airborne geophysical and satellite imagery anomalies. Although several areas of alteration and iron oxide-carbonate veining have been observed, no significant sample results have been returned to date. Results from the orientation soil survey over the known deposit area to test for any characteristic signature indicates the geochemical “halo” over the deposit is tightly restricted to sub/outcrop. Anomalous gold (>0.2 g/t) is most closely associated with elevated arsenic (>100 ppm) and zinc (>300ppm).
Modelling and interpretation of the IP data is pending. Material from the metallurgical holes will be sent to the KCA laboratory in Reno for testing. The RC program for water testing in not advanced enough to make any conclusions.
| Kappes, Cassiday & Associates | | |
| June 19, 2018 | | Page 9-1 |
| AMENDED AND RESTATED |
| Camino Rojo Preliminary Economic Assessment | | NI 43-101 Technical Report |
The drillhole database provided to IMC contained 900 drillholes and 368,418m of drilling. Table 10-1 summarizes the drilling by company, date, and type of drilling. During 2007 and 2008 Canplats drilled 121 holes for 39,831m of drilling, about 11% of the drilling by meters. This was 92 RC holes and 29 core holes. Between 2011 and 2015 Goldcorp drilled 779 holes for 328,587m of drilling. These were 95 RC holes, 306 rotary air blast (“RAB”) holes, and 378 core holes. The 2015 holes and some of the late 2014 holes were drilled for geotechnical investigations. Compared with the drilling reported in Section 6.2 of this report, Table 10-1 reports one less Canplats core hole, one less Goldcorp RC hole, and 37 less Goldcorp core holes. The remainder of the historic drilling is included in the current database. All drill results come from previous operators and no drilling conducted by or on behalf of Orla is included in this report.
Table 10-1
Summary of Camino Rojo Drilling, 2007-2015
| | | | | | RC Holes | | | RAB Holes | | | Core Holes | | | Total Holes | |
| Year | | | Company | | Holes | | | Meters | | | Holes | | | Meters | | | Holes | | | Meters | | | Holes | | | Meters | |
| 2007 | | | Canplats | | | 12 | | | | 2,367 | | | | | | | | | | | | | | | | | | | | 12 | | | | 2,367 | |
| 2008 | | | Canplats | | | 80 | | | | 21,621 | | | | | | | | | | | | 29 | | | | 15,843 | | | | 109 | | | | 37,464 | |
| 2007-08 | | | Canplats | | | 92 | | | | 23,988 | | | | | | | | | | | | 29 | | | | 15,843 | | | | 121 | | | | 39,831 | |
| 2011 | | | Goldcorp | | | 91 | | | | 18,447 | | | | 138 | | | | 10,008 | | | | 124 | | | | 54,249 | | | | 353 | | | | 82,704 | |
| 2012 | | | Goldcorp | | | 4 | | | | 1,116 | | | | 160 | | | | 18,514 | | | | 38 | | | | 35,606 | | | | 202 | | | | 55,236 | |
| 2013 | | | Goldcorp | | | | | | | | | | | | | | | | | | | 134 | | | | 110,305 | | | | 134 | | | | 110,305 | |
| 2014 | | | Goldcorp | | | | | | | | | | | 8 | | | | 2,764 | | | | 79 | | | | 75,478 | | | | 87 | | | | 78,242 | |
| 2015 | | | Goldcorp | | | | | | | | | | | | | | | | | | | 3 | | | | 2,100 | | | | 3 | | | | 2,100 | |
| 2011-15 | | | Goldcorp | | | 95 | | | | 19,563 | | | | 306 | | | | 31,286 | | | | 378 | | | | 277,738 | | | | 779 | | | | 328,587 | |
| ALL | | | | | | 187 | | | | 43,551 | | | | 306 | | | | 31,286 | | | | 407 | | | | 293,581 | | | | 900 | | | | 368,418 | |
Note: Quantity of drillholes is not consistent with Section 6.2 as the remainder of historical drillholes are in the IMC database.
Figure 10-1 shows the drillhole locations by drilling type and Figure 10-2 shows the drilling by company. Note that the RAB holes are mostly peripheral to the main mineral deposit area. The denser drilling in the northeast portion of the deposit is the area of interest for this PEA. This material is relatively close to the surface and oxidized. To the southwest the mineralization is deeper with higher amounts of sulfide.
| Kappes, Cassiday & Associates | | |
| June 19, 2018 | | Page 10-1 |
| AMENDED AND RESTATED |
| Camino Rojo Preliminary Economic Assessment | | NI 43-101 Technical Report |
The Canplats drilling was conducted during 2007 and 2008. It is reported the RC holes were drilled by Tiger Drilling de Mexico, S.A. de C.V. and Layne de Mexico, S.A. de C.V. The rigs used drilled holes of either 4.75in or 5.5in (12cm or 14cm) diameter. Most of the core holes are HQ and drilled by Major Drilling. Four PQ holes were drilled to collect metallurgical samples, but only three of them are in the IMC database.
It was reported that Canplats did not do downhole surveys for the RC holes. However, Goldcorp was able to re-enter most of the holes and do the surveys. Most of the Canplat RC holes currently have detailed downhole survey information.
Core and RC logging procedures for Canplats drilling were described by Blanchflower (2009). For RC drilling, Canplats sampling personnel extracted spoon size splits from each drill interval at the rig’s cyclone splitter, washed away the fine fraction with a strainer, and placed the washed splits into divided plastic chip trays. Canplats geologists subsequently logged the RC cuttings in the office and storage building, describing each interval on paper log forms with codes for lithology, alteration, mineralization and fracturing. The logged information was later captured into electronic spreadsheet files.
Core was logged prior to hydraulic splitting and sampling. Canplats geologists used paper logging forms to record descriptions of color, lithology, alteration, mineralization, bedding, and fracture and fault angles to the core axis. Descriptions used a combination of alpha-numeric codes and normal text, and included hand-drawn graphic sketches. The logged information was later captured into electronic spreadsheet files for importation in the database.
The Canplats drilling discovered and partially delineated the oxide mineral deposit that occurs at the northeast end of the Camino Rojo deposit, in the Represa zone. The drilling also discovered the deeper sulphide deposit to the southwest, in the Don Julio zone. This data was used to develop a mineral resource and PEA level study for the Represa zone by Canplats during 2009.
The Goldcorp drilling was conducted from 2011 to 2015. The RC drilling was conducted by Layne de Mexico and G4 Drilling. The RC holes were 4.75in to 5.125in in diameter (12cm to 13cm). The core holes were drilled by Layne, BD Drilling, and Boart-Longyear and were generally HQ core. In addition to the core and RC holes, 306 RAB holes were drilled. The average depth of these holes was only about 100m and were mostly peripheral to the main deposit area. Downhole surveys were conducted for the core and RC drilling, but not for the RAB holes. They were assumed vertical.
| Kappes, Cassiday & Associates | | |
| June 19, 2018 | | Page 10-2 |
| AMENDED AND RESTATED |
| Camino Rojo Preliminary Economic Assessment | | NI 43-101 Technical Report |
Most of the holes are orientated north with an approximate 60o north plunge. This is an optimal orientation for the bedding, which dips moderately to the south/southeast. This direction is less optimal for steep north dipping structures and intercepts with narrow veins at low to very low angles to the core axis have been observed in many holes. There are two sections with holes directed to the south drilled by Goldcorp. However, it would be desirable to drill more holes directed south with a 45 to 60o south plunge to intersect structures with a similar attitude as the dike, southwest to northeast trending with a steep north dip. However, these holes require access to ground controlled by the Adjacent Owner.
Goldcorp RC chip logging was recorded to paper log forms by Goldcorp geologists at the RC drill sites, concurrent with drilling. Washed fines and chips from each interval were examined and logged, and a spoon-sized split was placed into divided chip trays for future reference. As of this writing, the chip trays are available for inspection. The Goldcorp geologists described and recorded the lithology, alteration, fracture/fault zones, oxidation class, percent oxidation by volume, estimated percent and type of iron oxides, estimated percent sphalerite, galena, pyrite, and other sulfides, calcite, other veins, and color. Descriptive text and a graphic sketch column were also recorded. These data were later captured into electronic spreadsheet files for importation into the database.
Core logging by Goldcorp was carried out on whole core, prior to any core cutting or sampling. All core was brought by Goldcorp personnel to the core logging shelter, rinsed with water, and measured from run blocks to determine core depths contained in each core box. Goldcorp geologists logged lithology, alteration, fracture/fault zones, oxidation class, and percent oxidation by volume. Graphic sketch columns for lithology, bedding, fracture and fault angles to core axes, and mineralization were also recorded. Estimated percentages of sulphide and gangue minerals, as well as their mode of occurrence were recorded as text. Logged information was later captured into electronic spreadsheet files for importation into the database. In 2012 the logging was modified to include fields for estimated percentages of various sulphide minerals. During 2010 Goldcorp geologists re-logged the Canplats RC drill cuttings to determine the degree of oxidation of each drill interval in terms of percent oxidation of the rock by volume. The Goldcorp drilling further delineated both the oxide and sulphide mineral resources. The oxide portion of the deposit has sufficient drilling to conduct studies at the Feasibility Study level. The sulphide deposit has sufficient drilling to conduct studies at the PEA or Preliminary Feasibility level of study.
| Kappes, Cassiday & Associates | | |
| June 19, 2018 | | Page 10-3 |
| AMENDED AND RESTATED |
| Camino Rojo Preliminary Economic Assessment | | NI 43-101 Technical Report |
Goldcorp sample intervals were consistently 1.5m for core, RC, and RAB drilling. For Canplats RC drilling about 20% of the sample intervals were 1.0m and 80% 2.0m intervals. Canplats core samples tended to be 2.0m intervals, but about 30% of the intervals were shorter and of random length. According to the Canplats 2009 Technical Report, the geologist could adjust the sample intervals to correspond with geologic contacts.
For the RC drilling by Canplats and Goldcorp a splitter was used at the drill rig and the sample collected in the field. For core, for both Canplats and Goldcorp, the samples were split at the secure facilities and bagged for shipment to the sample preparation laboratories.
There is no recovery information for Canplats drilling or for any of the RC or RAB drilling. The recovery for Goldcorp core was very high, generally above 90% and the overall average was about 96%.
It is the opinion of IMC that the drilling and sampling procedures for Camino Rojo drill samples are reasonable and adequate. IMC does not know of any drilling, sampling, or recovery factors that would materially impact the reliability of the results.
| Kappes, Cassiday & Associates | | |
| June 19, 2018 | | Page 10-4 |
| AMENDED AND RESTATED |
| Camino Rojo Preliminary Economic Assessment | | NI 43-101 Technical Report |
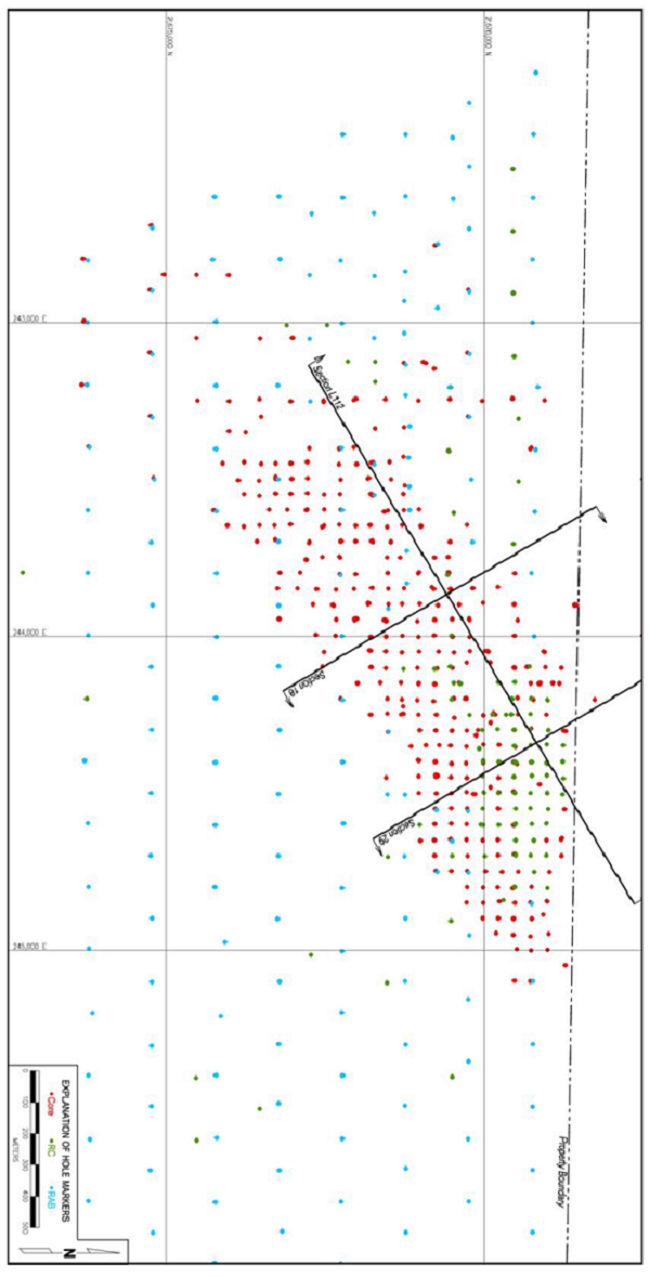
Figure 10-1
Drilling by Type, IMC 2018
| Kappes, Cassiday & Associates | | |
| June 19, 2018 | | Page 10-5 |
| AMENDED AND RESTATED |
| Camino Rojo Preliminary Economic Assessment | | NI 43-101 Technical Report |
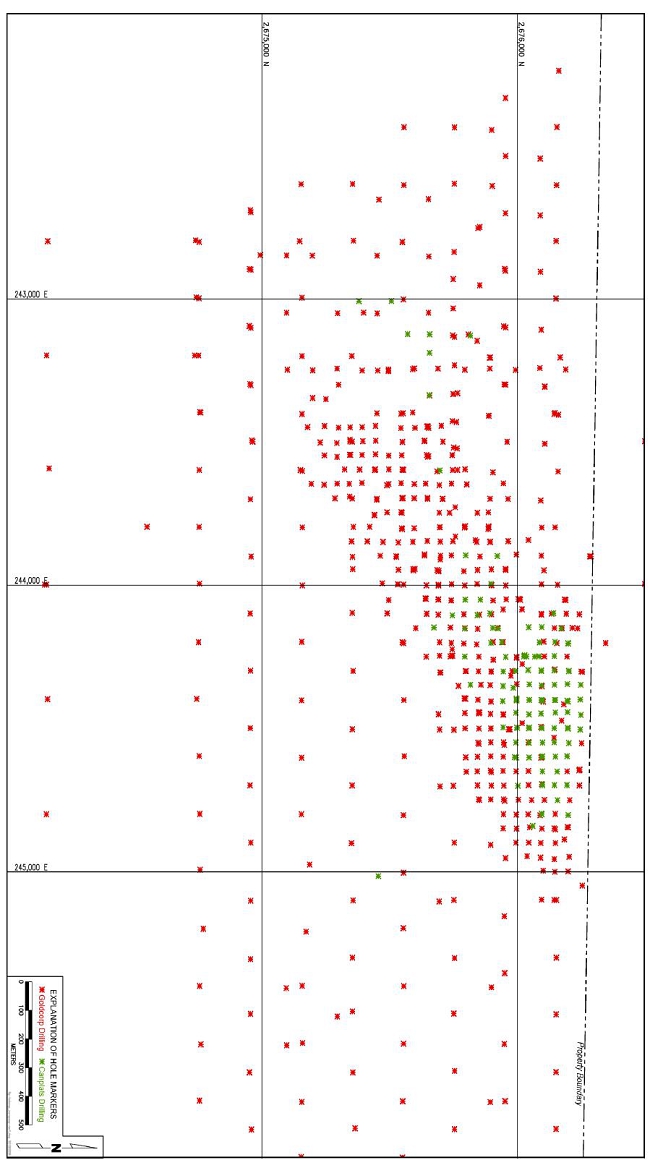
Figure 10-2
Drilling by Company, IMC 2018
| Kappes, Cassiday & Associates | | |
| June 19, 2018 | | Page 10-6 |
| | AMENDED AND RESTATED |
| Camino Rojo Preliminary Economic Assessment | NI 43-101 Technical Report |
| 11.0 | SAMPLE PREPARATION, ANALYSES AND SECURITY |
The sampling and analysis was supervised by the geological staff of Canplats for 2007 and 2008 drilling and by Goldcorp for 2011 through 2014 drilling. As of this writing, Orla has not done any additional drilling and sampling.
ALS Chemex has been the primary assay laboratory used for the routine assaying of surface and drill samples for both the Canplats and Goldcorp drilling/sampling programs. All of the assays have been done at the ALS Chemex laboratory in North Vancouver, British Columbia, certified under ISO 9001: 2000, and 2008, and accredited under ISO 17025:2005. ALS Chemex is independent of each of Canplats and Goldcorp.
The Canplats samples were prepared for assaying at the ALS Chemex sample preparation laboratory in Guadalajara, Mexico. Most of the Goldcorp samples were prepared at the ALS Chemex sample preparation laboratory in Zacatecas, Mexico. However, during 2013 and 2014 samples were also sent to the ALS Chihuahua facility and the ALS Guadalajara preparation lab as well as Zacatecas facility.
Upon receipt at the sample preparation labs the samples were dried, crushed in their entirety to >70% passing a 6mm screen. The crushed material was riffle split to extract an approximate 250 gram sub-sample that was pulverized to >85% passing 75 microns in a disc pulverizer. This sample preparation procedure is the standard ALS Chemex “PREP-31” procedure. Each of the 250 gram pulps were riffle split into two sealed paper sample envelopes, with one split air-shipped to the ALS Chemex assay facility in North Vancouver. The second split was returned to the property for storage. The same sample preparation procedure was used for core and RC chips.
The core and RC samples collected by Canplats and Goldcorp, as well as the surface pit and trench samples collected by Canplats, were assayed with the same analytical methods and at the same laboratory, the ALS Chemex facility in North Vancouver, British Columbia. For gold, all were assayed using the Au-AA23 30 gram fire assay fusion, with Atomic Absorption finish. A total of 33 other elements were determined four-acid sample digestion followed by Inductively Coupled Plasma Atomic Emission Spectrometry (ICP-AES). This is ALS Chemex method code ME-ICP61. The elements assayed by ICP-AES are Ag, Al, As, Ba, Be, Bi, Ca, Cd, Co, Cr, Cu, Fe, Ga, K, La, Mg, Mn, Mo, Na, Ni, P, Pb, S, Sb, Sc, Sr, Th, Ti, Tl, U, V, W, and Zn.
Kappes, Cassiday & Associates June 19, 2018 | Page 11-1 |
| | AMENDED AND RESTATED |
| Camino Rojo Preliminary Economic Assessment | NI 43-101 Technical Report |
Over-limits for gold were automatically re-assayed with 30-gram fire assay fusion with gravimetric finish (method code Au-GRA21). Over-limits for silver, copper, lead and zinc were automatically performed by four acid digestion of the sample followed by analysis by ICP-AES. This is ALS Chemex method code ME-OG62 for material grade samples.
RAB-style RC samples from 2011 to 2014 were analyzed at ALS Chemex using method code ME-MS61m, which employs the same four-acid digestion, and a combination of Inductively Coupled Plasma Atomic Emission Spectrometry (ICP-AES), mass-spectrometry, and cold-vapor Atomic Absorption to determine 48 elements plus mercury. Most of the RAB holes are peripheral to the main deposit area.
| 11.3.1 | Canplats QA/QC Program |
It is reported that the Canplats Quality Control/Quality Assurance (QA/QC) program was based on the insertion of control samples at a target rate of 5% to the assay laboratory (Blanchflower, 2009). A quality control sample was to be inserted randomly within every 20 consecutive samples, alternating between standard, blank or duplicate samples. The standard and blank samples were inserted into the sample sequence as the sample shipment was being readied. Duplicate samples were inserted into the sample sequence at the time of collection (Blanchflower, 2009). As reported by Blanchflower (2009) the final, compiled database for 2007 and 2008 drilling included 2,165 blanks and standards, and 1,078 field duplicates. However, relatively few of the Canplats QA/QC samples (about three holes) are included in the current database, so this data cannot be independently verified. Only about 10% of the drilling was done by Canplats.
| 11.3.2 | Goldcorp QA/QC Program |
Goldcorp’s QA/QC program included the use of blanks, standards and field duplicates for all drilling to monitor potential sample numbering issues and contamination during sample preparation, as well as analytical accuracy and precision. The control sample insertion rate was originally targeted at 7%, and Goldcorp personnel inserted all QA/QC samples during sample collection, prior to placing the samples in the storage area for shipment to the laboratory. A blank was inserted every 25 samples and consisted of fragments of unaltered calcareous siltstone and sandstone of the Caracol Formation, from a borrow pit near Tanque Nuevo, Zacatecas, approximately 60 km northeast of Camino Rojo. For RC blanks the Caracol material was hand-crushed to coarse gravel size, and for core drilling blanks the material was broken into fragments similar to drill core size. A standards was inserted every 50 samples usually immediately following the blanks. Standards have included the commercial standards CDN-ME-15 and CDN-ME-16, from CDN Resource Laboratories in Vancouver, B.C., and three in-house reference materials, PEN1850OX, PEN1850T and STDCR14-01, all prepared at SGS Minerales in Durango. The first two were prepared from bulk samples of oxide and mixed oxide-sulphide material from Peñasquito and the latter from Camino Rojo drill core. Field duplicates were inserted every 100th sample, labelled with a “B” suffix to the original sample number. Field duplicates were two ¼’s of the same ½ piece of sawn core. A total of 10,583 control samples were inserted in 2011 through 2013, for a realized control insertion rate of just below 8%.
Kappes, Cassiday & Associates June 19, 2018 | Page 11-2 |
| | AMENDED AND RESTATED |
| Camino Rojo Preliminary Economic Assessment | NI 43-101 Technical Report |
A comprehensive compilation and review of Goldcorp’s QA/QC program during 2014 determined that while adequate, the program had several aspects that could be significantly improved through a few simple and easy to implement changes including:
| · | At 8% the overall insertion rate was considered low and that a higher proportion of QA/QC samples, distributed more evenly, were needed. |
| · | Over significant periods of time only a single standard had been used and that several standards should be used on a rotation basis. |
| · | The ¼ core duplicate could not assess variability in the regular samples properly and that the full second half of core should be used instead. |
Early in 2014 a new QA/QC protocol was adopted where a QA/QC material would be inserted every 10th sample for an improved insertion rate of 10%. Three standards were used in a rotation, alternating with blanks and duplicates such that every 80 samples two blanks, two ½ core duplicates and 4 standards were inserted into the sample sequence.
Goldcorp implemented procedures in 2012 for improved follow-up of QA/QC analytical data (Ristorcelli and Ronning, 2012). The project database manager was to review blank and standard assay results as new data was received and loaded into the project master assay table. Standards more than three deviations from the expected values and blanks with gold values greater than 0.020 g/t, or silver values greater than to 1.5 g/t, were reported to the project exploration manager and via email to ALS Chemex for investigation. The exploration manager, database manager and ALS Chemex QA/QC staff communicated to identify the cause of the elevated blank or unexpected standard result.
Kappes, Cassiday & Associates June 19, 2018 | Page 11-3 |
| | AMENDED AND RESTATED |
| Camino Rojo Preliminary Economic Assessment | NI 43-101 Technical Report |
Depending on the cause, the exploration manager ordered appropriate steps as necessary for re-assays, or submission of remaining sample splits for new assays, and instructed the database manager on any changes needed to the assay database.
The Goldcorp QA/QC samples were included in the database provided to IMC. IMC has reviewed this data, including developing some independent control charts. It is the opinion of IMC that the Goldcorp QA/QC program met or exceeded industry standards.
After collection in the field, the Canplats core and RC samples were transported by truck to a secure warehouse in San Tiburcio, a distance of about 5 km. After each drill core sample was split in half by sawing and bagged, the sample bags were tied shut with non-slip plastic ties. The sample bags were then moved to a locked storage area in the core logging and storage facility controlled by the company geologists. Prior to shipping, several sample bags were placed into large woven nylon ‘rice’ bags, their contents were marked on each bag, and each bag was securely sealed.
The sample bags were delivered directly to the ALS Chemex assay laboratory in Guadalajara, Jalisco State, Mexico by company personnel.
During the Goldcorp tenure, samples were transported from the field to a secure warehouse and logging area in San Tiburcio, usually twice a day, morning and late afternoon. Sealed individual sample bags of sawn core were loaded into numbered rice sacks which were tied closed and placed in the secure storage building each afternoon. Once or twice a week the sealed sacks were loaded into a delivery truck operated under contract to ALS Chemex and delivered to the preparation labs.
Orla took possession of the Goldcorp facility in San Tiburcio. As of this writing the core, many of the assay pulps, and the RC chip trays are stored at this facility. The facility is walled with locked gates.
It is the opinion of IMC that the sample preparation, analysis, QA/QC programs and sample security were adequate to ensure the reliability of the drilling database.
Kappes, Cassiday & Associates June 19, 2018 | Page 11-4 |
| | AMENDED AND RESTATED |
| Camino Rojo Preliminary Economic Assessment | NI 43-101 Technical Report |
IMC selected 20 holes at random from the Camino Rojo database and compared the database with original assay certificates. The holes were:
| CR13-459D | CR11-289D | CR12-344D | CR11-332D |
| CR13-380D | CR13-428D | CR13-390D | CR13-422D |
| BCR-006 | BCR-044 | BCR-066 | CR13-424D |
| CR11-266D | BCR-078 | CRD-021 | CR11-284D |
| BCR-011 | BCR-019 | CR11-305D | CR13-497D |
The gold, silver, lead, and zinc assays in the database were compared with the certificates. The checked data amounted to about 7,623 assay intervals.
For gold there were minor discrepancies in the certificates versus the database for nine intervals; one in CR11-266D and eight in CR13-380D. The database and certificate values were similar, so the discrepancies are not material. There were also eight discrepancies for silver and zinc and seven discrepancies for lead in hole CR13-380D, generally in the same records as gold. This is an indication that a section of hole CR13-380D might have been re-assayed.
There were also 10 discrepancies for silver, lead, and zinc in hole BCR-019. They were the same 10 assay intervals. Again, the certificate and database values were similar, so the discrepancies are not material.
Based on the comparisons IMC concluded the database assay values are reliable.
IMC also compared collar elevations of the drillholes with topography. The elevations were in very good agreement with the exception of 15 holes, mostly on one drill fence, at the south end of the drilling. The holes are not in the resource area and are not material for the present study.
Minera Camino Rojo personnel have also re-surveyed many of the drillhole collars to verify the original surveys. IMC believes the collar coordinates of the drillholes are accurate.
IMC is of the opinion that the Camino Rojo drillhole database is acceptable for PEA, Prefeasibility and Feasibility level studies.
Kappes, Cassiday & Associates June 19, 2018 | Page 12-1 |
| | AMENDED AND RESTATED |
| Camino Rojo Preliminary Economic Assessment | NI 43-101 Technical Report |
| 13.0 | MINERAL PROCESSING AND METALLURGICAL TESTING |
Metallurgical test work programs on the Camino Rojo project were commissioned by the prior operators of the project, Canplats Mexico and Goldcorp, and are considered as historical data. No metallurgical studies have been conducted by Orla at this time. Test work and results from the programs carried out to date for Camino Rojo are summarized chronologically below.
Canplats commissioned SGS Mineral Services Minerals in Durango, Mexico to conduct bottle roll, column, and flotation tests between two programs on Camino Rojo drill core samples and in 2009 publicly disclosed results of 18 column tests, 61 bottle roll tests, and 35 flotation tests. The results summarized herein are extracted from the Canplats 2009 technical report (Blanchflower, K.D., Kaye, C., and Steidtmann, H., 2009).
Composite samples for the first program by SGS were obtained from diamond drill cores of oxide and transition material. Tests performed during the first program included bottle roll, column leach and flotation. The second program used samples from diamond drill cores of oxide, sulphide and transition materials. Material from the second program was used for bottle roll and flotation tests. No mineralogy, bond work index and crusher abrasion index tests were performed.
Column leach tests results are summarized in Table 13-1 and Table 13-2 for oxide and transition composites, respectively, and indicate crush sizes between 37mm and 9.5mm for oxide material have a negligible effect on gold recovery. Silver recoveries tended to increase as the crush size was reduced to 9.5mm. The effect of crush size on transition material was only evaluated on 2 samples and there were insufficient data to show any meaningful trends. In general, gold recovery was higher for oxide material than transition material. Silver recoveries were consistently higher in transition samples than in oxide samples. Maximum gold and silver recoveries for oxide material were achieved between 40 and 50 days. Different recovery trends for gold and silver based on material classification (oxide or transition) were evident. At a 19mm crush size, modeling of recovery versus head grades indicated that at a 0.7 gpt Au head grade, a gold recovery of approximately 74% for oxide material and 69% for transition material is predicted. At a 14 gpt Ag head grade, column test results indicated a silver recovery of approximately 23% for oxide material and 28% for transition material.
| Kappes, Cassiday & Associates | | |
| June 19, 2018 | | Page 13-1 |
| | AMENDED AND RESTATED |
| Camino Rojo Preliminary Economic Assessment | NI 43-101 Technical Report |
Table 13-1
Oxide Column Test Results SGS Mineral Services Minerals
| | Crush | | | Calculated Head
Grade | | | Extraction | | | Consumption | |
| Column | | Size
(mm) | | | Gold
(g/t) | | | Silver
(g/t) | | | Gold
(%) | | | Silver
(%) | | | NaCN
(kg/T) | | | CaO
(kg/T) | |
| CRM-06-1 | | | 38 | | | | 0.672 | | | | 8.27 | | | | 72.59 | | | | 12.84 | | | | 0.66 | | | | 2.29 | |
| | | | 19 | | | | 0.603 | | | | 9.36 | | | | 73.31 | | | | 14.91 | | | | 0.87 | | | | 3.34 | |
| | | | 9.5 | | | | 0.537 | | | | 9.00 | | | | 73.65 | | | | 19.02 | | | | 0.81 | | | | 4.28 | |
| | | | | | | | | | | | | | | | | | | | | | | | | | | | | |
| CRM-06-2/3 | | | 38 | | | | 1.952 | | | | 10.63 | | | | 83.66 | | | | 12.05 | | | | 0.79 | | | | 2.36 | |
| | | | 19 | | | | 1.794 | | | | 11.51 | | | | 86.6 | | | | 21.23 | | | | 0.99 | | | | 2.81 | |
| | | | 9.5 | | | | 1.795 | | | | 11.58 | | | | 86.49 | | | | 25.27 | | | | 1.23 | | | | 4.60 | |
| | | | | | | | | | | | | | | | | | | | | | | | | | | | | |
| CRM-14-1 | | | 38 | | | | 0.508 | | | | 19.24 | | | | 62.14 | | | | 30.39 | | | | 0.78 | | | | 3.00 | |
| | | | 19 | | | | 0.486 | | | | 18.01 | | | | 64.14 | | | | 32.29 | | | | 0.62 | | | | 3.30 | |
| | | | 9.5 | | | | 0.486 | | | | 18.01 | | | | 61.81 | | | | 28.06 | | | | 0.91 | | | | 4.30 | |
| | | | | | | | | | | | | | | | | | | | | | | | | | | | | |
| CRM-20-1 | | | 38 | | | | 0.369 | | | | 14.09 | | | | 65.15 | | | | 23.16 | | | | 0.58 | | | | 2.63 | |
| | | | 19 | | | | 0.338 | | | | 17.94 | | | | 78.08 | | | | 23.21 | | | | 0.55 | | | | 2.31 | |
| | | | 9.5 | | | | 0.359 | | | | 15.26 | | | | 74.81 | | | | 30.88 | | | | 0.71 | | | | 3.55 | |
Table 13-2
Transition Column Test Results SGS Mineral Services Minerals
| | | Crush | | | Calculated Head Grade | | | Extraction | | | Consumption | |
| Column | | Size
(mm) | | | Gold
(g/t) | | | Silver
(g/t) | | | Gold
(%) | | | Silver
(%) | | | NaCN
(kg/T) | | | CaO
(kg/T) | |
| CRM-14-2 | | | 38 | | | | 0.431 | | | | 15.51 | | | | 34.74 | | | | 33.71 | | | | 0.67 | | | | 1.59 | |
| | | | 19 | | | | 0.446 | | | | 13.63 | | | | 36.35 | | | | 38.95 | | | | 0.61 | | | | 1.44 | |
| | | | 9.5 | | | | 0.387 | | | | 15.33 | | | | 33.13 | | | | 44.15 | | | | 0.81 | | | | 2.53 | |
| | | | | | | | | | | | | | | | | | | | | | | | | | | | | |
| CRM-20-2 | | | 38 | | | | 0.593 | | | | 21.51 | | | | 55.2 | | | | 30.54 | | | | 0.54 | | | | 1.55 | |
| | | | 19 | | | | 0.585 | | | | 28.58 | | | | 62.39 | | | | 31.74 | | | | 0.47 | | | | 1.48 | |
| | | | 9.5 | | | | 0.589 | | | | 22.35 | | | | 60.51 | | | | 50.87 | | | | 0.84 | | | | 2.83 | |
Bottle roll tests did not show any clear distinction between gold and silver recoveries for the oxide, transition and sulphide materials tested. Dissolution of gold and silver was essentially complete after 48 hours. Slightly different recovery trends for gold associated with oxide and transition material were evident with recoveries being marginally higher for oxide material. Results for silver in oxide material were too scattered to determine a trend.
| Kappes, Cassiday & Associates | | |
| June 19, 2018 | | Page 13-2 |
| | AMENDED AND RESTATED |
| Camino Rojo Preliminary Economic Assessment | NI 43-101 Technical Report |
Flotation tests indicated that oxide material is not amenable to treatment by flotation and sulfidization did not improve the metallurgical response of this material. Flotation tests on sulphide samples produced some encouraging results for recoveries of base metals. Three tests recorded recoveries of lead to the lead rougher concentrate in excess of 85% while two indicated recoveries in excess of 70%. Apart from these tests, however, lead grades were mostly low and considerable upgrading would be required to produce a marketable lead concentrate. Recoveries of zinc to the zinc rougher concentrate were mostly modest although two tests recorded recoveries in excess of 75%. Considerable upgrading of both lead and zinc rougher concentrates are required to produce a marketable concentrate. Recoveries of gold and silver to the lead rougher concentrate were reasonable in some tests.
Between 2010 and 2015, Goldcorp carried out several metallurgical programs on oxide, sulphide and transition material. This work was performed by several different metallurgical testing groups including Kappes, Cassiday & Associates in Reno, NV, Blue Coast Research Metallurgy in Parksville, B.C., and Hazen Research in Golden, CO.
| 13.2.1 | Kappes, Cassiday & Associates (2010-2015) |
KCA completed four separate test programs for Goldcorp between 2010 and 2015 including column leach tests, agglomeration and percolation tests, bottle roll tests and cyanide shake tests.
Column leach tests were performed by KCA for their programs conducted in 2010, 2012 and 2015 and the results for gold and silver recovery of these tests are summarized in Table 13-3, Table 13-4, and Table 13-5, respectively. The column tests were completed on composite samples of split core material by material types and lithologies. The 2010 program included 18 column tests on 18 different composites as directed by Goldcorp. The 2012 program included 28 column tests on 14 different composites by pit and material type. The 2015 program included 26 column tests on 13 different composites by lithology.
| Kappes, Cassiday & Associates | | |
| June 19, 2018 | | Page 13-3 |
| | AMENDED AND RESTATED |
| Camino Rojo Preliminary Economic Assessment | NI 43-101 Technical Report |
Table 13-3
KCA 2010 Column Leach Test Results on Composites
| Composite | | | Crush
Size,
mm | | | Calculated
Head,
gms Au/t | | | Extracted,
% Au | | | Consumption NaCN,
kg/t | | | Hydrated
Lime
Addition,
kg/t | |
| 1 | | | 19.0 | | | 0.33 | | | 63 | % | | 1.30 | | | 1.01 | |
| 2 | | | 19.0 | | | 0.77 | | | 70 | % | | 1.10 | | | 1.00 | |
| 2 | | | 9.5 | | | 0.78 | | | 73 | % | | 1.07 | | | 1.00 | |
| 3 | | | 19.0 | | | 0.96 | | | 75 | % | | 0.95 | | | 1.01 | |
| 4 | | | 19.0 | | | 0.37 | | | 49 | % | | 0.95 | | | 1.00 | |
| 5 | | | 19.0 | | | 0.64 | | | 57 | % | | 1.06 | | | 1.01 | |
| 6 | | | 19.0 | | | 0.95 | | | 67 | % | | 1.06 | | | 1.01 | |
| 9 | | | 19.0 | | | 0.59 | | | 74 | % | | 1.16 | | | 1.01 | |
| 9 | | | 9.5 | | | 0.61 | | | 79 | % | | 1.34 | | | 1.01 | |
| 10 | | | 19.0 | | | 0.81 | | | 78 | % | | 1.30 | | | 1.01 | |
| 11 | | | 19.0 | | | 0.44 | | | 36 | % | | 1.01 | | | 1.01 | |
| 12 | | | 19.0 | | | 0.57 | | | 51 | % | | 1.28 | | | 1.01 | |
| 16 | | | 19.0 | | | 0.60 | | | 78 | % | | 1.08 | | | 1.01 | |
| 16 | | | 9.5 | | | 0.58 | | | 79 | % | | 0.98 | | | 1.01 | |
| 17 | | | 19.0 | | | 0.83 | | | 80 | % | | 0.77 | | | 1.00 | |
| 18 | | | 19.0 | | | 0.27 | | | 41 | % | | 0.90 | | | 1.00 | |
| Average | | | 19 | | | 0.63 | | | 63 | % | | 1.07 | | | 1.01 | |
| Average | | | 9.5 | | | 0.66 | | | 77 | % | | 1.13 | | | 1.01 | |
| Kappes, Cassiday & Associates | | |
| June 19, 2018 | | Page 13-4 |
| | AMENDED AND RESTATED |
| Camino Rojo Preliminary Economic Assessment | NI 43-101 Technical Report |
Table 13-4
KCA 2012 Summary of Column Leach Test Results by Material Type
| Description | | Crush Size,
mm | | Calculated Head,
g Au/t | | | Extracted,
% Au | | | Calculated Head,
g Ag/t | | | Extracted,
% Ag | | Calculated Tail p80
Size,mm | | Days of Leach | | | Consumption NaCN,
kg/t | | | Addition Hydrated Lime,
kg/t | |
| Composite 1, Central-Oxide | | 25.0 | | 0.376 | | | 67 | % | | 13.07 | | | 15 | % | 19.0 | | 113 | | | 1.41 | | | 2.04 | |
| Composite 1, Central-Oxide | | 12.5 | | 0.390 | | | 68 | % | | 15.37 | | | 19 | % | 9.19 | | 113 | | | 1.23 | | | 2.04 | |
| Composite 6, East-Oxide | | 25.0 | | 0.573 | | | 62 | % | | 11.20 | | | 1 | % | 17.8 | | 113 | | | 1.08 | | | 2.01 | |
| Composite 6, East-Oxide | | 12.5 | | 0.527 | | | 61 | % | | 13.62 | | | 2 | % | 9.04 | | 113 | | | 1.05 | | | 2.04 | |
| Composite 10, West-Oxide | | 25.0 | | 2.031 | | | 83 | % | | 10.74 | | | 3 | % | 17.8 | | 113 | | | 0.18 | | | 2.03 | |
| Composite 10, West-Oxide | | 12.5 | | 2.130 | | | 84 | % | | 13.24 | | | 2 | % | 9.47 | | 113 | | | 0.41 | | | 2.02 | |
| Composite 2, Central-Transition | | 25.0 | | 0.484 | | | 28 | % | | 13.14 | | | 36 | % | 18.5 | | 113 | | | 0.44 | | | 2.03 | |
| Composite 2, Central-Transition | | 12.5 | | 0.482 | | | 23 | % | | 15.03 | | | 41 | % | 9.75 | | 113 | | | 0.57 | | | 2.02 | |
| Composite 3, Central-Transition | | 25.0 | | 0.484 | | | 26 | % | | 16.98 | | | 37 | % | 17.9 | | 113 | | | 0.56 | | | 2.03 | |
| Composite 3, Central-Transition | | 12.5 | | 0.479 | | | 30 | % | | 18.26 | | | 45 | % | 9.37 | | 113 | | | 0.54 | | | 2.03 | |
| Composite 4, Central-Transition | | 25.0 | | 1.448 | | | 40 | % | | 26.62 | | | 37 | % | 18.5 | | 113 | | | 0.59 | | | 2.02 | |
| Composite 4, Central-Transition | | 12.5 | | 1.263 | | | 51 | % | | 29.05 | | | 49 | % | 9.19 | | 113 | | | 0.77 | | | 2.03 | |
| Composite 7, East-Transition | | 25.0 | | 0.518 | | | 25 | % | | 14.63 | | | 43 | % | 16.0 | | 113 | | | 0.76 | | | 2.04 | |
| Composite 7, East-Transition | | 12.5 | | 0.553 | | | 15 | % | | 16.97 | | | 46 | % | 8.87 | | 113 | | | 0.67 | | | 2.04 | |
| Composite 8, East-Transition | | 25.0 | | 0.867 | | | 28 | % | | 21.07 | | | 42 | % | 18.2 | | 113 | | | 0.62 | | | 2.03 | |
| Composite 8, East-Transition | | 12.5 | | 0.821 | | | 26 | % | | 23.74 | | | 52 | % | 9.25 | | 113 | | | 0.58 | | | 2.04 | |
| Composite 9, East-Transition | | 25.0 | | 0.592 | | | 12 | % | | 11.36 | | | 29 | % | 17.1 | | 113 | | | 0.68 | | | 2.03 | |
| Composite 9, East-Transition | | 12.5 | | 0.679 | | | 9 | % | | 11.07 | | | 33 | % | 8.91 | | 113 | | | 1.00 | | | 2.03 | |
| Composite 11, West-Transition | | 25.0 | | 0.652 | | | 33 | % | | 10.02 | | | 36 | % | 17.3 | | 113 | | | 0.75 | | | 2.03 | |
| Composite 11, West-Transition | | 12.5 | | 0.658 | | | 30 | % | | 11.17 | | | 35 | % | 9.26 | | 113 | | | 0.79 | | | 2.04 | |
| Composite 12, West-Transition | | 25.0 | | 0.454 | | | 17 | % | | 19.37 | | | 41 | % | 17.6 | | 113 | | | 0.94 | | | 2.04 | |
| Composite 12, West-Transition | | 12.5 | | 0.401 | | | 18 | % | | 19.70 | | | 41 | % | 9.73 | | 113 | | | 1.30 | | | 2.04 | |
| Composite 13, West-Transition | | 25.0 | | 0.532 | | | 70 | % | | 10.21 | | | 22 | % | 17.1 | | 113 | | | 0.65 | | | 2.04 | |
| Composite 13, West-Transition | | 12.5 | | 0.575 | | | 70 | % | | 15.46 | | | 26 | % | 8.38 | | 113 | | | 0.87 | | | 2.03 | |
| Composite 5, Central-Sulphide | | 25.0 | | 0.446 | | | 8 | % | | 8.25 | | | 11 | % | 17.8 | | 113 | | | 0.86 | | | 2.02 | |
| Composite 5, Central-Sulphide | | 12.5 | | 0.410 | | | 6 | % | | 6.42 | | | 17 | % | 9.56 | | 113 | | | 0.69 | | | 2.03 | |
| Composite 14, West-Sulphide | | 25.0 | | 0.429 | | | 17 | % | | 5.31 | | | 14 | % | 17.6 | | 113 | | | 0.81 | | | 2.03 | |
| Composite 14, West-Sulphide | | 12.5 | | 0.421 | | | 18 | % | | 4.62 | | | 18 | % | 9.15 | | 113 | | | 0.64 | | | 2.04 | |
| Average, Oxide | | 25.0 | | 0.993 | | | 71 | % | | 14.50 | | | 11 | % | 18.2 | | 113 | | | 0.89 | | | 2.03 | |
| Average, Oxide | | 12.5 | | 1.016 | | | 71 | % | | 11.67 | | | 6 | % | 9.2 | | 113 | | | 0.90 | | | 2.03 | |
| Average, Transition | | 25.0 | | 0.670 | | | 31 | % | | 17.58 | | | 38 | % | 17.6 | | 113 | | | 0.67 | | | 2.03 | |
| Average, Transition | | 12.5 | | 0.657 | | | 30 | % | | 15.93 | | | 36 | % | 9.2 | | 113 | | | 0.79 | | | 2.03 | |
| Average, Sulphide | | 25.0 | | 0.438 | | | 13 | % | | 10.94 | | | 22 | % | 17.7 | | 113 | | | 0.84 | | | 2.03 | |
| Average, Sulphide | | 12.5 | | 0.416 | | | 12 | % | | 6.78 | | | 13 | % | 9.4 | | 113 | | | 0.67 | | | 2.04 | |
| Kappes, Cassiday & Associates | | |
| June 19, 2018 | | Page 13-5 |
| | AMENDED AND RESTATED |
| Camino Rojo Preliminary Economic Assessment | NI 43-101 Technical Report |
Table 13-5
KCA 2015 Column Leach Test Results by Lithology
| Description | | Crush
Size,
mm | | | Calculated
Head,
g Au/t | | | Extracted,
% Au | | | Calculated
Head,
g Ag/t | | | Extracted,
% Au | | | Calculated
Tail p80 Size,
mm | | | Days
of
Leach | | | Consumption
NaCN,
kg/t | | | Addition
Hydrated
Lime,
kg/t | |
| HF - Ox 11 | | 25 | | | 1.060 | | | 78 | % | | 14.09 | | | 21 | % | | 16.52 | | | 90 | | | 1.39 | | | 1.00 | |
| HF - Ox 11 | | 12.5 | | | 1.033 | | | 81 | % | | 13.28 | | | 32 | % | | 9.27 | | | 90 | | | 1.42 | | | 1.01 | |
| HFT - Hi 2 | | 25 | | | 0.834 | | | 72 | % | | 23.67 | | | 31 | % | | 17.71 | | | 90 | | | 1.49 | | | 1.00 | |
| HFT - Hi 2 | | 12.5 | | | 0.855 | | | 75 | % | | 22.74 | | | 46 | % | | 9.93 | | | 90 | | | 1.37 | | | 1.00 | |
| IHT - Hi 4 | | 25 | | | 0.812 | | | 68 | % | | 17.90 | | | 25 | % | | 18.29 | | | 90 | | | 1.35 | | | 1.00 | |
| IHT - Hi 4 | | 12.5 | | | 0.858 | | | 73 | % | | 17.33 | | | 38 | % | | 9.92 | | | 90 | | | 1.37 | | | 1.00 | |
| HFT - Hi 8 | | 25 | | | 1.095 | | | 72 | % | | 10.51 | | | 44 | % | | 18.32 | | | 90 | | | 1.44 | | | 1.01 | |
| HFT - Hi 8 | | 12.5 | | | 0.973 | | | 74 | % | | 10.50 | | | 54 | % | | 10.16 | | | 90 | | | 1.52 | | | 1.02 | |
| HFT - Lo 1 | | 25 | | | 0.817 | | | 61 | % | | 10.91 | | | 35 | % | | 18.06 | | | 90 | | | 1.51 | | | 0.95 | |
| HFT - Lo 1 | | 12.5 | | | 0.788 | | | 63 | % | | 10.82 | | | 51 | % | | 9.51 | | | 90 | | | 1.33 | | | 0.95 | |
| HFT - Lo 7 | | 25 | | | 0.880 | | | 63 | % | | 5.32 | | | 41 | % | | 17.58 | | | 90 | | | 1.30 | | | 0.99 | |
| HFT - Lo 7 | | 12.5 | | | 0.912 | | | 70 | % | | 4.97 | | | 62 | % | | 9.84 | | | 90 | | | 1.79 | | | 0.99 | |
| IH - Ox 12 | | 25 | | | 0.610 | | | 59 | % | | 16.22 | | | 22 | % | | 18.75 | | | 90 | | | 1.22 | | | 1.01 | |
| IH - Ox 12 | | 12.5 | | | 0.589 | | | 63 | % | | 15.98 | | | 40 | % | | 9.90 | | | 90 | | | 1.59 | | | 1.01 | |
| IHT - Lo 3 | | 25 | | | 0.911 | | | 57 | % | | 23.25 | | | 33 | % | | 18.26 | | | 90 | | | 1.47 | | | 1.01 | |
| IHT - Lo 3 | | 12.5 | | | 0.932 | | | 58 | % | | 22.04 | | | 49 | % | | 9.74 | | | 90 | | | 1.45 | | | 1.01 | |
| OX - Ox 9 | | 25 | | | 0.269 | | | 73 | % | | 9.79 | | | 12 | % | | 18.66 | | | 90 | | | 1.41 | | | 1.01 | |
| OX - Ox 9 | | 12.5 | | | 0.281 | | | 74 | % | | 9.58 | | | 22 | % | | 9.77 | | | 90 | | | 1.54 | | | 1.01 | |
| OX - Ox 10 | | 25 | | | 0.729 | | | 78 | % | | 11.55 | | | 2 | % | | 17.66 | | | 90 | | | 0.89 | | | 1.01 | |
| OX - Ox 10 | | 12.5 | | | 0.765 | | | 79 | % | | 10.95 | | | 4 | % | | 10.01 | | | 90 | | | 0.76 | | | 1.01 | |
| PC - Ox 13 | | 25 | | | 0.557 | | | 60 | % | | 14.35 | | | 30 | % | | 18.10 | | | 90 | | | 1.24 | | | 0.93 | |
| PC - Ox 13 | | 12.5 | | | 0.554 | | | 55 | % | | 14.56 | | | 36 | % | | 13.661 | | | 90 | | | 1.25 | | | 0.93 | |
| PCT - Hi 6 | | 25 | | | 1.069 | | | 72 | % | | 11.87 | | | 37 | % | | 17.64 | | | 90 | | | 1.52 | | | 1.01 | |
| PCT - Hi 6 | | 12.5 | | | 1.087 | | | 69 | % | | 11.33 | | | 45 | % | | 9.51 | | | 90 | | | 1.24 | | | 1.04 | |
| PCT - Lo 5 | | 25 | | | 0.922 | | | 37 | % | | 43.26 | | | 50 | % | | 18.19 | | | 90 | | | 1.56 | | | 1.01 | |
| PCT - Lo 5 | | 12.5 | | | 0.989 | | | 26 | % | | 49.68 | | | 56 | % | | 9.06 | | | 90 | | | 1.54 | | | 1.01 | |
The results of column testing on material crushed to 100% passing 25mm and 12.5mm, respectively, reaffirmed the conclusion that the gold is insensitive to changes in particle size with the exception of oxide and transitional material logged as hornfels and incipient hornfels, which benefitted from a 3% to 5% recovery increase for oxide material and 4% to 10% increase for transition material with finer crush size. Gold extractions for all test work completed by KCA between 2010 and 2015 ranged from 12% to 81%. Silver recoveries ranged between 4% and 62% with material classified as oxide yielding the highest recoveries.
Bottle roll and shake tests performed by KCA on drillhole samples during their 2014 test program yielded equivocal information about preg-robbing characteristics of the samples tested. Results from the preg-robbing test work is presented in Table 13-6 and in Figure 13-1.
| Kappes, Cassiday & Associates | | |
| June 19, 2018 | | Page 13-6 |
| | AMENDED AND RESTATED |
| Camino Rojo Preliminary Economic Assessment | NI 43-101 Technical Report |
Table 13-6
Preg-Robbing Data Comparison for Camino Rojo
| Description | | | From,
meters | | | To,
meters | | | Average
Organic
C, % | | | Average
Sulfide
S, % | | | Average
Preg-
robbing, %1 | | | Average
Preg-
robbing, %2 | | | Calculated
Leach Preg-
robbing, %3 | |
| CR13-379DB | | | | 549.5 | | | | 551 | | | | 0.23 | | | | 5.14 | | | | 7 | % | | | 17 | % | | | 6 | % |
| CR13-380D | | | | 749.5 | | | | 751 | | | | 0.11 | | | | 0.01 | | | | 20 | % | | | 2 | % | | | 2 | % |
| CR13-380D | | | | 751 | | | | 752.5 | | | | 0.11 | | | | <0.01 | | | | 13 | % | | | 5 | % | | | 1 | % |
| CR13-390D | | | | 581 | | | | 582.5 | | | | 0.22 | | | | 1.76 | | | | 11 | % | | | 9 | % | | | 1 | % |
| CR13-390D | | | | 582.5 | | | | 584 | | | | 1.86 | | | | <0.01 | | | | 18 | % | | | 10 | % | | | 3 | % |
| CR13-390D | | | | 584 | | | | 585.5 | | | | 0.23 | | | | 1.11 | | | | 20 | % | | | 10 | % | | | 0 | % |
| CR13-390D | | | | 675.5 | | | | 677 | | | | 0.18 | | | | 0.01 | | | | 12 | % | | | 3 | % | | | 1 | % |
| CR13-390D | | | | 677 | | | | 678.5 | | | | 0.05 | | | | 0.01 | | | | 14 | % | | | 4 | % | | | 2 | % |
| CR13-390D | | | | 681.5 | | | | 683 | | | | 0.12 | | | | 0.16 | | | | 10 | % | | | 5 | % | | | 2 | % |
| CR13-390D | | | | 684.5 | | | | 686 | | | | 0.07 | | | | 0.02 | | | | 13 | % | | | 4 | % | | | 2 | % |
| CR13-390D | | | | 687.5 | | | | 689 | | | | 0.13 | | | | 0.31 | | | | 10 | % | | | 3 | % | | | 4 | % |
| CR13-390D | | | | 689 | | | | 690.5 | | | | 0.11 | | | | 2.42 | | | | 7 | % | | | 13 | % | | | 10 | % |
| CR13-400D | | | | 421.5 | | | | 423 | | | | 0.65 | | | | 4.45 | | | | 40 | % | | | 40 | % | | | 16 | % |
| CR13-400D | | | | 423 | | | | 424.5 | | | | 0.28 | | | | 0.43 | | | | 37 | % | | | 16 | % | | | 3 | % |
| CR13-400D | | | | 424.5 | | | | 426 | | | | 0.27 | | | | 0.27 | | | | 34 | % | | | 20 | % | | | 3 | % |
| CR13-410DB | | | | 19.5 | | | | 21 | | | | 0.06 | | | | 0.01 | | | | 6 | % | | | 12 | % | | | 4 | % |
| CR13-410DB | | | | 67.5 | | | | 69 | | | | 0.10 | | | | 0.01 | | | | 6 | % | | | 10 | % | | | 3 | % |
| CR13-410DB | | | | 175.5 | | | | 177 | | | | 0.12 | | | | <0.01 | | | | 18 | % | | | 11 | % | | | 8 | % |
| CR13-410DB | | | | 193.5 | | | | 195 | | | | 0.11 | | | | <0.01 | | | | 9 | % | | | 3 | % | | | 5 | % |
| CR13-410DB | | | | 195 | | | | 196.5 | | | | 0.17 | | | | 0.78 | | | | 30 | % | | | 15 | % | | | 14 | % |
| CR13-410DB | | | | 196.5 | | | | 198 | | | | 0.11 | | | | 0.19 | | | | 26 | % | | | 25 | % | | | 22 | % |
| CR13-418D | | | | 33.5 | | | | 35 | | | | 0.04 | | | | 0.01 | | | | 2 | % | | | 1 | % | | | 4 | % |
| CR13-418D | | | | 63.5 | | | | 65 | | | | 0.03 | | | | 0.03 | | | | 2 | % | | | 3 | % | | | 4 | % |
| CR13-418D | | | | 72.5 | | | | 74 | | | | 0.07 | | | | <0.01 | | | | 10 | % | | | 7 | % | | | 2 | % |
| CR13-418D | | | | 77 | | | | 78.5 | | | | 0.04 | | | | <0.01 | | | | 17 | % | | | 4 | % | | | 4 | % |
| CR13-418D | | | | 98 | | | | 99.5 | | | | 0.07 | | | | <0.01 | | | | 4 | % | | | 3 | % | | | 6 | % |
| CR13-418D | | | | 134 | | | | 135.5 | | | | 0.04 | | | | 0.01 | | | | 9 | % | | | 4 | % | | | 5 | % |
| CR13-419D | | | | 40.5 | | | | 42 | | | | 0.02 | | | | 0.02 | | | | 5 | % | | | 5 | % | | | 2 | % |
| CR13-419D | | | | 84 | | | | 85.5 | | | | 0.02 | | | | <0.01 | | | | 18 | % | | | 6 | % | | | 1 | % |
| CR13-419D | | | | 96 | | | | 97.5 | | | | 0.02 | | | | <0.01 | | | | 13 | % | | | 4 | % | | | 5 | % |
| CR13-466D | | | | 639.5 | | | | 641 | | | | 0.04 | | | | <0.01 | | | | 10 | % | | | 3 | % | | | 1 | % |
| CR13-466D | | | | 647 | | | | 648.5 | | | | 0.09 | | | | 0.09 | | | | 14 | % | | | 3 | % | | | 7 | % |
| CR13-466D | | | | 648.5 | | | | 650 | | | | 0.08 | | | | <0.01 | | | | 13 | % | | | 2 | % | | | 0 | % |
| CR13-466D | | | | 675.5 | | | | 677 | | | | 0.14 | | | | 2.90 | | | | 12 | % | | | 4 | % | | | 6 | % |
| Kappes, Cassiday & Associates | | |
| June 19, 2018 | | Page 13-7 |
| | AMENDED AND RESTATED |
| Camino Rojo Preliminary Economic Assessment | NI 43-101 Technical Report |
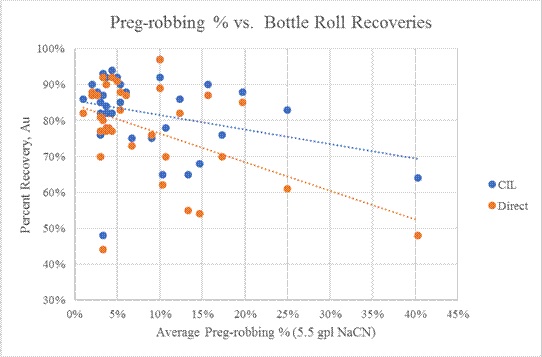
Figure 13-1
Preg-Robbing Percentage vs. CIL and Direct Bottle Roll Leach Test Recoveries
Calculated leach preg-robbing values based on the difference between CIL and direct bottle roll test recoveries ranged from 0% to 22%. Based on KCA’s experience, a difference greater than 3% indicates the material could be preg-robbing.
Preg-robbing test work performed on the head material did not prove to be an indication of preg-robbing during leaching. Samples that exhibited preg-robbing characteristics during the preg-robbing test work did not necessarily show the same characteristics during direct and CIL bottle roll leach tests. Additionally, no one individual drill hole exhibited any more tendency toward preg-robbing than another. No strong correlations were observed between sulphide sulphur content and off-rob values, or between organic carbon content and preg-rob values as shown in Figure 13-2 and Figure 13-3, respectively. The bottle roll tests also did not show a strong correlation between percent gold recovery and sulphide content, as shown in Figure 13-4.
| Kappes, Cassiday & Associates | | |
| June 19, 2018 | | Page 13-8 |
| | AMENDED AND RESTATED |
| Camino Rojo Preliminary Economic Assessment | NI 43-101 Technical Report |
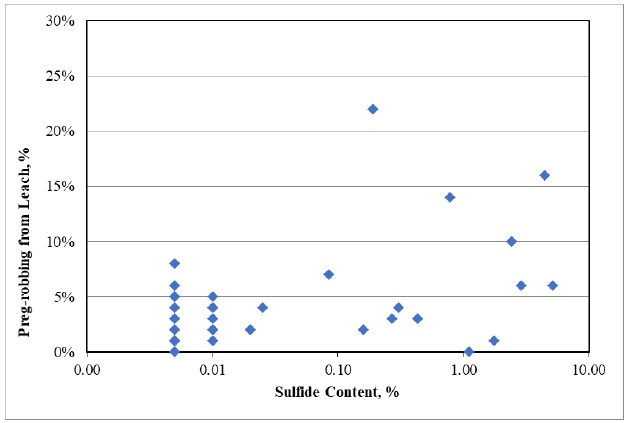
Figure 13-2
Preg-Robbing from Leach Percentage vs. Sulphide Content
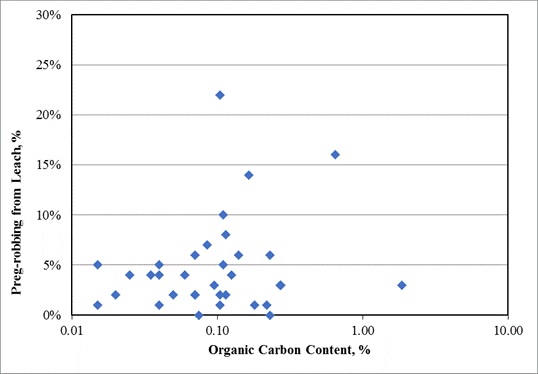
Figure 13-3
Preg-Robbing from Leach Percentage vs. Organic Carbon Content
| Kappes, Cassiday & Associates | | |
| June 19, 2018 | | Page 13-9 |
| | AMENDED AND RESTATED |
| Camino Rojo Preliminary Economic Assessment | NI 43-101 Technical Report |

Figure 13-4
Preg-Robbing from Leach Percentage vs. Organic Carbon Content
| 13.2.2 | Blue Coast Research Metallurgy (2012-2013) |
A test work program was undertaken in 2012/2013 at Blue Coast Research Metallurgy (“Blue Coast Research”) in Parksville, B.C. This program consisted of a variability study, a small gravity program, and a flotation flowsheet development component (Blue Coast Research Ltd., 2014). Tests were completed using four samples selected from the Represa transition to obtain information from a high oxidation and low oxidation sample from both the west and east zones of the deposit.
The variability program subjected 98 samples to small-scale bench flotation, small-scale leach testing, and small-scale gravity recovery tests. Flotation flowsheet development testing was conducted on three bulk sulphide composites: one from the Represa zone and two from the West Extension.
Blue Coast Research performed nine single-pass gravity recoverable gold (“GRG”) tests on different samples from various locations in the Camino Rojo deposit, both in the Represa and in the West Extension areas. A single extended GRG test was performed on a sulphide sample from the West Extension (WE MC1). The results of these tests demonstrated gold recoveries greater than 20% at nominal primary grind feed sizes with mass pulls averaging 2%. These results suggest that concentration of gold by an initial gravity process is a viable option. No subsequent gravity work has been conducted to date.
| Kappes, Cassiday & Associates | | |
| June 19, 2018 | | Page 13-10 |
| | AMENDED AND RESTATED |
| Camino Rojo Preliminary Economic Assessment | NI 43-101 Technical Report |
Very little transitional material was tested at Blue Coast Research; the majority of the test work completed was performed on sulphide material from the ‘West Extension’. Flowsheet development work conducted at Blue Coast Research formed the basis for understanding the processing options for the Camino Rojo sulphide deposit.
A full mineralogical analysis was performed on several samples during this study. The results of the QEMSCAN sulphide mineralogy indicated that the sphalerite was relatively coarse-grained, being well-liberated (having a 40% release size) well above 100 microns. Galena appeared finer-grained, being well-liberated at 90 microns.
Gold mineralogy was undertaken using both optical and D-SIMS techniques. Results indicated that gold was significantly linked to both pyrite and arsenopyrite. Higher gold values were associated with higher arsenic values.
Results from the Blue Coast Research Tests are presented in Table 13-7 through 13-9.
Table 13-7
Summary of Flotation Composite Feed Grades
| Composite | | | Au (g/t) | | | Ag (g/t) | | | Zn% | | | Pb% | |
| | WE MC1 | | | | 1.19 | | | | 10.8 | | | | 0.31 | | | | 0.10 | |
| | WE MC2 | | | | 0.89 | | | | 8.6 | | | | 0.26 | | | | 0.08 | |
Table 13-8
Lead Flotation Concentrate Grades
| Composite | | Au (g/t) | | | Ag (g/t) | | | Zn% | | | Pb% | |
| WE MC1 | | | 185 | | | | 2062 | | | | 0.3 | | | | 28.00 | |
| WE MC2 | | | 236 | | | | 2094 | | | | 9 | | | | 36 | |
Table 13-9
Zinc Flotation Concentrate Grades
| Composite | | | Au (g/t) | | | Ag (g/t) | | | Zn% | | | Pb% | |
| | WE MC1 | | | | 17 | | | | 112 | | | | 41 | | | | 0.50 | |
| | WE MC2 | | | | 9 | | | | 125 | | | | 43 | | | | 0.7 | |
| 13.2.3 | Hazen Research (2014) |
Hazen Research was commissioned to conduct grinding, flotation, and cyanide leaching studies of sulphide and transitional material. Some 112 composites were tested. Standard flotation methods yielded recoveries of ~90% Au, 74% to 81% Ag, 83% to 90% Zn, and 82% to 91% Pb for sulphide material, and recoveries of 60% to 67% Au, 56% to 63% Ag, 35% Zn, and 48% Pb for transition material (Hazen Research Inc., 2014).
| Kappes, Cassiday & Associates | | |
| June 19, 2018 | | Page 13-11 |
| | AMENDED AND RESTATED |
| Camino Rojo Preliminary Economic Assessment | NI 43-101 Technical Report |
| 13.2.4 | Comminution Testing |
Comminution testing occurred at SGS Vancouver in 2015 (SGS Canada Inc., 2015). Material for testing was sourced from the Camino Rojo site directly as well as from an existing stockpile of samples being stored at Hazen. From these two sources, a total of 23 half HQ composites and 2 full PQ composites were selected for testing. The HQ samples were selected based on 4 spatial quadrants, alteration, and oxidation. The PQ samples were selected based on their respective oxidation levels which included one near sulphide composite and one highly oxidized composite. JK Drop Weight, SMC, Abrasion Index, Crusher Work Index, Bond Ball Work Index, Bond Rod Work Index, SPI, Point Load Index, and Unconfined Compressive Strength tests were performed. It should be noted that only two relevant crusher work indices were obtained from testing data as shown in the summary of results in Table 13-10 below.
Table 13-10
Comminution Test Results Summary
| | | Axb | | | SPI
(min) | | | Ai (g) | | | CWi* (kWh/t) | | | BWi (kWh/t) | | | RWi (kWh/t) | | | UCS* (kN) | | | IS50
(Mpa) | |
| Mean | | | 38.9 | | | | 99.8 | | | | 0.123 | | | | | | | | 14.4 | | | | 15.9 | | | | | | | | 7.48 | |
| Min | | | 25.6 | | | | 34.4 | | | | 0.017 | | | | 9.4 | | | | 8.5 | | | | 10.8 | | | | 251.3 | | | | 3.82 | |
| Max | | | 68.2 | | | | 145.9 | | | | 0.276 | | | | 10.5 | | | | 19.4 | | | | 19.3 | | | | 522.3 | | | | 15.35 | |
| RSD% | | | 21.8 | | | | 29.2 | | | | 73.7 | | | | | | | | 21.2 | | | | 15.0 | | | | | | | | 43.9 | |
Additionally, comminution results are provided by alteration type in Table 13-11. These alterations are: Pyrite-Carbonate (PC), Incipient Potassic Hornfels (IH), and Potassic Hornfels (HF). As indicated in the table, “S” represents Sulphide and “T” represents Transition.
| Kappes, Cassiday & Associates | | |
| June 19, 2018 | | Page 13-12 |
| | AMENDED AND RESTATED |
| Camino Rojo Preliminary Economic Assessment | NI 43-101 Technical Report |
Table 13-11
Comminution Test Results by Alteration Type
| | | Axb | | | SPI
(min) | | | Ai (g) | | | BWi (kWh/t) | | | RWi (kWh/t) | | | IS50
(Mpa) | |
| PC (S) | | | 41.6 | | | | 93.0 | | | | 0.061 | | | | 12.8 | | | | 14.4 | | | | 6.07 | |
| PC (T) | | | 50.5 | | | | 57.2 | | | | 0.024 | | | | 9.6 | | | | 12.1 | | | | 4.78 | |
| IH (S) | | | 29.7 | | | | 141.2 | | | | 0.136 | | | | 16.8 | | | | 18.6 | | | | 7.93 | |
| IH (T) | | | 40.7 | | | | 92.0 | | | | 0.061 | | | | 13.2 | | | | 15.3 | | | | 5.18 | |
| HF (S) | | | 32.1 | | | | 120.1 | | | | 0.233 | | | | 17.6 | | | | 18.2 | | | | 13.46 | |
| HF (T) | | | 39.1 | | | | 99.4 | | | | 0.200 | | | | 16.2 | | | | 16.7 | | | | 6.89 | |
| 13.3 | Conclusions from Metallurgical Programs |
Based on data from the historical test work completed to date, key design parameters including metal recoveries, reagent consumptions, and other process design criteria items have been assigned for use in this study and are discussed in the following sections. Metallurgical samples were taken from drill core and are geographically representative of the majority of the oxide and transition resources. Future test programs should be performed to confirm or refine these results as part of future studies, especially with regards to the Ki material type which only has limited data available.
For this study, the three basic material types considered in the historical test work to date, Oxide, Sulphide, and Transition, have been further defined into distinct groups beyond the basic classifications. Oxide material has been classified relative to the material’s K alteration values from ICP testing and include the Kp (pervasive) and Ki (incipient) oxides. Transition material has been classified based on oxidation level via qualitative indicators which include Transition-Hi (60 to 90% oxidized), Transition-Lo (30 to 60% oxidized), and Transition-S (Sulphide, <30% oxidized). For the current PEA, only the Oxides, Transition-Hi and Transition-Lo groups are being considered.
| 13.3.1 | Crush Size and Recovery |
The column leach recovery by crush size was analyzed to determine the effect of crush size on recovery for the Oxide and Transition groups. Column tests were conducted on crushed product sizes ranging from a P80 of 7mm to a P80 of nearly 20mm (P80 sizes were estimated for the SGS data set). These data were aggregated and plotted against recoveries for both gold and silver for each material classification type. Trend lines were then used to establish projected recoveries for P80 sizes above 20mm. Crushed product size vs. recovery results are presented in Figure 13-5 and Figure 13-6 for Oxide and Transition material types, respectively.
| Kappes, Cassiday & Associates | | |
| June 19, 2018 | | Page 13-13 |
| | AMENDED AND RESTATED |
| Camino Rojo Preliminary Economic Assessment | NI 43-101 Technical Report |
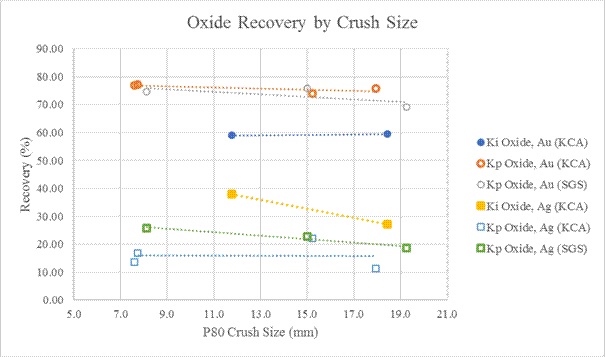
Figure 13-5
Oxide Recovery vs. Crush Size
| Kappes, Cassiday & Associates | | |
| June 19, 2018 | | Page 13-14 |
| | AMENDED AND RESTATED |
| Camino Rojo Preliminary Economic Assessment | NI 43-101 Technical Report |
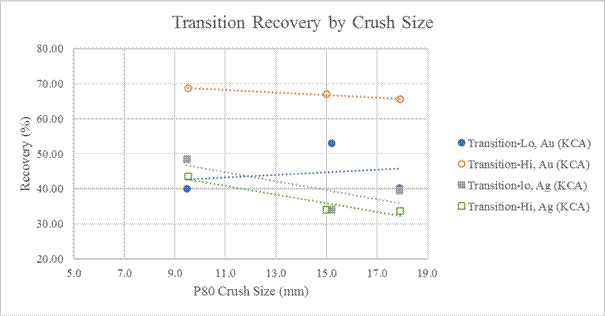
Figure 13-6
Transition Recovery vs. Crush Size
Based on the data available, gold recoveries for Kp Oxide material appear to decrease slightly as crush size increases while silver recoveries, depending on the data set (SGS or KCA) are relatively flat regardless of crush size. Gold recoveries for Ki Oxide material increased incrementally as crush size increased, while silver recoveries decreased with increased crush size.
With respect to the Transition-Hi material type, both gold and silver recoveries decreased with increased crush size. Recoveries for the Transition-Lo material varied over the crush size range with gold recoveries trending up with increased crush size and silver recoveries trending down with increased crush size.
Results for the column test programs were extrapolated to evaluate the expected metal recoveries at different crush sizes. From the extrapolated data, there is very little change in gold recoveries at coarser crush sizes. Projected gold recoveries ranged between 74% at P80 19mm to 71% at P80 50mm for Kp Oxides and from 60% to 61% for Ki Oxides. Projected silver recoveries ranged between 17% to 16% and 27% to 3% for Kp and Ki Oxides, respectively. Gold recoveries for Transition material ranged from 66% at P80 19mm to 61% at P80 50mm for Transition-hi material and from 47% to 53% for Transition-lo material. Silver recoveries ranged from 32% to 15% for Transition-hi material and from 35% to 18% for Transition-lo material.
| Kappes, Cassiday & Associates | | |
| June 19, 2018 | | Page 13-15 |
| | AMENDED AND RESTATED |
| Camino Rojo Preliminary Economic Assessment | NI 43-101 Technical Report |
Based on the data available, KCA recommends a crushed product size of 80% passing 38mm in order to minimize crushing requirements and recover most of the recoverable silver. Estimated recoveries by material type at P80 38mm, including a 2% field deduction for gold and 3% field deduction for silver, are presented in Table 13-12.
Table 13-12
Estimated Recoveries by Material Type for P80 38mm Crush Size
| Material Type | | Au | | | Ag | |
| Kp Oxide | | | 70 | % | | | 13 | % |
| Ki Oxide | | | 58 | % | | | 20 | % |
| Transition-hi | | | 60 | % | | | 17 | % |
| Transition-lo | | | 49 | % | | | 20 | % |
Additional column tests at coarser crush sizes should be considered as part of future test programs.
The Camino Rojo leach cycle has been estimated based on the column test work completed to date by evaluating the leach curves for gold and silver. The leach cycle considers tonnes of solution per tonne of material as well as total time required to reach the ultimate recovery in the column leach tests. Based on this data, the estimated leach cycle for the Camino Rojo material is 80 days.
| 13.3.3 | Reagent Consumption Projection |
The column leach test cyanide consumptions were studied and discounted appropriately to provide a basis for the expected field cyanide consumptions. The projected field consumptions by material type are shown in the Table 13-13.
| Kappes, Cassiday & Associates | | |
| June 19, 2018 | | Page 13-16 |
| | AMENDED AND RESTATED |
| Camino Rojo Preliminary Economic Assessment | NI 43-101 Technical Report |
Table 13-13
Projected Field Cyanide Consumptions by Material Type
| Material Type | | NaCN Cons. kg/t | |
| Kp avg ox | | | 0.325 | |
| Ki avg ox | | | 0.398 | |
| Trans-lo avg | | | 0.334 | |
| Trans-hi avg | | | 0.352 | |
| Avg., All | | | 0.331 | |
For the purposes of this study, an average projected NaCN consumption of 0.35 kg/t of material has been selected.
Lime is required for pH control during leaching. Because hydrated lime was utilized in the lab leach tests, the laboratory lime consumptions are adjusted to accurately predict consumptions of quicklime in the field. Estimated quicklime consumptions by material type are presented in
Table 13-14.
Table 13-14
Projected Field Lime Consumptions by Material Type
| Material Type | | Quicklime Cons. kg/t | |
| Kp avg ox | | | 1.080 | |
| Ki avg ox | | | 0.864 | |
| Trans-lo avg | | | 1.179 | |
| Trans-hi avg | | | 1.297 | |
| Avg. All | | | 1.105 | |
To ensure that proper pH is maintained throughout the heap, a lime consumption of 1.25 kg/t of material has been selected.
| 13.3.4 | Conclusions and Key Design Parameters |
There has been a significant amount of test work completed to date on representative samples from documented drill holes with good spatial distribution in the proposed pit. Based on the metallurgical data available, the Camino Rojo deposit shows significant variability in gold recoveries based on material type and geological domain with preg-robbing organic carbon being the only significant deleterious element identified. In general, recoveries for oxide material are good and will yield acceptable results using conventional heap leaching methods with cyanide. Recoveries for transition material and sulphides are significantly lower compared with the oxide material for conventional leaching with some areas of transition showing reasonably high recoveries. Reagent consumptions for all material types were reasonably low as described above.
| Kappes, Cassiday & Associates | | |
| June 19, 2018 | | Page 13-17 |
| | AMENDED AND RESTATED |
| Camino Rojo Preliminary Economic Assessment | NI 43-101 Technical Report |
Preg-robbing presents a low to moderate risk to the overall project and should be further investigated. Future test work should include preg-robbing tests at intervals in order to identify / quantify material with preg-robbing characteristics.
Key design parameters from the metallurgical test work are summarized below:
| · | Crush size of 80% passing 38mm. |
| · | Estimated gold recoveries (including 2% field deduction) of: |
| o | 60% for Transition-hi; and |
| · | Estimated silver recoveries (including 3% field deduction) of: |
| o | 17% for Transition-hi; and |
| · | Design leach cycle of 80 days. |
| · | Average cyanide consumption of 0.35 kg/t material. |
| · | Average lime consumption of 1.25 kg/t material. |
Additional column leach tests should be conducted to confirm recoveries at coarser crush sizes, especially for the Ki material type which has very little data available, in an effort to mitigate any associated risk.
| 13.4 | Sulphide Mineralization Discussion |
Metallurgical testing on sulphide mineralization has demonstrated that gold, silver, lead and zinc can be recovered into concentrates that are of potentially marketable grade.
A possible process flowsheet for the sulphide resource is a sequential flotation process consisting of an initial pre-flotation to remove organic carbon followed by lead flotation, zinc flotation, and pyrite/arsenopyrite flotation to recover additional precious metals. The pyrite/arsenopyrite concentrate would be oxidized to recover additional gold and silver by cyanide leaching. Payable products would be the Lead Concentrate, Zinc Concentrate, and Gold Silver doré recovered from the cyanide leaching of the pyrite/arsenopyrite concentrate. It is assumed that after oxidation 90% of the gold and silver can be recovered from the oxidized pyrite concentrate. Waste products would be the pre-flotation concentrate, the flotation tailings, and the leached residue of the pyrite/arsenopyrite concentrate.
| Kappes, Cassiday & Associates | | |
| June 19, 2018 | | Page 13-18 |
| | AMENDED AND RESTATED |
| Camino Rojo Preliminary Economic Assessment | NI 43-101 Technical Report |
Table 13-15 presents the distribution of metals to the various products based on preliminary test work.
Note that these numbers are only presented to provide guidance as to whether material is potentially a resource. The process flowsheet described above is based on commonly used metal recovery methods and the metallurgical test work to date is too preliminary to confirm these recoveries can be achieved or to determine the economic viability of the material.
Table 13-15
Distribution of Metals to Various Sulphide Products
| | | | | | Distribution % | |
| Product | | Wt % | | | Pb | | | Zn | | | Au | | | Ag | |
| Flotation Feed | | | 100 | | | | 100 | | | | 100 | | | | 100 | | | | 100 | |
| Lead Concentrate | | | 0.3 | | | | 60 | | | | 1 | | | | 49 | | | | 44 | |
| Zinc Concentrate | | | 0.6 | | | | 1 | | | | 64 | | | | 2 | | | | 7 | |
| Pyrite Concentrate | | | 19.6 | | | | (15 | ) | | | (19 | ) | | | (39 | ) | | | (28 | ) |
| Dore from leaching Pyrite Con | | | NA | | | | NA | | | | NA | | | | 35 | | | | 25 | |
| | | | | | | | | | | | | | | | | | | | | |
| Total Recovery for resource estimate | | | | | | | 60 | % | | | 64 | % | | | 86 | % | | | 76 | % |
| | | | | | | | | | | | | | | | | | | | | |
| Preflotation Concentrate | | | 4.4 | | | | 14 | | | | 6 | | | | 6 | | | | 16 | |
| Pyrite Leach Residue | | | 19.6 | | | | 15 | | | | 19 | | | | 4 | | | | 3 | |
| Flotation Tailings | | | 75.1 | | | | 10 | | | | 10 | | | | 4 | | | | 5 | |
Note: Based on preliminary testwork.
| Kappes, Cassiday & Associates | | |
| June 19, 2018 | | Page 13-19 |
| AMENDED AND RESTATED |
| Camino Rojo Preliminary Economic Assessment | NI 43-101 Technical Report |
| 14.0 | MINERAL RESOURCE ESTIMATES |
Table 14-1 presents the mineral resource for the Camino Rojo Project. Measured and indicated mineral resources amount to 354.9 million tonnes at 0.845 g/t gold, 8.97 g/t silver, 0.11% lead, and 0.29% zinc. Contained metal amounts to 9.6 million ounces gold, 102.4 million ounces of silver, 857.8 million pounds of lead, and 2.27 billion pounds of zinc. Inferred mineral resource is an additional 65.2 million tonnes at 0.867 g/t gold, 7.73 g/t silver, 0.05% lead, and 0.23% zinc. Contained metal amounts to 1.8 million ounces of gold, 16.2 million ounces of silver, 75.2 million pounds of lead, and 336.8 million pounds of zinc for the inferred mineral resource.
The mineral resource includes potential heap leach resource and potential mill resources. For the leach resource, measured and indicated mineral resources amount to 100.8 million tonnes at 0.734 g/t gold, 12.67 g/t silver, 0.21% lead, and 0.37% zinc. Contained metal amounts to 2.38 million ounces gold, 41.1 million ounces of silver, 455.8 million pounds of lead, and 814.8 million pounds of zinc. Inferred mineral resource is an additional 4.9 million tonnes at 0.772 g/t gold, 5.60 g/t silver, 0.07% lead, and 0.24% zinc. Contained metal amounts to 120,600 ounces of gold, 874,000 ounces of silver, 7.0 million pounds of lead, and 25.9 million pounds of zinc for the inferred mineral resource. The leach resources are oxide dominant and are the emphasis of this PEA study.
For the mill resource, measured and indicated mineral resources amount to 254.1 million tonnes at 0.889 g/t gold, 7.50 g/t silver, 0.07% lead, and 0.26% zinc. Contained metal amounts to 7.3 million ounces gold, 61.3 million ounces of silver, 402.0 million pounds of lead, and 1.46 billion pounds of zinc. Inferred mineral resource is an additional 60.3 million tonnes at 0.875 g/t gold, 7.90 g/t silver, 0.05% lead, and 0.23% zinc. Contained metal amounts to 1.7 million ounces of gold, 15.3 million ounces of silver, 68.1 million pounds of lead, and 310.8 million pounds of zinc for the inferred mineral resource.
Note that silver, lead, and zinc grades tend to be significantly higher in the leach resource than the mill resource.
The mineral resources are based on a block model developed by IMC during March and April 2018.
Kappes, Cassiday & Associates June 19, 2018
| Page 14-1 |
| AMENDED AND RESTATED |
| Camino Rojo Preliminary Economic Assessment | NI 43-101 Technical Report |
The mineral resources are contained within a floating cone pit shell to demonstrate “reasonable prospects for eventual economic extraction” as required by NI 43-101. Figure 14-1 shows the shell. Measured, indicated, and inferred mineral resources were allowed to contribute to the economics for the mineral resource cone shell.
Kappes, Cassiday & Associates June 19, 2018
| Page 14-2 |
| AMENDED AND RESTATED |
| Camino Rojo Preliminary Economic Assessment | NI 43-101 Technical Report |
Table 14-1
Mineral Resource
| | | NSR Cog | | | | | | NSR | | | Gold | | | Silver | | | Lead | | | Zinc | | | Gold | | | Silver | | | Lead | | | Zinc | |
| Resource Type | | ($/t) | | | Kt | | | ($/t) | | | (g/t) | | | (g/t) | | | (%) | | | (%) | | | (koz) | | | (koz) | | | (mlb) | | | (mlb) | |
| Leach Resource: | | | | | | | | | | | | | | | | | | | | | | | | | | | | | | | | | | | | | | | | | | | | |
| Measured Mineral Resource | | | 5.06 | | | | 16,147 | | | | 23.65 | | | | 0.794 | | | | 15.44 | | | | 0.26 | | | | 0.39 | | | | 412.1 | | | | 8,014 | | | | 92.1 | | | | 140.6 | |
| Indicated Mineral Resource | | | 5.06 | | | | 84,692 | | | | 20.07 | | | | 0.723 | | | | 12.15 | | | | 0.19 | | | | 0.36 | | | | 1,969.3 | | | | 33,076 | | | | 363.7 | | | | 674.3 | |
| Meas/Ind Mineral Resource | | | 5.06 | | | | 100,839 | | | | 20.64 | | | | 0.734 | | | | 12.67 | | | | 0.21 | | | | 0.37 | | | | 2,381.3 | | | | 41,091 | | | | 455.8 | | | | 814.8 | |
| Inferred Mineral Resource | | | 5.06 | | | | 4,858 | | | | 18.13 | | | | 0.772 | | | | 5.60 | | | | 0.07 | | | | 0.24 | | | | 120.6 | | | | 874 | | | | 7.0 | | | | 25.9 | |
| | | | | | | | | | | | | | | | | | | | | | | | | | | | | | | | | | | | | | | | | | | | | |
| Mill Resource: | | | | | | | | | | | | | | | | | | | | | | | | | | | | | | | | | | | | | | | | | | | | |
| Measured Mineral Resource | | | 13.72 | | | | 9,818 | | | | 39.27 | | | | 0.864 | | | | 7.45 | | | | 0.08 | | | | 0.28 | | | | 272.6 | | | | 2,352 | | | | 16.4 | | | | 60.1 | |
| Indicated Mineral Resource | | | 13.72 | | | | 244,251 | | | | 39.98 | | | | 0.890 | | | | 7.50 | | | | 0.07 | | | | 0.26 | | | | 6,992.2 | | | | 58,934 | | | | 385.6 | | | | 1,398.2 | |
| Meas/Ind Mineral Resource | | | 13.72 | | | | 254,069 | | | | 39.95 | | | | 0.889 | | | | 7.50 | | | | 0.07 | | | | 0.26 | | | | 7,264.8 | | | | 61,286 | | | | 402.0 | | | | 1,458.3 | |
| Inferred Mineral Resource | | | 13.72 | | | | 60,342 | | | | 39.04 | | | | 0.875 | | | | 7.90 | | | | 0.05 | | | | 0.23 | | | | 1,696.9 | | | | 15,334 | | | | 68.1 | | | | 310.8 | |
| | | | | | | | | | | | | | | | | | | | | | | | | | | | | | | | | | | | | | | | | | | | | |
| Total Mineral Resource | | | | | | | | | | | | | | | | | | | | | | | | | | | | | | | | | | | | | | | | | | | | |
| Measured Mineral Resource | | | | | | | 25,965 | | | | 29.55 | | | | 0.820 | | | | 12.42 | | | | 0.19 | | | | 0.35 | | | | 684.6 | | | | 10,367 | | | | 108.5 | | | | 200.7 | |
| Indicated Mineral Resource | | | | | | | 328,943 | | | | 34.86 | | | | 0.847 | | | | 8.70 | | | | 0.10 | | | | 0.29 | | | | 8,961.5 | | | | 92,010 | | | | 749.3 | | | | 2,072.5 | |
| Meas/Ind Mineral Resource | | | | | | | 354,908 | | | | 34.47 | | | | 0.845 | | | | 8.97 | | | | 0.11 | | | | 0.29 | | | | 9,646.1 | | | | 102,377 | | | | 857.8 | | | | 2,273.2 | |
| Inferred Mineral Resource | | | | | | | 65,200 | | | | 37.49 | | | | 0.867 | | | | 7.73 | | | | 0.05 | | | | 0.23 | | | | 1,817.5 | | | | 16,208 | | | | 75.2 | | | | 336.8 | |
Notes:
1. The mineral resource is effective as of April 27, 2018.
2. Columns may not sum exactly due to rounding.
3. Mineral resources that are not mineral reserves do not have demonstrated economic viability.
4. Mineral resources for leach material are based on prices of $1400/oz gold and $20/oz silver.
5. Mineral resources for mill material are based on prices of $1400/oz gold, $20/oz silver, $1.05/lb lead, and $1.25/lb zinc.
6. Mineral resources are based on NSR cut-off grades of $5.06/t for leach material and $13.72/t for mill material.
7. NSR value for leach material is as follows:
Kp Oxide: NSR ($/t) = 30.77 x gold (g/t) + 0.080 x silver (g/t), based on gold recovery of 70% and silver recovery of 13%
Ki Oxide: NSR ($/t) = 25.49 x gold (g/t) + 0.123 x silver (g/t), based on gold recovery of 58% and silver recovery of 20%
Tran-Hi: NSR ($/t) = 26.37 x gold (g/t) + 0.104 x silver (g/t), based on gold recovery of 60% and silver recovery of 17%
Tran-Lo: NSR ($/t) = 21.54 x gold (g/t) + 0.123 x silver (g/t), based on gold recovery of 49% and silver recovery of 20%
8. NSR value for mill material is 36.75 x gold (g/t) + 0.429 x silver (g/t) + 10.75 x lead (%) + 12.37 x zinc (%), based on recoveries of 86% gold, 76% silver, 60% lead, and 64% zinc.
9. Table 14-2 accompanies this Mineral Resource statement and shows all relevant parameters.
10. The mineral resource estimate assumes that the floating pit cone used to demonstrate reasonable prospects for eventual economic extraction extends onto land held by the Adjacent Owner. Any potential development of the Camino Rojo Project that includes an open pit encompassing the entire mineral resource estimate would be dependent on obtaining an agreement with the Adjacent Owner.
Kappes, Cassiday & Associates June 19, 2018
| Page 14-3 |
| AMENDED AND RESTATED |
| Camino Rojo Preliminary Economic Assessment | NI 43-101 Technical Report |
| 14.1.1 | Metal Prices for Mineral Resources |
Table 14-2 shows the economic and recovery parameters for the mineral resource estimate. Metal prices are based on the three year backward average price plus 12% to 17.6% as follows:
| | | 3 Year | | | | | | | |
| Metal | | Average Price | | | Resource | | | %Increase | |
| Gold | | $ | 1250 | | | $ | 1400 | | | | 12.0 | % |
| | | | | | | | | | | | | |
| Silver | | $ | 17 | | | $ | 20 | | | | 17.6 | % |
| | | | | | | | | | | | | |
| Lead | | $ | 0.92 | | | $ | 1.05 | | | | 14.1 | % |
| | | | | | | | | | | | | |
| Zinc | | $ | 1.08 | | | $ | 1.25 | | | | 15.7 | % |
The three year backward average is used as a benchmark by the US Security Exchange Commission (“SEC”).
| 14.1.2 | Cost and Recovery Estimates for Mineral Resources |
The mining cost is estimated at $1.65 per total tonne. This was estimated by IMC and is based on owner operation of the mining fleet.
Table 14-2 shows parameters for six material types. Note that costs used for the resource estimation vary somewhat from the costs estimated in the PEA because the resource was done earlier and the PEA does not consider the sulphide material. The costs used in the resource estimation were only used to demonstrate “reasonable prospects for eventual economic extraction”. For the first four materials, Kp Oxide, Ki Oxide, Transitional High Oxide, and Transitional Low Oxide, it is assumed that processing will be by crushing and heap leaching. The processing and G&A costs of $3.38 and $1.69 per processed tonne respectively were provided by KCA and are based on a process production rate of 18,000 tonnes per day or about 6.57 million tonnes per year. KCA also provided the recovery estimates for gold and silver shown on the table.
Kappes, Cassiday & Associates June 19, 2018
| Page 14-4 |
| AMENDED AND RESTATED |
| Camino Rojo Preliminary Economic Assessment | NI 43-101 Technical Report |
IMC assumed 100% refinery payables for this case. The gold and silver refining costs are also IMC estimates. The leach material is also subject to a 2% NSR royalty. Lead and zinc do not contribute to economics for leach material.
Due to two products, and also variable recoveries by material type, a gold equivalent grade or NSR value will be needed to tabulate proposed quantities of mineralized material. The gold and silver NSR factors for Kp Oxide are calculated as follows:
Gold NSR Factor = ($1400 – $5.00) x 0.70 x 1.00 x 0.98 / 31.103 = $30.768
Silver NSR Factor = ($20 – $0.50) x 0.13 x 1.00 x 0.98 / 31.103 = $0.0799
The units are US$ per gram per tonne. The 0.98 term is for the royalty.
Kappes, Cassiday & Associates June 19, 2018
| Page 14-5 |
| AMENDED AND RESTATED |
| Camino Rojo Preliminary Economic Assessment | NI 43-101 Technical Report |
Table 14-2
Economic Parameters for Mineral Resource Estimate
| Material Type | | Units | | Kp Oxide | | | Ki Oxide | | | Tran-Hi | | | Tran-Low | | | Tran-S | | | Sulfide | | | Waste | |
| Commodity Prices | | | | | | | | | | | | | | | | | | | | | | | | | | | | | | |
| Gold Price Per Ounce | | (US$) | | | 1400 | | | | 1400 | | | | 1400 | | | | 1400 | | | | 1400 | | | | 1400 | | �� | | | |
| Silver Price Per Ounce | | (US$) | | | 20.00 | | | | 20.00 | | | | 20.00 | | | | 20.00 | | | | 20.00 | | | | 20.00 | | | | | |
| Lead Price Per Pound | | (US$) | | | 1.05 | | | | 1.05 | | | | 1.05 | | | | 1.05 | | | | 1.05 | | | | 1.05 | | | | | |
| Zinc Price Per Pound | | (US$) | | | 1.25 | | | | 1.25 | | | | 1.25 | | | | 1.25 | | | | 1.25 | | | | 1.25 | | | | | |
| Plant Production Rate | | (ktpy) | | | 6,570 | | | | 6,570 | | | | 6,570 | | | | 6,570 | | | | 9,125 | | | | 9,125 | | | | | |
| Mining Cost Per Tonne | | | | | | | | | | | | | | | | | | | | | | | | | | | | | | |
| Total Mining Cost | | (US$) | | | 1.65 | | | | 1.65 | | | | 1.65 | | | | 1.65 | | | | 1.65 | | | | 1.65 | | | | 1.65 | |
| Process and G&A Cost Per Ore Tonne | | | | | | | | | | | | | | | | | | | | | | | | | | | | | | |
| Processing | | (US$) | | | 3.377 | | | | 3.377 | | | | 3.377 | | | | 3.377 | | | | 12.50 | | | | 12.50 | | | | | |
| G&A | | (US$) | | | 1.687 | | | | 1.687 | | | | 1.687 | | | | 1.687 | | | | 1.215 | | | | 1.215 | | | | | |
| Total Process and G&A | | (US$) | | | 5.064 | | | | 5.064 | | | | 5.064 | | | | 5.064 | | | | 13.72 | | | | 13.72 | | | | | |
| Plant Recovery | | | | | | | | | | | | | | | | | | | | | | | | | | | | | | |
| Gold | | (%) | | | 70 | % | | | 58 | % | | | 60 | % | | | 49 | % | | | 86 | % | | | 86 | % | | | | |
| Silver | | (%) | | | 13 | % | | | 20 | % | | | 17 | % | | | 20 | % | | | 76 | % | | | 76 | % | | | | |
| Lead | | (%) | | | 0 | % | | | 0 | % | | | 0 | % | | | 0 | % | | | 60 | % | | | 60 | % | | | | |
| Zinc | | (%) | | | 0 | % | | | 0 | % | | | 0 | % | | | 0 | % | | | 64 | % | | | 64 | % | | | | |
| Smelting/Refining Payables and Costs | | | | | | | | | | | | | | | | | | | | | | | | | | | | | | |
| Gold Refinery Payable | | (%) | | | 100 | % | | | 100 | % | | | 100 | % | | | 100 | % | | | 95 | % | | | 95 | % | | | | |
| Silver Refinery Payable | | (%) | | | 100 | % | | | 100 | % | | | 100 | % | | | 100 | % | | | 95 | % | | | 95 | % | | | | |
| Lead Smelter Payable | | (%) | | | 0 | % | | | 0 | % | | | 0 | % | | | 0 | % | | | 95 | % | | | 95 | % | | | | |
| Zinc Smelter Payable | | (%) | | | 0 | % | | | 0 | % | | | 0 | % | | | 0 | % | | | 85 | % | | | 85 | % | | | | |
| Gold Refining Per Ounce | | (US$) | | | 5.00 | | | | 5.00 | | | | 5.00 | | | | 5.00 | | | | 1.00 | | | | 1.00 | | | | | |
| Silver Refining Per Ounce | | (US$) | | | 0.50 | | | | 0.50 | | | | 0.50 | | | | 0.50 | | | | 1.50 | | | | 1.50 | | | | | |
| Lead Treatment Per Pound | | (US$) | | | 0.00 | | | | 0.00 | | | | 0.00 | | | | 0.00 | | | | 0.194 | | | | 0.194 | | | | | |
| Zinc Treatment Per Pound | | (US$) | | | 0.00 | | | | 0.00 | | | | 0.00 | | | | 0.00 | | | | 0.219 | | | | 0.219 | | | | | |
| Royalties | | | | | | | | | | | | | | | | | | | | | | | | | | | | | | |
| Royalty | | (%) | | | 2 | % | | | 2 | % | | | 2 | % | | | 2 | % | | | 0 | % | | | 0 | % | | | | |
| NSR Factors | | | | | | | | | | | | | | | | | | | | | | | | | | | | | | |
| Gold NSR Factor | | ($/g) | | | 30.768 | | | | 25.493 | | | | 26.372 | | | | 21.537 | | | | 36.748 | | | | 36.748 | | | | | |
| Silver NSR Factor | | ($/g) | | | 0.0799 | | | | 0.1229 | | | | 0.1044 | | | | 0.1229 | | | | 0.4294 | | | | 0.4294 | | | | | |
| Lead NSR Factor | | ($/%) | | | 0.00 | | | | 0.00 | | | | 0.00 | | | | 0.00 | | | | 10.753 | | | | 10.753 | | | | | |
| Zinc NSR Factor | | ($/%) | | | 0.00 | | | | 0.00 | | | | 0.00 | | | | 0.00 | | | | 12.369 | | | | 12.369 | | | | | |
| NSR Cutoff Grades | | | | | | | | | | | | | | | | | | | | | | | | | | | | | | |
| Breakeven NSR Cutoff Grade | | ($/t) | | | 6.71 | | | | 6.71 | | | | 6.71 | | | | 6.71 | | | | 15.37 | | | | 15.37 | | | | | |
| Internal NSR Cutoff Grade | | ($/t) | | | 5.06 | | | | 5.06 | | | | 5.06 | | | | 5.06 | | | | 13.72 | | | | 13.72 | | | | | |
| Gold Equivalent Cutoff Grades | | | | | | | | | | | | | | | | | | | | | | | | | | | | | | |
| Breakeven Cutoff Grade | | (g/t) | | | 0.22 | | | | 0.26 | | | | 0.25 | | | | 0.31 | | | | 0.42 | | | | 0.42 | | | | | |
| Internal Cutoff Grade | | (g/t) | | | 0.16 | | | | 0.20 | | | | 0.19 | | | | 0.24 | | | | 0.37 | | | | 0.37 | | | | | |
Note: Economic parameters used for the mineral resource vary slightly from the PEA economic model as they were done before the final economic analysis.
Kappes, Cassiday & Associates June 19, 2018
| Page 14-6 |
| AMENDED AND RESTATED |
| Camino Rojo Preliminary Economic Assessment | NI 43-101 Technical Report |
The NSR value for a block is calculated as:
NSR = $30.768 x gold + $0.0799 x silver
The breakeven NSR cutoff is $6.71, the mining + process + G&A cost per tonne. The internal NSR cutoff grade is $5.06 per tonne, the process + G&A cost. Internal cutoff applies to blocks that have to be removed from the pit, so mining is a sunk cost. Note the NSR cutoff does not vary by material type for the heap leach materials, so is convenient for mine planning and scheduling.
Breakeven and internal gold or gold equivalent cutoff grades can be calculated by dividing the NSR cutoff grades by the gold NSR factor shown on the table. For Kp Oxide the breakeven gold equivalent cutoff grade is $6.71/$30.768 or 0.22 g/t. The internal cutoff grade is $5.06/$30.768 or 0.16 g/t.
Also, for Kp Oxide, the silver divisor is $30.768/$0.0799 = 385.1, and
Gold Equivalent = Gold + Silver / 385.1
The cutoff grades for the other material types are also shown on the table.
| 14.1.3 | Parameters for Mill Material |
The process cost for the Transition Sulphide and Sulphide material types is estimated at $12.50 per tonne based on grinding and differential flotation to produce a lead, zinc, and a pyrite concentrate. The plant production rate is assumed to be 25,000 tpd or 9.12 million tonnes per year. The overall recoveries for gold and silver are based on the oxidation and cyanide leaching of the pyrite concentrate. The cost for this is included in the process cost estimate. It is assumed the lead and zinc will be recovered as concentrates that will be shipped to conventional smelters. Preliminary estimates of plant recoveries for gold, silver, lead, and zinc are shown on the table.
Table 14-3 shows typical treatment terms for lead and zinc concentrates, and is the basis for the payable amounts of lead and zinc and treatment charges shown in Table 14-2. Typical concentrate grades are assumed for the calculation but more testing is required.
Kappes, Cassiday & Associates June 19, 2018
| Page 14-7 |
| AMENDED AND RESTATED |
| Camino Rojo Preliminary Economic Assessment | NI 43-101 Technical Report |
The NSR factors for each metal are shown on the table and are calculated as follows:
Gold NSR Factor = ($1400 – $1.00) x 0.86 x 0.95 / 31.103 = $36.748
Silver NSR Factor = ($20 – $1.50) x 0.76 x 0.95 / 31.103 = $0.4294
Lead NSR Factor = ($1.05 - $0.194) x 0.60 x 0.95 x 22.046 = $10.753
Zinc NSR Factor = ($1.25 - $0.219) x 0.64 x 0.85 x 22.046 = $12.369
Table 14-3
Treatment Costs for Lead and Zinc Concentrates
| Parameter | | Units | | Lead | | | Zinc | |
| Concentrate Grade | | (%) | | | 60 | % | | | 53 | % |
| Moisture Content | | (%) | | | 8.5 | % | | | 8.5 | % |
| Concentrate Loss | | (%) | | | 0.0 | % | | | 0.0 | % |
| Payable Percentage | | (%) | | | 95 | % | | | 85 | % |
| Payable Lbs/Tonne | | (lbs) | | | 1,257 | | | | 993 | |
| Treatment Cost Per DMT | | (US$) | | | 217.00 | | | | 190.00 | |
| Freight Per WMT | | (US$) | | | 25.00 | | | | 25.00 | |
| Treatment Cost Per Pound | | (US$) | | | 0.173 | | | | 0.191 | |
| Transport Cost Per Pound | | (US$) | | | 0.022 | | | | 0.027 | |
| Total Cost Per Pound | | (US$) | | | 0.194 | | | | 0.219 | |
Total NSR is calculated by multiplying each factor times the mineral grade; the lead and zinc grades are assumed to be in percent (ppm/10000). The breakeven NSR cutoff grade is US$15.37 per tonne; internal NSR cutoff is US$13.72 per tonne. The mineral resources on Table 14-1 are based on internal NSR cutoff grades for all material types. There are no royalties applied to the mill material.
| 14.1.4 | Additional Information |
The mineral resources are classified in accordance with the Canadian Institute of Mining, Metallurgy and Petroleum (“CIM”) “CIM Definition Standards – For Mineral Resources and Mineral Reserves” adopted by the CIM Council (as amended, the “CIM Definition Standards”) in accordance with the requirements of NI 43-101. Mineral reserve and mineral resource estimates reflect the reasonable expectation that all necessary permits and approvals will be obtained and maintained.
There is no guarantee that any of the mineral resources will be converted to mineral reserve. The inferred mineral resources included in this Technical Report meet the current definition of inferred mineral resources. The quantity and grade of inferred mineral resources are uncertain in nature and there has been insufficient exploration to define these inferred mineral resources as an indicated mineral resource. It is, however, expected that the majority of inferred mineral resource could be upgraded to indicated mineral resource with continued exploration.
Kappes, Cassiday & Associates June 19, 2018
| Page 14-8 |
| AMENDED AND RESTATED |
| Camino Rojo Preliminary Economic Assessment | NI 43-101 Technical Report |
IMC does not believe that there are significant risks to the mineral resource estimates based on environmental, permitting, legal, title, taxation, socio-economic, marketing, or political factors. The project is in a jurisdiction friendly to mining. The most significant risks to the mineral resource are related to economic parameters such as prices lower than forecast, recoveries lower than forecast, or costs higher than the current estimates.
All of the mineralization comprised in the mineral resource estimate with respect to the Camino Rojo Project is contained on mineral titles controlled by Orla. However, the mineral resource estimate assumes that the north wall of the conceptual floating pit cone used to demonstrate reasonable prospects for eventual economic extraction extends onto lands where mineral title is held by the Adjacent Owner and that waste would be mined on the Adjacent Owner’s mineral titles. Any potential development of the Camino Rojo Project that includes an open pit encompassing the entire mineral resource estimate would be dependent on obtaining an agreement with the Adjacent Owner. It is estimated that approximately two-thirds of the mineral resource estimate is dependent on an agreement being obtained with the Adjacent Owner. The mineral resource estimate has been prepared based on the Qualified Person’s reasoned judgment, in accordance with CIM Best Practices Guidelines and his professional standards of competence, that there is a reasonable expectation that all necessary permits, agreements and approvals will be obtained and maintained, including an agreement with the Adjacent Owner to allow mining of waste material on its mineral concessions. In particular, in considering the prospects for eventual economic extraction, consideration was given to industry practice, including the past practices of the Adjacent Owner in entering similar agreements on commercially reasonable terms, and a timeframe of 10-15 years.
Delays in, or failure to obtain, such agreement would affect the development of a significant portion of the mineral resources of the Camino Rojo Project that are not included in the PEA, in particular by limiting access to significant mineralized material at depth. There can be no assurance that Orla will be able to negotiate such agreement on terms that are satisfactory to Orla or that there will not be delays in obtaining the necessary agreement.
Kappes, Cassiday & Associates June 19, 2018
| Page 14-9 |
| AMENDED AND RESTATED |
| Camino Rojo Preliminary Economic Assessment | NI 43-101 Technical Report |
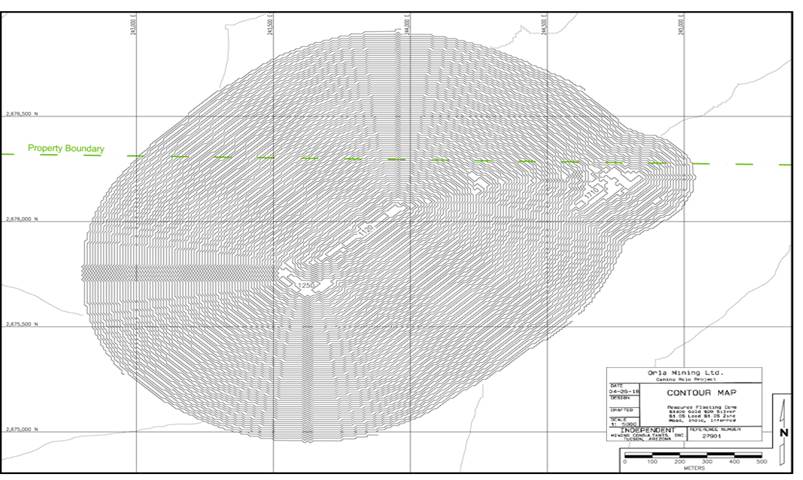
Figure 14-1
Mineral Resource Cone Shell, IMC 2018
Kappes, Cassiday & Associates June 19, 2018
| Page 14-10 |
| | AMENDED AND RESTATED |
| Camino Rojo Preliminary Economic Assessment | NI 43-101 Technical Report |
| 14.2 | Description of the Block Model |
The Camino Rojo mineral resource is based on a block model developed by IMC during March and April 2018. The model is based on 10m by 10m by 10m high blocks. The model is not rotated.
Orla personnel developed various geologic solids as follows:
| · | Solids for the Caracol, Indidura, and post mineral lithologic units. |
| · | Solids to represent higher and lower amounts of potassium alteration in the Caracol Formation; these were termed Potassium Pervasive (Kp) and Potassium Incipient (Ki) alteration zones. |
| · | Solids to represent several levels of oxidation. |
| · | Also a solid interpretation of a dike that runs through the deposit from southwest to northeast. |
IMC reviewed these solids and incorporated them in the model. The lithology model, variable “lith”, is defined as follows:
Table 14-4
Camino Rojo Model Rock Types (lith)
| Rock Code | Units | Description |
| 10 | PM | Post Mineral |
| 20 | Car | Caracol |
| 30 | Ind | Indidura |
The lithology code was assigned to the nearest whole block, i.e. the block was assigned if more than 50% of the block was inside the solid. Figure 14-2 shows the drillhole locations and the location of cross sections referenced in this section. Figure 14-3 shows the lithology on Section L112 along the long axis of the deposit (southwest to northeast). The Caracol unit is the main resource host.
| Kappes, Cassiday & Associates | | |
| June 19, 2018 | | Page 14-11 |
| | AMENDED AND RESTATED |
| Camino Rojo Preliminary Economic Assessment | NI 43-101 Technical Report |
The main control for grade estimation in the Caracol unit is based on the level of potassium alteration and is based on geologic logging and ICP assays of potassium.
The alteration model, variable “alt” is defined as follows:
Table 14-5
Camino Rojo Alteration Types (alt)
| Alteration Code | Alteration | Description |
| 10 | Kp | Caracol_P (Potassium Pervasive) |
| 20 | Ki | Caracol_I (Potassium Incipient) |
| 30 | Ind | Indidura |
| Kappes, Cassiday & Associates | | |
| June 19, 2018 | | Page 14-12 |
| | AMENDED AND RESTATED |
| Camino Rojo Preliminary Economic Assessment | NI 43-101 Technical Report |
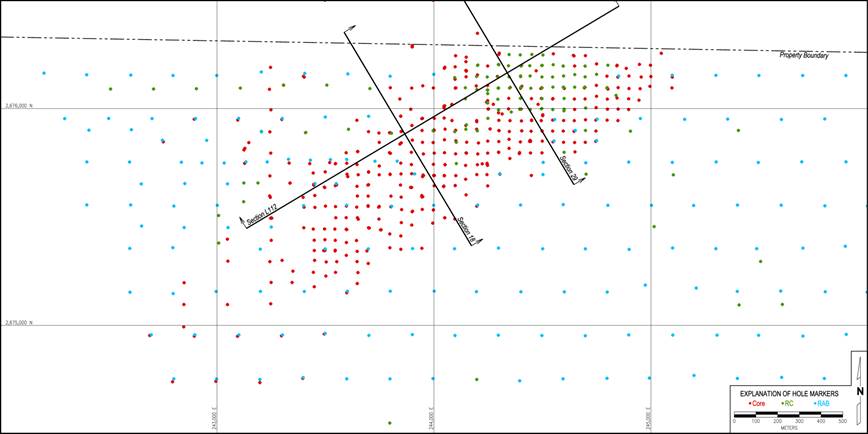
Figure 14-2
Hole and Cross Section Locations, IMC 2018
| Kappes, Cassiday & Associates | | |
| June 19, 2018 | | Page 14-13 |
| | AMENDED AND RESTATED |
| Camino Rojo Preliminary Economic Assessment | NI 43-101 Technical Report |
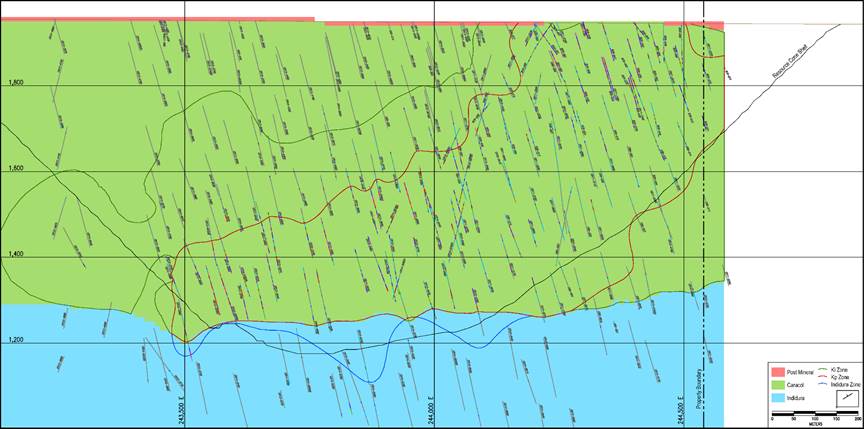
Figure 14-3
Lithology on Section L112, IMC 2018
| Kappes, Cassiday & Associates | | |
| June 19, 2018 | | Page 14-14 |
| | AMENDED AND RESTATED |
| Camino Rojo Preliminary Economic Assessment | NI 43-101 Technical Report |
The Kp (Potassium Pervasive) alteration tends to be pervasive potassium flooding and potassium content in ICP results and are consistently above 3% throughout the zone. It is efficient in defining the area of higher gold assays. The Ki (Potassium Incipient) alteration has potassium flooding localized in bands associated with structures and potassium in ICP results are variable, with the altered portions having greater than 3% and the unaltered <1 to 3% potassium. Figure 14-4 through 14-6 are sections of the alteration. Figure 14-4 is long Section L112. Figure 14-5 and Figure 14-6 are in the southwest and northeast portions of the deposit respectively. Note also that the Indidura “alteration zone” identifies the relatively well drilled portion of the Indidura Formation.
The oxide model, variable “oxide” is defined as follows:
Table 14-6
Camino Rojo Oxide-Sulphide Model (oxide)
| Oxide Code | Type | Description |
| 10 | Ox | Oxide |
| 20 | TrH | Transition 60-90% Oxide |
| 30 | TrL | Transition 30-60% Oxide |
| 40 | TrS | Transition 10-30% Oxide |
| 50 | Slf | Sulphide |
The solids were developed based on % oxide in the drillhole database as logged by Goldcorp. Orla geologists logged holes on several sections to verify the Goldcorp loggings. Figure 14-7 shows a cross section of the oxide model in the northeast portion of the deposit. The southwest portion of the deposit is mostly sulphide.
In addition to the above geologic controls, IMC also included a domain code in the model. This was due to perceived differences in the orientation of the mineralization in the higher elevation northeast portion of the Caracol versus the deeper southwest portion. These are described in Table 14-7. Figure 14-8 shows a long section of the domains.
Table 14-7
Camino Rojo Estimation Domains (domain)
| Domain Code | Domain | Description |
| 1 | NE | Northeast Area Kp and Ki |
| 2 | SW | Southwest Area Kp and Ki |
| 3 | Ind | Indidura |
| Kappes, Cassiday & Associates | | |
| June 19, 2018 | | Page 14-15 |
| | AMENDED AND RESTATED |
| Camino Rojo Preliminary Economic Assessment | NI 43-101 Technical Report |

Figure 14-4
Alteration on Section L112, IMC 2018
| Kappes, Cassiday & Associates | | |
| June 19, 2018 | | Page 14-16 |
| | AMENDED AND RESTATED |
| Camino Rojo Preliminary Economic Assessment | NI 43-101 Technical Report |
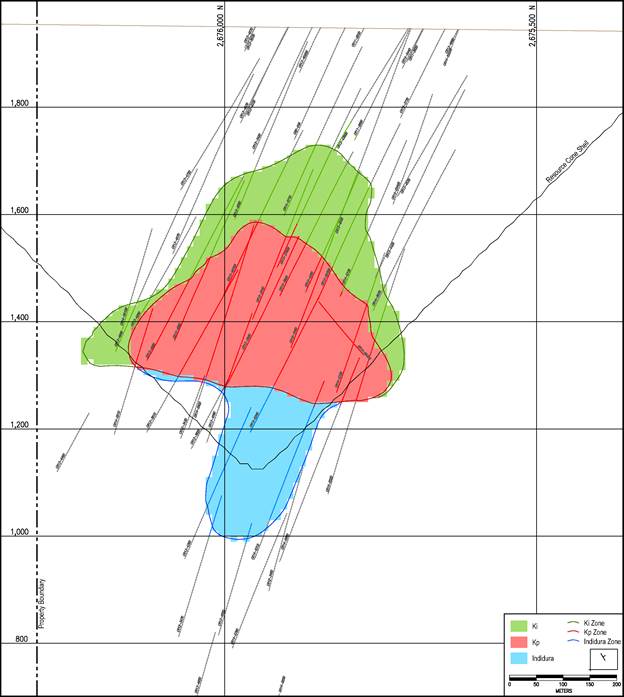
Figure 14-5
Alteration on Section 18, IMC 2018
| Kappes, Cassiday & Associates | | |
| June 19, 2018 | | Page 14-17 |
| | AMENDED AND RESTATED |
| Camino Rojo Preliminary Economic Assessment | NI 43-101 Technical Report |
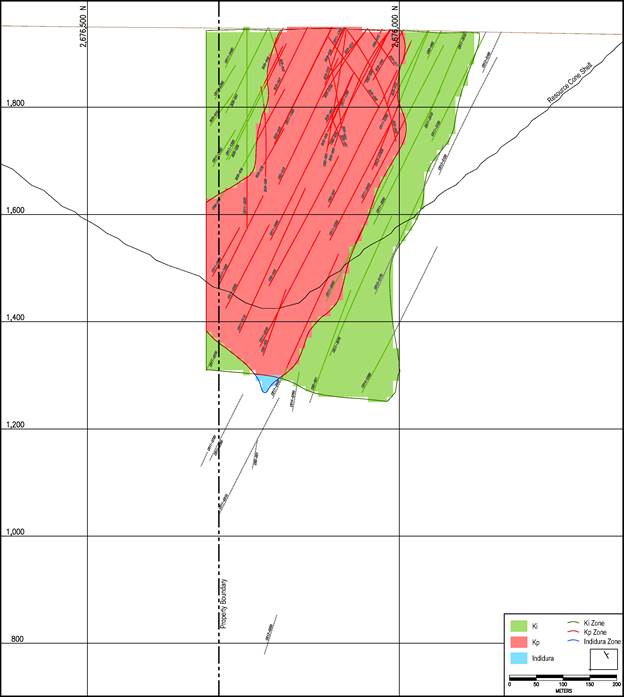
Figure 14-6
Alteration on Section 29, IMC 2018
| Kappes, Cassiday & Associates | | |
| June 19, 2018 | | Page 14-18 |
| | AMENDED AND RESTATED |
| Camino Rojo Preliminary Economic Assessment | NI 43-101 Technical Report |
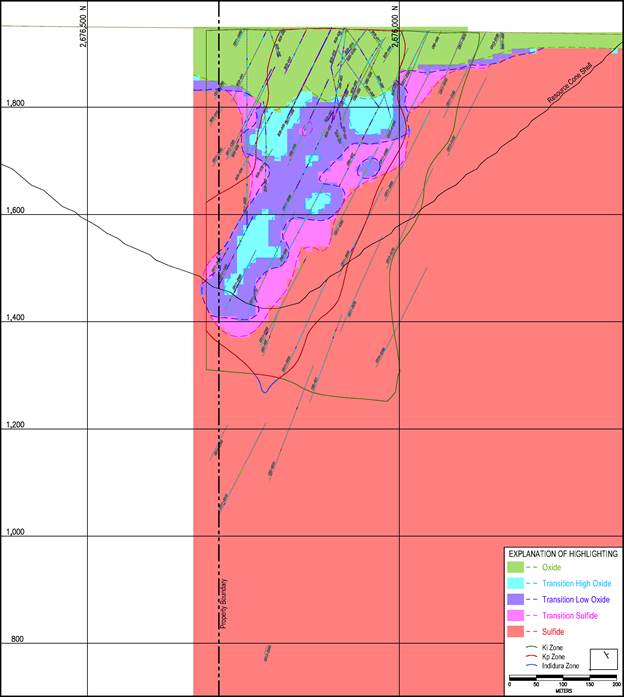
Figure 14-7
Oxidation Zones on Section 29, IMC 2018
| Kappes, Cassiday & Associates | | |
| June 19, 2018 | | Page 14-19 |
| | AMENDED AND RESTATED |
| Camino Rojo Preliminary Economic Assessment | NI 43-101 Technical Report |
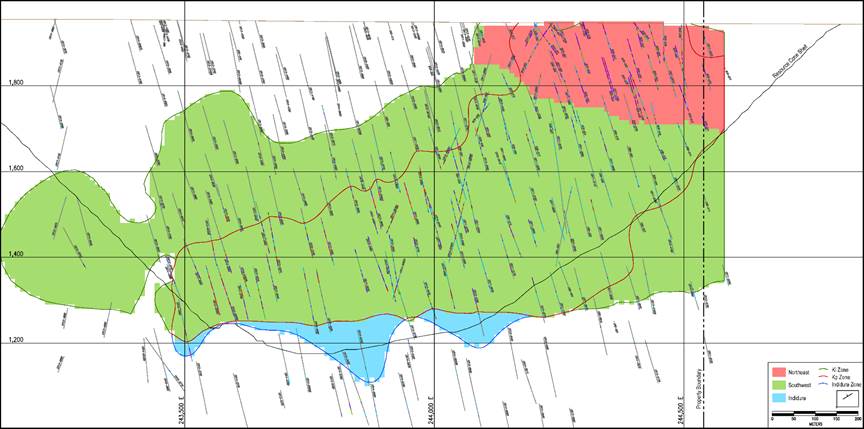
Figure 14-8
Estimation Domains on Section L112, IMC 2018
| Kappes, Cassiday & Associates | | |
| June 19, 2018 | | Page 14-20 |
| AMENDED AND RESTATED |
| Camino Rojo Preliminary Economic Assessment | NI 43-101 Technical Report |
| 14.2.3 | Cap Grades and Compositing |
IMC reviewed the distribution of assays for gold, silver, lead, and zinc, by five different populations and applied cap grades as shown in Table 14-8. The populations are Kp and Ki in the NE domain, Kp and Ki in the SW domain, and Indidura. The top part of the table shows the cap grades and the bottom shows the number of assays capped. The cap grades were generally derived by reviewing probability plots and sorted lists of the assays to find breaks in the distributions.
Table 14-8
Cap Grades and Number of Assays Capped
| | | | | Northeast | | | Southwest | | | | |
| Metal | | Units | | KP | | | KI | | | KP | | | KI | | | Indidura | |
| Gold | | (g/t) | | | 10.5 | | | | 4.5 | | | | 33 | | | | 7.1 | | | | 10 | |
| | | | | | | | | | | | | | | | | | | | | | | |
| Silver | | (g/t) | | | 115 | | | | 76 | | | | 170 | | | | 350 | | | | 75 | |
| | | | | | | | | | | | | | | | | | | | | | | |
| Lead | | (%) | | | 2.3 | | | | 1.6 | | | | 4.0 | | | | 2.4 | | | | 0.65 | |
| | | | | | | | | | | | | | | | | | | | | | | |
| Zinc | | (%) | | | 3.5 | | | | 2.1 | | | | 6.5 | | | | 4.2 | | | | 4 | |
Number of Assays Capped
| | | | | Northeast | | | Southwest | | | | |
| Metal | | Units | | KP | | | KI | | | KP | | | KI | | | Indidura | |
| Gold | | (none) | | | 28 | | | | 18 | | | | 42 | | | | 49 | | | | 21 | |
| | | | | | | | | | | | | | | | | | | | | | | |
| Silver | | (none) | | | 22 | | | | 21 | | | | 42 | | | | 36 | | | | 14 | |
| | | | | | | | | | | | | | | | | | | | | | | |
| Lead | | (none) | | | 6 | | | | 9 | | | | 13 | | | | 28 | | | | 7 | |
| | | | | | | | | | | | | | | | | | | | | | | |
| Zinc | | (none) | | | 6 | | | | 12 | | | | 8 | | | | 5 | | | | 20 | |
The cap grades tend to be around the 99.8 to 99.9 percentile of the distributions; they would not generally be considered very aggressive capping. Figure 14-9 and Figure 14-10 show probability plots of gold assays and gold composites respectively for the NE domain. The plots show original and capped values for the Kp and Ki alterations types. Figure 14-11 and Figure 14-12 show the probability plots for gold for the SW domain and Figure 14-13 and Figure 14-14 are for Indidura.
| Kappes, Cassiday & Associates | | |
| June 19, 2018 | | Page 14-21 |
| AMENDED AND RESTATED |
| Camino Rojo Preliminary Economic Assessment | NI 43-101 Technical Report |
The lithology and alteration codes were assigned to the drillhole database by back-assignment from the solids. The NE/SW domain codes were assigned to the database by back-assignment from the model.
The drillhole database was composited to regular 5m downhole composites, though the current model is based on 10m blocks. This was to avoid blurring the rock type and alteration contacts.
Table 14-9 and Table 14-10 show basic descriptive statistics for the assays and 5m composites respectively. Results are shown for gold, silver, lead, and zinc and are by the various domain and alteration populations. The left side of the table shows results for uncapped values and the right side shows capped values. One item of interest is that silver, lead, and zinc grades are significantly higher in the NE domain than the SW.
| Kappes, Cassiday & Associates | | |
| June 19, 2018 | | Page 14-22 |
| AMENDED AND RESTATED |
| Camino Rojo Preliminary Economic Assessment | NI 43-101 Technical Report |
Table 14-9
Summary Statistics of Assays
| | | Not Capped | | | Capped | |
| | | No. of | | | Mean | | | Std Dev | | | Max | | | Min | | | No. of | | | Mean | | | Std Dev | | | Max | | | Min | |
| Metal/Domain | | Samples | | | (g/t) | | | (g/t) | | | (g/t) | | | (g/t) | | | Samples | | | (g/t) | | | (g/t) | | | (g/t) | | | (g/t) | |
| Gold: | | | 87,152 | | | | 0.587 | | | | 2.206 | | | | 290.0 | | | | 0.002 | | | | 87,152 | | | | 0.565 | | | | 1.594 | | | | 33.0 | | | | 0.002 | |
| Northeast Domain: | | | 22,080 | | | | 0.569 | | | | 1.073 | | | | 51.3 | | | | 0.002 | | | | 22,080 | | | | 0.559 | | | | 0.899 | | | | 10.5 | | | | 0.002 | |
| Kp Alteration | | | 13,315 | | | | 0.797 | | | | 1.285 | | | | 51.3 | | | | 0.002 | | | | 13,315 | | | | 0.782 | | | | 1.050 | | | | 10.5 | | | | 0.002 | |
| Ki Alteration | | | 8,765 | | | | 0.223 | | | | 0.441 | | | | 8.4 | | | | 0.002 | | | | 8,765 | | | | 0.220 | | | | 0.412 | | | | 4.5 | | | | 0.002 | |
| Southwest Domain: | | | 60,446 | | | | 0.588 | | | | 2.505 | | | | 290.0 | | | | 0.002 | | | | 60,446 | | | | 0.564 | | | | 1.802 | | | | 33.0 | | | | 0.002 | |
| Kp Alteration | | | 30,113 | | | | 1.013 | | | | 3.410 | | | | 290.0 | | | | 0.002 | | | | 30,113 | | | | 0.975 | | | | 2.426 | | | | 33.0 | | | | 0.002 | |
| Ki Alteration | | | 30,333 | | | | 0.166 | | | | 0.777 | | | | 48.0 | | | | 0.002 | | | | 30,333 | | | | 0.156 | | | | 0.546 | | | | 7.1 | | | | 0.002 | |
| All Caracol | | | 82,526 | | | | 0.583 | | | | 2.215 | | | | 290.0 | | | | 0.002 | | | | 82,526 | | | | 0.562 | | | | 1.611 | | | | 33.0 | | | | 0.002 | |
| Kp Alteration | | | 43,428 | | | | 0.946 | | | | 2.929 | | | | 290.0 | | | | 0.002 | | | | 43,428 | | | | 0.916 | | | | 2.104 | | | | 33.0 | | | | 0.002 | |
| Ki Alteration | | | 39,098 | | | | 0.179 | | | | 0.716 | | | | 48.0 | | | | 0.002 | | | | 39,098 | | | | 0.170 | | | | 0.520 | | | | 7.1 | | | | 0.002 | |
| Indidura | | | 3,883 | | | | 0.720 | | | | 2.212 | | | | 63.8 | | | | 0.002 | | | | 3,883 | | | | 0.657 | | | | 1.321 | | | | 10.0 | | | | 0.002 | |
| | | Not Capped | | | Capped | |
| | | No. of | | | Mean | | | Std Dev | | | Max | | | Min | | | No. of | | | Mean | | | Std Dev | | | Max | | | Min | |
| Metal/Domain | | Samples | | | (g/t) | | | (g/t) | | | (g/t) | | | (g/t) | | | Samples | | | (g/t) | | | (g/t) | | | (g/t) | | | (g/t) | |
| Silver: | | | 87,155 | | | | 7.22 | | | | 25.58 | | | | 4870 | | | | 0.14 | | | | 87,155 | | | | 7.02 | | | | 16.25 | | | | 652 | | | | 0.14 | |
| Northeast Domain: | | | 22,080 | | | | 11.77 | | | | 35.71 | | | | 4870 | | | | 0.25 | | | | 22,080 | | | | 11.47 | | | | 12.86 | | | | 115 | | | | 0.25 | |
| Kp Alteration | | | 13,315 | | | | 15.71 | | | | 44.95 | | | | 4870 | | | | 0.25 | | | | 13,315 | | | | 15.26 | | | | 13.99 | | | | 115 | | | | 0.25 | |
| Ki Alteration | | | 8,765 | | | | 5.78 | | | | 9.14 | | | | 338 | | | | 0.25 | | | | 8,765 | | | | 5.72 | | | | 8.01 | | | | 76 | | | | 0.25 | |
| Southwest Domain: | | | 60,449 | | | | 5.68 | | | | 21.21 | | | | 1310 | | | | 0.14 | | | | 60,449 | | | | 5.51 | | | | 17.24 | | | | 350 | | | | 0.14 | |
| Kp Alteration | | | 30,116 | | | | 6.90 | | | | 15.91 | | | | 804 | | | | 0.25 | | | | 30,116 | | | | 6.79 | | | | 13.75 | | | | 170 | | | | 0.25 | |
| Ki Alteration | | | 30,333 | | | | 4.46 | | | | 25.34 | | | | 1310 | | | | 0.14 | | | | 30,333 | | | | 4.24 | | | | 20.03 | | | | 350 | | | | 0.14 | |
| All Caracol | | | 82,529 | | | | 7.31 | | | | 26.04 | | | | 4870 | | | | 0.14 | | | | 82,529 | | | | 7.10 | | | | 16.39 | | | | 350 | | | | 0.14 | |
| Kp Alteration | | | 43,431 | | | | 9.60 | | | | 28.49 | | | | 4870 | | | | 0.25 | | | | 43,431 | | | | 9.38 | | | | 14.37 | | | | 170 | | | | 0.25 | |
| Ki Alteration | | | 39,098 | | | | 4.76 | | | | 22.74 | | | | 1310 | | | | 0.14 | | | | 39,098 | | | | 4.57 | | | | 18.05 | | | | 350 | | | | 0.14 | |
| Indidura | | | 3,883 | | | | 5.59 | | | | 12.50 | | | | 421 | | | | 0.25 | | | | 3,883 | | | | 5.41 | | | | 9.73 | | | | 75 | | | | 0.25 | |
| | | Not Capped | | | Capped | |
| | | No. of | | | Mean | | | Std Dev | | | Max | | | Min | | | No. of | | | Mean | | | Std Dev | | | Max | | | Min | |
| Metal/Domain | | Samples | | | (%) | | | (%) | | | (%) | | | (%) | | | Samples | | | (%) | | | (%) | | | (%) | | | (%) | |
| Lead: | | | 87,154 | | | | 0.09 | | | | 0.22 | | | | 12.85 | | | | 0.00 | | | | 87,154 | | | | 0.09 | | | | 0.20 | | | | 4.00 | | | | 0.00 | |
| Northeast Domain: | | | 22,080 | | | | 0.20 | | | | 0.24 | | | | 8.85 | | | | 0.00 | | | | 22,080 | | | | 0.20 | | | | 0.23 | | | | 2.30 | | | | 0.00 | |
| Kp Alteration | | | 13,315 | | | | 0.27 | | | | 0.25 | | | | 3.72 | | | | 0.00 | | | | 13,315 | | | | 0.27 | | | | 0.24 | | | | 2.30 | | | | 0.00 | |
| Ki Alteration | | | 8,765 | | | | 0.09 | | | | 0.18 | | | | 8.85 | | | | 0.00 | | | | 8,765 | | | | 0.09 | | | | 0.15 | | | | 1.60 | | | | 0.00 | |
| Southwest Domain: | | | 60,449 | | | | 0.05 | | | | 0.21 | | | | 12.85 | | | | 0.00 | | | | 60,449 | | | | 0.05 | | | | 0.18 | | | | 4.00 | | | | 0.00 | |
| Kp Alteration | | | 30,116 | | | | 0.07 | | | | 0.23 | | | | 12.85 | | | | 0.00 | | | | 30,116 | | | | 0.07 | | | | 0.20 | | | | 4.00 | | | | 0.00 | |
| Ki Alteration | | | 30,333 | | | | 0.03 | | | | 0.17 | | | | 7.90 | | | | 0.00 | | | | 30,333 | | | | 0.03 | | | | 0.14 | | | | 2.40 | | | | 0.00 | |
| All Caracol | | | 82,529 | | | | 0.09 | | | | 0.23 | | | | 12.85 | | | | 0.00 | | | | 82,529 | | | | 0.09 | | | | 0.20 | | | | 4.00 | | | | 0.00 | |
| Kp Alteration | | | 43,431 | | | | 0.13 | | | | 0.26 | | | | 12.85 | | | �� | 0.00 | | | | 43,431 | | | | 0.13 | | | | 0.24 | | | | 4.00 | | | | 0.00 | |
| Ki Alteration | | | 39,098 | | | | 0.05 | | | | 0.18 | | | | 8.85 | | | | 0.00 | | | | 39,098 | | | | 0.04 | | | | 0.15 | | | | 2.40 | | | | 0.00 | |
| Indidura | | | 3,882 | | | | 0.02 | | | | 0.07 | | | | 2.69 | | | | 0.00 | | | | 3,882 | | | | 0.01 | | | | 0.05 | | | | 0.65 | | | | 0.00 | |
| | | Not Capped | | | Capped | |
| | | No. of | | | Mean | | | Std Dev | | | Max | | | Min | | | No. of | | | Mean | | | Std Dev | | | Max | | | Min | |
| Metal/Domain | | Samples | | | (%) | | | (%) | | | (%) | | | (%) | | | Samples | | | (%) | | | (%) | | | (%) | | | (%) | |
| Zinc: | | | 87,154 | | | | 0.21 | | | | 0.39 | | | | 22.20 | | | | 0.00 | | | | 87,154 | | | | 0.21 | | | | 0.37 | | | | 6.50 | | | | 0.00 | |
| Northeast Domain: | | | 22,080 | | | | 0.33 | | | | 0.32 | | | | 5.44 | | | | 0.00 | | | | 22,080 | | | | 0.33 | | | | 0.32 | | | | 3.50 | | | | 0.00 | |
| Kp Alteration | | | 13,315 | | | | 0.44 | | | | 0.34 | | | | 4.41 | | | | 0.00 | | | | 13,315 | | | | 0.44 | | | | 0.34 | | | | 3.50 | | | | 0.00 | |
| Ki Alteration | | | 8,765 | | | | 0.18 | | | | 0.22 | | | | 5.44 | | | | 0.00 | | | | 8,765 | | | | 0.18 | | | | 0.19 | | | | 2.10 | | | | 0.00 | |
| Southwest Domain: | | | 60,449 | | | | 0.16 | | | | 0.38 | | | | 22.20 | | | | 0.00 | | | | 60,449 | | | | 0.16 | | | | 0.37 | | | | 6.50 | | | | 0.00 | |
| Kp Alteration | | | 30,116 | | | | 0.26 | | | | 0.48 | | | | 22.20 | | | | 0.00 | | | | 30,116 | | | | 0.26 | | | | 0.45 | | | | 6.50 | | | | 0.00 | |
| Ki Alteration | | | 30,333 | | | | 0.07 | | | | 0.22 | | | | 7.31 | | | | 0.00 | | | | 30,333 | | | | 0.07 | | | | 0.22 | | | | 4.20 | | | | 0.00 | |
| All Caracol | | | 82,529 | | | | 0.21 | | | | 0.38 | | | | 22.20 | | | | 0.00 | | | | 82,529 | | | | 0.21 | | | | 0.36 | | | | 6.50 | | | | 0.00 | |
| Kp Alteration | | | 43,431 | | | | 0.31 | | | | 0.45 | | | | 22.20 | | | | 0.00 | | | | 43,431 | | | | 0.31 | | | | 0.43 | | | | 6.50 | | | | 0.00 | |
| Ki Alteration | | | 39,098 | | | | 0.09 | | | | 0.23 | | | | 7.31 | | | | 0.00 | | | | 39,098 | | | | 0.09 | | | | 0.22 | | | | 4.20 | | | | 0.00 | |
| Indidura | | | 3,882 | | | | 0.28 | | | | 0.58 | | | | 7.31 | | | | 0.00 | | | | 3,882 | | | | 0.27 | | | | 0.54 | | | | 4.00 | | | | 0.00 | |
| Kappes, Cassiday & Associates | | |
| June 19, 2018 | | Page 14-23 |
| AMENDED AND RESTATED |
| Camino Rojo Preliminary Economic Assessment | NI 43-101 Technical Report |
Table 14-10
Summary Statistics of 5m Composites
| | | Not Capped | | | Capped | |
| | | No. of | | | Mean | | | Std Dev | | | Max | | | Min | | | No. of | | | Mean | | | Std Dev | | | Max | | | Min | |
| Metal/Domain | | Samples | | | (g/t) | | | (g/t) | | | (g/t) | | | (g/t) | | | Samples | | | (g/t) | | | (g/t) | | | (g/t) | | | (g/t) | |
| Gold: | | | 27,269 | | | | 0.586 | | | | 1.389 | | | | 89.1 | | | | 0.002 | | | | 27,269 | | | | 0.565 | | | | 1.077 | | | | 29.0 | | | | 0.002 | |
| Northeast Domain: | | | 7,287 | | | | 0.578 | | | | 0.796 | | | | 22.3 | | | | 0.002 | | | | 7,287 | | | | 0.568 | | | | 0.695 | | | | 7.3 | | | | 0.002 | |
| Kp Alteration | | | 4,453 | | | | 0.798 | | | | 0.918 | | | | 22.3 | | | | 0.017 | | | | 4,453 | | | | 0.783 | | | | 0.781 | | | | 7.3 | | | | 0.017 | |
| Ki Alteration | | | 2,834 | | | | 0.232 | | | | 0.330 | | | | 4.4 | | | | 0.002 | | | | 2,834 | | | | 0.230 | | | | 0.309 | | | | 3.8 | | | | 0.002 | |
| Southwest Domain: | | | 18,545 | | | | 0.585 | | | | 1.573 | | | | 89.1 | | | | 0.002 | | | | 18,545 | | | | 0.561 | | | | 1.210 | | | | 29.0 | | | | 0.002 | |
| Kp Alteration | | | 9,278 | | | | 1.002 | | | | 2.084 | | | | 89.1 | | | | 0.002 | | | | 9,278 | | | | 0.965 | | | | 1.570 | | | | 29.0 | | | | 0.002 | |
| Ki Alteration | | | 9,267 | | | | 0.167 | | | | 0.505 | | | | 19.7 | | | | 0.002 | | | | 9,267 | | | | 0.157 | | | | 0.368 | | | | 6.2 | | | | 0.002 | |
| All Caracol | | | 25,832 | | | | 0.583 | | | | 1.398 | | | | 89.1 | | | | 0.002 | | | | 25,832 | | | | 0.563 | | | | 1.090 | | | | 29.0 | | | | 0.002 | |
| Kp Alteration | | | 13,731 | | | | 0.936 | | | | 1.794 | | | | 89.1 | | | | 0.002 | | | | 13,731 | | | | 0.906 | | | | 1.368 | | | | 29.0 | | | | 0.002 | |
| Ki Alteration | | | 12,101 | | | | 0.182 | | | | 0.471 | | | | 19.7 | | | | 0.002 | | | | 12,101 | | | | 0.174 | | | | 0.356 | | | | 6.2 | | | | 0.002 | |
| Indidura | | | 1,185 | | | | 0.722 | | | | 1.304 | | | | 21.6 | | | | 0.003 | | | | 1,185 | | | | 0.660 | | | | 0.846 | | | | 5.5 | | | | 0.003 | |
| | | Not Capped | | | Capped | |
| | | No. of | | | Mean | | | Std Dev | | | Max | | | Min | | | No. of | | | Mean | | | Std Dev | | | Max | | | Min | |
| Metal/Domain | | Samples | | | (g/t) | | | (g/t) | | | (g/t) | | | (g/t) | | | Samples | | | (g/t) | | | (g/t) | | | (g/t) | | | (g/t) | |
| Silver: | | | 27,269 | | | | 7.34 | | | | 17.78 | | | | 1961 | | | | 0.25 | | | | 27,269 | | | | 7.13 | | | | 11.50 | | | | 368 | | | | 0.25 | |
| Northeast Domain: | | | 7,287 | | | | 11.93 | | | | 25.36 | | | | 1961 | | | | 0.25 | | | | 7,287 | | | | 11.58 | | | | 10.44 | | | | 91 | | | | 0.25 | |
| Kp Alteration | | | 4,453 | | | | 15.78 | | | | 31.43 | | | | 1961 | | | | 0.25 | | | | 4,453 | | | | 15.25 | | | | 11.03 | | | | 91 | | | | 0.25 | |
| Ki Alteration | | | 2,834 | | | | 5.88 | | | | 6.40 | | | | 115 | | | | 0.25 | | | | 2,834 | | | | 5.81 | | | | 5.89 | | | | 58 | | | | 0.25 | |
| Southwest Domain: | | | 18,545 | | | | 5.67 | | | | 13.75 | | | | 531 | | | | 0.25 | | | | 18,545 | | | | 5.50 | | | | 11.42 | | | | 245 | | | | 0.25 | |
| Kp Alteration | | | 9,278 | | | | 6.90 | | | | 10.43 | | | | 252 | | | | 0.25 | | | | 9,278 | | | | 6.79 | | | | 9.33 | | | | 134 | | | | 0.25 | |
| Ki Alteration | | | 9,267 | | | | 4.43 | | | | 16.33 | | | | 531 | | | | 0.25 | | | | 9,267 | | | | 4.21 | | | | 13.07 | | | | 245 | | | | 0.25 | |
| All Caracol | | | 25,832 | | | | 7.43 | | | | 18.03 | | | | 1961 | | | | 0.25 | | | | 25,832 | | | | 7.21 | | | | 11.49 | | | | 245 | | | | 0.25 | |
| Kp Alteration | | | 13,731 | | | | 9.78 | | | | 20.28 | | | | 1961 | | | | 0.25 | | | | 13,731 | | | | 9.53 | | | | 10.67 | | | | 134 | | | | 0.25 | |
| Ki Alteration | | | 12,101 | | | | 4.77 | | | | 14.63 | | | | 531 | | | | 0.25 | | | | 12,101 | | | | 4.58 | | | | 11.80 | | | | 245 | | | | 0.25 | |
| Indidura | | | 1,185 | | | | 5.60 | | | | 8.34 | | | | 140 | | | | 0.25 | | | | 1,185 | | | | 5.42 | | | | 6.79 | | | | 67 | | | | 0.25 | |
| | | Not Capped | | | Capped | |
| | | No. of | | | Mean | | | Std Dev | | | Max | | | Min | | | No. of | | | Mean | | | Std Dev | | | Max | | | Min | |
| Metal/Domain | | Samples | | | (%) | | | (%) | | | (%) | | | (%) | | | Samples | | | (%) | | | (%) | | | (%) | | | (%) | |
| Lead: | | | 27,269 | | | | 0.09 | | | | 0.16 | | | | 4.61 | | | | 0.00 | | | | 27,269 | | | | 0.09 | | | | 0.15 | | | | 2.12 | | | | 0.00 | |
| Northeast Domain: | | | 7,287 | | | | 0.20 | | | | 0.19 | | | | 2.99 | | | | 0.00 | | | | 7,287 | | | | 0.20 | | | | 0.19 | | | | 1.45 | | | | 0.00 | |
| Kp Alteration | | | 4,453 | | | | 0.27 | | | | 0.20 | | | | 1.56 | | | | 0.00 | | | | 4,453 | | | | 0.27 | | | | 0.20 | | | | 1.45 | | | | 0.00 | |
| Ki Alteration | | | 2,834 | | | | 0.09 | | | | 0.12 | | | | 2.99 | | | | 0.00 | | | | 2,834 | | | | 0.09 | | | | 0.11 | | | | 0.93 | | | | 0.00 | |
| Southwest Domain: | | | 18,545 | | | | 0.05 | | | | 0.13 | | | | 4.61 | | | | 0.00 | | | | 18,545 | | | | 0.05 | | | | 0.12 | | | | 2.12 | | | | 0.00 | |
| Kp Alteration | | | 9,278 | | | | 0.07 | | | | 0.15 | | | | 4.61 | | | | 0.00 | | | | 9,278 | | | | 0.07 | | | | 0.14 | | | | 2.12 | | | | 0.00 | |
| Ki Alteration | | | 9,267 | | | | 0.03 | | | | 0.11 | | | | 3.62 | | | | 0.00 | | | | 9,267 | | | | 0.03 | | | | 0.09 | | | | 1.52 | | | | 0.00 | |
| All Caracol | | | 25,832 | | | | 0.09 | | | | 0.17 | | | | 4.61 | | | | 0.00 | | | | 25,832 | | | | 0.09 | | | | 0.16 | | | | 2.12 | | | | 0.00 | |
| Kp Alteration | | | 13,731 | | | | 0.13 | | | | 0.19 | | | | 4.61 | | | | 0.00 | | | | 13,731 | | | | 0.13 | | | | 0.18 | | | | 2.12 | | | | 0.00 | |
| Ki Alteration | | | 12,101 | | | | 0.05 | | | | 0.12 | | | | 3.62 | | | | 0.00 | | | | 12,101 | | | | 0.05 | | | | 0.10 | | | | 1.52 | | | | 0.00 | |
| Indidura | | | 1,185 | | | | 0.02 | | | | 0.05 | | | | 1.01 | | | | 0.00 | | | | 1,185 | | | | 0.01 | | | | 0.04 | | | | 0.44 | | | | 0.00 | |
| | | | | | | | | | | | | | | | | | | | | | | | | | | | | | | | | | | | | | | | | |
| | | Not Capped | | | Capped | |
| | | No. of | | | Mean | | | Std Dev | | | Max | | | Min | | | No. of | | | Mean | | | Std Dev | | | Max | | | Min | |
| Metal/Domain | | Samples | | | (%) | | | (%) | | | (%) | | | (%) | | | Samples | | | (%) | | | (%) | | | (%) | | | (%) | |
| Zinc: | | | 27,269 | | | | 0.21 | | | | 0.28 | | | | 7.83 | | | | 0.00 | | | | 27,269 | | | | 0.21 | | | | 0.27 | | | | 3.61 | | | | 0.00 | |
| Northeast Domain: | | | 7,287 | | | | 0.34 | | | | 0.27 | | | | 3.23 | | | | 0.01 | | | | 7,287 | | | | 0.34 | | | | 0.27 | | | | 3.12 | | | | 0.01 | |
| Kp Alteration | | | 4,453 | | | | 0.44 | | | | 0.28 | | | | 3.23 | | | | 0.04 | | | | 4,453 | | | | 0.44 | | | | 0.28 | | | | 3.12 | | | | 0.04 | |
| Ki Alteration | | | 2,834 | | | | 0.18 | | | | 0.17 | | | | 2.95 | | | | 0.01 | | | | 2,834 | | | | 0.18 | | | | 0.15 | | | | 1.37 | | | | 0.01 | |
| Southwest Domain: | | | 18,545 | | | | 0.16 | | | | 0.26 | | | | 7.83 | | | | 0.00 | | | | 18,545 | | | | 0.16 | | | | 0.26 | | | | 3.61 | | | | 0.00 | |
| Kp Alteration | | | 9,278 | | | | 0.26 | | | | 0.32 | | | | 7.83 | | | | 0.00 | | | | 9,278 | | | | 0.26 | | | | 0.31 | | | | 3.61 | | | | 0.00 | |
| Ki Alteration | | | 9,267 | | | | 0.07 | | | | 0.14 | | | | 2.55 | | | | 0.00 | | | | 9,267 | | | | 0.07 | | | | 0.14 | | | | 2.54 | | | | 0.00 | |
| All Caracol | | | 25,832 | | | | 0.21 | | | | 0.28 | | | | 7.83 | | | | 0.00 | | | | 25,832 | | | | 0.21 | | | | 0.27 | | | | 3.61 | | | | 0.00 | |
| Kp Alteration | | | 13,731 | | | | 0.32 | | | | 0.32 | | | | 7.83 | | | | 0.00 | | | | 13,731 | | | | 0.32 | | | | 0.31 | | | | 3.61 | | | | 0.00 | |
| Ki Alteration | | | 12,101 | | | | 0.09 | | | | 0.16 | | | | 2.95 | | | | 0.00 | | | | 12,101 | | | | 0.09 | | | | 0.15 | | | | 2.54 | | | | 0.00 | |
| Indidura | | | 1,185 | | | | 0.28 | | | | 0.37 | | | | 3.87 | | | | 0.00 | | | | 1,185 | | | | 0.27 | | | | 0.34 | | | | 2.93 | | | | 0.00 | |
| Kappes, Cassiday & Associates | | |
| June 19, 2018 | | Page 14-24 |
| AMENDED AND RESTATED |
| Camino Rojo Preliminary Economic Assessment | NI 43-101 Technical Report |

Figure 14-9
Probability Plot of Gold Assays by Alteration Type – NE Domain
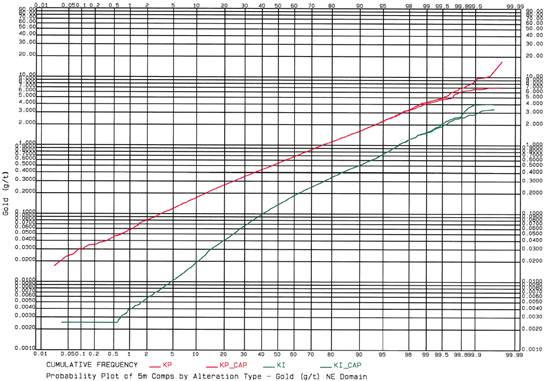
Figure 14-10
Probability Plot of Gold 5m Composites by Alteration Type – NE Domain
| Kappes, Cassiday & Associates | | |
| June 19, 2018 | | Page 14-25 |
| AMENDED AND RESTATED |
| Camino Rojo Preliminary Economic Assessment | NI 43-101 Technical Report |

Figure 14-11
Probability Plot of Gold Assays by Alteration Type – SW Domain
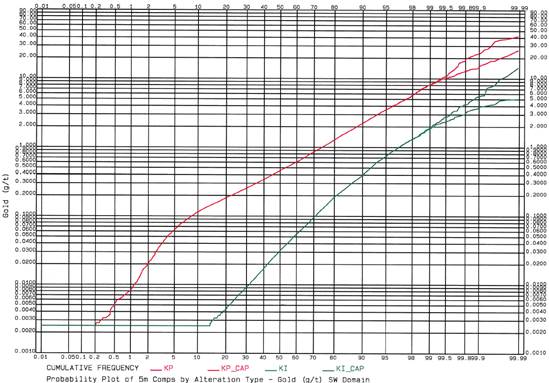
Figure 14-12
Probability Plot of Gold 5m Composites by Alteration Type – SW Domain
| Kappes, Cassiday & Associates | | |
| June 19, 2018 | | Page 14-26 |
| AMENDED AND RESTATED |
| Camino Rojo Preliminary Economic Assessment | NI 43-101 Technical Report |

Figure 14-13
Probability Plot of Gold Assays by Alteration Type – Indidura
| Kappes, Cassiday & Associates | | |
| June 19, 2018 | | Page 14-27 |
| AMENDED AND RESTATED |
| Camino Rojo Preliminary Economic Assessment | NI 43-101 Technical Report |
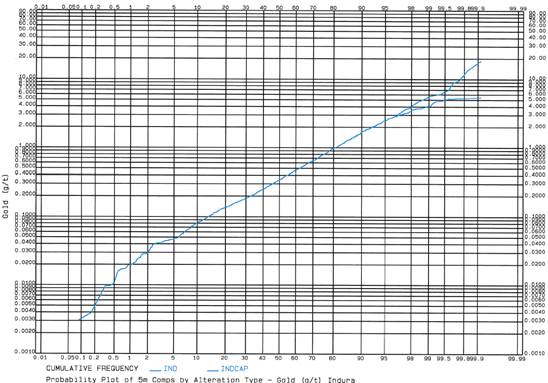
Figure 14-14
Probability Plot of Gold 5m Composites by Alteration Type – Indidura
IMC conducted a variogram analysis of gold in the Kp alteration type for the NE domain. The analysis was based on the 5m composites. Figure 14-15 shows the variogram in the N60oE direction with no dip. This is a good variogram in terms of clarity and has a range of about 135m. This direction is assumed as the major axis for the variogram model. Figure 14-16 shows the variogram in the S30oE direction with a dip of 15o. This is also a good variogram in terms of clarity with ranges of 85 and 160m for the two structures fit to it. It is noted that the primary and secondary directions conform to the strike and dip of the bedding.
Figure 14-17 shows the variogram in the north direction with a 60o dip. This is approximately, but not exactly, the tertiary direction to the previous variograms. This direction represents the approximate downhole direction for much of the drilling, so is a convenient direction for calculation. The variogram is of good clarity, but relatively short range. The range of the first structure fit to the variogram is about 32m and about 90% of the total variability in this variogram takes place within about this distance.
| Kappes, Cassiday & Associates | | |
| June 19, 2018 | | Page 14-28 |
| AMENDED AND RESTATED |
| Camino Rojo Preliminary Economic Assessment | NI 43-101 Technical Report |
Figure 14-18 shows the variogram in the S60oW direction with a 25o dip for the SW domain. This is assumed to be the primary axis, and it appears evident on cross sections. The variogram has good clarity with a range of about 100m.
Figure 14-19 shows the variogram in the north direction with a 60o dip. As previously mentioned, this is the approximate downhole direction for much of the drilling. Orla geologic personnel propose that a primary control of mineralization is related to structures trending about N60oE with a steep NNW dip. This variogram is approximately in that direction. It can be seen however that the range of the variogram is quite short, about 8m for the first structure and 31m for the second structure. However, IMC could not find any direction perpendicular to the major axis that produced good variogram results. Based on this, it was determined to assume the secondary and tertiary directions were the same, and about half the range of the primary direction.
IMC did not run variograms for Indidura; there is not sufficient drilling. Indidura grade estimation are the same as for the SW domain. IMC also did not run variogram for the lower grade Ki alteration zones. The Ki searches are assumed to be the same as for Kp alteration.
| Kappes, Cassiday & Associates | | |
| June 19, 2018 | | Page 14-29 |
| AMENDED AND RESTATED |
| Camino Rojo Preliminary Economic Assessment | NI 43-101 Technical Report |
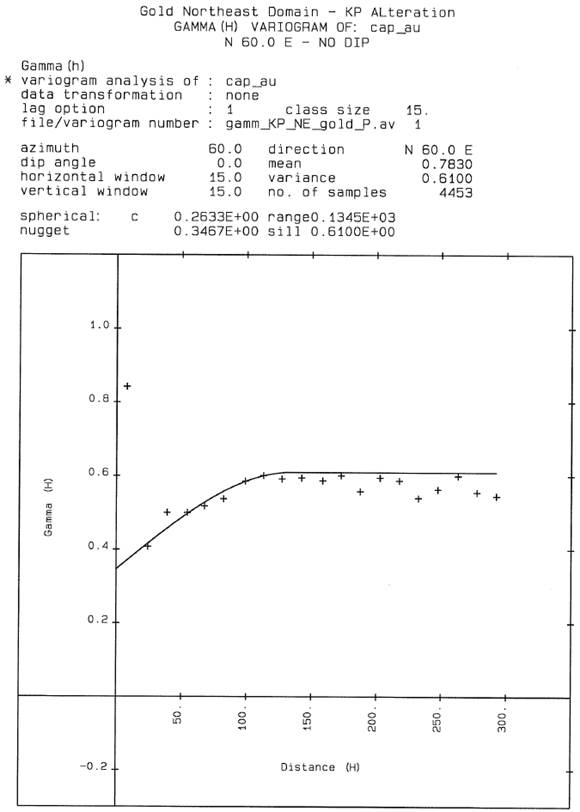
Figure 14-15
NE Domain Gold Variogram – Primary Axis
| Kappes, Cassiday & Associates | | |
| June 19, 2018 | | Page 14-30 |
| | AMENDED AND RESTATED |
| Camino Rojo Preliminary Economic Assessment | NI 43-101 Technical Report |
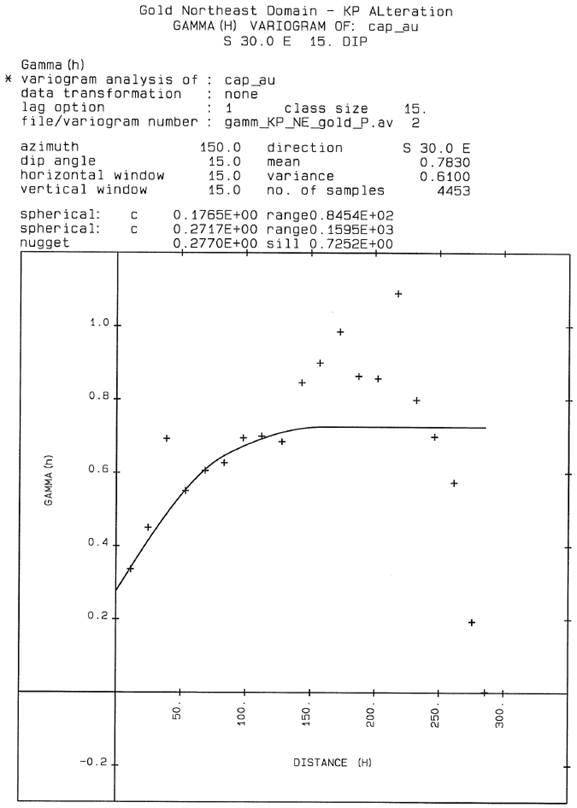
Figure 14-16
NE Domain Gold Variogram – Secondary Axis
| Kappes, Cassiday & Associates | | |
| June 19, 2018 | | Page 14-31 |
| | AMENDED AND RESTATED |
| Camino Rojo Preliminary Economic Assessment | NI 43-101 Technical Report |
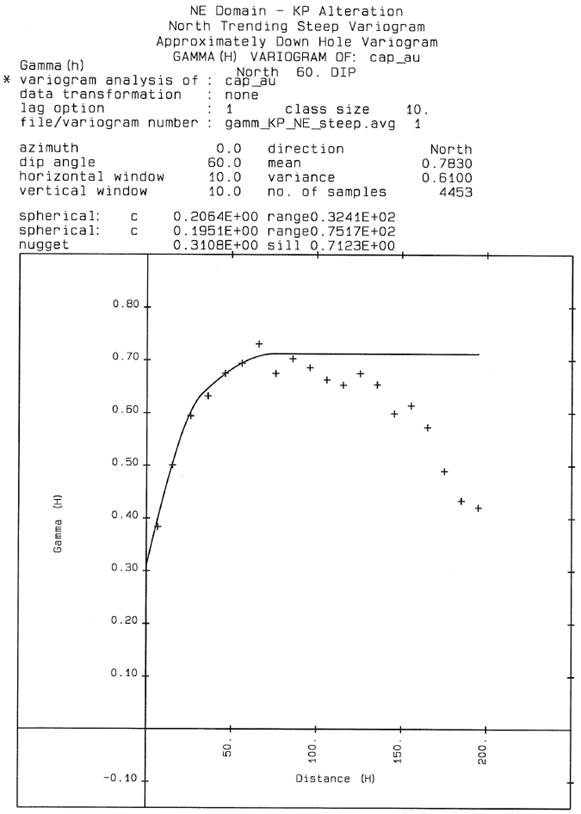
Figure 14-17
NE Domain Gold Variogram – Tertiary Axis
| Kappes, Cassiday & Associates | | |
| June 19, 2018 | | Page 14-32 |
| | AMENDED AND RESTATED |
| Camino Rojo Preliminary Economic Assessment | NI 43-101 Technical Report |
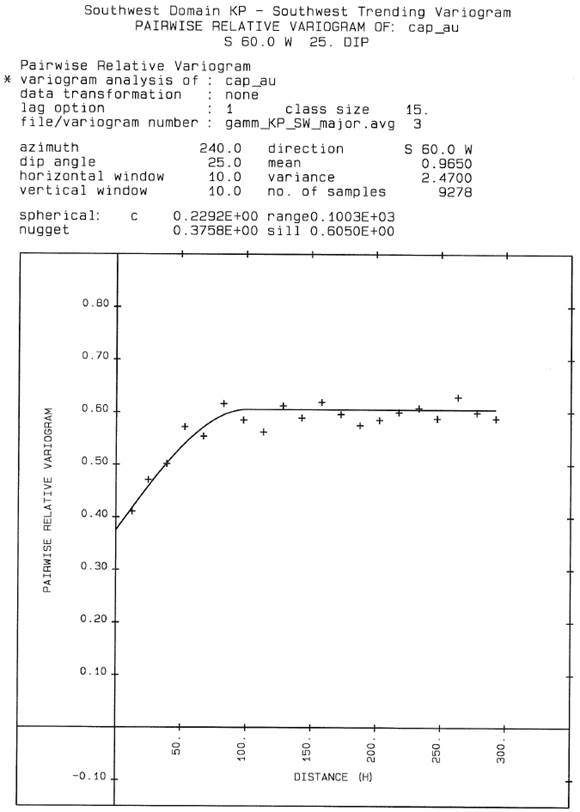
Figure 14-18
SW Domain Gold Variogram – Primary Axis
| Kappes, Cassiday & Associates | | |
| June 19, 2018 | | Page 14-33 |
| | AMENDED AND RESTATED |
| Camino Rojo Preliminary Economic Assessment | NI 43-101 Technical Report |
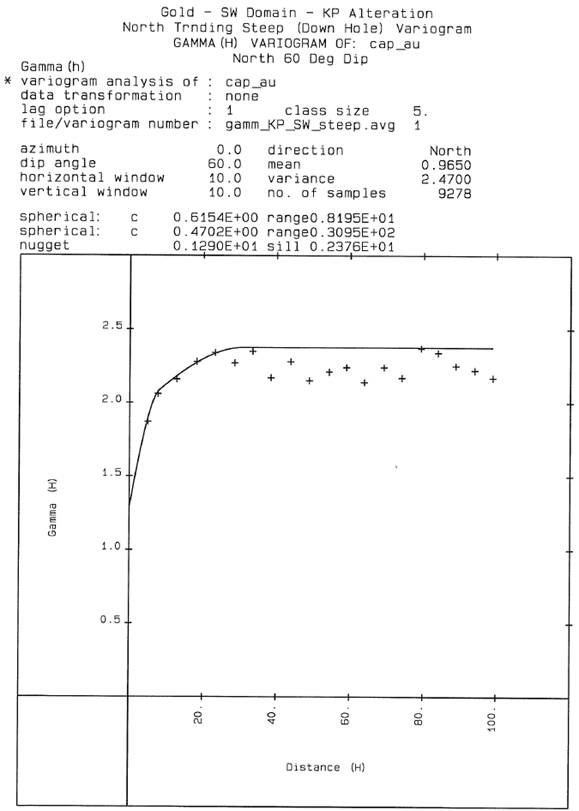
Figure 14-19
SW Domain Gold Variogram – Down Hole Variogram
| Kappes, Cassiday & Associates | | |
| June 19, 2018 | | Page 14-34 |
| | AMENDED AND RESTATED |
| Camino Rojo Preliminary Economic Assessment | NI 43-101 Technical Report |
| 14.2.5 | Block Grade Estimation |
The Kp versus Ki alteration types were treated as a hard boundary for estimation purposes. Kp blocks were only estimated with Kp composites, etc. The Indidura/Caracol boundary was also a hard boundary. The alteration types and estimation domains result in five combinations for grade estimation:
The NE and SW domains were not a hard boundary for estimation. The domains were used to control search orientation. For the NE Caracol (Kp and Ki), the primary axis of the search ellipse had a dip direction and dip of 60o (N60oE) and 0o respectively and the secondary axis had a dip direction and dip of 150o (S30oE) and 15o (down) respectively. The search radii were 100m along the primary and secondary directions and 30m in the tertiary direction.
IMC estimated grades for gold, silver, lead, and zinc using inverse distance with a power weight of 2 (ID2). A maximum of 15 composites, a minimum of three and a maximum of three composites per hole was used. The effect of inverse distance weighting along with a relatively low number of composites should produce relatively unsmoothed estimates of block grades. Also recall that 5m composites were used to estimate the grades of the 10m blocks. Figure 14-20 shows a cross section of the gold grades in the NE domain.
For the SW Caracol (again Kp and Ki), the primary axis of the search ellipse had a dip direction and dip of 240o (S60oW) and 25o (down). The search radii were 100m along the major axis and 50m, circular, perpendicular to the primary axis.
A maximum of 24 composites, a minimum of four and a maximum of eight composites per hole was used. This is more composites, and more per hole, than was used for the NE domain, but is necessary since there is not as much clarity on the secondary versus tertiary direction in the SW domain. Figure 14-21 shows a cross section of gold grades in the SW domain. Figure 14-22 shows the gold grades on the long section.
Indidura was estimated with the same parameters as the SW domain.
| Kappes, Cassiday & Associates | | |
| June 19, 2018 | | Page 14-35 |
| | AMENDED AND RESTATED |
| Camino Rojo Preliminary Economic Assessment | NI 43-101 Technical Report |
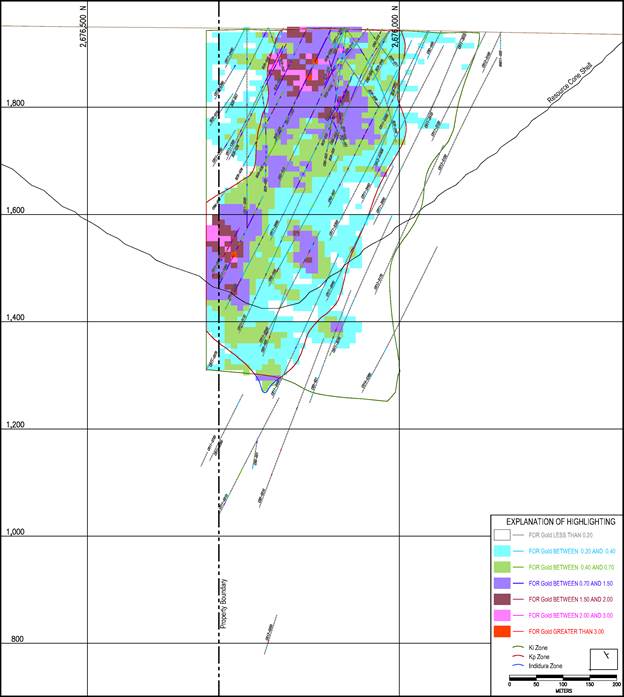
Figure 14-20
Gold Grades on Section 29, IMC 2018
| Kappes, Cassiday & Associates | | |
| June 19, 2018 | | Page 14-36 |
| | AMENDED AND RESTATED |
| Camino Rojo Preliminary Economic Assessment | NI 43-101 Technical Report |
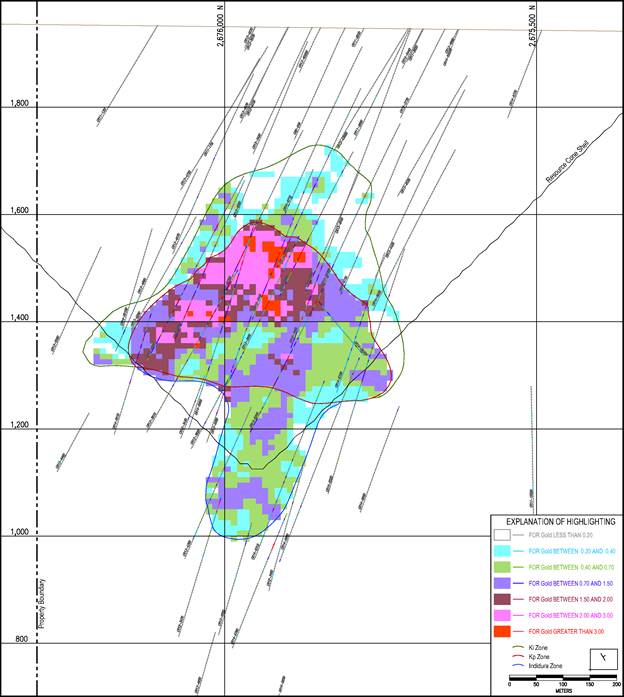
Figure 14-21
Gold Grades on Section 18, IMC 2018
| Kappes, Cassiday & Associates | | |
| June 19, 2018 | | Page 14-37 |
| | AMENDED AND RESTATED |
| Camino Rojo Preliminary Economic Assessment | NI 43-101 Technical Report |
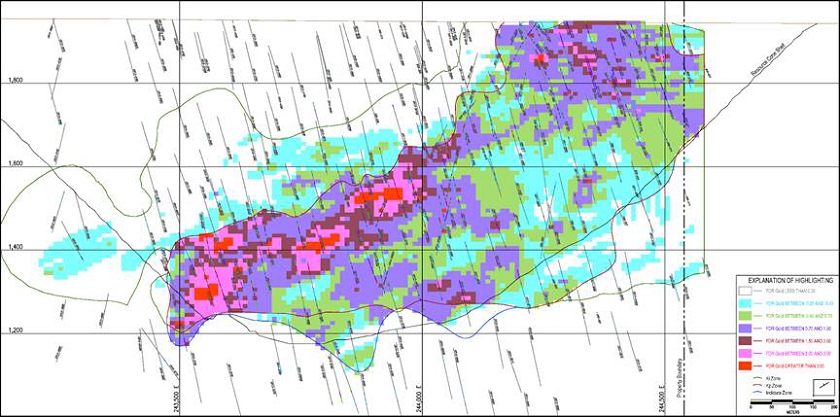
Figure 14-22
Gold Grades on Section L112, IMC 2018
| Kappes, Cassiday & Associates | | |
| June 19, 2018 | | Page 14-38 |
| | AMENDED AND RESTATED |
| Camino Rojo Preliminary Economic Assessment | NI 43-101 Technical Report |
| 14.2.6 | Resource Classification |
For the purpose of classifying the mineral resources, two additional block estimates were done. They were based on the same search orientations and search radii as the grade estimates. The first estimate was based on a maximum of four composites, a minimum of four, and a maximum of one composite per hole. The second estimate was based on a maximum of three composites, a minimum of three, and a maximum of one composite per hole. These estimates provide the average distance to the nearest three and four holes to each block and were put into the block model. Note the grade from this estimate was not used. The Kp/Ki contact was not used as a hard boundary for these estimations.
Blocks with an average distance to four holes less than or equal to 25m were assigned as measured mineral resource. Blocks with an average distance to the nearest three holes less than 45m, but greater than 25m from the nearest four holes, were assigned as indicated mineral resource. Blocks with an average distance to three holes greater than 45m were assigned to inferred mineral resource. The distribution of drilling at Camino Rojo is quite variable. Generally (not specific to Camino Rojo) an average distance to the nearest four holes of 25m corresponds to an average drill spacing of 30m to 33m. An average distance to the nearest three holes of 45m corresponds to an average drill spacing of about 60m. These estimates are approximate.
Figure 14-23, Figure 14-24 and Figure 14-25 show the probability plots for these average distances for the NE, SW, and Indidura domains respectively. The approximate percent of blocks in each resource category are as follows:
| | | Measured | | | Indicated | | | Inferred | |
| Northeast | | | 12.7 | % | | | 79.0 | % | | | 8.3 | % |
| | | | | | | | | | | | | |
| Southwest | | | 1.9 | % | | | 61.1 | % | | | 37.0 | % |
| | | | | | | | | | | | | |
| Indidura | | | 1.8 | % | | | 41.4 | % | | | 56.8 | % |
Figure 14-26 and Figure 14-27 show the resource classification on cross sections.
| Kappes, Cassiday & Associates | | |
| June 19, 2018 | | Page 14-39 |
| | AMENDED AND RESTATED |
| Camino Rojo Preliminary Economic Assessment | NI 43-101 Technical Report |
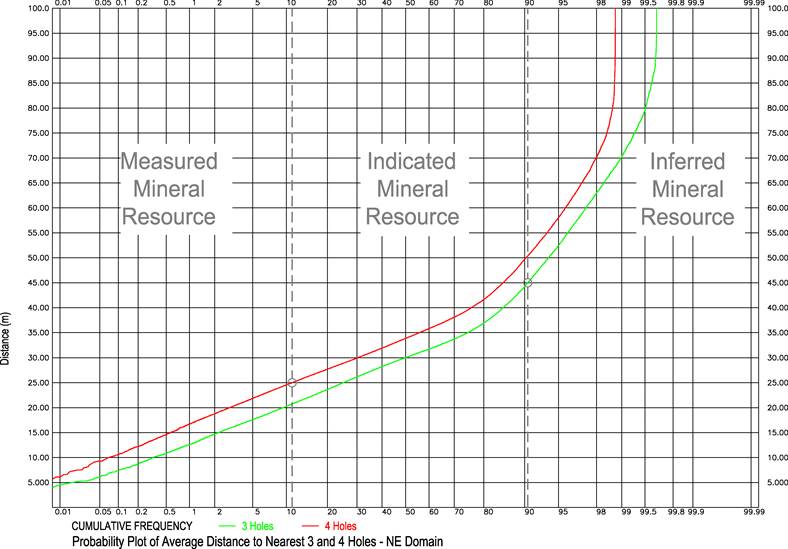
Figure 14-23
Average Distance to Nearest 3 and 4 Holes – NE Domain
| Kappes, Cassiday & Associates | | |
| June 19, 2018 | | Page 14-40 |
| | AMENDED AND RESTATED |
| Camino Rojo Preliminary Economic Assessment | NI 43-101 Technical Report |

Figure 14-24
Average Distance to Nearest 3 and 4 Holes – SW Domain
| Kappes, Cassiday & Associates | | |
| June 19, 2018 | | Page 14-41 |
| | AMENDED AND RESTATED |
| Camino Rojo Preliminary Economic Assessment | NI 43-101 Technical Report |
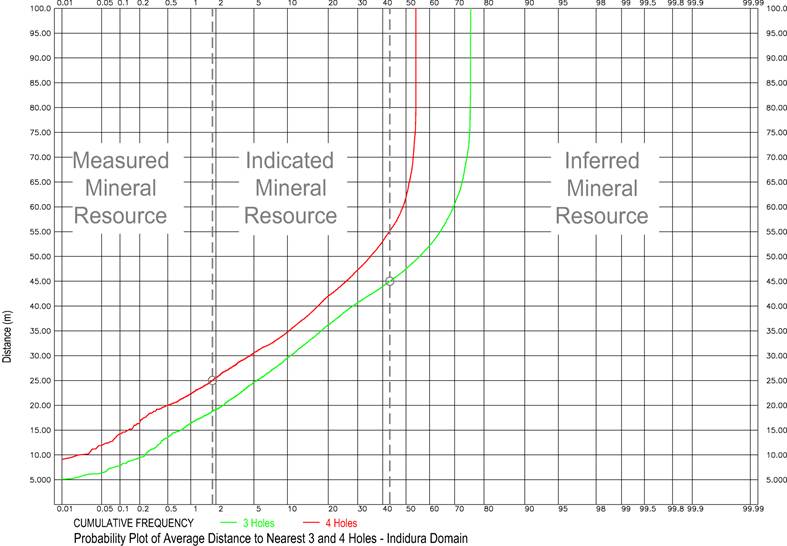
Figure 14-25
Average Distance to Nearest 3 and 4 Holes – Indidura
| Kappes, Cassiday & Associates | | |
| June 19, 2018 | | Page 14-42 |
| | AMENDED AND RESTATED |
| Camino Rojo Preliminary Economic Assessment | NI 43-101 Technical Report |
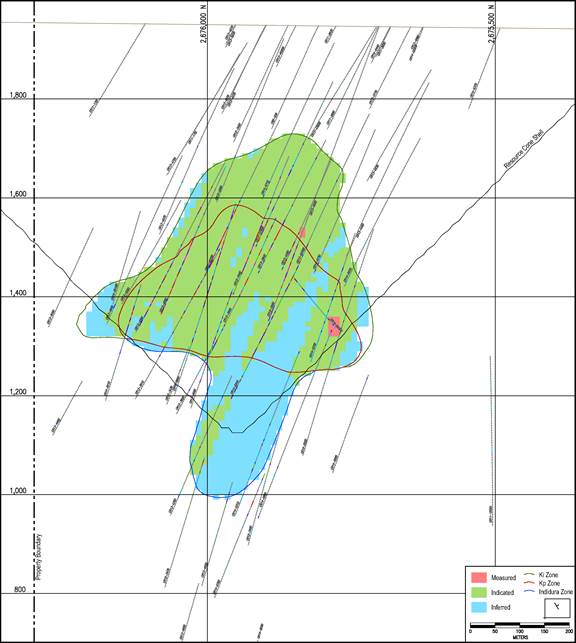
Figure 14-26
Resource Class on Section 18, IMC 2018
| Kappes, Cassiday & Associates | | |
| June 19, 2018 | | Page 14-43 |
| | AMENDED AND RESTATED |
| Camino Rojo Preliminary Economic Assessment | NI 43-101 Technical Report |
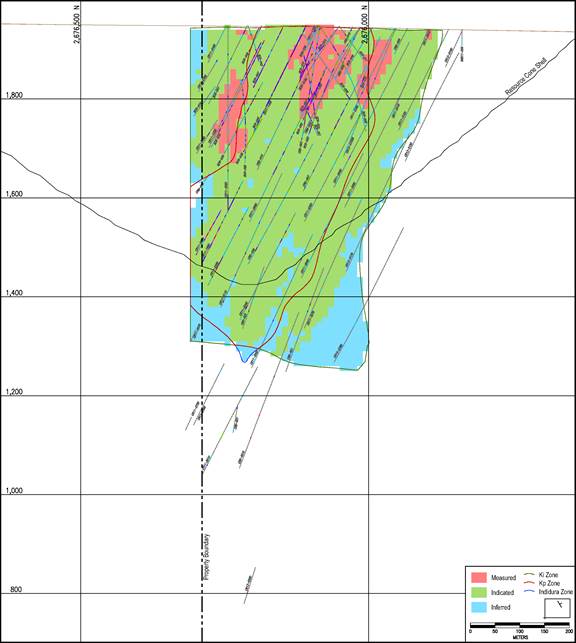
Figure 14-27
Resource Class on Section 29, IMC 2018
| Kappes, Cassiday & Associates | | |
| June 19, 2018 | | Page 14-44 |
| | AMENDED AND RESTATED |
| Camino Rojo Preliminary Economic Assessment | NI 43-101 Technical Report |
The database included about 10,000 specific gravity tests conducted on core. Some were based on the wax immersion method, but most were based on cutting whole core to obtain small cylinders and measuring them to obtain the volume; they were then weighed to obtain an estimate of dry specific gravity.
IMC examined this data by rock type and domain. Table 14-11 shows the results.
Table 14-11
Specific Gravity and Bulk Density
| Lithology | | Alteration | | Domain | | | Specific
Gravity | | | Bulk
Factor | | | Bulk
Density | | | Ktonnes/
Block | |
| Post Min | | | | | | | | | 2.00 | | | | 0.98 | | | | 1.96 | | | | 1.96 | |
| | | | | | | | | | | | | | | | | | | | | | | |
| Caracol | | None | | | None | | | | 2.60 | | | | 0.98 | | | | 2.55 | | | | 2.55 | |
| | | | | | | | | | | | | | | | | | | | | | | |
| Caracol | | Kp, Ki | | | NE | | | | 2.49 | | | | 0.98 | | | | 2.44 | | | | 2.44 | |
| | | | | | | | | | | | | | | | | | | | | | | |
| Indidura | | | | | | | | | 2.66 | | | | 0.98 | | | | 2.61 | | | | 2.61 | |
The post mineral rock types averaged about 2.0. The un-mineralized and also mineralized southwest Caracol unit averaged about 2.60. The Kp and Ki Caracol in the northeast domain were slightly lighter, averaging about 2.49. The Indidura unit averaged about 2.66.
The average specific gravity was reduced 2% to obtain an estimate of bulk density. This is to allow for voids in the rock mass at a larger scale than what could be captured in the small core samples.
| Kappes, Cassiday & Associates | | |
| June 19, 2018 | | Page 14-45 |
| | AMENDED AND RESTATED |
| Camino Rojo Preliminary Economic Assessment | NI 43-101 Technical Report |
| 15.0 | MINERAL RESERVE ESTIMATE |
It is not the intent of this Technical Report to report mineral reserves for the Camino Rojo project. At the Preliminary Economic Assessment level, mineral reserves are not required to be identified. Additional studies at the Pre-Feasibility or Feasibility Study level will be required to establish mineral reserves.
| Kappes, Cassiday & Associates | | |
| June 19, 2018 | | Page 15-1 |
| | AMENDED AND RESTATED |
| Camino Rojo Preliminary Economic Assessment | NI 43-101 Technical Report |
This PEA is preliminary in nature and it includes inferred mineral resources that are considered too speculative geologically to have the economic considerations applied to them that would enable them to be categorized as mineral reserves and there is no certainty that the PEA will be realized.
| 16.1 | Operating Parameters and Criteria |
The Camino Rojo PEA is based on a conventional open pit mine. Mine operations will consist of drilling medium diameter blast holes (approximately 17cm), blasting with either explosive slurries or ANFO (ammonium nitrate/fuel oil) depending on water conditions, and loading into large off-road trucks with hydraulic shovels and wheel loaders. Resource will be delivered to the primary crusher and waste to the waste storage facility southeast of the pit. There will also be a low-grade stockpile facility to store marginal resource for processing at the end of commercial pit operations. There will be a fleet of track dozers, rubber tired dozers, motor graders and water trucks to maintain the working areas of the pit, waste storage areas, and haul roads.
A mine plan was developed to supply resource to a conventional crushing and heap leach plant with the capacity to process 18,000 tpd (6,570 ktpy). The mine is scheduled to operate two 10 hour shifts per day for 365 days per year.
The mine plan is constrained by the Adjacent Owner concession boundary on the north side of the pit. The PEA is based on only a portion of the total mineral resource estimate and was prepared on the assumption that no mining activities would occur on the Adjacent Owner’s mineral titles. Accordingly, delays in, or failure to obtain, an agreement with the Adjacent Owner to conduct mining operations on its mineral titles would have no impact on the timetable or cost of development of the potential mine modelled in the PEA.
The geotechnical parameters relevant to the mine plan are discussed in Section 16.2 and are adequate for this PEA level study. If the constrained pit case is adopted for the next level of evaluations, some additional drilling and slope stability work is suggested to evaluate the revised position of the north wall.
Eventually, mining will be conducted below the water table and additional hydrogeological studies are required to better estimate pit dewatering requirements.
| Kappes, Cassiday & Associates | | |
| June 19, 2018 | | Page 16-1 |
| | AMENDED AND RESTATED |
| Camino Rojo Preliminary Economic Assessment | NI 43-101 Technical Report |
Slope angles are based on the report “Camino Rojo Project – Prefeasibility Pit Slope Design Study – Geotechnical Investigations and Slope Design Recommendations for the Proposed Oxide and Sulphide Open Pits”, dated May 2016 by Piteau Associates Engineering Ltd. (“Piteau”). Figure 16-1 shows the inter-ramp (“IR”) slope angle recommendations from that report.
The pit design proposed for this study is smaller than the pit shown on Figure 16-1 due to the Adjancent Owner concession boundary constraint. Piteau reviewed the slope angles for the smaller pit during May 2018 and allowed that the north wall with the 40o IR recommendation could be increased to 45o due to the pit not being as deep. They also allowed the slope angle for the north wall could be increased to 53o for the bottom six or so benches below a haul road in the pit design with some additional support for the road. The south wall was decreased 1o from 54o to 53o. The 54o IR angle was based on double benching 15m benches, instead of the 10m benches for the current design. Figure 16-1 illustrates the recommended slope angles for the pit.
| Kappes, Cassiday & Associates | | |
| June 19, 2018 | | Page 16-2 |
| | AMENDED AND RESTATED |
| Camino Rojo Preliminary Economic Assessment | NI 43-101 Technical Report |
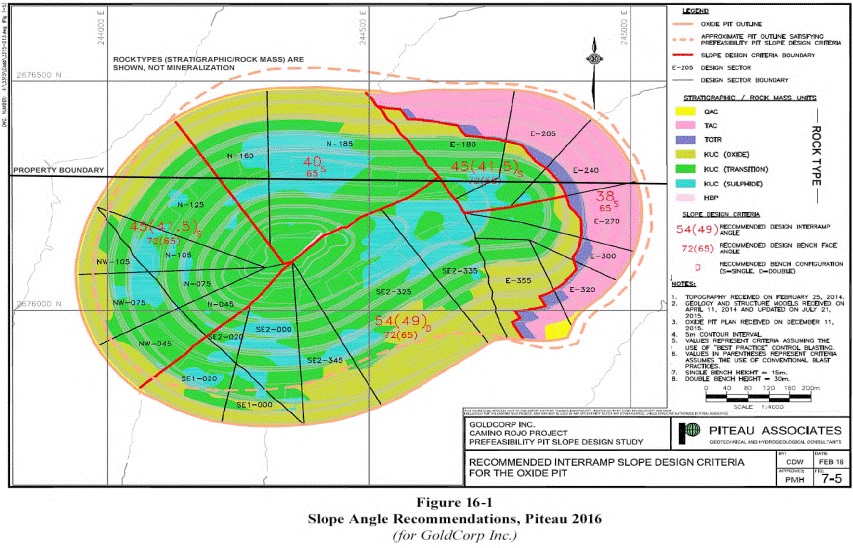
Figure 16-1
Slope Angle Recommendations, Piteau 2016
| Kappes, Cassiday & Associates | | |
| June 19, 2018 | | Page 16-3 |
| | AMENDED AND RESTATED |
| Camino Rojo Preliminary Economic Assessment | NI 43-101 Technical Report |
Table 16-1 shows the parameters for pit design. Only gold and silver are produced for this plan and the only material types considered are the Kp Oxide, Ki Oxide, Transitional Hi, and Transitional Low.
Gold and silver prices are $1250 and $17 respectively. These are consistent with the 3 year backward average that is used by the US SEC as a benchmark.
The mining cost is estimated at $2.00 per total tonne. This was estimated by IMC and is assumed to be an all-in cost for contract mining. It is based on a calculated owner mining cost plus an allowance for equipment depreciation and contractor profit. The unit costs for mining, processing, and G&A shown on Table 16-1 are preliminary estimates used for design and are not the final estimates developed by this study. The final estimates used for the economic analysis are presented in Section 21.0.
The processing and G&A costs of $3.03 and $1.69 per processed tonne respectively were provided by KCA and are based on a production rate of 18,000 tonnes per day or about 6.75 million tonnes per year of material processed. Processing is by crushing and heap leaching. The gold and silver recoveries by material type were also provided by KCA in the Process Design Criteria document.
IMC assumed 100% refinery payables for this case. The gold and silver refining costs are also IMC estimates. The oxide material is subject to a 2% NSR royalty.
Due to two products, and also variable recoveries by material type, a gold equivalent grade or NSR value was used to tabulate proposed quantities of mineralized material. The gold and silver NSR factors for Kp Oxide are calculated as follows:
Gold NSR Factor = ($1250 – $5.00) x 0.70 x 1.00 x 0.98 / 31.103 = $27.459
Silver NSR Factor = ($17 – $0.50) x 0.13 x 1.00 x 0.98 / 31.103 = $0.0676
The units are US$ per gram per tonne. The 0.98 term allows for the royalty.
The silver divisor is $27.459 / $0.0676 = 406.3, and
| Kappes, Cassiday & Associates | | |
| June 19, 2018 | | Page 16-4 |
| | AMENDED AND RESTATED |
| Camino Rojo Preliminary Economic Assessment | NI 43-101 Technical Report |
Gold Equivalent = Gold + Silver / 406.3
Alternatively, the NSR value for a block is calculated as:
NSR = $27.459 x gold + $0.0676 x silver
The breakeven gold equivalent cutoff grade for Kp Oxide is 0.24 g/t. Internal cutoff is 0.17 g/t. Internal cutoff applies to blocks that have to be removed from the pit, so mining is a sunk cost. The cutoff grades for the other material types are also shown on the table.
The breakeven NSR cutoff is $6.72, the mining + process + G&A cost per tonne. The internal NSR cutoff grade is $4.72 per tonne, the process + G&A cost. Note the NSR cutoff does not vary by material type, so is convenient for mine planning and scheduling.
IMC is assuming that measured, indicated, and inferred mineral resources are allowed to contribute to the economics for the PEA study.
Table 16-1 represents the economic parameters for the mine design.
| Kappes, Cassiday & Associates | | |
| June 19, 2018 | | Page 16-5 |
| | AMENDED AND RESTATED |
| Camino Rojo Preliminary Economic Assessment | NI 43-101 Technical Report |
Table 16-1
Economic Parameters for Mine Design
| Material Type | | Units | | | Kp Oxide | | | Ki Oxide | | | Tran-Hi | | | Tran-Low | | | Waste | |
| Commodity Prices | | | | | | | | | | | | | | | | | | | | | | | | |
| Gold Price Per Ounce | | | (US$) | | | | 1250 | | | | 1250 | | | | 1250 | | | | 1250 | | | | | |
| Silver Price Per Ounce | | | (US$) | | | | 17.00 | | | | 17.00 | | | | 17.00 | | | | 17.00 | | | | | |
| Mining Cost Per Tonne | | | | | | | | | | | | | | | | | | | | | | | | |
| Total Mining Cost | | | (US$) | | | | 2.00 | | | | 2.00 | | | | 2.00 | | | | 2.00 | | | | 2.00 | |
| Process and G&A Cost Per Ore Tonne | | | | | | | | | | | | | | | | | | | | | | | | |
| Processing | | | (US$) | | | | 3.033 | | | | 3.033 | | | | 3.033 | | | | 3.033 | | | | | |
| G&A | | | (US$) | | | | 1.687 | | | | 1.687 | | | | 1.687 | | | | 1.687 | | | | | |
| Total Process and G&A | | | (US$) | | | | 4.720 | | | | 4.720 | | | | 4.720 | | | | 4.720 | | | | | |
| Plant Recovery | | | | | | | | | | | | | | | | | | | | | | | | |
| Gold | | | (%) | | | | 70 | % | | | 58 | % | | | 60 | % | | | 49 | % | | | | |
| Silver | | | (%) | | | | 13 | % | | | 20 | % | | | 17 | % | | | 20 | % | | | | |
| Refinery Payables and Costs | | | | | | | | | | | | | | | | | | | | | | | | |
| Gold Refinery Payable | | | (%) | | | | 100 | % | | | 100 | % | | | 100 | % | | | 100 | % | | | | |
| Silver Refinery Payable | | | (%) | | | | 100 | % | | | 100 | % | | | 100 | % | | | 100 | % | | | | |
| Gold Refining Per Ounce | | | (US$) | | | | 5.00 | | | | 5.00 | | | | 5.00 | | | | 5.00 | | | | | |
| Silver Refining Per Ounce | | | (US$) | | | | 0.50 | | | | 0.50 | | | | 0.50 | | | | 0.50 | | | | | |
| Royalties | | | | | | | | | | | | | | | | | | | | | | | | |
| Royalty | | | (%) | | | | 2 | % | | | 2 | % | | | 2 | % | | | 2 | % | | | | |
| NSR Factors | | | | | | | | | | | | | | | | | | | | | | | | |
| Gold NSR Factor | | | ($/g) | | | | 27.459 | | | | 22.752 | | | | 23.537 | | | | 19.222 | | | | | |
| Silver NSR Factor | | | ($/g) | | | | 0.0676 | | | | 0.1040 | | | | 0.0884 | | | | 0.1040 | | | | | |
| Silver Divisor for Gold Equivalent | | | (none) | | | | 406.3 | | | | 218.8 | | | | 266.3 | | | | 184.9 | | | | | |
| Gold Equivalent Cutoff Grades | | | | | | | | | | | | | | | | | | | | | | | | |
| Breakeven Gold Equivalent Cutoff | | | (g/t) | | | | 0.24 | | | | 0.30 | | | | 0.29 | | | | 0.35 | | | | | |
| Internal Gold Equivalent Cutoff | | | (g/t) | | | | 0.17 | | | | 0.21 | | | | 0.20 | | | | 0.25 | | | | | |
| NSR Cutoff Grades | | | | | | | | | | | | | | | | | | | | | | | | |
| Breakeven NSR Cutoff Grade | | | ($/t) | | | | 6.72 | | | | 6.72 | | | | 6.72 | | | | 6.72 | | | | | |
| Internal NSR Cutoff Grade | | | ($/t) | | | | 4.72 | | | | 4.72 | | | | 4.72 | | | | 4.72 | | | | | |
The final pit design is based on the results of a floating cone analysis using the parameters discussed in the previous section. Figure 16-2 shows the final pit design. Due to space limitations there is only one mining phase, the final pit. The design includes the haul road and sufficient working room for the equipment. The road is 21m wide at a maximum grade of 10%. This will accommodate trucks of approximately 53 tonne capacity such as Caterpillar 773 class trucks.
| Kappes, Cassiday & Associates | | |
| June 19, 2018 | | Page 16-6 |
| | AMENDED AND RESTATED |
| Camino Rojo Preliminary Economic Assessment | NI 43-101 Technical Report |
| 16.5 | Mine Production Schedule |
The schedule is based on processing the resource by crushing and heap leaching at a production rate of 18,000 tpd, or 6,570 ktpy. Table 16-2 shows the schedule. Year 1 is by quarters, and the rest of the schedule is by years. The project has an estimated mine life of 6.6 years.
The upper section of the table shows crusher feed material by time period. This is material that is processed during the same time period it is mined and amounts to 37.6 million tonnes at 0.764 g/t gold and 14.20 g/t silver. This produces about 924,200 ounces of contained gold and 617,400 ounces of recoverable gold for an average recovery of 66.8%. Contained and recoverable silver amounts to 17.2 and 2.51 million ounces respectively for an average recovery of 14.6%. As we have discussed, due to two products, gold and silver, and different recoveries for the different material types, an NSR cutoff grade was used to classify resource and waste for scheduling. The internal NSR cutoff grade is $4.72, but this is only used for Year 6. For the other periods the cutoff grade varies by period to balance the mine and plant production capacities.
Low grade is material between an NSR cutoff grade of $5.50 per tonne and the operating cutoff grade for the year. This amounts to 4.86 million tonnes at 0.264 g/t gold and 8.56 g/t silver. The $5.50 low grade stockpile cutoff is the internal cutoff grade of $4.72 and an allowance of about $0.78 for rehandle costs. This material is processed at the end of commercial pit production during Years 6 and 7.
The bottom of Table 16-2 shows that preproduction is 500,000 tonnes of total material. Yr1 Q1 plant production is 50% of capacity and is made up of material mined during preproduction and Yr1 Q1. Total mine production also ramps up during the first quarter of Year 1 to a rate of about 3,300 kt per quarter for Year 1 quarters 2 through 4. Total material is about 13 million tonnes per year for Years 2 and 3, after which it reduces. Total material is 67.0 million tonnes. Waste, net of the low grade, is 24.5 million tonnes for an average waste ratio of 0.58 to 1.
Table 16-3 shows a proposed plant production schedule, including the direct feed material and the low grade stockpile. Total material processed amounts to 42.5 million tonnes at 0.707 g/t gold and 13.56 g/t silver for 965,500 contained gold ounces and 18.5 million contained silver ounces. Recoverable gold and silver amounts to 642,300 and 2.7 million ounces respectively.
Table 16-4 shows the proposed plant schedule by material type.
Figure 16-2 shows the final pit design. Figure 16-3 through 16-8 show the pit at the end of each mining year.
| Kappes, Cassiday & Associates | | |
| June 19, 2018 | | Page 16-7 |
| | AMENDED AND RESTATED |
| Camino Rojo Preliminary Economic Assessment | NI 43-101 Technical Report |
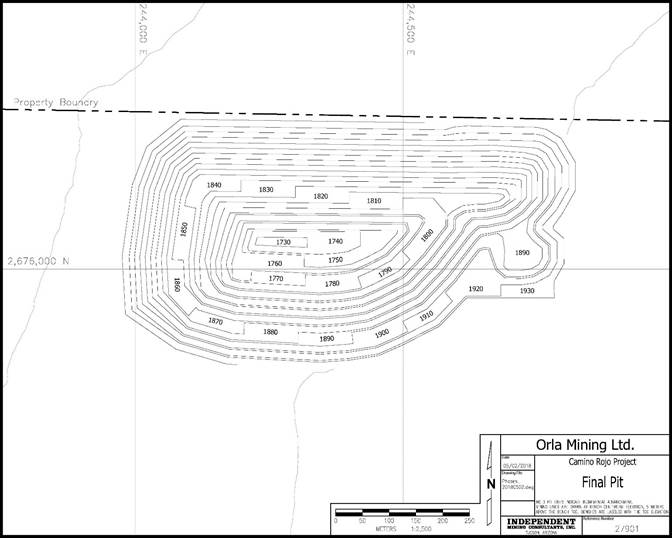
Figure 16-2
Final Pit, IMC 2018
| Kappes, Cassiday & Associates | | |
| June 19, 2018 | | Page 16-8 |
| | AMENDED AND RESTATED |
| Camino Rojo Preliminary Economic Assessment | NI 43-101 Technical Report |
Table 16-2
Mine Production Schedule - $1250MII - 6,570 KTPY - Base Case
MINE PRODUCTION
SCHEDULE: | | (Units) | | | TOTAL | | | PP | | | Yr1 Q1 | | | Yr1 Q2 | | | Yr1 Q3 | | | Yr1 Q4 | | | Year 2 | | | Year 3 | | | Year 4 | | | Year 5 | | | Year 6 | |
| LEACH RESOURCE: | | | | | | | | | | | | | | | | | | | | | | | | | | | | | | | | | | | | | | | | | | | | | | | | |
| NSR Cutoff | | | ($/t) | | | | | | | | 6.50 | | | | 6.50 | | | | 5.75 | | | | 6.00 | | | | 6.50 | | | | 7.00 | | | | 9.00 | | | | 9.00 | | | | 9.00 | | | | 4.72 | |
| Ktonnes | | | (kt) | | | | 37,618 | | | | 152 | | | | 669 | | | | 1,642 | | | | 1,642 | | | | 1,643 | | | | 6,570 | | | | 6,570 | | | | 6,570 | | | | 6,570 | | | | 5,590 | |
| NSR | | | ($/t) | | | | 21.10 | | | | 23.30 | | | | 23.27 | | | | 16.51 | | | | 16.62 | | | | 17.02 | | | | 18.70 | | | | 21.76 | | | | 23.80 | | | | 23.21 | | | | 21.08 | |
| Gold | | | (g/t) | | | | 0.764 | | | | 0.844 | | | | 0.843 | | | | 0.595 | | | | 0.599 | | | | 0.609 | | | | 0.664 | | | | 0.768 | | | | 0.837 | | | | 0.841 | | | | 0.833 | |
| Silver | | | (g/t) | | | | 14.20 | | | | 9.65 | | | | 9.64 | | | | 9.83 | | | | 9.88 | | | | 10.23 | | | | 11.00 | | | | 12.58 | | | | 15.06 | | | | 16.39 | | | | 20.70 | |
| Recovered Gold | | | (g/t) | | | | 0.510 | | | | 0.576 | | | | 0.575 | | | | 0.401 | | | | 0.404 | | | | 0.414 | | | | 0.456 | | | | 0.532 | | | | 0.580 | | | | 0.560 | | | | 0.492 | |
| Recovered Silver | | | (g/t) | | | | 2.08 | | | | 1.38 | | | | 1.38 | | | | 1.45 | | | | 1.45 | | | | 1.48 | | | | 1.53 | | | | 1.69 | | | | 2.02 | | | | 2.37 | | | | 3.55 | |
| Contained Gold | | | (koz) | | | | 924.2 | | | | 4.1 | | | | 18.1 | | | | 31.4 | | | | 31.6 | | | | 32.2 | | | | 140.3 | | | | 162.3 | | | | 176.9 | | | | 177.6 | | | | 149.7 | |
| Recoverable Gold | | | (koz) | | | | 617.4 | | | | 2.8 | | | | 12.4 | | | | 21.2 | | | | 21.3 | | | | 21.9 | | | | 96.3 | | | | 112.4 | | | | 122.4 | | | | 118.2 | | | | 88.4 | |
| Contained Silver | | | (koz) | | | | 17,180 | | | | 47 | | | | 207 | | | | 519 | | | | 522 | | | | 540 | | | | 2,323 | | | | 2,658 | | | | 3,181 | | | | 3,463 | | | | 3,720 | |
| Recoverable Silver | | | (koz) | | | | 2,513 | | | | 7 | | | | 30 | | | | 77 | | | | 77 | | | | 78 | | | | 324 | | | | 356 | | | | 426 | | | | 501 | | | | 639 | |
| Gold Recovery | | | (%) | | | | 66.8 | % | | | 68.2 | % | | | 68.2 | % | | | 67.5 | % | | | 67.5 | % | | | 68.0 | % | | | 68.7 | % | | | 69.2 | % | | | 69.2 | % | | | 66.6 | % | | | 59.1 | % |
| Silver Recovery | | | (%) | | | | 14.6 | % | | | 14.3 | % | | | 14.3 | % | | | 14.7 | % | | | 14.7 | % | | | 14.5 | % | | | 13.9 | % | | | 13.4 | % | | | 13.4 | % | | | 14.5 | % | | | 17.2 | % |
| LOW GRADE STOCKPILE: | | | | | | | | | | | | | | | | | | | | | | | | | | | | | | | | | | | | | | | | | | | | | | | | |
| NSR Cutoff | | | ($/t) | | | | | | | | 5.50 | | | | 5.50 | | | | 5.50 | | | | 5.50 | | | | 5.50 | | | | 5.50 | | | | 5.50 | | | | 5.50 | | | | 5.50 | | | | 5.50 | |
| Ktonnes | | | (kt) | | | | 4,859 | | | | 3 | | | | 13 | | | | 37 | | | | 73 | | | | 132 | | | | 749 | | | | 1,540 | | | | 1,367 | | | | 945 | | | | | |
| NSR | | | ($/t) | | | | 7.04 | | | | 6.13 | | | | 6.13 | | | | 5.62 | | | | 5.74 | | | | 6.01 | | | | 6.31 | | | | 7.21 | | | | 7.30 | | | | 7.26 | | | | | |
| Gold | | | (g/t) | | | | 0.264 | | | | 0.242 | | | | 0.242 | | | | 0.212 | | | | 0.216 | | | | 0.227 | | | | 0.240 | | | | 0.267 | | | | 0.268 | | | | 0.286 | | | | | |
| Silver | | | (g/t) | | | | 8.56 | | | | 6.04 | | | | 6.04 | | | | 7.21 | | | | 7.30 | | | | 7.15 | | | | 7.19 | | | | 8.48 | | | | 9.32 | | | | 9.05 | | | | | |
| Recovered Gold | | | (g/t) | | | | 0.160 | | | | 0.140 | | | | 0.140 | | | | 0.125 | | | | 0.130 | | | | 0.135 | | | | 0.144 | | | | 0.165 | | | | 0.163 | | | | 0.167 | | | | | |
| Recovered Silver | | | (g/t) | | | | 1.46 | | | | 1.21 | | | | 1.21 | | | | 1.42 | | | | 1.38 | | | | 1.32 | | | | 1.30 | | | | 1.44 | | | | 1.48 | | | | 1.61 | | | | | |
| Contained Gold | | | (koz) | | | | 41.3 | | | | 0.0 | | | | 0.1 | | | | 0.3 | | | | 0.5 | | | | 1.0 | | | | 5.8 | | | | 13.2 | | | | 11.8 | | | | 8.7 | | | | | |
| Recoverable Gold | | | (koz) | | | | 25.0 | | | | 0.0 | | | | 0.1 | | | | 0.1 | | | | 0.3 | | | | 0.6 | | | | 3.5 | | | | 8.2 | | | | 7.2 | | | | 5.1 | | | | | |
| Contained Silver | | | (koz) | | | | 1,337 | | | | 1 | | | | 3 | | | | 9 | | | | 17 | | | | 30 | | | | 173 | | | | 420 | | | | 410 | | | | 275 | | | | | |
| Recoverable Silver | | | (koz) | | | | 228 | | | | 0 | | | | 1 | | | | 2 | | | | 3 | | | | 6 | | | | 31 | | | | 71 | | | | 65 | | | | 49 | | | | | |
| Gold Recovery | | | (%) | | | | 60.4 | % | | | 57.9 | % | | | 57.9 | % | | | 58.8 | % | | | 60.1 | % | | | 59.6 | % | | | 59.8 | % | | | 61.6 | % | | | 61.0 | % | | | 58.4 | % | | | | |
| Silver Recovery | | | (%) | | | | 17.0 | % | | | 20.0 | % | | | 20.0 | % | | | 19.7 | % | | | 18.9 | % | | | 18.4 | % | | | 18.1 | % | | | 17.0 | % | | | 15.9 | % | | | 17.8 | % | | | | |
| TOTAL MATERIAL AND WASTE: | | | | | | | | | | | | | | | | | | | | | | | | | | | | | | | | | | | | | | | | | | | | | | | | |
| Total Material | | | (kt) | | | | 67,014 | | | | 500 | | | | 2,200 | | | | 3,281 | | | | 3,318 | | | | 3,324 | | | | 13,123 | | | | 12,954 | | | | 11,154 | | | | 10,095 | | | | 7,065 | |
| Waste (Net of Low Grade) | | | (kt) | | | | 24,537 | | | | 345 | | | | 1,518 | | | | 1,602 | | | | 1,603 | | | | 1,549 | | | | 5,804 | | | | 4,844 | | | | 3,217 | | | | 2,580 | | | | 1,475 | |
| Waste Ratio | | | (none) | | | | 0.58 | | | | 2.23 | | | | 2.23 | | | | 0.95 | | | | 0.93 | | | | 0.87 | | | | 0.79 | | | | 0.60 | | | | 0.41 | | | | 0.34 | | | | 0.26 | |
| Kappes, Cassiday & Associates | | |
| June 19, 2018 | | Page 16-9 |
| | AMENDED AND RESTATED |
| Camino Rojo Preliminary Economic Assessment | NI 43-101 Technical Report |
Table 16-3
Proposed Plant Production Schedule - $1250MII - 6,570 KTPY - Base Case
PLANT
PRODUCTION
SCHEDULE: | | (Units) | | | TOTAL | | | PP | | | Yr1 Q1 | | | Yr1 Q2 | | | Yr1 Q3 | | | Yr1 Q4 | | | Year 2 | | | Year 3 | | | Year 4 | | | Year 5 | | | Year 6 | | | Year 7 | |
| LEACH RESOURCE: | | | | | | | | | | | | | | | | | | | | | | | | | | | | | | | | | | | | | | | | | | | | | | | | | | | | |
| NSR Cutoff | | | ($/t) | | | | | | | | | | | | 7.50 | | | | 6.00 | | | | 6.00 | | | | 6.50 | | | | 7.00 | | | | 9.00 | | | | 9.00 | | | | 9.00 | | | | 5.06 | | | | 5.50 | |
| Ktonnes | | | (kt) | | | | 42,477 | | | | | | | | 821 | | | | 1,642 | | | | 1,642 | | | | 1,643 | | | | 6,570 | | | | 6,570 | | | | 6,570 | | | | 6,570 | | | | 6,570 | | | | 3,879 | |
| NSR | | | ($/t) | | | | 19.50 | | | | | | | | 23.27 | | | | 16.51 | | | | 16.62 | | | | 17.02 | | | | 18.70 | | | | 21.76 | | | | 23.80 | | | | 23.21 | | | | 19.01 | | | | 6.98 | |
| Gold | | | (g/t) | | | | 0.707 | | | | | | | | 0.843 | | | | 0.595 | | | | 0.599 | | | | 0.609 | | | | 0.664 | | | | 0.768 | | | | 0.837 | | | | 0.841 | | | | 0.752 | | | | 0.259 | |
| Silver | | | (g/t) | | | | 13.56 | | | | | | | | 9.64 | | | | 9.83 | | | | 9.88 | | | | 10.23 | | | | 11.00 | | | | 12.58 | | | | 15.06 | | | | 16.39 | | | | 18.93 | | | | 8.48 | |
| Recovered Gold | | | (g/t) | | | | 0.470 | | | | | | | | 0.575 | | | | 0.401 | | | | 0.404 | | | | 0.414 | | | | 0.456 | | | | 0.532 | | | | 0.580 | | | | 0.560 | | | | 0.443 | | | | 0.158 | |
| Recovered Silver | | | (g/t) | | | | 2.01 | | | | | | | | 1.38 | | | | 1.45 | | | | 1.45 | | | | 1.48 | | | | 1.53 | | | | 1.69 | | | | 2.02 | | | | 2.37 | | | | 3.26 | | | | 1.43 | |
| Contained Gold | | | (koz) | | | | 965.5 | | | | | | | | 22.3 | | | | 31.4 | | | | 31.6 | | | | 32.2 | | | | 140.3 | | | | 162.3 | | | | 176.9 | | | | 177.6 | | | | 158.7 | | | | 32.2 | |
| Recoverable Gold | | | (koz) | | | | 642.3 | | | | | | | | 15.2 | | | | 21.2 | | | | 21.3 | | | | 21.9 | | | | 96.3 | | | | 112.4 | | | | 122.4 | | | | 118.2 | | | | 93.6 | | | | 19.7 | |
| Contained Silver | | | (koz) | | | | 18,517 | | | | | | | | 254 | | | | 519 | | | | 522 | | | | 540 | | | | 2,323 | | | | 2,658 | | | | 3,181 | | | | 3,463 | | | | 3,999 | | | | 1,057 | |
| Recoverable Silver | | | (koz) | | | | 2,741 | | | | | | | | 36 | | | | 77 | | | | 77 | | | | 78 | | | | 324 | | | | 356 | | | | 426 | | | | 501 | | | | 689 | | | | 178 | |
| Gold Recovery | | | (%) | | | | 66.5 | % | | | | | | | 68.2 | % | | | 67.5 | % | | | 67.5 | % | | | 68.0 | % | | | 68.7 | % | | | 69.2 | % | | | 69.2 | % | | | 66.6 | % | | | 59.0 | % | | | 61.2 | % |
| Silver Recovery | | | (%) | | | | 14.8 | % | | | | | | | 14.3 | % | | | 14.7 | % | | | 14.7 | % | | | 14.5 | % | | | 13.9 | % | | | 13.4 | % | | | 13.4 | % | | | 14.5 | % | | | 17.2 | % | | | 16.8 | % |
| Kappes, Cassiday & Associates | | |
| June 19, 2018 | | Page 16-10 |
| | AMENDED AND RESTATED |
| Camino Rojo Preliminary Economic Assessment | NI 43-101 Technical Report |
Table 16-4
Proposed Plant Production Schedule by Material Type - $1250MII - 6,570 KTPY - Base Case
MATERIAL
TYPE: | | (Units) | | | TOTAL | | | PP | | | Yr1 Q1 | | | Yr1 Q2 | | | Yr1 Q3 | | | Yr1 Q4 | | | Year 2 | | | Year 3 | | | Year 4 | | | Year 5 | | | Year 6 | | | Year 7 | |
| KP Oxide: | | | | | | | | | | | | | | | | | | | | | | | | | | | | | | | | | | | | | | | | | | | | | | | | | | | | |
| Ktonnes | | | (kt) | | | | 28,561 | | | | | | | | 609 | | | | 1,098 | | | | 1,112 | | | | 1,202 | | | | 5,341 | | | | 5,958 | | | | 5,902 | | | | 4,739 | | | | 1,367 | | | | 1,233 | |
| NSR | | | ($/t) | | | | 22.57 | | | | | | | | 27.24 | | | | 20.10 | | | | 20.06 | | | | 19.89 | | | | 20.81 | | | | 22.79 | | | | 25.05 | | | | 25.69 | | | | 25.07 | | | | 7.35 | |
| Gold | | | (g/t) | | | | 0.788 | | | | | | | | 0.966 | | | | 0.705 | | | | 0.704 | | | | 0.697 | | | | 0.729 | | | | 0.798 | | | | 0.873 | | | | 0.895 | | | | 0.870 | | | | 0.239 | |
| Silver | | | (g/t) | | | | 13.82 | | | | | | | | 10.59 | | | | 11.00 | | | | 11.01 | | | | 11.12 | | | | 11.70 | | | | 13.08 | | | | 15.83 | | | | 16.54 | | | | 17.57 | | | | 11.65 | |
| Recovered Gold | | | (g/t) | | | | 0.551 | | | | | | | | 0.676 | | | | 0.493 | | | | 0.492 | | | | 0.488 | | | | 0.510 | | | | 0.558 | | | | 0.611 | | | | 0.626 | | | | 0.611 | | | | 0.167 | |
| Recovered Silver | | | (g/t) | | | | 1.80 | | | | | | | | 1.38 | | | | 1.43 | | | | 1.43 | | | | 1.45 | | | | 1.52 | | | | 1.70 | | | | 2.06 | | | | 2.15 | | | | 2.29 | | | | 1.51 | |
| KI Oxide: | | | | | | | | | | | | | | | | | | | | | | | | | | | | | | | | | | | | | | | | | | | | | | | | | | | | |
| Ktonnes | | | (kt) | | | | 7,524 | | | | | | | | 212 | | | | 544 | | | | 530 | | | | 441 | | | | 1,229 | | | | 612 | | | | 652 | | | | 348 | | | | 319 | | | | 2,637 | |
| NSR | | | ($/t) | | | | 9.11 | | | | | | | | 11.88 | | | | 9.25 | | | | 9.39 | | | | 9.18 | | | | 9.53 | | | | 11.74 | | | | 12.75 | | | | 12.90 | | | | 7.15 | | | | 6.82 | |
| Gold | | | (g/t) | | | | 0.366 | | | | | | | | 0.491 | | | | 0.372 | | | | 0.378 | | | | 0.368 | | | | 0.382 | | | | 0.481 | | | | 0.523 | | | | 0.537 | | | | 0.282 | | | | 0.268 | |
| Silver | | | (g/t) | | | | 7.42 | | | | | | | | 6.91 | | | | 7.47 | | | | 7.52 | | | | 7.79 | | | | 7.95 | | | | 7.73 | | | | 8.23 | | | | 6.53 | | | | 7.04 | | | | 7.01 | |
| Recovered Gold | | | (g/t) | | | | 0.212 | | | | | | | | 0.285 | | | | 0.216 | | | | 0.219 | | | | 0.213 | | | | 0.222 | | | | 0.279 | | | | 0.303 | | | | 0.312 | | | | 0.166 | | | | 0.154 | |
| Recovered Silver | | | (g/t) | | | | 1.48 | | | | | | | | 1.38 | | | | 1.49 | | | | 1.50 | | | | 1.56 | | | | 1.59 | | | | 1.54 | | | | 1.63 | | | | 1.31 | | | | 1.44 | | | | 1.39 | |
| Transitional High: | | | | | | | | | | | | | | | | | | | | | | | | | | | | | | | | | | | | | | | | | | | | | | | | | | | | |
| Ktonnes | | | (kt) | | | | 3,445 | | | | | | | | | | | | | | | | | | | | | | | | | | | | | | | | 9 | | | | 837 | | | | 2,599 | | | | | |
| NSR | | | ($/t) | | | | 19.97 | | | | | | | | | | | | | | | | | | | | | | | | | | | | | | | | 13.57 | | | | 18.57 | | | | 20.45 | | | | | |
| Gold | | | (g/t) | | | | 0.765 | | | | | | | | | | | | | | | | | | | | | | | | | | | | | | | | 0.529 | | | | 0.719 | | | | 0.781 | | | | | |
| Silver | | | (g/t) | | | | 22.10 | | | | | | | | | | | | | | | | | | | | | | | | | | | | | | | | 12.59 | | | | 18.69 | | | | 23.23 | | | | | |
| Recovered Gold | | | (g/t) | | | | 0.460 | | | | | | | | | | | | | | | | | | | | | | | | | | | | | | | | 0.318 | | | | 0.431 | | | | 0.469 | | | | | |
| Recovered Silver | | | (g/t) | | | | 3.76 | | | | | | | | | | | | | | | | | | | | | | | | | | | | | | | | 2.14 | | | | 3.18 | | | | 3.95 | | | | | |
| Transitional Low: | | | | | | | | | | | | | | | | | | | | | | | | | | | | | | | | | | | | | | | | | | | | | | | | | | | | |
| Ktonnes | | | (kt) | | | | 2,947 | | | | | | | | | | | | | | | | | | | | | | | | | | | | | | | | 7 | | | | 646 | | | | 2,285 | | | | 9 | |
| NSR | | | ($/t) | | | | 15.62 | | | | | | | | | | | | | | | | | | | | | | | | | | | | | | | | 10.79 | | | | 16.54 | | | | 15.41 | | | | 6.88 | |
| Gold | | | (g/t) | | | | 0.722 | | | | | | | | | | | | | | | | | | | | | | | | | | | | | | | | 0.540 | | | | 0.765 | | | | 0.712 | | | | 0.336 | |
| Silver | | | (g/t) | | | | 16.70 | | | | | | | | | | | | | | | | | | | | | | | | | | | | | | | | 3.96 | | | | 17.67 | | | | 16.52 | | | | 4.07 | |
| Recovered Gold | | | (g/t) | | | | 0.356 | | | | | | | | | | | | | | | | | | | | | | | | | | | | | | | | 0.247 | | | | 0.374 | | | | 0.352 | | | | 0.142 | |
| Recovered Silver | | | (g/t) | | | | 3.35 | | | | | | | | | | | | | | | | | | | | | | | | | | | | | | | | 0.76 | | | | 3.53 | | | | 3.31 | | | | 0.75 | |
| Kappes, Cassiday & Associates | | |
| June 19, 2018 | | Page 16-11 |
| AMENDED AND RESTATED |
| Camino Rojo Preliminary Economic Assessment | | NI 43-101 Technical Report |
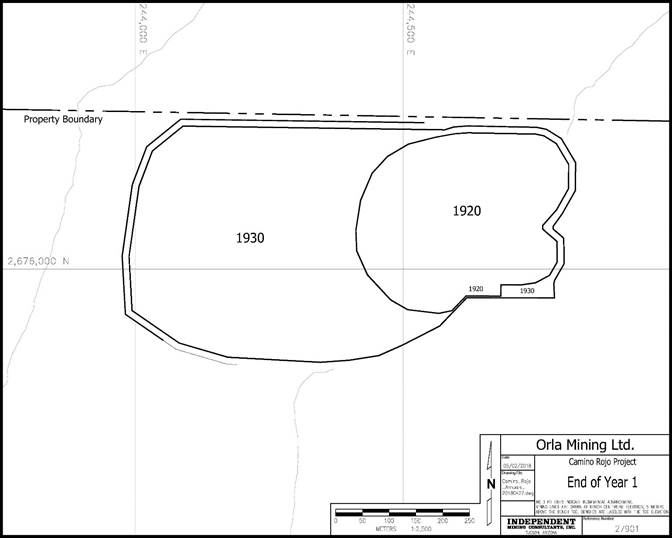
Figure 16-3
End of Year 1, IMC 2018
| Kappes, Cassiday & Associates | | |
| June 19, 2018 | | Page 16-12 |
| AMENDED AND RESTATED |
| Camino Rojo Preliminary Economic Assessment | | NI 43-101 Technical Report |
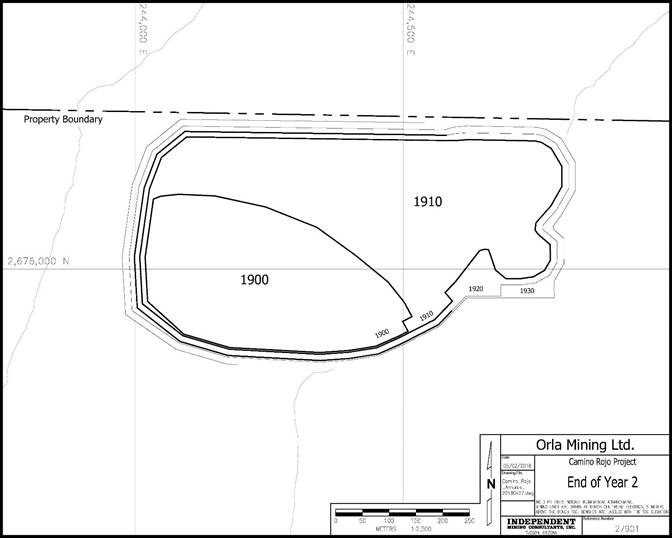
Figure 16-4
End of Year 2, IMC 2018
| Kappes, Cassiday & Associates | | |
| June 19, 2018 | | Page 16-13 |
| AMENDED AND RESTATED |
| Camino Rojo Preliminary Economic Assessment | | NI 43-101 Technical Report |
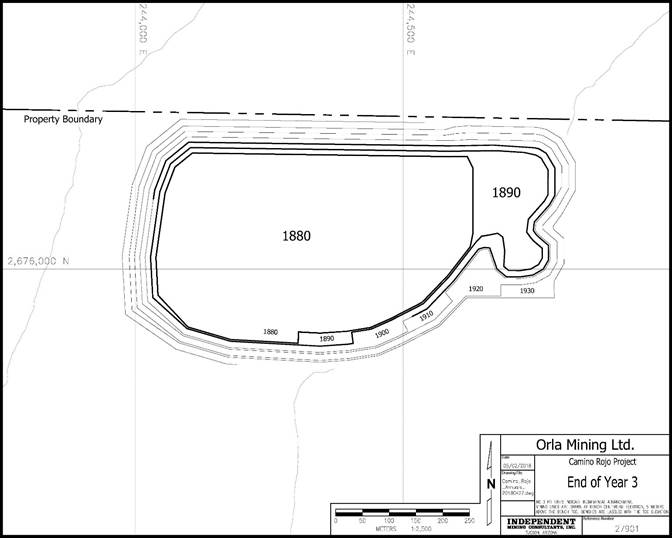
Figure 16-5
End of Year 3, IMC 2018
| Kappes, Cassiday & Associates | | |
| June 19, 2018 | | Page 16-14 |
| AMENDED AND RESTATED |
| Camino Rojo Preliminary Economic Assessment | | NI 43-101 Technical Report |
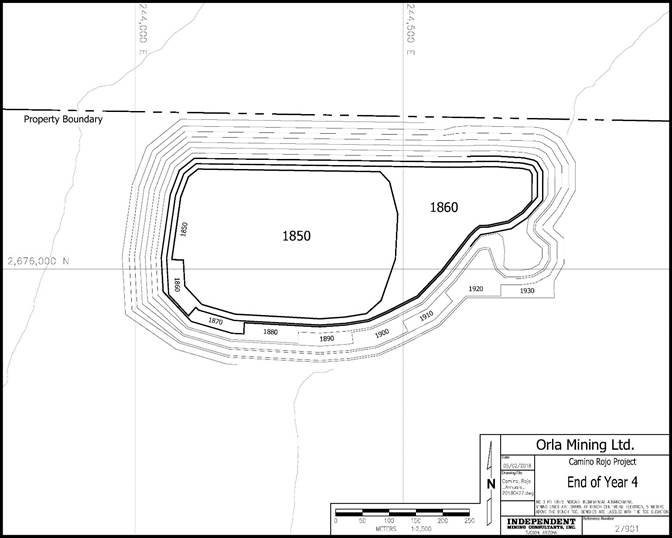
Figure 16-6
End of Year 4, IMC 2018
| Kappes, Cassiday & Associates | | |
| June 19, 2018 | | Page 16-15 |
| AMENDED AND RESTATED |
| Camino Rojo Preliminary Economic Assessment | | NI 43-101 Technical Report |
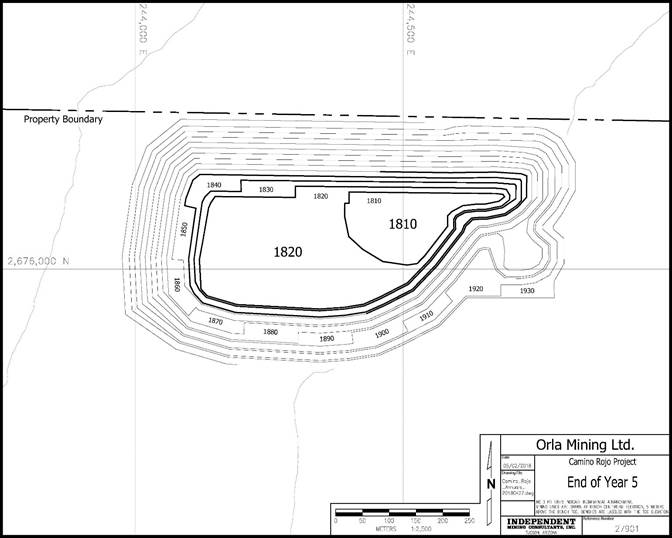
Figure 16-7
End of Year 5, IMC 2018
| Kappes, Cassiday & Associates | | |
| June 19, 2018 | | Page 16-16 |
| AMENDED AND RESTATED |
| Camino Rojo Preliminary Economic Assessment | | NI 43-101 Technical Report |
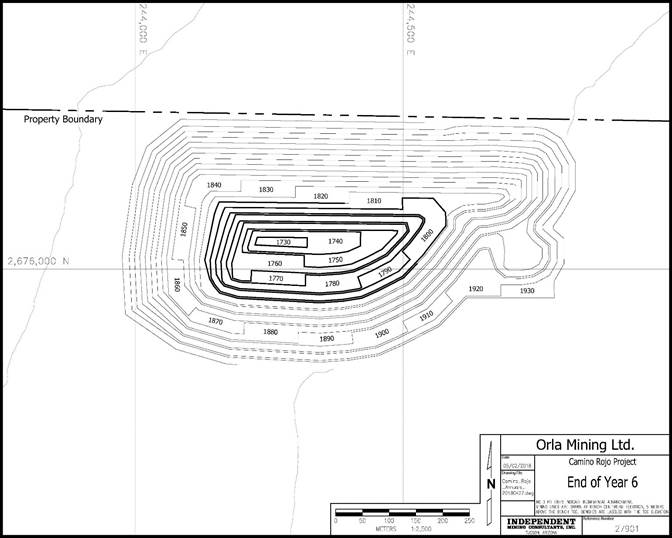
Figure 16-8
End of Year 6, IMC 2018
| Kappes, Cassiday & Associates | | |
| June 19, 2018 | | Page 16-17 |
| AMENDED AND RESTATED |
| Camino Rojo Preliminary Economic Assessment | | NI 43-101 Technical Report |
| 16.6 | Waste Storage Area and Stockpile |
A waste rock storage area was designed southeast of the pit to hold about 25 million tonnes of waste rock. Figure 16-9 shows the design. The facility is designed with 30m lifts at the angle of repose with a setback between lifts so the overall angle is 3H:1V.
The mine plan also produces about 5 million tonnes of low grade material that will be stockpiled and processed at the end of commercial pit production. This is also shown on Figure 16-9.
| Kappes, Cassiday & Associates | | |
| June 19, 2018 | | Page 16-18 |
| AMENDED AND RESTATED |
| Camino Rojo Preliminary Economic Assessment | | NI 43-101 Technical Report |
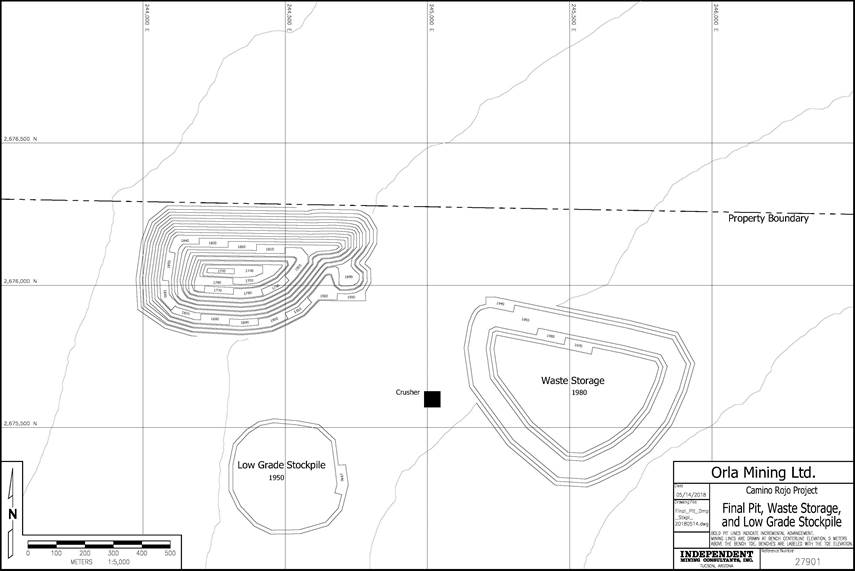
Figure 16-9
Mine Waste Storage Area, IMC 2018
| Kappes, Cassiday & Associates | | |
| June 19, 2018 | | Page 16-19 |
| AMENDED AND RESTATED |
| Camino Rojo Preliminary Economic Assessment | | NI 43-101 Technical Report |
Mine major equipment requirements were sized and estimated on a first principles basis based on the mine production schedule, the mine work schedule, and estimated equipment productivity rates. The mine equipment estimate is based on contract-miner operation and assumes a well-managed mining operation with a well-trained labor pool.
Table 16-5 shows major equipment requirements by year. This table represents the equipment required to perform the following duties:
| · | Developing access roads from the mine to the crusher, waste storage area, and the low grade stockpile, |
| · | Mining and transporting resource to the crusher or low grade stockpile, |
| · | Mining and transporting waste to the waste storage facility, |
| · | Maintaining the haul roads and waste storage areas. |
Table 16-5
Mine Major Equipment Fleet Requirement
| | | Capacity/ | | Time Period |
| Equipment Type | | Power | | PP | | Y1Q1 | | Y1Q2 | | Y1Q3 | | Y1Q4 | | 2 | | 3 | | 4 | | 5 | | 6 | | 7 |
| Atlas Copco DM30 II Drill | | (171 mm) | | 1 | | 2 | | 3 | | 3 | | 3 | | 3 | | 3 | | 2 | | 2 | | 2 | | 0 |
| Caterpillar 6018FS Hyd Shovel | | (10 cu m) | | 1 | | 2 | | 2 | | 2 | | 2 | | 2 | | 2 | | 2 | | 2 | | 2 | | 1 |
| Caterpillar 992K Wheel Loader | | (11.5 cu m) | | 1 | | 1 | | 1 | | 1 | | 1 | | 1 | | 1 | | 1 | | 1 | | 1 | | 1 |
| Caterpillar 773G Truck | | (53 mt) | | 2 | | 7 | | 9 | | 10 | | 10 | | 10 | | 12 | | 11 | | 12 | | 11 | | 4 |
| Caterpillar D9T Track Dozer | | (306 kw) | | 3 | | 3 | | 3 | | 3 | | 3 | | 3 | | 3 | | 3 | | 3 | | 2 | | 1 |
| Caterpillar 824H Wheel Dozer | | (264 kw) | | 2 | | 2 | | 2 | | 2 | | 2 | | 2 | | 2 | | 2 | | 2 | | 1 | | 1 |
| Caterpillar 14M Motor Grader | | (193 kw) | | 2 | | 2 | | 2 | | 2 | | 2 | | 2 | | 2 | | 2 | | 2 | | 1 | | 1 |
| Water Truck - 14,000 gal | | (53,000 l) | | 2 | | 2 | | 2 | | 2 | | 2 | | 2 | | 2 | | 2 | | 2 | | 1 | | 1 |
| Caterpillar 319DL Excavator | | (1.13 cu m) | | 1 | | 1 | | 1 | | 1 | | 1 | | 1 | | 1 | | 1 | | 1 | | 1 | | 0 |
| Sandvik DX680 TH Drill | | (102 mm) | | 1 | | 1 | | 1 | | 1 | | 1 | | 1 | | 1 | | 1 | | 1 | | 1 | | 0 |
| TOTAL | | | | 16 | | 23 | | 26 | | 27 | | 27 | | 27 | | 29 | | 27 | | 28 | | 23 | | 10 |
| Kappes, Cassiday & Associates | | |
| June 19, 2018 | | Page 16-20 |
| | AMENDED AND RESTATED |
| Camino Rojo Preliminary Economic Assessment | NI 43-101 Technical Report |
Test work results developed by KCA and others has indicated that part of the Camino Rojo mineral resource is amenable to heap leaching for the recovery of gold. This PEA models a scenario where material is mined by standard open pit mining methods. Material will be crushed at a rate of 18,000 tpd to 80% passing 38mm using a two-stage closed crushing circuit and conveyor stacked on the leach pad in 10m lifts. Lime will be added to the material for pH control before being stacked and leached with a dilute cyanide solution. Pregnant solution will flow by gravity to a pregnant solution pond before being pumped to a Merrill-Crowe plant for metal recovery. Gold and silver will be precipitated from the pregnant solution via zinc cementation. The precious metal precipitate will be dewatered using filters, dried in a mercury retort to remove mercury values, and smelted to produce the final doré product.
The process has been designed to process 6.57 million tonnes per year at an average processing rate of 18,000 tpd. The project has an estimated mine life of 6.6 years.
A summary of the processing design criteria is presented in Table 17-1.
| Kappes, Cassiday & Associates | | |
| June 19, 2018 | | Page 17-1 |
| | AMENDED AND RESTATED |
| Camino Rojo Preliminary Economic Assessment | NI 43-101 Technical Report |
Table 17-1
Processing Design Criteria Summary
| Item | Design Criteria |
| Annual Tonnage Processed | 6,570,000 tonnes |
| Crushing Production Rate | 18,000 tonnes/day average |
| Crushing Operation | 8 hours/shift, 3 shifts/day, 7 days/week |
| Crusher Availability | 75% |
| Crushing Product Size | 80% -38mm |
| Primary Leaching Cycle, days (Total) | 80 |
| Average Sodium Cyanide Consumption, kg/t | 0.35 |
| Average Lime Consumption, kg/t | 1.25 |
| Average Oxide Gold Recovery, Kp | 70% |
| Average Oxide Gold Recovery, Ki | 58% |
| Average Transition-Hi Gold Recovery | 60% |
| Average Transition-Lo Gold Recovery | 49% |
| Average Oxide Silver Recovery, Kp | 13% |
| Average Oxide Silver Recovery, Ki | 20% |
| Average Transition-Hi Silver Recovery | 17% |
| Average Transition-Lo Silver Recovery | 20% |
Electric power will be provided by line power to all elements of the process.
An event pond is included to collect contact solution from storm events. Solution collected will be returned to the process as soon as practical.
Figure 17-1 shows the overall process flowsheet and Figure 17-2 shows the general arrangement of the mine site.
| Kappes, Cassiday & Associates | | |
| June 19, 2018 | | Page 17-2 |
| | AMENDED AND RESTATED |
| Camino Rojo Preliminary Economic Assessment | NI 43-101 Technical Report |
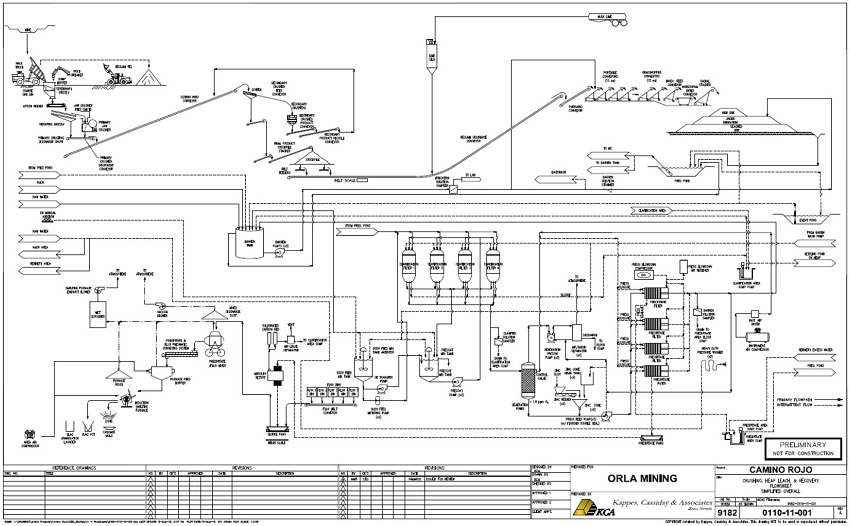
Figure 17-1
Mine Process Overall Flowsheet
| Kappes, Cassiday & Associates | | |
| June 19, 2018 | | Page 17-3 |
| | AMENDED AND RESTATED |
| Camino Rojo Preliminary Economic Assessment | NI 43-101 Technical Report |
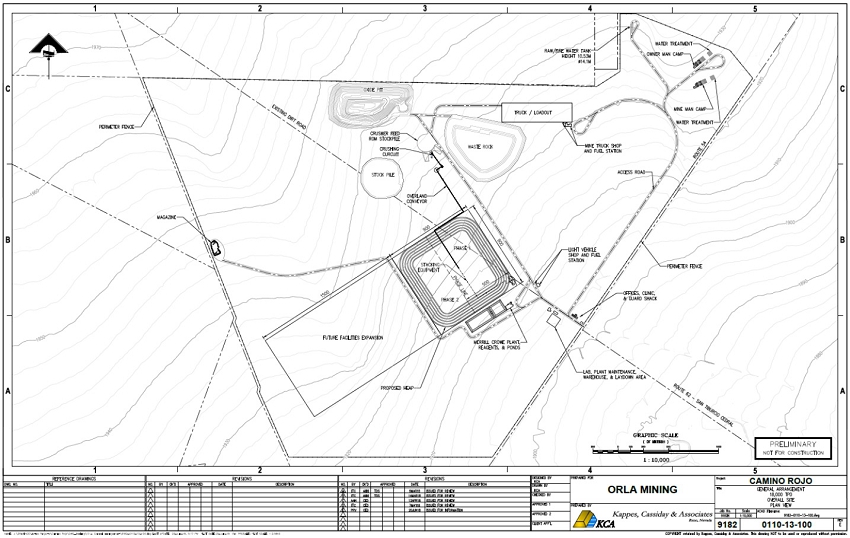
Figure 17-2
Mine General Arrangement
| Kappes, Cassiday & Associates | | |
| June 19, 2018 | | Page 17-4 |
| | AMENDED AND RESTATED |
| Camino Rojo Preliminary Economic Assessment | NI 43-101 Technical Report |
ROM material will be transported from the mine in 53-tonne surface haul trucks and dumped in the dump hopper or stockpiled in a ROM stockpile. Stockpiled material will be reclaimed by a front-end loader and fed to the dump hopper as needed, primarily during the four hours per day mine shutdown. Oversized rocks or large lumps will be broken using a rock breaker.
Material will be fed from the ROM dump hopper to a vibrating grizzly feeder via an apron feeder. The grizzly oversize will be fed to the jaw crusher and the grizzly undersize will be recombined with the jaw crusher product on the primary crusher discharge conveyor. The primary crusher discharge conveyor transfers primary crushed material to the screen feed conveyor, which feeds the secondary screen. A tramp metal electromagnet and metal detector will be installed on the screen feed conveyor to protect the secondary crushers.
Primary crushed material will be fed to the double deck vibrating secondary screen with oversize material being fed to the secondary cone crusher and undersize being transferred to the product stockpile stacker by the undersize transfer conveyor. Oversize material will be crushed by the secondary cone crusher which discharges onto the secondary crushed product conveyor. The secondary crushing circuit will be operated in closed circuit with the secondary crushed product conveyor feeding a recycle conveyor which recycles the cone crusher product to the screen feed conveyor.
The secondary screen undersize (crushed product) will be 80% passing 38mm (100% passing 66mm). Crushed product will be transferred to the product stockpile stacker by an undersize transfer conveyor located beneath the secondary screens. The crushed product will be stockpiled in a conical stockpile which will be reclaimed using belt feeders and conveyed to the leach pad for stacking.
All of the conveyors will be interlocked so that if one conveyor trips out, all upstream conveyors and the vibrating grizzly feeder will also trip. This interlocking is designed to prevent large spills and equipment damage. Both of these features are considered necessary to meet the design utilization for the system.
| 17.3 | Reclamation and Stacking |
The crushed product stockpile is sized to accommodate a total capacity of approximately 45,000 tonnes (live capacity of approximately 8,300 tonnes). Crushed material will be reclaimed from the stockpile by two belt feeders to a reclaim conveyor in a tunnel below the stockpile. Lime for pH control will be added to the reclaim tunnel conveyor at a rate of 1.25 kg per tonne of material from one 120-tonne silo equipped with a bin activator, variable speed screw feeder, and dust collector. The reclaim conveyor discharges to an overland conveyor which transfers material to the heap stacking circuit.
| Kappes, Cassiday & Associates | | |
| June 19, 2018 | | Page 17-5 |
| | AMENDED AND RESTATED |
| Camino Rojo Preliminary Economic Assessment | NI 43-101 Technical Report |
The heap will be constructed in 10m-high lifts, in cells 80m wide, using a mobile conveyor stacking system. The first lift will be stacked so that the toe of the heap is 5m from the inside toe of the perimeter berm. The effective overall slope of the heap is approximately 2.5H:1V.
The heap stacking system consists of mobile field conveyors (grasshoppers) that transfer the material to the conveyor stacking system, which includes an index feed, horizontal index, and radial stacker conveyors. The mobile grasshopper conveyor chain transfers material from the overland conveyor to the index feed conveyor which feeds the horizontal index conveyor which feeds the radial stacker. The horizontal index and radial stacker are able to retreat and stack material onto the heap. The number of grasshopper conveyors required varies depending on the area of the heap being stacked.
Once a lift of cells has finished leaching and is sufficiently drained and dry, a new lift can be stacked over the top of the old lift. The old lift will be cross-ripped prior to stacking new material on top of any old heap area or access road/ramp to break up any compacted or cemented sections.
Figure 17-3 illustrates the crushing and reclaim general arrangement.
| Kappes, Cassiday & Associates | | |
| June 19, 2018 | | Page 17-6 |
| | AMENDED AND RESTATED |
| Camino Rojo Preliminary Economic Assessment | NI 43-101 Technical Report |
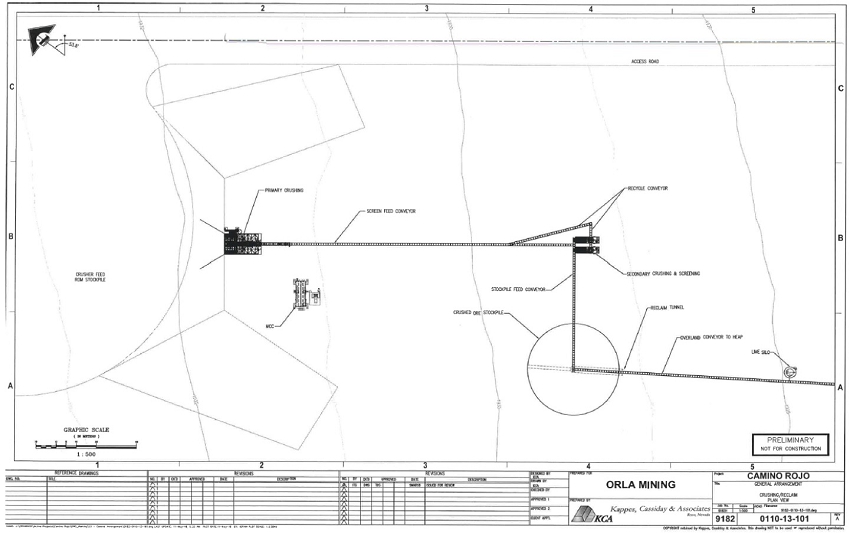
Figure 17-3
Crushing & Reclaim
| Kappes, Cassiday & Associates | | |
| June 19, 2018 | | Page 17-7 |
| | AMENDED AND RESTATED |
| Camino Rojo Preliminary Economic Assessment | NI 43-101 Technical Report |
The final location for the leach pad and ponds was selected considering the available area within the Camino Rojo property and the location of other project facilities. The leach pad location also allows for the development of a potential larger pit, which considers mining the entire mineral resource (including sulphide material), without moving the pad. The leach pad will be a single-use, multi-lift type leach pad and has been designed with a lining system in accordance with International Cyanide Code requirements and meets or exceeds the North American standards and practices for lining systems, piping systems and process ponds to lessen the environmental risk of the facilities impacting local soils, surface water and ground water in and around the site.
The total pad will be constructed in two phases. The initial or first phase construction will occur during Year -1 (start of construction). The second phase will start in the middle of Year 2. Phase 1 construction includes 440,000 m2 of lined leach pad and phase 2 covers approximately 360,000 m2. The final pad capacity is approximately 46 million tonnes assuming a heap bulk density of 1.45 tonnes/m3.
The pad lining system will consist of a 300mm thick clay soil type under liner system overlain by a 2.0mm LLDPE geomembrane liner. Geosynthetic clay liner (GCL) may be used in place of clay soil liner if a suitable clay source is not available. Overliner consisting of crushed low-grade material will be spread over the LLDPE liner at a thickness of 600mm to protect the liner and solution collection piping.
Figure 17-4 illustrates the proposed heap leach pad design.
| Kappes, Cassiday & Associates | | |
| June 19, 2018 | | Page 17-8 |
| | AMENDED AND RESTATED |
| Camino Rojo Preliminary Economic Assessment | NI 43-101 Technical Report |
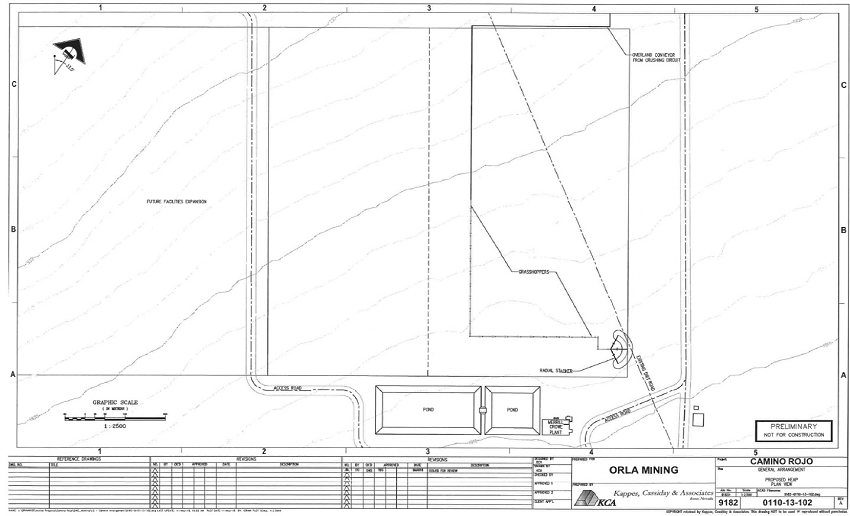
Figure 17-4
Heap Leach Pad
| Kappes, Cassiday & Associates | | |
| June 19, 2018 | | Page 17-9 |
| | AMENDED AND RESTATED |
| Camino Rojo Preliminary Economic Assessment | NI 43-101 Technical Report |
| 17.5 | Solution Application and Storage |
The Camino Rojo project will utilize a pregnant solution pond, barren solution tank and event solution pond for solution management.
Material will be leached in a single stage using barren solution consisting of a dilute sodium cyanide solution. Barren solution will be pumped from the barren solution tank to the active leach site using a dedicated set of horizontal centrifugal pumps (two operating, one standby) and will be applied to the heap by a system of drip emitters. Drip emitters will be used as they generate less evaporation than sprinklers and will minimize the make-up water requirements. Barren solution will be applied to the heap and an average rate of 10 L/h/m2. Based on metallurgical test work completed to date, a leach cycle of 80 days has been assumed. Concentrated cyanide will be added to the barren solution tank by metering pumps to maintain the cyanide in solution at 200-300 ppm. The barren solution tank is sized for 5 minutes of residence time at the design flow rate of 1,000 m3/h.
Pregnant solution containing gold and silver values from the heap drains by gravity to a pregnant solution pond from the heap. Perforated corrugated polyethylene pipes will be placed on the geomembrane liner to facilitate the collection and transport of pregnant leach solution to the pregnant pond.
The Pregnant Solution Pond is sized to contain a working volume of 24 hours at the total heap irrigation flow rate, plus a draindown volume equal to 12 hours at the total heap irrigation flow rate. Additionally, the pond has added capacity for incidental storm events of up to approximately 25mm of precipitation over the lined areas. An average 0.5m depth of “dead volume” is reserved in the bottom for accumulation of slimes. The pregnant solution pond will be constructed using two layers of HDPE liner (2mm upper liner and 1.5mm lower liner) with geonet in between over 300mm of clay type soil liner or GCL. Leak detection pipes will be provided beneath the primary and secondary pond liners to allow for monitoring and pumping of solutions from within the leak detection sumps.
The pregnant pond will be equipped with three submersible high flow pumps (two operating, one standby) which will pump solution to the Merrill-Crowe recovery circuit. Gold and silver will be precipitated from the pregnant solution by zinc cementation and the resulting barren solution is returned to the barren solution tank.
An event pond is included and has been sized to contain a 24 hour, 100 year storm event occurring over the entire lined facility (pad, ponds and collection channels) with a 100% runoff coefficient, but with a deduction for the storm capacity of the pregnant pond, 12 hours of heap drain down, and the maximum monthly wet season accumulation.
| Kappes, Cassiday & Associates | | |
| June 19, 2018 | | Page 17-10 |
| | AMENDED AND RESTATED |
| Camino Rojo Preliminary Economic Assessment | NI 43-101 Technical Report |
By incorporating normal working solution and drain down volumes in the Pregnant Solution Pond, it ensures that the Event Solution Pond will be used very infrequently, if at all. During typical operations, normal rainfall events can be accommodated in the Pregnant Pond as long as a significant heap drain down event does not occur at the same time. The solution storage system has been designed so that the barren solution tank overflows to the pregnant solution pond, and the pregnant solution pond overflows to the event pond in case of an emergency or significant storm event.
Due its infrequent use, the event pond has been designed with a single 1.5mm HDPE geomembrane liner over 300mm clay soil liner or GCL with a leak detection system. Because this pond is normally empty, it is easy to perform any required maintenance within the pond. The Event Pond will include a pump system to return solution to the active leach circuit.
Antiscalant polymer will continuously be added to the leach solutions to reduce the potential for scaling problems within the irrigation system.
An emergency backup generator is included and has been sized to run the Merrill-Crowe and solution pumping systems in the event of a power outage.
| 17.6 | Process Water Balance |
The Camino Rojo heap leach system is designed as a zero-discharge facility. The Camino Rojo project area is in a dry region which makes solution management fairly simple. Due to the very limited site rainfall, precipitation control will be based upon the volume needed to store a sudden storm event, using the event pond.
Precipitation data has been collected from several weather stations around the Project site. Average precipitation is based on the average precipitation data from the San Tiburcio weather station which is approximately four kilometers from the project site combined with limited data available from the Camino Rojo weather station that was previously on site.
| Kappes, Cassiday & Associates | | |
| June 19, 2018 | | Page 17-11 |
| | AMENDED AND RESTATED |
| Camino Rojo Preliminary Economic Assessment | NI 43-101 Technical Report |
For the storm event basis for designing the event pond, precipitation analysis from previous studies on the project were used. The design 24hr 100-year storm event is 113mm of precipitation over the lined area.
Based on the rainfall data, active water balances were calculated based on the requirement for the full processing tonnage of 18,000 tpd. Water balance spreadsheets were prepared for an average year, wet year, and dry year. For all scenarios, it was determined that the Camino Rojo Project will be in a water deficit and makeup water will be required. Makeup water requirements vary minimally between average, wet, and dry years due to the minimal overall precipitation at the Project site.
Table 17-2 summarizes the site-wide average water requirements for an average precipitation year for the Camino Rojo Project including water requirements for the camp, buildings, mining road dust control, etc.
Table 17-2
Site-Wide Average Year Water Requirements
| Description | Value | Comments |
| Crusher Dust Control | 11.3 | From Water Balance "Avg Year Diagram" |
| Heap Leach Usage | 72.2 | From Water Balance "Avg Year Diagram" |
| Road Dust Control | 15.0 | Allowance |
| Truck Shop Wash Down | 1.0 | 2.25 m3/h for 45 minutes, 7 times a day = ~0.4 m3/h. Assume 1 m3/h (24 m3/day) allowance. |
| Camp Usage | 4.2 | 0.25 m³/day per person, assume 400 permanent design population |
| Buildings | | |
| - Admin | 0.5 | allowance for bathroom / potable water |
| - Plant Shop & Warehouse | 0.5 | allowance for misc. usage / spillage / clean-up |
| - Mine Shop & Warehouse | 1.0 | allowance for misc. usage / spillage / clean-up |
| - Laboratory | 1.0 | allowance for misc. usage / clean-up |
| - Merrill-Crowe | 5.0 | allowance for misc. usage / spillage / clean-up |
| - Refinery | 0.5 | allowance for misc. usage / spillage / clean-up |
| | | |
| TOTAL Water Required | 112 | m3/h |
| or | 31 | l/s |
Note 1: Wet year reduces average instantaneous water requirement by ~41 m3/h
Note 2: Dry year increases average instantaneous water requirement by ~4 m3/h
| Kappes, Cassiday & Associates | | |
| June 19, 2018 | | Page 17-12 |
| | AMENDED AND RESTATED |
| Camino Rojo Preliminary Economic Assessment | NI 43-101 Technical Report |
| 17.7 |
Merrill-Crowe Recovery Plant |
A Merrill-Crowe facility will used for gold and silver recovery. The recovery plant will be constructed on a concrete containment slab located outdoors. A shed roof will cover the zinc addition and filter pre-coat circuits. Precipitation filtration and smelting operations will be located in a separate enclosed, secure building. Figure 17-5 shows the Merrill-Crowe recovery plant design.
The motor control center will be housed in a separate room proximal to the recovery plant area.
The following major plant components are included in the Merrill-Crowe facility:
| · | Four parallel clarification filters |
| · | Four precipitate filter presses; and |
The Merrill-Crowe recovery plant will process precious metal bearing solution from the heap leach pregnant pond.
Pregnant solution at the nominal rate of 1,000 m3/h will be pumped to three of the four pressure leaf type clarification filters (three operating, one on backwash/clean/precoat cycle). The filters remove suspended solids down to levels of less than 1 mg/L. Diatomaceous Earth for the clarification filters will be prepared in a body feed mix tank and transferred to a pre-coat mix tank. DE from the pre-coat mix tank will be used to precoat the clarification filters. A portion of body feed solution will be metered into the pregnant feed solution to the clarification filters during operation. The clear pregnant solution then reports to the deaeration tower. Liquid seal ring vacuum pumps (one operating, one standby) provide sufficient degassing capacity to maintain oxygen levels in solution of less than 1 ppm.
Deaerated clarified pregnant solution then discharges from the tower and is pumped to three of four precipitate filter presses. Zinc dust will be added at the press feed pump suction to precipitate gold and silver from the deaerated pregnant solution. Precipitated gold and silver from the zinc dust will be collected in the filter presses.
| Kappes, Cassiday & Associates | | |
| June 19, 2018 | | Page 17-13 |
| | AMENDED AND RESTATED |
| Camino Rojo Preliminary Economic Assessment | NI 43-101 Technical Report |
Solution discharging from the filter presses is now stripped of gold and silver and is termed barren solution. This barren solution will be returned to the barren solution tank, which acts as a surge tank and a head tank for miscellaneous uses of barren solution within the facility (gland water, wash down, fresh cyanide solution make-up, etc.) as well as irrigation solution for the heap.
Precipitate from the Merrill-Crowe circuit will be processed in the refinery to produce a doré bar. The refinery circuit includes the following major components:
| · | A mercury retort, electric; |
| · | A diesel-fired, tilting crucible furnace; |
| · | A smelting furnace hood and off-gas extraction blower; |
| · | A smelting furnace off-gas scrubber system, and |
| · | A slag granulation circuit |
The precipitate from the Merrill-Crowe recovery plant will be transferred to the refinery. Periodically, one press will be taken off line and the empty pre-coated press will be put on line. The press taken off line will then be put on a compressed air blow cycle to dry the filtered precipitate. After a four hour blow dry, the press will be opened and the precipitate, with a moisture content ranging from 15 to 20 percent, drops into pans. The pans will be loaded into an electric mercury retort with a fume collection system for drying and removal of mercury before being mixed with fluxes in preparation for smelting. Removed mercury is considered as a hazardous waste and will be transported off site for disposal.
The precipitate and flux will then fed to a tilting diesel fired furnace. After melting, slag will be poured off into cast iron molds until the remaining molten furnace charge is mostly molten metal (doré). Doré will be poured off into 40 kg bar molds, cooled, cleaned, and stored in a vault pending shipment to a third-party refiner. The doré poured from the furnace will represent the final product of the processing circuit.
Slag will be processed through a granulation circuit, milled, and tabled to remove metal droplets called prills. The classified slag will then be recycled to the heap leach pad via the crushing circuit.
| Kappes, Cassiday & Associates | | |
| June 19, 2018 | | Page 17-14 |
| | AMENDED AND RESTATED |
| Camino Rojo Preliminary Economic Assessment | NI 43-101 Technical Report |
A hood will collect the furnace fumes which will pass through a wet scrubbing system to remove particulates. The system will be designed to remove over 96% of the particulates present in the exhaust fumes.
| 17.7.2 | Process Reagents and Consumables |
Average estimated annual reagent and consumable consumption quantities for the process area are shown in Table 17-3.
Table 17-3
Projected Annual Reagents and Consumables
| Item | Form | Storage Capacity | Annual Consumption |
| Sodium Cyanide | Briquettes - 1 tonne Supersacks | 30 days | 2,300 tonnes |
| Lime | Bulk Delivery (20 tonne) | 5.3 days | 8,200 tonnes |
| Antiscalant | Liquid Tote 1 m3 Bins | 2 Months | 246 m3 |
| Zinc | Dry Powder, 50 kg canisters | 1 Month | 70,300 kg |
| Diatomaceous Earth | Dry Powder, 454 kg Supersacks | 1 Month | 560 tonnes |
| Silica | Dry Solid Sacks | 1 Month | 7.3 tonnes |
| Borax | Dry Solid Sacks | 1 Month | 9.6 tonnes |
| Niter | Dry Solid Sacks | 1 Month | 3.6 tonnes |
| Soda Ash | Dry Solid Sacks | 1 Month | 2.4 tonnes |
| Manganese Dioxide | Dry Solid Sacks | 1 Month | 1.2 tonnes |
| Diesel – Refinery Only | Bulk Delivery (truck) | TBD | 26 m3 |
Lime is assumed to be delivered in 20-tonne pneumatic trucks. Storage will be provided in one 120-tonne silo and the estimated consumption is 1.25 kg/tonne material.
Lime from the silos will be metered directly onto the reclaim conveyor via screw feeder.
Cyanide used for leaching and other process applications will be mixed onsite from briquettes delivered in 1,000 kg bulk bags. A one-month supply of dry cyanide inventory will be kept onsite in case of supply interruptions and is to be stored in a secure, fenced, and roofed area.
| Kappes, Cassiday & Associates | | |
| June 19, 2018 | | Page 17-15 |
| | AMENDED AND RESTATED |
| Camino Rojo Preliminary Economic Assessment | NI 43-101 Technical Report |
The zinc dust will be added to the zinc cone every shift and consumption is approximately 195 kg/day at an assumed rate of three times the metal precipitated. An inventory of 75 canisters of 50 kg each should be stored onsite (approximately a 20-day supply).
| 17.7.2.4 | Diatomaceous Earth |
Diatomaceous earth should be mixed every shift in the body tank to pre-coat the filters in the Merrill Crowe plant. A one-month reserve supply should be kept onsite in case of supply interruptions.
Antiscalant agents will be used to prevent the build-up of scale in the process solution and heap irrigation lines. Antiscalant agent will normally be added to the process pump intakes, or directly into pipelines. Consumption varies depending on the concentration of scale-forming species in the process stream. Delivery will be in liquid form in 1 m3 (1-tonne) bulk containers.
Antiscalant will be added directly from the supplier bulk containers into the pregnant and barren pumping systems using variable speed, chemical-metering pumps. On average, antiscalant consumption is expected to be about 10 kilograms per 1,000 m³ (10 ppm) of process solution to be treated (pregnant and barren).
Various fluxes will be used in the smelting process to remove impurities from the bullion in the form of a glass slag. The normal flux components will be a mix of silica sand, borax, and sodium carbonate (soda ash). The flux mix composition is variable and will be adjusted to meet individual project smelting needs: fluorspar and/or potassium nitrate (niter) are sometimes added to the mix. Dry fluxes will be delivered in 25-kg or 50-kg bags. Average consumption of fluxes has been estimated at 1.75 kilograms per kg of gold and silver produced.
| Kappes, Cassiday & Associates | | |
| June 19, 2018 | | Page 17-16 |
| | AMENDED AND RESTATED |
| Camino Rojo Preliminary Economic Assessment | NI 43-101 Technical Report |

Figure 17-5
Merrill-Crowe Recovery Plant
| Kappes, Cassiday & Associates | | |
| June 19, 2018 | | Page 17-17 |
| | AMENDED AND RESTATED |
| Camino Rojo Preliminary Economic Assessment | NI 43-101 Technical Report |
| 18.0 | PROJECT INFRASTRUCTURE |
| 18.1.1 | Existing Installations |
Existing infrastructure at the Camino Rojo project includes an exploration camp capable of housing approximately 20 people and dirt and gravel roads throughout the property.
Access to the project site is by the paved four lane Mexican Highway 54 and Route 62, a secondary paved highway that passes through San Tiburcio. Site access roads will be constructed during pre-production and will include approximately 8.4 km of dirt and gravel roads to allow access to all site facilities. A pedestrian bridge will be constructed from the site gate across Highway 54 to allow pedestrian access for workers from San Tiburcio.
The mine haul road will handle two-way traffic and is designed to service the pit, crushing circuit, waste rock dump, and mine truck shop.
Site buildings for the Camino Rojo project will primarily be prefabricated steel buildings or concrete masonry unit buildings. Figure 18-1 and Figure 18-2 show the mine truck shop, warehouse and administration buildings. Site buildings include:
| · | Administration Building; |
| Kappes, Cassiday & Associates | | |
| June 19, 2018 | | Page 18-1 |
| | AMENDED AND RESTATED |
| Camino Rojo Preliminary Economic Assessment | NI 43-101 Technical Report |

Figure 18-1
Mine Truck Shop
| Kappes, Cassiday & Associates | | |
| June 19, 2018 | | Page 18-2 |
| | AMENDED AND RESTATED |
| Camino Rojo Preliminary Economic Assessment | NI 43-101 Technical Report |
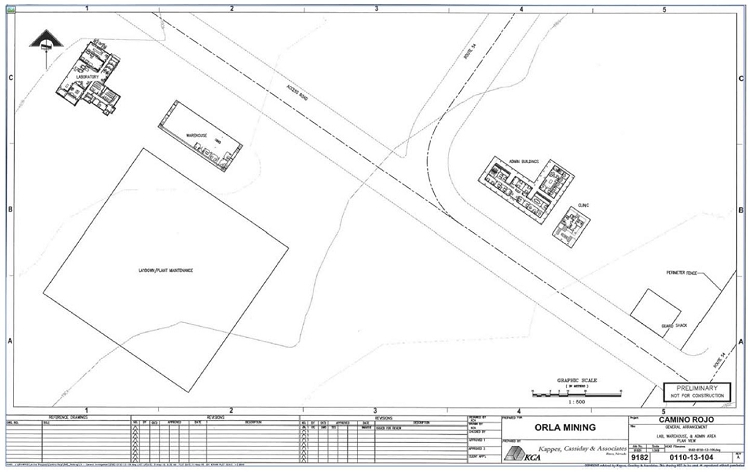
Figure 18-2
Lab, Warehouse and Administration Buildings
| Kappes, Cassiday & Associates | | |
| June 19, 2018 | | Page 18-3 |
| | AMENDED AND RESTATED |
| Camino Rojo Preliminary Economic Assessment | NI 43-101 Technical Report |
The mine man camp will be constructed early during pre-production and will be used for both construction and operation. The camp will include new dormitory units, bathroom units, laundry units, a kitchen and a dining wall, as well as improvements to the existing exploration camp. The combined occupancy of the improved exploration camp and mine camp will be 250 persons. Orla is undertaking studies on the availability of workers in the local region and has initiated worker training programs. It is anticipated that a significant number of workers could be sourced locally, and a smaller camp than this would be needed for operations.
A laboratory facility will be constructed near the Merrill-Crowe plant and will process samples from the mine and process. The lab includes a wet lab, atomic adsorption, and fire assay capability with capacity to process up to 150 samples per day.
| 18.1.7 | Fuel Storage and Dispensing |
Fuel for the mining fleet and process mobile equipment will be handled and stored at one central fuel depot facility. All works are assumed to be supplied, installed, and administrated by the fuel distributor as part of a committed contract.
The powder magazine includes ANFO and emulsion storage silos as well as two powder magazines. One powder magazine is used to store boosters, detonation cords and accessories used for blasting and the other for storing blasting caps. The powder magazine site will be located northeast of the leach pad and process facilities outside of the pit buffer zone and will be constructed with protective berms around the entire magazine facility. Figure 18-3 illustrates the plan view of the explosives magazine site.
| Kappes, Cassiday & Associates | | |
| June 19, 2018 | | Page 18-4 |
| | AMENDED AND RESTATED |
| Camino Rojo Preliminary Economic Assessment | NI 43-101 Technical Report |
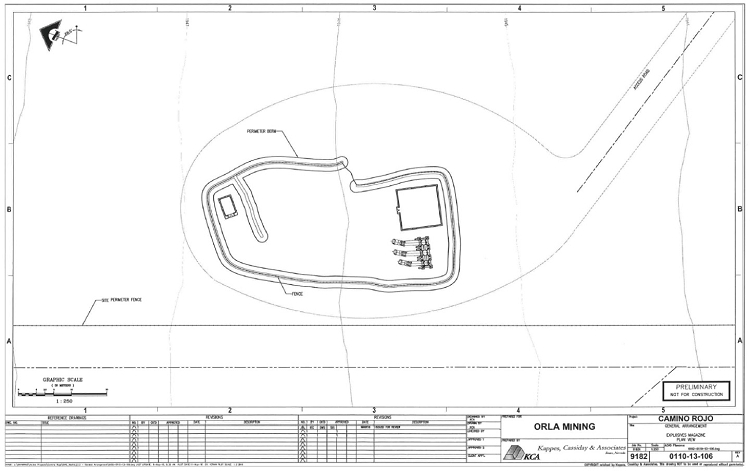
Figure 18-3
Explosives Magazine Site
| Kappes, Cassiday & Associates | | |
| June 19, 2018 | | Page 18-5 |
| | AMENDED AND RESTATED |
| Camino Rojo Preliminary Economic Assessment | NI 43-101 Technical Report |
| 18.2 | Power Supply, Communication Systems & IT |
The total estimated attached power for the project is 7.5 MW with an average demand of 4.3 MW.
Electrical power to site will be by a 115 kVA, three phase, 60 Hz overhead power line to a metering and switching station. There is a high voltage power line transecting the area near San Tiburcio. However, preliminary indications are that a connection may not be possible close to site and power will have to be brought from a switching yard 70 km away because the current local grid does not have sufficient capacity to meet the power demands for the project.
Approximately 70 km of new power line will need to be constructed.
In the event of a power failure or interruption, emergency power will be supplied by two diesel-fired backup generators. The emergency generators are sized to supply power to the process solution pumping systems and other critical process equipment.
| 18.2.2 | Site Power Distribution |
Power from the main substation will be at 4,160 V, 3 Phase, 60 Hz and will be further stepped down to 460 V and 110/220 V as necessary.
| 18.2.3 | Communication Systems & IT |
Internet and limited cellular communications are currently available at the project site. These systems will need to be expanded to meet site requirements during operations.
Based on a water balance around the site, the average make-up water required for the operation is approximately 112 m3/h. Details on the water balance are presented in Section 17.6. Make-up water will be sourced from underground wells around the project site.
| Kappes, Cassiday & Associates | | |
| June 19, 2018 | | Page 18-6 |
| | AMENDED AND RESTATED |
| Camino Rojo Preliminary Economic Assessment | NI 43-101 Technical Report |
| 18.3.2 | Potable and Domestic Water |
Potable water is available nearby and will be delivered to site by trucks. Potable water delivered to site will be stored in poly tanks and distributed by a small potable water pump.
| 18.3.3 | Fire Water and Protection |
The fire protection system is composed of pumps and hydrants around the project site. The raw water / fire water storage tank is designed with a minimum water reserve for fire emergencies. A fire water pumping system will be installed at the water tank consisting of an electrically driven and a backup diesel driven pump to assure operation in the event of an electrical outage. A small jockey pump is also included to maintain a constant water pressure on the system.
Sewage treatment systems will be installed to treat black and gray water waste generated by the mine camps.
Sewage generated by the mine and process facilities will be collected and directed to septic systems including septic tanks and drain fields sized for the building occupancy.
| Kappes, Cassiday & Associates | | |
| June 19, 2018 | | Page 18-7 |
| | AMENDED AND RESTATED |
| Camino Rojo Preliminary Economic Assessment | NI 43-101 Technical Report |
| 19.0 | MARKET STUDIES AND CONTRACTS |
No market studies were completed and no contracts are in place in support of this Technical Report. Gold production can generally be sold to any of a number of financial institutions or refining houses and therefore no market studies are required.
It is assumed that the doré produced at Camino Rojo will be of a specification comparable with other gold and silver producers and as such, acceptable to all refineries.
Gold produced by the Camino Rojo project would be sold to Bullion Banks or other financial institutions and the settlement price would be based on the then-current spot price for gold on public markets. There would be no direct marketing of the metal. The base case financial model for the Camino Rojo project utilizes a gold price of US$1,250/oz and a silver price of US$17/oz.
There are no contracts material to Orla at this time that are required for property development, including mining, concentrating, smelting, refining, transportation, handling, sales and hedging and forward sales.
| Kappes, Cassiday & Associates | | |
| June 19, 2018 | | Page 19-1 |
| | AMENDED AND RESTATED |
| Camino Rojo Preliminary Economic Assessment | NI 43-101 Technical Report |
| 20.0 | ENVIRONMENTAL STUDIES, PERMITTING AND SOCIAL OR COMMUNITY IMPACT |
| 20.1 | Environmental Studies |
Some baseline environmental studies were completed by previous operators of the project. In April 2018, Orla commissioned independent consultants to conduct more complete baseline environmental studies over the project area. These studies are in progress.
| 20.1.1 | Project Area Description |
The description of the Camino Rojo Environmental System (Sistema Ambiental) presented in this report has been summarized from current Federal environmental permits issued for the exploration drill program (SEMARNAT, Delegacion en el Estado De Zacatecas, Subdelegacion de Gestion para la Proteccion Ambiental y Recursos Naturales, 2013).
The climate is typical of the high altitude Mesa Central, dry and semi-arid. Temperatures commonly range from +30o to 20oC in the summer and 15o to 0o C in the winter. The median annual temperature is 17.1 C and annual precipitation of 337mm mostly during the rainy season in June and July. Wind speeds are variable with maximum wind speeds of 130 to 160 kph during extreme events.
Soils are dominantly calcisols (soils with high carbonate component) and leptosols (shallow soil over carbonate rock). These soils are not very suitable for agriculture.
The Project is located in Hydrologic Administrative Region III, North Central Basins, in Hydrologic Region Number 37 El Salada, within the RH37C Sierra de Rodriguez Basin characterized by open dendritic drainages.
| Kappes, Cassiday & Associates | | |
| June 19, 2018 | | Page 20-1 |
| | AMENDED AND RESTATED |
| Camino Rojo Preliminary Economic Assessment | NI 43-101 Technical Report |
The project is located in the Mesa Central physiographic province, dominated by gently sloping valley floor lowlands in basins separated by low hills and/or moderate relief mountains.
The site is in Seismic Zone A - nil to very low seismic activity. It is characterized by zero reported historic significant seismic events and expected temblor-caused soil accelerations of no more than 10% of the acceleration of gravity
The vegetation is dominantly scrub bushes with cacti, maguey, sage and coarse grasses with rare yucca. The site is dominated by matorral desértico micrófilo (small leaved and/or thorny desert scrub less than 4m high, 54%), desert scrub with sown pasture (23%), and matorral desiertico rosetofilo (desert scrub less than 4m high with rosette shaped leaves), with submountain matorral (mesquite shrub woodland, 8%).
Twenty-eight vertebrate species were identified in the project area, 19 bird species, 8 mammals, and one reptile. Two species are listed as at risk, and thus may require special consideration, the greater earless lizard (Cophosaurus texanus) and the Harris hawk (Parabuteo unicinctus harrisi).
| 20.1.2 | Environmental Management Plans |
A key corporate objective is to design and build the project in such a way that it does not cause significant adverse effects during construction, operation, closure and post-closure. To aid this objective, a number of Environmental Management Plans will be developed. An outline of some of the key plans is given in this section. These plans will need to be developed further before construction begins. They will also need to be reviewed and revised during the life of the project.
Costs for environmental monitoring, management plans and environmental protection measures are included in this study.
| Kappes, Cassiday & Associates | | |
| June 19, 2018 | | Page 20-2 |
| | AMENDED AND RESTATED |
| Camino Rojo Preliminary Economic Assessment | NI 43-101 Technical Report |
| 20.1.2.1 | Surface Water Management |
Orla is currently designing a program of systematic sampling of surface waters draining the project area. Once initiated, this program will be continued through the life of the mine, including reclamation period and post-closure until it has been determined that reclamation has been successful in preventing long-term effects on surface waters.
Water diversion structures will be constructed to keep surface water from flowing into the pad, mine pits, waste dumps and other operational areas. Surface drainage from disturbed areas which have no potential to produce chemical or metal contamination will be directed into small ponds to allow sediments to settle out before discharging to the environment.
Orla is currently commissioning a detailed investigation of Acid Rock Drainage (ARD) and metal leaching potential. Based upon results of this study, a Mine Waste Handling Plan will be developed before mining commences.
| 20.1.2.2 | Ground Water Management |
Groundwater effects could potentially come from the pad and ponds (if the liners leak) and from the waste rock piles. Therefore, monitoring wells will be constructed below the heap leach pad and waste rock dumps. A systematic sampling program will be developed to ensure any effects the operation has on groundwater are detected and appropriate changes to the operation can be made to negate these effects.
| 20.1.2.3 | Air Quality Management |
The primary potential effect on air quality will be because of dust. Costs for watering the road and dust control at the crushers have been included in this study. An air quality monitoring program will be initiated to ensure worker health and the environment are not adversely affected by air quality.
| 20.1.2.4 | Wildlife Management |
All operational areas will be fenced to keep animals out. A no hunting policy will be enforced amongst workers. Waterfowl are not common in the area. However, if required, a system to keep birds from landing in the operational ponds will be devised.
| Kappes, Cassiday & Associates | | |
| June 19, 2018 | | Page 20-3 |
| | AMENDED AND RESTATED |
| Camino Rojo Preliminary Economic Assessment | NI 43-101 Technical Report |
Orla has commissioned consultants to develop a cyanide management plan which will include measures to prevent interaction of wildlife with heap leach solutions.
Special wastes such as waste oil, glycol coolant, solvent fluids, used oil filters, used batteries, and contaminated fuel, will be handled, stored, transported, and disposed of in accordance with appropriate Hazardous Waste Regulations
| 20.1.3.2 | Non-hazardous Wastes |
A site for temporary storage of recyclable materials will be established at the laydown Area. Such items as scrap metal, tires, glass, recyclable plastics and drink containers will be separated, containerized as appropriate, and temporarily stored in the lay down area until sufficient volumes are available for shipment to a recycling point. Non-recyclable and non-hazardous waste will be buried in an on-site landfill.
| 20.1.3.3 | Putrescible (Domestic) Waste Disposal |
Putrescible organic food wastes generated from the camp accommodation facilities will be burned in an on-site incinerator. Ash produced by the incinerator will be buried in the landfill site along with other inert non-recyclable materials.
A location on the mine site will be designated as an outdoor storage or ‘boneyard’ area for placement of items that are not yet ready for disposal, but which may still be of use for spare parts. These items are likely to include equipment parts, vehicles, and pieces of equipment, and metal components. As much of this material as possible, will be utilized during the mine life. Materials remaining in the boneyard at the end of mine life will either be shipped off site for salvage value, or disposed of in the landfill if they meet the criteria for disposal at that location.
| Kappes, Cassiday & Associates | | |
| June 19, 2018 | | Page 20-4 |
| | AMENDED AND RESTATED |
| Camino Rojo Preliminary Economic Assessment | NI 43-101 Technical Report |
| 20.1.3.5 | On-site BioRemediation Cell |
“Land farming” is a commonly used method of soil remediation for hydrocarbon contaminated soil that relies on natural breakdown of hydrocarbons by microbial action. This is done by spreading a shallow layer of contaminated soil onto a lined "bermed" area referred to as a biocell. In the event of a minor hydrocarbon spill on site, the contaminated materials will be treated using a biocell as authorized in the Hazardous Waste Regulation.
| 20.1.3.6 | Waste Water (Sewage) Disposal |
The wastewater disposal systems for the camp and office areas will be engineered, constructed, and maintained under the direction of a qualified professional.
Reclamation will be undertaken during mining activities where possible, but the majority of work will occur after the completion of mining and final gold recovery. The reclamation land use objective will be to return the land to a grazing area for cattle and wildlife habitat. Closure objectives include securing the site to assure physical safety of people, protecting wildlife, protecting surface and groundwater quality and quantity, minimizing erosion and controlling fugitive dust. To accomplish these objectives, the following key elements will be included in the reclamation plan:
| 1. | Chemical stabilization, accomplished through rinsing and neutralizing the heap and stabilizing waste dumps and mine pits |
| 2. | Physical stabilization, accomplished through slope grooming, and the application of topsoil and revegetation; |
| 3. | Control of surface waters; and |
| 4. | Monitoring effluent chemistry from the pad and water draining the mine waste and pit areas. |
Closure will be accomplished in three stages:
| 1. | Concurrent: measures implemented during the operating life of the project; |
| 2. | Final: measures implemented after cessation of operations; and |
| 3. | Post-closure: provides for short-term maintenance and long-term monitoring of the closed facilities. |
| Kappes, Cassiday & Associates | | |
| June 19, 2018 | | Page 20-5 |
| | AMENDED AND RESTATED |
| Camino Rojo Preliminary Economic Assessment | NI 43-101 Technical Report |
An outline of the key components of the reclamation plan is given in this section. Further detailing of these components will be required before construction commences. During operation, the reclamation plan will be revised further.
All topsoil harvested during construction will be stockpiled for future use. However, the site is expected to be deficient of organic matter and other soils to support revegetation. Therefore, during operations topsoil will be created. This will be done by combining compostable materials with suitable native soils and natural topsoil. The produced topsoil will be stockpiled for future use; this process must start early since green wastes require time to compost before they are suitable to use as soil amendments.
Possible sources for organic matter include:
| · | Chipped wood, bark and brush from site clearing activities (from the entire site including the mine and waste dumps), beginning with the initial site clearing and including subsequent phases of expansion of the heap, waste dumps and open pits; |
| · | Composted organic fractions from solid wastes (especially food wastes) from the camp and canteen; and |
| · | Composted sewage sludge from the on-site disposal systems (ideally composted with the solid waste organic fraction). |
All camp buildings will be removed upon completion of the operation and the area graded and seeded.
| 20.1.4.3 | Central Operating Area |
Prior to reclamation, all hazardous material will be removed from site. All equipment and building in the central operating area, including the office and warehouse, truck shop, Merrill- Crowe plant, generators and fuel handling facility will be dismantled and removed, and the area graded and seeded.
| Kappes, Cassiday & Associates | | |
| June 19, 2018 | | Page 20-6 |
| | AMENDED AND RESTATED |
| Camino Rojo Preliminary Economic Assessment | NI 43-101 Technical Report |
Water diversion structures around the mine pits will be upgraded if required to ensure long-term operation. Material around the top of pits will be stabilized and fenced off if required but there is no plan to re-contour pit walls.
Mine waste dumps and roads will be reclaimed post mining. Mine roads and waste dumps will be re-sloped, re-contoured, have topsoil added, and be re-seeded.
Short and longer term monitoring of slope stabilities will be provided until deemed stable.
Preliminary results of geochemical testing of samples from core are favorable in terms of the limited acid production and restricted metal leaching properties shown in the results. A review of previous test results on potential waste rock is currently being conducted and confirmatory testing will be undertaken.
During reclamation, roads will be stabilized and any culverts removed. Except for the access road, surfaces will be scarified and seeded.
| 20.1.5 | Closure Activities – Heap Leach Facilities |
The following activities will be completed during the operating life of the project, beginning in year 3 of operations and continuing until the cessation of operations:
| 20.1.5.1 | Engineering, Modeling and Monitoring Systems |
Laboratory testing to investigate heap neutralization and long-term chemical and physical stability of the heap leach will be initiated in the next few months.
| Kappes, Cassiday & Associates | | |
| June 19, 2018 | | Page 20-7 |
| | AMENDED AND RESTATED |
| Camino Rojo Preliminary Economic Assessment | NI 43-101 Technical Report |
In the first years of operation detailed closure and monitoring plans will be developed considering the as-built facilities and the projected as-stacked heap. These plans will be of sufficient detail to allow the start of concurrent closure activities as well as planning for final closure.
Laboratory and field data will be collected to support geochemical and heap neutralization modeling and to allow accurate prediction of both the neutralization process and effluent chemistry following closure. Laboratory testing will include leach columns and kinetic testing to simulate long-term geochemistry. Field testing will include testing either pilot heaps or cells created inside the commercial heap to verify the laboratory data. Geochemical modeling will allow predictive modeling of effluent quality from the closed heap.
| 20.1.5.2 | Permanent Surface Water Diversion Works |
As the leach pad expands the lower portions of the surface water diversion systems will be in their final locations, and then they will be upgraded to meet permanent standards for erosion and storm size. This will also apply to the outlet structures and any associated erosion works.
| 20.1.5.3 | Permanent Slope Stabilization |
Once heap slopes are in their permanent configuration and leaching has ceased, final grooming, capping and revegetation of these slopes, along with associated surface water and erosion controls, will be implemented.
| 20.1.5.4 | Final Engineering and Monitoring Plans |
The plans developed during concurrent closure will require final revisions to accommodate both lessons learned and the final configuration of the heap and roads. This will also include final as-built surveys of the facilities.
| 20.1.5.5 | Heap Rinsing and Neutralization |
This process consists primarily of recirculating cleaner water through the heap, and treating the effluent to reduce contained metals and neutralize the pH. Initially the recirculated solutions will be process solutions, diluted by normal rainfall, with pH buffered to normal leaching levels to allow complete extraction of gold, silver and other metals. Once the concentrations of soluble metals are sufficiently low, the pH will be reduced to below 8.0 and rinsing will continue until the target cyanide levels are achieved. Individual areas of the heap, simulating approximately the normal leach areas, will be rinsed and neutralized so that the capacity of the drainage system and plant are properly utilized. Once the target levels for the controlled constituents (pH, metals and CN) are reached, the heap will be allowed to sit idle through at least one wet season and the effluent chemistry monitored to ensure the targets are maintained.
| Kappes, Cassiday & Associates | | |
| June 19, 2018 | | Page 20-8 |
| | AMENDED AND RESTATED |
| Camino Rojo Preliminary Economic Assessment | NI 43-101 Technical Report |
If any of the constituents exceed the targets, then rinsing will be repeated. If the geochemical modeling suggests any potential to produce acidic drainage, then the post-rinse pH will be left elevated to off-set this potential.
| 20.1.5.6 | Heap Slope Grooming and Slope Stabilization |
In most cases the heap slopes will remain in the as-stacked configuration, with only clean-up of benches and minor re-grading to promote proper drainage. In some cases where slope stability has been an issue during operations, some flattening of the slopes may be required as part of final closure. The required final slopes will be determined based on testing and analysis. In general, the slopes of the heap will be angle-of-repose lifts followed by nominally flat benches to create a stable over-all slope. Some areas may be graded to combine several benches to allow creation of permanent access roads or other features. The lower portions of the entire perimeter of the heap will be graded so that all exposed liner is covered.
| 20.1.5.7 | Topsoil Placement and Revegetation of Heap and Surrounding Areas |
The crest of the heap and the benches, as well as any disturbed ground in the vicinity (except roads and diversions to remain) will be covered with topsoil, supplemental nutrients as needed, and seed. For high-erosion prone areas some rapid growing, annual species of exotics may be used but the revegetation plan will emphasize the use of locally harvested native species. Experience has shown that locally harvested seeds have the highest survival rates and are the best suited to local soil and climate factors. Over the heap non-food species will be preferred to avoid accumulation of any metals in the food chain.
| 20.1.5.8 | Ponds and Pump Stations |
The solution and emergency ponds and pump stations will remain in place and in service for the first few years to allow management of heap effluents. The ponds may remain in service permanently to provide seasonal water to livestock and wildlife. This is a matter for further consideration.
| Kappes, Cassiday & Associates | | |
| June 19, 2018 | | Page 20-9 |
| | AMENDED AND RESTATED |
| Camino Rojo Preliminary Economic Assessment | NI 43-101 Technical Report |
| 20.1.5.9 | Physical and Mobile Equipment |
Except for the light mobile equipment (truck, backhoe, bulldozer) to remain on-site during the post-closure care and monitoring period, all equipment will be sold for scrap. Most of this equipment will be in serviceable condition and thus will probably be sold at a profit (i.e., sales proceeds exceed decommissioning costs).
| 20.1.5.10 | Roads, Diversion Works and Erosion Controls |
Roads and diversion works that are to remain in service post-closure will be upgraded to meet the closure design. Generally this will mean that the surfacing will be more robust and that the dimensions of drainage facilities will be enlarged to meet a larger design storm. Culverts will be replaced with surface crossings since culverts are only serviceable for 10-20 years (and are targets for theft).
All fencing around the pad and pond areas will be removed as the land is intended to return to grazing and wildlife habitat. Further, maintaining fencing would not likely to be successful in the long-term.
| 20.1.6 | Post Closure Activities |
| 20.1.6.1 | Physical Monitoring and Maintenance |
After the completion of final closure, the site will require regular maintenance for the first approximately 3 years post-closure or until there is no further signs of changing conditions. During this period, the site will be inspected every calendar quarter (3 months) and maintenance activities will be planned immediately following each wet season and following any unseasonal major storm events. The purpose of this is to ensure the drainage and erosion control measures are working as planned, and to allow the recently revegetated areas to mature and properly take hold. Maintenance work will consist of light manual labor (ditch tending, rubble removal, and so forth), and light equipment (backhoe and bulldozer) work to regrade or groom any areas showing signs of distress or erosion.
Once the site stops showing signs of seasonal distress and the functionality of the facilities has been field proofed, and when the geochemical performance matches predictive modeling, periodic inspection and maintenance activities can be reduced in frequency; initially to annually and eventually to only after unusually high rainfall periods.
| Kappes, Cassiday & Associates | | |
| June 19, 2018 | | Page 20-10 |
| | AMENDED AND RESTATED |
| Camino Rojo Preliminary Economic Assessment | NI 43-101 Technical Report |
| 20.1.6.2 | Geochemical Monitoring and Maintenance |
The quality of the water draining from the heap will require monitoring and comparison to the predicted chemistry. If the measured water quality significantly varies from that predicted, in an unfavorable manner, then the geochemical model will be revised and new forecasts prepared. In the extreme case additional rinsing and neutralization of the heap may be required. More likely it will only be required to extend the short-term maintenance period.
The ponds will remain in service indefinitely. Water collected in the ponds will be tested with each inspection cycle and if the water quality does not meet discharge standards then that water will be recirculated to the heap and/or evaporated. The ponds will likely accumulate sediments and precipitates as water accumulates and evaporates. These sediments will require periodic removal and can be buried within the heap. This will probably continue for at least one year post-closure and may be needed for up to five years, depending upon the effectiveness of the erosion control measures and re-vegetation efforts.
| 20.1.6.3 | Biological Monitoring and Maintenance |
Maintaining a healthy, robust biological system will improve both the physical and geochemical performance of the closed heap. Thus, the periodic inspections will pay special attention to the biological environment, the health of the vegetated areas as well as the health of the down-stream riparian habitats and surrounding vegetative areas. Reseeding and replacement of some topsoil will be planned annually for the first approximately 3 years. Biological monitoring will continue as long as physical monitoring does, and at least until all habitat and vegetative areas have been stable for multiple years and through extreme wet and dry seasons.
| 20.1.6.4 | Surplus Water Management |
If the geochemistry of the heap effluent supports closing the ponds, then they will be decommissioned and closed at such time. The liners will be perforated and the ponds backfilled with permeable waste rock or rinsed leach material. Heap effluent will continue to flow into the backfilled ponds, which will now act as infiltration basins.
Alternatively, if the geochemistry is stable and water quality acceptable, one or more of the ponds will be left in place as water storage facilities to support agricultural activities.
| Kappes, Cassiday & Associates | | |
| June 19, 2018 | | Page 20-11 |
| AMENDED AND RESTATED |
| Camino Rojo Preliminary Economic Assessment | NI 43-101 Technical Report |
Exploration and mining activities in Mexico are subject to control by the Federal agency of the Secretaria del Medio Ambiente y Recursos Naturales (Secretary of the Environment and Natural Resources), known by its acronym SEMARNAT, which has authority over the 2 principal Federal permits:
| i. | A Manifesto de Impacto Ambiental (Environmental Impact Statement), known by its acronym as an MIA, accompanied by a Estudio de Riesgo (Risk Study, hereafter referred to as ER) and: |
| ii. | A Cambio de Uso de Suelo (Land Used Change) permit, known by its acronym as a CUS, supported by an Estudio Tecnico Justificativo (Technical Justification Study, known by its acronym ETJ). |
Thus far exploration work at Camino Rojo has been conducted under the auspices of two separate MIA permits and corresponding CUS permits. These permits allow for extensive exploration drilling but are not sufficient for mine construction or operation.
In April 2018, Orla hired independent environmental permitting consultants to design and implement baseline environmental studies of the Camino Rojo project, and to work with Orla’s consultant engineers to collect the data required for obtaining a Manifesto de Impacto Ambiental (Environmental Impact Statement) and Cambio de Uso de Suelo (Land Use Change) permit.
The project is not located in an area with any special Federal environmental protection designation and no factors have been identified that would be expected to hinder authorization of required Federal and State environmental permits. Properly prepared MIA and CUS applications and mine operating permits for a project that does not affect federally protected biospheres or ecological reserves can usually be approved in 6 months.
The Peñasquito mine, a large scale, open pit mine, presently operated by Goldcorp, is in the same Municipality and the mine encountered no impediments to receipt of needed permits. Should construction and operation permits be solicited for the Camino Rojo project, no obstacles to obtaining them are anticipated provided that Orla obtains necessary surface rights and design and mitigation criteria meet all applicable standards.
Table 20-1 summarizes the Federal, State, and Municipal permits required for mine construction, andTable 20-2 for mine operation and closure. Figure 20-1 summarizes the permitting process.
| Kappes, Cassiday & Associates | | |
| June 19, 2018 | | Page 20-12 |
| AMENDED AND RESTATED |
| Camino Rojo Preliminary Economic Assessment | NI 43-101 Technical Report |
Table 20-1
Permits Required for Mine Construction
| Mining Stage | | Required formality | | Agency | | Response time
(Aprox.) | | Comments |
| CONSTRUCTION | | OPTION 1 | | Environmental Impact Manifest (MIA) | | SEMARNAT | | 3-6 months | | Baseline studies should be conducted to support the MIA. A comprehensive environmental manifest shall be prepared and submitted to SEMARNAT for evalutation and authorization. |
| | | | | Land Use Change Study (ETJ) | | SEMARNAT | | 2 3 months | | A detailed forestry inventory and a technical study shall be prepared and submitted to SEMARNATfor evaluation and authorization. |
| | | | | Risk Analysis Study (ER) | | SEMARNAT | | 3-6 months | | A risk analysis shall be prepared and submitted and will be evaluated together with the MIA, when high risk substances such as cyanide is used in the process. |
| | | | | | | | | | | |
| | | OPTION 2 | | Documento Técnico Unificado (DTU) | | SEMARNAT | | 3-6 months | | A comprehensive technical document that integrates information of the MIA, ER and ETJ should be prepared and submited to SEMARNAT for evaluation and authorization. |
| | | | | | | | | | | |
| | | | | Land Use/construction Licence | | Municipality | | 1 month | | An aplication letter shall be submitted to the municipal authorities to obtain the authoriztion letter. |
| | | | | Permit for disposal of non-hazardous residues | | Municipality | | 1 month | | An aplication letter needs to be submitted to the municipal authorities, specifying the expected type and amount of non-hazardous waste from the mine construction and operation. A response letter should be issue. |
| | | | | Explosive handling | | SEDENA, Municipality and State Government of Sonora | | 3 months | | An application letter shall be submitted to SEDENA. Also an endorsement letter shall be obtained from the State Government and the Municipality. |
| | | | | Archeological clearance | | INAH | | 1 to 8 months | | A request letter should be submitted to INAH. A survey will be done by INAH personnel and if there is some archeological interest a rescue and documenting program will be performed. |
| | | | | Water use concessions | | CONAGUA | | 3 months | | An application should be submitted before CONAGUA requesting a water use concesion, specifying the volume of water to use per year.
If the aquifer has no availabiltiy, water rights need to be purchased.
The volume of water to use in the mining activities should be measured and paid. |
| Kappes, Cassiday & Associates | | |
| June 19, 2018 | | Page 20-13 |
| AMENDED AND RESTATED |
| Camino Rojo Preliminary Economic Assessment | NI 43-101 Technical Report |
Table 20-2
Permits Required for Mine Operation and Closure
| Mining Stage | | Required formality | | Agency | | Response time
(Aprox.) | | Comments |
| OPERATION | | Water discharge permit | | CONAGUA | | 3 months | | An application needs to be filed before CONAGUA with estimated annual volume and the quality of the discharge. This may include the sannitary service water discharge or any other water discharge to septic tanks or natural environment. |
| | | Operation license | | SEMARNAT | | 2 to 4 months | | Needs to do an inventory of all air emissions, water discharges and solid wastes. |
| | | Accident prevention plan | | SEMARNAT | | None | | Based on the risk analysis, it is necessary to establish a plan and procedures to prevent and respond to emergencies and accidental events. SEMARNAT will register this plan. |
| | | Mining residues managament plan | | SEMARNAT | | None | | Need to prepare this plan according to NOM-157-SEMARNAT-2009. SEMARNAT will register this plan |
| | | Hazardous waste generator registry | | SEMARNAT | | None | | It is required to keep records of any hazardous waste movement at the mine facilities and deliveries to an authorized external company. |
| ABANDONMENT | | Closure and reclamation plan | | SEMARNAT | | Not specified | | Need to submit a comprehensive closure and reclamation plan, as early as possible before the closure of the mine. |
| Kappes, Cassiday & Associates | | |
| June 19, 2018 | | Page 20-14 |
| AMENDED AND RESTATED |
| Camino Rojo Preliminary Economic Assessment | NI 43-101 Technical Report |
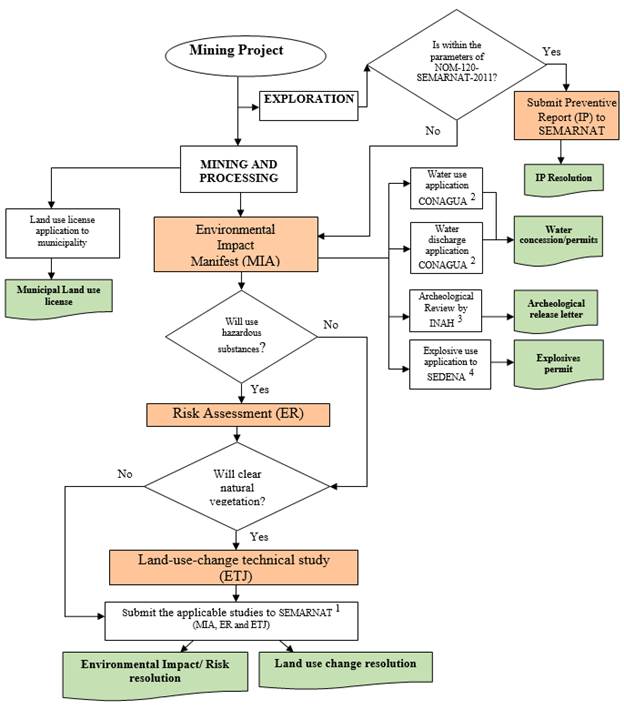
Figure 20-1
Permitting Process Flowsheet
| Kappes, Cassiday & Associates | | |
| June 19, 2018 | | Page 20-15 |
| AMENDED AND RESTATED |
| Camino Rojo Preliminary Economic Assessment | NI 43-101 Technical Report |
| 20.3 | Social and Community Impact |
In April 2018, Orla commissioned independent consultants to work with Minera Camino Rojo community relations staff to assess social and community impacts of development of the Camino Rojo project.
The project has a long association with the local communities, including Community and Social Responsibility Agreements as described in Section 4.3 of this report.
| Kappes, Cassiday & Associates | | |
| June 19, 2018 | | Page 20-16 |
| AMENDED AND RESTATED |
| Camino Rojo Preliminary Economic Assessment | NI 43-101 Technical Report |
| 21.0 | CAPITAL AND OPERATING COSTS |
This PEA is preliminary in nature and it includes inferred mineral resources that are considered too speculative geologically to have the economic considerations applied to them that would enable them to be categorized as mineral reserves and there is no certainty that the PEA will be realized.
Capital and operating costs for the process and general and administration components of the Camino Rojo project PEA were estimated by KCA. Costs for the mining components were provided by IMC. The estimated costs are considered to have an accuracy of +/-25% for capital costs and +/-20% for operating costs and are discussed in greater detail in this section.
The total capital cost for the Project is US$153.8 million, including US$13.8 million in working capital and not including reclamation and closure costs, IVA (value added tax) or other taxes; all IVA is assumed to be fully refundable. Table 21-1 presents the capital requirements for the Camino Rojo Project.
Table 21-1
Capital Cost Summary
| Description | | Cost (US$) | |
| Pre-Production Capital | | $ | 120,199,000 | |
| Working Capital & Initial Fills | | $ | 13,789,000 | |
| Mining Contractor Mobilization & Preproduction | | $ | 4,926,000 | |
| Sustaining Capital – Mine & Process | | $ | 14,871,000 | |
| Total excluding IVA | | $ | 153,785,000 | |
The average life of mine operating cost for the Project is US$8.02 per tonne of material processed. Table 21-2 presents the LOM operating cost requirements for the Camino Rojo Project.
Table 21-2
LOM Operating Cost Summary
| Description | | LOM Cost (US$/t) | |
| Mine | | $ | 3.05 | |
| Process & Support Services | | $ | 3.20 | |
| Site G & A | | $ | 1.77 | |
| Total | | $ | 8.02 | |
IVA is not included in the operating costs.
Kappes, Cassiday & Associates June 19, 2018
| Page 21-1 |
| AMENDED AND RESTATED |
| Camino Rojo Preliminary Economic Assessment | NI 43-101 Technical Report |
The total pre-production capital cost estimate for the Camino Rojo Project is estimated at US$138.9 million including all process equipment and infrastructure, construction indirect costs, mine contractor mobilization and working capital. All costs are presented in first quarter 2018 US dollars. The estimated capital costs are discussed in this section.
Pre-production capital costs required for the Camino Rojo Project are presented in Table 21-3.
Kappes, Cassiday & Associates June 19, 2018
| Page 21-2 |
| AMENDED AND RESTATED |
| Camino Rojo Preliminary Economic Assessment | NI 43-101 Technical Report |
Table 21-3
Summary of Pre-Production Capital Costs by Area
| Plant Totals Direct Costs | | Total Supply Cost | | | Install | | | Grand Total | |
| | | US$ | | | US$ | | | US$ | |
| Area 110 - General | | $ | 7,173,000 | | | $ | 790,000 | | | $ | 7,963,000 | |
| Area 113 - Crushing | | $ | 9,457,000 | | | $ | 2,081,000 | | | $ | 11,538,000 | |
| Area 115 - Material Reclaim and Stacking | | $ | 6,601,000 | | | $ | 604,000 | | | $ | 7,205,000 | |
| Area 120 - Heap Leach and Solution Handling | | $ | 5,832,000 | | | $ | 8,096,000 | | | $ | 13,928,000 | |
| Area 128 - Merrill-Crowe | | $ | 6,900,000 | | | $ | 1,084,000 | | | $ | 7,984,000 | |
| Area 131 - Refining | | $ | 2,841,000 | | | $ | 426,000 | | | $ | 3,267,000 | |
| Area 134 - Reagents | | $ | 345,000 | | | $ | 107,000 | | | $ | 452,000 | |
| Area 360 - Power | | $ | 7,758,000 | | | $ | 670,000 | | | $ | 8,428,000 | |
| Area 362 - Water Supply & Distribution | | $ | 3,005,000 | | | $ | 316,000 | | | $ | 3,321,000 | |
| Area 365 - Laboratory | | $ | 2,322,000 | | | $ | 185,000 | | | $ | 2,507,000 | |
| Area 367 - Mobile Equipment | | $ | 3,202,000 | | | $ | 0 | | | $ | 3,202,000 | |
| | | | | | | | | | | | | |
| Plant Total Direct Costs | | $ | 55,436,000 | | | $ | 14,359,000 | | | $ | 69,794,000 | |
| | | | | | | | | | | | | |
| Spare Parts | | $ | 1,081,000 | | | | | | | $ | 1,081,000 | |
| | | | | | | | | | | | | |
| Sub Total with Spare Parts | | | | | | | | | | $ | 70,875,000 | |
| | | | | | | | | | | | | |
| Contingency | | $ | 19,501,000 | | | | | | | $ | 19,501,000 | |
| | | | | | | | | | | | | |
| Plant Total Direct Costs with Contingency | | | | | | | | | | $ | 90,375,000 | |
| | | | | | | | | | | | | |
| Indirect Costs | | | | | | | | | | $ | 10,845,000 | |
| | | | | | | | | | | | | |
| Other Owner's Costs | | | | | | | | | | $ | 9,038,000 | |
| | | | | | | | | | | | | |
| Initial Fills | | | | | | | | | | $ | 787,000 | |
| | | | | | | | | | | | | |
| EPCM | | | | | | | | | | $ | 9,941,000 | |
| | | | | | | | | | | | | |
| Sub Total Process Costs before Working Capital | | | | | | | | | | $ | 120,986,000 | |
| | | | | | | | | | | | | |
| Working Capital (90 days) | | | | | | | | | | $ | 13,002,000 | |
| | | | | | | | | | | | | |
| Sub Total Overall Costs | | | | | | | | | | $ | 133,988,000 | |
| | | | | | | | | | | | | |
| Mining Costs | | | | | | | | | | $ | 4,926,000 | |
| | | | | | | | | | | | | |
| TOTAL COSTS (excluding IVA) | | | | | | | | | | $ | 138,914,000 | |
Note: Columns may not sum exactly due to rounding
Kappes, Cassiday & Associates June 19, 2018
| Page 21-3 |
| AMENDED AND RESTATED |
| Camino Rojo Preliminary Economic Assessment | NI 43-101 Technical Report |
| 21.1.1 | Mining Capital Costs |
IMC has developed an estimate of contract mining costs for the Camino Rojo Project. The estimate is not based on contractor quotes; it has been developed based on considerations of direct mining costs, contractor overhead and profit, and estimated equipment depreciation costs incurred by the contractor.
Overall, mining capital costs amount to a total of US$7.5 million, including US$4.9 million for initial capital and US$2.6 million for sustaining capital (including demobilization). Mine Capital Costs are presented in Table 21-4.
Kappes, Cassiday & Associates June 19, 2018
| Page 21-4 |
| | AMENDED AND RESTATED |
| Camino Rojo Preliminary Economic Assessment | NI 43-101 Technical Report |
Table 21-4
Mining Capital Costs
| Mine Capital Costs: | | | | | Units | | PP | | | Yr1 Q1 | | | Yr1 Q2 | | | Yr1 Q3 | | | Yr1 Q4 | | | Year 2 | | | Year 3 | | | Year 4 | | | Year 5 | | | Year 6 | | | Year 7 | | | TOTAL |
| Contractor Mobilization (% of Major) | | 8.0 | % | | ($x1000) | | | 1,351 | | | | 532 | | | | 192 | | | | 73 | | | | 0 | | | | 0 | | | | 0 | | | | 0 | | | | 0 | | | | 0 | | | | 0 | | | | 2,148 |
| Contractor Demobilization (% of Major) | | 5.0 | % | | ($x1000) | | | 0 | | | | 0 | | | | 0 | | | | 0 | | | | 0 | | | | 0 | | | | 0 | | | | 0 | | | | 0 | | | | 0 | | | | 1,343 | | | | 1,343 |
| Owner Equipment (% of Major) | | 4.0 | % | | ($x1000) | | | 675 | | | | 266 | | | | 96 | | | | 37 | | | | 0 | | | | 0 | | | | 37 | | | | 0 | | | | 0 | | | | 0 | | | | 0 | | | | 1,111 |
| Mine Development (From Below) | | | | | ($x1000) | | | 2,900 | | | | 0 | | | | 0 | | | | 0 | | | | 0 | | | | 0 | | | | 0 | | | | 0 | | | | 0 | | | | 0 | | | | 0 | | | | 2,900 |
| Mine Infrastructure | | | | | ($x1000) | | | | | | | | | | | | | | | | | | | | | | | | | | | | | | | | | | | | | | | | | | | | | | | 0 |
| TOTAL MINE CAPITAL COST | | | | | ($x1000) | | | 4,926 | | | | 799 | | | | 287 | | | | 110 | | | | 0 | | | | 0 | | | | 37 | | | | 0 | | | | 0 | | | | 0 | | | | 1,343 | | | | 7,501 |
| Kappes, Cassiday & Associates | | |
| June 19, 2018 | | Page 21-5 |
| | AMENDED AND RESTATED |
| Camino Rojo Preliminary Economic Assessment | NI 43-101 Technical Report |
| 21.1.1.1 | Mining Contractor Mobilization and Demobilization |
Estimates for contractor mobilization were made based on a preliminary build-up of capital costs for what an owner mine fleet would cost. Mobilization was estimated at 8% of the preliminary mine fleet cost, or US$2.15 million. This includes an allowance of about 4% of the equipment new price for equipment transportation and an additional 4% for logistics, hiring of personnel, procuring supplies/equipment, etc.
Demobilization costs were estimated in a similar manner but at 5% of the initial mine fleet cost, or US$1.34 million during Year 7.
| 21.1.1.2 | Mining Owner Equipment |
An allowance for owner equipment is estimated at 4% of the preliminary mine fleet capital cost, or US$1.11 million over the project life. This includes pickup trucks for mine technical services staff, computer equipment, surveying equipment, etc. that are paid directly by the owner and not through the contractor.
| 21.1.1.3 | Mine Development (Preproduction) |
Mine development is estimated at US$2.90 million which is the estimated operating cost to mine 500,000 tonnes of material during the preproduction period.
| 21.1.2 | Process and Infrastructure Capital Cost Estimate |
| 21.1.2.1 | Process and Infrastructure Capital Cost Basis |
Process and infrastructure costs have been estimated by KCA. All equipment and material requirements are based on the design information described in previous sections of this study. Budgetary capital costs have been estimated primarily based on recent quotes from similar projects in KCA’s database and cost guide data. Where recent quotes were not available, reasonable cost estimates or allowances were made. All capital cost estimates are based on the purchase of equipment quoted new from the manufacturer or to be fabricated new.
Each area in the process cost build-up has been separated into the following disciplines, as applicable:
| Kappes, Cassiday & Associates | | |
| June 19, 2018 | | Page 21-6 |
| | AMENDED AND RESTATED |
| Camino Rojo Preliminary Economic Assessment | NI 43-101 Technical Report |
| · | Major earthworks & liner; |
Pre-production, non-mining capital costs by discipline are presented in Table 21-5.
| Kappes, Cassiday & Associates | | |
| June 19, 2018 | | Page 21-7 |
| | AMENDED AND RESTATED |
| Camino Rojo Preliminary Economic Assessment | NI 43-101 Technical Report |
Table 21-5
Summary of Pre-Production Capital Costs by Discipline
| Plant Totals | | Cost @ Source | | | Freight | | | Customs
Fees &
Duties | | | Total
Supply Cost | | | Install | | | Grand Total | |
| | | US$ | | | US$ | | | US$ | | | US$ | | | US$ | | | US$ | |
| Major Earthworks | | $ | 3,005,000 | | | | | | | | | | | $ | 3,005,000 | | | $ | 8,705,000 | | | $ | 11,710,000 | |
| Civils (Supply & Install) | | $ | 1,462,000 | | | | | | | | | | | $ | 1,462,000 | | | | | | | $ | 1,462,000 | |
| Structural Steelwork (Supply & Install) | | $ | 841,000 | | | | | | | | | | | $ | 841,000 | | | $ | 616,000 | | | $ | 1,457,000 | |
| Platework (Supply & Install) | | $ | 454,000 | | | | | | | | | | | $ | 454,000 | | | $ | 212,000 | | | $ | 666,000 | |
| Mechanical Equipment | | $ | 23,771,000 | | | $ | 1,685,000 | | | $ | 606,000 | | | $ | 26,062,000 | | | $ | 2,689,000 | | | $ | 28,751,000 | |
| Piping | | $ | 2,658,000 | | | $ | 173,000 | | | $ | 62,000 | | | $ | 2,893,000 | | | $ | 397,000 | | | $ | 3,290,000 | |
| Electrical | | $ | 10,450,000 | | | $ | 395,000 | | | $ | 142,000 | | | $ | 10,987,000 | | | $ | 1,046,000 | | | $ | 12,033,000 | |
| Instrumentation | | $ | 716,000 | | | $ | 72,000 | | | $ | 26,000 | | | $ | 814,000 | | | $ | 199,000 | | | $ | 1,013,000 | |
| Infrastructure & Buildings | | $ | 8,135,000 | | | $ | 568,000 | | | $ | 213,000 | | | $ | 8,916,000 | | | $ | 496,000 | | | $ | 9,412,000 | |
| Spare Parts | | $ | 1,081,000 | | | | | | | | | | | $ | 1,081,000 | | | | | | | $ | 1,081,000 | |
| Contingency | | $ | 19,501,000 | | | | | | | | | | | $ | 19,501,000 | | | | | | | $ | 19,501,000 | |
| | | | | | | | | | | | | | | | | | | | | | | | | |
| Plant Total Direct Costs | | $ | 72,074,000 | | | $ | 2,893,000 | | | $ | 1,049,000 | | | $ | 76,016,000 | | | $ | 14,360,000 | | | $ | 90,376,000 | |
Freight, customs fees and duties, and installation costs are also considered and are discussed in the following sections.
Engineering, procurement, and construction management (EPCM), indirect costs, and initial fills inventory are also considered as part of the capital cost estimate.
Estimates for process equipment freight costs are based on loads as bulk freight and have been estimated at 10% of the equipment cost.
| 21.1.2.3 | Duties and Customs Fees |
Estimates for duties and customs fees are estimated at 3.6% of the mechanical equipment cost.
Installation estimates for the equipment are based on the equipment type and include all installation labor and equipment usage. Average installation costs are estimated at US$35 per hour.
| Kappes, Cassiday & Associates | | |
| June 19, 2018 | | Page 21-8 |
| | AMENDED AND RESTATED |
| Camino Rojo Preliminary Economic Assessment | NI 43-101 Technical Report |
| 21.1.2.5 | Major Earthworks and Liner |
Earthworks quantities for the project have been estimated by KCA based on the overall area requirements. Geomembrane liners for the leach pad and process solution ponds are included in this category. Earthworks and liner unit rates are based on recent contractor quotes in KCA’s files for a project recently completed in Mexico.
Civils include detailed earthworks and concrete. Concrete quantities have been estimated based on similar equipment installations, major equipment weights and on slab areas. Unit costs for concrete are based on recent contractor quotes in KCA’s files for projects completed in Mexico.
Costs for structural steel, including steel grating, structural steel, and handrails have been estimated based on general layouts and structural steel requirements for similar installations. Unit rates for structural steel are based on recent contractor quotes in KCA’s files for projects completed in Mexico.
The platework discipline includes costs for the supply and installation of steel tanks, bins, and chutes. Platework costs are primarily based on similar items from recent projects in KCA’s files.
| 21.1.2.9 | Mechanical Equipment |
Costs for mechanical equipment are based on a preliminary equipment list developed of all major equipment for the process. Costs are based on recent quotes from KCA’s files for similar items and cost guide information. Where recent quotes were not available, reasonable allowances have been made. All costs assume equipment purchased new from the manufacturer or to be fabricated new.
Installation hours for mechanical equipment is factored based on the equipment supply cost and includes installation labor and equipment usage.
| Kappes, Cassiday & Associates | | |
| June 19, 2018 | | Page 21-9 |
| | AMENDED AND RESTATED |
| Camino Rojo Preliminary Economic Assessment | NI 43-101 Technical Report |
| 21.1.2.10 | Piping, Electrical and Instrumentation |
Major piping, including heap irrigation and gravity drain pipes are based on recent estimates from similar sized projects in Mexico. Additional ancillary piping, fittings, and valve costs have been estimated on a percentage basis of the mechanical equipment costs.
Electrical and instrumentation costs have been estimated primarily as percentages of the mechanical equipment supply cost for each process area. A US$7 million allowance is included in the electrical estimate for running a 70 km power line to the project site.
Infrastructure for the Camino Rojo Project includes the construction of a 250-person man camp for operations and construction, a pedestrian bridge crossing the nearby highway, an administration building, mine truck shop, warehouse, guard house, on-site clinic and powder magazine. Process buildings including the laboratory, Merrill-Crowe plant and refinery are also included.
Water supply to the main water tank will be by three production wells. The production wells consider 200mm cased wells in 350mm boreholes and have an estimated cost of US$385,000 each, including the cost of the well pump, discharge pipe and sub cable. An allowance of US$360,000 is also included for six monitoring wells.
| 21.1.2.12 | Process Mobile Equipment |
Mobile equipment included in the capital cost estimate are detailed in Table 21-6.
Table 21-6
Process Mobile Equipment
| Description | | Quantity | |
| CAT 992 Loader or Equiv. | | | 1 | |
| CAT D6 Dozer or Equiv. | | | 1 | |
| Mechanical Service Truck | | | 1 | |
| Forklift, 2.5 ton | | | 2 | |
| Telehandler, 4 ton | | | 1 | |
| Pickup Truck, ¾ ton | | | 7 | |
| Backhoe w/ Fork Attachment, 1.1 cu. yd. | | | 1 | |
| Boom Truck, 10 ton | | | 1 | |
| Crane, 70 ton | | | 1 | |
| Ambulance | | | 1 | |
| Kappes, Cassiday & Associates | | |
| June 19, 2018 | | Page 21-10 |
| | AMENDED AND RESTATED |
| Camino Rojo Preliminary Economic Assessment | NI 43-101 Technical Report |
Spare parts costs are estimated at 6% of the mechanical equipment supply costs.
| 21.1.3 | Construction Indirect and Other Owner’s Costs |
Indirect field costs include temporary construction facilities, construction services, quality control, survey support, warehouse and fenced yards, support equipment, etc. These costs have been estimated at US$10.8 million, or 12% of the total direct costs. Owner’s costs are estimated at US$9 million, or 10% if the total direct costs which include G&A costs during construction.
Engineering, procurement and construction management costs are estimated at US$9.9 million, or 11% of the total direct costs.
| 21.1.4 | Initial Fills Inventory |
The initial fills consist of consumable items stored on site at the outset of operations, which includes sodium cyanide (NaCN), lime, zinc, diatomaceous earth (DE), and fluxes. The inventory of initial fills are estimated at US$800,000 and are to ensure that adequate consumables are available for the first stage of operation.
Contingency is included in the capital cost estimate and has been considered by discipline as a percentage of the direct capital costs. The overall contingency is US$19.5 million, or approximately 28% of the direct costs.
Working capital is money that is used to cover operating costs from start-up until a positive cash flow is achieved. Once a positive cash flow is attained, project expenses will be paid from earnings. Working capital for the Project is estimated to be US$13.0 million based on 90 days of operation and includes all mine, process and G&A operating costs.
| Kappes, Cassiday & Associates | | |
| June 19, 2018 | | Page 21-11 |
| | AMENDED AND RESTATED |
| Camino Rojo Preliminary Economic Assessment | NI 43-101 Technical Report |
Sustaining capital for project includes the expansion of the heap leach pad and addition of an overland conveyor in Year 2 of operation, and mining sustaining costs. Total sustaining capital is estimated at US$14.9 million.
Process operating costs for the Camino Rojo project have been primarily estimated by KCA based upon unit consumptions and, where possible, have been broken down by area. Mining costs were provided by IMC at US$1.81 per tonne moved (LOM US$3.05 per tonne of material processed) and assumes contract mining. LOM average processing costs are estimated at US$3.20 per tonne processed. G&A costs are estimated at US$1.77 per tonne processed.
Process operating costs have been estimated from first principles. Labor costs were estimated using project specific staffing, salary and wage and benefit requirements. Unit consumptions of materials, supplies, power, water and delivered supply costs were also estimated.
The process operating costs presented are based upon the ownership of all process production equipment and site facilities. The owner will employ and direct all operating maintenance and support personnel for all site activities.
Operating costs were estimated based on 1st quarter 2018 US dollars and are presented with no added contingency based upon the design and operating criteria present in this report. Operating costs are considered to have an accuracy of +/- 20%.
Operating costs estimates have been based upon information obtained from the following sources:
| · | Contractor mining costs from IMC; |
| · | Some G&A costs from Orla; |
| · | Project metallurgical test work and process engineering; |
| · | Recent KCA project file data; and |
| · | Experience of KCA staff with other similar operations. |
| Kappes, Cassiday & Associates | | |
| June 19, 2018 | | Page 21-12 |
| | AMENDED AND RESTATED |
| Camino Rojo Preliminary Economic Assessment | NI 43-101 Technical Report |
Where specific data does not exist, cost allowances have been based upon consumption and operating requirements from other similar properties for which reliable data exists. Freight costs have been estimated where delivered prices were not available.
| 21.2.1 | Mining Operating Costs |
Mining operating costs have been developed by IMC based on estimated owner mining costs plus contractor overhead, equipment depreciation and profit. Total contract mine operating cost during commercial production is estimated at US$129.6 million. This amounts to US$1.81 per total tonne moved or US$3.05 per processed tonne. The US$1.81 unit cost includes the cost and tonnage for rehandle of the low-grade stockpile, but excludes tonnage moved and costs incurred during the preproduction period. Preproduction costs are reported as mine development capital.
Estimated mining contractor costs are presented in Table 21-7.
| Kappes, Cassiday & Associates | | |
| June 19, 2018 | | Page 21-13 |
| | AMENDED AND RESTATED |
| Camino Rojo Preliminary Economic Assessment | NI 43-101 Technical Report |
Table 21-7
Contract Mining Cost Summary
| | | Units | | PP | | | Yr1 Q1 | | | Yr1 Q2 | | | Yr1 Q3 | | | Yr1 Q4 | | | Year 2 | | | Year 3 | | | Year 4 | | | Year 5 | | | Year 6 | | | Year 7 | | | TOTAL | |
| Owner Operating Cost | | ($x1000) | | | 2,380 | | | | 3,502 | | | | 4,416 | | | | 4,449 | | | | 4,510 | | | | 18,192 | | | | 18,593 | | | | 17,599 | | | | 17,693 | | | | 13,977 | | | | 3,006 | | | | 108,317 | |
| Less Technical Services and Supplies | | ($x1000) | | | 259 | | | | 262 | | | | 259 | | | | 259 | | | | 259 | | | | 1,041 | | | | 1,041 | | | | 1,041 | | | | 1,041 | | | | 634 | | | | 146 | | | | 6,242 | |
| Less Fuel (Owner Supplied) | | ($x1000) | | | 480 | | | | 1,027 | | | | 1,339 | | | | 1,351 | | | | 1,376 | | | | 5,594 | | | | 5,805 | | | | 5,503 | | | | 5,488 | | | | 4,158 | | | | 1,037 | | | | 33,158 | |
| Less Blasting (Separate Contract) | | ($x1000) | | | 96 | | | | 424 | | | | 715 | | | | 725 | | | | 731 | | | | 2,905 | | | | 2,887 | | | | 2,489 | | | | 2,252 | | | | 1,576 | | | | 0 | | | | 14,802 | |
| Contractor Direct Cost | | ($x1000) | | | 1,544 | | | | 1,789 | | | | 2,102 | | | | 2,113 | | | | 2,143 | | | | 8,652 | | | | 8,859 | | | | 8,567 | | | | 8,913 | | | | 7,609 | | | | 1,823 | | | | 54,114 | |
| Contractor Depreciation Charge | | ($x1000) | | | 288 | | | | 541 | | | | 660 | | | | 664 | | | | 672 | | | | 2,715 | | | | 2,782 | | | | 2,633 | | | | 2,604 | | | | 1,920 | | | | 556 | | | | 16,035 | |
| Contractor Overhead/Profit @15.0% | | ($x1000) | | | 232 | | | | 268 | | | | 315 | | | | 317 | | | | 322 | | | | 1,298 | | | | 1,329 | | | | 1,285 | | | | 1,337 | | | | 1,141 | | | | 273 | | | | 8,117 | |
| Total Contract Mining Cost | | ($x1000) | | | 2,064 | | | | 2,598 | | | | 3,077 | | | | 3,094 | | | | 3,137 | | | | 12,664 | | | | 12,971 | | | | 12,485 | | | | 12,853 | | | | 10,670 | | | | 2,653 | | | | 78,266 | |
| Add Back Technical Services and Supplies | | ($x1000) | | | 259 | | | | 262 | | | | 259 | | | | 259 | | | | 259 | | | | 1,041 | | | | 1,041 | | | | 1,041 | | | | 1,041 | | | | 634 | | | | 146 | | | | 6,242 | |
| Add Back Fuel | | ($x1000) | | | 480 | | | | 1,027 | | | | 1,339 | | | | 1,351 | | | | 1,376 | | | | 5,594 | | | | 5,805 | | | | 5,503 | | | | 5,488 | | | | 4,158 | | | | 1,037 | | | | 33,158 | |
| Add Back Blasting | | ($x1000) | | | 96 | | | | 424 | | | | 715 | | | | 725 | | | | 731 | | | | 2,905 | | | | 2,887 | | | | 2,489 | | | | 2,252 | | | | 1,576 | | | | 0 | | | | 14,802 | |
| TOTAL OPERATING COST - Commercial | | ($x1000) | | | | | | | 4,311 | | | | 5,391 | | | | 5,430 | | | | 5,504 | | | | 22,204 | | | | 22,704 | | | | 21,517 | | | | 21,634 | | | | 17,038 | | | | 3,836 | | | | 129,569 | |
| TOTAL OPERATING COST - Development | | ($x1000) | | | 2,900 | | | | | | | | | | | | | | | | | | | | | | | | | | | | | | | | | | | | | | | | | | | | 2,900 | |
| Total Material Moved (includes 5 M tonnes rehandle) | | (kt) | | | 0 | | | | 2,352 | | | | 3,281 | | | | 3,318 | | | | 3,324 | | | | 13,123 | | | | 12,954 | | | | 11,154 | | | | 10,095 | | | | 8,045 | | | | 3,879 | | | | 71,525 | |
| Total Processed | | (kt) | | | 0 | | | | 821 | | | | 1,642 | | | | 1,642 | | | | 1,643 | | | | 6,570 | | | | 6,570 | | | | 6,570 | | | | 6,570 | | | | 6,570 | | | | 3,879 | | | | 42,477 | |
| Cost Per Total Tonne | | (US$/t) | | | 0.000 | | | | 1.833 | | | | 1.643 | | | | 1.637 | | | | 1.656 | | | | 1.692 | | | | 1.753 | | | | 1.929 | | | | 2.143 | | | | 2.118 | | | | 0.989 | | | | 1.812 | |
| Cost Per Processed Tonne | | (US$/t) | | | 0.000 | | | | 5.251 | | | | 3.283 | | | | 3.307 | | | | 3.350 | | | | 3.380 | | | | 3.456 | | | | 3.275 | | | | 3.293 | | | | 2.593 | | | | 0.989 | | | | 3.050 | |
Kappes, Cassiday & Associates June 19, 2018 | Page 21-14 |
| | AMENDED AND RESTATED |
| Camino Rojo Preliminary Economic Assessment | NI 43-101 Technical Report |
21.2.1.1 Contract Mining Cost Basis
The contract mining cost estimate is based on an estimated owner mining scenario plus contractor profit and overhead. The estimate includes:
| · | Owner operating cost from first principles; |
| · | Mine technical services and supplies; |
| · | Fuel and blasting; |
| · | Contractor equipment depreciation; and |
| · | Contractor overhead and profit. |
The contractor direct operating cost is estimated as the owner operating cost, less the mine technical services, fuel and blasting costs, which are assumed as the owner’s costs and are added back after considering contractor depreciation and profit. Contractor overhead and profit is estimated at 15% of the direct mining costs.
21.2.1.2 Mine Technical Services, Fuel and Blasting Costs
Costs for mine technical services, fuel and blasting are considered as direct owner costs and are not subject to contractor markup.
Mine technical services and supplies includes the cost for engineering, geology, surveying and grade control personnel, and an allowance for supplies. These costs are estimated at US$6.24 million over the project life.
Fuel and blasting supplies will be contracted by the owner with different parties and will not be provided by the mining contractor. Fuel and blasting costs are estimated at US$33.2 million and US$14.8 million, respectively, over the mine life.
21.2.1.3 Contractor Equipment Depreciation
The contract mining cost will include significant charges for equipment depreciation. Table 21-8 shows IMC’s estimates of these costs; it is not certain how a specific contractor will calculate these values. The top portion of the table shows the estimated number of operating shifts for each equipment type for each year. The bottom portion of the table shows IMC’s estimate of depreciation charges per shift to be applied to each equipment type and total annual charges. A 15% allowance has also been added to account for small equipment.
Kappes, Cassiday & Associates June 19, 2018 | Page 21-15 |
| | AMENDED AND RESTATED |
| Camino Rojo Preliminary Economic Assessment | NI 43-101 Technical Report |
Life of mine the depreciation charge is US$16.0 million. This compares to US$37.26 million life of mine equipment capital costs for the owner operation case, about 43% of the capital cost. Equipment depreciation is 30% of the direct operating cost estimate of US$54.1 million.
Kappes, Cassiday & Associates June 19, 2018 | Page 21-16 |
| | AMENDED AND RESTATED |
| Camino Rojo Preliminary Economic Assessment | NI 43-101 Technical Report |
Table 21-8
Contract Mining Equipment Depreciation
| | | | | | | | | Units | | PP | | | Yr1 Q1 | | | Yr1 Q2 | | | Yr1 Q3 | | | Yr1 Q4 | | | Year 2 | | | Year 3 | | | Year 4 | | | Year 5 | | | Year 6 | | | Year 7 | | | TOTAL |
| MAJOR EQUIPMENT SHIFTS: | | | | | | | | | | | | | | | | | | | | | | | | | | | | | | | | | | | | | | | | | | | | | | | | | | | | | | | | |
| Atlas Copco DM30 II Drill | | | | | | | | | | (shifts) | | | 39 | | | | 170 | | | | 298 | | | | 302 | | | | 305 | | | | 1,214 | | | | 1,209 | | | | 1,043 | | | | 944 | | | | 661 | | | | 0 | | | 6,186 |
| Caterpillar 6018FS Hyd Shovel | | | | | | | | | | (shifts) | | | 36 | | | | 169 | | | | 274 | | | | 278 | | | | 281 | | | | 1,118 | | | | 1,112 | | | | 958 | | | | 867 | | | | 672 | | | | 256 | | | 6,023 |
| Caterpillar 992K Wheel Loader | | | | | | | | | | (shifts) | | | 27 | | | | 128 | | | | 127 | | | | 127 | | | | 125 | | | | 480 | | | | 461 | | | | 396 | | | | 358 | | | | 300 | | | | 197 | | | 2,726 |
| Caterpillar 773G Truck | | | | | | | | | | (shifts) | | | 194 | | | | 888 | | | | 1,260 | | | | 1,274 | | | | 1,333 | | | | 5,614 | | | | 6,221 | | | | 6,190 | | | | 6,596 | | | | 5,704 | | | | 1,040 | | | 36,315 |
| Caterpillar D9T Track Dozer | | | | | | | | | | (shifts) | | | 364 | | | | 368 | | | | 364 | | | | 364 | | | | 364 | | | | 1,460 | | | | 1,460 | | | | 1,460 | | | | 1,460 | | | | 730 | | | | 180 | | | 8,574 |
| Caterpillar 824H Wheel Dozer | | | | | | | | | | (shifts) | | | 182 | | | | 184 | | | | 182 | | | | 182 | | | | 182 | | | | 730 | | | | 730 | | | | 730 | | | | 730 | | | | 365 | | | | 180 | | | 4,377 |
| Caterpillar 14M Motor Grader | | | | | | | | | | (shifts) | | | 182 | | | | 184 | | | | 182 | | | | 182 | | | | 182 | | | | 730 | | | | 730 | | | | 730 | | | | 730 | | | | 365 | | | | 180 | | | 4,377 |
| Water Truck - 14,000 gal | | | | | | | | | | (shifts) | | | 182 | | | | 184 | | | | 182 | | | | 182 | | | | 182 | | | | 730 | | | | 730 | | | | 730 | | | | 730 | | | | 365 | | | | 180 | | | 4,377 |
| Caterpillar 319DL Excavator | | | | | | | | | | (shifts) | | | 120 | | | | 121 | | | | 120 | | | | 120 | | | | 120 | | | | 482 | | | | 482 | | | | 482 | | | | 482 | | | | 365 | | | | 0 | | | 2,894 |
| Sandvik DX680 TH Drill | | | | | | | | | | (shifts) | | | 120 | | | | 121 | | | | 120 | | | | 120 | | | | 120 | | | | 482 | | | | 482 | | | | 482 | | | | 482 | | | | 482 | | | | 0 | | | 3,011 |
| Total Major Equipment Shifts | | | | | | | | | | (shifts) | | | 1,446 | | | | 2,519 | | | | 3,109 | | | | 3,132 | | | | 3,194 | | | | 13,040 | | | | 13,617 | | | | 13,201 | | | | 13,380 | | | | 10,010 | | | | 2,213 | | | 78,861 |
| MAJOR EQUIPMENT DEPRECIATION COST: | | | | | | | Depr | | | | | | | | | | | | | | | | | | | | | | | | | | | | | | | | | | | | | | | | | | | | | | | | | |
| | | | | | | | ($/shift) | | | | | | | | | | | | | | | | | | | | | | | | | | | | | | | | | | | | | | | | | | | | | | | | | |
| Atlas Copco DM30 II Drill | | | | | | | 89.1 | | | ($x1000) | | | 3 | | | | 15 | | | | 27 | | | | 27 | | | | 27 | | | | 108 | | | | 108 | | | | 93 | | | | 84 | | | | 59 | | | | 0 | | | 551 |
| Caterpillar 6018FS Hyd Shovel | | | | | | | 479.0 | | | ($x1000) | | | 17 | | | | 81 | | | | 131 | | | | 133 | | | | 135 | | | | 535 | | | | 533 | | | | 459 | | | | 416 | | | | 322 | | | | 123 | | | 2,885 |
| Caterpillar 992K Wheel Loader | | | | | | | 577.5 | | | ($x1000) | | | 16 | | | | 74 | | | | 73 | | | | 73 | | | | 72 | | | | 277 | | | | 266 | | | | 228 | | | | 207 | | | | 173 | | | | 114 | | | 1,574 |
| Caterpillar 773G Truck | | | | | | | 120.0 | | | ($x1000) | | | 23 | | | | 107 | | | | 151 | | | | 153 | | | | 160 | | | | 674 | | | | 746 | | | | 743 | | | | 792 | | | | 685 | | | | 125 | | | 4,358 |
| Caterpillar D9T Track Dozer | | | | | | | 223.7 | | | ($x1000) | | | 81 | | | | 82 | | | | 81 | | | | 81 | | | | 81 | | | | 327 | | | | 327 | | | | 327 | | | | 327 | | | | 163 | | | | 40 | | | 1,918 |
| Caterpillar 824H Wheel Dozer | | | | | | | 150.9 | | | ($x1000) | | | 27 | | | | 28 | | | | 27 | | | | 27 | | | | 27 | | | | 110 | | | | 110 | | | | 110 | | | | 110 | | | | 55 | | | | 27 | | | 660 |
| Caterpillar 14M Motor Grader | | | | | | | 93.2 | | | ($x1000) | | | 17 | | | | 17 | | | | 17 | | | | 17 | | | | 17 | | | | 68 | | | | 68 | | | | 68 | | | | 68 | | | | 34 | | | | 17 | | | 408 |
| Water Truck - 14,000 gal | | | | | | | 213.6 | | | ($x1000) | | | 39 | | | | 39 | | | | 39 | | | | 39 | | | | 39 | | | | 156 | | | | 156 | | | | 156 | | | | 156 | | | | 78 | | | | 38 | | | 935 |
| Caterpillar 319DL Excavator | | | | | | | 41.7 | | | ($x1000) | | | 5 | | | | 5 | | | | 5 | | | | 5 | | | | 5 | | | | 20 | | | | 20 | | | | 20 | | | | 20 | | | | 15 | | | | 0 | | | 121 |
| Sandvik DX680 TH Drill | | | | | | | 176.8 | | | ($x1000) | | | 21 | | | | 21 | | | | 21 | | | | 21 | | | | 21 | | | | 85 | | | | 85 | | | | 85 | | | | 85 | | | | 85 | | | | 0 | | | 532 |
| MAJOR EQUIPMENT DEPRECIATION COST | | | | | | | ($x1000) | | | 251 | | | | 470 | | | | 574 | | | | 578 | | | | 585 | | | | 2,360 | | | | 2,419 | | | | 2,289 | | | | 2,264 | | | | 1,670 | | | | 484 | | | 13,943 |
| SMALL EQUIPMENT @ | | | 15.00 | % | | | | | | ($x1000) | | | 38 | | | | 71 | | | | 86 | | | | 87 | | | | 88 | | | | 354 | | | | 363 | | | | 343 | | | | 340 | | | | 250 | | | | 73 | | | 2,092 |
| TOTAL EQUIPMENT DEPRECIATION COST | | | | | | | ($x1000) | | | 288 | | | | 541 | | | | 660 | | | | 664 | | | | 672 | | | | 2,715 | | | | 2,782 | | | | 2,633 | | | | 2,604 | | | | 1,920 | | | | 556 | | | 16,035 |
Kappes, Cassiday & Associates June 19, 2018 | Page 21-17 |
| | AMENDED AND RESTATED |
| Camino Rojo Preliminary Economic Assessment | NI 43-101 Technical Report |
Table 21-9 shows IMC’s estimate of annual depreciation costs for each equipment type. The equipment replacement cost is the new, delivered price used for the owner operation case. The column labeled IMC Life shows the life of the equipment, in metered hours, that IMC used for equipment replacement calculations. IMC deducted 10,000 hours from each piece of equipment to obtain the adjusted equipment life. This can be thought of as accelerated depreciation or a risk premium for the contractor. Assuming a 10% salvage value for equipment, and straight-line depreciation, the equipment depreciation per metered hour and per shift are shown. This is based on 8.75 metered hours per shift.
Table 21-9
Contractor Equipment Depreciation
| | | Replace. | | | IMC Equip | | | Contractor | | | Depreciation (Notes 1,2) | |
| | Cost | | | Life | | | Life | | | Per Hr | | | Per Shift | |
| Equipment Type | | (US$) | | | (hrs) | | | (hrs) | | | ($/hr) | | | ($/shift) | |
| Atlas Copco DM30 II Drill | | | 565,700 | | | | 60,000 | | | | 50,000 | | | | 10.18 | | | | 89.10 | |
| Caterpillar 6018FS Hyd Shovel | | | 2,433,200 | | | | 50,000 | | | | 40,000 | | | | 54.75 | | | | 479.04 | |
| Caterpillar 992K Wheel Loader | | | 2,200,000 | | | | 40,000 | | | | 30,000 | | | | 66.00 | | | | 577.50 | |
| Caterpillar 773G Truck | | | 914,300 | | | | 70,000 | | | | 60,000 | | | | 13.71 | | | | 120.00 | |
| Caterpillar D9T Track Dozer | | | 1,136,500 | | | | 50,000 | | | | 40,000 | | | | 25.57 | | | | 223.75 | |
| Caterpillar 824H Wheel Dozer | | | 766,300 | | | | 50,000 | | | | 40,000 | | | | 17.24 | | | | 150.87 | |
| Caterpillar 14M Motor Grader | | | 473,300 | | | | 50,000 | | | | 40,000 | | | | 10.65 | | | | 93.18 | |
| Water Truck - 14,000 gal | | | 1,085,000 | | | | 50,000 | | | | 40,000 | | | | 24.41 | | | | 213.61 | |
| Caterpillar 319DL Excavator | | | 211,665 | | | | 50,000 | | | | 40,000 | | | | 4.76 | | | | 41.67 | |
| Sandvik DX680 TH Drill | | | 673,700 | | | | 40,000 | | | | 30,000 | | | | 20.21 | | | | 176.85 | |
Note 1: Depreciation assumes 10% salvage value, i.e. hourly depreciation = 0.9 x cost / life
Note 2: Assumes 8.75 metered hours per shift
21.2.2 Process and G&A Operating Costs
Average process and G&A operating costs based on 18,000 tpd material being processed in presented in Table 21-10.
Kappes, Cassiday & Associates June 19, 2018 | Page 21-18 |
| | AMENDED AND RESTATED |
| Camino Rojo Preliminary Economic Assessment | NI 43-101 Technical Report |
Table 21-10
Process, Support & G&A Operating Cost
| | | | | | | | | | | | | | US$ per | |
| | | | | | | | Unit | | | Annual | | | Tonne | |
| | | Units | | Qty | | | Costs, US$ | | | Costs, US$ | | | Processed | |
| Labor | | | | | | | | | | | | | | | | | | |
| Process | | ea | | | 132 | | | | | | | $ | 2,652,234 | | | $ | 0.404 | |
| Laboratory | | ea | | | 20 | | | | | | | $ | 389,571 | | | $ | 0.059 | |
| SUBTOTAL | | | | | | | | | | | | $ | 3,041,805 | | | $ | 0.463 | |
| | | | | | | | | | | | | | | | | | | |
| Crushing | | | | | | | | | | | | | | | | | | |
| Power | | kWh/t | | | 1.507 | | | $ | 0.100 | | | $ | 989,972 | | | $ | 0.151 | |
| 992 Loader | | h/mo | | | 426 | | | $ | 105.98 | | | $ | 541,558 | | | $ | 0.082 | |
| Wear | | | | | | | | | | | | $ | 1,314,000 | | | $ | 0.200 | |
| Overhaul & Maintenance | | | | | | | | | | | | $ | 657,000 | | | $ | 0.100 | |
| SUBTOTAL | | | | | | | | | | | | $ | 3,502,530 | | | $ | 0.533 | |
| | | | | | | | | | | | | | | | | | | |
| Reclaim & Convey/Stacking | | | | | | | | | | | | | | | | | | |
| Power | | kWh/t | | | 1.080 | | | $ | 0.100 | | | $ | 709,684 | | | $ | 0.108 | |
| D-6 Dozer | | h/mo | | | 480 | | | $ | 32.12 | | | $ | 185,011 | | | $ | 0.028 | |
| Maintenance Supplies | | lot | | | | | | | | | | $ | 328,500 | | | $ | 0.050 | |
| SUBTOTAL | | | | | | | | | | | | $ | 1,223,195 | | | $ | 0.186 | |
| | | | | | | | | | | | | | | | | | | |
| Heap Leach Systems | | | | | | | | | | | | | | | | | | |
| Power | | kWh/t | | | 0.943 | | | $ | 0.100 | | | $ | 619,743 | | | $ | 0.094 | |
| Piping | | lot | | | | | | | | | | $ | 197,100 | | | $ | 0.030 | |
| Maintenance Supplies | | lot | | | | | | | | | | $ | 65,700 | | | $ | 0.010 | |
| SUBTOTAL | | | | | | | | | | | | $ | 882,543 | | | $ | 0.134 | |
| | | | | | | | | | | | | | | | | | | |
| Merrill-Crowe | | | | | | | | | | | | | | | | | | |
| Power | | kWh/t | | | 0.545 | | | $ | 0.100 | | | $ | 358,161 | | | $ | 0.055 | |
| DE | | kg/day | | | 1,534 | | | $ | 0.800 | | | $ | 449,141 | | | $ | 0.068 | |
| Zinc | | kg/yr | | | 48,837 | | | $ | 7.49 | | | $ | 365,964 | | | $ | 0.056 | |
| Filter Cloths (Press) | | sets/year | | | 15 | | | $ | 8,000.00 | | | $ | 120,000 | | | $ | 0.018 | |
| Filter Cloths (Clarifier) | | sets/year | | | 5 | | | $ | 8,000.00 | | | $ | 40,000 | | | $ | 0.006 | |
| Misc. Operating Supplies | | lot | | | | | | | | | | $ | 131,400 | | | $ | 0.020 | |
| SUBTOTAL | | | | | | | | | | | | $ | 1,464,666 | | | $ | 0.223 | |
| | | | | | | | | | | | | | | | | | | |
| Refinery | | | | | | | | | | | | | | | | | | |
| Power | | kWh/t | | | 0.060 | | | $ | 0.100 | | | $ | 39,098 | | | $ | 0.006 | |
| Diesel (Furnace) | | L/mo | | | 2565 | | | $ | 0.810 | | | $ | 24,935 | | | $ | 0.004 | |
| Misc. Operating Supplies | | lot | | | | | | | | | | $ | 131,400 | | | $ | 0.020 | |
| Maintenance Supplies | | lot | | | | | | | | | | $ | 65,700 | | | $ | 0.010 | |
| SUBTOTAL | | | | | | | | | | | | $ | 261,133 | | | $ | 0.040 | |
| | | | | | | | | | | | | | | | | | | |
| Reagents | | | | | | | | | | | | | | | | | | |
| Power | | kWh/t | | | 0.009 | | | $ | 0.100 | | | $ | 6,043 | | | $ | 0.001 | |
| Lime | | kg/t | | | 1.250 | | | $ | 0.170 | | | $ | 1,396,125 | | | $ | 0.213 | |
| Cyanide | | kg/t | | | 0.35 | | | $ | 2.50 | | | $ | 5,748,750 | | | $ | 0.875 | |
| Antiscalant | | ppm | | | 10.0 | | | $ | 2.48 | | | $ | 611,915 | | | $ | 0.093 | |
| Fluxes | | kg/oz | | | 0.054 | | | $ | 1.50 | | | $ | 42,399 | | | $ | 0.006 | |
| Maintenance Supplies | | lot | | | | | | | | | | $ | 65,700 | | | $ | 0.010 | |
| SUBTOTAL | | | | | | | | | | | | $ | 7,870,931 | | | $ | 1.198 | |
Kappes, Cassiday & Associates June 19, 2018 | Page 21-19 |
| | AMENDED AND RESTATED |
| Camino Rojo Preliminary Economic Assessment | NI 43-101 Technical Report |
| | | | | | | | | | | | | | US$ per | |
| | | | | | | | Unit | | | Annual | | | Tonne | |
| | | Units | | Qty | | | Costs, US$ | | | Costs, US$ | | | Processed | |
| Water Supply & Distribution | | | | | | | | | | | | | | | | | | |
| Power | | kWh/t | | | 0.257 | | | $ | 0.100 | | | $ | 168,724 | | | $ | 0.026 | |
| Maintenance Supplies | | lot | | | | | | | | | | $ | 131,400 | | | $ | 0.02 | |
| SUBTOTAL | | | | | | | | | | | | $ | 300,124 | | | $ | 0.046 | |
| | | | | | | | | | | | | | | | | | | |
| Laboratory | | | | | | | | | | | | | | | | | | |
| Power | | kWh/t | | | 0.338 | | | $ | 0.100 | | | $ | 221,738 | | | $ | 0.034 | |
| Assays, Solids | | No/d | | | 150 | | | $ | 7.00 | | | $ | 383,250 | | | $ | 0.058 | |
| Assays, Solutions | | No/d | | | 100 | | | $ | 3.00 | | | $ | 109,500 | | | $ | 0.017 | |
| Misc. Supplies | | lot | | | | | | | | | | $ | 131,400 | | | $ | 0.020 | |
| SUBTOTAL | | | | | | | | | | | | $ | 845,888 | | | $ | 0.129 | |
| | | | | | | | | | | | | | | | | | | |
| Support Services / Facilities | | | | | | | | | | | | | | | | | | |
| Power | | kWh/t | | | 0.311 | | | $ | 0.10 | | | $ | 204,491 | | | $ | 0.031 | |
| Fork Lift, 2.5 t | | h/mo | | | 180 | | | $ | 7.82 | | | $ | 16,891 | | | $ | 0.003 | |
| Telehandler | | h/mo | | | 120 | | | $ | 10.03 | | | $ | 14,443 | | | $ | 0.002 | |
| Boom Truck 10 t | | h/mo | | | 90 | | | $ | 10.00 | | | $ | 10,800 | | | $ | 0.002 | |
| Backhoe/loader | | h/mo | | | 180 | | | $ | 15.09 | | | $ | 32,594 | | | $ | 0.005 | |
| Pickup Trucks (7) | | km/d | | | 350 | | | $ | 0.63 | | | $ | 80,483 | | | $ | 0.012 | |
| Maintenance Truck | | km/d | | | 100 | | | $ | 0.63 | | | $ | 22,995 | | | $ | 0.004 | |
| Crane - Rough Terrain | | h/mo | | | 24 | | | $ | 25.04 | | | $ | 7,212 | | | $ | 0.001 | |
| Bobcat | | h/mo | | | 180 | | | $ | 8.00 | | | $ | 17,280 | | | $ | 0.003 | |
| Maintenance Supplies | | lot | | | | | | | | | | $ | 131,400 | | | $ | 0.020 | |
| SUBTOTAL | | | | | | | | | | | | $ | 538,589 | | | $ | 0.082 | |
| | | | | | | | | | | | | | | | | | | |
| TOTAL COST (process Only) | | | | | | | | | | | | $ | 19,931,405 | | | $ | 3.034 | |
| | | | | | | | | | | | | | | | | | | |
| G&A | | | | | | | | | | | | | | | | | | |
| G&A Labor | | ea | | | 110 | | | | | | | $ | 1,986,653 | | | $ | 0.302 | |
| G&A Expenses | | | | | | | | | | | | $ | 5,000,000 | | | $ | 0.761 | |
| CSR and Ejido | | | | | | | | | | | | $ | 1,100,000 | | | $ | 0.167 | |
| Land Access Agreements | | | | | | | | | | | | $ | 1,200,000 | | | $ | 0.183 | |
| Water Rights | | | | | | | | | | | | $ | 1,300,000 | | | $ | 0.198 | |
| Concessions (1/4 Total Property) | | | | | | | | | | | | $ | 500,000 | | | $ | 0.076 | |
| TOTAL COST G&A | | | | | | | | | | | | $ | 11,086,653 | | | $ | 1.687 | |
| | | | | | | | | | | | | | | | | | | |
| TOTAL COST PROCESS & G&A | | | | | | | | | | | | $ | 31,018,058 | | | $ | 4.721 | |
Kappes, Cassiday & Associates June 19, 2018 | Page 21-20 |
| | AMENDED AND RESTATED |
| Camino Rojo Preliminary Economic Assessment | NI 43-101 Technical Report |
21.2.2.1 Personnel and Staffing
Staffing requirements for process and administration personnel have been estimated by KCA based on experience with similar sized operations. Total process personnel is estimated at 152 persons including 20 laboratory workers. G&A labor is estimated at 110 persons. Mining labor will be provided by the mining contractor and is considered in the mining cost estimate.
21.2.2.2 Power
Power usage for the process and process-related infrastructure was derived from estimated connected loads assigned to powered equipment from the mechanical equipment list. Equipment power demands under normal operation were assigned and coupled with estimated on-stream times to determine the average energy usage and cost.
The total attached power for the process and infrastructure is estimated at 7.5 MW, with an average draw of 4.3 MW. The total consumed power for these areas is approximately 5.05 kWh/t material processed. Power will be supplied to the project site by an overhead power line with an average estimated cost of US$0.10/kWh. Additional power supply studies are in progress to determine the power supply cost for the project, including power line and substation requirements.
21.2.2.3 Consumable Items
Operating supplies have been estimated based upon unit costs and consumption rates predicted by metallurgical tests and have been broken down by area. Freight costs are included in all operating supply and reagent estimates. Reagent consumptions have been derived from test work and from design criteria considerations. Other consumable items have been estimated by KCA based on KCA’s experience with other similar operations.
Operating costs for consumable items have been distributed based on tonnage and gold/silver production or smelting batches, as appropriate.
21.3 Reclamation & Closure Costs
Costs for concurrent reclamation and closure costs have been estimated at US$0.50 per tonne of material processed, or approximately US$21.2 million over the life of the project. These costs are in addition to any reclamation and closure costs considered in the normal operating and sustaining cost estimates.
Activities included as part of reclamation and closure are described in Section 20.1.4 of this Report.
Kappes, Cassiday & Associates June 19, 2018 | Page 21-21 |
| | AMENDED AND RESTATED |
| Camino Rojo Preliminary Economic Assessment | NI 43-101 Technical Report |
22.0 ECONOMIC ANALYSIS
This PEA is preliminary in nature and it includes inferred mineral resources that are considered too speculative geologically to have the economic considerations applied to them that would enable them to be categorized as mineral reserves and there is no certainty that the PEA will be realized.
22.1 Summary
Based on the estimated production schedule, capital costs and operating costs, a cash flow model was prepared by KCA for the economic analysis of the Camino Rojo Project. All of the information used in this economic evaluation has been taken from work completed by KCA and other consultants working on this project as described in previous sections of this study.
The project economics were evaluated using a discounted cash flow (DCF) method, which measures the Net Present Value (NPV) of future cash flow streams. The final economic model was developed by KCA based on the following methods:
| · | The cash flow model is based on the preliminary mine production schedule from IMC. |
| · | The period of analysis is nine years including one year of pre-production, seven years of production and one year for reclamation and closure. |
| · | All cash flow amounts are in US dollars (US$). All costs are considered to be 1st quarter 2018 costs. Inflation is not considered in this model. |
| · | The Internal Rate of Return (IRR) is calculated as the discount rate that yields a zero Net Present Value (NPV). |
| · | The NPV is calculated by discounting the annual cash back to Year -1 and different discount rates. All annual cash flows are assumed to occur at the end of each respective year. |
| · | The payback period is the amount of time, in years, required to recover the initial construction capital cost. |
| · | Working capital is considered in this model and includes mining, processing and general administrative operating costs. The model assumes working capital is recovered during the final two years of operation. |
| · | Royalties and government taxes are included in the model. |
| · | 100% equity financing is assumed. |
| · | Salvage value for process equipment is considered and is applied at the end of the project. |
| · | Reclamation and closure costs are included. |
Kappes, Cassiday & Associates June 19, 2018 | Page 22-1 |
| | AMENDED AND RESTATED |
| Camino Rojo Preliminary Economic Assessment | NI 43-101 Technical Report |
General assumptions for the model, including cost inputs, parameters, royalties and taxes are as follows:
| · | Gold price of US$1,250/oz. |
| · | Silver prize of US$17/oz. |
| · | Gold and silver production and revenue in the model are delayed from the time material is stacked to account for time required for gold to be recovered from the heap. This results in an estimated 15% of the recoverable values being delayed until the following year. |
| · | Pre-production capital costs for the project are spent entirely in Year -1. Sustaining capital for the heap leach pad expansion is spent in Year 2. Sustaining costs for the mine are spent in Years 1, 3 and 7. Capital cost estimates are presented in greater detail in Section 21.0 of this report. |
| · | IVA is applied at 16% to all capital costs as a part of this model and is assumed to be 100% refundable the following year. IVA is not applied to operating costs. |
| · | A 2% NSR is included for royalty agreements with Goldcorp. |
| · | A 0.5% NSR is included and payable to the government as an “extraordinary mining duty”. |
| · | An income tax of 30% is considered. |
| · | A 7.5% mining tax is included and is based on EBITDA less exploration and deductible earthworks costs. |
| · | A refinery and transportation cost of US$1.40/oz for gold and US$1.20/oz for silver is used in the model, including insurance. Gold and silver are assumed to be 99.9% and 98% payable, respectively. |
| · | By-product cash operating costs per payable ounce represent the mine site operating costs including mining, processing, metal transport, refining, administration costs and royalties with a credit for silver produced. Operating costs are presented in greater detail in Section 21.0 of this report. |
| · | All in sustaining costs per payable ounce represent the mine site operating costs including mining, processing, metal transport, refining, administration costs and royalties with a credit for silver produced as well as the LOM sustaining capital and reclamation and closure costs. |
| · | The cash flow analysis evaluates the project on a stand-alone basis. No withholding taxes or dividends are included. No head office or overheads for the parent company are included. |
Kappes, Cassiday & Associates June 19, 2018 | Page 22-2 |
| | AMENDED AND RESTATED |
| Camino Rojo Preliminary Economic Assessment | NI 43-101 Technical Report |
A summary of the key economic parameters is shown in Table 22-1.
Table 22-1
Key Economic Parameters
| Item | | Value | | | Units |
| Au Price | | | 1,250 | | | US$/oz |
| Ag Price | | | 17 | | | US$/oz |
| Au Avg. Recovery | | | 67 | | | % |
| Ag Avg. Recovery | | | 15 | | | % |
| Treatment Rate | | | 18,000 | | | t/d |
| Refining & Transportation Cost, Au | | | 1.40 | | | US$/oz |
| Refining & Transportation Cost, Au | | | 1.20 | | | US$/oz |
| Payable Factor, Au | | | 99.9 | | | % |
| Payable Factor, Ag | | | 98.0 | | | % |
| | | | | | | |
| Annual Produced eqAu, Avg. | | | 103 | | | koz |
| Income & Corporate Tax Rate | | | 30 | | | % |
| Royalties | | | 2.50 | | | % |
| | | | | | | |
| After-Tax NPV | | | | | | |
| i = 0% | | $ | 184,353,016 | | | |
| i = 5% | | $ | 120,834,790 | | | |
| i = 8% | | $ | 91,626,075 | | | |
| i = 10% | | $ | 75,039,610 | | | |
| i = 15% | | $ | 41,564,553 | | | |
| IRR | | | 24.5 | | | % |
| | | | | | | |
| Mine Life | | | 6.6 | | | years |
| Payback | | | 3.3 | | | years |
Based on the methods and assumptions presented above, a summary of the economic analysis is presented in Table 22-2. The complete cash flow model is shown in Table 22-3.
Kappes, Cassiday & Associates June 19, 2018 | Page 22-3 |
| | AMENDED AND RESTATED |
| Camino Rojo Preliminary Economic Assessment | NI 43-101 Technical Report |
Table 22-2
Economic Analysis Summary
| Economic Analysis | | | | | |
| Internal Rate of Return (IRR), Pre-Tax | | | 38.1 | % | | |
| Internal Rate of Return (IRR), After-Tax | | | 24.5 | % | | |
| Average Annual Cashflow (Pre-Tax) | | $ | 60 | | | M |
| NPV @ 5% (Pre-Tax) | | $ | 231 | | | M |
| Average Annual Cashflow (After-Tax) | | $ | 43 | | | M |
| NPV @ 5% (After-Tax) | | $ | 121 | | | M |
| Gold Price Assumption | | $ | 1,250 | | | /Ounce |
| Silver Price Assumption | | $ | 17 | | | /Ounce |
| Pay-Back Period (Rears based on After-Tax) | | | 3.3 | | | Years |
| | | | | | | |
| Capital Costs (Excluding VAT) | | | | | | |
| Initial Capital | | $ | 125 | | | M |
| Working Capital & Initial Fills | | $ | 14 | | | M |
| LOM Sustaining Capital | | $ | 15 | | | M |
| | | | | | | |
| Operating Costs (Average LOM) | | | | | | |
| Mining | | $ | 3.05 | | | /Tonne processed |
| Processing & Support | | $ | 3.20 | | | /Tonne processed |
| G&A | | $ | 1.77 | | | /Tonne processed |
| Total Operating Cost | | $ | 8.02 | | | /Tonne processed |
| Total By-product Cash Cost | | $ | 499 | | | /Ounce Au |
| All-in Sustaining Cost | | $ | 555 | | | /Ounce Au |
| | | | | | | |
| Production Data | | | | | | |
| Life of Mine | | | 6.6 | | | Years |
| Total Tonnes to Crusher | | | 42,477,000 | | | Tonnes |
| Grade Au (Avg.) | | | 0.71 | | | g/t |
| Grade Ag (Avg.) | | | 13.56 | | | g/t |
| Contained Au oz | | | 966,000 | | | Ounces |
| Contained Ag oz | | | 18,517,000 | | | Ounces |
| Mine Throughput per day | | | 18,000 | | | Tonnes/day |
| Mine Throughput per year | | | 6,570,000 | | | Tonnes/year |
| Metallurgical Recovery Au (Overall) | | | 67 | % | | |
| Metallurgical Recovery Ag (Overall) | | | 15 | % | | |
| Average Annual Gold Production | | | 97,472 | | | Ounces |
| Average Annual Silver Production | | | 415,981 | | | Ounces |
| Total Gold Produced | | | 642,382 | | | Ounces |
| Total Silver Produced | | | 2,741,485 | | | Ounces |
| LOM Strip Ratio | | | 0.58:1 | | | |
Kappes, Cassiday & Associates June 19, 2018 | Page 22-4 |
| AMENDED AND RESTATED |
| Camino Rojo Preliminary Economic Assessment | NI 43-101 Technical Report |
Table 22-3
Cash Flow Model
| Assumptions | | | | | | | Output | | | | | | | | |
| Au Price | | | | 1,250 | $/oz | | | Pre-Tax NPV | i, % | After-Tax NPV | | | | | |
| Ag Price | | | | 17 | $/oz | | | $324,052,617 | 0% | $184,353,016 | | Mine Life | 6.6 | years | |
| Au Recovery, Kp Oxide | | | | 70.0 | % | | | $230,634,552 | 5% | $120,834,790 | | Payback | 3.3 | years | |
| Ag Recovery, Kp Oxide | | | | 13.00 | % | | | $187,405,919 | 8% | $91,626,075 | | | | | |
| Au Recovery, Ki Oxide | | | | 58.00 | % | | | $162,750,704 | 10% | $75,039,610 | | | | | |
| Ag Recovery, Ki Oxide | | | | 20.00 | % | | | $112,663,113 | 15% | $41,564,553 | | | | | |
| Au Recovery, Transition Hi | | | | 60.00 | % | | | 38.1% | IRR | 24.5% | | | | | |
| Ag Recovery, Transition Hi | | | | 17.00 | % | | | | | | | | | | |
| Au Recovery, Transition Lo | | | | 49.00 | % | | | | | | | | | | |
| Ag Recovery, Transition Lo | | | | 20.00 | % | | Total Au Recovered | | 642,382 | Ounces | Stripping Ratio | | 0.58 | t/t | |
| | | | | | | | Payable Ounces | | 641,900 | Ounces | | | | | |
| Treatment Rate | | | | 18,000 | tpd | | | | | | | | | | |
| | | | | | | | Max Annual Au oz | | 120,974 | | | | | | |
| Exchange Rate: | | | | | | | By-Product Cash Cost | $499 | | | | | | |
| | | | | | | | All-in Sustaining Cost per ounce, $ | $555 | | LOM Tonnes | | 42,477,000 | | |
| Refining and Transport Cost Au | | | | 1.40 | $/oz - Assumed | | | | | | | | | | |
| Refining and Transport Cost Ag | | | | 1.20 | $/oz - Assumed | | | | | | | | | | |
| Gold Pay Factor | | | | 99.9% | Assumed | | | | | | | | | | |
| Silver Pay Factor | | | | 98.0% | Assumed | | | | | | | | | | |
| Royalties | | | | 2.00% | | | | | | | | | | | |
| Extraordinary Mining Duty | | | | 0.50% | | | | | | | | | | | |
| Export Tax | | | | 0.00% | | | | | | | | | | | |
| Income Tax Rate | | | | 30.0% | | | | | | | | | | | |
| Special Mining Tax Rate | | | | 7.5% | | | | | | | | | | | |
| | | | | | | | | | | | | | | | |
| Salvage Value Percentage (Process Eq.) | | | | 10.0% | Assumed | | | | | | | | | | |
| Salvage Value Percentage (Electrical Eq.) | | | | 5.0% | Assumed | | | | | | | | | | |
| | | | | | | | | | | | | | | | |
| | | | | | Year 1 | | | | | | | |
| Item | | TOTAL | Year -2 | Year -1 | Q1 | Q2 | Q3 | Q4 | Year 2 | Year 3 | Year 4 | Year 5 | Year 6 | Year 7 | Year 8 |
| Total Mined | | | | | | | | | | | | | | | |
| Leachable Tonnes | | 42,477,000 | | 155,000 | 682,000 | 1,679,000 | 1,715,000 | 1,775,000 | 7,319,000 | 8,110,000 | 7,937,000 | 7,515,000 | 5,590,000 | | |
| Au, g/t | | 0.71 | | 0.83 | 0.83 | 0.59 | 0.58 | 0.58 | 0.62 | 0.67 | 0.74 | 0.77 | 0.83 | | |
| Ag, g/t | | 13.56 | | 9.58 | 9.57 | 9.77 | 9.77 | 10.00 | 10.61 | 11.80 | 14.07 | 15.47 | 20.70 | | |
| Waste Mined | | 24,537,000 | | 345,000 | 1,518,000 | 1,602,000 | 1,603,000 | 1,549,000 | 5,804,000 | 4,844,000 | 3,217,000 | 2,580,000 | 1,475,000 | 0 | |
| Total mined | | 67,014,000 | | 500,000 | 2,200,000 | 3,281,000 | 3,318,000 | 3,324,000 | 13,123,000 | 12,954,000 | 11,154,000 | 10,095,000 | 7,065,000 | | |
| Strip Ratio | | 0.58 | | | 2.23 | 0.95 | 0.93 | 0.87 | 0.79 | 0.60 | 0.41 | 0.34 | 0.26 | | |
| Material Processed | | | | | | | | | | | | | | | |
| Kp Oxide | | 28,561,000 | | | 609,000 | 1,098,000 | 1,112,000 | 1,202,000 | 5,341,000 | 5,958,000 | 5,902,000 | 4,739,000 | 1,367,000 | 1,233,000 | |
| Ki Oxide | | 7,524,000 | | | 212,000 | 544,000 | 530,000 | 441,000 | 1,229,000 | 612,000 | 652,000 | 348,000 | 319,000 | 2,637,000 | |
| Transition Hi | | 3,445,000 | | | 0 | 0 | 0 | 0 | 0 | 0 | 9,000 | 837,000 | 2,599,000 | 0 | |
| Transition Lo | | 2,947,000 | | | 0 | 0 | 0 | 0 | 0 | 0 | 7,000 | 646,000 | 2,285,000 | 9,000 | |
| Total | | 42,477,000 | | 0 | 821,000 | 1,642,000 | 1,642,000 | 1,643,000 | 6,570,000 | 6,570,000 | 6,570,000 | 6,570,000 | 6,570,000 | 3,879,000 | |
Kappes, Cassiday & Associates June 19, 2018
| Page 22-5 |
| AMENDED AND RESTATED |
| Camino Rojo Preliminary Economic Assessment | NI 43-101 Technical Report |
| Au, g/t - Kp Oxide | | 0.79 | | | 0.97 | 0.71 | 0.70 | 0.70 | 0.73 | 0.80 | 0.87 | 0.90 | 0.87 | 0.24 | |
| Ag, g/t - Kp Oxide | | 13.82 | | | 10.59 | 11.00 | 11.01 | 11.12 | 11.70 | 13.08 | 15.83 | 16.54 | 17.57 | 11.65 | |
| Au, g/t - Ki Oxide | | 0.37 | | | 0.49 | 0.37 | 0.38 | 0.37 | 0.38 | 0.48 | 0.52 | 0.54 | 0.28 | 0.27 | |
| Ag, g/t - Ki Oxide | | 7.42 | | | 6.91 | 7.47 | 7.52 | 7.79 | 7.95 | 7.73 | 8.23 | 6.53 | 7.04 | 7.01 | |
| Au, g/t - Transition Hi | | 0.77 | | | 0.00 | 0.00 | 0.00 | 0.00 | 0.00 | 0.00 | 0.53 | 0.72 | 0.78 | 0.00 | |
| Ag, g/t - transition Hi | | 22.10 | | | 0.00 | 0.00 | 0.00 | 0.00 | 0.00 | 0.00 | 12.59 | 18.69 | 23.23 | 0.00 | |
| Au, g/t - Transition Lo | | 0.72 | | | 0.00 | 0.00 | 0.00 | 0.00 | 0.00 | 0.00 | 0.54 | 0.77 | 0.71 | 0.34 | |
| Ag, g/t - Transition Lo | | 16.70 | | | 0.00 | 0.00 | 0.00 | 0.00 | 0.00 | 0.00 | 3.96 | 17.67 | 16.52 | 4.07 | |
| contained Au, oz | | 965,524 | | | 22,261 | 31,394 | 31,611 | 32,154 | 140,278 | 162,327 | 176,896 | 177,612 | 158,743 | 32,248 | |
| contained Ag, oz | | 18,516,737 | | | 254,452 | 518,975 | 521,773 | 540,193 | 2,323,257 | 2,657,666 | 3,180,904 | 3,463,134 | 3,999,111 | 1,057,271 | |
| | | | | | | | | | | | | | | |
| Recoverable Gold, kg | 19,980 | | | 472 | 659 | 664 | 681 | 2,998 | 3,499 | 3,809 | 3,681 | 2,901 | 617 | |
| Total Recoverable Gold, koz | 642.4 | | | 15.2 | 21.2 | 21.4 | 21.9 | 96.4 | 112.5 | 122.5 | 118.3 | 93.3 | 19.8 | |
| Ultimate Recovery, Au | | 67% | | | 68% | 68% | 68% | 68% | 69% | 69% | 69% | 67% | 59% | 61% | |
| | | | | | | | | | | | | | | |
| Recoverable Silver, kg | 85,268 | | | 1,131 | 2,383 | 2,389 | 2,425 | 10,078 | 11,077 | 13,244 | 15,587 | 21,384 | 5,571 | |
| Total Recoverable Silver, koz | 2,741.5 | | | 36.4 | 76.6 | 76.8 | 78.0 | 324.0 | 356.1 | 425.8 | 501.1 | 687.5 | 179.1 | |
| Ultimate Recovery, Ag | | 15% | | | 14% | 15% | 15% | 14% | 14% | 13% | 13% | 14% | 17% | 17% | |
| | | | | | | | | | | | | | | |
| Recoverable Gold Delayed, oz | | | | 7,591 | 10,598 | 10,677 | 10,941 | 14,457 | 16,874 | 18,371 | 17,750 | 13,988 | | |
| Recoverable Silver Delayed, oz | | | | | 18,188 | 38,306 | 38,400 | 38,978 | 48,602 | 53,422 | 63,870 | 75,170 | 103,130 | | |
| | | | | | | | | | | | | | | | |
| Total Gold Produced, oz | 642,382 | | | 7,591 | 17,277 | 20,914 | 21,609 | 94,148 | 110,077 | 120,974 | 118,956 | 97,018 | 33,819 | |
| Total Silver Produced, oz | 2,741,485 | | | 18,188 | 54,312 | 74,292 | 77,367 | 318,997 | 351,324 | 415,353 | 489,831 | 659,570 | 282,250 | |
| Realized Recovery, Au | | | | | 34% | 46% | 54% | 57% | 63% | 65% | 66% | 66% | 65% | 67% | |
| Realized Recovery, Ag | | | | | 7% | 9% | 11% | 12% | 13% | 13% | 13% | 13% | 14% | 15% | |
| | | | | | | | | | | | | | | | |
| TOTAL EQUIVALENT Au oz PRODUCED | 679,666 | | | 7,838 | 18,016 | 21,924 | 22,661 | 98,486 | 114,855 | 126,623 | 125,618 | 105,988 | 37,658 | |
| | | | | | | | | | | | | | | |
| Gold payable, oz | 641,900 | | | 7,585 | 17,264 | 20,898 | 21,592 | 94,077 | 109,994 | 120,883 | 118,867 | 96,945 | 33,794 | |
| silver payable, oz | 2,686,655 | | | 17,824 | 53,225 | 72,806 | 75,820 | 312,617 | 344,298 | 407,046 | 480,034 | 646,379 | 276,605 | |
| equivalent Au payable oz | 678,438 | | | 7,827 | 17,988 | 21,889 | 22,623 | 98,329 | 114,677 | 126,419 | 125,395 | 105,736 | 37,555 | |
| | | | | | | | | | | | | | | | |
| Refining & Transportation Charge | 4,122,646 | | | $32,008 | $88,040 | $116,625 | $121,213 | $506,849 | $567,149 | $657,692 | $742,455 | $911,378 | $379,237 | |
| NET REVENUE | | $843,925,338 | $0.00 | | $9,752,101.67 | $22,397,265 | $27,244,059 | $28,158,109 | $122,404,211 | $142,778,555 | $157,366,011 | $156,001,882 | $131,258,007 | $46,565,137 | $0 |
| | | | | | Year 1 | | | | | | | |
| OPERATING COSTS | | Total | Year -2 | Year -1 | Q1 | Q2 | Q3 | Q4 | Year 2 | Year 3 | Year 4 | Year 5 | Year 6 | Year 7 | Year 8 |
| Operating Costs | | | | | | | | | | | | | | | |
| Mining Cost | $3.05 | $129,568,894 | | | $4,311,208 | $5,390,891 | $5,430,119 | $5,503,908 | $22,204,173 | $22,703,758 | $21,516,965 | $21,633,957 | $17,037,873 | $3,836,043 | $0 |
| Processing Cost | $3.20 | $135,958,641 | | | $3,068,821 | $4,981,686 | $4,981,686 | $4,984,016 | $19,931,405 | $19,931,405 | $19,931,405 | $19,931,405 | $19,931,405 | $13,661,586 | $4,623,822 |
| G&A Cost | $1.77 | $75,389,241 | | | $2,771,663 | $2,771,663 | $2,771,663 | $2,771,663 | $11,086,653 | $11,086,653 | $11,086,653 | $11,086,653 | $11,086,653 | $5,543,327 | $3,325,996 |
| TOTAL OPERATING COSTS | | $340,916,776 | $0.00 | $0.00 | $10,151,692.05 | $13,144,240.61 | $13,183,468.46 | $13,259,587.42 | $53,222,231 | $53,721,815 | $52,535,023 | $52,652,015 | $48,055,931 | $23,040,956 | $7,949,817 |
| | | | | | | | | | | | | | | | |
| OPERATNG CASH FLOW | | $503,008,561 | | $0 | -$399,590 | $9,253,024 | $14,060,590 | $14,898,522 | $69,181,980 | $89,056,740 | $104,830,988 | $103,349,867 | $83,202,076 | $23,524,182 | -$7,949,817 |
Kappes, Cassiday & Associates June 19, 2018
| Page 22-6 |
| AMENDED AND RESTATED |
| Camino Rojo Preliminary Economic Assessment | NI 43-101 Technical Report |
| | | | | | Year 1 | | | | | | | |
| TAXES | | Total | Year -2 | Year -1 | Q1 | Q2 | Q3 | Q4 | Year 2 | Year 3 | Year 4 | Year 5 | Year 6 | Year 7 | Year 8 |
| Taxes | | | | | | | | | | | | | | | |
| Mining Permit (Land Tax) | | $0 | | | | | | | | | | | | | |
| Special Mining Tax | | $35,580,704 | $0 | $0 | $0 | $660,381 | $1,013,678 | $1,075,152 | $4,600,180 | $6,305,799 | $7,466,986 | $7,357,948 | $5,883,980 | $1,216,600 | $0 |
| Income Tax Payable | | $104,118,897 | $0 | $0 | $0 | $2,641,524 | $4,054,713 | $0 | $10,474,470 | $19,945,530 | $24,590,279 | $24,154,128 | $18,258,254 | $0 | $0 |
| TOTAL TAXES | | $139,699,601 | $0 | $0 | $0 | $3,301,905 | $5,068,391 | $1,075,152 | $15,074,650 | $26,251,328 | $32,057,266 | $31,512,076 | $24,142,234 | $1,216,600 | $0 |
| | | | | | | | | | | | | | | | |
| CASH FLOW BEFORE CAPITAL | | $363,308,960 | | $0 | -$399,590 | $5,951,120 | $8,992,199 | $13,823,370 | $54,107,330 | $62,805,412 | $72,773,723 | $71,837,791 | $59,059,843 | $22,307,582 | -$7,949,817 |
| | | | | | | | | | | | | | | | |
| | | | | | Year 1 | | | | | | | |
| CAPITAL COSTS | | Total | Year -2 | Year -1 | Q1 | Q2 | Q3 | Q4 | Year 2 | Year 3 | Year 4 | Year 5 | Year 6 | Year 7 | Year 8 |
| Capital Costs | | | | | | | | | | | | | | | |
| Contractor Mobilization | | $2,148,045 | | $1,350,869 | $532,488 | $191,544 | $73,144 | $0 | $0 | $0 | $0 | $0 | $0 | $0 | |
| Contractor Demobilization | | $1,342,528 | | $0 | $0 | $0 | $0 | $0 | $0 | $0 | $0 | $0 | $0 | $1,342,528 | |
| Owner Equipment | | $1,110,595 | | $675,435 | $266,244 | $95,772 | $36,572 | $0 | $0 | $36,572 | $0 | $0 | $0 | $0 | |
| Pre-Production Stripping | | $2,899,752 | | $2,899,752 | $0 | $0 | $0 | $0 | $0 | $0 | $0 | $0 | $0 | $0 | |
| Mine Contingency | | $0 | | | | | | | | | | | | | |
| Mine Subtotal | | $7,500,920 | | $4,926,056 | $798,732 | $287,316 | $109,716 | $0 | $0 | $36,572 | $0 | $0 | $0 | $1,342,528 | $0 |
| | | | | | | | | | | | | | | | |
| | | | | | | | | | | | | | | | |
| Major Earthworks | | $13,569,558 | | $8,171,392 | | | | | $5,398,166 | | | | | | |
| Liner (Supply & Install) | | $5,761,773 | | $3,538,777 | | | | | $2,222,996 | | | | | | |
| Civils (Supply & Install) | | $1,462,400 | | $1,462,400 | | | | | | | | | | | |
| Structural Steel (Supply & Install) | | $1,457,746 | | $1,457,746 | | | | | | | | | | | |
| Platework (Supply) | | $453,997 | | $453,997 | | | | | | | | | | | |
| Platework (Install) | | $211,923 | | $211,923 | | | | | | | | | | | |
| Mechanical Equipment (Supply) | | $28,275,350 | | $26,062,058 | | | | | $2,213,292 | | | | | | |
| Mechanical Equipment (Install) | | $2,843,706 | | $2,688,761 | | | | | $154,945 | | | | | | |
| Piping (Supply & Install) | | $3,611,253 | | $3,290,099 | | | | | $321,153 | | | | | | |
| Electrical (Supply) | | $10,986,874 | | $10,986,874 | | | | | | | | | | | |
| Electrical (Install) | | $1,045,507 | | $1,045,507 | | | | | | | | | | | |
| Instrumentation (Supply & Install) | | $1,011,926 | | $1,011,926 | | | | | | | | | | | |
| Infrastructure (Supply & Install) | | $9,412,227 | | $9,412,227 | | | | | | | | | | | |
| Spare Parts | | $1,081,040 | | $1,081,040 | | | | | | | | | | | |
| Freight & Duties | | incl | | | | | | | | | | | | | |
| | | | | | | | | | | | | | | | |
| Process Contingency | | $21,486,144 | | $19,500,565 | | | | | $1,985,579 | | | | | | |
| EPCM | | $9,941,282 | | $9,941,282 | | | | | | | | | | | |
| Indirect Costs (incl. contingency) | | $10,845,035 | | $10,845,035 | | | | | | | | | | | |
| Owner's Costs (incl. contingency) | | $9,037,529 | | $9,037,529 | | | | | | | | | | | |
| | | | | | | | | | | | | | | | |
| Subtotal | | $139,996,190 | $0 | $125,125,194 | $798,732 | $287,316 | $109,716 | $0 | $12,296,131 | $36,572 | $0 | $0 | $0 | $1,342,528 | $0 |
| Working Capital (Initial Fills) | | $786,754 | | $786,754 | | | | | | | | | | | |
| Working Capital (90 days) | | $13,001,982 | | $13,001,982 | | | | | | | | | | | |
| Process Preproduction | | $0 | | | | | | | | | | | | | |
| Less: Working Capital Recovery | | $13,788,736 | | | | | | | | | | | $4,596,245 | $9,192,491 | |
| Net Working Capital | | $0 | | $13,788,736 | $0 | $0 | $0 | $0 | $0 | $0 | $0 | $0 | -$4,596,245 | -$9,192,491 | |
Kappes, Cassiday & Associates June 19, 2018
| Page 22-7 |
| AMENDED AND RESTATED |
| Camino Rojo Preliminary Economic Assessment | NI 43-101 Technical Report |
| | | | | | | | | | | | | | | | |
| Subtotal | | $139,996,190 | $0 | $138,913,930 | $798,732 | $287,316 | $109,716 | $0 | $12,296,131 | $36,572 | $0 | $0 | -$4,596,245 | -$7,849,963 | $0 |
| IVA | 16% | $22,208,068 | | $20,020,031 | | | | | $1,967,381 | $5,852 | $0 | $0 | $0 | $214,805 | $0 |
| Less: IVA (Rebate) | | $22,208,068 | | | | | | $20,020,031 | $0 | $1,967,381 | $5,852 | $0 | $0 | $0 | $214,805 |
| Net IVA | | $0 | | $20,020,031 | | | | -$20,020,031 | $1,967,381 | -$1,961,529 | -$5,852 | $0 | $0 | $214,805 | -$214,805 |
| | | | | | | | | | | | | | | | |
| Subtotal | | $139,996,190 | $0 | $158,933,961 | $798,732 | $287,316 | $109,716 | -$20,020,031 | $14,263,512 | -$1,924,957 | -$5,852 | $0 | -$4,596,245 | -$7,635,158 | -$214,805 |
| | | | | | | | | | | | | | | | |
| Reclamation & Closure (Assumed US$ 0.50/t) | $21,238,500 | | | | | | | | $2,123,850 | $2,123,850 | $2,123,850 | $2,123,850 | $6,371,550 | $6,371,550 |
| | | | | | | | | | | | | | | | |
| Less: Salvage Value | | $3,376,879 | | | | | | | | | | | | | $3,376,879 |
| | | | | | | | | | | | | | | | |
| TOTAL CAPITAL | | $157,857,811 | $0 | $158,933,961 | $798,732 | $287,316 | $109,716 | ($20,020,031) | $14,263,512 | $198,893 | $2,117,998 | $2,123,850 | ($2,472,395) | ($1,263,608) | $2,779,867 |
| | | | | | Year 1 | | | | | | | |
| PRE-TAX NET CASH FLOW | | Total | Year -2 | Year -1 | Q1 | Q2 | Q3 | Q4 | Year 2 | Year 3 | Year 4 | Year 5 | Year 6 | Year 7 | Year 8 |
| Pre-Tax Net Cash Flow | | | | | | | | | | | | | | | |
| Pre-tax net cash flow | | $345,150,751 | $0 | -$158,933,961 | -$1,198,322 | $8,965,708 | $13,950,874 | $34,918,553 | $54,918,468 | $88,857,847 | $102,712,990 | $101,226,017 | $85,674,472 | $24,787,789 | -$10,729,684 |
| Royalty Payable | 2.00% | $16,878,507 | $0 | $0 | $195,042 | $447,945 | $544,881 | $563,162 | $2,448,084 | $2,855,571 | $3,147,320 | $3,120,038 | $2,625,160 | $931,303 | $0 |
| Extraordinary Mining Duty | 0.50% | $4,219,627 | | $0 | $48,761 | $111,986 | $136,220 | $140,791 | $612,021 | $713,893 | $786,830 | $780,009 | $656,290 | $232,826 | $0 |
| Pre-tax net cash flow | | $324,052,617 | $0 | -$158,933,961 | -$1,442,125 | $8,405,777 | $13,269,773 | $34,214,600 | $51,858,362 | $85,288,384 | $98,778,839 | $97,325,970 | $82,393,021 | $23,623,661 | -$10,729,684 |
| Cumulative | | | $0 | -$158,933,961 | -$160,376,086 | -$151,970,310 | -$138,700,537 | -$104,485,937 | -$52,627,574 | $32,660,809 | $131,439,649 | $228,765,619 | $311,158,640 | $334,782,301 | $324,052,617 |
| | | | | | Year 1 | | | | | | | |
| AFTER-TAX NET CASH FLOW | | | Year -2 | Year -2 | Q1 | Q2 | Q3 | Q4 | Year 2 | Year 3 | Year 4 | Year 5 | Year 6 | Year 7 | Year 8 |
| After-Tax Net Cash Flow | | | | | | | | | | | | | | | |
| Income & Other Taxes | | $139,699,601 | $0 | $0 | $0 | $3,301,905 | $5,068,391 | $1,075,152 | $15,074,650 | $26,251,328 | $32,057,266 | $31,512,076 | $24,142,234 | $1,216,600 | $0 |
| After-Tax net annual Cash Flow, $ | | $184,353,016 | $0 | -$158,933,961 | -$1,442,125 | $5,103,872 | $8,201,382 | $33,139,448 | $36,783,713 | $59,037,055 | $66,721,574 | $65,813,894 | $58,250,788 | $22,407,061 | -$10,729,684 |
| Cumulative | | | $0 | -$158,933,961 | -$160,376,086 | -$155,272,214 | -$147,070,832 | -$113,931,384 | -$77,147,672 | -$18,110,617 | $48,610,957 | $114,424,851 | $172,675,639 | $195,082,700 | $184,353,016 |
| | | | | | | | | | | | | | | | |
| | | | | -1 | | | | 1 | 2 | 3 | 4 | 5 | 6 | 7 | 8 |
| | | | | 0 | | | | 13,823,370 | 54,107,330 | 62,805,412 | 72,773,723 | 71,837,791 | 59,059,843 | 22,307,582 | (7,949,817) |
| | | | | | Year 1 | | | | | | | |
| CALCULATION FOR INCOME TAX | | | Year -2 | Year -1 | Q1 | Q2 | Q3 | Q4 | Year 2 | Year 3 | Year 4 | Year 5 | Year 6 | Year 7 | Year 8 |
| Calculation for Income Tax | | | | | | | | | | | | | | | |
| Depreciation -Straight Line | | | | | | | | | | | | | | | |
| Depreciation Year 1 | | $113,869,262 | | | $16,327,903 | $16,256,893 | $16,256,893 | $16,256,893 | $16,256,893 | $16,256,893 | $16,256,893 | |
| Depreciation Year 2 | | $0 | | | | | | | | | | |
| Depreciation Year 3 | | $6,676,636 | | | | | $1,335,327 | $1,335,327 | $1,335,327 | $1,335,327 | $1,335,327 | |
| Depreciation Year 4 | | $0 | | | | | | | | | | |
| Depreciation Year 5 | | $0 | | | | | | | | | | |
| Depreciation Year 6 | | $0 | | | | | | | | | | |
| Depreciation Year 7 | | $0 | | | | | | | | | | |
| Depreciation Year 8 | | $0 | | | | | | | | | | |
| Depreciation Year 9 | | $0 | | | | | | | | | | |
| Depreciation Year 10 | | $0 | | | | | | | | | | |
| | | | | | | | | | | | | | | | |
| Total Depreciation for Income Tax | | $120,545,898 | $0 | $0 | $16,327,903 | $16,256,893 | $17,592,220 | $17,592,220 | $17,592,220 | $17,592,220 | $17,592,220 | $0 |
Kappes, Cassiday & Associates June 19, 2018
| Page 22-8 |
| AMENDED AND RESTATED |
| Camino Rojo Preliminary Economic Assessment | NI 43-101 Technical Report |
| | | | | | | | | | | | | |
| Revenue | | $843,925,338 | $0 | $0 | $9,752,102 | $22,397,265 | $27,244,059 | $28,158,109 | $122,404,211 | $142,778,555 | $157,366,011 | $156,001,882 | $131,258,007 | $46,565,137 | $0 |
| (-) Royalties | | $16,878,507 | $0 | $0 | $195,042 | $447,945 | $544,881 | $563,162 | $2,448,084 | $2,855,571 | $3,147,320 | $3,120,038 | $2,625,160 | $931,303 | $0 |
| (-) Operating Costs | | $340,916,776 | $0 | $0 | $10,151,692 | $13,144,241 | $13,183,468 | $13,259,587 | $53,222,231 | $53,721,815 | $52,535,023 | $52,652,015 | $48,055,931 | $23,040,956 | $7,949,817 |
| (-)Reclamation | | $21,238,500 | $0 | $0 | $0 | $0 | $0 | $0 | $0 | $2,123,850 | $2,123,850 | $2,123,850 | $2,123,850 | $6,371,550 | $6,371,550 |
| EBIDTA | | $464,891,555 | $0 | $0 | -$594,632 | $8,805,079 | $13,515,709 | $14,335,359 | $66,733,896 | $84,077,319 | $99,559,818 | $98,105,979 | $78,453,066 | $16,221,329 | -$14,321,367 |
| | | | | | | | | | | | | | | | |
| (-) Depreciation | | $120,545,898 | | | | | | $16,327,903 | $16,256,893 | $17,592,220 | $17,592,220 | $17,592,220 | $17,592,220 | $17,592,220 | $0 |
| (-) Deductible Earthworks | | $13,569,558 | $0 | $8,171,392 | $0 | $0 | $0 | $0 | $5,398,166 | $0 | $0 | $0 | $0 | $0 | $0 |
| (-) Exploration deductions | | $0 | $0 | $0 | $0 | $0 | $0 | $0 | $0 | $0 | $0 | $0 | $0 | $0 | $0 |
| Loss Brought Forward | | -$82,475,256 | $0 | $0 | $0 | $0 | $0 | ($8,171,392) | ($10,163,936) | $0 | $0 | $0 | $0 | $0 | ($1,370,892) |
| Taxable Income | | $248,300,843 | $0 | ($8,171,392) | ($594,632) | $8,805,079 | $13,515,709 | ($10,163,936) | $34,914,901 | $66,485,098 | $81,967,598 | $80,513,759 | $60,860,846 | ($1,370,892) | ($15,692,259) |
| | | | | | | | | | | | | | | | |
| Income Taxes | 30.0% | $104,118,897 | $0 | $0 | $0 | $2,641,524 | $4,054,713 | $0 | $10,474,470 | $19,945,530 | $24,590,279 | $24,154,128 | $18,258,254 | $0 | $0 |
| | | | | | | | | | | | | | | | |
| Loss Carry Forward | | | $0 | ($8,171,392) | ($594,632) | $0 | $0 | ($10,163,936) | $0 | $0 | $0 | $0 | $0 | ($1,370,892) | ($15,692,259) |
| | | | | | | | | | | | | | | | |
| EBIDTA | | $464,891,555 | $0 | $0 | ($594,632) | $8,805,079 | $13,515,709 | $14,335,359 | $66,733,896 | $84,077,319 | $99,559,818 | $98,105,979 | $78,453,066 | $16,221,329 | ($14,321,367) |
| (-) exploration | | $0 | $0 | $0 | $0 | $0 | $0 | $0 | $0 | $0 | $0 | $0 | $0 | $0 | $0 |
| (-) deductible earthworks | | $13,569,558 | $0 | $8,171,392 | $0 | $0 | $0 | $0 | $5,398,166 | $0 | $0 | $0 | $0 | $0 | $0 |
| Income Subject to Special Mining Tax | $451,321,996 | $0 | ($8,171,392) | ($594,632) | $8,805,079 | $13,515,709 | $14,335,359 | $61,335,730 | $84,077,319 | $99,559,818 | $98,105,979 | $78,453,066 | $16,221,329 | ($14,321,367) |
| | | | | | | | | | | | | | | | |
| Special Mining Tax | 7.5% | $35,580,704 | $0 | $0 | $0 | $660,381 | $1,013,678 | $1,075,152 | $4,600,180 | $6,305,799 | $7,466,986 | $7,357,948 | $5,883,980 | $1,216,600 | $0 |
Kappes, Cassiday & Associates June 19, 2018
| Page 22-9 |
| AMENDED AND RESTATED |
| Camino Rojo Preliminary Economic Assessment | NI 43-101 Technical Report |
The Camino Rojo cash flows are net of royalties and taxes. The project yields an after-tax return of 24.5%.
To estimate the relative strength of the project, base case sensitivity analyses have been completed analyzing the economic sensitivity to several parameters including changes in gold price, capital costs and average operating cash cost per tonne of material processed. The sensitivities are based on +/- 25% of the base case. The after-tax analysis is presented in Table 22-4. Figure 22-1 through 22-3 present graphical representations of the after-tax sensitivities. From these sensitivities it can be seen that the project is robust.
The economic indicators chosen for sensitivity evaluation are the internal rate of return (IRR) and NPV at 0% and 5% discount rates.
Table 22-4
Sensitivity Analysis Results
| | | | | | | | | NPV | |
| | | Variation | | | IRR | | | 0% | | | 5% | | | 10% | |
| Gold Price | | | | | | | | | | | | | | | | | | | | |
| 75% | | $ | 938 | | | | 8.9 | % | | $ | 58,516,467 | | | $ | 21,406,028 | | | $ | -4,959,165 | |
| 90% | | $ | 1,125 | | | | 18.6 | % | | $ | 134,018,397 | | | $ | 81,065,797 | | | $ | 43,044,271 | |
| 100% | | $ | 1,250 | | | | 24.5 | % | | $ | 184,353,016 | | | $ | 120,834,790 | | | $ | 75,039,610 | |
| 110% | | $ | 1,375 | | | | 29.9 | % | | $ | 233,731,543 | | | $ | 159,927,785 | | | $ | 106,543,772 | |
| 125% | | $ | 1,563 | | | | 37.5 | % | | $ | 306,847,950 | | | $ | 217,846,352 | | | $ | 153,235,796 | |
| | | | | | | | | | | | | | | | | | | | | |
| Capital Costs | | | | | | | | | | | | | | | | | | | | |
| 75% | | $ | 126,305,947 | | | | 33.4 | % | | $ | 206,009,548 | | | $ | 143,923,225 | | | $ | 98,818,340 | |
| 90% | | $ | 145,237,065 | | | | 27.6 | % | | $ | 193,262,389 | | | $ | 130,237,181 | | | $ | 84,666,217 | |
| 100% | | $ | 157,857,811 | | | | 24.5 | % | | $ | 184,353,016 | | | $ | 120,834,790 | | | $ | 75,039,610 | |
| 110% | | $ | 170,478,556 | | | | 21.8 | % | | $ | 175,244,883 | | | $ | 111,297,870 | | | $ | 65,320,279 | |
| 125% | | $ | 189,409,674 | | | | 18.3 | % | | $ | 161,582,683 | | | $ | 96,992,490 | | | $ | 50,741,283 | |
| | | | | | | | | | | | | | | | | | | | | |
| Operating Costs | | | | | | | | | | | | | | | | | | | | |
| 75% | | $ | 255,687,582 | | | | 30.6 | % | | $ | 239,000,813 | | | $ | 164,121,828 | | | $ | 110,010,823 | |
| 90% | | $ | 306,825,099 | | | | 27.0 | % | | $ | 206,592,687 | | | $ | 138,437,976 | | | $ | 89,253,783 | |
| 100% | | $ | 340,916,776 | | | | 24.5 | % | | $ | 184,353,016 | | | $ | 120,834,790 | | | $ | 75,039,610 | |
| 110% | | $ | 375,008,454 | | | | 21.9 | % | | $ | 161,675,682 | | | $ | 102,899,076 | | | $ | 60,564,501 | |
| 125% | | $ | 426,145,971 | | | | 17.8 | % | | $ | 127,659,682 | | | $ | 75,995,504 | | | $ | 38,851,838 | |
Kappes, Cassiday & Associates June 19, 2018
| Page 22-10 |
| AMENDED AND RESTATED |
| Camino Rojo Preliminary Economic Assessment | NI 43-101 Technical Report |
Figure 22-1
After Tax Sensitivity – IRR
Figure 22-2
After Tax Sensitivity – NPV @ 0%
Kappes, Cassiday & Associates June 19, 2018
| Page 22-11 |
| AMENDED AND RESTATED |
| Camino Rojo Preliminary Economic Assessment | NI 43-101 Technical Report |
Figure 22-3
After Tax Sensitivity – NPV @ 5%
Kappes, Cassiday & Associates June 19, 2018
| Page 22-12 |
| AMENDED AND RESTATED |
| Camino Rojo Preliminary Economic Assessment | NI 43-101 Technical Report |
There are no active exploration properties or producing mines immediately adjacent to the Camino Rojo project.
The Adjacent Owner controls a mining concession adjacent to the Camino Rojo concessions that abuts the northern limit of the Represa Zone. Drillpads and drillroads were observed on this claim during Dr. Gray’s site visit, but the drilling results were unavailable to the author. The Adjacent Owner, however, has a publicly available resource with respect to the adjacent mining concessions. Notwithstanding the absence of confirmed information, on this basis, it is concluded that the Represa mineralized zone extends onto the Adjance Owner’s claim, however, all interpretations, conclusions, and recommendations contained in this report relate exclusively to the mining concessions that comprise the Camino Rojo Project.
The nearest significant producing mines or past producers are Goldcorp’s Peñasquito mine, located 53 km N-NW of Camino Rojo, and various mines of the Concepcion del Oro district, 47 km N-NE of Camino Rojo. The Peñasquito mine exploits gold-silver-lead-zinc mineralization hosted in igneous diatreme-breccia and the surrounding Caracol Formation. Peñasquito mineralization gives way at depth to copper-gold sulphide breccias in garnet skarn, within limestone beneath the Caracol Formation (Rocha-Rocha, 2016). Concepcion del Oro mines produced from polymetallic and copper-gold skarn deposits and limestone-hosted manto (replacement) silver-lead-zinc sulphide deposits adjacent to Late Eocene igneous intrusions (Buseck, 1966). Dr. Gray has not verified this information and the mineralization described for the mines and mineral deposits in this section is not necessarily indicative of the mineralization at the Camino Rojo, Zacatecas property.
Kappes, Cassiday & Associates June 19, 2018
| Page 23-1 |
| AMENDED AND RESTATED |
| Camino Rojo Preliminary Economic Assessment | NI 43-101 Technical Report |
| 24.0 | OTHER RELEVANT DATA AND INFORMATION |
| 24.1 | Project Implementation |
As part of the continued development and implementation of the Camino Rojo project, a prefeasibility or feasibility level study is to be completed, including additional metallurgical, geotechnical and hydrogeological studies. If the results of these future studies are positive, the project would move to detailed engineering and construction. Assuming these additional evaluations commence soon after the completion of this study and there are no significant issues or set-backs, it is envisioned for the project to go into production during the first quarter of 2021. A proposed project development and implementation schedule is presented in Figure 24-1.
Kappes, Cassiday & Associates June 19, 2018
| Page 24-1 |
| AMENDED AND RESTATED |
| Camino Rojo Preliminary Economic Assessment | NI 43-101 Technical Report |
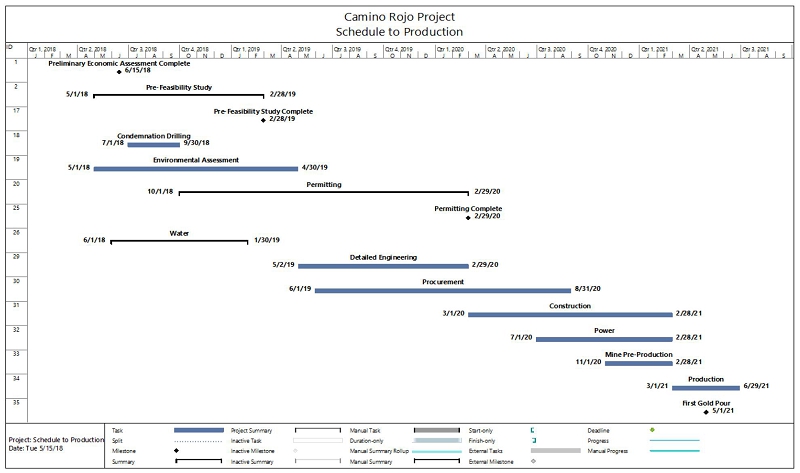
Figure 24-1
Project Development & Implementation Schedule
Kappes, Cassiday & Associates June 19, 2018
| Page 24-2 |
| AMENDED AND RESTATED |
| Camino Rojo Preliminary Economic Assessment | NI 43-101 Technical Report |
Results from historical exploration and metallurgical test work indicate that there is a potential sulphide resource that is not directly recoverable using conventional heap leaching methods but may be viable using different process techniques.
A possible process flowsheet for the sulphide resource is a sequential flotation process consisting of an initial pre-flotation to remove organic carbon followed by lead flotation, zinc flotation, and pyrite/arsenopyrite flotation to recover additional precious metals. The pyrite/arsenopyrite concentrate would be oxidized to recover additional gold and silver by cyanide leaching. Payable products would be the lead concentrate, zinc concentrate, and gold/silver doré recovered from the cyanide leaching of the pyrite/arsenopyrite concentrate.
Process operating costs for the sulphide resource were estimated by benchmarking data from Goldcorp’s Peñasquito operation. A NI-43-101 Technical Report dated March 2016 for Peñasquito estimated operating cost for the process plant, including a pyrite leach, to be US$7.37 per tonne milled. This estimate was based on a daily processing rate of 124,000 tonnes. With the potential sulphide resource at Camino Rojo of approximately 230,000,000 tonnes, the processing rate for a 10-year mine life at Camino Rojo would be approximately 60,000 tpd. To factor the US$7.37 per tonne operating costs to a smaller operation with a 0.6 exponential factor operating costs for Camino Rojo would be US$11.40 per tonne. For initial estimation purposes it is suggested to use US$12.50 per tonne for the process costs which do not include G&A and mining costs.
If an agreement can be achieved with the owner of the adjoining claim, there would be an increase in the amount of material that could potentially be mined and processed with the same general mine and process plan as the PEA is based upon. This would be positive for the project economics.
Kappes, Cassiday & Associates June 19, 2018
| Page 24-3 |
| AMENDED AND RESTATED |
| Camino Rojo Preliminary Economic Assessment | NI 43-101 Technical Report |
| 25.0 | INTERPRETATIONS AND CONCLUSIONS |
Based upon the studies of the Camino Rojo project, the following conclusions, opportunities, and risks have been identified that merit further consideration during future studies and project development:
The work that has been completed to date has demonstrated that Camino Rojo is a potentially technically and economically viable project and justifies additional work, including prefeasibility or feasibility analysis. More specific and detailed conclusions are presented in the sections below.
The Camino Rojo mine was modeled as a conventional open pit mine. The mine plan developed as the base case for this study has identified 42.5 million tonnes of potential plant feed at an average grade of 0.71 g/t gold and 13.6 g/t silver. This amounts to 966,000 contained ounces of gold and 18.5 million contained ounces of silver. The mine life is about 6.6 years and the life of mine strip ratio is 0.58 to 1, a relatively low ratio for a precious metal pit.
Pit operation should be relatively simple compared to most projects in Mexico. The ground in the deposit area is flat, and the haul distances to the proposed crusher and waste storage areas are only about 500m and a kilometer from the pit rim respectively.
The project is also close to a major road and only two to three hours from the major industrial cities of Saltillo and Monterrey, Mexico.
| 25.1.2 | Metallurgy and Process |
The project has been designed as an open-pit mine with heap leach for recovery of gold and silver from oxide and transition material. Leachable material will be crushed to P80 38mm, stockpiled, reclaimed and conveyor stacked onto the heap leach pad at an average rate of 18,000 tpd. Stacked material will be leached using low grade sodium cyanide solution and the resulting pregnant leach solution will be processed in a Merrill-Crowe plant for the recovery of gold and silver by zinc cementation.
Kappes, Cassiday & Associates June 19, 2018
| Page 25-1 |
| AMENDED AND RESTATED |
| Camino Rojo Preliminary Economic Assessment | NI 43-101 Technical Report |
Metallurgical test work completed on samples to date shows that the material is amenable to cyanide leaching for the recovery of precious metals with acceptable recoveries for gold and silver and low to moderate reagent consumptions. Cement agglomeration does not appear to be required based on compaction and permeability tests with only lime being required for pH control.
In addition to the leachable oxide resource, this study has identified a measured and indicated sulphide (mill) resource of 254.1 million tonnes at 0.89 g/t gold and 7.5 g/t silver. This amounts to 7.3 million contained ounces of gold and 61.3 million contained ounces of silver. Additional metallurgical studies will be required to evaluate potential recoveries for this material. This resource is contained on Orla property, but an agreement with the owner of the concession to the north of Orla’s property will be required to exploit this resource by open pit methods.
The base case mine plan for this study is constrained by Orla’s northern property boundary. If an agreement can be achieved with the owner of the adjoining claim and steepening of the north pit wall is allowable, there would be an increase in the amount of material that could potentially be mined and processed with the same general mine and process plan as the PEA is based upon. This would be positive for the project economics.
| 25.2.3 | Metallurgy and Process |
Test work to date indicates relatively minor effects on metal recovery vs. crush size, with gold being less sensitive to crush size than silver. Based on the results of future test work, it may be possible to achieve the same recoveries at even coarser crush sizes, which would result in reduced capital and operating costs for the project.
The Camino Rojo deposit occurs within a mineralized district that is highly prospective for discovery of additional deposits.
Kappes, Cassiday & Associates June 19, 2018
| Page 25-2 |
| AMENDED AND RESTATED |
| Camino Rojo Preliminary Economic Assessment | NI 43-101 Technical Report |
All of the mineralization comprised in the mineral resource estimate with respect to the Camino Rojo Project is contained on mineral titles controlled by Orla. However, the mineral resource estimate assumes that the north wall of the conceptual floating pit cone used to demonstrate reasonable prospects for eventual economic extraction extends onto lands where mineral title is held by an Adjacent Owner and that waste would be mined on the Adjacent Owner’s mineral titles. Any potential development of the Camino Rojo Project that includes an open pit encompassing the entire mineral resource estimate would be dependent on obtaining an agreement with the Adjacent Owner. It is estimated that approximately two-thirds of the mineral resource estimate is dependent on an agreement being obtained with the Adjacent Owner. Delays in, or failure to obtain, such agreement would affect the development of a significant portion of the mineral resources of the Camino Rojo Project that are not included in the PEA, in particular by limiting access to significant mineralized material at depth. Orla intends to seek an agreement with the Adjacent Owner in order to maximize the potential to develop a mine that exploits the full mineral resource. There can be no assurance that Orla will be able to negotiate such agreement on terms that are satisfactory to Orla or that there will not be delays in obtaining the necessary agreement.
The Camino Rojo project considers contract mining as part of the base case study. There are some specific risks related to contract mining. There is risk that the contractor may need financial assistance from the owner either in terms of cash, or loan guarantees, to procure some equipment, increasing the capital cost.
Mining operations will eventually be conducted below the water table. Additional studies need to be conducted to evaluate the amount of pit inflow and the potential to keep the water from entering the pit by lowering the water table with external wells.
There is geotechnical risk associated with the base case mine plan that is constrained by the property boundary. Mitigation of any slope failures of the north wall could prove difficult due to lack of access to the ground to the north.
Kappes, Cassiday & Associates June 19, 2018
| Page 25-3 |
| AMENDED AND RESTATED |
| Camino Rojo Preliminary Economic Assessment | NI 43-101 Technical Report |
The mine plan is constrained by the Adjacent Owner concession boundary on the north side of the pit. The PEA is based on only a portion of the total mineral resource estimate and was prepared on the assumption that no mining activities would occur on the Adjacent Owner’s mineral titles. Accordingly, delays in, or failure to obtain, an agreement with the Adjacent Owner to conduct mining operations on its mineral titles would have no impact on the timetable or cost of development of the potential mine modelled in the PEA.
| 25.3.3 | Metallurgy and Process |
Significant historical metallurgical test work has been completed on material for Camino Rojo and indicate decent recoveries and relatively low reagent consumption; however, there is very little direct test work on coarse crushed material, which is considered for this report. Additionally, there is very little data available for Ki Oxide material with only two column leach tests being completed to date. Due to the lack of confirmatory test work on material as considered, recoveries and reagent consumptions are somewhat speculative, based on KCA’s expertise and experience, and could possibly be over stated. Confirmatory test work on material should be included in future studies to confirm the values considered in this study.
Test work on the Camino Rojo material has also identified carbonaceous material with preg-robbing characteristics. Inclusion of preg-robbing material on the heap may reduce the overall heap performance and overall metal recovery. During mining, efforts should be taken to identify and remove pre-robbing material before being delivered to the process.
The project considers running a 70 km power line to the project site in order to meet the site power requirements. At this stage of study, the federal electricity commission (Comisión Federal de Electricidad, CFE) has been consulted, but there have not been any formal response or proposal from CFE with regards to the construction and schedule for the proposed power line and only a budgetary allowance for constructing this power line has been considered. It is possible that there may be unforeseen challenges for constructing this power line which may result in higher than estimated costs or make the construction of this power line unfeasible. Investigations into the construction of a power line to the project site should be included as part of future studies.
Kappes, Cassiday & Associates June 19, 2018
| Page 25-4 |
| AMENDED AND RESTATED |
| Camino Rojo Preliminary Economic Assessment | NI 43-101 Technical Report |
The project is subject to normal risks regarding access, title, permitting, and security. The project has had a productive relationship with the surface owners and no extraordinary risks to project access were discerned. Conditional upon continued compliance with annual requirements, no risk to validity of title was discerned. Conditional upon compliance with applicable regulations, permits for normal exploration activities, mine construction, and mine operation are expected to be attainable. Drug related violence, propagated by members of criminal cartels and directed against other members of criminal cartels, has occurred in the region and has affected local communities. The aggression is not directed at mining companies operating in the region and has not affected the ability of Orla or previous operators to explore the Camino Rojo project.
The chief non-technical project risk identified is that of a possible Federal designation of a protected biological-ecological reserve known as “Zacatecas Semiarid Desert” as a Natural Protected Area (ANP). If a designation of this ANP by the government includes the surface of the mining concession areas or ancillary work areas such as possible water well fields of Camino Rojo, this could limit the growth and continuity of the project. Mining activities (including both exploration and exploitation), depending on the corresponding sub-zone may be carried out provided they are authorized by CONANP (National Commission on Protected Natural Areas), without prejudice of other authorizations required for their execution. Goldcorp, the prior operator of the project, engaged in forums with government and community stakeholders, and submitted an official opinion regarding this ANP declaration to the government, with the objective of ensuring that if an ANP was created, the Camino Rojo project would not be restricted from development. Since the time that the idea of creating an ANP was first proposed there has been no formal movement on the proposal. The State government has opposed the declaration of an ANP in the region.
Kappes, Cassiday & Associates June 19, 2018
| Page 25-5 |
| AMENDED AND RESTATED |
| Camino Rojo Preliminary Economic Assessment | NI 43-101 Technical Report |
The PEA presents a potentially economically robust project. Based on these results, KCA recommends the following future work in regards to process and infrastructure development:
· The project should proceed to the prefeasibility or feasibility level;
· Additional studies and cost estimates for delivery of line power to the project site should be completed;
· Confirmatory metallurgical test work should be completed on representative samples for each metallurgical type, specifically column leach tests on coarse crushed material; and
· Perform geotechnical and hydrogeological studies at the proposed heap leach, pit and processing areas.
IMC recommends the following additional work for mining and resource development to advance the project to the PFS level:
· A limited infill drilling program to potentially convert the inferred mineral resource in the pit to indicated or measured mineral resource.
· Update the resource block model.
· Update the mine plan, and the mine capital and operating costs.
The limits of the sulphide resource described in Section 14.0 of this report have not been adequately determined, and higher grade portions of this sulphide resource are incompletely drill defined, thus there is potential to increase the tonnage and/or grade of the sulphide resource. RGI recommends an additional 5,000m of drilling to further evaluate the known sulphide resource, with the goal of defining mineralization that may be economically processed through a mill and flotation plant.
The Camino Rojo deposit occurs within a mineralized district that is highly prospective for discovery of additional deposits. Regional exploration, comprised of geophysical, geochemical, and geological surveys, is currently ongoing and is expected to identify other possible centers of mineralization, most of which will be masked by colluvial cover, thus evaluation of the project mineral concessions will require extensive drill testing.
In addition to the continuing the exploration work already underway, RGI recommends a 7,500m drill program to test satellite targets to the Camino Rojo deposit, with the goal of discovering one or more mineralized zones that may be of economic interest.
Kappes, Cassiday & Associates June 19, 2018
| Page 26-1 |
| AMENDED AND RESTATED |
| Camino Rojo Preliminary Economic Assessment | NI 43-101 Technical Report |
Additionally, the following investigations are recommended:
· Hydrological investigations need to be conducted to identify sources of water for the project and also to estimate pit dewatering requirements and costs.
· If the mine plan continues to be constrained by the north property boundary, some geotechnical drilling and investigations are recommended to evaluate the slope angle for this wall position and pit depth. The previous slope stability study, though detailed, evaluated a wall position about 200m north of the PEA mine plan and a significantly deeper pit.
· Environmental studies need to be conducted, including environmental baseline work and mine waste characterization. As of this writing, these studies are in progress.
· Ongoing work on permitting needs to continue.
The estimated costs for these recommendations as presented in this section are presented in Table 26-1.
Kappes, Cassiday & Associates June 19, 2018
| Page 26-2 |
| AMENDED AND RESTATED |
| Camino Rojo Preliminary Economic Assessment | NI 43-101 Technical Report |
Table 26-1
Recommendations
| Description | | Cost (US$) | |
| Resource Model | | | 245,000 | |
| Infill Drilling (1,000m @$200/m) | | | 200,000 | |
| Updated Model | | | 45,000 | |
| | | | | |
| Mine Plan and Mining Costs | | | 65,000 | |
| | | | | |
| Process and Infrastructure | | | 1,070,000 | |
| Metallurgical Drilling | | | 250,000 | |
| Metallurgical Testing | | | 370,000 | |
| PFS Level Studies | | | 400,000 | |
| Powerline Study | | | 50,000 | |
| | | | | |
| Hydrological Studies | | | 820,000 | |
| Drilling | | | 700,000 | |
| PFS Level Studies | | | 120,000 | |
| | | | | |
| Geotechnical Studies | | | 475,000 | |
| Geotechnical Drilling | | | 110,000 | |
| Slope Stability Study | | | 100,000 | |
| Foundation studies | | | 165,000 | |
| Sub-surface investigations | | | 100,000 | |
| | | | | |
| Environmental Assessment | | | 625,000 | |
| Environmental Baseline Studies | | | 400,000 | |
| Waste Characterization | | | 150,000 | |
| Sampling costs | | | 75,000 | |
| | | | | |
| Exploration | | | 2,950,000 | |
| Drilling (5,000m), sulphide zone extensions | | | 1,000,000 | |
| Regional Geophysics | | | 250,000 | |
| Regional Geochemistry | | | 100,000 | |
| Regional Geologic Mapping | | | 100,000 | |
| Regional Targets Drilling (7500m) | | | 1,500,000 | |
| | | | | |
| | | | | |
| Camp and Support (20%) | | | 1,250,000 | |
| | | | | |
| TOTAL | | | 7,500,000 | |
Kappes, Cassiday & Associates June 19, 2018
| Page 26-3 |
| AMENDED AND RESTATED |
| Camino Rojo Preliminary Economic Assessment | NI 43-101 Technical Report |
Aranda-Gomez, J. L.-M.-C., 2006, El volcanismo tipo intraplaca del Cenozoico tardío en el centro y norte de México: Una revision. Boletín De La Sociedad Geológica Mexicana, 187-225.
Barboza-Gudiño, J. Z.-M.-R.-N., 2010, Late Triassic stratigraphy and facies from northeastern Mexico: Tectonic setting and provenance. Geosphere, 621-640.
Blanchflower, J. (2009, January 15). Technical Report on the Mineral Resources of the Camino Rojo Property. Technical report posted by the Canplats on SEDAR, January 15, 2009, 70 p: Minorex Consulting.
Blanchflower, K. K. (2009). Technical Report Preliminary Assessment based on Report Titled "Technical Assessment of Camino Rojo Project, Zacatecas, Mexico", prepared by Minorex Consulting Mine and Quarry Engineering Services Inc. for Canplats Resources Corporation, October 16, 2009.
Blue Coast Research, Ltd., 2013 (September), PJ5119 – Goldcorp Camino Rojo Represa Transition Sample Summary, Prepared for Goldcorp.
Buseck, P. R., 1966, Contact metamorphism and ore deposition, Concepcion del Oro, Mexico. Economic Geology, 61(1), p 97-136.
Centeno-Garcia, E., 2005, Review of Upper Paleozoic and Lower Mesozoic stratigraphy and depositional environments of central and west Mexico: Constraints on terrane analysis and paleogeography. The Mojave-Sonora megashear hypothesis: Development, assessment, and alternatives: Geological Society of America Special Paper 393,Anderson, T.H., Nourse, J.A., McKee, J.W., and Steiner, M.B., eds., 233-258.
CONANP., 2014, Estudio previo justificativo para la declaratoria como Area Natural Protegida Reserva de la Biosfera Desierto Semiarido de Zacatecas. Mexico City, Mexico: Comision Nacional de Areas Naturales Protegidas.
Kappes, Cassiday & Associates June 19, 2018
| Page 27-1 |
| AMENDED AND RESTATED |
| Camino Rojo Preliminary Economic Assessment | NI 43-101 Technical Report |
Cruz-Gámez, E. V.-T.-F.-S.-D., 2017, Volcanic sequence in Late Triassic – Jurassic siliciclastic and evaporitic rocks from Galeana, NE Mexico. Geologica Acta: an international earth science journal, 89-106.
Ernst & Young, 2017, (May), Metals Tax Summary, Mexico - Mining and Metals Tax Guide.
Goldcorp, 2016 (September), Pre-Feasibility Study Report, Camino Rojo Project, San Tiburcio, Zacatecas, Mexico.
Goldcorp Inc., 2017, (March), Goldcorp Annual Information Form for the Financial Year Ending 31 December 2016.
Gray, M. D., 2016 (December), Site Visit Report, Camino Rojo Gold Project (Goldcorp), Zacatecas, Mexico, Prepared for Orla Mining Ltd. Rio Rico, Arizona, USA: Resource Geosciences Inc.
Gray, M. D, 2018, CSA NI43-101 Technical Report on the Camino Rojo Gold Project, Municipio of Mazapil, Zacatecas, Mexico. Rio Rico, AZ: Resource Geosciences Inc.
Hawkins, D., 2018, Groundwater Conditions – Camino Rojo Project. Tucson, Arizona: Barranca Group LLC.
Hazen Research Inc., 2014, Camino Rojo Project Variability Study. Golden, Colorado: Hazen Research Inc.
Heiras, M., 2017 (June), Legal opinion letter. Chihuahua, Chihuahua, Mexico: Heiras y Asociados S.C. Abogados.
Heiras, M., 2018 (January), Letter report, Camino Rojo permitting for exploration and Ejido relations. Chihuahua, Chihuahua, Mexico: Heiras y Asociados S.C., Abogados.
Huss, C., M3, 2012 (August), Camino Rojo Project Technical Report Prefeasibility Study, Zacatecas, Mexico, Document No. M3-PN100113, Prepared for Goldcorp.
Kappes, Cassiday & Associates, 2010 (April), Camino Rojo Project Report of Metallurgical Test Work, Prepared for Mine and Quarry Engineering Services, Inc.
Kappes, Cassiday & Associates June 19, 2018
| Page 27-2 |
| AMENDED AND RESTATED |
| Camino Rojo Preliminary Economic Assessment | NI 43-101 Technical Report |
Kappes, Cassiday & Associates, 2012 (May), Camino Rojo Project Report of Metallurgical Test Work, Prepared for Goldcorp.
Kappes, Cassiday & Associates, 2014 (October), Camino Rojo Project Report of Metallurgical Test Work, Prepared for Goldcorp.
Kappes, Cassiday & Associates, 2015 (August), Camino Rojo Project Report of Metallurgical Test Work, Prepared for Goldcorp.
Longo, A., 2017, Review of the exploration data for Camino Rojo, Orla Mining Ltd., private company report. Reno, NV.
Longo, A.A., Edwards, J., 2017, Camino Rojo: Observations leading to a new geologic model, and breccia modelling issues, private company report, Prepared for Orla Mining Ltd. Reno, NV.
Loza-Aguirre, I. N., 2008, Relaciones estratigráfico-estructurales en la intersección del sistema de fallas San Luis-Tepehuanes y el graben de Aguascalientes, México central, pp. 533-548.
Loza-Aguirre, I. N.-S.-Á.-O., 2012, Cenozoic volcanism and extension in northwestern Mesa Central, Durango, México. Boletín De La Sociedad Geológica Mexicana, 243-263.
Meinert, L.D., Dipple, G.M., and Nicolescu, S., 2005, World Skarn Deposits. In J. T. Hedenquist, Economic Geology One Hundredth Anniversary Volume 1905 - 2005. (p. 1136). Littleton, CO: Society of Economic Geologists, Inc.
Mitre-Salazar, L., 1989, La megafalla Laramídica de San Tiburcio, estado de Zacatecas. Univ. Nacional Autón. México, Inst. Geologia Revista, 47-51.
Nieto-Samaniego, A. A.-Á., 2007, Mesa Central of México: Stratigraphy, structure, and Cenozoic tectonic evolution. Geology of México: Celebrating the Centenary of the Geological Society of México: Geological Society of America, Special Paper 422, Álvarez, S.A., and Nieto-Samaniego, Á.F., eds., 41-70.
Ortega-Flores, B. S.-A., 2015, The Mesozoic successions of western Sierra de Zacatecas, Central Mexico: provenance and tectonic implications. Geology Magazine, 1-22.
Kappes, Cassiday & Associates June 19, 2018
| Page 27-3 |
| AMENDED AND RESTATED |
| Camino Rojo Preliminary Economic Assessment | NI 43-101 Technical Report |
Piteau Associates Engineering Ltd., 2016 (May), Goldcorp Inc. Camino Rojo Project Prefeasibility Pit Slope Design Study, Geotechnical Investigations and Slope Design Recommendations for the Proposed Oxide and Sulphide Open Pits, Prepared for Goldcorp.
Rocha-Rocha, M., 2016 (May), Metallogenesis of the Peñasquito polymetallic deposit: A contribution to the understanding of the magmatic ore system. Doctoral dissertation. Reno, Nevada, USA: University of Nevada Reno.
Sanchez, S., 2017 (May), The Mineralogy, Paragenesis And Alteration Of The Camino Rojo Deposit, Zacatecas, Mexico. Master of Science Thesis. Reno, Nevada, USA: University of Nevada, Reno.
SEMARNAT, Delegacion en el Estado De Zacatecas, Subdelegacion de Gestion para la Proteccion Ambiental y Recursos Naturales., 2013, Oficio No DFZ152-203/13/1675. Zactecas, Zacatecas: Secretaria de Medio Ambiente y Recursos Naturales, Mexico.
Servicio Geologico Mexicano, 2000, Carta Geologico-Minero Concepcion del Oro G14-10. Pachuca, Hidalgo, Mexico: Servicio Geologico Mexicano.
Servicio Geologico Mexicano, 2014, Carta Geologico-Minero San Tiburcio G14C82. Pachuca, Hidalgo, Mexico: Servicio Geologico Mexicano.
SGS Minerals Services, 2009 (August), Progress Report 1, Evaluation of the Amenability of Camino Rojo Drill Hole Samples to Cyanide Leaching and Flotation Processes, Report SGS 54-08, Prepared for Canplats de México, S.A. de C.V.
SGS Minerals Services, 2009 (August), An Investigation into the Amenability of 21 Camino Rojo Samples to Leaching and Flotation Processes, Report SGS-09-09, Progress Report 2, Prepared for Canplats de México, S.A. de C.V.
Tristán-González, M. A.-D.-H.-H., 2009, Post-Laramide and pre-Basin and Range deformation and implications for Paleogene (55–25 Ma) volcanism in central Mexico: A geological basis for a volcano-tectonic stress model. Tectonophysics, 136-152.
Kappes, Cassiday & Associates June 19, 2018
| Page 27-4 |
| AMENDED AND RESTATED |
| Camino Rojo Preliminary Economic Assessment | NI 43-101 Technical Report |
Weiss, S. I.-V.-D.-C.,2010, Geologic Setting and Polymetallic Style of Gold Mineralization, Camino Rojo Deposit, Northern Zacatecas, Mexico. Gold and Base Metal Deposits in the Mexican Altiplano, States of Zacatecas and San Luis Potosi, Central Mexico, Society of Economic Geologists Guidebook series, V. 40, 97-102.
Kappes, Cassiday & Associates June 19, 2018
| Page 27-5 |
| AMENDED AND RESTATED |
| Camino Rojo Preliminary Economic Assessment | NI 43-101 Technical Report |
| 28.0 | DATE AND SIGNATURE PAGE |
This report, entitled “Preliminary Economic Assessment – Amended NI 43-101 Technical Report on the Camino Rojo Gold Project – Municipality of Mazapil, Zacatecas, Mexico” has the following report dates:
Report Date is: June 19, 2018
Amendment Date: March 11, 2019
Mineral Resource Effective Date is: April 27, 2018
The report was prepared and signed by the Qualified Persons as presented in the following certificates:
Kappes, Cassiday & Associates June 19, 2018
| Page 28-6 |
CERTIFICATE OF QUALIFIED PERSON
I, Carl E. Defilippi, RM SME # 775870, of Reno, Nevada, USA, Sr. Project Engineer, Kappes, Cassiday & Associates, as an author of this report entitled “Preliminary Economic Assessment – Amended NI 43-101 Technical Report on the Camino Rojo Gold Project – Municipality of Mazapil, Zacatecas, Mexico”, dated June 19, 2018 and amended March 11, 2019, prepared for Orla Mining Ltd. (the “Issuer”) do hereby certify that:
| 1. | I am employed as a Sr. Project Engineer at Kappes, Cassiday & Associates, an independent metallurgical consulting firm, whose address is 7950 Security Circle, Reno, Nevada 89506. |
| 2. | This certificate applies to the technical report “Preliminary Economic Assessment – Amended NI 43-101 Technical Report on the Camino Rojo Gold Project – Municipality of Mazapil, Zacatecas, Mexico”, dated June 19, 2018 and amended March 11, 2019 (the “Technical Report”). |
| 3. | I am a registered member with the Society for Mining, Metallurgy and Exploration (SME) since 2011 and my qualifications include experience applicable to the subject matter of the Technical Report. In particular, I am a graduate of the University of Nevada with a B.S. in Chemical Engineering (1978) and a M.S. in Metallurgical Engineering (1981). I have practiced my profession continuously since 1982. Most of my professional practice has focused on the development of gold-silver leaching projects. I have successfully managed numerous studies at all levels on various cyanidation projects. |
| 4. | I am familiar with National Instrument 43-101 – Standards of Disclosure for Mineral Projects (“NI 43-101”) and by reason of education, experience and professional registration I fulfill the requirements of a “qualified person” as defined in NI 43-101. |
| 5. | I visited the Camino Rojo site on February 20 and 21, 2018 for a period of two days. |
| 6. | I am responsible for Sections 1.1, 1.5, 1.8, 1.9, 1.11, 1.12, 1.13, 1.14, 2, 3, 13, 17, 18, 19, all of 21 except 21.1.1 and 21.2.1, 22, and co-responsible for Sections 24 through 27 as they pertain to metallurgy, processing and infrastructure, of the Technical Report. |
| 7. | I am an independent qualified person as described in section 1.5 of NI 43-101, as I am not an employee of the Issuer. |
| 8. | I have had no prior involvement with the property. |
| 9. | I have read NI 43-101 and the Technical Report has been prepared in compliance with NI 43-101. |
| 10. | As of the effective date of the Technical Report, to the best of my knowledge, information and belief, the Technical Report contains all scientific and technical information that is required to be disclosed to make the Technical Report not misleading. |
Dated this 11th day of March, 2019
| | |
| Signed “Carl E. Defilippi” | |
Carl E. Defilippi RM SME # 775870 Sr. Project Engineer Kappes, Cassiday & Associates | |
CERTIFICATE OF QUALIFIED PERSON
I, Matthew D. Gray, Ph.D., C.P.G. #10688, of Rio Rico, Arizona, USA, Geologist at Resource Geosciences Incorporated, as an author of this report entitled “Preliminary Economic Assessment – Amended NI 43-101 Technical Report on the Camino Rojo Gold Project – Municipality of Mazapil, Zacatecas, Mexico” dated June 19, 2018 and amended March 11, 2019, prepared for Orla Mining Ltd. (the “Issuer”) do hereby certify that:
| 1. | I am employed as a geologist at Resource Geosciences Incorporated, (RGI) an independent consulting geosciences firm, whose address is 765A Dorotea Ct, Rio Rico, Arizona, 85648 USA. |
| 2. | This certificate applies to the technical report “Preliminary Economic Assessment – Amended NI 43-101 Technical Report on the Camino Rojo Gold Project – Municipality of Mazapil, Zacatecas, Mexico”, dated June 19, 2018 and amended March 11, 2019 (the “Technical Report”). |
| 3. | I am a Certified Professional Geologist (#10688) with the American Institute of Professional Geologists since 2003 and my qualifications include experience applicable to the subject matter of this Technical Report. In particular, I am a graduate of the Colorado School of Mines (Ph.D., Geology with Minor in Mineral Economics, 1994; B.Sc., Geological Engineering, 1985) and the University of Arizona (M.Sc., Geosciences, 1988) and I have practiced my profession continuously since 1988. Most of my professional practice has focused on exploration metallic mineral deposits, the creation of resource models, and the economic development of gold and copper deposits. I successfully managed mine permitting, water rights, and community relocation issues related to development of the Piedras Verdes copper mine, a large scale open pit mine in Sonora, Mexico. |
| 4. | I am familiar with National Instrument 43-101 – Standards of Disclosure for Mineral Projects (“NI 43-101”) and by reason of education, experience and professional registration I fulfill the requirements of a “qualified person” as defined in NI 43-101. |
| 5. | I visited the Camino Rojo property on February 19 to 22, 2018. |
| 6. | I am responsible for Sections 1.2, 1.3, 1.4, 1.10, 4 through 9, 20, and 23 of the Technical Report, and related summaries, conclusions, recommendations, and references as presented in Sections 24, 25, 26 and 27. |
| 7. | I am an independent of the Issuer as described in section 1.5 of NI 43-101. |
| 8. | I have had no prior involvement with the property that is the subject of the Technical Report. |
| 9. | I have read NI 43-101 and the Technical Report has been prepared in compliance with NI 43-101. |
| 10. | As of the effective date of the Technical Report, to the best of my knowledge, information and belief, the Technical Report contains all scientific and technical information that is required to be disclosed to make the Technical Report not misleading. |
Dated this 11th day of March, 2019
| “Matthew D. Gray” |  |
Matthew D. Gray, Ph.D., C.P.G. #10688 Geologist at Resource Geosciences Incorporated |
CERTIFICATE OF QUALIFIED PERSON
I, Michael G. Hester, FAusIMM, as an author of this report entitled “Preliminary Economic Assessment – Amended NI 43-101 Technical Report on the Camino Rojo Gold Project – Municipality of Mazapil, Zacatecas, Mexico”, dated June 19, 2018 and amended March 11, 2019, prepared for Orla Mining Ltd. do hereby certify that:
1. I am currently employed as Vice President and Principal Mining Engineer by Independent Mining Consultants, Inc. (“IMC”) of 3560 East Gas Road, Tucson, Arizona, 85714, USA, phone number (520) 294-9861.
2. This certificate applies to the technical report “ Preliminary Economic Assessment – Amended NI 43-101 Technical Report on the Camino Rojo Gold Project – Municipality of Mazapil, Zacatecas, Mexico” dated June 19, 2018 and amended March 11, 2019 (the “Technical Report”).
3. I hold the following academic qualifications:
B.S. (Mining Engineering) University of Arizona 1979
M.S. (Mining Engineering) University of Arizona 1982
4. I am a Fellow of the Australian Institute of Mining and Metallurgy (FAusIMM #221108), a professional association as defined by National Instrument 43-101 – Standards of Disclosure for Mineral Projects (“NI 43-101”). As well, I am a member in good standing of the following technical associations and societies:
Society for Mining, Metallurgy, and Exploration, Inc. (SME Member # 1423200)
Member of Resources and Reserves Committee of the Society of Mining, Metallurgy, and Exploration.
The Canadian Institute of Mining, Metallurgy and Petroleum (CIM Member #100809)
5. I have worked in the minerals industry as an engineer continuously since 1979, a period of 39 years. I am a founding partner, Vice President, and Principal Mining Engineer for Independent Mining Consultants, Inc. (“IMC”), a position I have held since 1983. I have been employed as an Adjunct Lecturer at the University of Arizona (1997-1998) where I taught classes in open pit mine planning and mine economic analysis. I am also a member of the Resources and Reserves Committee of the Society of Mining, Metallurgy, and Exploration since March 2012. I was employed as a staff engineer for Pincock, Allen & Holt, Inc. from 1979 to 1983. During my career I have had extensive experience reviewing and auditing deposit sampling methods, analytical procedures, and QA/QC analysis. I also have many years of experience developing mineral resource models, developing open pit mine plans and production schedules, calculating equipment requirements for open pit mining operations, developing mine capital and operating cost estimates, performing economic analysis of mining operations and managing various PEA, Pre-Feasibility, and Feasibility Studies.
6. I have read the definition of “Qualified Person” (“QP”) set out in NI 43-101 and certify that by reason of my education, affiliation with a professional association (as defined in NI 43-101) and past relevant work experience, I fulfill the requirements to be a “Qualified Person” for the purposes of NI 43-101.
7. I am the responsible for Sections 1.6, 1.7, 10, 11, 12, 14, 15, 16, 21.1.1, 21.2.1, and co-responsible for Sections 24 through 27 as they pertain to mineral resources and mining, of Technical Report.
8. I have had no prior involvement with the property.
9. I visited the Camino Rojo site on February 20 and 21, 2018 for a period of two days.
10. As of the date of the this certificate, to the best of my knowledge, information and belief, the portions of the Technical Report for which I am responsible contain all scientific and technical information that is required to be disclosed to make the Technical Report not misleading.
11. I am independent of the issuer applying all of the tests in Section 1.5 of National Instrument 43-101.
12. I have read National Instrument 43-101 and Form 43-101F1, and the Technical Report has been prepared in compliance with that instrument and form.
Dated this 11th day of March, 2019
| Signed “Michael G. Hester” | |
Michael G. Hester, FAusIMM