UNITED STATES
SECURITIES AND EXCHANGE COMMISSION
Washington, D.C. 20549
FORM N-CSR
CERTIFIED SHAREHOLDER REPORT OF REGISTERED
MANAGEMENT INVESTMENT COMPANIES
Investment Company Act file number (811-23226)
Listed Funds Trust
(Exact name of registrant as specified in charter)
615 East Michigan Street
Milwaukee, WI 53202
(Address of principal executive offices) (Zip code)
Gregory C. Bakken, President
Listed Funds Trust
c/o U.S. Bank Global Fund Services
811 E. Wisconsin Ave, 8th Floor
Milwaukee, WI 53202
(Name and address of agent for service)
(414) 765-4711
Registrant's telephone number, including area code
Date of fiscal year end: August 31
Date of reporting period: August 31, 2020
Item 1. Reports to Stockholders.

Overlay Shares ETFs
Overlay Shares Large Cap Equity ETF (OVL)
Overlay Shares Small Cap Equity ETF (OVS)
Overlay Shares Foreign Equity ETF (OVF)
Overlay Shares Core Bond ETF (OVB)
Overlay Shares Municipal Bond ETF (OVM)
ANNUAL REPORT
August 31, 2020
Beginning on January 1, 2021, as permitted by regulations adopted by the U.S. Securities and Exchange Commission (“SEC”), paper copies of the Funds’ shareholder reports will no longer be sent by mail, unless you specifically request paper copies of the Funds’ reports from your financial intermediary, such as a broker-dealer or bank. Instead, the reports will be made available on a website, and you will be notified by mail each time a report is posted and provided with a website link to access the report.
If you already elected to receive shareholder reports electronically, you will not be affected by this change and you need not take any action. Please contact your financial intermediary to elect to receive shareholder reports and other Fund communications electronically.
You may elect to receive all future Fund reports in paper free of charge. Please contact your financial intermediary to inform them that you wish to continue receiving paper copies of Fund shareholder reports and for details about whether your election to receive reports in paper will apply to all funds held with your financial intermediary.
Overlay Shares ETFs
Table of Contents
Letter to Shareholders (Unaudited) | 2 |
Shareholder Expense Example (Unaudited) | 6 |
Performance Overviews (Unaudited) | 7 |
Schedule of Investments and Written Options | 9 |
Overlay Shares Large Cap Equity ETF | 9 |
Overlay Shares Small Cap Equity ETF | 11 |
Overlay Shares Foreign Equity ETF | 13 |
Overlay Shares Core Bond ETF | 15 |
Overlay Shares Municipal Bond ETF | 17 |
Statements of Assets and Liabilities | 19 |
Statements of Operations | 20 |
Statement of Changes in Net Assets | 21 |
Overlay Shares Large Cap Equity ETF | 21 |
Overlay Shares Small Cap Equity ETF | 22 |
Overlay Shares Foreign Equity ETF | 23 |
Overlay Shares Core Bond ETF | 24 |
Overlay Shares Municipal Bond ETF | 25 |
Financial Highlights | 26 |
Overlay Shares Large Cap Equity ETF | 26 |
Overlay Shares Small Cap Equity ETF | 27 |
Overlay Shares Foreign Equity ETF | 28 |
Overlay Shares Core Bond ETF | 29 |
Overlay Shares Municipal Bond ETF | 30 |
Notes to Financial Statements | 31 |
Report of Independent Registered Public Accounting Firm | 42 |
Review of Liquidity Risk Management Program (Unaudited) | 43 |
Board of Trustees and Officers (Unaudited) | 44 |
Supplemental Information (Unaudited) | 46 |
Privacy Policy (Unaudited) | 48 |
1
Overlay Shares ETFs
Shareholder Letter
August 31, 2020 (Unaudited)
The first 11 months for the Overlay Shares ETFs came with periods of extreme market volatility related to COVID-19, resulting in mixed results for the Funds:
Since Inception Returns (9/30/19 - 8/31/20) | |||
Fund | Fund Returns | Benchmark | Benchmark Returns |
OVL NAV Returns OVL Market Price | 21.62% 22.22% | S&P 500 Total Return (“TR”) Index | 19.70% |
OVS NAV Returns OVS Market Price | -1.97% -1.91% | S&P SmallCap 600 TR Index | -3.76% |
OVF NAV Returns OVF Market Price | -0.03% -0.41% | MSCI AC World Index ex USA Index | 5.60% |
OVB NAV Returns OVB Market Price | 9.22% 9.38% | Bloomberg Barclays U.S. Aggregate Bond Index | 7.04% |
OVM NAV Returns OVM Market Price | 5.92% 5.71% | Bloomberg Barclays U.S. Municipal Bond Index | 4.07% |
Total Expense Ratio for all Funds 0.76%
The 11 months since inception can appropriately be divided into three distinct time periods that each had very different market environments:
Fund Inception to Mid-February 2020: The equity markets appreciated significantly as the economy and corporate earnings continued to grow at a reasonable rate while interest rates remained very low. Low interest rates helped to make equities more attractive than bonds on a relative basis. Overall market volatility was very low as investor sentiment was high.
Mid-February 2020 to Late-March 2020: COVID-19 cases in the U.S. began to rapidly accelerate and the global economy was largely shut down in an attempt to flatten the curve of the virus. This shutdown created massive economic uncertainty and fears of a possible depression, sending risk assets sharply lower and sending interest rates to new all-time lows as the Federal Reserve cut rates and investors moved to U.S. Treasuries in a flight to safety. Market volatility increased dramatically, reaching levels similar to that of the Great Financial Crisis.
Late-March 2020 to August 31, 2020: After the implementation of massive fiscal and monetary stimulus, investors quickly became more optimistic about the longer-term view of the economy, sending risk assets sharply higher. Some indices erased all of the losses from earlier in the year. Market volatility subsided as risk assets recovered.
Performance of less than one year is cumulative. You cannot invest directly in an index. Performance data quoted represents past performance and is no guarantee of future results. Investment return and principal value of an investment will fluctuate so that an investor’s shares, when redeemed, may be worth more or less than their original cost. Performance would have been lower without fee waivers in effect. Current performance may be lower or higher than the performance data quoted. For the most recent month-end performance, please call 1-866-704-OVLS. Overlay Shares are bought and sold at market price (not NAV) and are not individually redeemed from the Fund. Total Returns are calculated using the daily 4:00pm EST net asset value (NAV). Market price returns reflect the midpoint of the bid/ask spread as of the close of trading on the exchange where Fund shares are listed. Market price returns do not represent the returns you would receive if you traded shares at other times.
2
Overlay Shares ETFs
Shareholder Letter
August 31, 2020 (Unaudited) (Continued)
The following chart highlights the extreme volatility in most of the Fund benchmarks during this time frame:
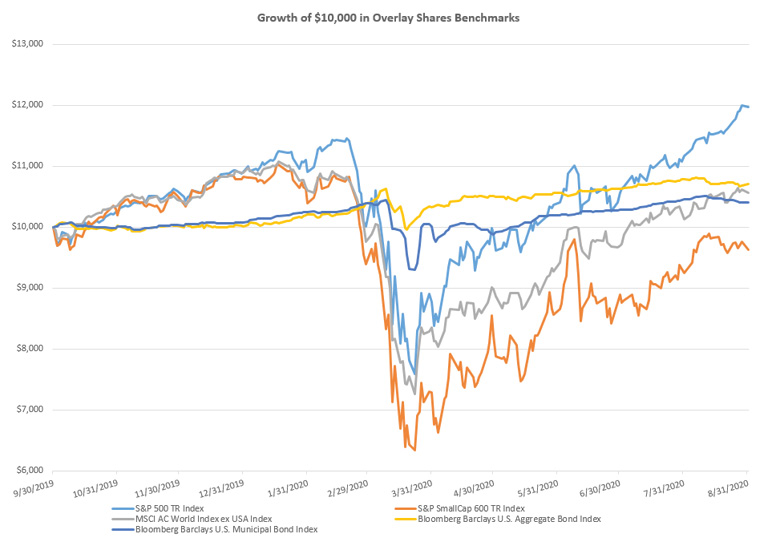
Indexes are unmanaged and the returns shown do not reflect any management fees, transaction costs or expenses. One cannot invest directly in an index. Past performance does not guarantee future results.
The Overlay Strategy
The returns of the Overlay Shares are based on a combination of the returns of passive index beta exposure and the income generated from our option writing strategy (the “Overlay”). As such, the Overlay is the only active component of the Funds and is managed the same way across all five of the Overlay Shares. The Overlay aims to generate positive income in a wide variety of markets but could experience short-term losses during times of market stress. As such, the strategy was designed with multiple layers of risk management to help mitigate losses during those environments. First, hedges are constantly used to limit and clearly define potential losses on each position to protect against rapid declines. Second, a volatility-based risk model quantifies when there is above-average risk in the equity markets, during which time the exposure levels in the Overlay may be significantly reduced. This risk model indicated high levels of market risk from late February through early April, during which time the Overlay strategy had little to no exposure. While the Strategy led to underperformance in the 1st quarter of the year due to the market decline, this proactive risk management and constant hedging helped to limit the lag during the market drawdown, resulting in overall positive gross outperformance since inception in the Overlay Shares. This income, when added to the underlying passive beta return of each Fund, produces the total gross return for the Funds.
Overlay Shares Large Cap Equity ETF (OVL)
OVL (at NAV) outperformed the S&P 500 TR Index by 1.92% since inception, returning 21.62% compared to 19.70% for the index. This outperformance was driven solely by the positive income generated by the Overlay. As the Fund obtained passive beta exposure through the Vanguard S&P 500 ETF (VOO), the Fund experienced a high level of correlation with the S&P 500 Index. As such, the Fund experienced heightened volatility during the market drawdown, but also benefited from the sharp market
3
Overlay Shares ETFs
Shareholder Letter
August 31, 2020 (Unaudited) (Continued)
recovery that began in late March. While the shift in COVID-related investor sentiment from extreme pessimism to muted optimism was a key driver of S&P 500 TR Index returns during the period, the S&P 500 TR Index significantly outperformed small cap and international equities during the period as investors focused buying on mega-cap technology companies that make up a significant portion of the index weighting.
Overlay Shares Small Cap Equity ETF (OVS)
OVS (at NAV) outperformed the S&P SmallCap 600 TR Index by 1.79% since inception, returning -1.97% compared to -3.76% for the index. This outperformance was driven solely by the positive income generated by the Overlay. As the Fund obtained passive beta exposure through the iShares Core S&P Small-Cap ETF (IJR), the Fund experienced a high level of correlation with the S&P SmallCap 600 TR Index. As such, the Fund experienced volatility even greater than the S&P 500 TR Index during the period as investors showed a preference for larger companies with stronger balance sheets. Despite the index recovering a significant portion of the losses from earlier in the year, greater uncertainty around future earnings for smaller companies resulted in the small cap equities underperforming the broader equity markets.
Overlay Shares Foreign Equity ETF (OVF)
OVF (at NAV) underperformed the MSCI AC World Index ex USA Index by 5.63% since inception, returning -0.03% compared to 5.60% for the index. While the Overlay contributed positively to the Fund (approximately 2.75% in income), the use of iShares MinVol factor versions of the MSCI EAFE Index (EFAV) and MSCI Emerging Markets Index (EEMV) generated underperformance. EFAV and EEMV are generally expected to outperform the standard indices during times of market stress but possibly underperform during rapidly rising markets. This was the case since inception of the Fund, as EFAV and EEMV dampened volatility relative to the benchmark during the times of market stress but lagged during the subsequent market recovery. Over the long term, the MinVol approach aims to produce returns comparable to the primary MSCI AC World Index ex USA Index but with less volatility.
Overlay Shares Core Bond ETF (OVB)
OVB (at NAV) outperformed the Bloomberg Barclays U.S. Aggregate Bond Index by 2.18% since inception, returning 9.22% compared to 7.04% for the index. This outperformance was driven solely by the positive income generated by the Overlay. As the Fund obtained passive beta exposure through the iShares Core U.S. Aggregate Bond ETF (AGG), the Fund experienced a high level of correlation with the Bloomberg Barclays U.S. Aggregate Bond Index. As such, the Fund tended to benefit from falling interest rates and tightening credit spreads. During the course of the market drawdown, corporate bonds experienced losses despite interest rates falling as credit spreads widened in response to economic concerns. Massive fiscal and monetary stimulus benefited corporate bonds greatly through a combination of lower interest rates and credit spreads tightening. Furthermore, a commitment by the Fed to purchase individual bonds as well as the ETFs holding corporate bonds helped to stabilize the corporate credit market and dampen the volatility of corporate bond ETFs.
Overlay Shares Municipal Bond ETF (OVM)
OVM (at NAV) outperformed the Bloomberg Barclays U.S. Municipal Bond Index by 1.85% since inception, returning 5.92% compared to 4.07% for the index. This outperformance was driven solely by the positive income generated by the Overlay. As the Fund obtained passive beta exposure through the iShares National Muni Bond ETF (MUB), the Fund experienced a high level of correlation with the Bloomberg Barclays U.S. Municipal Bond Index. As such, the Fund tended to benefit from falling interest rates and tightening credit spreads. During the course of the market drawdown, municipal bonds experienced losses despite interest rates falling as credit spreads widened in response to economic concerns. Massive fiscal and monetary stimulus benefited municipal bonds greatly through a combination of lower interest rates and credit spreads tightening. Furthermore, a commitment by the Fed to purchase municipal bonds in its asset purchase program helped to stabilize the municipal bond market.
Looking forward, there remains a significant amount of economic uncertainty relating to the pace and magnitude of the COVID-19 economic recovery as well other ongoing geo-political risks including U.S. elections and U.S./China trade relations. As such, it is likely that above average market volatility will continue for some time. While continued volatility may have a variety of impacts
4
Overlay Shares ETFs
Shareholder Letter
August 31, 2020 (Unaudited) (Continued)
on the indices that the Overlay Shares are tracking, the Overlay strategy has the ability to benefit from this volatility through higher premiums available in the market. The combination of higher premiums and our continued proactive risk management should create a favorable opportunity set for the Overlay to add supplemental income within the Overlay Shares.
Risk Factors
The Funds invest in options that derive their performance from the performance of the S&P 500 Index. Selling (writing) and buying options are speculative activities and entail greater than ordinary investment risks. The Funds’ use of put options can lead to losses because of adverse movements in the price or value of the underlying asset, which may be magnified by certain features of the options. When selling a put option, the Fund will receive a premium; however, this premium may not be enough to offset a loss incurred by the Fund if the price of the underlying asset is below the strike price by an amount equal to or greater than the premium. Purchased put options may expire worthless and the Fund would lose the premium it paid for the option. The Fund may lose significantly more than the premiums it receives in highly volatile market conditions. OVS: Investments made in small-capitalization companies may be more volatile and less liquid due to limited resources or product lines and more sensitive to economic factors. OVF: Investing in foreign securities may involve certain additional risks, exchange rate fluctuations, less liquidity, greater volatility and less regulation. OVB: The Fund is subject to the same risks as the underlying bonds in the portfolio such as credit, call and interest rate risk. As interest rates rise the value of bond prices will decline. OVM: Funds that invest primarily in state-specific municipal obligations of issuers and therefore will be affected by economic, political or other events affecting municipal issuers.
The Funds will invest in short term put options which are financial derivatives that give buyers the right, but not the obligation, to sell (put) an underlying asset at an agreed-upon price and date. The Funds’ use of options may reduce the Funds’ ability to profit from increases in the value of the underlying asset. The Funds could experience a loss or increased volatility if its derivatives do not perform as anticipated or are not correlated with the performance of their underlying asset or if the Funds are unable to purchase or liquidate a position.
The Funds were recently organized and have less than 1 year of operating history. As a result, investors have a limited track record on which to base their investment decision. Investments involve risk including the possible loss of principal.
5
Overlay Shares ETFs
Shareholder Expense Example
(Unaudited)
As a shareholder of a Fund you incur two types of costs: (1) transaction costs for purchasing and selling shares; and (2) ongoing costs, including management fees and other fund expenses. The following example is intended to help you understand your ongoing costs (in dollars and cents) of investing in a Fund and to compare these costs with the ongoing costs of investing in other funds. The examples are based on an investment of $1,000 invested at the beginning of the period and held throughout the entire period (March 1, 2020 to August 31, 2020), except as noted in footnotes below.
ACTUAL EXPENSES
The first line under each Fund in the table below provides information about actual account values and actual expenses. You may use the information in this line, together with the amount you invested, to estimate the expenses that you paid over the period. Simply divide your account value by $1,000 (for example, an $8,600 account value divided by $1,000 = 8.6), then multiply the result by the number in the first line for your Fund under the heading entitled “Expenses Paid During Period” to estimate the expenses you paid on your account during this period.
HYPOTHETICAL EXAMPLE FOR COMPARISON PURPOSES
The second line in the table provides information about hypothetical account values and hypothetical expenses based on each Fund’s actual expense ratio and an assumed rate of return of 5% per year before expenses, which is not the Fund’s actual return. The hypothetical account values and expenses may not be used to estimate the actual ending account balance or expenses you paid for the period. You may use this information to compare the ongoing costs of investing in the Fund and other funds. To do so, compare this 5% hypothetical example with the 5% hypothetical examples that appear in the shareholder reports of the other funds. Please note that the expenses shown in the table are meant to highlight your ongoing costs only and do not reflect any transactional costs, such as brokerage commissions paid on purchases and sales of Fund shares. Therefore, the second line in the table is useful in comparing ongoing Fund costs only and will not help you determine the relative total costs of owning different funds. In addition, if these transactional costs were included, your costs would have been higher.
Beginning | Ending | Annualized | Expenses | |
Overlay Shares Large Cap Equity ETF |
|
|
| |
Actual | $ 1,000.00 | $ 1,235.50 | 0.77% | $ 4.33 |
Hypothetical (5% return before expenses) | $ 1,000.00 | $ 1,021.27 | 0.77% | $ 3.91 |
Overlay Shares Small Cap Equity ETF |
|
|
| |
Actual | $ 1,000.00 | $ 1,060.30 | 0.76% | $ 3.94 |
Hypothetical (5% return before expenses) | $ 1,000.00 | $ 1,021.32 | 0.76% | $ 3.86 |
Overlay Shares Foreign Equity ETF |
|
|
| |
Actual | $ 1,000.00 | $ 1,059.50 | 0.76% | $ 3.93 |
Hypothetical (5% return before expenses) | $ 1,000.00 | $ 1,021.32 | 0.76% | $ 3.86 |
Overlay Shares Core Bond ETF | ||||
Actual | $ 1,000.00 | $ 1,067.40 | 0.77% | $ 4.00 |
Hypothetical (5% return before expenses) | $ 1,000.00 | $ 1,021.27 | 0.77% | $ 3.91 |
Overlay Shares Municipal Bond ETF |
|
|
| |
Actual | $ 1,000.00 | $ 1,040.60 | 0.76% | $ 3.90 |
Hypothetical (5% return before expenses) | $ 1,000.00 | $ 1,021.32 | 0.76% | $ 3.86 |
(1) | Expenses are calculated using the Fund’s annualized expense ratio, multiplied by the average account value for the period, multiplied by the 184/366 (to reflect the six-month period). |
6
Overlay Shares ETFs
Performance Overviews
August 31, 2020 (Unaudited)
Hypothetical Growth of $10,000 Investment
(Since Commencement through 8/31/2020)
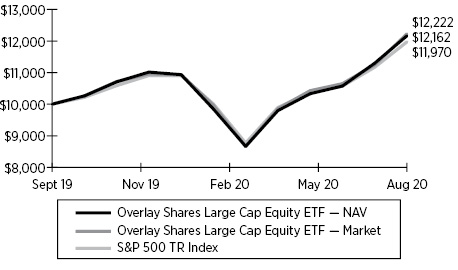
CUMULATIVE TOTAL RETURN | |
Total Returns | Since |
Overlay Shares Large Cap Equity ETF – NAV | 21.62% |
Overlay Shares Large Cap Equity ETF – Market | 22.22% |
S&P 500 TR Index | 19.70% |
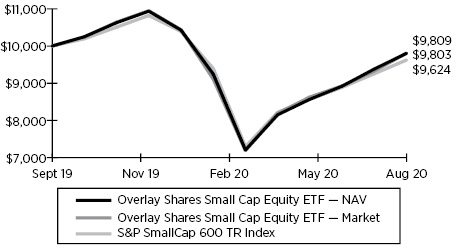
CUMULATIVE TOTAL RETURN | |
Total Returns | Since |
Overlay Shares Small Cap Equity ETF – NAV | (1.97)% |
Overlay Shares Small Cap Equity ETF – Market | (1.91)% |
S&P SmallCap 600 TR Index | (3.76)% |
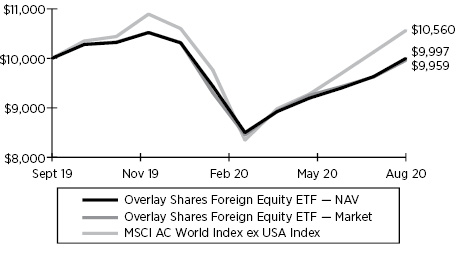
CUMULATIVE TOTAL RETURN | |
Total Returns | Since |
Overlay Shares Foreign Equity ETF – NAV | (0.03)% |
Overlay Shares Foreign Equity ETF – Market | (0.41)% |
MSCI AC World Index ex USA Index | 5.60% |
7
Overlay Shares ETFs
Performance Overviews
August 31, 2020 (Unaudited) (Continued)
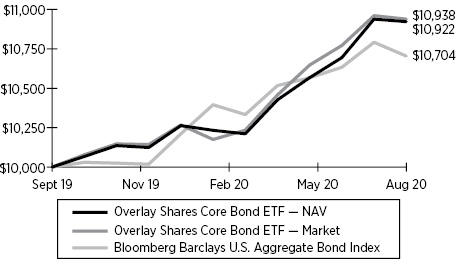
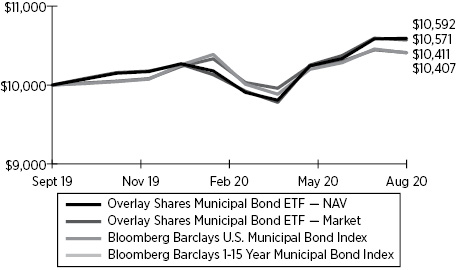
Hypothetical Growth of $10,000 Investment
(Since Commencement through 8/31/2020)
CUMULATIVE TOTAL RETURN | |
Total Returns | Since |
Overlay Shares Core Bond ETF — NAV | 9.22% |
Overlay Shares Core Bond ETF — Market | 9.38% |
Bloomberg Barclays U.S. Aggregate Bond Index | 7.04% |
CUMULATIVE TOTAL RETURN | |
Total Returns | Since |
Overlay Shares Municipal Bond ETF – NAV | 5.92% |
Overlay Shares Municipal Bond ETF – Market | 5.71% |
Bloomberg Barclays U.S. Municipal Bond Index | 4.07% |
Bloomberg Barclays 1-15 Year Municipal Bond Index | 4.11% |
1 | The Fund commenced operations on September 30, 2019. |
The performance data quoted represents past performance. Past performance does not guarantee future results. Current performance may be lower or higher than the performance data quoted. The investment return and principal value of an investment will fluctuate so that an investor’s shares, when sold or redeemed, may be worth more or less than their original cost. For the most recent month-end performance, please call (866) 704-6857. You cannot invest directly in an index. Shares are bought and sold at market price (closing price), not net asset value (“NAV”), and are not individually redeemed from the Fund. Market performance is determined using the bid/ask midpoint at 4:00 p.m. Eastern time when the NAV is typically calculated. Brokerage commissions will reduce returns. Returns shown include the reinvestment of all dividends and distributions. Returns shown do not reflect the deduction of taxes that a shareholder would pay on fund distributions or the redemption of fund shares.
The S&P 500 TR Index is a market-value weighted index consisting of 500 stocks chosen for market size, liquidity, and industry group representation, with each stock’s weight in the Index proportionate to its market value. The S&P SmallCap 600 TR Index seeks to measure the small-cap segment of the U.S. equity market. The index is designed to track companies that meet specific inclusion criteria to ensure that they are liquid and financially viable. The MSCI AC World Index ex USA Index captures large and mid-cap representation across 22 of 23 developed markets countries (excluding the U.S.) and 26 emerging markets countries. The Bloomberg Barclays U.S. Aggregate Bond Index is a broad-based flagship benchmark that measures the investments grade, U.S. dollar-denominated, fixed-rate taxable bond market. The index includes Treasuries, government-related and corporate securities, MBS (agency fixed-rate and hybrid ARM passthroughs), ABS and CMBS (agency and non-agency). The Bloomberg Barclays U.S. Municipal Index covers the USD-denominated long-term tax-exempt bond market. The index has four main sectors: state and local general obligation bonds, revenue bonds, insured bonds and prerefunded bonds. The Bloomberg Barclays 1-15 Year Municipal Bond Index is the 1-15 year component of the Municipal Bond index, a rules-based, market-value-weighted index engineered for the long-term tax-exempt bond market. The index is a broad measure of the municipal bond market with maturities of at least one year.
8
Overlay Shares Large Cap Equity ETF
Schedule of Investments
August 31, 2020
| Shares | Value |
| |||||||||
INVESTMENT COMPANIES — 99.8% | ||||||||||||
Exchange Traded Funds — 99.8% | ||||||||||||
Vanguard S&P 500 ETF (a)(b) | 304,017 | $ | 97,595,538 | |||||||||
TOTAL EXCHANGE TRADED FUNDS (Cost $87,527,522) | 97,595,538 | |||||||||||
MONEY MARKET FUNDS — 0.1% | ||||||||||||
First American Government Obligations Fund - Class X, 0.07% (c) | 64,391 | 64,391 | ||||||||||
TOTAL MONEY MARKET FUNDS (Cost $64,391) | 64,391 | |||||||||||
| Number of |
| Notional | |||||||||
PURCHASED OPTIONS — 0.0% (e) | ||||||||||||
PURCHASED PUT OPTIONS — 0.0% (e) | ||||||||||||
CBOE S&P 500 Index | ||||||||||||
Expiration: September 2020, Exercise Price: $3,335 (f) | 69 | 17,595 | $ | 24,152,139 | ||||||||
TOTAL PURCHASED OPTIONS (Cost $14,427) | 17,595 | |||||||||||
TOTAL INVESTMENTS (Cost $87,606,340) — 99.9% | 97,677,524 | |||||||||||
Other Assets in Excess of Liabilities — 0.1% | 90,773 | |||||||||||
NET ASSETS — 100.0% | $ | 97,768,297 | ||||||||||
Percentages are stated as a percent of net assets.
CBOE | Chicago Board Options Exchange |
(a) | Fair value of this security exceeds 25% of the Fund’s net assets. Additional information for this security, including the financial statements, is available from the SEC’s EDGAR database at www.sec.gov. |
(b) | All or a portion of the security is segregated as collateral for written options. The value of the security segregated as collateral for written options is $23,564,473. |
(c) | The rate shown is the annualized seven-day yield at period end. |
(d) | Each contract has a multiplier of 100. |
(e) | Less than 0.05%. |
(f) | Held in connection with a written option, see Schedule of Written Options for more detail. |
The accompanying notes are an integral part of the financial statements.
9
Overlay Shares Large Cap Equity ETF
Schedule of Written Options
August 31, 2020
| Number of | Value | Notional | |||||||||
WRITTEN OPTIONS — (0.1)% | ||||||||||||
WRITTEN PUT OPTIONS — (0.1)% | ||||||||||||
CBOE S&P 500 Index | ||||||||||||
Expiration: September 2020, Exercise Price: $3,440 | 69 | $ | 70,035 | $ | 24,152,139 | |||||||
TOTAL WRITTEN OPTIONS (Premiums Received $62,255) | $ | 70,035 | ||||||||||
Percentages are stated as a percent of net assets.
CBOE | Chicago Board Options Exchange |
(a) | Each contract has a multiplier of 100. |
The accompanying notes are an integral part of the financial statements.
10
Overlay Shares Small Cap Equity ETF
Schedule of Investments
August 31, 2020

| Shares | Value |
| |||||||||
INVESTMENT COMPANIES — 99.8% | ||||||||||||
Exchange Traded Funds — 99.8% | ||||||||||||
iShares Core S&P Small-Cap ETF (a)(b) | 40,937 | $ | 3,028,110 | |||||||||
TOTAL EXCHANGE TRADED FUNDS (Cost $3,432,688) | 3,028,110 | |||||||||||
MONEY MARKET FUNDS — 0.1% | ||||||||||||
First American Government Obligations Fund - Class X, 0.07% (c) | 1,159 | 1,159 | ||||||||||
TOTAL MONEY MARKET FUNDS (Cost $1,159) | 1,159 | |||||||||||
| Number of |
| Notional | |||||||||
PURCHASED OPTIONS — 0.0% (e) | ||||||||||||
PURCHASED PUT OPTIONS — 0.0% (e) | ||||||||||||
CBOE S&P 500 Index | ||||||||||||
Expiration: September 2020, Exercise Price: $3,335 (f) | 2 | 510 | $ | 700,062 | ||||||||
TOTAL PURCHASED OPTIONS (Cost $418) | 510 | |||||||||||
TOTAL INVESTMENTS (Cost $3,434,265) — 99.9% | 3,029,779 | |||||||||||
Other Assets in Excess of Liabilities — 0.1% | 4,192 | |||||||||||
NET ASSETS — 100.0% | $ | 3,033,971 | ||||||||||
Percentages are stated as a percent of net assets.
CBOE | Chicago Board Options Exchange |
(a) | Fair value of this security exceeds 25% of the Fund’s net assets. Additional information for this security, including the financial statements, is available from the SEC’s EDGAR database at www.sec.gov. |
(b) | All or a portion of the security is segregated as collateral for written options. The value of the security segregated as collateral for written options is $2,176,863. |
(c) | The rate shown is the annualized seven-day yield at period end. |
(d) | Each contract has a multiplier of 100. |
(e) | Less than 0.05%. |
(f) | Held in connection with a written option, see Schedule of Written Options for more detail. |
The accompanying notes are an integral part of the financial statements.
11
Overlay Shares Small Cap Equity ETF
Schedule of Written Options
August 31, 2020
| Number of | Value | Notional | |||||||||
WRITTEN OPTIONS — (0.1)% | ||||||||||||
WRITTEN PUT OPTIONS — (0.1)% | ||||||||||||
CBOE S&P 500 Index | ||||||||||||
Expiration: September 2020, Exercise Price: $3,440 | 2 | $ | 2,030 | $ | 700,062 | |||||||
TOTAL WRITTEN OPTIONS (Premiums Received $1,805) | $ | 2,030 | ||||||||||
Percentages are stated as a percent of net assets.
CBOE | Chicago Board Options Exchange |
(a) | Each contract has a multiplier of 100. |
The accompanying notes are an integral part of the financial statements.
12
Overlay Shares Foreign Equity ETF
Schedule of Investments
August 31, 2020

| Shares | Value |
| |||||||||
INVESTMENT COMPANIES — 99.8% | ||||||||||||
Exchange Traded Funds — 99.8% | ||||||||||||
iShares MSCI EAFE Min Vol Factor ETF (a)(b) | 48,970 | $ | 3,372,564 | |||||||||
iShares MSCI Emerging Markets Min Vol Factor ETF (b) | 15,111 | 841,381 | ||||||||||
TOTAL EXCHANGE TRADED FUNDS (Cost $4,600,152) | 4,213,945 | |||||||||||
MONEY MARKET FUNDS — 0.0% (e) | ||||||||||||
First American Government Obligations Fund - Class X, 0.07% (c) | 429 | 429 | ||||||||||
TOTAL MONEY MARKET FUNDS (Cost $429) | 429 | |||||||||||
| Number of |
| Notional | |||||||||
PURCHASED OPTIONS — 0.0% (e) | ||||||||||||
PURCHASED PUT OPTIONS — 0.0% (e) | ||||||||||||
CBOE S&P 500 Index | ||||||||||||
Expiration: September 2020, Exercise Price: $3,335 (f) | 3 | 765 | $ | 1,050,093 | ||||||||
TOTAL PURCHASED OPTIONS (Cost $627) | 765 | |||||||||||
TOTAL INVESTMENTS (Cost $4,601,208) — 99.8% | 4,215,139 | |||||||||||
Other Assets in Excess of Liabilities — 0.2% | 8,006 | |||||||||||
NET ASSETS — 100.0% | $ | 4,223,145 | ||||||||||
Percentages are stated as a percent of net assets.
CBOE | Chicago Board Options Exchange |
(a) | Fair value of this security exceeds 25% of the Fund’s net assets. Additional information for this security, including the financial statements, is available from the SEC’s EDGAR database at www.sec.gov. |
(b) | All or a portion of the security is segregated as collateral for written options. The value of the security segregated as collateral for written options is $1,365,976. |
(c) | The rate shown is the annualized seven-day yield at period end. |
(d) | Each contract has a multiplier of 100. |
(e) | Less than 0.05%. |
(f) | Held in connection with a written option, see Schedule of Written Options for more detail. |
The accompanying notes are an integral part of the financial statements.
13
Overlay Shares Foreign Equity ETF
Schedule of Written Options
August 31, 2020
| Number of | Value | Notional | |||||||||
WRITTEN OPTIONS — (0.1)% | ||||||||||||
WRITTEN PUT OPTIONS — (0.1)% | ||||||||||||
CBOE S&P 500 Index | ||||||||||||
Expiration: September 2020, Exercise Price: $3,440 | 3 | $ | 3,045 | $ | 1,050,093 | |||||||
TOTAL WRITTEN OPTIONS (Premiums Received $2,707) | $ | 3,045 | ||||||||||
Percentages are stated as a percent of net assets.
CBOE | Chicago Board Options Exchange |
(a) | Each contract has a multiplier of 100. |
The accompanying notes are an integral part of the financial statements.
14
Overlay Shares Core Bond ETF
Schedule of Investments
August 31, 2020
| Shares | Value |
| |||||||||
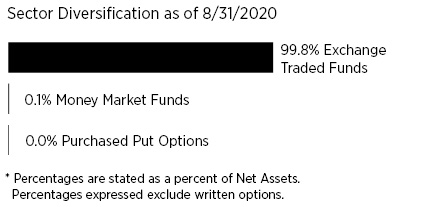
INVESTMENT COMPANIES — 99.8% | ||||||||||||
Exchange Traded Funds — 99.8% | ||||||||||||
iShares Core U.S. Aggregate Bond ETF (a)(b) | 959,198 | $ | 113,540,267 | |||||||||
TOTAL EXCHANGE TRADED FUNDS (Cost $109,691,035) | 113,540,267 | |||||||||||
MONEY MARKET FUNDS — 0.2% | ||||||||||||
First American Government Obligations Fund - Class X, 0.07% (c) | 178,222 | 178,222 | ||||||||||
TOTAL MONEY MARKET FUNDS (Cost $178,222) | 178,222 | |||||||||||
| Number of |
| Notional | |||||||||
PURCHASED OPTIONS — 0.0% (e) | ||||||||||||
PURCHASED PUT OPTIONS — 0.0% (e) | ||||||||||||
CBOE S&P 500 Index | ||||||||||||
Expiration: September 2020, Exercise Price: $3,335 (f) | 81 | 20,655 | $ | 28,352,511 | ||||||||
TOTAL PURCHASED OPTIONS (Cost $16,936) | 20,655 | |||||||||||
TOTAL INVESTMENTS (Cost $109,886,193) — 100.0% | 113,739,144 | |||||||||||
Other Assets in Excess of Liabilities — 0.0% (e) | 4,890 | |||||||||||
NET ASSETS — 100.0% | $ | 113,744,034 | ||||||||||
Percentages are stated as a percent of net assets.
CBOE | Chicago Board Options Exchange |
(a) | Fair value of this security exceeds 25% of the Fund’s net assets. Additional information for this security, including the financial statements, is available from the SEC’s EDGAR database at www.sec.gov. |
(b) | All or a portion of the security is segregated as collateral for written options. The value of the security segregated as collateral for written options is $33,586,777. |
(c) | The rate shown is the annualized seven-day yield at period end. |
(d) | Each contract has a multiplier of 100. |
(e) | Less than 0.05% |
(f) | Held in connection with a written option, see Schedule of Written Options for more detail. |
The accompanying notes are an integral part of the financial statements.
15
Overlay Shares Core Bond ETF
Schedule of Written Options
August 31, 2020
| Number of | Value | Notional | |||||||||
WRITTEN OPTIONS — (0.1)% | ||||||||||||
WRITTEN PUT OPTIONS — (0.1)% | ||||||||||||
CBOE S&P 500 Index | ||||||||||||
Expiration: September 2020, Exercise Price: $3,440 | 81 | $ | 82,215 | $ | 28,352,511 | |||||||
TOTAL WRITTEN OPTIONS (Premiums Received $73,082) | $ | 82,215 | ||||||||||
Percentages are stated as a percent of net assets.
CBOE | Chicago Board Options Exchange |
(a) | Each contract has a multiplier of 100. |
The accompanying notes are an integral part of the financial statements.
16
Overlay Shares Municipal Bond ETF
Schedule of Investments
August 31, 2020

| Shares | Value |
| |||||||||
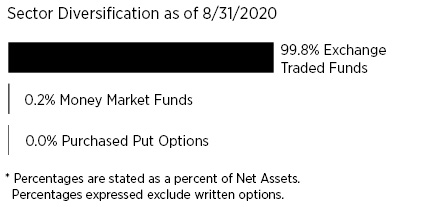
INVESTMENT COMPANIES — 99.8% | ||||||||||||
Exchange Traded Funds — 99.8% | ||||||||||||
iShares National Muni Bond ETF (a)(b) | 249,701 | $ | 28,960,322 | |||||||||
TOTAL EXCHANGE TRADED FUNDS (Cost $28,621,963) | 28,960,322 | |||||||||||
MONEY MARKET FUNDS — 0.2% | ||||||||||||
First American Government Obligations Fund - Class X, 0.07% (c) | 58,904 | 58,904 | ||||||||||
TOTAL MONEY MARKET FUNDS (Cost $58,904) | 58,904 | |||||||||||
| Number of |
| Notional | |||||||||
PURCHASED OPTIONS — 0.0% (e) | ||||||||||||
PURCHASED PUT OPTIONS — 0.0% (e) | ||||||||||||
CBOE S&P 500 Index | ||||||||||||
Expiration: September 2020, Exercise Price: $3,335 (f) | 20 | 5,100 | $ | 7,000,620 | ||||||||
TOTAL PURCHASED OPTIONS (Cost $4,182) | 5,100 | |||||||||||
TOTAL INVESTMENTS (Cost $28,685,049) — 100.0% | 29,024,326 | |||||||||||
Liabilities in Excess of Other Assets — 0.0% (e) | (3,848 | ) | ||||||||||
NET ASSETS — 100.0% | $ | 29,020,478 | ||||||||||
Percentages are stated as a percent of net assets.
CBOE | Chicago Board Options Exchange |
(a) | Fair value of this security exceeds 25% of the Fund’s net assets. Additional information for this security, including the financial statements, is available from the SEC’s EDGAR database at www.sec.gov. |
(b) | All or a portion of the security is segregated as collateral for written options. The value of the security segregated as collateral for written options is $11,378,798. |
(c) | The rate shown is the annualized seven-day yield at period end. |
(d) | Each contract has a multiplier of 100. |
(e) | Less than 0.05%. |
(f) | Held in connection with a written option, see Schedule of Written Options for more detail. |
The accompanying notes are an integral part of the financial statements.
17
Overlay Shares Municipal Bond ETF
Schedule of Written Options
August 31, 2020
| Number of | Value | Notional | |||||||||
WRITTEN OPTIONS — (0.1)% | ||||||||||||
WRITTEN PUT OPTIONS — (0.1)% | ||||||||||||
CBOE S&P 500 Index | ||||||||||||
Expiration: September 2020, Exercise Price: $3,440 | 20 | $ | 20,300 | $ | 7,000,620 | |||||||
TOTAL WRITTEN OPTIONS (Premiums Received $18,045) | $ | 20,300 | ||||||||||
Percentages are stated as a percent of net assets.
CBOE | Chicago Board Options Exchange |
(a) | Each contract has a multiplier of 100. |
The accompanying notes are an integral part of the financial statements.
18
Overlay Shares ETFs
Statements of Assets and Liabilities
August 31, 2020
Overlay Shares | Overlay Shares | Overlay | Overlay Shares | Overlay Shares | ||||||||||||||||
Assets | ||||||||||||||||||||
Investments, at value (cost $87,606,340, $3,434,265 $4,601,208, $109,886,193 and $28,685,049 respectively) | $ | 97,677,524 | $ | 3,029,779 | $ | 4,215,139 | $ | 113,739,144 | $ | 29,024,326 | ||||||||||
Deposits at broker for options | 223,293 | 8,303 | 14,718 | 161,890 | 35,848 | |||||||||||||||
Receivable for investment securities sold | 1,722 | 50 | 75 | 2,047 | 524 | |||||||||||||||
Interest receivable | 4 | — | — | 8 | 3 | |||||||||||||||
Total assets | 97,902,543 | 3,038,132 | 4,229,932 | 113,903,089 | 29,060,701 | |||||||||||||||
Liabilities | ||||||||||||||||||||
Payable to Adviser | 58,895 | 1,977 | 3,511 | 70,523 | 18,305 | |||||||||||||||
Written options, at value (premiums received $62,255, $1,805, $2,707, $73,082 and $18,045 respectively) | 70,035 | 2,030 | 3,045 | 82,215 | 20,300 | |||||||||||||||
Payable for investment securities purchased | 5,316 | 154 | 231 | 6,317 | 1,618 | |||||||||||||||
Total liabilities | 134,246 | 4,161 | 6,787 | 159,055 | 40,223 | |||||||||||||||
Net Assets | $ | 97,768,297 | $ | 3,033,971 | $ | 4,223,145 | $ | 113,744,034 | $ | 29,020,478 | ||||||||||
Net Assets Consists of: | ||||||||||||||||||||
Paid-in capital | $ | 86,369,016 | $ | 3,454,254 | $ | 4,652,383 | $ | 109,075,326 | $ | 28,506,079 | ||||||||||
Total distributable earnings (accumulated losses) | 11,399,281 | (420,283 | ) | (429,238 | ) | 4,668,708 | 514,399 | |||||||||||||
Net Assets | $ | 97,768,297 | $ | 3,033,971 | $ | 4,223,145 | $ | 113,744,034 | $ | 29,020,478 | ||||||||||
Shares of beneficial interest outstanding (unlimited number of shares authorized, no par value) | 3,250,000 | 125,000 | 175,000 | 4,275,000 | 1,125,000 | |||||||||||||||
Net asset value, redemption price and offering price per share | $ | 30.08 | $ | 24.27 | $ | 24.13 | $ | 26.61 | $ | 25.80 | ||||||||||
The accompanying notes are an integral part of the financial statements.
19
Overlay Shares ETFs
Statements of Operations
For the Period Ended August 31, 2020(1)
Overlay Shares | Overlay Shares | Overlay | Overlay Shares | Overlay Shares | ||||||||||||||||
Investment Income | ||||||||||||||||||||
Dividend income | $ | 735,069 | $ | 152,563 | $ | 702,048 | $ | 1,447,230 | $ | 407,850 | ||||||||||
Interest income | 2,684 | 794 | 1,436 | 4,305 | 1,150 | |||||||||||||||
Total investment income | 737,753 | 153,357 | 703,484 | 1,451,535 | 409,000 | |||||||||||||||
Expenses | ||||||||||||||||||||
Investment advisory fees | 342,001 | 69,168 | 126,180 | 489,362 | 142,946 | |||||||||||||||
Interest expense | 6,035 | 792 | 1,612 | 8,923 | 2,104 | |||||||||||||||
Total expenses | 348,036 | 69,960 | 127,792 | 498,285 | 145,050 | |||||||||||||||
Net Investment Income | 389,717 | 83,397 | 575,692 | 953,250 | 263,950 | |||||||||||||||
Realized and Unrealized Gain (Loss) on Investments | ||||||||||||||||||||
Net realized gain (loss) from: | ||||||||||||||||||||
Investments | 16,458 | (1,417,533 | ) | (2,645,673 | ) | 31,195 | (29,221 | ) | ||||||||||||
Purchased options | (1,338,955 | ) | (142,632 | ) | (213,379 | ) | (1,740,918 | ) | (476,198 | ) | ||||||||||
Written options | 2,933,906 | 228,873 | 306,903 | 3,714,536 | 1,012,281 | |||||||||||||||
Net realized gain (loss) | 1,611,409 | (1,331,292 | ) | (2,552,149 | ) | 2,004,813 | 506,862 | |||||||||||||
Net change in unrealized appreciation/depreciation on: | ||||||||||||||||||||
Investments | 10,068,016 | (404,578 | ) | (386,207 | ) | 3,849,232 | 338,359 | |||||||||||||
Purchased options | 3,168 | 92 | 138 | 3,719 | 918 | |||||||||||||||
Written options | (7,780 | ) | (225 | ) | (338 | ) | (9,133 | ) | (2,255 | ) | ||||||||||
Net change in unrealized appreciation/depreciation | 10,063,404 | (404,711 | ) | (386,407 | ) | 3,843,818 | 337,022 | |||||||||||||
Net realized and unrealized gain (loss) on investments | 11,674,813 | (1,736,003 | ) | (2,938,556 | ) | 5,848,631 | 843,884 | |||||||||||||
Net increase (decrease) in net assets from operations | $ | 12,064,530 | $ | (1,652,606 | ) | $ | (2,362,864 | ) | $ | 6,801,881 | $ | 1,107,834 | ||||||||
(1) | The Funds commenced operations on September 30, 2019. |
The accompanying notes are an integral part of the financial statements.
20
Overlay Shares Large Cap Equity ETF
Statement of Changes in Net Assets
| Period Ended | |||
From Operations | ||||
Net investment income | $ | 389,717 | ||
Net realized gain on investments, purchased options and written options | 1,611,409 | |||
Net change in unrealized appreciation/depreciation on investments, purchased options and written options | 10,063,404 | |||
Net increase in net assets resulting from operations | 12,064,530 | |||
From Distributions | ||||
Distributable earnings | (484,488 | ) | ||
Total distributions | (484,488 | ) | ||
From Capital Share Transactions | ||||
Proceeds from shares sold | 88,656,335 | |||
Cost of shares redeemed | (2,468,080 | ) | ||
Net increase in net assets resulting from capital share transactions | 86,188,255 | |||
Total Increase in Net Assets | 97,768,297 | |||
Net Assets | ||||
Beginning of period | — | |||
End of period | $ | 97,768,297 | ||
Changes in Shares Outstanding | ||||
Shares outstanding, beginning of period | — | |||
Shares sold | 3,350,000 | |||
Shares redeemed | (100,000 | ) | ||
Shares outstanding, end of period | 3,250,000 | |||
(1) | The Fund commenced operations on September 30, 2019. |
The accompanying notes are an integral part of the financial statements.
21
Overlay Shares Small Cap Equity ETF
Statement of Changes in Net Assets
Period Ended | ||||
From Operations | ||||
Net investment income | $ | 83,397 | ||
Net realized loss on investments, purchased options and written options | (1,331,292 | ) | ||
Net change in unrealized appreciation/depreciation on investments, purchased options and written options | (404,711 | ) | ||
Net decrease in net assets resulting from operations | (1,652,606 | ) | ||
From Distributions | ||||
Distributable earnings | (116,448 | ) | ||
Total distributions | (116,448 | ) | ||
From Capital Share Transactions | ||||
Proceeds from shares sold | 16,504,828 | |||
Cost of shares redeemed | (11,701,803 | ) | ||
Net increase in net assets resulting from capital share transactions | 4,803,025 | |||
Total Increase in Net Assets | 3,033,971 | |||
Net Assets | ||||
Beginning of period | — | |||
End of period | $ | 3,033,971 | ||
Changes in Shares Outstanding | ||||
Shares outstanding, beginning of period | — | |||
Shares sold | 650,000 | |||
Shares redeemed | (525,000 | ) | ||
Shares outstanding, end of period | 125,000 | |||
(1) | The Fund commenced operations on September 30, 2019. |
The accompanying notes are an integral part of the financial statements.
22
Overlay Shares Foreign Equity ETF
Statement of Changes in Net Assets
Period Ended | ||||
From Operations | ||||
Net investment income | $ | 575,692 | ||
Net realized loss on investments, purchased options and written options | (2,552,149 | ) | ||
Net change in unrealized appreciation/depreciation on investments, purchased options and written options | (386,407 | ) | ||
Net decrease in net assets resulting from operations | (2,362,864 | ) | ||
From Distributions | ||||
Distributable earnings | (603,912 | ) | ||
Return of capital | (12,224 | ) | ||
Total distributions | (616,136 | ) | ||
From Capital Share Transactions | ||||
Proceeds from shares sold | 33,871,680 | |||
Cost of shares redeemed | (26,669,535 | ) | ||
Net increase in net assets resulting from capital share transactions | 7,202,145 | |||
Total Increase in Net Assets | 4,223,145 | |||
Net Assets | ||||
Beginning of period | — | |||
End of period | $ | 4,223,145 | ||
Changes in Shares Outstanding | ||||
Shares outstanding, beginning of period | — | |||
Shares sold | 1,325,000 | |||
Shares redeemed | (1,150,000 | ) | ||
Shares outstanding, end of period | 175,000 | |||
(1) | The Fund commenced operations on September 30, 2019. |
The accompanying notes are an integral part of the financial statements.
23
Overlay Shares Core Bond ETF
Statement of Changes in Net Assets
Period Ended | ||||
From Operations | ||||
Net investment income | $ | 953,250 | ||
Net realized gain on investments, purchased options and written options | 2,004,813 | |||
Net change in unrealized appreciation/depreciation on investments, purchased options and written options | 3,843,818 | |||
Net increase in net assets resulting from operations | 6,801,881 | |||
From Distributions | ||||
Distributable earnings | (2,116,180 | ) | ||
Total distributions | (2,116,180 | ) | ||
From Capital Share Transactions | ||||
Proceeds from shares sold | 110,304,293 | |||
Cost of shares redeemed | (1,245,960 | ) | ||
Net increase in net assets resulting from capital share transactions | 109,058,333 | |||
Total Increase in Net Assets | 113,744,034 | |||
Net Assets | ||||
Beginning of period | — | |||
End of period | $ | 113,744,034 | ||
Changes in Shares Outstanding | ||||
Shares outstanding, beginning of period | — | |||
Shares sold | 4,325,000 | |||
Shares redeemed | (50,000 | ) | ||
Shares outstanding, end of period | 4,275,000 | |||
(1) | The Fund commenced operations on September 30, 2019. |
The accompanying notes are an integral part of the financial statements.
24
Overlay Shares Municipal Bond ETF
Statement of Changes in Net Assets
Period Ended | ||||
From Operations | ||||
Net investment income | $ | 263,950 | ||
Net realized gain on investments, purchased options and written options | 506,862 | |||
Net change in unrealized appreciation/depreciation on investments, purchased options and written options | 337,022 | |||
Net increase in net assets resulting from operations | 1,107,834 | |||
From Distributions | ||||
Distributable earnings | (617,811 | ) | ||
Total distributions | (617,811 | ) | ||
From Capital Share Transactions | ||||
Proceeds from shares sold | 29,124,958 | |||
Cost of shares redeemed | (594,503 | ) | ||
Net increase in net assets resulting from capital share transactions | 28,530,455 | |||
Total Increase in Net Assets | 29,020,478 | |||
Net Assets | ||||
Beginning of period | — | |||
End of period | $ | 29,020,478 | ||
Changes in Shares Outstanding | ||||
Shares outstanding, beginning of period | — | |||
Shares sold | 1,150,000 | |||
Shares redeemed | (25,000 | ) | ||
Shares outstanding, end of period | 1,125,000 | |||
(1) | The Fund commenced operations on September 30, 2019. |
The accompanying notes are an integral part of the financial statements.
25
Overlay Shares Large Cap Equity ETF
Financial Highlights
For a Share Outstanding Throughout the Period
| Period Ended | |||
Net Asset Value, Beginning of Period | $ | 25.00 | ||
Income from investment operations: | ||||
Net investment income(2) | 0.20 | |||
Net realized and unrealized gain | 5.15 | |||
Total from investment operations | 5.35 | |||
Less distributions paid: | ||||
From net investment income | (0.23 | ) | ||
From net realized gains | (0.04 | ) | ||
Total distributions paid | (0.27 | ) | ||
Net Asset Value, End of Period | $ | 30.08 | ||
Total return, at NAV(3) | 21.62 | %(4) | ||
Total return, at Market(3) | 22.22 | %(4) | ||
Supplemental Data and Ratios: | ||||
Net assets, end of period (000’s) | $ | 97,768 | ||
Ratio of expenses to average net assets: | 0.76 | %(5)(6)(8) | ||
Ratio of net investment income to average net assets: | 0.85 | %(5)(8) | ||
Portfolio turnover rate(7) | 4 | %(4) | ||
(1) | The Fund commenced investment operations on September 30, 2019. |
(2) | Per share net investment income was calculated using average shares outstanding. |
(3) | Total return in the table represents the rate that the investor would have earned or lost on an investment in the Fund, assuming reinvestment of dividends. |
(4) | Not annualized for periods less than one year. |
(5) | Annualized for periods less than one year. |
(6) | Includes interest expense of 0.01% for the period ended August 31, 2020. |
(7) | Excludes in-kind transactions associated with creations and redemptions of the Fund. |
(8) | Does not include income and expenses of investment companies in which the Fund invests. |
The accompanying notes are an integral part of the financial statements.
26
Overlay Shares Small Cap Equity ETF
Financial Highlights
For a Share Outstanding Throughout the Period
Period Ended | ||||
Net Asset Value, Beginning of Period | $ | 25.00 | ||
Income (Loss) from investment operations: | ||||
Net investment income(2) | 0.19 | |||
Net realized and unrealized loss | (0.68 | )(8) | ||
Total from investment operations | (0.49 | ) | ||
Less distributions paid: | ||||
From net investment income | (0.18 | ) | ||
From net realized gains | (0.06 | ) | ||
Total distributions paid | (0.24 | ) | ||
Net Asset Value, End of Period | $ | 24.27 | ||
Total return, at NAV(3) | (1.97 | )%(4) | ||
Total return, at Market(3) | (1.91 | )%(4) | ||
Supplemental Data and Ratios: | ||||
Net assets, end of period (000’s) | $ | 3,034 | ||
Ratio of expenses to average net assets: | 0.76 | %(5)(6)(9) | ||
Ratio of net investment income to average net assets: | 0.90 | %(5)(9) | ||
Portfolio turnover rate(7) | 6 | %(4) | ||
(1) | The Fund commenced investment operations on September 30, 2019. |
(2) | Per share net investment income was calculated using average shares outstanding. |
(3) | Total return in the table represents the rate that the investor would have earned or lost on an investment in the Fund, assuming reinvestment of dividends. |
(4) | Not annualized for periods less than one year. |
(5) | Annualized for periods less than one year. |
(6) | Includes interest expense of 0.01% for the period ended August 31, 2020. |
(7) | Excludes in-kind transactions associated with creations and redemptions of the Fund. |
(8) | Realized and unrealized gains and losses per share in this caption are balancing amounts necessary to reconcile the change in net asset value per share for the period, and may not reconcile with the aggregate gains and losses in the Statements of Operations due to share transactions for the period. |
(9) | Does not include income and expenses of investment companies in which the Fund invests. |
The accompanying notes are an integral part of the financial statements.
27
Overlay Shares Foreign Equity ETF
Financial Highlights
For a Share Outstanding Throughout the Period
Period Ended | ||||
Net Asset Value, Beginning of Period | $ | 25.00 | ||
Income (Loss) from investment operations: | ||||
Net investment income(2) | 0.73 | |||
Net realized and unrealized loss | (0.73 | )(8) | ||
Total from investment operations | 0.00 | |||
Less distributions paid: | ||||
From net investment income | (0.80 | ) | ||
From net realized gains | (0.05 | ) | ||
From return of capital | (0.02 | ) | ||
Total distributions paid | (0.87 | ) | ||
Net Asset Value, End of Period | $ | 24.13 | ||
Total return, at NAV(3) | (0.03 | )%(4) | ||
Total return, at Market(3) | �� | (0.41 | )%(4) | |
Supplemental Data and Ratios: | ||||
Net assets, end of period (000’s) | $ | 4,223 | ||
Ratio of expenses to average net assets: | 0.76 | %(5)(6)(9) | ||
Ratio of net investment income to average net assets: | 3.42 | %(5)(9) | ||
Portfolio turnover rate(7) | 8 | %(4) | ||
(1) | The Fund commenced investment operations on September 30, 2019. |
(2) | Per share net investment income was calculated using average shares outstanding. |
(3) | Total return in the table represents the rate that the investor would have earned or lost on an investment in the Fund, assuming reinvestment of dividends. |
(4) | Not annualized for periods less than one year. |
(5) | Annualized for periods less than one year. |
(6) | Includes interest expense of 0.01% for the period ended August 31, 2020. |
(7) | Excludes in-kind transactions associated with creations and redemptions of the Fund. |
(8) | Realized and unrealized gains and losses per share in this caption are balancing amounts necessary to reconcile the change in net asset value per share for the period, and may not reconcile with the aggregate gains and losses in the Statements of Operations due to share transactions for the period. |
(9) | Does not include income and expenses of investment companies in which the Fund invests. |
The accompanying notes are an integral part of the financial statements.
28
Overlay Shares Core Bond ETF
Financial Highlights
For a Share Outstanding Throughout the Period
Period Ended | ||||
Net Asset Value, Beginning of Period | $ | 25.00 | ||
Income from investment operations: | ||||
Net investment income(2) | 0.35 | |||
Net realized and unrealized gain | 1.92 | |||
Total from investment operations | 2.27 | |||
Less distributions paid: | ||||
From net investment income | (0.62 | ) | ||
From net realized gains | (0.04 | ) | ||
Total distributions paid | (0.66 | ) | ||
Net Asset Value, End of Period | $ | 26.61 | ||
Total return, at NAV(3) | 9.22 | %(4) | ||
Total return, at Market(3) | 9.38 | %(4) | ||
Supplemental Data and Ratios: | ||||
Net assets, end of period (000’s) | $ | 113,744 | ||
Ratio of expenses to average net assets: | 0.76 | %(5)(6)(8) | ||
Ratio of net investment income to average net assets: | 1.46 | %(5)(8) | ||
Portfolio turnover rate(7) | 5 | %(4) | ||
(1) | The Fund commenced investment operations on September 30, 2019. |
(2) | Per share net investment income was calculated using average shares outstanding. |
(3) | Total return in the table represents the rate that the investor would have earned or lost on an investment in the Fund, assuming reinvestment of dividends. |
(4) | Not annualized for periods less than one year. |
(5) | Annualized for periods less than one year. |
(6) | Includes interest expense of 0.01% for the period ended August 31, 2020. |
(7) | Excludes in-kind transactions associated with creations and redemptions of the Fund. |
(8) | Does not include income and expenses of investment companies in which the Fund invests. |
The accompanying notes are an integral part of the financial statements.
29
Overlay Shares Municipal Bond ETF
Financial Highlights
For a Share Outstanding Throughout the Period
Period Ended | ||||
Net Asset Value, Beginning of Period | $ | 25.00 | ||
Income from investment operations: | ||||
Net investment income(2) | 0.32 | |||
Net realized and unrealized gain | 1.14 | |||
Total from investment operations | 1.46 | |||
Less distributions paid: | ||||
From net investment income | (0.61 | ) | ||
From net realized gains | (0.05 | ) | ||
Total distributions paid | (0.66 | ) | ||
Net Asset Value, End of Period | $ | 25.80 | ||
Total return, at NAV(3) | 5.92 | %(4) | ||
Total return, at Market(3) | 5.71 | %(4) | ||
Supplemental Data and Ratios: | ||||
Net assets, end of period (000’s) | $ | 29,020 | ||
Ratio of expenses to average net assets: | 0.76 | %(5)(6)(8) | ||
Ratio of net investment income to average net assets: | 1.38 | %(5)(8) | ||
Portfolio turnover rate(7) | 4 | %(4) | ||
(1) | The Fund commenced investment operations on September 30, 2019. |
(2) | Per share net investment income was calculated using average shares outstanding. |
(3) | Total return in the table represents the rate that the investor would have earned or lost on an investment in the Fund, assuming reinvestment of dividends. |
(4) | Not annualized for periods less than one year. |
(5) | Annualized for periods less than one year. |
(6) | Includes interest expense of 0.01% for the period ended August 31, 2020. |
(7) | Excludes in-kind transactions associated with creations and redemptions of the Fund. |
(8) | Does not include income and expenses of investment companies in which the Fund invests. |
The accompanying notes are an integral part of the financial statements.
30
Overlay Shares ETFs
Notes to Financial Statements
August 31, 2020
1. | ORGANIZATION |
Overlay Shares Large Cap Equity ETF (OVL), Overlay Shares Small Cap Equity ETF (OVS), Overlay Shares Foreign Equity ETF (OVF), Overlay Shares Core Bond ETF (OVB), and Overlay Shares Municipal Bond ETF (OVM) (each a “Fund” and collectively, the “Funds”) are diversified series of Listed Funds Trust (the “Trust”), formerly Active Weighting Funds ETF Trust. The Trust was organized as a Delaware statutory trust on August 26, 2016, under a Declaration of Trust amended on December 21, 2018 and is registered with the U.S. Securities and Exchange Commission (the “SEC”) as an open-end management investment company under the Investment Company Act of 1940, as amended (the “1940 Act”).
Each Fund is an actively-managed exchange-traded fund (“ETF”) that seeks to achieve its total return investment objective by investing in one or more other ETFs that seek to obtain exposure based on the following:
Fund | Investment Objective |
OVL | U.S. large cap equity securities |
OVS | U.S. small cap equity securities |
OVF | Non-U.S. equity securities (from both developed and emerging markets) |
OVB | Investment grade, U.S. dollar-denominated, fixed-rate taxable bonds |
OVM | Investment grade municipal bonds and below investment grade municipal bonds |
The Funds may invest directly in the securities held by such ETFs and sell and purchase listed short-term put options to generate income to the Funds (the “Overlay Strategy”).
The Funds’ Overlay Strategy seeks to generate income for the Funds by utilizing a “put spread” consisting of the sale of exchange-listed short-term put options with a notional value up to 100% of each Fund’s net assets and the purchase of an identical number of short-term put options with a lower strike price. Each Fund seeks to generate income from the sale and purchase of put options with a lower strike price to hedge against a decline in the options’ underlying asset, the S&P 500 Index, which consists of approximately 500 leading U.S.-listed companies representing approximately 80% of the U.S. equity market capitalization. The Funds commenced operations on September 30, 2019.
Costs incurred by the Funds in connection with the organization, registration and the initial public offering of shares were paid by Liquid Strategies, LLC (“Liquid Strategies” or “Adviser”), the Funds’ Investment Adviser.
2. | SIGNIFICANT ACCOUNTING POLICIES |
Each Fund is an investment company and accordingly follows the investment company accounting and reporting guidance of the Financial Accounting Standards Board (“FASB”) Accounting Standards Codification (“ASC”) Topic 946, Financial Services — Investment Companies. Each Fund prepares its financial statements in accordance with accounting principles generally accepted in the United States of America (“U.S. GAAP”) and follows the significant accounting policies described below.
Use of Estimates
The preparation of the financial statements in conformity with U.S. GAAP requires management to make estimates and assumptions that affect the reported amounts of assets and liabilities and disclosures of contingent assets and liabilities at the date of the financial statements and the reported amounts of increases and decreases in net assets from operations during the reporting period. Actual results could differ from these estimates.
Share Transactions
The net asset value (“NAV”) per share of each Fund will be equal to a Fund’s total assets minus a Fund’s total liabilities divided by the total number of shares outstanding. The NAV is determined as of the close of trading (generally, 4:00 p.m. Eastern Time) on each day the New York Stock Exchange (“NYSE”) is open for trading.
31
Overlay Shares ETFs
Notes to Financial Statements
August 31, 2020 (Continued)
Fair Value Measurement
In calculating the NAV, each Fund’s exchange-traded equity securities will be valued at fair value, which will generally be determined using the last reported official closing or last trading price on the exchange or market on which the security is primarily traded at the time of valuation. Such valuations are typically categorized as Level 1 in the fair value hierarchy described below.
Securities listed on the NASDAQ Stock Market, Inc. are generally valued at the NASDAQ official closing price.
If market quotations are not readily available, or if it is determined that a quotation of a security does not represent fair value, then the security is valued at fair value as determined in good faith by the Adviser using procedures adopted by the Board of Trustees of the Trust (the “Board”). The circumstances in which a security may be fair valued include, among others: the occurrence of events that are significant to a particular issuer, such as mergers, restructurings or defaults; the occurrence of events that are significant to an entire market, such as natural disasters in a particular region or government actions; trading restrictions on securities; thinly traded securities; and market events such as trading halts and early market closings. Due to the inherent uncertainty of valuations, fair values may differ significantly from the values that would have been used had an active market existed. Fair valuation could result in a different NAV than a NAV determined by using market quotations. Such valuations are typically categorized as Level 2 or Level 3 in the fair value hierarchy described below.
Money market funds are valued at NAV. If NAV is not readily available the securities will be valued at fair value.
FASB ASC Topic 820, Fair Value Measurements and Disclosures (“ASC 820”) defines fair value, establishes a framework for measuring fair value in accordance with U.S. GAAP, and requires disclosure about fair value measurements. It also provides guidance on determining when there has been a significant decrease in the volume and level of activity for an asset or liability, when a transaction is not orderly, and how that information must be incorporated into fair value measurements. Under ASC 820, various inputs are used in determining the value of the Funds’ investments. These inputs are summarized in the following hierarchy:
● | Level 1 — Unadjusted quoted prices in active markets for identical assets or liabilities that the Funds have the ability to access. |
● | Level 2 — Observable inputs other than quoted prices included in Level 1 that are observable for the asset or liability, either directly or indirectly. These inputs may include quoted prices for the identical instrument on an inactive market, prices for similar securities, interest rates, prepayment speeds, credit risk, yield curves, default rates and similar data. |
● | Level 3 — Unobservable inputs for the asset or liability, to the extent relevant observable inputs are not available; representing the Funds’ own assumptions about the assumptions a market participant would use in valuing the asset or liability, and would be based on the best information available. |
The fair value hierarchy gives the highest priority to quoted prices (unadjusted) in active markets for identical assets or liabilities (Level 1) and the lowest priority to unobservable inputs (Level 3).
The availability of observable inputs can vary from security to security and is affected by a wide variety of factors, including, for example, the type of security, whether the security is new and not yet established in the marketplace, the liquidity of markets, and other characteristics particular to the security. To the extent that valuation is based on models or inputs that are less observable or unobservable in the market, the determination of fair value requires more judgment. Accordingly, the degree of judgment exercised in determining fair value is greatest for instruments categorized in Level 3.
Exchange-traded options are valued at the composite mean price, which calculates the mean of the highest bid price and lowest asked price across the exchange. On the last trading day prior to expiration, expiring options may be priced at intrinsic value. The premium a fund pays when purchasing a call option or receives when writing a call option will reflect, among other things, the market price of the security, the relationship of the exercise price to the market price of the security, the relationship of the exercise price to the volatility of the security, the length of the option period and supply and demand factors. The premium is the value of an option at the date of purchase.
32
Overlay Shares ETFs
Notes to Financial Statements
August 31, 2020 (Continued)
All other securities and investments for which market values are not readily available, including restricted securities, and those securities for which it is inappropriate to determine prices in accordance with the aforementioned procedures, are valued at fair value as determined in good faith under procedures adopted by the Board, although the actual calculations may be done by others. Factors considered in making this determination may include, but are not limited to, information obtained by contacting the issuer, analysts, or the appropriate stock exchange (for exchange-traded securities), analysis of the issuer’s financial statements or other available documents and, if necessary, available information concerning other securities in similar circumstances.
The inputs or methodology used for valuing securities are not necessarily an indication of the risk associated with investing in those securities. The hierarchy classification of inputs used to value the Funds’ investments at August 31, 2020 are as follows:
Overlay Shares Large Cap Equity ETF
Level 1 | Level 2 | Level 3 | Total | |||||||||||||
Investments - Assets: | ||||||||||||||||
Exchange Traded Funds | $ | 97,595,538 | $ | — | $ | — | $ | 97,595,538 | ||||||||
Money Market Funds | 64,391 | — | — | 64,391 | ||||||||||||
Purchased Put Options | 17,595 | — | — | 17,595 | ||||||||||||
Total Investments - Assets | $ | 97,677,524 | $ | — | $ | — | $ | 97,677,524 | ||||||||
Other Financial Instruments - Liabilities: | ||||||||||||||||
Written Put Options | $ | 70,035 | $ | — | $ | — | $ | 70,035 | ||||||||
Overlay Shares Small Cap Equity ETF
Level 1 | Level 2 | Level 3 | Total | |||||||||||||
Investments - Assets: | ||||||||||||||||
Exchange Traded Funds | $ | 3,028,110 | $ | — | $ | — | $ | 3,028,110 | ||||||||
Money Market Funds | 1,159 | — | — | 1,159 | ||||||||||||
Purchased Put Options | 510 | — | — | 510 | ||||||||||||
Total Investments - Assets | $ | 3,029,779 | $ | — | $ | — | $ | 3,029,779 | ||||||||
Other Financial Instruments - Liabilities: | ||||||||||||||||
Written Put Options | $ | 2,030 | $ | — | $ | — | $ | 2,030 | ||||||||
Overlay Shares Foreign Equity ETF
Level 1 | Level 2 | Level 3 | Total | |||||||||||||
Investments - Assets: | ||||||||||||||||
Exchange Traded Funds | $ | 4,213,945 | $ | — | $ | — | $ | 4,213,945 | ||||||||
Money Market Funds | 429 | — | — | 429 | ||||||||||||
Purchased Put Options | 765 | — | — | 765 | ||||||||||||
Total Investments - Assets | $ | 4,215,139 | $ | — | $ | — | $ | 4,215,139 | ||||||||
Other Financial Instruments - Liabilities: | ||||||||||||||||
Written Put Options | $ | 3,045 | $ | — | $ | — | $ | 3,045 | ||||||||
33
Overlay Shares ETFs
Notes to Financial Statements
August 31, 2020 (Continued)
Overlay Shares Core Bond ETF
Level 1 | Level 2 | Level 3 | Total | |||||||||||||
Investments - Assets: | ||||||||||||||||
Exchange Traded Funds | $ | 113,540,267 | $ | — | $ | — | $ | 113,540,267 | ||||||||
Money Market Funds | 178,222 | — | — | 178,222 | ||||||||||||
Purchased Put Options | 20,655 | — | — | 20,655 | ||||||||||||
Total Investments - Assets | $ | 113,739,144 | $ | — | $ | — | $ | 113,739,144 | ||||||||
Other Financial Instruments - Liabilities: | ||||||||||||||||
Written Put Options | $ | 82,215 | $ | — | $ | — | $ | 82,215 | ||||||||
Overlay Shares Municipal Bond ETF
Level 1 | Level 2 | Level 3 | Total | |||||||||||||
Investments - Assets: | ||||||||||||||||
Exchange Traded Funds | $ | 28,960,322 | $ | — | $ | — | $ | 28,960,322 | ||||||||
Money Market Funds | 58,904 | — | — | 58,904 | ||||||||||||
Purchased Put Options | 5,100 | — | — | 5,100 | ||||||||||||
Total Investments - Assets | $ | 29,024,326 | $ | — | $ | — | $ | 29,024,326 | ||||||||
Other Financial Instruments - Liabilities: | ||||||||||||||||
Written Put Options | $ | 20,300 | $ | — | $ | — | $ | 20,300 | ||||||||
Security Transactions
Investment transactions are recorded as of the date that the securities are purchased or sold (trade date). Realized gains and losses from the sale or disposition of securities are calculated based on the specific identification basis.
Investment Income
Dividend income is recognized on the ex-dividend date. Interest income is accrued daily. An amortized cost method of valuation may be used with respect to debt obligations with sixty days or less remaining to maturity, unless the Adviser determines in good faith that such method does not represent fair value.
Tax Information, Dividends and Distributions to Shareholders and Uncertain Tax Positions
The Funds are treated as separate entities for Federal income tax purposes. Each Fund intends to qualify as a regulated investment company (“RIC”) under Subchapter M of the Internal Revenue Code of 1986, as amended (the “Internal Revenue Code”). To qualify and remain eligible for the special tax treatment accorded to RICs, each Fund must meet certain annual income and quarterly asset diversification requirements and must distribute annually at least 90% of the sum of (i) its investment company taxable income (which includes dividends, interest and net short-term capital gains) and (ii) certain net tax-exempt income, if any. If so qualified, each Fund will not be subject to Federal income tax.
Distributions to shareholders are recorded on the ex-dividend date. The Funds, with the exception of OVF, generally pay out dividends from net investment income, if any, quarterly. OVF will distribute any net investment income, if any, semi-annually. Each Fund will distribute its net capital gains, if any, to shareholders at least annually. The Funds may also pay a special distribution at the end of the calendar year to comply with Federal tax requirements. The amount of dividends and distributions from net investment income and net realized capital gains are determined in accordance with Federal income tax regulations, which may differ from U.S. GAAP. These “book/tax” differences are either considered temporary or permanent in nature. To
34
Overlay Shares ETFs
Notes to Financial Statements
August 31, 2020 (Continued)
the extent these differences are permanent in nature, such amounts are reclassified within the components of net assets based on their Federal tax basis treatment; temporary differences do not require reclassification. Dividends and distributions which exceed earnings and profit for tax purposes are reported as a tax return of capital.
Management evaluates the Funds’ tax positions to determine if the tax positions taken meet the minimum recognition threshold in connection with accounting for uncertainties in income tax positions taken or expected to be taken for the purposes of measuring and recognizing tax liabilities in the financial statements. Recognition of tax benefits of an uncertain tax position is required only when the position is “more likely than not” to be sustained assuming examination by taxing authorities. Interest and penalties related to income taxes would be recorded as income tax expense. The Funds’ Federal income tax returns are subject to examination by the Internal Revenue Service (the “IRS”) for a period of three fiscal years after they are filed. State and local tax returns may be subject to examination for an additional fiscal year depending on the jurisdiction. As of August 31, 2020, the Funds’ fiscal period end, the Funds had no material uncertain tax positions and did not have a liability for any unrecognized tax benefits. As of August 31, 2020, the Funds’ fiscal period end, the Funds had no examination in progress and management is not aware of any tax positions for which it is reasonably possible that the amounts of unrecognized tax benefits will significantly change in the next twelve months.
The Funds recognized no interest or penalties related to uncertain tax benefits in the fiscal period 2020. At August 31, 2020, the Funds’ fiscal period end, the Funds’ initial tax period ending August 31, 2020 remained open to examination in the Funds’ major tax jurisdictions.
Indemnification
In the normal course of business, the Funds expect to enter into contracts that contain a variety of representations and warranties and which provide general indemnifications. The Funds’ maximum exposure under these anticipated arrangements is unknown, as this would involve future claims that may be made against the Funds that have not yet occurred. However, the Adviser expects the risk of loss to be remote.
Derivatives
Each Fund may purchase and write put and call options on indices and enter into related closing transactions. All options written on indices or securities must be covered, each Fund will segregate cash and/or other liquid assets in an amount equal to the Fund’s obligations. Put and call options on indices give the holder the right to receive, upon exercise of the option, an amount of cash if the closing level of the underlying index is greater than (or less than, in the case of puts) the exercise price of the option. This amount of cash is equal to the difference between the closing price of the index and the exercise price of the option, expressed in dollars multiplied by a specified number. The premium paid to the writer is the consideration for undertaking the obligations under the option contract.
The Funds invest in derivatives in order to protect against a possible decline in the market value of securities in its portfolio, to anticipate an increase in the market value of securities that the Funds may seek to purchase in the future and as a means of increasing the yield on its assets. The Funds purchasing put and call options pay a premium; therefore, if price movements in the underlying securities are such that exercise of the options would not be profitable for the Funds, loss of the premium paid may be offset by an increase in the value of the Funds’ securities or by a decrease in the cost of acquisition of securities by the Funds. When the Funds write an option, if the underlying securities do not increase or decrease to a price level that would make the exercise of the option profitable to the holder thereof, the option generally will expire without being exercised and the Funds will realize as profit the premium received for such option. When a call option of which the Funds are the writer is exercised, the Funds will be required to sell the underlying securities to the option holder at the strike price and will not participate in any increase in the price of such securities above the strike price. When a put option of which the Funds are the writer is exercised, the Funds will be required to purchase the underlying securities at a price in excess of the market value of such securities. The Funds maintain minimal counterparty risk through contracts bought or sold on an exchange. As of August 31, 2020, the Funds’ derivative instruments are not subject to a master netting arrangement.
35
Overlay Shares ETFs
Notes to Financial Statements
August 31, 2020 (Continued)
Derivative Investments
The average monthly value outstanding of purchased and written options during the period ended August 31, 2020 were as follows:
Overlay Shares | Overlay Shares | Overlay | Overlay Shares | Overlay Shares | ||||||||||||||||
Purchased Put Options | $ | 123,429 | $ | 31,378 | $ | 62,403 | $ | 188,317 | $ | 54,272 | ||||||||||
Written Put Options | 251,735 | 62,743 | 120,137 | 379,341 | 109,975 | |||||||||||||||
The following is a summary of the effect of derivative instruments on the Funds’ Statements of Assets and Liabilities as of August 31, 2020:
Equity Risk | Asset | Liability | ||||||||
Overlay Shares Large Cap Equity ETF | Purchased Options | $ | 17,595 | $ | — | |||||
Written Options | — | 70,035 | ||||||||
Overlay Shares Small Cap Equity ETF | Purchased Options | 510 | — | |||||||
Written Options | — | 2,030 | ||||||||
Overlay Shares Foreign Equity ETF | Purchased Options | 765 | — | |||||||
Written Options | — | 3,045 | ||||||||
Overlay Shares Core Bond ETF | Purchased Options | 20,655 | — | |||||||
Written Options | — | 82,215 | ||||||||
Overlay Shares Municipal Bond ETF | Purchased Options | 5,100 | — | |||||||
Written Options | — | 20,300 | ||||||||
The following is a summary of the effect of derivative instruments on the Funds’ Statements of Operations for the period ended August 31, 2020:
Realized Gain (Loss) | Change in Unrealized | |||||||||||||||||||
Purchased | Written | Purchased | Written | |||||||||||||||||
Overlay Shares Large Cap Equity ETF | Equity Risk Contracts | $ | (1,338,955 | ) | $ | 2,933,906 | $ | 3,168 | $ | (7,780 | ) | |||||||||
Overlay Shares Small Cap Equity ETF | Equity Risk Contracts | (142,632 | ) | 228,873 | 92 | (225 | ) | |||||||||||||
Overlay Shares Foreign Equity ETF | Equity Risk Contracts | (213,379 | ) | 306,903 | 138 | (338 | ) | |||||||||||||
Overlay Shares Core Bond ETF | Equity Risk Contracts | (1,740,918 | ) | 3,714,536 | 3,719 | (9,133 | ) | |||||||||||||
Overlay Shares Municipal Bond ETF | Equity Risk Contracts | (476,198 | ) | 1,012,281 | 918 | (2,255 | ) | |||||||||||||
36
Overlay Shares ETFs
Notes to Financial Statements
August 31, 2020 (Continued)
3. | INVESTMENT ADVISORY AND OTHER AGREEMENTS |
Investment Advisory Agreement
The Trust has entered into an Investment Advisory Agreement (the “Advisory Agreement”) with the Adviser. Under the Advisory Agreement, the Adviser provides a continuous investment program for the Funds’ assets in accordance with its investment objectives, policies and limitations, and oversees the day-to-day operations of the Funds subject to the supervision of the Board, including the Trustees who are not “interested persons” of the Trust as defined in the 1940 Act.
Pursuant to the Advisory Agreement between the Trust, on behalf of the Funds, and Liquid Strategies, each Fund pays a unified management fee to the Adviser, which is calculated daily and paid monthly, at an annual rate of 0.75% of each Fund’s average daily net assets. Liquid Strategies has agreed to pay all expenses of the Funds except the fee paid to Liquid Strategies under the Advisory Agreement, interest charges on any borrowings, dividends and other expenses on securities sold short, taxes, brokerage commissions and other expenses incurred in placing orders for the purchase and sale of securities and other investment instruments, acquired fund fees and expenses, accrued deferred tax liability, extraordinary expenses, and distribution (12b-1) fees and expenses (if any).
Distribution Agreement and 12b-1 Plan
Foreside Fund Services, LLC (the “Distributor”) serves as each Fund’s distributor pursuant to a Distribution Services Agreement. The Distributor receives compensation for the statutory underwriting services it provides to the Funds. The Distributor enters into agreements with certain broker-dealers and others that will allow those parties to be “Authorized Participants” and to subscribe for and redeem shares of the Funds. The Distributor will not distribute shares in less than whole Creation Units and does not maintain a secondary market in shares.
The Board has adopted a Distribution and Service Plan pursuant to Rule 12b-1 under the 1940 Act (“Rule 12b-1 Plan”). In accordance with the Rule 12b-1 Plan, each Fund is authorized to pay an amount up to 0.25% of the Fund’s average daily net assets each year for certain distribution-related activities. As authorized by the Board, no Rule 12b-1 fees are currently paid by the Funds and there are no plans to impose these fees. However, in the event Rule 12b-1 fees are charged in the future, they will be paid out of each Fund’s assets. The Adviser and its affiliates may, out of their own resources, pay amounts to third parties for distribution or marketing services on behalf of the Funds.
Administrator, Custodian and Transfer Agent
U.S. Bancorp Fund Services, LLC, doing business as U.S. Bank Global Fund Services (“Fund Services” or “Administrator”) serves as administrator, transfer agent and fund accountant of the Funds pursuant to a Fund Servicing Agreement. U.S. Bank N.A. (the “Custodian”), an affiliate of Fund Services, serves as the Funds’ custodian pursuant to a Custody Agreement. Under the terms of these agreements, the Adviser pays each Fund’s administrative, custody and transfer agency fees.
A Trustee and all officers of the Trust are affiliated with the Administrator and Custodian.
4. | CREATION AND REDEMPTION TRANSACTIONS |
Shares of the Funds are listed and traded on the NYSE Arca, Inc. (the “Exchange”). Each Fund issues and redeems shares on a continuous basis at NAV only in large blocks of shares called “Creation Units.” A Creation Unit consists of 25,000 shares. Creation Units are to be issued and redeemed principally in kind for a basket of securities and a balancing cash amount. Shares generally will trade in the secondary market in amounts less than a Creation Unit at market prices that change throughout the day. Market prices for the shares may be different from their NAV. The NAV is determined as of the close of trading (generally, 4:00 p.m. Eastern Time) on each day the NYSE is open for trading. The NAV of the shares of each Fund will be equal to a Fund’s total assets minus a Fund’s total liabilities divided by the total number of shares outstanding. The NAV that is published will be rounded to the nearest cent; however, for purposes of determining the price of Creation Units, the NAV will be calculated to five decimal places.
37
Overlay Shares ETFs
Notes to Financial Statements
August 31, 2020 (Continued)
Creation Transaction Fee
Authorized Participants may be required to pay to the Custodian a fixed transaction fee (the “Creation Transaction Fee”) in connection with the issuance of Creation Units. The standard Creation Transaction Fee will be the same regardless of the number of Creation Units purchased by an investor on the applicable business day. The Creation Transaction Fee charged by each Fund for each creation order is $250.
An additional variable fee of up to a maximum of 2% of the value of the Creation Units subject to the transaction may be imposed for (1) creations effected outside the Clearing Process and (2) creations made in an all cash amount (to offset the Trust’s brokerage and other transaction costs associated with using cash to purchase the requisite Deposit Securities). Investors are responsible for the costs of transferring the securities constituting the Deposit Securities to the account of the Trust. The Fund may determine to not charge a variable fee on certain orders when the Adviser has determined that doing so is in the best interests of Fund shareholders. Variable fees, if any, received by the Funds are displayed in the Capital Share Transactions section on the Statements of Changes in Net Assets.
Only “Authorized Participants” may purchase or redeem shares directly from the Funds. An Authorized Participant is either (i) a broker-dealer or other participant in the clearing process through the Continuous Net Settlement System of National Securities Clearing Corporation or (ii) a DTC participant and, in each case, must have executed a Participant Agreement with the Distributor. Most retail investors will not qualify as Authorized Participants or have the resources to buy and sell whole Creation Units. Therefore, they will be unable to purchase or redeem the shares directly from the Funds. Rather, most retail investors will purchase shares in the secondary market with the assistance of a broker and will be subject to customary brokerage commissions or fees. Securities received or delivered in connection with in-kind creates and redeems are valued as of the close of business on the effective date of the creation or redemption.
5. FEDERAL INCOME TAX
The tax character of distributions paid was as follows:
Period Ended August 31, 2020 | ||||||||||||||||
Ordinary | Tax-Exempt | Long-Term | Return of Capital | |||||||||||||
Overlay Shares Large Cap Equity ETF | $ | 456,959 | $ | — | $ | 27,529 | $ | — | ||||||||
Overlay Shares Small Cap Equity ETF | 83,397 | — | 33,051 | — | ||||||||||||
Overlay Shares Foreign Equity ETF | 575,692 | — | 28,220 | 12,224 | ||||||||||||
Overlay Shares Core Bond ETF | 1,758,480 | — | 357,700 | — | ||||||||||||
Overlay Shares Municipal Bond ETF | 213,521 | 263,076 | 141,214 | — | ||||||||||||
(1) | Ordinary income includes short-term capital gains. |
38
Overlay Shares ETFs
Notes to Financial Statements
August 31, 2020 (Continued)
At August 31, 2020, the Funds’ fiscal period end, the components of distributable earnings (accumulated losses) and the cost of investments on a tax basis, including the adjustments for financial reporting purposes as of the most recently completed Federal income tax reporting year, were as follows:
Overlay | Overlay | Overlay | Overlay | Overlay | ||||||||||||||||
Federal Tax Cost of Investments | $ | 87,773,811 | $ | 3,461,002 | $ | 4,636,698 | $ | 109,893,659 | $ | 28,689,561 | ||||||||||
Gross Tax Unrealized Appreciation | $ | 10,075,796 | $ | 226 | $ | 339 | $ | 3,913,587 | $ | 355,124 | ||||||||||
Gross Tax Unrealized Depreciation | (172,083 | ) | (431,449 | ) | (421,898 | ) | (68,102 | ) | (20,359 | ) | ||||||||||
Net Tax Unrealized Appreciation (Depreciation) | 9,903,713 | (431,223 | ) | (421,559 | ) | 3,845,485 | 334,765 | |||||||||||||
Undistributed Ordinary Income | 568,893 | — | — | — | — | |||||||||||||||
Undistributed Tax-Exempt Income | — | — | — | — | — | |||||||||||||||
Undistributed Long-Term Gains | 926,675 | 10,940 | — | 823,223 | 179,634 | |||||||||||||||
Other Accumulated Gain (Loss) | — | — | (7,679 | ) | — | — | ||||||||||||||
Total Distributable Earnings / (Accumulated Losses) | $ | 11,399,281 | $ | (420,283 | ) | $ | (429,238 | ) | $ | 4,668,708 | $ | 514,399 | ||||||||
The difference between book-basis and tax-basis unrealized appreciation/(depreciation) is attributable primarily to the tax deferral of losses on wash sales and Mark-to-Market of Section 1256 Contracts.
Under current tax law, net capital losses realized after October 31st and net ordinary losses incurred after December 31st may be deferred and treated as occurring on the first day of the following fiscal year. The Funds’ carryforward losses, post-October losses and post-December losses are determined only at the end of each fiscal year. At August 31, 2020, the Overlay Shares Foreign Equity ETF deferred, on a tax basis, post-October capital losses of $7,679.
U.S. GAAP requires that certain components of net assets relating to permanent differences be reclassified between financial and tax reporting. These reclassifications have no effect on net assets or NAV per share. The permanent differences primarily relate to redemptions in-kind. For the fiscal period ended August 31, 2020, the following reclassifications were made for permanent tax differences on the Statements of Assets and Liabilities.
Total | Paid-In Capital | |||||||
Overlay Shares Large Cap Equity ETF | $ | (180,761 | ) | $ | 180,761 | |||
Overlay Shares Small Cap Equity ETF | 1,348,771 | (1,348,771 | ) | |||||
Overlay Shares Foreign Equity ETF | 2,537,538 | (2,537,538 | ) | |||||
Overlay Shares Core Bond ETF | (16,993 | ) | 16,993 | |||||
Overlay Shares Municipal Bond ETF | 24,376 | (24,376 | ) | |||||
39
Overlay Shares ETFs
Notes to Financial Statements
August 31, 2020 (Continued)
6. | INVESTMENT TRANSACTIONS |
During the fiscal period ended August 31, 2020, the Funds realized net capital gains and losses resulting from in-kind redemptions, in which shareholders exchanged Fund shares for securities held by the Funds rather than for cash. Because such gains are not taxable to the Funds, and are not distributed to shareholders, they have been reclassified from distributable earnings (accumulated losses) to paid in-capital. The amounts of realized gains and losses from in-kind redemptions included in realized gain/(loss) on investments in the Statements of Operations is as follows:
Realized Gains | Realized Losses | |||||||
Overlay Shares Large Cap Equity ETF | $ | 180,761 | $ | — | ||||
Overlay Shares Small Cap Equity ETF | 112,954 | (1,461,725 | ) | |||||
Overlay Shares Foreign Equity ETF | 16,750 | (2,554,288 | ) | |||||
Overlay Shares Core Bond ETF | 28,091 | (11,098 | ) | |||||
Overlay Shares Municipal Bond ETF | — | (24,376 | ) | |||||
Purchases and sales of investments (excluding short-term investments), creations in-kind and redemptions in-kind for the period ended August 31, 2020 were as follows:
Purchases | Sales | Creations | Redemptions | |||||||||||||
Overlay Shares Large Cap Equity ETF | $ | 3,860,389 | $ | 1,973,699 | $ | 88,068,815 | $ | 2,444,441 | ||||||||
Overlay Shares Small Cap Equity ETF | 636,603 | 525,549 | 16,387,271 | 11,648,104 | ||||||||||||
Overlay Shares Foreign Equity ETF | 1,403,221 | 1,292,756 | 33,656,200 | 26,520,841 | ||||||||||||
Overlay Shares Core Bond ETF | 4,614,534 | 3,208,483 | 109,492,744 | 1,238,955 | ||||||||||||
Overlay Shares Municipal Bond ETF | 1,239,130 | 919,942 | 28,920,866 | 588,870 | ||||||||||||
7. | PRINCIPAL RISKS |
As with all ETFs, shareholders of the Funds are subject to the risk that their investment could lose money. Each Fund is subject to the principal risks, any of which may adversely affect a Fund’s NAV, trading price, yield, total return and ability to meet its investment objective.
The global outbreak of COVID-19 (commonly referred to as “coronavirus”) has disrupted economic markets and the prolonged economic impact is uncertain. The ultimate economic fallout from the pandemic, and the long-term impact on economies, markets, industries and individual issuers, are not known. The operational and financial performance of the issuers of securities in which the Funds invest depends on future developments, including the duration and spread of the outbreak, and such uncertainty may in turn adversely affect the value and liquidity of the Funds’ investments, impair the Funds’ ability to satisfy redemption requests, and negatively impact the Funds’ performance.
A complete description of principal risks is included in the prospectus under the heading ‘’Principal Investment Risks’’.
40
Overlay Shares ETFs
Notes to Financial Statements
August 31, 2020 (Continued)
8. | SUBSEQUENT EVENTS |
On October 6, 2020, the following Funds paid a distribution to shareholders of record on October 5, 2020 as follows:
Ordinary | Ordinary Income | |||||||
Overlay Shares Large Cap Equity ETF | $ | 0.27 | $ | 1,030,198 | ||||
Overlay Shares Small Cap Equity ETF | 0.21 | 26,173 | ||||||
Overlay Shares Core Bond ETF | 0.26 | 1,161,303 | ||||||
Overlay Shares Municipal Bond ETF | 0.26 | 296,436 | ||||||
Other than as disclosed, there were no other subsequent events requiring recognition or disclosure through the date the financial statements were issued.
41
Overlay Shares ETFs
Report of Independent Registered Public Accounting Firm
To the Shareholders of Overlay Shares Large Cap Equity ETF, Overlay Shares Small Cap Equity ETF, Overlay Shares Foreign Equity ETF, Overlay Shares Core Bond ETF, and Overlay Shares Municipal Bond ETF and Board of Trustees of Listed Funds Trust
Opinion on the Financial Statements
We have audited the accompanying statements of assets and liabilities, including the schedules of investments and written options, of Overlay Shares Large Cap Equity ETF, Overlay Shares Small Cap Equity ETF, Overlay Shares Foreign Equity ETF, Overlay Shares Core Bond ETF, and Overlay Shares Municipal Bond ETF (the “Funds”), each a series of Listed Funds Trust, as of August 31, 2020, the related statements of operations and changes in net assets, including the related notes, and the financial highlights for the period September 30, 2019 (commencement of operations) through August 31, 2020 (collectively referred to as the “financial statements”). In our opinion, the financial statements present fairly, in all material respects, the financial position of the each of the Funds as of August 31, 2020, the results of their operations, the changes in their net assets, and the financial highlights for the period then ended, in conformity with accounting principles generally accepted in the United States of America.
Basis for Opinion
These financial statements are the responsibility of the Funds’ management. Our responsibility is to express an opinion on the Funds’ financial statements based on our audit. We are a public accounting firm registered with the Public Company Accounting Oversight Board (United States) (“PCAOB”) and are required to be independent with respect to the Funds in accordance with the U.S. federal securities laws and the applicable rules and regulations of the Securities and Exchange Commission and the PCAOB.
We conducted our audit in accordance with the standards of the PCAOB. Those standards require that we plan and perform the audit to obtain reasonable assurance about whether the financial statements are free of material misstatement whether due to error or fraud.
Our audit included performing procedures to assess the risks of material misstatement of the financial statements, whether due to error or fraud, and performing procedures that respond to those risks. Such procedures included examining, on a test basis, evidence regarding the amounts and disclosures in the financial statements. Our procedures included confirmation of securities owned as of August 31, 2020, by correspondence with the custodian and brokers. Our audit also included evaluating the accounting principles used and significant estimates made by management, as well as evaluating the overall presentation of the financial statements. We believe that our audit provides a reasonable basis for our opinion.
We have served as the Funds’ auditor since 2019.

COHEN & COMPANY, LTD.
Cleveland, Ohio
October 29, 2020
42
Overlay Shares ETFs
Review of Liquidity Risk Management Program
(Unaudited)
Pursuant to Rule 22e-4 under the Investment Company Act of 1940, the Trust, on behalf of the series of the Trust covered by this shareholder report (the “Series”), has adopted a liquidity risk management program to govern the Trust’s approach to managing liquidity risk. Rule 22e-4 seeks to promote effective liquidity risk management, thereby reducing the risk that a fund will be unable to meet its redemption obligations and mitigating dilution of the interests of fund shareholders. The Trust’s liquidity risk management program is tailored to reflect the Series’ particular risks, but not to eliminate all adverse impacts of liquidity risk, which would be incompatible with the nature of such Series.
The investment adviser to the Series has adopted and implemented its own written liquidity risk management program (the “Program”) tailored specifically to assess and manage the liquidity risk of the Series. At a recent meeting of the Board of Trustees of the Trust, the Trustees received a report pertaining to the operation, adequacy, and effectiveness of implementation of the Program for the period ended December 31, 2019. The report concluded that the Program is reasonably designed to assess and manage the Series’ liquidity risk and has operated adequately and effectively to manage such risk. The report reflected that there were no liquidity events that impacted the Series’ ability to timely meet redemptions without dilution to existing shareholders. The report further noted that no material changes have been made to the Program since its implementation.
There can be no assurance that the Program will achieve its objectives in the future. Please refer to the prospectus for more information regarding the Series’ exposure to liquidity risk and other principal risks to which an investment in the Series may be subject.
43
Overlay Shares ETFs
Board of Trustees and Officers
August 31, 2020 (Unaudited)
The Funds’ Statement of Additional Information includes additional information about the Funds’ Trustees and Officers, and is available, without charge upon request by calling 1-866-704-6857, or by visiting the Funds’ website at www.overlayshares.com.
Name and Year of Birth | Position Held | Term of Office | Principal Occupation(s) | Number of | Other |
Independent Trustees | |||||
John L. Jacobs Year of birth: 1959 | Trustee and Audit Committee Chair | Indefinite term; since 2017 | Chairman of Alerian, Inc. (Since June 2018); Executive Director of Center for Financial Markets and Policy (Since 2016); Founder and CEO of Q3 Advisors, LLC (financial consulting firm) (since 2015); Distinguished Policy Fellow and Executive Director, Center for Financial Markets and Policy, Georgetown University (since 2015); Senior Advisor, Nasdaq OMX Group (2015–2016); Executive Vice President, Nasdaq OMX Group (2013–2015). | 14 | Director, tZERO Group, Inc. (since 2020); Independent Trustee, Procure ETF Trust II (since 2018) (1 portfolio); Independent Trustee, Horizons ETF Trust I (2015-2019) |
Koji Felton Year of birth: 1961 | Trustee | Indefinite term; since 2019 | Counsel, Kohlberg Kravis Roberts & Co. L.P. (investment firm) (2013–2015); Counsel, Dechert LLP (law firm) (2011–2013). | 14 | Independent Trustee, Series Portfolios Trust (since 2015) (8 portfolios) |
Pamela H. Conroy Year of birth: 1961 | Trustee and Nominating and Governance Committee Chair | Indefinite term; since 2019 | Retired; formerly Executive Vice President, Chief Operating Officer & Chief Compliance Officer, Institutional Capital Corporation (investment firm) (1994–2008). | 14 | Independent Trustee, Frontier Funds, Inc. (since 2020) (7 portfolios). |
Interested Trustee | |||||
Paul R. Fearday, CPA* Year of birth: 1979 | Trustee and Chairman | Indefinite term; since 2019 | Senior Vice President, U.S. Bancorp Fund Services, LLC (since 2008); Manager, PricewaterhouseCoopers LLP (accounting firm) (2002–2008). | 14 | None. |
* | This Trustee is considered an “Interested Trustee” as defined in the 1940 Act because of his affiliation with U.S. Bancorp Fund Services, d/b/a U.S. Bank Global Fund Services and U.S. Bank N.A., which provide fund accounting, administration, transfer agency and custodian services to the Funds. |
44
Overlay Shares ETFs
Board of Trustees and Officers
August 31, 2020 (Unaudited) (Continued)
Name and Year of Birth | Position(s) Held | Term of Office | Principal Occupation(s) During Past 5 Years |
Officers | |||
Gregory Bakken Year of birth: 1983 | President and Principal Executive Officer | Indefinite term, February 2019 | Vice President, U.S. Bancorp Fund Services, LLC (since 2006). |
Travis G. Babich Year of birth: 1980 | Treasurer and Principal Financial Officer | Indefinite term, September 2019 | Vice President, U.S. Bancorp Fund Services, LLC (since 2005). |
Kacie M. Gronstal Year of birth: 1992 | Assistant Treasurer | Indefinite term, March 2019 | Officer, U.S. Bancorp Fund Services, LLC (since 2014). |
Kent Barnes Year of birth: 1968 | Secretary | Indefinite term, February 2019 | Vice President, U.S. Bancorp Fund Services, LLC (since 2018); Chief Compliance Officer, Rafferty Asset Management, LLC (2016 to 2018); Vice President, U.S. Bancorp Fund Services, LLC (2007 to 2016). |
Steve Jensen Year of birth: 1957 | Chief Compliance Officer | Indefinite term, February 2019 | Senior Vice President, U.S. Bancorp Fund Services, LLC (since 2011). |
45
Overlay Shares ETFs
Supplemental Information
(Unaudited)
Investors should consider the investment objective and policies, risk considerations, charges and ongoing expenses of an investment carefully before investing. The prospectus contains this and other information relevant to an investment in the Funds. Please read the prospectus carefully before investing. A copy of the prospectus for the Funds may be obtained without charge by writing to the Funds, c/o U.S. Bank Global Fund Services, P.O. Box 701, Milwaukee, Wisconsin 53201-0701, by calling 1-866-704-6857, or by visiting the Funds’ website at www.overlayshares.com
QUARTERLY PORTFOLIO HOLDING INFORMATION
Each Fund files its complete schedule of portfolio holdings for its first and third fiscal quarters with the Securities and Exchange Commission (“SEC”) on Form N-Q or Part F of Form N-PORT (beginning with filings after March 31, 2020). The Funds’ Form N-Q or Part F of Form N-PORT (beginning with filings after March 31, 2020) is available without charge, upon request, by calling toll-free at 1-866-704-6857. Furthermore, you may obtain the Form N-Q or Part F of Form N-PORT (beginning with filings after March 31, 2020) on the SEC’s website at www.sec.gov.
PROXY VOTING INFORMATION
Each Fund is required to file a Form N-PX, with the Fund’s complete proxy voting record for the 12 months ended June 30, no later than August 31 of each year. The Fund’s proxy voting record will be available without charge, upon request, by calling toll-free 1-866-704-6857 and on the SEC’s website at www.sec.gov.
FREQUENCY DISTRIBUTION OF PREMIUMS AND DISCOUNTS
Information regarding how often shares of the Funds trade on an exchange at a price above (i.e., at a premium) or below (i.e., at a discount) the NAV of the Funds is available without charge, on the Funds’ website at www.overlayshares.com
TAX INFORMATION
For the fiscal period ended August 31, 2020, certain dividends paid by the Funds may be subject to a maximum tax rate of 20%, as provided for by the Jobs and Growth Tax Relief Reconciliation Act 2003. The percentage of dividends declared from ordinary income designated as qualified dividend income was as follows:
Overlay Shares Large Cap Equity ETF | 71.65% |
Overlay Shares Small Cap Equity ETF | 100.00% |
Overlay Shares Foreign Equity ETF | 62.27% |
Overlay Shares Core Bond ETF | 0.00% |
Overlay Shares Municipal Bond ETF | 0.00% |
For corporate shareholders, the percent of ordinary income distributions qualifying for the corporate dividends received deduction for the fiscal period ended August 31, 2020 was as follows:
Overlay Shares Large Cap Equity ETF | 66.70% |
Overlay Shares Small Cap Equity ETF | 100.00% |
Overlay Shares Foreign Equity ETF | 0.05% |
Overlay Shares Core Bond ETF | 0.00% |
Overlay Shares Municipal Bond ETF | 0.00% |
46
Overlay Shares ETFs
Supplemental Information
(Unaudited) (Continued)
The percentage of taxable ordinary income distributions that are designated as short-term capital gain distributions under Internal Revenue Section 871(k)(2)(C) for the Funds was as follows:
Overlay Shares Large Cap Equity ETF | 14.72% |
Overlay Shares Small Cap Equity ETF | 0.00% |
Overlay Shares Foreign Equity ETF | 0.00% |
Overlay Shares Core Bond ETF | 45.79% |
Overlay Shares Municipal Bond ETF | 44.62% |
Pursuant to Section 853 of the Internal Revenue code, the Funds designate the following amounts as foreign taxes paid for the period ended August 31, 2020. Foreign taxes paid for purposes of Section 853 may be less than actual foreign taxes paid for financial statement purposes.
Creditable | Per Share | Portion Of | ||||||||||
Overlay Shares Foreign Equity ETF | $ | 19,922 | $ | 0.11384 | $ | 319,518 | ||||||
Foreign taxes paid or withheld should be included in taxable income with an offsetting deduction from gross income or as a credit for taxes paid to foreign governments.
Above figures may differ from those cited elsewhere in this report due to difference in the calculation of income and gains under GAAP purposes and Internal Revenue Service purposes.
Shareholders are strongly advised to consult their own tax advisers with respect to the tax consequences of their investments in the Funds.
47
Overlay Shares ETFs
Privacy Policy
August 31, 2020 (Unaudited)
We are committed to respecting the privacy of personal information you entrust to us in the course of doing business with us.
The Funds collect non-public information about you from the following sources:
● | Information we receive about you on applications or other forms; |
● | Information you give us orally; and/or |
● | Information about your transactions with us or others. |
We do not disclose any non-public personal information about our customers or former customers without the customer’s authorization, except as permitted by law or in response to inquiries from governmental authorities. We may share information with affiliated and unaffiliated third parties with whom we have contracts for servicing the Funds. We will provide unaffiliated third parties with only the information necessary to carry out their assigned responsibilities. We maintain physical, electronic and procedural safeguards to guard your non-public personal information and require third parties to treat your personal information with the same high degree of confidentiality.
In the event that you hold shares of a Fund through a financial intermediary, including, but not limited to, a broker-dealer, bank, or trust company, the privacy policy of your financial intermediary would govern how your non-public personal information would be shared by those entities with unaffiliated third parties.
48
THIS PAGE INTENTIONALLY LEFT BLANK
Investment Adviser:
Liquid Strategies, LLC
3550 Lenox Road, Suite 2550
Atlanta, Georgia 30326
Legal Counsel:
Morgan, Lewis & Bockius LLP
1111 Pennsylvania Avenue, N.W.
Washington, D.C. 20004
Independent Registered Public Accounting Firm:
Cohen & Company, Ltd.
1350 Euclid Avenue, Suite 800
Cleveland, OH 44115
Distributor:
Foreside Fund Services, LLC
Three Canal Plaza, Suite 100
Portland, ME 04101
Administrator, Fund Accountant & Transfer Agent:
U.S. Bancorp Fund Services, LLC
d/b/a U.S. Bank Global Fund Services
615 E. Michigan St.
Milwaukee, WI 53202
Custodian:
U.S. Bank N.A.
1555 North RiverCenter Drive, Suite 302
Milwaukee, WI 53212
This information must be preceded or accompanied by a current prospectus for the Funds.
Item 2. Code of Ethics.
The registrant has adopted a code of ethics that applies to the registrant’s principal executive officer and principal financial officer. The Registrant has not made any substantive amendments to its code of ethics during the period covered by this report. The registrant has not granted any waivers from any provisions of the code of ethics during the period covered by this report.
A copy of the registrant’s Code of Ethics is filed herewith.
Item 3. Audit Committee Financial Expert.
The registrant’s Board of Trustees has determined that there is at least one audit committee financial expert serving on its audit committee. Mr. John Jacobs is the “audit committee financial expert” and is considered to be “independent” as each term is defined in Item 3 of Form N-CSR.
Item 4. Principal Accountant Fees and Services.
The registrant has engaged its principal accountant to perform audit services, audit-related services, tax services and other services during the past two fiscal years. “Audit services” refer to performing an audit of the registrant's annual financial statements or services that are normally provided by the accountant in connection with statutory and regulatory filings or engagements for those fiscal years. “Audit-related services” refer to the assurance and related services by the principal accountant that are reasonably related to the performance of the audit. “Tax services” refer to professional services rendered by the principal accountant for tax compliance, tax advice, and tax planning. There were no “Other services” provided by the principal accountant. The following table details the aggregate fees billed or expected to be billed for the last two fiscal years for audit fees, audit-related fees, tax fees and other fees by the principal accountant.
| FYE 08/31/2020 | FYE 08/31/2019 | |
| Audit Fees | $67,500 | N/A |
| Audit-Related Fees | $0 | N/A |
| Tax Fees | $15,000 | N/A |
| All Other Fees | $0 | N/A |
The audit committee has adopted pre-approval policies and procedures that require the audit committee to pre-approve all audit and non-audit services of the registrant, including services provided to any entity affiliated with the registrant.
The percentage of fees billed by Cohen & Company, Ltd. applicable to non-audit services pursuant to waiver of pre-approval requirement were as follows:
| FYE 08/31/2020 | FYE 08/31/2019 | |
| Audit-Related Fees | 0% | N/A |
| Tax Fees | 0% | N/A |
| All Other Fees | 0% | N/A |
1
All of the principal accountant’s hours spent on auditing the registrant’s financial statements were attributed to work performed by full-time permanent employees of the principal accountant.
The following table indicates the non-audit fees billed or expected to be billed by the registrant’s accountant for services to the registrant and to the registrant’s investment adviser (and any other controlling entity, etc.—not sub-adviser) for the last two years. The audit committee of the board of trustees/directors has considered whether the provision of non-audit services that were rendered to the registrant's investment adviser is compatible with maintaining the principal accountant's independence and has concluded that the provision of such non-audit services by the accountant has not compromised the accountant’s independence.
| Non-Audit Related Fees | FYE 08/31/2020 | FYE 08/31/2019 |
| Registrant | N/A | N/A |
| Registrant’s Investment Adviser | N/A | N/A |
Item 5. Audit Committee of Listed Registrants.
(a) The registrant is an issuer as defined in Rule 10A-3 under the Securities Exchange Act of 1934, (the “Act”) and has a separately-designated standing audit committee established in accordance with Section 3(a)(58)(A) of the Act. The entire Board of Trustees is acting as the registrant’s audit committee.
(b) Not Applicable.
Item 6. Investments.
| (a) | Schedule of Investments is included as part of the report to shareholders filed under Item 1 of this Form. |
| (b) | Not Applicable. |
Item 7. Disclosure of Proxy Voting Policies and Procedures for Closed-End Management Investment Companies.
Not applicable to open-end investment companies.
Item 8. Portfolio Managers of Closed-End Management Investment Companies.
Not applicable to open-end investment companies.
Item 9. Purchases of Equity Securities by Closed-End Management Investment Company and Affiliated Purchasers.
Not applicable to open-end investment companies.
2
Item 10. Submission of Matters to a Vote of Security Holders.
There have been no material changes to the procedures by which shareholders may recommend nominees to the Registrant’s Board of Trustees.
Item 11. Controls and Procedures.
| (a) | The Registrant’s President and Treasurer have reviewed the Registrant's disclosure controls and procedures (as defined in Rule 30a-3(c) under the Investment Company Act of 1940 (the “Act”)) as of a date within 90 days of the filing of this report, as required by Rule 30a-3(b) under the Act and Rules 13a-15(b) or 15d-15(b) under the Securities Exchange Act of 1934. Based on their review, such officers have concluded that the disclosure controls and procedures are effective in ensuring that information required to be disclosed in this report is appropriately recorded, processed, summarized and reported and made known to them by others within the Registrant and by the Registrant’s service provider. |
| (b) | There were no changes in the Registrant's internal control over financial reporting (as defined in Rule 30a-3(d) under the Act) that occurred during the period covered by this report that have materially affected, or are reasonably likely to materially affect, the Registrant's internal control over financial reporting. |
Item 12. Disclosure of Securities Lending Activities for Closed-End Management Investment Companies
Not applicable to open-end investment companies.
Item 13. Exhibits.
| (a) | (1) Any code of ethics or amendment thereto, that is the subject of the disclosure required by Item 2, to the extent that the registrant intends to satisfy Item 2 requirements through filing an exhibit. Filed herewith. |
(2) A separate certification for each principal executive officer and principal financial officer pursuant to Section 302 of the Sarbanes-Oxley Act of 2002. Filed herewith.
(3) Any written solicitation to purchase securities under Rule 23c-1 under the Act sent or given during the period covered by the report by or on behalf of the registrant to 10 or more persons. Not applicable to open-end investment companies.
(4)Change in the registrant’s independent public accountant. There was no change in the registrant’s independent public accountant for the period covered by this report.
| (b) | Certifications pursuant to Section 906 of the Sarbanes-Oxley Act of 2002. Furnished herewith. |
3
SIGNATURES
Pursuant to the requirements of the Securities Exchange Act of 1934 and the Investment Company Act of 1940, the registrant has duly caused this report to be signed on its behalf by the undersigned, thereunto duly authorized.
| (Registrant) | Listed Funds Trust |
| By (Signature and Title)* | /s/ Gregory C. Bakken | ||
| Gregory C. Bakken, President/Principal Executive Officer |
|
| Date | 11/05/2020 |
Pursuant to the requirements of the Securities Exchange Act of 1934 and the Investment Company Act of 1940, this report has been signed below by the following persons on behalf of the registrant and in the capacities and on the dates indicated.
| By (Signature and Title)* | /s/ Gregory C. Bakken | ||
| Gregory C. Bakken, President/Principal Executive Officer |
|
| Date | 11/05/2020 |
| By (Signature and Title)* | /s/ Travis G. Babich | ||
| Travis G. Babich, Treasurer/Principal Financial Officer |
|
| Date | 11/05/2020 |
| * | Print the name and title of each signing officer under his or her signature. |
4