UNITED STATES
SECURITIES AND EXCHANGE COMMISSION
Washington, D.C. 20549
FORM N-CSR
CERTIFIED SHAREHOLDER REPORT OF REGISTERED MANAGEMENT INVESTMENT COMPANIES
Investment Company Act file number (811-23226)
Listed Funds Trust
(Exact name of registrant as specified in charter)
615 East Michigan Street
Milwaukee, WI 53202
(Address of principal executive offices) (Zip code)
Kent P. Barnes, Secretary
Listed Funds Trust
c/o U.S. Bancorp Fund Services, LLC
777 East Wisconsin Avenue, 10th Floor
Milwaukee, WI 53202
(Name and address of agent for service)
(414) 765-6511
Registrant's telephone number, including area code
Date of fiscal year end: December 31
Date of reporting period: December 31, 2020
Item 1. Reports to Stockholders.
(a)
TrueShares ETFs
TrueShares Technology, AI & Deep Learning ETF (LRNZ)
TrueShares ESG Active Opportunities ETF (ECOZ)
TrueShares Structured Outcome (July) ETF (JULZ)
TrueShares Structured Outcome (August) ETF (AUGZ)
TrueShares Structured Outcome (September) ETF (SEPZ)
TrueShares Structured Outcome (October) ETF (OCTZ)
TrueShares Structured Outcome (November) ETF (NVMZ)
TrueShares Structured Outcome (December) ETF (DECZ)
ANNUAL REPORT
December 31, 2020
Beginning on January 1, 2021, as permitted by regulations adopted by the U.S. Securities and Exchange Commission(“SEC”), paper copies of the Funds’ shareholder reports will no longer be sent by mail, unless you specifically request paper copies of the Funds’ reports from your financial intermediary, such as a broker-dealer or bank. Instead, the reports will be made available on a website, and you will be notified by mail each time a report is posted and provided with a website link to access the report.
If you already elected to receive shareholder reports electronically, you will not be affected by this change and you need not take any action. Please contact your financial intermediary to elect to receive shareholder reports and other Fund communications electronically.
You may elect to receive all future Fund reports in paper free of charge. Please contact your financial intermediary to inform them that you wish to continue receiving paper copies of Fund shareholder reports and for details about whether your election to receive reports in paper will apply to all funds held with your financial intermediary.
This report is submitted for the general information of shareholders of the Funds. It is not authorized for distribution unless preceded or accompanied by a current prospectus for the Funds.
TrueShares ETFs
Table of Contents
| | |
Letter to Shareholders (Unaudited) | 2 |
Shareholder Expense Example (Unaudited) | 8 |
Performance Overviews (Unaudited) | 10 |
Schedule of Investments and Written Options | 13 |
Statements of Assets and Liabilities | 22 |
Statements of Operations | 24 |
Statements of Changes in Net Assets | 26 |
Financial Highlights | 28 |
Notes to Financial Statements | 30 |
Report of Independent Registered Public Accounting Firm | 43 |
Board of Trustees and Officers (Unaudited) | 45 |
Board Consideration and Approval of Advisory and Sub-Advisory Agreements (Unaudited) | 47 |
Review of Liquidity Risk Management Program (Unaudited) | 49 |
Supplemental Information (Unaudited) | 50 |
Privacy Policy (Unaudited) | 51 |
1
TrueShares ETFs
Letter to Shareholders
December 31, 2020 (Unaudited)
Dear Shareholder,
First and foremost, the TrueShares team sincerely hopes that this letter finds you healthy and optimistic during these somewhat chaotic times. Adequately describing the events of 2020, and now 2021, might present too great a challenge given the allotted space for this update. Nonetheless, I am sure we can all agree that the past twelve months have been one of the most unexpected, strangest, and trying years in at least a generation.
Unsurprisingly, the investment markets were no exception. The historic, pandemic driven drop in the first quarter of 2020 was followed by a meteoric rebound to new equity market highs, with plenty of volatility in between. It was against this backdrop that TrueShares successfully listed TrueShares Technology, AI & Deep Learning ETF (LRNZ), TrueShares ESG Active Opportunities ETF (ECOZ) and the TrueShares Structured Outcome Series. We have been very pleased with the performance of each of these ETFs thus far and we hope they have served your portfolios well.
Moving forward, our management team will continue to pursue the investment themes which inspired our current funds, while opportunistically expanding the TrueShares ETF suite as we uncover additional areas of the market that may prove fertile ground for our trademark active, concentrated investment philosophy. Keep an eye out for new TrueShares listings in 2021.
As always, please don’t hesitate to contact our team. We would love to hear from you. With so many avenues to engage shareholders and their advisors, communication has finally achieved a primary role in our industry and TrueShares strives to be a leader in this democratization of ETFs.
Sincerely,

Michael N. Loukas
CEO, TrueMark Investments
2
TrueShares Technology, AI & Deep Learning ETF
Letter to Shareholders
December 31, 2020 (Unaudited)
Dear Shareholder,
Black Hill Capital Partners, LLC, Sub-Adviser to the TrueShares Technology, AI and Deep Learning ETF (“LRNZ”) is pleased to provide you with the annual review and commentary for the year 2020 Annual Report. The Fund began trading on March 1, 2020, therefore, this report reflects the Fund’s performance from February 28, 2020 through December 31, 2020.
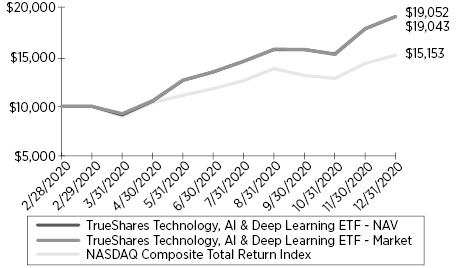
Despite the pandemic driven lockdowns present for most of the year, we are quite pleased with the performance of the Fund. LRNZ comfortably outperformed its benchmark in 2020, generating a 90.52% return at market and 90.43% return at NAV compared to the NASDAQ Composite Total Return Index at 51.53%. We continue to manage a concentrated portfolio of 20 holdings.
The portfolio’s outperformance during the period can generally be attributed to stock selection across the majority of its holdings. Soon after the onset of the lockdown cycle, investors started to identify the companies that would likely be the major beneficiaries of the shelter-in-place orders, broadly categorizing them as the “Work-From-Home” stocks. The lockdown clearly highlighted the power and advantages of these secular growth technologies companies which manifests in their ability to generate consistently robust results and guidance, quarter after quarter. We expect these companies to continue their favorable performance long after the economy gets back to a normal level. It is our belief that many of the trends that were spotlighted during the lockdowns were in place prior to the pandemic, realizing significant acceleration during the past year. As we move forward, we remain firmly committed to, through our proprietary fundamental research, continue discovering high quality secular growth companies with uncommon AI and Deep Learning expertise in the technology, healthcare and bio-technology sectors.
Investment Sub-adviser
Black Hill Capital Partners, LLC
Additional Information:
Expense ratio: 0.68%
As the Fund is less than a year old, Since Inception performance shown is cumulative. Short-term performance, in particular, is not a good indication of the Fund’s future performance, and an investment should not be made based solely on returns. Because of ongoing market volatility, fund performance may be subject to substantial short-term changes.
Performance data quoted represents past performance and does not guarantee future results. Investment return and principal value of an investment will fluctuate so that an investor’s shares, when redeemed or sold in the secondary market, may be worth more or less than the original cost. Investors will incur usual and customary brokerage commissions when buying or selling shares of the exchange-traded funds (“ETFs”) in the secondary market, and that, if reflected, the brokerage commissions would reduce the performance returns. Current performance may be lower or higher than the performance shown. Shares are bought and sold at market price not net asset value (“NAV”) and are not individually redeemable from the fund. Call 877.774.TRUE for more information.
Index performance does not represent TrueShares fund performance. It is not possible to invest directly in an index. All performance figures assume reinvestment of dividend and capital gains at net asset value; actual returns may differ.
Performance 1-year and less are cumulative; performance over 1-year are average annualized total returns. Market price performance is determined using the bid/ask midpoint at 4:00pm Eastern time, when the NAV is typically calculated. NAV price performance is determined using the daily calculated NAV. They do not represent the returns you would receive if you traded shares at other times. Performance figures do not reflect the deduction of taxes that a shareholder would pay on Fund distributions or upon redemption or sale of fund shares.
The NASDAQ Composite Total Return Index is a stock market index of the common stocks and similar securities listed on the NASDAQ stock market. The index measures the performance of all domestic and international based common type stocks listed on the NASDAQ Stock Market. It includes common stocks, ordinary shares, ADRs, shares of beneficial interest or limited partnership interests and tracking stocks. The index is market capitalization-weighted. The composition of the NASDAQ Composite is heavily weighted towards information technology companies.
3
TrueShares ESG Active Opportunities ETF
Letter to Shareholders
December 31, 2020 (Unaudited)
Dear Shareholder,
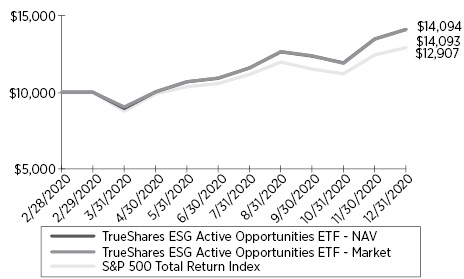
Happy 2021! We are pleased to inform you about the performance resilience of TrueShares’ ESG Active Opportunities ETF (“ECOZ”), for the year 2020. Despite the extreme market volatility, ECOZ was up 40.93% at market since its inception on February 28, 2020 and 40.94% at NAV. The S&P 500 Total Return Index, the benchmark for the product, was up 29.07% during the same period or 11.87% outperformance.
ECOZ is designed as a deep impact product that seeks long-term capital growth, and at the same time, drastically reduces your investment portfolio’s carbon footprint to just a fraction of a typical U.S. large cap product. We would like to congratulate you that through your investment in ECOZ, you are making an impact to help combat the climate issues and at the same time greatly benefited in investment result in 2020.
In managing ECOZ, we identify long-term business and economic trends toward better environment, equitable society and sound governance. We purposefully invest in the industry champions who lead the transitions. A key mega trend we have embraced is the decarbonization of the global economy and reduction in carbon emissions. This trend has several ramifications for industry transitions, such as electrification of transportation with electric vehicles and reduced traffic via ride sharing. The result is a rise of renewable as an energy source in a cleaner power grid. Our early investments in electric vehicle leader Tesla, ride hailing leader Uber, and solar firm Enphase, are among top contributors to ECOZ’s outperformance to the benchmark in 2020. We also invested in another major trend of the rise of fintech companies replacing certain functions of traditional large banks. Our early investment in Square is another top performance contributor. ECOZ also benefited from our long-term divestments from high carbon emitting industries such as fossil fuel energy firms and airlines.
On the other hand, the COVID-19 pandemic has more than proportionally negatively affected the restaurants, leisure, and real estate rental markets. Our investments in food distributor Sysco and a real estate service firm CBRE group are among top detractors from the relative performance. If there is a silver lining from a horrendous year of health, environmental and economic crisis’ we have witnessed, it is an overwhelming policy push for tackling climate crisis around the world and companies’ initiatives to improve social equity. With its $2 trillion climate plan, the new U.S. administration is likely to accelerate the economy decarbonization process. The private sector is also stepping up, with more companies setting carbon neutral target year and action plans aided by technology advancements and significant cost reduction to implement transitions. We are likely to see continued supportive backdrops for investment themes of clean environment and equitable society to thrive, themes that ECOZ is designed to embrace and take advantage of from both impact and performance perspectives in the long run.
Investment Sub-adviser
Purview Investments, LLC
Additional Information:
Expense ratio: 0.58%
As the Fund is less than a year old, since Inception performance shown is cumulative. Short-term performance, in particular, is not a good indication of the Fund’s future performance, and an investment should not be made based solely on returns. Because of ongoing market volatility, Fund performance may be subject to substantial short-term changes. Performance data quoted represents past performance and does not guarantee future results. Investment return and principal value of an investment will fluctuate so that an investor’s shares, when redeemed or sold in the secondary market, may be worth more or less than the original cost. Investors will incur usual and customary brokerage commissions when buying or selling shares of the exchange-traded funds (“ETFs”) in the secondary market, and that, if reflected, the brokerage commissions would reduce the performance returns. Current performance may be lower or higher than the performance shown. Shares are bought and sold at market price not net asset value (“NAV”) and are not individually redeemable from the fund. Call 877.774.TRUE for more information.
Index performance does not represent Fund performance. It is not possible to invest directly in an index. All performance figures assume reinvestment of dividend and capital gains at net asset value; actual returns may differ.
4
TrueShares ESG Active Opportunities ETF
Letter to Shareholders
December 31, 2020 (Continued) (Unaudited)
Performance 1-year and less are cumulative; performance over 1-year are average annualized total returns. Market price performance is determined using the bid/ask midpoint at 4:00pm Eastern time, when the NAV is typically calculated. NAV price performance is determined using the daily calculated NAV. They do not represent the returns you would receive if you traded shares at other times. Performance figures do not reflect the deduction of taxes that a shareholder would pay on Fund distributions or upon redemption or sale of fund shares.
The S&P 500 Index is a widely recognized capitalization-weighted index that measures the performance of the large-capitalization sector of the U.S. stock market.
5
TrueShares Structured Outcome ETFs
Letter to Shareholders
December 31, 2020 (Unaudited)
Dear Shareholder,
The year 2020 was unprecedented in many ways. The global pandemic affected capital markets, and more specifically the performance, volatility and path of the S&P 500 Index experienced record-setting levels. The TrueShares structured outcome launch occurred on the heels of the volatile conditions of the first two quarters of year, which exhibited some of the most vicious sell-offs and equally as impressive rallies in history. These events collectively registered one of the most volatile periods ever due to the COVID-19 induced pandemic selloff and the subsequent governmental response of fiscal and monetary policy intervention.
Performance Comparison:
The following table details the cumulative total returns as of December 31, 2020 since inception for the Funds and the Funds’ volatility against the S&P 500 Price Index for the same period:
FUND | | INCEPTION | | | FUND TOTAL
RETURN
(@ MARKET) | | | FUND TOTAL
RETURN
(@NAV) | | | S&P 500
PRICE INDEX | | | FUND
VOLATILITY
(ANNUALIZED) | | | S&P 500
VOLATILITY
(ANNUALIZED) | |
JULZ | | | 06/30/2020 | | | | 16.55 | % | | | 16.81 | % | | | 21.15 | % | | | 13.65 | % | | | 16.51 | % |
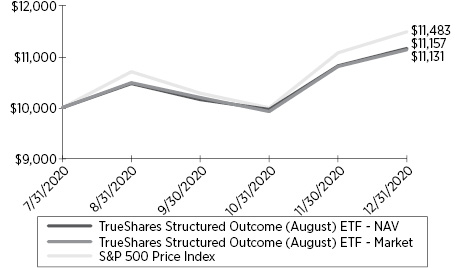
AUGZ | | | 07/31/2020 | | | | 11.31 | % | | | 11.57 | % | | | 14.83 | % | | | 14.12 | % | | | 17.14 | % |
SEPZ | | | 08/31/2020 | | | | 6.08 | % | | | 6.51 | % | | | 7.31 | % | | | 15.55 | % | | | 18.73 | % |
OCTZ | | | 09/30/2020 | | | | 8.57 | % | | | 8.85 | % | | | 11.69 | % | | | 13.33 | % | | | 16.35 | % |
NVMZ | | | 10/30/2020 | | | | 10.35 | % | | | 10.51 | % | | | 14.87 | % | | | 9.84 | % | | | 12.85 | % |
DECZ | | | 11/30/2020 | | | | 1.72 | % | | | 1.75 | % | | | 3.71 | % | | | 5.71 | % | | | 8.57 | % |
By design, the TrueShares structured outcome series seeks to deliver a “predictable” return given the performance of the S&P 500 over a one-year period from its inception or “initialization date” by buffering the first 10% of losses. The protection is generated while participating as much as possible, given market conditions, in the market upside, or “participation” rate. In the interim of course, the performance is less defined and subject to market conditions.
All of the Funds in the series delivered a return and volatility within a range of acceptance given the market conditions experienced. The use of derivatives, implicit in the structures, delivered on their expectations as implied volatility levels changed throughout the second half of 2020. As one can see, all series are positively correlated to the S&P 500 Index performance over the period, and this is to be expected in the majority of market conditions. Hence, the direction of the S&P 500 Index will be the largest contributor to the performance of all series.
The second largest contributing factor has been the level of volatility, and more specifically the relationship between the Implied Volatility in the put options the strategy has sold contrasted versus the call options the strategy has purchased. This factor and relationship dictates the participation ratio which subsequently determines the “upside capture” of the series. While the actual volatility profile of each series is less than the benchmark (S&P 500 Index), this is intentional and expected in the majority of environments as the structure is designed to deliver this feature.
The design of the structures have met our expectations, and as the subadvisor of the Funds we continue to have confidence in the structural design of the strategy and its ability to deliver a consistent “Structured Outcome” while striving to simultaneously deliver superior risk-adjusted returns as compared to other like funds or ETFs.
Broadly speaking, the series will lag the S&P 500 Index performance in an up market, as our “participation ratio” will be less than 1.0, but on a risk-adjusted basis, the structure has outperformed over the time frame. There have not been any significant factors that have surprisingly contributed positively or negatively to the performance realized during 2020. We have a keen focus on managing flows as the Funds continually grow to adhere to a consistent tracking error through time to deliver upon the “structured outcome” philosophy that TrueShares has brought to market.
6
TrueShares Structured Outcome ETFs
Letter to Shareholders
December 31, 2020 (Continued) (Unaudited)
On behalf of SpiderRock Advisors, thank you for your trust & confidence,
Sincerely,
Eric Metz
President & Chief Investment Officer
Investment Sub-adviser
SpiderRock Advisors, LLC
Additional Information:
Expense ratio: 0.79%
Performance data quoted represents past performance and does not guarantee future results. Investment return and principal value of an investment will fluctuate so that an investor’s shares, when redeemed or sold in the secondary market, may be worth more or less than the original cost. Investors will incur usual and customary brokerage commissions when buying or selling shares of the exchange-traded funds (“ETFs”) in the secondary market, and that, if reflected, the brokerage commissions would reduce the performance returns. Current performance may be lower or higher than the performance shown. Shares are bought and sold at market price not net asset value (“NAV”) and are not individually redeemable from the fund. Call 877-774-TRUE (8783) for performance data current to the most recent month end.
Index performance does not represent TrueShares fund performance. It is not possible to invest directly in an index. All performance figures assume reinvestment of dividend and capital gains at net asset value; actual returns may differ. Performance 1-year and less are cumulative; performance over 1-year are average annualized total returns. Market price performance is determined using the bid/ask midpoint at 4:00pm Eastern time, when the NAV is typically calculated. NAV price performance is determined using the daily calculated NAV. They do not represent the returns you would receive if you traded shares at other times. Performance figures do not reflect the deduction of taxes that a shareholder would pay on Fund distributions or upon redemption or sale of fund shares.
The TrueShares Structured Outcome ETF Series utilizes a “buffer protect” options strategy, that seeks to provide investors with returns (before fees and expenses) that track those of the S&P 500 Index while seeking to provide an 8-12% downside buffer (with the advisor targeting 10%) on the first of that index’s losses over a 12-month investment period.**
** | In the event an investor purchases Shares after the date on which the options were entered into or sells Shares prior to the expiration of the options, the buffer that the Fund seeks to provide may not be available and there may be limited to no upside potential. The Fund does not provide principal protection and an investor may experience significant losses on its investment, including the loss of its entire investment. |
The S&P 500 Index is a widely recognized capitalization-weighted index that measures the performance of the large-capitalization sector of the U.S. stock market. The S&P 500 Price Index does not include reinvestment of dividends.
7
TrueShares ETFs
Shareholder Expense Example
December 31, 2020 (Unaudited)
As a shareholder of a fund you incur two types of costs: (1) transaction costs for purchasing and selling shares; and (2) ongoing costs, including management fees and other fund expenses. The following example is intended to help you understand your ongoing costs (in dollars and cents) of investing in the Funds and to compare these costs with the ongoing costs of investing in other funds. The examples are based on an investment of $1,000 invested at the beginning of the period and held throughout the entire period (July 1, 2020 to December 31, 2020), except as noted in footnotes below.
ACTUAL EXPENSES
The following table provides information about actual account values and actual expenses. You may use the information in this line, together with the amount you invested, to estimate the expenses that you paid over the period. Simply divide your account value by $1,000 (for example, an $8,600 account value divided by $1,000 = 8.6), then multiply the result by the number in the applicable line under the heading entitled “Expenses Paid During Period” to estimate the expenses you paid on your account during this period.
| | Beginning
Account
Value | Ending
Account
Value | Annualized
Expense
Ratios | Expenses
Paid
During the
Period |
TrueShares Technology, AI & Deep Learning ETF | $1,000.00 | $ 1,414.30 | 0.68% | $4.13(1) |
TrueShares ESG Active Opportunities ETF | 1,000.00 | 1,292.20 | 0.58 | 3.34(1) |
TrueShares Structured Outcome (July) ETF | 1,000.00 | 1,168.10 | 0.79 | 4.31(1) |
TrueShares Structured Outcome (August) ETF | 1,000.00 | 1,115.70 | 0.79 | 3.52(2) |
TrueShares Structured Outcome (September) ETF | 1,000.00 | 1,065.10 | 0.79 | 2.74(3) |
TrueShares Structured Outcome (October) ETF | 1,000.00 | 1,088.50 | 0.79 | 2.10(4) |
TrueShares Structured Outcome (November) ETF | 1,000.00 | 1,105.10 | 0.79 | 1.43(5) |
TrueShares Structured Outcome (December) ETF | 1,000.00 | 1,017.50 | 0.79 | 0.70(6) |
(1) | Expenses are calculated using the Fund’s annualized expense ratio, multiplied by the average account value for the period, multiplied by 184/366 (to reflect the six-month period). |
(2) | Expenses are calculated using the Fund’s annualized expense ratio, multiplied by the average account value for the period, multiplied by 154/366 (to reflect the period since the Fund’s inception). |
(3) | Expenses are calculated using the Fund’s annualized expense ratio, multiplied by the average account value for the period, multiplied by 123/366 (to reflect the period since the Fund’s inception). |
(4) | Expenses are calculated using the Fund’s annualized expense ratio, multiplied by the average account value for the period, multiplied by 93/366 (to reflect the period since the Fund’s inception). |
(5) | Expenses are calculated using the Fund’s annualized expense ratio, multiplied by the average account value for the period, multiplied by 63/366 (to reflect the period since the Fund’s inception). |
(6) | Expenses are calculated using the Fund’s annualized expense ratio, multiplied by the average account value for the period, multiplied by 32/366 (to reflect the period since the Fund’s inception). |
8
TrueShares ETFs
Shareholder Expense Example
December 31, 2020 (Unaudited) (Continued)
HYPOTHETICAL EXAMPLE FOR COMPARISON PURPOSES
The following table provides information about hypothetical account values and hypothetical expenses based on the Funds’ actual expense ratios and an assumed rate of return of 5% per year before expenses, which are not the Funds’ actual returns. The hypothetical account values and expenses may not be used to estimate the actual ending account balance or expenses you paid for the period. You may use this information to compare the ongoing costs of investing in the Funds and other funds. To do so, compare this 5% hypothetical example with the 5% hypothetical examples that appear in the shareholder reports of the other funds. Please note that the expenses shown in the table are meant to highlight your ongoing costs only and do not reflect any transactional costs, such as brokerage commissions paid on purchases and sales of Fund shares with respect to the Funds. Therefore, the table below is useful in comparing ongoing costs only and will not help you determine the relative total costs of owning different funds. In addition, if these transactional costs were included, your costs would have been higher.
| | Beginning
Account
Value | Ending
Account
Value | Annualized
Expense
Ratios | Expenses
Paid
During the
Period(1) |
TrueShares Technology, AI & Deep Learning ETF | $1,000.00 | $ 1,021.72 | 0.68% | $3.46 |
TrueShares ESG Active Opportunities ETF | 1,000.00 | 1,022.22 | 0.58 | 2.95 |
TrueShares Structured Outcome (July) ETF | 1,000.00 | 1,021.17 | 0.79 | 4.01 |
TrueShares Structured Outcome (August) ETF | 1,000.00 | 1,021.17 | 0.79 | 4.01(2) |
TrueShares Structured Outcome (September) ETF | 1,000.00 | 1,021.17 | 0.79 | 4.01(2) |
TrueShares Structured Outcome (October) ETF | 1,000.00 | 1,021.17 | 0.79 | 4.01(2) |
TrueShares Structured Outcome (November) ETF | 1,000.00 | 1,021.17 | 0.79 | 4.01(2) |
TrueShares Structured Outcome (December) ETF | 1,000.00 | 1,021.17 | 0.79 | 4.01(2) |
(1) | Expenses are calculated using the Fund’s annualized expense ratio, multiplied by the average account value for the period, multiplied by 184/366 (to reflect the six-month period). |
(2) | For comparative purposes only as the Fund was not in operation for the full six-month period. |
9
TrueShares ETFs
Performance Overviews
December 31, 2020 (Unaudited)
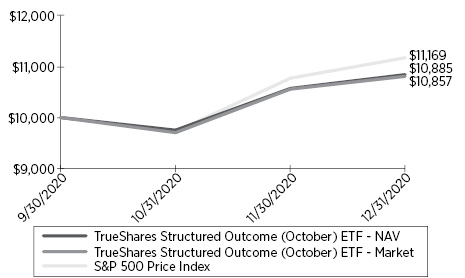
Hypothetical Growth of $10,000 Investment
(Since Inception through 12/31/2020)
1 | The Fund has an inception date and commenced operations on February 28, 2020 |
1 | The Fund has an inception date and commenced operations on February 28, 2020 |

1 | The Fund has an inception date of June 30, 2020 and commenced operations on July 1, 2020 |
CUMULATIVE TOTAL RETURN
FOR THE PERIOD ENDED DECEMBER 31, 2020 |
Total Returns | Since
Inception1 |
TrueShares Technology, AI & Deep Learning ETF — NAV | 90.43% |
TrueShares Technology, AI & Deep Learning ETF — Market | 90.52% |
NASDAQ Composite Total Return Index | 51.53% |
CUMULATIVE TOTAL RETURN
FOR THE PERIOD ENDED DECEMBER 31, 2020 |
Total Returns | Since
Inception1 |
TrueShares ESG Active Opportunities ETF — NAV | 40.94% |
TrueShares ESG Active Opportunities ETF — Market | 40.93% |
S&P 500 Total Return Index | 29.07% |
CUMULATIVE TOTAL RETURN
FOR THE PERIOD ENDED DECEMBER 31, 2020 |
Total Returns | Since
Inception1 |
TrueShares Structured Outcome (July) ETF — NAV | 16.81% |
TrueShares Structured Outcome (July) ETF — Market | 16.55% |
S&P 500 Price Index | 21.15% |
10
TrueShares ETFs
Performance Overviews
December 31, 2020 (Unaudited) (Continued)
Hypothetical Growth of $10,000 Investment
(Since Inception through 12/31/2020)
1 | The Fund has an inception date of July 31, 2020 and commenced operations on August 3, 2020 |

1 | The Fund has an inception date of August 31, 2020 and commenced operations on September 1, 2020 |
1 | The Fund has an inception date of September 30, 2020 and commenced operations on October 1, 2020 |
CUMULATIVE TOTAL RETURN
FOR THE PERIOD ENDED DECEMBER 31, 2020 |
Total Returns | Since
Inception1 |
TrueShares Structured Outcome (August) ETF — NAV | 11.57% |
TrueShares Structured Outcome (August) ETF — Market | 11.31% |
S&P 500 Price Index | 14.83% |
CUMULATIVE TOTAL RETURN
FOR THE PERIOD ENDED DECEMBER 31, 2020 |
Total Returns | Since
Inception1 |
TrueShares Structured Outcome (September) ETF — NAV | 6.51% |
TrueShares Structured Outcome (September) ETF — Market | 6.08% |
S&P 500 Price Index | 7.31% |
CUMULATIVE TOTAL RETURN
FOR THE PERIOD ENDED DECEMBER 31, 2020 |
Total Returns | Since
Inception1 |
TrueShares Structured Outcome (October) ETF – NAV | 8.85% |
TrueShares Structured Outcome (October) ETF – Market | 8.57% |
S&P 500 Price Index | 11.69% |
11
TrueShares ETFs
Performance Overviews
December 31, 2020 (Unaudited) (Continued)
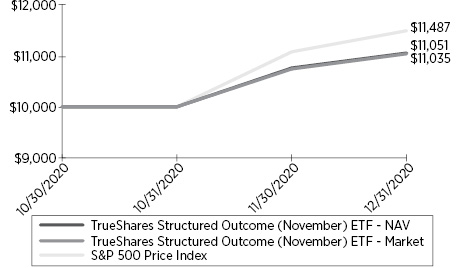
Hypothetical Growth of $10,000 Investment
(Since Inception through 12/31/2020)
1 | The Fund has an inception date of October 30, 2020 and commenced operations on November 2, 2020 |

1 | The Fund has an inception date of November 30, 2020 and commenced operations on December 1, 2020 |
CUMULATIVE TOTAL RETURN
FOR THE PERIOD ENDED DECEMBER 31, 2020 |
Total Returns | Since
Inception1 |
TrueShares Structured Outcome (November) ETF — NAV | 10.51% |
TrueShares Structured Outcome (November) ETF — Market | 10.35% |
S&P 500 Price Index | 14.87% |
CUMULATIVE TOTAL RETURN
FOR THE PERIOD ENDED DECEMBER 31, 2020 |
Total Returns | Since
Inception1 |
TrueShares Structured Outcome (December) ETF — NAV | 1.75% |
TrueShares Structured Outcome (December) ETF — Market | 1.72% |
S&P 500 Price Index | 3.71% |
The performance data quoted represents past performance. Past performance does not guarantee future results. Current performance may be lower or higher than the performance data quoted. The investment return and principal value of an investment will fluctuate so that an investor’s shares, when sold or redeemed, may be worth more or less than their original cost. For the most recent month-end performance, please call (877) 774-8789. You cannot invest directly in an index. Shares are bought and sold at market price (closing price), not net asset value (NAV), and are individually redeemed from the Fund. Market performance is determined using the bid/ask midpoint at 4:00pm Eastern time when the NAV is typically calculated. Brokerage commissions will reduce returns. Returns shown include the reinvestment of all dividends and distributions. Returns shown do not reflect the deduction of taxes that a shareholder would pay on fund distributions or the redemption of fund shares.
The NASDAQ Composite Total Return Index is a stock market index of the common stocks and similar securities listed on the NASDAQ stock market. The index measures the performance of all domestic and international based common type stocks listed on the NASDAQ Stock Market. It includes common stocks, ordinary shares, ADRs, shares of beneficial interest or limited partnership interests and tracking stocks. The index is market capitalization-weighted. The composition of the NASDAQ Composite is heavily weighted towards information technology companies. The total return index includes reinvestment of all cash dividends on the ex-date.
The S&P 500® Index is a widely recognized capitalization-weighted index that measures the performance of the large-capitalization sector of the U.S. stock market. The S&P 500 Price Index does not include reinvestment of dividends.
12
TrueShares Technology, AI & Deep Learning ETF
Schedule of Investments
December 31, 2020
Sector Diversification *
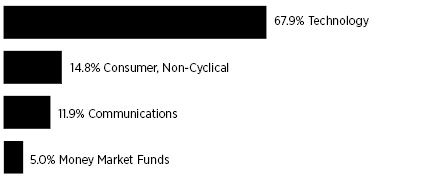
* | Percentages are stated as a percent of net assets. |
| | Shares | | | Value | |
COMMON STOCKS — 94.6% | | | | | | | | |
Biotechnology — 12.1% | | | | | | | | |
Berkeley Lights, Inc. (a) | | | 14,110 | | | $ | 1,261,575 | |
Guardant Health, Inc. (a) | | | 8,721 | | | | 1,123,962 | |
Relay Therapeutics, Inc. (a) | | | 22,110 | | | | 918,892 | |
| | | | | | | | 3,304,429 | |
Computers — 20.7% | | | | | | | | |
Crowdstrike Holdings, Inc. - Class A (a) | | | 10,401 | | | | 2,203,140 | |
Varonis Systems, Inc. (a) | | | 8,472 | | | | 1,386,104 | |
Zscaler, Inc. (a) | | | 10,407 | | | | 2,078,382 | |
| | | | | | | | 5,667,626 | |
Internet — 11.9% | | | | | | | | |
Amazon.com, Inc. (a) | | | 256 | | | | 833,774 | |
Anaplan, Inc. (a) | | | 16,998 | | | | 1,221,306 | |
Okta, Inc. (a) | | | 4,740 | | | | 1,205,193 | |
| | | | | | | | 3,260,273 | |
Pharmaceuticals — 2.7% | | | | | | | | |
AbCellera Biologics, Inc. (a)(b) | | | 18,611 | | | | 748,907 | |
| | | | | | | | | |
Semiconductors — 11.8% | | | | | | | | |
Advanced Micro Devices, Inc. (a) | | | 13,179 | | | | 1,208,646 | |
NVIDIA Corp. | | | 2,007 | | | | 1,048,056 | |
Xilinx, Inc. | | | 6,786 | | | | 962,051 | |
| | | | | | | | 3,218,753 | |
Software — 35.4% (c) | | | | | | | | |
C3.ai, Inc. - Class A (a) | | | 8,311 | | | | 1,153,151 | |
Datadog, Inc. - Class A (a) | | | 13,995 | | | | 1,377,668 | |
Elastic N.V. (a)(b) | | | 8,468 | | | | 1,237,429 | |
salesforce.com, Inc. (a) | | | 3,450 | | | | 767,728 | |
Schrodinger, Inc. (a) | | | 13,088 | | | | 1,036,308 | |
ServiceNow, Inc. (a) | | | 1,842 | | | | 1,013,892 | |
Twilio, Inc. - Class A (a) | | | 4,626 | | | | 1,565,901 | |
Unity Software, Inc. (a) | | | 9,943 | | | | 1,525,952 | |
| | | | | | | | 9,678,029 | |
TOTAL COMMON STOCKS (Cost $19,780,546) | | | | | | | 25,878,017 | |
MONEY MARKET FUNDS — 5.0% | | | | | | | | |
First American Treasury Obligations Fund - Class X, 0.04% (d) | | | 1,377,274 | | | | 1,377,274 | |
TOTAL MONEY MARKET FUNDS (Cost $1,377,274) | | | | | | | 1,377,274 | |
| | | | | | | | | |
TOTAL INVESTMENTS (Cost $21,157,820) — 99.6% | | | | | | | 27,255,291 | |
Other assets and liabilities, net — 0.4% | | | | | | | 119,174 | |
NET ASSETS — 100.0% | | | | | | $ | 27,374,465 | |
(a) | Non-income producing security. |
(b) | Foreign issued security. |
(c) | To the extent the Fund invests more heavily in particular sectors of the economy, its performance will be especially sensitive to developments that significantly affect those sectors. |
(d) | The rate shown is the annualized seven-day yield at period end. |
Percentages are stated as a percent of net assets.
The accompanying notes are an integral part of the financial statements.
13
TrueShares ESG Active Opportunities ETF
Schedule of Investments
December 31, 2020
Sector Diversification *

* | Percentages are stated as a percent of net assets. |
| | Shares | | | Value | |
COMMON STOCKS — 96.8% | | | | | | | | |
Apparel — 2.0% | | | | | | | | |
NIKE, Inc. - Class B | | | 1,016 | | | $ | 143,734 | |
| | | | | | | | | |
Auto Manufacturers — 4.1% | | | | | | | | |
Tesla, Inc. (a) | | | 403 | | | | 284,385 | |
| | | | | | | | | |
Banks — 1.7% | | | | | | | | |
JPMorgan Chase & Co. | | | 912 | | | | 115,888 | |
| | | | | | | | | |
Beverages — 1.4% | | | | | | | | |
PepsiCo, Inc. | | | 640 | | | | 94,912 | |
| | | | | | | | | |
Biotechnology — 1.1% | | | | | | | | |
Amgen, Inc. | | | 184 | | | | 42,306 | |
Gilead Sciences, Inc. | | | 601 | | | | 35,014 | |
| | | | | | | | 77,320 | |
Chemicals — 0.7% | | | | | | | | |
International Flavors & Fragrances, Inc. | | | 435 | | | | 47,345 | |
| | | | | | | | | |
Commercial Services — 7.5% | | | | | | | | |
Moody’s Corp. | | | 280 | | | | 81,267 | |
PayPal Holdings, Inc. (a) | | | 438 | | | | 102,580 | |
S&P Global, Inc. | | | 232 | | | | 76,265 | |
Square, Inc. - Class A (a) | | | 1,235 | | | | 268,785 | |
| | | | | | | | 528,897 | |
Computers — 2.6% | | | | | | | | |
Apple, Inc. | | | 1,383 | | | | 183,510 | |
| | | | | | | | | |
Cosmetics & Personal Care — 0.9% | | | | | | | | |
Colgate-Palmolive Co. | | | 712 | | | | 60,883 | |
| | | | | | | | | |
Distribution & Wholesale — 1.8% | | | | | | | | |
WW Grainger, Inc. | | | 309 | | | | 126,177 | |
| | | | | | | | | |
Diversified Financial Services — 5.6% | | | | | | | | |
American Express Co. | | | 701 | | | | 84,758 | |
BlackRock, Inc. | | | 136 | | | | 98,130 | |
Mastercard, Inc. - Class A | | | 360 | | | | 128,498 | |
Nasdaq, Inc. | | | 227 | | | | 30,132 | |
Visa, Inc. - Class A | | | 248 | | | | 54,245 | |
| | | | | | | | 395,763 | |
Electric — 1.0% | | | | | | | | |
Eversource Energy | | | 832 | | | | 71,976 | |
| | | | | | | | | |
Energy, Alternate Sources — 6.4% | | | | | | | | |
Enphase Energy, Inc. (a) | | | 2,006 | | | | 351,993 | |
SolarEdge Technologies, Inc. (a) | | | 310 | | | | 98,927 | |
| | | | | | | | 450,920 | |
Food — 2.7% | | | | | | | | |
Beyond Meat, Inc. (a) | | | 722 | | | | 90,250 | |
Sysco Corp. | | | 1,324 | | | | 98,320 | |
| | | | | | | | 188,570 | |
Healthcare Products — 2.8% | | | | | | | | |
Abbott Laboratories | | | 1,273 | | | | 139,381 | |
Baxter International, Inc. | | | 681 | | | | 54,643 | |
| | | | | | | | 194,024 | |
Healthcare Services — 2.1% | | | | | | | | |
Teladoc Health, Inc. (a) | | | 346 | | | | 69,186 | |
UnitedHealth Group, Inc. | | | 219 | | | | 76,799 | |
| | | | | | | | 145,985 | |
Household Products & Wares — 0.6% | | | | | | | | |
The Clorox Co. | | | 224 | | | | 45,230 | |
| | | | | | | | | |
Insurance — 0.9% | | | | | | | | |
The Allstate Corp. | | | 585 | | | | 64,309 | |
| | | | | | | | | |
Internet — 13.4% | | | | | | | | |
Alphabet, Inc. - Class A (a) | | | 99 | | | | 173,511 | |
Amazon.com, Inc. (a) | | | 64 | | | | 208,444 | |
Booking Holdings, Inc. (a) | | | 43 | | | | 95,773 | |
Netflix, Inc. (a) | | | 200 | | | | 108,146 | |
Twitter, Inc. (a) | | | 2,867 | | | | 155,248 | |
Uber Technologies, Inc. (a) | | | 3,043 | | | | 155,193 | |
VeriSign, Inc. (a) | | | 193 | | | | 41,765 | |
| | | | | | | | 938,080 | |
Machinery Diversified — 2.0% | | | | | | | | |
Rockwell Automation, Inc. | | | 572 | | | | 143,463 | |
| | | | | | | | | |
Media — 2.8% | | | | | | | | |
The Walt Disney Co. (a) | | | 1,077 | | | | 195,131 | |
| | | | | | | | | |
Miscellaneous Manufacturing — 0.6% | | | | | | | | |
Illinois Tool Works, Inc. | | | 216 | | | | 44,038 | |
The accompanying notes are an integral part of the financial statements.
14
TrueShares ESG Active Opportunities ETF
Schedule of Investments
December 31, 2020 (Continued)
| | Shares | | | Value | |
Packaging & Containers — 0.7% | | | | | | | | |
Ball Corp. | | | 529 | | | $ | 49,292 | |
| | | | | | | | | |
Pharmaceuticals — 3.9% | | | | | | | | |
AbbVie, Inc. | | | 377 | | | | 40,395 | |
AmerisourceBergen Corp. | | | 889 | | | | 86,909 | |
Bristol-Myers Squibb Co. | | | 619 | | | | 38,397 | |
Cardinal Health, Inc. | | | 510 | | | | 27,316 | |
Johnson & Johnson | | | 264 | | | | 41,548 | |
Merck & Co., Inc. | | | 449 | | | | 36,728 | |
| | | | | | | | 271,293 | |
Retail — 5.9% | | | | | | | | |
Costco Wholesale Corp. | | | 313 | | | | 117,932 | |
Starbucks Corp. | | | 1,264 | | | | 135,223 | |
Target Corp. | | | 384 | | | | 67,788 | |
The Home Depot, Inc. | | | 234 | | | | 62,155 | |
Tractor Supply Co. | | | 235 | | | | 33,036 | |
| | | | | | | | 416,134 | |
Semiconductors — 5.7% | | | | | | | | |
Advanced Micro Devices, Inc. (a) | | | 941 | | | | 86,299 | |
Lam Research Corp. | | | 194 | | | | 91,621 | |
NVIDIA Corp. | | | 240 | | | | 125,328 | |
QUALCOMM, Inc. | | | 656 | | | | 99,935 | |
| | | | | | | | 403,183 | |
Software — 11.8% | | | | | | | | |
Adobe, Inc. (a) | | | 243 | | | | 121,529 | |
Electronic Arts, Inc. | | | 798 | | | | 114,593 | |
Intuit, Inc. | | | 184 | | | | 69,892 | |
Microsoft Corp. | | | 944 | | | | 209,965 | |
MSCI, Inc. | | | 265 | | | | 118,330 | |
salesforce.com, Inc. (a) | | | 378 | | | | 84,116 | |
VMware, Inc. - Class A (a) | | | 283 | | | | 39,694 | |
Zoom Video Communications, Inc. - Class A (a) | | | 201 | | | | 67,801 | |
| | | | | | | | 825,920 | |
Telecommunications — 1.3% | | | | | | | | |
Verizon Communications, Inc. | | | 1,586 | | | | 93,178 | |
| | | | | | | | | |
Transportation — 2.8% | | | | | | | | |
Expeditors International of Washington, Inc. | | | 515 | | | | 48,982 | |
Union Pacific Corp. | | | 153 | | | | 31,858 | |
United Parcel Service, Inc. - Class B | | | 688 | | | | 115,859 | |
| | | | | | | | 196,699 | |
TOTAL COMMON STOCKS (Cost $4,976,492) | | | | | | | 6,796,239 | |
REAL ESTATE INVESTMENT TRUSTS — 1.9% | | | | | | | | |
Iron Mountain, Inc. | | | 1,049 | | | | 30,924 | |
Prologis, Inc. | | | 993 | | | | 98,962 | |
TOTAL REAL ESTATE INVESTMENT TRUSTS (Cost $117,406) | | | | | | | 129,886 | |
| | | | | | | | | |
MONEY MARKET FUNDS — 1.3% | | | | | | | | |
First American Treasury Obligations Fund - Class X, 0.04% (b) | | | 93,540 | | | | 93,540 | |
TOTAL MONEY MARKET FUNDS (Cost $93,540) | | | | | | | 93,540 | |
| | | | | | | | | |
TOTAL INVESTMENTS (Cost $5,187,438) — 100.0% | | | | | | | 7,019,665 | |
Other assets and liabilities, net — (0.0)% (c) | | | | | | | (73 | ) |
NET ASSETS — 100.0% | | | | | | $ | 7,019,592 | |
(a) | Non-income producing security. |
(b) | The rate shown is the annualized seven-day yield at period end. |
Percentages are stated as a percent of net assets.
The accompanying notes are an integral part of the financial statements.
15
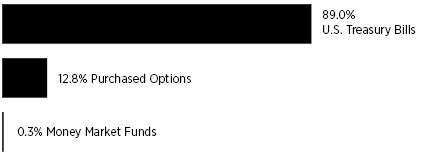
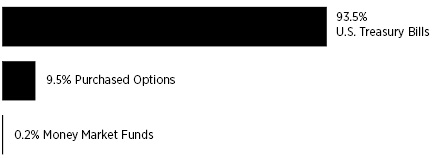
TrueShares Structured Outcome (July) ETF
Schedule of Investments
December 31, 2020
Sector Diversification *

* | Percentages are stated as a percent of net assets. Percentages expressed exclude written options. |
| | Shares /
Principal
Amount | | | Value | | | | |
SHORT-TERM INVESTMENTS — 85.4% |
Money Market Funds — 0.4% |
First American Treasury Obligations Fund - Class X, 0.04% (a) | | | 23,769 | | | $ | 23,769 | | | | | |
Total Money Market Funds (Cost $23,769) | | | | | | | 23,769 | | | | | |
| | | | | | | | | | | | | |
U.S. Treasury Bills — 85.0% | | | | | | | | | | | | |
0.07%, 06/24/2021 (c)(d) | | | 5,590,000 | | | | 5,588,075 | | | | | |
Total U.S. Treasury Bills (Cost $5,589,189) | | | | | | | 5,588,075 | | | | | |
TOTAL SHORT-TERM INVESTMENTS (Cost $5,612,958) | | | | | | | 5,611,844 | | | | | |
| | Number of
Contracts(b) | | | Value | | | Notional
Value | |
PURCHASED OPTIONS — 15.9% |
PURCHASED CALL OPTIONS — 15.9% |
CBOE SPDR S&P 500 ETF Trust | | | | | | | | | | | | |
Expiration: June 30, 2021, Exercise Price: $311 | | | 149 | | | | 1,046,757 | | | $ | 5,570,812 | |
TOTAL PURCHASED OPTIONS (Cost $440,179) | | | | | | | 1,046,757 | | | | | |
| | | | | | | | | | | | | |
TOTAL INVESTMENTS (Cost $6,053,137) — 101.3% | | | | | | | 6,658,601 | | | | | |
Other assets and liabilities, net — (1.3)% | | | | | | | (87,787 | ) | | | | |
NET ASSETS — 100.0% | | | | | | $ | 6,570,814 | | | | | |
Percentages are stated as a percent of net assets.
CBOE Chicago Board Options Exchange
SPDR Standard & Poor’s Depository Receipt
(a) | The rate shown is the annualized seven-day yield at period end. |
(b) | Each contract has a multiplier of 100. |
(c) | The rate shown is the effective yield as of December 31, 2020. |
(d) | Designated as collateral for written options. |
Schedule of Written Options
December 31, 2020
| | Number of
Contracts (a) | | | Value | | | Notional
Value | |
WRITTEN OPTIONS — (1.3)% | | | | |
WRITTEN PUT OPTIONS — (1.3)% |
CBOE SPDR S&P 500 ETF Trust | | | | | | | | | | | | |
Expiration: June 30, 2021, Exercise Price: $279 | | | 199 | | | $ | 83,458 | | | $ | 7,440,212 | |
TOTAL WRITTEN OPTIONS (Premiums Received $399,686) | | | | | | $ | 83,458 | | | | | |
Percentages are stated as a percent of net assets.
CBOE Chicago Board Options Exchange
SPDR Standard & Poor’s Depository Receipt
(a) | Each contract has a multiplier of 100. |
The accompanying notes are an integral part of the financial statements.
16
TrueShares Structured Outcome (August) ETF
Schedule of Investments
December 31, 2020
Sector Diversification *
* | Percentages are stated as a percent of net assets. Percentages expressed exclude written options. |
| | Shares /
Principal
Amount | | | Value | | | | |
SHORT-TERM INVESTMENTS — 89.3% |
Money Market Funds — 0.3% |
First American Treasury Obligations Fund - Class X, 0.04% (a) | | | 27,681 | | | $ | 27,681 | | | | | |
Total Money Market Funds (Cost $27,681) | | | | | | | 27,681 | | | | | |
| | | | | | | | | | | | | |
U.S. Treasury Bills — 89.0% | | | | | | | | | | | | |
0.04%, 01/28/2021 (c)(d) | | | 8,067,000 | | | | 8,066,745 | | | | | |
Total U.S. Treasury Bills (Cost $8,066,656) | | | | | | | 8,066,745 | | | | | |
TOTAL SHORT-TERM INVESTMENTS (Cost $8,094,337) | | | | | | | 8,094,426 | | | | | |
| | | | | | | | | | | | | |
| | Number of
Contracts(b) | | | Value | | | Notional
Value | |
PURCHASED OPTIONS — 12.8% |
PURCHASED CALL OPTIONS — 12.8% |
CBOE SPDR S&P 500 ETF Trust | | | | | | | | | | | | |
Expiration: July 30, 2021, Exercise Price: $329 | | | 205 | | | | 1,157,785 | | | $ | 7,664,540 | |
TOTAL PURCHASED OPTIONS (Cost $565,102) | | | | | | | 1,157,785 | | | | | |
| | | | | | | | | | | | | |
TOTAL INVESTMENTS (Cost $8,659,439) — 102.1% | | | | | | | 9,252,211 | | | | | |
Other assets and liabilities, net — (2.1)% | | | | | | | (187,012 | ) | | | | |
NET ASSETS — 100.0% | | | | | | $ | 9,065,199 | | | | | |
Percentages are stated as a percent of net assets.
CBOE Chicago Board Options Exchange
SPDR Standard & Poor’s Depository Receipt
(a) | The rate shown is the annualized seven-day yield at period end. |
(b) | Each contract has a multiplier of 100. |
(c) | The rate shown is the effective yield as of December 31, 2020. |
(d) | Designated as collateral for written options. |
Schedule of Written Options
December 31, 2020
| | Number of
Contracts (a) | | | Value | | | Notional
Value | |
WRITTEN OPTIONS — (2.0)% | | | | |
WRITTEN PUT OPTIONS — (2.0)% |
CBOE SPDR S&P 500 ETF Trust | | | | | | | | | | | | |
Expiration: July 30, 2021, Exercise Price: $296 | | | 272 | | | $ | 181,043 | | | $ | 10,169,536 | |
TOTAL WRITTEN OPTIONS (Premiums Received $531,408) | | | | | | $ | 181,043 | | | | | |
Percentages are stated as a percent of net assets.
CBOE Chicago Board Options Exchange
SPDR Standard & Poor’s Depository Receipt
(a) | Each contract has a multiplier of 100. |
The accompanying notes are an integral part of the financial statements.
17
TrueShares Structured Outcome (September) ETF
Schedule of Investments
December 31, 2020
Sector Diversification *
* | Percentages are stated as a percent of net assets. Percentages expressed exclude written options. |
| | Shares /
Principal
Amount | | | Value | | | | |
SHORT-TERM INVESTMENTS — 93.8% |
Money Market Funds — 0.3% |
First American Treasury Obligations Fund - Class X, 0.04% (a) | | | 25,071 | | | $ | 25,071 | | | | | |
Total Money Market Funds (Cost $25,071) | | | | | | | 25,071 | | | | | |
| | | | | | | | | | | | | |
U.S. Treasury Bills — 93.5% | | | | | | | | | | | | |
0.05%, 02/25/2021 (c)(d) | | | 9,960,000 | | | | 9,959,173 | | | | | |
Total U.S. Treasury Bills (Cost $9,959,045) | | | | | | | 9,959,173 | | | | | |
TOTAL SHORT-TERM INVESTMENTS (Cost $9,984,116) | | | | | | | 9,984,244 | | | | | |
| | | | | | | | | | | | | |
| | Number of
Contracts(b) | | | Value | | | Notional
Value | |
PURCHASED OPTIONS — 9.5% |
PURCHASED CALL OPTIONS — 9.5% |
CBOE SPDR S&P 500 ETF Trust | | | | | | | | | | | | |
Expiration: August 31, 2021, Exercise Price: $353 | | | 254 | | | | 1,012,892 | | | $ | 9,496,552 | |
TOTAL PURCHASED OPTIONS (Cost $648,024) | | | | | | | 1,012,892 | | | | | |
| | | | | | | | | | | | | |
TOTAL INVESTMENTS (Cost $10,632,140) — 103.3% | | | | | | | 10,997,136 | | | | | |
Other assets and liabilities, net — (3.3)% | | | | | | | (346,434 | ) | | | | |
NET ASSETS — 100.0% | | | | | | $ | 10,650,702 | | | | | |
Percentages are stated as a percent of net assets.
CBOE Chicago Board Options Exchange
SPDR Standard & Poor’s Depository Receipt
(a) | The rate shown is the annualized seven-day yield at period end. |
(b) | Each contract has a multiplier of 100. |
(c) | The rate shown is the effective yield as of December 31, 2020. |
(d) | Designated as collateral for written options. |
Schedule of Written Options
December 31, 2020
| | Number of
Contracts (a) | | | Value | | | Notional
Value | |
WRITTEN OPTIONS — (3.2)% | | | | |
WRITTEN PUT OPTIONS — (3.2)% |
CBOE SPDR S&P 500 ETF Trust | | | | | | | | | | | | |
Expiration: August 31, 2021, Exercise Price: $317 | | | 313 | | | $ | 339,382 | | | $ | 11,702,444 | |
TOTAL WRITTEN OPTIONS (Premiums Received $778,306) | | | | | | $ | 339,382 | | | | | |
Percentages are stated as a percent of net assets.
CBOE Chicago Board Options Exchange
SPDR Standard & Poor’s Depository Receipt
(a) | Each contract has a multiplier of 100. |
The accompanying notes are an integral part of the financial statements.
18
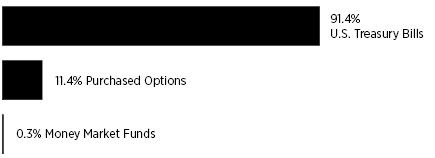
TrueShares Structured Outcome (October) ETF
Schedule of Investments
December 31, 2020
Sector Diversification *
* | Percentages are stated as a percent of net assets. Percentages expressed exclude written options. |
| | Shares /
Principal
Amount | | | Value | | | | |
SHORT-TERM INVESTMENTS — 91.7% |
Money Market Funds — 0.3% |
First American Treasury Obligations Fund - Class X, 0.04% (a) | | | 13,818 | | | $ | 13,818 | | | | | |
Total Money Market Funds (Cost $13,818) | | | | | | | 13,818 | | | | | |
| | | | | | | | | | | | | |
U.S. Treasury Bills — 91.4% | | | | | | | | | | | | |
0.06%, 03/25/2021 (c)(d) | | | 3,730,000 | | | | 3,729,461 | | | | | |
Total U.S. Treasury Bills (Cost $3,729,455) | | | | | | | 3,729,461 | | | | | |
TOTAL SHORT-TERM INVESTMENTS (Cost $3,743,273) | | | | | | | 3,743,279 | | | | | |
| | | | | | | | | | | | | |
| | Number of
Contracts(b) | | | Value | | | Notional
Value | |
PURCHASED OPTIONS — 11.4% |
PURCHASED CALL OPTIONS — 11.4% |
CBOE SPDR S&P 500 ETF Trust | | | | | | | | | | | | |
Expiration: September 30, 2021, Exercise Price: $337 | | | 90 | | | | 464,676 | | | $ | 3,364,920 | |
TOTAL PURCHASED OPTIONS (Cost $289,354) | | | | | | | 464,676 | | | | | |
| | | | | | | | | | | | | |
TOTAL INVESTMENTS (Cost $4,032,627) — 103.1% | | | | | | | 4,207,955 | | | | | |
Other assets and liabilities, net — (3.1)% | | | | | | | (126,138 | ) | | | | |
NET ASSETS — 100.0% | | | | | | $ | 4,081,817 | | | | | |
Percentages are stated as a percent of net assets.
CBOE Chicago Board Options Exchange
SPDR Standard & Poor’s Depository Receipt
(a) | The rate shown is the annualized seven-day yield at period end. |
(b) | Each contract has a multiplier of 100. |
(c) | The rate shown is the effective yield as of December 31, 2020. |
(d) | Designated as collateral for written options. |
Schedule of Written Options
December 31, 2020
| | Number of
Contracts (a) | | | Value | | | Notional
Value | |
WRITTEN OPTIONS — (3.0)% | | | | |
WRITTEN PUT OPTIONS — (3.0)% |
CBOE SPDR S&P 500 ETF Trust | | | | | | | | | | | | |
Expiration: September 30, 2021, Exercise Price: $303 | | | 122 | | | $ | 123,447 | | | $ | 4,561,336 | |
TOTAL WRITTEN OPTIONS (Premiums Received $258,682) | | | | | | $ | 123,447 | | | | | |
Percentages are stated as a percent of net assets.
CBOE Chicago Board Options Exchange
SPDR Standard & Poor’s Depository Receipt
(a) | Each contract has a multiplier of 100. |
The accompanying notes are an integral part of the financial statements.
19
TrueShares Structured Outcome (November) ETF
Schedule of Investments
December 31, 2020
Sector Diversification *

* | Percentages are stated as a percent of net assets. Percentages expressed exclude written options. |
| | Shares /
Principal
Amount | | | Value | | | | |
SHORT-TERM INVESTMENTS — 88.7% |
U.S. Treasury Bills — 88.7% | | | | | | | | | | | | |
0.07%, 04/29/2021 (b)(c) | | | 1,225,000 | | | $ | 1,224,706 | | | | | |
Total U.S. Treasury Bills (Cost $1,224,819) | | | | | | | 1,224,706 | | | | | |
TOTAL SHORT-TERM INVESTMENTS (Cost $1,224,819) | | | | | | | 1,224,706 | | | | | |
| | Number of
Contracts(a) | | | Value | | | Notional
Value | |
PURCHASED OPTIONS — 13.0% |
PURCHASED CALL OPTIONS — 13.0% |
CBOE SPDR S&P 500 ETF Trust | | | | | | | | | | | | |
Expiration: October 29, 2021, Exercise Price: $330 | | | 31 | | | | 179,478 | | | $ | 1,159,028 | |
TOTAL PURCHASED OPTIONS (Cost $89,994) | | | | | | | 179,478 | | | | | |
| | | | | | | | | | | | | |
TOTAL INVESTMENTS (Cost $1,314,813) — 101.7% | | | | | | | 1,404,184 | | | | | |
Other assets and liabilities, net — (1.7)% | | | | | | | (23,152 | ) | | | | |
NET ASSETS — 100.0% | | | | | | $ | 1,381,032 | | | | | |
Percentages are stated as a percent of net assets.
CBOE Chicago Board Options Exchange
SPDR Standard & Poor’s Depository Receipt
(a) | Each contract has a multiplier of 100. |
(b) | The rate shown is the effective yield as of December 31, 2020. |
(c) | Designated as collateral for written options. |
Schedule of Written Options
December 31, 2020
| | Number of
Contracts (a) | | | Value | | | Notional
Value | |
WRITTEN OPTIONS — (3.0)% | | | | |
WRITTEN PUT OPTIONS — (3.0)% |
CBOE SPDR S&P 500 ETF Trust | | | | | | | | | | | | |
Expiration: October 29, 2021, Exercise Price: $297 | | | 41 | | | $ | 42,050 | | | $ | 1,532,908 | |
TOTAL WRITTEN OPTIONS (Premiums Received $87,654) | | | | | | $ | 42,050 | | | | | |
Percentages are stated as a percent of net assets.
CBOE Chicago Board Options Exchange
SPDR Standard & Poor’s Depository Receipt
(a) | Each contract has a multiplier of 100. |
The accompanying notes are an integral part of the financial statements.
20
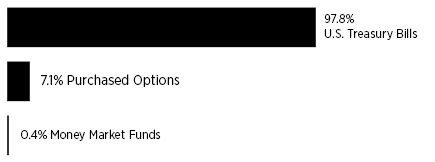
TrueShares Structured Outcome (December) ETF
Schedule of Investments
December 31, 2020
Sector Diversification *
* | Percentages are stated as a percent of net assets. Percentages expressed exclude written options. |
| | Shares /
Principal
Amount | | | Value | | | | |
SHORT-TERM INVESTMENTS — 98.2% |
Money Market Funds — 0.4% |
First American Treasury Obligations Fund - Class X, 0.04% (a) | | | 20,827 | | | $ | 20,827 | | | | | |
Total Money Market Funds (Cost $20,827) | | | | | | | 20,827 | | | | | |
| | | | | | | | | | | | | |
U.S. Treasury Bills — 97.8% | | | | | | | | | | | | |
0.07%, 05/27/2021 (c)(d) | | | 5,600,000 | | | | 5,598,498 | | | | | |
Total U.S. Treasury Bills (Cost $5,598,965) | | | | | | | 5,598,498 | | | | | |
TOTAL SHORT-TERM INVESTMENTS (Cost $5,619,792) | | | | | | | 5,619,325 | | | | | |
| | | | | | | | | | | | | |
| | Number of
Contracts(b) | | | Value | | | Notional
Value | |
PURCHASED OPTIONS — 7.1% | | | | | | | | | | | | |
PURCHASED CALL OPTIONS — 7.1% | | | | |
CBOE SPDR S&P 500 ETF Trust | | | | | | | | | | | | |
Expiration: November 30, 2021, Exercise Price: $366 | | | 121 | | | | 404,828 | | | $ | 4,523,948 | |
TOTAL PURCHASED OPTIONS (Cost $324,671) | | | | | | | 404,828 | | | | | |
| | | | | | | | | | | | | |
TOTAL INVESTMENTS (Cost $5,944,463) — 105.3% | | | | | | | 6,024,153 | | | | | |
Other assets and liabilities, net — (5.3)% | | | | | | | (300,722 | ) | | | | |
NET ASSETS — 100.0% | | | | | | $ | 5,723,431 | | | | | |
Percentages are stated as a percent of net assets.
CBOE Chicago Board Options Exchange
SPDR Standard & Poor’s Depository Receipt
(a) | The rate shown is the annualized seven-day yield at period end. |
(b) | Each contract has a multiplier of 100. |
(c) | The rate shown is the effective yield as of December 31, 2020. |
(d) | Designated as collateral for written options. |
Schedule of Written Options
December 31, 2020
| | Number of
Contracts (a) | | | Value | | | Notional
Value | |
WRITTEN OPTIONS — (5.2)% | | | | |
WRITTEN PUT OPTIONS — (5.2)% |
CBOE SPDR S&P 500 ETF Trust | | | | | | | | | | | | |
Expiration: November 30, 2021, Exercise Price: $329 | | | 169 | | | $ | 297,399 | | | $ | 6,318,572 | |
TOTAL WRITTEN OPTIONS (Premiums Received $314,583) | | | | | | $ | 297,399 | | | | | |
Percentages are stated as a percent of net assets.
CBOE Chicago Board Options Exchange
SPDR Standard & Poor’s Depository Receipt
(a) | Each contract has a multiplier of 100. |
The accompanying notes are an integral part of the financial statements.
21
TrueShares ETFs
Statements of Assets and Liabilities
December 31, 2020
| | | TrueShares
Technology, AI
& Deep Learning
ETF | | | TrueShares
ESG Active
Opportunities
ETF | | | TrueShares
Structured
Outcome
(July) ETF | | | TrueShares
Structured
Outcome
(August) ETF | |
Assets | | | | | | | | | | | | | | | | |
Investments, at value (cost $21,157,820, $5,187,438, $6,053,137, and $8,659,439 respectively) | | $ | 27,255,291 | | | $ | 7,019,665 | | | $ | 6,658,601 | | | $ | 9,252,211 | |
Dividends and interest receivable | | | 51 | | | | 3,303 | | | | — | | | | 1 | |
Fund shares sold | | | 2,380,390 | | | | — | | | | — | | | | — | |
Total assets | | | 29,635,732 | | | | 7,022,968 | | | | 6,658,601 | | | | 9,252,212 | |
| | | | | | | | | | | | | | | | | |
Liabilities | | | | | | | | | | | | | | | | |
Payable to Adviser | | | 13,282 | | | | 3,376 | | | | 4,329 | | | | 5,970 | |
Written options, at value (premiums received $0, $0, $399,686, and $531,408 respectively) | | | — | | | | — | | | | 83,458 | | | | 181,043 | |
Investment securities purchased | | | 2,247,985 | | | | — | | | | — | | | | — | |
Total liabilities | | | 2,261,267 | | | | 3,376 | | | | 87,787 | | | | 187,013 | |
Net Assets | | $ | 27,374,465 | | | $ | 7,019,592 | | | $ | 6,570,814 | | | $ | 9,065,199 | |
| | | | | | | | | | | | | | | | | |
Net Assets Consists of: | | | | | | | | | | | | | | | | |
Paid-in capital | | $ | 21,242,861 | | | $ | 5,296,432 | | | $ | 5,649,131 | | | $ | 8,128,357 | |
Total distributable earnings | | | 6,131,604 | | | | 1,723,160 | | | | 921,683 | | | | 936,842 | |
Net Assets | | $ | 27,374,465 | | | $ | 7,019,592 | | | $ | 6,570,814 | | | $ | 9,065,199 | |
| | | | | | | | | | | | | | | | | |
Shares of beneficial interest outstanding (unlimited number of shares authorized, no par value) | | | 575,000 | | | | 200,000 | | | | 225,000 | | | | 325,000 | |
Net Asset Value, redemption price and offering price per share | | $ | 47.61 | | | $ | 35.10 | | | $ | 29.20 | | | $ | 27.89 | |
The accompanying notes are an integral part of the financial statements.
22
TrueShares ETFs
Statements of Assets and Liabilities
December 31, 2020 (Continued)
| | | TrueShares
Structured
Outcome
(September)
ETF | | | TrueShares
Structured
Outcome
(October) ETF | | | TrueShares
Structured
Outcome
(November) ETF | | | TrueShares
Structured
Outcome
(December) ETF | |
Assets | | | | | | | | | | | | | | | | |
Investments, at value (cost $10,632,140, $4,032,627, $1,314,813, and $5,944,463 respectively) | | $ | 10,997,136 | | | $ | 4,207,955 | | | $ | 1,404,184 | | | $ | 6,024,153 | |
Cash | | | — | | | | — | | | | 20,449 | | | | — | |
Dividends and interest receivable | | | 1 | | | | — | | | | — | | | | 4 | |
Receivable for investment securities sold | | | — | | | | — | | | | 276 | | | | — | |
Total assets | | | 10,997,137 | | | | 4,207,955 | | | | 1,424,909 | | | | 6,024,157 | |
| | | | | | | | | | | | | | | | | |
Liabilities | | | | | | | | | | | | | | | | |
Payable to Adviser | | | 7,053 | | | | 2,691 | | | | 1,827 | | | | 3,327 | |
Written options, at value (premiums received $778,306, $258,682, $87,654 and $314,583 respectively) | | | 339,382 | | | | 123,447 | | | | 42,050 | | | | 297,399 | |
Total liabilities | | | 346,435 | | | | 126,138 | | | | 43,877 | | | | 300,726 | |
Net Assets | | $ | 10,650,702 | | | $ | 4,081,817 | | | $ | 1,381,032 | | | $ | 5,723,431 | |
| | | | | | | | | | | | | | | | | |
Net Assets Consists of: | | | | | | | | | | | | | | | | |
Paid-in capital | | $ | 9,834,008 | | | $ | 3,771,254 | | | $ | 1,176,859 | | | $ | 5,626,557 | |
Total distributable earnings | | | 816,694 | | | | 310,563 | | | | 204,173 | | | | 96,874 | |
Net Assets | | $ | 10,650,702 | | | $ | 4,081,817 | | | $ | 1,381,032 | | | $ | 5,723,431 | |
| | | | | | | | | | | | | | | | | |
Shares of beneficial interest outstanding (unlimited number of shares authorized, no par value) | | | 400,000 | | | | 150,000 | | | | 50,000 | | | | 225,000 | |
Net Asset Value, redemption price and offering price per share | | $ | 26.63 | | | $ | 27.21 | | | $ | 27.62 | | | $ | 25.44 | |
The accompanying notes are an integral part of the financial statements.
23
TrueShares ETFs
Statements of Operations
For the Period Ended December 31, 2020
| | | TrueShares
Technology,
AI & Deep
Learning ETF(1) | | | TrueShares
ESG Active
Opportunities
ETF(1) | | | TrueShares
Structured
Outcome
(July) ETF(2) | | | TrueShares
Structured
Outcome
(August) ETF(3) | |
Investment Income | | | | | | | | | | | | | | | | |
Dividend Income | | $ | 7,372 | | | $ | 48,563 | | | $ | — | | | $ | — | |
Interest income | | | 567 | | | | 80 | | | | 3,171 | | | | 1,929 | |
Total investment income | | | 7,939 | | | | 48,643 | | | | 3,171 | | | | 1,929 | |
| | | | | | | | | | | | | | | | | |
Expenses | | | | | | | | | | | | | | | | |
Investment advisory fees | | | 60,346 | | | | 22,118 | | | | 23,456 | | | | 27,635 | |
Total expenses | | | 60,346 | | | | 22,118 | | | | 23,456 | | | | 27,635 | |
Net investment income (loss) | | | (52,407 | ) | | | 26,525 | | | | (20,285 | ) | | | (25,706 | ) |
| | | | | | | | | | | | | | | | | |
Realized and Unrealized Gain (Loss) on Investments | | | | | | | | | | | | | | | | |
Net realized gain (loss) from: | | | | | | | | | | | | | | | | |
Investments | | | 168,341 | | | | (183,545 | ) | | | (9 | ) | | | (541 | ) |
Purchased options | | | — | | | | — | | | | — | | | | (3,507 | ) |
Written options | | | — | | | | — | | | | — | | | | (2,247 | ) |
Net realized gain (loss) | | | 168,341 | | | | (183,545 | ) | | | (9 | ) | | | (6,295 | ) |
Net change in unrealized appreciation/depreciation on: | | | | | | | | | | | | | | | | |
Investments | | | 6,097,471 | | | | 1,832,227 | | | | (1,114 | ) | | | 89 | |
Purchased options | | | — | | | | — | | | | 606,578 | | | | 592,683 | |
Written options | | | — | | | | — | | | | 316,228 | | | | 350,365 | |
Net change in unrealized appreciation/depreciation | | | 6,097,471 | | | | 1,832,227 | | | | 921,692 | | | | 943,137 | |
Net realized and unrealized gain on investments | | | 6,265,812 | | | | 1,648,682 | | | | 921,683 | | | | 936,842 | |
Net increase in net assets from operations | | $ | 6,213,405 | | | $ | 1,675,207 | | | $ | 901,398 | | | $ | 911,136 | |
(1) | The Fund commenced operations on February 28, 2020. |
(2) | The Fund commenced operations on July 1, 2020. |
(3) | The Fund commenced operations on August 3, 2020. |
The accompanying notes are an integral part of the financial statements.
24
TrueShares ETFs
Statements of Operations
For the Period Ended December 31, 2020 (Continued)
| | | TrueShares
Structured
Outcome
(September)
ETF (1) | | | TrueShares
Structured
Outcome
(October) ETF(2) | | | TrueShares
Structured
Outcome
(November)
ETF(3) | | | TrueShares
Structured
Outcome
(December)
ETF(4) | |
Investment Income | | | | | | | | | | | | | | | | |
Interest income | | $ | 2,239 | | | $ | 584 | | | $ | 183 | | | $ | 208 | |
Total investment income | | | 2,239 | | | | 584 | | | | 183 | | | | 208 | |
| | | | | | | | | | | | | | | | | |
Expenses | | | | | | | | | | | | | | | | |
Investment advisory fees | | | 28,087 | | | | 7,360 | | | | 3,426 | | | | 3,327 | |
Total expenses | | | 28,087 | | | | 7,360 | | | | 3,426 | | | | 3,327 | |
Net investment loss | | | (25,848 | ) | | | (6,776 | ) | | | (3,243 | ) | | | (3,119 | ) |
| | | | | | | | | | | | | | | | | |
Realized and Unrealized Gain (Loss) on Investments | | | | | | | | | | | | | | | | |
Net realized gain (loss) from: | | | | | | | | | | | | | | | | |
Investments | | | (339 | ) | | | (4 | ) | | | (400 | ) | | | — | |
Purchased options | | | (4,476 | ) | | | — | | | | 83,015 | | | | — | |
Written options | | | 46,632 | | | | 668 | | | | 46,649 | | | | — | |
Net realized gain | | | 41,817 | | | | 664 | | | | 129,264 | | | | — | |
Net change in unrealized appreciation/depreciation on: | | | | | | | | | | | | | | | | |
Investments | | | 128 | | | | 6 | | | | (113 | ) | | | (467 | ) |
Purchased options | | | 364,868 | | | | 175,322 | | | | 89,484 | | | | 80,157 | |
Written options | | | 438,924 | | | | 135,235 | | | | 45,604 | | | | 17,184 | |
Net change in unrealized appreciation/depreciation | | | 803,920 | | | | 310,563 | | | | 134,975 | | | | 96,874 | |
Net realized and unrealized gain on investments | | | 845,737 | | | | 311,227 | | | | 264,239 | | | | 96,874 | |
Net increase in net assets from operations | | $ | 819,889 | | | $ | 304,451 | | | $ | 260,996 | | | $ | 93,755 | |
(1) | The Fund commenced operations on September 1, 2020. |
(2) | The Fund commenced operations on October 1, 2020. |
(3) | The Fund commenced operations on November 2, 2020. |
(4) | The Fund commenced operations on December 1, 2020. |
The accompanying notes are an integral part of the financial statements.
25
TrueShares ETFs
Statements of Changes in Net Assets
For the Period Ended December 31, 2020
| | | TrueShares
Technology,
AI & Deep
Learning ETF(1) | | | TrueShares
ESG Active
Opportunities
ETF(1) | | | TrueShares
Structured
Outcome
(July) ETF(2) | | | TrueShares
Structured
Outcome
(August) ETF(3) | |
From Operations | | | | | | | | | | | | | | | | |
Net investment income (loss) | | $ | (52,407 | ) | | $ | 26,525 | | | $ | (20,285 | ) | | $ | (25,706 | ) |
Net realized gain (loss) on investments, purchased options and written options | | | 168,341 | | | | (183,545 | ) | | | (9 | ) | | | (6,295 | ) |
Net change in unrealized appreciation on investments, purchased options and written options | | | 6,097,471 | | | | 1,832,227 | | | | 921,692 | | | | 943,137 | |
Net increase in net assets resulting from operations | | | 6,213,405 | | | | 1,675,207 | | | | 901,398 | | | | 911,136 | |
| | | | | | | | | | | | | | | | | |
From Distributions | | | | | | | | | | | | | | | | |
Distributable earnings | | | — | | | | (26,525 | ) | | | — | | | | — | |
Return of capital | | | — | | | | (678 | ) | | | — | | | | — | |
Total distributions | | | — | | | | (27,203 | ) | | | — | | | | — | |
| | | | | | | | | | | | | | | | | |
From Capital Share Transactions | | | | | | | | | | | | | | | | |
Proceeds from shares sold | | | 23,714,745 | | | | 5,904,520 | | | | 5,668,907 | | | | 9,433,430 | |
Cost of shares redeemed | | | (2,553,685 | ) | | | (532,932 | ) | | | — | | | | (1,281,010 | ) |
Transaction fees (Note 4) | | | — | | | | — | | | | 509 | | | | 1,643 | |
Net increase in net assets resulting from capital share transactions | | | 21,161,060 | | | | 5,371,588 | | | | 5,669,416 | | | | 8,154,063 | |
| | | | | | | | | | | | | | | | | |
Total Increase in Net Assets | | | 27,374,465 | | | | 7,019,592 | | | | 6,570,814 | | | | 9,065,199 | |
| | | | | | | | | | | | | | | | | |
Net Assets | | | | | | | | | | | | | | | | |
Beginning of period | | | — | | | | — | | | | — | | | | — | |
End of period | | $ | 27,374,465 | | | $ | 7,019,592 | | | $ | 6,570,814 | | | $ | 9,065,199 | |
| | | | | | | | | | | | | | | | | |
Changes in Shares Outstanding | | | | | | | | | | | | | | | | |
Shares outstanding, beginning of period | | | — | | | | — | | | | — | | | | — | |
Shares sold | | | 675,000 | | | | 225,000 | | | | 225,000 | | | | 375,000 | |
Shares redeemed | | | (100,000 | ) | | | (25,000 | ) | | | — | | | | (50,000 | ) |
Shares outstanding, end of period | | | 575,000 | | | | 200,000 | | | | 225,000 | | | | 325,000 | |
(1) | The Fund commenced operations on February 28, 2020. |
(2) | The Fund commenced operations on July 1, 2020. |
(3) | The Fund commenced operations on August 3, 2020. |
The accompanying notes are an integral part of the financial statements.
26
TrueShares ETFs
Statements of Changes in Net Assets
For the Period Ended December 31, 2020 (Continued)
| | | TrueShares
Structured
Outcome
(September)
ETF (1) | | | TrueShares
Structured
Outcome
(October) ETF(2) | | | TrueShares
Structured
Outcome
(November)
ETF(3) | | | TrueShares
Structured
Outcome
(December)
ETF(4) | |
From Operations | | | | | | | | | | | | | | | | |
Net investment loss | | $ | (25,848 | ) | | $ | (6,776 | ) | | $ | (3,243 | ) | | $ | (3,119 | ) |
Net realized gain on investments, purchased options and written options | | | 41,817 | | | | 664 | | | | 129,264 | | | | — | |
Net change in unrealized appreciation on investments, purchased options and written options | | | 803,920 | | | | 310,563 | | | | 134,975 | | | | 96,874 | |
Net increase in net assets resulting from operations | | | 819,889 | | | | 304,451 | | | | 260,996 | | | | 93,755 | |
| | | | | | | | | | | | | | | | | |
From Capital Share Transactions | | | | | | | | | | | | | | | | |
Proceeds from shares sold | | | 11,765,612 | | | | 3,777,110 | | | | 2,500,000 | | | | 5,629,050 | |
Cost of shares redeemed | | | (1,937,040 | ) | | | — | | | | (1,380,240 | ) | | | — | |
Transaction fees (Note 4) | | | 2,241 | | | | 256 | | | | 276 | | | | 626 | |
Net increase in net assets resulting from capital share transactions | | | 9,830,813 | | | | 3,777,366 | | | | 1,120,036 | | | | 5,629,676 | |
| | | | | | | | | | | | | | | | | |
Total Increase in Net Assets | | | 10,650,702 | | | | 4,081,817 | | | | 1,381,032 | | | | 5,723,431 | |
| | | | | | | | | | | | | | | | | |
Net Assets | | | | | | | | | | | | | | | | |
Beginning of period | | | — | | | | — | | | | — | | | | — | |
End of period | | $ | 10,650,702 | | | $ | 4,081,817 | | | $ | 1,381,032 | | | $ | 5,723,431 | |
| | | | | | | | | | | | | | | | | |
Changes in Shares Outstanding | | | | | | | | | | | | | | | | |
Shares outstanding, beginning of period | | | — | | | | — | | | | — | | | | — | |
Shares sold | | | 475,000 | | | | 150,000 | | | | 100,000 | | | | 225,000 | |
Shares redeemed | | | (75,000 | ) | | | — | | | | (50,000 | ) | | | — | |
Shares outstanding, end of period | | | 400,000 | | | | 150,000 | | | | 50,000 | | | | 225,000 | |
(1) | The Fund commenced operations on September 1, 2020. |
(2) | The Fund commenced operations on October 1, 2020. |
(3) | The Fund commenced operations on November 2, 2020. |
(4) | The Fund commenced operations on December 1, 2020. |
The accompanying notes are an integral part of the financial statements.
27
TrueShares ETFs
Financial Highlights
For a Share Outstanding Throughout the Period
| | | | | | Per Share Operating Performance (For a share outstanding throughout the period) | |
| | | | | | Change in Net Assets Resulting from Operations: | | | Less Distributions Paid: | |
| | | Net Asset
Value,
Beginning
of Period | | | Net
investment
income
(loss)(1) | | | Net realized
and
unrealized
gain on
investments | | | Total from
investment
operations | | | Net
investment
income | | | Return of
capital | | | | Total distributions paid | |
TrueShares Technology, AI & Deep Learning ETF | | | | | | | | | | | | | | | | | | | | | | | | |
For the period 02/28/2020(7) - 12/31/2020 | | $ | 25.00 | | | | (0.19 | ) | | | 22.80 | | | | 22.61 | | | | — | | | | — | | | | — | |
TrueShares ESG Active Opportunities ETF | | | | | | | | | | | | | | | | | | | | | | | | |
For the period 02/28/2020(7) - 12/31/2020 | | $ | 25.00 | | | | 0.17 | | | | 10.07 | | | | 10.24 | | | | (0.14 | ) | | | (0.00 | )(8) | | | (0.14 | ) |
TrueShares Structured Outcome (July) ETF | | | | | | | | | | | | | | | | | | | | | | | | |
For the period 7/01/2020(7) - 12/31/2020 | | $ | 25.00 | | | | (0.09 | ) | | | 4.29 | | | | 4.20 | | | | — | | | | — | | | | — | |
TrueShares Structured Outcome (August) ETF | | | | | | | | | | | | | | | | | | | | | | | | |
For the period 8/03/2020(7) - 12/31/2020 | | $ | 25.00 | | | | (0.08 | ) | | | 2.96 | | | | 2.88 | | | | — | | | | — | | | | — | |
TrueShares Structured Outcome (September) ETF | | | | | | | | | | | | | | | | | | | | | | | | |
For the period 9/01/2020(7) - 12/31/2020 | | $ | 25.00 | | | | (0.06 | ) | | | 1.68 | | | | 1.62 | | | | — | | | | — | | | | — | |
TrueShares Structured Outcome (October) ETF | | | | | | | | | | | | | | | | | | | | | | | | |
For the period 10/01/2020(7) - 12/31/2020 | | $ | 25.00 | | | | (0.05 | ) | | | 2.26 | | | | 2.21 | | | | — | | | | — | | | | — | |
TrueShares Structured Outcome (November) ETF | | | | | | | | | | | | | | | | | | | | | | | | |
For the period 11/02/2020(7) - 12/31/2020 | | $ | 25.00 | | | | (0.03 | ) | | | 2.65 | | | | 2.62 | | | | — | | | | — | | | | — | |
TrueShares Structured Outcome (December) ETF | | | | | | | | | | | | | | | | | | | | | | | | |
For the period 12/01/2020(7) - 12/31/2020 | | $ | 25.00 | | | | (0.02 | ) | | | 0.46 | | | | 0.44 | | | | — | | | | — | | | | — | |
(1) | Per share net investment income (loss) was calculated using average shares outstanding. |
(2) | Annualized for periods less than one year. |
(3) | Total return in the table represents the rate that the investor would have earned or lost on an investment in the Fund, assuming reinvestment of dividends. |
(4) | Not annualized for periods less than one year. |
(5) | Excludes in-kind transactions associated with creations and redemptions of the Fund. |
(6) | The returns reflect the actual performance for the period and do not include the impact of trades executed on the last business day of the period that were recorded on the first business day of the next period. |
(7) | Commencement of operations. |
The accompanying notes are an integral part of the financial statements.
28
TrueShares ETFs
Financial Highlights
For a Share Outstanding Throughout the Period (Continued)
| | | | | | Per Share
Operating
Performance
(For a share
outstanding
throughout
the period) | | | Ratios/
Supplemental
Data | |
| | | | | | Captal Share
Transactions: | | | | | | | | | | | | | | | | | | | Ratios to
Average Net
Assets of: (2) | | | | | |
| | | | | | Transaction
fees
(see Note 4) | | | Net Asset Value,
End of Period | | | Total return,
at NAV(3)(4) | | | Total return,
at Market(3)(4) | | | Net assets,
end of period
(000’s) | | | Expenses | | | Net investment
income (loss) | | | Portfolio
turnover
rate(4)(5) | |
| | | | | | | | | | | | | | | | | | | | | | | | | | | | | | | | | | | | |
| | | | | | | — | | | $ | 47.61 | | | | 90.43 | % | | | 90.52 | % | | $ | 27,374 | | | | 0.68 | % | | | (0.59 | )% | | | 30 | % |
| | | | | | | | | | | | | | | | | | | | | | | | | | | | | | | | | | | | |
| | | | | | | — | | | $ | 35.10 | | | | 40.94 | % | | | 40.93 | % | | $ | 7,020 | | | | 0.58 | % | | | 0.70 | % | | | 29 | % |
| | | | | | | | | | | | | | | | | | | | | | | | | | | | | | | | | | | | |
| | | | | | | 0.00 | (8) | | $ | 29.20 | | | | 16.81 | % | | | 16.55 | % | | $ | 6,571 | | | | 0.79 | % | | | (0.68 | )% | | | 0 | % |
| | | | | | | | | | | | | | | | | | | | | | | | | | | | | | | | | | | | |
| | | | | | | 0.01 | | | $ | 27.89 | | | | 11.57 | % | | | 11.31 | % | | $ | 9,065 | | | | 0.79 | % | | | (0.73 | )% | | | 0 | % |
| | | | | | | | | | | | | | | | | | | | | | | | | | | | | | | | | | | | |
| | | | | | | 0.01 | | | $ | 26.63 | | | | 6.51 | % | | | 6.08 | % | | $ | 10,651 | | | | 0.79 | % | | | (0.73 | )% | | | 0 | % |
| | | | | | | | | | | | | | | | | | | | | | | | | | | | | | | | | | | | |
| | | | | | | 0.00 | (8) | | $ | 27.21 | | | | 8.85 | % | | | 8.57 | % | | $ | 4,082 | | | | 0.79 | % | | | (0.73 | )% | | | 0 | % |
| | | | | | | | | | | | | | | | | | | | | | | | | | | | | | | | | | | | |
| | | | | | | 0.00 | (8) | | $ | 27.62 | | | | 10.51 | %(6) | | | 10.35 | %(6) | | $ | 1,381 | | | | 0.79 | % | | | (0.75 | )% | | | 0 | % |
| | | | | | | | | | | | | | | | | | | | | | | | | | | | | | | | | | | | |
| | | | | | | 0.00 | (8) | | $ | 25.44 | | | | 1.75 | % | | | 1.72 | % | | $ | 5,723 | | | | 0.79 | % | | | (0.74 | )% | | | 0 | % |
The accompanying notes are an integral part of the financial statements.
29
TrueShares ETFs
Notes to Financial Statements
December 31, 2020
1. ORGANIZATION
The TrueShares ETFs are a series of Listed Funds Trust (the “Trust”), formerly Active Weighting Funds ETF Trust. The Trust was organized as a Delaware statutory trust on August 26, 2016, under a Declaration of Trust amended on December 21, 2018 and is registered with the U.S. Securities and Exchange Commission (the “SEC”) as an open-end management investment company under the Investment Company Act of 1940, as amended (the “1940 Act”). As of December 31, 2020, the TrueShares ETFs consist of eight active series identified below, all of which are covered in this report (each a “Fund,” and collectively, the “Funds”).
Fund Name | Ticker | Diversified/
Non-Diversified | Commencement
of Operations |
TrueShares Technology, AI & Deep Learning ETF (“AI ETF”) | LRNZ | Non-diversified | February 28, 2020 |
TrueShares ESG Active Opportunities ETF (“ESG ETF”) | ECOZ | Diversified | February 28, 2020 |
TrueShares Structured Outcome (July) ETF (“JULZ ETF”) | JULZ | Non-diversified | July 1, 2020 |
TrueShares Structured Outcome (August) ETF (“AUGZ ETF”) | AUGZ | Non-diversified | August 3, 2020 |
TrueShares Structured Outcome (September) ETF (“SEPZ ETF”) | SEPZ | Non-diversified | September 1, 2020 |
TrueShares Structured Outcome (October) ETF (“OCTZ ETF”) | OCTZ | Non-diversified | October 1, 2020 |
TrueShares Structured Outcome (November) ETF (“NVMZ ETF”) | NVMZ | Non-diversified | November 2, 2020 |
TrueShares Structured Outcome (December) ETF (“DECZ ETF”) | DECZ | Non-diversified | December 1, 2020 |
Each Fund is an actively-managed exchange-traded fund (“ETF”) that seeks to achieve its total return investment objective by investing in the following:
Fund | Investment Objective |
AI ETF | Common stock of technology, artificial intelligence and deep learning companies. |
ESG ETF | Common stock of environmental, social and governance (“ESG”) companies. |
JULZ ETF, AUGZ ETF, SEPZ ETF, OCTZ ETF, NVMZ ETF and DECZ ETF (collectively, the “Structured Outcome ETFs”) | Options that reference the S&P 500® Price Index, employing a “buffer protect” options strategies that uses such options to seek to achieve exposure to the S&P 500® Price Index while mitigating the first 8% to 12% decline in the S&P 500® Price Index over a 12-month period. |
Costs incurred by the Funds in connection with the organization, registration and the initial public offering of shares were paid by TrueMark Investments, LLC (“TrueMark” or the “Adviser”), the Funds’ Investment Adviser.
2. SIGNIFICANT ACCOUNTING POLICIES
Each Fund is an investment company and accordingly follows the investment company accounting and reporting guidance of the Financial Accounting Standards Board (“FASB”) Accounting Standards Codification (“ASC”) Topic 946, Financial Services — Investment Companies. Each Fund prepares its financial statements in accordance with accounting principles generally accepted in the United States of America (“U.S. GAAP”) and follows the significant accounting policies described below.
Use of Estimates
The preparation of the financial statements in conformity with U.S. GAAP requires management to make estimates and assumptions that affect the reported amounts of assets and liabilities and disclosures of contingent assets and liabilities at the date of the financial statements and the reported amounts of increases and decreases in net assets from operations during the reporting period. Actual results could differ from these estimates.
30
TrueShares ETFs
Notes to Financial Statements
December 31, 2020 (Continued)
Share Transactions
The net asset value (“NAV”) per share of each Fund will be equal to a Fund’s total assets minus a Fund’s total liabilities divided by the total number of shares outstanding. The NAV that is published will be rounded to the nearest cent. The NAV is determined as of the close of trading (generally, 4:00 p.m. Eastern Time) on each day the New York Stock Exchange (“NYSE”) is open for trading.
Fair Value Measurement
In calculating the NAV, each Fund’s exchange-traded equity securities will be valued at fair value, which will generally be determined using the last reported official closing or last trading price on the exchange or market on which the security is primarily traded at the time of valuation. Such valuations are typically categorized as Level 1 in the fair value hierarchy described below.
Securities listed on the NASDAQ Stock Market, Inc. are generally valued at the NASDAQ official closing price.
If market quotations are not readily available, or if it is determined that a quotation of a security does not represent fair value, then the security is valued at fair value as determined in good faith by the Adviser using procedures adopted by the Board of Trustees of the Trust (the “Board”). The circumstances in which a security may be fair valued include, among others: the occurrence of events that are significant to a particular issuer, such as mergers, restructurings or defaults; the occurrence of events that are significant to an entire market, such as natural disasters in a particular region or government actions; trading restrictions on securities; thinly traded securities; and market events such as trading halts and early market closings. Due to the inherent uncertainty of valuations, fair values may differ significantly from the values that would have been used had an active market existed. Fair valuation could result in a different NAV than a NAV determined by using market quotations. Such valuations are typically categorized as Level 2 or Level 3 in the fair value hierarchy described below.
Money market funds are valued at NAV. If NAV is not readily available the securities will be valued at fair value.
FASB ASC Topic 820, Fair Value Measurements and Disclosures (“ASC 820”) defines fair value, establishes a framework for measuring fair value in accordance with U.S. GAAP, and requires disclosure about fair value measurements. It also provides guidance on determining when there has been a significant decrease in the volume and level of activity for an asset or liability, when a transaction is not orderly, and how that information must be incorporated into fair value measurements. Under ASC 820, various inputs are used in determining the value of the Funds’ investments. These inputs are summarized in the following hierarchy:
| | ● | Level 1 — Unadjusted quoted prices in active markets for identical assets or liabilities that the Funds have the ability to access. |
| | ● | Level 2 — Observable inputs other than quoted prices included in Level 1 that are observable for the asset or liability, either directly or indirectly. These inputs may include quoted prices for the identical instrument on an inactive market, prices for similar securities, interest rates, prepayment speeds, credit risk, yield curves, default rates and similar data. |
| | ● | Level 3 — Unobservable inputs for the asset or liability, to the extent relevant observable inputs are not available; representing the Funds’ own assumptions about the assumptions a market participant would use in valuing the asset or liability, and would be based on the best information available. |
The fair value hierarchy gives the highest priority to quoted prices (unadjusted) in active markets for identical assets or liabilities (Level 1) and the lowest priority to unobservable inputs (Level 3).
The availability of observable inputs can vary from security to security and is affected by a wide variety of factors, including, for example, the type of security, whether the security is new and not yet established in the marketplace, the liquidity of markets, and other characteristics particular to the security. To the extent that valuation is based on models or inputs that are less observable or unobservable in the market, the determination of fair value requires more judgment. Accordingly, the degree of judgment exercised in determining fair value is greatest for instruments categorized in Level 3.
31
TrueShares ETFs
Notes to Financial Statements
December 31, 2020 (Continued)
Debt securities, including short-term debt instruments having a maturity of less than 60 days, are generally valued using the last available bid prices or current market quotations provided by dealers or prices (including evaluated prices) supplied by approved independent third-party pricing services. Pricing services may use matrix pricing or valuation models that utilize certain inputs and assumptions to derive values. Due to the inherent uncertainty of valuations, fair values may differ significantly from the values that would have been used had an active market existed.
Exchange-traded options are valued at the composite mean price, which calculates the mean of the highest bid price and lowest asked price across the exchange. On the last trading day prior to expiration, expiring options may be priced at intrinsic value. The premium a fund pays when purchasing a call option or receives when writing a call option will reflect, among other things, the market price of the security, the relationship of the exercise price to the market price of the security, the relationship of the exercise price to the volatility of the security, the length of the option period and supply and demand factors. The premium is the value of an option at the date of purchase.
FLexible EXchange Options (“FLEX Options”) are valued at a model-based price provided by the exchange on which the option is traded. If the exchange on which the option is traded is unable to provide a price, FLEX Options are valued at a model-based price provided by an approved secondary pricing service.
All other securities and investments for which market values are not readily available, including restricted securities, and those securities for which it is inappropriate to determine prices in accordance with the aforementioned procedures, are valued at fair value as determined in good faith under procedures adopted by the Board, although the actual calculations may be done by others. Factors considered in making this determination may include, but are not limited to, information obtained by contacting the issuer, analysts, or the appropriate stock exchange (for exchange-traded securities), analysis of the issuer’s financial statements or other available documents and, if necessary, available information concerning other securities in similar circumstances.
The inputs or methodology used for valuing securities are not necessarily an indication of the risk associated with investing in those securities. The hierarchy classification of inputs used to value the Funds’ investments at December 31, 2020 are as follows:
| | | Level 1 | | | Level 2 | | | Level 3 | | | Total | |
TrueShares Technology, AI & Deep Learning ETF | | | | | | | | | | | | | | | | |
Investments - Assets: | | | | | | | | | | | | | | | | |
Common Stocks* | | $ | 25,878,017 | | | $ | — | | | $ | — | | | $ | 25,878,017 | |
Money Market Funds | | | 1,377,274 | | | | — | | | | — | | | | 1,377,274 | |
Total Investments - Assets | | $ | 27,255,291 | | | $ | — | | | $ | — | | | $ | 27,255,291 | |
* See the Schedule of Investments for industry classifications.
| | | Level 1 | | | Level 2 | | | Level 3 | | | Total | |
TrueShares ESG Active Opportunities ETF | | | | | | | | | | | | | | | | |
Investments - Assets: | | | | | | | | | | | | | | | | |
Common Stocks* | | $ | 6,796,239 | | | $ | — | | | $ | — | | | $ | 6,796,239 | |
Real Estate Investment Trusts | | | 129,886 | | | | — | | | | — | | | | 129,886 | |
Money Market Funds | | | 93,540 | | | | — | | | | — | | | | 93,540 | |
Total Investments - Assets | | $ | 7,019,665 | | | $ | — | | | $ | — | | | $ | 7,019,665 | |
* See the Schedule of Investments for industry classifications.
32
TrueShares ETFs
Notes to Financial Statements
December 31, 2020 (Continued)
| | | Level 1 | | | Level 2 | | | Level 3 | | | Total | |
TrueShares Structured Outcome (July) ETF | | | | | | | | | | | | | | | | |
Investments - Assets: | | | | | | | | | | | | | | | | |
Money Market Funds | | $ | 23,769 | | | $ | — | | | $ | — | | | $ | 23,769 | |
U.S. Treasury Bills | | | — | | | | 5,588,075 | | | | — | | | | 5,588,075 | |
Purchased Call Options | | | — | | | | 1,046,757 | | | | — | | | | 1,046,757 | |
Total Investments - Assets | | $ | 23,769 | | | $ | 6,634,832 | | | $ | — | | | $ | 6,658,601 | |
Other Financial Instruments - Liabilities: | | | | | | | | | | | | | | | | |
Written Put Options | | $ | — | | | $ | 83,458 | | | $ | — | | | $ | 83,458 | |
| | | Level 1 | | | Level 2 | | | Level 3 | | | Total | |
TrueShares Structured Outcome (August) ETF | | | | | | | | | | | | | | | | |
Investments - Assets: | | | | | | | | | | | | | | | | |
Money Market Funds | | $ | 27,681 | | | $ | — | | | $ | — | | | $ | 27,681 | |
U.S. Treasury Bills | | | — | | | | 8,066,745 | | | | — | | | | 8,066,745 | |
Purchased Call Options | | | — | | | | 1,157,785 | | | | — | | | | 1,157,785 | |
Total Investments - Assets | | $ | 27,681 | | | $ | 9,224,530 | | | $ | — | | | $ | 9,252,211 | |
Other Financial Instruments - Liabilities: | | | | | | | | | | | | | | | | |
Written Put Options | | $ | — | | | $ | 181,043 | | | $ | — | | | $ | 181,043 | |
| | | Level 1 | | | Level 2 | | | Level 3 | | | Total | |
TrueShares Structured Outcome (September) ETF | | | | | | | | | | | | | | | | |
Investments - Assets: | | | | | | | | | | | | | | | | |
Money Market Funds | | $ | 25,071 | | | $ | — | | | $ | — | | | $ | 25,071 | |
U.S. Treasury Bills | | | — | | | | 9,959,173 | | | | — | | | | 9,959,173 | |
Purchased Call Options | | | — | | | | 1,012,892 | | | | — | | | | 1,012,892 | |
Total Investments - Assets | | $ | 25,071 | | | $ | 10,972,065 | | | $ | — | | | $ | 10,997,136 | |
Other Financial Instruments - Liabilities: | | | | | | | | | | | | | | | | |
Written Put Options | | $ | — | | | $ | 339,382 | | | $ | — | | | $ | 339,382 | |
| | | Level 1 | | | Level 2 | | | Level 3 | | | Total | |
TrueShares Structured Outcome (October) ETF | | | | | | | | | | | | | | | | |
Investments - Assets: | | | | | | | | | | | | | | | | |
Money Market Funds | | $ | 13,818 | | | $ | — | | | $ | — | | | $ | 13,818 | |
U.S. Treasury Bills | | | — | | | | 3,729,461 | | | | — | | | | 3,729,461 | |
Purchased Call Options | | | — | | | | 464,676 | | | | — | | | | 464,676 | |
Total Investments - Assets | | $ | 13,818 | | | $ | 4,194,137 | | | $ | — | | | $ | 4,207,955 | |
Other Financial Instruments - Liabilities: | | | | | | | | | | | | | | | | |
Written Put Options | | $ | — | | | $ | 123,447 | | | $ | — | | | $ | 123,447 | |
33
TrueShares ETFs
Notes to Financial Statements
December 31, 2020 (Continued)
| | | Level 1 | | | Level 2 | | | Level 3 | | | Total | |
TrueShares Structured Outcome (November) ETF | | | | | | | | | | | | | | | | |
Investments - Assets: | | | | | | | | | | | | | | | | |
U.S. Treasury Bills | | $ | — | | | $ | 1,224,706 | | | $ | — | | | $ | 1,224,706 | |
Purchased Call Options | | | — | | | | 179,478 | | | | — | | | | 179,478 | |
Total Investments - Assets | | $ | — | | | $ | 1,404,184 | | | $ | — | | | $ | 1,404,184 | |
Other Financial Instruments - Liabilities: | | | | | | | | | | | | | | | | |
Written Put Options | | $ | — | | | $ | 42,050 | | | $ | — | | | $ | 42,050 | |
| | | Level 1 | | | Level 2 | | | Level 3 | | | Total | |
TrueShares Structured Outcome (December) ETF | | | | | | | | | | | | | | | | |
Investments - Assets: | | | | | | | | | | | | | | | | |
Money Market Funds | | $ | 20,827 | | | $ | — | | | $ | — | | | $ | 20,827 | |
U.S. Treasury Bills | | | — | | | | 5,598,498 | | | | — | | | | 5,598,498 | |
Purchased Call Options | | | — | | | | 404,828 | | | | — | | | | 404,828 | |
Total Investments - Assets | | $ | 20,827 | | | $ | 6,003,326 | | | $ | — | | | $ | 6,024,153 | |
Other Financial Instruments - Liabilities: | | | | | | | | | | | | | | | | |
Written Put Options | | $ | — | | | $ | 297,399 | | | $ | — | | | $ | 297,399 | |
Security Transactions
Investment transactions are recorded as of the date that the securities are purchased or sold (trade date). Realized gains and losses from the sale or disposition of securities are calculated based on the specific identification basis.
Investment Income
Dividend income is recognized on the ex-dividend date. Interest income is accrued daily. Withholding taxes on foreign dividends has been provided for in accordance with the Funds’ understanding of the applicable tax rules and regulations. An amortized cost method of valuation may be used with respect to debt obligations with sixty days or less remaining to maturity, unless the Adviser determines in good faith that such method does not represent fair value.
Tax Information, Dividends and Distributions to Shareholders and Uncertain Tax Positions
The Funds are treated as separate entities for Federal income tax purposes. Each Fund intends to qualify as a regulated investment company (“RIC”) under Subchapter M of the Internal Revenue Code of 1986, as amended (the “Internal Revenue Code”). To qualify and remain eligible for the special tax treatment accorded to RICs, each Fund must meet certain annual income and quarterly asset diversification requirements and must distribute annually at least 90% of the sum of (i) its investment company taxable income (which includes dividends, interest and net short-term capital gains) and (ii) certain net tax-exempt income, if any. If so qualified, each Fund will not be subject to Federal income tax.
Distributions to shareholders are recorded on the ex-dividend date. The AI ETF and the ESG ETF generally pay out dividends from net investment income, if any, annually, and distributes its net capital gains, if any, to shareholders at least annually. The Structured Outcome ETFs intend to pay out dividends from net investment income and net capital gains, if any, just prior to the roll date of the Fund to a new structured outcome period of the next year. The Funds may also pay a special distribution at the end of the calendar year to comply with Federal tax requirements. The amount of dividends and distributions from net investment income and net realized capital gains are determined in accordance with Federal income tax regulations, which may differ from U.S. GAAP. These “book/tax” differences are either considered temporary or permanent in nature. To the extent these differences are permanent in nature, such amounts are reclassified within the components of net assets based on their Federal tax basis treatment; temporary differences do not require reclassification. Dividends and distributions which exceed earnings and profit for tax purposes are reported as a tax return of capital.
34
TrueShares ETFs
Notes to Financial Statements
December 31, 2020 (Continued)
Management evaluates the Funds’ tax positions to determine if the tax positions taken meet the minimum recognition threshold in connection with accounting for uncertainties in income tax positions taken or expected to be taken for the purposes of measuring and recognizing tax liabilities in the financial statements. Recognition of tax benefits of an uncertain tax position is required only when the position is “more likely than not” to be sustained assuming examination by taxing authorities. Interest and penalties related to income taxes would be recorded as income tax expense. The Funds’ Federal income tax returns are subject to examination by the Internal Revenue Service (the “IRS”) for a period of three fiscal years after they are filed. State and local tax returns may be subject to examination for an additional fiscal year depending on the jurisdiction. As of December 31, 2020, the Funds’ fiscal period end, the Funds had no material uncertain tax positions and did not have a liability for any unrecognized tax benefits. As of December 31, 2020, the Funds’ fiscal period end, the Funds had no examination in progress and management is not aware of any tax positions for which it is reasonably possible that the amounts of unrecognized tax benefits will significantly change in the next twelve months.
The Funds recognized no interest or penalties related to uncertain tax benefits in the fiscal period 2020. At December 31, 2020, the Funds’ fiscal period end, the tax period 2020 remained open to examination in the Funds’ major tax jurisdiction.
Indemnification
In the normal course of business, the Funds expect to enter into contracts that contain a variety of representations and warranties and which provide general indemnifications. The Funds’ maximum exposure under these anticipated arrangements is unknown, as this would involve future claims that may be made against the Funds that have not yet occurred. However, the Adviser expects the risk of loss to be remote.
Derivatives
The Structured Outcome ETFs employ a “buffer protect” options strategy that uses such options to seek to achieve exposure to the S&P 500® Price Index while mitigating the first 8% to 12% decline in the S&P 500® Price Index (the “Buffer”) over a 12-month period beginning on a specified day (each, a “Roll Date”). The period from one Roll Date to the next Roll Date is referred to as the “Investment Period,” and the first day of the Investment Period is referred to as the initial investment day. In the event an investor purchases shares after the date on which the options were entered into or sells shares prior to the expiration of the options, the Buffer that the Structured Outcome ETFs seeks to provide may not be available. The Structured Outcome ETFs are not designed to protect against declines of more than 8% to 12% in the level of the S&P 500® Price Index, and there can be no guarantee that the Structured Outcome ETFs will be successful in implementing the buffer protect options strategy to avoid the first 8% to 12% decline.
In general, the Structured Outcome ETFs invest in exchange-traded FLEX Options only. FLEX Options are customized option contracts made available by the Cboe Options Exchange with the ability to customize key contract terms like exercise price, style and expiration date while achieving price discovery in competitive, transparent auctions markets and avoiding the counterparty exposure of over–the–counter options positions. Like traditional exchange–traded options, FLEX Options are guaranteed for settlement by the Options Clearing Corporation, a market clearinghouse that guarantees performance by counterparties to certain derivatives contracts. The FLEX Options in which the Structured Outcome ETFs invest generally have a term of up to one year and are all European style options (options that are exercisable only on the expiration date) based on the S&P 500® Price Index or an ETF that tracks the S&P 500® Price Index and have an expiration date that is the last day of the Investment Period.
The Structured Outcome ETFs will purchase and sell call and put FLEX Options. In general, put and call options on indices give the holder the right to receive, upon exercise of the option, an amount of cash if the closing level of the underlying index is greater than (or less than, in the case of puts) the exercise price of the option. This amount of cash is equal to the difference between the closing price of the index and the exercise price of the option, expressed in dollars multiplied by a specified number. The premium paid to the writer is the consideration for undertaking the obligations under the option contract.
The Structured Outcome ETFs purchasing put and call options pay a premium; therefore, if price movements in the underlying securities are such that exercise of the options would not be profitable for the Structured Outcome ETFs, loss of the premium paid may be offset by an increase in the value of the Structured Outcome ETFs’ securities or by a decrease in the cost of acquisition of securities by the Structured Outcome ETFs. When the Structured Outcome ETFs write an option, if the underlying securities do not increase or decrease to a price level that would make the exercise of the option profitable to the holder thereof,
35
TrueShares ETFs
Notes to Financial Statements
December 31, 2020 (Continued)
the option generally will expire without being exercised and the Structured Outcome ETFs will realize as profit the premium received for such option. When a call option of which the Structured Outcome ETFs are the writer is exercised, the Structured Outcome ETFs will be required to sell the underlying securities to the option holder at the strike price and will not participate in any increase in the price of such securities above the strike price. When a put option of which the Structured Outcome ETFs are the writer is exercised, the Structured Outcome ETFs will be required to purchase the underlying securities at a price in excess of the market value of such securities. The Structured Outcome ETFs maintain minimal counterparty risk through contracts bought or sold on an exchange. As of December 31, 2020, the Structured Outcome ETFs’ derivative instruments are not subject to a master netting arrangement.
Derivative Investments
The average monthly value outstanding of purchased and written options during the period ended December 31, 2020 were as follows:
| | | TrueShares
Structured
Outcome
(July) ETF | | | TrueShares
Structured
Outcome
(August) ETF | | | TrueShares
Structured
Outcome
(September)
ETF | | | TrueShares
Structured
Outcome
(October) ETF | | | TrueShares
Structured
Outcome
(November) ETF | | | TrueShares
Structured
Outcome
(December) ETF | |
Purchased Options | | $ | 736,652 | | | $ | 849,470 | | | $ | 696,977 | | | $ | 348,087 | | | $ | 235,778 | | | $ | 404,828 | |
Written Options | | | 219,219 | | | | 395,579 | | | | 672,186 | | | | 190,792 | | | | 71,040 | | | | 297,399 | |
The following is a summary of the effect of derivative instruments on the Funds’ Statements of Assets and Liabilities as of December 31, 2020:
| | Equity Risk
Contracts | | Asset
Derivatives,
Investments,
at value | | | Liability
Derivatives,
Written options,
at value | |
TrueShares Structured Outcome (July) ETF | Purchased Options | | $ | 1,046,757 | | | $ | — | |
| | Written Options | | | — | | | | 83,458 | |
TrueShares Structured Outcome (August) ETF | Purchased Options | | | 1,157,785 | | | | — | |
| | Written Options | | | — | | | | 181,043 | |
TrueShares Structured Outcome (September) ETF | Purchased Options | | | 1,012,892 | | | | — | |
| | Written Options | | | — | | | | 339,382 | |
TrueShares Structured Outcome (October) ETF | Purchased Options | | | 464,676 | | | | — | |
| | Written Options | | | — | | | | 123,447 | |
TrueShares Structured Outcome (November) ETF | Purchased Options | | | 179,478 | | | | — | |
| | Written Options | | | — | | | | 42,050 | |
TrueShares Structured Outcome (December) ETF | Purchased Options | | | 404,828 | | | | — | |
| | Written Options | | | — | | | | 297,399 | |
36
TrueShares ETFs
Notes to Financial Statements
December 31, 2020 (Continued)
The following is a summary of the effect of derivative instruments on the Funds’ Statements of Operations for the period ended December 31, 2020:
| | | | Net Realized Gain (Loss) | | | Change in Unrealized
Appreciation/Depreciation | |
| | | | Purchased
Options | | | Written
Options | | | Purchased
Options | | | Written
Options | |
TrueShares Structured Outcome (July) ETF | Equity Risk Contracts | | $ | — | | | $ | — | | | $ | 606,578 | | | $ | 316,228 | |
TrueShares Structured Outcome (August) ETF | Equity Risk Contracts | | | (3,507 | ) | | | (2,247 | ) | | | 592,683 | | | | 350,365 | |
TrueShares Structured Outcome (September) ETF | Equity Risk Contracts | | | (4,476 | ) | | | 46,632 | | | | 364,868 | | | | 438,924 | |
TrueShares Structured Outcome (October) ETF | Equity Risk Contracts | | | — | | | | 668 | | | | 175,322 | | | | 135,235 | |
TrueShares Structured Outcome (November) ETF | Equity Risk Contracts | | | 83,015 | | | | 46,649 | | | | 89,484 | | | | 45,604 | |
TrueShares Structured Outcome (December) ETF | Equity Risk Contracts | | | — | | | | — | | | | 80,157 | | | | 17,184 | |
3. INVESTMENT ADVISORY AND OTHER AGREEMENTS
Investment Advisory Agreement
The Trust has entered into an Investment Advisory Agreement (the “Advisory Agreement”) with the Adviser. Under the Advisory Agreement, the Adviser provides a continuous investment program for the Funds’ assets in accordance with its investment objectives, policies and limitations, and oversees the day-to-day operations of the Funds subject to the supervision of the Board, including the Trustees who are not “interested persons” of the Trust as defined in the 1940 Act.
Pursuant to the Advisory Agreement between the Trust, on behalf of the Funds, and TrueMark, each Fund pays a unified management fee to the Adviser, which is calculated daily and paid monthly, at an annual rate of 0.68%, 0.58% and 0.79% of the AI ETF’s, the ESG ETF’s and the Structured Outcome ETF’s average daily net assets, respectively. TrueMark has agreed to pay all expenses of the Funds except the fee paid to TrueMark under the Advisory Agreement, interest charges on any borrowings, dividends and other expenses on securities sold short, taxes, brokerage commissions and other expenses incurred in placing orders for the purchase and sale of securities and other investment instruments, acquired fund fees and expenses, accrued deferred tax liability, extraordinary expenses, and distribution (12b-1) fees and expenses (if any). TrueMark, in turn, compensates the Sub-Advisers from the management fee it receives.
Black Hill Capital Partners, LLC (the “AI ETF Sub-Adviser”), a Delaware limited liability company serves as the sub-adviser to the AI ETF. Pursuant to a Sub-Advisory Agreement between the Adviser and the AI ETF Sub-Adviser, the AI ETF Sub-Adviser is responsible for trading portfolio securities on behalf of the Fund, including selecting broker-dealers to execute purchase and sale transactions, subject to the supervision of the Adviser and the Board, including the Independent Trustees. For its services, the AI ETF Sub-Adviser is entitled to a sub-advisory fee paid by the Adviser, which is 50% of the Adviser’s net profits. Net profits are calculated as follows: the total Adviser’s fees received by the Adviser from the AI ETF during a fiscal period, less the cumulative direct expenses incurred or paid by the Adviser during that period in relation to the AI ETF, which expenses include, without limitation: expense waivers and reimbursements; commissions; legal, administrative and custodial expenses; ntf/platform/omnibus fees; filing and registration fees; proxy solicitation expenses; taxes; interest.
Purview Investments, LLC (the “ESG ETF Sub-Adviser”), a Delaware limited liability company serves as the sub-adviser to the ESG ETF. Pursuant to a Sub-Advisory Agreement between the Adviser and the ESG ETF Sub-Adviser, the ESG ETF Sub-Adviser is responsible for trading portfolio securities on behalf of the Fund, including selecting broker-dealers to execute purchase and sale transactions, subject to the supervision of the Adviser and the Board, including the Independent Trustees. For its services,
37
TrueShares ETFs
Notes to Financial Statements
December 31, 2020 (Continued)
the ESG ETF Sub-Adviser is entitled to a sub-advisory fee paid by the Adviser, which is 50% of the Adviser’s net profits. Net profits are calculated as follows: the total Adviser’s fees received by the Adviser from the ESG ETF during a fiscal period, less the cumulative direct expenses incurred or paid by the Adviser during that period in relation to the ESG ETF, which expenses include, without limitation: expense waivers and reimbursements; commissions; legal, administrative and custodial expenses; ntf/platform/omnibus fees; filing and registration fees; proxy solicitation expenses; taxes; interest.
SpiderRock Advisors, LLC (the “Structured Outcome ETFs Sub-Adviser”), an Illinois limited liability company serves as the sub-adviser to the Structured Outcome ETFs. Pursuant to a Sub-Advisory Agreement between the Adviser and the Structured Outcome ETFs Sub-Adviser, the Structured Outcome ETFs Sub-Adviser is responsible for trading portfolio securities on behalf of the Funds, including selecting broker-dealers to execute purchase and sale transactions, subject to the supervision of the Adviser and the Board, including the Independent Trustees. For its services, the Structured Outcome ETFs Sub-Adviser is entitled to a sub-advisory fee paid by the Adviser, which is calculated daily and paid monthly at an annual rate based on the Fund assets under management of the Structured Outcome ETFs which is 0.34% on average daily assets less than $150 million and 0.39% on average daily assets greater than $150 million.
Distribution Agreement and 12b-1 Plan
Foreside Fund Services, LLC (the “Distributor”) serves as each Fund’s distributor pursuant to a Distribution Services Agreement. The Distributor receives compensation for the statutory underwriting services it provides to the Funds. The Distributor enters into agreements with certain broker-dealers and others that will allow those parties to be “Authorized Participants” and to subscribe for and redeem shares of the Funds. The Distributor will not distribute shares in less than whole Creation Units and does not maintain a secondary market in shares.
The Board has adopted a Distribution and Service Plan pursuant to Rule 12b-1 under the 1940 Act (“Rule 12b-1 Plan”). In accordance with the Rule 12b-1 Plan, each Fund is authorized to pay an amount up to 0.25% of the Fund’s average daily net assets each year for certain distribution-related activities. As authorized by the Board, no Rule 12b-1 fees are currently paid by the Funds and there are no plans to impose these fees. However, in the event Rule 12b-1 fees are charged in the future, they will be paid out of each Fund’s assets. The Adviser and its affiliates may, out of their own resources, pay amounts to third parties for distribution or marketing services on behalf of the Funds.
Administrator, Custodian and Transfer Agent
U.S. Bancorp Fund Services LLC, doing business as U.S. Bank Global Fund Services (“Fund Services” or “Administrator”) serves as administrator, transfer agent and fund accountant of the Funds pursuant to a Fund Servicing Agreement. U.S. Bank N.A. (the “Custodian”), an affiliate of Fund Services, serves as the Funds’ custodian pursuant to a Custody Agreement. Under the terms of these agreements, the Adviser pays each Fund’s administrative, custody and transfer agency fees.
A Trustee and all officers of the Trust are affiliated with the Administrator and Custodian.
4. CREATION AND REDEMPTION TRANSACTIONS
Shares of the AI ETF and the ESG ETF are listed and traded on the NYSE Arca, Inc. and the Structured Outcome ETFs are listed and traded on the Cboe BZX Exchange, Inc. Each Fund issues and redeems shares on a continuous basis at NAV only in large blocks of shares called “Creation Units”. A Creation Unit generally consists of 25,000 shares. Creation Units are to be issued and redeemed principally in kind for a basket of securities and a balancing cash amount. Shares generally will trade in the secondary market in amounts less than a Creation Unit at market prices that change throughout the day. Market prices for the shares may be different from their NAV. The NAV is determined as of the close of trading (generally, 4:00 p.m. Eastern Time) on each day the NYSE is open for trading. The NAV of the shares of each Fund will be equal to a Fund’s total assets minus a Fund’s total liabilities divided by the total number of shares outstanding. The NAV that is published will be rounded to the nearest cent; however, for purposes of determining the price of Creation Units, the NAV will be calculated to five decimal places.
38
TrueShares ETFs
Notes to Financial Statements
December 31, 2020 (Continued)
Creation Unit Transaction Fee
Authorized Participants will be required to pay to the Custodian a fixed transaction fee (the “Creation Unit Transaction Fee”) in connection with the issuance or redemption of Creation Units. The standard Creation Unit Transaction Fee will be the same regardless of the number of Creation Units purchased or redeemed by an investor on the applicable business day. The Creation Unit Transaction Fee charged by each Fund for each creation order is $250.
An additional variable fee of up to a maximum of 2% of the value of the Creation Units subject to the transaction may be imposed for (1) creations effected outside the clearing process and (2) creations made in an all cash amount (to offset the Trust’s brokerage and other transaction costs associated with using cash to purchase the requisite Deposit Securities). Investors are responsible for the costs of transferring the securities constituting the Deposit Securities to the account of the Trust. Each Fund may determine to not charge a variable fee on certain orders when the Adviser has determined that doing so is in the best interests of Fund shareholders. Variable fees, if any, received by the Funds are displayed in the Capital Share Transactions section on the Statements of Changes in Net Assets.
Only “Authorized Participants” may purchase or redeem shares directly from the Funds. An Authorized Participant is either (i) a broker-dealer or other participant in the clearing process through the Continuous Net Settlement System of National Securities Clearing Corporation or (ii) a DTC participant and, in each case, must have executed a Participant Agreement with the Distributor. Most retail investors will not qualify as Authorized Participants or have the resources to buy and sell whole Creation Units. Therefore, they will be unable to purchase or redeem the shares directly from the Funds. Rather, most retail investors will purchase shares in the secondary market with the assistance of a broker and will be subject to customary brokerage commissions or fees. Securities received or delivered in connection with in-kind creates and redeems are valued as of the close of business on the effective date of the creation or redemption.
A creation unit will generally not be issued until the transfer of good title of the deposit securities to the Funds and the payment of any cash amounts have been completed. To the extent contemplated by the applicable participant agreement, Creation Units of the Funds will be issued to such authorized participant notwithstanding the fact that the Funds’ deposits have not been received in part or in whole, in reliance on the undertaking of the authorized participant to deliver the missing deposit securities as soon as possible. If the Funds or their agents do not receive all of the deposit securities, or the required cash amounts, by such time, then the order may be deemed rejected and the authorized participant shall be liable to the Funds for losses, if any.
5. FEDERAL INCOME TAX
The tax character of distributions paid was as follows:
| | | Period Ended December 31, 2020 | |
| | | Ordinary
Income(1) | | | Return of
Capital | |
TrueShares Technology, AI & Deep Learning ETF | | $ | — | | | $ | — | |
TrueShares ESG Active Opportunities ETF | | | 26,525 | | | | 678 | |
TrueShares Structured Outcome (July) ETF | | | — | | | | — | |
TrueShares Structured Outcome (August) ETF | | | — | | | | — | |
TrueShares Structured Outcome (September) ETF | | | — | | | | — | |
TrueShares Structured Outcome (October) ETF | | | — | | | | — | |
TrueShares Structured Outcome (November) ETF | | | — | | | | — | |
TrueShares Structured Outcome (December) ETF | | | — | | | | — | |
(1) | Ordinary income includes short-term capital gains. |
39
TrueShares ETFs
Notes to Financial Statements
December 31, 2020 (Continued)
At December 31, 2020, the Funds’ fiscal period end, the components of distributable earnings (accumulated losses) and cost of investments on a tax basis, including the adjustments for financial reporting purposes as of the most recently completed Federal income tax reporting year, were as follows:
| | | TrueShares
Technology,
AI & Deep
Learning
ETF | | | TrueShares
ESG Active
Opportunities
ETF | | | TrueShares
Structured
Outcome
(July)
ETF | | | TrueShares
Structured
Outcome
(August)
ETF | | | TrueShares
Structured
Outcome
(September)
ETF | | | TrueShares
Structured
Outcome
(October)
ETF | | | TrueShares
Structured
Outcome
(November)
ETF | | | TrueShares
Structured
Outcome
(December)
ETF | |
Federal Tax Cost of Investments | | $ | 21,161,213 | | | $ | 5,194,863 | | | $ | 5,653,451 | | | $ | 8,128,563 | | | $ | 9,853,834 | | | $ | 3,773,945 | | | $ | 1,227,159 | | | $ | 5,629,880 | |
Gross Tax Unrealized Appreciation | | $ | 6,514,312 | | | $ | 1,879,889 | | | $ | 922,806 | | | $ | 943,137 | | | $ | 803,920 | | | $ | 310,599 | | | $ | 135,088 | | | $ | 97,341 | |
Gross Tax Unrealized Depreciation | | | (420,234 | ) | | | (55,087 | ) | | | (1,114 | ) | | | (532 | ) | | | — | | | | (36 | ) | | | (113 | ) | | | (467 | ) |
Net Tax Unrealized Appreciation (Depreciation) | | | 6,094,078 | | | | 1,824,802 | | | | 921,692 | | | | 942,605 | | | | 803,920 | | | | 310,563 | | | | 134,975 | | | | 96,874 | |
Undistributed Ordinary Income | | | 37,526 | | | | — | | | | — | | | | — | | | | 12,774 | | | | — | | | | 69,393 | | | | — | |
Other Accumulated Gain (Loss) | | | — | | | | (101,642 | ) | | | (9 | ) | | | (5,763 | ) | | | — | | | | — | | | | (195 | ) | | | — | |
Total Distributable Earnings / (Accumulated Losses) | | $ | 6,131,604 | | | $ | 1,723,160 | | | $ | 921,683 | | | $ | 936,842 | | | $ | 816,694 | | | $ | 310,563 | | | $ | 204,173 | | | $ | 96,874 | |
The difference between book-basis and tax-basis unrealized appreciation/(depreciation) is attributable primarily to the tax deferral of losses on wash sales.
Under current tax law, net capital losses realized and specified ordinary losses after October 31st may be deferred and treated as occurring on the first day of the following fiscal year. The Funds’ carryforward losses and post-October losses are determined only at the end of each fiscal year. The Funds did not defer any post-October losses. At December 31, 2020, the Funds had short-term capital losses which will be carried forward indefinitely to offset future realized capital gains as follows:
| | | Indefinite
Short-Term | |
TrueShares Technology, AI & Deep Learning ETF | | $ | — | |
TrueShares ESG Active Opportunities ETF | | | 101,642 | |
TrueShares Structured Outcome (July) ETF | | | 9 | |
TrueShares Structured Outcome (August) ETF | | | 5,763 | |
TrueShares Structured Outcome (September) ETF | | | — | |
TrueShares Structured Outcome (October) ETF | | | — | |
TrueShares Structured Outcome (November) ETF | | | — | |
TrueShares Structured Outcome (December) ETF | | | — | |
40
TrueShares ETFs
Notes to Financial Statements
December 31, 2020 (Continued)
U.S. GAAP requires that certain components of net assets relating to permanent differences be reclassified between financial and tax reporting. These reclassifications have no effect on net assets or NAV per share. The permanent differences primarily relate to redemptions in-kind, write-off of net operating losses, and the use of tax equalization. For the fiscal period ended December 31, 2020, the following reclassifications were made for permanent tax differences on the Statements of Assets and Liabilities.
| | | Total
Distributable
Earnings
(Accumulated
Losses) | | | Paid-in Capital | |
TrueShares Technology, AI & Deep Learning ETF | | $ | (81,801 | ) | | $ | 81,801 | |
TrueShares ESG Active Opportunities ETF | | | 74,478 | | | | (74,478 | ) |
TrueShares Structured Outcome (July) ETF | | | 20,285 | | | | (20,285 | ) |
TrueShares Structured Outcome (August) ETF | | | 25,706 | | | | (25,706 | ) |
TrueShares Structured Outcome (September) ETF | | | (3,195 | ) | | | 3,195 | |
TrueShares Structured Outcome (October) ETF | | | 6,112 | | | | (6,112 | ) |
TrueShares Structured Outcome (November) ETF | | | (56,823 | ) | | | 56,823 | |
TrueShares Structured Outcome (December) ETF | | | 3,119 | | | | (3,119 | ) |
6. INVESTMENT TRANSACTIONS
During the fiscal period ended December 31, 2020, the Funds realized amounts in net capital gains resulting from in-kind redemptions, in which shareholders exchanged Fund shares for securities held by the Funds rather than for cash. Because such gains are not taxable to the Funds, and are not distributed to shareholders, they have been reclassified from distributable earnings (accumulated losses) to paid in-capital. The amounts of realized gains and losses from in-kind redemptions included in realized gain/(loss) on investments in the Statements of Operations is as follows:
| | | Realized Gains | | | Realized Losses | |
TrueShares Technology, AI & Deep Learning ETF | | $ | 267,620 | | | $ | 214,793 | |
TrueShares ESG Active Opportunities ETF | | | 3,824 | | | | 78,302 | |
TrueShares Structured Outcome (July) ETF | | | — | | | | — | |
TrueShares Structured Outcome (August) ETF | | | — | | | | — | |
TrueShares Structured Outcome (September) ETF | | | — | | | | — | |
TrueShares Structured Outcome (October) ETF | | | — | | | | — | |
TrueShares Structured Outcome (November) ETF | | | — | | | | — | |
TrueShares Structured Outcome (December) ETF | | | — | | | | — | |
41
TrueShares ETFs
Notes to Financial Statements
December 31, 2020 (Continued)
Purchases and sales of investments (excluding short-term investments), creations in-kind and redemptions in-kind for the period ended December 31, 2020 were as follows:
| | | Purchases | | | Sales | | | Creations
In-Kind | | | Redemptions
In-Kind | |
TrueShares Technology, AI & Deep Learning ETF | | $ | 3,751,813 | | | $ | 3,075,764 | | | $ | 21,387,048 | | | $ | 2,450,892 | |
TrueShares ESG Active Opportunities ETF | | | 1,305,516 | | | | 1,317,195 | | | | 5,786,034 | | | | 495,827 | |
TrueShares Structured Outcome (July) ETF | | | — | | | | — | | | | — | | | | — | |
TrueShares Structured Outcome (August) ETF | | | — | | | | — | | | | — | | | | — | |
TrueShares Structured Outcome (September) ETF | | | — | | | | — | | | | — | | | | — | |
TrueShares Structured Outcome (October) ETF | | | — | | | | — | | | | — | | | | — | |
TrueShares Structured Outcome (November) ETF | | | — | | | | — | | | | — | | | | — | |
TrueShares Structured Outcome (December) ETF | | | — | | | | — | | | | — | | | | — | |
7. PRINCIPAL RISKS
As with all ETFs, shareholders of the Funds are subject to the risk that their investment could lose money. Each Fund is subject to the principal risks, any of which may adversely affect a Fund’s NAV, trading price, yield, total return and ability to meet its investment objective.
The global outbreak of COVID-19 (commonly referred to as “coronavirus”) has disrupted economic markets and the prolonged economic impact is uncertain. The ultimate economic fallout from the pandemic, and the long-term impact on economies, markets, industries and individual issuers, are not known. The operational and financial performance of the issuers of securities in which the Funds invest depends on future developments, including the duration and spread of the outbreak, and such uncertainty may in turn adversely affect the value and liquidity of the Funds’ investments, impair the Funds’ ability to satisfy redemption requests, and negatively impact the Funds’ performance.
A complete description of principal risks is included in the prospectus under the heading “Principal Investment Risks.”
8. SUBSEQUENT EVENTS
The Adviser launched three additional ETF’s subsequent to the fiscal period end of December 31, 2020.
Fund Name | | Ticker | | | Commencement of
Operations on Exchange | |
TrueShares Structured Outcome (January) ETF | | | JANZ | | | | 01/02/2021 | |
TrueShares Structured Outcome (February) ETF | | | FEBZ | | | | 02/01/2021 | |
TrueShares Low Volatility Equity Income ETF | | | DIVZ | | | | 01/27/2021 | |
TrueShares Structured Outcome (January) ETF and TrueShares Structured Outcome (February) ETF are the continuation of the TrueShares Structured Outcome ETF series of actively-managed ETFs that pursue their investment objective of total return by employing a “buffer protect” options strategy that uses such options to seek to achieve exposure to the S&P 500 Price Index while mitigating the first 8% to 12% decline in the S&P 500 Price Index over a 12-month period.
TrueShares Low Volatility Equity Income ETF is an actively-managed ETF that pursues its investment objective of capital appreciation with lower volatility and a higher dividend yield compared to the S&P 500 Index by purchasing 25-35 stocks of established businesses with high cash flow, stable revenue streams, and more disciplined capital reinvestment programs which may, in turn, experience lower volatility relative to the overall equity market.
Other than as disclosed, there were no other subsequent events requiring recognition or disclosure through the date the financial statements were issued.
42
TrueShares ETFs
Report of Independent Registered Public Accounting Firm
To the Shareholders of TrueShares ETFs and
Board of Trustees of Listed Funds Trust
Opinion on the Financial Statements
We have audited the accompanying statements of assets and liabilities, including the schedules of investments and written options (as applicable), of TrueShares Technology, AI & Deep Learning ETF, TrueShares ESG Active Opportunities ETF, TrueShares Structured Outcome (July) ETF, TrueShares Structured Outcome (August) ETF, TrueShares Structured Outcome (September) ETF, TrueShares Structured Outcome (October) ETF, TrueShares Structured Outcome (November) ETF, and TrueShares Structured Outcome (December) ETF (“TrueShares ETFs” or the “Funds”), each a series of Listed Funds Trust, as of December 31, 2020, the related statements of operations, the statements of changes in net assets, the related notes, and the financial highlights for each of the periods indicated below (collectively referred to as the “financial statements”). In our opinion, the financial statements present fairly, in all material respects, the financial position of each of the Funds as of December 31, 2020, the results of their operations, the changes in net assets, and the financial highlights for each of the periods indicated below in conformity with accounting principles generally accepted in the United States of America.
Fund Name | Statements of
Operations | Statements of Changes
in Net Assets | Financial Highlights |
TrueShares Technology, AI & Deep Learning ETF and TrueShares ESG Active Opportunities ETF | For the period from February 28, 2020 (commencement of operations) through December 31, 2020 |
TrueShares Structured Outcome (July) ETF | For the period from July 1, 2020 (commencement of operations) through December 31, 2020 |
TrueShares Structured Outcome (August) ETF | For the period from August 3, 2020 (commencement of operations) through December 31, 2020 |
TrueShares Structured Outcome (September) ETF | For the period from September 1, 2020 (commencement of operations) through December 31, 2020 |
TrueShares Structured Outcome (October) ETF | For the period from October 1, 2020 (commencement of operations) through December 31, 2020 |
TrueShares Structured Outcome (November) ETF | For the period from November 2, 2020 (commencement of operations) through December 31, 2020 |
TrueShares Structured Outcome (December) ETF | For the period from December 1, 2020 (commencement of operations) through December 31, 2020 |
Basis for Opinion
These financial statements are the responsibility of the Funds’ management. Our responsibility is to express an opinion on the Funds’ financial statements based on our audits. We are a public accounting firm registered with the Public Company Accounting Oversight Board (United States) (“PCAOB”) and are required to be independent with respect to the Funds in accordance with the U.S. federal securities laws and the applicable rules and regulations of the Securities and Exchange Commission and the PCAOB.
We conducted our audits in accordance with the standards of the PCAOB. Those standards require that we plan and perform the audit to obtain reasonable assurance about whether the financial statements are free of material misstatement whether due to error or fraud.
43
TrueShares ETFs
Report of Independent Registered Public Accounting Firm
(Continued)
Our audits included performing procedures to assess the risks of material misstatement of the financial statements, whether due to error or fraud, and performing procedures that respond to those risks. Such procedures included examining, on a test basis, evidence regarding the amounts and disclosures in the financial statements. Our procedures included confirmation of securities owned as of December 31, 2020, by correspondence with the custodian and brokers or by other appropriate auditing procedures where replies from brokers were not received. Our audits also included evaluating the accounting principles used and significant estimates made by management, as well as evaluating the overall presentation of the financial statements. We believe that our audits provide a reasonable basis for our opinion.
We have served as the Funds’ auditor since 2019.

COHEN & COMPANY, LTD.
Cleveland, Ohio
February 26, 2021
44
TrueShares ETFs
Board of Trustees and Officers
December 31, 2020 (Unaudited)
The Funds’ Statement of Additional Information includes additional information about the Funds’ Trustees and Officers, and is available, without charge upon request by calling 1-800-617-0004, or by visiting the Funds’ website at www.true-shares.com.
Name and Year of Birth | Position Held
with the Trust | Term of Office
and Length of
Time Served | Principal Occupation(s)
During Past 5 Years | Number of
Portfolios in
Fund Complex
Overseen by
Trustee | Other
Directorships Held
by Trustee During
Past 5 Years |
Independent Trustees | | | | | |
John L. Jacobs
Year of birth: 1959 | Trustee and Audit Committee Chair | Indefinite term; since 2017 | Chairman of Alerian, Inc. (Since June 2018); Executive Director of Center for Financial Markets and Policy (Since 2016); Founder and CEO of Q3 Advisors, LLC (financial consulting firm) (since 2015); Distinguished Policy Fellow and Executive Director, Center for Financial Markets and Policy, Georgetown University (since 2015); Senior Advisor, Nasdaq OMX Group (2015–2016); Executive Vice President, Nasdaq OMX Group (2013–2015). | 23 | Director, tZERO Group, Inc. (since 2020). Independent Trustee, Procure ETF Trust II (since 2018) (1 portfolio). Independent Trustee, Horizons ETF Trust I (2015-2019) (3 portfolios). |
Koji Felton
Year of birth: 1961 | Trustee | Indefinite term; since 2019 | Counsel, Kohlberg Kravis Roberts & Co. L.P. (investment firm) (2013–2015); Counsel, Dechert LLP (law firm) (2011–2013). | 23 | Independent Trustee, Series Portfolios Trust (since 2015) (8 portfolios). |
Pamela H. Conroy Year of birth: 1961 | Trustee and Nominating and Governance Committee Chair | Indefinite term; since 2019 | Retired; formerly Executive Vice President, Chief Operating Officer & Chief Compliance Officer, Institutional Capital Corporation (investment firm) (1994–2008). | 23 | Independent Trustee, Frontier Funds, Inc. (since 2020) (5 portfolios). |
45
TrueShares ETFs
Board of Trustees and Officers
December 31, 2020 (Unaudited) (Continued)
Name and Year of Birth | Position Held
with the Trust | Term of Office
and Length of
Time Served | Principal Occupation(s)
During Past 5 Years | Number of
Portfolios in
Fund Complex
Overseen by
Trustee | Other
Directorships Held
by Trustee During
Past 5 Years |
Interested Trustee | | | | | |
Paul R. Fearday, CPA* Year of birth: 1979 | Trustee and Chairman | Indefinite term; since 2019 | Senior Vice President, U.S. Bancorp Fund Services, LLC (since 2008); Manager, PricewaterhouseCoopers LLP (accounting firm) (2002–2008) | 23 | None. |
* | This Trustee is considered an “Interested Trustee” as defined in the 1940 Act because of his affiliation with U.S. Bancorp Fund Services, d/b/a U.S. Bank Global Fund Services and U.S. Bank N.A., which provide fund accounting, administration, transfer agency and custodian services to the Funds. |
Name and Year of Birth | Position(s)
Held with
the Trust | Term of Office
and Length of
Time Served | Principal Occupation(s) During Past 5 Years |
Officers | | | |
Gregory Bakken Year of birth: 1983 | President and Principal Executive Officer | Indefinite term, February 2019 | Vice President, U.S. Bancorp Fund Services, LLC (since 2006). |
Travis G. Babich Year of birth: 1980 | Treasurer and Principal Financial Officer | Indefinite term, September 2019 | Vice President, U.S. Bancorp Fund Services, LLC (since 2005) |
Kacie M. Gronstal Year of birth: 1992 | Assistant Treasurer | Indefinite term, March 2019 | Officer, U.S. Bancorp Fund Services, LLC (since 2014). |
Kent Barnes Year of birth: 1968 | Secretary | Indefinite term, February 2019 | Vice President, U.S. Bancorp Fund Services, LLC (since 2018); Chief Compliance Officer, Rafferty Asset Management, LLC (2016 to 2018); Vice President, U.S. Bancorp Fund Services, LLC (2007 to 2016). |
Steve Jensen Year of birth: 1957 | Chief Compliance Officer and Anti-Money Laundering Officer | Indefinite term, February 2019 | Senior Vice President, U.S. Bancorp Fund Services, LLC (since 2011). |
46
TrueShares Structured Outcome ETFs
Board Consideration and Approval of Advisory and Sub-Advisory Agreements
December 31, 2020 (Unaudited)
At a meeting held on March 19, 2020 (the “Meeting”), the Board of Trustees (the “Board”) of Listed Funds Trust (the “Trust”), including those trustees who are not “interested persons” of the Trust, as defined in the Investment Company Act of 1940 (the “1940 Act”) (the “Independent Trustees”), considered the approval of an advisory agreement (the “Advisory Agreement”) between TrueMark Investments, LLC (the “Adviser”) and the Trust, on behalf of the Structured Outcome ETFs (the “Funds”) and a separate sub-advisory agreement (the “Sub-Advisory Agreement” and, together with the Advisory Agreement, the “Agreements”) between the Adviser, the Trust, and SpiderRock Advisors, LLC (the “Sub-Adviser”) with respect to the Funds.
Pursuant to Section 15 of the 1940 Act and related exemptive relief, the Agreements must be approved by: (i) the vote of the Trustees or a vote of the shareholders of the Funds; and (ii) the vote of a majority of the Independent Trustees, cast at a meeting called for the purpose of voting on such approval. In connection with its consideration of such approval, the Board must request and evaluate, and the Adviser and Sub-Adviser are required to furnish, such information as may be reasonably necessary to evaluate the terms of the Agreements. In addition, rules under the 1940 Act require an investment company to disclose in its shareholder reports the material factors and the conclusions with respect thereto that formed the basis for the Board’s approval of an investment advisory agreement.
Consistent with those responsibilities, prior to the Meeting, the Board reviewed written materials from the Adviser and Sub-Adviser and, during the Meeting, representatives from the Adviser and Sub-Adviser presented additional oral and written information to help the Board evaluate the Agreements. Among other things, representatives from the Adviser and Sub-Adviser provided overviews of their advisory businesses, including information on investment personnel, financial resources, experience, investment processes, and compliance program. The representatives discussed the services to be provided by the Adviser and Sub-Adviser, as well as the rationale for launching the Funds, the Funds’ proposed fees, and the operational aspects of the Funds. During the Meeting, the Board discussed the materials it received, including memoranda from legal counsel to the Trust on the responsibilities of the Trustees in considering the approval of the investment advisory agreements under the 1940 Act, considered the written materials that it received before the Meeting and the oral presentations, and deliberated on the approval of the Agreements in light of this information. Throughout the process, the Trustees were afforded the opportunity to ask questions of and request additional materials from the Adviser and Sub-Adviser. The Independent Trustees also met in executive session with counsel to the Trust to further discuss the proposed advisory and sub-advisory arrangements and the Trustees’ responsibilities relating thereto. The consideration of the Agreements was conducted by both the full Board and the Independent Trustees, who also voted separately.
At the Meeting, the Board and the Independent Trustees evaluated a number of factors, including, among other things: (i) the nature, extent, and quality of the services to be provided by the Adviser and Sub-Adviser to the Funds; (ii) Fund expenses and performance; (iii) the cost of the services to be provided and profits to be realized by each of the Adviser and Sub-Adviser from its relationship with the Trust and the Funds; (iii) comparative fee and expense data for the Funds and other investment companies with similar investment objectives; (iv) the extent to which economies of scale would be realized as the Funds grow and whether the overall advisory fee for the Funds would enable investors to share in the benefits of economies of scale; (v) any benefits to be derived by the Adviser or Sub-Adviser from the relationship with the Trust, including any fall-out benefits enjoyed by the Adviser or Sub-Adviser; and (vi) other factors the Board deemed relevant. In its deliberations, the Board did not identify any single piece of information that was paramount or controlling and the individual Trustees may have attributed different weights to various factors.
Nature, Extent, and Quality of Services to be Provided. The Trustees considered the scope of services to be provided under the Agreements, noting that these services include, among other things, furnishing a continuous investment program for the Funds, including arranging for, or implementing, the purchase and sale of portfolio securities, the provision of related services such as portfolio management compliance services, and the preparation and filing of certain reports on behalf of the Trust. The Trustees reviewed the extensive responsibilities that the Adviser will have as investment adviser to the Funds, including the oversight of the activities and operations of the Sub-Adviser and other service providers, oversight of general fund compliance with federal and state laws, and the implementation of Board directives as they relate to the Funds. The Board also considered, among other things, the professional experience and qualifications of the senior management and key professional personnel of the Adviser and Sub-Adviser, including those individuals responsible for portfolio management. The Board also considered the Adviser’s and Sub-Adviser’s operational capabilities and resources and their experience in managing investment portfolios. The Board concluded that, within the context of its full deliberations, it was satisfied with the nature, extent and quality of the services to be provided to the Funds by the Adviser and Sub-Adviser.
47
TrueShares Structured Outcome ETFs
Board Consideration and Approval of Advisory and Sub-Advisory Agreements
December 31, 2020 (Unaudited) (Continued)
Fund Expenses and Performance. Because the Funds had not yet commenced operations, the Board noted that there were no historical performance records to consider. The Board was presented with information about each Fund’s investment strategies and expected break-even expense analyses. The Board also reviewed information regarding each Fund’s proposed advisory and sub-advisory fees, including advisory fees and total expense ratios of those funds that might be considered peers of the Funds. Based on this review, the Board concluded that the investment advisory and sub-advisory fees and expense ratios appeared to be competitive and otherwise reasonable in light of the information provided.
Cost of Services to be Provided and Profitability. The Board considered the cost of the services to be provided by the Adviser and Sub-Adviser, the proposed advisory and sub-advisory fees, and the estimated profitability projected by the Adviser and Sub-Adviser, including the methodology underlying such projection. The Board also reviewed information regarding the estimated break-even point for the Funds taking into consideration potential direct and ancillary revenue received by the Adviser in connection with the services to be provided to the Funds. The Board took into consideration that the advisory fee for the Funds is a “unified fee,” meaning the Funds would pay no expenses other than the advisory fee and certain other specified costs such as interest, brokerage and extraordinary expenses and, to the extent it is implemented, fees pursuant to a Distribution and/or Shareholder Servicing (12b-1) Plan. The Board noted that the Adviser would be responsible for compensating the Trust’s other service providers, including the Sub-Adviser, and paying the Funds’ other expenses out of its own resources.
Economies of Scale. The Board discussed whether economies of scale would be realized by the Funds at higher asset levels. The Board also assessed whether certain of the Adviser’s and Sub-Adviser’s costs would increase if asset levels rise. The Board noted that since the Funds had not yet launched, it was difficult to estimate whether economies of scale might be realized in the future. The Board also noted, however, that any economies would, to some degree, be shared with Fund shareholders through a Fund’s unitary fee structure. In the event there were to be significant asset growth in a Fund, the Board determined to reassess whether the advisory and sub-advisory fees appropriately took into account any economies of scale that had been realized as a result of that growth.
Other Benefits to the Adviser and Sub-Adviser. In addition to evaluating the services provided by the Adviser and Sub-Adviser, the Board also considered the extent to which the Adviser or Sub-Adviser may realize other benefits from its relationship to a Fund. While the Board acknowledged that the Adviser or Sub-Adviser may experience reputational success if the Funds perform well in the future, it did not identify any other potential benefits at this early stage and agreed to reassess potential benefits at a future meeting. Based on its review, the Board concluded that any ancillary benefits would not be disadvantageous to a Fund’s shareholders.
Conclusion. Based on a consideration of all the factors in their totality, the Board, including a majority of the Independent Trustees separately, unanimously: (i) concluded that the terms of each Agreement are fair and reasonable; (ii) concluded that the proposed advisory and sub-advisory fees were fair and reasonable in light of the services to be provided; and (iii) determined that the approval of each Agreement for an initial term of two years was in the best interests of each Fund and its future shareholders.
48
TrueShares ETFs
Review of Liquidity Risk Management Program
(Unaudited)
Pursuant to Rule 22e-4 under the Investment Company Act of 1940, the Trust, on behalf of the series of the Trust covered by this shareholder report (the “Series”), has adopted a liquidity risk management program to govern the Trust’s approach to managing liquidity risk. Rule 22e-4 seeks to promote effective liquidity risk management, thereby reducing the risk that a fund will be unable to meet its redemption obligations and mitigating dilution of the interests of fund shareholders. The Trust’s liquidity risk management program is tailored to reflect the Series’ particular risks, but not to eliminate all adverse impacts of liquidity risk, which would be incompatible with the nature of such Series.
The investment adviser to the Series has adopted and implemented its own written liquidity risk management program (the “Program”) tailored specifically to assess and manage the liquidity risk of the Series. At a recent meeting of the Board of Trustees of the Trust, the Trustees received a report pertaining to the operation, adequacy, and effectiveness of implementation of the Program for the period ended December 31, 2019. The report concluded that the Program is reasonably designed to assess and manage the Series’ liquidity risk and has operated adequately and effectively to manage such risk. The report reflected that there were no liquidity events that impacted the Series’ ability to timely meet redemptions without dilution to existing shareholders. The report further noted that no material changes have been made to the Program since its implementation.
There can be no assurance that the Program will achieve its objectives in the future. Please refer to the prospectus for more information regarding the Series’ exposure to liquidity risk and other principal risks to which an investment in the Series may be subject.
49
TrueShares ETFs
Supplemental Information
(Unaudited)
Investors should consider the investment objective and policies, risk considerations, charges and ongoing expenses of an investment carefully before investing. The prospectus contains this and other information relevant to an investment in the Funds. Please read the prospectus carefully before investing. A copy of the Prospectus for the Funds may be obtained without charge by writing to the Funds, c/o U.S. Bank Global Fund Services, P.O. Box 701, Milwaukee, Wisconsin 53201-0701, by calling 1-800-617-0004, or by visiting the Funds’ website at www.true-shares.com
QUARTERLY PORTFOLIO HOLDING INFORMATION
Each Fund files its complete schedule of portfolio holdings for its first and third fiscal quarters with the Securities and Exchange Commission (“SEC”) on Part F of Form N-PORT. The Funds’ Part F of Form N-PORT is available without charge, upon request, by calling toll-free at 1-800-617-0004. Furthermore, you may obtain the Part F of Form N-PORT on the SEC’s website at www.sec.gov.
PROXY VOTING INFORMATION
Each Fund is required to file a Form N-PX, with the Fund’s complete proxy voting record for the 12 months ended June 30, no later than August 31 of each year. The Fund’s proxy voting record will be available without charge, upon request, by calling toll-free 1-800-617-0004 and on the SEC’s website at www.sec.gov.
FREQUENCY DISTRIBUTION OF PREMIUMS AND DISCOUNTS
Information regarding how often shares of the Funds trade on an exchange at a price above (i.e., at a premium) or below (i.e., at a discount) the NAV of the Funds is available without charge, on the Funds’ website at www.true-shares.com
TAX INFORMATION
For the fiscal period ended December 31, 2020, certain dividends paid by the Funds may be subject to a maximum tax rate of 15%, as provided for by the Jobs and Growth Tax Relief Reconciliation Act 2003. The percentage of dividends declared from ordinary income designated as qualified dividend income was as follows:
TrueShares ESG Active Opportunities ETF | 100.00% |
For corporate shareholders, the percent of ordinary income distributions qualifying for the corporate dividends received deduction for the fiscal period ended December 31, 2020 was as follows:
TrueShares ESG Active Opportunities ETF | 100.00% |
50
TrueShares ETFs
Privacy Policy
(Unaudited)
We are committed to respecting the privacy of personal information you entrust to us in the course of doing business with us.
The Funds collect non-public information about you from the following sources:
| | ● | Information we receive about you on applications or other forms; |
| | ● | Information you give us orally; and/or |
| | ● | Information about your transactions with us or others. |
We do not disclose any non-public personal information about our customers or former customers without the customer’s authorization, except as permitted by law or in response to inquiries from governmental authorities. We may share information with affiliated and unaffiliated third parties with whom we have contracts for servicing the Funds. We will provide unaffiliated third parties with only the information necessary to carry out their assigned responsibilities. We maintain physical, electronic and procedural safeguards to guard your non-public personal information and require third parties to treat your personal information with the same high degree of confidentiality.
In the event that you hold shares of the Funds through a financial intermediary, including, but not limited to, a broker-dealer, bank, or trust company, the privacy policy of your financial intermediary would govern how your non-public personal information would be shared by those entities with unaffiliated third parties.
51
THIS PAGE INTENTIONALLY LEFT BLANK
THIS PAGE INTENTIONALLY LEFT BLANK
Investment Adviser:
TrueMark Investments, LLC
9450 W. Bryn Mawr
Rosemont, IL 60018
Investment Sub-Advisers:
Black Hill Capital Partners, LLC
101 California St.
San Francisco, CA 94111
Purview Investments, LLC
208 East 51st St.
New York, NY 10022
SpiderRock Advisors, LLC
300 South Riverside Plaza, Suite 2340
Chicago, IL 60606
Legal Counsel:
Morgan, Lewis & Bockius LLP
1111 Pennsylvania Avenue, N.W.
Washington, D.C. 20004
Independent Registered Public Accounting Firm:
Cohen & Company, Ltd.
1350 Euclid Avenue, Suite 800
Cleveland, OH 44115
Distributor:
Foreside Fund Services, LLC
Three Canal Plaza, Suite 100
Portland, ME 04101
Administrator, Fund Accountant & Transfer Agent:
U.S. Bancorp Fund Services, LLC
d/b/a U.S. Bank Global Fund Services
615 E. Michigan St.
Milwaukee, WI 53202
Custodian:
U.S. Bank N.A.
1555 North RiverCenter Drive, Suite 302
Milwaukee, WI 53212
This information must be preceded or accompanied by a current prospectus for the Funds.
(b) Not applicable.
Item 2. Code of Ethics.
The registrant has adopted a code of ethics that applies to the registrant’s principal executive officer and principal financial officer. The Registrant has not made any substantive amendments to its code of ethics during the period covered by this report. The registrant has not granted any waivers from any provisions of the code of ethics during the period covered by this report.
A copy of the registrant’s Code of Ethics is filed herewith.
Item 3. Audit Committee Financial Expert.
The registrant’s Board of Trustees has determined that there is at least one audit committee financial expert serving on its audit committee. Mr. John Jacobs is the “audit committee financial expert” and is considered to be “independent” as each term is defined in Item 3 of Form N-CSR.
Item 4. Principal Accountant Fees and Services.
The registrant has engaged its principal accountant to perform audit services, audit-related services, tax services and other services during the past two fiscal years. “Audit services” refer to performing an audit of the registrant's annual financial statements or services that are normally provided by the accountant in connection with statutory and regulatory filings or engagements for those fiscal years. “Audit-related services” refer to the assurance and related services by the principal accountant that are reasonably related to the performance of the audit. “Tax services” refer to professional services rendered by the principal accountant for tax compliance, tax advice, and tax planning. There were no “Other services” provided by the principal accountant. The following table details the aggregate fees billed or expected to be billed for the last two fiscal years for audit fees, audit-related fees, tax fees and other fees by the principal accountant.
| | FYE 12/31/2020 | FYE 12/31/2019 |
| Audit Fees | $100,000 | N/A |
| Audit-Related Fees | $0 | N/A |
| Tax Fees | $24,000 | N/A |
| All Other Fees | $0 | N/A |
The audit committee has adopted pre-approval policies and procedures that require the audit committee to pre-approve all audit and non-audit services of the registrant, including services provided to any entity affiliated with the registrant.
The percentage of fees billed by Cohen & Company, Ltd. applicable to non-audit services pursuant to waiver of pre-approval requirement were as follows:
| | FYE 12/31/2020 | FYE 12/31/2019 |
| Audit-Related Fees | 0% | N/A |
| Tax Fees | 0% | N/A |
| All Other Fees | 0% | N/A |
All of the principal accountant’s hours spent on auditing the registrant’s financial statements were attributed to work performed by full-time permanent employees of the principal accountant.
The following table indicates the non-audit fees billed or expected to be billed by the registrant’s accountant for services to the registrant and to the registrant’s investment adviser (and any other controlling entity, etc.—not sub-adviser) for the last two years. The audit committee of the board of trustees/directors has considered whether the provision of non-audit services that were rendered to the registrant's investment adviser is compatible with maintaining the principal accountant's independence and has concluded that the provision of such non-audit services by the accountant has not compromised the accountant’s independence.
| Non-Audit Related Fees | FYE 12/31/2020 | FYE 12/31/2019 |
| Registrant | N/A | N/A |
| Registrant’s Investment Adviser | N/A | N/A |
.
Item 5. Audit Committee of Listed Registrants.
| (a) | The registrant is an issuer as defined in Rule 10A-3 under the Securities Exchange Act of 1934, (the “Act”) and has a separately-designated standing audit committee established in accordance with Section 3(a)(58)(A) of the Act. The entire Board of Trustees is acting as the registrant’s audit committee. |
Item 6. Investments.
| (a) | Schedule of Investments is included as part of the report to shareholders filed under Item 1 of this Form. |
Item 7. Disclosure of Proxy Voting Policies and Procedures for Closed-End Management Investment Companies.
Not applicable to open-end investment companies.
Item 8. Portfolio Managers of Closed-End Management Investment Companies.
Not applicable to open-end investment companies.
Item 9. Purchases of Equity Securities by Closed-End Management Investment Company and Affiliated Purchasers.
Not applicable to open-end investment companies.
Item 10. Submission of Matters to a Vote of Security Holders.
There have been no material changes to the procedures by which shareholders may recommend nominees to the registrant’s Board of Trustees.
Item 11. Controls and Procedures.
| (a) | The Registrant’s President and Treasurer have reviewed the Registrant's disclosure controls and procedures (as defined in Rule 30a-3(c) under the Investment Company Act of 1940 (the “Act”)) as of a date within 90 days of the filing of this report, as required by Rule 30a-3(b) under the Act and Rules 13a-15(b) or 15d-15(b) under the Securities Exchange Act of 1934. Based on their review, such officers have concluded that the disclosure controls and procedures are effective in ensuring that information required to be disclosed in this report is appropriately recorded, processed, summarized and reported and made known to them by others within the Registrant and by the Registrant’s service provider. |
| (b) | There were no changes in the Registrant's internal control over financial reporting (as defined in Rule 30a-3(d) under the Act) that occurred during the period covered by this report that have materially affected, or are reasonably likely to materially affect, the Registrant's internal control over financial reporting. |
Item 12. Disclosure of Securities Lending Activities for Closed-End Management Investment Companies
Not applicable to open-end investment companies.
Item 13. Exhibits.
(2) A separate certification for each principal executive officer and principal financial officer pursuant to Section 302 of the Sarbanes-Oxley Act of 2002. Filed herewith.
(3) Any written solicitation to purchase securities under Rule 23c-1 under the Act sent or given during the period covered by the report by or on behalf of the registrant to 10 or more persons. Not applicable to open-end investment companies.
(4) Change in the registrant’s independent public accountant. There was no change in the registrant’s independent public accountant for the period covered by this report.
SIGNATURES
Pursuant to the requirements of the Securities Exchange Act of 1934 and the Investment Company Act of 1940, the registrant has duly caused this report to be signed on its behalf by the undersigned, thereunto duly authorized.
| (Registrant) | Listed Funds Trust | |
| | |
| By (Signature and Title)* | /s/ Gregory C. Bakken | |
| Gregory C. Bakken, President/Principal Executive Officer | |
| | |
| Date | March 4, 2021 | |
Pursuant to the requirements of the Securities Exchange Act of 1934 and the Investment Company Act of 1940, this report has been signed below by the following persons on behalf of the registrant and in the capacities and on the dates indicated.
| By (Signature and Title)* | /s/ Gregory C. Bakken | |
| | Gregory C. Bakken, President/Principal Executive Officer | |
| | |
| | |
| Date | March 4, 2021 | |
| | |
| By (Signature and Title)* | /s/ Travis G. Babich | |
| | Travis G. Babich, Treasurer/Principal Financial Officer | |
| | |
| Date | March 4, 2021 | |
| * | Print the name and title of each signing officer under his or her signature. |