UNITED STATES
SECURITIES AND EXCHANGE COMMISSION
Washington, D.C. 20549
FORM N-CSR
CERTIFIED SHAREHOLDER REPORT OF REGISTERED MANAGEMENT INVESTMENT COMPANIES
Investment Company Act file number (811-23226)
Listed Funds Trust
(Exact name of registrant as specified in charter)
615 East Michigan Street
Milwaukee, WI 53202
(Address of principal executive offices) (Zip code)
Kent P. Barnes, Secretary
Listed Funds Trust
c/o U.S. Bancorp Fund Services, LLC
777 East Wisconsin Avenue, 10th Floor
Milwaukee, WI 53202
(Name and address of agent for service)
(414) 516-1681
Registrant's telephone number, including area code
Date of fiscal year end: December 31
Date of reporting period: June 30, 2023
Item 1. Reports to Stockholders.

Horizon Kinetics ETFs
Horizon Kinetics Inflation Beneficiaries ETF (INFL)
Horizon Kinetics Blockchain Development ETF (BCDF)
Horizon Kinetics Medical ETF (MEDX)
Horizon Kinetics SPAC Active ETF (SPAQ)
Horizon Kinetics Energy and Remediation ETF (NVIR)
SEMI-ANNUAL REPORT
June 30, 2023
(Unaudited)
Horizon Kinetics ETFs
Table of Contents
(Unaudited)
| | |
Shareholder Expense Example | 2 |
Schedules of Investments | 4 |
Statements of Assets and Liabilities | 13 |
Statements of Operations | 15 |
Statements of Changes in Net Assets | 17 |
Financial Highlights | 22 |
Notes to Financial Statements | 29 |
Supplemental Information | 40 |
Board Consideration and Approval of Advisory and Sub-Advisory Agreements | 42 |
Review of Liquidity Risk Management Program | 46 |
1
Horizon Kinetics ETFs
Shareholder Expense Example
(Unaudited)
As a shareholder of the Funds you incur two types of costs: (1) transaction costs, including brokerage commissions on purchases and sales of Fund shares; and (2) ongoing costs, including management fees and other fund expenses. The following example is intended to help you understand your ongoing costs (in dollars and cents) of investing in the Funds and to compare these costs with the ongoing costs of investing in other funds. The examples are based on an investment of $1,000 invested at the beginning of the period and held throughout the entire period (January 1, 2023 to June 30, 2023).
ACTUAL EXPENSES
The first line under each Fund in the table below provides information about actual account values and actual expenses. You may use the information in this line, together with the amount you invested, to estimate the expenses that you paid over the period. Simply divide your account value by $1,000 (for example, an $8,600 account value divided by $1,000 = 8.6), then multiply the result by the number in the first line for your Fund under the heading entitled “Expenses Paid During Period” to estimate the expenses you paid on your account during this period.
HYPOTHETICAL EXAMPLE FOR COMPARISON PURPOSES
The second line in the table provides information about hypothetical account values and hypothetical expenses based on each Fund’s actual expense ratio and an assumed rate of return of 5% per year before expenses, which is not the Fund’s actual return. The hypothetical account values and expenses may not be used to estimate the actual ending account balance or expenses you paid for the period. You may use this information to compare the ongoing costs of investing in the Fund and other funds. To do so, compare this 5% hypothetical example with the 5% hypothetical examples that appear in the shareholder reports of the other funds. Please note that the expenses shown in the table are meant to highlight your ongoing costs only and do not reflect any transactional costs, such as brokerage commissions paid on purchases and sales of Fund shares. Therefore, the second line in the table is useful in comparing ongoing Fund costs only and will not help you determine the relative total costs of owning different funds. In addition, if these transactional costs were included, your costs would have been higher.
| | Beginning
Account Value
1/1/23 | Ending
Account Value
6/30/23 | Annualized
Expense
Ratios | Expenses
Paid During
the Period(1) |
Horizon Kinetics Inflation Beneficiaries ETF | | | | |
Actual | $ 1,000.00 | $ 979.70 | 0.85% | $ 4.17 |
Hypothetical (5% return before expenses) | $ 1,000.00 | $ 1,020.58 | 0.85% | $ 4.26 |
Horizon Kinetics Blockchain Development ETF | | | | |
Actual | $ 1,000.00 | $ 1,097.00 | 0.85% | $ 4.42 |
Hypothetical (5% return before expenses) | $ 1,000.00 | $ 1,020.58 | 0.85% | $ 4.26 |
Horizon Kinetics Medical ETF | | | | |
Actual | $ 1,000.00 | $ 969.90 | 0.93% | $ 4.54 |
Hypothetical (5% return before expenses) | $ 1,000.00 | $ 1,020.18 | 0.93% | $ 4.66 |
Horizon Kinetics SPAC Active ETF | | | | |
Actual | $ 1,000.00 | $ 1,034.30 | 0.86% | $ 4.34 |
Hypothetical (5% return before expenses) | $ 1,000.00 | $ 1,020.53 | 0.86% | $ 4.31 |
(1) | Expenses are calculated using the Fund’s annualized expense ratio, multiplied by the average account value for the period, multiplied by 181/365 (to reflect the six-month period). |
2
Horizon Kinetics ETFs
Shareholder Expense Example
(Unaudited) (Continued)
| | Hypothetical
Account Value
1/1/23 | Beginning
Account Value
2/21/23^ | Ending
Account Value
6/30/23 | Annualized
Expense
Ratios | Expenses
Paid During
the Period |
Horizon Kinetics Energy and Remediation ETF | | | | | |
Actual | N/A | $ 1,000.00 | $ 1,014.90 | 0.85% | $ 3.05(1) |
Hypothetical (5% return before expenses) | $ 1,000.00 | N/A | $ 1,020.58 | 0.85% | $ 3.29(2) |
^ | Fund commenced operations on February 21, 2023. |
(1) | Actual expenses are calculated using the Fund’s annualized expense ratio multiplied by the average account value during the period, multiplied by the number of days since inception, 130 days, and divided by the number of days in the most recent twelve-month period, 365 days. |
(2) | Hypothetical expenses are calculated using the Fund’s annualized expense ratio multiplied by the average account value during the period, multiplied by the number of days in the most recent six-month period, 181 days, and divided by the number of days in the most recent twelve-month period, 365 days. |
3
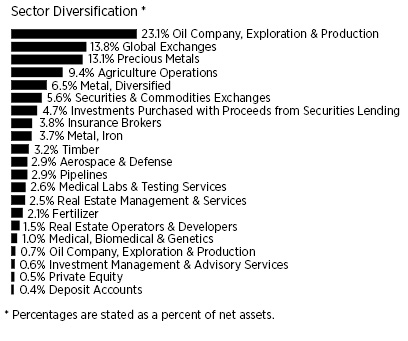
Horizon Kinetics Inflation Beneficiaries ETF
Schedule of Investments
June 30, 2023 (Unaudited)
| | Shares | | | Value | |
COMMON STOCKS — 98.8% |
Aerospace & Defense — 2.9% |
CACI International, Inc. - Class A (a) | | | 89,305 | | | $ | 30,438,716 | |
| | | | | | | | | |
Agriculture Operations — 9.4% | | | | | | | | |
Archer-Daniels-Midland Co. | | | 627,238 | | | | 47,394,103 | |
Bunge Ltd. (b) | | | 345,015 | | | | 32,552,165 | |
Clarkson PLC (b) | | | 92,250 | | | | 3,471,528 | |
Wilmar International Ltd. (b) | | | 4,945,217 | | | | 13,885,414 | |
| | | | | | | | 97,303,210 | |
Fertilizer — 2.1% | | | | | | | | |
Nutrien Ltd. | | | 369,807 | | | | 21,837,103 | |
| | | | | | | | | |
Global Exchanges — 13.7% | | | | | | | | |
ASX Ltd. (b) | | | 639,742 | | | | 26,828,206 | |
Aurubis AG (b) | | | 285,030 | | | | 24,423,413 | |
Deutsche Boerse AG (b) | | | 177,162 | | | | 32,684,291 | |
Japan Exchange Group, Inc. (b) | | | 432,656 | | | | 7,507,533 | |
Singapore Exchange Ltd. (b) | | | 3,937,403 | | | | 27,959,096 | |
TMX Group Ltd. (a)(b) | | | 1,008,395 | | | | 22,716,989 | |
| | | | | | | | 142,119,528 | |
Insurance Brokers — 3.7% | | | | | | | | |
Marsh & McLennan Cos., Inc. | | | 205,880 | | | | 38,721,910 | |
| | | | | | | | | |
Investment Management & Advisory Services — 0.6% | | | | | | | | |
Sprott, Inc. (b)(d) | | | 201,384 | | | | 6,524,842 | |
| | | | | | | | | |
Medical Labs & Testing Services — 2.6% | | | | | | | | |
Charles River Laboratories International, Inc. (a) | | | 129,102 | | | | 27,143,696 | |
| | | | | | | | | |
Medical, Biomedical & Genetics — 1.0% | | | | | | | | |
Royalty Pharma PLC - Class A (b) | | | 332,839 | | | | 10,231,471 | |
| | | | | | | | | |
Metal, Diversified — 6.5% | | | | | | | | |
Altius Minerals Corp. (a)(b) | | | 508,108 | | | | 8,409,269 | |
Cameco Corp. (b) | | | 660,074 | | | | 20,680,119 | |
Glencore PLC (b) | | | 6,785,296 | | | | 38,344,509 | |
| | | | | | | | 67,433,897 | |
Metal, Iron — 3.7% | | | | | | | | |
Deterra Royalties Ltd. (b) | | | 6,336,092 | | | | 19,401,063 | |
Labrador Iron Ore Royalty Corp. (a)(b)(d) | | | 322,206 | | | | 7,567,854 | |
Mesabi Trust | | | 550,552 | | | | 11,236,766 | |
| | | | | | | | 38,205,683 | |
Oil Company, Exploration & Production — 23.1% | | | | | | | | |
Permian Basin Royalty Trust | | | 1,100,830 | | | | 27,443,692 | |
PrairieSky Royalty, Ltd. (a)(b)(d) | | | 3,545,419 | | | | 62,053,205 | |
Sabine Royalty Trust | | | 26,628 | | | | 1,755,850 | |
San Juan Basin Royalty Trust (d) | | | 106,929 | | | | 794,482 | |
Sitio Royalties Corp. (d) | | | 1,629,860 | | | | 42,816,422 | |
Texas Pacific Land Corp. | | | 36,945 | | | | 48,638,093 | |
Topaz Energy Corp. (a)(b) | | | 525,495 | | | | 8,192,679 | |
Viper Energy Partners LP | | | 1,764,183 | | | | 47,333,030 | |
| | | | | | | | 239,027,453 | |
Pipelines — 2.9% | | | | | | | | |
Cheniere Energy, Inc. | | | 197,540 | | | | 30,097,194 | |
| | | | | | | | | |
Precious Metals — 13.1% | | | | | | | | |
Franco-Nevada Corp. (b) | | | 311,454 | | | | 44,413,341 | |
Metalla Royalty & Streaming Ltd. (a)(b) | | | 390,000 | | | | 1,692,600 | |
Osisko Gold Royalties Ltd. (b) | | | 1,786,644 | | | | 27,460,718 | |
Sandstorm Gold Ltd. (b) | | | 2,233,668 | | | | 11,436,380 | |
Wheaton Precious Metals Corp. (b) | | | 1,164,617 | | | | 50,334,747 | |
| | | | | | | | 135,337,786 | |
Private Equity — 0.5% | | | | | | | | |
Brookfield Asset Management Ltd. (b) | | | 158,303 | | | | 5,165,427 | |
| | | | | | | | | |
Real Estate Management & Services — 2.5% | | | | | | | | |
CBRE Group, Inc. - Class A (a) | | | 321,346 | | | | 25,935,836 | |
| | | | | | | | | |
Real Estate Operators & Developers — 1.5% | | | | | | | | |
The St. Joe Co. | | | 319,308 | | | | 15,435,349 | |
| | | | | | | | | |
Securities & Commodities Exchanges — 5.6% | | | | | | | | |
CME Group, Inc. | | | 85,436 | | | | 15,830,436 | |
Intercontinental Exchange, Inc. | | | 375,035 | | | | 42,408,958 | |
| | | | | | | | 58,239,394 | |
The accompanying notes are an integral part of the financial statements.
4
Horizon Kinetics Inflation Beneficiaries ETF
Schedule of Investments
June 30, 2023 (Unaudited) (Continued)
| | Shares | | | Value | |
Timber — 3.2% | | | | | | | | |
West Fraser Timber Co. Ltd. (b) | | | 386,866 | | | $ | 33,262,739 | |
TOTAL COMMON STOCKS (Cost $1,067,216,208) | | | | | | | 1,022,461,234 | |
| | | | | | | | | |
PARTNERSHIPS — 0.7% | | | | | | | | |
Oil Company, Exploration & Production — 0.7% | | | | | | | | |
Dorchester Minerals LP | | | 241,755 | | | | 7,242,980 | |
TOTAL PARTNERSHIPS (Cost $2,002,583) | | | | | | | 7,242,980 | |
| | | | | | | | | |
SHORT TERM INVESTMENTS — 0.4% | | | | | | | | |
Deposit Accounts — 0.4% | | | | | | | | |
U.S. Bank Money Market Deposit Account, 5.35% (c) | | | 4,101,288 | | | | 4,101,288 | |
TOTAL SHORT TERM INVESTMENTS (Cost $4,101,288) | | | | | | | 4,101,288 | |
| | | | | | | | | |
INVESTMENTS PURCHASED WITH PROCEEDS FROM SECURITIES LENDING — 4.7% | | | | | | | | |
U.S. Bank Money Market Deposit Account, 5.35% (c) | | | 48,266,085 | | | | 48,266,085 | |
TOTAL INVESTMENTS PURCHASED WITH PROCEEDS FROM SECURITIES LENDING (Cost $48,266,085) | | | | | | | 48,266,085 | |
| | | | | | | | | |
TOTAL INVESTMENTS — 104.6% (Cost $1,121,586,164) | | | | | | | 1,082,071,587 | |
Other assets and liabilities, net — (4.6)% | | | | | | | (47,612,670 | ) |
NET ASSETS — 100.0% | | | | | | $ | 1,034,458,917 | |
PLC | Public Limited Company |
(a) | Non-income producing security. |
(b) | Foreign issued security, or represents a foreign issued security. |
(c) | The rate shown is the seven-day yield at period end. |
(d) | All or a portion of this security is on loan as of June 30, 2023. The market value of securities out on loan is $46,505,935. |
COUNTRY | | Percentage of
Net Assets | |
United States | | | 50.6 | % |
Canada | | | 26.1 | %* |
Germany | | | 5.5 | % |
Australia | | | 4.5 | % |
Singapore | | | 4.0 | % |
Jersey | | | 3.7 | % |
Bermuda | | | 3.1 | % |
United Kingdom | | | 1.3 | % |
Japan | | | 0.7 | % |
Total Country | | | 99.5 | % |
SHORT-TERM INVESTMENTS | | | 0.4 | % |
INVESTMENTS PURCHASED WITH PROCEEDS FROM SECURITIES LENDING | | | 4.7 | % |
TOTAL INVESTMENTS | | | 104.6 | % |
Other assets and liabilities, net | | | (4.6 | )% |
NET ASSETS | | | 100.0 | % |
* | To the extent the Fund invests more heavily in particular countries, its performance will be especially sensitive to developments that significantly affect those countries. |
The accompanying notes are an integral part of the financial statements.
5
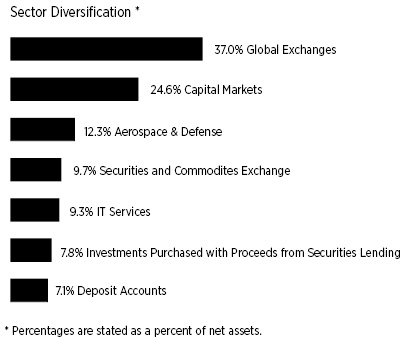
Horizon Kinetics Blockchain Development ETF
Schedule of Investments
June 30, 2023 (Unaudited)
| | Shares | | | Value | |
COMMON STOCKS — 92.9% |
Aerospace & Defense — 12.3% |
Science Applications International Corp. | | | 1,335 | | | $ | 150,161 | |
CACI International, Inc. - Class A (a) | | | 535 | | | | 182,350 | |
| | | | | | | | 332,511 | |
Capital Markets — 24.6% | | | | | | | | |
Bakkt Holdings, Inc.(a)(d) | | | 69,965 | | | | 86,057 | |
Galaxy Digital Holdings Ltd.(a)(b) | | | 28,655 | | | | 124,083 | |
MarketAxess Holdings, Inc. | | | 305 | | | | 79,733 | |
OTC Markets Group, Inc. | | | 725 | | | | 41,760 | |
Tradeweb Markets, Inc. - Class A | | | 1,253 | | | | 85,806 | |
Urbana Corp. - Class A (b) | | | 44,882 | | | | 128,210 | |
WisdomTree Investments, Inc. | | | 17,630 | | | | 120,942 | |
| | | | | | | | 666,591 | |
Global Exchanges — 37.0% (e) | | | | | | | | |
ASX, Ltd. (b) | | | 3,085 | | | | 129,373 | |
Cboe Global Markets, Inc. | | | 1,010 | | | | 139,390 | |
Deutsche Boerse AG (b) | | | 935 | | | | 172,496 | |
Japan Exchange Group, Inc. (b) | | | 6,770 | | | | 117,474 | |
London Stock Exchange Group PLC (b) | | | 1,265 | | | | 134,546 | |
Nasdaq, Inc. | | | 900 | | | | 44,865 | |
Singapore Exchange, Ltd. (b) | | | 17,910 | | | | 127,177 | |
TMX Group, Ltd. (b) | | | 6,035 | | | | 135,956 | |
| | | | | | | | 1,001,277 | |
IT Services — 9.3% | | | | | | | | |
Applied Digital Corp. (a)(d) | | | 14,470 | | | | 135,295 | |
Digital Garage, Inc. (b) | | | 4,390 | | | | 116,481 | |
| | | | | | | | 251,776 | |
| | | | | | | | | |
Securities & Commodities Exchanges — 9.7% | | | | | | | | |
CME Group, Inc. | | | 630 | | | | 116,733 | |
Intercontinental Exchange, Inc. | | | 1,280 | | | | 144,742 | |
| | | | | | | | 261,475 | |
TOTAL COMMON STOCKS (Cost $2,438,232) | | | | | | | 2,513,630 | |
| | | | | | | | | |
SHORT TERM INVESTMENTS — 7.1% | | | | | | | | |
Deposit Accounts — 7.1% | | | | | | | | |
U.S. Bank Money Market Deposit Account, 5.35% (c) | | | 191,900 | | | | 191,900 | |
TOTAL SHORT TERM INVESTMENTS (Cost $191,900) | | | | | | | 191,900 | |
| | | | | | | | | |
INVESTMENTS PURCHASED WITH PROCEEDS FROM SECURITIES LENDING — 7.8% | | | | | | | | |
U.S. Bank Money Market Deposit Account, 5.35% (c) | | | 211,470 | | | | 211,470 | |
TOTAL INVESTMENTS PURCHASED WITH PROCEEDS FROM SECURITIES LENDING (Cost $211,470) | | | | | | | 211,470 | |
| | | | | | | | | |
TOTAL INVESTMENTS (Cost $2,841,602) — 107.8% | | | | | | | 2,917,000 | |
Other assets and liabilities, net — (7.8)% | | | | | | | (211,333 | ) |
NET ASSETS — 100.0% | | | | | | $ | 2,705,667 | |
PLC | Public Limited Company |
(a) | Non-income producing security. |
(b) | Foreign issued security, or represents a foreign issued security. |
(c) | The rate shown is the seven-day yield at period end. |
(d) | All or a portion of this security is on loan as of June 30, 2023. The market value of securities out on loan is $218,649. |
(e) | To the extent the Fund invests more heavily in particular sectors of the economy, its performance will be especially sensitive to developments that significantly affect those sectors. |
The accompanying notes are an integral part of the financial statements.
6
Horizon Kinetics Blockchain Development ETF
Schedule of Investments
June 30, 2023 (Unaudited) (Continued)
COUNTRY | | Percentage of
Net Assets | |
United States | | | 49.1 | % |
Canada | | | 14.3 | % |
Japan | | | 8.6 | % |
Germany | | | 6.4 | % |
United Kingdom | | | 5.0 | % |
Australia | | | 4.8 | % |
Singapore | | | 4.7 | % |
Total Country | | | 92.9 | % |
SHORT-TERM INVESTMENTS | | | 7.1 | % |
INVESTMENTS PURCHASED WITH PROCEEDS FROM SECURITIES LENDING | | | 7.8 | % |
TOTAL INVESTMENTS | | | 107.8 | % |
Other assets and liabilities, net | | | (7.8 | )% |
NET ASSETS | | | 100.0 | % |
The accompanying notes are an integral part of the financial statements.
7
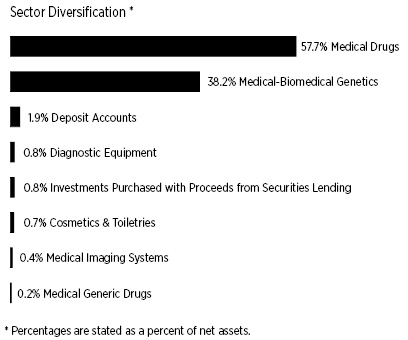
Horizon Kinetics Medical ETF
Schedule of Investments
June 30, 2023 (Unaudited)
| | Shares | | | Value | |
COMMON STOCKS — 98.0% |
Cosmetics & Toiletries — 0.7% |
Haleon PLC (b)(e) | | | 14,673 | | | $ | 122,960 | |
| | | | | | | | | |
Diagnostic Equipment — 0.8% | | | | | | | | |
Pacific Biosciences of California, Inc.(a) | | | 12,000 | | | | 159,600 | |
| | | | | | | | | |
Medical Imaging Systems — 0.4% | | | | | | | | |
GE HealthCare Technologies, Inc. | | | 1,000 | | | | 81,240 | |
| | | | | | | | | |
Medical-Biomedical/Genetics — 38.2% (g) | | | | | | | | |
2seventy bio, Inc.(a) | | | 18,000 | | | | 182,160 | |
Allogene Therapeutics, Inc.(a) | | | 20,000 | | | | 99,400 | |
Alnylam Pharmaceuticals, Inc.(a) | | | 3,000 | | | | 569,820 | |
Amgen, Inc. | | | 3,500 | | | | 777,070 | |
Beam Therapeutics, Inc.(a) | | | 10,000 | | | | 319,300 | |
Bicycle Therapeutics PLC (a)(b) | | | 15,000 | | | | 382,800 | |
Biogen, Inc.(a) | | | 3,250 | | | | 925,762 | |
Bluebird Bio, Inc.(a) | | | 38,000 | | | | 125,020 | |
CRISPR Therapeutics AG (a)(b) | | | 11,000 | | | | 617,540 | |
Editas Medicine, Inc.(a) | | | 33,000 | | | | 271,590 | |
Gilead Sciences, Inc. | | | 9,000 | | | | 693,630 | |
Immune Pharmaceuticals, Inc. (a)(d)(f) | | | 1 | | | | — | |
Intellia Therapeutics, Inc.(a) | | | 15,000 | | | | 611,700 | |
Ionis Pharmaceuticals, Inc.(a) | | | 13,000 | | | | 533,390 | |
Lantern Pharma, Inc.(a) | | | 30,000 | | | | 169,200 | |
Rain Oncology, Inc.(a)(e) | | | 25,000 | | | | 30,000 | |
Regeneron Pharmaceuticals, Inc.(a) | | | 750 | | | | 538,905 | |
Replimune Group, Inc.(a) | | | 15,000 | | | | 348,300 | |
Salarius Pharmaceuticals, Inc.(a) | | | 32,400 | | | | 48,276 | |
| | | | | | | | 7,243,863 | |
Medical-Drugs — 57.7% (g) | | | | | | | | |
AbbVie, Inc. | | | 8,000 | | | | 1,077,840 | |
Alkermes PLC (a)(b) | | | 24,000 | | | | 751,200 | |
AstraZeneca PLC (b) | | | 13,000 | | | | 930,410 | |
Bristol-Myers Squibb Co. | | | 18,500 | | | | 1,183,075 | |
Eli Lilly & Co. | | | 3,500 | | | | 1,641,430 | |
Galectin Therapeutics, Inc.(a) | | | 56,000 | | | | 80,640 | |
GSK PLC (b) | | | 11,738 | | | | 418,342 | |
Johnson & Johnson | | | 6,000 | | | | 993,120 | |
Merck & Co, Inc. | | | 7,000 | | | | 807,730 | |
Novartis AG (b) | | | 10,000 | | | | 1,009,100 | |
Organon & Co. | | | 8,400 | | | | 174,804 | |
Pfizer, Inc. | | | 27,000 | | | | 990,360 | |
Sanofi (b) | | | 13,000 | | | | 700,700 | |
Vanda Pharmaceuticals, Inc.(a) | | | 27,000 | | | | 177,930 | |
| | | | | | | | 10,936,681 | |
Medical-Generic Drugs — 0.2% | | | | | | | | |
Viatris, Inc. | | | 3,722 | | | | 37,146 | |
TOTAL COMMON STOCKS (Cost $12,089,420) | | | | | | | 18,581,490 | |
| | | | | | | | | |
SHORT TERM INVESTMENTS — 1.9% | | | | | | | | |
Deposit Accounts — 1.9% | | | | | | | | |
U.S. Bank Money Market Deposit Account, 5.35% | | | 363,228 | | | | 363,228 | |
TOTAL SHORT TERM INVESTMENTS (Cost $363,228) | | | | | | | 363,228 | |
| | | | | | | | | |
INVESTMENTS PURCHASED WITH PROCEEDS FROM SECURITIES LENDING — 0.8% | | | | | | | | |
U.S. Bank Money Market Deposit Account, 5.35% (c) | | | 153,721 | | | | 153,721 | |
TOTAL INVESTMENTS PURCHASED WITH PROCEEDS FROM SECURITIES LENDING (Cost $153,721) | | | | | | | 153,721 | |
| | | | | | | | | |
TOTAL INVESTMENTS — 100.7% (Cost $12,606,369) | | | | | | | 19,098,439 | |
Other assets and liabilities, net — (0.7)% | | | | | | | (127,336 | ) |
NET ASSETS — 100.0% | | | | | | $ | 18,971,103 | |
Percentages are stated as a percent of net assets.
PLC | Public Limited Company |
(a) | Non-income producing security. |
(b) | Foreign issued security, or represents a foreign issued security. |
(c) | The rate shown is the seven-day yield at period end. |
(d) | Security has been deemed illiquid according to the Fund’s liquidity guidelines. The value of this security totals $0, which represents 0.00% of total net assets. |
(e) | All or a portion of this security is on loan as of June 30, 2023. The market value of securities out on loan is $150,768. |
The accompanying notes are an integral part of the financial statements.
8
Horizon Kinetics Medical ETF
Schedule of Investments
June 30, 2023 (Unaudited) (Continued)
(f) | Value determined based on estimated fair value. The value of this security totals $0, which represents 0.00% of total net assets. Classified as Level 3 in the fair value hierarchy. Please refer to Note #2 of the Notes to Financial Statements. |
(g) | To the extent the Fund invests more heavily in particular sectors of the economy, its performance will be especially sensitive to developments that significantly affect those sectors. |
The accompanying notes are an integral part of the financial statements.
9
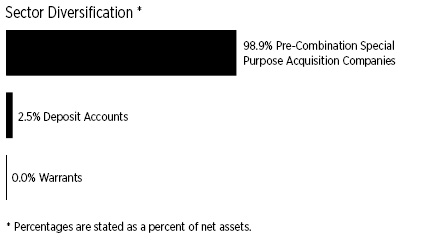
Horizon Kinetics SPAC Active ETF
Schedule of Investments
June 30, 2023 (Unaudited)
| | Shares | | | Value | |
COMMON STOCKS — 98.9% |
Pre-Combination Special Purpose Acquisition Companies — 98.9% (a) |
Alchemy Invts Acquisitn Corp. - Class A | | | 50,000 | | | $ | 509,250 | |
Andretti Acquisition Corp.(b) | | | 40,015 | | | | 425,760 | |
Aura FAT Projects Acquisition Corp.(b) | | | 17,775 | | | | 188,059 | |
Bilander Acquisition Corp. | | | 39,258 | | | | 398,469 | |
Bukit Jalil Global Acquisition 1 Ltd. - Unit (b) | | | 50,000 | | | | 509,000 | |
Cartesian Growth Corp.II (b) | | | 66,614 | | | | 710,771 | |
Chenghe Acquisition Co. (b) | | | 56,381 | | | | 603,277 | |
Consilium Acquisition Corp I Ltd.(b) | | | 67,251 | | | | 705,799 | |
Conyers Park III Acquisition Corp. | | | 69,000 | | | | 705,180 | |
Elliott Opportunity II Corp. (b) | | | 39,244 | | | | 406,568 | |
Embrace Change Acquisition Corp. (b) | | | 34,624 | | | | 366,322 | |
Enphys Acquisition Corp. | | | 68,296 | | | | 709,595 | |
ESH Acquisition Corp. - Unit | | | 40,000 | | | | 405,600 | |
Everest Consolidator Acquisition Corp. | | | 41,949 | | | | 446,757 | |
Golden Star Acquisition Corp. - Unit (b) | | | 48,000 | | | | 499,680 | |
Gores Holdings IX, Inc. | | | 45,567 | | | | 467,062 | |
Infinite Acquisition Corp. (b) | | | 30,000 | | | | 317,100 | |
Inflection Point Acquisition Corp II - Unit (b) | | | 50,000 | | | | 506,000 | |
Investcorp Europe Acquisition Corp I (b) | | | 58,132 | | | | 619,978 | |
Kensington Capital Acquisition Corp V (b) | | | 76,426 | | | | 807,058 | |
KnightSwan Acquisition Corp. | | | 30,000 | | | | 317,100 | |
Live Oak Crestview Climate Acquisition Corp. | | | 68,117 | | | | 698,199 | |
Pearl Holdings Acquisition Corp. (b) | | | 45,278 | | | | 478,136 | |
Screaming Eagle Acquisition Corp. (b) | | | 58,159 | | | | 600,782 | |
SILVERspac, Inc. (b) | | | 52,015 | | | | 540,436 | |
SK Growth Opportunities Corp. (b) | | | 45,000 | | | | 476,550 | |
Spring Valley Acquisition Corp II (b) | | | 50,000 | | | | 528,250 | |
Waverley Capital Acquisition Corp 1 (b) | | | 20,821 | | | | 215,914 | |
TOTAL COMMON STOCKS (Cost $13,948,192) | | | | | | | 14,162,652 | |
| | | | | | | | | |
WARRANTS — 0.0% (c) | | | | | | | | |
Alchemy Investments Acquisition Corp., Expiration: November 30, 2027, Exercise Price: $11.50 (b) | | | 25,000 | | | | 4,625 | |
TOTAL WARRANTS (Cost $3,632) | | | | | | | 4,625 | |
| | | | | | | | | |
SHORT TERM INVESTMENTS — 2.5% | | | | | | | | |
Deposit Accounts — 2.5% | | | | | | | | |
U.S. Bank Money Market Deposit Account, 5.35% | | | 359,483 | | | | 359,483 | |
TOTAL SHORT TERM INVESTMENTS (Cost $359,483) | | | | | | | 359,483 | |
| | | | | | | | | |
TOTAL INVESTMENTS — 101.4% (Cost $14,311,307) | | | | | | | 14,526,760 | |
Other assets and liabilities, net — (1.4)% | | | | | | | (200,918 | ) |
NET ASSETS — 100.0% | | | | | | $ | 14,325,842 | |
Percentages are stated as a percent of net assets.
(a) | Non-income producing security. |
(b) | Foreign issued security, or represents a foreign issued security. |
(c) | Amount is less than 0.05%. |
COUNTRY | | Percentage of
Net Assets | |
United States | | | 24.0 | % |
Cayman Islands | | | 74.9 | %* |
Total Country | | | 98.9 | % |
SHORT-TERM INVESTMENTS | | | 2.5 | % |
TOTAL INVESTMENTS | | | 101.4 | % |
Other assets and liabilities, net | | | (1.4 | )% |
NET ASSETS | | | 100.0 | % |
* | To the extent the Fund invests more heavily in particular countries, its performance will be especially sensitive to developments that significantly affect those countries. |
The accompanying notes are an integral part of the financial statements.
10
Horizon Kinetics Energy and Remediation ETF
Schedule of Investments
June 30, 2023 (Unaudited)

| | Shares | | | Value | |
COMMON STOCKS — 93.8% |
Chemical-Specialty — 2.0% |
Ecolab, Inc. | | | 264 | | | $ | 49,286 | |
| | | | | | | | | |
Diagnostic Equipment — 1.6% | | | | | | | | |
Danaher Corp. | | | 164 | | | | 39,360 | |
| | | | | | | | | |
Diagnostic Kits — 1.7% | | | | | | | | |
IDEXX Laboratories, Inc. (a) | | | 84 | | | | 42,187 | |
| | | | | | | | | |
Electronic Measure Instruments — 4.2% | | | | | | | | |
Badger Meter, Inc. | | | 352 | | | | 51,941 | |
Itron, Inc. (a) | | | 736 | | | | 53,066 | |
| | | | | | | | 105,007 | |
Engineering/R&D Services — 1.4% | | | | | | | | |
Fluor Corp. (a) | | | 1,144 | | | | 33,863 | |
| | | | | | | | | |
Machinery-Electrical — 1.8% | | | | | | | | |
Franklin Electric Co, Inc. | | | 444 | | | | 45,688 | |
| | | | | | | | | |
Machinery-Genral Industry — 1.6% | | | | | | | | |
IDEX Corp. | | | 184 | | | | 39,608 | |
| | | | | | | | | |
Machinery-Pumps — 5.3% | | | | | | | | |
Flowserve Corp. | | | 1,196 | | | | 44,431 | |
Watts Water Technologies, Inc. | | | 236 | | | | 43,360 | |
Xylem, Inc./NY | | | 400 | | | | 45,048 | |
| | | | | | | | 132,839 | |
Oil Company, Exploration & Production — 30.5%(f) | | | | | | | | |
Chesapeake Energy Corp. | | | 1,140 | | | | 95,395 | |
ConocoPhillips | | | 880 | | | | 91,177 | |
Denbury, Inc. (a) | | | 1,120 | | | | 96,611 | |
Diamondback Energy, Inc. | | | 680 | | | | 89,325 | |
Oil Company, Exploration & Production — 30.5%(f) (continued) | | | | |
EOG Resources, Inc. | | | 776 | | | | 88,806 | |
EQT Corp. | | | 2,964 | | | | 121,909 | |
Occidental Petroleum Corp. | | | 1,524 | | | | 89,611 | |
Pioneer Natural Resources Co. | | | 440 | | | | 91,159 | |
| | | | | | | | 763,993 | |
Oil Company-Integrated — 3.2% | | | | | | | | |
Suncor Energy, Inc. (b) | | | 2,772 | | | | 81,275 | |
| | | | | | | | | |
Oil-Field Services — 17.9% | | | | | | | | |
Calfrac Well Services, Ltd. (a)(b) | | | 9,548 | | | | 27,708 | |
CES Energy Solutions Corp. (b) | | | 19,764 | | | | 39,132 | |
Enerflex, Ltd. (b) | | | 6,660 | | | | 45,421 | |
Liberty Energy, Inc. | | | 2,772 | | | | 37,062 | |
Oil States International, Inc. (a) | | | 9,040 | | | | 67,529 | |
Schlumberger, Ltd. (b) | | | 1,692 | | | | 83,111 | |
Secure Energy Services, Inc. (b) | | | 6,964 | | | | 33,366 | |
STEP Energy Services, Ltd. (a)(b)(d) | | | 13,280 | | | | 32,717 | |
TETRA Technologies, Inc. (a) | | | 10,880 | | | | 36,774 | |
Trican Well Service, Ltd. (b) | | | 17,932 | | | | 47,837 | |
| | | | | | | | 450,657 | |
Oil-U.S. Royalty Trusts — 10.9% | | | | | | | | |
Permian Basin Royalty Trust (e) | | | 3,808 | | | | 94,934 | |
PrairieSky Royalty, Ltd. | | | 5,564 | | | | 97,383 | |
Sabine Royalty Trust | | | 173 | | | | 11,408 | |
San Juan Basin Royalty Trust (e) | | | 866 | | | | 6,434 | |
Texas Pacific Land Corp. | | | 48 | | | | 63,192 | |
| | | | | | | | 273,351 | |
Pipelines — 7.6% | | | | | | | | |
Cheniere Energy, Inc. | | | 628 | | | | 95,682 | |
The Williams Cos., Inc | | | 2,924 | | | | 95,410 | |
| | | | | | | | 191,092 | |
Water Treatment Systems — 4.1% | | | | | | | | |
Energy Recovery, Inc. (a) | | | 1,952 | | | | 54,558 | |
Pentair PLC | | | 756 | | | | 48,838 | |
| | | | | | | | 103,396 | |
TOTAL COMMON STOCKS (Cost $2,326,752) | | | | | | | 2,351,602 | |
| | | | | | | | | |
SHORT TERM INVESTMENTS — 6.1% | | | | | | | | |
Deposit Accounts — 6.1% | | | | | | | | |
U.S. Bank Money Market Deposit Account, 5.35% (c) | | | 153,883 | | | | 153,883 | |
TOTAL SHORT TERM INVESTMENTS (Cost $153,883) | | | | | | | 153,883 | |
| | | | | | | | | |
The accompanying notes are an integral part of the financial statements.
11
Horizon Kinetics Energy and Remediation ETF
Schedule of Investments
June 30, 2023 (Unaudited) (Continued)
| | Shares | | | Value | |
INVESTMENTS PURCHASED WITH PROCEEDS FROM SECURITIES LENDING — 0.7% | | | | | | | | |
U.S. Bank Money Market Deposit Account, 5.35% (c) | | | 16,709 | | | $ | 16,709 | |
TOTAL INVESTMENTS PURCHASED WITH PROCEEDS FROM SECURITIES LENDING (Cost $16,709) | | | | | | | 16,709 | |
| | | | | | | | | |
TOTAL INVESTMENTS — 100.6% (Cost $2,497,344) | | | | | | | 2,522,194 | |
Other assets and liabilities, net — (0.6)% | | | | | | | (14,438 | ) |
NET ASSETS — 100.0% | | | | | | $ | 2,507,756 | |
PLC | Public Limited Company |
(a) | Non-income producing security. |
(b) | Foreign issued security, or represents a foreign issued security. |
(c) | The rate shown is the seven-day yield at period end. |
(d) | Security exempt from registration pursuant to Rule 144A under the Securities Act of 1933, as amended. These securities may be resold in transactions exempt from registration to qualified institutional investors. |
(e) | All or a portion of this security is on loan as of June 30, 2023. The market value of securities out on loan is $16,117. |
(f) | To the extent the Fund invests more heavily in particular sectors of the economy, its performance will be especially sensitive to developments that significantly affect those sectors. |
The accompanying notes are an integral part of the financial statements.
12
Horizon Kinetics ETFs
Statements of Assets and Liabilities
June 30, 2023 (Unaudited)
| | | Horizon Kinetics
Inflation
Beneficiaries
ETF | | | Horizon Kinetics
Blockchain
Development
ETF | |
Assets | | | | | | | | |
Investments, at value(1)(2) | | $ | 1,082,071,587 | | | $ | 2,917,000 | |
Receivable for investment securities sold | | | 6,950,296 | | | | — | |
Dividends and interest receivable | | | 1,637,692 | | | | 1,376 | |
Securities lending income receivable | | | 12,107 | | | | 643 | |
Total assets | | | 1,090,671,682 | | | | 2,919,019 | |
| | | | | | | | | |
Liabilities | | | | | | | | |
Payable for collateral on securities loaned (Note 7) | | | 48,266,085 | | | | 211,470 | |
Payable to Custodian | | | — | | | | 12 | |
Payable for Fund shares redeemed | | | 6,826,995 | | | | — | |
Payable to Adviser | | | 745,684 | | | | 1,870 | |
Payable for investment securities purchased | | | 374,001 | | | | — | |
Total liabilities | | | 56,212,765 | | | | 213,352 | |
Net Assets | | $ | 1,034,458,917 | | | $ | 2,705,667 | |
| | | | | | | | | |
Net Assets Consists of: | | | | | | | | |
Paid-in capital | | $ | 1,077,910,754 | | | $ | 2,985,298 | |
Total distributable earnings | | | (43,451,837 | ) | | | (279,631 | ) |
Net Assets | | $ | 1,034,458,917 | | | $ | 2,705,667 | |
| | | | | | | | | |
Shares of beneficial interest outstanding (unlimited number of shares authorized, no par value) | | | 33,825,000 | | | | 125,000 | |
Net Asset Value, redemption price and offering price per share | | $ | 30.58 | | | $ | 21.65 | |
| | | | | | | | | |
(1) Includes loaned securities with a value of: | | $ | 46,505,935 | | | $ | 218,649 | |
(2) Cost of investments | | | 1,121,586,164 | | | | 2,841,602 | |
The accompanying notes are an integral part of the financial statements.
13
Horizon Kinetics ETFs
Statements of Assets and Liabilities
June 30, 2023 (Unaudited) (Continued)
| | | Horizon Kinetics
Medical
ETF | | | Horizon Kinetics
SPAC Active
ETF | | | Horizon Kinetics
Energy and
Remediation
ETF | |
Assets | | | | | | | | | | | | |
Investments, at value(1)(2) | | $ | 19,098,439 | | | $ | 14,526,760 | | | $ | 2,522,194 | |
Dividends and interest receivable | | | 47,736 | | | | 3,356 | | | | 4,342 | |
Securities lending income receivable | | | 445 | | | | — | | | | 40 | |
Total assets | | | 19,146,620 | | | | 14,530,116 | | | | 2,526,576 | |
| | | | | | | | | | | | | |
Liabilities | | | | | | | | | | | | |
Payable for collateral on securities loaned (Note 7) | | | 153,721 | | | | — | | | | 16,709 | |
Payable to Adviser | | | 13,720 | | | | 9,972 | | | | 1,698 | |
Accrued expenses | | | 8,076 | | | | 8,693 | | | | — | |
Payable for investment securities purchased | | | — | | | | 185,609 | | | | 413 | |
Total liabilities | | | 175,517 | | | | 204,274 | | | | 18,820 | |
Net Assets | | $ | 18,971,103 | | | $ | 14,325,842 | | | $ | 2,507,756 | |
| | | | | | | | | | | | | |
Net Assets Consists of: | | | | | | | | | | | | |
Paid-in capital | | $ | 10,030,248 | | | $ | 14,248,842 | | | $ | 2,465,003 | |
Total distributable earnings | | | 8,940,855 | | | | 77,000 | | | | 42,753 | |
Net Assets | | $ | 18,971,103 | | | $ | 14,325,842 | | | $ | 2,507,756 | |
| | | | | | | | | | | | | |
Shares of beneficial interest outstanding (unlimited number of shares authorized, no par value) | | | 619,946 | | | | 147,484 | | | | 100,000 | |
Net Asset Value, redemption price and offering price per share | | $ | 30.60 | | | $ | 97.13 | | | $ | 25.08 | |
| | | | | | | | | | | | | |
(1) Includes loaned securities with a value of: | | $ | 150,768 | | | $ | — | | | $ | 16,117 | |
(2) Cost of investments | | | 12,606,369 | | | | 14,311,307 | | | | 2,497,344 | |
The accompanying notes are an integral part of the financial statements.
14
Horizon Kinetics ETFs
Statements of Operations
For the Six Months Ended June 30, 2023 (Unaudited)
| | | Horizon Kinetics
Inflation
Beneficiaries
ETF | | | Horizon Kinetics
Blockchain
Development ETF | |
Investment Income | | | | | | | | |
Dividend income (net of withholding tax of $841,988 and $1,470, respectively) | | $ | 13,572,371 | | | $ | 22,932 | |
Interest income | | | 335,100 | | | | 4,348 | |
Securities lending income, net | | | 73,868 | | | | 985 | |
Total investment income | | | 13,981,339 | | | | 28,265 | |
| | | | | | | | | |
Expenses | | | | | | | | |
Investment advisory fees | | | 4,983,536 | | | | 10,210 | |
Total expenses | | | 4,983,536 | | | | 10,210 | |
Net investment income | | | 8,997,803 | | | | 18,055 | |
| | | | | | | | | |
Realized and Unrealized Gain (Loss) on Investments and Foreign Currency | | | | | | | | |
Net realized gain (loss) on: | | | | | | | | |
Investments | | | 3,098,121 | | | | (111,313 | ) |
Foreign currency transactions | | | 9,828 | | | | (46 | ) |
Net realized gain (loss) on investments and foreign currency transactions: | | | 3,107,949 | | | | (111,359 | ) |
Net change in unrealized appreciation/depreciation on: | | | | | | | | |
Investments | | | (41,213,421 | ) | | | 312,562 | |
Foreign currency translation | | | 1,481 | | | | 5 | |
Net change in unrealized appreciation/depreciation on investments and foreign currency translation | | | (41,211,940 | ) | | | 312,567 | |
Net realized and unrealized gain (loss) on investments and foreign currency transactions | | | (38,103,991 | ) | | | 201,208 | |
Net increase (decrease) in net assets from operations | | $ | (29,106,188 | ) | | $ | 219,263 | |
The accompanying notes are an integral part of the financial statements.
15
Horizon Kinetics ETFs
Statements of Operations
For the Period Ended June 30, 2023 (Unaudited) (Continued)
| | | Horizon Kinetics
Medical ETF | | | Horizon Kinetics
SPAC Active ETF | | | Horizon Kinetics
Energy and
Remediation
ETF (1) | |
Investment Income | | | | | | | | | | | | |
Dividend income (net of withholding tax and issuance fees of $4,954, $0 and $974, respectively) | | $ | 218,466 | | | $ | — | | | $ | 22,100 | |
Interest income | | | 21,299 | | | | 29,082 | | | | 2,421 | |
Securities lending income, net | | | 769 | | | | — | | | | 70 | |
Total investment income | | | 240,534 | | | | 29,082 | | | | 24,591 | |
| | | | | | | | | | | | | |
Expenses | | | | | | | | | | | | |
Investment advisory fees | | | 86,959 | | | | 50,272 | | | | 6,720 | |
Blue Sky Expense (2) | | | 18,250 | | | | 23,659 | | | | — | |
Legal Expense (2) | | | 13,812 | | | | 5,868 | | | | — | |
Other Expenses (2) | | | 12,474 | | | | 7,509 | | | | — | |
Total expenses | | | 131,495 | | | | 87,308 | | | | 6,720 | |
Less fees waived by the Adviser | | | (42,468 | ) | | | (36,760 | ) | | | — | |
Net Expenses | | | 89,027 | | | | 50,548 | | | | 6,720 | |
Net investment income (loss) | | | 151,507 | | | | (21,466 | ) | | | 17,871 | |
| | | | | | | | | | | | | |
Realized and Unrealized Gain (Loss) on Investments and Foreign Currency | | | | | | | | | | | | |
Net realized gain (loss) on: | | | | | | | | | | | | |
Investments | | | 2,179,363 | | | | (125,090 | ) | | | 25 | |
Foreign currency transactions | | | — | | | | — | | | | 4 | |
Net realized gain (loss) on investments and foreign currency transactions: | | | 2,179,363 | | | | (125,090 | ) | | | 29 | |
Net change in unrealized appreciation/depreciation on: | | | | | | | | | | | | |
Investments | | | (2,893,822 | ) | | | 529,567 | | | | 24,850 | |
Foreign currency translation | | | — | | | | — | | | | 4 | |
Net change in unrealized appreciation/depreciation on investments and foreign currency translation | | | (2,893,822 | ) | | | 529,567 | | | | 24,854 | |
Net realized and unrealized gain (loss) on investments and foreign currency transactions | | | (714,459 | ) | | | 404,477 | | | | 24,883 | |
Net increase (decrease) in net assets from operations | | $ | (562,952 | ) | | $ | 383,011 | | | $ | 42,754 | |
(1) | The Fund commenced operations on February 21, 2023. |
(2) | Expenses are that of the Predecessor Funds (See Note #1 in the accompanying notes to these financial statements). |
The accompanying notes are an integral part of the financial statements.
16
Horizon Kinetics Inflation Beneficiaries ETF
Statements of Changes in Net Assets
| | | Six Months
Ended
June 30,
2023
(Unaudited) | | | Year
Ended
December 31,
2022 | |
From Operations | | | | | | | | |
Net investment income | | $ | 8,997,803 | | | $ | 21,211,514 | |
Net realized gain on investments and foreign currency transactions | | | 3,107,949 | | | | 28,265,648 | |
Net change in unrealized appreciation/depreciation on investments and foreign currency translation | | | (41,211,940 | ) | | | (48,077,330 | ) |
Net increase (decrease) in net assets resulting from operations | | | (29,106,188 | ) | | | 1,399,832 | |
| | | | | | | | | |
From Distributions | | | | | | | | |
Distributable earnings | | | (8,408,897 | ) | | | (22,124,800 | ) |
Total distributions | | | (8,408,897 | ) | | | (22,124,800 | ) |
| | | | | | | | | |
From Capital Share Transactions | | | | | | | | |
Proceeds from shares sold | | | 26,617,590 | | | | 640,032,713 | |
Cost of shares redeemed | | | (228,866,638 | ) | | | (213,596,625 | ) |
Net increase (decrease) in net assets resulting from capital share transactions | | | (202,249,048 | ) | | | 426,436,088 | |
| | | | | | | | | |
Total Increase (Decrease) in Net Assets | | | (239,764,133 | ) | | | 405,711,120 | |
| | | | | | | | | |
Net Assets | | | | | | | | |
Beginning of period | | | 1,274,223,050 | | | | 868,511,930 | |
End of period | | $ | 1,034,458,917 | | | $ | 1,274,223,050 | |
| | | | | | | | | |
Changes in Shares Outstanding | | | | | | | | |
Shares outstanding, beginning of period | | | 40,500,000 | | | | 27,825,000 | |
Shares sold | | | 825,000 | | | | 19,750,000 | |
Shares redeemed | | | (7,500,000 | ) | | | (7,075,000 | ) |
Shares outstanding, end of period | | | 33,825,000 | | | | 40,500,000 | |
The accompanying notes are an integral part of the financial statements.
17
Horizon Kinetics Blockchain Development ETF
Statements of Changes in Net Assets
| | | Six Months
Ended
June 30,
2023
(Unaudited) | | | Period
Ended
December 31,
2022(1) | |
From Operations | | | | | | | | |
Net investment income | | $ | 18,055 | | | $ | 7,337 | |
Net realized loss on investments and foreign currency transactions | | | (111,359 | ) | | | (261,629 | ) |
Net change in unrealized appreciation/depreciation on investments and foreign currency translation | | | 312,567 | | | | (237,168 | ) |
Net increase (decrease) in net assets resulting from operations | | | 219,263 | | | | (491,460 | ) |
| | | | | | | | | |
From Distributions | | | | | | | | |
Distributable earnings | | | — | | | | (7,434 | ) |
Total distributions | | | — | | | | (7,434 | ) |
| | | | | | | | | |
From Capital Share Transactions | | | | | | | | |
Proceeds from shares sold | | | 513,475 | | | | 2,471,823 | |
Cost of shares redeemed | | | — | | | | — | |
Net increase in net assets resulting from capital share transactions | | | 513,475 | | | | 2,471,823 | |
| | | | | | | | | |
Total Increase in Net Assets | | | 732,738 | | | | 1,972,929 | |
| | | | | | | | | |
Net Assets | | | | | | | | |
Beginning of period | | | 1,972,929 | | | | — | |
End of period | | $ | 2,705,667 | | | $ | 1,972,929 | |
| | | | | | | | | |
Changes in Shares Outstanding | | | | | | | | |
Shares outstanding, beginning of period | | | 100,000 | | | | — | |
Shares sold | | | 25,000 | | | | 100,000 | |
Shares redeemed | | | — | | | | — | |
Shares outstanding, end of period | | | 125,000 | | | | 100,000 | |
(1) | The Fund commenced operations on August 1, 2022. |
The accompanying notes are an integral part of the financial statements.
18
Horizon Kinetics Medical ETF
Statements of Changes in Net Assets (1)
| | | Six Months
Ended
June 30,
2023
(Unaudited) | | | Year
Ended
December 31,
2022 | |
From Operations | | | | | | | | |
Net investment income | | $ | 151,507 | | | $ | 155,197 | |
Net realized gain on investments | | | 2,179,363 | | | | 267,028 | |
Net change in unrealized appreciation/depreciation on investments | | | (2,893,822 | ) | | | 313,715 | |
Net increase (decrease) in net assets resulting from operations | | | (562,952 | ) | | | 735,940 | |
| | | | | | | | | |
From Distributions | | | | | | | | |
Distributable earnings | | | — | | | | (316,610 | ) |
Total distributions | | | — | | | | (316,610 | ) |
| | | | | | | | | |
From Capital Share Transactions | | | | | | | | |
Proceeds from shares sold | | | 1,561,025 | | | | 3,533,428 | |
Reinvestment of dividends | | | — | | | | 309,042 | |
Cost of shares redeemed | | | (1,306,495 | ) | | | (3,387,177 | ) |
Redemption fees | | | — | | | | 15 | |
Net increase in net assets resulting from capital share transactions | | | 254,530 | | | | 455,308 | |
| | | | | | | | | |
Total Increase in Net Assets | | | (308,422 | ) | | | 874,638 | |
| | | | | | | | | |
Net Assets | | | | | | | | |
Beginning of period | | | 19,279,525 | | | | 18,404,887 | |
End of period | | $ | 18,971,103 | | | $ | 19,279,525 | |
| | | | | | | | | |
Changes in Shares Outstanding | | | | | | | | |
Shares outstanding, beginning of period | | | 611,165 | | | | 1,273,051 | |
Shares sold | | | 33,781 | | | | 110,718 | |
Shares reinvested | | | — | | | | 9,774 | |
Shares redeemed | | | (25,000 | ) | | | (782,378 | ) |
Shares outstanding, end of period | | | 619,946 | | | | 611,165 | |
(1) | For periods prior to the close of business on January 27, 2023, financial and other information shown herein for the Fund is that of the Kinetics Medical Fund. See Note #1. |
The accompanying notes are an integral part of the financial statements.
19
Horizon Kinetics SPAC Active ETF
Statements of Changes in Net Assets (1)
| | | Six Months
Ended
June 30,
2023
(Unaudited) | | | Year
Ended
December 31,
2022 | |
From Operations | | | | | | | | |
Net investment income (loss) | | $ | (21,466 | ) | | $ | 73,142 | |
Net realized gain (loss) on investments | | | (125,090 | ) | | | 5,423 | |
Net change in unrealized appreciation/depreciation on investments | | | 529,567 | | | | (401,371 | ) |
Net increase (decrease) in net assets resulting from operations | | | 383,011 | | | | (322,806 | ) |
| | | | | | | | | |
From Distributions | | | | | | | | |
Distributable earnings | | | — | | | | (78,921 | ) |
Total distributions | | | — | | | | (78,921 | ) |
| | | | | | | | | |
From Capital Share Transactions | | | | | | | | |
Proceeds from shares sold | | | 7,627,472 | | | | 11,010,999 | |
Reinvestment of dividends | | | — | | | | 73,690 | |
Cost of shares redeemed | | | (1,068,712 | ) | | | (11,579,783 | ) |
Redemption fees | | | — | | | | 207 | |
Net increase (decrease) in net assets resulting from capital share transactions | | | 6,558,760 | | | | (494,887 | ) |
| | | | | | | | | |
Total Increase (Decrease) in Net Assets | | | 6,941,771 | | | | (896,614 | ) |
| | | | | | | | | |
Net Assets | | | | | | | | |
Beginning of period | | | 7,384,071 | | | | 8,280,685 | |
End of period | | $ | 14,325,842 | | | $ | 7,384,071 | |
| | | | | | | | | |
Changes in Shares Outstanding | | | | | | | | |
Shares outstanding, beginning of period | | | 78,630 | | | | 83,747 | |
Shares sold | | | 80,000 | | | | 117,291 | |
Shares reinvested | | | — | | | | 783 | |
Shares redeemed | | | (11,146 | ) | | | (123,191 | ) |
Shares outstanding, end of period | | | 147,484 | | | | 78,630 | |
(1) | For periods prior to the close of business on January 27, 2023, financial and other information shown herein for the Fund is that of the Kinetics Alternative Income Fund. See Note #1. |
The accompanying notes are an integral part of the financial statements.
20
Horizon Kinetics Energy and Remediation ETF
Statement of Changes in Net Assets
| | | Six Months
Ended
June 30,
2023(1)
(Unaudited) | |
From Operations | | | | |
Net investment income | | $ | 17,871 | |
Net realized gain on investments and foreign currency transactions | | | 29 | |
Net change in unrealized appreciation/depreciation on investments and foreign currency translation | | | 24,854 | |
Net increase in net assets resulting from operations | | | 42,754 | |
| | | | | |
From Capital Share Transactions | | | | |
Proceeds from shares sold | | | 2,465,002 | |
Net increase in net assets resulting from capital share transactions | | | 2,465,002 | |
| | | | | |
Total Increase in Net Assets | | | 2,507,756 | |
| | | | | |
Net Assets | | | | |
Beginning of period | | | — | |
End of period | | $ | 2,507,756 | |
| | | | | |
Changes in Shares Outstanding | | | | |
Shares outstanding, beginning of period | | | — | |
Shares sold | | | 100,000 | |
Shares redeemed | | | — | |
Shares outstanding, end of period | | | 100,000 | |
(1) | The Fund commenced operations on February 21, 2023. |
The accompanying notes are an integral part of the financial statements.
21
Horizon Kinetics Inflation Beneficiaries ETF
Financial Highlights
For a Share Outstanding Throughout Each Period
| | | Six Months
Ended
June 30,
2023
(Unaudited) | | | Year
Ended
December 31,
2022 | | | Period
Ended
December 31,
2021(1) | |
Net Asset Value, Beginning of Period | | $ | 31.46 | | | $ | 31.21 | | | $ | 25.00 | |
| | | | | | | | | | | | | |
Income (Loss) from investment operations: | | | | | | | | | | | | |
Net investment income (loss)(2) | | | 0.23 | | | | 0.53 | | | | 0.30 | |
Net realized and unrealized gain (loss) on investments | | | (0.87 | ) | | | 0.24 | (8) | | | 6.19 | (8) |
Total from investment operations | | | (0.64 | ) | | | 0.77 | | | | 6.49 | |
| | | | | | | | | | | | | |
Less distributions paid: | | | | | | | | | | | | |
From net investment income | | | (0.24 | ) | | | (0.52 | ) | | | (0.27 | ) |
From net realized gains | | | — | | | | — | | | | (0.01 | ) |
Total distributions paid | | | (0.24 | ) | | | (0.52 | ) | | | (0.28 | ) |
| | | | | | | | | | | | | |
Net Asset Value, End of Period | | $ | 30.58 | | | $ | 31.46 | | | $ | 31.21 | |
| | | | | | | | | | | | | |
Total return, at NAV(3)(5) | | | (2.03 | )% | | | 2.57 | % | | | 26.05 | % |
Total return, at Market(4)(5) | | | (2.13 | )% | | | 2.66 | % | | | 26.03 | % |
| | | | | | | | | | | | | |
Supplemental Data and Ratios: | | | | | | | | | | | | |
Net assets, end of period (000’s) | | $ | 1,034,459 | | | $ | 1,274,223 | | | $ | 868,512 | |
| | | | | | | | | | | | | |
Ratio of expenses to average net assets(6) | | | 0.85 | % | | | 0.85 | % | | | 0.85 | % |
Ratio of net investment income (loss) to average net assets(6) | | | 1.53 | % | | | 1.73 | % | | | 1.02 | % |
Portfolio turnover rate (5)(7) | | | 7 | % | | | 9 | % | | | 0 | % |
(1) | The Fund commenced operations on January 11, 2021. |
(2) | Per share net investment income (loss) was caclulated using average shares outstanding. |
(3) | Net asset value total return is calculated assuming an initial investment made at the net asset value at the beginning of the period,
reinvestment of all dividends and distributions at net asset value during the period, if any, and redemption on the last day of the period at
net asset value. This percentage is not an indication of the performance of a shareholder’s investment in the Fund based on market value
due to the differences between the market price of the shares and the net asset value per share of the Fund. |
(4) | Market value total return is calculated assuming an initial investment made at market value at the beginning of the period, reinvestment of all dividends and distributions at market value during the period, if any, and redemption on the last day of the period at market value. Market value is determined by the composite closing price. Composite closing security price is defined as the last reported sale price on the New York Stock Exchange. The composite closing price is the last reported sale, regardless of volume, and not an average price, and may have occurred on a date prior to the close of the reporting period. Market value may be greater or less than net asset value, depending on the Fund’s closing price on the New York Stock Exchange. |
(5) | Not annualized for periods less than one year. |
(6) | Annualized for periods less than one year. |
(7) | Excludes in-kind transactions associated with creations and redemptions of the Fund. |
(8) | Realized and unrealized gains and losses per share in this caption are balancing amounts necessary to reconcile the change in net asset value per share for the period, and may not reconcile with the aggregate gains and losses in the Statement of Operations due to share
transactions for the period. |
The accompanying notes are an integral part of the financial statements.
22
Horizon Kinetics Blockchain Development ETF
Financial Highlights
For a Share Outstanding Throughout Each Period
| | | Six Months
Ended
June 30,
2023
(Unaudited) | | | Period
Ended
December 31,
2022(1) | |
Net Asset Value, Beginning of Period | | $ | 19.73 | | | $ | 25.23 | |
| | | | | | | | | |
Income (Loss) from investment operations: | | | | | | | | |
Net investment income (loss)(2) | | | 0.15 | | | | 0.08 | |
Net realized and unrealized gain (loss) on investments | | | 1.77 | | | | (5.51 | ) |
Total from investment operations | | | 1.92 | | | | (5.43 | ) |
| | | | | | | | | |
Less distributions paid: | | | | | | | | |
From net investment income | | | — | | | | (0.07 | ) |
Total distributions paid | | | — | | | | (0.07 | ) |
| | | | | | | | | |
Net Asset Value, End of Period | | $ | 21.65 | | | $ | 19.73 | |
| | | | | | | | | |
Total return, at NAV(3)(5) | | | 9.70 | % | | | (21.50 | )% |
Total return, at Market(4)(5) | | | 9.72 | % | | | (21.31 | )% |
| | | | | | | | | |
Supplemental Data and Ratios: | | | | | | | | |
Net assets, end of period (000’s) | | $ | 2,706 | | | $ | 1,973 | |
| | | | | | | | | |
Ratio of expenses to average net assets(6) | | | 0.85 | % | | | 0.87 | %(8) |
Ratio of net investment income (loss) to average net assets(6) | | | 1.50 | % | | | 0.90 | % |
Portfolio turnover rate (5)(7) | | | 9 | % | | | 5 | % |
(1) | The Fund commenced operations on August 1, 2022. |
(2) | Per share net investment income (loss) was caclulated using average shares outstanding. |
(3) | Net asset value total return is calculated assuming an initial investment made at the net asset value at the beginning of the period, reinvestment of all dividends and distributions at net asset value during the period, if any, and redemption on the last day of the period at net asset value. This percentage is not an indication of the performance of a shareholder’s investment in the Fund based on market value due to the differences between the market price of the shares and the net asset value per share of the Fund. |
(4) | Market value total return is calculated assuming an initial investment made at market value at the beginning of the period, reinvestment of all dividends and distributions at market value during the period, if any, and redemption on the last day of the period at market value. Market value is determined by the composite closing price. Composite closing security price is defined as the last reported sale price on the New York Stock Exchange. The composite closing price is the last reported sale, regardless of volume, and not an average price, and may have occurred on a date prior to the close of the reporting period. Market value may be greater or less than net asset value, depending on the Fund’s closing price on the New York Stock Exchange. |
(5) | Not annualized for periods less than one year. |
(6) | Annualized for periods less than one year. |
(7) | Excludes in-kind transactions associated with creations and redemptions of the Fund. |
(8) | Ratio of expenses to average net assets includes tax expense of 0.02% for the period ended December 31, 2022. |
The accompanying notes are an integral part of the financial statements.
23
Horizon Kinetics Medical ETF
Financial Highlights
For a Share Outstanding Throughout Each Period
| | | Six Months
Ended
June 30,
2023
(Unaudited)(8) | | | Year
Ended
December 31,
2022 | | | Year
Ended
December 31,
2021 | | | Year
Ended
December 31,
2020 | | | Year
Ended
December 31,
2019 | | | Year
Ended
December 31,
2018 | |
Net Asset Value, Beginning of Period | | $ | 31.55 | | | $ | 30.78 | | | $ | 28.13 | | | $ | 26.53 | | | $ | 23.47 | | | $ | 25.33 | |
| | | | | | | | | | | | | | | | | | | | | | | | | |
Income (Loss) from investment operations: | | | | | | | | | | | | | | | | | | | | | | | | |
Net investment income (loss)(1) | | | 0.24 | | | | 0.27 | | | | 0.25 | | | | 0.29 | | | | 0.33 | | | | 0.27 | |
Net realized and unrealized gain (loss) on investments | | | (1.19 | ) | | | 1.02 | | | | 2.73 | | | | 2.11 | | | | 3.43 | | | | 0.12 | |
Total from investment operations | | | (0.95 | ) | | | 1.29 | | | | 2.98 | | | | 2.40 | | | | 3.76 | | | | 0.39 | |
| | | | | | | | | | | | | | | | | | | | | | | | | |
Capital share transactions: | | | | | | | | | | | | | | | | | | | | | | | | |
Redemption Fees | | | 0.00 | | | | 0.00 | (9) | | | 0.00 | | | | 0.00 | | | | 0.00 | | | | 0.00 | |
| | | | | | | | | | | | | | | | | | | | | | | | | |
Less distributions paid: | | | | | | | | | | | | | | | | | | | | | | | | |
From net investment income | | | — | | | | (0.36 | ) | | | (0.26 | ) | | | (0.31 | ) | | | (0.35 | ) | | | (0.29 | ) |
From net realized gains | | | — | | | | (0.16 | ) | | | (0.07 | ) | | | (0.49 | ) | | | (0.35 | ) | | | (1.96 | ) |
Total distributions paid | | | — | | | | (0.52 | ) | | | (0.33 | ) | | | (0.80 | ) | | | (0.70 | ) | | | (2.25 | ) |
| | | | | | | | | | | | | | | | | | | | | | | | | |
Net Asset Value, End of Period | | $ | 30.60 | | | $ | 31.55 | | | $ | 30.78 | | | $ | 28.13 | | | $ | 26.53 | | | $ | 23.47 | |
| | | | | | | | | | | | | | | | | | | | | | | | | |
Total return, at NAV(2)(4) | | | (3.01 | )% | | | 4.21 | % | | | 10.59 | % | | | 9.04 | % | | | 16.04 | % | | | 1.67 | % |
Total return, at Market(3)(4) | | | (3.20 | )% | | | N/A | | | | N/A | | | | N/A | | | | N/A | | | | N/A | |
| | | | | | | | | | | | | | | | | | | | | | | | | |
Supplemental Data and Ratios: | | | | | | | | | | | | | | | | | | | | | | | | |
Net assets, end of period (000’s) | | $ | 18,971 | | | $ | 19,280 | | | $ | 16,188 | | | $ | 15,462 | | | $ | 15,442 | | | $ | 14,814 | |
| | | | | | | | | | | | | | | | | | | | | | | | | |
Ratio of expenses to average net assets:(5) | | | | | | | | | | | | | | | | | | | | | | | | |
Before expense reimbursement(7) | | | 1.38 | % | | | 2.21 | % | | | 2.18 | % | | | 2.26 | % | | | 2.34 | % | | | 2.23 | % |
After expense reimbursement(7) | | | 0.93 | % | | | 1.39 | % | | | 1.39 | % | | | 1.39 | % | | | 1.39 | % | | | 1.39 | % |
Ratio of net investment income (loss) to average net assets(5)(7) | | | 1.59 | % | | | 0.89 | % | | | 0.84 | % | | | 1.12 | % | | | 1.34 | % | | | 1.03 | % |
Portfolio turnover rate (4)(6) | | | 1 | % | | | 3 | % | | | 1 | % | | | 7 | % | | | 6 | % | | | 0 | % |
(1) | Per share net investment income (loss) was caclulated using average shares outstanding. |
(2) | Net asset value total return is calculated assuming an initial investment made at the net asset value at the beginning of the period, reinvestment of all dividends and distributions at net asset value during the period, if any, and redemption on the last day of the period at net asset value. This percentage is not an indication of the performance of a shareholder’s investment in the Fund based on market value due to the differences between the market price of the shares and the net asset value per share of the Fund. |
The accompanying notes are an integral part of the financial statements.
24
Horizon Kinetics Medical ETF
Financial Highlights
For a Share Outstanding Throughout Each Period (Continued)
(3) | Market value total return is calculated assuming an initial investment made at market value at the beginning of the period, reinvestment of all dividends and distributions at market value during the period, if any, and redemption on the last day of the period at market value. Market value is determined by the composite closing price. Composite closing security price is defined as the last reported sale price on the Nasdaq Stock Market. The composite closing price is the last reported sale, regardless of volume, and not an average price, and may have occurred on a date prior to the close of the reporting period. Market value may be greater or less than net asset value, depending on the Fund’s closing price on the Nasdaq Stock Market. |
(4) | Not annualized for periods less than one year. |
(5) | Annualized for periods less than one year. |
(6) | Excludes in-kind transactions associated with creations and redemptions of the Fund. |
(7) | Expense waived or reimbursed reflect reductions to total expenses, as discussed in the notes to the financial statements. These amounts would increase the net investment loss ratio or decrease the net investment income ratio, as applicable, had such reductions not occurred. See Note #3. |
(8) | For periods prior to the close of business on January 27, 2023, financial and other information shown herein for the Fund is that of the Kinetics Medical Fund. See Note #1. |
(9) | Amount calculated is less than $0.005. |
The accompanying notes are an integral part of the financial statements.
25
Horizon Kinetics SPAC Active ETF
Financial Highlights
For a Share Outstanding Throughout Each Period
| | | Six Months
Ended
June 30,
2023
(Unaudited)(8) | | | Year
Ended
December 31,
2022 | | | Year
Ended
December 31,
2021 | | | Year
Ended
December 31,
2020 | | | Year
Ended
December 31,
2019 | | | Year
Ended
December 31,
2018 | |
Net Asset Value, Beginning of Period | | $ | 93.91 | | | $ | 98.92 | | | $ | 100.24 | | | $ | 98.28 | | | $ | 97.46 | | | $ | 97.57 | |
| | | | | | | | | | | | | | | | | | | | | | | | | |
Income (Loss) from investment operations: | | | | | | | | | | | | | | | | | | | | | | | | |
Net investment income (loss)(1) | | | (0.17 | ) | | | 0.89 | | | | (0.15 | ) | | | 0.25 | | | | 1.39 | | | | 0.92 | |
Net realized and unrealized gain (loss) on investments | | | 3.39 | | | | (4.92 | ) | | | (1.17 | ) | | | 1.91 | | | | 1.01 | | | | (0.03 | ) |
Total from investment operations | | | 3.22 | | | | (4.03 | ) | | | (1.32 | ) | | | 2.16 | | | | 2.40 | | | | 0.89 | |
| | | | | | | | | | | | | | | | | | | | | | | | | |
Capital share transactions: | | | | | | | | | | | | | | | | | | | | | | | | |
Redemption Fees | | | — | | | | 0.00 | (9) | | | 0.00 | (9) | | | 0.02 | | | | 0.00 | (9) | | | 0.01 | |
| | | | | | | | | | | | | | | | | | | | | | | | | |
Less distributions paid: | | | | | | | | | | | | | | | | | | | | | | | | |
From net investment income | | | — | | | | (0.87 | ) | | | — | | | | (0.22 | ) | | | (1.58 | ) | | | (1.01 | ) |
From net realized gains | | | — | | | | (0.11 | ) | | | — | | | | — | | | | — | | | | — | |
Total distributions paid | | | — | | | | (0.98 | ) | | | — | | | | (0.22 | ) | | | (1.58 | ) | | | (1.01 | ) |
| | | | | | | | | | | | | | | | | | | | | | | | | |
Net Asset Value, End of Period | | $ | 97.13 | | | $ | 93.91 | | | $ | 98.92 | | | $ | 100.24 | | | $ | 98.28 | | | $ | 97.46 | |
| | | | | | | | | | | | | | | | | | | | | | | | | |
Total return, at NAV(2)(4) | | | 3.43 | % | | | (4.07 | )% | | | (1.32 | )% | | | 2.23 | % | | | 2.47 | % | | | 0.92 | % |
Total return, at Market(3)(4) | | | 3.45 | % | | | N/A | | | | N/A | | | | N/A | | | | N/A | | | | N/A | |
| | | | | | | | | | | | | | | | | | | | | | | | | |
Supplemental Data and Ratios: | | | | | | | | | | | | | | | | | | | | | | | | |
Net assets, end of period (000’s) | | $ | 14,326 | | | $ | 7,384 | | | $ | 2,626 | | | $ | 2,642 | | | $ | 3,482 | | | $ | 4,265 | |
| | | | | | | | | | | | | | | | | | | | | | | | | |
Ratio of expenses to average net assets:(5) | | | | | | | | | | | | | | | | | | | | | | | | |
Before expense reimbursement(7) | | | 1.48 | % | | | 2.76 | % | | | 2.35 | % | | | 2.16 | % | | | 2.01 | % | | | 1.88 | % |
After expense reimbursement(7) | | | 0.85 | % | | | 0.95 | % | | | 0.95 | % | | | 0.95 | % | | | 0.95 | % | | | 0.95 | % |
Ratio of net investment income (loss) to average net assets(5)(7) | | | (0.36 | )% | | | 0.93 | % | | | (0.15 | )% | | | 0.25 | % | | | 1.14 | % | | | 0.94 | % |
Portfolio turnover rate (4)(6) | | | 86 | % | | | 0 | % | | | 0 | % | | | 0 | % | | | 0 | % | | | 0 | % |
(1) | Per share net investment income (loss) was caclulated using average shares outstanding. |
(2) | Net asset value total return is calculated assuming an initial investment made at the net asset value at the beginning of the period, reinvestment of all dividends and distributions at net asset value during the period, if any, and redemption on the last day of the period at net asset value. This percentage is not an indication of the performance of a shareholder’s investment in the Fund based on market value due to the differences between the market price of the shares and the net asset value per share of the Fund. |
The accompanying notes are an integral part of the financial statements.
26
Horizon Kinetics SPAC Active ETF
Financial Highlights
For a Share Outstanding Throughout Each Period (Continued)
(3) | Market value total return is calculated assuming an initial investment made at market value at the beginning of the period, reinvestment of all dividends and distributions at market value during the period, if any, and redemption on the last day of the period at market value. Market value is determined by the composite closing price. Composite closing security price is defined as the last reported sale price on the Nasdaq Stock Market. The composite closing price is the last reported sale, regardless of volume, and not an average price, and may have occurred on a date prior to the close of the reporting period. Market value may be greater or less than net asset value, depending on the Fund’s closing price on the Nasdaq Stock Market. |
(4) | Not annualized for periods less than one year. |
(5) | Annualized for periods less than one year. |
(6) | Excludes in-kind transactions associated with creations and redemptions of the Fund. |
(7) | Expense waived or reimbursed reflect reductions to total expenses, as discussed in the notes to the financial statements. These amounts would increase the net investment loss ratio or decrease the net investment income ratio, as applicable, had such reductions not occurred. See Note #3. |
(8) | For periods prior to the close of business on January 27, 2023, financial and other information shown herein for the Fund is that of the Kinetics Alternative Income Fund. See Note #1. |
(9) | Amount is less than $0.005. |
The accompanying notes are an integral part of the financial statements.
27
Horizon Kinetics Energy and Remediation ETF
Financial Highlights
For a Share Outstanding Throughout the Period
| | | Period
Ended
June 30,
2023(1)
(Unaudited) | |
Net Asset Value, Beginning of Period | | $ | 24.71 | |
| | | | | |
Income (Loss) from investment operations: | | | | |
Net investment income (loss)(2) | | | 0.19 | |
Net realized and unrealized gain (loss) | | | 0.18 | |
Total from investment operations | | | 0.37 | |
| | | | | |
Net Asset Value, End of Period | | $ | 25.08 | |
| | | | | |
Total return, at NAV(3)(5) | | | 1.49 | % |
Total return, at Market(4)(5) | | | 1.77 | % |
| | | | | |
Supplemental Data and Ratios: | | | | |
Net assets, end of period (000’s) | | $ | 2,508 | |
| | | | | |
Ratio of expenses to average net assets(6) | | | 0.85 | % |
Ratio of net investment income (loss) to average net assets(6) | | | 2.26 | % |
Portfolio turnover rate (5)(7) | | | 0 | % |
(1) | The Fund commenced operations on February 21, 2023. |
(2) | Per share net investment income (loss) was caclulated using average shares outstanding. |
(3) | Net asset value total return is calculated assuming an initial investment made at the net asset value at the beginning of the period, reinvestment of all dividends and distributions at net asset value during the period, if any, and redemption on the last day of the period at net asset value. This percentage is not an indication of the performance of a shareholder’s investment in the Fund based on market value due to the differences between the market price of the shares and the net asset value per share of the Fund. |
(4) | Market value total return is calculated assuming an initial investment made at market value at the beginning of the period, reinvestment of all dividends and distributions at market value during the period, if any, and redemption on the last day of the period at market value. Market value is determined by the composite closing price. Composite closing security price is defined as the last reported sale price on the New York Stock Exchange. The composite closing price is the last reported sale, regardless of volume, and not an average price, and may have occurred on a date prior to the close of the reporting period. Market value may be greater or less than net asset value, depending on the Fund’s closing price on the New York Stock Exchange. |
(5) | Not annualized for periods less than one year. |
(6) | Annualized for periods less than one year. |
(7) | Excludes in-kind transactions associated with creations and redemptions of the Fund. |
The accompanying notes are an integral part of the financial statements.
28
Horizon Kinetics ETFs
Notes to Financial Statements
June 30, 2023 (Unaudited)
Horizon Kinetics Inflation Beneficiaries ETF (“INFL”), Horizon Kinetics Blockchain Development ETF (“BCDF”), Horizon Kinetics Medical ETF (“MEDX”), Horizon Kinetics SPAC Active ETF (“SPAQ”), and Horizon Kinetics Energy and Remediation ETF (“NVIR”) (each a “Fund” and collectively, the “Funds”) are non-diversified series of Listed Funds Trust (the “Trust”), formerly Active Weighting Funds ETF Trust. The Trust was organized as a Delaware statutory trust on August 26, 2016, under a Declaration of Trust amended on December 21, 2018 and is registered with the U.S. Securities and Exchange Commission (the “SEC”) as an open-end management investment company under the Investment Company Act of 1940, as amended (the “1940 Act”).
INFL is an actively managed exchange-traded fund (“ETF”) that seeks long-term capital growth in real (inflation-adjusted) terms. The Fund seeks to achieve its investment objective by investing primarily in the equity securities of domestic and foreign companies that are expected to benefit, either directly or indirectly, from rising prices (inflation).
BCDF is an actively managed ETF that seeks long-term growth of capital. The Fund seeks to achieve its investment objective by investing primarily in equity securities that to benefit, either directly or indirectly, from the use of blockchain technology in connection with the issuance, facilitation, custody, trading and administration of digital assets, including cryptocurrencies.
MEDX is an actively managed ETF that seeks long-term growth of capital. The Fund will invest primarily in patented first line pharmaceuticals and biologics as these products tend to have high profit margins and significant barriers to entry. The Fund employs a long-term perspective, seeking to capture returns of both intrinsic valuation realization and scientific discovery.
SPAQ is an actively managed ETF that seeks to generate realized capital gains in excess of short-term interest rates on a risk adjusted basis that pursues its investment objective primarily by investing, under normal circumstances, in special purpose acquisition companies (“SPACs”) that Ryan Heritage, LLP, the Fund’s investment sub-adviser (the “Sub-Adviser”), believes will generate net realized capital gains in excess of the income derived from bank certificates of deposit with similar maturities.
NVIR is an actively managed ETF that seeks long-term growth of capital. The Fund seeks to achieve its investment objective by investing primarily in the equity securities of domestic and foreign companies expected to benefit, either directly or indirectly, from the increasing focus on climate change and environmentally sensitive carbon-based energy production. The Fund employs a dual, reality-based mandate: (1) companies that produce carbon-based energy positioned to benefit from long-term global demand growth and developing structural supply insufficiency, and (2) remediation companies with existing and/or developing technologies that can alleviate the negative environmental impacts derived from the production and consumption of hydrocarbons.
MEDX and SPAQ are the successors in interest to the Kinetics Medical Fund and Kinetics Alternative Income Fund, respectively, each a series of Kinetics Mutual Funds, Inc., (the “Predecessor Funds”) pursuant to a tax-free reorganization that took place after the close of business on January 27, 2023. MEDX is the accounting and performance information successor of the Kinetics Medical Fund. SPAQ is the accounting information successor of the Kinetics Alternative Income Fund, but it has a different investment objective and strategy. Costs incurred by the Funds in connection with the reorganization were paid by the Horizon Kinetics Asset Management LLC (“Horizon Kinetics” or “Adviser”), the Funds’ Investment Adviser.
Costs incurred by the Funds in connection with the organization, registration and the initial public offering of shares were paid by the Adviser.
2. | SIGNIFICANT ACCOUNTING POLICIES |
Each Fund is an investment company and accordingly follows the investment company accounting and reporting guidance of the Financial Accounting Standards Board (“FASB”) Accounting Standards Codification (“ASC”) Topic 946, Financial Services — Investment Companies. Each Fund prepares its financial statements in accordance with accounting principles generally accepted in the United States of America (“U.S. GAAP”) and follows the significant accounting policies described below.
29
Horizon Kinetics ETFs
Notes to Financial Statements
June 30, 2023 (Unaudited) (Continued)
Use of Estimates
The preparation of the financial statements in conformity with U.S. GAAP requires management to make estimates and assumptions that affect the reported amounts of assets and liabilities and disclosures of contingent assets and liabilities at the date of the financial statements and the reported amounts of increases and decreases in net assets from operations during the reporting period. Actual results could differ from these estimates.
Share Transactions
The net asset value (“NAV”) per share of each Fund will be equal to the Fund’s total assets minus the Fund’s total liabilities divided by the total number of shares outstanding. The NAV that is published will be rounded to the nearest cent. The NAV is determined as of the close of trading (generally, 4:00 p.m. Eastern Time) on each day the New York Stock Exchange (“NYSE”) is open for trading.
Fair Value Measurement
In calculating the NAV, each Fund’s exchange-traded equity securities will be valued at fair value, which will generally be determined using the last reported official closing or last trading price on the exchange or market on which the security is primarily traded at the time of valuation. Such valuations are typically categorized as Level 1 in the fair value hierarchy described below.
Securities listed on the NASDAQ Stock Market, Inc. are generally valued at the NASDAQ official closing price.
If market quotations are not readily available, or if it is determined that a quotation of a security does not represent fair value, then the security is valued at fair value as determined in good faith by the Adviser using procedures adopted by the Board of Trustees of the Trust (the “Board”). The circumstances in which a security may be fair valued include, among others: the occurrence of events that are significant to a particular issuer, such as mergers, restructurings or defaults; the occurrence of events that are significant to an entire market, such as natural disasters in a particular region or government actions; trading restrictions on securities; thinly traded securities; and market events such as trading halts and early market closings. Due to the inherent uncertainty of valuations, fair values may differ significantly from the values that would have been used had an active market existed. Fair valuation could result in a different NAV than a NAV determined by using market quotations. Such valuations are typically categorized as Level 2 or Level 3 in the fair value hierarchy described below.
Money market funds are valued at NAV. If NAV is not readily available the securities will be valued at fair value.
FASB ASC Topic 820, Fair Value Measurements and Disclosures (“ASC 820”) defines fair value, establishes a framework for measuring fair value in accordance with U.S. GAAP, and requires disclosure about fair value measurements. It also provides guidance on determining when there has been a significant decrease in the volume and level of activity for an asset or liability, when a transaction is not orderly, and how that information must be incorporated into fair value measurements. Under ASC 820, various inputs are used in determining the value of the Fund’s investments. These inputs are summarized in the following hierarchy:
| | ● | Level 1 — Unadjusted quoted prices in active markets for identical assets or liabilities that the Fund has the ability to access. |
| | ● | Level 2 — Observable inputs other than quoted prices included in Level 1 that are observable for the asset or liability, either directly or indirectly. These inputs may include quoted prices for the identical instrument on an inactive market, prices for similar securities, interest rates, prepayment speeds, credit risk, yield curves, default rates and similar data. |
| | ● | Level 3 — Unobservable inputs for the asset or liability, to the extent relevant observable inputs are not available; representing the Fund’s own assumptions about the assumptions a market participant would use in valuing the asset or liability, and would be based on the best information available. |
30
Horizon Kinetics ETFs
Notes to Financial Statements
June 30, 2023 (Unaudited) (Continued)
The fair value hierarchy gives the highest priority to quoted prices (unadjusted) in active markets for identical assets or liabilities (Level 1) and the lowest priority to unobservable inputs (Level 3).
The availability of observable inputs can vary from security to security and is affected by a wide variety of factors, including, for example, the type of security, whether the security is new and not yet established in the marketplace, the liquidity of markets, and other characteristics particular to the security. To the extent that valuation is based on models or inputs that are less observable or unobservable in the market, the determination of fair value requires more judgment. Accordingly, the degree of judgment exercised in determining fair value is greatest for instruments categorized in Level 3.
Foreign securities, currencies and other assets denominated in foreign currencies are translated into U.S. dollars at the exchange rate of such currencies against the U.S. dollar using the applicable currency exchange rates as of the close of the NYSE, generally 4:00 p.m. Eastern Time.
All other securities and investments for which market values are not readily available, including restricted securities, and those securities for which it is inappropriate to determine prices in accordance with the aforementioned procedures, are valued at fair value as determined in good faith under procedures adopted by the Board, although the actual calculations may be done by others. Factors considered in making this determination may include, but are not limited to, information obtained by contacting the issuer, analysts, or the appropriate stock exchange (for exchange-traded securities), analysis of the issuer’s financial statements or other available documents and, if necessary, available information concerning other securities in similar circumstances.
The inputs or methodology used for valuing securities are not necessarily an indication of the risk associated with investing in those securities. The hierarchy classification of inputs used to value the Funds’ investments at June 30, 2023, are as follows:
| | | Level 1 | | | Level 2 | | | Level 3 | | | Total | |
INFL | | | | | | | | | | | | | | | | |
Investments - Assets: | | | | | | | | | | | | | | | | |
Common Stocks* | | $ | 1,022,461,234 | | | $ | — | | | $ | — | | | $ | 1,022,461,234 | |
Partnerships* | | | 7,242,980 | | | | — | | | | — | | | | 7,242,980 | |
Deposit Accounts | | | 4,101,288 | | | | — | | | | — | | | | 4,101,288 | |
Investments Purchased with Proceeds From Securities Lending | | | 48,266,085 | | | | — | | | | — | | | | 48,266,085 | |
Total Investments - Assets | | $ | 1,082,071,587 | | | $ | — | | | $ | — | | | $ | 1,082,071,587 | |
| | | Level 1 | | | Level 2 | | | Level 3 | | | Total | |
BCDF | | | | | | | | | | | | | | | | |
Investments - Assets: | | | | | | | | | | | | | | | | |
Common Stocks* | | $ | 2,513,630 | | | $ | — | | | $ | — | | | $ | 2,513,630 | |
Deposit Accounts | | | 191,900 | | | | — | | | | — | | | | 191,900 | |
Investments Purchased with Proceeds From Securities Lending | | | 211,470 | | | | — | | | | — | | | | 211,740 | |
Total Investments - Assets | | $ | 2,917,000 | | | $ | — | | | $ | — | | | $ | 2,917,000 | |
31
Horizon Kinetics ETFs
Notes to Financial Statements
June 30, 2023 (Unaudited) (Continued)
| | | Level 1 | | | Level 2 | | | Level 3 | | | Total | |
MEDX | | | | | | | | | | | | | | | | |
Investments - Assets: | | | | | | | | | | | | | | | | |
Common Stocks* | | $ | 18,581,490 | | | $ | — | | | $ | — | ^ | | $ | 18,581,490 | |
Deposit Accounts | | | 363,228 | | | | — | | | | — | | | | 363,228 | |
Investments Purchased with Proceeds From Securities Lending | | | 153,721 | | | | — | | | | — | | | | 153,721 | |
Total Investments - Assets | | $ | 19,098,439 | | | $ | — | | | $ | — | | | $ | 19,098,439 | |
| | | Level 1 | | | Level 2 | | | Level 3 | | | Total | |
SPAQ | | | | | | | | | | | | | | | | |
Investments - Assets: | | | | | | | | | | | | | | | | |
Common Stocks* | | $ | 11,199,212 | | | $ | 2,963,440 | | | $ | — | | | $ | 14,162,652 | |
Deposit Accounts | | | 359,483 | | | | — | | | | — | | | | 359,483 | |
Warrants | | | — | | | | 4,625 | | | | — | | | | 4,625 | |
Total Investments - Assets | | $ | 11,558,695 | | | $ | 2,968,065 | | | $ | — | | | $ | 14,526,760 | |
| | | Level 1 | | | Level 2 | | | Level 3 | | | Total | |
NVIR | | | | | | | | | | | | | | | | |
Investments - Assets: | | | | | | | | | | | | | | | | |
Common Stocks* | | $ | 2,351,602 | | | $ | — | | | $ | — | | | $ | 2,351,602 | |
Deposit Accounts | | | 153,883 | | | | — | | | | — | | | | 153,883 | |
Investments Purchased with Proceeds From Securities Lending | | | 16,709 | | | | — | | | | — | | | | 16,709 | |
Total Investments - Assets | | $ | 2,522,194 | | | $ | — | | | $ | — | | | $ | 2,522,194 | |
* | See Schedule of Investments for sector classifications. |
^ | The Fund held a Level 3 security at the end of the period valued at $0. The security classified as Level 3 is deemed immaterial and did not warrant a disclosure of significant unobservable valuation inputs. |
Security Transactions
Investment transactions are recorded as of the date that the securities are purchased or sold (trade date). Realized gains and losses from the sale or disposition of securities are calculated based on the specific identification basis.
The Funds do not isolate that portion of the results of operations resulting from changes in foreign exchange rates on investments and currency gains or losses realized between the trade and settlement dates on securities transactions from the fluctuations arising from changes in market prices of securities held. Such fluctuations are included with the net realized and unrealized gain or loss from investments.
The Funds report net realized foreign exchange gains or losses that arise from sales of foreign currencies, currency gains or losses realized between the trade and settlement dates on foreign currency transactions, and the difference between the amounts of dividends, interest, and foreign withholding taxes recorded on each Fund’s books and the U.S. dollar equivalent of the amounts actually received or paid. Net unrealized foreign exchange gains or losses arise from changes in the values of assets and liabilities, other than investments in securities at period end, resulting from changes in exchange rates.
32
Horizon Kinetics ETFs
Notes to Financial Statements
June 30, 2023 (Unaudited) (Continued)
Investment Income
Dividend income is recognized on the ex-dividend date. Interest income is accrued daily. Withholding taxes on foreign dividends has been provided for in accordance with the Funds’ understanding of the applicable tax rules and regulations. An amortized cost method of valuation may be used with respect to debt obligations with sixty days or less remaining to maturity, unless the Adviser determines in good faith that such method does not represent fair value.
Tax Information, Dividends and Distributions to Shareholders and Uncertain Tax Positions
The Funds are treated as a separate entity for Federal income tax purposes. Each Fund intends to qualify as a regulated investment company (“RIC”) under Subchapter M of the Internal Revenue Code of 1986, as amended (the “Internal Revenue Code”). To qualify and remain eligible for the special tax treatment accorded to RICs, each Fund must meet certain annual income and quarterly asset diversification requirements and must distribute annually at least 90% of the sum of (i) its investment company taxable income (which includes dividends, interest and net short-term capital gains) and (ii) certain net tax-exempt income, if any. If so qualified, each Fund will not be subject to Federal income tax.
Distributions to shareholders are recorded on the ex-dividend date. The Funds generally pays out dividends from net investment income, if any, at least quarterly, and distributes its net capital gains, if any, to shareholders at least annually. The Funds may also pay a special distribution at the end of the calendar year to comply with Federal tax requirements. The amount of dividends and distributions from net investment income and net realized capital gains are determined in accordance with Federal income tax regulations, which may differ from U.S. GAAP. These “book/tax” differences are either considered temporary or permanent in nature. To the extent these differences are permanent in nature, such amounts are reclassified within the components of net assets based on their Federal tax basis treatment; temporary differences do not require reclassification. Dividends and distributions which exceed earnings and profit for tax purposes are reported as a tax return of capital.
Management evaluates the Funds’ tax positions to determine if the tax positions taken meet the minimum recognition threshold in connection with accounting for uncertainties in income tax positions taken or expected to be taken for the purposes of measuring and recognizing tax liabilities in the financial statements. Recognition of tax benefits of an uncertain tax position is required only when the position is “more likely than not” to be sustained assuming examination by taxing authorities. Interest and penalties related to income taxes would be recorded as income tax expense. The Funds’ Federal income tax returns are subject to examination by the Internal Revenue Service (the “IRS”) for a period of three fiscal years after they are filed. State and local tax returns may be subject to examination for an additional fiscal year depending on the jurisdiction. As of December 31, 2022, the Funds’ most recent fiscal period end, the Funds had no examination in progress and management is not aware of any tax positions for which it is reasonably possible that the amounts of unrecognized tax benefits will significantly change in the next twelve months.
The Funds, except for NVIR, recognized no interest or penalties related to uncertain tax benefits in the 2022 fiscal period. At December 31, 2022, the Funds’ most recent fiscal period end, the tax periods for the prior three years are open to examination in the Funds’ major tax jurisdictions.
NVIR commenced operation after the December 31, 2022 fiscal period end; therefore, there was no tax information as of June 30, 2023.
Indemnification
In the normal course of business, the Funds expects to enter into contracts that contain a variety of representations and warranties and which provide general indemnifications. The Funds’ maximum exposure under these anticipated arrangements is unknown, as this would involve future claims that may be made against the Funds that have not yet occurred. However, based on experience, the Funds expect the risk of loss to be remote.
33
Horizon Kinetics ETFs
Notes to Financial Statements
June 30, 2023 (Unaudited) (Continued)
3. | INVESTMENT ADVISORY AND OTHER AGREEMENTS |
Investment Advisory Agreement
The Trust has entered into an Investment Advisory Agreement (the “Advisory Agreement”) with the Adviser. Under the Advisory Agreement, the Adviser provides a continuous investment program for the Funds’ assets in accordance with its investment objectives, policies and limitations, and oversees the day-to-day operations of the Funds subject to the supervision of the Board, including the Trustees who are not “interested persons” of the Trust as defined in the 1940 Act (the “Independent Trustees”).
Pursuant to the Advisory Agreement between the Trust, on behalf of the Funds, and Horizon Kinetics, each Fund pays a unified management fee to the Adviser, which is calculated daily and paid monthly, at an annual rate of 0.85% of the Fund’s average daily net assets. Horizon Kinetics has agreed to pay all expenses of the Funds except the fee paid to Horizon Kinetics under the Advisory Agreement, interest charges on any borrowings, dividends and other expenses on securities sold short, taxes, brokerage commissions and other expenses incurred in placing orders for the purchase and sale of securities and other investment instruments, acquired fund fees and expenses, accrued deferred tax liability, extraordinary expenses, and distribution (12b-1) fees and expenses (if any).
MEDX and SPAQ did not pay management fees to the Adviser for the fiscal year ended December 31, 2022. The table below shows advisory fees paid by each Predecessor Fund for the 2023 period prior to reorganization and the preceding two most recent fiscal years ended December 31.
Predecessor Medical Fund | | 2023 | | | 2022 | | | 2021 | |
Gross Advisory Fee | | $ | 18,232 | | | $ | 225,262 | | | $ | 230,269 | |
Less Advisory Fee Waiver | | $ | 18,232 | | | $ | 146,788 | | | $ | 144,487 | |
Less Expense Reimbursements | | $ | 10,154 | | | $ | — | | | $ | — | |
Net Advisory Fee | | $ | (10,154 | ) | | $ | 78,474 | | | $ | 85,782 | |
Predecessor Alternative Income Fund | | 2023 | | | 2022 | | | 2021 | |
Gross Advisory Fee | | $ | 4,909 | | | $ | 70,930 | | | $ | 99,556 | |
Less Advisory Fee Waiver | | $ | 4,909 | | | $ | 70,930 | | | $ | 98,375 | |
Less Expense Reimbursements | | $ | 13,881 | | | $ | 70,077 | | | $ | 54,773 | |
Net Advisory Fee | | $ | (13,881 | ) | | $ | (70,077 | ) | | $ | (53,592 | ) |
The Adviser previously agreed to waive management fees and reimburse Predecessor Medical Fund expenses so that Total Annual Fund Operating Expenses after Fee Waiver and/or Expense Reimbursements do not exceed 1.39%, excluding acquired fund fees and expenses (“AFFE”). The Adviser previously agreed to waive management fees and reimburse Predecessor Alternative Income Fund expenses so that Total Annual Fund Operating Expenses after Fee Waiver and/or Expense Reimbursements do not exceed 0.95%, excluding AFFE. These Predecessor Fund waivers and reimbursements terminated upon the closing of the reorganization.
The Sub-Adviser, a Delaware limited liability company serves as the sub-adviser to SPAQ. Pursuant to a Sub-Advisory Agreement between the Adviser and the Sub-Adviser (the “Sub-Advisory Agreement”), the Sub-Adviser is responsible for trading portfolio securities on behalf of the Fund, including selecting broker-dealers to execute purchase and sale transactions, subject to the supervision of the Adviser and the Board, including the independent Trustees. For its services, the Sub-Adviser is entitled to a sub-advisory fee paid by the Adviser, at an annual rate of 0.425% of the average daily net assets of the SPAQ ETF.
34
Horizon Kinetics ETFs
Notes to Financial Statements
June 30, 2023 (Unaudited) (Continued)
Distribution Agreement and 12b-1 Plan
Foreside Fund Services, LLC a wholly owned subsidiary of Foreside Financial Group, LLC (dba ACA Group) (the “Distributor”) serves as the Fund’s distributor pursuant to a Distribution Services Agreement. The Distributor receives compensation for the statutory underwriting services it provides to the Funds. The Distributor enters into agreements with certain broker-dealers and others that will allow those parties to be “Authorized Participants” and to subscribe for and redeem shares of the Funds. The Distributor will not distribute shares in less than whole Creation Units and does not maintain a secondary market in shares.
The Board has adopted a Distribution and Service Plan pursuant to Rule 12b-1 under the 1940 Act (“Rule 12b-1 Plan”). In accordance with the Rule 12b-1 Plan, each Fund is authorized to pay an amount up to 0.25% of the Fund’s average daily net assets each year for certain distribution-related activities. As authorized by the Board, no Rule 12b-1 fees are currently paid by the Funds and there are no plans to impose these fees. However, in the event Rule 12b-1 fees are charged in the future, they will be paid out of each Fund’s assets. The Adviser and its affiliates may, out of their own resources, pay amounts to third parties for distribution or marketing services on behalf of the Funds.
For the period January 1, 2023 to January 27, 2023, the distributor of the Predecessor Funds was Kinetics Funds Distributor, LLC, an affiliate of the Adviser.
Administrator, Custodian and Transfer Agent
U.S. Bancorp Fund Services, LLC, doing business as U.S. Bank Global Fund Services (“Fund Services” or “Administrator”) serves as administrator, transfer agent and fund accountant of the Funds pursuant to a Fund Servicing Agreement. U.S. Bank N.A. (the “Custodian”), an affiliate of Fund Services, serves as the Funds’ custodian pursuant to a Custody Agreement. Under the terms of these agreements, the Adviser pays each Fund’s administrative, custody and transfer agency fees. The Administrative fees and Transfer Agent fees as presented on the Statements of Operations are all pursuant to prior agreements of the Predecessor Funds, as detailed below.
For the period January 1, 2023 to January 27, 2023, Fund Services served as the Predecessor Funds’ administrator, transfer agent and fund accountant pursuant to a Fund Servicing Agreement. For the period January 1, 2023 to January 27, 2023, Fund Services received the following fee from each Predecessor Fund as presented on the Statements of Operations:
| | | MEDX | | | SPAQ | |
Administrative Fees | | $ | 660 | | | $ | 2,500 | |
Fund Accounting Fees | | | 157 | | | | 164 | |
Transfer Agent Fees | | | 346 | | | | 1,075 | |
A Trustee and all officers of the Trust are affiliated with the Administrator and the Custodian.
4. | CREATION AND REDEMPTION TRANSACTIONS |
Shares of the Funds are listed and traded on the NYSE Arca, Inc. (the “Exchange”). Each Fund issues and redeems shares on a continuous basis at NAV only in large blocks of shares called “Creation Units.” Creation Units are to be issued and redeemed principally in kind for a basket of securities and a balancing cash amount, unless determined otherwise at the discretion of the Adviser. Shares generally will trade in the secondary market in amounts less than a Creation Unit at market prices that change throughout the day. Market prices for the shares may be different from their NAV. The NAV is determined as of the close of trading (generally, 4:00 p.m. Eastern Time) on each day the NYSE is open for trading. The NAV of the shares of each Fund will be equal to the Fund’s total assets minus the Fund’s total liabilities divided by the total number of shares outstanding. The NAV that is published will be rounded to the nearest cent; however, for purposes of determining the price of Creation Units, the NAV will be calculated to four decimal places.
35
Horizon Kinetics ETFs
Notes to Financial Statements
June 30, 2023 (Unaudited) (Continued)
Creation Unit Transaction Fee
Authorized Participants may be required to pay to the Custodian a fixed transaction fee (the “Creation Unit Transaction Fee”) in connection with the issuance or redemption of Creation Units. The standard Creation Unit Transaction Fee will be the same regardless of the number of Creation Units purchased by an investor on the applicable business day. The Creation Unit Transaction Fee charged by each Fund for each creation order is $300.
An additional variable fee of up to a maximum of 2% of the value of the Creation Units subject to the transaction may be imposed for (1) creations effected outside the Clearing Process and (2) creations made in an all cash amount (to offset the Trust’s brokerage and other transaction costs associated with using cash to purchase the requisite Deposit Securities). Investors are responsible for the costs of transferring the securities constituting the Deposit Securities to the account of the Trust. Each Fund may determine to not charge a variable fee on certain orders when the Adviser has determined that doing so is in the best interests of Fund shareholders. Variable fees, if any, received by the Funds are displayed in the Capital Share Transactions section on the Statements of Changes in Net Assets.
Only “Authorized Participants” may purchase or redeem shares directly from the Funds. An Authorized Participant is either (i) a broker-dealer or other participant in the clearing process through the Continuous Net Settlement System of National Securities Clearing Corporation or (ii) a DTC participant and, in each case, must have executed a Participant Agreement with the Distributor. Most retail investors will not qualify as Authorized Participants or have the resources to buy and sell whole Creation Units. Therefore, they will be unable to purchase or redeem the shares directly from the Funds. Rather, most retail investors will purchase shares in the secondary market with the assistance of a broker and will be subject to customary brokerage commissions or fees. Securities received or delivered in connection with in-kind creates and redeems are valued as of the close of business on the effective date of the creation or redemption.
A Creation Unit will generally not be issued until the transfer of good title of the deposit securities to the Funds and the payment of any cash amounts have been completed. To the extent contemplated by the applicable participant agreement, Creation Units of the Funds will be issued to such authorized participant notwithstanding the fact that the Funds’ deposits have not been received in part or in whole, in reliance on the undertaking of the authorized participant to deliver the missing deposit securities as soon as possible. If the Funds or its agents do not receive all of the deposit securities, or the required cash amounts, by such time, then the order may be deemed rejected and the authorized participant shall be liable to the Fund for losses, if any.
The tax character of distributions paid was as follows:
For the Fiscal Period Ended June 30, 2023 | | Ordinary
Income (1) | |
INFL | | $ | 8,408,897 | |
BCDF | | | — | |
MEDX | | | — | |
SPAQ | | | — | |
NVIR | | | — | |
For the Fiscal Year/Period Ended December 31, 2022 | | Ordinary
Income (1) | | | Long-Term
Capital Gains | |
INFL | | $ | 22,124,800 | | | $ | — | |
BCDF | | | 7,434 | | | | — | |
MEDX | | | 219,395 | | | | 97,215 | |
SPAQ | | | 70,460 | | | | 8,461 | |
NVIR | | | — | | | | — | |
(1) | Ordinary income includes short-term capital gains. |
36
Horizon Kinetics ETFs
Notes to Financial Statements
June 30, 2023 (Unaudited) (Continued)
At December 31, 2022, the Funds’ most recent fiscal period end, the components of distributable earnings (accumulated losses) and the cost of investments on a tax basis, including the adjustments for financial reporting purposes as of the most recently completed Federal income tax reporting year for the Funds were as follows:
| | | INFL | | | BCDF | | | MEDX | | | SPAQ | |
Federal Tax Cost of Investments | | $ | 1,321,380,306 | | | $ | 2,210,553 | | | $ | 9,962,554 | | | $ | 7,677,897 | |
Gross Tax Unrealized Appreciation | | $ | 134,179,228 | | | $ | 58,620 | | | | 10,189,548 | | | | — | |
Gross Tax Unrealized Depreciation | | | (136,996,759 | ) | | | (296,104 | ) | | | (893,074 | ) | | | (314,114 | ) |
Net Tax Unrealized Appreciation (Depreciation) | | | (2,817,531 | ) | | | (237,484 | ) | | | 9,296,474 | | | | (314,114 | ) |
Undistributed Ordinary Income | | | — | | | | 112 | | | | 22,235 | | | | 7,695 | |
Undistributed Long-Term Capital Gains | | | (3,119,221 | ) | | | (261,522 | ) | | | 125,482 | | | | — | |
Total Distributable Earnings/(Accumulated Earnings) | | | (5,936,752 | ) | | | (498,894 | ) | | | 9,444,191 | | | | (306,419 | ) |
The difference between book-basis and tax-basis unrealized appreciation/(depreciation) is attributable primarily to wash sales and passive foreign investment company mark to market.
Under current tax law, net capital losses realized after October 31 as well as certain specified ordinary losses incurred after October 31 may be deferred and treated as occurring on the first day of the following fiscal year. The Funds’ carryforward losses and post-October losses are determined only at the end of each fiscal year. The Funds did not defer any later year losses or post-October losses for the period ended December 31, 2022, the most recent fiscal period end.
6. | INVESTMENT TRANSACTIONS |
During the period ended June 30, 2023, the Funds realized net capital gains resulting from in-kind redemptions, in which shareholders exchanged Fund shares for securities held by the Funds rather than for cash. Because such gains are not taxable to the Funds, and are not distributed to shareholders, they have been reclassified from total distributable earnings (accumulated losses) to paid in-capital. The amount of realized gains and losses from in-kind redemptions included in realized gain/(loss) on investments in the Statements of Operations is as follows:
| | | Realized Gains | | | Realized Losses | |
Horizon Kinetics Inflation Beneficiaries ETF | | $ | 42,100,074 | | | $ | (20,266,946 | ) |
Horizon Kinetics Blockchain Development ETF | | | — | | | | — | |
Horizon Kinetics Medical ETF | | | 399,151 | | | | (15,303 | ) |
Horizon Kinetics SPAC Active ETF | | | 9,643 | | | | (51 | ) |
Horizon Kinetics Energy and Remediation ETF | | | — | | | | — | |
Purchases and sales of investments (excluding short-term investments), creations in-kind and redemptions in-kind for the period ended June 30, 2023, were as follows:
| | | Purchases | | | Sales | | | Creations
In-Kind | | | Redemptions
In-Kind | |
Horizon Kinetics Inflation Beneficiaries ETF | | $ | 92,518,732 | | | $ | 80,540,009 | | | $ | 23,278,218 | | | $ | 216,516,514 | |
Horizon Kinetics Blockchain Development ETF | | | 247,282 | | | | 200,632 | | | | 424,620 | | | | — | |
Horizon Kinetics Medical ETF | | | 3,863,188 | | | | 244,010 | | | | 743,039 | | | | 765,573 | |
Horizon Kinetics SPAC Active ETF | | | 23,265,429 | | | | 9,551,622 | | | | 1,032,959 | | | | 905,127 | |
Horizon Kinetics Energy and Remediation ETF | | | 65,388 | | | | — | | | | 2,262,012 | | | | — | |
37
Horizon Kinetics ETFs
Notes to Financial Statements
June 30, 2023 (Unaudited) (Continued)
The Funds may lend domestic and foreign securities in its portfolio to approved brokers, dealers and financial institutions (but not individuals) under terms of participation in a securities lending program effective May 5, 2021, which is administered by the Custodian. The securities lending agreement requires that loans are initially collateralized in an amount equal to at least 105% of the then current market value of any loaned securities that are foreign securities, or 102% of the then current market value of any other loaned securities. The custodian performs on a daily basis marking to market loaned securities and collateral. Each borrower is required, if necessary, to deliver additional collateral so that the total collateral held in the account for all loans of the Funds to the borrower will equal at least 100% of the market value of the loaned securities. The cash collateral is invested by the Custodian in accordance with approved investment guidelines. Those guidelines allow the cash collateral to be invested in readily marketable, high quality, short-term obligations issued or guaranteed by the United States Government; however, such investments are subject to risk of payment delays, declines in the value of collateral provided, default on the part of the issuer or counterparty, or otherwise may not generate sufficient interest to support the costs associated with securities lending. The Funds could also experience delays in recovering their securities and possible loss of income or value if the borrower fails to return the borrowed securities, although the Funds are indemnified from this risk by contract with the securities lending agent.
The collateral invested in the Funds, if any, is reflected in the Fund’s Schedule of Investments and is included in the Statement of Assets and Liabilities in the line item labeled “Investments, at value.” A liability of equal value to the cash collateral received and subsequently invested in the Funds is included on the Statement of Assets and Liabilities as “Payable for collateral on securities loaned.” During the period ended June 30, 2023, the Funds loaned securities and received cash collateral for the loans, which was invested in the U.S. Bank Money Market Deposit Account. The Funds receives compensation in the form of loan fees owed by borrowers and income earned on collateral investments. A portion of the interest received on the loan collateral is retained by the Funds and the remainder is rebated to the borrower of the securities. Pursuant to the securities lending agreement between the Trust, on behalf of the Funds, and the Custodian, each Fund pays a fee to the Custodian, which is calculated daily and paid monthly, at a rate of 20% of the first $2 million of the Funds’ aggregate net income, 10% of the next $4 million of the Funds’ aggregate net income and 5% of the Funds’ aggregate net income that exceeds $6 million. The net amount of interest earned, after the interest rebate and the allocation to the Custodian, is included in the Statement of Operations as “Securities lending income.” The Funds continues to receive interest payments or dividends on the securities loaned during the borrowing period.
As of June 30, 2023, the value of the securities on loan and payable for collateral due to broker were as follows:
Value of Securities on Loan and Collateral Received
| | | Values of
Securities
on Loan | | | Fund Collateral
Received* | |
Horizon Kinetics Inflation Beneficiaries ETF | | $ | 46,505,935 | | | $ | 48,266,085 | |
Horizon Kinetics Blockchain Development ETF | | | 218,649 | | | | 211,470 | |
Horizon Kinetics Medical ETF | | | 150,768 | | | | 153,721 | |
Horizon Kinetics Energy and Remediation ETF | | | 16,117 | | | | 16,709 | |
* | The cash collateral received was invested in the U.S. Bank Money Market Deposit Account, with an overnight and continuous maturity, as shown on the Schedules of Investments. |
As with all ETFs, shareholders of the Funds are subject to the risk that their investment could lose money. Each Fund is subject to the principal risks, any of which may adversely affect the Fund’s NAV, trading price, yield, total return and ability to meet its investment objective.
A complete description of principal risks is included in the prospectus under the heading ‘’Principal Investment Risks’’.
38
Horizon Kinetics ETFs
Notes to Financial Statements
June 30, 2023 (Unaudited) (Continued)
9. | AGREEMENT AND PLAN OF REORGANIZATION |
On January 23, 2023, shareholders of the Predecessor Funds approved an Agreement and Plan of Reorganization between the Trust, on behalf of the Funds, and Kinetics Mutual Funds, Inc., a Delaware statutory trust, on behalf of the Predecessor Funds. The Agreement and Plan of Reorganization provided for the transfer of all of the assets of the Predecessor Funds to the Funds and the assumption of the liabilities (other than any excluded liabilities) of the Predecessor Funds by the Funds. For financial reporting purposes, assets received, and shares issued by the Funds were recorded at fair value; however, the cost basis of the investments received from the Predecessor Funds were carried forward to align ongoing reporting of the Funds’ realized and unrealized gains and losses with amounts distributable to shareholders for tax purposes. The reorganization was effective as of the close of business on January 27, 2023. The following table illustrates the specifics of the reorganization of the Predecessor Funds into the Funds:
MEDX
| | Predecessor Fund
Net Assets | | | Shares Issued to
Shareholders of
Predecessor Fund | | | Fund Net Assets | | | Combined Net Assets | | | Tax Status of Transfer | |
| | | $19,354,929 | | | | 619,946 | | | | $— | | | | $19,354,929 | | | | Non-taxable | |
(1) | Includes accumulated net investment income, accumulated realized losses and unrealized appreciation in the amounts of $7,560, $1,969,204 and $7,323,126, respectively. |
SPAQ
| | Predecessor Fund
Net Assets | | | Shares Issued to
Shareholders of
Predecessor Fund | | | Fund Net Assets | | | Combined Net Assets | | | Tax Status of Transfer | |
| | | $7,360,329 | | | | 77,484 | | | | $— | | | | $7,360,329 | | | | Non-taxable | |
(1) | Includes accumulated net investment income, accumulated realized losses and unrealized depreciation in the amounts of $8,619, $(234,857) and $5,005, respectively. |
Management has evaluated the Funds’ related events and transactions that occurred subsequent to June 30, 2023, through the date of issuance of the Funds’ financial statements. Management has determined that there were no subsequent events requiring recognition or disclosure in the financial statements.
39
Horizon Kinetics ETFs
Supplemental Information
(Unaudited)
Investors should consider the investment objective and policies, risk considerations, charges and ongoing expenses of an investment carefully before investing. The prospectus contains this and other information relevant to an investment in the Funds. Please read the prospectus carefully before investing. A copy of the prospectus for the Fund may be obtained without charge by writing to the Fund, c/o U.S. Bank Global Fund Services, P.O. Box 701, Milwaukee, Wisconsin 53201-0701, by calling 1-800-617-0004, or by visiting the Funds’ website at https://horizonkinetics.com.
QUARTERLY PORTFOLIO HOLDING INFORMATION
Each Fund files its complete schedule of portfolio holdings for its first and third fiscal quarters with the Securities and Exchange Commission (“SEC”) on Part F of Form N-PORT. The Funds’ Part F of Form N-PORT is available without charge, upon request, by calling toll-free at 1-800-617-0004. Furthermore, you may obtain the Part F of Form N-PORT on the SEC’s website at www.sec.gov.
PROXY VOTING INFORMATION
Each Fund is required to file a Form N-PX, with the Funds’ complete proxy voting record for the 12 months ended June 30, no later than August 31 of each year. The Fund’s proxy voting record will be available without charge, upon request, by calling toll-free 1-800-617-0004 and on the SEC’s website at www.sec.gov.
FREQUENCY DISTRIBUTION OF PREMIUMS AND DISCOUNTS
Information regarding how often shares of the Funds trade on an exchange at a price above (i.e., at a premium) or below (i.e., at a discount) the NAV of the Funds is available without charge, on the Funds’ website at https://horizonkinetics.com.
MATTERS SUBMITTED TO A SHAREHOLDER VOTE
A special meeting of shareholders of the Predecessor Funds was held on January 23, 2023, and the following matters were approved:
Proposal to approve an Agreement and Plan of Reorganization pursuant to which all of the assets of the Predecessor Funds will be transferred to the Funds, newly formed series of Listed Funds Trust, in exchange for shares of the Funds, distributed pro rata by the Predecessor Funds to its shareholders, and the Funds’ assumption of the Predecessor Funds’ stated liabilities.
MEDX
For: | | | 229,682 | |
Against: | | | 13,288 | |
Abstain: | | | 64,971 | |
Total: | | | 307,941 | |
SPAQ
For: | | | 35,946 | |
Against: | | | 27 | |
Abstain: | | | 4,410 | |
Total: | | | 40,383 | |
40
Horizon Kinetics ETFs
Supplemental Information
(Unaudited) (Continued)
TAX INFORMATION
For the period ended December 31, 2022, certain dividends paid by the Funds may be subject to a maximum tax rate of 23.8%, as provided for by the Jobs and Growth Tax Relief Reconciliation Act of 2003. The percentage of dividends declared from ordinary income designated as qualified dividend income was as follows:
Horizon Kinetics Inflation Beneficiaries ETF | | | 100.00 | % |
Horizon Kinetics Blockchain Development ETF | | | 0.00 | % |
For corporate shareholders, the percent of ordinary income distributions qualifying for the corporate dividends received deduction for the fiscal period ended December 31, 2022, was as follows:
Horizon Kinetics Inflation Beneficiaries ETF | | | 70.65 | % |
Horizon Kinetics Blockchain Development ETF | | | 0.00 | % |
For the fiscal period ended December 31, 2022, the Percentage of taxable ordinary income distributions that are designated as short-term capital gain distributions under Internal Revenue Code Section 871(k)(2)(C) for the Fund was as follows:
Horizon Kinetics Inflation Beneficiaries ETF | | | 0.00 | % |
Horizon Kinetics Blockchain Development ETF | | | 0.00 | % |
PREDECESSOR FUNDS TAX INFORMATION
For the fiscal year ended December 31, 2022, certain dividends paid by the Funds may be subject to a maximum tax rate of 15%, as provided for by the Jobs and Growth Tax Relief Reconciliation Act of 2003. The percentage of dividends declared from ordinary income designated as qualified dividend income was as follows:
The Medical Fund | | | 100.00 | % |
The Alternative Income Fund | | | 0.00 | % |
For corporate shareholders, the percent of ordinary income distributions qualifying for the corporate dividends received deduction for the fiscal year ended December 31, 2022 was as follows:
The Medical Fund | | | 100.00 | % |
The Alternative Income Fund | | | 0.00 | % |
The percentage of ordinary income distributions that are designated as interest related dividends under Internal Revenue Code Section 871(k)(1)(C) for the year ended December 31, 2022 was as follows:
The Medical Fund | | | 0.00 | % |
The Alternative Income Fund | | | 21.76 | % |
The percentage of taxable income distributions that are designated as ordinary and long-term capital gain distributions under Internal Revenue Section 871(k)(2)(C) for the year ended December 31, 2022 was as follows.
| | | Ordinary | | | Long-Term | |
The Medical Fund | | | 69.30 | % | | | 30.70 | % |
The Alternative Income Fund | | | 89.28 | % | | | 10.72 | % |
41
Horizon Kinetics Energy and Remediation ETF
Horizon Kinetics Medical ETF
Horizon Kinetics SPAC Active ETF
Board Consideration and Approval of Advisory and Sub-Advisory Agreements
(Unaudited)
At a meeting held on September 14, 2022 (the “Meeting”), the Board of Trustees (the “Board”) of Listed Funds Trust (the “Trust”), including those trustees who are not “interested persons” of the Trust, as defined in the Investment Company Act of 1940 (the “1940 Act”) (the “Independent Trustees”), considered the approval of an advisory agreement (the “Advisory Agreement”) between Horizon Kinetics Asset Management, LLC (the “Adviser”) and the Trust, on behalf of Horizon Kinetics Energy and Remediation ETF, Horizon Kinetics Medical ETF, and Horizon Kinetics SPAC Active ETF (each a “Fund” and together, the “Funds”), and a sub-advisory agreement (the “Sub-Advisory Agreement” and, together with the Advisory Agreement, the “Agreements”) between the Adviser, the Trust, and Ryan Heritage, LLP (the “Sub-Adviser”) with respect to Horizon Kinetics SPAC Active ETF.
Pursuant to Section 15 of the 1940 Act, the Agreements must be approved by: (i) the vote of the Board or shareholders of a Fund; and (ii) the vote of a majority of the Independent Trustees, cast at a meeting called for the purpose of voting on such approval. In connection with its consideration of such approval, the Board must request and evaluate, and the Adviser and Sub-Adviser are required to furnish, such information as may be reasonably necessary to evaluate the terms of the Agreements.
Consistent with those responsibilities, prior to the Meeting, the Board reviewed written materials from the Adviser and Sub-Adviser and, during the Meeting, representatives from the Adviser and Sub-Adviser presented additional information to assist the Board with its evaluation of the Agreements. Among other things, representatives from the Adviser and Sub-Adviser provided an overview of their respective advisory businesses, including information on investment personnel, financial resources, experience, investment processes, and compliance program. The representatives discussed the services to be provided by the Adviser and Sub-Adviser, as well as the rationale for launching the Funds, each Fund’s proposed fees, and the operational aspects of the Funds. During the Meeting, the Board considered the materials it received in advance of the Meeting, including a memorandum from legal counsel to the Trust regarding the responsibilities of the Trustees in considering the approval of the Agreements under the 1940 Act. The Board also considered the information conveyed during the Adviser’s and Sub-Adviser’s oral presentations. The Board deliberated on the approval of the Agreements in light of this information. Throughout the process, the Trustees were afforded the opportunity to ask questions of, and request additional materials from, the Adviser and Sub-Adviser. The Independent Trustees also met in executive session with counsel to the Trust to further discuss the proposed Agreements and the Independent Trustees’ responsibilities relating thereto.
At the Meeting, the Board, including a majority of the Independent Trustees, evaluated a number of factors, including, among other things: (i) the nature, extent, and quality of the services to be provided by the Adviser and Sub-Adviser to the Funds; (ii) each Fund’s anticipated expenses and performance; (iii) the cost of the services to be provided and anticipated profits to be realized by the Adviser and Sub-Adviser from its relationship with the Trust and the Funds; (iv) comparative fee and expense data for each Fund and other investment companies with similar investment objectives; (v) the extent to which economies of scale would be realized as each Fund grows and whether the overall advisory fee for each Fund would enable investors to share in the benefits of economies of scale; (vi) any benefits to be derived by the Adviser or Sub-Adviser from the relationship with the Trust and the Funds, including any fall-out benefits enjoyed by the Adviser or Sub-Adviser; and (vii) other factors the Board deemed relevant. In its deliberations, the Board did not identify any single piece of information that was paramount or controlling and the individual Trustees may have attributed different weights to various factors.
Approval of the Advisory Agreement with the Adviser
Nature, Extent, and Quality of Services to be Provided. The Trustees considered the scope of services to be provided under the Advisory Agreement, noting that the Adviser will be providing, among other things, a continuous investment program for each Fund, including arranging for, or implementing, the purchase and sale of portfolio securities, the provision of related services such as portfolio management compliance services, and the preparation and filing of certain reports on behalf of the Trust. The Trustees reviewed the extensive responsibilities that the Adviser will have as investment adviser to each Fund, including the oversight of the activities and operations of the Sub-Adviser and other service providers, oversight of general fund compliance with federal and state laws, and the implementation of Board directives as they relate to each Fund. In considering the nature, extent, and quality of the services to be provided by the Adviser, the Board considered the quality of the Adviser’s compliance program and past and current reports from the Trust’s Chief Compliance Officer (“CCO”) regarding her review of the Adviser’s
42
Horizon Kinetics Energy and Remediation ETF
Horizon Kinetics Medical ETF
Horizon Kinetics SPAC Active ETF
Board Consideration and Approval of Advisory and Sub-Advisory Agreements
(Unaudited) (Continued)
compliance program, as well as the Board’s experience with the Adviser as the investment adviser to other series of the Trust. The Board noted that it had received a copy of the Adviser’s Form ADV, as well as the responses of the Adviser to a detailed series of questions that included, among other things, information about the Adviser’s decision making process, details about each Fund, and information about the services to be provided by the Adviser. The Board also considered the Adviser’s operational capabilities and resources and its experience in managing investment portfolios. The Board concluded that, within the context of its full deliberations, it was satisfied with the nature, extent, and quality of the services to be provided to each Fund by the Adviser.
Fund Expenses and Performance. Because each Fund had not yet commenced operations, the Board noted that there were no historical performance records to consider. The Board was presented with information about each Fund’s investment strategy and expected break-even expense analyses. The Board also reviewed information regarding each Fund’s proposed advisory fees and noted that the advisory fee of The Medical ETF, The Alternative Income SPAC Active ETF, and Horizon AAA-AA Floating Rate Debt CLO ETF would be lower than the advisory fee of its respective Predecessor Fund. The Board reviewed the proposed expense ratio for each Fund and compared each Fund’s expense ratio to its respective Category Peer Group (defined below) as follows:
Horizon Kinetics Energy and Remediation ETF: The Board then reviewed the proposed expense ratio for the Fund and compared it to the universe of Equity Energy ETFs as reported by Morningstar (the “Category Peer Group”) and its most direct competitors as identified by the Adviser (the “Selected Peer Group”). The Board noted that the proposed expense ratio for the Fund was significantly higher than the median for the Category Peer Group, and was just higher than expense ratios for the Selected Peer Group. The Board also noted that, because the Category Peer Group included passively-managed funds of large fund complexes where economies of scale are more easily attainable, the Category Peer Group may not allow for an apt comparison by which to judge the Fund’s expense ratio. Based on its review, the Board concluded that the investment advisory fee and expense ratios appeared to be competitive and are otherwise reasonable in light of the information provided.
Horizon Kinetics Medical ETF: The Board then reviewed the proposed expense ratio for the Fund and compared it to the universe of Health ETFs as reported by Morningstar (the “Category Peer Group”) and its most direct competitors as identified by the Adviser (the “Selected Peer Group”). The Board noted that the proposed expense ratio for the Fund was higher than the median for the Category Peer Group, but was within the range of expense ratios of the Category Peer Group. The Board also noted that the proposed expense ratio for the Fund was just higher than the expense ratios for Selected Peer Group. The Board further noted that, because the Category Peer Group included passively-managed funds of large fund complexes where economies of scale are more easily attainable, the Category Peer Group may not allow for an apt comparison by which to judge the Fund’s expense ratio. Based on its review, the Board concluded that the investment advisory fee and expense ratios appeared to be competitive and are otherwise reasonable in light of the information provided.
Horizon Kinetics SPAC Active ETF: The Board then reviewed the proposed expense ratio for the Fund and compared it to the universes of Event Driven ETFs and Small Growth ETFs as reported by Morningstar (the “Category Peer Group”) and its most direct competitors as identified by the Adviser (the “Selected Peer Group”). The Board noted that the proposed expense ratio for the Fund was higher than the median for the Category Peer Group, but was within the range of expense ratios for both Peer Groups. The Board also noted that, because the Category Peer Group included passively-managed funds of large fund complexes where economies of scale are more easily attainable, the Category Peer Group may not allow for an apt comparison by which to judge the Fund’s expense ratio. Based on its review, the Board concluded that the investment advisory fee and expense ratios appeared to be competitive and are otherwise reasonable in light of the information provided.
Cost of Services to be Provided and Profitability. The Board considered the cost of the services to be provided by the Adviser, the proposed advisory and sub-advisory fees, and the estimated profitability projected by the Adviser, including the methodology underlying such projection. The Board took into consideration that the advisory fee for each Fund was a “unitary fee,” meaning a Fund would pay no expenses other than the advisory fee and certain other costs such as interest, brokerage, acquired fund fees and expenses, extraordinary expenses and, to the extent it is implemented, fees pursuant to a Distribution and/or Shareholder Servicing (12b-1) Plan. The Board noted that the Adviser would be responsible for compensating the Trust’s other
43
Horizon Kinetics Energy and Remediation ETF
Horizon Kinetics Medical ETF
Horizon Kinetics SPAC Active ETF
Board Consideration and Approval of Advisory and Sub-Advisory Agreements
(Unaudited) (Continued)
service providers, including the Sub-Adviser, and paying each Fund’s other expenses out of its own revenue and resources. The Board also evaluated the compensation and benefits expected to be received by the Adviser from its relationship with the Funds, taking into account the Adviser’s anticipated profitability analysis with respect to each Fund and the financial resources the Adviser had committed and proposed to commit to its business. The Board determined such analyses were not a significant factor given that the Funds had not yet commenced operations and consequently, the future size of each Fund and the Adviser’s future profitability were generally unpredictable.
Economies of Scale. The Board expressed the view that the Adviser might realize economies of scale in managing each Fund as assets grow in size. The Board noted, however, that any economies would, to some degree, be shared with each Fund’s shareholders through the Fund’s unitary fee structure. In the event there were to be significant asset growth in a Fund, the Board determined to reassess whether the advisory fee appropriately took into account any economies of scale that had been realized as a result of that growth.
Conclusion. No single factor was determinative of the Board’s decision to approve the Advisory Agreement; rather, the Board based its determination on the total mix of information available to it. Based on a consideration of all the factors in their totality, the Board, including a majority of the Independent Trustees, determined that the terms of the Advisory Agreement, including the compensation payable thereunder, were fair and reasonable to the Fund. The Board, including a majority of the Independent Trustees, therefore determined that the approval of the Advisory Agreement for an initial term of two years was in the best interests of the Funds and its respective shareholders.
Approval of the Sub-Advisory Agreement with the Sub-Adviser
Nature, Extent, and Quality of Services to be Provided. The Board considered the scope of services to be provided to The Alternative Income SPAC Active ETF under the Sub-Advisory Agreement, noting that the Sub-Adviser would provide investment management services to the Fund. The Board noted the responsibilities that the Sub-Adviser would have as the Fund’s investment sub-adviser, including: responsibility for the management of the securities and other assets of the Fund, subject to the supervision and oversight of the Adviser; determining the assets to be purchased, retained or sold by the Fund; executing placement of orders and selection of brokers or dealers for such orders; general portfolio compliance with relevant law; responsibility for daily monitoring of portfolio exposures and quarterly reporting to the Board; proxy voting with respect to securities held by the Fund; and implementation of Board directives as they relate to the Fund.
In considering the nature, extent, and quality of the services to be provided by the Sub-Adviser, the Board considered the quality of the Sub-Adviser’s compliance program, and the Sub-Adviser’s experience providing investment management services to other Investment Company Act of 1940 regulated investment vehicles. The Board further noted that they had received and reviewed materials with regard to the Sub-Adviser, including its responses to a detailed series of questions that included, among other things, information about the Sub-Adviser’s decision making process, details about the Fund, and information about the services to be provided by the Sub-Adviser. The Board also considered the Sub-Adviser’s resources and capacity with respect to portfolio management, compliance, and operations. The Board also considered, among other things, the professional experience and qualifications of the senior management and key professional personnel of the Sub-Adviser, including those individuals responsible for portfolio management. The Board concluded, within the context of its full deliberations, it was satisfied with the nature, extent, and quality of the services to be provided to the Fund by the Sub-Adviser.
Fund Expenses and Performance. Because the Fund had not yet commenced operations, the Board noted that there were no historical performance records to consider. The Board was presented with information about the Fund’s investment strategy and expected break-even expense analyses. The Board also reviewed information regarding the Fund’s proposed advisory and sub-advisory fees, including advisory fees and total expense ratios of those funds that might be considered peers of the Fund. The Board further noted that the advisory fee of The Alternative Income SPAC Active ETF would be lower than the advisory fee of its Predecessor Fund. Based on its review, the Board concluded that the sub-advisory fee and expense ratios appeared to be competitive and are otherwise reasonable in light of the information provided.
44
Horizon Kinetics Energy and Remediation ETF
Horizon Kinetics Medical ETF
Horizon Kinetics SPAC Active ETF
Board Consideration and Approval of Advisory and Sub-Advisory Agreements
(Unaudited) (Continued)
Costs of Services to be Provided and Profitability. The Board considered the cost of the services to be provided by the Adviser, the proposed advisory and sub-advisory fees, and the estimated profitability projected by the Adviser and Sub-Adviser, including the methodology underlying such projection. The Board considered that the fees to be paid to the Sub-Adviser would be paid by the Adviser from the fee the Adviser received from the Fund and noted that the fee reflected an arm’s-length negotiation between the Adviser and the Sub-Adviser. The Board further determined that the sub-advisory fee reflected an appropriate allocation of the advisory fee paid to the Adviser given the work to be performed by each firm. The Board also evaluated the compensation and benefits expected to be received by the Sub-Adviser from its relationship with the Fund, taking into account an analysis of the Sub-Adviser’s estimated profitability with respect to the Fund.
Economies of Scale. The Board expressed the view that it currently appeared that the Sub-Adviser might realize economies of scale in managing the Fund as assets grow in size. The Board determined that it would monitor fees as the Fund’s assets grow to determine whether economies of scale were being effectively shared with the Fund and its shareholders.
Conclusion. No single factor was determinative of the Board’s decision to approve the Sub-Advisory Agreement; rather, the Board based its determination on the total mix of information available to it. Based on a consideration of all the factors in their totality, the Board, including a majority of the Independent Trustees, determined that the terms of the Sub-Advisory Agreement, including the compensation payable thereunder, were fair and reasonable to the Fund. The Board, including a majority of the Independent Trustees, therefore determined that the approval of the Sub-Advisory Agreement for an initial two-year term was in the best interests of the Fund and its shareholders.
45
Horizon Kinetics ETFs
Review of Liquidity Risk Management Program
(Unaudited)
Pursuant to Rule 22e-4 under the Investment Company Act of 1940, the Trust, on behalf of the series of the Trust covered by this shareholder report (the “Series”), has adopted a liquidity risk management program to govern the Trust’s approach to managing liquidity risk. Rule 22e-4 seeks to promote effective liquidity risk management, thereby reducing the risk that a fund will be unable to meet its redemption obligations and mitigating dilution of the interests of fund shareholders. The Trust’s liquidity risk management program is tailored to reflect the Series’ particular risks, but not to eliminate all adverse impacts of liquidity risk, which would be incompatible with the nature of such Series.
The investment adviser to the Series has adopted and implemented its own written liquidity risk management program (the “Program”) tailored specifically to assess and manage the liquidity risk of the Series. At a recent meeting of the Board of Trustees of the Trust, the Trustees received a report pertaining to the operation, adequacy, and effectiveness of implementation of the Program for the period ended December 31, 2022. The report concluded that the Program is reasonably designed to assess and manage the Series’ liquidity risk and has operated adequately and effectively to manage such risk. The report reflected that there were no liquidity events that impacted the Series’ ability to timely meet redemptions without dilution to existing shareholders. The report further noted that no material changes have been made to the Program since its implementation.
There can be no assurance that the Program will achieve its objectives in the future. Please refer to the prospectus for more information regarding the Series’ exposure to liquidity risk and other principal risks to which an investment in the Series may be subject.
46
THIS PAGE INTENTIONALLY LEFT BLANK
THIS PAGE INTENTIONALLY LEFT BLANK
THIS PAGE INTENTIONALLY LEFT BLANK
Investment Adviser:
Horizon Kinetics Asset Management LLC
470 Park Avenue South, 3rd Floor South
New York, NY 10016
Investment Sub-Adviser:
Ryan Heritage, LLP
250 Pehle Avenue, Suite 708
Saddle Brook, NJ 07663
Legal Counsel:
Morgan, Lewis & Bockius LLP
1111 Pennsylvania Avenue, N.W.
Washington, D.C. 20004
Independent Registered Public Accounting Firm:
Cohen & Company, Ltd.
1350 Euclid Avenue, Suite 800
Cleveland, OH 44115
Distributor:
Foreside Fund Services, LLC
Three Canal Plaza, Suite 100
Portland, ME 04101
Administrator, Fund Accountant & Transfer Agent:
U.S. Bancorp Fund Services, LLC
d/b/a U.S. Bank Global Fund Services
615 E. Michigan St.
Milwaukee, WI 53202
Custodian:
U.S. Bank N.A.
1555 North RiverCenter Drive, Suite 302
Milwaukee, WI 53212
This information must be preceded or accompanied by a current prospectus for the Funds.
Item 2. Code of Ethics.
Not applicable for semi-annual reports.
Item 3. Audit Committee Financial Expert.
Not applicable for semi-annual reports.
Item 4. Principal Accountant Fees and Services.
Not applicable for semi-annual reports.
Item 5. Audit Committee of Listed Registrants.
(a) Not applicable for semi-annual reports.
(b) Not applicable.
Item 6. Investments.
| (a) | Schedule of Investments is included as part of the report to shareholders filed under Item 1 of this Form. |
Item 7. Disclosure of Proxy Voting Policies and Procedures for Closed-End Management Investment Companies.
Not applicable to open-end investment companies.
Item 8. Portfolio Managers of Closed-End Management Investment Companies.
Not applicable to open-end investment companies.
Item 9. Purchases of Equity Securities by Closed-End Management Investment Company and Affiliated Purchasers.
Not applicable to open-end investment companies.
Item 10. Submission of Matters to a Vote of Security Holders.
There have been no material changes to the procedures by which shareholders may recommend nominees to the registrant’s Board of Trustees.
Item 11. Controls and Procedures.
| (a) | The Registrant’s President and Treasurer have reviewed the Registrant's disclosure controls and procedures (as defined in Rule 30a-3(c) under the Investment Company Act of 1940 (the “Act”)) as of a date within 90 days of the filing of this report, as required by Rule 30a-3(b) under the Act and Rules 13a-15(b) or 15d 15(b) under the Securities Exchange Act of 1934. Based on their review, such officers have concluded that the disclosure controls and procedures are effective in ensuring that information required to be disclosed in this report is appropriately recorded, processed, summarized and reported and made known to them by others within the Registrant and by the Registrant’s service provider. |
| (b) | There were no changes in the Registrant's internal control over financial reporting (as defined in Rule 30a-3(d) under the Act) that occurred during the period covered by this report that have materially affected, or are reasonably likely to materially affect, the Registrant's internal control over financial reporting. |
Item 12. Disclosure of Securities Lending Activities for Closed-End Management Investment Companies
Not applicable to open-end investment companies.
Item 13. Exhibits.
| (a) | (1) Any code of ethics or amendment thereto, that is the subject of the disclosure required by Item 2, to the extent that the registrant intends to satisfy Item 2 requirements through filing an exhibit. Not Applicable. |
(2) A separate certification for each principal executive officer and principal financial officer pursuant to Section 302 of the Sarbanes-Oxley Act of 2002. Filed herewith.
(3) Any written solicitation to purchase securities under Rule 23c-1 under the Act sent or given during the period covered by the report by or on behalf of the registrant to 10 or more persons. Not applicable to open-end investment companies.
| (4) | Change in the registrant’s independent public accountant. There was no change in the registrant’s independent public accountant for the period covered by this report. |
SIGNATURES
Pursuant to the requirements of the Securities Exchange Act of 1934 and the Investment Company Act of 1940, the registrant has duly caused this report to be signed on its behalf by the undersigned, thereunto duly authorized.
| (Registrant) | Listed Funds Trust | |
| | | |
| By (Signature and Title)* | /s/ Gregory C. Bakken | |
| | Gregory C. Bakken, President/Principal Executive Officer |
Pursuant to the requirements of the Securities Exchange Act of 1934 and the Investment Company Act of 1940, this report has been signed below by the following persons on behalf of the registrant and in the capacities and on the dates indicated.
| By (Signature and Title)* | /s/ Gregory C. Bakken | |
| | Gregory C. Bakken, President/Principal Executive Officer |
| By (Signature and Title)* | /s/ Travis G. Babich | |
| | Travis G. Babich, Treasurer/Principal Financial Officer |
* Print the name and title of each signing officer under his or her signature.