UNITED STATES
SECURITIES AND EXCHANGE COMMISSION
Washington, D.C. 20549
FORM N-CSR
CERTIFIED SHAREHOLDER REPORT OF REGISTERED MANAGEMENT INVESTMENT COMPANIES
Investment Company Act file number (811-23226)
Listed Funds Trust
(Exact name of registrant as specified in charter)
615 East Michigan Street
Milwaukee, WI 53202
(Address of principal executive offices) (Zip code)
Kent P. Barnes, Secretary
Listed Funds Trust
c/o U.S. Bancorp Fund Services, LLC
777 East Wisconsin Avenue, 10th Floor
Milwaukee, WI 53202
(Name and address of agent for service)
(414) 516-1681
Registrant's telephone number, including area code
Date of fiscal year end: December 31
Date of reporting period: June 30, 2023
Item 1. Reports to Stockholders.
TrueShares ETFs
TrueShares Technology, AI & Deep Learning ETF (LRNZ)
TrueShares ESG Active Opportunities ETF (ECOZ)
TrueShares Low Volatility Equity Income ETF (DIVZ)
TrueShares Eagle Global Renewable Energy Income ETF (RNWZ)
RiverNorth Patriot ETF (FLDZ)
RiverNorth Enhanced Pre-Merger SPAC ETF (SPCZ)
SEMI-ANNUAL REPORT
June 30, 2023
(Unaudited)
This report is submitted for the general information of shareholders of the Funds. It is not authorized for distribution unless preceded or accompanied by a current prospectus for the Funds.
TrueShares ETFs
Table of Contents
(Unaudited)
| | |
Shareholder Expense Example | 2 |
Schedules of Investments | 4 |
Statements of Assets and Liabilities | 17 |
Statements of Operations | 19 |
Statements of Changes in Net Assets | 21 |
Financial Highlights | 24 |
Notes to Financial Statements | 30 |
Review of Liquidity Risk Management Program | 41 |
Supplemental Information | 42 |
1
TrueShares ETFs
Shareholder Expense Example
June 30, 2023 (Unaudited)
As a shareholder of a fund you incur two types of costs: (1) transaction costs, including brokerage commissions on purchases and sales of fund shares; and (2) ongoing costs, including management fees and other fund expenses. The following example is intended to help you understand your ongoing costs (in dollars and cents) of investing in the Funds and to compare these costs with the ongoing costs of investing in other funds. The examples are based on an investment of $1,000 invested at the beginning of the period and held throughout the entire period (January 1, 2023 to June 30, 2023).
ACTUAL EXPENSES
The following table provides information about actual account values and actual expenses. You may use the information in this line, together with the amount you invested, to estimate the expenses that you paid over the period. Simply divide your account value by $1,000 (for example, an $8,600 account value divided by $1,000 = 8.6), then multiply the result by the number in the applicable line under the heading entitled “Expenses Paid During Period” to estimate the expenses you paid on your account during this period.
| | Beginning
Account
Value
(1/1/23) | Ending
Account
Value
(6/30/23) | Annualized
Expense
Ratios | Expenses
Paid
During the
Period(1) |
TrueShares Technology, AI & Deep Learning ETF | $ 1,000.00 | $ 1,395.10 | 0.68% | $ 4.04 |
TrueShares ESG Active Opportunities ETF | 1,000.00 | 1,177.50 | 0.58 | 3.13 |
TrueShares Low Volatility Equity Income ETF | 1,000.00 | 961.70 | 0.65 | 3.16 |
TrueShares Eagle Global Renewable Energy Income ETF | 1,000.00 | 1,008.90 | 0.75 | 3.74 |
RiverNorth Patriot ETF | 1,000.00 | 1,042.70 | 0.70 | 3.55 |
RiverNorth Enhanced Pre-Merger SPAC ETF | 1,000.00 | 1,038.60 | 0.89 | 4.50 |
(1) | Expenses are calculated using the Fund’s annualized expense ratio, multiplied by the average account value for the period, multiplied by 181/365 (to reflect the six-month period). |
2
TrueShares ETFs
Shareholder Expense Example
June 30, 2023 (Unaudited) (Continued)
HYPOTHETICAL EXAMPLE FOR COMPARISON PURPOSES
The following table provides information about hypothetical account values and hypothetical expenses based on the Funds’ actual expense ratios and an assumed rate of return of 5% per year before expenses, which are not the Funds’ actual returns. The hypothetical account values and expenses may not be used to estimate the actual ending account balance or expenses you paid for the period. You may use this information to compare the ongoing costs of investing in the Funds and other funds. To do so, compare this 5% hypothetical example with the 5% hypothetical examples that appear in the shareholder reports of the other funds. Please note that the expenses shown in the table are meant to highlight your ongoing costs only and do not reflect any transactional costs, such as brokerage commissions paid on purchases and sales of Fund shares with respect to the Funds. Therefore, the table below is useful in comparing ongoing costs only and will not help you determine the relative total costs of owning different funds. In addition, if these transactional costs were included, your costs would have been higher.
| | Beginning
Account
Value
(1/1/23) | Ending
Account
Value
(6/30/23) | Annualized
Expense
Ratios | Expenses
Paid
During the
Period(1) |
TrueShares Technology, AI & Deep Learning ETF | $ 1,000.00 | $ 1,021.42 | 0.68% | $ 3.41 |
TrueShares ESG Active Opportunities ETF | 1,000.00 | 1,021.92 | 0.58 | 2.91 |
TrueShares Low Volatility Equity Income ETF | 1,000.00 | 1,021.57 | 0.65 | 3.26 |
TrueShares Eagle Global Renewable Energy Income ETF | 1,000.00 | 1,021.08 | 0.75 | 3.76 |
RiverNorth Patriot ETF | 1,000.00 | 1,021.32 | 0.70 | 3.51 |
RiverNorth Enhanced Pre-Merger SPAC ETF | 1,000.00 | 1,020.38 | 0.89 | 4.46 |
(1) | Expenses are calculated using the Fund’s annualized expense ratio, multiplied by the average account value for the period, multiplied by 181/365 (to reflect the six-month period). |
3
TrueShares Technology, AI & Deep Learning ETF
Schedule of Investments
June 30, 2023 (Unaudited)
Sector Diversification *
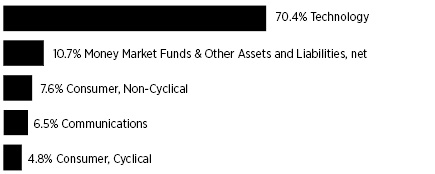
* | Percentages are stated as a percent of net assets. |
| | Shares | | | Value | |
COMMON STOCKS — 89.3% | | | | | | | | |
Auto Parts & Equipment — 4.8% | | | | | | | | |
Mobileye Global, Inc. - Class A (a) | | | 42,919 | | | $ | 1,648,948 | |
| | | | | | | | | |
Biotechnology — 5.6% | | | | | | | | |
Prime Medicine, Inc. (a) | | | 83,964 | | | | 1,230,073 | |
Relay Therapeutics, Inc. (a) | | | 53,564 | | | | 672,764 | |
| | | | | | | | 1,902,837 | |
Computers — 8.5% | | | | | | | | |
Crowdstrike Holdings, Inc. - Class A (a) | | | 10,549 | | | | 1,549,332 | |
Zscaler, Inc. (a) | | | 9,217 | | | | 1,348,447 | |
| | | | | | | | 2,897,779 | |
Internet — 6.5% | | | | | | | | |
Amazon.com, Inc. (a) | | | 8,428 | | | | 1,098,674 | |
Okta, Inc. (a) | | | 16,321 | | | | 1,131,861 | |
| | | | | | | | 2,230,535 | |
Pharmaceuticals — 2.1% | | | | | | | | |
AbCellera Biologics, Inc. (a)(b) | | | 108,773 | | | | 702,674 | |
| | | | | | | | | |
Semiconductors — 12.4% | | | | | | | | |
Advanced Micro Devices, Inc. (a) | | | 15,216 | | | | 1,733,255 | |
NVIDIA Corp. | | | 5,949 | | | | 2,516,545 | |
| | | | | | | | 4,249,800 | |
Software — 49.4% (c) | | | | | | | | |
Datadog, Inc. - Class A (a) | | | 15,174 | | | | 1,492,818 | |
Elastic N.V. (a)(b) | | | 19,918 | | | | 1,277,142 | |
ROBLOX Corp. - Class A (a) | | | 32,057 | | | | 1,291,897 | |
Samsara, Inc. - Class A (a) | | | 82,557 | | | | 2,287,655 | |
Schrodinger, Inc. (a) | | | 44,433 | | | | 2,218,095 | |
SentinelOne, Inc. - Class A (a) | | | 78,393 | | | | 1,183,734 | |
ServiceNow, Inc. (a) | | | 2,397 | | | | 1,347,042 | |
Snowflake, Inc. - Class A (a) | | | 12,768 | | | | 2,246,913 | |
Twilio, Inc. - Class A (a) | | | 17,181 | | | | 1,093,055 | |
UiPath, Inc. - Class A (a) | | | 60,183 | | | | 997,232 | |
Unity Software, Inc. (a) | | | 33,366 | | | | 1,448,752 | |
| | | | | | | | 16,884,335 | |
TOTAL COMMON STOCKS (Cost $34,642,915) | | | | | | | 30,516,908 | |
| | Shares | | | Value | |
MONEY MARKET FUNDS — 10.7% | | | | | | | | |
First American Treasury Obligations Fund - Class X, 5.04% (d) | | | 3,644,531 | | | $ | 3,644,531 | |
TOTAL MONEY MARKET FUNDS (Cost $3,644,531) | | | | | | | 3,644,531 | |
| | | | | | | | | |
TOTAL INVESTMENTS (Cost $38,287,446) — 100.0% | | | | | | | 34,161,439 | |
Other assets and liabilities, net — (0.0)% (e) | | | | | | | (6,938 | ) |
TOTAL NET ASSETS — 100.0% | | | | | | $ | 34,154,501 | |
Percentages are stated as a percent of net assets.
(a) | Non-income producing security. |
(b) | Foreign issued security. |
(c) | To the extent the Fund invests more heavily in particular sectors of the economy, its performance will be especially sensitive to developments that significantly affect those sectors. |
(d) | The rate shown is the seven day yield at period end. |
(e) | Amount is less than 0.05%. |
The accompanying notes are an integral part of the financial statements.
4
TrueShares ESG Active Opportunities ETF
Schedule of Investments
June 30, 2023 (Unaudited)
Sector Diversification *
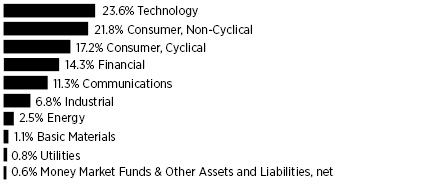
* | Percentages are stated as a percent of net assets. |
| | Shares | | | Value | |
COMMON STOCKS — 96.0% | | | | | | | | |
Apparel — 1.5% | | | | | | | | |
NIKE, Inc. - Class B | | | 335 | | | $ | 36,974 | |
| | | | | | | | | |
Auto Manufacturers — 4.0% | | | | | | | | |
Tesla, Inc. (a) | | | 376 | | | | 98,426 | |
| | | | | | | | | |
Banks — 2.7% | | | | | | | | |
JPMorgan Chase & Co. | | | 301 | | | | 43,778 | |
Truist Financial Corp. | | | 727 | | | | 22,064 | |
| | | | | | | | 65,842 | |
Beverages — 1.6% | | | | | | | | |
PepsiCo, Inc. | | | 208 | | | | 38,526 | |
| | | | | | | | | |
Biotechnology — 1.2% | | | | | | | | |
Amgen, Inc. | | | 62 | | | | 13,765 | |
Gilead Sciences, Inc. | | | 196 | | | | 15,106 | |
| | | | | | | | 28,871 | |
Chemicals — 1.1% | | | | | | | | |
International Flavors & Fragrances, Inc. | | | 346 | | | | 27,538 | |
| | | | | | | | | |
Commercial Services — 3.6% | | | | | | | | |
Block, Inc. (a) | | | 272 | | | | 18,107 | |
Moody’s Corp. | | | 69 | | | | 23,993 | |
PayPal Holdings, Inc. (a) | | | 185 | | | | 12,345 | |
S&P Global, Inc. | | | 82 | | | | 32,873 | |
| | | | | | | | 87,318 | |
Computers — 3.6% | | | | | | | | |
Apple, Inc. | | | 450 | | | | 87,287 | |
| | | | | | | | | |
Cosmetics & Personal Care — 0.5% | | | | | | | | |
Colgate-Palmolive Co. | | | 143 | | | | 11,017 | |
| | | | | | | | | |
Distribution & Wholesale — 4.2% | | | | | | | | |
WW Grainger, Inc. | | | 130 | | | | 102,517 | |
| | | | | | | | | |
| | Shares | | | Value | |
Diversified Financial Services — 6.0% | | | | | | | | |
American Express Co. | | | 377 | | | $ | 65,674 | |
BlackRock, Inc. | | | 51 | | | | 35,248 | |
Mastercard, Inc. - Class A | | | 117 | | | | 46,016 | |
| | | | | | | | 146,938 | |
Electric — 0.8% | | | | | | | | |
Eversource Energy | | | 275 | | | | 19,503 | |
| | | | | | | | | |
Energy, Alternate Sources — 2.5% | | | | | | | | |
Enphase Energy, Inc. (a) | | | 359 | | | | 60,125 | |
| | | | | | | | | |
Food — 2.4% | | | | | | | | |
Sysco Corp. | | | 775 | | | | 57,505 | |
| | | | | | | | | |
Healthcare Products — 3.5% | | | | | | | | |
Abbott Laboratories | | | 417 | | | | 45,461 | |
Thermo Fisher Scientific, Inc. | | | 74 | | | | 38,610 | |
| | | | | | | | 84,071 | |
Healthcare Services — 1.4% | | | | | | | | |
UnitedHealth Group, Inc. | | | 73 | | | | 35,087 | |
| | | | | | | | | |
Insurance — 1.6% | | | | | | | | |
The Allstate Corp. | | | 366 | | | | 39,909 | |
| | | | | | | | | |
Internet — 9.9% | | | | | | | | |
Alphabet, Inc. - Class A (a) | | | 605 | | | | 72,418 | |
Amazon.com, Inc. (a) | | | 338 | | | | 44,062 | |
Booking Holdings, Inc. (a) | | | 21 | | | | 56,707 | |
Netflix, Inc. (a) | | | 56 | | | | 24,667 | |
Uber Technologies, Inc. (a) | | | 992 | | | | 42,825 | |
| | | | | | | | 240,679 | |
Machinery Diversified — 3.7% | | | | | | | | |
Rockwell Automation, Inc. | | | 273 | | | | 89,940 | |
| | | | | | | | | |
Miscellaneous Manufacturing — 1.6% | | | | | | | | |
Illinois Tool Works, Inc. | | | 158 | | | | 39,525 | |
| | | | | | | | | |
Pharmaceuticals — 7.7% | | | | | | | | |
AbbVie, Inc. | | | 251 | | | | 33,817 | |
AmerisourceBergen Corp. | | | 361 | | | | 69,467 | |
Cardinal Health, Inc. | | | 421 | | | | 39,814 | |
Johnson & Johnson | | | 88 | | | | 14,566 | |
Merck & Co., Inc. | | | 149 | | | | 17,193 | |
Zoetis, Inc. | | | 69 | | | | 11,882 | |
| | | | | | | | 186,739 | |
Real Estate — 0.5% | | | | | | | | |
CBRE Group, Inc. - Class A (a) | | | 142 | | | | 11,461 | |
| | | | | | | | | |
The accompanying notes are an integral part of the financial statements.
5
TrueShares ESG Active Opportunities ETF
Schedule of Investments
June 30, 2023 (Unaudited) (Continued)
| | Shares | | | Value | |
Retail — 7.4% | | | | | | | | |
Costco Wholesale Corp. | | | 127 | | | $ | 68,374 | |
Starbucks Corp. | | | 411 | | | | 40,714 | |
Target Corp. | | | 147 | | | | 19,389 | |
The Home Depot, Inc. | | | 82 | | | | 25,472 | |
Tractor Supply Co. | | | 116 | | | | 25,648 | |
| | | | | | | | 179,597 | |
Semiconductors — 10.1% | | | | | | | | |
Advanced Micro Devices, Inc.(a) | | | 307 | | | | 34,970 | |
Lam Research Corp. | | | 69 | | | | 44,357 | |
NVIDIA Corp. | | | 330 | | | | 139,596 | |
QUALCOMM, Inc. | | | 220 | | | | 26,189 | |
| | | | | | | | 245,112 | |
Software — 10.0% | | | | | | | | |
Adobe, Inc. (a) | | | 81 | | | | 39,608 | |
Electronic Arts, Inc. | | | 215 | | | | 27,886 | |
Intuit, Inc. | | | 62 | | | | 28,408 | |
Microsoft Corp. | | | 291 | | | | 99,096 | |
MSCI, Inc. | | | 89 | | | | 41,767 | |
Zoom Video Communications, Inc. - Class A (a) | | | 82 | | | | 5,566 | |
| | | | | | | | 242,331 | |
Telecommunications — 1.4% | | | | | | | | |
AT&T, Inc. | | | 934 | | | | 14,897 | |
Verizon Communications, Inc. | | | 515 | | | | 19,153 | |
| | | | | | | | 34,050 | |
Transportation — 1.5% | | | | | | | | |
Expeditors International of Washington, Inc. | | | 303 | | | | 36,702 | |
| | | | | | | | | |
TOTAL COMMON STOCKS (Cost $2,034,378) | | | | | | | 2,333,590 | |
| | | | | | | | | |
REAL ESTATE INVESTMENT TRUSTS (REITS) — 3.4% | | | | | | | | |
AvalonBay Communities, Inc. | | | 183 | | | | 34,636 | |
Prologis, Inc. | | | 397 | | | | 48,685 | |
TOTAL REITS (Cost $93,744) | | | | | | | 83,321 | |
| | | | | | | | | |
| | Shares | | | Value | |
MONEY MARKET FUNDS — 0.5% | | | | | | | | |
First American Treasury Obligations Fund - Class X, 5.04% (b) | | | 12,646 | | | $ | 12,646 | |
TOTAL MONEY MARKET FUNDS (Cost $12,646) | | | | | | | 12,646 | |
| | | | | | | | | |
TOTAL INVESTMENTS (Cost $2,140,768) — 99.9% | | | | | | | 2,429,557 | |
Other assets and liabilities, net — 0.1% | | | | | | | 900 | |
TOTAL NET ASSETS — 100.0% | | | | | | $ | 2,430,457 | |
Percentages are stated as a percent of net assets.
(a) | Non-income producing security. |
(b) | The rate shown is the seven day yield at period end. |
The accompanying notes are an integral part of the financial statements.
6
TrueShares Low Volatility Equity Income ETF
Schedule of Investments
June 30, 2023 (Unaudited)
Sector Diversification *
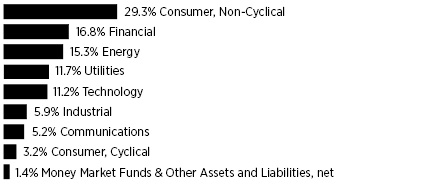
* | Percentages are stated as a percent of net assets. |
| | Shares | | | Value | |
COMMON STOCKS — 98.6% | | | | | | | | |
Aerospace & Defense — 6.0% | | | | | | | | |
Lockheed Martin Corp. | | | 5,670 | | | $ | 2,610,355 | |
Raytheon Technologies Corp. | | | 13,073 | | | | 1,280,631 | |
| | | | | | | | 3,890,986 | |
Agriculture — 11.0% | | | | | | | | |
Altria Group, Inc. | | | 28,929 | | | | 1,310,484 | |
British American Tobacco PLC - ADR (a) | | | 92,426 | | | | 3,068,543 | |
Philip Morris International, Inc. | | | 28,565 | | | | 2,788,515 | |
| | | | | | | | 7,167,542 | |
Banks — 3.5% | | | | | | | | |
JPMorgan Chase & Co. | | | 15,923 | | | | 2,315,841 | |
| | | | | | | | | |
Finance & Insurance — 10.1% | | | | | | | | |
CME Group, Inc. | | | 8,826 | | | | 1,635,370 | |
The Charles Schwab Corp. | | | 51,298 | | | | 2,907,570 | |
Visa, Inc. - Class A | | | 8,606 | | | | 2,043,753 | |
| | | | | | | | 6,586,693 | |
Electric — 11.7% | | | | | | | | |
American Electric Power Co, Inc. | | | 30,454 | | | | 2,564,227 | |
FirstEnergy Corp. | | | 70,360 | | | | 2,735,597 | |
WEC Energy Group, Inc. | | | 26,453 | | | | 2,334,213 | |
| | | | | | | | 7,634,037 | |
Food — 3.7% | | | | | | | | |
The Kroger Co. | | | 51,832 | | | | 2,436,104 | |
| | | | | | | | | |
Healthcare Products — 3.0% | | | | | | | | |
Medtronic PLC (a) | | | 22,178 | | | | 1,953,882 | |
| | | | | | | | | |
Healthcare Services — 4.9% | | | | | | | | |
UnitedHealth Group, Inc. | | | 6,675 | | | | 3,208,272 | |
| | | | | | | | | |
Oil & Gas — 11.7% | | | | | | | | |
Chevron Corp. | | | 16,616 | | | | 2,614,528 | |
Coterra Energy, Inc. | | | 59,088 | | | | 1,494,926 | |
| | Shares | | | Value | |
Oil & Gas (continued) | | | | | | | | |
Devon Energy Corp. | | | 14,518 | | | $ | 701,800 | |
Exxon Mobil Corp. | | | 26,550 | | | | 2,847,487 | |
| | | | | | | | 7,658,741 | |
Pharmaceuticals — 6.7% | | | | | | | | |
AbbVie, Inc. | | | 12,543 | | | | 1,689,918 | |
Johnson & Johnson | | | 16,364 | | | | 2,708,570 | |
| | | | | | | | 4,398,488 | |
Pipelines — 3.6% | | | | | | | | |
Kinder Morgan, Inc. | | | 135,804 | | | | 2,338,545 | |
| | | | | | | | | |
Retail — 3.2% | | | | | | | | |
Genuine Parts Co. | | | 12,387 | | | | 2,096,252 | |
| | | | | | | | | |
Savings & Loans — 3.1% | | | | | | | | |
New York Community Bancorp, Inc. | | | 182,417 | | | | 2,050,367 | |
| | | | | | | | | |
Semiconductors — 11.2% | | | | | | | | |
Analog Devices, Inc. | | | 10,639 | | | | 2,072,584 | |
Broadcom, Inc. | | | 3,390 | | | | 2,940,587 | |
QUALCOMM, Inc. | | | 19,331 | | | | 2,301,162 | |
| | | | | | | | 7,314,333 | |
Telecommunications — 5.2% | | | | | | | | |
AT&T, Inc. | | | 94,318 | | | | 1,504,372 | |
Verizon Communications, Inc. | | | 50,705 | | | | 1,885,719 | |
| | | | | | | | 3,390,091 | |
TOTAL COMMON STOCKS (Cost $62,495,909) | | | | | | | 64,440,174 | |
| | | | | | | | | |
MONEY MARKET FUNDS — 0.3% | | | | | | | | |
First American Treasury Obligations Fund - Class X, 5.04% (b) | | | 209,914 | | | | 209,914 | |
TOTAL MONEY MARKET FUNDS (Cost $209,914) | | | | | | | 209,914 | |
| | | | | | | | | |
TOTAL INVESTMENTS (Cost $62,705,823) — 98.9% | | | | | | | 64,650,088 | |
Other assets and liabilities, net — 1.1% | | | | | | | 695,396 | |
TOTAL NET ASSETS — 100.0% | | | | | | $ | 65,345,484 | |
Percentages are stated as a percent of net assets.
ADR — American Depositary Receipt
PLC — Public Limited Company
(a) | Foreign issued security. |
(b) | The rate shown is the yield at period end. |
The accompanying notes are an integral part of the financial statements.
7
TrueShares Eagle Global Renewable Energy Income ETF
Schedule of Investments
June 30, 2023 (Unaudited)
Sector Diversification *
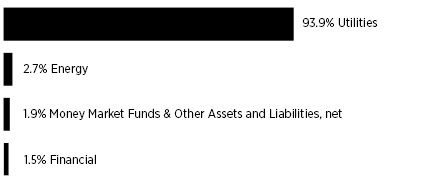
* | Percentages are stated as a percent of net assets. |
| | Shares | | | Value | |
COMMON STOCKS — 96.6% | | | | | | | | |
Electric — 93.9% (c) | | | | | | | | |
AGL Energy Ltd. (b) | | | 10,616 | | | $ | 76,447 | |
Atlantica Sustainable Infrastructure PLC (b) | | | 4,091 | | | | 95,893 | |
Boralex, Inc. - Class A (a)(b) | | | 2,068 | | | | 56,307 | |
Clearway Energy, Inc. - Class C | | | 2,895 | | | | 82,681 | |
EDP - Energias de Portugal SA (b) | | | 25,143 | | | | 122,804 | |
Electric Power Development Co. Ltd. (b) | | | 3,736 | | | | 54,864 | |
Endesa SA (b) | | | 6,334 | | | | 135,814 | |
Enel SpA (b) | | | 32,620 | | | | 219,550 | |
Enlight Renewable Energy Ltd. (a)(b) | | | 3,253 | | | | 57,741 | |
Fortum Oyj (b) | | | 4,190 | | | | 56,077 | |
Iberdrola SA (b) | | | 11,000 | | | | 143,439 | |
Mercury NZ Ltd. (b) | | | 16,492 | | | | 65,787 | |
NextEra Energy, Inc. | | | 4,046 | | | | 300,214 | |
Northland Power, Inc. (b) | | | 5,738 | | | | 119,676 | |
Orsted AS (b) | | | 2,361 | | | | 223,108 | |
PG&E Corp. (a) | | | 5,703 | | | | 98,548 | |
RWE AG (b) | | | 6,182 | | | | 268,956 | |
SSE PLC (b) | | | 9,971 | | | | 233,129 | |
The AES Corp. | | | 9,519 | | | | 197,329 | |
TransAlta Corp. (b) | | | 7,854 | | | | 73,515 | |
Verbund AG (b) | | | 1,002 | | | | 80,309 | |
| | | | | | | | 2,762,188 | |
Energy, Alternate Sources — 2.7% | | | | | | | | |
Enviva, Inc. | | | 7,217 | | | | 78,304 | |
TOTAL COMMON STOCKS (Cost $2,881,570) | | | | | | | 2,840,492 | |
| | | | | | | | | |
| | Shares | | | Value | |
REAL ESTATE INVESTMENT TRUSTS (REITS) — 1.5% | | | | | | | | |
Hannon Armstrong Sustainable Infrastructure Capital, Inc. | | | 1,735 | | | $ | 43,375 | |
TOTAL REITS (Cost $44,259) | | | | | | | 43,375 | |
| | | | | | | | | |
MONEY MARKET FUNDS — 2.3% | | | | | | | | |
First American Treasury Obligations Fund - Class X, 5.04% (d) | | | 68,350 | | | | 68,350 | |
TOTAL MONEY MARKET FUNDS (Cost $68,350) | | | | | | | 68,350 | |
| | | | | | | | | |
TOTAL INVESTMENTS (Cost $2,994,179) — 100.4% | | | | | | | 2,952,217 | |
Other assets and liabilities, net — (0.4)% | | | | | | | (11,605 | ) |
TOTAL NET ASSETS — 100.0% | | | | | | $ | 2,940,612 | |
Percentages are stated as a percent of net assets.
PLC — Public Limited Company
(a) | Non-income producing security. |
(b) | Foreign issued security. |
(c) | To the extent the Fund invests more heavily in particular sectors of the economy, its performance will be especially sensitive to developments that significantly affect those sectors. |
(d) | The rate shown is the seven day yield at period end. |
COUNTRY | | Percentage of
Net Assets | |
United States | | | 27.2 | % |
United Kingdom | | | 11.2 | % |
Spain | | | 9.5 | % |
Germany | | | 9.1 | % |
Canada | | | 8.5 | % |
Denmark | | | 7.6 | % |
Italy | | | 7.5 | % |
Portugal | | | 4.2 | % |
Austria | | | 2.7 | % |
Australia | | | 2.6 | % |
New Zealand | | | 2.2 | % |
Israel | | | 2.0 | % |
Finland | | | 1.9 | % |
Japan | | | 1.9 | % |
Total Country | | | 98.1 | % |
MONEY MARKET FUNDS | | | 2.3 | % |
TOTAL INVESTMENTS | | | 100.4 | % |
Other assets and liabilities, net | | | (0.4 | )% |
NET ASSETS | | | 100.0 | % |
The accompanying notes are an integral part of the financial statements.
8
RiverNorth Patriot ETF
Schedule of Investments
June 30, 2023 (Unaudited)
Sector Diversification *
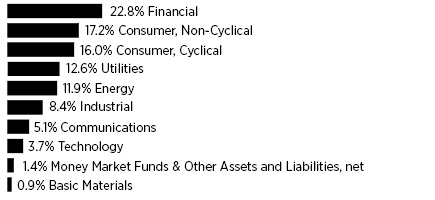
* | Percentages are stated as a percent of net assets. |
| | Shares | | | Value | |
COMMON STOCKS — 86.4% | | | | | | | | |
Advertising- 0.4% | | | | | | | | |
The Trade Desk, Inc. - Class A (a) | | | 177 | | | $ | 13,668 | |
| | | | | | | | | |
Agriculture — 0.5% | | | | | | | | |
Altria Group, Inc. | | | 331 | | | | 14,994 | |
| | | | | | | | | |
Airlines - 0.4% | | | | | | | | |
Southwest Airlines Co. | | | 372 | | | | 13,470 | |
| | | | | | | | | |
Auto Manufacturers — 0.9% | | | | | | | | |
Lucid Group, Inc. (a) | | | 2,079 | | | | 14,324 | |
Rivian Automotive, Inc. - Class A (a) | | | 903 | | | | 15,044 | |
| | | | | | | | 29,368 | |
Banks — 4.8% | | | | | | | | |
BOK Financial Corp. | | | 90 | | | | 7,270 | |
Citizens Financial Group, Inc. | | | 301 | | | | 7,850 | |
Comerica, Inc. | | | 142 | | | | 6,015 | |
Commerce Bancshares, Inc. | | | 162 | | | | 7,889 | |
Cullen/Frost Bankers, Inc. | | | 76 | | | | 8,172 | |
East West Bancorp, Inc. | | | 147 | | | | 7,760 | |
Fifth Third Bancorp | | | 287 | | | | 7,522 | |
First Citizens BancShares, Inc. - Class A | | | 5 | | | | 6,417 | |
First Horizon Corp. | | | 670 | | | | 7,551 | |
Huntington Bancshares, Inc. | | | 721 | | | | 7,772 | |
KeyCorp | | | 808 | | | | 7,466 | |
M&T Bank Corp. | | | 56 | | | | 6,931 | |
Prosperity Bancshares, Inc. | | | 103 | | | | 5,817 | |
Regions Financial Corp. | | | 437 | | | | 7,787 | |
SouthState Corp. | | | 91 | | | | 5,988 | |
The PNC Financial Services Group, Inc. | | | 73 | | | | 9,194 | |
Truist Financial Corp. | | | 248 | | | | 7,527 | |
U.S. Bancorp | | | 280 | | | | 9,251 | |
Webster Financial Corp. | | | 202 | | | | 7,626 | |
Wells Fargo & Co. | | | 219 | | | | 9,348 | |
| | | | | | | | 151,153 | |
| | Shares | | | Value | |
Beverages — 0.7% | | | | | | | | |
Coca-Cola Consolidated, Inc. | | | 15 | | | $ | 9,540 | |
Constellation Brands, Inc. - Class A | | | 55 | | | | 13,537 | |
| | | | | | | | 23,077 | |
Biotechnology — 1.7% | | | | | | | | |
Intra-Cellular Therapies, Inc. (a) | | | 209 | | | | 13,234 | |
Ionis Pharmaceuticals, Inc. (a) | | | 331 | | | | 13,581 | |
Sarepta Therapeutics, Inc. (a) | | | 117 | | | | 13,399 | |
Seagen, Inc. (a) | | | 73 | | | | 14,049 | |
| | | | | | | | 54,263 | |
Building Materials — 2.9% | | | | | | | | |
AAON, Inc. | | | 129 | | | | 12,230 | |
Builders FirstSource, Inc. (a) | | | 92 | | | | 12,512 | |
Eagle Materials, Inc. | | | 81 | | | | 15,100 | |
Martin Marietta Materials, Inc. | | | 26 | | | | 12,004 | |
Trex Co, Inc. (a) | | | 212 | | | | 13,899 | |
UFP Industries, Inc. | | | 121 | | | | 11,743 | |
Vulcan Materials Co. | | | 66 | | | | 14,879 | |
| | | | | | | | 92,367 | |
Chemicals — 0.5% | | | | | | | | |
Valvoline, Inc. | | | 368 | | | | 13,804 | |
| | | | | | | | | |
Commercial Services — 2.6% | | | | | | | | |
ADT, Inc. | | | 2,017 | | | | 12,163 | |
Booz Allen Hamilton Holding Corp. | | | 128 | | | | 14,285 | |
Paylocity Holding Corp. (a) | | | 75 | | | | 13,840 | |
R1 RCM, Inc. (a) | | | 741 | | | | 13,671 | |
Toast, Inc. - Class A (a) | | | 602 | | | | 13,587 | |
TriNet Group, Inc. (a) | | | 146 | | | | 13,866 | |
| | | | | | | | 81,412 | |
Computers — 0.9% | | | | | | | | |
CACI International, Inc. - Class A (a) | | | 41 | | | | 13,974 | |
Science Applications International Corp. | | | 126 | | | | 14,173 | |
| | | | | | | | 28,147 | |
Distribution & Wholesale — 0.4% | | | | | | | | |
SiteOne Landscape Supply, Inc. (a) | | | 81 | | | | 13,556 | |
| | | | | | | | | |
Diversified Financial Services — 3.6% | | | | | | | | |
Ally Financial, Inc. | | | 279 | | | | 7,536 | |
Ameriprise Financial, Inc. | | | 27 | | | | 8,968 | |
Apollo Global Management, Inc. | | | 100 | | | | 7,681 | |
Blue Owl Capital, Inc. | | | 516 | | | | 6,011 | |
Capital One Financial Corp. | | | 71 | | | | 7,765 | |
Cboe Global Markets, Inc. | | | 58 | | | | 8,005 | |
Credit Acceptance Corp. (a) | | | 13 | | | | 6,603 | |
Discover Financial Services | | | 69 | | | | 8,063 | |
LPL Financial Holdings, Inc. | | | 41 | | | | 8,915 | |
SoFi Technologies, Inc. (a) | | | 850 | | | | 7,089 | |
OneMain Holdings, Inc. | | | 140 | | | | 6,117 | |
The accompanying notes are an integral part of the financial statements.
9
RiverNorth Patriot ETF
Schedule of Investments
June 30, 2023 (Unaudited) (Continued)
| | Shares | | | Value | |
Diversified Financial Services (continued) | | | | | | | | |
Synchrony Financial | | | 219 | | | $ | 7,428 | |
T. Rowe Price Group, Inc. | | | 73 | | | | 8,177 | |
The Charles Schwab Corp. | | | 164 | | | | 9,296 | |
Voya Financial, Inc. | | | 100 | | | | 7,171 | |
| | | | | | | | 114,825 | |
Electric — 11.1% |
Alliant Energy Corp. | | | 231 | | | | 12,123 | |
Ameren Corp. | | | 145 | | | | 11,842 | |
American Electric Power Co., Inc. | | | 147 | | | | 12,377 | |
Avangrid, Inc. | | | 315 | | | | 11,869 | |
CenterPoint Energy, Inc. | | | 414 | | | | 12,068 | |
CMS Energy Corp. | | | 204 | | | | 11,985 | |
Consolidated Edison, Inc. | | | 130 | | | | 11,752 | |
Constellation Energy Corp. | | | 129 | | | | 11,810 | |
Dominion Energy, Inc. | | | 233 | | | | 12,067 | |
DTE Energy Co. | | | 102 | | | | 11,222 | |
Duke Energy Corp. | | | 144 | | | | 12,923 | |
Edison International | | | 171 | | | | 11,876 | |
Entergy Corp. | | | 118 | | | | 11,490 | |
Evergy, Inc. | | | 202 | | | | 11,801 | |
Eversource Energy | | | 172 | | | | 12,198 | |
Exelon Corp. | | | 302 | | | | 12,303 | |
FirstEnergy Corp. | | | 304 | | | | 11,820 | |
IDACORP, Inc. | | | 101 | | | | 10,363 | |
NextEra Energy, Inc. | | | 187 | | | | 13,875 | |
NRG Energy, Inc. | | | 325 | | | | 12,152 | |
OGE Energy Corp. | | | 334 | | | | 11,994 | |
PG&E Corp. (a) | | | 703 | | | | 12,148 | |
Pinnacle West Capital Corp. | | | 146 | | | | 11,893 | |
PPL Corp. | | | 446 | | | | 11,801 | |
Public Service Enterprise Group, Inc. | | | 200 | | | | 12,522 | |
The Southern Co. | | | 200 | | | | 14,050 | |
Vistra Corp. | | | 465 | | | | 12,206 | |
WEC Energy Group, Inc. | | | 131 | | | | 11,559 | |
Xcel Energy, Inc. | | | 189 | | | | 11,750 | |
| | | | | | | | 349,839 | |
Engineering & Construction — 1.2% | | | | | | | | |
Comfort Systems USA, Inc. | | | 69 | | | | 11,330 | |
EMCOR Group, Inc. | | | 68 | | | | 12,565 | |
MasTec, Inc. (a) | | | 120 | | | | 14,156 | |
| | | | | | | | 38,051 | |
Entertainment — 1.3% | | | | | | | | |
Caesars Entertainment, Inc. (a) | | | 273 | | | | 13,915 | |
Churchill Downs, Inc. | | | 100 | | | | 13,917 | |
DraftKings, Inc. - Class A (a) | | | 516 | | | | 13,710 | |
| | | | | | | | 41,542 | |
| | Shares | | | Value | |
Environmental Control — 0.9% | | | | | | | | |
Republic Services, Inc. | | | 83 | | | $ | 12,713 | |
Waste Management, Inc. | | | 83 | | | | 14,394 | |
| | | | | | | | 27,107 | |
Food — 2.9% | | | | | | | | |
Albertsons Cos., Inc. - Class A | | | 612 | | | | 13,354 | |
Campbell Soup Co. | | | 300 | | | | 13,713 | |
Flowers Foods, Inc. | | | 482 | | | | 11,992 | |
Lancaster Colony Corp. | | | 67 | | | | 13,473 | |
Performance Food Group Co. (a) | | | 221 | | | | 13,314 | |
The Kroger Co. | | | 290 | | | | 13,630 | |
US Foods Holding Corp. (a) | | | 302 | | | | 13,288 | |
| | | | | | | | 92,764 | |
Gas — 0.8% | | | | | | | | |
Atmos Energy Corp. | | | 100 | | | | 11,634 | |
NiSource, Inc. | | | 440 | | | | 12,034 | |
| | | | | | | | 23,668 | |
Healthcare Products — 1.2% | | | | | | | | |
Inspire Medical Systems, Inc. (a) | | | 41 | | | | 13,310 | |
Lantheus Holdings, Inc. (a) | | | 156 | | | | 13,091 | |
Natera, Inc. (a) | | | 260 | | | | 12,652 | |
| | | | | | | | 39,053 | |
Healthcare Services — 4.9% | | | | | | | | |
agilon health, Inc. (a) | | | 775 | | | | 13,439 | |
Centene Corp. (a) | | | 197 | | | | 13,288 | |
Chemed Corp. | | | 28 | | | | 15,168 | |
Elevance Health, Inc. | | | 29 | | | | 12,884 | |
HealthEquity, Inc. (a) | | | 189 | | | | 11,933 | |
Humana, Inc. | | | 28 | | | | 12,520 | |
Molina Healthcare, Inc. (a) | | | 41 | | | | 12,351 | |
Quest Diagnostics, Inc. | | | 96 | | | | 13,494 | |
Surgery Partners, Inc. (a) | | | 263 | | | | 11,832 | |
Tenet Healthcare Corp. (a) | | | 166 | | | | 13,509 | |
The Ensign Group, Inc. | | | 129 | | | | 12,314 | |
UnitedHealth Group, Inc. | | | 27 | | | | 12,977 | |
| | | | | | | | 155,709 | |
Home Builders — 2.5% | | | | | | | | |
DR Horton, Inc. | | | 109 | | | | 13,264 | |
Lennar Corp. - Class A | | | 109 | | | | 13,659 | |
NVR, Inc. (a) | | | 2 | | | | 12,701 | |
PulteGroup, Inc. | | | 176 | | | | 13,672 | |
Taylor Morrison Home Corp. (a) | | | 250 | | | | 12,193 | |
Toll Brothers, Inc. | | | 176 | | | | 13,916 | |
| | | | | | | | 79,405 | |
Household Products & Wares — 0.4% | | | | | | | | |
Reynolds Consumer Products, Inc. | | | 484 | | | | 13,673 | |
| | | | | | | | | |
Insurance — 3.6% | | | | | | | | |
American Financial Group, Inc. | | | 69 | | | | 8,194 | |
The accompanying notes are an integral part of the financial statements.
10
RiverNorth Patriot ETF
Schedule of Investments
June 30, 2023 (Unaudited) (Continued)
| | Shares | | | Value | |
Insurance (continued) | | | | | | | | |
Cincinnati Financial Corp. | | | 74 | | | $ | 7,202 | |
Equitable Holdings, Inc. | | | 279 | | | | 7,578 | |
Erie Indemnity Co. - Class A | | | 44 | | | | 9,241 | |
Fidelity National Financial, Inc. | | | 205 | | | | 7,380 | |
Globe Life, Inc. | | | 70 | | | | 7,673 | |
Kinsale Capital Group, Inc. | | | 13 | | | | 4,865 | |
Loews Corp. | | | 126 | | | | 7,482 | |
Markel Group, Inc. (a) | | | 5 | | | | 6,916 | |
Old Republic International Corp. | | | 309 | | | | 7,777 | |
The Allstate Corp. | | | 71 | | | | 7,742 | |
The Hartford Financial Services Group, Inc. | | | 114 | | | | 8,210 | |
The Progressive Corp. | | | 69 | | | | 9,133 | |
RLI Corp. | | | 55 | | | | 7,506 | |
Selective Insurance Group, Inc. | | | 72 | | | | 6,908 | |
| | | | | | | | 113,807 | |
Internet — 1.1% | | | | | | | | |
Robinhood Markets, Inc. - Class A (a) | | | 739 | | | | 7,375 | |
Roku, Inc. (a) | | | 208 | | | | 13,304 | |
Zillow Group, Inc. - Class C (a) | | | 258 | | | | 12,967 | |
| | | | | | | | 33,646 | |
Investment Companies — 0.6% |
Ares Capital Corp. | | | 408 | | | | 7,667 | |
FS KKR Capital Corp. | | | 308 | | | | 5,907 | |
Owl Rock Capital Corp. | | | 441 | | | | 5,918 | |
| | | | | | | | 19,492 | |
Iron & Steel — 0.4% | | | | | | | | |
Steel Dynamics, Inc. | | | 120 | | | | 13,072 | |
| | | | | | | | | |
Leisure Time — 0.4% | | | | | | | | |
Planet Fitness, Inc. - Class A (a) | | | 172 | | | | 11,600 | |
| | | | | | | | | |
Lodging — 0.4% | | | | | | | | |
Boyd Gaming Corp. | | | 198 | | | | 13,735 | |
| | | | | | | | | |
Media — 2.6% | | | | | | | | |
Charter Communications, Inc. - Class A (a) | | | 38 | | | | 13,960 | |
Fox Corp. - Class A | | | 396 | | | | 13,464 | |
Liberty Broadband Corp. - Class C (a) | | | 171 | | | | 13,699 | |
Nexstar Media Group, Inc. | | | 83 | | | | 13,824 | |
Sirius XM Holdings, Inc. | | | 3,174 | | | | 14,378 | |
The New York Times Co. - Class A | | | 335 | | | | 13,192 | |
| | | | | | | | 82,517 | |
Oil & Gas — 7.6% | | | | | | | | |
Antero Resources Corp. (a) | | | 601 | | | | 13,841 | |
Chesapeake Energy Corp. | | | 167 | | | | 13,975 | |
Chord Energy Corp. | | | 84 | | | | 12,919 | |
Civitas Resources, Inc. | | | 178 | | | | 12,348 | |
| | Shares | | | Value | |
Oil & Gas (continued) | | | | | | | | |
Coterra Energy, Inc. | | | 549 | | | $ | 13,889 | |
Devon Energy Corp. | | | 287 | | | | 13,874 | |
Diamondback Energy, Inc. | | | 98 | | | | 12,873 | |
EOG Resources, Inc. | | | 141 | | | | 16,136 | |
EQT Corp. | | | 334 | | | | 13,737 | |
HF Sinclair Corp. | | | 302 | | | | 13,472 | |
Marathon Oil Corp. | | | 606 | | | | 13,950 | |
Marathon Petroleum Corp. | | | 123 | | | | 14,342 | |
Matador Resources Co. | | | 260 | | | | 13,603 | |
PDC Energy, Inc. | | | 197 | | | | 14,015 | |
Pioneer Natural Resources Co. | | | 69 | | | | 14,295 | |
Range Resources Corp. | | | 464 | | | | 13,642 | |
Southwestern Energy Co. (a) | | | 2,320 | | | | 13,943 | |
Texas Pacific Land Corp. | | | 5 | | | | 6,583 | |
| | | | | | | | 241,437 | |
Pharmaceuticals — 2.2% | | | | | | | | |
Cardinal Health, Inc. | | | 137 | | | | 12,956 | |
CVS Health Corp. | | | 214 | | | | 14,794 | |
Neurocrine Biosciences, Inc. (a) | | | 146 | | | | 13,768 | |
Option Care Health, Inc. (a) | | | 374 | | | | 12,151 | |
The Cigna Group | | | 55 | | | | 15,432 | |
| | | | | | | | 69,101 | |
Pipelines — 1.7% | | | | | | | | |
Kinder Morgan, Inc. | | | 793 | | | | 13,655 | |
ONEOK, Inc. | | | 222 | | | | 13,702 | |
Targa Resources Corp. | | | 176 | | | | 13,394 | |
The Williams Cos., Inc. | | | 418 | | | | 13,639 | |
| | | | | | | | 54,390 | |
Private Equity — 0.5% | | | | | | | | |
Ares Management Corp. - Class A | | | 84 | | | | 8,093 | |
Blackstone, Inc. | | | 98 | | | | 9,111 | |
| | | | | | | | 17,204 | |
Retail — 9.6% | | | | | | | | |
AutoNation, Inc. (a) | | | 77 | | | | 12,675 | |
Beacon Roofing Supply, Inc. (a) | | | 140 | | | | 11,617 | |
BJ’s Wholesale Club Holdings, Inc. (a) | | | 207 | | | | 13,043 | |
Burlington Stores, Inc. (a) | | | 85 | | | | 13,378 | |
CarMax, Inc. (a) | | | 158 | | | | 13,225 | |
Casey’s General Stores, Inc. | | | 52 | | | | 12,682 | |
Chipotle Mexican Grill, Inc. (a) | | | 7 | | | | 14,973 | |
Darden Restaurants, Inc. | | | 87 | | | | 14,536 | |
Dick’s Sporting Goods, Inc. | | | 99 | | | | 13,087 | |
Dollar General Corp. | | | 84 | | | | 14,261 | |
Five Below, Inc. (a) | | | 68 | | | | 13,365 | |
Floor & Decor Holdings, Inc. - Class A (a) | | | 132 | | | | 13,723 | |
Lithia Motors, Inc. | | | 39 | | | | 11,860 | |
Murphy USA, Inc. | | | 41 | | | | 12,755 | |
The accompanying notes are an integral part of the financial statements.
11
RiverNorth Patriot ETF
Schedule of Investments
June 30, 2023 (Unaudited) (Continued)
| | Shares | | | Value | |
Retail (continued) | | | | | | | | |
O’Reilly Automotive, Inc. (a) | | | 13 | | | $ | 12,419 | |
RH (a) | | | 39 | | | | 12,854 | |
Ross Stores, Inc. | | | 127 | | | | 14,241 | |
Target Corp. | | | 114 | | | | 15,036 | |
Texas Roadhouse, Inc. | | | 124 | | | | 13,923 | |
Tractor Supply Co. | | | 57 | | | | 12,603 | |
Ulta Beauty, Inc. (a) | | | 27 | | | | 12,706 | |
Williams-Sonoma, Inc. | | | 110 | | | | 13,765 | |
Wingstop, Inc. | | | 53 | | | | 10,609 | |
| | | | | | | | 303,336 | |
Savings & Loans — 0.2% | | | | | | | | |
New York Community Bancorp, Inc. | | | 678 | | | | 7,621 | |
| | | | | | | | | |
Shipbuilding — 0.4% | | | | | | | | |
Huntington Ingalls Industries, Inc. | | | 56 | | | | 12,746 | |
| | | | | | | | | |
Software — 2.8% | | | | | | | | |
Bill.com Holdings, Inc. (a) | | | 106 | | | | 12,386 | |
Black Knight, Inc. (a) | | | 126 | | | | 7,526 | |
CCC Intelligent Solutions Holdings, Inc. (a) | | | 679 | | | | 7,612 | |
DoubleVerify Holdings, Inc. (a) | | | 349 | | | | 13,583 | |
Intuit, Inc. | | | 29 | | | | 13,288 | |
Jack Henry & Associates, Inc. | | | 42 | | | | 7,028 | |
Paychex, Inc. | | | 115 | | | | 12,865 | |
Paycom Software, Inc. | | | 44 | | | | 14,134 | |
| | | | | | | | 88,422 | |
Telecommunications — 1.0% | | | | | | | | |
AT&T, Inc. | | | 948 | | | | 15,121 | |
Verizon Communications, Inc. | | | 414 | | | | 15,396 | |
| | | | | | | | 30,517 | |
Transportation — 3.0% | | | | | | | | |
CSX Corp. | | | 444 | | | | 15,140 | |
JB Hunt Transport Services, Inc. | | | 68 | | | | 12,310 | |
Knight-Swift Transportation Holdings, Inc. | | | 248 | | | | 13,780 | |
Landstar System, Inc. | | | 67 | | | | 12,900 | |
Norfolk Southern Corp. | | | 69 | | | | 15,646 | |
Old Dominion Freight Line, Inc. | | | 36 | | | | 13,311 | |
Saia, Inc. (a) | | | 37 | | | | 12,669 | |
| | | | | | | | 95,756 | |
Water — 0.8% | | | | | | | | |
American Water Works Co., Inc. | | | 90 | | | | 12,848 | |
Essential Utilities, Inc. | | | 294 | | | | 11,734 | |
| | | | | | | | 24,582 | |
TOTAL COMMON STOCKS (Cost $2,740,100) | | | | | | | 2,737,896 | |
| | | | | | | | | |
| | Shares | | | Value | |
PARTNERSHIPS — 3.0% | | | | | | | | |
Investment Companies — 0.4% | | | | | | | | |
Icahn Enterprises LP | | | 479 | | | $ | 13,905 | |
| | | | | | | | | |
Pipelines — 2.6% | | | | | | | | |
Cheniere Energy Partners LP | | | 286 | | | | 13,196 | |
Energy Transfer LP | | | 1,049 | | | | 13,322 | |
Enterprise Products Partners LP | | | 579 | | | | 15,258 | |
Magellan Midstream Partners LP | | | 217 | | | | 13,524 | |
MPLX LP | | | 394 | | | | 13,372 | |
Western Midstream Partners LP | | | 505 | | | | 13,392 | |
| | | | | | | | 82,064 | |
TOTAL PARTNERSHIPS (Cost $83,783) | | | | | | | 95,969 | |
| | | | | | | | | |
REAL ESTATE INVESTMENTS TRUSTS (REITS) — 9.2% |
AGNC Investment Corp. | | | 736 | | | | 7,456 | |
Agree Realty Corp. | | | 115 | | | | 7,520 | |
Alexandria Real Estate Equities, Inc. | | | 72 | | | | 8,171 | |
American Homes 4 Rent - Class A | | | 213 | | | | 7,551 | |
Annaly Capital Management, Inc. | | | 364 | | | | 7,284 | |
Apartment Income REIT Corp. | | | 176 | | | | 6,352 | |
AvalonBay Communities, Inc. | | | 44 | | | | 8,328 | |
Boston Properties, Inc. | | | 135 | | | | 7,775 | |
Brixmor Property Group, Inc. | | | 353 | | | | 7,766 | |
Camden Property Trust | | | 74 | | | | 8,056 | |
Crown Castle, Inc. | | | 85 | | | | 9,686 | |
CubeSmart | | | 168 | | | | 7,503 | |
EastGroup Properties, Inc. | | | 43 | | | | 7,465 | |
Equity LifeStyle Properties, Inc. | | | 118 | | | | 7,893 | |
Equity Residential | | | 115 | | | | 7,587 | |
Essex Property Trust, Inc. | | | 28 | | | | 6,560 | |
Extra Space Storage, Inc. | | | 55 | | | | 8,186 | |
Federal Realty Investment Trust | | | 85 | | | | 8,225 | |
First Industrial Realty Trust, Inc. | | | 144 | | | | 7,580 | |
Gaming and Leisure Properties, Inc. | | | 161 | | | | 7,802 | |
Healthcare Realty Trust, Inc. | | | 412 | | | | 7,770 | |
Healthpeak Properties, Inc. | | | 375 | | | | 7,537 | |
Host Hotels & Resorts, Inc. | | | 454 | | | | 7,641 | |
Invitation Homes, Inc. | | | 213 | | | | 7,327 | |
Kimco Realty Corp. | | | 396 | | | | 7,809 | |
Lamar Advertising Co. - Class A | | | 82 | | | | 8,139 | |
Life Storage, Inc. | | | 55 | | | | 7,313 | |
Mid-America Apartment Communities, Inc. | | | 43 | | | | 6,530 | |
NNN REIT, Inc. | | | 186 | | | | 7,959 | |
Public Storage | | | 28 | | | | 8,173 | |
Regency Centers Corp. | | | 129 | | | | 7,968 | |
Rexford Industrial Realty, Inc. | | | 147 | | | | 7,676 | |
Ryman Hospitality Properties, Inc. | | | 72 | | | | 6,690 | |
The accompanying notes are an integral part of the financial statements.
12
RiverNorth Patriot ETF
Schedule of Investments
June 30, 2023 (Unaudited) (Continued)
| | Shares | | | Value | |
REITS (continued) | | | | |
Simon Property Group, Inc. | | | 69 | | | $ | 7,968 | |
Spirit Realty Capital, Inc. | | | 158 | | | | 6,222 | |
STAG Industrial, Inc. | | | 216 | | | | 7,750 | |
UDR, Inc. | | | 173 | | | | 7,432 | |
VICI Properties, Inc. | | | 249 | | | | 7,826 | |
TOTAL REITS (Cost $338,222) | | | | | | | 290,476 | |
| | | | | | | | | |
MONEY MARKET FUNDS — 3.9% | | | | | | | | |
First American Treasury Obligations Fund - Class X, 5.04% (b) | | | 122,080 | | | | 122,080 | |
TOTAL MONEY MARKET FUNDS (Cost $122,080) | | | | | | | 122,080 | |
| | | | | | | | | |
Total Investments (Cost $3,284,185) — 102.5% | | | | | | | 3,246,421 | |
Other assets and liabilities, net — (2.5)% | | | | | | | (78,675 | ) |
TOTAL NET ASSETS — 100.0% | | | | | | $ | 3,167,746 | |
Percentages are stated as a percent of net assets.
(a) | Non-income producing security. |
(b) | The rate shown is the seven day yield at period end. |
The accompanying notes are an integral part of the financial statements.
13
RiverNorth Enhanced Pre-Merger SPAC ETF
Schedule of Investments
June 30, 2023 (Unaudited)
Sector Diversification *
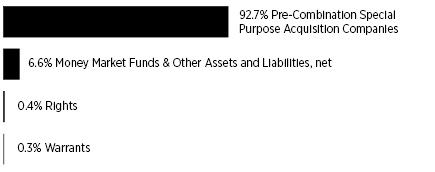
* | Percentages are stated as a percent of net assets. |
| | Shares | | | Value | |
COMMON STOCKS — 92.7% | | | | | | | | |
Pre-Combination Special Purpose Acquisition Companies — 92.7% (a) |
Acri Capital Acquisition Corp. | | | 10,522 | | | $ | 113,638 | |
Alchemy Investments Acquisition Corp. 1 - Tracking Stock (b) | | | 6,363 | | | | 65,157 | |
Ares Acquisition Corp. - Class A (b) | | | 7,946 | | | | 83,989 | |
Ares Acquisition Corp. II - Tracking Stock (b) | | | 23,273 | | | | 238,548 | |
Bukit Jalil Global Acquisition 1 Ltd. - Tracking Stock (b) | | | 23,000 | | | | 234,140 | |
Churchill Capital Corp. V - Class A | | | 20,425 | | | | 207,722 | |
Churchill Capital Corp. VII | | | 20,000 | | | | 206,800 | |
Conyers Park III Acquisition Corp. - Class A | | | 10,552 | | | | 107,841 | |
Distoken Acquisition Corp. (b) | | | 10,238 | | | | 105,810 | |
ESH Acquisition Corp. - Tracking Stock | | | 23,000 | | | | 233,220 | |
Four Leaf Acquisition Corp. - Class A | | | 23,000 | | | | 237,130 | |
FTAC Zeus Acquisition Corp. - Class A | | | 18,192 | | | | 189,652 | |
Fusion Acquisition Corp. II - Class A | | | 2 | | | | 22 | |
Fusion Acquisition Corp. II | | | 22,998 | | | | 238,719 | |
Goal Acquisitions Corp. | | | 6,973 | | | | 72,415 | |
Gores Holdings IX, Inc. - Class A | | | 21,142 | | | | 216,707 | |
Golden Star Acquisition Corp. - Tracking Stock (b) | | | 28,085 | | | | 292,365 | |
Graf Acquisition Corp. IV | | | 10,502 | | | | 108,486 | |
Hennessy Capital Investment Corp. VI - Class A | | | 14,565 | | | | 150,020 | |
Horizon Space Acquisition I Corp. (b) | | | 3,578 | | | | 37,372 | |
Inflection Point Acquisition Corp. II - Tracking Stock (b) | | | 23,374 | | | | 236,545 | |
Innovative International Acquisition Corp. - Class A (b) | | | 21,043 | | | | 229,578 | |
Israel Acquisitions Corp. - Class A (b) | | | 5,375 | | | | 55,846 | |
Kernel Group Holdings, Inc. - Class A (b) | | | 10,522 | | | | 110,481 | |
Live Oak Crestview Climate Acquisition Corp. - Class A | | | 7,077 | | | | 72,539 | |
Mars Acquisition Corp. (b) | | | 10,840 | | | | 112,519 | |
Newbury Street Acquisition Corp. | | | 21,043 | | | | 218,426 | |
Oak Woods Acquisition Corp. - Class A (b) | | | 23,000 | | | | 236,325 | |
OCA Acquisition Corp. - Class A | | | 13,677 | | | | 143,745 | |
| | Shares | | | Value | |
Pre-Combination Special Purpose Acquisition Companies (continued) |
Pono Capital Three, Inc. - Class A (b) | | | 10,989 | | | $ | 114,231 | |
Quantum FinTech Acquisition Corp. | | | 13,725 | | | | 142,603 | |
Screaming Eagle Acquisition Corp. - Class A (b) | | | 22,929 | | | | 236,856 | |
TMT Acquisition Corp. - Class A (b) | | | 23,000 | | | | 236,670 | |
Trailblazer Merger Corp. I | | | 22,022 | | | | 224,404 | |
TOTAL COMMON STOCKS (Cost $5,327,615) | | | | | | | 5,510,521 | |
| | | | | | | | | |
RIGHTS — 0.4% (a) | | | | | | | | |
Distoken Acquisition Corp., Expiration: November 2027 (b) | | | 10,238 | | | | 2,114 | |
Horizon Space Acquisition I Corp., Expiration: March 2024 (b) | | | 3,578 | | | | 531 | |
Mars Acquisition Corp., Expiration: February 2028 (b) | | | 10,840 | | | | 2,708 | |
Oak Woods Acquisition Corp., Expiration: March 2028 (b) | | | 23,000 | | | | 4,830 | |
TMT Acquisition Corp., Expiration: March 2028 (b) | | | 23,000 | | | | 8,050 | |
Trailblazer Merger Corp. I, Expiration: April 2028 | | | 22,022 | | | | 3,127 | |
TOTAL RIGHTS (Cost $15,050) | | | | | | | 21,360 | |
| | | | | | | | | |
WARRANTS — 0.3% (a) | | | | | | | | |
Apollo Strategic Growth Capital II - Class A, Expiration: December 2027, Exercise Price: $11.50 (b) | | | 3,562 | | | | 437 | |
Ares Acquisition Corp. - Class A, Expiration: December 2027, Exercise Price: $11.50 (b) | | | 767 | | | | 614 | |
Bite Acquisition Corp., Expiration: December 2027, Exercise Price: $11.50 | | | 2,317 | | | | 193 | |
CC Neuberger Principal Holdings III, Expiration: December 2027, Exercise Price: $11.50 (b) | | | 455 | | | | 86 | |
CF Acquisition Corp. IV, Expiration: December 2025, Exercise Price: $11.50 | | | 2,118 | | | | 147 | |
Churchill Capital Corp. V - Class A, Expiration: October 2027, Exercise Price: $11.50 | | | 3,679 | | | | 663 | |
Churchill Capital Corp. VI - Class A, Expiration: December 2027, Exercise Price: $11.50 | | | 3,511 | | | | 632 | |
Churchill Capital Corp. VII - Class A, Expiration: February 2028, Exercise Price: $11.50 | | | 3,382 | | | | 473 | |
Conyers Park III Acquisition Corp., Expiration: August 2028, Exercise Price: $11.50 | | | 2,175 | | | | 109 | |
Distoken Acquisition Corp., Expiration: March 2028, Exercise Price: $11.50 (b) | | | 10,238 | | | | 393 | |
The accompanying notes are an integral part of the financial statements.
14
RiverNorth Enhanced Pre-Merger SPAC ETF
Schedule of Investments
June 30, 2023 (Unaudited) (Continued)
| | Shares | | | Value | |
WARRANTS (continued) | | | | | | | | |
FAST Acquisition Corp. II - Class A, Expiration: March 2026, Exercise Price: $11.50 | | | 2,675 | | | $ | 1,870 | |
Four Leaf Acquisition Corp., Expiration: May 2028, Exercise Price: $11.50 | | | 23,000 | | | | 2,230 | |
Fusion Acquisition Corp. II - Class A, Expiration: December 2027, Exercise Price: $11.50 | | | 7,666 | | | | 38 | |
Goal Acquisitions Corp., Expiration: February 2026, Exercise Price: $11.50 | | | 2,841 | | | | 69 | |
Gores Holdings IX, Inc., Expiration: January 2029, Exercise Price: $11.50 | | | 5,071 | | | | 1,114 | |
Graf Acquisition Corp. IV, Expiration: May 2028, Exercise Price: $11.50 | | | 1,751 | | | | 399 | |
Hennessy Capital Investment Corp. VI - Class A, Expiration: December 2027, Exercise Price: $11.50 | | | 4,085 | | | | 449 | |
Horizon Space Acquisition I Corp., Expiration: January 2028, Exercise Price: $11.50 (b) | | | 3,578 | | | | 185 | |
Israel Acquisitions Corp., Expiration: February 2028, Exercise Price: $11.50 (b) | | | 5,375 | | | | 806 | |
Jaws Mustang Acquisition Corp., Expiration: January 2026, Exercise Price: $11.50 (b) | | | 2,053 | | | | 103 | |
Live Oak Crestview Climate Acquisition Corp., Expiration: March 2026, Exercise Price: $11.50 | | | 1,424 | | | | 49 | |
Net Power, Inc., Expiration: March 2026, Exercise Price: $11.50 | | | 1,085 | | | | 3,646 | |
Oak Woods Acquisition Corp., Expiration: May 2028, Exercise Price: $11.50 (b) | | | 23,000 | | | | 745 | |
Pono Capital Three, Inc. - Class A, Expiration: April 2028, Exercise Price: $11.50 (b) | | | 10,989 | | | | 1,868 | |
Screaming Eagle Acquisition Corp. - Class A, Expiration: December 2027, Exercise Price: $11.50 (b) | | | 5,917 | | | | 804 | |
Slam Corp. - Class A, Expiration: December 2027, Exercise Price: $11.50 (b) | | | 3,592 | | | | 682 | |
Twelve Seas Investment Co. II - Class A, Expiration: March 2028, Exercise Price: $11.50 | | | 3,509 | | | | 234 | |
TOTAL WARRANTS (Cost $15,603) | | | | | | | 19,038 | |
| | Shares | | | Value | |
MONEY MARKET FUNDS — 8.5% | | | | | | | | |
First American Treasury Obligations Fund - Class X, 5.04% (c) | | | 506,797 | | | $ | 506,797 | |
TOTAL MONEY MARKET FUNDS (Cost $506,797) | | | | | | | 506,797 | |
| | | | | | | | | |
TOTAL INVESTMENTS (Cost $5,865,065) — 101.9% | | | | | | | 6,057,716 | |
Other assets and liabilities, net — (1.9)% | | | | | | | (110,406 | ) |
TOTAL NET ASSETS — 100.0% | | | | | | $ | 5,947,310 | |
Percentages are stated as a percent of net assets.
(a) | Non-income producing security. |
(b) | Foreign issued security. |
(c) | The rate shown is the seven day yield at period end. |
COUNTRY | Percentage of
Net Assets |
United States | 48.5% |
Cayman Islands | 44.6%* |
Total Country | 93.1% |
RIGHTS | 0.4% |
WARRANTS | 0.3% |
MONEY MARKET FUNDS | 8.5% |
TOTAL INVESTMENTS | 101.9% |
Other assets and liabilities, net | (1.9)% |
NET ASSETS | 100.0% |
* | To the extent the Fund invests more heavily in particular countries, its performance will be especially sensitive to developments that significantly affect those countries. |
The accompanying notes are an integral part of the financial statements.
15
THIS PAGE INTENTIONALLY LEFT BLANK
TrueShares ETFs
Statements of Assets and Liabilities
June 30, 2023 (Unaudited)
| | | TrueShares
Technology,
AI & Deep
Learning ETF | | | TrueShares
ESG Active
Opportunities
ETF | | | TrueShares Low
Volatility Equity
Income ETF | | | TrueShares
Eagle Global
Renewable
Energy
Income ETF | |
Assets | | | | | | | | | | | | | | | | |
Investments, at value(1) | | $ | 34,161,439 | | | $ | 2,429,557 | | | $ | 64,650,088 | | | $ | 2,952,217 | |
Receivable for investment securities sold | | | — | | | | — | | | | 3,054,426 | | | | — | |
Receivable for Fund shares sold | | | — | | | | — | | | | 1,089,524 | | | | — | |
Dividends and interest receivable | | | 8,685 | | | | 2,222 | | | | 113,453 | | | | 11,593 | |
Total assets | | | 34,170,124 | | | | 2,431,779 | | | | 68,907,491 | | | | 2,963,810 | |
| | | | | | | | | | | | | | | | | |
Liabilities | | | | | | | | | | | | | | | | |
Payable to Adviser | | | 15,623 | | | | 1,322 | | | | 34,337 | | | | 1,780 | |
Payable for investment securities purchased | | | — | | | | — | | | | 2,429,406 | | | | 21,418 | |
Payable for Fund shares redeemed | | | — | | | | — | | | | 1,098,264 | | | | — | |
Total liabilities | | | 15,623 | | | | 1,322 | | | | 3,562,007 | | | | 23,198 | |
Net Assets | | $ | 34,154,501 | | | $ | 2,430,457 | | | $ | 65,345,484 | | | $ | 2,940,612 | |
| | | | | | | | | | | | | | | | | |
Net Assets Consists of: | | | | | | | | | | | | | | | | |
Paid-in capital | | $ | 46,228,764 | | | $ | 1,210,305 | | | $ | 67,919,996 | | | $ | 2,972,232 | |
Total distributable earnings (accumulated losses) | | | (12,074,263 | ) | | | 1,220,152 | | | | (2,574,512 | ) | | | (31,620 | ) |
Net Assets | | $ | 34,154,501 | | | $ | 2,430,457 | | | $ | 65,345,484 | | | $ | 2,940,612 | |
| | | | | | | | | | | | | | | | | |
Shares of beneficial interest outstanding (unlimited number of shares authorized, no par value) | | | 1,070,000 | | | | 65,000 | | | | 2,380,000 | | | | 120,000 | |
Net Asset Value, redemption price and offering price per share | | $ | 31.92 | | | $ | 37.39 | | | | 27.46 | | | | 24.51 | |
| | | | | | | | | | | | | | | | | |
(1) Cost of investments | | $ | 38,287,446 | | | $ | 2,140,768 | | | $ | 62,705,823 | | | $ | 2,994,179 | |
The accompanying notes are an integral part of the financial statements.
17
TrueShares ETFs
Statements of Assets and Liabilities
June 30, 2023 (Unaudited) (Continued)
| | | RiverNorth
Patriot ETF | | | RiverNorth
Enhanced
Pre-Merger
SPAC ETF | |
Assets | | | | | | | | |
Investments, at value(1) | | $ | 3,246,421 | | | $ | 6,057,716 | |
Dividends and interest receivable | | | 4,303 | | | | 2,948 | |
Receivable for investment securities sold | | | 165,259 | | | | — | |
Total assets | | | 3,415,983 | | | | 6,060,664 | |
| | | | | | | | | |
Liabilities | | | | | | | | |
Payable to Adviser | | | 1,772 | | | | 4,384 | |
Payable for investment securities purchased | | | 246,465 | | | | 108,970 | |
Total liabilities | | | 248,237 | | | | 113,354 | |
Net Assets | | $ | 3,167,746 | | | $ | 5,947,310 | |
| | | | | | | | | |
Net Assets Consists of: | | | | | | | | |
Paid-in capital | | $ | 3,523,075 | | | $ | 5,656,515 | |
Total distributable earnings (accumulated losses) | | | (355,329 | ) | | | 290,795 | |
Net Assets | | $ | 3,167,746 | | | $ | 5,947,310 | |
| | | | | | | | | |
Shares of beneficial interest outstanding (unlimited number of shares authorized, no par value) | | | 140,000 | | | | 225,000 | |
Net Asset Value, redemption price and offering price per share | | $ | 22.63 | | | $ | 26.43 | |
| | | | | | | | | |
(1) Cost of investments | | $ | 3,284,185 | | | $ | 5,865,065 | |
The accompanying notes are an integral part of the financial statements.
18
TrueShares ETFs
Statements of Operations
For the Six Months Ended June 30, 2023 (Unaudited)
| | | TrueShares
Technology,
AI & Deep
Learning ETF | | | TrueShares
ESG Active
Opportunities
ETF | | | TrueShares Low
Volatility Equity
Income ETF | | | TrueShares
Eagle Global
Renewable
Energy
Income ETF | |
Investment Income | | | | | | | | | | | | | | | | |
Dividend income (net of withholding taxes and issuance fees of $—, $—, $541 and $7,672, respectively) | | $ | 344 | | | $ | 37,305 | | | $ | 1,165,981 | | | $ | 46,548 | |
Interest income | | | 9,796 | | | | 1,469 | | | | 49,947 | | | | 1,275 | |
Total investment income | | | 10,140 | | | | 38,775 | | | | 1,215,928 | | | | 47,823 | |
| | | | | | | | | | | | | | | | | |
Expenses | | | | | | | | | | | | | | | | |
Investment advisory fees | | | 60,440 | | | | 14,560 | | | | 227,812 | | | | 9,349 | |
Total expenses | | | 60,440 | | | | 14,560 | | | | 227,812 | | | | 9,349 | |
Net Investment Income (Loss) | | | (50,300 | ) | | | 24,215 | | | | 988,116 | | | | 38,474 | |
| | | | | | | | | | | | | | | | | |
Realized and Unrealized Gain (Loss) on Investments and Foreign Currency | | | | | | | | | | | | | | | | |
Net realized gain (loss) on: | | | | | | | | | | | | | | | | |
Investments | | | (3,937,463 | ) | | | 996,961 | | | | (913,116 | ) | | | 2,039 | |
Foreign currency transactions | | | — | | | | — | | | | — | | | | (107 | ) |
Net realized gain (loss) on investments and foreign currency transactions | | | (3,937,463 | ) | | | 996,961 | | | | (913,116 | ) | | | 1,932 | |
Net change in unrealized appreciation/depreciation on: | | | | | | | | | | | | | | | | |
Investments | | | 9,543,766 | | | | (266,235 | ) | | | (2,877,169 | ) | | | (6,058 | ) |
Foreign currency translation | | | — | | | | — | | | | — | | | | 818 | |
Net change in unrealized appreciation/depreciation on investments and foreign currency translation | | | 9,543,766 | | | | (266,235 | ) | | | (2,877,169 | ) | | | (5,240 | ) |
Net realized and unrealized gain (loss) on investments and foreign currency | | | 5,606,303 | | | | 730,726 | | | | (3,790,285 | ) | | | (3,308 | ) |
Net increase (decrease) in net assets from operations | | $ | 5,556,003 | | | $ | 754,941 | | | $ | (2,802,169 | ) | | $ | 35,166 | |
The accompanying notes are an integral part of the financial statements.
19
TrueShares ETFs
Statements of Operations
For the Six Months Ended June 30, 2023 (Unaudited) (Continued)
| | | RiverNorth
Patriot ETF | | | RiverNorth
Enhanced
Pre-Merger
SPAC ETF | |
Investment Income | | | | | | | | |
Dividend income | | $ | 34,450 | | | $ | — | |
Interest income | | | 473 | | | | 12,420 | |
Total investment income | | | 34,923 | | | | 12,420 | |
| | | | | | | | | |
Expenses | | | | | | | | |
Investment advisory fees | | | 11,237 | | | | 25,596 | |
Total expenses | | | 11,237 | | | | 25,596 | |
Net Investment Income (Loss) | | | 23,686 | | | | (13,176 | ) |
| | | | | | | | | |
Realized and Unrealized Gain (Loss) on Investments | | | | | | | | |
Net realized gain (loss) on investments | | | (149,393 | ) | | | 102,508 | |
Net change in unrealized appreciation/depreciation on investments | | | 255,282 | | | | 131,070 | |
Net realized and unrealized gain on investments | | | 105,889 | | | | 233,578 | |
Net increase in net assets from operations | | $ | 129,575 | | | $ | 220,402 | |
The accompanying notes are an integral part of the financial statements.
20
TrueShares ETFs
Statements of Changes in Net Assets
| | | TrueShares Technology, AI
& Deep Learning ETF | | | TrueShares ESG Active
Opportunities ETF | |
| | | Six Months
Ended
June 30, 2023
(Unaudited) | | | Year Ended
December 31,
2022 | | | Six Months
Ended
June 30, 2023
(Unaudited) | | | Year Ended
December 31,
2022 | |
From Operations | | | | | | | | | | | | | | | | |
Net investment income (loss) | | $ | (50,300 | ) | | $ | (131,297 | ) | | $ | 24,215 | | | $ | 56,514 | |
Net realized gain (loss) on investments | | | (3,937,463 | ) | | | (1,688,095 | ) | | | 996,961 | | | | 518,697 | |
Net change in unrealized appreciation/depreciation on investments | | | 9,543,766 | | | | (16,195,089 | ) | | | (266,235 | ) | | | (2,722,553 | ) |
Net increase (decrease) in net assets resulting from operations | | | 5,556,003 | | | | (18,014,481 | ) | | | 754,941 | | | | (2,147,342 | ) |
| | | | | | | | | | | | | | | | | |
From Distributions | | | | | | | | | | | | | | | | |
Distributable earnings | | | — | | | | — | | | | — | | | | (55,980 | ) |
Total distributions | | | — | | | | — | | | | — | | | | (55,980 | ) |
| | | | | | | | | | | | | | | | | |
From Capital Share Transactions | | | | | | | | | | | | | | | | |
Proceeds from shares sold | | | 18,647,455 | | | | 5,630,240 | | | | — | | | | — | |
Cost of shares redeemed | | | (4,348,829 | ) | | | (11,009,818 | ) | | | (4,675,272 | ) | | | (1,793,493 | ) |
Net increase (decrease) in net assets resulting from capital share transactions | | | 14,298,626 | | | | (5,379,578 | ) | | | (4,675,272 | ) | | | (1,793,493 | ) |
| | | | | | | | | | | | | | | | | |
Total Increase (Decrease) in Net Assets | | | 19,854,629 | | | | (23,394,059 | ) | | | (3,920,331 | ) | | | (3,996,815 | ) |
| | | | | | | | | | | | | | | | | |
Net Assets | | | | | | | | | | | | | | | | |
Beginning of period | | | 14,299,872 | | | | 37,693,931 | | | | 6,350,788 | | | | 10,347,603 | |
End of period | | $ | 34,154,501 | | | $ | 14,299,872 | | | $ | 2,430,457 | | | $ | 6,350,788 | |
| | | | | | | | | | | | | | | | | |
Changes in Shares Outstanding | | | | | | | | | | | | | | | | |
Shares outstanding, beginning of period | | | 625,000 | | | | 800,000 | | | | 200,000 | | | | 250,000 | |
Shares sold | | | 600,000 | | | | 150,000 | | | | — | | | | — | |
Shares redeemed | | | (155,000 | ) | | | (325,000 | ) | | | (135,000 | ) | | | (50,000 | ) |
Shares outstanding, end of period | | | 1,070,000 | | | | 625,000 | | | | 65,000 | | | | 200,000 | |
The accompanying notes are an integral part of the financial statements.
21
TrueShares ETFs
Statements of Changes in Net Assets
(Continued)
| | | TrueShares Low Volatility
Equity Income ETF | | | TrueShares Eagle Global
Renewable Energy Income ETF | |
| | | Six Months
Ended
June 30, 2023
(Unaudited) | | | Year Ended
December 31,
2022 | | | Six Months
Ended
June 30, 2023
(Unaudited) | | | Period Ended
December 31,
2022(1) | |
From Operations | | | | | | | | | | | | | | | | |
Net investment income (loss) | | $ | 988,116 | | | $ | 2,076,126 | | | $ | 38,474 | | | $ | (271 | ) |
Net realized gain (loss) on investments and foreign currency | | | (913,116 | ) | | | (1,788,783 | ) | | | 1,932 | | | | (1,747 | ) |
Net change in unrealized appreciation/depreciation on investments and foreign currency | | | (2,877,169 | ) | | | 1,890,513 | | | | (5,240 | ) | | | (36,740 | ) |
Net increase (decrease) in net assets resulting from operations | | | (2,802,169 | ) | | | 2,177,856 | | | | 35,166 | | | | (38,758 | ) |
| | | | | | | | | | | | | | | | | |
From Distributions | | | | | | | | | | | | | | | | |
Distributable earnings | | | (987,990 | ) | | | (2,075,345 | ) | | | (28,300 | ) | | | — | |
Return of capital | | | — | | | | (693 | ) | | | — | | | | (238 | ) |
Total distributions | | | (987,990 | ) | | | (2,076,038 | ) | | | (28,300 | ) | | | (238 | ) |
| | | | | | | | | | | | | | | | | |
From Capital Share Transactions | | | | | | | | | | | | | | | | |
Proceeds from shares sold | | | 11,153,717 | | | | 39,931,580 | | | | 724,352 | | | | 2,494,265 | |
Cost of shares redeemed | | | (20,289,376 | ) | | | (7,987,377 | ) | | | (245,875 | ) | | | — | |
Net increase (decrease) in net assets resulting from capital share transactions | | | (9,135,659 | ) | | | 31,944,203 | | | | 478,477 | | | | 2,494,265 | |
| | | | | | | | | | | | | | | | | |
Total Increase (Decrease) in Net Assets | | | (12,925,818 | ) | | | 32,046,021 | | | | 485,343 | | | | 2,455,269 | |
| | | | | | | | | | | | | | | | | |
Net Assets | | | | | | | | | | | | | | | | |
Beginning of period | | | 78,271,302 | | | | 46,225,281 | | | | 2,455,269 | | | | — | |
End of period | | $ | 65,345,484 | | | $ | 78,271,302 | | | $ | 2,940,612 | | | $ | 2,455,269 | |
| | | | | | | | | | | | | | | | | |
Changes in Shares Outstanding | | | | | | | | | | | | | | | | |
Shares outstanding, beginning of period | | | 2,700,000 | | | | 1,600,000 | | | | 100,000 | | | | — | |
Shares sold | | | 400,000 | | | | 1,375,000 | | | | 30,000 | | | | 100,000 | |
Shares redeemed | | | (720,000 | ) | | | (275,000 | ) | | | (10,000 | ) | | | — | |
Shares outstanding, end of period | | | 2,380,000 | | | | 2,700,000 | | | | 120,000 | | | | 100,000 | |
(1) | The Fund commenced operations on December 8, 2022. |
The accompanying notes are an integral part of the financial statements.
22
TrueShares ETFs
Statements of Changes in Net Assets
(Continued)
| | | RiverNorth Patriot ETF | | | RiverNorth Enhanced Pre-
Merger SPAC ETF | |
| | | Six Months
Ended
June 30, 2023
(Unaudited) | | | Year Ended
December 31,
2022 | | | Six Months
Ended
June 30, 2023
(Unaudited) | | | Period Ended
December 31,
2022(1) | |
From Operations | | | | | | | | | | | | | | | | |
Net investment income (loss) | | $ | 23,686 | | | $ | 48,932 | | | $ | (13,176 | ) | | $ | (13,101 | ) |
Net realized gain (loss) on investments | | | (149,393 | ) | | | (163,346 | ) | | | 102,508 | | | | 31,432 | |
Net change in unrealized appreciation/depreciation on investments | | | 255,282 | | | | (293,046 | ) | | | 131,070 | | | | 61,581 | |
Net increase (decrease) in net assets resulting from operations | | | 129,575 | | | | (407,460 | ) | | | 220,402 | | | | 79,912 | |
| | | | | | | | | | | | | | | | | |
From Distributions | | | | | | | | | | | | | | | | |
Distributable earnings | | | — | | | | (48,932 | ) | | | — | | | | (8,355 | ) |
Return of capital | | | — | | | | (407 | ) | | | — | | | | — | |
Total distributions | | | — | | | | (49,339 | ) | | | — | | | | (8,355 | ) |
| | | | | | | | | | | | | | | | | |
From Capital Share Transactions | | | | | | | | | | | | | | | | |
Proceeds from shares sold | | | 222,927 | | | | 3,691,633 | | | | 2,430,981 | | | | 4,372,345 | |
Cost of shares redeemed | | | (439,785 | ) | | | (1,229,805 | ) | | | (522,192 | ) | | | (625,783 | ) |
Net increase (decrease) in net assets resulting from capital share transactions | | | (216,858 | ) | | | 2,461,828 | | | | 1,908,789 | | | | 3,746,562 | |
| | | | | | | | | | | | | | | | | |
Total Increase (Decrease) in Net Assets | | | (87,283 | ) | | | 2,005,029 | | | | 2,129,191 | | | | 3,818,119 | |
| | | | | | | | | | | | | | | | | |
Net Assets | | | | | | | | | | | | | | | | |
Beginning of period | | | 3,255,029 | | | | 1,250,000 | | | | 3,818,119 | | | | — | |
End of period | | $ | 3,167,746 | | | $ | 3,255,029 | | | $ | 5,947,310 | | | $ | 3,818,119 | |
| | | | | | | | | | | | | | | | | |
Changes in Shares Outstanding | | | | | | | | | | | | | | | | |
Shares outstanding, beginning of period | | | 150,000 | | | | 50,000 | | | | 150,000 | | | | — | |
Shares sold | | | 10,000 | | | | 150,000 | | | | 95,000 | | | | 175,000 | |
Shares redeemed | | | (20,000 | ) | | | (50,000 | ) | | | (20,000 | ) | | | (25,000 | ) |
Shares outstanding, end of period | | | 140,000 | | | | 150,000 | | | | 225,000 | | | | 150,000 | |
(1) | The Fund commenced operations on July 11, 2022. |
The accompanying notes are an integral part of the financial statements.
23
TrueShares ETFs
Financial Highlights
For a Share Outstanding Throughout each Period
| | | Per Share Operating Performance
(For a share outstanding throughout each period) | |
| | | | | | | Income from Investment Operations | | | Less Distributions Paid From | |
| | | Net Asset
Value,
Beginning
of Period | | | Net
investment
income
(loss)(1) | | | Net realized
and
unrealized
gain
(loss) on
investments | | | Total from
investment
operations | | | Net
investment
income | | | Return of
capital | | | Net realized
gains | | | Total
distributions
paid | |
TrueShares Technology, AI & Deep Learning ETF | | | | | | | | | | | | | | | | | | | | | | | | | | | | |
For the period 01/01/2023 - 6/30/2023 (Unaudited) | | $ | 22.88 | | | | (0.08 | ) | | | 9.12 | | | | 9.04 | | | | — | | | | — | | | | — | | | | — | |
For the year 01/01/2022 - 12/31/2022 | | $ | 47.12 | | | | (0.19 | ) | | | (24.05 | ) | | | (24.24 | ) | | | — | | | | — | | | | — | | | | — | |
For the year 01/01/2021 - 12/31/2021 | | $ | 47.61 | | | | (0.31 | ) | | | (0.12 | )(9) | | | (0.43 | ) | | | — | | | | — | | | | (0.06 | ) | | | (0.06 | ) |
For the period 02/28/2020(8) - 12/31/2020 | | $ | 25.00 | | | | (0.19 | ) | | | 22.80 | | | | 22.61 | | | | — | | | | — | | | | — | | | | — | |
TrueShares ESG Active Opportunities ETF | | | | | | | | | | | | | | | | | | | | | | | | | | | | |
For the period 01/01/2023 - 6/30/2023 (Unaudited) | | $ | 31.75 | | | | 0.16 | | | | 5.48 | | | | 5.64 | | | | — | | | | — | | | | — | | | | — | |
For the year 01/01/2022 - 12/31/2022 | | $ | 41.39 | | | | 0.26 | | | | (9.62 | ) | | | (9.36 | ) | | | (0.28 | ) | | | — | | | | — | | | | (0.28 | ) |
For the year 01/01/2021 - 12/31/2021 | | $ | 35.10 | | | | 0.16 | | | | 6.29 | | | | 6.45 | | | | (0.16 | ) | | | — | | | | — | | | | (0.16 | ) |
For the period 02/28/2020(8) - 12/31/2020 | | $ | 25.00 | | | | 0.17 | | | | 10.07 | | | | 10.24 | | | | (0.14 | ) | | | (0.00 | )(7) | | | — | | | | (0.14 | ) |
(1) | Per share net investment income (loss) was calculated using average shares outstanding. |
(2) | Annualized for periods less than one year. |
(3) | Net asset value total return is calculated assuming an initial investment made at the net asset value at the beginning of the period, reinvestment of all dividends and distributions at net asset value during the period, if any, and redemption on the last day of the period at net asset value. This percentage is not an indication of the performance of a shareholder’s investment in the Fund based on market value due to the differences between the market price of the shares and the net asset value per share of the Fund. |
(4) | Market value total return is calculated assuming an initial investment made at market value at the beginning of the period, reinvestment of all dividends and distributions at market value during the period, if any, and redemption on the last day of the period at market value. Market value is determined by the composite closing price. Composite closing security price is defined as the last reported sale price on the NYSE Arca, Inc. The composite closing price is the last reported sale, regardless of volume, and not an average price, and may have occurred on a date prior to the close of the reporting period. Market value may be greater or less than net asset value, depending on the Fund’s closing price on the NYSE Arca, Inc. |
The accompanying notes are an integral part of the financial statements.
24
TrueShares ETFs
Financial Highlights
For a Share Outstanding Throughout each Period (Continued)
| | Per Share
Operating
Performance
(For a share
outstanding
throughout
each period) | | | Ratios/Supplemental Data | |
| | | | | | | | | | | | | | | | | | Ratios to Average
Net Assets of: (2) | | | | | |
| | Net Asset Value,
End of Period | | | Total return,
at NAV(3)(5) | | | Total return,
at Market(4)(5) | | | Net assets,
end of period
(000’s) | | | Expenses | | | Net investment
income (loss) | | | Portfolio
turnover
rate(5)(6) | |
| | | | | | | | | | | | | | | | | | | | | | | | | | | | |
| | $ | 31.92 | | | | 39.51 | % | | | 39.70 | % | | $ | 34,155 | | | | 0.68 | % | | | (0.57 | )% | | | 23 | % |
| | $ | 22.88 | | | | (51.44 | )% | | | (51.46 | )% | | $ | 14,300 | | | | 0.68 | % | | | (0.60 | )% | | | 25 | % |
| | $ | 47.12 | | | | (0.90 | )% | | | (0.96 | )% | | $ | 37,694 | | | | 0.68 | % | | | (0.67 | )% | | | 14 | % |
| | $ | 47.61 | | | | 90.43 | % | | | 90.52 | % | | $ | 27,374 | | | | 0.68 | % | | | (0.59 | )% | | | 30 | % |
| | | | | | | | | | | | | | | | | | | | | | | | | | | | |
| | $ | 37.39 | | | | 17.75 | % | | | 17.97 | % | | $ | 2,430 | | | | 0.58 | % | | | 0.96 | % | | | 0 | % |
| | $ | 31.75 | | | | (22.61 | )% | | | (22.70 | )% | | $ | 6,351 | | | | 0.58 | % | | | 0.74 | % | | | 4 | % |
| | $ | 41.39 | | | | 18.40 | % | | | 18.42 | % | | $ | 10,348 | | | | 0.58 | % | | | 0.42 | % | | | 14 | % |
| | $ | 35.10 | | | | 40.94 | % | | | 40.93 | % | | $ | 7,020 | | | | 0.58 | % | | | 0.70 | % | | | 29 | % |
(5) | Not annualized for periods less than one year. |
(6) | Excludes in-kind transactions associated with creations and redemptions of the Fund. |
(8) | Commencement of Operations. |
(9) | Realized and unrealized gains and losses per share in this caption are balancing amounts necessary to reconcile the change in net asset value per share for the period, and may not reconcile with the aggregate gains and losses in the Statements of Operations due to share transactions for the period. |
The accompanying notes are an integral part of the financial statements.
25
TrueShares ETFs
Financial Highlights
For a Share Outstanding Throughout each Period (Continued)
| | | Per Share Operating Performance
(For a share outstanding throughout each period) | |
| | | | | | | Income from Investment Operations | | | Less Distributions Paid From | |
| | | Net Asset
Value,
Beginning
of Period | | | Net
investment
income
(loss)(1) | | | Net realized
and
unrealized
gain
(loss) on
investments | | | Total from
investment
operations | | | Net
investment
income | | | Return of
capital | | | Net realized
gains | | | Total
distributions
paid | |
TrueShares Low Volatility Equity Income ETF | | | | | | | | | | | | | | | | | | | | | | | | | | | | |
For the period 01/01/2023 - 6/30/2023 (Unaudited) | | $ | 28.99 | | | | 0.39 | | | | (1.50 | ) | | | (1.11 | ) | | | (0.42 | ) | | | — | | | | — | | | | (0.42 | ) |
For the year 01/01/2022 - 12/31/2022 | | $ | 28.89 | | | | 0.99 | | | | 0.04 | | | | 1.03 | | | | (0.93 | ) | | | (0.00 | )(9) | | | — | | | | (0.93 | ) |
For the period 01/27/2021(8) - 12/31/2021 | | $ | 25.00 | | | | 0.81 | | | | 4.19 | | | | 5.00 | | | | (0.69 | ) | | | — | | | | (0.42 | ) | | | (1.11 | ) |
TrueShares Eagle Global Renewal Energy Income ETF | | | | | | | | | | | | | | | | | | | | | | | | | | | | |
For the period 01/01/2023 - 6/30/2023 (Unaudited) | | $ | 24.55 | | | | 0.37 | | | | (0.15 | ) | | | 0.22 | | | | (0.26 | ) | | | — | | | | — | | | | (0.26 | ) |
For the period 12/08/2022(8) - 12/31/2022 | | $ | 24.76 | | | | (0.00 | )(9) | | | (0.21 | ) | | | (0.21 | ) | | | — | | | | (0.00 | )(9) | | | — | | | | (0.00 | )(9) |
(1) | Per share net investment income (loss) was calculated using average shares outstanding. |
(2) | Annualized for periods less than one year. |
(3) | Net asset value total return is calculated assuming an initial investment made at the net asset value at the beginning of the period, reinvestment of all dividends and distributions at net asset value during the period, if any, and redemption on the last day of the period at net asset value. This percentage is not an indication of the performance of a shareholder’s investment in the Fund based on market value due to the differences between the market price of the shares and the net asset value per share of the Fund. |
(4) | Market value total return is calculated assuming an initial investment made at market value at the beginning of the period, reinvestment of all dividends and distributions at market value during the period, if any, and redemption on the last day of the period at market value. Market value is determined by the composite closing price. Composite closing security price is defined as the last reported sale price on the NYSE Arca, Inc. The composite closing price is the last reported sale, regardless of volume, and not an average price, and may have occurred on a date prior to the close of the reporting period. Market value may be greater or less than net asset value, depending on the Fund’s closing price on the NYSE Arca, Inc. |
The accompanying notes are an integral part of the financial statements.
26
TrueShares ETFs
Financial Highlights
For a Share Outstanding Throughout each Period (Continued)
| | Per Share
Operating
Performance
(For a share
outstanding
throughout
each period) | | | Ratios/Supplemental Data | |
| | | | | | | | | | | | | | | | | | Ratios to Average
Net Assets of: (2) | | | | | |
| | Net Asset Value,
End of Period | | | Total return,
at NAV(3)(5) | | | Total return,
at Market(4)(5) | | | Net assets,
end of period
(000’s) | | | Expenses | | | Net investment
income (loss) | | | Portfolio
turnover
rate(5)(6) | |
| | | | | | | | | | | | | | | | | | | | | | | | | | | | |
| | $ | 27.46 | | | | (3.83 | )% | | | (3.68 | )% | | $ | 65,345 | | | | 0.65 | % | | | 2.82 | % | | | 46 | % |
| | $ | 28.99 | | | | 3.65 | % | | | 3.54 | % | | $ | 78,271 | | | | 0.65 | % | | | 3.42 | % | | | 41 | % |
| | $ | 28.89 | | | | 20.10 | %(7) | | | 20.17 | %(7) | | $ | 46,225 | | | | 0.65 | % | | | 3.08 | % | | | 55 | % |
| | | | | | | | | | | | | | | | | | | | | | | | | | | | |
| | $ | 24.51 | | | | 0.89 | % | | | 0.38 | % | | $ | 2,941 | | | | 0.75 | % | | | 3.09 | % | | | 31 | % |
| | $ | 24.55 | | | | (0.83 | )% | | | (0.18 | )% | | $ | 2,455 | | | | 0.75 | % | | | (0.22 | )% | | | 2 | % |
(5) | Not annualized for periods less than one year. |
(6) | Excludes in-kind transactions associated with creations and redemptions of the Fund. |
(7) | The returns reflect the actual performance for the period and do not include the impact of trades executed on the last business day of the period that were recorded on the first business day of the next period |
(8) | Commencement of Operations. |
The accompanying notes are an integral part of the financial statements.
27
TrueShares ETFs
Financial Highlights
For a Share Outstanding Throughout each Period (Continued)
| | | Per Share Operating Performance
(For a share outstanding throughout each period) | |
| | | | | | | Income from Investment Operations | | | Less Distributions Paid From | |
| | | Net Asset
Value,
Beginning
of Period | | | Net
investment
income
(loss)(1) | | | Net realized
and
unrealized
gain
(loss) on
investments | | | Total from
investment
operations | | | Net
investment
income | | | Return of
capital | | | Total
distributions
paid | |
RiverNorth Patriot ETF | | | | | | | | | | | | | | | | | | | | | | | | | | | | |
For the period 01/01/2023 - 6/30/2023 (Unaudited) | | $ | 21.70 | | | | 0.16 | | | | 0.77 | | | | 0.93 | | | | — | | | | — | | | | — | |
For the year 01/01/2022 - 12/31/2022 | | $ | 25.00 | | | | 0.34 | | | | (3.31 | ) | | | (2.97 | ) | | | (0.33 | ) | | | (0.00 | )(8) | | | (0.33 | ) |
For the period 12/31/2021(7) - 12/31/2021 | | $ | 25.00 | | | | — | | | | — | | | | — | | | | — | | | | — | | | | — | |
RiverNorth Enhanced Pre-Merger SPAC ETF | | | | | | | | | | | | | | | | | | | | | | | | | | | | |
For the period 01/01/2023 - 6/30/2023 (Unaudited) | | $ | 25.45 | | | | (0.06 | ) | | | 1.04 | | | | 0.98 | | | | — | | | | — | | | | — | |
For the period 07/11/2022(7) - 12/31/2022 | | $ | 25.00 | | | | (0.09 | ) | | | 0.60 | | | | 0.51 | | | | (0.06 | ) | | | — | | | | (0.06 | ) |
(1) | Per share net investment income (loss) was calculated using average shares outstanding. |
(2) | Annualized for periods less than one year. |
(3) | Net asset value total return is calculated assuming an initial investment made at the net asset value at the beginning of the period, reinvestment of all dividends and distributions at net asset value during the period, if any, and redemption on the last day of the period at net asset value. This percentage is not an indication of the performance of a shareholder’s investment in the Fund based on market value due to the differences between the market price of the shares and the net asset value per share of the Fund. |
(4) | Market value total return is calculated assuming an initial investment made at market value at the beginning of the period, reinvestment of all dividends and distributions at market value during the period, if any, and redemption on the last day of the period at market value. Market value is determined by the composite closing price. Composite closing security price is defined as the last reported sale price on the CBOE BXZ Exchange, Inc. The composite closing price is the last reported sale, regardless of volume, and not an average price, and may have occurred on a date prior to the close of the reporting period. Market value may be greater or less than net asset value, depending on the Fund’s closing price on the CBOE BXZ Exchange, Inc. |
The accompanying notes are an integral part of the financial statements.
28
TrueShares ETFs
Financial Highlights
For a Share Outstanding Throughout each Period (Continued)
| | Per Share
Operating
Performance
(For a share
outstanding
throughout
each period) | | | Ratios/Supplemental Data | |
| | | | | | | | | | | | | | | | | | Ratios to Average
Net Assets of: (2) | | | | | |
| | Net Asset Value,
End of Period | | | Total return,
at NAV(3)(5) | | | Total return,
at Market(4)(5) | | | Net assets,
end of period
(000’s) | | | Expenses | | | Net investment
income (loss) | | | Portfolio
turnover
rate(5)(6) | |
| | | | | | | | | | | | | | | | | | | | | | | | | | | | |
| | $ | 22.63 | | | | 4.27 | % | | | 4.33 | % | | $ | 3,168 | | | | 0.70 | % | | | 1.48 | % | | | 28 | % |
| | $ | 21.70 | | | | (11.89 | )% | | | (11.90 | )% | | $ | 3,255 | | | | 0.70 | % | | | 1.50 | % | | | 31 | % |
| | $ | 25.00 | | | | — | % | | | — | % | | $ | 1,250 | | | | 0.70 | % | | | — | % | | | — | % |
| | | | | | | | | | | | | | | | | | | | | | | | | | | | |
| | $ | 26.43 | | | | 3.86 | % | | | 3.71 | % | | $ | 5,947 | | | | 0.89 | % | | | (0.46 | )% | | | 85 | % |
| | $ | 25.45 | | | | 2.02 | % | | | 2.18 | % | | $ | 3,818 | | | | 0.89 | % | | | (0.76 | )% | | | 43 | % |
(5) | Not annualized for periods less than one year. |
(6) | Excludes in-kind transactions associated with creations and redemptions of the Fund. |
(7) | Commencement of Operations. |
The accompanying notes are an integral part of the financial statements.
29
TrueShares ETFs
Notes to Financial Statements
June 30, 2023 (Unaudited)
1. ORGANIZATION
The TrueShares ETFs are a series of Listed Funds Trust (the “Trust”), formerly Active Weighting Funds ETF Trust. The Trust was organized as a Delaware statutory trust on August 26, 2016, under a Declaration of Trust amended on December 21, 2018 and is registered with the U.S. Securities and Exchange Commission (the “SEC”) as an open-end management investment company under the Investment Company Act of 1940, as amended (the “1940 Act”). As of June 30, 2023, the TrueShares ETFs consist of eighteen active series, six of which are covered in this report (each a “Fund,” and collectively, the “Funds”).
Fund Name | Ticker | Diversified/
Non-Diversified | Commencement
of Operations |
TrueShares Technology, AI & Deep Learning ETF (“AI ETF”) | LRNZ | Non-diversified | February 28, 2020 |
TrueShares ESG Active Opportunities ETF (“ESG ETF”) | ECOZ | Diversified | February 28, 2020 |
TrueShares Low Volatility Equity Income ETF (“DIVZ ETF”) | DIVZ | Non-diversified | January 27, 2021 |
TrueShares Eagle Global Renewal Energy Income ETF (“RNWZ ETF”) | RNWZ | Non-diversified | December 8, 2022 |
RiverNorth Patriot ETF (“FLDZ ETF”) | FLDZ | Non-diversified | December 31, 2021 |
RiverNorth Enhanced Pre-Merger SPAC ETF (“SPCZ ETF”) | SPCZ | Non-diversified | July 11, 2022 |
The operational TrueShares ETFs covered outside of this report consists of:
Fund Name | Ticker | Diversified/
Non-Diversified | Commencement
of Operations |
TrueShares Structured Outcome (July) ETF (“JULZ ETF”) | JULZ | Non-diversified | July 1, 2020 |
TrueShares Structured Outcome (August) ETF (“AUGZ ETF”) | AUGZ | Non-diversified | August 3, 2020 |
TrueShares Structured Outcome (September) ETF (“SEPZ ETF”) | SEPZ | Non-diversified | September 1, 2020 |
TrueShares Structured Outcome (October) ETF (“OCTZ ETF”) | OCTZ | Non-diversified | October 1, 2020 |
TrueShares Structured Outcome (November) ETF (“NOVZ ETF”) | NOVZ | Non-diversified | November 2, 2020 |
TrueShares Structured Outcome (December) ETF (“DECZ ETF”) | DECZ | Non-diversified | December 1, 2020 |
TrueShares Structured Outcome (January) ETF (“JANZ ETF”) | JANZ | Non-diversified | January 4, 2021 |
TrueShares Structured Outcome (February) ETF (“FEBZ ETF”) | FEBZ | Non-diversified | February 1, 2021 |
TrueShares Structured Outcome (March) ETF (“MARZ ETF”) | MARZ | Non-diversified | March 1, 2021 |
TrueShares Structured Outcome (April) ETF (“APRZ ETF”) | APRZ | Non-diversified | April 1, 2021 |
TrueShares Structured Outcome (May) ETF (“MAYZ ETF”) | MAYZ | Non-diversified | May 3, 2021 |
TrueShares Structured Outcome (June) ETF (“JUNZ ETF”) | JUNZ | Non-diversified | June 1, 2021 |
30
TrueShares ETFs
Notes to Financial Statements
June 30, 2023 (Unaudited) (Continued)
Each Fund is an actively-managed exchange-traded fund (“ETF”) that seeks to achieve its following investment objectives:
Fund | Investment Objective |
AI ETF | Seeks to achieve its total return investment objective by investing in Common stock of technology, artificial intelligence and deep learning companies. |
ESG ETF | Seeks to achieve its total return investment objective by investing in Common stock of environmental, social and governance (“ESG”) companies. |
DIVZ ETF | Seeks to provide capital appreciation with lower volatility and a higher dividend yield compared to the S&P 500 Index by investing common stocks with the best combination of dividend yield with potential for dividend growth and are currently under-valued in the market. |
RNWZ ETF | Seeks to achieve its long-term growth of capital objective by investing in Common stock that primarily own or operate assets used in the development, generation, production, transmission, storage and sale of alternative and renewable energy such as solar power, wind power, biofuels, hydropower, nuclear or geothermal power. |
FLDZ ETF | Seeks capital appreciation by investing in mid to large cap companies that are domiciled in, and with revenues which are primarily generated in, the United States of America. FLDZ is designed to provide an alternative approach to charity and seeks to delivers true impact investing. |
SPCZ ETF | Seeks to preserve capital and provide incremental total return by investing primarily in units made up of common stock, warrants and rights of U.S.-listed special purpose acquisition companies (“SPACs”). |
Costs incurred by the Funds in connection with the organization, registration and the initial public offering of shares were paid by TrueMark Investments, LLC (“TrueMark” or the “Adviser”), the Funds’ Investment Adviser.
2. SIGNIFICANT ACCOUNTING POLICIES
Each Fund is an investment company and accordingly follows the investment company accounting and reporting guidance of the Financial Accounting Standards Board (“FASB”) Accounting Standards Codification (“ASC”) Topic 946, Financial Services — Investment Companies. Each Fund prepares its financial statements in accordance with accounting principles generally accepted in the United States of America (“U.S. GAAP”) and follows the significant accounting policies described below.
Use of Estimates
The preparation of the financial statements in conformity with U.S. GAAP requires management to make estimates and assumptions that affect the reported amounts of assets and liabilities and disclosures of contingent assets and liabilities at the date of the financial statements and the reported amounts of increases and decreases in net assets from operations during the reporting period. Actual results could differ from these estimates.
Share Transactions
The net asset value (“NAV”) per share of each Fund will be equal to a Fund’s total assets minus a Fund’s total liabilities divided by the total number of shares outstanding. The NAV that is published will be rounded to the nearest cent. The NAV is determined as of the close of trading (generally, 4:00 p.m. Eastern Time) on each day the New York Stock Exchange (“NYSE”) is open for trading.
Fair Value Measurement
In calculating the NAV, each Fund’s exchange-traded equity securities will be valued at fair value, which will generally be determined using the last reported official closing or last trading price on the exchange or market on which the security is primarily traded at the time of valuation. Such valuations are typically categorized as Level 1 in the fair value hierarchy described below.
Securities listed on the NASDAQ Stock Market, Inc. are generally valued at the NASDAQ official closing price.
31
TrueShares ETFs
Notes to Financial Statements
June 30, 2023 (Unaudited) (Continued)
If market quotations are not readily available, or if it is determined that a quotation of a security does not represent fair value, then the security is valued at fair value as determined in good faith by the Adviser using procedures adopted by the Board of Trustees of the Trust (the “Board”). The circumstances in which a security may be fair valued include, among others: the occurrence of events that are significant to a particular issuer, such as mergers, restructurings or defaults; the occurrence of events that are significant to an entire market, such as natural disasters in a particular region or government actions; trading restrictions on securities; thinly traded securities; and market events such as trading halts and early market closings. Due to the inherent uncertainty of valuations, fair values may differ significantly from the values that would have been used had an active market existed. Fair valuation could result in a different NAV than a NAV determined by using market quotations. Such valuations are typically categorized as Level 2 or Level 3 in the fair value hierarchy described below.
Money market funds are valued at NAV. If NAV is not readily available the securities will be valued at fair value.
FASB ASC Topic 820, Fair Value Measurements and Disclosures (“ASC 820”) defines fair value, establishes a framework for measuring fair value in accordance with U.S. GAAP, and requires disclosure about fair value measurements. It also provides guidance on determining when there has been a significant decrease in the volume and level of activity for an asset or liability, when a transaction is not orderly, and how that information must be incorporated into fair value measurements. Under ASC 820, various inputs are used in determining the value of the Funds’ investments. These inputs are summarized in the following hierarchy:
| | ● | Level 1 — Unadjusted quoted prices in active markets for identical assets or liabilities that the Funds have the ability to access. |
| | ● | Level 2 — Observable inputs other than quoted prices included in Level 1 that are observable for the asset or liability, either directly or indirectly. These inputs may include quoted prices for the identical instrument on an inactive market, prices for similar securities, interest rates, prepayment speeds, credit risk, yield curves, default rates and similar data. |
| | ● | Level 3 — Unobservable inputs for the asset or liability, to the extent relevant observable inputs are not available; representing the Funds’ own assumptions about the assumptions a market participant would use in valuing the asset or liability, and would be based on the best information available. |
The fair value hierarchy gives the highest priority to quoted prices (unadjusted) in active markets for identical assets or liabilities (Level 1) and the lowest priority to unobservable inputs (Level 3).
The availability of observable inputs can vary from security to security and is affected by a wide variety of factors, including, for example, the type of security, whether the security is new and not yet established in the marketplace, the liquidity of markets, and other characteristics particular to the security. To the extent that valuation is based on models or inputs that are less observable or unobservable in the market, the determination of fair value requires more judgment. Accordingly, the degree of judgment exercised in determining fair value is greatest for instruments categorized in Level 3.
Debt securities, including short-term debt instruments having a maturity of less than 60 days, are generally valued using the last available bid prices or current market quotations provided by dealers or prices (including evaluated prices) supplied by approved independent third-party pricing services. Pricing services may use matrix pricing or valuation models that utilize certain inputs and assumptions to derive values. Due to the inherent uncertainty of valuations, fair values may differ significantly from the values that would have been used had an active market existed. An amortized cost method of valuation may be used with respect to debt obligations with sixty days or less remaining to maturity, unless the Adviser determines in good faith that such method does not represent fair value.
Foreign securities, currencies and other assets denominated in foreign currencies are translated into U.S. dollars at the exchange rate of such currencies against the U.S. dollar using the applicable currency exchange rates as of the close of the NYSE, generally 4:00 p.m. Eastern Time.
All other securities and investments for which market values are not readily available, including restricted securities, and those securities for which it is inappropriate to determine prices in accordance with the aforementioned procedures, are valued at fair value as determined in good faith under procedures adopted by the Board, although the actual calculations may be done by others. Factors considered in making this determination may include, but are not limited to, information obtained
32
TrueShares ETFs
Notes to Financial Statements
June 30, 2023 (Unaudited) (Continued)
by contacting the issuer, analysts, or the appropriate stock exchange (for exchange-traded securities), analysis of the issuer’s financial statements or other available documents and, if necessary, available information concerning other securities in similar circumstances.
The inputs or methodology used for valuing securities are not necessarily an indication of the risk associated with investing in those securities. The hierarchy classification of inputs used to value the Funds’ investments at June 30, 2023, are as follows:
| | | Level 1 | | | Level 2 | | | Level 3 | | | Total | |
TrueShares Technology, AI & Deep Learning ETF | | | | | | | | | | | | | | | | |
Investments - Assets: | | | | | | | | | | | | | | | | |
Common Stocks* | | $ | 30,516,908 | | | $ | — | | | $ | — | | | $ | 30,516,908 | |
Money Market Funds | | | 3,644,531 | | | | — | | | | — | | | | 3,644,531 | |
Total Investments - Assets | | $ | 34,161,439 | | | $ | — | | | $ | — | | | $ | 34,161,439 | |
* See the Schedule of Investments for industry classifications.
| | | Level 1 | | | Level 2 | | | Level 3 | | | Total | |
TrueShares ESG Active Opportunities ETF | | | | | | | | | | | | | | | | |
Investments - Assets: | | | | | | | | | | | | | | | | |
Common Stocks* | | $ | 2,333,590 | | | $ | — | | | $ | — | | | $ | 2,333,590 | |
Real Estate Investment Trusts | | | 83,321 | | | | — | | | | — | | | | 83,321 | |
Money Market Funds | | | 12,646 | | | | — | | | | — | | | | 12,646 | |
Total Investments - Assets | | $ | 2,429,557 | | | $ | — | | | $ | — | | | $ | 2,429,557 | |
* See the Schedule of Investments for industry classifications.
| | | Level 1 | | | Level 2 | | | Level 3 | | | Total | |
TrueShares Low Volatility Equity Income ETF | | | | | | | | | | | | | | | | |
Investments - Assets: | | | | | | | | | | | | | | | | |
Common Stocks* | | $ | 64,440,174 | | | $ | — | | | $ | — | | | $ | 64,440,174 | |
Money Market Funds | | | 209,914 | | | | — | | | | — | | | | 209,914 | |
Total Investments - Assets | | $ | 64,650,088 | | | $ | — | | | $ | — | | | $ | 64,650,088 | |
* See the Schedule of Investments for industry classifications.
| | | Level 1 | | | Level 2 | | | Level 3 | | | Total | |
True Shares Eagle Global Renewable Energy Income ETF | | | | | | | | | | | | | | | | |
Investments - Assets: | | | | | | | | | | | | | | | | |
Common Stocks* | | $ | 2,840,492 | | | $ | — | | | $ | — | | | $ | 2,840,492 | |
Real Estate Investment Trusts | | | 43,375 | | | | — | | | | — | | | | 43,375 | |
Money Market Funds | | | 68,350 | | | | — | | | | — | | | | 68,350 | |
Total Investments - Assets | | $ | 2,952,217 | | | $ | — | | | $ | — | | | $ | 2,952,217 | |
* See the Schedule of Investments for industry classifications.
33
TrueShares ETFs
Notes to Financial Statements
June 30, 2023 (Unaudited) (Continued)
| | | Level 1 | | | Level 2 | | | Level 3 | | | Total | |
RiverNorth Patriot ETF | | | | | | | | | | | | | | | | |
Investments - Assets: | | | | | | | | | | | | | | | | |
Common Stocks* | | $ | 2,737,896 | | | $ | — | | | $ | — | | | $ | 2,737,896 | |
Partnerships* | | | 95,969 | | | | — | | | | — | | | | 95,969 | |
Real Estate Investment Trusts | | | 290,476 | | | | — | | | | — | | | | 290,476 | |
Money Market Funds | | | 122,080 | | | | — | | | | — | | | | 122,080 | |
Total Investments - Assets | | $ | 3,246,421 | | | $ | — | | | $ | — | | | $ | 3,246,421 | |
* See the Schedule of Investments for industry classifications.
| | | Level 1 | | | Level 2 | | | Level 3 | | | Total | |
RiverNorth Enhanced Pre- Merger SPAC ETF | | | | | | | | | | | | | | | | |
Investments - Assets: | | | | | | | | | | | | | | | | |
Common Stocks* | | $ | 3,662,006 | | | $ | 1,848,515 | | | $ | — | | | $ | 5,510,521 | |
Rights | | | 21,360 | | | | — | | | | — | | | | 21,360 | |
Warrants | | | 13,568 | | | | 5,470 | | | | — | | | | 19,038 | |
Money Market Funds | | | 506,797 | | | | — | | | | — | | | | 506,797 | |
Total Investments - Assets | | $ | 4,203,731 | | | $ | 1,853,985 | | | $ | — | | | $ | 6,057,716 | |
* See the Schedule of Investments for industry classifications.
Security Transactions
Investment transactions are recorded as of the date that the securities are purchased or sold (trade date). Realized gains and losses from the sale or disposition of securities are calculated based on the specific identification basis.
The Funds do not isolate the portion of the results of operations resulting from changes in foreign exchange rates on investments and currency gains or losses realized between the trade and settlement dates on securities transactions from the fluctuations arising from changes in market prices of securities held. Such fluctuations are included with the net realized and unrealized gain or loss from investments.
The Funds report net realized foreign exchange gains or losses that arise from sales of foreign currencies, currency gains or losses realized between the trade and settlement dates on foreign currency transactions, and the difference between the amounts of dividends, interest, and foreign withholding taxes recorded on the Funds’ books and the U.S. dollar equivalent of the amounts actually received or paid. Net unrealized foreign exchange gains or losses arise from changes in the values of assets and liabilities, other than investments in securities at period end, resulting from changes in exchange rates.
Investment Income
Dividend income is recognized on the ex-dividend date. Interest income is accrued daily. Withholding taxes on foreign dividends has been provided for in accordance with the Funds’ understanding of the applicable tax rules and regulations. Dividend withholding tax reclaims are filed in certain countries to recover a portion of the amounts previously withheld. Dividends received on investments that represent a return of capital are classified as a reduction of cost of investments.
Distributions received from each Fund’s investments in real estate investment trusts (“REITs”) may be characterized as ordinary income, net capital gain, or a return of capital. The proper characterization of REIT distributions is generally not known until after the end of each calendar year. As such, the Funds must use estimates in reporting the character of its income and distributions received during the current calendar year for financial statement purposes. The actual character of distributions to each Fund’s shareholders will be reflected on the Form 1099 received by shareholders after the end of the calendar year. Due to the nature of REIT investments, a portion of the distributions received by each Fund’s shareholders may represent a return of capital.
34
TrueShares ETFs
Notes to Financial Statements
June 30, 2023 (Unaudited) (Continued)
Tax Information, Dividends and Distributions to Shareholders and Uncertain Tax Positions
The Funds are treated as separate entities for Federal income tax purposes. Each Fund intends to qualify as a regulated investment company (“RIC”) under Subchapter M of the Internal Revenue Code of 1986, as amended (the “Internal Revenue Code”). To qualify and remain eligible for the special tax treatment accorded to RICs, each Fund must meet certain annual income and quarterly asset diversification requirements and must distribute annually at least 90% of the sum of (i) its investment company taxable income (which includes dividends, interest and net short-term capital gains) and (ii) certain net tax-exempt income, if any. If so qualified, each Fund will not be subject to Federal income tax.
Distributions to shareholders are recorded on the ex-dividend date. The AI ETF, the ESG ETF, FLDZ ETF and SPCZ ETF generally pay out dividends from net investment income, if any, at least annually, and distribute its net capital gains, if any, to shareholders at least annually. The DIVZ ETF and RNWZ ETF intend to pay out dividends from net investment income, if any, quarterly. The Funds will declare and pay capital gain distributions, if any, in cash at least annually. The Funds may also pay a special distribution at the end of the calendar year to comply with Federal tax requirements. The amount of dividends and distributions from net investment income and net realized capital gains are determined in accordance with Federal income tax regulations, which may differ from U.S. GAAP. These “book/tax” differences are either considered temporary or permanent in nature. To the extent these differences are permanent in nature, such amounts are reclassified within the components of net assets based on their Federal tax basis treatment; temporary differences do not require reclassification. Dividends and distributions which exceed earnings and profit for tax purposes are reported as a tax return of capital.
Management evaluates the Funds’ tax positions to determine if the tax positions taken meet the minimum recognition threshold in connection with accounting for uncertainties in income tax positions taken or expected to be taken for the purposes of measuring and recognizing tax liabilities in the financial statements. Recognition of tax benefits of an uncertain tax position is required only when the position is “more likely than not” to be sustained assuming examination by taxing authorities. Interest and penalties related to income taxes would be recorded as income tax expense. The Funds’ Federal income tax returns are subject to examination by the Internal Revenue Service (the “IRS”) for a period of three fiscal years after they are filed. State and local tax returns may be subject to examination for an additional fiscal year depending on the jurisdiction. As of December 31, 2022, the Funds’ most recent fiscal year or period end, the Funds had no material uncertain tax positions and did not have a liability for any unrecognized tax benefits. As of December 31, 2022, the Funds’ most recent fiscal year or period end, the Funds had no examination in progress and management is not aware of any tax positions for which it is reasonably possible that the amounts of unrecognized tax benefits will significantly change in the next twelve months.
The Funds recognized no interest or penalties related to uncertain tax benefits in the 2022 fiscal period. At December 31, 2022, the Funds’ most recent fiscal year or period end, the tax periods from commencement of operations remained open to examination in the Funds’ major tax jurisdiction.
Indemnification
In the normal course of business, the Funds expect to enter into contracts that contain a variety of representations and warranties and which provide general indemnifications. The Funds’ maximum exposure under these anticipated arrangements is unknown, as this would involve future claims that may be made against the Funds that have not yet occurred. However, based on experience, the Funds expect the risk of loss to be remote.
3. INVESTMENT ADVISORY AND OTHER AGREEMENTS
Investment Advisory Agreement
The Trust has entered into an Investment Advisory Agreement (the “Advisory Agreement”) with the Adviser. Under the Advisory Agreement, the Adviser provides a continuous investment program for the Funds’ assets in accordance with its investment objectives, policies and limitations, and oversees the day-to-day operations of the Funds subject to the supervision of the Board, including the Trustees who are not “interested persons” of the Trust as defined in the 1940 Act (the “Independent Trustees”).
35
TrueShares ETFs
Notes to Financial Statements
June 30, 2023 (Unaudited) (Continued)
Pursuant to the Advisory Agreement between the Trust, on behalf of the Funds, and TrueMark, each Fund pays a unified management fee to the Adviser, which is calculated daily and paid monthly, at an annual rate of each Fund’s respective average daily net assets, as follows:
TrueShares Technology, AI & Deep Learning ETF | 0.68% |
TrueShares ESG Active Opportunities ETF | 0.58% |
TrueShares Low Volatility Equity Income ETF | 0.65% |
TrueShares Eagle Global Renewal Energy Income ETF | 0.75% |
RiverNorth Patriot ETF | 0.70% |
RiverNorth Enhanced Pre- Merger SPAC ETF | 0.89% |
TrueMark has agreed to pay all expenses of the Funds except the fee paid to TrueMark under the Advisory Agreement, interest charges on any borrowings, dividends and other expenses on securities sold short, taxes, brokerage commissions and other expenses incurred in placing orders for the purchase and sale of securities and other investment instruments, acquired fund fees and expenses, accrued deferred tax liability, extraordinary expenses, and distribution (12b-1) fees and expenses (if any). TrueMark, in turn, compensates the Sub-Advisers from the management fee it receives.
Black Hill Capital Partners, LLC (the “AI ETF Sub-Adviser”), a Delaware limited liability company serves as the sub-adviser to the AI ETF. Pursuant to a Sub-Advisory Agreement between the Adviser and the AI ETF Sub-Adviser, the AI ETF Sub-Adviser is responsible for trading portfolio securities on behalf of the Fund, including selecting broker-dealers to execute purchase and sale transactions, subject to the supervision of the Adviser and the Board, including the Independent Trustees. For its services, the AI ETF Sub-Adviser is entitled to a sub-advisory fee paid by the Adviser, which is 50% of the Adviser’s net profits. “Net profits” means, the total Adviser’s fees received by the Adviser from the ETF during a fiscal period, less the cumulative direct expenses incurred or paid by the Adviser during that period in relation to the ETF, which expenses include, without limitation: expense waivers and reimbursements; commissions; legal, administrative and custodial expenses; ntf/platform/omnibus fees; filing and registration fees; proxy solicitation expenses; taxes; interest.
Opal Capital LLC (the “DIVZ ETF Sub-Advisor”), a Florida limited liability company serves as sub-adviser to the DIVZ ETF. Pursuant to a Sub-Advisory Agreement between the Adviser and the DIVZ ETF Sub-Adviser, the DIVZ ETF Sub-Adviser is responsible for trading portfolio securities on behalf of the Fund, including selecting broker-dealers to execute purchase and sale transactions, subject to the supervision of the Adviser and the Board, including the Independent Trustees. The DIVZ ETF Sub-Advisor is entitled to a sub-advisory fee paid by the Adviser, which is 70% the net profits of the DIVZ ETF, calculated monthly.
Eagle Global Advisors LLC (the “RNWZ ETF Sub-Advisor”), a Texas limited liability company serves as sub-adviser to the RNWZ ETF. Pursuant to a Sub-Advisory Agreement between the Adviser and the RNWZ ETF Sub-Adviser, the RNWZ ETF Sub-Adviser is responsible for trading portfolio securities on behalf of the Fund, including selecting broker-dealers to execute purchase and sale transactions, subject to the supervision of the Adviser and the Board, including the Independent Trustees. The RNWZ ETF Sub-Advisor is entitled to a sub-advisory fee paid by the Adviser, which is 50% the net profits of the RNWZ ETF, calculated monthly.
RiverNorth Capital Management, LLC (the “RiverNorth ETF’s Sub-Adviser”), a Delaware limited liability company serves as the sub-adviser to FLDZ and SPCZ. Pursuant to a Sub-Advisory Agreement between the Adviser and the RiverNorth ETF’s Sub-Adviser, the RiverNorth ETF’s Sub-Adviser is responsible for trading portfolio securities on behalf of the Funds, including selecting broker-dealers to execute purchase and sale transactions, subject to the supervision of the Adviser and the Board, including the Independent Trustees. For its services, the RiverNorth ETF’s Sub-Adviser is entitled to a sub-advisory fee paid by the Adviser, which is calculated daily and paid monthly at an annual rate as follows:
Fund | Rate |
RiverNorth Patriot ETF | 0.60% based on the daily net assets of the Fund |
RiverNorth Enhanced Pre- Merger SPAC ETF | 75% of the Net Profits |
36
TrueShares ETFs
Notes to Financial Statements
June 30, 2023 (Unaudited) (Continued)
The RiverNorth ETF’s Sub-Adviser will donate a majority of its sub-advisory fee from FLDZ or 100% of the profit derived from its management of the Fund, whichever is greater, to the Folds of Honor Foundation, a charity focused on providing scholarships to families of veterans.
Distribution Agreement and 12b-1 Plan
Foreside Fund Services, LLC a wholly owned subsidiary of Foreside Financial Group, LLC (dba ACA Group) (the “Distributor”) serves as each Fund’s distributor pursuant to a Distribution Agreement. The Distributor receives compensation from the Adviser for certain statutory underwriting services it provides to the Funds. The Distributor enters into agreements with certain broker-dealers and others that will allow those parties to be “Authorized Participants” and to subscribe for and redeem shares of the Funds. The Distributor will not distribute shares in less than whole Creation Units and does not maintain a secondary market in shares.
The Board has adopted a Distribution and Service Plan pursuant to Rule 12b-1 under the 1940 Act (“Rule 12b-1 Plan”). In accordance with the Rule 12b-1 Plan, each Fund is authorized to pay an amount up to 0.25% of the Fund’s average daily net assets each year for certain distribution-related activities. As authorized by the Board, no Rule 12b-1 fees are currently paid by the Funds and there are no plans to impose these fees. However, in the event Rule 12b-1 fees are charged in the future, they will be paid out of each Fund’s assets. The Adviser and its affiliates may, out of their own resources, pay amounts to third parties for distribution or marketing services on behalf of the Funds.
Administrator, Custodian and Transfer Agent
U.S. Bancorp Fund Services LLC, doing business as U.S. Bank Global Fund Services (“Fund Services” or “Administrator”) serves as administrator, transfer agent and fund accountant of the Funds pursuant to a Fund Servicing Agreement. U.S. Bank N.A. (the “Custodian”), an affiliate of Fund Services, serves as the Funds’ custodian pursuant to a Custody Agreement. Under the terms of these agreements, the Adviser pays each Fund’s administrative, custody and transfer agency fees.
A Trustee and all officers of the Trust are affiliated with the Administrator and the Custodian.
4. CREATION AND REDEMPTION TRANSACTIONS
Shares of the AI ETF, the ESG ETF, the DIVZ ETF and the RNWZ ETF are listed and traded on the NYSE Arca, Inc. Shares of the FLDZ ETF and SPCZ ETF are listed and traded on the CBOE BXZ Exchange, Inc. Each Fund issues and redeems shares on a continuous basis at NAV only in large blocks of shares called “Creation Units”. Creation Units are to be issued and redeemed principally in kind for a basket of securities and a balancing cash amount. Shares generally will trade in the secondary market in amounts less than a Creation Unit at market prices that change throughout the day. Market prices for the shares may be different from their NAV. The NAV is determined as of the close of trading (generally, 4:00 p.m. Eastern Time) on each day the NYSE is open for trading. The NAV of the shares of each Fund will be equal to a Fund’s total assets minus a Fund’s total liabilities divided by the total number of shares outstanding. The NAV that is published will be rounded to the nearest cent; however, for purposes of determining the price of Creation Units, the NAV will be calculated to four decimal places.
Creation Unit Transaction Fee
Authorized Participants will be required to pay to the Custodian a fixed transaction fee (the “Creation Unit Transaction Fee”) in connection with the issuance or redemption of Creation Units. The standard Creation Unit Transaction Fee will be the same regardless of the number of Creation Units purchased or redeemed by an investor on the applicable business day. The Creation Unit Transaction Fee charged by the AI ETF, ESG ETF and DIVZ ETF for each creation order is $300. The Creation Unit Transaction Fee charged by the RNWZ ETF, FLDZ ETF and SPCZ ETF for each creation order is $500.
An additional variable fee of up to a maximum of 2% of the value of the Creation Units subject to the transaction may be imposed for (1) creations effected outside the clearing process and (2) creations made in an all cash amount (to offset the Trust’s brokerage and other transaction costs associated with using cash to purchase the requisite Deposit Securities). Investors are responsible for the costs of transferring the securities constituting the Deposit Securities to the account of the Trust. Each
37
TrueShares ETFs
Notes to Financial Statements
June 30, 2023 (Unaudited) (Continued)
Fund may determine to not charge a variable fee on certain orders when the Adviser has determined that doing so is in the best interests of Fund shareholders. Variable fees, if any, received by the Funds are displayed in the Capital Share Transactions section on the Statements of Changes in Net Assets.
Only “Authorized Participants” may purchase or redeem shares directly from the Funds. An Authorized Participant is either (i) a broker-dealer or other participant in the clearing process through the Continuous Net Settlement System of National Securities Clearing Corporation or (ii) a DTC participant and, in each case, must have executed a Participant Agreement with the Distributor. Most retail investors will not qualify as Authorized Participants or have the resources to buy and sell whole Creation Units. Therefore, they will be unable to purchase or redeem the shares directly from the Funds. Rather, most retail investors will purchase shares in the secondary market with the assistance of a broker and will be subject to customary brokerage commissions or fees. Securities received or delivered in connection with in-kind creates and redeems are valued as of the close of business on the effective date of the creation or redemption.
A creation unit will generally not be issued until the transfer of good title of the deposit securities to the Funds and the payment of any cash amounts have been completed. To the extent contemplated by the applicable participant agreement, Creation Units of the Funds will be issued to such authorized participant notwithstanding the fact that the Funds’ deposits have not been received in part or in whole, in reliance on the undertaking of the authorized participant to deliver the missing deposit securities as soon as possible. If the Funds or their agents do not receive all of the deposit securities, or the required cash amounts, by such time, then the order may be deemed rejected and the authorized participant shall be liable to the Funds for losses, if any.
5. FEDERAL INCOME TAX
The tax character of distributions paid was as follows:
| | | Six Months Ended
June 30, 2023 | | | Year or Period Ended
December 31, 2022 | |
| | | Ordinary
Income(1) | | | Return of Capital | | | Ordinary
Income(1) | | | Return of Capital | |
TrueShares Technology, AI & Deep Learning ETF | | $ | — | | | $ | — | | | $ | — | | | $ | — | |
TrueShares ESG Active Opportunities ETF | | | — | | | | — | | | | 55,980 | | | | — | |
TrueShares Low Volatility Equity Income ETF | | | 987,990 | | | | — | | | | 2,075,345 | | | | 693 | |
TrueShares Eagle Global Renewable Energy Income ETF | | | 28,300 | | | | — | | | | — | | | | 238 | |
RiverNorth Patriot ETF | | | — | | | | — | | | | 48,932 | | | | 407 | |
RiverNorth Enhanced Pre-Merger SPAC ETF | | | — | | | | — | | | | 8,355 | | | | — | |
(1) | Ordinary income includes short-term capital gains. |
38
TrueShares ETFs
Notes to Financial Statements
June 30, 2023 (Unaudited) (Continued)
At December 31, 2022, the Funds’ most recent fiscal year or period end, the components of distributable earnings (accumulated losses) and cost of investments on a tax basis, including the adjustments for financial reporting purposes as of the most recently completed Federal income tax reporting year, were as follows:
| | | TrueShares
Technology,
AI & Deep
Learning ETF | | | TrueShares
ESG Active
Opportunities
ETF | | | TrueShares Low
Volatility Equity
Income ETF | | | TrueShares
Eagle Global
Renewable
Energy
Income ETF | | | RiverNorth
Patriot ETF | | | RiverNorth
Enhanced
Pre-Merger
SPAC ETF | |
Federal Tax Cost of Investments | | $ | 28,812,084 | | | $ | 5,851,425 | | | $ | 76,599,690 | | | $ | 2,638,420 | | | $ | 3,604,178 | | | $ | 3,836,354 | |
Gross Tax Unrealized Appreciation | | $ | 534,508 | | | $ | 1,168,174 | | | $ | 7,706,818 | | | $ | 14,592 | | | $ | 180,603 | | | $ | 67,142 | |
Gross Tax Unrealized Depreciation | | | (15,038,404 | ) | | | (615,437 | ) | | | (3,298,037 | ) | | | (53,078 | ) | | | (487,322 | ) | | | (33,895 | ) |
Net Tax Unrealized Appreciation (Depreciation) | | | (14,503,896 | ) | | | 552,737 | | | | 4,408,781 | | | | (38,486 | ) | | | (306,719 | ) | | | 33,247 | |
Undistributed Ordinary Income | | | — | | | | 534 | | | | — | | | | — | | | | — | | | | 37,146 | |
Other Accumulated Gain (Loss) | | | (3,126,370 | ) | | | (88,060 | ) | | | (3,193,134 | ) | | | — | | | | (178,185 | ) | | | — | |
Total Distributable Earnings / (Accumulated Losses) | | $ | (17,630,266 | ) | | $ | 465,211 | | | $ | 1,215,647 | | | $ | (38,486 | ) | | $ | (484,904 | ) | | $ | 70,393 | |
The difference between book-basis and tax-basis unrealized appreciation/(depreciation) is attributable primarily to the tax deferral of losses on wash sales.
Under current tax law, net capital losses realized and specified ordinary losses after October 31st may be deferred and treated as occurring on the first day of the following fiscal year. The Funds’ carryforward losses and post-October losses are determined only at the end of each fiscal year. At December 31, 2022, the Funds’ most recent fiscal year or period end, the Funds had carryforward losses which will be carried forward indefinitely to offset future realized capital gains as follows:
| | | Indefinite Short-
Term Capital
Loss Carryover | | | Indefinite Long-
Term Capital
Loss Carryover | |
TrueShares Technology, AI & Deep Learning ETF | | $ | 1,069,946 | | | $ | 2,056,424 | |
TrueShares ESG Active Opportunities ETF | | | 7,868 | | | | 80,192 | |
TrueShares Low Volatility Equity Income ETF | | | 1,951,943 | | | | 1,241,191 | |
TrueShares Eagle Global Renewable Energy Income ETF | | | — | | | | — | |
RiverNorth Patriot ETF | | | 178,185 | | | | — | |
RiverNorth Enhanced Pre-Merger SPAC ETF | | | — | | | | — | |
39
TrueShares ETFs
Notes to Financial Statements
June 30, 2023 (Unaudited) (Continued)
6. INVESTMENT TRANSACTIONS
During the six months ended June 30, 2023, the Funds realized amounts in net capital gains resulting from in-kind redemptions, in which shareholders exchanged Fund shares for securities held by the Funds rather than for cash. Because such gains are not taxable to the Funds, and are not distributed to shareholders, they have been reclassified from distributable earnings (accumulated losses) to paid in-capital. The amounts of realized gains and losses from in-kind redemptions included in realized gain/(loss) on investments in the Statements of Operations is as follows:
| | | Realized Gains | | | Realized Losses | |
TrueShares Technology, AI & Deep Learning ETF | | $ | 729.445 | | | $ | (47,050 | ) |
TrueShares ESG Active Opportunities ETF | | | 1,282,029 | | | | (258,635 | ) |
TrueShares Low Volatility Equity Income ETF | | | 3,046,831 | | | | (243,801 | ) |
TrueShares Eagle Global Renewable Energy Income ETF | | | 28,918 | | | | — | |
RiverNorth Patriot ETF | | | 107,316 | | | | (13,595 | ) |
RiverNorth Enhanced Pre-Merger SPAC ETF | | | 11,812 | | | | (443 | ) |
Purchases and sales of investments (excluding short-term investments), creations in-kind and redemptions in-kind for the six months ended June 30, 2023, were as follows:
| | | Purchases | | | Sales | | | Creations
In-Kind | | | Redemptions
In-Kind | |
TrueShares Technology, AI & Deep Learning ETF | | $ | 4,450,452 | | | $ | 4,165,845 | | | $ | 14,773,517 | | | $ | 4,318,970 | |
TrueShares ESG Active Opportunities ETF | | | — | | | | 32,733 | | | | — | | | | 4,548,691 | |
TrueShares Low Volatility Equity Income ETF | | | 32,188,988 | | | | 32,731,800 | | | | 10,853,775 | | | | 18,671,985 | |
TrueShares Eagle Global Renewable Energy Income ETF | | | 769,573 | | | | 799,823 | | | | 707,259 | | | | 192,776 | |
RiverNorth Patriot ETF | | | 1,016,532 | | | | 914,722 | | | | 212,932 | | | | 503,926 | |
RiverNorth Enhanced Pre-Merger SPAC ETF | | | 6,358,459 | | | | 4,418,265 | | | | — | | | | 333,422 | |
7. PRINCIPAL RISKS
As with all ETFs, shareholders of the Funds are subject to the risk that their investment could lose money. Each Fund is subject to the principal risks, any of which may adversely affect a Fund’s NAV, trading price, yield, total return and ability to meet its investment objective.
A complete description of principal risks is included in the prospectus under the heading “Principal Investment Risks.”
8. SUBSEQUENT EVENTS
On July 31, 2023, the TrueShares ESG Active Opportunities ETF liquidated according to the Plan of Liquidation.
Other than as disclosed, there were no other subsequent events requiring recognition or disclosure through the date the financial statements were issued.
40
TrueShares ETFs
Review of Liquidity Risk Management Program
(Unaudited)
Pursuant to Rule 22e-4 under the Investment Company Act of 1940, the Trust, on behalf of the series of the Trust covered by this shareholder report (the “Series”), has adopted a liquidity risk management program to govern the Trust’s approach to managing liquidity risk. Rule 22e-4 seeks to promote effective liquidity risk management, thereby reducing the risk that a fund will be unable to meet its redemption obligations and mitigating dilution of the interests of fund shareholders. The Trust’s liquidity risk management program is tailored to reflect the Series’ particular risks, but not to eliminate all adverse impacts of liquidity risk, which would be incompatible with the nature of such Series.
The investment adviser to the Series has adopted and implemented its own written liquidity risk management program (the “Program”) tailored specifically to assess and manage the liquidity risk of the Series. At a recent meeting of the Board of Trustees of the Trust, the Trustees received a report pertaining to the operation, adequacy, and effectiveness of implementation of the Program for the period ended December 31, 2022. The report concluded that the Program is reasonably designed to assess and manage the Series’ liquidity risk and has operated adequately and effectively to manage such risk. The report reflected that there were no liquidity events that impacted the Series’ ability to timely meet redemptions without dilution to existing shareholders. The report further noted that no material changes have been made to the Program since its implementation.
There can be no assurance that the Program will achieve its objectives in the future. Please refer to the prospectus for more information regarding the Series’ exposure to liquidity risk and other principal risks to which an investment in the Series may be subject.
41
TrueShares ETFs
Supplemental Information
(Unaudited)
Investors should consider the investment objective and policies, risk considerations, charges and ongoing expenses of an investment carefully before investing. The prospectus contains this and other information relevant to an investment in the Funds. Please read the prospectus carefully before investing. A copy of the Prospectus for the Funds may be obtained without charge by writing to the Funds, c/o U.S. Bank Global Fund Services, P.O. Box 701, Milwaukee, Wisconsin 53201-0701, by calling 1-800-617-0004, or by visiting the Funds’ website at www.true-shares.com
QUARTERLY PORTFOLIO HOLDING INFORMATION
Each Fund files its complete schedule of portfolio holdings for its first and third fiscal quarters with the Securities and Exchange Commission (“SEC”) on Part F of Form N-PORT. The Funds’ Part F of Form N-PORT is available without charge, upon request, by calling toll-free at 1-800-617-0004. Furthermore, you may obtain the Part F of Form N-PORT on the SEC’s website at www.sec.gov, or by visiting the Funds’ website at www.true-shares.com
PROXY VOTING INFORMATION
Each Fund is required to file a Form N-PX, with the Fund’s complete proxy voting record for the 12 months ended June 30, no later than August 31 of each year. The Fund’s proxy voting record will be available without charge, upon request, by calling toll-free 1-800-617-0004 and on the SEC’s website at www.sec.gov.
FREQUENCY DISTRIBUTION OF PREMIUMS AND DISCOUNTS
Information regarding how often shares of the Funds trade on an exchange at a price above (i.e., at a premium) or below (i.e., at a discount) the NAV of the Funds is available without charge, on the Funds’ website at www.true-shares.com
TAX INFORMATION
For the fiscal year or period end December 31, 2022, certain dividends paid by the Funds may be subject to a maximum tax rate of 20%, as provided for by the Jobs and Growth Tax Relief Reconciliation Act 2003. The percentage of dividends declared from ordinary income designated as qualified dividend income was as follows:
TrueShares Technology, AI & Deep Learning ETF | 0.00% |
TrueShares ESG Active Opportunities ETF | 100.00% |
TrueShares Low Volatility Equity Income ETF | 100.00% |
TrueShares Eagle Global Renewable Energy ETF | 0.00% |
RiverNorth Patriot ETF | 0.00% |
RiverNorth Enhanced Pre-Merger SPAC ETF | 0.00% |
For corporate shareholders, the percent of ordinary income distributions qualifying for the corporate dividends received deduction for the Funds’ fiscal year or period end December 31, 2022 was as follows:
TrueShares Technology, AI & Deep Learning ETF | 0.00% |
TrueShares ESG Active Opportunities ETF | 100.00% |
TrueShares Low Volatility Equity Income ETF | 100.00% |
TrueShares Eagle Global Renewable Energy ETF | 0.00% |
RiverNorth Patriot ETF | 0.00% |
RiverNorth Enhanced Pre-Merger SPAC ETF | 0.00% |
42
THIS PAGE INTENTIONALLY LEFT BLANK
THIS PAGE INTENTIONALLY LEFT BLANK
THIS PAGE INTENTIONALLY LEFT BLANK
Investment Adviser:
TrueMark Investments, LLC
433 W. Van Buren St., 1100-E
Chicago, IL 60607
Investment Sub-Adviser:
Black Hill Capital Partners, LLC
101 California St.
San Francisco, CA 94111
Eagle Global Advisors, LLC
1330 Post Oak Boulevard, Suite 3000
Houston, TX 77056
Opal Capital LLC
1919 Flower Drive
Palm Beach Gardens, FL 33410
RiverNorth Capital Management, LLC
433 W. Van Buren St., 1150-N
Chicago, IL 60607
Legal Counsel:
Morgan, Lewis & Bockius LLP
1111 Pennsylvania Avenue, N.W.
Washington, D.C. 20004
Independent Registered Public Accounting Firm:
Cohen & Company, Ltd.
1350 Euclid Avenue, Suite 800
Cleveland, OH 44115
Distributor:
Foreside Fund Services, LLC
Three Canal Plaza, Suite 100
Portland, ME 04101
Administrator, Fund Accountant & Transfer Agent:
U.S. Bancorp Fund Services, LLC
d/b/a U.S. Bank Global Fund Services
615 E. Michigan St.
Milwaukee, WI 53202
Custodian:
U.S. Bank N.A.
1555 North RiverCenter Drive, Suite 302
Milwaukee, WI 53212
This information must be preceded or accompanied by a current prospectus for the Funds.
Item 2. Code of Ethics.
Not applicable for semi-annual reports.
Item 3. Audit Committee Financial Expert.
Not applicable for semi-annual reports.
Item 4. Principal Accountant Fees and Services.
Not applicable for semi-annual reports.
Item 5. Audit Committee of Listed Registrants.
(a) Not applicable for semi-annual reports.
(b) Not applicable.
Item 6. Investments.
| (a) | Schedule of Investments is included as part of the report to shareholders filed under Item 1 of this Form. |
Item 7. Disclosure of Proxy Voting Policies and Procedures for Closed-End Management Investment Companies.
Not applicable to open-end investment companies.
Item 8. Portfolio Managers of Closed-End Management Investment Companies.
Not applicable to open-end investment companies.
Item 9. Purchases of Equity Securities by Closed-End Management Investment Company and Affiliated Purchasers.
Not applicable to open-end investment companies.
Item 10. Submission of Matters to a Vote of Security Holders.
There have been no material changes to the procedures by which shareholders may recommend nominees to the registrant’s Board of Trustees.
Item 11. Controls and Procedures.
| (a) | The Registrant’s President and Treasurer have reviewed the Registrant's disclosure controls and procedures (as defined in Rule 30a-3(c) under the Investment Company Act of 1940 (the “Act”)) as of a date within 90 days of the filing of this report, as required by Rule 30a-3(b) under the Act and Rules 13a-15(b) or 15d 15(b) under the Securities Exchange Act of 1934. Based on their review, such officers have concluded that the disclosure controls and procedures are effective in ensuring that information required to be disclosed in this report is appropriately recorded, processed, summarized and reported and made known to them by others within the Registrant and by the Registrant’s service provider. |
| (b) | There were no changes in the Registrant's internal control over financial reporting (as defined in Rule 30a-3(d) under the Act) that occurred during the period covered by this report that have materially affected, or are reasonably likely to materially affect, the Registrant's internal control over financial reporting. |
Item 12. Disclosure of Securities Lending Activities for Closed-End Management Investment Companies
Not applicable to open-end investment companies.
Item 13. Exhibits.
| (a) | (1) Any code of ethics or amendment thereto, that is the subject of the disclosure required by Item 2, to the extent that the registrant intends to satisfy Item 2 requirements through filing an exhibit. Not Applicable. |
(2) A separate certification for each principal executive officer and principal financial officer pursuant to Section 302 of the Sarbanes-Oxley Act of 2002. Filed herewith.
(3) Any written solicitation to purchase securities under Rule 23c-1 under the Act sent or given during the period covered by the report by or on behalf of the registrant to 10 or more persons. Not applicable to open-end investment companies.
| (4) | Change in the registrant’s independent public accountant. There was no change in the registrant’s independent public accountant for the period covered by this report. |
| (b) | Certifications pursuant to Section 906 of the Sarbanes-Oxley Act of 2002. Furnished herewith. |
SIGNATURES
Pursuant to the requirements of the Securities Exchange Act of 1934 and the Investment Company Act of 1940, the registrant has duly caused this report to be signed on its behalf by the undersigned, thereunto duly authorized.
| (Registrant) | Listed Funds Trust | |
| | | |
| By (Signature and Title)* | /s/ Gregory C. Bakken | |
| | Gregory C. Bakken, President/Principal Executive Officer | |
| | | |
| Date | 9/7/2023 | |
Pursuant to the requirements of the Securities Exchange Act of 1934 and the Investment Company Act of 1940, this report has been signed below by the following persons on behalf of the registrant and in the capacities and on the dates indicated.
| By (Signature and Title)* | /s/ Gregory C. Bakken | |
| | Gregory C. Bakken, President/Principal Executive Officer | |
| | | |
| Date | 9/7/2023 | |
| | | |
| By (Signature and Title)* | /s/ Travis G. Babich | |
| | Travis G. Babich, Treasurer/Principal Financial Officer | |
| | | |
| Date | 9/7/2023 | |
| * | Print the name and title of each signing officer under his or her signature. |