UNITED STATES
SECURITIES AND EXCHANGE COMMISSION
Washington, D.C. 20549
FORM N-CSR
CERTIFIED SHAREHOLDER REPORT OF REGISTERED
MANAGEMENT INVESTMENT COMPANIES
Investment Company Act file number (811-23226)
Listed Funds Trust
(Exact name of registrant as specified in charter)
615 East Michigan Street
Milwaukee, WI 53202
(Address of principal executive offices) (Zip code)
Kent P. Barnes, Secretary
Listed Funds Trust
c/o U.S. Bancorp Fund Services, LLC
777 East Wisconsin Avenue, 10th Floor
Milwaukee, WI 53202
(Name and address of agent for service)
(414) 516-1681
Registrant's telephone number, including area code
Date of fiscal year end: December 31
Date of reporting period: June 30, 2023
Item 1. Reports to Stockholders.

Roundhill ETFs
Roundhill Video Games ETF (NERD)
Roundhill Sports Betting & iGaming ETF (BETZ)
Roundhill Ball Metaverse ETF (METV)
Roundhill IO Digital Infrastructure ETF (BYTE)
Roundhill MEME ETF (MEME)
Roundhill Cannabis ETF (WEED)
Roundhill BIG Bank ETF (BIGB)
Roundhill BIG Tech ETF (BIGT)
SEMI-ANNUAL REPORT
June 30, 2023
(Unaudited)
Roundhill ETFs
Table of Contents
(Unaudited)
| | |
Schedules of Investments and Total Return Swaps | 2 |
Statements of Assets and Liabilities | 18 |
Statements of Operations | 21 |
Statements of Changes in Net Assets | 24 |
Financial Highlights | 28 |
Notes to Financial Statements | 32 |
Board Consideration and Approval of Advisory and Sub-Advisory Agreements | 46 |
Shareholder Expense Example | 56 |
Supplemental Information | 58 |
Review of Liquidity Risk Management Program | 60 |
1
Roundhill Video Games ETF
Schedule of Investments
June 30, 2023 (Unaudited)
Description | | Shares | | | Value | |
COMMON STOCKS — 100.0% | | | | | | | | |
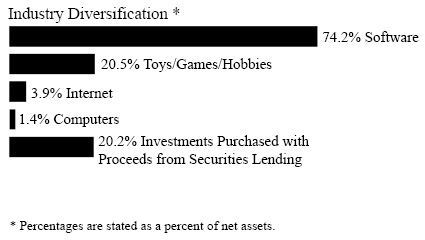
Computers — 1.4% | | | | | | | | |
Keywords Studios PLC (b) | | | 14,793 | | | $ | 340,406 | |
| | | | | | | | | |
Internet — 3.9% | | | | | | | | |
NCSoft Corp. (b) | | | 1,980 | | | | 443,290 | |
Webzen, Inc. (b) | | | 24,403 | | | | 256,318 | |
Wemade Co., Ltd. (b) | | | 9,181 | | | | 272,089 | |
| | | | | | | | 971,697 | |
Software — 74.2% (d) | | | | | | | | |
AppLovin Corp. - Class A (a)(e) | | | 22,255 | | | | 572,621 | |
Capcom Co., Ltd. (b) | | | 20,900 | | | | 823,506 | |
CD Projekt SA (b) | | | 15,286 | | | | 582,591 | |
COLOPL, Inc. (b) | | | 59,800 | | | | 268,931 | |
Com2uS Corp. (b) | | | 5,761 | | | | 264,954 | |
DeNA Co., Ltd. (b) | | | 24,700 | | | | 319,570 | |
Electronic Arts, Inc. | | | 19,220 | | | | 2,492,834 | |
Embracer Group AB (a)(b) | | | 124,537 | | | | 310,844 | |
Gree, Inc. (b) | | | 56,400 | | | | 248,958 | |
GungHo Online Entertainment, Inc. (b) | | | 18,800 | | | | 367,454 | |
IGG, Inc. (a)(b) | | | 568,000 | | | | 281,224 | |
International Games System Co., Ltd. (b) | | | 25,131 | | | | 498,674 | |
Kakao Games Corp. (a)(b) | | | 12,416 | | | | 309,540 | |
Koei Tecmo Holdings Co., Ltd. (b) | | | 25,200 | | | | 433,353 | |
Konami Group Corp. (b) | | | 11,000 | | | | 572,394 | |
Krafton, Inc. (a)(b) | | | 4,168 | | | | 616,193 | |
MIXI, Inc. (b) | | | 15,800 | | | | 292,421 | |
Modern Times Group AB - Class B (a)(b) | | | 45,482 | | | | 289,492 | |
Netmarble Corp. (a)(b)(f) | | | 8,078 | | | | 301,013 | |
Nexon Co., Ltd. (b) | | | 39,100 | | | | 743,126 | |
Paradox Interactive AB (b) | | | 14,564 | | | | 367,023 | |
Pearl Abyss Corp. (a)(b) | | | 10,526 | | | | 420,193 | |
ROBLOX Corp. - Class A (a)(e) | | | 40,448 | | | | 1,630,054 | |
Sega Sammy Holdings, Inc. (b) | | | 24,300 | | | | 516,481 | |
Square Enix Holdings Co., Ltd. (b) | | | 10,400 | | | | 481,234 | |
Stillfront Group AB (a)(b) | | | 165,106 | | | | 275,602 | |
Take-Two Interactive Software, Inc. (a)(e) | | | 12,887 | | | | 1,896,451 | |
Software (Continued) | | | | | | | | |
Team17 Group PLC (a)(b) | | | 64,694 | | | $ | 296,094 | |
Ubisoft Entertainment SA (a)(b) | | | 14,937 | | | | 421,748 | |
Unity Software, Inc. (a)(e) | | | 25,622 | | | | 1,112,507 | |
Wemade Max Co., Ltd. (a)(b) | | | 30,716 | | | | 241,504 | |
| | | | | | | | 18,248,584 | |
Toys/Games/Hobbies — 20.5% | | | | | | | | |
Bandai Namco Holdings, Inc. (b) | | | 33,900 | | | | 778,925 | |
Nintendo Co., Ltd. (b) | | | 94,000 | | | | 4,254,665 | |
| | | | | | | | 5,033,590 | |
TOTAL COMMON STOCKS (Cost $25,761,323) | | | | | | | 24,594,277 | |
| | | | | | | | | |
INVESTMENTS PURCHASED WITH PROCEEDS FROM SECURITIES LENDING — 20.2% | | | | | | | | |
Mount Vernon Liquid Assets Portfolio, LLC, 5.22% (c) | | | 4,989,523 | | | | 4,989,523 | |
TOTAL INVESTMENTS PURCHASED WITH PROCEEDS FROM SECURITIES LENDING (Cost $4,989,523) | | | | | | | 4,989,523 | |
| | | | | | | | | |
TOTAL INVESTMENTS (Cost $30,750,846) — 120.2% | | | | | | | 29,583,800 | |
Other assets and liabilities, net — (20.2)% | | | | | | | (4,980,788 | ) |
NET ASSETS — 100.0% | | | | | | $ | 24,603,012 | |
PLC Public Limited Company
(a) | Non-income producing security. |
(b) | Foreign issued security, or represents a foreign issued security. |
(c) | The rate shown is the seven day yield at period end. |
(d) | To the extent the Fund invests more heavily in particular sectors of the economy, its performance will be especially sensitive to developments that significantly affect those sectors. |
(e) | All or a portion of this security is on loan as of June 30, 2023. The market value of securities out on loan is $4,950,887. |
(f) | Security exempt from registration pursuant to Rule 144a under the Securities Act of 1933, as amended. These securities may be resold in transactions exempt from registration to qualified institutional investors. |
Percentages are stated as a percent of net assets.
The accompanying notes are an integral part of the financial statements.
2
Roundhill Video Games ETF
Schedule of Investments
June 30, 2023 (Unaudited) (Continued)
COUNTRY | Percentage
of Net Assets |
Japan | 41.1% |
United States | 31.3% |
Republic of Korea | 12.7% |
Sweden | 5.1% |
United Kingdom | 2.6% |
Poland | 2.4% |
Taiwan | 2.0% |
France | 1.7% |
Cayman Islands | 1.1% |
Total Country | 100.0% |
INVESTMENTS PURCHASED WITH PROCEEDS FROM SECURITIES LENDING | 20.2% |
TOTAL INVESTMENTS | 120.2% |
Other assets and liabilities, net | -20.2% |
NET ASSETS | 100.0% |
The accompanying notes are an integral part of the financial statements.
3
Roundhill Sports Betting & iGaming ETF
Schedule of Investments
June 30, 2023 (Unaudited)
Description | | Shares | | | Value | |
COMMON STOCKS — 99.5% | | | | | | | | |
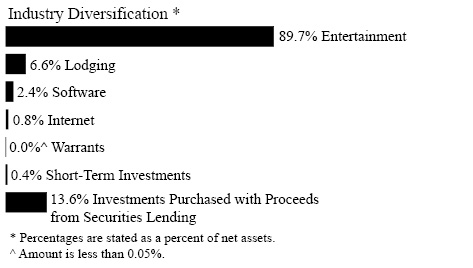
Entertainment — 89.7% (e) | | | | | | | | |
888 Holdings PLC (a)(b) | | | 1,922,574 | | | $ | 2,395,365 | |
Aristocrat Leisure, Ltd. (b) | | | 118,882 | | | | 3,059,315 | |
Bally’s Corp. (a)(f) | | | 162,299 | | | | 2,525,372 | |
Betmakers Technology Group, Ltd. (a)(b) | | | 9,688,709 | | | | 838,408 | |
Betsson AB (a)(b) | | | 212,543 | | | | 2,258,981 | |
Caesars Entertainment, Inc. (a)(f) | | | 102,258 | | | | 5,212,090 | |
Churchill Downs, Inc. | | | 34,772 | | | | 4,839,219 | |
DraftKings, Inc. - Class A (a)(f) | | | 348,390 | | | | 9,256,722 | |
Entain PLC (b) | | | 413,247 | | | | 6,682,815 | |
Evolution Gaming Group AB (b)(c) | | | 34,324 | | | | 4,340,192 | |
Flutter Entertainment PLC (a)(b) | | | 36,119 | | | | 7,255,301 | |
GAN, Ltd. (a)(b)(f) | | | 423,472 | | | | 694,494 | |
Genius Sports, Ltd. (a)(b) | | | 781,225 | | | | 4,835,783 | |
International Game Technology PLC (b) | | | 108,432 | | | | 3,457,897 | |
Intralot SA-Integrated Information Systems & Gaming Services (a)(b) | | | 153,268 | | | | 100,329 | |
Kambi Group PLC (a)(b) | | | 88,619 | | | | 1,627,768 | |
Kindred Group PLC - SDR (b) | | | 458,255 | | | | 4,872,616 | |
La Francaise des Jeux SAEM (b)(c) | | | 69,055 | | | | 2,715,219 | |
Light & Wonder, Inc. (a)(f) | | | 48,590 | | | | 3,341,048 | |
NEOGAMES SA (a)(b) | | | 883,365 | | | | 3,016,503 | |
OPAP SA (b) | | | 96,459 | | | | 2,519,509 | |
Penn National Gaming, Inc. (a)(f) | | | 176,988 | | | | 3,085,642 | |
PointsBet Holdings, Ltd. (a)(b) | | | 232,498 | | | | 5,586,928 | |
Rush Street Interactive, Inc. (a) | | | 3,584,158 | | | | 4,270,575 | |
Sportradar Holding AG - Class A (a)(b)(f) | | | 859,674 | | | | 2,682,183 | |
STS Holding SA (b) | | | 181,301 | | | | 2,338,783 | |
Super Group SGHC, Ltd. (a)(b)(f) | | | 66,201 | | | | 395,125 | |
Tabcorp Holdings, Ltd. (b) | | | 179,140 | | | | 519,506 | |
The Lottery Corp., Ltd. (b) | | | 9,419,596 | | | | 6,959,876 | |
Tokyotokeiba Co., Ltd. (b) | | | 96,800 | | | | 2,625,357 | |
| | | | | | | | 104,308,921 | |
Internet — 0.8% | | | | | | | | |
Catena Media PLC (a)(b)(f) | | | 276,662 | | | $ | 501,261 | |
Gambling.com Group, Ltd. (a)(b) | | | 29,911 | | | | 306,289 | |
Gaming Innovation Group, Inc. (a) | | | 40,943 | | | | 94,394 | |
| | | | | | | | 901,944 | |
Lodging — 6.6% | | | | | | | | |
Boyd Gaming Corp. (f) | | | 45,458 | | | | 3,153,421 | |
MGM Resorts International | | | 102,203 | | | | 4,488,756 | |
| | | | | | | | 7,642,177 | |
Software — 2.4% | | | | | | | | |
Better Collective AS (a)(b) | | | 21,373 | | | | 441,260 | |
Bragg Gaming Group, Inc. (a)(b) | | | 46,334 | | | | 143,213 | |
Playtech PLC (a)(b) | | | 302,875 | | | | 2,271,842 | |
| | | | | | | | 2,856,315 | |
TOTAL COMMON STOCKS (Cost $163,270,312) | | | | | | | 115,709,357 | |
| | | | | | | | | |
Warrants — 0.0% (h) | | | | | | | | |
PointsBet Holdings, Ltd., Expiration: July 2024, Exercise Price: $10.00 (a)(b)(g) | | | 151,840 | | | | — | |
TOTAL WARRANTS (Cost $0) | | | | | | | — | |
| | | | | | | | | |
SHORT-TERM INVESTMENTS — 0.4% | | | | | | | | |
Money Market Fund — 0.4% | | | | | | | | |
First American Government Obligations Fund, Class X, 5.01% (d) | | | 474,149 | | | | 474,149 | |
TOTAL SHORT-TERM INVESTMENTS (Cost $474,149) | | | | | | | 474,149 | |
| | | | | | | | | |
INVESTMENTS PURCHASED WITH PROCEEDS FROM SECURITIES LENDING — 13.6% | | | | | | | | |
Mount Vernon Liquid Assets Portfolio, LLC, 5.22% (d) | | | 15,819,564 | | | | 15,819,564 | |
TOTAL INVESTMENTS PURCHASED WITH PROCEEDS FROM SECURITIES LENDING (Cost $15,819,564) | | | | | | | 15,819,564 | |
| | | | | | | | | |
TOTAL INVESTMENTS (Cost $179,564,025) — 113.5% | | | | | | | 132,003,070 | |
Other assets and liabilities, net — (13.5)% | | | | | | | (15,727,787 | ) |
NET ASSETS — 100.0% | | | | | | $ | 116,275,283 | |
PLC Public Limited Company
SDR Special Drawing Rights
(a) | Non-income producing security. |
(b) | Foreign issued security, or represents a foreign issued security. |
(c) | Security exempt from registration pursuant to Rule 144a under the Securities Act of 1933, as amended. These securities may be resold in transactions exempt from registration to qualified institutional investors. |
(d) | The rate shown is the seven day yield at period end. |
The accompanying notes are an integral part of the financial statements.
4
Roundhill Sports Betting & iGaming ETF
Schedule of Investments
June 30, 2023 (Unaudited) (Continued)
(e) | To the extent the Fund invests more heavily in particular sectors of the economy, its performance will be especially sensitive to developments that significantly affect those sectors. |
(f) | All or a portion of this security is on loan as of June 30, 2023. The market value of securities out on loan is $15,618,389. |
(g) | Value determined based on estimated fair value. The value of these securities total $0, which represents 0.00% of net assets. Classified as Level 3 in the fair value hierarchy. |
(h) | Amount is less than 0.05%. |
Percentages are stated as a percent of net assets.
COUNTRY | Percentage
of Net Assets |
United States | 35.4% |
Australia | 15.6% |
Isle of Man | 7.7% |
Ireland | 6.2% |
Malta | 6.0% |
Sweden | 5.7% |
Guernsey | 4.6% |
United Kingdom | 3.0% |
Greece | 2.7% |
France | 2.3% |
Japan | 2.3% |
Luxembourg | 2.2% |
Gibraltar | 2.1% |
Switzerland | 2.0% |
Bermuda | 0.6% |
Denmark | 0.4% |
Poland | 0.3% |
Jersey | 0.3% |
Canada | 0.1% |
Total Country | 99.5% |
WARRANTS | 0.0%* |
SHORT-TERM INVESTMENTS | 0.4% |
INVESTMENTS PURCHASED WITH PROCEEDS FROM SECURITIES LENDING | 13.6% |
TOTAL INVESTMENTS | 113.5% |
Other assets and liabilities, net | -13.5% |
NET ASSETS | 100.0% |
* | Amount is less than 0.05%. |
The accompanying notes are an integral part of the financial statements.
5
Roundhill Ball Metaverse ETF
Schedule of Investments
June 30, 2023 (Unaudited)
Description | | Shares | | | Value | |
COMMON STOCKS — 99.2% | | | | | | | | |
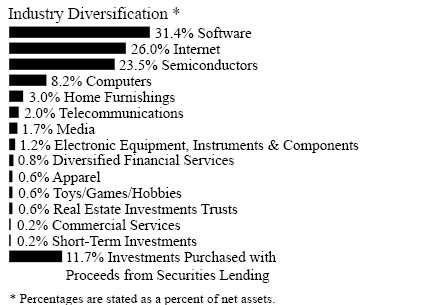
Apparel — 0.6% | | | | | | | | |
NIKE, Inc. - Class B | | | 27,765 | | | $ | 3,064,423 | |
| | | | | | | | | |
Commercial Services — 0.2% | | | | | | | | |
Block, Inc. (a) | | | 8,930 | | | | 594,470 | |
PayPal Holdings, Inc. (a) | | | 8,996 | | | | 600,303 | |
| | | | | | | | 1,194,773 | |
Computers — 8.2% | | | | | | | | |
Apple, Inc. | | | 210,788 | | | | 40,886,548 | |
| | | | | | | | | |
Diversified Financial Services — 0.8% | | | | | | | | |
Coinbase Global, Inc. - Class A (a)(e) | | | 56,661 | | | | 4,054,095 | |
| | | | | | | | | |
Electronic Equipment, Instruments & Components — 1.2% | | | | | | | | |
HEXAGON AB (b) | | | 496,593 | | | | 6,103,221 | |
| | | | | | | | | |
Home Furnishings — 3.0% | | | | | | | | |
Sony Group Corp. (b) | | | 165,500 | | | | 14,845,591 | |
| | | | | | | | | |
Internet — 26.0% (d) | | | | | | | | |
Alibaba Group Holding, Ltd. (a)(b) | | | 660,400 | | | | 6,842,825 | |
Alphabet, Inc. - Class A (a) | | | 120,680 | | | | 14,445,396 | |
Amazon.com, Inc. (a) | | | 123,638 | | | | 16,117,450 | |
Baidu, Inc. - ADR (a)(b) | | | 96,367 | | | | 13,193,606 | |
Edgio, Inc. (a) | | | 6,052,114 | | | | 4,079,125 | |
Meta Platforms, Inc. - Class A (a) | | | 99,680 | | | | 28,606,166 | |
NAVER Corp. (b) | | | 41,793 | | | | 5,798,020 | |
Sea, Ltd. - ADR (a)(b)(e) | | | 135,261 | | | | 7,850,548 | |
Snap, Inc. - Class A (a)(e) | | | 1,213,912 | | | | 14,372,718 | |
Tencent Holdings, Ltd. (b) | | | 422,700 | | | | 17,886,241 | |
| | | | | | | | 129,192,095 | |
Media — 1.7% | | | | | | | | |
The Walt Disney Co. (a) | | | 92,681 | | | $ | 8,274,560 | |
| | | | | | | | | |
Semiconductors — 23.5 | | | | | | | | |
Advanced Micro Devices, Inc. (a) | | | 78,055 | | | | 8,891,245 | |
Applied Materials, Inc. (e) | | | 36,016 | | | | 5,205,753 | |
ASML Holding NV (b) | | | 10,834 | | | | 7,851,942 | |
Broadcom, Inc. | | | 3,356 | | | | 2,911,095 | |
Intel Corp. | | | 152,455 | | | | 5,098,095 | |
Marvell Technology, Inc. | | | 46,165 | | | | 2,759,744 | |
NVIDIA Corp. | | | 66,996 | | | | 28,340,648 | |
QUALCOMM, Inc. | | | 151,571 | | | | 18,043,012 | |
Samsung Electronics Co., Ltd. (b) | | | 211,072 | | | | 11,565,589 | |
Skyworks Solutions, Inc. | | | 53,491 | | | | 5,920,919 | |
Taiwan Semiconductor Manufacturing Co., Ltd. - ADR (b) | | | 147,693 | | | | 14,905,178 | |
Texas Instruments, Inc. | | | 28,969 | | | | 5,214,999 | |
| | | | | | | | 116,708,219 | |
Software — 31.4% (d) | | | | | | | | |
Activision Blizzard, Inc. (a) | | | 37,181 | | | | 3,134,358 | |
Adobe, Inc. (a) | | | 11,390 | | | | 5,569,596 | |
Akamai Technologies, Inc. (a) | | | 62,012 | | | | 5,573,018 | |
Autodesk, Inc. (a)(e) | | | 79,146 | | | | 16,194,063 | |
Bentley Systems, Inc. - Class B (e) | | | 52,070 | | | | 2,823,756 | |
Cloudflare, Inc. - Class A (a)(e) | | | 87,808 | | | | 5,740,009 | |
Electronic Arts, Inc. | | | 61,173 | | | | 7,934,138 | |
Krafton, Inc. (a)(b) | | | 18,687 | | | | 2,762,667 | |
Matterport, Inc. (a)(e) | | | 2,906,372 | | | | 9,155,072 | |
Microsoft Corp. | | | 61,704 | | | | 21,012,680 | |
NetEase, Inc. - ADR (b)(e) | | | 63,525 | | | | 6,142,232 | |
PTC, Inc. (a) | | | 19,207 | | | | 2,733,156 | |
ROBLOX Corp. - Class A (a)(e) | | | 994,627 | | | | 40,083,468 | |
Take-Two Interactive Software, Inc. (a) | | | 69,509 | | | | 10,228,944 | |
Unity Software, Inc. (a)(e) | | | 394,476 | | | | 17,128,148 | |
| | | | | | | | 156,215,305 | |
Telecommunications — 2.0% | | | | | | | | |
Lumen Technologies, Inc. (e) | | | 3,130,569 | | | | 7,075,086 | |
Planet Labs PBC (a)(e) | | | 849,741 | | | | 2,736,166 | |
| | | | | | | | 9,811,252 | |
Toys/Games/Hobbies — 0.6% | | | | | | | | |
Nintendo Co., Ltd. (b) | | | 67,600 | | | | 3,059,738 | |
| | | | | | | | | |
TOTAL COMMON STOCKS (Cost $572,640,739) | | | | | | | 493,409,820 | |
| | | | | | | | | |
REAL ESTATE INVESTMENT TRUSTS — 0.6% | | | | | | | | |
Equinix, Inc. | | | 3,809 | | | | 2,986,027 | |
TOTAL REAL ESTATE INVESTMENT TRUSTS (Cost $2,995,696) | | | | | | | 2,986,027 | |
The accompanying notes are an integral part of the financial statements.
6
Roundhill Ball Metaverse ETF
Schedule of Investments
June 30, 2023 (Unaudited) (Continued)
Description | | Shares | | | Value | |
SHORT-TERM INVESTMENTS — 0.2% | | | | | | | | |
Money Market Fund — 0.2% | | | | | | | | |
First American Government Obligations Fund, Class X, 5.01% (c) | | | 1,287,330 | | | $ | 1,287,330 | |
TOTAL SHORT-TERM INVESTMENTS (Cost $1,287,330) | | | | | | | 1,287,330 | |
| | | | | | | | | |
INVESTMENTS PURCHASED WITH PROCEEDS FROM SECURITIES LENDING — 11.7% | | | | | | | | |
Mount Vernon Liquid Assets Portfolio, LLC, 5.22% (c) | | | 58,319,141 | | | | 58,319,141 | |
TOTAL INVESTMENTS PURCHASED WITH PROCEEDS FROM SECURITIES LENDING (Cost $58,319,141) | | | | | | | 58,319,141 | |
| | | | | | | | | |
TOTAL INVESTMENTS (Cost $635,242,906) — 111.7% | | | | | | | 556,002,318 | |
Other assets and liabilities, net — (11.7)% | | | | | | | (58,425,294 | ) |
NET ASSETS — 100.0% | | | | | | $ | 497,577,024 | |
ADR American Depositary Receipt
(a) | Non-income producing security. |
(b) | Foreign issued security, or represents a foreign issued security. |
(c) | The rate shown is the seven day yield at period end. |
(d) | To the extent the Fund invests more heavily in particular sectors of the economy, its performance will be especially sensitive to developments that significantly affect those sectors. |
(e) | All or a portion of this security is on loan as of June 30, 2023. The market value of securities out on loan is $57,269,608. |
Percentages are stated as a percent of net assets.
COUNTRY | Percentage
of Net Assets |
United States | 75.3% |
Cayman Islands | 10.4% |
Republic of Korea | 4.1% |
Japan | 3.6% |
Taiwan | 3.0% |
Netherlands | 1.6% |
Sweden | 1.2% |
Total Country | 99.2% |
REAL ESTATE INVESTMENT TRUSTS | 0.6% |
SHORT-TERM INVESTMENTS | 0.2% |
INVESTMENTS PURCHASED WITH PROCEEDS FROM SECURITIES LENDING | 11.7% |
TOTAL INVESTMENTS | 111.7% |
Other assets and liabilities, net | -11.7% |
NET ASSETS | 100.0% |
The accompanying notes are an integral part of the financial statements.
7
Roundhill IO Digital Infrastructure ETF
Schedule of Investments
June 30, 2023 (Unaudited)
Description | | Shares | | | Value | |
COMMON STOCKS — 73.4% | | | | | | | | |
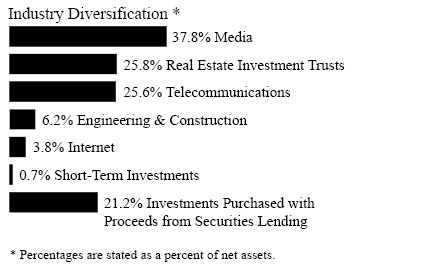
Engineering & Construction — 6.2% | | | | | | | | |
Cellnex Telecom SA (b)(c) | | | 480 | | | $ | 19,371 | |
China Tower Corp., Ltd. (b)(c) | | | 936,000 | | | | 103,912 | |
Helios Tower PLC (a)(b) | | | 14,287 | | | | 16,910 | |
Infrastrutture Wireless Italiane SpA (b)(c) | | | 1,477 | | | | 19,466 | |
Sarana Menara Nusantara Tbk PT (b) | | | 284,400 | | | | 20,013 | |
| | | | | | | | 179,672 | |
Internet — 3.8% | | | | | | | | |
Cogent Communications Holdings, Inc. | | | 1,365 | | | | 91,851 | |
Vnet Group, Inc. - ADR (a)(b) | | | 5,488 | | | | 15,915 | |
| | | | | | | | 107,766 | |
Media — 37.8% (e) | | | | | | | | |
Altice USA, Inc. - Class A (a) | | | 23,240 | | | | 70,185 | |
Cable One, Inc. (f) | | | 237 | | | | 155,728 | |
Charter Communications, Inc. - Class A (a)(f) | | | 505 | | | | 185,522 | |
Cogeco Communications, Inc. (b) | | | 4,279 | | | | 228,591 | |
Comcast Corp. - Class A | | | 5,105 | | | | 212,113 | |
Converge Information and Communications Technology Solutions, Inc. (a)(b) | | | 197,400 | | | | 39,051 | |
Liberty Global PLC - Class A (a)(b) | | | 969 | | | | 16,337 | |
Liberty Latin America, Ltd. - Class C (a)(b) | | | 6,814 | | | | 58,737 | |
NOS SGPS SA (b) | | | 3,930 | | | | 13,960 | |
Quebecor, Inc. - Class B (b) | | | 791 | | | | 19,517 | |
Telenet Group Holding NV (b) | | | 1,166 | | | | 26,231 | |
WideOpenWest, Inc. (a) | | | 7,185 | | | | 60,641 | |
| | | | | | | | 1,086,613 | |
Telecommunications — 25.6% (e) | | | | | | | | |
Aussie Broadband, Ltd. (a)(b) | | | 77,457 | | | | 153,647 | |
Chindata Group Holdings, Ltd. - ADR (a)(b)(f) | | | 2,761 | | | | 19,769 | |
Chorus, Ltd. (b) | | | 3,612 | | | | 18,644 | |
Consolidated Communications Holdings, Inc. (a) | | | 21,090 | | | | 80,775 | |
Telecommunications (Continued) | | | | | | | | |
DigitalBridge Group, Inc. (f) | | | 6,024 | | | $ | 88,613 | |
Frontier Communications Parent, Inc. (a) | | | 2,849 | | | | 53,105 | |
GDS Holdings, Ltd. - ADR (a)(b)(f) | | | 1,156 | | | | 12,704 | |
Gogo, Inc. (a) | | | 3,618 | | | | 61,542 | |
Lumen Technologies, Inc. (f) | | | 41,393 | | | | 93,548 | |
Megacable Holdings SAB de CV (b) | | | 6,723 | | | | 15,547 | |
NetLink NBN Trust (b) | | | 28,461 | | | | 17,981 | |
NEXTDC, Ltd. (a)(b) | | | 2,648 | | | | 22,174 | |
Shenandoah Telecommunications Co. | | | 960 | | | | 18,653 | |
Telekom Malaysia Berhad (b) | | | 75,820 | | | | 79,759 | |
| | | | | | | | 736,461 | |
TOTAL COMMON STOCKS (Cost $2,575,133) | | | | | | | 2,110,512 | |
| | | | | | | | | |
REAL ESTATE INVESTMENT TRUSTS — 25.8% (e) | | | | | | | | |
American Tower Corp. | | | 652 | | | | 126,449 | |
Crown Castle International Corp. | | | 765 | | | | 87,164 | |
Digital Realty Trust, Inc. | | | 676 | | | | 76,976 | |
Equinix, Inc. | | | 208 | | | | 163,059 | |
SBA Communications Corp. | | | 346 | | | | 80,189 | |
Uniti Group, Inc. (f) | | | 45,358 | | | | 209,554 | |
TOTAL REAL ESTATE INVESTMENT TRUSTS (Cost $804,135) | | | | | | | 743,391 | |
| | | | | | | | | |
SHORT-TERM INVESTMENTS — 0.7% | | | | | | | | |
Money Market Fund — 0.7% | | | | | | | | |
First American Government Obligations Fund, Class X, 5.01% (d) | | | 20,269 | | | | 20,269 | |
TOTAL SHORT-TERM INVESTMENTS (Cost $20,269) | | | | | | | 20,269 | |
| | | | | | | | | |
INVESTMENTS PURCHASED WITH PROCEEDS FROM SECURITIES LENDING — 21.2% | | | | | | | | |
Mount Vernon Liquid Assets Portfolio, LLC, 5.22% (d) | | | 610,919 | | | | 610,919 | |
TOTAL INVESTMENTS PURCHASED WITH PROCEEDS FROM SECURITIES LENDING (Cost $610,919) | | | | | | | 610,919 | |
| | | | | | | | | |
TOTAL INVESTMENTS (Cost $4,010,456) — 121.1% | | | | | | | 3,485,091 | |
Other assets and liabilities, net — (21.1)% | | | | | | | (607,267 | ) |
NET ASSETS — 100.0% | | | | | | $ | 2,877,824 | |
ADR American Depositary Receipt
PLC Public Limited Company
(a) | Non-income producing security. |
(b) | Foreign issued security, or represents a foreign issued security. |
The accompanying notes are an integral part of the financial statements.
8
Roundhill IO Digital Infrastructure ETF
Schedule of Investments
June 30, 2023 (Unaudited) (Continued)
(c) | Security exempt from registration pursuant to Rule 144a under the Securities Act of 1933, as amended. These securities may be resold in transactions exempt from registration to qualified institutional investors. |
(d) | The rate shown is the seven day yield at period end. |
(e) | To the extent the Fund invests more heavily in particular sectors of the economy, its performance will be especially sensitive to developments that significantly affect those sectors. |
(f) | All or a portion of this security is on loan as of June 30, 2023. The market value of securities out on loan is $592,069. |
Percentages are stated as a percent of net assets.
COUNTRY | Percentage
of Net Assets |
United States | 40.8% |
Canada | 8.6% |
Australia | 6.1% |
China | 3.6% |
Malaysia | 2.8% |
Bermuda | 2.0% |
Cayman Islands | 1.7% |
Philippines | 1.4% |
United Kingdom | 1.2% |
Belgium | 0.9% |
Indonesia | 0.7% |
Italy | 0.7% |
Spain | 0.7% |
New Zealand | 0.6% |
Singapore | 0.6% |
Mexico | 0.5% |
Portugal | 0.5% |
Total Country | 73.4% |
REAL ESTATE INVESTMENT TRUSTS | 25.8% |
SHORT-TERM INVESTMENTS | 0.7% |
INVESTMENTS PURCHASED WITH PROCEEDS FROM SECURITIES LENDING | 21.2% |
TOTAL INVESTMENTS | 121.1% |
Other assets and liabilities, net | -21.1% |
NET ASSETS | 100.0% |
The accompanying notes are an integral part of the financial statements.
9
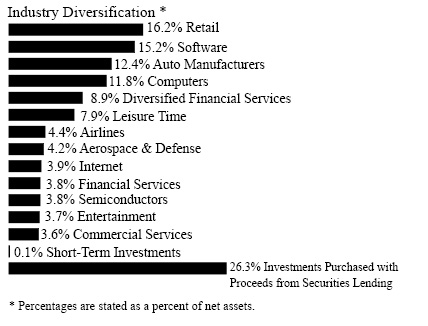
Roundhill MEME ETF
Schedule of Investments
June 30, 2023 (Unaudited)
Description | | Shares | | | Value | |
COMMON STOCKS — 99.8% | | | | | | | | |
Aerospace & Defense — 4.2% | | | | | | | | |
Rocket Lab USA, Inc. (a) | | | 7,602 | | | $ | 45,612 | |
| | | | | | | | | |
Airlines — 4.4% | | | | | | | | |
Delta Air Lines, Inc. (a) | | | 995 | | | | 47,302 | |
| | | | | | | | | |
Auto Manufacturers — 12.4% | | | | | | | | |
NIO, Inc. - ADR (a)(b) | | | 4,529 | | | | 43,886 | |
Rivian Automotive, Inc. - Class A (a)(d) | | | 2,861 | | | | 47,664 | |
Tesla, Inc. (a) | | | 163 | | | | 42,668 | |
| | | | | | | | 134,218 | |
Commercial Services — 3.6% | | | | | | | | |
Affirm Holdings, Inc. (a)(d) | | | 2,554 | | | | 39,153 | |
| | | | | | | | | |
Computers — 11.8% | | | | | | | | |
International Business Machines Corp. | | | 310 | | | | 41,481 | |
Super Micro Computer, Inc. (a) | | | 184 | | | | 45,862 | |
Zscaler, Inc. (a) | | | 276 | | | | 40,379 | |
| | | | | | | | 127,722 | |
Diversified Financial Services — 8.9% | | | | | | | | |
Coinbase Global, Inc. - Class A (a) | | | 766 | | | | 54,807 | |
Upstart Holdings, Inc. (a)(d) | | | 1,143 | | | | 40,931 | |
| | | | | | | | 95,738 | |
Entertainment — 3.7% | | | | | | | | |
AMC Entertainment Holdings, Inc. - Class A (a)(d) | | | 9,058 | | | | 39,855 | |
| | | | | | | | | |
Financial Services — 3.8% | | | | | | | | |
Sofi Technologies, Inc. (a)(d) | | | 4,950 | | | | 41,283 | |
| | | | | | | | | |
Internet — 3.9% | | | | | | | | |
Robinhood Markets, Inc. - Class A (a) | | | 4,244 | | | | 42,355 | |
Leisure Time — 7.9% | | | | | | | | |
Carnival Corp. (a)(b) | | | 2,694 | | | $ | 50,728 | |
Virgin Galactic Holdings, Inc. (a)(d) | | | 9,000 | | | | 34,920 | |
| | | | | | | | 85,648 | |
Retail — 16.2% | | | | | | | | |
Carvana Co. (a) | | | 1,681 | | | | 43,572 | |
Dave & Buster’s Entertainment, Inc. (a) | | | 1,060 | | | | 47,234 | |
GameStop Corp. - Class A (a) | | | 1,733 | | | | 42,025 | |
Lululemon Athletica, Inc. (a) | | | 111 | | | | 42,014 | |
| | | | | | | | 174,845 | |
Semiconductors — 3.8% | | | | | | | | |
Advanced Micro Devices, Inc. (a) | | | 355 | | | | 40,438 | |
| | | | | | | | | |
Software — 15.2% | | | | | | | | |
Cloudflare, Inc. - Class A (a) | | | 629 | | | | 41,118 | |
DocuSign, Inc. (a) | | | 791 | | | | 40,412 | |
Gitlab, Inc. - Class A (a)(d) | | | 831 | | | | 42,473 | |
Palantir Technologies, Inc. - Class A (a) | | | 2,612 | | | | 40,042 | |
| | | | | | | | 164,045 | |
TOTAL COMMON STOCKS (Cost $960,729) | | | | | | | 1,078,214 | |
| | | | | | | | | |
SHORT-TERM INVESTMENTS — 0.1% | | | | | | | | |
Money Market Fund — 0.1% | | | | | | | | |
First American Government Obligations Fund, Class X, 5.01% (c) | | | 877 | | | | 877 | |
TOTAL SHORT-TERM INVESTMENTS (Cost $877) | | | | | | | 877 | |
| | | | | | | | | |
INVESTMENTS PURCHASED WITH PROCEEDS FROM SECURITIES LENDING — 26.3% | | | | | | | | |
Mount Vernon Liquid Assets Portfolio, LLC, 5.22% (c) | | | 283,883 | | | | 283,883 | |
TOTAL INVESTMENTS PURCHASED WITH PROCEEDS FROM SECURITIES LENDING (Cost $283,883) | | | | | | | 283,883 | |
| | | | | | | | | |
TOTAL INVESTMENTS (Cost $1,245,489) — 126.2% | | | | | | | 1,362,974 | |
Other assets and liabilities, net — (26.2)% | | | | | | | (283,129 | ) |
NET ASSETS — 100.0% | | | | | | $ | 1,079,845 | |
ADR American Depositary Receipt
(a) | Non-income producing security. |
(b) | Foreign issued security, or represents a foreign issued security. |
(c) | The rate shown is the seven day yield at period end. |
(d) | All or a portion of this security is on loan as of June 30, 2023. The market value of securities out on loan is $271,886. |
Percentages are stated as a percent of net assets.
The accompanying notes are an integral part of the financial statements.
10
Roundhill MEME ETF
Schedule of Investments
June 30, 2023 (Unaudited) (Continued)
COUNTRY | Percentage
of Net Assets |
United States | 91.0% |
Panama | 4.7% |
Cayman Islands | 4.1% |
Total Country | 99.8% |
SHORT-TERM INVESTMENTS | 0.1% |
INVESTMENTS PURCHASED WITH PROCEEDS FROM SECURITIES LENDING | 26.3% |
TOTAL INVESTMENTS | 126.2% |
Other assets and liabilities, net | -26.2% |
NET ASSETS | 100.0% |
The accompanying notes are an integral part of the financial statements.
11
Roundhill Cannabis ETF
Schedule of Investments
June 30, 2023 (Unaudited)

Description | | Shares | | | Value | |
SHORT-TERM INVESTMENTS — 100.2% | | | | | | | | |
Money Market Fund — 0.5% | | | | | | | | |
First American Government Obligations Fund, Class X, 5.01% (a) | | | 9,883 | | | $ | 9,883 | |
Total Money Market Fund (Cost $9,883) | | | | | | | 9,883 | |
| | | | | | | | | |
U.S. Treasury Bills — 99.7% | | | | | | | | |
4.96%, 07/05/2023 (b)(c) | | | 2,110,000 | | | | 2,108,865 | |
Total U.S. Treasury Bills (Cost $2,108,865) | | | | | | | 2,108,865 | |
TOTAL SHORT-TERM INVESTMENTS (Cost $2,118,748) | | | | | | | 2,118,748 | |
| | | | | | | | | |
TOTAL INVESTMENTS (Cost $2,118,748) — 100.2% | | | | | | | 2,118,748 | |
Other assets and liabilities, net — (0.2)% | | | | | | | (4,652 | ) |
NET ASSETS — 100.0% | | | | | | $ | 2,114,096 | |
(a) | The rate shown is the seven day yield at period end. |
(b) | The rate shown is the effective yield as of June 30, 2023. |
(c) | Held as collateral for total return swaps. |
Percentages are stated as a percent of net assets.
| Percentage
of Net Assets |
SHORT-TERM INVESTMENTS | 100.2% |
TOTAL INVESTMENTS | 100.2% |
Other assets and liabilities, net | -0.2% |
NET ASSETS | 100.0% |
The accompanying notes are an integral part of the financial statements.
12
Roundhill Cannabis ETF
Schedule of Total Return Swaps
June 30, 2023 (Unaudited)
Long Total Return
Equity Swaps | | Fund Pays/
Receives
Reference
Entity | | Counterparty | | Payment
Frequency | | Financing Rate | | Expiration
Date | | | Upfront
Premiums
Paid/Received | | | Notional
Amount | | | Value/
Unrealized
Appreciation
(Depreciation) | |
Columbia Care, Inc. Swap | Receives | Nomura Securities International, Inc. | Monthly | Overnight Bank Funding Rate Index + 1.50% | June 20, 2024 | | $ | — | | | $ | 48,789 | | | $ | — | |
Cresco Labs, Inc. Swap | Receives | Nomura Securities International, Inc. | Monthly | Overnight Bank Funding Rate Index + 1.50% | June 20, 2024 | | | — | | | | 159,540 | | | | — | |
Curaleaf Holdings, Inc. Swap | Receives | Nomura Securities International, Inc. | Monthly | Overnight Bank Funding Rate Index + 1.50% | June 20, 2024 | | | — | | | | 703,922 | | | | — | |
Green Thumb Industries, Inc. Swap | Receives | Nomura Securities International, Inc. | Monthly | Overnight Bank Funding Rate Index + 1.50% | June 20, 2024 | | | — | | | | 639,028 | | | | — | |
Trulieve Cannabis Corp. Swap | Receives | Nomura Securities International, Inc. | Monthly | Overnight Bank Funding Rate Index + 1.50% | June 20, 2024 | | | — | | | | 228,387 | | | | — | |
Verano Holdings Corp. Swap | Receives | Nomura Securities International, Inc. | Monthly | Overnight Bank Funding Rate Index + 1.50% | June 20, 2024 | | | — | | | | 328,707 | | | | — | |
| | | | | | | | | | | | | | | | | $ | — | | | $ | 2,108,373 | | | $ | — | |
The accompanying notes are an integral part of the financial statements.
13
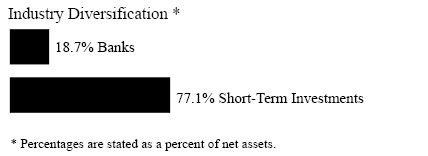
Roundhill BIG Bank ETF
Schedule of Investments
June 30, 2023 (Unaudited)
Description | | Shares | | | Value | |
COMMON STOCKS — 18.7% | | | | | | | | |
Banks — 18.7% | | | | | | | | |
Bank of America Corp. | | | 5,268 | | | $ | 151,139 | |
Citigroup, Inc. | | | 3,174 | | | | 146,131 | |
Goldman Sachs Group, Inc. | | | 476 | | | | 153,529 | |
JPMorgan Chase & Co. | | | 824 | | | | 119,843 | |
Morgan Stanley | | | 1,763 | | | | 150,560 | |
Wells Fargo & Co. | | | 3,186 | | | | 135,978 | |
TOTAL COMMON STOCKS (Cost $836,059) | | | | | | | 857,180 | |
| | | | | | | | | |
SHORT-TERM INVESTMENTS — 77.1% | | | | | | | | |
Money Market Fund — 2.0% | | | | | | | | |
First American Government Obligations Fund, Class X, 5.01% (a) | | | 91,144 | | | | 91,144 | |
Total Money Market Fund (Cost $91,144) | | | | | | | 91,144 | |
| | | | | | | | | |
U.S. Treasury Bills — 75.1% | | | | | | | | |
5.11%, 09/05/2023 (b)(c) | | | 3,475,000 | | | | 3,443,375 | |
Total U.S. Treasury Bills (Cost $3,442,896) | | | | | | | 3,443,375 | |
TOTAL SHORT-TERM INVESTMENTS (Cost $3,534,040) | | | | | | | 3,534,519 | |
| | | | | | | | | |
TOTAL INVESTMENTS (Cost $4,370,099) — 95.8% | | | | | | | 4,391,699 | |
Other assets and liabilities, net — 4.2% | | | | | | | 195,150 | |
NET ASSETS — 100.0% | | | | | | $ | 4,586,849 | |
(a) | The rate shown is the seven day yield at period end. |
(b) | The rate shown is the effective yield as of June 30, 2023. |
(c) | Held as collateral for total return swaps. |
Percentages are stated as a percent of net assets.
| Percentage
of Net Assets |
COMMON STOCKS | 18.7% |
SHORT-TERM INVESTMENTS | 77.1% |
TOTAL INVESTMENTS | 95.8% |
Other assets and liabilities, net | 4.2% |
NET ASSETS | 100.0% |
The accompanying notes are an integral part of the financial statements.
14
Roundhill BIG Bank ETF
Schedule of Total Return Swaps
June 30, 2023 (Unaudited)
Long Total Return
Equity Swaps | | Fund Pays/
Receives
Reference
Entity | | Counterparty | | Payment
Frequency | | Financing Rate | | Expiration
Date | | | Upfront
Premiums
Paid/Received | | | Notional
Amount | | | Value/
Unrealized
Appreciation
(Depreciation) | |
Bank of America Corp. Swap | Receives | Nomura Securities International, Inc. | At Maturity | Overnight Bank Funding Rate Index + 0.50% | April 2, 2024 | | $ | — | | | $ | 581,799 | | | $ | 21,924 | |
Citigroup, Inc. Swap | Receives | Nomura Securities International, Inc. | At Maturity | Overnight Bank Funding Rate Index + 0.50% | April 2, 2024 | | | — | | | | 569,010 | | | | 20,348 | |
Goldman Sachs Group, Inc. Swap | Receives | Nomura Securities International, Inc. | At Maturity | Overnight Bank Funding Rate Index + 0.50% | April 2, 2024 | | | — | | | | 594,269 | | | | 11,784 | |
JPMorgan Chase & Co. Swap | Receives | Nomura Securities International, Inc. | At Maturity | Overnight Bank Funding Rate Index + 0.50% | April 2, 2024 | | | — | | | | 574,439 | | | | 80,769 | |
Morgan Stanley Swap | Receives | Nomura Securities International, Inc. | At Maturity | Overnight Bank Funding Rate Index + 0.50% | April 2, 2024 | | | — | | | | 603,073 | | | | (2,626 | ) |
Wells Fargo & Co. Swap | Receives | Nomura Securities International, Inc. | At Maturity | Overnight Bank Funding Rate Index + 0.50% | April 2, 2024 | | | — | | | | 558,308 | | | | 81,679 | |
| | | | | | | | | | | | | | | | | $ | — | | | $ | 3,480,898 | | | $ | 213,878 | |
The accompanying notes are an integral part of the financial statements.
15
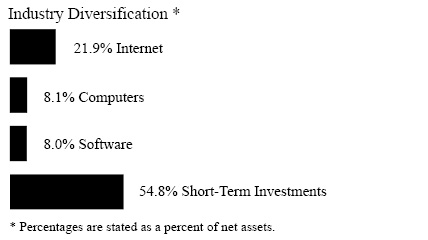
Roundhill BIG Tech ETF
Schedule of Investments
June 30, 2023 (Unaudited)
Description | | Shares | | | Value | |
COMMON STOCKS — 38.0% | | | | | | | | |
Computers — 8.1% | | | | | | | | |
Apple, Inc. | | | 1,516 | | | $ | 294,059 | |
| | | | | | | | | |
Internet — 21.9% | | | | | | | | |
Alphabet, Inc. - Class A (a) | | | 2,384 | | | | 285,365 | |
Amazon.com, Inc. (a) | | | 2,040 | | | | 265,934 | |
Meta Platforms, Inc. - Class A (a) | | | 850 | | | | 243,933 | |
| | | | | | | | 795,232 | |
Software — 8.0% | | | | | | | | |
Microsoft Corp. | | | 854 | | | | 290,821 | |
| | | | | | | | | |
TOTAL COMMON STOCKS (Cost $1,311,037) | | | | | | | 1,380,112 | |
| | | | | | | | | |
SHORT-TERM INVESTMENTS — 54.8% | | | | | | | | |
Money Market Fund — 2.9% | | | | | | | | |
First American Government Obligations Fund, Class X, 5.01% (b) | | | 105,332 | | | | 105,332 | |
Total Money Market Fund (Cost $105,332) | | | | | | | 105,332 | |
| | | | | | | | | |
U.S. Treasury Bills — 51.9% | | | | | | | | |
5.11%, 09/05/2023 (c)(d) | | | 1,900,000 | | | | 1,882,709 | |
Total U.S. Treasury Bills (Cost $1,882,447) | | | | | | | 1,882,709 | |
TOTAL SHORT-TERM INVESTMENTS (Cost $1,987,779) | | | | | | | 1,988,041 | |
| | | | | | | | | |
TOTAL INVESTMENTS (Cost $3,298,816) — 92.8% | | | | | | | 3,368,153 | |
Other assets and liabilities, net — 7.2% | | | | | | | 261,938 | |
NET ASSETS — 100.0% | | | | | | $ | 3,630,091 | |
(a) | Non-income producing security. |
(b) | The rate shown is the seven day yield at period end. |
(c) | The rate shown is the effective yield as of June 30, 2023. |
(d) | Held as collateral for total return swaps. |
Percentages are stated as a percent of net assets.
| Percentage
of Net Assets |
COMMON STOCKS | 38.0% |
SHORT-TERM INVESTMENTS | 54.8% |
TOTAL INVESTMENTS | 92.8% |
Other assets and liabilities, net | 7.2% |
NET ASSETS | 100.0% |
The accompanying notes are an integral part of the financial statements.
16
Roundhill BIG Tech ETF
Schedule of Total Return Swaps
June 30, 2023 (Unaudited)
Long Total Return
Equity Swaps | Fund Pays/
Receives
Reference
Entity | Counterparty | | Payment
Frequency | | Financing Rate | | Expiration
Date | | Upfront
Premiums
Paid/Received | | Notional
Amount | | Value/
Unrealized
Appreciation
(Depreciation) | |
Alphabet, Inc. - Class A Swap | Receives | Nomura Securities International, Inc. | At Maturity | Overnight Bank Funding Rate Index + 0.50% | April 2, 2024 | $ | — | | $ | 410,537 | | $ | 19,185 | |
Amazon.com, Inc. Swap | Receives | Nomura Securities International, Inc. | At Maturity | Overnight Bank Funding Rate Index + 0.50% | April 2, 2024 | | — | | | 387,223 | | | 72,166 | |
Apple, Inc. Swap | Receives | Nomura Securities International, Inc. | At Maturity | Overnight Bank Funding Rate Index + 0.50% | April 2, 2024 | | — | | | 387,312 | | | 54,552 | |
Meta Platforms, Inc. - Class A Swap | Receives | Nomura Securities International, Inc. | At Maturity | Overnight Bank Funding Rate Index + 0.50% | April 2, 2024 | | — | | | 390,491 | | | 87,618 | |
Microsoft Corp. Swap | Receives | Nomura Securities International, Inc. | At Maturity | Overnight Bank Funding Rate Index + 0.50% | April 2, 2024 | | — | | | 393,679 | | | 43,574 | |
| | | | | | | | | | | | | $ | — | | $ | 1,969,242 | | $ | 277,095 | |
The accompanying notes are an integral part of the financial statements.
17
Roundhill ETFs
Statements of Assets and Liabilities
June 30, 2023 (Unaudited)
| | | Roundhill Video
Games ETF | | | Roundhill
Sports Betting &
iGaming ETF | | | Roundhill Ball
Metaverse ETF | |
Assets | | | | | | | | | | | | |
Investments, at value (Cost $30,750,846, $179,564,025, $635,242,906, respectively)(1) | | $ | 29,583,800 | | | $ | 132,003,070 | | | $ | 556,002,318 | |
Dividends and interest receivable | | | 34,363 | | | | 168,684 | | | | 120,156 | |
Securities lending income receivable | | | 694 | | | | 4,431 | | | | 11,653 | |
Total Assets | | | 29,618,857 | | | | 132,176,185 | | | | 556,134,127 | |
| | | | | | | | | | | | | |
Liabilities | | | | | | | | | | | | |
Payable for collateral on securities loaned (Note 7) | | | 4,989,523 | | | | 15,819,564 | | | | 58,319,141 | |
Due to Custodian | | | 15,793 | | | | — | | | | — | |
Foreign currency payable to custodian, at value (Cost $0, $941, $0, respectively) | | | — | | | | 852 | | | | — | |
Payable to Adviser | | | 10,529 | | | | 80,486 | | | | 237,962 | |
Total Liabilities | | | 5,015,845 | | | | 15,900,902 | | | | 58,557,103 | |
Net Assets | | $ | 24,603,012 | | | $ | 116,275,283 | | | $ | 497,577,024 | |
| | | | | | | | | | | | | |
Net Assets Consists of: | | | | | | | | | | | | |
Paid-in capital | | $ | 65,567,704 | | | $ | 274,475,787 | | | $ | 858,950,648 | |
Total distributable earnings (accumulated losses) | | | (40,964,692 | ) | | | (158,200,504 | ) | | | (361,373,624 | ) |
Net Assets | | $ | 24,603,012 | | | $ | 116,275,283 | | | $ | 497,577,024 | |
| | | | | | | | | | | | | |
Shares of beneficial interest outstanding (unlimited number of shares authorized, no par value) | | | 1,575,000 | | | | 6,625,000 | | | | 47,850,000 | |
Net Asset Value, redemption price and offering price per share | | $ | 15.62 | | | $ | 17.55 | | | $ | 10.40 | |
| | | | | | | | | | | | | |
(1) Includes loaned securities with a value of: | | $ | 4,950,887 | | | $ | 15,618,389 | | | $ | 57,269,608 | |
The accompanying notes are an integral part of the financial statements.
18
Roundhill ETFs
Statements of Assets and Liabilities
June 30, 2023 (Unaudited) (Continued)
| | | Roundhill
IO Digital
Infrastructure
ETF | | | Roundhill
MEME ETF | | | Roundhill
Cannabis ETF | |
Assets | | | | | | | | | | | | |
Investments, at value (Cost $4,010,456, $1,245,489, $2,118,748, respectively)(1) | | $ | 3,485,091 | | | $ | 1,362,974 | | | $ | 2,118,748 | |
Dividends and interest receivable | | | 6,165 | | | | 5 | | | | 42 | |
Securities lending income receivable | | | 93 | | | | 1,335 | | | | — | |
Total Assets | | | 3,491,349 | | | | 1,364,314 | | | | 2,118,790 | |
| | | | | | | | | | | | | |
Liabilities | | | | | | | | | | | | |
Payable for collateral on securities loaned (Note 7) | | | 610,919 | | | | 283,883 | | | | — | |
Foreign currency payable to custodian, at value (Cost $1,411, $0, $0, respectively) | | | 1,434 | | | | — | | | | — | |
Payable for open swap contracts | | | — | | | | — | | | | 4,020 | |
Payable to Adviser | | | 1,172 | | | | 586 | | | | 674 | |
Total Liabilities | | | 613,525 | | | | 284,469 | | | | 4,694 | |
Net Assets | | $ | 2,877,824 | | | $ | 1,079,845 | | | $ | 2,114,096 | |
| | | | | | | | | | | | | |
Net Assets Consists of: | | | | | | | | | | | | |
Paid-in capital | | $ | 3,689,779 | | | $ | 2,131,900 | | | $ | 3,706,302 | |
Total distributable earnings (accumulated losses) | | | (811,955 | ) | | | (1,052,055 | ) | | | (1,592,206 | ) |
Net Assets | | $ | 2,877,824 | | | $ | 1,079,845 | | | $ | 2,114,096 | |
| | | | | | | | | | | | | |
Shares of beneficial interest outstanding (unlimited number of shares authorized, no par value) | | | 300,000 | | | | 30,000 | | | | 95,000 | |
Net Asset Value, redemption price and offering price per share | | $ | 9.59 | | | $ | 35.99 | | | $ | 22.25 | |
| | | | | | | | | | | | | |
(1) Includes loaned securities with a value of: | | $ | 592,069 | | | $ | 271,886 | | | $ | — | |
The accompanying notes are an integral part of the financial statements.
19
Roundhill ETFs
Statements of Assets and Liabilities
June 30, 2023 (Unaudited) (Continued)
| | | Roundhill
BIG Bank ETF | | | Roundhill
BIG Tech ETF | |
Assets | | | | | | | | |
Investments, at value (Cost $4,370,099,$3,298,816, respectively)(1) | | $ | 4,391,699 | | | $ | 3,368,153 | |
Dividends and interest receivable | | | 1,840 | | | | 538 | |
Variation margin on swap contracts | | | 213,878 | | | | 277,095 | |
Total Assets | | | 4,607,417 | | | | 3,645,786 | |
| | | | | | | | | |
Liabilities | | | | | | | | |
Payable for open swap contracts | | | 19,475 | | | | 14,934 | |
Payable to Adviser | | | 1,093 | | | | 761 | |
Total Liabilities | | | 20,568 | | | | 15,695 | |
Net Assets | | $ | 4,586,849 | | | $ | 3,630,091 | |
| | | | | | | | | |
Net Assets Consists of: | | | | | | | | |
Paid-in capital | | $ | 4,274,959 | | | $ | 3,174,959 | |
Total distributable earnings (accumulated losses) | | | 311,890 | | | | 455,132 | |
Net Assets | | $ | 4,586,849 | | | $ | 3,630,091 | |
| | | | | | | | | |
Shares of beneficial interest outstanding (unlimited number of shares authorized, no par value) | | | 170,000 | | | | 120,000 | |
Net Asset Value, redemption price and offering price per share | | $ | 26.98 | | | $ | 30.25 | |
| | | | | | | | | |
(1) Includes loaned securities with a value of: | | $ | — | | | $ | — | |
The accompanying notes are an integral part of the financial statements.
20
Roundhill ETFs
Statements of Operations
For the Period Ended June 30, 2023 (Unaudited)
| | | Roundhill Video
Games ETF | | | Roundhill
Sports Betting &
iGaming ETF | | | Roundhill Ball
Metaverse ETF | |
Investment Income | | | | | | | | | | | | |
Dividend income (net of withholding taxes and issuance fees of $27,424, $34,527, $78,485, respectively) | | $ | 167,334 | | | $ | 804,253 | | | $ | 2,032,838 | |
Securities lending income, net | | | 5,048 | | | | 59,120 | | | | 114,297 | |
Interest income | | | 372 | | | | 7,978 | | | | 9,885 | |
Total investment income | | | 172,754 | | | | 871,351 | | | | 2,157,020 | |
| | | | | | | | | | | | | |
Expenses | | | | | | | | | | | | |
Advisory fees | | | 63,207 | | | | 483,486 | | | | 1,287,675 | |
Total expenses | | | 63,207 | | | | 483,486 | | | | 1,287,675 | |
Net investment income | | | 109,547 | | | | 387,865 | | | | 869,345 | |
| | | | | | | | | | | | | |
Realized and Unrealized Gain (Loss) on Investments and Foreign Currency | | | | | | | | | | | | |
Net realized gain (loss) from: | | | | | | | | | | | | |
Investments | | | (289,975 | ) | | | (30,127,041 | ) | | | (16,080,607 | ) |
Foreign currency transactions | | | (4,834 | ) | | | (67,773 | ) | | | (37,912 | ) |
Net realized loss on investments, foreign currency transactions and total return swap contracts | | | (294,809 | ) | | | (30,194,814 | ) | | | (16,118,519 | ) |
Net change in unrealized appreciation/depreciation on: | | | | | | | | | | | | |
Investments | | | 2,860,394 | | | | 55,068,572 | | | | 172,783,297 | |
Foreign currency translation | | | (1,955 | ) | | | 567 | | | | (2,034 | ) |
Net change in unrealized appreciation/depreciation on investments and foreign currency translation | | | 2,858,439 | | | | 55,069,139 | | | | 172,781,263 | |
Net realized and unrealized gain on investments and foreign currency transactions | | | 2,563,630 | | | | 24,874,325 | | | | 156,662,744 | |
Net increase in net assets from operations | | $ | 2,673,177 | | | $ | 25,262,190 | | | $ | 157,532,089 | |
The accompanying notes are an integral part of the financial statements.
21
Roundhill ETFs
Statements of Operations
For the Period Ended June 30, 2023 (Unaudited) (Continued)
| | | Roundhill
IO Digital
Infrastructure
ETF | | | Roundhill
MEME ETF | | | Roundhill
Cannabis ETF | |
Investment Income | | | | | | | | | | | | |
Dividend income (net of withholding taxes and issuance fees of $2,335, $67, $0, respectively) | | $ | 40,971 | | | $ | 2,676 | | | $ | — | |
Securities lending income, net | | | 533 | | | | 16,256 | | | | — | |
Interest income | | | 244 | | | | 18 | | | | 41,087 | |
Total investment income | | | 41,748 | | | | 18,950 | | | | 41,087 | |
| | | | | | | | | | | | | |
Expenses | | | | | | | | | | | | |
Advisory fees | | | 10,093 | | | | 3,238 | | | | 5,401 | |
Less waivers and reimbursement by Adviser | | | — | | | | — | | | | (1,959 | ) |
Total expenses | | | 10,093 | | | | 3,238 | | | | 3,442 | |
Net investment income | | | 31,655 | | | | 15,712 | | | | 37,645 | |
| | | | | | | | | | | | | |
Realized and Unrealized Gain (Loss) on Investments, Foreign Currency and Total Return Swap Contracts | | | | | | | | | | | | |
Net realized gain (loss) from: | | | | | | | | | | | | |
Investments | | | (145,041 | ) | | | 109,649 | | | | 57 | |
Foreign currency transactions | | | 31 | | | | — | | | | — | |
Total return swap contracts | | | — | | | | — | | | | (585,295 | ) |
Net realized gain (loss) on investments, foreign currency transactions and total return swap contracts | | | (145,010 | ) | | | 109,649 | | | | (585,238 | ) |
Net change in unrealized appreciation/depreciation on: | | | | | | | | | | | | |
Investments | | | 137,293 | | | | 211,810 | | | | — | |
Foreign currency translation | | | 17 | | | | — | | | | — | |
Net change in unrealized appreciation/depreciation on investments and foreign currency translation | | | 137,310 | | | | 211,810 | | | | — | |
Net realized and unrealized gain (loss) on investments, foreign currency transactions and total return swap contracts | | | (7,700 | ) | | | 321,459 | | | | (585,238 | ) |
Net increase (decrease) in net assets from operations | | $ | 23,955 | | | $ | 337,171 | | | $ | (547,593 | ) |
The accompanying notes are an integral part of the financial statements.
22
Roundhill ETFs
Statements of Operations
For the Period Ended June 30, 2023 (Unaudited) (Continued)
| | | Roundhill
BIG Bank
ETF(1) | | | Roundhill
BIG Tech
ETF(2) | |
Investment Income | | | | | | | | |
Dividend income (net of withholding taxes and issuance fees of $0, $0, respectively) | | $ | 7,382 | | | $ | 546 | |
Interest income | | | 48,364 | | | | 14,876 | |
Total investment income | | | 55,746 | | | | 15,422 | |
| | | | | | | | | |
Expenses | | | | | | | | |
Advisory fees | | | 3,388 | | | | 1,502 | |
Total expenses | | | 3,388 | | | | 1,502 | |
Net investment income | | | 52,358 | | | | 13,920 | |
| | | | | | | | | |
Realized and Unrealized Gain (Loss) on Investments and Total Return Swap Contracts | | | | | | | | |
Net realized gain (loss) from: | | | | | | | | |
Investments | | | 43,529 | | | | 109,714 | |
Net realized gain on investments and total return swap contracts | | | 43,529 | | | | 109,714 | |
Net change in unrealized appreciation/depreciation on: | | | | | | | | |
Investments | | | 21,600 | | | | 69,337 | |
Total return swap contracts | | | 194,403 | | | | 262,161 | |
Net change in unrealized appreciation/depreciation on investments and total return swap contracts | | | 216,003 | | | | 331,498 | |
Net realized and unrealized gain on investments and total return swap contracts | | | 259,532 | | | | 441,212 | |
Net increase in net assets from operations | | $ | 311,890 | | | $ | 455,132 | |
(1) The Fund commenced operations on March 20, 2023.
(2) | The Fund commenced operations on April 10, 2023. |
The accompanying notes are an integral part of the financial statements.
23
Roundhill ETFs
Statements of Changes in Net Assets
| | | Roundhill Video Games ETF | | | Roundhill Sports Betting &
iGaming ETF | |
| | | Period
Ended
June 30,
2023
(Unaudited) | | | Year
Ended
December 31,
2022 | | | Period
Ended
June 30,
2023
(Unaudited) | | | Year
Ended
December 31,
2022 | |
From Operations | | | | | | | | | | | | | | | | |
Net investment income | | $ | 109,547 | | | $ | 292,574 | | | $ | 387,865 | | | $ | 604,454 | |
Net realized loss on investments and foreign currency transactions | | | (294,809 | ) | | | (37,470,667 | ) | | | (30,194,814 | ) | | | (67,507,904 | ) |
Net change in net unrealized appreciation/depreciation on investments and foreign currency translation | | | 2,858,439 | | | | 13,822,197 | | | | 55,069,139 | | | | (41,816,932 | ) |
Net increase (decrease) in net assets resulting from operations | | | 2,673,177 | | | | (23,355,896 | ) | | | 25,262,190 | | | | (108,720,382 | ) |
| | | | | | | | | | | | | | | | | |
From Distributions | | | | | | | | | | | | | | | | |
Distributable earnings | | | — | | | | (173,639 | ) | | | — | | | | (309,837 | ) |
Return of capital | | | — | | | | — | | | | — | | | | (470,671 | ) |
Total distributions | | | — | | | | (173,639 | ) | | | — | | | | (780,508 | ) |
| | | | | | | | | | | | | | | | | |
From Capital Share Transactions | | | | | | | | | | | | | | | | |
Proceeds from shares sold | | | 1,147,748 | | | | 2,186,870 | | | | 8,346,010 | | | | 53,179,428 | |
Cost of shares redeemed | | | (4,476,878 | ) | | | (15,895,572 | ) | | | (35,363,737 | ) | | | (116,157,365 | ) |
Transaction fees (Note 4) | | | 9,079 | | | | 12,714 | | | | 2,737 | | | | — | |
Net decrease in net assets resulting from capital share transactions | | | (3,320,051 | ) | | | (13,695,988 | ) | | | (27,014,990 | ) | | | (62,977,937 | ) |
| | | | | | | | | | | | | | | | | |
Total Decrease in Net Assets | | | (646,874 | ) | | | (37,225,523 | ) | | | (1,752,800 | ) | | | (172,478,827 | ) |
| | | | | | | | | | | | | | | | | |
Net Assets | | | | | | | | | | | | | | | | |
Beginning of period | | | 25,249,886 | | | | 62,475,409 | | | | 118,028,083 | | | | 290,506,910 | |
End of period | | $ | 24,603,012 | | | $ | 25,249,886 | | | $ | 116,275,283 | | | $ | 118,028,083 | |
| | | | | | | | | | | | | | | | | |
Changes in Shares Outstanding | | | | | | | | | | | | | | | | |
Shares outstanding, beginning of period | | | 1,800,000 | | | | 2,500,000 | | | | 8,225,000 | | | | 11,675,000 | |
Shares sold | | | 75,000 | | | | 100,000 | | | | 500,000 | | | | 2,950,000 | |
Shares redeemed | | | (300,000 | ) | | | (800,000 | ) | | | (2,100,000 | ) | | | (6,400,000 | ) |
Shares outstanding, end of period | | | 1,575,000 | | | | 1,800,000 | | | | 6,625,000 | | | | 8,225,000 | |
The accompanying notes are an integral part of the financial statements.
24
Roundhill ETFs
Statements of Changes in Net Assets
| | | Roundhill Ball Metaverse ETF | | | Roundhill IO Digital
Infrastructure ETF | |
| | | Period
Ended
June 30,
2023
(Unaudited) | | | Year
Ended
December 31,
2022 | | | Period
Ended
June 30,
2023
(Unaudited) | | | Year
Ended
December 31,
2022 | |
From Operations | | | | | | | | | | | | | | | | |
Net investment income | | $ | 869,345 | | | $ | 353,305 | | | $ | 31,655 | | | $ | 32,699 | |
Net realized loss on investments and foreign currency transactions | | | (16,118,519 | ) | | | (290,036,259 | ) | | | (145,010 | ) | | | (178,142 | ) |
Net change in net unrealized appreciation/depreciation on investments and foreign currency translation | | | 172,781,263 | | | | (211,465,576 | ) | | | 137,310 | | | | (693,837 | ) |
Net increase (decrease) in net assets resulting from operations | | | 157,532,089 | | | | (501,148,530 | ) | | | 23,955 | | | | (839,280 | ) |
| | | | | | | | | | | | | | | | | |
From Distributions | | | | | | | | | | | | | | | | |
Distributable earnings | | | — | | | | (325,056 | ) | | | — | | | | (31,809 | ) |
Return of capital | | | — | | | | (7,036 | ) | | | — | | | | — | |
Total distributions | | | — | | | | (332,092 | ) | | | — | | | | (31,809 | ) |
| | | | | | | | | | | | | | | | | |
From Capital Share Transactions | | | | | | | | | | | | | | | | |
Proceeds from shares sold | | | 38,093,213 | | | | 133,681,117 | | | | — | | | | 1,840,133 | |
Cost of shares redeemed | | | (68,296,505 | ) | | | (195,090,255 | ) | | | — | | | | — | |
Transaction fees (Note 4) | | | 6,352 | | | | 72,625 | | | | — | | | | 498 | |
Net increase (decrease) in net assets resulting from capital share transactions | | | (30,196,940 | ) | | | (61,336,513 | ) | | | — | | | | 1,840,631 | |
| | | | | | | | | | | | | | | | | |
Total Increase (Decrease) in Net Assets | | | 127,335,149 | | | | (562,817,135 | ) | | | 23,955 | | | | 969,542 | |
| | | | | | | | | | | | | | | | | |
Net Assets | | | | | | | | | | | | | | | | |
Beginning of period | | | 370,241,875 | | | | 933,059,010 | | | | 2,853,869 | | | | 1,884,327 | |
End of period | | $ | 497,577,024 | | | $ | 370,241,875 | | | $ | 2,877,824 | | | $ | 2,853,869 | |
| | | | | | | | | | | | | | | | | |
Changes in Shares Outstanding | | | | | | | | | | | | | | | | |
Shares outstanding, beginning of period | | | 51,375,000 | | | | 61,525,000 | | | | 300,000 | | | | 125,000 | |
Shares sold | | | 3,625,000 | | | | 11,500,000 | | | | — | | | | 175,000 | |
Shares redeemed | | | (7,150,000 | ) | | | (21,650,000 | ) | | | — | | | | — | |
Shares outstanding, end of period | | | 47,850,000 | | | | 51,375,000 | | | | 300,000 | | | | 300,000 | |
The accompanying notes are an integral part of the financial statements.
25
Roundhill ETFs
Statements of Changes in Net Assets
| | | Roundhill MEME ETF | | | Roundhill Cannabis ETF | |
| | | Period
Ended
June 30,
2023
(Unaudited) | | | Year
Ended
December 31,
2022 | | | Period
Ended
June 30,
2023
(Unaudited) | | | Period
Ended
December 31,
2022(1) | |
From Operations | | | | | | | | | | | | | | | | |
Net investment income | | $ | 15,712 | | | $ | 15,557 | | | $ | 37,645 | | | $ | 14,757 | |
Net realized gain (loss) on investments, foreign currency transactions and swap contracts | | | 109,649 | | | | (1,511,460 | ) | | | (585,238 | ) | | | (1,306,291 | ) |
Net change in net unrealized appreciation/depreciation on investments and foreign currency translation | | | 211,810 | | | | 108,396 | | | | — | | | | — | |
Net increase (decrease) in net assets resulting from operations | | | 337,171 | | | | (1,387,507 | ) | | | (547,593 | ) | | | (1,291,534 | ) |
| | | | | | | | | | | | | | | | | |
From Distributions | | | | | | | | | | | | | | | | |
Distributable earnings | | | — | | | | (15,557 | ) | | | — | | | | — | |
Return of capital | | | — | | | | (5,264 | ) | | | — | | | | — | |
Total distributions | | | — | | | | (20,821 | ) | | | — | | | | — | |
| | | | | | | | | | | | | | | | | |
From Capital Share Transactions | | | | | | | | | | | | | | | | |
Proceeds from shares sold | | | 1,555,720 | | | | 2,446,145 | | | | 1,165,275 | | | | 2,786,382 | |
Cost of shares redeemed | | | (1,575,845 | ) | | | (2,384,240 | ) | | | — | | | | — | |
Transaction fees (Note 4) | | | — | | | | — | | | | — | | | | 1,566 | |
Net increase (decrease) in net assets resulting from capital share transactions | | | (20,125 | ) | | | 61,905 | | | | 1,165,275 | | | | 2,787,948 | |
| | | | | | | | | | | | | | | | | |
Total Increase (Decrease) in Net Assets | | | 317,046 | | | | (1,346,423 | ) | | | 617,682 | | | | 1,496,414 | |
| | | | | | | | | | | | | | | | | |
Net Assets | | | | | | | | | | | | | | | | |
Beginning of period | | | 762,799 | | | | 2,109,222 | | | | 1,496,414 | | | | — | |
End of period | | $ | 1,079,845 | | | $ | 762,799 | | | $ | 2,114,096 | | | $ | 1,496,414 | |
| | | | | | | | | | | | | | | | | |
Changes in Shares Outstanding | | | | | | | | | | | | | | | | |
Shares outstanding, beginning of period | | | 150,000 | | | | 150,000 | | | | 250,000 | | | | — | |
Shares sold | | | 210,000 | | | | 350,000 | | | | 125,000 | | | | 250,000 | |
Shares redeemed | | | (330,000 | ) | | | (350,000 | ) | | | (280,000 | ) | | | — | |
Shares outstanding, end of period | | | 30,000 | | | | 150,000 | | | | 95,000 | | | | 250,000 | |
(1) | The Fund commenced operations on April 19, 2022. |
The accompanying notes are an integral part of the financial statements.
26
Roundhill ETFs
Statements of Changes in Net Assets
| | | Roundhill BIG
Bank ETF | | | Roundhill BIG
Tech ETF | |
| | | Period
Ended
June 30,
2023(1)
(Unaudited) | | | Period
Ended
June 30,
2023(2)
(Unaudited) | |
From Operations | | | | | | | | |
Net investment income | | $ | 52,358 | | | $ | 13,920 | |
Net realized gain on investments and swap contracts | | | 43,529 | | | | 109,714 | |
Net change in net unrealized appreciation/depreciation on investments and swap contracts | | | 216,003 | | | | 331,498 | |
Net increase in net assets resulting from operations | | | 311,890 | | | | 455,132 | |
| | | | | | | | | |
From Capital Share Transactions | | | | | | | | |
Proceeds from shares sold | | | 4,811,876 | | | | 3,769,975 | |
Cost of shares redeemed | | | (538,106 | ) | | | (595,016 | ) |
Transaction fees (Note 4) | | | 1,189 | | | | — | |
Net increase in net assets resulting from capital share transactions | | | 4,274,959 | | | | 3,174,959 | |
| | | | | | | | | |
Total Increase in Net Assets | | | 4,586,849 | | | | 3,630,091 | |
| | | | | | | | | |
Net Assets | | | | | | | | |
Beginning of period | | | — | | | | — | |
End of period | | $ | 4,586,849 | | | $ | 3,630,091 | |
| | | | | | | | | |
Changes in Shares Outstanding | | | | | | | | |
Shares outstanding, beginning of period | | | — | | | | — | |
Shares sold | | | 190,000 | | | | 140,000 | |
Shares redeemed | | | (20,000 | ) | | | (20,000 | ) |
Shares outstanding, end of period | | | 170,000 | | | | 120,000 | |
(1) | The Fund commenced operations on March 20, 2023. |
(2) | The Fund commenced operations on April 10, 2023. |
The accompanying notes are an integral part of the financial statements.
27
Roundhill ETFs
Financial Highlights
| | | Per Share
Operating
Performance
(For a
share
outstanding throughout each period) | |
| | | | | | | Income from
Investment
Operations: | | | Less
Distributions Paid From: | |
| | Net Asset
Value,
Beginning
of Period | | | Net
investment
income
(loss)(1) | | | Net realized
and
unrealized
gain (loss) on
investments | | | Total from
investment
operations | | | Net
investment
income | | | Net realized
gains | | | Return of
capital | | | Total
distributions
paid | |
Roundhill Video Games ETF | | | | | | | | | | | | | | | | | | | | | | | | |
For the period 01/01/2023 - 06/30/2023 (Unaudited) | | $ | 14.03 | | | | 0.06 | | | | 1.52 | | | | 1.58 | | | | — | | | | — | | | | — | | | | — | |
For the year 01/01/2022 - 12/31/2022 | | $ | 24.99 | | | | 0.14 | | | | (11.01 | ) | | | (10.87 | ) | | | (0.10 | ) | | | — | | | | — | | | | (0.10 | ) |
For the year 01/01/2021 - 12/31/2021 | | $ | 30.09 | | | | 0.05 | | | | (5.17 | ) | | | (5.12 | ) | | | (0.01 | ) | | | — | | | | — | | | | (0.01 | ) |
For the year 01/01/2020 - 12/31/2020 | | $ | 16.01 | | | | 0.04 | | | | 14.34 | | | | 14.38 | | | | (0.10 | ) | | | (0.22 | ) | | | — | | | | (0.32 | ) |
For the period 06/03/2019(7) - 12/31/2019 | | $ | 14.86 | | | | 0.08 | | | | 1.11 | | | | 1.19 | | | | (0.05 | ) | | | — | | | | (0.00 | )(8) | | | (0.05 | ) |
Roundhill Sports Betting & iGaming ETF | | | | | | | | | | | | | | | | | | | | | | | | | | | | |
For the period 01/01/2023 - 06/30/2023 (Unaudited) | | $ | 14.35 | | | | 0.05 | | | | 3.15 | | | | 3.20 | | | | — | | | | — | | | | — | | | | — | |
For the year 01/01/2022 - 12/31/2022 | | $ | 24.88 | | | | 0.07 | | | | (10.51 | ) | | | (10.44 | ) | | | (0.04 | ) | | | — | | | | (0.05 | ) | | | (0.09 | ) |
For the year 01/01/2021 - 12/31/2021 | | $ | 25.86 | | | | 0.08 | | | | (1.06 | ) | | | (0.98 | ) | | | — | | | | — | | | | — | | | | — | |
For the period 06/03/2020(7) - 12/31/2020 | | $ | 15.41 | | | | 0.11 | | | | 10.41 | | | | 10.52 | | | | (0.07 | ) | | | — | | | | (0.00 | )(8) | | | (0.07 | ) |
Roundhill Ball Metaverse ETF | | | | | | | | | | | | | | | | | | | | | | | | | | | | |
For the period 01/01/2023 - 06/30/2023 (Unaudited) | | $ | 7.21 | | | | 0.02 | | | | 3.17 | | | | 3.19 | | | | — | | | | — | | | | | — | | | — | |
For the year 01/01/2022 - 12/31/2022 | | $ | 15.17 | | | | 0.01 | | | | (7.96 | ) | | | (7.95 | ) | | | (0.01 | ) | | | — | | | | (0.00 | )(8) | | | (0.01 | ) |
For the period 06/29/2021(7) - 12/31/2021 | | $ | 15.07 | | | | (0.01 | ) | | | 0.10 | (9) | | | 0.09 | | | | — | | | | — | | | | — | | | | — | |
(1) | Per share net investment income (loss) was calculated using average shares outstanding. |
(2) | Annualized for periods less than one year. |
(3) | Total return in the table represents the rate that the investor would have earned or lost on an investment in the Fund, assuming reinvestment of dividends. |
(4) | Not annualized for periods less than one year. |
(5) | Excludes in-kind transactions associated with creations and redemptions of the Fund. |
(6) | The returns reflect the actual performance for the period and do not include the impact of trades executed on the last business day of the period that were recorded on the first business day of the next period. |
The accompanying notes are an integral part of the financial statements.
28
Roundhill ETFs
Financial Highlights
| | Per Share
Operating
Performance
(For a share
outstanding
throughout
each period) | | | Ratios/
Supplemental
Data | |
| | Capital Share
Transactions: | | | | | | | | | | | | | | | | | | | Ratios to
Average Net
Assets of: (2) | | | | | |
| | Transaction
fees
(see Note 4) | | | Net Asset
Value, End
of Period | | | Total return,
at NAV(3)(4) | | | Total return,
at Market(3)(4) | | | Net assets,
end of period
(000’s) | | | Expenses,
before
waivers | | | Expenses,
after waivers | | | Net
investment
income
(loss), before
waivers | | | Net
investment
income (loss),
after waivers | | | Portfolio
turnover
rate(4)(5) | |
| | | | | | | | | | | | | | | | | | | | | | | | | | | | | | | | | | | | | | | | |
| | | 0.01 | | | $ | 15.62 | | | | 11.36 | % | | | 11.72 | % | | $ | 24,603 | | | | 0.50 | % | | | 0.50 | % | | | 0.87 | % | | | 0.87 | % | | | 8 | % |
| | | 0.01 | | | $ | 14.03 | | | | -43.49 | % | | | -43.28 | % | | $ | 25,250 | | | | 0.50 | % | | | 0.50 | % | | | 0.78 | % | | | 0.78 | % | | | 83 | % |
| | | 0.03 | | | $ | 24.99 | | | | -16.93 | % | | | -17.57 | % | | $ | 62,475 | | | | 0.50 | % | | | 0.50 | % | | | 0.16 | % | | | 0.16 | % | | | 52 | % |
| | | 0.02 | | | $ | 30.09 | | | | 89.88 | %(6) | | | 89.62 | %(6) | | $ | 73,717 | | | | 0.50 | % | | | 0.44 | % | | | 0.12 | % | | | 0.18 | % | | | 93 | % |
| | | 0.01 | | | $ | 16.01 | | | | 8.11 | %(6) | | | 8.42 | %(6) | | $ | 10,810 | | | | 0.50 | % | | | 0.25 | % | | | 0.65 | % | | | 0.90 | % | | | 34 | % |
| | | | | | | | | | | | | | | | | | | | | | | | | | | | | | | | | | | | | | | | |
| | | 0.00 | (8) | | $ | 17.55 | | | | 22.31 | % | | | 22.30 | % | | $ | 116,275 | | | | 0.75 | % | | | 0.75 | % | | | 0.60 | % | | | 0.60 | % | | | 15 | % |
| | | — | | | $ | 14.35 | | | | -41.99 | % | | | -42.00 | % | | $ | 118,028 | | | | 0.75 | % | | | 0.75 | % | | | 0.38 | % | | | 0.38 | % | | | 43 | % |
| | | 0.00 | (8) | | $ | 24.88 | | | | -3.78 | % | | | -3.91 | % | | $ | 290,507 | | | | 0.75 | % | | | 0.75 | % | | | 0.26 | % | | | 0.26 | % | | | 52 | % |
| | | 0.00 | (8) | | $ | 25.86 | | | | 68.28 | % | | | 68.15 | % | | $ | 206,891 | | | | 0.75 | % | | | 0.75 | % | | | 0.92 | % | | | 0.92 | % | | | 43 | % |
| | | | | | | | | | | | | | | | | | | | | | | | | | | | | | | | | | | | | | | | |
| | | 0.00 | (8) | | $ | 10.40 | | | | 44.29 | % | | | 44.57 | % | | $ | 497,577 | | | | 0.59 | % | | | 0.59 | % | | | 0.40 | % | | | 0.40 | % | | | 15 | % |
| | | 0.00 | (8) | | $ | 7.21 | | | | -52.44 | % | | | -52.66 | % | | $ | 370,242 | | | | 0.60 | % | | | 0.60 | % | | | 0.06 | % | | | 0.06 | % | | | 47 | % |
| | | 0.01 | | | $ | 15.17 | | | | 0.63 | % | | | 0.73 | % | | $ | 933,059 | | | | 0.75 | % | | | 0.75 | % | | | -0.13 | % | | | -0.13 | % | | | 41 | % |
(7) | Commencement of operations. |
(9) | Realized and unrealized gains and losses per share in this caption are balancing amounts necessary to reconcile the change in net asset value per share for the period, and may not reconcile with the aggregate gains and losses in the Statements of Operations due to share transactions for the period. |
(10) | Includes tax expense of 0.01% and 0.06% for periods ended December 31, 2022 and December 31, 2021, respectively. |
The accompanying notes are an integral part of the financial statements.
29
Roundhill ETFs
Financial Highlights
| | | Per Share
Operating
Performance
(For a
share
outstanding throughout each period) | |
| | | | | | | Income from
Investment
Operations: | | | Less
Distributions Paid From: | |
| | Net Asset
Value,
Beginning
of Period | | | Net
investment
income
(loss)(1) | | | Net realized
and
unrealized
gain (loss) on
investments | | | Total from
investment
operations | | | Net
investment
income | | | Net realized
gains | | | Return of
capital | | | Total
distributions
paid | |
Roundhill IO Digital Infrastructure ETF | | | | | | | | | | | | | | | | | | | | | | | | | | | | |
For the period 01/01/2023 - 06/30/2023 (Unaudited) | | $ | 9.51 | | | | 0.11 | | | | (0.03 | ) | | | 0.08 | | | | — | | | | — | | | | — | | | | — | |
For the year 01/01/2022 - 12/31/2022 | | $ | 15.07 | | | | 0.17 | | | | (5.62 | ) | | | (5.45 | ) | | | (0.11 | ) | | | (0.00 | )(8) | | | — | | | | (0.11 | ) |
For the period 10/27/2021(7) - 12/31/2021 | | $ | 14.85 | | | | 0.03 | | | | 0.23 | | | | 0.26 | | | | (0.04 | ) | | | — | | | | — | | | | (0.04 | ) |
Roundhill MEME ETF | | | | | | | | | | | | | | | | | | | | | | | | | | | | |
For the period 01/01/2023 - 06/30/2023 (Unaudited)(11) | | $ | 25.45 | | | | 0.14 | | | | 10.40 | | | | 10.54 | | | | — | | | | — | | | | — | | | | — | |
For the year 01/01/2022 - 12/31/2022 | | $ | 70.30 | | | | 0.55 | | | | (44.70 | ) | | | (44.15 | ) | | | (0.50 | ) | | | — | | | | (0.20 | ) | | | (0.70 | ) |
For the period 12/07/2021(7) - 12/31/2021 | | $ | 78.20 | | | | (0.05 | ) | | | (7.85 | ) | | | (7.90 | ) | | | — | | | | — | | | | — | | | | — | |
Roundhill Cannabis ETF | | | | | | | | | | | | | | | | | | | | | | | | |
For the period 01/01/2023 - 06/30/2023 (Unaudited)(11) | | $ | 29.95 | | | | 0.15 | | | | (7.85 | ) | | | (7.70 | ) | | | — | | | | — | | | | — | | | | — | |
For the period 04/19/2022(7) - 12/31/2022 | | $ | 76.60 | | | | 0.45 | | | | (47.15 | ) | | | (46.70 | ) | | | — | | | | — | | | | — | | | | — | |
Roundhill BIG Bank ETF | | | | | | | | | | | | | | | | | | | | | | | | |
For the period 03/20/2023(7) - 06/30/2023 (Unaudited) | | $ | 25.15 | | | | 0.33 | | | | 1.49 | | | | 1.82 | | | | — | | | | — | | | | — | | | | — | |
Roundhill BIG Tech ETF | | | | | | | | | | | | | | | | | | | | | | | | |
For the period 04/10/2023(7) - 06/30/2023 (Unaudited) | | $ | 24.77 | | | | 0.17 | | | | 5.31 | | | | 5.48 | | | | — | | | | — | | | | — | | | | — | |
(1) | Per share net investment income (loss) was calculated using average shares outstanding. |
(2) | Annualized for periods less than one year. |
(3) | Total return in the table represents the rate that the investor would have earned or lost on an investment in the Fund, assuming reinvestment of dividends. |
(4) | Not annualized for periods less than one year. |
(5) | Excludes in-kind transactions associated with creations and redemptions of the Fund. |
(6) | The returns reflect the actual performance for the period and do not include the impact of trades executed on the last business day of the period that were recorded on the first business day of the next period. |
The accompanying notes are an integral part of the financial statements.
30
Roundhill ETFs
Financial Highlights
Per Share
Operating
Performance
(For a share
outstanding
throughout
each period) | | Ratios/
Supplemental
Data | |
Capital Share
Transactions: | | | | | | | | | | | | | | | | | | Ratios to
Average Net
Assets of: (2) | | | | | |
Transaction
fees
(see Note 4) | | Net Asset
Value, End
of Period | | | Total return,
at NAV(3)(4) | | | Total return,
at Market(3)(4) | | | Net assets,
end of period
(000’s) | | | Expenses,
before
waivers | | | Expenses,
after waivers | | | Net
investment
income
(loss), before
waivers | | | Net
investment
income (loss),
after waivers | | | Portfolio
turnover
rate(4)(5) | |
| | | | | | | | | | | | | | | | | | | | | | | | | | | | | | | | | | | | | |
— | | $ | 9.59 | | | | 0.84 | % | | | 1.09 | % | | $ | 2,878 | | | | 0.71 | % | | | 0.71 | % | | | 2.24 | % | | | 2.24 | % | | | 26 | % |
0.00(8) | | $ | 9.51 | | | | -36.22 | % | | | -36.30 | % | | $ | 2,854 | | | | 0.76 | %(10) | | | 0.76 | %(10) | | | 1.49 | % | | | 1.49 | % | | | 61 | % |
0.00(8) | | $ | 15.07 | | | | 1.76 | % | | | 2.01 | % | | $ | 1,884 | | | | 0.81 | %(10) | | | 0.81 | %(10) | | | 1.16 | % | | | 1.16 | % | | | 3 | % |
| | | | | | | | | | | | | | | | | | | | | | | | | | | | | | | | | | | | | |
— | | $ | 35.99 | | | | 41.40 | % | | | 42.19 | % | | $ | 1,080 | | | | 0.69 | % | | | 0.69 | % | | | 3.35 | % | | | 3.35 | % | | | 728 | % |
— | | $ | 25.45 | | | | -62.94 | % | | | -63.06 | % | | $ | 763 | | | | 0.69 | % | | | 0.69 | % | | | 1.34 | % | | | 1.34 | % | | | 1075 | % |
— | | $ | 70.30 | | | | -10.09 | % | | | -10.10 | % | | $ | 2,109 | | | | 0.69 | % | | | 0.69 | % | | | -0.69 | % | | | -0.69 | % | | | 32 | % |
| | | | | | | | | | | | | | | | | | | | | | | | | | | | | | | | | | | | | |
— | | $ | 22.25 | | | | -25.64 | % | | | -25.44 | % | | $ | 2,114 | | | | 0.61 | % | | | 0.39 | % | | | 4.04 | % | | | 4.26 | % | | | 0 | % |
0.05 | | $ | 29.95 | | | | -60.93 | % | | | -60.94 | % | | $ | 1,496 | | | | 0.75 | % | | | 0.52 | % | | | 1.09 | % | | | 1.32 | % | | | 65 | % |
| | | | | | | | | | | | | | | | | | | | | | | | | | | | | | | | | | | | | |
0.01 | | $ | 26.98 | | | | 7.28 | % | | | 7.53 | % | | $ | 4,587 | | | | 0.29 | % | | | 0.29 | % | | | 4.48 | % | | | 4.48 | % | | | 0 | % |
| | | | | | | | | | | | | | | | | | | | | | | | | | | | | | | | | | | | | |
— | | $ | 30.25 | | | | 22.13 | % | | | 22.12 | % | | $ | 3,630 | | | | 0.29 | % | | | 0.29 | % | | | 2.69 | % | | | 2.69 | % | | | 0 | % |
(7) | Commencement of operations. |
(9) | Realized and unrealized gains and losses per share in this caption are balancing amounts necessary to reconcile the change in net asset value per share for the period, and may not reconcile with the aggregate gains and losses in the Statements of Operations due to share transactions for the period. |
(10) | Includes tax expense of 0.01% and 0.06% for periods ended December 31, 2022 and December 31, 2021, respectively. |
(11) | During the period ended June 30, 2023, the Fund effected the following reverse stock split: May 1, 2023, 1 for 5. All historical per share information has been retroactively adjusted to reflect this reverse stock split. |
The accompanying notes are an integral part of the financial statements.
31
Roundhill ETFs
Notes to Financial Statements
June 30, 2023 (Unaudited)
Roundhill Video Games ETF (“NERD”), Roundhill Sports Betting & iGaming ETF (“BETZ”), Roundhill Ball Metaverse ETF (“METV”), Roundhill IO Digital Infrastructure ETF (“BYTE”), Roundhill MEME ETF (“MEME”), Roundhill Cannabis ETF (“WEED”), Roundhill BIG Bank ETF (“BIGB”) and Roundhill BIG Tech ETF (“BIGT”) (each a “Fund” and collectively, the “Funds”) are non-diversified series of Listed Funds Trust (the “Trust”), formerly Active Weighting Funds ETF Trust. The Trust was organized as a Delaware statutory trust on August 26, 2016, under a Declaration of Trust amended on December 21, 2018, and is registered with the U.S. Securities and Exchange Commission (the “SEC”) as an open-end management investment company under the Investment Company Act of 1940, as amended (the “1940 Act”).
NERD is a passively-managed exchange-traded fund (“ETF”). NERD’s objective is to track the total return performance, before fees and expenses, of the Nasdaq CTA Global Video Games Software Index (the “NERD Index”). The NERD Index, which was developed and is maintained by both Nasdaq and the Consumer Technology Association, is a modified theme-adjusted free float market capitalization index designed to track the performance of the common stock (or corresponding depositary receipts) of exchange-listed companies engaged in video game publishing and/or video game development.
BETZ is a passively-managed ETF. BETZ’s objective is to track the total return performance, before fees and expenses, of the Roundhill Sports Betting & iGaming Index (the “BETZ Index”). The BETZ Index tracks the performance of the common stock (or corresponding ADRs or GDRs) of exchange-listed companies that earn revenue from online gaming (“iGaming”). iGaming is broadly defined as the wagering of money or some other value on the outcome of an event or a game, using the internet. The BETZ Index includes: companies that operate in-person and/or online/internet sports books; companies that operate online/internet gambling platforms; and companies that provide infrastructure or technology to such companies.
METV is a passively-managed ETF. METV’s objective is to track the performance, before fees and expenses, of the Ball Metaverse Index (the “METV Index”). The META Index tracks the performance of globally-listed equity securities of companies that engage in activities or provide products, services, technologies, or technological capabilities to enable the Metaverse, and benefit from its generated revenues (“Metaverse Companies”). “Metaverse” is a term used to refer to a future iteration of the Internet. Users will primarily engage with the Metaverse through persistent, simultaneous, and shared three-dimensional virtual simulations and spaces. The Metaverse will also connect to physical spaces, two-dimensional Internet experiences (e.g., standard apps, webpages), and finite simulations (e.g., a game). The Metaverse will be supported by a wide range of technologies, tools, and standards that enable high volumes of concurrent users, a rich virtual-only economy of labor, goods, and services, and wide-ranging interoperability of data, digital assets, and content.
BYTE is a passively-managed ETF. BYTE’s objective seeks to track the performance, before fees and expenses, of the IO Digital Infrastructure Index (the “BYTE Index”), which tracks the performance of digital infrastructure companies. Digital infrastructure is comprised of the high-tech physical assets that support the efficient storage and transmission of data, powering the internet.
MEME is a passively-managed ETF. MEME’s objective seeks to track the performance, before fees and expenses, of the Solactive Roundhill Meme Stock Index (the “MEME Index”), which, in turn, seeks to track the performance of “meme stocks”. Meme stocks are equity securities of companies that exhibit a combination of elevated social media activity and high short interest both of which are indicators of market sentiment.
WEED is an actively managed ETF. WEED seeks to achieve its investment objective by investing primarily in exchange-listed equity securities and total return swaps intended to provide exposure to the cannabis and hemp ecosystem. The cannabis and hemp ecosystem encompasses businesses involved in the production, distribution and marketing of cannabis and hemp and products derived therefrom.
BIGB is an actively managed ETF. BIGB pursues its investment objective by seeking investment exposure to the largest companies (“Underlying Issuers”) in the bank and capital markets industries. BIGB offers exposure to Underlying Issuers primarily through the use of swap agreements and/or forward contracts, as well as equity securities issued by the Underlying Issuers.
BIGT is an actively managed ETF. BIGT pursues its investment objective by seeking investment exposure to the largest companies (“Underlying Issuers”) in technology industries, which includes technology hardware, e-commerce discretionary, internet media & services and software. BIGT offers exposure to Underlying Issuers primarily through the use of swap agreements and/or forward contracts, as well as equity securities issued by the Underlying Issuers.
Costs incurred by BIGB and BIGT in connection with the organization, registration and the initial public offering of shares were paid by Roundhill Financial Inc. (“Roundhill” or the “Adviser”), the Funds’ Investment Adviser.
32
Roundhill ETFs
Notes to Financial Statements
June 30, 2023 (Unaudited) (Continued)
2. | SIGNIFICANT ACCOUNTING POLICIES |
Each Fund is an investment company and accordingly follows the investment company accounting and reporting guidance of the Financial Accounting Standards Board (“FASB”) Accounting Standards Codification (“ASC”) Topic 946, Financial Services — Investment Companies. Each Fund prepares its financial statements in accordance with accounting principles generally accepted in the United States of America (“U.S. GAAP”) and follows the significant accounting policies described below.
Use of Estimates
The preparation of the financial statements in conformity with U.S. GAAP requires management to make estimates and assumptions that affect the reported amounts of assets and liabilities and disclosures of contingent assets and liabilities at the date of the financial statements and the reported amounts of increases and decreases in net assets from operations during the reporting period. Actual results could differ from these estimates.
Share Transactions
The net asset value (“NAV”) per share of each Fund will be equal to a Fund’s total assets minus a Fund’s total liabilities divided by the total number of shares outstanding. The NAV that is published will be rounded to the nearest cent. The NAV is determined as of the close of trading (generally, 4:00 p.m. Eastern Time) on each day the New York Stock Exchange (“NYSE”) is open for trading.
Fair Value Measurement
In calculating the NAV, each Fund’s exchange-traded equity securities will be valued at fair value, which will generally be determined using the last reported official closing or last trading price on the exchange or market on which the security is primarily traded at the time of valuation. Such valuations are typically categorized as Level 1 in the fair value hierarchy described below.
Securities listed on the NASDAQ Stock Market, Inc. are generally valued at the NASDAQ official closing price. Foreign securities will be priced in their local currencies as of the close of their primary exchange or market or as of the time each Fund calculates its NAV on the valuation date, whichever is earlier.
If market quotations are not readily available, or if it is determined that a quotation of a security does not represent fair value, then the security is valued at fair value as determined in good faith by the Adviser using procedures adopted by the Board of Trustees of the Trust (the “Board”). The circumstances in which a security may be fair valued include, among others: the occurrence of events that are significant to a particular issuer, such as mergers, restructurings or defaults; the occurrence of events that are significant to an entire market, such as natural disasters in a particular region or government actions; trading restrictions on securities; thinly traded securities; and market events such as trading halts and early market closings. Due to the inherent uncertainty of valuations, fair values may differ significantly from the values that would have been used had an active market existed. Fair valuation could result in a different NAV than a NAV determined by using market quotations. Such valuations are typically categorized as Level 2 or Level 3 in the fair value hierarchy described below.
Money market funds are valued at NAV. If NAV is not readily available, the securities will be valued at fair value.
FASB ASC Topic 820, Fair Value Measurements and Disclosures (“ASC 820”) defines fair value, establishes a framework for measuring fair value in accordance with U.S. GAAP, and requires disclosure about fair value measurements. It also provides guidance on determining when there has been a significant decrease in the volume and level of activity for an asset or liability, when a transaction is not orderly, and how that information must be incorporated into fair value measurements. Under ASC 820, various inputs are used in determining the value of the Funds’ investments. These inputs are summarized in the following hierarchy:
| | ● | Level 1 — Unadjusted quoted prices in active markets for identical assets or liabilities that the Funds have the ability to access. |
| | ● | Level 2 — Observable inputs other than quoted prices included in Level 1 that are observable for the asset or liability, either directly or indirectly. These inputs may include quoted prices for the identical instrument on an inactive market, prices for similar securities, interest rates, prepayment speeds, credit risk, yield curves, default rates and similar data. |
| | ● | Level 3 — Unobservable inputs for the asset or liability, to the extent relevant observable inputs are not available; representing the Funds’ own assumptions about the assumptions a market participant would use in valuing the asset or liability, and would be based on the best information available. |
33
Roundhill ETFs
Notes to Financial Statements
June 30, 2023 (Unaudited) (Continued)
The fair value hierarchy gives the highest priority to quoted prices (unadjusted) in active markets for identical assets or liabilities (Level 1) and the lowest priority to unobservable inputs (Level 3).
The availability of observable inputs can vary from security to security and is affected by a wide variety of factors, including, for example, the type of security, whether the security is new and not yet established in the marketplace, the liquidity of markets, and other characteristics particular to the security. To the extent that valuation is based on models or inputs that are less observable or unobservable in the market, the determination of fair value requires more judgment. Accordingly, the degree of judgment exercised in determining fair value is greatest for instruments categorized in Level 3.
Foreign securities, currencies and other assets denominated in foreign currencies are translated into U.S. dollars at the exchange rate of such currencies against the U.S. dollar using the applicable currency exchange rates as of the close of the NYSE, generally 4:00 p.m. Eastern Time.
All other securities and investments for which market values are not readily available, including restricted securities, and those securities for which it is inappropriate to determine prices in accordance with the aforementioned procedures, are valued at fair value as determined in good faith under procedures adopted by the Board, although the actual calculations may be done by others. Factors considered in making this determination may include, but are not limited to, information obtained by contacting the issuer, analysts, or the appropriate stock exchange (for exchange-traded securities), analysis of the issuer’s financial statements or other available documents and, if necessary, available information concerning other securities in similar circumstances.
The inputs or methodology used for valuing securities are not necessarily an indication of the risk associated with investing in those securities. The hierarchy classification of inputs used to value the Funds’ investments at June 30, 2023 are as follows:
| | | Level 1 | | | Level 2 | | | Level 3 | | | Total | |
NERD | | | | | | | | | | | | | | | | |
Investments - Assets: | | | | | | | | | | | | | | | | |
Common Stocks* | | $ | 24,594,277 | | | $ | — | | | $ | — | | | $ | 24,594,277 | |
Investments Purchased With Proceeds From Securities Lending** | | | — | | | | — | | | | — | | | | 4,989,523 | |
Total Investments - Assets | | $ | 24,594,277 | | | $ | — | | | $ | — | | | $ | 29,583,800 | |
| | | | | | | | | | | | | | | | | |
BETZ | | | | | | | | | | | | | | | | |
Investments - Assets: | | | | | | | | | | | | | | | | |
Common Stocks* | | $ | 115,709,357 | | | $ | — | | | $ | — | | | $ | 115,709,357 | |
Warrants | | | — | | | | — | | | | — | ^ | | | — | |
Money Market Fund | | | 474,149 | | | | — | | | | — | | | | 474,149 | |
Investments Purchased With Proceeds From Securities Lending** | | | — | | | | — | | | | — | | | | 15,819,564 | |
Total Investments - Assets | | $ | 116,183,506 | | | $ | — | | | $ | — | | | $ | 132,003,070 | |
METV | | | | | | | | | | | | | | | | |
Investments - Assets: | | | | | | | | | | | | | | | | |
Common Stocks* | | $ | 493,409,820 | | | $ | — | | | $ | — | | | $ | 493,409,820 | |
Real Estate Investment Trusts | | | 2,986,027 | | | | — | | | | — | | | | 2,986,027 | |
Money Market Fund | | | 1,287,330 | | | | — | | | | — | | | | 1,287,330 | |
Investments Purchased With Proceeds From Securities Lending** | | | — | | | | — | | | | — | | | | 58,319,141 | |
Total Investments - Assets | | $ | 497,683,177 | | | $ | — | | | $ | — | | | $ | 556,002,318 | |
| | | | | | | | | | | | | | | | | |
34
Roundhill ETFs
Notes to Financial Statements
June 30, 2023 (Unaudited) (Continued)
| | | Level 1 | | | Level 2 | | | Level 3 | | | Total | |
BYTE | | | | | | | | | | | | | | | | |
Investments - Assets: | | | | | | | | | | | | | | | | |
Common Stocks* | | $ | 2,110,512 | | | $ | — | | | $ | — | | | $ | 2,110,512 | |
Real Estate Investment Trusts | | | 743,391 | | | | — | | | | — | | | | 743,391 | |
Money Market Fund | | | 20,269 | | | | — | | | | — | | | | 20,269 | |
Investments Purchased With Proceeds From Securities Lending** | | | — | | | | — | | | | — | | | | 610,919 | |
Total Investments - Assets | | $ | 2,874,172 | | | $ | — | | | $ | — | | | $ | 3,485,091 | |
| | | | | | | | | | | | | | | | | |
MEME | | | | | | | | | | | | | | | | |
Investments - Assets: | | | | | | | | | | | | | | | | |
Common Stocks* | | $ | 1,078,214 | | | $ | — | | | $ | — | | | $ | 1,078,214 | |
Money Market Fund | | | 877 | | | | — | | | | — | | | | 877 | |
Investments Purchased With Proceeds From Securities Lending** | | | — | | | | — | | | | — | | | | 283,883 | |
Total Investments - Assets | | $ | 1,079,091 | | | $ | — | | | $ | — | | | $ | 1,362,974 | |
| | | | | | | | | | | | | | | | | |
WEED | | | | | | | | | | | | | | | | |
Investments - Assets: | | | | | | | | | | | | | | | | |
Money Market Fund | | $ | 9,883 | | | $ | — | | | $ | — | | | $ | 9,883 | |
U.S. Treasury Bills | | | — | | | | 2,108,865 | | | | — | | | | 2,108,865 | |
Total Investments - Assets | | $ | 9,883 | | | $ | 2,108,865 | | | $ | — | | | $ | 2,118,748 | |
| | | | | | | | | | | | | | | | | |
Swap Contracts*** | | | | | | | | | | | | | | | | |
Long Total Return Equity Swap Contracts | | $ | — | | | $ | — | | | $ | — | | | $ | — | |
Total Swap Contracts | | $ | — | | | $ | — | | | $ | — | | | $ | — | |
BIGB | | | | | | | | | | | | | | | | |
Investments - Assets: | | | | | | | | | | | | | | | | |
Common Stocks* | | $ | 857,180 | | | $ | — | | | $ | — | | | $ | 857,180 | |
Money Market Fund | | | 91,144 | | | | — | | | | — | | | | 91,144 | |
U.S. Treasury Bills | | | — | | | | 3,443,375 | | | | — | | | | 3,443,375 | |
Total Investments - Assets | | $ | 948,324 | | | $ | 3,443,375 | | | $ | — | | | $ | 4,391,699 | |
| | | | | | | | | | | | | | | | | |
Swap Contracts*** | | | | | | | | | | | | | | | | |
Long Total Return Equity Swap Contracts | | $ | 213,878 | | | $ | — | | | $ | — | | | $ | 213,878 | |
Total Swap Contracts | | $ | 213,878 | | | $ | — | | | $ | — | | | $ | 213,878 | |
| | | | | | | | | | | | | | | | | |
35
Roundhill ETFs
Notes to Financial Statements
June 30, 2023 (Unaudited) (Continued)
| | | Level 1 | | | Level 2 | | | Level 3 | | | Total | |
BIGT | | | | | | | | | | | | | | | | |
Investments - Assets: | | | | | | | | | | | | | | | | |
Common Stocks* | | $ | 1,380,112 | | | $ | — | | | $ | — | | | $ | 1,380,112 | |
Money Market Fund | | | 105,332 | | | | — | | | | — | | | | 105,332 | |
U.S. Treasury Bills | | | — | | | | 1,882,709 | | | | — | | | | 1,882,709 | |
Total Investments - Assets | | $ | 1,485,444 | | | $ | 1,881,254 | | | $ | — | | | $ | 3,368,153 | |
| | | | | | | | | | | | | | | | | |
Swap Contracts*** | | | | | | | | | | | | | | | | |
Long Total Return Equity Swap Contracts | | $ | 277,095 | | | $ | — | | | $ | — | | | $ | 277,095 | |
Total Swap Contracts | | $ | 277,095 | | | $ | — | | | $ | — | | | $ | 277,095 | |
* | See the Schedule of Investments for industry classifications. |
** | Certain investments that are measured at fair value using the net asset value per share (or its equivalent) practical expedient have not been categorized in the fair value hierarchy. The fair value amounts presented in the table are intended to permit reconciliation of the fair value hierarchy to the amounts presented in the Schedule of Investments. |
*** | Swap contracts are derivative instruments, which are presented at the unrealized appreciation/depreciation on the instrument. |
^ | The Fund held a Level 3 security at the end of the year valued at $0. |
Security Transactions
Investment transactions are recorded as of the date that the securities are purchased or sold (trade date). Realized gains and losses from the sale or disposition of securities are calculated based on the specific identification basis.
The Funds do not isolate that portion of the results of operations resulting from changes in foreign exchange rates on investments and currency gains or losses realized between the trade and settlement dates on securities transactions from the fluctuations arising from changes in market prices of securities held. Such fluctuations are included with the net realized and unrealized gain or loss from investments.
The Funds report net realized foreign exchange gains or losses that arise from sales of foreign currencies, currency gains or losses realized between the trade and settlement dates on foreign currency transactions, and the difference between the amounts of dividends, interest, and foreign withholding taxes recorded on each Fund’s books and the U.S. dollar equivalent of the amounts actually received or paid. Net unrealized foreign exchange gains or losses arise from changes in the values of assets and liabilities, other than investments in securities at period end, resulting from changes in exchange rates.
Investment Income
Dividend income is recognized on the ex-dividend date. Interest income is accrued daily. Withholding taxes on foreign dividends has been provided for in accordance with Funds’ understanding of the applicable tax rules and regulations. An amortized cost method of valuation may be used with respect to debt obligations with sixty days or less remaining to maturity, unless the Adviser determines in good faith that such method does not represent fair value.
Tax Information, Dividends and Distributions to Shareholders and Uncertain Tax Positions
The Funds are treated as separate entities for Federal income tax purposes. Each Fund intends to qualify as a regulated investment company (“RIC”) under Subchapter M of the Internal Revenue Code of 1986, as amended (the “Internal Revenue Code”). To qualify and remain eligible for the special tax treatment accorded to RICs, each Fund must meet certain annual income and quarterly asset diversification requirements and must distribute annually at least 90% of the sum of (i) its investment company taxable income (which includes dividends, interest and net short-term capital gains) and (ii) certain net tax-exempt income, if any. If so qualified, each Fund will not be subject to Federal income tax.
36
Roundhill ETFs
Notes to Financial Statements
June 30, 2023 (Unaudited) (Continued)
Distributions to shareholders are recorded on the ex-dividend date. The Funds generally pay out dividends from net investment income, if any, at least annually, and distribute their net capital gains, if any, to shareholders at least annually. The Funds may also pay a special distribution at the end of the calendar year to comply with Federal tax requirements. The amount of dividends and distributions from net investment income and net realized capital gains are determined in accordance with Federal income tax regulations, which may differ from U.S. GAAP. These “book/tax” differences are either considered temporary or permanent in nature. To the extent these differences are permanent in nature, such amounts are reclassified within the components of net assets based on their Federal tax basis treatment; temporary differences do not require reclassification. Dividends and distributions which exceed earnings and profit for tax purposes are reported as a tax return of capital. Distributions received from REITs may be classified as dividends, capital gains, or return of capital.
Management evaluates the Funds’ tax positions to determine if the tax positions taken meet the minimum recognition threshold in connection with accounting for uncertainties in income tax positions taken or expected to be taken for the purposes of measuring and recognizing tax liabilities in the financial statements. Recognition of tax benefits of an uncertain tax position is required only when the position is “more likely than not” to be sustained assuming examination by taxing authorities. Interest and penalties related to income taxes would be recorded as income tax expense. The Funds’ Federal income tax returns are subject to examination by the Internal Revenue Service (the “IRS”) for a period of three fiscal years after they are filed. State and local tax returns may be subject to examination for an additional fiscal year depending on the jurisdiction. As of December 31, 2022, the Funds’ most recent fiscal period end, the Funds had no material uncertain tax positions and did not have a liability for any unrecognized tax benefits. As of December 31, 2022, the Funds’ most recent fiscal period end, the Funds had no examination in progress and management is not aware of any tax positions for which it is reasonably possible that the amounts of unrecognized tax benefits will significantly change in the next twelve months.
The Funds, except for BIGB and BIGT, recognized no interest or penalties related to uncertain tax benefits in the most recent fiscal period 2022. At December 31, 2022, the Funds’ most recent fiscal period end, the tax periods from commencement of operations remained open to examination in the Funds’ major tax jurisdictions.
BIGB and BIGT commenced operations after the December 31, 2022 fiscal period end; therefore, there was no tax information as of June 30, 2023.
Indemnification
In the normal course of business, the Funds expect to enter into contracts that contain a variety of representations and warranties and which provide general indemnifications. The Funds’ maximum exposure under these anticipated arrangements is unknown, as this would involve future claims that may be made against the Funds that have not yet occurred. However, the Adviser expects the risk of loss to be remote.
Derivatives
WEED, BIGB and BIGT (the “Funds”) may enter into total return swap agreements. A total return swap is a contract in which one party agrees to make periodic payments to another party based on the change in market value of the assets underlying the contract, which may include a specified security, basket of securities, or securities indices during the specified period, in return for periodic payments based on a fixed or variable interest rate or the total return from other underlying assets. Swap agreements will usually be done on a net basis, i.e., where the two parties make net payments with a Fund receiving or paying, as the case may be, only the net amount of the two payments. The net amount of the excess, if any, of a Fund’s obligations over its entitlements with respect to each swap is accrued on a daily basis and an amount of cash or equivalents having an aggregate value at least equal to the accrued excess is maintained by the Funds.
The total return swap contracts are subject to master netting agreements, which are agreements between the Funds and their counterparties that provide for the net settlement of all transactions and collateral with the Funds through a single payment, in the event of default or termination. Amounts presented on the schedule of total return swaps are gross settlement amounts.
37
Roundhill ETFs
Notes to Financial Statements
June 30, 2023 (Unaudited) (Continued)
The following table presents the Funds’ gross derivative assets and liabilities by counterparty and contract type, net of amounts available for offset under a master netting agreement and the related collateral received or pledged by the Funds as of June 30, 2023.
Roundhill Cannabis ETF
| | | | Gross Amounts
of Recognized
Assets/
Liabilities
Presented in
the Statements | | | Gross Amounts
Offset in the
Statements | | | | | | | Gross Amounts not offset in the
Statements of Assets & Liabilities | | | | | |
Counterparty | Investment Type | | of Assets &
Liabilities | | | of Assets &
Liabilities | | | Net
Amount | | | Financial
Instruments | | | Collateral
Paid | | | Net
Amount | |
Nomura Securities International Inc. | Total Return Swap Contracts | | $ | (4,020 | ) | | $ | — | | | $ | (4,020 | ) | | $ | 4,020 | | | $ | — | | | $ | — | |
Roundhill BIG Bank ETF
| | | | Gross Amounts
of Recognized
Assets/
Liabilities
Presented in
the Statements | | | Gross Amounts
Offset in the
Statements | | | | | | | Gross Amounts not offset in the
Statements of Assets & Liabilities | | | | | |
Counterparty | Investment Type | | of Assets &
Liabilities | | | of Assets &
Liabilities | | | Net
Amount | | | Financial
Instruments | | | Collateral
Paid | | | Net
Amount | |
Nomura Securities International Inc. | Total Return Swap Contracts | | $ | (19,475 | ) | | $ | — | | | $ | (19,475 | ) | | $ | 19,475 | | | $ | — | | | $ | — | |
Roundhill BIG Tech ETF
| | | | Gross Amounts
of Recognized
Assets/
Liabilities
Presented in
the Statements | | | Gross Amounts
Offset in the
Statements | | | | | | | Gross Amounts not offset in the
Statements of Assets & Liabilities | | | | | |
Counterparty | Investment Type | | of Assets &
Liabilities | | | of Assets &
Liabilities | | | Net
Amount | | | Financial
Instruments | | | Collateral
Paid | | | Net
Amount | |
Nomura Securities International Inc. | Total Return Swap Contracts | | $ | (14,934 | ) | | $ | — | | | $ | (14,934 | ) | | $ | 14,934 | | | $ | — | | | $ | — | |
The average monthly notional amount of the swap contracts during the period ended June 30, 2023 was as follows:
| | | Average Monthly
Notional Amount
of Swap Contracts | |
Roundhill Cannabis ETF | | $ | 1,794,982 | |
Roundhill BIG Bank ETF | | | 3,392,528 | |
Roundhill BIG Tech ETF | | | 1,464,913 | |
38
Roundhill ETFs
Notes to Financial Statements
June 30, 2023 (Unaudited) (Continued)
The following is a summary of the effect of swap contracts on the Funds’ Statements of Assets and Liabilities as of June 30, 2023:
| | | | Assets | | | Liabilities | | | Net Unrealized
Gain (Loss) | |
Roundhill Cannabis ETF | Equity Risk Swap Contracts | | $ | — | | | $ | (4,020 | ) | | $ | — | |
Roundhill BIG Bank ETF | Equity Risk Swap Contracts | | | — | | | | (19,475 | ) | | | — | |
Roundhill BIG Tech ETF | Equity Risk Swap Contracts | | | — | | | | (14,934 | ) | | | — | |
The following is a summary of the effect of swap contracts on the Funds’ Statements of Operations for the period ended June 30, 2023:
| | | | Realized Gain
(Loss) | | | Change in
Unrealized
Appreciation/
Depreciation | |
Roundhill Cannabis ETF | Equity Risk Swap Contracts | | $ | (585,295 | ) | | $ | — | |
Roundhill BIG Bank ETF | Equity Risk Swap Contracts | | | — | | | | 194,403 | |
Roundhill BIG Tech ETF | Equity Risk Swap Contracts | | | — | | | | 262,161 | |
3. | INVESTMENT ADVISORY AND OTHER AGREEMENTS |
Investment Advisory Agreement
The Trust has entered into an Investment Advisory Agreement (the “Advisory Agreement”) with the Adviser. Under the Advisory Agreement, the Adviser provides a continuous investment program for the Funds’ assets in accordance with its investment objectives, policies and limitations, and oversees the day-to-day operations of the Funds subject to the supervision of the Board, including the Trustees who are not “interested persons” of the Trust as defined in the 1940 Act.
Pursuant to the Advisory Agreement between the Trust, on behalf of the Funds, and Roundhill, each Fund pays a unified management fee to the Adviser, which is calculated daily and paid monthly, at the following annual rates:
NERD 0.50%
BETZ 0.75%
METV 0.59%
BYTE 0.45%*
MEME 0.69%
WEED 0.39%**
BIGB 0.29%
BIGT 0.29%
* | Effective June 8, 2023, the BYTE management fee was reduced from 0.75%. |
** | Effective May 1, 2023, the WEED management fee was reduced from 0.75%. |
Roundhill has agreed to pay all expenses of the Funds except the fee paid to Roundhill under the Advisory Agreement, interest charges on any borrowings, dividends and other expenses on securities sold short, taxes, brokerage commissions and other expenses incurred in placing orders for the purchase and sale of securities and other investment instruments, acquired fund fees and expenses, accrued deferred tax liability, extraordinary expenses, and distribution (12b-1) fees and expenses (if any). Roundhill, in turn, compensates Exchange Traded Concepts, LLC as the Sub-Adviser from the management fee it receives.
Exchange Traded Concepts, LLC (the “Sub-Adviser”), an Oklahoma limited liability company serves as the sub-adviser to the Funds. The Sub-Adviser is majority owned by Cottonwood ETF Holdings LLC. Pursuant to a Sub-Advisory Agreement between the Adviser and the Sub-Adviser (the “Sub-Advisory Agreement”), the Sub-Adviser is responsible for trading portfolio securities on behalf of the Funds, including selecting broker-dealers to execute purchase and sale transactions as instructed by the Adviser or in connection with
39
Roundhill ETFs
Notes to Financial Statements
June 30, 2023 (Unaudited) (Continued)
any rebalancing or reconstitution of a Fund’s Index, subject to the supervision of the Adviser and the Board, including the independent Trustees. For its services, the Sub-Adviser is entitled to a sub-advisory fee paid by the Adviser, which is calculated daily and paid monthly, at an annual rate based on the average daily net assets of each Fund, and subject to a minimum annual fee as follows:
Minimum Annual Fee | Asset-Based Fee |
$15,000 | 4 bps (0.04%) on the first $200 million 3.5 bps (0.035%) on the next $800 million 3 bps (0.03%) on the next $1 billion 2.5 bps (0.025%) on the balance over $2 billion |
Fee Waiver Agreement
For WEED, the Adviser contractually agreed to waive 0.16% of the management fees of the Fund until April 30, 2023. Effective October 12, 2022, the agreement was amended to further waive 0.20% of the management fee, until April 30, 2023. The Adviser waived $1,959 during the period ended June 30, 2023. Pursuant to the Fee Waiver Agreement, waived fees are not subject to recoupment by the Adviser.
Distribution Agreement and 12b-1 Plan
Foreside Fund Services, LLC (the “Distributor”) serves as each Fund’s distributor pursuant to a Distribution Agreement. The Distributor receives compensation from the Adviser for certain statutory underwriting services it provides to the Funds. The Distributor enters into agreements with certain broker-dealers and others that will allow those parties to be “Authorized Participants” and to subscribe for and redeem shares of the Funds. The Distributor will not distribute shares in less than whole Creation Units and does not maintain a secondary market in shares.
The Board has adopted a Distribution and Service Plan pursuant to Rule 12b-1 under the 1940 Act (“Rule 12b-1 Plan”). In accordance with the Rule 12b-1 Plan, each Fund is authorized to pay an amount up to 0.25% of the Fund’s average daily net assets each year for certain distribution-related activities. As authorized by the Board, no Rule 12b-1 fees are currently paid by the Funds and there are no plans to impose these fees. However, in the event Rule 12b-1 fees are charged in the future, they will be paid out of each Fund’s assets. The Adviser and its affiliates may, out of their own resources, pay amounts to third parties for distribution or marketing services on behalf of the Funds.
Administrator, Custodian and Transfer Agent
U.S. Bancorp Fund Services, LLC, doing business as U.S. Bank Global Fund Services (“Fund Services” or “Administrator”) serves as administrator, transfer agent and fund accounting agent of the Funds pursuant to a Fund Servicing Agreement. U.S. Bank N.A. (the “Custodian”), an affiliate of Fund Services, serves as the Funds’ custodian pursuant to a Custody Agreement. Under the terms of these agreements, the Adviser pays each Fund’s administrative, custody and transfer agency fees.
A Trustee and all officers of the Trust are affiliated with the Administrator and Custodian.
4. | CREATION AND REDEMPTION TRANSACTIONS |
Shares of NERD, BETZ, METV, BYTE and MEME are listed and traded on the NYSE Arca, Inc. (the “Exchange”). Shares of WEED are listed on the CBOE BZX Exchange, Inc. Shares of BIGB and BIGT are listed on the NASDAQ Stock Market, LLC. Each Fund issues and redeems shares on a continuous basis at NAV only in large blocks of shares called “Creation Units.” Creation Units are to be issued and redeemed principally in kind for a basket of securities and a balancing cash amount. Shares generally will trade in the secondary market in amounts less than a Creation Unit at market prices that change throughout the day. Market prices for the shares may be different from their NAV. The NAV is determined as of the close of trading (generally, 4:00 p.m. Eastern Time) on each day the NYSE is open for trading. The NAV of the shares of each Fund will be equal to a Fund’s total assets minus a Fund’s total liabilities divided by the total number of shares outstanding. The NAV that is published will be rounded to the nearest cent; however, for purposes of determining the price of Creation Units, the NAV will be calculated to four decimal places.
40
Roundhill ETFs
Notes to Financial Statements
June 30, 2023 (Unaudited) (Continued)
Creation Unit Transaction Fee
Authorized Participants will be required to pay to the Custodian a fixed transaction fee (the “Creation Unit Transaction Fee”) in connection with the issuance or redemption of Creation Units. The standard Creation Unit Transaction Fee will be the same regardless of the number of Creation Units purchased or redeemed by an investor on the applicable business day. The Creation Unit Transaction Fee charged by each Fund for each creation order is as follows:
NERD | $ 500 |
BETZ | $ 500 |
METV | $ 500 |
BYTE | $ 750 |
MEME | $ 300 |
WEED | $ 300 |
BIGB | $ 300 |
BIGT | $ 300 |
The fixed creation unit transaction fee may be waived on certain orders if the applicable Fund’s custodian has determined to waive some or all of the Creation Order Costs associated with the order or another party, such as the Adviser, has agreed to pay such fee.
An additional variable fee of up to a maximum of 2% of the value of the Creation Units subject to the transaction may be imposed for (i) creations effected outside the Clearing Process and (ii) creations made in an all cash amount (to offset the Trust’s brokerage and other transaction costs associated with using cash to purchase or redeem the requisite Deposit Securities). Investors are responsible for the costs of transferring the securities constituting the Deposit Securities to the account of the Trust. Each Fund may determine to not charge a variable fee on certain orders when the Adviser has determined that doing so is in the best interests of Fund shareholders. Variable fees, if any, received by the Funds are displayed in the Capital Share Transactions section on the Statements of Changes in Net Assets.
Only “Authorized Participants” may purchase or redeem shares directly from the Funds. An Authorized Participant is either (i) a broker-dealer or other participant in the clearing process through the Continuous Net Settlement System of National Securities Clearing Corporation or (ii) a DTC participant and, in each case, must have executed a Participant Agreement with the Distributor. Most retail investors will not qualify as Authorized Participants or have the resources to buy and sell whole Creation Units. Therefore, they will be unable to purchase or redeem the shares directly from the Funds. Rather, most retail investors will purchase shares in the secondary market with the assistance of a broker and will be subject to customary brokerage commissions or fees. Securities received or delivered in connection with in-kind creates and redeems are valued as of the close of business on the effective date of the creation or redemption.
A creation unit will generally not be issued until the transfer of good title of the deposit securities to the Funds and the payment of any cash amounts have been completed. To the extent contemplated by the applicable participant agreement, Creation Units of the Funds will be issued to such authorized participant notwithstanding the fact that the Funds’ deposits have not been received in part or in whole, in reliance on the undertaking of the authorized participant to deliver the missing deposit securities as soon as possible. If the Funds or their agents do not receive all of the deposit securities, or the required cash amounts, by such time, then the order may be deemed rejected and the authorized participant shall be liable to the Funds for losses, if any.
41
Roundhill ETFs
Notes to Financial Statements
June 30, 2023 (Unaudited) (Continued)
The Funds did not make any distributions during the period ended June 30, 2023.
The tax character of distributions paid was as follows:
| | | Ordinary
Income(1) | | | Long-Term
Capital Gain | | | Return of
Capital | |
| | | Fiscal period ended December 31, 2022 | |
NERD | | $ | 173,639 | | | $ | — | | | $ | — | |
BETZ | | | 309,837 | | | | — | | | | 470,671 | |
METV | | | 325,056 | | | | — | | | | 7,036 | |
BYTE | | | 31,253 | | | | 556 | | | | — | |
MEME | | | 15,557 | | | | — | | | | 5,264 | |
WEED | | | — | | | | — | | | | — | |
(1) | Ordinary income includes short-term capital gains. |
At December 31, 2022, the Funds’ most recent fiscal period end, the components of distributable earnings (accumulated losses) and cost of investments on a tax basis, including the adjustments for financial reporting purposes as of the most recently completed Federal income tax reporting year, were as follows:
| | | NERD | | | BETZ | | | METV | |
Federal Tax Cost of Investments | | $ | 31,459,547 | | | $ | 236,777,004 | | | $ | 658,506,573 | |
Gross Tax Unrealized Appreciation | | $ | 1,159,411 | | | $ | 2,299,363 | | | $ | 1,602,298 | |
Gross Tax Unrealized Depreciation | | | (6,059,981 | ) | | | (110,624,216 | ) | | | (268,912,383 | ) |
Net Tax Unrealized Appreciation (Depreciation) | | | (4,900,570 | ) | | | (108,324,853 | ) | | | (267,310,085 | ) |
Undistributed Ordinary Income | | | 33,576 | | | | — | | | | — | |
Other Accumulated Gain (Loss) | | | (38,770,875 | ) | | | (74,667,170 | ) | | | (251,595,628 | ) |
Total Distributable Earnings / (Accumulated Losses) | | $ | (43,637,869 | ) | | $ | (182,992,023 | ) | | $ | (518,905,713 | ) |
| | | BYTE | | | MEME | | | WEED | |
Federal Tax Cost of Investments | | $ | 3,695,562 | | | $ | 1,228,515 | | | $ | 2,238,068 | |
Gross Tax Unrealized Appreciation | | $ | 72,509 | | | $ | 8,063 | | | | — | |
Gross Tax Unrealized Depreciation | | | (735,769 | ) | | | (342,200 | ) | | | — | |
Net Tax Unrealized Appreciation (Depreciation) | | | (663,260 | ) | | | (334,137 | ) | | | — | |
Undistributed Ordinary Income | | | 4,606 | | | | — | | | | — | |
Other Accumulated Gain (Loss) | | | (177,256 | ) | | | (1,055,089 | ) | | | (1,044,613 | ) |
Total Distributable Earnings / (Accumulated Losses) | | $ | (835,910 | ) | | $ | (1,389,226 | ) | | $ | (1,044,613 | ) |
The difference between book-basis and tax-basis unrealized appreciation/(depreciation) is attributable primarily to the tax deferral of losses on wash sales and mark-to-market treatment of passive foreign investment companies.
42
Roundhill ETFs
Notes to Financial Statements
June 30, 2023 (Unaudited) (Continued)
Under current tax law, net capital losses realized after October 31 as well as certain specified ordinary losses incurred after October 31, may be deferred and treated as occurring on the first day of the following fiscal year. The Funds’ carryforward losses and post-October losses are determined only at the end of each fiscal year. At December 31, 2022, the Funds’ most recent fiscal period end, the Funds had carryforward losses and post-October losses which will be carried forward indefinitely to offset future realized capital gains as follows:
| | | Indefinite
Long-Term
Capital Loss
Carryover | | | Indefinite
Short-Term
Capital Loss
Carryover | | | Late-Year
Losses | | | Post-October
Losses | |
Roundhill Video Games ETF | | $ | 31,526,896 | | | $ | 7,243,155 | | | $ | — | | | $ | — | |
Roundhill Sports Betting & iGaming ETF | | | 36,118,361 | | | | 38,536,279 | | | | 6,841 | | | | — | |
Roundhill Ball Metaverse ETF | | | 53,995,715 | | | | 197,589,220 | | | | 7,541 | | | | — | |
Roundhill IO Digital Infrastructure ETF | | | 1,273 | | | | 175,977 | | | | — | | | | — | |
Roundhill MEME ETF | | | 346 | | | | 1,011,437 | | | | — | | | | — | |
Roundhill Cannabis ETF | | | — | | | | 401,040 | | | | 637,409 | | | | 6,165 | |
6. | INVESTMENT TRANSACTIONS |
During the period ended June 30, 2023, the Funds realized net capital gains and losses resulting from in-kind redemptions, in which shareholders exchanged Fund shares for securities held by the Funds rather than for cash. The amount of realized gains and losses from in-kind redemptions included in realized gain/(loss) on investments in the Statements of Operations is as follows:
| | | Realized Gains | | | Realized Losses | |
NERD | | $ | 593,633 | | | $ | (98,541 | ) |
BETZ | | | 6,176,777 | | | | (1,078,827 | ) |
METV | | | 14,724,500 | | | | (2,217,408 | ) |
BYTE | | | — | | | | — | |
MEME | | | 192,987 | | | | (6,358 | ) |
WEED | | | — | | | | — | |
BIGB | | | 43,529 | | | | — | |
BIGT | | | 109,714 | | | | — | |
Purchases and sales of investments (excluding short-term investments), creations in-kind and redemptions in-kind for the period ended June 30, 2023 were as follows:
| | | Purchases | | | Sales | | | Creations
In-Kind | | | Redemptions
In-Kind | |
NERD | | $ | 1,897,735 | | | $ | 2,467,424 | | | $ | 910,708 | | | $ | 3,518,820 | |
BETZ | | | 19,065,473 | | | | 18,700,269 | | | | 7,008,890 | | | | 34,275,754 | |
METV | | | 68,297,728 | | | | 67,694,654 | | | | 34,112,783 | | | | 64,673,818 | |
BYTE | | | 756,014 | | | | 737,104 | | | | — | | | | — | |
MEME | | | 6,838,687 | | | | 6,973,968 | | | | 1,549,690 | | | | 1,418,448 | |
WEED | | | — | | | | — | | | | — | | | | — | |
BIGB | | | 1,327,892 | | | | — | | | | — | | | | 535,362 | |
BIGT | | | 1,795,306 | | | | — | | | | — | | | | 593,983 | |
43
Roundhill ETFs
Notes to Financial Statements
June 30, 2023 (Unaudited) (Continued)
The Funds may lend domestic and foreign securities in their portfolios to approved brokers, dealers and financial institutions (but not individuals) under terms of participation in a securities lending program effective November 19, 2020, which is administered by the Custodian. The securities lending agreement requires that loans are initially collateralized in an amount equal to at least 105% of the then current market value of any loaned securities that are foreign securities, or 102% of the then current market value of any other loaned securities. The custodian performs on a daily basis marking to market loaned securities and collateral. Each borrower is required, if necessary, to deliver additional collateral so that the total collateral held in the account for all loans of the Funds to the borrower will equal at least 100% of the market value of the loaned securities. The cash collateral is invested by the Custodian in accordance with approved investment guidelines. Those guidelines allow the cash collateral to be invested in readily marketable, high quality, short-term obligations issued or guaranteed by the United States Government; however, such investments are subject to risk of payment delays, declines in the value of collateral provided, default on the part of the issuer or counterparty, or otherwise may not generate sufficient interest to support the costs associated with securities lending. The Funds could also experience delays in recovering their securities and possible loss of income or value if the borrower fails to return the borrowed securities, although the Funds are indemnified from this risk by contract with the securities lending agent.
The collateral invested in the Funds, if any, is reflected in each Fund’s Schedule of Investments and is included in the Statements of Assets and Liabilities in the line item labeled “Investments, at value.” A liability of equal value to the cash collateral received and subsequently invested in the Funds is included on the Statements of Assets and Liabilities as “Payable for collateral on securities loaned.” During the period ended June 30, 2023, the Funds loaned securities and received cash collateral for the loans, which was invested in the Mount Vernon Liquid Assets Portfolio, LLC. The Funds receive compensation in the form of loan fees owed by borrowers and income earned on collateral investments. A portion of the interest received on the loan collateral is retained by the Funds and the remainder is rebated to the borrower of the securities. Pursuant to the securities lending agreement between the Trust, on behalf of the Funds, and the Custodian, each Fund pays a fee to the Custodian, which is calculated daily and paid monthly, at a rate of 20% of the Funds’ aggregate net income. The net amount of interest earned, after the interest rebate and the allocation to the Custodian, is included in the Statements of Operations as “Securities lending income, net.” The Funds continue to receive interest payments or dividends on the securities loaned during the borrowing period.
As of June 30, 2023, the value of the securities on loan and payable for collateral due to broker were as follows:
Value of Securities on Loan and Collateral Received
Fund | | Values of
Securities on Loan | | | Fund Collateral
Received* | |
NERD | | $ | 4,950,887 | | | $ | 4,989,523 | |
BETZ | | | 15,618,389 | | | | 15,819,564 | |
METV | | | 57,269,608 | | | | 58,319,141 | |
BYTE | | | 592,069 | | | | 610,919 | |
MEME | | | 271,886 | | | | 283,883 | |
WEED | | | — | | | | — | |
BIGB | | | — | | | | — | |
BIGT | | | — | | | | — | |
* | The cash collateral received was invested in the Mount Vernon Liquid Assets Portfolio, LLC, an investment with an overnight and continuous maturity, as shown on the Schedules of Investments. |
Due to the absence of a master netting agreement related to the Funds’ participation in securities lending, no additional offsetting disclosures have been made on behalf of the Funds for the total borrowings listed above.
As with all ETFs, shareholders of the Funds are subject to the risk that their investment could lose money. Each Fund is subject to the principal risks, any of which may adversely affect a Fund’s NAV, trading price, yield, total return and ability to meet its investment objective.
A complete description of the principal risks is included in the Funds’ prospectuses under the heading “Principal Investment Risks.”
44
Roundhill ETFs
Notes to Financial Statements
June 30, 2023 (Unaudited) (Continued)
During the period ended June 30, 2023, MEME and WEED shares were adjusted to reflect one reverse stock split. The effect of this reverse stock split was to reduce the number of shares outstanding in each Fund while maintaining the Fund’s and each shareholder’s aggregate net asset value. All historical per share information hass been retroactively adjusted to reflect this reverse stock split. Set forth below are details regarding the reverse stock splits effected on May 1, 2023:
| | | Date | | | Rate | | | Net Asset Value
Before Split | | | Net Asset Value
After Split | | | Shares
Outstanding
Before Split | | | Shares
Outstanding
After Split | |
MEME | | | 5/1/2023 | | | | 1 for 5 | | | $ | 6.08 | | | $ | 29.43 | | | | 150,000 | | | | 30,000 | |
WEED | | | 5/1/2023 | | | | 1 for 5 | | | $ | 4.35 | | | $ | 22.17 | | | | 350,000 | | | | 70,000 | |
Effective October 2, 2023, BETZ will change its index from the Roundhill Sports Betting & iGaming Index to the Morningstar® Sports Betting & iGaming Select IndexSM.
The Adviser filed a registration statement for the Roundhill S&P® Global Luxury ETF (“LUXX”). LUXX is a passively-managed ETF that seeks investment results that match, before fees and expenses, the performance of the S&P Global Luxury Index.
The Adviser also filed a registration statement for the Roundhill Alerian LNG ETF (“LNGG”). LNGG is a passively-managed ETF that seeks investment results that match, before fees and expenses, the performance of the Alerian Liquefied Natural Gas Index.
LUXX seeded on August 22, 2023 and listed on August 23, 2023. LNGG is expected to launch in the third quarter of 2023.
Other than as disclosed, there were no other subsequent events requiring recognition or disclosure through the date the financial statements were issued.
45
Roundhill Video Games ETF
Roundhill Sports Betting & iGaming ETF
Roundhill Ball Metaverse ETF
Roundhill IO Digital Infrastructure ETF
Roundhill MEME ETF
Board Consideration and Approval of
Advisory and Sub-Advisory Agreements
June 30, 2023 (Unaudited)
At meetings held on February 21, 2023 (the “February Meeting”) and March 8, 2023 (the “March Meeting”), the Board of Trustees (the “Board”) of Listed Funds Trust (the “Trust”), including those trustees who are not “interested persons” of the Trust, as defined in the Investment Company Act of 1940 (the “1940 Act”) (the “Independent Trustees”), considered the approval of the continuation of the advisory agreement (the “Advisory Agreement”) between Roundhill Financial Inc. (the “Adviser”) and the Trust, on behalf of Roundhill Video Games ETF, Roundhill Sports Betting & iGaming ETF, Roundhill Ball Metaverse ETF, Roundhill IO Digital Infrastructure ETF, and Roundhill MEME ETF (each a “Fund” and together, the “Funds”), and a sub-advisory agreement (the “Sub-Advisory Agreement” and, together with the Advisory Agreement, the “Agreements”) between the Adviser, the Trust, and Exchange Traded Concepts, LLC (the “Sub-Adviser”) with respect to the Funds.
In addition, at meetings held on May 31, 2023 (the “May Meeting”) and June 7, 2023 (the “June Meeting” and together with the May Meeting, the “May and June Meetings”), the Board considered the approval an amendment to the Advisory Agreement (the “Amendment”) between the Adviser and the Trust, on behalf of the Roundhill IO Digital Infrastructure ETF, for the sole purpose of reducing the Fund’s advisory fee from 0.75% to 0.45% of the Fund’s average daily net assets.
Pursuant to Section 15 of the 1940 Act, the continuation of the Agreements after their initial two-year term or a material amendment to the Agreements must be approved by: (i) the vote of the Board or shareholders of each Fund; and (ii) the vote of a majority of the Independent Trustees, cast at a meeting called for the purpose of voting on such approval. As discussed in greater detail below, in preparation for the Meetings, the Board requested from, and reviewed a wide variety of information provided by, the Adviser and Sub-Adviser.
In addition to the written materials provided to the Board in advance of the Meetings, representatives from the Adviser and Sub-Adviser provided the Board with an overview, during the March Meeting, of each firm’s advisory business, including information about its investment personnel, financial resources, experience, investment processes, quality control and compliance program. The representatives discussed the services provided to each Fund by their respective firms, as well as the Fund’s fees and information with respect to the Fund’s strategy and certain operational aspects of the Fund. The Board considered the Adviser’s and Sub-Adviser’s presentations and the materials it received in advance of the Meetings, including a memorandum from legal counsel to the Trust regarding the responsibilities of the Board in considering the approval of the Agreements. The Board also considered the information about the Funds and the Adviser and Sub-Adviser provided over the course of the prior year. The Board deliberated on the approval of the Agreements for an additional one-year period in light of this information. Throughout the process, the Board was afforded the opportunity to ask questions of, and request additional materials from, the Adviser and Sub-Adviser. The Independent Trustees also met in executive session with counsel to the Trust to further discuss the advisory and sub-advisory arrangements and the Independent Trustees’ responsibilities relating thereto.
At the Meetings, the Board, including a majority of the Independent Trustees, evaluated a number of factors, including, among other things: (i) the nature, extent, and quality of the services provided by the Adviser and Sub-Adviser to the Funds; (ii) each Fund’s expenses and performance; (iii) the cost of the services provided and profits to be realized by the Adviser and Sub-Adviser from the relationship with Funds; (iv) comparative fee and expense data for each Fund and other investment companies with similar investment objectives; (v) the extent to which the advisory fee for each Fund reflects economies of scale shared with its shareholders; (vi) any benefits derived by the Adviser and Sub-Adviser from the relationship with the Funds, including any fall-out benefits enjoyed by the Adviser and Sub-Adviser; and (vii) other factors the Board deemed relevant. In its deliberations, the Board considered the factors and reached the conclusions described below relating to the advisory arrangement and the approval of the reduced advisory fee for the Fund. In its deliberations, the Board considered the factors and reached the conclusions described below relating to the advisory and sub-advisory arrangements and the renewal of the Agreements.
46
Roundhill Video Games ETF
Roundhill Sports Betting & iGaming ETF
Roundhill Ball Metaverse ETF
Roundhill IO Digital Infrastructure ETF
Roundhill MEME ETF
Board Consideration and Approval of
Advisory and Sub-Advisory Agreements
June 30, 2023 (Unaudited) (Continued)
Approval of the Advisory Agreement with the Adviser
Nature, Extent, and Quality of Services Provided. The Board considered the scope of services provided under the Advisory Agreement, noting that the Adviser expected to continue to provide substantially similar investment managements services to each Fund with respect to implementing each Fund’s investment program, including arranging for, or implementing, the purchase and sale of portfolio securities, monitoring adherence to each Fund’s investment restrictions, overseeing the activities of the service providers, monitoring compliance with various policies and procedures with applicable securities regulations, and monitoring the extent to which each Fund achieved its investment objective. In considering the nature, extent, and quality of the services provided by the Adviser, the Board considered the quality of the Adviser’s compliance program and past and current reports from the Trust’s Chief Compliance Officer (“CCO”) regarding her review of the Adviser’s compliance program, as well as the Board’s experience with the Adviser as the investment adviser to other series of the Trust. The Board noted that it had received a copy of the Adviser’s Form ADV, as well as the responses of the Adviser to a detailed series of questions that included, among other things, information about the Adviser’s decision making process, details about each Fund, and information about the services to be provided by the Adviser.
Historical Performance. The Board next considered each Fund’s performance. The Board observed that additional information regarding each Fund’s past investment performance, for periods ended December 31, 2022, had been included in the Materials, including the Barrington Report, which compared the performance results of each Fund with the returns of a group of ETFs selected by Barrington Partners as most comparable (the “Peer Group”) as well as with funds in each Fund’s respective Morningstar category (each, a “Category Peer Group”). Additionally, at the Board’s request, the Adviser identified the funds the Adviser considered to be each Fund’s most direct competitors (each, a “Selected Peer Group”) and provided the Selected Peer Group’s performance results.
Roundhill Video Games ETF: Taking into account that the Fund changed underlying indexes during the reporting period, the Board noted that, for each of the one-year and since inception periods ended December 31, 2022, the Fund’s performance on a gross of fees basis (i.e., excluding the effect of fees and expenses on Fund performance) was generally consistent with the performance of its underlying index at the time, indicating that the Fund tracked its underlying index closely and in an appropriate manner. The Board also noted that the Fund underperformed its broad-based benchmark, the Solactive GBS Developed Markets Large & Mid Cap TR Index, for each of the one-year and since inception periods. The Solactive GBS Developed Markets Large & Mid Cap TR Index provides an indication of the performance of large- and mid-cap companies covering approximately the largest 85% of the free-float market capitalization of the developed markets. The Board noted, however, that the Fund seeks to provide investors with exposure to companies in a very specific industry, not broad exposure to the large- or mid-cap developed markets.
The Board noted that, for the one-year and three-year periods ended December 31, 2022, the Fund underperformed the median return of its Peer Group and Category Peer Group. The Board further noted that because the Category Peer Group included thematic funds with different investment strategies from the Fund, the Category Peer Group may not allow for an apt comparison by which to judge the Fund’s performance. The Board also noted that the Fund underperformed the funds in the Selected Peer Group for the same one-year and three-year periods. The Board considered that the funds included in the Selected Peer Group were described by the Adviser as funds that invest in companies that focus on gaming more broadly.
Roundhill Sports Betting & iGaming ETF: The Board noted that, for each of the one-year and since inception periods ended December 31, 2022, the Fund’s performance on a gross of fees basis (i.e., excluding the effect of fees and expenses on Fund performance) was generally consistent with the performance of its underlying index, indicating that the Fund tracked its underlying index closely and in an appropriate manner. The Board also noted that the Fund significantly underperformed its broad-based benchmark, the Solactive GBS Developed Markets Large & Mid Cap TR Index, for the one-year and since inception periods. The Solactive GBS Developed Markets Large & Mid Cap TR Index provides an indication of the performance of large- and mid-cap companies covering approximately the largest 85% of the free-float market capitalization of the developed markets. The Board noted, however, that the Fund seeks to provide investors with exposure to companies in a very specific industry, not broad exposure to the large- or mid-cap developed markets.
47
Roundhill Video Games ETF
Roundhill Sports Betting & iGaming ETF
Roundhill Ball Metaverse ETF
Roundhill IO Digital Infrastructure ETF
Roundhill MEME ETF
Board Consideration and Approval of
Advisory and Sub-Advisory Agreements
June 30, 2023 (Unaudited) (Continued)
The Board noted that, for the one-year period ended December 31, 2022, the Fund underperformed the median return of its Peer Group and Category Peer Group. The Board took into consideration that the Peer Group and Category Peer Group included thematic funds with different investment strategies from the Fund and therefore may not allow for an apt comparison by which to judge the Fund’s performance. The Board also noted that the Fund significantly underperformed the sole competitor in the Selected Peer Group for the same one-year period. The Board considered that the fund included in the Selected Peer Group were described by the Adviser as a fund that invests in companies that focus on the sports betting and iGaming theme more broadly.
Roundhill Ball Metaverse ETF: The Board noted that, for each of the one-year and since inception periods ended December 31, 2022, the Fund’s performance on a gross of fees basis (i.e., excluding the effect of fees and expenses on Fund performance) was generally consistent with the performance of its underlying index, indicating that the Fund tracked its underlying index closely and in an appropriate manner. The Board also noted that the Fund significantly underperformed its broad-based benchmark, the Solactive GBS Developed Markets Large & Mid Cap TR Index, for the one-year and since inception periods. The Solactive GBS Developed Markets Large & Mid Cap TR Index provides an indication of the performance of large- and mid-cap companies covering approximately the largest 85% of the free-float market capitalization of the developed markets. The Board noted, however, that the Fund seeks to provide investors with exposure to companies in a very specific industry, not broad exposure to the large- or mid-cap Developed Markets.
The Board noted that, for the one-year period ended December 31, 2022, the Fund underperformed the median return of its Peer Group and Category Peer Group. The Board took into consideration that the Peer Group and Category Peer Group included thematic funds with different investment strategies from the Fund and therefore may not allow for an apt comparison by which to judge the Fund’s performance. The Board also noted that the Fund underperformed the sole competitor in the Selected Peer Group for which performance data was available for the same one-year period. The Board considered that the funds included in the Selected Peer Group were described by the Adviser as funds that invest in companies that focus on the metaverse theme more broadly.
Roundhill IO Digital Infrastructure ETF: The Board noted that, for each of the one-year and since inception periods ended December 31, 2022, the Fund’s performance on a gross of fees basis (i.e., excluding the effect of fees and expenses on Fund performance) was generally consistent with the performance of its underlying index, indicating that the Fund tracked its underlying index closely and in an appropriate manner. The Board also noted that the Fund significantly underperformed its broad-based benchmark, the Solactive GBS Global Markets Large & Mid Cap USD TR Index, for the one-year and since inception periods. The Solactive GBS Global Markets Large & Mid Cap USD TR Index provides an indication of the performance of large- and mid-cap companies covering approximately the largest 85% of the free-float market capitalization of the global markets. The Board noted, however, that the Fund seeks to provide investors with exposure to companies in a very specific industry, not broad exposure to the large- or mid-cap global markets.
The Board noted that, for the one-year period ended December 31, 2022, the Fund underperformed the median return of its Peer Group and outperformed the median return of its Category Peer Group. The Board took into consideration that the Peer Group and Category Peer Group included thematic funds with different investment strategies from the Fund and therefore may not allow for an apt comparison by which to judge the Fund’s performance. The Board also noted that the Fund slightly underperformed the Selected Peer Group for the same one-year period. The Board considered that the funds included in the Selected Peer Group were described by the Adviser as funds that invest in companies that focus on the digital infrastructure theme more broadly.
Roundhill MEME ETF: The Board noted that, for each of the one-year and since inception periods ended December 31, 2022, the Fund’s performance on a gross of fees basis (i.e., excluding the effect of fees and expenses on Fund performance) was generally consistent with the performance of its underlying index, indicating that the Fund tracked its underlying index closely and in an appropriate manner. The Board also noted that the Fund significantly underperformed its broad-based benchmark, the Solactive GBS United States All Cap USD TR Index, for the one-year and since inception periods. The Solactive GBS United States All Cap USD TR Index provides an indication
48
Roundhill Video Games ETF
Roundhill Sports Betting & iGaming ETF
Roundhill Ball Metaverse ETF
Roundhill IO Digital Infrastructure ETF
Roundhill MEME ETF
Board Consideration and Approval of
Advisory and Sub-Advisory Agreements
June 30, 2023 (Unaudited) (Continued)
of the performance of all cap companies covering approximately the largest 100% of the free-float market capitalization of the United States. The Board noted, however, that the Fund seeks to provide investors with more targeted exposure than the Fund’s broad-based index.
The Board noted that, for the one-year period ended December 31, 2022, the Fund underperformed the median return of its Peer Group and Category Peer Group. The Board took into consideration that the Category Peer Group included thematic funds with different investment strategies from the Fund. The Board also noted that the Fund underperformed the Selected Peer Group for the same one-year period. The Board considered that the sole competitor identified in the Selected Peer Group was described by the Adviser as a fund that invested in companies that focus on the meme stock theme more broadly.
Cost of Services to be Provided and Profitability. The Board reviewed the expense ratio for each Fund and compared the expense ratio to its respective Peer Group and Category Peer Group as shown in the Barrington Report, as well as its respective Selected Peer Group.
The Board took into consideration that the Adviser charges a “unitary fee,” meaning the Funds pay no expenses except for the fee paid to the Adviser pursuant to the Advisory Agreement, interest charges on any borrowings, dividends and other expenses on securities sold short, taxes, brokerage commissions and other expenses incurred in placing orders for the purchase and sale of securities and other investment instruments, acquired fund fees and expenses, accrued deferred tax liability, extraordinary expenses, and distribution fees and expenses paid by the Trust under any distribution plan adopted pursuant to Rule 12b-1 under the 1940 Act. The Board noted that the Adviser continued to be responsible for compensating each Fund’s other service providers and paying each Fund’s other expenses out of its own fee and resources. The Board also evaluated the compensation and benefits received by the Adviser from its relationship with the Funds, taking into account analyses of the Adviser’s profitability with respect to the Funds.
Roundhill Video Games ETF: The Board noted that the expense ratio for the Fund was equivalent to its unitary fee. The Board further noted that the expense ratio for the Fund was lower than the average of its Peer Group and Category Peer Group. The Board also noted that the Fund’s expense ratio was within the range of the expense ratios for the Selected Peer Group.
Roundhill Sports Betting & iGaming ETF: The Board noted that the expense ratio for the Fund was equivalent to its unitary fee. The Board further noted that the expense ratio for the Fund was higher than the average of its Peer Group and was within the range of expense ratios for the Category Peer Group. The Board also noted that the Fund’s expense ratio was higher than the expense ratio for the sole competitor in the Selected Peer Group.
Roundhill Ball Metaverse ETF: The Board noted that the expense ratio for the Fund was equivalent to its unitary fee. The Board further noted that the expense ratio for the Fund was higher than the average of its Peer Group and was within the range of expense ratios for the Category Peer Group. The Board also noted that the Fund’s expense ratio was within the range of expense ratios for the Selected Peer Group.
Roundhill IO Digital Infrastructure ETF: The Board noted that the expense ratio for the Fund was equivalent to its unitary fee. The Board further noted that the expense ratio for the Fund was higher than the average of its Peer Group and was higher than the expense ratios for the Category Peer Group. The Board also noted that the Fund’s expense ratio was higher than the expense ratios for the Selected Peer Group.
Roundhill MEME ETF: The Board noted that the expense ratio for the Fund was equivalent to its unitary fee. The Board further noted that the expense ratio for the Fund was higher than the average of its Peer Group and was within the range of expense ratios for the Category Peer Group. The Board also noted that the Fund’s expense ratio was lower than the expense ratio of the sole competitor identified in the Selected Peer Group.
49
Roundhill Video Games ETF
Roundhill Sports Betting & iGaming ETF
Roundhill Ball Metaverse ETF
Roundhill IO Digital Infrastructure ETF
Roundhill MEME ETF
Board Consideration and Approval of
Advisory and Sub-Advisory Agreements
June 30, 2023 (Unaudited) (Continued)
Economies of Scale. The Board noted that it is not yet evident that the Funds have reached the size at which they have begun to realize economies of scale, but acknowledged that breakpoints might be warranted if the Funds’ assets continue to grow. However, the Board further determined that, based on the amount and structure of each Fund’s unitary fee, any such economies of scale would be shared with such Fund’s respective shareholders. The Board stated that it would monitor fees as the Funds grow and consider whether fee breakpoints may be warranted in the future.
Conclusion. No single factor was determinative of the Board’s decision to approve the continuation of the Advisory Agreement; rather, the Board based its determination on the total mix of information available to it. Based on a consideration of all the factors in their totality, the Board, including a majority of the Independent Trustees, determined that the Advisory Agreement, including the compensation payable under the Advisory Agreement, was fair and reasonable to each Fund. The Board, including a majority of the Independent Trustees, therefore determined that the approval of the continuation of the Advisory Agreement was in the best interests of each Fund and its shareholders, as well as the amendment to the Advisory Agreement for the reduction in the advisory fee on behalf of the Roundhill IO Digital Infrastructure ETF.
Approval of the Sub-Advisory Agreement with the Sub-Adviser
Nature, Extent, and Quality of Services Provided. The Board considered the scope of services provided to each Fund under the Sub-Advisory Agreement, noting that Sub-Adviser would continue to provide investment management services to the Funds. The Board noted the responsibilities that the Sub-Adviser has as the Funds’ investment sub-adviser, including: responsibility for the general management of the day-to-day investment and reinvestment of the assets of each Fund based on the analysis and investment recommendations from the Adviser; determining the daily baskets of deposit securities and cash components; executing portfolio security trades for purchases and redemptions of each Fund’s shares conducted on a cash-in-lieu basis; oversight of general portfolio compliance with relevant law; responsibility for quarterly reporting to the Board; and implementation of Board directives as they relate to each Fund.
In considering the nature, extent, and quality of the services provided by the Sub-Adviser, the Board considered past and current reports of the Trust’s CCO with respect to Sub-Adviser’s compliance program. The Board also considered the Sub-Adviser’s resources and capacity with respect to portfolio management, compliance, and operations given the number of funds for which it would be sub-advising. The Board further considered information provided by the Sub-Adviser with respect to the impact of the COVID-19 pandemic on its operations.
Historical Performance. The Board noted that it had received information regarding each Fund’s performance for various time periods in the Materials and primarily considered each Fund’s performance for periods ended December 31, 2022.
Costs of Services Provided and Economies of Scale. The Board reviewed the sub-advisory fees paid by the Adviser to the Sub-Adviser for its services to each Fund. The Board considered that the fees paid to the Sub-Adviser are paid by the Adviser and noted that the fee reflected an arm’s-length negotiation between the Adviser and the Sub-Adviser. The Board also took into account analyses of the Sub-Adviser’s profitability with respect to each Fund.
The Board expressed the view that the Sub-Adviser might realize economies of scale in managing each Fund as assets grow in size. The Board further noted that because each Fund pays the Adviser a unitary fee, any benefits from breakpoints in the sub-advisory fee schedule would accrue to the Adviser, rather than to each Fund’s shareholders. Consequently, the Board determined that it would monitor fees as each Fund grows to determine whether economies of scale were being effectively shared with each Fund and its respective shareholders.
Conclusion. No single factor was determinative of the Board’s decision to approve the Sub-Advisory Agreement; rather, the Board based its determination on the total mix of information available to it. Based on a consideration of all the factors in their totality, the Board, including a majority of the Independent Trustees, determined that the Sub-Advisory Agreement, including the compensation payable
50
Roundhill Video Games ETF
Roundhill Sports Betting & iGaming ETF
Roundhill Ball Metaverse ETF
Roundhill IO Digital Infrastructure ETF
Roundhill MEME ETF
Board Consideration and Approval of
Advisory and Sub-Advisory Agreements
June 30, 2023 (Unaudited) (Continued)
under the Sub-Advisory Agreement, was fair and reasonable to each Fund. The Board, including a majority of the Independent Trustees, therefore determined that the approval of the continuation of the Sub-Advisory Agreement was in the best interests of each Fund and its respective shareholders.
Approval of Amendment to the Advisory Agreement with the Adviser with respect to the Roundhill IO Digital Infrastructure ETF
In evaluating the approval of the Amendment, in addition to the written materials provided to the Board in advance of the February Meeting and March Meeting, the Adviser provided and the Board reviewed, in advance of the May and June Meetings, updated profitability analysis as it relates to the proposed new advisory fee. In addition, during the June Meeting representatives from the Adviser presented additional information to assist the Board with its evaluation of the Amendment. Among other things, the representatives from the Adviser discussed the services provided to the Fund by the Adviser, as well as the Fund’s fees and information with respect to the Fund’s strategy and certain operational aspects of the Fund. The Board considered the Adviser’s presentation and the materials it received in advance of the May and June Meetings, including a memorandum from legal counsel to the Trust regarding the responsibilities of the Trustees in considering the approval of the Amendment, a memorandum from the Adviser explaining the rationale for reducing the Fund’s advisory fee, and a certification from the Adviser that the reduced advisory fee would not result in any reduction in the nature and scope or quality of the services it provides to the Fund. The Board also considered information about the Fund and the Adviser provided over the course of the prior year, in particular the materials provided in advance of the March Meeting when the Fund’s advisory agreement was renewed for an additional one-year period. The Board deliberated on the approval of the Amendment in light of this information and throughout the process, the Trustees were afforded the opportunity to ask questions of, and request additional materials from, the Adviser. The Independent Trustees also met in executive session with counsel to the Trust to further discuss the proposed reduction in advisory fee and the Independent Trustees’ responsibilities relating thereto.
At the May and June Meetings, the Board, including a majority of the Independent Trustees, evaluated a number of factors, including, among other things: (i) the nature, extent, and quality of the services provided by the Adviser to the Fund; (ii) the Fund’s expenses and performance; (iii) the cost of the services provided and profits to be realized by the Adviser from its relationship with the Fund; (iv) comparative fee and expense data for the Fund and other investment companies with similar investment objectives; (v) the extent to which the proposed advisory fee for the Fund reflects economies of scale shared with its shareholders; (vi) any benefits derived by the Adviser from the relationship with the Fund, including any fall-out benefits enjoyed by the Adviser; and (vii) other factors the Board deemed relevant. In its deliberations, the Board considered the factors and reached the conclusions described below relating to the advisory arrangement and the approval of the reduced advisory fee for the Fund. In its deliberations, the Board did not identify any single piece of information that was paramount or controlling and the individual Trustees may have attributed different weights to various factors.
Nature, Extent, and Quality of Services Provided. The Board considered the scope of services provided under the Agreement, noting that the Adviser expected to continue to provide substantially similar investment management services to the Fund with respect to implementing the Fund’s investment program, including arranging for, or implementing, the purchase and sale of portfolio securities, monitoring adherence to the Fund’s investment restrictions, overseeing the activities of the service providers, monitoring compliance with various policies and procedures with applicable securities regulations, and monitoring the extent to which the Fund achieved its investment objective. In considering the nature, extent, and quality of the services provided by the Adviser, the Board considered the quality of the Adviser’s compliance infrastructure and past and current reports from the Trust’s CCO regarding her review of the Adviser’s compliance program, as well as the Board’s experience with the Adviser and the investment management services it has provided to the Fund and certain other series of the Trust. In evaluating the nature, extent and quality of services provided by the Adviser, the Board reviewed the materials received in advance of the February and March Meetings, with such updates as provided by the Adviser.
51
Roundhill Video Games ETF
Roundhill Sports Betting & iGaming ETF
Roundhill Ball Metaverse ETF
Roundhill IO Digital Infrastructure ETF
Roundhill MEME ETF
Board Consideration and Approval of
Advisory and Sub-Advisory Agreements
June 30, 2023 (Unaudited) (Continued)
Fund Expenses and Performance. The Board next considered the Fund’s performance. In evaluating the Fund’s performance, the Board relied on an came to the same conclusions reached during the March Meeting when the Fund’s advisory agreement was renewed for an additional one-year period.
Cost of Services Provided and Profitability. The Board reviewed the expense ratio for the Fund and compared the expense ratio to its Peer Group and Category Peer Group as shown in the Barrington Report, as well as its Selected Peer Group.
The Board took into consideration that the Adviser charges a “unitary fee,” meaning the Fund pays no expenses except for the fee paid to the Adviser pursuant to the Advisory Agreement, interest charges on any borrowings, dividends and other expenses on securities sold short, taxes, brokerage commissions and other expenses incurred in placing orders for the purchase and sale of securities and other investment instruments, acquired fund fees and expenses, accrued deferred tax liability, extraordinary expenses, and distribution fees and expenses paid by the Trust under any distribution plan adopted pursuant to Rule 12b-1 under the 1940 Act. The Board noted that the Adviser continued to be responsible for compensating the Fund’s other service providers and paying the Fund’s other expenses out of its own fee and resources. The Board also evaluated the compensation and benefits received by the Adviser from its relationship with the Fund, taking into account analyses of the Adviser’s profitability with respect to the Fund.
The Board noted that the expense ratio for the Fund was equivalent to its unitary fee. The Board further noted that the proposed expense ratio for the Fund was slightly higher than the average of its Peer Group and was lower than the expense ratios for the Category Peer Group, but was within the range of the both Peer Groups expense ratios. The Board also noted that the proposed expense ratio was lower than the expense ratios for the Selected Peer Group.
Economies of Scale. The Board expressed the view that the Adviser might realize economies of scale in managing the Fund as assets grow in size. The Board noted, however, that any economies would, to some degree, be shared with the Fund’s shareholders through the Fund’s unitary fee structure. In the event there were to be significant asset growth in the Fund, the Board determined to reassess whether the advisory fee appropriately took into account any economies of scale that had been realized as a result of that growth.
Conclusion. No single factor was determinative of the Board’s decision to approve the Amendment; rather, the Board based its determination on the total mix of information available to it. Based on a consideration of all the factors in their totality, the Board, including a majority of the Independent Trustees, determined that the terms of the Amendment, including the compensation payable thereunder, were fair and reasonable to the Fund. The Board, including a majority of the Independent Trustees, therefore determined that the approval of the Amendment was in the best interests of the Fund and its shareholders.
52
Roundhill BIG Tech ETF
Roundhill BIG Bank ETF
Board Consideration and Approval of
Advisory and Sub-Advisory Agreements
June 30, 2023 (Unaudited)
At a meeting held on December 6 and 8, 2022 (the “Meeting”), the Board of Trustees (the “Board”) of Listed Funds Trust (the “Trust”), including those trustees who are not “interested persons” of the Trust, as defined in the Investment Company Act of 1940 (the “1940 Act”) (the “Independent Trustees”), considered the approval of an advisory agreement between Roundhill Financial Inc. (the “Adviser”) and the Trust, on behalf of Roundhill BIG Tech ETF and Roundhill BIG Bank ETF (each, a “Fund” and collectively, the “Funds”) (the “Advisory Agreement”), and a sub-advisory agreement between the Adviser, the Trust, and Exchange Traded Concepts, LLC (the “Sub-Adviser”), with respect to the Funds (the “Sub-Advisory Agreement” and, together with the Advisory Agreement, the “Agreements”).
Pursuant to Section 15 of the 1940 Act, the Agreements must be approved by: (i) the vote of the Board or shareholders of a Fund; and (ii) the vote of a majority of the Independent Trustees, cast at a meeting called for the purpose of voting on such approval. In connection with its consideration of such approval, the Board must request and evaluate, and the Adviser and Sub-Adviser are required to furnish, such information as may be reasonably necessary to evaluate the terms of the Agreements.
Consistent with those responsibilities, prior to the Meeting, the Board reviewed written materials from the Adviser and Sub-Adviser and, during the Meeting, representatives from the Adviser and Sub-Adviser presented additional information to assist the Board with its evaluation of the Agreements. Among other things, representatives from the Adviser and Sub-Adviser provided an overview of their respective advisory businesses, including information on investment personnel, financial resources, experience, investment processes, and compliance program. The representatives discussed the services to be provided by the Adviser and Sub-Adviser, as well as the rationale for launching the Funds, each Fund’s proposed fees, and the operational aspects of the Funds. The Board also considered the materials it received in advance of the Meeting, including a memorandum from legal counsel to the Trust regarding the responsibilities of the Trustees in considering the approval of the Agreements, as well as information about the Funds, the Adviser and the Sub-Adviser provided during the Adviser’s and Sub-Adviser’s presentations during the Meeting. The Board deliberated on the approval of the Agreements in light of this information. Throughout the process, the Trustees were afforded the opportunity to ask questions of, and request additional materials from, the Adviser and Sub-Adviser. The Independent Trustees also met in executive session with counsel to the Trust to further discuss the proposed Agreements and the Independent Trustees’ responsibilities relating thereto.
At the Meeting, the Board, including a majority of the Independent Trustees, evaluated a number of factors, including, among other things: (i) the nature, extent, and quality of the services to be provided by the Adviser and Sub-Adviser to the Funds; (ii) each Fund’s anticipated expenses and performance; (iii) the cost of the services to be provided and anticipated profits to be realized by the Adviser and Sub-Adviser from its relationship with the Trust and the Funds; (iv) comparative fee and expense data for each Fund and other investment companies with similar investment objectives; (v) the extent to which economies of scale would be realized as each Fund grows and whether the overall advisory fee for each Fund would enable investors to share in the benefits of economies of scale; (vi) any benefits to be derived by the Adviser or Sub-Adviser from the relationship with the Trust and the Funds, including any fall-out benefits enjoyed by the Adviser or Sub-Adviser; and (vii) other factors the Board deemed relevant. In its deliberations, the Board did not identify any single piece of information that was paramount or controlling and the individual Trustees may have attributed different weights to various factors.
Approval of the Advisory Agreement with the Adviser
Nature, Extent, and Quality of Services to be Provided. The Trustees considered the scope of services to be provided under the Advisory Agreement, noting that the Adviser will be providing, among other things, a continuous investment program for each Fund, including arranging for, or implementing, the purchase and sale of portfolio securities, the provision of related services such as portfolio management compliance services, and the preparation and filing of certain reports on behalf of the Trust. The Trustees reviewed the extensive responsibilities that the Adviser will have as investment adviser to each Fund, including the oversight of the activities and operations of the Sub-Adviser and other service providers, oversight of general fund compliance with federal and state laws, and the implementation of Board directives as they relate to the Fund. In considering the nature, extent, and quality of the services to be provided by the Adviser, the Board considered the quality of the Adviser’s compliance program and past and current reports from the Trust’s Chief Compliance Officer (the “CCO”) regarding their review of the Adviser’s compliance program, as well as the Board’s experience with the Adviser as the investment adviser to other series of the Trust. The Board noted that it had received a copy of the Adviser’s Form ADV, as well as the responses of the Adviser to a detailed series of questions that included, among other things, information about the Adviser’s decision-making process, details about each Fund, and information about the services to be provided by the Adviser. The
53
Roundhill BIG Tech ETF
Roundhill BIG Bank ETF
Board Consideration and Approval of
Advisory and Sub-Advisory Agreements
June 30, 2023 (Unaudited) (Continued)
Board also considered the Adviser’s operational capabilities and resources and its experience in managing investment portfolios. The Board concluded that, within the context of its full deliberations, it was satisfied with the nature, extent, and quality of the services to be provided to each Fund by the Adviser.
Fund Expenses and Performance. Because the Funds had not yet commenced operations, the Board noted that there were no historical performance records to consider. The Board was presented with information about each Fund’s investment strategies and expected break-even expense analyses. The Board considered that each Fund’s advisory fee consists entirely of the “unified fee” described below.
Roundhill BIG Tech ETF: The Board noted that the expense ratio for the Fund was significantly lower than the median of the funds in the universe of Technology ETFs as reported by Morningstar. The Board also noted that the Fund’s expense ratio was lower than expense ratios for most direct competitors as identified by the Adviser which are passively managed ETFs focused on large market capitalization technology companies.
Roundhill BIG Bank ETF: The Board noted that the expense ratio for the Fund was lower than the median of the funds in the universe of Financial ETFs as reported by Morningstar. The Board also noted that the Fund’s expense ratio was within the range of expense ratios for most direct competitors as identified by the Adviser which are passively managed ETFs focused on large market capitalization banks and capital market companies.
Cost of Services to be Provided and Profitability. The Board considered the cost of the services to be provided by the Adviser, the proposed advisory and sub-advisory fees, and the estimated profitability projected by the Adviser, including the methodology underlying such projection. The Board took into consideration that the advisory fee for each Fund was a “unitary fee,” meaning each Fund would pay no expenses other than the fee payable to the Adviser under the Advisory Agreement, interest charges on any borrowings, dividends, and other expenses on securities sold short, taxes, brokerage commissions and other expenses incurred in placing orders for the purchase and sale of securities and other investment instruments, acquired fund fees and expenses, accrued deferred tax liability, extraordinary expenses, and distribution fees and expenses paid by the Trust under any distribution plan adopted pursuant to Rule 12b-1 under the 1940 Act. The Board noted that the Adviser would be responsible for compensating the Trust’s other service providers, including the Sub-Adviser, and paying each Fund’s other expenses out of its own revenue and resources. The Board also evaluated the compensation and benefits expected to be received by the Adviser from its relationship with the Funds, taking into account the Adviser’s anticipated profitability analysis with respect to each Fund and the financial resources the Adviser has committed and continues to commit to its business. The Board determined such analyses were not a significant factor given that the Funds had not yet commenced operations and consequently, the future size of each Fund and the Adviser’s future profitability were generally unpredictable.
Economies of Scale. The Board expressed the view that the Adviser might realize economies of scale in managing the Funds as assets grow in size. The Board noted, however, that any economies of scale would, to some degree, be shared with each Fund’s shareholders through the Fund’s unitary fee structure. In the event there were to be significant asset growth in a Fund, the Board determined to reassess whether the advisory fee appropriately took into account any economies of scale that had been realized as a result of that growth.
Conclusion. No single factor was determinative of the Board’s decision to approve the Advisory Agreement; rather, the Board based its determination on the total mix of information available to it. Based on a consideration of all the factors in their totality, the Board, including a majority of the Independent Trustees, determined that the terms of the Advisory Agreement, including the compensation payable thereunder, was fair and reasonable to each Fund. The Board, including a majority of the Independent Trustees, therefore determined that the approval of the Advisory Agreement for an initial term of two years was in the best interests of each Fund and its shareholders.
Approval of the Sub-Advisory Agreement with the Sub-Adviser
Nature, Extent, and Quality of Services to be Provided. The Board considered the scope of services to be provided to the Funds under the Sub-Advisory Agreement, noting that the Sub-Adviser would provide investment management services to each Fund. The Board noted the responsibilities that the Sub-Adviser would have as the Funds’ investment sub-adviser, including: responsibility for the management of the securities and other assets of each Fund, subject to the supervision and oversight of the Adviser; determining the assets to be
54
Roundhill BIG Tech ETF
Roundhill BIG Bank ETF
Board Consideration and Approval of
Advisory and Sub-Advisory Agreements
June 30, 2023 (Unaudited) (Continued)
purchased, retained or sold by each Fund; executing placement of orders and selection of brokers or dealers for such orders; general portfolio compliance with relevant law; responsibility for daily monitoring of portfolio exposures and quarterly reporting to the Board; proxy voting with respect to securities held by each Fund; and implementation of Board directives as they relate to each Fund.
In considering the nature, extent, and quality of the services to be provided by the Sub-Adviser, the Board considered the quality of the Sub-Adviser’s compliance program and past and current reports from the Trust’s CCO regarding her review of the Sub-Adviser’s compliance program, as well as the Board’s experience with the Sub-Adviser as the investment sub-adviser to other series of the Trust. The Board further noted that it had received and reviewed materials with regard to the Sub-Adviser, including its responses to a detailed series of questions that included, among other things, information about the Sub-Adviser’s decision making process, details about the Funds, and information about the services to be provided by the Sub-Adviser. The Board also considered the Sub-Adviser’s resources and capacity with respect to portfolio management, compliance, and operations. The Board also considered, among other things, the professional experience and qualifications of the senior management and key professional personnel of the Sub-Adviser, including those individuals responsible for portfolio management. The Board concluded, within the context of its full deliberations, it was satisfied with the nature, extent, and quality of the services to be provided to the Funds by the Sub-Adviser.
Fund Expenses and Performance. Because the Funds had not yet commenced operations, the Board noted that there were no historical performance records to consider. The Board was presented with information about each Fund’s investment strategies and expected break-even expense analyses. The Board also reviewed information regarding each Fund’s proposed advisory and sub-advisory fees, including advisory fees and total expense ratios of those funds that might be considered peers of the Fund. Based on its review, the Board concluded that the sub-advisory fee and expense ratios appeared to be competitive and are otherwise reasonable in light of the information provided.
Costs of Services to be Provided and Profitability. The Board considered the cost of the services to be provided by the Sub-Adviser, the proposed advisory and sub-advisory fees, and the estimated profitability projected by the Adviser and Sub-Adviser, including the methodology underlying such projection. The Board considered the fact that the fees payable to the Sub-Adviser would be paid by the Adviser from the management fee the Adviser received from each Fund and noted that the fee reflected an arm’s-length negotiation between the Adviser and the Sub-Adviser. The Board further determined the sub-advisory fee reflected an appropriate allocation of the advisory fee paid to the Adviser given the work performed by each firm. The Board also evaluated the compensation and benefits expected to be received by the Sub-Adviser from its relationship with the Funds, taking into account the Sub-Adviser’s estimated profitability analysis with respect to each Fund.
Economies of Scale. The Board expressed the view that it currently appeared that the Sub-Adviser might realize economies of scale in managing the Funds as assets grow in size. The Board determined that it would monitor fees as each Fund’s assets grow to determine whether economies of scale were being effectively shared with the Fund and its shareholders.
Conclusion. No single factor was determinative of the Board’s decision to approve the Sub-Advisory Agreement; rather, the Board based its determination on the total mix of information available to it. Based on a consideration of all the factors in their totality, the Board, including a majority of the Independent Trustees, determined that the terms of the Sub-Advisory Agreement, including the compensation payable thereunder, was fair and reasonable to each Fund. The Board, including a majority of the Independent Trustees, therefore determined that the approval of the Sub-Advisory Agreement for an initial two-year term was in the best interests of each Fund and its shareholders.
55
Roundhill ETFs
Shareholder Expense Example
June 30, 2023 (Unaudited)
As a shareholder of a Fund you incur two types of costs: (1) transaction costs for purchasing and selling shares; and (2) ongoing costs, including management fees and other fund expenses. The following example is intended to help you understand your ongoing costs (in dollars and cents) of investing in a Fund and to compare these costs with the ongoing costs of investing in other funds. The examples are based on an investment of $1,000 invested at the beginning of the period and held throughout the entire period (January 1, 2023 to June 30, 2023), except noted in the footnotes below.
ACTUAL EXPENSES
The first line under each Fund in the table below provides information about actual account values and actual expenses. You may use the information in this line, together with the amount you invested, to estimate the expenses that you paid over the period. Simply divide your account value by $1,000 (for example, an $8,600 account value divided by $1,000 = 8.6), then multiply the result by the number in the first line for your Fund under the heading entitled “Expenses Paid During Period” to estimate the expenses you paid on your account during this period.
HYPOTHETICAL EXAMPLE FOR COMPARISON PURPOSES
The second line in the table provides information about hypothetical account values and hypothetical expenses based on each Fund’s actual expense ratio and an assumed rate of return of 5% per year before expenses, which is not the Fund’s actual return. The hypothetical account values and expenses may not be used to estimate the actual ending account balance or expenses you paid for the period. You may use this information to compare the ongoing costs of investing in the Fund and other funds. To do so, compare this 5% hypothetical example with the 5% hypothetical examples that appear in the shareholder reports of the other funds. Please note that the expenses shown in the table are meant to highlight your ongoing costs only and do not reflect any transactional costs, such as brokerage commissions paid on purchases and sales of Fund shares. Therefore, the second line in the table is useful in comparing ongoing Fund costs only and will not help you determine the relative total costs of owning different funds. In addition, if these transactional costs were included, your costs would have been higher.
| | Beginning
Account Value
1/1/23 | Ending
Account Value
6/30/23 | Annualized
Expense
Ratios | Expenses
Paid During
the Period |
Roundhill Video Games ETF | | | | |
Actual | $ 1,000.00 | $ 1,113.60 | 0.50% | $ 2.62(1) |
Hypothetical (5% return before expenses) | $ 1,000.00 | $ 1,022.32 | 0.50% | $ 2.51(1) |
Roundhill Sports Betting & iGaming ETF | | | | |
Actual | $ 1,000.00 | $ 1,223.10 | 0.75% | $ 4.13(1) |
Hypothetical (5% return before expenses) | $ 1,000.00 | $ 1,021.08 | 0.75% | $ 3.76(1) |
Roundhill Ball Metaverse ETF | | | | |
Actual | $ 1,000.00 | $ 1,442.90 | 0.59% | $ 3.57(1) |
Hypothetical (5% return before expenses) | $ 1,000.00 | $ 1,021.87 | 0.59% | $ 2.96(1) |
Roundhill IO Digital Infrastructure ETF | | | | |
Actual | $ 1,000.00 | $ 1,008.40 | 0.71% | $ 3.55(1) |
Hypothetical (5% return before expenses) | $ 1,000.00 | $ 1,021.26 | 0.71% | $ 3.57(1) |
Roundhill MEME ETF | | | | |
Actual | $ 1,000.00 | $ 1,414.00 | 0.69% | $ 4.13(1) |
Hypothetical (5% return before expenses) | $ 1,000.00 | $ 1,021.37 | 0.69% | $ 3.46(1) |
56
Roundhill ETFs
Shareholder Expense Example
June 30, 2023 (Unaudited) (Continued)
| | Beginning
Account Value
1/1/23 | Ending
Account Value
6/30/23 | Annualized
Expense
Ratios | Expenses
Paid During
the Period |
Roundhill Cannabis ETF | | | | |
Actual | $ 1,000.00 | $ 743.60 | 0.39% | $ 1.69(1) |
Hypothetical (5% return before expenses) | $ 1,000.00 | $ 1,022.86 | 0.39% | $ 1.96(1) |
Roundhill BIG Bank ETF | | | | |
Actual | $ 1,000.00(5) | $ 1,072.80 | 0.29% | $ 0.85(2) |
Hypothetical (5% return before expenses) | $ 1,000.00 | $ 1,023.36 | 0.29% | $ 1.45(1)(4) |
Roundhill BIG Tech ETF | | | | |
Actual | $ 1,000.00(6) | $ 1,221.30 | 0.29% | $ 0.72(3) |
Hypothetical (5% return before expenses) | $ 1,000.00 | $ 1,023.36 | 0.29% | $ 1.45(1)(4) |
(1) | Expenses are calculated using the Fund’s annualized expense ratio, multiplied by the average account value during the period, multiplied by 181/365 days (to reflect the six-month period). |
(2) | Expenses are calculated using the Fund’s annualized expense ratio, multiplied by the average account value during the period, multiplied by 103/365 days (to reflect the period since the Fund’s inception). |
(3) | Expenses are calculated using the Fund’s annualized expense ratio, multiplied by the average account value during the period, multiplied by 82/365 days (to reflect the period since the Fund’s inception). |
(4) | For comparative purposes only as the Fund was not in operation for the full six-month period. |
(5) | The Fund commenced operations on March 20, 2023. The Beginning Account Value is representative of this commencement date. |
(6) | The Fund commenced operations on April 10, 2023. The Beginning Account Value is representative of this commencement date. |
57
Roundhill ETFs
Supplemental Information
June 30, 2023 (Unaudited)
Investors should consider the investment objective and policies, risk considerations, charges and ongoing expenses of an investment carefully before investing. The prospectus contains this and other information relevant to an investment in the Funds. Please read the prospectus carefully before investing. A copy of the prospectus for the Funds may be obtained without charge by writing to the Funds, c/o U.S. Bank Global Fund Services, P.O. Box 701, Milwaukee, Wisconsin 53201-0701, by calling 1-800-617-0004, or by visiting the Funds’ website at www.roundhillinvestments.com.
QUARTERLY PORTFOLIO HOLDING INFORMATION
Each Fund files its complete schedule of portfolio holdings for its first and third fiscal quarters with the Securities and Exchange Commission (“SEC”) on Part F of Form N-PORT. The Funds’ Part F of Form N-PORT is available without charge, upon request, by calling toll-free at 1-800-617-0004. Furthermore, you may obtain the Part F of Form N-PORT on the SEC’s website at www.sec.gov.
PROXY VOTING INFORMATION
Each Fund is required to file a Form N-PX, with the Fund’s complete proxy voting record for the 12 months ended June 30, no later than August 31 of each year. The Funds’ proxy voting record will be available without charge, upon request, by calling toll-free 1-800-617-0004 and on the SEC’s website at www.sec.gov.
FREQUENCY DISTRIBUTION OF PREMIUMS AND DISCOUNTS
Information regarding how often shares of the Funds trade on an exchange at a price above (i.e., at a premium) or below (i.e., at a discount) the NAV of the Funds is available without charge, on the Funds’ website at www.roundhillinvestments.com.
TAX INFORMATION
For the fiscal period ended December 31, 2022, certain dividends paid by the Funds may be subject to a maximum tax rate of 15%, as provided for by the Jobs and Growth Tax Relief Reconciliation Act 2003.
The percentage of dividends declared from ordinary income designated as qualified dividend income was as follows:
Roundhill Video Games ETF | | | 100.00% |
Roundhill Sports Betting & iGaming ETF | | | 100.00% |
Roundhill Ball Metaverse ETF | | | 100.00% |
Roundhill IO Digital Infrastructure ETF | | | 96.18% |
Roundhill MEME ETF | | | 54.99% |
Roundhill Cannabis ETF | | | 0.00% |
For corporate shareholders, the percent of ordinary income distributions qualifying for the corporate dividends received deduction for the fiscal period ended December 31, 2022 was as follows:
Roundhill Video Games ETF | | | 4.54% |
Roundhill Sports Betting & iGaming ETF | | | 7.70% |
Roundhill Ball Metaverse ETF | | | 100.00% |
Roundhill IO Digital Infrastructure ETF | | | 51.14% |
Roundhill MEME ETF | | | 2.70% |
Roundhill Cannabis ETF | | | 0.00% |
58
Roundhill ETFs
Supplemental Information
June 30, 2023 (Unaudited) (Continued)
For the fiscal period ended December 31, 2022, the percentage of taxable ordinary income distributions that are designated as short-term capital gain distributions under Internal Revenue Code Section 871(k)(2)(C) for the Funds was as follows:
Roundhill Video Games ETF | | | 0.00% |
Roundhill Sports Betting & iGaming ETF | | | 0.00% |
Roundhill Ball Metaverse ETF | | | 0.00% |
Roundhill IO Digital Infrastructure ETF | | | 12.87% |
Roundhill MEME ETF | | | 0.00% |
Roundhill Cannabis ETF | | | 0.00% |
For the fiscal period ended December 31, 2022, the Funds earned foreign source income and paid foreign taxes, which the Funds intend to pass through to its shareholders pursuant to Section 853 of the Internal Revenue Code as follows:
| | | Foreign Source
Income Earned | | | Foreign
Taxes Paid | |
Roundhill Video Games ETF | | $ | 494,373 | | | $ | 61,178 | |
Roundhill Sports Betting & iGaming ETF | | | 2,221,732 | | | | 115,301 | |
59
Roundhill ETFs
Review of Liquidity Risk Management Program
June 30, 2023 (Unaudited)
Pursuant to Rule 22e-4 under the Investment Company Act of 1940, the Trust, on behalf of the series of the Trust covered by this shareholder report (the “Series”), has adopted a liquidity risk management program to govern the Trust’s approach to managing liquidity risk. Rule 22e-4 seeks to promote effective liquidity risk management, thereby reducing the risk that a fund will be unable to meet its redemption obligations and mitigating dilution of the interests of fund shareholders. The Trust’s liquidity risk management program is tailored to reflect the Series’ particular risks, but not to eliminate all adverse impacts of liquidity risk, which would be incompatible with the nature of such Series.
The investment adviser to the Series has adopted and implemented its own written liquidity risk management program (the “Program”) tailored specifically to assess and manage the liquidity risk of the Series. At a recent meeting of the Board of Trustees of the Trust, the Trustees received a report pertaining to the operation, adequacy, and effectiveness of implementation of the Program for the period ended December 31, 2022. The report concluded that the Program is reasonably designed to assess and manage the Series’ liquidity risk and has operated adequately and effectively to manage such risk. The report reflected that there were no liquidity events that impacted the Series’ ability to timely meet redemptions without dilution to existing shareholders. The report further noted that no material changes have been made to the Program since its implementation.
There can be no assurance that the Program will achieve its objectives in the future. Please refer to the prospectus for more information regarding the Series’ exposure to liquidity risk and other principal risks to which an investment in the Series may be subject.
60
THIS PAGE INTENTIONALLY LEFT BLANK
Investment Adviser:
Roundhill Financial Inc.
154 W. 14th St., 2nd Floor
New York, NY 10011
Investment Sub-Adviser:
Exchange Traded Concepts, LLC
10900 Hefner Pointe Drive, Suite 400
Oklahoma City, OK 73120
Legal Counsel:
Morgan, Lewis & Bockius LLP
1111 Pennsylvania Avenue, N.W.
Washington, D.C. 20004
Independent Registered Public Accounting Firm:
Cohen & Company, Ltd.
1350 Euclid Avenue, Suite 800
Cleveland, OH 44115
Distributor:
Foreside Fund Services, LLC
Three Canal Plaza, Suite 100
Portland, ME 04101
Administrator, Fund Accountant & Transfer Agent:
U.S. Bancorp Fund Services, LLC
d/b/a U.S. Bank Global Fund Services
615 E. Michigan St.
Milwaukee, WI 53202
Custodian:
U.S. Bank N.A.
1555 North RiverCenter Drive, Suite 302
Milwaukee, WI 53212
This information must be preceded or accompanied by a current prospectus for the Funds.
Item 2. Code of Ethics.
Not applicable for semi-annual reports.
Item 3. Audit Committee Financial Expert.
Not applicable for semi-annual reports.
Item 4. Principal Accountant Fees and Services.
Not applicable for semi-annual reports.
Item 5. Audit Committee of Listed Registrants.
| (a) | Not applicable for semi-annual reports. |
Item 6. Investments.
| (a) | Schedule of Investments is included as part of the report to shareholders filed under Item 1 of this Form. |
Item 7. Disclosure of Proxy Voting Policies and Procedures for Closed-End Management Investment Companies.
Not applicable to open-end investment companies.
Item 8. Portfolio Managers of Closed-End Management Investment Companies.
Not applicable to open-end investment companies.
Item 9. Purchases of Equity Securities by Closed-End Management Investment Company and Affiliated Purchasers.
Not applicable to open-end investment companies.
Item 10. Submission of Matters to a Vote of Security Holders.
There have been no material changes to the procedures by which shareholders may recommend nominees to the registrant’s Board of Trustees.
Item 11. Controls and Procedures.
| (a) | The Registrant’s President and Treasurer have reviewed the Registrant's disclosure controls and procedures (as defined in Rule 30a-3(c) under the Investment Company Act of 1940 (the “Act”)) as of a date within 90 days of the filing of this report, as required by Rule 30a-3(b) under the Act and Rules 13a-15(b) or 15d-15(b) under the Securities Exchange Act of 1934. Based on their review, such officers have concluded that the disclosure controls and procedures are effective in ensuring that information required to be disclosed in this report is appropriately recorded, processed, summarized and reported and made known to them by others within the Registrant and by the Registrant’s service provider. |
| (b) | There were no changes in the Registrant's internal control over financial reporting (as defined in Rule 30a-3(d) under the Act) that occurred during the period covered by this report that have materially affected, or are reasonably likely to materially affect, the Registrant's internal control over financial reporting. |
Item 12. Disclosure of Securities Lending Activities for Closed-End Management Investment Companies
Not applicable to open-end investment companies.
Item 13. Exhibits.
| (a) | (1) Any code of ethics or amendment thereto, that is the subject of the disclosure required by Item 2, to the extent that the registrant intends to satisfy Item 2 requirements through filing an exhibit. Not Applicable. |
(2) A separate certification for each principal executive officer and principal financial officer pursuant to Section 302 of the Sarbanes-Oxley Act of 2002. Filed herewith.
(3) Any written solicitation to purchase securities under Rule 23c-1 under the Act sent or given during the period covered by the report by or on behalf of the registrant to 10 or more persons. Not applicable to open-end investment companies.
(4) Change in the registrant’s independent public accountant. There was no change in the registrant’s independent public accountant for the period covered by this report.
SIGNATURES
Pursuant to the requirements of the Securities Exchange Act of 1934 and the Investment Company Act of 1940, the registrant has duly caused this report to be signed on its behalf by the undersigned, thereunto duly authorized.
| (Registrant) | Listed Funds Trust | |
| | | |
| By (Signature and Title)* | /s/ Gregory C. Bakken | |
| | Gregory C. Bakken, President/Principal Executive Officer |
| | | |
| Date | 9/7/2023 | |
Pursuant to the requirements of the Securities Exchange Act of 1934 and the Investment Company Act of 1940, this report has been signed below by the following persons on behalf of the registrant and in the capacities and on the dates indicated.
| By (Signature and Title)* | /s/ Gregory C. Bakken | |
| | Gregory C. Bakken, President/Principal Executive Officer |
| | | |
| Date | 9/7/2023 | |
| | | |
| | | |
| By (Signature and Title)* | /s/ Travis G. Babich | |
| | Travis G. Babich, Treasurer/Principal Financial Officer |
| | | |
| Date | 9/7/2023 | |
| * | Print the name and title of each signing officer under his or her signature. |