UNITED STATES
SECURITIES AND EXCHANGE COMMISSION
WASHINGTON, D.C. 20549
FORM 10-Q
(Mark One)
☒ | QUARTERLY REPORT PURSUANT TO SECTION 13 OR 15(d) OF THE SECURITIES EXCHANGE ACT OF 1934 |
FOR THE QUARTERLY PERIOD ENDED March 31, 2019 OR
☐ | TRANSITION REPORT PURSUANT TO SECTION 13 OR 15(d) OF THE SECURITIES EXCHANGE ACT OF 1934 |
For the Transition period from to .
Commission file number 000-56046

Starwood Real Estate Income Trust, Inc.
(Exact name of Registrant as specified in Governing Instruments)
Maryland | 1601 Washington Avenue, Suite 800 Miami Beach, FL 33139 | 82-2023409 |
(State or other jurisdiction of incorporation or organization) | (Address of principal executive offices) (Zip Code) | (I.R.S. Employer Identification No.) |
Registrant’s telephone number, including area code: (305) 695-5500
Indicate by check mark whether the Registrant (1) has filed all reports required to be filed by Section 13 or 15(d) of the Securities Exchange Act of 1934 during the preceding 12 months (or for such shorter period that the Registrant was required to file such reports), and (2) has been subject to such filing requirements for the past 90 days. Yes ☒ No ☐
Indicate by check mark whether the registrant has submitted electronically every Interactive Data File required to be submitted pursuant to Rule 405 of Regulation S-T (§232.405 of this chapter) during the preceding 12 months (or for such shorter period that the registrant was required to submit such files). Yes ☒ No ☐
Indicate by check mark whether the registrant is a large accelerated filer, an accelerated filer, a non-accelerated filer, smaller reporting company, or an emerging growth company. See the definitions of “large accelerated filer,” “accelerated filer,” “smaller reporting company,” and “emerging growth company” in Rule 12b-2 of the Exchange Act.:
Large accelerated filer | | ☐ | | Accelerated filer | | ☐ |
Non-accelerated filer | | ☒ | | Smaller reporting company | | ☐ |
| | | | Emerging growth company | | ☒ |
If an emerging growth company, indicate by check mark if the registrant has elected not to use the extended transition period for complying with any new or revised financial accounting standards provided pursuant to Section 13(a) of the Exchange Act. ☒
Indicate by check mark whether the registrant is a shell company (as defined in Rule 12b-2 of the Act). Yes ☐ No ☒
Securities registered pursuant to Section 12(b) of the Act: None.
Title of each class | | Trading Symbol(s) | | Name of each exchange on which registered |
| | | | |
As of May 14, 2019, the issuer had the following shares outstanding shares: 466,188 shares of Class T common stock, 10,884,175 shares of Class S common stock, 494,298 shares of Class D common stock and 4,241,726 shares of Class I common stock.
TABLE OF CONTENTS
PART I. FINANCIAL INFORMATION
ITEM 1. | FINANCIAL STATEMENTS |
Starwood Real Estate Income Trust, Inc.
Consolidated Balance Sheets (Unaudited)
(in thousands, except share and per share data)
| | March 31, 2019 | | | December 31, 2018 | |
Assets | | | | | | | | |
Investments in real estate, net | | $ | 410,065 | | | $ | — | |
Investments in real estate-related securities | | | 107,195 | | | | — | |
Investments in unconsolidated real estate ventures | | | 12,568 | | | | — | |
Cash and cash equivalents | | | 31,038 | | | | 164,021 | |
Restricted cash | | | 55,515 | | | | 900 | |
Other assets | | | 8,634 | | | | 42 | |
Total assets | | $ | 625,015 | | | $ | 164,963 | |
Liabilities and Equity | | | | | | | | |
Mortgage notes, net | | $ | 257,791 | | | $ | — | |
Repurchase agreements | | | 63,567 | | | | — | |
Accounts payable, accrued expenses and other liabilities | | | 57,553 | | | | 1,087 | |
Due to affiliates | | | 21,119 | | | | 16,754 | |
Total liabilities | | $ | 400,030 | | | $ | 17,841 | |
| | | | | | | | |
Commitments and contingencies | | | — | | | | — | |
| | | | | | | | |
Equity | | | | | | | | |
Preferred stock, $0.01 par value per share, 100,000,000 shares authorized; none issued and outstanding as of March 31, 2019 and December 31, 2018 | | | — | | | | — | |
Common stock — Class T shares, $0.01 par value per share, 250,000,000 shares authorized; 207,535 and 483 shares issued and outstanding as of March 31, 2019 and December 31, 2018, respectively | | | 2 | | | | — | |
Common stock — Class S shares, $0.01 par value per share, 250,000,000 shares authorized; 8,340,840 and 6,610,280 shares issued and outstanding as of March 31, 2019 and December 31, 2018, respectively | | | 83 | | | | 66 | |
Common stock — Class D shares, $0.01 par value per share, 250,000,000 shares authorized; 309,860 and 46,075 shares issued and outstanding as of March 31, 2019 and December 31, 2018, respectively | | | 3 | | | | — | |
Common stock — Class I shares, $0.01 par value per share, 250,000,000 shares authorized; 3,602,218 and 1,542,000 shares issued and outstanding as of March 31, 2019 and December 31, 2018, respectively | | | 36 | | | | 15 | |
Additional paid-in capital | | | 230,689 | | | | 148,770 | |
Accumulated deficit and cumulative distributions | | | (5,828 | ) | | | (1,729 | ) |
Total equity | | | 224,985 | | | | 147,122 | |
Total liabilities and equity | | $ | 625,015 | | | $ | 164,963 | |
See accompanying notes to consolidated financial statements
1
Starwood Real Estate Income Trust, Inc.
Consolidated Statements of Operations (Unaudited)
(in thousands, except share and per share data)
| | Three Months Ended March 31, | |
| | 2019 | | | 2018 | |
Revenues | | | | | | | | |
Rental revenue | | $ | 4,310 | | | $ | — | |
Hotel revenue | | | 10,852 | | | | — | |
Other revenue | | | 253 | | | | — | |
Total revenues | | | 15,415 | | | | — | |
Expenses | | | | | | | | |
Rental property operating | | | 1,762 | | | | — | |
Hotel operating | | | 5,503 | | | | — | |
General and administrative expenses | | | 912 | | | | 16 | |
Performance participation allocation | | | 857 | | | | — | |
Depreciation and amortization | | | 5,358 | | | | — | |
Total expenses | | | 14,392 | | | | 16 | |
Other income (expense) | | | | | | | | |
Earnings from unconsolidated real estate ventures | | | 43 | | | | — | |
Income from real estate-related securities, net | | | 102 | | | | — | |
Interest income | | | 58 | | | | — | |
Interest expense | | | (3,598 | ) | | | — | |
Other expense | | | (96 | ) | | | — | |
Total other (expense) income | | | (3,491 | ) | | | — | |
Net loss | | $ | (2,468 | ) | | $ | (16 | ) |
Net loss per share of common stock, basic and diluted | | $ | (0.24 | ) | | $ | (1.55 | ) |
Weighted-average shares of common stock outstanding, basic and diluted | | | 10,089,598 | | | | 10,000 | |
See accompanying notes to consolidated financial statements
2
Starwood Real Estate Income Trust, Inc.
Consolidated Statement of Changes in Equity (Unaudited)
(in thousands)
| | Par Value | | | | | | | | | | | | | |
| | Common Stock Class T | | | Common Stock Class S | | | Common Stock Class D | | | Common Stock Class I | | | Additional Paid-In Capital | | | Accumulated Deficit and Cumulative Distributions | | | Total Equity | |
Balance at December 31, 2017 | | $ | — | | | $ | — | | | $ | — | | | $ | — | | | $ | 200 | | | $ | (36 | ) | | $ | 164 | |
Net loss | | | — | | | | — | | | | — | | | | — | | | | — | | | | (16 | ) | | | (16 | ) |
Balance at March 31, 2018 | | $ | — | | | $ | — | | | $ | — | | | $ | — | | | $ | 200 | | | $ | (52 | ) | | $ | 148 | |
| | | | | | | | | | | | | | | | | | | | | | | | | | | | |
Balance at December 31, 2018 | | $ | — | | | $ | 66 | | | $ | — | | | $ | 15 | | | $ | 148,770 | | | $ | (1,729 | ) | | $ | 147,122 | |
Common stock issued | | | 2 | | | | 17 | | | | 3 | | | | 21 | | | | 85,543 | | | | — | | | | 85,586 | |
Offering costs | | | — | | | | — | | | | — | | | | — | | | | (4,049 | ) | | | — | | | | (4,049 | ) |
Distribution reinvestments | | | — | | | | — | | | | — | | | | — | | | | 396 | | | | — | | | | 396 | |
Amortization of restricted stock grants | | | — | | | | — | | | | — | | | | — | | | | 29 | | | | — | | | | 29 | |
Net loss | | | — | | | | — | | | | — | | | | — | | | | — | | | | (2,468 | ) | | | (2,468 | ) |
Distributions declared on common stock (see note 9) | | | — | | | | — | | | | — | | | | — | | | | — | | | | (1,631 | ) | | | (1,631 | ) |
Balance at March 31, 2019 | | $ | 2 | | | $ | 83 | | | $ | 3 | | | $ | 36 | | | $ | 230,689 | | | $ | (5,828 | ) | | $ | 224,985 | |
See accompanying notes to consolidated financial statements
3
Starwood Real Estate Income Trust, Inc.
Consolidated Statements of Cash Flows (Unaudited)
(in thousands)
| | Three Months Ended March 31, | |
| | 2019 | | | 2018 | |
Cash flows from operating activities | | | | | | | | |
Net loss | | $ | (2,468 | ) | | $ | (16 | ) |
Adjustments to reconcile net loss to net cash provided by operating activities | | | | | | | | |
Performance participation allocation | | | 857 | | | | — | |
Depreciation and amortization | | | 5,358 | | | | — | |
Amortization of deferred financing costs | | | 156 | | | | | |
Unrealized loss on changes in fair value of financial instruments | | | 130 | | | | — | |
Amortization of restricted stock grants | | | 29 | | | | — | |
Earnings from unconsolidated joint ventures | | | (43 | ) | | | — | |
Change in assets and liabilities | | | | | | | | |
(Increase) / decrease in other assets | | | (10,302 | ) | | | 16 | |
Increase / (decrease) in due to affiliates | | | 189 | | | | — | |
Increase / (decrease) in accounts payable, accrued expenses and other liabilities | | | 8,256 | | | | — | |
Net cash provided by operating activities | | | 2,162 | | | | — | |
Cash flows from investing activities | | | | | | | | |
Acquisition of real estate | | | (205,980 | ) | | | — | |
Capital improvements to real estate | | | (389 | ) | | | — | |
Pre-acquisition costs | | | — | | | | — | |
Purchase of real estate-related securities | | | (107,325 | ) | | | — | |
Proceeds from settlement of real estate-related securities | | | — | | | | — | |
Net cash used in investing activities | | | (313,694 | ) | | | — | |
Cash flows from financing activities | | | | | | | | |
Proceeds from issuance of common stock | | | 85,586 | | | | — | |
Offering costs paid | | | (730 | ) | | | — | |
Subscriptions received in advance, net | | | 40,354 | | | | — | |
Borrowings from mortgage notes | | | 47,948 | | | | — | |
Repayments from mortgage notes | | | (363 | ) | | | — | |
Borrowings under repurchase agreements | | | 68,362 | | | | — | |
Settlement of repurchase agreements | | | (4,795 | ) | | | — | |
Payment of deferred financing costs | | | (3,020 | ) | | | — | |
Distributions | | | (178 | ) | | | — | |
Net cash provided by financing activities | | | 233,164 | | | | — | |
Net change in cash and cash equivalents and restricted cash | | | (78,368 | ) | | | — | |
Cash and cash equivalents at the beginning of the period | | $ | 164,921 | | | $ | 200 | |
Cash and cash equivalents at the end of the period | | $ | 86,553 | | | $ | 200 | |
Reconciliation of cash and cash equivalents and restricted cash to the consolidated balance sheets: | | | | | | | | |
Cash and cash equivalents | | $ | 31,038 | | | $ | 200 | |
Restricted cash | | | 55,515 | | | | — | |
Total cash and cash equivalents and restricted cash | | $ | 86,553 | | | $ | 200 | |
Non-cash financing activities: | | | | | | | | |
Assumption of mortgage notes in conjunction with acquisitions in real estate | | $ | 220,932 | | | $ | — | |
Accrued stockholder servicing fee due to affiliate | | $ | 3,150 | | | $ | — | |
Accrued offering costs due to affiliates | | $ | 159 | | | $ | — | |
Accrued distributions | | $ | 1,058 | | | $ | — | |
Distribution reinvestment | | $ | 396 | | | $ | — | |
See accompanying notes to consolidated financial statements
4
Starwood Real Estate Income Trust, Inc.
Notes to Consolidated Financial Statements
(Unaudited)
1. | Organization and Business Purpose |
Starwood Real Estate Income Trust, Inc. (the “Company”) was formed on June 22, 2017 as a Maryland corporation and intends to qualify as a real estate investment trust (“REIT”) for U.S. federal income tax purposes. The Company is the sole general partner of Starwood REIT Operating Partnership, L.P., a Delaware limited partnership (the “Operating Partnership”). Starwood REIT Special Limited Partner, L.L.C. (the “Special Limited Partner”), a wholly owned subsidiary of Starwood Capital Group Holdings, L.P. (the “Sponsor”), owns a special limited partner interest in the Operating Partnership. The Company was organized to invest primarily in stabilized, income-oriented commercial real estate and debt secured by commercial real estate. The Company’s portfolio principally is comprised of properties, and debt secured by properties, located in the United States but may also be diversified on a global basis through the acquisition of properties, and debt secured by properties, outside of the United States, with a focus on Europe. To a lesser extent, the Company invests in real estate-related securities. Substantially all of the Company’s business is conducted through the Operating Partnership. The Company and the Operating Partnership are externally managed by Starwood REIT Advisors, L.L.C. (the “Advisor”), an affiliate of the Sponsor.
The Company has registered with the Securities and Exchange Commission (the “SEC”) an offering of up to $5.0 billion in shares of common stock, consisting of up to $4.0 billion in shares in its primary offering and up to $1.0 billion in shares pursuant to its distribution reinvestment plan (the “Offering”). The Company intends to sell any combination of four classes of shares of its common stock, with a dollar value up to the maximum aggregate amount of the Offering. The share classes have different upfront selling commissions, dealer manager fees and ongoing stockholder servicing fees. As of March 31, 2019, the Company had received net proceeds of $249.5 million from selling an aggregate of 12,460,453 shares of the Company’s common stock (consisting of 207,535 Class T shares, 8,340,840 Class S shares, 309,860 Class D shares and 3,602,218 Class I shares). The Company intends to continue selling shares on a monthly basis.
As of March 31, 2019, the Company owned 15 investments in real estate and had 30 positions in real estate-related securities. The Company currently operates in three reportable segments: Multifamily, Hotel and Real Estate-Related Securities. Financial results by segment are reported in Note 12 – Segment Reporting.
2. | Summary of Significant Accounting Policies |
Principles of Consolidation and Basis of Presentation
The accompanying unaudited consolidated financial statements have been prepared in accordance with accounting principles generally accepted in the United States of America (“GAAP”) for interim financial information and the instructions to Form 10-Q and Rule 10-01 of Regulation S-X. All significant intercompany balances and transactions have been eliminated in consolidation. The consolidated financial statements, including the notes thereto, are unaudited and exclude some of the disclosures required in audited financial statements. Management believes it has made all necessary adjustments, consisting of only normal recurring items, so that the consolidated financial statements are presented fairly and that estimates made in preparing its consolidated financial statements are reasonable and prudent. The accompanying unaudited consolidated interim financial statements should be read in conjunction with the audited consolidated financial statements included in the Company’s Annual Report on Form 10-K for the fiscal year ended December 31, 2018 filed with the SEC.
Certain amounts in the Company’s prior period consolidated financial statements have been reclassified to conform to the current period presentation. The Company has chosen to aggregate certain financial statement line items in the Company’s Consolidated Statements of Operations and Consolidated Statements of Cash Flows. Such reclassifications had no effect on net loss or previously reported totals or subtotals in the Consolidated Statements of Operations and the Consolidated Statements of Cash Flows.
In determining whether the Company has a controlling financial interest in a partially owned entity and the requirement to consolidate the accounts of that entity, the Company considers whether the entity is a variable interest entity (“VIE”) and whether it is the primary beneficiary. The Company is the primary beneficiary of a VIE when it has (i) the power to direct the most significant activities impacting the economic performance of the VIE and (ii) the obligation to absorb losses or receive benefits significant to the VIE. The Operating Partnership and each of the Company’s joint ventures are considered to be a VIE. The Company consolidates the Operating Partnership because it has the ability to direct the most significant activities of the entities such as purchases, dispositions, financings, budgets, and overall operating plans. Where the Company does not have the power to direct the activities of the VIE that most significantly impact its economic performance, the Company's interest in partially owned entities are accounted for using the equity method of accounting.
5
The preparation of financial statements in conformity with GAAP requires management to make estimates and assumptions that affect the reported amounts of assets and liabilities and disclosures of contingent assets and liabilities at the date of the balance sheet. Actual results could differ from those estimates.
Cash and Cash Equivalents
Cash and cash equivalents represent cash held in banks, cash on hand, and liquid investments with original maturities of three months or less. The Company may have bank balances in excess of federally insured amounts; however, the Company deposits its cash and cash equivalents with high credit-quality institutions to minimize credit risk exposure.
Restricted Cash
As of March 31, 2019 and December 31, 2018, restricted cash primarily consists of $41.3 million and $0.9 million respectively, of cash received for subscriptions prior to the date in which the subscriptions are effective. The Company’s restricted cash is held primarily in a bank account controlled by the Company’s transfer agent but in the name of the Company. The remaining balance of restricted cash primarily consists of amounts in escrow related to real estate taxes and insurance in connection with mortgages at certain of our properties and tenant security deposits.
Investments in Real Estate
In accordance with the guidance for business combinations, the Company determines whether the acquisition of a property qualifies as a business combination, which requires that the assets acquired and liabilities assumed constitute a business. If the property acquired is not a business, the Company accounts for the transaction as an asset acquisition. All property acquisitions to date have been accounted for as asset acquisitions.
The Company capitalizes acquisition-related costs associated with asset acquisitions. Upon acquisition of a property, the Company assesses the fair value of acquired tangible and intangible assets (including land, buildings, tenant improvements, “above-market” and “below-market” leases, acquired in-place leases, other identified intangible assets and assumed liabilities) and allocates the purchase price to the acquired assets and assumed liabilities. The Company assesses and considers fair value based on estimated cash flow projections that utilize discount and/or capitalization rates that it deems appropriate, as well as other available market information. Estimates of future cash flows are based on a number of factors including the historical operating results, known and anticipated trends, and market and economic conditions.
The fair value of the tangible assets of an acquired property considers the value of the property as if it were vacant. The Company also considers an allocation of purchase price of other acquired intangibles, including acquired in-place leases that may have a customer relationship intangible value, including (but not limited to) the nature and extent of the existing relationship with the tenants, the tenants’ credit quality and expectations of lease renewals. Based on its acquisitions to date, the Company’s allocation to customer relationship intangible assets has not been material. Intangible assets are recorded as a component of Other Assets on the Company’s Consolidated Balance Sheets.
The cost of buildings and improvements includes the purchase price of the Company’s properties and any acquisition-related costs, along with any subsequent improvements to such properties. The Company’s investments in real estate are stated at cost and are generally depreciated on a straight-line basis over the estimated useful lives of the assets as follows:
Description | | Depreciable Life |
Building | | 35 - 40 years |
Building and site improvements | | 5 - 15 years |
Furniture, fixtures and equipment | | 5 - 7 years |
Lease intangibles | | Over lease term |
Repairs and maintenance are expensed to operations as incurred and are included in Rental property operating and Hotel operating expenses on the Company’s Consolidated Statements of Operations. Significant improvements to properties are capitalized. When assets are sold or retired, their costs and related accumulated depreciation are removed from the accounts with the resulting gains or losses reflected in net income or loss for the period.
6
The amortization of acquired above-market and below-market leases is recorded as an adjustment to rental revenue on the Consolidated Statements of Operations. The amortization of in-place leases is recorded as an adjustment to depreciation and amortization expense on the Consolidated Statements of Operations.
The Company’s management reviews its real estate properties for impairment when there is an event or change in circumstances that indicates an impaired value. Since cash flows on real estate properties considered to be “long-lived assets to be held and used” are considered on an undiscounted basis to determine whether an asset has been impaired, the Company’s strategy of holding properties over the long term directly decreases the likelihood of recording an impairment loss. If the Company’s strategy changes or market conditions otherwise dictate an earlier sale date, an impairment loss may be recognized and such loss could be material to the Company’s results. If the Company determines that an impairment has occurred, the affected assets must be reduced to their fair value, less cost to sell. During the period presented, no such impairment occurred.
Investments in Unconsolidated Real Estate Ventures
Investments in unconsolidated joint ventures are recorded initially at cost, and subsequently adjusted for equity in earnings and cash contributions and distributions. Under the equity method of accounting, the net equity investment of the Company is reflected within the Consolidated Balance Sheets, and the Company’s share of net income or loss from the joint ventures is included within the Consolidated Statements of Operations. The joint venture agreements may designate different percentage allocations among investors for profits and losses; however, the Company’s recognition of joint venture income or loss generally follows the joint venture’s distribution priorities, which may change upon the achievement of certain investment return thresholds. The Company’s investments in unconsolidated joint ventures are reviewed for impairment periodically and the Company records impairment charges when events or circumstances change indicating that a decline in the fair values below the carrying values has occurred and such decline is other-than-temporary. The ultimate realization of the investment in unconsolidated joint ventures is dependent on a number of factors, including the performance of each investment and market conditions. The Company will record an impairment charge if it determines that a decline in the value below the carrying value of an investment in an unconsolidated joint venture is other-than-temporary.
Investments in Real Estate-Related Securities
The Company has elected to classify its investment in real estate-related securities as trading securities and carry such investments at estimated fair value. As such, the resulting gains and losses are recorded as a component of Income from real estate-related securities on the Consolidated Statements of Operations. The Company’s investments in real estate-related securities consist of residential mortgage-backed securities (“RMBS”) and collateralized debt obligations (“CDO”).
Fair Value of Financial Instruments, Including Derivative Instruments
The valuation of financial instruments requires the Company to make estimates and judgments that affect the fair value of the instruments. The Company, where possible, bases the fair values of its financial instruments, including its derivative instruments, on listed market prices and third party quotes. Where these are not available, the Company bases its estimates on current instruments with similar terms and maturities or on other factors relevant to the financial instruments.
In the normal course of business, the Company is exposed to the effect of interest rate changes. The Company seeks to manage these risks by following established risk management policies and procedures including the use of derivatives to hedge interest rate risk on debt instruments. The Company recognizes all derivatives as either assets or liabilities in the consolidated balance sheets and measures those instruments at fair value. Any derivative instrument used for risk management that does not meet the hedging criteria is marked-to-market each period as a component of interest expense.
Fair Value Measurement
Under normal market conditions, the fair value of an investment is the amount that would be received to sell an asset or transfer a liability in an orderly transaction between market participants at the measurement date (i.e., the exit price). Additionally, there is a hierarchal framework that prioritizes and ranks the level of market price observability used in measuring investments at fair value. Market price observability is impacted by a number of factors, including the type of investment and the characteristics specific to the investment and the state of the market place, including the existence and transparency of transactions between market participants. Investments with readily available active quoted prices or for which fair value can be measured from actively quoted prices generally will have a higher degree of market price observability and a lesser degree of judgment used in measuring fair value.
7
Investments measured and reported at fair value are classified and disclosed in one of the following levels within the fair value hierarchy:
Level 1 — quoted prices are available in active markets for identical investments as of the measurement date. The Company does not adjust the quoted price for these investments.
Level 2 — quoted prices are available in markets that are not active or model inputs are based on inputs that are either directly or indirectly observable as of the measurement date.
Level 3 — pricing inputs are unobservable and include instances where there is minimal, if any, market activity for the investment. These inputs require significant judgment or estimation by management or third parties when determining fair value and generally represent anything that does not meet the criteria of Levels 1 and 2. Due to the inherent uncertainty of these estimates, these values may differ materially from the values that would have been used had a ready market for these investments existed.
The fair values of the Company’s financial instruments (other than mortgage notes payable and derivative instruments), including cash and cash equivalents and other financial instruments, approximate their carrying or contract value. The following table provides a summary of the carrying and fair values for the Company’s mortgage notes payable, consolidated derivative instruments and investments in real estate-related securities at March 31, 2019 (amounts in thousands):
| | Estimated Fair Value (Level 2) | | | | Estimated Fair Value (Level 3) | | | | Carrying Value | |
Mortgage notes payable, net | $ | | — | | | $ | | 260,655 | | | $ | | 261,717 | |
Interest rate caps | | | 740 | | | | | — | | | | | 740 | |
Investments in real estate-related securities | | | 107,195 | | | | | — | | | | | 107,195 | |
The Company generally determines the fair value of its real estate-related securities by utilizing third-party pricing service providers. In determining the value of a particular investment, pricing service providers may use broker-dealer quotations, reported trades or valuation estimates from their internal pricing models to determine the reported price. The pricing service providers’ internal models for mortgage-related securities such as RMBS usually consider the attributes applicable to a particular class of security (e.g., credit rating, seniority), current market data, and estimated cash flows for each class and incorporate deal collateral performance such as prepayment speeds and default rates, as available.
Fair value of the Company’s indebtedness is estimated by modeling the cash flows required by the Company’s debt agreements and discounting them back to the present value using the appropriate discount rate. Additionally, the Company considers current market rate and conditions by evaluating similar borrowing agreements with comparable loan-to-value ratios and credit profiles. The inputs used in determining the fair value of the Company’s indebtedness are considered Level 3.
The Company’s derivative positions are valued using models developed by the respective counterparty as well as third party pricing service providers that use as their basis readily observable market parameters (such as forward yield curves and credit default swap data). The fair values disclosed for mortgage notes payable were calculated using indicative rates provided by lenders of similar loans in the case of mortgage notes payable.
Deferred Charges
The Company’s deferred charges include financing costs. Deferred financing costs include legal, structuring, and other loan costs incurred by the Company for its financing agreements. Deferred financing costs related to the Company’s mortgage notes and term loans are recorded as an offset to the related liability and amortized over the term of the applicable financing instruments as interest expense.
Revenue Recognition
The Company commences revenue recognition on its leases based on a number of factors, including the initial determination that the contract is or contains a lease. Generally, all of the Company’s contracts are, or contain leases, and therefore revenue is recognized when the lessee takes possession of or controls the physical use of the leased assets. In most instances this occurs on the lease commencement date. At the inception of a new lease, including new leases that arise from amendments, the Company assesses the terms and conditions of the lease to determine the proper lease classification.
8
As described in recent Accounting Pronouncements elsewhere in Note 2, the Company adopted the provisions of Accounting Standards Update (“ASU”) 2016-02, Leases (Topic 842) and related ASUs subsequently issued (collectively, “ASC 842”) as of January 1, 2019.
A lease is classified as an operating lease if none of the following criteria are met: (i) ownership transfers to the lessee at the end of the lease term, (ii) the lessee has a purchase option that is reasonably expected to be exercised, (iii) the lease term is for a major part of the economic life of the leased property, (iv) the present value of the future lease payments and any residual value guaranteed by the lessee that is not already reflected in the lease payments equals or exceeds substantially all of the fair value of the leased property, and (v) the leased property is of such a specialized nature that it is expected to have no future alternative use to the Company at the end of the lease term. If one or more of these criteria are met, the lease will generally be classified as a sales-type lease, unless the lease contains a residual value guarantee from a third party other than the lessee, in which case it would be classified as a direct financing lease under certain circumstances in accordance with ASC 842.
The Company’s Rental revenue primarily consists of base rent arising from tenant leases at the Company’s multifamily properties under operating leases. Revenue under operating leases is recognized as revenue on a straight-line basis over the non-cancelable terms of the related leases. For leases that have fixed and measurable rent escalations, the difference between such rental income earned and the cash rent due under the provisions of the lease is recorded in the Consolidated Balance Sheets. The Company’s Hotel revenue consists of room revenue and food and beverage revenue. Room revenue is recognized when the related room is occupied and other hotel revenue is recognized when the service is rendered.
Certain of the Company’s contracts contain nonlease components (e.g., charges for management fees, common area maintenance, and reimbursement of third-party maintenance expenses) in addition to lease components (i.e., monthly rental charges). Services related to nonlease components are provided over the same period of time as, and billed in the same manner as, monthly rental charges. The Company elected to apply the practical expedient available under ASC 842, for all classes of assets, not to segregate the lease components from the nonlease components when accounting for operating leases. Since the lease component is the predominant component under each of these leases, combined revenues from both the lease and nonlease components are accounted for in accordance with ASC 842 and reported as rental revenues in the accompanying Consolidated Statements of Operations.
Other revenues and interest income are recorded on an accrual basis.
Organization and Offering Expenses
Organization expenses are expensed as incurred and recorded as a component of General and Administrative Expenses on the Company’s Consolidated Statements of Operations and offering costs are charged to equity as such amounts are incurred.
The Advisor has agreed to advance organization and offering expenses on behalf of the Company (including legal, accounting, and other expenses attributable to the organization, but excluding upfront selling commissions, dealer manager fees and stockholder servicing fees) through the first anniversary of the date on which the proceeds from escrow are released. The Company will reimburse the Advisor for all such advanced expenses ratably over a 60 month period following December 21, 2019. These organization and offering costs are recorded as a component of Due to affiliates on the Company’s Consolidated Balance Sheets as of March 31, 2019 and December 31, 2018.
Starwood Capital, L.L.C. (the “Dealer Manager”), a registered broker-dealer affiliated with the Advisor, serves as the dealer manager for the Offering. The Dealer Manager is entitled to receive selling commissions and dealer manager fees based on the transaction price of each applicable class of shares sold in the Offering. The Dealer Manager is also entitled to receive a stockholder servicing fee of 0.85%, 0.85% and 0.25% per annum of the aggregate net asset value (“NAV”) of the Company’s outstanding Class T shares, Class S shares and Class D shares, respectively. There is no stockholder servicing fee with respect to Class I shares.
The following table details the selling commissions, dealer manager fees, and stockholder servicing fees for each applicable share class as of March 31, 2019:
| | Common Stock Class T | | | Common Stock Class S | | | Common Stock Class D | | | Common Stock Class I |
Selling commissions and dealer manager fees (% of transaction price) | | up to 3.5% | | | up to 3.5% | | | — | | | — |
Stockholder servicing fee (% of NAV) | | 0.85% | | | 0.85% | | | 0.25% | | | — |
9
For Class S shares sold in the primary offering, investors will pay upfront selling commissions of up to 3.5% of the transaction price. For Class T shares sold in the primary offering, investors will pay upfront selling commissions of up to 3.0% of the transaction price and upfront dealer manager fees of 0.5% of the transaction price, however such amounts may vary at certain participating broker-dealers, provided that the sum will not exceed 3.5% of the transaction price.
The Dealer Manager is entitled to receive stockholder servicing fees of 0.85% per annum of the aggregate NAV for Class S shares and Class T shares. For Class T shares such stockholder servicing fee includes, an advisor stockholder servicing fee of 0.65% per annum, and a dealer stockholder servicing fee of 0.20% per annum, of the aggregate NAV for the Class T shares, however, with respect to Class T shares sold through certain participating broker-dealers, the advisor stockholder servicing fee and the dealer stockholder servicing fee may be other amounts, provided that the sum of such fees will always equal 0.85% per annum of the NAV of such shares. The Class D shares will incur a stockholder servicing fee equal to 0.25% per annum of the aggregate NAV for the Class D shares.
The Dealer Manager has entered into agreements with the selected dealers distributing the Company’s shares in the Offering, which provide, among other things, for the re-allowance of the full amount of the selling commissions and dealer manager fees received and all or a portion of the stockholder servicing fees to such selected dealers. The Company will cease paying the stockholder servicing fee with respect to any Class T share, Class S share or Class D share sold in the primary Offering at the end of the month in which the total selling commissions, dealer manager fees and stockholder servicing fees paid with respect to such share would exceed 8.75% (or, in the case of Class T shares sold through certain participating broker-dealers, a lower limit as set forth in any applicable agreement between the Dealer Manager and a participating broker-dealer) of the gross proceeds from the sale of such share (including the gross proceeds of any shares issued under the Company’s distribution reinvestment plan with respect thereto). The Company will accrue the full cost of the stockholder servicing fee as an offering cost at the time each Class T, Class S and Class D share is sold during the primary Offering. As of March 31, 2019 and December 31, 2018, the Company had accrued $14.0 million and $10.8 million respectively, of stockholder servicing fees related to shares sold and recorded such amount as a component of Due to affiliates on the Company’s consolidated balance sheets.
Income Taxes
The Company intends to make an election to be taxed as a REIT under Sections 856 through 860 of the Internal Revenue Code commencing with its taxable year ending December 31, 2019. If the Company qualifies for taxation as a REIT, the Company generally will not be subject to federal corporate income tax to the extent it distributes 90% of its taxable income to its stockholders. REITs are subject to a number of other organizational and operational requirements. Even if the Company qualifies for taxation as a REIT, it may be subject to certain state and local taxes on its income and property, and federal income and excise taxes on its undistributed income. In anticipation of the Company’s REIT election, the Company has formed wholly-owned subsidiaries to function as taxable REIT subsidiaries (“TRSs”). In general, a TRS may perform additional services for the Company’s tenants and generally may engage in any real estate or non-real estate-related business other than management or operation or operation of a lodging facility or a health care facility. The TRSs will be subject to taxation at the federal, state and local levels, as applicable. The Company accounts for applicable income taxes by utilizing the asset and liability method. As such, the Company records deferred tax assets and liabilities for the future tax consequences resulting from the difference between the carrying value of existing assets and liabilities and their respective tax basis. A valuation allowance for deferred tax assets is provided if the Company believes all or some portion of the deferred tax asset may not be realized.
The Company intends to file as taxable corporation for its tax year ended December 31, 2018. For the period ended March 31, 2019 and March 31, 2018, recognized an income tax provision of $0.1 million and $0.0 respectively.
Net Loss per Share
Basic net loss per share is computed by dividing net loss for the period by the weighted average number of common shares outstanding during the period. Diluted loss per share is computed by dividing net loss for the period by the weighted average number of common shares and common share equivalents outstanding (unless their effect is antidilutive) for the period. There are no common share equivalents outstanding that would have a dilutive effect as a result of the net loss, and accordingly, the weighted average number of common shares outstanding is identical for the periods ended March 31, 2019 and March 31, 2018, for both basic and diluted shares.
Recent Accounting Pronouncements
On August 2018, the Financial Accounting Standards Board (“FASB”) issued ASU 2018-13, “Fair Value Measurement (Topic 820) – Disclosure Framework,” which adds new disclosure requirements and modifies or eliminates existing disclosure requirements of ASC 820. This ASU is effective for annual periods, and interim periods therein, beginning after December 15, 2019. Early application is permitted. The Company does not expect the application of this ASU to materially impact the Company.
10
Investments in Real Estate
Investments in real estate, net consisted of the following ($ in thousands):
| | | March 31, 2019 | |
Building and building improvements | | $ | | 307,242 | |
Land and land improvements | | | | 81,030 | |
Furniture, fixtures and equipment | | | | 25,442 | |
Total | | | | 413,714 | |
Accumulated depreciation | | | | (3,649 | ) |
Investments in real estate, net | | $ | | 410,065 | |
During the three months ended March 31, 2019, the Company acquired wholly owned interests in fourteen properties, which were comprised of six multifamily and eight hotel properties. As of December 31, 2018, the Company had not commenced its principal operations and had not acquired any real estate investment properties.
The following table provides further details of the properties acquired during the three months ended March 31, 2019 ($ in thousands):
Investment | | Ownership Interest | | | Number of Properties | | Location | | Sector | | Acquisition Date | | Real Estate Acquisition | |
Florida Multifamily Portfolio | | 100% | | | 4 | | Jacksonville/Naples, FL | | Multifamily | | January 2019 | | $ | 104,049 | |
U.S. Select Service Portfolio | | 100% | | | 8 | | FL, CO, TN, OH, AR | | Hotel | | January 2019 | | | 232,198 | |
All other | | 100% | | | 2 | | Various | | Multifamily | | January 2019 | | | 82,988 | |
| | | | | | 14 | | | | | | | | $ | 419,235 | |
The following table summarizes the purchase price allocation for the properties acquired during the three months ended March 31, 2019 ($ in thousands):
| Florida Multifamily Portfolio | | | U.S. Select Service | | | All Other | | | Total | |
Building and building improvements | $ | | 71,054 | | | $ | | 164,266 | | | $ | | 65,974 | | | $ | | 301,294 | |
Land and land improvements | | | 25,620 | | | | | 42,256 | | | | | 13,227 | | | | | 81,103 | |
Furniture, fixtures and equipment | | | 1,195 | | | | | 22,377 | | | | | 1,742 | | | | | 25,314 | |
Other intangibles | | | 1,756 | | | | | 101 | | | | | 1,066 | | | | | 2,923 | |
Total purchase price(1) | $ | | 99,625 | | | $ | | 229,000 | | | $ | | 82,009 | | | $ | | 410,634 | |
Assumed mortgage notes(2) | | | (79,269 | ) | | | | (84,013 | ) | | | | (57,651 | ) | | | | (220,933 | ) |
Net purchase price | $ | | 20,356 | | | $ | | 144,987 | | | $ | | 24,358 | | | $ | | 189,701 | |
(1) | Purchase price does not include acquisition related costs and acquired working capital of $8,600. |
(2) | See Note 6 for additional details on the Company’s mortgage notes. |
Investments in unconsolidated real estate ventures
On March 13, 2019, the Company entered into a joint venture (the "Joint Venture") to acquire a Fort Lauderdale Hotel. The Company owns a 43% interest in the Joint Venture. The Company does not have a controlling financial interest in the VIE and is not the VIE’s primary beneficiary. As a result, the Joint Venture is accounted for using the equity method of accounting and is included in investment in unconsolidated real estate venture in the Company’s consolidated balance sheets. The Company's investment in the Joint Venture totaled $12.6 million as of March 31, 2019. The Company’s earnings from its investment in the Joint Venture is presented in earnings from unconsolidated joint ventures on the Company’s Consolidated Statements of Operations and totaled $0.1 million for the three months ended March 31, 2019.
11
The gross carrying amount and accumulated amortization of the Company’s intangible assets and liabilities consisted of the following ($ in thousands):
| March 31, 2019 | |
Intangible assets: | | | | |
In-place lease intangibles | $ | | 2,828 | |
Other | | | 1,200 | |
Total intangible assets | | | 4,028 | |
Accumulated amortization: | | | | |
In-place lease amortization | | | (1,690 | ) |
Other | | | (20 | ) |
Total accumulated amortization | | | (1,710 | ) |
Intangible assets, net | $ | | 2,318 | |
The estimated future amortization on the Company’s intangibles for each of the next five years and thereafter as of March 31, 2019 is as follows ($ in thousands):
| | In-place Lease Intangibles | | | Other | |
2019 (remaining) | | $ | | 1,138 | | | $ | | 60 | |
2020 | | | | — | | | | | 80 | |
2021 | | | | — | | | | | 80 | |
2022 | | | | — | | | | | 80 | |
2023 | | | | — | | | | | 80 | |
Thereafter | | | | — | | | | | 800 | |
| | $ | | 1,138 | | | $ | | 1,180 | |
5. | Investments in Real Estate-Related Securities |
The following table details the Company’s investments in real estate-related debt securities, which are comprised of RMBS and CDO ($ in thousands):
Instrument | | Number of Positions | | Credit Rating(1) | | Weighted Average Coupon | | | Weighted Average Maturity Date | | Cost Basis | | | Fair Value | |
RMBS | | 22 | | Other | | 4.25% | | | March 5, 2023 | | $ | 86,985 | | | $ | 86,973 | |
CDO | | 8 | | BBB | | 5.89% | | | June 7, 2020 | | | 20,340 | | | | 20,222 | |
| | 30 | | | | | | | | | | $ | 107,325 | | | $ | 107,195 | |
(1) | BBB represents credit ratings of BBB+, BBB, and BBB-. Other consists of investments that, as of March 31, 2019, were either not ratable or have not been submitted to ratings agencies. |
During the three months ended March 31, 2019, the Company recorded an unrealized loss of $0.1 million on its investments in real estate-related securities and recorded such amount as a component of income from real estate-related securities on its Consolidated Statements of Operations. During the three months ended March 31, 2019, the Company did not sell any securities.
12
The following table is a summary of the mortgage notes secured by the Company’s properties ($ in thousands):
Indebtedness | | Weighted Average Interest Rate(1) | | Weighted Average Maturity Date | | Principal Balance(2) | |
Fixed rate loans | | | | | | | | | |
Fixed rate mortgages | | 4.35% | | 12/11/2024 | | $ | | 156,118 | |
Total fixed rate loans | | | | | | | | 156,118 | |
Variable rate loans | | | | | | | | | |
Variable rate mortgages | | L + 1.98% | | 6/30/2026 | | | | 105,599 | |
Total variable rate loans | | | | | | | | 105,599 | |
Total loans secured by our properties | | | | | | | | 261,717 | |
Deferred financing costs, net | | | | | | | | (2,864 | ) |
Discount on assumed debt, net | | | | | | | | (1,062 | ) |
Mortgage notes, net | | | | | | $ | | 257,791 | |
(1) | The term “L” refers to the one-month LIBOR. As of March 31, 2019, one-month LIBOR was equal to 2.5%. |
(2) | The majority of the Company’s mortgages contain yield or spread maintenance provisions. |
The following table presents the future principal payments under the Company’s mortgage notes as of March 31, 2019 ($ in thousands):
Year | | Amount | |
2019 (remaining) | | $ | | 1,061 | |
2020 | | | | 1,477 | |
2021 | | | | 49,502 | |
2022 | | | | 1,624 | |
2023 | | | | 1,697 | |
Thereafter | | | | 206,356 | |
Total | | $ | | 261,717 | |
Repurchase agreements are treated as collateralized financing transactions and are carried at their contractual amounts, including accrued interest, as specified in the respective agreements. Although structured as a sale and repurchase obligation, a repurchase agreement operates as a financing under which securities are pledged as collateral to secure a short-term loan equal in value to a specified percentage of the market value of the pledged collateral. While used as collateral, the Company retains beneficial ownership of the pledged collateral, including the right to distributions. At the maturity of a repurchase agreement, the Company is required to repay the loan and concurrently receive the pledged collateral from the lender or, with the consent of the lender, renew such agreement at the then prevailing financing rate. The Company’s repurchase agreements typically have terms of up to one month at inception, with some having longer terms.
For financial statement purposes, the Company does not offset its repurchase agreements and securities lending transactions because the conditions for netting as specified by GAAP are not met. Although not offset on the Consolidated Balance Sheets, these transactions are included in the following table ($ in thousands):
| | March 31, 2019 | |
Security Interest | | Collateral Assets (1) | | | Outstanding Balance | |
RMBS | | $ | 57,778 | | | $ | 48,867 | |
CDO | | | 18,511 | | | | 14,700 | |
| | $ | 76,289 | | | $ | 63,567 | |
(1) | Represents the fair value of the Company’s investments in real estate-related securities. |
13
8. | Other Assets and Other Liabilities |
The following table summarizes the components of other assets ($ in thousands):
| | March 31, 2019 | | | December 31, 2018 | |
Receivables | | $ | | 4,182 | | | $ | | — | |
Real estate intangibles, net | | | | 2,318 | | | | | — | |
Interest rate caps | | | | 740 | | | | | — | |
Interest receivable | | | | 662 | | | | | 8 | |
Prepaid expenses | | | | 381 | | | | | — | |
Other | | | | 351 | | | | | 34 | |
Total | | $ | | 8,634 | | | $ | | 42 | |
The following table summarizes the components of accounts payable, accrued expenses, and other liabilities ($ in thousands):
| | March 31, 2019 | | | December 31, 2018 | |
Subscriptions received in advance | | $ | | 41,254 | | | $ | | 900 | |
Deferred income | | | | 7,289 | | | | | — | |
Accounts payable and accrued expenses | | | | 5,839 | | | | | 187 | |
Distribution payable | | | | 1,058 | | | | | — | |
Tenant security deposits | | | | 652 | | | | | — | |
Accrued interest expense | | | | 464 | | | | | — | |
Real estate taxes payable | | | | 152 | | | | | — | |
Other | | | | 845 | | | | | — | |
Total | | $ | | 57,553 | | | $ | | 1,087 | |
Authorized Capital
The Company is authorized to issue preferred stock and four classes of common stock consisting of Class T shares, Class S shares, Class D shares, and Class I shares. The Company’s board of directors has the ability to establish the preferences and rights of each class or series of preferred stock, without stockholder approval, and as such, it may afford the holders of any series or class of preferred stock preferences, powers and rights senior to the rights of holders of common stock. The differences among the common share classes relate to upfront selling commissions, dealer manager fees and ongoing stockholder servicing fees. See Note 2 for a further description of such items. Other than the differences in upfront selling commissions, dealer manager fees and ongoing stockholder servicing fees, each class of common stock is subject to the same economic and voting rights.
As of March 31, 2019, the Company had the authority to issue 1,100,000,000 shares of capital stock, consisting of the following:
Classification | | Number of Shares | | | Par Value | |
Preferred Stock | | | 100,000,000 | | | $ | 0.01 | |
Class T Shares | | | 250,000,000 | | | $ | 0.01 | |
Class S Shares | | | 250,000,000 | | | $ | 0.01 | |
Class D Shares | | | 250,000,000 | | | $ | 0.01 | |
Class I Shares | | | 250,000,000 | | | $ | 0.01 | |
Total | | | 1,100,000,000 | | | | | |
14
Common Stock
As of March 31, 2019, the Company had sold 12,460,453 shares of its common stock in the Offering for aggregate net proceeds of $249.5 million. The following table details the movement in the Company’s outstanding shares of common stock:
| | Three months ended March 31, 2019 | |
| | Class T | | | Class S | | | Class D | | | Class I | | | Total | |
December 31, 2018 | | | 483 | | | | 6,610,280 | | | | 46,075 | | | | 1,542,000 | | | | 8,198,838 | |
Common stock issued | | | 206,975 | | | | 1,717,020 | | | | 263,697 | | | | 2,054,214 | | | | 4,241,906 | |
Distribution reinvestment | | | 77 | | | | 13,540 | | | | 88 | | | | 6,004 | | | | 19,709 | |
March 31, 2019 | | | 207,535 | | | | 8,340,840 | | | | 309,860 | | | | 3,602,218 | | | | 12,460,453 | |
Distributions
The Company intends to distribute substantially all of its taxable income to its stockholders each year to comply with the REIT provisions of the Internal Revenue Code.
The following table details the aggregate distributions declared for each applicable class of common stock for the three months ended March 31, 2019:
| | Class T | | | Class S | | | Class D | | | Class I | |
Gross distributions declared per share of common stock | | $ | | 0.1790 | | | $ | | 0.1790 | | | $ | | 0.1790 | | | $ | | 0.1790 | |
Stockholder servicing fee per share of common stock | | | | (0.0277 | ) | | | | (0.0449 | ) | | | | (0.0105 | ) | | | | — | |
Net distributions declared per share of common stock | | $ | | 0.1513 | | | $ | | 0.1341 | | | $ | | 0.1685 | | | $ | | 0.1790 | |
Share Repurchase Plan
The Company has adopted a share repurchase plan, whereby on a monthly basis, stockholders may request that the Company repurchase all or any portion of their shares. The Company may choose to repurchase all, some or none of the shares that have been requested to be repurchased at the end of any particular month, in its discretion, subject to any limitations in the share repurchase plan. The total amount of aggregate repurchases of Class T, Class S, Class D, and Class I shares will be limited to 2% of the aggregate NAV per month and 5% of the aggregate NAV per calendar quarter. Shares are repurchased at a price equal to the transaction price on the applicable repurchase date, subject to any early repurchase deduction. Shares that have not been outstanding for at least one year would be repurchased at 95% of the transaction price. Due to the illiquid nature of investments in real estate, the Company may not have sufficient liquid resources to fund repurchase requests and may elect not to repurchase some or all of the shares submitted for repurchase in a given period. Further, the Company may modify, suspend or terminate the share repurchase plan.
Distribution Reinvestment Plan
The Company has adopted a distribution reinvestment plan whereby stockholders (other than clients of participating broker dealers and residents of certain states that do not permit automatic enrollment in the distribution reinvestment plan) will have their cash distributions automatically reinvested in additional shares of common stock unless they elect to receive their distributions in cash. Residents of Alabama, Arkansas, Idaho, Kansas, Kentucky, Maine, Maryland, Massachusetts, Nebraska, North Carolina, New Jersey, Ohio, Oregon and Washington and clients of participating broker-dealers that do not permit automatic enrollment in the distribution reinvestment plan will automatically receive their distributions in cash unless they elect to have their cash distributions reinvested in additional shares of our common stock. The per share purchase price for shares purchased pursuant to the distribution reinvestment plan will be equal to the transaction price before upfront selling commissions and dealer manager fees at the time the distribution is payable, which will generally be equal to the Company’s prior month’s NAV per share for that share class. Stockholders will not pay upfront selling commissions or dealer manager fees when purchasing shares pursuant to the distribution reinvestment plan. The stockholder servicing fees with respect to shares of the Company’s Class T shares, Class S shares and Class D shares are calculated based on the NAV for those shares and may reduce the NAV or, alternatively, the distributions payable with respect to shares of each such class, including shares issued in respect of distributions on such shares under the distribution reinvestment plan.
15
10. | Related Party Transactions |
Acquisition of Initial Investments
On January 3, 2019, the Company acquired a multifamily property portfolio (the “Florida Multifamily Portfolio”) from an affiliate of the Advisor, for approximately $100 million, excluding closing costs. The Florida Multifamily Portfolio is a garden style multifamily portfolio totaling 1,150 units and comprised of two properties located in Jacksonville, Florida and two properties located in Naples, Florida. The affiliate of the Advisor acquired the Florida Multifamily Portfolio on October 5, 2018 from an unaffiliated third party for approximately $100 million, excluding closing costs.
On January 3, 2019, the Company acquired the Phoenix Property from an affiliate of the Advisor for approximately $46 million, excluding closing costs. The Phoenix Property is a garden style multifamily property totaling 256 units and located in Mesa, Arizona. An affiliate of the Advisor acquired the Phoenix Property on June 29, 2018 from an unaffiliated third party for approximately $46 million, excluding closing costs.
On January 3, 2019, the Company acquired the Savannah Property from an affiliate of the Advisor for approximately $36 million, excluding closing costs. The Savannah Property is a new construction multifamily property located in Savannah, Georgia totaling 203 units. An affiliate of the Advisor acquired Savannah Property on July 19, 2018 from an unaffiliated third party for approximately $36 million, excluding closing costs.
Management Fee and Performance Participation Allocation
The Advisor is entitled to an annual management fee equal to 1.25% of the Company’s NAV, payable monthly as compensation for the services it provides to the Company. The management fee can be paid, at the Advisor’s election, in cash, shares of common stock, or Operating Partnership units. The Advisor has agreed to waive its management fee through March 31, 2019.
Additionally, the Special Limited Partner, an affiliate of the Advisor, holds a performance participation interest in Operating Partnership that entitles it to receive an allocation of Operating Partnership’s total return to its capital account. Total return is defined as distributions paid or accrued plus the change in NAV. Under the Operating Partnership agreement, the annual total return will be allocated solely to the Special Limited Partner after the other unit holders have received a total return of 5% (after recouping any loss carryforward amount) and such allocation will continue until the allocation between the Special Limited Partner and all other unit holders is equal to 12.5% and 87.5%, respectively. Thereafter, the Special Limited Partner will receive an allocation of 12.5% of the annual total return. The annual distribution of the performance participation interest will be paid in cash or Class I units of Operating Partnership, at the election of the Special Limited Partner. During the period ended March 31, 2019, the Company recognized $0.9 million of Performance participation allocation in the Company’s Consolidated Statement of Operations.
Due to Affiliate
The following table details the components of Due to affiliates ($ in thousands):
| March 31, 2019 | | | December 31, 2018 | |
Accrued stockholder servicing fee | $ | | 13,980 | | | $ | | 10,830 | |
Advanced organization and offering costs | | | 5,992 | | | | | 5,822 | |
Performance participation allocation | | | 857 | | | | | — | |
Accrued affiliate service provider expenses | | | 45 | | | | | — | |
Advanced expenses | | | 245 | | | | | 102 | |
Total | $ | | 21,119 | | | $ | | 16,754 | |
16
Accrued stockholder servicing fee
As described in Note 2, the Company accrues the full amount of the future stockholder servicing fees payable to the Dealer Manager for Class T, Class S, and Class D shares up to the 8.75% limit at the time such shares are sold. As of March 31, 2019 and December 31, 2018, the Company has accrued $14.0 million and $10.8 million, respectively, of stockholder servicing fees payable to the Dealer Manager related to the Class T, Class S shares and Class D shares sold. The Dealer Manager has entered into agreements with the selected dealers distributing the Company’s shares in the Offering, which provide, among other things, for the re-allowance of the full amount of the selling commissions and dealer manager fee and all or a portion of the stockholder servicing fees received by the Dealer Manager to such selected dealers.
Advanced organization and offering costs
As of March 31, 2019 and December 31, 2018, The Advisor and its affiliates has incurred $6.0 million and $5.8 million, respectively of organization and offering costs (excluding upfront selling commissions, dealer manager fees and stockholder servicing fees) on behalf of the Company through March 31, 2019. Such amounts will be reimbursed to the Advisor ratably over 60 months beginning after December 21, 2019.
Advanced expenses
As of March 31, 2019 and December 31, 2018, the Advisor had advanced approximately $0.2 million and $0.1 million respectively, of expenses on the Company’s behalf for general corporate expenses provided by unaffiliated third parties. Such amounts will be reimbursed to the Advisor ratably over a 60 month period following December 21, 2019 (the date the proceeds from the Offering were released from escrow).
Accrued affiliate service provider expenses
The Company has engaged and expects to continue to engage Highmark Residential (formerly Milestone Management), a portfolio company owned by an affiliate of Starwood Capital Group, to provide day-to-day operational and management services (including leasing, construction management, revenue management, accounting, legal and contract management, expense management, and capital expenditure projects and transaction support services) for the Company’s multifamily properties. The cost for such services are a percentage of the gross receipts and project costs respectively (which will be reviewed periodically and adjusted if appropriate), plus actual costs allocated for transaction support services. During the three months ended March 31, 2019, the Company has incurred approximately $0.1 million of expenses due to Highmark Residential services in connection with its investments and such amount is included in rental property operating expenses on the Company’s Consolidated Statement of Operations.
11. | Commitments and Contingencies |
As of March 31, 2019 and December 31, 2018, the Company is not subject to any material litigation nor is the Company aware of any material litigation threatened against it.
17
The Company operates in three reportable segments: Multifamily properties, Hotel properties and Real Estate-Related Securities. The Company allocates resources and evaluates results based on the performance of each segment individually. The Company believes that Segment Net Operating Income is the key performance metric that captures the unique operating characteristics of each segment.
The following table sets forth the financial results by segment for the three months ended March 31, 2019 ($ in thousands):
| Multifamily | | | Hotel | | | Real Estate- Related Securities | | | Other (Corporate) (1) | | | Total | |
Total Assets | $ | | 190,852 | | | $ | | 258,519 | | | $ | | 113,141 | | | $ | | 62,503 | | | $ | | 625,015 | |
| | | | | | | | | | | | | | | | | | | | | | | | |
Revenue | | | | | | | | | | | | | | | | | | | | | | | | |
Rental revenue | $ | | 4,310 | | | $ | | — | | | $ | | — | | | $ | | — | | | $ | | 4,310 | |
Hotel revenue | | | — | | | | | 10,852 | | | | | — | | | | | — | | | | | 10,852 | |
Other revenue | | | 199 | | | | | 54 | | | | | — | | | | | — | | | | | 253 | |
Total revenues | | | 4,509 | | | | | 10,906 | | | | | — | | | | | — | | | | | 15,415 | |
Expenses | | | | | | | | | | | | | | | | | | | | | | | | |
Rental property operating | | | 1,762 | | | | | — | | | | | — | | | | | — | | | | | 1,762 | |
Hotel operating | | | — | | | | | 5,503 | | | | | — | | | | | — | | | | | 5,503 | |
Total segment expenses | | | 1,762 | | | | | 5,503 | | | | | — | | | | | — | | | | | 7,265 | |
Income from real estate-related securities | | | — | | | | | — | | | | | 102 | | | | | — | | | | | 102 | |
Earnings from unconsolidated real estate ventures | | | — | | | | | 43 | | | | | — | | | | | — | | | | | 43 | |
Segment net operating income | $ | | 2,747 | | | $ | | 5,446 | | | $ | | 102 | | | $ | | — | | | $ | | 8,295 | |
Depreciation and amortization | $ | | 3,304 | | | $ | | 2,054 | | | $ | | — | | | $ | | — | | | $ | | 5,358 | |
Other income (expense): | | | | | | | | | | | | | | | | | | | | | | | | |
General and administrative | | | | | | | | | | | | | | | | | | | | | | | (912 | ) |
Management fee | | | | | | | | | | | | | | | | | | | | | | | — | |
Performance participation allocation | | | | | | | | | | | | | | | | | | | | | | | (857 | ) |
Interest income | | | | | | | | | | | | | | | | | | | | | | | 58 | |
Interest expense | | | | | | | | | | | | | | | | | | | | | | | (3,598 | ) |
Other expense | | | | | | | | | | | | | | | | | | | | | | | (96 | ) |
Net loss | | | | | | | | | | | | | | | | | | | | | $ | | (2,468 | ) |
(1) | The Other (Corporate) segment captures cash and other item not directly identifiable with the other three reporting segments. |
Status of the Offering
As of May 14, 2019, the Company had sold an aggregate of 16,086,387 shares of its common stock (consisting of 466,188 Class T shares, 10,884,175 Class S shares, 494,298 Class D shares, and 4,241,726 Class I shares) in the Offering resulting in net proceeds of approximately $322.1 million to the Company as payment for such shares.
18
ITEM 2. | MANAGEMENT'S DISCUSSION AND ANALYSIS OF FINANCIAL CONDITION AND RESULTS OF OPERATIONS |
References herein to "Starwood Real Estate Income Trust, Inc.", "Company," "we," "us," or "our" refer to Starwood Real Estate Income Trust, Inc. and its subsidiaries unless the context specifically requires otherwise.
The following discussion should be read in conjunction with the unaudited consolidated financial statements and notes thereto appearing elsewhere in this quarterly report on Form 10-Q. In addition to historical data, this discussion contains forward-looking statements about our business, operations and financial performance based on current expectations that involve risks, uncertainties and assumptions. Our actual results may differ materially from those in this discussion as a result of various factors, including but not limited to those discussed under "Item 1A. Risk Factors" in our Annual Report on Form 10-K filed with the SEC on March 28, 2019 and elsewhere in this Quarterly Report on Form 10-Q. We do not undertake to revise or update any forward-looking statements.
Forward-Looking Statements
This Quarterly Report on Form 10-Q contains forward-looking statements within the meaning of Section 27A of the Securities Act of 1933, as amended (the “Securities Act”), and Section 21E of the Exchange Act of 1934, as amended (the “Exchange Act”). Forward-looking statements include statements about our business, including, in particular, statements about our plans, strategies and objectives. Forward-looking statements can generally be identified by our use of forward-looking terminology such as “may,” “will,” “expect,” “intend,” “anticipate,” “estimate,” “believe,” “continue” or other similar words. These statements include our plans and objectives for future operations, including plans and objectives relating to future growth and availability of funds, and are based on current expectations that involve numerous risks and uncertainties. Assumptions relating to these statements involve judgments with respect to, among other things, future economic, competitive and market conditions and future business decisions, all of which are difficult or impossible to accurately predict and many of which are beyond our control.
Although we believe the assumptions underlying the forward-looking statements, and the forward-looking statements themselves, are reasonable, any of the assumptions could be inaccurate and, therefore, there can be no assurance that these forward-looking statements will prove to be accurate and our actual results, performance and achievements may be materially different from that expressed or implied by these forward-looking statements. In light of the significant uncertainties inherent in these forward looking statements, the inclusion of this information should not be regarded as a representation by us or any other person that our objectives and plans, which we consider to be reasonable, will be achieved.
You should carefully review Item 1A. Risk Factors in our Annual Report on Form 10-K for the year ended December 31, 2018, and elsewhere in this Quarterly Report on Form 10-Q for a discussion of the risks and uncertainties that we believe are material to our business, operating results, prospects and financial condition. Except as otherwise required by federal securities laws, we do not undertake to publicly update or revise any forward-looking statements, whether as a result of new information, future events or otherwise.
Overview
Starwood Real Estate Income Trust, Inc. was formed on June 22, 2017 as a Maryland corporation. We are an externally advised, perpetual-life real estate investment trust (“REIT”) and intend to qualify as a REIT for U.S. federal income tax purposes commencing with our taxable year ending December 31, 2019. We were formed to invest primarily in stabilized, income-oriented commercial real estate and debt secured by commercial real estate. Our portfolio is principally comprised of properties located in the United States, but may also be diversified on a global basis through investments in properties and debt secured by properties outside of the United States, with a focus on Europe. The Company is the sole general partner of Starwood REIT Operating Partnership, L.P., a Delaware limited partnership (the “Operating Partnership”). Starwood REIT Special Limited Partner, L.L.C. (the “Special Limited Partner”), a wholly owned subsidiary of Starwood Capital Group Holdings, L.P. (the “Sponsor” or “Starwood Capital”), owns a special limited partner interest in the Operating Partnership. All of our assets are owned through the Operating Partnership. The Company and the Operating Partnership are externally managed by our advisor, Starwood REIT Advisors, L.L.C. (the “Advisor”), an affiliate of the Sponsor.
19
Our board of directors will at all times have oversight and policy-making authority over us, including responsibility for governance, financial controls, compliance and disclosure with respect to the Operating Partnership. Pursuant to an advisory agreement among the Advisor, the Operating Partnership and us (the “Advisory Agreement”), however, we have delegated to the Advisor the authority to source, evaluate and monitor our investment opportunities and make decisions related to the acquisition, management, financing and disposition of our assets, in accordance with our investment objectives, guidelines, policies and limitations, subject to oversight by our board of directors.
We have registered with the Securities and Exchange Commission (the “SEC”) an offering of up to $5.0 billion in shares of common stock (in any combination of purchases of Class S, Class T, Class D and Class I shares of our common stock), consisting of up to $4.0 billion in shares in our primary offering and up to $1.0 billion in shares pursuant to our distribution reinvestment plan (the “Offering”). The share classes have different upfront selling commissions and ongoing stockholder servicing fees. As of December 21, 2018, we satisfied the minimum offering requirement and our board of directors authorized the release of proceeds from escrow. We intend to continue selling shares in the Offering on a monthly basis. As of March 31, 2019, we had received net proceeds of $249.5 million from selling an aggregate of 12,460,453 shares of our common stock (consisting of 8,340,840 Class S shares and 3,602,218 Class I shares, 309,860 Class D shares; and 207,535 Class T shares). We have contributed the net proceeds from the Offering to the Operating Partnership in exchange for a corresponding number of Class S and Class T, Class D and Class I units. The Operating Partnership has primarily used the net proceeds to make investments in real estate and real estate-related securities as further described below under “Portfolio”.
We are not aware of any material trends or uncertainties, favorable or unfavorable, other than national economic conditions affecting real estate generally that may be reasonably anticipated to have a material impact on either capital resources or the revenues or income to be derived from acquiring properties or real estate-related securities, other than those disclosed in Item 1A. Risk Factors in our annual report on Form 10-K for the year ended December 31, 2018, and elsewhere in this quarterly report on Form 10-Q.
Q1 2019 Highlights
Operating Results:
| • | Raised $85.5 million of net proceeds in the Offering during the three months ended March 31, 2019. |
| • | Declared monthly net distributions totaling $1.6 million for the three months ended March 31, 2019. |
| • | Inception through March 31, 2019 produced total returns without upfront selling commissions of 2.45% for Class S, 2.16% for Class T, 2.36% for Class D, and 2.55% for Class I shares. |
Investments:
| • | During the three months ended March 31, 2019, we acquired six multifamily and nine hotel properties across three transactions with a total purchase price of $431.8 million, inclusive of closing costs, consistent with our strategy of acquiring diversified, income producing, commercial real estate assets concentrated in high growth markets across the U.S. |
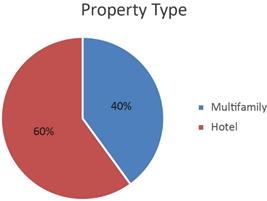
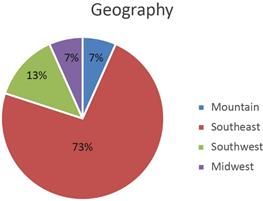
| • | Our properties as of March 31, 2019 consisted of Multifamily (60% based on fair value) and Hotel (40%) and our portfolio of real estate was concentrated in the following regions: Southeast (73%), Midwest (7%), Southwest (13%), and Mountain (7%). |
| • | Made investments in real estate-related securities in the form of residential mortgage-backed securities (“RMBS”) and collateralized debt obligations (“CDO”) (collectively “Real Estate-Related Securities”) with a total cost basis of $107.3 million during the three months ended March 31, 2019. |
20
Portfolio
Acquisitions of Real Estate
During the quarter ended March 31, 2019, we acquired fifteen properties with a total purchase price of approximately $423 million, excluding closing costs and related working capital. The following table provides a summary of our real estate acquisitions for the quarter ending March 31, 2019:
| | Number of | | | | Acquisition | | Ownership | | | Purchase Price | | | Units / | | | | | |
Asset Type and Portfolio / Property Name | | Properties | | Location | | Date | | Interest | | | (in millions)(1) | | | Keys | | | Occupancy(2) | |
Multifamily: | | | | | | | | | | | | | | | | | | | | | | |
Florida Multifamily Portfolio | | 4 | | Jacksonville/Naples, FL | | January 2019 | | 100% | | | $ | 99.6 | | | | 1,150 | | | 95% | |
Phoenix Property | | 1 | | Mesa, AZ | | January 2019 | | 100% | | | | 45.8 | | | | 256 | | | 95% | |
Savannah Property | | 1 | | Savannah, GA | | January 2019 | | 100% | | | | 36.2 | | | | 203 | | | 96% | |
Total Multifamily | | 6 | | | | | | | | | | $ | 181.6 | | | | 1,609 | | | | | |
Hotel: | | | | | | | | | | | | | | | | | | | | | | |
U.S. Select Service Portfolio | | 8 | | FL, CO, TN, OH, AR | | January 2019 | | 100% | | | | 229.0 | | | | 1,057 | | | 80% | |
Fort Lauderdale Hotel (3) | | 1 | | Fort Lauderdale, FL | | March 2019 | | 43% | | | | 12.3 | | | | 236 | | | 87% | |
Total Hotel | | 9 | | | | | | | | | | $ | 241.3 | | | | 1,293 | | | | | |
| | | | | | | | | | | | | | | | | | | | | | |
Total Investment Properties | | 15 | | | | | | | | | | $ | 422.9 | | | | | | | | | |
(1) | Purchase price excludes acquisition costs and acquired working capital. |
(2) | Occupancy as of March 31, 2019. |
(3) | Purchase price represents the Company's initial equity investment into the joint venture. |
The following provides descriptions of select properties in our portfolio:
U.S. Select Service Portfolio. On each of January 10, 2019, January 11, 2019 and January 15, 2019, we acquired a fee simple interest in hotel properties (the “U.S. Select Service Portfolio”). The U.S. Select Service Portfolio is a fully renovated, premium branded, stable select service portfolio totaling 1,057 hotel rooms, comprised of eight hotels located primarily in Florida and Colorado. The U.S. Select Service Portfolio was acquired for $229 million, excluding closing costs and related working capital. Four of the properties in the U.S. Select Service Portfolio are located in Florida - two in Tampa in close proximity to the Tampa Airport, and two in Ft. Myers. The remaining properties are located in Boulder, Colorado, Knoxville, Tennessee; Little Rock, Arkansas; and Cleveland, Ohio.
Fort Lauderdale Hotel. On March 13, 2019, we entered into a joint venture with affiliates of Dovehill Capital Management to acquire the Fort Lauderdale Hotel (the “Fort Lauderdale Hotel”), a 236-room hotel located on a 3.31 acre site in Fort Lauderdale, Florida. Following the acquisition, we own a 43% interest in the joint venture for which we paid approximately $12 million. The Fort Lauderdale Hotel is a 12 minute drive from Fort Lauderdale-Hollywood International Airport and is within walking distance of Port Everglades, the third busiest cruise port in the world.
Investments in real estate-related securities
Our real estate-related securities investments include of $87.0 million of RMBS and $20.2 million of CDOs. Our real estate-related securities are used to manage cash before investing subscription proceeds into investments while also seeking attractive investment return.
21
Summary of Portfolio
The following chart outlines the allocation of our investments in real properties and real estate-related securities (net of repurchase agreements) as of March 31, 2019. Percentage allocation is based on the March 31, 2019 fair value for all properties except for the Fort Lauderdale Hotel, which is reflected at cost for purposes for determining the percentages in the charts below:
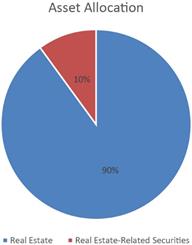
The following charts further describe the diversification of our investments in real properties as of March 31, 2019 (percentage allocation is based on the March 31, 2019 fair value for all properties except for the Fort Lauderdale Hotel, which is reflected at cost for purposes for determining the percentages in the charts below):
22
Results of Operations
From July 13, 2017 (date of our initial capitalization) through March 31, 2018, we had not commenced our principal operations and were focused on our formation and the registration of the Offering. Due to the significant amount of acquisitions of real estate and Real Estate-Related Securities we have made during the quarter ended March 31, 2019, our results of operations for the three months ended March 31, 2019 and 2018 are not comparable.
The follow table sets forth information regarding our consolidated results of operations ($ in thousands):
| | Three Months Ended | | | Three Months Ended | |
| | March 31, 2019 | | | March 31, 2018 | |
Revenues | | | | | | | | |
Rental revenue | | $ | 4,310 | | | $ | — | |
Hotel revenue | | | 10,852 | | | | — | |
Other revenue | | | 253 | | | | — | |
Total revenues | | | 15,415 | | | | — | |
| | | | | | | | |
Expenses | | | | | | | | |
Rental property operating | | | 1,762 | | | | — | |
Hotel operating | | | 5,503 | | | | — | |
General and administrative | | | 912 | | | | 16 | |
Performance participation allocation | | | 857 | | | | — | |
Depreciation and amortization | | | 5,358 | | | | — | |
Total expenses | | | 14,392 | | | | 16 | |
| | | | | | | | |
Other income (expense) | | | | | | | | |
Earnings from unconsolidated real estate ventures | | | 43 | | | | — | |
Income from real estate-related securities | | | 102 | | | | — | |
Interest income | | | 58 | | | | — | |
Interest expense | | | (3,598 | ) | | | — | |
Other expense | | | (96 | ) | | | — | |
Total other income (expense) | | | (3,491 | ) | | | — | |
Net loss | | $ | (2,468 | ) | | $ | (16 | ) |
Revenues, Rental Property Operating and Hotel Operating Expenses, Depreciation and Amortization
During the three months ended March 31, 2019, revenues, rental property operating and hotel operating expenses, and depreciation and amortization increased significantly compared to the corresponding period in 2018. The increase was driven by the growth in our portfolio, which increased from no properties as of January 1, 2019, to 15 properties as of March 31, 2019.
General and Administrative Expenses
During the three months ended March 31, 2019, general and administrative expenses were $0.9 million and consisted primarily of legal fees, accounting fees, transfer agent fees and other professional services.
Performance Participation Allocation
During the three months ended March 31, 2019, the performance participation allocation increased $0.9 million as compared to the corresponding period in 2018. The increase was primarily due to the appreciation in our NAV which is driven by the growth in the value of our portfolio. The performance participation allocation is measured annually and any amount earned by the Special Limited Partner becomes payable as of December 31 of the applicable year.
Interest Income
During the three months ended March 31, 2019, interest income was $0.1 million, which consisted of the interest earned on cash deposits.
23
Income Tax Expense
The Company intends to make an election to be taxed as a REIT under Sections 856 through 860 of the Internal Revenue Code commencing with its taxable year ending December 31, 2019. If the Company qualifies for taxation as a REIT, the Company generally will not be subject to federal corporate income tax on taxable income that it distributes to its stockholders. REITs are subject to a number of other organizational and operational requirements. Even if the Company qualifies for taxation as a REIT, it may be subject to certain state and local taxes on its income and property, and federal income and excise taxes on its undistributed income. The Company intends to elect to treat certain of its corporate subsidiaries as TRSs. During the three months ended March 31, 2019, the income tax expense of $0.1 million relates to the operations of the Company’s various taxable REIT subsidiaries.
Funds from Operations and Adjusted Funds from Operations
We believe funds from operations (“FFO”) is a meaningful supplemental non-GAAP operating metric. Our consolidated financial statements are presented under historical cost accounting which, among other things, requires depreciation of real estate investments to be calculated on a straight-line basis. As a result, our operating results imply that the value of our real estate investments will decrease evenly over a set time period. However, we believe that the value of real estate investments will fluctuate over time based on market conditions and as such, depreciation under historical cost accounting may be less informative. FFO is a standard REIT industry metric defined by the National Associational of Real Estate Investment Trusts (“NAREIT”).
FFO, as defined by NAREIT and presented below, is calculated as net income or loss (computed in accordance with GAAP), excluding gains or losses from sales of depreciable real property and impairment write-downs on depreciable real property, plus real estate-related depreciation and amortization, and similar adjustments for unconsolidated joint ventures.
The following table presents a reconciliation of FFO to net loss ($ in thousands):
| Three Months Ended March 31, 2019 | |
Net loss | $ | | (2,468 | ) |
Adjustments: | | | | |
Real estate depreciation and amortization | | | 5,358 | |
Investment in unconsolidated real estate ventures - depreciation | | | 37 | |
Funds from Operations | $ | | 2,927 | |
We also believe that adjusted FFO (“AFFO”) is a meaningful supplemental non-GAAP disclosure of our operating results. AFFO further adjusts FFO in order for our operating results to reflect the specific characteristics of our business by adjusting for items we believe are not related to our core operations. Our adjustments to FFO to arrive at AFFO include straight-line rental income, amortization of above- and below-market lease intangibles, organization costs, unrealized gains or losses from changes in the fair value of financial instruments, amortization of stock awards, and performance participation allocation not paid in cash. AFFO is not defined by NAREIT and our calculation of AFFO may not be comparable to disclosures made by other REITs.
The following table presents a reconciliation of FFO to AFFO ($ in thousands):
| Three Months Ended March 31, 2019 | |
Funds from Operations | $ | | 2,927 | |
Adjustments: | | | | |
Unrealized losses from changes in the fair value of financial instruments | | | 130 | |
Performance participation allocation | | | 857 | |
Amortization of deferred financing costs | | | 156 | |
Amortization of restricted stock awards | | | 29 | |
Adjusted Funds from Operations | $ | | 4,099 | |
FFO and AFFO should not be considered to be more relevant or accurate than the current GAAP methodology in calculating net income or in evaluating our operating performance. In addition, FFO and AFFO should not be considered as alternatives to net income (loss) as indications of our performance or as alternatives to cash flows from operating activities as indications of our liquidity, but rather should be reviewed in conjunction with these and other GAAP measurements. Further, FFO and AFFO are not intended to be used as liquidity measures indicative of cash flow available to fund our cash needs, including our ability to make distributions to our stockholders.
24
Net Asset Value
The purchase price per share for each class of our common stock will generally equal our prior month’s NAV per share, as determined monthly, plus applicable selling commissions and dealer manager fees. Our NAV for each class of shares is based on the net asset values of our investments (including real estate-related securities), the addition of any other assets (such as cash on hand) and the deduction of any liabilities, including the allocation/accrual of any performance participation, and any stockholder servicing fees applicable to such class of shares.
The following table provides a breakdown of the major components of our NAV ($ and shares in thousands):
Components of NAV | | March 31, 2019 | |
Investments in real properties | | $ | | 437,325 | |
Investments in real estate related securities | | | | 111,997 | |
Cash and cash equivalents | | | | 30,876 | |
Restricted cash | | | | 55,515 | |
Other assets | | | | 6,357 | |
Debt obligations | | | | (330,078 | ) |
Subscriptions received in advance | | | | (41,254 | ) |
Other liabilities | | | | (16,228 | ) |
Accrued performance participation accrual | | | | (857 | ) |
Accrued stockholder servicing fees(1) | | | | (133 | ) |
Net Asset Value | | $ | | 253,520 | |
Number of outstanding shares | | | | 12,460 | |
(1) | Stockholder servicing fees only apply to Class S, Class T, and Class D shares. See reconciliation of Stockholders' Equity to NAV below for an explanation of the differences between the $0.1 million accrued for purposes of NAV and the $14.0 million accrued under U.S. GAAP. |
The following table provides a breakdown of our total NAV and NAV per share by share class as of March 31, 2019:
NAV Per Share | | Class T Shares | | | Class S Shares | | | Class D Shares | | | Class I Shares | | | Total | |
Net asset value | | $ | 4,208,951 | | | $ | 169,784,141 | | | $ | 6,291,293 | | | $ | 73,236,017 | | | $ | 253,520,402 | |
Number of outstanding shares | | | 207,535 | | | | 8,340,840 | | | | 309,860 | | | | 3,602,218 | | | | 12,460,453 | |
NAV Per Share as of March 31, 2019 | | $ | 20.28 | | | $ | 20.36 | | | $ | 20.30 | | | $ | 20.33 | | | | | |
The following table reconciles stockholders’ equity per our consolidated balance sheet to our NAV ($ in thousands):
Reconciliation of Stockholders’ Equity to NAV | | March 31, 2019 | |
Stockholders’ equity under U.S. GAAP | | $ | | 224,985 | |
Adjustments: | | | | | |
Accrued stockholder servicing fee | | | | 13,846 | |
Organization and offering costs | | | | 6,246 | |
Unrealized real estate appreciation | | | | 2,847 | |
Investment in unconsolidated real estate ventures - depreciation | | | | 37 | |
Accumulated depreciation and amortization | | | | 5,358 | |
Amortization of deferred financing costs | | | | 156 | |
Loan discount amortization | | | | 45 | |
NAV | | $ | | 253,520 | |
25
The following details the adjustments to reconcile GAAP stockholders’ equity to our NAV:
| • | Accrued stockholder servicing fee represents the accrual for the full cost of the stockholder servicing fee for Class S, Class T and Class D shares. Under GAAP we accrued the full cost of the stockholder servicing fee as an offering cost at the time we sold the Class S, Class T and Class D shares. For purposes of NAV we recognize the stockholder servicing fee as a reduction of NAV on a monthly basis as such fee is paid. |
| • | The Advisor has agreed to advance organization and offering costs on our behalf through December 31, 2018. Such costs will be reimbursed to the Advisor pro rata over sixty months beginning December 21, 2019. Under GAAP organization and offering costs incurred by the Advisor on our behalf are classified as due to affiliate on our consolidated balance sheet. For NAV, such costs will be recognized as a reduction to NAV as they are reimbursed ratably over sixty months. |
| • | Our investments in real estate are presented under historical cost in our GAAP consolidated financial statements. As such, any increases in the fair market value of our investments in real estate are not included in our GAAP results. For purposes of determining our NAV, our investments in real estate are recorded at fair value. |
| • | In addition, we depreciate our investments in real estate and amortize certain other assets and liabilities in accordance with GAAP. Such depreciation and amortization is not recorded for purposes of determining our NAV. |
Distributions
The following table summarizes our distributions declared during the three months ended March 31, 2019 ($ in thousands). From July 13, 2017 (date of our initial capitalization) through March 31, 2018, we had not commenced our principal operations and as such, no distributions were made during this period.
| | Three Months Ended March 31, 2019 | |
| | Amount | | | Percentage | |
Distributions | | | | | | | | |
Paid in cash | | $ | 615 | | | | 38 | % |
Reinvested in shares | | | 1,017 | | | | 62 | % |
Total distributions | | $ | 1,632 | | | | 100 | % |
| | | | | | | | |
Sources of Distributions | | | | | | | | |
Cash flows from operating activities | | $ | 1,632 | | | | 100 | % |
Offering proceeds | | | — | | | | 0 | % |
Total sources of distributions | | $ | 1,632 | | | | 100 | % |
| | | | | | | | |
Cash flows from operating activities | | $ | 2,162 | | | | | |
Funds from Operations | | $ | 2,927 | | | | | |
Liquidity and Capital Resources
Our primary needs for liquidity and capital resources are to fund our investments, to make distributions to our stockholders, to repurchase shares of our common stock pursuant to our share repurchase plan, to pay our offering and operating fees and expenses and to pay interest on any outstanding indebtedness we may incur. We anticipate our operating expenses will include, among other things, the management fee we will pay to the Advisor, the performance participation allocation that the Operating Partnership will pay to the Special Limited Partner, stockholder servicing fees we will pay to the Dealer Manager, legal, audit and valuation expenses, federal and state filing fees, printing expenses, administrative fees, transfer agent fees, marketing and distribution expenses and fees related to acquiring, financing, appraising and managing our properties. We do not have any office or personnel expenses as we do not have any employees.
26
We will reimburse the Advisor for certain out-of-pocket expenses in connection with our operations. The Advisor has agreed to advance all of our organization and offering expenses on our behalf (other than upfront selling commissions, dealer manager fees and stockholder servicing fees) through December 21, 2019, the anniversary of the date on which we broke escrow for the Offering. We will reimburse the Advisor for such advanced expenses ratably over the 60 months following December 21, 2019. As of March 31, 2019, the Advisor had incurred approximately $6.0 million of organization and offering expenses on our behalf, which we recorded as a component of due to affiliate on our consolidated balance sheet.
Our cash needs for acquisitions and other investments will be funded primarily from the sale of shares of our common stock and through the assumption or incurrence of debt. Over time, we generally intend to fund additional cash needs from operations.
Other potential future sources of capital include secured or unsecured financings from banks or other lenders and proceeds from the sale of assets. If necessary, we may use financings or other sources of capital in the event of unforeseen significant capital expenditures. We have not yet identified any sources for these types of financings.
As of March 31, 2019, we received net proceeds of $249.5 million from the sale of an aggregate of 12,460,453 shares of our common stock (consisting of 207,535 Class T shares, 8,340,840 Class S shares, 309,860 Class D shares, and 3,602,218 Class I shares). The Company intends to continue selling shares in the Offering on a monthly basis.
Cash Flows
The following table provides a breakdown of the net change in our cash and cash equivalents and restricted cash ($ in thousands):
| | Three Months Ended | | Three Months Ended | |
| | March 31, 2019 | | March 31, 2018 | |
Cash flows provided by operating activities | | $ | 2,162 | | $ | — | |
Cash flows used in investing activities | | | (313,694 | ) | | — | |
Cash flows provided by financing activities | | | 233,164 | | | — | |
Net increase in cash and cash equivalents and restricted cash | | $ | (78,368 | ) | $ | — | |
Cash flows provided by operating activities increased $2.2 million during the three months ended March 31, 2019 compared to the corresponding period in 2018 due to increased cash flows from the operations of investments in real estate and income on our investments in Real Estate-Related Securities.
Cash flows used in investing activities increased $313.7 million during the three months ended March 31, 2019 compared to the corresponding period in 2018 primarily due to an acquisition of $206 million of real estate investments and $107 million of Real Estate-Related Securities.
Cash flows provided by financing activities increased $223.2 million during the three months ended March 31, 2019 compared to the corresponding period in 2018 primarily due to a net increase of $47.9 million in borrowings and of $85.1 million in proceeds from the issuance of our common stock.
27
Critical Accounting Policies
The preparation of the financial statements in accordance with GAAP involve significant judgments and assumptions and require estimates about matters that are inherently uncertain. These judgments will affect our reported amounts of assets and liabilities and our disclosure of contingent assets and liabilities at the dates of the financial statements and the reported amounts of revenue and expenses during the reporting periods. With different estimates or assumptions, materially different amounts could be reported in our financial statements. We consider our accounting policies over investments in real estate and lease intangibles, investments in securities, and revenue recognition to be our critical accounting policies. See Note 2 “Summary of Significant Accounting Policies” to our consolidated financial statements in this Quarterly Report on Form 10-Q for further descriptions of such accounting policies.
Recent Accounting Pronouncements
See Note 2 — “Summary of Significant Accounting Policies” to our consolidated financial statements in this quarterly report on Form 10-Q for a discussion concerning recent accounting pronouncements.
Off-Balance Sheet Arrangements
We currently have no off-balance sheet arrangements that are reasonably likely to have a material current or future effect on our financial condition, changes in financial condition, revenues or expenses, results of operations, liquidity, capital expenditures or capital resources.
Contractual Obligations
The following table aggregates our contractual obligations and commitments with payments due subsequent to March 31, 2019 ($ in thousands).
Obligations | | Total | | | Less then 1 year | | | 1-3 years | | | 3-5 years | | | More than 5 years | |
Organizational and offering costs | | $ | | 5,992 | | | $ | | 100 | | | $ | | 3,595 | | | $ | | 2,297 | | | $ | | — | |
Advanced operating expenses (1) | | | | 255 | | | | | 4 | | | | | 153 | | | $ | | 98 | | | | | — | |
Indebtedness | | | | 323,470 | | | | | 9,884 | | | | | 71,710 | | | | | 20,953 | | | | | 220,923 | |
Total | | $ | | 329,717 | | | $ | | 9,988 | | | $ | | 75,458 | | | $ | | 23,348 | | | $ | | 220,923 | |
The allocation of our indebtedness includes both principal and interest payments based on the current maturity date and interest rates in effect at March 31, 2019.
28
ITEM 3. | QUANTITATIVE AND QUALITATIVE DISCLOSURES ABOUT MARKET RISK |
Indebtedness
We are exposed to interest rate risk with respect to our variable-rate mortgage indebtedness, whereas an increase in interest rates would directly result in higher interest expense costs. As of March 31, 2019, the outstanding principal balance of our variable rate mortgage indebtedness was $105.6 million. These mortgage loans are indexed to one-month U.S. Dollar denominated LIBOR. For both the three months ended March 31, 2019, a 10% increase in one-month U.S. Dollar denominated LIBOR would not have resulted in a material increase in interest expense.
We intend to limit the impact of rising interest rates on earnings and cash flows through the use of fixed rate financings or the use of derivative financial instruments to hedge exposures to changes in interest rates on loans secured by our assets.
Investments in real estate-related securities
As of March 31, 2019, our investments in real estate-related securities consisted of $87.0 million of RMBS and $20.2 million of CDOs. These investments are exposed to interest rate risk. Our net income will increase or decrease depending on interest rate movements. We may also be exposed to market risk with respect to our investments in real-estate related securities due to changes in the fair value of our investments. The fair value of our investments may fluctuate, thus the amount we will realize upon any sale of our investments is unknown. As of March 31, 2019, the fair value at which we may sell our investments in real estate-related securities is $107.2 million, but a 10% change in the fair value of our investments in real estate-related securities may result in an unrealized gain or loss of $10.7 million.
ITEM 4. | CONTROLS AND PROCEDURES |
Evaluation of Disclosure Controls and Procedures
An evaluation of the effectiveness of the design and operation of our "disclosure controls and procedures" (as defined in Rule 13a-15(e) under the Securities Exchange Act of 1934, as amended (the "Exchange Act")), as of the end of the period covered by this quarterly report on Form 10-Q was made under the supervision and with the participation of our management, including our Chief Executive Officer ("CEO") and Chief Financial Officer ("CFO"). Based upon this evaluation, our CEO and CFO have concluded that our disclosure controls and procedures (a) are effective to ensure that information required to be disclosed by us in reports filed or submitted under the Exchange Act is recorded, processed, summarized and reported within the time periods specified by SEC rules and forms and (b) include, without limitation, controls and procedures designed to ensure that information required to be disclosed by us in reports filed or submitted under the Exchange Act is accumulated and communicated to our management, including our CEO and CFO, as appropriate to allow timely decisions regarding required disclosure.
Changes in Internal Controls over Financial Reporting
There have been no changes in our "internal control over financial reporting" (as defined in Rule 13a-15(f) of the Exchange Act) that occurred during the period covered by this quarterly report on Form 10-Q that have materially affected, or are reasonably likely to materially affect, our internal control over financial reporting.
29
PART II. OTHER INFORMATION
From time to time, we may be involved in various claims and legal actions arising in the ordinary course of business. As of March 31, 2019, we were not involved in any material legal proceedings.
There have been no material changes to the risk factors previously disclosed under Item 1A of our Annual Report on Form 10-K for the year ended December 31, 2018.
ITEM 2. | UNREGISTERED SALES OF EQUITY SECURITIES AND USE OF PROCEEDS |
Unregistered Sales of Equity Securities
During the three months ended March 31, 2019, we did not sell or issue any equity securities that were not registered under the Securities Act of 1933, as amended (the “Securities Act”).
Use of Proceeds
On December 27, 2017, our Registration Statement on Form S-11 (File No. 333-220997), covering our public offering of up to $5 billion of common stock (in any combination of purchases of Class T, Class S, Class D and Class I shares of our common stock), consisting of up to $4.0 billion in shares in our primary offering and up to $1.0 billion in shares pursuant to our distribution reinvestment plan, was declared effective under the Securities Act. The initial offering price of each class of our common stock was $20.00 per share, plus applicable selling commissions and dealer manager fees. The offering price for each class of our common stock is determined monthly and is made available on our website and in prospectus supplement filings.
The following table presents information about the Offering and use of proceeds therefrom ($ in thousands):
| | Class T | | | Class S | | | Class D | | | Class I | | | | | |
| | Shares | | | Shares | | | Shares | | | Shares | | | Total | |
Offering proceeds: | | | | | | | | | | | | | | | | | | | | |
Shares sold | | | 208 | | | | 8,341 | | | | 310 | | | | 3,602 | | | | 12,460 | |
Gross offering proceeds | | $ | 4,267 | | | $ | 168,168 | | | $ | 6,214 | | | $ | 72,206 | | | $ | 250,855 | |
Selling commissions and dealer manager fees | | | (107 | ) | | | (1,290 | ) | | | — | | | | — | | | | (1,397 | ) |
Accrued stockholder servicing fees | | | (5 | ) | | | (349 | ) | | | (2 | ) | | | — | | | | (356 | ) |
Net offering proceeds | | $ | 4,155 | | | $ | 166,529 | | | $ | 6,212 | | | $ | 72,206 | | | $ | 249,102 | |
We primarily used the net proceeds from the Offering toward the acquisition of $430.4 million of real estate and $107.1 million of real estate-related securities. In addition to the net proceeds from the Offering, we financed our acquisitions with $268.9 million of financing secured by our investments in real estate and $68.4 million of repurchase agreements. During the three months ended March 31, 2019, we did not repurchase any shares of our common stock.
Share Repurchase Plan
We have adopted a share repurchase plan, whereby on a monthly basis, stockholders may request that we repurchase all or any portion of their shares. We may choose to repurchase all, some or none of the shares that have been requested to be repurchased at the end of any particular month, in its discretion, subject to any limitations in the share repurchase plan. The total amount of aggregate repurchases of Class T, Class S, Class D, and Class I shares will be limited to 2% of the aggregate NAV per month and 5% of the aggregate NAV per calendar quarter. Shares are repurchased at a price equal to the transaction price on the applicable repurchase date, subject to any early repurchase deduction. Shares that have not been outstanding for at least one year would be repurchased at 95% of the transaction price. Due to the illiquid nature of investments in real estate, we may not have sufficient liquid resources to fund repurchase requests and may elect not to repurchase some or all of the shares submitted for repurchase in a given period. Further, we may modify, suspend or terminate the share repurchase plan.
We did not repurchase any equity securities through the Repurchase Program during the three months ended March 31, 2019.
30
ITEM 3. | DEFAULTS UPON SENIOR SECURITIES |
None.
ITEM 4. | MINE SAFETY DISCLOSURES |
Not applicable.
Not applicable.
31
Exhibit Number | | Description |
| | |
3.1 | | Articles of Amendment and Restatement of Starwood Real Estate Income Trust, Inc. (the “Company”), incorporated by reference to Exhibit 3.1 to Post-Effective Amendment No. 2 to the Company’s Registration Statement on Form S-11 filed with the SEC on April 12, 2018 |
| | |
3.2 | | Bylaws of the Company, incorporated by reference to Exhibit 3.2 to Post-Effective Amendment No. 2 to the Company’s Registration Statement on Form S-11 filed with the SEC on April 12, 2018 |
| | |
10.1 | | Hotel Purchase and Sale Agreement dated July 31, 2018 between SCG Global Holdings, L.L.C. and affiliates of Noble Investment Group, incorporated by reference to Exhibit 10.1 to the Company’s Current Report on Form 8-K filed with the SEC on January 10, 2019 |
| | |
10.2 | | First Amendment to the Hotel Purchase and Sale Agreement dated October 9, 2018, between SREIT Hotel Holdings, L.L.C. and affiliates of Noble Investment Group, incorporated by reference to Exhibit 10.2 to the Company’s Current Report on Form 8-K filed with the SEC on January 10, 2019 |
| | |
10.3 | | Second Amendment to the Hotel Purchase and Sale Agreement dated November 19, 2018, between SREIT Hotel Holdings, L.L.C. and affiliates of Noble Investment Group, incorporated by reference to Exhibit 10.3 to the Company’s Current Report on Form 8-K filed with the SEC on January 10, 2019 |
| | |
10.4 | | Third Amendment to the Hotel Purchase and Sale Agreement dated January 10, 2019, between SREIT Hotel Holdings, L.L.C. and affiliates of Noble Investment Group, incorporated by reference to Exhibit 10.4 to the Company’s Current Report on Form 8-K filed with the SEC on January 10, 2019 |
| | |
10.5 | | Fourth Amendment to the Hotel Purchase and Sale Agreement dated January 14, 2019, between SREIT Hotel Holdings, L.L.C. and affiliates of Noble Investment Group, incorporated by reference to Exhibit 10.5 to the Company’s Current Report on Form 8-K filed with the SEC on January 10, 2019 |
| | |
31.1* | | Certification of Chief Executive Officer pursuant to Section 302 of the Sarbanes-Oxley Act of 2002 |
| | |
31.2* | | Certification of Chief Financial Officer pursuant to Section 302 of the Sarbanes-Oxley Act of 2002 |
| | |
32.1* | | Certification of Chief Executive Officer pursuant to 18 U.S.C. Section 1350, as adopted pursuant to Section 906 of the Sarbanes-Oxley Act of 2002 |
| | |
32.2* | | Certification of Chief Financial Officer pursuant to 18 U.S.C. Section 1350, as adopted pursuant to Section 906 of the Sarbanes-Oxley Act of 2002 |
| | |
101 | | The following information from the Company's Quarterly Report on Form 10-Q for the quarter ended March 31, 2019, formatted in XBRL (eXtensible Business Reporting Language): (i) Consolidated Balance Sheets; (ii) Consolidated Statements of Operations (iii) Consolidated Statement of Changes in Equity; and (iv) Consolidated Statements of Cash Flows |
The agreements and other documents filed as exhibits to this report are not intended to provide factual information or other disclosure other than with respect to the terms of the agreements or other documents themselves, and you should not rely on them for that purpose. In particular, any representations and warranties made by us in these agreements or other documents were made solely within the specific context of the relevant agreement or document and may not describe the actual state of affairs as of the date they were made or at any other time.
32
SIGNATURES
Pursuant to the requirements of Section 13 or Section 15(d) of the Securities Exchange Act of 1934, the Registrant has duly caused this report to be signed on its behalf by the undersigned, thereunto duly authorized.
STARWOOD REAL ESTATE INCOME TRUST, INC.
May 14, 2019 | | /s/ John P. McCarthy, Jr. |
Date | | John P. McCarthy, Jr. |
| | Chief Executive Officer, President and Director (Principal Executive Officer) |
| | |
May 14, 2019 | | /s/ Dave Guiteau |
Date | | Dave Guiteau |
| | Chief Financial Officer and Treasurer (Principal Financial Officer and Principal Accounting Officer) |