UNITED STATES
SECURITIES AND EXCHANGE COMMISSION
Washington, D.C. 20549
FORM N-CSR
CERTIFIED SHAREHOLDER REPORT OF REGISTERED MANAGEMENT
INVESTMENT COMPANIES
Investment Company Act file number: 811-23285
| Name of Fund: | | BlackRock Multi-Sector Opportunities Trust |
| Fund Address: | | 100 Bellevue Parkway, Wilmington, DE 19809 |
Name and address of agent for service: John M. Perlowski, Chief Executive Officer, BlackRock Multi-Sector Opportunities Trust, 50 Hudson Yards, New York, NY 10001
Registrant’s telephone number, including area code: (800) 882-0052, Option 4
Date of fiscal year end: 12/31/2022
Date of reporting period: 12/31/2022
Item 1 – Report to Stockholders
(a) The Report to Shareholders is attached herewith.
| | |

| | DECEMBER 31, 2022 |
BlackRock Multi-Sector Opportunities Trust
BlackRock Multi-Sector Opportunities Trust II
|
| Not FDIC Insured • May Lose Value • No Bank Guarantee |
The Markets in Review
Dear Shareholder,
Significant economic headwinds emerged during the 12-month reporting period ended December 31, 2022, as investors navigated changing economic conditions and volatile markets. The U.S. economy shrank in the first half of 2022 before returning to modest growth in the third quarter, marking a shift to a more challenging post-reopening economic environment. Changes in consumer spending patterns and a tight labor market led to elevated inflation, which reached a 40-year high before beginning to moderate. Moreover, while the foremost effect of Russia’s invasion of Ukraine has been a severe humanitarian crisis, the ongoing war continued to present challenges for both investors and policymakers.
Equity prices fell as interest rates rose, particularly during the first half of the reporting period. Both large- and small-capitalization U.S. stocks fell, although equities began to recover in the second half of the year as inflation eased and economic growth resumed. Emerging market stocks and international equities from developed markets declined overall, pressured by rising interest rates and a strengthening U.S. dollar.
The 10-year U.S. Treasury yield rose notably during the reporting period, driving its price down, as investors reacted to fluctuating inflation data and attempted to anticipate its impact on future interest rate changes. The corporate bond market also faced inflationary headwinds, and heightened uncertainty led to higher corporate bond spreads (the difference in yield between U.S. Treasuries and similarly-dated corporate bonds).
The U.S. Federal Reserve (the “Fed”), acknowledging that inflation has been more persistent than expected, raised interest rates seven times. Furthermore, the Fed wound down its bond-buying programs and is accelerating the reduction of its balance sheet. While the Fed suggested that additional rate hikes were likely, it also gave indications that the pace of increases would slow if inflation continued to subside.
The pandemic’s restructuring of the economy brought an ongoing mismatch between supply and demand, contributing to the current inflationary regime. While growth slowed in 2022, we believe that taming inflation requires a more dramatic economic decline to bring demand back to a level more in line with the economy’s capacity. The Fed has been raising interest rates at the fastest pace in decades, and seems set to overtighten in its effort to get inflation back to target. With this in mind, we believe the possibility of a U.S. recession in the near-term is high, but this prospect has not yet been fully priced in by markets. Investors should expect a period of higher volatility as markets adjust to the new economic reality and policymakers attempt to adapt to rapidly changing conditions.
In this environment, while we favor an overweight to equities in the long-term, the market’s concerns over excessive rate hikes from central banks moderate our outlook. Rising input costs and a deteriorating economic backdrop are likely to challenge corporate earnings, so we are underweight equities overall in the near term. However, we see better opportunities in credit, where valuations are attractive and higher yields provide income opportunities. We believe that global investment-grade corporates, global inflation-linked bonds, and U.S. mortgage-backed securities offer strong opportunities for a six- to twelve-month horizon.
Overall, our view is that investors need to think globally, position themselves to be prepared for a decarbonizing economy, and be nimble as market conditions change. We encourage you to talk with your financial advisor and visit blackrock.com for further insight about investing in today’s markets.
Sincerely,

Rob Kapito
President, BlackRock Advisors, LLC

Rob Kapito
President, BlackRock Advisors, LLC
| | | | |
Total Returns as of December 31, 2022 |
| | | 6-Month | | 12-Month |
| | |
U.S. large cap equities (S&P 500® Index) | | 2.31% | | (18.11)% |
| | |
U.S. small cap equities (Russell 2000® Index) | | 3.91 | | (20.44) |
| | |
International equities (MSCI Europe, Australasia, Far East Index) | | 6.36 | | (14.45) |
| | |
Emerging market equities (MSCI Emerging Markets Index) | | (2.99) | | (20.09) |
| | |
3-month Treasury bills (ICE BofA 3-Month U.S. Treasury Bill Index) | | 1.32 | | 1.47 |
| | |
U.S. Treasury securities (ICE BofA 10-Year U.S. Treasury Index) | | (5.58) | | (16.28) |
| | |
U.S. investment grade bonds (Bloomberg U.S. Aggregate Bond Index) | | (2.97) | | (13.01) |
| | |
Tax-exempt municipal bonds (Bloomberg Municipal Bond Index) | | 0.50 | | (8.53) |
| | |
U.S. high yield bonds (Bloomberg U.S. Corporate High Yield 2% Issuer Capped Index) | | 3.50 | | (11.18) |
Past performance is not an indication of future results. Index performance is shown for illustrative purposes only. You cannot invest directly in an index. |
| | |
| 2 | | T H I S P A G E I S N O T P A R T O F Y O U R F U N D R E P O R T |
Table of Contents
The Benefits and Risks of Leveraging
The Trusts may utilize leverage to seek to enhance the distribution rate on, and net asset value (“NAV”) of, their common shares (“Common Shares”). However, there is no guarantee that these objectives can be achieved in all interest rate environments.
In general, the concept of leveraging is based on the premise that the financing cost of leverage, which is based on short-term interest rates, is normally lower than the income earned by a Trust on its longer-term portfolio investments purchased with the proceeds from leverage. To the extent that the total assets of each Trust (including the assets obtained from leverage) are invested in higher-yielding portfolio investments, each Trust’s shareholders benefit from the incremental net income. The interest earned on securities purchased with the proceeds from leverage (after paying the leverage costs) is paid to shareholders in the form of dividends, and the value of these portfolio holdings (less the leverage liability) is reflected in the per share NAV.
To illustrate these concepts, assume a Trust’s capitalization is $100 million and it utilizes leverage for an additional $30 million, creating a total value of $130 million available for investment in longer-term income securities. If prevailing short-term interest rates are 3% and longer-term interest rates are 6%, the yield curve has a strongly positive slope. In this case, a Trust’s financing costs on the $30 million of proceeds obtained from leverage are based on the lower short-term interest rates. At the same time, the securities purchased by a Trust with the proceeds from leverage earn income based on longer-term interest rates. In this case, a Trust’s financing cost of leverage is significantly lower than the income earned on a Trust’s longer-term investments acquired from such leverage proceeds, and therefore the holders of Common Shares (“Common Shareholders”) are the beneficiaries of the incremental net income.
However, in order to benefit shareholders, the return on assets purchased with leverage proceeds must exceed the ongoing costs associated with the leverage. If interest and other costs of leverage exceed a Trust’s return on assets purchased with leverage proceeds, income to shareholders is lower than if a Trust had not used leverage. Furthermore, the value of the Trusts’ portfolio investments generally varies inversely with the direction of long-term interest rates, although other factors can influence the value of portfolio investments. In contrast, the amount of each Trust’s obligations under its respective leverage arrangement generally does not fluctuate in relation to interest rates. As a result, changes in interest rates can influence the Trusts’ NAVs positively or negatively. Changes in the future direction of interest rates are very difficult to predict accurately, and there is no assurance that a Trust’s intended leveraging strategy will be successful.
The use of leverage also generally causes greater changes in each Trust’s NAV, market price and dividend rates than comparable portfolios without leverage. In a declining market, leverage is likely to cause a greater decline in the NAV and market price of a Trust’s shares than if the Trust were not leveraged. In addition, each Trust may be required to sell portfolio securities at inopportune times or at distressed values in order to comply with regulatory requirements applicable to the use of leverage or as required by the terms of leverage instruments, which may cause the Trust to incur losses. The use of leverage may limit a Trust’s ability to invest in certain types of securities or use certain types of hedging strategies. Each Trust incurs expenses in connection with the use of leverage, all of which are borne by shareholders and may reduce income to the shareholders. Moreover, to the extent the calculation of each Trust’s investment advisory fees includes assets purchased with the proceeds of leverage, the investment advisory fees payable to each Trust’s investment adviser will be higher than if the Trusts did not use leverage.
Each Trust may utilize leverage through reverse repurchase agreements as described in the Notes to Financial Statements, if applicable.
Under the Investment Company Act of 1940, as amended (the “1940 Act”), each Trust is permitted to borrow money (including through the use of TOB Trusts) or issue debt securities up to 33 1/3% of its total managed assets. A Trust may voluntarily elect to limit its leverage to less than the maximum amount permitted under the 1940 Act.
Derivative Financial Instruments
The Trusts may invest in various derivative financial instruments. These instruments are used to obtain exposure to a security, commodity, index, market, and/or other assets without owning or taking physical custody of securities, commodities and/or other referenced assets or to manage market, equity, credit, interest rate, foreign currency exchange rate, commodity and/or other risks. Derivative financial instruments may give rise to a form of economic leverage and involve risks, including the imperfect correlation between the value of a derivative financial instrument and the underlying asset, possible default of the counterparty to the transaction or illiquidity of the instrument. Pursuant to Rule 18f-4 under the 1940 Act, among other things, the Trusts must either use derivative financial instruments with embedded leverage in a limited manner or comply with an outer limit on fund leverage risk based on value-at-risk. The Trusts’ successful use of a derivative financial instrument depends on the investment adviser’s ability to predict pertinent market movements accurately, which cannot be assured. The use of these instruments may result in losses greater than if they had not been used, may limit the amount of appreciation a Trust can realize on an investment and/or may result in lower distributions paid to shareholders. The Trusts’ investments in these instruments, if any, are discussed in detail in the Notes to Financial Statements.
| | |
| 4 | | 2 0 2 2 B L A C K R O C K A N N U A L R E P O R T T O S H A R E H O L D E R S |
| | |
| Trust Summary as of December 31, 2022 | | BlackRock Multi-Sector Opportunities Trust (MSO) |
Investment Objective
BlackRock Multi-Sector Opportunities Trust’s (MSO) (the “Trust”) investment objective is to seek to provide high income and total return. The Trust seeks to achieve its investment objective by investing at least 80% of its total assets in fixed income securities and other financial instruments that pay periodic income. The Trust may invest any amount of its assets in securities of any credit quality, including securities that are rated at the time of investment below investment grade — i.e., ‘‘Ba’’ or ‘‘BB’’ or below by Moody’s Investor’s Service, Inc. (“Moody’s”), S&P Global Ratings or Fitch Ratings, or securities that are judged to be of comparable quality by the Trust’s investment advisers. It is anticipated that the Trust will terminate on February 22, 2024 (the “Termination Date”); however, the Board of Trustees may, without shareholder approval, extend the Termination Date by up to one year to a date on or before February 22, 2025. The Board of Trustees may also, without shareholder approval, adopt a plan of liquidation at any time preceding the anticipated Termination Date. The Trust may invest directly in securities or synthetically through the use of derivatives.
The Trust’s common shares are not listed on any securities exchange. Investors should consider that they may not have access to their investment until the Termination Date. The Trust is designed for long-term investors and an investment in the common shares, unlike an investment in a traditional listed closed-end fund, should be considered illiquid.
No assurance can be given that the Trust’s investment objective will be achieved.
Trust Information
| | |
Initial Offering Date | | February 23, 2018 |
| |
Termination Date(a) | | February 22, 2024 |
| |
Current Quarterly Distribution per Common Share(b) | | $1.5210 |
| |
Current Annualized Distribution per Common Share(b) | | $6.0840 |
| |
Leverage as of December 31, 2022(c) | | 1% |
| | (a) | The Board of Trustees may terminate the Trust, without shareholder approval, prior to the Termination Date and may, without shareholder approval, extend the Termination Date by up to one year to a date on or before February 22, 2025. | |
| | (b) | The distribution rate is not constant and is subject to change. A portion of the distribution may be deemed a return of capital or net realized gain. | |
| | (c) | Represents reverse repurchase agreements as a percentage of total managed assets, which is the total assets of the Trust (including any assets attributable to any borrowings) minus the sum of its liabilities (other than borrowings representing financial leverage). Does not reflect derivatives or other instruments that may give rise to economic leverage. For a discussion of leveraging techniques utilized by the Trust, please see The Benefits and Risks of Leveraging and Derivative Financial Instruments. | |
Net Asset Value Per Share Summary
| | | | | | | | | | | | | | | | | | | | |
| | | 12/31/22 | | | 12/31/21 | | | Change | | | High | | | Low | |
Net Asset Value | | | $ 66.67 | | | | $ 84.34 | | | | (20.95) | % | | $ | 84.34 | | | $ | 65.67 | |
GROWTH OF $10,000 INVESTMENT
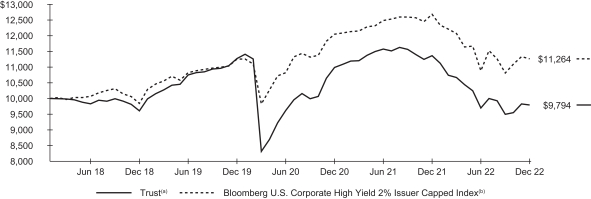
MSO commenced operations on February 23, 2018.
| | (a) | Represents the Trust’s NAV and reflects the reinvestment of dividends and/or distributions at NAV on the payable date. | |
| | (b) | An unmanaged index comprised of issuers that meet the following criteria: at least $150 million par value outstanding; maximum credit rating of Ba1; at least one year to maturity; and no issuer represents more than 2% of the index. | |
| | |
T R U S T S U M M A R Y | | 5 |
| | |
Trust Summary as of December 31, 2022 (continued) | | BlackRock Multi-Sector Opportunities Trust (MSO) |
Performance
Returns for the period ended December 31, 2022 were as follows:
| | | | | | | | |
| | | Average Annual Total Returns | |
| | |
| | | | 1 Year | | |
| Since
Inception |
(a) |
Trust at NAV(b) | | | (13.82 | )% | | | (0.43 | )% |
Bloomberg U.S. Corporate High Yield 2% Issuer Capped Index | | | (11.18 | ) | | | 2.48 | |
| | (a) | MSO commenced operations on February 23, 2018. | |
| | (b) | All returns reflect reinvestment of dividends and/or distributions at NAV on the payable date. Performance results reflect the Trust’s use of leverage. | |
Performance results may include adjustments made for financial reporting purposes in accordance with U.S. generally accepted accounting principles. Past performance is not an indication of future results.
The Trust is presenting the performance of one or more indices for informational purposes only. The Trust is actively managed and does not seek to track or replicate the performance of any index. The index performance shown is not intended to be indicative of the Trust’s investment strategies, portfolio components or past or future performance.
More information about the Trust’s historical performance can be found in the “Closed End Funds” section of blackrock.com.
The following discussion relates to the Trust’s absolute performance based on NAV:
What factors influenced performance?
The detractors from performance over the period were the Trust’s exposures to emerging market debt, securitized assets including collateralized loan obligations (“CLOs”) and commercial mortgage-backed securities (“CMBS”), European corporate credit, U.S. high yield corporate bonds and U.S. investment grade corporate bonds. The Trust’s positioning with respect to duration and corresponding interest rate sensitivity also detracted from performance as Treasury yields moved higher over the period.
The Trust’s allocation to private assets contributed to performance over the period.
Describe recent portfolio activity.
The Trust was positioned defensively over the period as the market has been dealing with persistent inflation and heightened volatility. The Trust held core allocations in U.S. high yield corporate bonds, emerging market debt, structured products including CLOs, CMBS and non-agency residential mortgage-backed securities (“MBS”), European corporate credit, agency MBS and U.S. investment grade corporate bonds. The Trust added to its agency MBS allocation based on attractive spreads and the outlook for declining interest rate volatility. The Trust added to risk within its emerging market debt allocation while actively managing concerns around tighter central bank policies, weakening growth, and reduced liquidity. The Trust remained cautious with respect to U.S. high yield corporate exposure and trimmed exposure to CMBS.
The Trust used Treasury futures during the period to hedge duration and yield curve exposure. The use of derivatives marginally contributed to performance.
Describe portfolio positioning at period end.
As of December 31, 2022, the Trust’s portfolio had an effective duration of 1.91 years and approximately 1% leverage, with a nominal yield of 9.19%. The Trust maintained a diversified exposure within spread sectors, including emerging markets, high yield corporate bonds, and securitized assets. Private assets comprised approximately 6% of total portfolio assets. The Trust continues to seek opportunities to harvest the illiquidity premium and enhance yield by adding exposure to private investments.
The views expressed reflect the opinions of BlackRock as of the date of this report and are subject to change based on changes in market, economic or other conditions. These views are not intended to be a forecast of future events and are no guarantee of future results.
| | |
| 6 | | 2 0 2 2 B L A C K R O C K A N N U A L R E P O R T T O S H A R E H O L D E R S |
| | |
Trust Summary as of December 31, 2022 (continued) | | BlackRock Multi-Sector Opportunities Trust (MSO) |
Overview of the Trust’s Total Investments
| | | | |
| PORTFOLIO COMPOSITION | |
| | |
Asset Type | | 12/31/22 | |
| |
Corporate Bonds | | | 43.4 | % |
| |
Asset-Backed Securities | | | 15.5 | |
| |
Floating Rate Loan Interests | | | 9.0 | |
| |
Non-Agency Mortgage-Backed Securities | | | 7.9 | |
| |
Foreign Agency Obligations | | | 7.4 | |
| |
U.S. Government Sponsored Agency Securities | | | 6.7 | |
| |
Preferred Securities | | | 4.8 | |
| |
Short-Term Securities | | | 4.0 | |
| |
Other* | | | 1.3 | |
| | | | |
| CREDITQUALITY ALLOCATION | |
| | |
Credit Rating(a)(b) | | 12/31/22 | |
| |
AAA/Aaa(c) | | | 7.0 | % |
| |
A | | | 3.5 | |
| |
BBB/Baa | | | 15.9 | |
| |
BB/Ba | | | 34.8 | |
| |
B | | | 17.1 | |
| |
CCC/Caa | | | 4.4 | |
| |
CC | | | 0.1 | |
| |
C | | | — | (d) |
| |
N/R | | | 17.2 | |
| (a) | For financial reporting purposes, credit quality ratings shown above reflect the highest rating assigned by either S&P Global Ratings or Moody’s Investors Service, Inc. if ratings differ. These rating agencies are independent, nationally recognized statistical rating organizations and are widely used. Investment grade ratings are credit ratings of BBB/Baa or higher. Below investment grade ratings are credit ratings of BB/Ba or lower. Investments designated N/R are not rated by either rating agency. Unrated investments do not necessarily indicate low credit quality. Credit quality ratings are subject to change. |
| (b) | Excludes short-term securities. |
| (c) | Includes U.S. Government Sponsored Agency Securities which are deemed AAA/Aaa by the investment adviser. |
| (d) | Rounds to less than 1% of total investments. |
| * | Includes one or more investment categories that individually represents less than 1.0% of the Trust’s total investments. Please refer to the Schedule of Investments for details. |
| | |
T R U S T S U M M A R Y | | 7 |
| | |
Trust Summary as of December 31, 2022 | | BlackRock Multi-Sector Opportunities Trust II (MSO2) |
Investment Objective
BlackRock Multi-Sector Opportunities Trust II’s (MSO2) (the “Trust”) investment objective is to seek to provide high income and total return. The Trust seeks to achieve its investment objective by investing at least 80% of its total assets in fixed income securities and other financial instruments that pay periodic income. The Trust may invest any amount of its assets in securities of any credit quality, including securities that are rated at the time of investment below investment grade — i.e., ‘‘Ba’’ or ‘‘BB’’ or below by Moody’s, S&P Global Ratings or Fitch, or securities that are judged to be of comparable quality by the Trust’s investment advisers. It is anticipated that the Trust will terminate on February 28, 2025 (the “Termination Date”); however, the Board of Trustees may, without shareholder approval, extend the Termination Date by up to one year to a date on or before February 28, 2026. The Board of Trustees may also, without shareholder approval, adopt a plan of liquidation at any time preceding the anticipated Termination Date. The Trust may invest directly in securities or synthetically through the use of derivatives.
The Trust’s common shares are not listed on any securities exchange. Investors should consider that they may not have access to their investment until the Termination Date. The Trust is designed for long-term investors and an investment in the common shares, unlike an investment in a traditional listed closed-end fund, should be considered illiquid.
No assurance can be given that the Trust’s investment objective will be achieved.
Trust Information
| | |
Initial Offering Date | | April 16, 2019 |
| |
Termination Date(a) | | February 28, 2025 |
| |
Current Quarterly Distribution per Common Share(b) | | $1.5780 |
| |
Current Annualized Distribution per Common Share(b) | | $6.3120 |
| |
Leverage as of December 31, 2022(c) | | 15% |
| | (a) | The Board of Trustees may terminate the Trust, without shareholder approval, prior to the Termination Date and may, without shareholder approval, extend the Termination Date by up to one year to a date on or before February 28, 2026. | |
| | (b) | The distribution rate is not constant and is subject to change. A portion of the distribution may be deemed a return of capital or net realized gain. | |
| | (c) | Represents reverse repurchase agreements as a percentage of total managed assets, which is the total assets of the Trust (including any assets attributable to any borrowings) minus the sum of its liabilities (other than borrowings representing financial leverage). Does not reflect derivatives or other instruments that may give rise to economic leverage. For a discussion of leveraging techniques utilized by the Trust, please see The Benefits and Risks of Leveraging and Derivative Financial Instruments. | |
Net Asset Value Per Share Summary
| | | | | | | | | | | | | | | | | | | | |
| | | 12/31/22 | | | 12/31/21 | | | Change | | | High | | | Low | |
Net Asset Value | | $ | 69.62 | | | $ | 87.63 | | | | (20.55 | )% | | $ | 87.63 | | | $ | 67.53 | |
GROWTH OF$10,000 INVESTMENT
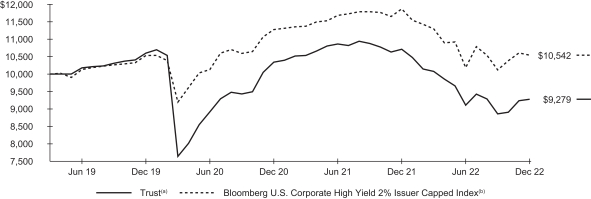
MSO2 commenced operations on April 16, 2019.
| | (a) | Represents the Trust’s NAV and reflects the reinvestment of dividends and/or distributions at NAV on the payable date. | |
| | (b) | An unmanaged index comprised of issuers that meet the following criteria: at least $150 million par value outstanding; maximum credit rating of Ba1; at least one year to maturity; and no issuer represents more than 2% of the index. | |
| | |
| 8 | | 2 0 2 2 B L A C K R O C K A N N U A L R E P O R T T O S H A R E H O L D E R S |
| | |
Trust Summary as of December 31, 2022 (continued) | | BlackRock Multi-Sector Opportunities Trust II (MSO2) |
Performance
Returns for the period ended December 31, 2022 were as follows:
| | | | | | | | |
| | | Average Annual Total Returns | |
| | | 1 Year | | | Since Inception(a) | |
Trust at NAV(b) | | | (13.37 | )% | | | (2.00 | )% |
Bloomberg U.S. Corporate High Yield 2% Issuer Capped Index | | | (11.18 | ) | | | 1.43 | |
| | (a) | MSO2 commenced operations on April 16, 2019. | |
| | (b) | All returns reflect reinvestment of dividends and/or distributions at NAV on the payable date. Performance results reflect the Trust’s use of leverage. | |
Performance results may include adjustments made for financial reporting purposes in accordance with U.S. generally accepted accounting principles. Past performance is not an indication of future results.
The Trust is presenting the performance of one or more indices for informational purposes only. The Trust is actively managed and does not seek to track or replicate the performance of any index. The index performance shown is not intended to be indicative of the Trust’s investment strategies, portfolio components or past or future performance.
More information about the Trust’s historical performance can be found in the “Closed End Funds” section of blackrock.com.
The following discussion relates to the Trust’s absolute performance based on NAV:
What factors influenced performance?
The detractors from performance over the period were the Trust’s exposures to emerging market debt, securitized assets including collateralized loan obligations (“CLOs”) and commercial mortgage-backed securities (“CMBS”), European corporate credit, U.S. high yield corporate bonds and U.S. investment grade corporate bonds. The Trust’s positioning with respect to duration and corresponding interest rate sensitivity also detracted from performance as Treasury yields moved higher over the period.
The Trust’s allocation to private assets contributed to performance over the period.
Describe recent portfolio activity.
The Trust was positioned defensively over the period as the market has been dealing with persistent inflation and heightened volatility. The Trust held core allocations in U.S. high yield corporate bonds, emerging market debt, structured products including CLOs, CMBS and non-agency residential mortgage-backed securities (“MBS”), European corporate credit, agency MBS and U.S. investment grade corporate bonds. The Trust added to its agency MBS allocation based on attractive spreads and the outlook for declining interest rate volatility. The Trust added to risk within its emerging market debt allocation while actively managing concerns around tighter central bank policies, weakening growth, and reduced liquidity. The Trust remained cautious with respect to U.S. high yield corporate exposure and trimmed exposure to CMBS.
The Trust used Treasury futures during the period to hedge duration and yield curve exposure. The use of derivatives marginally contributed to performance. The Trust’s cash position did not materially impact performance.
Describe portfolio positioning at period end.
As of December 31, 2022, the Trust’s portfolio had an effective duration of 2.28 years and approximately 15% leverage, with a nominal yield of 9.73%. The Trust maintained a diversified exposure within spread sectors, including emerging markets, high yield corporate bonds, and securitized assets. Private assets comprised approximately 4.7% of total portfolio assets. The Trust continues to seek opportunities to harvest the illiquidity premium and enhance yield by adding exposure to private investments.
The views expressed reflect the opinions of BlackRock as of the date of this report and are subject to change based on changes in market, economic or other conditions. These views are not intended to be a forecast of future events and are no guarantee of future results.
| | |
T R U S T S U M M A R Y | | 9 |
| | |
Trust Summary as of December 31, 2022 (continued) | | BlackRock Multi-Sector Opportunities Trust II (MSO2) |
Overview of the Trust’s Total Investments
PORTFOLIO COMPOSITION
| | | | |
| Asset Type | | 12/31/22 | |
Corporate Bonds | | | 39.6 | % |
Asset-Backed Securities | | | 20.1 | |
Non-Agency Mortgage-Backed Securities | | | 12.2 | |
Foreign Agency Obligations | | | 7.4 | |
Short-Term Securities | | | 5.7 | |
Floating Rate Loan Interests | | | 5.3 | |
U.S. Government Sponsored Agency Securities | | | 5.0 | |
Preferred Securities | | | 4.2 | |
Other* | | | 0.5 | |
CREDIT QUALITY ALLOCATION
| | | | |
| Credit Rating(a)(b) | | 12/31/22 | |
AAA/Aaa(c) | | | 5.9 | % |
A | | | 3.4 | |
BBB/Baa | | | 18.7 | |
BB/Ba | | | 33.4 | |
B | | | 15.3 | |
CCC/Caa | | | 2.5 | |
CC | | | 1.5 | |
C | | | 2.5 | |
N/R | | | 16.8 | |
| (a) | For financial reporting purposes, credit quality ratings shown above reflect the highest rating assigned by either S&P Global Ratings or Moody’s Investors Service, Inc. if ratings differ. These rating agencies are independent, nationally recognized statistical rating organizations and are widely used. Investment grade ratings are credit ratings of BBB/Baa or higher. Below investment grade ratings are credit ratings of BB/Ba or lower. Investments designated N/R are not rated by either rating agency. Unrated investments do not necessarily indicate low credit quality. Credit quality ratings are subject to change. | |
| (b) | Excludes short-term securities. | |
| (c) | Includes U.S. Government Sponsored Agency Securities which are deemed AAA/Aaa by the investment adviser. | |
| * | Includes one or more investment categories that individually represents less than 1.0% of the Trust’s total investments. Please refer to the Schedule of Investments for details. | |
| | |
| 10 | | 2 0 2 2 B L A C K R O C K A N N U A L R E P O R T T O S H A R E H O L D E R S |
| | |
Schedule of Investments December 31, 2022 | | BlackRock Multi-Sector Opportunities Trust (MSO) (Percentages shown are based on Net Assets) |
| | | | | | | | | | | | |
| Security | | | | | Par
(000) | | | Value | |
| | | |
| Asset-Backed Securities | | | | | | | | | |
Ajax Mortgage Loan Trust(a) | | | | | | | | | | | | |
Series 2018-A, Class B, 0.00%, 04/25/58(b) | | | USD | | | | 13 | | | $ | 12,503 | |
Series 2018-B, Class B, 0.00%, 02/26/57 | | | | | | | 31 | | | | 27,024 | |
Anchorage Capital CLO 5-R Ltd., Series 2014-5RA, Class E, (3 mo. LIBOR US + 5.40%), 9.48%, 01/15/30(a)(c) | | | | | | | 1,000 | | | | 908,299 | |
Anchorage Capital CLO Ltd., Series 2013-1A, Class DR, (3 mo. LIBOR US + 6.80%), 10.74%, 10/13/30(a)(c) | | | | | | | 3,050 | | | | 2,719,233 | |
Apidos CLO XV, Series 2013-15A, Class ERR, (3 mo. LIBOR US + 5.70%), 9.94%, 04/20/31(a)(c) | | | | | | | 1,000 | | | | 860,642 | |
Apres Static CLO Ltd., Series 2019-1A, Class CR, (3 mo. LIBOR US + 4.25%), 8.33%, 10/15/28(a)(c) | | | | | | | 500 | | | | 472,583 | |
Ares LI CLO Ltd., Series 2019-51A, Class ER, (3 mo. LIBOR US + 6.85%), 10.93%, 07/15/34(a)(c) | | | | | | | 700 | | | | 618,901 | |
Ares LV CLO Ltd., Series 2020-55A, Class DR, (3 mo. LIBOR US + 3.15%), 7.23%, 07/15/34(a)(c) | | | | | | | 1,000 | | | | 921,007 | |
Ares XXXVII CLO Ltd., Series 2015-4A, Class DR, (3 mo. LIBOR US + 6.15%), 10.23%, 10/15/30(a)(c) | | | | | | | 1,450 | | | | 1,172,964 | |
BankAmerica Manufactured Housing Contract Trust, | | | | | | | | | | | | |
Series 1997-2, Class B1, 7.07%, 02/10/22(c) | | | | | | | 2,300 | | | | 692,373 | |
Bean Creek CLO Ltd., Series 2015-1A, Class ER, (3 mo. LIBOR US + 5.75%), 9.99%, 04/20/31(a)(c) | | | | | | | 1,500 | | | | 1,237,828 | |
Brookside Mill CLO Ltd., Series 2013-1A, Class DR, (3 mo. LIBOR US + 2.65%), 6.73%, 01/17/28(a)(c) | | | | | | | 250 | | | | 241,299 | |
CarVal CLO II Ltd., Series 2019-1A, Class DR, (3 mo. LIBOR US + 3.20%), 7.44%, 04/20/32(a)(c) | | | | | | | 250 | | | | 235,016 | |
CarVal CLO III Ltd., Series 2019-2A, Class E, (3 mo. LIBOR US + 6.44%), 10.68%, 07/20/32(a)(c) | | | | | | | 2,200 | | | | 1,905,110 | |
Cedar Funding IX CLO Ltd., Series 2018-9A, Class E, (3 mo. LIBOR US + 5.35%), 9.59%, 04/20/31(a)(c) | | | | | | | 2,000 | | | | 1,767,123 | |
Cedar Funding XIV CLO Ltd.(a)(c) | | | | | | | | | | | | |
Series 2021-14A, Class D, (3 mo. LIBOR US + 3.25%), 7.33%, 07/15/33 | | | | | | | 1,000 | | | | 929,242 | |
Series 2021-14A, Class E, (3 mo. LIBOR US + 6.34%), 10.42%, 07/15/33 | | | | | | | 750 | | | | 679,040 | |
Series 2021-14A, Class SUB, 0.00%, 07/15/33 | | | | | | | 750 | | | | 404,175 | |
Deer Creek CLO Ltd., Series 2017-1A, Class E, (3 mo. LIBOR US + 6.35%), 10.59%, 10/20/30(a)(c) | | | | | | | 1,000 | | | | 867,534 | |
Elmwood CLO II Ltd., Series 2019-2A, Class ER, (3 mo. LIBOR US + 6.80%), 11.04%, 04/20/34(a)(c) | | | | | | | 250 | | | | 229,945 | |
Fairstone Financial Issuance Trust I, Series 2020-1A, Class D, 6.87%, 10/20/39(a) | | | CAD | | | | 210 | | | | 141,018 | |
Generate CLO 2 Ltd., Series 2A, Class ER, (3 mo. LIBOR US + 5.65%), 9.97%, 01/22/31(a)(c) | | | USD | | | | 500 | | | | 425,714 | |
Gilbert Park CLO Ltd., Series 2017-1A, Class D, (3 mo. LIBOR US + 2.95%), 7.03%, 10/15/30(a)(c) | | | | | | | 550 | | | | 513,578 | |
Goldentree Loan Management U.S. CLO 2 Ltd., Series 2017-2A, Class E, (3 mo. LIBOR US + 4.70%), 8.94%,
11/28/30(a)(c) | | | | | | | 1,500 | | | | 1,279,591 | |
GoldenTree Loan Opportunities IX Ltd., Series 2014-9A, Class ER2, (3 mo. LIBOR US + 5.66%), 10.07%, 10/29/29(a)(c) | | | | | | | 500 | | | | 451,047 | |
Gulf Stream Meridian 1 Ltd., Series 2020-IA, Class E, (3 mo. LIBOR US + 6.45%), 10.53%, 04/15/33(a)(c) | | | | | | | 250 | | | | 216,740 | |
JP Morgan Mortgage Acquisition Corp., Series 2006- FRE2, Class M2, (1 mo. LIBOR US + 0.54%), 4.93%, 02/25/36(c) | | | | | | | 2,787 | | | | 2,360,061 | |
| | | | | | | | | | | | |
| Security | | | | | Par
(000) | | | Value | |
|
| Asset-Backed Securities (continued) | |
Lending Funding Trust, Series 2020-2A, Class D, 6.77%, 04/21/31(a) | | | USD | | | | 315 | | | $ | 267,547 | |
Madison Park Funding XXX Ltd. | | | | | | | | | | | | |
Series 2018-30A, Class E, (3 mo. LIBOR US + 4.95%), 9.03%, 04/15/29(a)(c) | | | | | | | 1,250 | | | | 1,128,866 | |
Series 2018-30X, Class E, 9.03%, 04/15/29 | | | | | | | 250 | | | | 225,773 | |
Mariner Finance Issuance Trust, Series 2020-AA, Class D, 5.75%, 08/21/34(a) | | | | | | | 250 | | | | 214,477 | |
Mosaic Solar Loan Trust, Series 2018-2GS, Class C, 5.97%, 02/22/44(a)(d) | | | | | | | 228 | | | | 191,535 | |
Oceana Australian Fixed Income Trust, A Note Upsize, 8.00%, 09/28/23(d) | | | AUD | | | | 1,210 | | | | 811,471 | |
OCP CLO Ltd.(a)(c) | | | | | | | | | | | | |
Series 2013-4A, Class CRR, (3 mo. LIBOR US + 3.00%), 7.32%, 04/24/29 | | | USD | | | | 600 | | | | 571,746 | |
Series 2019-16A, Class ER, (3 mo. LIBOR US + 6.35%), 10.26%, 04/10/33 | | | | | | | 250 | | | | 218,965 | |
Series 2019-17A, Class ER, (3 mo. LIBOR US + 6.50%), 10.74%, 07/20/32 | | | | | | | 1,000 | | | | 872,989 | |
Palmer Square CLO Ltd.(a)(c) | | | | | | | | | | | | |
Series 2015-2A, Class CR2, (3 mo. LIBOR US + 2.75%), 6.99%, 07/20/30 | | | | | | | 250 | | | | 230,260 | |
Series 2018-2A, Class D, (3 mo. LIBOR US + 5.60%), 9.68%, 07/16/ 31 | | | | | | | 1,500 | | | | 1,343,652 | |
Rad CLO 6 Ltd., Series 2019-6A, Class E, (3 mo. LIBOR US + 7.53%), 11.77%, 01/20/33(a)(c) | | | | | | | 500 | | | | 457,429 | |
Republic Finance Issuance Trust, Series 2020-A, Class D, 7.00%, 11/20/30(a) | | | | | | | 700 | | | | 645,420 | |
Rockford Tower CLO Ltd., Series 2017-3A, Class D, (3 mo. LIBOR US + 2.65%), 6.89%, 10/20/30(a)(c) | | | | | | | 970 | | | | 888,909 | |
Signal Peak CLO 7 Ltd., Series 2019-1A, Class E, (3 mo. LIBOR US + 6.89%), 11.30%, 04/30/32(a)(c) | | | | | | | 250 | | | | 222,876 | |
Strata CLO I Ltd.(a)(c) | | | | | | | | | | | | |
Series 2018-1A, Class E, (3 mo. LIBOR US + 7.08%), 11.16%, 01/15/31 | | | | | | | 500 | | | | 440,784 | |
Series 2018-1A, Class USUB, 0.00%, 01/15/2118 | | | | | | | 1,750 | | | | 648,137 | |
TICP CLO VII Ltd., Series 2017-7A, Class ER, (3 mo. LIBOR US + 7.05%), 11.13%, 04/15/33(a)(c) | | | | | | | 500 | | | | 446,875 | |
TICP CLO XII Ltd., Series 2018-12A, Class ER, (3 mo. LIBOR US + 6.25%), 10.33%, 07/15/34(a)(c) | | | | | | | 725 | | | | 631,879 | |
Trestles CLO II Ltd., Series 2018-2A, Class D, (3 mo. LIBOR US + 5.75%), 10.11%, 07/25/31(a)(c) | | | | | | | 1,900 | | | | 1,587,058 | |
York CLO 1 Ltd., Series 2014-1A, Class DRR, (3 mo. LIBOR US + 3.01%), 7.33%, 10/22/29(a)(c) | | | | | | | 250 | | | | 237,110 | |
| | | | | | | | | | | | |
| | | |
Total Asset-Backed Securities — 16.1%
(Cost: $41,177,572) | | | | | | | | | | | 34,573,348 | |
| | | | | | | | | | | | |
| | | |
| | | | | | Shares | | | | |
| | | |
Common Stocks | | | | | | | | | | | | |
| |
Equity Real Estate Investment Trusts (REITs) — 0.0% | | | | | |
Service Properties Trust | | | | 4,000 | | | | 29,160 | |
| | | | | | | | | | | | |
| | |
S C H E D U L E O F I N V E S T M E N T S | | 11 |
| | |
Schedule of Investments (continued) December 31, 2022 | | BlackRock Multi-Sector Opportunities Trust (MSO) (Percentages shown are based on Net Assets) |
| | | | | | | | | | | | |
| Security | | | | |
Shares | | | Value | |
| | |
| Hotels, Restaurants & Leisure — 0.1% | | | | | | | |
Caesars Entertainment, Inc.(e) | | | | | | | 3,435 | | | $ | 142,896 | |
Carlson Travel, Inc. | | | | | | | 5,800 | | | | 35,380 | |
| | | | | | | | | | | | |
| | | | | | | | | | | 178,276 | |
| | | |
| Oil, Gas & Consumable Fuels — 0.4% | | | | | | | | | |
California Resources Corp. | | | | | | | 19,725 | | | | 858,235 | |
| | | | | | | | | | | | |
| |
Total Common Stocks — 0.5%
(Cost: $1,311,347) | | | | 1,065,671 | |
| | | | | | | | | | | | |
| | | |
| | | | | | Par
(000) | | | | |
| | | |
| Corporate Bonds | | | | | | | | | |
| | | |
Aerospace & Defense — 1.0% | | | | | | | | | | | | |
Embraer Netherlands Finance BV, 6.95%, 01/17/28(a) | | | USD | | | | 291 | | | | 289,963 | |
Rolls-Royce PLC, 1.63%, 05/09/28(f) | | | EUR | | | | 100 | | | | 84,432 | |
TransDigm, Inc.
6.25%, 03/15/26(a) | | | USD | | | | 1,505 | | | | 1,484,216 | |
6.38%, 06/15/26 | | | | | | | 348 | | | | 338,588 | |
| | | | | | | | | | | | |
| | | | | | | | | | | 2,197,199 | |
| | | |
| Airlines — 0.6% | | | | | | | | | |
Air France-KLM, 3.88%, 07/01/26(f) | | | EUR | | | | 100 | | | | 95,780 | |
Allegiant Travel Co., 7.25%, 08/15/27(a) | | | USD | | | | 56 | | | | 53,265 | |
Avianca Midco 2 PLC, 9.00%, 12/01/28(a) | | | | | | | 615 | | | | 448,715 | |
Azul Investments LLP, 7.25%, 06/15/26(a) | | | | | | | 220 | | | | 134,791 | |
Deutsche Lufthansa AG, 2.88%, 05/16/27(f) | | | EUR | | | | 100 | | | | 92,861 | |
Gol Finance SA(a)
7.00%, 01/31/25 | | | USD | | | | 500 | | | | 217,594 | |
8.00%, 06/30/26 | | | | | | | 200 | | | | 118,100 | |
International Consolidated Airlines Group SA, 2.75%, 03/25/25(f) | | | EUR | | | | 100 | | | | 97,445 | |
| | | | | | | | | | | | |
| | | | | | | | | | | 1,258,551 | |
| | | |
| Auto Components — 0.5% | | | | | | | | | |
Aptiv PLC, 3.10%, 12/01/51 | | | USD | | | | 273 | | | | 161,339 | |
Clarios Global LP/Clarios U.S. Finance Co., 6.25%, 05/15/26(a) | | | | | | | 71 | | | | 69,403 | |
Dana, Inc., 5.63%, 06/15/28 | | | | | | | 175 | | | | 159,191 | |
Faurecia SE(f)
3.13%, 06/15/26 | | | EUR | | | | 100 | | | | 94,537 | |
2.75%, 02/15/27 | | | | | | | 100 | | | | 90,068 | |
IHO Verwaltungs GmbH, (4.50% PIK), 3.75%, 09/15/26(f)(g) | | | | | | | 113 | | | | 104,843 | |
ZF Finance GmbH(f)
3.00%, 09/21/25 | | | | | | | 100 | | | | 98,349 | |
3.75%, 09/21/28 | | | | | | | 300 | | | | 269,196 | |
| | | | | | | | | | | | |
| | | | | | | | | | | 1,046,926 | |
| | | |
| Automobiles — 0.4% | | | | | | | | | |
Constellation Automotive Financing PLC, 4.88%, 07/15/27(f) | | | GBP | | | | 100 | | | | 78,789 | |
Ford Motor Co., 6.10%, 08/19/32 | | | USD | | | | 197 | | | | 181,901 | |
Ford Motor Credit Co. LLC, 5.58%, 03/18/24 | | | | | | | 612 | | | | 603,952 | |
Jaguar Land Rover Automotive PLC, 4.50%, 07/15/28(f) | | | EUR | | | | 100 | | | | 80,837 | |
| | | | | | | | | | | | |
| | | | | | | | | | | 945,479 | |
| | | |
| Banks — 1.1% | | | | | | | | | |
Bangkok Bank PCL, (5 year CMT + 4.73%), 5.00% | | | USD | | | | 200 | | | | 189,350 | |
BBK BSC, 5.50%, 07/09/24(f) | | | | | | | 279 | | | | 272,252 | |
Commerzbank AG, (5 year EUR Swap + 6.36%), 6.13%(c)(f)(h) | | | EUR | | | | 400 | | | | 397,171 | |
| | | | | | | | | | | | |
| Security | | | | | Par
(000) | | | Value | |
| | | |
| Banks (continued) | | | | | | | | | |
Freedom Mortgage Corp., 8.25%, 04/15/25(a) | | | USD | | | | 357 | | | $ | 321,113 | |
Grupo Aval Ltd., 4.38%, 02/04/30(a) | | | | | | | 780 | | | | 630,240 | |
Intesa Sanpaolo SpA, (5 year EUR Swap + 6.09%), 5.88%(c)(f)(h) | | | EUR | | | | 250 | | | | 214,887 | |
NBK Tier 1 Ltd., (6 year CMT + 2.88%), 3.63%(a)(c)(h) | | | USD | | | | 341 | | | | 296,841 | |
| | | | | | | | | | | | |
| | | | | | | | | | | 2,321,854 | |
| | | |
| Beverages — 1.1% | | | | | | | | | |
Anheuser-Busch Cos. LLC/Anheuser-Busch InBev Worldwide, Inc., 4.70%, 02/01/36 | | | | | | | 145 | | | | 136,944 | |
Ardagh Metal Packaging Finance USA LLC/Ardagh Metal Packaging Finance PLC, 3.25%, 09/01/28(a) | | | | | | | 493 | | | | 418,777 | |
Ardagh Packaging Finance PLC/Ardagh Holdings USA, Inc., 4.75%, 07/15/27(f) | | | GBP | | | | 190 | | | | 157,655 | |
Mauser Packaging Solutions Holding Co., 5.50%, 04/15/24(a) | | | USD | | | | 1,092 | | | | 1,061,803 | |
OI European Group BV, 2.88%, 02/15/25(f) | | | EUR | | | | 260 | | | | 267,184 | |
Trivium Packaging Finance BV, 5.50%, 08/15/26(a) | | | USD | | | | 446 | | | | 408,953 | |
| | | | | | | | | | | | |
| | | | | | | | | | | 2,451,316 | |
| | | |
| Biotechnology — 0.3% | | | | | | | | | |
Amgen, Inc. | | | | | | | | | | | | |
3.00%, 01/15/52 | | | | | | | 390 | | | | 248,912 | |
2.77%, 09/01/53 | | | | | | | 218 | | | | 131,204 | |
Gilead Sciences, Inc., | | | | | | | | | | | | |
2.60%, 10/01/40 | | | | | | | 355 | | | | 247,680 | |
| | | | | | | | | | | | |
| | | | | | | | | | | 627,796 | |
| | | |
| Building Materials — 0.2% | | | | | | | | | |
Cemex SAB de CV, 3.13%, 03/19/26(f) | | | EUR | | | | 300 | | | | 307,346 | |
Standard Industries, Inc., 4.75%, 01/15/28(a) | | | USD | | | | 46 | | | | 41,395 | |
| | | | | | | | | | | | |
| | | | | | | | | | | 348,741 | |
| | | |
| Building Products — 0.3% | | | | | | | | | |
Home Depot, Inc. | | | | | | | | | | | | |
2.75%, 09/15/51 | | | | | | | 335 | | | | 218,883 | |
3.63%, 04/15/52 | | | | | | | 107 | | | | 82,595 | |
Lowe’s Cos., Inc. | | | | | | | | | | | | |
3.00%, 10/15/50 | | | | | | | 413 | | | | 262,726 | |
4.25%, 04/01/52 | | | | | | | 100 | | | | 79,280 | |
SRS Distribution, Inc., | | | | | | | | | | | | |
4.63%, 07/01/28(a) | | | | | | | 29 | | | | 25,708 | |
| | | | | | | | | | | | |
| | | | | | | | | | | 669,192 | |
| | | |
| Capital Markets — 0.5% | | | | | | | | | |
Intercorp Peru Ltd., 3.88%, 08/15/29(a) | | | | | | | 400 | | | | 329,250 | |
Sherwood Financing PLC(f) | | | | | | | | | | | | |
4.50%, 11/15/26 | | | EUR | | | | 100 | | | | 86,037 | |
6.00%, 11/15/26 | | | GBP | | | | 156 | | | | 145,219 | |
SURA Asset Management SA, 4.88%, 04/17/24(f) | | | USD | | | | 417 | | | | 413,873 | |
| | | | | | | | | | | | |
| | | | | | | | | | | 974,379 | |
| | | |
| Chemicals — 1.5% | | | | | | | | | |
Alpek SAB de CV, 3.25%, 02/25/31(a) | | | | | | | 324 | | | | 269,183 | |
Axalta Coating Systems Dutch Holding B BV, 3.75%, 01/15/25(f) | | | EUR | | | | 100 | | | | 102,316 | |
Braskem Idesa SAPI, 6.99%, 02/20/32(a) | | | USD | | | | 300 | | | | 213,750 | |
Chemours Co., 4.00%, 05/15/26 | | | EUR | | | | 100 | | | | 95,554 | |
Equate Petrochemical BV | | | | | | | | | | | | |
4.25%, 11/03/26(f) | | | USD | | | | 200 | | | | 190,850 | |
2.63%, 04/28/28(a) | | | | | | | 200 | | | | 173,600 | |
NOVA Chemicals Corp., 4.88%, 06/01/24(a) | | | | | | | 1,407 | | | | 1,361,267 | |
OCI NV, 3.63%, 10/15/25(f) | | | EUR | | | | 90 | | | | 95,247 | |
Sasol Financing USA LLC | | | | | | | | | | | | |
4.38%, 09/18/26(i) | | | USD | | | | 200 | | | | 176,725 | |
| | |
| 12 | | 2 0 2 2 B L A C K R O C K A N N U A L R E P O R T T O S H A R E H O L D E R S |
| | |
Schedule of Investments (continued) December 31, 2022 | | BlackRock Multi-Sector Opportunities Trust (MSO) (Percentages shown are based on Net Assets) |
| | | | | | | | | | | | |
| Security | | | | | Par
(000) | | | Value | |
| | | |
| Chemicals (continued) | | | | | | | | | |
| | | |
| Sasol Financing USA LLC (continued) | | | | | | | | | |
6.50%, 09/27/28 | | | USD | | | | 200 | | | $ | 180,725 | |
5.50%, 03/18/31 | | | | | | | 315 | | | | 255,012 | |
SCIL IV LLC/SCIL USA Holdings LLC, 4.38%, 11/01/26(f) | | | EUR | | | | 100 | | | | 91,523 | |
| | | | | | | | | | | | |
| | | | | | | | | | | 3,205,752 | |
| | |
| Commercial Services & Supplies — 0.2% | | | | | | | |
AMN Healthcare, Inc., 4.63%, 10/01/27(a) | | | USD | | | | 210 | | | | 193,636 | |
Loxam SAS, 3.75%, 07/15/26(f) | | | EUR | | | | 200 | | | | 192,407 | |
| | | | | | | | | | | | |
| | | | | | | | | | | 386,043 | |
| | | |
| Construction & Engineering — 0.0% | | | | | | | | | |
Ferrovial Netherlands BV, (5 year EUR Swap + 2.13%), 2.12%(c)(f)(h) | | | | | | | 100 | | | | 84,030 | |
| | | | | | | | | | | | |
| | | |
| Construction Materials — 0.1% | | | | | | | | | |
KAR Auction Services, Inc., 5.13%, 06/01/25(a) | | | USD | | | | 180 | | | | 175,849 | |
| | | | | | | | | | | | |
| | | |
| Consumer Discretionary(f) — 0.2% | | | | | | | | | |
Carnival Corp., 10.13%, 02/01/26 | | | EUR | | | | 110 | | | | 116,412 | |
Q-Park Holding I BV | | | | | | | | | | | | |
1.50%, 03/01/25 | | | | | | | 100 | | | | 98,013 | |
(3 mo. EURIBOR + 2.00%), 3.98%, 03/01/26(c) | | | | | | | 100 | | | | 98,702 | |
Techem Verwaltungsgesellschaft 674 mbH, 6.00%, 07/30/26 | | | | | | | 88 | | | | 88,267 | |
| | | | | | | | | | | | |
| | | | | | | | | | | 401,394 | |
| | | |
| Consumer Finance — 0.1% | | | | | | | | | |
Encore Capital Group, Inc., 4.88%, 10/15/25(f) | | | | | | | 200 | | | | 200,435 | |
Moody’s Corp., 3.10%, 11/29/61 | | | USD | | | | 17 | | | | 10,699 | |
| | | | | | | | | | | | |
| | | | | | | | | | | 211,134 | |
| | | |
| Containers & Packaging — 0.6% | | | | | | | | | |
Klabin Austria GmbH, 3.20%, 01/12/31(a) | | | | | | | 305 | | | | 245,525 | |
Suzano Austria GmbH | | | | | | | | | | | | |
3.13%, 01/15/32 | | | | | | | 290 | | | | 225,838 | |
7.00%, 03/16/47(a) | | | | | | | 773 | | | | 770,729 | |
| | | | | | | | | | | | |
| | | | | | | | | | | 1,242,092 | |
| | | |
| Diversified Consumer Services — 0.1% | | | | | | | | | |
Rekeep SpA, 7.25%, 02/01/26(f) | | | EUR | | | | 200 | | | | 177,958 | |
| | | | | | | | | | | | |
| | | |
| Diversified Financial Services — 2.3% | | | | | | | | | |
ASG Finance Designated Activity Co., 7.88%, 12/03/24(a) | | | USD | | | | 428 | | | | 413,020 | |
Bank of America Corp., (3 mo. LIBOR US + 3.15%), 4.08%, 03/20/51(c) | | | | | | | 325 | | | | 254,332 | |
BNP Paribas SA, (5 year CMT + 3.34%), 4.63%(c)(f)(h) | | | | | | | 400 | | | | 309,040 | |
Garfunkelux Holdco 3 SA(f) | | | | | | | | | | | | |
6.75%, 11/01/25 | | | EUR | | | | 300 | | | | 256,025 | |
7.75%, 11/01/25 | | | GBP | | | | 100 | | | | 93,932 | |
Goldman Sachs Group, Inc.
4.80%, 07/08/44 | | | USD | | | | 195 | | | | 172,403 | |
(1 day SOFR + 1.47%), 2.91%, 07/21/42(c) | | | | | | | 23 | | | | 15,640 | |
Intrum AB, 4.88%, 08/15/25(f) | | | EUR | | | | 100 | | | | 97,047 | |
JPMorgan Chase & Co.(c) | | | | | | | | | | | | |
(1 day SOFR + 1.51%), 2.53%, 11/19/41 | | | USD | | | | 23 | | | | 15,037 | |
(1 day SOFR + 1.58%), 3.33%, 04/22/52 | | | | | | | 380 | | | | 256,810 | |
Lloyds Banking Group PLC, (5 year USD Swap + 4.76%), 7.50%(c)(h) | | | | | | | 500 | | | | 484,600 | |
Oceana Australian Fixed Income Trust, 10.00%, 08/31/23(d) | | | AUD | | | | 2,424 | | | | 1,650,381 | |
| | | | | | | | | | | | |
| Security | | | | | Par
(000) | | | Value | |
| |
| Diversified Financial Services (continued) | | | | |
Operadora de Servicios Mega SA de CV Sofom ER, 8.25%, 02/11/25(a) | | | USD | | | | 661 | | | $ | 326,906 | |
ProGroup AG, 3.00%, 03/31/26(f) | | | EUR | | | | 100 | | | | 93,798 | |
Sun Country Airlines Holdings, Inc., 7.00%, 12/15/23(d) | | | USD | | | | 422 | | | | 411,366 | |
UBS Group AG, (1 year CMT + 0.83%), 1.01%, 07/30/24(a)(c) | | | | | | | 150 | | | | 145,852 | |
| | | | | | | | | | | | |
| | | | | | | | | | | 4,996,189 | |
| | | |
| Diversified Telecommunication Services — 1.6% | | | | | | | | | |
Level 3 Financing, Inc.(a)
4.63%, 09/15/27 | | | | | | | 19 | | | | 15,818 | |
4.25%, 07/01/28 | | | | | | | 975 | | | | 768,007 | |
3.63%, 01/15/29 | | | | | | | 865 | | | | 633,388 | |
Oi SA, (10.00% Cash or 8.00% Cash + 4.00% PIK), 10.00%, 07/27/25(g) | | | | | | | 375 | | | | 62,766 | |
SoftBank Group Corp.(f)
4.75%, 07/30/25 | | | EUR | | | | 300 | | | | 300,261 | |
(5 year USD ICE Swap + 4.23%),
6.00%(c)(h) | | | USD | | | | 200 | | | | 189,960 | |
Telecom Italia Capital SA, 6.38%, 11/15/33 | | | | | | | 1,239 | | | | 1,013,614 | |
Telecom Italia SpA/Milano, 5.88%, 05/19/23 | | | GBP | | | | 150 | | | | 179,719 | |
Verizon Communications, Inc. | | | | | | | | | | | | |
2.88%, 11/20/50 | | | USD | | | | 195 | | | | 122,257 | |
2.99%, 10/30/56 | | | | | | | 328 | | | | 200,113 | |
| | | | | | | | | | | | |
| | | | | | | | | | | 3,485,903 | |
| | | |
| Electric Utilities — 1.5% | | | | | | | | | |
Adani Electricity Mumbai Ltd., 3.95%, 02/12/30(a) | | | | | | | 250 | | | | 188,641 | |
Comision Federal de Electricidad, 4.88%, 01/15/24 | | | | | | | 400 | | | | 395,325 | |
Empresas Publicas de Medellin ESP, 4.25%, 07/18/29(a) | | | | | | | 305 | | | | 241,579 | |
Oncor Electric Delivery Co. LLC, 2.70%, 11/15/51 | | | | | | | 485 | | | | 316,752 | |
Oryx Funding Ltd., 5.80%, 02/03/31(a) | | | | | | | 200 | | | | 189,975 | |
Talen Energy Supply LLC(a)(e)(j) | | | | | | | | | | | | |
7.25%, 05/15/27 | | | | | | | 1,243 | | | | 1,286,505 | |
6.63%, 01/15/28 | | | | | | | 675 | | | | 690,187 | |
| | | | | | | | | | | | |
| | | | | | | | | | | 3,308,964 | |
| | | |
| Electrical Equipment(f) — 0.0% | | | | | | | | | |
Pearl Holding II Ltd., (6.00% Cash or 8.00% PIK), 6.00%(g)(h) | | | | | | | 95 | | | | 2,774 | |
Pearl Holding III Ltd., 9.00%, 10/22/25 | | | | | | | 76 | | | | 26,505 | |
| | | | | | | | | | | | |
| | | | | | | | | | | 29,279 | |
| | | |
| Energy Equipment & Services — 0.4% | | | | | | | | | |
Transocean Phoenix 2 Ltd., 7.75%, 10/15/24(a) | | | | | | | 735 | | | | 727,848 | |
Vallourec SA, 8.50%, 06/30/26(f) | | | EUR | | | | 42 | | | | 44,077 | |
| | | | | | | | | | | | |
| | | | | | | | | | | 771,925 | |
| | |
| Environmental, Maintenance & Security Service — 0.1% | | | | | | | |
Covanta Holding Corp., 4.88%, 12/01/29(a) | | | USD | | | | 22 | | | | 18,024 | |
Republic Services, Inc., 3.05%, 03/01/50 | | | | | | | 345 | | | | 237,079 | |
| | | | | | | | | | | | |
| | | | | | | | | | | 255,103 | |
| | | |
| Equity Real Estate Investment Trusts (REITs) — 0.8% | | | | | | | | | |
American Tower Corp., 3.10%, 06/15/50 | | | | | | | 218 | | | | 137,174 | |
Crown Castle, Inc., 2.90%, 04/01/41 | | | | | | | 195 | | | | 133,587 | |
Equinix, Inc., 2.95%, 09/15/51 | | | | | | | 195 | | | | 121,460 | |
Mid-America Apartments LP, 2.88%, 09/15/51 | | | | | | | 28 | | | | 17,845 | |
Park Intermediate Holdings LLC/PK Domestic Property LLC/PK Finance Co-Issuer, 4.88%, 05/15/29(a) | | | | | | | 87 | | | | 73,646 | |
Service Properties Trust | | | | | | | | | | | | |
4.50%, 06/15/23 | | | | | | | 865 | | | | 850,028 | |
4.35%, 10/01/24 | | | | | | | 24 | | | | 21,818 | |
| | |
S C H E D U L E O F I N V E S T M E N T S | | 13 |
| | |
Schedule of Investments (continued) December 31, 2022 | | BlackRock Multi-Sector Opportunities Trust (MSO) (Percentages shown are based on Net Assets) |
| | | | | | | | | | | | |
| Security | | | | | Par
(000) | | | Value | |
|
| Equity Real Estate Investment Trusts (REITs) (continued) | |
| | | |
| Service Properties Trust (continued) | | | | | | | | | |
7.50%, 09/15/25 | | | USD | | | | 69 | | | $ | 65,752 | |
Trust Fibra Uno, 5.25%, 01/30/26(a) | | | | | | | 230 | | | | 222,353 | |
XHR LP(a) | | | | | | | | | | | | |
6.38%, 08/15/25 | | | | | | | 148 | | | | 142,296 | |
4.88%, 06/01/29 | | | | | | | 27 | | | | 22,116 | |
| | | | | | | | | | | | |
| | | | | | | | | | | 1,808,075 | |
| | | |
Food & Staples Retailing — 0.4% | | | | | | | | | | | | |
Albertsons Cos., Inc./Safeway, Inc./New Albertsons
LP/Albertsons LLC, 4.63%, 01/15/27(a) | | | | | | | 360 | | | | 334,392 | |
Bellis Acquisition Co. PLC, 3.25%, 02/16/26(f) | | | GBP | | | | 200 | | | | 196,333 | |
Market Bidco Finco PLC, 5.50%, 11/04/27(f) | | | | | | | 100 | | | | 91,832 | |
Ocado Group PLC, 3.88%, 10/08/26(f) | | | | | | | 100 | | | | 93,089 | |
Picard Groupe SAS, 3.88%, 07/01/26(f) | | | EUR | | | | 100 | | | | 91,102 | |
| | | | | | | | | | | | |
| | | | | | | | | | | 806,748 | |
| | | |
Food Products — 0.2% | | | | | | | | | | | | |
BRF SA, 4.88%, 01/24/30(f) | | | USD | | | | 200 | | | | 168,413 | |
Frigorifico Concepcion SA, 7.70%, 07/21/28(a) | | | | | | | 200 | | | | 159,913 | |
Grupo Bimbo SAB de CV, (5 year CMT + 3.28%), 5.95%(a)(c)(h) | | | | | | | 200 | | | | 198,162 | |
| | | | | | | | | | | | |
| | | | | | | | | | | 526,488 | |
| |
Health Care Equipment & Supplies — 0.0% | | | | | |
Becton Dickinson and Co., 3.79%, 05/20/50 | | | | | | | 88 | | | | 67,530 | |
| | | | | | | | | | | | |
| |
| Health Care Providers & Services — 2.4% | | | | |
Medline Borrower LP, 3.88%, 04/01/29(a) | | | | | | | 1,052 | | | | 847,870 | |
Phoenix PIB Dutch Finance BV, 2.38%, 08/05/25(f) | | | EUR | | | | 100 | | | | 100,125 | |
Select Medical Corp., 6.25%, 08/15/26(a)(i) | | | USD | | | | 780 | | | | 741,647 | |
Tenet Healthcare Corp.(a) | | | | | | | | | | | | |
4.63%, 09/01/24 | | | | | | | 901 | | | | 875,103 | |
4.88%, 01/01/26 | | | | | | | 1,488 | | | | 1,407,117 | |
4.63%, 06/15/28 | | | | | | | 49 | | | | 43,842 | |
4.25%, 06/01/29 | | | | | | | 1,124 | | | | 973,721 | |
4.38%, 01/15/30 | | | | | | | 111 | | | | 96,078 | |
| | | | | | | | | | | | |
| | | | | | | | | | | 5,085,503 | |
| | | |
Health Care Technology — 0.1% | | | | | | | | | | | | |
Chrome Bidco SASU, 3.50%, 05/31/28(f) | | | EUR | | | | 100 | | | | 89,650 | |
Universal Health Services, Inc., 2.65%, 10/15/30 | | | USD | | | | 137 | | | | 109,035 | |
| | | | | | | | | | | | |
| | | | | | | | | | | 198,685 | |
| | | |
Hotels, Restaurants & Leisure — 3.7% | | | | | | | | | | | | |
Affinity Gaming, 6.88%, 12/15/27(a) | | | | | | | 367 | | | | 311,157 | |
Boyd Gaming Corp., 4.75%, 12/01/27 | | | | | | | 797 | | | | 742,310 | |
Caesars Entertainment, Inc.(a) | | | | | | | | | | | | |
6.25%, 07/01/25 | | | | | | | 486 | | | | 472,234 | |
8.13%, 07/01/27(i) | | | | | | | 314 | | | | 308,521 | |
CDI Escrow Issuer, Inc., 5.75%, 04/01/30(a) | | | | | | | 9 | | | | 8,068 | |
Cedar Fair LP/Canada’s Wonderland Co./Magnum | | | | | | | | | | | | |
Management Corp./Millennium Op, 5.50%, 05/01/25(a) | | | | | | | 220 | | | | 217,606 | |
Cirsa Finance International SARL, 4.75%,
05/22/25(f) | | | EUR | | | | 100 | | | | 100,827 | |
CPUK Finance Ltd., 6.50%, 08/28/26(f) | | | GBP | | | | 100 | | | | 110,691 | |
Dave & Buster’s, Inc., 7.63%, 11/01/25(a) | | | USD | | | | 35 | | | | 35,175 | |
Fortune Star BVI Ltd., 6.85%, 07/02/24(f) | | | | | | | 200 | | | | 175,520 | |
Full House Resorts, Inc., 8.25%, 02/15/28(a) | | | | | | | 29 | | | | 25,674 | |
Golden Entertainment, Inc., 7.63%, 04/15/26(a) | | | | | | | 274 | | | | 270,059 | |
Hilton Grand Vacations Borrower Escrow LLC/Hilton Grand Vacations Borrower Esc, 5.00%, 06/01/29(a) | | | | | | | 361 | | | | 310,460 | |
IRB Holding Corp., 7.00%, 06/15/25(a) | | | | | | | 151 | | | | 150,622 | |
| | | | | | | | | | | | |
| Security | | | | | Par
(000) | | | Value | |
| |
| Hotels, Restaurants & Leisure (continued) | | | | |
Marriott International, Inc. | | | | | | | | | | | | |
Series FF, 4.63%, 06/15/30 | | | USD | | | | 106 | | | $ | 98,910 | |
Series GG, 3.50%, 10/15/32 | | | | | | | 508 | | | | 422,587 | |
Marriott Ownership Resorts, Inc.(a) | | | | | | | | | | | | |
6.13%, 09/15/25 | | | | | | | 278 | | | | 286,515 | |
4.50%, 06/15/29 | | | | | | | 370 | | | | 306,962 | |
MGM Resorts International | | | | | | | | | | | | |
4.63%, 09/01/26 | | | | | | | 355 | | | | 325,437 | |
5.50%, 04/15/27 | | | | | | | 355 | | | | 330,224 | |
Midwest Gaming Borrower LLC/Midwest Gaming Finance Corp., 4.88%, 05/01/29(a) | | | | | | | 218 | | | | 185,488 | |
Scientific Games International, Inc., 7.00%, 05/15/28(a) | | | | | | | 464 | | | | 442,614 | |
SeaWorld Parks & Entertainment, Inc.,
8.75%, 05/01/25(a) | | | | | | | 669 | | | | 684,889 | |
Stonegate Pub Co. Financing PLC(f) | | | | | | | | | | | | |
8.00%, 07/13/25 | | | GBP | | | | 100 | | | | 107,597 | |
8.25%, 07/31/25 | | | | | | | 200 | | | | 218,095 | |
Studio City Finance Ltd., 5.00%, 01/15/29(a) | | | USD | | | | 200 | | | | 147,750 | |
Travel & Leisure Co., 6.63%, 07/31/26(a) | | | | | | | 189 | | | | 184,891 | |
Wynn Las Vegas LLC/Wynn Las Vegas Capital Corp.(a) | | | | | | | | | | | | |
5.50%, 03/01/25 | | | | | | | 391 | | | | 371,194 | |
5.25%, 05/15/27 | | | | | | | 7 | | | | 6,317 | |
Wynn Macau Ltd., 5.50%, 01/15/26(f) | | | | | | | 200 | | | | 182,100 | |
Wynn Resorts Finance LLC/Wynn Resorts Capital Corp., 5.13%, 10/01/29(a) | | | | | | | 482 | | | | 413,137 | |
| | | | | | | | | | | | |
| | | | | | | | | | | 7,953,631 | |
| | | |
Household Durables — 3.3% | | | | | | | | | | | | |
Ashton Woods USA LLC/Ashton Woods Finance Co.(a) | | | | | | | | | | | | |
6.63%, 01/15/28 | | | | | | | 495 | | | | 435,511 | |
4.63%, 08/01/29 | | | | | | | 66 | | | | 52,848 | |
Brookfield Residential Properties, Inc./Brookfield Residential U.S. LLC(a) | | | | | | | | | | | | |
6.25%, 09/15/27 | | | | | | | 541 | | | | 480,462 | |
5.00%, 06/15/29 | | | | | | | 27 | | | | 21,097 | |
Century Communities, Inc., 6.75%, 06/01/27 | | | | | | | 110 | | | | 104,952 | |
Forestar Group, Inc.(a) | | | | | | | | | | | | |
3.85%, 05/15/26 | | | | | | | 560 | | | | 490,947 | |
5.00%, 03/01/28 | | | | | | | 669 | | | | 573,978 | |
M/I Homes, Inc., 4.95%, 02/01/28 | | | | | | | 510 | | | | 453,115 | |
PulteGroup, Inc., 7.88%, 06/15/32 | | | | | | | 1,138 | | | | 1,264,661 | |
Taylor Morrison Communities, Inc.(a) | | | | | | | | | | | | |
5.88%, 06/15/27 | | | | | | | 647 | | | | 621,198 | |
5.75%, 01/15/28 | | | | | | | 2,269 | | | | 2,124,584 | |
Tri Pointe Homes, Inc. | | | | | | | | | | | | |
5.25%, 06/01/27 | | | | | | | 505 | | | | 450,829 | |
5.70%, 06/15/28 | | | | | | | 38 | | | | 34,422 | |
| | | | | | | | | | | | |
| | | | | | | | | | | 7,108,604 | |
|
Independent Power and Renewable Electricity Producers — 1.3% | |
Calpine Corp.(a) | | | | | | | | | | | | |
4.50%, 02/15/28 | | | | | | | 1,523 | | | | 1,358,483 | |
5.13%, 03/15/28(i) | | | | | | | 722 | | | | 644,235 | |
Greenko Solar Mauritius Ltd., 5.95%, 07/29/26(f) | | | | | | | 100 | | | | 90,625 | |
India Cleantech Energy, 4.70%, 08/10/26(a) | | | | | | | 237 | | | | 202,421 | |
SCC Power PLC(a)(g) | | | | | | | | | | | | |
(4.00% PIK), 4.00%, 05/17/32 | | | | | | | 745 | | | | 22,354 | |
(8.00% Cash or 4.00% Cash + 4.00% PIK), 8.00%, 12/31/28 | | | | | | | 1,376 | | | | 468,744 | |
| | | | | | | | | | | | |
| | | | | | | | | | | 2,786,862 | |
| | |
| 14 | | 2 0 2 2 B L A C K R O C K A N N U A L R E P O R T T O S H A R E H O L D E R S |
| | |
Schedule of Investments (continued) December 31, 2022 | | BlackRock Multi-Sector Opportunities Trust (MSO) (Percentages shown are based on Net Assets) |
| | | | | | | | | | | | |
| Security | | | | | Par
(000) | | | Value | |
| | | |
Insurance(f) — 0.6% | | | | | | | | | | | | |
Argentum Netherlands BV for Swiss Re Ltd., (3 mo. LIBOR US + 3.78%),
5.63%, 08/15/52(c) | | | USD | | | | 400 | | | $ | 366,000 | |
Argentum Netherlands BV for Zurich Insurance Co. Ltd.,
(3 mo. EURIBOR + 3.95%), 3.50%, 10/01/46(c) | | | EUR | | | | 300 | | | | 302,632 | |
AXA SA, (3 mo. EURIBOR + 3.75%),
3.38%, 07/06/47(c) | | | | | | | 300 | | | | 297,027 | |
Galaxy Bidco Ltd., 6.50%, 07/31/26 | | | GBP | | | | 220 | | | | 225,276 | |
| | | | | | | | | | | | |
| | | | | | | | | | | 1,190,935 | |
| | | |
Interactive Media & Services(f) — 0.1% | | | | | | | | | | | | |
iliad SA, 5.38%, 06/14/27 | | | EUR | | | | 100 | | | | 106,189 | |
United Group BV, 4.88%, 07/01/24 | | | | | | | 130 | | | | 129,179 | |
| | | | | | | | | | | | |
| | | | | | | | | | | 235,368 | |
| | | |
Internet Software & Services — 0.1% | | | | | | | | | | | | |
Gen Digital, Inc., 6.75%, 09/30/27(a) | | | USD | | | | 120 | | | | 117,600 | |
| | | | | | | | | | | | |
| | | |
IT Services — 0.2% | | | | | | | | | | | | |
Centurion Bidco SpA, 5.88%, 09/30/26(f) | | | EUR | | | | 200 | | | | 184,188 | |
International Business Machines Corp., 2.95%, 05/15/50 | | | USD | | | | 218 | | | | 141,862 | |
La Financiere Atalian SASU, 6.63%, 05/15/25(f) | | | GBP | | | | 200 | | | | 161,012 | |
| | | | | | | | | | | | |
| | | | | | | | | | | 487,062 | |
| | | |
Machinery — 0.3% | | | | | | | | | | | | |
TK Elevator Midco GmbH(f) | | | | | | | | | | | | |
4.38%, 07/15/27 | | | EUR | | | | 115 | | | | 108,908 | |
(3 mo. EURIBOR + 4.75%), 6.13%, 07/15/27(c) | | | | | | | 173 | | | | 178,706 | |
TK Elevator U.S. Newco, Inc., 5.25%, 07/15/27(a) | | | USD | | | | 274 | | | | 243,186 | |
| | | | | | | | | | | | |
| | | | | | | | | | | 530,800 | |
| | | |
Media — 1.4% | | | | | | | | | | | | |
Altice Financing SA, 2.25%, 01/15/25(f) | | | EUR | | | | 180 | | | | 176,361 | |
Charter Communications Operating LLC/Charter Communications Operating Capital, 3.85%, 04/01/61 | | | USD | | | | 23 | | | | 13,302 | |
Clear Channel Outdoor Holdings, Inc., 5.13%, 08/15/27(a) | | | | | | | 738 | | | | 639,477 | |
Comcast Corp. | | | | | | | | | | | | |
2.89%, 11/01/51 | | | | | | | 235 | | | | 150,928 | |
2.45%, 08/15/52 | | | | | | | 198 | | | | 115,359 | |
CSC Holdings LLC, 5.38%, 02/01/28(a) | | | | | | | 360 | | | | 290,250 | |
Liquid Telecommunications Financing PLC, 5.50%, 09/04/26(a) | | | | | | | 200 | | | | 143,225 | |
Lorca Telecom Bondco SA, 4.00%, 09/18/27(f) | | | EUR | | | | 150 | | | | 143,306 | |
Nexstar Media, Inc., 5.63%, 07/15/27(a) | | | USD | | | | 733 | | | | 672,423 | |
SES SA, (5 year EUR Swap + 5.40%), 5.63%(c)(f)(h) | | | EUR | | | | 100 | | | | 103,913 | |
Sirius XM Radio, Inc.(a) | | | | | | | | | | | | |
5.00%, 08/01/27 | | | USD | | | | 70 | | | | 64,705 | |
5.50%, 07/01/29 | | | | | | | 66 | | | | 60,243 | |
Summer BC Holdco B SARL, 5.75%, 10/31/26(f) | | | EUR | | | | 131 | | | | 117,968 | |
TEGNA, Inc., 4.63%, 03/15/28 | | | USD | | | | 301 | | | | 285,860 | |
Tele Columbus AG, 3.88%, 05/02/25(f) | | | EUR | | | | 100 | | | | 80,165 | |
| | | | | | | | | | | | |
| | | | | | | | | | | 3,057,485 | |
| | | |
Metals & Mining — 1.5% | | | | | | | | | | | | |
AngloGold Ashanti Holdings PLC, 3.75%, 10/01/30 | | | USD | | | | 471 | | | | 408,681 | |
Commercial Metals Co., 4.13%, 01/15/30 | | | | | | | 650 | | | | 575,157 | |
Freeport Indonesia PT, 4.76%, 04/14/27(f) | | | | | | | 344 | | | | 329,848 | |
Metinvest BV(f) 8.50%, 04/23/26 | | | | | | | 296 | | | | 153,328 | |
7.65%, 10/01/27 | | | | | | | 400 | | | | 205,250 | |
Nexa Resources SA, 5.38%, 05/04/27(a) | | | | | | | 462 | | | | 433,067 | |
| | | | | | | | | | | | |
| Security | | | | | Par
(000) | | | Value | |
| | | |
| Metals & Mining (continued) | | | | | | | | | |
Periama Holdings LLC, 5.95%, 04/19/26(f) | | | USD | | | | 200 | | | $ | 186,037 | |
Stillwater Mining Co., 4.00%, 11/16/26(f) | | | | | | | 567 | | | | 498,358 | |
thyssenkrupp AG, 1.88%, 03/06/23(f) | | | EUR | | | | 127 | | | | 135,267 | |
Vedanta Resources Finance II PLC, 8.95%, 03/11/25(a) | | | USD | | | | 320 | | | | 216,400 | |
| | | | | | | | | | | | |
| | | | | | | | | | | 3,141,393 | |
| | | |
Multi-Utilities — 0.2% | | | | | | | | | | | | |
Promigas SA ESP/Gases del Pacifico SAC, 3.75%, 10/16/29(a) | | | | | | | 300 | | | | 244,125 | |
UGI International LLC, 2.50%, 12/01/29(f) | | | EUR | | | | 100 | | | | 81,656 | |
| | | | | | | | | | | | |
| | | | | | | | | | | 325,781 | |
| | | |
Oil, Gas & Consumable Fuels — 5.9% | | | | | | | | | | | | |
AI Candelaria Spain SA, 7.50%, 12/15/28(f) | | | USD | | | | 235 | | | | 223,057 | |
BP Capital Markets PLC, (5 year EUR Swap + 4.12%), 3.63%(c)(f)(h) | | | EUR | | | | 812 | | | | 745,303 | |
Buckeye Partners LP, 4.13%, 03/01/25(a) | | | USD | | | | 195 | | | | 185,719 | |
California Resources Corp., 7.13%, 02/01/26(a) | | | | | | | 378 | | | | 363,273 | |
Chesapeake Energy Corp., 5.50%, 02/01/26(a) | | | | | | | 110 | | | | 106,147 | |
CrownRock LP/CrownRock Finance, Inc., 5.63%, 10/15/25(a) | | | | | | | 54 | | | | 52,110 | |
Ecopetrol SA | | | | | | | | | | | | |
4.13%, 01/16/25 | | | | | | | 440 | | | | 418,220 | |
4.63%, 11/02/31 | | | | | | | 339 | | | | 258,488 | |
EIG Pearl Holdings SARL, 3.55%, 08/31/36(a) | | | | | | | 401 | | | | 336,289 | |
Geopark Ltd., 5.50%, 01/17/27(a) | | | | | | | 205 | | | | 176,595 | |
Hammerhead Resources, Inc., Series AI, (12.00% PIK), 9.00%, 07/10/22(d)(g) | | | | | | | 442 | | | | 441,431 | |
HTA Group Ltd., 7.00%, 12/18/25(a) | | | | | | | 415 | | | | 380,970 | |
IHS Holding Ltd., 6.25%, 11/29/28(a) | | | | | | | 305 | | | | 245,201 | |
Kinetik Holdings LP, 5.88%, 06/15/30(a) | | | | | | | 47 | | | | 44,076 | |
Leviathan Bond Ltd., 5.75%, 06/30/23(a)(f) | | | | | | | 124 | | | | 123,130 | |
MC Brazil Downstream Trading SARL | | | | | | | | | | | | |
7.25%, 06/30/31(a) | | | | | | | 315 | | | | 258,497 | |
7.25%, 06/30/31(f) | | | | | | | 200 | | | | 164,125 | |
Medco Oak Tree Pte. Ltd., 7.38%, 05/14/26(f) | | | | | | | 200 | | | | 189,750 | |
Neptune Energy Bondco PLC, 6.63%, 05/15/25(a) | | | | | | | 200 | | | | 194,202 | |
NGPL PipeCo LLC, 7.77%, 12/15/37(a) | | | | | | | 1,032 | | | | 1,073,813 | |
Oil & Gas Holding Co. BSCC, 7.63%, 11/07/24(f) | | | | | | | 263 | | | | 267,323 | |
OQ SAOC, 5.13%, 05/06/28(a) | | | | | | | 286 | | | | 269,698 | |
Permian Resources Operating LLC(a) | | | | | | | | | | | | |
5.38%, 01/15/26 | | | | | | | 1,841 | | | | 1,675,834 | |
6.88%, 04/01/27 | | | | | | | 127 | | | | 119,664 | |
Pertamina Persero PT, 3.65%, 07/30/29(f) | | | | | | | 404 | | | | 368,694 | |
Petroleos Mexicanos 6.50%, 03/13/27 | | | | | | | 934 | | | | 848,772 | |
8.75%, 06/02/29 | | | | | | | 406 | | | | 379,940 | |
5.95%, 01/28/31 | | | | | | | 514 | | | | 388,584 | |
6.70%, 02/16/32 | | | | | | | 181 | | | | 141,859 | |
Puma International Financing SA, 5.13%, 10/06/24(a) | | | | | | | 442 | | | | 408,850 | |
SM Energy Co., 6.75%, 09/15/26 | | | | | | | 341 | | | | 331,060 | |
Sunoco LP/Sunoco Finance Corp. | | | | | | | | | | | | |
4.50%, 05/15/29 | | | | | | | 67 | | | | 58,605 | |
4.50%, 04/30/30 | | | | | | | 427 | | | | 370,657 | |
TotalEnergies SE(c)(f)(h) | | | | | | | | | | | | |
(5 year EUR Swap + 2.15%), 2.63% | | | EUR | | | | 180 | | | | 180,236 | |
Series NC7, (5 year EUR Swap + 1.99%), 1.63% | | | | | | | 400 | | | | 347,138 | |
Transocean Guardian Ltd., 5.88%, 01/15/24(a) | | | USD | | | | 131 | | | | 128,270 | |
Vivo Energy Investments BV, 5.13%, 09/24/27(a) | | | | | | | 400 | | | | 356,450 | |
| | | | | | | | | | | | |
| | | | | | | | | | | 12,622,030 | |
| | |
S C H E D U L E O F I N V E S T M E N T S | | 15 |
| | |
Schedule of Investments (continued) December 31, 2022 | | BlackRock Multi-Sector Opportunities Trust (MSO) (Percentages shown are based on Net Assets) |
| | | | | | | | | | | | |
| Security | | | | | Par
(000) | | | Value | |
| | | |
Personal Products — 0.0% | | | | | | | | | | | | |
Coty, Inc., 3.88%, 04/15/26(f) | | | EUR | | | | 100 | | | $ | 99,390 | |
| | | | | | | | | | | | |
| | | |
Pharmaceuticals — 0.8% | | | | | | | | | | | | |
Cheplapharm Arzneimittel GmbH(f) | | | | | | | | | | | | |
3.50%, 02/11/27 | | | | | | | 100 | | | | 93,450 | |
4.38%, 01/15/28 | | | | | | | 331 | | | | 310,401 | |
CVS Health Corp. | | | | | | | | | | | | |
2.70%, 08/21/40 | | | USD | | | | 295 | | | | 203,807 | |
5.05%, 03/25/48 | | | | | | | 195 | | | | 175,021 | |
Merck & Co., Inc., 2.75%, 12/10/51 | | | | | | | 538 | | | | 359,459 | |
Nidda Healthcare Holding GmbH, 7.50%, 08/21/26(f) | | | EUR | | | | 172 | | | | 175,142 | |
Rossini SARL(f) | | | | | | | | | | | | |
6.75%, 10/30/25 | | | | | | | 100 | | | | 105,852 | |
(3 mo. EURIBOR + 3.88%), 5.48%, 10/30/25(c) | | | | | | | 100 | | | | 104,904 | |
Teva Pharmaceutical Finance Netherlands II BV 3.75%, 05/09/27 | | | | | | | 100 | | | | 92,279 | |
4.38%, 05/09/30 | | | | | | | 100 | | | | 88,131 | |
| | | | | | | | | | | | |
| | | | | | | | | | | 1,708,446 | |
|
Real Estate Management & Development — 1.6% | |
Adler Group SA(e)(f)(j) | | | | | | | | | | | | |
3.25%, 08/05/25 | | | | | | | 300 | | | | 130,381 | |
2.75%, 11/13/26 | | | | | | | 100 | | | | 42,283 | |
Arabian Centres Sukuk II Ltd., 5.63%, 10/07/26(a) | | | USD | | | | 510 | | | | 461,805 | |
China Evergrande Group(e)(f)(j) | | | | | | | | | | | | |
9.50%, 04/11/22 | | | | | | | 200 | | | | 13,500 | |
11.50%, 01/22/23 | | | | | | | 200 | | | | 13,662 | |
DEMIRE Deutsche Mittelstand Real Estate AG, 1.88%,
10/15/24(f) | | | EUR | | | | 100 | | | | 72,748 | |
Fantasia Holdings Group Co. Ltd.(e)(f)(j) | | | | | | | | | | | | |
11.75%, 04/17/22 | | | USD | | | | 400 | | | | 31,000 | |
9.25%, 07/28/23 | | | | | | | 200 | | | | 15,500 | |
Five Point Operating Co. LP/Five Point Capital Corp., | | | | | | | | | | | | |
7.88%, 11/15/25(a) | | | | | | | 750 | | | | 630,466 | |
Heimstaden Bostad AB, (5 year EUR Swap + 3.15%), 2.63%(c)(f)(h) | | | EUR | | | | 100 | | | | 55,580 | |
Howard Hughes Corp., 5.38%, 08/01/28(a) | | | USD | | | | 981 | | | | 883,616 | |
JGC Ventures Pte. Ltd.(g) | | | | | | | | | | | | |
(3.00% PIK), 0.00%, 06/30/25 | | | | | | | 7 | | | | 1,527 | |
(3.00% PIK), 3.00%, 06/30/25(e)(f)(j) | | | | | | | 239 | | | | 95,550 | |
(3.00% PIK), 10.75%, 06/30/25 | | | | | | | — | (k) | | | 56 | |
Jingrui Holdings Ltd., 12.00%, 07/25/22(e)(f)(j) | | | | | | | 200 | | | | 18,400 | |
Kaisa Group Holdings Ltd., 11.95%, 10/22/22(e)(j) | | | | | | | 200 | | | | 26,000 | |
MAF Global Securities Ltd., (5 year CMT + 3.54%), 6.38%(c)(f)(h) | | | | | | | 200 | | | | 191,225 | |
MAF Sukuk Ltd.(f) | | | | | | | | | | | | |
4.64%, 05/14/29 | | | | | | | 250 | | | | 242,547 | |
3.93%, 02/28/30 | | | | | | | 243 | | | | 224,896 | |
Modern Land China Co. Ltd.(e)(j) | | | | | | | | | | | | |
11.50%, 11/13/22 | | | | | | | 240 | | | | 12,759 | |
9.80%, 04/11/23(f) | | | | | | | 200 | | | | 11,500 | |
Ronshine China Holdings Ltd.(e)(f)(j) | | | | | | | | | | | | |
7.35%, 12/15/23 | | | | | | | 200 | | | | 10,000 | |
7.10%, 01/25/25 | | | | | | | 200 | | | | 10,000 | |
Sinic Holdings Group Co. Ltd., 10.50%, 06/18/22(e)(j) | | | | | | | 200 | | | | 2,000 | |
Yango Justice International Ltd.(e)(j) | | | | | | | | | | | | |
10.25%, 09/15/22 | | | | | | | 250 | | | | 5,000 | |
7.88%, 09/04/24(f) | | | | | | | 200 | | | | 3,000 | |
Yanlord Land HK Co. Ltd., 6.80%, 02/27/24(f) | | | | | | | 200 | | | | 192,000 | |
| | | | | | | | | | | | |
| | | | | | | | | | | 3,397,001 | |
| | | | | | | | | | | | |
| Security | | | | | Par
(000) | | | Value | |
| | | |
Road & Rail — 0.5% | | | | | | | | | | | | |
CMA CGM SA, 7.50%, 01/15/26(f) | | | EUR | | | | 236 | | | $ | 260,584 | |
Danaos Corp., 8.50%, 03/01/28(a) | | | USD | | | | 100 | | | | 96,000 | |
Getlink SE, 3.50%, 10/30/25(f) | | | EUR | | | | 175 | | | | 181,709 | |
Norfolk Southern Corp., 3.05%, 05/15/50 | | | USD | | | | 450 | | | | 301,402 | |
United Rentals North America, Inc., 6.00%, 12/15/29 | | | | | | | 133 | | | | 132,168 | |
| | | | | | | | | | | | |
| | | | | | | | | | | 971,863 | |
|
Semiconductors & Semiconductor Equipment — 0.2% | |
ams-OSRAM AG, Series AMS, 0.00%, 03/05/25(f)(l) | | | EUR | | | | 200 | | | | 163,833 | |
Broadcom, Inc., 3.75%, 02/15/51(a) | | | USD | | | | 390 | | | | 269,248 | |
NXP BV/NXP Funding LLC/NXP USA, Inc., 3.25%, 11/30/51 | | | | | | | 23 | | | | 14,286 | |
| | | | | | | | | | | | |
| | | | | | | | | | | 447,367 | |
| | | |
Software — 0.5% | | | | | | | | | | | | |
Boxer Parent Co., Inc., 6.50%, 10/02/25(f) | | | EUR | | | | 100 | | | | 101,636 | |
Cloud Software Group Holdings, Inc., 6.50%, 03/31/29(a) | | | USD | | | | 239 | | | | 201,306 | |
Open Text Corp., 6.90%, 12/01/27 | | | | | | | 76 | | | | 76,000 | |
Oracle Corp. | | | | | | | | | | | | |
3.60%, 04/01/50 | | | | | | | 443 | | | | 298,257 | |
3.95%, 03/25/51 | | | | | | | 48 | | | | 34,197 | |
Playtika Holding Corp., 4.25%, 03/15/29(a) | | | | | | | 436 | | | | 342,238 | |
| | | | | | | | | | | | |
| | | | | | | | | | | 1,053,634 | |
| | | |
Specialty Retail — 0.1% | | | | | | | | | | | | |
Goldstory SASU, 5.38%, 03/01/26(f) | | | EUR | | | | 254 | | | | 248,150 | |
| | | | | | | | | | | | |
|
Technology Hardware, Storage & Peripherals — 0.0% | |
Dell International LLC/EMC Corp., 8.35%, 07/15/46 | | | USD | | | | 49 | | | | 55,824 | |
| | | | | | | | | | | | |
| | | |
Thrifts & Mortgage Finance — 0.7% | | | | | | | | | | | | |
doValue SpA, 3.38%, 07/31/26(f) | | | EUR | | | | 259 | | | | 243,084 | |
Jerrold Finco PLC(f) | | | | | | | | | | | | |
4.88%, 01/15/26 | | | GBP | | | | 100 | | | | 103,909 | |
5.25%, 01/15/27 | | | | | | | 100 | | | | 99,859 | |
Nationstar Mortgage Holdings, Inc., 6.00%, 01/15/27(a) | | | USD | | | | 24 | | | | 21,480 | |
Rocket Mortgage LLC/Rocket Mortgage Co.-Issuer, Inc.(a) | | | | | | | | | | | | |
2.88%, 10/15/26 | | | | | | | 179 | | | | 153,432 | |
3.63%, 03/01/29 | | | | | | | 541 | | | | 428,709 | |
3.88%, 03/01/31 | | | | | | | 122 | | | | 93,120 | |
United Wholesale Mortgage LLC, 5.75%, 06/15/27(a) | | | | | | | 374 | | | | 321,974 | |
| | | | | | | | | | | | |
| | | | | | | | | | | 1,465,567 | |
| | | |
Transportation Infrastructure — 0.6% | | | | | | | | | | | | |
Aeropuerto Internacional de Tocumen SA, 5.13%, 08/11/61(a) | | | | | | | 310 | | | | 253,677 | |
Aeropuertos Dominicanos Siglo XXI SA, 6.75%, 03/30/29(a) | | | | | | | 347 | | | | 336,156 | |
DP World Salaam, (5 year CMT + 5.75%), 6.00%(c)(f)(h) | | | | | | | 200 | | | | 197,500 | |
Mexico City Airport Trust, 5.50%, 07/31/47(f) | | | | | | | 500 | | | | 385,000 | |
| | | | | | | | | | | | |
| | | | | | | | | | | 1,172,333 | |
| | | |
Utilities — 1.1% | | | | | | | | | | | | |
AES Panama Generation Holdings SRL, 4.38%, 05/31/30(f) | | | | | | | 212 | | | | 182,824 | |
Electricite de France SA, (12 year EUR Swap + 3.04%), 5.00%(c)(f)(h) | | | EUR | | | | 100 | | | | 97,365 | |
FEL Energy VI SARL, 5.75%, 12/01/40 | | | USD | | | | 277 | | | | 236,179 | |
Genneia SA, 8.75%, 09/02/27(a) | | | | | | | 197 | | | | 190,594 | |
Orano SA, 2.75%, 03/08/28(f) | | | EUR | | | | 100 | | | | 96,217 | |
Thames Water Kemble Finance PLC, 4.63%, 05/19/26(f) | | | | | | | 293 | | | | 298,630 | |
| | |
| 16 | | 2 0 2 2 B L A C K R O C K A N N U A L R E P O R T T O S H A R E H O L D E R S |
| | |
Schedule of Investments (continued) December 31, 2022 | | BlackRock Multi-Sector Opportunities Trust (MSO) (Percentages shown are based on Net Assets) |
| | | | | | | | | | | | |
| Security | | | | | Par
(000) | | | Value | |
| | | |
| Utilities (continued) | | | | | | | | | |
Veolia Environnement SA, (5 year EUR Swap + 2.84%), 2.50%(c)(f)(h) | | | EUR | | | | 700 | | | $ | 595,600 | |
Vistra Operations Co. LLC, 5.00%, 07/31/27(a) | | | USD | | | | 792 | | | | 735,050 | |
| | | | | | | | | | | | |
| | | | | | | | | | | 2,432,459 | |
| | | |
Wireless Telecommunication Services — 1.9% | | | | | | | | | | | | |
Altice France SA/France(f) 2.50%, 01/15/25 | | | EUR | | | | 141 | | | | 135,085 | |
2.13%, 02/15/25 | | | | | | | 148 | | | | 139,449 | |
5.88%, 02/01/27 | | | | | | | 100 | | | | 93,114 | |
4.25%, 10/15/29 | | | | | | | 200 | | | | 160,093 | |
GLP Capital LP/GLP Financing II, Inc., 4.00%, 01/15/31 | | | USD | | | | 350 | | | | 300,230 | |
Kenbourne Invest SA, 6.88%, 11/26/24(a) | | | | | | | 400 | | | | 377,825 | |
Millicom International Cellular SA, 4.50%, 04/27/31(a) | | | | | | | 380 | | | | 319,034 | |
T-Mobile USA, Inc., 3.30%, 02/15/51 | | | | | | | 390 | | | | 260,263 | |
VICI Properties LP/VICI Note Co., Inc.(a) 5.63%, 05/01/24 | | | | | | | 1,895 | | | | 1,876,543 | |
4.63%, 06/15/25 | | | | | | | 123 | | | | 117,926 | |
Vmed O2 U.K. Financing I PLC(f) 3.25%, 01/31/31 | | | EUR | | | | 133 | | | | 112,828 | |
4.50%, 07/15/31 | | | GBP | | | | 300 | | | | 275,677 | |
| | | | | | | | | | | | |
| | | | | | | | | | | 4,168,067 | |
| | | | | | | | | | | | |
| | | |
Total Corporate Bonds — 45.2%
(Cost: $113,016,275) | | | | | | | | | | | 96,843,729 | |
| | | | | | | | | | | | |
| | | |
Floating Rate Loan Interests(c) | | | | | | | | | | | | |
| | | |
| Air Freight & Logistics — 0.0% | | | | | | | | | |
Kestrel Bidco, Inc., Term Loan B, (1 mo. LIBOR + 3.00%, 1.00% Floor), 7.35%, 12/11/26 | | | USD | | | | 1 | | | | 419 | |
| | | | | | | | | | | | |
| | | |
| Building Materials — 0.8% | | | | | | | | | |
Cornerstone Building Brands, Inc., 2021 Term Loan B, (1 mo. LIBOR + 3.25%, 0.50% Floor), 7.57%, 04/12/28 | | | | | | | 1,930 | | | | 1,725,349 | |
| | | | | | | | | | | | |
| | | |
| Chemicals — 0.1% | | | | | | | | | |
SCIH Salt Holdings, Inc., 2021 Incremental Term Loan B, (3 mo. LIBOR + 4.00%, 0.75% Floor), 8.41%, 03/16/27 | | | | | | | 266 | | | | 257,425 | |
| | | | | | | | | | | | |
|
| Commercial Services & Supplies — 0.5% | |
Interface Security Systems LLC, Term Loan, (3 mo. LIBOR + 7.00%, 7.00% PIK), 8.75%, 08/07/23(d)(g) | | | | | | | 1,174 | | | | 1,101,753 | |
| | | | | | | | | | | | |
| | | |
| Diversified Financial Services — 4.9% | | | | | | | | | |
Colorado Plaza, Term Loan, (1 mo. LIBOR + 0.00%),
0.00%, 05/15/24(d)(e)(j) | | | | | | | 4,118 | | | | 2,067,647 | |
Credito Real SAB de CV Sofom ENR, Term Loan B, (3 mo. LIBOR + 3.75%), 6.73%, 02/17/23(d) | | | | | | | 112 | | | | 2,128 | |
LBM Acquisition LLC, Term Loan B, (6 mo. LIBOR + 3.75%, 0.75% Floor), 8.90%, 12/17/27 | | | | | | | 72 | | | | 77,845 | |
Luxembourg Life Fund, 2021 Term Loan, (3 mo. LIBOR + 9.25%), 13.93%, 04/01/23(d) | | | | | | | 5,041 | | | | 5,034,868 | |
Oceana Australian Fixed Income Trust, A Note Upsize, 8.00%, 01/21/24(d) | | | AUD | | | | 4,300 | | | | 2,876,422 | |
White Cap Buyer LLC, Term Loan B, (1 mo. SOFR CME + 3.75%), 8.07%, 10/19/27 | | | USD | | | | 427 | | | | 412,518 | |
| | | | | | | | | | | | |
| | | | | | | | | | | 10,471,428 | |
| | | | | | | | | | | | |
| Security | | | | | Par
(000) | | | Value | |
| | | |
Equity Real Estate Investment Trusts (REITs) — 0.0% | | | | | | | | | | | | |
Magnum Intermediate Holdings I LLC, 2nd Lien Term Loan, (Defaulted), 0.00%, 01/01/59(d)(e)(j) | | | USD | | | | 17,000 | | | $ | 2 | |
| | | | | | | | | | | | |
| | | |
Health Care Providers & Services — 0.1% | | | | | | | | | | | | |
Select Medical Corp., 2017 Term Loan B, (1 mo. LIBOR + 2.50%), 6.89%, 03/06/25 | | | | | | | 240 | | | | 234,986 | |
| | | | | | | | | | | | |
| | | |
Hotels, Restaurants & Leisure — 0.6% | | | | | | | | | | | | |
Aimbridge Acquisition Co., Inc., 2019 Term Loan B, (1 mo. LIBOR + 3.75%), 8.13%, 02/02/26 | | | | | | | 399 | | | | 360,595 | |
ECL Entertainment LLC, Term Loan, (1 mo. LIBOR + 7.50%, 0.75% Floor), 11.88%, 05/01/28 | | | | | | | 268 | | | | 267,028 | |
Fertitta Entertainment LLC, 2022 Term Loan B, (1 mo. SOFRTE + 4.00%, 0.50% Floor), 8.32%, 01/27/29 | | | | | | | 587 | | | | 556,408 | |
| | | | | | | | | | | | |
| | | | | | | | | | | 1,184,031 | |
| | | |
Industrial Conglomerates — 0.5% | | | | | | | | | | | | |
Robertshaw U.S. Holding Corp., 2018 1st Lien Term Loan, (1 mo. LIBOR + 3.50%, 1.00% Floor), 8.25%,
02/28/25 | | | | | | | 1,712 | | | | 1,150,504 | |
| | | | | | | | | | | | |
| | | |
Media — 0.5% | | | | | | | | | | | | |
Connect Finco SARL, 2021 Term Loan B, (1 mo. LIBOR + 3.50%, 1.00% Floor), 7.89%, 12/11/26 | | | | | | | 826 | | | | 815,135 | |
Diamond Sports Group LLC, Term Loan, (1 mo. LIBOR + 3.35%), 7.47%, 08/24/26 | | | | | | | 1,480 | | | | 162,868 | |
| | | | | | | | | | | | |
| | | | | | | | | | | 978,003 | |
| | | |
Thrifts & Mortgage Finance — 1.4% | | | | | | | | | | | | |
Caliber Home Loans, Inc., 2018 Revolver, (1 mo. LIBOR + 3.25%), 7.37%, 07/24/25(d) | | | | | | | 3,000 | | | | 2,985,000 | |
| | | | | | | | | | | | |
|
Total Floating Rate Loan Interests — 9.4% | |
(Cost: $31,102,063) | | | | | | | | | | | 20,088,900 | |
| | | | | | | | | | | | |
| | | |
Foreign Agency Obligations | | | | | | | | | | | | |
| | | |
| Bahrain — 0.1% | | | | | | | | | |
Bahrain Government International Bond, 7.00%, 01/26/26(f) | | | | | | | 295 | | | | 301,140 | |
| | | | | | | | | | | | |
| | | |
| Chile — 0.2% | | | | | | | | | |
Chile Government International Bond 4.34%, 03/07/42 | | | | | | | 213 | | | | 179,426 | |
4.00%, 01/31/52 | | | | | | | 200 | | | | 153,975 | |
| | | | | | | | | | | | |
| | | | | | | | | | | 333,401 | |
| | | |
| Colombia — 0.8% | | | | | | | | | |
Colombia Government International Bond | | | | | | | | | | | | |
4.50%, 01/28/26 | | | | | | | 411 | | | | 385,775 | |
3.88%, 04/25/27 | | | | | | | 573 | | | | 505,780 | |
3.13%, 04/15/31 | | | | | | | 400 | | | | 296,450 | |
4.13%, 05/15/51(i) | | | | | | | 350 | | | | 209,847 | |
Republic of Colombia Senior Unsecured, 8.00%, 04/20/33 | | | | | | | 373 | | | | 372,254 | |
| | | | | | | | | | | | |
| | | | | | | | | | | 1,770,106 | |
| | | |
| Dominican Republic — 0.9% | | | | | | | | | |
Dominican Republic International Bond | | | | | | | | | | | | |
6.88%, 01/29/26(f) | | | | | | | 279 | | | | 281,145 | |
5.95%, 01/25/27(f) | | | | | | | 379 | | | | 369,833 | |
5.50%, 02/22/29(a) | | | | | | | 240 | | | | 219,795 | |
4.50%, 01/30/30(a)(i) | | | | | | | 435 | | | | 369,016 | |
4.88%, 09/23/32(a) | | | | | | | 737 | | | | 609,314 | |
| | | | | | | | | | | | |
| | | | | | | | | | | 1,849,103 | |
| | |
S C H E D U L E O F I N V E S T M E N T S | | 17 |
| | |
Schedule of Investments (continued) December 31, 2022 | | BlackRock Multi-Sector Opportunities Trust (MSO) (Percentages shown are based on Net Assets) |
| | | | | | | | | | | | |
| Security | | | | | Par
(000) | | | Value | |
| |
| | | |
| Egypt — 0.2% | | | | | | | | | |
Egypt Government International Bond(a) | | | | | | | | | | | | |
5.75%, 05/29/24 | | | USD | | | | 265 | | | $ | 252,744 | |
8.50%, 01/31/47 | | | | | | | 200 | | | | 132,000 | |
7.50%, 02/16/61 | | | | | | | 200 | | | | 122,000 | |
| | | | | | | | | | | | |
| | | | | | | | | | | 506,744 | |
| | | |
| Guatemala — 0.5% | | | | | | | | | |
Guatemala Government Bond | | | | | | | | | | | | |
4.50%, 05/03/26(f) | | | | | | | 201 | | | | 192,621 | |
5.25%, 08/10/29(a) | | | | | | | 200 | | | | 191,850 | |
3.70%, 10/07/33(f) | | | | | | | 361 | | | | 296,426 | |
4.65%, 10/07/41(a) | | | | | | | 477 | | | | 381,689 | |
| | | | | | | | | | | | |
| | | | | | | | | | | 1,062,586 | |
| | | |
| Hungary — 0.4% | | | | | | | | | |
Hungary Government International Bond | | | | | | | | | | | | |
5.38%, 03/25/24 | | | | | | | 330 | | | | 329,237 | |
5.25%, 06/16/29(a) | | | | | | | 510 | | | | 484,914 | |
| | | | | | | | | | | | |
| | | | | | | | | | | 814,151 | |
| | | |
| Indonesia — 0.2% | | | | | | | | | |
Indonesia Government International Bond,
5.35%, 02/11/49 | | | | | | | 515 | | | | 500,894 | |
| | | | | | | | | | | | |
| | | |
| Ivory Coast — 0.4% | | | | | | | | | |
Ivory Coast Government International Bond,
6.38%, 03/03/28(f) | | | | | | | 808 | | | | 781,740 | |
| | | | | | | | | | | | |
| | | |
| Mexico — 0.4% | | | | | | | | | |
Mexico Government International Bond | | | | | | | | | | | | |
3.75%, 01/11/28 | | | | | | | 388 | | | | 365,496 | |
4.88%, 05/19/33 | | | | | | | 400 | | | | 368,400 | |
4.35%, 01/15/47(i) | | | | | | | 230 | | | | 172,184 | |
| | | | | | | | | | | | |
| | | | | | | | | | | 906,080 | |
| | | |
| Morocco — 0.1% | | | | | | | | | |
Morocco Government International Bond,
2.38%, 12/15/27(a) | | | | | | | 217 | | | | 187,949 | |
| | | | | | | | | | | | |
| | | |
| Nigeria — 0.3% | | | | | | | | | |
Nigeria Government International Bond | | | | | | | | | | | | |
8.38%, 03/24/29(a) | | | | | | | 441 | | | | 363,825 | |
7.88%, 02/16/32(f) | | | | | | | 343 | | | | 257,250 | |
| | | | | | | | | | | | |
| | | | | | | | | | | 621,075 | |
| | | |
| Oman — 0.5% | | | | | | | | | |
Oman Government International Bond(f) | | | | | | | | | | | | |
6.50%, 03/08/47 | | | | | | | 457 | | | | 414,727 | |
6.75%, 01/17/48 | | | | | | | 400 | | | | 372,325 | |
7.00%, 01/25/51 | | | | | | | 329 | | | | 316,416 | |
| | | | | | | | | | | | |
| | | | | | | | | | | 1,103,468 | |
| | | |
| Panama — 0.5% | | | | | | | | | |
Panama Government International Bond | | | | | | | | | | | | |
3.88%, 03/17/28 | | | | | | | 563 | | | | 531,261 | |
3.16%, 01/23/30 | | | | | | | 430 | | | | 369,209 | |
4.50%, 04/16/50 | | | | | | | 210 | | | | 158,392 | |
| | | | | | | | | | | | |
| | | | | | | | | | | 1,058,862 | |
| | | |
| Paraguay — 0.4% | | | | | | | | | |
Paraguay Government International Bond
4.95%, 04/28/31(a) | | | | | | | 200 | | | | 193,038 | |
| | | | | | | | | | | | |
| Security | | | | | Par (000) | | | Value | |
| |
| | | |
| Paraguay (continued) | | | | | | | | | |
Paraguay Government International Bond (continued) | | | | | | | | | |
5.60%, 03/13/48(f) | | | USD | | | | 321 | | | $ | 279,130 | |
5.40%, 03/30/50(f) | | | | | | | 460 | | | | 394,967 | |
| | | | | | | | | | | | |
| | | | | | | | | | | 867,135 | |
| | | |
| Peru — 0.2% | | | | | | | | | |
Corp. Financiera de Desarrollo SA, 4.75%, 07/15/25(f) | | | | | | | 361 | | | | 348,320 | |
Peruvian Government International Bond,
3.30%, 03/11/41 | | | | | | | 240 | | | | 174,870 | |
| | | | | | | | | | | | |
| | | | | | | | | | | 523,190 | |
| | | |
| Romania — 0.8% | | | | | | | | | |
Romanian Government International Bond | | | | | | | | | | | | |
5.25%, 11/25/27(a) | | | | | | | 406 | | | | 388,441 | |
2.88%, 03/11/29(f) | | | EUR | | | | 449 | | | | 396,611 | |
2.50%, 02/08/30(f) | | | | | | | 475 | | | | 392,089 | |
2.12%, 07/16/31(f) | | | | | | | 499 | | | | 366,997 | |
4.00%, 02/14/51(f) | | | USD | | | | 230 | | | | 151,053 | |
| | | | | | | | | | | | |
| | | | | | | | | | | 1,695,191 | |
| | | |
| Saudi Arabia — 0.2% | | | | | | | | | |
Saudi Government International Bond(f) | | | | | | | | | | | | |
2.25%, 02/02/33 | | | | | | | 360 | | | | 290,767 | |
3.75%, 01/21/55 | | | | | | | 230 | | | | 180,162 | |
| | | | | | | | | | | | |
| | | | | | | | | | | 470,929 | |
| | | |
| Senegal — 0.1% | | | | | | | | | |
Senegal Government International Bond,
6.25%, 05/23/33(f) | | | | | | | 200 | | | | 164,225 | |
| | | | | | | | | | | | |
| | | |
| South Africa — 0.4% | | | | | | | | | |
Republic of South Africa Government International Bond | | | | | | | | | | | | |
4.85%, 09/30/29 | | | | | | | 340 | | | | 301,707 | |
5.88%, 04/20/32 | | | | | | | 440 | | | | 395,450 | |
5.00%, 10/12/46 | | | | | | | 200 | | | | 139,350 | |
| | | | | | | | | | | | |
| | | | | | | | | | | 836,507 | |
| | | |
| Sri Lanka — 0.0% | | | | | | | | | |
Sri Lanka Government International Bond,
6.35%, 06/28/24(e)(f)(j) | | | | | | | 200 | | | | 58,475 | |
| | | | | | | | | | | | |
| | | |
| Ukraine — 0.1% | | | | | | | | | |
Ukraine Government International Bond(e)(f)(j) | | | | | |
8.99%, 02/01/26 | | | | | | | 447 | | | | 98,145 | |
7.75%, 09/01/27 | | | | | | | 369 | | | | 76,521 | |
| | | | | | | | | | | | |
| | | | | | | | | | | 174,666 | |
| | | | | | | | | | | | |
| | |
Total Foreign Agency Obligations — 7.7%
(Cost: $18,534,389) | | | | | | | | 16,587,617 | |
| | | | | | | | | | | | |
| | | |
| | | | | | Shares | | | | |
| | | |
| Investment Companies | | | | | | | | | |
| | | |
| Fixed Income Funds — 0.8% | | | | | | | | | |
iShares iBoxx High Yield Corporate Bond ETF(m) | | | | | | | 22,500 | | | | 1,656,675 | |
| | | | | | | | | | | | |
| | | |
Total Investment Companies — 0.8%
(Cost: $1,787,578) | | | | | | | | | | | 1,656,675 | |
| | | | | | | | | | | | |
| | |
| 18 | | 2 0 2 2 B L A C K R O C K A N N U A L R E P O R T T O S H A R E H O L D E R S |
| | |
Schedule of Investments (continued) December 31, 2022 | | BlackRock Multi-Sector Opportunities Trust (MSO) (Percentages shown are based on Net Assets) |
| | | | | | | | | | | | |
| Security | | | | | Par (000) | | | Value | |
| |
| | | |
Municipal Bonds | | | | | | | | | | | | |
| | | |
| Puerto Rico(c) — 0.1% | | | | | | | | | |
Commonwealth of Puerto Rico, GO | | | | | | | | | | | | |
0.00%, 11/01/43 | | | USD | | | | 50 | | | $ | 21,998 | |
0.00%, 11/01/51 | | | | | | | 555 | | | | 183,073 | |
Commonwealth of Puerto Rico, RB, 0.00%, 11/01/51 | | | | | | | 235 | | | | 75,856 | |
| | | | | | | | | | | | |
| | | | | | | | | | | 280,927 | |
| | | | | | | | | | | | |
Total Municipal Bonds — 0.1%
(Cost: $352,651) | | | | | | | | | | | 280,927 | |
| | | | | | | | | | | | |
| |
Non-Agency Mortgage-Backed Securities | | | | | |
| |
| Collateralized Mortgage Obligations(c) — 2.4% | | | | |
BCAP LLC Trust, Series 2012-RR3, Class 1A5, 5.05%, 12/26/37(a)(b) | | | | | | | 974 | | | | 844,405 | |
Cascade Funding Mortgage Trust, Series 2019-RM3, Class C, 4.00%, 06/25/69(a) | | | | | | | 2,161 | | | | 1,893,485 | |
Connecticut Avenue Securities Trust, Series 2021-R01, Class 1B2, (30 day SOFR + 6.00%), 9.93%, 10/25/41(a) | | | | | | | 457 | | | | 413,549 | |
Seasoned Credit Risk Transfer Trust, Series 2018-1, Class BX, 2.73%, 05/25/57 | | | | | | | 4,347 | | | | 2,018,694 | |
| | | | | | | | | | | | |
| | | | | | | | | | | 5,170,133 | |
| |
| Commercial Mortgage-Backed Securities —5.8% | | | | |
Ashford Hospitality Trust, Series 2018-ASHF, Class E, (1 mo. LIBOR US + 3.10%), 7.42%, 04/15/35(a)(c) | | | | | | | 315 | | | | 287,949 | |
Benchmark Mortgage Trust, Series
2019-B9, Class XD, 2.00%, 03/15/52(a)(c) | | | | 11,550 | | | | 1,089,578 | |
BX Commercial Mortgage Trust, Series 2021-MFM1, Class G, (1 mo. LIBOR US + 3.90%), 8.22%, 01/15/34(a)(c) | | | | | | | 205 | | | | 186,778 | |
CFK Trust, Series 2019-FAX, Class E, 4.64%, 01/15/39(a)(c) | | | | | | | 2,000 | | | | 1,606,069 | |
Citigroup Commercial Mortgage Trust, Series 2019- PRM, Class F, 4.73%, 05/10/36(a)(c) | | | | | | | 2,000 | | | | 1,978,490 | |
Cold Storage Trust, Series 2020-ICE5, Class F, (1 mo. LIBOR US + 3.49%), 7.81%, 11/15/37(a)(c) | | | | | | | 265 | | | | 252,899 | |
Credit Suisse Mortgage Capital Certificates Trust(a)(c) | | | | | | | | | |
Series 2020-FACT, Class F, (1 mo. LIBOR US + 6.16%), 10.48%, 10/15/37 | | | | | | | 700 | | | | 639,683 | |
Series 2021-BHAR, Class E, (1 mo. LIBOR US + 3.50%), 7.82%, 11/15/38 | | | | | | | 250 | | | | 237,706 | |
DBGS Mortgage Trust, Series 2019-1735, Class F, 4.19%, 04/10/37(a)(c) | | | | | | | 369 | | | | 224,291 | |
ELP Commercial Mortgage Trust, Series 2021-ELP, Class J, (1 mo. LIBOR US + 3.61%), 7.93%, 11/15/38(a)(c) | | | | | | | 50 | | | | 45,556 | |
GS Mortgage Securities Corp. Trust, Series 2021-DM, Class F, (1 mo. LIBOR US + 3.44%), 7.75%, 11/15/36(a)(c) | | | | | | | 110 | | | | 100,768 | |
GS Mortgage Securities Trust, Series 2012-GCJ9, Class C, 4.45%, 11/10/45(a)(c) | | | | | | | 252 | | | | 251,011 | |
HONO Mortgage Trust(a)(c) | | | | | | | | | | | | |
Series 2021-LULU, Class E, (1 mo. LIBOR US + 3.35%), 7.67%, 10/15/36 | | | | | | | 200 | | | | 180,990 | |
Series 2021-LULU, Class F, (1 mo. LIBOR US + 4.40%), 8.72%, 10/15/36 | | | | | | | 110 | | | | 99,152 | |
| | | | | | | | | | | | |
| Security | | | | | Par (000) | | | Value | |
| |
| |
| Commercial Mortgage-Backed Securities (continued) | | | | |
JP Morgan Chase Commercial Mortgage Securities Trust, Series 2022-NLP, Class F, (1 mo. SOFR CME + 3.54%), 7.88%, 04/15/37(a)(c) | | | USD | | | | 249 | | | $ | 200,581 | |
JPMBB Commercial Mortgage Securities Trust, Series 2015-C33, Class D1, 4.12%, 12/15/48(a)(c) | | | | | | | 257 | | | | 217,752 | |
JPMDB Commercial Mortgage Securities Trust, Series 2018-C8, Class XD, 1.50%, 06/15/51(a)(c) | | | | | | | 11,427 | | | | 701,479 | |
LSTAR Commercial Mortgage Trust, Series 2016-4, Class C, 4.60%, 03/10/49(a)(c) | | | | | | | 476 | | | | 425,332 | |
MED Trust, Series 2021, Class G, (1 mo. LIBOR US + 5.25%), 9.57%, 11/15/38(a)(c) | | | | | | | 175 | | | | 159,919 | |
MF1 Trust, Series 2021-W10, Class G, (1 mo. SOFR CME + 4.22%), 8.56%, 12/15/34(a)(c) | | | | | | | 310 | | | | 280,092 | |
Morgan Stanley Capital I, Series 2017-HR2, Class D, 2.73%, 12/15/50 | | | | | | | 250 | | | | 170,154 | |
Morgan Stanley Capital I Trust(a) | | | | | | | | | | | | |
Series 2018-MP, Class E, 4.28%, 07/11/40(c) | | | | | | | 551 | | | | 388,227 | |
Series 2018-SUN, Class F, (1 mo. LIBOR US + 2.55%), 6.87%, 07/15/35(c) | | | | | | | 1,360 | | | | 1,298,466 | |
Series 2019-H7, Class D, 3.00%, 07/15/52 | | | | | | | 1,250 | | | | 838,038 | |
One New York Plaza Trust, Series 2020-1NYP, Class D, (1 mo. LIBOR US + 2.75%), 7.07%, 01/15/36(a)(c) | | | | | | | 100 | | | | 87,522 | |
Velocity Commercial Capital Loan Trust(a) | | | | | | | | | | | | |
Series 2018-1, Class M5, 6.26%, 04/25/48 | | | | | | | 162 | | | | 129,041 | |
Series 2018-1, Class M6, 7.26%, 04/25/48 | | | | | | | 231 | | | | 170,644 | |
Wells Fargo Commercial Mortgage Trust, Series 2020- SDAL, Class E, (1 mo. LIBOR US + 2.74%), 7.06%, 02/15/37(a)(c) | | | | | | | 100 | | | | 92,761 | |
| | | | | | | | | | | | |
| | | | | | | | | | | 12,340,928 | |
| | | | | | | | | | | | |
Total Non-Agency Mortgage-Backed Securities — 8.2%
(Cost: $19,654,958) | | | | | | | | 17,511,061 | |
| | | | | | | | | | | | |
| | | |
Preferred Securities | | | | | | | | | | | | |
| | | |
| Capital Trusts — 4.8% | | | | | | | | | |
| | | |
| Banks(c)(h) — 1.4% | | | | | | | | | |
ABN AMRO Bank NV, 4.75%(f) | | | EUR | | | | 800 | | | | 725,748 | |
AIB Group PLC, 5.25%(f) | | | | | | | 200 | | | | 196,338 | |
Banco Bilbao Vizcaya Argentaria SA, 6.00%(f) | | | | | | | 200 | | | | 208,088 | |
Banco Mercantil del Norte SA(a) | | | | | | | | | | | | |
5.88% | | | USD | | | | 350 | | | | 311,675 | |
6.75% | | | | | | | 770 | | | | 749,932 | |
CaixaBank SA, 6.75%(f) | | | EUR | | | | 200 | | | | 208,577 | |
ING Groep NV, 3.88% | | | USD | | | | 400 | | | | 291,448 | |
Svenska Handelsbanken AB, 4.38%(f) | | | | | | | 400 | | | | 356,520 | |
| | | | | | | | | | | | |
| | | | | | | | | | | 3,048,326 | |
| | | |
| Chemicals — 0.3% | | | | | | | | | |
Solvay SA, 2.50%(c)(f)(h) | | | EUR | | | | 600 | | | | 565,795 | |
| | | | | | | | | | | | |
| | |
| Diversified Financial Services(c)(h) — 1.1% | | | | | | | |
Banco Santander SA(f) | | | | | | | | | | | | |
3.63% | | | | | | | 400 | | | | 296,001 | |
4.38% | | | | | | | 200 | | | | 181,698 | |
Barclays PLC | | | | | | | | | | | | |
8.00% | | | USD | | | | 550 | | | | 534,383 | |
6.13% | | | | | | | 273 | | | | 249,113 | |
NatWest Group PLC, 4.60% | | | | | | | 400 | | | | 286,371 | |
UBS Group AG, 4.88%(a) | | | | | | | 525 | | | | 444,938 | |
| | |
S C H E D U L E O F I N V E S T M E N T S | | 19 |
| | |
Schedule of Investments (continued) December 31, 2022 | | BlackRock Multi-Sector Opportunities Trust (MSO) (Percentages shown are based on Net Assets) |
| | | | | | | | | | | | |
| Security | | | | | Par
(000) | | | Value | |
| |
| |
| Diversified Financial Services (continued) | | | | |
UniCredit SpA(f) | | | | | | | | | | | | |
6.63% | | | EUR | | | | 200 | | | $ | 206,789 | |
7.50% | | | | | | | 200 | | | | 207,939 | |
| | | | | | | | | | | | |
| | | | | | | | | | | 2,407,232 | |
| |
| Diversified Telecommunication Services(c) — 0.7% | | | | |
British Telecommunications PLC, 4.25%, 11/23/81(a) | | | USD | | | | 200 | | | | 167,316 | |
Telefonica Europe BV(f)(h) | | | | | | | | | | | | |
4.38% | | | EUR | | | | 200 | | | | 203,903 | |
2.38% | | | | | | | 1,400 | | | | 1,120,225 | |
| | | | | | | | | | | | |
| | | | | | | | | | | 1,491,444 | |
| | | |
| Electric Utilities(c)(f)(h) — 0.2% | | | | | | | | | |
Iberdrola International BV, Series NC9, 1.83% | | | | | | | 300 | | | | 244,323 | |
Naturgy Finance BV, 2.37% | | | | | | | 100 | | | | 92,779 | |
| | | | | | | | | | | | |
| | | | | | | | | | | 337,102 | |
| | | |
| Insurance — 0.1% | | | | | | | | | |
Allianz SE, 3.20%(c)(f)(h) | | | USD | | | | 400 | | | | 297,304 | |
| | | | | | | | | | | | |
| | | |
| Media — 0.1% | | | | | | | | | |
SES SA, 2.88%(c)(f)(h) | | | EUR | | | | 250 | | | | 212,377 | |
| | | | | | | | | | | | |
| | | |
| Multi-Utilities — 0.1% | | | | | | | | | |
Electricite de France SA, 7.50%, 12/31/29 | | | | | | | 200 | | | | 212,711 | |
| | | | | | | | | | | | |
| |
| Oil, Gas & Consumable Fuels(c)(f)(h) — 0.2% | | | | |
Abertis Infraestructuras Finance BV, 3.25% | | | | | | | 100 | | | | 90,346 | |
Eni SpA, Series NC-9, 2.75% | | | | | | | 450 | | | | 370,492 | |
| | | | | | | | | | | | |
| | | | | | | | | | | 460,838 | |
| | | |
| Pharmaceuticals — 0.3% | | | | | | | | | |
Bayer AG, 3.13%, 11/12/79(c)(f) | | | | | | | 700 | | | | 634,107 | |
| | | | | | | | | | | | |
| |
| Real Estate Management & Development — 0.1% | | | | |
ATF Netherlands BV, 3.75%(c)(f)(h) | | | | | | | 300 | | | | 156,316 | |
| | | | | | | | | | | | |
| | | |
| Utilities(c)(f)(h) — 0.2% | | | | | | | | | |
Electricite de France SA | | | | | | | | | | | | |
5.38% | | | | | | | 300 | | | | 304,677 | |
3.38% | | | | | | | 200 | | | | 154,247 | |
| | | | | | | | | | | | |
| | | | | | | | | | | 458,924 | |
| |
| Wireless Telecommunication Services — 0.0% | | | | |
Vodafone Group PLC, 4.20%, 10/03/78(c)(f) | | | | | | | 100 | | | | 96,876 | |
| | | | | | | | | | | | |
| | | | | | | | | | | 10,379,352 | |
| | | | | | | | | | | | |
| | | | | | | | | | | | |
| Security | | �� | | | Shares | | | Value | |
| |
| | | |
| Preferred Stocks — 0.2% | | | | | | | | | |
| |
| Wireless Telecommunication Services — 0.2% | | | | |
2020 Cash Mandatory Exchangeable Trust, 5.25%, 06/01/23(a) | | | | | | | 295 | | | $ | 337,486 | |
| | | | | | | | | | | | |
| | | | | | | | | | | 337,486 | |
| | | | | | | | | | | | |
| | |
Total Preferred Securities — 5.0%
(Cost: $13,176,586) | | | | | | | | 10,716,838 | |
| | | | | | | | | | | | |
| | | |
| | | | | | Par (000) | | | | |
| |
|
U.S. Government Sponsored Agency Securities | |
| |
| Collateralized Mortgage Obligations — 0.9% | | | | |
Freddie Mac Structured Agency Credit Risk Debt Notes, Series 2018-DNA1, Class B1, (1 mo. LIBOR US + 3.15%), 7.54%, 07/25/30(c) | | | USD | | | | 2,000 | | | | 2,017,088 | |
| | | | | | | | | | | | |
| |
| Commercial Mortgage-Backed Securities — 0.2% | | | | |
FREMF Mortgage Trust, Series 2017-
KGX1, Class BFX, 3.59%, 10/25/27(a)(c) | | | | 370 | | | | 328,056 | |
| | | | | | | | | | | | |
| | |
| Mortgage-Backed Securities(n) — 5.8% | | | | | | | |
Uniform Mortgage-Backed Securities | | | | | | | | | | | | |
4.50%, 01/12/53 | | | | | | | 6,439 | | | | 6,195,792 | |
5.00%, 01/12/53 | | | | | | | 6,439 | | | | 6,343,660 | |
| | | | | | | | | | | | |
| | | | | | | | | | | 12,539,452 | |
| | | | | | | | | | | | |
| | |
Total U.S. Government Sponsored Agency Securities — 6.9%
(Cost: $14,951,038) | | | | | | | | 14,884,596 | |
| | | | | | | | | | | | |
| | |
Total Long-Term Investments — 99.9%
(Cost: $255,064,457) | | | | | | | | 214,209,362 | |
| | | | | | | | | | | | |
| | | |
| | | | | | Shares | | | | |
| |
| | | |
Short-Term Securities | | | | | | | | | | | | |
| | | |
| Money Market Funds — 4.1% | | | | | | | | | |
BlackRock Liquidity Funds, T-Fund, Institutional Class, 4.03%(m)(o) | | | | | | | 8,842,853 | | | | 8,842,853 | |
| | | | | | | | | | | | |
| | |
Total Short-Term Securities — 4.1%
(Cost: $8,842,853) | | | | | | | | 8,842,853 | |
| | | | | | | | | | | | |
| | |
Total Investments Before TBA Sale Commitments — 104.0%
(Cost: $263,907,310) | | | | | | | | 223,052,215 | |
| | | | | | | | | | | | |
| | |
| 20 | | 2 0 2 2 B L A C K R O C K A N N U A L R E P O R T T O S H A R E H O L D E R S |
| | |
Schedule of Investments (continued) December 31, 2022 | | BlackRock Multi-Sector Opportunities Trust (MSO) (Percentages shown are based on Net Assets) |
| | | | | | | | | | | | |
| Security | | | | | Par
(000) | | | Value | |
| | |
TBA Sale Commitments | | | | | | | | | |
| |
| Mortgage-Backed Securities — (2.9)% | | | | |
Uniform Mortgage-Backed Securities, 5.00%, 01/12/53(n) | | | USD | | | | (6,439 | ) | | $ | (6,343,660 | ) |
| | | | | | | | | | | | |
| |
Total TBA Sale Commitments — (2.9)%
(Proceeds: $(6,377,550)) | | | | (6,343,660 | ) |
| | | | | | | | | | | | |
| | |
Total Investments, Net of TBA Sale Commitments — 101.1%
(Cost: $257,529,760) | | | | | | | | 216,708,555 | |
| |
Liabilities in Excess of Other Assets — (1.1)% | | | | (2,324,680 | ) |
| | | | | | | | | | | | |
| | |
Net Assets — 100.0% | | | | | | | $ | 214,383,875 | |
| | | | | | | | | | | | |
| (a) | Security exempt from registration pursuant to Rule 144A under the Securities Act of 1933, as amended. These securities may be resold in transactions exempt from registration to qualified institutional investors. |
| (b) | When-issued security. |
| (c) | Variable rate security. Interest rate resets periodically. The rate shown is the effective interest rate as of period end. Security description also includes the reference rate and spread if published and available. |
| (d) | Security is valued using significant unobservable inputs and is classified as Level 3 in the fair value hierarchy. |
| (e) | Non-income producing security. |
| (f) | This security may be resold to qualified foreign investors and foreign institutional buyers under Regulation S of the Securities Act of 1933. |
| (g) | Payment-in-kind security which may pay interest/dividends in additional par/shares and/or in cash. Rates shown are the current rate and possible payment rates. |
| (h) | Perpetual security with no stated maturity date. |
| (i) | All or a portion of the security has been pledged as collateral in connection with outstanding reverse repurchase agreements. |
| (j) | Issuer filed for bankruptcy and/or is in default. |
| (k) | Rounds to less than 1,000. |
| (m) | Affiliate of the Trust. |
| (n) | Represents or includes a TBA transaction. |
| (o) | Annualized 7-day yield as of period end. |
For Trust compliance purposes, the Trust’s industry classifications refer to one or more of the industry sub-classifications used by one or more widely recognized market indexes or rating group indexes, and/or as defined by the investment adviser. These definitions may not apply for purposes of this report, which may combine such industry sub-classifications for reporting ease.
Affiliates
Investments in issuers considered to be affiliate(s) of the Trust during the year ended December 31, 2022 for purposes of Section 2(a)(3) of the Investment Company Act of 1940, as amended, were as follows:
| | | | | | | | | | | | | | | | | | | | | | | | | | | | | | | | | | | | |
| Affiliated Issuer | | Value at
12/31/21 | | | Purchases
at Cost | | | Proceeds
from Sales | | | Net
Realized
Gain (Loss) | | | Change in
Unrealized
Appreciation
(Depreciation) | | | Value at
12/31/22 | | | Shares
Held at
12/31/22 | | | Income | | | Capital Gain
Distributions
from
Underlying
Funds | |
BlackRock Liquidity Funds, T-Fund, Institutional Class | | $ | 24,175,756 | | | $ | — | | | $ | (15,332,903 | )(a) | | $ | — | | | $ | — | | | $ | 8,842,853 | | | | 8,842,853 | | | $ | 220,943 | | | $ | — | |
iShares iBoxx $ High Yield Corporate Bond ETF | | | 2,610,300 | | | | — | | | | (596,398 | ) | | | (6,753 | ) | | | (350,474 | ) | | | 1,656,675 | | | | 22,500 | | | | 97,225 | | | | — | |
iShares iBoxx $ Investment Grade Corporate Bond ETF(b) | | | — | | | | 10,756,668 | | | | (11,001,565 | ) | | | 244,897 | | | | — | | | | — | | | | — | | | | — | | | | — | |
| | | | | | | | | | | | | | | | | | | | | | | | | | | | | | | | | | | | |
| | | | | | | | | | | | | | $ | 238,144 | | | $ | (350,474 | ) | | $ | 10,499,528 | | | | | | | $ | 318,168 | | | $ | — | |
| | | | | | | | | | | | | | | | | | | | | | | | | | | | | | | | | | | | |
| | (a) | Represents net amount purchased (sold). | |
| | (b) | As of period end, the entity is no longer held. | |
Reverse Repurchase Agreements
| | | | | | | | | | | | | | | | | | | | | | | | | | |
| Counterparty | |
| Interest
Rate |
| |
| Trade
Date |
| |
| Maturity
Date |
(a) | | | Face Value | | |
| Face Value
Including
Accrued Interest |
| | Type of Non-Cash Underlying
Collateral | |
| Remaining
Contractual Maturity
of the Agreements |
(a) |
Nomura Securities International, Inc. | | | 4.48 | %(b) | | | 11/09/22 | | | | Open | | | $ | 289,180 | | | $ | 290,850 | | | Corporate Bonds | | | Open/Demand | |
Barclays Capital, Inc. | | | 4.30 | (b) | | | 11/16/22 | | | | Open | | | | 118,688 | | | | 119,254 | | | Foreign Agency Obligations | | | Open/Demand | |
Barclays Capital, Inc. | | | 4.35 | (b) | | | 11/16/22 | | | | Open | | | | 177,187 | | | | 178,045 | | | Foreign Agency Obligations | | | Open/Demand | |
BNP Paribas S.A. | | | 4.35 | (b) | | | 12/05/22 | | | | Open | | | | 690,300 | | | | 692,239 | | | Corporate Bonds | | | Open/Demand | |
Barclays Capital, Inc. | | | 4.40 | (b) | | | 12/28/22 | | | | Open | | | | 152,515 | | | | 152,571 | | | Foreign Agency Obligations | | | Open/Demand | |
Barclays Capital, Inc. | | | 4.45 | (b) | | | 12/28/22 | | | | Open | | | | 161,500 | | | | 161,560 | | | Corporate Bonds | | | Open/Demand | |
Nomura Securities International, Inc. | | | 4.48 | (b) | | | 12/28/22 | | | | Open | | | | 625,432 | | | | 625,666 | | | Corporate Bonds | | | Open/Demand | |
| | | | | | | | | | | | | | | | | | | | | | | | | | |
| | | | | | | | | | | | | | $ | 2,214,802 | | | $ | 2,220,185 | | | | | | | |
| | | | | | | | | | | | | | | | | | | | | | | | | | |
| | (a) | Certain agreements have no stated maturity and can be terminated by either party at any time. |
| | (b) | Variable rate security. Rate as of period end and maturity is the date the principal owed can be recovered through demand. |
| | |
S C H E D U L E O F I N V E S T M E N T S | | 21 |
| | |
Schedule of Investments (continued) December 31, 2022 | | BlackRock Multi-Sector Opportunities Trust (MSO) |
Derivative Financial Instruments Outstanding as of Period End
Futures Contracts
| | | | | | | | | | | | | | | | |
| Description | | Number of
Contracts | | | Expiration
Date | | | Notional
Amount (000) | | | Value/
Unrealized
Appreciation
(Depreciation) | |
Long Contracts | | | | | | | | | | | | | | | | |
10-Year U.S. Treasury Note | | | 193 | | | | 03/22/23 | | | $ | 21,643 | | | $ | (96,554 | ) |
U.S. Long Bond | | | 13 | | | | 03/22/23 | | | | 1,621 | | | | (6,725 | ) |
Ultra U.S. Treasury Bond | | | 25 | | | | 03/22/23 | | | | 3,338 | | | | (277,158 | ) |
2-Year U.S. Treasury Note | | | 227 | | | | 03/31/23 | | | | 46,535 | | | | 17,252 | |
| | | | | | | | | | | | | | | | |
| | | | | | | | | | | | | | | (363,185 | ) |
| | | | | | | | | | | | | | | | |
Short Contracts | | | | | | | | | | | | | | | | |
10-Year Japanese Government Treasury Bonds | | | 7 | | | | 03/13/23 | | | | 7,758 | | | | 142,470 | |
10-Year U.S. Ultra Long Treasury Note | | | 249 | | | | 03/22/23 | | | | 29,355 | | | | 358,474 | |
5-Year U.S. Treasury Note | | | 324 | | | | 03/31/23 | | | | 34,936 | | | | 27,814 | |
| | | | | | | | | | | | | | | | |
| | | | | | | | | | | | | | | 528,758 | |
| | | | | | | | | | | | | | | | |
| | | | | | | | | | | | | | $ | 165,573 | |
| | | | | | | | | | | | | | | | |
Forward Foreign Currency Exchange Contracts
| | | | | | | | | | | | | | | | | | | | |
| Currency Purchased | | | Currency Sold | | | Counterparty | | Settlement Date | | | Unrealized
Appreciation
(Depreciation) | |
| BRL | | | 2,087,935 | | | USD | | | 385,171 | | | Morgan Stanley & Co. International PLC | | | 03/15/23 | | | $ | 5,123 | |
| EUR | | | 1,054,000 | | | USD | | | 1,131,040 | | | Morgan Stanley & Co. International PLC | | | 03/15/23 | | | | 2,625 | |
| EUR | | | 8,398,000 | | | USD | | | 8,963,849 | | | UBS AG | | | 03/15/23 | | | | 68,903 | |
| USD | | | 591,805 | | | EUR | | | 549,000 | | | Bank of America N.A. | | | 03/15/23 | | | | 1,310 | |
| USD | | | 1,243,617 | | | GBP | | | 1,019,000 | | | HSBC Bank PLC | | | 03/15/23 | | | | 9,554 | |
| USD | | | 1,706,933 | | | GBP | | | 1,372,073 | | | Morgan Stanley & Co. International PLC | | | 03/15/23 | | | | 45,280 | |
| | | | | | | | | | | | | | | | | | | | |
| | | | | | | | | | | | | | | | | | | 132,795 | |
| | | | | | | | | | | | | | | | | | | | |
| USD | | | 14,802 | | | AUD | | | 22,000 | | | Deutsche Bank AG | | | 03/15/23 | | | | (219 | ) |
| USD | | | 5,388,770 | | | AUD | | | 7,934,000 | | | The Bank of New York Mellon | | | 03/15/23 | | | | (28,345 | ) |
| USD | | | 132,000 | | | CAD | | | 180,000 | | | Bank of America N.A. | | | 03/15/23 | | | | (1,013 | ) |
| USD | | | 295,500 | | | CNH | | | 2,044,993 | | | Morgan Stanley & Co. International PLC | | | 03/15/23 | | | | (1,598 | ) |
| USD | | | 22,543,747 | | | EUR | | | 21,008,058 | | | Deutsche Bank AG | | | 03/15/23 | | | | (52,178 | ) |
| USD | | | 398,561 | | | EUR | | | 372,426 | | | JPMorgan Chase Bank N.A. | | | 03/15/23 | | | | (2,015 | ) |
| USD | | | 6,870,860 | | | EUR | | | 6,406,940 | | | Morgan Stanley & Co. International PLC | | | 03/15/23 | | | | (20,340 | ) |
| USD | | | 413,293 | | | EUR | | | 390,020 | | | The Bank of New York Mellon | | | 03/15/23 | | | | (6,206 | ) |
| | | | | | | | | | | | | | | | | | | | |
| | | | | | | | | | | | | | | | | | | (111,914 | ) |
| | | | | | | | | | | | | | | | | | | | |
| | | | | | | | | | | | | | | | | | $ | 20,881 | |
| | | | | | | | | | | | | | | | | | | | |
Centrally Cleared Credit Default Swaps — Sell Protection
| | | | | | | | | | | | | | | | | | | | | | | | | | | | | | | | | | | | |
| Reference Obligation/Index | | Financing
Rate Received
by the Trust | | | Payment
Frequency | | | Termination
Date | | | Credit
Rating(a) | | | Notional Amount (000)(b) | | | Value | | | Upfront
Premium
Paid
(Received) | | | Unrealized
Appreciation
(Depreciation) | |
CDX.NA.HY.30.V15 | | | 5.00 | % | | | Quarterly | | | | 06/20/23 | | | | C | | | | USD | | | | 10,750 | | | $ | 166,967 | | | $ | (12,050 | ) | | $ | 179,017 | |
CDX.NA.HY.32.V13 | | | 5.00 | | | | Quarterly | | | | 06/20/24 | | | | C | | | | USD | | | | 8,923 | | | | 244,923 | | | | (18,659 | ) | | | 263,582 | |
CDX.NA.HY.34.V10 | | | 5.00 | | | | Quarterly | | | | 06/20/25 | | | | CC- | | | | USD | | | | 13,741 | | | | 345,028 | | | | (34,434 | ) | | | 379,462 | |
| | | | | | | | | | | | | | | | | | | | | | | | | | | | | | | | | | | | |
| | | | | | | | | | | | | | | | | | | | | | | | | | $ | 756,918 | | | $ | (65,143 | ) | | $ | 822,061 | |
| | | | | | | | | | | | | | | | | | | | | | | | | | | | | | | | | | | | |
| | (a) | Using the rating of the issuer or the underlying securities of the index, as applicable, provided by S&P Global Ratings. | |
| | (b) | The maximum potential amount the Trust may pay should a negative credit event take place as defined under the terms of the agreement. | |
| | |
| 22 | | 2 0 2 2 B L A C K R O C K A N N U A L R E P O R T T O S H A R E H O L D E R S |
| | |
Schedule of Investments (continued) December 31, 2022 | | BlackRock Multi-Sector Opportunities Trust (MSO) |
Centrally Cleared Interest Rate Swaps
| | | | | | | | | | | | | | | | | | | | | | | | | | | | | | | | |
| Paid by the Trust | | Received by the Trust | | Effective
Date | | | Termination
Date | | | Notional
Amount (000) | | | Value | | | Upfront
Premium
Paid
(Received) | | | Unrealized
Appreciation
(Depreciation) | |
| Rate | | Frequency | | Rate | | Frequency |
| 4.18% | | Annual | | 1-Day SOFR, 4.32% | | Annual | | | N/A | | | | 06/21/24 | | | USD | | | 4,685 | | | $ | 27,211 | | | $ | (8,977 | ) | | $ | 36,188 | |
| 1-Day SOFR, 4.32% | | Annual | | 3.71% | | Annual | | | N/A | | | | 01/10/27 | | | USD | | | 7,146 | | | | (38,100 | ) | | | 55,565 | | | | (93,665 | ) |
| 1-Day SOFR, 4.32% | | Annual | | 1.56% | | Annual | | | N/A | | | | 03/07/27 | | | USD | | | 8,805 | | | | (803,947 | ) | | | 68 | | | | (804,015 | ) |
| 3.50% | | Annual | | 1-Day SOFR, 4.32% | | Annual | | | N/A | | | | 05/28/31 | | | USD | | | 200 | | | | 1,129 | | | | (3,526 | ) | | | 4,655 | |
| 3.22% | | Annual | | 1-Day SOFR, 4.32% | | Annual | | | N/A | | | | 05/28/51 | | | USD | | | 89 | | | | 476 | | | | (4,663 | ) | | | 5,139 | |
| | | | | | | | | | | | | | | | | | | | | | | | | | | | | | | | |
| | | | | | | | | | | | | | | | | | | | | | $ | (813,231 | ) | | $ | 38,467 | | | $ | (851,698 | ) |
| | | | | | | | | | | | | | | | | | | | | | | | | | | | | | | | |
OTC Credit Default Swaps — Sell Protection
| | | | | | | | | | | | | | | | | | | | | | | | | | | | | | | | | | | | |
Reference Obligation/Index | |
| Financing
Rate Received
by the Trust |
| |
| Payment
Frequency |
| | Counterparty | |
| Termination
Date |
| | Credit
Rating(a) | |
| Notional
Amount (000)(b) |
| | | Value | | |
| Upfront
Premium
Paid
(Received) |
| |
| Unrealized
Appreciation
(Depreciation) |
|
CMA CGM SA | | | 5.00 | % | | | Quarterly | | | Credit Suisse International | | | 06/20/27 | | | BB+ | | | EUR | | | | 6 | | | $ | 224 | | | $ | 180 | | | $ | 44 | |
CMA CGM SA | | | 5.00 | | | | Quarterly | | | JPMorgan Chase Bank N.A. | | | 06/20/27 | | | BB+ | | | EUR | | | | 6 | | | | 226 | | | | 196 | | | | 30 | |
CMA CGM SA | | | 5.00 | | | | Quarterly | | | JPMorgan Chase Bank N.A. | | | 06/20/27 | | | BB+ | | | EUR | | | | 5 | | | | 211 | | | | 183 | | | | 28 | |
CMA CGM SA | | | 5.00 | | | | Quarterly | | | JPMorgan Chase Bank N.A. | | | 06/20/27 | | | BB+ | | | EUR | | | | 3 | | | | 101 | | | | 87 | | | | 14 | |
CMBX.NA.9 | | | 3.00 | | | | Monthly | | | Morgan Stanley & Co. International PLC | | | 09/17/58 | | | N/R | | | USD | | | | 2,226 | | | | (418,153 | ) | | | (156,026 | ) | | | (262,127 | ) |
CMBX.NA.15 | | | 3.00 | | | | Monthly | | | Goldman Sachs International | | | 11/15/64 | | | N/R | | | USD | | | | 3,523 | | | | (672,543 | ) | | | (755,168 | ) | | | 82,625 | |
CMBX.NA.15 | | | 3.00 | | | | Monthly | | | Morgan Stanley & Co. International PLC | | | 11/15/64 | | | N/R | | | USD | | | | 3,522 | | | | (672,390 | ) | | | (685,360 | ) | | | 12,970 | |
CMBX.NA.15 | | | 3.00 | | | | Monthly | | | Morgan Stanley & Co. International PLC | | | 11/18/64 | | | N/R | | | USD | | | | 4,000 | | | | (763,646 | ) | | | (749,502 | ) | | | (14,144 | ) |
| | | | | | | | | | | | | | | | | | | | | | | | | | | | | | | | | | | | |
| | | | | | | | | | | | | | | | | | | | | | | | | | $ | (2,525,970 | ) | | $ | (2,345,410 | ) | | $ | (180,560 | ) |
| | | | | | | | | | | | | | | | | | | | | | | | | | | | | | | | | | | | |
| | (a) | Using the rating of the issuer or the underlying securities of the index, as applicable, provided by S&P Global Ratings. | |
| | (b) | The maximum potential amount the Trust may pay should a negative credit event take place as defined under the terms of the agreement. | |
OTC Total Return Swaps
| | | | | | | | | | | | | | | | | | | | | | | | | | | | | | | | |
Paid by the Trust | | Received by the Trust | | Counterparty | | Effective
Date | | | Termination
Date | | Notional
Amount (000) | | | Value | | | Upfront
Premium
Paid
(Received) | | | Unrealized
Appreciation
(Depreciation) | |
| Rate/Reference | | Frequency | | Rate/Reference | | Frequency |
1-Day SOFR minus 0.40%, 4.32% | | Monthly | | iShares iBoxx $ High Yield Corporate Bond ETF | | Monthly | | JPMorgan Chase
Bank N.A. | | | N/A | | | 03/17/23 | | USD | | | 328 | | | $ | (4,626 | ) | | $ | — | | | $ | (4,626 | ) |
| | | | | | | | | | | | | | | | | | | | | | | | | | | | | | | | |
Balances Reported in the Statements of Assets and Liabilities for Centrally Cleared Swaps and OTC Swaps
| | | | | | | | | | | | | | | | |
| Description | | Swap
Premiums
Paid | | | Swap
Premiums
Received | | | Unrealized
Appreciation | | | Unrealized
Depreciation | |
Centrally Cleared Swaps(a) | | $ | 55,633 | | | | $ (82,309 | ) | | $ | 868,043 | | | $ | (897,680 | ) |
OTC Swaps | | | 646 | | | | (2,346,056 | ) | | | 95,711 | | | | (280,897 | ) |
| | (a) | Includes cumulative appreciation (depreciation) on centrally cleared swaps, as reported in the Schedule of Investments. Only current day’s variation margin is reported within the Statements of Assets and Liabilities and is net of any previously paid (received) swap premium amounts. | |
| | |
S C H E D U L E O F I N V E S T M E N T S | | 23 |
| | |
Schedule of Investments (continued) December 31, 2022 | | BlackRock Multi-Sector Opportunities Trust (MSO) |
Derivative Financial Instruments Categorized by Risk Exposure
As of period end, the fair values of derivative financial instruments located in the Statements of Assets and Liabilities were as follows:
| | | | | | | | | | | | | | | | | | | | | | | | | | | | |
| | | Commodity
Contracts | | | Credit
Contracts | | | Equity
Contracts | | | Foreign
Currency
Exchange
Contracts | | | Interest
Rate
Contracts | | | Other
Contracts | | | Total | |
Assets — Derivative Financial Instruments | | | | | | | | | | | | | | | | | | | | | | | | | |
Futures contracts | | | | | | | | | | | | | | | | | | | | | | | | | | | | |
Unrealized appreciation on futures contracts(a) | | $ | — | | | $ | — | | | $ | — | | | $ | — | | | $ | 546,010 | | | $ | — | | | $ | 546,010 | |
Forward foreign currency exchange contracts | | | | | | | | | | | | | | | | | | | | | | | | | | | | |
Unrealized appreciation on forward foreign currency exchange contracts | | | — | | | | — | | | | — | | | | 132,795 | | | | — | | | | — | | | | 132,795 | |
Swaps — centrally cleared | | | | | | | | | | | | | | | | | | | | | | | | | | | | |
Unrealized appreciation on centrally cleared swaps(a) | | | — | | | | 822,061 | | | | — | | | | — | | | | 45,982 | | | | — | | | | 868,043 | |
Swaps — OTC | | | | | | | | | | | | | | | | | | | | | | | | | | | | |
Unrealized appreciation on OTC swaps; Swap premiums paid | | | — | | | | 96,357 | | | | — | | | | — | | | | — | | | | — | | | | 96,357 | |
| | | | | | | | | | | | | | | | | | | | | | | | | | | | |
| | $ | — | | | $ | 918,418 | | | $ | — | | | $ | 132,795 | | | $ | 591,992 | | | $ | — | | | $ | 1,643,205 | |
| | | | | | | | | | | | | | | | | | | | | | | | | | | | |
| | | | | | |
| Liabilities — Derivative Financial Instruments | | | | | | | | | | | | | | | | | | | |
Futures contracts | | | | | | | | | | | | | | | | | | | | | | | | | | | | |
Unrealized depreciation on futures contracts(a) | | $ | — | | | $ | — | | | $ | — | | | $ | — | | | $ | 380,437 | | | $ | — | | | $ | 380,437 | |
Forward foreign currency exchange contracts | | | | | | | | | | | | | | | | | | | | | | | | | | | | |
Unrealized depreciation on forward foreign currency exchange contracts | | | — | | | | — | | | | — | | | | 111,914 | | | | — | | | | — | | | | 111,914 | |
Swaps — centrally cleared | | | | | | | | | | | | | | | | | | | | | | | | | | | | |
Unrealized depreciation on centrally cleared swaps(a) | | | — | | | | — | | | | — | | | | — | | | | 897,680 | | | | — | | | | 897,680 | |
Swaps — OTC | | | | | | | | | | | | | | | | | | | | | | | | | | | | |
Unrealized depreciation on OTC swaps; Swap premiums received | | | — | | | | 2,622,327 | | | | 4,626 | | | | — | | | | — | | | | — | | | | 2,626,953 | |
| | | | | | | | | | | | | | | | | | | | | | | | | | | | |
| | $ | — | | | $ | 2,622,327 | | | $ | 4,626 | | | $ | 111,914 | | | $ | 1,278,117 | | | $ | — | | | $ | 4,016,984 | |
| | | | | | | | | | | | | | | | | | | | | | | | | | | | |
| | (a) | Net cumulative unrealized appreciation (depreciation) on futures contracts and centrally cleared swaps, if any, are reported in the Schedule of Investments. In the Statements of Assets and Liabilities, only current day’s variation margin is reported in receivables or payables and the net cumulative unrealized appreciation (depreciation) is included in accumulated earnings (loss). | |
For the period ended December 31, 2022, the effect of derivative financial instruments in the Statements of Operations was as follows:
| | | | | | | | | | | | | | | | | | | | | | | | | | | | |
| | | Commodity
Contracts | | | Credit
Contracts | | | Equity
Contracts | | | Foreign
Currency
Exchange
Contracts | | | Interest
Rate
Contracts | | | Other
Contracts | | | Total | |
Net Realized Gain (Loss) from: | | | | | | | | | | | | | | | | | | | | | | | | | |
Futures contracts | | $ | — | | | $ | — | | | $ | — | | | $ | — | | | $ | 3,416,439 | | | $ | — | | | $ | 3,416,439 | |
Forward foreign currency exchange contracts | | | — | | | | — | | | | — | | | | 3,840,509 | | | | — | | | | — | | | | 3,840,509 | |
Options purchased(a) | | | — | | | | — | | | | 532,811 | | | | (97,407 | ) | | | (56,459 | ) | | | — | | | | 378,945 | |
Options written | | | — | | | | — | | | | (81,149 | ) | | | 35,926 | | | | 18,138 | | | | — | | | | (27,085 | ) |
Swaps | | | — | | | | (1,214,565 | ) | | | 6,308 | | | | — | | | | (439,619 | ) | | | — | | | | (1,647,876 | ) |
| | | | | | | | | | | | | | | | | | | | | | | | | | | | |
| | $ | — | | | $ | (1,214,565 | ) | | $ | 457,970 | | | $ | 3,779,028 | | | $ | 2,938,499 | | | $ | — | | | $ | 5,960,932 | |
| | | | | | | | | | | | | | | | | | | | | | | | | | | | |
Net Change in Unrealized Appreciation (Depreciation) on: | | | | | | | | | | | | | | | | | | | | | | | | | | | | |
Futures contracts | | $ | — | | | $ | — | | | $ | — | | | $ | — | | | $ | 216,957 | | | $ | — | | | $ | 216,957 | |
Forward foreign currency exchange contracts | | | — | | | | — | | | | — | | | | 264,323 | | | | — | | | | — | | | | 264,323 | |
Options purchased(b) | | | — | | | | — | | | | 53,602 | | | | — | | | | (8,628 | ) | | | — | | | | 44,974 | |
Options written | | | — | | | | — | | | | (20,308 | ) | | | — | | | | (9,001 | ) | | | — | | | | (29,309 | ) |
Swaps | | | — | | | | (1,389,001 | ) | | | (4,626 | ) | | | — | | | | (911,335 | ) | | | — | | | | (2,304,962 | ) |
| | | | | | | | | | | | | | | | | | | | | | | | | | | | |
| | $ | — | | | $ | (1,389,001 | ) | | $ | 28,668 | | | $ | 264,323 | | | $ | (712,007 | ) | | $ | — | | | $ | (1,808,017 | ) |
| | | | | | | | | | | | | | | | | | | | | | | | | | | | |
| | (a) | Options purchased are included in net realized gain (loss) from investments — unaffiliated. | |
| | (b) | Options purchased are included in net change in unrealized appreciation (depreciation) on investments — unaffiliated. | |
Average Quarterly Balances of Outstanding Derivative Financial Instruments
| | | | |
Futures contracts: | | | | |
Average notional value of contracts — long | | $ | 58,227,504 | |
Average notional value of contracts — short | | $ | 72,090,494 | |
| | |
| 24 | | 2 0 2 2 B L A C K R O C K A N N U A L R E P O R T T O S H A R E H O L D E R S |
| | |
Schedule of Investments (continued) December 31, 2022 | | BlackRock Multi-Sector Opportunities Trust (MSO) |
Average Quarterly Balances of Outstanding Derivative Financial Instruments (continued)
| | | | |
Forward foreign currency exchange contracts: | | | | |
Average amounts purchased — in USD | | $ | 45,858,658 | |
Average amounts sold — in USD | | $ | 13,007,573 | |
Options: | | | | |
Average value of option contracts purchased | | $ | 90,481 | |
Average value of option contracts written | | $ | 34,690 | |
Average notional value of swaption contracts purchased | | $ | 1,041,136 | |
Average notional value of swaption contracts written | | $ | — | (a) |
Credit default swaps: | | | | |
Average notional value — sell protection | | $ | 64,761,883 | |
Interest rate swaps: | | | | |
Average notional value — pays fixed rate | | $ | 5,156,846 | |
Average notional value — receives fixed rate | | $ | 17,127,533 | |
Total return swaps: | | | | |
Average notional value | | $ | 92,708 | |
| | (a) | Derivative not held at any quarter-end. The risk exposure table serves as an indicator of activity during the period. | |
For more information about the Trust’s investment risks regarding derivative financial instruments, refer to the Notes to Financial Statements.
Derivative Financial Instruments — Offsetting as of Period End
The Trust’s derivative assets and liabilities (by type) were as follows:
| | | | | | | | |
| | | Assets | | | Liabilities | |
Derivative Financial Instruments | | | | | | | | |
Futures contracts | | $ | 286,602 | | | $ | 145,164 | |
Forward foreign currency exchange contracts | | | 132,795 | | | | 111,914 | |
Swaps — centrally cleared | | | — | | | | 37,814 | |
Swaps — OTC(a) | | | 96,357 | | | | 2,626,953 | |
| | | | | | | | |
Total derivative assets and liabilities in the Statements of Assets and Liabilities | | | 515,754 | | | | 2,921,845 | |
| | | | | | | | |
Derivatives not subject to a Master Netting Agreement or similar agreement (“MNA”) | | | (286,602 | ) | | | (182,978 | ) |
| | | | | | | | |
Total derivative assets and liabilities subject to an MNA | | $ | 229,152 | | | $ | 2,738,867 | |
| | | | | | | | |
| | (a) | Includes unrealized appreciation (depreciation) on OTC swaps and swap premiums (paid/received) in the Statements of Assets and Liabilities. | |
The following table presents the Trust’s derivative assets and liabilities by counterparty net of amounts available for offset under an MNA and net of the related collateral received (and pledged) by the Trust:
| | | | | | | | | | | | | | | | | | | | |
| Counterparty | |
| Derivative
Assets
Subject to an
MNA by
Counterparty |
| |
| Derivatives
Available
for Offset |
(a) | |
| Non-Cash
Collateral
Received |
| |
| Cash
Collateral
Received |
| |
| Net Amount
of Derivative
Assets |
(b)(c) |
Bank of America N.A. | | $ | 1,310 | | | $ | (1,013 | ) | | $ | — | | | $ | — | | | $ | 297 | |
Credit Suisse International | | | 224 | | | | — | | | | — | | | | — | | | | 224 | |
Goldman Sachs International | | | 82,625 | | | | (82,625 | ) | | | — | | | | — | | | | — | |
HSBC Bank PLC | | | 9,554 | | | | — | | | | — | | | | — | | | | 9,554 | |
JPMorgan Chase Bank N.A | | | 538 | | | | (538 | ) | | | — | | | | — | | | | — | |
Morgan Stanley & Co. International PLC | | | 65,998 | | | | (65,998 | ) | | | — | | | | — | | | | — | |
UBS AG | | | 68,903 | | | | — | | | | — | | | | — | | | | 68,903 | |
| | | | | | | | | | | | | | | | | | | | |
| | $ | 229,152 | | | $ | (150,174 | ) | | $ | — | | | $ | — | | | $ | 78,978 | |
| | | | | | | | | | | | | | | | | | | | |
| | |
S C H E D U L E O F I N V E S T M E N T S | | 25 |
| | |
Schedule of Investments (continued) December 31, 2022 | | BlackRock Multi-Sector Opportunities Trust (MSO) |
| | | | | | | | | | | | | | | | | | | | |
| Counterparty | |
| Derivative
Liabilities
Subject to
an MNA by
Counterparty |
| |
| Derivatives
Availablefor Offset |
(a) | |
| Non-Cash
Collateral
Pledged |
| |
| Cash
CollateralPledged |
(d) | |
| Net Amount
of Derivative
Liabilities |
(b)(e) |
Bank of America N.A. | | $ | 1,013 | | | $ | (1,013 | ) | | $ | — | | | $ | — | | | $ | — | |
Deutsche Bank AG | | | 52,397 | | | | — | | | | — | | | | — | | | | 52,397 | |
Goldman Sachs International | | | 755,168 | | | | (82,625 | ) | | | — | | | | (672,543 | ) | | | — | |
JPMorgan Chase Bank N.A | | | 6,641 | | | | (538 | ) | | | — | | | | — | | | | 6,103 | |
Morgan Stanley & Co. International PLC | | | 1,889,097 | | | | (65,998 | ) | | | — | | | | (1,823,099 | ) | | | — | |
The Bank of New York Mellon | | | 34,551 | | | | — | | | | — | | | | — | | | | 34,551 | |
| | | | | | | | | | | | | | | | | | | | |
| | $ | 2,738,867 | | | $ | (150,174 | ) | | $ | — | | | $ | (2,495,642 | ) | | $ | 93,051 | |
| | | | | | | | | | | | | | | | | | | | |
| | (a) | The amount of derivatives available for offset is limited to the amount of derivative asset and/or liabilities that are subject to an MNA. | |
| | (b) | Net amount may also include forward foreign currency exchange contracts that are not required to be collateralized. | |
| | (c) | Net amount represents the net amount receivable from the counterparty in the event of default. | |
| | (d) | Excess of collateral received/pledged, if any, from the individual counterparty is not shown for financial reporting purposes. | |
| | (e) | Net amount represents the net amount payable due to counterparty in the event of default. | |
Fair Value Hierarchy as of Period End
Various inputs are used in determining the fair value of financial instruments. For a description of the input levels and information about the Trust’s policy regarding valuation of financial instruments, refer to the Notes to Financial Statements.
The following table summarizes the Trust’s financial instruments categorized in the fair value hierarchy. The breakdown of the Trust’s financial instruments into major categories is disclosed in the Schedule of Investments above.
| | | | | | | | | | | | | | | | |
| | | Level 1 | | | Level 2 | | | Level 3 | | | Total | |
Assets | | | | | | | | | | | | | | | | |
Investments | | | | | | | | | | | | | | | | |
Long-Term Investments | | | | | | | | | | | | | | | | |
Asset-Backed Securities | | $ | — | | | $ | 33,570,342 | | | $ | 1,003,006 | | | $ | 34,573,348 | |
Common Stocks | | | | | | | | | | | | | | | | |
Equity Real Estate Investment Trusts (REITs) | | | 29,160 | | | | — | | | | — | | | | 29,160 | |
Hotels, Restaurants & Leisure | | | 142,896 | | | | 35,380 | | | | — | | | | 178,276 | |
Oil, Gas & Consumable Fuels | | | 858,235 | | | | — | | | | — | | | | 858,235 | |
Corporate Bonds | | | | | | | | | | | | | | | | |
Aerospace & Defense | | | — | | | | 2,197,199 | | | | — | | | | 2,197,199 | |
Airlines | | | — | | | | 1,258,551 | | | | — | | | | 1,258,551 | |
Auto Components | | | — | | | | 1,046,926 | | | | — | | | | 1,046,926 | |
Automobiles | | | — | | | | 945,479 | | | | — | | | | 945,479 | |
Banks | | | — | | | | 2,321,854 | | | | — | | | | 2,321,854 | |
Beverages | | | — | | | | 2,451,316 | | | | — | | | | 2,451,316 | |
Biotechnology | | | — | | | | 627,796 | | | | — | | | | 627,796 | |
Building Materials | | | — | | | | 348,741 | | | | — | | | | 348,741 | |
Building Products | | | — | | | | 669,192 | | | | — | | | | 669,192 | |
Capital Markets | | | — | | | | 974,379 | | | | — | | | | 974,379 | |
Chemicals | | | — | | | | 3,205,752 | | | | — | | | | 3,205,752 | |
Commercial Services & Supplies | | | — | | | | 386,043 | | | | — | | | | 386,043 | |
Construction & Engineering | | | — | | | | 84,030 | | | | — | | | | 84,030 | |
Construction Materials | | | — | | | | 175,849 | | | | — | | | | 175,849 | |
Consumer Discretionary | | | — | | | | 401,394 | | | | — | | | | 401,394 | |
Consumer Finance | | | — | | | | 211,134 | | | | — | | | | 211,134 | |
Containers & Packaging | | | — | | | | 1,242,092 | | | | — | | | | 1,242,092 | |
Diversified Consumer Services | | | — | | | | 177,958 | | | | — | | | | 177,958 | |
Diversified Financial Services | | | — | | | | 2,934,442 | | | | 2,061,747 | | | | 4,996,189 | |
Diversified Telecommunication Services | | | — | | | | 3,485,903 | | | | — | | | | 3,485,903 | |
Electric Utilities | | | — | | | | 3,308,964 | | | | — | | | | 3,308,964 | |
Electrical Equipment | | | — | | | | 29,279 | | | | — | | | | 29,279 | |
Energy Equipment & Services | | | — | | | | 771,925 | | | | — | | | | 771,925 | |
Environmental, Maintenance & Security Service | | | — | | | | 255,103 | | | | — | | | | 255,103 | |
Equity Real Estate Investment Trusts (REITs) | | | — | | | | 1,808,075 | | | | — | | | | 1,808,075 | |
Food & Staples Retailing | | | — | | | | 806,748 | | | | — | | | | 806,748 | |
Food Products | | | — | | | | 526,488 | | | | — | | | | 526,488 | |
Health Care Equipment & Supplies | | | — | | | | 67,530 | | | | — | | | | 67,530 | |
| | |
| 26 | | 2 0 2 2 B L A C K R O C K A N N U A L R E P O R T T O S H A R E H O L D E R S |
| | |
Schedule of Investments (continued) December 31, 2022 | | BlackRock Multi-Sector Opportunities Trust (MSO) |
Fair Value Hierarchy as of Period End (continued)
| | | | | | | | | | | | | | | | |
| | | Level 1 | | | Level 2 | | | Level 3 | | | Total | |
Corporate Bonds (continued) | | | | | | | | | | | | | | | | |
Health Care Providers & Services | | $ | — | | | $ | 5,085,503 | | | $ | — | | | $ | 5,085,503 | |
Health Care Technology | | | — | | | | 198,685 | | | | — | | | | 198,685 | |
Hotels, Restaurants & Leisure | | | — | | | | 7,953,631 | | | | — | | | | 7,953,631 | |
Household Durables | | | — | | | | 7,108,604 | | | | — | | | | 7,108,604 | |
Independent Power and Renewable Electricity Producers | | | — | | | | 2,786,862 | | | | — | | | | 2,786,862 | |
Insurance | | | — | | | | 1,190,935 | | | | — | | | | 1,190,935 | |
Interactive Media & Services | | | — | | | | 235,368 | | | | — | | | | 235,368 | |
Internet Software & Services | | | — | | | | 117,600 | | | | — | | | | 117,600 | |
IT Services | | | — | | | | 487,062 | | | | — | | | | 487,062 | |
Machinery | | | — | | | | 530,800 | | | | — | | | | 530,800 | |
Media | | | — | | | | 3,057,485 | | | | — | | | | 3,057,485 | |
Metals & Mining | | | — | | | | 3,141,393 | | | | — | | | | 3,141,393 | |
Multi-Utilities | | | — | | | | 325,781 | | | | — | | | | 325,781 | |
Oil, Gas & Consumable Fuels | | | — | | | | 12,180,599 | | | | 441,431 | | | | 12,622,030 | |
Personal Products | | | — | | | | 99,390 | | | | — | | | | 99,390 | |
Pharmaceuticals | | | — | | | | 1,708,446 | | | | — | | | | 1,708,446 | |
Real Estate Management & Development | | | — | | | | 3,397,001 | | | | — | | | | 3,397,001 | |
Road & Rail | | | — | | | | 971,863 | | | | — | | | | 971,863 | |
Semiconductors & Semiconductor Equipment | | | 163,833 | | | | 283,534 | | | | — | | | | 447,367 | |
Software | | | — | | | | 1,053,634 | | | | — | | | | 1,053,634 | |
Specialty Retail | | | — | | | | 248,150 | | | | — | | | | 248,150 | |
Technology Hardware, Storage & Peripherals | | | — | | | | 55,824 | | | | — | | | | 55,824 | |
Thrifts & Mortgage Finance | | | — | | | | 1,465,567 | | | | — | | | | 1,465,567 | |
Transportation Infrastructure | | | — | | | | 1,172,333 | | | | — | | | | 1,172,333 | |
Utilities | | | — | | | | 2,432,459 | | | | — | | | | 2,432,459 | |
Wireless Telecommunication Services | | | — | | | | 4,168,067 | | | | — | | | | 4,168,067 | |
Floating Rate Loan Interests | | | — | | | | 6,021,080 | | | | 14,067,820 | | | | 20,088,900 | |
Foreign Agency Obligations | | | — | | | | 16,587,617 | | | | — | | | | 16,587,617 | |
Investment Companies | | | 1,656,675 | | | | — | | | | — | | | | 1,656,675 | |
Municipal Bonds | | | — | | | | 280,927 | | | | — | | | | 280,927 | |
Non-Agency Mortgage-Backed Securities | | | — | | | | 17,511,061 | | | | — | | | | 17,511,061 | |
Preferred Securities | | | | | | | | | | | | | | | | |
Capital Trusts | | | — | | | | 10,379,352 | | | | — | | | | 10,379,352 | |
Preferred Stocks | | | 337,486 | | | | — | | | | — | | | | 337,486 | |
U.S. Government Sponsored Agency Securities | | | — | | | | 14,884,596 | | | | — | | | | 14,884,596 | |
Short-Term Securities | | | | | | | | | | | | | | | | |
Money Market Funds | | | 8,842,853 | | | | — | | | | — | | | | 8,842,853 | |
Liabilities | | | | | | | | | | | | | | | | |
Investments | | | | | | | | | | | | | | | | |
TBA Sale Commitments | | | — | | | | (6,343,660 | ) | | | — | | | | (6,343,660 | ) |
| | | | | | | | | | | | | | | | |
| | $ | 12,031,138 | | | $ | 187,103,413 | | | $ | 17,574,004 | | | $ | 216,708,555 | |
| | | | | | | | | | | | | | | | |
Derivative Financial Instruments(a) | | | | | | | | | | | | | | | | |
Assets | | | | | | | | | | | | | | | | |
Credit Contracts | | $ | — | | | $ | 917,772 | | | $ | — | | | $ | 917,772 | |
Foreign Currency Exchange Contracts | | | — | | | | 132,795 | | | | — | | | | 132,795 | |
Interest Rate Contracts | | | 546,010 | | | | 45,982 | | | | — | | | | 591,992 | |
Liabilities | | | | | | | | | | | | | | | | |
Credit Contracts | | | — | | | | (276,271 | ) | | | — | | | | (276,271 | ) |
Equity Contracts | | | — | | | | (4,626 | ) | | | — | | | | (4,626 | ) |
Foreign Currency Exchange Contracts | | | — | | | | (111,914 | ) | | | — | | | | (111,914 | ) |
Interest Rate Contracts | | | (380,437 | ) | | | (897,680 | ) | | | — | | | | (1,278,117 | ) |
| | | | | | | | | | | | | | | | |
| | $ | 165,573 | | | $ | (193,942 | ) | | $ | — | | | $ | (28,369 | ) |
| | | | | | | | | | | | | | | | |
| | (a) | Derivative financial instruments are swaps, futures contracts and forward foreign currency exchange contracts. Swaps, futures contracts and forward foreign currency exchange contracts are valued at the unrealized appreciation (depreciation) on the instrument. | |
The Trust may hold assets and/or liabilities in which the fair value approximates the carrying amount or face value, including accrued interest, for financial statement purposes. As of period end, reverse repurchase agreements of $2,220,185 are categorized as Level 2 within the fair value hierarchy.
| | |
S C H E D U L E O F I N V E S T M E N T S | | 27 |
| | |
Schedule of Investments (continued) December 31, 2022 | | BlackRock Multi-Sector Opportunities Trust (MSO) |
A reconciliation of Level 3 financial instruments is presented when the Trust had a significant amount of Level 3 investments and derivative financial instruments at the beginning and/or end of the year in relation to net assets. The following table is a reconciliation of Level 3 investments for which significant unobservable inputs were used in determining fair value:
| | | | | | | | | | | | | | | | |
| | | Asset-Backed
Securities | | | Corporate
Bonds | | | Floating Rate Loan
Interests | | | Total | |
Assets | | | | | | | | | | | | | | | | |
Opening balance, as of December 31, 2021 | | $ | 260,152 | | | $ | 3,510,918 | | | $ | 16,135,486 | | | $ | 19,906,556 | |
Transfers into Level 3 | | | 297,716 | | | | — | | | | — | | | | 297,716 | |
Transfers out of Level 3 | | | — | | | | (3,817 | ) | | | — | | | | (3,817 | ) |
Accrued discounts/premiums | | | (153 | ) | | | (12,591 | ) | | | 40,901 | | | | 28,157 | |
Net realized gain (loss) | | | (862,420 | ) | | | (11,257 | ) | | | 7,460 | | | | (866,217 | ) |
Net change in unrealized appreciation (depreciation)(a)(b) | | | 675,703 | | | | (127,234 | ) | | | (2,171,298 | ) | | | (1,622,829 | ) |
Purchases | | | 910,707 | | | | 99,504 | | | | 3,320,316 | | | | 4,330,527 | |
Sales | | | (278,699 | ) | | | (952,345 | ) | | | (3,265,045 | ) | | | (4,496,089 | ) |
| | | | | | | | | | | | | | | | |
Closing balance, as of December 31, 2022 | | $ | 1,003,006 | | | $ | 2,503,178 | | | $ | 14,067,820 | | | $ | 17,574,004 | |
| | | | | | | | | | | | | | | | |
Net change in unrealized appreciation (depreciation) on investments still held at December 31, 2022(b) | | $ | (149,395 | ) | | $ | (127,562 | ) | | $ | (2,172,818 | ) | | $ | (2,449,775 | ) |
| | | | | | | | | | | | | | | | |
| | (a) | Included in the related net change in unrealized appreciation (depreciation) in the Statements of Operations. | |
| | (b) | Any difference between net change in unrealized appreciation (depreciation) and net change in unrealized appreciation (depreciation) on investments still held at December 31, 2022 is generally due to investments no longer held or categorized as Level 3 at period end. | |
The following table summarizes the valuation approaches used and unobservable inputs utilized by the BlackRock Valuation Committee (the “Valuation Committee”) to determine the value of certain of the Trust’s Level 3 financial instruments as of period end. The table does not include Level 3 financial instruments with values based upon unadjusted third-party pricing information in the amount of $3,178,665. A significant change in third party information could result in a significantly lower or higher value of such Level 3 financial instruments.
| | | | | | | | | | | | | | | | | | | | |
| | | | Value | | |
| Valuation
Approach |
| |
| Unobservable
Inputs |
| |
| Range of
Unobservable Inputs Utilized |
(a) | |
| Weighted
Average of Unobservable Inputs Based on Fair Value |
|
Assets | | | | | | | | | | | | | | | | | | | | |
Corporate Bonds | | $ | 2,503,178 | | | | Income | | | | Discount Rate | | | | 10%-11% | | | | 10% | |
| | | | | |
Floating Rate Loan Interests | | | 11,080,690 | | |
| Income
Estimated Recovery Value |
| |
| Discount Rate
Discount Rate |
| |
| 10%-17%
50% |
| |
| 14%
— |
|
| | | | | |
Asset Backed Securities | | | 811,471 | | | | Income | | | | Discount Rate | | | | 10% | | | | — | |
| | | | | | | | | | | | | | | | | | | | |
| | $ | 14,395,339 | | | | | | | | | | | | | | | | | |
| | | | | | | | | | | | | | | | | | | | |
| | (a) | A significant change in unobservable input would have resulted in a correlated (inverse) significant change to value. | |
See notes to financial statements.
| | |
| 28 | | 2 0 2 2 B L A C K R O C K A N N U A L R E P O R T T O S H A R E H O L D E R S |
| | |
Schedule of Investments December 31, 2022 | | BlackRock Multi-Sector Opportunities Trust II (MSO2) (Percentages shown are based on Net Assets) |
| | | | | | | | | | | | |
Security | | | | | Par
(000) | | | Value | |
| |
Asset-Backed Securities | | | | | |
AGL CLO 9 Ltd., Series 2020-9A, Class E, (3 mo. LIBOR US + 7.26%), 11.50%, 01/20/34(a)(b) | | | USD | | | | 250 | | | $ | 228,828 | |
Anchorage Capital CLO 7 Ltd., Series 2015-7A, Class D1R2, (3 mo. LIBOR US + 3.50%), 7.87%, 01/28/31(a)(b) | | | | | | | 250 | | | | 224,599 | |
Ares LI CLO Ltd., Series 2019-51A, Class ER, (3 mo. LIBOR US + 6.85%), 10.93%, 07/15/34(a)(b) | | | | | | | 300 | | | | 265,243 | |
Ares LV CLO Ltd., Series 2020-55A, Class DR, (3 mo. LIBOR US + 3.15%), 7.23%, 07/15/34(a)(b) | | | | | | | 750 | | | | 690,755 | |
CarVal CLO I Ltd., Series 2018-1A, Class D, (3 mo. LIBOR US + 2.89%), 6.97%, 07/16/31(a)(b) | | | | | | | 250 | | | | 230,941 | |
CarVal CLO II Ltd., Series 2019-1A, Class DR, (3 mo. LIBOR US + 3.20%), 7.44%, 04/20/32(a)(b) | | | | | | | 2,000 | | | | 1,880,128 | |
CarVal CLO III Ltd., Series 2019-2A, Class E, (3 mo. LIBOR US + 6.44%), 10.68%, 07/20/32(a)(b) | | | | | | | 1,300 | | | | 1,125,747 | |
Cedar Funding XIV CLO Ltd.(a)(b) | | | | | | | | | | | | |
Series 2021-14A, Class D, (3 mo. LIBOR US + 3.25%), 7.33%, 07/15/33 | | | | | | | 500 | | | | 464,621 | |
Series 2021-14A, Class E, (3 mo. LIBOR US + 6.34%), 10.42%, 07/15/33 | | | | | | | 375 | | | | 339,520 | |
Series 2021-14A, Class SUB, 0.00%, 07/15/33 | | | | | | | 250 | | | | 134,725 | |
Elmwood CLO II Ltd., Series 2019-2A, Class ER, (3 mo. LIBOR US + 6.80%), 11.04%, 04/20/34(a)(b) | | | | | | | 250 | | | | 229,945 | |
Elmwood CLO VII Ltd., Series 2020-4A, Class E, (3 mo. LIBOR US + 7.10%), 11.18%, 01/17/34(a)(b) | | | | | | | 250 | | | | 229,590 | |
Fairstone Financial Issuance Trust I, Series 2020-1A, Class D, 6.87%, 10/20/39(b) | | | CAD | | | | 150 | | | | 100,727 | |
Generate CLO 3 Ltd., Series 3A, Class DR, (3 mo. LIBOR US + 3.60%), 7.84%, 10/20/29(a)(b) | | | USD | | | | 500 | | | | 457,058 | |
Generate CLO 4 Ltd., Series 4A, Class ER, (3 mo. LIBOR US + 6.75%), 10.99%, 04/20/32(a)(b) | | | | | | | 250 | | | | 223,068 | |
Gilbert Park CLO Ltd., Series 2017-1A, Class D, (3 mo. LIBOR US + 2.95%), 7.03%, 10/15/30(a)(b) | | | | | | | 750 | | | | 700,334 | |
GoldenTree Loan Management U.S. CLO 1 Ltd., Series 2021-11A, Class E, (3 mo. LIBOR US + 5.35%), 9.59%, 10/20/34(a)(b) | | | | | | | 250 | | | | 209,887 | |
Golub Capital Partners CLO 55B Ltd., Series 2021-55A, Class E, (3 mo. LIBOR US + 6.56%), 10.80%, 07/20/34(a)(b) | | | | | | | 250 | | | | 220,129 | |
GSAA Home Equity Trust, Series 2005-14, Class 1A2, (1 mo. LIBOR US + 0.70%), 5.09%, 12/25/35(a) | | | | | | | 3,371 | | | | 1,476,060 | |
Gulf Stream Meridian 1 Ltd., Series 2020-IA, Class E, (3 mo. LIBOR US + 6.45%), 10.53%, 04/15/33(a)(b) | | | | | | | 250 | | | | 216,740 | |
Gulf Stream Meridian 7 Ltd., Series 2022-7A, Class D, (3 mo. SOFR + 6.85%), 10.71%, 07/15/35(a)(b) | | | | | | | 250 | | | | 224,951 | |
Lending Funding Trust, Series 2020-2A, Class D, 6.77%, 04/21/31(b) | | | | | | | 400 | | | | 339,742 | |
Mariner Finance Issuance Trust, Series 2020-AA, Class D, 5.75%, 08/21/34(b) | | | | | | | 200 | | | | 171,582 | |
Mosaic Solar Loan Trust, Series
2018-2GS, Class C, 5.97%, 02/22/44(b)(c) | | | | 228 | | | | 191,535 | |
Neuberger Berman Loan Advisers CLO 32 Ltd., Series 2019-32A, Class ER, (3 mo. LIBOR US + 6.10%), 10.33%, 01/20/32(a)(b) | | | | | | | 400 | | | | 359,604 | |
Neuberger Berman Loan Advisers CLO 37 Ltd., Series 2020-37A, Class ER, (3 mo. LIBOR US + 5.75%), 9.99%, 07/20/31(a)(b) | | | | | | | 250 | | | | 227,129 | |
| | | | | | | | | | | | |
Security | | | | | Par
(000) | | | Value | |
| |
Asset-Backed Securities (continued) | | | | | |
OCP CLO Ltd.(a)(b) | | | | | | | | | | | | |
Series 2013-4A, Class CRR, (3 mo. LIBOR US + 3.00%), 7.32%, 04/24/29 | | | USD | | | | 300 | | | $ | 285,873 | |
Series 2014-7A, Class B1RR, (3 mo. LIBOR US + 2.25%), 6.49%, 07/20/29 | | | | | | | 500 | | | | 481,784 | |
Series 2019-17A, Class ER, (3 mo. LIBOR US + 6.50%), 10.74%, 07/20/32 | | | | | | | 1,500 | | | | 1,309,484 | |
Octagon Investment Partners 49 Ltd., Series 2020-5A, Class E, (3 mo. LIBOR US + 6.75%), 10.83%, 01/15/33(a)(b) | | | | | | | 500 | | | | 457,576 | |
OHA Credit Funding 11 Ltd., Series 2022-11A, Class E, (3 mo. SOFR + 7.25%), 11.21%, 07/19/33(a)(b) | | | | | | | 250 | | | | 228,207 | |
Palmer Square Loan Funding Ltd., Series 2022-2A, Class D, (3 mo. SOFR + 6.20%), 10.06%, 10/15/30(a)(b) | | | | | | | 250 | | | | 228,751 | |
Rad CLO 6 Ltd., Series 2019-6A, Class E, (3 mo. LIBOR US + 7.53%), 11.77%, 01/20/33(a)(b) | | | | | | | 250 | | | | 228,714 | |
Recette CLO Ltd., Series 2015-1A, Class DRR, (3 mo. LIBOR US + 3.25%), 7.49%, 04/20/34(a)(b) | | | | | | | 1,000 | | | | 897,476 | |
Rockford Tower CLO Ltd., Series 2017-3A, Class D, (3 mo. LIBOR US + 2.65%), 6.89%, 10/20/30(a)(b) | | | | | | | 430 | | | | 394,052 | |
Saxon Asset Securities Trust, Series 2007-1, Class M1, (1 mo. LIBOR US + 0.29%), 4.68%, 01/25/47(a) | | | | | | | 2,767 | | | | 2,405,743 | |
Signal Peak CLO 7 Ltd., Series 2019-1A, Class E, (3 mo. LIBOR US + 6.89%), 11.30%, 04/30/32(a)(b) | | | | | | | 1,250 | | | | 1,114,381 | |
TICP CLO XII Ltd., Series 2018-12A, Class ER, (3 mo. LIBOR US + 6.25%), 10.33%, 07/15/34(a)(b) | | | | | | | 250 | | | | 217,889 | |
Trestles CLO II Ltd., Series 2018-2A, Class D, (3 mo. LIBOR US + 5.75%), 10.11%, 07/25/31(a)(b) | | | | | | | 250 | | | | 208,823 | |
Trestles CLO Ltd., Series 2017-1A, Class CR, (3 mo. LIBOR US + 2.90%), 7.26%, 04/25/32(a)(b) | | | | | | | 1,000 | | | | 929,277 | |
Whitebox CLO III Ltd., Series 2021-3A, Class E, (3 mo. LIBOR US + 6.85%), 10.93%, 10/15/34(a)(b) | | | | | | | 250 | | | | 227,048 | |
| | | | | | | | | | | | |
| |
Total Asset-Backed Securities — 23.9%
(Cost: $22,415,165) | | | | 20,778,266 | |
| | | | | | | | | | | | |
| | | |
| | | | | | Shares | | | | |
| | | |
| Common Stocks | | | | | | | | | |
| |
Equity Real Estate Investment Trusts (REITs) — 0.0% | | | | | |
Service Properties Trust | | | | | | | 2,000 | | | | 14,580 | |
| | | | | | | | | | | | |
| | | |
Hotels, Restaurants & Leisure — 0.1% | | | | | | | | | | | | |
Caesars Entertainment, Inc.(d) | | | | | | | 1,350 | | | | 56,160 | |
| | | | | | | | | | | | |
| | | |
Oil, Gas & Consumable Fuels — 0.4% | | | | | | | | | | | | |
California Resources Corp. | | | | | | | 7,618 | | | | 331,459 | |
| | | | | | | | | | | | |
| |
Total Common Stocks — 0.5%
(Cost: $185,514) | | | | 402,199 | |
| | | | | | | | | | | | |
| | |
S C H E D U L E O F I N V E S T M E N T S | | 29 |
| | |
Schedule of Investments (continued) December 31, 2022 | | BlackRock Multi-Sector Opportunities Trust II (MSO2) (Percentages shown are based on Net Assets) |
| | | | | | | | | | | | |
| Security | | | | | Par
(000) | | | Value | |
| | | |
Corporate Bonds | | | | | | | | | | | | |
| | | |
| Aerospace & Defense — 1.4% | | | | | | | | | |
Embraer Netherlands Finance BV, 6.95%, 01/17/28(b) | | | USD | | | | 250 | | | $ | 249,109 | |
TransDigm, Inc. | | | | | | | | | | | | |
6.25%, 03/15/26(b)(e) | | | | | | | 870 | | | | 857,985 | |
6.38%, 06/15/26 | | | | | | | 142 | | | | 138,160 | |
| | | | | | | | | | | | |
| | | | | | | | | | | 1,245,254 | |
| | | |
| Airlines — 0.6% | | | | | | | | | |
Air France-KLM, 3.88%, 07/01/26(f) | | | EUR | | | | 100 | | | | 95,780 | |
Allegiant Travel Co., 7.25%, 08/15/27(b) | | | USD | | | | 24 | | | | 22,828 | |
Avianca Midco 2 PLC, 9.00%, 12/01/28(b) | | | | | | | 263 | | | | 192,215 | |
Deutsche Lufthansa AG, 2.88%, 05/16/27(f) | | | EUR | | | | 100 | | | | 92,861 | |
Gol Finance SA, 7.00%, 01/31/25(b) | | | USD | | | | 200 | | | | 87,037 | |
| | | | | | | | | | | | |
| | | | | | | | | | | 490,721 | |
| | | |
| Auto Components — 0.5% | | | | | | | | | |
Aptiv PLC, 3.10%, 12/01/51(e) | | | | | | | 109 | | | | 64,418 | |
Clarios Global LP/Clarios U.S. Finance Co., 6.25%, 05/15/26(b) | | | | | | | 130 | | | | 127,075 | |
Dana, Inc., 5.63%, 06/15/28 | | | | | | | 72 | | | | 65,496 | |
IHO Verwaltungs GmbH, (4.50% PIK), 3.75%, 09/15/26(f)(g) | | | EUR | | | | 100 | | | | 92,781 | |
ZF Finance GmbH, 3.75%, 09/21/28(f) | | | | | | | 100 | | | | 89,732 | |
| | | | | | | | | | | | |
| | | | | | | | | | | 439,502 | |
| | | |
| Automobiles — 1.0% | | | | | | | | | |
Constellation Automotive Financing PLC, 4.88%, 07/15/27(f) | | | GBP | | | | 100 | | | | 78,789 | |
Ford Motor Co., 6.10%, 08/19/32 | | | USD | | | | 76 | | | | 70,175 | |
Ford Motor Credit Co. LLC, 5.58%, 03/18/24(e) | | | | | | | 597 | | | | 589,149 | |
Jaguar Land Rover Automotive PLC, 4.50%, 07/15/28(f). | | | EUR | | | | 100 | | | | 80,837 | |
| | | | | | | | | | | | |
| | | | | | | | | | | 818,950 | |
| | | |
| Banks — 1.1% | | | | | | | | | |
Commerzbank AG, (5 year EUR Swap + 6.36%), 6.13%(a)(f)(h) | | | | | | | 200 | | | | 198,586 | |
Freedom Mortgage Corp., 8.25%, 04/15/25(b) | | | USD | | | | 144 | | | | 129,525 | |
Grupo Aval Ltd., 4.38%, 02/04/30(b) | | | | | | | 200 | | | | 161,600 | |
Intesa Sanpaolo SpA, (5 year EUR Swap + 6.09%), 5.88%(a)(f)(h) | | | EUR | | | | 250 | | | | 214,887 | |
NBK Tier 1 Ltd., (6 year CMT + 2.88%), 3.63%(a)(b)(h) | | | USD | | | | 277 | | | | 241,128 | |
| | | | | | | | | | | | |
| | | | | | | | | | | 945,726 | |
| | | |
| Beverages — 1.1% | | | | | | | | | |
Anheuser-Busch Cos. LLC/Anheuser-Busch InBev Worldwide, Inc., 4.70%, 02/01/36 | | | | | | | 63 | | | | 59,500 | |
Ardagh Metal Packaging Finance USA LLC/Ardagh Metal Packaging Finance PLC, 3.25%, 09/01/28(b) | | | | | | | 201 | | | | 170,738 | |
Ardagh Packaging Finance PLC/Ardagh Holdings USA, Inc., 4.75%, 07/15/27(f) | | | GBP | | | | 100 | | | | 82,976 | |
Mauser Packaging Solutions Holding Co., 5.50%, 04/15/24(b)(e) | | | USD | | | | 402 | | | | 390,884 | |
OI European Group BV, 2.88%, 02/15/25(f) | | | EUR | | | | 100 | | | | 102,763 | |
Trivium Packaging Finance BV, 5.50%, 08/15/26(b) | | | USD | | | | 200 | | | | 183,387 | |
| | | | | | | | | | | | |
| | | | | | | | | | | 990,248 | |
| | | |
| Biotechnology — 0.3% | | | | | | | | | |
Amgen, Inc. | | | | | | | | | | | | |
3.00%, 01/15/52(e) | | | | | | | 160 | | | | 102,118 | |
2.77%, 09/01/53 | | | | | | | 84 | | | | 50,555 | |
Gilead Sciences, Inc., 2.60%, 10/01/40 | | | | | | | 130 | | | | 90,700 | |
| | | | | | | | | | | | |
| | | | | | | | | | | 243,373 | |
| | | | | | | | | | | | |
| Security | | | | | Par
(000) | | | Value | |
| | | |
| Building Materials — 0.2% | | | | | | | | | |
Cemex SAB de CV, 3.13%, 03/19/26(f) | | | EUR | | | | 100 | | | $ | 102,449 | |
Masonite International Corp., Class C, 5.38%, 02/01/28(b) | | | USD | | | | 9 | | | | 8,321 | |
Standard Industries, Inc.(b) | | | | | | | | | | | | |
5.00%, 02/15/27 | | | | | | | 9 | | | | 8,305 | |
4.75%, 01/15/28 | | | | | | | 35 | | | | 31,496 | |
| | | | | | | | | | | | |
| | | | | | | | | | | 150,571 | |
| | | |
| Building Products — 0.3% | | | | | | | | | |
Home Depot, Inc. | | | | | | | | | | | | |
2.75%, 09/15/51(e) | | | | | | | 130 | | | | 84,940 | |
3.63%, 04/15/52 | | | | | | | 42 | | | | 32,421 | |
Lowe’s Cos., Inc. | | | | | | | | | | | | |
3.00%, 10/15/50(e) | | | | | | | 169 | | | | 107,507 | |
4.25%, 04/01/52 | | | | | | | 41 | | | | 32,505 | |
SRS Distribution, Inc., 4.63%, 07/01/28(b) | | | | | | | 11 | | | | 9,751 | |
| | | | | | | | | | | | |
| | | | | | | | | | | 267,124 | |
| | | |
| Capital Markets(f) — 0.3% | | | | | | | | | |
Sherwood Financing PLC, 6.00%, 11/15/26 | | | GBP | | | | 100 | | | | 93,089 | |
SURA Asset Management SA, 4.88%, 04/17/24 | | | USD | | | | 171 | | | | 169,718 | |
| | | | | | | | | | | | |
| | | | | | | | | | | 262,807 | |
| | | |
| Chemicals — 1.9% | | | | | | | | | |
Alpek SAB de CV, 3.25%, 02/25/31(b)(e) | | | | | | | 200 | | | | 166,162 | |
Axalta Coating Systems Dutch Holding B BV, 3.75%, 01/15/25(f) | | | EUR | | | | 100 | | | | 102,316 | |
Braskem Idesa SAPI, 6.99%, 02/20/32(b) | | | USD | | | | 200 | | | | 142,500 | |
Chemours Co., 4.00%, 05/15/26 | | | EUR | | | | 100 | | | | 95,554 | |
Equate Petrochemical BV, 4.25%, 11/03/26(f) | | | USD | | | | 200 | | | | 190,850 | |
NOVA Chemicals Corp., 4.88%, 06/01/24(b) | | | | | | | 621 | | | | 600,815 | |
OCI NV, 3.63%, 10/15/25(f) | | | EUR | | | | 90 | | | | 95,247 | |
Sasol Financing USA LLC, 6.50%, 09/27/28(e) | | | USD | | | | 287 | | | | 259,340 | |
| | | | | | | | | | | | |
| | | | | | | | | | | 1,652,784 | |
| | |
| Commercial Services & Supplies — 0.2% | | | | | | | |
AMN Healthcare, Inc., 4.63%, 10/01/27(b) | | | | | | | 99 | | | | 91,285 | |
Loxam SAS, 3.75%, 07/15/26(f) | | | EUR | | | | 100 | | | | 96,203 | |
| | | | | | | | | | | | |
| | | | | | | | | | | 187,488 | |
| | | |
| Construction & Engineering — 0.1% | | | | | | | | | |
Ferrovial Netherlands BV, (5 year EUR Swap + 2.13%), 2.12%(a)(f)(h) | | | | | | | 100 | | | | 84,030 | |
| | | | | | | | | | | | |
| | | |
| Construction Materials — 0.1% | | | | | | | | | |
KAR Auction Services, Inc., 5.13%, 06/01/25(b) | | | USD | | | | 98 | | | | 95,740 | |
| | | | | | | | | | | | |
| | | |
| Consumer Discretionary — 0.1% | | | | | | | | | |
Atento Luxco 1 SA, 8.00%, 02/10/26(b) | | | | | | | 200 | | | | 106,913 | |
| | | | | | | | | | | | |
| | | |
| Consumer Finance — 0.1% | | | | | | | | | |
Encore Capital Group, Inc., 4.88%, 10/15/25(f) | | | EUR | | | | 100 | | | | 100,218 | |
Moody’s Corp., 3.10%, 11/29/61 | | | USD | | | | 7 | | | | 4,405 | |
| | | | | | | | | | | | |
| | | | | | | | | | | 104,623 | |
| | | |
| Containers & Packaging — 0.6% | | | | | | | | | |
Klabin Austria GmbH, 3.20%, 01/12/31(b) | | | | | | | 200 | | | | 161,000 | |
Suzano Austria GmbH | | | | | | | | | | | | |
3.13%, 01/15/32(e) | | | | | | | 150 | | | | 116,813 | |
7.00%, 03/16/47(b) | | | | | | | 200 | | | | 199,412 | |
| | | | | | | | | | | | |
| | | | | | | | | | | 477,225 | |
| | | |
| Diversified Consumer Services — 0.1% | | | | | | | | | |
Rekeep SpA, 7.25%, 02/01/26(f) | | | EUR | | | | 100 | | | | 88,979 | |
| | | | | | | | | | | | |
| | |
| 30 | | 2 0 2 2 B L A C K R O C K A N N U A L R E P O R T T O S H A R E H O L D E R S |
| | |
Schedule of Investments (continued) December 31, 2022 | | BlackRock Multi-Sector Opportunities Trust II (MSO2) (Percentages shown are based on Net Assets) |
| | | | | | | | | | | | |
| Security | | | | | Par
(000) | | | Value | |
|
| Diversified Financial Services — 2.6% | |
ASG Finance Designated Activity Co., 7.88%, 12/03/24(b) | | | USD | | | | 214 | | | $ | 206,510 | |
Bank of America Corp., (3 mo. LIBOR US + 3.15%), 4.08%, 03/20/51(a)(e) | | | | | | | 130 | | | | 101,733 | |
BNP Paribas SA, (5 year CMT + 3.34%), 4.63%(a)(f)(h) | | | | | | | 200 | | | | 154,520 | |
Garfunkelux Holdco 3 SA, 7.75%, 11/01/25(f) | | | GBP | | | | 100 | | | | 93,932 | |
Goldman Sachs Group, Inc. | | | | | | | | | | | | |
4.80%, 07/08/44(e) | | | USD | | | | 85 | | | | 75,150 | |
(1 day SOFR + 1.47%), 2.91%, 07/21/42(a) | | | | | | | 9 | | | | 6,120 | |
JPMorgan Chase & Co.(a) | | | | | | | | | | | | |
(1 day SOFR + 1.51%), 2.53%, 11/19/41 | | | | | | | 9 | | | | 5,884 | |
(1 day SOFR + 1.58%), 3.33%, 04/22/52(e) | | | | | | | 100 | | | | 67,582 | |
Lloyds Banking Group PLC, (5 year USD Swap + 4.76%), 7.50%(a)(h) | | | | | | | 200 | | | | 193,840 | |
Oceana Australian Fixed Income Trust, 10.00%, 08/31/23(c) | | | AUD | | | | 966 | | | | 657,701 | |
Oceana Australian Fixed Income Trust, A Note Upsize, 8.00%, 03/28/24(c) | | | | | | | 480 | | | | 321,089 | |
Operadora de Servicios Mega SA de CV Sofom ER, 8.25%, 02/11/25(b) | | | USD | | | | 400 | | | | 197,825 | |
Sun Country Airlines Holdings, Inc., 7.00%, 12/15/23(c) | | | | | | | 181 | | | | 176,300 | |
| | | | | | | | | | | | |
| | | |
| | | | | | | | | | | 2,258,186 | |
|
| Diversified Telecommunication Services — 1.3% | |
Level 3 Financing, Inc.(b) | | | | | | | | | | | | |
4.63%, 09/15/27 | | | | | | | 25 | | | | 20,813 | |
4.25%, 07/01/28(e) | | | | | | | 431 | | | | 339,499 | |
3.63%, 01/15/29(e) | | | | | | | 381 | | | | 278,984 | |
Oi SA, (10.00% Cash or 8.00% Cash + 4.00% PIK), 10.00%, 07/27/25(g) | | | | | | | 200 | | | | 33,475 | |
SoftBank Group Corp.(f) | | | | | | | | | | | | |
4.75%, 07/30/25 | | | EUR | | | | 100 | | | | 100,087 | |
(5 year USD ICE Swap + 4.23%), 6.00%(a)(h) | | | USD | | | | 200 | | | | 189,960 | |
Telecom Italia SpA/Milano, 5.88%, 05/19/23 | | | GBP | | | | 50 | | | | 59,906 | |
Verizon Communications, Inc. | | | | | | | | | | | | |
2.88%, 11/20/50(e) | | | USD | | | | 80 | | | | 50,157 | |
2.99%, 10/30/56 | | | | | | | 124 | | | | 75,652 | |
| | | | | | | | | | | | |
| | | |
| | | | | | | | | | | 1,148,533 | |
|
| Electric Utilities — 1.5% | |
Adani Electricity Mumbai Ltd., 3.95%, 02/12/30(b) | | | | | | | 200 | | | | 150,912 | |
Empresas Publicas de Medellin ESP, 4.25%, 07/18/29(b) | | | | | | | 253 | | | | 200,392 | |
Oncor Electric Delivery Co. LLC, 2.70%, 11/15/51 | | | | | | | 185 | | | | 120,823 | |
Talen Energy Supply LLC(b)(d)(i) | | | | | | | | | | | | |
7.25%, 05/15/27 | | | | | | | 501 | | | | 518,535 | |
6.63%, 01/15/28 | | | | | | | 274 | | | | 280,165 | |
| | | | | | | | | | | | |
| | | |
| | | | | | | | | | | 1,270,827 | |
|
| Energy Equipment & Services — 0.4% | |
Transocean Phoenix 2 Ltd., 7.75%, 10/15/24(b)(e) | | | | | | | 292 | | | | 289,080 | |
Vallourec SA, 8.50%, 06/30/26(f) | | | EUR | | | | 17 | | | | 17,841 | |
| | | | | | | | | | | | |
| | | |
| | | | | | | | | | | 306,921 | |
|
| Environmental, Maintenance & Security Service — 0.1% | |
Covanta Holding Corp., 4.88%, 12/01/29(b) | | | USD | | | | 9 | | | | 7,374 | |
Republic Services, Inc., 3.05%, 03/01/50(e) | | | | | | | 135 | | | | 92,770 | |
| | | | | | | | | | | | |
| | | |
| | | | | | | | | | | 100,144 | |
|
| Equity Real Estate Investment Trusts (REITs) — 0.8% | |
American Tower Corp., 3.10%, 06/15/50(e) | | | | | | | 89 | | | | 56,002 | |
Crown Castle, Inc., 2.90%, 04/01/41(e) | | | | | | | 85 | �� | | | 58,230 | |
Equinix, Inc., 2.95%, 09/15/51(e) | | | | | | | 85 | | | | 52,944 | |
| | | | | | | | | | | | |
| Security | | | | | Par
(000) | | | Value | |
|
| Equity Real Estate Investment Trusts (REITs) (continued) | |
Mid-America Apartments LP, 2.88%, 09/15/51 | | | USD | | | | 12 | | | $ | 7,648 | |
MPT Operating Partnership LP/MPT Finance Corp. | | | | | | | | | | | | |
5.25%, 08/01/26 | | | | | | | 9 | | | | 8,197 | |
4.63%, 08/01/29 | | | | | | | 16 | | | | 12,201 | |
Park Intermediate Holdings LLC/PK Domestic Property LLC/PK Finance Co-Issuer, 4.88%, 05/15/29(b) | | | | | | | 37 | | | | 31,321 | |
RHP Hotel Properties LP/RHP Finance Corp., 4.75%, 10/15/27 | | | | | | | 12 | | | | 10,860 | |
Service Properties Trust | | | | | | | | | | | | |
4.50%, 06/15/23(e) | | | | | | | 386 | | | | 379,319 | |
4.35%, 10/01/24 | | | | | | | 10 | | | | 9,091 | |
7.50%, 09/15/25 | | | | | | | 33 | | | | 31,447 | |
XHR LP(b) | | | | | | | | | | | | |
6.38%, 08/15/25 | | | | | | | 68 | | | | 65,380 | |
4.88%, 06/01/29 | | | | | | | 11 | | | | 9,010 | |
| | | | | | | | | | | | |
| | | |
| | | | | | | | | | | 731,650 | |
|
| Food & Staples Retailing — 0.5% | |
Albertsons Cos., Inc./Safeway, Inc./New Albertsons LP/Albertsons LLC(b) | | | | | | | | | | | | |
4.63%, 01/15/27 | | | | | | | 147 | | | | 136,544 | |
5.88%, 02/15/28 | | | | | | | 13 | | | | 12,359 | |
4.88%, 02/15/30 | | | | | | | 17 | | | | 15,172 | |
Bellis Acquisition Co. PLC, 3.25%, 02/16/26(f) | | | GBP | | | | 100 | | | | 98,167 | |
Market Bidco Finco PLC, 5.50%, 11/04/27(f) | | | | | | | 100 | | | | 91,832 | |
Picard Groupe SAS, 3.88%, 07/01/26(f) | | | EUR | | | | 100 | | | | 91,101 | |
| | | | | | | | | | | | |
| | | |
| | | | | | | | | | | 445,175 | |
|
| Food Products(b) — 0.2% | |
Aramark Services, Inc., 5.00%, 02/01/28 | | | USD | | | | 20 | | | | 18,659 | |
Frigorifico Concepcion SA, 7.70%, 07/21/28 | | | | | | | 200 | | | | 159,912 | |
| | | | | | | | | | | | |
| | | |
| | | | | | | | | | | 178,571 | |
|
| Health Care Equipment & Supplies — 0.0% | |
Becton Dickinson and Co., 3.79%, 05/20/50(e) | | | | | | | 38 | | | | 29,161 | |
| | | | | | | | | | | | |
|
| Health Care Providers & Services — 2.7% | |
HCA, Inc., 5.38%, 09/01/26 | | | | | | | 17 | | | | 16,811 | |
Medline Borrower LP, 3.88%, 04/01/29(b)(e) | | | | | | | 419 | | | | 337,697 | |
Phoenix PIB Dutch Finance BV, 2.38%, 08/05/25(f) | | | EUR | | | | 100 | | | | 100,125 | |
Select Medical Corp., 6.25%, 08/15/26(b)(e) | | | USD | | | | 360 | | | | 342,299 | |
Tenet Healthcare Corp.(b) | | | | | | | | | | | | |
4.63%, 09/01/24(e) | | | | | | | 384 | | | | 372,963 | |
4.88%, 01/01/26(e) | | | | | | | 654 | | | | 618,450 | |
6.25%, 02/01/27 | | | | | | | 26 | | | | 24,973 | |
5.13%, 11/01/27 | | | | | | | 26 | | | | 24,186 | |
4.63%, 06/15/28 | | | | | | | 23 | | | | 20,579 | |
4.25%, 06/01/29(e) | | | | | | | 507 | | | | 439,214 | |
4.38%, 01/15/30 | | | | | | | 44 | | | | 38,085 | |
| | | | | | | | | | | | |
| | | |
| | | | | | | | | | | 2,335,382 | |
|
| Health Care Technology — 0.1% | |
Charles River Laboratories International, Inc., 4.25%, 05/01/28(b) | | | | | | | 9 | | | | 8,289 | |
Universal Health Services, Inc., 2.65%, 10/15/30 | | | | | | | 63 | | | | 50,140 | |
| | | | | | | | | | | | |
| | | |
| | | | | | | | | | | 58,429 | |
|
| Hotels, Restaurants & Leisure — 4.0% | |
Affinity Gaming, 6.88%, 12/15/27(b) | | | | | | | 150 | | | | 127,176 | |
Boyd Gaming Corp., 4.75%, 12/01/27(e) | | | | | | | 331 | | | | 308,287 | |
Burger King (Restaurant Brands Int)/New Red Finance, Inc., 3.88%, 01/15/28(b) | | | | | | | 13 | | | | 11,629 | |
Caesars Entertainment, Inc.(b) | | | | | | | | | | | | |
6.25%, 07/01/25 | | | | | | | 228 | | | | 221,542 | |
| | |
S C H E D U L E O F I N V E S T M E N T S | | 31 |
| | |
Schedule of Investments (continued) December 31, 2022 | | BlackRock Multi-Sector Opportunities Trust II (MSO2) (Percentages shown are based on Net Assets) |
| | | | | | | | | | | | |
| Security | | | | | Par
(000) | | | Value | |
|
| Hotels, Restaurants & Leisure (continued) | |
Caesars Entertainment, Inc.(b) (continued) | | | | | | | | | |
8.13%, 07/01/27 | | | USD | | | | 146 | | | $ | 143,452 | |
CDI Escrow Issuer, Inc., 5.75%, 04/01/30(b) | | | | | | | 3 | | | | 2,689 | |
Cedar Fair LP, 5.25%, 07/15/29 | | | | | | | 9 | | | | 8,082 | |
Cedar Fair LP/Canada’s Wonderland Co./Magnum Management Corp./Millennium Op | | | | | | | | | | | | |
5.50%, 05/01/25(b) | | | | | | | 102 | | | | 100,890 | |
5.38%, 04/15/27 | | | | | | | 9 | | | | 8,595 | |
Churchill Downs, Inc.(b) | | | | | | | | | | | | |
5.50%, 04/01/27 | | | | | | | 10 | | | | 9,476 | |
4.75%, 01/15/28 | | | | | | | 9 | | | | 8,054 | |
CPUK Finance Ltd., 6.50%, 08/28/26(f) | | | GBP | | | | 100 | | | | 110,691 | |
Full House Resorts, Inc., 8.25%, 02/15/28(b) | | | USD | | | | 13 | | | | 11,509 | |
Golden Entertainment, Inc., 7.63%, 04/15/26(b) | | | | | | | 34 | | | | 33,511 | |
Hilton Domestic Operating Co., Inc., 4.88%, 01/15/30 | | | | | | | 17 | | | | 15,406 | |
Hilton Grand Vacations Borrower Escrow LLC/Hilton Grand Vacations Borrower Esc, 5.00%, 06/01/29(b) | | | | | | | 147 | | | | 126,420 | |
IRB Holding Corp., 7.00%, 06/15/25(b) | | | | | | | 72 | | | | 71,820 | |
Marriott International, Inc. | | | | | | | | | | | | |
Series FF, 4.63%, 06/15/30 | | | | | | | 50 | | | | 46,656 | |
Series GG, 3.50%, 10/15/32(e) | | | | | | | 232 | | | | 192,992 | |
Marriott Ownership Resorts, Inc.(b) | | | | | | | | | | | | |
6.13%, 09/15/25 | | | | | | | 133 | | | | 137,074 | |
4.50%, 06/15/29 | | | | | | | 151 | | | | 125,274 | |
MGM Resorts International | | | | | | | | | | | | |
5.75%, 06/15/25 | | | | | | | 12 | | | | 11,662 | |
4.63%, 09/01/26 | | | | | | | 152 | | | | 139,342 | |
5.50%, 04/15/27 | | | | | | | 157 | | | | 146,043 | |
Midwest Gaming Borrower LLC/Midwest Gaming Finance Corp., 4.88%, 05/01/29(b) | | | | | | | 102 | | | | 86,788 | |
Scientific Games International, Inc., 7.00%, 05/15/28(b) . | | | | | | | 194 | | | | 185,058 | |
SeaWorld Parks & Entertainment, Inc., 8.75%, 05/01/25(b)(e) | | | | | | | 310 | | | | 317,362 | |
Stonegate Pub Co. Financing PLC, 8.25%, 07/31/25(f) | | | GBP | | | | 100 | | | | 109,047 | |
Travel & Leisure Co., 6.63%, 07/31/26(b)(e) | | | USD | | | | 90 | | | | 88,044 | |
Wynn Las Vegas LLC/Wynn Las Vegas Capital Corp.(b) | | | | | | | | | | | | |
5.50%, 03/01/25 | | | | | | | 190 | | | | 180,376 | |
5.25%, 05/15/27 | | | | | | | 19 | | | | 17,147 | |
Wynn Macau Ltd., 5.50%, 01/15/26(f) | | | | | | | 200 | | | | 182,100 | |
Wynn Resorts Finance LLC/Wynn Resorts Capital | | | | | | | | | | | | |
Corp., 5.13%, 10/01/29(b) | | | | | | | 213 | | | | 182,569 | |
| | | | | | | | | | | | |
| | | |
| | | | | | | | | | | 3,466,763 | |
|
| Household Durables — 3.4% | |
Ashton Woods USA LLC/Ashton Woods Finance Co.(b) | | | | | | | | | | | | |
6.63%, 01/15/28 | | | | | | | 216 | | | | 190,041 | |
4.63%, 08/01/29 | | | | | | | 30 | | | | 24,022 | |
Brookfield Residential Properties, Inc./Brookfield Residential U.S. LLC(b) | | | | | | | | | | | | |
6.25%, 09/15/27 | | | | | | | 234 | | | | 207,815 | |
5.00%, 06/15/29 | | | | | | | 10 | | | | 7,814 | |
Century Communities, Inc., 6.75%, 06/01/27 | | | | | | | 44 | | | | 41,981 | |
Forestar Group, Inc.(b) | | | | | | | | | | | | |
3.85%, 05/15/26 | | | | | | | 244 | | | | 213,912 | |
5.00%, 03/01/28(e) | | | | | | | 319 | | | | 273,691 | |
M/I Homes, Inc., 4.95%, 02/01/28 | | | | | | | 225 | | | | 199,903 | |
Mattamy Group Corp., 5.25%, 12/15/27(b) | | | | | | | 9 | | | | 7,982 | |
Newell Brands, Inc., 4.45%, 04/01/26 | | | | | | | 35 | | | | 32,928 | |
Taylor Morrison Communities, Inc.(b)(e) | | | | | | | | | | | | |
5.88%, 06/15/27 | | | | | | | 270 | | | | 259,233 | |
| | | | | | | | | | | | |
| Security | | | | | Par
(000) | | | Value | |
|
| Household Durables (continued) | |
Taylor Morrison Communities, Inc.(b)(e) (continued) | | | | | |
5.75%, 01/15/28 | | | USD | | | | 914 | | | $ | 855,826 | |
Tri Pointe Homes, Inc. | | | | | | | | | | | | |
5.25%, 06/01/27(e) | | | | | | | 705 | | | | 629,375 | |
5.70%, 06/15/28 | | | | | | | 18 | | | | 16,305 | |
| | | | | | | | | | | | |
| | | |
| | | | | | | | | | | 2,960,828 | |
|
| Independent Power and Renewable Electricity Producers — 1.7% | |
Calpine Corp.(b)(e) | | | | | | | | | | | | |
4.50%, 02/15/28 | | | | | | | 652 | | | | 581,570 | |
5.13%, 03/15/28 | | | | | | | 578 | | | | 515,745 | |
Greenko Solar Mauritius Ltd., 5.95%, 07/29/26(f) | | | | | | | 200 | | | | 181,250 | |
NRG Energy, Inc. | | | | | | | | | | | | |
5.75%, 01/15/28 | | | | | | | 14 | | | | 13,141 | |
5.25%, 06/15/29(b) | | | | | | | 13 | | | | 11,476 | |
SCC Power PLC(b)(g) | | | | | | | | | | | | |
(4.00% PIK), 4.00%, 05/17/32 | | | | | | | 271 | | | | 8,131 | |
(8.00% Cash or 4.00% Cash + 4.00% PIK), 8.00%, 12/31/28 | | | | | | | 501 | | | | 170,509 | |
| | | | | | | | | | | | |
| | | |
| | | | | | | | | | | 1,481,822 | |
|
| Insurance(a)(f) — 0.4% | |
Argentum Netherlands BV for Swiss Re Ltd., (3 mo. LIBOR US + 3.78%), 5.63%, 08/15/52 | | | | | | | 200 | | | | 183,000 | |
Argentum Netherlands BV for Zurich Insurance Co. Ltd., (3 mo. EURIBOR + 3.95%), 3.50%, 10/01/46 | | | EUR | | | | 100 | | | | 100,877 | |
AXA SA, (3 mo. EURIBOR + 3.75%), 3.38%, 07/06/47 | | | | | | | 100 | | | | 99,009 | |
| | | | | | | | | | | | |
| | | |
| | | | | | | | | | | 382,886 | |
|
| Interactive Media & Services(f) — 0.4% | |
iliad SA, 5.38%, 06/14/27 | | | | | | | 100 | | | | 106,188 | |
United Group BV | | | | | | | | | | | | |
4.88%, 07/01/24 | | | | | | | 100 | | | | 99,369 | |
(3 mo. EURIBOR + 4.88%), 6.52%, 02/01/29(a) | | | | | | | 100 | | | | 92,059 | |
| | | | | | | | | | | | |
| | | |
| | | | | | | | | | | 297,616 | |
|
| Internet Software & Services — 0.1% | |
Gen Digital, Inc., 6.75%, 09/30/27(b) | | | USD | | | | 48 | | | | 47,040 | |
| | | | | | | | | | | | |
|
| IT Services — 0.3% | |
Centurion Bidco SpA, 5.88%, 09/30/26(f) | | | EUR | | | | 100 | | | | 92,094 | |
International Business Machines Corp., 2.95%, 05/15/50(e) | | | USD | | | | 109 | | | | 70,931 | |
La Financiere Atalian SASU, 6.63%, 05/15/25(f) | | | GBP | | | | 100 | | | | 80,506 | |
| | | | | | | | | | | | |
| | | |
| | | | | | | | | | | 243,531 | |
|
| Machinery — 0.4% | |
TK Elevator Midco GmbH(f) | | | | | | | | | | | | |
4.38%, 07/15/27 | | | EUR | | | | 100 | | | | 94,703 | |
(3 mo. EURIBOR + 4.75%), 6.13%, 07/15/27(a) | | | | | | | 100 | | | | 103,298 | |
TK Elevator U.S. Newco, Inc., 5.25%, 07/15/27(b) | | | USD | | | | 200 | | | | 177,508 | |
| | | | | | | | | | | | |
| | | |
| | | | | | | | | | | 375,509 | |
|
| Media — 1.6% | |
Altice Financing SA, 2.25%, 01/15/25(f) | | | EUR | | | | 100 | | | | 97,978 | |
AMC Networks, Inc., 5.00%, 04/01/24 | | | USD | | | | 7 | | | | 6,545 | |
Charter Communications Operating LLC/Charter Communications Operating Capital, 3.85%, 04/01/61 | | | | | | | 9 | | | | 5,205 | |
Clear Channel Outdoor Holdings, Inc., 5.13%, 08/15/27(b)(e) | | | | | | | 306 | | | | 265,149 | |
Comcast Corp. | | | | | | | | | | | | |
2.89%, 11/01/51(e) | | | | | | | 105 | | | | 67,436 | |
2.45%, 08/15/52 | | | | | | | 9 | | | | 5,244 | |
| | |
| 32 | | 2 0 2 2 B L A C K R O C K A N N U A L R E P O R T T O S H A R E H O L D E R S |
| | |
Schedule of Investments (continued) December 31, 2022 | | BlackRock Multi-Sector Opportunities Trust II (MSO2) (Percentages shown are based on Net Assets) |
| | | | | | | | | | | | |
| Security | | | | | Par
(000) | | | Value | |
|
| Media (continued) | |
iHeartCommunications, Inc. | | | | | | | | | | | | |
6.38%, 05/01/26 | | | USD | | | | 14 | | | $ | 12,797 | |
5.25%, 08/15/27(b) | | | | | | | 13 | | | | 11,012 | |
4.75%, 01/15/28(b) | | | | | | | 9 | | | | 7,329 | |
Lamar Media Corp., 3.75%, 02/15/28 | | | | | | | 10 | | | | 8,951 | |
Liquid Telecommunications Financing PLC, 5.50%, 09/04/26(b) | | | | | | | 200 | | | | 143,225 | |
Lorca Telecom Bondco SA, 4.00%, 09/18/27(f) | | | EUR | | | | 100 | | | | 95,538 | |
Nexstar Media, Inc., 5.63%, 07/15/27(b)(e) | | | USD | | | | 300 | | | | 275,207 | |
Outfront Media Capital LLC/Outfront Media Capital Corp.(b) | | | | | | | | | | | | |
5.00%, 08/15/27 | | | | | | | 11 | | | | 9,903 | |
4.63%, 03/15/30 | | | | | | | 9 | | | | 7,446 | |
SES SA, (5 year EUR Swap + 5.40%), 5.63%(a)(f)(h) | | | EUR | | | | 100 | | | | 103,913 | |
Sirius XM Radio, Inc.(b) | | | | | | | | | | | | |
5.00%, 08/01/27 | | | USD | | | | 54 | | | | 49,916 | |
5.50%, 07/01/29 | | | | | | | 48 | | | | 43,813 | |
TEGNA, Inc. | | | | | | | | | | | | |
4.63%, 03/15/28(e) | | | | | | | 150 | | | | 142,455 | |
5.00%, 09/15/29 | | | | | | | 19 | | | | 18,027 | |
| | | | | | | | | | | | |
| | | |
| | | | | | | | | | | 1,377,089 | |
|
| Metals & Mining — 1.1% | |
AngloGold Ashanti Holdings PLC, 3.75%, 10/01/30 | | | | | | | 200 | | | | 173,538 | |
Freeport Indonesia PT, 4.76%, 04/14/27(f) | | | | | | | 200 | | | | 191,772 | |
Nexa Resources SA, 5.38%, 05/04/27(b) | | | | | | | 200 | | | | 187,475 | |
Stillwater Mining Co., 4.00%, 11/16/26(f) | | | | | | | 200 | | | | 175,787 | |
thyssenkrupp AG, 1.88%, 03/06/23(f) | | | EUR | | | | 43 | | | | 45,799 | |
Vedanta Resources Finance II PLC, 8.95%, 03/11/25(b) | | | USD | | | | 200 | | | | 135,250 | |
| | | | | | | | | | | | |
| | | |
| | | | | | | | | | | 909,621 | |
|
| Oil, Gas & Consumable Fuels — 5.5% | |
BP Capital Markets PLC, (5 year EUR Swap + 4.12%), 3.63%(a)(f)(h) | | | EUR | | | | 205 | | | | 188,162 | |
Buckeye Partners LP | | | | | | | | | | | | |
4.13%, 03/01/25(b) | | | USD | | | | 87 | | | | 82,859 | |
3.95%, 12/01/26 | | | | | | | 10 | | | | 8,947 | |
California Resources Corp., 7.13%, 02/01/26(b) | | | | | | | 142 | | | | 136,468 | |
Chesapeake Energy Corp., 5.50%, 02/01/26(b) | | | | | | | 51 | | | | 49,214 | |
CrownRock LP/CrownRock Finance, Inc., 5.63%, 10/15/25(b) | | | | | | | 42 | | | | 40,530 | |
Ecopetrol SA | | | | | | | | | | | | |
4.13%, 01/16/25 | | | | | | | 181 | | | | 172,040 | |
4.63%, 11/02/31 | | | | | | | 40 | | | | 30,500 | |
EIG Pearl Holdings SARL, 3.55%, 08/31/36(b) | | | | | | | 200 | | | | 167,725 | |
Geopark Ltd., 5.50%, 01/17/27(b)(e) | | | | | | | 200 | | | | 172,287 | |
HTA Group Ltd., 7.00%, 12/18/25(b) | | | | | | | 200 | | | | 183,600 | |
IHS Holding Ltd., 6.25%, 11/29/28(b) | | | | | | | 200 | | | | 160,788 | |
Kinetik Holdings LP, 5.88%, 06/15/30(b) | | | | | | | 20 | | | | 18,756 | |
Leviathan Bond Ltd., 5.75%, 06/30/23(b) | | | | | | | 108 | | | | 107,552 | |
Matador Resources Co., 5.88%, 09/15/26 | | | | | | | 18 | | | | 17,306 | |
MC Brazil Downstream Trading SARL, 7.25%, 06/30/31(b)(e) | | | | | | | 200 | | | | 164,125 | |
NGPL PipeCo LLC, 7.77%, 12/15/37(b)(e) | | | | | | | 178 | | | | 185,212 | |
Oil & Gas Holding Co. BSCC, 7.63%, 11/07/24(f) | | | | | | | 200 | | | | 203,287 | |
OQ SAOC, 5.13%, 05/06/28(b) | | | | | | | 200 | | | | 188,600 | |
PDC Energy, Inc., 5.75%, 05/15/26 | | | | | | | 10 | | | | 9,546 | |
Permian Resources Operating LLC(b) | | | | | | | | | | | | |
5.38%, 01/15/26(e) | | | | | | | 834 | | | | 759,177 | |
6.88%, 04/01/27 | | | | | | | 51 | | | | 48,054 | |
| | | | | | | | | | | | |
| Security | | | | | Par
(000) | | | Value | |
|
| Oil, Gas & Consumable Fuels (continued) | |
Pertamina Persero PT, 3.65%, 07/30/29(f) | | | USD | | | | 200 | | | $ | 182,522 | |
Petroleos Mexicanos | | | | | | | | | | | | |
6.50%, 03/13/27 | | | | | | | 279 | | | | 253,541 | |
8.75%, 06/02/29 | | | | | | | 176 | | | | 164,703 | |
5.95%, 01/28/31 | | | | | | | 205 | | | | 154,980 | |
6.70%, 02/16/32 | | | | | | | 245 | | | | 192,019 | |
Puma International Financing SA, 5.13%, 10/06/24(b) | | | | | | | 200 | | | | 185,000 | |
SM Energy Co., 6.75%, 09/15/26 | | | | | | | 139 | | | | 134,948 | |
Sunoco LP/Sunoco Finance Corp. | | | | | | | | | | | | |
4.50%, 05/15/29 | | | | | | | 32 | | | | 27,990 | |
4.50%, 04/30/30(e) | | | | | | | 172 | | | | 149,305 | |
Targa Resources Partners LP/Targa Resources Partners Finance Corp., 5.00%, 01/15/28 | | | | | | | 13 | | | | 12,401 | |
TotalEnergies SE(a)(f)(h) | | | | | | | | | | | | |
(5 year EUR Swap + 2.15%), 2.63% | | | EUR | | | | 100 | | | | 100,131 | |
Series NC7, (5 year EUR Swap + 1.99%), 1.63% | | | | | | | 100 | | | | 86,785 | |
Transocean Guardian Ltd., 5.88%, 01/15/24(b) | | | USD | | | | 53 | | | | 51,414 | |
| | | | | | | | | | | | |
| | | |
| | | | | | | | | | | 4,790,474 | |
|
| Pharmaceuticals — 0.7% | |
Bausch Health Cos., Inc., 5.50%, 11/01/25(b) | | | | | | | 30 | | | | 25,485 | |
Cheplapharm Arzneimittel GmbH, 4.38%, 01/15/28(f) | | | EUR | | | | 100 | | | | 93,777 | |
CVS Health Corp. | | | | | | | | | | | | |
2.70%, 08/21/40 | | | USD | | | | 115 | | | | 79,450 | |
5.05%, 03/25/48(e) | | | | | | | 85 | | | | 76,291 | |
Elanco Animal Health, Inc., 6.40%, 08/28/28 | | | | | | | 13 | | | | 12,370 | |
Merck & Co., Inc., 2.75%, 12/10/51 | | | | | | | 203 | | | | 135,632 | |
Nidda Healthcare Holding GmbH, 7.50%, 08/21/26(f) | | | EUR | | | | 100 | | | | 101,827 | |
Rossini SARL, 6.75%, 10/30/25(f) | | | | | | | 100 | | | | 105,852 | |
| | | | | | | | | | | | |
| | | |
| | | | | | | | | | | 630,684 | |
|
| Real Estate — 0.0% | |
VICI Properties LP/VICI Note Co., Inc., 5.75%, 02/01/27(b) | | | USD | | | | 13 | | | | 12,672 | |
| | | | | | | | | | | | |
|
| Real Estate Management & Development — 2.2% | |
Adler Group SA, 3.25%, 08/05/25(d)(f)(i) | | | EUR | | | | 100 | | | | 43,460 | |
Arabian Centres Sukuk II Ltd., 5.63%, 10/07/26(b)(e) | | | USD | | | | 270 | | | | 244,485 | |
China Evergrande Group, 10.50%, 04/11/24(d)(f)(i) | | | | | | | 200 | | | | 13,850 | |
DEMIRE Deutsche Mittelstand Real Estate AG, 1.88%, 10/15/24(f) | | | EUR | | | | 100 | | | | 72,748 | |
Fantasia Holdings Group Co. Ltd., 11.75%, 04/17/22(d)(f)(i) | | | USD | | | | 200 | | | | 15,500 | |
Five Point Operating Co. LP/Five Point Capital Corp., 7.88%, 11/15/25(b)(e) | | | | | | | 467 | | | | 392,570 | |
Howard Hughes Corp., 5.38%, 08/01/28(b)(e) | | | | 451 | | | | 406,229 | |
JGC Ventures Pte. Ltd.(g) | | | | | | | | | | | | |
(3.00% PIK), 0.00%, 06/30/25 | | | | | | | 7 | | | | 1,527 | |
(3.00% PIK), 3.00%, 06/30/25(d)(f)(i) | | | | | | | 239 | | | | 95,551 | |
(3.00% PIK), 10.75%, 06/30/25 | | | | | | | — | (j) | | | 57 | |
Kaisa Group Holdings Ltd., 11.95%, 10/22/22(d)(i) | | | | | | | 200 | | | | 26,000 | |
MAF Global Securities Ltd., (5 year CMT + 3.54%), 6.38%(a)(f)(h) | | | | | | | 200 | | | | 191,225 | |
MAF Sukuk Ltd., 4.64%, 05/14/29(f) | | | | | | | 267 | | | | 259,040 | |
Modern Land China Co. Ltd., 11.50%, 11/13/22(d)(i) | | | | | | | 200 | | | | 10,632 | |
RKPF Overseas Ltd., Series 2019-A, 6.00%, 09/04/25(f) | | | | | | | 200 | | | | 159,100 | |
Yango Justice International Ltd., 8.25%, 11/25/23(d)(f)(i) | | | | | | | 200 | | | | 3,000 | |
| | | | | | | | | | | | |
| | | |
| | | | | | | | | | | 1,934,974 | |
|
| Road & Rail — 0.4% | |
CMA CGM SA, 7.50%, 01/15/26(f) | | | EUR | | | | 100 | | | | 110,417 | |
| | |
S C H E D U L E O F I N V E S T M E N T S | | 33 |
| | |
Schedule of Investments (continued) December 31, 2022 | | BlackRock Multi-Sector Opportunities Trust II (MSO2) (Percentages shown are based on Net Assets) |
| | | | | | | | | | | | |
| Security | | | | | Par
(000) | | | Value | |
|
| Road & Rail (continued) | |
Getlink SE, 3.50%, 10/30/25(f) | | | EUR | | | | 100 | | | $ | 103,834 | |
Norfolk Southern Corp., 3.05%, 05/15/50(e) | | | USD | | | | 175 | | | | 117,212 | |
United Rentals North America, Inc., 6.00%, 12/15/29 | | | | | | | 51 | | | | 50,681 | |
| | | | | | | | | | | | |
| | | |
| | | | | | | | | | | 382,144 | |
|
| Semiconductors & Semiconductor Equipment — 0.1% | |
Broadcom, Inc., 3.75%, 02/15/51(b)(e) | | | | | | | 165 | | | | 113,913 | |
NXP BV/NXP Funding LLC/NXP USA, Inc., 3.25%, 11/30/51 | | | | | | | 9 | | | | 5,590 | |
| | | | | | | | | | | | |
| | | |
| | | | | | | | | | | 119,503 | |
|
| Software — 0.6% | |
Boxer Parent Co., Inc., 6.50%, 10/02/25(f) | | | EUR | | | | 100 | | | | 101,636 | |
Cloud Software Group Holdings, Inc., 6.50%, 03/31/29(b) | | | USD | | | | 95 | | | | 80,016 | |
Open Text Corp., 6.90%, 12/01/27 | | | | | | | 31 | | | | 31,000 | |
Oracle Corp. | | | | | | | | | | | | |
3.60%, 04/01/50(e) | | | | | | | 179 | | | | 120,515 | |
3.95%, 03/25/51 | | | | | | | 23 | | | | 16,386 | |
Playtika Holding Corp., 4.25%, 03/15/29(b) | | | | | | | 182 | | | | 142,861 | |
| | | | | | | | | | | | |
| | | |
| | | | | | | | | | | 492,414 | |
|
| Specialty Retail — 0.1% | |
Goldstory SASU, 5.38%, 03/01/26(f) | | | EUR | | | | 100 | | | | 97,697 | |
| | | | | | | | | | | | |
|
| Technology Hardware, Storage & Peripherals — 0.0% | |
Dell International LLC/EMC Corp., 8.35%, 07/15/46 | | | USD | | | | 21 | | | | 23,925 | |
| | | | | | | | | | | | |
|
| Thrifts & Mortgage Finance — 0.7% | |
doValue SpA, 3.38%, 07/31/26(f) | | | EUR | | | | 102 | | | | 95,732 | |
Jerrold Finco PLC, 4.88%, 01/15/26(f) | | | GBP | | | | 100 | | | | 103,909 | |
Nationstar Mortgage Holdings, Inc., 6.00%, 01/15/27(b) | | | USD | | | | 11 | | | | 9,845 | |
Rocket Mortgage LLC/Rocket Mortgage Co.-Issuer, Inc.(b) | | | | | | | | | | | | |
2.88%, 10/15/26 | | | | | | | 72 | | | | 61,716 | |
3.63%, 03/01/29 | | | | | | | 228 | | | | 180,676 | |
3.88%, 03/01/31 | | | | | | | 56 | | | | 42,744 | |
United Wholesale Mortgage LLC, 5.75%, 06/15/27(b) | | | | | | | 153 | | | | 131,716 | |
| | | | | | | | | | | | |
| | | |
| | | | | | | | | | | 626,338 | |
|
| Transportation Infrastructure(b) — 0.4% | |
Aeropuerto Internacional de Tocumen SA, 5.13%, 08/11/61(e) | | | | | | | 200 | | | | 163,662 | |
Aeropuertos Dominicanos Siglo XXI SA, 6.75%, 03/30/29 | | | | | | | 200 | | | | 193,750 | |
| | | | | | | | | | | | |
| | | |
| | | | | | | | | | | 357,412 | |
|
| Utilities — 0.9% | |
Genneia SA, 8.75%, 09/02/27(b) | | | | | | | 93 | | | | 90,081 | |
Orano SA, 2.75%, 03/08/28(f) | | | EUR | | | | 100 | | | | 96,217 | |
Veolia Environnement SA, (5 year EUR Swap + 2.84%), 2.50%(a)(f)(h) | | | | | | | 300 | | | | 255,258 | |
Vistra Operations Co. LLC(b) | | | | | | | | | | | | |
5.50%, 09/01/26 | | | USD | | | | 17 | | | | 16,378 | |
5.63%, 02/15/27 | | | | | | | 23 | | | | 21,819 | |
5.00%, 07/31/27(e) | | | | | | | 343 | | | | 318,336 | |
| | | | | | | | | | | | |
| | | |
| | | | | | | | | | | 798,089 | |
|
| Wireless Telecommunication Services — 1.9% | |
Altice France SA/France(f) | | | | | | | | | | | | |
2.13%, 02/15/25 | | | EUR | | | | 100 | | | | 94,222 | |
5.88%, 02/01/27 | | | | | | | 100 | | | | 93,114 | |
GLP Capital LP/GLP Financing II, Inc., 4.00%, 01/15/31 | | | USD | | | | 164 | | | | 140,679 | |
| | | | | | | | | | | | |
| Security | | | | | Par
(000) | | | Value | |
|
| Wireless Telecommunication Services (continued) | |
Kenbourne Invest SA, 6.88%,
11/26/24(b)(e) | | | USD | | | | 234 | | | $ | 221,028 | |
Millicom International Cellular SA, 5.13%, 01/15/28(f) | | | | | | | 242 | | | | 224,669 | |
T-Mobile USA, Inc., 3.30%, 02/15/51(e) | | | | | | | 165 | | | | 110,111 | |
VICI Properties LP/VICI Note Co., Inc.(b) | | | | | | | | | | | | |
5.63%, 05/01/24(e) | | | | | | | 450 | | | | 445,617 | |
3.50%, 02/15/25 | | | | | | | 13 | | | | 12,257 | |
4.63%, 06/15/25 | | | | | | | 59 | | | | 56,566 | |
4.50%, 09/01/26 | | | | | | | 9 | | | | 8,470 | |
4.25%, 12/01/26 | | | | | | | 22 | | | | 20,524 | |
3.75%, 02/15/27 | | | | | | | 13 | | | | 11,801 | |
4.13%, 08/15/30 | | | | | | | 17 | | | | 14,878 | |
Vmed O2 U.K. Financing I PLC(f) | | | | | | | | | | | | |
3.25%, 01/31/31 | | | EUR | | | | 100 | | | | 84,833 | |
4.50%, 07/15/31 | | | GBP | | | | 100 | | | | 91,892 | |
| | | | | | | | | | | | |
| | | |
| | | | | | | | | | | 1,630,661 | |
| | | | | | | | | | | | |
| | |
Total Corporate Bonds — 47.1%
(Cost: $47,511,501) | | | | | | | | 40,954,729 | |
| | | | | | | | | | | | |
| |
Floating Rate Loan Interests(a) | | | | | |
|
| Air Freight & Logistics — 0.0% | |
Kestrel Bidco, Inc., Term Loan B, (1 mo. LIBOR + 3.00%, 1.00% Floor), 7.35%, 12/11/26 | | | USD | | | | — | (j) | | | 174 | |
| | | | | | | | | | | | |
|
| Building Materials — 0.6% | |
Cornerstone Building Brands, Inc., 2021 Term Loan B, (1 mo. LIBOR + 3.25%, 0.50% Floor), 7.57%, 04/12/28 | | | | | | | 609 | | | | 544,340 | |
| | | | | | | | | | | | |
|
| Chemicals — 0.1% | |
SCIH Salt Holdings, Inc., 2021 Incremental Term Loan B, (3 mo. LIBOR + 4.00%, 0.75% Floor), 8.41%, 03/16/27 | | | | | | | 106 | | | | 102,813 | |
| | | | | | | | | | | | |
|
| Commercial Services & Supplies — 0.5% | |
Interface Security Systems LLC, Term Loan, (3 mo. LIBOR + 7.00%, 7.00% PIK), 8.75%, 08/07/23(c)(g) | | | | | | | 486 | | | | 456,977 | |
| | | | | | | | | | | | |
|
| Diversified Financial Services — 3.9% | |
Credito Real SAB de CV Sofom ENR, Term Loan B, (3 mo. LIBOR + 3.75%), 6.73%, 02/17/23(c) | | | | | | | 42 | | | | 798 | |
LBM Acquisition LLC, Term Loan B, (6 mo. LIBOR + 3.75%, 0.75% Floor), 8.90%, 12/17/27 | | | | | | | 34 | | | | 35,808 | |
Luxembourg Life Fund, 2021 Term Loan, (3 mo. LIBOR + 9.25%), 13.93%, 04/01/23(c) | | | | | | | 1,997 | | | | 1,994,747 | |
Oceana Australian Fixed Income Trust, A Note Upsize, 8.00%, 01/21/24(c) | | | AUD | | | | 1,740 | | | | 1,163,947 | |
White Cap Buyer LLC, Term Loan B, (1 mo. SOFR CME + 3.75%), 8.07%, 10/19/27 | | | USD | | | | 199 | | | | 192,067 | |
| | | | | | | | | | | | |
| | | |
| | | | | | | | | | | 3,387,367 | |
|
| Health Care Providers & Services — 0.1% | |
Select Medical Corp., 2017 Term Loan B, (1 mo. LIBOR + 2.50%), 6.89%, 03/06/25 | | | | | | | 101 | | | | 99,350 | |
| | | | | | | | | | | | |
|
| Hotels, Restaurants & Leisure — 0.6% | |
Aimbridge Acquisition Co., Inc., 2019 Term Loan B, (1 mo. LIBOR + 3.75%), 8.13%, 02/02/26 | | | | | | | 168 | | | | 152,061 | |
| | |
| 34 | | 2 0 2 2 B L A C K R O C K A N N U A L R E P O R T T O S H A R E H O L D E R S |
| | |
Schedule of Investments (continued) December 31, 2022 | | BlackRock Multi-Sector Opportunities Trust II (MSO2) (Percentages shown are based on Net Assets) |
| | | | | | | | | | | | |
| Security | | | | | Par
(000) | | | Value | |
|
| Hotels, Restaurants & Leisure (continued) | |
ECL Entertainment LLC, Term Loan,
(1 mo. LIBOR + 7.50%, 0.75% Floor), 11.88%, 05/01/28 | | | USD | | | | 109 | | | $ | 107,989 | |
Fertitta Entertainment LLC, 2022 Term Loan B, (1 mo. SOFRTE + 4.00%, 0.50% Floor), 8.32%, 01/27/29 | | | | | | | 247 | | | | 234,494 | |
| | | | | | | | | | | | |
| | | |
| | | | | | | | | | | 494,544 | |
|
| Media — 0.5% | |
Connect Finco SARL, 2021 Term Loan B, (1 mo. LIBOR + 3.50%, 1.00% Floor), 7.89%, 12/11/26 | | | | | | | 349 | | | | 344,447 | |
Diamond Sports Group LLC, Term Loan, (1 mo. LIBOR + 3.35%), 7.47%, 08/24/26 | | | | | | | 598 | | | | 65,786 | |
| | | | | | | | | | | | |
| | | |
| | | | | | | | | | | 410,233 | |
| | | | | | | | | | | | |
| |
Total Floating Rate Loan Interests — 6.3%
(Cost: $6,281,935) | | | | 5,495,798 | |
| | | | | | | | | | | | |
|
Foreign Agency Obligations | |
|
| Bahrain — 0.2% | |
Bahrain Government International Bond, 6.75%, 09/20/29(f) | | | | | | | 200 | | | | 198,163 | |
| | | | | | | | | | | | |
|
| Chile — 0.2% | |
Chile Government International Bond, 4.34%, 03/07/42 . | | | | | | | 200 | | | | 168,475 | |
| | | | | | | | | | | | |
|
| Colombia — 0.9% | |
Colombia Government International Bond | | | | | | | | | | | | |
4.50%, 01/28/26 | | | | | | | 200 | | | | 187,725 | |
3.13%, 04/15/31(e) | | | | | | | 340 | | | | 251,982 | |
4.13%, 05/15/51(e) | | | | | | | 200 | | | | 119,913 | |
Republic of Colombia Senior Unsecured, 8.00%, 04/20/33 | | | | | | | 200 | | | | 199,600 | |
| | | | | | | | | | | | |
| | | | | | | | | | | 759,220 | |
|
| Dominican Republic — 0.7% | |
Dominican Republic International Bond
6.88%, 01/29/26(f) | | | | | | | 114 | | | | 114,877 | |
5.95%, 01/25/27(f) | | | | | | | 128 | | | | 124,904 | |
5.50%, 02/22/29(b) | | | | | | | 175 | | | | 160,267 | |
4.88%, 09/23/32(b)(e) | | | | | | | 311 | | | | 257,119 | |
| | | | | | | | | | | | |
| | | | | | | | | | | 657,167 | |
|
| Egypt — 0.2% | |
Egypt Government International Bond, 8.50%, 01/31/47(e)(f) | | | | | | | 284 | | | | 187,440 | |
| | | | | | | | | | | | |
|
| Guatemala — 0.7% | |
Guatemala Government Bond
4.50%, 05/03/26(f) | | | | | | | 200 | | | | 191,663 | |
5.25%, 08/10/29(b) | | | | | | | 200 | | | | 191,850 | |
5.38%, 04/24/32(b)(e) | | | | | | | 200 | | | | 194,912 | |
| | | | | | | | | | | | |
| | | | | | | | | | | 578,425 | |
|
| Hungary — 0.4% | |
Hungary Government International Bond
5.38%, 03/25/24 | | | | | | | 142 | | | | 141,672 | |
5.25%, 06/16/29(b) | | | | | | | 200 | | | | 190,162 | |
| | | | | | | | | | | | |
| | | | | | | | | | | 331,834 | |
|
| Indonesia — 0.2% | |
Indonesia Government International Bond, 5.35%, 02/11/49 | | | | | | | 200 | | | | 194,522 | |
| | | | | | | | | | | | |
| | | | | | | | | | | | |
| Security | | | | | Par
(000) | | | Value | |
|
| Ivory Coast — 0.4% | |
Ivory Coast Government International Bond, 6.38%, 03/03/28(f) | | | USD | | | | 400 | | | $ | 387,000 | |
| | | | | | | | | | | | |
|
| Mexico — 0.6% | |
Mexico Government International Bond
3.75%, 01/11/28 | | | | | | | 200 | | | | 188,400 | |
4.88%, 05/19/33 | | | | | | | 200 | | | | 184,200 | |
4.35%, 01/15/47(e) | | | | | | | 200 | | | | 149,725 | |
| | | | | | | | | | | | |
| | | |
| | | | | | | | | | | 522,325 | |
|
| Morocco — 0.2% | |
Morocco Government International Bond, 2.38%, 12/15/27(b) | | | | | | | 202 | | | | 174,957 | |
| | | | | | | | | | | | |
|
| Nigeria — 0.4% | |
Nigeria Government International Bond
8.38%, 03/24/29(b) | | | | | | | 200 | | | | 165,000 | |
7.88%, 02/16/32(f) | | | | | | | 200 | | | | 150,000 | |
| | | | | | | | | | | | |
| | | |
| | | | | | | | | | | 315,000 | |
|
| Oman — 0.5% | |
Oman Government International Bond(f)
6.50%, 03/08/47 | | | | | | | 306 | | | | 277,695 | |
6.75%, 01/17/48 | | | | | | | 200 | | | | 186,162 | |
| | | | | | | | | | | | |
| | | |
| | | | | | | | | | | 463,857 | |
|
| Panama — 0.6% | |
Panama Government International Bond
3.88%, 03/17/28 | | | | | | | 200 | | | | 188,725 | |
3.16%, 01/23/30 | | | | | | | 200 | | | | 171,725 | |
4.50%, 04/16/50(e) | | | | | | | 200 | | | | 150,850 | |
| | | | | | | | | | | | |
| | | |
| | | | | | | | | | | 511,300 | |
|
| Paraguay — 0.3% | |
Paraguay Government International Bond, 5.40%, 03/30/50(b)(e) | | | | | | | 300 | | | | 257,588 | |
| | | | | | | | | | | | |
|
| Peru — 0.4% | |
Corp. Financiera de Desarrollo SA, 4.75%, 07/15/25(f) | | | | | | | 200 | | | | 192,975 | |
Peruvian Government International Bond, 3.30%, 03/11/41(e) | | | | | | | 170 | | | | 123,866 | |
| | | | | | | | | | | | |
| | | |
| | | | | | | | | | | 316,841 | |
|
| Romania — 0.7% | |
Romanian Government International Bond
5.25%, 11/25/27(b) | | | | | | | 174 | | | | 166,474 | |
2.88%, 03/11/29(f) | | | EUR | | | | 177 | | | | 156,348 | |
2.50%, 02/08/30(f) | | | | | | | 187 | | | | 154,359 | |
2.12%, 07/16/31(f) | | | | | | | 216 | | | | 158,861 | |
| | | | | | | | | | | | |
| | | |
| | | | | | | | | | | 636,042 | |
|
| Saudi Arabia — 0.4% | |
Saudi Government International Bond(f)
2.25%, 02/02/33 | | | USD | | | | 200 | | | | 161,537 | |
3.75%, 01/21/55 | | | | | | | 200 | | | | 156,663 | |
| | | | | | | | | | | | |
| | | |
| | | | | | | | | | | 318,200 | |
|
| Senegal — 0.2% | |
Senegal Government International Bond, 6.25%, 05/23/33(f) | | | | | | | 200 | | | | 164,225 | |
| | | | | | | | | | | | |
| | |
S C H E D U L E O F I N V E S T M E N T S | | 35 |
| | |
Schedule of Investments (continued) December 31, 2022 | | BlackRock Multi-Sector Opportunities Trust II (MSO2) (Percentages shown are based on Net Assets) |
| | | | | | | | | | | | |
| Security | | | | | Par
(000) | | | Value | |
|
| South Africa — 0.4% | |
Republic of South Africa Government International Bond | | | | | | | | | | | | |
4.85%, 09/30/29 | | | USD | | | | 200 | | | $ | 177,475 | |
5.88%, 04/20/32 | | | | | | | 200 | | | | 179,750 | |
| | | | | | | | | | | | |
| | | |
| | | | | | | | | | | 357,225 | |
|
| Ukraine — 0.2% | |
Ukraine Government International Bond(d)(i) | | | | | | | | | |
8.99%, 02/01/26(f) | | | | | | | 200 | | | | 43,913 | |
7.75%, 09/01/27(f) | | | | | | | 110 | | | | 22,811 | |
7.25%, 03/15/35(b) | | | | | | | 400 | | | | 74,575 | |
| | | | | | | | | | | | |
| | | |
| | | | | | | | | | | 141,299 | |
| | | | | | | | | | | | |
| | |
Total Foreign Agency Obligations — 8.8%
(Cost: $8,947,275) | | | | | | | | 7,641,105 | |
| | | | | | | | | | | | |
|
Municipal Bonds | |
|
| Puerto Rico(a) — 0.1% | |
Commonwealth of Puerto Rico, GO | | | | | | | | | | | | |
0.00%, 11/01/43 | | | | | | | 20 | | | | 8,716 | |
0.00%, 11/01/51 | | | | | | | 217 | | | | 71,560 | |
Commonwealth of Puerto Rico, RB, 0.00%, 11/01/51 | | | | | | | 91 | | | | 29,614 | |
| | | | | | | | | | | | |
| | | |
| | | | | | | | | | | 109,890 | |
| | | | | | | | | | | | |
| | |
Total Municipal Bonds — 0.1%
(Cost: $137,949) | | | | | | | | 109,890 | |
| | | | | | | | | | | | |
|
Non-Agency Mortgage-Backed Securities | |
|
| Banks — 4.0% | |
Western Alliance Bank, 10.22%, 12/30/24 | | | | | | | 3,510 | | | | 3,507,682 | |
| | | | | | | | | | | | |
| |
| Collateralized Mortgage Obligations(b) — 5.2% | | | | |
Cascade Funding Mortgage Trust, Series 2019-RM3, Class C, 4.00%, 06/25/69(a) | | | | | | | 1,058 | | | | 926,599 | |
Connecticut Avenue Securities Trust, Series 2021-R01, Class 1B2, (30 day SOFR + 6.00%), 9.93%, 10/25/41(a) | | | | | | | 137 | | | | 124,065 | |
Credit Suisse Mortgage Capital Certificates Trust | | | | | | | | | | | | |
Series 2021-JR1, Class A2, 3.50%, 09/27/66(a) | | | | | | | 507 | | | | 446,025 | |
Series 2021-JR1, Class B2, 32.56%, 09/27/66 | | | | | | | 875 | | | | 762,463 | |
Series 2021-JR1, Class PT2, 0.00%, 07/26/60(a)(c) | | | | | | | 726 | | | | 261,306 | |
Structured Asset Securities Corp. Mortgage Loan Trust, Series 2006-RF3, Class 1A2, 6.00%, 10/25/36 | | | | | | | 1,901 | | | | 1,046,865 | |
Voyager OPTONE Delaware Trust, Series 2009-1, Class SAA7, (1 mo. LIBOR), 4.29%, 02/25/38(a) | | | | | | | 3,455 | | | | 957,344 | |
| | | | | | | | | | | | |
| | | |
| | | | | | | | | | | 4,524,667 | |
|
| Commercial Mortgage-Backed Securities — 5.3% | |
Ashford Hospitality Trust, Series 2018-ASHF, Class E, (1 mo. LIBOR US + 3.10%), 7.42%, 04/15/35(a)(b) | | | | | | | 125 | | | | 114,266 | |
BX Commercial Mortgage Trust(a)(b) | | | | | | | | | | | | |
Series 2019-XL, Class J, (1 mo. SOFR CME + 2.76%), 7.10%, 10/15/36 | | | | | | | 595 | | | | 565,582 | |
Series 2021-MFM1, Class G, (1 mo. LIBOR US + 3.90%), 8.22%, 01/15/34 | | | | | | | 100 | | | | 91,111 | |
Citigroup Commercial Mortgage Trust(a)(b) | | | | | | | | | | | | |
Series 2019-PRM, Class E, 4.73%, 05/10/36 | | | | | | | 500 | | | | 496,587 | |
Series 2019-PRM, Class F, 4.73%, 05/10/36 | | | | | | | 750 | | | | 741,934 | |
Cold Storage Trust, Series 2020-ICE5, Class F, (1 mo. LIBOR US + 3.49%), 7.81%, 11/15/37(a)(b) | | | | | | | 127 | | | | 120,830 | |
| | | | | | | | | | | | |
| Security | | | | | Par
(000) | | | Value | |
|
| Commercial Mortgage-Backed Securities (continued) | |
Commercial Mortgage Trust, Series 2013-GAM, Class E, 3.42%,
02/10/28(a)(b)(c) | | | USD | | | | 110 | | | $ | 102,912 | |
Credit Suisse Mortgage Capital Certificates Trust(a)(b) | | | | | | | | | | | | |
Series 2020-FACT, Class F, (1 mo. LIBOR US + 6.16%), 10.48%, 10/15/37 | | | | | | | 300 | | | | 274,150 | |
Series 2021-BHAR, Class E, (1 mo. LIBOR US + 3.50%), 7.82%, 11/15/38 | | | | | | | 250 | | | | 237,706 | |
HONO Mortgage Trust, Series 2021-LULU, Class F, (1 mo. LIBOR US + 4.40%), 8.72%, 10/15/36(a)(b) | | | | | | | 125 | | | | 112,673 | |
Hudson Yards Mortgage Trust, Series 2019-55HY, Class F, 2.94%,
12/10/41(a)(b) | | | | | | | 498 | | | | 334,955 | |
JP Morgan Chase Commercial Mortgage Securities Trust, Series 2022-NLP, Class F, (1 mo. SOFR CME + 3.54%), 7.88%, 04/15/37(a)(b) | | | | | | | 100 | | | | 80,232 | |
MED Trust, Series 2021, Class G, (1 mo. LIBOR US + 5.25%), 9.57%, 11/15/38(a)(b) | | | | | | | 71 | | | | 64,881 | |
MF1 Trust, Series 2021-W10, Class G, (1 mo. SOFR CME + 4.22%), 8.56%, 12/15/34(a)(b) | | | | | | | 120 | | | | 108,423 | |
Morgan Stanley Capital I, Series 2017-HR2, Class D, 2.73%, 12/15/50 | | | | | | | 625 | | | | 425,384 | |
Morgan Stanley Capital I Trust(b) | | | | | | | | | | | | |
Series 2018-MP, Class E, 4.28%, 07/11/40(a) | | | | | | | 247 | | | | 174,033 | |
Series 2019-H7, Class D, 3.00%, 07/15/52 | | | | | | | 750 | | | | 502,823 | |
Wells Fargo Commercial Mortgage Trust, Series 2020- SDAL, Class E, (1 mo. LIBOR US + 2.74%), 7.06%, 02/15/37(a)(b) | | | | | | | 50 | | | | 46,380 | |
| | | | | | | | | | | | |
| | | |
| | | | | | | | | | | 4,594,862 | |
| | | | | | | | | | | | |
| | |
Total Non-Agency Mortgage-Backed Securities — 14.5%
(Cost: $14,148,111) | | | | | | | | 12,627,211 | |
| | | | | | | | | | | | |
|
Preferred Securities | |
| | |
| Capital Trusts — 5.1%(a) | | | | | | | |
| | |
| Banks(h) — 1.6% | | | | | | | |
ABN AMRO Bank NV, 4.75%(f) | | | EUR | | | | 200 | | | | 181,437 | |
AIB Group PLC, 6.25%(f) | | | | | | | 200 | | | | 199,950 | |
Banco Mercantil del Norte SA(b) | | | | | | | | | | | | |
5.88% | | | USD | | | | 200 | | | | 178,100 | |
6.75% | | | | | | | 300 | | | | 292,181 | |
CaixaBank SA, 6.38%(f) | | | EUR | | | | 200 | | | | 208,452 | |
ING Groep NV, Series NC10, 4.25% | | | USD | | | | 200 | | | | 137,252 | |
Svenska Handelsbanken AB, 4.38%(f) | | | | | | | 200 | | | | 178,260 | |
| | | | | | | | | | | | |
| | | |
| | | | | | | | | | | 1,375,632 | |
| | | |
| Chemicals — 0.3% | | | | | | | | | |
Solvay SA, 2.50%(f)(h) | | | EUR | | | | 300 | | | | 282,897 | |
| | | | | | | | | | | | |
| | |
| Diversified Financial Services(h) — 1.2% | | | | | | | |
Banco Santander SA, 3.63%(f) | | | | | | | 200 | | | | 148,000 | |
Barclays PLC | | | | | | | | | | | | |
8.00% | | | USD | | | | 200 | | | | 194,321 | |
6.13% | | | | | | | 200 | | | | 182,500 | |
Credit Suisse Group AG, 6.25%(b) | | | | | | | 200 | | | | 156,306 | |
NatWest Group PLC, 4.60% | | | | | | | 200 | | | | 143,186 | |
UBS Group AG(b) | | | | | | | | | | | | |
4.88% | | | | | | | 220 | | | | 186,450 | |
7.00% | | | | | | | 50 | | | | 49,191 | |
| | | | | | | | | | | | |
| | | |
| | | | | | | | | | | 1,059,954 | |
| | |
| 36 | | 2 0 2 2 B L A C K R O C K A N N U A L R E P O R T T O S H A R E H O L D E R S |
| | |
Schedule of Investments (continued) December 31, 2022 | | BlackRock Multi-Sector Opportunities Trust II (MSO2) (Percentages shown are based on Net Assets) |
| | | | | | | | | | | | |
| Security | | | | | Par
(000) | | | Value | |
|
| Diversified Telecommunication Services — 0.8% | |
British Telecommunications PLC, 4.25%, 11/23/81(b) | | | USD | | | | 200 | | | $ | 167,316 | |
Telefonica Europe BV(f)(h) | | | | | | | | | | | | |
4.38% | | | EUR | | | | 100 | | | | 101,951 | |
2.38% | | | | | | | 500 | | | | 400,081 | |
| | | | | | | | | | | | |
| | | |
| | | | | | | | | | | 669,348 | |
|
| Electric Utilities — 0.1% | |
Iberdrola International BV, Series NC9, 1.83%(f)(h) | | | | | | | 100 | | | | 81,441 | |
| | | | | | | | | | | | |
|
| Insurance — 0.2% | |
Allianz SE, 3.20%(f)(h) | | | USD | | | | 200 | | | | 148,652 | |
| | | | | | | | | | | | |
|
| Media — 0.1% | |
SES SA, 2.88%(f)(h) | | | EUR | | | | 100 | | | | 84,951 | |
| | | | | | | | | | | | |
|
| Oil, Gas & Consumable Fuels — 0.2% | |
Eni SpA, Series NC-9, 2.75%(f)(h) | | | | | | | 200 | | | | 164,663 | |
| | | | | | | | | | | | |
|
| Pharmaceuticals — 0.3% | |
Bayer AG, 3.13%, 11/12/79(f) | | | | | | | 300 | | | | 271,760 | |
| | | | | | | | | | | | |
|
| Utilities — 0.2% | |
Electricite de France SA, 3.38%(f)(h) | | | | | | | 200 | | | | 154,247 | |
| | | | | | | | | | | | |
|
| Wireless Telecommunication Services — 0.1% | |
Vodafone Group PLC, 4.20%, 10/03/78(f) | | | | | | | 100 | | | | 96,876 | |
| | | | | | | | | | | | |
| | | |
| | | | | | | | | | | 4,390,421 | |
| | | | | | | | | | | | |
| | |
Total Preferred Securities — 5.1%
(Cost: $5,451,009) | | | | | | | | 4,390,421 | |
| | | | | | | | | | | | |
|
U.S. Government Sponsored Agency Securities | |
|
| Commercial Mortgage-Backed Securities(a)(b) — 1.1% | |
FREMF Mortgage Trust | | | | | | | | | | | | |
Series 2017-KGX1, Class BFX, 3.59%, 10/25/27 | | | USD | | | | 130 | | | | 115,263 | |
Series 2019-K99, Class C, 3.65%, 10/25/52 | | | | | | | 1,000 | | | | 850,974 | |
| | | | | | | | | | | | |
| | | |
| | | | | | | | | | | 966,237 | |
|
| Mortgage-Backed Securities(k) — 4.9% | |
Uniform Mortgage-Backed Securities | | | | | | | | | | | | |
4.50%, 01/12/53 | | | | | | | 2,185 | | | | 2,101,930 | |
5.00%, 01/12/53 | | | | | | | 2,184 | | | | 2,163,593 | |
| | | | | | | | | | | | |
| | | |
| | | | | | | | | | | 4,265,523 | |
| | | | | | | | | | | | |
| | |
Total U.S. Government Sponsored Agency Securities — 6.0%
(Cost: $5,404,401) | | | | | | | | 5,231,760 | |
| | | | | | | | | | | | |
| | |
Total Long-Term Investments — 112.3%
(Cost: $110,482,860) | | | | | | | | 97,631,379 | |
| | | | | | | | | | | | |
| | | | | | | | | | | | |
| | | |
| Security | | | | | Shares | | | Value | |
|
Short-Term Securities | |
|
| Money Market Funds — 6.7% | |
BlackRock Liquidity Funds, T-Fund, Institutional Class, 4.03%(l)(m) | | | | | | | 5,876,317 | | | $ | 5,876,317 | |
| | | | | | | | | | | | |
| | |
Total Short-Term Securities — 6.7%
(Cost: $5,876,317) | | | | | | | | 5,876,317 | |
| | | | | | | | | | | | |
| | |
Total Investments Before TBA Sale Commitments — 119.0%
(Cost: $116,359,177) | | | | | | | | 103,507,696 | |
| | | | | | | | | | | | |
| | | |
| | | | | | Par
(000) | | | | |
|
TBA Sale Commitments | |
|
| Mortgage-Backed Securities — (2.5)% | |
Uniform Mortgage-Backed Securities, 5.00%, 01/12/53(k) | | | | | | | (2,184 | ) | | | (2,163,593 | ) |
| | | | | | | | | | | | |
| |
Total TBA Sale Commitments — (2.5)%
(Proceeds: $(2,163,593)) | | | | (2,163,593 | ) |
| | | | | | | | | | | | |
| | |
Total Investments, Net of TBA Sale Commitments — 116.5%
(Cost: $114,195,584) | | | | | | | | 101,344,103 | |
Liabilities in Excess of Other Assets — (16.5)% | | | | (14,382,947 | ) |
| | | | | | | | | | | | |
| |
Net Assets — 100.0% | | | $ | 86,961,156 | |
| | | | | | | | | | | | |
| (a) | Variable rate security. Interest rate resets periodically. The rate shown is the effective interest rate as of period end. Security description also includes the reference rate and spread if published and available. |
| (b) | Security exempt from registration pursuant to Rule 144A under the Securities Act of 1933, as amended. These securities may be resold in transactions exempt from registration to qualified institutional investors. |
| (c) | Security is valued using significant unobservable inputs and is classified as Level 3 in the fair value hierarchy. |
| (d) | Non-income producing security. |
| (e) | All or a portion of the security has been pledged as collateral in connection with outstanding reverse repurchase agreements. |
| (f) | This security may be resold to qualified foreign investors and foreign institutional buyers under Regulation S of the Securities Act of 1933. |
| (g) | Payment-in-kind security which may pay interest/dividends in additional par/shares and/or in cash. Rates shown are the current rate and possible payment rates. |
| (h) | Perpetual security with no stated maturity date. |
| (i) | Issuer filed for bankruptcy and/or is in default. |
| (j) | Rounds to less than 1,000. |
| (k) | Represents or includes a TBA transaction. |
| (l) | Affiliate of the Trust. |
| (m) | Annualized 7-day yield as of period end. |
For Trust compliance purposes, the Trust’s industry classifications refer to one or more of the industry sub-classifications used by one or more widely recognized market indexes or rating group indexes, and/or as defined by the investment adviser. These definitions may not apply for purposes of this report, which may combine such industry sub-classifications for reporting ease.
| | |
S C H E D U L E O F I N V E S T M E N T S | | 37 |
| | |
Schedule of Investments (continued) December 31, 2022 | | BlackRock Multi-Sector Opportunities Trust II (MSO2) |
Affiliates
Investments in issuers considered to be affiliate(s) of the Trust during the year ended December 31, 2022 for purposes of Section 2(a)(3) of the Investment Company Act of 1940, as amended, were as follows:
| | | | | | | | | | | | | | | | | | | | | | | | | | | | | | | | | | | | |
| Affiliated Issuer | | Value at
12/31/21 | | | Purchases
at Cost | | | Proceeds
from Sales | | | Net
Realized
Gain (Loss) | | | Change in
Unrealized
Appreciation
(Depreciation) | | | Value at
12/31/22 | | | Shares
Held at
12/31/22 | | | Income | | | Capital Gain
Distributions
from
Underlying
Funds | |
BlackRock Liquidity Funds, T-Fund, Institutional Class | | $ | 4,817,225 | | | $ | 1,059,092 | (a) | | $ | — | | | $ | — | | | $ | — | | | $ | 5,876,317 | | | | 5,876,317 | | | $ | 84,291 | | | $ | — | |
iShares iBoxx $ High Yield Corporate Bond ETF(b) | | | 2,806,508 | | | | — | | | | (2,514,562 | ) | | | (98,058 | ) | | | (193,888 | ) | | | — | | | | — | | | | 40,365 | | | | — | |
iShares iBoxx $ Investment Grade Corporate Bond ETF(b) | | | — | | | | 4,365,308 | | | | (4,464,705 | ) | | | 99,397 | | | | — | | | | — | | | | — | | | | — | | | | — | |
| | | | | | | | | | | | | | | | | | | | | | | | | | | | | | | | | | | | |
| | | | | | | | | | | | | | $ | 1,339 | | | $ | (193,888 | ) | | $ | 5,876,317 | | | | | | | $ | 124,656 | | | $ | — | |
| | | | | | | | | | | | | | | | | | | | | | | | | | | | | | | | | | | | |
| | (a) | Represents net amount purchased (sold). | |
| | (b) | As of period end, the entity is no longer held. | |
Reverse Repurchase Agreements
| | | | | | | | | | | | | | | | | | | | | | | | |
| Counterparty | | Interest
Rate | | | Trade
Date | | | Maturity Date(a) | | | Face Value | | | Face Value
Including
Accrued Interest | | | Type of Non-Cash Underlying
Collateral | | Remaining
Contractual Maturity of the Agreements(a) |
Barclays Capital, Inc. | | | 3.25 | %(b) | | | 10/17/22 | | | | Open | | | $ | 123,975 | | | $ | 124,825 | | | Corporate Bonds | | Open/Demand |
RBC Capital Markets LLC | | | 4.53 | (b) | | | 11/09/22 | | | | Open | | | | 170,213 | | | | 171,208 | | | Corporate Bonds | | Open/Demand |
RBC Capital Markets LLC | | | 4.65 | (b) | | | 11/09/22 | | | | Open | | | | 255,106 | | | | 256,643 | | | Corporate Bonds | | Open/Demand |
RBC Capital Markets LLC | | | 4.65 | (b) | | | 11/09/22 | | | | Open | | | | 245,354 | | | | 246,831 | | | Corporate Bonds | | Open/Demand |
RBC Capital Markets LLC | | | 4.65 | (b) | | | 11/09/22 | | | | Open | | | | 307,835 | | | | 309,689 | | | Corporate Bonds | | Open/Demand |
RBC Capital Markets LLC | | | 4.65 | (b) | | | 11/09/22 | | | | Open | | | | 280,689 | | | | 282,379 | | | Corporate Bonds | | Open/Demand |
RBC Capital Markets LLC | | | 4.65 | (b) | | | 11/09/22 | | | | Open | | | | 356,062 | | | | 358,207 | | | Corporate Bonds | | Open/Demand |
RBC Capital Markets LLC | | | 4.65 | (b) | | | 11/09/22 | | | | Open | | | | 253,812 | | | | 255,341 | | | Corporate Bonds | | Open/Demand |
RBC Capital Markets LLC | | | 4.65 | (b) | | | 11/09/22 | | | | Open | | | | 210,540 | | | | 211,808 | | | Corporate Bonds | | Open/Demand |
RBC Capital Markets LLC | | | 4.65 | (b) | | | 11/09/22 | | | | Open | | | | 230,029 | | | | 231,414 | | | Corporate Bonds | | Open/Demand |
RBC Capital Markets LLC | | | 4.50 | (b) | | | 11/10/22 | | | | Open | | | | 78,163 | | | | 78,582 | | | Corporate Bonds | | Open/Demand |
RBC Capital Markets LLC | | | 4.50 | (b) | | | 11/10/22 | | | | Open | | | | 109,156 | | | | 109,741 | | | Corporate Bonds | | Open/Demand |
RBC Capital Markets LLC | | | 4.65 | (b) | | | 11/10/22 | | | | Open | | | | 209,510 | | | | 210,675 | | | Corporate Bonds | | Open/Demand |
TD Securities (USA) LLC | | | 4.49 | (b) | | | 11/10/22 | | | | Open | | | | 85,050 | | | | 85,506 | | | Corporate Bonds | | Open/Demand |
TD Securities (USA) LLC | | | 4.49 | (b) | | | 11/10/22 | | | | Open | | | | 64,125 | | | | 64,468 | | | Corporate Bonds | | Open/Demand |
Barclays Capital, Inc. | | | 4.35 | (b) | | | 11/16/22 | | | | Open | | | | 101,250 | | | | 101,740 | | | Foreign Agency Obligations | | Open/Demand |
Barclays Capital, Inc. | | | 4.45 | (b) | | | 11/16/22 | | | | Open | | | | 155,135 | | | | 155,905 | | | Foreign Agency Obligations | | Open/Demand |
Barclays Capital, Inc. | | | 4.55 | (b) | | | 11/16/22 | | | | Open | | | | 200,250 | | | | 201,269 | | | Foreign Agency Obligations | | Open/Demand |
BNP Paribas S.A. | | | 4.52 | (b) | | | 11/16/22 | | | | Open | | | | 63,919 | | | | 64,242 | | | Corporate Bonds | | Open/Demand |
Credit Suisse Securities (USA) LLC | | | 4.60 | (b) | | | 11/16/22 | | | | Open | | | | 201,875 | | | | 202,915 | | | Foreign Agency Obligations | | Open/Demand |
RBC Capital Markets LLC | | | 4.55 | (b) | | | 11/16/22 | | | | Open | | | | 165,500 | | | | 166,342 | | | Corporate Bonds | | Open/Demand |
RBC Capital Markets LLC | | | 4.62 | (b) | | | 11/16/22 | | | | Open | | | | 119,325 | | | | 119,943 | | | Corporate Bonds | | Open/Demand |
RBC Capital Markets LLC | | | 4.65 | (b) | | | 11/29/22 | | | | Open | | | | 478,405 | | | | 480,183 | | | Corporate Bonds | | Open/Demand |
RBC Capital Markets LLC | | | 4.65 | (b) | | | 11/29/22 | | | | Open | | | | 694,912 | | | | 697,495 | | | Corporate Bonds | | Open/Demand |
RBC Capital Markets LLC | | | 4.65 | (b) | | | 11/29/22 | | | | Open | | | | 422,662 | | | | 424,233 | | | Corporate Bonds | | Open/Demand |
RBC Capital Markets LLC | | | 4.65 | (b) | | | 11/29/22 | | | | Open | | | | 633,840 | | | | 636,196 | | | Corporate Bonds | | Open/Demand |
BNP Paribas S.A. | | | 4.35 | (b) | | | 12/05/22 | | | | Open | | | | 318,600 | | | | 319,495 | | | Corporate Bonds | | Open/Demand |
BNP Paribas S.A. | | | 4.50 | (b) | | | 12/14/22 | | | | Open | | | | 131,341 | | | | 131,593 | | | Corporate Bonds | | Open/Demand |
TD Securities (USA) LLC | | | 4.65 | (b) | | | 12/20/22 | | | | Open | | | | 824,885 | | | | 826,057 | | | Corporate Bonds | | Open/Demand |
TD Securities (USA) LLC | | | 4.65 | (b) | | | 12/20/22 | | | | Open | | | | 584,512 | | | | 585,343 | | | Corporate Bonds | | Open/Demand |
TD Securities (USA) LLC | | | 4.65 | (b) | | | 12/20/22 | | | | Open | | | | 405,600 | | | | 406,176 | | | Corporate Bonds | | Open/Demand |
TD Securities (USA) LLC | | | 4.65 | (b) | | | 12/20/22 | | | | Open | | | | 323,154 | | | | 323,613 | | | Corporate Bonds | | Open/Demand |
TD Securities (USA) LLC | | | 4.65 | (b) | | | 12/20/22 | | | | Open | | | | 549,986 | | | | 550,768 | | | Corporate Bonds | | Open/Demand |
TD Securities (USA) LLC | | | 4.65 | (b) | | | 12/20/22 | | | | Open | | | | 270,100 | | | | 270,484 | | | Corporate Bonds | | Open/Demand |
Barclays Capital, Inc. | | | 4.35 | (b) | | | 12/28/22 | | | | Open | | | | 140,423 | | | | 140,474 | | | Foreign Agency Obligations | | Open/Demand |
Barclays Capital, Inc. | | | 4.45 | (b) | | | 12/28/22 | | | | Open | | | | 115,475 | | | | 115,518 | | | Foreign Agency Obligations | | Open/Demand |
Barclays Capital, Inc. | | | 4.50 | (b) | | | 12/28/22 | | | | Open | | | | 136,250 | | | | 136,301 | | | Corporate Bonds | | Open/Demand |
Barclays Capital, Inc. | | | 4.50 | (b) | | | 12/28/22 | | | | Open | | | | 137,000 | | | | 137,051 | | | Corporate Bonds | | Open/Demand |
Barclays Capital, Inc. | | | 4.50 | (b) | | | 12/28/22 | | | | Open | | | | 182,250 | | | | 182,318 | | | Foreign Agency Obligations | | Open/Demand |
Barclays Capital, Inc. | | | 4.55 | (b) | | | 12/28/22 | | | | Open | | | | 97,400 | | | | 97,437 | | | Corporate Bonds | | Open/Demand |
Barclays Capital, Inc. | | | 4.55 | (b) | | | 12/28/22 | | | | Open | | | | 27,455 | | | | 27,465 | | | Corporate Bonds | | Open/Demand |
Barclays Capital, Inc. | | | 4.55 | (b) | | | 12/28/22 | | | | Open | | | | 107,625 | | | | 107,666 | | | Corporate Bonds | | Open/Demand |
Barclays Capital, Inc. | | | 4.55 | (b) | | | 12/28/22 | | | | Open | | | | 104,775 | | | | 104,815 | | | Corporate Bonds | | Open/Demand |
| | |
| 38 | | 2 0 2 2 B L A C K R O C K A N N U A L R E P O R T T O S H A R E H O L D E R S |
| | |
Schedule of Investments (continued) December 31, 2022 | | BlackRock Multi-Sector Opportunities Trust II (MSO2) |
Reverse Repurchase Agreements (continued)
| | | | | | | | | | | | | | | | | | | | | | | | |
| Counterparty | | Interest
Rate | | | Trade
Date | | | Maturity Date(a) | | | Face Value | | | Face Value
Including
Accrued Interest | | | Type of Non-Cash Underlying
Collateral | | Remaining
Contractual Maturity of the Agreements(a) |
Barclays Capital, Inc. | | | 4.55 | %(b) | | | 12/28/22 | | | | Open | | | $ | 230,513 | | | $ | 230,600 | | | Corporate Bonds | | Open/Demand |
Barclays Capital, Inc. | | | 4.55 | (b) | | | 12/28/22 | | | | Open | | | | 61,125 | | | | 61,148 | | | Corporate Bonds | | Open/Demand |
BNP Paribas S.A. | | | 4.52 | (b) | | | 12/28/22 | | | | Open | | | | 117,725 | | | | 117,769 | | | Foreign Agency Obligations | | Open/Demand |
BNP Paribas S.A. | | | 4.52 | (b) | | | 12/28/22 | | | | Open | | | | 55,675 | | | | 55,696 | | | Corporate Bonds | | Open/Demand |
BNP Paribas S.A. | | | 4.52 | (b) | | | 12/28/22 | | | | Open | | | | 111,788 | | | | 111,830 | | | Corporate Bonds | | Open/Demand |
BNP Paribas S.A. | | | 4.52 | (b) | | | 12/28/22 | | | | Open | | | | 48,200 | | | | 48,218 | | | Corporate Bonds | | Open/Demand |
BNP Paribas S.A. | | | 4.52 | (b) | | | 12/28/22 | | | | Open | | | | 56,250 | | | | 56,271 | | | Corporate Bonds | | Open/Demand |
BNP Paribas S.A. | | | 4.53 | (b) | | | 12/28/22 | | | | Open | | | | 72,781 | | | | 72,809 | | | Corporate Bonds | | Open/Demand |
BNP Paribas S.A. | | | 4.53 | (b) | | | 12/28/22 | | | | Open | | | | 157,392 | | | | 157,452 | | | Corporate Bonds | | Open/Demand |
BNP Paribas S.A. | | | 4.55 | (b) | | | 12/28/22 | | | | Open | | | | 142,750 | | | | 142,804 | | | Foreign Agency Obligations | | Open/Demand |
BNP Paribas S.A. | | | 4.55 | (b) | | | 12/28/22 | | | | Open | | | | 182,410 | | | | 182,479 | | | Corporate Bonds | | Open/Demand |
RBC Capital Markets LLC | | | 4.50 | (b) | | | 12/28/22 | | | | Open | | | | 99,775 | | | | 99,812 | | | Corporate Bonds | | Open/Demand |
RBC Capital Markets LLC | | | 4.50 | (b) | | | 12/28/22 | | | | Open | | | | 100,200 | | | | 100,238 | | | Corporate Bonds | | Open/Demand |
RBC Capital Markets LLC | | | 4.50 | (b) | | | 12/28/22 | | | | Open | | | | 74,481 | | | | 74,509 | | | Corporate Bonds | | Open/Demand |
RBC Capital Markets LLC | | | 4.50 | (b) | | | 12/28/22 | | | | Open | | | | 49,000 | | | | 49,018 | | | Corporate Bonds | | Open/Demand |
RBC Capital Markets LLC | | | 4.50 | (b) | | | 12/28/22 | | | | Open | | | | 52,063 | | | | 52,082 | | | Corporate Bonds | | Open/Demand |
RBC Capital Markets LLC | | | 4.62 | (b) | | | 12/28/22 | | | | Open | | | | 115,500 | | | | 115,544 | | | Corporate Bonds | | Open/Demand |
RBC Capital Markets LLC | | | 4.62 | (b) | | | 12/28/22 | | | | Open | | | | 72,788 | | | | 72,816 | | | Corporate Bonds | | Open/Demand |
RBC Capital Markets LLC | | | 4.65 | (b) | | | 12/28/22 | | | | Open | | | | 296,395 | | | | 296,510 | | | Corporate Bonds | | Open/Demand |
RBC Capital Markets LLC | | | 4.65 | (b) | | | 12/28/22 | | | | Open | | | | 234,000 | | | | 234,091 | | | Corporate Bonds | | Open/Demand |
RBC Capital Markets LLC | | | 4.65 | (b) | | | 12/28/22 | | | | Open | | | | 219,938 | | | | 220,023 | | | Corporate Bonds | | Open/Demand |
RBC Capital Markets LLC | | | 4.65 | (b) | | | 12/28/22 | | | | Open | | | | 335,995 | | | | 336,125 | | | Corporate Bonds | | Open/Demand |
RBC Capital Markets LLC | | | 4.65 | (b) | | | 12/28/22 | | | | Open | | | | 317,077 | | | | 317,200 | | | Corporate Bonds | | Open/Demand |
RBC Capital Markets LLC | | | 4.65 | (b) | | | 12/28/22 | | | | Open | | | | 516,412 | | | | 516,613 | | | Corporate Bonds | | Open/Demand |
RBC Capital Markets LLC | | | 4.65 | (b) | | | 12/28/22 | | | | Open | | | | 201,949 | | | | 202,027 | | | Corporate Bonds | | Open/Demand |
RBC Capital Markets LLC | | | 4.65 | (b) | | | 12/28/22 | | | | Open | | | | 320,479 | | | | 320,603 | | | Corporate Bonds | | Open/Demand |
| | | | | | | | | | | | | | | | | | | | | | | | |
| | | | | | | |
| | | | | | | | | | | | | | $ | 14,916,184 | | | $ | 14,954,641 | | | | | |
| | | | | | | | | | | | | | | | | | | | | | | | |
| | (a) | Certain agreements have no stated maturity and can be terminated by either party at any time. | |
| | (b) | Variable rate security. Rate as of period end and maturity is the date the principal owed can be recovered through demand. | |
Derivative Financial Instruments Outstanding as of Period End
Futures Contracts
| | | | | | | | | | | | | | | | |
| Description | | Number of
Contracts | | | Expiration
Date | | | Notional
Amount (000) | | | Value/
Unrealized
Appreciation
(Depreciation) | |
Long Contracts | | | | | | | | | | | | | | | | |
10-Year U.S. Treasury Note | | | 67 | | | | 03/22/23 | | | $ | 7,513 | | | $ | (40,187 | ) |
U.S. Long Bond | | | 7 | | | | 03/22/23 | | | | 873 | | | | (7,949 | ) |
Ultra U.S. Treasury Bond | | | 10 | | | | 03/22/23 | | | | 1,335 | | | | (112,978 | ) |
2-Year U.S. Treasury Note | | | 85 | | | | 03/31/23 | | | | 17,425 | | | | 5,444 | |
| | | | | | | | | | | | | | | | |
| | | | |
| | | | | | | | | | | | | | | (155,670 | ) |
| | | | | | | | | | | | | | | | |
Short Contracts | | | | | | | | | | | | | | | | |
10-Year Japanese Government Treasury Bonds | | | 3 | | | | 03/13/23 | | | | 3,325 | | | | 61,177 | |
10-Year U.S. Ultra Long Treasury Note | | | 95 | | | | 03/22/23 | | | | 11,200 | | | | 137,403 | |
5-Year U.S. Treasury Note | | | 124 | | | | 03/31/23 | | | | 13,371 | | | | 11,604 | |
| | | | | | | | | | | | | | | | |
| | | | |
| | | | | | | | | | | | | | | 210,184 | |
| | | | | | | | | | | | | | | | |
| | | | |
| | | | | | | | | | | | | | $ | 54,514 | |
| | | | | | | | | | | | | | | | |
Forward Foreign Currency Exchange Contracts
| | | | | | | | | | | | | | | | | | | | |
| Currency Purchased | | | Currency Sold | | | Counterparty | | Settlement Date | | | Unrealized
Appreciation
(Depreciation) | |
| BRL | | | 803,818 | | | USD | | | 148,284 | | | Morgan Stanley & Co. International PLC | | | 03/15/23 | | | $ | 1,972 | |
| EUR | | | 331,000 | | | USD | | | 355,194 | | | Morgan Stanley & Co. International PLC | | | 03/15/23 | | | | 824 | |
| | |
S C H E D U L E O F I N V E S T M E N T S | | 39 |
| | |
Schedule of Investments (continued) December 31, 2022 | | BlackRock Multi-Sector Opportunities Trust II (MSO2) |
Forward Foreign Currency Exchange Contracts (continued)
| | | | | | | | | | | | | | | | | | | | |
Currency
Purchased | | | Currency Sold | | | Counterparty | | Settlement Date | | | Unrealized
Appreciation
(Depreciation) | |
| EUR | | | 3,981,000 | | | USD | | | 4,249,236 | | | UBS AG | | | 03/15/23 | | | $ | 32,663 | |
| USD | | | 234,997 | | | EUR | | | 218,000 | | | Bank of America N.A. | | | 03/15/23 | | | | 520 | |
| USD | | | 366,036 | | | GBP | | | 300,000 | | | Deutsche Bank AG | | | 03/15/23 | | | | 2,720 | |
| USD | | | 867,106 | | | GBP | | | 697,000 | | | Morgan Stanley & Co. International PLC | | | 03/15/23 | | | | 23,002 | |
| | | | | | | | | | | | | | | | | | | | |
| | | | | | |
| | | | | | | | | | | | | | | | | | | 61,701 | |
| | | | | | | | | | | | | | | | | | | | |
| USD | | | 5,383 | | | AUD | | | 8,000 | | | Deutsche Bank AG | | | 03/15/23 | | | | (79 | ) |
| USD | | | 2,164,030 | | | AUD | | | 3,186,000 | | | UBS AG | | | 03/15/23 | | | | (11,282 | ) |
| USD | | | 94,600 | | | CAD | | | 129,000 | | | Bank of America N.A. | | | 03/15/23 | | | | (726 | ) |
| USD | | | 116,000 | | | CNH | | | 802,742 | | | Morgan Stanley & Co. International PLC | | | 03/15/23 | | | | (623 | ) |
| USD | | | 6,833,373 | | | EUR | | | 6,368,000 | | | BNP Paribas SA | | | 03/15/23 | | | | (15,944 | ) |
| USD | | | 5,162,935 | | | EUR | | | 4,811,234 | | | Deutsche Bank AG | | | 03/15/23 | | | | (11,950 | ) |
| USD | | | 172,523 | | | EUR | | | 161,210 | | | JPMorgan Chase Bank N.A. | | | 03/15/23 | | | | (872 | ) |
| USD | | | 318,751 | | | EUR | | | 300,830 | | | JPMorgan Chase Bank N.A. | | | 03/15/23 | | | | (4,817 | ) |
| | | | | | | | | | | | | | | | | | | | |
| | | | | | |
| | | | | | | | | | | | | | | | | | | (46,293 | ) |
| | | | | | | | | | | | | | | | | | | | |
| | | | | | |
| | | | | | | | | | | | | | | | | | $ | 15,408 | |
| | | | | | | | | | | | | | | | | | | | |
Centrally Cleared Credit Default Swaps — Sell Protection
| | | | | | | | | | | | | | | | | | | | | | | | | | | | | | | | | | | | |
| Reference Obligation/Index | | Financing
Rate Received
by the Trust | | | Payment
Frequency | | | Termination
Date | | | Credit Rating(a) | | | Notional Amount (000)(b) | | | Value | | | Upfront
Premium
Paid (Received) | | | Unrealized
Appreciation
(Depreciation) | |
CDX.NA.HY.33.V13 | | | 5.00 | % | | | Quarterly | | | | 12/20/24 | | | | C+ | | | | USD | | | | 6,380 | | | $ | 194,016 | | | $ | (3,189 | ) | | $ | 197,205 | |
CDX.NA.HY.34.V10 | | | 5.00 | | | | Quarterly | | | | 06/20/25 | | | | CC- | | | | USD | | | | 5,278 | | | | 132,527 | | | | (2,808 | ) | | | 135,335 | |
| | | | | | | | | | | | | | | | | | | | | | | | | | | | | | | | | | | | |
| | | | | | | | | |
| | | | | | | | | | | | | | | | | | | | | | | | | | $ | 326,543 | | | $ | (5,997 | ) | | $ | 332,540 | |
| | | | | | | | | | | | | | | | | | | | | | | | | | | | | | | | | | | | |
| | (a) | Using the rating of the issuer or the underlying securities of the index, as applicable, provided by S&P Global Ratings. | |
| | (b) | The maximum potential amount the Trust may pay should a negative credit event take place as defined under the terms of the agreement. | |
Centrally Cleared Interest Rate Swaps
| | | | | | | | | | | | | | | | | | | | | | | | | | | | | | | | |
Paid by the Trust | | Received by the Trust | | Effective
Date | | | Termination
Date | | | Notional
Amount (000) | | | Value | | | Upfront
Premium
Paid
(Received) | | | Unrealized
Appreciation
(Depreciation) | |
| Rate | | Frequency | | Rate | | Frequency |
| 4.18% | | Annual | | 1-Day SOFR, 4.32% | | Annual | | | N/A | | | | 06/21/24 | | | USD | | | 2,108 | | | $ | 12,245 | | | $ | (4,040 | ) | | $ | 16,285 | |
| 1-Day SOFR, 4.32% | | Annual | | 3.71% | | Annual | | | N/A | | | | 01/10/27 | | | USD | | | 2,366 | | | | (12,613 | ) | | | 18,394 | | | | (31,007 | ) |
| 1-Day SOFR, 4.32% | | Annual | | 1.56% | | Annual | | | N/A | | | | 03/07/27 | | | USD | | | 2,933 | | | | (267,839 | ) | | | (72,231 | ) | | | (195,608 | ) |
| 3.50% | | Annual | | 1-Day SOFR, 4.32% | | Annual | | | N/A | | | | 05/28/31 | | | USD | | | 76 | | | | 432 | | | | (1,347 | ) | | | 1,779 | |
| 3.22% | | Annual | | 1-Day SOFR, 4.32% | | Annual | | | N/A | | | | 05/28/51 | | | USD | | | 34 | | | | 181 | | | | (1,782 | ) | | | 1,963 | |
| | | | | | | | | | | | | | | | | | | | | | | | | | | | | | | | |
| | | | | | | | | | |
| | | | | | | | | | | | | | | | | | | | | | $ | (267,594 | ) | | $ | (61,006 | ) | | $ | (206,588 | ) |
| | | | | | | | | | | | | | | | | | | | | | | | | | | | | | | | |
| | |
| 40 | | 2 0 2 2 B L A C K R O C K A N N U A L R E P O R T T O S H A R E H O L D E R S |
| | |
Schedule of Investments (continued) December 31, 2022 | | BlackRock Multi-Sector Opportunities Trust II (MSO2) |
OTC Credit Default Swaps — Sell Protection
| | | | | | | | | | | | | | | | | | | | | | | | | | | | | | | | | | | | |
| Reference Obligation/Index | |
| Financing
Rate Received
by the Trust |
| |
| Payment
Frequency |
| | Counterparty | |
| Termination
Date |
| | Credit Rating(a) | |
| Notional
Amount (000)(b) |
| | | Value | | |
| Upfront
Premium
Paid
(Received) |
| |
| Unrealized
Appreciation
(Depreciation) |
|
CMA CGM SA | | | 5.00 | % | | | Quarterly | | | JPMorgan Chase Bank N.A. | | | 06/20/27 | | | BB+ | | | EUR | | | | 4 | | | $ | 160 | | | $ | 139 | | | $ | 21 | |
CMA CGM SA | | | 5.00 | | | | Quarterly | | | JPMorgan Chase Bank N.A. | | | 06/20/27 | | | BB+ | | | EUR | | | | 4 | | | | 150 | | | | 131 | | | | 19 | |
CMA CGM SA | | | 5.00 | | | | Quarterly | | | JPMorgan Chase Bank N.A. | | | 06/20/27 | | | BB+ | | | EUR | | | | 2 | | | | 71 | | | | 61 | | | | 10 | |
CMBX.NA.9 | | | 3.00 | | | | Monthly | | | Morgan Stanley & Co. International PLC | | | 09/17/58 | | | N/R | | | USD | | | | 943 | | | | (177,123 | ) | | | (3,695 | ) | | | (173,428 | ) |
CMBX.NA.15 | | | 3.00 | | | | Monthly | | | Goldman Sachs International | | | 11/15/64 | | | N/R | | | USD | | | | 1,023 | | | | (195,245 | ) | | | (219,232 | ) | | | 23,987 | |
CMBX.NA.15 | | | 3.00 | | | | Monthly | | | Morgan Stanley & Co. International PLC | | | 11/15/64 | | | N/R | | | USD | | | | 1,023 | | | | (195,302 | ) | | | (199,069 | ) | | | 3,767 | |
CMBX.NA.15 | | | 3.00 | | | | Monthly | | | Morgan Stanley & Co. International PLC | | | 11/18/64 | | | N/R | | | USD | | | | 1,000 | | | | (190,912 | ) | | | (187,376 | ) | | | (3,536 | ) |
| | | | | | | | | | | | | | | | | | | | | | | | | | | | | | | | | | | | |
| | | | | | | | | | |
| | | | | | | | | | | | | | | | | | | | | | | | | | $ | (758,201 | ) | | $ | (609,041 | ) | | $ | (149,160 | ) |
| | | | | | | | | | | | | | | | | | | | | | | | | | | | | | | | | | | | |
| | (a) | Using the rating of the issuer or the underlying securities of the index, as applicable, provided by S&P Global Ratings. | |
| | (b) | The maximum potential amount the Trust may pay should a negative credit event take place as defined under the terms of the agreement. | |
OTC Total Return Swaps
| | | | | | | | | | | | | | | | | | | | | | | | | | | | | | | | |
| Paid by the Trust | | Received by the Trust | | Counterparty | | Effective Date | | | Termination Date | | Notional Amount
(000) | | | Value | | | Upfront
Premium
Paid (Received) | | | Unrealized
Appreciation (Depreciation) | |
| Rate/Reference | | Frequency | | Rate/Reference | | Frequency |
1-Day SOFR minus 0.40%, 4.32% | | Monthly | | iShares iBoxx $ High Yield Corporate Bond ETF | | Monthly | | BNP Paribas SA | | | N/A | | | 03/17/23 | | USD | | | 1,885 | | | $ | (28,272 | ) | | $ | 205 | | | $ | (28,477 | ) |
1-Day SOFR minus 0.40%, 4.32% | | Monthly | | iShares iBoxx $ High Yield Corporate Bond ETF | | Monthly | | JPMorgan Chase Bank
N.A. | | | N/A | | | 03/17/23 | | USD | | | 119 | | | | (1,682 | ) | | | — | | | | (1,682 | ) |
| | | | | | | | | | | | | | | | | | | | | | | | | | | | | | | | |
| | | | | | | | | | | | | | | | | | | | | | $ | (29,954 | ) | | $ | 205 | | | $ | (30,159 | ) |
| | | | | | | | | | | | | | | | | | | | | | | | | | | | | | | | |
Balances Reported in the Statements of Assets and Liabilities for Centrally Cleared Swaps and OTC Swaps
| | | | | | | | | | | | | | | | |
| Description | | Swap
Premiums
Paid | | | Swap
Premiums
Received | | | Unrealized
Appreciation | | | Unrealized
Depreciation | |
Centrally Cleared Swaps(a) | | $ | 18,394 | | | | $ (85,397 | ) | | $ | 352,567 | | | $ | (226,615 | ) |
OTC Swaps | | | 536 | | | | (609,372 | ) | | | 27,804 | | | | (207,123 | ) |
| | (a) | Includes cumulative appreciation (depreciation) on centrally cleared swaps, as reported in the Schedule of Investments. Only current day’s variation margin is reported within the Statements of Assets and Liabilities and is net of any previously paid (received) swap premium amounts. | |
Derivative Financial Instruments Categorized by Risk Exposure
As of period end, the fair values of derivative financial instruments located in the Statements of Assets and Liabilities were as follows:
| | | | | | | | | | | | | | | | | | | | | | | | | | | | |
| | | Commodity
Contracts | | | Credit
Contracts | | | Equity
Contracts | | | Foreign
Currency
Exchange
Contracts | | | Interest
Rate
Contracts | | | Other
Contracts | | | Total | |
Assets — Derivative Financial Instruments | | | | | | | | | | | | | | | | | | | | | | | | | |
Futures contracts | | | | | | | | | | | | | | | | | | | | | | | | | | | | |
Unrealized appreciation on futures contracts(a) | | $ | — | | | $ | — | | | $ | — | | | $ | — | | | $ | 215,628 | | | $ | — | | | $ | 215,628 | |
Forward foreign currency exchange contracts | | | | | | | | | | | | | | | | | | | | | | | | | | | | |
Unrealized appreciation on forward foreign currency exchange contracts | | | — | | | | — | | | | — | | | | 61,701 | | | | — | | | | — | | | | 61,701 | |
| | |
S C H E D U L E O F I N V E S T M E N T S | | 41 |
| | |
Schedule of Investments (continued) December 31, 2022 | | BlackRock Multi-Sector Opportunities Trust II (MSO2) |
Derivative Financial Instruments Categorized by Risk Exposure (continued)
| | | | | | | | | | | | | | | | | | | | | | | | | | | | |
| | | Commodity
Contracts | | | Credit
Contracts | | | Equity
Contracts | | | Foreign
Currency
Exchange
Contracts | | | Interest
Rate
Contracts | | | Other
Contracts | | | Total | |
Swaps — centrally cleared | | | | | | | | | | | | | | | | | | | | | | | | | | | | |
Unrealized appreciation on centrally cleared swaps(a) | | $ | — | | | $ | 332,540 | | | $ | — | | | $ | — | | | $ | 20,027 | | | $ | — | | | $ | 352,567 | |
Swaps — OTC | | | | | | | | | | | | | | | | | | | | | | | | | | | | |
Unrealized appreciation on OTC swaps; Swap premiums paid | | | — | | | | 28,135 | | | | 205 | | | | — | | | | — | | | | — | | | | 28,340 | |
| | | | | | | | | | | | | | | | | | | | | | | | | | | | |
| | | | | | | |
| | $ | — | | | $ | 360,675 | | | $ | 205 | | | $ | 61,701 | | | $ | 235,655 | | | $ | — | | | $ | 658,236 | |
| | | | | | | | | | | | | | | | | | | | | | | | | | | | |
| | | | | | |
| Liabilities — Derivative Financial Instruments | | | | | | | | | | | | | | | | | | | |
Futures contracts | | | | | | | | | | | | | | | | | | | | | | | | | | | | |
Unrealized depreciation on futures contracts(a) | | $ | — | | | $ | — | | | $ | — | | | $ | — | | | $ | 161,114 | | | $ | — | | | $ | 161,114 | |
Forward foreign currency exchange contracts | | | | | | | | | | | | | | | | | | | | | | | | | | | | |
Unrealized depreciation on forward foreign currency exchange contracts | | | — | | | | — | | | | — | | | | 46,293 | | | | — | | | | — | | | | 46,293 | |
Swaps — centrally cleared | | | | | | | | | | | | | | | | | | | | | | | | | | | | |
Unrealized depreciation on centrally cleared swaps(a) | | | — | | | | — | | | | — | | | | — | | | | 226,615 | | | | — | | | | 226,615 | |
Swaps — OTC | | | | | | | | | | | | | | | | | | | | | | | | | | | | |
Unrealized depreciation on OTC swaps; Swap premiums received | | | — | | | | 786,336 | | | | 30,159 | | | | — | | | | — | | | | — | | | | 816,495 | |
| | | | | | | | | | | | | | | | | | | | | | | | | | | | |
| | | | | | | |
| | $ | — | | | $ | 786,336 | | | $ | 30,159 | | | $ | 46,293 | | | $ | 387,729 | | | $ | — | | | $ | 1,250,517 | |
| | | | | | | | | | | | | | | | | | | | | | | | | | | | |
| | (a) | Net cumulative unrealized appreciation (depreciation) on futures contracts and centrally cleared swaps, if any, are reported in the Schedule of Investments. In the Statements of Assets and Liabilities, only current day’s variation margin is reported in receivables or payables and the net cumulative unrealized appreciation (depreciation) is included in accumulated earnings (loss). | |
For the period ended December 31, 2022, the effect of derivative financial instruments in the Statements of Operations was as follows:
| | | | | | | | | | | | | | | | | | | | | | | | | | | | |
| | | Commodity
Contracts | | | Credit
Contracts | | | Equity
Contracts | | | Foreign
Currency
Exchange
Contracts | | | Interest
Rate
Contracts | | | Other
Contracts | | | Total | |
Net Realized Gain (Loss) from: | | | | | | | | | | | | | | | | | | | | | | | | | | | | |
Futures contracts | | $ | — | | | $ | — | | | $ | — | | | $ | — | | | $ | 1,598,116 | | | $ | — | | | $ | 1,598,116 | |
Forward foreign currency exchange contracts | | | — | | | | — | | | | — | | | | 1,418,436 | | | | — | | | | — | | | | 1,418,436 | |
Options purchased(a) | | | — | | | | — | | | | 217,069 | | | | (36,725 | ) | | | (18,691 | ) | | | — | | | | 161,653 | |
Options written | | | — | | | | — | | | | (33,671 | ) | | | 13,545 | | | | 6,043 | | | | — | | | | (14,083 | ) |
Swaps | | | — | | | | (591,485 | ) | | | (11,698 | ) | | | — | | | | (176,923 | ) | | | — | | | | (780,106 | ) |
| | | | | | | | | | | | | | | | | | | | | | | | | | | | |
| | | | | | | |
| | $ | — | | | $ | (591,485 | ) | | $ | 171,700 | | | $ | 1,395,256 | | | $ | 1,408,545 | | | $ | — | | | $ | 2,384,016 | |
| | | | | | | | | | | | | | | | | | | | | | | | | | | | |
| | | | | | | |
| Net Change in Unrealized Appreciation (Depreciation) on: | | | | | | | | | | | | | | | | | | | | | |
Futures contracts | | $ | — | | | $ | — | | | $ | — | | | $ | — | | | $ | 89,427 | | | $ | — | | | $ | 89,427 | |
Forward foreign currency exchange contracts | | | — | | | | — | | | | — | | | | 182,486 | | | | — | | | | — | | | | 182,486 | |
Options purchased(b) | | | — | | | | — | | | | 21,514 | | | | — | | | | (2,856 | ) | | | — | | | | 18,658 | |
Options written | | | — | | | | — | | | | (8,150 | ) | | | — | | | | (2,980 | ) | | | — | | | | (11,130 | ) |
Swaps | | | — | | | | (242,757 | ) | | | (30,159 | ) | | | — | | | | (233,844 | ) | | | — | | | | (506,760 | ) |
| | | | | | | | | | | | | | | | | | | | | | | | | | | | |
| | | | | | | |
| | $ | — | | | $ | (242,757 | ) | | $ | (16,795 | ) | | $ | 182,486 | | | $ | (150,253 | ) | | $ | — | | | $ | (227,319 | ) |
| | | | | | | | | | | | | | | | | | | | | | | | | | | | |
| | (a) | Options purchased are included in net realized gain (loss) from investments — unaffiliated. | |
| | (b) | Options purchased are included in net change in unrealized appreciation (depreciation) on investments — unaffiliated. | |
Average Quarterly Balances of Outstanding Derivative Financial Instruments
| | | | |
Futures contracts: | | | | |
Average notional value of contracts — long | | $ | 22,146,945 | |
Average notional value of contracts — short | | $ | 28,317,550 | |
Forward foreign currency exchange contracts: | | | | |
Average amounts purchased — in USD | | $ | 17,845,135 | |
Average amounts sold — in USD | | $ | 4,724,286 | |
Options: | | | | |
Average value of option contracts purchased | | $ | 36,529 | |
Average value of option contracts written | | $ | 13,880 | |
Average notional value of swaption contracts purchased | | $ | 344,662 | |
Average notional value of swaption contracts written | | $ | — | (a) |
| | |
| 42 | | 2 0 2 2 B L A C K R O C K A N N U A L R E P O R T T O S H A R E H O L D E R S |
| | |
Schedule of Investments (continued) December 31, 2022 | | BlackRock Multi-Sector Opportunities Trust II (MSO2) |
Average Quarterly Balances of Outstanding Derivative Financial Instruments (continued)
| | | | |
Credit default swaps: | | | | |
Average notional value — sell protection | | $ | 20,858,530 | |
Interest rate swaps: | | | | |
Average notional value — pays fixed rate | | $ | 2,299,256 | |
Average notional value — receives fixed rate | | $ | 5,733,860 | |
Total return swaps: | | | | |
Average notional value | | $ | 1,460,390 | |
| | (a) | Derivative not held at any quarter-end. The risk exposure table serves as an indicator of activity during the period. | |
For more information about the Trust’s investment risks regarding derivative financial instruments, refer to the Notes to Financial Statements.
Derivative Financial Instruments — Offsetting as of Period End
The Trust’s derivative assets and liabilities (by type) were as follows:
| | | | | | | | |
| | | Assets | | | Liabilities | |
Derivative Financial Instruments | | | | | | | | |
Futures contracts | | $ | 67,897 | | | $ | 56,097 | |
Forward foreign currency exchange contracts | | | 61,701 | | | | 46,293 | |
Swaps — centrally cleared | | | — | | | | 6,468 | |
Swaps — OTC(a) | | | 28,340 | | | | 816,495 | |
| | | | | | | | |
Total derivative assets and liabilities in the Statements of Assets and Liabilities | | | 157,938 | | | | 925,353 | |
| | | | | | | | |
Derivatives not subject to a Master Netting Agreement or similar agreement (“MNA”) | | | (67,897 | ) | | | (62,565 | ) |
| | | | | | | | |
| | |
Total derivative assets and liabilities subject to an MNA | | $ | 90,041 | | | $ | 862,788 | |
| | | | | | | | |
| | (a) | Includes unrealized appreciation (depreciation) on OTC swaps and swap premiums (paid/received) in the Statements of Assets and Liabilities. | |
The following table presents the Trust’s derivative assets and liabilities by counterparty net of amounts available for offset under an MNA and net of the related collateral received (and pledged) by the Trust:
| | | | | | | | | | | | | | | | | | | | |
| Counterparty | | Derivative
Assets
Subject to
an MNA by
Counterparty | | | Derivatives
Available for Offset(a) | | | Non-Cash
Collateral
Received | | | Cash
Collateral
Received | | | Net
Amount of
Derivative Assets(b)(c) | |
Bank of America N.A | | $ | 520 | | | $ | (520 | ) | | $ | — | | | $ | — | | | $ | — | |
BNP Paribas SA | | | 205 | | | | (205 | ) | | | — | | | | — | | | | — | |
Deutsche Bank AG | | | 2,720 | | | | (2,720 | ) | | | — | | | | — | | | | — | |
Goldman Sachs International | | | 23,987 | | | | (23,987 | ) | | | — | | | | — | | | | — | |
JPMorgan Chase Bank N.A | | | 381 | | | | (381 | ) | | | — | | | | — | | | | — | |
Morgan Stanley & Co. International PLC | | | 29,565 | | | | (29,565 | ) | | | — | | | | — | | | | — | |
UBS AG | | | 32,663 | | | | (11,282 | ) | | | — | | | | — | | | | 21,381 | |
| | | | | | | | | | | | | | | | | | | | |
| | | | | |
| | $ | 90,041 | | | $ | (68,660 | ) | | $ | — | | | $ | — | | | $ | 21,381 | |
| | | | | | | | | | | | | | | | | | | | |
| | |
S C H E D U L E O F I N V E S T M E N T S | | 43 |
| | |
Schedule of Investments (continued) December 31, 2022 | | BlackRock Multi-Sector Opportunities Trust II (MSO2) |
| | | | | | | | | | | | | | | | | | | | |
| Counterparty | | Derivative
Liabilities
Subject to
an MNA by
Counterparty | | | Derivatives
Available for Offset(a) | | | Non-Cash
Collateral
Pledged | | | Cash
Collateral Pledged(d) | | | Net Amount
of Derivative Liabilities(b)(e) | |
Bank of America N.A. | | $ | 726 | | | $ | (520 | ) | | $ | — | | | $ | — | | | $ | 206 | |
BNP Paribas SA | | | 44,421 | | | | (205 | ) | | | — | | | | — | | | | 44,216 | |
Deutsche Bank AG | | | 12,029 | | | | (2,720 | ) | | | — | | | | — | | | | 9,309 | |
Goldman Sachs International | | | 219,232 | | | | (23,987 | ) | | | — | | | | — | | | | 195,245 | |
JPMorgan Chase Bank N.A. | | | 7,371 | | | | (381 | ) | | | — | | | | — | | | | 6,990 | |
Morgan Stanley & Co. International PLC | | | 567,727 | | | | (29,565 | ) | | | — | | | | (538,162 | ) | | | — | |
UBS AG | | | 11,282 | | | | (11,282 | ) | | | — | | | | — | | | | — | |
| | | | | | | | | | | | | | | | | | | | |
| | $ | 862,788 | | | $ | (68,660 | ) | | $ | — | | | $ | (538,162 | ) | | $ | 255,966 | |
| | | | | | | | | | | | | | | | | | | | |
| | (a) | The amount of derivatives available for offset is limited to the amount of derivative asset and/or liabilities that are subject to an MNA. | |
| | (b) | Net amount may also include forward foreign currency exchange contracts that are not required to be collateralized. | |
| | (c) | Net amount represents the net amount receivable from the counterparty in the event of default. | |
| | (d) | Excess of collateral received/pledged, if any, from the individual counterparty is not shown for financial reporting purposes. (e) Net amount represents the net amount payable due to counterparty in the event of default. | |
Fair Value Hierarchy as of Period End
Various inputs are used in determining the fair value of financial instruments. For a description of the input levels and information about the Trust’s policy regarding valuation of financial instruments, refer to the Notes to Financial Statements.
The following table summarizes the Trust’s financial instruments categorized in the fair value hierarchy. The breakdown of the Trust’s financial instruments into major categories is disclosed in the Schedule of Investments above.
| | | | | | | | | | | | | | | | |
| | | Level 1 | | | Level 2 | | | Level 3 | | | Total | |
Assets | | | | | | | | | | | | | | | | |
Investments | | | | | | | | | | | | | | | | |
Long-Term Investments | | | | | | | | | | | | | | | | |
Asset-Backed Securities | | $ | — | | | $ | 20,586,731 | | | $ | 191,535 | | | $ | 20,778,266 | |
Common Stocks | | | 402,199 | | | | — | | | | — | | | | 402,199 | |
Corporate Bonds | | | — | | | | 39,799,639 | | | | 1,155,090 | | | | 40,954,729 | |
Floating Rate Loan Interests | | | — | | | | 1,879,329 | | | | 3,616,469 | | | | 5,495,798 | |
Foreign Agency Obligations | | | — | | | | 7,641,105 | | | | — | | | | 7,641,105 | |
Municipal Bonds | | | — | | | | 109,890 | | | | — | | | | 109,890 | |
Non-Agency Mortgage-Backed Securities | | | — | | | | 12,262,993 | | | | 364,218 | | | | 12,627,211 | |
Preferred Securities | | | | | | | | | | | | | | | | |
Capital Trusts | | | — | | | | 4,390,421 | | | | — | | | | 4,390,421 | |
U.S. Government Sponsored Agency Securities | | | — | | | | 5,231,760 | | | | — | | | | 5,231,760 | |
Short-Term Securities | | | | | | | | | | | | | | | | |
Money Market Funds | | | 5,876,317 | | | | — | | | | — | | | | 5,876,317 | |
Liabilities | | | | | | | | | | | | | | | | |
Investments | | | | | | | | | | | | | | | | |
TBA Sale Commitments | | | — | | | | (2,163,593 | ) | | | — | | | | (2,163,593 | ) |
| | | | | | | | | | | | �� | | | | |
| | $ | 6,278,516 | | | $ | 89,738,275 | | | $ | 5,327,312 | | | $ | 101,344,103 | |
| | | | | | | | | | | | | | | | |
Derivative Financial Instruments(a) | | | | | | | | | | | | | | | | |
Assets | | | | | | | | | | | | | | | | |
Credit Contracts | | $ | — | | | $ | 360,344 | | | $ | — | | | $ | 360,344 | |
Foreign Currency Exchange Contracts | | | — | | | | 61,701 | | | | — | | | | 61,701 | |
Interest Rate Contracts | | | 215,628 | | | | 20,027 | | | | — | | | | 235,655 | |
Liabilities | | | | | | | | | | | | | | | | |
Credit Contracts | | | — | | | | (176,964 | ) | | | — | | | | (176,964 | ) |
Equity Contracts | | | — | | | | (30,159 | ) | | | — | | | | (30,159 | ) |
Foreign Currency Exchange Contracts | | | — | | | | (46,293 | ) | | | — | | | | (46,293 | ) |
Interest Rate Contracts | | | (161,114 | ) | | | (226,615 | ) | | | — | | | | (387,729 | ) |
| | | | | | | | | | | | | | | | |
| | $ | 54,514 | | | $ | (37,959 | ) | | $ | — | | | $ | 16,555 | |
| | | | | | | | | | | | | | | | |
| | (a) | Derivative financial instruments are swaps, futures contracts and forward foreign currency exchange contracts. Swaps, futures contracts and forward foreign currency exchange contracts are valued at the unrealized appreciation (depreciation) on the instrument. | |
| | |
| 44 | | 2 0 2 2 B L A C K R O C K A N N U A L R E P O R T T O S H A R E H O L D E R S |
| | |
Schedule of Investments (continued) December 31, 2022 | | BlackRock Multi-Sector Opportunities Trust II (MSO2) |
The Trust may hold assets and/or liabilities in which the fair value approximates the carrying amount or face value, including accrued interest, for financial statement purposes. As of period end, reverse repurchase agreements of $14,954,641 are categorized as Level 2 within the fair value hierarchy.
A reconciliation of Level 3 financial instruments is presented when the Trust had a significant amount of Level 3 investments and derivative financial instruments at the beginning and/or end of the year in relation to net assets. The following table is a reconciliation of Level 3 investments for which significant unobservable inputs were used in determining fair value:
| | | | | | | | | | | | | | | | | | | | |
| | | Asset-
Backed
Securities | | | Corporate
Bonds | | | Floating
Rate Loan
Interests | | | Non-Agency
Mortgage
-Backed
Securities | | | Total | |
Assets | | | | | | | | | | | | | | | | | | | | |
Opening balance, as of December 31, 2021 | | $ | 65,038 | | | $ | 1,005,613 | | | $ | 3,280,642 | | | $ | 786,988 | | | $ | 5,138,281 | |
Transfers into Level 3 | | | 297,716 | | | | — | | | | — | | | | 472,188 | | | | 769,904 | |
Transfers out of Level 3 | | | — | | | | — | | | | — | | | | (491,044 | ) | | | (491,044 | ) |
Accrued discounts/premiums | | | (153 | ) | | | — | | | | 15,808 | | | | 22 | | | | 15,677 | |
Net realized gain (loss) | | | (232,611 | ) | | | (5,632 | ) | | | 1,984 | | | | 24,868 | | | | (211,391 | ) |
Net change in unrealized appreciation (depreciation)(a)(b) | | | 172,052 | | | | (88,938 | ) | | | (139,988 | ) | | | 20,421 | | | | (36,453 | ) |
Purchases | | | — | | | | 361,272 | | | | 1,297,042 | | | | — | | | | 1,658,314 | |
Sales | | | (110,507 | ) | | | (117,225 | ) | | | (839,019 | ) | | | (449,225 | ) | | | (1,515,976 | ) |
| | | | | | | | | | | | | | | | | | | | |
Closing balance, as of December 31, 2022 | | $ | 191,535 | | | $ | 1,155,090 | | | $ | 3,616,469 | | | $ | 364,218 | | | $ | 5,327,312 | |
| | | | | | | | | | | | | | | | | | | | |
Net change in unrealized appreciation (depreciation) on investments still held at December 31, 2022(b) | | $ | (50,160 | ) | | $ | (89,634 | ) | | $ | (140,456 | ) | | $ | 20,421 | | | $ | (259,829 | ) |
| | | | | | | | | | | | | | | | | | | | |
| | (a) | Included in the related net change in unrealized appreciation (depreciation) in the Statements of Operations. | |
| | (b) | Any difference between net change in unrealized appreciation (depreciation) and net change in unrealized appreciation (depreciation) on investments still held at December 31, 2022 is generally due to investments no longer held or categorized as Level 3 at period end. | |
The following table summarizes the valuation approaches used and unobservable inputs utilized by the BlackRock Valuation Committee (the “Valuation Committee”) to determine the value of certain of the Trust’s Level 3 financial instruments as of period end. The table does not include Level 3 financial instruments with values based upon unadjusted third-party pricing information in the amount of $556,551. A significant change in third party information could result in a significantly lower or higher value of such Level 3 financial instruments.
| | | | | | | | | | | | | | | | | | | | |
| | | Value | | | Valuation
Approach | | | Unobservable
Inputs | | | Range of
Unobservable
Inputs Utilized(a) | | | Weighted
Average of
Unobservable
Inputs Based
on Fair Value | |
Assets | | | | | | | | | | | | | | | | | | | | |
Corporate Bonds | | $ | 1,155,090 | | | | Income | | | | Discount Rate | | | | 10% - 10% | | | | 10 | % |
| | | | | |
Floating Rate Loan Interests | | | 3,615,671 | | | | Income | | | | Discount Rate | | | | 10% - 17% | | | | 14 | % |
| | | | | | | | | | | | | | | | | | | | |
| | | | | |
| | $ | 4,770,761 | | | | | | | | | | | | | | | | | |
| | | | | | | | | | | | | | | | | | | | |
| | (a) | A significant change in unobservable input would have resulted in a correlated (inverse) significant change to value. | |
See notes to financial statements.
| | |
S C H E D U L E O F I N V E S T M E N T S | | 45 |
Statement of Assets and Liabilities
December 31, 2022
| | | | | | | | |
| | | BlackRock Multi-Sector
Opportunities Trust | | | BlackRock Multi-Sector
Opportunities Trust II | |
| | |
ASSETS | | | | | | | | |
Investments, at value — unaffiliated(a) | | $ | 212,552,687 | | | $ | 97,631,379 | |
Investments, at value — affiliated(b) | | | 10,499,528 | | | | 5,876,317 | |
Cash | | | 3,986 | | | | 63,453 | |
Cash pledged: | | | | | | | | |
Collateral — OTC derivatives | | | 2,672,000 | | | | 700,000 | |
Futures contracts | | | 1,016,000 | | | | 392,000 | |
Centrally cleared swaps | | | 2,209,000 | | | | 876,000 | |
Foreign currency, at value(c) | | | 690,206 | | | | 263,675 | |
Receivables: | | | | | | | | |
Investments sold | | | 494,402 | | | | 4,390 | |
Reverse repurchase agreements | | | — | | | | 123,975 | |
TBA sale commitments | | | 6,377,550 | | | | 2,163,593 | |
Capital shares sold | | | — | | | | 133,655 | |
Dividends — affiliated | | | 35,162 | | | | 15,123 | |
Interest — unaffiliated | | | 3,100,861 | | | | 1,419,756 | |
Due from broker | | | — | | | | 50,000 | |
Variation margin on futures contracts | | | 286,602 | | | | 67,897 | |
Swap premiums paid | | | 646 | | | | 536 | |
Unrealized appreciation on: | | | | | | | | |
Forward foreign currency exchange contracts | | | 132,795 | | | | 61,701 | |
OTC swaps | | | 95,711 | | | | 27,804 | |
Prepaid expenses | | | 1,765 | | | | 705 | |
| | | | | | | | |
Total assets | | | 240,168,901 | | | | 109,871,959 | |
| | | | | | | | |
| | |
LIABILITIES | | | | | | | | |
Due to broker | | | 310,000 | | | | 66,969 | |
TBA sale commitments, at value(d) | | | 6,343,660 | | | | 2,163,593 | |
Reverse repurchase agreements, at value | | | 2,220,185 | | | | 14,954,641 | |
Payables: | | | | | | | | |
Investments purchased | | | 12,662,445 | | | | 4,295,752 | |
Reverse repurchase agreements | | | 796,197 | | | | 197,730 | |
Accounting services fees | | | 19,428 | | | | 11,730 | |
Custodian fees | | | 15,940 | | | | 12,468 | |
Interest expense | | | 9,837 | | | | — | |
Investment advisory fees | | | 235,215 | | | | 86,843 | |
Trustees’ and Officer’s fees | | | 745 | | | | 306 | |
Other accrued expenses | | | 68,809 | | | | 36,974 | |
Principal payups | | | 51,027 | | | | 44,101 | |
Professional fees | | | 103,269 | | | | 90,879 | |
Distribution fees | | | — | | | | 22,324 | |
Transfer agent fees | | | 26,424 | | | | 1,140 | |
Variation margin on futures contracts | | | 145,164 | | | | 56,097 | |
Variation margin on centrally cleared swaps | | | 37,814 | | | | 6,468 | |
Swap premiums received | | | 2,346,056 | | | | 609,372 | |
Unrealized depreciation on: | | | | | | | | |
Forward foreign currency exchange contracts | | | 111,914 | | | | 46,293 | |
OTC swaps | | | 280,897 | | | | 207,123 | |
| | | | | | | | |
Total liabilities | | | 25,785,026 | | | | 22,910,803 | |
| | | | | | | | |
NET ASSETS | | $ | 214,383,875 | | | $ | 86,961,156 | |
| | | | | | | | |
| | |
| 46 | | 2 0 2 2 B L A C K R O C K A N N U A L R E P O R T T O S H A R E H O L D E R S |
Statement of Assets and Liabilities (continued)
December 31, 2022
| | | | | | | | |
| | | BlackRock Multi-Sector
Opportunities Trust | | | BlackRock Multi-Sector
Opportunities Trust II | |
| | |
NET ASSETS CONSIST OF | | | | | | | | |
Paid-in capital(e)(f)(g) | | $ | 328,908,651 | | | $ | 126,135,987 | |
Accumulated loss | | | (114,524,776 | ) | | | (39,174,831 | ) |
| | | | | | | | |
| | |
NET ASSETS | | $ | 214,383,875 | | | $ | 86,961,156 | |
| | | | | | | | |
| | |
Net asset value | | $ | 66.67 | | | $ | 69.62 | |
| | | | | | | | |
| | |
(a) Investments, at cost — unaffiliated | | $ | 253,276,879 | | | $ | 110,482,860 | |
(b) Investments, at cost — affiliated | | $ | 10,630,431 | | | $ | 5,876,317 | |
(c) Foreign currency, at cost | | $ | 683,158 | | | $ | 260,799 | |
(d) Proceeds from TBA sale commitments | | $ | 6,377,550 | | | $ | 2,163,593 | |
(e) Shares outstanding | | | 3,215,627 | | | | 1,249,010 | |
(f) Shares authorized | | | Unlimited | | | | Unlimited | |
(g) Par value | | $ | 0.001 | | | $ | 0.001 | |
See notes to financial statements.
| | |
F I N A N C I A L S T A T E M E N T S | | 47 |
Statement of Operations
Year Ended December 31, 2022
| | | | | | | | |
| | | BlackRock Multi-Sector
Opportunities
Trust | | | BlackRock
Multi-Sector
Opportunities
Trust II | |
| | |
INVESTMENT INCOME | | | | | | | | |
Dividends — unaffiliated | | $ | 25,667 | | | $ | 47,275 | |
Dividends — affiliated | | | 318,168 | | | | 124,656 | |
Interest — unaffiliated | | | 17,499,360 | | | | 7,836,292 | |
Other income — unaffiliated | | | 110,650 | | | | 44,765 | |
Foreign taxes withheld | | | (212 | ) | | | (173 | ) |
| | | | | | | | |
| | |
Total investment income | | | 17,953,633 | | | | 8,052,815 | |
| | | | | | | | |
| | |
EXPENSES | | | | | | | | |
Investment advisory | | | 3,740,048 | | | | 1,661,637 | |
Professional | | | 142,843 | | | | 129,323 | |
Transfer agent | | | 108,514 | | | | 11,565 | |
Accounting services | | | 58,641 | | | | 35,735 | |
Custodian | | | 50,249 | | | | 40,451 | |
Printing and postage | | | 33,702 | | | | 27,018 | |
Trustees and Officer | | | 14,000 | | | | 6,528 | |
Service and distribution | | | — | | | | 255,786 | |
Miscellaneous | | | 36,134 | | | | 25,600 | |
| | | | | | | | |
| | |
Total expenses excluding interest expense | | | 4,184,131 | | | | 2,193,643 | |
Interest expense | | | 614,300 | | | | 472,210 | |
| | | | | | | | |
| | |
Total expenses | | | 4,798,431 | | | | 2,665,853 | |
Less: | | | | | | | | |
Fees waived and/or reimbursed by the Manager | | | (33,703 | ) | | | (347,062 | ) |
| | | | | | | | |
| | |
Total expenses after fees waived and/or reimbursed | | | 4,764,728 | | | | 2,318,791 | |
| | | | | | | | |
| | |
Net investment income | | | 13,188,905 | | | | 5,734,024 | |
| | | | | | | | |
| | |
REALIZED AND UNREALIZED GAIN (LOSS) | | | | | | | | |
Net realized gain (loss) from: | | | | | | | | |
Investments — unaffiliated | | | (35,004,152 | ) | | | (13,797,661 | ) |
Investments — affiliated | | | 238,144 | | | | 1,339 | |
Forward foreign currency exchange contracts | | | 3,840,509 | | | | 1,418,436 | |
Foreign currency transactions | | | (158,546 | ) | | | (22,471 | ) |
Futures contracts | | | 3,416,439 | | | | 1,598,116 | |
Options written | | | (27,085 | ) | | | (14,083 | ) |
Swaps | | | (1,647,876 | ) | | | (780,106 | ) |
| | | | | | | | |
| | |
| | | (29,342,567 | ) | | | (11,596,430 | ) |
| | | | | | | | |
Net change in unrealized appreciation (depreciation) on: | | | | | | | | |
Investments — unaffiliated | | | (23,152,775 | ) | | | (10,024,156 | ) |
Investments — affiliated | | | (350,474 | ) | | | (193,888 | )�� |
Forward foreign currency exchange contracts | | | 264,323 | | | | 182,486 | |
Foreign currency translations | | | 27,468 | | | | 10,853 | |
Futures contracts | | | 216,957 | | | | 89,427 | |
Options written | | | (29,309 | ) | | | (11,130 | ) |
Swaps | | | (2,304,962 | ) | | | (506,760 | ) |
Unfunded floating rate loan interests | | | — | | | | (558 | ) |
| | | | | | | | |
| | |
| | | (25,328,772 | ) | | | (10,453,726 | ) |
| | | | | | | | |
| | |
Net realized and unrealized loss | | | (54,671,339 | ) | | | (22,050,156 | ) |
| | | | | | | | |
| | |
NET DECREASE IN NET ASSETS RESULTING FROM OPERATIONS | | $ | (41,482,434 | ) | | $ | (16,316,132 | ) |
| | | | | | | | |
See notes to financial statements.
| | |
| 48 | | 2 0 2 2 B L A C K R O C K A N N U A L R E P O R T T O S H A R E H O L D E R S |
Statement of Changes in Net Assets
| | | | | | | | | | | | | | | | |
| | | BlackRock Multi-Sector
Opportunities Trust | | | BlackRock Multi-Sector
Opportunities Trust II | |
| | | | |
| | | Year Ended
12/31/22 | | | Year Ended
12/31/21 | | | Year Ended
12/31/22 | | | Year Ended
12/31/21 | |
| |
| | | | |
INCREASE (DECREASE) IN NET ASSETS | | | | | | | | | | | | | | | | |
| | | | |
OPERATIONS | | | | | | | | | | | | | | | | |
Net investment income | | $ | 13,188,905 | | | $ | 19,949,959 | | | $ | 5,734,024 | | | $ | 7,053,350 | |
Net realized gain (loss) | | | (29,342,567 | ) | | | 7,665,337 | | | | (11,596,430 | ) | | | 2,675,616 | |
Net change in unrealized appreciation (depreciation) | | | (25,328,772 | ) | | | (15,180,207 | ) | | | (10,453,726 | ) | | | (4,590,221 | ) |
| | | | | | | | | | | | | | | | |
| | | | |
Net increase (decrease) in net assets resulting from operations | | | (41,482,434 | ) | | | 12,435,089 | | | | (16,316,132 | ) | | | 5,138,745 | |
| | | | | | | | | | | | | | | | |
| | | | |
DISTRIBUTIONS TO SHAREHOLDERS(a) | | | | | | | | | | | | | | | | |
From net investment income | | | (19,467,423 | ) | | | (24,880,519 | ) | | | (8,272,966 | ) | | | (9,296,750 | ) |
Return of capital | | | (1,175,297 | ) | | | — | | | | — | | | | (108,369 | ) |
| | | | | | | | | | | | | | | | |
| | | | |
Decrease in net assets resulting from distributions to shareholders | | | (20,642,720 | ) | | | (24,880,519 | ) | | | (8,272,966 | ) | | | (9,405,119 | ) |
| | | | | | | | | | | | | | | | |
| | | | |
CAPITAL SHARE TRANSACTIONS | | | | | | | | | | | | | | | | |
Reinvestment of distributions | | | 2,558,006 | | | | 3,875,358 | | | | 4,364,460 | | | | 4,434,742 | |
Repurchase of shares resulting from tender offers | | | (42,632,881 | ) | | | (35,196,527 | ) | | | (21,147,382 | ) | | | (13,991,330 | ) |
| | | | | | | | | | | | | | | | |
| | | | |
Net decrease in net assets derived from capital share transactions | | | (40,074,875 | ) | | | (31,321,169 | ) | | | (16,782,922 | ) | | | (9,556,588 | ) |
| | | | | | | | | | | | | | | | |
| | | | |
NET ASSETS | | | | | | | | | | | | | | | | |
Total decrease in net assets | | | (102,200,029 | ) | | | (43,766,599 | ) | | | (41,372,020 | ) | | | (13,822,962 | ) |
Beginning of year | | | 316,583,904 | | | | 360,350,503 | | | | 128,333,176 | | | | 142,156,138 | |
| | | | | | | | | | | | | | | | |
End of year | | $ | 214,383,875 | | | $ | 316,583,904 | | | $ | 86,961,156 | | | $ | 128,333,176 | |
| | | | | | | | | | | | | | | | |
| (a) | Distributions for annual periods determined in accordance with U.S. federal income tax regulations. |
See notes to financial statements.
| | |
F I N A N C I A L S T A T E M E N T S | | 49 |
Statement of Cash Flows
Year Ended December 31, 2022
| | | | | | | | |
| | | BlackRock Multi-Sector
Opportunities Trust | | | BlackRock Multi-Sector
Opportunities
Trust II | |
| |
| | |
CASH PROVIDED BY (USED FOR) OPERATING ACTIVITIES | | | | | | | | |
Net decrease in net assets resulting from operations | | $ | (41,482,434 | ) | | $ | (16,316,132 | ) |
Adjustments to reconcile net decrease in net assets resulting from operations to net cash provided by operating activities: | | | | | | | | |
Proceeds from sales of long-term investments and principal paydowns/payups | | | 200,665,315 | | | | 86,398,282 | |
Purchases of long-term investments | | | (95,813,539 | ) | | | (39,082,036 | ) |
Net proceeds from sales (purchases) of short-term securities | | | 15,318,409 | | | | (1,127,693 | ) |
Amortization of premium and accretion of discount on investments and other fees | | | 185,797 | | | | (118,529 | ) |
Paid-in-kind income | | | (70,376 | ) | | | (30,267 | ) |
Premiums paid on closing options written | | | (511,405 | ) | | | (206,819 | ) |
Premiums received from options written | | | 488,635 | | | | 194,753 | |
Net realized loss on investments and options written | | | 34,793,106 | | | | 13,810,405 | |
Net unrealized depreciation on investments, options written, swaps, foreign currency translations and unfunded floating rate loan interests | | | 23,612,160 | | | | 9,322,150 | |
(Increase) Decrease in Assets | | | | | | | | |
Receivables | | | | | | | | |
Dividends — affiliated | | | (35,039 | ) | | | (15,105 | ) |
From the Manager | | | 1,797 | | | | — | |
Interest — unaffiliated | | | 1,070,947 | | | | 406,533 | |
Variation margin on futures contracts | | | (271,602 | ) | | | (61,834 | ) |
Variation margin on centrally cleared swaps | | | 37,057 | | | | 14,868 | |
Swap premiums paid | | | 652 | | | | (536 | ) |
Prepaid expenses | | | 892 | | | | 363 | |
Increase (Decrease) in Liabilities | | | | | | | | |
Due to broker | | | 310,000 | | | | 66,969 | |
Payables | | | | | | | | |
Accounting services fees | | | (4,803 | ) | | | (2,073 | ) |
Custodian fees | | | (8,012 | ) | | | 918 | |
Interest expense | | | (179,228 | ) | | | (73,830 | ) |
Investment advisory fees | | | (186,321 | ) | | | (94,973 | ) |
Trustees’ and Officer’s fees | | | (920 | ) | | | (352 | ) |
Other accrued expenses | | | (9,261 | ) | | | (267 | ) |
Professional fees | | | 9,650 | | | | 13,053 | |
Distribution fees | | | — | | | | (8,678 | ) |
Transfer agent fees | | | 10,716 | | | | (3,053 | ) |
Variation margin on futures contracts | | | 90,299 | | | | 35,484 | |
Variation margin on centrally cleared swaps | | | 37,814 | | | | 6,468 | |
Swap premiums received | | | (1,119,167 | ) | | | 581,635 | |
Other liabilities | | | (38,893 | ) | | | — | |
| | | | | | | | |
Net cash provided by operating activities | | | 136,902,246 | | | | 53,709,704 | |
| | | | | | | | |
| | |
CASH PROVIDED BY (USED FOR) FINANCING ACTIVITIES | | | | | | | | |
Cash dividends paid to shareholders | | | (18,084,714 | ) | | | (3,908,506 | ) |
Net payments on redemption of capital shares including change in redemptions payable | | | (42,632,881 | ) | | | (21,147,382 | ) |
Proceeds from issuance of capital shares | | | — | | | | (133,655 | ) |
Net borrowing of reverse repurchase agreements | | | (79,137,369 | ) | | | (29,720,687 | ) |
| | | | | | | | |
Net cash used for financing activities | | | (139,854,964 | ) | | | (54,910,230 | ) |
| | | | | | | | |
| | |
CASH IMPACT FROM FOREIGN EXCHANGE FLUCTUATIONS | | | | | | | | |
Cash impact from foreign exchange fluctuations | | | 2,686 | | | | 1,106 | |
| | | | | | | | |
| | |
| 50 | | 2 0 2 2 B L A C K R O C K A N N U A L R E P O R T T O S H A R E H O L D E R S |
Statement of Cash Flows (continued)
Year Ended December 31, 2022
| | | | | | | | |
| | | BlackRock Multi-Sector
Opportunities
Trust | | | BlackRock
Multi-Sector
Opportunities
Trust II | |
| |
| | |
CASH AND FOREIGN CURRENCY | | | | | | | | |
Net decrease in restricted and unrestricted cash and foreign currency | | $ | (2,950,032 | ) | | $ | (1,199,420 | ) |
Restricted and unrestricted cash and foreign currency at beginning of year | | | 9,541,224 | | | | 3,544,548 | |
| | | | | | | | |
Restricted and unrestricted cash and foreign currency at end of year | | $ | 6,591,192 | | | $ | 2,345,128 | |
| | | | | | | | |
| | |
SUPPLEMENTAL DISCLOSURE OF CASH FLOW INFORMATION | | | | | | | | |
Cash paid during the year for interest expense | | $ | 793,528 | | | $ | 546,040 | |
| | | | | | | | |
| | |
NON-CASH FINANCING ACTIVITIES | | | | | | | | |
Reinvestment of distributions | | $ | 2,558,006 | | | $ | 4,364,460 | |
| | | | | | | | |
| | |
RECONCILIATION OF RESTRICTED AND UNRESTRICTED CASH AND FOREIGN CURRENCY AT THE END OF YEAR TO THE STATEMENTS OF ASSETS AND LIABILITIES | | | | | | | | |
Cash | | $ | 3,986 | | | $ | 63,453 | |
Cash pledged | | | | | | | | |
Collateral — OTC derivatives | | | 2,672,000 | | | | 700,000 | |
Futures contracts | | | 1,016,000 | | | | 392,000 | |
Centrally cleared swaps | | | 2,209,000 | | | | 876,000 | |
Foreign currency at value | | | 690,206 | | | | 263,675 | |
Due from broker | | | — | | | | 50,000 | |
| | | | | | | | |
| | $ | 6,591,192 | | | $ | 2,345,128 | |
| | | | | | | | |
See notes to financial statements.
| | |
F I N A N C I A L S T A T E M E N T S | | 51 |
Financial Highlights
(For a share outstanding throughout each period)
| | | | | | | | | | | | | | | | | | | | |
| | | BlackRock Multi-Sector Opportunities Trust | |
| | | Year
Ended
12/31/22 | | | Year
Ended
12/31/21 | | | Year
Ended
12/31/20 | | | Year
Ended
12/31/19 | | | Period from 02/23/18(a) to 12/31/18 | |
| | | | | |
Net asset value, beginning of period | | $ | 84.34 | | | $ | 87.75 | | | $ | 98.42 | | | $ | 90.55 | | | $ | 100.00 | |
| | | | | | | | | | | | | | | | | | | | |
| | | | | |
Net investment income(b) | | | 3.82 | | | | 5.09 | | | | 5.41 | | | | 5.99 | | | | 4.29 | |
Net realized and unrealized gain (loss) | | | (15.41 | ) | | | (2.06 | ) | | | (8.93 | ) | | | 9.38 | | | | (8.11 | ) |
| | | | | | | | | | | | | | | | | | | | |
| | | | | |
Net increase (decrease) from investment operations | | | (11.59 | ) | | | 3.03 | | | | (3.52 | ) | | | 15.37 | | | | (3.82 | ) |
| | | | | | | | | | | | | | | | | | | | |
| | | | | |
Distributions(c) | | | | | | | | | | | | | | | | | | | | |
From net investment income | | | (5.74 | ) | | | (6.44 | ) | | | (5.86 | ) | | | (7.32 | ) | | | (4.19 | ) |
From net realized gain | | | — | | | | — | | | | — | | | | (0.18 | ) | | | (1.44 | ) |
Return of capital | | | (0.34 | ) | | | — | | | | (1.29 | ) | | | — | | | | — | |
Total distributions | | | (6.08 | ) | | | (6.44 | ) | | | (7.15 | ) | | | (7.50 | ) | | | (5.63 | ) |
| | | | | | | | | | | | | | | | | | | | |
| | | | | |
Net asset value, end of period | | $ | 66.67 | | | $ | 84.34 | | | $ | 87.75 | | | $ | 98.42 | | | $ | 90.55 | |
| | | | | | | | | | | | | | | | | | | | |
| | | | | |
Total Return(d) | | | | | | | | | | | | | | | | | | | | |
Based on net asset value | | | (13.82 | )% | | | 3.40 | % | | | (2.50 | )% | | | 17.35 | % | | | (3.95 | )%(e)(f) |
| | | | | | | | | | | | | | | | | | | | |
| | | | | |
Ratios to Average Net Assets(g) | | | | | | | | | | | | | | | | | | | | |
Total expenses | | | 1.89 | % | | | 1.93 | % | | | 2.29 | % | | | 2.67 | % | | | 1.78 | %(h)(i) |
| | | | | | | | | | | | | | | | | | | | |
| | | | | |
Total expenses after fees waived and/or reimbursed | | | 1.88 | % | | | 1.92 | % | | | 2.28 | % | | | 2.67 | % | | | 1.77 | %(h) |
| | | | | | | | | | | | | | | | | | | | |
| | | | | |
Total expenses after fees waived and/or reimbursed and excluding interest expense, fees and amortization of offering costs | | | 1.64 | % | | | 1.76 | % | | | 1.83 | % | | | 1.75 | % | | | 1.50 | %(h) |
| | | | | | | | | | | | | | | | | | | | |
| | | | | |
Net investment income | | | 5.20 | % | | | 5.77 | % | | | 6.42 | % | | | 6.20 | % | | | 5.23 | %(h) |
| | | | | | | | | | | | | | | | | | | | |
| | | | | |
Supplemental Data | | | | | | | | | | | | | | | | | | | | |
Net assets, end of period (000) | | $ | 214,384 | | | $ | 316,584 | | | $ | 360,351 | | | $ | 430,922 | | | $ | 421,764 | |
| | | | | | | | | | | | | | | | | | | | |
| | | | | |
Borrowings outstanding, end of period (000) | | $ | 2,220 | | | $ | 81,697 | | | $ | 106,756 | | | $ | 160,085 | | | $ | 117,177 | |
| | | | | | | | | | | | | | | | | | | | |
| | | | | |
Portfolio turnover rate(j) | | | 38 | % | | | 34 | % | | | 31 | % | | | 47 | % | | | 57 | % |
| | | | | | | | | | | | | | | | | | | | |
| (a) | Commencement of operations. |
| (b) | Based on average shares outstanding. |
| (c) | Distributions for annual periods determined in accordance with U.S. federal income tax regulations. |
| (d) | Where applicable, excludes the effects of any sales charges and assumes the reinvestment of distributions. |
| (e) | Includes proceeds received from a settlement of litigation, which had no impact on the Trust’s total return. |
| (g) | Excludes fees and expenses incurred indirectly as a result of investments in underlying funds. |
| (i) | Audit costs were not annualized in the calculation of the expense ratio. If these expenses were annualized, the total expenses would have been 1.78%. |
| (j) | Includes mortgage dollar roll transactions (“MDRs”). Additional information regarding portfolio turnover rate is as follows: |
| | | | | | | | | | | | | | | | | | | | |
| | | Year Ended
12/31/22 | | | Year Ended
12/31/21 | | | Year Ended
12/31/20 | | | Year Ended
12/31/19 | | | Period from 02/23/18(a) to 12/31/18 | |
Portfolio turnover rate (excluding MDRs) | | | 36 | % | | | 34 | % | | | 31 | % | | | 47 | % | | | 57 | % |
| | | | | | | | | | | | | | | | | | | | |
See notes to financial statements.
| | |
| 52 | | 2 0 2 2 B L A C K R O C K A N N U A L R E P O R T T O S H A R E H O L D E R S |
Financial Highlights (continued)
(For a share outstanding throughout each period)
| | | | | | | | | | | | | | | | |
| | | BlackRock Multi-Sector Opportunities Trust II | |
| | | Year
Ended
12/31/22 | | | Year
Ended
12/31/21 | | | Year
Ended
12/31/20 | | | Period from 04/16/19(a) to 12/31/19 | |
| | | | |
Net asset value, beginning of period | | $ | 87.63 | | | $ | 90.65 | | | $ | 101.48 | | | $ | 100.00 | |
| | | | | | | | | | | | | | | | |
| | | | |
Net investment income(b) | | | 4.28 | | | | 4.68 | | | | 4.68 | | | | 3.07 | |
Net realized and unrealized gain (loss) | | | (15.98 | ) | | | (1.39 | ) | | | (8.31 | ) | | | 2.84 | |
| | | | | | | | | | | | | | | | |
| | | | |
Net increase (decrease) from investment operations | | | (11.70 | ) | | | 3.29 | | | | (3.63 | ) | | | 5.91 | |
| | | | | | | | | | | | | | | | |
| | | | |
Distributions(c) | | | | | | | | | | | | | | | | |
From net investment income | | | (6.31 | ) | | | (6.24 | ) | | | (5.13 | ) | | | (3.69 | ) |
From net realized gain | | | — | | | | — | | | | — | | | | (0.18 | ) |
Return of capital | | | — | | | | (0.07 | ) | | | (2.07 | ) | | | (0.56 | ) |
| | | | | | | | | | | | | | | | |
| | | | |
Total distributions | | | (6.31 | ) | | | (6.31 | ) | | | (7.20 | ) | | | (4.43 | ) |
| | | | | | | | | | | | | | | | |
| | | | |
Net asset value, end of period | | $ | 69.62 | | | $ | 87.63 | | | $ | 90.65 | | | $ | 101.48 | |
| | | | | | | | | | | | | | | | |
| | | | |
Total Return(d) | | | | | | | | | | | | | | | | |
Based on net asset value | | | (13.37 | )% | | | 3.61 | % | | | (2.45 | )% | | | 5.99 | %(e) |
| | | | | | | | | | | | | | | | |
| | | | |
Ratios to Average Net Assets(f) | | | | | | | | | | | | | | | | |
Total expenses | | | 2.61 | % | | | 2.36 | % | | | 2.63 | % | | | 2.07 | %(g)(h) |
| | | | | | | | | | | | | | | | |
| | | | |
Total expenses after fees waived and/or reimbursed | | | 2.27 | % | | | 2.34 | % | | | 2.60 | % | | | 2.04 | %(g) |
| | | | | | | | | | | | | | | | |
| | | | |
Total expenses after fees waived and/or reimbursed and excluding interest expense, fees and amortization of offering costs | | | 1.80 | % | | | 2.13 | % | | | 2.11 | % | | | 1.77 | %(g) |
| | | | | | | | | | | | | | | | |
| | | | |
Net investment income | | | 5.60 | % | | | 5.11 | % | | | 5.41 | % | | | 4.30 | %(g) |
| | | | | | | | | | | | | | | | |
| | | | |
Supplemental Data | | | | | | | | | | | | | | | | |
Net assets, end of period (000) | | $ | 86,961 | | | $ | 128,333 | | | $ | 142,156 | | | $ | 160,697 | |
| | | | | | | | | | | | | | | | |
| | | | |
Borrowings outstanding, end of period (000) | | $ | 14,955 | | | $ | 44,417 | | | $ | 48,543 | | | $ | 55,798 | |
| | | | | | | | | | | | | | | | |
| | | | |
Portfolio turnover rate(i) | | | 34 | % | | | 39 | % | | | 39 | % | | | 29 | % |
| | | | | | | | | | | | | | | | |
| (a) | Commencement of operations. |
| (b) | Based on average shares outstanding. |
| (c) | Distributions for annual periods determined in accordance with U.S. federal income tax regulations. |
| (d) | Where applicable, excludes the effects of any sales charges and assumes the reinvestment of distributions. |
| (f) | Excludes fees and expenses incurred indirectly as a result of investments in underlying funds. |
| (h) | Audit costs were not annualized in the calculation of the expense ratio. If these expenses were annualized, the total expenses would have been 2.09%. |
| (i) | Includes mortgage dollar roll transactions (“MDRs”). Additional information regarding portfolio turnover rate is as follows: |
| | | | | | | | | | | | | | | | |
| | | Year Ended
12/31/22 | | | Year Ended
12/31/21 | | | Year Ended
12/31/20 | | | Period from 04/16/19(a) to 12/31/19 | |
Portfolio turnover rate (excluding MDRs) | | | 32 | % | | | 39 | % | | | 39 | % | | | 29 | % |
| | | | | | | | | | | | | | | | |
See notes to financial statements.
| | |
F I N A N C I A L H I G H L I G H T S | | 53 |
Notes to Financial Statements
The following are registered under the Investment Company Act of 1940, as amended (the “1940 Act”), as closed-end management investment companies and are referred to herein collectively as the “Trusts”, or individually as a “Trust”:
| | | | | | |
| Trust Name | | Herein Referred To As | | Organized | | Diversification
Classification |
BlackRock Multi-Sector Opportunities Trust | | MSO | | Delaware | | Diversified |
BlackRock Multi-Sector Opportunities Trust II | | MSO2 | | Delaware | | Diversified* |
| | * | The Trust’s classification changed from non-diversified to diversified during the reporting period. | |
The Boards of Trustees of the Trusts are collectively referred to throughout this report as the “Board,” and the trustees thereof are collectively referred to throughout this report as “Trustees”. The Trusts determine and make available for publication the net asset values (“NAVs”) of their Common Shares on a daily basis.
The Trusts, together with certain other registered investment companies advised by BlackRock Advisors, LLC (the “Manager”) or its affiliates, are included in a complex of funds referred to as the BlackRock Fixed-Income Complex.
| 2. | SIGNIFICANT ACCOUNTING POLICIES |
The financial statements are prepared in conformity with accounting principles generally accepted in the United States of America (“U.S. GAAP”), which may require management to make estimates and assumptions that affect the reported amounts of assets and liabilities in the financial statements, disclosure of contingent assets and liabilities at the date of the financial statements and the reported amounts of increases and decreases in net assets from operations during the reporting period. Actual results could differ from those estimates. Each Trust is considered an investment company under U.S. GAAP and follows the accounting and reporting guidance applicable to investment companies. Below is a summary of significant accounting policies:
Investment Transactions and Income Recognition: For financial reporting purposes, investment transactions are recorded on the dates the transactions are executed. Realized gains and losses on investment transactions are determined using the specific identification method. Dividend income and capital gain distributions, if any, are recorded on the ex-dividend dates. Non-cash dividends, if any, are recorded on the ex-dividend dates at fair value. Dividends from foreign securities where the ex-dividend dates may have passed are subsequently recorded when the Trusts are informed of the ex-dividend dates. Under the applicable foreign tax laws, a withholding tax at various rates may be imposed on capital gains, dividends and interest. Upon notification from issuers, a portion of the dividend income received from a real estate investment trust may be redesignated as a reduction of cost of the related investment and/or realized gain. Interest income, including amortization and accretion of premiums and discounts on debt securities, is recognized daily on an accrual basis.
Foreign Currency Translation: Each Trust’s books and records are maintained in U.S. dollars. Securities and other assets and liabilities denominated in foreign currencies are translated into U.S. dollars using exchange rates determined as of the close of trading on the New York Stock Exchange (“NYSE”). Purchases and sales of investments are recorded at the rates of exchange prevailing on the respective dates of such transactions. Generally, when the U.S. dollar rises in value against a foreign currency, the investments denominated in that currency will lose value; the opposite effect occurs if the U.S. dollar falls in relative value.
Each Trust does not isolate the effect of fluctuations in foreign exchange rates from the effect of fluctuations in the market prices of investments for financial reporting purposes. Accordingly, the effects of changes in exchange rates on investments are not segregated in the Statements of Operations from the effects of changes in market prices of those investments, but are included as a component of net realized and unrealized gain (loss) from investments. Each Trust reports realized currency gains (losses) on foreign currency related transactions as components of net realized gain (loss) for financial reporting purposes, whereas such components are generally treated as ordinary income for U.S. federal income tax purposes.
Foreign Taxes: The Trusts may be subject to foreign taxes (a portion of which may be reclaimable) on income, stock dividends, capital gains on investments, or certain foreign currency transactions. All foreign taxes are recorded in accordance with the applicable foreign tax regulations and rates that exist in the foreign jurisdictions in which each Trust invests. These foreign taxes, if any, are paid by each Trust and are reflected in its Statements of Operations as follows: foreign taxes withheld at source are presented as a reduction of income, foreign taxes on securities lending income are presented as a reduction of securities lending income, foreign taxes on stock dividends are presented as “Foreign taxes withheld”, and foreign taxes on capital gains from sales of investments and foreign taxes on foreign currency transactions are included in their respective net realized gain (loss) categories. Foreign taxes payable or deferred as of December 31, 2022, if any, are disclosed in the Statements of Assets and Liabilities.
The Trusts file withholding tax reclaims in certain jurisdictions to recover a portion of amounts previously withheld. The Trusts may record a reclaim receivable based on collectability, which includes factors such as the jurisdiction’s applicable laws, payment history and market convention. The Statements of Operations include tax reclaims recorded as well as professional and other fees, if any, associated with recovery of foreign withholding taxes.
Collateralization: If required by an exchange or counterparty agreement, the Trusts may be required to deliver/deposit cash and/or securities to/with an exchange, or broker-dealer or custodian as collateral for certain investments.
Distributions: Distributions from net investment income are declared and paid quarterly. Distributions of capital gains are recorded on the ex-dividend dates and made at least annually. The portion of distributions, if any, that exceeds a fund’s current and accumulated earnings and profits, as measured on a tax basis, constitute a non-taxable return of capital. The character and timing of distributions are determined in accordance with U.S. federal income tax regulations, which may differ from U.S. GAAP.
Deferred Compensation Plan: Under the Deferred Compensation Plan (the “Plan”) approved by each Trust’s Board, the trustees who are not “interested persons” of the Trusts, as defined in the 1940 Act (“Independent Trustees”), may defer a portion of their annual complex-wide compensation. Deferred amounts earn an approximate return as
| | |
| 54 | | 2 0 2 2 B L A C K R O C K A N N U A L R E P O R T T O S H A R E H O L D E R S |
Notes to Financial Statements (continued)
though equivalent dollar amounts had been invested in common shares of certain funds in the BlackRock Fixed-Income Complex selected by the Independent Trustees. This has the same economic effect for the Independent Trustees as if the Independent Trustees had invested the deferred amounts directly in certain funds in the BlackRock Fixed-Income Complex.
The Plan is not funded and obligations thereunder represent general unsecured claims against the general assets of each Trust, as applicable. Deferred compensation liabilities, if any, are included in the Trustees’ and Officer’s fees payable in the Statements of Assets and Liabilities and will remain as a liability of the Trusts until such amounts are distributed in accordance with the Plan. Net appreciation (depreciation) in the value of participants’ deferral accounts is allocated among the participating funds in the BlackRock Fixed-Income Complex and reflected as Trustees and Officer expense on the Statements of Operations. The Trustees and Officer expense may be negative as a result of a decrease in value of the deferred accounts.
Indemnifications: In the normal course of business, a Trust enters into contracts that contain a variety of representations that provide general indemnification. A Trust’s maximum exposure under these arrangements is unknown because it involves future potential claims against a Trust, which cannot be predicted with any certainty.
Other: Expenses directly related to a Trust are charged to that Trust. Other operating expenses shared by several funds, including other funds managed by the Manager, are prorated among those funds on the basis of relative net assets or other appropriate methods.
| 3. | INVESTMENT VALUATION AND FAIR VALUE MEASUREMENTS |
Investment Valuation Policies: Each Trust’s investments are valued at fair value (also referred to as “market value” within the financial statements) each day that the Trust is open for business and, for financial reporting purposes, as of the report date. U.S. GAAP defines fair value as the price a fund would receive to sell an asset or pay to transfer a liability in an orderly transaction between market participants at the measurement date. The Board has approved the designation of each Trust’s Manager as the valuation designee for each Trust. Each Trust determines the fair values of its financial instruments using various independent dealers or pricing services under the Manager’s policies. If a security’s market price is not readily available or does not otherwise accurately represent the fair value of the security, the security will be valued in accordance with the Manager’s policies and procedures as reflecting fair value. The Manager has formed a committee (the “Valuation Committee”) to develop pricing policies and procedures and to oversee the pricing function for all financial instruments, with assistance from other BlackRock pricing committees.
Fair Value Inputs and Methodologies: The following methods and inputs are used to establish the fair value of each Trust’s assets and liabilities:
| | • | | Equity investments traded on a recognized securities exchange are valued at that day’s official closing price, as applicable, on the exchange where the stock is primarily traded. Equity investments traded on a recognized exchange for which there were no sales on that day may be valued at the last available bid (long positions) or ask (short positions) price. |
| | • | | Fixed-income investments for which market quotations are readily available are generally valued using the last available bid price or current market quotations provided by independent dealers or third-party pricing services. Floating rate loan interests are valued at the mean of the bid prices from one or more independent brokers or dealers as obtained from a third-party pricing service. Pricing services generally value fixed-income securities assuming orderly transactions of an institutional round lot size, but a fund may hold or transact in such securities in smaller, odd lot sizes. Odd lots may trade at lower prices than institutional round lots. The pricing services may use matrix pricing or valuation models that utilize certain inputs and assumptions to derive values, including transaction data (e.g., recent representative bids and offers), market data, credit quality information, perceived market movements, news, and other relevant information. Certain fixed-income securities, including asset-backed and mortgage related securities may be valued based on valuation models that consider the estimated cash flows of each tranche of the entity, establish a benchmark yield and develop an estimated tranche specific spread to the benchmark yield based on the unique attributes of the tranche. The amortized cost method of valuation may be used with respect to debt obligations with sixty days or less remaining to maturity unless the Manager determines such method does not represent fair value. |
| | • | | Exchange-traded funds (“ETFs”) and closed-end funds traded on a recognized securities exchange are valued at that day’s official closing price, as applicable, on the exchange where the stock is primarily traded. ETFs and closed-end funds traded on a recognized exchange for which there were no sales on that day may be valued at the last available bid (long positions) or ask (short positions) price. |
| | • | | Investments in open-end U.S. mutual funds (including money market funds) are valued at that day’s published NAV. |
| | • | | Futures contracts are valued based on that day’s last reported settlement or trade price on the exchange where the contract is traded. |
| | • | | Forward foreign currency exchange contracts are valued at the mean between the bid and ask prices and are determined as of the close of trading on the NYSE based on that day’s prevailing forward exchange rate for the underlying currencies. |
| | • | | Exchange-traded options are valued at the mean between the last bid and ask prices at the close of the options market in which the options trade. An exchange-traded option for which there is no mean price is valued at the last bid (long positions) or ask (short positions) price. If no bid or ask price is available, the prior day’s price will be used, unless it is determined that the prior day’s price no longer reflects the fair value of the option. OTC options and options on swaps (“swaptions”) are valued by an independent pricing service using a mathematical model, which incorporates a number of market data factors, such as the trades and prices of the underlying instruments. |
| | • | | Swap agreements are valued utilizing quotes received daily by independent pricing services or through brokers, which are derived using daily swap curves and models that incorporate a number of market data factors, such as discounted cash flows, trades and values of the underlying reference instruments. |
| | |
N O T E S T O F I N A N C I A L S T A T E M E N T S | | 55 |
Notes to Financial Statements (continued)
Generally, trading in foreign instruments is substantially completed each day at various times prior to the close of trading on the NYSE. Each business day, the Trusts use current market factors supplied by independent pricing services to value certain foreign instruments (“Systematic Fair Value Price”). The Systematic Fair Value Price is designed to value such foreign securities at fair value as of the close of trading on the NYSE, which follows the close of the local markets.
If events (e.g., market volatility, company announcement or a natural disaster) occur that are expected to materially affect the value of such investment, or in the event that application of these methods of valuation results in a price for an investment that is deemed not to be representative of the market value of such investment, or if a price is not available, the investment will be valued by the Valuation Committee in accordance with the Manager’s policies and procedures as reflecting fair value (“Fair Valued Investments”). The fair valuation approaches that may be used by the Valuation Committee include market approach, income approach and cost approach. Valuation techniques such as discounted cash flow, use of market comparables and matrix pricing are types of valuation approaches and are typically used in determining fair value. When determining the price for Fair Valued Investments, the Valuation Committee seeks to determine the price that each Trust might reasonably expect to receive or pay from the current sale or purchase of that asset or liability in an arm’s-length transaction. Fair value determinations shall be based upon all available factors that the Valuation Committee deems relevant and consistent with the principles of fair value measurement.
For investments in equity or debt issued by privately held companies or funds (“Private Company” or collectively, the “Private Companies”) and other Fair Valued Investments, the fair valuation approaches that are used by the Valuation Committee and third-party pricing services utilized by the Valuation Committee include one or a combination of, but not limited to, the following inputs.
| | |
| | | Standard Inputs Generally Considered By The Valuation Committee And Third-Party Pricing Services |
Market approach | | (i) recent market transactions, including subsequent rounds of financing, in the underlying investment or comparable issuers; (ii) recapitalizations and other transactions across the capital structure; and (iii) market multiples of comparable issuers. |
Income approach | | (i) future cash flows discounted to present and adjusted as appropriate for liquidity, credit, and/or market risks; (ii) quoted prices for similar investments or assets in active markets; and (iii) other risk factors, such as interest rates, yield curves, volatilities, prepayment speeds, loss severities, credit risks, recovery rates, liquidation amounts and/or default rates. |
Cost approach | | (i) audited or unaudited financial statements, investor communications and financial or operational metrics issued by the Private Company; (ii) changes in the valuation of relevant indices or publicly traded companies comparable to the Private Company; (iii) relevant news and other public sources; and (iv) known secondary market transactions in the Private Company’s interests and merger or acquisition activity in companies comparable to the Private Company. |
Investments in series of preferred stock issued by Private Companies are typically valued utilizing market approach in determining the enterprise value of the company. Such investments often contain rights and preferences that differ from other series of preferred and common stock of the same issuer. Enterprise valuation techniques such as an option pricing model (“OPM”), a probability weighted expected return model (“PWERM”), current value method or a hybrid of those techniques are used as deemed appropriate under the circumstances. The use of these valuation techniques involve a determination of the exit scenarios of the investment in order to appropriately allocate the enterprise value of the company among the various parts of its capital structure.
The Private Companies are not subject to the public company disclosure, timing, and reporting standards applicable to other investments held by a Trust. Typically, the most recently available information by a Private Company is as of a date that is earlier than the date a Trust is calculating its NAV. This factor may result in a difference between the value of the investment and the price a Trust could receive upon the sale of the investment.
Fair Value Hierarchy: Various inputs are used in determining the fair value of financial instruments. These inputs to valuation techniques are categorized into a fair value hierarchy consisting of three broad levels for financial reporting purposes as follows:
| | • | | Level 1 – Unadjusted price quotations in active markets/exchanges for identical assets or liabilities that each Trust has the ability to access; |
| | • | | Level 2 – Other observable inputs (including, but not limited to, quoted prices for similar assets or liabilities in markets that are active, quoted prices for identical or similar assets or liabilities in markets that are not active, inputs other than quoted prices that are observable for the assets or liabilities (such as interest rates, yield curves, volatilities, prepayment speeds, loss severities, credit risks and default rates) or other market–corroborated inputs); and |
| | • | | Level 3 – Unobservable inputs based on the best information available in the circumstances, to the extent observable inputs are not available (including the Valuation Committee’s assumptions used in determining the fair value of financial instruments). |
The hierarchy gives the highest priority to unadjusted quoted prices in active markets for identical assets or liabilities (Level 1 measurements) and the lowest priority to unobservable inputs (Level 3 measurements). Accordingly, the degree of judgment exercised in determining fair value is greatest for instruments categorized in Level 3. The inputs used to measure fair value may fall into different levels of the fair value hierarchy. In such cases, for disclosure purposes, the fair value hierarchy classification is determined based on the lowest level input that is significant to the fair value measurement in its entirety. Investments classified within Level 3 have significant unobservable inputs used by the Valuation Committee in determining the price for Fair Valued Investments. Level 3 investments include equity or debt issued by Private Companies that may not have a secondary market and/or may have a limited number of investors. The categorization of a value determined for financial instruments is based on the pricing transparency of the financial instruments and is not necessarily an indication of the risks associated with investing in those securities.
| | |
| 56 | | 2 0 2 2 B L A C K R O C K A N N U A L R E P O R T T O S H A R E H O L D E R S |
Notes to Financial Statements (continued)
| 4. | SECURITIES AND OTHER INVESTMENTS |
Asset-Backed and Mortgage-Backed Securities: Asset-backed securities are generally issued as pass-through certificates or as debt instruments. Asset-backed securities issued as pass-through certificates represent undivided fractional ownership interests in an underlying pool of assets. Asset-backed securities issued as debt instruments, which are also known as collateralized obligations, are typically issued as the debt of a special purpose entity organized solely for the purpose of owning such assets and issuing such debt. Asset-backed securities are often backed by a pool of assets representing the obligations of a number of different parties. The yield characteristics of certain asset-backed securities may differ from traditional debt securities. One such major difference is that all or a principal part of the obligations may be prepaid at any time because the underlying assets (i.e., loans) may be prepaid at any time. As a result, a decrease in interest rates in the market may result in increases in the level of prepayments as borrowers, particularly mortgagors, refinance and repay their loans. An increased prepayment rate with respect to an asset-backed security will have the effect of shortening the maturity of the security. In addition, a fund may subsequently have to reinvest the proceeds at lower interest rates. If a fund has purchased such an asset-backed security at a premium, a faster than anticipated prepayment rate could result in a loss of principal to the extent of the premium paid.
For mortgage pass-through securities (the “Mortgage Assets”) there are a number of important differences among the agencies and instrumentalities of the U.S. Government that issue mortgage-related securities and among the securities that they issue. For example, mortgage-related securities guaranteed by Ginnie Mae are guaranteed as to the timely payment of principal and interest by Ginnie Mae and such guarantee is backed by the full faith and credit of the United States. However, mortgage-related securities issued by Freddie Mac and Fannie Mae, including Freddie Mac and Fannie Mae guaranteed mortgage pass-through certificates, which are solely the obligations of Freddie Mac and Fannie Mae, are not backed by or entitled to the full faith and credit of the United States, but are supported by the right of the issuer to borrow from the U.S. Treasury.
Non-agency mortgage-backed securities are securities issued by non-governmental issuers and have no direct or indirect government guarantees of payment and are subject to various risks. Non-agency mortgage loans are obligations of the borrowers thereunder only and are not typically insured or guaranteed by any other person or entity. The ability of a borrower to repay a loan is dependent upon the income or assets of the borrower. A number of factors, including a general economic downturn, acts of God, terrorism, social unrest and civil disturbances, may impair a borrower’s ability to repay its loans.
Collateralized Debt Obligations: Collateralized debt obligations (“CDOs”), including collateralized bond obligations (“CBOs”) and collateralized loan obligations (“CLOs”), are types of asset-backed securities. A CDO is an entity that is backed by a diversified pool of debt securities (CBOs) or syndicated bank loans (CLOs). The cash flows of the CDO can be split into multiple segments, called “tranches,” which will vary in risk profile and yield. The riskiest segment is the subordinated or “equity” tranche. This tranche bears the greatest risk of defaults from the underlying assets in the CDO and serves to protect the other, more senior, tranches from default in all but the most severe circumstances. Since it is shielded from defaults by the more junior tranches, a “senior” tranche will typically have higher credit ratings and lower yields than their underlying securities, and often receive investment grade ratings from one or more of the nationally recognized rating agencies. Despite the protection from the more junior tranches, senior tranches can experience substantial losses due to actual defaults, increased sensitivity to future defaults and the disappearance of one or more protecting tranches as a result of changes in the credit profile of the underlying pool of assets.
Multiple Class Pass-Through Securities: Multiple class pass-through securities, including collateralized mortgage obligations (“CMOs”) and commercial mortgage-backed securities, may be issued by Ginnie Mae, U.S. Government agencies or instrumentalities or by trusts formed by private originators of, or investors in, mortgage loans. In general, CMOs are debt obligations of a legal entity that are collateralized by a pool of residential or commercial mortgage loans or Mortgage Assets. The payments on these are used to make payments on the CMOs or multiple pass-through securities. Multiple class pass-through securities represent direct ownership interests in the Mortgage Assets. Classes of CMOs include interest only (“IOs”), principal only (“POs”), planned amortization classes and targeted amortization classes. IOs and POs are stripped mortgage-backed securities representing interests in a pool of mortgages, the cash flow from which has been separated into interest and principal components. IOs receive the interest portion of the cash flow while POs receive the principal portion. IOs and POs can be extremely volatile in response to changes in interest rates. As interest rates rise and fall, the value of IOs tends to move in the same direction as interest rates. POs perform best when prepayments on the underlying mortgages rise since this increases the rate at which the principal is returned and the yield to maturity on the PO. When payments on mortgages underlying a PO are slower than anticipated, the life of the PO is lengthened and the yield to maturity is reduced. If the underlying Mortgage Assets experience greater than anticipated prepayments of principal, a fund’s initial investment in the IOs may not fully recoup.
Stripped Mortgage-Backed Securities: Stripped mortgage-backed securities are typically issued by the U.S. Government, its agencies and instrumentalities. Stripped mortgage-backed securities are usually structured with two classes that receive different proportions of the interest (IOs) and principal (POs) distributions on a pool of Mortgage Assets. Stripped mortgage-backed securities may be privately issued.
Zero-Coupon Bonds: Zero-coupon bonds are normally issued at a significant discount from face value and do not provide for periodic interest payments. These bonds may experience greater volatility in market value than other debt obligations of similar maturity which provide for regular interest payments.
Capital Securities and Trust Preferred Securities: Capital securities, including trust preferred securities, are typically issued by corporations, generally in the form of interest-bearing notes with preferred securities characteristics. In the case of trust preferred securities, an affiliated business trust of a corporation issues these securities, generally in the form of beneficial interests in subordinated debentures or similarly structured securities. The securities can be structured with either a fixed or adjustable coupon that can have either a perpetual or stated maturity date. For trust preferred securities, the issuing bank or corporation pays interest to the trust, which is then distributed to holders of these securities as a dividend. Dividends can be deferred without creating an event of default or acceleration, although maturity cannot take place unless all cumulative payment obligations have been met. The deferral of payments does not affect the purchase or sale of these securities in the open market. These securities generally are rated below that of the issuing company’s senior debt securities and are freely callable at the issuer’s option.
Preferred Stocks: Preferred stock has a preference over common stock in liquidation (and generally in receiving dividends as well), but is subordinated to the liabilities of the issuer in all respects. As a general rule, the market value of preferred stock with a fixed dividend rate and no conversion element varies inversely with interest rates and perceived credit risk, while the market price of convertible preferred stock generally also reflects some element of conversion value. Because preferred stock is junior to debt securities and other obligations of the issuer, deterioration in the credit quality of the issuer will cause greater changes in the value of a preferred stock than in a more senior
| | |
N O T E S T O F I N A N C I A L S T A T E M E N T S | | 57 |
Notes to Financial Statements (continued)
debt security with similar stated yield characteristics. Unlike interest payments on debt securities, preferred stock dividends are payable only if declared by the issuer’s board of directors. Preferred stock also may be subject to optional or mandatory redemption provisions.
Floating Rate Loan Interests: Floating rate loan interests are typically issued to companies (the “borrower”) by banks, other financial institutions, or privately and publicly offered corporations (the “lender”). Floating rate loan interests are generally non-investment grade, often involve borrowers whose financial condition is troubled or uncertain and companies that are highly leveraged or in bankruptcy proceedings. In addition, transactions in floating rate loan interests may settle on a delayed basis, which may result in proceeds from the sale not being readily available for a fund to make additional investments or meet its redemption obligations. Floating rate loan interests may include fully funded term loans or revolving lines of credit. Floating rate loan interests are typically senior in the corporate capital structure of the borrower. Floating rate loan interests generally pay interest at rates that are periodically determined by reference to a base lending rate plus a premium. Since the rates reset only periodically, changes in prevailing interest rates (and particularly sudden and significant changes) can be expected to cause some fluctuations in the NAV of a fund to the extent that it invests in floating rate loan interests. The base lending rates are generally the lending rate offered by one or more European banks, such as the London Interbank Offered Rate (“LIBOR”), the prime rate offered by one or more U.S. banks or the certificate of deposit rate. Floating rate loan interests may involve foreign borrowers, and investments may be denominated in foreign currencies. These investments are treated as investments in debt securities for purposes of a fund’s investment policies.
When a fund purchases a floating rate loan interest, it may receive a facility fee and when it sells a floating rate loan interest, it may pay a facility fee. On an ongoing basis, a fund may receive a commitment fee based on the undrawn portion of the underlying line of credit amount of a floating rate loan interest. Facility and commitment fees are typically amortized to income over the term of the loan or term of the commitment, respectively. Consent and amendment fees are recorded to income as earned. Prepayment penalty fees, which may be received by a fund upon the prepayment of a floating rate loan interest by a borrower, are recorded as realized gains. A fund may invest in multiple series or tranches of a loan. A different series or tranche may have varying terms and carry different associated risks.
Floating rate loan interests are usually freely callable at the borrower’s option. A fund may invest in such loans in the form of participations in loans (“Participations”) or assignments (“Assignments”) of all or a portion of loans from third parties. Participations typically will result in a fund having a contractual relationship only with the lender, not with the borrower. A fund has the right to receive payments of principal, interest and any fees to which it is entitled only from the lender selling the Participation and only upon receipt by the lender of the payments from the borrower. In connection with purchasing Participations, a fund generally will have no right to enforce compliance by the borrower with the terms of the loan agreement, nor any rights of offset against the borrower. A fund may not benefit directly from any collateral supporting the loan in which it has purchased the Participation. As a result, a fund assumes the credit risk of both the borrower and the lender that is selling the Participation. A fund’s investment in loan participation interests involves the risk of insolvency of the financial intermediaries who are parties to the transactions. In the event of the insolvency of the lender selling the Participation, a fund may be treated as a general creditor of the lender and may not benefit from any offset between the lender and the borrower. Assignments typically result in a fund having a direct contractual relationship with the borrower, and a fund may enforce compliance by the borrower with the terms of the loan agreement.
Forward Commitments, When-Issued and Delayed Delivery Securities: The Trusts may purchase securities on a when-issued basis and may purchase or sell securities on a forward commitment basis. Settlement of such transactions normally occurs within a month or more after the purchase or sale commitment is made. The Trusts may purchase securities under such conditions with the intention of actually acquiring them but may enter into a separate agreement to sell the securities before the settlement date. Since the value of securities purchased may fluctuate prior to settlement, the Trusts may be required to pay more at settlement than the security is worth. In addition, a fund is not entitled to any of the interest earned prior to settlement. When purchasing a security on a delayed delivery basis, the Trusts assume the rights and risks of ownership of the security, including the risk of price and yield fluctuations. In the event of default by the counterparty, the Trusts’ maximum amount of loss is the unrealized appreciation of unsettled when-issued transactions.
TBA Commitments: TBA commitments are forward agreements for the purchase or sale of securities, including mortgage-backed securities for a fixed price, with payment and delivery on an agreed upon future settlement date. The specific securities to be delivered are not identified at the trade date. However, delivered securities must meet specified terms, including issuer, rate and mortgage terms. When entering into TBA commitments, a fund may take possession of or deliver the underlying mortgage-backed securities but can extend the settlement or roll the transaction. TBA commitments involve a risk of loss if the value of the security to be purchased or sold declines or increases, respectively, prior to settlement date, if there are expenses or delays in connection with the TBA transactions, or if the counterparty fails to complete the transaction.
In order to better define contractual rights and to secure rights that will help a fund mitigate its counterparty risk, TBA commitments may be entered into by a fund under Master Securities Forward Transaction Agreements (each, an “MSFTA”). An MSFTA typically contains, among other things, collateral posting terms and netting provisions in the event of default and/or termination event. The collateral requirements are typically calculated by netting the mark-to-market amount for each transaction under such agreement and comparing that amount to the value of the collateral currently pledged by a fund and the counterparty. Cash collateral that has been pledged to cover the obligations of a fund and cash collateral received from the counterparty, if any, is reported separately in the Statements of Assets and Liabilities as cash pledged as collateral for TBA commitments or cash received as collateral for TBA commitments, respectively. Non-cash collateral pledged by a fund, if any, is noted in the Schedules of Investments. Typically, a fund is permitted to sell, re-pledge or use the collateral it receives; however, the counterparty is not permitted to do so. To the extent amounts due to a fund are not fully collateralized, contractually or otherwise, a fund bears the risk of loss from counterparty non-performance.
Mortgage Dollar Roll Transactions: The Trusts may sell TBA mortgage-backed securities and simultaneously contract to repurchase substantially similar (i.e., same type, coupon and maturity) securities on a specific future date at an agreed upon price. During the period between the sale and repurchase, a fund is not entitled to receive interest and principal payments on the securities sold. Mortgage dollar roll transactions are treated as purchases and sales and a fund realizes gains and losses on these transactions. Mortgage dollar rolls involve the risk that the market value of the securities that a fund is required to purchase may decline below the agreed upon repurchase price of those securities.
Reverse Repurchase Agreements: Reverse repurchase agreements are agreements with qualified third-party broker dealers in which a fund sells securities to a bank or broker-dealer and agrees to repurchase the same securities at a mutually agreed upon date and price. A fund receives cash from the sale to use for other investment purposes. During the term of the reverse repurchase agreement, a fund continues to receive the principal and interest payments on the securities sold. Certain agreements have no stated maturity and can be terminated by either party at any time. Interest on the value of the reverse repurchase agreements issued and outstanding is based upon competitive market rates determined at the time of issuance. A fund may utilize reverse repurchase agreements when it is anticipated that the interest income to be earned from
| | |
| 58 | | 2 0 2 2 B L A C K R O C K A N N U A L R E P O R T T O S H A R E H O L D E R S |
Notes to Financial Statements (continued)
the investment of the proceeds of the transaction is greater than the interest expense of the transaction. Reverse repurchase agreements involve leverage risk. If a fund suffers a loss on its investment of the transaction proceeds from a reverse repurchase agreement, a fund would still be required to pay the full repurchase price. Further, a fund remains subject to the risk that the market value of the securities repurchased declines below the repurchase price. In such cases, a fund would be required to return a portion of the cash received from the transaction or provide additional securities to the counterparty.
Cash received in exchange for securities delivered plus accrued interest due to the counterparty is recorded as a liability in the Statements of Assets and Liabilities at face value including accrued interest. Due to the short-term nature of the reverse repurchase agreements, face value approximates fair value. Interest payments made by a fund to the counterparties are recorded as a component of interest expense in the Statements of Operations. In periods of increased demand for the security, a fund may receive a fee for the use of the security by the counterparty, which may result in interest income to a fund.
For the year ended December 31, 2022, the average daily amount of reverse repurchase agreements outstanding and the weighted average interest rate for the Trusts were as follows:
| | | | | | | | |
| Trust Name | | Average Amount
Outstanding | | | Weighted Average
Interest Rate | |
MSO | | $ | 45,235,690 | | | | 1.36 | % |
MSO2 | | | 30,489,101 | | | | 1.55 | |
Reverse repurchase transactions are entered into by a fund under Master Repurchase Agreements (each, an “MRA”), which permit a fund, under certain circumstances, including an event of default (such as bankruptcy or insolvency), to offset payables and/or receivables under the MRA with collateral held and/or posted to the counterparty and create one single net payment due to or from a fund. With reverse repurchase transactions, typically a fund and counterparty under an MRA are permitted to sell, re-pledge, or use the collateral associated with the transaction. Bankruptcy or insolvency laws of a particular jurisdiction may impose restrictions on or prohibitions against such a right of offset in the event of the MRA counterparty’s bankruptcy or insolvency. Pursuant to the terms of the MRA, a fund receives or posts securities and cash as collateral with a market value in excess of the repurchase price to be paid or received by a fund upon the maturity of the transaction. Upon a bankruptcy or insolvency of the MRA counterparty, a fund is considered an unsecured creditor with respect to excess collateral and, as such, the return of excess collateral may be delayed.
As of period end, the following table is a summary of the Trusts’ open reverse repurchase agreements by counterparty which are subject to offset under an MRA on a net basis:
| | | | | | | | | | | | | | | | |
| Trust Name/Counterparty | | Reverse Repurchase
Agreements | | | Fair Value of
Non-Cash Collateral
Pledged Including Accrued Interest(a) | | | Cash Collateral Pledged/Received(a) | | | Net Amount | |
MSO | | | | | | | | | | | | | | | | |
Barclays Capital, Inc. | | $ | (611,430) | | | $ | 611,430 | | | $ | — | | | $ | — | |
BNP Paribas S.A. | | | (692,239) | | | | 692,239 | | | | — | | | | — | |
Nomura Securities International, Inc. | | | (916,516) | | | | 916,516 | | | | — | | | | — | |
| | | | | | | | | | | | | | | | |
| | $ | (2,220,185) | | | $ | 2,220,185 | | | $ | — | | | $ | — | |
| | | | | | | | | | | | | | | | |
| | (a) | Collateral, if any, with a value of $2,412,521 has been pledged in connection with open reverse repurchase agreements. Excess of collateral pledged to the individual counterparty is not shown for financial reporting purposes. | |
| | | | | | | | | | | | | | | | |
| Trust Name/Counterparty | | Reverse Repurchase
Agreements | | | Fair Value of Non-Cash Collateral Pledged Including Accrued Interest(a) | | | Cash Collateral Pledged/Received(a) | | | Net Amount | |
MSO2 | | | | | | | | | | | | | | | | |
Barclays Capital, Inc. | | $ | (1,924,532) | | | $ | 1,924,532 | | | $ | — | | | $ | — | |
BNP Paribas S.A. | | | (1,460,658) | | | | 1,460,658 | | | | — | | | | — | |
Credit Suisse Securities (USA) LLC | | | (202,915) | | | | 202,915 | | | | — | | | | — | |
RBC Capital Markets LLC | | | (8,254,121) | | | | 8,254,121 | | | | — | | | | — | |
TD Securities (USA) LLC | | | (3,112,415) | | | | 3,112,415 | | | | — | | | | — | |
| | | | | | | | | | | | | | | | |
| | $ | (14,954,641) | | | $ | 14,954,641 | | | $ | — | | | $ | — | |
| | | | | | | | | | | | | | | | |
| | (a) | Collateral, if any, with a value of $17,400,407 has been pledged in connection with open reverse repurchase agreements. Excess of collateral pledged to the individual counterparty is not shown for financial reporting purposes. | |
In the event the counterparty of securities under an MRA files for bankruptcy or becomes insolvent, a fund’s use of the proceeds from the agreement may be restricted while the counterparty, or its trustee or receiver, determines whether or not to enforce a fund’s obligation to repurchase the securities.
| 5. | DERIVATIVE FINANCIAL INSTRUMENTS |
The Trusts engage in various portfolio investment strategies using derivative contracts both to increase the returns of the Trusts and/or to manage their exposure to certain risks such as credit risk, equity risk, interest rate risk, foreign currency exchange rate risk, commodity price risk or other risks (e.g., inflation risk). Derivative financial instruments categorized by risk exposure are included in the Schedules of Investments. These contracts may be transacted on an exchange or OTC.
| | |
N O T E S T O F I N A N C I A L S T A T E M E N T S | | 59 |
Notes to Financial Statements (continued)
Futures Contracts: Futures contracts are purchased or sold to gain exposure to, or manage exposure to, changes in interest rates (interest rate risk) and changes in the value of equity securities (equity risk) or foreign currencies (foreign currency exchange rate risk).
Futures contracts are exchange-traded agreements between the Trusts and a counterparty to buy or sell a specific quantity of an underlying instrument at a specified price and on a specified date. Depending on the terms of a contract, it is settled either through physical delivery of the underlying instrument on the settlement date or by payment of a cash amount on the settlement date. Upon entering into a futures contract, the Trusts are required to deposit initial margin with the broker in the form of cash or securities in an amount that varies depending on a contract’s size and risk profile. The initial margin deposit must then be maintained at an established level over the life of the contract. Amounts pledged, which are considered restricted, are included in cash pledged for futures contracts in the Statements of Assets and Liabilities.
Securities deposited as initial margin are designated in the Schedules of Investments and cash deposited, if any, are shown as cash pledged for futures contracts in the Statements of Assets and Liabilities. Pursuant to the contract, the Trusts agree to receive from or pay to the broker an amount of cash equal to the daily fluctuation in market value of the contract (“variation margin”). Variation margin is recorded as unrealized appreciation (depreciation) and, if any, shown as variation margin receivable (or payable) on futures contracts in the Statements of Assets and Liabilities. When the contract is closed, a realized gain or loss is recorded in the Statements of Operations equal to the difference between the notional amount of the contract at the time it was opened and the notional amount at the time it was closed. The use of futures contracts involves the risk of an imperfect correlation in the movements in the price of futures contracts and interest rates, foreign currency exchange rates or underlying assets.
Forward Foreign Currency Exchange Contracts: Forward foreign currency exchange contracts are entered into to gain or reduce exposure to foreign currencies (foreign currency exchange rate risk).
A forward foreign currency exchange contract is an agreement between two parties to buy and sell a currency at a set exchange rate on a specified date. These contracts help to manage the overall exposure to the currencies in which some of the investments held by the Trusts are denominated and in some cases, may be used to obtain exposure to a particular market. The contracts are traded OTC and not on an organized exchange.
The contract is marked-to-market daily and the change in market value is recorded as unrealized appreciation (depreciation) in the Statements of Assets and Liabilities. When a contract is closed, a realized gain or loss is recorded in the Statements of Operations equal to the difference between the value at the time it was opened and the value at the time it was closed. Non-deliverable forward foreign currency exchange contracts are settled with the counterparty in cash without the delivery of foreign currency. The use of forward foreign currency exchange contracts involves the risk that the value of a forward foreign currency exchange contract changes unfavorably due to movements in the value of the referenced foreign currencies, and such value may exceed the amount(s) reflected in the Statements of Assets and Liabilities. Cash amounts pledged for forward foreign currency exchange contracts are considered restricted and are included in cash pledged as collateral for OTC derivatives in the Statements of Assets and Liabilities. A Trust’s risk of loss from counterparty credit risk on OTC derivatives is generally limited to the aggregate unrealized gain netted against any collateral held by the Trust.
Options: The Trusts may purchase and write call and put options to increase or decrease their exposure to the risks of underlying instruments, including equity risk, interest rate risk and/or commodity price risk and/or, in the case of options written, to generate gains from options premiums.
A call option gives the purchaser (holder) of the option the right (but not the obligation) to buy, and obligates the seller (writer) to sell (when the option is exercised) the underlying instrument at the exercise or strike price at any time or at a specified time during the option period. A put option gives the holder the right to sell and obligates the writer to buy the underlying instrument at the exercise or strike price at any time or at a specified time during the option period.
Premiums paid on options purchased and premiums received on options written, as well as the daily fluctuation in market value, are included in investments at value –unaffiliated and options written at value, respectively, in the Statements of Assets and Liabilities. When an instrument is purchased or sold through the exercise of an option, the premium is offset against the cost or proceeds of the underlying instrument. When an option expires, a realized gain or loss is recorded in the Statements of Operations to the extent of the premiums received or paid. When an option is closed or sold, a gain or loss is recorded in the Statements of Operations to the extent the cost of the closing transaction exceeds the premiums received or paid. When the Trusts write a call option, such option is typically “covered,” meaning that they hold the underlying instrument subject to being called by the option counterparty. When the Trusts write a put option, cash is segregated in an amount sufficient to cover the obligation. These amounts, which are considered restricted, are included in cash pledged as collateral for options written in the Statements of Assets and Liabilities.
| | • | | Swaptions — The Trusts may purchase and write options on swaps (“swaptions”) primarily to preserve a return or spread on a particular investment or portion of the Trusts’ holdings, as a duration management technique or to protect against an increase in the price of securities it anticipates purchasing at a later date. The purchaser and writer of a swaption is buying or granting the right to enter into a previously agreed upon interest rate or credit default swap agreement (interest rate risk and/or credit risk) at any time before the expiration of the option. |
In purchasing and writing options, the Trusts bear the risk of an unfavorable change in the value of the underlying instrument or the risk that they may not be able to enter into a closing transaction due to an illiquid market. Exercise of a written option could result in the Trusts purchasing or selling a security when they otherwise would not, or at a price different from the current market value.
Swaps: Swap contracts are entered into to manage exposure to issuers, markets and securities. Such contracts are agreements between the Trusts and a counterparty to make periodic net payments on a specified notional amount or a net payment upon termination. Swap agreements are privately negotiated in the OTC market and may be entered into as a bilateral contract (“OTC swaps”) or centrally cleared (“centrally cleared swaps”).
For OTC swaps, any upfront premiums paid and any upfront fees received are shown as swap premiums paid and swap premiums received, respectively, in the Statements of Assets and Liabilities and amortized over the term of the contract. The daily fluctuation in market value is recorded as unrealized appreciation (depreciation) on OTC Swaps in the Statements of Assets and Liabilities. Payments received or paid are recorded in the Statements of Operations as realized gains or losses, respectively. When an OTC swap is terminated, a realized gain or loss is recorded in the Statements of Operations equal to the difference between the proceeds from (or cost of) the closing transaction and the Trusts’ basis in the contract, if any. Generally, the basis of the contract is the premium received or paid.
| | |
| 60 | | 2 0 2 2 B L A C K R O C K A N N U A L R E P O R T T O S H A R E H O L D E R S |
Notes to Financial Statements (continued)
In a centrally cleared swap, immediately following execution of the swap contract, the swap contract is novated to a central counterparty (the “CCP”) and the CCP becomes the Trusts’ counterparty on the swap. Each Trust is required to interface with the CCP through the broker. Upon entering into a centrally cleared swap, each Trust is required to deposit initial margin with the broker in the form of cash or securities in an amount that varies depending on the size and risk profile of the particular swap. Securities deposited as initial margin are designated in the Schedules of Investments and cash deposited is shown as cash pledged for centrally cleared swaps in the Statements of Assets and Liabilities. Amounts pledged, which are considered restricted cash, are included in cash pledged for centrally cleared swaps in the Statements of Assets and Liabilities. Pursuant to the contract, each Trust agrees to receive from or pay to the broker an amount of cash equal to the daily fluctuation in market value of the contract (“variation margin”). Variation margin is recorded as unrealized appreciation (depreciation) and shown as variation margin receivable (or payable) on centrally cleared swaps in the Statements of Assets and Liabilities. Payments received from (paid to) the counterparty are amortized over the term of the contract and recorded as realized gains (losses) in the Statements of Operations, including those at termination.
| | • | | Credit default swaps — Credit default swaps are entered into to manage exposure to the market or certain sectors of the market, to reduce risk exposure to defaults of corporate and/or sovereign issuers or to create exposure to corporate and/or sovereign issuers to which a fund is not otherwise exposed (credit risk). |
| | | | The Trusts may either buy or sell (write) credit default swaps on single-name issuers (corporate or sovereign), a combination or basket of single-name issuers or traded indexes. Credit default swaps are agreements in which the protection buyer pays fixed periodic payments to the seller in consideration for a promise from the protection seller to make a specific payment should a negative credit event take place with respect to the referenced entity (e.g., bankruptcy, failure to pay, obligation acceleration, repudiation, moratorium or restructuring). As a buyer, if an underlying credit event occurs, the Trusts will either (i) receive from the seller an amount equal to the notional amount of the swap and deliver the referenced security or underlying securities comprising the index, or (ii) receive a net settlement of cash equal to the notional amount of the swap less the recovery value of the security or underlying securities comprising the index. As a seller (writer), if an underlying credit event occurs, the Trusts will either pay the buyer an amount equal to the notional amount of the swap and take delivery of the referenced security or underlying securities comprising the index or pay a net settlement of cash equal to the notional amount of the swap less the recovery value of the security or underlying securities comprising the index. |
| | • | | Total return swaps — Total return swaps are entered into to obtain exposure to a security or market without owning such security or investing directly in such market or to exchange the risk/return of one security or market (e.g., fixed-income) with another security or market (e.g., equity or commodity prices) (equity risk, commodity price risk and/or interest rate risk). |
| | | | Total return swaps are agreements in which there is an exchange of cash flows whereby one party commits to make payments based on the total return (distributions plus capital gains/losses) of an underlying instrument, or basket of underlying instruments, in exchange for fixed or floating rate interest payments. If the total return of the instrument(s) or index underlying the transaction exceeds or falls short of the offsetting fixed or floating interest rate obligation, the Trusts receive payment from or make a payment to the counterparty. |
| | • | | Interest rate swaps — Interest rate swaps are entered into to gain or reduce exposure to interest rates or to manage duration, the yield curve or interest rate (interest rate risk). |
| | | | Interest rate swaps are agreements in which one party pays a stream of interest payments, either fixed or floating, in exchange for another party’s stream of interest payments, either fixed or floating, on the same notional amount for a specified period of time. In more complex interest rate swaps, the notional principal amount may decline (or amortize) over time. |
Swap transactions involve, to varying degrees, elements of interest rate, credit and market risks in excess of the amounts recognized in the Statements of Assets and Liabilities. Such risks involve the possibility that there will be no liquid market for these agreements, that the counterparty to the agreements may default on its obligation to perform or disagree as to the meaning of the contractual terms in the agreements, and that there may be unfavorable changes in interest rates and/or market values associated with these transactions.
Master Netting Arrangements: In order to define its contractual rights and to secure rights that will help it mitigate its counterparty risk, a Trust may enter into an International Swaps and Derivatives Association, Inc. Master Agreement (“ISDA Master Agreement”) or similar agreement with its counterparties. An ISDA Master Agreement is a bilateral agreement between a Trust and a counterparty that governs certain OTC derivatives and typically contains, among other things, collateral posting terms and netting provisions in the event of a default and/or termination event. Under an ISDA Master Agreement, a Trust may, under certain circumstances, offset with the counterparty certain derivative financial instruments’ payables and/or receivables with collateral held and/or posted and create one single net payment. The provisions of the ISDA Master Agreement typically permit a single net payment in the event of default including the bankruptcy or insolvency of the counterparty. However, bankruptcy or insolvency laws of a particular jurisdiction may impose restrictions on or prohibitions against the right of offset in bankruptcy, insolvency or other events.
Collateral Requirements: For derivatives traded under an ISDA Master Agreement, the collateral requirements are typically calculated by netting the mark-to-market amount for each transaction under such agreement and comparing that amount to the value of any collateral currently pledged by the Trust and the counterparty.
Cash collateral that has been pledged to cover obligations of the Trusts and cash collateral received from the counterparty, if any, is reported separately in the Statements of Assets and Liabilities as cash pledged as collateral and cash received as collateral, respectively. Non-cash collateral pledged by the Trusts, if any, is noted in the Schedules of Investments. Generally, the amount of collateral due from or to a counterparty is subject to a certain minimum transfer amount threshold before a transfer is required, which is determined at the close of business of the Trusts. Any additional required collateral is delivered to/pledged by the Trusts on the next business day. Typically, the counterparty is not permitted to sell, re-pledge or use cash and non-cash collateral it receives. A Trust generally agrees not to use non-cash collateral that it receives but may, absent default or certain other circumstances defined in the underlying ISDA Master Agreement, be permitted to use cash collateral received. In such cases, interest may be paid pursuant to the collateral arrangement with the counterparty. To the extent amounts due to the Trusts from the counterparties are not fully collateralized, each Trust bears the risk of loss from counterparty non-performance. Likewise, to the extent the Trusts have delivered collateral to a counterparty and stand ready to perform under the terms of their agreement with such counterparty, each Trust bears the risk of loss from a counterparty in the amount of the value of the collateral in the event the counterparty fails to return such collateral. Based on the terms of agreements, collateral may not be required for all derivative contracts.
| | |
N O T E S T O F I N A N C I A L S T A T E M E N T S | | 61 |
Notes to Financial Statements (continued)
For financial reporting purposes, the Trusts do not offset derivative assets and derivative liabilities that are subject to netting arrangements, if any, in the Statements of Assets and Liabilities.
| 6. | INVESTMENT ADVISORY AGREEMENT AND OTHER TRANSACTIONS WITH AFFILIATES |
Investment Advisory: Each Trust entered into an Investment Advisory Agreement with the Manager, the Trusts’ investment adviser and an indirect, wholly-owned subsidiary of BlackRock, Inc. (“BlackRock”), to provide investment advisory and administrative services. The Manager is responsible for the management of each Trust’s portfolio and provides the personnel, facilities, equipment and certain other services necessary to the operations of each Trust.
For such services, each Trust pays the Manager a monthly fee at an annual rate equal to 1.25% of the average daily value of each Trust’s managed assets. For purposes of calculating these fees, “managed assets” are determined as total assets of each Trust (including any assets attributable to money borrowed for investment purposes) less the sum of its accrued liabilities (other than money borrowed for investment purposes).
With respect to each Trust, the Manager entered into separate sub-advisory agreements with BlackRock International Limited (“BIL”) and BlackRock (Singapore) Limited (“BSL”) (collectively, the “Sub-Advisers”), each an affiliate of the Manager. The Manager pays BIL and BSL for services they provide for that portion of each Trust for which BIL and BSL, as applicable, acts as sub-adviser, a monthly fee that is equal to a percentage of the investment advisory fees paid by each Trust to the Manager.
Service and Distribution Fees: MSO2 entered into a Distribution Agreement with BlackRock Investments, LLC (“BRIL”), an affiliate of the Manager. Pursuant to the Distribution Agreement, MSO2 pays BRIL ongoing service fees. The fees are accrued daily and paid monthly at an annual rate of 0.25% based upon the month-end net assets of the common shares of MSO2.
BRIL and broker-dealers, pursuant to sub-agreements with BRIL, provide shareholder servicing to the Trusts. The ongoing service fee compensates BRIL and each broker-dealer for providing shareholder servicing related services to shareholders.
Expense Waivers: With respect to MSO2, the Manager voluntarily agreed to waive a portion of its investment advisory fees equal to the annual rate of 0.25% of the Trust’s average daily managed assets, plus the proceeds of any outstanding borrowings used for leverage. This amount is included in fees waived and/or reimbursed by the Manager in the Statements of Operations. During the year ended December 31, 2022, the Manager waived $332,325 pursuant to this agreement.
With respect to each Trust, the Manager contractually agreed to waive its investment advisory fees by the amount of investment advisory fees each Trust pays to the Manager indirectly through its investment in affiliated money market funds (the “affiliated money market fund waiver”) through June 30, 2024. The contractual agreement may be terminated upon 90 days’ notice by a majority of the Independent Trustees, or by a vote of a majority of the outstanding voting securities of a Trust. These amounts are included in fees waived and/or reimbursed by the Manager in the Statements of Operations. For the year ended December 31, 2022, the amounts waived were as follows:
| | | | |
| Trust Name | | Fees Waived and/or Reimbursed
by the Manager | |
MSO | | $ | 9,178 | |
MSO2 | | | 3,008 | |
The Manager contractually agreed to waive its investment advisory fee with respect to any portion of each Trust’s assets invested in affiliated equity and fixed-income mutual funds and affiliated exchange-traded funds that have a contractual management fee through June 30, 2024. The agreement can be renewed for annual periods thereafter, and may be terminated on 90 days’ notice, each subject to approval by a majority of the Trusts’ Independent Trustees. These amounts are included in fees waived and/or reimbursed by the Manager in the Statements of Operations. For the year ended December 31, 2022, the amounts waived in investment advisory fees pursuant to these arrangements were as follows:
| | | | |
| Trust Name | | Fees Waived and/or Reimbursed
by the Manager | |
MSO | | $ | 24,525 | |
MSO2 | | | 11,729 | |
Trustees and Officers: Certain trustees and/or officers of the Trusts are directors and/or officers of BlackRock or its affiliates. The Trusts reimburse the Manager for a portion of the compensation paid to the Trusts’ Chief Compliance Officer, which is included in Trustees and Officer in the Statements of Operations.
Other Transactions: The Trusts may purchase securities from, or sell securities to, an affiliated fund provided the affiliation is due solely to having a common investment adviser, common officers, or common trustees. For the year ended December 31, 2022, the purchase and sale transactions and any net realized gains (losses) with affiliated funds in compliance with Rule 17a-7 under the 1940 Act were as follows:
| | | | | | | | | | | | |
| Trust Name | | Purchases | | | Sales | | | Net Realized
Gain (Loss) | |
MSO | | $ | 416,405 | | | $ | 2,900,024 | | | $ | (651,542 | ) |
MSO2 | | | 103,287 | | | | 1,443,699 | | | | (222,774 | ) |
| | |
| 62 | | 2 0 2 2 B L A C K R O C K A N N U A L R E P O R T T O S H A R E H O L D E R S |
Notes to Financial Statements (continued)
For the year ended December 31, 2022, purchases and sales of investments, including paydowns/payups and mortgage dollar rolls, excluding short-term securities, were as follows:
| | | | | | | | |
| Trust Name | | Purchases | | | Sales | |
MSO | | $ | 106,825,978 | | | $ | 204,934,504 | |
MSO2 | | | 42,424,868 | | | | 86,119,115 | |
For the year ended December 31, 2022, purchases and sales related to mortgage dollar rolls were as follows:
| | | | | | | | |
| Trust Name | | Purchases | | | Sales | |
MSO | | $ | 6,407,126 | | | $ | 6,408,635 | |
MSO2 | | | 2,173,626 | | | | 2,174,138 | |
It is each Trust’s policy to comply with the requirements of the Internal Revenue Code of 1986, as amended, applicable to regulated investment companies, and to distribute substantially all of its taxable income to its shareholders. Therefore, no U.S. federal income tax provision is required.
Each Trust files U.S. federal and various state and local tax returns. No income tax returns are currently under examination. The statute of limitations on each Trust’s U.S. federal tax returns generally remains open for a period of three years after they are filed. The statutes of limitations on each Trust’s state and local tax returns may remain open for an additional year depending upon the jurisdiction.
Management has analyzed tax laws and regulations and their application to the Trusts as of December 31, 2022, inclusive of the open tax return years, and does not believe that there are any uncertain tax positions that require recognition of a tax liability in the Trusts’ financial statements.
U.S. GAAP requires that certain components of net assets be adjusted to reflect permanent differences between financial and tax reporting. These reclassifications have no effect on net assets or NAVs per share. As of period end, permanent differences attributable to distributions paid in excess of taxable income were reclassified to the following accounts:
| | | | | | | | |
| Trust Name | | Paid-in Capital | | | Accumulated
Earnings (Loss) | |
MSO2 | | $ | 23,722 | | | $ | (23,722 | ) |
The tax character of distributions paid was as follows:
| | | | | | | | |
| Trust Name | | Year Ended
12/31/22 | | | Year Ended
12/31/21 | |
MSO | | | | | | | | |
Ordinary income | | $ | 19,467,423 | | | $ | 24,880,519 | |
Return of capital | | | 1,175,297 | | | | — | |
| | | | | | | | |
| | $ | 20,642,720 | | | $ | 24,880,519 | |
| | | | | | | | |
MSO2 | | | | | | | | |
Ordinary income | | $ | 8,272,966 | | | $ | 9,296,750 | |
Return of capital | | | — | | | | 108,369 | |
| | | | | | | | |
| | $ | 8,272,966 | | | $ | 9,405,119 | |
| | | | | | | | |
As of December 31, 2022, the tax components of accumulated earnings (loss) were as follows:
| | | | | | | | | | | | | | | | |
| Trust Name | | Non-Expiring
Capital Loss
Carryforwards(a) | | | Net Unrealized Gains (Losses)(b) | | | Qualified
Late-Year Losses(c) | | | Total | |
MSO | | $ | (70,737,501 | ) | | $ | (41,682,545 | ) | | $ | (2,104,730 | ) | | | $ (114,524,776 | ) |
MSO2 | | | (25,122,082 | ) | | | (13,316,548 | ) | | | (736,201 | ) | | | (39,174,831 | ) |
| | (a) | Amounts available to offset future realized capital gains. | |
| | (b) | The difference between book-basis and tax-basis net unrealized gains (losses) were attributable primarily to the tax deferral of losses on wash sales and straddles, the realization for tax purposes of unrealized gains/losses on certain futures and foreign currency contracts, the accounting for swap agreements, the accrual of income on securities in default, the classification of investments, and amortization methods for premiums on fixed income securities. | |
| | (c) | The Trust has elected to defer certain qualified late-year losses and recognize such losses in the next taxable year. | |
| | |
N O T E S T O F I N A N C I A L S T A T E M E N T S | | 63 |
Notes to Financial Statements (continued)
As of December 31, 2022, gross unrealized appreciation and depreciation based on cost of investments (including short positions and derivatives, if any) for U.S. federal income tax purposes were as follows:
| | | | | | | | | | | | | | | | |
| Trust Name | | Tax Cost | | | Gross Unrealized
Appreciation | | | Gross Unrealized
Depreciation | | | Net Unrealized
Appreciation
(Depreciation) | |
MSO | | $ | 264,516,642 | | | $ | 2,380,856 | | | $ | (43,919,455 | ) | | $ | (41,538,599 | ) |
MSO2 | | | 116,778,653 | | | | 1,255,645 | | | | (14,529,889 | ) | | | (13,274,244 | ) |
Each Trust is a party to an existing 364-day, $2.50 billion credit agreement with a group of lenders, along with certain other funds managed by the Manager and its affiliates (“Participating Funds”). Under this agreement, the Trusts may borrow to fund shareholder tender offers. Excluding commitments designated for certain individual funds, the Participating Funds, including the Trusts, can borrow up to an aggregate commitment amount of $1.75 billion at any time outstanding, subject to asset coverage and other limitations as specified in the agreement. The credit agreement has the following terms: a fee of 0.10% per annum on unused commitment amounts and interest at a rate equal to the higher of (a) one-month Overnight Bank Fund Rate (“OBFR”) (but, in any event, not less than 0.00%) on the date the loan is made plus 0.80% per annum, (b) the Fed Funds rate (but, in any event, not less than 0.00%) in effect from time to time plus 0.80% per annum on amounts borrowed or (c) the sum of (x) Daily Simple Secured Overnight Financing Rate (“SOFR”) (but, in any event, not less than 0.00%) on the date the loan is made plus 0.10% and (y) 0.80% per annum. The agreement expires in April 2023 unless extended or renewed. During the year ended December 31, 2022, the Trusts did not borrow under the credit agreement.
In the normal course of business, the Trusts invest in securities or other instruments and may enter into certain transactions, and such activities subject each Trust to various risks, including among others, fluctuations in the market (market risk) or failure of an issuer to meet all of its obligations. The value of securities or other instruments may also be affected by various factors, including, without limitation: (i) the general economy; (ii) the overall market as well as local, regional or global political and/or social instability; (iii) regulation, taxation or international tax treaties between various countries; or (iv) currency, interest rate and price fluctuations. Local, regional or global events such as war, acts of terrorism, the spread of infectious illness or other public health issues, recessions, or other events could have a significant impact on the Trusts and their investments.
MSO will terminate at the close of business on February 22, 2024; however, the Board may, without shareholder approval, extend the Termination Date by up to one year to a date on or before February 22, 2025. MSO2 will terminate at the close of business on February 28, 2025; however, the Board may, without shareholder approval, extend the Termination Date by up to one year to a date on or before February 28, 2026. Each Trust is not a target term fund and thus does not seek to return its initial public offering price of $100 per common share upon termination. The final distribution of net assets upon termination may be more than, equal to or less than $100 per common share. Because each Trust does not list its common shares on any securities exchange, an investment in the Trust, unlike an investment in a traditional listed closed-end fund, should be considered illiquid.
The Trusts may invest without limitation in illiquid or less liquid investments or investments in which no secondary market is readily available or which are otherwise illiquid, including private placement securities. The Trusts may not be able to readily dispose of such investments at prices that approximate those at which the Trusts could sell such investments if they were more widely traded and, as a result of such illiquidity, the Trusts may have to sell other investments or engage in borrowing transactions if necessary to raise funds to meet their obligations. Limited liquidity can also affect the market price of investments, thereby adversely affecting each Trust’s NAV and ability to make dividend distributions. Privately issued debt securities are often of below investment grade quality, frequently are unrated and present many of the same risks as investing in below investment grade public debt securities.
Market Risk: Each Trust may be exposed to prepayment risk, which is the risk that borrowers may exercise their option to prepay principal earlier than scheduled during periods of declining interest rates, which would force each Trust to reinvest in lower yielding securities. Each Trust may also be exposed to reinvestment risk, which is the risk that income from each Trust’s portfolio will decline if each Trust invests the proceeds from matured, traded or called fixed-income securities at market interest rates that are below each Trust portfolio’s current earnings rate.
Municipal securities are subject to the risk that litigation, legislation or other political events, local business or economic conditions, credit rating downgrades, or the bankruptcy of the issuer could have a significant effect on an issuer’s ability to make payments of principal and/or interest or otherwise affect the value of such securities. Municipal securities can be significantly affected by political or economic changes, including changes made in the law after issuance of the securities, as well as uncertainties in the municipal market related to, taxation, legislative changes or the rights of municipal security holders, including in connection with an issuer insolvency. Municipal securities backed by current or anticipated revenues from a specific project or specific assets can be negatively affected by the discontinuance of the tax benefits supporting the project or assets or the inability to collect revenues for the project or from the assets. Municipal securities may be less liquid than taxable bonds, and there may be less publicly available information on the financial condition of municipal security issuers than for issuers of other securities.
Infectious Illness Risk: An outbreak of an infectious illness, such as the COVID-19 pandemic, may adversely impact the economies of many nations and the global economy, and may impact individual issuers and capital markets in ways that cannot be foreseen. An infectious illness outbreak may result in, among other things, closed international borders, prolonged quarantines, supply chain disruptions, market volatility or disruptions and other significant economic, social and political impacts.
Valuation Risk: The market values of equities, such as common stocks and preferred securities or equity related investments, such as futures and options, may decline due to general market conditions which are not specifically related to a particular company. They may also decline due to factors which affect a particular industry or industries. A Trust may invest in illiquid investments. An illiquid investment is any investment that a Trust reasonably expects cannot be sold or disposed of in current market conditions in seven calendar days or less without the sale or disposition significantly changing the market value of the investment. A Trust may experience difficulty in selling illiquid
| | |
| 64 | | 2 0 2 2 B L A C K R O C K A N N U A L R E P O R T T O S H A R E H O L D E R S |
Notes to Financial Statements (continued)
investments in a timely manner at the price that it believes the investments are worth. Prices may fluctuate widely over short or extended periods in response to company, market or economic news. Markets also tend to move in cycles, with periods of rising and falling prices. This volatility may cause each Trust’s NAV to experience significant increases or decreases over short periods of time. If there is a general decline in the securities and other markets, the NAV of a Trust may lose value, regardless of the individual results of the securities and other instruments in which a Trust invests.
The price a Trust could receive upon the sale of any particular portfolio investment may differ from a Trust’s valuation of the investment, particularly for securities that trade in thin or volatile markets or that are valued using a fair valuation technique or a price provided by an independent pricing service. Changes to significant unobservable inputs and assumptions (i.e., publicly traded company multiples, growth rate, time to exit) due to the lack of observable inputs may significantly impact the resulting fair value and therefore a Trust’s results of operations. As a result, the price received upon the sale of an investment may be less than the value ascribed by a Trust, and a Trust could realize a greater than expected loss or lesser than expected gain upon the sale of the investment. A Trust’s ability to value its investments may also be impacted by technological issues and/or errors by pricing services or other third-party service providers.
Counterparty Credit Risk: The Trusts may be exposed to counterparty credit risk, or the risk that an entity may fail to or be unable to perform on its commitments related to unsettled or open transactions, including making timely interest and/or principal payments or otherwise honoring its obligations. The Trusts manage counterparty credit risk by entering into transactions only with counterparties that the Manager believes have the financial resources to honor their obligations and by monitoring the financial stability of those counterparties. Financial assets, which potentially expose the Trusts to market, issuer and counterparty credit risks, consist principally of financial instruments and receivables due from counterparties. The extent of the Trusts’ exposure to market, issuer and counterparty credit risks with respect to these financial assets is approximately their value recorded in the Statements of Assets and Liabilities, less any collateral held by the Trusts.
A derivative contract may suffer a mark-to-market loss if the value of the contract decreases due to an unfavorable change in the market rates or values of the underlying instrument. Losses can also occur if the counterparty does not perform under the contract.
For OTC options purchased, each Trust bears the risk of loss in the amount of the premiums paid plus the positive change in market values net of any collateral held by the Trusts should the counterparty fail to perform under the contracts. Options written by the Trusts do not typically give rise to counterparty credit risk, as options written generally obligate the Trusts, and not the counterparty, to perform. The Trusts may be exposed to counterparty credit risk with respect to options written to the extent each Trust deposits collateral with its counterparty to a written option.
With exchange-traded options purchased and exchange-traded futures and centrally cleared swaps, there is less counterparty credit risk to the Trusts since the exchange or clearinghouse, as counterparty to such instruments, guarantees against a possible default. The clearinghouse stands between the buyer and the seller of the contract; therefore, credit risk is limited to failure of the clearinghouse. While offset rights may exist under applicable law, a Trust does not have a contractual right of offset against a clearing broker or clearinghouse in the event of a default (including the bankruptcy or insolvency). Additionally, credit risk exists in exchange-traded options purchased and exchange-traded futures and centrally cleared swaps with respect to initial and variation margin that is held in a clearing broker’s customer accounts. While clearing brokers are required to segregate customer margin from their own assets, in the event that a clearing broker becomes insolvent or goes into bankruptcy and at that time there is a shortfall in the aggregate amount of margin held by the clearing broker for all its clients, typically the shortfall would be allocated on a pro rata basis across all the clearing broker’s customers, potentially resulting in losses to the Trusts.
Concentration Risk: A diversified portfolio, where this is appropriate and consistent with a fund’s objectives, minimizes the risk that a price change of a particular investment will have a material impact on the NAV of a fund. The investment concentrations within each Trust’s portfolio are disclosed in its Schedule of Investments.
Certain Trusts invest a significant portion of their assets in high yield securities. High yield securities that are rated below investment-grade (commonly referred to as “junk bonds”) or are unrated may be deemed speculative, involve greater levels of risk than higher-rated securities of similar maturity and are more likely to default. High yield securities may be issued by less creditworthy issuers, and issuers of high yield securities may be unable to meet their interest or principal payment obligations. High yield securities are subject to extreme price fluctuations, may be less liquid than higher rated fixed-income securities, even under normal economic conditions, and frequently have redemption features.
Certain Trusts invest a significant portion of their assets in fixed-income securities and/or use derivatives tied to the fixed-income markets. Changes in market interest rates or economic conditions may affect the value and/or liquidity of such investments. Interest rate risk is the risk that prices of bonds and other fixed-income securities will decrease as interest rates rise and increase as interest rates fall. The Trusts may be subject to a greater risk of rising interest rates due to the recent period of historically low interest rates. The Federal Reserve has recently begun to raise the federal funds rate as part of its efforts to address inflation. There is a risk that interest rates will continue to rise, which will likely drive down the prices of bonds and other fixed-income securities, and could negatively impact the Trusts’ performance.
Certain Trusts invest a significant portion of their assets in securities backed by commercial or residential mortgage loans or in issuers that hold mortgage and other asset-backed securities. When a Trust concentrates its investments in this manner, it assumes a greater risk of prepayment or payment extension by securities issuers. Changes in economic conditions, including delinquencies and/or defaults on assets underlying these securities, can affect the value, income and/or liquidity of such positions. Investment percentages in these securities are presented in the Schedules of Investments.
LIBOR Transition Risk: The United Kingdom’s Financial Conduct Authority announced a phase out of the LIBOR. Although many LIBOR rates ceased to be published or no longer are representative of the underlying market they seek to measure after December 31, 2021, a selection of widely used USD LIBOR rates will continue to be published through June 2023 in order to assist with the transition. The Trusts may be exposed to financial instruments tied to LIBOR to determine payment obligations, financing terms, hedging strategies or investment value. The transition process away from LIBOR might lead to increased volatility and illiquidity in markets for, and reduce the effectiveness of new hedges placed against instruments whose terms currently include LIBOR. The ultimate effect of the LIBOR transition process on the Trusts is uncertain.
| | |
N O T E S T O F I N A N C I A L S T A T E M E N T S | | 65 |
Notes to Financial Statements (continued)
| 11. | CAPITAL SHARE TRANSACTIONS |
Each Trust is authorized to issue an unlimited number of shares, all of which were initially classified as Common Shares. Each Board is authorized, however, to reclassify any unissued Common Shares to Preferred Shares without the approval of Common Shareholders.
With respect to MSO, for the year ended December 31, 2022, common shares issued and outstanding had a net decrease of 538,147 as a result of 36,569 shares issued from dividend reinvestment and 574,716 shares repurchased in tender offers. For the period ended December 31, 2021, common shares issued and outstanding had a net decrease of 352,700 as a result of 44,414 shares issued from dividend reinvestment and 397,114 shares repurchased in tender offers.
With respect to MSO2, for the year ended December 31, 2022, common shares issued and outstanding had a net decrease of 215,557 as a result of 60,347 shares issued from dividend reinvestment and 275,904 shares repurchased in tender offers. For the period ended December 31, 2021, common shares issued and outstanding had a net decrease of 103,615 as a result of 49,167 shares issued from dividend reinvestment and 152,782 shares repurchased in tender offers.
Each Trust intends, but is not obligated, to conduct quarterly tender offers for up to 5% of the common shares then outstanding in the sole discretion of its Board until it adopts a plan of liquidation. In a tender offer, each Trust repurchases outstanding common shares at its NAV on the valuation date for the tender offer. In any given year, the Advisor may or may not recommend to the Board that a Trust conduct tender offers.
Accordingly, there may be years in which no tender offer is made. Therefore, common shares will not be redeemable at an investor’s option nor will they be exchangeable for shares of any other trust.
With respect to MSO, tender offers for the year ended December 31, 2022 were as follows:
| | | | | | | | | | | | | | | | | | | | | | | | | | | | |
| | | | | | | | |
Commencement
Date of Tender
Offer Period(a) | | Valuation
Date | | | Number of Shares
Tendered | | | Tendered Shares
as a Percentage of
Outstanding Shares | | | Number of Tendered
Shares
Purchased | | | Tendered Shares
Purchased
as a Percentage of
Outstanding Shares | | | Purchase Price | | | Total Amount of
Purchases | |
January 7, 2022 | | | February 7, 2022 | | | | 149,010 | | | | 4.0 | % | | | 149,010 | | | | 4.0 | % | | | $82.1200 | | | | $12,236,702 | |
April 8, 2022 | | | May 9, 2022 | | | | 225,663 | | | | 6.2 | | | | 180,702 | | | | 5.0 | | | | 74.6900 | | | | 13,496,632 | |
July 8, 2022 | | | August 9, 2022 | | | | 116,018 | | | | 3.4 | | | | 116,018 | | | | 3.4 | | | | 71.6300 | | | | 8,310,369 | |
October 7, 2022 | | | November 8, 2022 | | | | 128,986 | | | | 3.9 | | | | 128,986 | | | | 3.9 | | | | 66.5900 | | | | 8,589,178 | |
| | | | | | | | | | | | | | | | | | | | | | | | | | | | |
| | | | | | | | |
Commencement
Date of Tender
Offer Period(a) | | Valuation
Date | | | Number of Shares
Tendered | | | Tendered Shares
as a Percentage of
Outstanding Shares | | | Number of Tendered
Shares
Purchased | | | Tendered Shares
Purchased
as a Percentage of
Outstanding Shares | | | Purchase Price | | | Total Amount of
Purchases | |
January 8, 2021 | | | February 8, 2021 | | | | 164,362 | | | | 4.0 | % | | | 102,661 | | | | 2.5 | % | | | $89.1600 | | | | $9,153,256 | |
April 9, 2021 | | | May 10, 2021 | | | | 155,811 | | | | 3.9 | | | | 100,379 | | | | 2.5 | | | | 89.6500 | | | | 8,998,977 | |
July 9, 2021 | | | August 25, 2021 | | | | 131,180 | | | | 3.4 | | | | 98,133 | | | | 2.5 | | | | 89.4600 | | | | 8,778,977 | |
October 8, 2021 | | | November 9, 2021 | | | | 109,042 | | | | 2.9 | | | | 95,941 | | | | 2.5 | | | | 86.1500 | | | | 8,265,317 | |
| | (a) | Date the tender offer period began. | |
With respect to MSO2, tender offers for the year ended December 31, 2022 were as follows:
| | | | | | | | | | | | | | | | | | | | | | | | | | | | |
| | | | | | | | |
Commencement
Date of Tender
Offer Period(a) | | Valuation
Date | | | Number of Shares
Tendered | | | Tendered Shares
as a Percentage of
Outstanding Shares | | | Number of Tendered
Shares
Purchased | | | Tendered Shares
Purchased
as a Percentage of
Outstanding Shares | | | Purchase Price | | | Total Amount of
Purchases | |
January 7, 2022 | | | February 7, 2022 | | | | 195,090 | | | | 13.3 | % | | | 73,217 | | | | 5.0 | % | | | $85.2000 | | | | $6,238,115 | |
April 8, 2022 | | | May 9, 2022 | | | | 169,160 | | | | 12.0 | | | | 70,252 | | | | 5.0 | | | | 77.7400 | | | | 5,461,395 | |
July 8, 2022 | | | August 9, 2022 | | | | 121,244 | | | | 9.0 | | | | 67,509 | | | | 5.0 | | | | 74.1000 | | | | 5,002,393 | |
October 7, 2022 | | | November 8, 2022 | | | | 68,843 | | | | 5.3 | | | | 64,926 | | | | 5.0 | | | | 68.4700 | | | | 4,445,479 | |
| | | | | | | | | | | | | | | | | | | | | | | | | | | | |
| | | | | | | | |
Commencement
Date of Tender
Offer Period(a) | | Valuation
Date | | | Number of Shares
Tendered | | | Tendered Shares
as a Percentage of
Outstanding Shares | | | Number of Tendered
Shares
Purchased | | | Tendered Shares
Purchased
as a Percentage of
Outstanding Shares | | | Purchase Price | | | Total Amount of
Purchases | |
January 8, 2021 | | | February 8, 2021 | | | | 262,893 | | | | 16.8 | % | | | 39,197 | | | | 2.5 | % | | | $91.9500 | | | | $3,604,198 | |
April 9, 2021 | | | May 10, 2021 | | | | 217,341 | | | | 14.1 | | | | 38,513 | | | | 2.5 | | | | 92.6100 | | | | 3,566,673 | |
July 9, 2021 | | | August 25, 2021 | | | | 205,045 | | | | 13.5 | | | | 37,851 | | | | 2.5 | | | | 92.3200 | | | | 3,494,425 | |
October 8, 2021 | | | November 9, 2021 | | | | 191,535 | | | | 12.9 | | | | 37,221 | | | | 2.5 | | | | 89.3600 | | | | 3,326,034 | |
| | (a) | Date the tender offer period began. | |
Tendered share amounts are shown as repurchase of shares resulting from tender offers in the Statements of Changes in Net Assets.
As of December 31, 2022, BlackRock Financial Management, Inc., an affiliate of MSO2, owned 1,333 shares of MSO2.
| | |
| 66 | | 2 0 2 2 B L A C K R O C K A N N U A L R E P O R T T O S H A R E H O L D E R S |
Notes to Financial Statements (continued)
Management’s evaluation of the impact of all subsequent events on the Trusts’ financial statements was completed through the date the financial statements were issued and the following items were noted:
MSO and MSO2 each commenced a quarterly tender offer on January 9, 2023 for up to 5% of its issued and outstanding common shares. The expiration date of each tender offer is February 8, 2023, unless otherwise extended.
The results of MSO’s tender offer were as follows:
| | | | | | | | | | | | | | | | | | | | | | | | | | | | |
| | | | | | | | |
Commencement
Date of Tender
Offer Period(a) | | Valuation
Date | | | Number of Shares
Tendered | | | Tendered Shares
as a Percentage of
Outstanding Shares | | | Number of Tendered
Shares to be
Purchased | | | Tendered Shares to be
Purchased
as a Percentage of
Outstanding Shares | | | Purchase Price | | | Total Amount of
Purchases | |
January 9, 2023 | | | February 8, 2023 | | | | 120,766 | | | | 3.8 | % | | | 120,766 | | | | 3.8 | % | | | $68.9900 | | | | $8,331,646 | |
| | (a) | Date the tender offer period began. | |
The results of MSO2’s tender offer were as follows:
| | | | | | | | | | | | | | | | | | | | | | | | | | | | |
| | | | | | | | |
Commencement
Date of Tender
Offer Period(a) | | Valuation
Date | | | Number of Shares
Tendered | | | Tendered Shares
as a Percentage of
Outstanding Shares | | | Number of Tendered
Shares to be
Purchased | | | Tendered Shares to be
Purchased
as a Percentage of
Outstanding Shares | | | Purchase Price | | | Total Amount of
Purchases | |
January 9, 2023 | | | February 8, 2023 | | | | 52,630 | | | | 4.2 | % | | | 52,630 | | | | 4.2 | % | | | $72.1300 | | | | $3,796,234 | |
| | (a) | Date the tender offer period began. | |
As a result of MSO2’s tender offer that was completed on February 8, 2023, MSO2 shares are held by fewer than 500 persons. As a result, MSO2 will not be treated as a “publicly offered regulated investment company” for the taxable year ending December 31, 2023. Refer to Additional Information section for further information.
| | |
N O T E S T O F I N A N C I A L S T A T E M E N T S | | 67 |
Report of Independent Registered Public Accounting Firm
To the Shareholders and the Board of Trustees of BlackRock Multi-Sector Opportunities Trust and BlackRock Multi-Sector Opportunities Trust II:
Opinion on the Financial Statements and Financial Highlights
We have audited the accompanying statements of assets and liabilities of BlackRock Multi-Sector Opportunities Trust and BlackRock Multi-Sector Opportunities Trust II (the “Funds”), including the schedules of investments, as of December 31, 2022, the related statements of operations and cash flows for the year then ended, the statements of changes in net assets for each of the two years in the period then ended and the financial highlights for the periods indicated in the table below, and the related notes. In our opinion, the financial statements and financial highlights present fairly, in all material respects, the financial position of the Funds as of December 31, 2022, and the results of their operations and their cash flows for the year then ended, the changes in their net assets for each of the two years in the period then ended, and the financial highlights for the periods indicated in the table below, in conformity with accounting principles generally accepted in the United States of America.
| | |
| | |
| Fund | | Financial Highlights |
BlackRock Multi-Sector Opportunities Trust | | For each of the four years in the period ended December 31, 2022 and for the period from February 23, 2018 (commencement of operations) through December 31, 2018 |
BlackRock Multi-Sector Opportunities Trust II | | For the three years in the period ended December 31, 2022 and for the period from April 16, 2019 (commencement of operations) through December 31, 2019 |
Basis for Opinion
These financial statements and financial highlights are the responsibility of the Funds’ management. Our responsibility is to express an opinion on the Funds’ financial statements and financial highlights based on our audits. We are a public accounting firm registered with the Public Company Accounting Oversight Board (United States) (PCAOB) and are required to be independent with respect to the Funds in accordance with the U.S. federal securities laws and the applicable rules and regulations of the Securities and Exchange Commission and the PCAOB.
We conducted our audits in accordance with the standards of the PCAOB. Those standards require that we plan and perform the audit to obtain reasonable assurance about whether the financial statements and financial highlights are free of material misstatement, whether due to error or fraud. The Funds are not required to have, nor were we engaged to perform, an audit of their internal control over financial reporting. As part of our audits we are required to obtain an understanding of internal control over financial reporting but not for the purpose of expressing an opinion on the effectiveness of the Funds’ internal control over financial reporting. Accordingly, we express no such opinion.
Our audits included performing procedures to assess the risks of material misstatement of the financial statements and financial highlights, whether due to error or fraud, and performing procedures that respond to those risks. Such procedures included examining, on a test basis, evidence regarding the amounts and disclosures in the financial statements and financial highlights. Our audits also included evaluating the accounting principles used and significant estimates made by management, as well as evaluating the overall presentation of the financial statements and financial highlights. Our procedures included confirmation of securities owned as of December 31, 2022, by correspondence with custodians or counterparties; when replies were not received, we performed other auditing procedures. We believe that our audits provide a reasonable basis for our opinion.
Deloitte & Touche LLP
Boston, Massachusetts
February 23, 2023
We have served as the auditor of one or more BlackRock investment companies since 1992.
| | |
| 68 | | 2 0 2 2 B L A C K R O C K A N N U A L R E P O R T T O S H A R E H O L D E R S |
| | |
| Important Tax Information (unaudited) | | |
The following amounts, or maximum amounts allowable by law, are hereby designated as qualified dividend income for individuals for the fiscal year ended December 31, 2022:
| | | | |
| | |
| Trust Name | | Qualified Dividend
Income | |
| |
MSO | | $ | 737,606 | |
MSO2 | | | 340,582 | |
The Trusts hereby designate the following amounts, or maximum amounts allowable by law, as interest income eligible to be treated as a Section 163(j) interest dividend for the fiscal year ended December 31, 2022:
| | | | |
| | |
| Trust Name | | Interest
Dividends | |
| |
MSO | | $ | 14,199,402 | |
MSO2 | | | 6,043,399 | |
The Trusts hereby designate the following amounts, or maximum amounts allowable by law, as interest-related dividends eligible for exemption from U.S. withholding tax for nonresident aliens and foreign corporations for the fiscal year ended December 31, 2022:
| | | | |
| | |
| Trust Name | | Interest
Related
Dividends | |
| |
MSO | | $ | 6,538,401 | |
MSO2 | | | 3,225,535 | |
| | |
I M P O R T A N T T A X I N F O R M A T I O N | | 69 |
Investment Objectives, Policies and Risks
Recent Changes
The following information is a summary of certain changes since December 31, 2021.This information may not reflect all of the changes that have occurred since you purchased the relevant Trust.
Effective April 16, 2022, BlackRock Multi-Sector Opportunities Trust II’s (MSO II) classification changed from non-diversified to diversified.
Except as noted above, during each Trust’s most recent fiscal year, there were no material changes in the Trust’s investment objectives or policies that have not been approved by shareholders or in the principal risk factors associated with investment in the Trust.
Investment Objectives and Policies
BlackRock Multi-Sector Opportunities Trust (MSO)
The Trust’s investment objective is to seek to provide high income and total return. The Trust’s investment objective may be changed by the Board of Trustees of the Trust (the “Board”) without prior shareholder approval.
In accordance with the Trust’s Agreement and Declaration of Trust, the Trust will terminate at the close of business on February 22, 2024, the sixth anniversary of the Trust’s initial public offering (the “Termination Date”). The Board may terminate the Trust, without shareholder approval, prior to the Termination Date. The Board may also, without shareholder approval, extend the Termination Date by up to one year to a date on or before February 22, 2025, the seventh anniversary of the Trust’s initial public offering, which date shall then become the Termination Date.
Under normal conditions, the Trust will invest at least 80% of its total assets in fixed income securities and other financial instruments that pay periodic income. Fixed income securities may be of any type, including those with fixed, floating or variable interest rates, those with interest rates that change based on multiples of changes in a specified reference interest rate or index of interest rates and those with interest rates that change inversely to changes in interest rates, as well as those that do not bear interest. The Trust may hold securities of any duration or maturity and does not maintain set policies with respect to the average duration or maturity of the Trust’s portfolio. The Trust may invest in U.S. dollar and non-U.S. dollar denominated securities of issuers located anywhere in the world, including issuers located in emerging market countries, and of issuers that operate in any industry. The Trust may invest directly in securities or synthetically through the use of derivatives.
The Trust may invest in a broad range of debt and equity instruments and sectors and strategies to achieve its investment objective, including, but not limited to, second lien or other subordinated or unsecured floating rate and fixed loans or debt, loans and loan participations, including senior secured floating rate and fixed rate loans or debt, whole loans (including whole loan mortgages), bridge loans, convertible securities, debtor-in-possession financing, bank loans, private mortgage loans, non-performing loans, real estate debt, pay-in-kind bonds, asset-backed lending/securities, including asset-backed securities, commercial mortgage-backed securities, residential mortgage-backed securities and leases, collateralized debt obligations, which include collateralized bond obligations, collateralized loan obligations and other similarly structured products, structured notes, global bonds, sovereign debt, U.S. Government and agency securities, municipal securities, post-reorganization/restructured equities, distressed debt (including corporate loans, real estate loans and structured finance), trade claims, equity investments associated with corporate restructurings, equity (both long and short positions), preferred equity, equity-like and debt-like instruments, credit default swaps, credit linked notes and other over-the-counter derivative instruments. In addition, the Trust may invest in mortgage servicing rights (“MSRs”), including the rights to the cash flows payable to the actual mortgage servicer of a pool of mortgage loans to the extent such cash flows do not exceed a reasonable amount of consideration for normal servicing activities (“Normal MSRs”) and the rights to any amount of cash flows in excess of Normal MSRs, as well as other investments related to MSRs. Furthermore, the Trust may invest in the debt and equity (both long and short positions) of issuers involved in the origination of residential or commercial real estate mortgages or other consumer loans, including acquiring all or substantially all of the equity of a mortgage or loan origination business. The Trust may make direct loans and engage in direct lending. The Trust may also invest directly in physical assets, including but not limited to real estate, aviation assets, maritime assets and commodities.
The Trust intends to invest across multiple sectors and employ multiple strategies. BlackRock Advisors, LLC (the “Manager”), BlackRock International Limited (“BIL”) and BlackRock (Singapore) Limited (collectively with BIL and the Manager, the “Advisors”) have the flexibility to allocate the Trust’s assets across various segments of the securities markets and may focus on particular countries, regions, asset classes and sectors to the exclusion of others at any time and from time to time. One strategy the Trust intends to employ is an opportunistic strategy, which seeks to invest in special situations, including private opportunistic investments, that the Advisors believe present the greatest potential for increased yield and capital appreciation. While any permitted investment could be characterized within this opportunistic portion of the Trust’s strategy based on its individual characteristics, the Trust expects that the following types of investments are most likely to fall within the opportunistic portion of its investment strategy: less liquid investments with a weighted average life of three to five years that, in the Advisors’ view, have a potentially higher return profile than the more liquid portions of the Trust’s portfolio. The Trust may, however, hold assets with a weighted average life longer than five years. While the amount of the Trust’s assets that may be allocated to these opportunistic investments is expected to vary over time, the Advisors currently anticipate allocating approximately 10-40% of the Trust’s assets to these types of investments. The Trust also expects to employ a value investing strategy, which typically involves buying securities that the Advisors believe are currently undervalued by the market and thus have a lower price than their true worth. The Trust’s allocation of its investments across various segments of the securities markets and various countries, regions, asset classes, strategies and sectors may vary significantly over time based on the Advisors’ analysis and judgment.
The Trust intends to limit investments in illiquid securities in the opportunistic portion of its portfolio if, immediately after the investment, the expected aggregate cash flows (e.g., interest and principal) representing the dollar amount (i.e., original capital) invested in such illiquid securities that would be paid beyond the seventh anniversary of the Trust’s initial public offering, as projected by the Manager, would exceed 5% of the Trust’s total assets; provided, however, the Manager may exceed this amount if approved by a majority of the Board (or a designated committee of Trustees who are not “interested persons” (as defined in the Investment Company Act of 1940, as amended (the “1940 Act”), of the Trust). To this end, at the time of making any illiquid investment in the opportunistic portion of the Trust’s portfolio, the Manager will consider the then projected timing and amounts of cash flows anticipated by the Manager to be received by the Trust from such illiquid investment. There is no guarantee, however, that a shareholder’s investment in the Trust will not lose money or that the Trust will not return less over the life of the Trust than such shareholders initial investment. In addition, the Manager’s cash flow projections will depend on modeling, estimates and judgments made by the Manager at the time of investment, concerning a number of factors that are
| | |
| 70 | | 2 0 2 2 B L A C K R O C K A N N U A L R E P O R T T O S H A R E H O L D E R S |
Investment Objectives, Policies and Risks (continued)
Investment Objectives and Policies (continued)
not possible to precisely predict. In the event that any of these models, estimates or judgments turn out to be incorrect, the timing and amount of anticipated cash flows to the Trust may be substantially different from the Manager’s projections at the time of investment. Further, a substantial and unexpected increase in market interest rates or a decline in economic conditions, as well as other factors, may materially adversely affect the accuracy of these projections. There is no limit on the maturity or duration of securities in which the Trust may invest. There is always the risk that substantial portions of Trust assets will not be available for distribution on or before the seventh anniversary of the Trust’s public offering, if at all.
The Trust may also invest in privately placed or restricted securities (including in Rule 144A securities, which are privately placed securities purchased by qualified institutional buyers), illiquid investments and investments in which no secondary market is readily available, including those of private companies.
The Trust may invest any amount of its assets in securities of any credit quality, including securities that are rated at the time of investment below investment grade—i.e., “Ba” or “BB” or below by Moody’s Investor’s Service, Inc., S&P Global Ratings or Fitch Ratings, Inc. or securities that are judged to be of comparable quality by the Advisors. Securities of below investment grade quality are regarded as having predominantly speculative characteristics with respect to the issuer’s capacity to pay interest and repay principal, and are commonly referred to as “junk bonds” or “high yield securities.” In the case of securities with split ratings (i.e., a security receiving two different ratings from two different rating agencies), the Trust will apply the higher of the applicable ratings.
The Trust may enter into any type of derivatives transaction. The Trust may purchase and sell futures contracts, enter into various interest rate transactions such as swaps, caps, floors or collars, currency transactions such as currency forward contracts, currency futures contracts, currency swaps or options on currency or currency futures and swap contracts (including, but not limited to, credit default swaps index products, credit default swaps, total return swaps and interest rate swaps) and may purchase and sell exchange-listed and off-exchange (“over-the-counter” or “OTC”) put and call options on securities and swap contracts, financial indices and futures contracts and use other derivative instruments or management techniques (collectively, “Strategic Transactions”). The Trust may use Strategic Transactions for hedging purposes or to enhance total return. Additionally, the Trust may enter into any type of Strategic Transaction for the purpose or effect of creating investment leverage to the maximum extent permitted by the SEC and/or SEC staff rules, guidance or positions.
If the Manager determines it to be appropriate or necessary, the Trust may form one or more wholly owned subsidiaries in one or more jurisdictions (each, a “Subsidiary,” and together, the “Subsidiaries”), each of which would be treated as a corporation for U.S. federal income tax purposes. Any Subsidiary will share the same portfolio management team as the Trust. The Trust may invest either directly or indirectly through the Subsidiaries. The Trust may invest an aggregate of up to 25% of its total assets in Subsidiaries. The Trust typically expects to invest indirectly through the Subsidiaries if it believes it is desirable to do so to comply with the requirements for qualification as a RIC under the Code. Any Subsidiary organized in the United States will generally be subject to U.S. federal income tax at corporate rates. The Subsidiaries will not be registered under the 1940 Act and will not be subject to the investor protections of the 1940 Act. The Subsidiaries will be advised or managed by the Manager and have the same investment objective as the Trust. The Manager, however, will not receive an additional management fee for any services provided to any Subsidiary. The Trust will look through any Subsidiaries for purposes of compliance with its investment policies and the applicable provisions of the 1940 Act relating to capital structure, affiliated transactions and custody.
The Trust may also invest in securities of other affiliated and unaffiliated open- or closed-end investment companies, including exchange-traded funds and business development companies, subject to applicable regulatory limits, that invest primarily in securities the types of which the Trust may invest in directly. The Trust will classify its investments in such investment companies for purposes of its investment policies based upon such investment companies’ stated investment objectives, policies and restrictions.
Unless otherwise stated herein, the Trust’s investment policies are non-fundamental policies and may be changed by the Board without prior shareholder approval. Unless otherwise expressly stated herein, or otherwise required by applicable law, all percentage and ratings or credit quality limitations stated herein apply only at the time of investment and subsequent changes in percentage (including changes resulting from the Trust having a smaller base of assets after a tender offer), value, ratings downgrades, liquidity profile or changes in credit quality will not result in the Trust being required to dispose of any portfolio security.
Leverage
The Trust will use leverage to seek to achieve its investment objective. The Trust’s use of leverage may increase or decrease from time to time in its discretion and the Trust may, in the future, determine not to use leverage. The Trust may use leverage by investing in reverse repurchase agreements or other derivative instruments with leverage embedded in them, by borrowing funds from banks or other financial institutions and/or by issuing preferred shares.
The Trust may enter into dollar roll transactions.
The Trust, along with certain other funds managed by the Manager and its affiliates, is party to a credit agreement under which it may borrow to fund shareholder tender offers. The Trust may also borrow money as a temporary measure for extraordinary or emergency purposes, including the payment of dividends and the settlement of securities transactions which otherwise might require untimely dispositions of Trust securities.
BlackRock Multi-Sector Opportunities Trust II (MSO II)
The Trust’s investment objective is to seek to provide high income and total return. The Trust’s investment objective may be changed by the Board of Trustees of the Trust (the “Board”) without prior shareholder approval.
In accordance with the Trust’s Agreement and Declaration, the Trust will terminate at the close of business on February 28, 2025 (the “Termination Date”). The Board may terminate the Trust, without shareholder approval, prior to the Termination Date. The Board may also, without shareholder approval, extend the Termination Date by up to one year to a date on or before February 28, 2026, which date shall then become the Termination Date.
| | |
I N V E S T M E N T O B J E C T I V E S , P O L I C I E S A N D R I S K S | | 71 |
Investment Objectives, Policies and Risks (continued)
Investment Objectives and Policies (continued)
Under normal conditions, the Trust will invest at least 80% of its total assets in fixed income securities and other financial instruments that pay periodic income. Fixed income securities may be of any type, including those with fixed, floating or variable interest rates, those with interest rates that change based on multiples of changes in a specified reference interest rate or index of interest rates and those with interest rates that change inversely to changes in interest rates, as well as those that do not bear interest. The Trust may hold securities of any duration or maturity and does not maintain set policies with respect to the average duration or maturity of the Trust’s portfolio. The Trust may invest in U.S. dollar and non-U.S. dollar denominated securities of issuers located anywhere in the world, including issuers located in emerging market countries, and of issuers that operate in any industry. The Trust may invest directly in securities or synthetically through the use of derivatives.
The Trust may invest in a broad range of debt and equity instruments and sectors and strategies to achieve its investment objective, including, but not limited to, second lien or other subordinated or unsecured floating rate and fixed loans or debt, loans and loan participations, including senior secured floating rate and fixed rate loans or debt, whole loans (including whole loan mortgages), bridge loans, convertible securities, debtor-in-possession financing, bank loans, private mortgage loans, non-performing loans, real estate debt, pay-in-kind bonds, asset-backed lending/securities, including asset-backed securities, commercial mortgage-backed securities, residential mortgage-backed securities and leases, collateralized debt obligations, which include collateralized bond obligations, collateralized loan obligations and other similarly structured products, structured notes, global bonds, sovereign debt, U.S. Government and agency securities, municipal securities, post-reorganization/restructured equities, distressed debt (including corporate loans, real estate loans and structured finance), trade claims, equity investments associated with corporate restructurings, equity (both long and short positions), preferred equity, equity-like and debt-like instruments, credit default swaps, credit linked notes and other over-the-counter derivative instruments. In addition, the Trust may invest in mortgage servicing rights (“MSRs”), including the rights to the cash flows payable to the actual mortgage servicer of a pool of mortgage loans to the extent such cash flows do not exceed a reasonable amount of consideration for normal servicing activities (“Normal MSRs”) and the rights to any amount of cash flows in excess of Normal MSRs, as well as other investments related to MSRs. Furthermore, the Trust may invest in the debt and equity (both long and short positions) of issuers involved in the origination of residential or commercial real estate mortgages or other consumer loans, including acquiring all or substantially all of the equity of a mortgage or loan origination business. The Trust may make direct loans and engage in direct lending. The Trust may also invest directly in physical assets, including but not limited to real estate, aviation assets, maritime assets and commodities.
The Trust intends to invest across multiple sectors and employ multiple strategies. BlackRock Advisors, LLC (the “Manager”), BlackRock International Limited (“BIL”) and BlackRock (Singapore) Limited (collectively with BIL and the Manager, the “Advisors”) have the flexibility to allocate the Trust’s assets across various segments of the securities markets and may focus on particular countries, regions, asset classes and sectors to the exclusion of others at any time and from time to time. One strategy the Trust intends to employ is an opportunistic strategy, which seeks to invest in special situations, including private opportunistic investments, that the Advisors believe present the greatest potential for increased yield and capital appreciation. While any permitted investment could be characterized within this opportunistic portion of the Trust’s strategy based on its individual characteristics, the Trust expects that the following types of investments are most likely to fall within the opportunistic portion of its investment strategy: less liquid investments with a weighted average life of three to five years that, in the Advisors’ view, have a potentially higher return profile than the more liquid portions of the Trust’s portfolio. The Trust may, however, hold assets with a weighted average life longer than five years. While the amount of the Trust’s assets that may be allocated to these opportunistic investments is expected to vary over time, the Advisors currently anticipate allocating approximately 10-40% of the Trust’s assets to these types of investments. The Trust also expects to employ a value investing strategy, which typically involves buying securities that the Advisors believe are currently undervalued by the market and thus have a lower price than their true worth. The Trust’s allocation of its investments across various segments of the securities markets and various countries, regions, asset classes, strategies and sectors may vary significantly over time based on the Advisors’ analysis and judgment.
There is no guarantee that a shareholder’s investment in the Trust will not lose money or that the Trust will not return less over the life of the Trust than such shareholders initial investment. There is no limit on the maturity or duration of securities in which the Trust may invest. There is always the risk that substantial portions of Trust assets will not be available for distribution on or before the seventh anniversary of the public offering, if at all.
The Trust may also invest in privately placed or restricted securities (including in Rule 144A securities, which are privately placed securities purchased by qualified institutional buyers), illiquid investments and investments in which no secondary market is readily available, including those of private companies.
The Trust may invest any amount of its assets in securities of any credit quality, including securities that are rated at the time of investment below investment grade—i.e., “Ba” or “BB” or below by Moody’s Investor’s Service, Inc., S&P Global Ratings or Fitch Ratings, Inc. or securities that are judged to be of comparable quality by the Advisors. Securities of below investment grade quality are regarded as having predominantly speculative characteristics with respect to the issuer’s capacity to pay interest and repay principal, and are commonly referred to as “junk bonds” or “high yield securities.” In the case of securities with split ratings (i.e., a security receiving two different ratings from two different rating agencies), the Trust will apply the higher of the applicable ratings.
The Trust may enter into any type of derivatives transaction. The Trust may purchase and sell futures contracts, enter into various interest rate transactions such as swaps, caps, floors or collars, currency transactions such as currency forward contracts, currency futures contracts, currency swaps or options on currency or currency futures and swap contracts (including, but not limited to, credit default swaps index products, credit default swaps, total return swaps and interest rate swaps) and may purchase and sell exchange-listed and off-exchange (“over-the-counter” or “OTC”) put and call options on securities and swap contracts, financial indices and futures contracts and use other derivative instruments or management techniques (collectively, “Strategic Transactions”). The Trust may use Strategic Transactions for hedging purposes or to enhance total return. Additionally, the Trust may enter into any type of Strategic Transaction for the purpose or effect of creating investment leverage to the maximum extent permitted by the SEC and/or SEC staff rules, guidance or positions.
If the Manager determines it to be appropriate or necessary, the Trust may form one or more wholly owned subsidiaries in one or more jurisdictions (each a “Subsidiary,” and together, the “Subsidiaries”), each of which would be treated as a corporation for U.S. federal income tax purposes. Any Subsidiary will share the same portfolio management team as the Trust. The Trust may invest either directly or indirectly through the Subsidiaries. The Trust may invest an aggregate of up to 25% of its total assets in Subsidiaries. The Trust typically expects to invest indirectly through the Subsidiaries if it believes it is desirable to do so to comply with the requirements for qualification as a RIC under the Code. Any Subsidiary organized in the United States will generally be subject to U.S. federal income tax at corporate rates. The Subsidiaries will not be registered under the Investment Company Act of 1940, as amended (the “1940 Act”), and will not be subject to the investor protections of the 1940 Act. The Subsidiaries will be advised or managed by the Manager and have the same investment objective as the Trust. The Manager, however, will not receive an additional management fee for any services provided to any
| | |
| 72 | | 2 0 2 2 B L A C K R O C K A N N U A L R E P O R T T O S H A R E H O L D E R S |
Investment Objectives, Policies and Risks (continued)
Investment Objectives and Policies (continued)
Subsidiary. The Trust will look through any Subsidiaries for purposes of compliance with its investment policies and the applicable provisions of the 1940 Act relating to capital structure, affiliated transactions and custody.
The Trust may also invest in securities of other affiliated and unaffiliated open- or closed-end investment companies, including exchange-traded funds (“ETFs”) and business development companies (“BDCs”), subject to applicable regulatory limits, that invest primarily in securities the types of which the Trust may invest in directly. The Trust will classify its investments in such investment companies for purposes of its investment policies based upon such investment companies’ stated investment objectives, policies and restrictions.
Unless otherwise stated herein, the Trust’s investment policies are non-fundamental policies and may be changed by the Board without prior shareholder approval. Unless otherwise expressly stated herein, or otherwise required by applicable law, all percentage and ratings or credit quality limitations stated herein apply only at the time of investment and subsequent changes in percentage (including changes resulting from the Trust having a smaller base of assets after a tender offer), value, ratings downgrades, liquidity profile or changes in credit quality will not result in the Trust being required to dispose of any portfolio security.
Leverage
The Trust will use leverage to seek to achieve its investment objective. The Trust’s use of leverage may increase or decrease from time to time in its discretion and the Trust may, in the future, determine not to use leverage. The Trust may use leverage by investing in reverse repurchase agreements or other derivative instruments with leverage embedded in them, by borrowing funds from banks or other financial institutions and/or by issuing preferred shares.
The Trust may enter into dollar roll transactions.
The Trust, along with certain other funds managed by the Manager and its affiliates, is party to a credit agreement under which it may borrow to fund shareholder tender offers. The Trust may also borrow money as a temporary measure for extraordinary or emergency purposes, including the payment of dividends and the settlement of securities transactions which otherwise might require untimely dispositions of Trust securities.
Risk Factors
This section contains a discussion of the general risks of investing in each Trust. The net asset value and market price of, and dividends paid on, the common shares will fluctuate with and be affected by, among other things, the risks more fully described below. As with any fund, there can be no guarantee that a Trust will meet its investment objective or that the Trust’s performance will be positive for any period of time. Each risk noted below is applicable to each Trust unless the specific Trust or Trusts are noted in a parenthetical. The order of the below risk factors does not indicate the significance of any particular risk factor.
Limited Term Risk: The Trust will terminate in accordance with its Agreement and Declaration of Trust. The Trust is not a target term fund and thus does not seek to return its purchase price of $100.00 per common share upon termination. As the assets of the Trust will be liquidated in connection with its termination, the Trust may be required to sell portfolio securities when it otherwise would not, including at times when market conditions are not favorable, which may cause the Trust to lose money. As the Trust approaches its applicable Termination Date, the Manager may begin liquidating all or a portion of the Trust’s portfolio through opportunistic sales. During this time, the portfolio composition of the Trust may change and the Trust may not achieve its investment objective, comply with the investment guidelines or be able to sustain its historical distribution levels. Rather than reinvesting proceeds received from sales of or payments received in respect of portfolio securities, the Trust may distribute such proceeds in one or more liquidating distributions prior to the final liquidation, which may cause the Trust’s fixed expenses to increase when expressed as a percentage of net assets attributable to common shares, or the Trust may invest the proceeds in lower yielding securities or hold the proceeds in cash or cash equivalents, which may adversely affect the performance of the Trust. The final distribution of net assets upon termination may be more than, equal to or less than $100.00 per common share. Because the Trust may adopt a plan of liquidation and make liquidating distributions in advance of the Termination Date, the total value of the Trust’s assets returned to common shareholders upon termination will be impacted by decisions of the Board and the Trust’s management regarding the timing of adopting a plan of liquidation and making liquidating distributions. This may result in common shareholders receiving liquidating distributions with a value more or less than the value that would have been received if the Trust had liquidated all of its assets on the Termination Date, or any other potential target date for liquidating, and distributed the proceeds thereof to common shareholders.
Although it is anticipated that the Trust will have distributed substantially all of its net assets to shareholders as soon as practicable after the Termination Date, securities for which no market exists or securities trading at depressed prices, if any, may be placed in a liquidating trust. The Manager currently anticipates allocating approximately 10-40% of the Trust’s assets to these types of investments prior to winding down. Although the Manager anticipates that these less liquid investments will have a weighted average life of three to five years, the Trust may hold assets with a weighted average life longer than five years. Securities placed in a liquidating trust may be held for an indefinite period of time, potentially several years or longer, until they can be sold or pay out all of their cash flows. During such time, the shareholders will continue to be exposed to the risks associated with the Trust and the value of their interest in the liquidating trust will fluctuate with the value of the liquidating trust’s remaining assets. Additionally, the tax treatment of the liquidating trust’s assets may differ from the tax treatment applicable to such assets when held by the Trust. To the extent the costs associated with a liquidating trust exceed the value of the remaining securities, the liquidating trust trustees may determine to dispose of the remaining securities in a manner of their choosing. The Trust cannot predict the amount, if any, of securities that will be required to be placed in a liquidating trust or how long it will take to sell or otherwise dispose of such securities.
Investment Risk: An investment in the Trust’s common shares is subject to investment risk, including the possible loss of the entire amount that you invest. As with any stock, the price of the Trust’s common shares will fluctuate with market conditions and other factors. If shares are sold, the price received may be more or less than the original investment. Common shares are designed for long-term investors and the Trust should not be treated as a trading vehicle. At any point in time an investment in the Trust’s common shares may be worth less than the original amount invested, even after taking into account distributions paid by the Trust. During periods in which the Trust may use leverage, the Trust’s investment, market discount and certain other risks will be magnified.
Illiquidity of Common Shares: The Trust is designed for long-term investors and not as a trading vehicle. An investment in the common shares, unlike an investment in a traditional listed closed-end fund, should be considered illiquid. The common shares are appropriate only for investors who are seeking an investment in less liquid portfolio
| | |
I N V E S T M E N T O B J E C T I V E S , P O L I C I E S A N D R I S K S | | 73 |
Investment Objectives, Policies and Risks (continued)
Risk Factors (continued)
investments within an illiquid fund. An investment in common shares is not suitable for investors who need access to the money they invest. Unlike open-end funds (commonly known as mutual funds) which generally permit redemptions on a daily basis, the common shares will not be redeemable at an investor’s option. Unlike traditional listed closed-end funds, the Trust does not intend to list the common shares for trading on any securities exchange, and the Trust does not expect any secondary market to develop for the common shares in the foreseeable future. The net asset value of the common shares may be volatile and the Trust’s use of leverage will increase this volatility. As the common shares are not traded, investors may not be able to dispose of their investment in the Trust no matter how the Trust performs.
Tender Offer Risk: The Trust intends, but is not obligated, to conduct quarterly tender offers for up to 5% of the common shares then outstanding in the sole discretion of the Board. If the Board elects to conduct a tender offer, the Trust will offer to repurchase outstanding common shares at the Trust’s net asset value per common share or a percentage of the Trust’s net asset value per common share on the last day of the offer. In any given quarter, the Manager may or may not recommend to the Board that the Trust conduct a tender offer, and even if the Manager does recommend to the Board that the Trust conduct a tender offer, the Board may not approve such recommendation. For example, if adverse market conditions cause the Trust’s investments to become illiquid or trade at depressed prices or if the Manager and/or Board believe that conducting a tender offer for 5% or less of the common shares then outstanding would impose an undue burden on common shareholders who do not tender compared to the benefits of giving common shareholders the opportunity to sell all or a portion of their common shares at net asset value, the Trust may choose not to conduct a tender offer or may choose to conduct a tender offer for less than 5% of the common shares then outstanding. Accordingly, there may be periods during which no tender offer is made, and it is possible that no tender offers will be conducted during the term of the Trust. If a tender offer is not made during the life of the Trust, common shareholders may not be able to sell their common shares until the Trust terminates, as it is unlikely that a secondary market for the common shares will develop or, if a secondary market does develop, common shareholders may be able to sell their common shares only at substantial discounts from net asset value.
If the Trust does conduct tender offers, it may be required to sell its more liquid, higher quality portfolio securities to purchase common shares that are tendered, which may increase risks for remaining common shareholders and increase Trust expenses as a percent of assets. The Trust may, subject to its investment restriction with respect to leverage, utilize leverage to finance the repurchase of common shares pursuant to any tender offers. There can be no assurance, however, that the Trust will be able to obtain such financing for tender offers if it attempts to do so. The use of borrowings to finance the repurchase of common shares will further increase the Trust’s expenses borne by shareholders of the Trust, in addition to the increase in pro rata expenses that will result from having a smaller base of assets after any such tender offers over which to spread fixed expenses. The Trust is designed primarily for long-term investors and an investment in the common shares should be considered illiquid. While the Trust intends to conduct quarterly tender offers, the Trust is not required to do so and may amend, suspend or terminate such tender offers at any time. Investors have no right to require the Trust to redeem their common shares.
Debt Securities Risk: Debt securities, such as bonds, involve interest rate risk, credit risk, extension risk, and prepayment risk, among other things.
| | • | | Interest Rate Risk — The market value of bonds and other fixed-income securities changes in response to interest rate changes and other factors. Interest rate risk is the risk that prices of bonds and other fixed-income securities will increase as interest rates fall and decrease as interest rates rise. |
The Trust may be subject to a greater risk of rising interest rates due to the recent period of historically low interest rates. For example, if interest rates increase by 1%, assuming a current portfolio duration of ten years, and all other factors being equal, the value of the Trust’s investments would be expected to decrease by 10%.
(Duration is a measure of the price sensitivity of a debt security or portfolio of debt securities to relative changes in interest rates.) The magnitude of these fluctuations in the market price of bonds and other fixed-income securities is generally greater for those securities with longer maturities. Fluctuations in the market price of the Trust’s investments will not affect interest income derived from instruments already owned by the Trust, but will be reflected in the Trust’s net asset value. The Trust may lose money if short-term or long-term interest rates rise sharply in a manner not anticipated by Trust management.
To the extent the Trust invests in debt securities that may be prepaid at the option of the obligor (such as mortgage-backed securities), the sensitivity of such securities to changes in interest rates may increase (to the detriment of the Trust) when interest rates rise. Moreover, because rates on certain floating rate debt securities typically reset only periodically, changes in prevailing interest rates (and particularly sudden and significant changes) can be expected to cause some fluctuations in the net asset value of the Trust to the extent that it invests in floating rate debt securities.
These basic principles of bond prices also apply to U.S. Government securities. A security backed by the “full faith and credit” of the U.S. Government is guaranteed only as to its stated interest rate and face value at maturity, not its current market price. Just like other fixed-income securities, government-guaranteed securities will fluctuate in value when interest rates change.
A general rise in interest rates has the potential to cause investors to move out of fixed-income securities on a large scale, which may increase redemptions from funds that hold large amounts of fixed-income securities. Heavy redemptions could cause the Trust to sell assets at inopportune times or at a loss or depressed value and could hurt the Trust’s performance.
| | • | | Credit Risk — Credit risk refers to the possibility that the issuer of a debt security (i.e., the borrower) will not be able to make payments of interest and principal when due. Changes in an issuer’s credit rating or the market’s perception of an issuer’s creditworthiness may also affect the value of the Trust’s investment in that issuer. The degree of credit risk depends on both the financial condition of the issuer and the terms of the obligation. |
| | • | | Extension Risk — When interest rates rise, certain obligations will be paid off by the obligor more slowly than anticipated, causing the value of these obligations to fall. |
| | • | | Prepayment Risk — When interest rates fall, certain obligations will be paid off by the obligor more quickly than originally anticipated, and the Trust may have to invest the proceeds in securities with lower yields. |
Junk Bonds Risk: Although junk bonds generally pay higher rates of interest than investment grade bonds, junk bonds are high risk investments that are considered speculative and may cause income and principal losses for the Trust.
| | |
| 74 | | 2 0 2 2 B L A C K R O C K A N N U A L R E P O R T T O S H A R E H O L D E R S |
Investment Objectives, Policies and Risks (continued)
Risk Factors (continued)
Distressed Securities Risk: Distressed securities are speculative and involve substantial risks in addition to the risks of investing in junk bonds. The Trust will generally not receive interest payments on the distressed securities and may incur costs to protect its investment. In addition, distressed securities involve the substantial risk that principal will not be repaid. These securities may present a substantial risk of default or may be in default at the time of investment. The Trust may incur additional expenses to the extent it is required to seek recovery upon a default in the payment of principal of or interest on its portfolio holdings. In any reorganization or liquidation proceeding relating to a portfolio company, the Trust may lose its entire investment or may be required to accept cash or securities with a value less than its original investment. Distressed securities and any securities received in an exchange for such securities may be subject to restrictions on resale.
Merger or Other Event Driven Arbitrage Strategies: The Trust may invest in companies involved in (or which are the target of) acquisition attempts or takeover or tender offers or mergers or companies involved in work-outs, liquidations, demergers, spin-offs, reorganizations, bankruptcies, share buy-backs and other capital market transactions or “special situations.” The level of analytical sophistication, both financial and legal, necessary for a successful investment in companies experiencing significant business and financial distress is unusually high. There is no assurance that the Advisors will correctly evaluate the nature and magnitude of the various factors that could, for example, affect the prospects for a successful reorganization or similar action. There exists the risk that the transaction in which such business enterprise is involved either will be unsuccessful, take considerable time or will result in a distribution of cash or a new security the value of which will be less than the purchase price of the security or other financial instrument in respect of which such distribution is received. Acquisitions sometimes fail because the U.S. government, European Union or some other governmental entity does not approve of aspects of a transaction due to anti-trust concerns, tax reasons, subsequent disagreements between the acquirer or target as to management transition or corporate governance matters or changing market conditions. Similarly, if an anticipated transaction does not in fact occur, or takes more time than anticipated, the Trust may be required to sell its investment at a loss. As there may be uncertainty concerning the outcome of transactions involving financially troubled companies in which Trust may invest, there is potential risk of loss by the Trust of its entire investment in such companies. In some circumstances, investments may be relatively illiquid making it difficult to acquire or dispose of them at the prices quoted on the various exchanges. Accordingly, the Trust’s ability to respond to market movements may be impaired and consequently the Trust may experience adverse price movements upon liquidation of its investments. Settlement of transactions may be subject to delay and administrative uncertainties. An investment in securities of a company involved in bankruptcy or other reorganization and liquidation proceedings ordinarily remains unpaid unless and until such company successfully reorganizes and/or emerges from bankruptcy, and the Trust may suffer a significant or total loss on any such investment during the relevant proceedings.
Investing in securities of companies in a special situation or otherwise in distress requires active monitoring of such companies and may, at times, require active participation by the Trust (including by way of board membership or corporate governance oversight) in the management or in the bankruptcy or reorganization proceedings of such companies. Such involvement may restrict the Trust’s ability to trade in the securities of such companies. It may also prevent the Trust from focusing on matters relating to other existing investments or potential future investments of the Trust. In addition, as a result of its activities, the Trust may incur additional legal or other expenses, including, but not limited to, costs associated with conducting proxy contests, public filings, litigation expenses and indemnification payments to the investment manager or persons serving at the investment manager’s request on the boards of directors of companies in which the Trust has an interest. It should also be noted that any such board representatives have a fiduciary duty to act in the best interests of all shareholders, and not simply the Trust, and thus may be obligated at times to act in a manner that is adverse to the Trust’s interests. The occurrence of any of the above events may have a material adverse effect on the performance of the Trust.
Illiquid Investments Risk: The Trust may invest without limitation in illiquid or less liquid investments or investments in which no secondary market is readily available or which are otherwise illiquid, including private placement securities. The Trust may not be able to readily dispose of such investments at prices that approximate those at which the Trust could sell such investments if they were more widely traded and, as a result of such illiquidity, the Trust may have to sell other investments or engage in borrowing transactions if necessary to raise cash to meet its obligations. Limited liquidity can also affect the market price of investments, thereby adversely affecting the Trust’s net asset value and ability to make dividend distributions. The financial markets in general, and certain segments of the mortgage-related securities markets in particular, have in recent years experienced periods of extreme secondary market supply and demand imbalance, resulting in a loss of liquidity during which market prices were suddenly and substantially below traditional measures of intrinsic value. During such periods, some investments could be sold only at arbitrary prices and with substantial losses. Periods of such market dislocation may occur again at any time. Privately issued debt securities are often of below investment grade quality, frequently are unrated and present many of the same risks as investing in below investment grade public debt securities.
Leverage Risk: The Trust’s use of leverage may increase or decrease from time to time in its discretion and the Trust may, in the future, determine not to use leverage.
The use of leverage creates an opportunity for increased common share net investment income dividends, but also creates risks for the holders of common shares. The Trust cannot assure you that the use of leverage will result in a higher yield on the common shares. Any leveraging strategy the Trust employs may not be successful.
Leverage involves risks and special considerations for common shareholders, including:
| | • | | the likelihood of greater volatility of net asset value, market price and dividend rate of the common shares than a comparable portfolio without leverage; |
| | • | | the risk that fluctuations in interest rates or dividend rates on any leverage that the Trust must pay will reduce the return to the common shareholders; |
| | • | | the effect of leverage in a declining market, which is likely to cause a greater decline in the net asset value of the common shares than if the Trust were not leveraged, which may result in a greater decline in the market price of the common shares; |
| | • | | leverage may increase operating costs, which may reduce total return. |
Any decline in the net asset value of the Trust’s investments will be borne entirely by the holders of common shares. Therefore, if the market value of the Trust’s portfolio declines, leverage will result in a greater decrease in net asset value to the holders of common shares than if the Trust were not leveraged. This greater net asset value decrease will also tend to cause a greater decline in the market price for the common shares.
| | |
I N V E S T M E N T O B J E C T I V E S , P O L I C I E S A N D R I S K S | | 75 |
Investment Objectives, Policies and Risks (continued)
Risk Factors (continued)
Reverse Repurchase Agreements Risk: Reverse repurchase agreements involve the sale of securities held by the Trust with an agreement to repurchase the securities at an agreed-upon price, date and interest payment. Reverse repurchase agreements involve the risk that the other party may fail to return the securities in a timely manner or at all. The Trust could lose money if it is unable to recover the securities and the value of the collateral held by the Trust, including the value of the investments made with cash collateral, is less than the value of the securities. These events could also trigger adverse tax consequences for the Trust. In addition, reverse repurchase agreements involve the risk that the interest income earned in the investment of the proceeds will be less than the interest expense.
Dollar Rolls Risk: Dollar rolls involve the risk that the market value of the securities that the Trust is committed to buy may decline below the price of the securities the Trust has sold. These transactions may involve leverage.
Derivatives Risk: The Trust’s use of derivatives may increase its costs, reduce the Trust’s returns and/or increase volatility. Derivatives involve significant risks, including:
| | • | | Leverage Risk — The Trust’s use of derivatives can magnify the Trust’s gains and losses. Relatively small market movements may result in large changes in the value of a derivatives position and can result in losses that greatly exceed the amount originally invested. |
| | • | | Market Risk — Some derivatives are more sensitive to interest rate changes and market price fluctuations than other securities. The Trust could also suffer losses related to its derivatives positions as a result of unanticipated market movements, which losses are potentially unlimited. Finally, the Manager may not be able to predict correctly the direction of securities prices, interest rates and other economic factors, which could cause the Trust’s derivatives positions to lose value. |
| | • | | Counterparty Risk — Derivatives are also subject to counterparty risk, which is the risk that the other party in the transaction will be unable or unwilling to fulfill its contractual obligation, and the related risks of having concentrated exposure to such a counterparty. |
| | • | | Illiquidity Risk — The possible lack of a liquid secondary market for derivatives and the resulting inability of the Trust to sell or otherwise close a derivatives position could expose the Trust to losses and could make derivatives more difficult for the Trust to value accurately. |
| | • | | Operational Risk — The use of derivatives includes the risk of potential operational issues, including documentation issues, settlement issues, systems failures, inadequate controls and human error. |
| | • | | Legal Risk — The risk of insufficient documentation, insufficient capacity or authority of counterparty, or legality or enforceability of a contract. |
| | • | | Volatility and Correlation Risk — Volatility is defined as the characteristic of a security, an index or a market to fluctuate significantly in price within a short time period. A risk of the Trust’s use of derivatives is that the fluctuations in their values may not correlate with the overall securities markets. |
| | • | | Valuation Risk — Valuation for derivatives may not be readily available in the market. Valuation may be more difficult in times of market turmoil since many investors and market makers may be reluctant to purchase complex instruments or quote prices for them. |
| | • | | Hedging Risk — Hedges are sometimes subject to imperfect matching between the derivative and the underlying security, and there can be no assurance that the Trust’s hedging transactions will be effective. The use of hedging may result in certain adverse tax consequences. |
| | • | | Tax Risk — Certain aspects of the tax treatment of derivative instruments, including swap agreements and commodity-linked derivative instruments, are currently unclear and may be affected by changes in legislation, regulations or other legally binding authority. Such treatment may be less favorable than that given to a direct investment in an underlying asset and may adversely affect the timing, character and amount of income the Trust realizes from its investments. |
| | • | | Regulatory Risk — Derivative contracts are subject to regulation under the Dodd-Frank Wall Street Reform and Consumer Protection Act (the “Dodd-Frank Act”) in the United States and under comparable regimes in Europe, Asia and other non-U.S. jurisdictions. Under the Dodd-Frank Act, with respect to uncleared swaps, swap dealers are required to collect variation margin from the Trust and may be required by applicable regulations to collect initial margin from the Trust. Both initial and variation margin may be comprised of cash and/or securities, subject to applicable regulatory haircuts. Shares of investment companies (other than certain money market funds) may not be posted as collateral under applicable regulations. In addition, regulations adopted by global prudential regulators that are now in effect require certain bank-regulated counterparties and certain of their affiliates to include in certain financial contracts, including many derivatives contracts, terms that delay or restrict the rights of counterparties, such as the Trust, to terminate such contracts, foreclose upon collateral, exercise other default rights or restrict transfers of credit support in the event that the counterparty and/or its affiliates are subject to certain types of resolution or insolvency proceedings. The implementation of these requirements with respect to derivatives, as well as regulations under the Dodd-Frank Act regarding clearing, mandatory trading and margining of other derivatives, may increase the costs and risks to the Trust of trading in these instruments and, as a result, may affect returns to investors in the Trust. |
Direct Lending Risk: The Trust may make direct loans and engage in direct lending. This practice involves certain risks. If a loan is foreclosed, the Trust could become part owner of any collateral and would bear the costs and liabilities associated with owning and disposing of the collateral. As a result, the Trust may be exposed to losses resulting from default and foreclosure. Any costs or delays involved in the effectuation of a foreclosure of the loan or a liquidation of the underlying assets will further reduce the proceeds and thus increase the loss. There is no assurance that the Trust will correctly evaluate the value of the assets collateralizing the loan. In the event of a reorganization or liquidation proceeding relating to the borrower, the Trust may lose all or part of the amounts advanced to the borrower. There is no assurance that the protection of the Trust’s interests will be adequate, including the validity or enforceability of the loan and the maintenance of the anticipated priority and perfection of the applicable security interests. Furthermore, there is no assurance that claims will not be asserted that might interfere with enforcement of the Trust’s rights.
Whole Loan Mortgages Risk: The Trust directly or indirectly may invest in whole loan mortgages. Unlike mortgage-backed securities, whole loan mortgages generally are not government guaranteed or privately insured, though in some cases they may benefit from private mortgage insurance. A whole loan mortgage is directly exposed to losses resulting from default and foreclosure. Therefore, the value of the underlying property, the creditworthiness and financial position of the borrower, and the priority and
| | |
| 76 | | 2 0 2 2 B L A C K R O C K A N N U A L R E P O R T T O S H A R E H O L D E R S |
Investment Objectives, Policies and Risks (continued)
Risk Factors (continued)
enforceability of the lien are each of great importance. Whether or not the Advisors or their affiliates have participated in the negotiation of the terms of any such mortgages, there can be no assurance as to the adequacy of the protection of the terms of the loan, including the validity or enforceability of the loan and the maintenance of the anticipated priority and perfection of the applicable security interests. Furthermore, claims may be asserted that might interfere with enforcement of the rights of the Trust. In the event of a foreclosure, the Trust may assume direct ownership of the underlying real estate. The liquidation proceeds upon sale of such real estate may not be sufficient to recover the Trust’s cost basis in the loan, resulting in a loss to the Trust. Any costs or delays involved in the effectuation of a foreclosure of the loan or a liquidation of the underlying property will further reduce the proceeds and thus increase the loss.
Whole loan mortgages have risks above and beyond those discussed above. For example, whole loan mortgages are subject to “special hazard” risk (property damage caused by hazards, such as earthquakes or environmental hazards, not covered by standard property insurance policies) and to bankruptcy risk (reduction in a borrower’s mortgage debt by a bankruptcy court). In addition, claims may be assessed against the Trust on account of its position as mortgage holder or property owner, including responsibility for tax payments, environmental hazards and other liabilities.
Mortgage Servicing Rights Risk: MSRs are the contractual right to cash flows payable to the actual mortgage servicer of a pool of mortgage loans for their ongoing administrative duties. Investing in MSRs will subject the Trust to numerous additional risks. MSR’s performance may be closely tied to economic and market conditions affecting mortgages and entities operating, directly or indirectly, in, or otherwise related to, the mortgage market, including sensitivity to regulatory changes, supply and demand in the mortgage market and sensitivity to overall market forecasts and swings. The mortgage market in the United States has experienced and may continue to experience a variety of difficulties and challenging economic conditions. Any deterioration of the U.S. mortgage market and declines in real estate prices could result in increased delinquencies or defaults on the mortgage loans underlying MSRs held by the Trust or require the Trust to make advances in respect of such delinquencies or defaults that may not be recovered.
Real Estate-Related Securities Risk: The main risk of real estate-related securities is that the value of the underlying real estate may go down. Many factors may affect real estate values. These factors include both the general and local economies, vacancy rates, tenant bankruptcies, the ability to re-lease space under expiring leases on attractive terms, the amount of new construction in a particular area, the laws and regulations (including zoning, environmental and tax laws) affecting real estate and the costs of owning, maintaining and improving real estate. The availability of mortgage financing and changes in interest rates may also affect real estate values. If the Trust’s real estate-related investments are concentrated in one geographic area or in one property type, the Trust will be particularly subject to the risks associated with that area or property type. Many issuers of real estate-related securities are highly leveraged, which increases the risk to holders of such securities. The value of the securities the Trust buys will not necessarily track the value of the underlying investments of the issuers of such securities.
Foreign Securities Risk: Foreign investments often involve special risks not present in U.S. investments that can increase the chances that the Trust will lose money. These risks include:
| | • | | The Trust generally holds its foreign securities and cash in foreign banks and securities depositories, which may be recently organized or new to the foreign custody business and may be subject to only limited or no regulatory oversight. |
| | • | | Changes in foreign currency exchange rates can affect the value of the Trust’s portfolio. |
| | • | | The economies of certain foreign markets may not compare favorably with the economy of the United States with respect to such issues as growth of gross national product, reinvestment of capital, resources and balance of payments position. |
| | • | | The governments of certain countries, or the U.S. Government with respect to certain countries, may prohibit or impose substantial restrictions through capital controls and/or sanctions on foreign investments in the capital markets or certain industries in those countries, which may prohibit or restrict the ability to own or transfer currency, securities, derivatives or other assets. |
| | • | | Many foreign governments do not supervise and regulate stock exchanges, brokers and the sale of securities to the same extent as does the United States and may not have laws to protect investors that are comparable to U.S. securities laws. |
| | • | | Settlement and clearance procedures in certain foreign markets may result in delays in payment for or delivery of securities not typically associated with settlement and clearance of U.S. investments. |
| | • | | The Trust’s claims to recover foreign withholding taxes may not be successful, and if the likelihood of recovery of foreign withholding taxes materially decreases, due to, for example, a change in tax regulation or approach in the foreign country, accruals in the Trust’s net asset value for such refunds may be written down partially or in full, which will adversely affect the Trust’s net asset value. |
| | • | | The European financial markets have recently experienced volatility and adverse trends due to concerns about economic downturns in, or rising government debt levels of, several European countries as well as acts of war in the region. These events may spread to other countries in Europe and may affect the value and liquidity of certain of the Trust’s investments. |
Emerging Markets Risk: Emerging markets are riskier than more developed markets because they tend to develop unevenly and may never fully develop. Investments in emerging markets may be considered speculative. Emerging markets are more likely to experience hyperinflation and currency devaluations, which adversely affect returns to U.S. investors. In addition, many emerging securities markets have far lower trading volumes and less liquidity than developed markets.
Sovereign Debt Risk: Sovereign debt instruments are subject to the risk that a governmental entity may delay or refuse to pay interest or repay principal on its sovereign debt, due, for example, to cash flow problems, insufficient foreign currency reserves, political considerations, the relative size of the governmental entity’s debt position in relation to the economy or the failure to put in place economic reforms required by the International Monetary Fund or other multilateral agencies.
| | |
I N V E S T M E N T O B J E C T I V E S , P O L I C I E S A N D R I S K S | | 77 |
Investment Objectives, Policies and Risks (continued)
Risk Factors (continued)
Tax Characterization Risk: The Trust intends to employ an opportunistic strategy, which seeks to invest in special situations, including private opportunistic investments, that the Advisors believe present the greatest potential for increased yield and capital appreciation. The Advisor currently anticipates allocating approximately 10-40% of the Trust’s assets to these types of investments. The amount of taxable income and the tax character of income derived from these types of investments may not be determined at the time of a distribution from the Trust and may be recharacterized on the IRS Form 1099 sent to shareholders, and any increase in the amount of taxable income recognized from these transactions over the amount initially anticipated by the Trust could, among other things, increase the portion of Trust distributions that are taxable to investors as ordinary dividend income and cause the Trust to be subject to excise taxes on undistributed taxable income. Additionally, to the extent the Trust’s investments are held in a liquidating trust following the Trust’s termination, shareholder distributions paid out of the liquidating trust may be reported on a Grantor Information Statement.
Unrated Securities Risk: Because the Trust may purchase securities that are not rated by any rating organization, an Advisor may, after assessing their credit quality, internally assign ratings to those securities in categories similar to those of rating organizations. Some unrated securities may not have an active trading market or may be difficult to value, which means the Trust might have difficulty selling them promptly at an acceptable price. To the extent that the Trust invests in unrated securities, the Trust’s ability to achieve its investment objective will be more dependent on an Advisor’s credit analysis than would be the case when the Trust invests in rated securities.
Debtor-In-Possession (“DIP”) Financing Risk: The Trust’s participation in DIP financings is subject to risks. DIP financings are arranged when an entity seeks the protections of the bankruptcy court under Chapter 11 of the U.S. Bankruptcy Code and must be approved by the bankruptcy court. These financings allow the entity to continue its business operations while reorganizing under Chapter 11. DIP financings are typically fully secured by a lien on the debtor’s otherwise unencumbered assets or secured by a junior lien on the debtor’s encumbered assets (so long as the loan is fully secured based on the most recent current valuation or appraisal report of the debtor). DIP financings are often required to close with certainty and in a rapid manner in order to satisfy existing creditors and to enable the issuer to emerge from bankruptcy or to avoid a bankruptcy proceeding. There is a risk that the borrower will not emerge from Chapter 11 bankruptcy proceedings and be forced to liquidate its assets under Chapter 7 of the U.S. Bankruptcy Code. In the event of liquidation, the Trust’s only recourse will be against the property securing the DIP financing.
Special Commercial and Residential Mortgage Loan Risks: The Trust directly or indirectly may invest in performing, sub-performing and non-performing mortgage loans. Such investments would subject the Trust to the risks of commercial and residential real estate and real estate-related investments. These risks include, among others: (i) continued declines in the value of commercial and residential real estate; (ii) risks related to general and local economic conditions; (iii) possible lack of availability of mortgage funds for borrowers to refinance or sell their property; (iv) overbuilding; (v) the general deterioration of the borrower’s ability to keep a rehabilitated sub-performing or non-performing mortgage loan current; (vi) increases in property taxes and operating expenses; (vii) changes in zoning laws; (viii) costs resulting from the clean-up of, and liability to third parties for damages resulting from, environmental problems; (ix) casualty or condemnation losses; (x) uninsured damages from floods, earthquakes or other natural disasters; (xi) limitations on and variations in rents; (xii) fluctuations in interest rates; and (xiii) fraud by borrowers, originators and/or sellers of mortgage loans. To the extent that assets underlying such investments are concentrated geographically, by property type or in certain other respects, the Trust may be subject to certain of the foregoing risks to a greater extent. Additionally, the Trust may be required to foreclose distressed mortgage loans and such actions would subject the Trust to greater concentration of the risks of the commercial and residential real estate markets and risks related to the ownership and management of real property.
The mortgage loans and loan portfolios to which the Trust may have direct or indirect exposure generally will have been originated by third parties. There is a risk that the underlying mortgage loan documentation and calculations of outstanding principal, interest, late fees and other amounts will be deficient and/or inaccurate and that the Trust will not detect such deficiencies and inaccuracies prior to gaining such economic exposure. Accordingly, such loans or loan portfolios may be compromised, reducing the value of any investment therein by the Trust.
Risk of Decline in Value of Real Estate Collateral: The value of the real estate that underlies mortgage loans is subject to market conditions. Changes in the real estate market may adversely affect the value of the collateral and thereby lower the value to be derived from a liquidation. In addition, adverse changes in the real estate market increase the risk of default, as the incentive of the borrower to retain and protect equity in the property declines. Furthermore, many of the properties that may secure loans to which the Trust has direct or indirect economic exposure may be suffering varying degrees of financial distress or may be located in economically distressed areas. During the financial crisis of 2007-2009, there was a substantial decline in the value of housing in many markets in the United States. It is possible that real estate values could again decline for a substantial period. Loans to which the Trust may have direct or indirect economic exposure may become non-performing for a wide variety of reasons, including, without limitation, because the mortgaged property is too highly leveraged (and, therefore, the borrower is unable to meet debt service payments), the borrower falls upon financial distress (such as from job loss or income reduction, or the reset of interest rates on the mortgage itself, which reduces the borrower’s ability to pay) or the property is in a market which has suffered a decline in home prices (and therefore, a borrower has a reduced willingness to pay). Such non-performing loans may require a substantial amount of workout negotiations and/or restructuring, which may entail, among other things, a substantial reduction in the interest rate, capitalization of interest payments and a substantial write-down of the principal of the loan. However, even if such restructuring were successfully accomplished, a risk exists that the borrower will not be able or willing to maintain the restructured payments or refinance the restructured mortgage upon maturity.
It is possible that the Trust may find it necessary or desirable to foreclose on some of the loans it acquires. The foreclosure process may be lengthy and expensive. Borrowers may resist mortgage foreclosure actions by asserting numerous claims, counterclaims and defenses against the Trust, including, without limitation, numerous lender liability claims and defenses, even when such assertions may have no basis in fact, in an effort to prolong the foreclosure action and force the lender into a modification of the loan or a favorable buy-out of the borrower’s position. In some states, foreclosure actions can sometimes take several years or more to litigate. At any time prior to or during the foreclosure proceedings, the borrower may file for bankruptcy, which would have the effect of staying the foreclosure actions and further delaying the foreclosure process. Foreclosure may create a negative public image of the mortgaged property and may result in a diminution of value.
The default rate for residential mortgage rates may increase due in large part to borrowers’ inability or unwillingness to carry the mortgage loan on a current basis, increased mortgage loan carrying costs resulting from resets of adjustable rate mortgages and increases in taxes and insurance, the inability of borrowers to refinance mortgage loans and general factors that reduce the ability of the borrower to pay its mortgage loan obligations, including loss of employment, increased cost of living and unexpected significant bills such as healthcare-related expenses. Lenders may exercise their foreclosure rights that will further decrease the value of the residential real estate as foreclosure sales are often at lower prices than sales in the ordinary course. Such conditions could further decrease the value of the residential real estate. The Trust could face increased default
| | |
| 78 | | 2 0 2 2 B L A C K R O C K A N N U A L R E P O R T T O S H A R E H O L D E R S |
Investment Objectives, Policies and Risks (continued)
Risk Factors (continued)
rates on sub-performing and non-performing mortgage loans to which it has direct or indirect economic exposure, including loans that were modified with the expectation that they would be re-performing loans.
Environmental Hazards: Under applicable environmental laws, owners of property may be liable for the cleanup and removal of hazardous substances even where the owner was not responsible for placing the hazardous substances on the property or where the property was contaminated prior to the time the owner took title. The kinds of hazardous substances for which liability may be incurred include, among others, chemicals and other materials commonly used by small businesses and manufacturing operations. The costs of removal and clean-up of hazardous substances and wastes can be extremely expensive and, in some cases, can exceed the value of a property. If any property acquired by the Trust through foreclosure or otherwise subsequently were found to have an environmental problem, the Trust could incur substantial costs and suffer a complete loss of its investment in such property as well as of other assets. Similarly, real estate is subject to loss due to so-called “special hazards” (e.g., floods, earthquakes and hurricanes). It may be impractical or impossible to fully insure against such events and, should such an event occur, the Trust could incur substantial costs and suffer a complete loss of its investment in such property.
Mortgage-Related Issuers Risk: The Trust may invest in mortgage servicers, originators and other mortgage-related issuers, including acquiring all or substantially all of the equity of a mortgage origination business. There can be no assurance that any such investments will be made or, if made, that they will be profitable.
Because investments in mortgage-related issuers are relatively illiquid, the Trust’s ability to promptly sell one or more related investments in response to changing economic, financial and investment conditions is limited. The mortgage and real estate market is affected by many factors, such as general economic conditions, availability of financing, interest rates and other factors, including supply and demand, that are beyond the Trust’s control. The Trust cannot predict whether it will be able to sell any investment in a mortgage-related issuer, including a mortgage originator or servicer, for the price or on the terms set by the Trust or whether any price or other terms offered by a prospective purchaser would be acceptable to the Trust. The Trust also cannot predict the length of time needed to find a willing and suitable purchaser.
Mortgage- and Asset-Backed Securities Risk: Mortgage- and asset-backed securities represent interests in “pools” of mortgages or other assets, including consumer loans or receivables held in trust. Mortgage- and asset-backed securities are subject to credit, interest rate, prepayment and extension risks. These securities also are subject to risk of default on the underlying mortgage or asset, particularly during periods of economic downturn. Small movements in interest rates (both increases and decreases) may quickly and significantly reduce the value of certain mortgage-backed securities.
Collateralized Debt Obligations Risk: In addition to the typical risks associated with fixed-income securities and asset-backed securities, collateralized debt obligations (“CDOs”), including collateralized loan obligations, carry additional risks including, but not limited to: (i) the possibility that distributions from collateral securities will not be adequate to make interest or other payments; (ii) the risk that the collateral may default or decline in value or be downgraded, if rated by a nationally recognized statistical rating organization; (iii) the Trust may invest in tranches of CDOs that are subordinate to other tranches; (iv) the structure and complexity of the transaction and the legal documents could lead to disputes among investors regarding the characterization of proceeds; (v) the investment return achieved by the Trust could be significantly different than those predicted by financial models; (vi) the lack of a readily available secondary market for CDOs; (vii) the risk of forced “fire sale” liquidation due to technical defaults such as coverage test failures; and (viii) the CDO’s manager may perform poorly.
Pay-in-Kind Bonds Risk: Similar to zero coupon obligations, pay-in-kind bonds also carry additional risk as holders of these types of securities realize no cash until the cash payment date unless a portion of such securities is sold and, if the issuer defaults, the Trust may obtain no return at all on its investment. The market price of pay-in-kind bonds is affected by interest rate changes to a greater extent, and therefore tends to be more volatile, than that of securities which pay interest in cash.
Senior Loans Risk: There is less readily available, reliable information about most senior loans than is the case for many other types of securities. An economic downturn generally leads to a higher non-payment rate, and a senior loan may lose significant value before a default occurs. Moreover, any specific collateral used to secure a senior loan may decline in value or become illiquid, which would adversely affect the senior loan’s value. No active trading market may exist for certain senior loans, which may impair the ability of the Trust to realize full value in the event of the need to sell a senior loan and which may make it difficult to value senior loans. Although senior loans in which the Trust will invest generally will be secured by specific collateral, there can be no assurance that liquidation of such collateral would satisfy the borrower’s obligation in the event of non-payment of scheduled interest or principal or that such collateral could be readily liquidated. To the extent that a senior loan is collateralized by stock in the borrower or its subsidiaries, such stock may lose all of its value in the event of the bankruptcy of the borrower. Uncollateralized senior loans involve a greater risk of loss.
Second Lien Loans Risk: Second lien loans generally are subject to similar risks as those associated with investments in senior loans. Because second lien loans are subordinated or unsecured and thus lower in priority of payment to senior loans, they are subject to the additional risk that the cash flow of the borrower and property securing the loan or debt, if any, may be insufficient to meet scheduled payments after giving effect to the senior secured obligations of the borrower.
Bank Loan Risk: The market for bank loans may lack liquidity and the Trust may have difficulty selling them. These investments expose the Trust to the credit risk of both the financial institution and the underlying borrower.
Risks of Loan Assignments and Participations: As the purchaser of an assignment, the Trust typically succeeds to all the rights and obligations of the assigning institution and becomes a lender under the credit agreement with respect to the debt obligation; however, the Trust may not be able to unilaterally enforce all rights and remedies under the loan and with regard to any associated collateral. Because assignments may be arranged through private negotiations between potential assignees and potential assignors, the rights and obligations acquired by the Trust as the purchaser of an assignment may differ from, and be more limited than, those held by the assigning lender. In addition, if the loan is foreclosed, the Trust could become part owner of any collateral and could bear the costs and liabilities of owning and disposing of the collateral. The Trust may be required to pass along to a purchaser that buys a loan from the Trust by way of assignment a portion of any fees to which the Trust is entitled under the loan. In connection with purchasing participations, the Trust generally will have no right to enforce compliance by the borrower with the terms of the loan agreement relating to the loan, nor any rights of set-off against the borrower, and the Trust may not directly benefit from any collateral supporting the loan in which it has purchased the participation. As a result, the Trust will be subject to the credit risk of both the borrower and the lender that is selling the participation. In the event of the insolvency of the lender selling a participation, the Trust may be treated as a general creditor of the lender and may not benefit from any set-off between the lender and the borrower.
| | |
I N V E S T M E N T O B J E C T I V E S , P O L I C I E S A N D R I S K S | | 79 |
Investment Objectives, Policies and Risks (continued)
Risk Factors (continued)
Equity Securities Risk: Stock markets are volatile. The price of equity securities fluctuates based on changes in a company’s financial condition and overall market and economic conditions.
Preferred Securities Risk: Preferred securities may pay fixed or adjustable rates of return. Preferred securities are subject to issuer-specific and market risks applicable generally to equity securities. In addition, a company’s preferred securities generally pay dividends only after the company makes required payments to holders of its bonds and other debt. For this reason, the value of preferred securities will usually react more strongly than bonds and other debt to actual or perceived changes in the company’s financial condition or prospects. Preferred securities of smaller companies may be more vulnerable to adverse developments than preferred securities of larger companies.
Dividend Paying Equity Securities Risk: Dividends on common equity securities that the Trust may hold are not fixed but are declared at the discretion of an issuer’s board of directors. Companies that have historically paid dividends on their securities are not required to continue to pay dividends on such securities. There is no guarantee that the issuers of the common equity securities in which the Trust invests will declare dividends in the future or that, if declared, they will remain at current levels or increase over time. Therefore, there is the possibility that such companies could reduce or eliminate the payment of dividends in the future. Dividend producing equity securities, in particular those whose market price is closely related to their yield, may exhibit greater sensitivity to interest rate changes. The Trust’s investments in dividend producing equity securities may also limit its potential for appreciation during a broad market advance.
The prices of dividend producing equity securities can be highly volatile. Investors should not assume that the Trust’s investments in these securities will necessarily reduce the volatility of the Trust’s net asset value or provide “protection,” compared to other types of equity securities, when markets perform poorly.
Investment Style Risk: Under certain market conditions, value investments have performed better during periods of economic recovery. Therefore, this investment style may over time go in and out of favor. At times when the investment style used by the Trust is out of favor, the Trust may underperform other equity funds that use different investment styles.
Structured Notes Risk: Structured notes and other related instruments purchased by the Trust are generally privately negotiated debt obligations where the principal and/or interest is determined by reference to the performance of a specific asset, benchmark asset, market or interest rate (“reference measure”). The purchase of structured notes exposes the Trust to the credit risk of the issuer of the structured product. Structured notes may be leveraged, increasing the volatility of each structured note’s value relative to the change in the reference measure. Structured notes may also be less liquid and more difficult to price accurately than less complex securities and instruments or more traditional debt securities.
U.S. Government Obligations Risk: Certain securities in which the Trust may invest, including securities issued by certain U.S. Government agencies and U.S. Government sponsored enterprises, are not guaranteed by the U.S. Government or supported by the full faith and credit of the United States.
U.S. Government Mortgage-Related Securities Risk: There are a number of important differences among the agencies and instrumentalities of the U.S. Government that issue mortgage-related securities and among the securities that they issue. Mortgage-related securities guaranteed by the Government National Mortgage Association (“GNMA” or “Ginnie Mae”) are guaranteed as to the timely payment of principal and interest by GNMA and such guarantee is backed by the full faith and credit of the United States. GNMA securities also are supported by the right of GNMA to borrow funds from the U.S. Treasury to make payments under its guarantee. Mortgage-related securities issued by Fannie Mae or Freddie Mac are solely the obligations of Fannie Mae or Freddie Mac, as the case may be, and are not backed by or entitled to the full faith and credit of the United States but are supported by the right of the issuer to borrow from the Treasury.
Municipal Securities Risks: Municipal securities risks include the ability of the issuer to repay the obligation, the relative lack of information about certain issuers of municipal securities, and the possibility of future legislative changes which could affect the market for and value of municipal securities. These risks include:
| | • | | General Obligation Bonds Risks — Timely payments depend on the issuer’s credit quality, ability to raise tax revenues and ability to maintain an adequate tax base. |
| | • | | Revenue Bonds Risks — These payments depend on the money earned by the particular facility or class of facilities, or the amount of revenues derived from another source. |
| | • | | Private Activity Bonds Risks — Municipalities and other public authorities issue private activity bonds to finance development of industrial facilities for use by a private enterprise. The private enterprise pays the principal and interest on the bond, and the issuer does not pledge its full faith, credit and taxing power for repayment. |
| | • | | Moral Obligation Bonds Risks — Moral obligation bonds are generally issued by special purpose public authorities of a state or municipality. If the issuer is unable to meet its obligations, repayment of these bonds becomes a moral commitment, but not a legal obligation, of the state or municipality. |
| | • | | Municipal Notes Risks — Municipal notes are shorter term municipal debt obligations. If there is a shortfall in the anticipated proceeds, the notes may not be fully repaid and the Trust may lose money. |
| | • | | Municipal Lease Obligations Risks — In a municipal lease obligation, the issuer agrees to make payments when due on the lease obligation. Although the issuer does not pledge its unlimited taxing power for payment of the lease obligation, the lease obligation is secured by the leased property. |
| | • | | Tax-Exempt Status Risk — The Trust and its investment manager will rely on the opinion of issuers’ bond counsel and, in the case of derivative securities, sponsors’ counsel, on the tax-exempt status of interest on municipal bonds and payments under derivative securities. Neither the Trust nor its investment manager will independently review the bases for those tax opinions, which may ultimately be determined to be incorrect and subject the Trust and its shareholders to substantial tax liabilities. |
| | |
| 80 | | 2 0 2 2 B L A C K R O C K A N N U A L R E P O R T T O S H A R E H O L D E R S |
Investment Objectives, Policies and Risks (continued)
Risk Factors (continued)
Variable and Floating Rate Instrument Risk: Variable and floating rate securities provide for periodic adjustment in the interest rate paid on the securities. These securities may be subject to greater illiquidity risk than other fixed income securities, meaning the absence of an active market for these securities could make it difficult for the Trust to dispose of them at any given time.
Convertible Securities Risk: The market value of a convertible security performs like that of a regular debt security; that is, if market interest rates rise, the value of a convertible security usually falls. In addition, convertible securities are subject to the risk that the issuer will not be able to pay interest or dividends when due, and their market value may change based on changes in the issuer’s credit rating or the market’s perception of the issuer’s creditworthiness. Since it derives a portion of its value from the common stock into which it may be converted, a convertible security is also subject to the same types of market and issuer risks that apply to the underlying common stock.
Investment Companies and ETFs Risk: Subject to the limitations set forth in the 1940 Act and the rules thereunder, the Trust may acquire shares in other investment companies and in exchange-traded funds (“ETFs”), some of which may be affiliated investment companies. These investment companies and ETFs will generally have investment exposure to the commodities markets which may subject them to greater volatility than investments in traditional securities. The market value of the shares of other investment companies and ETFs may differ from their net asset value. As an investor in investment companies and ETFs, the Trust would bear its ratable share of that entity’s expenses, including its investment advisory and administration fees, while continuing to pay its own advisory and administration fees and other expenses (to the extent not offset by the Manager through waivers). As a result, shareholders will be absorbing duplicate levels of fees with respect to investments in other investment companies and ETFs (to the extent not offset by the Manager through waivers).
The securities of other investment companies and ETFs in which the Trust may invest may be leveraged. As a result, the Trust may be indirectly exposed to leverage through an investment in such securities. An investment in securities of other investment companies and ETFs that use leverage may expose the Trust to higher volatility in the market value of such securities and the possibility that the Trust’s long-term returns on such securities (and, indirectly, the long-term returns of shares of the Trust) will be diminished.
As with other investments, investments in other investment companies, including ETFs, are subject to market and selection risk. To the extent the Trust is held by an affiliated fund, the ability of the Trust itself to hold other investment companies may be limited.
Subsidiary Risk: By investing in any Subsidiary, the Trust will be indirectly exposed to the risks associated with such Subsidiary’s investments. The instruments that will be held by any Subsidiary will generally be similar to those that are permitted to be held by the Trust and will be subject to the same risks that apply to similar investments if held directly by the Trust. The Subsidiaries will not be registered under the 1940 Act, and, unless otherwise noted, will not be subject to all the investor protections of the 1940 Act. However, the Trust will wholly own and control any Subsidiary, and the Trust and any Subsidiary will each be managed by the Advisors and share the same portfolio management teams. The Trust’s Board will have oversight responsibility for the investment activities of the Trust, including its investment in the Subsidiaries, and the Trust’s role as sole shareholder of any Subsidiary. Changes in the laws of the United States and/or any jurisdiction in which a Subsidiary is formed could result in the inability of the Trust and/or the Subsidiaries to operate as described and could adversely affect the Trust.
Commodities Related Investments Risk: Exposure to the commodities markets may subject the Trust to greater volatility than investments in traditional securities. The value of commodity-linked derivative investments may be affected by changes in overall market movements, commodity index volatility, changes in interest rates, or factors affecting a particular industry or commodity, such as drought, floods, weather, embargoes, tariffs and international economic, political and regulatory developments.
Market Risk and Selection Risk: Market risk is the risk that one or more markets in which the Trust invests will go down in value, including the possibility that the markets will go down sharply and unpredictably. The value of a security or other asset may decline due to changes in general market conditions, economic trends or events that are not specifically related to the issuer of the security or other asset, or factors that affect a particular issuer or issuers, exchange, country, group of countries, region, market, industry, group of industries, sector or asset class. Local, regional or global events such as war, acts of terrorism, the spread of infectious illness or other public health issues like pandemics or epidemics, recessions, or other events could have a significant impact on the Trust and its investments. Selection risk is the risk that the securities selected by Trust management will underperform the markets, the relevant indices or the securities selected by other funds with similar investment objectives and investment strategies. This means you may lose money.
An outbreak of an infectious coronavirus (COVID-19) that was first detected in December 2019 developed into a global pandemic that has resulted in numerous disruptions in the market and has had significant economic impact leaving general concern and uncertainty. Although vaccines have been developed and approved for use by various governments, the duration of the pandemic and its effects cannot be predicted with certainty. The impact of this coronavirus, and other epidemics and pandemics that may arise in the future, could affect the economies of many nations, individual companies and the market in general ways that cannot necessarily be foreseen at the present time.
| | |
I N V E S T M E N T O B J E C T I V E S , P O L I C I E S A N D R I S K S | | 81 |
Automatic Dividend Reinvestment Plan
With respect to MSO, unless the registered owner of common shares elects to receive cash by contacting Computershare Trust Company, N.A. (the “MSO Reinvestment Plan Agent”), all dividends or other distributions (together, a “dividend”) declared for your common shares of the Trust will be automatically reinvested by the MSO Reinvestment Plan Agent, as agent for shareholders in administering the Trust’s dividend reinvestment plan (the “MSO Reinvestment Plan”), in additional common shares of the Trust. Shareholders who elect not to participate in the MSO Reinvestment Plan will receive all dividends in cash paid directly to the shareholder of record (or, if the common shares are held in street or other nominee name, then to such nominee) by Computershare Trust Company, N.A., as dividend disbursing agent. You may elect not to participate in the MSO Reinvestment Plan and to receive all dividends in cash by contacting your broker/other financial intermediary or if your shares are held directly by the fund, by contacting the MSO Reinvestment Plan Agent, at the address set forth below. Participation in the MSO Reinvestment Plan is completely voluntary and may be terminated or resumed at any time without penalty by written notice if received and processed by the MSO Reinvestment Plan Agent prior to the dividend record date. Additionally, the MSO Reinvestment Plan Agent seeks to process notices received after the record date but prior to the payable date and such notices often will become effective by the payable date. Where late notices are not processed by the applicable payable date, such termination or resumption will be effective with respect to any subsequently declared dividend.
The MSO Reinvestment Plan Agent will open an account for each common shareholder under the MSO Reinvestment Plan in the same name in which such common shareholder’s common shares are registered. Whenever the Trust declares a dividend payable in cash, non-participants in the MSO Reinvestment Plan will receive cash and participants in the MSO Reinvestment Plan will receive the equivalent in common shares. The number of newly issued common shares to be credited to each participant’s account will be determined by dividing the dollar amount of the dividend by the NAV on the reinvestment date.
The MSO Reinvestment Plan Agent maintains all shareholders’ accounts in the MSO Reinvestment Plan and furnishes written confirmation of all transactions in the accounts, including information needed by shareholders for tax records. Common shares in the account of each MSO Reinvestment Plan participant will be held by the MSO Reinvestment Plan Agent on behalf of the Reinvestment Plan participant, and each shareholder proxy will include those shares purchased or received pursuant to the Reinvestment Plan.
In the case of shareholders such as banks, brokers or nominees, which hold shares for others who are the beneficial owners, the MSO Reinvestment Plan Agent will administer the Reinvestment Plan on the basis of the number of common shares certified from time to time by the record shareholder’s name and held for the account of beneficial owners who participate in the Reinvestment Plan.
The MSO Reinvestment Plan Agent’s fees for the handling of the reinvestment of dividends will be paid by the Trust. The automatic reinvestment of dividends will not relieve participants of any federal, state or local income tax that may be payable (or required to be withheld) on such dividends.
The Trust reserves the right to amend or terminate the MSO Reinvestment Plan. There is no direct service charge to participants with regard to newly issued common shares in the MSO Reinvestment Plan; however, the Trust reserves the right to amend the MSO Reinvestment Plan to include a service charge payable by the participants. Notice of amendments to the MSO Reinvestment Plan will be sent to participants.
All correspondence concerning the MSO Reinvestment Plan should be directed to the MSO Reinvestment Plan Agent, through the internet at computershare.com/blackrock, or in writing to Computershare, P. O. Box 43006 Providence, RI 02940-3078, Telephone: (800) 699-1236. Overnight correspondence should be directed to the MSO Reinvestment Plan Agent at Computershare, 150 Royall Street, Suite 101, Canton MA 02021.
Pursuant to the MSO2’s dividend reinvestment plan (the “MSO2 Reinvestment Plan”), registered shareholders will have all dividends, including any capital gain dividends, reinvested automatically in additional common shares of the Trust by BNY Mellon Investment Servicing (US) Inc. (the “MSO2 Reinvestment Plan Agent”), unless the shareholder elects to receive cash. Shareholders who elect not to participate in the MSO2 Reinvestment Plan will receive all dividends in cash paid directly to the shareholder of record (or, if the common shares are held through banks, brokers or other nominee name, then to such banks, brokers or other nominee) by BNY Mellon Investment Servicing (US) Inc., as dividend disbursing agent. You may elect not to participate in the MSO2 Reinvestment Plan and to receive all dividends in cash by contacting your bank, broker or other nominee who holds your Trust common shares or if your Trust common shares are held directly by the Trust, by contacting the MSO2 Reinvestment Plan Agent, at the address set forth below. Participation in the MSO2 Reinvestment Plan is completely voluntary and may be terminated or resumed at any time without penalty by written notice if received and processed by the MSO2 Reinvestment Plan Agent prior to the dividend record date. Additionally, the MSO2 Reinvestment Plan Agent seeks to process notices received after the record date but prior to the payable date and such notices often will become effective by the payable date. Where late notices are not processed by the applicable payable date, such termination or resumption will be effective with respect to any subsequently declared dividend.
In the case of record shareholders such as banks, brokers or other nominees that hold Trust common shares for others who are the beneficial owners, the MSO2 Reinvestment Plan Agent will administer the MSO2 Reinvestment Plan on the basis of the number of Trust common shares certified from time to time by the record shareholder as representing the total amount registered in such shareholder’s name and held for the account of beneficial owners who are to participate in the MSO2 Reinvestment Plan. Shareholders whose Trust common shares are held in the name of a bank, broker or other nominee should contact the bank, broker or other nominee for details. Such shareholders may not be able to transfer their shares to another bank, broker or other nominee and continue to participate in the MSO2 Reinvestment Plan.
The number of newly issued Trust common shares to be credited to each participant’s account will be determined by dividing the dollar amount of the dividend by the NAV on the reinvestment date; there is no sales or other charge for reinvestment.
The MSO2 Reinvestment Plan Agent’s fees for the handling of the reinvestment of dividends will be paid by the Trust. The Trust reserves the right to amend or terminate the MSO2 Reinvestment Plan. There is no direct service charge to participants with regard to newly issued Trust common shares in the MSO2 Reinvestment Plan. Notice of amendments to the Reinvestment Plan will be sent to participants.
All correspondence concerning the MSO2 Reinvestment Plan should be directed to the MSO2 Reinvestment Plan Agent, in writing to: BlackRock Funds, C/O BNY Mellon Investment Servicing, P.O. Box 9819, Providence, RI 02940.
| | |
| 82 | | 2 0 2 2 B L A C K R O C K A N N U A L R E P O R T T O S H A R E H O L D E R S |
Trustee and Officer Information
| | | | | | | | |
| Independent Trustees(a) |
| | | | | |
Name Year of Birth(b) | | Position(s) Held
(Length of Service)(c) | | Principal Occupation(s) During Past 5 Years | | Number of BlackRock-Advised
Registered Investment Companies
(“RICs”) Consisting of
Investment Portfolios
(“Portfolios”) Overseen | | Public Company
and Other
Investment
Company
Directorships Held
During
Past 5 Years |
| | | | |
R. Glenn Hubbard 1958 | | Chair of the Board (Since 2022) Trustee (Since 2007) | | Dean, Columbia Business School from 2004 to 2019; Faculty member, Columbia Business School since 1988. | | 70 RICs consisting of 102 Portfolios | | ADP (data and information services) from 2004 to 2020; Metropolitan Life Insurance Company (insurance); TotalEnergies SE (multi-energy) |
| | | | |
W. Carl Kester(d) 1951 | | Vice Chair of the Board (Since 2022) Trustee (Since 2007) | | George Fisher Baker Jr. Professor of Business Administration, Harvard Business School since 2008; Deputy Dean for Academic Affairs from 2006 to 2010; Chairman of the Finance Unit, from 2005 to 2006; Senior Associate Dean and Chairman of the MBA Program from 1999 to 2005; Member of the faculty of Harvard Business School since 1981. | | 72 RICs consisting of 104 Portfolios | | None |
| | | | |
Cynthia L. Egan 1955 | | Trustee (Since 2016) | | Advisor, U.S. Department of the Treasury from 2014 to 2015; President, Retirement Plan Services, for T. Rowe Price Group, Inc. from 2007 to 2012; executive positions within Fidelity Investments from 1989 to 2007. | | 70 RICs consisting of 102 Portfolios | | Unum (insurance); The Hanover Insurance Group (Board Chair); Huntsman Corporation (Lead Independent Director and non Executive Vice Chair of the Board) (chemical products) |
| | | | |
Frank J. Fabozzi(d) 1948 | | Trustee (Since 2007) | | Editor of The Journal of Portfolio Management since 1986; Professor of Finance, EDHEC Business School (France) from 2011 to 2022; Professor of Practice, Johns Hopkins University since 2021; Professor in the Practice of Finance, Yale University School of Management from 1994 to 2011 and currently a Teaching Fellow in Yale’s Executive Programs; Visiting Professor, Rutgers University for the Spring 2019 semester; Visiting Professor, New York University for the 2019 academic year; Adjunct Professor of Finance, Carnegie Mellon University in fall 2020 semester. | | 72 RICs consisting of 104 Portfolios | | None |
| | | | |
Lorenzo A. Flores 1964 | | Trustee (Since 2021) | | Vice Chairman, Kioxia, Inc. since 2019; Chief Financial Officer, Xilinx, Inc. from 2016 to 2019; Corporate Controller, Xilinx, Inc. from 2008 to 2016. | | 70 RICs consisting of 102 Portfolios | | None |
| | | | |
Stayce D. Harris 1959 | | Trustee (Since 2021) | | Lieutenant General, Inspector General, Office of the Secretary of the United States Air Force from 2017 to 2019; Lieutenant General, Assistant Vice Chief of Staff and Director, Air Staff, United States Air Force from 2016 to 2017; Major General, Commander, 22nd Air Force, AFRC, Dobbins Air Reserve Base, Georgia from 2014 to 2016; Pilot, United Airlines from 1990 to 2020. | | 70 RICs consisting of 102 Portfolios | | The Boeing Company (airplane manufacturer) |
| | | | |
J. Phillip Holloman 1955 | | Trustee (Since 2021) | | President and Chief Operating Officer, Cintas Corporation from 2008 to 2018. | | 70 RICs consisting of 102 Portfolios | | PulteGroup, Inc. (home construction); Rockwell Automation Inc. (industrial automation) |
| | |
T R U S T E E A N D O F F I C E R I N F O R M A T I O N | | 83 |
Trustee and Officer Information (continued)
| | | | | | | | |
| Independent Trustees(a) (continued) |
| | | | | |
Name Year of Birth(b) | | Position(s) Held
(Length of Service)(c) | | Principal Occupation(s) During Past 5 Years | | Number of BlackRock-Advised
Registered Investment Companies
(“RICs”) Consisting of
Investment Portfolios
(“Portfolios”) Overseen | | Public Company
and Other
Investment
Company
Directorships Held
During
Past 5 Years |
| | | | |
Catherine A. Lynch(d) 1961 | | Trustee (Since 2016) | | Chief Executive Officer, Chief Investment Officer and various other positions, National Railroad Retirement Investment Trust from 2003 to 2016; Associate Vice President for Treasury Management, The George Washington University from 1999 to 2003; Assistant Treasurer, Episcopal Church of America from 1995 to 1999. | | 72 RICs consisting of 104 Portfolios | | PennyMac Mortgage Investment Trust |
|
| Interested Trustees(a)(e) |
| | | | | |
Name
Year of Birth(b) | | Position(s) Held
(Length of Service)(c) | | Principal Occupation(s) During Past 5 Years | | Number of BlackRock-Advised
Registered Investment Companies
(“RICs”) Consisting of
Investment Portfolios
(“Portfolios”) Overseen | | Public Company
and Other
Investment
Company
Directorships
Held During
Past 5 Years |
| | | | |
Robert Fairbairn 1965 | | Trustee (Since 2018) | | Vice Chairman of BlackRock, Inc. since 2019; Member of BlackRock’s Global Executive and Global Operating Committees; Co-Chair of BlackRock’s Human Capital Committee; Senior Managing Director of BlackRock, Inc. from 2010 to 2019; oversaw BlackRock’s Strategic Partner Program and Strategic Product Management Group from 2012 to 2019; Member of the Board of Managers of BlackRock Investments, LLC from 2011 to 2018; Global Head of BlackRock’s Retail and iShares® businesses from 2012 to 2016. | | 98 RICs consisting of 266 Portfolios | | None |
| | | | |
John M. Perlowski(d) 1964 | | Trustee (Since 2015) President and Chief Executive Officer (Since 2010) | | Managing Director of BlackRock, Inc. since 2009; Head of BlackRock Global Accounting and Product Services since 2009; Advisory Director of Family Resource Network (charitable foundation) since 2009. | | 100 RICs consisting of 268 Portfolios | | None |
(a) The address of each Trustee is c/o BlackRock, Inc., 55 East 52nd Street, New York, New York 10055. |
(b) Each Independent Trustee holds office until his or her successor is duly elected and qualifies or until his or her earlier death, resignation, retirement or removal as provided by the Trust’s by-laws or charter or statute, or until December 31 of the year in which he or she turns 75. Trustees who are “interested persons,” as defined in the Investment Company Act serve until their successor is duly elected and qualifies or until their earlier death, resignation, retirement or removal as provided by the Trust’s by-laws or statute, or until December 31 of the year in which they turn 72. The Board may determine to extend the terms of Independent Trustees on a case-by-case basis, as appropriate. |
(c) Following the combination of Merrill Lynch Investment Managers, L.P. (“MLIM”) and BlackRock, Inc. in September 2006, the various legacy MLIM and legacy BlackRock fund boards were realigned and consolidated into three new fund boards in 2007. Certain Independent Trustees first became members of the boards of other legacy MLIM or legacy BlackRock funds as follows: Frank J. Fabozzi, 1988; R. Glenn Hubbard, 2004; and W. Carl Kester, 1995. |
(d) Dr. Fabozzi, Dr. Kester, Ms. Lynch and Mr. Perlowski are also trustees of the BlackRock Credit Strategies Fund and BlackRock Private Investments Fund. |
(e) Mr. Fairbairn and Mr. Perlowski are both “interested persons,” as defined in the 1940 Act, of the Trust based on their positions with BlackRock, Inc. and its affiliates. Mr. Fairbairn and Mr. Perlowski are also board members of the BlackRock Multi-Asset Complex. |
| | |
| 84 | | 2 0 2 2 B L A C K R O C K A N N U A L R E P O R T T O S H A R E H O L D E R S |
Trustee and Officer Information (continued)
| | | | |
| Officers Who Are Not Trustees(a) |
| | | |
Name Year of Birth(b) | | Position(s) Held (Length of Service) | | Principal Occupation(s) During Past 5 Years |
Jonathan Diorio 1980 | | Vice President (Since 2015) | | Managing Director of BlackRock, Inc. since 2015; Director of BlackRock, Inc. from 2011 to 2015. |
Trent Walker 1974 | | Chief Financial Officer (Since 2021) | | Managing Director of BlackRock, Inc. since September 2019; Executive Vice President of PIMCO from 2016 to 2019; Senior Vice President of PIMCO from 2008 to 2015; Treasurer from 2013 to 2019 and Assistant Treasurer from 2007 to 2017 of PIMCO Funds, PIMCO Variable Insurance Trust, PIMCO ETF Trust, PIMCO Equity Series, PIMCO Equity Series VIT, PIMCO Managed Accounts Trust, 2 PIMCO-sponsored interval funds and 21 PIMCO-sponsored closed-end funds. |
Jay M. Fife 1970 | | Treasurer (Since 2007) | | Managing Director of BlackRock, Inc. since 2007. |
Charles Park 1967 | | Chief Compliance Officer (Since 2014) | | Anti-Money Laundering Compliance Officer for certain BlackRock-advised Funds from 2014 to 2015; Chief Compliance Officer of BlackRock Advisors, LLC and the BlackRock-advised Funds in the BlackRock Multi-Asset Complex and the BlackRock Fixed-Income Complex since 2014; Principal of and Chief Compliance Officer for iShares® Delaware Trust Sponsor LLC since 2012 and BlackRock Fund Advisors (“BFA”) since 2006; Chief Compliance Officer for the BFA-advised iShares® exchange traded funds since 2006; Chief Compliance Officer for BlackRock Asset Management International Inc. since 2012. |
Janey Ahn 1975 | | Secretary (Since 2012) | | Managing Director of BlackRock, Inc. since 2018; Director of BlackRock, Inc. from 2009 to 2017. |
(a) The address of each Officer is c/o BlackRock, Inc., 55 East 52nd Street, New York, New York 10055. |
(b) Officers of the Trust serve at the pleasure of the Board. |
Effective May 31, 2022, Karen P. Robards retired as a Trustee of the Trusts.
Effective January 31, 2022, the Trusts’ portfolio managers are Rick Rieder, Amer Bisat, Ronald Redmond, and Jacob Caplain.
| | |
T R U S T E E A N D O F F I C E R I N F O R M A T I O N | | 85 |
Additional Information
Environmental, Social and Governance (“ESG”) Integration
Although a Trust does not seek to implement a specific sustainability strategy unless otherwise disclosed, Trust management will consider ESG characteristics as part of the investment process for actively managed Trusts. These considerations will vary depending on a Trust’s particular investment strategies and may include consideration of third-party research as well as consideration of proprietary BlackRock research across the ESG risks and opportunities regarding an issuer. Trust management will consider such ESG characteristics it deems relevant or additive, if any, when making investment decisions for a Trust. The ESG characteristics utilized in a Trust’s investment process are anticipated to evolve over time and one or more characteristics may not be relevant with respect to all issuers that are eligible for investment. ESG characteristics are not the sole considerations when making investment decisions for a Trust. Further, investors can differ in their views of what constitutes positive or negative ESG characteristics. As a result, a Trust may invest in issuers that do not reflect the beliefs and values with respect to ESG of any particular investor. ESG considerations may affect a Trust’s exposure to certain companies or industries and a Trust may forego certain investment opportunities. While Trust management views ESG considerations as having the potential to contribute to a Trust’s long-term performance, there is no guarantee that such results will be achieved.
Dividend Policy
Each Trust’s dividend policy is to distribute all or a portion of its net investment income to its shareholders on a quarterly basis. In order to provide shareholders with a more stable level of dividend distributions, the distributions paid by a Trust for any particular quarter may be more or less than the amount of net investment income earned by a Trust during such quarter. The portion of distributions that exceeds a Trust current and accumulated earnings and profits, which are measured on a tax basis, will constitute a nontaxable return of capital. The Trusts’ current accumulated but undistributed net investment income, if any, is disclosed as accumulated earnings (loss) in the Statements of Assets and Liabilities, which comprises part of the financial information included in this report.
General Information
The Trusts do not make available copies of their Statements of Additional Information because the Trust’s shares are not continuously offered, which means that the Statement of Additional Information of each Trust has not been updated after completion of the respective Trust’s offerings and the information contained in each Trust’s Statement of Additional Information may have become outdated.
For the taxable year ended December 31, 2022 and all prior taxable years, MSO2 has been treated as a “publicly offered regulated investment company.” To be treated as a “publicly offered regulated investment company,” MSO2’s shares must, among other things, be held by or for at least 500 persons at all times during the taxable year. As of December 31, 2022, MSO2’s shares were held by 508 persons. This number could decrease below 500 persons in a taxable year following December 31, 2022 as a result of shareholders’ shares being repurchased in one or more quarterly tender offers.
The failure of MSO2 to be treated as a “publicly offered regulated investment company” in a given taxable year could have potential adverse tax consequences for U.S. shareholders that are individuals, trusts, estates, and certain other pass-through entities. In such situation, each affected shareholder will be treated as receiving a distribution equal to that shareholder’s allocable share of management fees and certain other expenses paid by MSO2 (“MSO2 Fees and Expenses”), but will not be able to take an offsetting deduction. MSO2 Fees and Expenses will be treated as miscellaneous itemized deductions, which are currently not deductible by such U.S. shareholders.
Investors should consult with their tax advisors regarding the potential individual tax consequences should MSO2 fail to be treated as a “publicly offered regulated investment company” in a given taxable year. Each U.S. shareholder’s share of MSO2 Fees and Expenses, if applicable, would be reported on a Form 1099-DIV.
To mitigate any potential economic impact should MSO2 fail to be treated as a “publicly offered regulated investment company”, effective January 1, 2022, BlackRock Advisors, LLC (the “Manager”) voluntarily agreed to waive its annual management fee rate by 0.25%, such that MSO2 will be subject to a net management fee at an annual rate of 1.00% of the average daily value of MSO2’s managed assets. The Manager may terminate this voluntary waiver at any time without notice. The fees waived under the voluntary management fee waiver are not subject to recoupment by the Manager.
The following information is a summary of certain changes since December 31, 2021. This information may not reflect all of the changes that have occurred since you purchased the relevant Trust.
Except if noted otherwise herein, there were no changes to the Trusts’ charters or by-laws that would delay or prevent a change of control of the Trusts that were not approved by the shareholders. Except if noted otherwise herein, there have been no changes in the persons who are primarily responsible for the day-to-day management of the Trusts’ portfolios.
In accordance with Section 23(c) of the Investment Company Act of 1940, each Trust may from time to time purchase shares of its common stock in the open market or in private transactions.
Quarterly performance, semi-annual and annual reports, current net asset value and other information regarding the Trusts may be found on BlackRock’s website, which can be accessed at blackrock.com. Any reference to BlackRock’s website in this report is intended to allow investors public access to information regarding the Trusts and does not, and is not intended to, incorporate BlackRock’s website in this report.
BlackRock, Inc. or its subsidiaries (“BlackRock”) has entered into an arrangement with Markit Indices Limited (“Markit”) related to derivative fixed-income products that are based on certain iShares exchange-traded funds (“ETFs”). Markit is the index provider for underlying fixed-income indexes used by such iShares ETFs. In connection with these derivative products, BlackRock will receive payments for licensing intellectual property belonging to BlackRock and for facilitating provision of data in connection with such derivative products. These payments may be based on the trading volumes of, or revenues generated by, such products. Each Trust may transact in such products where permitted by each Trust’s investment strategy. These transactions could contribute to the viability of such products, potentially leading to increased payments to BlackRock, greater liquidity for such products, increased purchases of the applicable iShares ETFs and increased assets under management for BlackRock.
| | |
| 86 | | 2 0 2 2 B L A C K R O C K A N N U A L R E P O R T T O S H A R E H O L D E R S |
Additional Information (continued)
Electronic Delivery
Shareholders can sign up for e-mail notifications of quarterly statements, annual and semi-annual shareholder reports by enrolling in the electronic delivery program. Electronic copies of shareholder reports are available on BlackRock’s website.
To enroll in electronic delivery:
Shareholders Who Hold Accounts with Investment Advisers, Banks or Brokerages:
Please contact your financial adviser. Please note that not all investment advisers, banks or brokerages may offer this service.
Householding
The Trusts will mail only one copy of shareholder documents, annual and semi-annual reports, Rule 30e-3 notices and proxy statements, to shareholders with multiple accounts at the same address. This practice is commonly called “householding” and is intended to reduce expenses and eliminate duplicate mailings of shareholder documents. Mailings of your shareholder documents may be householded indefinitely unless you instruct us otherwise. If you do not want the mailing of these documents to be combined with those for other members of your household, please call the Trusts at (800) 882-0052.
Availability of Quarterly Schedule of Investments
The Trusts file their complete schedules of portfolio holdings with the SEC for the first and third quarters of each fiscal year as an exhibit to their reports on Form N-PORT. The Trusts’ Forms N-PORT are available on the SEC’s website at sec.gov. Additionally, each Trust makes its portfolio holdings for the first and third quarters of each fiscal year available at blackrock.com/fundreports.
Availability of Proxy Voting Policies, Procedures and Voting Records
A description of the policies and procedures that the Trusts use to determine how to vote proxies relating to portfolio securities and information about how the Trusts voted proxies relating to securities held in the Trusts’ portfolios during the most recent 12-month period ended June 30 is available without charge, upon request (1) by calling (800) 882-0052; (2) on the BlackRock website at blackrock.com; and (3) on the SEC’s website at sec.gov.
Availability of Trust Updates
BlackRock will update performance and certain other data for the Trusts on a monthly basis on its website in the “Closed-end Funds” section of blackrock.com as well as certain other material information as necessary from time to time. Investors and others are advised to check the website for updated performance information and the release of other material information about the Trusts. This reference to BlackRock’s website is intended to allow investors public access to information regarding the Trusts and does not, and is not intended to, incorporate BlackRock’s website in this report.
BlackRock Privacy Principles
BlackRock is committed to maintaining the privacy of its current and former fund investors and individual clients (collectively, “Clients”) and to safeguarding their non-public personal information. The following information is provided to help you understand what personal information BlackRock collects, how we protect that information and why in certain cases we share such information with select parties.
If you are located in a jurisdiction where specific laws, rules or regulations require BlackRock to provide you with additional or different privacy-related rights beyond what is set forth below, then BlackRock will comply with those specific laws, rules or regulations.
BlackRock obtains or verifies personal non-public information from and about you from different sources, including the following: (i) information we receive from you or, if applicable, your financial intermediary, on applications, forms or other documents; (ii) information about your transactions with us, our affiliates, or others; (iii) information we receive from a consumer reporting agency; and (iv) from visits to our websites.
BlackRock does not sell or disclose to non-affiliated third parties any non-public personal information about its Clients, except as permitted by law or as is necessary to respond to regulatory requests or to service Client accounts. These non-affiliated third parties are required to protect the confidentiality and security of this information and to use it only for its intended purpose.
We may share information with our affiliates to service your account or to provide you with information about other BlackRock products or services that may be of interest to you. In addition, BlackRock restricts access to non-public personal information about its Clients to those BlackRock employees with a legitimate business need for the information. BlackRock maintains physical, electronic and procedural safeguards that are designed to protect the non-public personal information of its Clients, including procedures relating to the proper storage and disposal of such information.
| | |
A D D I T I O N A L I N F O R M A T I O N | | 87 |
Additional Information (continued)
Trust and Service Providers
Investment Adviser
BlackRock Advisors, LLC
Wilmington, DE 19809
Sub-Adviser
BlackRock International Limited
Edinburgh, EH3 8BL
United Kingdom
BlackRock (Singapore) Limited
079912 Singapore
Accounting Agent and Custodian
State Street Bank and Trust Company
Boston, MA 02111
Transfer Agent
Computershare Trust Company, N.A.(a)
Canton, MA 02021
BNY Mellon Investment Servicing (US) Inc.(b)
Wilmington, DE 19809
Independent Registered Public Accounting Firm
Deloitte & Touche LLP
Boston, MA 02116
Legal Counsel
Willkie Farr & Gallagher LLP
New York, NY 10019
Address of the Trusts
100 Bellevue Parkway
Wilmington, DE 19809
| | |
| 88 | | 2 0 2 2 B L A C K R O C K A N N U A L R E P O R T T O S H A R E H O L D E R S |
Glossary of Terms Used in this Report
| | |
| Currency Abbreviation |
| |
| AUD | | Australian Dollar |
| |
| BRL | | Brazilian Real |
| |
| CAD | | Canadian Dollar |
| |
| CNH | | Chinese Yuan |
| |
| EUR | | Euro |
| |
| GBP | | British Pound |
| |
| USD | | United States Dollar |
| | |
| Portfolio Abbreviation |
| |
| CDI | | CREST Depository Interest |
| |
| CLO | | Collateralized Loan Obligation |
| |
| CMT | | Constant Maturity Treasury |
| |
| CR | | Custodian Receipt |
| |
| ETF | | Exchange-Traded Fund |
| |
| EURIBOR | | Euro Interbank Offered Rate |
| |
| FREMF | | Freddie Mac Multifamily Securities |
| |
| GO | | General Obligation Bonds |
| |
| LIBOR | | London Interbank Offered Rate |
| |
| PCL | | Public Company Limited |
| |
| PIK | | Payment-in-Kind |
| |
| RB | | Revenue Bond |
| |
| SAB | | Special Assessment Bonds |
| |
| SOFR | | Secured Overnight Financing Rate |
| |
| SOFR CME | | Secured Overnight Financing Rate Chicago Mercantile Exchange |
| |
| SOFRTE | | Term Secured Overnight Financing Rate |
| |
| TBA | | To-Be-Announced |
| | |
G L O S S A R Y O F T E R M S U S E D I N T H I S R E P O R T | | 89 |
Want to know more?
blackrock.com | 800-882-0052
This report is intended for current holders. It is not a prospectus. Past performance results shown in this report should not be considered a representation of future performance. Statements and other information herein are as dated and are subject to change.
MSO-12/22-AR
(b) Not Applicable
| Item 2 – | Code of Ethics – The registrant (or the “Fund”) has adopted a code of ethics, as of the end of the period covered by this report, applicable to the registrant’s principal executive officer, principal financial officer, principal accounting officer or controller, or persons performing similar functions. During the period covered by this report, the code of ethics was amended to update certain information and to make other non-material changes. During the period covered by this report, there have been no waivers granted under the code of ethics. The registrant undertakes to provide a copy of the code of ethics to any person upon request, without charge, who calls 1-800-882-0052, option 4. |
| Item 3 – | Audit Committee Financial Expert – The registrant’s board of directors (the “board of directors”), has determined that (i) the registrant has the following audit committee financial experts serving on its audit committee and (ii) each audit committee financial expert is independent: |
Frank J. Fabozzi
Lorenzo A. Flores
Catherine A. Lynch
Under applicable securities laws, a person determined to be an audit committee financial expert will not be deemed an “expert” for any purpose, including without limitation for the purposes of Section 11 of the Securities Act of 1933, as a result of being designated or identified as an audit committee financial expert. The designation or identification of a person as an audit committee financial expert does not impose on such person any duties, obligations, or liabilities greater than the duties, obligations, and liabilities imposed on such person as a member of the audit committee and board of directors in the absence of such designation or identification. The designation or identification of a person as an audit committee financial expert does not affect the duties, obligations, or liability of any other member of the audit committee or board of directors.
| Item 4 – | Principal Accountant Fees and Services |
The following table presents fees billed by Deloitte & Touche LLP (“D&T”) in each of the last two fiscal years for the services rendered to the Fund:
| | | | | | | | | | | | | | | | |
| | | (a) Audit Fees | | (b) Audit-Related Fees1 | | (c) Tax Fees2 | | (d) All Other Fees |
| Entity Name | | Current
Fiscal Year
End | | Previous Fiscal Year
End | | Current Fiscal Year
End | | Previous Fiscal Year
End | | Current Fiscal Year
End | | Previous Fiscal Year
End | | Current Fiscal Year
End | | Previous Fiscal Year
End |
| BlackRock Multi-Sector Opportunities Trust | | $64,974 | | $64,337 | | $0 | | $207 | | $22,000 | | $20,000 | | $431 | | $0 |
The following table presents fees billed by D&T that were required to be approved by the registrant’s audit committee (the “Committee”) for services that relate directly to the operations or financial reporting of the Fund and that are rendered on behalf of BlackRock Advisors, LLC ( the “Investment Adviser” or “BlackRock”) and entities controlling, controlled by, or under common control with BlackRock (not including any sub-adviser whose role is primarily portfolio management and is subcontracted with or overseen by another investment adviser) that provide ongoing services to the Fund (“Affiliated Service Providers”):
| | | | |
| | | Current Fiscal Year End | | Previous Fiscal Year End |
(b) Audit-Related Fees1 | | $0 | | $0 |
(c) Tax Fees2 | | $0 | | $0 |
(d) All Other Fees3 | | $2,098,000 | | $2,032,000 |
1 The nature of the services includes assurance and related services reasonably related to the performance of the audit or review of financial statements not included in Audit Fees, including accounting consultations, agreed-upon procedure reports, attestation reports, comfort letters, out-of-pocket expenses and internal control reviews not required by regulators.
2 The nature of the services includes tax compliance and/or tax preparation, including services relating to the filing or amendment of federal, state or local income tax returns, regulated investment company qualification reviews, taxable income and tax distribution calculations.
3 Non-audit fees of $2,098,000 and $2,032,000 for the current fiscal year and previous fiscal year, respectively, were paid to the Fund’s principal accountant in their entirety by BlackRock, in connection with services provided to the Affiliated Service Providers of the Fund and of certain other funds sponsored and advised by BlackRock or its affiliates for a service organization review and an accounting research tool subscription. These amounts represent aggregate fees paid by BlackRock and were not allocated on a per fund basis.
(e)(1) Audit Committee Pre-Approval Policies and Procedures:
The Committee has adopted policies and procedures with regard to the pre-approval of services. Audit, audit-related and tax compliance services provided to the registrant on an annual basis require specific pre-approval by the Committee. The Committee also must approve other non-audit services provided to the registrant and those non-audit services provided to the Investment Adviser and Affiliated Service Providers that relate directly to the operations and the financial reporting of the registrant. Certain of these non-audit services that the Committee believes are (a) consistent with the SEC’s auditor independence rules and (b) routine and recurring services that will not impair the independence of the independent accountants may be approved by the Committee without consideration on a specific case-by-case basis (“general pre-approval”). The term of any general pre-approval is 12 months from the date of the pre-approval, unless the Committee provides for a different period. Tax or other non-audit services provided to the registrant which have a direct impact on the operations or financial reporting of the registrant will only be deemed pre-approved provided that any individual project does not exceed $10,000 attributable to the registrant or $50,000 per project. For this purpose, multiple projects will be aggregated to determine if they exceed the previously mentioned cost levels.
Any proposed services exceeding the pre-approved cost levels will require specific pre-approval by the Committee, as will any other services not subject to general pre-approval (e.g., unanticipated but permissible services). The Committee is informed of each service approved subject to general pre-approval at the next regularly scheduled in-person board meeting. At this meeting, an analysis of such services is presented to the Committee for ratification. The Committee may delegate to the Committee Chairman the authority to approve the provision of and fees for any specific engagement of permitted non-audit services, including services exceeding pre-approved cost levels.
(e)(2) None of the services described in each of Items 4(b) through (d) were approved by the Committee pursuant to the de minimis exception in paragraph (c)(7)(i)(C) of Rule 2-01 of Regulation S-X.
(f) Not Applicable
(g) The aggregate non-audit fees, defined as the sum of the fees shown under “Audit-Related Fees,”
“Tax Fees” and “All Other Fees,” paid to the accountant for services rendered by the accountant to the registrant, the Investment Adviser and the Affiliated Service Providers were:
| | | | | | |
| Entity Name | | Current Fiscal Year End | | Previous Fiscal Year End | | |
| BlackRock Multi-Sector Opportunities Trust | | $22,431 | | $20,207 |
Additionally, the amounts billed by D&T in connection with services provided to the Affiliated Service Providers of the Fund and of other funds sponsored or advised by BlackRock or its affiliates during the current and previous fiscal years for a service organization review and an accounting research tool subscription were:
| | | | |
Current Fiscal Year End | | Previous Fiscal Year End | | |
$2,098,000 | | $2,032,000 |
These amounts represent aggregate fees paid by BlackRock and were not allocated on a per fund basis.
(h) The Committee has considered and determined that the provision of non-audit services that were rendered to the Investment Adviser, and the Affiliated Service Providers that were not pre-approved pursuant to paragraph (c)(7)(ii) of Rule 2-01 of Regulation S-X is compatible with maintaining the principal accountant’s independence.
(i) – Not Applicable
(j) – Not Applicable
| Item 5 – | Audit Committee of Listed Registrant |
(a) Not Applicable
(b) Not Applicable
(a) The registrant’s Schedule of Investments is included as part of the Report to Stockholders filed under Item 1(a) of this Form.
(b) Not Applicable due to no such divestments during the semi-annual period covered since the previous Form N-CSR filing.
| Item 7 – | Disclosure of Proxy Voting Policies and Procedures for Closed-End Management Investment Companies – The board of directors has delegated the voting of proxies for the Fund’s portfolio securities to the Investment Adviser pursuant to the Investment Adviser’s proxy voting guidelines. Under these guidelines, the Investment Adviser will vote proxies related to Fund securities in the best interests of the Fund and its stockholders. From time to time, a vote may present a conflict |
between the interests of the Fund’s stockholders, on the one hand, and those of the Investment Adviser, or any affiliated person of the Fund or the Investment Adviser, on the other. In such event, provided that the Investment Adviser’s Equity Investment Policy Oversight Committee, or a sub-committee thereof (the “Oversight Committee”) is aware of the real or potential conflict or material non-routine matter and if the Oversight Committee does not reasonably believe it is able to follow its general voting guidelines (or if the particular proxy matter is not addressed in the guidelines) and vote impartially, the Oversight Committee may retain an independent fiduciary to advise the Oversight Committee on how to vote or to cast votes on behalf of the Investment Adviser’s clients. If the Investment Adviser determines not to retain an independent fiduciary, or does not desire to follow the advice of such independent fiduciary, the Oversight Committee shall determine how to vote the proxy after consulting with the Investment Adviser’s Portfolio Management Group and/or the Investment Adviser’s Legal and Compliance Department and concluding that the vote cast is in its client’s best interest notwithstanding the conflict. A copy of the Fund’s Proxy Voting Policy and Procedures are attached as Exhibit 99.PROXYPOL, a copy of the Fund’s Global Corporate Governance & Engagement Principles are attached as Exhibit 99.GLOBAL.CORP.GOV and a copy of the Fund’s Corporate Governance and Proxy Voting Guidelines for U.S. Securities are attached as Exhibit 99.US.CORP.GOV. Information on how the Fund voted proxies relating to portfolio securities during the most recent 12-month period ended June 30 is available without charge, (i) at www.blackrock.com and (ii) on the SEC’s website at http://www.sec.gov.
| Item 8 – | Portfolio Managers of Closed-End Management Investment Companies |
(a)(1) As of the date of filing this Report:
The registrant is managed by a team of investment professionals comprised of Amer Bisat, Managing Director at BlackRock, Rick Rieder, Managing Director at BlackRock, Ronald Redmond, Managing Director at BlackRock and Jacob Caplain, Managing Director at BlackRock. Messrs. Bisat, Rieder, Redmond and Caplain are the Fund’s portfolio managers and are responsible for the day-to-day management of the Fund’s portfolio and the selection of its investments. Messrs. Bisat, Rieder, Redmond and Caplain have been members of the Fund’s portfolio management team since 2018.
| | |
Portfolio Manager | | Biography |
| Amer Bisat | | Managing Director of BlackRock, Inc. since 2013; Partner at Traxis from 2007 to 2013; Partner at Rubicon from 2004 to 2007; Portfolio Manager at UBS from 2002 to 2004; Portfolio Manager at Morgan Stanley Investment Management from 1999 to 2002. Senior economist at the IMF from 1991 to 1998. |
| Rick Rieder | | Global Chief Investment Officer of Fixed Income, Co-head of BlackRock’s Global Fixed Income platform, member of Global Operating Committee and Chairman of the BlackRock firmwide Investment Council. Managing Director of BlackRock, Inc. since 2009. President and Chief Executive Officer of R3 Capital Partners from 2008 to 2009; Managing Director of Lehman Brothers from 1994 to 2008. |
| | |
| Ronald Redmond | | Managing Director of BlackRock, Inc. since 2013; Managing Director of Deutsche Bank Securities from 2007 to 2012. |
| Jacob Caplain | | Managing Director of BlackRock, Inc. since 2023; Director of BlackRock, Inc. from 2019 to 2022; Vice President of BlackRock, Inc. from 2017 to 2018; Associate of BlackRock, Inc. from 2015 to 2016; Analyst of BlackRock, Inc. from 2012 to 2014. |
(a)(2) As of December 31, 2022:
| | | | | | | | | | | | |
| | | (ii) Number of Other Accounts Managed and Assets by Account Type | | (iii) Number of Other Accounts and Assets for Which Advisory Fee is Performance-Based |
(i) Name of Portfolio Manager | | Other Registered Investment Companies | | Other
Pooled Investment Vehicles | | Other Accounts | | Other Registered Investment Companies | | Other
Pooled Investment Vehicles | | Other Accounts |
Amer Bisat | | 6 | | 20 | | 141 | | 0 | | 0 | | 0 |
| | | $1.19 Billion | | $6.31 Billion | | $9.75 Billion | | $0 | | $0 | | $0 |
Rick Rieder | | 23 | | 37 | | 18 | | 0 | | 7 | | 3 |
| | | $101.6 Billion | | $38.48 Billion | | $3.31 Billion | | $0 | | $533.4 Million | | $265.8 Million |
Ronald Redmond | | 1 | | 6 | | 0 | | 0 | | 4 | | 0 |
| | | $86.98 Million | | $86.39 Million | | $0 | | $0 | | $53.43 Million | | $0 |
Jacob Caplain | | 2 | | 3 | | 3 | | 0 | | 1 | | 1 |
| | | $86.98 Million | | $595.1
Million | | $2.57
Billion | | $0 | | $145.2
Million | | $0 |
(iv) Portfolio Manager Potential Material Conflicts of Interest
BlackRock has built a professional working environment, firm-wide compliance culture and compliance procedures and systems designed to protect against potential incentives that may favor one account over another. BlackRock has adopted policies and procedures that address the allocation of investment opportunities, execution of portfolio transactions, personal trading by employees and other potential conflicts of interest that are designed to ensure that all client accounts are treated equitably over time. Nevertheless, BlackRock furnishes investment management and advisory services to numerous clients in addition to the Fund, and BlackRock may, consistent with applicable law, make investment recommendations to other clients or accounts (including accounts which are hedge funds or have performance or higher fees paid to BlackRock, or in which portfolio managers have a personal interest in the receipt of such fees), which may be the same as or different from those made to the Fund. In addition, BlackRock, Inc., its affiliates and significant shareholders and any officer, director, shareholder or employee may or may not have an interest in the securities whose purchase and sale BlackRock recommends to the Fund. BlackRock, Inc., or any of its affiliates or significant shareholders, or any officer, director, shareholder, employee or any member of their families may take different actions than those recommended to the Fund by BlackRock with respect to the same securities. Moreover, BlackRock may refrain from rendering any advice or services concerning securities of companies of which any of BlackRock, Inc.’s (or its affiliates’ or significant shareholders’) officers, directors or employees are directors or officers, or companies as to which BlackRock, Inc. or any of its affiliates or significant
shareholders or the officers, directors and employees of any of them has any substantial economic interest or possesses material non-public information. Certain portfolio managers also may manage accounts whose investment strategies may at times be opposed to the strategy utilized for a fund. It should also be noted that Messrs. Bisat, Rieder, Redmond and Caplain may be managing hedge fund and/or long only accounts, or may be part of a team managing hedge fund and/or long only accounts, subject to incentive fees. Messrs. Bisat, Rieder, Redmond and Caplain may therefore be entitled to receive a portion of any incentive fees earned on such accounts.
As a fiduciary, BlackRock owes a duty of loyalty to its clients and must treat each client fairly. When BlackRock purchases or sells securities for more than one account, the trades must be allocated in a manner consistent with its fiduciary duties. BlackRock attempts to allocate investments in a fair and equitable manner among client accounts, with no account receiving preferential treatment. To this end, BlackRock, Inc. has adopted policies that are intended to ensure reasonable efficiency in client transactions and provide BlackRock with sufficient flexibility to allocate investments in a manner that is consistent with the particular investment discipline and client base, as appropriate.
(a)(3) As of December 31, 2022:
Portfolio Manager Compensation Overview
The discussion below describes the portfolio managers’ compensation as of December 31, 2022.
BlackRock’s financial arrangements with its portfolio managers, its competitive compensation and its career path emphasis at all levels reflect the value senior management places on key resources. Compensation may include a variety of components and may vary from year to year based on a number of factors. The principal components of compensation include a base salary, a performance-based discretionary bonus, participation in various benefits programs and one or more of the incentive compensation programs established by BlackRock.
Base Compensation. Generally, portfolio managers receive base compensation based on their position with the firm.
Discretionary Incentive Compensation
Discretionary incentive compensation is a function of several components: the performance of BlackRock, Inc., the performance of the portfolio manager’s group within BlackRock, the investment performance, including risk-adjusted returns, of the firm’s assets under management or supervision by that portfolio manager relative to predetermined benchmarks, and the individual’s performance and contribution to the overall performance of these portfolios and BlackRock. In most cases, these benchmarks are the same as the benchmark or benchmarks against which the performance of the funds or other accounts managed by the portfolio managers are measured. Among other things, BlackRock’s Chief Investment Officers make a subjective determination with respect to each portfolio manager’s compensation based on the performance of the funds and other accounts managed by each portfolio manager relative to the various benchmarks. Performance of fixed income funds is measured on a pre-tax and/or after-tax basis over various time periods including 1-, 3- and 5- year periods, as applicable. With respect to these portfolio managers, such benchmarks for the Fund and other accounts are:
| | |
Portfolio Manager | | Applicable Benchmarks |
| Amer Bisat | | A combination of market-based indices (e.g., EMBI Global Non-Diversified Index) and certain customized indices. |
Rick Rieder Jacob Caplain | | A combination of market-based indices (e.g., Bloomberg U.S. Aggregate Bond Index), certain customized indices and certain fund industry peer groups. |
| Ronald Redmond | | No Benchmarks. |
Distribution of Discretionary Incentive Compensation
Discretionary incentive compensation is distributed to portfolio managers in a combination of cash, deferred BlackRock, Inc. stock awards, and/or deferred cash awards that notionally track the return of certain BlackRock investment products.
Portfolio managers receive their annual discretionary incentive compensation in the form of cash. Portfolio managers whose total compensation is above a specified threshold also receive deferred BlackRock, Inc. stock awards annually as part of their discretionary incentive compensation. Paying a portion of discretionary incentive compensation in the form of deferred BlackRock, Inc. stock puts compensation earned by a portfolio manager for a given year “at risk” based on BlackRock’s ability to sustain and improve its performance over future periods. In some cases, additional deferred BlackRock, Inc. stock may be granted to certain key employees as part of a long-term incentive award to aid in retention, align interests with long-term shareholders and motivate performance. Deferred BlackRock, Inc. stock awards are generally granted in the form of BlackRock, Inc. restricted stock units that vest pursuant to the terms of the applicable plan and, once vested, settle in BlackRock, Inc. common stock. The portfolio managers of this Fund have deferred BlackRock, Inc. stock awards.
For certain portfolio managers, a portion of the discretionary incentive compensation is also distributed in the form of deferred cash awards that notionally track the returns of select BlackRock investment products they manage, which provides direct alignment of portfolio manager discretionary incentive compensation with investment product results. Deferred cash awards vest ratably over a number of years and, once vested, settle in the form of cash. Only portfolio managers who manage specified products and whose total compensation is above a specified threshold are eligible to participate in the deferred cash award program.
Other Compensation Benefits. In addition to base salary and discretionary incentive compensation, portfolio managers may be eligible to receive or participate in one or more of the following:
Incentive Savings Plans — BlackRock, Inc. has created a variety of incentive savings plans in which BlackRock, Inc. employees are eligible to participate, including a 401(k) plan, the BlackRock Retirement Savings Plan (RSP), and the BlackRock Employee Stock Purchase Plan (ESPP). The employer contribution components of the RSP include a company match equal to 50% of the first 8% of eligible pay contributed to the plan capped at $5,000 per year, and a company retirement contribution equal to 3-5% of eligible compensation up to the Internal Revenue Service limit ($305,000 for 2022). The RSP offers a range of investment options, including registered investment companies and collective investment funds managed by
the firm. BlackRock, Inc. contributions follow the investment direction set by participants for their own contributions or, absent participant investment direction, are invested into a target date fund that corresponds to, or is closest to, the year in which the participant attains age 65. The ESPP allows for investment in BlackRock, Inc. common stock at a 5% discount on the fair market value of the stock on the purchase date. Annual participation in the ESPP is limited to the purchase of 1,000 shares of common stock or a dollar value of $25,000 based on its fair market value on the purchase date. All of the eligible portfolio managers are eligible to participate in these plans.
(a)(4) Beneficial Ownership of Securities – As of December 31, 2022.
| | |
Portfolio Manager | | Dollar Range of Equity Securities of the Fund Beneficially Owned |
Amer Bisat | | $50,001 - $100,000 |
Rick Rieder | | Over $1,000,000 |
Ronald Redmond | | $100,001 - $500,000 |
Jacob Caplain | | $10,001 - $50,000 |
(b) Not Applicable
| Item 9 – | Purchases of Equity Securities by Closed-End Management Investment Company and Affiliated Purchasers – Not Applicable due to no such purchases during the period covered by this report. |
| Item 10 – | Submission of Matters to a Vote of Security Holders – There have been no material changes to these procedures. |
| Item 11 – | Controls and Procedures |
(a) The registrant’s principal executive and principal financial officers, or persons performing similar functions, have concluded that the registrant’s disclosure controls and procedures (as defined in Rule 30a-3(c) under the Investment Company Act of 1940, as amended (the “1940 Act”)) are effective as of a date within 90 days of the filing of this report based on the evaluation of these controls and procedures required by Rule 30a-3(b) under the 1940 Act and Rule 15d-15(b) under the Securities Exchange Act of 1934, as amended.
(b) There were no changes in the registrant’s internal control over financial reporting (as defined in Rule 30a-3(d) under the 1940 Act) that occurred during the period covered by this report that have materially affected, or are reasonably likely to materially affect, the registrant’s internal control over financial reporting.
| Item 12 – | Disclosure of Securities Lending Activities for Closed-End Management Investment Companies – Not Applicable |
| Item 3 – | Exhibits attached hereto |
(a)(1) Code of Ethics – See Item 2
(a)(2) Section 302 Certifications are attached
(a)(3) Any written solicitation to purchase securities under Rule 23c-1 – Not Applicable
(a)(4) Change in Registrant’s independent public accountant – Not Applicable
(b) Section 906 Certifications are attached
Pursuant to the requirements of the Securities Exchange Act of 1934 and the Investment Company Act of 1940, the registrant has duly caused this report to be signed on its behalf by the undersigned, thereunto duly authorized.
BlackRock Multi-Sector Opportunities Trust
| | | | |
| | By: | | /s/ John M. Perlowski |
| | | | John M. Perlowski |
| | | | Chief Executive Officer (principal executive officer) of |
| | | | BlackRock Multi-Sector Opportunities Trust |
Date: February 23, 2023
Pursuant to the requirements of the Securities Exchange Act of 1934 and the Investment Company Act of 1940, this report has been signed below by the following persons on behalf of the registrant and in the capacities and on the dates indicated.
| | | | |
| | By: | | /s/ John M. Perlowski |
| | | | John M. Perlowski |
| | | | Chief Executive Officer (principal executive officer) of |
| | | | BlackRock Multi-Sector Opportunities Trust |
Date: February 23, 2023
| | | | |
| | By: | | /s/ Trent Walker |
| | | | Trent Walker |
| | | | Chief Financial Officer (principal financial officer) of |
| | | | BlackRock Multi-Sector Opportunities Trust |
Date: February 23, 2023