UNITED STATES
SECURITIES AND EXCHANGE COMMISSION
Washington, DC 20549
FORM N-CSR
CERTIFIED SHAREHOLDER REPORT OF REGISTERED
MANAGEMENT INVESTMENT COMPANY
Investment Company Act file number 811-23309
Destra International & Event-Driven Credit Fund
(Exact name of registrant as specified in charter)
444 West Lake Street, Suite 1700
Chicago, IL 60606
(Address of principal executive offices) (Zip code)
Robert A. Watson
C/O Destra Capital Advisors LLC
444 West Lake Street, Suite 1700
Chicago, IL 60606
(Name and address of agent for service)
Registrant’s telephone number, including area code: (312) 843-6161
Date of fiscal year end: September 30
Date of reporting period: September 30, 2020
ITEM 1. REPORTS TO STOCKHOLDERS.
![]()
Destra International & Event-Driven Credit Fund
Annual Report
September 30, 2020
Beginning on January 1, 2021, as permitted by regulations adopted by the U.S. Securities and Exchange Commission, paper copies of the Fund’s annual and semi-annual shareholder reports will no longer be sent by mail, unless you specifically request paper copies of the reports. Instead, the reports will be made available on the Fund’s website at www.destracapital.com, and you will be notified by mail each time a report is posted and provided with a website link to access the report.
If you already elected to receive shareholder reports electronically, you will not be affected by this change and you need not take any action. You may elect to receive shareholder reports and other communications from the Fund electronically anytime by contacting your financial intermediary (such as a broker-dealer or bank), through the Fund’s transfer agent by calling the Fund toll-free at 844-9DESTRA (933-7872), or if you are a direct investor, by enrolling at www.destracapital.com.
You may elect to receive all future reports in paper free of charge. If you invest through a financial intermediary, you can contact your financial intermediary to request that you continue to receive paper copies of your shareholder reports. If you invest directly with the Fund, you can call toll-free at 844-9DESTRA (933-7872) to let the Fund know you wish to continue receiving paper copies of your shareholder reports. Your election to receive reports in paper will apply to all funds held in your account if you invest through your financial intermediary or all funds held with the Destra Fund Complex if you invest directly with the Fund.
Table of Contents
3 | ||
4 | ||
5 | ||
7 | ||
8 | ||
16 | ||
18 | ||
19 | ||
20 | ||
21 | ||
36 | ||
37 | ||
38 | ||
40 |
2
We are pleased to present you with your Fiscal 2020 Annual Report (the “Report”) for the Destra International & Event Driven Credit Fund (the “Fund”), a closed-end interval fund. This Annual Report covers the period between October 1, 2019 and September 30, 2020 (the “Fiscal Year”).
On the subsequent pages, you will find specific details regarding investment results and discussion of the factors that most affected performance during the reporting period.
For the 12 months ended, September 30, 2020, the Stock market, as represented by the S&P 500 index (“S&P”) returned over +15.1% and global equities, as represented by the MSCI World Index, returned over +8%. That robust return endured a dramatic series of events in stocks due to COVID-19. After initially rising, global equities experienced a sharp decline in February and March 2020. This was largely due to concerns over the impact of the virus. In March 2020, the U.S. equity market ended its 11-year bull market run, as the global economy endured its first recession since the 2008 financial crisis. However, global equities began a sharp rally as investor sentiment improved given significant stimulus efforts from central banks around the world.
Bonds, as measured by the Bloomberg Barclays US Aggregate Index (“Agg”) returned +6.9% for the Fiscal Year period, underperforming Stocks. Alternatives, such as the Morningstar Diversified Alternative Index (“MDA”) Underperformed both stocks and bonds significantly, posting -5.2% return in the Fiscal Year.
The Destra International & Event Driven Credit Fund returned a positive 0.64% for the Class I shares during the fiscal year outperforming the MDA Index by over 5.5%, but underperforming stocks and bonds for the period.
The Fund, sub-advised by BlueBay Asset Management crossed its two year anniversary in May 2020. BlueBay is a premier alternative income asset manager based in the UK, with over $62 billion under management and 19 years of experience managing credit, debt, and distressed assets. We are thrilled to be working with such a storied and tenured manager.
We appreciate the continued confidence you have placed in us and our investment partner, BlueBay. Please read this Report carefully and be sure to contact your Financial Advisor or Destra Capital if you have any additional questions.
Sincerely,
Robert A. Watson, CFP(R)
President
Destra Capital Advisors LLC
Destra International & Event-Driven Credit Fund
3
This document may contain forward-looking statements representing Destra Capital Advisors LLC’s (“Destra”), the portfolio managers’ or sub-adviser’s beliefs concerning future operations, strategies, financial results or other developments. Investors are cautioned that such forward-looking statements involve risks and uncertainties. Because these forward-looking statements are based on estimates and assumptions that are subject to significant business, economic and competitive uncertainties, many of which are beyond Destra’s, the portfolio managers’ or sub-advisers’ control or are subject to change, actual results could be materially different. There is no guarantee that such forward-looking statements will come to pass.
Certain impacts to public health conditions particular to the coronavirus (COVID-19) outbreak may have a significant negative impact on the operations and profitability of the Fund’s investments. The extent of the impact to the financial performance of the Fund will depend on future developments, including (i) the duration and spread of the outbreak, (ii) the restrictions and advisories, (iii) the effects on the financial markets, and (iv) the effects on the economy overall, all of which are highly uncertain and cannot be predicted.
Investors should consider the investment objective and policies, risk considerations, charges and ongoing expenses of an investment carefully before investing. The prospectus contains this and other information relevant to an investment in the Fund. Please read the prospectus carefully before investing. To obtain a prospectus, please contact your investment representative or Destra Capital Investments LLC at 844-9DESTRA (933-7872) or access our website at www.destracapital.com.
4
Destra International & Event-Driven Credit Fund |
September 30, 2020 (unaudited) |
Average Annual Total Returns for the period ended September 30, 2020 | ||||||||||
Inception Date: May 9, 2018 | Inception Date: December 21, 2018 | |||||||||
Share Class | 1 Year | Since | Share Class | 1 Year | Since | |||||
Class I | 0.64% | 3.33% | Class A at NAV | 0.39% | 6.51% | |||||
Class A with Load | -5.40% | 3.03% | ||||||||
Class L at NAV | 0.13% | 6.25% | ||||||||
Class L with Load | -4.13% | 3.68% | ||||||||
Class T at NAV | -0.11% | 5.99% | ||||||||
Class T with Load | -3.11% | 4.19% | ||||||||
The performance data quoted is historical. Past performance is no guarantee of future results. Current performance may be higher or lower than the performance data quoted. The principal value and investment return of an investment will fluctuate so that your shares may be worth more or less than their original cost. The returns shown do not reflect the deduction of taxes that a shareholder would pay on Fund distributions or on the redemptions of Fund shares. Please read the Fund’s Prospectus, including the description of the Fund’s repurchase policy carefully before investing. For performance information current to the most recent month-end, please call the Fund at 1-844-9DESTRA (933-7873).
Growth of an Assumed $100,000 Investment
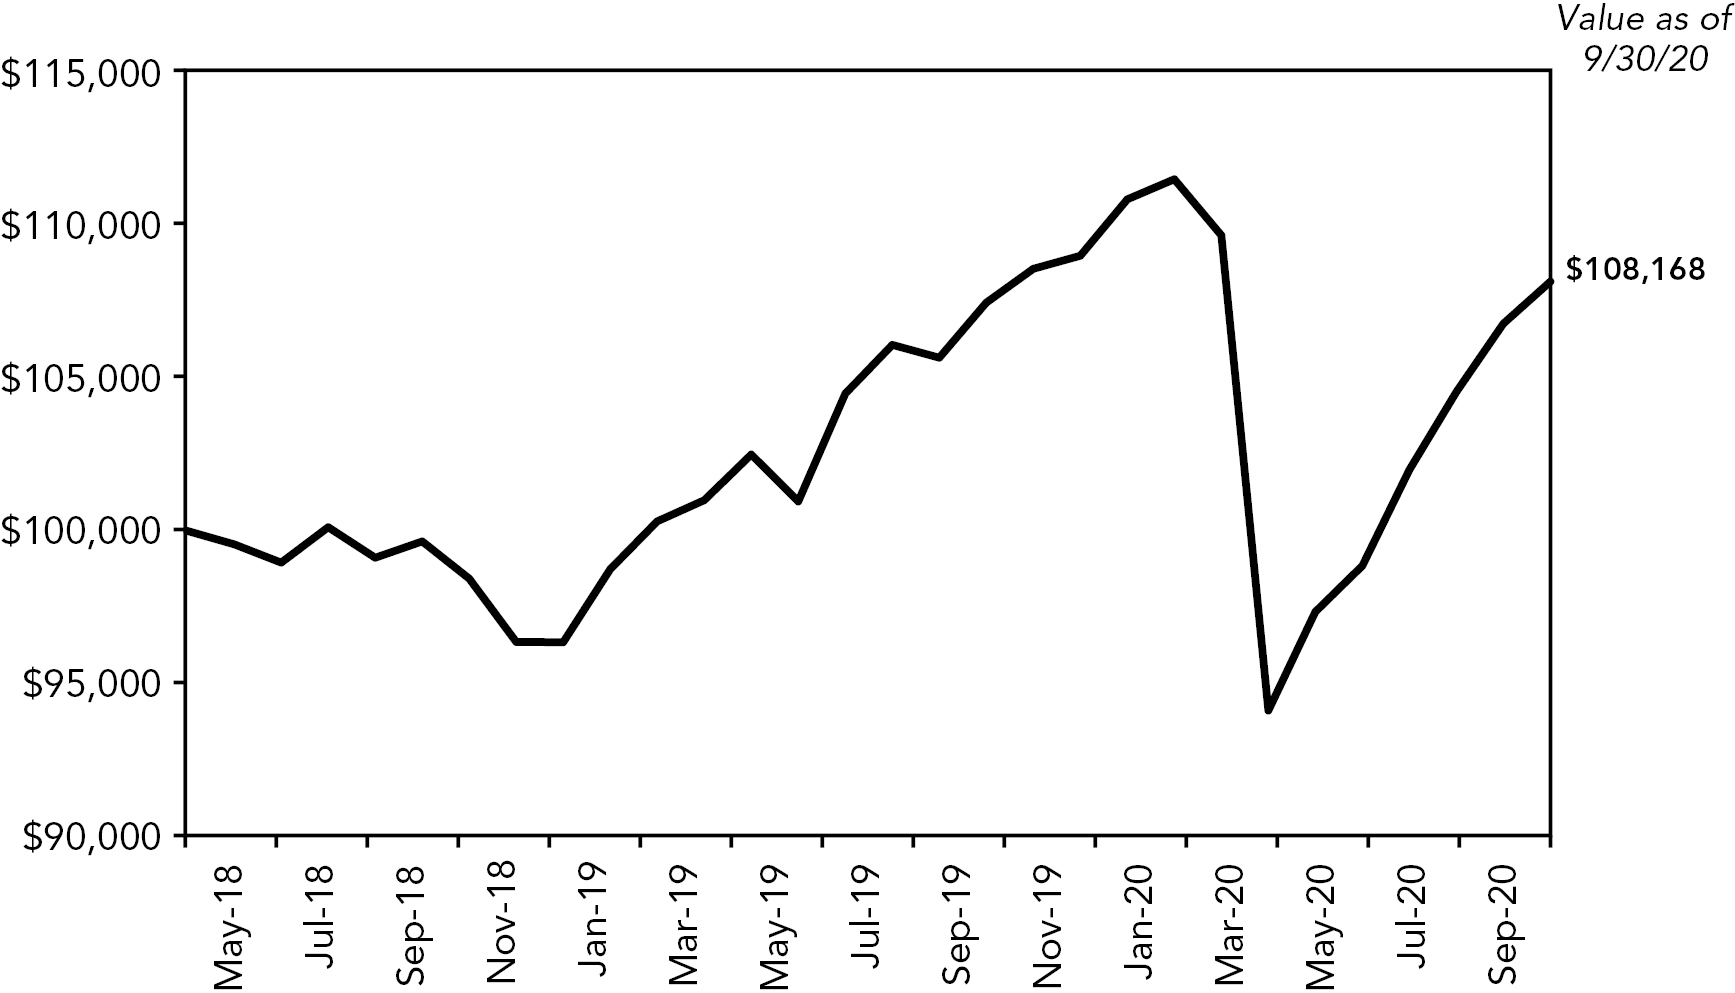
This graph illustrates the hypothetical investment of $100,000 in the Fund, Class I, from May 9, 2018 (inception date) to September 30, 2020. The Average Annual and Cumulative Total Return table and Growth of Assumed $100,000 Investment graph do not reflect the deduction of taxes that a shareholder would pay on fund distributions or the redemption of fund shares.
5
Destra International & Event-Driven Credit Fund |
Performance and Graphical Illustrations (continued) |
September 30, 2020 (unaudited) |
Summary of Portfolio Assets Allocation
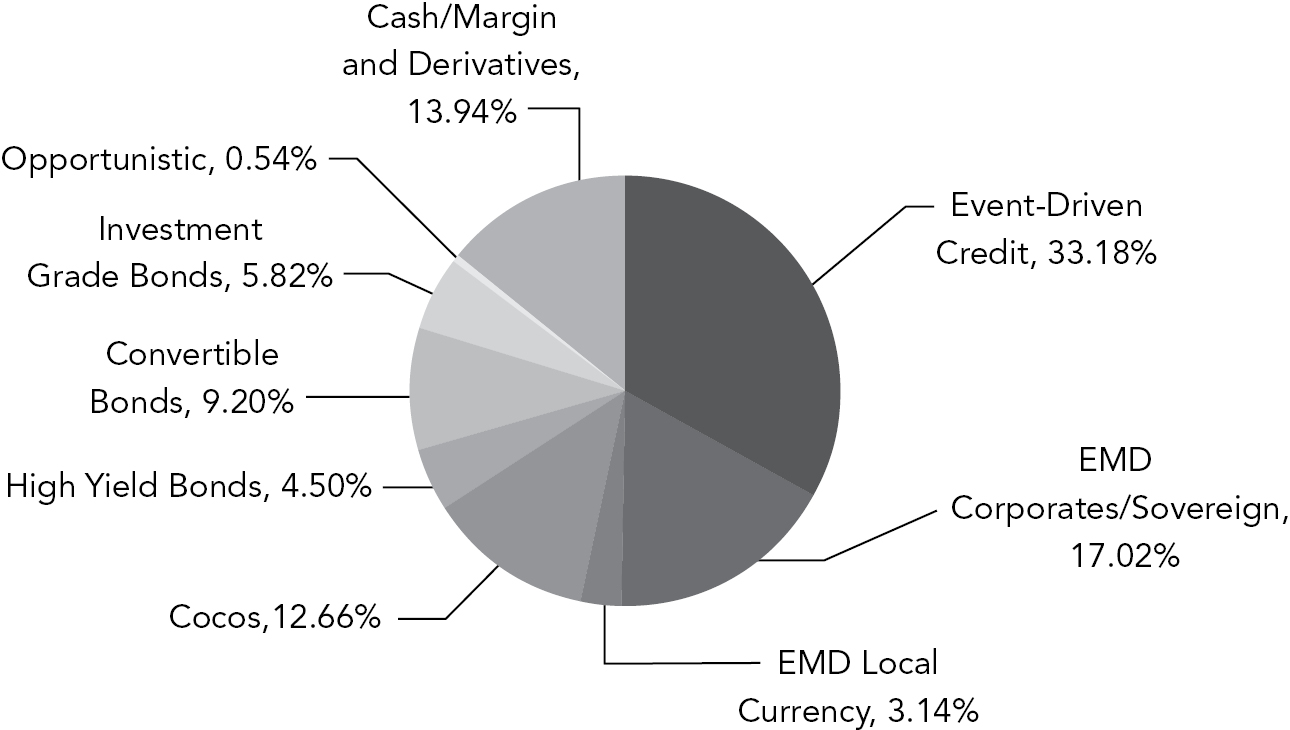
The above chart provides a visual breakdown of the Fund’s major investment types that the underlying securities represent, as a percentage of the total investments held as of September 30, 2020. Please see the Schedule of Investments on the following pages for a detailed list of the Fund’s holdings. The Fund’s portfolio composition is subject to change at any time and may not necessarily reflect adjustments that are routinely made when presenting net assets for formal financial statement processes.
6
Investment Environment
After a prolonged period of strong asset performance in 2019, no-one could have predicted how 2020 would unfold, with the emergence of COVID-19 and the subsequent pandemic rendering much of the developed world in some type of lockdown and central banks and governments announcing unprecedented stimulus. The second quarter of 2020 saw a “black swan” market event, as many global indices fell well beyond two or three times their historic standard deviations. Investors rushed for safer assets as the pandemic led to lockdowns on an extraordinary scale and to a sharp contraction in economic activity; credit market returns suffered an indiscriminate panic selling phase mid-March. Asset class returns were highly correlated as investors sold what they could rather than what they wished to.
In response governments and central banks immediately provided substantial amounts of stimulus and lockdowns began easing, leading to a strong and sustained rebound in risk assets, with almost all asset classes posting record returns in the second quarter. Asia led the recovery in economic activity compared to the rest of the world, with China currently expected to be the only global economy to post positive GDP growth this year. Over that period, the opportunity set for active management has been vast.
Over Q3 2020 markets continued to rise on the hopes of a vaccine and most credit markets now display a classic ‘V-shaped’ recovery over the course of the year.
Performance Discussion
For the twelve-month period ended September 30, 2020, the Fund had a return of 0.64%, net of fees. While the returns in Q4 2019 were a minor contributor, understandably returns over the year were driven by the COVID-19 market turmoil of 2020.
The largest contribution to returns over the year came from the allocation to event-driven credit, which represented around 40% of managed assets. Notably, after event-driven credit as an asset class lagged in the early period of the pandemic, it recovered strongly, and this was amplified by some very positive individual opportunities we held. The allocation to retail (Takko) and long held positioning in basic industry (Vertellus, Lecta) were notable in driving returns. Exposure to energy (Shelf Drilling, Bruin E&P) and global aircraft leasing (HNA Group) weighed on returns, with the former suffering in the face of headwinds to global oil demand.
The allocation to multi-asset credit, with constitutes around 60% of the managed assets, detracted from returns over the year. The COVID-induced sell-off saw some high conviction sub-asset classes detract from returns; of note were financial capital (cocos), emerging market and structured credit allocations. In the latter, which is the largest sub-asset class detractor over the period, we saw fundamental and technical factors force spreads wider across all ratings tranches, as the asset class came up against unprecedented market stress. We cut our exposure to zero against an outlook of deteriorating underlying collateral.
As the market recovered in Q2 and Q3 2020, our thesis of holding assets closest to central bank and government policy was additive to returns, with financial capital (cocos) recovering and new investment grade holdings being notably strong. In the latter, new issues were added at attractive levels and traded well in the secondary markets as investors sought high-quality paper. Of note, our sovereign holdings in the opportunistic sleeve were strong over the period. A holding in Italian sovereign debt was the largest single contributor, as European Central Bank intervention and hopes for a European Recovery Fund helped to compress spreads in the periphery. We exited the position at the security’s all-time high cash price.
Viewpoint & Outlook
The question remains where to from here, and despite the strong and consistent upward movement of markets, and our success in catching the continued bounce, our mindset remains one of prudence and our approach fluid. Risk assets have recovered positively on a combination of more supportive economic data, vaccine hopes and central-bank liquidity. In the absence of very bad news, we believe that certain factors, such as the US elections, may mean we see a lull in policy announcements, which we feel is a risk to market sentiment in the near term.
Notwithstanding the above comments, our view is there will likely be positive news on a vaccine before year end which will be beneficial for markets. Specifically, we see two conditions for a continued rally in markets: 1) central banks keep providing stimulus as required, and 2) the prospects for economic growth are upward. Therefore, we enter Q4 pre-prepared for a range of outcomes and knowing that this quarter will likely be more volatile than Q3.
7
Shares or | Description | Value | |||
BANK LOANS – 1.2% |
| ||||
UNITED STATES – 1.2% |
| ||||
109,771 | Dealer Tire LLC, 4.399% (1-Month USD Libor + 425 basis points), 02/05/2027(1) | $ | 107,575 | ||
392,896 | Doncasters Finance Alloy PIK, 14.000%, 03/06/2025 |
| 123,108 | ||
468,645 | Zayo Group Holdings, Inc., 3.147% (1-Month USD Libor + 300 basis points), 03/09/2027(1) |
| 455,842 | ||
| 686,525 | ||||
TOTAL BANK LOANS |
| ||||
(Cost $824,248) |
| 686,525 | |||
| |||||
COMMON STOCK – 0.1% |
| ||||
MARSHALL ISLANDS – 0.1% |
| ||||
2,501 | Scorpio Tankers, Inc. |
| 27,686 | ||
TOTAL COMMON STOCK |
| ||||
(Cost $87,096) |
| 27,686 | |||
| |||||
CORPORATE DEBT SECURITIES – 25.5% | |||||
AUSTRIA – 0.9% |
| ||||
241,000 | Eldorado Intl. Finance GmbH, 8.625%, 06/16/2021(2) |
| 243,380 | ||
200,000 | Erste Group Bank AG, 6.500%(3)(4) |
| 252,593 | ||
| 495,973 | ||||
| |||||
CANADA – 0.9% |
| ||||
526,000 | First Quantum Minerals, Ltd., 6.875%, 10/15/2027(2) |
| 507,590 | ||
| |||||
CAYMAN ISLANDS – 4.3% |
| ||||
615,532 | Global Aircraft Leasing Co., Ltd., 6.500%, 09/15/2024(2) |
| 345,467 | ||
740,000 | Momo, Inc., 1.250%, 07/01/2025 |
| 582,750 | ||
Tencent Holdings, Ltd.: |
| ||||
800,000 | 2.390%, 06/03/2030(2) |
| 814,865 | ||
400,000 | 3.240%, 06/03/2050(2) |
| 407,038 | ||
300,000 | 3.290%, 06/03/2060(2) |
| 306,516 | ||
| 2,456,636 | ||||
| |||||
CHILE – 0.4% |
| ||||
200,000 | VTR Comunicaciones SpA, 5.125%, 01/15/2028(2) |
| 207,100 | ||
Shares or | Description | Value | |||
CORPORATE DEBT SECURITIES (continued) |
| ||||
FRANCE – 1.0% |
| ||||
200,000 | Altice France SA, 7.375%, 05/01/2026(2) | $ | 209,790 | ||
332,000 | Banijay Entertainment SASU, 3.500%, 03/01/2025(2) |
| 381,065 | ||
| 590,855 | ||||
| |||||
LUXEMBOURG – 1.5% |
| ||||
742,000 | Altice France Holding SA, 10.500%, 05/15/2027(2) |
| 825,939 | ||
| |||||
MAURITIUS – 1.1% |
| ||||
600,000 | HTA Group, Ltd./Mauritius, 7.000%, 12/18/2025(2) |
| 630,750 | ||
| |||||
MEXICO – 1.1% |
| ||||
600,000 | Banco Mercantil del Norte SA/Grand Cayman, 8.375%(2)(3)(4) |
| 627,900 | ||
| |||||
NETHERLANDS – 3.7% |
| ||||
1,430,000 | Petrobras Global Finance BV, 6.750%, 06/03/2050 |
| 1,550,720 | ||
300,000 | Prosus, 4.027%, 08/03/2050(2) |
| 307,654 | ||
200,000 | VTR Finance, 6.375%, 07/15/2028(2) |
| 211,000 | ||
| 2,069,374 | ||||
| |||||
UNITED KINGDOM – 1.8% |
| ||||
400,000 | Lloyds Banking Group PLC, 7.500%(3)(4) |
| 426,178 | ||
320,000 | Natwest Group PLC, 6.000%(3)(4) |
| 326,400 | ||
670,000 | Petra Diamonds U.S. Treasury PLC, 7.250%, 05/01/2022(2)(5) |
| 251,250 | ||
| 1,003,828 | ||||
| |||||
UNITED STATES – 8.8% |
| ||||
536,000 | Bruin E&P Partners LLC, 8.875%, 08/01/2023(2)(5) |
| 1,742 | ||
154,000 | Dealer Tire LLC, 8.000%, 02/01/2028(2) |
| 157,465 | ||
173,000 | Frontier Communications Corp., 8.500%, 04/01/2026(2)(5) |
| 174,557 | ||
96,000 | MGIC Investment Corp., 5.250%, 08/15/2028 |
| 99,197 | ||
See accompanying Notes to Financial Statements.
8
Destra International & Event-Driven Credit Fund |
Schedule of Investments (continued) |
As of September 30, 2020 |
Shares or | Description | Value | |||
CORPORATE DEBT SECURITIES (continued) |
| ||||
UNITED STATES (continued) |
| ||||
Nationstar Mortgage Holdings, Inc.: |
| ||||
200,000 | 9.125%, 07/15/2026(2) | $ | 214,813 | ||
68,000 | 5.500%, 08/15/2028(2) |
| 68,042 | ||
271,000 | Neon Holdings, Inc., 10.125%, 04/01/2026(2) |
| 287,260 | ||
450,000 | Pioneer Natural Resources Co., 0.250%, 05/15/2025(2) |
| 497,697 | ||
428,000 | Radiate Holdco LLC, 6.500%, 09/15/2028(2) |
| 439,936 | ||
500,000 | RegionalCare Hospital Partners Holdings, Inc., 9.750%, 12/01/2026(2) |
| 532,500 | ||
997,000 | Resolute Forest Products, Inc., 5.875%, 05/15/2023 |
| 973,217 | ||
645,000 | Talen Energy Supply LLC, 7.625%, 06/01/2028(2) |
| 646,209 | ||
64,000 | Tenet Healthcare Corp., 7.500%, 04/01/2025(2) |
| 68,891 | ||
446,000 | Terrier Media Buyer, Inc., 8.875%, 12/15/2027(2) |
| 450,181 | ||
384,000 | Voyager Aviation Holdings LLC, 8.500%, 08/15/2021(2) |
| 192,000 | ||
146,000 | Windstream Escrow LLC, 7.750%, 08/15/2028(2) |
| 143,810 | ||
| 4,947,517 | ||||
TOTAL CORPORATE DEBT SECURITIES |
| ||||
(Cost $14,742,593) |
| 14,363,462 | |||
| |||||
INTERNATIONAL DEBT SECURITIES – 50.2% | |||||
BELGIUM – 1.1% |
| ||||
400,000 | Anheuser-Busch InBev SA, 3.700%, 04/02/2040 |
| 601,238 | ||
| |||||
BERMUDA – 0.9% |
| ||||
500,000 | SFL Corp., Ltd., 5.750%, 10/15/2021 |
| 493,857 | ||
| |||||
BRAZIL – 1.0% |
| ||||
1,020,000 | Samarco Mineracao SA, 4.125%, 11/01/2022(5)(6) |
| 544,425 | ||
| |||||
CAYMAN ISLANDS – 3.2% |
| ||||
4,000,000 | China Education Group Holdings, Ltd., 2.000%, 03/28/2024 |
| 601,372 | ||
10,000,000 | China Evergrande Group, 4.250%, 02/14/2023 |
| 1,201,613 | ||
| 1,802,985 | ||||
Shares or | Description | Value | |||
INTERNATIONAL DEBT SECURITIES (continued) |
| ||||
DOMINICAN REPUBLIC – 0.9% |
| ||||
Dominican Republic International Bond: |
| ||||
235,000 | 4.875%, 09/23/2032 | $ | 234,295 | ||
280,000 | 5.875%, 01/30/2060 |
| 266,003 | ||
| 500,298 | ||||
| |||||
FRANCE – 4.0% |
| ||||
BNP Paribas SA: |
| ||||
200,000 | 7.000%(3)(4) |
| 230,913 | ||
810,000 | 6.625%(2)(3)(4) |
| 860,625 | ||
Electricite de France SA: |
| ||||
200,000 | 5.375%(3)(4) |
| 258,121 | ||
700,000 | 5.000%(3)(4) |
| 897,445 | ||
| 2,247,104 | ||||
| |||||
ISRAEL – 0.9% |
| ||||
520,000 | Delek & Avner Tamar Bond, Ltd., 5.412%, 12/30/2025(2) |
| 529,513 | ||
| |||||
ITALY – 3.9% |
| ||||
Banca Monte dei Paschi di Siena SpA: |
| ||||
255,000 | 10.500%, 07/23/2029 |
| 335,644 | ||
245,000 | 8.000%, 01/22/2030(4) |
| 264,488 | ||
247,000 | Intesa Sanpaolo SpA, 7.750%(3)(4) |
| 326,632 | ||
2,303,000 | Moby SpA, 7.750%, 02/15/2023(5) |
| 594,114 | ||
600,000 | UniCredit SpA, 6.625%(3)(4) |
| 699,906 | ||
| 2,220,784 | ||||
| |||||
JERSEY – 0.8% |
| ||||
400,000 | AA Bond Co., Ltd., 5.500%, 07/31/2043 |
| 475,372 | ||
| |||||
LEBANON – 0.1% |
| ||||
Lebanon Government International Bond: |
| ||||
83,000 | 6.375%, 03/09/2021(5) |
| 15,554 | ||
195,000 | 6.150%, 06/19/2021(5) |
| 36,586 | ||
| 52,140 | ||||
| |||||
LUXEMBOURG – 5.5% |
| ||||
203,000 | Altice France Holding SA, 8.000%, 05/15/2027 |
| 253,155 | ||
200,000 | Avation Capital SA, 6.500%, 05/15/2021(2) |
| 136,225 | ||
See accompanying Notes to Financial Statements.
9
Destra International & Event-Driven Credit Fund |
Schedule of Investments (continued) |
As of September 30, 2020 |
Shares or | Description | Value | |||
INTERNATIONAL DEBT SECURITIES (continued) |
| ||||
LUXEMBOURG (continued) |
| ||||
Paper Industries Intermediate Financing Sarl: |
| ||||
810,666 | 6.000% (3-Month EUR Libor + 600 basis points), 03/01/2025(1)(2) | $ | 722,451 | ||
328,000 | 6.000% (3-Month EUR Libor + 600 basis points), 03/01/2025(1) |
| 294,265 | ||
557,384 | 7.000% (3-Month EUR Libor + 700 basis points), 03/01/2025(1)(2) |
| 598,037 | ||
1,009,000 | Takko Luxembourg 2 SCA, 5.375%, 11/15/2023 |
| 940,246 | ||
100,000 | Telecom Italia Finance SA, 7.750%, 01/24/2033 |
| 169,011 | ||
| 3,113,390 | ||||
| |||||
MALAYSIA – 2.8% |
| ||||
1,000,000 | 1MDB Energy, Ltd., 5.990%, 05/11/2022 |
| 1,052,831 | ||
2,000,000 | Malaysia Government Bond, 3.885%, 08/15/2029 |
| 527,401 | ||
| 1,580,232 | ||||
| |||||
MEXICO – 1.0% |
| ||||
10,100,000 | Mexican Bonos, 8.500%, 05/31/2029 |
| 541,418 | ||
| |||||
NETHERLANDS – 5.6% |
| ||||
800,000 | Cooperatieve Rabobank UA, 4.625%(3)(4) |
| 966,819 | ||
434,000 | EA Partners II BV, 6.750%, 06/01/2021(5) |
| 184,450 | ||
526,575 | MV24 Capital BV, 6.748%, 06/01/2034 |
| 532,368 | ||
Prosus: |
| ||||
300,000 | 1.539%, 08/03/2028(2) |
| 354,570 | ||
300,000 | 2.031%, 08/03/2032(2) |
| 354,569 | ||
600,000 | Yandex, 0.750%, 03/03/2025 |
| 742,833 | ||
| 3,135,609 | ||||
| |||||
PERU – 1.2% |
| ||||
2,100,000 | Peruvian Government International Bond, 6.900%, 08/12/2037 |
| 697,247 | ||
| |||||
PORTUGAL – 0.9% |
| ||||
400,000 | Caixa Geral de Depositos SA, 10.750%(3)(4) |
| 509,449 | ||
Shares or | Description | Value | |||
INTERNATIONAL DEBT SECURITIES (continued) |
| ||||
SINGAPORE – 1.3% |
| ||||
1,309,913 | Mulhacen Pte, Ltd., 6.500%, 08/01/2023 | $ | 722,050 | ||
| |||||
SPAIN – 1.8% |
| ||||
200,000 | Autonomous Community of Catalonia, 4.220%, 04/26/2035 |
| 303,094 | ||
CaixaBank SA: |
| ||||
400,000 | 6.750%(3)(4) |
| 489,348 | ||
200,000 | 5.250%(3)(4) |
| 218,401 | ||
| 1,010,843 | ||||
| |||||
SWEDEN – 0.6% |
| ||||
300,000 | Fastighets AB Balder, 3.000%, 03/07/2078(4) |
| 348,013 | ||
| |||||
SWITZERLAND – 1.2% |
| ||||
600,000 | Credit Suisse Group AG, 7.250%(3)(4) |
| 650,667 | ||
| |||||
UNITED ARAB EMIRATES – 1.0% |
| ||||
460,000 | Abu Dhabi Government International Bond, 3.875%, 04/16/2050 |
| 563,500 | ||
| |||||
UNITED KINGDOM – 8.6% |
| ||||
570,000 | Barclays PLC, 8.000%(3)(4) |
| 607,342 | ||
BP Capital Markets PLC: |
| ||||
750,000 | 4.375%(3)(4) |
| 783,750 | ||
500,000 | 4.875%(3)(4) |
| 536,250 | ||
3,150,000 | House of Fraser Funding PLC, 6.530% (3-Month GBP Libor + 575 basis points), 09/15/2020(1)(5)(6) |
| 61,085 | ||
500,000 | Lloyds Banking Group PLC, 4.947%(3)(4) |
| 581,760 | ||
573,000 | Matalan Finance PLC, 6.750%, 01/31/2023 |
| 496,349 | ||
100,000 | Miller Homes Group Holdings PLC, 5.500%, 10/15/2024 |
| 127,785 | ||
420,000 | Virgin Media Finance PLC, 3.750%, 07/15/2030(2) |
| 472,750 | ||
906,000 | Voyage Care BondCo PLC, 10.000%, 11/01/2023 |
| 1,046,502 | ||
100,000 | William Hill PLC, 4.875%, 09/07/2023 |
| 135,346 | ||
| 4,848,919 | ||||
See accompanying Notes to Financial Statements.
10
Destra International & Event-Driven Credit Fund |
Schedule of Investments (continued) |
As of September 30, 2020 |
Shares or | Description | Value | |||
INTERNATIONAL DEBT SECURITIES (continued) |
| ||||
VIETNAM – 0.9% |
| ||||
500,000 | No Va Land Investment Group Corp., 5.500%, 04/27/2023 | $ | 502,488 | ||
| |||||
VIRGIN ISLANDS (BRITISH) – 1.0% | |||||
660,000 | PB Issuer No. 5, Ltd., 3.000%, 12/10/2025 |
| 562,043 | ||
| |||||
TOTAL INTERNATIONAL DEBT SECURITIES |
| ||||
(Cost $27,946,024) |
| 28,253,584 | |||
| |||||
INTERNATIONAL EQUITIES – 0.4% | |||||
CAYMAN ISLANDS – 0.0% |
| ||||
52,758 | Shelf Drilling, Ltd.(2)(6) |
| 11,616 | ||
| |||||
GERMANY – 0.3% |
| ||||
55,671 | Tele Columbus AG(2)(6) |
| 166,138 | ||
| |||||
UNITED KINGDOM – 0.1% |
| ||||
94,740 | AA PLC |
| 35,520 | ||
83,185 | Amigo Holdings PLC(2) |
| 10,711 | ||
| 46,231 | ||||
TOTAL INTERNATIONAL EQUITIES |
| ||||
(Cost $409,836) |
| 223,985 | |||
| |||||
PRIVATE COMPANIES – 9.7% |
| ||||
AUSTRALIA – 0.2% |
| ||||
65,000 | Quintis Australia Pty, Ltd., Common Shares(7) |
| 46,150 | ||
Quintis Australia Pty, Ltd., Corporate Debt: |
| ||||
7,300 | 7.500%, 10/01/2026(2)(7) |
| 6,899 | ||
117,000 | 0.000%, 10/01/2028(2)(7) |
| 66,807 | ||
| 119,856 | ||||
| |||||
ITALY – 1.1% |
| ||||
600,000 | Saxa Gres SpA, 7.000%, 07/10/2023(7) |
| 633,208 | ||
| |||||
LUXEMBOURG – 1.5% |
| ||||
25,947,663 | Paper Industries TopCo Ltd., Common Shares |
| 836,727 | ||
557,384 | Paper Industries TopCo Ltd., Warrants, 06/23/2025(7) |
| 6 | ||
| 836,733 | ||||
Shares or | Description | Value | |||
PRIVATE COMPANIES (continued) |
| ||||
UNITED KINGDOM – 0.0% |
| ||||
363,443 | Alloy Topco Ltd., Common Shares(7) | $ | 47 | ||
| |||||
UNITED STATES – 6.9% |
| ||||
1,641,791 | Bacchus LLC, Common Shares(7) |
| 4,104 | ||
1,641,791 | V Global Holdings LLC, Common Shares(7) |
| 3,858,209 | ||
| 3,862,313 | ||||
| |||||
TOTAL PRIVATE COMPANIES |
| ||||
(Cost $3,068,357) |
| 5,452,157 | |||
| |||||
SHORT-TERM INVESTMENTS – 5.9% | |||||
UNITED STATES – 5.9% |
| ||||
3,327,526 | BlackRock Liquidity Funds FedFund Portfolio – Institutional Class, 0.048%(8) |
| 3,327,526 | ||
TOTAL SHORT-TERM INVESTMENTS |
| ||||
(Cost $3,327,526) |
| 3,327,526 | |||
TOTAL INVESTMENTS – 93.0% |
| ||||
(Cost $50,405,680) |
| 52,334,925 | |||
Other Assets in Excess of Liabilities – 7.0% |
| 3,958,165 | |||
TOTAL NET ASSETS – 100.0% | $ | 56,293,090 | |||
1 Floating rate security. Rate as of September 30, 2020 is disclosed.
2 Security exempt from registration under Rule 144A of the Securities Act of 1933. These securities are restricted and may be resold in transactions exempt from registration normally to qualified institutional buyers. At September 30, 2020 the total value of these securities is $14,443,318 representing 25.7% of net assets.
3 Security is perpetual in nature with no stated maturity date.
4 Variable rate security. Rate as of September 30, 2020 is disclosed.
5 Security is in default.
6 Non-income producing security.
7 Fair valued, illiquid and restricted under direction of the Board of Trustees.
8 The rate is the annualized seven-day yield as of September 30, 2020.
See accompanying Notes to Financial Statements.
11
Destra International & Event-Driven Credit Fund |
Schedule of Investments (continued) |
As of September 30, 2020 |
At September 30, 2020, the Destra International & Event-Driven Credit Fund had open outstanding forward foreign exchange contracts as set forth below:
Settlement | Counterparty | Currency | Currency | Contract Amount | Value | Unrealized | |||||||||||||||
Buy | Sell | ||||||||||||||||||||
October 27, 2020 | Citibank, N.A. | Chinese Yuan Renminbi | U.S. Dollar | CNH | 4,162,800 | $ | 600,000 | $ | 609,950 | $ | 9,950 |
| |||||||||
November 4, 2020 | Citibank, N.A. | Brazil Real | U.S. Dollar | BRL | 2,633,750 | $ | 497,337 |
| 467,785 |
| (29,552 | ) | |||||||||
November 4, 2020 | Citibank, N.A. | U.S. Dollar | Brazil Real | $ | 66,000 | BRL | 372,154 |
| 66,099 |
| (99 | ) | |||||||||
November 4, 2020 | Citibank, N.A. | U.S. Dollar | Brazil Real | $ | 134,000 | BRL | 760,115 |
| 135,005 |
| (1,005 | ) | |||||||||
December 16, 2020 | Barclays Capital, Inc. | Euro Currency | U.S. Dollar | EUR | 83,000 | $ | 98,826 |
| 97,504 |
| (1,322 | ) | |||||||||
December 16, 2020 | BNP Paribas Securities Corp. | U.S. Dollar | Pound Sterling | $ | 12,744 | GBP | 10,000 |
| 12,915 |
| (171 | ) | |||||||||
December 16, 2020 | Brown Brothers Harriman | Euro Currency | U.S. Dollar | EUR | 100,000 | $ | 117,819 |
| 117,474 |
| (345 | ) | |||||||||
December 16, 2020 | Brown Brothers Harriman | Euro Currency | U.S. Dollar | EUR | 43,900 | $ | 51,201 |
| 51,571 |
| 370 |
| |||||||||
December 16, 2020 | Brown Brothers Harriman | U.S. Dollar | Euro Currency | $ | 10,393,791 | EUR | 8,765,000 |
| 10,296,605 |
| 97,186 |
| |||||||||
December 16, 2020 | Brown Brothers Harriman | U.S. Dollar | Hong Kong Dollar | $ | 100,065 | HKD | 776,000 |
| 100,096 |
| (31 | ) | |||||||||
December 16, 2020 | Brown Brothers Harriman | U.S. Dollar | Hong Kong Dollar | $ | 1,761,216 | HKD | 13,658,000 |
| 1,761,749 |
| (533 | ) | |||||||||
December 16, 2020 | Brown Brothers Harriman | U.S. Dollar | Norwegian Krone | $ | 49,147 | NOK | 443,701 |
| 47,562 |
| 1,585 |
| |||||||||
December 16, 2020 | Brown Brothers Harriman | U.S. Dollar | Pound Sterling | $ | 540,882 | GBP | 415,000 |
| 535,971 |
| 4,911 |
| |||||||||
December 16, 2020 | Brown Brothers Harriman | U.S. Dollar | Pound Sterling | $ | 2,131,487 | GBP | 1,635,000 |
| 2,111,596 |
| 19,891 |
| |||||||||
December 16, 2020 | Royal Bank of Scotland | U.S. Dollar | Euro Currency | $ | 7,276,328 | EUR | 6,136,400 |
| 7,208,681 |
| 67,647 |
| |||||||||
December 16, 2020 | Standard Chartered | Pound Sterling | U.S. Dollar | GBP | 35,000 | $ | 45,164 |
| 45,202 |
| 38 |
| |||||||||
| $ | 168,520 |
| ||||||||||||||||||
See accompanying Notes to Financial Statements.
12
Destra International & Event-Driven Credit Fund |
Schedule of Investments (continued) |
As of September 30, 2020 |
At September 30, 2020, the Destra International & Event-Driven Credit Fund had open swap contracts as set forth below:
Credit Default Swap Contracts:
Underlying Instrument | Counterparty | Pay Rate / | Maturity | Notional | Premium | Unrealized | Value | |||||||||||||
Markit iTrax Europe Crossover Index Swap(2) | Morgan Stanley & Co. | 5.000% / Quarterly | 12/20/2025 | $ | 2,089,000 | $ | (193,685 | ) | $ | 15,374 | $ | (178,311 | ) | |||||||
Interest Rate Swap Contracts:
Counterparty | Payments Made / | Payments | Maturity | Notional | Premium | Unrealized | Value | ||||||||||||
Goldman Sachs & Co. | BRL-CDI / Once at Maturity | 4.078% | 1/2/2023 | BRL 10,527,521 | $ | — | $ | (4,404 | ) | $ | (4,404 | ) | |||||||
Citigroup, Inc. | 7-day Reverse | 2.650% | 10/27/2025 | CNY 9,500,000 |
| — |
| (581 | ) |
| (581 | ) | |||||||
| $ | (4,985 | ) | $ | (4,985 | ) | |||||||||||||
1 The maximum potential amount the Fund may receive should a credit event take place as defined under the terms of the contract.
2 The underlying issuer is ITRX XOVER CDSI S34 5Y Corp.
At September 30, 2020, the Destra International & Event-Driven Credit Fund had open futures contracts as set forth below:
Interest Rate Futures Contracts:
Expiration Date | Number of | Description | Notional | Value | Unrealized | |||||||||||
Short Futures Contracts: |
|
|
|
|
|
| ||||||||||
December 2020 | 7 | 5-Year U.S. Treasury Note | $ | (880,908 | ) | $ | (882,219 | ) | $ | (1,311 | ) | |||||
December 2020 | 5 | 10-Year U.S. Treasury Note |
| (695,695 | ) |
| (697,656 | ) |
| (1,961 | ) | |||||
December 2020 | 5 | Ultra Long U.S. Treasury Bond |
| (1,117,023 | ) |
| (1,109,063 | ) |
| 7,960 |
| |||||
$ | (2,693,626 | ) | $ | (2,688,938 | ) | $ | 4,688 |
| ||||||||
See accompanying Notes to Financial Statements.
13
Destra International & Event-Driven Credit Fund |
Schedule of Investments (continued) |
As of September 30, 2020 |
Summary by Industry Group | Value | % of | ||||
Bank Loans |
|
| ||||
Distribution/Wholesale | $ | 107,575 | 0.2 | % | ||
Metal Fabricate/Hardware |
| 123,108 | 0.2 |
| ||
Telecommunications |
| 455,842 | 0.8 |
| ||
Total Bank Loans |
| 686,525 | 1.2 |
| ||
Common Stock |
|
| ||||
Transportation |
| 27,686 | 0.1 |
| ||
Total Common Stock |
| 27,686 | 0.1 |
| ||
Corporate Debt Securities |
|
| ||||
Advertising |
| 450,181 | 0.8 |
| ||
Auto Parts & Equipment |
| 157,465 | 0.3 |
| ||
Banks |
| 1,633,071 | 3.0 |
| ||
Chemicals |
| 287,260 | 0.5 |
| ||
Diversified Financial Services |
| 820,322 | 1.4 |
| ||
Electric |
| 646,209 | 1.2 |
| ||
Entertainment |
| 381,065 | 0.7 |
| ||
Forest Products & Paper |
| 1,216,597 | 2.1 |
| ||
Healthcare-Services |
| 601,391 | 1.0 |
| ||
Insurance |
| 99,197 | 0.2 |
| ||
Internet |
| 2,418,823 | 4.2 |
| ||
Investment Companies |
| 825,939 | 1.5 |
| ||
Media |
| 650,936 | 1.2 |
| ||
Metal Fabricate/Hardware |
| 630,750 | 1.1 |
| ||
Mining |
| 758,840 | 1.3 |
| ||
Oil & Gas |
| 2,050,159 | 3.7 |
| ||
Telecommunications |
| 735,257 | 1.3 |
| ||
Total Corporate Debt Securities |
| 14,363,462 | 25.5 |
| ||
International Debt Securities |
|
| ||||
Airlines |
| 184,450 | 0.3 |
| ||
Apparel |
| 940,246 | 1.7 |
| ||
Banks |
| 6,741,994 | 12.0 |
| ||
Beverages |
| 601,238 | 1.1 |
| ||
Commercial Services |
| 1,076,744 | 1.9 |
| ||
Distribution/Wholesale |
| 496,349 | 0.9 |
| ||
Diversified Financial Services |
| 858,275 | 1.5 |
| ||
Electric |
| 2,208,397 | 4.0 |
| ||
Entertainment |
| 135,346 | 0.2 |
| ||
Forest Products & Paper |
| 1,614,753 | 2.9 |
| ||
Healthcare-Services |
| 1,046,502 | 1.9 |
| ||
Home Builders |
| 127,785 | 0.2 |
| ||
Internet |
| 1,451,972 | 2.6 |
| ||
Iron/Steel |
| 544,425 | 1.0 |
| ||
See accompanying Notes to Financial Statements.
14
Destra International & Event-Driven Credit Fund |
Schedule of Investments (continued) |
As of September 30, 2020 |
Summary by Industry Group | Value | % of | ||||
Media | $ | 472,750 | 0.8 | % | ||
Municipal |
| 303,094 | 0.5 |
| ||
Oil & Gas |
| 1,849,513 | 3.3 |
| ||
Real Estate |
| 2,052,114 | 3.6 |
| ||
Retail |
| 61,085 | 0.1 |
| ||
Sovereign |
| 2,882,004 | 5.1 |
| ||
Telecommunications |
| 422,166 | 0.7 |
| ||
Transportation |
| 2,182,382 | 3.9 |
| ||
Total International Debt Securities |
| 28,253,584 | 50.2 |
| ||
International Equities |
|
| ||||
Commercial Services |
| 35,520 | 0.1 |
| ||
Diversified Financial Services |
| 10,711 | 0.0 |
| ||
Media |
| 166,138 | 0.3 |
| ||
Oil & Gas |
| 11,616 | 0.0 |
| ||
Total International Equities |
| 223,985 | 0.4 |
| ||
Private Companies |
|
| ||||
Building Materials |
| 633,208 | 1.1 |
| ||
Chemicals |
| 3,862,313 | 6.9 |
| ||
Forest Products & Paper |
| 956,589 | 1.7 |
| ||
Metal Fabricate/Hardware |
| 47 | 0.0 |
| ||
Total Private Companies |
| 5,452,157 | 9.7 |
| ||
Short-Term Investments |
|
| ||||
Money Market Fund |
| 3,327,526 | 5.9 |
| ||
Total Short-Term Investments |
| 3,327,526 | 5.9 |
| ||
Total Investments |
| 52,334,925 | 93.0 |
| ||
Other Assets in Excess of Liabilities |
| 3,958,165 | 7.0 |
| ||
Total Net Assets | $ | 56,293,090 | 100.0 | % | ||
See accompanying Notes to Financial Statements.
15
Destra International & Event-Driven Credit Fund |
September 30, 2020 |
Assets: |
| ||
Investments, at value (cost $50,405,680) | $ | 52,334,925 | |
Cash |
| 53,762 | |
Restricted cash: |
| ||
Deposits held at broker for open swap and futures contracts |
| 1,282,560 | |
Foreign currency, at value (cost $2,951,301) |
| 2,970,138* | |
Unrealized appreciation on: |
| ||
Forward foreign exchange contracts |
| 201,578 | |
Credit default swap contracts |
| 15,374 | |
Receivables: |
| ||
Interest |
| 604,429 | |
Investments sold |
| 314,418 | |
Prepaid expenses |
| 17,918 | |
Total assets |
| 57,795,102 | |
Liabilities: |
| ||
Premiums paid on credit default swap contracts |
| 193,685 | |
Unrealized depreciation on: |
| ||
Forward foreign exchange contracts |
| 33,058 | |
Interest rate swap contracts |
| 4,985 | |
Payables: |
| ||
Investments purchased |
| 1,021,359 | |
Management fee (see note 4) |
| 134,106 | |
Professional fees |
| 61,575 | |
Accounting and administrative fees |
| 19,452 | |
Custody fees |
| 15,415 | |
Transfer agent fees and expenses |
| 10,554 | |
Chief compliance officer fees |
| 1,667 | |
Distribution fees |
| 869 | |
Shareholder servicing fees |
| 780 | |
Accrued other expenses |
| 4,507 | |
Total liabilities |
| 1,502,012 | |
Net assets | $ | 56,293,090 | |
Net assets consist of: |
| ||
Paid-in capital (unlimited shares authorized at $0.001 par value common stock) | $ | 54,917,146 | |
Distributable earnings |
| 1,375,944 | |
Net assets | $ | 56,293,090 | |
Net assets: |
| ||
Class I | $ | 52,398,033 | |
Class A |
| 1,145,273 | |
Class L |
| 1,113,715 | |
Class T |
| 1,636,069 | |
Shares outstanding: |
| ||
Class I |
| 2,188,716 | |
Class A |
| 47,835 | |
Class L |
| 46,517 | |
Class T |
| 68,371 |
____________
* Foreign currency held at broker designated as restricted cash is $446,464.
See accompanying Notes to Financial Statements.
16
Destra International & Event-Driven Credit Fund |
Statement of Assets and Liabilities (continued) |
September 30, 2020 |
Net asset value per share: |
| ||
Class I | $ | 23.94 | |
Class A |
| 23.94 | |
Maximum offering price per share(1) |
| 25.40 | |
Class L |
| 23.94 | |
Maximum offering price per share(2) |
| 25.00 | |
Class T |
| 23.93 | |
Maximum offering price per share(3) |
| 24.67 |
1 Includes a sales charge of 5.75%.
2 Includes a sales charge of 4.25%.
3 Includes a sales charge of 3.00%.
See accompanying Notes to Financial Statements.
17
Destra International & Event-Driven Credit Fund |
For the Year Ended September 30, 2020 |
Investment income: |
|
| ||
Interest income(1) | $ | 2,868,167 |
| |
Dividend income |
| 6,844 |
| |
Total investment income |
| 2,875,011 |
| |
Expenses: |
|
| ||
Management fee (see note 4) |
| 962,436 |
| |
Accounting and administrative fees |
| 184,100 |
| |
Professional fees |
| 160,779 |
| |
Custody fees |
| 110,684 |
| |
Transfer agent fees and expenses |
| 63,196 |
| |
Registration fees |
| 46,851 |
| |
Interest expense |
| 26,692 |
| |
Chief financial officer fees (see note 15) |
| 22,000 |
| |
Chief compliance officer fees (see note 15) |
| 20,001 |
| |
Trustee fees (see note 15) |
| 19,374 |
| |
Shareholder reporting fees |
| 18,855 |
| |
Insurance expense |
| 5,426 |
| |
Distribution fees Class L (see note 7) |
| 2,712 |
| |
Distribution fees Class T (see note 7) |
| 6,041 |
| |
Shareholder servicing fees Class A (see note 7) |
| 2,743 |
| |
Shareholder servicing fees Class L (see note 7) |
| 2,712 |
| |
Shareholder servicing fees Class T (see note 7) |
| 3,021 |
| |
Other expenses |
| 19,845 |
| |
Total expenses: |
| 1,677,468 |
| |
Expenses waived by adviser (see note 5) |
| (399,569 | ) | |
Net expenses |
| 1,277,899 |
| |
Net investment income |
| 1,597,112 |
| |
Net realized and unrealized gain (loss): |
|
| ||
Net realized gain (loss) on: |
|
| ||
Investments |
| (1,288,032 | ) | |
Foreign currency transactions |
| 53,742 |
| |
Forward foreign exchange contracts |
| (847,105 | ) | |
Futures contracts |
| (49,662 | ) | |
Swap contracts |
| 64,010 |
| |
Purchased options contracts |
| (241,999 | ) | |
Total net realized loss |
| (2,309,046 | ) | |
Net change in unrealized appreciation (depreciation) on: |
|
| ||
Investments |
| 1,259,789 |
| |
Foreign currency translations |
| 41,257 |
| |
Forward foreign exchange contracts |
| (274,236 | ) | |
Futures contracts |
| 4,688 |
| |
Swap contracts |
| 13,696 |
| |
Purchased options contracts |
| 4,687 |
| |
Total net change in unrealized appreciation |
| 1,049,881 |
| |
Net realized and unrealized loss |
| (1,259,165 | ) | |
Net increase in net assets resulting from operations | $ | 337,947 |
|
1 Net of foreign withholding taxes of $3,814.
See accompanying Notes to Financial Statements.
18
Year Ended | Year Ended | |||||||
Increase in net assets resulting from operations: |
|
|
|
| ||||
Net investment income | $ | 1,597,112 |
| $ | 1,681,227 |
| ||
Net realized gain (loss) |
| (2,309,046 | ) |
| 1,692,466 |
| ||
Net change in unrealized appreciation |
| 1,049,881 |
|
| 1,510,393 |
| ||
Net increase in net assets resulting from operations |
| 337,947 |
|
| 4,884,086 |
| ||
Distributions to shareholders: |
|
|
|
| ||||
Class I |
| (1,344,639 | ) |
| (2,320,088 | ) | ||
Class A |
| (27,879 | ) |
| (47,974 | ) | ||
Class L |
| (26,563 | ) |
| (45,940 | ) | ||
Class T |
| (28,383 | ) |
| (43,909 | ) | ||
Total distributions to shareholders |
| (1,427,464 | ) |
| (2,457,911 | ) | ||
Return of capital to shareholders: |
|
|
|
| ||||
Class I |
| (1,556,225 | ) |
| — |
| ||
Class A |
| (31,905 | ) |
| — |
| ||
Class L |
| (29,918 | ) |
| — |
| ||
Class T |
| (32,710 | ) |
| — |
| ||
Total return of capital to shareholders |
| (1,650,758 | ) |
| — |
| ||
Capital transactions: |
|
|
|
| ||||
Proceeds from shares sold: |
|
|
|
| ||||
Class I |
| 528,335 |
|
| 22,070,000 |
| ||
Class A |
| 24,000 |
|
| 1,000,000 |
| ||
Class L |
| — |
|
| 1,000,000 |
| ||
Class T |
| 515,756 |
|
| 1,000,000 |
| ||
Reinvestment of distributions: |
|
|
|
| ||||
Class I |
| 2,893,372 |
|
| 2,319,744 |
| ||
Class A |
| 59,784 |
|
| 47,974 |
| ||
Class L |
| 56,481 |
|
| 45,940 |
| ||
Class T |
| 56,875 |
|
| 43,909 |
| ||
Cost of shares repurchased: |
|
|
|
| ||||
Class I |
| (266,055 | ) |
| — |
| ||
Net increase in net assets from capital transactions |
| 3,868,548 |
|
| 27,527,567 |
| ||
Total increase in net assets |
| 1,128,273 |
|
| 29,953,742 |
| ||
Net assets: |
|
|
|
| ||||
Beginning of year |
| 55,164,817 |
|
| 25,211,075 |
| ||
End of year | $ | 56,293,090 |
| $ | 55,164,817 |
| ||
Capital share transactions: |
|
|
|
| ||||
Shares sold: |
|
|
|
| ||||
Class I |
| 21,186 |
|
| 932,209 |
| ||
Class A |
| 1,093 |
|
| 42,248 |
| ||
Class L |
| — |
|
| 42,248 |
| ||
Class T |
| 21,918 |
|
| 42,248 |
| ||
Shares reinvested: |
|
|
|
| ||||
Class I |
| 122,386 |
|
| 95,137 |
| ||
Class A |
| 2,526 |
|
| 1,968 |
| ||
Class L |
| 2,383 |
|
| 1,886 |
| ||
Class T |
| 2,402 |
|
| 1,803 |
| ||
Shares repurchased: |
|
|
|
| ||||
Class I |
| (11,380 | ) |
| — |
| ||
Net increase from capital share transactions |
| 162,514 |
|
| 1,159,747 |
| ||
1 Class A, Class L and Class T inception date is December 21, 2018.
See accompanying Notes to Financial Statements.
19
Destra International & Event-Driven Credit Fund |
For a share of common stock outstanding throughout the periods indicated |
Year ending September 30, | Net asset | Net | Net | Total from | Distributions | Distributions | Distributions | Total | Net | Total | Gross | Net | Net | Net assets, | Portfolio | ||||||||||||||||||||||||||||||||||||
Class I |
|
|
|
|
|
|
|
|
|
|
|
|
|
|
|
|
|
|
|
|
| ||||||||||||||||||||||||||||||
2020 | $ | 25.20 | $ | 0.71 | $ | (0.59 | ) | $ | 0.12 |
| $ | (0.48 | ) | $ | (0.16 | ) | $ | (0.74 | ) | $ | (1.38 | ) | $ | 23.94 | 0.64 | % | 3.06 | % | 2.32 | % | 2.98 | % | $ | 52,398 | 130 | % | |||||||||||||||
2019 |
| 24.50 |
| 0.90 |
| 0.96 |
|
| 1.86 |
|
| (1.16 | ) |
| — |
|
| — |
|
| (1.16 | ) |
| 25.20 | 7.85 |
| 4.08 |
| 2.95 |
| 3.68 |
|
| 51,828 | 124 |
| |||||||||||||||
2018(7) |
| 25.00 |
| 0.24 |
| (0.33 | ) |
| (0.09 | ) |
| (0.41 | ) |
| — |
|
| — |
|
| (0.41 | ) |
| 24.50 | (0.35 | ) | 5.56 |
| 2.25 |
| 2.50 |
|
| 25,211 | 30 |
| |||||||||||||||
Class A |
|
|
|
|
|
|
|
|
|
|
|
|
|
|
|
|
|
|
|
|
| ||||||||||||||||||||||||||||||
2020 |
| 25.20 |
| 0.65 |
| (0.59 | ) |
| 0.06 |
|
| (0.46 | ) |
| (0.16 | ) |
| (0.70 | ) |
| (1.32 | ) |
| 23.94 | 0.39 |
| 3.31 |
| 2.57 |
| 2.72 |
|
| 1,145 | 130 |
| |||||||||||||||
2019(8) |
| 23.67 |
| 0.65 |
| 2.00 |
|
| 2.65 |
|
| (1.12 | ) |
| — |
|
| — |
|
| (1.12 | ) |
| 25.20 | 11.42 |
| 4.26 |
| 3.24 |
| 3.41 |
|
| 1,114 | 124 |
| |||||||||||||||
Class L |
|
|
|
|
|
|
|
|
|
|
|
|
|
|
|
|
|
|
|
|
| ||||||||||||||||||||||||||||||
2020 |
| 25.20 |
| 0.60 |
| (0.60 | ) |
| — |
|
| (0.44 | ) |
| (0.16 | ) |
| (0.66 | ) |
| (1.26 | ) |
| 23.94 | 0.13 |
| 3.56 |
| 2.82 |
| 2.49 |
|
| 1,114 | 130 |
| |||||||||||||||
2019(8) |
| 23.67 |
| 0.60 |
| 2.00 |
|
| 2.60 |
|
| (1.07 | ) |
| — |
|
| — |
|
| (1.07 | ) |
| 25.20 | 11.22 |
| 4.50 |
| 3.49 |
| 3.16 |
|
| 1,112 | 124 |
| |||||||||||||||
Class T |
|
|
|
|
|
|
|
|
|
|
|
|
|
|
|
|
|
|
|
|
| ||||||||||||||||||||||||||||||
2020 |
| 25.20 |
| 0.44 |
| (0.50 | ) |
| (0.06 | ) |
| (0.42 | ) |
| (0.16 | ) |
| (0.63 | ) |
| (1.21 | ) |
| 23.93 | (0.11 | ) | 3.81 |
| 3.07 |
| 1.86 |
|
| 1,636 | 130 |
| |||||||||||||||
2019(8) |
| 23.67 |
| 0.55 |
| 2.00 |
|
| 2.55 |
|
| (1.02 | ) |
| — |
|
| — |
|
| (1.02 | ) |
| 25.20 | 11.01 |
| 4.76 |
| 3.74 |
| 2.91 |
|
| 1,110 | 124 |
| |||||||||||||||
1 Based on average shares outstanding during the period.
2 Based on the net asset value as of period end. Assumes an investment at net asset value at the beginning of the period, reinvestment of all distributions during the period and does not include payment of the maximum sales charge. The return would have been lower if certain expenses had not been waived or reimbursed by the investment adviser.
3 Not annualized for periods less than one year.
4 Annualized for periods less than one year, with the exception of non-recurring organizational costs.
5 Percentages shown include interest expense. Gross and net expense ratios, respectively, excluding interest expense are as follows:
Gross | Net | Gross | Net | |||||||||||||||
Class I |
|
| Class L |
|
| |||||||||||||
2020 | 3.01 | % | 2.27 | % | 2020 | 3.51 | % | 2.77 | % | |||||||||
2019 | 3.62 |
| 2.48 |
| 2019(8) | 4.02 |
| 3.00 |
| |||||||||
2018(7) | 5.56 |
| 2.25 |
| Class T |
|
| |||||||||||
Class A |
|
| 2020 | 3.76 |
| 3.02 |
| |||||||||||
2020 | 3.26 |
| 2.52 |
| 2019(8) | 4.27 |
| 3.25 |
| |||||||||
2019(8) | 3.77 |
| 2.75 |
| ||||||||||||||
6 The contractual fee and expense waiver is reflected in both the net expense and net investment income (loss) ratios (see Note 5). Effective November 19, 2018, the Adviser agreed to reimburse and/or pay “ordinary operating expenses” that exceed 0.50% per annum of the Fund’s average daily net assets. Prior to November 19, 2018, the Adviser had agreed to reimburse and/or pay its investment management fee and ordinary operating expenses that exceeded 2.25% annum of the Fund’s daily “managed assets.”
7 Reflects operations for the period from May 9, 2018 (inception date) to September 30, 2018. Prior to the inception date, the Fund had been inactive except for matters related to the Fund’s establishment, designation and planned registration.
8 Reflects operations for the period from December 21, 2018 (inception date of Class A, Class L and Class T) to September 30, 2019.
Credit Facility, period ended September 30: | 2020 | 2019 | 2018 | |||||||||||||
Senior securities, end of year (000’s) | $ | — |
| $ | 5,000 |
| $ | — |
| |||||||
Asset coverage, per $1,000 of senior security principal amount |
| — |
|
| 12,033 |
|
| — |
| |||||||
Asset coverage ratio of senior securities |
| — | % |
| 1,203 | % |
| — | % | |||||||
See accompanying Notes to Financial Statements
20
Destra International & Event-Driven Credit Fund |
Notes to Financial Statements (continued) |
September 30, 2020 |
1. Organization
Destra International & Event-Driven Credit Fund (the “Fund”) was established as a Delaware statutory trust on November 13, 2017. The Fund is registered with the Securities and Exchange Commission (the “SEC”) as a non-diversified, closed-end management investment company that operates as an “interval fund” under the Investment Company Act of 1940, as amended (the “1940 Act”). The shares of beneficial interest of the Fund (the “Shares”) are continuously offered under Rule 415 under the Securities Act of 1933, as amended (the “Securities Act”). The Fund currently offers four classes of Shares, Classes I, A, L, and T. All classes of Shares have equal rights and voting privileges, except in matters affecting a single class. The Fund has adopted a fundamental policy to make a quarterly repurchase offer (“Repurchase Offer”) between 5% and 25% of the Fund’s outstanding Shares. The Fund’s inception date was May 9, 2018 (Class I Shares). The Fund’s commencement of investment operations date was on the business day following the inception date.
The Fund’s investment adviser is Destra Capital Advisors LLC (the “Adviser”), the Fund’s sub-adviser is BlueBay Asset Management LLP (the “Sub-Adviser”), and the Fund’s sub-sub-adviser is BlueBay Asset Management USA LLC (the “Sub-Sub-Adviser,”) (the Sub-Adviser, Sub-Sub-Adviser and together with the Adviser, are referred to herein as the “Advisers”). The Sub-Adviser and Sub-Sub-Adviser are wholly-owned subsidiaries of Royal Bank of Canada (“RBC”).
The Fund’s investment objective is to provide attractive total returns, consisting of income and capital appreciation. Under normal market conditions, the Fund will invest at least 80% of its total assets (including borrowings for investment purposes) in credit related instruments and/or investments that have similar economic characteristics as credit related instruments that are considered by the Fund to have the potential to provide a high level of total return. Credit related instruments include bonds, debt securities and loans issued by various U.S. and non-U.S. public- or private-sector entities, including issuers in emerging markets, derivatives and cash equivalents. There is no limit on the credit quality, duration or maturity of any investment in the Fund’s portfolio. Under normal market conditions, the Fund will invest at least 40% of its total assets in securities of non-U.S. issuers.
The Fund will allocate its assets between two strategies: (i) Multi-Strategy International Credit and (ii) Event-Driven Credit. The Fund’s allocation to the strategies will vary from time to time, when the Advisers deem such variances appropriate from a portfolio management standpoint. The allocation to Multi-Strategy International Credit is expected to be between 0% and 100% of the Fund’s total assets. Due to the episodic nature of Event-Driven Credit opportunities, the Fund will have a varying degree of exposure to the strategy, but during normal market conditions such exposure will be significant and is expected to be up to 50% of the Fund’s total assets.
The Fund is an investment company and follows the accounting and reporting guidance under Financial Accounting Standards Board (“FASB”) Accounting Standards Codification (“ASC”) Topic 946, Financial Services — Investment Companies. The following is a summary of significant accounting policies consistently followed by the Fund in the preparation of its financial statements.
2. Significant Accounting Policies
(a) Use of Estimates
The preparation of the financial statements in conformity with U.S. generally accepted accounting principles (“U.S. GAAP”) requires management to make estimates and assumptions that affect the reported amounts of assets and liabilities and disclosure of contingent assets and liabilities at the date of the statement of assets and liabilities. Actual results could differ from those estimates.
(b) Investment Income, Expenses and Distributions
Investment income, expenses other than class specific expenses and realized and unrealized gains and losses are allocated daily to each class of Shares based upon the proportion of the net asset value (“NAV”) of each class of Shares at the beginning of each day. Investment transactions are recorded on a trade-date basis. Interest income and expenses are accrued daily. Dividend income and distributions to shareholders are recorded on the ex-dividend date. The Fund distributes net investment income, if any, quarterly and net realized gains (net of any capital loss carryovers) annually. Discounts and premiums on securities purchased are accreted and amortized over the lives of the respective securities. Withholding taxes on foreign interest have been provided in accordance with the Fund’s understanding of the applicable country’s tax rules and rates.
(c) Cash, Cash Equivalents and Restricted Cash
Cash and cash equivalents include U.S. dollar deposits at bank accounts at amounts which may exceed insured limits. The Fund is subject to risk to the extent that the institutions may be unable to fulfill their obligations. As of September 30, 2020, the Fund has restricted cash in the amount of $1,282,560 and foreign currency at value of $446,464. The restricted cash represents deposits held at brokers for open credit default swap and futures contracts.
21
Destra International & Event-Driven Credit Fund |
Notes to Financial Statements (continued) |
September 30, 2020 |
(d) Investment Valuation
The Adviser determines the values of the Fund’s assets in good faith pursuant to the Fund’s valuation policy and consistently applied valuation process, which was developed by the audit committee of the Fund’s board of trustees (the “Board”) and approved by the Board. Portfolio securities and other assets for which market quotes are readily available are valued at market value. In circumstances where market quotes are not readily available, the Board has adopted methods for determining the fair value of such securities and other assets and has delegated the responsibility for applying the valuation methods to the Adviser. On a quarterly basis, the Board reviews the valuation determinations made with respect to the Fund’s investments during the preceding quarter and evaluates whether such determinations were made in a manner consistent with the Fund’s valuation process.
In determining NAV, portfolio instruments generally are valued using prices provided by independent pricing services or obtained from other sources, such as broker-dealer quotations. Exchange-traded instruments, including futures contracts, generally are valued at the last reported sales price or official closing price on an exchange, if available. Independent pricing services typically value non-exchange-traded instruments utilizing a range of market-based inputs and assumptions, including readily available market quotations obtained from broker-dealers making markets in such instruments, cash flows, and transactions for comparable instruments. In pricing certain instruments, the pricing services may consider information about an instrument’s issuer or market activity provided by the Fund’s Sub-Adviser. Non-U.S. securities and currency are valued in U.S. dollars based on non-U.S. currency exchange rate quotations supplied by an independent quotation service.
For non-U.S. traded securities whose principal local markets close before the close of the NYSE, the Fund may adjust the local closing price based upon such factors as developments in non-U.S. markets, the performance of U.S. securities markets and the performance of instruments trading in U.S. markets that represent non-U.S. securities. The Fund may rely on an independent fair valuation service in making any such fair value determinations. If the Fund holds portfolio instruments that are primarily listed on non-U.S. exchanges, the value of such instruments may change on days when shareholders will not be able to purchase or redeem the Fund’s Shares.
In certain situations, the Adviser, with input from the Sub-Adviser and Sub-Sub-Adviser, may use the fair value of a portfolio instrument if such portfolio instrument is not priced by a pricing service, if the pricing service’s price is deemed unreliable or if events occur after the close of a securities market (usually a foreign market) and before the Fund values its assets that would materially affect NAV. A portfolio instrument that is fair valued may be valued at a price higher or lower than actual market quotations or the value determined by other funds using their own fair valuation procedures. Because non-U.S. portfolio instruments may trade on days when Fund Shares are not priced, the value of portfolio instruments held by the Fund can change on days when Fund Shares cannot be redeemed. The Adviser expects to use fair value pricing primarily when a portfolio instrument is not priced by a pricing service or a pricing service’s price is deemed unreliable.
Due to the subjective nature of fair value pricing, the Fund’s value for a particular portfolio instrument may be different from the last price determined by the pricing service or the last bid or ask price in the market.
Certain short-term instruments maturing within 60 days or less are valued at amortized cost, which approximates fair value. The value of the securities of other open-end funds held by the Fund, if any, will be calculated using the NAV of such open-end funds, and the prospectuses for such open-end funds explain the circumstances under which they use fair value pricing and the effects of using fair value pricing.
Below is a description of factors that may be considered when valuing securities for which no active secondary market exists:
Valuation of fixed income investments, such as loans and debt securities, depends upon a number of factors, including prevailing interest rates for like securities, expected volatility in future interest rates, call features, put features and other relevant terms of the debt. For investments without readily available market prices, these factors may be incorporated into discounted cash flow models to arrive at fair value. Other factors that may be considered include the borrower’s ability to adequately service its debt, the fair market value of the portfolio company in relation to the face amount of its outstanding debt and the quality of the collateral securing its debt investments.
Asset-backed securities are generally issued as pass-through certificates or as debt instruments. Asset-backed securities issued as pass-through certificates represent undivided fractional ownership interests in an underlying pool of assets. Asset-backed securities issued as debt instruments, which are also known as collateralized obligations, are typically issued as the debt of a special purpose entity organized solely for the purpose of owning such assets and issuing such debt. Asset-backed securities are often backed by a pool of assets representing the obligations of a number of different parties. The yield characteristics of certain asset-backed securities may differ from traditional debt securities. One such major difference is that all or a principal part of the obligations may be prepaid at any time because the underlying assets
22
Destra International & Event-Driven Credit Fund |
Notes to Financial Statements (continued) |
September 30, 2020 |
(i.e., loans) may be prepaid at any time. As a result, a decrease in interest rates in the market may result in increases in the level of prepayments as borrowers, particularly mortgagors, refinance and repay their loans. An increased prepayment rate with respect to an asset-backed security will have the effect of shortening the maturity of the security. In addition, the Fund may subsequently have to reinvest the proceeds at lower interest rates. If the Fund has purchased such an asset-backed security at a premium, a faster than anticipated prepayment rate could result in a loss of principal to the extent of the premium paid. For convertible debt securities, fair value will generally approximate the fair value of the debt plus the fair value of an option to purchase the underlying security (the security into which the debt may convert) at the conversion price. To value such an option, a standard option pricing model may be used.
For private company equity interests, various factors may be considered in determining fair value, including but not limited to multiples of earnings before interest, taxes, depreciation and amortization (“EBITDA”), cash flows, net income, revenues or, in limited instances, book value or liquidation value. All of these factors may be subject to adjustments based upon the particular circumstances of a private company or the Fund’s actual investment position. For example, adjustments to EBITDA may take into account compensation to previous owners or an acquisition, recapitalization, restructuring or other related items.
Other factors that may be considered in valuing securities include private merger and acquisition statistics, public trading multiples discounted for illiquidity and other factors, valuations implied by third-party investments in the private companies, the acquisition price of such investment or industry practices in determining fair value. The Adviser may also consider the size and scope of a private company and its specific strengths and weaknesses, and may apply discounts or premiums, where and as appropriate, due to the higher (or lower) financial risk and/ or the size of the private company relative to comparable firms, as well as such other factors as the Adviser, in consultation with any third-party valuation or pricing service, if applicable, may consider relevant in assessing fair value.
If the Fund receives warrants or other equity securities at nominal or no additional cost in connection with an investment in a debt security, the cost basis in the investment will be allocated between the debt securities and any such warrants or other equity securities received at the time of origination. Such warrants or other equity securities will subsequently be valued at fair value.
Portfolio securities that carry certain restrictions on sale will typically be valued at a discount from the public market value of the security, where applicable.
If events materially affecting the price of foreign portfolio securities occur between the time when their price was last determined on such foreign securities exchange or market and the time when the Fund’s NAV was last calculated (for example, movements in certain U.S. securities indices which demonstrate strong correlation to movements in certain foreign securities markets), such securities may be valued at their fair value as determined in good faith in accordance with procedures established by the Board. For purposes of calculating NAV, all assets and liabilities initially expressed in foreign currencies will be converted into U.S. dollars at prevailing exchange rates as may be determined in good faith by the Adviser, under the supervision of the Board.
Swaps typically will be valued using valuations provided by a third-party pricing service. Such pricing service valuations generally will be based on the present value of fixed and projected floating rate cash flows over the term of the swap contract and, in the case of credit default swaps, generally will be based on credit spread quotations obtained from broker-dealers and expected default recovery rates determined by the third-party pricing service using proprietary models. Future cash flows will be discounted to their present value using swap rates provided by electronic data services or by broker-dealers.
(e) Commitments and Contingencies
In the normal course of business, the Fund may enter into contracts that contain a variety of representations which provide general indemnifications for certain liabilities. The Fund’s maximum exposure under these arrangements is unknown. However, since its commencement of operations, the Fund has not had claims or losses pursuant to these contracts and expects the risk of loss to be remote.
(f) Derivatives
Futures Contracts — The Fund may purchase futures contracts to manage cash flows, enhance yield, or to potentially reduce transaction costs. Upon entering into a futures contract with a broker, the Fund is required to deposit in a segregated account a specified amount of cash or U.S. government securities. Futures contracts are valued daily and unrealized gains or losses are recorded in a “variation margin” account. Daily, the Fund receives from, or pays to, the broker a specified amount of cash based upon changes in the variation margin account. When a contract is closed, the Fund recognizes a realized gain or loss. Futures contracts have market risks, including the risk that the change in the value of the contract may not correlate with changes in the value of the underlying securities.
23
Destra International & Event-Driven Credit Fund |
Notes to Financial Statements (continued) |
September 30, 2020 |
Purchasing a futures contract creates an obligation to take delivery of the specific type of financial instrument at a specific future time at a specific price for contracts that require physical delivery, or net payment for cash-settled contracts. Engaging in transactions in futures contracts involves risk of loss to the Fund. No assurance can be given that a liquid market will exist for any particular futures contract at any particular time. All terms of futures contracts are set forth in the rules of the exchange on which the futures contracts are traded. Many futures exchanges and boards of trade limit the amount of fluctuation permitted in futures contract prices during a single trading day. Once the daily limit has been reached in a particular contract, no trades may be made that day at a price beyond that limit or trading may be suspended for specified periods during the trading day. Futures contract prices could move to the limit for several consecutive trading days with little or no trading, preventing prompt liquidation of futures positions and potentially subjecting the Fund to substantial losses. Successful use of futures also is subject to the Adviser’s ability to predict correctly the direction of movements in the relevant market, and, to the extent the transaction is entered into for hedging purposes, to determine the appropriate correlation between the transaction being hedged and the price movements of the futures contract.
Swap Contracts — The Fund may engage in various swap transactions, including forward rate and interest rate agreements, primarily to manage risk, or as alternatives to direct investments. The Fund may also engage in credit default swaps, which involve the exchange of a periodic premium for protection against a defined credit event (such as payment default, refinancing or bankruptcy). The Fund engaged in credit default swaps to protect against credit events and interest rate swaps to hedge currency risks.
Under the terms of a credit default swap contract, one party acts as a guarantor receiving a periodic payment that is a fixed percentage applied to a notional amount. In return, the party agrees to purchase the notional amount of the underlying instrument, at par, if a credit event occurs during the term of the contract. The Fund may enter into credit default swaps in which the Fund acts as guarantor (a seller of protection) and may enter into credit default swaps in which the counterparty acts as guarantor (a buyer of protection). Premiums paid to or by the Fund are accrued daily and included in realized gain (loss) on swaps. The contracts are marked-to-market daily using fair value estimates provided by an independent pricing service. Changes in value are recorded as net change in unrealized appreciation/(depreciation) on the statement of operations. Unrealized gains are reported as an asset and unrealized losses are reported as a liability on the statement of assets and liabilities. Gains or losses are realized upon termination of the contracts. The risk of loss under a swap contract may exceed the amount recorded as an asset or a liability. The notional amount of a swap contract is the reference amount pursuant to which the counterparties make payments. For swaps in which the referenced obligation is an index, in the event of default of any debt security included in the corresponding index, the Fund pays or receives the percentage of the corresponding index that the defaulted security comprises (1) multiplied by the notional value and (2) multiplied by the ratio of one minus the ratio of the market value of the defaulted debt security to its par value.
Interest rate swaps are agreements between two parties to exchange cash flows based on a notional principal amount. The Fund may elect to pay a fixed rate and receive a floating rate or receive a fixed rate and pay a floating rate on a notional principal amount. The net interest received or paid on interest rate swap agreements is accrued daily as interest income/expense. Interest rate swaps are marked-to-market daily using fair value estimates provided by an independent pricing service. Changes in value, including accrued interest, are recorded as net change in unrealized appreciation/(depreciation) on the statement of operations. Unrealized gains are reported as an asset and unrealized losses are reported as a liability on the statement of assets and liabilities. Gains or losses are realized upon termination of the contracts. The risk of loss under a swap contract may exceed the amount recorded as an asset or a liability. As of September 30, 2020, the Fund had two outstanding interest rate swap contracts.
Risks associated with swap contracts include changes in the returns of underlying instruments, failure of the counterparties to perform under the contracts’ terms and the possible lack of liquidity with respect to the contracts. Credit default swaps can involve greater risks than if an investor had invested in the reference obligation directly since, in addition to general market risks, credit default swaps are subject to counterparty credit risk, leverage risk, hedging risk, correlation risk and liquidity risk. The Fund discloses swap contracts on a gross basis, with no netting of contracts held with the same counterparty. As of September 30, 2020, the Fund had one outstanding credit default swap contract.
Foreign Exchange Contracts — The Fund may enter into foreign currency exchange contracts. The Fund may enter into these contracts for the purchase or sale of a specific foreign currency at a fixed price on a future date to hedge various investments, for investment purposes, for risk management and/or in a manner intended to increase income or gain to the Fund. All foreign currency exchange contracts are market-to-market daily at the applicable translation rates resulting in unrealized gains or losses. Realized gains or losses are recorded at the time the foreign currency exchange contract is offset by entering into a closing transaction, or by the delivery, or receipt, of the currency. Risk may arise upon entering into these contracts from the potential inability of counterparties to meet the terms of their contracts and from unanticipated movements in the value of a foreign currency relative to the U.S. dollar.
24
Destra International & Event-Driven Credit Fund |
Notes to Financial Statements (continued) |
September 30, 2020 |
Options — The Fund may purchase put and call options on currencies or securities. A put option gives the purchaser the right to compel the writer of the option to purchase from the option holder an underlying currency or security or its equivalent at a specified price at any time during the option period. In contrast, a call option gives the purchaser the right to buy the underlying currency or security covered by the option or its equivalent from the writer of the option at the stated exercise price.
As a holder of a put option, the Fund will have the right to sell the currencies or securities underlying the option and as the holder of a call option, the Fund will have the right to purchase the currencies or securities underlying the option, in each case at their exercise price at any time prior to the option’s expiration date. The Fund may seek to terminate its option positions prior to their expiration by entering into closing transactions. The ability of the Fund to enter into a closing sale transaction depends on the existence of a liquid secondary market. There can be no assurance that a closing purchase or sale transaction can be affected when the Fund so desires. The Fund may close out a position when writing options by purchasing an option on the same security with the same exercise price and expiration date as the option that it has previously written on the security. In such a case, the Fund will realize a profit or loss if the amount paid to purchase an option is less or more than the amount received from the sale of the option.
The hours of trading for options may not conform to the hours during which the underlying securities are traded. To the extent that the options markets close before the markets for the underlying securities, significant price and rate movements can take place in the underlying markets that cannot be reflected in the options markets. The purchase of options is a highly specialized activity which involves investment techniques and risks different from those associated with ordinary portfolio securities transactions. The purchase of options involves the risk that the premium and transaction costs paid by the Fund in purchasing an option will be lost as a result of unanticipated movements in prices of the securities on which the option is based. Imperfect correlation between the options and securities markets may detract from the effectiveness of attempted hedging. Options transactions may result in significantly higher transaction costs and portfolio turnover for the Fund.
(g) Restricted Securities
Restricted securities are securities that may be resold only upon registration under federal securities laws or in transactions exempt from such registration. In some cases, the issuer of restricted securities has agreed to register such securities for resale, at the issuer’s expense either upon demand by the Fund or in connection with another registered offering of the securities. Many restricted securities may be resold in the secondary market in transactions exempt from registration. Such restricted securities may be determined to be liquid under criteria established by the Board. The restricted securities may be valued at the price provided by dealers in the secondary market or, if no market prices are available, the fair value as determined in good faith using methods approved by the Board.
Additional information on each illiquid and restricted investment held by the Fund at September 30, 2020 is as follows:
Security | Acquisition | Cost | Value | Percentage of | |||||||
Alloy Topco Ltd., Common Shares | 3/10/2020 | $ | — | $ | 47 | 0.00 | % | ||||
Bacchus LLC, Common Shares | 7/24/2020 |
| 984 |
| 4,104 | 0.01 |
| ||||
Paper Industries TopCo Ltd., Warrants | 7/16/2020 |
| — |
| 6 | 0.00 |
| ||||
Quintis Australia Pty, Ltd., Common Shares | 10/30/2019 |
| — |
| 46,150 | 0.08 |
| ||||
Quintis Australia Pty, Ltd., Corporate Debt, 7.500% | 9/11/2019 |
| 5,450 |
| 6,899 | 0.01 |
| ||||
Quintis Australia Pty, Ltd., Corporate Debt, 0.000% | 9/11/2019 |
| 47,987 |
| 66,807 | 0.12 |
| ||||
Saxa Gres SpA | 11/27/2018 |
| 678,428 |
| 633,208 | 1.12 |
| ||||
V Global Holdings LLC, Common Shares | 8/6/2018 |
| 1,741,596 |
| 3,858,209 | 6.85 |
| ||||
(h) Foreign Currency
The accounting records of the Fund are maintained in U.S. dollars. All assets and liabilities denominated in foreign currencies are translated into U.S. dollars based on the rate of exchange of such currencies against U.S. dollars on the date of valuation. Purchases and sales of securities, income and expenses are translated at the rate of exchange quoted on the respective date that such transactions are recorded. The Fund does not isolate that portion of the results of operations resulting from changes in foreign exchange rates on investments from the fluctuations arising from changes in market prices of securities held. Such fluctuations are included with the net realized and unrealized gain or loss from investments.
25
Destra International & Event-Driven Credit Fund |
Notes to Financial Statements (continued) |
September 30, 2020 |
Reported net realized foreign exchange gains or losses arise from sales of portfolio securities, sales and maturities of short-term securities, sales of foreign currencies, currency gains or losses realized between the trade and settlement dates on securities transactions, and the difference between the amounts of dividends, interest, and foreign withholding taxes recorded on the Fund’s books and the U.S. dollar equivalent of the amounts actually received or paid. Net unrealized foreign exchange gains and losses arise from changes in the value of assets and liabilities other than investments in securities at each reporting period, resulting from changes in the exchange rate.
3. Fair Value Measurement
U.S. GAAP defines fair value, establishes a three-tier framework for measuring fair value based on a hierarchy of inputs, and expands disclosure about fair value measurements. It also provides guidance on determining when there has been a significant decrease in the volume and level of activity for an asset or liability, when a transaction is not orderly and how that information must be incorporated into a fair value measurement. The hierarchy distinguishes between market data obtained from independent sources (observable inputs) and the Fund’s own market assumptions (unobservable inputs).
These inputs are used in determining the fair value of the Fund’s investments. These inputs are summarized in the three broad levels listed below:
• Level 1 – unadjusted quoted prices in active markets for identical assets and liabilities that the Fund has the ability to access.
• Level 2 – other significant observable inputs (including quoted prices for similar securities, interest rates, prepayment speeds, credit risk, etc. and quoted prices for identical or similar assets in markets that are not active).
• Level 3 – significant unobservable inputs (including the Fund’s own assumptions in determining the fair value of investments).
The inputs or methodology used for valuing securities are not necessarily an indication of the risk associated with investing in those securities. The following is a summary of the valuation inputs used to value the Fund’s assets and liabilities reflected in the Schedule of Investments as of September 30, 2020:
Level 1 | Level 2 | Level 3 | Total | |||||||||
Bank Loans(1) | $ | — | $ | 686,525 | $ | — | $ | 686,525 | ||||
Common Stocks(2) |
| 27,686 |
| — |
| — |
| 27,686 | ||||
Corporate Debt Securities(1) |
| — |
| 14,363,462 |
| — |
| 14,363,462 | ||||
International Debt Securities(1) |
| — |
| 28,253,584 |
| — |
| 28,253,584 | ||||
International Equities (2) |
| 223,985 |
| — |
| — |
| 223,985 | ||||
Private Companies |
|
|
|
| ||||||||
Australia |
| — |
| — |
| 119,856 |
| 119,856 | ||||
Italy |
| — |
| — |
| 633,208 |
| 633,208 | ||||
Luxembourg |
| — |
| 836,727 |
| 6 |
| 836,733 | ||||
United Kingdom |
| — |
| — |
| 47 |
| 47 | ||||
United States |
| — |
| — |
| 3,862,313 |
| 3,862,313 | ||||
Short-Term Investments |
| 3,327,526 |
| — |
| — |
| 3,327,526 | ||||
Total | $ | 3,579,197 | $ | 44,140,298 | $ | 4,615,430 | $ | 52,334,925 | ||||
1 All sub-categories represent Level 2 evaluation status.
2 All sub-categories represent Level 1 evaluation status.
The following is a summary of valuation inputs used to measure the Fund’s assets and liabilities of other financial instruments that are derivative instruments not reflected in the Schedule of Investments as of September 30, 2020
Level 1 | Level 2 | Level 3 | Total | |||||||||
Forward Foreign Exchange Contracts | $ | — | $ | 168,520 | $ | — | $ | 168,520 | ||||
Futures Contracts |
| 4,688 |
| — |
| — |
| 4,688 | ||||
Swap Contracts |
| — |
| 10,389 |
| — |
| 10,389 | ||||
Total | $ | 4,688 | $ | 178,909 | $ | — | $ | 183,597 | ||||
26
Destra International & Event-Driven Credit Fund |
Notes to Financial Statements (continued) |
September 30, 2020 |
The following is a reconciliation of investments in which significant Level 3 unobservable inputs were used in determining fair value as of September 30, 2020:
Investments | Balance as of | Purchase of Investments(1) | Proceeds | Net | Amortization | Net Change | Balance as of | |||||||||||||||
Private Companies |
|
|
|
|
|
|
|
| ||||||||||||||
Australia | $ | 82,940 | $ | 46,683 | $ | — | $ | — | $ | 12,517 | $ | (22,284 | ) |
| 119,856 | |||||||
Italy |
| 654,093 |
| — |
| — |
| — |
| — |
| (20,885 | ) |
| 633,208 | |||||||
Luxembourg |
| — |
| 6 |
| — |
| — |
| — |
| — |
|
| 6 | |||||||
United Kingdom |
| — |
| 47 |
| — |
| — |
| — |
| — |
|
| 47 | |||||||
United States |
| 1,505,926 |
| 795,740 |
| — |
| — |
| — |
| 1,560,647 |
|
| 3,862,313 | |||||||
Total Investments | $ | 2,242,959 | $ | 842,476 | $ | — | $ | — | $ | 12,517 | $ | 1,517,478 |
| $ | 4,615,430 | |||||||
1 Includes acquisitions related to corporate actions.
2 Includes return of capital.
The following table summarizes the valuation techniques and significant unobservable inputs used for the Fund’s investments that are categorized in Level 3 of the fair value hierarchy as of September 30, 2020:
Investments | Fair Value | Valuation Techniques | Unobservable | Discount | Impact on | ||||||||
Private Companies |
|
|
| ||||||||||
Australia |
|
|
| ||||||||||
Quintis Australia Pty, Ltd., | $ | 46,150 | Discounted Cash Flow | WACC/Liquidity Discount |
| 19.30 | % | Decrease | |||||
|
|
| |||||||||||
Quintis Australia Pty, Ltd., |
| 6,899 | Discounted Cash Flow | Discount Rate/Liquidity Discount |
| 8.10 | % | Decrease | |||||
|
|
| |||||||||||
Quintis Australia Pty, Ltd., |
| 66,807 | Discounted Cash Flow | Discount Rate/Liquidity Discount |
| 14.80 | % | Decrease | |||||
|
|
| |||||||||||
Italy |
|
|
| ||||||||||
Saxa Gres SpA |
| 633,208 | Discounted Cash Flow | Discount Rate/Liquidity Discount |
| 9.50 | % | Decrease | |||||
|
|
| |||||||||||
United States |
|
|
| ||||||||||
Bacchus LLC, |
| 4,104 | Guideline Transaction Market Approach | Capital Contribution/ROFO Transactions | $ | 0.0025 |
| Increase | |||||
|
|
| |||||||||||
V Global Holdings LLC, |
| 3,858,209 | Discounted Cash Flow | WACC/Liquidity Discount |
| 20.00 | % | Decrease | |||||
|
| Guideline Public Company Market Approach | Terminal Multiple Discount |
| 7.50x |
| Increase | ||||||
Total Investments(2) | $ | 4,615,377 |
|
| |||||||||
1 As there was no range for each significant unobservable input, weighted average is not reported.
2 Certain of the Fund’s significant Level 3 investments have been valued using unadjusted third-party transactions and quotations or unadjusted historical third party financial information. As a result, fair value assets of $53 have been excluded from the preceding table as quantitative unobservable inputs for the valuations of such assets were not developed or adjusted by the Adviser.
27
Destra International & Event-Driven Credit Fund |
Notes to Financial Statements (continued) |
September 30, 2020 |
Certain of the Fund’s significant Level 3 investments have been valued using unadjusted third-party transactions and quotations or unadjusted historical third party financial information. As a result, fair value assets of $6 have been excluded from the preceding table as quantitative unobservable inputs for the valuations of such assets were not developed or adjusted by the Fund.
4. Investment Management
The Fund has entered into an investment management agreement (the “Investment Management Agreement”) with the Adviser. Subject to the oversight of the Fund’s Board, the Adviser is responsible for managing the Fund’s business affairs and providing day-to-day administrative services to the Fund either directly or through others selected by it for the Fund.
Under the Investment Management Agreement, the Adviser is entitled to a management fee, calculated and payable quarterly in arrears, at the annual rate of 1.75% of the Fund’s average daily Managed Assets during such period (the “Management Fee”). “Managed Assets” means the total assets of the Fund (including any assets attributable to money borrowed for investment purposes) minus the sum of the Fund’s accrued liabilities (other than money borrowed for investment purposes).
The Fund and Adviser have entered into an investment sub-advisory agreement (the “Sub-Advisory Agreement”) with the Sub-Adviser. Under the Sub-Advisory Agreement, the Sub-Adviser will receive a sub-advisory fee (the “Sub-Advisory Fee”, payable by the Adviser out of the Management Fee) at the rates set forth below (on an annualized basis) of the Fund’s average daily Managed Assets:
Managed Assets of the Fund | Sub-Advisory | ||
$1 to $50,000,000 | 1.75 | % | |
Over $50,000,000 to $100,000,000 | 1.225 | % | |
Over $100,000,000 to $150,000,000 | 1.1375 | % | |
Over $150,000,000 to $250,000,000 | 1.05 | % | |
In excess of $250,000,000 | 0.875 | % | |
The Sub-Adviser has entered into an investment sub-sub-advisory agreement (the “Sub-Sub-Advisory Agreement”) with the Sub-Sub-Adviser. Under the Sub-Sub-Advisory Agreement, the Sub-Sub-Adviser will receive a sub-sub-advisory fee equal to the costs incurred by the Sub-Sub-Adviser in providing advisory services to the Fund plus a margin of 10% of such costs.
5. Expense Limitation
Effective November 19, 2018, the Adviser and the Fund have entered into an expense limitation and reimbursement agreement (the “Expense Limitation Agreement”) under which the Adviser has agreed to reimburse and/or pay or absorb, on a quarterly basis, the “ordinary operating expenses” (as defined below) of the Fund to the extent that such expenses exceed 0.50% per annum of the Fund’s average daily net assets (the “Expense Limitation”). The Expense Limitation may be adjusted for different classes of Shares to account for class-specific expenses.
Prior to November 19, 2018, the Adviser and the Fund had an expense limitation and reimbursement agreement under which the Adviser had agreed to waive its Management Fee and/or pay, on a quarterly basis, both the “ordinary operating expenses” (as defined below) and the Management Fee of the Fund to the extent that such total expenses exceeded 2.25% per annum of the Fund’s average daily Managed Assets.
In consideration of the Expense Limitation Agreement, the Fund has agreed to repay the Adviser pro rata in the amount of any Fund expense paid or waived by it, subject to the limitations that: (1) the reimbursement for expenses will be made only if payable not more than three years following the date such payment or waiver was made; and (2) the reimbursement may not be made if it would cause the Fund’s then-current Expense Limitation, if any, and the Expense Limitation that was in effect at the time when the Adviser reimbursed, paid or absorbed the ordinary operating expenses that are the subject of the repayment, to be exceeded. Unless earlier terminated by the Board, the Expense Limitation Agreement will remain in effect until February 13, 2030, and will automatically continue in effect for successive twelve-month periods thereafter. The Adviser may not terminate the Expense Limitation Agreement during the initial term. After the initial term, either the Board or the Adviser may terminate the Expense Limitation Agreement upon 30 days’ written notice. For the purposes of the Expense Limitation Agreement, “ordinary operating expenses” consist of all ordinary expenses of the Fund,
28
Destra International & Event-Driven Credit Fund |
Notes to Financial Statements (continued) |
September 30, 2020 |
including administration fees, transfer agent fees, organization and offering expenses, fees paid to the Fund’s trustees, legal fees related to the organization and offering of the Fund, administrative services expenses, and related costs associated with legal, regulatory compliance and investor relations, but excluding the following: (a) Management Fee, (b) portfolio transaction and other investment-related costs (including brokerage commissions, dealer and underwriter spreads, commitment fees on leverage facilities, prime broker fees and expenses, and dividend expenses related to short sales), (c) interest expense and other financing costs, (d) taxes, (e) distribution and/or shareholder servicing fees, if any, (f) acquired fund fees and expenses, and (g) extraordinary expenses.
For the year ended September 30, 2020, the Adviser waived expenses totaling $399,569 that are subject to reimbursement. As of September 30, 2020, the following amounts are subject to recapture by the Adviser by the following dates:
May 10, | September 30, | September 30, | September 30, | |||||||
$ 101,826 | $ 343,089 | $ 520,927 | $ 399,569 |
6. Capital Stock
The Fund engages in a continuous offering of Shares under Rule 415 under the Securities Act of 1933, as amended. The Fund has registered a total of 5,040,000 Shares and is authorized as a Delaware statutory trust to issue an unlimited number of Shares in all classes, with a par value of $0.001. The Fund is offering to sell, through its distributor, Destra Capital Investments LLC (the “Distributor”) its Shares at the then-current NAV per Share. In addition, certain institutions (including banks, trust companies, brokers and investment advisers) may be authorized to accept, on behalf of the Fund, purchase and exchange orders and repurchase requests placed by or on behalf of their customers, and if approved by the Fund, may designate other financial intermediaries to accept such orders. The Distributor is not required to sell any specific number or dollar amount of the Fund’s Shares, but will use its best efforts to solicit orders for the sale of the Shares. The minimum initial investment (waived in certain circumstances) for Class I, A, L, and T Shares is $100,000, $2,500, $2,500, and $2,500 respectively. There is no minimum for subsequent investments. All Share purchases are subject to approval of the Adviser. The minimum investment requirement may be waived in the Fund’s sole discretion. Monies received will be invested promptly and no arrangements have been made to place such monies in an escrow, trust or similar account.
The Shares have no history of public trading, nor is it intended that the Shares will be listed on a public exchange at this time, if ever. No secondary market is expected to develop for the Fund’s Shares; liquidity for the Shares will be provided only through quarterly Repurchase Offers for no less than 5% and no more than 25% of the Fund’s outstanding Shares pursuant to Rule 23c-3 of the 1940 Act, and there is no guarantee that an investor will be able to sell all the Shares that the investor desires to sell in the Repurchase Offer. If shareholders tender more than the Repurchase Offer amount for any given Repurchase Offer, the Fund may repurchase up to an additional 2% of the outstanding Shares. If Fund shareholders tender more Shares than the Fund decides to repurchase, the Fund will repurchase the Shares on a pro rata basis, subject to limited exceptions. Due to these restrictions, an investor should consider an investment in the Fund to be of limited liquidity. Investing in the Fund’s Shares may be speculative and involves a high degree of risk, including the risks associated with leverage.
During the year ended September 30, 2020, the Fund had four Repurchase Offers as follows:
Repurchase Offer Notice | Repurchase | Repurchase | % of Shares | Number | ||||||
December 18, 2019 | January 22, 2020 | 5% | N/A | (1) | N/A | (1) | ||||
March 18, 2020 | April 22, 2020 | 5% | N/A | (1) | N/A | (1) | ||||
June 17, 2020 | July 22, 2020 | 5% | 0.49 | % | 11,380 |
| ||||
September 17, 2020 | October 22, 2020 | 5% | N/A | (1) | N/A | (1) | ||||
1 There were no shares repurchased.
7. Distribution and Shareholder Servicing Plans
Class L and Class T Shares have adopted a distribution plan (the “Distribution Plan”) in accordance with Rule 12b-1 under the 1940 Act. The Plan is a compensation type plan that permits the payment at an annual rate of up to 0.25% and 0.50% of the average daily net assets of Class L and Class T Shares, respectively. Payments are made to the Distributor, who may make ongoing payments to financial intermediaries based on the value of Shares held by such intermediaries’ customers.
29
Destra International & Event-Driven Credit Fund |
Notes to Financial Statements (continued) |
September 30, 2020 |
Class A, Class L and Class T Shares have adopted a shareholder servicing plan (the “Servicing Plan”) under which the Fund may compensate financial industry professionals or firms for providing ongoing services in respect of customers who own Class A, Class L or Class T Shares of the Fund. The Servicing Plan permits the payment at an annual rate of up to 0.25% of the average daily net assets of Class A, Class L and Class T Shares, respectively.
8. Investment Transactions
Purchases and sales of investments, excluding short-term U.S. government securities and short-term obligations, for the year ended September 30, 2020, were $63,795,309 and $70,791,722, respectively.
9. Revolving Credit Facility
On August 13, 2018, the Fund entered into a secured, revolving line of credit facility with BNP Paribas (the “Credit Facility”) with no stated maturity date. The Fund may borrow an amount up to the lesser of the Credit Facility maximum commitment financing of $500,000,000 or one-third of the value of its total assets. The interest rate on borrowings from the Credit Facility is equal to 3-month LIBOR plus 0.90% per annum. During the year ended September 30, 2020, the average principal balance outstanding and weighted average interest rate was approximately $2,325,763 and 2.84% per annum, respectively. The maximum outstanding balance during the period of the Credit Facility was $5,000,000 on October 1, 2019. At September 30, 2020, there was no principal balance outstanding.
10. Asset Coverage
Under the provisions of the 1940 Act, the Fund is permitted to issue senior securities, including debt securities and preferred stock, and borrow from banks or other financial institutions, provided that the Fund satisfies certain asset coverage requirements. With respect to senior securities representing indebtedness, such as the Credit Facility, the Fund is required to have asset coverage of at least 300%, as measured at the time of borrowing and calculated as the ratio of the Fund’s total assets, less all liabilities and indebtedness not represented by senior securities, over the aggregate amount of the Fund’s outstanding senior securities representing indebtedness. If the Fund’s asset coverage declines below 300%, the Fund would be prohibited under the 1940 Act from incurring additional debt or making certain distributions to its shareholders.
Please refer to the Fund’s Financial Highlights for summary of the Fund’s asset coverage with respect to senior securities.
11. Other Derivative Information
The following is a summary of the average quarterly notional value of derivatives as of September 30, 2020, as well as the notional value outstanding as of September 30, 2020:
Average | Notional | |||||
Forward foreign exchange contracts purchased long | $ | 2,225,307 | $ | 1,410,347 | ||
Forward foreign exchange contracts sold short |
| 24,506,610 |
| 22,465,660 | ||
Credit default swap contracts |
| 1,252,500 |
| 2,089,000 | ||
Interest rate swap contracts |
| 2,030,510 |
| 3,355,513 | ||
Interest rate futures contracts |
| 1,570,367 |
| 2,693,626 | ||
Purchased options contracts |
| 1,725,000 |
| — | ||
30
Destra International & Event-Driven Credit Fund |
Notes to Financial Statements (continued) |
September 30, 2020 |
The effects of these derivative instruments on the Fund’s financial positions and financial performance are reflected in the Statement of Assets and Liabilities (“SAL”) and Statement of Operations, and are presented in the table below. The values of derivative instruments as of September 30, 2020 by risk category are as follows:
Risk Category | |||||||||||||||
Derivative Assets (Liabilities) | Forward | Credit Risk | Equity Risk | Interest | |||||||||||
Unrealized appreciation on forward foreign exchange contracts | $ | 201,578 |
| $ | — |
| $ | — | $ | — |
| ||||
Unrealized depreciation on forward foreign exchange contracts |
| (33,058 | ) |
| — |
|
| — |
| — |
| ||||
Premiums paid on swap contracts |
| — |
|
| (193,685 | ) |
| — |
| — |
| ||||
Unrealized appreciation on swap contracts |
| — |
|
| 15,374 |
|
| — |
| — |
| ||||
Unrealized depreciation on swap contracts |
| — |
|
| — |
|
| — |
| (4,985 | ) | ||||
Unrealized appreciation on futures contracts |
| — |
|
| — |
|
| — |
| 7,960 |
| ||||
Unrealized depreciation on futures contracts |
| — |
|
| — |
|
| — |
| (3,272 | ) | ||||
Net | $ | 168,520 |
| $ | (178,311 | ) | $ | — | $ | (297 | ) | ||||
Risk Category | |||||||||||||||
Derivative Realized Gain (Loss) | Forward | Credit | Equity | Interest | |||||||||||
Forward foreign exchange contracts | $ | (847,105 | ) | $ | — | $ | — |
| $ | — |
| ||||
Swap contracts |
| — |
|
| 120,040 |
| — |
|
| (56,030 | ) | ||||
Purchased options contracts |
| — |
|
| — |
| (241,999 | ) |
| — |
| ||||
Futures contracts |
| — |
|
| — |
| (3,882 | ) |
| (45,780 | ) | ||||
Net | $ | (847,105 | ) | $ | 120,040 | $ | (245,881 | ) | $ | (101,810 | ) | ||||
Risk Category | ||||||||||||||
Derivative Unrealized Appreciation (Depreciation) | Forward | Credit | Equity | Interest | ||||||||||
Forward foreign exchange contracts | $ | (274,236 | ) | $ | — | $ | — | $ | — |
| ||||
Swap contracts |
| — |
|
| 18,681 |
| — |
| (4,985 | ) | ||||
Purchased options contracts |
| — |
|
| — |
| 4,687 |
| — |
| ||||
Futures contracts |
| — |
|
| — |
| — |
| 4,688 |
| ||||
Net | $ | (274,236 | ) | $ | 18,681 | $ | 4,687 | $ | (297 | ) | ||||
31
Destra International & Event-Driven Credit Fund |
Notes to Financial Statements (continued) |
September 30, 2020 |
Offsetting of Assets and Liabilities — Disclosures about offsetting assets and liabilities require an entity to disclose information about offsetting and related arrangements to enable users of its financial statements to understand the effect of those arrangements on its financial position. As of September 30, 2020, no master netting arrangements exist related to the Fund. The Fund’s SAL presents derivative instruments on a gross basis, therefore, no net amounts and no offset amounts exist within the SAL to present below. Gross amounts of the derivative instruments, amounts related to financial instruments/cash collateral not offset in the SAL and net amounts are presented below:
Derivative Assets | Derivative (Liabilities) | Collateral Pledged | ||||||||||||||||||||||||||||||||
Counterparty | Credit | Forward | Interest | Forward | Interest | Interest | Net | Financial | Cash | Net | ||||||||||||||||||||||||
BNP Paribas Securities Corp. | $ | — | $ | — | $ | — | $ | (171 | ) | $ | — |
| $ | — |
| $ | (171 | ) | $ | — | $ | 171 | $ | — | ||||||||||
Barclays Capital, Inc. |
| — |
| — |
| — |
| (1,322 | ) |
| — |
|
| — |
|
| (1,322 | ) |
| — |
| 1,322 |
| — | ||||||||||
Brown Brothers Harriman |
| — |
| 123,943 |
| — |
| (909 | ) |
| — |
|
| — |
|
| 123,034 |
|
| — |
| — |
| 123,034 | ||||||||||
Citibank, N.A. |
| — |
| 9,950 |
| — |
| (30,656 | ) |
| — |
|
| — |
|
| (20,706 | ) |
| — |
| 20,706 |
| — | ||||||||||
Citigroup, Inc. |
| — |
| — |
| 7,960 |
| — |
|
| (3,272 | ) |
| (581 | ) |
| 4,107 |
|
| — |
| — |
| 4,107 | ||||||||||
Goldman Sachs & Co. |
| — |
| — |
| — |
| — |
|
| — |
|
| (4,404 | ) |
| (4,404 | ) |
| — |
| 4,404 |
| — | ||||||||||
Morgan Stanley & Co. LLC |
| 15,374 |
| — |
| — |
| — |
|
| — |
|
| — |
|
| 15,374 |
|
| — |
| — |
| 15,374 | ||||||||||
Royal Bank of Scotland |
| — |
| 67,647 |
| — |
| — |
|
| — |
|
| — |
|
| 67,647 |
|
| — |
| — |
| 67,647 | ||||||||||
Standard Chartered |
| — |
| 38 |
| — |
| — |
|
| — |
|
| — |
|
| 38 |
|
| — |
| — |
| 38 | ||||||||||
12. Federal Tax Information
The Fund intends to qualify as a “regulated investment company” under Subchapter M of the Internal Revenue Code of 1986. If so qualified, the Fund will not be subject to federal income tax to the extent it distributes substantially all of its net investment income and capital gains to shareholders. Therefore, no federal income tax provision is required.
The timing and character of income and capital gain distributions are determined in accordance with income tax regulations, which may differ from U.S. GAAP.
To the extent that differences arise that are permanent in nature, such amounts are reclassified within the capital accounts, on the Statement of Assets and Liabilities, based on their Federal tax basis treatment; temporary differences do not require reclassification and had no impact on the NAV of the Fund.
The Fund complies with FASB interpretation Accounting for Uncertainty in Income Taxes which provides guidance for how uncertain tax provisions should be recognized, measured, presented and disclosed in the financial statements. Accounting for Uncertainty in Income Taxes requires the affirmative evaluation of tax positions taken or expected to be taken in the course of preparing the Fund’s tax returns to determine whether it is “more-likely-than-not,” (i.e., greater than 50 percent) of being sustained by the applicable tax authority. Tax positions not deemed to meet the more-likely-than-not threshold may result in a tax benefit or expense in the current period.
Accounting for Uncertainty in Income Taxes requires management of the Fund to analyze all open tax years, as defined by the statutes of limitations, for all major jurisdictions, which includes federal and certain states. Open tax years are those that are open for exam by the taxing authorities (i.e., the last three tax years and the interim tax period since then). The Fund has no examination in progress during the year ended September 30, 2020. For all open tax years and all major taxing jurisdictions through the end of the reporting period, management of the Fund reviewed all tax positions taken or expected to be taken in the preparation of the Fund’s tax returns and concluded that Accounting for Uncertainty in Income Taxes resulted in no effect on the Fund’s reported net assets or results of operations as of and during the year ended September 30, 2020. Management of the Fund also is not aware of any tax positions for which it is reasonably possible that the total amounts of recognized tax benefits will significantly change in the next twelve months.
32
Destra International & Event-Driven Credit Fund |
Notes to Financial Statements (continued) |
September 30, 2020 |
At September 30, 2020, gross unrealized appreciation/(depreciation) of investments, based on cost for federal income tax purposes were as follows:
Cost of investments | $ | 50,126,553 |
| |
Gross unrealized appreciation |
| 5,173,390 |
| |
Gross unrealized depreciation |
| (2,965,018 | ) | |
Net unrealized appreciation | $ | 2,208,372 |
|
The difference between cost amounts for financial statement and federal income tax purposes, if any, is due primarily to timing differences in recognizing certain gains and losses in security transactions.
U.S. GAAP requires that certain components of net assets be reclassified between financial and tax reporting. These reclassifications have no effect on net assets or NAV per share.
For the year ended September 30, 2020, permanent differences in book and tax accounting have been reclassified to paid-in capital and distributable earnings as follows:
| Paid-in |
| Distributable | |||||
$ | (455,152) | $ | 455,152 |
Permanent differences are primarily the result of the write-off of net operating losses.
As of September 30, 2020, the components of distributable earnings on a tax basis was as follows:
Undistributed ordinary income | $ | — |
| |
Undistributed long-term capital gains |
| — |
| |
Tax distributable earnings |
| — |
| |
Accumulated capital and other losses |
| (853,491 | ) | |
Unrealized appreciation other |
| 18,273 |
| |
Unrealized appreciation on foreign currency translations |
| 2,790 |
| |
Unrealized appreciation on investments |
| 2,208,372 |
| |
Total distributable earnings | $ | 1,375,944 |
|
Under current tax law, net capital losses realized after October 31st and net ordinary losses incurred after December 31st may be deferred and treated as occurring on the first day of the following fiscal year. For the tax year ending 9/30/2020, the Fund did not have any qualified post-October capital losses or post-December ordinary losses.
The tax character of distributions paid during the years ended September 30, 2019 and September 30, 2020 was as follows:
2020 | 2019 | |||||
Distributions paid from: |
|
| ||||
Ordinary income | $ | 1,280,471 | $ | 2,457,911 | ||
Return of capital |
| 1,650,758 |
| — | ||
Net long-term capital gains |
| 146,993 |
| — | ||
Total distributions paid | $ | 3,078,222 | $ | 2,457,911 | ||
At September 30, 2020, the Fund had an accumulated capital loss carry forward as follows:
Short-term | $ | — | |
Long-term |
| 853,491 | |
Total | $ | 853,491 |
To the extent that the Fund may realize future net capital gains, those gains will be offset by any of its unused capital loss carry forward. Future capital loss carry forward utilization in any given year may be subject to Internal Revenue Code limitations.
The Fund did not utilize any of its capital loss carry forward during the year ended September 30, 2020.
33
Destra International & Event-Driven Credit Fund |
Notes to Financial Statements (continued) |
September 30, 2020 |
13. Offering Price Per Share
A maximum front-end sales load of 5.75% for Class A Shares, 4.25% for Class L and 3.00% for Class T Shares is imposed on purchases. Class I Shares are not subject to a sales load. For the year ended September 30, 2020, there were $15,951 in sales charges received by broker dealers and no sales charges received by affiliates.
14. Beneficial Ownership
The beneficial ownership, either directly or indirectly, of more than 25% of the voting securities of the Fund creates a presumption of control under Section 2(a)(9) of the 1940 Act. As of September 30, 2020, RBC owned 98% of the Fund.
15. Trustees and Officers
The Destra Fund Complex (consisting of the Fund, the Destra Flaherty & Crumrine Preferred and Income Fund and Destra Granahan Small Cap Advantage Fund, both a series of the Destra Investment Trust, and the Destra Multi-Alternative Fund) pays each Independent Trustee a retainer of $39,000 per year, and the Chairman of the Board a retainer of $46,000 per year for their services in this capacity. Each fund in the Destra Fund Complex pays a portion of the retainer received by each Trustee, which is allocated annually across the Destra Fund Complex based on each fund’s respective net assets as of December 31 of the preceding year. Trustees are also reimbursed for travel-related and authorized business expenses. The Fund does not pay compensation to Trustees who also serve in an executive officer capacity for the Fund or the Advisers.
The Fund’s Chief Compliance Officer monitors and tests the policies and procedures of the Fund in conjunction with requirements under Rule 38a-1 under the 1940 Act and receives an annual base fee. Fees paid by the Fund for the year ended September 30, 2020 are disclosed in the Statement of Operations.
Employees of PINE Advisor Solutions, LLC (“PINE”) serve as the Fund’s Chief Financial Officer and Assistant Treasurer. PINE receives an annual base fee for the services provided to the Fund. PINE is reimbursed for certain out-of-pocket expenses by the Fund. Service fees paid by the Fund for the year ended September 30, 2020 are disclosed in the Statement of Operations.
16. Other Service Providers
UMB Fund Services serves as the Fund’s Administrator, Accounting Agent and Transfer Agent. The Bank of New York Mellon serves as the Custodian for the Fund.
17. Principal Risks
Risk is inherent in all investing. The value of your investment in the Fund, as well as the amount of return you receive on your investment, may fluctuate significantly from day to day and over time. You may lose part or all of your investment in the Fund or your investment may not perform as well as other similar investments. The following is a summary description of certain risks of investing in the Fund.
Recent Market and Economic Developments — Certain impacts to public health conditions particular to the coronavirus (COVID-19) may have a significant negative impact on the operations and profitability of the Fund’s investments. The extent of the impact to the financial performance of the Fund will depend on future developments, including (i) the duration and spread of the outbreak, (ii) the restrictions and advisories, (iii) the effects on the financial markets, and (iv) the effects on the economy overall, all of which are highly uncertain and cannot be predicted.
Asset-Backed Securities Risk — Asset-backed securities may be particularly sensitive to changes in prevailing interest rates. Payment of interest and repayment of principal on asset-backed securities is largely dependent upon the cash flows generated by the assets backing the securities and, in certain cases, supported by letters of credit, surety bonds or other credit enhancements.
Credit and Counterparty Risk — Credit Risk is the risk that an issuer of a security may be unable or unwilling to make dividend, interest and principal payments when due and the related risk that the value of a security may decline because of concerns about the issuer’s ability or willingness to make such payments. Credit risk may be heightened for the Fund because it will invest in below investment grade securities.
Equity Securities Risk — Stock markets are volatile. The price of equity securities fluctuates based on changes in a company’s financial condition and overall market and economic conditions.
34
Destra International & Event-Driven Credit Fund |
Notes to Financial Statements (continued) |
September 30, 2020 |
Foreign Securities Risk — Investing in foreign securities may include certain risks and considerations not typically associated with investing in U.S. securities, such as fluctuating currency values and changing local and regional economic, political and social conditions, which may result in greater market volatility. In addition, certain foreign securities may not be as liquid as U.S. securities. To the extent that the Fund concentrates its investment exposure to any one or a few specific countries, the Fund will be particularly susceptible to the various conditions, events or other factors impacting those countries and may, therefore, have a greater risk than that of a fund which is more geographically diversified.
Interest Rate Risk — If interest rates increase, the value of the Fund’s investments generally will decline. Securities with longer maturities tend to produce higher yields, but are more sensitive to changes in interest rates and are subject to greater fluctuations in value.
Loans Risk — Senior loans are subject to the risk of non-payment of scheduled interest or principal. Such non-payment would result in a reduction of income to the Fund, a reduction in the value of the investment and a potential decrease in the NAV of the Shares. The liquidation value of any collateral securing a senior loan may not satisfy the borrower’s obligation in the event of non-payment of scheduled interest or principal payments. In addition to risks similar to those of senior loans, subordinated loans do not have the first priority lien on underlying collateral of the loan and any claims will be subordinated to those lienholders with a higher claim.
Non-Diversified Risk — Because the Fund is non-diversified and can invest a greater portion of its assets in securities of individual issuers than diversified funds, changes in the market value of a single investment could cause greater fluctuations in Share price than would a diversified fund.
Non-U.S. Securities Risk — The Fund’s investments in non-U.S. securities may result in the Fund experiencing more rapid and extreme changes in value than a fund that invests exclusively in securities of U.S. companies, due to less liquid markets, and adverse economic, political, diplomatic, financial, and regulatory events. Foreign governments also may impose limits on investment and repatriation and impose taxes. Any of these events could cause the value of the Fund’s investments to decline.
18. Subsequent Events
The Fund has evaluated the events and transactions through the date the financial statements were issued and has identified the following for disclosure in the Fund’s subsequent events:
On October 22, 2020, the Fund completed a quarterly Repurchase Offer (See Note 6). No shares were repurchased.
On October 14, 2020, Destra Capital Management LLC (“DCM”), the parent company of the Adviser, entered into a redemption agreement with Continuum Funds Holdings, LLC, the majority owner of DCM, pursuant to which DCM agreed to buy back all of the outstanding equity interests of DCM (the “Adviser Transaction”). Closing of the Adviser Transaction is contingent upon, among other things, shareholder approval of a new advisory agreement between the Adviser and the Fund (the “New Advisory Agreement”), which means that the Adviser Transaction will not occur unless shareholders of the Fund approve the New Advisory Agreement. Such approval will be sought from shareholders via proxy.
35
Destra International & Event-Driven Credit Fund |
|
To the Shareholders and Board of Trustees of
Destra International & Event-Driven Credit Fund
Opinion on the Financial Statements
We have audited the accompanying statement of assets and liabilities, including the schedule of investments, of Destra International & Event-Driven Credit Fund (the “Fund”) as of September 30, 2020, the related statement of operations for the year then ended, the statements of changes in net assets for each of the two years in the period then ended, including the related notes, and the financial highlights for each of the three periods in the period then ended (collectively referred to as the “financial statements”). In our opinion, the financial statements present fairly, in all material respects, the financial position of the Fund as of September 30, 2020, the results of its operations for the year then ended, the changes in its net assets for each of the two years in the period then ended, and the financial highlights for each of the three periods in the period then ended, in conformity with accounting principles generally accepted in the United States of America.
Basis for Opinion
These financial statements are the responsibility of the Fund’s management. Our responsibility is to express an opinion on the Fund’s financial statements based on our audits. We are a public accounting firm registered with the Public Company Accounting Oversight Board (United States) (“PCAOB”) and are required to be independent with respect to the Fund in accordance with the U.S. federal securities laws and the applicable rules and regulations of the Securities and Exchange Commission and the PCAOB.
We conducted our audits in accordance with the standards of the PCAOB. Those standards require that we plan and perform the audit to obtain reasonable assurance about whether the financial statements are free of material misstatement whether due to error or fraud.
Our audits included performing procedures to assess the risks of material misstatement of the financial statements, whether due to error or fraud, and performing procedures that respond to those risks. Such procedures included examining, on a test basis, evidence regarding the amounts and disclosures in the financial statements. Our procedures included confirmation of securities owned as of September 30, 2020, by correspondence with the custodian, brokers and underlying private company management, or by other appropriate auditing procedures where replies from brokers or counterparties were not received. Our audit also included evaluating the accounting principles used and significant estimates made by management, as well as evaluating the overall presentation of the financial statements. We believe that our audits provide a reasonable basis for our opinion.
We have served as the auditor of one or more investment companies advised by Destra Capital Advisors LLC since 2018.

COHEN & COMPANY, LTD.
Chicago, Illinois
November 30, 2020
36
This report is sent to shareholders of the Fund for their information. It is not a prospectus, circular or representation intended for use in the purchase or sale of Shares of the Fund or of any securities mentioned in this report.
Corporate Dividends Received Deduction — For the year ended September 30, 2020, the Fund had 0% of dividends paid from net investment income qualify for the 70% dividends received deduction available to corporate shareholders.
Qualified Dividend Income — For the year ended September 30, 2020, the Fund had 0% of dividends paid from net investment income, designated as qualified dividend income.
Proxy Voting — Policies and procedures that the Fund uses to determine how to vote proxies as well as information regarding how the Fund voted proxies for portfolio securities is available without charge and upon request by calling 844-9DESTRA (933-7872) or visiting Destra Capital Investments LLC’s website at www.destracapital.com or by accessing the Fund’s Form N-PX on the SEC’s website at www.sec.gov.
Disclosure of Portfolio Holdings — The Fund files its complete schedule of portfolio holdings with the SEC for the first and third quarters of each fiscal year on Form N-PORT (or its predecessor Form N-Q). The Fund’s Form N-PORT (or its predecessor Form N-Q) is available on the SEC website at www.sec.gov or by visiting Destra Capital Investments LLC’s website at www.destracapital.com.
37
Destra International & Event-Driven Credit Fund |
September 30, 2020 (unaudited) |
The management of the Fund, including general supervision of the duties performed for the Fund under the Investment Management Agreement, is the responsibility of the Board. The Board consists of four trustees, one of whom is an “Interested Person” (as the term “Interested Person” is defined in the 1940 Act) and three of whom are not Interested Persons (referred to herein as “Independent Trustees” and together with the Interested Person, the “Trustees”). None of the Independent Trustees has ever been a Trustee, director or employee of, or consultant to, Destra Capital Advisors LLC or its affiliates. The identity of the Trustees and the Fund’s executive officers and biographical information as of September 30, 2020 is set forth below. The address for each Trustee is c/o Destra International & Event-Driven Credit Fund, 444 West Lake Street, Suite 1700, Chicago, Illinois 60606. A Trustee’s term of office shall continue until his or her death, resignation or removal.
Name and Birth Year | Trustee Since | Principal Occupation(s) | Number of | Other | ||||
Independent Trustees |
|
|
|
| ||||
John S. Emrich, CFA | November 2017 | Mortgage Banker, The Mortgage Company (January 2018 to present); Financial Planner (self-employed, consulting) (January 2018 to present); Private Investor, (January 2011 to present); Co-Founder and Portfolio Manager, Ironworks Capital Management (an investment adviser) (April 2005 to December 2010); Member (June 2012 to present) and Manager (2013 to 2015), Iroquois Valley Farms LLC (a farmland finance company); Board Member, Clean Energy Credit Union (September 2017 to April 2019). | 4 | Meridian Fund, Inc. (registered investment company) (4 portfolios) | ||||
Michael S. Erickson | November 2017 | Private Investor (August 2007 to present); Chief Operating Officer and Chief Financial Officer, Erickson Holding Corp. (a passive real estate holding company) (2003 to present); Chief Operating Officer and Chief Financial Officer, McGee Island LLC (a real estate management company) (2015 to present). | 4 | Meridian Fund, Inc. (registered investment company) (4 portfolios) | ||||
Jeffrey S. Murphy | November 2017 | Retired (2014 to present). | 4 | None | ||||
Interested Trustee |
|
|
|
| ||||
Nicholas Dalmaso,(2) | November 2017 | General Counsel and Chief Compliance Officer of M1 Holdings LLC (2014 to present); General Counsel and Chief Compliance Officer of M1 Finance LLC (an investment adviser) (2014 to present); General Counsel and Chief Compliance Officer of M1 Advisory Services LLC (an investment adviser) (2014 to present). | 4 | None |
1 The Fund Complex consists of the Fund, the Destra Multi-Alternative Fund, the Destra Granahan Small Cap Advantage Fund, and the Destra Flaherty & Crumrine Preferred and Income Fund, each of the latter two being a series of the Destra Investment Trust.
2 Mr. Dalmaso is an “interested person” of the Fund, as defined in the 1940 Act, by reason of his former position with Destra Capital Management LLC and its subsidiaries.
38
Destra International & Event-Driven Credit Fund |
Trustees and Officers Information (continued) |
September 30, 2020 (unaudited) |
The following persons serve as the Fund’s executive officers in the following capacities:
Name and Birth Year | Position(s) Held | Principal Occupation(s) | ||
Robert Watson | President since 2017 | Senior Managing Director and Investment Product Strategist, Destra Capital Investments LLC (2011 to present). | ||
Derek Mullins | Chief Financial Officer and Treasurer since 2018 | Managing Partner and Co-Founder, PINE Advisor Solutions (2018 to present); Director of Operations, ArrowMark Partners LLC (2009 to 2018); Chief Financial Officer (Principal Financial Officer) and Treasurer, Meridian Fund, Inc. (2013 to 2018). | ||
Jane Hong Shissler | Chief Compliance Officer and Secretary since 2017 | General Counsel, Destra Capital Management LLC, Destra Capital Investments LLC and Destra Capital Advisors LLC (2015 to present); Partner (2012-2015), Chapman and Cutler LLP. | ||
Marcie McVeigh | Assistant Treasurer since 2020* | Associate Director of CFO Services, PINE Advisor Solutions (2020 to present); Assistant Vice President and Performance Measurement Manager, Brown Brothers Harriman (2019 to 2020); Senior Financial Reporting Specialist, American Century Investments (2011 to 2018). | ||
Jake Schultz | Assistant Secretary since 2020* | Product Analyst, Destra Capital Management LLC, Destra Capital Investments LLC and Destra Capital Advisors LLC (2019 to present). |
* Appointed at a meeting of the Board held on August 27, 2020.
The address for each executive officer is c/o Destra International & Event-Driven Credit Fund, 444 West Lake Street, Suite 1700, Chicago, Illinois 60606.
The Fund’s Statement of Additional Information includes additional information about the Trustees and is available without charge and upon request by calling 844-9DESTRA (933-7872), or visiting Destra Capital Investments LLC’s website at www.destracapital.com.
39
Board of Trustees | Officers | Investment Adviser | ||
John S. Emrich | Robert Watson | Destra Capital Advisors LLC | ||
Michael S. Erickson | President | Chicago, IL | ||
Jeffery S. Murphy | ||||
Nicholas Dalmaso* | Derek Mullins | Sub-Adviser | ||
Chief Financial Officer and Treasurer | BlueBay Asset Management LLP | |||
London, United Kingdom | ||||
Jane Hong Shissler | ||||
Chief Compliance Officer and Secretary | Sub-Sub-Adviser | |||
BlueBay Asset Management USA LLC | ||||
Marcie McVeigh | Stamford, CT | |||
Assistant Treasurer | ||||
Jake Schultz | Distributor | |||
Assistant Secretary | Destra Capital Investments LLC | |||
Chicago, IL | ||||
* “Interested Person” of the Fund, as | Administrator, Accounting Agent, | |||
defined in the Investment Company | and Transfer Agent | |||
Act of 1940, as amended. | UMB Fund Services, Inc. | |||
Milwaukee, WI | ||||
Custodian | ||||
Bank of New York Mellon | ||||
New York, NY | ||||
Legal Counsel | ||||
Feagre Drinker Biddle & Reath LLP | ||||
Philadelphia, PA | ||||
Independent Registered Public | ||||
Accounting Firm | ||||
Cohen & Company, Ltd | ||||
Chicago, IL |
This report has been prepared for the general information of the shareholders. It is not authorized for distribution to prospective investors unless preceded or accompanied by a current prospectus. The Fund’s prospectus contains more complete information about the objectives, policies, expenses and risks of the Fund. The Fund is not a bank deposit, not FDIC insured and may lose value. Please read the prospectus carefully before investing or sending money.
This report contains certain forward looking statements which are subject to known and unknown risks and uncertainties that could cause actual results to differ materially from those expressed or implied by such statements. Forward looking statements generally include words such as ‘‘believes,’’ ‘‘expects,’’ ‘‘anticipates’’ and other words of similar import. Such risks and uncertainties include, among other things, the Risk Factors noted in the Fund’s filings with the Securities and Exchange Commission. The Fund undertakes no obligation to update any forward looking statement.
Privacy Principles of the Fund for Shareholders
The Fund is committed to maintaining the privacy of its shareholders and to safeguarding their non-public personal information. The following information is provided to help you understand what personal information the Fund collects, how we protect that information and why, in certain cases, we may share information with select other parties.
Generally, the Fund does not receive any non-public personal information relating to its shareholders, although certain non-public personal information of its shareholders may become available to the Fund. The Fund does not disclose any non-public personal information about its shareholders or former shareholders to anyone, except as permitted by law or as is necessary in order to service shareholder accounts (for example, to a transfer agent or third party administrator).
The Fund restricts access to non-public personal information about the shareholders to Destra Capital Advisors LLC employees with a legitimate business need for the information. The Fund maintains physical, electronic and procedural safeguards designed to protect the non-public personal information of its shareholders.
Questions concerning your Shares of the Fund?
• If your Shares are held in a Brokerage Account, contact your respective Broker.
40
ITEM 2. CODE OF ETHICS.
The Registrant has a code of ethics (the “Code”) that applies to the Registrant’s principal executive officer and principal financial officer. During the period covered by this report, there were no amendments to the provisions of the Code, nor were there any implicit or explicit waivers to the provisions of the Code. The Code is filed herewith.
ITEM 3. AUDIT COMMITTEE FINANCIAL EXPERT.
The Registrant’s Board of Trustees has determined that the Registrant has one audit committee financial expert serving on its audit committee, whom is “independent” within the meaning of Form N-CSR: Mr. Jeff Murphy. Under applicable securities laws, a person who is determined to be an audit committee financial expert will not be deemed an “expert” for any purpose, including without limitation for purposes of Section 11 of the Securities Act of 1933, as amended, as a result of being designated or identified as an audit committee financial expert. The designation or identification of a person as an audit committee financial expert does not impose on such person any duties, obligations, or liabilities that are greater than the duties, obligations, and liabilities imposed on such person as a member of the audit committee and Board of Trustees in the absence of such designation or identification.
ITEM 4. PRINCIPAL ACCOUNTANT FEES AND SERVICES.
The aggregate fees for professional services by Cohen & Company, Ltd. during the fiscal years 2019 and 2020 were as follows:
(a) Audit Fees for Registrant.
| Fiscal year ended September 30, 2019 | $35,000 |
| Fiscal year ended September 30, 2020 | $40,000 |
(b) Audit-Related Fees for Registrant. These are fees by the Registrant’s independent auditors for assurance and related services that were reasonably related to the performance of the audit of the Registrant’s financial statements that are not reported under “Audit Fees”. These fees include amounts related to Form N-17f-2 filings.
| Fiscal year ended September 30, 2019 | None |
| Fiscal year ended September 30, 2020 | None |
(c) Tax Fees for Registrant. These are fees for professional services rendered by the Registrant’s independent auditors for tax compliance, tax advice, and tax planning. These fees include federal, excise and state tax reviews; performed by Cohen & Company, Ltd.
| Fiscal year ended September 30, 2019 | $5,000 |
| Fiscal year ended September 30, 2020 | $5,250 |
(d) All Other Fees.
| Fiscal year ended September 30, 2019 | None |
| Fiscal year ended September 30, 2020 | None |
(e) Audit Committee’s pre-approval policies and procedures.
(1) The Audit Committee has adopted pre-approval policies and procedures that require the Audit Committee to pre-approve all audit and non-audit services of the Registrant, including services provided to the Registrant’s investment adviser or any entity controlling, controlled by or under common control with the Registrant’s investment adviser that provides ongoing services to the Registrant with respect to any engagement that directly relates to the operations and financial reporting of the Registrant.
(2) None of the services described in paragraphs (b) through (d) of this Item 4 were approved by the audit committee pursuant to paragraph (c)(7)(i)(C) of Rule 2-01 of Regulation S-X.
(f) None.
(g) None.
(h) The registrant's audit committee of the board of trustees has considered whether the provision of non-audit services that were rendered to the registrant's investment adviser (not including any sub-adviser whose role is primarily portfolio management and is subcontracted with or overseen by another investment adviser), and any entity controlling, controlled by, or under common control with the investment adviser that provides ongoing services to the registrant that were not pre-approved pursuant to paragraph (c)(7)(ii) of Rule 2-01 of Regulation S-X is compatible with maintaining the principal accountant's independence.
ITEM 5. AUDIT COMMITTEE OF LISTED REGISTRANTS.
Not applicable.
ITEM 6. INVESTMENTS.
(a) Schedule of Investments in securities of unaffiliated issuers as of the close of the period are included as part of the report to shareholders filed under Item 1 of this Form N-CSR.
(b) Not applicable.
ITEM 7. DISCLOSURE OF PROXY VOTING POLICIES AND PROCEDURES FOR CLOSED-END MANAGEMENT INVESTMENT COMPANIES.
A closed-end management investment company that is filing an annual report on this Form N-CSR must, unless it invests exclusively in non-voting securities, describe the policies and procedures that it uses to determine how to vote proxies relating to portfolio securities, including the procedures that the company uses when a vote presents a conflict between the interests of its shareholders, on the one hand, and those of the company’s investment adviser; principal underwriter; or any affiliated person (as defined in section 2(a)(3) of the Investment Company Act of 1940 (15 U.S.C. 80a-2(a)(3)) and the rules thereunder) of the company, its investment adviser, or its principal underwriter, on the other. Include any policies and procedures of the company’s investment adviser, or any other third party, that the company uses, or that are used on the company’s behalf, to determine how to vote proxies relating to portfolio securities.
These policies are included as Appendix A.
ITEM 8. PORTFOLIO MANAGERS OF CLOSED-END MANAGEMENT INVESTMENT COMPANIES.
(a)(1) Identification of Portfolio Manager(s) and Description of Role of Portfolio Manager(s)
The following table provides biographical information about the Portfolio Managers, who are primarily responsible for the day-to-day portfolio management of the Fund as of the date hereof:
| Name of Portfolio Manager | Title | Length of Time of Service to the Fund | Principal Occupation During the past 5 years | |||
| Tim Leary | Portfolio Manger | Since Inception | 2017-current, Portfolio Manager 2012-2017, Head of Trading – North America (All positions at BlueBay Asset Management plc) | |||
| Blair Reid | Portfolio Manger | Since Inception | 2017-current, Partner, Senior PM, Multi-Asset & Income 2016-2017, Partner, IPM, Multi-Asset & Income 2016-2016, Partner, Institutional Portfolio Manager 2013-2016, Institutional Portfolio Manager (All positions at BlueBay Asset Management plc) | |||
| Duncan Farley | Portfolio Manager | Since Inception | 2018-present, Portfolio Manager 2015-2018 Head of Event Driven Research, Global Leverage Finance 2013-2015, Credit Analyst – High Yield (BlueBay Asset Management plc and King Street) |
(a)(2) Other Accounts Managed by Portfolio Manager(s) or Management Team Member and Potential Conflicts of Interest
The following table provides information about portfolios and accounts, other than the Fund, for which the Portfolio Managers are primarily responsible for the day-to-day portfolio management as of September 30, 2020:
| Name of Portfolio Manager | Type of Accounts | Total Number of Accounts Managed | Total Assets (in thousands) | Number of Accounts Managed for Which Advisory Fee is Based on Performance | Total Assets for Which Advisory Fee is Based on Performance (in thousands) | |||||
| Tim Leary | Registered Investment Companies | 0 | $ - | 0 | $ - | |||||
| Other Pooled Investment Vehicles | 4 | $1,914,577 | 1 | $40,811 | ||||||
| Other Accounts | 1 | $397,616 | 0 | $ - | ||||||
| Blair Reid | Registered Investment Companies | 0 | $ - | 0 | $ - | |||||
| Other Pooled Investment Vehicles | 6 | $4,127,646 | 1 | $99,424 | ||||||
| Other Accounts | 5 | $1,511,303 | 0 | $ - | ||||||
| Duncan Farley | Registered Investment Companies | 0 | $ - | 0 | $ - | |||||
| Other Pooled Investment Vehicles | 1 | $40,811 | 1 | $40,811 | ||||||
| Other Accounts | 0 | $ - | 0 | $ - |
Potential Conflicts of Interests
A conflict of interest may arise as a result of a portfolio manager being responsible for multiple accounts, including the Fund, which may have different investment guidelines and objectives. In addition to the Fund, these accounts may include other mutual funds managed on an advisory or sub-advisory basis, separate accounts and collective trust accounts. An investment opportunity may be suitable for the Fund as well as for any of the other managed accounts. However, the investment may not be available in sufficient quantity for all of the accounts to participate fully. In addition, there may be limited opportunity to sell an investment held by the Fund and the other accounts. The other accounts may have similar investment objectives or strategies as the Fund, they may track the same benchmarks or indexes as the Fund tracks, and they may sell securities that are eligible to be held, sold or purchased by the Fund. A portfolio manager may be responsible for accounts that have different advisory fee schedules, which may create the incentive for the portfolio manager to favor one account over another in terms of access to investment opportunities. A portfolio manager also may manage accounts whose investment objectives and policies differ from those of the Fund, which may cause the portfolio manager to effect trading in one account that may have an adverse effect on the value of the holdings within another account, including the Fund.
To address and manage these potential conflicts of interest, Destra Capital Advisors LLC (the “Adviser”), BlueBay Asset Management LLP (“BlueBay UK”) and BlueBay Asset Management USA LLC (“BlueBay USA”, and together with BlueBay UK, “BlueBay”) have each adopted compliance policies and procedures to allocate investment opportunities and to ensure that each of their clients is treated on a fair and equitable basis. Such policies and procedures include, but are not limited to, trade allocation and trade aggregation policies, cross trading policies, portfolio manager assignment practices and oversight by investment management and/or compliance departments.
(a)(3) Compensation Structure of Portfolio Manager(s)
Portfolio manager compensation consists of three components: for employees of BlueBay, a base salary, a discretionary bonus, and a retention award plan; for partners, drawings and a discretionary profit allocation.
All portfolio managers are evaluated and rewarded annually during the yearly compensation review process. BlueBay has a Remuneration Committee which reviews the compensation arrangements annually. Compensation for any given individual is paid according to both quantitative and qualitative considerations. BlueBay operates a discretionary bonus scheme. Remuneration of all investment professionals is geared to fund performance and takes into account the profitable growth of each investment team's business.
BlueBay has established a deferral ratio for all partners and employees who are awarded discretionary profit allocations (partners) or discretionary bonuses (employees) over a certain threshold. Partners and employees may also be given additional discretionary awards which are all deferred. Deferrals will track BlueBay funds and/or a combination of BlueBay funds and a reference index, a shadow equity vehicle aligned to the performance of BlueBay and its parent company. Deferrals will vest on a cliff basis after a period of three years.
(a)(4) Disclosure of Securities Ownership
The following table sets forth the dollar range of equity securities beneficially owned by each Portfolio Manager in the Fund as of September 30, 2020:
| Portfolio Manager | Dollar Range of Fund Shares Beneficially Owned | |
| Tim Leary | None | |
| Blair Reid | None | |
| Duncan Farley | None |
ITEM 9. PURCHASES OF EQUITY SECURITIES BY CLOSED-END MANAGEMENT INVESTMENT COMPANY AND AFFILIATED PURCHASERS.
There were no purchases made by or on behalf of the registrant or any “affiliated purchaser,” as defined in Rule 10b-18(a)(3) under the Exchange Act (17 CFR 240.10b-18(a)(3)), of shares or other units of any class of the registrant’s equity securities that is registered by the registrant pursuant to Section 12 of the Exchange Act (15 U.S.C. 781).
There were no purchases that do not satisfy the conditions of the safe harbor of Rule 10b-18 under the Exchange Act (17 CFR 240.10b-18), made in the period covered by this report.
ITEM 10. SUBMISSION OF MATTERS TO A VOTE OF SECURITY HOLDERS.
There have been no material changes to the procedures by which the shareholders may recommend nominees to the registrant’s board of trustees, where those changes were implemented after the registrant last provided disclosure in response to the requirements of Item 407(c)(2)(iv) of Regulation S-K (17 CFR 229.407) (as required by Item 22(b)(15) of Schedule 14A (17 CFR 240.14a-101)), or this Item.
ITEM 11. CONTROLS AND PROCEDURES.
| (a) | The Registrant’s principal executive officer and principal financial officer have concluded, based on their evaluation of the Registrant’s disclosure controls and procedures as conducted within 90 days of the filing date of this report, that these disclosure controls and procedures are adequately designed and are operating effectively to ensure that information required to be disclosed by the Registrant on Form N-CSR is (i) accumulated and communicated to the Registrant’s management, including its certifying officers, to allow timely decisions regarding required disclosure; and (ii) recorded, processed, summarized and reported within the time periods specified in the Securities and Exchange Commission’s rules and forms. |
| (b) | There were no changes in the Registrant’s internal control over financial reporting (as defined in Rule 30a-3(d) under the Act (17 CFR 270.30a-3(d)) that occurred during the period covered by this report that have materially affected or are reasonably likely to materially affect, the Registrant’s internal control over financial reporting. |
ITEM 12. DISCLOSURE OF SECURITIES LENDING ACTIVITIES FOR CLOSED-END MANAGEMENT INVESTMENT COMPANIES.
Not applicable.
ITEM 13. EXHIBITS.
(a)(1) Code of ethics that is subject to Item 2 is attached hereto.
(a)(3) Not applicable.
(a)(4) Not applicable.
SIGNATURES
Pursuant to the requirements of the Securities Exchange Act of 1934 and the Investment Company Act of 1940, the registrant has duly caused this report to be signed on its behalf by the undersigned, thereunto duly authorized.
| (Registrant) | Destra International & Event-Driven Credit Fund | ||
| By (Signature and Title) | /s/ Robert A. Watson | ||
| Robert A. Watson, President | |||
| (Principal Executive Officer) | |||
| Date | 12/9/2020 | ||
Pursuant to the requirements of the Securities Exchange Act of 1934 and the Investment Company Act of 1940, this report has been signed below by the following persons on behalf of the registrant and in the capacities and on the dates indicated.
| By (Signature and Title) | /s/ Robert A. Watson | ||
| Robert A. Watson, President | |||
| (Principal Executive Officer) | |||
| Date | 12/9/2020 | ||
| By (Signature and Title) | /s/ Derek J. Mullins | ||
| Derek J. Mullins, Chief Financial Officer | |||
| (Principal Financial Officer) | |||
| Date | 12/9/2020 | ||
Appendix A
Destra International & Event-Driven Credit Fund (the “Fund”)
Proxy Voting Policies and Procedures
Pursuant to rules established by the SEC under the 1940 Act, the Board has adopted formal, written guidelines for proxy voting. The Board oversees voting policies and decisions for each Fund.
The Fund exercises its proxy voting rights with regard to the companies in the Fund's investment portfolio, with the goals of maximizing the value of the Fund's investments, promoting accountability of a company's management and board of directors to its shareholders, aligning the interests of management with those of shareholders, and increasing transparency of a company's business and operations.
In general, the Board believes that the Sub-Adviser, which select the individual companies that are part of the Fund's portfolio, are the most knowledgeable and best suited to make decisions about proxy votes. Therefore, the Board defers to and relies on the Sub-Adviser to make decisions on casting proxy votes. The Adviser oversees the proxy voting policies and procedures and works with each Sub-Adviser to implement the policy.
Form N-PX/Annual Report of Proxy Voting Record
Form N-PX is used by investment companies to file reports with the SEC containing their proxy voting record for the most recent 12-month period ended June 30. Form N-PX must be filed not later than August 31 of each year. The following information must be collected for the Trust separately for each Fund in order to complete and file Form N-PX:
| • | The name of the issuer of the Fund security; |
| • | The exchange ticker symbol of the Fund security; |
| • | The CUSIP number (may be omitted if it is not available through reasonably practicable means); |
| • | The shareholder meeting date; |
| • | A brief description of the matter voted on; |
| • | Whether the matter was proposed by the issuer or the security holder; |
| • | Whether the Fund cast its vote on the matter; |
| • | How the Fund cast its vote (e.g., for or against proposal, or abstain; for or withhold regarding election of directors) |
| • | Whether the Fund cast its vote for or against management |
Compliance Process:
| • | At the time a Fund manager votes proxies on behalf of a Fund, the Fund manager shall record the vote via proxy advisory services company or keep its own records of such votes, as appropriate. |
| • | Destra shall engage a proxy advisory services company to record proxy votes elected by the Sub-Adviser, as necessary. |
| • | The Fund manager shall grant access to the CCO with respect to all proxy voting records. |
| • | At least 30 days prior to August 31, the CCO shall review appropriate proxy voting records as obtained by a proxy advisory services company or the Sub-Adviser. |
| • | The CCO or his/her designee shall compile all proxy voting records for the 12-month period ended June 30 and complete Form N-PX. |
| • | The completed Form N-PX shall be sent to the Administrator, who shall file Form N-PX with the SEC by August 30 of each year. |
The Sub-Adviser
Proxy Voting Policies and Procedures
Introduction
This paper outlines BlueBay Asset Management LLP’s (“BlueBay”) overall policy (and procedure on corporate governance and corporate responsibility (CR) proxy voting for client securities within managed portfolios, in the Appendix). It does not set out guidelines on voting position on specific corporate governance and Corporate Responsible issues.
It should be noted that given BlueBay’s specialist focus on fixed income assets, the number of occasions in which BlueBay will be engaged in proxy voting will be limited. Where this may occur is most likely with regards Convertible Bond and High Yield bond investments, where an investment may take on formal voting rights.
This Policy is reviewed annually and updated where necessary to reflect changes in circumstances and actual practice.
Approach
The main objective of a company should be to optimize over time, the returns to its investors, this means ensuring the long-term viability of its business (through prudent management of material corporate governance and corporate responsibility issues), and to manage effectively its relationships with stakeholders.
BlueBay has a fiduciary duty to act in the best interests of its clients and manages clients’ assets with the objective of achieving the greatest possible return consistent with their investment objectives.
BlueBay, on behalf of itself and other entities within the BlueBay group (including BlueBay Funds Management Company S.A.), has established a series of principles to be applied when exercising voting rights attached to client securities within managed portfolios. These are that:
| · | In reaching a recommendation as to how a proxy should be voted, BlueBay must act prudently and in the best interests of the affected clients and will ensure that voting rights are exercised in accordance with the portfolio’s objectives and investment policies. |
| · | BlueBay may depart from the principles to avoid voting decisions that may be contrary to clients’ best interests in particular cases. |
| · | BlueBay may also choose not to vote where voting may be detrimental to the best interests of clients, such as due to high administrative costs associated with voting or share blocking requirements that “lock up” securities, which would limit liquidity or access to market opportunities. |
BlueBay notes UK and international corporate governance systems vary according to factors such as the legal system, the extent of shareholder rights and the level of dispersed ownership. As such in forming a position on the governance of companies, how they meet good practice guidelines according to general as well as local market codes of best practice must be considered.
Reporting
Reporting on the use of voting rights, where this has occurred, will be available to clients upon request.
Contact details
For more information on our corporate governance and corporate responsibility proxy voting policy and procedure, please contact: Compliance Department, BlueBay Asset Management LLP, 77 Grosvenor Street, London, W1K 3JR.
December 2014
APPENDIX: Proxy voting procedure
Receipt and notification of proxy rights
The ProxyEdge system is used for voting and the Operations department receive notifications with regards to holdings of BlueBay funds. Operations then promptly submit such materials to the relevant member(s) of the BlueBay portfolio management team.
Persons authorised to exercise voting rights
The relevant members of BlueBay’s portfolio management team will be responsible for recommending how proxies relating to securities held by clients in managed portfolios should be voted.
The relevant personnel will consider each exercise of rights and in particular will take into consideration the best interests of clients, with voting on specific events or issues associated with the board and its committees (e.g. such as board independence and diversity), shareholder rights, audit and internal control, executive remuneration, use of capital (e.g. M&As) and other business, being considered on a case by case basis.
With regards to the voting decision, investment teams retain discretion but will consult with the ESG Specialist for advice and guidance, especially around corporate responsibility matters. Once a recommendation on how to vote has been determined, this will be communicated to Operations to handle the voting process. The voting decision is documented by Operations.
Segregated mandates
The approach to be taken will be determined by the Investment Management Agreement (IMA) and this will be agreed with relevant departments as part of the account opening process.
Conflicts of interest
When evaluating any given proxy, the portfolio management team will consider whether or not BlueBay has a potential conflict relating to the security being voted, such as if a BlueBay Portfolio Manager sits on the Board of Directors of the company. Any such conflict of interest will be notified to the BlueBay Compliance team.
If Compliance deems the conflict to be material, Compliance will determine whether the vote proposed by the portfolio management team is in the best interests of all clients. If Compliance cannot conclusively determine that the vote is in the best interest of the affected client, Compliance will seek the advice of an independent third-party service to provide the proxy voting recommendation. The process will be documented.
Reporting
For regulatory purposes, BlueBay’s Compliance department maintains a record of all past proxy voting decisions covering a minimum period of the last five years. Reporting on the use of voting rights, where this has occurred, will be available to clients upon request.
This document is issued in the United Kingdom (UK) by BlueBay Asset Management LLP (BlueBay), which is authorised and regulated by the UK Financial Conduct Authority (FCA), registered with the US Securities and Exchange Commission, the Commodities Futures Trading Commission and is a member of the National Futures Association. In the United States by BlueBay Asset Management USA LLC which is registered with the US Securities and Exchange Commission. In Japan by BlueBay Asset Management International Limited which is registered with the Kanto Local Finance Bureau of Ministry of Finance, Japan. In Hong Kong by BlueBay Hong Kong Limited which is registered by the Securities and Futures Commission. In Australia BlueBay is exempt from the requirement to hold an Australian financial services licence under the Corporations Act in respect of financial services as it is regulated by the FCA under the laws of the UK which differ from Australian laws. In Canada, BlueBay is not registered under securities laws and is relying on the international dealer exemption under applicable provincial securities legislation, which permit BlueBay to carry out certain specified dealer activities for those Canadian residents that qualify as "a Canadian permitted client”, as such term is defined under applicable securities legislation.
All data has been sourced by BlueBay. To the best of BlueBay’s knowledge and belief this document is true and accurate at the date hereof. BlueBay makes no express or implied warranties or representations with respect to the information contained in this document and hereby expressly disclaim all warranties of accuracy, completeness or fitness for a particular purpose. The document is intended for “professional clients” and “eligible counterparties” (as defined by the FCA) only and should not be relied upon by any other category of customer. This document does not constitute an offer to sell or the solicitation of an offer to purchase any security or investment product in any jurisdiction and is for information purposes only. This document is not available for distribution in any jurisdiction where such distribution would be prohibited and is not aimed at such persons in those jurisdictions. Except where agreed explicitly in writing, BlueBay does not provide investment or other advice and nothing in this document constitutes any advice, nor should be interpreted as such. All information provided in this document is for informational purposes only and should not be deemed as a guide to investing or a recommendation to buy the securities mentioned. BlueBay closely monitors the markets and may make changes to BlueBay’s investment strategy or outlook when warranted by changing market conditions. There is no guarantee that the opinions expressed herein will be valid beyond the date of this document. No BlueBay Fund will be offered, except pursuant and subject to the offering memorandum and subscription materials (the "Offering Materials"). This document is for general information only and is not a complete description of an investment in any BlueBay Fund. If there is an inconsistency between this document and the Offering Materials for the BlueBay Fund, the provisions in the Offering Materials shall prevail. The investments discussed may fluctuate in value and investors may not get back the amount invested. You should read the Offering Materials carefully before investing in any BlueBay fund.
No part of this document may be reproduced in any manner without the prior written permission of BlueBay Asset Management LLP. Copyright 2014 © BlueBay, the investment manager, advisor and global distributor of the BlueBay Funds, is a wholly-owned subsidiary of Royal Bank of Canada and the BlueBay Funds may be considered to be related and/or connected issuers to Royal Bank of Canada and its other affiliates. ® Registered trademark of Royal Bank of Canada. RBC Global Asset Management is a trademark of Royal Bank of Canada. BlueBay Asset Management LLP, registered office 77 Grosvenor Street, London W1K 3JR, partnership registered in England and Wales number OC370085. All rights reserved.