Table of Contents
UNITED STATES
SECURITIES AND EXCHANGE COMMISSION
WASHINGTON, D.C. 20549
FORMN-CSR
CERTIFIED SHAREHOLDER REPORT OF REGISTERED
MANAGEMENT INVESTMENT COMPANIES
Investment Company Act file number:811-23325
SIX CIRCLES TRUST
(Exact name of registrant as specified in charter)
383 Madison Avenue
New York, NY 10179
(Address of principal executive offices) (Zip Code)
The Corporation Trust Company
1209 Orange Street
Wilmington, DE 19801
(Name and address of agent for service)
Registrant’s telephone number, including area code: (212)270-6000
Date of fiscal year end: December 31
Date of reporting period: June 30, 2019
FormN-CSR is to be used by management investment companies to file reports with the Commission not later than 10 days after the transmission to stockholders of any report that is required to be transmitted to stockholders under Rule30e-1 under the Investment Company Act of 1940 (17 CFR270.30e-1). The Commission may use the information provided on FormN-CSR in its regulatory, disclosure review, inspection, and policymaking roles.
A registrant is required to disclose the information specified by FormN-CSR, and the Commission will make this information public. A registrant is not required to respond to the collection of information contained in FormN-CSR unless the Form displays a currently valid Office of Management and Budget (“OMB”) control number. Please direct comments concerning the accuracy of the information collection burden estimate and any suggestions for reducing the burden to Secretary, Securities and Exchange Commission, 450 Fifth Street, NW, Washington, DC 20549-0609. The OMB has reviewed this collection of information under the clearance requirements of 44 U.S.C. § 3507.
Table of Contents
Item 1. Report to Stockholders.
Table of Contents
Semi-Annual Report
SIX CIRCLESSM FUNDS
June 30, 2019
Six Circles Ultra Short Duration Fund
Six Circles Tax Aware Ultra Short Duration Fund
Six Circles U.S. Unconstrained Equity Fund
Six Circles International Unconstrained Equity Fund
Beginning on February 1, 2021, as permitted by regulations adopted by the Securities and Exchange Commission, paper copies of the Six Circles Funds’ shareholder reports will no longer be sent by mail, unless you specifically request paper copies of the reports from a Fund. Instead, the reports will be made available on the Funds’ website (www.sixcirclesfunds.com/literature), and you will be notified by mail each time a report is posted and provided with a website link to access the report.
If you already elected to receive shareholder reports electronically, you will not be affected by this change and you need not take any action. You may elect to receive shareholder reports and other communications from a Fund by contacting your J.P. Morgan representative or by calling us collect at1-212-464-2070.
You may elect to receive all future reports in paper free of charge. You can inform the Funds that you wish to continue receiving paper copies of your shareholder reports by contacting your J.P. Morgan representative or by calling us collect at1-212-464-2070. Your election to receive reports in paper will apply to all Six Circles Funds.
 |
Table of Contents
| Market Overview | 1 | |||
| Fund Commentaries | ||||
| 2 | ||||
| 4 | ||||
| 6 | ||||
| 8 | ||||
| Schedules of Portfolio Investments | 10 | |||
| Financial Statements | 56 | |||
| Financial Highlights | 68 | |||
| Notes to Financial Statements | 76 | |||
| Schedule of Shareholder Expenses | 92 | |||
| Board Approval of Investment Advisory Agreement | 93 | |||
Investments in a Fund are not deposits or obligations of, or guaranteed or endorsed by, any bank and are not insured or guaranteed by the FDIC, the Federal Reserve Board or any other government agency. You could lose money if you sell when a Fund’s share price is lower than when you invested.
Past performance is no guarantee of future performance. The general market views expressed in this report are opinions based on market and other conditions through the end of the reporting period and are subject to change without notice. These views are not intended to predict the future performance of a Fund or the securities markets. References to specific securities and their issuers are for illustrative purposes only and are not intended to be, and should not be interpreted as, recommendations to purchase or sell such securities. Such views are not meant as investment advice and may not be relied on as an indication of trading intent on behalf of any Fund.
For more complete information about the Funds, including the Funds’ objectives, risks, charges and expenses, call your J.P. Morgan representative or call1-212-464-2070 or go to www.sixcirclesfunds.com for a prospectus. Read the prospectus carefully. An investment in these Funds and any other Fund is not designed to be a complete investment program. The Funds are NOT designed to be used as stand-alone investments.
Table of Contents
As of June 30, 2019 (Unaudited)
Global equity markets provided positive returns in the first half of 2019. In Q1 2019, U.S. equities rebounded from their Q4 2018 lows and continued the rise in Q2, with the MSCI USA Index up 18.79% through the first six months of the year. Developed non-U.S. and emerging markets equities also closed in positive territory, with the MSCI World ex-USA Index up 14.64% and the MSCI Emerging Markets Index up 10.6%.
Bond and cash markets broadly underperformed equities; the Bloomberg Barclays 1-3 Month U.S. Treasury Bill Index returned 1.22%, the Bloomberg Barclays Global Aggregate Hedged Index returned 5.82%, and the MSCI World Index returned 17.56% for the first half of the year.
With the Fed hiking rates four times in 2018 and labor markets remaining tight, the Fed kept its benchmark policy rate range
unchanged from Q4 2018 at 2.25% to 2.5%. Following its mid-June meeting, the Federal Open Market Committee stated that uncertainties about the outlook had increased, and indicated that it would continue to closely monitor economic data and take appropriate action to “sustain the expansion.” The European Central Bank and Bank of Japan continue to maintain accommodative policies.
The Adviser continues to believe that the current economic cycle is in its later stages. While the recent pivot by the Fed towards a more dovish stance may extend the length of the cycle, ongoing trade tensions and other geopolitical risks may threaten future economic growth.
| JUNE 30, 2019 | SIX CIRCLES TRUST | 1 | ||||||
Table of Contents
Six Circles Ultra Short Duration Fund
Period January 1, 2019 Through June 30, 2019 (Unaudited)
| REPORTING PERIOD RETURN | ||||
| Fund* | 1.69% | |||
| Bloomberg Barclays 1-3 Month U.S. Treasury Bill Index | 1.22% | |||
| Net Assets as of 6/30/2019 (In Thousands) | $ | 1,119,653 | ||
| Duration | 0.69 years | |||
INVESTMENT OBJECTIVES AND STRATEGY**
Six Circles Ultra Short Duration Fund (the “Fund”) seeks to generate current income consistent with capital preservation. Mainly invests in U.S. dollar and non-U.S. dollar denominated investment grade short-term fixed and floating rate debt securities. Allocates assets among securities with various maturities which, under normal market conditions, will not exceed an average effective portfolio duration of two years.
INVESTMENT APPROACH
J.P. Morgan Private Investments Inc., the Fund’s investment adviser (“JPMPI” or the “Adviser”) constructs the Fund’s portfolios by allocating the Fund’s assets among investment strategies managed by one or more sub-advisers retained by the Adviser (each a “Sub-Adviser”). The Adviser currently allocates Fund assets to the following Sub-Advisers:
| • | Goldman Sachs Asset Management, L.P. (“Goldman”) |
| • | BlackRock Investment Management, LLC (“BlackRock”) |
| • | Pacific Investment Management Company LLC (“PIMCO”) |
The Fund is specifically designed to serve as a completion portfolio and accomplish particular goals within discretionary portfolios managed by JPMPI or its affiliates (the “Portfolios”). The Adviser utilizes the Fund to express targeted investment views, while taking into consideration positions held at the aggregate level in the broader Portfolios. As such, the Fund’s allocations and performance should be evaluated in the context of the broader Portfolios and not on a standalone basis.
WHAT WERE THE MAIN DRIVERS OF THE FUND’S PERFORMANCE?
During the period of January 1, 2019 through June 30, 2019, the Fund posted a positive return on an absolute basis, and outperformed relative to the Bloomberg Barclays 1-3 Month U.S. Treasury Bill Index (the “Index”). References to the Index are for informational purposes. The use of the Index does not imply the Fund is being managed to the Index, but rather is disclosed to allow for comparison of the Fund’s performance to that of a well-known and widely-recognized index.
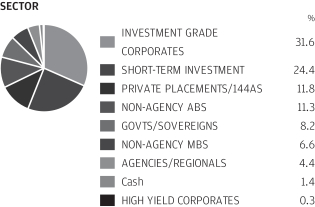
By sector composition, Investment Grade Credit and Securitized Credit comprised approximately 66% of the Fund’s exposure at the end of the reporting period, and were the Fund’s largest sector overweights relative to the Index. During the reporting period, both sectors contributed to the Fund’s performance on an absolute basis, as well as relative to the Index.
The Fund’s exposure to Government Bonds was the Fund’s largest sector underweight relative to the Index and comprised approximately 5% of the Fund’s exposure at the end of the reporting period. During the reporting period, this sector contributed to the Fund’s performance on an absolute basis, but detracted from the Fund’s performance relative to the Index.
All three of the Fund’s allocations – Conservative Income, Global Markets, and Core Ultra Short – contributed to the Fund’s return on an absolute basis during the reporting period.
HOW WAS THE FUND POSITIONED?
At the end of the reporting period, the Fund was allocated to three Sub-Advisers across various sectors, credit ratings, maturity buckets, and regional exposures.
| PORTFOLIO ALLOCATION*** | ||||
| Conservative Income (Goldman) | 40 | % | ||
| Global Markets (PIMCO) | 30 | |||
| Core Ultra Short (BlackRock) | 30 | |||
| * | The return shown is based on the net asset value calculated for shareholder transactions. Certain adjustments were made to the net assets of the Fund at June 30, 2019 for financial reporting purposes, and as a result, the net asset value for shareholder transactions and the total return based on that net asset value may differ from the adjusted net assets and the total return for financial reporting. |
| ** | The Adviser seeks to achieve the Fund’s objective. There can be no guarantee it will be achieved. |
| *** | Percentages are based on total investments as of June 30, 2019. The portfolio allocation is subject to change. |
Within the fixed income allocation on the broader Portfolio level, the Adviser prefers high-quality liquid investments combined with flexibility to implement opportunistic ideas across fixed income markets. The majority of the Fund’s assets were invested into the more liquid segments of the fixed income market, with approximately 90% of the Fund invested into instruments with maturities of 3 years and under as of June 30, 2019.
The Adviser allocates in a diversified manner, with the expectation that the Sub-Advisers will capitalize on the opportunities present in the segment of the fixed income market that their specific mandate is focused on.
The Conservative Income allocation, which comprised approximately 40% of the Fund as of June 30, 2019, is focused on the highest quality, shortest maturity and the most liquid part of the U.S. fixed income market, balancing safety against income.
| 2 | SIX CIRCLES TRUST | JUNE 30, 2019 | ||||
Table of Contents
The Global Markets allocation, which comprised approximately 30% of the Fund as of June 30, 2019, has a broad investment universe, seeking total return opportunities within the global fixed income markets.
The Core Ultra Short allocation, which comprised approximately 30% of the Fund as of June 30, 2019, invests in a diversified fixed income portfolio on the shorter end of the U.S. fixed income market, balancing income against credit quality.
GROWTH OF $10,000 REPORT(07/9/18 TO 6/30/19)
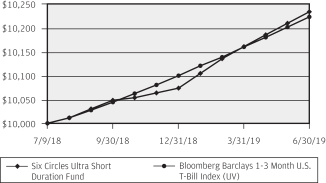
The allocation of the various strategies employed by the Fund may shift and therefore, the performance shown may not be a true indication of how the Fund may perform going forward. Performance quoted is past performance and is no guarantee of future results. Investment returns and principal value will fluctuate, so shares, when sold, may be worth more or less than original cost. Current performance may be higher or lower than returns shown. As of the latest prospectus, the gross and net expense ratios for the Fund were 0.63% and 0.23% respectively. Contact your J.P. Morgan representative or call1-212-464-2070 for the most recentmonth-end performance.
The Fund commenced operations on July 9, 2018.
The graph illustrates comparative performance for $10,000 invested in the Six Circles Ultra Short Duration Fund and the Bloomberg Barclays1-3 Month U.S. Treasury Bill Index from July 9, 2018 to June 30, 2019. The performance of the Fund reflects the deduction of Fund expenses and assumes reinvestment of all dividends and capital gain distributions, if any. The performance of the Bloomberg Barclays1-3 Month U.S. Treasury Bill Index does not reflect the deduction of expenses associated with a mutual fund and has been adjusted to reflect reinvestment of all dividends and capital gain distributions of the securities included in the Index, if applicable. The Bloomberg Barclays1-3 Month U.S. Treasury Bill Index measures the performance of Treasury securities and is selected by a Market Value process. Investors cannot invest directly in an index.
Fund performance may reflect the waiver of the Fund’s fees and/or reimbursement of expenses for certain periods since the inception date. Without these waivers and reimbursements, performance would have been lower. Also, performance shown in this section does not reflect the deduction of taxes that a shareholder may pay on Fund distributions or redemptions or sales of Fund shares.
| JUNE 30, 2019 | SIX CIRCLES TRUST | 3 | ||||||
Table of Contents
Six Circles Tax Aware Ultra Short Duration Fund
Period January 1, 2019 Through June 30, 2019 (Unaudited)
| REPORTING PERIOD RETURN | ||||
| Fund* | 1.11% | |||
| iMoneyNet Tax-Free National Institutional Money Market Index | 0.70% | |||
| Net Assets as of 6/30/2019 (In Thousands) | $ | 1,267,712 | ||
| Duration | 0.63 years | |||
INVESTMENT OBJECTIVES AND STRATEGY**
Six Circles Tax Aware Ultra Short Duration Fund (the “Fund”) seeks to generate current income consistent with capital preservation. Invests at least 50% of its net assets in municipal securities, the income from which is exempt from federal income tax. The Fund also may invest in taxable instruments. Allocates assets among securities with various maturities which, under normal market conditions, will not exceed an average effective portfolio duration of two years.
INVESTMENT APPROACH
J.P. Morgan Private Investments Inc., the Fund’s investment adviser (“JPMPI” or the “Adviser”) constructs the Fund’s portfolios by allocating the Fund’s assets among investment strategies managed by one or moresub-advisers retained by the Adviser (each a“Sub-Adviser”). The Adviser currently allocates Fund assets to the followingSub-Advisers:
| • | Goldman Sachs Asset Management, L.P. (“Goldman”) |
| • | Mellon Investments Corporation (“Mellon”) |
| • | Pacific Investment Management Company LLC (“PIMCO”) |
The Fund is specifically designed to serve as a completion portfolio and accomplish particular goals within discretionary portfolios managed by JPMPI or its affiliates (the “Portfolios”). The Adviser utilizes the Fund to express targeted investment views, while taking into consideration positions held at the aggregate level in the broader Portfolios. As such, the Fund’s allocations and performance should be evaluated in the context of the broader Portfolios and not on a standalone basis.
WHAT WERE THE MAIN DRIVERS OF THE FUND’S PERFORMANCE?
During the period of January 1, 2019 through June 30, 2019, the Fund posted a positive return on an absolute basis, and outperformed relative to the iMoneyNetTax-Free National Institutional Money Market Index (the “Index”). References to the Index are for informational purposes. The use of the Index does not imply the Fund is being managed to the Index, but rather is disclosed to allow for comparison of the Fund’s performance to that of a well-known and widely-recognized index.
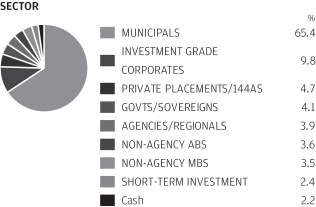
By sector composition, Municipal Bonds were the largest sector exposure in the Fund and comprised approximately 65% of the Fund at the end of the reporting period, and contributed to the Fund’s performance on an absolute basis.
Investment Grade Credit comprised approximately 21% of the Fund’s sector exposure at the end of the reporting period, and also contributed to the Fund’s performance on an absolute basis.
All three of the Fund’s allocations — Municipal Conservative Income, Global Markets, and Core Municipal Ultra Short — contributed to the Fund’s return on an absolute basis during the reporting period.
HOW WAS THE FUND POSITIONED?
At the end of the reporting period, the Fund was allocated to threeSub-Advisers across various sectors, credit ratings, maturity buckets, and regional exposures.
| PORTFOLIO ALLOCATION*** | ||||
| Municipal Conservative Income (Goldman) | 40 | % | ||
| Global Markets (PIMCO) | 30 | |||
| Core Municipal Ultra Short (Mellon) | 30 | |||
| * | The return shown is based on the net asset value calculated for shareholder transactions. Certain adjustments were made to the net assets of the Fund at June 30, 2019 for financial reporting purposes, and as a result, the net asset value for shareholder transactions and the total return based on that net asset value may differ from the adjusted net assets and the total return for financial reporting. |
| ** | The Adviser seeks to achieve the Fund’s objective. There can be no guarantee it will be achieved. |
| *** | Percentages are based on total investments as of June 30, 2019. The portfolio allocation is subject to change. |
Within the fixed income allocation on the broader Portfolio level, the Adviser prefers high-quality liquid investments combined with flexibility to implement opportunistic ideas across fixed income markets. The majority of the Fund’s assets were invested into the more liquid segments of the fixed income market, with approximately 93% of the Fund invested into instruments with adjusted maturities of 3 years and under as of June 30, 2019.
The Adviser allocates in a diversified manner, with the expectation that theSub-Advisers will capitalize on the opportunities present in the segment of the fixed income market that their specific mandate is focused on.
The Municipal Conservative Income allocation, which comprised approximately 40% of the Fund as of June 30, 2019, is focused
| 4 | SIX CIRCLES TRUST | JUNE 30, 2019 | ||||
Table of Contents
on the highest quality, shortest maturity and the most liquid part of the U.S. Municipal fixed income market, balancing safety against income.
The Global Markets allocation, which comprised approximately 30% of the Fund as of June 30, 2019, has a broad investment universe, seeking total return opportunities within the global taxable fixed income markets.
The Core Municipal Ultra Short allocation, which comprised approximately 30% of the Fund as of June 30, 2019, invests in a diversified fixed income portfolio on the shorter end of the U.S. Municipal fixed income market, balancing income against credit quality.
GROWTH OF $10,000 REPORT(07/9/18 TO 6/30/19)
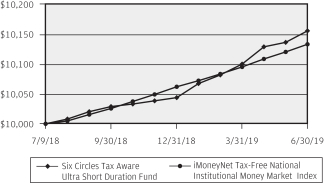
The allocation of the various strategies employed by the Fund may shift and therefore, the performance shown may not be a true indication of how the Fund may perform going forward. Performance quoted is past performance and is no guarantee of future results. Investment returns and principal value will fluctuate, so shares, when sold, may be worth more or less than original cost. Current performance may be higher or lower than returns shown. As of the latest prospectus, the gross and net expense ratios for the Fund were 0.64% and 0.22% respectively. Contact your J.P. Morgan representative or call1-212-464-2070 for the most recentmonth-end performance.
The Fund commenced operations on July 9, 2018.
The graph illustrates comparative performance for $10,000 invested in the Six Circles Tax Aware Ultra Short Duration Fund and the iMoneyNetTax-Free National Institutional Money Market Index from July 9, 2018 to June 30, 2019. The performance of the Fund reflects the deduction of Fund expenses and assumes reinvestment of all dividends and capital gain distributions, if any. The performance of the iMoneyNetTax-Free National Institutional Money Market Index does not reflect the deduction of expenses associated with a mutual fund and has been adjusted to reflect reinvestment of all dividends and capital gain distributions of the securities included in the Index, if applicable. The iMoneyNetTax-Free National Institutional Money Market Index is an average of alltax-free and municipal, U.S.-domiciled institutional and retail money market funds. Investors cannot invest directly in an index.
Fund performance may reflect the waiver of the Fund’s fees and/or reimbursement of expenses for certain periods since the inception date. Without these waivers and reimbursements, performance would have been lower. Also, performance shown in this section does not reflect the deduction of taxes that a shareholder may pay on Fund distributions or redemptions or sales of Fund shares.
| JUNE 30, 2019 | SIX CIRCLES TRUST | 5 | ||||||
Table of Contents
Six Circles U.S. Unconstrained Equity Fund
Period January 1, 2019 Through June 30, 2019 (Unaudited)
| REPORTING PERIOD RETURN | ||||
| Fund* | 14.81% | |||
| MSCI USA Index | 18.79% | |||
| Net Assets as of 6/30/2019 (In Thousands) | $ | 10,160,215 | ||
INVESTMENT OBJECTIVES AND STRATEGY**
Six Circles U.S. Unconstrained Equity Fund (the “Fund”) seeks to provide capital appreciation. Invests at least 80% of its net assets in equity securities issued by U.S. companies and other instruments with economic characteristics similar to equity securities issued by U.S. companies. The Fund is generally unconstrained by any particular capitalization, style or industry sector.
INVESTMENT APPROACH
J.P. Morgan Private Investments Inc., the Fund’s investment adviser (“JPMPI” or the “Adviser”), actively allocates the Fund’s investments among a range of indexed investment strategies that are managed by the currentsub-adviser, BlackRock Investment Management, LLC (the“Sub-Adviser” or “BlackRock”). For each indexed investment strategy, theSub-Adviser seeks to replicate the performance of an index orsub-index selected by the Adviser. The Fund is specifically designed to serve as a completion portfolio and accomplish particular goals within discretionary portfolios managed by JPMPI or its affiliates (the “Portfolios”). The Adviser utilizes the Fund to express targeted investment views, while taking into consideration positions held at the aggregate level in the broader Portfolios. As such, the Fund’s allocations and performance should be evaluated in the context of the broader Portfolios and not on a standalone basis.
WHAT WERE THE MAIN DRIVERS OF THE FUND’S PERFORMANCE?
During the period of January 1, 2019 through June 30, 2019, the Fund posted a positive return on an absolute basis, but underperformed relative to the MSCI USA Index (the “Index”). References to the Index are for informational purposes. The use of the Index does not imply the Fund is being managed to the Index, but rather is disclosed to allow for comparison of the Fund’s performance to that of a well-known and widely-recognized index.
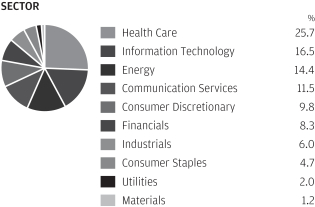
Health Care and Energy sectors comprised approximately 40% of the Fund’s sector exposure at the end of the reporting period, and were the Fund’s largest sector overweights relative to the Index. During the reporting period, both sectors contributed to the Fund’s performance on an absolute basis. That said, both Health Care and Energy detracted from the Fund’s performance relative to the Index.
Financials and Information Technology sectors comprised approximately 25% of the Fund’s sector exposure at the end of the reporting period, and were the Fund’s largest sector underweights relative to the Index. Both sectors contributed to the Fund’s performance on an absolute basis. Relative to the index, exposure to Information Technology contributed to the Fund’s performance, while exposure to Financials detracted.
The Fund’s allocation to U.S. Dividend Growth was the largest contributor to the Fund’s return during the reporting period, while the allocation to U.S. Interactive Media & Services was the only detractor from the Fund’s return on an absolute basis during the reporting period.
HOW WAS THE FUND POSITIONED?
At the end of the reporting period, the Fund was allocated to eight strategies managed by oneSub-Adviser, across various sector,sub-industry, and factor exposures as follows.
| PORTFOLIO ALLOCATION*** | ||||
| U.S. Dividend Growth (BlackRock) | 44 | % | ||
| U.S. Energy (BlackRock) | 12 | |||
| U.S. Pharmaceuticals (BlackRock) | 10 | |||
| U.S. Software (BlackRock) | 10 | |||
| U.S. Interactive Media & Services (BlackRock) | 9 | |||
| U.S. Internet Retail (BlackRock) | 6 | |||
| U.S. Biotechnology (BlackRock) | 5 | |||
| U.S. Managed Health Care (BlackRock) | 4 | |||
| * | The return shown is based on the net asset value calculated for shareholder transactions. Certain adjustments were made to the net assets of the Fund at June 30, 2019 for financial reporting purposes, and as a result, the net asset value for shareholder transactions and the total return based on that net asset value may differ from the adjusted net assets and the total return for financial reporting. |
| ** | The Adviser seeks to achieve the Fund’s objective. There can be no guarantee it will be achieved. |
| *** | Percentages are based on total investments as of June 30, 2019. The portfolio allocation is subject to change. |
Allocation to U.S. Dividend Growth comprised approximately 44% of the Fund as of June 30, 2019. Within the context of the broader Portfolios, the Adviser believes that exposure to U.S. Dividend Growth serves as a defensive anchor and is one of the few defensive factors trading at what the Adviser believes is a reasonable valuation.
| 6 | SIX CIRCLES TRUST | JUNE 30, 2019 | ||||
Table of Contents
The Adviser believes that U.S. Energy valuations have become more attractive, after being significantly overvalued for several years. The U.S. Energy allocation was approximately 12% of the Fund as of June 30, 2019.
Allocation to U.S. Pharmaceuticals comprised approximately 10% of the Fund as of June 30, 2019, and provides what the Adviser believes is an attractive dividend yield given a meaningful valuation discount.
Allocation to U.S. Software and U.S. Internet Retail provides what the Adviser believes is a multi-year opportunity for the leaders in this space to take advantage of businesses shifting workloads onto Cloud-based platforms. These exposures comprised approximately 16% of the Fund as of June 30, 2019.
Allocation to U.S. Interactive Media & Services, which focuses on companies engaged in content and information creation or distribution through proprietary platforms, where revenues are derived primarily throughpay-per-click advertisements, is trading at what the Adviser believes is a reasonableprice-to-earnings ratio, and was approximately 9% of the Fund as of June 30, 2019.
The Adviser believes that the U.S. Biotechnologysub-industry trades at a meaningful valuation discount and provides attractive dividend yield. Allocation to U.S. Biotechnology comprised approximately 5% of the Fund as of June 30, 2019.
Allocation to U.S. Managed Health Care was approximately 4% of the Fund’s exposure as of June 30, 2019 and reflects the Adviser’s conviction in thissub-industry’s potential for growth in the medium term.
GROWTH OF $10,000 REPORT(07/9/18 TO 6/30/19)
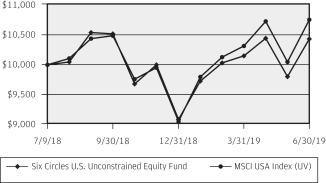
The allocation of the various strategies employed by the Fund may shift and therefore, the performance shown may not be a true indication of how the Fund may perform going forward. Performance quoted is past performance and is no guarantee of future results. Investment returns and principal value will fluctuate, so shares, when sold, may be worth more or less than original cost. Current performance may be higher or lower than returns shown. As of the latest prospectus, the gross and net expense ratios for the Fund were 0.43% and 0.15% respectively. Contact your J.P. Morgan representative or call1-212-464-2070 for the most recentmonth-end performance.
The Fund commenced operations on July 9, 2018.
The graph illustrates comparative performance for $10,000 invested in the Six Circles U.S. Unconstrained Equity Fund and the MSCI USA Index from July 9, 2018 to June 30, 2019. The performance of the Fund reflects the deduction of Fund expenses and assumes reinvestment of all dividends and capital gain distributions, if any. The performance of the MSCI USA Index does not reflect the deduction of expenses associated with a mutual fund and has been adjusted to reflect reinvestment of all dividends and capital gain distributions of the securities included in the Index, if applicable. The MSCI USA Index is designed to measure the performance of the large andmid-cap segments of the U.S. market. With 627 constituents, the index covers approximately 85% of the free float-adjusted market capitalization in the United States. Investors cannot invest directly in an index.
Fund performance may reflect the waiver of the Fund’s fees and/or reimbursement of expenses for certain periods since the inception date. Without these waivers and reimbursements, performance would have been lower. Also, performance shown in this section does not reflect the deduction of taxes that a shareholder may pay on Fund distributions or redemptions or sales of Fund shares.
The MSCI information may only be used for your internal use, may not be reproduced or redisseminated in any form and may not be used as a basis for or a component of any financial instruments or products or indices. None of the MSCI information is intended to constitute investment advice or a recommendation to make (or refrain from making) any kind of investment decision and may not be relied on as such. Historical data and analysis should not be taken as an indication or guarantee of any future performance analysis, forecast or prediction. The MSCI information is provided on an “as is” basis and the user of this information assumes the entire risk of any use made of this information. MSCI, each of its affiliates and each other person involved in or related to compiling, computing or creating any MSCI information (collectively, the “MSCI Parties”) expressly disclaims all warranties (including, without limitation, any warranties of originality, accuracy, completeness, timeliness,non-infringement, merchantability and fitness for a particular purpose) with respect this information. Without limiting any of the foregoing, in no event shall any MSCI Party have any liability for any direct, indirect, special, incidental, punitive, consequential (including, without limitation, lost profits) or any other damages. (www.msci.com)
| JUNE 30, 2019 | SIX CIRCLES TRUST | 7 | ||||||
Table of Contents
Six Circles International Unconstrained Equity Fund
Period January 1, 2019 Through June 30, 2019 (Unaudited)
| REPORTING PERIOD RETURN | ||||
Fund* | 14.82% | |||
MSCI World ex USA Index | 14.64% | |||
Net Assets as of 6/30/2019 (In Thousands) | $ | 5,086,015 | ||
INVESTMENT OBJECTIVES AND STRATEGY**
Six Circles International Unconstrained Equity Fund (the “Fund”) seeks to provide capital appreciation. Invests at least 80% of its net assets in equity securities and other instruments with economic characteristics similar to equity securities. Primarily invests in the equity securities ofnon-U.S. companies and is generally unconstrained by any particular capitalization, style or sector ornon-U.S. country.
INVESTMENT APPROACH
J.P. Morgan Private Investments Inc., the Fund’s investment adviser (“JPMPI” or the “Adviser”), actively allocates the Fund’s investments among a range of indexed investment strategies that are managed by the currentsub-adviser, BlackRock Investment Management, LLC (the“Sub-Adviser” or “BlackRock”). For each indexed investment strategy, theSub-Adviser seeks to replicate the performance of an index orsub-index selected by the Adviser. The Fund is specifically designed to serve as a completion portfolio and accomplish particular goals within discretionary portfolios managed by JPMPI or its affiliates (the “Portfolios”). The Adviser utilizes the Fund to express targeted investment views, while taking into consideration positions held at the aggregate level in the Portfolios. As such, the Fund’s allocations and performance should be evaluated in the context of the broader Portfolios and not on a standalone basis.
WHAT WERE THE MAIN DRIVERS OF THE FUND’S PERFORMANCE?
During the period of January 1, 2019 through June 30, 2019, the Fund posted a positive return on an absolute basis, and outperformed the MSCI World ex USA Index (the “Index”). References to the Index are for informational purposes. The use of the Index does not imply the Fund is being managed to the Index, but rather is disclosed to allow for comparison of the Fund’s performance to that of a well-known and widely-recognized index.
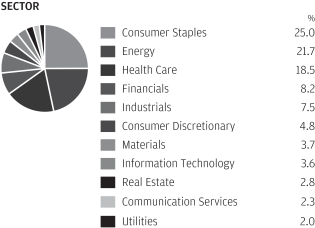
Energy and Consumer Staples sectors comprised approximately 47% of the Fund’s sector exposure at the end of the reporting period, and were the Fund’s largest sector overweights relative to the Index. Both sectors contributed to the Fund’s performance on an absolute basis, with Consumer Staples contributing to the Fund’s performance relative to the Index, and Energy detracting.
Consumer Discretionary, Industrials, and Financials comprised approximately 20% of the Fund’s sector exposure at the end of the reporting period, and were the Fund’s largest sector
underweights relative to the Index. All three of these sectors contributed to the Fund’s performance on an absolute basis, as well as relative to the Index.
Europe and Emerging Markets comprised approximately 95% of the Fund’s regional exposure at the end of the reporting period, and were the Fund’s largest regional overweights relative to the Index. During the reporting period, Europe exposure contributed to the Fund’s performance both on an absolute basis and relative to the Index. Emerging Markets detracted from the Fund’s performance on an absolute basis, as well as relative to the Index.
Asiaex-Japan, Canada, and Japan were the Fund’s largest regional underweights relative to the Index. Asiaex-Japan exposure detracted both on an absolute basis, and relative to the Index. The Fund didn’t have exposure to Canada or Japan, and the underweight to Canada detracted while the underweight to Japan contributed to performance relative to the Index.
The Fund’s allocations to European Momentum, EuropeanMid-Cap, and broad Europe were the largest contributors to the Fund’s return during the reporting period, while the allocation to Asiaex-Japan detracted from the Fund’s return on an absolute basis during the reporting period.
HOW WAS THE FUND POSITIONED?
At the end of the reporting period, the Fund was allocated to five strategies managed by oneSub-Adviser, across various sector andsub-industry exposures as follows.
| PORTFOLIO ALLOCATION*** | ||||
| Europe (BlackRock) | 37 | % | ||
| Europe Food, Beverage & Tobacco (BlackRock) | 19 | |||
| Europe Integrated Oil & Gas (BlackRock) | 18 | |||
| Europe Pharmaceuticals (BlackRock) | 13 | |||
| All Countries Asia ex-Japan Mid Cap (BlackRock) | 13 | |||
| * | The return shown is based on the net asset value calculated for shareholder transactions. Certain adjustments were made to the net assets of the Fund at June 30, 2019 for financial reporting purposes, and as a result, the net asset value for shareholder transactions and the total return based on that net asset value may differ from the adjusted net assets and the total return for financial reporting. |
| ** | The Adviser seeks to achieve the Fund’s objective. There can be no guarantee it will be achieved. |
| *** | Percentages are based on total investments as of June 30, 2019. The portfolio allocation is subject to change. |
| 8 | SIX CIRCLES TRUST | JUNE 30, 2019 | ||||
Table of Contents
Six Circles International Unconstrained Equity Fund
FUND COMMENTARY
Period January 1, 2019 Through June 30, 2019 (Unaudited) (continued)
Within the broader Portfolios, allocation to Europe provides a broad passive European exposure, comprising approximately 37% of the Fund as of June 30, 2019.
The Adviser believes that allocation to Europe Food, Beverage & Tobacco serves as a defensive anchor in the broader Portfolios while providing above-average earnings growth. This allocation was approximately 19% of the Fund as of June 30, 2019.
Allocation to Europe Integrated Oil & Gas provides what the Adviser believes are attractive valuations, and comprised approximately 18% of the Fund as of June 30, 2019.
Allocation to Europe Pharmaceuticals comprised approximately 13% of the Fund as of June 30, 2019 and provides what the Adviser believes to be a defensive exposure with attractive fundamentals.
Allocation to All Countries Asiaex-Japan Mid Cap provides what the Adviser believes to be a more defensive emerging markets exposure, given that it avoids the more volatile areas of emerging markets. This allocation comprised approximately 13% of the Fund as of June 30, 2019.
Within the broader context of the Portfolios, the Adviser currently believes that Europe Momentum is an attractive allocation that could outperform in the later part of business cycle and offers higher risk-adjusted returns among European style factors. The Adviser currently believes Europe Enhanced Value and Europe Mid Cap allocations have attractive relative valuations and complement other exposures within the broader Portfolios. Within the Energy sector, the Adviser currently has conviction in the sustainability of a multi-year capital expenditure rationalization cycle, which the Adviser expects will lead to improving free cash flow generation and returns on capital employed.
GROWTH OF $10,000 REPORT(07/9/18 TO 6/30/19)
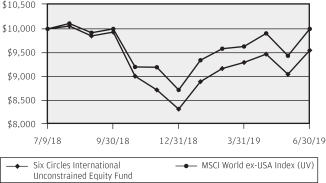
The allocation of the various strategies employed by the Fund may shift and therefore, the performance shown may not be a true indication of how the Fund may perform going forward. Performance quoted is past performance and is no guarantee of future results. Investment returns and principal value will fluctuate, so shares, when sold, may be worth more or less than original cost. Current performance may be higher or lower than returns shown. As of the latest prospectus, the gross and net expense ratios for the Fund were 0.56% and 0.22% respectively. Contact your J.P. Morgan representative or call1-212-464-2070 for the most recentmonth-end performance.
The Fund commenced operations on July 9, 2018.
The graph illustrates comparative performance for $10,000 invested in the Six Circles International Unconstrained Equity Fund and the MSCI Worldex-USA Index from July 9, 2018 to June 30, 2019. The performance of the Fund reflects the deduction of Fund expenses and assumes reinvestment of all dividends and capital gain distributions, if any. The performance of the MSCI Worldex-USA Index does not reflect the deduction of expenses associated with a mutual fund and has been adjusted to reflect reinvestment of all dividends and capital gain distributions of the securities included in the Index, if applicable. The MSCI World ex USA Index captures large andmid-cap representation across 22 of 23 Developed Markets (DM) countries*—excluding the United States. With 1,016 constituents, the index covers approximately 85% of the free float-adjusted market capitalization in each country. Investors cannot invest directly in an index.
Fund performance may reflect the waiver of the Fund’s fees and/or reimbursement of expenses for certain periods since the inception date. Without these waivers and reimbursements, performance would have been lower. Also, performance shown in this section does not reflect the deduction of taxes that a shareholder may pay on Fund distributions or redemptions or sales of Fund shares.
International investing has a greater degree of risk and increased volatility due to political and economic instability of some overseas markets. Changes in currency exchange rates and different accounting and taxation policies outside the U.S. can affect returns.
The MSCI information may only be used for your internal use, may not be reproduced or redisseminated in any form and may not be used as a basis for or a component of any financial instruments or products or indices. None of the MSCI information is intended to constitute investment advice or a recommendation to make (or refrain from making) any kind of investment decision and may not be relied on as such. Historical data and analysis should not be taken as an indication or guarantee of any future performance analysis, forecast or prediction. The MSCI information is provided on an “as is” basis and the user of this information assumes the entire risk of any use made of this information. MSCI, each of its affiliates and each other person involved in or related to compiling, computing or creating any MSCI information (collectively, the “MSCI Parties”) expressly disclaims all warranties (including, without limitation, any warranties of originality, accuracy, completeness, timeliness,non-infringement, merchantability and fitness for a particular purpose) with respect this information. Without limiting any of the foregoing, in no event shall any MSCI Party have any liability for any direct, indirect, special, incidental, punitive, consequential (including, without limitation, lost profits) or any other damages. (www.msci.com)
| JUNE 30, 2019 | SIX CIRCLES TRUST | 9 | ||||||
Table of Contents
Six Circles Ultra Short Duration Fund
SCHEDULE OF PORTFOLIO INVESTMENTS
AS OF JUNE 30, 2019 (Unaudited)
(Amounts in U.S. Dollars, unless otherwise noted)
(Amounts in thousands, except number of Futures contracts)
| SECURITY DESCRIPTION | PRINCIPAL AMOUNT($) | VALUE($) | ||||||
Asset-Backed Securities — 10.5% | ||||||||
Ally Auto Receivables Trust, Series2018-3, Class A2, 2.72%, 05/17/2021 | 1,096 | 1,097 | ||||||
American Express Credit Account Master Trust, Series2018-1, Class A, 2.67%, 10/17/2022 | 2,250 | 2,257 | ||||||
Anchorage Capital CLO 7 Ltd., (Cayman Islands), Series2015-7A, Class AR, (ICE LIBOR USD 3 Month + 0.96%), 3.56%, 10/15/2027 (e) (aa) | 577 | 576 | ||||||
Anchorage Capital CLO 8 Ltd., (Cayman Islands), Series2016-8A, Class AR, (ICE LIBOR USD 3 Month + 1.00%), 3.58%, 07/28/2028 (e) (aa) | 1,850 | 1,839 | ||||||
ARI Fleet Lease Trust, Series2017-A, Class A2, 1.91%, 04/15/2026 (e) | 1,108 | 1,105 | ||||||
Atlas Senior Loan Fund III Ltd., (Cayman Islands), Series2013-1A, Class AR, (ICE LIBOR USD 3 Month + 0.83%), 3.36%, 11/17/2027 (e) (aa) | 595 | 592 | ||||||
Atrium XII, (Cayman Islands), Series 12A, Class AR, (ICE LIBOR USD 3 Month + 0.83%), 3.42%, 04/22/2027 (e) (aa) | 1,000 | 997 | ||||||
BA Credit Card Trust, Series2017-A2, Class A2, 1.84%, 01/17/2023 | 2,010 | 2,004 | ||||||
Bank of The West Auto Trust, Series2018-1, Class A2, 3.09%, 04/15/2021 (e) | 2,577 | 2,582 | ||||||
Battalion CLO X Ltd., (Cayman Islands),Series 2016-10A, Class A1R, (ICE LIBOR USD 3 Month + 1.25%), 3.78%, 01/24/2029 (e) (aa) | 1,500 | 1,500 | ||||||
BlueMountain CLO Ltd., (Cayman Islands), Series2012-2A, Class AR2, (ICE LIBOR USD 3 Month + 1.05%), 3.57%, 11/20/2028 (e) (aa) | 2,100 | 2,091 | ||||||
BMW Canada Auto Trust, (Canada),Series 2019-1A, Class A1, 2.15%, 10/20/2021 (e) | CAD 2,200 | 1,680 | ||||||
BMW Vehicle Owner Trust, Series2016-A, Class A4, 1.37%, 12/27/2022 | 585 | 581 | ||||||
Capital One Multi-Asset Execution Trust, | ||||||||
Series2016-A4, Class A4, 1.33%, 06/15/2022 | 1,500 | 1,498 | ||||||
Series2016-A6, Class A6, 1.82%, 09/15/2022 | 2,542 | 2,538 | ||||||
CarMax Auto Owner Trust, | ||||||||
Series2017-1, Class A3, 1.98%, 11/15/2021 | 357 | 356 | ||||||
Series2017-2, Class A3, 1.93%, 03/15/2022 | 601 | 600 | ||||||
Series2017-3, Class A3, 1.97%, 04/15/2022 | 1,328 | 1,326 | ||||||
Series2018-3, Class A2A, 2.88%, 10/15/2021 | 2,366 | 2,372 | ||||||
Series2019-1, Class A2A, 3.02%, 07/15/2022 | 1,760 | 1,768 | ||||||
| SECURITY DESCRIPTION | PRINCIPAL AMOUNT($) | VALUE($) | ||||||
CBAM Ltd., (Cayman Islands), Series2017-3A, Class A, (ICE LIBOR USD 3 Month + 1.23%), 3.82%, 10/17/2029 (e) (aa) | 1,140 | 1,140 | ||||||
Chesapeake Funding II LLC, | ||||||||
Series2016-2A, Class A1, 1.88%, 06/15/2028 (e) | 1,291 | 1,289 | ||||||
Series2019-1A, Class A1, 2.94%, 04/15/2031 (e) | 1,500 | 1,518 | ||||||
Chrysler Capital Auto Receivables Trust,Series 2016-BA, Class A4, 1.87%, 02/15/2022 (e) | 1,800 | 1,794 | ||||||
Citibank Credit Card Issuance Trust, | ||||||||
Series2014-A6, Class A6, 2.15%, 07/15/2021 | 2,000 | 2,000 | ||||||
Series2016-A1, Class A1, 1.75%, 11/19/2021 | 2,000 | 1,996 | ||||||
Series2017-A8, Class A8, 1.86%, 08/08/2022 | 1,185 | 1,182 | ||||||
Series2017-A9, Class A9, 1.80%, 09/20/2021 | 2,065 | 2,062 | ||||||
CNH Equipment Trust, Series2019-A, Class A2, 2.96%, 05/16/2022 | 840 | 846 | ||||||
Discover Card Execution Note Trust,Series 2016-A4, Class A4, 1.39%, 03/15/2022 | 2,335 | 2,330 | ||||||
Drive Auto Receivables Trust, Series2019-1, Class A2A, 3.08%, 09/15/2021 | 1,913 | 1,917 | ||||||
Ford Credit Auto Owner Trust, | ||||||||
Series2016-C, Class A3, 1.22%, 03/15/2021 | 547 | 545 | ||||||
Series2017-B, Class A3, 1.69%, 11/15/2021 | 1,979 | 1,972 | ||||||
Ford Credit Floorplan Master Owner Trust A, | ||||||||
Series2015-2, Class A1, 1.98%, 01/15/2022 | 5,206 | 5,196 | ||||||
Series2016-3, Class A1, 1.55%, 07/15/2021 | 2,585 | 2,584 | ||||||
Series2018-3, Class A2, (ICE LIBOR USD 1 Month + 0.40%), 2.79%, 10/15/2023 (aa) | 3,000 | 2,999 | ||||||
Series2019-1, Class A, 2.84%, 03/15/2024 | 1,400 | 1,426 | ||||||
GM Financial Automobile Leasing Trust,Series 2019-1, Class A2A, 2.91%, 04/20/2021 | 1,750 | 1,756 | ||||||
Gracechurch Card Funding plc, (United Kingdom), Series2018-1A, Class A, (ICE LIBOR USD 1 Month + 0.40%), 2.79%, 07/15/2022 (e) (aa) | 200 | 200 | ||||||
Home Equity Asset Trust, Series2005-8, Class M1, (ICE LIBOR USD 1 Month + 0.43%), 2.83%, 02/25/2036 (aa) | 2,119 | 2,126 | ||||||
Honda Auto Receivables Owner Trust,Series 2018-4, Class A2, 2.98%, 05/17/2021 | 1,405 | 1,410 | ||||||
Legacy Mortgage Asset Trust, Series2019-GS3, Class A1, SUB, 3.75%, 04/25/2059 (e) | 294 | 298 | ||||||
SEE NOTES TO FINANCIAL STATEMENTS.
| 10 | SIX CIRCLES TRUST | JUNE 30, 2019 | ||||
Table of Contents
| SECURITY DESCRIPTION | PRINCIPAL AMOUNT($) | VALUE($) | ||||||
Asset-Backed Securities — continued | ||||||||
Marlette Funding Trust, Series2018-4A, Class A, 3.71%, 12/15/2028 (e) | 848 | 857 | ||||||
Mercedes-Benz Auto Lease Trust,Series 2019-A, Class A2, 3.01%, 02/16/2021 | 1,500 | 1,504 | ||||||
MMAF Equipment Finance LLC, Series2016-AA, Class A3, 1.48%, 06/15/2020 (e) | 1,048 | 1,046 | ||||||
Navient Private Education Refi Loan Trust, | ||||||||
Series2018-A, Class A1, 2.53%, 02/18/2042 (e) | 1,308 | 1,310 | ||||||
Series2018-CA, Class A1, 3.01%, 06/16/2042 (e) | 2,236 | 2,253 | ||||||
Navient Student Loan Trust, Series2018-EA, Class A1, 3.43%, 12/15/2059 (e) | 2,377 | 2,406 | ||||||
Nelnet Student Loan Trust, Series2019-2A, Class A, (ICE LIBOR USD 1 Month + 0.90%), 3.30%, 06/27/2067 (e) (aa) | 1,490 | 1,480 | ||||||
Neuberger Berman Loan Advisers CLO 26 Ltd., (Cayman Islands), Series2017-26A, Class A, (ICE LIBOR USD 3 Month + 1.17%), 3.77%, 10/18/2030 (e) (aa) | 1,900 | 1,895 | ||||||
Nissan Auto Receivables Owner Trust, | ||||||||
Series2017-B, Class A3, 1.75%, 10/15/2021 | 1,715 | 1,710 | ||||||
Series2019-A, Class A2A, 2.82%, 01/18/2022 | 2,000 | 2,009 | ||||||
OneMain Direct Auto Receivables Trust,Series 2017-2A, Class A, 2.31%, 12/14/2021 (e) | 919 | 918 | ||||||
Oscar US Funding X LLC, (Japan),Series 2019-1A, Class A2, 3.10%, 04/11/2022 (e) | 1,500 | 1,507 | ||||||
OZLM VIII Ltd., (Cayman Islands),Series 2014-8A, Class A1RR, (ICE LIBOR USD 3 Month + 1.17%), 3.76%, 10/17/2029 (e) (aa) | 1,180 | 1,178 | ||||||
OZLM XII Ltd., (Cayman Islands),Series 2015-12A, Class A1R, (ICE LIBOR USD 3 Month + 1.05%), 3.63%, 04/30/2027 (e) (aa) | 250 | 250 | ||||||
Palmer Square Loan Funding Ltd., (Cayman Islands), Series2018-5A, Class A1, (ICE LIBOR USD 3 Month + 0.85%), 3.44%, 01/20/2027 (e) (aa) | 1,898 | 1,892 | ||||||
PFS Financing Corp., Series2018-C, Class A, (ICE LIBOR USD 1 Month + 0.48%), 2.87%, 04/15/2022 (e) (aa) | 1,430 | 1,430 | ||||||
Regatta Funding LP, (Cayman Islands),Series 2013-2A, Class A1R2, (ICE LIBOR USD 3 Month + 1.25%), 3.75%, 01/15/2029 (e) (aa) | 600 | 601 | ||||||
Santander Drive Auto Receivables Trust,Series 2018-5, Class A3, 3.19%, 03/15/2022 | 430 | 432 | ||||||
Securitized Term Auto Receivables Trust, (Canada), Series2018-2A, Class A2A, 3.06%, 02/25/2021 (e) | 1,048 | 1,052 | ||||||
| SECURITY DESCRIPTION | PRINCIPAL AMOUNT($) | VALUE($) | ||||||
SLC Student Loan Trust, Series2005-1, Class A3, (ICE LIBOR USD 3 Month + 0.10%), 2.62%, 02/15/2025 (aa) | 1,673 | 1,671 | ||||||
SLM Private Education Loan Trust,Series 2011-C, Class A2A, (ICE LIBOR USD 1 Month + 3.25%), 5.64%, 10/17/2044 (e) (aa) | 613 | 618 | ||||||
SLM Student Loan Trust, Series2003-10A, Class A3, (ICE LIBOR USD 3 Month + 0.47%), 2.88%, 12/15/2027 (e) (aa) | 2,214 | 2,216 | ||||||
SMB Private Education Loan Trust, | ||||||||
Series2015-A, Class A2A, 2.49%, 06/15/2027 (e) | 2,461 | 2,465 | ||||||
Series2015-B, Class A2A, 2.98%, 07/15/2027 (e) | 1,610 | 1,627 | ||||||
Series2018-A, Class A1, (ICE LIBOR USD 1 Month + 0.35%), 2.74%, 03/16/2026 (e) (aa) | 1,181 | 1,182 | ||||||
Series2018-B, Class A1, (ICE LIBOR USD 1 Month + 0.32%), 2.71%, 12/16/2024 (e) (aa) | 852 | 852 | ||||||
Series2018-C, Class A1, (ICE LIBOR USD 1 Month + 0.30%), 2.69%, 09/15/2025 (e) (aa) | 1,631 | 1,631 | ||||||
SoFi Consumer Loan Program Trust, | ||||||||
Series2019-1, Class A, 3.24%, 02/25/2028 (e) | 799 | 807 | ||||||
Series2019-3, Class A, 2.90%, 05/25/2028 (e) | 1,000 | 1,005 | ||||||
Sofi Professional Loan Program LLC,Series 2018-A, Class A2A, 2.39%, 02/25/2042 (e) | 1,503 | 1,504 | ||||||
Toyota Auto Receivables, Series2016-C, Class A4, 1.32%, 11/15/2021 | 475 | 472 | ||||||
Toyota Auto Receivables Owner Trust,Series 2019-A, Class A2A, 2.83%, 10/15/2021 | 1,690 | 1,697 | ||||||
Venture XVIII CLO Ltd., (Cayman Islands),Series 2014-18A, Class AR, (ICE LIBOR USD 3 Month + 1.22%), 3.82%, 10/15/2029 (e) (aa) | 2,100 | 2,099 | ||||||
Volkswagen Auto Loan Enhanced Trust,Series 2018-2, Class A2A, 3.05%, 08/20/2021 | 2,804 | 2,813 | ||||||
Wheels SPV 2 LLC, Series2017-1A, Class A2, 1.88%, 04/20/2026 (e) | 746 | 744 | ||||||
|
| |||||||
Total Asset-Backed Securities | 117,078 | |||||||
|
| |||||||
Certificates of Deposit — 0.5% |
| |||||||
Financial — 0.5% | ||||||||
Banks — 0.5% | ||||||||
Credit Suisse AG, 2.81%, 03/09/2020 | 4,000 | 4,011 | ||||||
Nordea Bank Abp, (Sweden), (ICE LIBOR USD 3 Month + 0.30%), 2.78%, 06/05/2020 (aa) | 2,000 | 2,004 | ||||||
|
| |||||||
Total Financial | 6,015 | |||||||
|
| |||||||
Total Certificates of Deposit | 6,015 | |||||||
|
| |||||||
SEE NOTES TO FINANCIAL STATEMENTS.
| JUNE 30, 2019 | SIX CIRCLES TRUST | 11 | ||||||
Table of Contents
Six Circles Ultra Short Duration Fund
SCHEDULE OF PORTFOLIO INVESTMENTS
AS OF JUNE 30, 2019 (Unaudited) (continued)
(Amounts in U.S. Dollars, unless otherwise noted)
(Amounts in thousands, except number of Futures contracts)
| SECURITY DESCRIPTION | PRINCIPAL AMOUNT($) | VALUE($) | ||||||
Collateralized Mortgage Obligations — 1.2% | ||||||||
Credit Suisse Mortgage Capital Certificates, Series 2019-RPL4, Class A1, 3.83%, 08/26/2058 (e) | 297 | 300 | ||||||
FNMA REMICS, Series2018-86, Class FN, (ICE LIBOR USD 1 Month + 0.35%), 2.84%, 12/25/2048 (aa) | 2,443 | 2,431 | ||||||
GNMA, | ||||||||
Series2015-H04, Class FA, (ICE LIBOR USD 1 Month + 0.65%), 3.12%, 12/20/2064 (aa) | 2,133 | 2,136 | ||||||
Series2018-H18, Class FC, (ICE LIBOR USD 1 Month + 0.35%), 2.82%, 08/20/2065 (aa) | 2,898 | 2,888 | ||||||
Lanark Master Issuer plc, (United Kingdom), Series2019-1A, Class 1A1, (ICE LIBOR USD 3 Month + 0.77%), 3.29%, 12/22/2069 (e) (aa) | 1,500 | 1,497 | ||||||
New Residential Mortgage Loan Trust,Series 2018-3A, Class A1, 4.50%, 05/25/2058 (e) (z) | 259 | 273 | ||||||
Ripon Mortgages plc, (United Kingdom), Series 1X, Class A2, Reg. S, (ICE LIBOR GBP 3 Month + 0.80%), 1.60%, 08/20/2056 (aa) | GBP 2,578 | 3,271 | ||||||
Silverstone Master Issuer plc, (United Kingdom), Series2019-1A, Class 1A, (ICE LIBOR USD 3 Month + 0.57%), 3.15%, 01/21/2070 (e) (aa) | 200 | 200 | ||||||
Trinity Square plc, (United Kingdom),Series 2015-1X, Class A, Reg. S, (ICE LIBOR GBP 3 Month + 1.15%), 1.97%, 07/15/2051 (aa) | GBP | 162 | 206 | |||||
|
| |||||||
Total Collateralized Mortgage Obligations | 13,202 | |||||||
|
| |||||||
Commercial Mortgage-Backed Securities — 3.8% |
| |||||||
AREIT Trust, Series 2018-CRE2, Class A, (ICE LIBOR USD 1 Month + 0.98%), 3.38%, 11/14/2035 (e) (aa) | 2,158 | 2,158 | ||||||
Aventura Mall Trust, Series2013-AVM, Class A, 3.87%, 12/05/2032 (e) (z) | 1,500 | 1,522 | ||||||
BAMLL Commercial Mortgage Securities Trust, | ||||||||
Series2019-AHT, Class A, (ICE LIBOR USD 1 Month + 1.20%), 3.59%, 03/15/2034 (e) (aa) | 300 | 301 | ||||||
Series2019-RLJ, Class A, (ICE LIBOR USD 1 Month + 1.05%), 3.44%, 04/15/2036 (e) (aa) | 400 | 400 | ||||||
BX Commercial Mortgage Trust,Series 2018-IND, Class A, (ICE LIBOR USD 1 Month + 0.75%), 3.14%, 11/15/2035 (e) (aa) | 2,761 | 2,764 | ||||||
Citigroup Commercial Mortgage Trust, Series 2015-GC29, Class A2, 2.67%, 04/10/2048 | 1,012 | 1,013 | ||||||
| SECURITY DESCRIPTION | PRINCIPAL AMOUNT($) | VALUE($) | ||||||
COMM Mortgage Trust, | ||||||||
Series 2015-CR23, Class A2, 2.85%, 05/10/2048 | 2,450 | 2,453 | ||||||
Series 2015-CR27, Class A2, 2.22%, 10/10/2048 | 1,160 | 1,156 | ||||||
Series 2015-LC19, Class A2, 2.79%, 02/10/2048 | 2,490 | 2,490 | ||||||
GPMT Ltd., (Cayman Islands), Series2018-FL1, Class A, (ICE LIBOR USD 1 Month + 0.90%), 3.28%, 11/21/2035 (e) (aa) | 920 | 920 | ||||||
Grace Mortgage Trust, Series 2014-GRCE, Class A, 3.37%, 06/10/2028 (e) | 1,000 | 1,019 | ||||||
GS Mortgage Securities Corp. II, | 1,527 | 1,526 | ||||||
GS Mortgage Securities Trust, | ||||||||
Series2011-GC5, Class A3, 3.82%, 08/10/2044 | 1,659 | 1,675 | ||||||
Series 2013-GC14, Class A3, 3.53%, 08/10/2046 | 2,177 | 2,194 | ||||||
Series 2014-GC24, Class A2, 3.10%, 09/10/2047 | 108 | 108 | ||||||
Madison Avenue Trust, Series 2013-650M, Class A, 3.84%, 10/12/2032 (e) | 2,000 | 2,029 | ||||||
Morgan Stanley Bank of America Merrill Lynch Trust, | ||||||||
Series2013-C11, Class AAB, 3.85%, 08/15/2046 | 834 | 861 | ||||||
Series2014-C18, Class A2, 3.19%, 10/15/2047 | 894 | 894 | ||||||
Series2014-C19, Class A2, 3.10%, 12/15/2047 | 2,985 | 2,989 | ||||||
Series2015-C23, Class A2, 2.98%, 07/15/2050 | 1,715 | 1,717 | ||||||
Morgan Stanley Capital I Trust, | ||||||||
Series2014-CPT, Class A, 3.35%, 07/13/2029 (e) | 1,500 | 1,530 | ||||||
Series 2019-PLND, Class A, (ICE LIBOR USD 1 Month + 1.00%), 3.39%, 05/15/2036 (e) (aa) | 700 | 700 | ||||||
PFP Ltd., (Cayman Islands), Series2019-5, Class A, (ICE LIBOR USD 1 Month + 0.97%), 3.37%, 04/14/2036 (e) (aa) | 1,500 | 1,500 | ||||||
UBS-Citigroup Commercial Mortgage Trust, Series2011-C1, Class AAB, 3.19%, 01/10/2045 | 954 | 961 | ||||||
VMC Finance LLC, Series2018-FL2, Class A, (ICE LIBOR USD 1 Month + 0.92%), 3.31%, 10/15/2035 (e) (aa) | 2,153 | 2,151 | ||||||
Wells Fargo Commercial Mortgage Trust, | ||||||||
Series2012-LC5, Class ASB, 2.53%, 10/15/2045 | 1,656 | 1,661 | ||||||
Series 2015-NXS2, Class A2, 3.02%, 07/15/2058 | 1,500 | 1,500 | ||||||
Series 2016-NXS5, Class A2, 2.71%, 01/15/2059 | 1,160 | 1,163 | ||||||
SEE NOTES TO FINANCIAL STATEMENTS.
| 12 | SIX CIRCLES TRUST | JUNE 30, 2019 | ||||
Table of Contents
| SECURITY DESCRIPTION | PRINCIPAL AMOUNT($) | VALUE($) | ||||||
Commercial Mortgage-Backed Securities — continued |
| |||||||
WFRBS Commercial Mortgage Trust,Series 2013-C12, Class ASB, 2.84%, 03/15/2048 | 1,547 | 1,560 | ||||||
|
| |||||||
Total Commercial Mortgage-Backed Securities | 42,915 | |||||||
|
| |||||||
Corporate Bonds — 44.1% | ||||||||
Basic Materials — 0.9% | ||||||||
Chemicals — 0.9% | ||||||||
Air Liquide Finance SA, (France), 1.38%, 09/27/2019 (e) | 4,350 | 4,337 | ||||||
DuPont de Nemours, Inc., | ||||||||
(ICE LIBOR USD 3 Month + 0.71%), 3.23%, 11/15/2020 (aa) | 1,500 | 1,510 | ||||||
3.77%, 11/15/2020 | 500 | 509 | ||||||
Incitec Pivot Finance LLC, Reg. S, 6.00%, 12/10/2019 | 200 | 203 | ||||||
Sherwin-Williams Co. (The), 2.25%, 05/15/2020 | 3,910 | 3,903 | ||||||
|
| |||||||
| 10,462 | ||||||||
|
| |||||||
Forest Products & Paper — 0.0%(g) | ||||||||
Georgia-Pacific LLC, 5.40%, 11/01/2020 (e) | 200 | 208 | ||||||
|
| |||||||
Total Basic Materials | 10,670 | |||||||
|
| |||||||
Communications — 2.2% | ||||||||
Advertising — 0.0%(g) | ||||||||
Interpublic Group of Cos., Inc. (The), 3.50%, 10/01/2020 | 15 | 15 | ||||||
|
| |||||||
Media — 0.5% | ||||||||
Charter Communications Operating LLC / Charter Communications Operating Capital, 3.58%, 07/23/2020 | 1,300 | 1,312 | ||||||
Comcast Corp., (ICE LIBOR USD 3 Month + 0.44%), 2.76%, 10/01/2021 (aa) | 4,100 | 4,116 | ||||||
Discovery Communications LLC, 2.20%, 09/20/2019 | 200 | 200 | ||||||
|
| |||||||
| 5,628 | ||||||||
|
| |||||||
Telecommunications — 1.7% | ||||||||
AT&T, Inc., | ||||||||
(ICE LIBOR USD 3 Month + 0.93%), 3.26%, 06/30/2020 (aa) | 1,733 | 1,745 | ||||||
(ICE LIBOR USD 3 Month + 0.75%), 3.27%, 06/01/2021 (aa) | 1,810 | 1,819 | ||||||
(ICE LIBOR USD 3 Month + 0.95%), 3.55%, 07/15/2021 (aa) | 500 | 505 | ||||||
(ICE LIBOR USD 3 Month + 1.18%), 3.62%, 06/12/2024 (aa) | 2,000 | 2,025 | ||||||
Sprint Spectrum Co. LLC / Sprint Spectrum Co. II LLC / Sprint Spectrum Co. III LLC, 3.36%, 09/20/2021 (e) | 266 | 266 | ||||||
Telefonica Emisiones SA, (Spain), 5.88%, 07/15/2019 | 3,400 | 3,404 | ||||||
| SECURITY DESCRIPTION | PRINCIPAL AMOUNT($) | VALUE($) | ||||||
Telecommunications — continued | ||||||||
Verizon Communications, Inc., | ||||||||
(ICE LIBOR USD 3 Month + 0.37%), 2.89%, 08/15/2019 (aa) | �� | 200 | 200 | |||||
(ICE LIBOR USD 3 Month + 0.55%), 3.07%, 05/22/2020 (aa) | 2,790 | 2,801 | ||||||
3.45%, 03/15/2021 | 2,000 | 2,045 | ||||||
Vodafone Group plc, (United Kingdom), (ICE LIBOR USD 3 Month + 0.99%), 3.59%, 01/16/2024 (aa) | 3,800 | 3,809 | ||||||
|
| |||||||
| 18,619 | ||||||||
|
| |||||||
Total Communications | 24,262 | |||||||
|
| |||||||
Consumer Cyclical — 5.6% | ||||||||
Airlines — 0.1% | ||||||||
Delta Air Lines, Inc., 2.88%, 03/13/2020 | 200 | 200 | ||||||
Southwest Airlines Co., 2.75%, 11/06/2019 | 150 | 150 | ||||||
WestJet Airlines Ltd., (Canada), 3.50%, 06/16/2021 (e) | 600 | 604 | ||||||
|
| |||||||
| 954 | ||||||||
|
| |||||||
Auto Manufacturers — 5.0% | ||||||||
American Honda Finance Corp., | ||||||||
(ICE LIBOR USD 3 Month + 0.15%), 2.69%, 11/13/2019 (aa) | 2,750 | 2,751 | ||||||
(ICE LIBOR USD 3 Month + 0.35%), 2.92%, 11/05/2021 (aa) | 300 | 301 | ||||||
BMW US Capital LLC, | ||||||||
(ICE LIBOR USD 3 Month + 0.41%), 3.01%, 04/12/2021 (e) (aa) | 100 | 100 | ||||||
(ICE LIBOR USD 3 Month + 0.50%), 3.04%, 08/13/2021 (e) (aa) | 3,400 | 3,410 | ||||||
3.25%, 08/14/2020 (e) | 200 | 202 | ||||||
Daimler Finance North America LLC, 2.70%, 08/03/2020 (e) | 800 | 802 | ||||||
(ICE LIBOR USD 3 Month + 0.39%), 2.96%, 05/04/2020 (e) (aa) | 3,400 | 3,403 | ||||||
(ICE LIBOR USD 3 Month + 0.45%), 2.97%, 02/22/2021 (e) (aa) | 700 | 699 | ||||||
3.10%, 05/04/2020 (e) | 1,105 | 1,111 | ||||||
(ICE LIBOR USD 3 Month + 0.63%), 3.22%, 01/06/2020 (e) (aa) | 5,735 | 5,749 | ||||||
Ford Motor Credit Co. LLC, 2.34%, 11/02/2020 | 600 | 596 | ||||||
2.43%, 06/12/2020 | 200 | 199 | ||||||
2.60%, 11/04/2019 | 2,800 | 2,799 | ||||||
(ICE LIBOR USD 3 Month + 0.43%), 3.01%, 11/02/2020 (aa) | 1,000 | 990 | ||||||
(ICE LIBOR USD 3 Month + 1.00%), 3.59%, 01/09/2020 (aa) | 1,500 | 1,503 | ||||||
(ICE LIBOR USD 3 Month + 1.27%), 3.60%, 03/28/2022 (aa) | 300 | 295 | ||||||
SEE NOTES TO FINANCIAL STATEMENTS.
| JUNE 30, 2019 | SIX CIRCLES TRUST | 13 | ||||||
Table of Contents
Six Circles Ultra Short Duration Fund
SCHEDULE OF PORTFOLIO INVESTMENTS
AS OF JUNE 30, 2019 (Unaudited) (continued)
(Amounts in U.S. Dollars, unless otherwise noted)
(Amounts in thousands, except number of Futures contracts)
| SECURITY DESCRIPTION | PRINCIPAL AMOUNT($) | VALUE($) | ||||||
Corporate Bonds — continued | ||||||||
Auto Manufacturers — continued | ||||||||
General Motors Financial Co., Inc., 2.45%, 11/06/2020 | 1,922 | 1,916 | ||||||
(ICE LIBOR USD 3 Month + 0.54%), 3.11%, 11/06/2020 (aa) | 500 | 498 | ||||||
(ICE LIBOR USD 3 Month + 0.85%), 3.44%, 04/09/2021 (aa) | 1,000 | 1,000 | ||||||
(ICE LIBOR USD 3 Month + 0.93%), 3.53%, 04/13/2020 (aa) | 4,000 | 4,012 | ||||||
(ICE LIBOR USD 3 Month + 1.10%), 3.67%, 11/06/2021 (aa) | 730 | 729 | ||||||
3.70%, 11/24/2020 | 2,900 | 2,937 | ||||||
4.20%, 03/01/2021 | 1,500 | 1,533 | ||||||
Harley-Davidson Financial Services, Inc., 2.15%, 02/26/2020 (e) | 1,500 | 1,494 | ||||||
Hyundai Capital America, 2.60%, 03/19/2020 (e) | 800 | 800 | ||||||
Reg. S, (ICE LIBOR USD 3 Month + 0.82%), 3.26%, 03/12/2021 (aa) | 2,200 | 2,200 | ||||||
(ICE LIBOR USD 3 Month + 0.80%), 3.40%, 04/03/2020 (e) (aa) | 100 | 100 | ||||||
(ICE LIBOR USD 3 Month + 1.00%), 3.40%, 09/18/2020 (e) (aa) | 100 | 100 | ||||||
Nissan Motor Acceptance Corp., 2.15%, 07/13/2020 (e) | 700 | 697 | ||||||
Reg. S, (ICE LIBOR USD 3 Month + 0.39%), 2.72%, 09/28/2020 (aa) | 800 | 799 | ||||||
(ICE LIBOR USD 3 Month + 0.52%), 2.93%, 03/15/2021 (e) (aa) | 200 | 200 | ||||||
(ICE LIBOR USD 3 Month + 0.69%), 3.02%, 09/28/2022 (e) (aa) | 1,800 | 1,789 | ||||||
(ICE LIBOR USD 3 Month + 0.65%), 3.25%, 07/13/2022 (e) (aa) | 1,500 | 1,492 | ||||||
(ICE LIBOR USD 3 Month + 0.89%), 3.49%, 01/13/2022 (e) (aa) | 40 | 40 | ||||||
Toyota Motor Credit Corp., | ||||||||
(ICE LIBOR USD 3 Month + 0.14%), 2.67%, 11/14/2019 (aa) | 3,000 | 3,001 | ||||||
(ICE LIBOR USD 3 Month + 0.10%), 2.68%, 01/10/2020 (aa) | 1,200 | 1,200 | ||||||
(ICE LIBOR USD 3 Month + 0.28%), 2.88%, 04/13/2021 (aa) | 500 | 502 | ||||||
(ICE LIBOR USD 3 Month + 0.44%), 3.04%, 10/18/2019 (aa) | 1,450 | 1,452 | ||||||
Volkswagen Group of America Finance LLC, 2.40%, 05/22/2020 (e) | 2,000 | 1,995 | ||||||
4.00%, 11/12/2021 (e) | 400 | 413 | ||||||
Volkswagen International Finance NV, (Netherlands), 4.00%, 08/12/2020 (e) | 600 | 610 | ||||||
|
| |||||||
| 56,419 | ||||||||
|
| |||||||
Auto Parts & Equipment — 0.1% | ||||||||
ZF North America Capital, Inc., 4.00%, 04/29/2020 (e) | 650 | 653 | ||||||
|
| |||||||
| SECURITY DESCRIPTION | PRINCIPAL AMOUNT($) | VALUE($) | ||||||
Retail — 0.4% | ||||||||
McDonald’s Corp., (ICE LIBOR USD 3 Month + 0.43%), 3.01%, 10/28/2021 (aa) | 1,000 | 1,001 | ||||||
Walgreens Boots Alliance, Inc., 2.70%, 11/18/2019 | 3,950 | 3,950 | ||||||
|
| |||||||
| 4,951 | ||||||||
|
| |||||||
Total Consumer Cyclical | 62,977 | |||||||
|
| |||||||
ConsumerNon-cyclical — 7.7% | ||||||||
Agriculture — 1.3% | ||||||||
BAT Capital Corp., | 6,860 | 6,846 | ||||||
(ICE LIBOR USD 3 Month + 0.59%), 3.12%, 08/14/2020 (aa) | 400 | 401 | ||||||
(ICE LIBOR USD 3 Month + 0.88%), 3.40%, 08/15/2022 (aa) | 3,200 | 3,208 | ||||||
Imperial Brands Finance plc, (United Kingdom), 2.95%, 07/21/2020 (e) | 1,000 | 1,003 | ||||||
Reynolds American, Inc., | 300 | 312 | ||||||
6.88%, 05/01/2020 | 2,927 | 3,029 | ||||||
|
| |||||||
| 14,799 | ||||||||
|
| |||||||
Biotechnology — 0.2% | ||||||||
Amgen, Inc., (ICE LIBOR USD 3 Month + 0.45%), 2.99%, 05/11/2020 (aa) | 950 | 952 | ||||||
Gilead Sciences, Inc., 2.55%, 09/01/2020 | 1,000 | 1,003 | ||||||
|
| |||||||
| 1,955 | ||||||||
|
| |||||||
Commercial Services — 1.5% | ||||||||
Central Nippon Expressway Co. Ltd., (Japan), | ||||||||
Reg. S, 2.36%, 05/28/2021 | 10,000 | 9,989 | ||||||
Reg. S, 2.38%, 09/17/2020 | 500 | 500 | ||||||
Reg. S, (ICE LIBOR USD 3 Month + 0.56%), 3.13%, 11/02/2021 (aa) | 3,600 | 3,601 | ||||||
Equifax, Inc., (ICE LIBOR USD 3 Month + 0.87%), 3.39%, 08/15/2021 (aa) | 2,800 | 2,793 | ||||||
|
| |||||||
| 16,883 | ||||||||
|
| |||||||
Food — 0.8% | ||||||||
Conagra Brands, Inc., (ICE LIBOR USD 3 Month + 0.50%), 3.09%, 10/09/2020 (aa) | 900 | 898 | ||||||
General Mills, Inc., (ICE LIBOR USD 3 Month + 0.54%), 3.14%, 04/16/2021 (aa) | 1,840 | 1,841 | ||||||
Mondelez International Holdings Netherlands BV, (Netherlands), (ICE LIBOR USD 3 Month + 0.61%), 3.19%, 10/28/2019 (e) (aa) | 1,500 | 1,502 | ||||||
Tyson Foods, Inc., | ||||||||
(ICE LIBOR USD 3 Month + 0.45%), 2.97%, 08/21/2020 (aa) | 150 | 150 | ||||||
(ICE LIBOR USD 3 Month + 0.55%), 3.07%, 06/02/2020 (aa) | 500 | 500 | ||||||
Wm Wrigley Jr Co., | 4,000 | 4,003 | ||||||
3.38%, 10/21/2020 (e) | 500 | 507 | ||||||
|
| |||||||
| 9,401 | ||||||||
|
| |||||||
SEE NOTES TO FINANCIAL STATEMENTS.
| 14 | SIX CIRCLES TRUST | JUNE 30, 2019 | ||||
Table of Contents
| SECURITY DESCRIPTION | PRINCIPAL AMOUNT($) | VALUE($) | ||||||
Corporate Bonds — continued | ||||||||
Healthcare—Services — 0.4% | ||||||||
Dignity Health, 2.64%, 11/01/2019 | 3,000 | 2,997 | ||||||
HCA, Inc., 6.50%, 02/15/2020 | 2,000 | 2,046 | ||||||
|
| |||||||
| 5,043 | ||||||||
|
| |||||||
Pharmaceuticals — 3.5% | ||||||||
AbbVie, Inc., 2.50%, 05/14/2020 | 6,090 | 6,089 | ||||||
Allergan Funding SCS, (Luxembourg), 3.00%, 03/12/2020 | 6,480 | 6,499 | ||||||
Bayer US Finance II LLC, | ||||||||
(ICE LIBOR USD 3 Month + 0.63%), 2.98%, 06/25/2021 (e) (aa) | 1,150 | 1,142 | ||||||
(ICE LIBOR USD 3 Month + 1.01%), 3.42%, 12/15/2023 (e) (aa) | 3,400 | 3,339 | ||||||
Bristol-Myers Squibb Co., | ||||||||
(ICE LIBOR USD 3 Month + 0.20%), 2.72%, 11/16/2020 (e) (aa) | 3,550 | 3,550 | ||||||
(ICE LIBOR USD 3 Month + 0.38%), 2.90%, 05/16/2022 (e) (aa) | 1,200 | 1,203 | ||||||
Cigna Corp., | ||||||||
(ICE LIBOR USD 3 Month + 0.35%), 2.76%, 03/17/2020 (e) (aa) | 2,000 | 2,002 | ||||||
3.20%, 09/17/2020 (e) | 1,765 | 1,781 | ||||||
CVS Health Corp., | 2,430 | 2,436 | ||||||
(ICE LIBOR USD 3 Month + 0.63%), 3.08%, 03/09/2020 (aa) | 1,000 | 1,002 | ||||||
3.13%, 03/09/2020 | 3,400 | 3,413 | ||||||
(ICE LIBOR USD 3 Month + 0.72%), 3.17%, 03/09/2021 (aa) | 3,580 | 3,596 | ||||||
GlaxoSmithKline Capital plc, (United Kingdom), (ICE LIBOR USD 3 Month + 0.35%), 2.88%, 05/14/2021 (aa) | 750 | 752 | ||||||
Shire Acquisitions Investments Ireland DAC, (Ireland), 2.40%, 09/23/2021 | 40 | 40 | ||||||
Takeda Pharmaceutical Co. Ltd., (Japan), 3.80%, 11/26/2020 (e) | 1,924 | 1,959 | ||||||
|
| |||||||
| 38,803 | ||||||||
|
| |||||||
Total ConsumerNon-cyclical | 86,884 | |||||||
|
| |||||||
Diversified — 0.2% | ||||||||
Holding Companies — 0.2% | ||||||||
CK Hutchison International 17 II Ltd., (Cayman Islands), | ||||||||
2.25%, 09/29/2020 (e) | 200 | 200 | ||||||
Reg. S, 2.25%, 09/29/2020 | 1,500 | 1,496 | ||||||
|
| |||||||
Total Diversified | 1,696 | |||||||
|
| |||||||
Energy — 2.6% | ||||||||
Coal — 0.1% | ||||||||
China Shenhua Overseas Capital Co. Ltd., (British Virgin Islands), Reg. S, 3.13%, 01/20/2020 | 510 | 511 | ||||||
|
| |||||||
| SECURITY DESCRIPTION | PRINCIPAL AMOUNT($) | VALUE($) | ||||||
Oil & Gas — 0.8% | ||||||||
BP Capital Markets plc, (United Kingdom), 2.32%, 02/13/2020 | 1,174 | 1,174 | ||||||
CNOOC Finance 2015 Australia Pty Ltd., (Australia), 2.63%, 05/05/2020 | 3,250 | 3,255 | ||||||
Petronas Global Sukuk Ltd., (Malaysia), Reg. S, 2.71%, 03/18/2020 | 200 | 200 | ||||||
Phillips 66, (ICE LIBOR USD 3 Month + 0.75%), 3.35%, 04/15/2020 (e) (aa) | 500 | 500 | ||||||
Shell International Finance BV, (Netherlands), (ICE LIBOR USD 3 Month + 0.35%), 2.79%, 09/12/2019 (aa) | 4,316 | 4,319 | ||||||
|
| |||||||
| 9,448 | ||||||||
|
| |||||||
Pipelines — 1.7% | ||||||||
Enbridge, Inc., (Canada), | ||||||||
(ICE LIBOR USD 3 Month + 0.40%), 2.98%, 01/10/2020 (aa) | 3,700 | 3,701 | ||||||
(ICE LIBOR USD 3 Month + 0.70%), 3.11%, 06/15/2020 (aa) | 6,000 | 6,016 | ||||||
Enterprise Products Operating LLC, 5.20%, 09/01/2020 | 1,500 | 1,548 | ||||||
Florida Gas Transmission Co. LLC, 5.45%, 07/15/2020 (e) | 500 | 513 | ||||||
Rockies Express Pipeline LLC, 5.63%, 04/15/2020 (e) | 1,000 | 1,016 | ||||||
TransCanada PipeLines Ltd., (Canada), 3.80%, 10/01/2020 | 3,350 | 3,406 | ||||||
Williams Cos., Inc. (The), 4.13%, 11/15/2020 | 500 | 509 | ||||||
5.25%, 03/15/2020 | 2,025 | 2,063 | ||||||
|
| |||||||
| 18,772 | ||||||||
|
| |||||||
Total Energy | 28,731 | |||||||
|
| |||||||
Financial — 16.7% | ||||||||
Banks — 12.5% | ||||||||
ABN AMRO Bank NV, (Netherlands), 1.80%, 09/20/2019 (e) | 4,500 | 4,493 | ||||||
Aozora Bank Ltd., (Japan), Reg. S, 2.75%, 03/09/2020 | 200 | 200 | ||||||
Australia & New Zealand Banking Group Ltd., (Australia), (ICE LIBOR USD 3 Month + 0.32%), 2.88%, 11/09/2020 (e) (aa) | 4,000 | 4,007 | ||||||
Banco Santander Chile, (Chile), (ICE LIBOR USD 3 Month + 1.20%), 3.72%, 11/28/2021 (aa) | 3,000 | 3,052 | ||||||
Bank of America Corp., 2.63%, 10/19/2020 | 1,645 | 1,652 | ||||||
(ICE LIBOR USD 3 Month + 0.65%), 2.97%, 10/01/2021 (aa) | 1,250 | 1,253 | ||||||
(ICE LIBOR USD 3 Month + 0.66%), 3.25%, 07/21/2021 (aa) | 100 | 100 | ||||||
(ICE LIBOR USD 3 Month + 1.18%), 3.77%, 10/21/2022 (aa) | 1,000 | 1,013 | ||||||
(ICE LIBOR USD 3 Month + 1.42%), 4.01%, 04/19/2021 (aa) | 3,000 | 3,056 | ||||||
SEE NOTES TO FINANCIAL STATEMENTS.
| JUNE 30, 2019 | SIX CIRCLES TRUST | 15 | ||||||
Table of Contents
Six Circles Ultra Short Duration Fund
SCHEDULE OF PORTFOLIO INVESTMENTS
AS OF JUNE 30, 2019 (Unaudited) (continued)
(Amounts in U.S. Dollars, unless otherwise noted)
(Amounts in thousands, except number of Futures contracts)
| SECURITY DESCRIPTION | PRINCIPAL AMOUNT($) | VALUE($) | ||||||
Corporate Bonds — continued | ||||||||
Banks — continued | ||||||||
Bank of Montreal, (Canada), | ||||||||
(ICE LIBOR USD 3 Month + 0.34%), 2.94%, 07/13/2020 (aa) | 2,350 | 2,355 | ||||||
(ICE LIBOR USD 3 Month + 0.60%), 3.04%, 12/12/2019 (aa) | 785 | 787 | ||||||
(ICE LIBOR USD 3 Month + 0.79%), 3.31%, 08/27/2021 (aa) | 100 | 101 | ||||||
Barclays plc, (United Kingdom), 2.75%, 11/08/2019 | 5,600 | 5,594 | ||||||
2.88%, 06/08/2020 | 2,000 | 2,001 | ||||||
BB&T Corp., (ICE LIBOR USD 3 Month + 0.57%), 2.98%, 06/15/2020 (aa) | 4,000 | 4,020 | ||||||
Citibank NA, | 1,750 | 1,760 | ||||||
(ICE LIBOR USD 3 Month + 0.60%), 3.12%, 05/20/2022 (aa) | 1,600 | 1,602 | ||||||
Citigroup, Inc., | 100 | 101 | ||||||
(ICE LIBOR USD 3 Month + 1.07%), 3.52%, 12/08/2021 (aa) | 2,000 | 2,021 | ||||||
Citizens Bank NA, (ICE LIBOR USD 3 Month + 0.54%), 3.06%, 03/02/2020 (aa) | 5,000 | 5,009 | ||||||
Commonwealth Bank of Australia, (Australia), 2.05%, 09/18/2020 (e) | 1,500 | 1,496 | ||||||
Credit Suisse Group Funding Guernsey Ltd., (Guernsey), 2.75%, 03/26/2020 | 5,800 | 5,809 | ||||||
Fifth Third Bank, | ||||||||
(ICE LIBOR USD 3 Month + 0.25%), 2.83%, 10/30/2020 (aa) | 1,000 | 1,000 | ||||||
(ICE LIBOR USD 3 Month + 0.59%), 2.90%, 09/27/2019 (aa) | 1,550 | 1,551 | ||||||
Goldman Sachs Group, Inc. (The), 2.35%, 11/15/2021 | 55 | 55 | ||||||
2.75%, 09/15/2020 | 50 | 50 | ||||||
(ICE LIBOR USD 3 Month + 0.73%), 3.04%, 12/27/2020 (aa) | 4,900 | 4,909 | ||||||
(ICE LIBOR USD 3 Month + 1.17%), 3.69%, 11/15/2021 (aa) | 750 | 756 | ||||||
(ICE LIBOR USD 3 Month + 1.16%), 3.75%, 04/23/2020 (aa) | 3,800 | 3,824 | ||||||
(ICE LIBOR USD 3 Month + 1.36%), 3.94%, 04/23/2021 (aa) | 100 | 101 | ||||||
HSBC Holdings plc, (United Kingdom), | ||||||||
(ICE LIBOR USD 3 Month + 0.60%), 3.12%, 05/18/2021 (aa) | 1,700 | 1,701 | ||||||
(ICE LIBOR USD 3 Month + 1.00%), 3.52%, 05/18/2024 (aa) | 2,000 | 2,005 | ||||||
(ICE LIBOR USD 3 Month + 1.50%), 4.10%, 01/05/2022 (aa) | 1,000 | 1,022 | ||||||
(ICE LIBOR USD 3 Month + 1.66%), 4.18%, 05/25/2021 (aa) | 1,450 | 1,482 | ||||||
Huntington National Bank (The), | ||||||||
2.38%, 03/10/2020 | 1,500 | 1,499 | ||||||
2.88%, 08/20/2020 | 400 | 403 | ||||||
| SECURITY DESCRIPTION | PRINCIPAL AMOUNT($) | VALUE($) | ||||||
Banks — continued | ||||||||
Lloyds Bank plc, (United Kingdom), 5.80%, 01/13/2020 (e) | 500 | 509 | ||||||
Lloyds Banking Group plc, (United Kingdom), (ICE LIBOR USD 3 Month + 0.80%), 3.19%, 06/21/2021 (aa) | 1,000 | 1,000 | ||||||
Mitsubishi UFJ Financial Group, Inc., (Japan), | ||||||||
(ICE LIBOR USD 3 Month + 0.65%), 3.24%, 07/26/2021 (aa) | 700 | 703 | ||||||
(ICE LIBOR USD 3 Month + 0.79%), 3.37%, 07/25/2022 (aa) | 3,400 | 3,411 | ||||||
(ICE LIBOR USD 3 Month + 1.06%), 3.51%, 09/13/2021 (aa) | 1,400 | 1,415 | ||||||
Mizuho Financial Group, Inc., (Japan), | ||||||||
(ICE LIBOR USD 3 Month + 0.88%), 3.33%, 09/11/2022 (aa) | 3,400 | 3,420 | ||||||
(ICE LIBOR USD 3 Month + 0.94%), 3.46%, 02/28/2022 (aa) | 1,000 | 1,008 | ||||||
Morgan Stanley, | 50 | 50 | ||||||
2.80%, 06/16/2020 | 1,300 | 1,306 | ||||||
(ICE LIBOR USD 3 Month + 0.55%), 3.10%, 02/10/2021 (aa) | 3,300 | 3,304 | ||||||
(ICE LIBOR USD 3 Month + 0.93%), 3.52%, 07/22/2022 (aa) | 2,700 | 2,717 | ||||||
(ICE LIBOR USD 3 Month + 1.18%), 3.77%, 01/20/2022 (aa) | 1,000 | 1,011 | ||||||
National Australia Bank Ltd., (Australia), (ICE LIBOR USD 3 Month + 1.00%), 3.60%, 07/12/2021 (e) (aa) | 1,150 | 1,164 | ||||||
Nordea Bank Abp, (Finland), 2.13%, 05/29/2020 (e) | 2,000 | �� | 1,996 | |||||
(ICE LIBOR USD 3 Month + 0.47%), 2.99%, 05/29/2020 (e) (aa) | 1,500 | 1,505 | ||||||
(ICE LIBOR USD 3 Month + 0.94%), 3.46%, 08/30/2023 (e) (aa) | 200 | 197 | ||||||
QNB Finance Ltd., (Cayman Islands), Reg. S, (ICE LIBOR USD 3 Month + 1.35%), 3.87%, 05/31/2021 (aa) | 200 | 202 | ||||||
Royal Bank of Scotland Group plc, (United Kingdom), (ICE LIBOR USD 3 Month + 1.47%), 3.99%, 05/15/2023 (aa) | 400 | 399 | ||||||
Santander UK plc, (United Kingdom), 2.38%, 03/16/2020 | 200 | 200 | ||||||
Skandinaviska Enskilda Banken AB, (Sweden), 2.63%, 11/17/2020 (e) | 200 | 200 | ||||||
(ICE LIBOR USD 3 Month + 0.43%), 2.96%, 05/17/2021 (e) (aa) | 1,500 | 1,504 | ||||||
Standard Chartered plc, (United Kingdom), 2.10%, 08/19/2019 (e) | 200 | 200 | ||||||
3.05%, 01/15/2021 (e) | 1,000 | 1,007 | ||||||
(ICE LIBOR USD 3 Month + 1.13%), 3.65%, 08/19/2019 (e) (aa) | 3,200 | 3,204 | ||||||
State Bank of India, (India), Reg. S, (ICE LIBOR USD 3 Month + 0.95%), 3.54%, 04/06/2020 (aa) | 2,800 | 2,805 | ||||||
SEE NOTES TO FINANCIAL STATEMENTS.
| 16 | SIX CIRCLES TRUST | JUNE 30, 2019 | ||||
Table of Contents
| SECURITY DESCRIPTION | PRINCIPAL AMOUNT($) | VALUE($) | ||||||
Corporate Bonds — continued | ||||||||
Banks — continued | ||||||||
Sumitomo Mitsui Banking Corp., (Japan), 2.45%, 01/16/2020 | 2,000 | 2,000 | ||||||
Sumitomo Mitsui Financial Group, Inc., (Japan), | ||||||||
(ICE LIBOR USD 3 Month + 0.78%), 3.38%, 07/12/2022 (aa) | 3,400 | 3,414 | ||||||
(ICE LIBOR USD 3 Month + 1.68%), 4.13%, 03/09/2021 (aa) | 100 | 102 | ||||||
SunTrust Bank, (ICE LIBOR USD 3 Month + 0.50%), 3.09%, 10/26/2021 (aa) | 1,180 | 1,182 | ||||||
Svenska Handelsbanken AB, (Sweden), (ICE LIBOR USD 3 Month + 0.36%), 2.81%, 09/08/2020 (aa) | 2,500 | 2,505 | ||||||
Synchrony Bank, (ICE LIBOR USD 3 Month + 0.63%), 2.95%, 03/30/2020 (aa) | 2,200 | 2,202 | ||||||
UBS AG, (Switzerland), | 2,000 | 2,000 | ||||||
2.45%, 12/01/2020 (e) | 400 | 400 | ||||||
(ICE LIBOR USD 3 Month + 0.58%), 3.03%, 06/08/2020 (e) (aa) | 2,100 | 2,108 | ||||||
UBS Group Funding Switzerland AG, (Switzerland), (ICE LIBOR USD 3 Month + 1.78%), 4.38%, 04/14/2021 (e) (aa) | 3,400 | 3,482 | ||||||
US Bank NA, (ICE LIBOR USD 3 Month + 0.48%), 3.06%, 10/28/2019 (aa) | 1,320 | 1,321 | ||||||
Wells Fargo & Co., | ||||||||
(ICE LIBOR USD 3 Month + 0.68%), 3.26%, 01/30/2020 (aa) | 1,500 | 1,505 | ||||||
(ICE LIBOR USD 3 Month + 0.93%), 3.47%, 02/11/2022 (aa) | 1,500 | 1,509 | ||||||
(ICE LIBOR USD 3 Month + 1.01%), 3.48%, 12/07/2020 (aa) | 100 | 101 | ||||||
Wells Fargo Bank NA, | ||||||||
(ICE LIBOR USD 1 Month + 0.22%), 2.60%, 07/15/2020 (aa) | 3,000 | 3,001 | ||||||
(United States SOFR + 0.48%), 2.90%, 03/25/2020 (aa) | 1,250 | 1,251 | ||||||
(ICE LIBOR USD 3 Month + 0.62%), 3.14%, 05/27/2022 (aa) | 3,000 | 3,007 | ||||||
(ICE LIBOR USD 3 Month + 0.49%), 3.33%, 07/23/2021 (aa) | 2,000 | 2,019 | ||||||
|
| |||||||
| 139,386 | ||||||||
|
| |||||||
Diversified Financial Services — 2.2% | ||||||||
AerCap Ireland Capital DAC / AerCap Global Aviation Trust, (Ireland), 4.25%, 07/01/2020 | 600 | 609 | ||||||
4.63%, 10/30/2020 | 3,580 | 3,671 | ||||||
Aircastle Ltd., (Bermuda), 5.50%, 02/15/2022 | 1,350 | 1,431 | ||||||
American Express Co., | 3,300 | 3,340 | ||||||
(ICE LIBOR USD 3 Month + 0.33%), 2.91%, 10/30/2020 (aa) | 2,000 | 2,003 | ||||||
(ICE LIBOR USD 3 Month + 0.53%), 3.05%, 05/17/2021 (aa) | 1,000 | 1,004 | ||||||
| SECURITY DESCRIPTION | PRINCIPAL AMOUNT($) | VALUE($) | ||||||
Diversified Financial Services — continued | ||||||||
BOC Aviation Ltd., (Singapore), | ||||||||
Reg. S, 2.38%, 09/15/2021 | 2,200 | 2,173 | ||||||
(ICE LIBOR USD 3 Month + 1.05%), 3.63%, 05/02/2021 (e) (aa) | 200 | 201 | ||||||
Capital One Financial Corp., 2.40%, 10/30/2020 | 3,000 | 3,003 | ||||||
2.50%, 05/12/2020 | 1,000 | 1,001 | ||||||
GE Capital International Funding Co. Unlimited Co., (Ireland), 2.34%, 11/15/2020 | 700 | 697 | ||||||
Mitsubishi UFJ Lease & Finance Co. Ltd., (Japan), 2.65%, 09/19/2022 (e) | 800 | 800 | ||||||
Reg. S, 2.75%, 10/21/2020 | 2,500 | 2,509 | ||||||
Nomura Holdings, Inc., (Japan), 6.70%, 03/04/2020 | 200 | 206 | ||||||
OMX Timber Finance Investments I LLC, 5.42%, 10/31/2019 (e) | 200 | 202 | ||||||
Synchrony Financial, 3.00%, 08/15/2019 | 2,050 | 2,050 | ||||||
|
| |||||||
| 24,900 | ||||||||
|
| |||||||
Insurance — 1.0% | ||||||||
AIA Group Ltd., (Hong Kong), (ICE LIBOR USD 3 Month + 0.52%), 2.91%, 09/20/2021 (e) (aa) | 3,400 | 3,397 | ||||||
American International Group, Inc., 3.38%, 08/15/2020 | 7 | 7 | ||||||
Metropolitan Life Global Funding I, | ||||||||
(ICE LIBOR USD 3 Month + 0.23%), 2.82%, 01/08/2021 (e) (aa) | 2,000 | 2,000 | ||||||
(United States SOFR + 0.50%), 2.92%, 05/28/2021 (e) (aa) | 3,900 | 3,899 | ||||||
Protective Life Global Funding, 1.56%, 09/13/2019 (e) | 2,000 | 1,996 | ||||||
|
| |||||||
| 11,299 | ||||||||
|
| |||||||
Real Estate — 0.5% | ||||||||
Qatari Diar Finance Co., (Qatar), Reg. S, 5.00%, 07/21/2020 | 5,000 | 5,119 | ||||||
Sinochem Overseas Capital Co. Ltd., (British Virgin Islands), Reg. S, 4.50%, 11/12/2020 | 200 | 205 | ||||||
|
| |||||||
| 5,324 | ||||||||
|
| |||||||
REITS — 0.4% | ||||||||
WEA Finance LLC / Westfield UK & Europe Finance plc, 2.70%, 09/17/2019 (e) | 4,500 | 4,500 | ||||||
|
| |||||||
Savings & Loans — 0.1% | ||||||||
Nationwide Building Society, (United Kingdom), | ||||||||
Reg. S, 2.35%, 01/21/2020 | 200 | 200 | ||||||
6.25%, 02/25/2020 (e) | 1,000 | 1,024 | ||||||
|
| |||||||
| 1,224 | ||||||||
|
| |||||||
Total Financial | 186,633 | |||||||
|
| |||||||
SEE NOTES TO FINANCIAL STATEMENTS.
| JUNE 30, 2019 | SIX CIRCLES TRUST | 17 | ||||||
Table of Contents
Six Circles Ultra Short Duration Fund
SCHEDULE OF PORTFOLIO INVESTMENTS
AS OF JUNE 30, 2019 (Unaudited) (continued)
(Amounts in U.S. Dollars, unless otherwise noted)
(Amounts in thousands, except number of Futures contracts)
| SECURITY DESCRIPTION | PRINCIPAL AMOUNT($) | VALUE($) | ||||||
Corporate Bonds — continued | ||||||||
Industrial — 3.7% | ||||||||
Aerospace/Defense — 0.7% | ||||||||
Boeing Co. (The), 4.88%, 02/15/2020 | 4,250 | 4,313 | ||||||
Harris Corp., (ICE LIBOR USD 3 Month + 0.48%), 3.06%, 04/30/2020 (aa) | 200 | 200 | ||||||
Northrop Grumman Corp., 2.08%, 10/15/2020 | 1,000 | 998 | ||||||
Rolls-Royce plc, (United Kingdom), 2.38%, 10/14/2020 (e) | 1,500 | 1,498 | ||||||
United Technologies Corp., 3.35%, 08/16/2021 | 480 | 491 | ||||||
|
| |||||||
| 7,500 | ||||||||
|
| |||||||
Building Materials — 0.0%(g) | ||||||||
Holcim US Finance Sarl & Cie SCS, (Luxembourg), Reg. S, 6.00%, 12/30/2019 | 250 | 253 | ||||||
|
| |||||||
Electronics — 0.4% | ||||||||
Honeywell International, Inc., (ICE LIBOR USD 3 Month + 0.04%), 2.62%, 10/30/2019 (aa) | 4,150 | 4,151 | ||||||
Tyco Electronics Group SA, (Luxembourg), (ICE LIBOR USD 3 Month + 0.45%), 2.93%, 06/05/2020 (aa) | 1,000 | 1,001 | ||||||
|
| |||||||
| 5,152 | ||||||||
|
| |||||||
Machinery—Diversified — 0.3% | ||||||||
CNH Industrial Capital LLC, 3.38%, 07/15/2019 | 200 | 200 | ||||||
John Deere Capital Corp., (ICE LIBOR USD 3 Month + 0.18%), 2.77%, 01/07/2020 (aa) | 3,000 | 3,002 | ||||||
|
| |||||||
| 3,202 | ||||||||
|
| |||||||
Miscellaneous Manufacturers — 0.6% | ||||||||
General Electric Co., | 1,500 | 1,534 | ||||||
6.00%, 08/07/2019 | 975 | 978 | ||||||
Siemens Financieringsmaatschappij NV, (Netherlands), | 3,250 | 3,245 | ||||||
(ICE LIBOR USD 3 Month + 0.32%), 2.77%, 09/13/2019 (e) (aa) | 1,030 | 1,031 | ||||||
|
| |||||||
| 6,788 | ||||||||
|
| |||||||
Transportation — 1.0% | ||||||||
Burlington Northern Santa Fe LLC, 4.70%, 10/01/2019 | 3,000 | 3,015 | ||||||
Ryder System, Inc., | 1,843 | 1,843 | ||||||
2.65%, 03/02/2020 | 3,800 | 3,803 | ||||||
2.88%, 06/01/2022 | 1,500 | 1,517 | ||||||
United Parcel Service of America, Inc., 8.38%, 04/01/2020 | 1,356 | 1,417 | ||||||
|
| |||||||
| 11,595 | ||||||||
|
| |||||||
| SECURITY DESCRIPTION | PRINCIPAL AMOUNT($) | VALUE($) | ||||||
Trucking & Leasing — 0.7% | ||||||||
Aviation Capital Group LLC, 2.88%, 01/20/2022 (e) | 3,300 | 3,323 | ||||||
GATX Corp., (ICE LIBOR USD 3 Month + 0.72%), 3.29%, 11/05/2021 (aa) | 500 | 498 | ||||||
Penske Truck Leasing Co. LP / PTL Finance Corp., 3.20%, 07/15/2020 (e) | 3,700 | 3,717 | ||||||
|
| |||||||
| 7,538 | ||||||||
|
| |||||||
Total Industrial | 42,028 | |||||||
|
| |||||||
Technology — 2.8% | ||||||||
Computers — 1.0% | ||||||||
Dell International LLC / EMC Corp., 4.42%, 06/15/2021 (e) | 1,000 | 1,030 | ||||||
DXC Technology Co., (ICE LIBOR USD 3 Month + 0.95%), 3.47%, 03/01/2021 (aa) | 2,000 | 2,000 | ||||||
Hewlett Packard Enterprise Co., | ||||||||
(ICE LIBOR USD 3 Month + 0.72%), 3.32%, 10/05/2021 (aa) | 1,464 | 1,464 | ||||||
3.60%, 10/15/2020 | 1,250 | 1,267 | ||||||
IBM Credit LLC, (ICE LIBOR USD 3 Month + 0.47%), 2.99%, 11/30/2020 (aa) | 420 | 422 | ||||||
International Business Machines Corp., 1.90%, 01/27/2020 | 4,500 | 4,491 | ||||||
NetApp, Inc., 2.00%, 09/27/2019 | 900 | 899 | ||||||
|
| |||||||
| 11,573 | ||||||||
|
| |||||||
Semiconductors — 1.0% | ||||||||
Broadcom Corp. / Broadcom Cayman Finance Ltd., | 650 | 644 | ||||||
2.38%, 01/15/2020 | 4,745 | 4,737 | ||||||
Intel Corp., (ICE LIBOR USD 3 Month + 0.08%), 2.62%, 05/11/2020 (aa) | 1,500 | 1,501 | ||||||
KLA-Tencor Corp., 3.38%, 11/01/2019 | 1,000 | 1,002 | ||||||
NXP BV / NXP Funding LLC, (Netherlands), 3.88%, 09/01/2022 (e) | 400 | 411 | ||||||
4.13%, 06/01/2021 (e) | 2,300 | 2,353 | ||||||
|
| |||||||
| 10,648 | ||||||||
|
| |||||||
Software — 0.8% | ||||||||
Adobe, Inc., 4.75%, 02/01/2020 | 1,250 | 1,267 | ||||||
Fidelity National Information Services, Inc., 3.63%, 10/15/2020 | 2,850 | 2,892 | ||||||
Oracle Corp., 5.00%, 07/08/2019 | 4,500 | 4,502 | ||||||
VMware, Inc., 2.30%, 08/21/2020 | 200 | 200 | ||||||
|
| |||||||
| 8,861 | ||||||||
|
| |||||||
Total Technology | 31,082 | |||||||
|
| |||||||
Utilities — 1.7% | ||||||||
Electric — 1.7% | ||||||||
Chugoku Electric Power Co., Inc. (The), (Japan), Reg. S, 2.70%, 03/16/2020 | 3,300 | 3,303 | ||||||
Electricite de France SA, (France), 4.60%, 01/27/2020 (e) | 4,000 | 4,049 | ||||||
SEE NOTES TO FINANCIAL STATEMENTS.
| 18 | SIX CIRCLES TRUST | JUNE 30, 2019 | ||||
Table of Contents
| SECURITY DESCRIPTION | PRINCIPAL AMOUNT($) | VALUE($) | ||||||
Corporate Bonds — continued | ||||||||
Electric — continued | ||||||||
Exelon Generation Co. LLC, 5.20%, 10/01/2019 | 2,000 | 2,012 | ||||||
Iberdrola Finance Ireland DAC, (Ireland), 5.00%, 09/11/2019 (e) | 200 | 201 | ||||||
NextEra Energy Capital Holdings, Inc., | ||||||||
(ICE LIBOR USD 3 Month + 0.32%), 2.84%, 09/03/2019 (aa) | 1,500 | 1,501 | ||||||
(ICE LIBOR USD 3 Month + 0.40%), 2.92%, 08/21/2020 (aa) | 3,400 | 3,398 | ||||||
Sempra Energy, | ||||||||
(ICE LIBOR USD 3 Month + 0.25%), 2.85%, 07/15/2019 (aa) | 2,809 | 2,809 | ||||||
(ICE LIBOR USD 3 Month + 0.50%), 3.10%, 01/15/2021 (aa) | 200 | 199 | ||||||
Southern Co. (The), 2.75%, 06/15/2020 | 1,181 | 1,185 | ||||||
|
| |||||||
Total Utilities | 18,657 | |||||||
|
| |||||||
Total Corporate Bonds | 493,620 | |||||||
|
| |||||||
Foreign Government Securities — 2.0% | ||||||||
Export-Import Bank of India, (India), | ||||||||
Reg. S, 2.75%, 08/12/2020 | 200 | 200 | ||||||
Reg. S, (ICE LIBOR USD 3 Month + 1.00%), 3.52%, 08/21/2022 (aa) | 3,400 | 3,398 | ||||||
Export-Import Bank of Korea, (South Korea), (ICE LIBOR USD 3 Month + 0.58%), 3.10%, 06/01/2021 (aa) | 6,250 | 6,263 | ||||||
International Bank for Reconstruction & Development, (Supranational), 2.82%, 06/05/2024 | 3,000 | 3,034 | ||||||
Japan Treasury Discount Bill, (Japan), Zero Coupon, 07/22/2019 | JPY 1,082,000 | 10,037 | ||||||
|
| |||||||
Total Foreign Government Securities | 22,932 | |||||||
|
| |||||||
Mortgage-Backed Securities — 2.7% | ||||||||
FNMA Pool, Single Family, 15 years, 3.50%, 04/01/2033 | 909 | 947 | ||||||
3.50%, 11/01/2033 | 14,951 | 15,450 | ||||||
3.50%, 01/01/2034 | 11,689 | 12,076 | ||||||
FNMA or FHLMC, Single Family, 30 years, TBA, 4.00%, 08/01/2049 (w) | 1,900 | 1,963 | ||||||
|
| |||||||
Total Mortgage-Backed Securities | 30,436 | |||||||
|
| |||||||
U.S. Government Agency Security — 0.4% | ||||||||
FHLMC, 2.80%, 06/03/2024 | 4,000 | 4,004 | ||||||
|
| |||||||
U.S. Treasury Obligations — 7.1% | ||||||||
U.S. Treasury Floating Rate Notes, | ||||||||
(U.S. Treasury 3 Month Bill Market Yield + 0.05%), 2.14%, 10/31/2020 (aa) | 5,000 | 4,992 | ||||||
(U.S. Treasury 3 Month Bill Market Yield + 0.12%), 2.21%, 01/31/2021 (aa) | 10,000 | 9,991 | ||||||
| SECURITY DESCRIPTION | PRINCIPAL AMOUNT($) | VALUE($) | ||||||
U.S. Treasury Obligations — continued | ||||||||
U.S. Treasury Inflation Indexed Notes, 0.13%, 04/15/2022 | 6,305 | 6,256 | ||||||
0.13%, 01/15/2023 (cc) | 9,189 | 9,137 | ||||||
0.38%, 07/15/2023 (cc) | 6,644 | 6,697 | ||||||
0.63%, 04/15/2023 (cc) | 16,975 | 17,175 | ||||||
U.S. Treasury Notes, | 10,000 | 9,952 | ||||||
1.25%, 10/31/2019 | 3,000 | 2,991 | ||||||
1.50%, 06/15/2020 | 10,000 | 9,956 | ||||||
3.38%, 11/15/2019 | 1,900 | 1,908 | ||||||
|
| |||||||
Total U.S. Treasury Obligations | 79,055 | |||||||
|
| |||||||
Short-Term Investments — 30.4% | ||||||||
Certificates of Deposit — 3.4% | ||||||||
Bank of Nova Scotia, (Canada), (ICE LIBOR USD 3 Month + 0.06%), 2.63%, 05/07/2020 (aa) | 4,000 | 4,000 | ||||||
Barclays Bank plc, (United Kingdom), (ICE LIBOR USD 3 Month + 0.28%), 2.85%, 05/07/2020 (aa) | 2,000 | 2,000 | ||||||
Canadian Imperial Bank of Commerce, (Canada), (ICE LIBOR USD 1 Month + 0.30%), 2.70%, 07/29/2019 (aa) | 2,500 | 2,500 | ||||||
Credit Agricole Corporate and Investment Bank, (France), (United States FEDEF + 0.33%), 2.71%, 06/12/2020 (aa) | 4,000 | 4,000 | ||||||
Lloyds Bank Corporate Markets plc, 3.04%, 07/29/2019 (n) | 3,500 | 3,502 | ||||||
MUFG Bank Ltd., 2.97%, 01/28/2020 (n) | 1,000 | 1,004 | ||||||
Natixis SA, (France), (ICE LIBOR USD 1 Month + 0.29%), 2.70%, 06/05/2020 (aa) | 4,500 | 4,503 | ||||||
Norinchukin Bank, 2.53%, 12/04/2019 (n) | 4,500 | 4,504 | ||||||
Societe Generale, (France), (ICE LIBOR USD 3 Month + 0.18%), 2.77%, 04/24/2020 (aa) | 4,000 | 4,001 | ||||||
Standard Chartered Bank, (United Kingdom), (ICE LIBOR USD 1 Month + 0.13%), 2.54%, 12/11/2019 (aa) | 4,500 | 4,501 | ||||||
Sumitomo Mitsui Banking Corp., (Japan), (ICE LIBOR USD 3 Month + 0.04%), 2.64%, 10/18/2019 (aa) | 1,000 | 1,000 | ||||||
Sumitomo Mitsui Trust Bank Ltd., (Japan), (ICE LIBOR USD 3 Month + 0.20%), 2.79%, 07/09/2019 (aa) | 250 | 250 | ||||||
Swedbank AB, (Sweden), (ICE LIBOR USD 1 Month + 0.29%), 2.69%, 07/25/2019 (aa) | 2,000 | 2,000 | ||||||
|
| |||||||
Total Certificates of Deposit | 37,765 | |||||||
|
| |||||||
Commercial Papers — 8.4% | ||||||||
AT&T, Inc., 2.82%, 07/29/2019 (n) | 3,780 | 3,772 | ||||||
BAT International Finance plc, (United Kingdom), 2.96%, 07/09/2019 (e) (n) | 2,000 | 1,998 | ||||||
Bedford Row Funding Corp., 3.09%, 10/18/2019 (e) (n) | 2,000 | 1,986 | ||||||
SEE NOTES TO FINANCIAL STATEMENTS.
| JUNE 30, 2019 | SIX CIRCLES TRUST | 19 | ||||||
Table of Contents
Six Circles Ultra Short Duration Fund
SCHEDULE OF PORTFOLIO INVESTMENTS
AS OF JUNE 30, 2019 (Unaudited) (continued)
(Amounts in U.S. Dollars, unless otherwise noted)
(Amounts in thousands, except number of Futures contracts)
| SECURITY DESCRIPTION | PRINCIPAL AMOUNT($) | VALUE($) | ||||||
Short-Term Investments — continued | ||||||||
Commercial Papers — continued | ||||||||
Bell Canada, Inc., (Canada), Series CP, 3.01%, 08/19/2019 (e) (n) | 3,000 | 2,989 | ||||||
Commonwealth Bank of Australia, (Australia), (ICE LIBOR USD 1 Month + 0.17%), 2.61%, 04/02/2020 (e) (aa) | 3,000 | 3,001 | ||||||
DNB Bank ASA, (Norway), (ICE LIBOR USD 3 Month + 0.04%), 2.49%, 03/09/2020 (e) (aa) | 4,500 | 4,500 | ||||||
Duke Energy Corp., 2.89%, 08/16/2019 (e) (n) | 4,000 | 3,986 | ||||||
Eli Lilly & Co., 2.75%, 10/31/2019 (e) (n) | 4,000 | 3,968 | ||||||
EssilorLuxottica SA, (France), 2.73%, 09/03/2019 (e) (n) | 4,500 | 4,480 | ||||||
Exxon Mobil Corp., | 4,500 | 4,470 | ||||||
2.30%, 09/17/2019 (e) (n) | 4,500 | 4,477 | ||||||
Ford Motor Credit Co. LLC, 3.43%, 01/21/2020 (e) (n) | 1,400 | 1,375 | ||||||
HSBC Bank plc, (United Kingdom), (ICE LIBOR USD 3 Month + 0.20%), 2.55%, 09/25/2019 (e) (aa) | 1,500 | 1,501 | ||||||
LVMH Moet Hennessy Louis Vuitton, Inc., 2.74%, 10/07/2019 (e) (n) | 4,000 | 3,973 | ||||||
Marriott International, Inc., | 1,000 | 996 | ||||||
2.75%, 08/14/2019 (e) (n) | 3,000 | 2,990 | ||||||
National Australia Bank Ltd., (Australia), (ICE LIBOR USD 1 Month + 0.18%), 2.58%, 06/25/2020 (e) (aa) | 4,500 | 4,500 | ||||||
Nationwide Building Society, (United Kingdom), 2.52%, 11/01/2019 (e) (n) | 4,500 | 4,464 | ||||||
Nutrien Ltd., (Canada), 2.58%, 07/25/2019 (e) (n) | 2,500 | 2,495 | ||||||
PepsiCo., Inc., 2.27%, 07/22/2019 (e) (n) | 5,000 | 4,992 | ||||||
Reckitt Benckiser Treasury Service plc, (United Kingdom), 2.81%, 07/25/2019 (e) (n) | 3,250 | 3,244 | ||||||
Regency Markets No. 1 LLC, 2.45%, 07/05/2019 (n) | 3,500 | 3,498 | ||||||
Royal Bank of Canada, (Canada), (United States FEDEF + 0.28%), 2.66%, 04/09/2020 (e) (aa) | 2,000 | 2,000 | ||||||
Societe Generale SA, (France), (ICE LIBOR USD 3 Month + 0.18%), 2.74%, 05/11/2020 (e) (aa) | 4,500 | 4,501 | ||||||
Suncor Energy, Inc., (Canada), 2.81%, 07/22/2019 (e) (n) | 3,000 | 2,995 | ||||||
Syngenta Wilmington, Inc., 3.30%, 07/08/2019 (e) (n) | 3,300 | 3,298 | ||||||
Toronto-Dominion Bank (The), (Canada), 3.09%, 10/18/2019 (e) (n) | 2,000 | 1,986 | ||||||
VW Credit, Inc., | 1,400 | 1,370 | ||||||
3.03%, 10/07/2019 (n) | 1,000 | 993 | ||||||
3.06%, 12/06/2019 (n) | 1,050 | 1,038 | ||||||
Walgreens Boots Alliance, Inc., 2.54%, 09/27/2019 (e) (n) | 2,000 | 1,987 | ||||||
|
| |||||||
Total Commercial Papers | 93,823 | |||||||
|
| |||||||
| SECURITY DESCRIPTION | PRINCIPAL AMOUNT($) | VALUE($) | ||||||
Corporate Notes — 0.5% | ||||||||
BellSouth LLC, 4.27%, 04/26/2020 (e) | 2,000 | 2,027 | ||||||
Caterpillar Financial Services Corp., (ICE LIBOR USD 3 Month + 0.10%), 2.52%, 06/19/2020 (aa) | 3,993 | 3,992 | ||||||
|
| |||||||
Total Corporate Notes | 6,019 | |||||||
|
| |||||||
Repurchase Agreements — 17.2% | ||||||||
BNP Paribas SA, 2.49%, dated 06/28/2019, due 07/01/2019, repurchase price $64,013, collateralized by U.S. Treasury Securities, 0.00% - 2.75%, due 07/18/2019 - 11/15/2045, with a value of $65,256. | 64,000 | 64,000 | ||||||
BofA Securities, Inc., 2.48%, dated 06/28/2019, due 07/01/2019, repurchase price $64,013, collateralized by U.S. Treasury Securities, 1.38% - 1.88%, due 02/29/2020 - 02/28/2022, with a value of $65,297. | 64,000 | 64,000 | ||||||
Citibank NA, 2.49%, dated 06/28/2019, due 07/01/2019, repurchase price $64,013, collateralized by U.S. Treasury Securities, 0.75% - 3.63%, due 01/15/2028 -02/15/2044, with a value of $65,299. | 64,000 | 64,000 | ||||||
|
| |||||||
Total Repurchase Agreements | 192,000 | |||||||
|
| |||||||
Time Deposits — 0.9% | ||||||||
Australia & New Zealand Banking Group Ltd., 1.76%, 07/01/2019 | 9,177 | 9,177 | ||||||
Brown Brothers Harriman, | GBP | 1 | 1 | |||||
0.81%, 07/02/2019 | CAD | 215 | 164 | |||||
1.76%, 07/01/2019 | 327 | 327 | ||||||
Citibank NA, | ||||||||
(0.58%), 07/01/2019 | EUR | 249 | 283 | |||||
1.76%, 07/01/2019 | 527 | 527 | ||||||
|
| |||||||
Total Time Deposits | 10,479 | |||||||
|
| |||||||
Total Short-Term Investments | 340,086 | |||||||
|
| |||||||
Total Investments — 102.7% | 1,149,343 | |||||||
Liabilities in Excess of Other Assets — (2.7)% | (29,690 | ) | ||||||
|
| |||||||
NET ASSETS — 100.0% | $ | 1,119,653 | ||||||
|
| |||||||
SEE NOTES TO FINANCIAL STATEMENTS.
| 20 | SIX CIRCLES TRUST | JUNE 30, 2019 | ||||
Table of Contents
| Futures contracts outstanding as of June 30, 2019: | ||||||||||||||||||||
| Exchange Traded | ||||||||||||||||||||
| DESCRIPTION | NUMBER OF CONTRACTS | EXPIRATION DATE | TRADING CURRENCY | NOTIONAL AMOUNT($) | VALUE AND UNREALIZED APPRECIATION (DEPRECIATION)($) | |||||||||||||||
Long Contracts |
| |||||||||||||||||||
Canadian 10 Year Government Bond | 40 | 09/2019 | CAD | 4,385 | (19 | ) | ||||||||||||||
Canadian Bankers’ Acceptance | 234 | 06/2020 | CAD | 43,443 | 460 | |||||||||||||||
Canadian Bankers’ Acceptance | 177 | 12/2020 | CAD | 33,195 | 42 | |||||||||||||||
Canadian Bankers’ Acceptance | 116 | 09/2020 | CAD | 21,628 | 149 | |||||||||||||||
U.S. Treasury 5 Year Note | 66 | 09/2019 | USD | 7,667 | 131 | |||||||||||||||
U.S. Ultra Treasury 10 Year Note | 30 | 09/2019 | USD | 4,057 | 87 | |||||||||||||||
|
| |||||||||||||||||||
| 850 | ||||||||||||||||||||
|
| |||||||||||||||||||
Short Contracts | ||||||||||||||||||||
3 Month Eurodollar | (885 | ) | 06/2020 | USD | (217,248 | ) | (418 | ) | ||||||||||||
U.S. Treasury 2 Year Note | (52 | ) | 09/2019 | USD | (11,152 | ) | (37 | ) | ||||||||||||
|
| |||||||||||||||||||
| (455 | ) | |||||||||||||||||||
|
| |||||||||||||||||||
Total unrealized appreciation (depreciation) | 395 | |||||||||||||||||||
|
| |||||||||||||||||||
| Forward foreign currency exchange contracts outstanding as of June 30, 2019: | ||||||||||||||||||||
| CURRENCY PURCHASED | CURRENCY SOLD | COUNTERPARTY | SETTLEMENT DATE | UNREALIZED APPRECIATION (DEPRECIATION)($) | ||||||||||||||||
USD | 10,121 | JPY | 1,082,000 | Morgan Stanley & Co. | 07/22/2019 | 69 | ||||||||||||||
CAD | 519 | USD | 385 | Morgan Stanley & Co. | 08/15/2019 | 12 | ||||||||||||||
|
| |||||||||||||||||||
Total unrealized appreciation | 81 | |||||||||||||||||||
|
| |||||||||||||||||||
USD | 2,236 | CAD | 2,980 | Morgan Stanley & Co. | 08/15/2019 | (41 | ) | |||||||||||||
USD | 3,443 | GBP | 2,706 | Morgan Stanley & Co. | 08/15/2019 | (1 | ) | |||||||||||||
|
| |||||||||||||||||||
Total unrealized depreciation | (42 | ) | ||||||||||||||||||
|
| |||||||||||||||||||
Net unrealized appreciation (depreciation) | 39 | |||||||||||||||||||
|
| |||||||||||||||||||
| Centrally Cleared Interest Rate Swap contracts outstanding as of June 30, 2019: | ||||||||||||||||||||||||||||||
| FLOATING RATE INDEX (a) | FIXED RATE | PAY/RECEIVE FLOATING RATE | MATURITY DATE | NOTIONAL AMOUNT | UPFRONT PAYMENTS (RECEIPTS)($) | UNREALIZED APPRECIATION (DEPRECIATION)($) | VALUE($) | |||||||||||||||||||||||
EURIBOR 3 Month | 0.00 % annually | Pay | 01/30/2021 | EUR | 173,000 | 110 | 384 | 494 | ||||||||||||||||||||||
United States FEDEF Intraday | 2.50 % annually | Pay | 03/01/2020 | USD | 173,800 | 91 | 678 | 769 | ||||||||||||||||||||||
United States FEDEF Intraday | 2.34 % annually | Pay | 03/18/2020 | USD | 269,700 | (3 | ) | 483 | 480 | |||||||||||||||||||||
United States FEDEF Intraday | 2.30 % annually | Receive | 03/01/2022 | USD | 147,600 | 92 | (3,108 | ) | (3,016 | ) | ||||||||||||||||||||
|
|
|
|
|
| |||||||||||||||||||||||||
Total |
| 290 | (1,563 | ) | (1,273 | ) | ||||||||||||||||||||||||
|
|
|
|
|
| |||||||||||||||||||||||||
| (a) | Value of floating rate index as of June 30, 2019 was as follows: |
| FLOATING RATE INDEX | ||||
EURIBOR 3 Month | (0.35% | ) | ||
FEDEF | 2.40% | |||
SEE NOTES TO FINANCIAL STATEMENTS.
| JUNE 30, 2019 | SIX CIRCLES TRUST | 21 | ||||||
Table of Contents
Six Circles Ultra Short Duration Fund
SCHEDULE OF PORTFOLIO INVESTMENTS
AS OF JUNE 30, 2019 (Unaudited) (continued)
(Amounts in U.S. Dollars, unless otherwise noted)
(Amounts in thousands, except number of Futures contracts)
| Sale-Buyback Transactions | ||||||||||||||||||||
| COUNTERPARTY | BORROWING DATE | MATURITY DATE | BORROWING RATE | AMOUNT BORROWED | PAYABLE FOR SALE-BUYBACK TRANSACTIONS | |||||||||||||||
Morgan Stanley & Co. LLC. | 06/28/2019 | 07/01/2019 | 2.79 | % | 17,200 | (17,204 | ) | |||||||||||||
Morgan Stanley & Co. LLC. | 06/28/2019 | 07/01/2019 | 2.79 | % | 5,990 | (9,145 | ) | |||||||||||||
Morgan Stanley & Co. LLC. | 06/28/2019 | 07/01/2019 | 2.79 | % | 9,144 | (5,992 | ) | |||||||||||||
|
| |||||||||||||||||||
| (32,341 | ) | |||||||||||||||||||
|
| |||||||||||||||||||
NOTES TO SCHEDULE OF PORTFOLIO INVESTMENTS
| CLO | — Collateralized Loan Obligations | |
| FEDEF | — Federal Fund Effective Rate (Continuous Series) | |
| FNMA | — Federal National Mortgage Association | |
| FHLMC | — Federal Home Loan Mortgage Corp. | |
| GNMA | — Government National Mortgage Association | |
| ICE | — Intercontinental Exchange | |
| LIBOR | — London Interbank Offered Rate | |
| REIT | — Real Estate Investment Trust | |
| REMICS | — Real Estate Mortgage Investment Conduit | |
| Reg. S | — Security was purchased pursuant to Regulation S under the Securities Act of 1933, as amended (the “Securities Act”), which exempts from registration securities offered and sold outside of the United States. Such a security cannot be sold in the United States without either an effective registration statement filed pursuant to the Securities Act, or pursuant to an exemption from registration. | |
| SOFR | — Secured Overnight Financing Rate | |
| SUB | — Step-Up Bond. The interest rate shown is the rate in effect as of June 30, 2019. | |
| TBA | — To Be Announced | |
| (e) | — Security is exempt from registration under Rule 144A of the Securities Act of 1933, as amended. Unless otherwise indicated, this security has been determined to be liquid under procedures established by the Board of Trustees and may be resold in transactions exempt from registration, normally to qualified institutional buyers. | |
| (g) | — Amount rounds to less than 0.05%. | |
| (n) | — The rate shown is the effective yield as of June 30, 2019. | |
| (w) | — All or a portion of the security is a when-issued security, delayed delivery security, or forward commitment. | |
| (z) | — Variable or floating rate security, the interest rate of which adjusts periodically based on changes in current interest rates and prepayments on the underlying pool of assets. The interest rate shown is the current rate as of June 30, 2019. | |
| (aa) | — Variable or floating rate security, linked to the referenced benchmark. The interest rate shown is the current rate as of June 30, 2019 | |
| (cc) | — All or a portion of these U.S. Treasury Obligations were purchased in a sale-buyback transaction. The value of these securities total $32,290, which represents 2.9% of total net assets. | |
| * | — The cost of securities is substantially the same for federal income tax purposes. | |
| CAD | — Canadian Dollar | |
| EUR | — Euro | |
| GBP | — British Pound | |
| JPY | — Japanese Yen | |
| USD | — United States Dollar |
SEE NOTES TO FINANCIAL STATEMENTS.
| 22 | SIX CIRCLES TRUST | JUNE 30, 2019 | ||||
Table of Contents
Six Circles Tax Aware Ultra Short Duration Fund
SCHEDULE OF PORTFOLIO INVESTMENTS
AS OF JUNE 30, 2019 (Unaudited)
(Amounts in U.S. Dollars, unless otherwise noted)
(Amounts in thousands, except number of Futures contracts)
| SECURITY DESCRIPTION | PRINCIPAL AMOUNT($) | VALUE($) | ||||||
Asset-Backed Securities — 3.2% |
| |||||||
Bank of The West Auto Trust, Series2018-1, Class A2, 3.09%, 04/15/2021 (e) | 2,577 | 2,582 | ||||||
BMW Canada Auto Trust, (Canada),Series 2019-1A, Class A1, 2.15%, 10/20/2021 (e) | CAD 2,500 | 1,909 | ||||||
Chesapeake Funding II LLC, | ||||||||
Series2016-2A, Class A1, 1.88%, 06/15/2028 (e) | 1,205 | 1,203 | ||||||
Series2019-1A, Class A1, 2.94%, 04/15/2031 (e) | 1,500 | 1,518 | ||||||
Chrysler Capital Auto Receivables Trust, Series2016-BA, Class A4, 1.87%, 02/15/2022 (e) | 1,800 | 1,794 | ||||||
Ford Credit Floorplan Master Owner Trust A, | ||||||||
Series2015-2, Class A1, 1.98%, 01/15/2022 | 3,000 | 2,994 | ||||||
Series2018-3, Class A2, (ICE LIBOR USD 1 Month + 0.40%), 2.79%, 10/15/2023 (aa) | 2,900 | 2,899 | ||||||
Gracechurch Card Funding plc, (United Kingdom), Series2018-1A, Class A, (ICE LIBOR USD 1 Month + 0.40%), 2.79%, 07/15/2022 (e) (aa) | 200 | 200 | ||||||
Home Equity Asset Trust, Series2005-8, Class M1, (ICE LIBOR USD 1 Month + 0.43%), 2.83%, 02/25/2036 (aa) | 2,153 | 2,160 | ||||||
Legacy Mortgage Asset Trust, Series2019-GS3, Class A1, SUB, 3.75%, 04/25/2059 (e) | 294 | 297 | ||||||
Marlette Funding Trust, Series2018-4A, Class A, 3.71%, 12/15/2028 (e) | 848 | 857 | ||||||
Mercedes-Benz Auto Lease Trust,Series 2019-A, Class A2, 3.01%, 02/16/2021 | 1,500 | 1,504 | ||||||
MMAF Equipment Finance LLC,Series 2016-AA, Class A3, 1.48%, 06/15/2020 (e) | 948 | 946 | ||||||
Navient Private Education Refi Loan Trust, | ||||||||
Series2018-A, Class A1, 2.53%, 02/18/2042 (e) | 1,579 | 1,582 | ||||||
Series2018-CA, Class A1, 3.01%, 06/16/2042 (e) | 2,459 | 2,478 | ||||||
Navient Student Loan Trust, Series2018-EA, Class A1, 3.43%, 12/15/2059 (e) | 2,377 | 2,405 | ||||||
Nelnet Student Loan Trust, Series2019-2A, Class A, (ICE LIBOR USD 1 Month + 0.90%), 3.30%, 06/27/2067 (e) (aa) | 1,689 | 1,678 | ||||||
Oscar US Funding X LLC, (Japan),Series 2019-1A, Class A2, 3.10%, 04/11/2022 (e) | 1,500 | 1,507 | ||||||
Securitized Term Auto Receivables Trust, (Canada), Series2018-2A, Class A2A, 3.06%, 02/25/2021 (e) | 1,048 | 1,052 | ||||||
| SECURITY DESCRIPTION | PRINCIPAL AMOUNT($) | VALUE($) | ||||||
SLC Student Loan Trust, Series2005-1, Class A3, (ICE LIBOR USD 3 Month + 0.10%), 2.62%, 02/15/2025 (aa) | 1,813 | 1,811 | ||||||
SMB Private Education Loan Trust, | ||||||||
Series2015-A, Class A2A, 2.49%, 06/15/2027 (e) | 2,576 | 2,580 | ||||||
Series2015-B, Class A2A, 2.98%, 07/15/2027 (e) | 1,610 | 1,627 | ||||||
SoFi Consumer Loan Program Trust, | ||||||||
Series2019-1, Class A, 3.24%, 02/25/2028 (e) | 799 | 807 | ||||||
Series2019-3, Class A, 2.90%, 05/25/2028 (e) | 1,000 | 1,005 | ||||||
Sofi Professional Loan Program LLC,Series 2018-A, Class A2A, 2.39%, 02/25/2042 (e) | 1,253 | 1,254 | ||||||
|
| |||||||
Total Asset-Backed Securities | 40,649 | |||||||
|
| |||||||
Collateralized Mortgage Obligations — 1.1% |
| |||||||
Credit Suisse Mortgage Capital Certificates, Series 2019-RPL4, Class A1, 3.83%, 08/26/2058 (e) | 297 | 300 | ||||||
FNMA REMICS, Series2018-86, Class FN, (ICE LIBOR USD 1 Month + 0.35%), 2.84%, 12/25/2048 (aa) | 2,443 | 2,431 | ||||||
GNMA, | ||||||||
Series2015-H04, Class FA, (ICE LIBOR USD 1 Month + 0.65%), 3.12%, 12/20/2064 (aa) | 2,133 | 2,136 | ||||||
Series2018-H18, Class FC, (ICE LIBOR USD 1 Month + 0.35%), 2.82%, 08/20/2065 (aa) | 2,898 | 2,888 | ||||||
Lanark Master Issuer plc, (United Kingdom), Series2019-1A, Class 1A1, (ICE LIBOR USD 3 Month + 0.77%), 3.29%, 12/22/2069 (e) (aa) | 1,500 | 1,497 | ||||||
New Residential Mortgage Loan Trust,Series 2018-3A, Class A1, 4.50%, 05/25/2058 (e) (z) | 259 | 273 | ||||||
Ripon Mortgages plc, (United Kingdom), Series 1X, Class A2, Reg. S, (ICE LIBOR GBP 3 Month + 0.80%), 1.60%, 08/20/2056 (aa) | GBP 2,969 | 3,766 | ||||||
Silverstone Master Issuer plc, (United Kingdom), Series2019-1A, Class 1A, (ICE LIBOR USD 3 Month + 0.57%), 3.15%, 01/21/2070 (e) (aa) | 200 | 200 | ||||||
Trinity Square plc, (United Kingdom),Series 2015-1X, Class A, Reg. S, (ICE LIBOR GBP 3 Month + 1.15%), 1.97%, 07/15/2051 (aa) | GBP 162 | 206 | ||||||
|
| |||||||
Total Collateralized Mortgage Obligations (Cost $13,721) | 13,697 | |||||||
|
| |||||||
SEE NOTES TO FINANCIAL STATEMENTS.
| JUNE 30, 2019 | SIX CIRCLES TRUST | 23 | ||||||
Table of Contents
Six Circles Tax Aware Ultra Short Duration Fund
SCHEDULE OF PORTFOLIO INVESTMENTS
AS OF JUNE 30, 2019 (Unaudited) (continued)
(Amounts in U.S. Dollars, unless otherwise noted)
(Amounts in thousands, except number of Futures contracts)
| SECURITY DESCRIPTION | PRINCIPAL AMOUNT($) | VALUE($) | ||||||
Commercial Mortgage-Backed Securities — 1.0% |
| |||||||
AREIT Trust, Series 2018-CRE2, Class A, (ICE LIBOR USD 1 Month + 0.98%), 3.38%, 11/14/2035 (e) (aa) | 2,158 | 2,158 | ||||||
BAMLL Commercial Mortgage Securities Trust, | ||||||||
Series2019-AHT, Class A, (ICE LIBOR USD 1 Month + 1.20%), 3.59%, 03/15/2034 (e) (aa) | 300 | 301 | ||||||
Series2019-RLJ, Class A, (ICE LIBOR USD 1 Month + 1.05%), 3.44%, 04/15/2036 (e) (aa) | 400 | 400 | ||||||
BX Commercial Mortgage Trust,Series 2018-IND, Class A, (ICE LIBOR USD 1 Month + 0.75%), 3.14%, 11/15/2035 (e) (aa) | 3,005 | 3,007 | ||||||
GPMT Ltd., (Cayman Islands),Series 2018-FL1, Class A, (ICE LIBOR USD 1 Month + 0.90%), 3.28%, 11/21/2035 (e) (aa) | 920 | 920 | ||||||
Morgan Stanley Bank of America Merrill Lynch Trust, Series2013-C11, Class AAB, 3.85%, 08/15/2046 | 834 | 861 | ||||||
Morgan Stanley Capital I Trust, | 700 | 700 | ||||||
PFP Ltd., (Cayman Islands), | 1,500 | 1,500 | ||||||
VMC Finance LLC, Series2018-FL2, Class A, (ICE LIBOR USD 1 Month + 0.92%), 3.31%, 10/15/2035 (e) (aa) | 2,447 | 2,445 | ||||||
|
| |||||||
Total Commercial Mortgage-Backed Securities (Cost $12,275) | 12,292 | |||||||
|
| |||||||
Corporate Bonds — 16.7% |
| |||||||
Basic Materials — 0.0% (g) |
| |||||||
Chemicals — 0.0% (g) |
| |||||||
Incitec Pivot Finance LLC, Reg. S, 6.00%, 12/10/2019 | 200 | 203 | ||||||
|
| |||||||
Forest Products & Paper — 0.0% (g) |
| |||||||
Georgia-Pacific LLC, 5.40%, 11/01/2020 (e) | 200 | 208 | ||||||
|
| |||||||
Total Basic Materials | 411 | |||||||
|
| |||||||
Communications — 1.2% | ||||||||
Internet — 0.3% | ||||||||
eBay, Inc., (ICE LIBOR USD 3 Month + 0.48%), 3.06%, 08/01/2019 (aa) | 3,700 | 3,702 | ||||||
|
| |||||||
Media — 0.1% |
| |||||||
Charter Communications Operating LLC / Charter Communications Operating Capital, 3.58%, 07/23/2020 | 1,500 | 1,513 | ||||||
Discovery Communications LLC, 2.20%, 09/20/2019 | 200 | 200 | ||||||
|
| |||||||
| 1,713 | ||||||||
|
| |||||||
| SECURITY DESCRIPTION | PRINCIPAL AMOUNT($) | VALUE($) | ||||||
Telecommunications — 0.8% | ||||||||
AT&T, Inc., (ICE LIBOR USD 3 Month + 1.18%), 3.62%, 06/12/2024 (aa) | 2,100 | 2,127 | ||||||
Telefonica Emisiones SA, (Spain), 5.88%, 07/15/2019 | 3,700 | 3,704 | ||||||
Vodafone Group plc, (United Kingdom), (ICE LIBOR USD 3 Month + 0.99%), 3.59%, 01/16/2024 (aa) | 3,700 | 3,709 | ||||||
|
| |||||||
| 9,540 | ||||||||
|
| |||||||
Total Communications | 14,955 | |||||||
|
| |||||||
Consumer Cyclical — 2.8% | ||||||||
Airlines — 0.1% | ||||||||
Delta Air Lines, Inc., 2.88%, 03/13/2020 | 200 | 200 | ||||||
Southwest Airlines Co., 2.75%, 11/06/2019 | 150 | 150 | ||||||
WestJet Airlines Ltd., (Canada), 3.50%, 06/16/2021 (e) | 749 | 753 | ||||||
|
| |||||||
| 1,103 | ||||||||
|
| |||||||
Auto Manufacturers — 2.7% | ||||||||
BMW US Capital LLC, (ICE LIBOR USD 3 Month + 0.50%), 3.04%, 08/13/2021 (e) (aa) | 3,700 | 3,711 | ||||||
Daimler Finance North America LLC, 2.70%, 08/03/2020 (e) | 800 | 802 | ||||||
(ICE LIBOR USD 3 Month + 0.39%), 2.96%, 05/04/2020 (e) (aa) | 3,700 | 3,703 | ||||||
(ICE LIBOR USD 3 Month + 0.45%), 2.97%, 02/22/2021 (e) (aa) | 700 | 700 | ||||||
Ford Motor Credit Co. LLC, | 800 | 794 | ||||||
2.43%, 06/12/2020 | 200 | 199 | ||||||
(ICE LIBOR USD 3 Month + 0.43%), 3.01%, 11/02/2020 (aa) | 1,200 | 1,189 | ||||||
(ICE LIBOR USD 3 Month + 0.88%), 3.48%, 10/12/2021 (aa) | 150 | 148 | ||||||
(ICE LIBOR USD 3 Month + 1.00%), 3.59%, 01/09/2020 (aa) | 1,000 | 1,002 | ||||||
(ICE LIBOR USD 3 Month + 1.27%), 3.60%, 03/28/2022 (aa) | 350 | 344 | ||||||
General Motors Financial Co., Inc., | ||||||||
(ICE LIBOR USD 3 Month + 0.93%), 3.53%, 04/13/2020 (aa) | 4,000 | 4,012 | ||||||
3.70%, 11/24/2020 | 3,200 | 3,241 | ||||||
Harley-Davidson Financial Services, Inc., 2.15%, 02/26/2020 (e) | 1,500 | 1,494 | ||||||
Hyundai Capital America, 2.60%, 03/19/2020 (e) | 500 | 500 | ||||||
Reg. S, (ICE LIBOR USD 3 Month + 0.82%), 3.26%, 03/12/2021 (aa) | 2,645 | 2,645 | ||||||
(ICE LIBOR USD 3 Month + 0.80%), 3.40%, 04/03/2020 (e) (aa) | 100 | 100 | ||||||
SEE NOTES TO FINANCIAL STATEMENTS.
| 24 | SIX CIRCLES TRUST | JUNE 30, 2019 | ||||
Table of Contents
| SECURITY DESCRIPTION | PRINCIPAL AMOUNT($) | VALUE($) | ||||||
Corporate Bonds — continued |
| |||||||
Auto Manufacturers — continued | ||||||||
Nissan Motor Acceptance Corp., | 1,100 | 1,095 | ||||||
(ICE LIBOR USD 3 Month + 0.39%), 2.72%, 09/28/2020 (e) (aa) | 1,000 | 999 | ||||||
(ICE LIBOR USD 3 Month + 0.52%), 2.93%, 03/15/2021 (e) (aa) | 200 | 200 | ||||||
(ICE LIBOR USD 3 Month + 0.69%), 3.02%, 09/28/2022 (e) (aa) | 1,620 | 1,610 | ||||||
(ICE LIBOR USD 3 Month + 0.65%), 3.25%, 07/13/2022 (e) (aa) | 1,700 | 1,691 | ||||||
Volkswagen Group of America Finance LLC, 2.40%, 05/22/2020 (e) | 2,000 | 1,995 | ||||||
2.45%, 11/20/2019 (e) | 200 | 200 | ||||||
4.00%, 11/12/2021 (e) | 400 | 413 | ||||||
Volkswagen International Finance NV, (Netherlands), 4.00%, 08/12/2020 (e) | 800 | 813 | ||||||
|
| |||||||
| 33,600 | ||||||||
|
| |||||||
Auto Parts & Equipment — 0.0% (g) | ||||||||
ZF North America Capital, Inc., 4.00%, 04/29/2020 (e) | 600 | 603 | ||||||
|
| |||||||
Total Consumer Cyclical | 35,306 | |||||||
|
| |||||||
ConsumerNon-cyclical — 2.9% | ||||||||
Agriculture — 0.4% | ||||||||
BAT Capital Corp., | ||||||||
(ICE LIBOR USD 3 Month + 0.59%), 3.12%, 08/14/2020 (aa) | 1,000 | 1,002 | ||||||
(ICE LIBOR USD 3 Month + 0.88%), 3.40%, 08/15/2022 (aa) | 3,500 | 3,510 | ||||||
|
| |||||||
| 4,512 | ||||||||
|
| |||||||
Commercial Services — 1.3% | ||||||||
Central Nippon Expressway Co. Ltd., (Japan), | ||||||||
Reg. S, 2.36%, 05/28/2021 | 10,000 | 9,989 | ||||||
Reg. S, (ICE LIBOR USD 3 Month + 0.56%), 3.13%, 11/02/2021 (aa) | 3,900 | 3,901 | ||||||
Equifax, Inc., (ICE LIBOR USD 3 Month + 0.87%), 3.39%, 08/15/2021 (aa) | 3,090 | 3,082 | ||||||
|
| |||||||
| 16,972 | ||||||||
|
| |||||||
Food — 0.1% |
| |||||||
Conagra Brands, Inc., (ICE LIBOR USD 3 Month + 0.50%), 3.09%, 10/09/2020 (aa) | 1,000 | 998 | ||||||
|
| |||||||
Healthcare—Services — 0.4% | ||||||||
Dignity Health, 2.64%, 11/01/2019 | 3,100 | 3,097 | ||||||
HCA, Inc., 6.50%, 02/15/2020 | 2,000 | 2,046 | ||||||
|
| |||||||
| 5,143 | ||||||||
|
| |||||||
Pharmaceuticals — 0.7% |
| |||||||
Bayer US Finance II LLC, (ICE LIBOR USD 3 Month + 1.01%), 3.42%, 12/15/2023 (e) (aa) | 3,700 | 3,633 | ||||||
| SECURITY DESCRIPTION | PRINCIPAL AMOUNT($) | VALUE($) | ||||||
Pharmaceuticals — continued |
| |||||||
Bristol-Myers Squibb Co., (ICE LIBOR USD 3 Month + 0.38%), 2.90%, 05/16/2022 (e) (aa) | 1,200 | 1,203 | ||||||
CVS Health Corp., 3.13%, 03/09/2020 | 3,700 | 3,714 | ||||||
|
| |||||||
| 8,550 | ||||||||
|
| |||||||
Total ConsumerNon-cyclical | 36,175 | |||||||
|
| |||||||
Diversified — 0.1% | ||||||||
Holding Companies — 0.1% | ||||||||
CK Hutchison International 17 II Ltd., (Cayman Islands), | 200 | 200 | ||||||
Reg. S, 2.25%, 09/29/2020 | 1,500 | 1,496 | ||||||
|
| |||||||
Total Diversified | 1,696 | |||||||
|
| |||||||
Energy — 0.7% | ||||||||
Coal — 0.0% (g) | ||||||||
China Shenhua Overseas Capital Co. Ltd., (British Virgin Islands), Reg. S, 3.13%, 01/20/2020 | 500 | 501 | ||||||
| �� |
|
| ||||||
Oil & Gas — 0.3% | ||||||||
CNOOC Finance 2015 Australia Pty Ltd., (Australia), 2.63%, 05/05/2020 | 3,400 | 3,405 | ||||||
Petronas Global Sukuk Ltd., (Malaysia), Reg. S, 2.71%, 03/18/2020 | 200 | 200 | ||||||
|
| |||||||
| 3,605 | ||||||||
|
| |||||||
Pipelines — 0.4% | ||||||||
Enbridge, Inc., (Canada), (ICE LIBOR USD 3 Month + 0.40%), 2.98%, 01/10/2020 (aa) | 3,500 | 3,501 | ||||||
Florida Gas Transmission Co. LLC, 5.45%, 07/15/2020 (e) | 500 | 513 | ||||||
Rockies Express Pipeline LLC, 5.63%, 04/15/2020 (e) | 1,000 | 1,016 | ||||||
|
| |||||||
| 5,030 | ||||||||
|
| |||||||
Total Energy | 9,136 | |||||||
|
| |||||||
Financial — 6.4% | ||||||||
Banks — 4.0% | ||||||||
Aozora Bank Ltd., (Japan), Reg. S, 2.75%, 03/09/2020 | 200 | 200 | ||||||
Banco Santander Chile, (Chile), (ICE LIBOR USD 3 Month + 1.20%), 3.72%, 11/28/2021 (aa) | 3,200 | 3,255 | ||||||
Bank of America Corp., (ICE LIBOR USD 3 Month + 1.18%), 3.77%, 10/21/2022 (aa) | 1,200 | 1,215 | ||||||
Barclays plc, (United Kingdom), 2.75%, 11/08/2019 | 3,900 | 3,896 | ||||||
Citibank NA, (ICE LIBOR USD 3 Month + 0.60%), 3.12%, 05/20/2022 (aa) | 1,800 | 1,802 | ||||||
Goldman Sachs Group, Inc. (The), (ICE LIBOR USD 3 Month + 0.73%), 3.04%, 12/27/2020 (aa) | 3,700 | 3,707 | ||||||
SEE NOTES TO FINANCIAL STATEMENTS.
| JUNE 30, 2019 | SIX CIRCLES TRUST | 25 | ||||||
Table of Contents
Six Circles Tax Aware Ultra Short Duration Fund
SCHEDULE OF PORTFOLIO INVESTMENTS
AS OF JUNE 30, 2019 (Unaudited) (continued)
(Amounts in U.S. Dollars, unless otherwise noted)
(Amounts in thousands, except number of Futures contracts)
| SECURITY DESCRIPTION | PRINCIPAL AMOUNT($) | VALUE($) | ||||||
Corporate Bonds — continued |
| |||||||
Banks — continued | ||||||||
HSBC Holdings plc, (United Kingdom), | ||||||||
(ICE LIBOR USD 3 Month + 0.60%), 3.12%, 05/18/2021 (aa) | 1,800 | 1,801 | ||||||
(ICE LIBOR USD 3 Month + 1.00%), 3.52%, 05/18/2024 (aa) | 2,300 | 2,306 | ||||||
(ICE LIBOR USD 3 Month + 1.50%), 4.10%, 01/05/2022 (aa) | 1,000 | 1,022 | ||||||
Lloyds Bank plc, (United Kingdom), 5.80%, 01/13/2020 (e) | 500 | 509 | ||||||
Mitsubishi UFJ Financial Group, Inc., (Japan), | ||||||||
(ICE LIBOR USD 3 Month + 0.65%), 3.24%, 07/26/2021 (aa) | 900 | 904 | ||||||
(ICE LIBOR USD 3 Month + 0.79%), 3.37%, 07/25/2022 (aa) | 3,700 | 3,712 | ||||||
Mizuho Financial Group, Inc., (Japan), (ICE LIBOR USD 3 Month + 0.88%), 3.33%, 09/11/2022 (aa) | 3,700 | 3,721 | ||||||
Morgan Stanley, | ||||||||
(ICE LIBOR USD 3 Month + 0.93%), 3.52%, 07/22/2022 (aa) | 2,400 | 2,415 | ||||||
(ICE LIBOR USD 3 Month + 1.18%), 3.77%, 01/20/2022 (aa) | 1,000 | 1,011 | ||||||
Nordea Bank Abp, (Finland), (ICE LIBOR USD 3 Month + 0.94%), 3.46%, 08/30/2023 (e) (aa) | 200 | 197 | ||||||
QNB Finance Ltd., (Cayman Islands), Reg. S, (ICE LIBOR USD 3 Month + 1.35%), 3.87%, 05/31/2021 (aa) | 200 | 202 | ||||||
Royal Bank of Scotland Group plc, (United Kingdom), (ICE LIBOR USD 3 Month + 1.47%), 3.99%, 05/15/2023 (aa) | 700 | 698 | ||||||
Santander UK plc, (United Kingdom), 2.38%, 03/16/2020 | 200 | 200 | ||||||
Standard Chartered plc, (United Kingdom), 2.10%, 08/19/2019 (e) | 900 | 899 | ||||||
(ICE LIBOR USD 3 Month + 1.13%), 3.65%, 08/19/2019 (e) (aa) | 2,800 | 2,804 | ||||||
State Bank of India, (India), Reg. S, (ICE LIBOR USD 3 Month + 0.95%), 3.54%, 04/06/2020 (aa) | 3,300 | 3,306 | ||||||
Sumitomo Mitsui Financial Group, Inc., (Japan), (ICE LIBOR USD 3 Month + 0.78%), 3.38%, 07/12/2022 (aa) | 3,700 | 3,715 | ||||||
UBS Group Funding Switzerland AG, (Switzerland), (ICE LIBOR USD 3 Month + 1.78%), 4.38%, 04/14/2021 (e) (aa) | 3,700 | 3,789 | ||||||
Wells Fargo Bank NA, (ICE LIBOR USD 3 Month + 0.62%), 3.14%, 05/27/2022 (aa) | 3,500 | 3,508 | ||||||
|
| |||||||
| 50,794 | ||||||||
|
| |||||||
| SECURITY DESCRIPTION | PRINCIPAL AMOUNT($) | VALUE($) | ||||||
Diversified Financial Services — 1.2% | ||||||||
AerCap Ireland Capital DAC / AerCap Global Aviation Trust, (Ireland), 4.25%, 07/01/2020 | 400 | 406 | ||||||
Aircastle Ltd., (Bermuda), 5.50%, 02/15/2022 | 1,450 | 1,537 | ||||||
American Express Co., 2.75%, 05/20/2022 | 3,700 | 3,745 | ||||||
BOC Aviation Ltd., (Singapore), | ||||||||
Reg. S, 2.38%, 09/15/2021 | 2,500 | 2,470 | ||||||
(ICE LIBOR USD 3 Month + 1.05%), 3.63%, 05/02/2021 (e) (aa) | 200 | 201 | ||||||
GE Capital International Funding Co. Unlimited Co., (Ireland), 2.34%, 11/15/2020 | 900 | 896 | ||||||
Mitsubishi UFJ Lease & Finance Co. Ltd., (Japan), 2.65%, 09/19/2022 (e) | 1,200 | 1,200 | ||||||
Reg. S, 2.75%, 10/21/2020 | 2,500 | 2,509 | ||||||
Nomura Holdings, Inc., (Japan), 6.70%, 03/04/2020 | 200 | 206 | ||||||
OMX Timber Finance Investments I LLC, 5.42%, 10/31/2019 (e) | 200 | 201 | ||||||
Synchrony Financial, 3.00%, 08/15/2019 | 2,120 | 2,120 | ||||||
|
| |||||||
| 15,491 | ||||||||
|
| |||||||
Insurance — 0.7% |
| |||||||
AIA Group Ltd., (Hong Kong), (ICE LIBOR USD 3 Month + 0.52%), 2.91%, 09/20/2021 (e) (aa) | 3,700 | 3,696 | ||||||
Metropolitan Life Global Funding I, (United States SOFR + 0.50%), 2.92%, 05/28/2021 (e) (aa) | 4,500 | 4,500 | ||||||
|
| |||||||
| 8,196 | ||||||||
|
| |||||||
Real Estate — 0.4% |
| |||||||
Qatari Diar Finance Co., (Qatar), Reg. S, 5.00%, 07/21/2020 | 5,000 | 5,119 | ||||||
Sinochem Overseas Capital Co. Ltd., (British Virgin Islands), Reg. S, 4.50%, 11/12/2020 | 200 | 205 | ||||||
|
| |||||||
| 5,324 | ||||||||
|
| |||||||
Savings & Loans — 0.1% |
| |||||||
Nationwide Building Society, (United Kingdom), | ||||||||
Reg. S, 2.35%, 01/21/2020 | 200 | 199 | ||||||
6.25%, 02/25/2020 (e) | 1,000 | 1,024 | ||||||
|
| |||||||
| 1,223 | ||||||||
|
| |||||||
Total Financial | 81,028 | |||||||
|
| |||||||
Industrial — 0.7% |
| |||||||
Aerospace/Defense — 0.0% (g) |
| |||||||
Harris Corp., (ICE LIBOR USD 3 Month + 0.48%), 3.06%, 04/30/2020 (aa) | 200 | 200 | ||||||
|
| |||||||
SEE NOTES TO FINANCIAL STATEMENTS.
| 26 | SIX CIRCLES TRUST | JUNE 30, 2019 | ||||
Table of Contents
| SECURITY DESCRIPTION | PRINCIPAL AMOUNT($) | VALUE($) | ||||||
Corporate Bonds — continued |
| |||||||
Building Materials — 0.0% (g) |
| |||||||
Holcim US Finance Sarl & Cie SCS, (Luxembourg), Reg. S, 6.00%, 12/30/2019 | 250 | 253 | ||||||
|
| |||||||
Machinery—Diversified — 0.0% (g) |
| |||||||
CNH Industrial Capital LLC, 3.38%, 07/15/2019 | 200 | 200 | ||||||
|
| |||||||
Miscellaneous Manufacturers — 0.2% |
| |||||||
General Electric Co., 5.55%, 05/04/2020 | 1,500 | 1,535 | ||||||
6.00%, 08/07/2019 | 975 | 978 | ||||||
|
| |||||||
| 2,513 | ||||||||
|
| |||||||
Transportation — 0.2% |
| |||||||
Ryder System, Inc., 2.88%, 06/01/2022 | 1,900 | 1,922 | ||||||
|
| |||||||
Trucking & Leasing — 0.3% |
| |||||||
Aviation Capital Group LLC, 2.88%, 01/20/2022 (e) | 3,700 | 3,726 | ||||||
GATX Corp., (ICE LIBOR USD 3 Month + 0.72%), 3.29%, 11/05/2021 (aa) | 500 | 498 | ||||||
|
| |||||||
| 4,224 | ||||||||
|
| |||||||
Total Industrial | 9,312 | |||||||
|
| |||||||
Technology — 1.1% |
| |||||||
Computers — 0.4% |
| |||||||
Dell International LLC / EMC Corp., 4.42%, 06/15/2021 (e) | 1,200 | 1,236 | ||||||
DXC Technology Co., (ICE LIBOR USD 3 Month + 0.95%), 3.47%, 03/01/2021 (aa) | 2,300 | 2,300 | ||||||
NetApp, Inc., 2.00%, 09/27/2019 | 960 | 959 | ||||||
|
| |||||||
| 4,495 | ||||||||
|
| |||||||
Semiconductors — 0.7% |
| |||||||
Broadcom Corp. / Broadcom Cayman Finance Ltd., 2.38%, 01/15/2020 | 4,500 | 4,492 | ||||||
KLA-Tencor Corp., 3.38%, 11/01/2019 | 1,000 | 1,002 | ||||||
NXP BV / NXP Funding LLC, (Netherlands), 3.88%, 09/01/2022 (e) | 400 | 411 | ||||||
4.13%, 06/01/2021 (e) | 2,700 | 2,763 | ||||||
|
| |||||||
| 8,668 | ||||||||
|
| |||||||
Software — 0.0% (g) |
| |||||||
VMware, Inc., 2.30%, 08/21/2020 | 200 | 199 | ||||||
|
| |||||||
Total Technology | 13,362 | |||||||
|
| |||||||
Utilities — 0.8% |
| |||||||
Electric — 0.8% |
| |||||||
Chugoku Electric Power Co., Inc. (The), (Japan), Reg. S, 2.70%, 03/16/2020 | 3,150 | 3,152 | ||||||
Exelon Generation Co. LLC, 5.20%, 10/01/2019 | 2,000 | 2,012 | ||||||
Iberdrola Finance Ireland DAC, (Ireland), 5.00%, 09/11/2019 (e) | 200 | 201 | ||||||
NextEra Energy Capital Holdings, Inc., (ICE LIBOR USD 3 Month + 0.40%), 2.92%, 08/21/2020 (aa) | 3,700 | 3,698 | ||||||
| SECURITY DESCRIPTION | PRINCIPAL AMOUNT($) | VALUE($) | ||||||
Electric — continued |
| |||||||
Sempra Energy, (ICE LIBOR USD 3 Month + 0.25%), 2.85%, 07/15/2019 (aa) | 700 | 700 | ||||||
|
| |||||||
Total Utilities | 9,763 | |||||||
|
| |||||||
Total Corporate Bonds | 211,144 | |||||||
|
| |||||||
Foreign Government Securities — 1.9% |
| |||||||
Export-Import Bank of India, (India), | ||||||||
Reg. S, 2.75%, 08/12/2020 | 200 | 200 | ||||||
Reg. S, (ICE LIBOR USD 3 Month + 1.00%), 3.52%, 08/21/2022 (aa) | 3,700 | 3,698 | ||||||
Export-Import Bank of Korea, (South Korea), (ICE LIBOR USD 3 Month + 0.58%), 3.10%, 06/01/2021 (aa) | 6,300 | 6,313 | ||||||
International Bank for Reconstruction & Development, (Supranational), 2.82%, 06/05/2024 | 3,000 | 3,034 | ||||||
Japan Treasury Discount Bill, (Japan), Zero Coupon, 07/22/2019 | JPY 1,225,000 | 11,363 | ||||||
|
| |||||||
Total Foreign Government Securities | 24,608 | |||||||
|
| |||||||
Mortgage-Backed Securities — 2.6% |
| |||||||
FNMA or FHLMC, Single Family, 30 years, TBA, 08/01/2049 (w) | 4,800 | 4,959 | ||||||
FNMA Pool, Single Family, 15 years, 3.50%, 04/01/2033 | 909 | 947 | ||||||
3.50%, 11/01/2033 | 14,414 | 14,895 | ||||||
3.50%, 01/01/2034 | 12,414 | 12,825 | ||||||
|
| |||||||
Total Mortgage-Backed Securities | 33,626 | |||||||
|
| |||||||
Municipal Bonds — 60.5% (t) |
| |||||||
Alabama — 0.0% (g) |
| |||||||
County of Jefferson, Series A, GO, 5.00%, 04/01/2020 | 500 | 514 | ||||||
|
| |||||||
Alaska — 0.3% |
| |||||||
Alaska Housing Finance Corp., Home Mortgage, Series B, Rev., VRDO, 1.85%, 07/05/2019 (z) | 2,400 | 2,400 | ||||||
City of Valdez, Exxon Pipeline Co. Project, Rev., VRDO, 1.99%, 07/01/2019 (z) | 2,000 | 2,000 | ||||||
|
| |||||||
| 4,400 | ||||||||
|
| |||||||
Arizona — 1.5% |
| |||||||
Arizona Health Facilities Authority, Banner Health Obligated Group, Series G, Rev., VRDO, LOC: Wells Fargo Bank NA, 2.02%, 07/05/2019 (z) | 4,060 | 4,060 | ||||||
Arizona Health Facilities Authority, Dignity Health Obligated Group, Series B, Rev., VRDO, LOC: Barclays Bank plc, 1.95%, 07/05/2019 (z) | 8,800 | 8,800 | ||||||
SEE NOTES TO FINANCIAL STATEMENTS.
| JUNE 30, 2019 | SIX CIRCLES TRUST | 27 | ||||||
Table of Contents
Six Circles Tax Aware Ultra Short Duration Fund
SCHEDULE OF PORTFOLIO INVESTMENTS
AS OF JUNE 30, 2019 (Unaudited) (continued)
(Amounts in U.S. Dollars, unless otherwise noted)
(Amounts in thousands, except number of Futures contracts)
| SECURITY DESCRIPTION | PRINCIPAL AMOUNT($) | VALUE($) | ||||||
Municipal Bonds — continued |
| |||||||
Arizona — continued |
| |||||||
Arizona Transportation Board, Maricopa County Regional Area, Rev., 5.00%, 07/01/2019 | 2,385 | 2,385 | ||||||
City of Phoenix, Civic Improvement Corp., | ||||||||
Rev., AMT, 5.00%, 07/01/2020 | 620 | 642 | ||||||
Rev., 5.00%, 07/01/2020 | 1,000 | 1,037 | ||||||
Rev., AMT, 5.00%, 07/01/2021 | 1,750 | 1,871 | ||||||
Maricopa County Industrial Development Authority, Scottsdale Healthcare Hospitals Obligated Group, Series A, Rev., 5.00%, 09/01/2021 | 725 | 779 | ||||||
|
| |||||||
| 19,574 | ||||||||
|
| |||||||
California — 1.5% |
| |||||||
ABAG Finance Authority for Nonprofit Corps, Lakeside Village Apartments, Series A, Rev., VRDO, LOC: FHLMC, LIQ: FHLMC, 1.35%, 07/05/2019 (z) | 400 | 400 | ||||||
California Health Facilities Financing Authority, Kaiser Permanente, Series C, Rev., VRDO, 1.54%, 07/05/2019 (z) | 800 | 800 | ||||||
California Pollution Control Financing Authority, Republic Services, Inc. Project, Series A1, Rev., AMT, 1.90%, 11/01/2042 (e) (z) | 3,000 | 3,000 | ||||||
City of Riverside, Electric Revenue, Series A, Rev., VRDO, LOC: Barclays Bank plc, 1.50%, 07/05/2019 (z) | 200 | 200 | ||||||
Golden State Tobacco Securitization Corp., Series A1, Rev., 5.00%, 06/01/2021 | 400 | 425 | ||||||
Los Angeles Department of Water & Power, Power System Revenue, | ||||||||
Series B5, Rev., VRDO, 1.40%, 07/05/2019 (z) | 600 | 600 | ||||||
Series B7, Rev., VRDO, 1.43%, 07/05/2019 (z) | 3,800 | 3,800 | ||||||
Metropolitan Water District of Southern California, Series A2, Rev., VRDO, 1.45%, 07/05/2019 (z) | 450 | 450 | ||||||
San Francisco City & County Airport Comm-San Francisco International Airport, Special Facilities Lease, SFO Fuel Co. LLC, Series A, Rev., AMT, 5.00%, 01/01/2021 | 6,405 | 6,739 | ||||||
Santa Clara County Financing Authority, Multiple Facilities Projects, Series M, Rev., VRDO, LOC: Bank of America NA, 1.46%, 07/05/2019 (z) | 1,550 | 1,550 | ||||||
State of California, Series B3, GO, VRDO, LOC: Sumitomo Mitsui Banking Corp., 1.44%, 07/05/2019 (z) | 500 | 500 | ||||||
|
| |||||||
| 18,464 | ||||||||
|
| |||||||
| SECURITY DESCRIPTION | PRINCIPAL AMOUNT($) | VALUE($) | ||||||
Colorado — 2.0% |
| |||||||
City & County of Denver, Airport System Revenue, Series A, Rev., AMT, 5.00%, 11/15/2021 | 2,000 | 2,163 | ||||||
Colorado Educational & Cultural Facilities Authority, Nature Conservancy (The), Rev., VRDO, 1.91%, 07/05/2019 (z) | 2,050 | 2,050 | ||||||
Colorado Health Facilities Authority, Sisters of Charity of Leavenworth Health System, Inc., | ||||||||
Series B, Rev., VRDO, LIQ: Wells Fargo Bank NA, 1.92%, 07/05/2019 (z) | 300 | 300 | ||||||
Series C, Rev., VRDO, 1.85%, 07/05/2019 (z) | 10,755 | 10,755 | ||||||
Colorado Housing & Finance Authority, Adjusted Single Family Mortgage, Series I, Rev., VRDO, LOC: Sumitomo Mitsui Banking Corp., 1.95%, 07/05/2019 (z) | 670 | 670 | ||||||
University of Colorado Hospital Authority, Health Obligated Group, | ||||||||
Series B1, Rev., VRDO, 1.93%, 07/05/2019 (z) | 4,600 | 4,600 | ||||||
Series B2, Rev., VRDO, 1.93%, 07/05/2019 (z) | 4,400 | 4,400 | ||||||
|
| |||||||
| 24,938 | ||||||||
|
| |||||||
Connecticut — 1.5% |
| |||||||
Connecticut Housing Finance Authority, | ||||||||
Series B3, Rev., VRDO, 1.90%, 07/05/2019 (z) | 280 | 280 | ||||||
Series B4, Rev., VRDO, 1.80%, 07/05/2019 (z) | 3,500 | 3,500 | ||||||
Series E3, Rev., VRDO, 1.82%, 07/05/2019 (z) | 4,000 | 4,000 | ||||||
Series F3, Rev., VRDO, 1.90%, 07/05/2019 (z) | 10,000 | 10,000 | ||||||
Connecticut State Health & Educational Facilities Authority, Covenant Retirement Communities Obligated Group, Series B, Rev., 5.00%, 12/01/2020 | 1,000 | 1,046 | ||||||
|
| |||||||
| 18,826 | ||||||||
|
| |||||||
District of Columbia — 0.3% |
| |||||||
District of Columbia, Georgetown University, Series B1, Rev., VRDO, LOC: Bank of America NA, 1.85%, 07/05/2019 (z) | 500 | 500 | ||||||
Metropolitan Washington Airports Authority, | ||||||||
Series A, Rev., AMT, 4.00%, 10/01/2020 | 1,500 | 1,548 | ||||||
Series C2, Rev., VRDO, LOC: Sumitomo Mitsui Banking Corp., 1.90%, 07/05/2019 (z) | 2,075 | 2,075 | ||||||
|
| |||||||
| 4,123 | ||||||||
|
| |||||||
SEE NOTES TO FINANCIAL STATEMENTS.
| 28 | SIX CIRCLES TRUST | JUNE 30, 2019 | ||||
Table of Contents
| SECURITY DESCRIPTION | PRINCIPAL AMOUNT($) | VALUE($) | ||||||
Municipal Bonds — continued |
| |||||||
Florida — 3.3% |
| |||||||
City of Gainesville, Utilities System Revenue, | ||||||||
Series A, Rev., 5.00%, 10/01/2021 | 1,400 | 1,514 | ||||||
Series B, Rev., VRDO, 1.86%, 07/05/2019 (z) | 4,830 | 4,830 | ||||||
City of Orlando, Capital Improvement, | ||||||||
Series B, Rev., 4.00%, 10/01/2020 | 500 | 517 | ||||||
Series B, Rev., 5.00%, 10/01/2021 | 775 | 839 | ||||||
County of Hillsborough, Community Investment Tax Revenue, Rev., 5.00%, 11/01/2019 | 5,000 | 5,060 | ||||||
Florida Atlantic University Finance Corp., Series A, Rev., 5.00%, 07/01/2021 | 880 | �� | 941 | |||||
Florida Gulf Coast University Financing Corp., Parking Project, Series A, Rev., VRDO, LOC: Harris NA, 1.87%, 07/05/2019 (z) | 3,770 | 3,770 | ||||||
Highlands County Health Facilities Authority, Adventist Health System/Sunbelt Obligated Group, Series A, Rev., VRDO, 1.85%, 07/05/2019 (z) | 4,000 | 4,000 | ||||||
JEA, Water & Sewer System Revenue, Series A2, Rev., VRDO, LOC: Sumitomo Mitsui Banking Corp., 2.02%, 07/05/2019 (z) | 300 | 300 | ||||||
Lee Memorial Health System,, Series A1, Rev., 5.00%, 04/01/2022 | 1,000 | 1,096 | ||||||
Orlando Utilities Commission, | ||||||||
Series 1, Rev., VRDO, 1.82%, 07/05/2019 (z) | 6,200 | 6,200 | ||||||
Series 2, Rev., VRDO, 1.90%, 07/05/2019 (z) | 7,400 | 7,400 | ||||||
State of Florida, Board Education Lottery Revenue, Series A, Rev., 5.00%, 07/01/2019 | 5,000 | 5,000 | ||||||
|
| |||||||
| 41,467 | ||||||||
|
| |||||||
Georgia — 2.3% |
| |||||||
Athens-Clarke County Unified Government Development Authority, University of Georgia Athletic Association, Inc., Series B, Rev., VRDO, LOC: Wells Fargo Bank NA, 1.88%, 07/01/2019 (z) | 505 | 505 | ||||||
DeKalb County School District, Sales & Tax, GO, 4.00%, 10/01/2019 | 9,930 | 9,997 | ||||||
Municipal Electric Authority of Georgia, Series B, Rev., VRDO, LOC: Barclays Bank plc, 1.95%, 07/05/2019 (z) | 6,760 | 6,760 | ||||||
Private Colleges & Universities Authority, Emory University, | ||||||||
Series B1, Rev., VRDO, 1.85%, 07/05/2019 (z) | 6,295 | 6,295 | ||||||
Series C1, Rev., VRDO, 1.92%, 07/05/2019 (z) | 5,400 | 5,400 | ||||||
Series C4, Rev., VRDO, 1.90%, 07/05/2019 (z) | 600 | 600 | ||||||
|
| |||||||
| 29,557 | ||||||||
|
| |||||||
| SECURITY DESCRIPTION | PRINCIPAL AMOUNT($) | VALUE($) | ||||||
Idaho — 0.2% |
| |||||||
Idaho Health Facilities Authority, Trinity Health Corp. Obligated Group, Series D, Rev., 5.00%, 12/01/2020 | 2,500 | 2,626 | ||||||
|
| |||||||
Illinois — 3.0% |
| |||||||
Chicago Midway International Airport, Series A, Rev., AMT, 5.00%, 01/01/2021 | 3,580 | 3,763 | ||||||
Chicago O’Hare International Airport, | ||||||||
Series A, Rev., AMT, 5.00%, 01/01/2021 | 3,730 | 3,921 | ||||||
Series A, Rev., AMT, 5.00%, 01/01/2022 | 2,000 | 2,163 | ||||||
Fountaindale Public Library District, GO, 5.00%, 02/01/2021 | 1,050 | 1,106 | ||||||
Illinois Finance Authority, Illinois St Clean Water Initiative, Rev., 5.00%, 07/01/2019 | 3,340 | 3,340 | ||||||
Illinois Finance Authority, Northwestern University, Series C, Rev., VRDO, 1.89%, 07/05/2019 (z) | 3,500 | 3,500 | ||||||
Illinois Finance Authority, University of Chicago (The), Series C, Rev., VRDO, 1.82%, 07/05/2019 (z) | 1,955 | 1,955 | ||||||
Illinois Finance Authority, University of Chicago Medical Center Obligated Group, Series B, Rev., VRDO, LOC: Wells Fargo Bank NA, 1.87%, 07/01/2019 (z) | 200 | 200 | ||||||
Illinois Housing Development Authority, Series B, Rev., VRDO, 1.95%, 07/05/2019 (z) (w) | 3,000 | 3,000 | ||||||
Illinois Housing Development Authority, Multifamily Housing, Century Woods TC LP, Rev., GNMA COLL, 1.90%, 10/01/2022 (z) | 1,500 | 1,510 | ||||||
Illinois Housing Development Authority, Multifamily Housing, Heather Ridge TC LP, Rev., 1.90%, 10/01/2022 (z) | 3,000 | 3,020 | ||||||
Illinois State Toll Highway Authority,Series A-1B, Rev., VRDO, LOC: Bank of America NA, 1.91%, 07/05/2019 (z) | 10,300 | 10,300 | ||||||
|
| |||||||
| 37,778 | ||||||||
|
| |||||||
Indiana — 2.7% |
| |||||||
Indiana Finance Authority, Ascension Health Credit Group, Rev., VRDO, 2.00%, 07/05/2019 (z) | 3,770 | 3,770 | ||||||
Indiana Finance Authority, Health Systems, Sisters of St. Francis, Series I, Rev., VRDO, LOC: Barclays Bank plc, 1.97%, 07/01/2019 (z) | 1,000 | 1,000 | ||||||
Indiana Finance Authority, Indiana University Health, Inc., Obligated Group, | ||||||||
Series B, Rev., VRDO, LOC: TD Bank NA, 1.90%, 07/05/2019 (z) | 6,975 | 6,975 | ||||||
Series C, Rev., VRDO, LOC: Northern Trust Co., 1.87%, 07/05/2019 (z) | 8,000 | 8,000 | ||||||
Series E, Rev., VRDO, LOC: Bank of America NA, 1.83%, 07/05/2019 (z) | 6,000 | 6,000 | ||||||
SEE NOTES TO FINANCIAL STATEMENTS.
| JUNE 30, 2019 | SIX CIRCLES TRUST | 29 | ||||||
Table of Contents
Six Circles Tax Aware Ultra Short Duration Fund
SCHEDULE OF PORTFOLIO INVESTMENTS
AS OF JUNE 30, 2019 (Unaudited) (continued)
(Amounts in U.S. Dollars, unless otherwise noted)
(Amounts in thousands, except number of Futures contracts)
| SECURITY DESCRIPTION | PRINCIPAL AMOUNT($) | VALUE($) | ||||||
Municipal Bonds — continued |
| |||||||
Indiana — continued |
| |||||||
Indiana Health Facility Financing Authority, Ascension Health Credit Group, Series A2, Rev., VRDO, 2.00%, 07/05/2019 (z) | 7,700 | 7,700 | ||||||
Purdue University, Student Facilities System, Series C, Rev., VRDO, 1.79%, 07/05/2019 (z) | 200 | 200 | ||||||
|
| |||||||
| 33,645 | ||||||||
|
| |||||||
Iowa — 0.0% (g) |
| |||||||
Iowa Finance Authority, Trinity Health Corp. Obligated Group, Series D, Rev., VRDO, 1.94%, 07/05/2019 (z) | 100 | 100 | ||||||
|
| |||||||
Louisiana — 0.2% |
| |||||||
Consolidated Government of the City of Baton Rouge & Parish of East Baton Rouge, Exxon Mobil Corp. Project, Rev., VRDO, 1.89%, 07/01/2019 (z) | 2,600 | 2,600 | ||||||
|
| |||||||
Maryland — 1.0% |
| |||||||
County of Montgomery, Consolidated Public Improvement, Series A, GO, 5.00%, 11/01/2020 | 8,000 | 8,396 | ||||||
County of Prince George’s, Consolidated Public Improvement, Series A, GO, 5.00%, 07/15/2019 | 2,455 | 2,458 | ||||||
State of Maryland, Series E, GO, 5.00%, 08/01/2019 | 1,450 | 1,454 | ||||||
|
| |||||||
| 12,308 | ||||||||
|
| |||||||
Massachusetts — 6.0% |
| |||||||
Commonwealth of Massachusetts, | ||||||||
Series B, GO, 5.00%, 08/01/2019 | 4,440 | 4,453 | ||||||
Series C, GO, VRDO, 1.75%, 07/05/2019 (z) | 4,900 | 4,900 | ||||||
Commonwealth of Massachusetts, Central Artery, Series A, GO, VRDO, 1.87%, 07/05/2019 (z) | 1,625 | 1,625 | ||||||
Massachusetts Bay Transportation Authority, | ||||||||
Series A1, Rev., VRDO, 1.94%, 07/05/2019 (z) | 2,000 | 2,000 | ||||||
Series A2, Rev., VRDO, 1.83%, 07/05/2019 (z) | 6,695 | 6,695 | ||||||
Massachusetts Bay Transportation Authority, General Transportation System, Series A2, Rev., VRDO, 1.95%, 07/05/2019 (z) | 100 | 100 | ||||||
Massachusetts Development Finance Agency, Partners Healthcare System, Inc., | ||||||||
Series K1, Rev., VRDO, 1.85%, 07/05/2019 (z) | 5,700 | 5,700 | ||||||
Series K2, Rev., VRDO, 1.92%, 07/05/2019 (z) | 22,360 | 22,360 | ||||||
Massachusetts Development Finance Agency, Tufts University, Series R, Rev., VRDO, 1.87%, 07/01/2019 (z) | 10,000 | 10,000 | ||||||
| SECURITY DESCRIPTION | PRINCIPAL AMOUNT($) | VALUE($) | ||||||
Massachusetts — continued |
| |||||||
Massachusetts Educational Financing Authority, | ||||||||
Series A, Rev., AMT, 5.00%, 01/01/2021 | 3,150 | 3,304 | ||||||
Series J, Rev., AMT, 5.00%, 07/01/2020 | 400 | 414 | ||||||
Massachusetts Health & Educational Facilities Authority, Tufts University, Series N1, Rev., VRDO, 1.93%, 07/01/2019 (z) | 8,700 | 8,700 | ||||||
Massachusetts Water Resources Authority, | ||||||||
Series A2, Rev., VRDO, 1.80%, 07/05/2019 (z) | 1,540 | 1,540 | ||||||
Series A3, Rev., VRDO, 1.86%, 07/05/2019 (z) | 4,495 | 4,495 | ||||||
|
| |||||||
| 76,286 | ||||||||
|
| |||||||
Michigan — 1.9% |
| |||||||
Michigan Finance Authority, Clean Water Revolving Fund, Series B, Rev., 4.00%, 10/01/2020 | 7,515 | 7,769 | ||||||
Michigan Finance Authority, Great Lakes Water Authority Water Supply System Revenue, Local Government Loan Program, Series D1, Rev., AGM, 5.00%, 07/01/2020 | 2,700 | 2,794 | ||||||
Michigan Finance Authority, Hospital Project, Ascension Health Credit Group, Rev., VRDO, 1.94%, 07/05/2019 (z) | 2,275 | 2,275 | ||||||
University of Michigan, | ||||||||
Series A, Rev., VRDO, 1.78%, 07/05/2019 (z) | 5,325 | 5,325 | ||||||
Series D1, Rev., VRDO, 1.80%, 07/01/2019 (z) | 200 | 200 | ||||||
Series D2, Rev., VRDO, 1.80%, 07/05/2019 (z) | 970 | 970 | ||||||
Wayne County Airport Authority, Series A, Rev., AMT, 5.00%, 12/01/2020 | 4,985 | 5,224 | ||||||
|
| |||||||
| 24,557 | ||||||||
|
| |||||||
Minnesota — 0.3% |
| |||||||
City of Rochester, Health Care Facilities, Mayo Clinic, Rev., VRDO, 1.93%, 07/05/2019 (z) | 500 | 500 | ||||||
County of Hennepin, Series B, GO, VRDO, 1.86%, 07/05/2019 (z) | 2,740 | 2,740 | ||||||
|
| |||||||
| 3,240 | ||||||||
|
| |||||||
Mississippi — 1.0% |
| |||||||
Mississippi Business Finance Corp., Chevron USA, Inc. Project, | ||||||||
Series A, Rev., VRDO, 1.93%, 07/01/2019 (z) | 2,300 | 2,300 | ||||||
Series A, Rev., VRDO, 1.97%, 07/05/2019 (z) | 510 | 510 | ||||||
Series B, Rev., VRDO, 2.00%, 07/01/2019 (z) | 1,000 | 1,000 | ||||||
SEE NOTES TO FINANCIAL STATEMENTS.
| 30 | SIX CIRCLES TRUST | JUNE 30, 2019 | ||||
Table of Contents
| SECURITY DESCRIPTION | PRINCIPAL AMOUNT($) | VALUE($) | ||||||
Municipal Bonds — continued |
| |||||||
Mississippi — continued |
| |||||||
Series C, Rev., VRDO, 1.94%, 07/05/2019 (z) | 1,400 | 1,400 | ||||||
Series D, Rev., VRDO, 1.94%, 07/05/2019 (z) | 300 | 300 | ||||||
Series E, Rev., VRDO, 2.00%, 07/01/2019 (z) | 6,300 | 6,300 | ||||||
Series F, Rev., VRDO, 1.85%, 07/05/2019 (z) | 275 | 275 | ||||||
Series K, Rev., VRDO, 2.00%, 07/01/2019 (z) | 700 | 700 | ||||||
|
| |||||||
| 12,785 | ||||||||
|
| |||||||
Missouri — 0.5% |
| |||||||
City of St Louis, Airport Revenue, Series B, Rev., AGM, AMT, 4.00%, 07/01/2020 | 1,500 | 1,536 | ||||||
Missouri Development Finance Board, Nelson Gallery Foundation (The), Series A, Rev., VRDO, 1.92%, 07/01/2019 (z) | 5,000 | 5,000 | ||||||
|
| |||||||
| 6,536 | ||||||||
|
| |||||||
Nevada — 0.4% |
| |||||||
County of Clark Department of Aviation, Series A1, Rev., AMT, 5.00%, 07/01/2021 | 5,000 | 5,348 | ||||||
|
| |||||||
New Hampshire — 1.3% |
| |||||||
New Hampshire Health and Education Facilities Authority Act, Trustees of Dartmouth College, Series B, Rev., VRDO, 1.97%, 07/01/2019 (z) | 6,000 | 6,000 | ||||||
New Hampshire Health and Education Facilities Authority Act, University System of New Hampshire, | ||||||||
Series A1, Rev., VRDO, 1.97%, 07/01/2019 (z) | 800 | 800 | ||||||
Series B, Rev., VRDO, 1.97%, 07/01/2019 (z) | 9,710 | 9,710 | ||||||
|
| |||||||
| 16,510 | ||||||||
|
| |||||||
New Jersey — 0.7% |
| |||||||
New Jersey Housing & Mortgage Finance Agency, | ||||||||
Series D, Rev., AMT, 4.00%, 04/01/2020 | 1,125 | 1,144 | ||||||
Series D, Rev., AMT, 4.00%, 10/01/2020 | 1,290 | 1,326 | ||||||
New Jersey Sports & Exposition Authority, | ||||||||
Series A, Rev., 5.00%, 09/01/2020 | 1,000 | 1,035 | ||||||
Series A, Rev., 5.00%, 09/01/2021 | 4,000 | 4,274 | ||||||
New Jersey Transit Corp., Series A, Rev., GAN, 5.00%, 09/15/2019 | 500 | 504 | ||||||
|
| |||||||
| 8,283 | ||||||||
|
| |||||||
New Mexico — 0.3% |
| |||||||
New Mexico Municipal Energy Acquisition Authority, Gas Supply, | ||||||||
Series A, Rev., LIQ: Royal Bank of Canada, 4.00%, 11/01/2020 (w) | 2,600 | 2,682 | ||||||
Series A, Rev., LIQ: Royal Bank of Canada, 4.00%, 11/01/2021 (w) | 625 | 659 | ||||||
|
| |||||||
| 3,341 | ||||||||
|
| |||||||
| SECURITY DESCRIPTION | PRINCIPAL AMOUNT($) | VALUE($) | ||||||
New York — 9.8% |
| |||||||
City of New York, | ||||||||
Series 1, GO, 5.00%, 08/01/2019 | 5,000 | 5,015 | ||||||
Series G4, GO, VRDO, LOC: Citibank NA, 1.84%, 07/05/2019 (z) | 1,000 | 1,000 | ||||||
Series G4, GO, VRDO, 1.95%, 07/05/2019 (z) | 425 | 425 | ||||||
Series I3, GO, VRDO, LOC: Bank of America NA, 1.95%, 07/01/2019 (z) | 750 | 750 | ||||||
City of New York, Fiscal Year 2017, Series A4, GO, VRDO, LOC: Citibank NA, 1.84%, 07/05/2019 (z) | 7,000 | 7,000 | ||||||
City of New York, Fiscal Year 2018, Series B5, GO, VRDO, 1.97%, 07/01/2019 (z) | 7,400 | 7,400 | ||||||
Metropolitan Transportation Authority, | ||||||||
Series A1, Rev., VRDO, LOC: TD Bank NA, 1.92%, 07/01/2019 (z) | 5,220 | 5,220 | ||||||
Series A2, Rev., BAN, 4.00%, 08/15/2019 | 5,000 | 5,014 | ||||||
Series A, Rev., BAN, 5.00%, 03/01/2022 | 2,000 | 2,192 | ||||||
Series D2, Rev., VRDO, LOC: Landesbank Hessen-Thueringen, 1.75%, 07/01/2019 (z) | 5,600 | 5,600 | ||||||
Series G2, Rev., VRDO, LOC: TD Bank NA, 1.89%, 07/05/2019 (z) | 750 | 750 | ||||||
Nassau County Interim Finance Authority, Sales Tax Secured, Series A, Rev., VRDO, 1.88%, 07/05/2019 (z) | 13,640 | 13,640 | ||||||
New York City Housing Development Corp., Series C4, Rev., VRDO, 1.85%, 07/05/2019 (z) | 7,000 | 7,000 | ||||||
New York City Housing Development Corp., Multi-Family Mortgage, New LLC, 245 East 124th Street, Rev., VRDO, LOC: FHLMC, LIQ: FHLMC, 1.85%, 07/05/2019 (z) | 8,200 | 8,200 | ||||||
New York City Housing Development Corp., Multi-Family Rental Housing, 90 Washington Street, Series A, Rev., VRDO, LOC: FNMA, LIQ: FNMA, 1.85%, 07/05/2019 (z) | 600 | 600 | ||||||
New York City Housing Development Corp., Multi-Family Mortgage, Bruckner by the Bridge LLC, Series A, Rev., VRDO, LIQ: FHLMC, 1.85%, 07/05/2019 (z) | 4,700 | 4,700 | ||||||
New York City Municipal Water Finance Authority, Water & Sewer System,Series F-1A, Rev., VRDO, 1.90%, 07/05/2019 (z) | 6,000 | 6,000 | ||||||
New York City Municipal Water Finance Authority, Water & Sewer System, Second General Resolution, Fiscal Year 2008, Series BB2, Rev., VRDO, 1.98%, 07/01/2019 (z) | 3,500 | 3,500 | ||||||
SEE NOTES TO FINANCIAL STATEMENTS.
| JUNE 30, 2019 | SIX CIRCLES TRUST | 31 | ||||||
Table of Contents
Six Circles Tax Aware Ultra Short Duration Fund
SCHEDULE OF PORTFOLIO INVESTMENTS
AS OF JUNE 30, 2019 (Unaudited) (continued)
(Amounts in U.S. Dollars, unless otherwise noted)
(Amounts in thousands, except number of Futures contracts)
| SECURITY DESCRIPTION | PRINCIPAL AMOUNT($) | VALUE($) | ||||||
Municipal Bonds — continued |
| |||||||
New York — continued |
| |||||||
New York City Transitional Finance Authority, Future Tax, Series A4, Rev., VRDO, 1.92%, 07/01/2019 (z) | 2,250 | 2,250 | ||||||
New York City Transitional Finance Authority, Future Tax Secured Revenue, | ||||||||
Series B5, Rev., VRDO, 1.96%, 07/01/2019 (z) | 800 | 800 | ||||||
Series F5, Rev., VRDO, LOC: Sumitomo Mitsui Banking Corp., 1.85%, 07/05/2019 (z) | 7,285 | 7,285 | ||||||
New York City Transitional Finance Authority, New York City Recovery, Series 1E, Rev., VRDO, LOC: Sumitomo Mitsui Banking Corp., 1.92%, 07/05/2019 (z) | 375 | 375 | ||||||
New York City Trust for Cultural Resources, Metropolitan Museum of Art (The), Series A1, Rev., VRDO, 1.78%, 07/05/2019 (z) | 525 | 525 | ||||||
New York State Dormitory Authority, City University of New York (The), Consolidated Fifth, Series C, Rev., VRDO, LOC: Bank of America NA, 1.81%, 07/05/2019 (z) | 1,200 | 1,200 | ||||||
New York State Dormitory Authority, School District, Financing Program, Series D, Rev., 5.00%, 10/01/2020 | 1,500 | 1,569 | ||||||
New York State Housing Finance Agency, Series L, Rev., VRDO, LOC: Bank of America NA, 1.75%, 07/05/2019 (z) | 100 | 100 | ||||||
New York State Housing Finance Agency, Clinton Park Housing, Series A, Rev., VRDO, LIQ: FHLMC, 1.87%, 07/05/2019 (z) | 200 | 200 | ||||||
New York State Housing Finance Agency, Housing Related, Taconic, Rev., VRDO, LOC: FNMA, LIQ: FNMA, 1.95%, 07/05/2019 (z) | 1,220 | 1,220 | ||||||
Onondaga County Resource Recovery Agency, Series A, Rev., AGM, AMT, 5.00%, 05/01/2021 | 1,915 | 2,039 | ||||||
Onondaga County Trust for Cultural Resources, Syracuse University Project, Series A, Rev., VRDO, LOC: Wells Fargo Bank NA, 1.70%, 07/05/2019 (z) | 1,000 | 1,000 | ||||||
Port Authority of New York & New Jersey, Consolidated One Hundred Eighty, Rev., AMT, 5.00%, 09/01/2021 | 3,060 | 3,291 | ||||||
Triborough Bridge & Tunnel Authority, | ||||||||
Series B2, Rev., VRDO, LOC: Citibank NA, 1.79%, 07/01/2019 (z) | 1,100 | 1,100 | ||||||
Series B3, Rev., VRDO, LOC: State Street Bank & Trust Co., 1.94%, 07/01/2019 (z) | 9,620 | 9,620 | ||||||
Series F, Rev., VRDO, LOC: Citibank NA, 1.79%, 07/01/2019 (z) | 8,175 | 8,175 | ||||||
|
| |||||||
| 124,755 | ||||||||
|
| |||||||
| SECURITY DESCRIPTION | PRINCIPAL AMOUNT($) | VALUE($) | ||||||
North Carolina — 1.9% |
| |||||||
City of Charlotte, Water & Sewer System Revenue, Series B, Rev., VRDO, 1.82%, 07/05/2019 (z) | 12,800 | 12,800 | ||||||
City of Raleigh, Combined Enterprise System Revenue, Series B, Rev., VRDO, 2.00%, 07/05/2019 (z) | 3,800 | 3,800 | ||||||
University of North Carolina, University Hospital at Chapel Hill, | ||||||||
Series A, Rev., VRDO, 1.91%, 07/05/2019 (z) | 100 | 100 | ||||||
Series B, Rev., VRDO, 1.90%, 07/01/2019 (z) | 2,900 | 2,900 | ||||||
Series C, Rev., VRDO, 1.87%, 07/05/2019 (z) | 4,000 | 4,000 | ||||||
|
| |||||||
| 23,600 | ||||||||
|
| |||||||
Ohio — 4.2% |
| |||||||
County of Franklin, Hospital Facilities, OhioHealth Corp. Obligated Group, Series C, Rev., VRDO, 1.95%, 07/05/2019 (z) | 6,000 | 6,000 | ||||||
County of Franklin, Trinity Health Corp. Obligated Group, Series OH, Rev., 1.75%, 12/01/2046 (z) | 8,700 | 8,703 | ||||||
County of Lucas, Promedica Healthcare Obligated Group, Series A, Rev., 5.00%, 11/15/2019 | 1,000 | 1,011 | ||||||
County of Montgomery, Premier Health Partners Obligated Group, Miami Valley Hospital, Series E, Rev., VRDO, LOC: Barclays Bank plc, 1.97%, 07/01/2019 (z) | 700 | 700 | ||||||
Ohio Higher Educational Facility Commission, Cleveland Clinic Health System Obligated Group, Series B1, Rev., VRDO, 1.85%, 07/01/2019 (z) | 950 | 950 | ||||||
Ohio Higher Educational Facility Commission, Hospital, Cleveland Clinic Health System Obligated Group, Series B4, Rev., VRDO, 1.92%, 07/01/2019 (z) | 6,650 | 6,650 | ||||||
Ohio State University (The), | ||||||||
Series B2, Rev., VRDO, 1.85%, 07/05/2019 (z) | 6,725 | 6,725 | ||||||
Series B, Rev., VRDO, 1.85%, 07/05/2019 (z) | 5,800 | 5,800 | ||||||
Series E, Rev., VRDO, 1.85%, 07/05/2019 (z) | 3,500 | 3,500 | ||||||
State of Ohio, Infrastructure Improvement, | ||||||||
Series A, GO, VRDO, 2.00%, 07/05/2019 (z) | 12,775 | 12,775 | ||||||
Series B, GO, 5.00%, 09/01/2019 | 530 | 533 | ||||||
|
| |||||||
| 53,347 | ||||||||
|
| |||||||
SEE NOTES TO FINANCIAL STATEMENTS.
| 32 | SIX CIRCLES TRUST | JUNE 30, 2019 | ||||
Table of Contents
| SECURITY DESCRIPTION | PRINCIPAL AMOUNT($) | VALUE($) | ||||||
Municipal Bonds — continued |
| |||||||
Oregon — 0.0% (g) |
| |||||||
Oregon Health & Science University, Series B3, Rev., VRDO, LOC: U.S. Bank NA, 1.92%, 07/01/2019 (z) | 350 | 350 | ||||||
|
| |||||||
Pennsylvania — 1.5% |
| |||||||
Commonwealth of Pennsylvania, First Series, GO, 5.00%, 08/15/2021 | 7,210 | 7,768 | ||||||
Delaware River Port Authority, Series B, Rev., 5.00%, 01/01/2021 | 3,100 | 3,266 | ||||||
Geisinger Authority, Geisinger Health System Obligated Group, Series A2, Rev., VRDO, 1.87%, 07/01/2019 (z) | 800 | 800 | ||||||
Monroeville Finance Authority, UPMC Obligated Group, Rev., 5.00%, 02/15/2021 | 1,155 | 1,221 | ||||||
Pennsylvania Economic Development Financing Authority, UPMC Obligated Group, Series A, Rev., 4.00%, 11/15/2020 | 1,000 | 1,035 | ||||||
Pennsylvania Economic Development Financing Authority, Waste Management Obligated Group Project, Series A, Rev., 2.15%, 11/01/2021 | 1,375 | 1,385 | ||||||
Pennsylvania Higher Educational Facilities Authority, Drexel University, Series B, Rev., VRDO, LOC: TD Bank NA, 1.90%, 07/01/2019 (z) | 2,650 | 2,650 | ||||||
Philadelphia Authority for Industrial Development, City Service Agreement, Rebuild Project, | ||||||||
Rev., 5.00%, 05/01/2020 | 500 | 515 | ||||||
Rev., 5.00%, 05/01/2021 | 750 | 797 | ||||||
|
| |||||||
| 19,437 | ||||||||
|
| |||||||
South Carolina — 0.1% |
| |||||||
South Carolina Educational Facilities Authority, Furman University, Series B, Rev., VRDO, 1.93%, 07/01/2019 (z) | 1,100 | 1,100 | ||||||
|
| |||||||
Tennessee — 0.6% |
| |||||||
Tennessee Energy Acquisition Corp., | ||||||||
Series A, Rev., 5.25%, 09/01/2019 | 5,875 | 5,907 | ||||||
Series A, Rev., 5.25%, 09/01/2021 | 2,040 | 2,182 | ||||||
|
| |||||||
| 8,089 | ||||||||
|
| |||||||
Texas — 3.5% |
| |||||||
City of Arlington, Water & Wastewater System Revenue, Series A, Rev., 2.00%, 06/01/2021 | 400 | 405 | ||||||
City of Austin, Airport System, Rev., AMT, 5.00%, 11/15/2020 | 2,500 | 2,620 | ||||||
City of Garland, Texas, GO, 5.00%, 02/15/2021 | 1,700 | 1,800 | ||||||
Cypress-Fairbanks Texas Independent School District, GO,PSF-GTD, 5.00%, 02/15/2021 | 2,465 | 2,612 | ||||||
| SECURITY DESCRIPTION | PRINCIPAL AMOUNT($) | VALUE($) | ||||||
Texas — continued |
| |||||||
Gulf Coast Waste Disposal Authority, Pollution Control, Exxon Project,, Rev., VRDO, 1.99%, 07/01/2019 (z) | 4,000 | 4,000 | ||||||
Lower Neches Valley Authority Industrial Development Corp., Exxonmobil, Rev., VRDO, 1.89%, 07/01/2019 (z) | 5,500 | 5,500 | ||||||
North Texas Tollway Authority System, First Tier, Series A, Rev., 5.00%, 01/01/2021 | 1,000 | 1,054 | ||||||
Northwest Independent School District, Series B, GO,PSF-GTD, 5.00%, 02/15/2021 | 2,000 | 2,119 | ||||||
Permanent University Fund—University of Texas System, Series A, Rev., VRDO, 1.85%, 07/05/2019 (z) | 800 | 800 | ||||||
Socorro Independent School District, GO,PSF-GTD, 4.00%, 08/15/2020 | 3,220 | 3,317 | ||||||
State of Texas, College Student Loan, Series B, GO, AMT, 5.00%, 08/01/2020 | 4,010 | 4,164 | ||||||
State of Texas, Public Finance Authority, GO, 5.00%, 10/01/2019 | 5,300 | 5,349 | ||||||
State of Texas, Veterans, | ||||||||
GO, VRDO, LIQ: FHLB, 2.05%, 07/05/2019 (z) | 2,500 | 2,500 | ||||||
Series C, GO, VRDO, 2.06%, 07/05/2019 (z) | 1,175 | 1,175 | ||||||
Tarrant County Cultural Education Facilities Finance Corp., Texas Health Resources Obligated Group, Series B, Rev., VRDO, 2.06%, 07/05/2019 (z) | 3,000 | 3,000 | ||||||
Texas Municipal Gas Acquisition & Supply Corp. I, Series A, Rev., 5.25%, 12/15/2019 | 3,920 | 3,985 | ||||||
|
| |||||||
| 44,400 | ||||||||
|
| |||||||
Utah — 0.1% |
| |||||||
County of Utah, IHC Health Services, Inc. Obligated Group, Series B, Rev., VRDO, 1.89%, 07/05/2019 (z) | 1,150 | 1,150 | ||||||
|
| |||||||
Virginia — 3.8% |
| |||||||
Albermarle County Economic Development Authority, Sentara Healthcare Obligated Group, Series B, Rev., VRDO, 1.95%, 07/01/2019 (z) | 350 | 350 | ||||||
County of Chesterfield, Series B, GO, 5.00%, 01/01/2021 | 1,430 | 1,510 | ||||||
Fairfax County Economic Development Authority, Smithsonian Institution, Series A, Rev., VRDO, 1.75%, 07/05/2019 (z) | 4,325 | 4,325 | ||||||
Fairfax County Industrial Development Authority, Inova Health System Obligated Group Project, Series C, Rev., VRDO, 1.80%, 07/05/2019 (z) | 10,300 | 10,300 | ||||||
SEE NOTES TO FINANCIAL STATEMENTS.
| JUNE 30, 2019 | SIX CIRCLES TRUST | 33 | ||||||
Table of Contents
Six Circles Tax Aware Ultra Short Duration Fund
SCHEDULE OF PORTFOLIO INVESTMENTS
AS OF JUNE 30, 2019 (Unaudited) (continued)
(Amounts in U.S. Dollars, unless otherwise noted)
(Amounts in thousands, except number of Futures contracts)
| SECURITY DESCRIPTION | PRINCIPAL AMOUNT($) | VALUE($) | ||||||
Municipal Bonds — continued |
| |||||||
Virginia — continued |
| |||||||
Loudoun County Economic Development Authority, Howard Hughes Medical Institute, | ||||||||
Series B, Rev., VRDO, 1.94%, 07/05/2019 (z) | 2,630 | 2,630 | ||||||
Series C, Rev., VRDO, 1.94%, 07/05/2019 (z) | 4,500 | 4,500 | ||||||
Series D, Rev., VRDO, 1.94%, 07/05/2019 (z) | 200 | 200 | ||||||
Series F, Rev., VRDO, 1.95%, 07/05/2019 (z) | 4,100 | 4,100 | ||||||
Norfolk Economic Development Authority, Sentara Healthcare Obligated Group, | ||||||||
Series A, Rev., VRDO, 1.90%, 07/05/2019 (z) | 10,500 | 10,500 | ||||||
Series B, Rev., VRDO, 1.95%, 07/05/2019 (z) | 6,500 | 6,500 | ||||||
Virginia Port Authority, Port Facility Refunding, | ||||||||
Series B, Rev., AMT, 5.00%, 07/01/2020 | 1,730 | 1,787 | ||||||
Series B, Rev., AMT, 5.00%, 07/01/2021 | 1,405 | 1,498 | ||||||
|
| |||||||
| 48,200 | ||||||||
|
| |||||||
Washington — 2.0% |
| |||||||
Chelan County Public Utility District No. 1, Series B, Rev., VRDO, 1.95%, 07/05/2019 (z) | 6,000 | 6,000 | ||||||
King County Public Hospital District No. 1, Valley Medical Center, GO, 4.00%, 12/01/2020 | 475 | 491 | ||||||
King County School District No. 412 Shoreline, GO, SCH BD GTY, 5.00%, 12/01/2020 | 1,000 | 1,052 | ||||||
State of Washington, Series2015-C, GO, 5.00%, 07/01/2019 | 1,100 | 1,100 | ||||||
State of Washington, Motor Vehicle Fuel Tax, Series B, GO, 5.00%, 08/01/2020 | 4,730 | 4,919 | ||||||
State of Washington, Various Purpose, Series A, GO, 5.00%, 08/01/2019 | 3,870 | 3,882 | ||||||
Washington Health Care Facilities Authority, Providence Health & Service, Series C, Rev., VRDO, 1.93%, 07/05/2019 (z) | 5,100 | 5,100 | ||||||
Washington State Housing Finance Commission, Interurban Senior Living Associates LP, Rev., VRDO, LOC: FHLMC, LIQ: FHLMC, 1.85%, 07/05/2019 (z) | 2,350 | 2,350 | ||||||
|
| |||||||
| 24,894 | ||||||||
|
| |||||||
Wisconsin — 0.4% |
| |||||||
State of Wisconsin, Series B, GO, 5.00%, 05/01/2021 | 2,435 | 2,598 | ||||||
Wisconsin Health & Educational Facilities Authority, Ascension Health Credit Group, Series B2, Rev., 4.00%, 11/15/2020 | 1,530 | 1,586 | ||||||
| SECURITY DESCRIPTION | PRINCIPAL AMOUNT($) | VALUE($) | ||||||
Wisconsin — continued |
| |||||||
Wisconsin Housing & Economic Development Authority, Series B, Rev., FNMA COLL, VRDO, 1.90%, 07/05/2019 (z) | 1,000 | 1,000 | ||||||
|
| |||||||
| 5,184 | ||||||||
|
| |||||||
Wyoming — 0.4% | ||||||||
County of Lincoln, Exxon Capital Ventures, Inc., Rev., VRDO, 1.99%, 07/01/2019 (z) | 5,000 | 5,000 | ||||||
| �� | |||||||
Total Municipal Bonds | 767,312 | |||||||
|
| |||||||
U.S. Government Agency Security — 0.3% |
| |||||||
FHLMC, 2.80%, 06/03/2024 | 4,000 | 4,005 | ||||||
|
| |||||||
U.S. Treasury Obligations — 3.3% |
| |||||||
U.S. Treasury Inflation Indexed Bonds, | 6,620 | 6,568 | ||||||
0.13%, 01/15/2023 | 10,518 | 10,458 | ||||||
0.38%, 07/15/2023 | 4,557 | 4,594 | ||||||
0.63%, 04/15/2023 (cc) | 20,268 | 20,506 | ||||||
|
| |||||||
Total U.S. Treasury Obligations | 42,126 | |||||||
|
| |||||||
Short-Term Investments — 11.3% |
| |||||||
Commercial Papers — 4.2% |
| |||||||
Board Of Trustees Michigan State University, 1.48%, 07/02/2019 (n) | 600 | 600 | ||||||
City of Dallas, | ||||||||
Series D1, 1.47%, 07/02/2019 (n) | 4,000 | 4,000 | ||||||
Series D1, 1.83%, 07/02/2019 (n) | 1,000 | 1,000 | ||||||
City of El Paso, | ||||||||
Series B, 1.47%, 07/23/2019 (n) | 7,000 | 6,999 | ||||||
Series B, 1.65%, 07/08/2019 (n) | 5,000 | 4,999 | ||||||
Series B, 1.77%, 07/08/2019 (n) | 1,400 | 1,400 | ||||||
District of Columbia, | ||||||||
Series 18, 1.43%, 07/09/2019 (n) | 5,000 | 4,999 | ||||||
Series 18, 1.83%, 07/30/2019 (n) | 6,000 | 6,001 | ||||||
Ford Motor Credit Co. LLC, 3.43%, 01/21/2020 (e) (n) | 1,900 | 1,866 | ||||||
Huntsville Health Care Authority, 1.88%, 07/02/2019 (n) | 6,000 | 6,000 | ||||||
Massachusetts Health & Educational Facilities Authority, 1.75%, 10/10/2019 (n) | 3,000 | 3,000 | ||||||
Montgomery County, 1.42%, 07/18/2019 (n) | 3,000 | 3,000 | ||||||
Syngenta Wilmington, Inc., 3.30%, 07/08/2019 (e) (n) | 3,700 | 3,697 | ||||||
University of Virginia Rector & Visitors, Series A, 1.64%, 08/06/2019 (n) | 6,000 | 6,000 | ||||||
|
| |||||||
Total Commercial Papers | 53,561 | |||||||
|
| |||||||
SEE NOTES TO FINANCIAL STATEMENTS.
| 34 | SIX CIRCLES TRUST | JUNE 30, 2019 | ||||
Table of Contents
| SECURITY DESCRIPTION | PRINCIPAL AMOUNT($) | VALUE($) | ||||||
Short-Term Investments — continued |
| |||||||
Municipal Bonds — 4.8% |
| |||||||
City of Phoenix, Civic Improvement Corp., Rev., AMT, 5.00%, 07/01/2019 | 525 | 525 | ||||||
County of Los Angeles, Rev., TRAN, 5.00%, 06/30/2020 (w) | 6,500 | 6,747 | ||||||
County of Suffolk, | ||||||||
GO, TAN, 5.00%, 07/24/2019 | 7,000 | 7,014 | ||||||
Series I, GO, TAN, 5.00%, 09/26/2019 | 6,300 | 6,352 | ||||||
King County Public Hospital District No. 1, Valley Medical Center, GO, 4.00%, 12/01/2019 | 450 | 455 | ||||||
Metropolitan Transportation Authority, Series A, Rev., BAN, 4.00%, 02/03/2020 | 6,000 | 6,091 | ||||||
New Jersey Sports & Exposition Authority, Series A, Rev., 4.00%, 09/01/2019 | 1,100 | 1,104 | ||||||
New Mexico Municipal Energy Acquisition Authority, Gas Supply, Series A, Rev., LOC: Royal Bank of Canada, 4.00%, 05/01/2020 (w) | 5,045 | 5,141 | ||||||
New York State Thruway Authority, Rev., RAN, 4.00%, 02/01/2020 | 5,000 | 5,026 | ||||||
San Francisco City & County Airport Comm-San Francisco International Airport, Special Facilities Lease, SFO Fuel Co. LLC, Series A, Rev., AMT, 5.00%, 01/01/2020 | 1,010 | 1,028 | ||||||
State of Idaho, GO, TAN, 3.00%, 06/30/2020 (w) | 7,000 | 7,119 | ||||||
| SECURITY DESCRIPTION | PRINCIPAL AMOUNT($) | VALUE($) | ||||||
Municipal Bonds — continued |
| |||||||
State of Texas, Rev., TRAN, 4.00%, 08/29/2019 | 13,800 | 13,853 | ||||||
|
| |||||||
Total Municipal Bonds | 60,455 | |||||||
|
| |||||||
Time Deposits — 2.3% |
| |||||||
Australia & New Zealand Banking Group Ltd., 1.76%, 07/01/2019 | 25,518 | 25,518 | ||||||
BNP Paribas SA, (0.58%), 07/01/2019 | EUR | 185 | 211 | |||||
Brown Brothers Harriman, 0.36%, 07/01/2019 | GBP | — | (h) | — | (h) | |||
0.81%, 07/02/2019 | CAD | 244 | 186 | |||||
Citibank NA, | ||||||||
(0.58%), 07/01/2019 | EUR | 87 | 99 | |||||
1.76%, 07/01/2019 | 2,893 | 2,893 | ||||||
|
| |||||||
Total Time Deposits | 28,907 | |||||||
|
| |||||||
Total Short-Term Investments | 142,923 | |||||||
|
| |||||||
Total Investments — 101.9% | 1,292,382 | |||||||
Liabilities in Excess of Other Assets — (1.9)% |
| (24,670 | ) | |||||
|
| |||||||
NET ASSETS — 100.0% | $ | 1,267,712 | ||||||
|
| |||||||
| Futures contracts outstanding as of June 30, 2019: | ||||||||||||||||||||
| Exchange Traded | ||||||||||||||||||||
| DESCRIPTION | NUMBER OF CONTRACTS | EXPIRATION DATE | TRADING CURRENCY | NOTIONAL AMOUNT($) | VALUE AND (DEPRECIATION)($) | |||||||||||||||
Long Contracts |
| |||||||||||||||||||
Canadian 10 Year Government Bond | 44 | 09/2019 | CAD | 4,824 | (22 | ) | ||||||||||||||
Canadian Bankers’ Acceptance | 252 | 06/2020 | CAD | 46,780 | 501 | |||||||||||||||
Canadian Bankers’ Acceptance | 159 | 09/2020 | CAD | 29,676 | 174 | |||||||||||||||
Canadian Bankers’ Acceptance | 189 | 12/2020 | CAD | 35,446 | 45 | |||||||||||||||
U.S. Ultra Treasury 10 Year Note | 33 | 09/2019 | USD | 4,462 | 96 | |||||||||||||||
|
| |||||||||||||||||||
| 794 | ||||||||||||||||||||
|
| |||||||||||||||||||
Short Contracts |
| |||||||||||||||||||
3 Month Eurodollar | (876 | ) | 06/2020 | USD | (215,037 | ) | (415 | ) | ||||||||||||
U.S. Treasury 2 Year Note | (95 | ) | 09/2019 | USD | (20,374 | ) | (68 | ) | ||||||||||||
|
| |||||||||||||||||||
| (483 | ) | |||||||||||||||||||
|
| |||||||||||||||||||
Total unrealized appreciation (depreciation) | 311 | |||||||||||||||||||
|
| |||||||||||||||||||
SEE NOTES TO FINANCIAL STATEMENTS.
| JUNE 30, 2019 | SIX CIRCLES TRUST | 35 | ||||||
Table of Contents
Six Circles Tax Aware Ultra Short Duration Fund
SCHEDULE OF PORTFOLIO INVESTMENTS
AS OF JUNE 30, 2019 (Unaudited) (continued)
(Amounts in U.S. Dollars, unless otherwise noted)
(Amounts in thousands, except number of Futures contracts)
| Forward foreign currency exchange contracts outstanding as of June 30, 2019: | ||||||||||||||||||||
| CURRENCY PURCHASED | CURRENCY SOLD | COUNTERPARTY | SETTLEMENT DATE | UNREALIZED APPRECIATION (DEPRECIATION)($) | ||||||||||||||||
| USD | 11,459 | JPY | 1,225,000 | Morgan Stanley & Co. | 07/22/2019 | 78 | ||||||||||||||
| CAD | 537 | USD | 398 | Morgan Stanley & Co. | 08/15/2019 | 12 | ||||||||||||||
|
| |||||||||||||||||||
| Total unrealized appreciation | 90 | |||||||||||||||||||
|
| |||||||||||||||||||
| USD | 2,502 | CAD | 3,335 | Morgan Stanley & Co. | 08/15/2019 | (47 | ) | |||||||||||||
| USD | 3,939 | GBP | 3,096 | Morgan Stanley & Co. | 08/15/2019 | (1 | ) | |||||||||||||
|
| |||||||||||||||||||
| Total unrealized depreciation | (48 | ) | ||||||||||||||||||
|
| |||||||||||||||||||
| Net unrealized appreciation (depreciation) | 42 | |||||||||||||||||||
|
| |||||||||||||||||||
| Centrally Cleared Interest Rate Swap contracts outstanding as of June 30, 2019: | ||||||||||||||||||||||||||||||
| FLOATING RATE INDEX (a) | FIXED RATE | PAY/RECEIVE FLOATING RATE | MATURITY DATE | NOTIONAL AMOUNT | UPFRONT PAYMENTS (RECEIPTS)($) | UNREALIZED APPRECIATION (DEPRECIATION)($) | VALUE($) | |||||||||||||||||||||||
EURIBOR 3 Month | 0.00% annually | Pay | 01/30/2021 | EUR | 194,800 | 137 | 420 | 557 | ||||||||||||||||||||||
United States FEDEF Intraday | 2.50% annually | Pay | 03/01/2020 | USD | 198,900 | 118 | 762 | 880 | ||||||||||||||||||||||
United States FEDEF Intraday | 2.34% annually | Pay | 03/18/2020 | USD | 267,800 | (3 | ) | 480 | 477 | |||||||||||||||||||||
United States FEDEF Intraday | 2.30% annually | Receive | 03/01/2022 | USD | 147,400 | 28 | (3,041 | ) | (3,013 | ) | ||||||||||||||||||||
|
|
|
|
|
| |||||||||||||||||||||||||
Total | 280 | (1,379 | ) | (1,099 | ) | |||||||||||||||||||||||||
|
|
|
|
|
| |||||||||||||||||||||||||
| (a) | Value of floating rate index as of June 30, 2019 was as follows: |
| FLOATING RATE INDEX | ||||
EURIBOR 3 Month | (0.35% | ) | ||
FEDEF | 2.40% | |||
| Sale-Buyback Transactions | ||||||||||||||||||||
| COUNTERPARTY | BORROWING DATE | MATURITY DATE | BORROWING RATE | AMOUNT BORROWED | PAYABLE FOR SALE-BUYBACK TRANSACTIONS | |||||||||||||||
Morgan Stanley & Co. LLC. | 06/28/2019 | 07/01/2019 | 2.79 | % | (7,193 | ) | (7,194 | ) | ||||||||||||
SEE NOTES TO FINANCIAL STATEMENTS.
| 36 | SIX CIRCLES TRUST | JUNE 30, 2019 | ||||
Table of Contents
NOTES TO SCHEDULE OF PORTFOLIO INVESTMENTS
| AGM | — Insured by Assured Guaranty Municipal Corp. | |
| AMT | — Alternative Minimum Tax | |
| BAN | — Bond Anticipation Note | |
| COLL | — Collateral | |
| EURIBOR | — Euro Interbank Offered Rate | |
| FEDEF | — Federal Fund Effective Rate (Continuous Series) | |
| FHLB | — Federal Home Loan Bank | |
| FHLMC | — Federal Home Loan Mortgage Corp. | |
| FNMA | — Federal National Mortgage Association | |
| GAN | — Grant Anticipation Note | |
| GO | — General Obligation | |
| GNMA | — Government National Mortgage Association | |
| GTD | — Guaranteed | |
| GTY | — Guaranty | |
| ICE | — Intercontinental Exchange | |
| LIBOR | — London Interbank Offered Rate | |
| LIQ | — Liquidity Agreement | |
| LOC | — Letter of Credit | |
| PSF | — Permanent School Fund | |
| RAN | — Revenue Anticipation Note | |
| Reg. S | — Security was purchased pursuant to Regulation S under the Securities Act of 1933, as amended (the “Securities Act”), which exempts from registration securities offered and sold outside of the United States. Such a security cannot be sold in the United States without either an effective registration statement filed pursuant to the Securities Act, or pursuant to an exemption from registration. | |
| REMICS | — Real Estate Mortgage Investment Conduit | |
| Rev. | — Revenue | |
| SCH BD | — School Bond | |
| SOFR | — Secured Overnight Financing Rate | |
| SUB | — Step-Up Bond. The interest rate shown is the rate in effect as of June 30, 2019. |
| TAN | — Tax Anticipation Note | |
| TBA | — To Be Announced | |
| TRAN | — Tax & Revenue Anticipation Note | |
| VRDO | — Variable Rate Demand Obligation. The interest rate shown is the rate in effect as of June 30, 2019. | |
| (e) | — Security is exempt from registration under Rule 144A of the Securities Act of 1933, as amended. Unless otherwise indicated, this security has been determined to be liquid under procedures established by the Board of Trustees and may be resold in transactions exempt from registration, normally to qualified institutional buyers. | |
| (g) | — Amount rounds to less than 0.05%. | |
| (h) | — Amount rounds to less than 500. | |
| (n) | — The rate shown is the effective yield as of June 30, 2019. | |
| (t) | — The date shown represents the earliest of the next put date or final maturity date. | |
| (w) | — All or a portion of the security is a when-issued security, delayed delivery security, or forward commitment. | |
| (z) | — Variable or floating rate security, the interest rate of which adjusts periodically based on changes in current interest rates and prepayments on the underlying pool of assets. The interest rate shown is the current rate as of June 30, 2019. | |
| (aa) | — Variable or floating rate security, linked to the referenced benchmark. The interest rate shown is the current rate as of June 30, 2019. | |
| (cc) | — All or a portion of these U.S. Treasury Obligations were purchased in a sale-buyback transaction. The value of these securities total $7,182, which represents 0.6% of total net assets. | |
| * | — The cost of securities is substantially the same for federal income tax purposes. | |
| CAD | — Canadian Dollar | |
| EUR | — Euro | |
| GBP | — British Pound | |
| JPY | — Japanese Yen | |
| USD | — United States Dollar |
SEE NOTES TO FINANCIAL STATEMENTS.
| JUNE 30, 2019 | SIX CIRCLES TRUST | 37 | ||||||
Table of Contents
Six Circles U.S. Unconstrained Equity Fund
SCHEDULE OF PORTFOLIO INVESTMENTS
AS OF JUNE 30, 2019 (Unaudited)
(Amounts in U.S. Dollars, unless otherwise noted)
(Amounts in thousands, except number of Futures contracts)
| SECURITY DESCRIPTION | SHARES | VALUE($) | ||||||
Common Stocks — 99.9% |
| |||||||
Basic Materials — 1.0% |
| |||||||
Chemicals — 0.8% |
| |||||||
Air Products & Chemicals, Inc. | 71 | 15,972 | ||||||
Albemarle Corp. | 24 | 1,660 | ||||||
Ashland Global Holdings, Inc. | 7 | 540 | ||||||
Cabot Corp. | 16 | 744 | ||||||
Celanese Corp., Class A | 39 | 4,198 | ||||||
Eastman Chemical Co. | 63 | 4,891 | ||||||
Ecolab, Inc. | 43 | 8,534 | ||||||
HB Fuller Co. | 1 | 54 | ||||||
International Flavors & Fragrances, Inc. | 24 | 3,447 | ||||||
Linde plc, (United Kingdom) | 137 | 27,504 | ||||||
NewMarket Corp. | 1 | 419 | ||||||
PolyOne Corp. | 15 | 457 | ||||||
PPG Industries, Inc. | 61 | 7,066 | ||||||
RPM International, Inc. | 35 | 2,129 | ||||||
Sensient Technologies Corp. | 5 | 377 | ||||||
Sherwin-Williams Co. (The) | 11 | 5,183 | ||||||
Valvoline, Inc. | 36 | 706 | ||||||
Westlake Chemical Corp. | 4 | 289 | ||||||
|
| |||||||
| 84,170 | ||||||||
|
| |||||||
Forest Products & Paper — 0.0% (g) | ||||||||
Domtar Corp. | 36 | 1,591 | ||||||
|
| |||||||
Iron/Steel — 0.2% | ||||||||
Nucor Corp. | 163 | 8,969 | ||||||
Reliance Steel & Aluminum Co. | 23 | 2,170 | ||||||
Steel Dynamics, Inc. | 103 | 3,105 | ||||||
|
| |||||||
| 14,244 | ||||||||
|
| |||||||
Mining — 0.0% (g) | ||||||||
Kaiser Aluminum Corp. | 2 | 157 | ||||||
Royal Gold, Inc. | 6 | 619 | ||||||
|
| |||||||
| 776 | ||||||||
|
| |||||||
Total Basic Materials | 100,781 | |||||||
|
| |||||||
Communications — 18.7% | ||||||||
Advertising — 0.1% | ||||||||
Interpublic Group of Cos., Inc. (The) | 208 | 4,693 | ||||||
Omnicom Group, Inc. | 95 | 7,755 | ||||||
|
| |||||||
| 12,448 | ||||||||
|
| |||||||
Internet — 15.4% | ||||||||
Alphabet, Inc., Class A (a) | 239 | 259,237 | ||||||
Alphabet, Inc., Class C (a) | 245 | 264,866 | ||||||
Amazon.com, Inc. (a) | 286 | 542,186 | ||||||
Booking Holdings, Inc. (a) | 30 | 56,189 | ||||||
CDW Corp. | 19 | 2,118 | ||||||
eBay, Inc. | 567 | 22,404 | ||||||
Expedia Group, Inc. | 95 | 12,674 | ||||||
Facebook, Inc., Class A (a) | 1,921 | 370,744 | ||||||
Symantec Corp. | 362 | 7,888 | ||||||
TripAdvisor, Inc. (a) | 83 | 3,831 | ||||||
Twitter, Inc. (a) | 584 | 20,376 | ||||||
|
| |||||||
| 1,562,513 | ||||||||
|
| |||||||
| SECURITY DESCRIPTION | SHARES | VALUE($) | ||||||
Media — 1.0% | ||||||||
Comcast Corp., Class A | 1,298 | 54,870 | ||||||
FactSet Research Systems, Inc. | 3 | 1,000 | ||||||
John Wiley & Sons, Inc., Class A | 8 | 350 | ||||||
Meredith Corp. | 17 | 927 | ||||||
Nexstar Media Group, Inc., Class A | 7 | 739 | ||||||
Sinclair Broadcast Group, Inc., Class A | 10 | 550 | ||||||
Walt Disney Co. (The) | 315 | 43,994 | ||||||
|
| |||||||
| 102,430 | ||||||||
|
| |||||||
Telecommunications — 2.2% | ||||||||
Cisco Systems, Inc. | 1,542 | 84,395 | ||||||
Corning, Inc. | 274 | 9,120 | ||||||
Motorola Solutions, Inc. | 29 | 4,864 | ||||||
Telephone & Data Systems, Inc. | 15 | 462 | ||||||
Verizon Communications, Inc. | 2,196 | 125,439 | ||||||
|
| |||||||
| 224,280 | ||||||||
|
| |||||||
Total Communications | 1,901,671 | |||||||
|
| |||||||
Consumer Cyclical — 4.7% | ||||||||
Airlines — 0.2% | ||||||||
Alaska Air Group, Inc. | 32 | 2,058 | ||||||
Delta Air Lines, Inc. | 229 | 12,974 | ||||||
Southwest Airlines Co. | 85 | 4,301 | ||||||
|
| |||||||
| 19,333 | ||||||||
|
| |||||||
Apparel — 0.3% | ||||||||
Carter’s, Inc. | 9 | 854 | ||||||
Hanesbrands, Inc. | 162 | 2,784 | ||||||
NIKE, Inc., Class B | 209 | 17,542 | ||||||
VF Corp. | 109 | 9,561 | ||||||
|
| |||||||
| 30,741 | ||||||||
|
| |||||||
Auto Manufacturers — 0.1% | ||||||||
PACCAR, Inc. | 118 | 8,420 | ||||||
|
| |||||||
Auto Parts & Equipment — 0.1% | ||||||||
Autoliv, Inc., (Sweden) | 39 | 2,734 | ||||||
BorgWarner, Inc. | 39 | 1,656 | ||||||
Goodyear Tire & Rubber Co. (The) | 153 | 2,343 | ||||||
Lear Corp. | 23 | 3,170 | ||||||
|
| |||||||
| 9,903 | ||||||||
|
| |||||||
Distribution/Wholesale — 0.1% | ||||||||
Core-Mark Holding Co., Inc. | 3 | 134 | ||||||
Fastenal Co. | 201 | 6,549 | ||||||
IAA, Inc. (a) | 35 | 1,354 | ||||||
KAR Auction Services, Inc. | 35 | 873 | ||||||
Pool Corp. | 4 | 794 | ||||||
WW Grainger, Inc. | 12 | 3,228 | ||||||
|
| |||||||
| 12,932 | ||||||||
|
| |||||||
Entertainment — 0.0% (g) | ||||||||
Marriott Vacations Worldwide Corp. | 5 | 514 | ||||||
|
| |||||||
Food Service — 0.0% (g) | ||||||||
Aramark | 35 | 1,274 | ||||||
|
| |||||||
SEE NOTES TO FINANCIAL STATEMENTS.
| 38 | SIX CIRCLES TRUST | JUNE 30, 2019 | ||||
Table of Contents
| SECURITY DESCRIPTION | SHARES | VALUE($) | ||||||
Common Stocks — continued |
| |||||||
Home Builders — 0.0% (g) | ||||||||
DR Horton, Inc. | 53 | 2,274 | ||||||
Thor Industries, Inc. | 13 | 787 | ||||||
|
| |||||||
| 3,061 | ||||||||
|
| |||||||
Home Furnishings — 0.1% | ||||||||
Dolby Laboratories, Inc., Class A | 4 | 288 | ||||||
Leggett & Platt, Inc. | 61 | 2,355 | ||||||
Whirlpool Corp. | 32 | 4,626 | ||||||
|
| |||||||
| 7,269 | ||||||||
|
| |||||||
Housewares — 0.0% (g) | ||||||||
Scotts Miracle-Gro Co. (The) | 9 | 840 | ||||||
Toro Co. (The) | 13 | 846 | ||||||
|
| |||||||
| 1,686 | ||||||||
|
| |||||||
Leisure Time — 0.1% | ||||||||
Brunswick Corp. | 13 | 599 | ||||||
Harley-Davidson, Inc. | 86 | 3,086 | ||||||
Polaris Industries, Inc. | 17 | 1,512 | ||||||
Royal Caribbean Cruises Ltd. | 56 | 6,772 | ||||||
|
| |||||||
| 11,969 | ||||||||
|
| |||||||
Lodging — 0.1% | ||||||||
Marriott International, Inc., Class A | 53 | 7,444 | ||||||
Wyndham Destinations, Inc. | 47 | 2,068 | ||||||
Wyndham Hotels & Resorts, Inc. | 20 | 1,090 | ||||||
|
| |||||||
| 10,602 | ||||||||
|
| |||||||
Office Furnishings — 0.0% (g) | ||||||||
Herman Miller, Inc. | 6 | 286 | ||||||
HNI Corp. | 9 | 315 | ||||||
|
| |||||||
| 601 | ||||||||
|
| |||||||
Retail — 3.5% | ||||||||
Best Buy Co., Inc. | 97 | 6,787 | ||||||
Big Lots, Inc. | 8 | 229 | ||||||
Brinker International, Inc. | 9 | 344 | ||||||
Casey’s General Stores, Inc. | 1 | 199 | ||||||
Cheesecake Factory, Inc. (The) | 7 | 290 | ||||||
Children’s Place, Inc. (The) | 1 | 88 | ||||||
Costco Wholesale Corp. | 62 | 16,291 | ||||||
Cracker Barrel Old Country Store, Inc. | 8 | 1,295 | ||||||
Darden Restaurants, Inc. | 42 | 5,133 | ||||||
Dick’s Sporting Goods, Inc. | 22 | 755 | ||||||
Domino’s Pizza, Inc. | 4 | 998 | ||||||
Dunkin’ Brands Group, Inc. | 16 | 1,271 | ||||||
Foot Locker, Inc. | 51 | 2,157 | ||||||
Genuine Parts Co. | 55 | 5,731 | ||||||
Home Depot, Inc. (The) | 430 | 89,443 | ||||||
Kohl’s Corp. | 124 | 5,889 | ||||||
Lithia Motors, Inc., Class A | 1 | 116 | ||||||
Lowe’s Cos., Inc. | 223 | 22,485 | ||||||
McDonald’s Corp. | 247 | 51,250 | ||||||
MSC Industrial Direct Co., Inc., Class A | 16 | 1,187 | ||||||
Nu Skin Enterprises, Inc., Class A | 13 | 638 | ||||||
| SECURITY DESCRIPTION | SHARES | VALUE($) | ||||||
Retail — continued |
| |||||||
Penske Automotive Group, Inc. | 9 | 413 | ||||||
Ross Stores, Inc. | 48 | 4,769 | ||||||
Signet Jewelers Ltd. | 41 | 728 | ||||||
Starbucks Corp. | 304 | 25,485 | ||||||
Target Corp. | 204 | 17,707 | ||||||
Texas Roadhouse, Inc., Class A | 13 | 680 | ||||||
Tiffany & Co. | 31 | 2,931 | ||||||
TJX Cos., Inc. (The) | 300 | 15,881 | ||||||
Tractor Supply Co. | 18 | 1,939 | ||||||
Walgreens Boots Alliance, Inc. | 367 | 20,090 | ||||||
Walmart, Inc. | 398 | 43,955 | ||||||
Wendy’s Co. (The) | 31 | 604 | ||||||
Williams-Sonoma, Inc. | 29 | 1,914 | ||||||
Yum! Brands, Inc. | 64 | 7,071 | ||||||
|
| |||||||
| 356,743 | ||||||||
|
| |||||||
Storage/Warehousing — 0.0% (g) | ||||||||
Mobile Mini, Inc. | 7 | 213 | ||||||
|
| |||||||
Toys/Games/Hobbies — 0.1% | ||||||||
Hasbro, Inc. | 37 | 3,871 | ||||||
|
| |||||||
Total Consumer Cyclical | 479,132 | |||||||
|
| |||||||
ConsumerNon-cyclical — 30.0% | ||||||||
Agriculture — 0.1% | ||||||||
Archer-Daniels-Midland Co. | 262 | 10,679 | ||||||
Bunge Ltd. | 60 | 3,322 | ||||||
|
| |||||||
| 14,001 | ||||||||
|
| |||||||
Beverages — 1.6% | ||||||||
Brown-Forman Corp., Class A | 15 | 848 | ||||||
Brown-Forman Corp., Class B | 19 | 1,048 | ||||||
Coca-Cola Co. (The) | 1,653 | 84,172 | ||||||
PepsiCo., Inc. | 550 | 72,088 | ||||||
|
| |||||||
| 158,156 | ||||||||
|
| |||||||
Biotechnology — 4.6% | ||||||||
Alexion Pharmaceuticals, Inc. (a) | 192 | 25,182 | ||||||
Alnylam Pharmaceuticals, Inc. (a) | 82 | 5,970 | ||||||
Amgen, Inc. | 823 | 151,585 | ||||||
Biogen, Inc. (a) | 169 | 39,579 | ||||||
BioMarin Pharmaceutical, Inc. (a) | 153 | 13,144 | ||||||
Celgene Corp. (a) | 604 | 55,842 | ||||||
Exact Sciences Corp. (a) | 108 | 12,771 | ||||||
Gilead Sciences, Inc. | 1,097 | 74,137 | ||||||
Incyte Corp. (a) | 157 | 13,299 | ||||||
Ionis Pharmaceuticals, Inc. (a) | 113 | 7,270 | ||||||
Regeneron Pharmaceuticals, Inc. (a) | 69 | 21,684 | ||||||
Seattle Genetics, Inc. (a) | 97 | 6,692 | ||||||
Vertex Pharmaceuticals, Inc. (a) | 220 | 40,334 | ||||||
|
| |||||||
| 467,489 | ||||||||
|
| |||||||
Commercial Services — 0.4% | ||||||||
ABM Industries, Inc. | 13 | 516 | ||||||
Automatic Data Processing, Inc. | 111 | 18,375 | ||||||
SEE NOTES TO FINANCIAL STATEMENTS.
| JUNE 30, 2019 | SIX CIRCLES TRUST | 39 | ||||||
Table of Contents
Six Circles U.S. Unconstrained Equity Fund
SCHEDULE OF PORTFOLIO INVESTMENTS
AS OF JUNE 30, 2019 (Unaudited) (continued)
(Amounts in U.S. Dollars, unless otherwise noted)
(Amounts in thousands, except number of Futures contracts)
| SECURITY DESCRIPTION | SHARES | VALUE($) | ||||||
Common Stocks — continued |
| |||||||
Commercial Services — continued | ||||||||
Booz Allen Hamilton Holding Corp., Class A | 21 | 1,377 | ||||||
Cintas Corp. | 9 | 2,097 | ||||||
Healthcare Services Group, Inc. | 11 | 332 | ||||||
ManpowerGroup, Inc. | 19 | 1,827 | ||||||
MarketAxess Holdings, Inc. | 2 | 712 | ||||||
Matthews International Corp., Class A | 1 | 34 | ||||||
Moody’s Corp. | 28 | 5,461 | ||||||
Robert Half International, Inc. | 29 | 1,669 | ||||||
Rollins, Inc. | 11 | 383 | ||||||
S&P Global, Inc. | 43 | 9,748 | ||||||
Sabre Corp. | 76 | 1,693 | ||||||
Service Corp. International | 31 | 1,472 | ||||||
|
| |||||||
| 45,696 | ||||||||
|
| |||||||
Cosmetics/Personal Care — 1.3% | ||||||||
Colgate-Palmolive Co. | 271 | 19,421 | ||||||
Estee Lauder Cos., Inc. (The), Class A | 27 | 4,881 | ||||||
Procter & Gamble Co. (The) | 947 | 103,824 | ||||||
|
| |||||||
| 128,126 | ||||||||
|
| |||||||
Food — 0.6% | ||||||||
Hershey Co. (The) | 37 | 4,919 | ||||||
Hormel Foods Corp. | 65 | 2,653 | ||||||
Ingredion, Inc. | 23 | 1,887 | ||||||
JM Smucker Co. (The) | 39 | 4,480 | ||||||
Kellogg Co. | 128 | 6,870 | ||||||
Kroger Co. (The) | 244 | 5,293 | ||||||
Lancaster Colony Corp. | 2 | 242 | ||||||
McCormick & Co., Inc. | 22 | 3,362 | ||||||
Mondelez International, Inc., Class A | 370 | 19,961 | ||||||
Sysco Corp. | 137 | 9,662 | ||||||
Tyson Foods, Inc., Class A | 74 | 5,940 | ||||||
|
| |||||||
| 65,269 | ||||||||
|
| |||||||
Healthcare—Products — 1.1% | ||||||||
Abbott Laboratories | 395 | 33,190 | ||||||
Baxter International, Inc. | 61 | 5,030 | ||||||
Becton Dickinson & Co. | 47 | 11,763 | ||||||
Danaher Corp. | 44 | 6,218 | ||||||
DENTSPLY SIRONA, Inc. | 13 | 744 | ||||||
Hill-Rom Holdings, Inc. | 3 | 335 | ||||||
Medtronic plc, (Ireland) | 391 | 38,058 | ||||||
Patterson Cos., Inc. | 36 | 816 | ||||||
ResMed, Inc. | 21 | 2,548 | ||||||
STERIS plc | 8 | 1,231 | ||||||
Stryker Corp. | 43 | 8,845 | ||||||
West Pharmaceutical Services, Inc. | 2 | 213 | ||||||
|
| |||||||
| 108,991 | ||||||||
|
| |||||||
Healthcare—Services — 4.5% | ||||||||
Anthem, Inc. | 303 | 85,495 | ||||||
Centene Corp. (a) | 425 | 22,288 | ||||||
Encompass Health Corp. | 17 | 1,109 | ||||||
Humana, Inc. | 152 | 40,406 | ||||||
| SECURITY DESCRIPTION | SHARES | VALUE($) | ||||||
Healthcare—Services — continued | ||||||||
Quest Diagnostics, Inc. | 35 | 3,572 | ||||||
UnitedHealth Group, Inc. | 1,175 | 286,675 | ||||||
WellCare Health Plans, Inc. (a) | 52 | 14,747 | ||||||
|
| |||||||
| 454,292 | ||||||||
|
| |||||||
Household Products/Wares — 0.3% | ||||||||
Avery Dennison Corp. | 18 | 2,049 | ||||||
Church & Dwight Co., Inc. | 34 | 2,478 | ||||||
Clorox Co. (The) | 40 | 6,139 | ||||||
Kimberly-Clark Corp. | 139 | 18,512 | ||||||
WD-40 Co. | — | (h) | 19 | |||||
|
| |||||||
| 29,197 | ||||||||
|
| |||||||
Pharmaceuticals — 15.5% | ||||||||
AbbVie, Inc. | 2,360 | 171,620 | ||||||
Alkermes plc, (Ireland) (a) | 134 | 3,026 | ||||||
Allergan plc | 284 | 47,483 | ||||||
AmerisourceBergen Corp., Class A | 35 | 3,007 | ||||||
Bristol-Myers Squibb Co. | 2,264 | 102,662 | ||||||
Cardinal Health, Inc. | 166 | 7,822 | ||||||
Eli Lilly & Co. | 795 | 88,104 | ||||||
Johnson & Johnson | 3,333 | 464,164 | ||||||
McKesson Corp. | 27 | 3,693 | ||||||
Merck & Co., Inc. | 3,299 | 276,583 | ||||||
Mylan NV (a) | 475 | 9,043 | ||||||
Nektar Therapeutics, Class A (a) | 161 | 5,717 | ||||||
Perrigo Co. plc, (Ireland) | 139 | 6,624 | ||||||
Pfizer, Inc. | 7,662 | 331,903 | ||||||
Zoetis, Inc., Class A | 475 | 53,961 | ||||||
|
| |||||||
| 1,575,412 | ||||||||
|
| |||||||
Total ConsumerNon-cyclical | 3,046,629 | |||||||
|
| |||||||
Energy — 14.4% | ||||||||
Oil & Gas — 12.3% | ||||||||
Anadarko Petroleum Corp. | 515 | 36,346 | ||||||
Apache Corp. | 386 | 11,172 | ||||||
Cabot Oil & Gas Corp. | 434 | 9,970 | ||||||
Chevron Corp. | 2,992 | 372,362 | ||||||
Cimarex Energy Co. | 104 | 6,176 | ||||||
Concho Resources, Inc. | 206 | 21,233 | ||||||
ConocoPhillips | 1,159 | 70,724 | ||||||
Devon Energy Corp. | 426 | 12,148 | ||||||
Diamondback Energy, Inc. | 159 | 17,304 | ||||||
EOG Resources, Inc. | 595 | 55,462 | ||||||
Exxon Mobil Corp. | 4,341 | 332,617 | ||||||
Helmerich & Payne, Inc. | 113 | 5,730 | ||||||
Hess Corp. | 261 | 16,623 | ||||||
HollyFrontier Corp. | 161 | 7,459 | ||||||
Marathon Oil Corp. | 839 | 11,923 | ||||||
Marathon Petroleum Corp. | 1,093 | 61,061 | ||||||
Noble Energy, Inc. | 490 | 10,984 | ||||||
Occidental Petroleum Corp. | 767 | 38,584 | ||||||
Phillips 66 | 681 | 63,682 | ||||||
Pioneer Natural Resources Co. | 173 | 26,584 | ||||||
SEE NOTES TO FINANCIAL STATEMENTS.
| 40 | SIX CIRCLES TRUST | JUNE 30, 2019 | ||||
Table of Contents
| SECURITY DESCRIPTION | SHARES | VALUE($) | ||||||
Common Stocks — continued |
| |||||||
Oil & Gas — continued | ||||||||
Valero Energy Corp. | 699 | 59,856 | ||||||
|
| |||||||
| 1,248,000 | ||||||||
|
| |||||||
Oil & Gas Services — 1.1% | ||||||||
Baker Hughes a GE Co., Class A | 528 | 13,010 | ||||||
Halliburton Co. | 897 | 20,388 | ||||||
National Oilwell Varco, Inc. | 396 | 8,802 | ||||||
Schlumberger Ltd. | 1,421 | 56,469 | ||||||
TechnipFMC plc, (United Kingdom) | 432 | 11,208 | ||||||
|
| |||||||
| 109,877 | ||||||||
|
| |||||||
Pipelines — 1.0% | ||||||||
Kinder Morgan, Inc. | 1,997 | 41,701 | ||||||
ONEOK, Inc. | 423 | 29,137 | ||||||
Williams Cos., Inc. (The) | 1,243 | 34,857 | ||||||
|
| |||||||
| 105,695 | ||||||||
|
| |||||||
Total Energy | 1,463,572 | |||||||
|
| |||||||
Financial — 8.6% | ||||||||
Banks — 5.1% | ||||||||
Associated Banc-Corp. | 179 | 3,775 | ||||||
Atlantic Union Bankshares Corp. | 88 | 3,126 | ||||||
BancFirst Corp. | 41 | 2,303 | ||||||
BancorpSouth Bank | 107 | 3,122 | ||||||
Bank of America Corp. | 2,710 | 78,583 | ||||||
Bank of New York Mellon Corp. (The) | 355 | 15,694 | ||||||
Bank OZK | 106 | 3,181 | ||||||
Banner Corp. | 12 | 631 | ||||||
BB&T Corp. | 386 | 18,972 | ||||||
BOK Financial Corp. | 41 | 3,074 | ||||||
Cathay General Bancorp | 101 | 3,635 | ||||||
Chemical Financial Corp. | 90 | 3,690 | ||||||
Citizens Financial Group, Inc. | 295 | 10,414 | ||||||
Columbia Banking System, Inc. | 28 | 1,010 | ||||||
Comerica, Inc. | 115 | 8,335 | ||||||
Commerce Bancshares, Inc. | 62 | 3,670 | ||||||
Community Bank System, Inc. | 17 | 1,094 | ||||||
Cullen/Frost Bankers, Inc. | 50 | 4,665 | ||||||
CVB Financial Corp. | 151 | 3,171 | ||||||
First Busey Corp. | 97 | 2,559 | ||||||
First Financial Bankshares, Inc. | 99 | 3,050 | ||||||
First Horizon National Corp. | 320 | 4,776 | ||||||
First Interstate BancSystem, Inc., Class A | 72 | 2,861 | ||||||
First Merchants Corp. | 81 | 3,064 | ||||||
First Midwest Bancorp, Inc. | 30 | 606 | ||||||
First Republic Bank | 41 | 3,966 | ||||||
Glacier Bancorp, Inc. | 30 | 1,217 | ||||||
Goldman Sachs Group, Inc. (The) | 95 | 19,364 | ||||||
Home BancShares, Inc. | 176 | 3,393 | ||||||
Hope Bancorp, Inc. | 69 | 952 | ||||||
Huntington Bancshares, Inc. | 762 | 10,531 | ||||||
Independent Bank Corp. | 12 | 877 | ||||||
Independent Bank Group, Inc. | 49 | 2,717 | ||||||
KeyCorp. | 676 | 12,005 | ||||||
| SECURITY DESCRIPTION | SHARES | VALUE($) | ||||||
Banks — continued | ||||||||
LegacyTexas Financial Group, Inc. | 71 | 2,907 | ||||||
Morgan Stanley | 549 | 24,056 | ||||||
NBT Bancorp, Inc. | 17 | 636 | ||||||
Northern Trust Corp. | 97 | 8,708 | ||||||
PNC Financial Services Group, Inc. (The) | 182 | 25,020 | ||||||
Prosperity Bancshares, Inc. | 56 | 3,716 | ||||||
Regions Financial Corp. | 696 | 10,402 | ||||||
S&T Bancorp, Inc. | 11 | 410 | ||||||
ServisFirst Bancshares, Inc. | 68 | 2,330 | ||||||
Simmons First National Corp., Class A | 34 | 802 | ||||||
South State Corp. | 41 | 3,033 | ||||||
State Street Corp. | 195 | 10,921 | ||||||
SunTrust Banks, Inc. | 225 | 14,160 | ||||||
Towne Bank | 93 | 2,533 | ||||||
UMB Financial Corp. | 46 | 3,038 | ||||||
United Community Banks, Inc. | 3 | 91 | ||||||
US Bancorp | 619 | 32,443 | ||||||
Webster Financial Corp. | 91 | 4,367 | ||||||
Wells Fargo & Co. | 2,287 | 108,235 | ||||||
WesBanco, Inc. | 81 | 3,113 | ||||||
Westamerica Bancorporation | 10 | 639 | ||||||
Wintrust Financial Corp. | 41 | 3,031 | ||||||
Zions Bancorp NA | 119 | 5,450 | ||||||
|
| |||||||
| 514,124 | ||||||||
|
| |||||||
Diversified Financial Services — 1.6% | ||||||||
Air Lease Corp., Class A | 9 | 362 | ||||||
American Express Co. | 138 | 17,045 | ||||||
Ameriprise Financial, Inc. | 51 | 7,394 | ||||||
BlackRock, Inc., Class A | 49 | 23,009 | ||||||
CME Group, Inc., Class A | 81 | 15,788 | ||||||
Discover Financial Services | 121 | 9,389 | ||||||
Eaton Vance Corp. | 44 | 1,896 | ||||||
Evercore, Inc., Class A | 10 | 894 | ||||||
Franklin Resources, Inc. | 173 | 6,029 | ||||||
Intercontinental Exchange, Inc. | 125 | 10,778 | ||||||
Mastercard, Inc., Class A | 69 | 18,331 | ||||||
Nasdaq, Inc. | 36 | 3,471 | ||||||
Raymond James Financial, Inc. | 30 | 2,572 | ||||||
SEI Investments Co. | 14 | 801 | ||||||
T Rowe Price Group, Inc. | 102 | 11,166 | ||||||
TD Ameritrade Holding Corp. | 101 | 5,066 | ||||||
Visa, Inc., Class A | 152 | 26,351 | ||||||
|
| |||||||
| 160,342 | ||||||||
|
| |||||||
Insurance — 1.8% | ||||||||
Aflac, Inc. | 243 | 13,314 | ||||||
Allstate Corp. (The) | 111 | 11,320 | ||||||
American Equity Investment Life Holding Co. | 13 | 350 | ||||||
American Financial Group, Inc. | 15 | 1,541 | ||||||
Aon plc, (United Kingdom) | 35 | 6,730 | ||||||
Argo Group International Holdings Ltd., (Bermuda) | 2 | 148 | ||||||
SEE NOTES TO FINANCIAL STATEMENTS.
| JUNE 30, 2019 | SIX CIRCLES TRUST | 41 | ||||||
Table of Contents
Six Circles U.S. Unconstrained Equity Fund
SCHEDULE OF PORTFOLIO INVESTMENTS
AS OF JUNE 30, 2019 (Unaudited) (continued)
(Amounts in U.S. Dollars, unless otherwise noted)
(Amounts in thousands, except number of Futures contracts)
| SECURITY DESCRIPTION | SHARES | VALUE($) | ||||||
Common Stocks — continued |
| |||||||
Insurance — continued | ||||||||
Arthur J Gallagher & Co. | 44 | 3,889 | ||||||
Assurant, Inc. | 20 | 2,135 | ||||||
Assured Guaranty Ltd., (Bermuda) | 15 | 622 | ||||||
Axis Capital Holdings Ltd., (Bermuda) | 25 | 1,498 | ||||||
Brown & Brown, Inc. | 19 | 632 | ||||||
Chubb Ltd., (Switzerland) | 137 | 20,231 | ||||||
Cincinnati Financial Corp. | 52 | 5,347 | ||||||
CNO Financial Group, Inc. | 30 | 506 | ||||||
Erie Indemnity Co., Class A | 3 | 657 | ||||||
Everest Re Group Ltd., (Bermuda) | 14 | 3,516 | ||||||
FBL Financial Group, Inc., Class A | 8 | 480 | ||||||
Fidelity National Financial, Inc. | 132 | 5,321 | ||||||
First American Financial Corp. | 44 | 2,371 | ||||||
Hanover Insurance Group, Inc. (The) | 7 | 923 | ||||||
Hartford Financial Services Group, Inc. (The) | 147 | 8,191 | ||||||
Horace Mann Educators Corp. | 5 | 209 | ||||||
Lincoln National Corp. | 89 | 5,732 | ||||||
Marsh & McLennan Cos., Inc. | 129 | 12,888 | ||||||
MetLife, Inc. | 519 | 25,785 | ||||||
Old Republic International Corp. | 161 | 3,603 | ||||||
Primerica, Inc. | 3 | 383 | ||||||
Prudential Financial, Inc. | 248 | 25,037 | ||||||
Reinsurance Group of America, Inc., Class A | 14 | 2,159 | ||||||
RenaissanceRe Holdings Ltd., (Bermuda) | 3 | 540 | ||||||
RLI Corp. | 1 | 51 | ||||||
Selective Insurance Group, Inc. | 3 | 209 | ||||||
Torchmark Corp. | 19 | 1,692 | ||||||
Travelers Cos., Inc. (The) | 88 | 13,206 | ||||||
Unum Group | 112 | 3,771 | ||||||
WR Berkley Corp. | 14 | 896 | ||||||
|
| |||||||
| 185,883 | ||||||||
|
| |||||||
Private Equity — 0.0% (g) | ||||||||
Kennedy-Wilson Holdings, Inc. | 50 | 1,021 | ||||||
|
| |||||||
Real Estate — 0.0% (g) | ||||||||
Jones Lang LaSalle, Inc. | 6 | 791 | ||||||
|
| |||||||
Savings & Loans — 0.1% | ||||||||
Investors Bancorp, Inc. | 337 | 3,754 | ||||||
Northwest Bancshares, Inc. | 55 | 972 | ||||||
Provident Financial Services, Inc. | 59 | 1,425 | ||||||
Washington Federal, Inc. | 92 | 3,226 | ||||||
WSFS Financial Corp. | 34 | 1,425 | ||||||
|
| |||||||
| 10,802 | ||||||||
|
| |||||||
Total Financials | 872,963 | |||||||
|
| |||||||
Industrial — 5.8% | ||||||||
Aerospace/Defense — 1.7% | ||||||||
Boeing Co. (The) | 171 | 62,097 | ||||||
General Dynamics Corp. | 86 | 15,685 | ||||||
Harris Corp. | 21 | 3,992 | ||||||
Lockheed Martin Corp. | 88 | 32,097 | ||||||
| SECURITY DESCRIPTION | SHARES | VALUE($) | ||||||
Aerospace/Defense — continued | ||||||||
Northrop Grumman Corp. | 40 | 12,912 | ||||||
Raytheon Co. | 80 | 13,987 | ||||||
United Technologies Corp. | 272 | 35,439 | ||||||
|
| |||||||
| 176,209 | ||||||||
|
| |||||||
Building Materials — 0.2% | ||||||||
Fortune Brands Home & Security, Inc. | 25 | 1,439 | ||||||
Johnson Controls International plc | 361 | 14,904 | ||||||
Lennox International, Inc. | 3 | 880 | ||||||
Masco Corp. | 47 | 1,843 | ||||||
MDU Resources Group, Inc. | 68 | 1,742 | ||||||
Owens Corning | 22 | 1,285 | ||||||
Simpson Manufacturing Co., Inc. | 1 | 88 | ||||||
Vulcan Materials Co. | 14 | 1,922 | ||||||
|
| |||||||
| 24,103 | ||||||||
|
| |||||||
Electrical Components & Equipments — 0.2% |
| |||||||
Emerson Electric Co. | 296 | 19,764 | ||||||
Hubbell, Inc., Class B | 17 | 2,239 | ||||||
Littelfuse, Inc. | 1 | 197 | ||||||
|
| |||||||
| 22,200 | ||||||||
|
| |||||||
Electronics — 0.5% | ||||||||
Allegion plc, (Ireland) | 10 | 1,060 | ||||||
Amphenol Corp., Class A | 35 | 3,351 | ||||||
Brady Corp., Class A | 4 | 176 | ||||||
FLIR Systems, Inc. | 17 | 914 | ||||||
Gentex Corp. | 54 | 1,319 | ||||||
Honeywell International, Inc. | 201 | 35,084 | ||||||
National Instruments Corp. | 28 | 1,188 | ||||||
nVent Electric plc, (United Kingdom) | 48 | 1,186 | ||||||
SYNNEX Corp. | 5 | 483 | ||||||
TE Connectivity Ltd., (Switzerland) | 93 | 8,874 | ||||||
|
| |||||||
| 53,635 | ||||||||
|
| |||||||
Environmental Control — 0.2% | ||||||||
Pentair plc, (United Kingdom) | 33 | 1,221 | ||||||
Republic Services, Inc., Class A | 75 | 6,489 | ||||||
Tetra Tech, Inc. | 1 | 65 | ||||||
Waste Management, Inc. | 115 | 13,222 | ||||||
|
| |||||||
| 20,997 | ||||||||
|
| |||||||
Hand/Machine Tools — 0.1% | ||||||||
Lincoln Electric Holdings, Inc. | 16 | 1,292 | ||||||
MSA Safety, Inc. | 4 | 417 | ||||||
Regal Beloit Corp. | 3 | 262 | ||||||
Snap-on, Inc. | 15 | 2,546 | ||||||
Stanley Black & Decker, Inc. | 37 | 5,328 | ||||||
|
| |||||||
| 9,845 | ||||||||
|
| |||||||
Machinery—Construction & Mining — 0.3% |
| |||||||
BWX Technologies, Inc. | 11 | 561 | ||||||
Caterpillar, Inc. | 221 | 30,153 | ||||||
Oshkosh Corp. | 8 | 652 | ||||||
|
| |||||||
| 31,366 | ||||||||
|
| |||||||
SEE NOTES TO FINANCIAL STATEMENTS.
| 42 | SIX CIRCLES TRUST | JUNE 30, 2019 | ||||
Table of Contents
| SECURITY DESCRIPTION | SHARES | VALUE($) | ||||||
Common Stocks — continued |
| |||||||
Machinery—Diversified — 0.3% | ||||||||
AGCO Corp. | 3 | 196 | ||||||
Altra Industrial Motion Corp. | 6 | 208 | ||||||
Applied Industrial Technologies, Inc. | 5 | 284 | ||||||
Cummins, Inc. | 61 | 10,497 | ||||||
Dover Corp. | 35 | 3,552 | ||||||
Graco, Inc. | 21 | 1,052 | ||||||
IDEX Corp. | 10 | 1,800 | ||||||
Nordson Corp. | 4 | 620 | ||||||
Rockwell Automation, Inc. | 40 | 6,513 | ||||||
Roper Technologies, Inc. | 8 | 2,794 | ||||||
Wabtec Corp. | 9 | 645 | ||||||
Xylem, Inc. | 24 | 2,042 | ||||||
|
| |||||||
| 30,203 | ||||||||
|
| |||||||
Metal Fabricate/Hardware — 0.0% (g) | ||||||||
Timken Co. (The) | 14 | 697 | ||||||
Worthington Industries, Inc. | 3 | 126 | ||||||
|
| |||||||
| 823 | ||||||||
|
| |||||||
Miscellaneous Manufacturers — 1.0% | ||||||||
3M Co. | 271 | 46,907 | ||||||
AO Smith Corp. | 29 | 1,371 | ||||||
AptarGroup, Inc. | 7 | 849 | ||||||
Carlisle Cos., Inc. | 6 | 868 | ||||||
Donaldson Co., Inc. | 19 | 957 | ||||||
Eaton Corp. plc | 236 | 19,641 | ||||||
Hillenbrand, Inc. | 8 | 321 | ||||||
Illinois Tool Works, Inc. | 120 | 18,091 | ||||||
Ingersoll-Rand plc | 61 | 7,756 | ||||||
ITT, Inc. | 5 | 331 | ||||||
Trinity Industries, Inc. | 44 | 921 | ||||||
|
| |||||||
| 98,013 | ||||||||
|
| |||||||
Packaging & Containers — 0.2% | ||||||||
Amcor plc, (United Kingdom) (a) | 169 | 1,938 | ||||||
Packaging Corp. of America | 38 | 3,651 | ||||||
Silgan Holdings, Inc. | 2 | 63 | ||||||
Sonoco Products Co. | 29 | 1,884 | ||||||
WestRock Co. | 171 | 6,223 | ||||||
|
| |||||||
| 13,759 | ||||||||
|
| |||||||
Shipbuilding — 0.0% (g) | ||||||||
Huntington Ingalls Industries, Inc. | 7 | 1,671 | ||||||
|
| |||||||
Transportation — 1.1% | ||||||||
CH Robinson Worldwide, Inc. | 44 | 3,682 | ||||||
CSX Corp. | 158 | 12,222 | ||||||
Expeditors International of Washington, Inc. | 26 | 1,990 | ||||||
FedEx Corp. | 56 | 9,148 | ||||||
JB Hunt Transport Services, Inc. | 9 | 865 | ||||||
Kansas City Southern | 14 | 1,742 | ||||||
Ryder System, Inc. | 27 | 1,567 | ||||||
Union Pacific Corp. | 216 | 36,475 | ||||||
United Parcel Service, Inc., Class B | 375 | 38,711 | ||||||
| �� |
|
| ||||||
| 106,402 | ||||||||
|
| |||||||
| SECURITY DESCRIPTION | SHARES | VALUE($) | ||||||
Trucking & Leasing — 0.0% (g) | ||||||||
GATX Corp. | 7 | 557 | ||||||
|
| |||||||
Total Industrials | 589,783 | |||||||
|
| |||||||
Technology — 14.7% | ||||||||
Computers — 1.7% | ||||||||
Accenture plc, (Ireland), Class A | 141 | 25,977 | ||||||
Apple, Inc. | 679 | 134,466 | ||||||
Fortinet, Inc. (a) | 85 | 6,547 | ||||||
NetApp, Inc. | 81 | 4,987 | ||||||
|
| |||||||
| 171,977 | ||||||||
|
| |||||||
Office/Business Equipment — 0.0% (g) |
| |||||||
Xerox Corp. | 67 | 2,360 | ||||||
|
| |||||||
Semiconductors — 1.6% | ||||||||
Analog Devices, Inc. | 105 | 11,823 | ||||||
Broadcom, Inc. | 206 | 59,431 | ||||||
KLA-Tencor Corp. | 58 | 6,828 | ||||||
Lam Research Corp. | 54 | 10,215 | ||||||
Maxim Integrated Products, Inc. | 113 | 6,760 | ||||||
Microchip Technology, Inc. | 52 | 4,474 | ||||||
MKS Instruments, Inc. | 3 | 205 | ||||||
NVIDIA Corp. | 35 | 5,816 | ||||||
Skyworks Solutions, Inc. | 44 | 3,426 | ||||||
Texas Instruments, Inc. | 377 | 43,221 | ||||||
Xilinx, Inc. | 47 | 5,487 | ||||||
|
| |||||||
| 157,686 | ||||||||
|
| |||||||
Software — 11.4% | ||||||||
Activision Blizzard, Inc. | 77 | 3,615 | ||||||
Adobe, Inc. (a) | 286 | 84,323 | ||||||
ANSYS, Inc. (a) | 49 | 10,082 | ||||||
Autodesk, Inc. (a) | 129 | 20,982 | ||||||
Broadridge Financial Solutions, Inc. | 26 | 3,262 | ||||||
Cadence Design Systems, Inc. (a) | 165 | 11,671 | ||||||
Citrix Systems, Inc. | 73 | 7,197 | ||||||
Fidelity National Information Services, Inc. | 48 | 5,853 | ||||||
Intuit, Inc. | 176 | 46,076 | ||||||
j2 Global, Inc. | 8 | 737 | ||||||
Jack Henry & Associates, Inc. | 9 | 1,199 | ||||||
Microsoft Corp. | 5,504 | 737,263 | ||||||
MSCI, Inc., Class A | 12 | 2,954 | ||||||
Oracle Corp. | 2,073 | 118,118 | ||||||
Red Hat, Inc. (a) | 104 | 19,574 | ||||||
salesforce.com, Inc. (a) | 455 | 69,103 | ||||||
Synopsys, Inc. (a) | 88 | 11,314 | ||||||
|
| |||||||
| 1,153,323 | ||||||||
|
| |||||||
Total Technology | 1,485,346 | |||||||
|
| |||||||
Utilities — 2.0% | ||||||||
Electric — 1.8% | ||||||||
AES Corp. | 293 | 4,914 | ||||||
ALLETE, Inc. | 14 | 1,191 | ||||||
Alliant Energy Corp. | 85 | 4,179 | ||||||
SEE NOTES TO FINANCIAL STATEMENTS.
| JUNE 30, 2019 | SIX CIRCLES TRUST | 43 | ||||||
Table of Contents
Six Circles U.S. Unconstrained Equity Fund
SCHEDULE OF PORTFOLIO INVESTMENTS
AS OF JUNE 30, 2019 (Unaudited) (continued)
(Amounts in U.S. Dollars, unless otherwise noted)
(Amounts in thousands, except number of Futures contracts)
| SECURITY DESCRIPTION | SHARES | VALUE($) | ||||||
Common Stocks — continued |
| |||||||
Electric — continued | ||||||||
American Electric Power Co., Inc. | 226 | 19,862 | ||||||
Avista Corp. | 22 | 1,000 | ||||||
Black Hills Corp. | 14 | 1,065 | ||||||
CenterPoint Energy, Inc. | 256 | 7,336 | ||||||
CMS Energy Corp. | 95 | 5,513 | ||||||
Consolidated Edison, Inc. | 163 | 14,265 | ||||||
DTE Energy Co. | 82 | 10,518 | ||||||
El Paso Electric Co. | 6 | 363 | ||||||
Evergy, Inc. | 103 | 6,174 | ||||||
Eversource Energy | 123 | 9,287 | ||||||
IDACORP, Inc. | 12 | 1,245 | ||||||
MGE Energy, Inc. | 4 | 260 | ||||||
NextEra Energy, Inc. | 170 | 34,803 | ||||||
NorthWestern Corp. | 16 | 1,125 | ||||||
OGE Energy Corp. | 81 | 3,447 | ||||||
Otter Tail Corp. | 6 | 327 | ||||||
Pinnacle West Capital Corp. | 42 | 3,971 | ||||||
PNM Resources, Inc. | 17 | 841 | ||||||
Portland General Electric Co. | 24 | 1,305 | ||||||
Public Service Enterprise Group, Inc. | 225 | 13,213 | ||||||
Sempra Energy | 109 | 14,929 | ||||||
WEC Energy Group, Inc. | 117 | 9,781 | ||||||
Xcel Energy, Inc. | 227 | 13,495 | ||||||
|
| |||||||
| 184,409 | ||||||||
|
| |||||||
Gas — 0.1% | ||||||||
Atmos Energy Corp. | 28 | 2,987 | ||||||
National Fuel Gas Co. | 29 | 1,549 | ||||||
New Jersey Resources Corp. | 20 | 991 | ||||||
NiSource, Inc. | 127 | 3,667 | ||||||
South Jersey Industries, Inc. | 32 | 1,064 | ||||||
Southwest Gas Holdings, Inc. | 13 | 1,176 | ||||||
Spire, Inc. | 14 | 1,187 | ||||||
UGI Corp. | 39 | 2,082 | ||||||
|
| |||||||
| 14,703 | ||||||||
|
| |||||||
| SECURITY DESCRIPTION | SHARES | VALUE($) | ||||||
Water — 0.1% | ||||||||
American States Water Co. | 2 | 150 | ||||||
American Water Works Co., Inc. | 38 | 4,445 | ||||||
Aqua America, Inc. | 51 | 2,091 | ||||||
California Water Service Group | 1 | 72 | ||||||
|
| |||||||
| 6,758 | ||||||||
|
| |||||||
Total Utilities | 205,870 | |||||||
|
| |||||||
Total Common Stocks | 10,145,747 | |||||||
|
| |||||||
| PRINCIPAL AMOUNT($) | ||||||||
Short-Term Investments — 0.1% | ||||||||
Time Deposits — 0.1% | ||||||||
Australia & New Zealand Banking Group Ltd., 1.76%, 07/01/2019 | 2,725 | 2,725 | ||||||
Barclays SA, 1.76%, 07/01/2019 | 3,824 | 3,824 | ||||||
Brown Brothers Harriman, 1.76%, 07/01/2019 | 1,510 | 1,510 | ||||||
Citibank NA, 1.76%, 07/01/2019 | 5,114 | 5,114 | ||||||
|
| |||||||
Total Short-Term Investments | 13,173 | |||||||
|
| |||||||
Total Investments — 100.0% | 10,158,920 | |||||||
Other Assets in Excess of Liabilities — 0.0%(g) |
| 1,295 | ||||||
|
| |||||||
NET ASSETS — 100.0% | $ | 10,160,215 | ||||||
|
| |||||||
Percentages indicated are based on net assets.
| Futures contracts outstanding as of June 30, 2019: | ||||||||||||||||||||
| Exchange Traded | ||||||||||||||||||||
| DESCRIPTION | NUMBER OF CONTRACTS | EXPIRATION DATE | TRADING CURRENCY | NOTIONAL AMOUNT($) | VALUE AND UNREALIZED APPRECIATION (DEPRECIATION)($) | |||||||||||||||
Long Contracts | ||||||||||||||||||||
| E-mini Russell 2000 Index | 2 | 09/2019 | USD | 153 | 4 | |||||||||||||||
| NASDAQ 100E-mini Index | 12 | 09/2019 | USD | 1,831 | 16 | |||||||||||||||
| S&P 500E-mini Index | 76 | 09/2019 | USD | 11,031 | 157 | |||||||||||||||
| S&P MidCap 400E-mini Index | 1 | 09/2019 | USD | 193 | 2 | |||||||||||||||
|
| |||||||||||||||||||
Total unrealized appreciation (depreciation) | 179 | |||||||||||||||||||
|
| |||||||||||||||||||
SEE NOTES TO FINANCIAL STATEMENTS.
| 44 | SIX CIRCLES TRUST | JUNE 30, 2019 | ||||
Table of Contents
Summary of Investments by Industry, June 30, 2019
The following table represents the portfolio investments of the Fund by industry classifications as a percentage of total investments:
| INDUSTRY | PERCENTAGE | |||
Pharmaceuticals | 15.5 | % | ||
Internet | 15.4 | % | ||
Oil & Gas | 12.3 | % | ||
Software | 11.4 | % | ||
Banks | 5.1 | % | ||
Biotechnology | 4.6 | % | ||
Healthcare — Services | 4.5 | % | ||
Retail | 3.5 | % | ||
Telecommunications | 2.2 | % | ||
Insurance | 1.8 | % | ||
Electric | 1.8 | % | ||
Aerospace/Defense | 1.7 | % | ||
Computers | 1.7 | % | ||
Diversified Financial Services | 1.6 | % | ||
Beverages | 1.6 | % | ||
Semiconductors | 1.6 | % | ||
Cosmetics/Personal Care | 1.3 | % | ||
Oil & Gas Services | 1.1 | % | ||
Healthcare — Products | 1.1 | % | ||
Transportation | 1.1 | % | ||
Pipelines | 1.0 | % | ||
Media | 1.0 | % | ||
Others (Each less than 1.0%) | 7.0 | % | ||
Short-Term Investments | 0.1 | % | ||
NOTES TO SCHEDULE OF PORTFOLIO INVESTMENTS
| (a) | — Non-income producing security. | |
| (g) | — Amount rounds to less than 0.05%. | |
| (h) | — Amount rounds to less than 500. | |
| * | — The cost of securities is substantially the same for federal income tax purposes. | |
| USD | — United States Dollar |
SEE NOTES TO FINANCIAL STATEMENTS.
| JUNE 30, 2019 | SIX CIRCLES TRUST | 45 | ||||||
Table of Contents
Six Circles International Unconstrained Equity Fund
SCHEDULE OF PORTFOLIO INVESTMENTS
AS OF JUNE 30, 2019 (Unaudited)
(Amounts in U.S. Dollars, unless otherwise noted)
(Amounts in thousands, except number of Futures contracts)
| SECURITY DESCRIPTION | SHARES | VALUE($) | ||||||
Common Stocks — 99.1% |
| |||||||
Australia — 0.2% | ||||||||
BHP Group plc | 454 | 11,600 | ||||||
MMG Ltd. (a) | 2,412 | 844 | ||||||
|
| |||||||
| 12,444 | ||||||||
|
| |||||||
Austria — 0.3% | ||||||||
ANDRITZ AG | 16 | 589 | ||||||
Erste Group Bank AG | 65 | 2,396 | ||||||
OMV AG | 247 | 12,053 | ||||||
Raiffeisen Bank International AG | 32 | 746 | ||||||
Verbund AG | 15 | 766 | ||||||
voestalpine AG | 25 | 771 | ||||||
|
| |||||||
| 17,321 | ||||||||
|
| |||||||
Belgium — 2.2% | ||||||||
Ageas | 39 | 2,042 | ||||||
Anheuser-Busch InBev SA | 1,027 | 90,902 | ||||||
Colruyt SA | 12 | 716 | ||||||
Groupe Bruxelles Lambert SA | 17 | 1,702 | ||||||
KBC Group NV | 54 | 3,519 | ||||||
Proximus SADP | 33 | 966 | ||||||
Solvay SA | 16 | 1,653 | ||||||
Telenet Group Holding NV | 10 | 563 | ||||||
UCB SA | 117 | 9,741 | ||||||
Umicore SA | 42 | 1,359 | ||||||
|
| |||||||
| 113,163 | ||||||||
|
| |||||||
Chile — 0.0% (g) | ||||||||
Antofagasta plc | 85 | 1,000 | ||||||
|
| |||||||
China — 1.5% | ||||||||
3SBio, Inc. (a) (e) | 1,271 | 2,181 | ||||||
51job, Inc., ADR (a) | 24 | 1,845 | ||||||
Baozun, Inc., ADR (a) | 39 | 1,950 | ||||||
BeiGene Ltd., ADR (a) | 36 | 4,479 | ||||||
China Aoyuan Group Ltd. | 1,226 | 1,724 | ||||||
China Conch Venture Holdings Ltd. | 1,629 | 5,754 | ||||||
China Medical System Holdings Ltd. | 1,363 | 1,252 | ||||||
China Oriental Group Co. Ltd. | 1,142 | 668 | ||||||
China Zhongwang Holdings Ltd. | 1,606 | 810 | ||||||
CIFI Holdings Group Co. Ltd. | 2,718 | 1,791 | ||||||
COSCO SHIPPING Energy Transportation Co. Ltd., Class H | 1,274 | 753 | ||||||
Future Land Development Holdings Ltd. | 1,782 | 2,346 | ||||||
GDS Holdings Ltd., ADR (a) | 59 | 2,228 | ||||||
Genscript Biotech Corp. (a) | 918 | 2,303 | ||||||
GOME Retail Holdings Ltd. (a) | 10,194 | 1,097 | ||||||
Greentown Service Group Co. Ltd. | 1,076 | 869 | ||||||
Haitian International Holdings Ltd. | 631 | 1,309 | ||||||
HengTen Networks Group Ltd. (a) | 22,932 | 547 | ||||||
Hua Hong Semiconductor Ltd. (e) | 434 | 842 | ||||||
Huaneng Renewables Corp. Ltd., Class H (a) | 4,718 | 1,299 | ||||||
Inner Mongolia Yitai Coal Co. Ltd., Class B | 1,074 | 1,165 | ||||||
Kaisa Group Holdings Ltd. | 2,446 | 1,208 | ||||||
Kingdee International Software Group Co. Ltd. | 2,303 | 2,495 | ||||||
| SECURITY DESCRIPTION | SHARES | VALUE($) | ||||||
China — continued | ||||||||
Kingsoft Corp. Ltd. (a) | 840 | 1,819 | ||||||
KWG Group Holdings Ltd. | 1,250 | 1,270 | ||||||
Li Ning Co. Ltd. | 1,984 | 4,692 | ||||||
Luye Pharma Group Ltd. (e) | 1,173 | 851 | ||||||
Noah Holdings Ltd., ADR (a) | 31 | 1,317 | ||||||
Semiconductor Manufacturing International Corp. (a) | 3,052 | 3,402 | ||||||
Shandong Weigao Group Medical Polymer Co. Ltd., Class H | 2,064 | 1,873 | ||||||
Shui On Land Ltd. | 3,638 | 844 | ||||||
Sihuan Pharmaceutical Holdings Group Ltd. | 3,696 | 834 | ||||||
Sino-Ocean Group Holding Ltd. | 3,132 | 1,332 | ||||||
Sinotrans Ltd., Class H | 2,042 | 743 | ||||||
Sinotruk Hong Kong Ltd. | 689 | 1,194 | ||||||
SOHO China Ltd. | 2,081 | 736 | ||||||
Tong Ren Tang Technologies Co. Ltd., Class H | 575 | 685 | ||||||
Uni-President China Holdings Ltd. | 1,331 | 1,483 | ||||||
Xinyi Solar Holdings Ltd. | 3,012 | 1,488 | ||||||
Yangzijiang Shipbuilding Holdings Ltd. | 2,515 | 2,850 | ||||||
Yihai International Holding Ltd. (a) | 476 | 2,469 | ||||||
Yuzhou Properties Co. Ltd. | 1,662 | 781 | ||||||
YY, Inc., ADR (a) | 50 | 3,457 | ||||||
Zhaojin Mining Industry Co. Ltd., Class H | 1,012 | 1,136 | ||||||
Zhongsheng Group Holdings Ltd. | 582 | 1,621 | ||||||
|
| |||||||
| 77,792 | ||||||||
|
| |||||||
Denmark — 2.6% | ||||||||
AP Moller—Maersk A/S, Class A | 1 | 941 | ||||||
AP Moller—Maersk A/S, Class B | 1 | 1,747 | ||||||
Carlsberg A/S, Class B | 144 | 19,152 | ||||||
Chr Hansen Holding A/S | 23 | 2,132 | ||||||
Coloplast A/S, Class B | 26 | 2,884 | ||||||
Danske Bank A/S | 144 | 2,286 | ||||||
Demant A/S (a) | 24 | 759 | ||||||
DSV A/S | 38 | 3,777 | ||||||
Genmab A/S (a) | 13 | 2,428 | ||||||
H Lundbeck A/S | 65 | 2,563 | ||||||
ISS A/S | 34 | 1,025 | ||||||
Novo Nordisk A/S, Class B | 1,598 | 81,628 | ||||||
Novozymes A/S, Class B | 47 | 2,192 | ||||||
Orsted A/S (e) | 41 | 3,514 | ||||||
Pandora A/S | 22 | 798 | ||||||
Tryg A/S | 26 | 845 | ||||||
Vestas Wind Systems A/S | 42 | 3,636 | ||||||
|
| |||||||
| 132,307 | ||||||||
|
| |||||||
Finland — 0.7% | ||||||||
Elisa OYJ | 31 | 1,490 | ||||||
Fortum OYJ | 95 | 2,108 | ||||||
Kone OYJ, Class B | 73 | 4,298 | ||||||
Metso OYJ | 23 | 889 | ||||||
Neste OYJ | 91 | 3,089 | ||||||
Nokia OYJ | 1,210 | 6,028 | ||||||
SEE NOTES TO FINANCIAL STATEMENTS.
| 46 | SIX CIRCLES TRUST | JUNE 30, 2019 | ||||
Table of Contents
| SECURITY DESCRIPTION | SHARES | VALUE($) | ||||||
Common Stocks — continued |
| |||||||
Finland — continued | ||||||||
Nokian Renkaat OYJ | 27 | 833 | ||||||
Nordea Bank Abp | 652 | 4,737 | ||||||
Orion OYJ, Class B | 97 | 3,546 | ||||||
Sampo OYJ, Class A | 95 | 4,494 | ||||||
Stora Enso OYJ, Class R | 125 | 1,470 | ||||||
UPM-Kymmene OYJ | 115 | 3,050 | ||||||
Wartsila OYJ Abp | 95 | 1,384 | ||||||
|
| |||||||
| 37,416 | ||||||||
|
| |||||||
France — 14.0% | ||||||||
Accor SA | 39 | 1,693 | ||||||
Aeroports de Paris | 6 | 1,125 | ||||||
Air Liquide SA | 92 | 12,899 | ||||||
Airbus SE | 125 | 17,697 | ||||||
Alstom SA | 34 | 1,557 | ||||||
Amundi SA (e) | 13 | 907 | ||||||
Arkema SA | 15 | 1,374 | ||||||
Atos SE | 21 | 1,726 | ||||||
AXA SA | 417 | 10,941 | ||||||
BioMerieux | 9 | 737 | ||||||
BNP Paribas SA | 242 | 11,451 | ||||||
Bollore SA | 189 | 832 | ||||||
Bouygues SA | 48 | 1,773 | ||||||
Bureau Veritas SA | 62 | 1,523 | ||||||
Capgemini SE | 34 | 4,244 | ||||||
Carrefour SA | 127 | 2,454 | ||||||
Casino Guichard Perrachon SA | 12 | 402 | ||||||
Cie de Saint-Gobain | 106 | 4,125 | ||||||
Cie Generale des Etablissements Michelin SCA | 37 | 4,639 | ||||||
CNP Assurances | 37 | 837 | ||||||
Covivio | 10 | 1,025 | ||||||
Credit Agricole SA | 246 | 2,938 | ||||||
Danone SA | 831 | 70,381 | ||||||
Dassault Aviation SA | 1 | 773 | ||||||
Dassault Systemes SE | 28 | 4,479 | ||||||
Edenred | 51 | 2,623 | ||||||
Eiffage SA | 17 | 1,664 | ||||||
Electricite de France SA | 129 | 1,630 | ||||||
Engie SA | 392 | 5,948 | ||||||
EssilorLuxottica SA | 60 | 7,884 | ||||||
Eurazeo SE | 9 | 601 | ||||||
Eutelsat Communications SA | 37 | 700 | ||||||
Faurecia SA | 16 | 756 | ||||||
Gecina SA | 10 | 1,471 | ||||||
Getlink SE | 94 | 1,514 | ||||||
Hermes International | 7 | 4,903 | ||||||
ICADE | 6 | 587 | ||||||
Iliad SA | 6 | 639 | ||||||
Imerys SA | 8 | 407 | ||||||
Ingenico Group SA | 13 | 1,140 | ||||||
Ipsen SA | 35 | 4,776 | ||||||
JCDecaux SA | 16 | 484 | ||||||
Kering SA | 16 | 9,604 | ||||||
| SECURITY DESCRIPTION | SHARES | VALUE($) | ||||||
France — continued | ||||||||
Klepierre SA | 44 | 1,470 | ||||||
Legrand SA | 57 | 4,189 | ||||||
L’Oreal SA | 54 | 15,397 | ||||||
LVMH Moet Hennessy Louis Vuitton SE | 60 | 25,359 | ||||||
Natixis SA | 203 | 817 | ||||||
Orange SA | 428 | 6,758 | ||||||
Pernod Ricard SA | 286 | 52,724 | ||||||
Peugeot SA | 126 | 3,109 | ||||||
Publicis Groupe SA | 45 | 2,400 | ||||||
Remy Cointreau SA | 30 | 4,390 | ||||||
Renault SA | 41 | 2,595 | ||||||
Safran SA | 70 | 10,282 | ||||||
Sanofi | 1,042 | 90,079 | ||||||
Sartorius Stedim Biotech | 6 | 937 | ||||||
Schneider Electric SE | 118 | 10,687 | ||||||
SCOR SE | 35 | 1,535 | ||||||
SEB SA | 5 | 872 | ||||||
Societe BIC SA | 5 | 414 | ||||||
Societe Generale SA | 165 | 4,160 | ||||||
Sodexo SA | 19 | 2,221 | ||||||
Suez | 73 | 1,059 | ||||||
Teleperformance | 12 | 2,486 | ||||||
Thales SA | 23 | 2,827 | ||||||
TOTAL SA | 3,992 | 223,927 | ||||||
Ubisoft Entertainment SA (a) | 18 | 1,404 | ||||||
Unibail—Rodamco-Westfield | 30 | 4,449 | ||||||
Valeo SA | 52 | 1,680 | ||||||
Veolia Environnement SA | 115 | 2,810 | ||||||
Vinci SA | 109 | 11,152 | ||||||
Vivendi SA | 196 | 5,389 | ||||||
Wendel SA | 6 | 813 | ||||||
Worldline SA (a) (e) | 18 | 1,282 | ||||||
|
| |||||||
| 709,536 | ||||||||
|
| |||||||
Germany — 5.9% | ||||||||
1&1 Drillisch AG | 11 | 380 | ||||||
adidas AG | 39 | 11,983 | ||||||
Allianz SE (Registered) | 91 | 21,984 | ||||||
Axel Springer SE | 10 | 735 | ||||||
BASF SE | 197 | 14,349 | ||||||
Bayer AG (Registered) | 866 | 60,053 | ||||||
Bayerische Motoren Werke AG | 71 | 5,256 | ||||||
Beiersdorf AG | 22 | 2,596 | ||||||
Brenntag AG | 33 | 1,628 | ||||||
Carl Zeiss Meditec AG | 9 | 853 | ||||||
Commerzbank AG | 215 | 1,545 | ||||||
Continental AG | 24 | 3,440 | ||||||
Covestro AG (e) | 37 | 1,901 | ||||||
Daimler AG (Registered) | 195 | 10,892 | ||||||
Delivery Hero SE (a) (e) | 24 | 1,096 | ||||||
Deutsche Bank AG (Registered) | 422 | 3,251 | ||||||
Deutsche Boerse AG | 41 | 5,760 | ||||||
Deutsche Lufthansa AG (Registered) | 51 | 875 | ||||||
Deutsche Post AG (Registered) | 212 | 6,988 | ||||||
SEE NOTES TO FINANCIAL STATEMENTS.
| JUNE 30, 2019 | SIX CIRCLES TRUST | 47 | ||||||
Table of Contents
Six Circles International Unconstrained Equity Fund
SCHEDULE OF PORTFOLIO INVESTMENTS
AS OF JUNE 30, 2019 (Unaudited) (continued)
(Amounts in U.S. Dollars, unless otherwise noted)
(Amounts in thousands, except number of Futures contracts)
| SECURITY DESCRIPTION | SHARES | VALUE($) | ||||||
Common Stocks — continued |
| |||||||
Germany — continued | ||||||||
Deutsche Telekom AG (Registered) | 716 | 12,401 | ||||||
Deutsche Wohnen SE | 77 | 2,809 | ||||||
E.ON SE | 473 | 5,129 | ||||||
Evonik Industries AG | 40 | 1,166 | ||||||
Fraport AG Frankfurt Airport Services Worldwide | 9 | 769 | ||||||
Fresenius Medical Care AG & Co. KGaA | 46 | 3,635 | ||||||
Fresenius SE & Co. KGaA | 90 | 4,865 | ||||||
GEA Group AG | 33 | 935 | ||||||
Hannover Rueck SE | 13 | 2,094 | ||||||
HeidelbergCement AG | 32 | 2,586 | ||||||
Henkel AG & Co. KGaA | 22 | 2,051 | ||||||
HOCHTIEF AG | 5 | 647 | ||||||
HUGO BOSS AG | 14 | 907 | ||||||
Infineon Technologies AG | 268 | 4,769 | ||||||
Innogy SE (e) | 30 | 1,414 | ||||||
KION Group AG | 14 | 882 | ||||||
Knorr-Bremse AG | 10 | 1,157 | ||||||
LANXESS AG | 19 | 1,109 | ||||||
Merck KGaA | 120 | 12,533 | ||||||
METRO AG | 39 | 707 | ||||||
MTU Aero Engines AG | 11 | 2,663 | ||||||
Muenchener Rueckversicherungs-Gesellschaft AG in Muenchen (Registered) | 32 | 8,050 | ||||||
Puma SE | 18 | 1,188 | ||||||
RWE AG | 117 | 2,898 | ||||||
SAP SE | 211 | 28,934 | ||||||
Siemens AG (Registered) | 164 | 19,559 | ||||||
Siemens Healthineers AG (e) | 32 | 1,357 | ||||||
Symrise AG, Class A | 28 | 2,661 | ||||||
Telefonica Deutschland Holding AG | 192 | 535 | ||||||
thyssenkrupp AG | 87 | 1,269 | ||||||
TUI AG | 95 | 930 | ||||||
Uniper SE | 43 | 1,310 | ||||||
United Internet AG (Registered) | 26 | 870 | ||||||
Volkswagen AG | 7 | 1,196 | ||||||
Vonovia SE | 106 | 5,049 | ||||||
Wirecard AG | 25 | 4,256 | ||||||
Zalando SE (a) (e) | 27 | 1,192 | ||||||
|
| |||||||
| 302,047 | ||||||||
|
| |||||||
Hong Kong — 2.7% | ||||||||
Alibaba Pictures Group Ltd. (a) | 14,010 | 3,013 | ||||||
ASM Pacific Technology Ltd. | 309 | 3,164 | ||||||
Bank of East Asia Ltd. (The) | 1,301 | 3,637 | ||||||
China Agri-Industries Holdings Ltd. | 2,336 | 751 | ||||||
China Education Group Holdings Ltd. | 630 | 986 | ||||||
China Everbright Ltd. | 960 | 1,419 | ||||||
China First Capital Group Ltd. (a) | 3,030 | 904 | ||||||
China Jinmao Holdings Group Ltd. | 5,178 | 3,150 | ||||||
China Power International Development Ltd. | 4,444 | 1,086 | ||||||
China Traditional Chinese Medicine Holdings Co. Ltd. | 2,280 | 1,109 | ||||||
| SECURITY DESCRIPTION | SHARES | VALUE($) | ||||||
Hong Kong — continued | ||||||||
COSCO SHIPPING Ports Ltd. | 1,724 | 1,701 | ||||||
Dairy Farm International Holdings Ltd. | 345 | 2,464 | ||||||
Far East Horizon Ltd. | 2,163 | 2,212 | ||||||
Hang Lung Properties Ltd. | 2,019 | 4,803 | ||||||
HK Electric Investments & HK Electric Investments Ltd. | 2,702 | 2,767 | ||||||
HKT Trust & HKT Ltd. | 3,849 | 6,110 | ||||||
Hutchison China MediTech Ltd., ADR (a) | 54 | 1,197 | ||||||
Hysan Development Co. Ltd. | 631 | 3,260 | ||||||
Kerry Properties Ltd. | 657 | 2,760 | ||||||
Kingboard Holdings Ltd. | 659 | 1,835 | ||||||
Kingboard Laminates Holdings Ltd. | 1,111 | 1,019 | ||||||
Lee & Man Paper Manufacturing Ltd. | 1,377 | 963 | ||||||
Link REIT | 2,114 | 26,014 | ||||||
Melco Resorts & Entertainment Ltd., ADR | 210 | 4,559 | ||||||
New World Development Co. Ltd. | 6,165 | 9,643 | ||||||
NWS Holdings Ltd. | 1,573 | 3,235 | ||||||
PCCW Ltd. | 4,311 | 2,488 | ||||||
Shanghai Industrial Holdings Ltd. | 524 | 1,136 | ||||||
Shangri-La Asia Ltd. | 1,284 | 1,617 | ||||||
Shenzhen International Holdings Ltd. | 980 | 1,946 | ||||||
Shenzhen Investment Ltd. | 3,226 | 1,191 | ||||||
Sino Land Co. Ltd. | 3,070 | 5,149 | ||||||
SJM Holdings Ltd. | 2,022 | 2,299 | ||||||
SSY Group Ltd. | 1,500 | 1,356 | ||||||
Techtronic Industries Co. Ltd. | 1,376 | 10,538 | ||||||
Towngas China Co. Ltd. (a) | 990 | 713 | ||||||
Vitasoy International Holdings Ltd. | 744 | 3,578 | ||||||
Wharf Holdings Ltd. (The) | 1,230 | 3,260 | ||||||
Wheelock & Co. Ltd. | 822 | 5,902 | ||||||
Yue Yuen Industrial Holdings Ltd. | 733 | 2,009 | ||||||
Yuexiu Property Co. Ltd. | 6,988 | 1,584 | ||||||
|
| |||||||
| 138,527 | ||||||||
|
| |||||||
India — 1.2% | ||||||||
Ambuja Cements Ltd. | 596 | 1,837 | ||||||
Ashok Leyland Ltd. | 1,171 | 1,482 | ||||||
Bharat Forge Ltd. | 213 | 1,384 | ||||||
Container Corp. Of India Ltd. | 210 | 1,724 | ||||||
Divi’s Laboratories Ltd. | 79 | 1,834 | ||||||
Dr Reddy’s Laboratories Ltd. | 116 | 4,315 | ||||||
Glenmark Pharmaceuticals Ltd. | 144 | 921 | ||||||
Havells India Ltd. | 248 | 2,815 | ||||||
Hindalco Industries Ltd. | 1,162 | 3,487 | ||||||
ICICI Lombard General Insurance Co. Ltd. (e) | 136 | 2,189 | ||||||
Indiabulls Housing Finance Ltd., ADR | 283 | 2,487 | ||||||
InterGlobe Aviation Ltd. (e) | 93 | 2,094 | ||||||
LIC Housing Finance Ltd. | 304 | 2,461 | ||||||
Lupin Ltd. | 223 | 2,433 | ||||||
Mahindra & Mahindra Financial Services Ltd. | 305 | 1,705 | ||||||
Marico Ltd. | 447 | 2,396 | ||||||
Page Industries Ltd. | 5 | 1,646 | ||||||
SEE NOTES TO FINANCIAL STATEMENTS.
| 48 | SIX CIRCLES TRUST | JUNE 30, 2019 | ||||
Table of Contents
| SECURITY DESCRIPTION | SHARES | VALUE($) | ||||||
Common Stocks — continued |
| |||||||
India — continued | ||||||||
Petronet LNG Ltd. | 604 | 2,153 | ||||||
Pidilite Industries Ltd. | 123 | 2,160 | ||||||
Piramal Enterprises Ltd. | 83 | 2,348 | ||||||
REC Ltd. | 696 | 1,663 | ||||||
Shriram Transport Finance Co. Ltd. | 149 | 2,325 | ||||||
Tata Power Co. Ltd. (The) | 1,098 | 1,098 | ||||||
United Spirits Ltd. (a) | 290 | 2,458 | ||||||
UPL Ltd. | 357 | 4,864 | ||||||
Zee Entertainment Enterprises Ltd. | 555 | 2,712 | ||||||
|
| |||||||
| 58,991 | ||||||||
|
| |||||||
Indonesia — 0.3% | ||||||||
Adaro Energy Tbk. PT | 14,810 | 1,428 | ||||||
Bank Tabungan Negara Persero Tbk. PT | 4,357 | 759 | ||||||
Barito Pacific Tbk. PT | 5,512 | 1,253 | ||||||
Bukit Asam Tbk. PT | 2,837 | 595 | ||||||
Bumi Serpong Damai Tbk. PT (a) | 8,194 | 890 | ||||||
Indah Kiat Pulp & Paper Corp. Tbk. PT | 2,704 | 1,797 | ||||||
Indofood Sukses Makmur Tbk. PT | 4,424 | 2,200 | ||||||
Jasa Marga Persero Tbk. PT | 2,256 | 913 | ||||||
Pabrik Kertas Tjiwi Kimia Tbk. PT | 1,437 | 1,280 | ||||||
Pakuwon Jati Tbk. PT | 17,005 | 878 | ||||||
Semen Indonesia Persero Tbk. PT | 2,983 | 2,443 | ||||||
Surya Citra Media Tbk. PT | 6,477 | 739 | ||||||
|
| |||||||
| 15,175 | ||||||||
|
| |||||||
Ireland — 0.8% | ||||||||
AerCap Holdings NV (a) | 28 | 1,477 | ||||||
AIB Group plc | 175 | 715 | ||||||
Bank of Ireland Group plc | 209 | 1,091 | ||||||
CRH plc | 174 | 5,695 | ||||||
DCC plc | 21 | 1,883 | ||||||
Flutter Entertainment plc | 17 | 1,267 | ||||||
Kerry Group plc, Class A | 214 | 25,560 | ||||||
Kingspan Group plc | 33 | 1,788 | ||||||
Smurfit Kappa Group plc | 48 | 1,468 | ||||||
|
| |||||||
| 40,944 | ||||||||
|
| |||||||
Isle of Man — 0.0% (g) | ||||||||
GVC Holdings plc | 125 | 1,036 | ||||||
|
| |||||||
Italy — 2.6% | ||||||||
Assicurazioni Generali SpA | 235 | 4,430 | ||||||
Atlantia SpA | 106 | 2,775 | ||||||
Davide Campari-Milano SpA | 782 | 7,658 | ||||||
Enel SpA | 1,747 | 12,184 | ||||||
ENI SpA | 4,271 | 71,019 | ||||||
Ferrari NV | 26 | 4,253 | ||||||
FinecoBank Banca Fineco SpA | 111 | 1,240 | ||||||
Intesa Sanpaolo SpA | 3,196 | 6,843 | ||||||
Leonardo SpA | 87 | 1,099 | ||||||
Mediobanca Banca di Credito Finanziario SpA | 133 | 1,375 | ||||||
Moncler SpA | 38 | 1,648 | ||||||
Pirelli & C SpA (e) | 86 | 507 | ||||||
| SECURITY DESCRIPTION | SHARES | VALUE($) | ||||||
Italy — continued | ||||||||
Poste Italiane SpA (e) | 112 | 1,182 | ||||||
Prysmian SpA | 52 | 1,071 | ||||||
Recordati SpA | 97 | 4,046 | ||||||
Snam SpA | 502 | 2,496 | ||||||
Telecom Italia SpA (a) | 1,959 | 1,070 | ||||||
Telecom Italia SpA | 1,294 | 671 | ||||||
Terna Rete Elettrica Nazionale SpA | 302 | 1,925 | ||||||
UniCredit SpA | 431 | 5,306 | ||||||
|
| |||||||
| 132,798 | ||||||||
|
| |||||||
Luxembourg — 0.2% | ||||||||
ArcelorMittal | 143 | 2,552 | ||||||
Aroundtown SA | 170 | 1,400 | ||||||
Eurofins Scientific SE (a) | 2 | 1,087 | ||||||
Millicom International Cellular SA, SDR | 14 | 800 | ||||||
RTL Group SA | 8 | 425 | ||||||
SES SA, Class A | 78 | 1,223 | ||||||
Tenaris SA | 101 | 1,330 | ||||||
|
| |||||||
| 8,817 | ||||||||
|
| |||||||
Macau — 0.1% | ||||||||
MGM China Holdings Ltd. | 970 | 1,649 | ||||||
Wynn Macau Ltd. | 1,557 | 3,485 | ||||||
|
| |||||||
| 5,134 | ||||||||
|
| |||||||
Malaysia — 0.5% | ||||||||
AirAsia Group Bhd. | 1,681 | 1,110 | ||||||
Alliance Bank Malaysia Bhd. | 1,046 | 952 | ||||||
AMMB Holdings Bhd. | 1,767 | 1,809 | ||||||
British American Tobacco Malaysia Bhd. | 150 | 1,043 | ||||||
Fraser & Neave Holdings Bhd. | 161 | 1,347 | ||||||
Gamuda Bhd. | 1,861 | 1,691 | ||||||
Genting Plantations Bhd. | 277 | 670 | ||||||
Hartalega Holdings Bhd. | 1,584 | 2,009 | ||||||
IJM Corp. Bhd. | 2,879 | 1,671 | ||||||
Press Metal Aluminium Holdings Bhd. | 1,439 | 1,532 | ||||||
QL Resources Bhd. | 720 | 1,192 | ||||||
Sime Darby Bhd. | 2,922 | 1,599 | ||||||
Sime Darby Property Bhd. | 2,795 | 696 | ||||||
SP Setia Bhd. Group | 1,800 | 941 | ||||||
Telekom Malaysia Bhd. | 1,227 | 1,189 | ||||||
Top Glove Corp. Bhd. | 1,619 | 1,924 | ||||||
Westports Holdings Bhd. | 983 | 939 | ||||||
YTL Corp. Bhd. | 2,956 | 801 | ||||||
|
| |||||||
| 23,115 | ||||||||
|
| |||||||
Mexico — 0.0% (g) | ||||||||
Fresnillo plc | 47 | 525 | ||||||
|
| |||||||
Netherlands — 11.5% | ||||||||
ABN AMRO Bank NV, CVA, GDR (e) | 91 | 1,944 | ||||||
Adyen NV (a) (e) | 2 | 1,714 | ||||||
Aegon NV | 383 | 1,900 | ||||||
Akzo Nobel NV | 49 | 4,596 | ||||||
ASML Holding NV | 91 | 19,022 | ||||||
EXOR NV | 23 | 1,632 | ||||||
SEE NOTES TO FINANCIAL STATEMENTS.
| JUNE 30, 2019 | SIX CIRCLES TRUST | 49 | ||||||
Table of Contents
Six Circles International Unconstrained Equity Fund
SCHEDULE OF PORTFOLIO INVESTMENTS
AS OF JUNE 30, 2019 (Unaudited) (continued)
(Amounts in U.S. Dollars, unless otherwise noted)
(Amounts in thousands, except number of Futures contracts)
| SECURITY DESCRIPTION | SHARES | VALUE($) | ||||||
Common Stocks — continued |
| |||||||
Netherlands — continued | ||||||||
Heineken Holding NV | 156 | 16,289 | ||||||
Heineken NV | 349 | 38,931 | ||||||
ING Groep NV | 836 | 9,681 | ||||||
Koninklijke Ahold Delhaize NV | 254 | 5,707 | ||||||
Koninklijke DSM NV | 39 | 4,807 | ||||||
Koninklijke KPN NV | 767 | 2,356 | ||||||
Koninklijke Philips NV | 199 | 8,648 | ||||||
Koninklijke Vopak NV | 20 | 936 | ||||||
NN Group NV | 66 | 2,650 | ||||||
NXP Semiconductors NV | 63 | 6,194 | ||||||
QIAGEN NV (a) | 50 | 2,017 | ||||||
Randstad NV | 26 | 1,404 | ||||||
Royal Dutch Shell plc, Class A | 7,433 | 242,599 | ||||||
Royal Dutch Shell plc, Class B | 6,289 | 206,057 | ||||||
Wolters Kluwer NV | 60 | 4,370 | ||||||
|
| |||||||
| 583,454 | ||||||||
|
| |||||||
Norway — 1.4% | ||||||||
Aker BP ASA | 23 | 669 | ||||||
DNB ASA | 207 | 3,852 | ||||||
Equinor ASA | 1,682 | 33,360 | ||||||
Gjensidige Forsikring ASA | 43 | 866 | ||||||
Mowi ASA | 592 | 13,862 | ||||||
Norsk Hydro ASA | 289 | 1,034 | ||||||
Orkla ASA | 1,031 | 9,150 | ||||||
Schibsted ASA, Class B | 21 | 549 | ||||||
Telenor ASA | 158 | 3,357 | ||||||
Yara International ASA | 38 | 1,853 | ||||||
|
| |||||||
| 68,552 | ||||||||
|
| |||||||
Pakistan — 0.0% (g) | ||||||||
Habib Bank Ltd. | 575 | 408 | ||||||
MCB Bank Ltd. | 445 | 486 | ||||||
|
| |||||||
| 894 | ||||||||
|
| |||||||
Philippines — 0.3% | ||||||||
Alliance Global Group, Inc. | 3,979 | 1,198 | ||||||
DMCI Holdings, Inc. | 3,920 | 788 | ||||||
Globe Telecom, Inc. | 33 | 1,472 | ||||||
GT Capital Holdings, Inc. | 90 | 1,660 | ||||||
International Container Terminal Services, Inc. | 1,011 | 2,890 | ||||||
Megaworld Corp. (a) | 11,757 | 1,400 | ||||||
Metro Pacific Investments Corp. | 13,993 | 1,311 | ||||||
Robinsons Land Corp. | 2,136 | 1,098 | ||||||
Security Bank Corp. | 225 | 747 | ||||||
|
| |||||||
| 12,564 | ||||||||
|
| |||||||
Portugal — 0.3% | ||||||||
EDP—Energias de Portugal SA | 550 | 2,089 | ||||||
Galp Energia SGPS SA | 842 | 12,943 | ||||||
Jeronimo Martins SGPS SA | 54 | 872 | ||||||
|
| |||||||
| 15,904 | ||||||||
|
| |||||||
| SECURITY DESCRIPTION | SHARES | VALUE($) | ||||||
Russia — 0.0% (g) | ||||||||
Evraz plc | 108 | 919 | ||||||
|
| |||||||
Singapore — 1.1% | ||||||||
Ascendas Real Estate Investment Trust | 2,589 | 5,974 | ||||||
BOC Aviation Ltd. (e) | 210 | 1,760 | ||||||
CapitaLand Commercial Trust | 2,704 | 4,339 | ||||||
CapitaLand Mall Trust | 2,665 | 5,183 | ||||||
City Developments Ltd. | 473 | 3,316 | ||||||
ComfortDelGro Corp. Ltd. | 2,245 | 4,415 | ||||||
Golden Agri-Resources Ltd. | 6,944 | 1,491 | ||||||
Keppel Corp. Ltd. | 1,478 | 7,285 | ||||||
SATS Ltd. | 698 | 2,692 | ||||||
Sembcorp Industries Ltd. | 1,035 | 1,845 | ||||||
Singapore Exchange Ltd. | 795 | 4,656 | ||||||
Singapore Press Holdings Ltd. | 520 | 937 | ||||||
Singapore Technologies Engineering Ltd. | 1,600 | 4,901 | ||||||
Suntec Real Estate Investment Trust | 1,963 | 2,815 | ||||||
UOL Group Ltd. | 499 | 2,785 | ||||||
Venture Corp. Ltd. | 287 | 3,459 | ||||||
|
| |||||||
| 57,853 | ||||||||
|
| |||||||
South Africa — 0.0% (g) | ||||||||
Investec plc | 146 | 952 | ||||||
|
| |||||||
South Korea — 2.1% | ||||||||
BGF retail Co. Ltd. | 8 | 1,398 | ||||||
BNK Financial Group, Inc. | 276 | 1,792 | ||||||
Celltrion Pharm, Inc. (a) | 15 | 624 | ||||||
Cheil Worldwide, Inc. | 71 | 1,809 | ||||||
CJ CheilJedang Corp. | 8 | 2,140 | ||||||
CJ Corp. | 14 | 1,269 | ||||||
CJ ENM Co. Ltd. | 11 | 1,676 | ||||||
CJ Logistics Corp. (a) | 9 | 1,065 | ||||||
Daelim Industrial Co. Ltd. | 28 | 2,799 | ||||||
Daewoo Engineering & Construction Co. Ltd. (a) | 186 | 795 | ||||||
Daewoo Shipbuilding & Marine Engineering Co. Ltd. (a) | 39 | 1,096 | ||||||
DB Insurance Co. Ltd. | 50 | 2,545 | ||||||
Doosan Bobcat, Inc. | 50 | 1,578 | ||||||
E-MART, Inc. | 21 | 2,588 | ||||||
Fila Korea Ltd. | 49 | 3,237 | ||||||
GS Engineering & Construction Corp. | 61 | 2,134 | ||||||
GS Holdings Corp. | 51 | 2,244 | ||||||
GS Retail Co. Ltd. | 28 | 953 | ||||||
Hanmi Pharm Co. Ltd. | 6 | 2,262 | ||||||
Hanmi Science Co. ltd | 13 | 754 | ||||||
Hanon Systems | 187 | 1,889 | ||||||
Hanwha Chemical Corp. | 108 | 2,137 | ||||||
Hanwha Corp. | 41 | 951 | ||||||
Hanwha Life Insurance Co. Ltd. | 332 | 942 | ||||||
HDC Hyundai Development Co.-Engineering & Construction | 26 | 989 | ||||||
Helixmith Co. Ltd. (a) | 14 | 2,090 | ||||||
HLB, Inc. (a) | 33 | 1,026 | ||||||
SEE NOTES TO FINANCIAL STATEMENTS.
| 50 | SIX CIRCLES TRUST | JUNE 30, 2019 | ||||
Table of Contents
| SECURITY DESCRIPTION | SHARES | VALUE($) | ||||||
Common Stocks — continued |
| |||||||
South Korea — continued | ||||||||
Hotel Shilla Co. Ltd. | 31 | 2,646 | ||||||
Hyundai Department Store Co. Ltd. | 14 | 1,026 | ||||||
Hyundai Engineering & Construction Co. Ltd. | 79 | 3,655 | ||||||
Hyundai Heavy Industries Holdings Co. Ltd. | 10 | 2,751 | ||||||
Hyundai Marine & Fire Insurance Co. Ltd. | 63 | 1,552 | ||||||
KCC Corp. | 6 | 1,398 | ||||||
Korea Aerospace Industries Ltd. | 73 | 2,290 | ||||||
Korea Gas Corp. | 28 | 1,031 | ||||||
Korea Investment Holdings Co. Ltd. | 42 | 2,941 | ||||||
Korean Air Lines Co. Ltd. | 49 | 1,219 | ||||||
Kumho Petrochemical Co. Ltd. | 19 | 1,579 | ||||||
LG Innotek Co. Ltd. | 14 | 1,367 | ||||||
Medy-Tox, Inc. | 4 | 1,713 | ||||||
Meritz Securities Co. Ltd. | 296 | 1,373 | ||||||
Mirae Asset Daewoo Co. Ltd. | 399 | 2,832 | ||||||
NH Investment & Securities Co. Ltd. | 141 | 1,770 | ||||||
OCI Co. Ltd. | 19 | 1,546 | ||||||
Orange Life Insurance Ltd. (e) | 33 | 918 | ||||||
Orion Corp. | 24 | 1,899 | ||||||
Ottogi Corp. | 1 | 786 | ||||||
Pan Ocean Co. Ltd. (a) | 269 | 1,085 | ||||||
Pearl Abyss Corp. (a) | 6 | 1,188 | ||||||
POSCO Chemical Co. Ltd. | 24 | 1,112 | ||||||
Posco International Corp. | 49 | 780 | ||||||
S-1 Corp. | 17 | 1,453 | ||||||
Samsung Card Co. Ltd. | 30 | 979 | ||||||
Samsung Engineering Co. Ltd. (a) | 158 | 2,352 | ||||||
Samsung Heavy Industries Co. Ltd. (a) | 440 | 3,116 | ||||||
Samsung Securities Co. Ltd. | 62 | 2,118 | ||||||
Shinsegae, Inc. | 8 | 1,968 | ||||||
SillaJen, Inc. (a) | 60 | 2,591 | ||||||
Woongjin Coway Co. Ltd. | 53 | 3,524 | ||||||
Yuhan Corp. | 9 | 1,907 | ||||||
|
| |||||||
| 105,247 | ||||||||
|
| |||||||
Spain — 2.4% | ||||||||
ACS Actividades de Construccion y Servicios SA | 54 | 2,163 | ||||||
Aena SME SA (e) | 15 | 3,001 | ||||||
Amadeus IT Group SA | 96 | 7,599 | ||||||
Banco Bilbao Vizcaya Argentaria SA | 1,454 | 8,112 | ||||||
Banco de Sabadell SA | 1,208 | 1,253 | ||||||
Banco Santander SA | 3,514 | 16,284 | ||||||
Bankia SA | 265 | 626 | ||||||
Bankinter SA | 145 | 998 | ||||||
CaixaBank SA | 771 | 2,210 | ||||||
Cellnex Telecom SA (a) (e) | 42 | 1,543 | ||||||
Endesa SA | 68 | 1,754 | ||||||
Ferrovial SA | 110 | 2,808 | ||||||
Grifols SA | 64 | 1,896 | ||||||
Iberdrola SA | 1,273 | 12,670 | ||||||
Industria de Diseno Textil SA | 239 | 7,184 | ||||||
Mapfre SA | 231 | 677 | ||||||
| SECURITY DESCRIPTION | SHARES | VALUE($) | ||||||
Spain — continued | ||||||||
Naturgy Energy Group SA | 71 | 1,959 | ||||||
Red Electrica Corp. SA | 93 | 1,936 | ||||||
Repsol SA | 2,366 | 37,132 | ||||||
Siemens Gamesa Renewable Energy SA | 51 | 851 | ||||||
Telefonica SA | 1,019 | 8,378 | ||||||
|
| |||||||
| 121,034 | ||||||||
|
| |||||||
Sweden — 1.6% | ||||||||
Alfa Laval AB | 68 | 1,476 | ||||||
Assa Abloy AB, Class B | 215 | 4,856 | ||||||
Atlas Copco AB, Class A | 144 | 4,621 | ||||||
Atlas Copco AB, Class B | 84 | 2,409 | ||||||
Boliden AB | 59 | 1,505 | ||||||
Electrolux AB, Class B | 48 | 1,242 | ||||||
Epiroc AB, Class A | 142 | 1,475 | ||||||
Epiroc AB, Class B | 84 | 831 | ||||||
Essity AB, Class B | 130 | 4,007 | ||||||
Hennes & Mauritz AB, Class B | 173 | 3,065 | ||||||
Hexagon AB, Class B | 56 | 3,109 | ||||||
Husqvarna AB, Class B | 90 | 840 | ||||||
ICA Gruppen AB | 19 | 836 | ||||||
Industrivarden AB, Class C | 36 | 796 | ||||||
Investor AB, Class B | 98 | 4,704 | ||||||
Kinnevik AB, Class B | 52 | 1,352 | ||||||
L E Lundbergforetagen AB, Class B | 16 | 612 | ||||||
Lundin Petroleum AB | 40 | 1,253 | ||||||
Sandvik AB | 242 | 4,455 | ||||||
Securitas AB, Class B | 67 | 1,180 | ||||||
Skandinaviska Enskilda Banken AB, Class A | 350 | 3,236 | ||||||
Skanska AB, Class B | 73 | 1,320 | ||||||
SKF AB, Class B | 82 | 1,502 | ||||||
Svenska Handelsbanken AB, Class A | 328 | 3,236 | ||||||
Swedbank AB, Class A | 194 | 2,928 | ||||||
Swedish Match AB | 238 | 10,050 | ||||||
Tele2 AB, Class B | 107 | 1,566 | ||||||
Telefonaktiebolaget LM Ericsson, Class B | 660 | 6,263 | ||||||
Telia Co. AB | 604 | 2,680 | ||||||
Volvo AB, Class B | 319 | 5,068 | ||||||
|
| |||||||
| 82,473 | ||||||||
|
| |||||||
Switzerland — 19.1% | ||||||||
ABB Ltd. (Registered) | 396 | 7,934 | ||||||
Adecco Group AG (Registered) | 34 | 2,042 | ||||||
Alcon, Inc. (a) | 93 | 5,750 | ||||||
Baloise Holding AG (Registered) | 10 | 1,856 | ||||||
Barry Callebaut AG (Registered) | 3 | 5,931 | ||||||
Chocoladefabriken Lindt & Spruengli AG | 1 | 10,561 | ||||||
Chocoladefabriken Lindt & Spruengli AG (Registered) | — | (h) | 11,143 | |||||
Cie Financiere Richemont SA (Registered) | 112 | 9,526 | ||||||
Clariant AG (Registered) (a) | 43 | 870 | ||||||
Coca-Cola HBC AG (a) | 271 | 10,224 | ||||||
Credit Suisse Group AG (Registered) (a) | 549 | 6,570 | ||||||
SEE NOTES TO FINANCIAL STATEMENTS.
| JUNE 30, 2019 | SIX CIRCLES TRUST | 51 | ||||||
Table of Contents
Six Circles International Unconstrained Equity Fund
SCHEDULE OF PORTFOLIO INVESTMENTS
AS OF JUNE 30, 2019 (Unaudited) (continued)
(Amounts in U.S. Dollars, unless otherwise noted)
(Amounts in thousands, except number of Futures contracts)
| SECURITY DESCRIPTION | SHARES | VALUE($) | ||||||
Common Stocks — continued |
| |||||||
Switzerland — continued | ||||||||
Dufry AG (Registered) (a) | 9 | 784 | ||||||
EMS-Chemie Holding AG (Registered) | 2 | 1,141 | ||||||
Geberit AG (Registered) | 8 | 3,718 | ||||||
Givaudan SA (Registered) | 2 | 5,601 | ||||||
Glencore plc (a) | 2,389 | 8,269 | ||||||
Julius Baer Group Ltd. (a) | 48 | 2,141 | ||||||
Kuehne + Nagel International AG (Registered) | 12 | 1,723 | ||||||
LafargeHolcim Ltd. (Registered) (a) | 104 | 5,098 | ||||||
Lonza Group AG (Registered) (a) | 16 | 5,399 | ||||||
Nestle SA (Registered) | 4,129 | 427,492 | ||||||
Novartis AG (Registered) | 2,013 | 183,760 | ||||||
Pargesa Holding SA | 8 | 639 | ||||||
Partners Group Holding AG | 4 | 3,157 | ||||||
Roche Holding AG | 652 | 183,415 | ||||||
Schindler Holding AG | 9 | 1,949 | ||||||
Schindler Holding AG (Registered) | 4 | 945 | ||||||
SGS SA (Registered) | 1 | 2,924 | ||||||
Sika AG (Registered) | 27 | 4,682 | ||||||
Sonova Holding AG (Registered) | 12 | 2,714 | ||||||
STMicroelectronics NV | 147 | 2,601 | ||||||
Straumann Holding AG (Registered) | 2 | 1,959 | ||||||
Swatch Group AG (The) | 6 | 1,804 | ||||||
Swatch Group AG (The) (Registered) | 12 | 650 | ||||||
Swiss Life Holding AG (Registered) | 7 | 3,644 | ||||||
Swiss Prime Site AG (Registered) (a) | 16 | 1,424 | ||||||
Swiss Re AG | 65 | 6,651 | ||||||
Swisscom AG (Registered) | 6 | 2,794 | ||||||
Temenos AG (Registered) (a) | 14 | 2,459 | ||||||
UBS Group AG (Registered) (a) | 828 | 9,842 | ||||||
Vifor Pharma AG | 42 | 6,106 | ||||||
Zurich Insurance Group AG | 33 | 11,309 | ||||||
|
| |||||||
| 969,201 | ||||||||
|
| |||||||
Taiwan — 2.0% | ||||||||
Acer, Inc. (a) | 2,883 | 1,792 | ||||||
Airtac International Group | 122 | 1,371 | ||||||
Asia Cement Corp. | 2,185 | 3,348 | ||||||
AU Optronics Corp. | 8,829 | 2,645 | ||||||
Chailease Holding Co. Ltd. | 1,164 | 4,824 | ||||||
Chicony Electronics Co. Ltd. | 594 | 1,464 | ||||||
China Airlines Ltd. | 2,641 | 836 | ||||||
China Life Insurance Co. Ltd. | 2,654 | 2,125 | ||||||
Compal Electronics, Inc. | 4,240 | 2,781 | ||||||
Eclat Textile Co. Ltd. | 192 | 2,460 | ||||||
Eva Airways Corp. | 2,452 | 1,179 | ||||||
Evergreen Marine Corp. Taiwan Ltd. | 2,423 | 972 | ||||||
Feng TAY Enterprise Co. Ltd. | 301 | 2,351 | ||||||
Formosa Taffeta Co. Ltd. | 895 | 1,128 | ||||||
Foxconn Technology Co. Ltd. | 948 | 1,928 | ||||||
Giant Manufacturing Co. Ltd. | 302 | 2,368 | ||||||
Highwealth Construction Corp. | 811 | 1,292 | ||||||
Hiwin Technologies Corp. | 230 | 1,931 | ||||||
Innolux Corp. | 8,492 | 2,008 | ||||||
Inventec Corp. | 2,500 | 1,987 | ||||||
| SECURITY DESCRIPTION | SHARES | VALUE($) | ||||||
Taiwan — continued | ||||||||
Lite-On Technology Corp., ADR | 2,147 | 3,147 | ||||||
Micro-Star International Co. Ltd. | 672 | 1,911 | ||||||
Nien Made Enterprise Co. Ltd. | 159 | 1,197 | ||||||
Novatek Microelectronics Corp. | 580 | 3,237 | ||||||
Phison Electronics Corp. | 146 | 1,332 | ||||||
Pou Chen Corp. | 2,228 | 2,763 | ||||||
Powertech Technology, Inc. | 739 | 1,811 | ||||||
Realtek Semiconductor Corp. | 486 | 3,580 | ||||||
Ruentex Development Co. Ltd. | 572 | 819 | ||||||
Ruentex Industries Ltd. | 364 | 887 | ||||||
Shin Kong Financial Holding Co. Ltd. | 10,520 | 3,197 | ||||||
SinoPac Financial Holdings Co. Ltd. | 10,850 | 4,561 | ||||||
Standard Foods Corp. | 416 | 813 | ||||||
Synnex Technology International Corp. | 1,372 | 1,726 | ||||||
TaiMed Biologics, Inc. (a) | 171 | 876 | ||||||
Taishin Financial Holding Co. Ltd. | 9,537 | 4,394 | ||||||
Taiwan Business Bank | 3,860 | 1,699 | ||||||
Taiwan Cement Corp. | 4,623 | 6,853 | ||||||
Taiwan High Speed Rail Corp. | 1,982 | 2,918 | ||||||
Tatung Co. Ltd. (a) | 1,924 | 1,163 | ||||||
Vanguard International Semiconductor Corp. | 891 | 1,876 | ||||||
Walsin Technology Corp. | 324 | 1,721 | ||||||
Win Semiconductors Corp. | 338 | 2,176 | ||||||
Winbond Electronics Corp. | 2,911 | 1,427 | ||||||
Wistron Corp. | 2,844 | 2,221 | ||||||
WPG Holdings Ltd. | 1,525 | 1,982 | ||||||
Zhen Ding Technology Holding Ltd. | 449 | 1,436 | ||||||
|
| |||||||
| 102,513 | ||||||||
|
| |||||||
Thailand — 0.6% | ||||||||
Bangkok Expressway & Metro PCL, NVDR | 7,562 | 2,812 | ||||||
Banpu PCL, NVDR | 4,365 | 2,137 | ||||||
BTS Group Holdings PCL, NVDR | 6,465 | 2,529 | ||||||
Bumrungrad Hospital PCL, NVDR | 456 | 2,513 | ||||||
Electricity Generating PCL, NVDR | 292 | 3,092 | ||||||
Energy Absolute PCL, NVDR | 1,682 | 3,058 | ||||||
Gulf Energy Development PCL, NVDR | 538 | 2,157 | ||||||
IRPC PCL, NVDR | 11,772 | 1,922 | ||||||
Land & Houses PCL, NVDR | 8,414 | 3,047 | ||||||
Muangthai Capital PCL, NVDR | 678 | 1,250 | ||||||
Ratch Group PCL, NVDR | 762 | 1,659 | ||||||
Robinson PCL, NVDR | 517 | 949 | ||||||
Thai Union Group PCL, NVDR | 3,509 | 2,095 | ||||||
TMB Bank PCL, NVDR | 10,855 | 694 | ||||||
Total Access Communication PCL, NVDR | 735 | 1,270 | ||||||
|
| |||||||
| 31,184 | ||||||||
|
| |||||||
United Arab Emirates — 0.0% (g) | ||||||||
NMC Health plc | 20 | 616 | ||||||
|
| |||||||
United Kingdom — 20.8% | ||||||||
3i Group plc | 209 | 2,956 | ||||||
Admiral Group plc | 41 | 1,137 | ||||||
Anglo American plc | 226 | 6,465 | ||||||
SEE NOTES TO FINANCIAL STATEMENTS.
| 52 | SIX CIRCLES TRUST | JUNE 30, 2019 | ||||
Table of Contents
| SECURITY DESCRIPTION | SHARES | VALUE($) | ||||||
Common Stocks — continued |
| |||||||
United Kingdom — continued | ||||||||
Ashtead Group plc | 102 | 2,908 | ||||||
Associated British Foods plc | 480 | 15,026 | ||||||
AstraZeneca plc | 1,176 | 96,175 | ||||||
Auto Trader Group plc (e) | 201 | 1,398 | ||||||
Aviva plc | 838 | 4,440 | ||||||
BAE Systems plc | 686 | 4,314 | ||||||
Barclays plc | 3,680 | 6,999 | ||||||
Barratt Developments plc | 218 | 1,585 | ||||||
Berkeley Group Holdings plc | 26 | 1,247 | ||||||
BP plc | 34,015 | 236,977 | ||||||
British American Tobacco plc | 3,092 | 107,974 | ||||||
British Land Co. plc (The) | 195 | 1,332 | ||||||
BT Group plc | 1,811 | 4,529 | ||||||
Bunzl plc | 72 | 1,906 | ||||||
Burberry Group plc | 88 | 2,094 | ||||||
Centrica plc | 1,223 | 1,364 | ||||||
CNH Industrial NV | 218 | 2,240 | ||||||
Coca-Cola European Partners plc | 320 | 18,055 | ||||||
Compass Group plc | 341 | 8,165 | ||||||
Croda International plc | 28 | 1,795 | ||||||
Diageo plc | 3,260 | 140,304 | ||||||
Direct Line Insurance Group plc | 295 | 1,245 | ||||||
easyJet plc | 34 | 413 | ||||||
Experian plc | 195 | 5,920 | ||||||
Ferguson plc | 50 | 3,546 | ||||||
Fiat Chrysler Automobiles NV | 233 | 3,235 | ||||||
G4S plc | 333 | 882 | ||||||
GlaxoSmithKline plc | 4,610 | 92,399 | ||||||
Halma plc | 82 | 2,094 | ||||||
Hargreaves Lansdown plc | 61 | 1,493 | ||||||
HSBC Holdings plc | 4,306 | 35,940 | ||||||
Imperial Brands plc | 1,290 | 30,267 | ||||||
Informa plc | 269 | 2,851 | ||||||
InterContinental Hotels Group plc | 37 | 2,430 | ||||||
Intertek Group plc | 35 | 2,423 | ||||||
ITV plc | 778 | 1,067 | ||||||
J Sainsbury plc | 378 | 940 | ||||||
John Wood Group plc | 146 | 843 | ||||||
Johnson Matthey plc | 42 | 1,757 | ||||||
Kingfisher plc | 453 | 1,235 | ||||||
Land Securities Group plc | 151 | 1,602 | ||||||
Legal & General Group plc | 1,280 | 4,386 | ||||||
Lloyds Banking Group plc | 15,323 | 11,005 | ||||||
London Stock Exchange Group plc | 67 | 4,689 | ||||||
Marks & Spencer Group plc | 419 | 1,120 | ||||||
Meggitt plc | 167 | 1,112 | ||||||
Melrose Industries plc | 1,043 | 2,398 | ||||||
Merlin Entertainments plc (e) | 154 | 878 | ||||||
Micro Focus International plc | 74 | 1,935 | ||||||
Mondi plc | 79 | 1,795 | ||||||
National Grid plc | 732 | 7,788 | ||||||
Next plc | 30 | 2,069 | ||||||
Ocado Group plc (a) | 98 | 1,447 | ||||||
Pearson plc | 168 | 1,746 | ||||||
| SECURITY DESCRIPTION | SHARES | VALUE($) | ||||||
United Kingdom — continued | ||||||||
Persimmon plc | 68 | 1,733 | ||||||
Prudential plc | 557 | 12,157 | ||||||
Reckitt Benckiser Group plc | 152 | 11,996 | ||||||
RELX plc | 421 | 10,223 | ||||||
Rentokil Initial plc | 397 | 2,005 | ||||||
Rio Tinto plc | 245 | 15,152 | ||||||
Rolls-Royce Holdings plc (a) | 366 | 3,914 | ||||||
Royal Bank of Scotland Group plc | 1,035 | 2,887 | ||||||
RSA Insurance Group plc | 221 | 1,616 | ||||||
Sage Group plc (The) | 233 | 2,378 | ||||||
Schroders plc | 27 | 1,036 | ||||||
Segro plc | 233 | 2,162 | ||||||
Severn Trent plc | 51 | 1,325 | ||||||
Smith & Nephew plc | 188 | 4,080 | ||||||
Smiths Group plc | 85 | 1,692 | ||||||
Spirax-Sarco Engineering plc | 16 | 1,846 | ||||||
SSE plc | 220 | 3,142 | ||||||
St James’s Place plc | 114 | 1,588 | ||||||
Standard Chartered plc | 604 | 5,480 | ||||||
Standard Life Aberdeen plc | 535 | 2,002 | ||||||
Taylor Wimpey plc | 704 | 1,413 | ||||||
Tesco plc | 2,103 | 6,063 | ||||||
Unilever NV, CVA | 313 | 19,018 | ||||||
Unilever plc | 238 | 14,799 | ||||||
United Utilities Group plc | 146 | 1,458 | ||||||
Vodafone Group plc | 5,738 | 9,405 | ||||||
Weir Group plc (The) | 56 | 1,097 | ||||||
Whitbread plc | 39 | 2,280 | ||||||
Wm Morrison Supermarkets plc | 509 | 1,302 | ||||||
WPP plc | 271 | 3,413 | ||||||
|
| |||||||
| 1,054,997 | ||||||||
|
| |||||||
United States — 0.1% | ||||||||
Carnival plc | 35 | 1,555 | ||||||
Nexteer Automotive Group Ltd. | 871 | 1,084 | ||||||
|
| |||||||
| 2,639 | ||||||||
|
| |||||||
Total Common Stocks | 5,039,084 | |||||||
|
| |||||||
Preferred Stocks — 0.3% | ||||||||
Germany — 0.3% | ||||||||
Bayerische Motoren Werke AG | 12 | 740 | ||||||
FUCHS PETROLUB SE | 15 | 586 | ||||||
Henkel AG & Co. KGaA | 38 | 3,743 | ||||||
Porsche Automobil Holding SE | 33 | 2,130 | ||||||
Sartorius AG | 8 | 1,566 | ||||||
Volkswagen AG | 40 | 6,713 | ||||||
|
| |||||||
Total Preferred Stocks | 15,478 | |||||||
|
| |||||||
SEE NOTES TO FINANCIAL STATEMENTS.
| JUNE 30, 2019 | SIX CIRCLES TRUST | 53 | ||||||
Table of Contents
Six Circles International Unconstrained Equity Fund
SCHEDULE OF PORTFOLIO INVESTMENTS
AS OF JUNE 30, 2019 (Unaudited) (continued)
(Amounts in U.S. Dollars, unless otherwise noted)
(Amounts in thousands, except number of Futures contracts)
| SECURITY DESCRIPTION | NUMBER OF RIGHTS | VALUE($) | ||||||
Rights — 0.0% (g) | ||||||||
South Korea — 0.0% (g) | ||||||||
Helixmith Co. Ltd., expiring 08/05/2019 (a) (bb) | 1 | 27 | ||||||
|
| |||||||
Spain — 0.0% (g) | ||||||||
ACS Actividades de Construccion y Servicios SA, expiring 07/08/2019 (a) | 108 | 170 | ||||||
Repsol SA, expiring 07/04/2019 (a) | 1,758 | 975 | ||||||
|
| |||||||
| 1,145 | ||||||||
|
| |||||||
Total Rights | 1,172 | |||||||
|
| |||||||
| PRINCIPAL AMOUNT($) | ||||||||
Short-Term Investments — 0.4% | ||||||||
Time Deposits — 0.4% | ||||||||
Australia & New Zealand Banking Group Ltd., 1.76%, 07/01/2019 | 2,052 | 2,052 | ||||||
BNP Paribas SA, (0.58%), 07/01/2019 | EUR | 4,306 | 4,897 | |||||
Brown Brothers Harriman, | ||||||||
(1.58%), 07/01/2019 | CHF | 1,182 | 1,211 | |||||
(0.85%), 07/01/2019 | DKK | 210 | 32 | |||||
(0.50%), 07/01/2019 | SEK | 775 | 83 | |||||
0.36%, 07/01/2019 | GBP | — | (h) | — | (h) | |||
0.52%, 07/01/2019 | NOK | 371 | 44 | |||||
0.60%, 07/01/2019 | SGD | 14 | 10 | |||||
1.76%, 07/01/2019 | 15 | 15 | ||||||
2.10%, 07/02/2019 | HKD | 6,326 | 810 | |||||
| SECURITY DESCRIPTION | PRINCIPAL | VALUE($) | ||||||
Time Deposits — continued | ||||||||
Citibank NA, | ||||||||
(0.58%), 07/01/2019 | EUR | 445 | 506 | |||||
0.36%, 07/01/2019 | GBP | 6,191 | 7,862 | |||||
1.76%, 07/01/2019 | 2,814 | 2,814 | ||||||
|
| |||||||
Total Short-Term Investments | 20,336 | |||||||
|
| |||||||
Total Investments — 99.8% | 5,076,070 | |||||||
Other Assets in Excess of Liabilities — 0.2% |
| 9,945 | ||||||
|
| |||||||
NET ASSETS — 100.0% | $ | 5,086,015 | ||||||
|
| |||||||
Percentages indicated are based on net assets
| Futures contracts outstanding as of June 30, 2019: | ||||||||||||||||||||
| Exchange Traded | ||||||||||||||||||||
| DESCRIPTION | NUMBER OF CONTRACTS | EXPIRATION DATE | TRADING CURRENCY | NOTIONAL AMOUNT($) | VALUE AND UNREALIZED APPRECIATION (DEPRECIATION)($) | |||||||||||||||
Long Contracts |
| |||||||||||||||||||
| EURO STOXX 50 Index | 116 | 09/2019 | EUR | 4,525 | 47 | |||||||||||||||
| FTSE 100 Index | 54 | 09/2019 | GBP | 5,025 | 29 | |||||||||||||||
| MSCI Emerging Markets Index | 59 | 09/2019 | USD | 3,042 | 65 | |||||||||||||||
|
| |||||||||||||||||||
Total unrealized appreciation (depreciation) |
| 141 | ||||||||||||||||||
|
| |||||||||||||||||||
SEE NOTES TO FINANCIAL STATEMENTS.
| 54 | SIX CIRCLES TRUST | JUNE 30, 2019 | ||||
Table of Contents
Summary of Investments by Industry, June 30, 2019
The following table represents the portfolio investments of the Fund by industry classifications as a percentage of total investments:
| Industry | PERCENTAGE | |||
Oil & Gas | 21.4 | % | ||
Pharmaceuticals | 16.8 | % | ||
Food | 12.5 | % | ||
Beverages | 8.0 | % | ||
Banks | 3.9 | % | ||
Agriculture | 3.0 | % | ||
Insurance | 2.5 | % | ||
Telecommunications | 1.8 | % | ||
Chemicals | 1.6 | % | ||
Real Estate | 1.5 | % | ||
Electric | 1.5 | % | ||
Diversified Financial Services | 1.4 | % | ||
Apparel | 1.4 | % | ||
Commercial Services | 1.3 | % | ||
Engineering & Construction | 1.2 | % | ||
REITS | 1.2 | % | ||
Software | 1.1 | % | ||
Cosmetics/Personal Care | 1.1 | % | ||
Semiconductors | 1.1 | % | ||
Mining | 1.0 | % | ||
Retail | 1.0 | % | ||
Other | 13.3 | % | ||
Short term | 0.4 | % | ||
NOTES TO SCHEDULE OF PORTFOLIO INVESTMENTS
| ADR | — American Depositary Receipt | |
| CVA | — Dutch Certification | |
| GDR | — Global Depositary Receipt | |
| NVDR | — Non-Voting Depository Receipt | |
| REIT | — Real Estate Investment Trust | |
| SDR | — Swedish Depository Receipt | |
| (a) | — Non-income producing security. | |
| (e) | — Security is exempt from registration under Rule 144A of the Securities Act of 1933, as amended. Unless otherwise indicated, this security has been determined to be liquid under procedures established by the Board of Trustees and may be resold in transactions exempt from registration, normally to qualified institutional buyers. | |
| (g) | — Amount rounds to less than 0.05%. | |
| (h) | — Amount rounds to less than 500. | |
| (bb) | — Security has been valued using significant unobservable inputs. | |
| * | — The cost of securities is substantially the same for federal income tax purposes. | |
| CHF | — Swiss Franc | |
| DKK | — Danish Krone | |
| EUR | — Euro | |
| GBP | — British Pound | |
| HKD | — Hong Kong Dollar | |
| NOK | — Norwegian Krone | |
| SEK | — Swedish Krona | |
| SGD | — Singapore Dollar | |
| USD | — United States Dollar |
SEE NOTES TO FINANCIAL STATEMENTS.
| JUNE 30, 2019 | SIX CIRCLES TRUST | 55 | ||||||
Table of Contents
STATEMENTS OF ASSETS AND LIABILITIES
AS OF JUNE 30, 2019 (Unaudited)
(Amounts in thousands, except per share amounts)
| Six Circles Ultra Short Duration Fund | ||||
ASSETS: | ||||
Investments in non-affiliates, at value | $ | 957,343 | ||
Repurchase agreements, at value | 192,000 | |||
Cash | 16 | |||
Deposits at broker for futures contracts | 687 | |||
Deposits at broker for centrally cleared swaps | 1,051 | |||
Prepaid expenses | 37 | |||
Receivables: | ||||
Investment securities sold | 203 | |||
Investment securities sold — delayed delivery securities | 1,959 | |||
Fund shares sold | 765 | |||
Interest and dividends from non-affiliates | 4,242 | |||
Variation margin on futures contracts | 114 | |||
Variation margin on centrally cleared swaps (net upfront payments of $290) | 363 | |||
Unrealized appreciation on forward foreign currency exchange contracts | 81 | |||
|
| |||
Total Assets | 1,158,861 | |||
|
| |||
LIABILITIES: | ||||
Payables: | ||||
Due to custodian | 1 | |||
Sale-buyback transactions | 32,341 | |||
Investment securities purchased | 2,006 | |||
Investment securities purchased — delayed delivery securities | 3,912 | |||
Fund shares redeemed | 610 | |||
Unrealized depreciation on forward foreign currency exchange contracts | 42 | |||
Accrued liabilities: | ||||
Investment advisory fees | 88 | |||
Administration fees | 25 | |||
Custodian and accounting fees | 43 | |||
Trustees’ fees | 22 | |||
Registration and filing fees | 28 | |||
Offering costs | 7 | |||
Other | 83 | |||
|
| |||
Total Liabilities | 39,208 | |||
|
| |||
Net Assets | $ | 1,119,653 | ||
|
| |||
NET ASSETS: | ||||
Paid-in capital | $ | 1,120,389 | ||
Total distributable earnings (loss) | (736 | ) | ||
|
| |||
Total Net Assets | $ | 1,119,653 | ||
|
| |||
Outstanding units of beneficial interest (shares) | 111,931 | |||
Net Asset Value, offering and redemption price per share (a): | $ | 10.00 | ||
Cost of investments in non-affiliates | $ | 953,426 | ||
Cost of repurchase agreements | 192,000 | |||
Cost of foreign currency | (1 | ) | ||
| (a) | Per share amounts may not recalculate due to rounding of net assets and/or shares outstanding. |
SEE NOTES TO FINANCIAL STATEMENTS.
| 56 | SIX CIRCLES TRUST | JUNE 30, 2019 | ||||
Table of Contents
| Six Circles Tax Aware Ultra Short Duration Fund | ||||
ASSETS: | ||||
Investments in non-affiliates, at value | $ | 1,292,382 | ||
Cash | 4 | |||
Deposits at broker for futures contracts | 743 | |||
Deposits at broker for centrally cleared swaps | 1,035 | |||
Prepaid expenses | 37 | |||
Receivables: | ||||
Investment securities sold | 203 | |||
Investment securities sold — delayed delivery securities | 4,949 | |||
Fund shares sold | 756 | |||
Interest and dividends from non-affiliates | 6,993 | |||
Variation margin on futures contracts | 107 | |||
Variation margin on centrally cleared swaps (net upfront payments of $280) | 399 | |||
Unrealized appreciation on forward foreign currency exchange contracts | 90 | |||
|
| |||
Total Assets | 1,307,698 | |||
|
| |||
LIABILITIES: | ||||
Payables: | ||||
Due to custodian | 1 | |||
Sale-buyback transactions | 7,194 | |||
Investment securities purchased | 22,333 | |||
Investment securities purchased — delayed delivery securities | 9,882 | |||
Fund shares redeemed | 199 | |||
Unrealized depreciation on forward foreign currency exchange contracts | 48 | |||
Accrued liabilities: | ||||
Investment advisory fees | 90 | |||
Administration fees | 23 | |||
Custodian and accounting fees | 37 | |||
Trustees’ fees | 23 | |||
Registration and filing fees | 73 | |||
Offering costs | 7 | |||
Other | 76 | |||
|
| |||
Total Liabilities | 39,986 | |||
|
| |||
Net Assets | $ | 1,267,712 | ||
|
| |||
NET ASSETS: | ||||
Paid-in capital | $ | 1,268,568 | ||
Total distributable earnings (loss) | (856 | ) | ||
|
| |||
Total Net Assets | $ | 1,267,712 | ||
|
| |||
Outstanding units of beneficial interest (shares) | 126,858 | |||
Net Asset Value, offering and redemption price per share (a): | $ | 9.99 | ||
Cost of investments in non-affiliates | $ | 1,288,072 | ||
Cost of foreign currency | (1 | ) | ||
| (a) | Per share amounts may not recalculate due to rounding of net assets and/or shares outstanding. |
SEE NOTES TO FINANCIAL STATEMENTS.
| JUNE 30, 2019 | SIX CIRCLES TRUST | 57 | ||||||
Table of Contents
STATEMENTS OF ASSETS AND LIABILITIES
AS OF JUNE 30, 2019 (Unaudited)
(Amounts in thousands, except per share amounts)
| Six Circles U.S. Unconstrained Equity Fund | ||||
ASSETS: | ||||
Investments in non-affiliates, at value | $ | 10,158,920 | ||
Deposits at broker for futures contracts | 672 | |||
Prepaid expenses | 37 | |||
Receivables: | ||||
Investment securities sold | 7,771 | |||
Fund shares sold | 4,817 | |||
Interest and dividends from non-affiliates | 7,378 | |||
Tax reclaims | — | (a) | ||
Variation margin on futures contracts | 64 | |||
|
| |||
Total Assets | 10,179,659 | |||
|
| |||
LIABILITIES: | ||||
Payables: | ||||
Due to custodian | 2,132 | |||
Investment securities purchased | 9,066 | |||
Fund shares redeemed | 7,201 | |||
Accrued liabilities: | ||||
Investment advisory fees | 327 | |||
Administration fees | 62 | |||
Custodian and accounting fees | 170 | |||
Trustees’ fees | 9 | |||
Registration and filing fees | 336 | |||
Other | 141 | |||
|
| |||
Total Liabilities | 19,444 | |||
|
| |||
Net Assets | $ | 10,160,215 | ||
|
| |||
NET ASSETS: | ||||
Paid-in capital | $ | 9,755,499 | ||
Total distributable earnings (loss) | 404,716 | |||
|
| |||
Total Net Assets | $ | 10,160,215 | ||
|
| |||
Outstanding units of beneficial interest (shares) | 978,117 | |||
Net Asset Value, offering and redemption price per share (b): | $ | 10.39 | ||
Cost of investments in non-affiliates | $ | 9,836,219 | ||
| (a) | Amount rounds to less than $500. |
| (b) | Per share amounts may not recalculate due to rounding of net assets and/or shares outstanding. |
SEE NOTES TO FINANCIAL STATEMENTS.
| 58 | SIX CIRCLES TRUST | JUNE 30, 2019 | ||||
Table of Contents
| Six Circles International Unconstrained Equity Fund | ||||
ASSETS: | ||||
Investments in non-affiliates, at value | $ | 5,076,070 | ||
Foreign currency, at value | 140 | |||
Deposits at broker for futures contracts | 790 | |||
Prepaid expenses | 35 | |||
Receivables: | ||||
Fund shares sold | 2,059 | |||
Interest and dividends from non-affiliates | 7,314 | |||
Tax reclaims | 5,468 | |||
Variation margin on futures contracts | 58 | |||
|
| |||
Total Assets | 5,091,934 | |||
|
| |||
LIABILITIES: | ||||
Payables: | ||||
Due to custodian | 375 | |||
Investment securities purchased | 1,438 | |||
Fund shares redeemed | 3,245 | |||
Accrued liabilities: | ||||
Investment advisory fees | 173 | |||
Administration fees | 37 | |||
Custodian and accounting fees | 379 | |||
Trustees’ fees | 5 | |||
Registration and filing fees | 168 | |||
Offering costs | 6 | |||
Other | 93 | |||
|
| |||
Total Liabilities | 5,919 | |||
|
| |||
Net Assets | $ | 5,086,015 | ||
|
| |||
NET ASSETS: | ||||
Paid-in capital | $ | 4,900,705 | ||
Total distributable earnings (loss) | 185,310 | |||
|
| |||
Total Net Assets | $ | 5,086,015 | ||
|
| |||
Outstanding units of beneficial interest (shares) | 533,837 | |||
Net Asset Value, offering and redemption price per share (b): | $ | 9.53 | ||
Cost of investments in non-affiliates | $ | 4,946,142 | ||
Cost of foreign currency | $ | 140 | ||
| (b) | Per share amounts may not recalculate due to rounding of net assets and/or shares outstanding. |
SEE NOTES TO FINANCIAL STATEMENTS.
| JUNE 30, 2019 | SIX CIRCLES TRUST | 59 | ||||||
Table of Contents
STATEMENTS OF OPERATIONS
FOR THE SIX MONTHS ENDED JUNE 30, 2019 (Unaudited)
(Amounts in thousands)
| Six Circles Ultra Short Duration Fund | ||||
INVESTMENT INCOME: |
| |||
Interest income from non-affiliates | $ | 16,735 | ||
|
| |||
Total investment income | 16,735 | |||
|
| |||
EXPENSES: | ||||
Investment advisory fees | 1,365 | |||
Administration fees | 59 | |||
Custodian and accounting fees | 103 | |||
Professional fees | 73 | |||
Trustees’ fees | 47 | |||
Printing and mailing costs | 33 | |||
Registration and filing fees | 61 | |||
Transfer agency fees | 26 | |||
Recoupment of expense reimbursement | 256 | |||
Offering costs | 100 | |||
Interest expense | 499 | |||
Other | 7 | |||
|
| |||
Total expenses | 2,629 | |||
|
| |||
Less advisory fees waived | (840 | ) | ||
|
| |||
Net expenses | 1,789 | |||
|
| |||
Net investment income (loss) | 14,946 | |||
|
| |||
REALIZED/UNREALIZED GAINS (LOSSES): | ||||
Net realized gain (loss) on: | ||||
Investments in non-affiliates | 567 | |||
Futures contracts | (1,831 | ) | ||
Securities sold short | (144 | ) | ||
Foreign currency transactions | 42 | |||
Forward foreign currency exchange contracts | 108 | |||
Swaps | (810 | ) | ||
|
| |||
Net realized gain (loss) | (2,068 | ) | ||
|
| |||
Change in net unrealized appreciation (depreciation) of: | ||||
Investments in non-affiliates | 5,522 | |||
Futures contracts | 640 | |||
Foreign currency translations | (14 | ) | ||
Forward foreign currency exchange contracts | 11 | |||
Swaps | (878 | ) | ||
|
| |||
Change in net unrealized appreciation (depreciation) | 5,281 | |||
|
| |||
Net realized/unrealized gains (losses) | 3,213 | |||
|
| |||
Change in net assets resulting from operations | $ | 18,159 | ||
|
| |||
SEE NOTES TO FINANCIAL STATEMENTS.
| 60 | SIX CIRCLES TRUST | JUNE 30, 2019 | ||||
Table of Contents
| Six Circles Tax Aware Ultra Short Duration Fund | ||||
INVESTMENT INCOME: |
| |||
Interest income from non-affiliates | $ | 13,461 | ||
|
| |||
Total investment income | 13,461 | |||
|
| |||
EXPENSES: | ||||
Investment advisory fees | 1,475 | |||
Administration fees | 57 | |||
Custodian and accounting fees | 89 | |||
Professional fees | 69 | |||
Trustees’ fees | 50 | |||
Printing and mailing costs | 35 | |||
Registration and filing fees | 76 | |||
Transfer agency fees | 26 | |||
Recoupment of expense reimbursement | 261 | |||
Offering costs | 100 | |||
Interest expense | 403 | |||
Other | 7 | |||
|
| |||
Total expenses | 2,648 | |||
|
| |||
Less advisory fees waived | (961 | ) | ||
|
| |||
Net expenses | 1,687 | |||
|
| |||
Net investment income (loss) | 11,774 | |||
|
| |||
REALIZED/UNREALIZED GAINS (LOSSES): | ||||
Net realized gain (loss) on: | ||||
Investments in non-affiliates | 595 | |||
Futures contracts | (2,013 | ) | ||
Foreign currency transactions | 47 | |||
Forward foreign currency exchange contracts | 6 | |||
Swaps | (1,093 | ) | ||
|
| |||
Net realized gain (loss) | (2,458 | ) | ||
|
| |||
Change in net unrealized appreciation (depreciation) of: | ||||
Investments in non-affiliates | 4,517 | |||
Futures contracts | 601 | |||
Foreign currency translations | (16 | ) | ||
Forward foreign currency exchange contracts | 36 | |||
Swaps | (704 | ) | ||
|
| |||
Change in net unrealized appreciation (depreciation) | 4,434 | |||
|
| |||
Net realized/unrealized gains (losses) | 1,976 | |||
|
| |||
Change in net assets resulting from operations | $ | 13,750 | ||
|
| |||
SEE NOTES TO FINANCIAL STATEMENTS.
| JUNE 30, 2019 | SIX CIRCLES TRUST | 61 | ||||||
Table of Contents
STATEMENTS OF OPERATIONS
FOR THE SIX MONTHS ENDED JUNE 30, 2019 (Unaudited)
(Amounts in thousands)
| Six Circles U.S. Unconstrained Equity Fund | ||||
INVESTMENT INCOME: |
| |||
Interest income from non-affiliates | $ | 466 | ||
Dividend income from non-affiliates | 80,514 | |||
|
| |||
Total investment income | 80,980 | |||
|
| |||
EXPENSES: | ||||
Investment advisory fees | 9,431 | |||
Administration fees | 209 | |||
Custodian and accounting fees | 345 | |||
Professional fees | 238 | |||
Trustees’ fees | 182 | |||
Printing and mailing costs | 175 | |||
Registration and filing fees | 264 | |||
Transfer agency fees | 26 | |||
Offering costs | 96 | |||
Interest expense | 4 | |||
Other | 31 | |||
|
| |||
Total expenses | 11,001 | |||
|
| |||
Less advisory fees waived | (8,082 | ) | ||
|
| |||
Net expenses | 2,919 | |||
|
| |||
Net investment income (loss) | 78,061 | |||
|
| |||
REALIZED/UNREALIZED GAINS (LOSSES): | ||||
Net realized gain (loss) on: | ||||
Investments in non-affiliates | 40,567 | |||
Futures contracts | 305 | |||
|
| |||
Net realized gain (loss) | 40,872 | |||
|
| |||
Change in net unrealized appreciation (depreciation) of: | ||||
Investments in non-affiliates | 707,075 | |||
Futures contracts | 148 | |||
|
| |||
Change in net unrealized appreciation (depreciation) | 707,223 | |||
|
| |||
Net realized/unrealized gains (losses) | 748,095 | |||
|
| |||
Change in net assets resulting from operations | $ | 826,156 | ||
|
| |||
SEE NOTES TO FINANCIAL STATEMENTS.
| 62 | SIX CIRCLES TRUST | JUNE 30, 2019 | ||||
Table of Contents
| Six Circles International Unconstrained Equity Fund | ||||
INVESTMENT INCOME: |
| |||
Interest income from non-affiliates | $ | 193 | ||
Dividend income from non-affiliates | 107,060 | |||
Foreign taxes withheld | (10,708 | ) | ||
|
| |||
Total investment income | 96,545 | |||
|
| |||
EXPENSES: | ||||
Investment advisory fees | 4,677 | |||
Administration fees | 122 | |||
Custodian and accounting fees | 840 | |||
Professional fees | 141 | |||
Trustees’ fees | 91 | |||
Printing and mailing costs | 86 | |||
Registration and filing fees | 137 | |||
Transfer agency fees | 26 | |||
Offering costs | 95 | |||
Interest expense | 9 | |||
Other | 17 | |||
|
| |||
Total expenses | 6,241 | |||
|
| |||
Less advisory fees waived | (3,851 | ) | ||
|
| |||
Net expenses | 2,390 | |||
|
| |||
Net investment income (loss) | 94,155 | |||
|
| |||
REALIZED/UNREALIZED GAINS (LOSSES): | ||||
Net realized gain (loss) on: | ||||
Investments in non-affiliates | 3,531 | |||
Futures contracts | 2,063 | |||
Foreign currency transactions | (474 | ) | ||
Forward foreign currency exchange contracts | (329 | ) | ||
|
| |||
Net realized gain (loss) | 4,791 | |||
|
| |||
Change in net unrealized appreciation (depreciation) of: | ||||
Investments in non-affiliates | 302,478 | |||
Futures contracts | 79 | |||
Foreign currency translations | 101 | |||
|
| |||
Change in net unrealized appreciation (depreciation) | 302,658 | |||
|
| |||
Net realized/unrealized gains (losses) | 307,449 | |||
|
| |||
Change in net assets resulting from operations | $ | 401,604 | ||
|
| |||
SEE NOTES TO FINANCIAL STATEMENTS.
| JUNE 30, 2019 | SIX CIRCLES TRUST | 63 | ||||||
Table of Contents
STATEMENTS OF CHANGES IN NET ASSETS
FOR THE PERIODS INDICATED (Unaudited)
(Amounts in thousands)
| Six Circles Ultra Short Duration Fund | ||||||||
| Six Months Ended June 30, 2019 (Unaudited) | Period Ended December 31, 2018* | |||||||
CHANGE IN NET ASSETS RESULTING FROM OPERATIONS: | ||||||||
Net investment income (loss) | $ | 14,946 | $ | 4,983 | ||||
Net realized gain (loss) | (2,068 | ) | (1,172 | ) | ||||
Change in net unrealized appreciation (depreciation) | 5,281 | (2,504 | ) | |||||
|
|
|
| |||||
Change in net assets resulting from operations | 18,159 | 1,307 | ||||||
|
|
|
| |||||
DISTRIBUTIONS TO SHAREHOLDERS: | ||||||||
Distributions to shareholders | (15,167 | ) | (5,035 | ) | ||||
CAPITAL TRANSACTIONS: | ||||||||
Change in net assets resulting from capital transactions | 33,811 | 1,086,578 | ||||||
|
|
|
| |||||
NET ASSETS: | ||||||||
Change in net assets | 36,803 | 1,082,850 | ||||||
Beginning of period | 1,082,850 | — | ||||||
|
|
|
| |||||
End of period | $ | 1,119,653 | $ | 1,082,850 | ||||
|
|
|
| |||||
CAPITAL TRANSACTIONS: | ||||||||
Proceeds from shares issued | $ | 101,365 | $ | 1,156,695 | ||||
Distributions reinvested | 15,167 | 5,035 | ||||||
Cost of shares redeemed | (82,721 | ) | (75,152 | ) | ||||
|
|
|
| |||||
Total change in net assets resulting from capital transactions | $ | 33,811 | $ | 1,086,578 | ||||
|
|
|
| |||||
SHARE TRANSACTIONS: | ||||||||
Issued | 10,130 | 115,561 | ||||||
Reinvested | 1,517 | 504 | ||||||
Redeemed | (8,268 | ) | (7,513 | ) | ||||
|
|
|
| |||||
Change in Shares | 3,379 | 108,552 | ||||||
|
|
|
| |||||
| * | Six Circles Ultra Short Duration Fund was launched on July 9, 2018. |
SEE NOTES TO FINANCIAL STATEMENTS.
| 64 | SIX CIRCLES TRUST | JUNE 30, 2019 | ||||
Table of Contents
| Six Circles Tax Aware Ultra Short Duration Fund | ||||||||
| Six Months Ended June 30, 2019 (Unaudited) | Period Ended December 31, 2018* | |||||||
CHANGE IN NET ASSETS RESULTING FROM OPERATIONS: | ||||||||
Net investment income (loss) | $ | 11,774 | $ | 3,686 | ||||
Net realized gain (loss) | (2,458 | ) | (1,154 | ) | ||||
Change in net unrealized appreciation (depreciation) | 4,434 | (1,163 | ) | |||||
|
|
|
| |||||
Change in net assets resulting from operations | 13,750 | 1,369 | ||||||
|
|
|
| |||||
DISTRIBUTIONS TO SHAREHOLDERS: | ||||||||
Distributions to shareholders | (12,165 | ) | (3,810 | ) | ||||
CAPITAL TRANSACTIONS: | ||||||||
Change in net assets resulting from capital transactions | 168,123 | 1,100,445 | ||||||
|
|
|
| |||||
NET ASSETS: | ||||||||
Change in net assets | 169,708 | 1,098,004 | ||||||
Beginning of period | 1,098,004 | — | ||||||
|
|
|
| |||||
End of period | $ | 1,267,712 | $ | 1,098,004 | ||||
|
|
|
| |||||
CAPITAL TRANSACTIONS: | ||||||||
Proceeds from shares issued | $ | 240,580 | $ | 1,164,544 | ||||
Distributions reinvested | 12,165 | 3,810 | ||||||
Cost of shares redeemed | (84,622 | ) | (67,909 | ) | ||||
|
|
|
| |||||
Total change in net assets resulting from capital transactions | $ | 168,123 | $ | 1,100,445 | ||||
|
|
|
| |||||
SHARE TRANSACTIONS: | ||||||||
Issued | 24,062 | 116,455 | ||||||
Reinvested | 1,217 | 381 | ||||||
Redeemed | (8,464 | ) | (6,793 | ) | ||||
|
|
|
| |||||
Change in Shares | 16,815 | 110,043 | ||||||
|
|
|
| |||||
| * | Six Circles Tax Aware Ultra Short Duration Fund was launched on July 9, 2018. |
SEE NOTES TO FINANCIAL STATEMENTS.
| JUNE 30, 2019 | SIX CIRCLES TRUST | 65 | ||||||
Table of Contents
STATEMENTS OF CHANGES IN NET ASSETS
FOR THE PERIODS INDICATED (Unaudited)
(Amounts in thousands)
| Six Circles U.S. Unconstrained Equity Fund | ||||||||
Six Months Ended June 30, 2019 | Period Ended December 31, 2018* | |||||||
CHANGE IN NET ASSETS RESULTING FROM OPERATIONS: | ||||||||
Net investment income (loss) | $ | 78,061 | $ | 19,261 | ||||
Net realized gain (loss) | 40,872 | (36,513 | ) | |||||
Change in net unrealized appreciation (depreciation) | 707,223 | (384,343 | ) | |||||
|
|
|
| |||||
Change in net assets resulting from operations | 826,156 | (401,595 | ) | |||||
|
|
|
| |||||
DISTRIBUTIONS TO SHAREHOLDERS: | ||||||||
Distributions to shareholders | — | (19,845 | ) | |||||
CAPITAL TRANSACTIONS: | ||||||||
Change in net assets resulting from capital transactions | 4,354,601 | 5,400,898 | ||||||
|
|
|
| |||||
NET ASSETS: | ||||||||
Change in net assets | 5,180,757 | 4,979,458 | ||||||
Beginning of period | 4,979,458 | — | ||||||
|
|
|
| |||||
End of period | $ | 10,160,215 | $ | 4,979,458 | ||||
|
|
|
| |||||
CAPITAL TRANSACTIONS: | ||||||||
Proceeds from shares issued | $ | 4,777,855 | $ | 5,520,423 | ||||
Distributions reinvested | — | 19,845 | ||||||
Cost of shares redeemed | (423,254 | ) | (139,370 | ) | ||||
|
|
|
| |||||
Total change in net assets resulting from capital transactions | $ | 4,354,601 | $ | 5,400,898 | ||||
|
|
|
| |||||
SHARE TRANSACTIONS: | ||||||||
Issued | 469,998 | 562,971 | ||||||
Reinvested | — | 2,208 | ||||||
Redeemed | (42,191 | ) | (14,869 | ) | ||||
|
|
|
| |||||
Change in Shares | 427,807 | 550,310 | ||||||
|
|
|
| |||||
| * | Six Circles U.S. Unconstrained Equity Fund was launched on July 9, 2018. |
SEE NOTES TO FINANCIAL STATEMENTS.
| 66 | SIX CIRCLES TRUST | JUNE 30, 2019 | ||||
Table of Contents
| Six Circles International Unconstrained Equity Fund | ||||||||
Six Months Ended June 30, 2019 (Unaudited) | Period Ended December 31, 2018* | |||||||
CHANGE IN NET ASSETS RESULTING FROM OPERATIONS: | ||||||||
Net investment income (loss) | $ | 94,155 | $ | 7,543 | ||||
Net realized gain (loss) | 4,791 | (46,435 | ) | |||||
Change in net unrealized appreciation (depreciation) | 302,658 | (172,436 | ) | |||||
|
|
|
| |||||
Change in net assets resulting from operations | 401,604 | (211,328 | ) | |||||
|
|
|
| |||||
DISTRIBUTIONS TO SHAREHOLDERS: | ||||||||
Distributions to shareholders | — | (4,966 | ) | |||||
CAPITAL TRANSACTIONS: | ||||||||
Change in net assets resulting from capital transactions | 2,179,903 | 2,720,802 | ||||||
|
|
|
| |||||
NET ASSETS: | ||||||||
Change in net assets | 2,581,507 | 2,504,508 | ||||||
Beginning of period | 2,504,508 | — | ||||||
|
|
|
| |||||
End of period | $ | 5,086,015 | $ | 2,504,508 | ||||
|
|
|
| |||||
CAPITAL TRANSACTIONS: | ||||||||
Proceeds from shares issued | $ | 2,399,903 | $ | 2,786,528 | ||||
Distributions reinvested | — | 4,966 | ||||||
Cost of shares redeemed | (220,000 | ) | (70,692 | ) | ||||
|
|
|
| |||||
Total change in net assets resulting from capital transactions | $ | 2,179,903 | $ | 2,720,802 | ||||
|
|
|
| |||||
SHARE TRANSACTIONS: | ||||||||
Issued | 255,903 | 309,559 | ||||||
Reinvested | — | 602 | ||||||
Redeemed | (23,960 | ) | (8,267 | ) | ||||
|
|
|
| |||||
Change in Shares | 231,943 | 301,894 | ||||||
|
|
|
| |||||
| * | Six Circles International Unconstrained Equity Fund was launched on July 9, 2018. |
SEE NOTES TO FINANCIAL STATEMENTS.
| JUNE 30, 2019 | SIX CIRCLES TRUST | 67 | ||||||
Table of Contents
FOR THE PERIODS INDICATED (Unaudited)
| Per share operating performance | ||||||||||||||||||||||||||||
| Investment operations | Distributions | |||||||||||||||||||||||||||
| Net asset value, beginning of period | Net investment income (loss) (b) | Net realized and unrealized gains (losses) on investments and foreign currency transactions | Total from investment operations | Net investment income | Net realized gain | Total distributions | ||||||||||||||||||||||
Six Circles Ultra Short Duration Fund | ||||||||||||||||||||||||||||
Six Months Ended June 30, 2019 (Unaudited) | $ | 9.98 | $ | 0.14 | $ | 0.02 | $ | 0.16 | $ | (0.14 | ) | $ | — | $ | (0.14 | ) | ||||||||||||
Period Ended December 31, 2018* | 10.00 | 0.11 | (0.04 | ) | 0.07 | (0.09 | ) | — | (0.09 | ) | ||||||||||||||||||
| * | Six Circles Ultra Short Duration Fund was launched on July 9, 2018. |
| (a) | Certain expenses incurred by the Fund were not annualized for the period. |
| (b) | Calculated based upon average shares outstanding. |
| (c) | Not annualized for periods less than one year. |
| (d) | Includes adjustments in accordance with accounting principles generally accepted in the United States of America and as such, the net asset values for financial reporting purposes and the returns based upon those net asset values may differ from the net asset values and returns for shareholder transactions. |
| (e) | Includes interest expense, which is less than 0.005% for the period ended December 31, 2018. |
SEE NOTES TO FINANCIAL STATEMENTS.
| 68 | SIX CIRCLES TRUST | JUNE 30, 2019 | ||||
Table of Contents
| Ratios/Supplemental data | |||||||||||||||||||||||||||||
| Ratios to average net assets(a) | ||||||||||||||||||||||||||||||
| Net asset value, end of period | Total return (c)(d) | Net assets, end of period (000’s) | Net expenses, with interest expense | Net expenses, without interest expense | Net investment income (loss) | Expenses without waivers and reimbursements | Portfolio turnover rate (c) | |||||||||||||||||||||||
| $ | 10.00 | 1.59 | % | $ | 1,119,653 | 0.32 | % | 0.23 | % | 2.75 | % | 0.47 | % | 24.35 | % | |||||||||||||||
| 9.98 | 0.74 | 1,082,850 | 0.23 | (e) | 0.23 | 2.46 | 0.63 | 24.56 | ||||||||||||||||||||||
SEE NOTES TO FINANCIAL STATEMENTS.
| JUNE 30, 2019 | SIX CIRCLES TRUST | 69 | ||||||
Table of Contents
FINANCIAL HIGHLIGHTS
FOR THE PERIODS INDICATED (Unaudited)
| Per share operating performance | ||||||||||||||||||||||||||||
| Investment operations | Distributions | |||||||||||||||||||||||||||
| Net asset value, beginning of period | Net investment income (loss) (b) | Net realized and unrealized gains (losses) on investments and foreign currency transactions | Total from investment operations | Net investment income | Net realized gain | Total distributions | ||||||||||||||||||||||
Six Circles Tax Aware Ultra Short Duration Fund |
| |||||||||||||||||||||||||||
Six Months Ended June 30, 2019 (Unaudited) | $ | 9.98 | $ | 0.10 | $ | 0.01 | $ | 0.11 | $ | (0.10 | ) | $ | — | $ | (0.10 | ) | ||||||||||||
Period Ended December 31, 2018* | 10.00 | 0.08 | (0.03 | ) | 0.05 | (0.07 | ) | — | (0.07 | ) | ||||||||||||||||||
| * | Six Circles Tax Aware Ultra Short Duration Fund was launched on July 9, 2018. |
| (a) | Certain expenses incurred by the Fund were not annualized for the period. |
| (b) | Calculated based upon average shares outstanding. |
| (c) | Not annualized for periods less than one year. |
| (d) | Includes adjustments in accordance with accounting principles generally accepted in the United States of America and as such, the net asset values for financial reporting purposes and the returns based upon those net asset values may differ from the net asset values and returns for shareholder transactions. |
| (e) | Includes interest expense, which is less than 0.005% for the period ended December 31, 2018. |
SEE NOTES TO FINANCIAL STATEMENTS.
| 70 | SIX CIRCLES TRUST | JUNE 30, 2019 | ||||
Table of Contents
| Ratios/Supplemental data | |||||||||||||||||||||||||||||
| Ratios to average net assets(a) | ||||||||||||||||||||||||||||||
| Net asset value, end of period | Total return (c)(d) | Net assets, end of period (000’s) | Net expenses, with interest expense | Net expenses, without interest expense | Net investment income (loss) | Expenses without waivers and reimbursements | Portfolio turnover rate (c) | |||||||||||||||||||||||
| $ | 9.99 | 1.11 | % | $ | 1,267,712 | 0.28 | % | 0.21 | % | 2.00 | % | 0.44 | % | 26.13 | % | |||||||||||||||
| 9.98 | 0.48 | 1,098,004 | 0.22 | (e) | 0.22 | 1.90 | 0.64 | 33.02 | ||||||||||||||||||||||
SEE NOTES TO FINANCIAL STATEMENTS.
| JUNE 30, 2019 | SIX CIRCLES TRUST | 71 | ||||||
Table of Contents
FINANCIAL HIGHLIGHTS
FOR THE PERIODS INDICATED (Unaudited)
| Per share operating performance | ||||||||||||||||||||||||||||
| Investment operations | Distributions | |||||||||||||||||||||||||||
| Net asset value, beginning of period | Net investment income (loss) (b) | Net realized and unrealized gains (losses) on investments and foreign currency transactions | Total from investment operations | Net investment income | Net realized gain | Total distributions | ||||||||||||||||||||||
Six Circles U.S. Unconstrained Equity Fund |
| |||||||||||||||||||||||||||
Six Months Ended June 30, 2019 (Unaudited) | $ | 9.05 | $ | 0.10 | $ | 1.24 | $ | 1.34 | $ | — | $ | — | $ | — | ||||||||||||||
Period Ended December 31, 2018* | 10.00 | 0.10 | (1.01 | ) | (0.91 | ) | (0.04 | ) | — | (f) | (0.04 | ) | ||||||||||||||||
| * | Six Circles U.S. Unconstrained Equity Fund was launched on July 9, 2018. |
| (a) | Certain expenses incurred by the Fund were not annualized for the period. |
| (b) | Calculated based upon average shares outstanding. |
| (c) | Not annualized for periods less than one year. |
| (d) | Includes adjustments in accordance with accounting principles generally accepted in the United States of America and as such, the net asset values for financial reporting purposes and the returns based upon those net asset values may differ from the net asset values and returns for shareholder transactions. |
| (e) | Includes interest expense, if applicable, which is less than 0.005% unless otherwise noted. |
| (f) | Amount rounds to less than $0.005. |
SEE NOTES TO FINANCIAL STATEMENTS.
| 72 | SIX CIRCLES TRUST | JUNE 30, 2019 | ||||
Table of Contents
| Ratios/Supplemental data | |||||||||||||||||||||||||
| Ratios to average net assets(a) | ||||||||||||||||||||||||||
| Net asset value, end of period | Total return (c)(d) | Net assets, end of period (000’s) | Net expenses (e) | Net investment income (loss) | Expenses without waivers and reimbursements | Portfolio turnover rate (c) | ||||||||||||||||||||
| $ | 10.39 | 14.81 | % | $ | 10,160,215 | 0.08 | % | 2.07 | % | 0.29 | % | 29.09 | % | |||||||||||||
| 9.05 | (9.13 | ) | 4,979,458 | 0.14 | 2.27 | 0.42 | 15.24 | |||||||||||||||||||
SEE NOTES TO FINANCIAL STATEMENTS.
| JUNE 30, 2019 | SIX CIRCLES TRUST | 73 | ||||||
Table of Contents
FINANCIAL HIGHLIGHTS
FOR THE PERIODS INDICATED (Unaudited)
| Per share operating performance | ||||||||||||||||||||||||||||
| Investment operations | Distributions | |||||||||||||||||||||||||||
| Net asset value, beginning of period | Net investment income (loss) (b) | Net realized and unrealized gains (losses) on investments and foreign currency transactions | Total from investment operations | Net investment income | Net realized gain | Total distributions | ||||||||||||||||||||||
Six Circles International Unconstrained Equity Fund |
| |||||||||||||||||||||||||||
Six Months Ended June 30, 2019 (Unaudited) | $ | 8.30 | $ | 0.23 | $ | 1.00 | $ | 1.23 | $ | — | $ | — | $ | — | ||||||||||||||
Period Ended December 31, 2018* | 10.00 | 0.07 | (1.75 | ) | (1.68 | ) | (0.02 | ) | — | (0.02 | ) | |||||||||||||||||
| * | Six Circles International Unconstrained Equity Fund was launched on July 9, 2018. |
| (a) | Certain expenses incurred by the Fund were not annualized for the period. |
| (b) | Calculated based upon average shares outstanding. |
| (c) | Not annualized for periods less than one year. |
| (d) | Includes adjustments in accordance with accounting principles generally accepted in the United States of America and as such, the net asset values for financial reporting purposes and the returns based upon those net asset values may differ from the net asset values and returns for shareholder transactions. |
| (e) | Includes interest expense, if applicable, which is less than 0.005% unless otherwise noted. |
| (f) | Includes interest expense, which was 0.006% for the period ended December 31, 2018. |
SEE NOTES TO FINANCIAL STATEMENTS.
| 74 | SIX CIRCLES TRUST | JUNE 30, 2019 | ||||
Table of Contents
| Ratios/Supplemental data | |||||||||||||||||||||||||
| Ratios to average net assets(a) | ||||||||||||||||||||||||||
| Net asset value, end of period | Total return (c)(d) | Net assets, end of period (000’s) | Net expenses (e) | Net investment income (loss) | Expenses without waivers and reimbursements | Portfolio turnover rate (c) | ||||||||||||||||||||
| $ | 9.53 | 14.82 | % | $ | 5,086,015 | 0.13 | % | 5.04 | % | 0.33 | % | 80.79 | % | |||||||||||||
| 8.30 | (16.83 | ) | 2,504,508 | 0.21 | (f) | 1.84 | 0.55 | 76.24 | ||||||||||||||||||
SEE NOTES TO FINANCIAL STATEMENTS.
| JUNE 30, 2019 | SIX CIRCLES TRUST | 75 | ||||||
Table of Contents
AS OF JUNE 30, 2019 (Unaudited)
1. Organization
Six Circles Trust (the “Trust”) was formed on November 8, 2017, as a Delaware statutory trust, pursuant to a Declaration of Trust dated November 8, 2017, as amended and restated June 12, 2018, and further amended September 21, 2018 and is registered under the Investment Company Act of 1940, as amended (the “1940 Act”), as anopen-end management investment company.
Six Circles Ultra Short Duration Fund, Six Circles Tax Aware Ultra Short Duration Fund, Six Circles U.S. Unconstrained Equity Fund and Six Circles International Unconstrained Equity Fund are four separate series of the Trust (each, a “Fund” and collectively, the “Funds”) covered by this report. The Funds are classified as“non-diversified” funds. Each Fund currently offers one class of shares. The Funds commenced operations on July 9, 2018.
The investment objective of each of the Six Circles Ultra Short Duration Fund and the Six Circles Tax Aware Ultra Short Duration Fund is to generate current income consistent with capital preservation.
The investment objective of each of the Six Circles U.S. Unconstrained Equity Fund and the Six Circles International Unconstrained Equity Fund is to provide capital appreciation.
J.P. Morgan Private Investments Inc. (“JPMPI”), an indirect, wholly-owned subsidiary of JPMorgan Chase & Co. (“JPMorgan”), acts as the Funds’ investment adviser (the “Adviser”). The Adviser has engaged certainSub-Advisers to manage the assets of the Funds.
2. Significant Accounting Policies
The following is a summary of significant accounting policies followed by the Funds in the preparation of their financial statements. The Funds are investment companies and, accordingly, follow the investment company accounting and reporting guidance of the Financial Accounting Standards Board (“FASB”) Accounting Standards Codification Topic 946 — Investment Companies, which is part of U.S. generally accepted accounting principles (“GAAP”). The preparation of financial statements in conformity with GAAP requires management to make estimates and assumptions that affect the reported amounts of assets and liabilities and disclosure of contingent assets and liabilities at the date of the financial statements and the reported amounts of increases and decreases in net assets from operations during the reporting period. Actual results could differ from those estimates.
A. Valuation of Investments — The valuation of investments is in accordance with GAAP and the Funds’ valuation policies set forth by and under the supervision and responsibility of the Board of Trustees (the “Board”), which established the following approach to valuation, as described more fully below: (i) investments for which market quotations are readily available shall be valued at unadjusted quoted prices and (ii) all other investments for which market quotations are not readily available shall be valued at their fair value as determined in good faith by the Board.
The Board has appointed the Six Circles Funds Valuation Committee (“VC”), comprised of officers of the Funds and other personnel of the Adviser, to assist the Board with the oversight and monitoring of the valuation of the Funds’ investments. The VC oversees and carries out policies and procedures for the valuation of investments held by the Funds. This includes monitoring the appropriateness of fair values based on results of ongoing valuation oversight including, but not limited to, consideration of macro or security specific events, market events and pricing vendor due diligence. The VC, through the Adviser, is responsible for assessing the potential impacts to the fair values on an ongoing basis, and discussing this on at least a quarterly basis with the Board.
A market-based approach is primarily used to value the Funds’ investments for which market quotations are readily available and which are generally valued at their current market value. Other securities and assets, including securities for which market quotations are not readily available, market quotations are determined not to be reliable, or whose value has been materially affected by events occurring after the close of trading on the exchange or market on which the security is principally traded but before a Fund’s net asset value (“NAV”) is calculated, are valued by approved pricing vendors or third party broker-dealers (collectively referred to as “Pricing Services”) or may be internally fair valued using methods set forth by the valuation policies approved by the Board. The valuation may include related or comparable assets or liabilities, recent transactions, market multiples, book values and other relevant information for the investment in order to determine the fair value of the investment. An income-based valuation approach may be used in which the anticipated future cash flows of the investment are discounted to calculate the fair value. Discounts may be applied due to the nature or duration of any restrictions on the disposition of the investments. Valuations may be based on current market prices of securities that are comparable in coupon, rating, maturity and industry. It is possible that the estimated values may differ significantly from the values that would have been used, had a ready market for the investments existed, and such differences could be material.
Equity securities listed on a North American, Central American, South American or Caribbean (“Americas”) securities exchange are generally valued at the last sale price or official market closing price on the primary exchange on which the security is principally traded that is reported before the time when the net assets values of the Funds are calculated on a valuation date. The Funds calculate their NAV as of 4 p.m. Eastern time each day the New York Stock Exchange (NYSE) is open for trading.
Foreign equity securities are valued as of the close of trading on the stock exchange on which the security is primarily traded, or as of 4 p.m. Eastern time. The value is then converted into its U.S. dollar equivalent at the foreign exchange rate in effect at 4 p.m. Eastern time on the day that the value of the security is determined. Generally foreign equity securities, as well as certain derivatives with equity reference obligations, are valued by applying international fair value factors provided by approved Pricing Services.
The factors seek to adjust the local closing price for movements of local markets post-closing, but prior to the time the NAVs are calculated. The fair valued securities are converted at the exchange rates available at 4 p.m. Eastern time.
| 76 | SIX CIRCLES TRUST | JUNE 30, 2019 | ||||
Table of Contents
Fixed income securities are valued based on prices received from Pricing Services. In instances where sufficient market activity exists, the Pricing Services may utilize a market-based approach through which trades or quotes from market makers are used to determine the valuation of these instruments. In instances where sufficient market activity may not exist, Pricing Services may consider a variety of inputs and factors, including, but not limited to proprietary models that may take into account market transactions in securities with comparable characteristics, yield curves, option-adjusted spreads, credit spreads, estimated default rates, coupon rates, underlying collateral and estimated cash flows.
Shares of exchange-traded funds (“ETFs”) are generally valued at the last sale price on the exchange on which the ETF is principally traded. Shares ofopen-end investment companies are valued at their respective NAVs.
Futures are generally valued on the basis of available market quotations. Swaps and forward foreign currency exchange contracts are valued utilizing market quotations from approved Pricing Services.
Valuations reflected in this report are as of the report date. As a result, changes in valuation due to market events and/or issuer related events after the report date and prior to issuance of the report are not reflected herein.
The various inputs that are used in determining the valuation of the Funds’ investments are summarized into the three broad levels listed below.
| • | Level 1 —Unadjusted inputs using quoted prices in active markets for identical investments. |
| • | Level 2 —Other significant observable inputs including, but not limited to, quoted prices for similar investments, inputs other than quoted prices that are observable for investments (such as interest rates, prepayment speeds, credit risk, etc.) or other market corroborated inputs. |
| • | Level 3 —Significant inputs based on the best information available in the circumstances, to the extent observable inputs are not available (including the Funds’ assumptions in determining the fair value of investments). |
A financial instrument’s level within the fair value hierarchy is based on the lowest level of any input, both individually and in the aggregate, that is significant to the fair value measurement. The inputs or methodology used for valuing instruments are not necessarily an indication of the risk associated with investing in those instruments.
The following tables represent each valuation input as presented on the Schedules of Portfolio Investments (“SOIs”) (amounts in thousands):
Six Circles Ultra Short Duration Fund
| Level 1 Quoted prices | Level 2 Other significant observable inputs | Level 3 Significant | Total | |||||||||||||
Investments in Securities | ||||||||||||||||
Debt Securities | ||||||||||||||||
Asset-Backed Securities | $ | — | $ | 117,078 | $ | — | $ | 117,078 | ||||||||
Certificates of Deposit | ||||||||||||||||
Financial | — | 6,015 | — | 6,015 | ||||||||||||
Collateralized Mortgage Obligations | — | 13,202 | — | 13,202 | ||||||||||||
Commercial Mortgage-Backed Securities | — | 42,915 | — | 42,915 | ||||||||||||
Corporate Bonds | ||||||||||||||||
Basic Materials | — | 10,670 | — | 10,670 | ||||||||||||
Communications | — | 24,262 | — | 24,262 | ||||||||||||
Consumer Cyclical | — | 62,977 | — | 62,977 | ||||||||||||
Consumer Non-cyclical | — | 86,884 | — | 86,884 | ||||||||||||
Diversified | — | 1,696 | — | 1,696 | ||||||||||||
Energy | — | 28,731 | — | 28,731 | ||||||||||||
Financial | — | 186,633 | — | 186,633 | ||||||||||||
Industrial | — | 42,028 | — | 42,028 | ||||||||||||
Technology | — | 31,082 | — | 31,082 | ||||||||||||
Utilities | — | 18,657 | — | 18,657 | ||||||||||||
|
|
|
|
|
|
|
| |||||||||
Total Corporate Bonds | — | 493,620 | — | 493,620 | ||||||||||||
|
|
|
|
|
|
|
| |||||||||
Foreign Government Securities | — | 22,932 | — | 22,932 | ||||||||||||
Mortgage-Backed Securities | — | 30,436 | — | 30,436 | ||||||||||||
U.S. Government Agency Security | — | 4,004 | — | 4,004 | ||||||||||||
U.S. Treasury Obligations | — | 79,055 | — | 79,055 | ||||||||||||
| JUNE 30, 2019 | SIX CIRCLES TRUST | 77 | ||||||
Table of Contents
NOTES TO FINANCIAL STATEMENTS
AS OF JUNE 30, 2019 (Unaudited) (continued)
Six Circles Ultra Short Duration Fund (Continued)
| Level 1 Quoted prices | Level 2 Other significant observable inputs | Level 3 Significant | Total | |||||||||||||
Short-Term Investments | ||||||||||||||||
Certificates of Deposit | $ | — | $ | 37,765 | $ | — | $ | 37,765 | ||||||||
Commercial Papers | — | 93,823 | — | 93,823 | ||||||||||||
Corporate Notes | — | 6,019 | — | 6,019 | ||||||||||||
Repurchase Agreements | — | 192,000 | — | 192,000 | ||||||||||||
Time Deposits | — | 10,479 | — | 10,479 | ||||||||||||
|
|
|
|
|
|
|
| |||||||||
Total Short-Term Investments | — | 340,086 | — | 340,086 | ||||||||||||
|
|
|
|
|
|
|
| |||||||||
Total Investments in Securities | $ | — | $ | 1,149,343 | $ | — | $ | 1,149,343 | ||||||||
|
|
|
|
|
|
|
| |||||||||
Appreciation in Other Financial Instruments | ||||||||||||||||
Future contracts | $ | 869 | $ | — | $ | — | $ | 869 | ||||||||
Centrally Cleared Interest Rate Swap contracts | — | 1,545 | — | 1,545 | ||||||||||||
Forward Foreign Currency Exchange contracts | — | 81 | — | 81 | ||||||||||||
|
|
|
|
|
|
|
| |||||||||
Total Appreciation in Other Financial Instruments | $ | 869 | $ | 1,626 | $ | — | $ | 2,495 | ||||||||
|
|
|
|
|
|
|
| |||||||||
Depreciation in Other Financial Instruments | ||||||||||||||||
Future contracts | $ | (474 | ) | $ | — | $ | — | $ | (474 | ) | ||||||
Centrally Cleared Interest Rate Swap contracts | — | (3,108 | ) | — | (3,108 | ) | ||||||||||
Forward Foreign Currency Exchange contracts | — | (42 | ) | — | (42 | ) | ||||||||||
|
|
|
|
|
|
|
| |||||||||
Total Depreciation in Other Financial Instruments | $ | (474 | ) | $ | (3,150 | ) | $ | — | $ | (3,624 | ) | |||||
|
|
|
|
|
|
|
| |||||||||
Six Circles Tax Aware Ultra Short Duration Fund
| Level 1 Quoted prices | Level 2 Other significant observable inputs | Level 3 Significant unobservable inputs | Total | |||||||||||||
Investments in Securities | ||||||||||||||||
Debt Securities | ||||||||||||||||
Asset-Backed Securities | $ | — | $ | 40,649 | $ | — | $ | 40,649 | ||||||||
Collateralized Mortgage Obligations | — | 13,697 | — | 13,697 | ||||||||||||
Commercial Mortgage-Backed Securities | — | 12,292 | — | 12,292 | ||||||||||||
Corporate Bonds | ||||||||||||||||
Basic Materials | — | 411 | — | 411 | ||||||||||||
Communications | — | 14,955 | — | 14,955 | ||||||||||||
Consumer Cyclical | — | 35,306 | — | 35,306 | ||||||||||||
Consumer Non-cyclical | — | 36,175 | — | 36,175 | ||||||||||||
Diversified | — | 1,696 | — | 1,696 | ||||||||||||
Energy | — | 9,136 | — | 9,136 | ||||||||||||
Financial | — | 81,028 | — | 81,028 | ||||||||||||
Industrial | — | 9,312 | — | 9,312 | ||||||||||||
Technology | — | 13,362 | — | 13,362 | ||||||||||||
Utilities | — | 9,763 | — | 9,763 | ||||||||||||
|
|
|
|
|
|
|
| |||||||||
Total Corporate Bonds | — | 211,144 | — | 211,144 | ||||||||||||
|
|
|
|
|
|
|
| |||||||||
Foreign Government Securities | — | 24,608 | — | 24,608 | ||||||||||||
Mortgage-Backed Securities | — | 33,626 | — | 33,626 | ||||||||||||
Municipal Bonds | — | 767,312 | — | 767,312 | ||||||||||||
U.S. Government Agency Security | — | 4,005 | — | 4,005 | ||||||||||||
U.S. Treasury Obligations | — | 42,126 | — | 42,126 | ||||||||||||
Short-Term Investments | ||||||||||||||||
Commercial Papers | — | 53,561 | — | 53,561 | ||||||||||||
Municipal Bonds | — | 60,455 | — | 60,455 | ||||||||||||
Time Deposits | — | 28,907 | — | 28,907 | ||||||||||||
|
|
|
|
|
|
|
| |||||||||
Total Short-Term Investments | — | 142,923 | — | 142,923 | ||||||||||||
|
|
|
|
|
|
|
| |||||||||
Total Investments in Securities | $ | — | $ | 1,292,382 | $ | — | $ | 1,292,382 | ||||||||
|
|
|
|
|
|
|
| |||||||||
| 78 | SIX CIRCLES TRUST | JUNE 30, 2019 | ||||
Table of Contents
Six Circles Tax Aware Ultra Short Duration Fund (Continued)
| Level 1 Quoted prices | Level 2 Other significant observable inputs | Level 3 Significant unobservable inputs | Total | |||||||||||||
Appreciation in Other Financial Instruments | ||||||||||||||||
Futures contracts | $ | 816 | $ | — | $ | — | $ | 816 | ||||||||
Centrally Cleared Interest Rate Swap contracts | — | 1,662 | — | 1,662 | ||||||||||||
Forward Foreign Currency Exchange contracts | — | 90 | — | 90 | ||||||||||||
|
|
|
|
|
|
|
| |||||||||
Total Appreciation in Other Financial Instruments | $ | 816 | $ | 1,752 | $ | — | $ | 2,568 | ||||||||
|
|
|
|
|
|
|
| |||||||||
Depreciation in Other Financial Instruments | ||||||||||||||||
Futures contracts | $ | (505 | ) | $ | — | $ | — | $ | (505 | ) | ||||||
Centrally Cleared Interest Rate Swap contracts | — | (3,041 | ) | — | (3,041 | ) | ||||||||||
Forward Foreign Currency Exchange contracts | — | (48 | ) | — | (48 | ) | ||||||||||
|
|
|
|
|
|
|
| |||||||||
Total Depreciation in Other Financial Instruments | $ | (505 | ) | $ | (3,089 | ) | $ | — | $ | (3,594 | ) | |||||
|
|
|
|
|
|
|
| |||||||||
Six Circles U.S. Unconstrained Equity Fund
The following tables represent each valuation input as presented on the Schedule of Portfolio Investments (“SOIs”) (amounts in thousands):
Level 1 Quoted prices | Level 2 Other significant observable inputs | Level 3 Significant | Total | |||||||||||||
Investments in Securities | ||||||||||||||||
Common Stocks | ||||||||||||||||
Basic Materials | $ | 100,781 | $ | — | $ | — | $ | 100,781 | ||||||||
Communications | 1,901,671 | — | — | 1,901,671 | ||||||||||||
Consumer Cyclical | 479,132 | — | — | 479,132 | ||||||||||||
Consumer Non-cyclical | 3,046,629 | — | — | 3,046,629 | ||||||||||||
Energy | 1,463,572 | — | — | 1,463,572 | ||||||||||||
Financial | 872,963 | — | — | 872,963 | ||||||||||||
Industrial | 589,783 | — | — | 589,783 | ||||||||||||
Technology | 1,485,346 | — | — | 1,485,346 | ||||||||||||
Utilities | 205,870 | — | — | 205,870 | ||||||||||||
|
|
|
|
|
|
|
| |||||||||
Total Common Stocks | 10,145,747 | — | — | 10,145,747 | ||||||||||||
|
|
|
|
|
|
|
| |||||||||
Short-Term Investments | — | 13,173 | — | 13,173 | ||||||||||||
|
|
|
|
|
|
|
| |||||||||
Total Investments in Securities | $ | 10,145,747 | $ | 13,173 | $ | — | $ | 10,158,920 | ||||||||
|
|
|
|
|
|
|
| |||||||||
Appreciation in Other Financial Instruments Futures contracts | $ | 179 | $ | — | $ | — | $ | 179 | ||||||||
|
|
|
|
|
|
|
| |||||||||
Six Circles International Unconstrained Equity Fund
| Level 1 Quoted prices | Level 2 Other significant observable inputs | Level 3 Significant unobservable inputs | Total | |||||||||||||
Investments in Securities | ||||||||||||||||
Common Stocks | ||||||||||||||||
Australia | $ | — | $ | 12,444 | $ | — | $ | 12,444 | ||||||||
Austria | — | 17,321 | — | 17,321 | ||||||||||||
Belgium | — | 113,163 | — | 113,163 | ||||||||||||
Chile | — | 1,000 | — | 1,000 | ||||||||||||
China | 15,276 | 62,516 | — | 77,792 | ||||||||||||
Denmark | 3,226 | 129,081 | — | 132,307 | ||||||||||||
Finland | 1,490 | 35,926 | — | 37,416 | ||||||||||||
France | 26,012 | 683,524 | — | 709,536 | ||||||||||||
Germany | 5,029 | 297,018 | — | 302,047 | ||||||||||||
Hong Kong | 16,845 | 121,682 | — | 138,527 | ||||||||||||
India | 4,622 | 54,369 | — | 58,991 | ||||||||||||
Indonesia | — | 15,175 | — | 15,175 | ||||||||||||
| JUNE 30, 2019 | SIX CIRCLES TRUST | 79 | ||||||
Table of Contents
NOTES TO FINANCIAL STATEMENTS
AS OF JUNE 30, 2019 (Unaudited) (continued)
Six Circles Tax Aware Ultra Short Duration Fund (Continued)
| Level 1 Quoted prices | Level 2 Other significant observable inputs | Level 3 Significant unobservable inputs | Total | |||||||||||||
Ireland | $ | 30,807 | $ | 10,137 | $ | — | $ | 40,944 | ||||||||
Isle of Man | — | 1,036 | — | 1,036 | ||||||||||||
Italy | — | 132,798 | — | 132,798 | ||||||||||||
Luxembourg | 1,223 | 7,594 | — | 8,817 | ||||||||||||
Macau | — | 5,134 | — | 5,134 | ||||||||||||
Malaysia | — | 23,115 | — | 23,115 | ||||||||||||
Mexico | — | 525 | — | 525 | ||||||||||||
Netherlands | 6,194 | 577,260 | — | 583,454 | ||||||||||||
Norway | 549 | 68,003 | — | 68,552 | ||||||||||||
Pakistan | 894 | — | — | 894 | ||||||||||||
Philippines | 8,395 | 4,169 | — | 12,564 | ||||||||||||
Portugal | — | 15,904 | — | 15,904 | ||||||||||||
Russia | — | 919 | — | 919 | ||||||||||||
Singapore | — | 57,853 | — | 57,853 | ||||||||||||
South Africa | — | 952 | — | 952 | ||||||||||||
South Korea | 11,708 | 93,539 | — | 105,247 | ||||||||||||
Spain | — | 121,034 | — | 121,034 | ||||||||||||
Sweden | 836 | 81,637 | — | 82,473 | ||||||||||||
Switzerland | 27,454 | 941,747 | — | 969,201 | ||||||||||||
Taiwan | — | 102,513 | — | 102,513 | ||||||||||||
Thailand | — | 31,184 | — | 31,184 | ||||||||||||
United Arab Emirates | — | 616 | — | 616 | ||||||||||||
United Kingdom | 18,055 | 1,036,942 | 1,054,997 | |||||||||||||
United States | — | 2,639 | — | 2,639 | ||||||||||||
|
|
|
|
|
|
|
| |||||||||
Total Common Stocks | 178,615 | 4,860,469 | — | 5,039,084 | ||||||||||||
|
|
|
|
|
|
|
| |||||||||
Preferred Stocks | ||||||||||||||||
Germany | — | 15,478 | — | 15,478 | ||||||||||||
|
|
|
|
|
|
|
| |||||||||
Rights | ||||||||||||||||
South Korea | — | — | 27 | 27 | ||||||||||||
Spain | 1,145 | — | — | 1,145 | ||||||||||||
|
|
|
|
|
|
|
| |||||||||
Total Rights | 1,145 | — | 27 | 1,172 | ||||||||||||
|
|
|
|
|
|
|
| |||||||||
Short-Term Investments | ||||||||||||||||
Time Deposits | — | 20,336 | — | 20,336 | ||||||||||||
|
|
|
|
|
|
|
| |||||||||
Total Investments in Securities | $ | 179,760 | $ | 4,896,283 | $ | 27 | $ | 5,076,070 | ||||||||
|
|
|
|
|
|
|
| |||||||||
Appreciation in Other Financial Instruments | ||||||||||||||||
Futures contracts | $ | 141 | $ | — | $ | — | $ | 141 | ||||||||
B. Restricted Securities — Certain securities held by the Funds may be subject to legal or contractual restrictions on resale. Restricted securities generally are resold in transactions exempt from registration under the Securities Act of 1933 (the “Securities Act”). Disposal of these securities may involve time-consuming negotiations and expense. Prompt sale at the current valuation may be difficult and could adversely affect the net asset value of the Funds.
As of June 30, 2019, the Funds had no investments in restricted securities other than securities sold to the Funds under Rule 144A or Regulation S under the Securities Act.
C. When-Issued Securities, Delayed Delivery Securities and Forward Commitments — The Funds may purchase when-issued securities, including To Be Announced (“TBA”) securities, and enter into contracts to purchase or sell securities for a fixed price that may be settled a month or more after the trade date, or purchase delayed delivery securities which generally settle seven days after the trade date. When-issued securities are securities that have been authorized, but not issued in the market. A forward commitment involves entering into a contract to purchase or sell securities for a fixed price at a future date that may be settled a month or more after the trade date. A delayed delivery security is agreed upon in advance between the buyer and the seller of the security and is generally delivered beyond seven days of the agreed upon date. The purchase of securities on a when-issued, delayed delivery or forward commitment basis involves the risk that the value of the security to be purchased declines before the settlement date. The sale of securities on a forward commitment basis involves the risk that the value of the securities sold may increase before the settlement date. The Funds may be exposed to credit risk if the counterparty fails to perform under the terms of the transaction. Interest income for securities purchased on a when-issued, delayed delivery or forward commitment basis is not accrued until the settlement date.
| 80 | SIX CIRCLES TRUST | JUNE 30, 2019 | ||||
Table of Contents
D. Derivatives — The Funds used derivative instruments including futures, forward foreign currency exchange contracts and swaps, in connection with their respective investment strategies. Derivative instruments may be used as substitutes for securities in which the Funds can invest, to hedge portfolio investments or to generate income or gain to the Funds. Derivatives may also be used to manage duration, sector and yield curve exposures as well as credit and spread volatility.
The Funds may be subject to various risks from the use of derivatives including the risk that changes in the value of a derivative may not correlate perfectly with the underlying asset, rate or index; counterparty credit risk related to derivatives counterparties’ failure to perform under contract terms; liquidity risk related to the lack of a liquid market for these contracts allowing a Fund to close out its position(s); and documentation risk relating to disagreement over contract terms. Investing in certain derivatives also results in a form of leverage and as such, the Funds’ risk of loss associated with these instruments may exceed their value, as recorded on the Statements of Assets and Liabilities.
The Funds are party to various derivative contracts governed by International Swaps and Derivatives Association master agreements (“ISDA agreements”). The Funds’ ISDA agreements, which are separately negotiated by theSub-Advisers, with each dealer counterparty, may contain provisions allowing, absent other considerations, a counterparty to exercise rights, to the extent not otherwise waived, against the Funds in the event the Funds’ net assets decline over time by apre-determined percentage or fall below apre-determined floor. The ISDA agreements may also contain provisions allowing, absent other conditions, the Funds to exercise rights, to the extent not otherwise waived, against a counterparty (e.g., decline in a counterparty’s credit rating below a specified level). Such rights for both a counterparty and the Funds often include the ability to terminate (i.e., close out) open contracts at prices which may favor a counterparty, which could have an adverse effect on the Funds. The ISDA agreements give the Funds and a counterparty the right, upon an event of default, to close out all transactions traded under such agreements and to net amounts owed or due across all transactions and offset such net payable or receivable with collateral posted to a segregated account by one party to the other.
Counterparty credit risk may be mitigated to the extent a counterparty posts collateral for mark to market gains to the Fund.
Notes D(1) — D(3) below describe the various derivatives used by the Funds.
(1) Futures Contracts — The Funds used interest rate futures and index futures to manage interest rate risks associated with portfolio investments and/or to gain or reduce exposure to fluctuations of a particular sector, country or region as well as to lengthen or shorten the duration of the overall investment portfolio.
Futures contracts provide for the delayed delivery of the underlying instrument at a fixed price or are settled for a cash amount based on the change in the value of the underlying instrument at a specific date in the future. Upon entering into a futures contract, the Funds are required to deposit with the broker, cash or securities in an amount equal to a certain percentage of the contract amount, which is referred to as the initial margin deposit. Subsequent payments, referred to as variation margin, are made or received by the Funds periodically and are based on changes in the market value of open futures contracts. Changes in the market value of open futures contracts are recorded as Change in net unrealized appreciation/depreciation on the Statements of Operations. Realized gains or losses, representing the difference between the value of the contract at the time it was opened and the value at the time it was closed, are reported on the Statements of Operations at the closing or expiration of the futures contract. Securities deposited as initial margin are designated on the SOIs and cash deposited is recorded on the Statements of Assets and Liabilities. A receivable from and/or a payable to brokers for the daily variation margin is also recorded on the Statements of Assets and Liabilities. Futures contracts outstanding at period end, if any, are listed after each Fund’s SOI.
The use of futures contracts may expose the Funds to interest rate risk. The Funds may be subject to the risk that the change in the value of the futures contract may not correlate perfectly with the underlying instrument. Use of long futures contracts subjects the Fund to risk of loss in excess of the amounts shown on the Statements of Assets and Liabilities, up to the notional amount of the futures contracts. Use of short futures contracts subjects the Fund to unlimited risk of loss. The Funds may enter into futures contracts only on exchanges or boards of trade. The exchange or board of trade acts as the counterparty to each futures transaction; therefore, the Funds credit risk is limited to failure of the exchange or board of trade. Under some circumstances, futures exchanges may establish daily limits on the amount that the price of a futures contract can vary from the previous day’s settlement price, which could effectively prevent the liquidation of positions.
The Funds’ futures contracts are not subject to master netting arrangements (the right to close out all transactions traded with a counterparty and net amounts owed or due across transactions).
(2) Forward Foreign Currency Exchange Contracts — The Funds may be exposed to foreign currency risks associated with some or all of the portfolio investments and used forward foreign currency exchange contracts to hedge or manage certain of these exposures as part of an investment strategy. The Funds also bought forward foreign currency exchange contracts to gain exposure to currencies. Forward foreign currency exchange contracts represent obligations to purchase or sell foreign currency on a specified future date at a price fixed at the time the contracts are entered into.Non-deliverable forward foreign currency exchange contracts are settled with the counterparty in U.S. Dollars without the delivery of foreign currency. Forward contracts outstanding at period end, if any, are listed after each Fund’s SOI.
The values of the forward foreign currency exchange contracts are adjusted daily based on the applicable exchange rate of the underlying currency. Changes in the value of these contracts are recorded as unrealized appreciation/depreciation until the contract settlement date. When the forward foreign currency exchange contract is closed, the Fund records a realized gain or loss equal to the difference between the value at the time the contract was opened and the value at the time it was closed. The Fund also records a realized gain or loss when a forward foreign currency exchange contract offsets another forward foreign currency exchange contract with the same counterparty upon settlement.
| JUNE 30, 2019 | SIX CIRCLES TRUST | 81 | ||||||
Table of Contents
NOTES TO FINANCIAL STATEMENTS
AS OF JUNE 30, 2019 (Unaudited) (continued)
The Funds’ forward foreign currency exchange contracts may be subject to master netting arrangements (the right to close out all transactions witha counterparty and net amounts owed or due across transactions). The Funds may be required to post or receive collateral fornon-deliverable forward foreign currency exchange contracts.
(3) Swaps — Six Circles Ultra Short Duration Fund and Six Circles Tax Aware Ultra Short Duration Fund engaged in various swap transactions, including interest swaps, to manage interest rate (e.g., duration, yield curve) risks within their respective portfolios. The Funds also used swaps as alternatives to direct investments. Swap transactions are negotiated contracts over the counter (“OTC swaps”) between a fund and a counterparty or centrally cleared (“centrally cleared swaps”) with a central clearinghouse through a Futures Commission Merchant (“FCM”), to exchange investment cash flows, assets, foreign currencies or market-linked returns at specified, future intervals. Swap contracts outstanding at period end, if any, are listed after each Fund’s SOI.
Upfront payments made and/or received are recorded as assets or liabilities, respectively on the Statements of Assets and Liabilities and amortized over the term of the swap. The value of an OTC swap agreement is recorded as either an asset or a liability on the Statements of Assets and Liabilities at the beginning of the measurement period.
Upon entering into a centrally cleared swap, the Funds are required to deposit with the FCM cash or securities, which is referred to as initial margin deposit. Securities deposited as initial margin are designated on the SOIs and cash deposited is recorded on the Statements of Assets and Liabilities. Daily changes in valuation of centrally cleared swaps, if any, are recorded as a variation margin receivable or payable on the Statements of Assets and Liabilities. The change in the value of swaps, including accruals of periodic amounts of interest to be paid or received on swaps, is reported as Change in net unrealized appreciation/depreciation on the Statements of Operations. A realized gain or loss is recorded upon payment or receipt of a periodic payment or payment made upon termination of a swap agreement.
The central clearing house acts as the counterparty to each centrally cleared swap transaction, therefore credit risk is limited to the failure of the clearing house.
The Funds may be required to post or receive collateral in the form of cash or securities based on the net value of the Fund’s outstanding OTC swap contracts with the counterparty. Daily movement of collateral is subject to minimum threshold amounts. Collateral posted by the Funds is held in a segregated account at the Funds’ custodian bank. Collateral received by the Funds is held in escrow in segregated accounts maintained by Brown Brothers Harriman & Co.
Interest Rate Swaps
Six Circles Ultra Short Duration Fund and Six Circles Tax Aware Ultra Short Duration Fund entered into interest rate swap contracts to manage fund exposure to interest rates and/or to preserve or generate a return on a particular investment or portion of its portfolio. These are agreements between counterparties to exchange periodic payments based on interest rates. One cash flow stream will typically be a floating rate payment based upon a specified interest rate while the other is typically a fixed interest rate.
(4) Summary of Derivatives Information
The following tables present the value of derivatives held as of June 30, 2019, by their primary underlying risk exposure and respective location on the Statements of Assets and Liabilities (amounts in thousands):
Six Circles Ultra Short Duration Fund
| Derivative Contracts | Statements of Assets and Liabilities Location | |||||||||||||||||
| Gross Assets: | Futures Contracts (a) | Forward Foreign Exchange Contracts | Centrally Cleared Swaps (b) | Total | ||||||||||||||
Interest rate contracts | Receivables, Net Assets — Unrealized Appreciation | $ | 869 | $ | — | $ | 1,743 | $ | 2,612 | |||||||||
Foreign exchange contracts | Receivables | — | 81 | — | 81 | |||||||||||||
|
|
|
|
|
|
|
| |||||||||||
Total | $ | 869 | $ | 81 | $ | 1,743 | $ | 2,693 | ||||||||||
|
|
|
|
|
|
|
| |||||||||||
Gross Liabilities: | ||||||||||||||||||
Interest rate contracts | Payables, Net Assets — Unrealized Depreciation | $ | (474 | ) | $ | — | $ | (3,016 | ) | $ | (3,490 | ) | ||||||
Foreign exchange contracts | Payables | — | (42 | ) | — | (42 | ) | |||||||||||
|
|
|
|
|
|
|
| |||||||||||
Total | $ | (474 | ) | $ | (42 | ) | $ | (3,016 | ) | $ | (3,532 | ) | ||||||
|
|
|
|
|
|
|
| |||||||||||
| (a) | This amount represents the cumulative appreciation (depreciation) of futures contracts as reported on the SOIs. The Statements of Assets and Liabilities only reflect the current day variation margin receivable/payable from/to brokers. |
| (b) | This amount represents the value of centrally cleared swaps as reported on the SOIs. The Statements of Assets and Liabilities only reflect the current day variation margin receivable/payable from/to brokers. |
| 82 | SIX CIRCLES TRUST | JUNE 30, 2019 | ||||
Table of Contents
Six Circles Tax Aware Ultra Short Duration Fund
| Derivative Contracts | Statements of Assets and Liabilities Location | |||||||||||||||||
| Gross Assets: | Futures Contracts (a) | Forward Foreign Exchange Contracts | Centrally Cleared Swaps (b) | Total | ||||||||||||||
Interest rate contracts | Receivables, Net Assets — Unrealized Appreciation | $ | 816 | $ | — | $ | 1,914 | $ | 2,730 | |||||||||
Foreign exchange contracts | Receivables | — | 90 | — | 90 | |||||||||||||
|
|
|
|
|
|
|
| |||||||||||
Total | $ | 816 | $ | 90 | $ | 1,914 | $ | 2,820 | ||||||||||
|
|
|
|
|
|
|
| |||||||||||
Gross Liabilities: | ||||||||||||||||||
Interest rate contracts | Payables, Net Assets — Unrealized Depreciation | $ | (505 | ) | $ | — | $ | (3,013 | ) | $ | (3,518 | ) | ||||||
Foreign exchange contracts | Payables | — | (48 | ) | — | (48 | ) | |||||||||||
|
|
|
|
|
|
|
| |||||||||||
Total | $ | (505 | ) | $ | (48 | ) | $ | (3,013 | ) | $ | (3,566 | ) | ||||||
|
|
|
|
|
|
|
| |||||||||||
| (a) | This amount represents the cumulative appreciation (depreciation) of futures contracts as reported on the SOIs. The Statements of Assets and Liabilities only reflect the current day variation margin receivable/payable from/to brokers. |
| (b) | This amount represents the value of centrally cleared swaps as reported on the SOIs. The Statements of Assets and Liabilities only reflect the current day variation margin receivable/payable from/to brokers. |
Six Circles U.S. Unconstrained Equity Fund
| Derivative Contracts | Statements of Assets and Liabilities Location | |||||
| Gross Assets: | Futures Contracts (a) | |||||
Equity contracts | Receivables, Net Assets — Unrealized Appreciation | $ | 179 | |||
|
| |||||
| (a) | This amount represents the cumulative appreciation (depreciation) of futures contracts as reported on the SOIs. |
The Statements of Assets and Liabilities only reflect the current day variation margin receivable/payable from/to brokers. |
Six Circles International Unconstrained Equity Fund
| Derivative Contracts | Statements of Assets and Liabilities Location | |||||
| Gross Assets: | Futures Contracts (a) | |||||
Equity contracts | Receivables, Net Assets — Unrealized Appreciation | $ | 141 | |||
|
| |||||
| (a) | This amount represents the cumulative appreciation (depreciation) of futures contracts as reported on the SOIs. |
The Statements of Assets and Liabilities only reflect the current day variation margin receivable/payable from/to brokers. |
The following tables present the Funds’ gross derivative assets and liabilities by counterparty net of amounts available for offset under netting arrangements and any related collateral received or posted by the Fund as of June 30, 2019 (amounts in thousands):
Six Circles Ultra Short Duration Fund
| Counterparty | Gross Amount of Derivative Assets Subject to Netting Arrangements Presented on the Statements of Assets and Liabilities(a) | Derivatives Available for offset | Collateral Received | Net Amount Due From Counterparty (Not less than zero) | ||||||||||||
Morgan Stanley & Co. | $ | 81 | $ | (42 | ) | $ | — | $ | 39 | |||||||
|
|
|
|
|
|
|
| |||||||||
| JUNE 30, 2019 | SIX CIRCLES TRUST | 83 | ||||||
Table of Contents
NOTES TO FINANCIAL STATEMENTS
AS OF JUNE 30, 2019 (Unaudited) (continued)
| Counterparty | Gross Amount of Derivative Liabilities Subject to Netting Arrangements Presented on the Statements of Assets and Liabilities(a) | Derivatives Available for offset | Collateral Posted | Net Amount Due To Counterparty (Not less than zero) | ||||||||||||
Morgan Stanley & Co. | $ | 42 | $ | (42 | ) | $ | — | $ | - | |||||||
|
|
|
|
|
|
|
| |||||||||
| (a) | For financial reporting purposes, the Fund does not offset derivative assets and derivative liabilities subject to master netting arrangements on the Statements of Assets and Liabilities. |
Six Circles Tax Aware Ultra Short Duration Fund
| Counterparty | Gross Amount of Derivative Assets Subject to Netting Arrangements Presented on the Statements of Assets and Liabilities(a) | Derivatives Available for offset | Collateral Received | Net Amount Due From Counterparty (Not less than zero) | ||||||||||||
Morgan Stanley & Co. | $ | 90 | $ | (48 | ) | $ | — | $ | 42 | |||||||
|
|
|
|
|
|
|
| |||||||||
| Counterparty | Gross Amount of Derivative Liabilities Subject to Netting Arrangements Presented on the Statements of Assets and Liabilities(a) | Derivatives Available for offset | Collateral Posted | Net Amount Due To Counterparty (Not less than zero) | ||||||||||||
Morgan Stanley & Co. | $ | 48 | $ | (48 | ) | $ | — | $ | — | |||||||
|
|
|
|
|
|
|
| |||||||||
| (a) | For financial reporting purposes, the Fund does not offset derivative assets and derivative liabilities subject to master netting arrangements on the Statements of Assets and Liabilities. |
The following tables present the effect of derivatives on the Statements of Operations for the six months ended June 30, 2019, by primary underlying risk exposure (amounts in thousands):
Six Circles Ultra Short Duration Fund
| Amount of Realized Gain (Loss) on Derivatives Recognized on the Statements of Operations | ||||||||||||||||
| Derivative Contracts | Futures Contracts | Forward Foreign Currency Exchange Contracts | Swaps | Total | ||||||||||||
Interest rate contracts | $ | (1,831 | ) | $ | — | $ | (810 | ) | $ | (2,641 | ) | |||||
Foreign exchange contracts | — | 108 | — | 108 | ||||||||||||
|
|
|
|
|
|
|
| |||||||||
Total | $ | (1,831 | ) | $ | 108 | $ | (810 | ) | $ | (2,533 | ) | |||||
|
|
|
|
|
|
|
| |||||||||
| Amount of Change in Unrealized Appreciation (Depreciation) on Derivatives Recognized on the Statements of Operations | ||||||||||||||||
| Derivative Contracts | Futures Contracts | Forward Foreign Currency Exchange Contracts | Swaps | Total | ||||||||||||
Interest rate contracts | $ | 640 | $ | — | $ | (878 | ) | $ | (238 | ) | ||||||
Foreign exchange contracts | — | 11 | — | 11 | ||||||||||||
|
|
|
|
|
|
|
| |||||||||
Total | $ | 640 | $ | 11 | $ | (878 | ) | $ | (227 | ) | ||||||
|
|
|
|
|
|
|
| |||||||||
| 84 | SIX CIRCLES TRUST | JUNE 30, 2019 | ||||
Table of Contents
Six Circles Tax Aware Ultra Short Duration Fund
| Amount of Realized Gain (Loss) on Derivatives Recognized on the Statements of Operations | ||||||||||||||||
| Derivative Contracts | Futures Contracts | Forward Foreign Currency Exchange Contracts | Swaps | Total | ||||||||||||
Interest rate contracts | $ | (2,013 | ) | $ | — | $ | (1,093 | ) | $ | (3,106 | ) | |||||
Foreign exchange contracts | — | 6 | — | 6 | ||||||||||||
|
|
|
|
|
|
|
| |||||||||
Total | $ | (2,013 | ) | $ | 6 | $ | (1,093 | ) | $ | (3,100 | ) | |||||
|
|
|
|
|
|
|
| |||||||||
| Amount of Change in Unrealized Appreciation (Depreciation) on Derivatives Recognized on the Statements of Operations | ||||||||||||||||
| Derivative Contracts | Futures Contracts | Forward Foreign Currency Exchange Contracts | Swaps | Total | ||||||||||||
Interest rate contracts | $ | 601 | $ | — | $ | (704 | ) | $ | (103 | ) | ||||||
Foreign exchange contracts | — | 36 | — | 36 | ||||||||||||
|
|
|
|
|
|
|
| |||||||||
Total | $ | 601 | $ | 36 | $ | (704 | ) | $ | (67 | ) | ||||||
|
|
|
|
|
|
|
| |||||||||
Six Circles U.S. Unconstrained Equity Fund
| Amount of Realized Gain (Loss) on Derivatives Recognized on the Statements of Operations | ||||
| Derivative Contracts | Futures Contracts | |||
Equity contracts | $ | 305 | ||
|
| |||
| Amount of Change in Unrealized Appreciation (Depreciation) on Derivatives Recognized on the Statements of Operations | ||||
| Derivative Contracts | Futures Contracts | |||
Equity contracts | $ | 148 | ||
|
| |||
Six Circles International Unconstrained Equity Fund
Amount of Realized Gain (Loss) on Derivatives Recognized on the Statements of Operations | ||||||||||||
| Derivative Contracts | Futures Contracts | Forward Foreign Currency Exchange Contracts | Total | |||||||||
Equity contracts | $ | 2,063 | $ | — | $ | 2,063 | ||||||
Foreign exchange contracts | — | (329 | ) | (329 | ) | |||||||
|
|
|
|
|
| |||||||
Total | $ | 2,063 | $ | (329 | ) | $ | 1,734 | |||||
|
|
|
|
|
| |||||||
| Amount of Change in Unrealized Appreciation (Depreciation) on Derivatives Recognized on the Statements of Operations | ||||||||||||
| Derivative Contracts | Futures Contracts | Forward Foreign Currency Exchange Contracts | Total | |||||||||
Equity contracts | $ | 79 | $ | — | $ | 79 | ||||||
|
|
|
|
|
| |||||||
| JUNE 30, 2019 | SIX CIRCLES TRUST | 85 | ||||||
Table of Contents
NOTES TO FINANCIAL STATEMENTS
AS OF JUNE 30, 2019 (Unaudited) (continued)
Derivatives Volume
The tables below disclose the volume of the Funds’ futures contracts, forward foreign currency exchange contracts and swaps activity during the six months ended June 30, 2019 (amounts in thousands, except number of contracts). Please refer to the tables in the Summary of Derivative Information for derivative-related gains and losses associated with volume activity (amounts in thousands).
| Six Circles Ultra Short Duration Fund | Six Circles Tax Aware Ultra Short Duration Fund | Six Circles U.S. Unconstrained Equity Fund | Six Circles International Unconstrained Equity Fund | |||||||||||||
Futures Contracts: | ||||||||||||||||
Average Notional Amount Long | $ | 246,352 | $ | 255,695 | $ | 10,591 | $ | 19,394 | ||||||||
Average Notional Amount Short | 258,344 | 261,603 | — | 2,152 | (a) | |||||||||||
Forward Foreign Currency Exchange: | ||||||||||||||||
Average Principal Amount Purchased | 357 | (b) | 398 | (a) | — | — | ||||||||||
Average Principal Amount Sold | 5,348 | 3,469 | — | — | ||||||||||||
Swap contracts: | ||||||||||||||||
Average Notional Amount | 648,097 | 676,668 | — | — | ||||||||||||
| (a) | Positions were held for one month during the period. |
| (b) | Positions were held for 3 months during the period. |
E. Foreign Currency Translation — The books and records of the Funds are maintained in U.S. dollars. Foreign currency amounts are translated into U.S. dollars at the prevailing exchange rates of such currencies against the U.S. dollar. The market value of investment securities and other assets and liabilities are translated at the exchange rate as of the valuation date. Purchases and sales of investment securities, income and expenses are translated at the exchange rate prevailing on the respective dates of such transactions.
The Funds do not isolate the effect of changes in foreign exchange rates from changes in market prices on securities held. Accordingly, such changes are included within the Change in net unrealized appreciation/depreciation on investments on the Statements of Operations.
Reported realized foreign currency gains and losses arise from the disposition of foreign currency. Currency gains or losses may be realized between the trade and settlement dates on securities transactions, and the difference between the amounts of dividends, interest and foreign withholding taxes recorded on each Fund’s books on the transaction date and the U.S. dollar equivalent of the amounts actually received or paid. These reported realized foreign currency gains and losses are included in Net realized gain (loss) on foreign currency transactions on the Statements of Operations. Unrealized foreign currency gains and losses arise from changes (due to changes in exchange rates) in the value of foreign currency and other assets and liabilities denominated in foreign currencies, which are held at period end and are included in Change in net unrealized appreciation/depreciation on foreign currency translations on the Statements of Operations.
F. Short Sales — The Funds may engage in short sales as part of their normal investment activities. In a short sale, the Funds sell securities they do not own in anticipation of a decline in the market value of those securities. In order to deliver securities to the purchaser, the Funds borrow securities from a broker. To close out a short position, the Funds deliver the same securities to the broker.
The Funds are required to pledge cash or securities to the broker as collateral for the securities sold short. Collateral requirements are calculated daily based on the current market value of the short positions. Cash collateral deposited with the custodian is recorded as Restricted cash on the Statements of Assets and Liabilities. Securities segregated as collateral are denoted on the SOIs. The Funds may receive or pay the net of the following amounts: (i) a portion of the income from the investment of cash collateral; (ii) the broker’s fee on the borrowed securities (calculated daily based upon the market value of each borrowed security and a variable rate that is dependent on availability of the security); and (iii) a financing charge for the difference between the market value of the short position and cash collateral deposited with the broker. The net income or fee is reported as Interest income or Interest expense, respectively, on securities sold short on the Statements of Operations. The Funds are obligated to pay the broker dividends declared on short positions when a position is open on the record date. Dividends on short positions are reported onex-dividend date on the Statements of Operations as Dividend expense on securities sold short.
Liabilities for securities sold short are reported at market value on the Statements of Assets and Liabilities and the change in market value is recorded as Change in net unrealized appreciation (depreciation) on the Statements of Operations. Short sale transactions may result in unlimited losses as the security’s price increases and the short position loses value. There is no upward limit on the price a borrowed security could attain. The Funds are also subject to risk of loss if the broker were to fail to perform its obligations under the contractual terms. The Funds will record a realized loss if the price of the borrowed security increases between the date of the short sale and the date on which the Funds replace the borrowed security. The Funds will record a realized gain if the price of the borrowed security declines between those dates.
G. Security Transactions, Investment Income and Expense Allocation — Securities transactions are recorded on a trade date basis. Realized gain and loss from securities transactions are recorded on an identified cost basis for financial reporting and federal income tax purposes. Interest income is determined on the basis of coupon interest accrued using the effective interest method which adjusts for amortization of premiums and accretion of discounts. Dividend income, net of foreign taxes withheld, if any, is recorded on theex-dividend date or when the Fund first learns of
| 86 | SIX CIRCLES TRUST | JUNE 30, 2019 | ||||
Table of Contents
the dividend. Tax Aware Ultra Short Duration Fund and Ultra Short Duration Fund invests in treasury inflation protected securities (TIPS). The principal amount of TIPS is adjusted periodically and is increased for inflation or decreased for deflation based on a monthly published index. These adjustments are recorded as increases or decreases to interest income on the Statements of Operations. Coupon payments are based on the adjusted principal at the time the interest is paid. Distributions received from certain investments held by the Funds may be comprised of dividends, realized gains and returns of capital. The Funds originally estimate the expected classification of such payments. The amounts may subsequently be reclassified upon receipt of information from the issuer.
The Funds are charged for those expenses of the Trust that are directly attributable to each Fund. Expenses that are not directly attributable to a Fund are typically allocated among the Funds in proportion to their respective net assets.
H. Repurchase Agreements — The Funds may invest in repurchase agreements, which are short term investments whereby the Funds acquire ownership of a debt security and the seller agrees to repurchase the security at a future date at a specified price. When entering into repurchase agreements, it is the Funds’ policy that their custodian take possession of the underlying collateral securities, the market value of which, at all times, shall equal at least 100% of the principal amount of the repurchase transaction. The repurchase agreements further authorize the Funds to demand additional collateral in the event that the dollar value of the collateral falls below 100%. The Funds will make payments for such securities only upon physical delivery or upon evidence of book entry transfer to the account of the custodian.
I. Federal Income Tax — Each Fund is treated as a separate taxable entity for Federal income tax purposes. Each Fund’s policy is to comply with the provisions of Subchapter M of the Internal Revenue Code of 1986, as amended (the “Code”) applicable to regulated investment companies. Each Fund intends to distribute to shareholders, substantially all of its distributable net investment income and net realized capital gains on investments. Accordingly, no provision for Federal income tax is necessary.
The Funds follow the provisions of FASB Codification Section 740 (“ASC Section 740”) “Accounting for Uncertainty in Income Taxes” which clarifies the accounting for uncertainty in tax positions taken or expected to be taken on a tax return. ASC Section 740 sets forth a threshold for financial statement recognition, measurement and disclosure of tax positions taken or expected to be taken on a tax return. The Funds are required to recognize the tax effects of certain tax positions under a “more likely than not” standard, that based on their technical merits, have more than 50 percent likelihood of being sustained upon examination. Management has analyzed the tax positions taken on the Funds’ federal income tax returns for all open years, and has concluded that no provision for federal income tax is required in the Funds’ financial statements. At June 30, 2019, the Funds did not have any uncertain tax benefits that require recognition,de-recognition or disclosure. The Funds’ federal, state and local income and federal excise tax returns for which the applicable statutes of limitations have not expired are subject to examination by the Internal Revenue Service and state departments of revenue.
J. Foreign Tax — The Funds may be subject to foreign taxes on income, gains on investments or currency purchases/repatriation, a portion of which may be recoverable. The Funds will accrue such taxes and recoveries as applicable, based upon its current interpretation of tax rules and regulations that exist in the markets in which it invests.
K. Distributions to Shareholders — Distributions to shareholders are recorded on theex-dividend date. Distributions from net investment income and net realized capital gains are generally declared and paid according to the following schedule:
| Fund Name | Net Investment Income | Net Realized Capital Gains | ||||||
Six Circles Ultra Short Duration Fund | Monthly | Annual | ||||||
Six Circles Tax Aware Ultra Short Duration Fund | Monthly | Annual | ||||||
Six Circles U.S. Unconstrained Equity Fund | Annual | Annual | ||||||
Six Circles International Unconstrained Equity Fund | Annual | Annual | ||||||
Income and capital gain distributions will be determined in accordance with federal income tax regulations which may differ from GAAP. Differences may be permanent or temporary. Permanent differences are reclassified among capital accounts in the financial statements to reflect their tax character.
Temporary differences arise when certain items of income, expense, gain, or loss are recognized in different periods for financial statement and tax purposes. These differences will reverse at some time in the future. Differences in classification may also result from the treatment of short- term gains as ordinary income for tax purposes. As a result, income dividends and capital gain distributions declared during a fiscal period may differ significantly from the net investment income (loss) and realized gain (loss) reported on the Fund financial statements presented under GAAP.
Distributions classified as a tax basis return of capital, if any, are reflected on the Statement of Changes in Net Assets and have been recorded topaid-in capital.
L. Sale-buyback Transactions —A sale-buyback financing transaction consists of a sale of a security by a Fund to a counterparty, with a simultaneous agreement to repurchase the same or substantially the same security at an agreed-upon price and date. The Fund is not entitled to receive principal and interest payments, if any, made on the security sold to the counterparty during the term of the agreement. The agreed-upon proceeds for securities to be repurchased by the Fund are reflected in the payable for investments purchased on the Statements of Assets and Liabilities. The Fund will recognize net income represented by the price differential between the price received for the transferred security and the agreed-upon repurchase price. This is commonly referred to as the ‘price drop’. A price drop consists of (i) the foregone interest and inflationary income
| JUNE 30, 2019 | SIX CIRCLES TRUST | 87 | ||||||
Table of Contents
NOTES TO FINANCIAL STATEMENTS
AS OF JUNE 30, 2019 (Unaudited) (continued)
adjustments, if any, the Fund would have otherwise received had the security not been sold and (ii) the negotiated financing terms between the Fund and counterparty. In periods of increased demand for the security, the Fund may receive a fee for use of the security by the counterparty, which may result in interest income to the Fund. The Fund will segregate assets determined to be liquid by the Sub-adviser or will otherwise cover its obligations under sale-buyback transactions. Sale-buyback transactions are governed by Master Securities Forward Transaction Agreements (“Master Forward Agreements”), which are agreements between the Fund and select counterparties. The Master Forward Agreements maintain provisions for, among other things, transaction initiation and confirmation, payment and transfer, events of default, termination and maintenance of collateral. The market value of sale-buyback transactions as of period end is disclosed in each Fund’s Summary Schedule of Investments.
Six Circles Ultra Short Duration Fund had an average amount of borrowings outstanding during the period ended June 30, 2019 of $37,985,677 at a weighted average interest rate of 2.623%. Six Circles Tax Aware Short Duration Fund had an average amount of borrowings outstanding during the period ended June 30, 2019 of $30,583,699 at a weighted average interest rate of 2.618%.
3. Fees and Other Transactions with Affiliates
A. Investment Advisory Fees —The Adviser serves as the Funds’ investment adviser pursuant to an investment advisory agreement (the “Investment Advisory Agreement”). Under the terms of the Investment Advisory Agreement, the Adviser generally manages the Funds’ investments in accordance with the stated policies of each Fund, subject to the supervision of the Funds’ Board of Trustees. For the services provided to the Funds, the Adviser receives a fee, accrued daily and paid monthly, at the annual rate of 0.25% of the average daily net assets of each Fund.
The Adviser selects and oversees professional money managers (the“Sub-Advisers”) who are responsible for investing the assets of the Funds undersub-advisory agreements (the“Sub-Advisory Agreements”). Pursuant to each respectiveSub-Advisory Agreement, the Adviser agrees to pay eachSub-Adviser asub-advisory fee from its investment advisory fees. BlackRock Investment Management, LLC (“BlackRock”), BNY Mellon Asset Management North America Corporation, (now known as Mellon Investments Corporation) (“Mellon”), Goldman Sachs Asset Management, L.P. (“Goldman”) and Pacific Investment Management Company LLC (“PIMCO”) currently serve as theSub-Advisers to the Funds. TheSub-Advisers are paid a management fee by the Adviser pursuant to their individually negotiatedSub-Advisory Agreements.
As of June 30, 2019, the allocation of assets to eachSub-Adviser for the Funds was as follows:
| Sub—Adviser | Six Circles Ultra Short Duration Fund % | Six Circles Tax Aware Ultra Short Duration Fund % | Six Circles U.S. Unconstrained Equity Fund % | Six Circles International Unconstrained Equity Fund % | ||||||||||||
BlackRock | 30 | — | 100 | 100 | ||||||||||||
PIMCO | 30 | 30 | — | — | ||||||||||||
Goldman Sachs | 40 | 40 | — | — | ||||||||||||
Mellon | — | 30 | — | — | ||||||||||||
On October 5, 2018, the Adviser engaged Russell Investments Implementation Services, LLC (“Russell”) to providestand-by interimsub-advisory services, as well as transition management services, for each Fund, to be utilized as needed in certain transitional circumstances involving a FundSub-Adviser. As of June 30, 2019, the Funds have not allocated assets to Russell.
During the period, the Adviser agreed to increase annual sub-advisory fees for the Six Circles U.S. Unconstrained Equity Fund and the Six Circles International Unconstrained Equity Fund by 0.01%, beginning April 10, 2019.
The Adviser waived Investment Advisory fees and/or reimbursed expenses as outlined in Note 3G and reflected on the Statement of Operations.
During the period a payment by an affiliate was made to the Six Circles U.S. Unconstrained Equity Fund in the amount of $2,190, the payment was related to the timing of trades instructed by the Sub-Adviser.
B. Administration and Accounting Fees — Pursuant to an Administrative Agency Agreement, Brown Brothers Harriman & Co. (the “Administrator”) provides certain administration and fund accounting services to the Funds.
C. Distribution Fees — Pursuant to a Distribution Agreement, Foreside Fund Services, LLC (the “Distributor”), will serve as the Funds’ principal underwriter and acts as the agent of the Funds’ in connection with the continuous offering of shares of each Fund. The Distributor and its officers have no role in determining the investment policies or which securities are to be purchased or sold by the Funds. The Distributor does not receive compensation from the Funds, but instead is compensated by the Adviser for certain distribution-related expenses.
D. Custodian — Pursuant to a Custodian Agreement, Brown Brothers Harriman & Co. serves as the custodian (the “Custodian”) for each of the Funds and is responsible for holding portfolio securities and cash and maintaining the books of account and records of portfolio transactions.
E. Transfer Agent — Pursuant to a Transfer Agency and Service Agreement, DST Asset Manager Solutions, Inc. (the “Transfer Agent”) serves as each Fund’s transfer and dividend disbursing agent. The Transfer Agent is responsible for maintaining account records, detailing the ownership of Fund shares and for crediting income, capital gains and other changes in share ownership to shareholder accounts.
F. Offering Costs — Offering costs, including professional fees, printing fees and initial registration costs, are amortized overa period not longer than twelve months from the date the Fund commenced operations.
G. Waivers and Reimbursements — The Adviser has contractually agreed through at least April 30, 2020, to waive any management fees that exceed the aggregate management fees the Adviser is contractually required to pay the Fund’sSub-Advisers. Thereafter, this waiver will continue for subsequent one year terms unless terminated in accordance with its terms. Such waivers are not subject to reimbursement by the Fund. The
| 88 | SIX CIRCLES TRUST | JUNE 30, 2019 | ||||
Table of Contents
Adviser has also contractually agreed through at least April 30, 2020, to reimburse expenses to the extent Total Annual Fund Operating Expenses (excluding acquired fund fees and expenses, if any, dividend and interest expenses related to short sales, brokerage fees, interest on borrowings, taxes, expenses related to litigation and potential litigation, and extraordinary expenses) exceed the following percentages of the average daily net assets of each Fund (the “Expense Cap”):
| Fund | Expense Cap | |||
Six Circles Ultra Short Duration Fund | 0.40 | % | ||
Six Circles Tax Aware Ultra Short Duration Fund | 0.40 | % | ||
Six Circles U.S. Unconstrained Equity Fund | 0.45 | % | ||
Six Circles International Unconstrained Equity Fund | 0.50 | % | ||
An expense reimbursement by the Fund’s Adviser is subject to repayment by the Fund only to the extent it can be made withinthirty-six months following the date of such reimbursement by the Adviser. Repayment must be limited to amounts that would not cause the Fund’s operating expenses (taking into account any reimbursements by the Adviser and repayments by the Fund) to exceed the Expense Cap in effect at the time of the reimbursement by the Adviser or at the time of repayment by the Fund. This expense reimbursement is in effect through April 30, 2020, at which time the Adviser and/or its affiliates will determine whether to renew or revise it.
For the six months ended June 30, 2019, the amounts waived and reimbursed by the Adviser, as well as the amounts available for potential future recoupment by the Adviser and the expiration schedule at June 30, 2019 are as follows (amounts in thousands):
| Fund | Fees reimbursed for the six months ended June 30, 2019 | Total potential recoupment amount June 30, 2019 | Potential recoupment amount expiring December 31, 2021 | |||||||||
Six Circles Ultra Short Duration Fund* | $ | — | $ | — | $ | — | ||||||
Six Circles Tax Aware Ultra Short Duration Fund* | — | — | — | |||||||||
|
|
|
|
|
| |||||||
Totals | $ | — | $ | — | $ | — | ||||||
| �� |
|
|
|
|
|
| ||||||
| * | Fund has recouped all eligible expenses during the period. The Six Circles Ultra Short Duration Fund and the Six Circles Tax Aware Ultra Short Duration Fund recouped $256,000 and $261,000 respectively. |
H. Cross Trades — The Funds may participate in purchase and sale transactions with the Funds or other funds or accounts that have a common investment adviser (orSub-Adviser), commonly referred to as “cross trades.” These cross trades are executed in accordance with procedures adopted by the Trust’s Board and comply with Rule17a-7 of the 1940 Act, which require, among other things, that such cross trades be effected at the independent current market price of the security. During the six months ended June 30, 2019, the aggregate value of purchases and sale cross trades with other funds or accounts, including those entered bySub-Advisers, were as follows (amounts in thousands):
| Fund Name | Purchases | Sales | ||||||
Six Circles U.S. Unconstrained Equity Fund | $ | 159,203 | $ | 123,186 | ||||
Six Circles International Unconstrained Equity Fund | 190,247 | 45,631 | ||||||
There were no cross trades between the Funds during the period.
4. Investment Transactions
During the six months ended June 30, 2019, purchases and sales of investments (excluding short-term investments) were as follows (amounts in thousands):
| Purchases (excluding U.S. Government) | Sales (excluding U.S. Government) | Purchases of U.S. Government | Sales of U.S. Government | |||||||||||||
Six Circles Ultra Short Duration Fund | $ | 211,523 | $ | 82,253 | $ | 105,225 | $ | 71,811 | ||||||||
Six Circles Tax Aware Ultra Short Duration Fund | 359,522 | 170,956 | 111,704 | 93,150 | ||||||||||||
Six Circles U.S. Unconstrained Equity Fund | 6,598,460 | 2,159,620 | — | — | ||||||||||||
Six Circles International Unconstrained Equity Fund | 5,226,891 | 2,965,364 | — | — | ||||||||||||
5. Risks, Concentrations and Indemnifications
In the normal course of business, the Funds enter into contracts that contain a variety of representations which provide general indemnifications. The Funds’ maximum exposure under these arrangements is unknown. The amount of exposure would depend on future claims that may be made against the Funds that have not yet occurred. However, based on experience, the Funds expect the risk of loss to be remote.
Since the Funds arenon-diversified, they may invest a greater percentage of their assets in a particular issuer or group of issuers than a diversified fund would. This increased investment in fewer issuers may result in the Funds` shares being more sensitive to economic results among those issuing the securities.
| JUNE 30, 2019 | SIX CIRCLES TRUST | 89 | ||||||
Table of Contents
NOTES TO FINANCIAL STATEMENTS
AS OF JUNE 30, 2019 (Unaudited) (continued)
The Six Circles International Unconstrained Equity Fund may have elements of risk not typically associated with investments in the United States of America due to concentrated investments in a limited number of countries or regions, which may vary throughout the period depending on the Funds. Such concentrations may subject the Funds to additional risks resulting from political or economic conditions in such countries or regions and the possible imposition of adverse governmental laws or currency exchange restrictions could cause the securities and their markets to be less liquid and their prices to be more volatile than those of comparable U.S. securities.
As of June 30, 2019, the Six Circles International Unconstrained Equity Fund hadnon-U.S. country allocations representing greater than 10% of Net Assets as follows:
| France | Netherlands | Switzerland | United Kingdom | |||
| 14.0% | 11.5% | 19.1% | 20.8% |
As of June 30, 2019, a significant portion of the Six Circles International Unconstrained Equity Fund’s net assets consisted of securities that were denominated in foreign currencies. Changes in currency exchange rates will affect the value of, and investment income from, such securities.
Six Circles Ultra Short Duration Fund and Six Circles Tax Aware Ultra Short Duration Fund are subject to risks associated with securities with contractual cash flows including asset-backed and mortgage related securities such as collateralized mortgage obligations, mortgage pass-through securities and commercial mortgage-backed securities, including securities backed bysub-prime mortgage loans. The value, liquidity and related income of these securities are sensitive to changes in economic conditions, including real estate value,pre-payments, delinquencies and/or defaults, and may be adversely affected by shifts in the market’s perception of the issuers and changes in interest rates.
The Six Circles Ultra Short Duration Fund and Six Circles Tax Aware Ultra Short Duration Fund may be subject to leveraging risk, which is the risk that certain transactions of the Fund, such as loans of portfolio securities, and the use of when-issued, delayed delivery or forward commitment transactions, or derivative instruments, may give rise to leverage, magnifying gains and losses and causing the Fund to be more volatile than if it had not been leveraged.
Six Circles Ultra Short Duration Fund and Six Circles Tax Aware Ultra Short Duration Fund may invest in high yield securities that are not rated or rated below investment grade (commonly known as “junk bonds”). These securities are considered to be high risk investments. Investments in lower-rated securities or unrated securities of comparable quality tend to be more sensitive to economic conditions than higher rated securities. Junk bonds involve a greater risk of default by the issuer because such securities are generally unsecured and are often subordinated to other creditors’ claims. The market price of these securities can change suddenly and unexpectedly. As a result, the Funds are intended for investors who are able and willing to assume a high degree of risk.
The Funds are subject to the risk that, should the Funds decide to sell an illiquid investment when a ready buyer is not available at a price the Funds deem to be representative of its value, the value of the Funds’ net assets could be adversely affected.
The Funds may also invest in shares of other investment companies and ETFs. ETFs are ownership interests in unit investment trusts, depositary receipts, and other pooled investment vehicles that hold a portfolio of securities or stocks designed to track the price performance and dividend yield of a particular broad-based, sector or international index. ETFs include a wide range of investments. Shareholders bear both their proportionate share of the Fund’s expenses and similar expenses of the underlying investment company or ETF when the Fund invests in shares of another investment company or ETF. The Fund is subject to the risks associated with the ETF’s or investment company’s investments. ETFs, investment companies and other investment vehicles that invest in commodities or currencies are subject to the risks associated with direct investments in commodities or currencies. The price and movement of an ETF orclosed-end fund designed to track an index may not track the index and may result in a loss. In addition,closed-end funds that trade on an exchange often trade at a price below their net asset value (also known as a discount). Certain ETFs orclosed-end funds traded on exchanges may be thinly-traded and experience large spreads between the “ask” price quoted by a seller and the “bid” price offered by a buyer.
Derivatives may be riskier than other types of investments because they may be more sensitive to changes in economic or market conditions than other types of investments and could result in losses that significantly exceed each Fund’s original investment. Many derivatives create leverage thereby causing the Funds to be more volatile than they would have been if they had not used derivatives. Derivatives also expose the Funds to counterparty risk (the risk that the derivative counterparty will not fulfill its contractual obligations), including credit risk of the derivative counterparty.
The Funds are also subject to counterparty credit risk, which is the risk that a counterparty fails to perform on agreements with the Funds such as swap contracts and forward foreign currency exchange contracts.
The Funds are subject to interest rate and credit risk. The value of debt securities may decline as interest rates increase. The Funds could lose money if the issuer of a fixed income security is unable to pay interest or repay principal when it is due. The Fund may invest in variable and floating rate securities. Although these instruments are generally less sensitive to interest rate changes than fixed rate instruments, the value of variable and floating rate securities may decline if their interest rates do not rise as quickly, or as much, as general interest rates. Many factors can cause interest rates to rise. Some examples include central bank monetary policy, rising inflation rates and general economic conditions. The ability of the issuers of debt to meet their obligations may be affected by the economic and political developments in a specific industry or region.
| 90 | SIX CIRCLES TRUST | JUNE 30, 2019 | ||||
Table of Contents
The Six Circles Tax Aware Ultra Short Duration Fund invests primarily in a portfolio of debt obligations issued by states, territories and possessions of the United States and by the District of Columbia, and by their political subdivisions and duly constituted authorities. These debt obligations may be insured by private insurers who guarantee the payment of principal and interest in the event of issuer default. The value of these investments may be impacted by changes to bond insurers’ ratings and the Fund’s ability to collect principal and interest in the event of an issuer’s default may be limited if the private insurer does not have the wherewithal to satisfy its obligation.
6. Income Taxes and Distributions to Shareholders
For Federal income tax purposes, the estimated cost and unrealized appreciation (depreciation) in value of investments held at June 30, 2019 were as follows (amounts in thousands):
| Aggregate Tax Cost | Gross Unrealized Appreciation | Gross Unrealized Depreciation | Net Unrealized Appreciation (Depreciation) | |||||||||||||
Six Circles Ultra Short Duration Fund | $ | 1,145,761 | $ | 6,741 | $ | (3,998 | ) | $ | 2,743 | |||||||
Six Circles Tax Aware Ultra Short Duration Fund | 1,288,352 | 7,174 | (3,890 | ) | 3,284 | |||||||||||
Six Circles U.S. Unconstrained Equity Fund | 9,836,219 | 588,650 | (265,770 | ) | 322,880 | |||||||||||
Six Circles International Unconstrained Equity Fund | 4,946,142 | 264,556 | (134,487 | ) | 130,069 | |||||||||||
As of December 31, 2018, the following Funds had the following post-enactment net capital loss carryforwards (amounts in thousands):
| Capital Loss Carryforward Character | ||||||||
| Short-Term | Long-Term | |||||||
Six Circles Ultra Short Duration Fund | $ | 693 | $ | 1,322 | ||||
Six Circles Tax Aware Ultra Short Duration Fund | 693 | 1,336 | ||||||
Six Circles International Unconstrained Equity Fund | 10,548 | 3,408 | ||||||
Net capital losses incurred after October 31 within the taxable year are deemed to arise on the first business day of the Funds’ next taxable year. For the year ended December 31, 2018 the Funds deferred to January 1, 2019 the following specified ordinary losses and net capital losses of (amounts in thousands):
| Net Capital Loss | Specified Ordinary Loss | |||||||||||
| Short-Term | Long-Term | |||||||||||
Six Circles U.S. Unconstrained Equity Fund | $ | 17,866 | — | $ | — | |||||||
Six Circles International Unconstrained Equity Fund | — | — | 100 | |||||||||
7. Ownership Concentration
As of June 30, 2019, each of the Funds had one affiliated omnibus account for the benefit of its clients which owned 100% of its outstanding shares.
8. Recent Accounting Pronouncements
In March 2017, the Financial Accounting Standards Board (“FASB”) issued Accounting Standards Update (“ASU”)2017-08 (“ASU2017-08”) Premium Amortization on Purchased Callable Debt Securities, which shortens the premium amortization period for purchasednon-contingently callable debt securities. ASU2017-08 requires that the premium be amortized to the earliest call date, for purchasednon-contingently callable debt securities. ASU2017-08 is effective for the fiscal years, and interim periods within those fiscal years, beginning after December 15, 2018. Management is currently evaluating the implications of these changes on the financial statements, if any.
In August 2018, FASB issued Accounting Standards UpdateNo. 2018-13, “Fair Value Measurement (Topic 820: Disclosure Framework — Changes to the Disclosure Requirements for Fair Value Measurement” (“ASU2018-13”). ASU2018-13 eliminates the requirement to disclose the amount of and reasons for transfers between Level 1 and Level 2 of the fair value hierarchy, the timing of transfers between levels of the fair value hierarchy and the valuation processes for Level 3 fair value measurements. ASU2018-13 does not eliminate the requirement to disclose the range and weighted average used to develop significant unobservable inputs for Level 3 fair value measurements, and the changes in unrealized gains and losses for recurring Level 3 fair value measurements. ASU2018-13 requires that information is provided about the measurement uncertainty of Level 3 fair value measurements as of the reporting date. The guidance is effective for fiscal years, and interim periods within those fiscal years, beginning after December 15, 2019. Management has early adopted the above guidance and determined there to be no impact on the current period financial statements.
9. Subsequent Events
The Funds have evaluated subsequent events through the date of issuance of this report and have determined that there are no material events that need disclosure.
| JUNE 30, 2019 | SIX CIRCLES TRUST | 91 | ||||||
Table of Contents
SCHEDULE OF SHAREHOLDER EXPENSES
(Unaudited)
Hypothetical $1,000 Investment
As a shareholder of the Funds, you incur two types of costs: (1) transaction costs, including sales charges (loads) on purchase payments and redemption fees and (2) ongoing costs, including investment advisory fees, administration fees, distribution fees and other Fund expenses. The examples below are intended to help you understand your ongoing costs (in dollars) of investing in the Funds and to compare these ongoing costs with the ongoing costs of investing in other mutual funds. The examples assume that you had a $1,000 investment in each fund at the beginning of the reporting period, January 1, 2019, and continued to hold your shares at the end of the reporting period, June 30, 2019.
Actual Expenses
For each Fund in the table below, the first line provides information about actual account values and actual expenses. You may use the information in this line, together with the amount you invested, to estimate the expenses that you paid over the period. Simply divide your account value by $1,000 (for example, an $8,600 account value divided by $1,000 = 8.6), then multiply the result by the number in the first line
under the heading entitled “Expenses Paid During the Period” to estimate the expenses you paid on your account during this period.
Hypothetical Example for Comparison Purposes
The second line in the table below provides information about hypothetical account values and hypothetical expenses based on the Fund’s actual expense ratio and an assumed rate of return of 5% per year before expenses, which is not the actual return. The hypothetical account values and expenses may not be used to estimate the actual ending account balance or expenses you paid for the period. You may use this information to compare the ongoing costs of investing in the Fund and other funds. To do so, compare this 5% hypothetical example with the 5% hypothetical examples that appear in the shareholder reports of the other funds. Please note that the expenses shown in the table are meant to highlight your ongoing costs only and do not reflect any transaction costs, such as sales charges (loads) or redemption fees. Therefore, the second line in the table is useful in comparing ongoing costs only, and will not help you determine the relative total costs of owning different funds. In addition, if these transaction costs were included, your costs would have been higher. The examples also assume all dividends and distributions have been reinvested.
| Beginning Account Value January 1, 2019 | Ending Account Value June 30, 2019 | Expenses Paid During the Period* | Annualized Expense Ratio | |||||||||||||
Six Circles Ultra Short Duration Fund | ||||||||||||||||
Actual | $ | 1,000.00 | $ | 1,015,90 | $ | 1.60 | 0.32 | % | ||||||||
Hypothetical | 1,000.00 | 1,023.21 | 1.61 | 0.32 | ||||||||||||
Six Circles Tax Aware Ultra Short Duration Fund | ||||||||||||||||
Actual | 1,000.00 | 1,011.10 | 1.40 | 0.28 | % | |||||||||||
Hypothetical | 1,000.00 | 1,023.41 | 1.40 | 0.28 | ||||||||||||
Six Circles U.S. Unconstrained Equity Fund | ||||||||||||||||
Actual | 1,000.00 | 1,148.10 | 0.41 | 0.08 | % | |||||||||||
Hypothetical | 1,000.00 | 1,024.41 | 0.39 | 0.08 | ||||||||||||
Six Circles International Unconstrained Equity Fund | ||||||||||||||||
Actual | 1,000.00 | 1,148.20 | 0.69 | 0.13 | % | |||||||||||
Hypothetical | 1,000.00 | 1,024.15 | 0.65 | 0.13 | ||||||||||||
| * | Expenses are equal to each Fund’s respective annualized expense ratio, multiplied by the average account value over the period, multiplied by 181/365 (to reflect theone-half year period). |
| 92 | SIX CIRCLES TRUST | JUNE 30, 2019 | ||||
Table of Contents
BOARD REVIEW AND APPROVAL OF PROPOSED AMENDMENT TO THE BLACKROCKSUB-ADVISORY AGREEMENT
The Board of Trustees (the “Board” or the “Trustees”) of the Six Circles Trust (the “Trust”), including the Trustees who are not “interested persons” (as defined in the Investment Company Act of 1940, as amended, the “1940 Act”) of J.P. Morgan Private Investments Inc. (“JPMPI” or the “Adviser”), BlackRock (as defined below) or their affiliates (the “Independent Trustees”) met in person on March 29, 2019 (the “Meeting”) to consider and approve a proposed amendment to the InvestmentSub-Advisory Agreement (the “BlackRockSub-Advisory Agreement”) between JPMPI and BlackRock Investment Management, LLC (“BlackRock”) forsub-advisory services provided to the Six Circles U.S. Unconstrained Equity Fund, the Six Circles International Unconstrained Equity Fund, the Six Circles Managed Equity Portfolio U.S. Unconstrained Equity Fund, and the Six Circles Managed Equity Portfolio International Unconstrained Equity Fund, (each an “Equity Fund” and together, the “Equity Funds”). At the Meeting, the Board, including the Independent Trustees, unanimously approved the amendment to the BlackRockSub-Advisory Agreement.
Set forth below is a summary of the material factors evaluated by the Board that formed the basis for the Board’s approval of the amendment to the BlackRockSub-Advisory Agreement. The Board’s conclusions as to the approval of the amendment to the BlackRockSub-Advisory Agreement were based on a comprehensive consideration of all information provided to the Trustees. In deciding to approve the amendment to the BlackRockSub-Advisory Agreement, the Board did not identify any single factor or particular information that, in isolation, was controlling. Some of the factors that figured particularly in the Boards’ deliberations are described below, although individual Trustees may have evaluated the information presented differently from one another, attributing different weights to various factors.
Materials Reviewed.It was noted that the purpose of the proposed amendment to the BlackRockSub-Advisory agreement was to increase thesub-advisory fee thereunder in connection with BlackRock providing portfolio transition management services to the Equity Funds, utilizing the expertise of its specialized transition management team (the “TRIM Team”), and that the amendment would not otherwise change the nature of thesub-advisory services currently provided by BlackRock or otherwise alter the terms of the current agreement. In considering the approval of the amendment to the BlackRockSub-Advisory Agreement, the Board took into account the wide variety of materials relating to the services currently provided by BlackRock that was furnished for the June and November 2018 Board meetings, including a memorandum provided by Ropes & Gray (“Ropes & Gray”) counsel to the Independent Trustees, regarding the responsibilities of the Trustees in considering the approval of advisory andsub-advisory agreements. The Board also took into account the information provided by BlackRock and JPMPI prior to the Meeting regarding the portfolio transition management services proposed to be provided by
Blackrock, the presentations relating thereto made during the Meeting, and the extensive discussions thereon before and during the Meeting. In that regard, the Board reviewed information related to the proposed amendment to the BlackRockSub-Advisory Agreement, including information related to the capabilities of the TRIM Team and the expanded services to be provided by BlackRock. They also reviewed comparative fee and expense information with respect to peer funds prepared by Broadridge Financial Solutions (“Broadridge”). The Board had previously reviewed information relating to, among other things, the Equity Funds’ operations, including the compliance program of BlackRock, valuation oversight, and other information related to personnel of BlackRock that provide investment management services to the Equity Funds.
Representatives of BlackRock also participated in the Meeting, at which the Board discussed the proposed amendment to the BlackRockSub-Advisory Agreement. The Independent Trustees also discussed the proposed amendment in an executive session of the Meeting with Ropes & Gray at which no representatives of JPMPI or BlackRock were present.
Review Process.In connection with the approval of the amendment to the BlackRockSub-Advisory Agreement, the Board reviewed written materials provided by JPMPI, which included, among other things, comparative fee data prepared by Broadridge, an independent provider of investment company performance and fee and expense data. The Board also previously requested and received assistance and advice regarding applicable legal standards from Ropes & Gray. The Board additionally considered the written information previously provided by BlackRock in response to the Boards’ prior request for information, and other information provided by JPMPI. The Board also heard oral presentations on matters related to the amendment to the BlackRockSub-Advisory Agreement. In deciding to approve the amendment to the BlackRockSub-Advisory Agreement, the Trustees did not identify any single factor or particular information that, in isolation, was controlling.
Nature, Extent and Quality of Services.The Board considered the depth and quality of the investment management process of BlackRock, including the experience and capabilities of its senior management, investment and other personnel (including the TRIM Team). The Board had previously considered the overall financial strength and stability of the organization.
The Board considered thesub-advisory services currently provided, as well as those additional transition services proposed to be provided, by BlackRock to the Equity Funds. The Board also considered information about BlackRock’s investment personnel responsible for providing services under the BlackRockSub-Advisory Agreement, including personnel on the TRIM Team. The Board noted that they had previously reviewed the nature and quality of BlackRock’s investment management, trading, risk management, compliance capabilities and
| JUNE 30, 2019 | SIX CIRCLES TRUST | 93 | ||||||
Table of Contents
BOARD REVIEW AND APPROVAL OF PROPOSED AMENDMENT TO THE BLACKROCKSUB-ADVISORY AGREEMENT(continued)
resources, research capabilities, and the experience and capabilities of its portfolio management personnel, and its overall financial strength. The Board noted the certificates previously received from BlackRock regarding both its compliance program and code of ethics, which noted that BlackRock had compliance policies and procedures in place that were reasonably designed to prevent violations of the federal securities laws with respect to the services provided by BlackRock and that BlackRock had adopted a code of ethics that included provisions reasonably necessary to prevent access persons from (i) engaging in certain specified conduct and (ii) violating the code of ethics.
Ultimately, the Board concluded that the nature, extent and quality of services to be provided by BlackRock under the amendedSub-Advisory Agreement were likely to benefit the Equity Funds and their shareholders.
Investment Performance.The Board noted that they had considered the manner in which BlackRock has managed the Six Circles U.S. Unconstrained Equity Fund and the Six Circles International Unconstrained Equity Fund to date, and the manner in which BlackRock has proposed to manage the Six Circles Managed Equity Portfolio U.S. Unconstrained Equity Fund and the Six Circles Managed Equity Portfolio International Unconstrained Equity Fund , as well as BlackRock’s performance records in managing accounts similar to the strategies they use to manage the Six Circles U.S. Unconstrained Equity Fund and the Six Circles International Unconstrained Equity Fund, and will use to manage the Six Circles Managed Equity Portfolio U.S. Unconstrained Equity Fund and the Six Circles Managed Equity Portfolio International Unconstrained Equity Fund, as applicable, as described in the materials provided for the June and November 2018 Board meetings. The Board also previously discussed the background and experience of BlackRock and its personnel. The Board also discussed the experience of the TRIM Team that will be assisting with the Equity Funds. The Board concluded that based on the experience of BlackRock, the Adviser had a reasonable expectation of delivering acceptable performance to shareholders of the Equity Funds.
Advisory Fees and Total Expenses.It was noted that the Board had previously reviewed and approved the retention of BlackRock assub-adviser to the Equity Funds at the June and November 2018 Board meetings, at which time the Board had unanimously determined that the proposed fee structures were reasonable, fair and equitable and, in light of the matters that the Board considered to be relevant in the exercise of their reasonable judgment, approved the BlackRockSub-Advisory Agreement for each Equity Fund.
JPMPI reported to the Board that, in proposing the amendment to the BlackRockSub-Advisory Agreement, JPMPI considered a number of factors, including the implementation of the TRIM Team into the investment process for the Equity Funds, the
type and complexity of the services to be provided, the estimated cost of providing services, the competitive marketplace for financial products, and the attractiveness of potential returns to prospective investors in the Equity Funds.
The Board next reviewed the proposed amended fee schedule under the BlackRockSub-Advisory Agreement for the Equity Funds. The Board noted that JPMPI had: (1) agreed to contractually reimburse expenses for the Equity Funds to the extent the total expense ratio for each Equity Fund exceeded a certain specified limit; and (2) agreed to contractually waive any advisory fees that exceeded the aggregate advisory fees JPMPI is contractually required to pay to BlackRock. The Board considered how these agreements would affect the expenses borne by Equity Fund shareholders. It was noted that JPMPI does not retain any of the advisory fees it receives from each Equity Fund under the advisory agreement, but rather waives its advisory fees to the extent that they exceed the aggregatesub-advisory fees JPMPI is contractually required to pay thesub-advisers to such Equity Fund (“Contractual Management Fee Waiver”). The Board further noted that an increase in BlackRock’ssub-advisory fees paid by JPMPI would in effect reduce the amount of JPMPI’s Contractual Management Fee Waiver, which would in turn increase the Equity Funds’ expense ratios and expenses paid by shareholders by the amount of the one basis point increase in BlackRock’ssub-advisory fees.
The Board reviewed the proposed advisory fee and estimated total expenses of each Equity Fund (each as a percentage of average net assets) and compared such amounts with the average and median fees and expense levels of other similar funds, assuming that the proposedsub-advisory fee was adopted. With respect to advisory fees, the Board reviewed data from Broadridge that compared the average and median advisory fees of other funds in a peer group of comparable funds, as well as the universe of other similar funds. The Board compared each of the Equity Fund’s estimated total expenses to other funds in the applicable peer group provided by Broadridge and found the total expenses of each Fund to be reasonable. The Trustees noted that the Broadridge information showed that the proposed advisory fee for each Equity Fund was in the low to middle range of the applicable Broadridge peer group and universe. They further noted that the estimated total expense ratio for each Equity Fund was also within the low range of total expenses, when taking into account the proposedsub-advisory fee increase together with the fee waiver and expense reimbursement arrangements in place for each Equity Fund. The Trustees also found the proposed increasedsub-advisory fees to be paid by JPMPI to BlackRock to be reasonable, noting that JPMPI compensates BlackRock out of the advisory fee it receives from the Equity Funds, although they also noted that Fund shareholders would bear additional net expenses as a result of the amendment to the BlackRockSub-Advisory Agreement as described above. The Trustees noted the most-favored nation provisions agreed to by
| 94 | SIX CIRCLES TRUST | JUNE 30, 2019 | ||||
Table of Contents
BlackRock, which should help ensure thesub-advisory fee rates charged are at least equal to the range of fees BlackRock charges to similar clients.
Based on the information presented by JPMPI, BlackRock, and Broadridge, the Trustees determined that the level of thesub-advisory fees to be paid by JPMPI to BlackRock, including the proposedsub-advisory fee increase, as well as the estimated total expenses of each Equity Fund, are reasonable, fair and equitable and that approval of the amendment to the BlackRockSub-Advisory Agreement would likely benefit each Equity Fund and its shareholders.
Adviser Costs, Level of Profits and Economies of Scale.As the Equity Funds are recently organized, information regarding JPMPI’s and BlackRock’s actual costs in providing services to the Equity Funds for an annual period was not available.
The Board considered the estimated profits to be realized by JPMPI in connection with the operation of the Equity Funds based in part on profitability estimates for the Equity Funds included in the materials provided for the June and November 2018 Board meetings, and whether the amount of estimated profit represented a fair entrepreneurial profit for the management of the Equity Funds. The Board also considered the Equity Funds’ current operating expenses and the Six Circles Managed Equity Portfolio U.S. Unconstrained Equity Fund’s and the Six Circles Managed Equity Portfolio International Unconstrained Equity Fund’s estimated operating expenses and the expected impact of the increased BlackRocksub-advisory fee on the Adviser’s estimated profits. The Board considered that due to the Contractual Management Fee Waiver, it is not expected that the increase in BlackRock’ssub-advisory fees will affect JPMPI’s profitability with respect to the Equity Funds. The Board further noted that JPMPI did not expect to be profitable with respect to the Equity Funds during their first full year of operations.
The Board further noted that the proposed amendedsub-advisory fee rates to be paid by JPMPI to BlackRock do not include break points.
Ultimately, the Board concluded that each Equity Fund’s proposed fee and expense structure, taking into account the amendment to the BlackRockSub-Advisory Agreement is reasonable, fair and equitable.
Ancillary Benefits.The Board previously considered whether BlackRock or any of its affiliates may receive other benefits as a result of BlackRock’s proposed relationship with JPMPI, the Trust or the Equity Funds. The Board considered that BlackRock was not affiliated with any of the Equity Funds’ service providers, and therefore would not benefit from those contractual relationships. Taking this consideration into account, the Board concluded that BlackRock and its affiliates would not receive collateral benefits that would materially affect the reasonableness of the proposedsub-advisory fees under the proposed amendment to the BlackRockSub-Advisory Agreement.
Conclusions.Having requested and received such information from the Adviser and BlackRock as the Board believed to be reasonably necessary to evaluate the terms of the proposed amendment to the BlackRockSub-Advisory Agreement, the Board, including the Independent Trustees, unanimously concluded that the proposedsub-advisory fee structure, as amended, was reasonable and, in light of the matters that the Board had considered to be relevant in the exercise of their reasonable judgment, approved the amendment to the BlackRockSub-Advisory Agreement for each Equity Fund.
Liquidity Risk Management Program
The Funds have adopted and implemented a written Liquidity Risk Management Program (“Liquidity Program”) designed to reasonably assess and manage the Funds’ liquidity risk pursuant to Rule22e-4. The Liquidity Program was reviewed and approved by the Board in May 2019. As the Liquidity Program has been operating only for a short time, it is too early to appropriately assess its operation and effectiveness.
| JUNE 30, 2019 | SIX CIRCLES TRUST | 95 | ||||||
Table of Contents
The Six Circles Funds are distributed by Foreside Fund Services, LLC a member of FINRA.
Contact Six Circles Funds collect at 1-212-464-2070 for a fund prospectus. You can also visit us at www.sixcirclesfunds.com. Investors should carefully consider the investment objectives and risk as well as charges and expenses of the Six Circles Funds before investing. The prospectus contains this and other information about the Six Circles Funds. Read the prospectus carefully before investing.
The Six Circles Funds file complete schedules of their fund holdings for the first and third quarters of their fiscal year with the SEC on Form N-PORT. The Six Circles Funds’ Forms N-PORT are available on the SEC’s website at http://www.sec.gov. Shareholders may request a Form N-PORT without charge by calling collect at 1-212-464-2070 or by visiting the Six Circles Funds’ website at www.sixcirclesfunds.com/literature.
A description of the Six Circles Funds’ policies and procedures with respect to the disclosure of the Six Circles Funds’ holdings is available in the prospectuses and Statements of Additional Information.
A copy of proxy policies and procedures is available without charge upon request by calling collect 1-212-464-2070 and on the Six Circles Funds’ website at www.sixcirclesfunds.com. A description of such policies and procedures is on the SEC’s website at www.sec.gov. The Trustees have delegated the authority to vote proxies for securities owned by the Fund to the Adviser, and the Adviser in turn has delegated such authority to the Sub-Advisers. A copy of the Six Circles Funds’ voting record for the most recent 12-month period ended June 30 will be available on the SEC’s website at www.sec.gov or at the Six Circles Funds’ website at www.sixcirclesfunds.com no later than August 31 of each year. The Six Circles Funds’ proxy voting record will include, among other things, a brief description of the matter voted on for each fund security, and will state how each vote was cast, for example, for or against the proposal.
©JPMorgan Chase & Co. 2019. All rights reserved. June 30, 2019.
Table of Contents
Semi-Annual Report
SIX CIRCLESSM FUNDS
June 30, 2019
Six Circles Managed Equity Portfolio U.S. Unconstrained Fund
Six Circles Managed Equity Portfolio International Unconstrained Fund
Beginning on February 1, 2021, as permitted by regulations adopted by the Securities and Exchange Commission, paper copies of the Six Circles Funds’ shareholder reports will no longer be sent by mail, unless you specifically request paper copies of the reports from a Fund. Instead, the reports will be made available on the Funds’ website (www.sixcirclesfunds.com/literature), and you will be notified by mail each time a report is posted and provided with a website link to access the report.
If you already elected to receive shareholder reports electronically, you will not be affected by this change and you need not take any action. You may elect to receive shareholder reports and other communications from a Fund by contacting your J.P. Morgan representative or by calling us collect at1-212-464-2070.
You may elect to receive all future reports in paper free of charge. You can inform the Funds that you wish to continue receiving paper copies of your shareholder reports by contacting your J.P. Morgan representative or by calling us collect at1-212-464-2070. Your election to receive reports in paper will apply to all Six Circles Funds.
 |
Table of Contents
Investments in a Fund are not deposits or obligations of, or guaranteed or endorsed by, any bank and are not insured or guaranteed by the FDIC, the Federal Reserve Board or any other government agency. You could lose money if you sell when a Fund’s share price is lower than when you invested.
Past performance is no guarantee of future performance. The general market views expressed in this report are opinions based on market and other conditions through the end of the reporting period and are subject to change without notice. These views are not intended to predict the future performance of a Fund or the securities markets. References to specific securities and their issuers are for illustrative purposes only and are not intended to be, and should not be interpreted as, recommendations to purchase or sell such securities. Such views are not meant as investment advice and may not be relied on as an indication of trading intent on behalf of any Fund.
For more complete information about the Funds, including the Funds’ objectives, risks, charges and expenses, call your J.P. Morgan representative or call1-212-464-2070 or go to www.sixcirclesfunds.com for a prospectus. Read the prospectus carefully. An investment in these Funds and any other Fund is not designed to be a complete investment program. The Funds are NOT designed to be used as stand-alone investments.
Table of Contents
JUNE 30, 2019 (Unaudited)
Dear Shareholder,
In 2018, J.P. Morgan Private Bank introduced Six Circles Funds, a suite of mutual funds designed for exclusive use in its discretionary portfolios. In 2019, the suite expanded with the addition of Six Circles Managed Equity Portfolio U.S. Unconstrained Fund and Six Circles Managed Equity Portfolio International Unconstrained Fund, which were created specifically for use in the J.P. Morgan Managed Equity Portfolios.
As markets become more complex, specialization matters even more. Each of the Six Circles Funds is designed to provide access to a broader range of strategies and more precise implementation of our desired exposures. For example, Six Circles Funds allows us to implement our views, more precisely, by targeting sub-sectors. The Funds allow us to invest where we have stronger conviction, such as U.S. Internet U.S. Internet Retail, versus investing in the broader Technology sector.
J.P. Morgan Private Investments Inc. (“JPMPI”), an affiliate of J.P. Morgan, acts as investment adviser to the funds and engages third party investment managers as sub-advisors to oversee the different exposures in these Funds. JPMPI partners
with third party managers with demonstrated asset class specialization to sub-advise the Funds in accordance with our investment philosophy; BlackRock is the current Sub-Adviser.
The Six Circles Funds are purposefully constructed as completion funds, and are not meant to be standalone investments. As such, we believe they should be reviewed and evaluated within the context of your broader portfolio.
On the following pages, you will find our Market Outlook and Fund commentaries. Should you have any questions about the Funds, please contact your J.P. Morgan team, visit the Fund’s website at www.sixcirclesfunds.com or call 212-464-2070.
Sincerely,

Mary Savino
President, Six Circles Funds
| JUNE 30, 2019 | SIX CIRCLES TRUST | 1 | ||||||
Table of Contents
As of June 30, 2019 (Unaudited)
Global equity markets provided positive returns in the first half of 2019. In Q1 2019, U.S. equities rebounded from their Q4 2018 lows and continued the rise in Q2, with the MSCI USA Index up 18.79% through the first six months of the year. Developednon-U.S. and emerging markets equities also closed in positive territory, with the MSCI Worldex-USA Index up 14.64% and the MSCI Emerging Markets Index up 10.6%.
Bond and cash markets broadly underperformed equities; the Bloomberg Barclays1-3 Month U.S. Treasury Bill Index returned 1.22%, the Bloomberg Barclays Global Aggregate Hedged Index returned 5.82%, and the MSCI World Index returned about 17.56% for the first half of the year.
With the Fed hiking rates four times in 2018 and labor markets remaining tight, the Fed kept its benchmark policy rate range
unchanged from Q4 2018 at 2.25% to 2.5%. Following its mid-June meeting, the Federal Open Market Committee stated that uncertainties about the outlook had increased, and indicated that it would continue to closely monitor economic data and take appropriate action to “sustain the expansion.” The European Central Bank and Bank of Japan continue to maintain accommodative policies.
The Adviser continues to believe the current economic cycle is in its later stages. While the recent pivot by the Fed towards a more dovish stance may extend the length of the cycle, ongoing trade tensions and other geopolitical risks may threaten future economic growth.
| 2 | SIX CIRCLES TRUST | JUNE 30, 2019 | ||||
Table of Contents
Six Circles Managed Equity Portfolio U.S. Unconstrained Fund
Period April 10, 2019 (Fund Inception Date) Through June 30, 2019 (Unaudited)
| REPORTING PERIOD RETURN | ||||
| Fund (Since Inception)* | 1.10% | |||
| MSCI USA Index (Since Inception) | 2.25% | |||
| Net Assets as of 6/30/2019 (In Thousands) | $ | 1,169,304 | ||
INVESTMENT OBJECTIVES AND STRATEGY**
Six Circles Managed Equity Portfolio U.S. Unconstrained Fund (the “Fund”) seeks to provide capital appreciation. Invest at least 80% of its net assets in equity securities issued by U.S. companies and other instruments with economic characteristics similar to equity securities issued by U.S. companies. The Fund is generally unconstrained by any particular capitalization, style or industry, sector.
INVESTMENT APPROACH
The Fund was launched on April 10, 2019. J.P. Morgan Private Investments Inc., the Fund’s investment adviser (“JPMPI” or the “Adviser”), actively allocates the Fund’s investments among a range of indexed investment strategies that are managed by the currentsub-adviser, BlackRock Investment Management, LLC (the“Sub-Adviser” or “BlackRock”). For each indexed investment strategy, theSub-Adviser seeks to replicate the performance of an index orsub-index selected by the Adviser. The Fund is specifically designed to serve as a completion portfolio and accomplish particular goals within discretionary Managed Equity Portfolios managed by JPMPI or its affiliates (the “Portfolios”). The Adviser utilizes the Fund to express targeted investment views, while taking into consideration positions held at the aggregate level in the broader Portfolios. As such, the Fund’s allocations and performance should be evaluated in the context of the broader Portfolios and not on a standalone basis.
WHAT WERE THE MAIN DRIVERS OF THE FUND’S PERFORMANCE?
Since its launch on April 10, 2019 through June 30, 2019, the Fund posted a positive return on an absolute basis, but underperformed relative to the MSCI USA Index (the “Index”). References to the Index are for informational purposes. The use of the Index does not imply the Fund is being managed to the Index, but rather is disclosed to allow for comparison of the Fund’s performance to that of a well-known and widely-recognized index.
Health Care and Communication Services sectors comprised approximately 41% of the Fund’s sector exposure at the end of the reporting period, and were the Fund’s largest sector overweights relative to the Index. During the reporting period, Health Care contributed to the Fund’s performance on an
absolute basis, while Communication Services detracted. Both Health Care and Communication Services sectors detracted from the Fund’s performance relative to the Index.
Industrials and Information Technology sectors comprised approximately 22% of the Fund’s sector exposure at the end of the reporting period, and were the Fund’s largest sector underweights relative to the Index. During the reporting period, both sectors contributed to the Fund’s performance on an absolute basis. Relative to the index, exposure to Information Technology contributed, while exposure to Industrials didn’t have significant impact on the Fund’s performance relative to the Index.
The Fund’s allocation to U.S. Software was the largest contributor to the Fund’s return during the reporting period, while the allocations to U.S. Biotechnology, U.S. Tobacco, and U.S. Interactive Media & Services were the largest detractors from the Fund’s return on an absolute basis during the reporting period.
HOW WAS THE FUND POSITIONED?
At the end of the reporting period, the Fund was allocated to thirteen strategies managed by oneSub-Adviser, across various sector,sub-industry, and factor exposures as follows.
| PORTFOLIO ALLOCATION*** | ||||
| U.S. Dividend Growth (BlackRock) | 15 | % | ||
| U.S. Interactive Media & Services (BlackRock) | 14 | |||
| U.S. Software (BlackRock) | 14 | |||
| U.S. Pharmaceuticals (BlackRock) | 12 | |||
| U.S. Diversified Banks (BlackRock) | 10 | |||
| U.S. Internet Retail (BlackRock) | 8 | |||
| U.S. Biotechnology (BlackRock) | 8 | |||
| U.S. Energy (BlackRock) | 5 | |||
| U.S. Managed Health Care (BlackRock) | 5 | |||
| U.S. Tobacco (BlackRock) | 4 | |||
| U.S. Aerospace & Defense (BlackRock) | 3 | |||
| U.S. Oil & Gas Exploration & Production (BlackRock) | 1 | |||
| U.S. Technology Hardware Storage & Peripherals (BlackRock) | 1 | |||
| * | The return shown is based on the net asset value calculated for shareholder transactions. Certain adjustments were made to the net assets of the Fund at June 30, 2019 for financial reporting |
| JUNE 30, 2019 | SIX CIRCLES TRUST | 3 | ||||||
Table of Contents
Six Circles Managed Equity Portfolio U.S. Unconstrained Fund
FUND COMMENTARY
Period April 10, 2019 (Fund Inception Date) Through June 30, 2019 (Unaudited) (continued)
| purposes, and as a result, the net asset value for shareholder transactions and the total return based on that net asset value may differ from the adjusted net assets and the total return for financial reporting. |
| ** | The Adviser seeks to achieve the Fund’s objective. There can be no guarantee it will be achieved. |
| *** | Percentages are based on total investments as of June 30, 2019. The portfolio allocation is subject to change. |
Allocation to U.S. Dividend Growth comprised approximately 15% of the Fund as of June 30, 2019. Within the context of the broader Portfolios, the Adviser believes that the allocation to U.S. Dividend Growth serves as a defensive anchor within the Portfolios and is one of the few defensive factors trading at what the Adviser believes is a reasonable valuation.
Allocation to U.S. Interactive Media & Services, which comprised approximately 14% of the Fund as of June 30, 2019, is trading at what the Adviser believes is a reasonable P/E.
Allocations to U.S. Software and U.S. Internet Retail provide what the Adviser believes is a multi-year opportunity for the leaders in this space to take advantage of businesses shifting workloads onto Cloud platforms. These allocations comprised approximately 22% of the Fund as of June 30, 2019.
The Adviser believes that allocation to U.S. Pharmaceuticals provides an attractive dividend yield given a meaningful valuation discount. This allocation is comprised approximately 12% of the Fund as of June 30, 2019.
Allocation to U.S. Diversified Banks is trading at what the Adviser believes to be a big valuation discount, and comprised approximately 10% of the Fund as of June 30, 2019.
The Adviser believes that the U.S. Biotechnologysub-industry also trades at a meaningful valuation discount and provides attractive dividend yield. This allocation comprised approximately 8% of the Fund as of June 30, 2019.
Allocation to U.S. Energy comprised approximately 5% of the Fund as of June 30, 2019. The Adviser believes that U.S. Energy valuations have become more attractive, after being significantly overvalued for several years.
Allocation to U.S. Managed Health Care was approximately 5% of the Fund’s exposure as of June 30, 2019 and reflects the Adviser’s conviction in thissub-industry’s potential for growth in the medium term.
Allocation to U.S. Tobacco and U.S. Aerospace & Defense comprised approximately 7% of the Fund as of June 30, 2019, reflecting what the Adviser’s believes to be defensivesub-industry exposures.
Allocation to U.S. Oil & Gas Exploration & Production comprised approximately 1% of the Fund as of June 30, 2019, reflecting the Adviser’s belief that companies have begun to rationalize their capital expenditures, potentially leading to improved returns on capital.
Allocation to U.S. Technology Hardware Storage & Peripherals, which allows the Adviser to access specific exposures within the Technology sector, was approximately 1% of the Fund as of June 30, 2019.
| 4 | SIX CIRCLES TRUST | JUNE 30, 2019 | ||||
Table of Contents
GROWTH OF $10,000 REPORT(04/10/19 to 06/30/19)
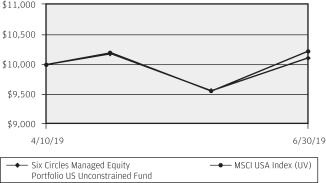
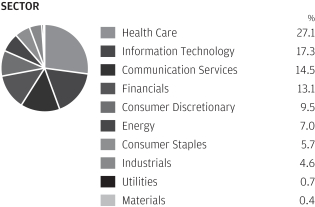
The allocation of the various strategies employed by the Fund may shift and therefore, the performance shown may not be a true indication of how the Fund may perform going forward. Performance quoted is past performance and is no guarantee of future results. Investment returns and principal value will fluctuate, so shares, when sold, may be worth more or less than original cost. Current performance may be higher or lower than returns shown. As of the latest prospectus, the gross and net expense ratios for the Fund were 0.31% and 0.10% respectively. Contact your J.P. Morgan representative or call1-212-464-2070 for the most recentmonth-end performance.
The Fund commenced operations on April 10, 2019.
The graph illustrates comparative performance for $10,000 invested in the Six Circles Managed Equity Portfolio U.S. Unconstrained Fund and the MSCI USA Index from April 10, 2019 to June 30, 2019. The performance of the Fund reflects the deduction of Fund expenses and assumes reinvestment of all dividends and capital gain distributions, if any. The performance of the MSCI USA Index does not reflect the deduction of expenses associated with a mutual fund and has been adjusted to reflect reinvestment of all dividends and capital gain distributions of the securities included in the Index, if applicable. The MSCI USA Index is designed to measure the performance of the large and mid-cap segments of the U.S. market. With 627 constituents, the index covers approximately 85% of the free float-adjusted market capitalization in the United States. Investors cannot invest directly in an index.
Fund performance may reflect the waiver of the Fund’s fees and/or reimbursement of expenses for certain periods since the inception date. Without these waivers and reimbursements, performance would have been lower. Also, performance shown in this section does not reflect the deduction of taxes that a shareholder may pay on Fund distributions or redemptions or sales of Fund shares.
The MSCI information may only be used for your internal use, may not be reproduced or redisseminated in any form and may not be used as a basis for or a component of any financial instruments or products or indices. None of the MSCI information is intended to constitute investment advice or a recommendation to make (or refrain from making) any kind of investment decision and may not be relied on as such. Historical data and analysis should not be taken as an indication or guarantee of any future performance analysis, forecast or prediction. The MSCI information is provided on an “as is” basis and the user of this information assumes the entire risk of any use made of this information. MSCI, each of its affiliates and each other person involved in or related to compiling, computing or creating any MSCI information (collectively, the “MSCI Parties”) expressly disclaims all warranties (including, without limitation, any warranties of originality, accuracy, completeness, timeliness, non-infringement, merchantability and fitness for a particular purpose) with respect this information. Without limiting any of the foregoing, in no event shall any MSCI Party have any liability for any direct, indirect, special, incidental, punitive, consequential (including, without limitation, lost profits) or any other damages. (www.msci.com)
| JUNE 30, 2019 | SIX CIRCLES TRUST | 5 | ||||||
Table of Contents
Six Circles Managed Equity Portfolio International Unconstrained Fund
FUND COMMENTARY
Period April 10, 2019 (Fund Inception Date) Through June 30, 2019 (Unaudited)
| REPORTING PERIOD RETURN | ||||
| Fund (Since Inception)* | 0.40% | |||
| MSCI World ex USA Index (Since Inception) | 1.76% | |||
| Net Assets as of 6/30/2019 (In Thousands) | $ | 669,415 | ||
INVESTMENT OBJECTIVES AND STRATEGY**
Six Circles Managed Equity Portfolio International Unconstrained Fund (the “Fund”) seeks to provide capital appreciation. Invests at least 80% of its net assets in equity securities and other instruments with economic characteristics similar to equity securities. Primarily invests in the equity securities ofnon-U.S. companies and is generally unconstrained by any particular capitalization, style or sector ornon-U.S. country.
INVESTMENT APPROACH
The Fund was launched on April 10, 2019. J.P. Morgan Private Investments Inc., the Fund’s investment adviser (“JPMPI” or the “Adviser”), actively allocates the Fund’s investments among a range of indexed investment strategies that are managed by the currentsub-adviser, BlackRock Investment Management, LLC (the“Sub-Adviser” or “BlackRock”). For each indexed investment strategy, theSub-Adviser seeks to replicate the performance of an index orsub-index selected by the Adviser. The Fund is specifically designed to serve as a completion portfolio and accomplish particular goals within discretionary Managed Equity Portfolios managed by JPMPI or its affiliates (the “Portfolios”). The Adviser utilizes the Fund to express targeted investment views, while taking into consideration positions held at the aggregate level in the Portfolios. As such, the Fund’s allocations and performance should be evaluated in the context of the broader Portfolios and not on a standalone basis.
WHAT WERE THE MAIN DRIVERS OF THE FUND’S PERFORMANCE?
Since its launch on April 10, 2019 through June 30, 2019, the Fund posted a positive return on an absolute basis, but underperformed the MSCI World ex USA Index (the “Index”). References to the Index are for informational purposes. The use of the Index does not imply the Fund is being managed to the Index, but rather is disclosed to allow for comparison of the Fund’s performance to that of a well-known and widely-recognized index.
Energy and Consumer Staples sectors comprised approximately 44% of the Fund’s sector exposure at the end of the reporting period, and were the Fund’s largest sector overweights relative to the Index. Consumer Staples contributed to the Fund’s performance on an absolute basis, as well as relative to the Index.
Energy detracted from the Fund’s performance on an absolute basis, as well as relative to the Index.
Consumer Discretionary and Industrials comprised approximately 10% of the Fund’s sector exposure at the end of the reporting period, and were the Fund’s largest sector underweights relative to the Index. Both of these sectors contributed to the Fund’s performance on an absolute basis, with Consumer Discretionary contributing and Industrials detracting from the Fund’s performance relative to the Index.
Europe and Emerging Markets comprised approximately 92% of the Fund’s regional exposure at the end of the reporting period, and were the Fund’s largest regional overweights relative to the Index. During the reporting period, Europe exposure contributed to the Fund’s performance both on an absolute basis and relative to the Index. Emerging Markets exposure detracted from the Fund’s performance on an absolute basis, as well as relative to the Index.
Asiaex-Japan, Canada, and Japan were the Fund’s largest regional underweights relative to the Index. Asiaex-Japan exposure detracted both on an absolute basis, and relative to the index. Canada exposure contributed to performance on an absolute basis, but detracted from performance relative to the Index. The Fund didn’t have exposure to Japan at the end of the reporting period, and the underweight to Japan contributed to the Fund’s performance relative to the Index.
On the sleeve level, the Fund’s allocations to Europe Food, Beverage & Tobacco and Europeex-UK Insurance were the largest contributors to the Fund’s return during the reporting period, while the allocations to Europe Enhanced Value and Europe Integrated Oil & Gas detracted from the Fund’s return on an absolute basis during the reporting period.
| 6 | SIX CIRCLES TRUST | JUNE 30, 2019 | ||||
Table of Contents
HOW WAS THE FUND POSITIONED?
At the end of the reporting period, the Fund was allocated to eight strategies managed by oneSub-Adviser, across various sector,sub-industry, and factor exposures as follows.
| PORTFOLIO ALLOCATION*** | ||||
| Europe (BlackRock) | 25 | % | ||
| Europe Integrated Oil & Gas (BlackRock) | 19 | |||
| Europe Food, Beverage & Tobacco (BlackRock) | 17 | |||
| Europe Pharmaceuticals (BlackRock) | 10 | |||
| Europe ex-UK Insurance (BlackRock) | 9 | |||
| All Countries Asia ex-Japan Mid Cap (BlackRock) | 8 | |||
| Emerging Markets Minimum Volatility (BlackRock) | 8 | |||
| Canada (BlackRock) | 4 | |||
| * | The return shown is based on the net asset value calculated for shareholder transactions. Certain adjustments were made to the net assets of the Fund at June 30, 2019 for financial reporting purposes, and as a result, the net asset value for shareholder transactions and the total return based on that net asset value may differ from the adjusted net assets and the total return for financial reporting. |
| ** | The Adviser seeks to achieve the Fund’s objective. There can be no guarantee it will be achieved. |
| *** | Percentages are based on total investments as of June 30, 2019. The portfolio allocation is subject to change. |
Within the broader Portfolios, allocation to Europe provides a broad passive European exposure, comprising approximately 25% of the Fund as of June 30, 2019.
Allocation to Europe Integrated Oil & Gas provides what the Adviser believes are attractive valuations, and comprised approximately 19% of the Fund as of June 30, 2019.
The Adviser believes that allocation to Europe Food, Beverage & Tobacco serves as a defensive anchor in the broader Portfolios while providing above-average earnings growth. This allocation was approximately 17% of the Fund as of June 30, 2019.
Allocation to Europe Pharmaceuticals comprised approximately 10% of the Fund as of June 30, 2019 and provides what the Adviser believes to be a defensive exposure with attractive fundamentals.
Allocation to Europeex-UK Insurance was approximately 9% of the Fund as of June 30, 2019 and allows the Adviser to be underweight to European Banks and UK Insurance on the broader Portfolio level, which the Adviser believes are not attractive from a fundamental perspective.
| JUNE 30, 2019 | SIX CIRCLES TRUST | 7 | ||||||
Table of Contents
Six Circles Managed Equity Portfolio International Unconstrained Fund
FUND COMMENTARY
Period April 10, 2019 (Fund Inception Date) Through June 30, 2019 (Unaudited) (continued)
Allocation to All Countries Asiaex-Japan Mid Cap provides what the Adviser believes to be a more defensive emerging markets exposure, given that it avoids the more volatile areas of emerging markets. This allocation comprised approximately 8% of the Fund as of June 30, 2019.
The Adviser believes that allocation Emerging Markets Minimum Volatility is a substitute for traditional defensive sectors which are trading at expensive valuations. Allocation Emerging Markets Minimum Volatility was approximately 8% of the Fund as of June 30, 2019.
Allocation to Canada provides what the Adviser believes to be a complement to the Canada exposure in the broader Portfolios, and comprised approximately 4% of the Fund as of June 30, 2019.
GROWTH OF $10,000 REPORT(04/10/19 to 06/30/19)
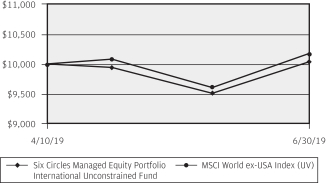
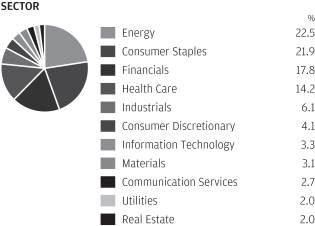
The allocation of the various strategies employed by the Fund may shift and therefore, the performance shown may not be a true indication of how the Fund may perform going forward. Performance quoted is past performance and is no guarantee of future results. Investment returns and principal value will fluctuate, so shares, when sold, may be worth more or less than original cost. Current performance may be higher or lower than returns shown. As of the latest prospectus, the gross and net expense ratios for the Fund were 0.38% and 0.18% respectively. Contact your J.P. Morgan representative or call1-212-464-2070 for the most recentmonth-end performance.
The Fund commenced operations on April 10, 2019.
The graph illustrates comparative performance for $10,000 invested in the Six Circles Managed Equity Portfolio International Unconstrained Fund and the MSCI World ex-USA Index from April 10, 2019 to June 30, 2019. The performance of the Fund reflects the deduction of Fund expenses and assumes reinvestment of all dividends and capital gain distributions, if any. The performance of the MSCI World ex-USA Index does not reflect the deduction of expenses associated with a mutual fund and has been adjusted to reflect reinvestment of all dividends and capital gain distributions of the securities included in the Index, if applicable. The MSCI World ex USA Index captures large and mid-cap representation across 22 of 23 Developed Markets (DM) countries*—excluding the United States. With 1,016 constituents, the index covers approximately 85% of the free float-adjusted market capitalization in each country. Investors cannot invest directly in an index.
Fund performance may reflect the waiver of the Fund’s fees and/or reimbursement of expenses for certain periods since the inception date. Without these waivers and reimbursements, performance would have been lower. Also, performance shown in this section does not reflect the deduction of taxes that a shareholder may pay on Fund distributions or redemptions or sales of Fund shares.
International investing has a greater degree of risk and increased volatility due to political and economic instability of some overseas markets. Changes in currency exchange rates and different accounting and taxation policies outside the U.S. can affect returns.
The MSCI information may only be used for your internal use, may not be reproduced or redisseminated in any form and may not be used as a basis for or a component of any financial instruments or products or indices. None of the MSCI information is intended to constitute investment advice or a recommendation to make (or refrain from making) any kind of investment decision and may not be relied on as such. Historical data and analysis should not be taken as an indication or guarantee of any future performance analysis, forecast or prediction. The MSCI information is provided on an “as is” basis and the user of this information assumes the entire risk of any use made of this information. MSCI, each of its affiliates and each other person involved in or related to compiling, computing or creating any MSCI information (collectively, the “MSCI Parties”) expressly disclaims all warranties (including, without limitation, any warranties of originality, accuracy, completeness, timeliness, non-infringement, merchantability and fitness for a particular purpose) with respect this information. Without limiting any of the foregoing, in no event shall any MSCI Party have any liability for any direct, indirect, special, incidental, punitive, consequential (including, without limitation, lost profits) or any other damages. (www.msci.com)
| 8 | SIX CIRCLES TRUST | JUNE 30, 2019 | ||||
Table of Contents
Six Circles Managed Equity Portfolio U.S. Unconstrained Fund
SCHEDULE OF PORTFOLIO INVESTMENTS
AS OF JUNE 30, 2019 (Unaudited)
(Amounts in U.S. Dollars, unless otherwise noted)
(Amounts in thousands, except number of shares and Futures contracts)
| SECURITY DESCRIPTION | SHARES | VALUE($) | ||||||
Common Stocks — 99.7% | ||||||||
Basic Materials — 0.3% | ||||||||
Chemicals — 0.3% | ||||||||
Air Products & Chemicals, Inc. | 2,752 | 623 | ||||||
Albemarle Corp. | 916 | 64 | ||||||
Ashland Global Holdings, Inc. | 262 | 21 | ||||||
Cabot Corp. | 602 | 29 | ||||||
Celanese Corp., Class A | 1,481 | 160 | ||||||
Eastman Chemical Co. | 2,359 | 184 | ||||||
Ecolab, Inc. | 1,633 | 322 | ||||||
HB Fuller Co. | 46 | 2 | ||||||
Innospec, Inc. | 11 | 1 | ||||||
International Flavors & Fragrances, Inc. | 941 | 137 | ||||||
Linde plc, (United Kingdom) | 5,440 | 1,092 | ||||||
NewMarket Corp. | 40 | 16 | ||||||
PolyOne Corp. | 568 | 18 | ||||||
PPG Industries, Inc. | 2,443 | 285 | ||||||
Quaker Chemical Corp. | 4 | 1 | ||||||
RPM International, Inc. | 1,348 | 82 | ||||||
Sensient Technologies Corp. | 222 | 16 | ||||||
Sherwin-Williams Co. (The) | 515 | 236 | ||||||
Valvoline, Inc. | 1,405 | 27 | ||||||
Westlake Chemical Corp. | 85 | 6 | ||||||
|
| |||||||
| 3,322 | ||||||||
|
| |||||||
Forest Products & Paper — 0.0%(g) | ||||||||
Domtar Corp. | 989 | 44 | ||||||
|
| |||||||
Iron/Steel — 0.0%(g) | ||||||||
Nucor Corp. | 6,745 | 372 | ||||||
Reliance Steel & Aluminum Co. | 816 | 77 | ||||||
Steel Dynamics, Inc. | 4,014 | 121 | ||||||
|
| |||||||
| 570 | ||||||||
|
| |||||||
Mining — 0.0%(g) | ||||||||
Kaiser Aluminum Corp. | 53 | 5 | ||||||
Royal Gold, Inc. | 235 | 24 | ||||||
|
| |||||||
| 29 | ||||||||
|
| |||||||
Total Basic Materials | 3,965 | |||||||
|
| |||||||
Communications — 23.2% | ||||||||
Advertising — 0.0%(g) | ||||||||
Interpublic Group of Cos., Inc. (The) | 8,140 | 184 | ||||||
Omnicom Group, Inc. | 3,714 | 304 | ||||||
|
| |||||||
| 488 | ||||||||
|
| |||||||
Internet — 22.1% | ||||||||
Alphabet, Inc., Class A (a) | 41,991 | 45,468 | ||||||
Alphabet, Inc., Class C (a) | 42,978 | 46,455 | ||||||
Amazon.com, Inc. (a) | 43,378 | 82,142 | ||||||
Booking Holdings, Inc. (a) | 4,541 | 8,513 | ||||||
CDW Corp. | 757 | 84 | ||||||
eBay, Inc. | 85,929 | 3,394 | ||||||
Expedia Group, Inc. | 12,929 | 1,720 | ||||||
| SECURITY DESCRIPTION | SHARES | VALUE($) | ||||||
Internet — continued |
| |||||||
Facebook, Inc., Class A (a) | 336,921 | 65,026 | ||||||
Symantec Corp. | 59,619 | 1,297 | ||||||
TripAdvisor, Inc. (a) | 14,515 | 672 | ||||||
Twitter, Inc. (a) | 102,400 | 3,574 | ||||||
|
| |||||||
| 258,345 | ||||||||
|
| |||||||
Media — 0.3% | ||||||||
Comcast Corp., Class A | 51,409 | 2,174 | ||||||
FactSet Research Systems, Inc. | 136 | 39 | ||||||
John Wiley & Sons, Inc., Class A | 334 | 15 | ||||||
Meredith Corp. | 653 | 36 | ||||||
Nexstar Media Group, Inc., Class A | 284 | 29 | ||||||
Sinclair Broadcast Group, Inc., Class A | 329 | 18 | ||||||
Walt Disney Co. (The) | 12,635 | 1,764 | ||||||
|
| |||||||
| 4,075 | ||||||||
|
| |||||||
Telecommunications — 0.8% | ||||||||
Cisco Systems, Inc. | 61,031 | 3,340 | ||||||
Corning, Inc. | 10,347 | 344 | ||||||
Motorola Solutions, Inc. | 1,143 | 191 | ||||||
Telephone & Data Systems, Inc. | 590 | 18 | ||||||
Verizon Communications, Inc. | 86,856 | 4,962 | ||||||
|
| |||||||
| 8,855 | ||||||||
|
| |||||||
Total Communications | 271,763 | |||||||
|
| |||||||
Consumer Cyclical — 1.6% | ||||||||
Airlines — 0.1% | ||||||||
Alaska Air Group, Inc. | 1,251 | 80 | ||||||
Delta Air Lines, Inc. | 8,866 | 503 | ||||||
Southwest Airlines Co. | 3,382 | 172 | ||||||
|
| |||||||
| 755 | ||||||||
|
| |||||||
Apparel — 0.1% | ||||||||
Carter’s, Inc. | 340 | 33 | ||||||
Hanesbrands, Inc. | 6,347 | 110 | ||||||
NIKE, Inc., Class B | 8,266 | 694 | ||||||
Oxford Industries, Inc. | 17 | 1 | ||||||
VF Corp. | 4,238 | 370 | ||||||
|
| |||||||
| 1,208 | ||||||||
|
| |||||||
Auto Manufacturers — 0.0%(g) | ||||||||
PACCAR, Inc. | 4,244 | 304 | ||||||
|
| |||||||
Auto Parts & Equipment — 0.0%(g) | ||||||||
Autoliv, Inc., (Sweden) | 1,509 | 107 | ||||||
BorgWarner, Inc. | 1,469 | 62 | ||||||
Goodyear Tire & Rubber Co. (The) | 4,906 | 75 | ||||||
Lear Corp. | 785 | 109 | ||||||
|
| |||||||
| 353 | ||||||||
|
| |||||||
Distribution/Wholesale — 0.1% | ||||||||
Core-Mark Holding Co., Inc. | 27 | 1 | ||||||
Fastenal Co. | 8,146 | 265 | ||||||
SEE NOTES TO FINANCIAL STATEMENTS.
| JUNE 30, 2019 | SIX CIRCLES TRUST | 9 | ||||||
Table of Contents
Six Circles Managed Equity Portfolio U.S. Unconstrained Fund
SCHEDULE OF PORTFOLIO INVESTMENTS
AS OF JUNE 30, 2019 (Unaudited) (continued)
(Amounts in U.S. Dollars, unless otherwise noted)
(Amounts in thousands, except number of shares and Futures contracts)
| SECURITY DESCRIPTION | SHARES | VALUE($) | ||||||
Common Stocks — continued |
| |||||||
Distribution/Wholesale — continued | ||||||||
IAA, Inc. (a) | 1,383 | 54 | ||||||
KAR Auction Services, Inc. | 1,383 | 35 | ||||||
Pool Corp. | 161 | 31 | ||||||
WW Grainger, Inc. | 490 | 131 | ||||||
|
| |||||||
| 517 | ||||||||
|
| |||||||
Entertainment — 0.0%(g) | ||||||||
Marriott Vacations Worldwide Corp. | 225 | 22 | ||||||
|
| |||||||
Food Service — 0.0% (g) | ||||||||
Aramark | 1,200 | 43 | ||||||
|
| |||||||
Home Builders — 0.0%(g) | ||||||||
DR Horton, Inc. | 2,069 | 89 | ||||||
Thor Industries, Inc. | 523 | 31 | ||||||
|
| |||||||
| 120 | ||||||||
|
| |||||||
Home Furnishings — 0.0%(g) | ||||||||
Dolby Laboratories, Inc., Class A | 174 | 11 | ||||||
Leggett & Platt, Inc. | 2,383 | 92 | ||||||
Whirlpool Corp. | 1,215 | 173 | ||||||
|
| |||||||
| 276 | ||||||||
|
| |||||||
Housewares — 0.0%(g) | ||||||||
Scotts Miracle-Gro Co. (The) | 332 | 33 | ||||||
Toro Co. (The) | 516 | 34 | ||||||
|
| |||||||
| 67 | ||||||||
|
| |||||||
Leisure Time — 0.1% | ||||||||
Brunswick Corp. | 507 | 23 | ||||||
Harley-Davidson, Inc. | 3,270 | 117 | ||||||
Polaris Industries, Inc. | 663 | 61 | ||||||
Royal Caribbean Cruises Ltd. | 2,195 | 266 | ||||||
|
| |||||||
| 467 | ||||||||
|
| |||||||
Lodging — 0.0%(g) | ||||||||
Marriott International, Inc., Class A | 2,073 | 291 | ||||||
Wyndham Destinations, Inc. | 1,740 | 76 | ||||||
Wyndham Hotels & Resorts, Inc. | 790 | 44 | ||||||
|
| |||||||
| 411 | ||||||||
|
| |||||||
Office Furnishings — 0.0%(g) | ||||||||
Herman Miller, Inc. | 252 | 11 | ||||||
HNI Corp. | 347 | 13 | ||||||
|
| |||||||
| 24 | ||||||||
|
| |||||||
Retail — 1.2% | ||||||||
Best Buy Co., Inc. | 3,775 | 263 | ||||||
Big Lots, Inc. | 310 | 9 | ||||||
Brinker International, Inc. | 340 | 13 | ||||||
Casey’s General Stores, Inc. | 45 | 7 | ||||||
Cheesecake Factory, Inc. (The) | 297 | 13 | ||||||
Children’s Place, Inc. (The) | 31 | 3 | ||||||
Costco Wholesale Corp. | 2,486 | 657 | ||||||
| SECURITY DESCRIPTION | SHARES | VALUE($) | ||||||
Retail — continued | ||||||||
Cracker Barrel Old Country Store, Inc. | 301 | 51 | ||||||
Darden Restaurants, Inc. | 1,559 | 190 | ||||||
Dick’s Sporting Goods, Inc. | 797 | 28 | ||||||
Dillard’s, Inc., Class A | 1 | — | (h) | |||||
Domino’s Pizza, Inc. | 145 | 40 | ||||||
Dunkin’ Brands Group, Inc. | 619 | 49 | ||||||
Foot Locker, Inc. | 1,909 | 80 | ||||||
Genuine Parts Co. | 2,173 | 225 | ||||||
Home Depot, Inc. (The) | 17,069 | 3,550 | ||||||
Kohl’s Corp. | 4,835 | 230 | ||||||
Lowe’s Cos., Inc. | 8,710 | 879 | ||||||
McDonald’s Corp. | 9,762 | 2,027 | ||||||
MSC Industrial Direct Co., Inc., Class A | 621 | 46 | ||||||
Nu Skin Enterprises, Inc., Class A | 538 | 27 | ||||||
Papa John’s International, Inc. | 23 | 1 | ||||||
Penske Automotive Group, Inc. | 340 | 16 | ||||||
Ross Stores, Inc. | 1,900 | 188 | ||||||
Signet Jewelers Ltd. | 1,598 | 29 | ||||||
Starbucks Corp. | 11,768 | 987 | ||||||
Target Corp. | 8,316 | 720 | ||||||
Texas Roadhouse, Inc., Class A | 493 | 26 | ||||||
Tiffany & Co. | 1,234 | 116 | ||||||
TJX Cos., Inc. (The) | 11,802 | 624 | ||||||
Tractor Supply Co. | 708 | 77 | ||||||
Walgreens Boots Alliance, Inc. | 14,502 | 793 | ||||||
Walmart, Inc. | 15,740 | 1,739 | ||||||
Wendy’s Co. (The) | 1,197 | 23 | ||||||
Williams-Sonoma, Inc. | 1,171 | 76 | ||||||
Yum! Brands, Inc. | 2,390 | 265 | ||||||
|
| |||||||
| 14,067 | ||||||||
|
| |||||||
Storage/Warehousing — 0.0%(g) | ||||||||
Mobile Mini, Inc. | 271 | 8 | ||||||
|
| |||||||
Toys/Games/Hobbies — 0.0%(g) | ||||||||
Hasbro, Inc. | 1,432 | 151 | ||||||
|
| |||||||
Total Consumer Cyclical | 18,793 | |||||||
|
| |||||||
ConsumerNon-cyclical — 32.7% | ||||||||
Agriculture — 4.2% | ||||||||
Altria Group, Inc. | 431,500 | 20,431 | ||||||
Archer-Daniels-Midland Co. | 11,115 | 453 | ||||||
Bunge Ltd. | 2,385 | 133 | ||||||
Philip Morris International, Inc. | 357,870 | 28,104 | ||||||
|
| |||||||
| 49,121 | ||||||||
|
| |||||||
Beverages — 0.5% | ||||||||
Brown-Forman Corp., Class A | 92 | 5 | ||||||
Brown-Forman Corp., Class B | 734 | 41 | ||||||
Coca-Cola Co. (The) | 65,109 | 3,315 | ||||||
PepsiCo., Inc. | 21,760 | 2,854 | ||||||
|
| |||||||
| 6,215 | ||||||||
|
| |||||||
SEE NOTES TO FINANCIAL STATEMENTS.
| 10 | SIX CIRCLES TRUST | JUNE 30, 2019 | ||||
Table of Contents
| SECURITY DESCRIPTION | SHARES | VALUE($) | ||||||
Common Stocks — continued |
| |||||||
Biotechnology — 6.3% | ||||||||
Alexion Pharmaceuticals, Inc. (a) | 33,218 | 4,351 | ||||||
Alnylam Pharmaceuticals, Inc. (a) | 14,216 | 1,032 | ||||||
Amgen, Inc. | 103,755 | 19,120 | ||||||
Biogen, Inc. (a) | 29,240 | 6,838 | ||||||
BioMarin Pharmaceutical, Inc. (a) | 26,515 | 2,271 | ||||||
Celgene Corp. (a) | 104,375 | 9,648 | ||||||
Exact Sciences Corp. (a) | 18,694 | 2,207 | ||||||
Gilead Sciences, Inc. | 189,602 | 12,809 | ||||||
Incyte Corp. (a) | 27,045 | 2,298 | ||||||
Ionis Pharmaceuticals, Inc. (a) | 19,544 | 1,256 | ||||||
Regeneron Pharmaceuticals, Inc. (a) | 11,970 | 3,747 | ||||||
Seattle Genetics, Inc. (a) | 16,707 | 1,156 | ||||||
Vertex Pharmaceuticals, Inc. (a) | 38,003 | 6,969 | ||||||
|
| |||||||
| 73,702 | ||||||||
|
| |||||||
Commercial Services — 0.1% | ||||||||
ABM Industries, Inc. | 236 | 10 | ||||||
Automatic Data Processing, Inc. | 4,385 | 725 | ||||||
Booz Allen Hamilton Holding Corp., Class A | 807 | 53 | ||||||
Cintas Corp. | 325 | 77 | ||||||
Healthcare Services Group, Inc. | 426 | 13 | ||||||
Insperity, Inc. | 59 | 7 | ||||||
ManpowerGroup, Inc. | 653 | 63 | ||||||
MarketAxess Holdings, Inc. | 78 | 25 | ||||||
Moody’s Corp. | 1,143 | 223 | ||||||
Robert Half International, Inc. | 1,137 | 65 | ||||||
Rollins, Inc. | 414 | 15 | ||||||
S&P Global, Inc. | 1,746 | 398 | ||||||
Sabre Corp. | 3,035 | 67 | ||||||
Service Corp. International | 1,188 | 56 | ||||||
|
| |||||||
| 1,797 | ||||||||
|
| |||||||
Cosmetics/Personal Care — 0.4% | ||||||||
Colgate-Palmolive Co. | 10,695 | 766 | ||||||
Estee Lauder Cos., Inc. (The), Class A | 1,054 | 193 | ||||||
Inter Parfums, Inc. | 8 | 1 | ||||||
Procter & Gamble Co. (The) | 37,474 | 4,109 | ||||||
|
| |||||||
| 5,069 | ||||||||
|
| |||||||
Food — 0.2% | ||||||||
Calavo Growers, Inc. | 6 | 1 | ||||||
Hershey Co. (The) | 1,442 | 193 | ||||||
Hormel Foods Corp. | 2,540 | 103 | ||||||
Ingredion, Inc. | 897 | 74 | ||||||
JM Smucker Co. (The) | 1,538 | 177 | ||||||
Kellogg Co. | 5,065 | 271 | ||||||
Kroger Co. (The) | 9,621 | 209 | ||||||
Lancaster Colony Corp. | 63 | 9 | ||||||
McCormick & Co., Inc. | 848 | 132 | ||||||
Mondelez International, Inc., Class A | 14,835 | 800 | ||||||
Sysco Corp. | 5,276 | 373 | ||||||
| SECURITY DESCRIPTION | SHARES | VALUE($) | ||||||
Food — continued | ||||||||
Tyson Foods, Inc., Class A | 3,022 | 244 | ||||||
|
| |||||||
| 2,586 | ||||||||
|
| |||||||
Healthcare — Products — 0.4% | ||||||||
Abbott Laboratories | 15,479 | 1,302 | ||||||
Baxter International, Inc. | 2,291 | 188 | ||||||
Becton Dickinson & Co. | 1,815 | 457 | ||||||
Danaher Corp. | 1,808 | 258 | ||||||
DENTSPLY SIRONA, Inc. | 495 | 29 | ||||||
Hill-Rom Holdings, Inc. | 124 | 13 | ||||||
Medtronic plc, (Ireland) | 15,318 | 1,492 | ||||||
Patterson Cos., Inc. | 1,385 | 32 | ||||||
ResMed, Inc. | 822 | 100 | ||||||
STERIS plc | 321 | 48 | ||||||
Stryker Corp. | 1,673 | 344 | ||||||
West Pharmaceutical Services, Inc. | 66 | 8 | ||||||
|
| |||||||
| 4,271 | ||||||||
|
| |||||||
Healthcare — Services — 5.2% | ||||||||
Anthem, Inc. | 40,917 | 11,547 | ||||||
Centene Corp. (a) | 63,326 | 3,321 | ||||||
Chemed Corp. | 2 | 1 | ||||||
Encompass Health Corp. | 679 | 43 | ||||||
Humana, Inc. | 21,215 | 5,628 | ||||||
Quest Diagnostics, Inc. | 1,379 | 141 | ||||||
UnitedHealth Group, Inc. | 153,392 | 37,429 | ||||||
WellCare Health Plans, Inc. (a) | 7,708 | 2,197 | ||||||
|
| |||||||
| 60,307 | ||||||||
|
| |||||||
Household Products/Wares — 0.1% | ||||||||
Avery Dennison Corp. | 702 | 81 | ||||||
Church & Dwight Co., Inc. | 1,339 | 98 | ||||||
Clorox Co. (The) | 1,579 | 242 | ||||||
Kimberly-Clark Corp. | 5,482 | 730 | ||||||
WD-40 Co. | 5 | 1 | ||||||
|
| |||||||
| 1,152 | ||||||||
|
| |||||||
Pharmaceuticals — 15.3% | ||||||||
AbbVie, Inc. | 262,522 | 19,090 | ||||||
Alkermes plc, (Ireland) (a) | 23,195 | 523 | ||||||
Allergan plc | 39,591 | 6,629 | ||||||
AmerisourceBergen Corp., Class A | 1,389 | 118 | ||||||
Bristol-Myers Squibb Co. | 240,083 | 10,888 | ||||||
Cardinal Health, Inc. | 6,544 | 308 | ||||||
Eli Lilly & Co. | 111,016 | 12,299 | ||||||
Johnson & Johnson | 376,491 | 52,438 | ||||||
McKesson Corp. | 1,129 | 152 | ||||||
Merck & Co., Inc. | 367,549 | 30,819 | ||||||
Mylan NV (a) | 66,229 | 1,261 | ||||||
Nektar Therapeutics, Class A (a) | 22,396 | 797 | ||||||
Perrigo Co. plc, (Ireland) | 17,003 | 810 | ||||||
Pfizer, Inc. | 814,385 | 35,279 | ||||||
SEE NOTES TO FINANCIAL STATEMENTS.
| JUNE 30, 2019 | SIX CIRCLES TRUST | 11 | ||||||
Table of Contents
Six Circles Managed Equity Portfolio U.S. Unconstrained Fund
SCHEDULE OF PORTFOLIO INVESTMENTS
AS OF JUNE 30, 2019 (Unaudited) (continued)
(Amounts in U.S. Dollars, unless otherwise noted)
(Amounts in thousands, except number of shares and Futures contracts)
| SECURITY DESCRIPTION | SHARES | VALUE($) | ||||||
Common Stocks — continued |
| |||||||
Pharmaceuticals — continued | ||||||||
Zoetis, Inc., Class A | 62,870 | 7,135 | ||||||
|
| |||||||
| 178,546 | ||||||||
|
| |||||||
Total ConsumerNon-cyclical | 382,766 | |||||||
|
| |||||||
Energy — 7.0% | ||||||||
Oil & Gas — 6.1% | ||||||||
Anadarko Petroleum Corp. | 48,678 | 3,435 | ||||||
Apache Corp. | 36,444 | 1,056 | ||||||
Cabot Oil & Gas Corp. | 41,035 | 942 | ||||||
Chevron Corp. | 132,018 | 16,428 | ||||||
Cimarex Energy Co. | 9,833 | 583 | ||||||
Concho Resources, Inc. | 19,447 | 2,007 | ||||||
ConocoPhillips | 109,564 | 6,683 | ||||||
Devon Energy Corp. | 40,251 | 1,148 | ||||||
Diamondback Energy, Inc. | 15,006 | 1,635 | ||||||
EOG Resources, Inc. | 56,259 | 5,241 | ||||||
Exxon Mobil Corp. | 201,567 | 15,446 | ||||||
Helmerich & Payne, Inc. | 5,265 | 267 | ||||||
Hess Corp. | 24,710 | 1,571 | ||||||
HollyFrontier Corp. | 7,484 | 346 | ||||||
Marathon Oil Corp. | 79,292 | 1,127 | ||||||
Marathon Petroleum Corp. | 48,015 | 2,683 | ||||||
Noble Energy, Inc. | 46,362 | 1,039 | ||||||
Occidental Petroleum Corp. | 35,635 | 1,792 | ||||||
Phillips 66 | 30,021 | 2,808 | ||||||
Pioneer Natural Resources Co. | 16,328 | 2,512 | ||||||
Valero Energy Corp. | 30,522 | 2,613 | ||||||
|
| |||||||
| 71,362 | ||||||||
|
| |||||||
Oil & Gas Services — 0.5% | ||||||||
Baker Hughes a GE Co., Class A | 24,530 | 604 | ||||||
Halliburton Co. | 41,636 | 947 | ||||||
National Oilwell Varco, Inc. | 18,385 | 409 | ||||||
Schlumberger Ltd. | 65,986 | 2,622 | ||||||
TechnipFMC plc, (United Kingdom) | 20,065 | 521 | ||||||
|
| |||||||
| 5,103 | ||||||||
|
| |||||||
Pipelines — 0.4% | ||||||||
Kinder Morgan, Inc. | 92,745 | 1,936 | ||||||
ONEOK, Inc. | 19,663 | 1,353 | ||||||
Williams Cos., Inc. (The) | 57,728 | 1,619 | ||||||
|
| |||||||
| 4,908 | ||||||||
|
| |||||||
Total Energy | 81,373 | |||||||
|
| |||||||
Financial — 13.1% | ||||||||
Banks — 11.9% | ||||||||
Associated Banc-Corp. | 7,017 | 148 | ||||||
Atlantic Union Bankshares Corp. | 3,569 | 126 | ||||||
BancFirst Corp. | 1,765 | 98 | ||||||
BancorpSouth Bank | 4,285 | 124 | ||||||
Bank of America Corp. | 1,517,825 | 44,017 | ||||||
| SECURITY DESCRIPTION | SHARES | VALUE($) | ||||||
Banks — continued | ||||||||
Bank of New York Mellon Corp. (The) | 14,031 | 620 | ||||||
Bank OZK | 4,159 | 125 | ||||||
Banner Corp. | 482 | 26 | ||||||
BB&T Corp. | 15,253 | 749 | ||||||
BOK Financial Corp. | 1,613 | 122 | ||||||
Cathay General Bancorp | 3,929 | 141 | ||||||
Chemical Financial Corp. | 3,484 | 143 | ||||||
Citigroup, Inc. | 408,222 | 28,588 | ||||||
Citizens Financial Group, Inc. | 11,643 | 412 | ||||||
Columbia Banking System, Inc. | 1,179 | 43 | ||||||
Comerica, Inc. | 4,501 | 327 | ||||||
Commerce Bancshares, Inc. | 2,429 | 145 | ||||||
Community Bank System, Inc. | 625 | 41 | ||||||
Cullen/Frost Bankers, Inc. | 1,967 | 184 | ||||||
CVB Financial Corp. | 5,947 | 125 | ||||||
First Busey Corp. | 4,164 | 110 | ||||||
First Financial Bankshares, Inc. | 3,915 | 121 | ||||||
First Horizon National Corp. | 12,415 | 185 | ||||||
First Interstate BancSystem, Inc., Class A | 2,896 | 115 | ||||||
First Merchants Corp. | 3,226 | 122 | ||||||
First Midwest Bancorp, Inc. | 1,215 | 25 | ||||||
First Republic Bank | 1,606 | 157 | ||||||
Glacier Bancorp, Inc. | 1,164 | 47 | ||||||
Goldman Sachs Group, Inc. (The) | 3,736 | 764 | ||||||
Home BancShares, Inc. | 6,837 | 132 | ||||||
Hope Bancorp, Inc. | 2,682 | 37 | ||||||
Huntington Bancshares, Inc. | 29,937 | 414 | ||||||
Independent Bank Corp. | 447 | 34 | ||||||
Independent Bank Group, Inc. | 1,957 | 108 | ||||||
KeyCorp | 26,743 | 475 | ||||||
LegacyTexas Financial Group, Inc. | 2,825 | 115 | ||||||
Morgan Stanley | 21,711 | 951 | ||||||
NBT Bancorp, Inc. | 656 | 25 | ||||||
Northern Trust Corp. | 3,604 | 324 | ||||||
PNC Financial Services Group, Inc. (The) | 7,098 | 974 | ||||||
Prosperity Bancshares, Inc. | 2,184 | 144 | ||||||
Regions Financial Corp. | 27,541 | 411 | ||||||
S&T Bancorp, Inc. | 166 | 6 | ||||||
ServisFirst Bancshares, Inc. | 3,141 | 108 | ||||||
Simmons First National Corp., Class A | 1,339 | 31 | ||||||
South State Corp. | 1,638 | 121 | ||||||
State Street Corp. | 7,949 | 446 | ||||||
SunTrust Banks, Inc. | 8,900 | 559 | ||||||
Towne Bank | 4,041 | 110 | ||||||
UMB Financial Corp. | 1,792 | 118 | ||||||
US Bancorp | 413,359 | 21,660 | ||||||
Webster Financial Corp. | 3,600 | 172 | ||||||
Wells Fargo & Co. | 694,480 | 32,863 | ||||||
WesBanco, Inc. | 3,356 | 129 | ||||||
SEE NOTES TO FINANCIAL STATEMENTS.
| 12 | SIX CIRCLES TRUST | JUNE 30, 2019 | ||||
Table of Contents
| SECURITY DESCRIPTION | SHARES | VALUE($) | ||||||
Common Stocks — continued |
| |||||||
Banks — continued | ||||||||
Westamerica Bancorporation | 383 | 24 | ||||||
Wintrust Financial Corp. | 1,608 | 118 | ||||||
Zions Bancorp NA | 4,641 | 213 | ||||||
|
| |||||||
| 138,772 | ||||||||
|
| |||||||
Diversified Financial Services — 0.6% | ||||||||
Air Lease Corp., Class A | 341 | 14 | ||||||
American Express Co. | 5,467 | 675 | ||||||
Ameriprise Financial, Inc. | 2,164 | 314 | ||||||
BlackRock, Inc., Class A | 1,940 | 911 | ||||||
CME Group, Inc., Class A | 3,191 | 619 | ||||||
Discover Financial Services | 4,779 | 371 | ||||||
Eaton Vance Corp. | 1,748 | 75 | ||||||
Evercore, Inc., Class A | 392 | 35 | ||||||
Franklin Resources, Inc. | 6,036 | 210 | ||||||
Intercontinental Exchange, Inc. | 4,867 | 418 | ||||||
Mastercard, Inc., Class A | 2,767 | 732 | ||||||
Nasdaq, Inc. | 1,268 | 122 | ||||||
Raymond James Financial, Inc. | 1,500 | 127 | ||||||
SEI Investments Co. | 555 | 31 | ||||||
T Rowe Price Group, Inc. | 3,862 | 424 | ||||||
TD Ameritrade Holding Corp. | 3,810 | 190 | ||||||
Visa, Inc., Class A | 6,006 | 1,042 | ||||||
|
| |||||||
| 6,310 | ||||||||
|
| |||||||
Insurance — 0.6% | ||||||||
Aflac, Inc. | 9,627 | 528 | ||||||
Allstate Corp. (The) | 4,426 | 450 | ||||||
American Financial Group, Inc. | 577 | 59 | ||||||
Aon plc, (United Kingdom) | 1,433 | 277 | ||||||
Argo Group International Holdings Ltd., (Bermuda) | 101 | 7 | ||||||
Arthur J Gallagher & Co. | 1,752 | 153 | ||||||
Assurant, Inc. | 848 | 90 | ||||||
Assured Guaranty Ltd., (Bermuda) | 561 | 24 | ||||||
Axis Capital Holdings Ltd., (Bermuda) | 926 | 55 | ||||||
Brown & Brown, Inc. | 732 | 25 | ||||||
Chubb Ltd., (Switzerland) | 5,441 | 801 | ||||||
Cincinnati Financial Corp. | 1,759 | 182 | ||||||
CNO Financial Group, Inc. | 1,180 | 20 | ||||||
Erie Indemnity Co., Class A | 121 | 31 | ||||||
Everest Re Group Ltd., (Bermuda) | 503 | 124 | ||||||
Fidelity National Financial, Inc. | 5,778 | 233 | ||||||
First American Financial Corp. | 1,593 | 86 | ||||||
Hanover Insurance Group, Inc. (The) | 292 | 37 | ||||||
Hartford Financial Services Group, Inc. (The) | 5,825 | 325 | ||||||
Horace Mann Educators Corp. | 201 | 8 | ||||||
Lincoln National Corp. | 3,841 | 248 | ||||||
Marsh & McLennan Cos., Inc. | 5,364 | 535 | ||||||
MetLife, Inc. | 20,526 | 1,020 | ||||||
Old Republic International Corp. | 4,702 | 105 | ||||||
| SECURITY DESCRIPTION | SHARES | VALUE($) | ||||||
Insurance — continued | ||||||||
Primerica, Inc. | 124 | 15 | ||||||
Prudential Financial, Inc. | 9,806 | 990 | ||||||
Reinsurance Group of America, Inc., Class A | 803 | 125 | ||||||
RenaissanceRe Holdings Ltd., (Bermuda) | 78 | 14 | ||||||
RLI Corp. | 23 | 2 | ||||||
Selective Insurance Group, Inc. | 109 | 8 | ||||||
Torchmark Corp. | 499 | 45 | ||||||
Travelers Cos., Inc. (The) | 3,504 | 524 | ||||||
Unum Group | 4,798 | 161 | ||||||
WR Berkley Corp. | 534 | 35 | ||||||
|
| |||||||
| 7,342 | ||||||||
|
| |||||||
Private Equity — 0.0% (g) | ||||||||
Kennedy-Wilson Holdings, Inc. | 1,926 | 39 | ||||||
|
| |||||||
Real Estate — 0.0%(g) | ||||||||
Jones Lang LaSalle, Inc. | 204 | 29 | ||||||
|
| |||||||
Savings & Loans — 0.0%(g) | ||||||||
Investors Bancorp, Inc. | 13,067 | 146 | ||||||
Northwest Bancshares, Inc. | 2,159 | 38 | ||||||
Provident Financial Services, Inc. | 1,251 | 30 | ||||||
Washington Federal, Inc. | 3,651 | 128 | ||||||
WSFS Financial Corp. | 2,523 | 104 | ||||||
|
| |||||||
| 446 | ||||||||
|
| |||||||
Total Financials | 152,938 | |||||||
|
| |||||||
Industrial — 4.5% | ||||||||
Aerospace/Defense — 3.0% | ||||||||
Arconic, Inc. | 18,327 | 473 | ||||||
Boeing Co. (The) | 30,833 | 11,224 | ||||||
General Dynamics Corp. | 15,869 | 2,885 | ||||||
Harris Corp. | 6,259 | 1,184 | ||||||
L3 Technologies, Inc. | 3,636 | 891 | ||||||
Lockheed Martin Corp. | 14,800 | 5,380 | ||||||
Northrop Grumman Corp. | 9,345 | 3,020 | ||||||
Raytheon Co. | 16,047 | 2,790 | ||||||
TransDigm Group, Inc. (a) | 2,246 | 1,087 | ||||||
United Technologies Corp. | 48,051 | 6,256 | ||||||
|
| |||||||
| 35,190 | ||||||||
|
| |||||||
Building Materials — 0.1% | ||||||||
Fortune Brands Home & Security, Inc. | 978 | 56 | ||||||
Johnson Controls International plc | 13,956 | 577 | ||||||
Lennox International, Inc. | 118 | 32 | ||||||
Masco Corp. | 1,592 | 62 | ||||||
MDU Resources Group, Inc. | 2,688 | 69 | ||||||
Owens Corning | 733 | 43 | ||||||
Simpson Manufacturing Co., Inc. | 52 | 3 | ||||||
Vulcan Materials Co. | 557 | 77 | ||||||
|
| |||||||
| 919 | ||||||||
|
| |||||||
SEE NOTES TO FINANCIAL STATEMENTS.
| JUNE 30, 2019 | SIX CIRCLES TRUST | 13 | ||||||
Table of Contents
Six Circles Managed Equity Portfolio U.S. Unconstrained Fund
SCHEDULE OF PORTFOLIO INVESTMENTS
AS OF JUNE 30, 2019 (Unaudited) (continued)
(Amounts in U.S. Dollars, unless otherwise noted)
(Amounts in thousands, except number of shares and Futures contracts)
| SECURITY DESCRIPTION | SHARES | VALUE($) | ||||||
Common Stocks — continued |
| |||||||
Electrical Components & Equipments — 0.1% |
| |||||||
Emerson Electric Co. | 11,666 | 778 | ||||||
Hubbell, Inc., Class B | 681 | 89 | ||||||
Littelfuse, Inc. | 35 | 6 | ||||||
|
| |||||||
| 873 | ||||||||
|
| |||||||
Electronics — 0.2% | ||||||||
Allegion plc, (Ireland) | 372 | 41 | ||||||
Amphenol Corp., Class A | 1,374 | 132 | ||||||
Brady Corp., Class A | 139 | 7 | ||||||
FLIR Systems, Inc. | 656 | 35 | ||||||
Gentex Corp. | 2,067 | 51 | ||||||
Honeywell International, Inc. | 7,956 | 1,389 | ||||||
National Instruments Corp. | 1,100 | 46 | ||||||
nVent Electric plc, (United Kingdom) | 1,858 | 46 | ||||||
SYNNEX Corp. | 356 | 35 | ||||||
TE Connectivity Ltd., (Switzerland) | 3,637 | 348 | ||||||
Watts Water Technologies, Inc., Class A | 17 | 2 | ||||||
|
| |||||||
| 2,132 | ||||||||
|
| |||||||
Engineering & Construction — 0.0%(g) |
| |||||||
Exponent, Inc. | 34 | 2 | ||||||
|
| |||||||
Environmental Control — 0.1% | ||||||||
Pentair plc, (United Kingdom) | 1,274 | 47 | ||||||
Republic Services, Inc., Class A | 2,445 | 212 | ||||||
Tetra Tech, Inc. | 33 | 3 | ||||||
Waste Management, Inc. | 4,448 | 513 | ||||||
|
| |||||||
| 775 | ||||||||
|
| |||||||
Hand/Machine Tools — 0.0%(g) | ||||||||
Franklin Electric Co., Inc. | 15 | 1 | ||||||
Lincoln Electric Holdings, Inc. | 610 | 50 | ||||||
MSA Safety, Inc. | 154 | 16 | ||||||
Regal Beloit Corp. | 124 | 10 | ||||||
Snap-on, Inc. | 607 | 101 | ||||||
Stanley Black & Decker, Inc. | 1,515 | 219 | ||||||
|
| |||||||
| 397 | ||||||||
|
| |||||||
Machinery — Construction & Mining — 0.1% |
| |||||||
BWX Technologies, Inc. | 418 | 22 | ||||||
Caterpillar, Inc. | 8,927 | 1,217 | ||||||
Oshkosh Corp. | 315 | 26 | ||||||
Terex Corp. | 46 | 1 | ||||||
|
| |||||||
| 1,266 | ||||||||
|
| |||||||
Machinery — Diversified — 0.1% | ||||||||
AGCO Corp. | 99 | 8 | ||||||
Altra Industrial Motion Corp. | 210 | 8 | ||||||
Applied Industrial Technologies, Inc. | 180 | 11 | ||||||
Cummins, Inc. | 2,575 | 441 | ||||||
Dover Corp. | 1,449 | 145 | ||||||
Graco, Inc. | 813 | 41 | ||||||
IDEX Corp. | 416 | 72 | ||||||
Nordson Corp. | 171 | 24 | ||||||
Rockwell Automation, Inc. | 1,629 | 267 | ||||||
| SECURITY DESCRIPTION | SHARES | VALUE($) | ||||||
Machinery — Diversified — continued |
| |||||||
Roper Technologies, Inc. | 285 | 104 | ||||||
Wabtec Corp. | 374 | 27 | ||||||
Xylem, Inc. | 947 | 79 | ||||||
|
| |||||||
| 1,227 | ||||||||
|
| |||||||
Metal Fabricate/Hardware — 0.0%(g) |
| |||||||
Timken Co. (The) | 528 | 27 | ||||||
Worthington Industries, Inc. | 116 | 5 | ||||||
|
| |||||||
| 32 | ||||||||
|
| |||||||
Miscellaneous Manufacturers — 0.4% |
| |||||||
3M Co. | 10,867 | 1,884 | ||||||
AO Smith Corp. | 1,130 | 53 | ||||||
AptarGroup, Inc. | 265 | 33 | ||||||
Carlisle Cos., Inc. | 240 | 34 | ||||||
Donaldson Co., Inc. | 732 | 37 | ||||||
Eaton Corp. plc | 9,295 | 774 | ||||||
Hillenbrand, Inc. | 315 | 13 | ||||||
Illinois Tool Works, Inc. | 4,908 | 740 | ||||||
Ingersoll-Rand plc | 2,427 | 307 | ||||||
ITT, Inc. | 197 | 13 | ||||||
Textron, Inc. | 10,684 | 567 | ||||||
Trinity Industries, Inc. | 1,708 | 35 | ||||||
|
| |||||||
| 4,490 | ||||||||
|
| |||||||
Packaging & Containers — 0.0% (g) | ||||||||
Amcor plc, (United Kingdom) (a) | 7,755 | 89 | ||||||
Packaging Corp. of America | 1,509 | 144 | ||||||
Silgan Holdings, Inc. | 80 | 2 | ||||||
Sonoco Products Co. | 1,145 | 75 | ||||||
WestRock Co. | 6,833 | 249 | ||||||
|
| |||||||
| 559 | ||||||||
|
| |||||||
Shipbuilding — 0.0%(g) | ||||||||
Huntington Ingalls Industries, Inc. | 2,196 | 494 | ||||||
|
| |||||||
Transportation — 0.4% | ||||||||
CH Robinson Worldwide, Inc. | 1,604 | 135 | ||||||
CSX Corp. | 5,831 | 451 | ||||||
Expeditors International of Washington, Inc. | 1,018 | 77 | ||||||
FedEx Corp. | 2,318 | 381 | ||||||
JB Hunt Transport Services, Inc. | 367 | 34 | ||||||
Kansas City Southern | 518 | 63 | ||||||
Ryder System, Inc. | 813 | 47 | ||||||
Union Pacific Corp. | 8,534 | 1,443 | ||||||
United Parcel Service, Inc., Class B | 14,927 | 1,542 | ||||||
|
| |||||||
| 4,173 | ||||||||
|
| |||||||
Trucking & Leasing — 0.0%(g) | ||||||||
GATX Corp. | 277 | 22 | ||||||
Greenbrier Cos., Inc. (The) | 59 | 2 | ||||||
|
| |||||||
| 24 | ||||||||
|
| |||||||
Total Industrials | 52,553 | |||||||
|
| |||||||
SEE NOTES TO FINANCIAL STATEMENTS.
| 14 | SIX CIRCLES TRUST | JUNE 30, 2019 | ||||
Table of Contents
| SECURITY DESCRIPTION | SHARES | VALUE($) | ||||||
Common Stocks — continued |
| |||||||
Technology — 16.6% | ||||||||
Computers — 1.9% | ||||||||
Accenture plc, (Ireland), Class A | 5,867 | 1,084 | ||||||
Apple, Inc. | 92,794 | 18,366 | ||||||
Fortinet, Inc. (a) | 13,998 | 1,075 | ||||||
Hewlett Packard Enterprise Co. | 20,171 | 302 | ||||||
HP, Inc. | 22,689 | 472 | ||||||
NetApp, Inc. | 6,897 | 425 | ||||||
Seagate Technology plc | 3,795 | 179 | ||||||
Western Digital Corp. | 4,413 | 210 | ||||||
|
| |||||||
| 22,113 | ||||||||
|
| |||||||
Office/Business Equipment — 0.0%(g) |
| |||||||
Xerox Corp. | 5,579 | 197 | ||||||
|
| |||||||
Semiconductors — 0.6% | ||||||||
Analog Devices, Inc. | 3,955 | 446 | ||||||
AVX Corp. | 38 | 1 | ||||||
Broadcom, Inc. | 8,165 | 2,350 | ||||||
KLA-Tencor Corp. | 2,279 | 269 | ||||||
Lam Research Corp. | 2,078 | 390 | ||||||
Maxim Integrated Products, Inc. | 4,453 | 266 | ||||||
Microchip Technology, Inc. | 2,029 | 176 | ||||||
MKS Instruments, Inc. | 109 | 9 | ||||||
NVIDIA Corp. | 1,451 | 238 | ||||||
Power Integrations, Inc. | 12 | 1 | ||||||
Skyworks Solutions, Inc. | 1,745 | 135 | ||||||
Texas Instruments, Inc. | 14,872 | 1,707 | ||||||
Xilinx, Inc. | 1,793 | 212 | ||||||
|
| |||||||
| 6,200 | ||||||||
|
| |||||||
Software — 14.1% | ||||||||
Activision Blizzard, Inc. | 3,011 | 142 | ||||||
Adobe, Inc. (a) | 47,058 | 13,866 | ||||||
ANSYS, Inc. (a) | 8,094 | 1,658 | ||||||
Autodesk, Inc. (a) | 21,180 | 3,450 | ||||||
Broadridge Financial Solutions, Inc. | 985 | 126 | ||||||
Cadence Design Systems, Inc. (a) | 27,103 | 1,919 | ||||||
Citrix Systems, Inc. | 12,062 | 1,184 | ||||||
Fidelity National Information Services, Inc. | 1,871 | 230 | ||||||
Intuit, Inc. | 25,954 | 6,783 | ||||||
j2 Global, Inc. | 342 | 30 | ||||||
Jack Henry & Associates, Inc. | 360 | 48 | ||||||
Microsoft Corp. | 778,956 | 104,349 | ||||||
MSCI, Inc., Class A | 437 | 104 | ||||||
Oracle Corp. | 259,158 | 14,764 | ||||||
Red Hat, Inc. (a) | 17,143 | 3,219 | ||||||
salesforce.com, Inc. (a) | 74,890 | 11,363 | ||||||
Synopsys, Inc. (a) | 14,456 | 1,860 | ||||||
|
| |||||||
| 165,095 | ||||||||
|
| |||||||
Total Technology | 193,605 | |||||||
|
| |||||||
| SECURITY DESCRIPTION | SHARES | VALUE($) | ||||||
Utilities — 0.7% | ||||||||
Electric — 0.6% | ||||||||
AES Corp. | 11,597 | 194 | ||||||
ALLETE, Inc. | 575 | 48 | ||||||
Alliant Energy Corp. | 3,341 | 164 | ||||||
American Electric Power Co., Inc. | 8,962 | 789 | ||||||
Avista Corp. | 871 | 39 | ||||||
Black Hills Corp. | 550 | 43 | ||||||
CenterPoint Energy, Inc. | 10,110 | 289 | ||||||
CMS Energy Corp. | 3,731 | 216 | ||||||
Consolidated Edison, Inc. | 6,448 | 565 | ||||||
DTE Energy Co. | 3,129 | 400 | ||||||
El Paso Electric Co. | 241 | 16 | ||||||
Evergy, Inc. | 4,040 | 243 | ||||||
Eversource Energy | 4,674 | 354 | ||||||
IDACORP, Inc. | 498 | 50 | ||||||
MGE Energy, Inc. | 137 | 10 | ||||||
NextEra Energy, Inc. | 6,726 | 1,378 | ||||||
NorthWestern Corp. | 629 | 45 | ||||||
OGE Energy Corp. | 3,224 | 137 | ||||||
Ormat Technologies, Inc. | 15 | 1 | ||||||
Otter Tail Corp. | 274 | 15 | ||||||
Pinnacle West Capital Corp. | 1,675 | 158 | ||||||
PNM Resources, Inc. | 674 | 34 | ||||||
Portland General Electric Co. | 966 | 52 | ||||||
Public Service Enterprise Group, Inc. | 8,737 | 514 | ||||||
Sempra Energy | 4,175 | 574 | ||||||
WEC Energy Group, Inc. | 4,605 | 384 | ||||||
Xcel Energy, Inc. | 8,146 | 485 | ||||||
|
| |||||||
| 7,197 | ||||||||
|
| |||||||
Gas — 0.1% | ||||||||
Atmos Energy Corp. | 1,115 | 117 | ||||||
National Fuel Gas Co. | 1,171 | 62 | ||||||
New Jersey Resources Corp. | 807 | 40 | ||||||
NiSource, Inc. | 5,061 | 146 | ||||||
South Jersey Industries, Inc. | 1,275 | 43 | ||||||
Southwest Gas Holdings, Inc. | 528 | 47 | ||||||
Spire, Inc. | 569 | 48 | ||||||
UGI Corp. | 1,513 | 81 | ||||||
|
| |||||||
| 584 | ||||||||
|
| |||||||
Water — 0.0%(g) | ||||||||
American States Water Co. | 60 | 5 | ||||||
American Water Works Co., Inc. | 1,517 | 176 | ||||||
Aqua America, Inc. | 2,002 | 83 | ||||||
California Water Service Group | 69 | 3 | ||||||
|
| |||||||
| 267 | ||||||||
|
| |||||||
Total Utilities | 8,048 | |||||||
|
| |||||||
Total Common Stocks | 1,165,804 | |||||||
|
| |||||||
SEE NOTES TO FINANCIAL STATEMENTS.
| JUNE 30, 2019 | SIX CIRCLES TRUST | 15 | ||||||
Table of Contents
Six Circles Managed Equity Portfolio U.S. Unconstrained Fund
SCHEDULE OF PORTFOLIO INVESTMENTS
AS OF JUNE 30, 2019 (Unaudited) (continued)
(Amounts in U.S. Dollars, unless otherwise noted)
(Amounts in thousands, except number of shares and Futures contracts)
| SECURITY DESCRIPTION | PRINCIPAL AMOUNT($) | VALUE($) | ||||||
Short-Term Investments — 1.0% | ||||||||
Time Deposits — 1.0% | ||||||||
Australia & New Zealand Banking Group Ltd., 1.76%, 07/01/2019 | 9,013 | 9,013 | ||||||
Brown Brothers Harriman, 1.76%, 07/01/2019 | 2,319 | 2,319 | ||||||
|
| |||||||
Total Short-Term Investments | ||||||||
(Cost $11,332) | 11,332 | |||||||
|
| |||||||
Total Investments — 100.7% | 1,177,136 | |||||||
Liabilities in Excess of Other Assets — (0.7)% |
| (7,832 | ) | |||||
|
| |||||||
NET ASSETS — 100.0% | $ | 1,169,304 | ||||||
|
| |||||||
Percentages indicated are based on net assets.
Futures contracts outstanding as of June 30, 2019: | ||||||||||||||||||||
| Exchange Traded | ||||||||||||||||||||
| DESCRIPTION | NUMBER OF CONTRACTS | EXPIRATION DATE | TRADING CURRENCY | NOTIONAL AMOUNT($) | VALUE AND UNREALIZED APPRECIATION (DEPRECIATION)($) | |||||||||||||||
Long Contracts | ||||||||||||||||||||
| E-mini Russell 2000 Index | 1 | 09/2019 | USD | 77 | 1 | |||||||||||||||
| NASDAQ 100E-mini Index | 2 | 09/2019 | USD | 302 | 6 | |||||||||||||||
| S&P 500E-mini Index | 11 | 09/2019 | USD | 1,606 | 14 | |||||||||||||||
|
| |||||||||||||||||||
Total unrealized appreciation (depreciation) | 21 | |||||||||||||||||||
|
| |||||||||||||||||||
Summary of Investments by Industry, June 30, 2019
The following table represents the portfolio investments of the Fund by industry classifications as a percentage of total investments:
| INDUSTRY | PERCENTAGE | |||
Internet | 22.0 | % | ||
Pharmaceuticals | 15.2 | % | ||
Software | 14.0 | % | ||
Banks | 11.8 | % | ||
Biotechnology | 6.2 | % | ||
Oil & Gas | 6.0 | % | ||
Healthcare — Services | 5.1 | % | ||
Agriculture | 4.2 | % | ||
Aerospace/Defense | 3.0 | % | ||
Computers | 1.9 | % | ||
Retail | 1.2 | % | ||
Others (Each less than 1.0%) | 8.4 | % | ||
Short-Term Investments | 1.0 | % | ||
NOTES TO SCHEDULE OF PORTFOLIO INVESTMENTS
| (a) | — Non-income producing security. | |
| (g) | — Amount rounds to less than 0.05%. | |
| (h) | — Amount rounds to less than $500. | |
| * | — The cost of securities is substantially the same for federal income tax purposes. | |
| USD | — United States Dollar |
SEE NOTES TO FINANCIAL STATEMENTS.
| 16 | SIX CIRCLES TRUST | JUNE 30, 2019 | ||||
Table of Contents
Six Circles Managed Equity Portfolio International Unconstrained Fund
SCHEDULE OF PORTFOLIO INVESTMENTS
AS OF JUNE 30, 2019 (Unaudited)
(Amounts in U.S. Dollars, unless otherwise noted)
(Amounts in thousands, except number of shares, rights and Futures contracts)
| SECURITY DESCRIPTION | SHARES | VALUE($) | ||||||
Common Stocks — 97.9% |
| |||||||
Australia — 0.2% |
| |||||||
BHP Group plc | 39,321 | 1,006 | ||||||
MMG Ltd. (a) | 212,000 | 74 | ||||||
|
| |||||||
| 1,080 | ||||||||
|
| |||||||
Austria — 0.3% | ||||||||
ANDRITZ AG | 1,327 | 50 | ||||||
Erste Group Bank AG | 5,607 | 208 | ||||||
OMV AG | 32,008 | 1,560 | ||||||
Raiffeisen Bank International AG | 2,696 | 63 | ||||||
Verbund AG | 1,241 | 65 | ||||||
voestalpine AG | 2,113 | 66 | ||||||
|
| |||||||
| 2,012 | ||||||||
|
| |||||||
Belgium — 2.0% | ||||||||
Ageas | 28,200 | 1,467 | ||||||
Anheuser-Busch InBev SA | 113,888 | 10,078 | ||||||
Colruyt SA | 1,046 | 61 | ||||||
Groupe Bruxelles Lambert SA | 1,552 | 152 | ||||||
KBC Group NV | 4,673 | 307 | ||||||
Proximus SADP | 2,770 | 82 | ||||||
Solvay SA | 1,431 | 149 | ||||||
Telenet Group Holding NV | 857 | 48 | ||||||
UCB SA | 11,667 | 968 | ||||||
Umicore SA | 3,589 | 115 | ||||||
|
| |||||||
| 13,427 | ||||||||
|
| |||||||
Brazil — 0.2% | ||||||||
Ambev SA | 12,778 | 59 | ||||||
BB Seguridade Participacoes SA | 25,451 | 215 | ||||||
Equatorial Energia SA | 14,430 | 345 | ||||||
Hypera SA | 22,403 | 175 | ||||||
IRB Brasil Resseguros S/A | 1,589 | 41 | ||||||
Magazine Luiza SA | 1,200 | 66 | ||||||
Raia Drogasil SA | 902 | 18 | ||||||
Rumo SA (a) | 14,540 | 78 | ||||||
Sul America SA | 4,376 | 43 | ||||||
|
| |||||||
| 1,040 | ||||||||
|
| |||||||
Canada — 4.1% | ||||||||
Agnico Eagle Mines Ltd. | 4,518 | 232 | ||||||
Alimentation Couche-Tard, Inc., Class B | 8,457 | 532 | ||||||
AltaGas Ltd. | 5,345 | 81 | ||||||
Atco Ltd., Class I | 1,487 | 50 | ||||||
Aurora Cannabis, Inc. (a) | 13,702 | 107 | ||||||
Bank of Montreal | 12,316 | 930 | ||||||
Bank of Nova Scotia (The) | 23,644 | 1,270 | ||||||
Barrick Gold Corp. | 33,906 | 535 | ||||||
BCE, Inc. | 2,964 | 135 | ||||||
BlackBerry Ltd. (a) | 9,947 | 74 | ||||||
Bombardier, Inc., Class B (a) | 40,448 | 68 | ||||||
Brookfield Asset Management, Inc., Class A | 16,294 | 780 | ||||||
| SECURITY DESCRIPTION | SHARES | VALUE($) | ||||||
Canada — continued | ||||||||
CAE, Inc. | 5,159 | 139 | ||||||
Cameco Corp. | 7,734 | 83 | ||||||
Canadian Imperial Bank of Commerce | 8,572 | 674 | ||||||
Canadian National Railway Co. | 13,965 | 1,292 | ||||||
Canadian Natural Resources Ltd. | 23,233 | 626 | ||||||
Canadian Pacific Railway Ltd. | 2,705 | 637 | ||||||
Canadian Tire Corp. Ltd., Class A | 1,161 | 127 | ||||||
Canadian Utilities Ltd., Class A | 2,452 | 69 | ||||||
Canopy Growth Corp. (a) | 3,942 | 159 | ||||||
CCL Industries, Inc., Class B | 2,876 | 141 | ||||||
Cenovus Energy, Inc. | 20,341 | 179 | ||||||
CGI, Inc. (a) | 4,758 | 366 | ||||||
CI Financial Corp. | 4,469 | 73 | ||||||
Constellation Software, Inc. | 388 | 366 | ||||||
Cronos Group, Inc. (a) | 3,619 | 58 | ||||||
Dollarama, Inc. | 5,790 | 204 | ||||||
Emera, Inc. | 1,110 | 45 | ||||||
Empire Co. Ltd. | 3,390 | 85 | ||||||
Enbridge, Inc. | 39,020 | 1,409 | ||||||
Encana Corp. | 29,069 | 149 | ||||||
Fairfax Financial Holdings Ltd. | 534 | 262 | ||||||
First Capital Realty, Inc. | 3,405 | 57 | ||||||
First Quantum Minerals Ltd. | 13,176 | 125 | ||||||
Fortis, Inc. | 8,248 | 326 | ||||||
Franco-Nevada Corp. | 3,583 | 304 | ||||||
George Weston Ltd. | 1,460 | 111 | ||||||
Gildan Activewear, Inc., Class A | 3,975 | 154 | ||||||
Great-West Lifeco, Inc. | 5,374 | 124 | ||||||
H&R Real Estate Investment Trust | 2,755 | 48 | ||||||
Husky Energy, Inc. | 6,750 | 64 | ||||||
Hydro One Ltd. (e) | 6,399 | 112 | ||||||
iA Financial Corp., Inc. | 2,065 | 84 | ||||||
IGM Financial, Inc. | 1,662 | 47 | ||||||
Imperial Oil Ltd. | 5,234 | 145 | ||||||
Intact Financial Corp. | 2,678 | 247 | ||||||
Inter Pipeline Ltd. | 7,857 | 122 | ||||||
Keyera Corp. | 4,026 | 104 | ||||||
Kinross Gold Corp. (a) | 24,355 | 94 | ||||||
Kirkland Lake Gold Ltd. | 3,860 | 166 | ||||||
Loblaw Cos. Ltd. | 3,576 | 183 | ||||||
Lundin Mining Corp. | 12,636 | 70 | ||||||
Magna International, Inc. | 6,101 | 304 | ||||||
Manulife Financial Corp. | 37,923 | 689 | ||||||
Methanex Corp. | 1,279 | 58 | ||||||
Metro, Inc. | 4,957 | 186 | ||||||
National Bank of Canada | 6,451 | 306 | ||||||
Nutrien Ltd. | 11,645 | 623 | ||||||
Onex Corp. | 1,626 | 98 | ||||||
Open Text Corp. | 5,177 | 214 | ||||||
Pembina Pipeline Corp. | 9,850 | 367 | ||||||
Power Corp. of Canada | 5,758 | 124 | ||||||
SEE NOTES TO FINANCIAL STATEMENTS.
| JUNE 30, 2019 | SIX CIRCLES TRUST | 17 | ||||||
Table of Contents
Six Circles Managed Equity Portfolio International Unconstrained Fund
SCHEDULE OF PORTFOLIO INVESTMENTS
AS OF JUNE 30, 2019 (Unaudited) (continued)
(Amounts in U.S. Dollars, unless otherwise noted)
(Amounts in thousands, except number of shares, rights and Futures contracts)
| SECURITY DESCRIPTION | SHARES | VALUE($) | ||||||
Common Stocks — continued |
| |||||||
Canada — continued |
| |||||||
Power Financial Corp. | 5,175 | 119 | ||||||
PrairieSky Royalty Ltd. | 4,125 | 58 | ||||||
Quebecor, Inc., Class B | 3,434 | 82 | ||||||
Restaurant Brands International, Inc. | 4,595 | 320 | ||||||
RioCan Real Estate Investment Trust | 2,901 | 58 | ||||||
Rogers Communications, Inc., Class B | 7,042 | 377 | ||||||
Royal Bank of Canada | 27,733 | 2,204 | ||||||
Saputo, Inc. | 4,516 | 135 | ||||||
Shaw Communications, Inc., Class B | 8,973 | 183 | ||||||
Shopify, Inc., Class A (a) | 1,901 | 571 | ||||||
SmartCentres Real Estate Investment Trust | 1,374 | 35 | ||||||
SNC-Lavalin Group, Inc. | 3,335 | 67 | ||||||
Stars Group, Inc. (The) (a) | 4,183 | 71 | ||||||
Sun Life Financial, Inc. | 11,556 | 479 | ||||||
Suncor Energy, Inc. | 30,478 | 951 | ||||||
TC Energy Corp. | 17,787 | 882 | ||||||
Teck Resources Ltd., Class B | 9,718 | 224 | ||||||
TELUS Corp. | 3,807 | 141 | ||||||
Thomson Reuters Corp. | 3,858 | 249 | ||||||
Toronto-Dominion Bank (The) | 35,418 | 2,070 | ||||||
Tourmaline Oil Corp. | 4,890 | 62 | ||||||
Vermilion Energy, Inc. | 2,951 | 64 | ||||||
West Fraser Timber Co. Ltd. | 1,033 | 47 | ||||||
Wheaton Precious Metals Corp. | 8,594 | 208 | ||||||
WSP Global, Inc. | 2,050 | 113 | ||||||
|
| |||||||
| 27,363 | ||||||||
|
| |||||||
Chile — 0.2% | ||||||||
Aguas Andinas SA, Class A | 376,600 | 223 | ||||||
Antofagasta plc | 7,180 | 85 | ||||||
Banco de Chile | 5,078,003 | 746 | ||||||
Banco de Credito e Inversiones SA | 1,313 | 91 | ||||||
Cia Cervecerias Unidas SA | 2,215 | 31 | ||||||
Colbun SA | 228,207 | 47 | ||||||
Enel Americas SA | 253,771 | 45 | ||||||
SACI Falabella | 54,997 | 357 | ||||||
|
| |||||||
| 1,625 | ||||||||
|
| |||||||
China — 2.7% | ||||||||
3SBio, Inc. (a) (e) | 111,000 | 190 | ||||||
51job, Inc., ADR (a) | 2,821 | 213 | ||||||
Agricultural Bank of China Ltd., Class H | 959,000 | 401 | ||||||
Alibaba Group Holding Ltd., ADR (a) | 3,847 | 652 | ||||||
ANTA Sports Products Ltd. | 32,000 | 221 | ||||||
Autohome, Inc., ADR (a) | 528 | 45 | ||||||
Baidu, Inc., ADR (a) | 1,919 | 225 | ||||||
Bank of China Ltd., Class H | 1,234,000 | 521 | ||||||
Bank of Communications Co. Ltd., Class A | 30,300 | 27 | ||||||
Bank of Communications Co. Ltd., Class H | 189,000 | 144 | ||||||
| SECURITY DESCRIPTION | SHARES | VALUE($) | ||||||
China — continued | ||||||||
Baozun, Inc., ADR (a) | 3,498 | 174 | ||||||
BeiGene Ltd., ADR (a) | 3,119 | 387 | ||||||
Beijing Capital International Airport Co. Ltd., Class H | 114,000 | 100 | ||||||
CGN Power Co. Ltd., Class H (e) | 863,000 | 238 | ||||||
China Aoyuan Group Ltd. | 107,000 | 150 | ||||||
China CITIC Bank Corp. Ltd., Class H | 296,000 | 169 | ||||||
China Conch Venture Holdings Ltd. | 142,000 | 502 | ||||||
China Construction Bank Corp., Class H | 115,000 | 99 | ||||||
China Everbright Bank Co. Ltd., Class H | 240,000 | 110 | ||||||
China Life Insurance Co. Ltd., Class H | 29,000 | 72 | ||||||
China Medical System Holdings Ltd. | 120,000 | 110 | ||||||
China Minsheng Banking Corp. Ltd., Class A | 29,100 | 27 | ||||||
China Oriental Group Co. Ltd. | 96,000 | 56 | ||||||
China Petroleum & Chemical Corp., Class H | 586,000 | 399 | ||||||
China Railway Signal & Communication Corp. Ltd., Class H (e) | 363,000 | 264 | ||||||
China Reinsurance Group Corp., Class H | 1,244,000 | 221 | ||||||
China Resources Pharmaceutical Group Ltd. (e) | 148,000 | 167 | ||||||
China Telecom Corp. Ltd., Class H | 1,128,000 | 568 | ||||||
China Tower Corp. Ltd., Class H (e) | 346,000 | 91 | ||||||
China Yangtze Power Co. Ltd., Class A (a) | 22,000 | 57 | ||||||
China Zhongwang Holdings Ltd. | 146,800 | 74 | ||||||
CIFI Holdings Group Co. Ltd. | 228,000 | 150 | ||||||
CNOOC Ltd. | 35,000 | 60 | ||||||
COSCO SHIPPING Energy Transportation Co. Ltd., Class H | 292,000 | 173 | ||||||
CRRC Corp. Ltd., Class H | 162,000 | 135 | ||||||
Ctrip.com International Ltd., ADR (a) | 1,348 | 50 | ||||||
Dali Foods Group Co. Ltd. (e) | 125,500 | 83 | ||||||
Dongfeng Motor Group Co. Ltd., Class H | 190,000 | 156 | ||||||
ENN Energy Holdings Ltd. | 10,200 | 99 | ||||||
Future Land Development Holdings Ltd. | 156,000 | 205 | ||||||
Fuyao Glass Industry Group Co. Ltd., Class H (e) | 20,000 | 62 | ||||||
GDS Holdings Ltd., ADR (a) | 5,243 | 197 | ||||||
Genscript Biotech Corp. (a) | 80,000 | 201 | ||||||
GOME Retail Holdings Ltd. (a) | 2,272,000 | 244 | ||||||
Gree Electric Appliances, Inc. of Zhuhai, Class A | 100 | 1 | ||||||
Greentown Service Group Co. Ltd. | 90,000 | 73 | ||||||
Haitian International Holdings Ltd. | 55,000 | 114 | ||||||
Hengan International Group Co. Ltd. | 32,000 | 236 | ||||||
HengTen Networks Group Ltd. (a) | 1,972,000 | 47 | ||||||
Hua Hong Semiconductor Ltd. (e) | 41,000 | 80 | ||||||
Huadian Power International Corp. Ltd., Class H | 214,000 | 85 | ||||||
SEE NOTES TO FINANCIAL STATEMENTS.
| 18 | SIX CIRCLES TRUST | JUNE 30, 2019 | ||||
Table of Contents
| SECURITY DESCRIPTION | SHARES | VALUE($) | ||||||
Common Stocks — continued |
| |||||||
China — continued | ||||||||
Huaneng Power International, Inc., Class H | 420,000 | 247 | ||||||
Huaneng Renewables Corp. Ltd., Class H (a) | 410,000 | 113 | ||||||
Industrial & Commercial Bank of China Ltd., Class H | 461,000 | 337 | ||||||
Industrial Bank Co. Ltd., Class A | 10,200 | 27 | ||||||
Inner Mongolia Yitai Coal Co. Ltd., Class B | 228,400 | 248 | ||||||
Jiangsu Expressway Co. Ltd., Class H | 274,000 | 390 | ||||||
Kaisa Group Holdings Ltd. | 205,000 | 101 | ||||||
Kingdee International Software Group Co. Ltd. | 204,000 | 221 | ||||||
Kingsoft Corp. Ltd. (a) | 71,000 | 154 | ||||||
KWG Group Holdings Ltd. | 108,000 | 110 | ||||||
Lenovo Group Ltd. | 380,000 | 294 | ||||||
Li Ning Co. Ltd. | 172,000 | 407 | ||||||
Luye Pharma Group Ltd. (e) | 98,500 | 71 | ||||||
NetEase, Inc., ADR | 766 | 196 | ||||||
New Oriental Education & Technology Group, Inc., ADR (a) | 2,260 | 218 | ||||||
Noah Holdings Ltd., ADR (a) | 2,595 | 110 | ||||||
PetroChina Co. Ltd., Class H | 466,000 | 257 | ||||||
Ping An Insurance Group Co. of China Ltd., Class H | 12,000 | 144 | ||||||
Semiconductor Manufacturing International Corp. (a) | 263,500 | 294 | ||||||
Shandong Weigao Group Medical Polymer Co. Ltd., Class H | 328,000 | 298 | ||||||
Shanghai Lujiazui Finance & Trade Zone Development Co. Ltd., Class B | 237,840 | 288 | ||||||
Shanghai Pharmaceuticals Holding Co. Ltd., Class H | 64,400 | 127 | ||||||
Shanghai Pudong Development Bank Co. Ltd., Class A | 17,000 | 29 | ||||||
Shenzhou International Group Holdings Ltd. | 31,600 | 436 | ||||||
Shui On Land Ltd. | 315,000 | 73 | ||||||
Sihuan Pharmaceutical Holdings Group Ltd. | 334,000 | 75 | ||||||
Sino-Ocean Group Holding Ltd. | 259,000 | 110 | ||||||
Sinopec Shanghai Petrochemical Co. Ltd., Class H | 172,000 | 69 | ||||||
Sinopharm Group Co. Ltd., Class H | 32,400 | 114 | ||||||
Sinotrans Ltd., Class H | 183,000 | 67 | ||||||
Sinotruk Hong Kong Ltd. | 59,000 | 102 | ||||||
SOHO China Ltd. | 185,000 | 65 | ||||||
TAL Education Group, ADR (a) | 3,003 | 114 | ||||||
Tencent Holdings Ltd. | 5,800 | 262 | ||||||
Tong Ren Tang Technologies Co. Ltd., Class H | 53,000 | 63 | ||||||
TravelSky Technology Ltd., Class H | 30,000 | 60 | ||||||
Uni-President China Holdings Ltd. | 113,000 | 126 | ||||||
| SECURITY DESCRIPTION | SHARES | VALUE($) | ||||||
China — continued | ||||||||
Want Want China Holdings Ltd. | 115,000 | 94 | ||||||
Xinyi Solar Holdings Ltd. | 272,000 | 134 | ||||||
Yangzijiang Shipbuilding Holdings Ltd. | 218,500 | 248 | ||||||
Yihai International Holding Ltd. (a) | 41,000 | 213 | ||||||
Yum China Holdings, Inc. | 10,570 | 488 | ||||||
Yuzhou Properties Co. Ltd. | 142,000 | 67 | ||||||
YY, Inc., ADR (a) | 4,264 | 297 | ||||||
Zhaojin Mining Industry Co. Ltd., Class H | 330,000 | 370 | ||||||
Zhongsheng Group Holdings Ltd. | 48,500 | 135 | ||||||
Zhuzhou CRRC Times Electric Co. Ltd., Class H | 15,100 | 80 | ||||||
ZTE Corp., Class H | 18,800 | 54 | ||||||
ZTO Express Cayman, Inc., ADR | 2,701 | 52 | ||||||
|
| |||||||
| 17,774 | ||||||||
|
| |||||||
Colombia — 0.0% (g) | ||||||||
Grupo Argos SA | 5,209 | 28 | ||||||
|
| |||||||
Czech Republic — 0.1% |
| |||||||
CEZ AS (a) | 2,297 | 55 | ||||||
Komercni banka as | 3,868 | 154 | ||||||
Moneta Money Bank AS (e) | 27,606 | 95 | ||||||
|
| |||||||
| 304 | ||||||||
|
| |||||||
Denmark — 2.0% | ||||||||
AP Moller—Maersk A/S, Class A | 69 | 80 | ||||||
AP Moller—Maersk A/S, Class B | 129 | 161 | ||||||
Carlsberg A/S, Class B | 16,040 | 2,128 | ||||||
Chr Hansen Holding A/S | 1,994 | 188 | ||||||
Coloplast A/S, Class B | 2,235 | 253 | ||||||
Danske Bank A/S | 12,524 | 198 | ||||||
Demant A/S (a) | 2,067 | 64 | ||||||
DSV A/S | 3,336 | 328 | ||||||
Genmab A/S (a) | 1,146 | 211 | ||||||
H Lundbeck A/S | 6,330 | 251 | ||||||
ISS A/S | 2,874 | 87 | ||||||
Novo Nordisk A/S, Class B | 158,194 | 8,080 | ||||||
Novozymes A/S, Class B | 4,080 | 190 | ||||||
Orsted A/S (e) | 3,536 | 306 | ||||||
Pandora A/S | 1,903 | 68 | ||||||
Tryg A/S | 18,564 | 604 | ||||||
Vestas Wind Systems A/S | 3,649 | 316 | ||||||
|
| |||||||
| 13,513 | ||||||||
|
| |||||||
Egypt — 0.0% (g) | ||||||||
Commercial International Bank Egypt SAE, GDR | 400 | 2 | ||||||
|
| |||||||
Finland — 0.9% |
| |||||||
Elisa OYJ | 2,590 | 126 | ||||||
Fortum OYJ | 8,463 | 187 | ||||||
Kone OYJ, Class B | 6,311 | 373 | ||||||
Metso OYJ | 1,917 | 75 | ||||||
SEE NOTES TO FINANCIAL STATEMENTS.
| JUNE 30, 2019 | SIX CIRCLES TRUST | 19 | ||||||
Table of Contents
Six Circles Managed Equity Portfolio International Unconstrained Fund
SCHEDULE OF PORTFOLIO INVESTMENTS
AS OF JUNE 30, 2019 (Unaudited) (continued)
(Amounts in U.S. Dollars, unless otherwise noted)
(Amounts in thousands, except number of shares, rights and Futures contracts)
| SECURITY DESCRIPTION | SHARES | VALUE($) | ||||||
Common Stocks — continued |
| |||||||
Finland — continued |
| |||||||
Neste OYJ | 7,951 | 270 | ||||||
Nokia OYJ | 105,042 | 523 | ||||||
Nokian Renkaat OYJ | 2,262 | 71 | ||||||
Nordea Bank Abp | 56,427 | 410 | ||||||
Orion OYJ, Class B | 9,549 | 350 | ||||||
Sampo OYJ, Class A | 68,395 | 3,229 | ||||||
Stora Enso OYJ, Class R | 10,593 | 125 | ||||||
UPM-Kymmene OYJ | 10,032 | 267 | ||||||
Wartsila OYJ Abp | 8,632 | 125 | ||||||
|
| |||||||
| 6,131 | ||||||||
|
| |||||||
France — 12.5% | ||||||||
Accor SA | 3,539 | 152 | ||||||
Aeroports de Paris | 540 | 95 | ||||||
Air Liquide SA | 7,997 | 1,119 | ||||||
Airbus SE | 10,840 | 1,534 | ||||||
Alstom SA | 3,019 | 140 | ||||||
Amundi SA (e) | 1,102 | 77 | ||||||
Arkema SA | 1,254 | 117 | ||||||
Atos SE | 1,793 | 150 | ||||||
AXA SA | 299,333 | 7,861 | ||||||
BioMerieux | 754 | 62 | ||||||
BNP Paribas SA | 20,941 | 993 | ||||||
Bollore SA | 15,990 | 71 | ||||||
Bouygues SA | 4,154 | 154 | ||||||
Bureau Veritas SA | 5,230 | 129 | ||||||
Capgemini SE | 2,963 | 368 | ||||||
Carrefour SA | 11,216 | 217 | ||||||
Casino Guichard Perrachon SA | 1,000 | 34 | ||||||
Cie de Saint-Gobain | 9,165 | 358 | ||||||
Cie Generale des Etablissements Michelin SCA | 3,174 | 401 | ||||||
CNP Assurances | 26,368 | 598 | ||||||
Covivio | 831 | 87 | ||||||
Credit Agricole SA | 21,581 | 258 | ||||||
Danone SA | 92,347 | 7,819 | ||||||
Dassault Aviation SA | 46 | 66 | ||||||
Dassault Systemes SE | 2,433 | 388 | ||||||
Edenred | 4,527 | 231 | ||||||
Eiffage SA | 1,461 | 144 | ||||||
Electricite de France SA | 11,616 | 146 | ||||||
Engie SA | 34,326 | 520 | ||||||
EssilorLuxottica SA | 5,260 | 685 | ||||||
Eurazeo SE | 732 | 51 | ||||||
Eutelsat Communications SA | 3,178 | 59 | ||||||
Faurecia SA | 1,383 | 64 | ||||||
Gecina SA | 888 | 133 | ||||||
Getlink SE | 8,012 | 128 | ||||||
Hermes International | 588 | 424 | ||||||
ICADE | 542 | 50 | ||||||
Iliad SA | 483 | 54 | ||||||
| SECURITY DESCRIPTION | SHARES | VALUE($) | ||||||
France — continued | ||||||||
Imerys SA | 651 | 34 | ||||||
Ingenico Group SA | 1,093 | 97 | ||||||
Ipsen SA | 3,450 | 471 | ||||||
JCDecaux SA | 1,356 | 41 | ||||||
Kering SA | 1,411 | 833 | ||||||
Klepierre SA | 3,967 | 133 | ||||||
Legrand SA | 4,969 | 363 | ||||||
L’Oreal SA | 4,694 | 1,335 | ||||||
LVMH Moet Hennessy Louis Vuitton SE | 5,171 | 2,198 | ||||||
Natixis SA | 17,209 | 69 | ||||||
Orange SA | 37,358 | 589 | ||||||
Pernod Ricard SA | 31,771 | 5,851 | ||||||
Peugeot SA | 11,043 | 272 | ||||||
Publicis Groupe SA | 4,013 | 212 | ||||||
Remy Cointreau SA | 3,303 | 476 | ||||||
Renault SA | 3,632 | 228 | ||||||
Safran SA | 6,093 | 891 | ||||||
Sanofi | 103,176 | 8,917 | ||||||
Sartorius Stedim Biotech | 503 | 79 | ||||||
Schneider Electric SE | 10,240 | 927 | ||||||
SCOR SE | 25,108 | 1,101 | ||||||
SEB SA | 411 | 74 | ||||||
Societe BIC SA | 460 | 35 | ||||||
Societe Generale SA | 14,306 | 361 | ||||||
Sodexo SA | 1,682 | 197 | ||||||
Suez | 6,223 | 90 | ||||||
Teleperformance | 1,094 | 219 | ||||||
Thales SA | 2,007 | 248 | ||||||
TOTAL SA | 514,941 | 28,885 | ||||||
Ubisoft Entertainment SA (a) | 1,523 | 119 | ||||||
Unibail—Rodamco-Westfield | 2,574 | 386 | ||||||
Valeo SA | 4,478 | 146 | ||||||
Veolia Environnement SA | 10,116 | 246 | ||||||
Vinci SA | 9,467 | 967 | ||||||
Vivendi SA | 16,936 | 465 | ||||||
Wendel SA | 505 | 69 | ||||||
Worldline SA (a) (e) | 1,497 | 109 | ||||||
|
| |||||||
| 83,670 | ||||||||
|
| |||||||
Germany — 7.1% | ||||||||
1&1 Drillisch AG | 966 | 32 | ||||||
adidas AG | 3,358 | 1,039 | ||||||
Allianz SE (Registered) | 65,494 | 15,796 | ||||||
Axel Springer SE | 884 | 62 | ||||||
BASF SE | 17,100 | 1,244 | ||||||
Bayer AG (Registered) | 85,705 | 5,944 | ||||||
Bayerische Motoren Werke AG | 6,141 | 454 | ||||||
Beiersdorf AG | 1,904 | 228 | ||||||
Brenntag AG | 2,982 | 146 | ||||||
Carl Zeiss Meditec AG | 733 | 72 | ||||||
Commerzbank AG | 18,243 | 131 | ||||||
Continental AG | 2,059 | 300 | ||||||
SEE NOTES TO FINANCIAL STATEMENTS.
| 20 | SIX CIRCLES TRUST | JUNE 30, 2019 | ||||
Table of Contents
| SECURITY DESCRIPTION | SHARES | VALUE($) | ||||||
Common Stocks — continued |
| |||||||
Germany — continued | ||||||||
Covestro AG (e) | 3,333 | 170 | ||||||
Daimler AG (Registered) | 16,930 | 944 | ||||||
Delivery Hero SE (a) (e) | 2,047 | 93 | ||||||
Deutsche Bank AG (Registered) | 36,902 | 284 | ||||||
Deutsche Boerse AG | 3,541 | 500 | ||||||
Deutsche Lufthansa AG (Registered) | 4,327 | 74 | ||||||
Deutsche Post AG (Registered) | 18,521 | 609 | ||||||
Deutsche Telekom AG (Registered) | 62,084 | 1,076 | ||||||
Deutsche Wohnen SE | 6,718 | 246 | ||||||
E.ON SE | 40,808 | 443 | ||||||
Evonik Industries AG | 3,394 | 99 | ||||||
Fraport AG Frankfurt Airport Services Worldwide | 757 | 65 | ||||||
Fresenius Medical Care AG & Co. KGaA | 4,031 | 317 | ||||||
Fresenius SE & Co. KGaA | 7,747 | 421 | ||||||
GEA Group AG | 2,794 | 79 | ||||||
Hannover Rueck SE | 9,331 | 1,509 | ||||||
HeidelbergCement AG | 2,812 | 227 | ||||||
Henkel AG & Co. KGaA | 1,983 | 182 | ||||||
HOCHTIEF AG | 450 | 55 | ||||||
HUGO BOSS AG | 1,154 | 77 | ||||||
Infineon Technologies AG | 23,302 | 414 | ||||||
Innogy SE (e) | 2,530 | 120 | ||||||
KION Group AG | 1,183 | 75 | ||||||
Knorr-Bremse AG | 880 | 98 | ||||||
LANXESS AG | 1,584 | 94 | ||||||
Merck KGaA | 11,910 | 1,244 | ||||||
METRO AG | 3,280 | 60 | ||||||
MTU Aero Engines AG | 982 | 234 | ||||||
Muenchener Rueckversicherungs-Gesellschaft AG in Muenchen (Registered) | 23,078 | 5,785 | ||||||
Puma SE | 1,511 | 101 | ||||||
RWE AG | 10,285 | 254 | ||||||
SAP SE | 18,297 | 2,508 | ||||||
Siemens AG (Registered) | 14,242 | 1,696 | ||||||
Siemens Healthineers AG (e) | 2,732 | 115 | ||||||
Symrise AG, Class A | 2,426 | 234 | ||||||
Telefonica Deutschland Holding AG | 16,249 | 45 | ||||||
thyssenkrupp AG | 7,369 | 108 | ||||||
TUI AG | 8,028 | 79 | ||||||
Uniper SE | 3,665 | 111 | ||||||
United Internet AG (Registered) | 2,239 | 74 | ||||||
Volkswagen AG | 591 | 101 | ||||||
Vonovia SE | 9,128 | 436 | ||||||
Wirecard AG | 2,184 | 369 | ||||||
Zalando SE (a) (e) | 2,282 | 101 | ||||||
|
| |||||||
| 47,374 | ||||||||
|
| |||||||
Greece — 0.1% | ||||||||
Hellenic Telecommunications Organization SA (a) | 4,930 | 73 | ||||||
JUMBO SA | 2,412 | 47 | ||||||
| SECURITY DESCRIPTION | SHARES | VALUE($) | ||||||
Greece — continued | ||||||||
Motor Oil Hellas Corinth Refineries SA | 3,529 | 90 | ||||||
OPAP SA | 4,593 | 52 | ||||||
Titan Cement Co. SA | 5,911 | 115 | ||||||
|
| |||||||
| 377 | ||||||||
|
| |||||||
Hong Kong — 2.3% | ||||||||
Alibaba Pictures Group Ltd. (a) | 1,230,000 | 264 | ||||||
ASM Pacific Technology Ltd. | 26,400 | 271 | ||||||
Bank of East Asia Ltd. (The) | 112,600 | 315 | ||||||
China Agri-Industries Holdings Ltd. | 210,000 | 68 | ||||||
China Education Group Holdings Ltd. | 55,000 | 86 | ||||||
China Everbright Ltd. | 82,000 | 121 | ||||||
China First Capital Group Ltd. (a) | 510,000 | 152 | ||||||
China Gas Holdings Ltd. | 31,200 | 116 | ||||||
China Jinmao Holdings Group Ltd. | 452,000 | 275 | ||||||
China Mengniu Dairy Co. Ltd. (a) | 44,000 | 171 | ||||||
China Merchants Port Holdings Co. Ltd. | 28,000 | 48 | ||||||
China Mobile Ltd. | 89,000 | 810 | ||||||
China Power International Development Ltd. | 396,000 | 97 | ||||||
China Resources Beer Holdings Co. Ltd. | 58,000 | 276 | ||||||
China Resources Gas Group Ltd. | 34,000 | 169 | ||||||
China Resources Power Holdings Co. Ltd. | 56,000 | 82 | ||||||
China Traditional Chinese Medicine Holdings Co. Ltd. | 196,000 | 95 | ||||||
China Unicom Hong Kong Ltd. | 62,000 | 68 | ||||||
CITIC Ltd. | 192,000 | 276 | ||||||
COSCO SHIPPING Ports Ltd. | 348,000 | 343 | ||||||
Dairy Farm International Holdings Ltd. | 29,600 | 212 | ||||||
Far East Horizon Ltd. | 193,000 | 197 | ||||||
Guangdong Investment Ltd. | 418,000 | 826 | ||||||
Hang Lung Properties Ltd. | 174,000 | 414 | ||||||
HK Electric Investments & HK Electric Investments Ltd. | 231,500 | 237 | ||||||
HKT Trust & HKT Ltd. | 335,000 | 532 | ||||||
Hutchison China MediTech Ltd., ADR (a) | 8,460 | 186 | ||||||
Hysan Development Co. Ltd. | 54,000 | 279 | ||||||
Kerry Properties Ltd. | 56,000 | 235 | ||||||
Kingboard Holdings Ltd. | 58,000 | 162 | ||||||
Kingboard Laminates Holdings Ltd. | 91,500 | 84 | ||||||
Kunlun Energy Co. Ltd. | 78,000 | 68 | ||||||
Lee & Man Paper Manufacturing Ltd. | 255,000 | 178 | ||||||
Link REIT | 183,000 | 2,252 | ||||||
Melco Resorts & Entertainment Ltd., ADR | 17,976 | 390 | ||||||
New World Development Co. Ltd. | 533,000 | 834 | ||||||
NWS Holdings Ltd. | 137,000 | 282 | ||||||
PCCW Ltd. | 382,000 | 220 | ||||||
Shanghai Industrial Holdings Ltd. | 43,000 | 93 | ||||||
Shangri-La Asia Ltd. | 112,000 | 141 | ||||||
Shenzhen International Holdings Ltd. | 124,000 | 246 | ||||||
Shenzhen Investment Ltd. | 260,000 | 96 | ||||||
Sino Land Co. Ltd. | 264,000 | 443 | ||||||
SEE NOTES TO FINANCIAL STATEMENTS.
| JUNE 30, 2019 | SIX CIRCLES TRUST | 21 | ||||||
Table of Contents
Six Circles Managed Equity Portfolio International Unconstrained Fund
SCHEDULE OF PORTFOLIO INVESTMENTS
AS OF JUNE 30, 2019 (Unaudited) (continued)
(Amounts in U.S. Dollars, unless otherwise noted)
(Amounts in thousands, except number of shares, rights and Futures contracts)
| SECURITY DESCRIPTION | SHARES | VALUE($) | ||||||
Common Stocks — continued |
| |||||||
Hong Kong — continued | ||||||||
SJM Holdings Ltd. | 174,000 | 198 | ||||||
SSY Group Ltd. | 130,000 | 117 | ||||||
Sun Art Retail Group Ltd. | 84,500 | 80 | ||||||
Techtronic Industries Co. Ltd. | 119,500 | 915 | ||||||
Towngas China Co. Ltd. (a) | 85,000 | 61 | ||||||
Vitasoy International Holdings Ltd. | 64,000 | 308 | ||||||
Wharf Holdings Ltd. (The) | 107,000 | 284 | ||||||
Wheelock & Co. Ltd. | 71,000 | 510 | ||||||
Yue Yuen Industrial Holdings Ltd. | 64,000 | 176 | ||||||
Yuexiu Property Co. Ltd. | 618,000 | 140 | ||||||
|
| |||||||
| 15,499 | ||||||||
|
| |||||||
Hungary — 0.1% | ||||||||
MOL Hungarian Oil & Gas plc | 16,880 | 188 | ||||||
OTP Bank Nyrt | 2,465 | 98 | ||||||
Richter Gedeon Nyrt | 12,486 | 230 | ||||||
|
| |||||||
| 516 | ||||||||
|
| |||||||
India — 1.5% | ||||||||
Ambuja Cements Ltd. | 52,441 | 162 | ||||||
Ashok Leyland Ltd. | 103,446 | 131 | ||||||
Asian Paints Ltd. | 17,932 | 353 | ||||||
Bajaj Finance Ltd. | 2,974 | 159 | ||||||
Bajaj Finserv Ltd. | 1,245 | 154 | ||||||
Bharat Forge Ltd. | 18,307 | 119 | ||||||
Bharti Infratel Ltd. | 14,133 | 55 | ||||||
Britannia Industries Ltd. | 4,481 | 178 | ||||||
Cipla Ltd. | 5,654 | 45 | ||||||
Coal India Ltd. | 11,305 | 42 | ||||||
Container Corp. Of India Ltd. | 17,991 | 148 | ||||||
Dabur India Ltd. | 59,107 | 342 | ||||||
Divi’s Laboratories Ltd. | 6,803 | 157 | ||||||
Dr Reddy’s Laboratories Ltd. | 11,006 | 409 | ||||||
Eicher Motors Ltd. | 14 | 4 | ||||||
Glenmark Pharmaceuticals Ltd. | 12,081 | 78 | ||||||
Havells India Ltd. | 21,480 | 244 | ||||||
HCL Technologies Ltd. | 19,953 | 308 | ||||||
Hindalco Industries Ltd. | 100,579 | 302 | ||||||
Hindustan Unilever Ltd. | 13,817 | 358 | ||||||
Housing Development Finance Corp. Ltd. | 4,569 | 145 | ||||||
ICICI Lombard General Insurance Co. Ltd. (e) | 11,345 | 182 | ||||||
Indiabulls Housing Finance Ltd., ADR | 24,149 | 212 | ||||||
Infosys Ltd. | 46,152 | 492 | ||||||
InterGlobe Aviation Ltd. (e) | 9,330 | 211 | ||||||
ITC Ltd. | 13,389 | 53 | ||||||
LIC Housing Finance Ltd. | 26,144 | 212 | ||||||
Lupin Ltd. | 22,072 | 241 | ||||||
Mahindra & Mahindra Financial Services Ltd. | �� | 26,462 | 148 | |||||
Marico Ltd. | 76,631 | 411 | ||||||
Maruti Suzuki India Ltd. | 235 | 22 | ||||||
| SECURITY DESCRIPTION | SHARES | VALUE($) | ||||||
India — continued | ||||||||
Nestle India Ltd. | 544 | 94 | ||||||
Page Industries Ltd. | 482 | 145 | ||||||
Petronet LNG Ltd. | 87,277 | 311 | ||||||
Pidilite Industries Ltd. | 12,916 | 228 | ||||||
Piramal Enterprises Ltd. | 7,208 | 203 | ||||||
Power Grid Corp. of India Ltd. | 31,571 | 94 | ||||||
REC Ltd. | 60,732 | 145 | ||||||
Reliance Industries Ltd. (a) | 7,415 | 135 | ||||||
Shriram Transport Finance Co. Ltd. | 12,976 | 203 | ||||||
Sun Pharmaceutical Industries Ltd. | 9,180 | 53 | ||||||
Tata Consultancy Services Ltd. | 13,291 | 429 | ||||||
Tata Power Co. Ltd. (The) | 97,050 | 97 | ||||||
Tech Mahindra Ltd. | 20,117 | 206 | ||||||
Titan Co. Ltd. | 7,193 | 139 | ||||||
United Spirits Ltd. (a) | 25,296 | 214 | ||||||
UPL Ltd. | 30,910 | 421 | ||||||
Wipro Ltd. | 82,532 | 336 | ||||||
Zee Entertainment Enterprises Ltd. | 45,957 | 225 | ||||||
|
| |||||||
| 9,755 | ||||||||
|
| |||||||
Indonesia — 0.5% | ||||||||
Adaro Energy Tbk. PT | 1,199,100 | 116 | ||||||
Bank Central Asia Tbk. PT | 410,700 | 872 | ||||||
Bank Tabungan Negara Persero Tbk. PT | 345,400 | 60 | ||||||
Barito Pacific Tbk. PT | 441,500 | 100 | ||||||
Bukit Asam Tbk. PT | 223,400 | 47 | ||||||
Bumi Serpong Damai Tbk. PT (a) | 646,100 | 70 | ||||||
Gudang Garam Tbk. PT | 19,900 | 108 | ||||||
Hanjaya Mandala Sampoerna Tbk. PT | 858,700 | 191 | ||||||
Indah Kiat Pulp & Paper Corp. Tbk. PT | 241,100 | 160 | ||||||
Indofood CBP Sukses Makmur Tbk. PT | 167,000 | 120 | ||||||
Indofood Sukses Makmur Tbk. PT | 552,100 | 275 | ||||||
Jasa Marga Persero Tbk. PT | 174,500 | 71 | ||||||
Pabrik Kertas Tjiwi Kimia Tbk. PT | 120,700 | 107 | ||||||
Pakuwon Jati Tbk. PT | 1,358,300 | 70 | ||||||
Semen Indonesia Persero Tbk. PT | 264,400 | 217 | ||||||
Surya Citra Media Tbk. PT | 672,400 | 77 | ||||||
Telekomunikasi Indonesia Persero Tbk. PT | 1,215,300 | 356 | ||||||
Unilever Indonesia Tbk. PT | 92,600 | 295 | ||||||
|
| |||||||
| 3,312 | ||||||||
|
| |||||||
Ireland — 0.6% | ||||||||
AerCap Holdings NV (a) | 2,409 | 125 | ||||||
AIB Group plc | 14,828 | 61 | ||||||
Bank of Ireland Group plc | 17,680 | 92 | ||||||
CRH plc | 15,021 | 491 | ||||||
DCC plc | 1,880 | 168 | ||||||
Flutter Entertainment plc | 1,428 | 107 | ||||||
Kerry Group plc, Class A | 23,770 | 2,838 | ||||||
Kingspan Group plc | 2,942 | 160 | ||||||
Smurfit Kappa Group plc | 4,378 | 133 | ||||||
|
| |||||||
| 4,175 | ||||||||
|
| |||||||
SEE NOTES TO FINANCIAL STATEMENTS.
| 22 | SIX CIRCLES TRUST | JUNE 30, 2019 | ||||
Table of Contents
| SECURITY DESCRIPTION | SHARES | VALUE($) | ||||||
Common Stocks — continued |
| |||||||
Isle of Man — 0.0% (g) | ||||||||
GVC Holdings plc | 10,596 | 88 | ||||||
|
| |||||||
Italy — 2.7% | ||||||||
Assicurazioni Generali SpA | 169,054 | 3,183 | ||||||
Atlantia SpA | 9,325 | 243 | ||||||
Davide Campari-Milano SpA | 86,756 | 850 | ||||||
Enel SpA | 151,421 | 1,056 | ||||||
ENI SpA | 550,957 | 9,161 | ||||||
Ferrari NV | 2,274 | 369 | ||||||
FinecoBank Banca Fineco SpA | 9,425 | 105 | ||||||
Intesa Sanpaolo SpA | 277,386 | 594 | ||||||
Leonardo SpA | 7,283 | 92 | ||||||
Mediobanca Banca di Credito Finanziario SpA | 11,307 | 117 | ||||||
Moncler SpA | 3,458 | 148 | ||||||
Pirelli & C SpA (e) | 7,284 | 43 | ||||||
Poste Italiane SpA (e) | 80,520 | 848 | ||||||
Prysmian SpA | 4,395 | 91 | ||||||
Recordati SpA | 9,576 | 399 | ||||||
Snam SpA | 43,820 | 218 | ||||||
Telecom Italia SpA (a) | 166,111 | 91 | ||||||
Telecom Italia SpA | 109,768 | 57 | ||||||
Terna Rete Elettrica Nazionale SpA | 26,223 | 167 | ||||||
UniCredit SpA | 37,231 | 458 | ||||||
|
| |||||||
| 18,290 | ||||||||
|
| |||||||
Luxembourg — 0.1% | ||||||||
ArcelorMittal | 12,571 | 225 | ||||||
Aroundtown SA | 14,385 | 118 | ||||||
Eurofins Scientific SE (a) | 209 | 92 | ||||||
Millicom International Cellular SA, SDR | 1,204 | 68 | ||||||
Reinet Investments SCA | 3,956 | 64 | ||||||
RTL Group SA | 704 | 36 | ||||||
SES SA, Class A | 6,633 | 104 | ||||||
Tenaris SA | 8,599 | 113 | ||||||
|
| |||||||
| 820 | ||||||||
|
| |||||||
Macau — 0.1% | ||||||||
MGM China Holdings Ltd. | 84,000 | 143 | ||||||
Wynn Macau Ltd. | 135,200 | 302 | ||||||
|
| |||||||
| 445 | ||||||||
|
| |||||||
Malaysia — 0.8% | ||||||||
AirAsia Group Bhd. | 135,100 | 89 | ||||||
Alliance Bank Malaysia Bhd. | 92,700 | 84 | ||||||
AMMB Holdings Bhd. | 152,200 | 156 | ||||||
British American Tobacco Malaysia Bhd. | 14,300 | 100 | ||||||
DiGi.Com Bhd. | 56,100 | 68 | ||||||
Fraser & Neave Holdings Bhd. | 25,900 | 217 | ||||||
Gamuda Bhd. | 172,900 | 157 | ||||||
Genting Plantations Bhd. | 30,600 | 74 | ||||||
HAP Seng Consolidated Bhd. | 80,600 | 194 | ||||||
| SECURITY DESCRIPTION | SHARES | VALUE($) | ||||||
Malaysia — continued | ||||||||
Hartalega Holdings Bhd. | 133,800 | 170 | ||||||
Hong Leong Bank Bhd. | 98,400 | 453 | ||||||
IHH Healthcare Bhd. | 156,600 | 220 | ||||||
IJM Corp. Bhd. | 240,600 | 140 | ||||||
IOI Corp. Bhd. | 25,600 | 26 | ||||||
Kuala Lumpur Kepong Bhd. | 28,400 | 169 | ||||||
Malayan Banking Bhd. | 279,400 | 601 | ||||||
Maxis Bhd. | 101,700 | 137 | ||||||
Nestle Malaysia Bhd. | 700 | 25 | ||||||
Petronas Chemicals Group Bhd. | 86,900 | 177 | ||||||
Petronas Dagangan Bhd. | 16,400 | 101 | ||||||
PPB Group Bhd. | 37,000 | 167 | ||||||
Press Metal Aluminium Holdings Bhd. | 122,400 | 130 | ||||||
Public Bank Bhd. | 131,200 | 731 | ||||||
QL Resources Bhd. | 62,100 | 103 | ||||||
Sime Darby Bhd. | 236,300 | 129 | ||||||
Sime Darby Property Bhd. | 229,800 | 57 | ||||||
SP Setia Bhd. Group | 142,200 | 74 | ||||||
Telekom Malaysia Bhd. | 105,500 | 102 | ||||||
Tenaga Nasional Bhd. | 62,000 | 208 | ||||||
Top Glove Corp. Bhd. | 137,800 | 164 | ||||||
Westports Holdings Bhd. | 106,500 | 102 | ||||||
YTL Corp. Bhd. | 244,000 | 66 | ||||||
|
| |||||||
| 5,391 | ||||||||
|
| |||||||
Mexico — 0.1% | ||||||||
Arca Continental SAB de CV | 26,619 | 144 | ||||||
Coca-Cola Femsa SAB de CV | 7,605 | 47 | ||||||
Fresnillo plc | 4,026 | 45 | ||||||
Gruma SAB de CV, Class B | 6,016 | 57 | ||||||
Infraestructura Energetica Nova SAB de CV | 26,977 | 106 | ||||||
Wal-Mart de Mexico SAB de CV | 115,890 | 316 | ||||||
|
| |||||||
| 715 | ||||||||
|
| |||||||
Netherlands — 11.0% | ||||||||
ABN AMRO Bank NV, CVA, GDR (e) | 7,884 | 169 | ||||||
Adyen NV (a) (e) | 193 | 149 | ||||||
Aegon NV | 274,960 | 1,366 | ||||||
Akzo Nobel NV | 4,240 | 398 | ||||||
ASML Holding NV | 7,925 | 1,649 | ||||||
EXOR NV | 1,975 | 138 | ||||||
Heineken Holding NV | 17,288 | 1,811 | ||||||
Heineken NV | 38,829 | 4,328 | ||||||
ING Groep NV | 72,454 | 839 | ||||||
Koninklijke Ahold Delhaize NV | 22,269 | 500 | ||||||
Koninklijke DSM NV | 3,368 | 416 | ||||||
Koninklijke KPN NV | 66,582 | 204 | ||||||
Koninklijke Philips NV | 17,243 | 750 | ||||||
Koninklijke Vopak NV | 1,725 | 79 | ||||||
NN Group NV | 47,428 | 1,907 | ||||||
NXP Semiconductors NV | 5,507 | 537 | ||||||
SEE NOTES TO FINANCIAL STATEMENTS.
| JUNE 30, 2019 | SIX CIRCLES TRUST | 23 | ||||||
Table of Contents
Six Circles Managed Equity Portfolio International Unconstrained Fund
SCHEDULE OF PORTFOLIO INVESTMENTS
AS OF JUNE 30, 2019 (Unaudited) (continued)
(Amounts in U.S. Dollars, unless otherwise noted)
(Amounts in thousands, except number of shares, rights and Futures contracts)
| SECURITY DESCRIPTION | SHARES | VALUE($) | ||||||
Common Stocks — continued |
| |||||||
Netherlands — continued | ||||||||
QIAGEN NV (a) | 4,405 | 179 | ||||||
Randstad NV | 2,169 | 119 | ||||||
Royal Dutch Shell plc, Class A | 958,820 | 31,294 | ||||||
Royal Dutch Shell plc, Class B | 811,187 | 26,580 | ||||||
Wolters Kluwer NV | 5,208 | 379 | ||||||
|
| |||||||
| 73,791 | ||||||||
|
| |||||||
Norway — 1.3% | ||||||||
Aker BP ASA | 1,967 | 57 | ||||||
DNB ASA | 17,965 | 335 | ||||||
Equinor ASA | 216,916 | 4,303 | ||||||
Gjensidige Forsikring ASA | 30,722 | 619 | ||||||
Mowi ASA | 65,861 | 1,541 | ||||||
Norsk Hydro ASA | 24,489 | 88 | ||||||
Orkla ASA | 113,135 | 1,004 | ||||||
Schibsted ASA, Class B | 1,785 | 46 | ||||||
Telenor ASA | 13,771 | 293 | ||||||
Yara International ASA | 3,401 | 165 | ||||||
|
| |||||||
| 8,451 | ||||||||
|
| |||||||
Pakistan — 0.0% (g) | ||||||||
Habib Bank Ltd. | 51,700 | 37 | ||||||
MCB Bank Ltd. | 96,900 | 106 | ||||||
|
| |||||||
| 143 | ||||||||
|
| |||||||
Peru — 0.1% | ||||||||
Cia de Minas Buenaventura SAA, ADR | 5,252 | 88 | ||||||
Credicorp Ltd. | 2,631 | 602 | ||||||
|
| |||||||
| 690 | ||||||||
|
| |||||||
Philippines — 0.4% | ||||||||
Aboitiz Equity Ventures, Inc. | 50,110 | 54 | ||||||
Aboitiz Power Corp. | 273,600 | 186 | ||||||
Alliance Global Group, Inc. | 338,900 | 102 | ||||||
Bank of the Philippine Islands | 175,240 | 269 | ||||||
BDO Unibank, Inc. | 144,790 | 396 | ||||||
DMCI Holdings, Inc. | 344,700 | 69 | ||||||
Globe Telecom, Inc. | 2,930 | 129 | ||||||
GT Capital Holdings, Inc. | 7,730 | 142 | ||||||
International Container Terminal Services, Inc. | 129,120 | 369 | ||||||
Jollibee Foods Corp. | 53,660 | 295 | ||||||
Manila Electric Co. | 23,390 | 177 | ||||||
Megaworld Corp. (a) | 931,000 | 111 | ||||||
Metro Pacific Investments Corp. | 1,210,000 | 113 | ||||||
Metropolitan Bank & Trust Co. | 70,440 | 98 | ||||||
Robinsons Land Corp. | 179,700 | 93 | ||||||
Security Bank Corp. | 40,110 | 133 | ||||||
SM Investments Corp. | 2,240 | 42 | ||||||
Universal Robina Corp. | 26,030 | 84 | ||||||
|
| |||||||
| 2,862 | ||||||||
|
| |||||||
| SECURITY DESCRIPTION | SHARES | VALUE($) | ||||||
Poland — 0.0% (g) | ||||||||
Bank Polska Kasa Opieki SA | 4,027 | 121 | ||||||
Cyfrowy Polsat SA | 6,966 | 55 | ||||||
|
| |||||||
| 176 | ||||||||
|
| |||||||
Portugal — 0.3% | ||||||||
EDP—Energias de Portugal SA | 47,705 | 181 | ||||||
Galp Energia SGPS SA | 108,572 | 1,670 | ||||||
Jeronimo Martins SGPS SA | 4,583 | 74 | ||||||
|
| |||||||
| 1,925 | ||||||||
|
| |||||||
Qatar — 0.3% | ||||||||
Barwa Real Estate Co. | 19,838 | 186 | ||||||
Commercial Bank PQSC (The) | 97,240 | 123 | ||||||
Masraf Al Rayan QSC | 320,450 | 335 | ||||||
Qatar Electricity & Water Co. QSC | 53,500 | 245 | ||||||
Qatar Islamic Bank SAQ | 91,820 | 418 | ||||||
Qatar National Bank QPSC | 65,510 | 342 | ||||||
|
| |||||||
| 1,649 | ||||||||
|
| |||||||
Russia — 0.0% (g) | ||||||||
Evraz plc | 9,198 | 78 | ||||||
Rosneft Oil Co. PJSC (Registered), GDR | 16,992 | 111 | ||||||
|
| |||||||
| 189 | ||||||||
| �� | |||||||
Saudi Arabia — 0.0% (g) | ||||||||
Saudi Telecom Co. | 10 | — | (h) | |||||
|
| |||||||
Singapore — 0.8% | ||||||||
Ascendas Real Estate Investment Trust | 227,300 | 524 | ||||||
BOC Aviation Ltd. (e) | 27,900 | 234 | ||||||
CapitaLand Commercial Trust | 238,600 | 383 | ||||||
CapitaLand Mall Trust | 231,700 | 451 | ||||||
City Developments Ltd. | 42,700 | 299 | ||||||
ComfortDelGro Corp. Ltd. | 197,600 | 389 | ||||||
Golden Agri-Resources Ltd. | 614,900 | 132 | ||||||
Keppel Corp. Ltd. | 130,600 | 643 | ||||||
SATS Ltd. | 65,300 | 252 | ||||||
Sembcorp Industries Ltd. | 96,100 | 171 | ||||||
Singapore Exchange Ltd. | 66,300 | 388 | ||||||
Singapore Press Holdings Ltd. | 300 | 1 | ||||||
Singapore Technologies Engineering Ltd. | 144,100 | 441 | ||||||
Suntec Real Estate Investment Trust | 176,200 | 253 | ||||||
UOL Group Ltd. | 43,700 | 244 | ||||||
Venture Corp. Ltd. | 26,000 | 314 | ||||||
|
| |||||||
| 5,119 | ||||||||
|
| |||||||
South Africa — 0.1% | ||||||||
AngloGold Ashanti Ltd. | 7,578 | 136 | ||||||
Bidvest Group Ltd. (The) | 3,763 | 51 | ||||||
Fortress REIT Ltd., Class A | 146,568 | 223 | ||||||
Gold Fields Ltd. | 12,787 | 69 | ||||||
Investec plc | 12,421 | 81 | ||||||
SPAR Group Ltd. (The) | 2,176 | 29 | ||||||
SEE NOTES TO FINANCIAL STATEMENTS.
| 24 | SIX CIRCLES TRUST | JUNE 30, 2019 | ||||
Table of Contents
| SECURITY DESCRIPTION | SHARES | VALUE($) | ||||||
Common Stocks — continued |
| |||||||
South Africa — continued | ||||||||
Tiger Brands Ltd. | 1,460 | 23 | ||||||
Vodacom Group Ltd. | 10,007 | 85 | ||||||
|
| |||||||
| 697 | ||||||||
|
| |||||||
South Korea — 1.9% | ||||||||
BGF retail Co. Ltd. | 691 | 126 | ||||||
BNK Financial Group, Inc. | 23,660 | 154 | ||||||
Celltrion Pharm, Inc. (a) | 1,350 | 56 | ||||||
Celltrion, Inc. (a) | 304 | 54 | ||||||
Cheil Worldwide, Inc. | 8,441 | 215 | ||||||
CJ CheilJedang Corp. | 872 | 224 | ||||||
CJ Corp. | 1,262 | 110 | ||||||
CJ ENM Co. Ltd. | 931 | 143 | ||||||
CJ Logistics Corp. (a) | 1,382 | 161 | ||||||
Daelim Industrial Co. Ltd. | 2,423 | 242 | ||||||
Daewoo Engineering & Construction Co. Ltd. (a) | 15,768 | 68 | ||||||
Daewoo Shipbuilding & Marine Engineering Co. Ltd. (a) | 3,246 | 92 | ||||||
DB Insurance Co. Ltd. | 9,108 | 468 | ||||||
Doosan Bobcat, Inc. | 4,300 | 136 | ||||||
E-MART, Inc. | 2,176 | 264 | ||||||
Fila Korea Ltd. | 4,808 | 319 | ||||||
GS Engineering & Construction Corp. | 5,229 | 183 | ||||||
GS Holdings Corp. | 4,560 | 202 | ||||||
GS Retail Co. Ltd. | 2,734 | 93 | ||||||
Hanmi Pharm Co. Ltd. | 561 | 196 | ||||||
Hanmi Science Co. ltd | 1,461 | 86 | ||||||
Hanon Systems | 16,638 | 168 | ||||||
Hanwha Chemical Corp. | 9,440 | 186 | ||||||
Hanwha Corp. | 3,403 | 79 | ||||||
Hanwha Life Insurance Co. Ltd. | 36,260 | 103 | ||||||
HDC Hyundai Development Co.-Engineering & Construction | 2,244 | 85 | ||||||
Helixmith Co. Ltd. (a) | 1,258 | 184 | ||||||
HLB, Inc. (a) | 2,901 | 89 | ||||||
Hotel Shilla Co. Ltd. | 2,772 | 233 | ||||||
Hyundai Department Store Co. Ltd. | 1,235 | 89 | ||||||
Hyundai Engineering & Construction Co. Ltd. | 6,779 | 315 | ||||||
Hyundai Glovis Co. Ltd. | 336 | 47 | ||||||
Hyundai Heavy Industries Holdings Co. Ltd. | 860 | 242 | ||||||
Hyundai Marine & Fire Insurance Co. Ltd. | 8,279 | 204 | ||||||
Hyundai Mobis Co. Ltd. | 202 | 41 | ||||||
Kangwon Land, Inc. | 9,574 | 251 | ||||||
KCC Corp. | 510 | 122 | ||||||
Kia Motors Corp. | 3,386 | 129 | ||||||
Korea Aerospace Industries Ltd. | 6,409 | 200 | ||||||
Korea Electric Power Corp. | 2,252 | 50 | ||||||
Korea Gas Corp. | 2,977 | 109 | ||||||
Korea Investment Holdings Co. Ltd. | 3,682 | 258 | ||||||
| SECURITY DESCRIPTION | SHARES | VALUE($) | ||||||
South Korea — continued | ||||||||
Korean Air Lines Co. Ltd. | 4,067 | 102 | ||||||
KT&G Corp. | 5,363 | 458 | ||||||
Kumho Petrochemical Co. Ltd. | 1,619 | 137 | ||||||
LG Innotek Co. Ltd. | 1,262 | 120 | ||||||
Lotte Chemical Corp. | 71 | 16 | ||||||
Lotte Corp. | 317 | 12 | ||||||
Lotte Shopping Co. Ltd. | 319 | 44 | ||||||
Medy-Tox, Inc. | 425 | 166 | ||||||
Meritz Securities Co. Ltd. | 25,734 | 119 | ||||||
Mirae Asset Daewoo Co. Ltd. | 34,507 | 245 | ||||||
NAVER Corp. | 1,024 | 101 | ||||||
NCSoft Corp. | 408 | 169 | ||||||
NH Investment & Securities Co. Ltd. | 12,253 | 154 | ||||||
OCI Co. Ltd. | 1,624 | 131 | ||||||
Orange Life Insurance Ltd. (e) | 2,867 | 79 | ||||||
Orion Corp. | 2,103 | 169 | ||||||
Ottogi Corp. | 107 | 63 | ||||||
Pan Ocean Co. Ltd. (a) | 22,923 | 92 | ||||||
Pearl Abyss Corp. (a) | 547 | 101 | ||||||
POSCO Chemical Co. Ltd. | 2,025 | 94 | ||||||
Posco International Corp. | 4,435 | 71 | ||||||
S-1 Corp. | 4,314 | 365 | ||||||
Samsung Biologics Co. Ltd. (a) (e) | 197 | 55 | ||||||
Samsung Card Co. Ltd. | 2,684 | 89 | ||||||
Samsung Electronics Co. Ltd. | 6,092 | 248 | ||||||
Samsung Engineering Co. Ltd. (a) | 13,637 | 203 | ||||||
Samsung Fire & Marine Insurance Co. Ltd. | 1,293 | 300 | ||||||
Samsung Heavy Industries Co. Ltd. (a) | 38,622 | 273 | ||||||
Samsung Life Insurance Co. Ltd. | 3,491 | 253 | ||||||
Samsung Securities Co. Ltd. | 5,572 | 189 | ||||||
Shinsegae, Inc. | 628 | 164 | ||||||
SillaJen, Inc. (a) | 5,213 | 223 | ||||||
SK Hynix, Inc. | 2,096 | 126 | ||||||
SK Telecom Co. Ltd. | 1,909 | 428 | ||||||
Woongjin Coway Co. Ltd. | 5,623 | 377 | ||||||
Yuhan Corp. | 770 | 163 | ||||||
|
| |||||||
| 12,875 | ||||||||
|
| |||||||
Spain — 1.9% | ||||||||
ACS Actividades de Construccion y Servicios SA | 4,780 | 191 | ||||||
Aena SME SA (e) | 1,293 | 256 | ||||||
Amadeus IT Group SA | 8,262 | 655 | ||||||
Banco Bilbao Vizcaya Argentaria SA | 125,151 | 698 | ||||||
Banco de Sabadell SA | 110,510 | 115 | ||||||
Banco Santander SA | 302,281 | 1,401 | ||||||
Bankia SA | 26,042 | 61 | ||||||
Bankinter SA | 13,501 | 93 | ||||||
CaixaBank SA | 68,222 | 196 | ||||||
Cellnex Telecom SA (a) (e) | 3,745 | 139 | ||||||
Endesa SA | 6,084 | 156 | ||||||
SEE NOTES TO FINANCIAL STATEMENTS.
| JUNE 30, 2019 | SIX CIRCLES TRUST | 25 | ||||||
Table of Contents
Six Circles Managed Equity Portfolio International Unconstrained Fund
SCHEDULE OF PORTFOLIO INVESTMENTS
AS OF JUNE 30, 2019 (Unaudited) (continued)
(Amounts in U.S. Dollars, unless otherwise noted)
(Amounts in thousands, except number of shares, rights and Futures contracts)
| SECURITY DESCRIPTION | SHARES | VALUE($) | ||||||
Common Stocks — continued |
| |||||||
Spain — continued | ||||||||
Ferrovial SA | 9,373 | 240 | ||||||
Grifols SA | 5,718 | 169 | ||||||
Iberdrola SA | 109,254 | 1,088 | ||||||
Industria de Diseno Textil SA | 20,315 | 611 | ||||||
Mapfre SA | 168,299 | 492 | ||||||
Naturgy Energy Group SA | 6,169 | 170 | ||||||
Red Electrica Corp. SA | 8,067 | 168 | ||||||
Repsol SA | 306,549 | 4,811 | ||||||
Siemens Gamesa Renewable Energy SA | 4,798 | 80 | ||||||
Telefonica SA | 87,616 | 720 | ||||||
|
| |||||||
| 12,510 | ||||||||
|
| |||||||
Sweden — 1.1% | ||||||||
Alfa Laval AB | 5,729 | 125 | ||||||
Assa Abloy AB, Class B | 18,616 | 420 | ||||||
Atlas Copco AB, Class A | 12,485 | 400 | ||||||
Atlas Copco AB, Class B | 7,395 | 213 | ||||||
Boliden AB | 4,980 | 128 | ||||||
Electrolux AB, Class B | 4,107 | 105 | ||||||
Epiroc AB, Class A | 12,000 | 125 | ||||||
Epiroc AB, Class B | 7,101 | 70 | ||||||
Essity AB, Class B | 11,302 | 348 | ||||||
Hennes & Mauritz AB, Class B | 15,151 | 269 | ||||||
Hexagon AB, Class B | 4,891 | 272 | ||||||
Husqvarna AB, Class B | 7,604 | 71 | ||||||
ICA Gruppen AB | 1,648 | 71 | ||||||
Industrivarden AB, Class C | 3,042 | 67 | ||||||
Investor AB, Class B | 8,459 | 407 | ||||||
Kinnevik AB, Class B | 4,719 | 123 | ||||||
L E Lundbergforetagen AB, Class B | 1,384 | 52 | ||||||
Lundin Petroleum AB | 3,409 | 106 | ||||||
Sandvik AB | 21,006 | 386 | ||||||
Securitas AB, Class B | 5,702 | 100 | ||||||
Skandinaviska Enskilda Banken AB, Class A | 30,518 | 282 | ||||||
Skanska AB, Class B | 6,194 | 112 | ||||||
SKF AB, Class B | 6,918 | 127 | ||||||
Svenska Handelsbanken AB, Class A | 28,633 | 283 | ||||||
Swedbank AB, Class A | 17,047 | 257 | ||||||
Swedish Match AB | 26,471 | 1,119 | ||||||
Tele2 AB, Class B | 9,655 | 141 | ||||||
Telefonaktiebolaget LM Ericsson, Class B | 57,584 | 547 | ||||||
Telia Co. AB | 53,079 | 235 | ||||||
Volvo AB, Class B | 27,561 | 438 | ||||||
|
| |||||||
| 7,399 | ||||||||
|
| |||||||
Switzerland — 17.1% | ||||||||
ABB Ltd. (Registered) | 34,376 | 689 | ||||||
Adecco Group AG (Registered) | 3,020 | 181 | ||||||
Alcon, Inc. (a) | 8,031 | 496 | ||||||
Baloise Holding AG (Registered) | 7,534 | 1,334 | ||||||
Barry Callebaut AG (Registered) | 322 | 646 | ||||||
Chocoladefabriken Lindt & Spruengli AG | 159 | 1,157 | ||||||
| SECURITY DESCRIPTION | SHARES | VALUE($) | ||||||
Switzerland — continued | ||||||||
Chocoladefabriken Lindt & Spruengli AG (Registered) | 15 | 1,220 | ||||||
Cie Financiere Richemont SA (Registered) | 9,718 | 826 | ||||||
Clariant AG (Registered) (a) | 3,626 | 74 | ||||||
Coca-Cola HBC AG (a) | 29,864 | 1,128 | ||||||
Credit Suisse Group AG (Registered) (a) | 47,939 | 574 | ||||||
Dufry AG (Registered) (a) | 785 | 67 | ||||||
EMS-Chemie Holding AG (Registered) | 150 | 97 | ||||||
Geberit AG (Registered) | 693 | 324 | ||||||
Givaudan SA (Registered) | 171 | 483 | ||||||
Glencore plc (a) | 207,211 | 717 | ||||||
Julius Baer Group Ltd. (a) | 4,171 | 186 | ||||||
Kuehne + Nagel International AG (Registered) | 984 | 146 | ||||||
LafargeHolcim Ltd. (Registered) (a) | 9,039 | 442 | ||||||
Lonza Group AG (Registered) (a) | 1,381 | 466 | ||||||
Nestle SA (Registered) | 457,878 | 47,401 | ||||||
Novartis AG (Registered) | 199,294 | 18,194 | ||||||
Pargesa Holding SA | 702 | 54 | ||||||
Partners Group Holding AG | 351 | 276 | ||||||
Roche Holding AG | 64,582 | 18,160 | ||||||
Schindler Holding AG | 779 | 174 | ||||||
Schindler Holding AG (Registered) | 366 | 80 | ||||||
SGS SA (Registered) | 101 | 257 | ||||||
Sika AG (Registered) | 2,371 | 405 | ||||||
Sonova Holding AG (Registered) | 1,047 | 238 | ||||||
STMicroelectronics NV | 12,919 | 229 | ||||||
Straumann Holding AG (Registered) | 192 | 170 | ||||||
Swatch Group AG (The) | 546 | 157 | ||||||
Swatch Group AG (The) (Registered) | 1,016 | 55 | ||||||
Swiss Life Holding AG (Registered) | 5,285 | 2,620 | ||||||
Swiss Prime Site AG (Registered) (a) | 1,383 | 121 | ||||||
Swiss Re AG | 47,062 | 4,782 | ||||||
Swisscom AG (Registered) | 489 | 246 | ||||||
Temenos AG (Registered) (a) | 1,211 | 217 | ||||||
UBS Group AG (Registered) (a) | 71,789 | 853 | ||||||
Vifor Pharma AG | 4,156 | 601 | ||||||
Zurich Insurance Group AG | 23,353 | 8,126 | ||||||
|
| |||||||
| 114,669 | ||||||||
|
| |||||||
Taiwan — 2.5% | ||||||||
Acer, Inc. (a) | 248,000 | 154 | ||||||
Advantech Co. Ltd. | 38,000 | 324 | ||||||
Airtac International Group | 11,000 | 124 | ||||||
Asia Cement Corp. | 193,000 | 296 | ||||||
Asustek Computer, Inc. | 30,000 | 215 | ||||||
AU Optronics Corp. | 958,000 | 287 | ||||||
Cathay Financial Holding Co. Ltd. (a) | 49,000 | 68 | ||||||
Chailease Holding Co. Ltd. | 101,000 | 419 | ||||||
Chicony Electronics Co. Ltd. | 151,000 | 372 | ||||||
China Airlines Ltd. | 244,000 | 77 | ||||||
SEE NOTES TO FINANCIAL STATEMENTS.
| 26 | SIX CIRCLES TRUST | JUNE 30, 2019 | ||||
Table of Contents
| SECURITY DESCRIPTION | SHARES | VALUE($) | ||||||
Common Stocks — continued |
| |||||||
Taiwan — continued | ||||||||
China Development Financial Holding Corp. | 286,000 | 87 | ||||||
China Life Insurance Co. Ltd. | 226,656 | 181 | ||||||
Chunghwa Telecom Co. Ltd. | 216,000 | 786 | ||||||
Compal Electronics, Inc. | 447,000 | 293 | ||||||
E.Sun Financial Holding Co. Ltd. | 370,000 | 310 | ||||||
Eclat Textile Co. Ltd. | 17,000 | 218 | ||||||
Eva Airways Corp. | 257,000 | 124 | ||||||
Evergreen Marine Corp. Taiwan Ltd. | 194,000 | 78 | ||||||
Far EasTone Telecommunications Co. Ltd. | 322,000 | 811 | ||||||
Feng TAY Enterprise Co. Ltd. | 26,000 | 203 | ||||||
First Financial Holding Co. Ltd. | 1,167,000 | 857 | ||||||
Formosa Petrochemical Corp. | 49,000 | 175 | ||||||
Formosa Plastics Corp. | 32,000 | 118 | ||||||
Formosa Taffeta Co. Ltd. | 79,000 | 100 | ||||||
Foxconn Technology Co. Ltd. | 81,000 | 165 | ||||||
Giant Manufacturing Co. Ltd. | 26,000 | 204 | ||||||
Highwealth Construction Corp. | 69,000 | 110 | ||||||
Hiwin Technologies Corp. | 19,000 | 160 | ||||||
Hua Nan Financial Holdings Co. Ltd. | 744,000 | 500 | ||||||
Innolux Corp. | 757,000 | 179 | ||||||
Inventec Corp. | 218,000 | 173 | ||||||
Lite-On Technology Corp., ADR | 203,000 | 297 | ||||||
Mega Financial Holding Co. Ltd. | 188,000 | 187 | ||||||
Micro-Star International Co. Ltd. | 59,000 | 168 | ||||||
Nien Made Enterprise Co. Ltd. | 14,000 | 105 | ||||||
Novatek Microelectronics Corp. | 50,000 | 279 | ||||||
Phison Electronics Corp. | 13,000 | 119 | ||||||
Pou Chen Corp. | 194,000 | 241 | ||||||
Powertech Technology, Inc. | 96,000 | 235 | ||||||
President Chain Store Corp. | 36,000 | 348 | ||||||
Quanta Computer, Inc. | 32,000 | 62 | ||||||
Realtek Semiconductor Corp. | 42,000 | 309 | ||||||
Ruentex Development Co. Ltd. | 47,000 | 67 | ||||||
Ruentex Industries Ltd. | 30,000 | 73 | ||||||
Shin Kong Financial Holding Co. Ltd. | 912,000 | 277 | ||||||
SinoPac Financial Holdings Co. Ltd. | 935,000 | 393 | ||||||
Standard Foods Corp. | 49,000 | 96 | ||||||
Synnex Technology International Corp. | 271,000 | 341 | ||||||
TaiMed Biologics, Inc. (a) | 16,000 | 82 | ||||||
Taishin Financial Holding Co. Ltd. | 826,000 | 381 | ||||||
Taiwan Business Bank | 779,000 | 343 | ||||||
Taiwan Cement Corp. | 400,000 | 593 | ||||||
Taiwan Cooperative Financial Holding Co. Ltd. | 1,271,000 | 852 | ||||||
Taiwan High Speed Rail Corp. | 277,000 | 408 | ||||||
Taiwan Mobile Co. Ltd. | 210,000 | 828 | ||||||
Taiwan Semiconductor Manufacturing Co. Ltd. | 60,000 | 459 | ||||||
Tatung Co. Ltd. (a) | 165,000 | 100 | ||||||
| SECURITY DESCRIPTION | SHARES | VALUE($) | ||||||
Taiwan — continued | ||||||||
Uni-President Enterprises Corp. | 10,000 | 27 | ||||||
United Microelectronics Corp. | 67,000 | 30 | ||||||
Vanguard International Semiconductor Corp. | 78,000 | 164 | ||||||
Walsin Technology Corp. | 27,000 | 143 | ||||||
Win Semiconductors Corp. | 29,000 | 187 | ||||||
Winbond Electronics Corp. | 259,000 | 127 | ||||||
Wistron Corp. | 246,000 | 192 | ||||||
WPG Holdings Ltd. | 207,000 | 269 | ||||||
Zhen Ding Technology Holding Ltd. | 37,000 | 118 | ||||||
|
| |||||||
| 17,068 | ||||||||
|
| |||||||
Thailand — 1.0% | ||||||||
Advanced Info Service PCL, NVDR | 33,700 | 240 | ||||||
Airports of Thailand PCL, NVDR | 254,500 | 610 | ||||||
Bangkok Dusit Medical Services PCL, NVDR | 478,000 | 405 | ||||||
Bangkok Expressway & Metro PCL, NVDR | 1,659,900 | 617 | ||||||
Banpu PCL, NVDR | 395,800 | 194 | ||||||
BTS Group Holdings PCL, NVDR | 1,725,300 | 675 | ||||||
Bumrungrad Hospital PCL, NVDR | 78,000 | 430 | ||||||
Central Pattana PCL, NVDR | 6,300 | 15 | ||||||
CP ALL PCL, NVDR | 207,100 | 581 | ||||||
Electricity Generating PCL, NVDR | 54,300 | 576 | ||||||
Energy Absolute PCL, NVDR | 146,700 | 267 | ||||||
Gulf Energy Development PCL, NVDR | 45,600 | 183 | ||||||
Home Product Center PCL, NVDR | 380,800 | 217 | ||||||
Intouch Holdings PCL, NVDR | 58,500 | 120 | ||||||
IRPC PCL, NVDR | 1,290,100 | 211 | ||||||
Kasikornbank PCL, NVDR | 23,800 | 146 | ||||||
Krung Thai Bank PCL, NVDR | 453,500 | 288 | ||||||
Land & Houses PCL, NVDR | 727,400 | 264 | ||||||
Minor International PCL, NVDR | 26,100 | 35 | ||||||
Muangthai Capital PCL, NVDR | 56,800 | 105 | ||||||
PTT Global Chemical PCL, NVDR | 13,600 | 28 | ||||||
Ratch Group PCL, NVDR | 64,500 | 140 | ||||||
Robinson PCL, NVDR | 78,400 | 144 | ||||||
Siam Cement PCL (The), NVDR | 5,100 | 79 | ||||||
Thai Union Group PCL, NVDR | 378,300 | 226 | ||||||
TMB Bank PCL, NVDR | 1,089,600 | 70 | ||||||
Total Access Communication PCL, NVDR | 62,200 | 107 | ||||||
|
| |||||||
| 6,973 | ||||||||
|
| |||||||
United Arab Emirates — 0.2% | ||||||||
DP World plc | 5,474 | 87 | ||||||
Dubai Islamic Bank PJSC | 58,557 | 82 | ||||||
Emaar Development PJSC | 27,302 | 30 | ||||||
Emirates Telecommunications Group Co. PJSC | 92,302 | 419 | ||||||
First Abu Dhabi Bank PJSC | 142,618 | 578 | ||||||
NMC Health plc | 1,706 | 52 | ||||||
|
| |||||||
| 1,248 | ||||||||
|
| |||||||
SEE NOTES TO FINANCIAL STATEMENTS.
| JUNE 30, 2019 | SIX CIRCLES TRUST | 27 | ||||||
Table of Contents
Six Circles Managed Equity Portfolio International Unconstrained Fund
SCHEDULE OF PORTFOLIO INVESTMENTS
AS OF JUNE 30, 2019 (Unaudited) (continued)
(Amounts in U.S. Dollars, unless otherwise noted)
(Amounts in thousands, except number of shares, rights and Futures contracts)
| SECURITY DESCRIPTION | SHARES | VALUE($) | ||||||
Common Stocks — continued |
| |||||||
United Kingdom — 16.6% | ||||||||
3i Group plc | 18,315 | 259 | ||||||
Admiral Group plc | 3,438 | 96 | ||||||
Anglo American plc | 19,773 | 565 | ||||||
Ashtead Group plc | 8,897 | 255 | ||||||
Associated British Foods plc | 53,482 | 1,674 | ||||||
AstraZeneca plc | 116,451 | 9,520 | ||||||
Auto Trader Group plc (e) | 17,015 | 118 | ||||||
Aviva plc | 72,617 | 385 | ||||||
BAE Systems plc | 59,519 | 374 | ||||||
Barclays plc | 320,682 | 610 | ||||||
Barratt Developments plc | 18,469 | 134 | ||||||
Berkeley Group Holdings plc | 2,231 | 106 | ||||||
BP plc | 4,387,739 | 30,568 | ||||||
British American Tobacco plc | 342,842 | 11,971 | ||||||
British Land Co. plc (The) | 16,497 | 113 | ||||||
BT Group plc | 156,858 | 392 | ||||||
Bunzl plc | 6,270 | 165 | ||||||
Burberry Group plc | 7,850 | 186 | ||||||
Centrica plc | 103,739 | 116 | ||||||
CNH Industrial NV | 19,294 | 198 | ||||||
Coca-Cola European Partners plc | 35,567 | 2,009 | ||||||
Compass Group plc | 29,562 | 709 | ||||||
Croda International plc | 2,462 | 160 | ||||||
Diageo plc | 361,403 | 15,555 | ||||||
Direct Line Insurance Group plc | 25,038 | 106 | ||||||
easyJet plc | 2,893 | 35 | ||||||
Experian plc | 16,962 | 514 | ||||||
Ferguson plc | 4,337 | 309 | ||||||
Fiat Chrysler Automobiles NV | 20,359 | 283 | ||||||
G4S plc | 28,253 | 75 | ||||||
GlaxoSmithKline plc | 456,294 | 9,146 | ||||||
Halma plc | 7,226 | 186 | ||||||
Hargreaves Lansdown plc | 5,182 | 127 | ||||||
HSBC Holdings plc | 373,710 | 3,119 | ||||||
Imperial Brands plc | 143,255 | 3,361 | ||||||
Informa plc | 23,580 | 250 | ||||||
InterContinental Hotels Group plc | 3,256 | 214 | ||||||
Intertek Group plc | 3,055 | 214 | ||||||
ITV plc | 65,971 | 90 | ||||||
J Sainsbury plc | 32,087 | 80 | ||||||
John Wood Group plc | 12,410 | 71 | ||||||
Johnson Matthey plc | 3,726 | 157 | ||||||
Kingfisher plc | 38,426 | 105 | ||||||
Land Securities Group plc | 12,827 | 136 | ||||||
Legal & General Group plc | 110,922 | 380 | ||||||
Lloyds Banking Group plc | 1,328,342 | 954 | ||||||
London Stock Exchange Group plc | 5,820 | 406 | ||||||
Marks & Spencer Group plc | 35,507 | 95 | ||||||
Meggitt plc | 14,146 | 94 | ||||||
Melrose Industries plc | 92,120 | 212 | ||||||
Merlin Entertainments plc (e) | 13,028 | 74 | ||||||
| SECURITY DESCRIPTION | SHARES | VALUE($) | ||||||
United Kingdom — continued | ||||||||
Micro Focus International plc | 6,386 | 168 | ||||||
Mondi plc | 6,845 | 156 | ||||||
National Grid plc | 63,614 | 676 | ||||||
Next plc | 2,622 | 184 | ||||||
Ocado Group plc (a) | 8,277 | 123 | ||||||
Pearson plc | 15,015 | 156 | ||||||
Persimmon plc | 6,114 | 155 | ||||||
Prudential plc | 48,277 | 1,054 | ||||||
Reckitt Benckiser Group plc | 13,172 | 1,040 | ||||||
RELX plc | 36,540 | 886 | ||||||
Rentokil Initial plc | 34,467 | 174 | ||||||
Rio Tinto plc | 21,222 | 1,313 | ||||||
Rolls-Royce Holdings plc (a) | 31,787 | 340 | ||||||
Royal Bank of Scotland Group plc | 90,736 | 253 | ||||||
RSA Insurance Group plc | 19,816 | 145 | ||||||
Sage Group plc (The) | 20,580 | 210 | ||||||
Schroders plc | 2,263 | 88 | ||||||
Segro plc | 20,612 | 191 | ||||||
Severn Trent plc | 4,320 | 112 | ||||||
Smith & Nephew plc | 16,300 | 354 | ||||||
Smiths Group plc | 7,379 | 147 | ||||||
Spirax-Sarco Engineering plc | 1,410 | 165 | ||||||
SSE plc | 19,266 | 275 | ||||||
St James’s Place plc | 9,641 | 135 | ||||||
Standard Chartered plc | 52,139 | 473 | ||||||
Standard Life Aberdeen plc | 47,576 | 178 | ||||||
Taylor Wimpey plc | 59,701 | 120 | ||||||
Tesco plc | 183,910 | 530 | ||||||
Unilever NV, CVA | 27,135 | 1,649 | ||||||
Unilever plc | 20,667 | 1,283 | ||||||
United Utilities Group plc | 12,417 | 124 | ||||||
Vodafone Group plc | 497,461 | 815 | ||||||
Weir Group plc (The) | 4,725 | 93 | ||||||
Whitbread plc | 3,429 | 202 | ||||||
Wm Morrison Supermarkets plc | 43,125 | 110 | ||||||
WPP plc | 23,634 | 298 | ||||||
|
| |||||||
| 111,406 | ||||||||
|
| |||||||
United States — 0.1% | ||||||||
Bausch Health Cos., Inc. (a) | 6,096 | 154 | ||||||
Carnival plc | 2,996 | 132 | ||||||
Nexteer Automotive Group Ltd. | 77,000 | 96 | ||||||
|
| |||||||
| 382 | ||||||||
|
| |||||||
Total Common Stocks | 654,948 | |||||||
|
| |||||||
Exchange-Traded Fund — 0.3% | ||||||||
United States — 0.3% | ||||||||
iShares MSCI Saudi Arabia ETF | 67,000 | 2,212 | ||||||
|
| |||||||
SEE NOTES TO FINANCIAL STATEMENTS.
| 28 | SIX CIRCLES TRUST | JUNE 30, 2019 | ||||
Table of Contents
| SECURITY DESCRIPTION | SHARES | VALUE($) | ||||||
Preferred Stocks — 0.2% | ||||||||
Brazil — 0.0% (g) | ||||||||
Telefonica Brasil SA | 6,584 | 86 | ||||||
|
| |||||||
Colombia — 0.0% (g) | ||||||||
Grupo de Inversiones Suramericana SA | 2,763 | 27 | ||||||
|
| |||||||
Germany — 0.2% | ||||||||
Bayerische Motoren Werke AG | 1,013 | 63 | ||||||
FUCHS PETROLUB SE | 1,266 | 49 | ||||||
Henkel AG & Co. KGaA | 3,330 | 326 | ||||||
Porsche Automobil Holding SE | 2,854 | 185 | ||||||
Sartorius AG | 688 | 141 | ||||||
Volkswagen AG | 3,478 | 586 | ||||||
|
| |||||||
| 1,350 | ||||||||
|
| |||||||
Total Preferred Stocks | 1,463 | |||||||
|
| |||||||
| NUMBER OF RIGHTS | ||||||||
Rights — 0.0%(g) |
| |||||||
Chile — 0.0% (g) | ||||||||
Enel Americas SA, expiring 07/26/2019 (a) | 82,730 | 1 | ||||||
|
| |||||||
South Korea — 0.0% (g) | ||||||||
Helixmith Co. Ltd., expiring 08/05/2019 (a) (bb) | 84 | 2 | ||||||
|
| |||||||
Spain — 0.0% (g) | ||||||||
ACS Actividades de Construccion y Servicios SA, expiring 07/08/2019 (a) | 9,168 | 15 | ||||||
Repsol SA, expiring 07/04/2019 (a) | 241,594 | 134 | ||||||
|
| |||||||
| 149 | ||||||||
|
| |||||||
Total Rights | 152 | |||||||
|
| |||||||
| SECURITY DESCRIPTION | PRINCIPAL AMOUNT($) | VALUE($) | ||||||
Short-Term Investments — 0.9% |
| |||||||
Time Deposits — 0.9% | ||||||||
Australia & New Zealand Banking Group Ltd., 1.76%, 07/01/2019 | 920 | 920 | ||||||
Barclays SA, 1.76%, 07/01/2019 | 630 | 630 | ||||||
BNP Paribas SA, (0.58%), 07/01/2019 | EUR | 1,322 | 1,503 | |||||
Brown Brothers Harriman, | ||||||||
(1.58%), 07/01/2019 | CHF 396 | 405 | ||||||
(0.85%), 07/01/2019 | DKK 147 | 22 | ||||||
(0.58%), 07/01/2019 | EUR 4 | 4 | ||||||
(0.50%), 07/01/2019 | SEK 86 | 9 | ||||||
0.36%, 07/01/2019 | GBP 163 | 207 | ||||||
0.52%, 07/01/2019 | NOK 145 | 17 | ||||||
0.60%, 07/01/2019 | SGD 35 | 26 | ||||||
0.81%, 07/02/2019 | CAD 77 | 59 | ||||||
1.76%, 07/01/2019 | 21 | 21 | ||||||
2.10%, 07/02/2019 | HKD 1,742 | 223 | ||||||
5.69%, 07/01/2019 | ZAR 79 | 6 | ||||||
Citibank NA, | ||||||||
(0.58%), 07/01/2019 | EUR 73 | 84 | ||||||
0.36%, 07/01/2019 | GBP 641 | 814 | ||||||
1.76%, 07/01/2019 | 1,138 | 1,138 | ||||||
|
| |||||||
Total Short-Term Investments | 6,088 | |||||||
|
| |||||||
Total Investments — 99.3% | 664,863 | |||||||
Other Assets in Excess of Liabilities — 0.7% |
| 4,552 | ||||||
|
| |||||||
NET ASSETS — 100.0% | $ | 669,415 | ||||||
|
| |||||||
Percentages indicated are based on net assets.
| Futures contracts outstanding as of June 30, 2019: | ||||||||||||||||||||
| Exchange Traded | ||||||||||||||||||||
| DESCRIPTION | NUMBER OF CONTRACTS | EXPIRATION DATE | TRADING CURRENCY | NOTIONAL AMOUNT($) | VALUE AND UNREALIZED APPRECIATION (DEPRECIATION)($) | |||||||||||||||
Long Contracts |
| |||||||||||||||||||
| Euro Stoxx 50 Index | 25 | 09/2019 | EUR | 976 | 9 | |||||||||||||||
| FTSE 100 Index | 6 | 09/2019 | GBP | 558 | 3 | |||||||||||||||
| FTSE China A50 Index | 4 | 07/2019 | USD | 54 | (— | )(h) | ||||||||||||||
| MSCI Emerging Markets Index | 39 | 09/2019 | USD | 1,978 | 77 | |||||||||||||||
|
| |||||||||||||||||||
Total unrealized appreciation (depreciation) |
| 89 | ||||||||||||||||||
|
| |||||||||||||||||||
SEE NOTES TO FINANCIAL STATEMENTS.
| JUNE 30, 2019 | SIX CIRCLES TRUST | 29 | ||||||
Table of Contents
Six Circles Managed Equity Portfolio International Unconstrained Fund
SCHEDULE OF PORTFOLIO INVESTMENTS
AS OF JUNE 30, 2019 (Unaudited) (continued)
(Amounts in U.S. Dollars, unless otherwise noted)
(Amounts in thousands, except number of shares, rights and Futures contracts)
Summary of Investments by Industry, June 30, 2019
The following table represents the portfolio investments of the Fund by industry classifications as a percentage of total investments:
| INDUSTRY | PERCENTAGE | |||
Oil & Gas | 21.6 | % | ||
Pharmaceuticals | 12.8 | % | ||
Food | 10.7 | % | ||
Insurance | 10.5 | % | ||
Beverages | 6.8 | % | ||
Banks | 5.3 | % | ||
Agriculture | 2.7 | % | ||
Telecommunications | 2.2 | % | ||
Electric | 1.5 | % | ||
Diversified Financial Services | 1.4 | % | ||
Retail | 1.4 | % | ||
Chemicals | 1.3 | % | ||
Commercial Services | 1.1 | % | ||
Mining | 1.1 | % | ||
Real Estate | 1.1 | % | ||
Apparel | 1.0 | % | ||
Others (Each less than 1.0%) | 16.6 | % | ||
Short-Term Investments | 0.9 | % | ||
| NOTES TO SCHEDULE OF PORTFOLIO INVESTMENTS | ||
| ADR | — American Depositary Receipt | |
| CVA | — Dutch Certification | |
| GDR | — Global Depositary Receipt | |
| NVDR | — Non-Voting Depository Receipt | |
| REIT | — Real Estate Investment Trust | |
| SDR | — Swedish Depository Receipt | |
| (a) | — Non-income producing security. | |
| (e) | — Security is exempt from registration under Rule 144A of the Securities Act of 1933, as amended. Unless otherwise indicated, this security has been determined to be liquid under procedures established by the Board of Trustees and may be resold in transactions exempt from registration, normally to qualified institutional buyers. | |
| (g) | — Amount rounds to less than 0.05%. | |
| (h) | — Amount rounds to less than $500. | |
| (bb) | — Security has been valued using significant unobservable inputs. | |
| * | — The cost of securities is substantially the same for federal income tax purposes. | |
| CAD | — Canadian Dollar | |
| CHF | — Swiss Franc | |
| DKK | — Danish Krone | |
| EUR | — Euro | |
| GBP | — British Pound | |
| HKD | — Hong Kong Dollar | |
| NOK | — Norwegian Krone | |
| SEK | — Swedish Krona | |
| SGD | — Singapore Dollar | |
| USD | — United States Dollar | |
| ZAR | — South African Rand | |
SEE NOTES TO FINANCIAL STATEMENTS.
| 30 | SIX CIRCLES TRUST | JUNE 30, 2019 | ||||
Table of Contents
STATEMENTS OF ASSETS AND LIABILITIES
AS OF JUNE 30, 2019 (Unaudited)
(Amounts in thousands, except per share amounts)
| Six Circles Managed Equity Portfolio U.S. Unconstrained Fund | ||||
ASSETS: | ||||
Investments innon-affiliates, at value | $ | 1,177,136 | ||
Cash | 30 | |||
Deposits at broker for futures contracts | 126 | |||
Deferred offering costs | 95 | |||
Prepaid expenses | 36 | |||
Receivables: | ||||
Investment securities sold | 129 | |||
Fund shares sold | 2,317 | |||
Interest and dividends fromnon-affiliates | 1,270 | |||
Tax reclaims | 2 | |||
Variation margin on futures contracts | 8 | |||
|
| |||
Total Assets | 1,181,149 | |||
|
| |||
LIABILITIES: | ||||
Payables: | ||||
Investment securities purchased | 10,124 | |||
Fund shares redeemed | 1,529 | |||
Accrued liabilities: | ||||
Investment advisory fees | 34 | |||
Administration fees | 40 | |||
Custodian and accounting fees | 46 | |||
Trustees’ fees | 1 | |||
Registration and filing fees | 50 | |||
Other | 21 | |||
|
| |||
Total Liabilities | 11,845 | |||
|
| |||
Net Assets | $ | 1,169,304 | ||
|
| |||
NET ASSETS: | ||||
Paid-in capital | $ | 1,165,712 | ||
Total distributable earnings (loss) | 3,592 | |||
|
| |||
Total Net Assets | $ | 1,169,304 | ||
|
| |||
Outstanding units of beneficial interest (shares) | 115,628 | |||
Net Asset Value, offering and redemption price per share (b): | $ | 10.11 | ||
Cost of investments innon-affiliates | $ | 1,176,656 | ||
| (b) | Per share amounts may not recalculate due to rounding of net assets and/or shares outstanding. |
SEE NOTES TO FINANCIAL STATEMENTS.
| JUNE 30, 2019 | SIX CIRCLES TRUST | 31 | ||||||
Table of Contents
STATEMENTS OF ASSETS AND LIABILITIES
AS OF JUNE 30, 2019 (Unaudited) (continued)
(Amounts in thousands, except per share amounts)
| Six Circles Managed Equity Portfolio International Unconstrained Fund | ||||
ASSETS: | ||||
Investments innon-affiliates, at value | $ | 664,863 | ||
Cash | 6 | |||
Foreign currency, at value | 144 | |||
Deposits at broker for futures contracts | 218 | |||
Deferred offering costs | 92 | |||
Prepaid expenses | 31 | |||
Receivables: | ||||
Fund shares sold | 6,175 | |||
Interest and dividends fromnon-affiliates | 952 | |||
Tax reclaims | 502 | |||
Variation margin on futures contracts | 7 | |||
|
| |||
Total Assets | 672,990 | |||
|
| |||
LIABILITIES: | ||||
Payables: | ||||
Investment securities purchased | 2,454 | |||
Fund shares redeemed | 934 | |||
Accrued liabilities: | ||||
Investment advisory fees | 23 | |||
Administration fees | 26 | |||
Custodian and accounting fees | 76 | |||
Trustees’ fees | 1 | |||
Registration and filing fees | 33 | |||
Other | 28 | |||
|
| |||
Total Liabilities | 3,575 | |||
|
| |||
Net Assets | $ | 669,415 | ||
|
| |||
NET ASSETS: | ||||
Paid-in capital | $ | 658,478 | ||
Total distributable earnings (loss) | 10,937 | |||
|
| |||
Total Net Assets | $ | 669,415 | ||
|
| |||
Outstanding units of beneficial interest (shares) | 66,679 | |||
Net Asset Value, offering and redemption price per share (b): | $ | 10.04 | ||
Cost of investments innon-affiliates | $ | 656,038 | ||
Cost of foreign currency | $ | 144 | ||
| (b) | Per share amounts may not recalculate due to rounding of net assets and/or shares outstanding. |
SEE NOTES TO FINANCIAL STATEMENTS.
| 32 | SIX CIRCLES TRUST | JUNE 30, 2019 | ||||
Table of Contents
STATEMENTS OF OPERATIONS
FOR THE PERIOD ENDED JUNE 30, 2019 (Unaudited)
(Amounts in thousands)
| Six Circles Managed Equity Portfolio U.S. Unconstrained Fund* | ||||
INVESTMENT INCOME: |
| |||
Interest income fromnon-affiliates | $ | 99 | ||
Dividend income fromnon-affiliates | 3,749 | |||
Foreign taxes withheld | (1 | ) | ||
|
| |||
Total investment income | 3,847 | |||
|
| |||
EXPENSES: | ||||
Investment advisory fees | 415 | |||
Administration fees | 39 | |||
Custodian and accounting fees | 46 | |||
Professional fees | 23 | |||
Trustees’ fees | 1 | |||
Printing and mailing costs | 4 | |||
Registration and filing fees | 51 | |||
Transfer agency fees | 8 | |||
Recoupment of expense reimbursement | 54 | |||
Offering costs | 26 | |||
Interest expense | — | (a) | ||
Other | 2 | |||
|
| |||
Total expenses | 669 | |||
|
| |||
Less advisory fees waived | (350 | ) | ||
Less expense reimbursements | (54 | ) | ||
|
| |||
Net expenses | 265 | |||
|
| |||
Net investment income (loss) | 3,582 | |||
|
| |||
REALIZED/UNREALIZED GAINS (LOSSES): | ||||
Net realized gain (loss) on: | ||||
Investments innon-affiliates | (449 | ) | ||
Futures contracts | (42 | ) | ||
|
| |||
Net realized gain (loss) | (491 | ) | ||
|
| |||
Change in net unrealized appreciation (depreciation) of: | ||||
Investments innon-affiliates | 480 | |||
Futures contracts | 21 | |||
|
| |||
Change in net unrealized appreciation (depreciation) | 501 | |||
|
| |||
Net realized/unrealized gains (losses) | 10 | |||
|
| |||
Change in net assets resulting from operations | $ | 3,592 | ||
|
| |||
| * | Six Circles Managed Equity Portfolio U.S. Unconstrained Fund was launched on April 10, 2019. |
| (a) | Amount rounds to less than $500. |
SEE NOTES TO FINANCIAL STATEMENTS.
| JUNE 30, 2019 | SIX CIRCLES TRUST | 33 | ||||||
Table of Contents
STATEMENTS OF OPERATIONS
FOR THE PERIOD ENDED JUNE 30, 2019 (Unaudited) (continued)
(Amounts in thousands)
| Six Circles Managed Equity Portfolio International Unconstrained Fund* | ||||
INVESTMENT INCOME: |
| |||
Interest income fromnon-affiliates | $ | 62 | ||
Dividend income fromnon-affiliates | 7,304 | |||
Foreign taxes withheld | (766 | ) | ||
|
| |||
Total investment income | 6,600 | |||
|
| |||
EXPENSES: | ||||
Investment advisory fees | 260 | |||
Administration fees | 26 | |||
Custodian and accounting fees | 76 | |||
Professional fees | 28 | |||
Trustees’ fees | 1 | |||
Printing and mailing costs | 3 | |||
Registration and filing fees | 34 | |||
Transfer agency fees | 8 | |||
Recoupment of expense reimbursement | 63 | |||
Offering costs | 29 | |||
Interest expense | 9 | |||
Other | 2 | |||
|
| |||
Total expenses | 539 | |||
|
| |||
Less advisory fees waived | (212 | ) | ||
Less expense reimbursements | (63 | ) | ||
|
| |||
Net expenses | 264 | |||
|
| |||
Net investment income (loss) | 6,336 | |||
|
| |||
REALIZED/UNREALIZED GAINS (LOSSES): | ||||
Net realized gain (loss) on: | ||||
Investments innon-affiliates | (3,507 | ) | ||
Futures contracts | (1,006 | ) | ||
Foreign currency transactions | 201 | |||
Forward foreign currency exchange contracts | (10 | ) | ||
|
| |||
Net realized gain (loss) | (4,322 | ) | ||
|
| |||
Change in net unrealized appreciation (depreciation) of: | ||||
Investments innon-affiliates | 8,825 | |||
Futures contracts | 89 | |||
Foreign currency translations | 9 | |||
|
| |||
Change in net unrealized appreciation (depreciation) | 8,923 | |||
|
| |||
Net realized/unrealized gains (losses) | 4,601 | |||
|
| |||
Change in net assets resulting from operations | $ | 10,937 | ||
|
| |||
| * | Six Circles Managed Equity Portfolio International Unconstrained Fund was launched on April 10, 2019. |
SEE NOTES TO FINANCIAL STATEMENTS.
| 34 | SIX CIRCLES TRUST | JUNE 30, 2019 | ||||
Table of Contents
STATEMENTS OF CHANGES IN NET ASSETS
FOR THE PERIOD ENDED JUNE 30, 2019 (Unaudited)
(Amounts in thousands)
| Six Circles Managed Equity Portfolio U.S. Unconstrained Fund* | ||||
| Period Ended June 30, 2019 | ||||
CHANGE IN NET ASSETS RESULTING FROM OPERATIONS: | ||||
Net investment income (loss) | $ | 3,582 | ||
Net realized gain (loss) | (491 | ) | ||
Change in net unrealized appreciation (depreciation) | 501 | |||
|
| |||
Change in net assets resulting from operations | 3,592 | |||
|
| |||
CAPITAL TRANSACTIONS: | ||||
Change in net assets resulting from capital transactions | 1,165,712 | |||
|
| |||
NET ASSETS: | ||||
Change in net assets | 1,169,304 | |||
Beginning of period | — | |||
|
| |||
End of period | $ | 1,169,304 | ||
|
| |||
CAPITAL TRANSACTIONS: | ||||
Proceeds from shares issued | $ | 1,190,415 | ||
Cost of shares redeemed | (24,703 | ) | ||
|
| |||
Total change in net assets resulting from capital transactions | $ | 1,165,712 | ||
|
| |||
SHARE TRANSACTIONS: | ||||
Issued | 118,105 | |||
Redeemed | (2,477 | ) | ||
|
| |||
Change in Shares | 115,628 | |||
|
| |||
| * | Six Circles Managed Equity Portfolio U.S. Unconstrained Fund was launched on April 10, 2019. |
SEE NOTES TO FINANCIAL STATEMENTS.
| JUNE 30, 2019 | SIX CIRCLES TRUST | 35 | ||||||
Table of Contents
STATEMENTS OF CHANGES IN NET ASSETS
FOR THE PERIOD ENDED JUNE 30, 2019 (Unaudited) (continued)
(Amounts in thousands)
| Six Circles Managed Equity Portfolio International Unconstrained Fund* | ||||
Period Ended June 30, 2019 | ||||
CHANGE IN NET ASSETS RESULTING FROM OPERATIONS: | ||||
Net investment income (loss) | $ | 6,336 | ||
Net realized gain (loss) | (4,322 | ) | ||
Change in net unrealized appreciation (depreciation) | 8,923 | |||
|
| |||
Change in net assets resulting from operations | 10,937 | |||
|
| |||
CAPITAL TRANSACTIONS: | ||||
Change in net assets resulting from capital transactions | 658,478 | |||
|
| |||
NET ASSETS: | ||||
Change in net assets | 669,415 | |||
Beginning of period | — | |||
|
| |||
End of period | $ | 669,415 | ||
|
| |||
CAPITAL TRANSACTIONS: | ||||
Proceeds from shares issued | $ | 674,729 | ||
Cost of shares redeemed | (16,251 | ) | ||
|
| |||
Total change in net assets resulting from capital transactions | $ | 658,478 | ||
|
| |||
SHARE TRANSACTIONS: | ||||
Issued | 68,338 | |||
Redeemed | (1,659 | ) | ||
|
| |||
Change in Shares | 66,679 | |||
|
| |||
| * | Six Circles Managed Equity Portfolio International Unconstrained Fund was launched on April 10, 2019. |
SEE NOTES TO FINANCIAL STATEMENTS.
| 36 | SIX CIRCLES TRUST | JUNE 30, 2019 | ||||
Table of Contents
THIS PAGE IS INTENTIONALLY LEFT BLANK
| JUNE 30, 2019 | SIX CIRCLES TRUST | 37 | ||||||
Table of Contents
FOR THE PERIOD ENDED JUNE 30, 2019 (Unaudited)
| Per share operating performance | ||||||||||||||||||||||||||||
| Investment operations | Distributions | |||||||||||||||||||||||||||
| Net asset value, beginning of period | Net investment income (loss) (b) | Net realized and unrealized gains (losses) on investments and foreign currency transactions | Total from investment operations | Net investment income | Net realized gain | Total distributions | ||||||||||||||||||||||
Six Circles Managed Equity Portfolio U.S. Unconstrained Fund* |
| |||||||||||||||||||||||||||
Six Months Ended June 30, 2019 (Unaudited) | $ | 10.00 | $ | 0.05 | $ | 0.06 | (f) | $ | 0.11 | $ | — | $ | — | $ | — | |||||||||||||
| * | Six Circles Managed Equity Portfolio U.S. Unconstrained Fund was launched on April 10, 2019. |
| (a) | Certain expenses incurred by the Fund were not annualized for the period. |
| (b) | Calculated based upon average shares outstanding. |
| (c) | Not annualized for periods less than one year. |
| (d) | Includes adjustments in accordance with accounting principles generally accepted in the United States of America and as such, the net asset values for financial reporting purposes and the returns based upon those net asset values may differ from the net asset values and returns for shareholder transactions. |
| (e) | Includes interest expense, if applicable, which is less than 0.005% unless otherwise noted. |
| (f) | Calculation of the net realized and unrealized gains (losses) per share do not correlate with the Fund’s net realized and unrealized gains (losses) presented on the Statements of Operations due to the timing of capital transactions in relation to the fluctuating market values of the Fund’s investments. |
SEE NOTES TO FINANCIAL STATEMENTS.
| 38 | SIX CIRCLES TRUST | JUNE 30, 2019 | ||||
Table of Contents
| Ratios/Supplemental data | |||||||||||||||||||||||||
| Ratios to average net assets(a) | ||||||||||||||||||||||||||
| Net asset value, end of period | Total return (c)(d) | Net assets, end of period (000’s) | Net expenses (e) | Net investment income (loss) | Expenses without waivers and reimbursements | Portfolio turnover rate (c) | ||||||||||||||||||||
| $ | 10.11 | 1.10 | % | $ | 1,169,304 | 0.11 | % | 2.21 | % | 0.36 | % | 1.93 | % | |||||||||||||
SEE NOTES TO FINANCIAL STATEMENTS.
| JUNE 30, 2019 | SIX CIRCLES TRUST | 39 | ||||||
Table of Contents
FINANCIAL HIGHLIGHTS
FOR THE PERIOD ENDED JUNE 30, 2019 (Unaudited)
| Per share operating performance | ||||||||||||||||||||||||||||
| Investment operations | Distributions | |||||||||||||||||||||||||||
| Net asset value, beginning of period | Net investment income (loss) (b) | Net realized and unrealized gains (losses) on investments and foreign currency transactions | Total from investment operations | Net investment income | Net realized gain | Total distributions | ||||||||||||||||||||||
Six Circles Managed Equity Portfolio International Unconstrained Fund* |
| |||||||||||||||||||||||||||
Six Months Ended June 30, 2019 (Unaudited) | $ | 10.00 | $ | 0.14 | $ | (0.10 | ) | $ | 0.04 | $ | — | $ | — | $ | — | |||||||||||||
| * | Six Circles Managed Equity Portfolio International Unconstrained Fund was launched on April 10, 2019. |
| (a) | Certain expenses incurred by the Fund were not annualized for the period. |
| (b) | Calculated based upon average shares outstanding. |
| (c) | Not annualized for periods less than one year. |
| (d) | Includes adjustments in accordance with accounting principles generally accepted in the United States of America and as such, the net asset values for financial reporting purposes and the returns based upon those net asset values may differ from the net asset values and returns for shareholder transactions. |
| (e) | Includes interest expense, if applicable, which is less than 0.01% unless otherwise noted. |
SEE NOTES TO FINANCIAL STATEMENTS.
| 40 | SIX CIRCLES TRUST | JUNE 30, 2019 | ||||
Table of Contents
| Ratios/Supplemental data | |||||||||||||||||||||||||
| Ratios to average net assets(a) | ||||||||||||||||||||||||||
| Net asset value, end of period | Total return (c)(d) | Net assets, end of period (000’s) | Net expenses (e) | Net investment income (loss) | Expenses without waivers and reimbursements | Portfolio turnover rate (c) | ||||||||||||||||||||
| $ | 10.04 | 0.40 | % | $ | 669,415 | 0.19 | % | 6.16 | % | 0.45 | % | 21.91 | % | |||||||||||||
SEE NOTES TO FINANCIAL STATEMENTS.
| JUNE 30, 2019 | SIX CIRCLES TRUST | 41 | ||||||
Table of Contents
AS OF JUNE 30, 2019 (Unaudited)
1. Organization
Six Circles Trust (the “Trust”) was formed on November 8, 2017, as a Delaware statutory trust, pursuant to a Declaration of Trust dated November 8, 2017, as amended and restated June 12, 2018, and further amended September 21, 2018 and is registered under the Investment Company Act of 1940, as amended (the “1940 Act”), as anopen-end management investment company.
Six Circles Managed Equity Portfolio U.S. Unconstrained Fund and Six Circles Managed Equity Portfolio International Unconstrained Fund are two separate series of the Trust (each, a “Fund” and collectively, the “Funds”) covered by this report. The Funds are classified as“non-diversified” funds. Each Fund currently offers one class of shares. The Funds commenced operations on April 10, 2019.
The investment objective of each of the Six Circles Managed Equity Portfolio U.S. Unconstrained Fund and Six Circles Managed Equity Portfolio International Unconstrained Fund is to provide capital appreciation.
J.P. Morgan Private Investments Inc. (“JPMPI”), an indirect, wholly-owned subsidiary of JPMorgan Chase & Co. (“JPMorgan”), acts as the Funds’ investment adviser (the “Adviser”). The Adviser has engaged aSub-Adviser to manage the assets of the Funds.
2. Significant Accounting Policies
The following is a summary of significant accounting policies followed by the Funds in the preparation of their financial statements. The Funds are investment companies and, accordingly, follow the investment company accounting and reporting guidance of the Financial Accounting Standards Board (“FASB”) Accounting Standards Codification Topic 946 —Investment Companies, which is part of U.S. generally accepted accounting principles (“GAAP”). The preparation of financial statements in conformity with GAAP requires management to make estimates and assumptions that affect the reported amounts of assets and liabilities and disclosure of contingent assets and liabilities at the date of the financial statements and the reported amounts of increases and decreases in net assets from operations during the reporting period. Actual results could differ from those estimates.
A. Valuation of Investments — The valuation of investments is in accordance with GAAP and the Funds’ valuation policies set forth by and under the supervision and responsibility of the Board of Trustees (the “Board”), which established the following approach to valuation, as described more fully below: (i) investments for which market quotations are readily available shall be valued at unadjusted quoted prices and (ii) all other investments for which market quotations are not readily available shall be valued at their fair value as determined in good faith by the Board.
The Board has appointed the Six Circles Funds Valuation Committee (“VC”), comprised of officers of the Funds and other personnel of the Adviser, to assist the Board with the oversight and monitoring of the valuation of the Funds’ investments. The VC oversees and carries out policies and procedures for the valuation of investments held by the Funds. This includes monitoring the appropriateness of fair values based on results of ongoing valuation oversight including, but not limited to, consideration of macro or security specific events, market events and pricing vendor due diligence. The VC, through the Adviser, is responsible for assessing the potential impacts to the fair values on an ongoing basis, and discussing this on at least a quarterly basis with the Board.
A market-based approach is primarily used to value the Funds’ investments for which market quotations are readily available and which are generally valued at their current market value. Other securities and assets, including securities for which market quotations are not readily available, market quotations are determined not to be reliable, or whose value has been materially affected by events occurring after the close of trading on the exchange or market on which the security is principally traded but before a Fund’s net asset value (“NAV”) is calculated, are valued by approved pricing vendors or third party broker-dealers (collectively referred to as “Pricing Services”) or may be internally fair valued using methods set forth by the valuation policies approved by the Board. The valuation may include related or comparable assets or liabilities, recent transactions, market multiples, book values and other relevant information for the investment in order to determine the fair value of the investment. An income-based valuation approach may be used in which the anticipated future cash flows of the investment are discounted to calculate the fair value. Discounts may be applied due to the nature or duration of any restrictions on the disposition of the investments. Valuations may be based on current market prices of securities that are comparable in coupon, rating, maturity and industry. It is possible that the estimated values may differ significantly from the values that would have been used, had a ready market for the investments existed, and such differences could be material.
Equity securities listed on a North American, Central American, South American or Caribbean (“Americas”) securities exchange are generally valued at the last sale price or official market closing price on the primary exchange on which the security is principally traded that is reported before the time when the net assets values of the Funds are calculated on a valuation date. The Funds calculate their NAV as of 4 p.m. Eastern time each day the New York Stock Exchange (NYSE) is open for trading.
Foreign equity securities are valued as of the close of trading on the stock exchange on which the security is primarily traded, or as of 4 p.m. Eastern time. The value is then converted into its U.S. dollar equivalent at the foreign exchange rate in effect at 4 p.m. Eastern time on the day that the value of the security is determined. Generally foreign equity securities, as well as certain derivatives with equity reference obligations, are valued by applying international fair value factors provided by approved Pricing Services.
The factors seek to adjust the local closing price for movements of local markets post-closing, but prior to the time the NAVs are calculated. The fair valued securities are converted at the exchange rates available at 4 p.m. Eastern time.
Fixed income securities are valued based on prices received from Pricing Services. In instances where sufficient market activity exists, the Pricing Services may utilize a market-based approach through which trades or quotes from market makers are used to determine the valuation of these instruments. In instances where sufficient market activity may not exist, Pricing Services may consider a variety of inputs and factors, including, but
| 42 | SIX CIRCLES TRUST | JUNE 30, 2019 | ||||
Table of Contents
not limited to proprietary models that may take into account market transactions in securities with comparable characteristics, yield curves, option-adjusted spreads, credit spreads, estimated default rates, coupon rates, underlying collateral and estimated cash flows.
Shares of exchange-traded funds (“ETFs”) are generally valued at the last sale price on the exchange on which the ETF is principally traded. Shares ofopen-end investment companies are valued at their respective NAVs.
Futures are generally valued on the basis of available market quotations. Swaps and forward foreign currency exchange contracts are valued utilizing market quotations from approved Pricing Services.
Valuations reflected in this report are as of the report date. As a result, changes in valuation due to market events and/or issuer related events after the report date and prior to issuance of the report are not reflected herein.
The various inputs that are used in determining the valuation of the Funds’ investments are summarized into the three broad levels listed below.
| • | Level 1 — Unadjusted inputs using quoted prices in active markets for identical investments. |
| • | Level 2 — Other significant observable inputs including, but not limited to, quoted prices for similar investments, inputs other than quoted prices that are observable for investments (such as interest rates, prepayment speeds, credit risk, etc.) or other market corroborated inputs. |
| • | Level 3 — Significant inputs based on the best information available in the circumstances, to the extent observable inputs are not available (including the Funds’ assumptions in determining the fair value of investments). |
A financial instrument’s level within the fair value hierarchy is based on the lowest level of any input, both individually and in the aggregate, that is significant to the fair value measurement. The inputs or methodology used for valuing instruments are not necessarily an indication of the risk associated with investing in those instruments.
The following tables represent each valuation input as presented on the Schedules of Portfolio Investments (“SOIs”) (amounts in thousands):
Six Circles Managed Equity Portfolio U.S. Unconstrained Fund
Level 1 Quoted prices | Level 2 Other significant observable inputs | Level 3 Significant unobservable inputs | Total | |||||||||||||
Investments in Securities | ||||||||||||||||
Common Stocks | ||||||||||||||||
Basic Materials | $ | 3,965 | $ | — | $ | — | $ | 3,965 | ||||||||
Communications | 271,763 | — | — | 271,763 | ||||||||||||
Consumer Cyclical | 18,793 | — | — | 18,793 | ||||||||||||
ConsumerNon-cyclical | 382,766 | — | — | 382,766 | ||||||||||||
Energy | 81,373 | — | — | 81,373 | ||||||||||||
Financial | 152,938 | — | — | 152,938 | ||||||||||||
Industrial | 52,553 | — | — | 52,553 | ||||||||||||
Technology | 193,605 | — | — | 193,605 | ||||||||||||
Utilities | 8,048 | — | — | 8,048 | ||||||||||||
|
|
|
|
|
|
|
| |||||||||
Total Common Stocks | 1,165,804 | — | — | 1,165,804 | ||||||||||||
|
|
|
|
|
|
|
| |||||||||
Short-Term Investments | ||||||||||||||||
Time Deposits | — | 11,332 | — | 11,332 | ||||||||||||
|
|
|
|
|
|
|
| |||||||||
Total Investments in Securities | $ | 1,165,804 | $ | 11,332 | $ | — | $ | 1,177,136 | ||||||||
|
|
|
|
|
|
|
| |||||||||
Appreciation in Other Financial Instruments | ||||||||||||||||
Futures contracts | $ | 21 | $ | — | $ | — | $ | 21 | ||||||||
|
|
|
|
|
|
|
| |||||||||
Six Circles Managed Equity Portfolio International Unconstrained Fund
Level 1 Quoted prices | Level 2 Other significant observable inputs | Level 3 Significant unobservable inputs | Total | |||||||||||||
Investments in Securities | ||||||||||||||||
Common Stocks | ||||||||||||||||
Australia | $ | — | $ | 1,080 | $ | — | $ | 1,080 | ||||||||
Austria | — | 2,012 | — | 2,012 | ||||||||||||
Belgium | — | 13,427 | — | 13,427 | ||||||||||||
Brazil | 1,040 | — | — | 1,040 | ||||||||||||
Canada | 27,363 | — | — | 27,363 | ||||||||||||
Chile | 1,540 | 85 | — | 1,625 | ||||||||||||
| JUNE 30, 2019 | SIX CIRCLES TRUST | 43 | ||||||
Table of Contents
NOTES TO FINANCIAL STATEMENTS
AS OF JUNE 30, 2019 (Unaudited) (continued)
Six Circles Managed Equity Portfolio International Unconstrained Fund—(Continued)
Level 1 Quoted prices | Level 2 Other significant observable inputs | Level 3 Significant unobservable inputs | Total | |||||||||||||
China | $ | 3,418 | $ | 14,356 | $ | — | $ | 17,774 | ||||||||
Colombia | 28 | — | — | 28 | ||||||||||||
Czech Republic | — | 304 | — | 304 | ||||||||||||
Denmark | 279 | 13,234 | — | 13,513 | ||||||||||||
Egypt | 2 | — | — | 2 | ||||||||||||
Finland | 126 | 6,005 | — | 6,131 | ||||||||||||
France | 2,369 | 81,301 | — | 83,670 | ||||||||||||
Germany | 426 | 46,948 | — | 47,374 | ||||||||||||
Greece | 278 | 99 | — | 377 | ||||||||||||
Hong Kong | 1,542 | 13,957 | — | 15,499 | ||||||||||||
Hungary | 230 | 286 | — | 516 | ||||||||||||
India | 423 | 9,332 | — | 9,755 | ||||||||||||
Indonesia | — | 3,312 | — | 3,312 | ||||||||||||
Ireland | 3,291 | 884 | — | 4,175 | ||||||||||||
Isle of Man | — | 88 | — | 88 | ||||||||||||
Italy | — | 18,290 | — | 18,290 | ||||||||||||
Luxembourg | 168 | 652 | — | 820 | ||||||||||||
Macau | — | 445 | — | 445 | ||||||||||||
Malaysia | 169 | 5,222 | — | 5,391 | ||||||||||||
Mexico | 670 | 45 | — | 715 | ||||||||||||
Netherlands | 537 | 73,254 | — | 73,791 | ||||||||||||
Norway | 46 | 8,405 | — | 8,451 | ||||||||||||
Pakistan | 143 | — | — | 143 | ||||||||||||
Peru | 690 | — | — | 690 | ||||||||||||
Philippines | 1,090 | 1,772 | — | 2,862 | ||||||||||||
Poland | — | 176 | — | 176 | ||||||||||||
Portugal | — | 1,925 | — | 1,925 | ||||||||||||
Qatar | 766 | 883 | — | 1,649 | ||||||||||||
Russia | — | 189 | — | 189 | ||||||||||||
Saudi Arabia | — | (a) | — | — | — | (a) | ||||||||||
Singapore | — | 5,119 | — | 5,119 | ||||||||||||
South Africa | 223 | 474 | — | 697 | ||||||||||||
South Korea | 2,368 | 10,507 | — | 12,875 | ||||||||||||
Spain | — | 12,510 | — | 12,510 | ||||||||||||
Sweden | 71 | 7,328 | — | 7,399 | ||||||||||||
Switzerland | 2,873 | 111,796 | — | 114,669 | ||||||||||||
Taiwan | 828 | 16,240 | — | 17,068 | ||||||||||||
Thailand | — | 6,973 | — | 6,973 | ||||||||||||
United Arab Emirates | 536 | 712 | — | 1,248 | ||||||||||||
United Kingdom | 2,009 | 109,397 | — | 111,406 | ||||||||||||
United States | 154 | 228 | — | 382 | ||||||||||||
|
|
|
|
|
|
|
| |||||||||
Total Common Stocks | 55,696 | 599,252 | — | 654,948 | ||||||||||||
|
|
|
|
|
|
|
| |||||||||
Exchange-Traded Funds | ||||||||||||||||
United States | 2,212 | — | — | 2,212 | ||||||||||||
|
|
|
|
|
|
|
| |||||||||
Preferred Stocks | ||||||||||||||||
Brazil | 86 | — | — | 86 | ||||||||||||
Colombia | 27 | — | — | 27 | ||||||||||||
Germany | — | 1,350 | — | 1,350 | ||||||||||||
|
|
|
|
|
|
|
| |||||||||
Total Preferred Stocks | 113 | 1,350 | — | 1,463 | ||||||||||||
|
|
|
|
|
|
|
| |||||||||
| 44 | SIX CIRCLES TRUST | JUNE 30, 2019 | ||||
Table of Contents
Six Circles Managed Equity Portfolio International Unconstrained Fund (Continued)
Level 1 Quoted prices | Level 2 Other significant observable inputs | Level 3 Significant unobservable inputs | Total | |||||||||||||
Rights | ||||||||||||||||
Chile | $ | 1 | $ | — | $ | — | $ | 1 | ||||||||
South Korea | — | — | 2 | 2 | ||||||||||||
Spain | 149 | — | — | 149 | ||||||||||||
|
|
|
|
|
|
|
| |||||||||
Total Rights | 150 | — | 2 | 152 | ||||||||||||
|
|
|
|
|
|
|
| |||||||||
Short-Term Investments | ||||||||||||||||
Time Deposits | — | 6,088 | — | 6,088 | ||||||||||||
|
|
|
|
|
|
|
| |||||||||
Total Investments in Securities | $ | 58,171 | $ | 606,690 | $ | 2 | $ | 664,863 | ||||||||
|
|
|
|
|
|
|
| |||||||||
Appreciation in Other Financial Instruments | ||||||||||||||||
Futures contracts | $ | 89 | $ | — | $ | — | $ | 89 | ||||||||
|
|
|
|
|
|
|
| |||||||||
Depreciation in Other Financial Instruments | ||||||||||||||||
Futures contracts | $ | (—) | (a) | $ | — | $ | — | $ | (—) | (a) | ||||||
|
|
|
|
|
|
|
| |||||||||
(a) — Amount rounds to less than $500.
B. Restricted Securities — Certain securities held by the Funds may be subject to legal or contractual restrictions on resale. Restricted securities generally are resold in transactions exempt from registration under the Securities Act of 1933 (the “Securities Act”). Disposal of these securities may involve time-consuming negotiations and expense. Prompt sale at the current valuation may be difficult and could adversely affect the net asset value of the Funds.
As of June 30, 2019, the Funds had no investments in restricted securities other than securities sold to the Funds under Rule 144A or Regulation S under the Securities Act.
C. When-Issued Securities, Delayed Delivery Securities and Forward Commitments — The Funds may purchase when-issued securities, including To Be Announced (“TBA”) securities, and enter into contracts to purchase+ or sell securities for a fixed price that may be settled a month or more after the trade date, or purchase delayed delivery securities which generally settle seven days after the trade date. When-issued securities are securities that have been authorized, but not issued in the market. A forward commitment involves entering into a contract to purchase or sell securities for a fixed price at a future date that may be settled a month or more after the trade date. A delayed delivery security is agreed upon in advance between the buyer and the seller of the security and is generally delivered beyond seven days of the agreed upon date. The purchase of securities on a when-issued, delayed delivery or forward commitment basis involves the risk that the value of the security to be purchased declines before the settlement date. The sale of securities on a forward commitment basis involves the risk that the value of the securities sold may increase before the settlement date. The Funds may be exposed to credit risk if the counterparty fails to perform under the terms of the transaction. Interest income for securities purchased on a when-issued, delayed delivery or forward commitment basis is not accrued until the settlement date.
D. Derivatives — The Funds used derivative instruments including futures, in connection with their respective investment strategies. Derivative instruments may be used as substitutes for securities in which the Funds can invest, to hedge portfolio investments or to generate income or gain to the Funds. Derivatives may also be used to manage duration, sector and yield curve exposures as well as credit and spread volatility.
The Funds may be subject to various risks from the use of derivatives including the risk that changes in the value of a derivative may not correlate perfectly with the underlying asset, rate or index; counterparty credit risk related to derivatives counterparties’ failure to perform under contract terms; liquidity risk related to the lack of a liquid market for these contracts allowing a Fund to close out its position(s); and documentation risk relating to disagreement over contract terms. Investing in certain derivatives also results in a form of leverage and as such, the Funds’ risk of loss associated with these instruments may exceed their value, as recorded on the Statements of Assets and Liabilities.
The Funds are party to various derivative contracts governed by International Swaps and Derivatives Association master agreements (“ISDA agreements”). The Funds’ ISDA agreements, which are separately negotiated by theSub-Advisers, with each dealer counterparty, may contain provisions allowing, absent other considerations, a counterparty to exercise rights, to the extent not otherwise waived, against the Funds in the event the Funds’ net assets decline over time by apre-determined percentage or fall below apre-determined floor. The ISDA agreements may also contain provisions allowing, absent other conditions, the Funds to exercise rights, to the extent not otherwise waived, against a counterparty (e.g., decline in a counterparty’s credit rating below a specified level). Such rights for both a counterparty and the Funds often include the ability to terminate (i.e., close out) open contracts at prices which may favor a counterparty, which could have an adverse effect on the Funds. The ISDA agreements give the Funds and a counterparty the right, upon an event of default, to close out all transactions traded under such agreements and to net amounts owed or due across all transactions and offset such net payable or receivable with collateral posted to a segregated account by one party to the other.
Counterparty credit risk may be mitigated to the extent a counterparty posts collateral for mark to market gains to the Fund.
| JUNE 30, 2019 | SIX CIRCLES TRUST | 45 | ||||||
Table of Contents
NOTES TO FINANCIAL STATEMENTS
AS OF JUNE 30, 2019 (Unaudited) (continued)
Note D(1) - D(2) below describe the various derivatives used by the Funds.
(1) Futures Contracts — The Funds used index futures to manage interest rate risks associated with portfolio investments and/or to gain or reduce exposure to fluctuations of a particular sector, country or region as well as to lengthen or shorten the duration of the overall investment portfolio.
Futures contracts provide for the delayed delivery of the underlying instrument at a fixed price or are settled for a cash amount based on the change in the value of the underlying instrument at a specific date in the future. Upon entering into a futures contract, the Funds are required to deposit with the broker, cash or securities in an amount equal to a certain percentage of the contract amount, which is referred to as the initial margin deposit.
Subsequent payments, referred to as variation margin, are made or received by the Funds periodically and are based on changes in the market value of open futures contracts. Changes in the market value of open futures contracts are recorded as Change in net unrealized appreciation/depreciation on the Statements of Operations. Realized gains or losses, representing the difference between the value of the contract at the time it was opened and the value at the time it was closed, are reported on the Statements of Operations at the closing or expiration of the futures contract. Securities deposited as initial margin are designated on the SOIs and cash deposited is recorded on the Statements of Assets and Liabilities. A receivable from and/or a payable to brokers for the daily variation margin is also recorded on the Statements of Assets and Liabilities. Futures contracts outstanding at period end, if any, are listed after each Fund’s SOI.
The use of futures contracts may expose the Funds to interest rate risk. The Funds may be subject to the risk that the change in the value of the futures contract may not correlate perfectly with the underlying instrument. Use of long futures contracts subjects the Funds to risk of loss in excess of the amounts shown on the Statements of Assets and Liabilities, up to the notional amount of the futures contracts. Use of short futures contracts subjects the Funds to unlimited risk of loss. The Funds may enter into futures contracts only on exchanges or boards of trade. The exchange or board of trade acts as the counterparty to each futures transaction; therefore, the Funds credit risk is limited to failure of the exchange or board of trade.
Under some circumstances, futures exchanges may establish daily limits on the amount that the price of a futures contract can vary from the previous day’s settlement price, which could effectively prevent the liquidation of positions.
The Funds’ futures contracts are not subject to master netting arrangements (the right to close out all transactions traded with a counterparty and net amounts owed or due across transactions).
(2) Forward Foreign Currency Exchange Contracts —The Funds may be exposed to foreign currency risks associated with some or all of the portfolio investments and used forward foreign currency exchange contracts to hedge or manage certain of these exposures as part of an investment strategy. The Funds also bought forward foreign currency exchange contracts to gain exposure to currencies. Forward foreign currency exchange contracts represent obligations to purchase or sell foreign currency on a specified future date at a price fixed at the time the contracts are entered into.Non-deliverable forward foreign currency exchange contracts are settled with the counterparty in U.S. Dollars without the delivery of foreign currency. Forward contracts outstanding at period end, if any, are listed after each Fund’s SOI.
The values of the forward foreign currency exchange contracts are adjusted daily based on the applicable exchange rate of the underlying currency. Changes in the value of these contracts are recorded as unrealized appreciation/depreciation until the contract settlement date. When the forward foreign currency exchange contract is closed, the Fund records a realized gain or loss equal to the difference between the value at the time the contract was opened and the value at the time it was closed. The Fund also records a realized gain or loss when a forward foreign currency exchange contract offsets another forward foreign currency exchange contract with the same counterparty upon settlement.
The Funds’ forward foreign currency exchange contracts may be subject to master netting arrangements (the right to close out all transactions with a counterparty and net amounts owed or due across transactions). The Funds may be required to post or receive collateral fornon-deliverable forward foreign currency exchange contracts.
(3) Summary of Derivatives Information
The following tables present the value of derivatives held as of June 30, 2019, by their primary underlying risk exposure and respective location on the Statements of Assets and Liabilities (amounts in thousands):
Six Circles Managed Equity Portfolio U.S. Unconstrained Fund
| Derivative Contracts | Statements of Assets and Liabilities Location | |||||
| Gross Assets: | Futures Contracts (a) | |||||
Equity contracts | Receivables, Net Assets — Unrealized Appreciation | $ | 21 | |||
|
| |||||
| (a) | This amount represents the cumulative appreciation (depreciation) of futures contracts as reported on the SOIs. |
The Statements of Assets and Liabilities only reflect the current day variation margin receivable/payable from/to brokers. |
| 46 | SIX CIRCLES TRUST | JUNE 30, 2019 | ||||
Table of Contents
Six Circles Managed Equity Portfolio International Unconstrained Fund
| Derivative Contracts | Statements of Assets and Liabilities Location | |||||
| Gross Assets: | Futures Contracts (a) | |||||
Equity contracts | Receivables, Net Assets — Unrealized Appreciation | $ | 89 | |||
|
| |||||
Gross Liabilities: | ||||||
Equity contracts | Receivables, Net Assets — Unrealized Depreciation | $ | (- | )(b) | ||
|
| |||||
| (a) | This amount represents the cumulative appreciation (depreciation) of futures contracts as reported on the SOIs. |
The Statements of Assets and Liabilities only reflect the current day variation margin receivable/payable from/to brokers. |
| (b) | Amount rounds to less than $500. |
The following tables present the effect of derivatives on the Statements of Operations for the period ended June 30, 2019, by primary underlying risk exposure (amounts in thousands):
Six Circles Managed Equity Portfolio U.S. Unconstrained Fund
| Amount of Realized Gain (Loss) on Derivatives Recognized on the Statements of Operations | ||||
| Derivative Contracts | Futures Contracts | |||
Equity contracts | $ | (42 | ) | |
|
| |||
| Amount of Change in Unrealized Appreciation (Depreciation) on Derivatives Recognized on the Statements of Operations | ||||
| Derivative Contracts | Futures Contracts | |||
Equity contracts | $ | 21 | ||
|
| |||
Six Circles Managed Equity Portfolio International Unconstrained Fund
| Amount of Realized Gain (Loss) on Derivatives Recognized on the Statements of Operations | ||||||||||||
| Derivative Contracts | Futures Contracts | Forward Foreign Currency Exchange Contracts | Total | |||||||||
Equity contracts | $ | (1,006 | ) | $ | — | $ | (1,006 | ) | ||||
Foreign Exchange contracts | — | (10 | ) | (10 | ) | |||||||
|
|
|
|
|
| |||||||
Total | $ | (1,006 | ) | $ | (10 | ) | $ | (1,016 | ) | |||
|
|
|
|
|
| |||||||
| Amount of Change in Unrealized Appreciation (Depreciation) on Derivatives Recognized on the Statements of Operations | ||||
| Derivative Contracts | Futures Contracts | |||
Equity contracts | $ | 89 | ||
|
| |||
Derivatives Volume
The tables below disclose the volume of the Funds’ futures contracts activity during the period ended June 30, 2019 (amounts in thousands, except number of contracts). Please refer to the tables in the Summary of Derivative Information for derivative-related gains and losses associated with volume activity (amounts in thousands).
| Six Circles Managed Equity Portfolio U.S. Unconstrained Fund | Six Circles Managed Equity Portfolio International Unconstrained Fund (a) | |||||||
Futures Contracts: | ||||||||
Average Notional Amount Long | $ | 3,112 | $ | 26,404 | ||||
| (a) | The Fund invested in an immaterial volume of Forward Foreign Currency Exchange Contracts during the period, and no positions were held as of June 30, 2019. |
| JUNE 30, 2019 | SIX CIRCLES TRUST | 47 | ||||||
Table of Contents
NOTES TO FINANCIAL STATEMENTS
AS OF JUNE 30, 2019 (Unaudited) (continued)
E. Foreign Currency Translation — The books and records of the Funds are maintained in U.S. dollars. Foreign currency amounts are translated into U.S. dollars at the prevailing exchange rates of such currencies against the U.S. dollar. The market value of investment securities and other assets and liabilities are translated at the exchange rate as of the valuation date. Purchases and sales of investment securities, income and expenses are translated at the exchange rate prevailing on the respective dates of such transactions.
The Funds do not isolate the effect of changes in foreign exchange rates from changes in market prices on securities held. Accordingly, such changes are included within the Change in net unrealized appreciation/depreciation on investments on the Statements of Operations.
Reported realized foreign currency gains and losses arise from the disposition of foreign currency. Currency gains or losses may be realized between the trade and settlement dates on securities transactions, and the difference between the amounts of dividends, interest and foreign withholding taxes recorded on each Fund’s books on the transaction date and the U.S. dollar equivalent of the amounts actually received or paid. These reported realized foreign currency gains and losses are included in Net realized gain (loss) on foreign currency transactions on the Statements of Operations. Unrealized foreign currency gains and losses arise from changes (due to changes in exchange rates) in the value of foreign currency and other assets and liabilities denominated in foreign currencies, which are held at period end and are included in Change in net unrealized appreciation/depreciation on foreign currency translations on the Statements of Operations.
F. Short Sales — The Funds may engage in short sales as part of their normal investment activities. In a short sale, the Funds sell securities they do not own in anticipation of a decline in the market value of those securities. In order to deliver securities to the purchaser, the Funds borrow securities from a broker. To close out a short position, the Funds deliver the same securities to the broker.
The Funds are required to pledge cash or securities to the broker as collateral for the securities sold short. Collateral requirements are calculated daily based on the current market value of the short positions. Cash collateral deposited with the custodian is recorded as Restricted cash on the Statements of Assets and Liabilities. Securities segregated as collateral are denoted on the SOIs. The Funds may receive or pay the net of the following amounts: (i) a portion of the income from the investment of cash collateral; (ii) the broker’s fee on the borrowed securities (calculated daily based upon the market value of each borrowed security and a variable rate that is dependent on availability of the security); and (iii) a financing charge for the difference between the market value of the short position and cash collateral deposited with the broker. The net income or fee is reported as Interest income or Interest expense, respectively, on securities sold short on the Statements of Operations. The Funds are obligated to pay the broker dividends declared on short positions when a position is open on the record date. Dividends on short positions are reported onex-dividend date on the Statements of Operations as Dividend expense on securities sold short.
Liabilities for securities sold short are reported at market value on the Statements of Assets and Liabilities and the change in market value is recorded as Change in net unrealized appreciation (depreciation) on the Statements of Operations. Short sale transactions may result in unlimited losses as the security’s price increases and the short position loses value. There is no upward limit on the price a borrowed security could attain. The Funds are also subject to risk of loss if the broker were to fail to perform its obligations under the contractual terms. The Funds will record a realized loss if the price of the borrowed security increases between the date of the short sale and the date on which the Funds replace the borrowed security. The Funds will record a realized gain if the price of the borrowed security declines between those dates.
G. Security Transactions, Investment Income and Expense Allocation — Securities transactions are recorded on a trade date basis. Realized gain and loss from securities transactions are recorded on an identified cost basis for financial reporting and federal income tax purposes. Interest income is determined on the basis of coupon interest accrued using the effective interest method which adjusts for amortization of premiums and accretion of discounts. Dividend income, net of foreign taxes withheld, if any, is recorded on theex-dividend date or when the Fund first learns of the dividend. Coupon payments are based on the adjusted principal at the time the interest is paid. Distributions received from certain investments held by the Funds may be comprised of dividends, realized gains and returns of capital. The Funds originally estimate the expected classification of such payments. The amounts may subsequently be reclassified upon receipt of information from the issuer.
The Funds are charged for those expenses of the Trust that are directly attributable to each Fund. Expenses that are not directly attributable to a Fund are typically allocated among the Funds in proportion to their respective net assets.
H. Repurchase Agreements — The Funds may invest in repurchase agreements, which are short term investments whereby the Funds acquire ownership of a debt security and the seller agrees to repurchase the security at a future date at a specified price. When entering into repurchase agreements, it is the Funds’ policy that their custodian take possession of the underlying collateral securities, the market value of which, at all times, shall equal at least 100% of the principal amount of the repurchase transaction. The repurchase agreements further authorize the Funds to demand additional collateral in the event that the dollar value of the collateral falls below 100%. The Funds will make payments for such securities only upon physical delivery or upon evidence of book entry transfer to the account of the custodian.
I. Federal Income Tax — Each Fund is treated as a separate taxable entity for Federal income tax purposes. Each Fund’s policy is to comply with the provisions of Subchapter M of the Internal Revenue Code of 1986, as amended (the “Code”) applicable to regulated investment companies. Each Fund intends to distribute to shareholders, substantially all of its distributable net investment income and net realized capital gains on investments. Accordingly, no provision for Federal income tax is necessary.
The Funds follow the provisions of FASB Codification Section 740 (“ASC Section 740”) “Accounting for Uncertainty in Income Taxes” which clarifies the accounting for uncertainty in tax positions taken or expected to be taken on a tax return. ASC Section 740 sets forth a threshold for financial statement recognition, measurement and disclosure of tax positions taken or expected to be taken on a tax return. The Funds are required to
| 48 | SIX CIRCLES TRUST | JUNE 30, 2019 | ||||
Table of Contents
recognize the tax effects of certain tax positions under a “more likely than not” standard, that based on their technical merits, have more than 50 percent likelihood of being sustained upon examination. Management has analyzed the tax positions taken on the Funds’ federal income tax returns for all open periods, and has concluded that no provision for federal income tax is required in the Funds’ financial statements. At June 30, 2019, the Funds did not have any uncertain tax benefits that require recognition,de-recognition or disclosure. The Funds’ federal, state and local income and federal excise tax returns for which the applicable statutes of limitations have not expired are subject to examination by the Internal Revenue Service and state departments of revenue.
J. Foreign Tax — The Funds may be subject to foreign taxes on income, gains on investments or currency purchases/repatriation, a portion of which may be recoverable. The Funds will accrue such taxes and recoveries as applicable, based upon its current interpretation of tax rules and regulations that exist in the markets in which it invests.
K. Distributions to Shareholders — Distributions to shareholders are recorded on theex-dividend date. Distributions from net investment income and net realized capital gains are generally declared and paid according to the following schedule:
| Fund Name | Net Investment Income | Net Realized Capital Gains | ||||||
Six Circles Managed Equity Portfolio U.S. Unconstrained Fund | Annual | Annual | ||||||
Six Circles Managed Equity Portfolio International Unconstrained Fund | Annual | Annual | ||||||
Income and capital gain distributions will be determined in accordance with federal income tax regulations which may differ from GAAP. Differences may be permanent or temporary. Permanent differences are reclassified among capital accounts in the financial statements to reflect their tax character.
Temporary differences arise when certain items of income, expense, gain, or loss are recognized in different periods for financial statement and tax purposes. These differences will reverse at some time in the future. Differences in classification may also result from the treatment of short-term gains as ordinary income for tax purposes. As a result, income dividends and capital gain distributions declared during a fiscal period may differ significantly from the net investment income (loss) and realized gain (loss) reported on the Fund financial statements presented under GAAP.
Distributions classified as a tax basis return of capital, if any, are reflected on the Statement of Changes in Net Assets and have been recorded topaid-in capital.
3. Fees and Other Transactions with Affiliates
A. Investment Advisory Fees —The Adviser serves as the Funds’ investment adviser pursuant to an investment advisory agreement (the “Investment Advisory Agreement”). Under the terms of the Investment Advisory Agreement, the Adviser generally manages the Funds’ investments in accordance with the stated policies of each Fund, subject to the supervision of the Funds’ Board of Trustees. For the services provided to the Funds, the Adviser receives a fee, accrued daily and paid monthly, at the annual rate of 0.25% of the average daily net assets of each Fund.
The Adviser selects and oversees professional money managers (the“Sub-Advisers”) who are responsible for investing the assets of the Fundsunder sub-advisory agreements (the“Sub-Advisory Agreements”). Pursuant to each respectiveSub-Advisory Agreement, the Adviser agrees to pay eachSub-Adviser asub-advisory fee from its investment advisory fees. BlackRock Investment Management, LLC (“BlackRock”) currently serves as theSub-Adviser to the Funds. TheSub-Adviser is paid a management fee by the Adviser pursuant to their individually negotiatedSub-Advisory Agreement.
The Adviser engaged Russell Investments Implementation Services, LLC (“Russell”) to providestand-by interimsub-advisory services, as well as transition management services, for each Fund, to be utilized as needed in certain transitional circumstances involving a FundSub-Adviser. As of June 30, 2019, the Funds have not allocated assets to Russell.
The Adviser waived Investment Advisory fees and/or reimbursed expenses as outlined in Note 3G and reflected on the Statement of Operations.
B. Administration and Accounting Fees — Pursuant to an Administrative Agency Agreement, Brown Brothers Harriman & Co. (the “Administrator”) provides certain administration and fund accounting services to the Funds.
C. Distribution Fees — Pursuant to a Distribution Agreement, Foreside Fund Services, LLC (the “Distributor”), will serve as the Funds’ principal underwriter and acts as the agent of the Funds’ in connection with the continuous offering of shares of each Fund. The Distributor and its officers have no role in determining the investment policies or which securities are to be purchased or sold by the Funds. The Distributor does not receive compensation from the Funds, but instead is compensated by the Adviser for certain distribution-related expenses.
D. Custodian — Pursuant to a Custodian Agreement, Brown Brothers Harriman & Co. serves as the custodian (the “Custodian”) for each of the Funds and is responsible for holding portfolio securities and cash and maintaining the books of account and records of portfolio transactions.
E. Transfer Agent — Pursuant to a Transfer Agency and Service Agreement, DST Asset Manager Solutions, Inc. (the “Transfer Agent”) serves as each Fund’s transfer and dividend disbursing agent. The Transfer Agent is responsible for maintaining account records, detailing the ownership of Fund shares and for crediting income, capital gains and other changes in share ownership to shareholder accounts.
F. Offering Costs — Offering costs, including professional fees, printing fees and initial registration costs, are amortized over a period not longer than twelve months from the date the Fund commenced operations.
| JUNE 30, 2019 | SIX CIRCLES TRUST | 49 | ||||||
Table of Contents
NOTES TO FINANCIAL STATEMENTS
AS OF JUNE 30, 2019 (Unaudited) (continued)
G. Waivers and Reimbursements — The Adviser has contractually agreed through at least April 30, 2020, to waive any management fees that exceed the aggregate management fees the Adviser is contractually required to pay the Fund’sSub-Adviser. Thereafter, this waiver will continue for subsequent one year terms unless terminated in accordance with its terms. Such waivers are not subject to reimbursement by the Fund. The Adviser has also contractually agreed through at least April 30, 2020, to reimburse expenses to the extent Total Annual Fund Operating Expenses (excluding acquired fund fees and expenses, if any, dividend and interest expenses related to short sales, brokerage fees, interest on borrowings, taxes, expenses related to litigation and potential litigation, and extraordinary expenses) exceed the following percentages of the average daily net assets of each Fund (the “Expense Cap”):
| Fund | Expense Cap | |||
Six Circles Managed Equity Portfolio U.S. Unconstrained Fund | 0.45 | % | ||
Six Circles Managed Equity Portfolio International Unconstrained Fund | 0.50 | % | ||
An expense reimbursement by the Fund’s Adviser is subject to repayment by the Fund only to the extent it can be made withinthirty-six months following the date of such reimbursement by the Adviser. Repayment must be limited to amounts that would not cause the Fund’s operating expenses (taking into account any reimbursements by the Adviser and repayments by the Fund) to exceed the Expense Cap in effect at the time of the reimbursement by the Adviser or at the time of repayment by the Fund. This expense reimbursement is in effect through April 30, 2020, at which time the Adviser and/or its affiliates will determine whether to renew or revise it.
For the period ended June 30, 2019, the amounts waived and reimbursed by the Adviser, as well as the amounts available for potential future recoupment by the Adviser and the expiration schedule at June 30, 2019 are as follows (amounts in thousands):
| Fund | Fees reimbursed for the period ended June 30, 2019 | Total potential recoupment amount June 30, 2019 | Potential recoupment amount expiring June 30, 2022 | |||||||||
Six Circles Managed Equity Portfolio U.S. Unconstrained Fund* | $ | 54 | $ | — | $ | — | ||||||
Six Circles Managed Equity Portfolio International Unconstrained Fund* | 63 | — | — | |||||||||
|
|
|
|
|
| |||||||
Totals | $ | 117 | $ | — | $ | — | ||||||
|
|
|
|
|
| |||||||
| * | Fund has recouped all eligible expenses during the period. |
H. Cross Trades — The Funds may participate in purchase and sale transactions with the Funds or other funds or accounts that have a common investment adviser (orSub-Adviser), commonly referred to as “cross trades.” These cross trades are executed in accordance with procedures adopted by the Trust’s Board and comply with Rule17a-7 of the 1940 Act, which require, among other things, that such cross trades be effected at the independent current market price of the security.
During the period ended June 30, 2019, the aggregate value of purchases and sale cross trades with other funds or accounts, including those entered bySub-Advisers, were as follows (amounts in thousands):
| Fund Name | Purchases | Sales | ||||||
Six Circles Managed Equity Portfolio U.S. Unconstrained Fund | $ | 20,814 | $ | 5,425 | ||||
Six Circles Managed Equity Portfolio International Unconstrained Fund | 50,267 | 2,487 | ||||||
There were no cross trades between the Funds during the period.
4. Investment Transactions
During the period ended June 30, 2019, purchases and sales of investments (excluding short-term investments) were as follows (amounts in thousands):
| Purchases (excluding U.S. Government) | Sales (excluding U.S. Government) | Purchases of U.S. Government | Sales of U.S. Government | |||||||||||||
Six Circles Managed Equity Portfolio U.S. Unconstrained Fund | $ | 1,182,305 | $ | 16,532 | $ | — | $ | — | ||||||||
Six Circles Managed Equity Portfolio International Unconstrained Fund | 763,643 | 110,317 | — | — | ||||||||||||
5. Risks, Concentrations and Indemnifications
In the normal course of business, the Funds enter into contracts that contain a variety of representations which provide general indemnifications. The Funds’ maximum exposure under these arrangements is unknown. The amount of exposure would depend on future claims that may be made against the Funds that have not yet occurred. However, based on experience, the Funds expect the risk of loss to be remote.
Since the Funds arenon-diversified, they may invest a greater percentage of their assets in a particular issuer or group of issuers than a diversified fund would. This increased investment in fewer issuers may result in the Funds` shares being more sensitive to economic results among those issuing the securities.
| 50 | SIX CIRCLES TRUST | JUNE 30, 2019 | ||||
Table of Contents
The Funds may have elements of risk not typically associated with investments in the United States of America due to concentrated investments in a limited number of countries or regions, which may vary throughout the period depending on the Funds. Such concentrations may subject the Funds to additional risks resulting from political or economic conditions in such countries or regions and the possible imposition of adverse governmental laws or currency exchange restrictions could cause the securities and their markets to be less liquid and their prices to be more volatile than those of comparable U.S. securities.
As of June 30, 2019, the Six Circles Managed Equity Portfolio International Unconstrained Fund hadnon-U.S. country allocations representing greater than 10% of Net Assets as follows:
| France | Netherlands | Switzerland | United Kingdom | |||||||||
| 12.5% | 11.0 | % | 17.1 | % | 16.6 | % | ||||||
As of June 30, 2019, a significant portion of the Six Circles Managed Equity Portfolio International Unconstrained Fund net assets consisted of securities that were denominated in foreign currencies. Changes in currency exchange rates will affect the value of, and investment income from, such securities.
The Funds are subject to the risk that, should the Funds decide to sell an illiquid investment when a ready buyer is not available at a price the Funds deem to be representative of its value, the value of the Funds’ net assets could be adversely affected.
The Funds may also invest in shares of other investment companies and ETFs. ETFs are ownership interests in unit investment trusts, depositary receipts, and other pooled investment vehicles that hold a portfolio of securities or stocks designed to track the price performance and dividend yield of a particular broad-based, sector or international index. ETFs include a wide range of investments. Shareholders bear both their proportionate share of the Fund’s expenses and similar expenses of the underlying investment company or ETF when the Fund invests in shares of another investment company or ETF. The Fund is subject to the risks associated with the ETF’s or investment company’s investments. ETFs, investment companies and other investment vehicles that invest in commodities or currencies are subject to the risks associated with direct investments in commodities or currencies. The price and movement of an ETF orclosed-end fund designed to track an index may not track the index and may result in a loss. In addition,closed-end funds that trade on an exchange often trade at a price below their net asset value (also known as a discount). Certain ETFs orclosed-end funds traded on exchanges may be thinly-traded and experience large spreads between the “ask” price quoted by a seller and the “bid” price offered by a buyer.
Derivatives may be riskier than other types of investments because they may be more sensitive to changes in economic or market conditions than other types of investments and could result in losses that significantly exceed each Fund’s original investment. Many derivatives create leverage thereby causing the Funds to be more volatile than they would have been if they had not used derivatives. Derivatives also expose the Funds to counterparty risk (the risk that the derivative counterparty will not fulfill its contractual obligations), including credit risk of the derivative counterparty.
The Funds are also subject to counterparty credit risk, which is the risk that a counterparty fails to perform on agreements with the Funds such as swap contracts and forward foreign currency exchange contracts.
The Six Circles Managed Equity Portfolio U.S. Unconstrained Fund primarily invests in a portfolio of equity securities issued by U.S. companies and other instruments with economic characteristics similar to equity securities issued by U.S. companies.
The Six Circles Managed Equity Portfolio International Unconstrained Fund primarily invests in the equity securities ofnon-U.S. companies and is generally unconstrained by any particular capitalization, style or sector ornon-U.S. country.
6. Income Taxes and Distributions to Shareholders
For Federal income tax purposes, the estimated cost and unrealized appreciation (depreciation) in value of investments held at June 30, 2019 were as follows (amounts in thousands):
| Aggregate Tax Cost | Gross Unrealized Appreciation | Gross Unrealized Depreciation | Net Unrealized Appreciation (Depreciation) | |||||||||||||
Six Circles Managed Equity Portfolio U.S. Unconstrained Fund | $ | 1,176,656 | $ | 25,846 | $ | (25,345 | ) | $ | 501 | |||||||
Six Circles Managed Equity Portfolio International Unconstrained Fund | 656,038 | 24,601 | (15,687 | ) | 8,914 | |||||||||||
7. Ownership Concentration
As of June 30, 2019, each of the Funds had one affiliated omnibus account for the benefit of its clients which owned 100% of its outstanding shares.
8. Recent Accounting Pronouncements
In March 2017, the Financial Accounting Standards Board (“FASB”) issued Accounting Standards Update (“ASU”)2017-08 (“ASU2017-08”) Premium Amortization on Purchased Callable Debt Securities, which shortens the premium amortization period for purchasednon-contingently callable debt securities. ASU2017-08 requires that the premium be amortized to the earliest call date, for purchasednon-contingently callable debt securities. ASU2017-08 is effective for the fiscal years, and interim periods within those fiscal years, beginning after December 15, 2018. Management is currently evaluating the implications of these changes on the financial statements, if any.
| JUNE 30, 2019 | SIX CIRCLES TRUST | 51 | ||||||
Table of Contents
NOTES TO FINANCIAL STATEMENTS
AS OF JUNE 30, 2019 (Unaudited) (continued)
In August 2018, FASB issued Accounting Standards UpdateNo. 2018-13, “Fair Value Measurement (Topic 820: Disclosure Framework — Changes to the Disclosure Requirements for Fair Value Measurement” (“ASU2018-13”). ASU2018-13 eliminates the requirement to disclose the amount of and reasons for transfers between Level 1 and Level 2 of the fair value hierarchy, the timing of transfers between levels of the fair value hierarchy and the valuation processes for Level 3 fair value measurements. ASU2018-13 does not eliminate the requirement to disclose the range and weighted average used to develop significant unobservable inputs for Level 3 fair value measurements, and the changes in unrealized gains and losses for recurring Level 3 fair value measurements. ASU2018-13 requires that information is provided about the measurement uncertainty of Level 3 fair value measurements as of the reporting date. The guidance is effective for fiscal years, and interim periods within those fiscal years, beginning after December 15, 2019. Management has early adopted the above guidance and determined there to be no impact on the current period financial statements.
9. Subsequent Events
The Funds have evaluated subsequent events through the date of issuance of this report and have determined that there are no material events that need disclosure.
| 52 | SIX CIRCLES TRUST | JUNE 30, 2019 | ||||
Table of Contents
SCHEDULE OF SHAREHOLDER EXPENSES
(Unaudited)
Hypothetical $1,000 Investment
As a shareholder of the Funds, you incur two types of costs: (1) transaction costs, including sales charges (loads) on purchase payments and redemption fees and (2) ongoing costs, including investment advisory fees, administration fees, distribution fees and other Fund expenses. The examples below are intended to help you understand your ongoing costs (in dollars) of investing in the Funds and to compare these ongoing costs with the ongoing costs of investing in other mutual funds. The examples assume that you had a $1,000 investment in each fund at the beginning of the reporting period, April 10, 2019, and continued to hold your shares at the end of the reporting period, June 30, 2019.
Actual Expenses
For each Fund in the table below, the first line provides information about actual account values and actual expenses. You may use the information in this line, together with the amount you invested, to estimate the expenses that you paid over the period. Simply divide your account value by $1,000 (for example, an $8,600 account value divided by $1,000 = 8.6), then multiply the result by the number in the first line under the heading entitled “Expenses Paid During the Period” to estimate the expenses you paid on your account during this period.
Hypothetical Example for Comparison Purposes
The second line in the table below provides information about hypothetical account values and hypothetical expenses based on the Fund’s actual expense ratio and an assumed rate of return of 5% per year before expenses, which is not the actual return. The hypothetical account values and expenses may not be used to estimate the actual ending account balance or expenses you paid for the period. You may use this information to compare the ongoing costs of investing in the Fund and other funds. To do so, compare this 5% hypothetical example with the 5% hypothetical examples that appear in the shareholder reports of the other funds. Please note that the expenses shown in the table are meant to highlight your ongoing costs only and do not reflect any transaction costs, such as sales charges (loads) or redemption fees. Therefore, the second line in the table is useful in comparing ongoing costs only, and will not help you determine the relative total costs of owning different funds. In addition, if these transaction costs were included, your costs would have been higher. The examples also assume all dividends and distributions have been reinvested.
Beginning Account Value April 10, 2019 | Ending Account Value June 30, 2019 | Expenses Paid During the Period* | Annualized Expense Ratio | |||||||||||||
Six Circles Managed Equity Portfolio U.S. Unconstrained Fund | ||||||||||||||||
Actual* | $ | 1,000.00 | $ | 1,011.00 | $ | 0.25 | 0.11 | % | ||||||||
Hypothetical** | 1,000.00 | 1,024.38 | 0.56 | 0.11 | ||||||||||||
Six Circles Managed Equity Portfolio International Unconstrained Fund | ||||||||||||||||
Actual* | 1,000.00 | 1,004.00 | 0.43 | 0.19 | ||||||||||||
Hypothetical** | 1,000.00 | 1,023.98 | 0.96 | 0.19 | ||||||||||||
| * | Expenses are equal to each Fund’s respective annualized expense ratio, multiplied by the average account value over the period, multiplied by 182/365 (to reflect theone-half year period). |
| ** | Expenses are equal to the Fund’s respective annualized expense ratio, multiplied by the average account value over the period, multiplied by 81/365 (to reflect the actual period). Commencement of operations was April 10, 2019. |
| JUNE 30, 2019 | SIX CIRCLES TRUST | 53 | ||||||
Table of Contents
Board Review and Initial Approval of Advisory andSub-Advisory Agreements for the Managed Equity Portfolio Funds
The Board of Trustees (the “Board” or the “Trustees”) of the Six Circles Trust (the “Trust”), including the Trustees who are not “interested persons” (as defined in the Investment Company Act of 1940, as amended, the “1940 Act”) of J.P. Morgan Private Investments Inc. (“JPMPI” or the “Adviser”), theSub-Advisers (as defined below) or their affiliates (the “Independent Trustees”), as part of the Board’s quarterly meeting for the Trust, met in person on November27-28, 2018 (the “Meeting”) to consider and approve (i) the proposed Investment Advisory Agreement (the “Advisory Agreement”) between the Trust, on behalf of the Six Circles Managed Equity Portfolio U.S. Unconstrained Fund and the Six Circles Managed Equity Portfolio International Unconstrained Fund (each a “Fund” and together, the “Funds”), each a series of the Trust, and JPMPI; (ii) the proposedSub-Advisory Agreement between JPMPI and BlackRock Investment Management, LLC (“BlackRock” or the“Sub-Adviser”), (the“Sub-Advisory Agreement”); and (iii) the proposed InterimSub-Advisory Agreement between JPMPI and Russell Investments Implementation Services, LLC (the “Interim Agreement” and, together with theSub-Advisory Agreement and the Advisory Agreement, the “Agreements”) each for an initial term of two years. At the Meeting, the Board, including the Independent Trustees, unanimously approved the Advisory Agreement, theSub-Advisory Agreement and the Interim Agreement.
Materials Requested Prior to Meeting. Prior to the Meeting, Ropes & Gray LLP (“Ropes & Gray”), counsel to the Independent Trustees, had prepared letters on behalf of the Independent Trustees requesting detailed information from JPMPI and eachSub-Adviser in connection with the proposed Advisory Agreement, theSub-Advisory Agreement and the Interim Agreement in an effort to observe the requirement under Section 15(c) of the 1940 Act that the Trustees request and evaluate, and that the investment adviser andsub-advisers furnish, such information as may be necessary to evaluate the terms of the proposed agreements. JPMPI and eachSub-Adviser responded to the information requests and provided memoranda and related materials and information for consideration by the Trustees, which were included in the materials for the Meeting (together, the “15(c) Materials”). Following receipt and review, the Independent Trustees and their counsel, Ropes & Gray, held a separate conference call to consider the 15(c) Materials and related proposed advisory,sub-advisory, and interimsub-advisory arrangements in anticipation of the upcoming in person Meeting.
Set forth below is a summary of the material factors evaluated by the Trustees that formed the basis for the Board’s approval of the Advisory Agreement, theSub-Advisory Agreement and the Interim Agreement. The Trustees’ conclusions as to the approval of the Agreements were based on a comprehensive consideration of all information provided to the Trustees. In deciding to approve the Advisory Agreement, theSub-Advisory Agreement and the Interim Agreement, the Board did not
identify any single factor or particular information that, in isolation, was controlling. Some of the factors that figured particularly in the Trustees’ deliberations are described below, although individual Trustees may have evaluated the information presented differently from one another, attributing different weights to various factors.
Materials Reviewed.In considering the approval of the Advisory Agreement, theSub-Advisory Agreement and the Interim Agreement, the Board took into account the wide variety of materials relating to the services to be provided by JPMPI, BlackRock, and RIIS (with respect to interimsub-advisory services) provided prior to and during the Meeting, the presentations made during the Meeting, and the extensive discussions during the Meeting. The Board reviewed information relating to, among other things, proposed Fund operations, including the compliance programs of the Adviser, BlackRock and RIIS, valuation, and other information related to personnel of the Adviser, BlackRock and RIIS that would be providing investment management services to the Funds. They further reviewed information related to the proposed interimsub-advisory services to be provided by RIIS, including information related to the capabilities of RIIS to manage various asset categories represented in the Funds on an interim basis as and when called for, and the circumstances under which RIIS may be utilized by JPMPI as an interimsub-adviser in connection with JPMPI’s selection and oversight of the Funds’sub-advisers. They also reviewed comparative fee information prepared by Broadridge Financial Solutions (“Broadridge”), an independent provider of investment company performance and fee and expense data, a memorandum provided by Ropes & Gray regarding the responsibilities of the Board in considering the approval of the Agreements for the Funds, and information regarding personnel who would be providing investment management services to the Funds.
Representatives of BlackRock and RIIS also participated in the Meeting, at which the Board discussed the proposed arrangements with BlackRock and RIIS. The Independent Trustees also discussed the proposed Advisory Agreement,Sub-Advisory Agreement and Interim Agreement in an executive session of the Meeting with Ropes & Gray at which no representatives of JPMPI, BlackRock or RIIS were present.
Review Process.In connection with the approval of the Advisory Agreement,Sub-Advisory Agreement and Interim Agreement, the Board reviewed written materials provided by JPMPI, which included, among other things, comparative fee data prepared by Broadridge, an independent provider of investment company performance and fee and expense data. The Board also requested and received assistance and advice regarding applicable legal standards from Ropes & Gray. The Board additionally considered the written information provided by the Adviser, BlackRock and RIIS in response to the Board’s requests for information, and other information provided by JPMPI. The
| 54 | SIX CIRCLES TRUST | JUNE 30, 2019 | ||||
Table of Contents
Board also heard oral presentations on matters related to the Advisory Agreement,Sub-Advisory Agreement and Interim Agreement, as well as related arrangements from representatives of JPMPI and RIIS. In deciding to approve the Advisory Agreement,Sub-Advisory Agreement and Interim Agreement, the Board did not identify any single factor or particular information that, in isolation, was controlling.
Nature, Extent and Quality of Services.The Board considered the depth and quality of the investment management process of JPMPI, BlackRock, and RIIS (if and when called upon to serve as an interimsub-adviser), including for each entity, the experience and capabilities of its senior management, investment and other personnel, and the overall financial strength and stability of the organizations. The Board also considered the nature, extent and quality of the various services that JPMPI would provide under the Advisory Agreement. The Board also noted JPMPI’s commitment to investing in information technology supporting compliance, as well as JPMPI’s continuing efforts to attract and retain qualified personnel and to maintain and enhance its resources and systems. The Board considered its review of JPMPI’s policies, procedures and systems to assure compliance with applicable laws and regulations and to conduct effective oversight of eachsub-adviser; and its processes to keep the Trustees informed about matters relevant to the Funds and their shareholders.
Similarly, the Board considered thesub-advisory services proposed to be provided by each BlackRock and RIIS to the Funds. The Board also considered information about BlackRock’s and RIIS’s investment personnel responsible for providing services under theSub-Advisory Agreement and Interim Agreement, respectively. The Board reviewed the nature and quality of BlackRock and RIIS’s investment management, trading, risk management, compliance capabilities and resources, research capabilities, and the experience and capabilities of its portfolio management personnel, and the overall financial strength of each organization. The Board reviewed the experience and capabilities of RIIS’s portfolio management personnel. The Board noted the certificates received from JPMPI, BlackRock and RIIS regarding both their compliance programs and codes of ethics, which noted that JPMPI, BlackRock and RIIS each had compliance policies and procedures in place that were reasonably designed to prevent violations of the federal securities laws with respect to the services to be provided, respectively, by JPMPI, BlackRock and RIIS and that JPMPI, BlackRock and RIIS had each adopted a code of ethics that included provisions reasonably necessary to prevent access persons from (i) engaging in certain specified conduct and (ii) violating the code of ethics.
Ultimately, the Board concluded that the nature, extent and quality of services proposed to be provided by JPMPI, BlackRock, and RIIS under the Advisory Agreement,Sub-Advisory Agreement and Interim Agreement (if and when called upon to
serve as an interimsub-adviser), respectively, were likely to benefit the Funds and their shareholders.
Investment Performance.Since the Funds had not yet commenced operations, the Board did not receive or consider investment performance information related to the Funds. The Board considered the manner in which the Adviser, BlackRock and RIIS proposed to manage the Funds or particular sleeves of the Funds, as well as BlackRock’s and RIIS’s performance records in managing accounts similar to the strategies they will use to manage their respective sleeves of the Funds, as applicable, as described in the 15(c) Materials. The Board also discussed the background and experience of BlackRock and RIIS and their personnel. The Board concluded that based on the experience of the Adviser, BlackRock and RIIS (if and when called upon to serve as an interimsub-adviser), the Adviser had a reasonable expectation of delivering acceptable performance to shareholders of the Funds.
Advisory Fees and Total Expenses.JPMPI reported to the Board that, in proposing fees and expenses for each Fund, JPMPI considered a number of factors, including the type and complexity of the services to be provided, the estimated cost of providing services, the risk assumed by JPMPI in the provision of services, the impact on potential returns from different levels of fees, the competitive marketplace for financial products, and the attractiveness of potential returns to prospective investors in the Funds. The Board noted JPMPI’s explanation that the proposed advisory fee is consistent across all series of the Trust and each applicable sleeve because each Fund and sleeve is expected to receive similar investment management services from JPMPI, including asset allocation, investment oversight and other management services, as the existing series of the Trust.
The Board next reviewed the proposed advisory fee schedule under the Advisory Agreement,Sub-Advisory Agreement and Interim Agreement for the Funds. The Board noted that the Adviser had: (1) agreed to contractually reimburse expenses for the Funds to the extent the total expense ratio for each Fund exceeded a certain specified limit; and (2) agreed to contractually waive any advisory fees that exceeded the aggregate advisory fees JPMPI is contractually required to pay to BlackRock and RIIS. The Board considered how these agreements would affect the expenses borne by Fund shareholders.
The Board reviewed the proposed advisory fee and estimated total expenses of each Fund (each as a percentage of average net assets) and compared such amounts with the average and median fees and expense levels of other similar funds. With respect to advisory fees, the Board reviewed data from Broadridge that compared the average and median advisory fees of other funds in a peer group of comparable funds, as well as the universe of other similar funds. The Board compared each of the Funds’ estimated total expenses to other funds in the applicable peer group provided by Broadridge and found the
| JUNE 30, 2019 | SIX CIRCLES TRUST | 55 | ||||||
Table of Contents
Board Review and Initial Approval of Advisory andSub-Advisory Agreements for the Managed Equity Portfolio Funds
(continued)
total expenses of each Fund to be reasonable. The Board noted that the Broadridge information showed that the proposed advisory fee for each Fund was in the low to middle range of the applicable Broadridge peer group and universe. They further noted that the estimated total expense ratio for each Fund was also within the low range of total expenses, when taking into account the proposed fee waiver and expense reimbursement arrangements for each Fund. The Board also found the proposed fees to be paid by JPMPI to BlackRock and RIIS to be reasonable, noting that the Funds will not pay the fees to BlackRock and RIIS directly, but that JPMPI will compensate eachsub-advisor out of the advisory fee it receives from the Funds. The Board noted that neither JPMPI nor BlackRock nor RIIS identified any funds or accounts that they manage with similar investment objectives and strategies as the Funds. The Board further noted the Adviser’s views regarding the limitations of fee comparisons to separately managed accounts in light of the differences in services provided to the Funds as compared to those provided to separately managed accounts. Additionally, the Board noted the most-favored nation provisions agreed to by BlackRock and RIIS, which should help ensure thesub-advisory and interim advisory fee rates charged are at least equal to the range of fees BlackRock and RIIS charge to similar clients.
Based on the information presented by JPMPI, BlackRock, RIIS and Broadridge, the Trustees determined that the level of the advisory fees to be charged by JPMPI, the level of thesub-advisory fees to be paid by JPMPI to BlackRock and RIIS (if and when called upon to serve assub-adviser), as well as the estimated total expenses of each Fund, are reasonable, fair and equitable and that approval of the Advisory Agreement, Interim Agreement andSub-Advisory Agreement would likely benefit each Fund and its shareholders.
Adviser Costs, Level of Profits and Economies of Scale. As the Funds are newly organized, information regarding JPMPI’s, BlackRock’s and RIIS’s actual costs in providing services to the Funds was not available.
The Board considered the estimated profits to be realized by the Adviser in connection with the operation of the Funds based on profitability estimates included in the 15(c) Materials, and whether the amount of estimated profit represented a fair entrepreneurial profit for the management of the Funds. In doing so, the Board also took into account the entrepreneurial and business risk JPMPI will undertake as investment manager and sponsor of the Funds. The Board also considered the Funds’ estimated operating expenses and the expected impact of the proposed expense limitation agreement and fee waiver agreement to be observed by JPMPI on the Adviser’s estimated profits. The Board noted that JPMPI did not expect to be profitable with respect to the Funds during their first year of operations. The Board also noted that JPMPI had no current plans to utilize RIIS for any particular Fund strategy as of the date
thereof, or what level of assets might be managed by RIIS over any particular time period.
The Board further noted that the proposedsub-advisory fee rates to be paid by JPMPI to BlackRock and RIIS (if and when called upon to serve assub-adviser) do not have break points, but due to the proposed fee waiver arrangements, JPMPI will not retain any portion of the advisory fees paid by the Funds.
Ultimately, the Board concluded that each Funds’ proposed fee and expense structure is reasonable, fair and equitable.
Ancillary Benefits.The Board next considered whether the Adviser, BlackRock, RIIS or any of their affiliates may receive other benefits as a result of the Adviser’s, BlackRock’s or RIIS’s proposed relationship with the Trust or the Funds. The Board considered that the Adviser was not affiliated with any of the Funds’ proposed service providers, and therefore would not benefit from those contractual relationships. The Board additionally considered that BlackRock and RIIS were not affiliated with any of the Funds’ proposed service providers, and therefore would not benefit from those contractual relationships. The Board also considered portfolio trading practices of RIIS, noting the relatively low trading costs that RIIS expects to incur in completing portfolio transactions for the Funds. Additionally, the Trustees considered that RIIS may receive ancillary benefits of potentially receiving fees from serving as transition manager to the Funds under an Implementation Services Agreement between the Adviser and RIIS, but noted that those possible fees are not contingent on RIIS serving as an interimsub-adviser and would be for services that are distinct from RIIS’sub-advisory services. The Board also considered the proprietary nature of the Funds and whether any benefit would result to the Adviser by placing assets of JPMPI private bank clients into the Funds. The Board also considered portfolio trading practices, noting that while the Adviser was affiliated with a broker-dealer, the broker-dealer affiliate would not execute portfolio transactions on behalf of the Funds and would not receive the benefit of research provided by any such broker-dealer. Additionally, the Board considered that J.P. Morgan will receive the ancillary benefit of collecting fees from J.P. Morgan accounts that invest in the Funds. Taking these considerations into account, the Trustees concluded that the Adviser, BlackRock, RIIS and their affiliates would not receive collateral benefits that would materially affect the reasonableness of the proposed advisory fees under the proposed Advisory Agreement,Sub-Advisory Agreement or Interim Agreement.
Conclusions.Having requested and received such information from the Adviser, BlackRock and RIIS as the Board believed to be reasonably necessary to evaluate the terms of the proposed Advisory Agreement,Sub-Advisory Agreement and Interim Agreement, the Board, including the Independent Trustees, unanimously concluded that the proposed advisory fee andsub-advisory fee structures were reasonable and, in light of the matters that the Trustees had considered to be relevant in the
| 56 | SIX CIRCLES TRUST | JUNE 30, 2019 | ||||
Table of Contents
exercise of their reasonable judgment, approved the Advisory Agreement,Sub-Advisory Agreement and the Interim Agreement for an initial term of two years.
Board Review and Approval of Proposed Amendment to the BlackRockSub-Advisory Agreement
The Board of Trustees (the “Board” or the “Trustees”) of the Six Circles Trust (the “Trust”), including the Trustees who are not “interested persons” (as defined in the Investment Company Act of 1940, as amended, the “1940 Act”) of J.P. Morgan Private Investments Inc. (“JPMPI” or the “Adviser”), BlackRock (as defined below) or their affiliates (the “Independent Trustees”) met in person on March 29, 2019 (the “Meeting”) to consider and approve a proposed amendment to the InvestmentSub-Advisory Agreement (the “BlackRockSub-Advisory Agreement”) between JPMPI and BlackRock Investment Management, LLC (“BlackRock”) forsub-advisory services provided to the Six Circles U.S. Unconstrained Equity Fund, the Six Circles International Unconstrained Equity Fund, the Six Circles Managed Equity Portfolio U.S. Unconstrained Equity Fund, and the Six Circles Managed Equity Portfolio International Unconstrained Equity Fund, (each an “Equity Fund” and together, the “Equity Funds”). At the Meeting, the Board, including the Independent Trustees, unanimously approved the amendment to the BlackRockSub-Advisory Agreement.
Set forth below is a summary of the material factors evaluated by the Board that formed the basis for the Board’s approval of the amendment to the BlackRockSub-Advisory Agreement. The Board’s conclusions as to the approval of the amendment to the BlackRockSub-Advisory Agreement were based on a comprehensive consideration of all information provided to the Trustees. In deciding to approve the amendment to the BlackRockSub-Advisory Agreement, the Board did not identify any single factor or particular information that, in isolation, was controlling. Some of the factors that figured particularly in the Boards’ deliberations are described below, although individual Trustees may have evaluated the information presented differently from one another, attributing different weights to various factors.
Materials Reviewed.It was noted that the purpose of the proposed amendment to the BlackRockSub-Advisory agreement was to increase thesub-advisory fee thereunder in connection with BlackRock providing portfolio transition management services to the Equity Funds, utilizing the expertise of its specialized transition management team (the “TRIM Team”), and that the amendment would not otherwise change the nature of thesub-advisory services currently provided by BlackRock or otherwise alter the terms of the current agreement. In considering the approval of the amendment to the BlackRockSub-Advisory Agreement, the Board took into account the wide variety of materials relating to the services currently provided by BlackRock that was furnished for the June and November 2018 Board meetings, including a memorandum provided by
Ropes & Gray (“Ropes & Gray”) counsel to the Independent Trustees, regarding the responsibilities of the Trustees in considering the approval of advisory andsub-advisory agreements. The Board also took into account the information provided by BlackRock and JPMPI prior to the Meeting regarding the portfolio transition management services proposed to be provided by Blackrock, the presentations relating thereto made during the Meeting, and the extensive discussions thereon before and during the Meeting. In that regard, the Board reviewed information related to the proposed amendment to the BlackRockSub-Advisory Agreement, including information related to the capabilities of the TRIM Team and the expanded services to be provided by BlackRock. They also reviewed comparative fee and expense information with respect to peer funds prepared by Broadridge Financial Solutions (“Broadridge”). The Board had previously reviewed information relating to, among other things, the Equity Funds’ operations, including the compliance program of BlackRock, valuation oversight, and other information related to personnel of BlackRock that provide investment management services to the Equity Funds.
Representatives of BlackRock also participated in the Meeting, at which the Board discussed the proposed amendment to the BlackRockSub-Advisory Agreement. The Independent Trustees also discussed the proposed amendment in an executive session of the Meeting with Ropes & Gray at which no representatives of JPMPI or BlackRock were present.
Review Process.In connection with the approval of the amendment to the BlackRockSub-Advisory Agreement, the Board reviewed written materials provided by JPMPI, which included, among other things, comparative fee data prepared by Broadridge, an independent provider of investment company performance and fee and expense data. The Board also previously requested and received assistance and advice regarding applicable legal standards from Ropes & Gray. The Board additionally considered the written information previously provided by BlackRock in response to the Boards’ prior request for information, and other information provided by JPMPI. The Board also heard oral presentations on matters related to the amendment to the BlackRockSub-Advisory Agreement. In deciding to approve the amendment to the BlackRockSub-Advisory Agreement, the Trustees did not identify any single factor or particular information that, in isolation, was controlling.
Nature, Extent and Quality of Services.The Board considered the depth and quality of the investment management process of BlackRock, including the experience and capabilities of its senior management, investment and other personnel (including the TRIM Team). The Board had previously considered the overall financial strength and stability of the organization.
The Board considered thesub-advisory services currently provided, as well as those additional transition services proposed to be provided, by BlackRock to the Equity Funds. The Board
| JUNE 30, 2019 | SIX CIRCLES TRUST | 57 | ||||||
Table of Contents
Board Review and Initial Approval of Advisory andSub-Advisory Agreements for the Managed Equity Portfolio Funds
(continued)
also considered information about BlackRock’s investment personnel responsible for providing services under the BlackRockSub-Advisory Agreement, including personnel on the TRIM Team. The Board noted that they had previously reviewed the nature and quality of BlackRock’s investment management, trading, risk management, compliance capabilities and resources, research capabilities, and the experience and capabilities of its portfolio management personnel, and its overall financial strength. The Board noted the certificates previously received from BlackRock regarding both its compliance program and code of ethics, which noted that BlackRock had compliance policies and procedures in place that were reasonably designed to prevent violations of the federal securities laws with respect to the services provided by BlackRock and that BlackRock had adopted a code of ethics that included provisions reasonably necessary to prevent access persons from (i) engaging in certain specified conduct and (ii) violating the code of ethics.
Ultimately, the Board concluded that the nature, extent and quality of services to be provided by BlackRock under the amendedSub-Advisory Agreement were likely to benefit the Equity Funds and their shareholders.
Investment Performance.The Board noted that they had considered the manner in which BlackRock has managed the Six Circles U.S. Unconstrained Equity Fund and the Six Circles International Unconstrained Equity Fund to date, and the manner in which BlackRock has proposed to manage the Six Circles Managed Equity Portfolio U.S. Unconstrained Equity Fund and the Six Circles Managed Equity Portfolio International Unconstrained Equity Fund , as well as BlackRock’s performance records in managing accounts similar to the strategies they use to manage the Six Circles U.S. Unconstrained Equity Fund and the Six Circles International Unconstrained Equity Fund, and will use to manage the Six Circles Managed Equity Portfolio U.S. Unconstrained Equity Fund and the Six Circles Managed Equity Portfolio International Unconstrained Equity Fund, as applicable, as described in the materials provided for the June and November 2018 Board meetings. The Board also previously discussed the background and experience of BlackRock and its personnel. The Board also discussed the experience of the TRIM Team that will be assisting with the Equity Funds. The Board concluded that based on the experience of BlackRock, the Adviser had a reasonable expectation of delivering acceptable performance to shareholders of the Equity Funds.
Advisory Fees and Total Expenses.It was noted that the Board had previously reviewed and approved the retention of BlackRock assub-adviser to the Equity Funds at the June and November 2018 Board meetings, at which time the Board had unanimously determined that the proposed fee structures were reasonable, fair and equitable and, in light of the matters that the Board considered to be relevant in the exercise of their
reasonable judgment, approved the BlackRockSub-Advisory Agreement for each Equity Fund.
JPMPI reported to the Board that, in proposing the amendment to the BlackRockSub-Advisory Agreement, JPMPI considered a number of factors, including the implementation of the TRIM Team into the investment process for the Equity Funds, the type and complexity of the services to be provided, the estimated cost of providing services, the competitive marketplace for financial products, and the attractiveness of potential returns to prospective investors in the Equity Funds.
The Board next reviewed the proposed amended fee schedule under the BlackRockSub-Advisory Agreement for the Equity Funds. The Board noted that JPMPI had: (1) agreed to contractually reimburse expenses for the Equity Funds to the extent the total expense ratio for each Equity Fund exceeded a certain specified limit; and (2) agreed to contractually waive any advisory fees that exceeded the aggregate advisory fees JPMPI is contractually required to pay to BlackRock. The Board considered how these agreements would affect the expenses borne by Equity Fund shareholders. It was noted that JPMPI does not retain any of the advisory fees it receives from each Equity Fund under the advisory agreement, but rather waives its advisory fees to the extent that they exceed the aggregatesub-advisory fees JPMPI is contractually required to pay thesub-advisers to such Equity Fund (“Contractual Management Fee Waiver”). The Board further noted that an increase in BlackRock’ssub-advisory fees paid by JPMPI would in effect reduce the amount of JPMPI’s Contractual Management Fee Waiver, which would in turn increase the Equity Funds’ expense ratios and expenses paid by shareholders by the amount of the one basis point increase in BlackRock’ssub-advisory fees.
The Board reviewed the proposed advisory fee and estimated total expenses of each Equity Fund (each as a percentage of average net assets) and compared such amounts with the average and median fees and expense levels of other similar funds, assuming that the proposedsub-advisory fee was adopted. With respect to advisory fees, the Board reviewed data from Broadridge that compared the average and median advisory fees of other funds in a peer group of comparable funds, as well as the universe of other similar funds. The Board compared each of the Equity Fund’s estimated total expenses to other funds in the applicable peer group provided by Broadridge and found the total expenses of each Fund to be reasonable. The Trustees noted that the Broadridge information showed that the proposed advisory fee for each Equity Fund was in the low to middle range of the applicable Broadridge peer group and universe. They further noted that the estimated total expense ratio for each Equity Fund was also within the low range of total expenses, when taking into account the proposedsub-advisory fee increase together with the fee waiver and expense reimbursement arrangements in place for each Equity Fund. The Trustees also found the proposed increased
| 58 | SIX CIRCLES TRUST | JUNE 30, 2019 | ||||
Table of Contents
sub-advisory fees to be paid by JPMPI to BlackRock to be reasonable, noting that JPMPI compensates BlackRock out of the advisory fee it receives from the Equity Funds, although they also noted that Fund shareholders would bear additional net expenses as a result of the amendment to the BlackRockSub-Advisory Agreement as described above. The Trustees noted the most-favored nation provisions agreed to by BlackRock, which should help ensure thesub-advisory fee rates charged are at least equal to the range of fees BlackRock charges to similar clients.
Based on the information presented by JPMPI, BlackRock, and Broadridge, the Trustees determined that the level of thesub-advisory fees to be paid by JPMPI to BlackRock, including the proposedsub-advisory fee increase, as well as the estimated total expenses of each Equity Fund, are reasonable, fair and equitable and that approval of the amendment to the BlackRockSub-Advisory Agreement would likely benefit each Equity Fund and its shareholders.
Adviser Costs, Level of Profits and Economies of Scale.As the Equity Funds are recently organized, information regarding JPMPI’s and BlackRock’s actual costs in providing services to the Equity Funds for an annual period was not available.
The Board considered the estimated profits to be realized by JPMPI in connection with the operation of the Equity Funds based in part on profitability estimates for the Equity Funds included in the materials provided for the June and November 2018 Board meetings, and whether the amount of estimated profit represented a fair entrepreneurial profit for the management of the Equity Funds. The Board also considered the Equity Funds’ current operating expenses and the Six Circles Managed Equity Portfolio U.S. Unconstrained Equity Fund’s and the Six Circles Managed Equity Portfolio International Unconstrained Equity Fund’s estimated operating expenses and the expected impact of the increased BlackRocksub-advisory fee on the Adviser’s estimated profits. The Board considered that due to the Contractual Management Fee Waiver, it is not expected that the increase in BlackRock’ssub-advisory fees will affect JPMPI’s profitability with respect to the Equity Funds. The Board further noted that JPMPI did not expect to be profitable with respect to the Equity Funds during their first full year of operations.
The Board further noted that the proposed amendedsub-advisory fee rates to be paid by JPMPI to BlackRock do not include break points.
Ultimately, the Board concluded that each Equity Fund’s proposed fee and expense structure, taking into account the amendment to the BlackRockSub-Advisory Agreement is reasonable, fair and equitable.
Ancillary Benefits.The Board previously considered whether BlackRock or any of its affiliates may receive other benefits as a result of BlackRock’s proposed relationship with JPMPI, the Trust or the Equity Funds. The Board considered that BlackRock was not affiliated with any of the Equity Funds’ service providers, and therefore would not benefit from those contractual relationships. Taking this consideration into account, the Board concluded that BlackRock and its affiliates would not receive collateral benefits that would materially affect the reasonableness of the proposedsub-advisory fees under the proposed amendment to the BlackRockSub-Advisory Agreement.
Conclusions.Having requested and received such information from the Adviser and BlackRock as the Board believed to be reasonably necessary to evaluate the terms of the proposed amendment to the BlackRockSub-Advisory Agreement, the Board, including the Independent Trustees, unanimously concluded that the proposedsub-advisory fee structure, as amended, was reasonable and, in light of the matters that the Board had considered to be relevant in the exercise of their reasonable judgment, approved the amendment to the BlackRockSub-Advisory Agreement for each Equity Fund.
Liquidity Risk Management Program
The Funds have adopted and implemented a written Liquidity Risk Management Program (“Liquidity Program”) designed to reasonably assess and manage the Funds’ liquidity risk pursuant to Rule22e-4. The Liquidity Program was reviewed and approved by the Board in May 2019. As the Liquidity Program has been operating only for a short time, it is too early to appropriately assess its operation and effectiveness.
| JUNE 30, 2019 | SIX CIRCLES TRUST | 59 | ||||||
Table of Contents
The Six Circles Funds are distributed by Foreside Fund Services, LLC a member of FINRA.
Contact Six Circles Funds collect at 1-212-464-2070 for a fund prospectus. You can also visit us at www.sixcirclesfunds.com. Investors should carefully consider the investment objectives and risk as well as charges and expenses of the Six Circles Funds before investing. The prospectus contains this and other information about the Six Circles Funds. Read the prospectus carefully before investing.
The Six Circles Funds file complete schedules of their fund holdings for the first and third quarters of their fiscal year with the SEC on Form N-PORT. The Six Circles Funds’ Forms N-PORT are available on the SEC’s website at http://www.sec.gov. Shareholders may request a Form N-PORT without charge by calling collect at 1-212-464-2070 or by visiting the Six Circles Funds’ website at www.sixcirclesfunds.com/literature.
A description of the Six Circles Funds’ policies and procedures with respect to the disclosure of the Six Circles Funds’ holdings is available in the prospectuses and Statements of Additional Information.
A copy of proxy policies and procedures is available without charge upon request by calling collect 1-212-464-2070 and on the Six Circles Funds’ website at www.sixcirclesfunds.com. A description of such policies and procedures is on the SEC’s website at www.sec.gov. The Trustees have delegated the authority to vote proxies for securities owned by the Fund to the Adviser, and the Adviser in turn has delegated such authority to the Sub-Advisers. A copy of the Six Circles Funds’ voting record for the most recent 12-month period ended June 30 will be available on the SEC’s website at www.sec.gov or at the Six Circles Funds’ website at www.sixcirclesfunds.com no later than August 31 of each year. The Six Circles Funds’ proxy voting record will include, among other things, a brief description of the matter voted on for each fund security, and will state how each vote was cast, for example, for or against the proposal.
©JPMorgan Chase & Co. 2019. All rights reserved. June 30, 2019.
Table of Contents
Item 2. Code of Ethics.
Not Applicable. This item is only required in an annual report on FormN-CSR.
Item 3. Audit Committee Financial Expert.
Not Applicable. This item is only required in an annual report on FormN-CSR.
Item 4. Principal Accountant Fees and Services.
Not Applicable. This item is only required in an annual report on FormN-CSR.
Item 5. Audit Committee of Listed Registrants.
Not Applicable. This item is only required in an annual report on FormN-CSR.
Item 6. Investments.
| (a) | A Schedule of Investments in securities of unaffiliated issuers as of the close of the Reporting Period is included as part of the report to shareholders filed under Item 1 of this FormN-CSR. |
| (b) | Not applicable. |
Item 7. Disclosure of Proxy Voting Policies and Procedures forClosed-End Management Investment Companies.
Not applicable.
Item 8. Portfolio Managers ofClosed-End Management Investment Companies.
Not applicable.
Item 9. Purchases of Equity Securities byClosed-End Management Investment Company and Affiliated Purchasers.
Not applicable.
Item 10. Submission of Matters to a Vote of Security Holders.
Not applicable.
Table of Contents
Item 11. Controls and Procedures.
| (a) | The Registrant’s principal executive and financial officers have concluded that the Registrant’s disclosure controls and procedures (as defined in Rule30a-3(c) under the Investment Company Act of 1940, as amended (the “1940 Act”)) are effective, as of a date within 90 days of the filing date of this FormN-CSR, based on their evaluation of these controls and procedures required by Rule30a-3(b) under the 1940 Act and Rules13a-15(b) or15d-15(b) under the Securities Exchange Act of 1934, as amended (the “Exchange Act”). |
| (b) | There were no changes in the Registrant’s internal control over financial reporting (as defined in Rule30a-3(d) under the 1940 Act) that occurred during the period covered by this FormN-CSR, that have materially affected, or are reasonably likely to materially affect, the Registrant’s internal control over financial reporting. |
Item 12. Disclosure of Securities Lending Activities forClosed-End Management Investment Companies.
Not applicable.
Item 13. Exhibits.
| (a)(1) | Not applicable. | |
| (a)(2) | Certifications required by Rule30a-2(a) under the 1940 Act and Section 302 of the Sarbanes-Oxley Act of 2002 are filed as Exhibit 13(a)(2) to this FormN-CSR. | |
| (a)(3) | Not applicable. | |
| (a)(4) | Not applicable. | |
| (b) | Certifications required by Rule30a-2(b) under the 1940 Act and Section 906 of the Sarbanes-Oxley Act of 2002 are furnished as Exhibit 13(b) to this FormN-CSR. | |
Table of Contents
SIGNATURES
Pursuant to the requirements of the Securities Exchange Act of 1934 and the Investment Company Act of 1940, the Registrant has duly caused this report to be signed on its behalf by the undersigned, thereunto duly authorized.
(Registrant) Six Circles Trust
By: (Signature and Title)
| /s/ Mary Savino |
| Mary Savino |
| Title: President - Principal Executive Officer |
| Date: August 26, 2019 |
Pursuant to the requirements of the Securities Exchange Act of 1934 and the Investment Company Act of 1940, this report has been signed below by the following persons on behalf of the Registrant and in the capacities and on the dates indicated.
By: (Signature and Title)
| /s/ Mary Savino |
| Mary Savino |
| Title: President - Principal Executive Officer |
| Date: August 26, 2019 |
By: (Signature and Title)
| /s/ Gregory McNeil |
| Gregory McNeil |
| Title: Treasurer - Principal Financial Officer |
| Date: August 26, 2019 |