UNITED STATES
SECURITIES AND EXCHANGE COMMISSION
WASHINGTON, D.C. 20549
FORM N-CSR
CERTIFIED SHAREHOLDER REPORT OF REGISTERED
MANAGEMENT INVESTMENT COMPANIES
Investment Company Act file number: 811-23325
SIX CIRCLES TRUST
(Exact name of registrant as specified in charter)
383 Madison Avenue
New York, NY 10179
(Address of principal executive offices) (Zip Code)
The Corporation Trust Company
1209 Orange Street
Wilmington, DE 19801
(Name and address of agent for service)
Registrant’s telephone number, including area code: (212) 270-6000
Date of fiscal year end: December 31
Date of reporting period: June 30, 2021
Form N-CSR is to be used by management investment companies to file reports with the Commission not later than 10 days after the transmission to stockholders of any report that is required to be transmitted to stockholders under Rule 30e-1 under the Investment Company Act of 1940 (17 CFR 270.30e-1). The Commission may use the information provided on Form N-CSR in its regulatory, disclosure review, inspection, and policymaking roles.
A registrant is required to disclose the information specified by Form N-CSR, and the Commission will make this information public. A registrant is not required to respond to the collection of information contained in Form N-CSR unless the Form displays a currently valid Office of Management and Budget (“OMB”) control number. Please direct comments concerning the accuracy of the information collection burden estimate and any suggestions for reducing the burden to Secretary, Securities and Exchange Commission, 450 Fifth Street, NW, Washington, DC 20549-0609. The OMB has reviewed this collection of information under the clearance requirements of 44 U.S.C. § 3507.
Item 1. Report to Stockholders.
Semi-Annual Report
SIX CIRCLES® FUNDS
June 30, 2021
Six Circles Ultra Short Duration Fund
Six Circles Tax Aware Ultra Short Duration Fund
Six Circles U.S. Unconstrained Equity Fund
Six Circles International Unconstrained Equity Fund
Six Circles Global Bond Fund
Six Circles Tax Aware Bond Fund
Six Circles Credit Opportunities Fund
CONTENTS
Investments in a Fund are not deposits or obligations of, or guaranteed or endorsed by, any bank and are not insured or guaranteed by the FDIC, the Federal Reserve Board or any other government agency. You could lose money if you sell when a Fund’s share price is lower than when you invested.
Past performance is no guarantee of future performance. The general market views expressed in this report are opinions based on market and other conditions through the end of the reporting period and are subject to change without notice. These views are not intended to predict the future performance of a Fund or the securities markets. References to specific securities and their issuers are for illustrative purposes only and are not intended to be, and should not be interpreted as, recommendations to purchase or sell such securities. Such views are not meant as investment advice and may not be relied on as an indication of trading intent on behalf of any Fund.
For more complete information about the Funds, including the Funds’ objectives, risks, charges and expenses, call your J.P. Morgan representative or call 1-212-464-2070 or go to www.sixcirclesfunds.com for a prospectus. Read the prospectus carefully. An investment in these Funds and any other Fund is not designed to be a complete investment program. The Funds are NOT designed to be used as stand-alone investments.
PRESIDENT’S LETTER
JUNE 30, 2021 (Unaudited)
Dear Shareholder,
As many of us begin a cautious, yet hopeful transition to a new normal, we remain keenly aware that in some regions of the world, challenges remain. Our thoughts are with all of those who have been, and continue to be impacted by the COVID-19 virus, and we look forward to the day when we can confidently say for all that the worst is behind us.
Following a 12-month period of unprecedented market volatility, the six months covered by this report were characterized by recovery, as the markets responded positively to the rollout of COVID-19 vaccination programs. Against this backdrop, the Six Circles Funds provided us with the means to target key themes within our discretionary portfolios. On the following pages, we provide detailed discussions on the strategies we implemented in each of the Six Circles Funds during this time, and how they performed.
As a reminder, the Six Circles Funds are not meant to be standalone investments. They are purposefully constructed as completion funds and, as such, we believe they should be reviewed and evaluated within the context of your broader portfolio for a complete picture of their performance.
I hope you find the information on these pages to be informative and helpful. If you should have any questions about the Funds, you can contact your J.P. Morgan team, visit the Fund’s website at www.sixcirclesfunds.com, or call us at 212-464-2070.
Sincerely,

Mary Savino
President, Six Circles Funds
| | | | | | | | |
| | | |
| JUNE 30, 2021 | | SIX CIRCLES TRUST | | | | | 1 | |
Market Overview
As Of June 30, 2021 (Unaudited)
Equity markets across the globe posted positive returns in the first half of 2021. The successful rollout of COVID-19 vaccinations in the U.S. is helping the economy to recover and is boosting company earnings leading to equity markets trading at or near an all-time high. While certain international regions are behind in the COVID-19 recovery, we expect them to follow the path of the U.S. The MSCI USA Index was up 14.9% in the first half of 2021, with Developed Non-U.S. and Emerging Markets Equities also closing in positive territory with the MSCI World ex-USA Index and the MSCI Emerging Markets Index up 9.9% and 7.5% respectively.
Global Bond and cash markets trailed equities; the Bloomberg Barclays U.S. 1-3 Month Treasury Bills Index returned 0.02%
and the Bloomberg Barclays Global Aggregate Hedged Index had a negative return of -1.5%, while the MSCI World Index was up 13.1% in the first half of 2021.
The Federal Open Market Committee decided to maintain the target range for the federal funds rate at 0 – 0.25%, with the view that this level is appropriate to support economic activity, the labor market, and inflation. The Committee stated that it anticipates maintaining an accommodative stance of monetary policy until its employment targets are achieved and inflation has risen to 2% and is on track to moderately exceed 2% for some time. The Committee will continue to monitor economic data to assess any future changes to the target federal funds range.
| | | | | | |
| | | |
| 2 | | | | SIX CIRCLES TRUST | | JUNE 30, 2021 |
Six Circles Ultra Short Duration Fund
FUND COMMENTARY
Period January 1, 2021 Through June 30, 2021 (Unaudited)
| | | | |
| REPORTING PERIOD RETURN | |
| Fund* | | | 0.34% | |
| Bloomberg Barclays 1-3 Month U.S. Treasury Bill Index | | | 0.02% | |
| |
| Net Assets as of 6/30/2021 (In Thousands) | | | $552,249 | |
| Duration | | | 0.90 years | |
INVESTMENT OBJECTIVES AND STRATEGY**
Six Circles Ultra Short Duration Fund (the “Fund”) seeks to generate current income consistent with capital preservation. The Fund mainly invests in U.S. dollar and non-U.S. dollar denominated investment grade short-term fixed and floating rate debt securities. The Fund allocates assets among securities with various maturities which, under normal market conditions, will not exceed an average effective portfolio duration of two years.
INVESTMENT APPROACH
J.P. Morgan Private Investments Inc., the Fund’s investment adviser (“JPMPI” or the “Adviser”) constructs the Fund’s portfolios by allocating the Fund’s assets among investment strategies managed by one or more sub-advisers retained by the Adviser (each a “Sub-Adviser”). The Adviser currently engages the following Sub-Advisers:
| • | | Goldman Sachs Asset Management, L.P. (“Goldman”)(a) |
| • | | BlackRock Investment Management, LLC (“BlackRock”) |
| • | | Pacific Investment Management Company LLC (“PIMCO”) |
(a) During the reporting period, the Adviser did not allocate Fund assets to Goldman.
The Adviser may adjust allocations to the Sub-Advisers at any time or make recommendations to the Board of Trustees of the Six Circles Trust (the “Board”) with respect to the hiring, termination or replacement of a Sub-Adviser. As such, the identity of the Fund’s Sub-Advisers, the investment strategies they pursue and the portion of the Fund allocated to them, may change over time.
The Fund is specifically designed to serve as a completion portfolio and accomplish particular goals within discretionary portfolios managed by JPMPI or its affiliates (the “Portfolios”). The Adviser utilizes the Fund to express targeted investment views, while taking into consideration positions held at the aggregate level in the broader Portfolios. As such, the Fund’s allocations and performance should be evaluated in the context of the broader Portfolios and not on a standalone basis.
WHAT WERE THE MAIN DRIVERS OF THE FUND’S PERFORMANCE?
During the period of January 1, 2021 through June 30, 2021 (the “reporting period”), the Fund posted a positive return on an absolute basis, and outperformed relative to the Bloomberg
Barclays 1-3 Month U.S. T-Bill Index (the “Index”). References to the Index are for informational purposes. The use of the Index does not imply the Fund is being managed to the Index, but rather is disclosed to allow for comparison of the Fund’s performance to that of a well-known and widely-recognized index.
By sector composition, Investment Grade Credit and Securitized Credit comprised approximately 76% of the Fund’s exposure on a look-through basis at the end of the reporting period, and were the Fund’s largest sector overweights relative to the Index. During the reporting period, both sectors contributed to the Fund’s performance on an absolute basis, as well as relative to the Index.
The Fund’s exposure to Government Bonds was the Fund’s largest sector underweight relative to the Index and comprised approximately 12% of the Fund’s exposure on a look-through basis at the end of the reporting period. During the reporting period, the sector detracted from the Fund’s performance on an absolute basis as well as relative to the Index.
On allocation level, both of the Fund’s allocations – Global Markets and Core Ultra Short – contributed to the Fund’s return on an absolute basis during the reporting period.
HOW WAS THE FUND POSITIONED?
At the end of the reporting period the Fund was allocated to two Sub-Advisers as follows.
| | | | |
| PORTFOLIO ALLOCATION*** | |
| Core Ultra Short (BlackRock) | | | 70 | % |
| Global Markets (PIMCO) | | | 30 | |
| * | | The return shown is based on the net asset value calculated for shareholder transactions. Certain adjustments were made to the net assets of the Fund at June 30, 2021 for financial reporting purposes, and as a result, the net asset value for shareholder transactions and the total return based on that net asset value may differ from the adjusted net assets and the total return for financial reporting. |
| ** | | The Adviser seeks to achieve the Fund’s objective. There can be no guarantee it will be achieved. |
| *** | | Percentages are based on total investments as of June 30, 2021. The portfolio allocation is subject to change. |
| | | | | | | | |
| | | |
| JUNE 30, 2021 | | SIX CIRCLES TRUST | | | | | 3 | |
Six Circles Ultra Short Duration Fund
FUND COMMENTARY
Period January 1, 2021 Through June 30, 2021 (Unaudited) (continued)
Within the fixed income allocation on the broader Portfolio level, the Adviser prefers high-quality liquid investments combined with flexibility to implement opportunistic ideas across fixed income markets. The majority of the Fund’s assets were invested into the more liquid segments of the fixed income market, with approximately 89% of the Fund invested in instruments with maturities of 3 years and under as of June 30, 2021.
The Adviser allocates to the two Sub-Advisers, with the expectation that the Sub-Advisers will capitalize on the opportunities present in the segment of the fixed income market that their specific mandate is focused on.
The Core Ultra Short allocation, which comprised approximately 70% of the Fund as of June 30, 2021, invests in a diversified fixed income portfolio on the shorter end of the U.S. fixed income market, balancing income against credit quality, within the context of the broader portfolios.
The Global Markets allocation, which comprised approximately 30% of the Fund as of June 30, 2021, has a broad investment universe, seeking total return opportunities within the global fixed income markets.
| | | | | | | | | | | | |
AVERAGE ANNUAL TOTAL RETURNS
AS OF JUNE 30, 2021 | |
| | | 6 Months* | | | 1 Year | | | Since
Inception
(July 9, 2018) | |
| Six Circles Ultra Short Duration Fund | | | 0.34% | | | | 1.16 | % | | | 2.01 | % |
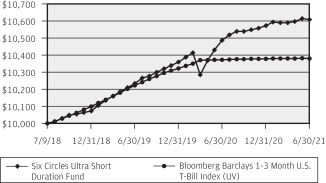
GROWTH OF $10,000 REPORT (07/9/2018 TO 06/30/2021)
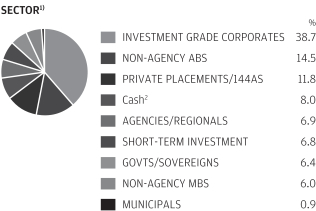
| 1) | Presented percentages may not sum to 100% due to rounding to the nearest percent. The above Sector allocation uses The Global Industry Classification Standard (GICS®) and may differ from categories listed within the Schedule of Investments. |
| 2) | 0.90% of the amount shown in the Fund’s “Cash” line item reflects the mark-to-market value of the Funds derivative positions. |
The allocation of the various strategies employed by the Fund may shift and therefore, the performance shown may not be a true indication of how the Fund may perform going forward. Performance quoted is past performance and is no guarantee of future results. Investment returns and principal value will fluctuate, so shares, when sold, may be worth more or less than original cost. Current performance may be higher or lower than returns shown. As of the latest prospectus, the gross and net expense ratios for the Fund were 0.31% and 0.17% respectively. Contact your J.P. Morgan representative or call 1-212-464-2070 for the most recent month-end performance.
The Fund commenced operations on July 9, 2018.
The graph illustrates comparative performance for $10,000 invested in the Six Circles Ultra Short Duration Fund and the Bloomberg Barclays 1-3 Month U.S. Treasury Bill Index from July 9, 2018 to June 30, 2021. The performance of the Fund reflects the deduction of Fund expenses and assumes reinvestment of all dividends and capital gain distributions, if any. The performance of the Bloomberg Barclays 1-3 Month U.S. Treasury Bill Index does not reflect the deduction of expenses associated with a mutual fund and has been adjusted to reflect reinvestment of all dividends and capital gain distributions of the securities included in the Index, if applicable. The Bloomberg Barclays 1-3 Month U.S. Treasury Bill Index measures the performance of Treasury securities and is selected by a Market Value process. Investors cannot invest directly in an index.
Fund performance may reflect the waiver of the Fund’s fees and/or reimbursement of expenses for certain periods since the inception date. Without these waivers and reimbursements, performance would have been lower. Also, performance shown in this section does not reflect the deduction of taxes that a shareholder may pay on Fund distributions or redemptions or sales of Fund shares.
The Global Industry Classification Standard (“GICS”) was developed by and is the exclusive property and a service mark of MSCI Inc. (“MSCI”) and Standard & Poor’s, a division of The McGraw-Hill Companies, Inc. (“S&P”) and is licensed for use by JP MORGAN CHASE BANK NA. Neither MSCI, S&P nor any third party involved in making or compiling the GICS or any GICS classifications makes any express or implied warranties or representations with respect to such standard or classification (or the results to be obtained by the use thereof), and all such parties hereby expressly disclaim all warranties of originality, accuracy, completeness, merchantability and fitness for a particular purpose with respect to any of such standard or classification. Without limiting any of the foregoing, in no event shall MSCI, S&P, any of their affiliates or any third party involved in making or compiling the GICS or any GICS classifications have any liability for any direct, indirect, special, punitive, consequential or any other damages (including lost profits) even if notified of the possibility of such damages.
| | | | | | |
| | | |
| 4 | | | | SIX CIRCLES TRUST | | JUNE 30, 2021 |
Six Circles Tax Aware Ultra Short Duration Fund
FUND COMMENTARY
Period January 1, 2021 Through June 30, 2021 (Unaudited)
| | | | |
| REPORTING PERIOD RETURN | |
| Fund* | | | 0.14% | |
| iMoneyNet Tax-Free National Institutional Money Market Index | | | 0.01% | |
| |
| Net Assets as of 6/30/2021 (In Thousands) | | | $600,615 | |
| Duration | | | 0.73 years | |
INVESTMENT OBJECTIVES AND STRATEGY**
Six Circles Tax Aware Ultra Short Duration Fund (the “Fund”) seeks to generate current income consistent with capital preservation. The Fund invests at least 50% of its net assets in municipal securities, the income from which is exempt from federal income tax(1). The Fund also may invest in taxable instruments. Allocates assets among securities with various maturities which, under normal market conditions, will not exceed an average effective portfolio duration of two years.
INVESTMENT APPROACH
J.P. Morgan Private Investments Inc., the Fund’s investment adviser (“JPMPI” or the “Adviser”) constructs the Fund’s portfolios by allocating the Fund’s assets among investment strategies managed by one or more sub-advisers retained by the Adviser (each a “Sub-Adviser”). The Adviser currently engages the following Sub-Advisers:
| • | | Goldman Sachs Asset Management, L.P. (“Goldman”)(a) |
| • | | Mellon Investments Corporation (“Mellon”) |
| • | | Pacific Investment Management Company LLC (“PIMCO”) |
(a) During the reporting period, the Adviser did not allocate Fund assets to Goldman.
The Adviser may adjust allocations to the Sub-Advisers at any time or make recommendations to the Board of Trustees of the Six Circles Trust (the “Board”) with respect to the hiring, termination or replacement of a Sub-Adviser. As such, the identity of the Fund’s Sub-Advisers, the investment strategies they pursue and the portion of the Fund allocated to them, may change over time.
The Fund is specifically designed to serve as a completion portfolio and accomplish particular goals within discretionary portfolios managed by JPMPI or its affiliates (the “Portfolios”). The Adviser utilizes the Fund to express targeted investment views, while taking into consideration positions held at the aggregate level in the broader Portfolios. As such, the Fund’s allocations and performance should be evaluated in the context of the broader Portfolios and not on a standalone basis.
WHAT WERE THE MAIN DRIVERS OF THE FUND’S PERFORMANCE?
During the period of January 1, 2021 through June 30, 2021, the Fund posted a positive return on an absolute basis, and
outperformed relative to the iMoneyNet Tax-Free National Institutional Money Market (the “Index”). References to the Index are for informational purposes. The use of the Index does not imply the Fund is being managed to the Index, but rather is disclosed to allow for comparison of the Fund’s performance to that of a well-known and widely-recognized index.
By sector composition, Municipal Bonds and Investment Grade Credit were the largest sector exposures in the Fund on a look-through basis and comprised approximately 69% and 13% of the Fund, respectively, at the end of the reporting period. Both of these exposures contributed to the Fund’s performance on an absolute basis, as well as relative to the Index.
On allocation level, both of the Fund’s allocations – Global Markets and Core Municipal Ultra Short – contributed to the Fund’s return on an absolute basis during the reporting period.
HOW WAS THE FUND POSITIONED?
At the end of the reporting period the Fund was allocated to two Sub-Advisers as follows.
| | | | |
| PORTFOLIO ALLOCATION*** | |
| Core Municipal Ultra Short (Mellon) | | | 70 | % |
| Global Markets (PIMCO) | | | 30 | |
| * | | The return shown is based on the net asset value calculated for shareholder transactions. Certain adjustments were made to the net assets of the Fund at June 30, 2021 for financial reporting purposes, and as a result, the net asset value for shareholder transactions and the total return based on that net asset value may differ from the adjusted net assets and the total return for financial reporting. |
| ** | | The Adviser seeks to achieve the Fund’s objective. There can be no guarantee it will be achieved. |
| *** | | Percentages are based on total investments as of June 30, 2021. The portfolio allocation is subject to change. |
| 1) | | Interest on Municipal securities is exempt from federal income tax however interest on certain bonds may be subject to the federal alternative minimum tax for individuals. |
Within the fixed income allocation on the broader Portfolio level, the Adviser prefers high-quality liquid investments combined with flexibility to implement opportunistic ideas across fixed income markets. The majority of the Fund’s assets were invested into the
| | | | | | | | |
| | | |
| JUNE 30, 2021 | | SIX CIRCLES TRUST | | | | | 5 | |
Six Circles Tax Aware Ultra Short Duration Fund
FUND COMMENTARY
Period January 1, 2021 Through June 30, 2021 (Unaudited) (continued)
more liquid segments of the fixed income market, with approximately 96% of the Fund invested into instruments with maturities of three years and under as of June 30, 2021.
The Adviser allocates to the two Sub-Advisers, with the expectation that the Sub-Advisers will capitalize on the opportunities present in the segment of the fixed income market that their specific mandate is focused on.
The Core Municipal Ultra Short allocation, which comprised approximately 70% of the Fund as of June 30, 2021, invests in a diversified fixed income portfolio on the shorter end of the U.S. municipal fixed income market, balancing income against credit quality, within the context of the broader portfolio.
The Global Markets allocation, which comprised approximately 30% of the Fund as of June 30, 2021, has a broad investment universe, seeking total return opportunities within the global taxable fixed income markets.
| | | | | | | | | | |
AVERAGE ANNUAL TOTAL RETURNS
AS OF JUNE 30, 2021 | |
| | | 6 Months* | | 1 Year | | | Since
Inception
(July 9, 2018) | |
| Six Circles Tax Aware Ultra Short Duration Fund | | 0.14% | | | 0.81 | % | | | 1.48 | % |
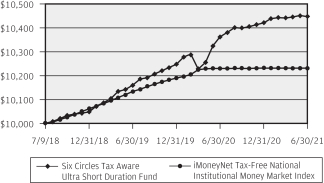
GROWTH OF $10,000 REPORT (07/9/2018 TO 06/30/2021)
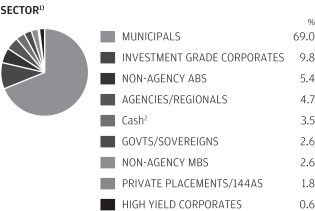
| 1) | Presented percentages may not sum to 100% due to rounding to the nearest percent. The above Sector allocation uses The Global Industry Classification Standard (GICS®) and may differ from categories listed within the Schedule of Investments. |
| 2) | 0.12% of the amount shown in the Fund’s “Cash” line item reflects the mark-to-market value of the Fund’s derivative positions. |
The allocation of the various strategies employed by the Fund may shift and therefore, the performance shown may not be a true indication of how the Fund may perform going forward. Performance quoted is past performance and is no guarantee of future results. Investment returns and principal value will fluctuate, so shares, when sold, may be worth more or less than original cost. Current performance may be higher or lower than returns shown. As of the latest prospectus, the gross and net expense ratios for the Fund were 0.30% and 0.14% respectively. Contact your J.P. Morgan representative or call 1-212-464-2070 for the most recent month-end performance.
The Fund commenced operations on July 9, 2018.
The graph illustrates comparative performance for $10,000 invested in the Six Circles Tax Aware Ultra Short Duration Fund and the iMoneyNet Tax-Free National Institutional Money Market Index from July 9, 2018 to June 30, 2021. The performance of the Fund reflects the deduction of Fund expenses and assumes reinvestment of all dividends and capital gain distributions, if any. Although the performance of the iMoneyNet Tax-Free National Institutional Money Market Index reflects returns of constituent mutual funds net of expenses, the index itself is unmanaged and no expenses are deducted at the index level. The performance of the Index has also been adjusted to reflect reinvestment of all dividends and capital gain distributions of the mutual funds included in the Index, if applicable.
The iMoneyNet Tax-Free National Institutional Money Market Index is an average of all tax-free and municipal, U.S.-domiciled institutional and retail money market funds. Investors cannot invest directly in an index.
Fund performance may reflect the waiver of the Fund’s fees and/or reimbursement of expenses for certain periods since the inception date. Without these waivers and reimbursements, performance would have been lower. Also, performance shown in this section does not reflect the deduction of taxes that a shareholder may pay on Fund distributions or redemptions or sales of Fund shares.
The Global Industry Classification Standard (“GICS”) was developed by and is the exclusive property and a service mark of MSCI Inc. (“MSCI”) and Standard & Poor’s, a division of The McGraw-Hill Companies, Inc. (“S&P”) and is licensed for use by JP MORGAN CHASE BANK NA. Neither MSCI, S&P nor any third party involved in making or compiling the GICS or any GICS classifications makes any express or implied warranties or representations with respect to such standard or classification (or the results to be obtained by the use thereof), and all such parties hereby expressly disclaim all warranties of originality, accuracy, completeness, merchantability and fitness for a particular purpose with respect to any of such standard or classification. Without limiting any of the foregoing, in no event shall MSCI, S&P, any of their affiliates or any third party involved in making or compiling the GICS or any GICS classifications have any liability for any direct, indirect, special, punitive, consequential or any other damages (including lost profits) even if notified of the possibility of such damages.
| | | | | | |
| | | |
| 6 | | | | SIX CIRCLES TRUST | | JUNE 30, 2021 |
Six Circles U.S. Unconstrained Equity Fund
FUND COMMENTARY
Period January 1, 2021 Through June 30, 2021 (Unaudited)
| | | | |
| REPORTING PERIOD RETURN | |
| Fund* | | | 19.12% | |
| MSCI USA Index | | | 14.87% | |
| |
| Net Assets as of 6/30/2021 (In Thousands) | | $ | 18,173,992 | |
INVESTMENT OBJECTIVES AND STRATEGY**
Six Circles U.S. Unconstrained Equity Fund (the “Fund”) seeks to provide capital appreciation. The Fund invests at least 80% of its net assets in equity securities issued by U.S. companies and other instruments with economic characteristics similar to equity securities issued by U.S. companies. The Fund is generally unconstrained by any particular capitalization, style or industry sector.
INVESTMENT APPROACH
J.P. Morgan Private Investments Inc., the Fund’s investment adviser (“JPMPI” or the “Adviser”), actively allocates the Fund’s investments among a range of indexed investment strategies that are managed by the current sub-adviser, BlackRock Investment Management, LLC (the “Sub-Adviser” or “BlackRock”). For each indexed investment strategy, the Sub-Adviser seeks to replicate the performance of an index or sub-index selected by the Adviser. The Fund is specifically designed to serve as a completion portfolio and accomplish particular goals within discretionary portfolios managed by JPMPI or its affiliates (the “Portfolios”). The Adviser utilizes the Fund to express targeted investment views, while taking into consideration positions held at the aggregate level in the broader Portfolios. As such, the Fund’s allocations and performance should be evaluated in the context of the broader Portfolios and not on a standalone basis.
WHAT WERE THE MAIN DRIVERS OF THE FUND’S PERFORMANCE?
During the period of January 1, 2021 through June 30, 2021 (the “reporting period”), the Fund posted a positive return on an absolute basis, and outperformed relative to the MSCI USA Index (the “Index”). References to the Index are for informational purposes. The use of the Index does not imply the Fund is being managed to the Index, but rather is disclosed to allow for comparison of the Fund’s performance to that of a well-known and widely-recognized index.
Industrials, Financials and Communications Services sectors comprised approximately 42% of the Fund’s sector exposure on a look-through basis at the end of the reporting period, and were the Fund’s largest sector overweights relative to the Index. During the reporting period, all the three sectors contributed to the Fund’s performance on an absolute basis, as well as relative to the Index.
Consumer Discretionary, Health Care and Energy sectors comprised approximately 22% of the Fund’s sector exposure on a look-through basis at the end of the reporting period, and were the Fund’s largest sector underweights relative to the Index. All the three sectors contributed to the Fund’s performance on an absolute basis. While broad Consumer Discretionary underweight contributed, relative positioning in Energy and Health Care detracted.
On the sleeve level, the Fund’s allocation to U.S. Financials was the largest contributor. There were no detractors to the Fund’s return on an absolute basis during the reporting period.
HOW WAS THE FUND POSITIONED?
At the end of the reporting period, the Fund was allocated to thirteen strategies managed by one Sub-Adviser, across various sector and sub-industry exposures as follows.
| | | | |
| PORTFOLIO ALLOCATION*** | | | |
| S&P 500 Equal Weight | | | 16 | % |
| U.S. Software | | | 14 | |
| U.S. Financials | | | 12 | |
| U.S. Interactive Media & Services | | | 11 | |
| U.S. Tech Hardware Equip | | | 8 | |
| U.S. Internet Retail | | | 8 | |
| U.S. Industrials | | | 7 | |
| U.S. Pharmaceuticals | | | 6 | |
| S&P 500 Air Freight & Logistics | | | 5 | |
| U.S. Beverages | | | 4 | |
| U.S. Biotechnology | | | 3 | |
| U.S. Semi & Semi Equip | | | 3 | |
| USA | | | 3 | |
| * | | The return shown is based on the net asset value calculated for shareholder transactions. Certain adjustments were made to the net assets of the Fund at June 30, 2021 for financial reporting purposes, and as a result, the net asset value for shareholder transactions and the total return based on that net asset value may differ from the adjusted net assets and the total return for financial reporting. |
| ** | | The Adviser seeks to achieve the Fund’s objective. There can be no guarantee it will be achieved. |
| *** | | Percentages are based on total investments as of June 30, 2021. The portfolio allocation is subject to change. |
| | | | | | | | |
| | | |
| JUNE 30, 2021 | | SIX CIRCLES TRUST | | | | | 7 | |
Six Circles U.S. Unconstrained Equity Fund
FUND COMMENTARY
Period January 1, 2021 Through June 30, 2021 (Unaudited) (continued)
Allocation to the S&P 500 Equal Weight comprised approximately 16% of the Fund as of June 30, 2021. The Adviser believes that the allocation to equally weighted index allows us to lean into cyclicals and diversify away from mega-cap technology companies.
Allocation to U.S. Software and U.S. Internet Retail provides what the Adviser believes is a multi-year opportunity for the leaders in this space to take advantage of businesses shifting workloads onto Cloud-based platforms. These exposures collectively comprised approximately 22% of the Fund as of June 30, 2021.
Allocation to the U.S. Financials comprised approximately 12% of the Fund as of June 30, 2021. The Adviser believes in capital adequacy and dividend sustainability in the sector, and has conviction in the position given compelling valuations and more realistic market expectations about potential credit costs and buybacks.
Allocation to U.S. Interactive Media & Services focuses on companies engaged in content and information creation or distribution through proprietary platforms, where revenues are derived primarily through pay-per-click advertisements. This allocation was approximately 11% of the Fund as of June 30, 2021. The Adviser believes in the opportunities available in the cloud market and views this exposure as potential for continued strength in earnings growth.
Allocation to U.S. Technology Hardware Storage & Peripherals, which allows the Adviser to access specific exposures within the Technology sector, was approximately 8% of the Fund as of June 30, 2021.
Allocation to the U.S. Industrials was approximately 7% of the Fund as of June 30, 2021. The Adviser believes that the Industrials are cyclical companies that would benefit from economic recovery and growth.
Allocation to U.S. Pharmaceuticals and U.S. Biotechnology comprised approximately 6% and 3% of the Fund respectively, as of June 30, 2021. The Adviser believes that the market is overestimating the risks that potential policy changes may have, given the industry’s long-term growth tailwinds.
The Adviser believes that allocation to U.S. Air Freight & Logistics has benefited from COVID-19 given the sector’s ecommerce networks. This allocation comprised approximately 5% of the Fund as of June 30, 2021.
Allocation to U.S. Beverages was approximately 4% of the Fund’s exposure as of June 30, 2021 and reflects the Adviser’s belief that major players of this sector are going through structural changes and are set to improve free cash flow conversion.
The Adviser believes that allocation to U.S. Semis & Semi Equipment industries are attractive industries within the
broader Information Technology Sector. This allocation comprised approximately 3% of the Fund as of June 30, 2021.
Allocation to Broad USA comprised approximately 3% of the Fund as of June 30, 2021. Within the context of the broader Portfolios, the Adviser believes that the allocation provides ability to tactically allocate to broad U.S. large cap exposure and use as a potential funding source for future targeted allocations.
| | | | | | | | | | | | |
AVERAGE ANNUAL TOTAL RETURNS
AS OF JUNE 30, 2021 | |
| | | 6 Months* | | | 1 Year | | | Since
Inception
(July 9, 2018) | |
| Six Circles U.S. Unconstrained Equity Fund | | | 19.12% | | | | 49.23 | % | | | 20.14 | % |
GROWTH OF $10,000 REPORT (07/9/2018 TO 06/30/2021)

| 1) | Presented percentages may not sum to 100% due to rounding to the nearest percent. Cash and mark-to-market value on derivatives contracts represent less than 0.5%. The above Sector allocation uses The Global Industry Classification Standard (GICS®) and may differ from categories listed within the Schedule of Investments. |
| | | | | | |
| | | |
| 8 | | | | SIX CIRCLES TRUST | | JUNE 30, 2021 |
The allocation of the various strategies employed by the Fund may shift and therefore, the performance shown may not be a true indication of how the Fund may perform going forward. Performance quoted is past performance and is no guarantee of future results. Investment returns and principal value will fluctuate, so shares, when sold, may be worth more or less than original cost. Current performance may be higher or lower than returns shown. As of the latest prospectus, the gross and net expense ratios for the Fund were 0.27% and 0.06% respectively. Contact your J.P. Morgan representative or call 1-212-464-2070 for the most recent month-end performance.
The Fund commenced operations on July 9, 2018.
The graph illustrates comparative performance for $10,000 invested in the Six Circles U.S. Unconstrained Equity Fund and the MSCI USA Index from July 9, 2018 to June 30, 2021. The performance of the Fund reflects the deduction of Fund expenses and assumes reinvestment of all dividends and capital gain distributions, if any. The performance of the MSCI USA Index does not reflect the deduction of expenses associated with a mutual fund and has been adjusted to reflect reinvestment of all dividends and capital gain distributions of the securities included in the Index, if applicable. The MSCI USA Index is designed to measure the performance of the large and mid-cap segments of the U.S. market. With 627 constituents, the index covers approximately 85% of the free float-adjusted market capitalization in the United States. Investors cannot invest directly in an index.
Fund performance may reflect the waiver of the Fund’s fees and/or reimbursement of expenses for certain periods since the inception date. Without these waivers and reimbursements, performance would have been lower. Also, performance shown in this section does not reflect the deduction of taxes that a shareholder may pay on Fund distributions or redemptions or sales of Fund shares.
The MSCI information may only be used for your internal use, may not be reproduced or redisseminated in any form and may not be used as a basis for
or a component of any financial instruments or products or indices. None of the MSCI information is intended to constitute investment advice or a recommendation to make (or refrain from making) any kind of investment decision and may not be relied on as such. Historical data and analysis should not be taken as an indication or guarantee of any future performance analysis, forecast or prediction. The MSCI information is provided on an “as is” basis and the user of this information assumes the entire risk of any use made of this information. MSCI, each of its affiliates and each other person involved in or related to compiling, computing or creating any MSCI information (collectively, the “MSCI Parties”) expressly disclaims all warranties (including, without limitation, any warranties of originality, accuracy, completeness, timeliness, non-infringement, merchantability and fitness for a particular purpose) with respect this information. Without limiting any of the foregoing, in no event shall any MSCI Party have any liability for any direct, indirect, special, incidental, punitive, consequential (including, without limitation, lost profits) or any other damages. (www.msci.com)
The Global Industry Classification Standard (“GICS”) was developed by and is the exclusive property and a service mark of MSCI Inc. (“MSCI”) and Standard & Poor’s, a division of The McGraw-Hill Companies, Inc. (“S&P”) and is licensed for use by JP MORGAN CHASE BANK NA. Neither MSCI, S&P nor any third party involved in making or compiling the GICS or any GICS classifications makes any express or implied warranties or representations with respect to such standard or classification (or the results to be obtained by the use thereof), and all such parties hereby expressly disclaim all warranties of originality, accuracy, completeness, merchantability and fitness for a particular purpose with respect to any of such standard or classification. Without limiting any of the foregoing, in no event shall MSCI, S&P, any of their affiliates or any third party involved in making or compiling the GICS or any GICS classifications have any liability for any direct, indirect, special, punitive, consequential or any other damages (including lost profits) even if notified of the possibility of such damages.
| | | | | | | | |
| | | |
| JUNE 30, 2021 | | SIX CIRCLES TRUST | | | | | 9 | |
Six Circles International Unconstrained Equity Fund
FUND COMMENTARY
Period January 1, 2021 Through June 30, 2021 (Unaudited)
| | | | |
| REPORTING PERIOD RETURN | |
| Fund* | | | 10.42% | |
| MSCI World ex- USA Index | | | 9.92% | |
| |
| Net Assets as of 6/30/2021 (In Thousands) | | $ | 11,444,907 | |
INVESTMENT OBJECTIVES AND STRATEGY**
Six Circles International Unconstrained Equity Fund (the “Fund”) seeks to provide capital appreciation. The Fund invests at least 80% of its net assets in equity securities and other instruments with economic characteristics similar to equity securities. The Fund primarily invests in the equity securities of non-U.S. companies and is generally unconstrained by any particular capitalization, style or sector or non-U.S. country.
INVESTMENT APPROACH
J.P. Morgan Private Investments Inc., the Fund’s investment adviser (“JPMPI” or the “Adviser”), actively allocates the Fund’s investments among a range of indexed investment strategies that are managed by the current sub-adviser, BlackRock Investment Management, LLC (the “Sub-Adviser” or “BlackRock”). For each indexed investment strategy, the Sub-Adviser seeks to replicate the performance of an index or sub-index selected by the Adviser. The Fund is specifically designed to serve as a completion portfolio and accomplish particular goals within discretionary portfolios managed by JPMPI or its affiliates (the “Portfolios”). The Adviser utilizes the Fund to express targeted investment views, while taking into consideration positions held at the aggregate level in the Portfolios. As such, the Fund’s allocations and performance should be evaluated in the context of the broader Portfolios and not on a standalone basis.
WHAT WERE THE MAIN DRIVERS OF THE FUND’S PERFORMANCE?
During the period of January 1, 2021 through June 30, 2021 (the “reporting period”), the Fund posted a positive return on an absolute basis, and outperformed the MSCI World ex USA Index (the “Index”). References to the Index are for informational purposes. The use of the Index does not imply the Fund is being managed to the Index, but rather is disclosed to allow for comparison of the Fund’s performance to that of a well-known and widely-recognized index.
Information Technology, Utilities and Health Care sectors comprised approximately 48% of the Fund’s sector exposure on a look-through basis at the end of the reporting period, and were the Fund’s largest sector overweights relative to the Index. Health Care and Information Technology contributed to the Fund’s performance on an absolute basis, as well as relative to the Index, while Utilities detracted.
Consumer Discretionary and Materials sectors comprised approximately 8% of the Fund’s sector exposure on a look-through basis at the end of the reporting period, and were the Fund’s largest sector underweights relative to the Index. Both sectors contributed to the Fund’s performance on an absolute basis, as well as relative to index.
On the sleeve level, the Fund’s allocation to Europe Industrials was the largest contributor, while the allocation to Europe ex Utilities was the largest detractor from the Fund’s return on an absolute basis during the reporting period.
HOW WAS THE FUND POSITIONED?
At the end of the reporting period, the Fund was allocated to thirteen strategies managed by one Sub-Adviser, across various sector and sub-industry exposures as follows.
| | | | |
| PORTFOLIO ALLOCATION*** | | | |
| Europe Financials | | | 16 | % |
| Europe Pharmaceuticals | | | 16 | |
| Europe Industrials | | | 10 | |
| Broad UK | | | 8 | |
| Europe ex-UK Utilities | | | 8 | |
| Switzerland Pharmaceuticals | | | 7 | |
| Europe ex-UK | | | 6 | |
| European Info Technology | | | 6 | |
| Korea Tech Hardware Storage & Peripherals | | | 6 | |
| Switzerland Food Products | | | 5 | |
| Emerging Markets | | | 4 | |
| Europe Autos | | | 4 | |
| Europe Food, Beverage & Tobacco | | | 4 | |
| * | | The return shown is based on the net asset value calculated for shareholder transactions. Certain adjustments were made to the net assets of the Fund at June 30, 2021 for financial reporting purposes, and as a result, the net asset value for shareholder transactions and the total return based on that net asset value may differ from the adjusted net assets and the total return for financial reporting. |
| ** | | The Adviser seeks to achieve the Fund’s objective. There can be no guarantee it will be achieved. |
| *** | | Percentages are based on total investments as of June 30, 2021. The portfolio allocation is subject to change. |
Allocation to Europe Financials was approximately 16% of the Fund as of June 30, 2021. The Adviser believes in the capital adequacy and the capacity of the sector to pay dividends.
| | | | | | |
| | | |
| 10 | | | | SIX CIRCLES TRUST | | JUNE 30, 2021 |
Valuations have been compelling and the market has become more realistic about the outlook for credit costs.
Allocation to Europe and Switzerland Pharmaceuticals comprised approximately 16% and 7% of the Fund as of June 30, 2021 respectively, and provides what the Adviser believes to be a defensive exposure with attractive fundamentals and valuations, within the context of the broader Portfolios.
Allocation to the Europe Industrials was approximately 10% of the Fund as of June 30, 2021. The Adviser believes that the Industrials sector is built on cyclical exposures that would benefit from economic recovery and growth.
Allocation to Broad UK comprised approximately 8% of the Fund as of June 30, 2021. Within the context of the broader Portfolios, the Adviser believes that the allocation adds to a more cyclical European market that has clarity with the resolution of Brexit issues and as COVID-19 subsides.
The Adviser believes that allocation to Europe ex-UK Utilities serves as a defensive position with exposure to renewable energy, which helps diversify against European Energy positions and provides a growth dynamic to the sector. This allocation was approximately 8% of the Fund as of June 30, 2021.
Allocation to Broad Europe ex-UK comprised approximately 6% of the Fund as of June 30, 2021. Within the context of the broader Portfolios, the Adviser believes to have high conviction in Europe with successful vaccine rollout and recovery of the market.
Allocation to Europe Information Technology, which allows the Adviser to access broad European Technology within the Technology sector with secular tailwinds and a large concentration in semiconductors, was approximately 6% of the Fund as of June 30, 2021.
The Adviser believes that the allocation to Korea Technology Hardware, Software and Peripherals provides exposure to a strong player within the global technology supply chain. The allocation was approximately 6% of the Fund as of June 30, 2021.
The Adviser believes that the valuations of Emerging Markets look reasonable and the prospects for growth have improved. The sector has become less dependent on commodity-based industries like energy and is gaining more technology exposure. This allocation was approximately 4% of the Fund as of June 30, 2021.
The Adviser believes that allocation to Europe Automobiles is expected to perform well as the economy recovers. The focus on electric vehicles are likely to be a tailwind. This allocation comprised approximately 4% of the Fund as of June 30, 2021.
The Adviser believes that allocation to Europe Food, Beverage & Tobacco and Switzerland Food Products serves as a defensive anchor in the broader Portfolios, with better fundamentals and valuations than many other defensive exposures. This allocation was approximately 4% and 5% respectively of the Fund as of June 30, 2021.
| | | | | | | | | | | | |
AVERAGE ANNUAL TOTAL RETURNS
AS OF JUNE 30, 2021 | |
| | | 6 Months* | | | 1 Year | | | Since
Inception
(July 9, 2018) | |
| Six Circles International Unconstrained Equity Fund | | | 10.42% | | | | 37.11 | % | | | 5.09 | % |
GROWTH OF $10,000 REPORT (07/9/2018 TO 06/30/2021)
| 1) | Presented percentages may not sum to 100% due to rounding to the nearest percent. Cash and mark-to-market value on derivatives contracts represent less than 0.5%. The above Sector allocation uses The Global Industry Classification Standard (GICS®) and may differ from categories listed within the Schedule of Investments. |
| | | | | | | | |
| | | |
| JUNE 30, 2021 | | SIX CIRCLES TRUST | | | | | 11 | |
Six Circles International Unconstrained Equity Fund
FUND COMMENTARY
Period January 1, 2021 Through June 30, 2021 (Unaudited) (continued)
The allocation of the various strategies employed by the Fund may shift and therefore, the performance shown may not be a true indication of how the Fund may perform going forward. Performance quoted is past performance and is no guarantee of future results. Investment returns and principal value will fluctuate, so shares, when sold, may be worth more or less than original cost. Current performance may be higher or lower than returns shown. As of the latest prospectus, the gross and net expense ratios for the Fund were 0.30% and 0.10% respectively. Contact your J.P. Morgan representative or call 1-212-464-2070 for the most recent month-end performance.
The Fund commenced operations on July 9, 2018.
The graph illustrates comparative performance for $10,000 invested in the Six Circles International Unconstrained Equity Fund and the MSCI World ex-USA Index from July 9, 2018 to June 30, 2021. The performance of the Fund reflects the deduction of Fund expenses and assumes reinvestment of all dividends and capital gain distributions, if any. The performance of the MSCI World ex-USA Index does not reflect the deduction of expenses associated with a mutual fund and has been adjusted to reflect reinvestment of all dividends and capital gain distributions of the securities included in the Index, if applicable. The MSCI World ex USA Index captures large and mid-cap representation across 22 of 23 Developed Markets (DM) countries—excluding the United States. With 1016 constituents, the index covers approximately 85% of the free float-adjusted market capitalization in each country. Investors cannot invest directly in an index.
Fund performance may reflect the waiver of the Fund’s fees and/or reimbursement of expenses for certain periods since the inception date. Without these waivers and reimbursements, performance would have been lower. Also, performance shown in this section does not reflect the deduction of taxes that a shareholder may pay on Fund distributions or redemptions or sales of Fund shares.
International investing has a greater degree of risk and increased volatility due to political and economic instability of some overseas markets. Changes in currency exchange rates and different accounting and taxation policies outside the U.S. can affect returns.
The MSCI information may only be used for your internal use, may not be reproduced or redisseminated in any form and may not be used as a basis for or a component of any financial instruments or products or indices. None of the MSCI information is intended to constitute investment advice or a recommendation to make (or refrain from making) any kind of investment decision and may not be relied on as such. Historical data and analysis should not be taken as an indication or guarantee of any future performance analysis, forecast or prediction. The MSCI information is provided on an “as is” basis and the user of this information assumes the entire risk of any use made of this information. MSCI, each of its affiliates and each other person involved in or related to compiling, computing or creating any MSCI information (collectively, the “MSCI Parties”) expressly disclaims all warranties (including, without limitation, any warranties of originality, accuracy, completeness, timeliness, non-infringement, merchantability and fitness for a particular purpose) with respect this information. Without limiting any of the foregoing, in no event shall any MSCI Party have any liability for any direct, indirect, special, incidental, punitive, consequential (including, without limitation, lost profits) or any other damages. (www.msci.com)
The Global Industry Classification Standard (“GICS”) was developed by and is the exclusive property and a service mark of MSCI Inc. (“MSCI”) and Standard & Poor’s, a division of The McGraw-Hill Companies, Inc. (“S&P”) and is licensed for use by JP MORGAN CHASE BANK NA. Neither MSCI, S&P nor any third party involved in making or compiling the GICS or any GICS classifications makes any express or implied warranties or representations with respect to such standard or classification (or the results to be obtained by the use thereof), and all such parties hereby expressly disclaim all warranties of originality, accuracy, completeness, merchantability and fitness for a particular purpose with respect to any of such standard or classification. Without limiting any of the foregoing, in no event shall MSCI, S&P, any of their affiliates or any third party involved in making or compiling the GICS or any GICS classifications have any liability for any direct, indirect, special, punitive, consequential or any other damages (including lost profits) even if notified of the possibility of such damages.
| | | | | | |
| | | |
| 12 | | | | SIX CIRCLES TRUST | | JUNE 30, 2021 |
Six Circles Global Bond Fund
FUND COMMENTARY
Period January 1, 2021 Through June 30, 2021 (Unaudited)
| | | | |
| REPORTING PERIOD RETURN | |
| Fund* | | | (0.82)% | |
| Bloomberg Barclays Global-Aggregate Index - Hedged USD | | | (1.52)% | |
| |
| Net Assets as of 6/30/2021 (In Thousands) | | $ | 7,115,595 | |
| Duration | | | 6.27 years | |
INVESTMENT OBJECTIVES AND STRATEGY**
Six Circles Global Bond Fund (the “Fund”) seeks to provide total return. The Fund invests mainly in a global portfolio of investment grade fixed income securities with varying maturities across government, corporate, and securitized fixed income sectors. The Fund will also allocate across a number of different countries around the World.
INVESTMENT APPROACH
J.P. Morgan Private Investments Inc., the Fund’s investment adviser (“JPMPI” or the “Adviser”) constructs the Fund’s portfolios by allocating the Fund’s assets among investment strategies managed by one or more sub-advisers retained by the Adviser (each a “Sub-Adviser”). The Adviser currently engages the following Sub-Advisers:
| • | | BlackRock Investment Management, LLC (“BlackRock”) |
| • | | Pacific Investment Management Company LLC (“PIMCO”) |
The Adviser may adjust allocations to the Sub-Advisers at any time or make recommendations to the Board of Trustees of the Six Circles Trust (the “Board”) with respect to the hiring, termination or replacement of a Sub-Adviser. As such, the identity of the Fund’s Sub-Advisers, the investment strategies they pursue and the portion of the Fund allocated to them, may change over time.
The Fund is specifically designed to serve as a completion portfolio and accomplish particular goals within discretionary portfolios managed by JPMPI or its affiliates (the “Portfolios”). The Adviser utilizes the Fund to express targeted investment views, while taking into consideration positions held at the aggregate level in the broader Portfolios. As such, the Fund’s allocations and performance should be evaluated in the context of the broader Portfolios and not on a standalone basis.
WHAT WERE THE MAIN DRIVERS OF THE FUND’S PERFORMANCE?
During the period January 1, 2021 through June 30, 2021, (the “reporting period”) the Fund posted a negative return on an absolute basis, but outperformed relative to the Bloomberg Barclays Global Aggregate Index (the “Hedged Index”). References to the Index are for informational purposes. The use of the Index does not imply the Fund is being managed to the Index, but rather is disclosed to allow for comparison of the Fund’s performance to that of a well-known and widely-recognized index.
By sector composition, Government Bonds were the largest sector exposure in the Fund on a look-through basis and comprised approximately 50% of the Fund at the end of the reporting period, with the Fund being underweight this sector relative to the Index. Government Bonds detracted from the Fund’s performance on an absolute basis during the reporting period, but contributed relative to the Index.
Emerging Market Debt comprised approximately 7% of the Fund’s exposure on a look-through basis at the end of the reporting period, with the Fund being overweight this sector relative to the Index. During the reporting period, exposure to Extended Credit contributed to the Fund’s performance on an absolute basis, as well as relative to the index.
On the allocation level, the Fund’s allocation to Pan-European Government was the largest detractor from the Fund’s return on an absolute basis during the reporting period.
HOW WAS THE FUND POSITIONED?
At the end of the reporting period, the Fund was allocated to nine strategies across various sectors, credit ratings, maturity buckets, and regional exposures.
| | | | |
| PORTFOLIO ALLOCATION*** | |
| Asian Pacific Government (BlackRock) | | | 41 | % |
| Global Credit (PGIM) | | | 10 | |
| Global Securitized (PIMCO) | | | 10 | |
| Pan-European Government (BlackRock) | | | 9 | |
| U.S. Securitized (BlackRock) | | | 9 | |
| Pan-European Credit (BlackRock) | | | 8 | |
| U.S. Government (BlackRock) | | | 7 | |
| Global Government (PGIM) | | | 5 | |
| U.S. Credit (BlackRock) | | | 1 | |
| * | | The return shown is based on the net asset value calculated for shareholder transactions. Certain adjustments were made to the net assets of the Fund at June 30, 2021 for financial reporting purposes, and as a result, the net asset value for shareholder transactions and the total return based on that net asset value may differ from the adjusted net assets and the total return for financial reporting. |
| ** | | The Adviser seeks to achieve the Fund’s objective. There can be no guarantee it will be achieved. |
| *** | | Percentages are based on total investments as of June 30, 2021. The portfolio allocation is subject to change. |
| | | | | | | | | | |
| | | | | |
| JUNE 30, 2021 | | SIX CIRCLES TRUST | | | | | | | | 13 |
Six Circles Global Bond Fund
FUND COMMENTARY
Period January 1, 2021 Through June 30, 2021 (Unaudited) (continued)
Allocations to Asia Pacific Government and Pan-European Government comprised approximately 50% of the Fund as of June 30, 2021 and provide what the Adviser believes is a low tracking error, tactical way to allocate to government bonds within these regions.
Allocation to Global Credit and Pan European Credit comprised approximately 18% of the Fund as of June 30, 2021, and provides what the Adviser believes to be a full tracking error, flexible access point to a broad range global corporate bonds across different regions, sectors, and credit qualities.
Allocation to Global Securitized comprised approximately 10% of the Fund as of June 30, 2021 and provides what the Adviser believes to be full tracking error, flexible access to a broad range of securitized debt across different regions, sectors, and credit qualities.
The Adviser believes that the allocation to Global Government provides full tracking error access to a broad range of government bonds across different regions. The allocation was approximately 5% of the Fund as of June 30, 2021.
Allocations to U.S. Credit, U.S. Government, and U.S. Securitized comprised approximately 17% of the Fund as of June 30, 2021. These allocations provide what the Adviser believes is a low tracking error, tactical way to allocate within these sectors.
| | | | | | | | | | | | |
AVERAGE ANNUAL TOTAL RETURNS
AS OF JUNE 30, 2021 | |
| | | 6 Months* | | | 1 Year | | | Since
Inception
(May 19, 2020) | |
| Six Circles Global Bond Fund | | | (0.82)% | | | | 0.64 | | | | 1.64% | |
GROWTH OF $10,000 REPORT (05/19/2020 TO 06/30/2021)
| 1) | Presented percentages may not sum to 100% due to rounding to the nearest percent. The above Sector allocation uses The Global Industry Classification Standard (GICS®) and may differ from categories listed within the Schedule of Investments. |
| 2) | 0.25% of the amount shown in the Fund’s “Cash” line item reflects the mark-to-market value of the Fund’s derivative positions. |
The allocation of the various strategies employed by the Fund may shift and therefore, the performance shown may not be a true indication of how the Fund may perform going forward. Performance quoted is past performance and is no guarantee of future results. Investment returns and principal value will fluctuate, so shares, when sold, may be worth more or less than original cost. Current performance may be higher or lower than returns shown.
As of the latest prospectus, the gross and net expense ratios for the Fund were 0.36% and 0.16% respectively. Contact your J.P. Morgan representative or call 1-212-464-2070 for the most recent month-end performance.
The Fund commenced operations on May 19, 2020.
The graph illustrates comparative performance for $10,000 invested in the Six Circles Global Bond Fund and the Bloomberg Barclays Global-Aggregate Index - Hedged USD from May 19, 2020 to June 30, 2021. The performance of the Fund reflects the deduction of Fund expenses and assumes reinvestment of all dividends and capital gain distributions, if any. The performance of the Bloomberg Barclays Global-Aggregate Index - Hedged USD does not reflect the deduction of expenses associated with a mutual fund and has been adjusted to reflect reinvestment of all dividends and capital gain distributions of the securities included in the Index, if applicable.
The Bloomberg Barclays Global Aggregate Index provides a broad-based measure of the global investment grade fixed income markets. Investors cannot invest directly in an index.
Fund performance may reflect the waiver of the Fund’s fees and/or reimbursement of expenses for certain periods since the inception date. Without these waivers and reimbursements, performance would have been lower. Also, performance shown in this section does not reflect the deduction of taxes that a shareholder may pay on Fund distributions or redemptions or sales of Fund shares.
International investing has a greater degree of risk and increased volatility due to political and economic instability of some overseas markets. Changes in currency exchange rates and different accounting and taxation policies outside the U.S. can affect returns.
The Global Industry Classification Standard (“GICS”) was developed by and is the exclusive property and a service mark of MSCI Inc. (“MSCI”) and Standard & Poor’s, a division of The McGraw-Hill Companies, Inc. (“S&P”) and is licensed for use by JP MORGAN CHASE BANK NA. Neither MSCI, S&P nor any third party involved in making or compiling the GICS or any GICS classifications makes any express or implied warranties or representations with respect to such standard
| | | | | | | | | | |
| | | | | |
| 14 | | | | | | | | SIX CIRCLES TRUST | | JUNE 30, 2021 |
or classification (or the results to be obtained by the use thereof), and all such parties hereby expressly disclaim all warranties of originality, accuracy, completeness, merchantability and fitness for a particular purpose with respect to any of such standard or classification. Without limiting any of the foregoing, in no event shall MSCI, S&P, any of their affiliates or any third party involved in making or compiling the GICS or any GICS classifications have any liability for any direct, indirect, special, punitive, consequential or any other damages (including lost profits) even if notified of the possibility of such damages.
| | | | | | | | | | |
| | | | | |
| JUNE 30, 2021 | | SIX CIRCLES TRUST | | | | | | | | 15 |
Six Circles Tax Aware Bond Fund
FUND COMMENTARY
Period January 1, 2021 Through June 30, 2021 (Unaudited)
| | | | |
REPORTING PERIOD RETURN | |
Fund* | | | 0.80% | |
Bloomberg Barclays 1-15 Year Municipal Bond Index | | | 0.57% | |
| |
Net Assets as of 6/30/2021 (In Thousands) | | | $5,738,326 | |
Duration | | | 4.65 years | |
INVESTMENT OBJECTIVES AND STRATEGY**
Six Circles Tax Aware Bond Fund (the “Fund”) seeks to provide after-tax total return. The Fund invests at least 50% in municipal securities across varying maturity ranges, the income from which is exempt from federal income tax(1). The Fund also may invest in taxable instruments.
INVESTMENT APPROACH
J.P. Morgan Private Investments Inc., the Fund’s investment adviser (“JPMPI” or the “Adviser”) constructs the Fund’s portfolios by allocating the Fund’s assets among investment strategies managed by one or more sub-advisers retained by the Adviser (each a “Sub-Adviser”).
The Adviser currently engages the following Sub-Advisers:
| • | | Capital International Inc. (“Capital Group”) |
| • | | Nuveen Asset Management, LLC (“Nuveen”) |
| • | | Wells Capital Management Incorporated (“WellsCap”) |
The Adviser may adjust allocations to the Sub-Advisers at any time or make recommendations to the Board of Trustees of the Six Circles Trust (the “Board”) with respect to the hiring, termination or replacement of a Sub-Adviser. As such, the identity of the Fund’s Sub-Advisers, the investment strategies they pursue and the portion of the Fund allocated to them, may change over time.
The Fund is specifically designed to serve as a completion portfolio and accomplish particular goals within discretionary portfolios managed by JPMPI or its affiliates (the “Portfolios”). The Adviser utilizes the Fund to express targeted investment views, while taking into consideration positions held at the aggregate level in the broader Portfolios. As such, the Fund’s allocations and performance should be evaluated in the context of the broader Portfolios and not on a standalone basis.
WHAT WERE THE MAIN DRIVERS OF THE FUND’S PERFORMANCE?
During the period January 1, 2021 through June 30, 2021, (the “reporting period”), the Fund posted a positive return on an absolute basis, and outperformed relative to the Bloomberg Barclays Municipal Bond Blend 1-15 Year Index (the “Index”). References to the Index are for informational purposes. The use of the Index does not imply the Fund is being managed to
the Index, but rather is disclosed to allow for comparison of the Fund’s performance to that of a well-known and widely-recognized index.
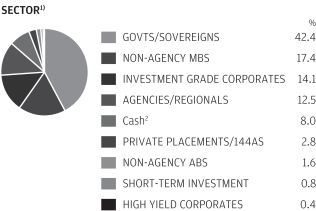
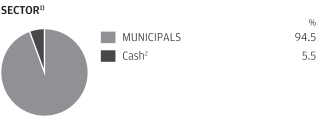
By sector composition, Municipal Bonds were the largest sector exposure in the Fund on a look-through basis and comprised approximately 89% of the Fund at the end of the reporting period. This sector contributed to the Fund’s performance on an absolute basis as well relative to the Index during the reporting period.
High Yield Municipal Bonds were approximately 2% of the Fund’s exposure on a look-through basis at the end of the reporting period, with the Fund being underweight this sector relative to the Index. During the reporting period, exposure to High Yield Municipal Bonds contributed to the Fund’s performance on an absolute basis, as well as relative to the Index.
On the allocation level, the full tracking error Municipal allocations managed by Nuveen and WellsCap were the largest contributors, while Intermediate Duration Municipal allocation was a detractor on an absolute basis during the reporting period.
HOW WAS THE FUND POSITIONED?
At the end of the reporting period, the Fund was allocated to five strategies across various sectors, credit ratings, maturity buckets, and regional exposures.
| | | | |
PORTFOLIO ALLOCATION*** | |
Municipals (Nuveen) | | | 30 | % |
Municipals (WellsCap) | | | 30 | |
Short Duration Municipal (Capital Group) | | | 26 | |
Intermediate Duration Municipal (Capital Group) | | | 8 | |
Long Duration Municipal (Capital Group) | | | 6 | |
| * | | The return shown is based on the net asset value calculated for shareholder transactions. Certain adjustments were made to the net assets of the Fund at June 30, 2021 for financial reporting purposes, and as a result, the net asset value for shareholder transactions and the total return based on that net asset value may differ from the adjusted net assets and the total return for financial reporting. |
| ** | | The Adviser seeks to achieve the Fund’s objective. There can be no guarantee it will be achieved. |
| *** | | Percentages are based on total investments as of June 30, 2021. The portfolio allocation is subject to change. |
| | | | | | | | | | |
| | | | | |
| 16 | | | | | | | | SIX CIRCLES TRUST | | JUNE 30, 2021 |
| 1) | | Interest on Municipal securities is exempt from federal income tax however interest on certain bonds may be subject to the federal alternative minimum tax for individuals. |
Allocations to Short Duration Municipal, Intermediate Duration Municipal and Long Duration Municipal comprised approximately 26%, 8% and 6% of the Fund, respectively, as of June 30, 2021. These allocations provide what the Adviser believes to be low tracking error, flexible access points to municipal debt within short and intermediate maturity ranges.
The Adviser believes that the allocations to Municipal strategies sub-advised by Nuveen and WellsCap provide full tracking error, flexible access to a broad range of municipals across different sectors and credit qualities. Each of these allocations were approximately 30% of the Fund as of June 30, 2021.
| | | | | | | | | | | | |
AVERAGE ANNUAL TOTAL RETURNS
AS OF JUNE 30, 2021 | |
| | | 6 Months* | | | 1 Year | | | Since
Inception
(May 19, 2020) | |
| Six Circles Tax Aware Bond Fund | | | 0.80% | | | | 3.65% | | | | 5.25% | |
GROWTH OF $10,000 REPORT (05/19/2020 TO 06/30/2021)
| 1) | Presented percentages may not sum to 100% due to rounding to the nearest percent. The above Sector allocation uses The Global Industry Classification Standard (GICS®) and may differ from categories listed within the Schedule of Investments. |
| 2) | 0.01% of the amount shown in the Fund’s “Cash” line item reflects the mark-to-market value of the Fund’s derivative positions. |
The allocation of the various strategies employed by the Fund may shift and therefore, the performance shown may not be a true indication of how the Fund may perform going forward. Performance quoted is past performance and is no guarantee of future results. Investment returns and principal value will fluctuate, so shares, when sold, may be worth more or less than original cost. Current performance may be higher or lower than returns shown. As of the latest prospectus, the gross and net expense ratios for the Fund were 0.35% and 0.18% respectively. Contact your J.P. Morgan representative or call 1-212-464-2070 for the most recent month-end performance.
The Fund commenced operations on May 19, 2020.
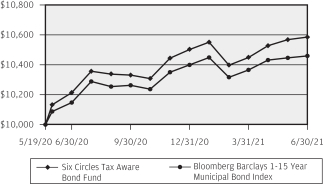
The graph illustrates comparative performance for $10,000 invested in the Six Circles Tax Aware Bond Fund and the Bloomberg Barclays 1-15 Year Municipal Bond Index from May 19, 2020 to June 30, 2021. The performance of the Fund reflects the deduction of Fund expenses and assumes reinvestment of all dividends and capital gain distributions, if any. The performance of the Bloomberg Barclays 1-15 Year Municipal Bond Index does not reflect the deduction of expenses associated with a mutual fund and has been adjusted to reflect reinvestment of all dividends and capital gain distributions of the securities included in the Index, if applicable.
The Bloomberg Barclays 1-15 Year Municipal Bond Index consists of a broad selection of investment grade general obligation and revenue bonds of maturities ranging from one year to 17 years. Investors cannot invest directly in an index.
Fund performance may reflect the waiver of the Fund’s fees and/or reimbursement of expenses for certain periods since the inception date. Without these waivers and reimbursements, performance would have been lower. Also, performance shown in this section does not reflect the deduction of taxes that a shareholder may pay on Fund distributions or redemptions or sales of Fund shares.
The Global Industry Classification Standard (“GICS”) was developed by and is the exclusive property and a service mark of MSCI Inc. (“MSCI”) and Standard & Poor’s, a division of The McGraw-Hill Companies, Inc. (“S&P”) and is licensed for use by JP MORGAN CHASE BANK NA. Neither MSCI, S&P nor any third party involved in making or compiling the GICS or any GICS classifications makes any express or implied warranties or representations with respect to such standard or classification (or the results to be obtained by the use thereof), and all such parties hereby expressly disclaim all warranties of originality, accuracy, completeness, merchantability and fitness for a particular purpose with respect to any of such standard or classification. Without limiting any of the foregoing, in no event shall MSCI, S&P, any of their affiliates or any third party involved in making or compiling the GICS or any GICS classifications have any liability for any direct, indirect, special, punitive, consequential or any other damages (including lost profits) even if notified of the possibility of such damages.
| | | | | | | | | | |
| | | | | |
| JUNE 30, 2021 | | SIX CIRCLES TRUST | | | | | | | | 17 |
Six Circles Credit Opportunities Fund
FUND COMMENTARY
Period January 1, 2021 Through June 30, 2021 (Unaudited)
| | | | |
REPORTING PERIOD RETURN | |
Fund* | | | 2.20% | |
Bloomberg Barclays U.S. Intermediate Corporate Bond Index | | | (0.52)% | |
| |
Net Assets as of 6/30/2021 (In Thousands) | | $ | 3,451,797 | |
Duration | | | 3.27 years | |
INVESTMENT OBJECTIVES AND STRATEGY**
Six Circles Credit Opportunities Fund (the “Fund”) seeks to provide total return. The Fund invests mainly in global fixed income opportunities, including below investment-grade debt, as well as other tactical credit opportunities.
INVESTMENT APPROACH
J.P. Morgan Private Investments Inc., the Fund’s investment adviser (“JPMPI” or the “Adviser”) constructs the Fund’s portfolios by allocating the Fund’s assets among investment strategies managed by one or more sub-advisers retained by the Adviser (each a “Sub-Adviser”).
The Adviser currently engages the following Sub-Advisers:
| • | | BlackRock Investment Management, LLC (“BlackRock”) |
| • | | BlueBay Asset Management LLP (“BlueBay”)(a) |
| • | | Federated Investment Management Company (“Federated”) |
| • | | Lord Abbett & Co, LLC (“Lord Abbett”) |
| • | | Muzinich & Co., Inc. (“Muzinich”)(a) |
| • | | Pacific Investment Management Company LLC (“PIMCO”)(a) |
(a) During the reporting period, the Adviser did not allocate Fund assets to these Sub-Advisers.
The Adviser may adjust allocations to the Sub-Advisers at any time or make recommendations to the Board of Trustees of the Six Circles Trust (the “Board”) with respect to the hiring, termination or replacement of a Sub-Adviser. As such, the identity of the Fund’s Sub-Advisers, the investment strategies they pursue and the portion of the Fund allocated to them, may change over time.
The Fund is specifically designed to serve as a completion portfolio and accomplish particular goals within discretionary portfolios managed by JPMPI or its affiliates (the “Portfolios”). The Adviser utilizes the Fund to express targeted investment views, while taking into consideration positions held at the aggregate level in the broader Portfolios. As such, the Fund’s allocations and performance should be evaluated in the context of the broader Portfolios and not on a standalone basis.
WHAT WERE THE MAIN DRIVERS OF THE FUND’S PERFORMANCE?
During the period January 1, 2021 through June 30, 2021, (the “reporting period”) the Fund posted positive return on an
absolute basis, and outperformed relative to the Bloomberg Barclays U.S. Intermediate Corporate Bond Index (the “Index”). References to the Index are for informational purposes. The use of the Index does not imply the Fund is being managed to the Index, but rather is disclosed to allow for comparison of the Fund’s performance to that of a well-known and widely- recog- nized index.
By sector composition, High Yield was the largest sector exposure in the Fund on a look-through basis and comprised approximately 72% of the Fund at the end of the reporting period. This sector contributed to the Fund’s performance on an absolute basis and relative to the Index during the reporting period.
Investment Grade Corporate Bonds was the largest sector underweight, with approximately 11% of the Fund’s exposure on a look-through basis at the end of the reporting period. During the reporting period, exposure to Investment Grade Corporate Bonds contributed to the Fund’s performance on an absolute basis and relative to the Index.
On the sleeve level, High Yield allocations managed by BlackRock Investment Management, LLC (“BlackRock”) and PGIM, Inc. (“PGIM”) were the largest contributors on an absolute basis during the reporting period.
HOW WAS THE FUND POSITIONED?
At the end of the reporting period, the Fund was allocated to four Sub-Advisers across various sectors, credit ratings, maturity buckets, and regional exposures.
| | | | |
PORTFOLIO ALLOCATION*** | |
High Yield (BlackRock) | | | 37 | % |
High Yield (PGIM) | | | 29 | |
| Short Duration (Lord Abbett) | | | 25 | |
High Yield (Federated) | | | 9 | |
| * | | The return shown is based on the net asset value calculated for shareholder transactions. Certain adjustments were made to the net assets of the Fund at June 30, 2021 for financial reporting purposes, and as a result, the net asset value for shareholder transactions and the total return based on that net asset value may differ from the adjusted net assets and the total return for financial reporting. |
| ** | | The Adviser seeks to achieve the Fund’s objective. There can be no guarantee it will be achieved. |
| *** | | Percentages are based on total investments as of June 30, 2021. The portfolio allocation is subject to change. |
| | | | | | | | | | |
| | | | | |
| 18 | | | | | | | | SIX CIRCLES TRUST | | JUNE 30, 2021 |
Allocations to High Yield managed by BlackRock comprised approximately 37% of the Fund as of June 30, 2021. The Adviser believes that the allocation provides flexibility in the portfolio construction process for adjusting credit quality and sector allocations in response to market movements.
Allocations to High Yield managed by PGIM comprised approximately 29% of the Fund as of June 30, 2021. This allocation provide what the Adviser believes to be a broader market exposure, with potential ability to offer excess returns without taking large sector or credit rating bets.
Allocations to Short Duration managed by Lord Abbett comprised approximately 25% of the Fund as of June 30, 2021. The adviser believes that this allocation provides a higher quality, shorter duration exposure and consists of investment grade and securitized bonds.
The allocation High Yield managed by Federated comprised approximately 9% of the Fund as of June 30, 2021 and provides what the Adviser believes to be a more focused exposure to CCC or B-rated names.
| | | | | | | | |
AVERAGE ANNUAL TOTAL RETURNS
AS OF JUNE 30, 2021 | |
| | | 6 Months* | | | Since
Inception
(August 19, 2020)* | |
| Six Circles Credit Opportunities Fund | | | 2.20 | % | | | 6.40 | % |
GROWTH OF $10,000 REPORT (08/19/2020 TO 06/30/2021)
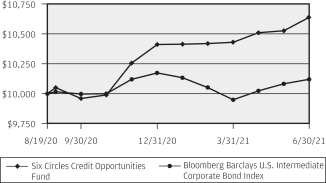
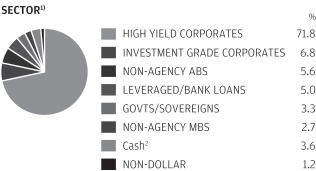
| 1) | Presented percentages may not sum to 100% due to rounding to the nearest percent. The above Sector allocation uses The Global Industry Classification Standard (GICS®) and may differ from categories listed within the Schedule of Investments. |
| 2) | 0.08% of the amount shown in the Fund’s “Cash” line item reflects the mark-to-market value of the Fund’s derivative positions. |
The allocation of the various strategies employed by the Fund may shift and therefore, the performance shown may not be a true indication of how the Fund may perform going forward. Performance quoted is past performance and is no guarantee of future results. Investment returns and principal value will fluctuate, so shares, when sold, may be worth more or less than original cost. Current performance may be higher or lower than returns shown. As of the latest prospectus, the gross and net expense ratios for the Fund were 1.11% and 0.44% respectively. Contact your J.P. Morgan representative or call 1-212-464-2070 for the most recent month-end performance.
The Fund commenced operations on August 19, 2020.
The graph illustrates comparative performance for $10,000 invested in the Six Circles Credit Opportunities Fund and the Bloomberg Barclays U.S. Intermediate Corporate Bond Index from August 19, 2020 to June 30, 2021. The performance of the Fund reflects the deduction of Fund expenses and assumes reinvestment of all dividends and capital gain distributions, if any. The performance of the Bloomberg Barclays U.S. Intermediate Corporate Bond Index does not reflect the deduction of expenses associated with a mutual fund and has been adjusted to reflect reinvestment of all dividends and capital gain distributions of the securities included in the Index, if applicable.
The Bloomberg Barclays U.S. Intermediate Corporate Total Return Bond Index measures the investment grade, fixed-rate, taxable corporate bond market whose maturity ranges between 1 to 9.9999 years. It includes USD denominated securities publicly issued by U.S. and non-U.S. industrial, utility and financial issuers. Investors cannot invest directly in an index.
Fund performance may reflect the waiver of the Fund’s fees and/or reimbursement of expenses for certain periods since the inception date. Without these waivers and reimbursements, performance would have been lower. Also, performance shown in this section does not reflect the deduction of taxes that a shareholder may pay on Fund distributions or redemptions or sales of Fund shares.
The Global Industry Classification Standard (“GICS”) was developed by and is the exclusive property and a service mark of MSCI Inc. (“MSCI”) and Standard & Poor’s, a division of The McGraw-Hill Companies, Inc. (“S&P”) and is licensed for use by JP MORGAN CHASE BANK NA. Neither MSCI, S&P nor any third party involved in making or compiling the GICS or any GICS classifications makes any express or implied warranties or representations with respect to such standard or classification (or the results to be obtained by the use thereof), and all such parties hereby expressly disclaim all warranties of originality, accuracy, completeness, merchantability and fitness for a particular purpose with respect to any of such standard or classification. Without limiting any of the foregoing, in no event shall MSCI, S&P, any of their affiliates or any third party involved in making or compiling the GICS or any GICS classifications have any liability for any direct, indirect, special, punitive, consequential or any other damages (including lost profits) even if notified of the possibility of such damages.
| | | | | | | | | | |
| | | | | |
| JUNE 30, 2021 | | SIX CIRCLES TRUST | | | | | | | | 19 |
Six Circles Ultra Short Duration Fund
SCHEDULE OF PORTFOLIO INVESTMENTS
AS OF JUNE 30, 2021 (Unaudited)
(Amounts in U.S. Dollars, unless otherwise noted)
(Amounts in thousands, except number of Futures contracts)
| | | | | | | | |
| SECURITY DESCRIPTION | | PRINCIPAL
AMOUNT($) | | | VALUE($) | |
Asset-Backed Securities — 13.2% | | | | | | | | |
AMMC CLO XII Ltd., (Cayman Islands), Series 2013-12A, Class AR, (ICE LIBOR USD 3 Month + 1.20%), 1.36%, 11/10/2030 (e) (aa) | | | 1,250 | | | | 1,250 | |
Anchorage Capital CLO Ltd., (Cayman Islands), | | | | | | | | |
Series 2014-3RA, Class A, (ICE LIBOR USD 3 Month + 1.05%), 1.23%, 01/28/2031 (e) (aa) | | | 1,250 | | | | 1,250 | |
Series 2015-7A, Class AR2, (ICE LIBOR USD 3 Month + 1.09%), 1.27%, 01/28/2031 (e) (aa) | | | 1,577 | | | | 1,576 | |
Series 2016-8A, Class AR, (ICE LIBOR USD 3 Month + 1.00%), 1.18%, 07/28/2028 (e) (aa) | | | 1,497 | | | | 1,498 | |
Apidos CLO XXI, (Cayman Islands), Series 2015-21A, Class A1R, (ICE LIBOR USD 3 Month + 0.93%), 1.12%, 07/18/2027 (e) (aa) | | | 668 | | | | 668 | |
Atlas Senior Loan Fund III Ltd., (Cayman Islands), Series 2013-1A, Class AR, (ICE LIBOR USD 3 Month + 0.83%), 0.99%, 11/17/2027 (e) (aa) | | | 338 | | | | 338 | |
Atrium XII, (Cayman Islands), Series 12A, Class AR, (ICE LIBOR USD 3 Month + 0.83%), 1.01%, 04/22/2027 (e) (aa) | | | 906 | | | | 905 | |
Avery Point VI CLO Ltd., (Cayman Islands), Series 2015-6A, Class AR2, (ICE LIBOR USD 3 Month + 0.90%), 1.08%, 08/05/2027 (e) (aa) | | | 1,472 | | | | 1,470 | |
BA Credit Card Trust, Series 2021-A1, Class A1, 0.44%, 09/15/2026 | | | 2,180 | | | | 2,174 | |
Battalion CLO Ltd., (Cayman Islands), Series 2020-18A, Class A1, (ICE LIBOR USD 3 Month + 1.80%), 1.98%, 10/15/2032 (e) (aa) | | | 1,000 | | | | 1,003 | |
Benefit Street Partners CLO VI Ltd., (Cayman Islands), Series 2015-VIA, Class A1R, (ICE LIBOR USD 3 Month + 1.24%), 1.43%, 10/18/2029 (e) (aa) | | | 1,000 | | | | 1,000 | |
Benefit Street Partners CLO VIII Ltd., (Cayman Islands), Series 2015-8A, Class A1AR, (ICE LIBOR USD 3 Month + 1.10%), 1.29%, 01/20/2031 (e) (aa) | | | 1,000 | | | | 1,000 | |
Birch Grove CLO Ltd., (Cayman Islands), | | | | | | | | |
Series 19A, Class A, (ICE LIBOR USD 3 Month + 1.49%), 1.61%, 06/15/2031 (e) (aa) | | | 2,000 | | | | 2,002 | |
Series 19A, Class AR, (ICE LIBOR USD 3 Month + 1.13%), 0.00%, 06/15/2031 (e) (w) (aa) | | | 2,000 | | | | 2,000 | |
BlueMountain CLO Ltd., (Cayman Islands), Series 2012-2A, Class AR2, (ICE LIBOR USD 3 Month + 1.05%), 1.21%, 11/20/2028 (e) (aa) | | | 1,688 | | | | 1,689 | |
| | | | | | | | |
| SECURITY DESCRIPTION | | PRINCIPAL
AMOUNT($) | | | VALUE($) | |
| | | | | | | | |
BMW Canada Auto Trust, (Canada), Series 2020-1A, Class A1, 1.96%, 09/20/2022 (e) | | CAD | 557 | | | | 451 | |
Burnham Park CLO Ltd., (Cayman Islands), Series 2016-1A, Class AR, (ICE LIBOR USD 3 Month + 1.15%), 1.34%, 10/20/2029 (e) (aa) | | | 500 | | | | 500 | |
CarMax Auto Owner Trust, Series 2021-2, Class A3, 0.52%, 02/17/2026 | | | 1,060 | | | | 1,061 | |
CBAM Ltd., (Cayman Islands), Series 2017-3A, Class A, (ICE LIBOR USD 3 Month + 1.23%), 1.42%, 10/17/2029 (e) (aa) | | | 1,140 | | | | 1,140 | |
Chesapeake Funding II LLC, | | | | | | | | |
Series 2018-2A, Class A1, 3.23%, 08/15/2030 (e) | | | 622 | | | | 627 | |
Series 2019-1A, Class A1, 2.94%, 04/15/2031 (e) | | | 620 | | | | 626 | |
Series 2020-1A, Class A2, (ICE LIBOR USD 1 Month + 0.65%), 0.72%, 08/16/2032 (e) (aa) | | | 843 | | | | 847 | |
CIFC Funding Ltd., (Cayman Islands), Series 2014-5A, Class A1R2, (ICE LIBOR USD 3 Month + 1.20%), 1.39%, 10/17/2031 (e) (aa) | | | 750 | | | | 750 | |
CIT Mortgage Loan Trust, Series 2007-1, Class 1A, (ICE LIBOR USD 1 Month + 1.35%), 1.44%, 10/25/2037 (e) (aa) | | | 386 | | | | 389 | |
CNH Equipment Trust, Series 2020-A, Class A2, 1.08%, 07/17/2023 | | | 229 | | | | 230 | |
Credit Acceptance Auto Loan Trust, Series 2021-3A, Class A, 1.00%, 05/15/2030 (e) | | | 350 | | | | 351 | |
Dryden 49 Senior Loan Fund, (Cayman Islands), Series 2017-49A, Class AR, (ICE LIBOR USD 3 Month + 0.95%), 1.14%, 07/18/2030 (e) (aa) | | | 1,500 | | | | 1,499 | |
DT Auto Owner Trust, Series 2020-3A, Class A, 0.54%, 04/15/2024 (e) | | | 1,046 | | | | 1,048 | |
Enterprise Fleet Financing LLC, | | | | | | | | |
Series 2018-2, Class A2, 3.14%, 02/20/2024 (e) | | | 66 | | | | 66 | |
Series 2019-3, Class A2, 2.06%, 05/20/2025 (e) | | | 904 | | | | 916 | |
FirstKey Homes Trust, Series 2020-SFR2, Class A, 1.27%, 10/19/2037 (e) | | | 798 | | | | 797 | |
Ford Auto Securitization Trust, (Canada), Series 2019-BA, Class A2, 2.32%, 10/15/2023 (e) | | CAD | 578 | | | | 470 | |
Ford Credit Auto Lease Trust, Series 2020-B, Class A2B, (ICE LIBOR USD 1 Month + 0.26%), 0.33%, 12/15/2022 (aa) | | | 678 | | | | 678 | |
SEE NOTES TO FINANCIAL STATEMENTS.
| | | | | | | | | | |
| | | | | |
| 20 | | | | | | | | SIX CIRCLES TRUST | | JUNE 30, 2021 |
| | | | | | | | |
| SECURITY DESCRIPTION | | PRINCIPAL
AMOUNT($) | | | VALUE($) | |
Asset-Backed Securities — continued | |
Ford Credit Floorplan Master Owner Trust A, | | | | | | | | |
Series 2018-3, Class A2, (ICE LIBOR USD 1 Month + 0.40%), 0.47%, 10/15/2023 (aa) | | | 3,000 | | | | 3,003 | |
Series 2019-1, Class A, 2.84%, 03/15/2024 | | | 1,400 | | | | 1,426 | |
Series 2019-3, Class A2, (ICE LIBOR USD 1 Month + 0.60%), 0.67%, 09/15/2024 (aa) | | | 2,480 | | | | 2,496 | |
Series 2020-1, Class A1, 0.70%, 09/15/2025 | | | 1,400 | | | | 1,407 | |
Gilbert Park CLO Ltd., (Cayman Islands), Series 2017-1A, Class A, (ICE LIBOR USD 3 Month + 1.19%), 1.37%, 10/15/2030 (e) (aa) | | | 1,650 | | | | 1,650 | |
GMF Canada Leasing Trust, (Canada), Series 2021-1A, Class A2, 0.64%, 03/20/2024 (e) | | CAD | 800 | | | | 645 | |
Home Equity Asset Trust, Series 2005-8, Class M1, (ICE LIBOR USD 1 Month + 0.65%), 0.52%, 02/25/2036 (aa) | | | 413 | | | | 413 | |
Honda Auto Receivables Owner Trust, Series 2018-4, Class A3, 3.16%, 01/17/2023 | | | 244 | | | | 246 | |
ICG US CLO Ltd., (Cayman Islands), Series 2015-1A, Class A1R, (ICE LIBOR USD 3 Month + 1.14%), 1.33%, 10/19/2028 (e) (aa) | | | 953 | | | | 953 | |
John Deere Owner Trust, Series 2020-B, Class A2, 0.41%, 03/15/2023 | | | 728 | | | | 729 | |
KVK CLO Ltd., (Cayman Islands), Series 2018-1A, Class A, (ICE LIBOR USD 3 Month + 0.93%), 1.09%, 05/20/2029 (e) (aa) | | | 297 | | | | 297 | |
Legacy Mortgage Asset Trust, Series 2019-GS3, Class A1, SUB, 3.75%, 04/25/2059 (e) | | | 226 | | | | 228 | |
Master Credit Card Trust, (Canada), Series 2021-1A, Class A, 0.53%, 11/21/2025 (e) | | | 1,500 | | | | 1,496 | |
Navient Private Education Loan Trust, Series 2017-A, Class A2B, (ICE LIBOR USD 1 Month + 0.90%), 0.97%, 12/16/2058 (e) (aa) | | | 558 | | | | 559 | |
Nelnet Student Loan Trust, Series 2019-2A, Class A, (ICE LIBOR USD 1 Month + 0.90%), 0.99%, 06/27/2067 (e) (aa) | | | 1,175 | | | | 1,191 | |
Neuberger Berman Loan Advisers CLO Ltd., (Cayman Islands), Series 2017-26A, Class A, (ICE LIBOR USD 3 Month + 1.17%), 1.36%, 10/18/2030 (e) (aa) | | | 1,900 | | | | 1,901 | |
| | | | | | | | |
| SECURITY DESCRIPTION | | PRINCIPAL
AMOUNT($) | | | VALUE($) | |
| | | | | | | | |
Oscar US Funding XI LLC, (Japan), Series 2019-2A, Class A4, 2.68%, 09/10/2026 (e) | | | 300 | | | | 312 | |
Oscar US Funding XII LLC, (Japan), Series 2021-1A, Class A2, 0.40%, 03/11/2024 (e) | | | 1,500 | | | | 1,499 | |
OZLM XII Ltd., (Cayman Islands), Series 2015-12A, Class A1R, (ICE LIBOR USD 3 Month + 1.05%), 1.24%, 04/30/2027 (e) (aa) | | | 109 | | | | 109 | |
OZLM XIV Ltd., (Cayman Islands), Series 2015-14A, Class A1AR, (ICE LIBOR USD 3 Month + 1.16%), 1.34%, 01/15/2029 (e) (aa) | | | 439 | | | | 439 | |
Palmer Square Loan Funding Ltd., (Cayman Islands), Series 2018-5A, Class A1, (ICE LIBOR USD 3 Month + 0.85%), 1.04%, 01/20/2027 (e) (aa) | | | 699 | | | | 700 | |
Park Place Securities, Inc. Asset-Backed Pass-Through Certificates, Series 2005-WCW2, Class M2, (ICE LIBOR USD 1 Month + 0.80%), 0.89%, 07/25/2035 (aa) | | | 1,320 | | | | 1,319 | |
RR 3 Ltd., (Cayman Islands), Series 2018-3A, Class A1R2, (ICE LIBOR USD 3 Month + 1.09%), 1.27%, 01/15/2030 (e) (aa) | | | 1,000 | | | | 999 | |
Santander Drive Auto Receivables Trust, | | | | | | | | |
Series 2020-4, Class A3, 0.48%, 07/15/2024 | | | 500 | | | | 501 | |
Series 2021-2, Class A2, 0.28%, 04/15/2024 | | | 340 | | | | 340 | |
SLM Student Loan Trust, | | | | | | | | |
Series 2003-10A, Class A3, (ICE LIBOR USD 3 Month + 0.47%), 0.59%, 12/15/2027 (e) (aa) | | | 661 | | | | 661 | |
Series 2004-10, Class A7B, (ICE LIBOR USD 3 Month + 0.60%), 0.78%, 10/25/2029 (e) (aa) | | | 1,512 | | | | 1,514 | |
SMB Private Education Loan Trust, | | | | | | | | |
Series 2015-B, Class A2A, 2.98%, 07/15/2027 (e) | | | 471 | | | | 476 | |
Series 2016-B, Class A2B, (ICE LIBOR USD 1 Month + 1.45%), 1.52%, 02/17/2032 (e) (aa) | | | 1,069 | | | | 1,084 | |
Series 2016-C, Class A2A, 2.34%, 09/15/2034 (e) | | | 753 | | | | 770 | |
Series 2017-A, Class A2B, (ICE LIBOR USD 1 Month + 0.90%), 1.00%, 09/15/2034 (e) (aa) | | | 1,479 | | | | 1,489 | |
Series 2020-PTA, Class A1, (ICE LIBOR USD 1 Month + 0.30%), 0.39%, 09/15/2054 (e) (aa) | | | 340 | | | | 340 | |
Series 2020-PTA, Class A2A, 1.60%, 09/15/2054 (e) | | | 700 | | | | 707 | |
SEE NOTES TO FINANCIAL STATEMENTS.
| | | | | | | | | | |
| | | | | |
| JUNE 30, 2021 | | SIX CIRCLES TRUST | | | | | | | | 21 |
Six Circles Ultra Short Duration Fund
SCHEDULE OF PORTFOLIO INVESTMENTS
AS OF JUNE 30, 2021 (Unaudited) (continued)
(Amounts in U.S. Dollars, unless otherwise noted)
(Amounts in thousands, except number of Futures contracts)
| | | | | | | | |
| SECURITY DESCRIPTION | | PRINCIPAL
AMOUNT($) | | | VALUE($) | |
Asset-Backed Securities — continued | |
Series 2020-PTB, Class A1, (ICE LIBOR USD 1 Month + 0.30%), 0.39%, 09/15/2054 (e) (aa) | | | 258 | | | | 259 | |
Series 2021-C, Class A1, (ICE LIBOR USD 1 Month + 0.40%), 0.49%, 01/15/2053 (e) (aa) | | | 590 | | | | 590 | |
SoFi Consumer Loan Program Trust, Series 2019-3, Class A, 2.90%, 05/25/2028 (e) | | | 104 | | | | 104 | |
SoFi Professional Loan Program LLC, Series 2016-C, Class A2B, 2.36%, 12/27/2032 (e) | | | 381 | | | | 385 | |
SoFi Professional Loan Program Trust, Series 2020-A, Class A1FX, 2.06%, 05/15/2046 (e) | | | 688 | | | | 691 | |
Springleaf Funding Trust, Series 2017-AA, Class A, 2.68%, 07/15/2030 (e) | | | 140 | | | | 141 | |
TCI-Symphony CLO Ltd., (Cayman Islands), Series 2016-1A, Class AR, (ICE LIBOR USD 3 Month + 1.16%), 1.35%, 10/13/2029 (e) (aa) | | | 265 | | | | 265 | |
Toyota Auto Loan Extended Note Trust, Series 2020-1A, Class A, 1.35%, 05/25/2033 (e) | | | 1,500 | | | | 1,525 | |
Venture XVIII CLO Ltd., (Cayman Islands), Series 2014-18A, Class AR, (ICE LIBOR USD 3 Month + 1.22%), 1.40%, 10/15/2029 (e) (aa) | | | 2,100 | | | | 2,100 | |
Verizon Owner Trust, Series 2020-A, Class A1B, (ICE LIBOR USD 1 Month + 0.27%), 0.36%, 07/22/2024 (aa) | | | 520 | | | | 521 | |
Voya CLO Ltd., (Cayman Islands), | | | | | | | | |
Series 2015-2A, Class AR, (ICE LIBOR USD 3 Month + 0.97%), 1.14%, 07/23/2027 (e) (aa) | | | 625 | | | | 625 | |
Series 2018-3A, Class A1A, (ICE LIBOR USD 3 Month + 1.15%), 1.33%, 10/15/2031 (e) (aa) | | | 1,150 | | | | 1,150 | |
VOYA CLO, (Cayman Islands), Series 2017-2A, Class A1R, (ICE LIBOR USD 3 Month + 0.98%), 1.16%, 06/07/2030 (e) (aa) | | | 270 | | | | 270 | |
World Omni Select Auto Trust, Series 2020-A, Class A2, 0.47%, 06/17/2024 | | | 400 | | | | 400 | |
| | | | | | | | |
Total Asset-Backed Securities
(Cost $72,878) | | | | | | | 73,194 | |
| | | | | | | | |
Certificates of Deposit — 2.0% | |
Financial — 2.0% | |
Banks — 2.0% | |
Barclays Bank plc, (United Kingdom), 0.33%, 02/01/2022 | | | 1,900 | | | | 1,901 | |
Credit Suisse AG, (Switzerland), | | | | | | | | |
(United States SOFR + 0.43%), 0.48%, 10/28/2022 (aa) | | | 4,500 | | | | 4,501 | |
0.50%, 10/28/2022 | | | 1,400 | | | | 1,399 | |
| | | | | | | | |
| SECURITY DESCRIPTION | | PRINCIPAL
AMOUNT($) | | | VALUE($) | |
| | | | | | | | |
Banks — continued | |
Sumitomo Mitsui Banking Corp., (Japan), 0.70%, 07/15/2022 | | | 3,000 | | | | 3,013 | |
| | | | | | | | |
Total Financial | | | | | | | 10,814 | |
| | | | | | | | |
Total Certificates of Deposit
(Cost $10,800) | | | | | | | 10,814 | |
| | | | | | | | |
Collateralized Mortgage Obligations — 4.4% | |
Brass NO 8 plc, (United Kingdom), Series 8A, Class A1, (ICE LIBOR USD 3 Month + 0.70%), 0.86%, 11/16/2066 (e) (aa) | | | 132 | | | | 133 | |
Canterbury Finance NO 1 plc, (United Kingdom), Series 1, Class A2, Reg. S, (SONIA Deposit Rates Swap 3 Month + 1.35%), 1.40%, 05/16/2056 (aa) | | GBP | 1,000 | | | | 1,398 | |
COLT Mortgage Loan Trust, Series 2020-1R, Class A1, 1.26%, 09/25/2065 (e) (z) | | | 285 | | | | 286 | |
CSMC Trust, Series 2021-RPL4, Class A1, 1.80%, 12/27/2060 (e) (z) | | | 394 | | | | 395 | |
Finsbury Square plc, (United Kingdom), | | | | | | | | |
Series 2018-2, Class A, Reg. S, (ICE LIBOR GBP 3 Month + 0.95%), 1.03%, 09/12/2068 (aa) | | GBP | 255 | | | | 354 | |
Series 2019-3, Class A, Reg. S, (SONIA Deposit Rates Swap 3 Month + 1.01%), 1.06%, 12/16/2069 (aa) | | GBP | 251 | | | | 350 | |
Series 2020-2A, Class A, (SONIA Deposit Rates Swap 3 Month + 1.30%), 1.35%, 06/16/2070 (e) (aa) | | GBP | 443 | | | | 619 | |
FNMA REMICS, Series 2020-29, Class FC, (ICE LIBOR USD 1 Month + 0.80%), 0.91%, 05/25/2050 (aa) | | | 2,402 | | | | 2,423 | |
GCAT LLC, Series 2020-3, Class A1, SUB, 2.98%, 09/25/2025 (e) | | | 897 | | | | 905 | |
GNMA, | | | | | | | | |
Series 2015-H04, Class FA, (ICE LIBOR USD 1 Month + 0.65%), 0.76%, 12/20/2064 (aa) | | | 1,643 | | | | 1,662 | |
Series 2017-121, Class PE, 3.00%, 07/20/2046 | | | 562 | | | | 575 | |
Series 2018-H18, Class FC, (ICE LIBOR USD 1 Month + 0.35%), 0.46%, 08/20/2065 (aa) | | | 2,193 | | | | 2,196 | |
Series 2019-54, Class KF, (ICE LIBOR USD 1 Month + 0.42%), 0.51%, 05/20/2044 (aa) | | | 653 | | | | 654 | |
Series 2021-H09, Class FG, (United States 30 Day Average SOFR + 1.50%), 1.51%, 06/20/2071 (aa) (bb) (cc) | | | 1,600 | | | | 1,742 | |
GS Mortgage-Backed Securities Corp. Trust, Series 2021-RPL1, Class A1, 1.75%, 12/25/2060 (e) (z) | | | 476 | | | | 483 | |
SEE NOTES TO FINANCIAL STATEMENTS.
| | | | | | | | | | |
| | | | | |
| 22 | | | | | | | | SIX CIRCLES TRUST | | JUNE 30, 2021 |
| | | | | | | | |
| SECURITY DESCRIPTION | | PRINCIPAL
AMOUNT($) | | | VALUE($) | |
Collateralized Mortgage Obligations — continued | |
Lanark Master Issuer plc, (United Kingdom), Series 2019-1A, Class 1A1, (ICE LIBOR USD 3 Month + 0.77%), 0.92%, 12/22/2069 (e) (aa) | | | 750 | | | | 751 | |
Legacy Mortgage Asset Trust, Series 2021-GS3, Class A1, SUB, 1.75%, 07/25/2061 (e) | | | 1,484 | | | | 1,480 | |
London Wall Mortgage Capital plc, (United Kingdom), Series 2017-FL1, Class A, Reg. S, (ICE LIBOR GBP 3 Month + 0.85%), 0.94%, 11/15/2049 (aa) | | GBP | 62 | | | | 86 | |
MFA Trust, Series 2021-RPL1, Class A1, 1.13%, 07/25/2060 (e) (z) | | | 588 | | | | 586 | |
New Residential Mortgage Loan Trust, | | | | | | | | |
Series 2018-3A, Class A1, 4.50%, 05/25/2058 (e) (z) | | | 170 | | | | 185 | |
Series 2021-NQ2R, Class A1, 0.94%, 09/25/2058 (e) (z) | | | 1,475 | | | | 1,474 | |
Polaris RMBS, (United Kingdom), Series 2019-1, Class A, Reg. S, (SONIA Deposit Rates Swap 1 Month + 1.25%), 1.30%, 04/27/2057 (aa) | | GBP | 508 | | | | 706 | |
Pretium Mortgage Credit Partners LLC, Series 2021-RN1, Class A1, SUB, 1.99%, 02/25/2061 (e) | | | 400 | | | | 399 | |
Ripon Mortgages plc, (United Kingdom), Series 1X, Class A1, Reg. S, (ICE LIBOR GBP 3 Month + 0.80%), 0.88%, 08/20/2056 (aa) | | GBP | 183 | | | | 253 | |
Sage AR Funding No 1 plc, (United Kingdom), Series 1A, Class A, (SONIA Interest Rate Benchmark + 1.25%), 1.30%, 11/17/2030 (e) (aa) | | GBP | 800 | | | | 1,109 | |
Silverstone Master Issuer plc, (United Kingdom), Series 2019-1A, Class 1A, (ICE LIBOR USD 3 Month + 0.57%), 0.76%, 01/21/2070 (e) (aa) | | | 127 | | | | 127 | |
Starwood Mortgage Residential Trust, | | | | | | | | |
Series 2020-3, Class A1, 1.49%, 04/25/2065 (e) (z) | | | 633 | | | | 639 | |
Series 2020-INV1, Class A1, 1.03%, 11/25/2055 (e) (z) | | | 350 | | | | 350 | |
Series 2021-2, Class A1, 0.94%, 05/25/2065 (e) (z) | | | 725 | | | | 725 | |
Stratton Mortgage Funding, (United Kingdom), Series 2021-2A, Class A, (SONIA Deposit Rates Swap 3 Month + 0.90%), 0.95%, 07/20/2060 (e) (aa) | | GBP | 194 | | | | 270 | |
Towd Point Mortgage Funding, (United Kingdom), Series 2019-A13A, Class A1, (SONIA Deposit Rates Swap 3 Month + 0.90%), 0.95%, 07/20/2045 (e) (aa) | | GBP | 776 | | | | 1,077 | |
| | | | | | | | |
Total Collateralized Mortgage Obligations (Cost $23,858) | | | | | | | 24,392 | |
| | | | | | | | |
| | | | | | | | |
| SECURITY DESCRIPTION | | PRINCIPAL
AMOUNT($) | | | VALUE($) | |
Commercial Mortgage-Backed Securities — 4.2% | |
AREIT Trust, Series 2019-CRE3, Class A, (ICE LIBOR USD 1 Month + 1.02%), 1.14%, 09/14/2036 (e) (aa) | | | 500 | | | | 500 | |
BAMLL Commercial Mortgage Securities Trust, Series 2019-RLJ, Class A, (ICE LIBOR USD 1 Month + 1.05%), 1.12%, 04/15/2036 (e) (aa) | | | 400 | | | | 399 | |
BX Commercial Mortgage Trust, Series 2018-IND, Class A, (ICE LIBOR USD 1 Month + 0.75%), 0.82%, 11/15/2035 (e) (aa) | | | 997 | | | | 997 | |
CFCRE Commercial Mortgage Trust, Series 2016-C4, Class ASB, 3.09%, 05/10/2058 | | | 1,180 | | | | 1,238 | |
Citigroup Commercial Mortgage Trust, Series 2013-GC15, Class A4, 4.37%, 09/10/2046 (z) | | | 1,000 | | | | 1,074 | |
COMM, Series 2013-GAM, Class A2, 3.37%, 02/10/2028 (e) | | | 1,385 | | | | 1,380 | |
COMM Mortgage Trust, | | | | | | | | |
Series 2013-CR8, Class A5, 3.61%, 06/10/2046 (z) | | | 418 | | | | 439 | |
Series 2013-CR11, Class A4, 4.26%, 08/10/2050 | | | 750 | | | | 804 | |
Series 2013-CR12, Class A4, 4.05%, 10/10/2046 | | | 260 | | | | 278 | |
Series 2014-UBS2, Class ASB, 3.47%, 03/10/2047 | | | 1,064 | | | | 1,105 | |
Series 2014-UBS3, Class A4, 3.82%, 06/10/2047 | | | 1,600 | | | | 1,727 | |
Series 2015-CR23, Class A2, 2.85%, 05/10/2048 | | | 573 | | | | 577 | |
Series 2015-LC19, Class A2, 2.79%, 02/10/2048 | | | 431 | | | | 431 | |
Series 2015-LC19, Class ASB, 3.04%, 02/10/2048 | | | 428 | | | | 445 | |
GS Mortgage Securities Trust, | | | | | | | | |
Series 2012-GCJ9, Class A3, 2.77%, 11/10/2045 | | | 971 | | | | 992 | |
Series 2013-GC14, Class A3, 3.53%, 08/10/2046 | | | 147 | | | | 147 | |
Series 2013-GC16, Class A4, 4.27%, 11/10/2046 | | | 1,000 | | | | 1,072 | |
JP Morgan Chase Commercial Mortgage Securities Corp., Series 2018-AON, Class A, 4.13%, 07/05/2031 (e) | | | 1,000 | | | | 1,061 | |
Morgan Stanley Bank of America Merrill Lynch Trust, | | | | | | | | |
Series 2013-C10, Class ASB, 3.91%, 07/15/2046 (z) | | | 144 | | | | 148 | |
Series 2013-C11, Class AAB, 3.85%, 08/15/2046 | | | 451 | | | | 466 | |
Morgan Stanley Capital I Trust, | | | | | | | | |
Series 2012-C4, Class AS, 3.77%, 03/15/2045 | | | 1,400 | | | | 1,424 | |
SEE NOTES TO FINANCIAL STATEMENTS.
| | | | | | | | | | |
| | | | | |
| JUNE 30, 2021 | | SIX CIRCLES TRUST | | | | | | | | 23 |
Six Circles Ultra Short Duration Fund
SCHEDULE OF PORTFOLIO INVESTMENTS
AS OF JUNE 30, 2021 (Unaudited) (continued)
(Amounts in U.S. Dollars, unless otherwise noted)
(Amounts in thousands, except number of Futures contracts)
| | | | | | | | |
| SECURITY DESCRIPTION | | PRINCIPAL
AMOUNT($) | | | VALUE($) | |
Commercial Mortgage-Backed Securities — continued | |
Series 2019-PLND, Class A, (ICE LIBOR USD 1 Month + 1.00%), 1.07%, 05/15/2036 (e) (aa) | | | 700 | | | | 697 | |
PFP Ltd., (Cayman Islands), Series 2019-5, Class A, (ICE LIBOR USD 1 Month + 0.97%), 1.04%, 04/14/2036 (e) (aa) | | | 543 | | | | 542 | |
Wells Fargo Commercial Mortgage Trust, | | | | | | | | |
Series 2012-LC5, Class ASB, 2.53%, 10/15/2045 | | | 488 | | | | 492 | |
Series 2013-LC12, Class A3FL, (ICE LIBOR USD 1 Month + 1.05%), 1.13%, 07/15/2046 (e) (aa) | | | 749 | | | | 748 | |
Series 2015-NXS2, Class A2, 3.02%, 07/15/2058 | | | 423 | | | | 432 | |
Series 2016-NXS5, Class A2, 2.71%, 01/15/2059 | | | 8 | | | | 8 | |
WFRBS Commercial Mortgage Trust, | | | | | | | | |
Series 2012-C9, Class A3, 2.87%, 11/15/2045 | | | 1,654 | | | | 1,690 | |
Series 2013-C12, Class ASB, 2.84%, 03/15/2048 | | | 595 | | | | 605 | |
Series 2013-C18, Class A5, 4.16%, 12/15/2046 (z) | | | 1,250 | | | | 1,348 | |
| | | | | | | | |
Total Commercial Mortgage-Backed Securities
(Cost $23,315) | | | | | | | 23,266 | |
| | | | | | | | |
Corporate Bonds — 52.3% | | | | | | | | |
Basic Materials — 0.9% | | | | | | | | |
Chemicals — 0.9% | | | | | | | | |
International Flavors & Fragrances, Inc., 0.70%, 09/15/2022 (e) | | | 2,400 | | | | 2,401 | |
LYB International Finance III LLC, (ICE LIBOR USD 3 Month + 1.00%), 1.14%, 10/01/2023 (aa) | | | 2,400 | | | | 2,404 | |
| | | | | | | | |
Total Basic Materials | | | | | | | 4,805 | |
| | | | | | | | |
Communications — 3.9% | | | | | | | | |
Internet — 0.1% | | | | | | | | |
SK Broadband Co. Ltd., (South Korea), Reg. S, 3.88%, 08/13/2023 | | | 400 | | | | 425 | |
| | | | | | | | |
Media — 1.6% | | | | | | | | |
Charter Communications Operating LLC / Charter Communications Operating Capital, | | | | | | | | |
(ICE LIBOR USD 3 Month + 1.65%), 1.83%, 02/01/2024 (aa) | | | 3,200 | | | | 3,290 | |
4.46%, 07/23/2022 | | | 5,250 | | | | 5,435 | |
| | | | | | | | |
| | |
| | | | | | | 8,725 | |
| | | | | | | | |
Telecommunications — 2.2% | | | | | | | | |
AT&T, Inc., | | | | | | | | |
(United States SOFR + 0.64%), 0.69%, 03/25/2024 (aa) | | | 3,750 | | | | 3,759 | |
(ICE LIBOR USD 3 Month + 1.18%), 1.30%, 06/12/2024 (aa) | | | 4,000 | | | | 4,102 | |
| | | | | | | | |
| SECURITY DESCRIPTION | | PRINCIPAL
AMOUNT($) | | | VALUE($) | |
| | | | | | | | |
Telecommunications — continued | |
NTT Finance Corp., (Japan), 0.37%, 03/03/2023 (e) | | | 2,500 | | | | 2,500 | |
SK Telecom Co. Ltd., (South Korea), Reg. S, 3.75%, 04/16/2023 | | | 400 | | | | 421 | |
Sprint Spectrum Co. LLC / Sprint Spectrum Co. II LLC / Sprint Spectrum Co. III LLC, 3.36%, 09/20/2021 (e) | | | 30 | | | | 30 | |
Verizon Communications, Inc., | | | | | | | | |
(ICE LIBOR USD 3 Month + 1.10%), 1.26%, 05/15/2025 (aa) | | | 200 | | | | 206 | |
Reg. S, (BBSW ASX Australian 3 Month + 1.22%), 1.26%, 02/17/2023 (aa) | | AUD | 1,800 | | | | 1,361 | |
| | | | | | | | |
| | |
| | | | | | | 12,379 | |
| | | | | | | | |
Total Communications | | | | | | | 21,529 | |
| | | | | | | | |
Consumer Cyclical — 6.4% | | | | | | | | |
Auto Manufacturers — 6.0% | | | | | | | | |
BMW Finance NV, (Netherlands), 2.25%, 08/12/2022 (e) | | | 1,100 | | | | 1,123 | |
Daimler Finance North America LLC, | | | | | | | | |
Reg. S, (ICE LIBOR USD 3 Month + 0.67%), 0.85%, 11/05/2021 (aa) | | | 300 | | | | 301 | |
1.75%, 03/10/2023 (e) | | | 1,800 | | | | 1,837 | |
2.55%, 08/15/2022 (e) | | | 3,250 | | | | 3,326 | |
General Motors Financial Co., Inc., | | | | | | | | |
(ICE LIBOR USD 3 Month + 1.10%), 1.28%, 11/06/2021 (aa) | | | 730 | | | | 732 | |
3.45%, 04/10/2022 | | | 2,000 | | | | 2,037 | |
3.55%, 07/08/2022 | | | 4,750 | | | | 4,902 | |
Hyundai Capital America, 0.80%, 04/03/2023 (e) | | | 2,790 | | | | 2,789 | |
Nissan Motor Acceptance Corp., | | | | | | | | |
(ICE LIBOR USD 3 Month + 0.64%), 0.77%, 03/08/2024 (e) (aa) | | | 875 | | | | 876 | |
(ICE LIBOR USD 3 Month + 0.69%), 0.84%, 09/28/2022 (e) (aa) | | | 1,800 | | | | 1,802 | |
(ICE LIBOR USD 3 Month + 0.65%), 0.84%, 07/13/2022 (e) (aa) | | | 600 | | | | 601 | |
1.05%, 03/08/2024 (e) | | | 1,170 | | | | 1,162 | |
(ICE LIBOR USD 3 Month + 0.89%), 1.08%, 01/13/2022 (e) (aa) | | | 40 | | | | 40 | |
Stellantis NV, (Netherlands), 5.25%, 04/15/2023 | | | 2,000 | | | | 2,157 | |
Toyota Motor Credit Corp., 3.30%, 01/12/2022 | | | 1,100 | | | | 1,118 | |
Volkswagen Group of America Finance LLC, | | | | | | | | |
0.75%, 11/23/2022 (e) | | | 6,000 | | | | 6,023 | |
(ICE LIBOR USD 3 Month + 0.86%), 0.99%, 09/24/2021 (e) (aa) | | | 1,000 | | | | 1,002 | |
2.70%, 09/26/2022 (e) | | | 200 | | | | 206 | |
2.90%, 05/13/2022 (e) | | | 1,250 | | | | 1,276 | |
| | | | | | | | |
| | |
| | | | | | | 33,310 | |
| | | | | | | | |
SEE NOTES TO FINANCIAL STATEMENTS.
| | | | | | | | | | |
| | | | | |
| 24 | | | | | | | | SIX CIRCLES TRUST | | JUNE 30, 2021 |
| | | | | | | | |
| SECURITY DESCRIPTION | | PRINCIPAL
AMOUNT($) | | | VALUE($) | |
Corporate Bonds — continued | |
Lodging — 0.4% | | | | | | | | |
Marriott International, Inc., Series N, 3.13%, 10/15/2021 | | | 2,000 | | | | 2,002 | |
| | | | | | | | |
Total Consumer Cyclical | | | | | | | 35,312 | |
| | | | | | | | |
Consumer Non-cyclical — 7.9% | |
Agriculture — 1.3% | |
BAT Capital Corp., (ICE LIBOR USD 3 Month + 0.88%), 1.04%, 08/15/2022 (aa) | | | 3,200 | | | | 3,220 | |
Imperial Brands Finance plc, (United Kingdom), 3.75%, 07/21/2022 (e) | | | 2,800 | | | | 2,873 | |
JT International Financial Services BV, (Netherlands), Reg. S, 3.50%, 09/28/2023 | | | 1,000 | | | | 1,061 | |
| | | | | | | | |
| | |
| | | | | | | 7,154 | |
| | | | | | | | |
Biotechnology — 0.2% | |
Gilead Sciences, Inc., 2.50%, 09/01/2023 | | | 782 | | | | 814 | |
| | | | | | | | |
Commercial Services — 0.5% | |
Equifax, Inc., (ICE LIBOR USD 3 Month + 0.87%), 1.03%, 08/15/2021 (aa) | | | 2,800 | | | | 2,802 | |
| | | | | | | | |
Food — 2.4% | |
General Mills, Inc., | | | | | | | | |
(ICE LIBOR USD 3 Month + 1.01%), 1.20%, 10/17/2023 (aa) | | | 1,797 | | | | 1,829 | |
2.60%, 10/12/2022 | | | 915 | | | | 938 | |
6.41%, 10/15/2022 | | | 500 | | | | 536 | |
Kroger Co. (The), 2.80%, 08/01/2022 | | | 3,000 | | | | 3,072 | |
Mondelez International Holdings Netherlands BV, (Netherlands), 2.00%, 10/28/2021 (e) | | | 6,000 | | | | 6,026 | |
Tyson Foods, Inc., 4.50%, 06/15/2022 | | | 792 | | | | 815 | |
| | | | | | | | |
| | |
| | | | | | | 13,216 | |
| | | | | | | | |
Healthcare — Services — 1.0% | |
Anthem, Inc., | | | | | | | | |
2.95%, 12/01/2022 | | | 1,500 | | | | 1,551 | |
3.13%, 05/15/2022 | | | 4,149 | | | | 4,251 | |
| | | | | | | | |
| | |
| | | | | | | 5,802 | |
| | | | | | | | |
Pharmaceuticals — 2.5% | |
AbbVie, Inc., | | | | | | | | |
2.90%, 11/06/2022 | | | 3,500 | | | | 3,615 | |
5.00%, 12/15/2021 | | | 3,455 | | | | 3,488 | |
Bayer US Finance II LLC, (ICE LIBOR USD 3 Month + 1.01%), 1.13%, 12/15/2023 (e) (aa) | | | 2,700 | | | | 2,738 | |
Becton Dickinson and Co., (ICE LIBOR USD 3 Month + 1.03%), 1.16%, 06/06/2022 (aa) | | | 945 | | | | 953 | |
Cigna Corp., 3.75%, 07/15/2023 | | | 1,624 | | | | 1,729 | |
CVS Health Corp., 3.50%, 07/20/2022 | | | 279 | | | | 287 | |
Takeda Pharmaceutical Co. Ltd., (Japan), 4.40%, 11/26/2023 | | | 1,000 | | | | 1,085 | |
| | | | | | | | |
| | |
| | | | | | | 13,895 | |
| | | | | | | | |
Total Consumer Non-cyclical | | | | | | | 43,683 | |
| | | | | | | | |
| | | | | | | | |
| SECURITY DESCRIPTION | | PRINCIPAL
AMOUNT($) | | | VALUE($) | |
| | | | | | | | |
Diversified — 0.2% | |
Holding Companies—Diversified —0.2% | | | | | | | | |
Hutchison Whampoa International 12 II Ltd., (Cayman Islands), Reg. S, 3.25%, 11/08/2022 | | | 900 | | | | 933 | |
| | | | | | | | |
Energy — 2.0% | |
Oil & Gas — 1.3% | |
BG Energy Capital plc, (United Kingdom), 4.00%, 10/15/2021 (e) | | | 750 | | | | 758 | |
Cenovus Energy, Inc., (Canada), 3.80%, 09/15/2023 | | | 1,900 | | | | 2,004 | |
Diamondback Energy, Inc., 0.90%, 03/24/2023 | | | 900 | | | | 900 | |
Dolphin Energy Ltd. LLC, (United Arab Emirates), Reg. S, 5.50%, 12/15/2021 | | | 1,500 | | | | 1,532 | |
Phillips 66, 0.90%, 02/15/2024 | | | 1,800 | | | | 1,803 | |
| | | | | | | | |
| | |
| | | | | | | 6,997 | |
| | | | | | | | |
Pipelines — 0.7% | |
Enbridge, Inc., (Canada), | | | | | | | | |
(United States SOFR + 0.40%), 0.43%, 02/17/2023 (aa) | | | 375 | | | | 376 | |
4.00%, 10/01/2023 | | | 1,750 | | | | 1,867 | |
Williams Cos., Inc. (The), 3.60%, 03/15/2022 | | | 1,500 | | | | 1,525 | |
| | | | | | | | |
| | |
| | | | | | | 3,768 | |
| | | | | | | | |
Total Energy | | | | | | | 10,765 | |
| | | | | | | | |
Financial — 25.7% | |
Banks — 21.7% | |
Banco Santander Chile, (Chile), (ICE LIBOR USD 3 Month + 1.20%), 1.34%, 11/28/2021 (aa) | | | 3,000 | | | | 3,008 | |
Banco Santander SA, (Spain), | | | | | | | | |
(CMT Index 1 Year + 0.45%), 0.70%, 06/30/2024 (aa) | | | 1,200 | | | | 1,202 | |
3.85%, 04/12/2023 | | | 3,400 | | | | 3,594 | |
Bank of America Corp., | | | | | | | | |
(ICE LIBOR USD 3 Month + 0.96%), 1.13%, 07/23/2024 (aa) | | | 1,500 | | | | 1,521 | |
(Canada Bankers Acceptances 3 Month + 1.13%), 2.60%, 03/15/2023 (f) (aa) | | CAD | 1,000 | | | | 819 | |
(ICE LIBOR USD 3 Month + 0.79%), 3.00%, 12/20/2023 (aa) | | | 4,500 | | | | 4,663 | |
Barclays plc, (United Kingdom), | | | | | | | | |
(ICE LIBOR USD 3 Month + 1.38%), 1.54%, 05/16/2024 (aa) | | | 4,400 | | | | 4,480 | |
Reg. S, (BBSW ASX Australian 3 Month + 1.80%), 1.82%, 06/15/2023 (aa) | | AUD | 1,000 | | | | 766 | |
(ICE LIBOR USD 3 Month + 1.40%), 4.61%, 02/15/2023 (aa) | | | 3,600 | | | | 3,691 | |
BNP Paribas SA, (France), Reg. S, (BBSW ASX Australian 3 Month + 1.75%), 1.77%, 12/16/2022 (aa) | | AUD | 500 | | | | 381 | |
SEE NOTES TO FINANCIAL STATEMENTS.
| | | | | | | | | | |
| | | | | |
| JUNE 30, 2021 | | SIX CIRCLES TRUST | | | | | | | | 25 |
Six Circles Ultra Short Duration Fund
SCHEDULE OF PORTFOLIO INVESTMENTS
AS OF JUNE 30, 2021 (Unaudited) (continued)
(Amounts in U.S. Dollars, unless otherwise noted)
(Amounts in thousands, except number of Futures contracts)
| | | | | | | | |
| SECURITY DESCRIPTION | | PRINCIPAL
AMOUNT($) | | | VALUE($) | |
Corporate Bonds — continued | |
Banks — continued | |
BPCE SA, (France), | | | | | | | | |
(ICE LIBOR USD 3 Month + 1.24%), 1.36%, 09/12/2023 (e) (aa) | | | 1,000 | | | | 1,020 | |
(ICE LIBOR USD 3 Month + 1.22%), 1.37%, 05/22/2022 (e) (aa) | | | 1,000 | | | | 1,009 | |
3.00%, 05/22/2022 (e) | | | 1,000 | | | | 1,024 | |
Canadian Imperial Bank of Commerce, (Canada), 0.45%, 06/22/2023 | | | 2,200 | | | | 2,199 | |
CIT Group, Inc., 5.00%, 08/15/2022 | | | 200 | | | | 209 | |
Citigroup, Inc., | | | | | | | | |
(ICE LIBOR USD 3 Month + 0.95%), 1.13%, 07/24/2023 (aa) | | | 700 | | | | 706 | |
(ICE LIBOR USD 3 Month + 1.07%), 1.20%, 12/08/2021 (aa) | | | 2,000 | | | | 2,007 | |
(United States SOFR + 1.67%), 1.68%, 05/15/2024 (aa) | | | 1,250 | | | | 1,276 | |
(United States SOFR + 0.87%), 2.31%, 11/04/2022 (aa) | | | 700 | | | | 704 | |
(ICE LIBOR USD 3 Month + 0.72%), 3.14%, 01/24/2023 (aa) | | | 4,233 | | | | 4,297 | |
Citizens Bank NA, 3.25%, 02/14/2022 | | | 2,000 | | | | 2,032 | |
Credit Suisse Group AG, (Switzerland), 3.80%, 06/09/2023 | | | 1,000 | | | | 1,060 | |
Credit Suisse Group Funding Guernsey Ltd., (Guernsey), 3.80%, 09/15/2022 | | | 2,340 | | | | 2,435 | |
Danske Bank A/S, (Denmark), | | | | | | | | |
Reg. S, (ICE LIBOR USD 3 Month + 1.06%), 1.18%, 09/12/2023 (aa) | | | 500 | | | | 505 | |
(ICE LIBOR USD 3 Month + 1.25%), 3.00%, 09/20/2022 (e) (aa) | | | 1,000 | | | | 1,005 | |
Deutsche Bank AG, (Germany), 3.95%, 02/27/2023 | | | 1,500 | | | | 1,574 | |
Federation des Caisses Desjardins du Quebec, (Canada), (United States SOFR + 0.43%), 0.47%, 05/21/2024 (e) (aa) | | | 1,900 | | | | 1,905 | |
First Abu Dhabi Bank PJSC, (United Arab Emirates), Reg. S, (ICE LIBOR USD 3 Month + 0.95%), 1.13%, 04/16/2022 (aa) | | | 1,700 | | | | 1,706 | |
Goldman Sachs Group, Inc. (The), | | | | | | | | |
0.48%, 01/27/2023 | | | 2,650 | | | | 2,651 | |
0.52%, 03/08/2023 | | | 4,000 | | | | 4,003 | |
(ICE LIBOR USD 3 Month + 0.75%), 0.90%, 02/23/2023 (aa) | | | 1,000 | | | | 1,009 | |
3.20%, 02/23/2023 | | | 1,516 | | | | 1,582 | |
Hana Bank, (South Korea), (ICE LIBOR USD 3 Month + 0.70%), 0.85%, 10/02/2022 (e) (aa) | | | 400 | | | | 402 | |
HSBC Holdings plc, (United Kingdom), | | | | | | | | |
(ICE LIBOR USD 3 Month + 1.00%), 1.16%, 05/18/2024 (aa) | | | 3,000 | | | | 3,039 | |
(ICE LIBOR USD 3 Month + 1.23%), 1.35%, 03/11/2025 (aa) | | | 1,000 | | | | 1,020 | |
3.60%, 05/25/2023 | | | 1,500 | | | | 1,588 | |
| | | | | | | | |
| SECURITY DESCRIPTION | | PRINCIPAL
AMOUNT($) | | | VALUE($) | |
| | | | | | | | |
Banks — continued | |
Lloyds Banking Group plc, (United Kingdom), (ICE LIBOR USD 3 Month + 1.25%), 2.86%, 03/17/2023 (aa) | | | 4,600 | | | | 4,679 | |
Mitsubishi UFJ Financial Group, Inc., (Japan), | | | | | | | | |
(ICE LIBOR USD 3 Month + 0.86%), 1.04%, 07/26/2023 (aa) | | | 2,300 | | | | 2,331 | |
3.22%, 03/07/2022 | | | 3,000 | | | | 3,061 | |
Mizuho Financial Group, Inc., (Japan), | | | | | | | | |
(ICE LIBOR USD 3 Month + 0.63%), 0.78%, 05/25/2024 (aa) | | | 5,000 | | | | 5,029 | |
(ICE LIBOR USD 3 Month + 0.94%), 1.08%, 02/28/2022 (aa) | | | 1,000 | | | | 1,006 | |
3.55%, 03/05/2023 | | | 2,500 | | | | 2,629 | |
Morgan Stanley, | | | | | | | | |
(United States SOFR + 0.46%), 0.53%, 01/25/2024 (aa) | | | 3,000 | | | | 2,999 | |
(United States SOFR + 0.70%), 0.72%, 01/20/2023 (aa) | | | 900 | | | | 902 | |
(Canada Bankers Acceptances 3 Month + 0.30%), 0.74%, 02/03/2023 (f) (aa) | | CAD | 1,800 | | | | 1,454 | |
(ICE LIBOR USD 3 Month + 0.93%), 1.11%, 07/22/2022 (aa) | | | 700 | | | | 700 | |
3.75%, 02/25/2023 | | | 1,000 | | | | 1,054 | |
Natwest Group plc, (United Kingdom), | | | | | | | | |
(ICE LIBOR USD 3 Month + 1.47%), 1.63%, 05/15/2023 (aa) | | | 400 | | | | 404 | |
(ICE LIBOR USD 3 Month + 1.55%), 1.70%, 06/25/2024 (aa) | | | 1,750 | | | | 1,790 | |
(ICE LIBOR USD 3 Month + 1.48%), 3.50%, 05/15/2023 (aa) | | | 1,000 | | | | 1,026 | |
3.88%, 09/12/2023 | | | 3,000 | | | | 3,204 | |
NatWest Markets plc, (United Kingdom), (United States SOFR + 1.66%), 1.71%, 09/29/2022 (e) (aa) | | | 2,100 | | | | 2,138 | |
Nordea Bank Abp, (Finland), (ICE LIBOR USD 3 Month + 0.94%), 1.08%, 08/30/2023 (e) (aa) | | | 200 | | | | 202 | |
QNB Finance Ltd., (Cayman Islands), Reg. S, (ICE LIBOR USD 3 Month + 1.00%), 1.18%, 05/02/2022 (aa) | | | 800 | | | | 803 | |
Royal Bank of Canada, (Canada), (United States SOFR + 0.30%), 0.32%, 01/19/2024 (aa) | | | 800 | | | | 801 | |
Santander UK Group Holdings plc, (United Kingdom), 3.57%, 01/10/2023 | | | 1,000 | | | | 1,016 | |
Shinhan Bank Co. Ltd., (South Korea), Reg. S, 2.88%, 03/28/2022 | | | 1,900 | | | | 1,931 | |
Standard Chartered plc, (United Kingdom), | | | | | | | | |
Reg. S, (ICE LIBOR USD 3 Month + 1.20%), 1.33%, 09/10/2022 (aa) | | | 300 | | | | 301 | |
(ICE LIBOR USD 3 Month + 1.56%), 3.79%, 05/21/2025 (e) (aa) | | | 1,600 | | | | 1,720 | |
SEE NOTES TO FINANCIAL STATEMENTS.
| | | | | | | | | | |
| | | | | |
| 26 | | | | | | | | SIX CIRCLES TRUST | | JUNE 30, 2021 |
| | | | | | | | |
| SECURITY DESCRIPTION | | PRINCIPAL
AMOUNT($) | | | VALUE($) | |
Corporate Bonds — continued | |
Banks — continued | |
Synchrony Bank, 3.00%, 06/15/2022 | | | 300 | | | | 307 | |
Truist Bank, (ICE LIBOR USD 3 Month + 0.59%), 0.75%, 05/17/2022 (aa) | | | 1,000 | | | | 1,005 | |
UBS AG, (Switzerland), | | | | | | | | |
0.38%, 06/01/2023 (e) | | | 1,000 | | | | 999 | |
Reg. S, (BBSW ASX Australian 3 Month + 0.87%), 0.91%, 07/30/2025 (aa) | | AUD | 2,100 | | | | 1,596 | |
UBS Group AG, (Switzerland), (ICE LIBOR USD 3 Month + 0.95%), 2.86%, 08/15/2023 (e) (aa) | | | 3,500 | | | | 3,591 | |
Wells Fargo & Co., | | | | | | | | |
(United States SOFR + 1.60%), 1.65%, 06/02/2024 (aa) | | | 3,000 | | | | 3,064 | |
2.51%, 10/27/2023 (f) | | CAD | 2,500 | | | | 2,080 | |
| | | | | | | | |
| | |
| | | | | | | 119,914 | |
| | | | | | | | |
Diversified Financial Services — 4.0% | | | | | | | | |
AerCap Ireland Capital DAC / AerCap Global Aviation Trust, (Ireland), | | | | | | | | |
4.13%, 07/03/2023 | | | 1,500 | | | | 1,591 | |
4.45%, 12/16/2021 | | | 700 | | | | 711 | |
5.00%, 10/01/2021 | | | 1,460 | | | | 1,476 | |
Air Lease Corp., (ICE LIBOR USD 3 Month + 0.35%), 0.48%, 12/15/2022 (aa) | | | 2,800 | | | | 2,804 | |
Aircastle Ltd., (Bermuda), 5.50%, 02/15/2022 | | | 1,350 | | | | 1,390 | |
Ally Financial, Inc., 4.63%, 05/19/2022 | | | 500 | | | | 518 | |
American Express Co., 3.40%, 02/27/2023 | | | 1,257 | | | | 1,316 | |
Aviation Capital Group LLC, 2.88%, 01/20/2022 (e) | | | 1,400 | | | | 1,414 | |
BOC Aviation Ltd., (Singapore), Reg. S, 2.38%, 09/15/2021 | | | 2,200 | | | | 2,203 | |
Capital One Bank USA NA, (United States SOFR + 0.62%), 2.01%, 01/27/2023 (aa) | | | 1,500 | | | | 1,514 | |
Capital One Financial Corp., 2.60%, 05/11/2023 | | | 3,500 | | | | 3,634 | |
GE Capital Canada Funding Co., (Canada), 4.60%, 01/26/2022 | | CAD | 600 | | | | 495 | |
Mitsubishi HC Capital, Inc., (Japan), 2.65%, 09/19/2022 (e) | | | 800 | | | | 818 | |
Nomura Holdings, Inc., (Japan), 1.85%, 07/16/2025 | | | 1,900 | | | | 1,943 | |
Synchrony Financial, 2.85%, 07/25/2022 | | | 300 | | | | 307 | |
| | | | | | | | |
| | |
| | | | | | | 22,134 | |
| | | | | | | | |
Total Financial | | | | | | | 142,048 | |
| | | | | | | | |
Industrial — 1.5% | |
Aerospace/Defense — 0.4% | |
Boeing Co. (The), | | | | | | | | |
1.17%, 02/04/2023 | | | 1,000 | | | | 1,005 | |
4.51%, 05/01/2023 | | | 1,000 | | | | 1,066 | |
| | | | | | | | |
| | |
| | | | | | | 2,071 | |
| | | | | | | | |
| | | | | | | | |
| SECURITY DESCRIPTION | | PRINCIPAL
AMOUNT($) | | | VALUE($) | |
| | | | | | | | |
Building Materials — 0.1% | |
Martin Marietta Materials, Inc., 0.65%, 07/15/2023 (w) | | | 695 | | | | 697 | |
| | | | | | | | |
Trucking & Leasing — 1.0% | |
GATX Corp., (ICE LIBOR USD 3 Month + 0.72%), 0.90%, 11/05/2021 (aa) | | | 500 | | | | 501 | |
Penske Truck Leasing Co. LP / PTL Finance Corp., | | | | | | | | |
2.70%, 03/14/2023 (e) | | | 3,000 | | | | 3,096 | |
3.90%, 02/01/2024 (e) | | | 2,000 | | | | 2,146 | |
| | | | | | | | |
| | |
| | | | | | | 5,743 | |
| | | | | | | | |
Total Industrial | | | | | | | 8,511 | |
| | | | | | | | |
Technology — 1.5% | |
Computers — 0.3% | |
Hewlett Packard Enterprise Co., (ICE LIBOR USD 3 Month + 0.72%), 0.91%, 10/05/2021 (aa) | | | 1,464 | | | | 1,464 | |
| | | | | | | | |
Semiconductors — 0.6% | |
NXP BV / NXP Funding LLC, (Multinational), | | | | | | | | |
4.63%, 06/01/2023 (e) | | | 2,500 | | | | 2,686 | |
3.88%, 09/01/2022 (e) | | | 400 | | | | 415 | |
| | | | | | | | |
| | |
| | | | | | | 3,101 | |
| | | | | | | | |
Software — 0.6% | |
Fidelity National Information Services, Inc., 0.38%, 03/01/2023 | | | 3,745 | | | | 3,740 | |
| | | | | | | | |
Total Technology | | | | | | | 8,305 | |
| | | | | | | | |
Utilities — 2.3% | |
Electric — 2.3% | |
Dominion Energy, Inc., Series D, (ICE LIBOR USD 3 Month + 0.53%), 0.65%, 09/15/2023 (aa) | | | 1,800 | | | | 1,801 | |
Duke Energy Corp., (ICE LIBOR USD 3 Month + 0.65%), 0.77%, 03/11/2022 (aa) | | | 2,000 | | | | 2,008 | |
Israel Electric Corp. Ltd., (Israel), Series 6, Reg. S, 5.00%, 11/12/2024 (e) | | | 300 | | | | 335 | |
NextEra Energy Capital Holdings, Inc., | | | | | | | | |
(United States SOFR + 0.54%), 0.58%, 03/01/2023 (aa) | | | 710 | | | | 713 | |
0.65%, 03/01/2023 | | | 3,965 | | | | 3,981 | |
Pacific Gas and Electric Co., | | | | | | | | |
1.75%, 06/16/2022 | | | 600 | | | | 599 | |
3.25%, 06/15/2023 | | | 100 | | | | 103 | |
3.40%, 08/15/2024 | | | 100 | | | | 105 | |
3.75%, 02/15/2024 | | | 100 | | | | 105 | |
3.85%, 11/15/2023 | | | 100 | | | | 105 | |
4.25%, 08/01/2023 | | | 800 | | | | 848 | |
Southern California Edison Co., 0.70%, 04/03/2023 | | | 2,200 | | | | 2,201 | |
| | | | | | | | |
Total Utilities | | | | | | | 12,904 | |
| | | | | | | | |
Total Corporate Bonds
(Cost $287,786) | | | | | | | 288,795 | |
| | | | | | | | |
SEE NOTES TO FINANCIAL STATEMENTS.
| | | | | | | | | | |
| | | | | |
| JUNE 30, 2021 | | SIX CIRCLES TRUST | | | | | | | | 27 |
Six Circles Ultra Short Duration Fund
SCHEDULE OF PORTFOLIO INVESTMENTS
AS OF JUNE 30, 2021 (Unaudited) (continued)
(Amounts in U.S. Dollars, unless otherwise noted)
(Amounts in thousands, except number of Futures contracts)
| | | | | | | | |
| SECURITY DESCRIPTION | | PRINCIPAL
AMOUNT($) | | | VALUE($) | |
Foreign Government Securities — 2.3% | | | | | | | | |
International Bank for Reconstruction & Development, (Supranational), 0.65%, 02/10/2026 | | | 3,100 | | | | 3,067 | |
Japan Treasury Discount Bill, (Japan), Series 952, Zero Coupon, 11/22/2021 | | JPY | 800,000 | | | | 7,204 | |
Korea Development Bank (The), (South Korea), Reg. S, (ICE LIBOR USD 3 Month + 0.80%), 0.98%, 10/30/2022 (aa) | | | 400 | | | | 403 | |
Korea National Oil Corp., (South Korea), Reg. S, (ICE LIBOR USD 3 Month + 0.88%), 1.06%, 07/16/2023 (aa) | | | 800 | | | | 808 | |
Saudi Government International Bond, (Saudi Arabia), Reg. S, 2.38%, 10/26/2021 | | | 1,200 | | | | 1,207 | |
| | | | | | | | |
Total Foreign Government Securities
(Cost $12,866) | | | | | | | 12,689 | |
| | | | | | | | |
Municipal Bonds — 0.7% (t) | | | | | | | | |
Alaska — 0.1% | |
Alaska Municipal Bond Bank Authority, Taxable, Series 2, Rev., 0.34%, 12/01/2022 | | | 235 | | | | 235 | |
| | | | | | | | |
California — 0.1% | |
Municipal Improvement Corp. of Los Angeles, Series A, Rev., 0.42%, 11/01/2023 | | | 590 | | | | 586 | |
| | | | | | | | |
Maryland — 0.1% | |
State of Maryland Department of Transportation, Series A, Rev., 0.36%, 08/01/2023 | | | 450 | | | | 449 | |
| | | | | | | | |
North Carolina — 0.1% | |
University of North Carolina at Charlotte (The), | | | | | | | | |
Rev., 0.29%, 04/01/2022 | | | 175 | | | | 175 | |
Rev., 0.41%, 04/01/2023 | | | 350 | | | | 350 | |
| | | | | | | | |
| | |
| | | | | | | 525 | |
| | | | | | | | |
Pennsylvania — 0.3% | |
Pennsylvania Economic Development Financing Authority, State System Higher Education, Rev., 0.29%, 06/15/2022 | | | 315 | | | | 314 | |
Philadelphia Authority for Industrial Development, Rev., 0.94%, 04/15/2024 | | | 1,555 | | | | 1,536 | |
| | | | | | | | |
| | |
| | | | | | | 1,850 | |
| | | | | | | | |
Total Municipal Bonds
(Cost $3,670) | | | | | | | 3,645 | |
| | | | | | | | |
U.S. Government Agency Securities — 2.0% | |
FHLBs, | | | | | | | | |
0.50%, 04/22/2024 | | | 1,000 | | | | 1,000 | |
0.96%, 03/05/2026 | | | 3,100 | | | | 3,100 | |
FHLMC, | | | | | | | | |
0.60%, 10/20/2025 | | | 4,000 | | | | 3,961 | |
0.65%, 10/27/2025 | | | 3,000 | | | | 2,974 | |
| | | | | | | | |
Total U.S. Government Agency Securities (Cost $11,100) | | | | | | | 11,035 | |
| | | | | | | | |
| | | | | | | | |
| SECURITY DESCRIPTION | | PRINCIPAL
AMOUNT($) | | | VALUE($) | |
Short-Term Investments — 19.0% | | | | | | | | |
Certificates of Deposit — 3.2% | |
Bank of Montreal, (Canada), (ICE LIBOR USD 3 Month + 0.04%), 0.23%, 10/06/2021 (aa) | | | 2,000 | | | | 2,000 | |
Barclays Bank plc, (United Kingdom), | | | | | | | | |
0.24%, 04/08/2022 (n) | | | 2,000 | | | | 2,000 | |
0.27%, 03/03/2022 (n) | | | 2,000 | | | | 2,000 | |
(ICE LIBOR USD 3 Month + 0.48%), 0.67%, 07/30/2021 (aa) | | | 4,000 | | | | 4,002 | |
Deutsche Bank AG, (Germany), 0.58%, 08/11/2021 | | | 2,000 | | | | 2,001 | |
Lloyds Bank Corporate Markets plc, 0.47%, 07/20/2021 (n) | | | 2,800 | | | | 2,801 | |
Standard Chartered Bank, (United Kingdom), (ICE LIBOR USD 3 Month + 0.15%), 0.30%, 08/24/2021 (aa) | | | 2,750 | | | | 2,750 | |
| | | | | | | | |
Total Certificates of Deposit | | | | | | | 17,554 | |
| | | | | | | | |
Commercial Papers — 1.7% | |
Enel Finance America LLC, 0.43%, 02/22/2022 (e) (n) | | | 4,000 | | | | 3,993 | |
VW Credit, Inc., 0.37%, 02/16/2022 (e) (n) | | | 5,500 | | | | 5,491 | |
| | | | | | | | |
Total Commercial Papers | | | | | | | 9,484 | |
| | | | | | | | |
Corporate Bonds — 0.4% | |
Pacific Gas and Electric Co., (ICE LIBOR USD 3 Month + 1.38%), 1.53%, 11/15/2021 (aa) | | | 900 | | | | 902 | |
Southern California Edison Co., Series F, (United States SOFR + 0.35%), 0.40%, 06/13/2022 (aa) | | | 1,500 | | | | 1,500 | |
| | | | | | | | |
Total Corporate Bonds | | | | | | | 2,402 | |
| | | | | | | | |
Foreign Government Securities — 5.0% | |
Alberta T-Bill, (Canada), Zero Coupon, 09/14/2021 | | CAD | 5,275 | | | | 4,254 | |
Japan Treasury Discount Bill, (Japan), | | | | | | | | |
Series 987, Zero Coupon, 07/26/2021 | | JPY | 900,000 | | | | 8,102 | |
Series 992, Zero Coupon, 08/10/2021 | | JPY | 699,000 | | | | 6,293 | |
Series 1003, Zero Coupon, 09/21/2021 | | JPY | 1,000,000 | | | | 9,003 | |
| | | | | | | | |
Total Foreign Government Securities | | | | | | | 27,652 | |
| | | | | | | | |
Municipal Bonds — 0.2% (t) | |
Alaska Municipal Bond Bank Authority, Taxable, Series 2, Rev., 0.24%, 12/01/2021 | | | 440 | | | | 440 | |
City of Philadelphia, Water & Wastewater Revenue, Taxable, Series B, Rev., 0.25%, 01/01/2022 | | | 755 | | | | 755 | |
| | | | | | | | |
Total Municipal Bonds | | | | | | | 1,195 | |
| | | | | | | | |
Time Deposits — 6.3% | |
Barclays SA, 0.01%, 07/01/2021 | | | 31,780 | | | | 31,780 | |
Brown Brothers Harriman, | | | | | | | | |
(0.44%), 07/01/2021 | | AUD | 8 | | | | 6 | |
0.01%, 07/02/2021 | | CAD | 215 | | | | 173 | |
SEE NOTES TO FINANCIAL STATEMENTS.
| | | | | | | | | | |
| | | | | |
| 28 | | | | | | | | SIX CIRCLES TRUST | | JUNE 30, 2021 |
| | | | | | | | |
| SECURITY DESCRIPTION | | PRINCIPAL
AMOUNT($) | | | VALUE($) | |
Short-Term Investments — continued | |
Time Deposits — continued | |
Citibank NA, | | | | | | | | |
0.01%, 07/01/2021 | | GBP | 92 | | | | 128 | |
0.01%, 07/01/2021 | | | 2,377 | | | | 2,377 | |
Sumitomo Mitsui Trust Bank Ltd., 0.01%, 07/01/2021 | | | 107 | | | | 107 | |
| | | | | | | | |
Total Time Deposits | | | | | | | 34,571 | |
| | | | | | | | |
U.S. Government Agency Security — 1.6% | |
FHLB DNs, Zero Coupon, 08/27/2021 | | | 8,700 | | | | 8,699 | |
| | | | | | | | |
U.S. Treasury Obligations — 0.6% | |
U.S. Cash Management Bill, Zero Coupon, 09/28/2021 | | | 1,700 | | | | 1,700 | |
| | | | | | | | |
| SECURITY DESCRIPTION | | PRINCIPAL
AMOUNT($) | | | VALUE($) | |
| |
U.S. Treasury Obligations — continued | |
U.S. Treasury Bill, Zero Coupon, 07/13/2021 | | | 1,800 | | | | 1,800 | |
| | | | | | | | |
Total U.S. Treasury Obligations | | | | | | | 3,500 | |
| | | | | | | | |
Total Short-Term Investments
(Cost $105,304) | | | | | | | 105,057 | |
| | | | | | | | |
| | |
Total Investments — 100.1%
(Cost — $551,577)* | | | | | | | 552,887 | |
| | |
Liabilities in Excess of Other Assets — (0.1)% | | | | | | | (638 | ) |
| | | | | | | | |
| | |
NET ASSETS — 100.0% | | | | | | $ | 552,249 | |
| | | | | | | | |
Percentages indicated are based on net assets
| | | | | | | | | | | | | | | | | | | | |
| Futures contracts outstanding as of June 30, 2021: | |
| Exchange Traded | |
| DESCRIPTION | | NUMBER OF
CONTRACTS | | | EXPIRATION
DATE | | | TRADING
CURRENCY | | | NOTIONAL
AMOUNT($) | | | VALUE AND
UNREALIZED
APPRECIATION
(DEPRECIATION)($) | |
Long Contracts | | | | | | | | | | | | | | | | | | | | |
Canadian Bankers’ Acceptance | | | 73 | | | | 12/2022 | | | | CAD | | | | 14,555 | | | | (10 | ) |
Canadian Bankers’ Acceptance | | | 123 | | | | 03/2023 | | | | CAD | | | | 24,639 | | | | (180 | ) |
U.S. Treasury 2 Year Note | | | 207 | | | | 09/2021 | | | | USD | | | | 45,688 | | | | (82 | ) |
| | | | | | | | | | | | | | | | | | | | |
| | | | | | | | | | | | | | | | | | | (272 | ) |
| | | | | | | | | | | | | | | | | | | | |
| | | | | |
Short Contracts | | | | | | | | | | | | | | | | | | | | |
U.S. Treasury 5 Year Note | | | (161 | ) | | | 09/2021 | | | | USD | | | | (19,909 | ) | | | 37 | |
U.S. Ultra Treasury 10 Year Note | | | (51 | ) | | | 09/2021 | | | | USD | | | | (7,376 | ) | | | (132 | ) |
| | | | | | | | | | | | | | | | | | | | |
| | | | | | | | | | | | | | | | | | | (95 | ) |
| | | | | | | | | | | | | | | | | | | | |
Total unrealized appreciation (depreciation) | | | | | | | | | | | | | | | | | | | (367 | ) |
| | | | | | | | | | | | | | | | | | | | |
| | | | | | | | | | | | | | | | | | | | |
| Forward foreign currency exchange contracts outstanding as of June 30, 2021: | |
| CURRENCY PURCHASED | | | CURRENCY SOLD | | | COUNTERPARTY | | SETTLEMENT
DATE | | | UNREALIZED
APPRECIATION
(DEPRECIATION)($) | |
USD | | | 2,840 | | | AUD | | | 3,675 | | | Bank of America, NA | | | 07/02/2021 | | | | 83 | |
USD | | | 1,319 | | | AUD | | | 1,721 | | | Bank of America, NA | | | 07/02/2021 | | | | 28 | |
USD | | | 6,879 | | | CAD | | | 8,315 | | | Bank of America, NA | | | 07/02/2021 | | | | 171 | |
USD | | | 6,494 | | | GBP | | | 4,578 | | | Bank of America, NA | | | 07/02/2021 | | | | 162 | |
USD | | | 8,183 | | | JPY | | | 900,000 | | | BNP Paribas | | | 07/26/2021 | | | | 80 | |
USD | | | 2,335 | | | AUD | | | 3,101 | | | Bank of America, NA | | | 08/03/2021 | | | | 9 | |
USD | | | 1,736 | | | AUD | | | 2,295 | | | Morgan Stanley & Co. | | | 08/03/2021 | | | | 15 | |
USD | | | 6,720 | | | CAD | | | 8,315 | | | Morgan Stanley & Co. | | | 08/03/2021 | | | | 13 | |
USD | | | 6,338 | | | GBP | | | 4,578 | | | Morgan Stanley & Co. | | | 08/03/2021 | | | | 5 | |
USD | | | 6,410 | | | JPY | | | 699,000 | | | Barclays Bank plc | | | 08/10/2021 | | | | 116 | |
USD | | | 33 | | | CAD | | | 40 | | | BNP Paribas | | | 09/14/2021 | | | | — | (h) |
USD | | | 4,234 | | | CAD | | | 5,235 | | | Citibank NA | | | 09/14/2021 | | | | 11 | |
USD | | | 9,037 | | | JPY | | | 1,000,000 | | | BNP Paribas | | | 09/21/2021 | | | | 29 | |
USD | | | 7,346 | | | JPY | | | 800,000 | | | Citibank NA | | | 11/22/2021 | | | | 134 | |
| | | | | | | | | | | | | | | | | | | | |
Total unrealized appreciation | | | | | | | | | | 856 | |
| | | | | | | | | | | |
SEE NOTES TO FINANCIAL STATEMENTS.
| | | | | | | | | | |
| | | | | |
| JUNE 30, 2021 | | SIX CIRCLES TRUST | | | | | | | | 29 |
Six Circles Ultra Short Duration Fund
SCHEDULE OF PORTFOLIO INVESTMENTS
AS OF JUNE 30, 2021 (Unaudited) (continued)
(Amounts in U.S. Dollars, unless otherwise noted)
(Amounts in thousands, except number of Futures contracts)
| | | | | | | | | | | | | | | | | | | | |
| Forward foreign currency exchange contracts outstanding as of June 30, 2021: | |
| CURRENCY PURCHASED | | | CURRENCY SOLD | | | COUNTERPARTY | | SETTLEMENT
DATE | | | UNREALIZED
APPRECIATION
(DEPRECIATION)($) | |
AUD | | | 3,101 | | | USD | | | 2,335 | | | Bank of America, NA | | | 07/02/2021 | | | | (9 | ) |
AUD | | | 2,295 | | | USD | | | 1,736 | | | Morgan Stanley & Co. | | | 07/02/2021 | | | | (15 | ) |
| | | | | | | | | | | | | | | | | | | | |
Total unrealized depreciation | | | | | | | | | | (24 | ) |
| | | | | | | | | | | |
Net unrealized appreciation (depreciation) | | | | | | | 832 | |
| | | | | | | | | | | |
| | | | | | | | | | | | | | | | | | | | | | | | | | | | | | | | |
| Centrally Cleared Interest Rate Swap contracts outstanding as of June 30, 2021: | |
| FLOATING RATE INDEX (a) | | FIXED RATE | | | PAY/ RECEIVE
FLOATING RATE | | | MATURITY DATE | | | NOTIONAL
AMOUNT | | | UPFRONT
PAYMENTS
(RECEIPTS)($) | | | UNREALIZED
APPRECIATION
(DEPRECIATION)($) | | | VALUE($) | |
ICE LIBOR USD 1 Month | | | ICE LIBOR USD 3 Month | | | | Pay | | | | 01/13/2023 | | | | USD | | | | 9,600 | | | | — | | | | (4 | ) | | | (4 | ) |
ICE LIBOR USD 1 Month | | | ICE LIBOR USD 3 Month | | | | Pay | | | | 01/13/2023 | | | | USD | | | | 12,500 | | | | — | | | | (6 | ) | | | (6 | ) |
| | | | | | | | | | | | | | | | | | | | | | | | | | | | | | | | |
Total | | | | — | | | | (10 | ) | | | (10 | ) |
| | | | | | | | | | | | | |
| (a) | Value of floating rate index as of June 30, 2021 was as follows: |
| | | | |
| FLOATING RATE INDEX | | | |
ICE LIBOR USD 1 Month | | | 0.10% | |
ICE LIBOR USD 3 Month | | | 0.15% | |
| | | | | | | | | | | | | | | | | | | | | | | | | | | | | | | | | | | | |
| Centrally Cleared Credit default swap contracts outstanding — buy protection (1) as of June 30, 2021: | | | | |
REFERENCE OBLIGATION/
INDEX | | FINANCING
RATE PAID
BY THE
FUND (%) | | | PAYMENT
FREQUENCY | | | MATURITY
DATE | | | IMPLIED
CREDIT
SPREAD
(%) (2) | | | NOTIONAL
AMOUNT (3) | | | UPFRONT
PAYMENTS
(RECEIPTS)($) (4) | | | UNREALIZED
APPRECIATION
(DEPRECIATION)($) | | | VALUE($) | |
CDX.NA.IG.36-V1 | | | 1.00 | | | | Quarterly | | | | 6/20/26 | | | | 0.48 | | | | USD | | | | 10,700 | | | | (242 | ) | | | (31 | ) | | | (273 | ) |
CDX.NA.IG.35-V1 | | | 1.00 | | | | Quarterly | | | | 12/20/25 | | | | 0.43 | | | | USD | | | | 700 | | | | (15 | ) | | | (3 | ) | | | (18 | ) |
| | | | | | | | | | | | | | | | | | | | | | | | | | | | | | | | | | | | |
Total | | | | | | | | | | | | | | | | | | | | | | | | | | | (257 | ) | | | (34 | ) | | | (291 | ) |
| | | | | | | | | | | | | | | | | | | | | | | | | | | | | | | | | | | | |
| (1) | The Fund, as a buyer of credit protection, is generally obligated to make periodic payments and may also pay or receive an upfront premium to or from the protection seller, in exchange for the right to receive a contingent payment, upon occurrence of a credit event with respect to an underlying reference obligation, as defined under the terms of individual swap contracts. |
| (2) | Implied credit spreads are an indication of the seller’s performance risk, related to the likelihood of a credit event occurring that would require a seller to make payment to a buyer. Implied credit spreads are used to determine the value of swap contracts and reflect the cost of buying/selling protection, which may include upfront payments made to enter into the contract. Therefore, higher spreads would indicate a greater likelihood that a seller will be obligated to perform (i.e. make payment) under the swap contract. Increasing values, in absolute terms and relative to notional amounts, are also indicative of greater performance risk. Implied credit spreads for credit default swaps on credit indices are linked to the weighted average spread across the underlying reference obligations included in a particular index. |
| (3) | The notional amount is the maximum amount that a seller of credit protection would be obligated to pay and a buyer of credit protection would receive, upon occurrence of a credit event. |
| (4) | Upfront payments and receipts generally represent premiums paid or received at the initiation of the agreement to compensate the differences between the stated terms of the swap agreement and current market conditions (credit spreads, interest rates and other relevant factors). |
SEE NOTES TO FINANCIAL STATEMENTS.
| | | | | | | | | | |
| | | | | |
| 30 | | | | | | | | SIX CIRCLES TRUST | | JUNE 30, 2021 |
NOTES TO SCHEDULE OF PORTFOLIO INVESTMENTS
| | |
| ASX | | — Australian Stock Exchange |
| BBSW | | — Bank Bill Swap Rate |
| CDX | | — Credit Default Swap Index |
| CLO | | — Collateralized Loan Obligations |
| CMT | | — Constant Maturity Treasury |
| DN | | — Discount Notes |
| FHLB | | — Federal Home Loan Bank |
| FHLMC | | — Federal Home Loan Mortgage Corp. |
| FNMA | | — Federal National Mortgage Association |
| GNMA | | — Government National Mortgage Association |
| ICE | | — Intercontinental Exchange |
| LIBOR | | — London Interbank Offered Rate |
| Reg. S | | — Security was purchased pursuant to Regulation S under the Securities Act of 1933, as amended (the “Securities Act”), which exempts from registration securities offered and sold outside of the United States. Such a security cannot be sold in the United States without either an effective registration statement filed pursuant to the Securities Act, or pursuant to an exemption from registration. |
| REMICS | | — Real Estate Mortgage Investment Conduit |
| Rev. | | — Revenue |
| RMBS | | — Residential Mortgage Backed Security |
| SOFR | | — Secured Overnight Financing Rate |
| SONIA | | — Sterling Overnight Interbank Average Rate |
| SUB | | — Step-Up Bond. The interest rate shown is the rate in effect as of June 30, 2021. |
| (e) | | — Security is exempt from registration under Rule 144A of the Securities Act of 1933, as amended. Unless otherwise indicated, this security has been determined to be liquid under procedures established by the Board of Trustees and may be resold in transactions exempt from registration, normally to qualified institutional buyers. |
| | |
| (f) | | — Security is exempt from registration under Rule 144A or Section 4 (a) (2) of the Securities Act of 1933, as amended. |
| (h) | | — Amount rounds to less than 500 shares or principal/$500. |
| (n) | | — The rate shown is the effective yield as of June 30, 2021. |
| (t) | | — The date shown represents the earliest of the next put date, next demand date or final maturity date. |
| (w) | | — All or a portion of the security is a when-issued security, delayed delivery security, or forward commitment. |
| (z) | | — Variable or floating rate security, the interest rate of which adjusts periodically based on changes in current interest rates and prepayments on the underlying pool of assets. The interest rate shown is the current rate as of June 30, 2021. |
| (aa) | | — Variable or floating rate security, linked to the referenced benchmark. The interest rate shown is the current rate as of June 30, 2021. |
| (bb) | | — Security has been valued using significant unobservable inputs. |
| (cc) | | — Security is valued in good faith at fair value by or under the direction of the Board of Trustees. |
| * | | — The cost of securities is substantially the same for federal income tax purposes. |
| AUD | | — Australian Dollar |
| CAD | | — Canadian Dollar |
| GBP | | — British Pound |
| JPY | | — Japanese Yen |
| USD | | — United States Dollar |
SEE NOTES TO FINANCIAL STATEMENTS.
| | | | | | | | | | |
| | | | | |
| JUNE 30, 2021 | | SIX CIRCLES TRUST | | | | | | | | 31 |
Six Circles Tax Aware Ultra Short Duration Fund
SCHEDULE OF PORTFOLIO INVESTMENTS
AS OF JUNE 30, 2021 (Unaudited)
(Amounts in U.S. Dollars, unless otherwise noted)
(Amounts in thousands, except number of Futures contracts)
| | | | | | | | |
| SECURITY DESCRIPTION | | PRINCIPAL
AMOUNT($) | | | VALUE($) | |
Asset-Backed Securities — 3.9% | | | | | | | | |
BMW Canada Auto Trust, (Canada), Series 2020-1A, Class A1, 1.96%, 09/20/2022 (e) | | CAD | 602 | | | | 487 | |
Chesapeake Funding II LLC, Series 2019-1A, Class A1, 2.94%, 04/15/2031 (e) | | | 620 | | | | 626 | |
CIT Mortgage Loan Trust, Series 2007-1, Class 1A, (ICE LIBOR USD 1 Month + 1.35%), 1.44%, 10/25/2037 (e) (aa) | | | 386 | | | | 389 | |
DT Auto Owner Trust, Series 2020-3A, Class A, 0.54%, 04/15/2024 (e) | | | 1,203 | | | | 1,205 | |
FirstKey Homes Trust, Series 2020-SFR2, Class A, 1.27%, 10/19/2037 (e) | | | 898 | | | | 897 | |
Ford Auto Securitization Trust, (Canada), Series 2019-BA, Class A2, 2.32%, 10/15/2023 (e) | | CAD | 578 | | | | 470 | |
Ford Credit Floorplan Master Owner Trust A, | | | | | | | | |
Series 2018-3, Class A2, (ICE LIBOR USD 1 Month + 0.40%), 0.47%, 10/15/2023 (aa) | | | 2,900 | | | | 2,903 | |
Series 2019-3, Class A2, (ICE LIBOR USD 1 Month + 0.60%), 0.67%, 09/15/2024 (aa) | | | 600 | | | | 604 | |
Series 2020-1, Class A1, 0.70%, 09/15/2025 | | | 1,700 | | | | 1,708 | |
GMF Canada Leasing Trust, (Canada), Series 2021-1A, Class A2, 0.64%, 03/20/2024 (e) | | CAD | 800 | | | | 645 | |
Home Equity Asset Trust, Series 2005-8, Class M1, (ICE LIBOR USD 1 Month + 0.65%), 0.52%, 02/25/2036 (aa) | | | 419 | | | | 419 | |
Legacy Mortgage Asset Trust, Series 2019-GS3, Class A1, SUB, 3.75%, 04/25/2059 (e) | | | 226 | | | | 228 | |
Master Credit Card Trust, (Canada), Series 2021-1A, Class A, 0.53%, 11/21/2025 (e) | | | 900 | | | | 898 | |
Nelnet Student Loan Trust, Series 2019-2A, Class A, (ICE LIBOR USD 1 Month + 0.90%), 0.99%, 06/27/2067 (e) (aa) | | | 1,331 | | | | 1,350 | |
Oscar US Funding XI LLC, (Japan), Series 2019-2A, Class A4, 2.68%, 09/10/2026 (e) | | | 350 | | | | 364 | |
Oscar US Funding XII LLC, (Japan), Series 2021-1A, Class A2, 0.40%, 03/11/2024 (e) | | | 1,700 | | | | 1,699 | |
Park Place Securities, Inc. Asset-Backed Pass-Through Certificates, Series 2005-WCW2, Class M2, (ICE LIBOR USD 1 Month + 0.80%), 0.89%, 07/25/2035 (aa) | | | 1,712 | | | | 1,712 | |
SLM Student Loan Trust, Series 2004-10, Class A7B, (ICE LIBOR USD 3 Month + 0.60%), 0.78%, 10/25/2029 (e) (aa) | | | 1,680 | | | | 1,682 | |
SMB Private Education Loan Trust, | | | | | | | | |
Series 2015-B, Class A2A, 2.98%, 07/15/2027 (e) | | | 471 | | | | 476 | |
| | | | | | | | |
| SECURITY DESCRIPTION | | PRINCIPAL
AMOUNT($) | | | VALUE($) | |
| | | | | | | | |
Series 2016-C, Class A2A, 2.34%, 09/15/2034 (e) | | | 800 | | | | 818 | |
Series 2020-PTA, Class A1, (ICE LIBOR USD 1 Month + 0.30%), 0.39%, 09/15/2054 (e) (aa) | | | 90 | | | | 90 | |
Series 2020-PTA, Class A2A, 1.60%, 09/15/2054 (e) | | | 800 | | | | 808 | |
SoFi Consumer Loan Program Trust, Series 2019-3, Class A, 2.90%, 05/25/2028 (e) | | | 104 | | | | 104 | |
SoFi Professional Loan Program Trust, Series 2020-A, Class A1FX, 2.06%, 05/15/2046 (e) | | | 318 | | | | 319 | |
Toyota Auto Loan Extended Note Trust, Series 2020-1A, Class A, 1.35%, 05/25/2033 (e) | | | 1,800 | | | | 1,831 | |
World Omni Select Auto Trust, Series 2020-A, Class A2, 0.47%, 06/17/2024 | | | 400 | | | | 400 | |
| | | | | | | | |
Total Asset-Backed Securities
(Cost $22,848) | | | | | | | 23,132 | |
| | | | | | | | |
Collateralized Mortgage Obligations — 4.3% | |
Brass NO 8 plc, (United Kingdom), Series 8A, Class A1, (ICE LIBOR USD 3 Month + 0.70%), 0.86%, 11/16/2066 (e) (aa) | | | 132 | | | | 133 | |
Canterbury Finance NO 1 plc, (United Kingdom), Series 1, Class A2, Reg. S, (SONIA Deposit Rates Swap 3 Month + 1.35%), 1.40%, 05/16/2056 (aa) | | GBP | 1,000 | | | | 1,398 | |
COLT Mortgage Loan Trust, Series 2020-1R, Class A1, 1.26%, 09/25/2065 (e) (z) | | | 285 | | | | 286 | |
CSMC Trust, Series 2021-RPL4, Class A1, 1.80%, 12/27/2060 (e) (z) | | | 394 | | | | 395 | |
Finsbury Square plc, (United Kingdom), | | | | | | | | |
Series 2018-2, Class A, Reg. S, (ICE LIBOR GBP 3 Month + 0.95%), 1.03%, 09/12/2068 (aa) | | GBP | 638 | | | | 884 | |
Series 2019-3, Class A, Reg. S, (SONIA Deposit Rates Swap 3 Month + 1.01%), 1.06%, 12/16/2069 (aa) | | GBP | 335 | | | | 467 | |
Series 2020-2A, Class A, (SONIA Deposit Rates Swap 3 Month + 1.30%), 1.35%, 06/16/2070 (e) (aa) | | GBP | 443 | | | | 619 | |
FNMA REMICS, Series 2020-29, Class FC, (ICE LIBOR USD 1 Month + 0.80%), 0.91%, 05/25/2050 (aa) | | | 2,677 | | | | 2,700 | |
GCAT LLC, Series 2020-3, Class A1, SUB, 2.98%, 09/25/2025 (e) | | | 1,016 | | | | 1,026 | |
GNMA, | | | | | | | | |
Series 2015-H04, Class FA, (ICE LIBOR USD 1 Month + 0.65%), 0.76%, 12/20/2064 (aa) | | | 1,643 | | | | 1,663 | |
Series 2017-121, Class PE, 3.00%, 07/20/2046 | | | 667 | | | | 682 | |
SEE NOTES TO FINANCIAL STATEMENTS.
| | | | | | | | | | |
| | | | | |
| 32 | | | | | | | | SIX CIRCLES TRUST | | JUNE 30, 2021 |
| | | | | | | | |
| SECURITY DESCRIPTION | | PRINCIPAL
AMOUNT($) | | | VALUE($) | |
Collateralized Mortgage Obligations — continued | |
Series 2018-H18, Class FC, (ICE LIBOR USD 1 Month + 0.35%), 0.46%, 08/20/2065 (aa) | | | 2,193 | | | | 2,196 | |
Series 2019-54, Class KF, (ICE LIBOR USD 1 Month + 0.42%), 0.51%, 05/20/2044 (aa) | | | 767 | | | | 767 | |
Series 2021-H09, Class FG, (United States 30 Day Average SOFR + 1.50%), 1.51%, 06/20/2071 (aa) (bb) (cc) | | | 1,700 | | | | 1,851 | |
GS Mortgage-Backed Securities Corp. Trust, Series 2021-RPL1, Class A1, 1.75%, 12/25/2060 (e) (z) | | | 381 | | | | 386 | |
Lanark Master Issuer plc, (United Kingdom), Series 2019-1A, Class 1A1, (ICE LIBOR USD 3 Month + 0.77%), 0.92%, 12/22/2069 (e) (aa) | | | 750 | | | | 751 | |
Legacy Mortgage Asset Trust, Series 2021-GS3, Class A1, SUB, 1.75%, 07/25/2061 (e) | | | 1,583 | | | | 1,579 | |
London Wall Mortgage Capital plc, (United Kingdom), Series 2017-FL1, Class A, Reg. S, (ICE LIBOR GBP 3 Month + 0.85%), 0.94%, 11/15/2049 (aa) | | GBP | 77 | | | | 107 | |
MFA Trust, Series 2021-RPL1, Class A1, 1.13%, 07/25/2060 (e) (z) | | | 686 | | | | 684 | |
New Residential Mortgage Loan Trust, | | | | | | | | |
Series 2018-3A, Class A1, 4.50%, 05/25/2058 (e) (z) | | | 170 | | | | 185 | |
Series 2021-NQ2R, Class A1, 0.94%, 09/25/2058 (e) (z) | | | 1,567 | | | | 1,566 | |
Polaris RMBS, (United Kingdom), Series 2019-1, Class A, Reg. S, (SONIA Deposit Rates Swap 1 Month + 1.25%), 1.30%, 04/27/2057 (aa) | | GBP | 559 | | | | 776 | |
Pretium Mortgage Credit Partners LLC, Series 2021-RN1, Class A1, SUB, 1.99%, 02/25/2061 (e) | | | 400 | | | | 400 | |
Ripon Mortgages plc, (United Kingdom), Series 1X, Class A1, Reg. S, (ICE LIBOR GBP 3 Month + 0.80%), 0.88%, 08/20/2056 (aa) | | GBP | 244 | | | | 338 | |
Sage AR Funding No 1 plc, (United Kingdom), Series 1A, Class A, (SONIA Interest Rate Benchmark + 1.25%), 1.30%, 11/17/2030 (e) (aa) | | GBP | 800 | | | | 1,109 | |
Silverstone Master Issuer plc, (United Kingdom), Series 2019-1A, Class 1A, (ICE LIBOR USD 3 Month + 0.57%), 0.76%, 01/21/2070 (e) (aa) | | | 127 | | | | 127 | |
Starwood Mortgage Residential Trust, | | | | | | | | |
Series 2020-3, Class A1, 1.49%, 04/25/2065 (e) (z) | | | 760 | | | | 767 | |
Series 2021-2, Class A1, 0.94%, 05/25/2065 (e) (z) | | | 816 | | | | 815 | |
| | | | | | | | |
| SECURITY DESCRIPTION | | PRINCIPAL
AMOUNT($) | | | VALUE($) | |
| | | | | | | | |
Stratton Mortgage Funding, (United Kingdom), Series 2021-2A, Class A, (SONIA Deposit Rates Swap 3 Month + 0.90%), 0.95%, 07/20/2060 (e) (aa) | | GBP | 194 | | | | 270 | |
Towd Point Mortgage Funding, (United Kingdom), Series 2019-A13A, Class A1, (SONIA Deposit Rates Swap 3 Month + 0.90%), 0.95%, 07/20/2045 (e) (aa) | | GBP | 776 | | | | 1,077 | |
| | | | | | | | |
Total Collateralized Mortgage Obligations
(Cost $25,396) | | | | | | | 26,004 | |
| | | | | | | | |
Commercial Mortgage-Backed Securities — 1.0% | |
AREIT Trust, Series 2019-CRE3, Class A, (ICE LIBOR USD 1 Month + 1.02%), 1.14%, 09/14/2036 (e) (aa) | | | 500 | | | | 500 | |
AREIT Trust, (Cayman Islands),
Series 2020-CRE4, Class A, (ICE LIBOR USD 1 Month + 2.62%), 2.74%, 04/15/2037 (e) (aa) | | | 741 | | | | 745 | |
BAMLL Commercial Mortgage Securities Trust, Series 2019-RLJ, Class A, (ICE LIBOR USD 1 Month + 1.05%), 1.12%, 04/15/2036 (e) (aa) | | | 400 | | | | 399 | |
BX Commercial Mortgage Trust, Series 2018-IND, Class A, (ICE LIBOR USD 1 Month + 0.75%), 0.82%, 11/15/2035 (e) (aa) | | | 1,085 | | | | 1,085 | |
CFCRE Commercial Mortgage Trust, Series 2016-C4, Class ASB, 3.09%, 05/10/2058 | | | 983 | | | | 1,032 | |
Morgan Stanley Bank of America Merrill Lynch Trust, Series 2013-C11, Class AAB, 3.85%, 08/15/2046 | | | 451 | | | | 466 | |
Morgan Stanley Capital I Trust, Series 2019-PLND, Class A, (ICE LIBOR USD 1 Month + 1.00%), 1.07%, 05/15/2036 (e) (aa) | | | 700 | | | | 696 | |
PFP Ltd., (Cayman Islands), Series 2019-5, Class A, (ICE LIBOR USD 1 Month + 0.97%), 1.04%, 04/14/2036 (e) (aa) | | | 543 | | | | 542 | |
VMC Finance LLC, Series 2021-FL4, Class A, (ICE LIBOR USD 1 Month + 1.10%), 1.18%, 06/16/2036 (e) (aa) | | | 600 | | | | 600 | |
| | | | | | | | |
Total Commercial Mortgage-Backed Securities
(Cost $6,071) | | | | | | | 6,065 | |
| | | | | | | | |
Corporate Bonds — 14.9% | | | | | | | | |
Communications — 0.4% | | | | | | | | |
Internet — 0.0% (g) | | | | | | | | |
SK Broadband Co. Ltd., (South Korea), Reg. S, 3.88%, 08/13/2023 | | | 200 | | | | 212 | |
| | | | | | | | |
Media — 0.2% | | | | | | | | |
Charter Communications Operating LLC / Charter Communications Operating Capital, (ICE LIBOR USD 3 Month + 1.65%), 1.83%, 02/01/2024 (aa) | | | 1,100 | | | | 1,131 | |
| | | | | | | | |
SEE NOTES TO FINANCIAL STATEMENTS.
| | | | | | | | | | |
| | | | | |
| JUNE 30, 2021 | | SIX CIRCLES TRUST | | | | | | | | 33 |
Six Circles Tax Aware Ultra Short Duration Fund
SCHEDULE OF PORTFOLIO INVESTMENTS
AS OF JUNE 30, 2021 (Unaudited) (continued)
(Amounts in U.S. Dollars, unless otherwise noted)
(Amounts in thousands, except number of Futures contracts)
| | | | | | | | |
| SECURITY DESCRIPTION | | PRINCIPAL
AMOUNT($) | | | VALUE($) | |
Corporate Bonds — continued | | | | | | | | |
Telecommunications — 0.2% | | | | | | | | |
Verizon Communications, Inc., | | | | | | | | |
(ICE LIBOR USD 3 Month + 1.10%), 1.26%, 05/15/2025 (aa) | | | 200 | | | | 206 | |
Reg. S, (BBSW ASX Australian 3 Month + 1.22%), 1.26%, 02/17/2023 (aa) | | AUD | 1,400 | | | | 1,059 | |
| | | | | | | | |
| | | | | | | 1,265 | |
| | | | | | | | |
Total Communications | | | | | | | 2,608 | |
| | | | | | | | |
Consumer Cyclical — 1.2% | | | | | | | | |
Auto Manufacturers — 1.1% | | | | | | | | |
General Motors Financial Co., Inc., 3.45%, 04/10/2022 | | | 1,500 | | | | 1,528 | |
Hyundai Capital America, | | | | | | | | |
0.80%, 04/03/2023 (e) | | | 1,200 | | | | 1,200 | |
3.00%, 06/20/2022 (e) | | | 174 | | | | 178 | |
Nissan Motor Acceptance Corp., | | | | | | | | |
Reg. S, (ICE LIBOR USD 3 Month + 0.63%), 0.76%, 09/21/2021 (aa) | | | 400 | | | | 400 | |
(ICE LIBOR USD 3 Month + 0.69%), 0.84%, 09/28/2022 (e) (aa) | | | 1,620 | | | | 1,622 | |
(ICE LIBOR USD 3 Month + 0.65%), 0.84%, 07/13/2022 (e) (aa) | | | 700 | | | | 701 | |
Volkswagen Group of America Finance LLC, (ICE LIBOR USD 3 Month + 0.86%), 0.99%, 09/24/2021 (e) (aa) | | | 1,000 | | | | 1,002 | |
| | | | | | | | |
| | | | | | | 6,631 | |
| | | | | | | | |
Retail — 0.1% | | | | | | | | |
McDonald’s Corp., Reg. S, (BBSW ASX Australian 3 Month + 1.13%), 1.15%, 03/08/2024 (aa) | | AUD | 600 | | | | 455 | |
| | | | | | | | |
Total Consumer Cyclical | | | | | | | 7,086 | |
| | | | | | | | |
Consumer Non-cyclical — 2.5% | | | | | | | | |
Agriculture — 1.3% | | | | | | | | |
BAT Capital Corp., (ICE LIBOR USD 3 Month + 0.88%), 1.04%, 08/15/2022 (aa) | | | 3,500 | | | | 3,522 | |
Imperial Brands Finance plc, (United Kingdom), 3.75%, 07/21/2022 (e) | | | 3,100 | | | | 3,181 | |
JT International Financial Services BV, (Netherlands), Reg. S, 3.50%, 09/28/2023 | | | 1,200 | | | | 1,273 | |
| | | | | | | | |
| | | | | | | 7,976 | |
| | | | | | | | |
Commercial Services — 0.5% | | | | | | | | |
Equifax, Inc., (ICE LIBOR USD 3 Month + 0.87%), 1.03%, 08/15/2021 (aa) | | | 3,090 | | | | 3,093 | |
| | | | | | | | |
Food — 0.1% | | | | | | | | |
General Mills, Inc., 6.41%, 10/15/2022 | | | 600 | | | | 643 | |
| | | | | | | | |
Pharmaceuticals — 0.6% | | | | | | | | |
Bayer US Finance II LLC, (ICE LIBOR USD 3 Month + 1.01%), 1.13%, 12/15/2023 (e) (aa) | | | 3,500 | | | | 3,548 | |
| | | | | | | | |
Total Consumer Non-cyclical | | | | | | | 15,260 | |
| | | | | | | | |
| | | | | | | | |
| SECURITY DESCRIPTION | | PRINCIPAL
AMOUNT($) | | | VALUE($) | |
| | | | | | | | |
Diversified — 0.2% | | | | | | | | |
Holding Companies—Diversified — 0.2% | | | | | | | | |
Hutchison Whampoa International 12 II Ltd., (Cayman Islands), Reg. S, 3.25%, 11/08/2022 | | | 1,225 | | | | 1,270 | |
| | | | | | | | |
Energy — 0.5% | | | | | | | | |
Oil & Gas — 0.5% | | | | | | | | |
BG Energy Capital plc, (United Kingdom), 4.00%, 10/15/2021 (e) | | | 1,045 | | | | 1,056 | |
Dolphin Energy Ltd. LLC, (United Arab Emirates), Reg. S, 5.50%, 12/15/2021 | | | 1,600 | | | | 1,634 | |
| | | | | | | | |
Total Energy | | | | | | | 2,690 | |
| | | | | | | | |
Financial — 8.5% | | | | | | | | |
Banks — 5.8% | | | | | | | | |
Banco Santander Chile, (Chile), (ICE LIBOR USD 3 Month + 1.20%), 1.34%, 11/28/2021 (aa) | | | 3,200 | | | | 3,208 | |
Bank of America Corp., (Canada Bankers Acceptances 3 Month + 1.13%), 2.60%, 03/15/2023 (f) (aa) | | CAD | 1,200 | | | | 982 | |
Barclays plc, (United Kingdom), | | | | | | | | |
(ICE LIBOR USD 3 Month + 1.38%), 1.54%, 05/16/2024 (aa) | | | 1,000 | | | | 1,018 | |
Reg. S, (BBSW ASX Australian 3 Month + 1.80%), 1.82%, 06/15/2023 (aa) | | AUD | 750 | | | | 575 | |
BNP Paribas SA, (France), Reg. S, (BBSW ASX Australian 3 Month + 1.75%), 1.77%, 12/16/2022 (aa) | | AUD | 700 | | | | 534 | |
CIT Group, Inc., 5.00%, 08/15/2022 | | | 500 | | | | 523 | |
Citigroup, Inc., (ICE LIBOR USD 3 Month + 0.95%), 1.13%, 07/24/2023 (aa) | | | 850 | | | | 857 | |
Danske Bank A/S, (Denmark), | | | | | | | | |
Reg. S, (ICE LIBOR USD 3 Month + 1.06%), 1.18%, 09/12/2023 (aa) | | | 600 | | | | 606 | |
(ICE LIBOR USD 3 Month + 1.25%), 3.00%, 09/20/2022 (e) (aa) | | | 1,200 | | | | 1,206 | |
First Abu Dhabi Bank PJSC, (United Arab Emirates), Reg. S, (ICE LIBOR USD 3 Month + 0.95%), 1.13%, 04/16/2022 (aa) | | | 1,800 | | | | 1,806 | |
Goldman Sachs Group, Inc. (The), (ICE LIBOR USD 3 Month + 0.75%), 0.90%, 02/23/2023 (aa) | | | 200 | | | | 202 | |
Hana Bank, (South Korea), (ICE LIBOR USD 3 Month + 0.70%), 0.85%, 10/02/2022 (e) (aa) | | | 500 | | | | 502 | |
HSBC Holdings plc, (United Kingdom), | | | | | | | | |
(ICE LIBOR USD 3 Month + 1.00%), 1.16%, 05/18/2024 (aa) | | | 800 | | | | 810 | |
(ICE LIBOR USD 3 Month + 1.23%), 1.35%, 03/11/2025 (aa) | | | 1,000 | | | | 1,021 | |
Mitsubishi UFJ Financial Group, Inc., (Japan), (ICE LIBOR USD 3 Month + 0.86%), 1.04%, 07/26/2023 (aa) | | | 2,500 | | | | 2,533 | |
SEE NOTES TO FINANCIAL STATEMENTS.
| | | | | | | | | | |
| | | | | |
| 34 | | | | | | | | SIX CIRCLES TRUST | | JUNE 30, 2021 |
| | | | | | | | |
| SECURITY DESCRIPTION | | PRINCIPAL
AMOUNT($) | | | VALUE($) | |
Corporate Bonds — continued | | | | | | | | |
Banks — continued | | | | | | | | |
Mizuho Financial Group, Inc., (Japan), (ICE LIBOR USD 3 Month + 0.63%), 0.78%, 05/25/2024 (aa) | | | 3,400 | | | | 3,420 | |
Morgan Stanley, | | | | | | | | |
(United States SOFR + 0.70%), 0.72%, 01/20/2023 (aa) | | | 1,594 | | | | 1,599 | |
(Canada Bankers Acceptances 3 Month + 0.30%), 0.74%, 02/03/2023 (f) (aa) | | CAD | 2,000 | | | | 1,615 | |
Natwest Group plc, (United Kingdom), | | | | | | | | |
(ICE LIBOR USD 3 Month + 1.47%), 1.63%, 05/15/2023 (aa) | | | 700 | | | | 707 | |
(ICE LIBOR USD 3 Month + 1.55%), 1.70%, 06/25/2024 (aa) | | | 700 | | | | 716 | |
NatWest Markets plc, (United Kingdom), (United States SOFR + 1.66%), 1.71%, 09/29/2022 (e) (aa) | | | 2,360 | | | | 2,403 | |
Nordea Bank Abp, (Finland), (ICE LIBOR USD 3 Month + 0.94%), 1.08%, 08/30/2023 (e) (aa) | | | 200 | | | | 202 | |
QNB Finance Ltd., (Cayman Islands), Reg. S, (ICE LIBOR USD 3 Month + 1.00%), 1.18%, 05/02/2022 (aa) | | | 1,100 | | | | 1,104 | |
Royal Bank of Canada, (Canada), (United States SOFR + 0.30%), 0.32%, 01/19/2024 (aa) | | | 400 | | | | 400 | |
Shinhan Bank Co. Ltd., (South Korea), Reg. S, 2.88%, 03/28/2022 | | | 2,100 | | | | 2,134 | |
Standard Chartered plc, (United Kingdom), | | | | | | | | |
Reg. S, (ICE LIBOR USD 3 Month + 1.20%), 1.33%, 09/10/2022 (aa) | | | 500 | | | | 501 | |
(ICE LIBOR USD 3 Month + 1.56%), 3.79%, 05/21/2025 (e) (aa) | | | 1,700 | | | | 1,828 | |
UBS AG, (Switzerland), Reg. S, (BBSW ASX Australian 3 Month + 0.87%), 0.91%, 07/30/2025 (aa) | | AUD | 2,200 | | | | 1,672 | |
| | | | | | | | |
| | | | | | | 34,684 | |
| | | | | | | | |
Diversified Financial Services — 2.7% | | | | | | | | |
AerCap Ireland Capital DAC / AerCap Global Aviation Trust, (Ireland), 4.45%, 12/16/2021 | | | 700 | | | | 711 | |
Aircastle Ltd., (Bermuda), 5.50%, 02/15/2022 | | | 1,450 | | | | 1,493 | |
Ally Financial, Inc., 4.63%, 05/19/2022 | | | 200 | | | | 207 | |
American Express Co., 2.75%, 05/20/2022 | | | 3,700 | | | | 3,773 | |
Aviation Capital Group LLC, 2.88%, 01/20/2022 (e) | | | 1,600 | | | | 1,616 | |
BOC Aviation Ltd., (Singapore), Reg. S, 2.38%, 09/15/2021 | | | 2,500 | | | | 2,504 | |
GE Capital Canada Funding Co., (Canada), 4.60%, 01/26/2022 | | CAD | 800 | | | | 660 | |
Mitsubishi HC Capital, Inc., (Japan), 2.65%, 09/19/2022 (e) | | | 1,700 | | | | 1,738 | |
| | | | | | | | |
| SECURITY DESCRIPTION | | PRINCIPAL
AMOUNT($) | | | VALUE($) | |
| | | | | | | | |
Diversified Financial Services — continued | | | | | | | | |
Nomura Holdings, Inc., (Japan), 1.85%, 07/16/2025 | | | 2,300 | | | | 2,352 | |
ORIX Corp., (Japan), 2.90%, 07/18/2022 | | | 688 | | | | 706 | |
Synchrony Financial, 2.85%, 07/25/2022 | | | 600 | | | | 614 | |
| | | | | | | | |
| | | | | | | 16,374 | |
| | | | | | | | |
Total Financial | | | | | | | 51,058 | |
| | | | | | | | |
Industrial — 0.5% | | | | | | | | |
Aerospace/Defense — 0.4% | | | | | | | | |
Boeing Co. (The), | | | | | | | | |
1.17%, 02/04/2023 | | | 800 | | | | 804 | |
4.51%, 05/01/2023 | | | 1,400 | | | | 1,492 | |
| | | | | | | | |
| | | | | | | 2,296 | |
| | | | | | | | |
Trucking & Leasing — 0.1% | | | | | | | | |
GATX Corp., (ICE LIBOR USD 3 Month + 0.72%), 0.90%, 11/05/2021 (aa) | | | 500 | | | | 501 | |
| | | | | | | | |
Total Industrial | | | | | | | 2,797 | |
| | | | | | | | |
Technology — 0.1% | | | | | | | | |
Semiconductors — 0.1% | | | | | | | | |
NXP BV / NXP Funding LLC, (Multinational), 3.88%, 09/01/2022 (e) | | | 400 | | | | 415 | |
| | | | | | | | |
Utilities — 1.0% | | | | | | | | |
Electric — 1.0% | | | | | | | | |
American Electric Power Co., Inc., Series A, (ICE LIBOR USD 3 Month + 0.48%), 0.66%, 11/01/2023 (aa) | | | 1,300 | | | | 1,301 | |
Dominion Energy, Inc., Series D, (ICE LIBOR USD 3 Month + 0.53%), 0.65%, 09/15/2023 (aa) | | | 800 | | | | 801 | |
Israel Electric Corp. Ltd., (Israel), Series 6, Reg. S, 5.00%, 11/12/2024 (e) | | | 300 | | | | 335 | |
Pacific Gas and Electric Co., | | | | | | | | |
1.75%, 06/16/2022 | | | 600 | | | | 599 | |
3.25%, 06/15/2023 | | | 200 | | | | 207 | |
3.75%, 02/15/2024 | | | 100 | | | | 105 | |
3.85%, 11/15/2023 | | | 400 | | | | 419 | |
4.25%, 08/01/2023 | | | 800 | | | | 848 | |
Southern California Edison Co., (United States SOFR + 0.64%), 0.69%, 04/03/2023 (aa) | | | 1,700 | | | | 1,704 | |
| | | | | | | | |
Total Utilities | | | | | | | 6,319 | |
| | | | | | | | |
Total Corporate Bonds
(Cost $88,765) | | | | | | | 89,503 | |
| | | | | | | | |
Foreign Government Securities — 1.1% | | | | | | | | |
Export-Import Bank of Korea, (South Korea), (ICE LIBOR USD 3 Month + 0.53%), 0.67%, 06/25/2022 (aa) | | | 1,000 | | | | 1,003 | |
International Bank for Reconstruction & Development, (Supranational), 0.65%, 02/10/2026 | | | 3,400 | | | | 3,364 | |
SEE NOTES TO FINANCIAL STATEMENTS.
| | | | | | | | | | |
| | | | | |
| JUNE 30, 2021 | | SIX CIRCLES TRUST | | | | | | | | 35 |
Six Circles Tax Aware Ultra Short Duration Fund
SCHEDULE OF PORTFOLIO INVESTMENTS
AS OF JUNE 30, 2021 (Unaudited) (continued)
(Amounts in U.S. Dollars, unless otherwise noted)
(Amounts in thousands, except number of Futures contracts)
| | | | | | | | |
| SECURITY DESCRIPTION | | PRINCIPAL
AMOUNT($) | | | VALUE($) | |
Foreign Government Securities — continued | | | | | | | | |
Korea Development Bank (The), (South Korea), Reg. S, (ICE LIBOR USD 3 Month + 0.80%), 0.98%, 10/30/2022 (aa) | | | 500 | | | | 504 | |
Korea National Oil Corp., (South Korea), Reg. S, (ICE LIBOR USD 3 Month + 0.88%), 1.06%, 07/16/2023 (aa) | | | 500 | | | | 505 | |
Saudi Government International Bond, (Saudi Arabia), Reg. S, 2.38%, 10/26/2021 | | | 1,300 | | | | 1,308 | |
| | | | | | | | |
Total Foreign Government Securities
(Cost $6,716) | | | | | | | 6,684 | |
| | | | | | | | |
Municipal Bonds — 65.7% (t) | | | | | | | | |
Alabama — 0.1% | | | | | | | | |
Lower Alabama Gas District, Series A, Rev., 4.00%, 12/01/2022 | | | 550 | | | | 578 | |
| | | | | | | | |
Alaska — 0.4% | | | | | | | | |
Alaska Housing Finance Corp., Series B, Rev., VRDO, 0.03%, 07/07/2021 (z) | | | 2,400 | | | | 2,400 | |
| | | | | | | | |
Arizona — 1.1% | | | | | | | | |
Arizona State University, Series A, Rev., VRDO, 0.03%, 07/07/2021 (z) | | | 1,900 | | | | 1,900 | |
City of Phoenix Civic Improvement Corp., Senior Lien, Rev., AMT, 5.00%, 07/01/2021 | | | 1,750 | | | | 1,750 | |
Maricopa County Industrial Development Authority, Honorhealth, Series A, Rev., 5.00%, 09/01/2021 | | | 725 | | | | 731 | |
Maricopa County Unified School District, GO, 5.00%, 07/01/2022 | | | 1,310 | | | | 1,374 | |
Maricopa County, Union High School District No. 210, School Improvement Project 2011 and 2017, GO, 5.00%, 07/01/2022 | | | 1,000 | | | | 1,048 | |
| | | | | | | | |
| | |
| | | | | | | 6,803 | |
| | | | | | | | |
California — 2.5% | | | | | | | | |
Burbank-Glendale-Pasadena Airport Authority Brick Campaign, Series B, Rev., AMT, 5.00%, 07/01/2022 | | | 1,430 | | | | 1,497 | |
California Statewide Communities Development Authority, Washington Court Apartments, Rev., HUD, 0.22%, 08/01/2023 (z) | | | 2,250 | | | | 2,248 | |
City of Long Beach, Series B, Rev., AMT, 4.00%, 05/15/2022 | | | 3,000 | | | | 3,095 | |
City of Long Beach, Harbor Revenue, Series C, Rev., 4.00%, 07/15/2021 | | | 2,000 | | | | 2,003 | |
Los Angeles Department of Water, Series B4, Rev., VRDO, 0.01%, 07/01/2021 (z) | | | 500 | | | | 500 | |
Sacramento County Sanitation Districts Financing Authority, Rev., 5.00%, 12/01/2022 | | | 2,000 | | | | 2,137 | |
Southern California Public Power Authority, Windy Point/Windy Flats Project, Rev., 5.00%, 07/01/2021 | | | 1,250 | | | | 1,250 | |
| | | | | | | | |
| SECURITY DESCRIPTION | | PRINCIPAL
AMOUNT($) | | | VALUE($) | |
| | | | | | | | |
California — continued | | | | | | | | |
State of California, | | | | | | | | |
GO, 5.00%, 10/01/2022 | | | 1,000 | | | | 1,060 | |
GO, 5.00%, 11/01/2022 | | | 1,000 | | | | 1,065 | |
| | | | | | | | |
| | |
| | | | | | | 14,855 | |
| | | | | | | | |
Colorado — 2.4% | | | | | | | | |
City & County of Denver, Airport System, Series A, Rev., AMT, 5.00%, 11/15/2021 | | | 2,000 | | | | 2,036 | |
Colorado Health Facilities Authority, Sisters of Charity of Leavenworth Health System, Inc. Obligated Group, Series A, Rev., 5.00%, 01/01/2022 | | | 2,500 | | | | 2,560 | |
Colorado Housing & Finance Authority, Multifamily Project, Series B2, Class I, Rev., 1.35%, 02/01/2022 | | | 5,000 | | | | 5,004 | |
Denver City & County School District No. 1, GO, 5.00%, 12/01/2022 | | | 3,000 | | | | 3,207 | |
Weld County School District No. 6 Greeley, GO, 5.00%, 12/01/2022 | | | 1,850 | | | | 1,978 | |
| | | | | | | | |
| | |
| | | | | | | 14,785 | |
| | | | | | | | |
Connecticut — 2.7% | | | | | | | | |
Connecticut Housing Finance Authority, | | | | | | | | |
Series B3, Rev., VRDO, 0.03%, 07/07/2021 (z) | | | 680 | | | | 680 | |
Series F3, Rev., VRDO, 0.03%, 07/07/2021 (z) | | | 10,000 | | | | 10,000 | |
Connecticut State Health & Educational Facilities Authority, Stamford Hospital Issuer, | | | | | | | | |
Rev., 4.00%, 07/01/2022 | | | 500 | | | | 518 | |
Rev., 4.00%, 07/01/2023 | | | 550 | | | | 589 | |
Connecticut State, Health & Educational Facilities Authority, Yale University, Series U2, Rev., 2.00%, 07/01/2033 (z) | | | 1,300 | | | | 1,314 | |
Hartford County, Metropolitan District (The), Series A, GO, 5.00%, 07/15/2022 | | | 1,200 | | | | 1,261 | |
State of Connecticut Special Tax Revenue, Series A, Rev., 4.00%, 05/01/2023 | | | 1,530 | | | | 1,638 | |
| | | | | | | | |
| | |
| | | | | | | 16,000 | |
| | | | | | | | |
District of Columbia — 0.4% | | | | | | | | |
District of Columbia, Georgetown University, Series B2, Rev., VRDO, LOC: Bank of America NA, 0.03%, 07/07/2021 (z) | | | 1,000 | | | | 1,000 | |
District of Columbia, Georgetown University (The), Series B1, Rev., VRDO, LOC: Bank of America NA, 0.03%, 07/07/2021 (z) | | | 1,555 | | | | 1,555 | |
| | | | | | | | |
| | |
| | | | | | | 2,555 | |
| | | | | | | | |
Florida — 6.8% | | | | | | | | |
Central Florida Expressway Authority, Senior Lien, | | | | | | | | |
Rev., AGM, 5.00%, 07/01/2022 | | | 1,100 | | | | 1,153 | |
Rev., AGM, 5.00%, 07/01/2023 | | | 1,000 | | | | 1,094 | |
SEE NOTES TO FINANCIAL STATEMENTS.
| | | | | | | | | | |
| | | | | |
| 36 | | | | | | | | SIX CIRCLES TRUST | | JUNE 30, 2021 |
| | | | | | | | |
| SECURITY DESCRIPTION | | PRINCIPAL
AMOUNT($) | | | VALUE($) | |
Municipal Bonds — continued | | | | | | | | |
Florida — continued | | | | | | | | |
City of Fort Lauderdale, Police and Public Safety Project, Series B, GO, 5.00%, 07/01/2022 | | | 1,215 | | | | 1,274 | |
City of Gainesville, Utilities System, | | | | | | | | |
Series A, Rev., 5.00%, 10/01/2021 | | | 1,400 | | | | 1,417 | |
Series B, Rev., VRDO, 0.03%, 07/07/2021 (z) | | | 5,415 | | | | 5,415 | |
City of Orlando, Series B, Rev., 5.00%, 10/01/2021 | | | 775 | | | | 784 | |
County of Miami-Dade Aviation, Series C, Rev., 5.00%, 10/01/2021 | | | 1,650 | | | | 1,670 | |
County of Miami-Dade, Building Better Communities Project, Series A, GO, 5.00%, 07/01/2022 | | | 6,000 | | | | 6,289 | |
Florida Atlantic University Finance Corp., Series A, Rev., 5.00%, 07/01/2021 | | | 880 | | | | 880 | |
Florida Gulf Coast University Financing Corp., Parking Project, Series A, Rev., VRDO, LOC: TD Bank NA, 0.03%, 07/07/2021 (z) | | | 3,455 | | | | 3,455 | |
Highlands County Health Facilities Authority, Adventist Health System/Sunbelt Obligated Group, Series A, Rev., VRDO, 0.03%, 07/07/2021 (z) | | | 4,000 | | | | 4,000 | |
Lee Memorial Health System, Series A1, Rev., 5.00%, 04/01/2022 | | | 1,000 | | | | 1,035 | |
Orange County Health Facilities Authority, Nemours Foundation, Series B, Rev., VRDO, LOC: Northern Trust Co., 0.02%, 07/07/2021 (z) | | | 900 | | | | 900 | |
Orlando Utilities Commission, Series 1, Rev., VRDO, 0.03%, 07/07/2021 (z) | | | 6,785 | | | | 6,785 | |
Seacoast Utility Authority, Series B, Rev., 5.00%, 03/01/2023 | | | 2,215 | | | | 2,392 | |
State of Florida, Board Education, Capital Outlay, Series A, GO, 5.00%, 06/01/2022 | | | 2,500 | | | | 2,612 | |
| | | | | | | | |
| | |
| | | | | | | 41,155 | |
| | | | | | | | |
Georgia — 0.2% | | | | | | | | |
Brookhaven Development Authority, Children’s Healthcare of Atlanta Obligated Group, Series A, Rev., 5.00%, 07/01/2022 | | | 1,040 | | | | 1,090 | |
| | | | | | | | |
Hawaii — 0.2% | | | | | | | | |
State of Hawaii, Series EA, GO, 5.00%, 12/01/2021 | | | 1,075 | | | | 1,097 | |
| | | | | | | | |
Idaho — 0.7% | | | | | | | | |
Idaho Health Facilities Authority, St. Luke’s Health System Obligated Group, Rev., VRDO, LOC: U.S. Bank NA, 0.02%, 07/01/2021 (z) | | | 4,500 | | | | 4,500 | |
| | | | | | | | |
| | | | | | | | |
| SECURITY DESCRIPTION | | PRINCIPAL
AMOUNT($) | | | VALUE($) | |
| | | | | | | | |
Illinois — 2.7% | | | | | | | | |
Chicago O’Hare International Airport, Senior Lien, | | | | | | | | |
Series A, Rev., AMT, 5.00%, 01/01/2022 (p) | | | 2,000 | | | | 2,047 | |
Series C, Rev., 5.00%, 01/01/2022 | | | 3,670 | | | | 3,757 | |
County of Cook, Series A, GO, 5.00%, 11/15/2023 | | | 2,250 | | | | 2,498 | |
Illinois Finance Authority, Northwestern Memorial Hospital, Series A2, Rev., VRDO, 0.02%, 07/01/2021 (z) | | | 2,675 | | | | 2,675 | |
Illinois Housing Development Authority, Multifamily Housing, Century Woods IL TC LP, Rev., GNMA COLL, 1.90%, 10/01/2022 (z) | | | 1,500 | | | | 1,506 | |
Illinois Housing Development Authority, Multifamily Housing, Heather Ridge IL TC LP, Rev., 1.90%, 10/01/2022 (z) | | | 3,000 | | | | 3,013 | |
State of Illinois, Series A, GO, 5.00%, 03/01/2023 | | | 500 | | | | 538 | |
| | | | | | | | |
| | |
| | | | | | | 16,034 | |
| | | | | | | | |
Indiana — 1.8% | | | | | | | | |
Indiana Finance Authority, Educational Facilities, Marian University Project, Rev., 6.50%, 09/15/2030 (p) | | | 3,000 | | | | 3,038 | |
Indiana Finance Authority, Green Bond, Series B, Rev., 5.00%, 02/01/2022 | | | 950 | | | | 977 | |
Indiana Finance Authority, Health Systems, Sisters of St. Francis, Series I, Rev., VRDO, LOC: Barclays Bank plc, 0.01%, 07/01/2021 (z) | | | 800 | | | | 800 | |
Indiana Finance Authority, Sisters of St Francis, Rev., VRDO, LOC: Barclays Bank plc, 0.01%, 07/01/2021 (z) | | | 1,000 | | | | 1,000 | |
Indiana Municipal Power Agency, Series B, Rev., VRDO, LOC: U.S. Bank NA, 0.02%, 07/01/2021 (z) | | | 1,300 | | | | 1,300 | |
Indianapolis Local Public Improvement Bond Bank, Series A, Rev., 5.00%, 06/01/2022 | | | 400 | | | | 417 | |
Indianapolis Local Public Improvement Bond Bank, Indianapolis Airport Authority, Rev., AMT, 5.00%, 01/01/2022 | | | 3,085 | | | | 3,156 | |
| | | | | | | | |
| | |
| | | | | | | 10,688 | |
| | | | | | | | |
Kansas — 0.2% | | | | | | | | |
Geary County Unified School District No. 475, Series B, GO, 5.00%, 09/01/2022 | | | 1,275 | | | | 1,347 | |
| | | | | | | | |
Louisiana — 0.4% | | | | | | | | |
Jefferson Sales Tax District, Series A, Rev., AGM, 5.00%, 12/01/2021 | | | 2,325 | | | | 2,370 | |
| | | | | | | | |
SEE NOTES TO FINANCIAL STATEMENTS.
| | | | | | | | | | |
| | | | | |
| JUNE 30, 2021 | | SIX CIRCLES TRUST | | | | | | | | 37 |
Six Circles Tax Aware Ultra Short Duration Fund
SCHEDULE OF PORTFOLIO INVESTMENTS
AS OF JUNE 30, 2021 (Unaudited) (continued)
(Amounts in U.S. Dollars, unless otherwise noted)
(Amounts in thousands, except number of Futures contracts)
| | | | | | | | |
| SECURITY DESCRIPTION | | PRINCIPAL
AMOUNT($) | | | VALUE($) | |
Municipal Bonds — continued | | | | | | | | |
Maine — 0.2% | | | | | | | | |
Maine Health & Higher Educational Facilities Authority, | | | | | | | | |
Series A, Rev., AGM, 5.00%, 07/01/2022 | | | 500 | | | | 525 | |
Series A, Rev., AGM, 5.00%, 07/01/2023 | | | 550 | | | | 602 | |
| | | | | | | | |
| | |
| | | | | | | 1,127 | |
| | | | | | | | |
Maryland — 0.4% | | | | | | | | |
City of Frederick, Public Improvement, GO, 3.00%, 12/01/2022 | | | 1,000 | | | | 1,041 | |
County of Anne Arundel, General Improvements, GO, 5.00%, 04/01/2022 | | | 1,165 | | | | 1,207 | |
| | | | | | | | |
| | |
| | | | | | | 2,248 | |
| | | | | | | | |
Massachusetts — 4.4% | | | | | | | | |
Commonwealth of Massachusetts, Series B, GO, 5.00%, 07/01/2023 | | | 4,650 | | | | 5,097 | |
Massachusetts Bay Transportation Authority, Series A2, Rev., VRDO, 0.02%, 07/07/2021 (z) | | | 5,130 | | | | 5,130 | |
Massachusetts Development Finance Agency, Beth Israel Lahey Health Obligated Group, Series K, Rev., 4.00%, 07/01/2021 | | | 720 | | | | 720 | |
Massachusetts Development Finance Agency, Dana-Farber Cancer Institute Obligated Group, Series O, Rev., 5.00%, 12/01/2021 | | | 1,000 | | | | 1,020 | |
Massachusetts Development Finance Agency, Northeastern University, Series A, Rev., 5.00%, 10/01/2022 | | | 2,350 | | | | 2,490 | |
Massachusetts Development Finance Agency, Partners Healthcare System, Inc., Series K1, Rev., VRDO, 0.02%, 07/07/2021 (z) | | | 5,700 | | | | 5,700 | |
Massachusetts Educational Financing Authority, | | | | | | | | |
Series B, Rev., AMT, 5.00%, 07/01/2021 | | | 900 | | | | 900 | |
Series B, Rev., AMT, 5.00%, 07/01/2022 | | | 2,000 | | | | 2,095 | |
Massachusetts School Building Authority, | | | | | | | | |
Series A, Rev., 5.00%, 08/15/2022 (p) | | | 2,710 | | | | 2,857 | |
Town of Hingham, Water Bonds, GO, 5.00%, 02/15/2022 | | | 650 | | | | 670 | |
| | | | | | | | |
| | |
| | | | | | | 26,679 | |
| | | | | | | | |
Michigan — 0.6% | | | | | | | | |
University of Michigan, Series D1, Rev., VRDO, 0.01%, 07/01/2021 (z) | | | 3,675 | | | | 3,675 | |
| | | | | | | | |
Missouri — 0.4% | | | | | | | | |
State of Missouri, Health & Educational Facilities Authority, Series F, Rev., VRDO, 0.01%, 07/01/2021 (z) | | | 2,635 | | | | 2,635 | |
| | | | | | | | |
Nevada — 1.4% | | | | | | | | |
County of Clark Department of Aviation, Series A1, Rev., AMT, 5.00%, 07/01/2021 | | | 5,000 | | | | 5,000 | |
| | | | | | | | |
| SECURITY DESCRIPTION | | PRINCIPAL
AMOUNT($) | | | VALUE($) | |
| | | | | | | | |
Nevada — continued | | | | | | | | |
Las Vegas Valley Water District, Series B, GO, 5.00%, 06/01/2022 | | | 2,000 | | | | 2,089 | |
Washoe County School District, Series C, GO, 5.00%, 10/01/2021 | | | 1,250 | | | | 1,265 | |
| | | | | | | | |
| | |
| | | | | | | 8,354 | |
| | | | | | | | |
New Hampshire — 1.2% | | | | | | | | |
New Hampshire Health and Education Facilities Authority Act, University System of New Hampshire, Series B, Rev., VRDO, 0.01%, 07/01/2021 (z) | | | 3,680 | | | | 3,680 | |
New Hampshire Health and Education Facilities Authority, University System, Series B1, Rev., VRDO, 0.01%, 07/01/2021 (z) | | | 3,420 | | | | 3,420 | |
| | | | | | | | |
| | |
| | | | | | | 7,100 | |
| | | | | | | | |
New Jersey — 0.8% | | | | | | | | |
City of Newark, Series A, GO, 5.00%, 10/01/2022 | | | 700 | | | | 735 | |
New Jersey Higher Education Student Assistance Authority, Series B, Rev., AMT, 5.00%, 12/01/2023 | | | 300 | | | | 333 | |
New Jersey Sports & Exposition Authority, Series A, Rev., 5.00%, 09/01/2021 | | | 4,000 | | | | 4,029 | |
| | | | | | | | |
| | |
| | | | | | | 5,097 | |
| | | | | | | | |
New Mexico — 0.1% | | | | | | | | |
New Mexico Municipal Energy Acquisition Authority, Series A, Rev., LIQ: Royal Bank of Canada, 4.00%, 11/01/2021 | | | 625 | | | | 633 | |
| | | | | | | | |
New York — 10.0% | | | | | | | | |
City of New York, | | | | | | | | |
Series F, GO, 5.00%, 08/01/2022 | | | 1,125 | | | | 1,157 | |
Series G6, GO, VRDO, LOC: Mizuho Bank Ltd., 0.02%, 07/01/2021 (z) | | | 315 | | | | 315 | |
Series I4, GO, VRDO, LOC: TD Bank NA, 0.02%, 07/01/2021 (z) | | | 2,000 | | | | 2,000 | |
City of New York, Fiscal Year 2017, Series A4, GO, VRDO, LOC: Citibank NA, 0.03%, 07/07/2021 (z) | | | 390 | | | | 390 | |
Metropolitan Transportation Authority, | | | | | | | | |
Series A, Rev., BAN, 4.00%, 02/01/2022 | | | 12,000 | | | | 12,259 | |
Series A, Rev., BAN, 5.00%, 03/01/2022 | | | 2,000 | | | | 2,063 | |
New York City Municipal Water Finance Authority, Water & Sewer System, Second General Resolution, Series BB, Rev., VRDO, 0.01%, 07/01/2021 (z) | | | 1,000 | | | | 1,000 | |
New York City Transitional Finance Authority, Future Tax Secured Revenue, | | | | | | | | |
Rev., 5.00%, 11/01/2023 | | | 1,000 | | | | 1,111 | |
Series A4, Rev., VRDO, 0.02%, 07/01/2021 (z) | | | 3,500 | | | | 3,500 | |
Series B1, Rev., 4.00%, 11/01/2022 | | | 1,800 | | | | 1,893 | |
SEE NOTES TO FINANCIAL STATEMENTS.
| | | | | | | | | | |
| | | | | |
| 38 | | | | | | | | SIX CIRCLES TRUST | | JUNE 30, 2021 |
| | | | | | | | |
| SECURITY DESCRIPTION | | PRINCIPAL
AMOUNT($) | | | VALUE($) | |
Municipal Bonds — continued | | | | | | | | |
New York — continued | | | | | | | | |
Series B5, Rev., VRDO, 0.02%, 07/01/2021 (z) | | | 1,000 | | | | 1,000 | |
Series E1, Rev., 5.00%, 02/01/2022 | | | 2,490 | | | | 2,560 | |
New York City Water & Sewer System, Municipal Water Finance Authority, Series F1, Rev., VRDO, 0.01%, 07/01/2021 (z) | | | 8,700 | | | | 8,700 | |
New York State Dormitory Authority, | | | | | | | | |
Series A, Rev., AGM, 4.00%, 10/01/2023 | | | 1,150 | | | | 1,248 | |
Series B, Rev., 4.00%, 10/01/2023 | | | 2,805 | | | | 3,035 | |
New York State Dormitory Authority, School Districts Financing Program, Rev., 5.00%, 10/01/2023 | | | 1,245 | | | | 1,376 | |
New York State Dormitory Authority, St Johns University, Series A, Rev., 5.00%, 07/01/2023 | | | 500 | | | | 548 | |
New York State Urban Development Corp., Series A, Rev., 5.00%, 03/15/2022 | | | 8,575 | | | | 8,869 | |
Port Authority of New York & New Jersey, Consolidated, | | | | | | | | |
Series 178, Rev., AMT, 5.00%, 09/01/2021 | | | 3,060 | | | | 3,084 | |
Series 195, Rev., AMT, 5.00%, 10/01/2021 | | | 1,600 | | | | 1,619 | |
Town of Oyster Bay, GO, 2.00%, 03/01/2022 | | | 900 | | | | 909 | |
Triborough Bridge & Tunnel Authority, Series B3, Rev., VRDO, LOC: State Street Bank & Trust Co., 0.01%, 07/01/2021 (z) | | | 1,430 | | | | 1,430 | |
| | | | | | | | |
| | |
| | | | | | | 60,066 | |
| | | | | | | | |
North Carolina — 0.8% | | | | | | | | |
County of Durham, GO, 5.00%, 04/01/2022 | | | 1,135 | | | | 1,176 | |
North Carolina Turnpike Authority, Rev., BAN, 5.00%, 02/01/2024 | | | 3,000 | | | | 3,356 | |
| | | | | | | | |
| | |
| | | | | | | 4,532 | |
| | | | | | | | |
Ohio — 2.6% | | | | | | | | |
City of Cincinnati, Series A, GO, 5.00%, 12/01/2032 (p) | | | 1,700 | | | | 1,775 | |
County of Franklin, Facilities, OhioHealth Corp., Series D, Rev., VRDO, LOC: Northern Trust Co., 0.02%, 07/07/2021 (z) | | | 2,500 | | | | 2,500 | |
Ohio Higher Educational Facility Commission, Cleveland Clinic Health System Obligated Group, Series B3, Rev., VRDO, 0.02%, 07/01/2021 (z) | | | 3,800 | | | | 3,800 | |
Ohio State University (The), Series B2, Rev., VRDO, 0.02%, 07/07/2021 (z) | | | 6,725 | | | | 6,725 | |
State of Ohio, Mental Health Facilities Improvement, Series A, Rev., 5.00%, 02/01/2024 | | | 500 | | | | 561 | |
| | | | | | | | |
| | |
| | | | | | | 15,361 | |
| | | | | | | | |
| | | | | | | | |
| SECURITY DESCRIPTION | | PRINCIPAL
AMOUNT($) | | | VALUE($) | |
| | | | | | | | |
Oklahoma — 0.4% | | | | | | | | |
Tulsa County, Independent School District No. 1, Series A, GO, 2.00%, 03/01/2023 | | | 2,130 | | | | 2,194 | |
| | | | | | | | |
| | | | | | | | |
Oregon — 0.2% | | | | | | | | |
Oregon State Lottery, Series A, Rev., 5.00%, 04/01/2024 | | | 1,100 | | | | 1,242 | |
| | | | | | | | |
| | | | | | | | |
Pennsylvania — 4.0% | | | | | | | | |
Commonwealth of Pennsylvania, First Series, GO, 5.00%, 08/15/2021 | | | 7,210 | | | | 7,252 | |
Geisinger Authority, Health System, Series A, Rev., 5.00%, 04/01/2022 | | | 2,400 | | | | 2,487 | |
Lancaster Higher Education Authority, Harrisburg Area Community, Rev., BAM, 5.00%, 10/01/2023 | | | 600 | | | | 663 | |
Pennsylvania Economic Development Financing Authority, | | | | | | | | |
Series A, Rev., 4.00%, 10/15/2022 | | | 600 | | | | 630 | |
Series A, Rev., 4.00%, 10/15/2023 | | | 700 | | | | 759 | |
Pennsylvania Economic Development Financing Authority, Waste Management PA Obligated Group, Series A, Rev., 2.15%, 11/01/2021 | | | 1,375 | | | | 1,384 | |
Philadelphia Authority for Industrial Development, Rev., 5.00%, 10/01/2021 | | | 4,000 | | | | 4,046 | |
Phoenixville Area School District, GO, 4.00%, 11/15/2022 | | | 1,000 | | | | 1,051 | |
Ringgold Pennsylvania School District, GO, BAM, 3.00%, 09/01/2022 | | | 2,325 | | | | 2,400 | |
School District of Philadelphia (The), | | | | | | | | |
Series A, GO, 5.00%, 09/01/2021 | | | 1,600 | | | | 1,612 | |
Series F, GO, 5.00%, 09/01/2021 | | | 1,500 | | | | 1,512 | |
| | | | | | | | |
| | |
| | | | | | | 23,796 | |
| | | | | | | | |
Rhode Island — 0.3% | | | | | | | | |
Rhode Island Commerce Corp., Grant Anticipation Rhode Island, Rev., 5.00%, 06/15/2022 | | | 1,550 | | | | 1,621 | |
| | | | | | | | |
Tennessee — 1.1% | | | | | | | | |
Memphis-Shelby County Airport Authority, Series B, Rev., AMT, 5.00%, 07/01/2022 | | | 1,750 | | | | 1,833 | |
Shelby County Health Educational & Housing Facilities Board, Methodist Le Bonheur, Rev., VRDO, AGM, 0.02%, 07/01/2021 (z) | | | 2,775 | | | | 2,775 | |
Tennessee Energy Acquisition Corp., Series A, Rev., 5.25%, 09/01/2021 | | | 2,040 | | | | 2,057 | |
| | | | | | | | |
| | |
| | | | | | | 6,665 | |
| | | | | | | | |
Texas — 9.7% | | | | | | | | |
Allen Independent School District, | | | | | | | | |
GO, PSF-GTD, 5.00%, 02/15/2022 | | | 3,000 | | | | 3,091 | |
GO, PSF-GTD, 5.00%, 02/15/2023 | | | 1,205 | | | | 1,300 | |
SEE NOTES TO FINANCIAL STATEMENTS.
| | | | | | | | | | |
| | | | | |
| JUNE 30, 2021 | | SIX CIRCLES TRUST | | | | | | | | 39 |
Six Circles Tax Aware Ultra Short Duration Fund
SCHEDULE OF PORTFOLIO INVESTMENTS
AS OF JUNE 30, 2021 (Unaudited) (continued)
(Amounts in U.S. Dollars, unless otherwise noted)
(Amounts in thousands, except number of Futures contracts)
| | | | | | | | |
| SECURITY DESCRIPTION | | PRINCIPAL
AMOUNT($) | | | VALUE($) | |
Municipal Bonds — continued | | | | | | | | |
Texas — continued | | | | | | | | |
City of Corpus Christi, Utility System Revenue, Junior Lien, Rev., 5.00%, 07/15/2021 | | | 3,635 | | | | 3,641 | |
City of Dallas, Refunding and Improvement, GO, 5.00%, 02/15/2022 | | | 3,000 | | | | 3,091 | |
City of Houston, Series A, GO, 5.00%, 03/01/2022 | | | 2,505 | | | | 2,586 | |
City of Houston, Airport System, Series D, Rev., 5.00%, 07/01/2021 | | | 1,150 | | | | 1,150 | |
City of Mesquite, GO, 3.00%, 02/15/2023 | | | 1,000 | | | | 1,046 | |
City of San Antonio, Municipal Drainage Utility, Rev., 5.00%, 02/01/2023 | | | 1,000 | | | | 1,076 | |
Collin County, Community College District, Series A, GO, 5.00%, 08/15/2022 | | | 1,310 | | | | 1,382 | |
County of Harris, Road Bonds, Series A, GO, 5.00%, 10/01/2022 | | | 1,660 | | | | 1,761 | |
County of Williamson, | | | | | | | | |
GO, 4.00%, 02/15/2022 | | | 3,190 | | | | 3,266 | |
GO, 4.00%, 02/15/2023 | | | 2,315 | | | | 2,457 | |
GO, 5.00%, 02/15/2022 | | | 1,000 | | | | 1,030 | |
Dallas Fort Worth International Airport, Series B, Rev., 5.00%, 11/01/2022 | | | 3,000 | | | | 3,191 | |
Fort Bend Independent School District, | | | | | | | | |
GO, PSF-GTD, 5.00%, 08/15/2021 | | | 1,000 | | | | 1,006 | |
GO, PSF-GTD, 5.00%, 08/15/2022 | | | 1,000 | | | | 1,054 | |
Frisco Independent School District, | | | | | | | | |
GO, PSF-GTD, 5.00%, 02/15/2022 | | | 2,000 | | | | 2,060 | |
GO, PSF-GTD, 5.00%, 08/15/2022 | | | 1,240 | | | | 1,308 | |
Garland Independent School District, GO, PSF-GTD, 5.00%, 02/15/2023 | | | 1,160 | | | | 1,250 | |
Harris County Toll Road Authority, First Lien, | | | | | | | | |
Rev., 5.00%, 08/15/2022 | | | 2,100 | | | | 2,215 | |
Rev., 5.00%, 08/15/2023 | | | 1,600 | | | | 1,761 | |
North Texas Tollway Authority, Rev., 5.00%, 01/01/2022 (p) | | | 880 | | | | 901 | |
North Texas Tollway Authority, Unrefunded, Rev., 5.00%, 01/01/2022 | | | 1,120 | | | | 1,147 | |
Round Rock Independent School District, Series A, GO, PSF-GTD, 5.00%, 08/01/2022 | | | 1,280 | | | | 1,347 | |
San Antonio Independent School District, GO, PSF-GTD, 5.00%, 02/15/2022 | | | 6,560 | | | | 6,759 | |
Texas State University System, Series A, Rev., 5.00%, 03/15/2022 | | | 2,200 | | | | 2,275 | |
Texas Water Development Board, | | | | | | | | |
Rev., 3.00%, 10/15/2021 | | | 1,750 | | | | 1,764 | |
Rev., 3.00%, 04/15/2022 | | | 1,000 | | | | 1,023 | |
Rev., 3.00%, 10/15/2022 | | | 2,000 | | | | 2,074 | |
| | | | | | | | |
| | | | | | | 58,012 | |
| | | | | | | | |
Utah — 0.1% | | | | | | | | |
Central Valley Water Reclamation Facility, Green Bond, Series C, Rev., 5.00%, 03/01/2024 | | | 500 | | | | 563 | |
| | | | | | | | |
| | | | | | | | |
| SECURITY DESCRIPTION | | PRINCIPAL
AMOUNT($) | | | VALUE($) | |
| | | | | | | | |
Virginia — 2.3% | | | | | | | | |
Albermarle County Economic Development Authority, Sentara Healthcare Obligated Group, Series B, Rev., VRDO, 0.01%, 07/02/2021 (z) | | | 1,350 | | | | 1,350 | |
Norfolk Economic Development Authority, Sentara Healthcare Obligated Group, Series A, Rev., VRDO, 0.02%, 07/07/2021 (z) | | | 9,400 | | | | 9,400 | |
Virginia College Building Authority, 21st Century College, Series E1, Rev., 5.00%, 02/01/2024 | | | 1,285 | | | | 1,441 | |
Virginia Port Authority, Series B, Rev., AMT, 5.00%, 07/01/2021 | | | 1,405 | | | | 1,405 | |
| | | | | | | | |
| | | | | | | 13,596 | |
| | | | | | | | |
Washington — 1.3% | | | | | | | | |
Chelan County Public Utility District No. 1, Series B, Rev., VRDO, 0.02%, 07/07/2021 (z) | | | 4,000 | | | | 4,000 | |
Pierce County, School District No. 403 Bethel, GO, SCH BD GTY, 4.00%, 12/01/2021 | | | 850 | | | | 864 | |
Port of Seattle, Intermediate Lien, Rev., AMT, 5.00%, 04/01/2022 | | | 2,000 | | | | 2,071 | |
Snohomish County School District No. 6 Mukilteo, GO, SCH BD GTY, 5.00%, 12/01/2023 | | | 1,000 | | | | 1,115 | |
| | | | | | | | |
| | | | | | | 8,050 | |
| | | | | | | | |
Wisconsin — 0.8% | | | | | | | | |
State of Wisconsin, Series A, GO, 5.00%, 05/01/2022 | | | 4,815 | | | | 5,010 | |
| | | | | | | | |
Total Municipal Bonds
(Cost $393,510) | | | | | | | 394,513 | |
| | | | | | | | |
U.S. Government Agency Securities — 1.9% | |
FHLB, 0.96%, 03/05/2026 | | | 3,400 | | | | 3,400 | |
FHLMC, | | | | | | | | |
0.60%, 10/20/2025 | | | 4,600 | | | | 4,555 | |
0.65%, 10/27/2025 | | | 3,600 | | | | 3,569 | |
| | | | | | | | |
Total U.S. Government Agency Securities (Cost $11,600) | | | | | | | 11,524 | |
| | | | | | | | |
Short-Term Investments — 7.0% | | | | | | | | |
Foreign Government Security — 1.1% | | | | | | | | |
Japan Treasury Discount Bill, (Japan), Series 992, Zero Coupon, 08/10/2021 | | JPY | 753,000 | | | | 6,779 | |
| | | | | | | | |
Municipal Bonds — 2.7% (t) | | | | | | | | |
City of San Antonio, GO, 5.00%, 08/01/2021 | | | 1,550 | | | | 1,556 | |
Connecticut State Health & Educational Facilities Authority, Stamford Hospital Issuer, Rev., 3.00%, 07/01/2021 | | | 350 | | | | 350 | |
County of Los Angeles, Rev., TRAN, 4.00%, 06/30/2022 (w) | | | 1,000 | | | | 1,039 | |
SEE NOTES TO FINANCIAL STATEMENTS.
| | | | | | | | | | |
| | | | | |
| 40 | | | | | | | | SIX CIRCLES TRUST | | JUNE 30, 2021 |
| | | | | | | | |
| SECURITY DESCRIPTION | | PRINCIPAL
AMOUNT($) | | | VALUE($) | |
Short-Term Investments — continued | | | | | | | | |
Municipal Bonds — continued | | | | | | | | |
Memphis-Shelby County Airport Authority, Series B, Rev., AMT, 5.00%, 07/01/2021 | | | 1,100 | | | | 1,100 | |
State of Illinois, Series A, GO, 5.00%, 03/01/2022 | | | 500 | | | | 516 | |
State of Texas, Rev., TRAN, 4.00%, 08/26/2021 | | | 11,900 | | | | 11,971 | |
| | | | | | | | |
Total Municipal Bonds | | | | | | | 16,532 | |
| | | | | | | | |
Time Deposits — 1.7% | | | | | | | | |
Australia & New Zealand Banking Group Ltd., 0.01%, 07/01/2021 | | | 105 | | | | 105 | |
BNP Paribas SA, (0.78%), 07/01/2021 | | EUR | 2 | | | | 2 | |
Brown Brothers Harriman, | | | | | | | | |
(0.44%), 07/01/2021 | | AUD | 9 | | | | 7 | |
0.01%, 07/02/2021 | | CAD | 230 | | | | 185 | |
Citibank NA, | | | | | | | | |
0.01%, 07/01/2021 | | GBP | 22 | | | | 31 | |
0.01%, 07/01/2021 | | | 9,612 | | | | 9,612 | |
| | | | | | | | |
Total Time Deposits | | | | | | | 9,942 | |
| | | | | | | | |
| | | | | | | | |
| SECURITY DESCRIPTION | | PRINCIPAL
AMOUNT($) | | | VALUE($) | |
| | | | | | | | |
U.S. Government Agency Security — 0.2% | | | | | | | | |
FHLB DNs, Zero Coupon, 07/16/2021 | | | 900 | | | | 900 | |
| | | | | | | | |
U.S. Treasury Obligations — 1.3% | | | | | | | | |
U.S. Cash Management Bill, | | | | | | | | |
Zero Coupon, 07/27/2021 | | | 1,600 | | | | 1,600 | |
Zero Coupon, 09/28/2021 | | | 1,800 | | | | 1,799 | |
U.S. Treasury Bill, | | | | | | | | |
Zero Coupon, 07/13/2021 | | | 1,800 | | | | 1,800 | |
Zero Coupon, 08/26/2021 | | | 2,400 | | | | 2,400 | |
| | | | | | | | |
Total U.S. Treasury Obligations | | | | | | | 7,599 | |
| | | | | | | | |
Total Short-Term Investments
(Cost $41,907) | | | | | | | 41,752 | |
| | | | | | | | |
| | |
Total Investments — 99.8%
(Cost — $596,813)* | | | | | | | 599,177 | |
| | |
Other Assets in Excess of Liabilities — 0.2% | | | | | | | 1,438 | |
| | | | | | | | |
| | |
NET ASSETS — 100.0% | | | | | | $ | 600,615 | |
| | | | | | | | |
Percentages indicated are based on net assets
| | | | | | | | | | | | | | | | | | | | |
| Futures contracts outstanding as of June 30, 2021: | |
| Exchange Traded | |
| DESCRIPTION | | NUMBER OF
CONTRACTS | | | EXPIRATION
DATE | | | TRADING
CURRENCY | | | NOTIONAL
AMOUNT($) | | | VALUE AND
UNREALIZED
APPRECIATION
(DEPRECIATION)($) | |
Long Contracts | | | | | | | | | | | | | | | | | | | | |
Canadian Bankers’ Acceptance | | | 80 | | | | 12/2022 | | | | CAD | | | | 15,951 | | | | (11 | ) |
Canadian Bankers’ Acceptance | | | 157 | | | | 03/2023 | | | | CAD | | | | 31,450 | | | | (230 | ) |
U.S. Treasury 2 Year Note | | | 213 | | | | 09/2021 | | | | USD | | | | 47,013 | | | | (84 | ) |
| | | | | | | | | | | | | | | | | | | | |
| | | | | | | | | | | | | | | | | | | (325 | ) |
| | | | | | | | | | | | | | | | | | | | |
| | | | | |
Short Contracts | | | | | | | | | | | | | | | | | | | | |
U.S. Ultra Treasury 10 Year Note | | | (55 | ) | | | 09/2021 | | | | USD | | | | (7,954 | ) | | | (142 | ) |
U.S. Treasury 5 Year Note | | | (176 | ) | | | 09/2021 | | | | USD | | | | (21,766 | ) | | | 42 | |
| | | | | | | | | | | | | | | | | | | | |
| | | | | | | | | | | | | | | | | | | (100 | ) |
| | | | | | | | | | | | | | | | | | | | |
Total unrealized appreciation (depreciation) | | | | | | | | | | | | | | | | | | | (425 | ) |
| | | | | | | | | | | | | | | | | | | | |
| | | | | | | | | | | | | | | | | | | | |
| Forward foreign currency exchange contracts outstanding as of June 30, 2021: | |
| CURRENCY PURCHASED | | | CURRENCY SOLD | | | COUNTERPARTY | | SETTLEMENT
DATE | | | UNREALIZED
APPRECIATION
(DEPRECIATION)($) | |
USD | | | 3,036 | | | AUD | | | 3,930 | | | Bank of America, NA | | | 07/02/2021 | | | | 89 | |
USD | | | 1,319 | | | AUD | | | 1,721 | | | Bank of America, NA | | | 07/02/2021 | | | | 28 | |
USD | | | 5,401 | | | CAD | | | 6,528 | | | Bank of America, NA | | | 07/02/2021 | | | | 134 | |
USD | | | 7,445 | | | GBP | | | 5,248 | | | Bank of America, NA | | | 07/02/2021 | | | | 185 | |
USD | | | 2,445 | | | AUD | | | 3,247 | | | Bank of America, NA | | | 08/03/2021 | | | | 10 | |
USD | | | 1,818 | | | AUD | | | 2,404 | | | Morgan Stanley & Co. | | | 08/03/2021 | | | | 16 | |
USD | | | 5,276 | | | CAD | | | 6,528 | | | Morgan Stanley & Co. | | | 08/03/2021 | | | | 10 | |
USD | | | 7,070 | | | GBP | | | 5,107 | | | Morgan Stanley & Co. | | | 08/03/2021 | | | | 5 | |
USD | | | 6,905 | | | JPY | | | 753,000 | | | Barclays Bank plc | | | 08/10/2021 | | | | 125 | |
| | | | | | | | | | | | | | | | | | | | |
Total unrealized appreciation | | | | | | | | | | 602 | |
| | | | | | | | | | | |
SEE NOTES TO FINANCIAL STATEMENTS.
| | | | | | | | | | |
| | | | | |
| JUNE 30, 2021 | | SIX CIRCLES TRUST | | | | | | | | 41 |
Six Circles Tax Aware Ultra Short Duration Fund
SCHEDULE OF PORTFOLIO INVESTMENTS
AS OF JUNE 30, 2021 (Unaudited) (continued)
(Amounts in U.S. Dollars, unless otherwise noted)
(Amounts in thousands, except number of Futures contracts)
| | | | | | | | | | | | | | | | | | | | |
| Forward foreign currency exchange contracts outstanding as of June 30, 2021: | |
| CURRENCY PURCHASED | | | CURRENCY SOLD | | | COUNTERPARTY | | SETTLEMENT
DATE | | | UNREALIZED
APPRECIATION
(DEPRECIATION)($) | |
AUD | | | 3,247 | | | USD | | | 2,445 | | | Bank of America, NA | | | 07/02/2021 | | | | (9 | ) |
AUD | | | 2,404 | | | USD | | | 1,818 | | | Morgan Stanley & Co. | | | 07/02/2021 | | | | (16 | ) |
GBP | | | 141 | | | USD | | | 196 | | | Morgan Stanley & Co. | | | 07/02/2021 | | | | (1 | ) |
| | | | | | | | | | | | | | | | | | | | |
Total unrealized depreciation | | | | | | | | | | (26 | ) |
| | | | | | | | | | | |
Net unrealized appreciation (depreciation) | | | | | | | | | | 576 | |
| | | | | | | | | | | |
| | | | | | | | | | | | | | | | | | | | | | | | | | | | | | |
| Centrally Cleared Interest Rate Swap contracts outstanding as of June 30, 2021: | | | | |
| FLOATING RATE INDEX (a) | | FIXED RATE | | | PAY/RECEIVE
FLOATING RATE | | MATURITY DATE | | | NOTIONAL
AMOUNT | | | UPFRONT
PAYMENTS
(RECEIPTS)($) | | | UNREALIZED
APPRECIATION
(DEPRECIATION)($) | | | VALUE($) | |
ICE LIBOR USD 1 Month | | | ICE LIBOR USD 3 Month | | | Pay | | | 01/13/2023 | | | | USD | | | | 10,800 | | | | — | | | | (5 | ) | | | (5 | ) |
ICE LIBOR USD 1 Month | | | ICE LIBOR USD 3 Month | | | Pay | | | 01/13/2023 | | | | USD | | | | 14,200 | | | | — | | | | (6 | ) | | | (6 | ) |
| | | | | | | | | | | | | | | | | | | | | | | | | | | | | | |
Total | | | | — | | | | (11 | ) | | | (11 | ) |
| | | | | | | | | | | | | | | | | | | | | | | | | | | | | | |
| (a) | Value of floating rate index as of June 30, 2021 was as follows: |
| | | | |
| FLOATING RATE INDEX | | | |
ICE LIBOR USD 1 Month | | | 0.10% | |
ICE LIBOR USD 3 Month | | | 0.15% | |
| | | | | | | | | | | | | | | | | | | | | | | | | | | | | | | | | | | | |
| Centrally Cleared Credit default swap contracts outstanding — buy protection (1) as of June 30, 2021: | |
REFERENCE
OBLIGATION/INDEX | | FINANCING
RATE PAID
BY THE
FUND (%) | | | PAYMENT
FREQUENCY | | | MATURITY
DATE | | | IMPLIED
CREDIT
SPREAD
(%) (2) | | | NOTIONAL
AMOUNT (3) | | | UPFRONT
PAYMENTS
(RECEIPTS)($) (4) | | | UNREALIZED
APPRECIATION
(DEPRECIATION)($) | | | VALUE($) | |
CDX.NA.IG.36-V1 | | | 1.00 | | | | Quarterly | | | | 6/20/26 | | | | 0.48 | | | | USD | | | | 13,800 | | | | (312 | ) | | | (41 | ) | | | (353 | ) |
CDX.NA.IG.35-V1 | | | 1.00 | | | | Quarterly | | | | 12/20/25 | | | | 0.43 | | | | USD | | | | 900 | | | | (19 | ) | | | (4 | ) | | | (23 | ) |
| | | | | | | | | | | | | | | | | | | | | | | | | | | | | | | | | | | | |
Total | | | | | | | | | | | | | | | | | | | | | | | | | | | (331 | ) | | | (45 | ) | | | (376 | ) |
| | | | | | | | | | | | | | | | | | | | | | | | | | | | | | | | | | | | |
| (1) | The Fund, as a buyer of credit protection, is generally obligated to make periodic payments and may also pay or receive an upfront premium to or from the protection seller, in exchange for the right to receive a contingent payment, upon occurrence of a credit event with respect to an underlying reference obligation, as defined under the terms of individual swap contracts. |
| (2) | Implied credit spreads are an indication of the seller’s performance risk, related to the likelihood of a credit event occurring that would require a seller to make payment to a buyer. Implied credit spreads are used to determine the value of swap contracts and reflect the cost of buying/selling protection, which may include upfront payments made to enter into the contract. Therefore, higher spreads would indicate a greater likelihood that a seller will be obligated to perform (i.e. make payment) under the swap contract. Increasing values, in absolute terms and relative to notional amounts, are also indicative of greater performance risk. Implied credit spreads for credit default swaps on credit indices are linked to the weighted average spread across the underlying reference obligations included in a particular index. |
| (3) | The notional amount is the maximum amount that a seller of credit protection would be obligated to pay and a buyer of credit protection would receive, upon occurrence of a credit event. |
| (4) | Upfront payments and receipts generally represent premiums paid or received at the initiation of the agreement to compensate the differences between the stated terms of the swap agreement and current market conditions (credit spreads, interest rates and other relevant factors). |
SEE NOTES TO FINANCIAL STATEMENTS.
| | | | | | | | | | |
| | | | | |
| 42 | | | | | | | | SIX CIRCLES TRUST | | JUNE 30, 2021 |
NOTES TO SCHEDULE OF PORTFOLIO INVESTMENTS
| | |
| AGM | | — Insured by Assured Guaranty Municipal Corp. |
| AMT | | — Alternative Minimum Tax |
| ASX | | — Australian Stock Exchange |
| BAM | | — Insured by Build America Mutual |
| BAN | | — Bond Anticipation Note |
| BBSW | | — Bank Bill Swap Rate |
| CDX | | — Credit Default Swap Index |
| COLL | | — Collateral |
| DN | | — Discount Notes |
| FHLB | | — Federal Home Loan Bank |
| FHLMC | | — Federal Home Loan Mortgage Corp. |
| FNMA | | — Federal National Mortgage Association |
| GNMA | | — Government National Mortgage Association |
| GO | | — General Obligation |
| GTD | | — Guaranteed |
| HUD | | — U.S. Department of Housing and Urban Development |
| ICE | | — Intercontinental Exchange |
| LIBOR | | — London Interbank Offered Rate |
| LIQ | | — Liquidity Agreement |
| LOC | | — Letter of Credit |
| PSF | | — Permanent School Fund |
| Reg. S | | — Security was purchased pursuant to Regulation S under the Securities Act of 1933, as amended (the “Securities Act”), which exempts from registration securities offered and sold outside of the United States. Such a security cannot be sold in the United States without either an effective registration statement filed pursuant to the Securities Act, or pursuant to an exemption from registration. |
| REMICS | | — Real Estate Mortgage Investment Conduit |
| Rev. | | — Revenue |
| RMBS | | — Residential Mortgage-Backed Securities |
| SCH BD GTY | | — School Bond Guaranty |
| SOFR | | — Secured Overnight Financing Rate |
| SONIA | | — Sterling Overnight Interbank Average Rate |
| SUB | | — Step-Up Bond. The interest rate shown is the rate in effect as of June 30, 2021. |
| | |
| TRAN | | — Tax & Revenue Anticipation Note |
| VRDO | | — Variable Rate Demand Obligation. The interest rate shown is the rate in effect as of June 30, 2021. |
| (e) | | — Security is exempt from registration under Rule 144A of the Securities Act of 1933, as amended. Unless otherwise indicated, this security has been determined to be liquid under procedures established by the Board of Trustees and may be resold in transactions exempt from registration, normally to qualified institutional buyers. |
| (f) | | — Security is exempt from registration under Rule 144A or Section 4 (a) (2) of the Securities Act of 1933, as amended. |
| (g) | | — Amount rounds to less than 0.05%. |
| (p) | | — Security is prerefunded or escrowed to maturity. |
| (t) | | — The date shown represents the earliest of the prerefunded date, next put date or final maturity date. |
| (w) | | — All or a portion of the security is a when-issued security, delayed delivery security, or forward commitment. |
| (z) | | — Variable or floating rate security, the interest rate of which adjusts periodically based on changes in current interest rates and prepayments on the underlying pool of assets. The interest rate shown is the current rate as of June 30, 2021. |
| (aa) | | — Variable or floating rate security, linked to the referenced benchmark. The interest rate shown is the current rate as of June 30, 2021. |
| (bb) | | — Security has been valued using significant unobservable inputs. |
| (cc) | | — Security is valued in good faith at fair value by or under the direction of the Board of Trustees. |
| * | | — The cost of securities is substantially the same for federal income tax purposes. |
| AUD | | — Australian Dollar |
| CAD | | — Canadian Dollar |
| EUR | | — Euro |
| GBP | | — British Pound |
| JPY | | — Japanese Yen |
| USD | | — United States Dollar |
SEE NOTES TO FINANCIAL STATEMENTS.
| | | | | | | | | | |
| | | | | |
| JUNE 30, 2021 | | SIX CIRCLES TRUST | | | | | | | | 43 |
Six Circles U.S. Unconstrained Equity Fund
SCHEDULE OF PORTFOLIO INVESTMENTS
AS OF JUNE 30, 2021 (Unaudited)
(Amounts in U.S. Dollars, unless otherwise noted)
(Amounts in thousands, except number of Futures contracts)
| | | | | | | | |
| SECURITY DESCRIPTION | |
SHARES | | | VALUE($) | |
Common Stocks — 99.3% | | | | | | | | |
Basic Materials — 0.6% | | | | | | | | |
Chemicals — 0.5% | | | | | | | | |
Air Products & Chemicals, Inc. | | | 23 | | | | 6,627 | |
Albemarle Corp. | | | 36 | | | | 6,126 | |
Celanese Corp., Class A | | | 39 | | | | 5,901 | |
CF Industries Holdings, Inc. | | | 114 | | | | 5,860 | |
Dow, Inc. | | | 98 | | | | 6,202 | |
DuPont de Nemours, Inc. | | | 80 | | | | 6,168 | |
Eastman Chemical Co. | | | 51 | | | | 5,988 | |
Ecolab, Inc. | | | 31 | | | | 6,466 | |
FMC Corp. | | | 51 | | | | 5,518 | |
International Flavors & Fragrances, Inc. | | | 44 | | | | 6,563 | |
Linde plc, (United Kingdom) | | | 28 | | | | 8,204 | |
LyondellBasell Industries NV, Class A | | | 58 | | | | 5,923 | |
Mosaic Co. (The) | | | 178 | | | | 5,668 | |
PPG Industries, Inc. | | | 37 | | | | 6,281 | |
RPM International, Inc. | | | 2 | | | | 152 | |
Sherwin-Williams Co. (The) | | | 25 | | | | 6,843 | |
| | | | | | | | |
| | |
| | | | | | | 94,490 | |
| | | | | | | | |
Forest Products & Paper — 0.0% (g) | | | | | | | | |
International Paper Co. | | | 102 | | | | 6,237 | |
| | | | | | | | |
Iron/Steel — 0.0% (g) | | | | | | | | |
Nucor Corp. | | | 61 | | | | 5,885 | |
Steel Dynamics, Inc. | | | 3 | | | | 178 | |
| | | | | | | | |
| | |
| | | | | | | 6,063 | |
| | | | | | | | |
Mining — 0.1% | | | | | | | | |
Freeport-McMoRan, Inc. | | | 167 | | | | 6,193 | |
Newmont Corp. | | | 97 | | | | 6,127 | |
| | | | | | | | |
| | |
| | | | | | | 12,320 | |
| | | | | | | | |
Total Basic Materials | | | | | | | 119,110 | |
| | | | | | | | |
Communications — 21.8% | | | | | | | | |
Advertising — 0.2% | | | | | | | | |
Interpublic Group of Cos., Inc. (The) | | | 180 | | | | 5,837 | |
Omnicom Group, Inc. | | | 78 | | | | 6,215 | |
Trade Desk, Inc. (The), Class A (a) | | | 264 | | | | 20,439 | |
| | | | | | | | |
| | |
| | | | | | | 32,491 | |
| | | | | | | | |
Internet — 20.0% | | | | | | | | |
Airbnb, Inc., Class A (a) | | | 1 | | | | 98 | |
Alphabet, Inc., Class A (a) | | | 244 | | | | 595,225 | |
Alphabet, Inc., Class C (a) | | | 239 | | | | 598,339 | |
Amazon.com, Inc. (a) | | | 368 | | | | 1,264,988 | |
Booking Holdings, Inc. (a) | | | 3 | | | | 6,855 | |
CDW Corp. | | | 105 | | | | 18,313 | |
Chewy, Inc., Class A (a) | | | 69 | | | | 5,520 | |
eBay, Inc. | | | 670 | | | | 47,071 | |
Etsy, Inc. (a) | | | 144 | | | | 29,557 | |
Expedia Group, Inc. (a) | | | 36 | | | | 5,926 | |
F5 Networks, Inc. (a) | | | 61 | | | | 11,372 | |
Facebook, Inc., Class A (a) | | | 1,957 | | | | 680,446 | |
GoDaddy, Inc., Class A (a) | | | 2 | | | | 195 | |
IAC/InterActiveCorp. (a) | | | 64 | | | | 9,793 | |
| | | | | | | | |
| SECURITY DESCRIPTION | |
SHARES | | | VALUE($) | |
| | | | | | | | |
Internet — continued | | | | | | | | |
Lyft, Inc., Class A (a) | | | 106 | | | | 6,397 | |
Match Group, Inc. (a) | | | 206 | | | | 33,203 | |
MercadoLibre, Inc., (Argentina) (a) | | | 38 | | | | 59,762 | |
Netflix, Inc. (a) | | | 18 | | | | 9,760 | |
NortonLifeLock, Inc. | | | 610 | | | | 16,592 | |
Okta, Inc., Class A (a) | | | 2 | | | | 392 | |
Palo Alto Networks, Inc. (a) | | | 67 | | | | 24,822 | |
Pinterest, Inc., Class A (a) | | | 429 | | | | 33,853 | |
Roku, Inc., Class A (a) | | | 1 | | | | 661 | |
Snap, Inc., Class A (a) | | | 757 | | | | 51,609 | |
Twitter, Inc. (a) | | | 742 | | | | 51,033 | |
Uber Technologies, Inc. (a) | | | 498 | | | | 24,944 | |
VeriSign, Inc. (a) | | | 28 | | | | 6,413 | |
Wayfair, Inc., Class A (a) | | | 63 | | | | 19,741 | |
Zendesk, Inc. (a) | | | 81 | | | | 11,693 | |
Zillow Group, Inc., Class A (a) | | | 49 | | | | 6,033 | |
Zillow Group, Inc., Class C (a) | | | 126 | | | | 15,407 | |
| | | | | | | | |
| | |
| | | | | | | 3,646,013 | |
| | | | | | | | |
Media — 0.4% | | | | | | | | |
Altice USA, Inc., Class A (a) | | | 3 | | | | 105 | |
Cable One, Inc. | | | — | (h) | | | 138 | |
Charter Communications, Inc., Class A (a) | | | 11 | | | | 7,611 | |
Comcast Corp., Class A | | | 167 | | | | 9,549 | |
Discovery, Inc., Class A (a) | | | 73 | | | | 2,243 | |
Discovery, Inc., Class C (a) | | | 135 | | | | 3,906 | |
DISH Network Corp., Class A (a) | | | 151 | | | | 6,316 | |
FactSet Research Systems, Inc. | | | 20 | | | | 6,660 | |
Fox Corp., Class A | | | 111 | | | | 4,136 | |
Fox Corp., Class B | | | 55 | | | | 1,948 | |
Liberty Broadband Corp., Class A (a) | | | — | (h) | | | 56 | |
Liberty Broadband Corp., Class C (a) | | | 2 | | | | 357 | |
Liberty Global plc, (United Kingdom), Class A (a) | | | 3 | | | | 80 | |
Liberty Global plc, (United Kingdom), Class C (a) | | | 5 | | | | 130 | |
Liberty Media Corp.-Liberty Formula One, Class C (a) | | | 3 | | | | 123 | |
Liberty Media Corp.-Liberty SiriusXM, Class A (a) | | | 2 | | | | 91 | |
Liberty Media Corp.-Liberty SiriusXM, Class C (a) | | | 2 | | | | 94 | |
News Corp., Class A | | | 178 | | | | 4,581 | |
News Corp., Class B | | | 55 | | | | 1,336 | |
Sirius XM Holdings, Inc. | | | 14 | | | | 89 | |
ViacomCBS, Inc., Class B | | | 149 | | | | 6,717 | |
Walt Disney Co. (The) (a) | | | 58 | | | | 10,232 | |
| | | | | | | | |
| | |
| | | | | | | 66,498 | |
| | | | | | | | |
Telecommunications — 1.2% | | | | | | | | |
Arista Networks, Inc. (a) | | | 44 | | | | 16,070 | |
AT&T, Inc. | | | 302 | | | | 8,695 | |
Cisco Systems, Inc. | | | 2,175 | | | | 115,274 | |
SEE NOTES TO FINANCIAL STATEMENTS.
| | | | | | | | | | |
| | | | | |
| 44 | | | | | | | | SIX CIRCLES TRUST | | JUNE 30, 2021 |
| | | | | | | | |
| SECURITY DESCRIPTION | |
SHARES | | | VALUE($) | |
Common Stocks — continued | | | | | | | | |
Telecommunications — continued | | | | | | | | |
Corning, Inc. | | | 513 | | | | 20,969 | |
Juniper Networks, Inc. | | | 367 | | | | 10,041 | |
Lumen Technologies, Inc. | | | 401 | | | | 5,456 | |
Motorola Solutions, Inc. | | | 111 | | | | 23,974 | |
T-Mobile US, Inc. (a) | | | 50 | | | | 7,203 | |
Verizon Communications, Inc. | | | 159 | | | | 8,936 | |
| | | | | | | | |
| | |
| | | | | | | 216,618 | |
| | | | | | | | |
Total Communications | | | | | | | 3,961,620 | |
| | | | | | | | |
Consumer Cyclical — 2.9% | | | | | | | | |
Airlines — 0.2% | | | | | | | | |
Alaska Air Group, Inc. (a) | | | 91 | | | | 5,474 | |
American Airlines Group, Inc. (a) | | | 254 | | | | 5,377 | |
Delta Air Lines, Inc. (a) | | | 194 | | | | 8,376 | |
Southwest Airlines Co. (a) | | | 167 | | | | 8,880 | |
United Airlines Holdings, Inc. (a) | | | 106 | | | | 5,524 | |
| | | | | | | | |
| | |
| | | | | | | 33,631 | |
| | | | | | | | |
Apparel — 0.3% | | | | | | | | |
Hanesbrands, Inc. | | | 304 | | | | 5,676 | |
NIKE, Inc., Class B | | | 62 | | | | 9,649 | |
PVH Corp. (a) | | | 54 | | | | 5,793 | |
Ralph Lauren Corp., Class A | | | 48 | | | | 5,703 | |
Tapestry, Inc. (a) | | | 134 | | | | 5,832 | |
Under Armour, Inc., Class A (a) | | | 148 | | | | 3,120 | |
Under Armour, Inc., Class C (a) | | | 150 | | | | 2,786 | |
VF Corp. | | | 77 | | | | 6,306 | |
| | | | | | | | |
| | |
| | | | | | | 44,865 | |
| | | | | | | | |
Auto Manufacturers — 0.4% | | | | | | | | |
Cummins, Inc. | | | 85 | | | | 20,745 | |
Ford Motor Co. (a) | | | 443 | | | | 6,582 | |
General Motors Co. (a) | | | 115 | | | | 6,793 | |
PACCAR, Inc. | | | 208 | | | | 18,578 | |
Tesla, Inc. (a) | | | 20 | | | | 13,606 | |
| | | | | | | | |
| | |
| | | | | | | 66,304 | |
| | | | | | | | |
Auto Parts & Equipment — 0.1% | | | | | | | | |
Aptiv plc, (Ireland) (a) | | | 42 | | | | 6,567 | |
Autoliv, Inc., (Sweden) | | | 1 | | | | 103 | |
BorgWarner, Inc. | | | 116 | | | | 5,645 | |
Lear Corp. | | | 1 | | | | 175 | |
| | | | | | | | |
| | |
| | | | | | | 12,490 | |
| | | | | | | | |
Distribution/Wholesale — 0.3% | | | | | | | | |
Copart, Inc. (a) | | | 136 | | | | 17,905 | |
Fastenal Co. | | | 350 | | | | 18,195 | |
LKQ Corp. (a) | | | 125 | | | | 6,147 | |
Pool Corp. | | | 14 | | | | 6,563 | |
WW Grainger, Inc. | | | 31 | | | | 13,757 | |
| | | | | | | | |
| | |
| | | | | | | 62,567 | |
| | | | | | | | |
Entertainment — 0.1% | | | | | | | | |
Caesars Entertainment, Inc. (a) | | | 57 | | | | 5,899 | |
DraftKings, Inc., Class A (a) | | | 2 | | | | 125 | |
| | | | | | | | |
| SECURITY DESCRIPTION | |
SHARES | | | VALUE($) | |
| | | | | | | | |
Entertainment — continued | | | | | | | | |
Live Nation Entertainment, Inc. (a) | | | 70 | | | | 6,160 | |
Penn National Gaming, Inc. (a) | | | 71 | | | | 5,430 | |
Vail Resorts, Inc. (a) | | | 1 | | | | 173 | |
| | | | | | | | |
| | |
| | | | | | | 17,787 | |
| | | | | | | | |
Food Service — 0.0% (g) | | | | | | | | |
Aramark | | | 3 | | | | 98 | |
| | | | | | | | |
Home Builders — 0.1% | | | | | | | | |
DR Horton, Inc. | | | 72 | | | | 6,514 | |
Lennar Corp., Class A | | | 70 | | | | 6,995 | |
NVR, Inc. (a) | | | 1 | | | | 6,485 | |
PulteGroup, Inc. | | | 114 | | | | 6,214 | |
| | | | | | | | |
| | |
| | | | | | | 26,208 | |
| | | | | | | | |
Home Furnishings — 0.1% | | | | | | | | |
Leggett & Platt, Inc. | | | 111 | | | | 5,750 | |
Whirlpool Corp. | | | 28 | | | | 6,004 | |
| | | | | | | | |
| | |
| | | | | | | 11,754 | |
| | | | | | | | |
Housewares — 0.0% (g) | | | | | | | | |
Newell Brands, Inc. | | | 220 | | | | 6,054 | |
| | | | | | | | |
Leisure Time — 0.1% | | | | | | | | |
Carnival Corp. (a) | | | 214 | | | | 5,649 | |
Norwegian Cruise Line Holdings Ltd. (a) | | | 185 | | | | 5,442 | |
Peloton Interactive, Inc., Class A (a) | | | 3 | | | | 411 | |
Royal Caribbean Cruises Ltd. (a) | | | 69 | | | | 5,913 | |
| | | | | | | | |
| | |
| | | | | | | 17,415 | |
| | | | | | | | |
Lodging — 0.2% | | | | | | | | |
Hilton Worldwide Holdings, Inc. (a) | | | 50 | | | | 6,062 | |
Las Vegas Sands Corp. (a) | | | 112 | | | | 5,885 | |
Marriott International, Inc., Class A (a) | | | 47 | | | | 6,422 | |
MGM Resorts International | | | 147 | | | | 6,288 | |
Wynn Resorts Ltd. (a) | | | 48 | | | | 5,857 | |
| | | | | | | | |
| | |
| | | | | | | 30,514 | |
| | | | | | | | |
Retail — 1.0% | | | | | | | | |
Advance Auto Parts, Inc. | | | 31 | | | | 6,350 | |
AutoZone, Inc. (a) | | | 5 | | | | 7,085 | |
Best Buy Co., Inc. | | | 56 | | | | 6,386 | |
Burlington Stores, Inc. (a) | | | 1 | | | | 282 | |
CarMax, Inc. (a) | | | 53 | | | | 6,827 | |
Carvana Co., Class A (a) | | | 1 | | | | 251 | |
Chipotle Mexican Grill, Inc., Class A (a) | | | 5 | | | | 7,431 | |
Costco Wholesale Corp. | | | 22 | | | | 8,654 | |
Darden Restaurants, Inc. | | | 45 | | | | 6,606 | |
Dollar General Corp. | | | 32 | | | | 6,913 | |
Dollar Tree, Inc. (a) | | | 62 | | | | 6,176 | |
Domino’s Pizza, Inc. | | | 14 | | | | 6,372 | |
Gap, Inc. (The) | | | 184 | | | | 6,196 | |
Genuine Parts Co. | | | 48 | | | | 6,101 | |
Home Depot, Inc. (The) | | | 34 | | | | 10,931 | |
L Brands, Inc. | | | 93 | | | | 6,718 | |
Lowe’s Cos., Inc. | | | 42 | | | | 8,097 | |
SEE NOTES TO FINANCIAL STATEMENTS.
| | | | | | | | | | |
| | | | | |
| JUNE 30, 2021 | | SIX CIRCLES TRUST | | | | | | | | 45 |
Six Circles U.S. Unconstrained Equity Fund
SCHEDULE OF PORTFOLIO INVESTMENTS
AS OF JUNE 30, 2021 (Unaudited) (continued)
(Amounts in U.S. Dollars, unless otherwise noted)
(Amounts in thousands, except number of Futures contracts)
| | | | | | | | |
| SECURITY DESCRIPTION | |
SHARES | | | VALUE($) | |
Common Stocks — continued | | | | | | | | |
Retail — continued | | | | | | | | |
Lululemon Athletica, Inc., (Canada) (a) | | | 2 | | | | 600 | |
McDonald’s Corp. | | | 36 | | | | 8,268 | |
O’Reilly Automotive, Inc. (a) | | | 12 | | | | 6,815 | |
Ross Stores, Inc. | | | 54 | | | | 6,718 | |
Starbucks Corp. | | | 70 | | | | 7,873 | |
Target Corp. | | | 32 | | | | 7,830 | |
TJX Cos., Inc. (The) | | | 107 | | | | 7,190 | |
Tractor Supply Co. | | | 33 | | | | 6,221 | |
Ulta Beauty, Inc. (a) | | | 19 | | | | 6,446 | |
Walgreens Boots Alliance, Inc. | | | 117 | | | | 6,174 | |
Walmart, Inc. | | | 65 | | | | 9,160 | |
Yum! Brands, Inc. | | | 53 | | | | 6,153 | |
| | | | | | | | |
| | |
| | | | | | | 186,824 | |
| | | | | | | | |
Textiles — 0.0% (g) | | | | | | | | |
Mohawk Industries, Inc. (a) | | | 32 | | | | 6,135 | |
| | | | | | | | |
Toys/Games/Hobbies — 0.0% (g) | | | | | | | | |
Hasbro, Inc. | | | 64 | | | | 6,009 | |
| | | | | | | | |
Total Consumer Cyclical | | | | | | | 528,655 | |
| | | | | | | | |
Consumer Non-cyclical — 17.7% | | | | | | | | |
Agriculture — 0.1% | | | | | | | | |
Altria Group, Inc. | | | 144 | | | | 6,876 | |
Archer-Daniels-Midland Co. | | | 100 | | | | 6,038 | |
Bunge Ltd. | | | 2 | | | | 182 | |
Philip Morris International, Inc. | | | 81 | | | | 8,010 | |
| | | | | | | | |
| | |
| | | | | | | 21,106 | |
| | | | | | | | |
Beverages — 4.0% | | | | | | | | |
Boston Beer Co., Inc. (The), Class A (a) | | | 11 | | | | 11,324 | |
Brown-Forman Corp., Class B | | | 456 | | | | 34,195 | |
Coca-Cola Co. (The) | | | 5,108 | | | | 276,386 | |
Constellation Brands, Inc., Class A | | | 233 | | | | 54,467 | |
Keurig Dr Pepper, Inc. | | | 860 | | | | 30,294 | |
Molson Coors Beverage Co., Class B (a) | | | 333 | | | | 17,859 | |
Monster Beverage Corp. (a) | | | 548 | | | | 50,019 | |
PepsiCo., Inc. | | | 1,727 | | | | 255,837 | |
| | | | | | | | |
| | |
| | | | | | | 730,381 | |
| | | | | | | | |
Biotechnology — 2.6% | | | | | | | | |
Alexion Pharmaceuticals, Inc. (a) | | | 177 | | | | 32,484 | |
Alnylam Pharmaceuticals, Inc. (a) | | | 76 | | | | 12,944 | |
Amgen, Inc. | | | 401 | | | | 97,731 | |
Biogen, Inc. (a) | | | 114 | | | | 39,560 | |
BioMarin Pharmaceutical, Inc. (a) | | | 118 | | | | 9,865 | |
Bio-Rad Laboratories, Inc., Class A (a) | | | 11 | | | | 6,819 | |
Corteva, Inc. | | | 144 | | | | 6,384 | |
Exact Sciences Corp. (a) | | | 110 | | | | 13,679 | |
Gilead Sciences, Inc. | | | 905 | | | | 62,311 | |
Horizon Therapeutics Plc (a) | | | 138 | | | | 12,968 | |
Illumina, Inc. (a) | | | 15 | | | | 7,113 | |
Incyte Corp. (a) | | | 194 | | | | 16,284 | |
Moderna, Inc. (a) | | | 206 | | | | 48,399 | |
Novavax, Inc. (a) | | | 46 | | | | 9,694 | |
Regeneron Pharmaceuticals, Inc. (a) | | | 80 | | | | 44,844 | |
| | | | | | | | |
| SECURITY DESCRIPTION | |
SHARES | | | VALUE($) | |
| | | | | | | | |
Biotechnology — continued | | | | | | | | |
Royalty Pharma plc, Class A | | | 2 | | | | 92 | |
Seagen, Inc. (a) | | | 88 | | | | 13,952 | |
Vertex Pharmaceuticals, Inc. (a) | | | 201 | | | | 40,446 | |
| | | | | | | | |
| | |
| | | | | | | 475,569 | |
| | | | | | | | |
Commercial Services — 1.7% | | | | | | | | |
AMERCO | | | 4 | | | | 2,484 | |
Automatic Data Processing, Inc. | | | 36 | | | | 7,121 | |
Avalara, Inc. (a) | | | 59 | | | | 9,509 | |
Booz Allen Hamilton Holding Corp., Class A | | | 57 | | | | 4,838 | |
Cintas Corp. | | | 56 | | | | 21,397 | |
CoStar Group, Inc. (a) | | | 163 | | | | 13,493 | |
Equifax, Inc. | | | 76 | | | | 18,292 | |
FleetCor Technologies, Inc. (a) | | | 23 | | | | 5,857 | |
Gartner, Inc. (a) | | | 27 | | | | 6,489 | |
Global Payments, Inc. | | | 35 | | | | 6,507 | |
IHS Markit Ltd., (United Kingdom) | | | 211 | | | | 23,776 | |
MarketAxess Holdings, Inc. | | | 33 | | | | 15,241 | |
Moody’s Corp. | | | 105 | | | | 38,029 | |
Nielsen Holdings plc | | | 227 | | | | 5,593 | |
PayPal Holdings, Inc. (a) | | | 37 | | | | 10,757 | |
Quanta Services, Inc. | | | 67 | | | | 6,041 | |
Robert Half International, Inc. | | | 113 | | | | 10,028 | |
Rollins, Inc. | | | 266 | | | | 9,110 | |
S&P Global, Inc. | | | 144 | | | | 59,084 | |
Square, Inc., Class A (a) | | | 5 | | | | 1,255 | |
TransUnion | | | 79 | | | | 8,657 | |
United Rentals, Inc. (a) | | | 49 | | | | 15,735 | |
Verisk Analytics, Inc., Class A | | | 98 | | | | 17,204 | |
| | | | | | | | |
| | |
| | | | | | | 316,497 | |
| | | | | | | | |
Cosmetics/Personal Care — 0.1% | | | | | | | | |
Colgate-Palmolive Co. | | | 83 | | | | 6,722 | |
Estee Lauder Cos., Inc. (The), Class A | | | 23 | | | | 7,297 | |
Procter & Gamble Co. (The) | | | 79 | | | | 10,678 | |
| | | | | | | | |
| | |
| | | | | | | 24,697 | |
| | | | | | | | |
Food — 0.5% | | | | | | | | |
Campbell Soup Co. | | | 130 | | | | 5,912 | |
Conagra Brands, Inc. | | | 166 | | | | 6,030 | |
General Mills, Inc. | | | 104 | | | | 6,332 | |
Hershey Co. (The) | | | 36 | | | | 6,273 | |
Hormel Foods Corp. | | | 127 | | | | 6,081 | |
J M Smucker Co. (The) | | | 45 | | | | 5,818 | |
Kellogg Co. | | | 97 | | | | 6,237 | |
Kraft Heinz Co. (The) | | | 147 | | | | 6,010 | |
Kroger Co. (The) | | | 165 | | | | 6,338 | |
Lamb Weston Holdings, Inc. | | | 72 | | | | 5,831 | |
McCormick & Co., Inc. | | | 70 | | | | 6,170 | |
Mondelez International, Inc., Class A | | | 118 | | | | 7,365 | |
Sysco Corp. | | | 81 | | | | 6,295 | |
Tyson Foods, Inc., Class A | | | 82 | | | | 6,059 | |
| | | | | | | | |
| | |
| | | | | | | 86,751 | |
| | | | | | | | |
SEE NOTES TO FINANCIAL STATEMENTS.
| | | | | | | | | | |
| | | | | |
| 46 | | | | | | | | SIX CIRCLES TRUST | | JUNE 30, 2021 |
| | | | | | | | |
| SECURITY DESCRIPTION | |
SHARES | | | VALUE($) | |
Common Stocks — continued | | | | | | | | |
Healthcare — Products — 0.9% | | | | | | | | |
10X Genomics, Inc., Class A (a) | | | 1 | | | | 169 | |
Abbott Laboratories | | | 78 | | | | 9,057 | |
ABIOMED, Inc. (a) | | | 20 | | | | 6,384 | |
Align Technology, Inc. (a) | | | 11 | | | | 6,569 | |
Avantor, Inc. (a) | | | 7 | | | | 247 | |
Baxter International, Inc. | | | 80 | | | | 6,426 | |
Bio-Techne Corp. | | | — | (h) | | | 205 | |
Boston Scientific Corp. (a) | | | 159 | | | | 6,798 | |
Cooper Cos., Inc. (The) | | | 16 | | | | 6,509 | |
Danaher Corp. | | | 33 | | | | 8,803 | |
DENTSPLY SIRONA, Inc. | | | 94 | | | | 5,918 | |
Edwards Lifesciences Corp. (a) | | | 68 | | | | 7,065 | |
Henry Schein, Inc. (a) | | | 78 | | | | 5,798 | |
Hologic, Inc. (a) | | | 97 | | | | 6,489 | |
IDEXX Laboratories, Inc. (a) | | | 11 | | | | 7,166 | |
Insulet Corp. (a) | | | 1 | | | | 240 | |
Intuitive Surgical, Inc. (a) | | | 8 | | | | 7,810 | |
Masimo Corp. (a) | | | 1 | | | | 168 | |
Medtronic plc, (Ireland) | | | 70 | | | | 8,639 | |
Novocure Ltd., (Jersey) (a) | | | 1 | | | | 270 | |
PerkinElmer, Inc. | | | 42 | | | | 6,528 | |
ResMed, Inc. | | | 29 | | | | 7,224 | |
STERIS plc | | | 31 | | | | 6,395 | |
Stryker Corp. | | | 28 | | | | 7,321 | |
Teleflex, Inc. | | | 16 | | | | 6,293 | |
Thermo Fisher Scientific, Inc. | | | 18 | | | | 9,166 | |
West Pharmaceutical Services, Inc. | | | 18 | | | | 6,568 | |
Zimmer Biomet Holdings, Inc. | | | 42 | | | | 6,734 | |
| | | | | | | | |
| | |
| | | | | | | 156,959 | |
| | | | | | | | |
Healthcare — Services — 0.5% | | | | | | | | |
Anthem, Inc. | | | 19 | | | | 7,209 | |
Catalent, Inc. (a) | | | 194 | | | | 20,922 | |
Centene Corp. (a) | | | 92 | | | | 6,683 | |
Charles River Laboratories International, Inc. (a) | | | 18 | | | | 6,486 | |
DaVita, Inc. (a) | | | 50 | | | | 5,986 | |
HCA Healthcare, Inc. | | | 33 | | | | 6,768 | |
Humana, Inc. | | | 16 | | | | 6,998 | |
IQVIA Holdings, Inc. (a) | | | 27 | | | | 6,540 | |
Laboratory Corp. of America Holdings (a) | | | 24 | | | | 6,709 | |
Molina Healthcare, Inc. (a) | | | 1 | | | | 193 | |
Oak Street Health, Inc. (a) | | | 1 | | | | 63 | |
PPD, Inc. (a) | | | 1 | | | | 53 | |
Quest Diagnostics, Inc. | | | 48 | | | | 6,389 | |
Teladoc Health, Inc. (a) | | | 2 | | | | 280 | |
UnitedHealth Group, Inc. | | | 28 | | | | 11,199 | |
Universal Health Services, Inc., Class B | | | 39 | | | | 5,657 | |
| | | | | | | | |
| | |
| | | | | | | 98,135 | |
| | | | | | | | |
Household Products/Wares — 0.1% | | | | | | | | |
Avery Dennison Corp. | | | 29 | | | | 6,001 | |
Church & Dwight Co., Inc. | | | 76 | | | | 6,499 | |
| | | | | | | | |
| SECURITY DESCRIPTION | |
SHARES | | | VALUE($) | |
| | | | | | | | |
Household Products/Wares — continued | |
Clorox Co. (The) | | | 35 | | | | 6,376 | |
Kimberly-Clark Corp. | | | 50 | | | | 6,679 | |
| | | | | | | | |
| | |
| | | | | | | 25,555 | |
| | | | | | | | |
Pharmaceuticals — 7.2% | | | | | | | | |
AbbVie, Inc. | | | 1,201 | | | | 135,335 | |
AmerisourceBergen Corp., Class A | | | 52 | | | | 5,914 | |
Becton Dickinson and Co. | | | 29 | | | | 6,946 | |
Bristol-Myers Squibb Co. | | | 1,912 | | | | 127,748 | |
Cardinal Health, Inc. | | | 104 | | | | 5,928 | |
Cigna Corp. | | | 30 | | | | 7,225 | |
CVS Health Corp. | | | 89 | | | | 7,396 | |
Dexcom, Inc. (a) | | | 16 | | | | 6,858 | |
Elanco Animal Health, Inc. (a) | | | 6 | | | | 194 | |
Eli Lilly & Co. | | | 675 | | | | 154,930 | |
Jazz Pharmaceuticals plc, (Ireland) (a) | | | 1 | | | | 161 | |
Johnson & Johnson | | | 2,182 | | | | 359,536 | |
McKesson Corp. | | | 33 | | | | 6,217 | |
Merck & Co., Inc. | | | 2,142 | | | | 166,575 | |
Neurocrine Biosciences, Inc. (a) | | | 61 | | | | 5,935 | |
Organon & Co. (a) | | | 403 | | | | 12,200 | |
Perrigo Co. plc, (Ireland) | | | 232 | | | | 10,631 | |
Pfizer, Inc. | | | 4,709 | | | | 184,408 | |
Viatris, Inc. | | | 1,366 | | | | 19,516 | |
Zoetis, Inc., Class A | | | 419 | | | | 78,143 | |
| | | | | | | | |
| | |
| | | | | | | 1,301,796 | |
| | | | | | | | |
Total Consumer Non-cyclical | | | | | | | 3,237,446 | |
| | | | | | | | |
Energy — 1.0% | | | | | | | | |
Energy — Alternate Sources — 0.2% | | | | | | | | |
Enphase Energy, Inc. (a) | | | 69 | | | | 12,707 | |
Plug Power, Inc. (a) | | | 207 | | | | 7,092 | |
SolarEdge Technologies, Inc., (Israel) (a) | | | 12 | | | | 3,356 | |
Sunrun, Inc. (a) | | | 71 | | | | 3,952 | |
| | | | | | | | |
| | |
| | | | | | | 27,107 | |
| | | | | | | | |
Oil & Gas — 0.6% | | | | | | | | |
APA Corp. | | | 267 | | | | 5,783 | |
Cabot Oil & Gas Corp. | | | 345 | | | | 6,019 | |
Chevron Corp. | | | 83 | | | | 8,726 | |
ConocoPhillips | | | 119 | | | | 7,230 | |
Devon Energy Corp. | | | 212 | | | | 6,175 | |
Diamondback Energy, Inc. | | | 69 | | | | 6,490 | |
EOG Resources, Inc. | | | 82 | | | | 6,862 | |
Exxon Mobil Corp. | | | 155 | | | | 9,797 | |
Hess Corp. | | | 70 | | | | 6,070 | |
Marathon Oil Corp. | | | 449 | | | | 6,113 | |
Marathon Petroleum Corp. | | | 103 | | | | 6,224 | |
Occidental Petroleum Corp. | | | 222 | | | | 6,943 | |
Phillips 66 | | | 71 | | | | 6,079 | |
Pioneer Natural Resources Co. | | | 39 | | | | 6,348 | |
Valero Energy Corp. | | | 78 | | | | 6,126 | |
| | | | | | | | |
| | |
| | | | | | | 100,985 | |
| | | | | | | | |
SEE NOTES TO FINANCIAL STATEMENTS.
| | | | | | | | | | |
| | | | | |
| JUNE 30, 2021 | | SIX CIRCLES TRUST | | | | | | | | 47 |
Six Circles U.S. Unconstrained Equity Fund
SCHEDULE OF PORTFOLIO INVESTMENTS
AS OF JUNE 30, 2021 (Unaudited) (continued)
(Amounts in U.S. Dollars, unless otherwise noted)
(Amounts in thousands, except number of Futures contracts)
| | | | | | | | |
| SECURITY DESCRIPTION | |
SHARES | | | VALUE($) | |
Common Stocks — continued | | | | | | | | |
Oil & Gas Services — 0.1% | | | | | | | | |
Baker Hughes Co., Class A | | | 243 | | | | 5,554 | |
Halliburton Co. | | | 258 | | | | 5,959 | |
NOV, Inc. (a) | | | 353 | | | | 5,407 | |
Schlumberger NV | | | 192 | | | | 6,141 | |
| | | | | | | | |
| | |
| | | | | | | 23,061 | |
| | | | | | | | |
Pipelines — 0.1% | | | | | | | | |
Cheniere Energy, Inc. (a) | | | 3 | | | | 276 | |
Kinder Morgan, Inc. | | | 333 | | | | 6,074 | |
ONEOK, Inc. | | | 115 | | | | 6,419 | |
Williams Cos., Inc. (The) | | | 229 | | | | 6,071 | |
| | | | | | | | |
| | |
| | | | | | | 18,840 | |
| | | | | | | | |
Total Energy | | | | | | | 169,993 | |
| | | | | | | | |
Financial — 14.5% | | | | | | | | |
Banks — 5.4% | | | | | | | | |
Bank of America Corp. | | | 4,334 | | | | 178,711 | |
Bank of New York Mellon Corp. (The) | | | 686 | | | | 35,132 | |
Citigroup, Inc. | | | 1,249 | | | | 88,388 | |
Citizens Financial Group, Inc. | | | 490 | | | | 22,454 | |
Comerica, Inc. | | | 83 | | | | 5,922 | |
Fifth Third Bancorp | | | 702 | | | | 26,840 | |
First Republic Bank | | | 160 | | | | 29,944 | |
Goldman Sachs Group, Inc. (The) | | | 205 | | | | 77,671 | |
Huntington Bancshares, Inc. | | | 1,577 | | | | 22,506 | |
KeyCorp. | | | 1,087 | | | | 22,453 | |
M&T Bank Corp. | | | 147 | | | | 21,355 | |
Morgan Stanley | | | 837 | | | | 76,738 | |
Northern Trust Corp. | | | 210 | | | | 24,227 | |
PNC Financial Services Group, Inc. (The) | | | 290 | | | | 55,331 | |
Regions Financial Corp. | | | 1,075 | | | | 21,698 | |
State Street Corp. | | | 323 | | | | 26,589 | |
SVB Financial Group (a) | | | 50 | | | | 27,909 | |
Truist Financial Corp. | | | 924 | | | | 51,258 | |
US Bancorp | | | 954 | | | | 54,338 | |
Wells Fargo & Co. | | | 2,409 | | | | 109,111 | |
Zions Bancorp NA | | | 113 | | | | 5,971 | |
| | | | | | | | |
| | |
| | | | | | | 984,546 | |
| | | | | | | | |
Diversified Financial Services — 3.2% | | | | | | | | |
Ally Financial, Inc. | | | 191 | | | | 9,497 | |
American Express Co. | | | 435 | | | | 71,948 | |
Ameriprise Financial, Inc. | | | 83 | | | | 20,666 | |
Apollo Global Management, Inc., Class A | | | 87 | | | | 5,405 | |
BlackRock, Inc., Class A | | | 67 | | | | 58,736 | |
Capital One Financial Corp. | | | 321 | | | | 49,720 | |
Cboe Global Markets, Inc. | | | 115 | | | | 13,747 | |
Charles Schwab Corp. (The) | | | 848 | | | | 61,765 | |
CME Group, Inc., Class A | | | 249 | | | | 52,978 | |
Discover Financial Services | | | 270 | | | | 31,882 | |
Franklin Resources, Inc. | | | 331 | | | | 10,579 | |
Intercontinental Exchange, Inc. | | | 387 | | | | 45,954 | |
Invesco Ltd. | | | 400 | | | | 10,680 | |
Mastercard, Inc., Class A | | | 28 | | | | 10,301 | |
| | | | | | | | |
| SECURITY DESCRIPTION | |
SHARES | | | VALUE($) | |
| | | | | | | | |
Diversified Financial Services — continued | |
Nasdaq, Inc. | | | 97 | | | | 17,089 | |
Raymond James Financial, Inc. | | | 110 | | | | 14,238 | |
SEI Investments Co. | | | 124 | | | | 7,700 | |
Synchrony Financial | | | 439 | | | | 21,283 | |
T Rowe Price Group, Inc. | | | 188 | | | | 37,297 | |
Tradeweb Markets, Inc., Class A | | | 72 | | | | 6,077 | |
Visa, Inc., Class A | | | 49 | | | | 11,536 | |
Western Union Co. (The) | | | 243 | | | | 5,575 | |
| | | | | | | | |
| | |
| | | | | | | 574,653 | |
| | | | | | | | |
Insurance — 4.6% | | | | | | | | |
Aflac, Inc. | | | 583 | | | | 31,307 | |
Alleghany Corp. (a) | | | 8 | | | | 5,549 | |
Allstate Corp. (The) | | | 242 | | | | 31,580 | |
American Financial Group, Inc. | | | 56 | | | | 6,970 | |
American International Group, Inc. | | | 635 | | | | 30,203 | |
Aon plc, Class A | | | 144 | | | | 34,298 | |
Arch Capital Group Ltd., (Bermuda) (a) | | | 206 | | | | 8,024 | |
Arthur J Gallagher & Co. | | | 141 | | | | 19,684 | |
Assurant, Inc. | | | 66 | | | | 10,233 | |
Athene Holding Ltd., (Bermuda), Class A (a) | | | 67 | | | | 4,514 | |
Berkshire Hathaway, Inc., Class B (a) | | | 752 | | | | 209,118 | |
Brown & Brown, Inc. | | | 121 | | | | 6,405 | |
Chubb Ltd., (Switzerland) | | | 312 | | | | 49,547 | |
Cincinnati Financial Corp. | | | 147 | | | | 17,114 | |
Equitable Holdings, Inc. | | | 200 | | | | 6,102 | |
Erie Indemnity Co., Class A | | | 12 | | | | 2,284 | |
Everest Re Group Ltd., (Bermuda) | | | 43 | | | | 10,900 | |
Fidelity National Financial, Inc. | | | 132 | | | | 5,739 | |
Globe Life, Inc. | | | 139 | | | | 13,236 | |
Hartford Financial Services Group, Inc. (The) | | | 311 | | | | 19,257 | |
Lincoln National Corp. | | | 231 | | | | 14,531 | |
Loews Corp. | | | 223 | | | | 12,161 | |
Markel Corp. (a) | | | 10 | | | | 11,769 | |
Marsh & McLennan Cos., Inc. | | | 360 | | | | 50,705 | |
MetLife, Inc. | | | 602 | | | | 36,057 | |
Principal Financial Group, Inc. | | | 337 | | | | 21,314 | |
Progressive Corp. (The) | | | 413 | | | | 40,601 | |
Prudential Financial, Inc. | | | 333 | | | | 34,139 | |
Reinsurance Group of America, Inc. | | | 34 | | | | 3,834 | |
RenaissanceRe Holdings Ltd., (Bermuda) | | | 25 | | | | 3,698 | |
Travelers Cos., Inc. (The) | | | 216 | | | | 32,379 | |
Unum Group | | | 196 | | | | 5,553 | |
Voya Financial, Inc. | | | 146 | | | | 8,962 | |
Willis Towers Watson plc, (United Kingdom) | | | 97 | | | | 22,299 | |
WR Berkley Corp. | | | 173 | | | | 12,846 | |
| | | | | | | | |
| | |
| | | | | | | 832,912 | |
| | | | | | | | |
Private Equity — 0.3% | | | | | | | | |
Blackstone Group, Inc. (The) | | | 433 | | | | 42,018 | |
Carlyle Group, Inc. (The) | | | 77 | | | | 3,587 | |
SEE NOTES TO FINANCIAL STATEMENTS.
| | | | | | | | | | |
| | | | | |
| 48 | | | | | | | | SIX CIRCLES TRUST | | JUNE 30, 2021 |
| | | | | | | | |
| SECURITY DESCRIPTION | |
SHARES | | | VALUE($) | |
Common Stocks — continued | | | | | | | | |
Private Equity — continued | | | | | | | | |
KKR & Co., Inc. | | | 266 | | | | 15,764 | |
| | | | | | | | |
| | |
| | | | | | | 61,369 | |
| | | | | | | | |
Real Estate — 0.0% (g) | | | | | | | | |
CBRE Group, Inc., Class A (a) | | | 75 | | | | 6,402 | |
| | | | | | | | |
REITS — 1.0% | | | | | | | | |
AGNC Investment Corp. | | | 270 | | | | 4,555 | |
Alexandria Real Estate Equities, Inc. | | | 33 | | | | 5,956 | |
American Tower Corp. | | | 28 | | | | 7,623 | |
Annaly Capital Management, Inc. | | | 708 | | | | 6,289 | |
AvalonBay Communities, Inc. | | | 31 | | | | 6,457 | |
Boston Properties, Inc. | | | 51 | | | | 5,792 | |
Camden Property Trust | | | 1 | | | | 151 | |
Crown Castle International Corp. | | | 37 | | | | 7,142 | |
Digital Realty Trust, Inc. | | | 41 | | | | 6,113 | |
Duke Realty Corp. | | | 126 | | | | 5,966 | |
Equinix, Inc. | | | 9 | | | | 6,847 | |
Equity LifeStyle Properties, Inc. | | | 2 | | | | 171 | |
Equity Residential | | | 80 | | | | 6,124 | |
Essex Property Trust, Inc. | | | 20 | | | | 5,981 | |
Extra Space Storage, Inc. | | | 39 | | | | 6,416 | |
Federal Realty Investment Trust | | | 48 | | | | 5,599 | |
Healthpeak Properties, Inc. | | | 178 | | | | 5,929 | |
Host Hotels & Resorts, Inc. (a) | | | 342 | | | | 5,844 | |
Invitation Homes, Inc. | | | 8 | | | | 285 | |
Iron Mountain, Inc. | | | 133 | | | | 5,620 | |
Kimco Realty Corp. | | | 268 | | | | 5,587 | |
Medical Properties Trust, Inc. | | | 8 | | | | 153 | |
Mid-America Apartment Communities, Inc. | | | 37 | | | | 6,149 | |
Omega Healthcare Investors, Inc. | | | 3 | | | | 111 | |
Prologis, Inc. | | | 58 | | | | 6,969 | |
Public Storage | | | 22 | | | | 6,763 | |
Realty Income Corp. | | | 93 | | | | 6,190 | |
Regency Centers Corp. | | | 89 | | | | 5,706 | |
SBA Communications Corp., Class A | | | 20 | | | | 6,465 | |
Simon Property Group, Inc. | | | 49 | | | | 6,358 | |
Sun Communities, Inc. | | | 1 | | | | 209 | |
UDR, Inc. | | | 122 | | | | 5,951 | |
Ventas, Inc. | | | 108 | | | | 6,181 | |
VEREIT, Inc. | | | 3 | | | | 140 | |
VICI Properties, Inc. | | | 7 | | | | 222 | |
Vornado Realty Trust | | | 122 | | | | 5,683 | |
Welltower, Inc. | | | 82 | | | | 6,824 | |
Weyerhaeuser Co. | | | 179 | | | | 6,169 | |
WP Carey, Inc. | | | 2 | | | | 173 | |
| | | | | | | | |
| | |
| | | | | | | 186,863 | |
| | | | | | | | |
Savings & Loans — 0.0% (g) | | | | | | | | |
People’s United Financial, Inc. | | | 343 | | | | 5,876 | |
| | | | | | | | |
Total Financial | | | | | | | 2,652,621 | |
| | | | | | | | |
Industrial — 14.2% | | | | | | | | |
Aerospace/Defense — 1.6% | | | | | | | | |
Boeing Co. (The) (a) | | | 253 | | | | 60,682 | |
| | | | | | | | |
| SECURITY DESCRIPTION | |
SHARES | | | VALUE($) | |
| | | | | | | | |
Aerospace/Defense — continued | | | | | | | | |
General Dynamics Corp. | | | 132 | | | | 24,868 | |
HEICO Corp. | | | 18 | | | | 2,492 | |
HEICO Corp., Class A | | | 30 | | | | 3,728 | |
Howmet Aerospace, Inc. (a) | | | 327 | | | | 11,271 | |
L3Harris Technologies, Inc. | | | 114 | | | | 24,542 | |
Lockheed Martin Corp. | | | 120 | | | | 45,255 | |
Northrop Grumman Corp. | | | 81 | | | | 29,583 | |
Raytheon Technologies Corp. | | | 696 | | | | 59,358 | |
Teledyne Technologies, Inc. (a) | | | 34 | | | | 14,184 | |
TransDigm Group, Inc. (a) | | | 31 | | | | 19,802 | |
| | | | | | | | |
| | |
| | | | | | | 295,765 | |
| | | | | | | | |
Building Materials — 0.5% | | | | | | | | |
Carrier Global Corp. | | | 471 | | | | 22,885 | |
Fortune Brands Home & Security, Inc. | | | 118 | | | | 11,786 | |
Johnson Controls International plc | | | 388 | | | | 26,625 | |
Lennox International, Inc. | | | 14 | | | | 4,925 | |
Martin Marietta Materials, Inc. | | | 18 | | | | 6,284 | |
Masco Corp. | | | 207 | | | | 12,182 | |
Owens Corning | | | 43 | | | | 4,233 | |
Vulcan Materials Co. | | | 36 | | | | 6,312 | |
| | | | | | | | |
| | |
| | | | | | | 95,232 | |
| | | | | | | | |
Electrical Components & Equipments — 0.4% | |
AMETEK, Inc. | | | 140 | | | | 18,642 | |
Emerson Electric Co. | | | 312 | | | | 29,990 | |
Generac Holdings, Inc. (a) | | | 43 | | | | 17,849 | |
| | | | | | | | |
| | |
| | | | | | | 66,481 | |
| | | | | | | | |
Electronics — 1.2% | | | | | | | | |
Agilent Technologies, Inc. | | | 46 | | | | 6,789 | |
Allegion plc, (Ireland) | | | 80 | | | | 11,207 | |
Amphenol Corp., Class A | | | 382 | | | | 26,104 | |
Arrow Electronics, Inc. (a) | | | 37 | | | | 4,231 | |
Fortive Corp. | | | 217 | | | | 15,132 | |
Garmin Ltd., (Switzerland) | | | 44 | | | | 6,318 | |
Honeywell International, Inc. | | | 315 | | | | 68,992 | |
Keysight Technologies, Inc. (a) | | | 131 | | | | 20,256 | |
Mettler-Toledo International, Inc. (a) | | | 5 | | | | 6,727 | |
Sensata Technologies Holding plc (a) | | | 65 | | | | 3,775 | |
TE Connectivity Ltd., (Switzerland) | | | 207 | | | | 28,050 | |
Trimble, Inc. (a) | | | 200 | | | | 16,380 | |
Waters Corp. (a) | | | 19 | | | | 6,397 | |
| | | | | | | | |
| | |
| | | | | | | 220,358 | |
| | | | | | | | |
Engineering & Construction — 0.1% | | | | | | | | |
Jacobs Engineering Group, Inc. | | | 97 | | | | 12,982 | |
| | | | | | | | |
Environmental Control — 0.4% | | | | | | | | |
Pentair plc, (United Kingdom) | | | 156 | | | | 10,562 | |
Republic Services, Inc., Class A | | | 150 | | | | 16,504 | |
Waste Connections, Inc. | | | 109 | | | | 12,999 | |
Waste Management, Inc. | | | 220 | | | | 30,800 | |
| | | | | | | | |
| | |
| | | | | | | 70,865 | |
| | | | | | | | |
SEE NOTES TO FINANCIAL STATEMENTS.
| | | | | | | | | | |
| | | | | |
| JUNE 30, 2021 | | SIX CIRCLES TRUST | | | | | | | | 49 |
Six Circles U.S. Unconstrained Equity Fund
SCHEDULE OF PORTFOLIO INVESTMENTS
AS OF JUNE 30, 2021 (Unaudited) (continued)
(Amounts in U.S. Dollars, unless otherwise noted)
(Amounts in thousands, except number of Futures contracts)
| | | | | | | | |
| SECURITY DESCRIPTION | |
SHARES | | | VALUE($) | |
Common Stocks — continued | | | | | | | | |
Hand/Machine Tools — 0.2% | | | | | | | | |
Snap-on, Inc. | | | 47 | | | | 10,612 | |
Stanley Black & Decker, Inc. | | | 96 | | | | 19,659 | |
| | | | | | | | |
| | |
| | | | | | | 30,271 | |
| | | | | | | | |
Machinery — Construction & Mining — 0.3% | |
Caterpillar, Inc. | | | 252 | | | | 54,946 | |
| | | | | | | | |
Machinery — Diversified — 0.9% | | | | | | | | |
Cognex Corp. | | | 86 | | | | 7,218 | |
Deere & Co. | | | 141 | | | | 49,571 | |
Dover Corp. | | | 100 | | | | 15,067 | |
IDEX Corp. | | | 59 | | | | 12,926 | |
Ingersoll Rand, Inc. (a) | | | 279 | | | | 13,621 | |
Nordson Corp. | | | 22 | | | | 4,738 | |
Otis Worldwide Corp. | | | 245 | | | | 20,000 | |
Rockwell Automation, Inc. | | | 69 | | | | 19,831 | |
Westinghouse Air Brake Technologies Corp. | | | 147 | | | | 12,113 | |
Xylem, Inc. | | | 125 | | | | 14,960 | |
| | | | | | | | |
| | |
| | | | | | | 170,045 | |
| | | | | | | | |
Miscellaneous Manufacturers — 1.3% | | | | | | | | |
3M Co. | | | 269 | | | | 53,494 | |
AO Smith Corp. | | | 142 | | | | 10,261 | |
Eaton Corp. plc | | | 208 | | | | 30,785 | |
General Electric Co. | | | 4,065 | | | | 54,717 | |
Illinois Tool Works, Inc. | | | 157 | | | | 35,173 | |
Parker-Hannifin Corp. | | | 74 | | | | 22,642 | |
Textron, Inc. | | | 181 | | | | 12,431 | |
Trane Technologies plc, (Ireland) | | | 131 | | | | 24,110 | |
| | | | | | | | |
| | |
| | | | | | | 243,613 | |
| | | | | | | | |
Packaging & Containers — 0.2% | | | | | | | | |
Amcor plc, (United Kingdom) | | | 501 | | | | 5,742 | |
Ball Corp. | | | 77 | | | | 6,277 | |
Crown Holdings, Inc. | | | 2 | | | | 182 | |
Packaging Corp. of America | | | 43 | | | | 5,819 | |
Sealed Air Corp. | | | 103 | | | | 6,112 | |
Westrock Co. | | | 111 | | | | 5,895 | |
| | | | | | | | |
| | |
| | | | | | | 30,027 | |
| | | | | | | | |
Shipbuilding — 0.1% | | | | | | | | |
Huntington Ingalls Industries, Inc. | | | 44 | | | | 9,194 | |
| | | | | | | | |
Transportation — 7.0% | | | | | | | | |
CH Robinson Worldwide, Inc. | | | 611 | | | | 57,213 | |
CSX Corp. | | | 1,138 | | | | 36,513 | |
Expeditors International of Washington, Inc. | | | 748 | | | | 94,642 | |
FedEx Corp. | | | 1,035 | | | | 308,688 | |
JB Hunt Transport Services, Inc. | | | 71 | | | | 11,560 | |
Kansas City Southern | | | 58 | | | | 16,392 | |
Knight-Swift Transportation Holdings, Inc., Class A | | | 66 | | | | 2,978 | |
Norfolk Southern Corp. | | | 127 | | | | 33,752 | |
Old Dominion Freight Line, Inc. | | | 65 | | | | 16,457 | |
| | | | | | | | |
| SECURITY DESCRIPTION | |
SHARES | | | VALUE($) | |
| | | | | | | | |
Transportation — continued | | | | | | | | |
Union Pacific Corp. | | | 304 | | | | 66,933 | |
United Parcel Service, Inc., Class B | | | 3,024 | | | | 628,800 | |
XPO Logistics, Inc. (a) | | | 36 | | | | 5,023 | |
| | | | | | | | |
| | |
| | | | | | | 1,278,951 | |
| | | | | | | | |
Total Industrial | | | | | | | 2,578,730 | |
| | | | | | | | |
Technology — 25.6% | | | | | | | | |
Computers — 7.4% | | | | | | | | |
Accenture plc, (Ireland), Class A | | | 31 | | | | 9,021 | |
Apple, Inc. | | | 8,240 | | | | 1,128,496 | |
Cognizant Technology Solutions Corp., Class A | | | 92 | | | | 6,388 | |
Crowdstrike Holdings, Inc., Class A (a) | | | 123 | | | | 30,924 | |
Dell Technologies, Inc., Class C (a) | | | 129 | | | | 12,823 | |
DXC Technology Co. (a) | | | 144 | | | | 5,613 | |
EPAM Systems, Inc. (a) | | | 1 | | | | 383 | |
Fortinet, Inc. (a) | | | 122 | | | | 28,947 | |
Hewlett Packard Enterprise Co. | | | 1,009 | | | | 14,714 | |
HP, Inc. | | | 808 | | �� | | 24,385 | |
International Business Machines Corp. | | | 52 | | | | 7,611 | |
Leidos Holdings, Inc. | | | 111 | | | | 11,252 | |
NetApp, Inc. | | | 180 | | | | 14,743 | |
Seagate Technology Holdings plc, (Ireland) | | | 166 | | | | 14,556 | |
Western Digital Corp. (a) | | | 230 | | | | 16,341 | |
Zscaler, Inc. (a) | | | 55 | | | | 11,967 | |
| | | | | | | | |
| | |
| | | | | | | 1,338,164 | |
| | | | | | | | |
Office/Business Equipment — 0.1% | | | | | | | | |
Zebra Technologies Corp., Class A (a) | | | 38 | | | | 19,953 | |
| | | | | | | | |
Semiconductors — 3.5% | | | | | | | | |
Advanced Micro Devices, Inc. (a) | | | 357 | | | | 33,563 | |
Analog Devices, Inc. | | | 123 | | | | 21,129 | |
Applied Materials, Inc. | | | 259 | | | | 36,860 | |
Broadcom, Inc. | | | 109 | | | | 51,892 | |
Intel Corp. | | | 1,057 | | | | 59,327 | |
IPG Photonics Corp. (a) | | | 48 | | | | 10,015 | |
KLA Corp. | | | 55 | | | | 17,824 | |
Lam Research Corp. | | | 43 | | | | 27,852 | |
Marvell Technology, Inc. | | | 187 | | | | 10,902 | |
Maxim Integrated Products, Inc. | | | 121 | | | | 12,704 | |
Microchip Technology, Inc. | | | 103 | | | | 15,452 | |
Micron Technology, Inc. (a) | | | 338 | | | | 28,722 | |
Monolithic Power Systems, Inc. | | | 27 | | | | 10,154 | |
NVIDIA Corp. | | | 153 | | | | 122,797 | |
NXP Semiconductors NV, (Netherlands) | | | 95 | | | | 19,450 | |
ON Semiconductor Corp. (a) | | | 97 | | | | 3,722 | |
Qorvo, Inc. (a) | | | 60 | | | | 11,732 | |
QUALCOMM, Inc. | | | 311 | | | | 44,388 | |
Skyworks Solutions, Inc. | | | 73 | | | | 14,084 | |
Teradyne, Inc. | | | 86 | | | | 11,491 | |
Texas Instruments, Inc. | | | 248 | | | | 47,680 | |
Xilinx, Inc. | | | 104 | | | | 14,999 | |
| | | | | | | | |
| | |
| | | | | | | 626,739 | |
| | | | | | | | |
SEE NOTES TO FINANCIAL STATEMENTS.
| | | | | | | | | | |
| | | | | |
| 50 | | | | | | | | SIX CIRCLES TRUST | | JUNE 30, 2021 |
| | | | | | | | |
| SECURITY DESCRIPTION | |
SHARES | | | VALUE($) | |
Common Stocks — continued | | | | | | | | |
Software — 14.6% | | | | | | | | |
Activision Blizzard, Inc. | | | 73 | | | | 6,973 | |
Adobe, Inc. (a) | | | 341 | | | | 199,478 | |
Akamai Technologies, Inc. (a) | | | 53 | | | | 6,139 | |
ANSYS, Inc. (a) | | | 78 | | | | 26,905 | |
Autodesk, Inc. (a) | | | 173 | | | | 50,403 | |
Bentley Systems, Inc., Class B | | | 118 | | | | 7,644 | |
Black Knight, Inc. (a) | | | 108 | | | | 8,397 | |
Broadridge Financial Solutions, Inc. | | | 38 | | | | 6,147 | |
Cadence Design Systems, Inc. (a) | | | 238 | | | | 32,544 | |
Ceridian HCM Holding, Inc. (a) | | | 92 | | | | 8,820 | |
Cerner Corp. | | | 78 | | | | 6,110 | |
Citrix Systems, Inc. | | | 134 | | | | 15,711 | |
Clarivate plc, (United Kingdom) (a) | | | 138 | | | | 3,797 | |
Cloudflare, Inc., Class A (a) | | | 155 | | | | 16,403 | |
Coupa Software, Inc. (a) | | | 50 | | | | 13,015 | |
Datadog, Inc., Class A (a) | | | 120 | | | | 12,514 | |
DocuSign, Inc., Class A (a) | | | 128 | | | | 35,879 | |
Dropbox, Inc., Class A (a) | | | 217 | | | | 6,585 | |
Dynatrace, Inc. (a) | | | 126 | | | | 7,388 | |
Electronic Arts, Inc. | | | 44 | | | | 6,397 | |
Fair Isaac Corp. (a) | | | 20 | | | | 10,114 | |
Fidelity National Information Services, Inc. | | | 51 | | | | 7,171 | |
Fiserv, Inc. (a) | | | 62 | | | | 6,641 | |
Guidewire Software, Inc. (a) | | | 55 | | | | 6,165 | |
HubSpot, Inc. (a) | | | 30 | | | | 17,646 | |
Intuit, Inc. | | | 201 | | | | 98,585 | |
Jack Henry & Associates, Inc. | | | 37 | | | | 6,102 | |
Microsoft Corp. | | | 4,954 | | | | 1,342,113 | |
MongoDB, Inc., Class A (a) | | | 1 | | | | 259 | |
MSCI, Inc., Class A | | | 55 | | | | 29,374 | |
Oracle Corp. | | | 1,389 | | | | 108,119 | |
Palantir Technologies, Inc., Class A (a) | | | 362 | | | | 9,536 | |
Paychex, Inc. | | | 62 | | | | 6,642 | |
Paycom Software, Inc. (a) | | | 53 | | | | 19,137 | |
PTC, Inc. (a) | | | 121 | | | | 17,142 | |
RingCentral, Inc., Class A (a) | | | 52 | | | | 15,067 | |
Roper Technologies, Inc. | | | 56 | | | | 26,519 | |
salesforce.com, Inc. (a) | | | 656 | | | | 160,332 | |
ServiceNow, Inc. (a) | | | 147 | | | | 80,931 | |
Slack Technologies, Inc., Class A (a) | | | 328 | | | | 14,519 | |
Snowflake, Inc., Class A (a) | | | — | (h) | | | 88 | |
Splunk, Inc. (a) | | | 111 | | | | 16,085 | |
SS&C Technologies Holdings, Inc. | | | 160 | | | | 11,497 | |
Synopsys, Inc. (a) | | | 128 | | | | 35,217 | |
Take-Two Interactive Software, Inc. (a) | | | 34 | | | | 5,987 | |
Twilio, Inc., Class A (a) | | | 2 | | | | 833 | |
Tyler Technologies, Inc. (a) | | | 42 | | | | 18,839 | |
Unity Software, Inc. (a) | | | 38 | | | | 4,200 | |
Veeva Systems, Inc., Class A (a) | | | 2 | | | | 557 | |
VMware, Inc., Class A (a) | | | 58 | | | | 9,277 | |
Workday, Inc., Class A (a) | | | 124 | | | | 29,567 | |
| | | | | | | | |
| SECURITY DESCRIPTION | |
SHARES | | | VALUE($) | |
| | | | | | | | |
Software — continued | | | | | | | | |
Zoom Video Communications, Inc., Class A (a) | | | 141 | | | | 54,483 | |
| | | | | | | | |
| | |
| | | | | | | 2,645,993 | |
| | | | | | | | |
Total Technology | | | | | | | 4,630,849 | |
| | | | | | | | |
Utilities — 1.0% | | | | | | | | |
Electric — 0.9% | | | | | | | | |
AES Corp. (The) | | | 238 | | | | 6,197 | |
Alliant Energy Corp. | | | 105 | | | | 5,836 | |
Ameren Corp. | | | 72 | | | | 5,736 | |
American Electric Power Co., Inc. | | | 78 | | | | 6,585 | |
CenterPoint Energy, Inc. | | | 233 | | | | 5,720 | |
CMS Energy Corp. | | | 102 | | | | 6,029 | |
Consolidated Edison, Inc. | | | 82 | | | | 5,913 | |
Dominion Energy, Inc. | | | 89 | | | | 6,514 | |
DTE Energy Co. | | | 48 | | | | 6,194 | |
Duke Energy Corp. | | | 69 | | | | 6,844 | |
Edison International | | | 107 | | | | 6,201 | |
Entergy Corp. | | | 57 | | | | 5,733 | |
Evergy, Inc. | | | 96 | | | | 5,792 | |
Eversource Energy | | | 77 | | | | 6,140 | |
Exelon Corp. | | | 144 | | | | 6,370 | |
FirstEnergy Corp. | | | 161 | | | | 5,974 | |
NextEra Energy, Inc. | | | 108 | | | | 7,895 | |
NRG Energy, Inc. | | | 162 | | | | 6,522 | |
PG&E Corp. (a) | | | 20 | | | | 199 | |
Pinnacle West Capital Corp. | | | 70 | | | | 5,713 | |
PPL Corp. | | | 213 | | | | 5,951 | |
Public Service Enterprise Group, Inc. | | | 108 | | | | 6,479 | |
Sempra Energy | | | 48 | | | | 6,301 | |
Southern Co. (The) | | | 110 | | | | 6,679 | |
Vistra Corp. | | | 6 | | | | 108 | |
WEC Energy Group, Inc. | | | 68 | | | | 6,063 | |
Xcel Energy, Inc. | | | 93 | | | | 6,124 | |
| | | | | | | | |
| | |
| | | | | | | 155,812 | |
| | | | | | | | |
Gas — 0.1% | | | | | | | | |
Atmos Energy Corp. | | | 59 | | | | 5,697 | |
NiSource, Inc. | | | 231 | | | | 5,667 | |
UGI Corp. | | | 3 | | | | 154 | |
| | | | | | | | |
| | |
| | | | | | | 11,518 | |
| | | | | | | | |
Water — 0.0% (g) | | | | | | | | |
American Water Works Co., Inc. | | | 40 | | | | 6,137 | |
Essential Utilities, Inc. | | | 3 | | | | 141 | |
| | | | | | | | |
| | |
| | | | | | | 6,278 | |
| | | | | | | | |
Total Utilities | | | | | | | 173,608 | |
| | | | | | | | |
Total Common Stocks
(Cost $13,749,851) | | | | | | | 18,052,632 | |
| | | | | | | | |
SEE NOTES TO FINANCIAL STATEMENTS.
| | | | | | | | | | |
| | | | | |
| JUNE 30, 2021 | | SIX CIRCLES TRUST | | | | | | | | 51 |
Six Circles U.S. Unconstrained Equity Fund
SCHEDULE OF PORTFOLIO INVESTMENTS
AS OF JUNE 30, 2021 (Unaudited) (continued)
(Amounts in U.S. Dollars, unless otherwise noted)
(Amounts in thousands, except number of Futures contracts)
| | | | | | | | |
| SECURITY DESCRIPTION | | PRINCIPAL
AMOUNT($) | | | VALUE($) | |
Time Deposits — 0.8% | | | | | | | | |
Australia & New Zealand Banking Group Ltd., 0.01%, 07/01/2021 | | | 7,687 | | | | 7,687 | |
Barclays SA, 0.01%, 07/01/2021 | | | 12,240 | | | | 12,240 | |
BNP Paribas SA, 0.01%, 07/01/2021 | | | 27,684 | | | | 27,684 | |
Brown Brothers Harriman, 0.01%, 07/01/2021 | | | — | (h) | | | — | (h) |
Citibank NA, 0.01%, 07/01/2021 | | | 88,912 | | | | 88,912 | |
| | | | | | | | |
Total Short-Term Investments
(Cost $136,523) | | | | | | | 136,523 | |
| | | | | | | | |
| | |
Total Investments — 100.1%
(Cost — $13,886,374)* | | | | | | | 18,189,155 | |
| |
Liabilities in Excess of Other Assets — (0.1)% | | | | (15,163 | ) |
| | | | | | | | |
| | |
NET ASSETS — 100.0% | | | | | | | $18,173,992 | |
| | | | | | | | |
Percentages indicated are based on net assets.
| | | | | | | | | | | | | | | | | | | | |
| Futures contracts outstanding as of June 30, 2021: | |
| Exchange Traded | |
| DESCRIPTION | | NUMBER OF
CONTRACTS | | | EXPIRATION
DATE | | | TRADING
CURRENCY | | | NOTIONAL
AMOUNT($) | | | VALUE AND
UNREALIZED
APPRECIATION
(DEPRECIATION)($) | |
Long Contracts | | | | | | | | | | | | | | | | | | | | |
E-mini Russell 2000 Index | | | 9 | | | | 09/2021 | | | | USD | | | | 1,043 | | | | (4 | ) |
Micro E-mini NASDAQ 100 Index | | | 81 | | | | 09/2021 | | | | USD | | | | 2,267 | | | | 90 | |
NASDAQ 100 E-mini Index | | | 105 | | | | 09/2021 | | | | USD | | | | 29,402 | | | | 1,151 | |
S&P 500 E-mini Index | | | 274 | | | | 09/2021 | | | | USD | | | | 57,997 | | | | 755 | |
S&P MidCap 400 E-mini Index | | | 50 | | | | 09/2021 | | | | USD | | | | 13,519 | | | | (57 | ) |
| | | | | | | | | | | | | | | | | | | | |
Total unrealized appreciation (depreciation) | | | | 1,935 | |
| | | | | |
NOTES TO SCHEDULE OF PORTFOLIO INVESTMENTS
| | |
| REIT | | — Real Estate Investment Trust |
| (a) | | — Non-income producing security. |
| (g) | | — Amount rounds to less than 0.05%. |
| (h) | | — Amount rounds to less than 500. |
| * | | — The cost of securities is substantially the same for federal income tax purposes. |
| USD | | — United States Dollar |
SEE NOTES TO FINANCIAL STATEMENTS.
| | | | | | | | | | |
| | | | | |
| 52 | | | | | | | | SIX CIRCLES TRUST | | JUNE 30, 2021 |
Summary of Investments by Industry, June 30, 2021
The following table represents the portfolio investments of the Fund by industry classifications as a percentage of total investments:
| | | | |
| INDUSTRY | | PERCENTAGE | |
| |
Internet | | | 20.0 | % |
| |
Software | | | 14.6 | % |
| |
Computers | | | 7.4 | % |
| |
Pharmaceuticals | | | 7.2 | % |
| |
Transportation | | | 7.0 | % |
| |
Banks | | | 5.4 | % |
| |
Insurance | | | 4.6 | % |
| |
Beverages | | | 4.0 | % |
| |
Semiconductors | | | 3.5 | % |
| |
Diversified Financial Services | | | 3.2 | % |
| |
Biotechnology | | | 2.6 | % |
| |
Commercial Services | | | 1.7 | % |
| |
Aerospace/Defense | | | 1.6 | % |
| |
Miscellaneous Manufacturers | | | 1.3 | % |
| |
Electronics | | | 1.2 | % |
| |
Telecommunications | | | 1.2 | % |
| |
REITS | | | 1.0 | % |
| |
Retail | | | 1.0 | % |
| |
Others (Each less than 1.0%) | | | 10.7 | % |
| |
Short-Term Investments | | | 0.8 | % |
SEE NOTES TO FINANCIAL STATEMENTS.
| | | | | | | | | | |
| | | | | |
| JUNE 30, 2021 | | SIX CIRCLES TRUST | | | | | | | | 53 |
Six Circles International Unconstrained Equity Fund
SCHEDULE OF PORTFOLIO INVESTMENTS
AS OF JUNE 30, 2021 (Unaudited)
(Amounts in U.S. Dollars, unless otherwise noted)
(Amounts in thousands, except number of Futures contracts)
| | | | | | | | |
| SECURITY DESCRIPTION | | PRINCIPAL
AMOUNT($) | | | VALUE($) | |
Corporate Bond — 0.0% (g) | | | | | | | | |
Consumer Non-cyclical — 0.0% (g) | | | | | | | | |
Food — 0.0% (g) | | | | | | | | |
Britannia Industries Ltd., (India), 5.50%, 06/03/2024
(Cost $— h) | | INR | 140 | | | | 2 | |
| | | | | | | | |
| | |
| | | SHARES | | | | |
Common Stocks — 95.9% | | | | | | | | |
Argentina — 0.0% (g) | | | | | | | | |
Adecoagro SA (a) | | | 5 | | | | 47 | |
YPF SA, ADR (a) | | | 8 | | | | 38 | |
| | | | | | | | |
| | |
| | | | | | | 85 | |
| | | | | | | | |
Australia — 0.2% | | | | | | | | |
BHP Group plc | | | 806 | | | | 23,858 | |
MMG Ltd. (a) | | | 116 | | | | 51 | |
| | | | | | | | |
| | |
| | | | | | | 23,909 | |
| | | | | | | | |
Austria — 0.2% | | | | | | | | |
Erste Group Bank AG | | | 312 | | | | 11,453 | |
OMV AG | | | 12 | | | | 666 | |
Raiffeisen Bank International AG | | | 166 | | | | 3,763 | |
Verbund AG | | | 171 | | | | 15,775 | |
voestalpine AG | | | 9 | | | | 360 | |
| | | | | | | | |
| | |
| | | | | | | 32,017 | |
| | | | | | | | |
Belgium — 1.0% | | | | | | | | |
Ageas SA | | | 195 | | | | 10,851 | |
Anheuser-Busch InBev SA | | | 395 | | | | 28,456 | |
Elia Group SA | | | 80 | | | | 8,457 | |
Etablissements Franz Colruyt NV | | | 5 | | | | 262 | |
Groupe Bruxelles Lambert SA | | | 126 | | | | 14,059 | |
KBC Group NV | | | 278 | | | | 21,256 | |
Proximus SADP | | | 13 | | | | 256 | |
Sofina SA | | | 17 | | | | 7,404 | |
Solvay SA | | | 6 | | | | 753 | |
UCB SA | | | 214 | | | | 22,370 | |
Umicore SA | | | 16 | | | | 962 | |
| | | | | | | | |
| | |
| | | | | | | 115,086 | |
| | | | | | | | |
Brazil — 0.1% | | | | | | | | |
Ambev SA | | | 234 | | | | 802 | |
Atacadao SA | | | 17 | | | | 73 | |
B2W Cia Digital (a) | | | 9 | | | | 126 | |
B3 SA — Brasil Bolsa Balcao | | | 290 | | | | 980 | |
Banco Bradesco SA | | | 77 | | | | 339 | |
Banco BTG Pactual SA | | | 13 | | | | 327 | |
Banco do Brasil SA | | | 40 | | | | 258 | |
Banco Inter SA | | | 12 | | | | 194 | |
Banco Santander Brasil SA | | | 19 | | | | 152 | |
BB Seguridade Participacoes SA | | | 29 | | | | 137 | |
BRF SA (a) | | | 32 | | | | 174 | |
CCR SA | | | 66 | | | | 178 | |
Centrais Eletricas Brasileiras SA | | | 14 | | | | 124 | |
Cia de Saneamento Basico do Estado de Sao Paulo | | | 18 | | | | 131 | |
| | | | | | | | |
| SECURITY DESCRIPTION | |
SHARES | | | VALUE($) | |
| | | | | | | | |
Brazil — continued | | | | | | | | |
Cia Siderurgica Nacional SA | | | 34 | | | | 302 | |
Cosan SA | | | 56 | | | | 268 | |
CPFL Energia SA | | | 8 | | | | 46 | |
Energisa SA | | | 8 | | | | 73 | |
Engie Brasil Energia SA | | | 10 | | | | 79 | |
Equatorial Energia SA | | | 46 | | | | 229 | |
Hapvida Participacoes e Investimentos SA (e) | | | 44 | | | | 137 | |
Hypera SA | | | 21 | | | | 142 | |
JBS SA | | | 46 | | | | 270 | |
Klabin SA (a) | | | 41 | | | | 217 | |
Localiza Rent a Car SA | | | 27 | | | | 344 | |
Lojas Renner SA | | | 41 | | | | 368 | |
Magazine Luiza SA | | | 136 | | | | 580 | |
Natura & Co. Holding SA (a) | | | 43 | | | | 494 | |
Notre Dame Intermedica Participacoes SA | | | 24 | | | | 408 | |
Petrobras Distribuidora SA | | | 38 | | | | 205 | |
Petroleo Brasileiro SA | | | 175 | | | | 1,064 | |
Raia Drogasil SA | | | 54 | | | | 267 | |
Rede D’Or Sao Luiz SA (e) | | | 10 | | | | 136 | |
Rumo SA (a) | | | 67 | | | | 258 | |
Sul America SA | | | — | (h) | | | — | (h) |
Suzano SA (a) | | | 33 | | | | 394 | |
Telefonica Brasil SA | | | 24 | | | | 207 | |
TIM SA | | | 44 | | | | 103 | |
TOTVS SA | | | 29 | | | | 221 | |
Ultrapar Participacoes SA | | | 40 | | | | 150 | |
Vale SA | | | 186 | | | | 4,230 | |
Via Varejo S/A (a) | | | 54 | | | | 172 | |
WEG SA | | | 80 | | | | 541 | |
| | | | | | | | |
| | |
| | | | | | | 15,900 | |
| | | | | | | | |
Chile — 0.0% (g) | | | | | | | | |
Antofagasta plc | | | 150 | | | | 2,990 | |
Banco de Chile | | | 1,989 | | | | 196 | |
Banco de Credito e Inversiones SA | | | 2 | | | | 95 | |
Banco Santander Chile | | | 2,952 | | | | 146 | |
Cencosud SA | | | 61 | | | | 121 | |
Cencosud Shopping SA | | | 66 | | | | 109 | |
Cia Cervecerias Unidas SA | | | 6 | | | | 60 | |
Colbun SA | | | 309 | | | | 43 | |
Empresas CMPC SA | | | 56 | | | | 134 | |
Empresas COPEC SA | | | 19 | | | | 183 | |
Enel Americas SA | | | 939 | | | | 138 | |
Enel Chile SA | | | 1,169 | | | | 67 | |
Falabella SA | | | 31 | | | | 136 | |
| | | | | | | | |
| | |
| | | | | | | 4,418 | |
| | | | | | | | |
China — 1.3% | | | | | | | | |
21Vianet Group, Inc., ADR (a) | | | 4 | | | | 85 | |
360 DigiTech, Inc., ADR (a) | | | 4 | | | | 172 | |
360 Security Technology, Inc., Class A (a) | | | 38 | | | | 71 | |
SEE NOTES TO FINANCIAL STATEMENTS.
| | | | | | | | | | |
| | | | | |
| 54 | | | | | | | | SIX CIRCLES TRUST | | JUNE 30, 2021 |
| | | | | | | | |
| SECURITY DESCRIPTION | |
SHARES | | | VALUE($) | |
Common Stocks — continued | | | | | | | | |
China — continued | | | | | | | | |
3SBio, Inc. (a) (e) | | | 66 | | | | 81 | |
51job, Inc., ADR (a) | | | 1 | | | | 98 | |
AAC Technologies Holdings, Inc. | | | 40 | | | | 296 | |
AECC Aviation Power Co. Ltd., Class A | | | 6 | | | | 46 | |
Agile Group Holdings Ltd. | | | 54 | | | | 70 | |
Agora, Inc., ADR (a) | | | 3 | | | | 105 | |
Agricultural Bank of China Ltd., Class A | | | 216 | | | | 101 | |
Agricultural Bank of China Ltd., Class H | | | 1,307 | | | | 454 | |
Aier Eye Hospital Group Co. Ltd., Class A | | | 14 | | | | 155 | |
Air China Ltd., Class A | | | 40 | | | | 48 | |
Air China Ltd., Class H (a) | | | 62 | | | | 46 | |
Airtac International Group | | | 6 | | | | 231 | |
Akeso, Inc. (a) (e) | | | 13 | | | | 105 | |
Alibaba Group Holding Ltd. (a) | | | 717 | | | | 20,337 | |
A-Living Smart City Services Co. Ltd. (e) | | | 21 | | | | 103 | |
Aluminum Corp. of China Ltd., Class A (a) | | | 14 | | | | 11 | |
Aluminum Corp. of China Ltd., Class H (a) | | | 184 | | | | 109 | |
Anhui Conch Cement Co. Ltd., Class A | | | 15 | | | | 95 | |
Anhui Conch Cement Co. Ltd., Class H | | | 54 | | | | 284 | |
Anhui Gujing Distillery Co. Ltd., Class A | | | 1 | | | | 52 | |
Anhui Gujing Distillery Co. Ltd., Class B | | | 8 | | | | 109 | |
Anhui Kouzi Distillery Co. Ltd., Class A | | | 1 | | | | 6 | |
ANTA Sports Products Ltd. | | | 52 | | | | 1,220 | |
Asymchem Laboratories Tianjin Co. Ltd., Class A (a) | | | 1 | | | | 58 | |
Autobio Diagnostics Co. Ltd., Class A | | | — | (h) | | | 5 | |
Autohome, Inc., ADR | | | 3 | | | | 208 | |
AVIC Jonhon Optronic Technology Co. Ltd., Class A | | | 1 | | | | 11 | |
AVIC Shenyang Aircraft Co. Ltd., Class A | | | 5 | | | | 48 | |
AVIC Xi’an Aircraft Industry Group Co. Ltd., Class A | | | 8 | | | | 32 | |
AviChina Industry & Technology Co. Ltd., Class H | | | 103 | | | | 68 | |
Baidu, Inc., ADR (a) | | | 13 | | | | 2,588 | |
Bank of Beijing Co. Ltd., Class A | | | 55 | | | | 41 | |
Bank of Chengdu Co. Ltd., Class A | | | 26 | | | | 50 | |
Bank of China Ltd., Class A | | | 126 | | | | 60 | |
Bank of China Ltd., Class H | | | 3,773 | | | | 1,355 | |
Bank of Communications Co. Ltd., Class A | | | 151 | | | | 114 | |
Bank of Communications Co. Ltd., Class H | | | 369 | | | | 248 | |
Bank of Hangzhou Co. Ltd., Class A | | | 13 | | | | 29 | |
Bank of Jiangsu Co. Ltd., Class A | | | 50 | | | | 55 | |
Bank of Nanjing Co. Ltd., Class A | | | 31 | | | | 51 | |
Bank of Ningbo Co. Ltd., Class A | | | 17 | | | | 101 | |
Bank of Shanghai Co. Ltd., Class A | | | 37 | | | | 47 | |
Baoshan Iron & Steel Co. Ltd., Class A | | | 44 | | | | 52 | |
Baozun, Inc., ADR (a) | | | 4 | | | | 129 | |
BeiGene Ltd., ADR (a) | | | 2 | | | | 757 | |
| | | | | | | | |
| SECURITY DESCRIPTION | |
SHARES | | | VALUE($) | |
| | | | | | | | |
China — continued | | | | | | | | |
Beijing Capital International Airport Co. Ltd., Class H (a) | | | 142 | | | | 94 | |
Beijing Dabeinong Technology Group Co. Ltd., Class A | | | 5 | | | | 5 | |
Beijing Enlight Media Co. Ltd., Class A | | | 4 | | | | 6 | |
Beijing New Building Materials plc, Class A | | | 6 | | | | 36 | |
Beijing Shunxin Agriculture Co. Ltd., Class A | | | 1 | | | | 4 | |
Beijing Tiantan Biological Products Corp. Ltd., Class A | | | 5 | | | | 29 | |
Beijing Yanjing Brewery Co. Ltd., Class A | | | 5 | | | | 6 | |
Beijing-Shanghai High Speed Railway Co. Ltd., Class A | | | 86 | | | | 71 | |
Betta Pharmaceuticals Co. Ltd., Class A | | | — | (h) | | | 7 | |
BGI Genomics Co. Ltd., Class A | | | 2 | | | | 37 | |
Bilibili, Inc., ADR (a) | | | 8 | | | | 917 | |
BOE Technology Group Co. Ltd., Class A | | | 113 | | | | 109 | |
Burning Rock Biotech Ltd., ADR (a) | | | 2 | | | | 65 | |
BYD Co. Ltd., Class A | | | 4 | | | | 170 | |
BYD Co. Ltd., Class H | | | 38 | | | | 1,141 | |
BYD Electronic International Co. Ltd. | | | 28 | | | | 184 | |
By-health Co. Ltd., Class A | | | 2 | | | | 8 | |
Caitong Securities Co. Ltd., Class A | | | 3 | | | | 5 | |
CanSino Biologics, Inc., Class H (a) (e) | | | 4 | | | | 212 | |
CGN Power Co. Ltd., Class H (e) | | | 343 | | | | 76 | |
Changchun High & New Technology Industry Group, Inc., Class A | | | 1 | | | | 72 | |
Changjiang Securities Co. Ltd., Class A (a) | | | 6 | | | | 7 | |
Changzhou Xingyu Automotive Lighting Systems Co. Ltd., Class A | | | — | (h) | | | 10 | |
Chaozhou Three-Circle Group Co. Ltd., Class A | | | 8 | | | | 53 | |
Chifeng Jilong Gold Mining Co. Ltd., Class A (a) | | | 3 | | | | 6 | |
China Aoyuan Group Ltd. | | | 53 | | | | 45 | |
China Bohai Bank Co. Ltd., Class H (e) | | | 134 | | | | 46 | |
China Cinda Asset Management Co. Ltd., Class H | | | 327 | | | | 62 | |
China CITIC Bank Corp. Ltd., Class H | | | 455 | | | | 215 | |
China Communications Services Corp. Ltd., Class H (a) | | | 112 | | | | 56 | |
China Conch Venture Holdings Ltd. | | | 83 | | | | 349 | |
China Construction Bank Corp., Class A | | | 17 | | | | 18 | |
China Construction Bank Corp., Class H | | | 4,551 | | | | 3,571 | |
China East Education Holdings Ltd. (e) | | | 28 | | | | 43 | |
China Eastern Airlines Corp. Ltd., Class A | | | 9 | | | | 7 | |
China Everbright Bank Co. Ltd., Class A (a) | | | 169 | | | | 99 | |
China Everbright Bank Co. Ltd., Class H (a) | | | 115 | | | | 47 | |
China Evergrande Group | | | 101 | | | | 131 | |
China Feihe Ltd. (e) | | | 175 | | | | 377 | |
SEE NOTES TO FINANCIAL STATEMENTS.
| | | | | | | | | | |
| | | | | |
| JUNE 30, 2021 | | SIX CIRCLES TRUST | | | | | | | | 55 |
Six Circles International Unconstrained Equity Fund
SCHEDULE OF PORTFOLIO INVESTMENTS
AS OF JUNE 30, 2021 (Unaudited) (continued)
(Amounts in U.S. Dollars, unless otherwise noted)
(Amounts in thousands, except number of Futures contracts)
| | | | | | | | |
| SECURITY DESCRIPTION | |
SHARES | | | VALUE($) | |
Common Stocks — continued | | | | | | | | |
China — continued | | | | | | | | |
China Galaxy Securities Co. Ltd., Class A | | | 24 | | | | 40 | |
China Galaxy Securities Co. Ltd., Class H | | | 122 | | | | 72 | |
China Greatwall Technology Group Co. Ltd., Class A | | | 3 | | | | 7 | |
China Hongqiao Group Ltd. | | | 110 | | | | 148 | |
China Huarong Asset Management Co. Ltd., Class H (e) (bb) (cc) | | | 374 | | | | 37 | |
China International Capital Corp. Ltd., Class A (a) | | | 4 | | | | 38 | |
China International Capital Corp. Ltd., Class H (e) | | | 62 | | | | 167 | |
China Jushi Co. Ltd., Class A | | | 14 | | | | 34 | |
China Lesso Group Holdings Ltd. | | | 50 | | | | 123 | |
China Life Insurance Co. Ltd., Class A | | | 9 | | | | 48 | |
China Life Insurance Co. Ltd., Class H | | | 336 | | | | 666 | |
China Literature Ltd. (a) (e) | | | 20 | | | | 218 | |
China Longyuan Power Group Corp. Ltd., Class H | | | 141 | | | | 243 | |
China Medical System Holdings Ltd. | | | 60 | | | | 158 | |
China Meidong Auto Holdings Ltd. | | | 28 | | | | 153 | |
China Merchants Bank Co. Ltd., Class A | | | 59 | | | | 490 | |
China Merchants Bank Co. Ltd., Class H | | | 186 | | | | 1,580 | |
China Merchants Energy Shipping Co. Ltd., Class A | | | 10 | | | | 7 | |
China Merchants Securities Co. Ltd., Class A | | | 23 | | | | 67 | |
China Merchants Shekou Industrial Zone Holdings Co. Ltd., Class A | | | 38 | | | | 64 | |
China Minsheng Banking Corp. Ltd., Class A | | | 136 | | | | 93 | |
China Minsheng Banking Corp. Ltd., Class H | | | 237 | | | | 113 | |
China Molybdenum Co. Ltd., Class A (a) | | | 56 | | | | 44 | |
China Molybdenum Co. Ltd., Class H | | | 165 | | | | 98 | |
China National Building Material Co. Ltd., Class H | | | 170 | | | | 200 | |
China National Software & Service Co. Ltd., Class A | | | 1 | | | | 6 | |
China Northern Rare Earth Group High-Tech Co. Ltd., Class A | | | 17 | | | | 53 | |
China Oilfield Services Ltd., Class H | | | 72 | | | | 65 | |
China Pacific Insurance Group Co. Ltd., Class A | | | 21 | | | | 94 | |
China Pacific Insurance Group Co. Ltd., Class H | | | 124 | | | | 390 | |
China Petroleum & Chemical Corp., Class A | | | 103 | | | | 69 | |
China Petroleum & Chemical Corp., Class H | | | 1,102 | | | | 560 | |
China Railway Group Ltd., Class A | | | 96 | | | | 77 | |
China Railway Group Ltd., Class H | | | 193 | | | | 101 | |
China Resources Mixc Lifestyle Services Ltd. (e) | | | 20 | | | | 137 | |
| | | | | | | | |
| SECURITY DESCRIPTION | |
SHARES | | | VALUE($) | |
| | | | | | | | |
China — continued | | | | | | | | |
China Resources Pharmaceutical Group Ltd. (e) | | | 76 | | | | 47 | |
China Shenhua Energy Co. Ltd., Class A (a) | | | 24 | | | | 73 | |
China Shenhua Energy Co. Ltd., Class H | | | 149 | | | | 292 | |
China Shipbuilding Industry Co. Ltd., Class A (a) | | | 73 | | | | 46 | |
China South Publishing & Media Group Co. Ltd., Class A | | | 33 | | | | 45 | |
China Southern Airlines Co. Ltd., Class A (a) | | | 80 | | | | 75 | |
China Southern Airlines Co. Ltd., Class H (a) | | | 54 | | | | 34 | |
China State Construction Engineering Corp. Ltd., Class A | | | 117 | | | | 84 | |
China Tourism Group Duty Free Corp. Ltd., Class A | | | 5 | | | | 250 | |
China Tower Corp. Ltd., Class H (e) | | | 1,826 | | | | 251 | |
China TransInfo Technology Co. Ltd., Class A | | | 19 | | | | 48 | |
China Vanke Co. Ltd., Class A | | | 30 | | | | 111 | |
China Vanke Co. Ltd., Class H | | | 78 | | | | 244 | |
China Yangtze Power Co. Ltd., Class A | | | 56 | | | | 180 | |
China Yuhua Education Corp. Ltd. (e) | | | 92 | | | | 83 | |
China Zheshang Bank Co. Ltd., Class A | | | 112 | | | | 68 | |
Chindata Group Holdings Ltd., ADR (a) | | | 5 | | | | 69 | |
Chongqing Brewery Co. Ltd., Class A (a) | | | 2 | | | | 61 | |
Chongqing Changan Automobile Co. Ltd., Class A (a) | | | 12 | | | | 47 | |
Chongqing Rural Commercial Bank Co. Ltd., Class H | | | 190 | | | | 75 | |
Chongqing Zhifei Biological Products Co. Ltd., Class A | | | 4 | | | | 124 | |
CIFI Holdings Group Co. Ltd. | | | 142 | | | | 111 | |
CITIC Ltd. | | | 281 | | | | 303 | |
CITIC Securities Co. Ltd., Class A | | | 35 | | | | 135 | |
CITIC Securities Co. Ltd., Class H (a) | | | 101 | | | | 252 | |
Contemporary Amperex Technology Co. Ltd., Class A (a) | | | 6 | | | | 515 | |
COSCO SHIPPING Holdings Co. Ltd., Class A (a) | | | 39 | | | | 185 | |
COSCO SHIPPING Holdings Co. Ltd., Class H (a) | | | 122 | | | | 307 | |
Country Garden Holdings Co. Ltd. | | | 365 | | | | 409 | |
Country Garden Services Holdings Co. Ltd. | | | 69 | | | | 745 | |
CSC Financial Co. Ltd., Class A (a) | | | 17 | | | | 81 | |
CSPC Pharmaceutical Group Ltd. | | | 418 | | | | 604 | |
Dada Nexus Ltd., ADR (a) | | | 3 | | | | 89 | |
Dali Foods Group Co. Ltd. (e) | | | 117 | | | | 70 | |
Daqo New Energy Corp., ADR (a) | | | 3 | | | | 179 | |
DaShenLin Pharmaceutical Group Co. Ltd., Class A | | | 3 | | | | 27 | |
Dongfang Electric Corp. Ltd., Class A | | | 4 | | | | 7 | |
SEE NOTES TO FINANCIAL STATEMENTS.
| | | | | | | | | | |
| | | | | |
| 56 | | | | | | | | SIX CIRCLES TRUST | | JUNE 30, 2021 |
| | | | | | | | |
| SECURITY DESCRIPTION | |
SHARES | | | VALUE($) | |
Common Stocks — continued | | | | | | | | |
China — continued | | | | | | | | |
Dongfeng Motor Group Co. Ltd., Class H | | | 114 | | | | 102 | |
Dongxing Securities Co. Ltd., Class A | | | 23 | | | | 39 | |
DouYu International Holdings Ltd., ADR (a) | | | 5 | | | | 36 | |
East Money Information Co. Ltd., Class A | | | 31 | | | | 157 | |
Ecovacs Robotics Co. Ltd., Class A | | | 2 | | | | 67 | |
ENN Energy Holdings Ltd. | | | 37 | | | | 705 | |
Eve Energy Co. Ltd., Class A | | | 6 | | | | 98 | |
Ever Sunshine Lifestyle Services Group Ltd. | | | 30 | | | | 75 | |
Everbright Securities Co. Ltd., Class A | | | 12 | | | | 33 | |
Fangda Carbon New Material Co. Ltd., Class A | | | 8 | | | | 10 | |
FAW Jiefang Group Co. Ltd., Class A (a) | | | 4 | | | | 7 | |
Fiberhome Telecommunication Technologies Co. Ltd., Class A | | | 14 | | | | 41 | |
First Capital Securities Co. Ltd., Class A (a) | | | 5 | | | | 5 | |
Flat Glass Group Co. Ltd., Class H | | | 26 | | | | 107 | |
Focus Media Information Technology Co. Ltd., Class A | | | 48 | | | | 70 | |
Foshan Haitian Flavouring & Food Co. Ltd., Class A | | | 10 | | | | 192 | |
Fosun International Ltd. | | | 114 | | | | 163 | |
Founder Securities Co. Ltd., Class A (a) | | | 46 | | | | 66 | |
Foxconn Industrial Internet Co. Ltd., Class A (a) | | | 39 | | | | 75 | |
Fu Jian Anjoy Foods Co. Ltd., Class A (a) | | | 1 | | | | 35 | |
Fuyao Glass Industry Group Co. Ltd., Class A | | | 7 | | | | 60 | |
Fuyao Glass Industry Group Co. Ltd., Class H (e) | | | 28 | | | | 200 | |
Ganfeng Lithium Co. Ltd., Class A | | | 3 | | | | 63 | |
Ganfeng Lithium Co. Ltd., Class H (e) | | | 8 | | | | 125 | |
GDS Holdings Ltd., ADR (a) | | | 4 | | | | 335 | |
GEM Co. Ltd., Class A | | | 24 | | | | 34 | |
Gemdale Corp., Class A | | | 19 | | | | 30 | |
Genscript Biotech Corp. (a) | | | 50 | | | | 218 | |
GF Securities Co. Ltd., Class A | | | 21 | | | | 49 | |
GF Securities Co. Ltd., Class H | | | 40 | | | | 52 | |
Gigadevice Semiconductor Beijing, Inc., Class A | | | 2 | | | | 69 | |
GoerTek, Inc., Class A | | | 11 | | | | 71 | |
GOME Retail Holdings Ltd. (a) | | | 446 | | | | 57 | |
Gotion High-tech Co. Ltd., Class A (a) | | | 7 | | | | 50 | |
Great Wall Motor Co. Ltd., Class A | | | 8 | | | | 56 | |
Great Wall Motor Co. Ltd., Class H | | | 143 | | | | 461 | |
Greenland Holdings Corp. Ltd., Class A | | | 8 | | | | 6 | |
Greentown China Holdings Ltd. | | | 42 | | | | 65 | |
Greentown Service Group Co. Ltd. | | | 64 | | | | 99 | |
Gaotu Techedu, Inc., ADR (a) | | | 6 | | | | 85 | |
Guangdong Haid Group Co. Ltd., Class A (a) | | | 6 | | | | 69 | |
| | | | | | | | |
| SECURITY DESCRIPTION | |
SHARES | | | VALUE($) | |
| | | | | | | | |
China — continued | | | | | | | | |
Guangdong Hongda Blasting Co. Ltd., Class A | | | 1 | | | | 6 | |
Guangdong Kinlong Hardware Products Co. Ltd., Class A | | | — | (h) | | | 9 | |
Guanghui Energy Co. Ltd., Class A (a) | | | 14 | | | | 7 | |
Guangzhou Automobile Group Co. Ltd., Class H | | | 126 | | | | 113 | |
Guangzhou Baiyunshan Pharmaceutical Holdings Co. Ltd., Class A | | | 13 | | | | 66 | |
Guangzhou Haige Communications Group, Inc. Co., Class A | | | 27 | | | | 39 | |
Guangzhou Kingmed Diagnostics Group Co. Ltd., Class A | | | 2 | | | | 42 | |
Guangzhou R&F Properties Co. Ltd., Class H | | | 75 | | | | 86 | |
Guangzhou Shiyuan Electronic Technology Co. Ltd., Class A | | | 2 | | | | 29 | |
Guangzhou Tinci Materials Technology Co. Ltd., Class A | | | 1 | | | | 14 | |
Guangzhou Yuexiu Financial Holdings Group Co. Ltd., Class A (a) | | | 15 | | | | 30 | |
Guolian Securities Co. Ltd., Class A | | | 10 | | | | 25 | |
Guosen Securities Co. Ltd., Class A | | | 29 | | | | 48 | |
Guotai Junan Securities Co. Ltd., Class A | | | 21 | | | | 54 | |
Guoyuan Securities Co. Ltd., Class A | | | 5 | | | | 7 | |
Haidilao International Holding Ltd. (e) | | | 51 | | | | 269 | |
Haier Smart Home Co. Ltd., Class A | | | 27 | | | | 109 | |
Haier Smart Home Co. Ltd., Class H (a) | | | 86 | | | | 301 | |
Haitian International Holdings Ltd. | | | 29 | | | | 97 | |
Haitong Securities Co. Ltd., Class A | | | 69 | | | | 122 | |
Haitong Securities Co. Ltd., Class H | | | 88 | | | | 77 | |
Hangzhou First Applied Material Co. Ltd., Class A | | | 4 | | | | 57 | |
Hangzhou Tigermed Consulting Co. Ltd., Class A | | | 3 | | | | 87 | |
Hangzhou Tigermed Consulting Co. Ltd., Class H (e) | | | 4 | | | | 98 | |
Hansoh Pharmaceutical Group Co. Ltd. (e) | | | 54 | | | | 236 | |
Hefei Meiya Optoelectronic Technology, Inc., Class A | | | 5 | | | | 46 | |
Heilongjiang Agriculture Co. Ltd., Class A | | | 16 | | | | 36 | |
Henan Shuanghui Investment & Development Co. Ltd., Class A | | | 9 | | | | 42 | |
Hengan International Group Co. Ltd. | | | 29 | | | | 191 | |
Hengli Petrochemical Co. Ltd., Class A | | | 18 | | | | 74 | |
HengTen Networks Group Ltd. (a) | | | 132 | | | | 106 | |
Hengyi Petrochemical Co. Ltd., Class A (a) | | | 3 | | | | 6 | |
Hesteel Co. Ltd., Class A (a) | | | 118 | | | | 45 | |
Hithink RoyalFlush Information Network Co. Ltd., Class A | | | 2 | | | | 31 | |
Hongfa Technology Co. Ltd., Class A | | | 1 | | | | 9 | |
Hua Hong Semiconductor Ltd. (a) (e) | | | 26 | | | | 144 | |
SEE NOTES TO FINANCIAL STATEMENTS.
| | | | | | | | | | |
| | | | | |
| JUNE 30, 2021 | | SIX CIRCLES TRUST | | | | | | | | 57 |
Six Circles International Unconstrained Equity Fund
SCHEDULE OF PORTFOLIO INVESTMENTS
AS OF JUNE 30, 2021 (Unaudited) (continued)
(Amounts in U.S. Dollars, unless otherwise noted)
(Amounts in thousands, except number of Futures contracts)
| | | | | | | | |
| SECURITY DESCRIPTION | |
SHARES | | | VALUE($) | |
Common Stocks — continued | | | | | | | | |
China — continued | | | | | | | | |
Huadong Medicine Co. Ltd., Class A | | | 7 | | | | 49 | |
Huagong Tech Co. Ltd., Class A | | | 18 | | | | 64 | |
Hualan Biological Engineering, Inc., Class A | | | 7 | | | | 41 | |
Huaneng Power International, Inc., Class H | | | 192 | | | | 75 | |
Huatai Securities Co. Ltd., Class A | | | 19 | | | | 47 | |
Huatai Securities Co. Ltd., Class H (a) (e) | | | 68 | | | | 100 | |
Huaxia Bank Co. Ltd., Class A (a) | | | 33 | | | | 32 | |
Huaxin Cement Co. Ltd., Class A | | | 2 | | | | 5 | |
Huayu Automotive Systems Co. Ltd., Class A | | | 9 | | | | 38 | |
Huazhu Group Ltd., ADR (a) | | | 9 | | | | 453 | |
Hubei Biocause Pharmaceutical Co. Ltd., Class A | | | 10 | | | | 5 | |
Huizhou Desay Sv Automotive Co. Ltd., Class A | | | 2 | | | | 39 | |
Hunan Valin Steel Co. Ltd., Class A | | | 31 | | | | 31 | |
Hundsun Technologies, Inc., Class A (a) | | | 4 | | | | 53 | |
HUYA, Inc., ADR (a) | | | 3 | | | | 55 | |
Iflytek Co. Ltd., Class A | | | 9 | | | | 90 | |
I-Mab, ADR (a) | | | 2 | | | | 141 | |
Industrial & Commercial Bank of China Ltd., Class A (a) | | | 162 | | | | 129 | |
Industrial & Commercial Bank of China Ltd., Class H | | | 2,748 | | | | 1,610 | |
Industrial Bank Co. Ltd., Class A | | | 65 | | | | 206 | |
Industrial Securities Co. Ltd., Class A | | | 34 | | | | 51 | |
Ingenic Semiconductor Co. Ltd., Class A | | | 1 | | | | 8 | |
Inner Mongolia BaoTou Steel Union Co. Ltd., Class A (a) | | | 233 | | | | 56 | |
Inner Mongolia Junzheng Energy & Chemical Industry Group Co. Ltd., Class A | | | 9 | | | | 7 | |
Inner Mongolia Yili Industrial Group Co. Ltd., Class A | | | 19 | | | | 110 | |
Innovent Biologics, Inc. (a) (e) | | | 57 | | | | 659 | |
Inspur Electronic Information Industry Co. Ltd., Class A | | | 9 | | | | 38 | |
iQIYI, Inc., ADR (a) | | | 12 | | | | 188 | |
JA Solar Technology Co. Ltd., Class A (a) | | | 1 | | | | 9 | |
Jafron Biomedical Co. Ltd., Class A | | | 4 | | | | 48 | |
Jason Furniture Hangzhou Co. Ltd., Class A | | | 1 | | | | 7 | |
JCET Group Co. Ltd., Class A (a) | | | 6 | | | | 34 | |
JD Health International, Inc. (a) (e) | | | 16 | | | | 227 | |
JD.com, Inc., ADR (a) | | | 41 | | | | 3,257 | |
Jiangsu Changshu Rural Commercial Bank Co. Ltd., Class A | | | 35 | | | | 33 | |
Jiangsu Eastern Shenghong Co. Ltd., Class A | | | 14 | | | | 45 | |
Jiangsu Expressway Co. Ltd., Class H | | | 64 | | | | 72 | |
Jiangsu Hengli Hydraulic Co. Ltd., Class A | | | 4 | | | | 52 | |
| | | | | | | | |
| SECURITY DESCRIPTION | |
SHARES | | | VALUE($) | |
| | | | | | | | |
China — continued | | | | | | | | |
Jiangsu Hengrui Medicine Co. Ltd., Class A | | | 18 | | | | 186 | |
Jiangsu King’s Luck Brewery JSC Ltd., Class A | | | 5 | | | | 44 | |
Jiangsu Shagang Co. Ltd., Class A | | | 4 | | | | 7 | |
Jiangsu Yanghe Brewery Joint-Stock Co. Ltd., Class A (a) | | | 4 | | | | 133 | |
Jiangsu Yangnong Chemical Co. Ltd., Class A | | | — | (h) | | | 7 | |
Jiangsu Zhongtian Technology Co. Ltd., Class A | | | 4 | | | | 6 | |
Jiangxi Copper Co. Ltd., Class A | | | 16 | | | | 56 | |
Jiangxi Copper Co. Ltd., Class H | | | 38 | | | | 78 | |
Jiangxi Zhengbang Technology Co. Ltd., Class A | | | 3 | | | | 5 | |
Jinke Properties Group Co. Ltd., Class A | | | 6 | | | | 5 | |
Jinxin Fertility Group Ltd. (e) | | | 58 | | | | 146 | |
JiuGui Liquor Co. Ltd., Class A (a) | | | 1 | | | | 28 | |
Jiumaojiu International Holdings Ltd. (e) | | | 35 | | | | 143 | |
Joinn Laboratories China Co. Ltd., Class A (a) | | | 2 | | | | 43 | |
Jonjee Hi-Tech Industrial And Commercial Holding Co. Ltd., Class A | | | 3 | | | | 21 | |
JOYY, Inc., ADR | | | 3 | | | | 171 | |
Juewei Food Co. Ltd., Class A | | | 3 | | | | 33 | |
Kaisa Group Holdings Ltd. (a) | | | 118 | | | | 45 | |
KE Holdings, Inc., ADR (a) | | | 17 | | | | 810 | |
Kingdee International Software Group Co. Ltd. (a) | | | 116 | | | | 393 | |
Kingfa Sci & Tech Co. Ltd., Class A | | | 15 | | | | 47 | |
Kingsoft Cloud Holdings Ltd., ADR (a) | | | 4 | | | | 121 | |
Kingsoft Corp. Ltd. | | | 47 | | | | 282 | |
Kuaishou Technology, Class B (a) (e) | | | 13 | | | | 335 | |
Kuang-Chi Technologies Co. Ltd., Class A (a) | | | 12 | | | | 37 | |
Kweichow Moutai Co. Ltd., Class A | | | 4 | | | | 1,112 | |
KWG Group Holdings Ltd. | | | 57 | | | | 76 | |
Lenovo Group Ltd. | | | 356 | | | | 409 | |
Lens Technology Co. Ltd., Class A | | | 15 | | | | 66 | |
Leyard Optoelectronic Co. Ltd., Class A | | | 7 | | | | 8 | |
Li Auto, Inc., ADR (a) | | | 23 | | | | 791 | |
Li Ning Co. Ltd. | | | 107 | | | | 1,305 | |
Liaoning Cheng Da Co. Ltd., Class A (a) | | | 2 | | | | 6 | |
Lingyi iTech Guangdong Co., Class A | | | 19 | | | | 27 | |
Logan Group Co. Ltd. | | | 61 | | | | 91 | |
Lomon Billions Group Co. Ltd., Class A | | | 4 | | | | 22 | |
Longfor Group Holdings Ltd. (e) | | | 87 | | | | 482 | |
LONGi Green Energy Technology Co. Ltd., Class A | | | 15 | | | | 200 | |
Lufax Holding Ltd., ADR (a) | | | 9 | | | | 105 | |
Luxshare Precision Industry Co. Ltd., Class A (a) | | | 21 | | | | 147 | |
Luzhou Laojiao Co. Ltd., Class A | | | 4 | | | | 152 | |
Maccura Biotechnology Co. Ltd., Class A | | | 1 | | | | 7 | |
SEE NOTES TO FINANCIAL STATEMENTS.
| | | | | | | | | | |
| | | | | |
| 58 | | | | | | | | SIX CIRCLES TRUST | | JUNE 30, 2021 |
| | | | | | | | |
| SECURITY DESCRIPTION | |
SHARES | | | VALUE($) | |
Common Stocks — continued | | | | | | | | |
China — continued | | | | | | | | |
Mango Excellent Media Co. Ltd., Class A | | | 6 | | | | 58 | |
Maxscend Microelectronics Co. Ltd., Class A | | | 1 | | | | 108 | |
Meinian Onehealth Healthcare Holdings Co. Ltd., Class A (a) | | | 4 | | | | 6 | |
Meituan, Class B (a) (e) | | | 170 | | | | 7,009 | |
Metallurgical Corp. of China Ltd., Class A | | | 18 | | | | 8 | |
Microport Scientific Corp. | | | 31 | | | | 278 | |
Midea Group Co. Ltd., Class A | | | 12 | | | | 131 | |
Ming Yuan Cloud Group Holdings Ltd. (a) | | | 18 | | | | 89 | |
Minth Group Ltd. | | | 34 | | | | 161 | |
Momo, Inc., ADR | | | 6 | | | | 98 | |
Muyuan Foods Co. Ltd., Class A | | | 15 | | | | 137 | |
NanJi E-Commerce Co. Ltd., Class A | | | 3 | | | | 5 | |
Nanjing Securities Co. Ltd., Class A | | | 4 | | | | 6 | |
NARI Technology Co. Ltd., Class A | | | 19 | | | | 69 | |
NAURA Technology Group Co. Ltd., Class A (a) | | | 2 | | | | 69 | |
NavInfo Co. Ltd., Class A | | | 3 | | | | 6 | |
NetEase, Inc., ADR | | | 19 | | | | 2,217 | |
New China Life Insurance Co. Ltd., Class A | | | 8 | | | | 58 | |
New China Life Insurance Co. Ltd., Class H | | | 33 | | | | 114 | |
New Hope Liuhe Co. Ltd., Class A (a) | | | 12 | | | | 27 | |
New Oriental Education & Technology Group, Inc., ADR (a) | | | 72 | | | | 586 | |
Ningbo Tuopu Group Co. Ltd., Class A | | | 1 | | | | 7 | |
Ningxia Baofeng Energy Group Co. Ltd., Class A | | | 20 | | | | 43 | |
NIO, Inc., ADR (a) | | | 61 | | | | 3,240 | |
Noah Holdings Ltd., ADR (a) | | | 2 | | | | 116 | |
Nongfu Spring Co. Ltd., Class H (e) | | | 21 | | | | 107 | |
Offcn Education Technology Co. Ltd., Class A (a) | | | 6 | | | | 20 | |
OFILM Group Co. Ltd., Class A | | | 3 | | | | 4 | |
OneConnect Financial Technology Co. Ltd., ADR (a) | | | 6 | | | | 69 | |
Oppein Home Group, Inc., Class A | | | 2 | | | | 42 | |
Orient Securities Co. Ltd., Class A (a) | | | 29 | | | | 45 | |
Ovctek China, Inc., Class A | | | 2 | | | | 39 | |
Pangang Group Vanadium Titanium & Resources Co. Ltd., Class A (a) | | | 97 | | | | 34 | |
People’s Insurance Co. Group of China Ltd. (The), Class H | | | 389 | | | | 130 | |
Perfect World Co. Ltd./China, Class A | | | 2 | | | | 6 | |
PetroChina Co. Ltd., Class A | | | 11 | | | | 9 | |
PetroChina Co. Ltd., Class H | | | 990 | | | | 485 | |
Pharmaron Beijing Co. Ltd., Class A | | | 3 | | | | 84 | |
Pharmaron Beijing Co. Ltd., Class H (e) | | | 7 | | | | 178 | |
PICC Property & Casualty Co. Ltd., Class H | | | 312 | | | | 273 | |
Pinduoduo, Inc., ADR (a) | | | 21 | | | | 2,623 | |
Ping An Bank Co. Ltd., Class A | | | 60 | | | | 209 | |
| | | | | | | | |
| SECURITY DESCRIPTION | |
SHARES | | | VALUE($) | |
| | | | | | | | |
China — continued | | | | | | | | |
Ping An Healthcare and Technology Co. Ltd. (a) (e) | | | 22 | | | | 272 | |
Ping An Insurance Group Co. of China Ltd., Class A | | | 30 | | | | 298 | |
Ping An Insurance Group Co. of China Ltd., Class H | | | 299 | | | | 2,923 | |
Poly Developments and Holdings Group Co. Ltd., Class A (a) | | | 38 | | | | 71 | |
Poly Property Services Co. Ltd., Class H | | | 6 | | | | 38 | |
Postal Savings Bank of China Co. Ltd., Class A (a) | | | 69 | | | | 53 | |
Postal Savings Bank of China Co. Ltd., Class H (a) (e) | | | 396 | | | | 266 | |
Power Construction Corp. of China Ltd., Class A | | | 74 | | | | 44 | |
Powerlong Real Estate Holdings Ltd. | | | 71 | | | | 61 | |
Proya Cosmetics Co. Ltd., Class A | | | — | (h) | | | 9 | |
Qingdao Rural Commercial Bank Corp., Class A (a) | | | 9 | | | | 6 | |
RLX Technology, Inc., ADR (a) | | | 9 | | | | 75 | |
Rongsheng Petrochemical Co. Ltd., Class A | | | 36 | | | | 97 | |
SAIC Motor Corp. Ltd., Class A (a) | | | 23 | | | | 76 | |
Sanan Optoelectronics Co. Ltd., Class A (a) | | | 16 | | | | 78 | |
Sangfor Technologies, Inc., Class A | | | 1 | | | | 56 | |
Sany Heavy Equipment International Holdings Co. Ltd. | | | 57 | | | | 58 | |
Sany Heavy Industry Co. Ltd., Class A | | | 25 | | | | 112 | |
SDIC Capital Co. Ltd., Class A | | | 5 | | | | 6 | |
Seazen Group Ltd. (a) | | | 90 | | | | 85 | |
Seazen Holdings Co. Ltd., Class A | | | 8 | | | | 52 | |
SF Holding Co. Ltd., Class A | | | 12 | | | | 120 | |
SG Micro Corp., Class A | | | — | (h) | | | 12 | |
Shaanxi Coal Industry Co. Ltd., Class A | | | 27 | | | | 49 | |
Shandong Gold Mining Co. Ltd., Class A | | | 15 | | | | 45 | |
Shandong Gold Mining Co. Ltd., Class H (e) | | | 37 | | | | 66 | |
Shandong Hualu Hengsheng Chemical Co. Ltd., Class A | | | 8 | | | | 40 | |
Shandong Linglong Tyre Co. Ltd., Class A | | | 5 | | | | 33 | |
Shandong Sinocera Functional Material Co. Ltd., Class A | | | 6 | | | | 46 | |
Shandong Sun Paper Industry JSC Ltd., Class A | | | 7 | | | | 14 | |
Shandong Weigao Group Medical Polymer Co. Ltd., Class H | | | 108 | | | | 252 | |
Shanghai Bairun Investment Holding Group Co. Ltd., Class A | | | 4 | | | | 51 | |
Shanghai Baosight Software Co. Ltd., Class A | | | 1 | | | | 7 | |
Shanghai Electric Group Co. Ltd., Class A (a) | | | 63 | | | | 41 | |
SEE NOTES TO FINANCIAL STATEMENTS.
| | | | | | | | | | |
| | | | | |
| JUNE 30, 2021 | | SIX CIRCLES TRUST | | | | | | | | 59 |
Six Circles International Unconstrained Equity Fund
SCHEDULE OF PORTFOLIO INVESTMENTS
AS OF JUNE 30, 2021 (Unaudited) (continued)
(Amounts in U.S. Dollars, unless otherwise noted)
(Amounts in thousands, except number of Futures contracts)
| | | | | | | | |
| SECURITY DESCRIPTION | |
SHARES | | | VALUE($) | |
Common Stocks — continued | | | | | | | | |
China — continued | | | | | | | | |
Shanghai Fosun Pharmaceutical Group Co. Ltd., Class A | | | 6 | | | | 61 | |
Shanghai Fosun Pharmaceutical Group Co. Ltd., Class H | | | 22 | | | | 178 | |
Shanghai International Airport Co. Ltd., Class A | | | 4 | | | | 31 | |
Shanghai International Port Group Co. Ltd., Class A | | | 151 | | | | 111 | |
Shanghai Jahwa United Co. Ltd., Class A | | | 1 | | | | 12 | |
Shanghai Jinjiang International Hotels Co. Ltd., Class A | | | 5 | | | | 45 | |
Shanghai Lujiazui Finance & Trade Zone Development Co. Ltd., Class B | | | 56 | | | | 52 | |
Shanghai M&G Stationery, Inc., Class A | | | 3 | | | | 44 | |
Shanghai Pharmaceuticals Holding Co. Ltd., Class H | | | 33 | | | | 71 | |
Shanghai Pudong Development Bank Co. Ltd., Class A | | | 76 | | | | 118 | |
Shanghai Putailai New Energy Technology Co. Ltd., Class A | | | 1 | | | | 12 | |
Shanghai RAAS Blood Products Co. Ltd., Class A | | | 32 | | | | 37 | |
Shanghai Yuyuan Tourist Mart Group Co. Ltd., Class A | | | 5 | | | | 8 | |
Shanxi Meijin Energy Co. Ltd., Class A (a) | | | 7 | | | | 8 | |
Shanxi Taigang Stainless Steel Co. Ltd., Class A | | | 12 | | | | 13 | |
Shanxi Xinghuacun Fen Wine Factory Co. Ltd., Class A (a) | | | 3 | | | | 180 | |
Shenergy Co. Ltd., Class A | | | 42 | | | | 39 | |
Shengyi Technology Co. Ltd., Class A | | | 9 | | | | 32 | |
Shennan Circuits Co. Ltd., Class A | | | — | (h) | | | 7 | |
Shenwan Hongyuan Group Co. Ltd., Class A | | | 90 | | | | 65 | |
Shenzhen Capchem Technology Co. Ltd., Class A | | | — | (h) | | | 6 | |
Shenzhen Energy Group Co. Ltd., Class A | | | 4 | | | | 6 | |
Shenzhen Goodix Technology Co. Ltd., Class A | | | 1 | | | | 29 | |
Shenzhen Inovance Technology Co. Ltd., Class A | | | 8 | | | | 88 | |
Shenzhen Kangtai Biological Products Co. Ltd., Class A | | | 3 | | | | 62 | |
Shenzhen Mindray Bio-Medical Electronics Co. Ltd., Class A | | | 4 | | | | 259 | |
Shenzhen Overseas Chinese Town Co. Ltd., Class A | | | 6 | | | | 7 | |
Shenzhen SC New Energy Technology Corp., Class A | | | — | (h) | | | 5 | |
Shenzhen Sunway Communication Co. Ltd., Class A | | | 1 | | | | 6 | |
Shenzhou International Group Holdings Ltd. | | | 40 | | | | 1,010 | |
| | | | | | | | |
| SECURITY DESCRIPTION | |
SHARES | | | VALUE($) | |
| | | | | | | | |
China — continued | | | | | | | | |
Shijiazhuang Yiling Pharmaceutical Co. Ltd., Class A (a) | | | 1 | | | | 3 | |
Shimao Services Holdings Ltd. (e) | | | 31 | | | | 107 | |
Sichuan Chuantou Energy Co. Ltd., Class A | | | 22 | | | | 42 | |
Sichuan Swellfun Co. Ltd., Class A | | | 1 | | | | 12 | |
Silergy Corp. | | | 4 | | | | 543 | |
Sinolink Securities Co. Ltd., Class A | | | 3 | | | | 5 | |
Sinoma Science & Technology Co. Ltd., Class A | | | 2 | | | | 9 | |
Sinopharm Group Co. Ltd., Class H | | | 65 | | | | 192 | |
Sinotrans Ltd., Class A | | | 62 | | | | 48 | |
Sinotruk Hong Kong Ltd. | | | 31 | | | | 66 | |
Skshu Paint Co. Ltd., Class A | | | 2 | | | | 46 | |
Smoore International Holdings Ltd. (e) | | | 57 | | | | 316 | |
Songcheng Performance Development Co. Ltd., Class A | | | 11 | | | | 29 | |
SooChow Securities Co. Ltd., Class A (a) | | | 4 | | | | 6 | |
Spring Airlines Co. Ltd., Class A | | | 2 | | | | 16 | |
Sunac China Holdings Ltd. (a) | | | 142 | | | | 487 | |
Sunac Services Holdings Ltd. (e) | | | 34 | | | | 126 | |
Sungrow Power Supply Co. Ltd., Class A | | | 4 | | | | 78 | |
Suning.com Co. Ltd., Class A (bb) (cc) | | | 34 | | | | 30 | |
Sunny Optical Technology Group Co. Ltd. | | | 33 | | | | 1,045 | |
Sunwoda Electronic Co. Ltd., Class A | | | 2 | | | | 8 | |
Suzhou Dongshan Precision Manufacturing Co. Ltd., Class A | | | 2 | | | | 5 | |
TAL Education Group, ADR (a) | | | 20 | | | | 493 | |
TBEA Co. Ltd., Class A | | | 5 | | | | 10 | |
TCL Technology Group Corp., Class A | | | 49 | | | | 58 | |
Tencent Holdings Ltd. | | | 273 | | | | 20,532 | |
Tencent Music Entertainment Group, ADR (a) | | | 32 | | | | 493 | |
Thunder Software Technology Co. Ltd., Class A | | | 1 | | | | 17 | |
Tianfeng Securities Co. Ltd., Class A (a) | | | 7 | | | | 5 | |
Tianjin Zhonghuan Semiconductor Co. Ltd., Class A | | | 13 | | | | 76 | |
Tianma Microelectronics Co. Ltd., Class A (a) | | | 3 | | | | 7 | |
Tianshui Huatian Technology Co. Ltd., Class A | | | 3 | | | | 8 | |
Tingyi Cayman Islands Holding Corp. | | | 88 | | | | 176 | |
Tongcheng-Elong Holdings Ltd. (a) | | | 38 | | | | 94 | |
Tonghua Dongbao Pharmaceutical Co. Ltd., Class A | | | 20 | | | | 37 | |
Tongkun Group Co. Ltd., Class A | | | 9 | | | | 33 | |
Tongling Nonferrous Metals Group Co. Ltd., Class A | | | 17 | | | | 7 | |
Tongwei Co. Ltd., Class A | | | 13 | | | | 87 | |
Topchoice Medical Corp., Class A (a) | | | 1 | | | | 63 | |
Topsec Technologies Group, Inc., Class A (a) | | | 2 | | | | 7 | |
Topsports International Holdings Ltd. (e) | | | 79 | | | | 129 | |
SEE NOTES TO FINANCIAL STATEMENTS.
| | | | | | | | | | |
| | | | | |
| 60 | | | | | | | | SIX CIRCLES TRUST | | JUNE 30, 2021 |
| | | | | | | | |
| SECURITY DESCRIPTION | |
SHARES | | | VALUE($) | |
Common Stocks — continued | | | | | | | | |
China — continued | | | | | | | | |
TravelSky Technology Ltd., Class H | | | 40 | | | | 86 | |
Trip.com Group Ltd., ADR (a) | | | 24 | | | | 851 | |
Tsingtao Brewery Co. Ltd., Class A (a) | | | 3 | | | | 48 | |
Tsingtao Brewery Co. Ltd., Class H (a) | | | 26 | | | | 280 | |
Unigroup Guoxin Microelectronics Co. Ltd., Class A | | | 2 | | | | 48 | |
Uni-President China Holdings Ltd. | | | 70 | | | | 77 | |
Unisplendour Corp. Ltd., Class A | | | 13 | | | | 43 | |
Universal Scientific Industrial Shanghai Co. Ltd., Class A | | | 2 | | | | 6 | |
Up Fintech Holding Ltd., ADR (a) | | | 4 | | | | 118 | |
Venus MedTech Hangzhou, Inc., Class H (a) (e) | | | 12 | | | | 96 | |
Vipshop Holdings Ltd., ADR (a) | | | 22 | | | | 434 | |
Walvax Biotechnology Co. Ltd., Class A | | | 4 | | | | 34 | |
Wangfujing Group Co. Ltd., Class A | | | 6 | | | | 28 | |
Wanhua Chemical Group Co. Ltd., Class A | | | 9 | | | | 157 | |
Want Want China Holdings Ltd. | | | 230 | | | | 163 | |
Weibo Corp., ADR (a) | | | 3 | | | | 177 | |
Weichai Power Co. Ltd., Class A | | | 12 | | | | 33 | |
Weichai Power Co. Ltd., Class H | | | 89 | | | | 198 | |
Weihai Guangwei Composites Co. Ltd., Class A | | | 4 | | | | 46 | |
Weimob, Inc. (a) (e) | | | 88 | | | | 194 | |
Wens Foodstuffs Group Co. Ltd., Class A | | | 21 | | | | 47 | |
Western Securities Co. Ltd., Class A | | | 32 | | | | 41 | |
Will Semiconductor Co. Ltd. Shanghai, Class A | | | 3 | | | | 124 | |
Wingtech Technology Co. Ltd., Class A | | | 4 | | | | 58 | |
Wuhan Guide Infrared Co. Ltd., Class A | | | 10 | | | | 41 | |
Wuhu Sanqi Interactive Entertainment Network Technology Group Co. Ltd., Class A | | | 8 | | | | 30 | |
Wuliangye Yibin Co. Ltd., Class A (a) | | | 12 | | | | 529 | |
WuXi AppTec Co. Ltd., Class A | | | 7 | | | | 168 | |
WuXi AppTec Co. Ltd., Class H (e) | | | 16 | | | | 381 | |
Wuxi Biologics Cayman, Inc. (a) (e) | | | 161 | | | | 2,948 | |
Wuxi Lead Intelligent Equipment Co. Ltd., Class A | | | 5 | | | | 49 | |
Xiamen Tungsten Co. Ltd., Class A | | | 14 | | | | 45 | |
Xiaomi Corp., Class B (a) (e) | | | 674 | | | | 2,344 | |
Xinjiang Goldwind Science & Technology Co. Ltd., Class A | | | 3 | | | | 6 | |
Xinjiang Goldwind Science & Technology Co. Ltd., Class H | | | 38 | | | | 60 | |
Xinyi Solar Holdings Ltd. | | | 232 | | | | 499 | |
XPeng, Inc., ADR (a) | | | 16 | | | | 690 | |
Yadea Group Holdings Ltd. (e) | | | 66 | | | | 142 | |
Yantai Eddie Precision Machinery Co. Ltd., Class A | | | 1 | | | | 7 | |
Yanzhou Coal Mining Co. Ltd., Class H | | | 72 | | | | 97 | |
Yealink Network Technology Corp. Ltd., Class A | | | 4 | | | | 54 | |
Yifeng Pharmacy Chain Co. Ltd., Class A | | | 1 | | | | 5 | |
| | | | | | | | |
| SECURITY DESCRIPTION | |
SHARES | | | VALUE($) | |
| | | | | | | | |
China — continued | | | | | | | | |
Yihai International Holding Ltd. (a) | | | 21 | | | | 141 | |
Yihai Kerry Arawana Holdings Co. Ltd., Class A | | | 3 | | | | 34 | |
Yonghui Superstores Co. Ltd., Class A (a) | | | 7 | | | | 5 | |
Yonyou Network Technology Co. Ltd., Class A | | | 11 | | | | 57 | |
Youngor Group Co. Ltd., Class A | | | 7 | | | | 7 | |
YTO Express Group Co. Ltd., Class A | | | 4 | | | | 6 | |
Yum China Holdings, Inc. | | | 20 | | | | 1,346 | |
Yunda Holding Co. Ltd., Class A (a) | | | 3 | | | | 6 | |
Yunnan Baiyao Group Co. Ltd., Class A | | | 4 | | | | 73 | |
Yunnan Energy New Material Co. Ltd., Class A | | | 3 | | | | 112 | |
Zai Lab Ltd., ADR (a) | | | 3 | | | | 610 | |
Zhangzhou Pientzehuang Pharmaceutical Co. Ltd., Class A | | | 2 | | | | 132 | |
Zhaojin Mining Industry Co. Ltd., Class H | | | 74 | | | | 70 | |
Zhejiang Century Huatong Group Co. Ltd., Class A (a) | | | 37 | | | | 37 | |
Zhejiang Chint Electrics Co. Ltd., Class A (a) | | | 13 | | | | 67 | |
Zhejiang Dahua Technology Co. Ltd., Class A | | | 14 | | | | 46 | |
Zhejiang Dingli Machinery Co. Ltd., Class A (a) | | | 2 | | | | 22 | |
Zhejiang Expressway Co. Ltd., Class H | | | 90 | | | | 80 | |
Zhejiang Huahai Pharmaceutical Co. Ltd., Class A | | | 1 | | | | 4 | |
Zhejiang Huayou Cobalt Co. Ltd., Class A | | | 4 | | | | 65 | |
Zhejiang Jingsheng Mechanical & Electrical Co. Ltd., Class A (a) | | | 1 | | | | 11 | |
Zhejiang Juhua Co. Ltd., Class A | | | 26 | | | | 36 | |
Zhejiang Longsheng Group Co. Ltd., Class A | | | 3 | | | | 7 | |
Zhejiang NHU Co. Ltd., Class A | | | 11 | | | | 49 | |
Zhejiang Sanhua Intelligent Controls Co. Ltd., Class A | | | 12 | | | | 45 | |
Zhejiang Semir Garment Co. Ltd., Class A | | | 26 | | | | 47 | |
Zhejiang Weixing New Building Materials Co. Ltd., Class A | | | 10 | | | | 30 | |
Zhejiang Wolwo Bio-Pharmaceutical Co. Ltd., Class A | | | 1 | | | | 6 | |
Zhenro Properties Group Ltd. | | | 68 | | | | 38 | |
Zheshang Securities Co. Ltd., Class A (a) | | | 17 | | | | 35 | |
ZhongAn Online P&C Insurance Co. Ltd., Class H (a) (e) | | | 28 | | | | 159 | |
Zhongjin Gold Corp. Ltd., Class A | | | 25 | | | | 34 | |
Zhongsheng Group Holdings Ltd. | | | 26 | | | | 216 | |
Zhuzhou CRRC Times Electric Co. Ltd., Class H (a) | | | 23 | | | | 136 | |
Zijin Mining Group Co. Ltd., Class A | | | 70 | | | | 104 | |
Zijin Mining Group Co. Ltd., Class H | | | 248 | | | | 333 | |
Zoomlion Heavy Industry Science and Technology Co. Ltd., Class A | | | 26 | | | | 37 | |
SEE NOTES TO FINANCIAL STATEMENTS.
| | | | | | | | | | |
| | | | | |
| JUNE 30, 2021 | | SIX CIRCLES TRUST | | | | | | | | 61 |
Six Circles International Unconstrained Equity Fund
SCHEDULE OF PORTFOLIO INVESTMENTS
AS OF JUNE 30, 2021 (Unaudited) (continued)
(Amounts in U.S. Dollars, unless otherwise noted)
(Amounts in thousands, except number of Futures contracts)
| | | | | | | | |
| SECURITY DESCRIPTION | |
SHARES | | | VALUE($) | |
Common Stocks — continued | | | | | | | | |
China — continued | | | | | | | | |
Zoomlion Heavy Industry Science and Technology Co. Ltd., Class H | | | 52 | | | | 55 | |
ZTE Corp., Class A | | | 9 | | | | 46 | |
ZTE Corp., Class H | | | 29 | | | | 92 | |
ZTO Express Cayman, Inc., ADR | | | 21 | | | | 649 | |
| | | | | | | | |
| | |
| | | | | | | 144,461 | |
| | | | | | | | |
Colombia — 0.0% (g) | | | | | | | | |
Bancolombia SA | | | 10 | | | | 70 | |
Ecopetrol SA | | | 217 | | | | 157 | |
Grupo de Inversiones Suramericana SA | | | 8 | | | | 42 | |
Interconexion Electrica SA ESP | | | 19 | | | | 110 | |
| | | | | | | | |
| | |
| | | | | | | 379 | |
| | | | | | | | |
Cyprus — 0.0% (g) | | | | | | | | |
Polymetal International plc | | | 16 | | | | 354 | |
TCS Group Holding plc (Registered), GDR | | | 6 | | | | 496 | |
| | | | | | | | |
| | |
| | | | | | | 850 | |
| | | | | | | | |
Czech Republic — 0.0% (g) | | | | | | | | |
CEZ AS | | | 8 | | | | 229 | |
Komercni banka as (a) | | | 4 | | | | 147 | |
Moneta Money Bank AS (a) (e) | | | 21 | | | | 81 | |
| | | | | | | | |
| | |
| | | | | | | 457 | |
| | | | | | | | |
Denmark — 3.9% | | | | | | | | |
Ambu A/S, Class B | | | 14 | | | | 527 | |
AP Moller — Maersk A/S, Class A | | | 2 | | | | 6,692 | |
AP Moller — Maersk A/S, Class B | | | 5 | | | | 13,341 | |
Carlsberg A/S, Class B | | | 53 | | | | 9,959 | |
Chr Hansen Holding A/S | | | 9 | | | | 770 | |
Coloplast A/S, Class B | | | 9 | | | | 1,556 | |
Danske Bank A/S | | | 772 | | | | 13,594 | |
Demant A/S (a) | | | 9 | | | | 504 | |
DSV PANALPINA A/S | | | 157 | | | | 36,550 | |
Genmab A/S (a) | | | 5 | | | | 2,142 | |
GN Store Nord AS | | | 10 | | | | 893 | |
Novo Nordisk A/S, Class B | | | 2,909 | | | | 243,521 | |
Novozymes A/S, Class B | | | 17 | | | | 1,253 | |
Orsted AS (e) | | | 478 | | | | 67,146 | |
Pandora A/S | | | 8 | | | | 1,076 | |
ROCKWOOL International A/S, Class B | | | 6 | | | | 3,153 | |
Tryg A/S | | | 399 | | | | 9,811 | |
Vestas Wind Systems A/S | | | 764 | | | | 29,846 | |
| | | | | | | | |
| | |
| | | | | | | 442,334 | |
| | | | | | | | |
Egypt — 0.0% (g) | | | | | | | | |
Commercial International Bank Egypt SAE, GDR (a) | | | 64 | | | | 215 | |
Eastern Co. SAE | | | 52 | | | | 39 | |
| | | | | | | | |
| | |
| | | | | | | 254 | |
| | | | | | | | |
Finland — 1.4% | | | | | | | | |
Elisa OYJ | | | 11 | | | | 685 | |
Fortum OYJ | | | 1,125 | | | | 31,032 | |
| | | | | | | | |
| SECURITY DESCRIPTION | |
SHARES | | | VALUE($) | |
| | | | | | | | |
Finland — continued | | | | | | | | |
Kesko Oyj, Class B | | | 22 | | | | 813 | |
Kone OYJ, Class B | | | 257 | | | | 20,983 | |
Neste OYJ | | | 34 | | | | 2,070 | |
Nokia OYJ (a) | | | 4,462 | | | | 23,907 | |
Nordea Bank Abp | | | 3,608 | | | | 40,176 | |
Orion OYJ, Class B | | | 180 | | | | 7,724 | |
Sampo OYJ, Class A | | | 555 | | | | 25,538 | |
Stora Enso OYJ, Class R | | | 46 | | | | 847 | |
UPM-Kymmene OYJ | | | 43 | | | | 1,612 | |
Wartsila OYJ Abp | | | 359 | | | | 5,335 | |
| | | | | | | | |
| | |
| | | | | | | 160,722 | |
| | | | | | | | |
France — 9.6% | | | | | | | | |
Accor SA (a) | | | 14 | | | | 514 | |
Aeroports de Paris (a) | | | 22 | | | | 2,930 | |
Air Liquide SA | | | 38 | | | | 6,626 | |
Airbus SE (a) | | | 445 | | | | 57,320 | |
Alstom SA (a) | | | 211 | | | | 10,640 | |
Amundi SA (e) | | | 68 | | | | 6,030 | |
Arkema SA | | | 5 | | | | 621 | |
Atos SE | | | 82 | | | | 4,987 | |
AXA SA | | | 2,154 | | | | 54,705 | |
BioMerieux | | | 3 | | | | 367 | |
BNP Paribas SA | | | 1,253 | | | | 78,608 | |
Bollore SA | | | 69 | | | | 370 | |
Bouygues SA | | | 173 | | | | 6,391 | |
Bureau Veritas SA (a) | | | 222 | | | | 7,031 | |
Capgemini SE | | | 133 | | | | 25,520 | |
Carrefour SA | | | 49 | | | | 963 | |
Cie de Saint-Gobain | | | 383 | | | | 25,262 | |
Cie Generale des Etablissements Michelin SCA | | | 14 | | | | 2,157 | |
CNP Assurances | | | 192 | | | | 3,269 | |
Covivio | | | 4 | | | | 345 | |
Credit Agricole SA | | | 1,300 | | | | 18,225 | |
Danone SA | | | 338 | | | | 23,774 | |
Dassault Aviation SA | | | 2 | | | | 2,249 | |
Dassault Systemes SE | | | 109 | | | | 26,538 | |
Edenred | | | 204 | | | | 11,635 | |
Eiffage SA | | | 63 | | | | 6,413 | |
Electricite de France SA | | | 1,187 | | | | 16,219 | |
Engie SA | | | 4,658 | | | | 63,876 | |
EssilorLuxottica SA | | | 23 | | | | 4,205 | |
Eurazeo SE | | | 44 | | | | 3,833 | |
Faurecia SE | | | 9 | | | | 465 | |
Gecina SA | | | 4 | | | | 558 | |
Getlink SE | | | 331 | | | | 5,174 | |
Hermes International | | | 3 | | | | 3,686 | |
Iliad SA | | | 1 | | | | 165 | |
Ipsen SA | | | 64 | | | | 6,626 | |
Kering SA | | | 6 | | | | 5,242 | |
Klepierre SA | | | 17 | | | | 436 | |
La Francaise des Jeux SAEM (e) | | | 8 | | | | 462 | |
Legrand SA | | | 202 | | | | 21,429 | |
SEE NOTES TO FINANCIAL STATEMENTS.
| | | | | | | | | | |
| | | | | |
| 62 | | | | | | | | SIX CIRCLES TRUST | | JUNE 30, 2021 |
| | | | | | | | |
| SECURITY DESCRIPTION | |
SHARES | | | VALUE($) | |
Common Stocks — continued | | | | | | | | |
France — continued | | | | | | | | |
L’Oreal SA | | | 20 | | | | 8,975 | |
LVMH Moet Hennessy Louis Vuitton SE | | | 22 | | | | 17,420 | |
Natixis SA | | | 1,051 | | | | 4,992 | |
Orange SA | | | 159 | | | | 1,816 | |
Orpea SA (a) | | | 4 | | | | 508 | |
Pernod Ricard SA | | | 109 | | | | 24,122 | |
Publicis Groupe SA | | | 18 | | | | 1,138 | |
Remy Cointreau SA | | | 12 | | | | 2,407 | |
Renault SA (a) | | | 337 | | | | 13,680 | |
Safran SA | | | 259 | | | | 35,880 | |
Sanofi | | | 1,914 | | | | 201,120 | |
Sartorius Stedim Biotech | | | 2 | | | | 1,045 | |
Schneider Electric SE | | | 407 | | | | 64,238 | |
SCOR SE (a) | | | 175 | | | | 5,568 | |
SEB SA | | | 2 | | | | 419 | |
Societe Generale SA | | | 903 | | | | 26,705 | |
Sodexo SA (a) | | | 7 | | | | 667 | |
Suez SA | | | 880 | | | | 20,926 | |
Teleperformance | | | 44 | | | | 18,040 | |
Thales SA | | | 81 | | | | 8,278 | |
TotalEnergies SE | | | 199 | | | | 9,028 | |
Ubisoft Entertainment SA (a) | | | 8 | | | | 525 | |
Unibail-Rodamco-Westfield (a) | | | 10 | | | | 862 | |
Valeo SA | | | 18 | | | | 554 | |
Veolia Environnement SA | | | 1,372 | | | | 41,486 | |
Vinci SA | | | 403 | | | | 43,046 | |
Vivendi SE | | | 57 | | | | 1,907 | |
Wendel SE | | | 30 | | | | 4,013 | |
Worldline SA (a) (e) | | | 197 | | | | 18,425 | |
| | | | | | | | |
| | |
| | | | | | | 1,093,656 | |
| | | | | | | | |
Germany — 10.1% | | | | | | | | |
adidas AG | | | 15 | | | | 5,667 | |
Allianz SE (Registered) | | | 459 | | | | 114,573 | |
BASF SE | | | 73 | | | | 5,784 | |
Bayer AG (Registered) | | | 1,660 | | | | 100,906 | |
Bayerische Motoren Werke AG | | | 581 | | | | 61,613 | |
Bechtle AG | | | 23 | | | | 4,196 | |
Beiersdorf AG | | | 8 | | | | 971 | |
Brenntag SE | | | 117 | | | | 10,862 | |
Carl Zeiss Meditec AG | | | 3 | | | | 630 | |
Commerzbank AG (a) | | | 1,114 | | | | 7,912 | |
Continental AG | | | 9 | | | | 1,291 | |
Covestro AG (e) | | | 15 | | | | 996 | |
Daimler AG (Registered) | | | 1,502 | | | | 134,242 | |
Delivery Hero SE (a) (e) | | | 13 | | | | 1,655 | |
Deutsche Bank AG (Registered) (a) | | | 2,301 | | | | 30,005 | |
Deutsche Boerse AG | | | 212 | | | | 36,929 | |
Deutsche Lufthansa AG (Registered) (a) | | | 227 | | | | 2,552 | |
Deutsche Post AG (Registered) | | | 750 | | | | 51,064 | |
Deutsche Telekom AG (Registered) | | | 266 | | | | 5,623 | |
Deutsche Wohnen SE | | | 27 | | | | 1,669 | |
E.ON SE | | | 5,722 | | | | 66,207 | |
Evonik Industries AG | | | 17 | | | | 562 | |
| | | | | | | | |
| SECURITY DESCRIPTION | |
SHARES | | | VALUE($) | |
| | | | | | | | |
Germany — continued | | | | | | | | |
Fresenius Medical Care AG & Co. KGaA | | | 16 | | | | 1,359 | |
Fresenius SE & Co. KGaA | | | 33 | | | | 1,741 | |
GEA Group AG | | | 116 | | | | 4,706 | |
Hannover Rueck SE | | | 67 | | | | 11,254 | |
HeidelbergCement AG | | | 12 | | | | 1,019 | |
HelloFresh SE (a) | | | 13 | | | | 1,281 | |
Henkel AG & Co. KGaA | | | 9 | | | | 823 | |
Infineon Technologies AG | | | 1,081 | | | | 43,472 | |
KION Group AG | | | 55 | | | | 5,830 | |
Knorr-Bremse AG | | | 55 | | | | 6,355 | |
LANXESS AG | | | 6 | | | | 438 | |
LEG Immobilien SE | | | 6 | | | | 835 | |
Merck KGaA | | | 218 | | | | 41,896 | |
MTU Aero Engines AG | | | 40 | | | | 10,002 | |
Muenchener Rueckversicherungs-Gesellschaft AG in Muenchen (Registered) | | | 156 | | | | 42,755 | |
Nemetschek SE | | | 48 | | | | 3,697 | |
Puma SE | | | 8 | | | | 1,005 | |
Rational AG | | | 4 | | | | 3,526 | |
RWE AG | | | 1,632 | | | | 59,172 | |
SAP SE | | | 864 | | | | 121,384 | |
Scout24 AG (a) (e) | | | 7 | | | | 611 | |
Siemens AG (Registered) | | | 579 | | | | 91,877 | |
Siemens Energy AG (a) | | | 302 | | | | 9,097 | |
Siemens Healthineers AG (e) | | | 21 | | | | 1,314 | |
Symrise AG, Class A | | | 10 | | | | 1,430 | |
TeamViewer AG (a) (e) | | | 133 | | | | 4,999 | |
Telefonica Deutschland Holding AG | | | 79 | | | | 209 | |
Uniper SE | | | 246 | | | | 9,050 | |
United Internet AG (Registered) | | | 8 | | | | 338 | |
Volkswagen AG | | | 57 | | | | 18,710 | |
Vonovia SE | | | 43 | | | | 2,771 | |
Zalando SE (a) (e) | | | 74 | | | | 8,945 | |
| | | | | | | | |
| | |
| | | | | | | 1,157,810 | |
| | | | | | | | |
Greece — 0.0% (g) | | | | | | | | |
Eurobank Ergasias Services and Holdings SA (a) | | | 133 | | | | 135 | |
Hellenic Telecommunications Organization SA | | | 12 | | | | 201 | |
JUMBO SA | | | 5 | | | | 84 | |
OPAP SA | | | 11 | | | | 159 | |
| | | | | | | | |
| | |
| | | | | | | 579 | |
| | | | | | | | |
Hong Kong — 0.1% | | | | | | | | |
Alibaba Health Information Technology Ltd. (a) | | | 192 | | | | 425 | |
Alibaba Pictures Group Ltd. (a) | | | 590 | | | | 82 | |
Beijing Enterprises Holdings Ltd. | | | 21 | | | | 75 | |
Beijing Enterprises Water Group Ltd. (a) | | | 216 | | | | 82 | |
Bosideng International Holdings Ltd. | | | 226 | | | | 161 | |
Brilliance China Automotive Holdings Ltd. (bb) (cc) | | | 122 | | | | 76 | |
SEE NOTES TO FINANCIAL STATEMENTS.
| | | | | | | | | | |
| | | | | |
| JUNE 30, 2021 | | SIX CIRCLES TRUST | | | | | | | | 63 |
Six Circles International Unconstrained Equity Fund
SCHEDULE OF PORTFOLIO INVESTMENTS
AS OF JUNE 30, 2021 (Unaudited) (continued)
(Amounts in U.S. Dollars, unless otherwise noted)
(Amounts in thousands, except number of Futures contracts)
| | | | | | | | |
| SECURITY DESCRIPTION | |
SHARES | | | VALUE($) | |
Common Stocks — continued | | | | | | | | |
Hong Kong — continued | | | | | | | | |
China Education Group Holdings Ltd. | | | 39 | | | | 87 | |
China Everbright Environment Group Ltd. | | | 157 | | | | 89 | |
China Everbright Ltd. | | | 38 | | | | 45 | |
China Gas Holdings Ltd. | | | 146 | | | | 445 | |
China Jinmao Holdings Group Ltd. | | | 226 | | | | 76 | |
China Mengniu Dairy Co. Ltd. (a) | | | 151 | | | | 912 | |
China Merchants Port Holdings Co. Ltd. | | | 66 | | | | 96 | |
China Overseas Land & Investment Ltd. | | | 178 | | | | 403 | |
China Overseas Property Holdings Ltd. | | | 60 | | | | 64 | |
China Power International Development Ltd. | | | 182 | | | | 40 | |
China Resources Beer Holdings Co. Ltd. | | | 70 | | | | 628 | |
China Resources Cement Holdings Ltd. | | | 106 | | | | 101 | |
China Resources Gas Group Ltd. | | | 46 | | | | 276 | |
China Resources Land Ltd. | | | 144 | | | | 582 | |
China Resources Power Holdings Co. Ltd. | | | 80 | | | | 109 | |
China State Construction International Holdings Ltd. | | | 88 | | | | 60 | |
China Taiping Insurance Holdings Co. Ltd. | | | 71 | | | | 117 | |
China Traditional Chinese Medicine Holdings Co. Ltd. (a) | | | 126 | | | | 86 | |
China Youzan Ltd. (a) | | | 608 | | | | 116 | |
COSCO SHIPPING Ports Ltd. | | | 92 | | | | 72 | |
Far East Horizon Ltd. | | | 95 | | | | 99 | |
Geely Automobile Holdings Ltd. | | | 281 | | | | 883 | |
Guangdong Investment Ltd. | | | 146 | | | | 210 | |
Hopson Development Holdings Ltd. | | | 28 | | | | 128 | |
Hutchmed China Ltd., ADR (a) | | | 3 | | | | 127 | |
Kingboard Holdings Ltd. | | | 39 | | | | 216 | |
Kingboard Laminates Holdings Ltd. | | | 54 | | | | 120 | |
Kunlun Energy Co. Ltd. | | | 202 | | | | 186 | |
Lee & Man Paper Manufacturing Ltd. | | | 65 | | | | 49 | |
Nine Dragons Paper Holdings Ltd. | | | 77 | | | | 99 | |
Perennial Energy Holdings Ltd. | | | 40 | | | | 9 | |
Shenzhen International Holdings Ltd. | | | 80 | | | | 110 | |
Shenzhen Investment Ltd. | | | 150 | | | | 46 | |
Shimao Group Holdings Ltd. | | | 52 | | | | 127 | |
Sino Biopharmaceutical Ltd. | | | 484 | | | | 474 | |
SSY Group Ltd. | | | 60 | | | | 54 | |
Sun Art Retail Group Ltd. (a) | | | 105 | | | | 78 | |
Vinda International Holdings Ltd. | | | 18 | | | | 55 | |
Wharf Holdings Ltd. (The) | | | 71 | | | | 271 | |
Yuexiu Property Co. Ltd. | | | 75 | | | | 79 | |
| | | | | | | | |
| | |
| | | | | | | 8,725 | |
| | | | | | | | |
Hungary — 0.0% (g) | | | | | | | | |
MOL Hungarian Oil & Gas plc (a) | | | 15 | | | | 123 | |
OTP Bank Nyrt (a) | | | 10 | | | | 545 | |
Richter Gedeon Nyrt | | | 7 | | | | 174 | |
| | | | | | | | |
| | |
| | | | | | | 842 | |
| | | | | | | | |
| | | | | | | | |
| SECURITY DESCRIPTION | |
SHARES | | | VALUE($) | |
| | | | | | | | |
India — 0.4% | | | | | | | | |
ACC Ltd. | | | 4 | | | | 95 | |
Adani Enterprises Ltd. (a) | | | 7 | | | | 144 | |
Adani Green Energy Ltd. (a) | | | 19 | | | | 288 | |
Adani Ports & Special Economic Zone Ltd. | | | 22 | | | | 209 | |
Adani Total Gas Ltd. | | | 5 | | | | 68 | |
Adani Transmission Ltd. (a) | | | 11 | | | | 158 | |
Ambuja Cements Ltd. | | | 31 | | | | 142 | |
Apollo Hospitals Enterprise Ltd. | | | 5 | | | | 221 | |
Asian Paints Ltd. | | | 18 | | | | 707 | |
Aurobindo Pharma Ltd. | | | 12 | | | | 161 | |
Avenue Supermarts Ltd. (a) (e) | | | 8 | | | | 351 | |
Axis Bank Ltd. (a) | | | 106 | | | | 1,074 | |
Bajaj Auto Ltd. (a) | | | 3 | | | | 162 | |
Bajaj Finance Ltd. (a) | | | 13 | | | | 1,033 | |
Bajaj Finserv Ltd. (a) | | | 2 | | | | 279 | |
Balkrishna Industries Ltd. | | | 4 | | | | 112 | |
Bandhan Bank Ltd. (a) (e) | | | 33 | | | | 145 | |
Berger Paints India Ltd. | | | 13 | | | | 144 | |
Bharat Electronics Ltd. | | | 53 | | | | 128 | |
Bharat Forge Ltd. (a) | | | 10 | | | | 103 | |
Bharat Petroleum Corp. Ltd. | | | 39 | | | | 247 | |
Bharti Airtel Ltd. | | | 116 | | | | 821 | |
Biocon Ltd. (a) | | | 20 | | | | 111 | |
Britannia Industries Ltd. | | | 5 | | | | 237 | |
Cholamandalam Investment and Finance Co. Ltd. | | | 19 | | | | 130 | |
Cipla Ltd. (a) | | | 23 | | | | 298 | |
Coal India Ltd. | | | 62 | | | | 123 | |
Colgate-Palmolive India Ltd. | | | 7 | | | | 157 | |
Container Corp. Of India Ltd. | | | 12 | | | | 116 | |
Dabur India Ltd. | | | 29 | | | | 224 | |
Divi’s Laboratories Ltd. (a) | | | 6 | | | | 382 | |
DLF Ltd. | | | 27 | | | | 101 | |
Dr Reddy’s Laboratories Ltd. | | | 6 | | | | 409 | |
Eicher Motors Ltd. (a) | | | 6 | | | | 206 | |
GAIL India Ltd. | | | 68 | | | | 138 | |
Godrej Consumer Products Ltd. (a) | | | 18 | | | | 208 | |
Grasim Industries Ltd. | | | 14 | | | | 281 | |
Havells India Ltd. | | | 10 | | | | 130 | |
HCL Technologies Ltd. | | | 49 | | | | 656 | |
HDFC Asset Management Co. Ltd. (e) | | | 2 | | | | 89 | |
HDFC Life Insurance Co. Ltd. (e) | | | 39 | | | | 357 | |
Hero MotoCorp. Ltd. | | | 5 | | | | 201 | |
Hindalco Industries Ltd. | | | 75 | | | | 375 | |
Hindustan Petroleum Corp. Ltd. | | | 26 | | | | 103 | |
Hindustan Unilever Ltd. | | | 39 | | | | 1,302 | |
Housing Development Finance Corp. Ltd. | | | 81 | | | | 2,709 | |
ICICI Bank Ltd. (a) | | | 241 | | | | 2,048 | |
ICICI Lombard General Insurance Co. Ltd. (e) | | | 11 | | | | 228 | |
ICICI Prudential Life Insurance Co. Ltd. (e) | | | 21 | | | | 176 | |
Indian Oil Corp. Ltd. | | | 68 | | | | 99 | |
SEE NOTES TO FINANCIAL STATEMENTS.
| | | | | | | | | | |
| | | | | |
| 64 | | | | | | | | SIX CIRCLES TRUST | | JUNE 30, 2021 |
| | | | | | | | |
| SECURITY DESCRIPTION | |
SHARES | | | VALUE($) | |
Common Stocks — continued | | | | | | | | |
India — continued | | | | | | | | |
Indraprastha Gas Ltd. | | | 14 | | | | 104 | |
Indus Towers Ltd. | | | 39 | | | | 126 | |
Info Edge India Ltd. | | | 4 | | | | 260 | |
Infosys Ltd. | | | 161 | | | | 3,397 | |
InterGlobe Aviation Ltd. (a) (e) | | | 4 | | | | 101 | |
Ipca Laboratories Ltd. | | | 3 | | | | 85 | |
ITC Ltd. | | | 139 | | | | 379 | |
JSW Steel Ltd. | | | 40 | | | | 370 | |
Jubilant Foodworks Ltd. (a) | | | 4 | | | | 148 | |
Kotak Mahindra Bank Ltd. (a) | | | 26 | | | | 598 | |
Larsen & Toubro Infotech Ltd. (e) | | | 3 | | | | 161 | |
Larsen & Toubro Ltd. | | | 33 | | | | 668 | |
Lupin Ltd. | | | 10 | | | | 153 | |
Mahindra & Mahindra Ltd. | | | 41 | | | | 433 | |
Marico Ltd. | | | 24 | | | | 173 | |
Maruti Suzuki India Ltd. | | | 6 | | | | 626 | |
Motherson Sumi Systems Ltd. (a) | | | 62 | | | | 203 | |
MRF Ltd. | | | — | (h) | | | 93 | |
Muthoot Finance Ltd. | | | 5 | | | | 107 | |
Nestle India Ltd. | | | 2 | | | | 389 | |
NTPC Ltd. | | | 229 | | | | 359 | |
Oil & Natural Gas Corp. Ltd. | | | 141 | | | | 224 | |
Page Industries Ltd. | | | — | (h) | | | 105 | |
Petronet LNG Ltd. | | | 39 | | | | 118 | |
PI Industries Ltd. | | | 4 | | | | 144 | |
Pidilite Industries Ltd. (a) | | | 8 | | | | 225 | |
Piramal Enterprises Ltd. | | | 4 | | | | 130 | |
Power Grid Corp. of India Ltd. | | | 111 | | | | 349 | |
REC Ltd. | | | 38 | | | | 75 | |
Reliance Industries Ltd. | | | 135 | | | | 3,845 | |
SBI Cards & Payment Services Ltd. (a) | | | 9 | | | | 114 | |
SBI Life Insurance Co. Ltd. (e) | | | 23 | | | | 310 | |
Shree Cement Ltd. (a) | | | 1 | | | | 209 | |
Shriram Transport Finance Co. Ltd. | | | 10 | | | | 182 | |
Siemens Ltd. | | | 3 | | | | 86 | |
State Bank of India | | | 86 | | | | 484 | |
Sun Pharmaceutical Industries Ltd. | | | 40 | | | | 360 | |
Tata Consultancy Services Ltd. | | | 43 | | | | 1,943 | |
Tata Consumer Products Ltd. | | | 30 | | | | 308 | |
Tata Motors Ltd. (a) | | | 79 | | | | 364 | |
Tata Steel Ltd. | | | 31 | | | | 482 | |
Tech Mahindra Ltd. | | | 30 | | | | 440 | |
Titan Co. Ltd. | | | 18 | | | | 412 | |
Torrent Pharmaceuticals Ltd. | | | 2 | | | | 84 | |
Trent Ltd. | | | 8 | | | | 90 | |
UltraTech Cement Ltd. | | | 5 | | | | 467 | |
United Spirits Ltd. (a) | | | 13 | | | | 115 | |
UPL Ltd. | | | 22 | | | | 232 | |
Vedanta Ltd. | | | 56 | | | | 197 | |
Wipro Ltd. | | | 67 | | | | 490 | |
Yes Bank Ltd. (a) | | | 631 | | | | 116 | |
| | | | | | | | |
| | |
| | | | | | | 40,019 | |
| | | | | | | | |
| | | | | | | | |
| SECURITY DESCRIPTION | |
SHARES | | | VALUE($) | |
| | | | | | | | |
Indonesia — 0.0% (g) | | | | | | | | |
Adaro Energy Tbk. PT | | | 550 | | | | 46 | |
Aneka Tambang Tbk | | | 333 | | | | 53 | |
Astra International Tbk. PT | | | 958 | | | | 327 | |
Bank Central Asia Tbk. PT | | | 522 | | | | 1,085 | |
Bank Mandiri Persero Tbk. PT | | | 823 | | | | 335 | |
Bank Negara Indonesia Persero Tbk. PT | | | 424 | | | | 136 | |
Bank Rakyat Indonesia Persero Tbk. PT | | | 2,693 | | | | 732 | |
Barito Pacific Tbk. PT | | | 1,143 | | | | 68 | |
Charoen Pokphand Indonesia Tbk. PT | | | 314 | | | | 135 | |
Gudang Garam Tbk. PT (a) | | | 37 | | | | 112 | |
Indah Kiat Pulp & Paper Tbk. PT | | | 115 | | | | 59 | |
Indocement Tunggal Prakarsa Tbk. PT | | | 58 | | | | 41 | |
Indofood CBP Sukses Makmur Tbk. PT | | | 153 | | | | 86 | |
Indofood Sukses Makmur Tbk. PT | | | 192 | | | | 82 | |
Kalbe Farma Tbk. PT | | | 704 | | | | 68 | |
Merdeka Copper Gold Tbk. PT (a) | | | 493 | | | | 100 | |
Sarana Menara Nusantara Tbk. PT | | | 1,326 | | | | 114 | |
Semen Indonesia Persero Tbk. PT | | | 129 | | | | 84 | |
Telkom Indonesia Persero Tbk. PT | | | 2,296 | | | | 499 | |
Tower Bersama Infrastructure Tbk. PT | | | 370 | | | | 82 | |
Unilever Indonesia Tbk. PT | | | 326 | | | | 111 | |
United Tractors Tbk. PT | | | 67 | | | | 93 | |
| | | | | | | | |
| | |
| | | | | | | 4,448 | |
| | | | | | | | |
Ireland — 0.7% | | | | | | | | |
CRH plc | | | 63 | | | | 3,167 | |
DCC plc | | | 104 | | | | 8,537 | |
Experian plc | | | 971 | | | | 37,484 | |
Flutter Entertainment plc (a) | | | 14 | | | | 2,617 | |
Kerry Group plc, Class A | | | 82 | | | | 11,519 | |
Kingspan Group plc | | | 117 | | | | 11,021 | |
Smurfit Kappa Group plc | | | 20 | | | | 1,065 | |
| | | | | | | | |
| | |
| | | | | | | 75,410 | |
| | | | | | | | |
Isle of Man — 0.1% | | | | | | | | |
Entain plc (a) | | | 224 | | | | 5,405 | |
| | | | | | | | |
Italy — 4.1% | | | | | | | | |
Amplifon SpA | | | 10 | | | | 505 | |
Assicurazioni Generali SpA | | | 1,228 | | | | 24,664 | |
Atlantia SpA (a) | | | 377 | | | | 6,846 | |
Davide Campari-Milano NV | | | 271 | | | | 3,636 | |
DiaSorin SpA | | | 2 | | | | 361 | |
Enel SpA | | | 20,637 | | | | 191,773 | |
Eni SpA | | | 201 | | | | 2,455 | |
Ferrari NV | | | 221 | | | | 45,677 | |
FinecoBank Banca Fineco SpA (a) | | | 661 | | | | 11,534 | |
Infrastrutture Wireless Italiane SpA (e) | | | 28 | | | | 318 | |
Intesa Sanpaolo SpA | | | 18,391 | | | | 50,876 | |
Mediobanca Banca di Credito Finanziario SpA (a) | | | 698 | | | | 8,168 | |
Moncler SpA | | | 15 | | | | 1,048 | |
Nexi SpA (a) (e) | | | 364 | | | | 7,996 | |
Poste Italiane SpA (e) | | | 588 | | | | 7,780 | |
SEE NOTES TO FINANCIAL STATEMENTS.
| | | | | | | | | | |
| | | | | |
| JUNE 30, 2021 | | SIX CIRCLES TRUST | | | | | | | | 65 |
Six Circles International Unconstrained Equity Fund
SCHEDULE OF PORTFOLIO INVESTMENTS
AS OF JUNE 30, 2021 (Unaudited) (continued)
(Amounts in U.S. Dollars, unless otherwise noted)
(Amounts in thousands, except number of Futures contracts)
| | | | | | | | |
| SECURITY DESCRIPTION | |
SHARES | | | VALUE($) | |
Common Stocks — continued | | | | | | | | |
Italy — continued | | | | | | | | |
Prysmian SpA | | | 193 | | | | 6,917 | |
Recordati Industria Chimica e Farmaceutica SpA | | | 176 | | | | 10,041 | |
Snam SpA | | | 5,407 | | | | 31,275 | |
Telecom Italia SpA | | | 1,317 | | | | 672 | |
Terna SPA | | | 3,662 | | | | 27,312 | |
UniCredit SpA | | | 2,367 | | | | 27,981 | |
| | | | | | | | |
| | |
| | | | | | | 467,835 | |
| | | | | | | | |
Jordan — 0.1% | | | | | | | | |
Hikma Pharmaceuticals plc | | | 346 | | | | 11,695 | |
| | | | | | | | |
Kuwait — 0.0% (g) | | | | | | | | |
Agility Public Warehousing Co. KSC | | | 72 | | | | 218 | |
Boubyan Bank KSCP (a) | | | 18 | | | | 45 | |
Kuwait Finance House KSCP | | | 170 | | | | 428 | |
Mabanee Co. KPSC | | | 45 | | | | 108 | |
Mobile Telecommunications Co. KSCP | | | 123 | | | | 241 | |
National Bank of Kuwait SAKP | | | 279 | | | | 786 | |
| | | | | | | | |
| | |
| | | | | | | 1,826 | |
| | | | | | | | |
Luxembourg — 0.0% (g) | | | | | | | | |
ArcelorMittal SA | | | 57 | | | | 1,760 | |
Aroundtown SA | | | 80 | | | | 624 | |
Eurofins Scientific SE (a) | | | 11 | | | | 1,218 | |
Reinet Investments SCA | | | 9 | | | | 174 | |
Tenaris SA | | | 39 | | | | 429 | |
| | | | | | | | |
| | |
| | | | | | | 4,205 | |
| | | | | | | | |
Malaysia — 0.0% (g) | | | | | | | | |
AMMB Holdings Bhd. | | | 88 | | | | 63 | |
Axiata Group Bhd. | | | 115 | | | | 103 | |
CIMB Group Holdings Bhd. | | | 294 | | | | 326 | |
Dialog Group Bhd. | | | 189 | | | | 132 | |
DiGi.Com Bhd. | | | 167 | | | | 166 | |
Fraser & Neave Holdings Bhd. | | | 7 | | | | 43 | |
Genting Bhd. | | | 89 | | | | 106 | |
Genting Malaysia Bhd. | | | 124 | | | | 83 | |
HAP Seng Consolidated Bhd. | | | 24 | | | | 45 | |
Hartalega Holdings Bhd. | | | 75 | | | | 133 | |
Hong Leong Bank Bhd. | | | 34 | | | | 152 | |
Hong Leong Financial Group Bhd. | | | 14 | | | | 59 | |
IHH Healthcare Bhd. | | | 88 | | | | 116 | |
IOI Corp. Bhd. | | | 144 | | | | 131 | |
Kossan Rubber Industries | | | 57 | | | | 44 | |
Kuala Lumpur Kepong Bhd. | | | 21 | | | | 101 | |
Malayan Banking Bhd. | | | 188 | | | | 366 | |
Malaysia Airports Holdings Bhd. (a) | | | 47 | | | | 67 | |
Maxis Bhd. | | | 98 | | | | 104 | |
MISC Bhd. | | | 58 | | | | 94 | |
Nestle Malaysia Bhd. | | | 4 | | | | 112 | |
Petronas Chemicals Group Bhd. | | | 115 | | | | 224 | |
Petronas Dagangan Bhd. | | | 16 | | | | 74 | |
Petronas Gas Bhd. | | | 32 | | | | 120 | |
| | | | | | | | |
| SECURITY DESCRIPTION | |
SHARES | | | VALUE($) | |
| | | | | | | | |
Malaysia — continued | | | | | | | | |
PPB Group Bhd. | | | 33 | | | | 147 | |
Press Metal Aluminium Holdings Bhd. | | | 155 | | | | 178 | |
Public Bank Bhd. | | | 697 | | | | 690 | |
QL Resources Bhd. | | | 59 | | | | 80 | |
RHB Bank Bhd. | | | 84 | | | | 109 | |
Sime Darby Bhd. | | | 103 | | | | 54 | |
Sime Darby Plantation Bhd. | | | 87 | | | | 84 | |
Supermax Corp. Bhd. | | | 65 | | | | 51 | |
Telekom Malaysia Bhd. | | | 50 | | | | 73 | |
Tenaga Nasional Bhd. | | | 109 | | | | 258 | |
Top Glove Corp. Bhd. | | | 252 | | | | 253 | |
Westports Holdings Bhd. | | | 37 | | | | 37 | |
| | | | | | | | |
| | |
| | | | | | | 4,978 | |
| | | | | | | | |
Mexico — 0.1% | | | | | | | | |
America Movil SAB de CV, Class C | | | 1,643 | | | | 1,236 | |
Arca Continental SAB de CV | | | 26 | | | | 151 | |
Becle SAB de CV (a) | | | 44 | | | | 117 | |
Cemex SAB de CV (a) | | | 724 | | | | 610 | |
Coca-Cola Femsa SAB de CV | | | 24 | | | | 128 | |
Fibra Uno Administracion SA de CV | | | 142 | | | | 153 | |
Fomento Economico Mexicano SAB de CV | | | 89 | | | | 750 | |
Gruma SAB de CV, Class B | | | 11 | | | | 122 | |
Grupo Aeroportuario del Pacifico SAB de CV, Class B (a) | | | 17 | | | | 186 | |
Grupo Aeroportuario del Sureste SAB de CV, Class B | | | 9 | | | | 174 | |
Grupo Bimbo SAB de CV, Class A | | | 90 | | | | 198 | |
Grupo Carso SAB de CV | | | 18 | | | | 55 | |
Grupo Financiero Banorte SAB de CV, Class O | | | 121 | | | | 777 | |
Grupo Financiero Inbursa SAB de CV, Class O (a) | | | 109 | | | | 108 | |
Grupo Mexico SAB de CV, Class B | | | 145 | | | | 682 | |
Grupo Televisa SAB | | | 121 | | | | 346 | |
Industrias Penoles SAB de CV (a) | | | 6 | | | | 82 | |
Kimberly-Clark de Mexico SAB de CV, Class A | | | 73 | | | | 129 | |
Megacable Holdings SAB de CV | | | 18 | | | | 63 | |
Orbia Advance Corp. SAB de CV | | | 48 | | | | 126 | |
Promotora y Operadora de Infraestructura SAB de CV | | | 12 | | | | 94 | |
Telesites SAB de CV (a) | | | 71 | | | | 66 | |
Wal-Mart de Mexico SAB de CV | | | 250 | | | | 815 | |
| | | | | | | | |
| | |
| | | | | | | 7,168 | |
| | | | | | | | |
Netherlands — 5.1% | | | | | | | | |
ABN AMRO Bank NV, GDR, CVA (a) (e) | | | 476 | | | | 5,764 | |
Adyen NV (a) (e) | | | 16 | | | | 40,037 | |
Aegon NV | | | 1,989 | | | | 8,273 | |
Akzo Nobel NV | | | 15 | | | | 1,882 | |
Argenx SE (a) | | | 4 | | | | 1,103 | |
ASM International NV | | | 39 | | | | 12,913 | |
SEE NOTES TO FINANCIAL STATEMENTS.
| | | | | | | | | | |
| | | | | |
| 66 | | | | | | | | SIX CIRCLES TRUST | | JUNE 30, 2021 |
| | | | | | | | |
| SECURITY DESCRIPTION | |
SHARES | | | VALUE($) | |
Common Stocks — continued | | | | | | | | |
Netherlands — continued | | | | | | | | |
ASML Holding NV | | | 347 | | | | 239,659 | |
EXOR NV | | | 121 | | | | 9,732 | |
Heineken Holding NV | | | 60 | | | | 6,047 | |
Heineken NV | | | 134 | | | | 16,301 | |
ING Groep NV | | | 4,344 | | | | 57,658 | |
JDE Peet’s NV (a) | | | 39 | | | | 1,432 | |
Just Eat Takeaway.com NV (a) (e) | | | 14 | | | | 1,323 | |
Koninklijke Ahold Delhaize NV | | | 83 | | | | 2,484 | |
Koninklijke DSM NV | | | 14 | | | | 2,570 | |
Koninklijke KPN NV | | | 268 | | | | 839 | |
Koninklijke Philips NV | | | 73 | | | | 3,607 | |
Koninklijke Vopak NV | | | 6 | | | | 252 | |
NN Group NV | | | 312 | | | | 14,730 | |
Prosus NV (a) | | | 39 | | | | 3,809 | |
QIAGEN NV (a) | | | 18 | | | | 890 | |
Randstad NV | | | 90 | | | | 6,906 | |
Royal Dutch Shell plc, Class A | | | 1,566 | | | | 31,387 | |
Royal Dutch Shell plc, Class B | | | 1,415 | | | | 27,465 | |
Stellantis NV | | | 3,560 | | | | 70,030 | |
Wolters Kluwer NV | | | 202 | | | | 20,339 | |
| | | | | | | | |
| | |
| | | | | | | 587,432 | |
| | | | | | | | |
Norway — 0.4% | | | | | | | | |
Adevinta ASA, Class B (a) | | | 23 | | | | 437 | |
DNB ASA | | | 1,036 | | | | 22,575 | |
Equinor ASA | | | 78 | | | | 1,650 | |
Gjensidige Forsikring ASA | | | 222 | | | | 4,900 | |
Mowi ASA | | | 228 | | | | 5,797 | |
Norsk Hydro ASA | | | 108 | | | | 689 | |
Orkla ASA | | | 387 | | | | 3,949 | |
Schibsted ASA, Class A | | | 6 | | | | 281 | |
Schibsted ASA, Class B | | | 9 | | | | 374 | |
Telenor ASA | | | 56 | | | | 941 | |
Yara International ASA | | | 14 | | | | 733 | |
| | | | | | | | |
| | |
| | | | | | | 42,326 | |
| | | | | | | | |
Pakistan — 0.0% (g) | | | | | | | | |
Habib Bank Ltd. | | | 1 | | | | 1 | |
Lucky Cement Ltd. (a) | | | 8 | | | | 44 | |
MCB Bank Ltd. | | | 69 | | | | 70 | |
| | | | | | | | |
| | |
| | | | | | | 115 | |
| | | | | | | | |
Peru — 0.0% (g) | | | | | | | | |
Cia de Minas Buenaventura SAA, ADR (a) | | | 10 | | | | 94 | |
Credicorp Ltd. (a) | | | 3 | | | | 409 | |
Southern Copper Corp. | | | 5 | | | | 307 | |
| | | | | | | | |
| | |
| | | | | | | 810 | |
| | | | | | | | |
Philippines — 0.0% (g) | | | | | | | | |
Aboitiz Equity Ventures, Inc. | | | 81 | | | | 70 | |
Ayala Corp. | | | 12 | | | | 204 | |
Ayala Land, Inc. | | | 361 | | | | 266 | |
Bank of the Philippine Islands | | | 88 | | | | 160 | |
BDO Unibank, Inc. | | | 93 | | | | 215 | |
Globe Telecom, Inc. | | | 2 | | | | 60 | |
| | | | | | | | |
| SECURITY DESCRIPTION | |
SHARES | | | VALUE($) | |
| | | | | | | | |
Philippines — continued | | | | | | | | |
GT Capital Holdings, Inc. | | | 4 | | | | 50 | |
International Container Terminal Services, Inc. | | | 57 | | | | 190 | |
JG Summit Holdings, Inc. | | | 159 | | | | 203 | |
Jollibee Foods Corp. | | | 20 | | | | 86 | |
Manila Electric Co. | | | 10 | | | | 57 | |
Metro Pacific Investments Corp. | | | 676 | | | | 54 | |
Metropolitan Bank & Trust Co. | | | 93 | | | | 92 | |
PLDT, Inc. | | | 4 | | | | 100 | |
SM Investments Corp. | | | 12 | | | | 249 | |
SM Prime Holdings, Inc. | | | 482 | | | | 361 | |
Universal Robina Corp. | | | 38 | | | | 113 | |
| | | | | | | | |
| | |
| | | | | | | 2,530 | |
| | | | | | | | |
Poland — 0.1% | | | | | | | | |
Allegro.eu SA (a) (e) | | | 18 | | | | 309 | |
Bank Polska Kasa Opieki SA (a) | | | 9 | | | | 208 | |
CD Projekt SA | | | 4 | | | | 188 | |
Cyfrowy Polsat SA | | | 17 | | | | 130 | |
Dino Polska SA (a) (e) | | | 2 | | | | 163 | |
InPost SA (a) | | | 151 | | | | 3,025 | |
KGHM Polska Miedz SA | | | 6 | | | | 308 | |
LPP SA (a) | | | — | (h) | | | 203 | |
Orange Polska SA (a) | | | 36 | | | | 64 | |
PGE Polska Grupa Energetyczna SA (a) | | | 38 | | | | 94 | |
Polski Koncern Naftowy ORLEN SA | | | 14 | | | | 287 | |
Polskie Gornictwo Naftowe i Gazownictwo SA | | | 93 | | | | 162 | |
Powszechna Kasa Oszczednosci Bank Polski SA (a) | | | 44 | | | | 441 | |
Powszechny Zaklad Ubezpieczen SA (a) | | | 28 | | | | 267 | |
Santander Bank Polska SA (a) | | | 2 | | | | 120 | |
| | | | | | | | |
| | |
| | | | | | | 5,969 | |
| | | | | | | | |
Portugal — 0.3% | | | | | | | | |
EDP — Energias de Portugal SA | | | 7,169 | | | | 37,998 | |
Galp Energia SGPS SA | | | 40 | | | | 433 | |
Jeronimo Martins SGPS SA | | | 21 | | | | 377 | |
| | | | | | | | |
| | |
| | | | | | | 38,808 | |
| | | | | | | | |
Qatar — 0.0% (g) | | | | | | | | |
Barwa Real Estate Co. | | | 143 | | | | 118 | |
Commercial Bank PSQC (The) | | | 111 | | | | 160 | |
Industries Qatar QSC | | | 80 | | | | 292 | |
Masraf Al Rayan QSC | | | 174 | | | | 213 | |
Mesaieed Petrochemical Holding Co. | | | 263 | | | | 136 | |
Ooredoo QPSC | | | 51 | | | | 102 | |
Qatar Electricity & Water Co. QSC | | | 27 | | | | 123 | |
Qatar Fuel QSC | | | 23 | | | | 112 | |
Qatar Gas Transport Co. Ltd. | | | 144 | | | | 119 | |
Qatar International Islamic Bank QSC | | | 35 | | | | 90 | |
Qatar Islamic Bank SAQ | | | 61 | | | | 290 | |
Qatar National Bank QPSC | | | 210 | | | | 1,035 | |
| | | | | | | | |
| | |
| | | | | | | 2,790 | |
| | | | | | | | |
SEE NOTES TO FINANCIAL STATEMENTS.
| | | | | | | | | | |
| | | | | |
| JUNE 30, 2021 | | SIX CIRCLES TRUST | | | | | | | | 67 |
Six Circles International Unconstrained Equity Fund
SCHEDULE OF PORTFOLIO INVESTMENTS
AS OF JUNE 30, 2021 (Unaudited) (continued)
(Amounts in U.S. Dollars, unless otherwise noted)
(Amounts in thousands, except number of Futures contracts)
| | | | | | | | |
| SECURITY DESCRIPTION | |
SHARES | | | VALUE($) | |
Common Stocks — continued | | | | | | | | |
Romania — 0.0% (g) | | | | | | | | |
NEPI Rockcastle plc | | | 27 | | | | 190 | |
| | | | | | | | |
Russia — 0.1% | | | | | | | | |
Alrosa PJSC | | | 111 | | | | 204 | |
Gazprom PJSC | | | 560 | | | | 2,146 | |
Inter RAO UES PJSC | | | 2,111 | | | | 135 | |
LUKOIL PJSC | | | 20 | | | | 1,844 | |
Magnit PJSC (Registered), ADR, GDR | | | 16 | | | | 225 | |
Mail.Ru Group Ltd.(Registered), GDR (a) | | | 6 | | | | 134 | |
MMC Norilsk Nickel PJSC | | | 3 | | | | 1,005 | |
Mobile TeleSystems PJSC, ADR | | | 25 | | | | 229 | |
Moscow Exchange MICEX-RTS PJSC | | | 75 | | | | 175 | |
Novatek PJSC (Registered), ADR | | | 4 | | | | 904 | |
Novolipetsk Steel PJSC | | | 75 | | | | 237 | |
Ozon Holdings plc, ADR (a) | | | 3 | | | | 150 | |
PhosAgro PJSC (Registered), GDR | | | 6 | | | | 121 | |
Polyus PJSC | | | 2 | | | | 322 | |
Rosneft Oil Co. PJSC | | | 60 | | | | 467 | |
Sberbank of Russia PJSC | | | 518 | | | | 2,165 | |
Severstal PAO | | | 11 | | | | 241 | |
Surgutneftegas PJSC | | | 389 | | | | 195 | |
Tatneft PJSC | | | 66 | | | | 477 | |
VTB Bank PJSC | | | 222,468 | | | | 147 | |
X5 Retail Group NV (Registered), GDR | | | 6 | | | | 226 | |
Yandex NV, Class A (a) | | | 15 | | | | 1,041 | |
| | | | | | | | |
| | |
| | | | | | | 12,790 | |
| | | | | | | | |
Saudi Arabia — 0.1% | | | | | | | | |
Abdullah Al Othaim Markets Co. | | | 2 | | | | 81 | |
Advanced Petrochemical Co. | | | 5 | | | | 91 | |
Al Rajhi Bank | | | 57 | | | | 1,695 | |
Alinma Bank | | | 62 | | | | 350 | |
Almarai Co. JSC | | | 13 | | | | 226 | |
Arab National Bank | | | 30 | | | | 179 | |
Bank AlBilad (a) | | | 20 | | | | 195 | |
Bank Al-Jazira (a) | | | 20 | | | | 100 | |
Banque Saudi Fransi | | | 28 | | | | 287 | |
Bupa Arabia for Cooperative Insurance Co. | | | 3 | | | | 94 | |
Co. for Cooperative Insurance (The) | | | 3 | | | | 67 | |
Dar Al Arkan Real Estate Development Co. (a) | | | 23 | | | | 64 | |
Dr Sulaiman Al Habib Medical Services Group Co. | | | 3 | | | | 127 | |
Emaar Economic City (a) | | | 17 | | | | 58 | |
Etihad Etisalat Co. | | | 17 | | | | 151 | |
Jarir Marketing Co. | | | 2 | | | | 132 | |
Mobile Telecommunications Co. Saudi Arabia (a) | | | 19 | | | | 74 | |
Mouwasat Medical Services Co. | | | 2 | | | | 105 | |
Saudi National Bank (The) | | | 107 | | | | 1,636 | |
National Industrialization Co. (a) | | | 19 | | | | 97 | |
National Petrochemical Co. | | | 7 | | | | 84 | |
Rabigh Refining & Petrochemical Co. (a) | | | 12 | | | | 73 | |
| | | | | | | | |
| SECURITY DESCRIPTION | |
SHARES | | | VALUE($) | |
| | | | | | | | |
Saudi Arabia — continued | | | | | | | | |
Riyad Bank | | | 64 | | | | 451 | |
SABIC Agri-Nutrients Co. | | | 10 | | | | 326 | |
Sahara International Petrochemical Co. | | | 16 | | | | 129 | |
Saudi Arabian Mining Co. (a) | | | 21 | | | | 360 | |
Saudi Arabian Oil Co. (e) | | | 106 | | | | 995 | |
Saudi Basic Industries Corp. | | | 44 | | | | 1,428 | |
Saudi British Bank (The) (a) | | | 37 | | | | 314 | |
Saudi Cement Co. | | | 4 | | | | 65 | |
Saudi Electricity Co. | | | 36 | | | | 231 | |
Saudi Industrial Investment Group | | | 10 | | | | 95 | |
Saudi Kayan Petrochemical Co. (a) | | | 33 | | | | 157 | |
Saudi Telecom Co. | | | 29 | | | | 1,017 | |
Savola Group (The) | | | 12 | | | | 139 | |
Yanbu National Petrochemical Co. | | | 12 | | | | 236 | |
| | | | | | | | |
| | |
| | | | | | | 11,909 | |
| | | | | | | | |
Singapore — 0.0% (g) | | | | | | | | |
BOC Aviation Ltd. (e) | | | 9 | | | | 77 | |
| | | | | | | | |
South Africa — 0.1% | | | | | | | | |
Absa Group Ltd. (a) | | | 32 | | | | 306 | |
African Rainbow Minerals Ltd. | | | 5 | | | | 91 | |
Anglo American Platinum Ltd. | | | 3 | | | | 304 | |
AngloGold Ashanti Ltd. | | | 19 | | | | 346 | |
Aspen Pharmacare Holdings Ltd. (a) | | | 20 | | | | 224 | |
Bid Corp. Ltd. (a) | | | 15 | | | | 321 | |
Bidvest Group Ltd. (The) | | | 15 | | | | 197 | |
Capitec Bank Holdings Ltd. | | | 4 | | | | 459 | |
Clicks Group Ltd. | | | 12 | | | | 213 | |
Discovery Ltd. (a) | | | 22 | | | | 192 | |
Exxaro Resources Ltd. | | | 10 | | | | 116 | |
FirstRand Ltd. | | | 226 | | | | 849 | |
Gold Fields Ltd. | | | 43 | | | | 386 | |
Growthpoint Properties Ltd. | | | 208 | | | | 217 | |
Harmony Gold Mining Co. Ltd. | | | 25 | | | | 92 | |
Impala Platinum Holdings Ltd. | | | 37 | | | | 611 | |
Kumba Iron Ore Ltd. | | | 2 | | | | 111 | |
Mr Price Group Ltd. | | | 10 | | | | 151 | |
MTN Group (a) | | | 80 | | | | 574 | |
MultiChoice Group | | | 19 | | | | 155 | |
Naspers Ltd., Class N | | | 20 | | | | 4,308 | |
Nedbank Group Ltd. (a) | | | 16 | | | | 193 | |
Northam Platinum Ltd. (a) | | | 18 | | | | 268 | |
Old Mutual Ltd. | | | 218 | | | | 206 | |
Rand Merchant Investment Holdings Ltd. | | | 33 | | | | 73 | |
Remgro Ltd. | | | 22 | | | | 175 | |
Sanlam Ltd. | | | 85 | | | | 367 | |
Sasol Ltd. (a) | | | 27 | | | | 409 | |
Shoprite Holdings Ltd. | | | 22 | | | | 236 | |
Sibanye Stillwater Ltd. | | | 148 | | | | 616 | |
SPAR Group Ltd. (The) | | | 7 | | | | 94 | |
Standard Bank Group Ltd. | | | 62 | | | | 552 | |
Tiger Brands Ltd. | | | 7 | | | | 95 | |
Vodacom Group Ltd. | | | 31 | | | | 281 | |
SEE NOTES TO FINANCIAL STATEMENTS.
| | | | | | | | | | |
| | | | | |
| 68 | | | | | | | | SIX CIRCLES TRUST | | JUNE 30, 2021 |
| | | | | | | | |
| SECURITY DESCRIPTION | |
SHARES | | | VALUE($) | |
Common Stocks — continued | | | | | | | | |
South Africa — continued | | | | | | | | |
Woolworths Holdings Ltd. (a) | | | 49 | | | | 185 | |
| | | | | | | | |
| | |
| | | | | | | 13,973 | |
| | | | | | | | |
South Korea — 5.5% | | | | | | | | |
Alteogen, Inc. (a) | | | 1 | | | | 96 | |
Amorepacific Corp. | | | 2 | | | | 345 | |
AMOREPACIFIC Group | | | 1 | | | | 70 | |
BGF retail Co. Ltd. | | | — | (h) | | | 48 | |
Celltrion Healthcare Co. Ltd. (a) | | | 4 | | | | 411 | |
Celltrion Pharm, Inc. (a) | | | 1 | | | | 97 | |
Celltrion, Inc. (a) | | | 5 | | | | 1,092 | |
Cheil Worldwide, Inc. | | | 3 | | | | 70 | |
CJ CheilJedang Corp. | | | — | (h) | | | 150 | |
CJ Corp. | | | 1 | | | | 58 | |
CJ ENM Co. Ltd. | | | — | (h) | | | 68 | |
CJ Logistics Corp. (a) | | | — | (h) | | | 67 | |
Coway Co. Ltd. | | | 3 | | | | 179 | |
Daewoo Shipbuilding & Marine Engineering Co. Ltd. (a) | | | 1 | | | | 46 | |
DB Insurance Co. Ltd. | | | 2 | | | | 94 | |
Doosan Bobcat, Inc. (a) | | | 2 | | | | 89 | |
Doosan Heavy Industries & Construction Co. Ltd. (a) | | | 11 | | | | 234 | |
Douzone Bizon Co. Ltd. | | | 1 | | | | 61 | |
E-MART, Inc. | | | 1 | | | | 119 | |
Fila Holdings Corp. | | | 2 | | | | 105 | |
Green Cross Corp. | | | — | (h) | | | 81 | |
GS Engineering & Construction Corp. | | | 2 | | | | 89 | |
GS Holdings Corp. | | | 3 | | | | 118 | |
Hana Financial Group, Inc. | | | 14 | | | | 576 | |
Hankook Tire & Technology Co. Ltd. | | | 4 | | | | 181 | |
Hanmi Pharm Co. Ltd. | | | — | (h) | | | 122 | |
Hanon Systems | | | 10 | | | | 153 | |
Hanwha Solutions Corp. (a) | | | 7 | | | | 265 | |
HLB, Inc. (a) | | | 4 | | | | 114 | |
HMM Co. Ltd. (a) | | | 12 | | | | 479 | |
Hotel Shilla Co. Ltd. | | | 1 | | | | 111 | |
HYBE Co. Ltd. (a) | | | — | (h) | | | 118 | |
Hyundai Engineering & Construction Co. Ltd. | | | 4 | | | | 195 | |
Hyundai Glovis Co. Ltd. | | | 1 | | | | 158 | |
Hyundai Heavy Industries Holdings Co. Ltd. | | | 2 | | | | 144 | |
Hyundai Mobis Co. Ltd. | | | 3 | | | | 844 | |
Hyundai Motor Co. | | | 6 | | | | 1,382 | |
Hyundai Steel Co. | | | 4 | | | | 209 | |
Industrial Bank of Korea | | | 12 | | | | 115 | |
Kakao Corp. | | | 15 | | | | 2,142 | |
Kangwon Land, Inc. (a) | | | 4 | | | | 103 | |
KB Financial Group, Inc. | | | 18 | | | | 904 | |
Kia Corp. | | | 12 | | | | 995 | |
KMW Co. Ltd. (a) | | | 1 | | | | 54 | |
Korea Aerospace Industries Ltd. | | | 3 | | | | 92 | |
Korea Electric Power Corp. | | | 11 | | | | 236 | |
| | | | | | | | |
| SECURITY DESCRIPTION | |
SHARES | | | VALUE($) | |
| | | | | | | | |
South Korea — continued | | | | | | | | |
Korea Investment Holdings Co. Ltd. | | | 2 | | | | 165 | |
Korea Shipbuilding & Offshore Engineering Co. Ltd. (a) | | | 2 | | | | 224 | |
Korea Zinc Co. Ltd. | | | — | (h) | | | 137 | |
Korean Air Lines Co. Ltd. (a) | | | 7 | | | | 199 | |
KT&G Corp. | | | 5 | | | | 403 | |
Kumho Petrochemical Co. Ltd. | | | 1 | | | | 179 | |
LG Chem Ltd. | | | 2 | | | | 1,626 | |
LG Corp. | | | 4 | | | | 374 | |
LG Display Co. Ltd. | | | 12 | | | | 261 | |
LG Electronics, Inc. | | | 5 | | | | 764 | |
LG Household & Health Care Ltd. | | | — | (h) | | | 679 | |
LG Innotek Co. Ltd. | | | 1 | | | | 122 | |
LG Uplus Corp. | | | 12 | | | | 161 | |
Lotte Chemical Corp. | | | 1 | | | | 169 | |
Lotte Shopping Co. Ltd. | | | — | (h) | | | 40 | |
Meritz Securities Co. Ltd. | | | 10 | | | | 44 | |
Mirae Asset Securities Co. Ltd. | | | 12 | | | | 103 | |
NAVER Corp. | | | 6 | | | | 2,165 | |
NCSoft Corp. | | | 1 | | | | 551 | |
Netmarble Corp. (e) | | | 1 | | | | 108 | |
NH Investment & Securities Co. Ltd. | | | 7 | | | | 86 | |
Orion Corp. | | | 1 | | | | 106 | |
Pan Ocean Co. Ltd. | | | 13 | | | | 100 | |
Pearl Abyss Corp. (a) | | | 1 | | | | 94 | |
POSCO | | | 3 | | | | 1,072 | |
POSCO Chemical Co. Ltd. | | | 1 | | | | 191 | |
S-1 Corp. | | | 1 | | | | 59 | |
Samsung Biologics Co. Ltd. (a) (e) | | | 1 | | | | 576 | |
Samsung C&T Corp. | | | 4 | | | | 490 | |
Samsung Electro-Mechanics Co. Ltd. | | | 3 | | | | 426 | |
Samsung Electronics Co. Ltd. | | | 7,266 | | | | 520,169 | |
Samsung Electronics Co. Ltd. (Registered), GDR | | | 39 | | | | 69,043 | |
Samsung Engineering Co. Ltd. (a) | | | 6 | | | | 127 | |
Samsung Fire & Marine Insurance Co. Ltd. | | | 1 | | | | 272 | |
Samsung Heavy Industries Co. Ltd. (a) | | | 20 | | | | 119 | |
Samsung Life Insurance Co. Ltd. | | | 3 | | | | 245 | |
Samsung SDI Co. Ltd. | | | 3 | | | | 1,616 | |
Samsung SDS Co. Ltd. | | | 2 | | | | 317 | |
Samsung Securities Co. Ltd. | | | 3 | | | | 109 | |
Seegene, Inc. | | | 2 | | | | 114 | |
Shin Poong Pharmaceutical Co. Ltd. | | | 1 | | | | 94 | |
Shinhan Financial Group Co. Ltd. | | | 20 | | | | 731 | |
Shinsegae, Inc. | | | — | (h) | | | 69 | |
SK Biopharmaceuticals Co. Ltd. (a) | | | 1 | | | | 130 | |
SK Chemicals Co. Ltd. | | | — | (h) | | | 74 | |
SK Holdings Co. Ltd. | | | 1 | | | | 374 | |
SK Hynix, Inc. | | | 26 | | | | 2,901 | |
SK Innovation Co. Ltd. (a) | | | 2 | | | | 624 | |
SK Telecom Co. Ltd. | | | 2 | | | | 528 | |
SKC Co. Ltd. | | | 1 | | | | 139 | |
S-Oil Corp. | | | 2 | | | | 208 | |
SEE NOTES TO FINANCIAL STATEMENTS.
| | | | | | | | | | |
| | | | | |
| JUNE 30, 2021 | | SIX CIRCLES TRUST | | | | | | | | 69 |
Six Circles International Unconstrained Equity Fund
SCHEDULE OF PORTFOLIO INVESTMENTS
AS OF JUNE 30, 2021 (Unaudited) (continued)
(Amounts in U.S. Dollars, unless otherwise noted)
(Amounts in thousands, except number of Futures contracts)
| | | | | | | | |
| SECURITY DESCRIPTION | |
SHARES | | | VALUE($) | |
Common Stocks — continued | | | | | | | | |
South Korea — continued | | | | | | | | |
Woori Financial Group, Inc. | | | 23 | | | | 233 | |
Yuhan Corp. | | | 2 | | | | 117 | |
| | | | | | | | |
| | |
| | | | | | | 623,506 | |
| | | | | | | | |
Spain — 4.1% | | | | | | | | |
ACS Actividades de Construccion y Servicios SA | | | 176 | | | | 4,725 | |
Aena SME SA (a) (e) | | | 57 | | | | 9,326 | |
Amadeus IT Group SA (a) | | | 373 | | | | 26,283 | |
Banco Bilbao Vizcaya Argentaria SA | | | 7,425 | | | | 46,057 | |
Banco Santander SA | | | 19,309 | | | | 73,860 | |
CaixaBank SA | | | 4,964 | | | | 15,284 | |
Cellnex Telecom SA (e) | | | 41 | | | | 2,592 | |
EDP Renovaveis SA | | | 720 | | | | 16,688 | |
Enagas SA | | | 404 | | | | 9,332 | |
Endesa SA | | | 869 | | | | 21,084 | |
Ferrovial SA | | | 364 | | | | 10,709 | |
Grifols SA | | | 24 | | | | 645 | |
Iberdrola SA | | | 14,760 | | | | 179,998 | |
Industria de Diseno Textil SA | | | 87 | | | | 3,072 | |
Naturgy Energy Group SA | | | 783 | | | | 20,144 | |
Red Electrica Corp. SA | | | 897 | | | | 16,663 | |
Repsol SA | | | 120 | | | | 1,508 | |
Siemens Gamesa Renewable Energy SA | | | 181 | | | | 6,036 | |
Telefonica SA (cc) | | | 417 | | | | 1,944 | |
| | | | | | | | |
| | |
| | | | | | | 465,950 | |
| | | | | | | | |
Sweden — 3.5% | | | | | | | | |
Alfa Laval AB | | | 236 | | | | 8,354 | |
Assa Abloy AB, Class B | | | 758 | | | | 22,856 | |
Atlas Copco AB, Class A | | | 508 | | | | 31,192 | |
Atlas Copco AB, Class B | | | 295 | | | | 15,544 | |
Boliden AB | | | 21 | | | | 800 | |
Electrolux AB, Class B | | | 17 | | | | 468 | |
Embracer Group AB, Class B (a) | | | 19 | | | | 515 | |
Epiroc AB, Class A | | | 498 | | | | 11,332 | |
Epiroc AB, Class B | | | 298 | | | | 5,856 | |
EQT AB | | | 265 | | | | 9,644 | |
Essity AB, Class B | | | 46 | | | | 1,539 | |
Evolution AB (e) | | | 14 | | | | 2,143 | |
Fastighets AB Balder, Class B (a) | | | 8 | | | | 504 | |
H & M Hennes & Mauritz AB, Class B (a) | | | 55 | | | | 1,315 | |
Hexagon AB, Class B | | | 1,630 | | | | 24,157 | |
Husqvarna AB, Class B | | | 32 | | | | 425 | |
ICA Gruppen AB | | | 8 | | | | 357 | |
Industrivarden AB, Class A | | | 118 | | | | 4,609 | |
Industrivarden AB, Class C | | | 178 | | | | 6,512 | |
Investment AB Latour, Class B | | | 111 | | | | 3,653 | |
Investor AB, Class B | | | 2,029 | | | | 46,765 | |
Kinnevik AB, Class B (a) | | | 269 | | | | 10,752 | |
L E Lundbergforetagen AB, Class B | | | 84 | | | | 5,402 | |
Lundin Energy AB | | | 14 | | | | 508 | |
Nibe Industrier AB, Class B | | | 1,078 | | | | 11,362 | |
Sandvik AB | | | 854 | | | | 21,835 | |
| | | | | | | | |
| SECURITY DESCRIPTION | |
SHARES | | | VALUE($) | |
| | | | | | | | |
Sweden — continued | | | | | | | | |
Securitas AB, Class B | | | 235 | | | | 3,709 | |
Sinch AB (a) (e) | | | 416 | | | | 7,006 | |
Skandinaviska Enskilda Banken AB, Class A | | | 1,812 | | | | 23,426 | |
Skanska AB, Class B | | | 258 | | | | 6,837 | |
SKF AB, Class B | | | 289 | | | | 7,358 | |
Svenska Cellulosa AB SCA, Class B | | | 45 | | | | 741 | |
Svenska Handelsbanken AB, Class A | | | 1,619 | | | | 18,276 | |
Swedbank AB, Class A | | | 1,008 | | | | 18,774 | |
Swedish Match AB | | | 835 | | | | 7,119 | |
Tele2 AB, Class B | | | 38 | | | | 515 | |
Telefonaktiebolaget LM Ericsson, Class B | | | 2,416 | | | | 30,373 | |
Telia Co. AB | | | 202 | | | | 896 | |
Volvo AB, Class A | | | 151 | | | | 3,759 | |
Volvo AB, Class B | | | 1,081 | | | | 26,060 | |
| | | | | | | | |
| | |
| | | | | | | 403,248 | |
| | | | | | | | |
Switzerland — 25.4% | | | | | | | | |
ABB Ltd. (Registered) | | | 1,312 | | | | 44,575 | |
Adecco Group AG (Registered) | | | 118 | | | | 8,020 | |
Alcon, Inc. | | | 40 | | | | 2,796 | |
Baloise Holding AG (Registered) | | | 52 | | | | 8,061 | |
Banque Cantonale Vaudoise (Registered) | | | 34 | | | | 3,067 | |
Barry Callebaut AG (Registered) | | | 7 | | | | 16,303 | |
Chocoladefabriken Lindt & Spruengli AG | | | 2 | | | | 20,206 | |
Chocoladefabriken Lindt & Spruengli AG (Registered) | | | — | (h) | | | 22,517 | |
Cie Financiere Richemont SA (Registered), Class A | | | 42 | | | | 5,048 | |
Clariant AG (Registered) | | | 18 | | | | 349 | |
Coca-Cola HBC AG | | | 164 | | | | 5,950 | |
Credit Suisse Group AG, Class A (Registered) | | | 2,726 | | | | 28,532 | |
EMS-Chemie Holding AG (Registered) | | | 1 | | | | 569 | |
Geberit AG (Registered) | | | 28 | | | | 21,046 | |
Givaudan SA (Registered) | | | 1 | | | | 3,519 | |
Glencore plc (a) | | | 3,815 | | | | 16,373 | |
Julius Baer Group Ltd. | | | 250 | | | | 16,309 | |
Kuehne + Nagel International AG (Registered) | | | 41 | | | | 13,971 | |
Holcim Ltd. (a) | | | 42 | | | | 2,510 | |
Logitech International SA (Registered) | | | 143 | | | | 17,398 | |
Lonza Group AG (Registered) | | | 6 | | | | 4,211 | |
Nestle SA (Registered) | | | 5,674 | | | | 707,187 | |
Novartis AG (Registered) | | | 7,556 | | | | 689,319 | |
Partners Group Holding AG | | | 25 | | | | 38,309 | |
Roche Holding AG | | | 2,500 | | | | 945,272 | |
Schindler Holding AG | | | 31 | | | | 9,412 | |
Schindler Holding AG (Registered) | | | 15 | | | | 4,528 | |
SGS SA (Registered) | | | 5 | | | | 14,125 | |
Sika AG (Registered) | | | 11 | | | | 3,706 | |
Sonova Holding AG (Registered) | | | 4 | | | | 1,655 | |
STMicroelectronics NV | | | 565 | | | | 20,554 | |
SEE NOTES TO FINANCIAL STATEMENTS.
| | | | | | | | | | |
| | | | | |
| 70 | | | | | | | | SIX CIRCLES TRUST | | JUNE 30, 2021 |
| | | | | | | | |
| SECURITY DESCRIPTION | |
SHARES | | | VALUE($) | |
Common Stocks — continued | | | | | | | | |
Switzerland — continued | | | | | | | | |
Straumann Hoding AG (Registered) | | | 1 | | | | 1,316 | |
Swatch Group AG (The) | | | 2 | | | | 793 | |
Swatch Group AG (The) (Registered) | | | 5 | | | | 357 | |
Swiss Life Holding AG (Registered) | | | 36 | | | | 17,358 | |
Swiss Prime Site AG (Registered) | | | 6 | | | | 629 | |
Swiss Re AG | | | 336 | | | | 30,337 | |
Swisscom AG (Registered) | | | 2 | | | | 1,180 | |
Temenos AG (Registered) | | | 55 | | | | 8,886 | |
UBS Group AG (Registered) | | | 4,082 | | | | 62,530 | |
Vifor Pharma AG | | | 166 | | | | 21,496 | |
Zurich Insurance Group AG | | | 168 | | | | 67,296 | |
| | | | | | | | |
| | |
| | | | | | | 2,907,575 | |
| | | | | | | | |
Taiwan — 0.5% | | | | | | | | |
Accton Technology Corp. | | | 25 | | | | 296 | |
Acer, Inc. | | | 159 | | | | 167 | |
Advantech Co. Ltd. | | | 16 | | | | 198 | |
ASE Technology Holding Co. Ltd. | | | 160 | | | | 642 | |
Asia Cement Corp. | | | 95 | | | | 173 | |
ASMedia Technology, Inc. | | | 1 | | | | 48 | |
Asustek Computer, Inc. (a) | | | 34 | | | | 453 | |
AU Optronics Corp. | | | 379 | | | | 306 | |
Catcher Technology Co. Ltd. | | | 29 | | | | 189 | |
Cathay Financial Holding Co. Ltd. | | | 331 | | | | 640 | |
Chailease Holding Co. Ltd. (a) | | | 51 | | | | 370 | |
Chang Hwa Commercial Bank Ltd. | | | 285 | | | | 165 | |
Cheng Shin Rubber Industry Co. Ltd. | | | 72 | | | | 121 | |
China Development Financial Holding Corp. | | | 688 | | | | 324 | |
China Life Insurance Co. Ltd. | | | 112 | | | | 106 | |
China Steel Corp. | | | 554 | | | | 787 | |
Chunghwa Telecom Co. Ltd. | | | 189 | | | | 771 | |
Compal Electronics, Inc. | | | 213 | | | | 171 | |
CTBC Financial Holding Co. Ltd. | | | 885 | | | | 721 | |
Delta Electronics, Inc. | | | 89 | | | | 967 | |
E.Sun Financial Holding Co. Ltd. | | | 571 | | | | 539 | |
Eclat Textile Co. Ltd. | | | 9 | | | | 212 | |
Evergreen Marine Corp. Taiwan Ltd. (a) | | | 124 | | | | 876 | |
Far Eastern New Century Corp. | | | 126 | | | | 145 | |
Far EasTone Telecommunications Co. Ltd. | | | 72 | | | | 167 | |
Feng TAY Enterprise Co. Ltd. | | | 22 | | | | 193 | |
First Financial Holding Co. Ltd. | | | 501 | | | | 408 | |
Formosa Chemicals & Fibre Corp. | | | 164 | | | | 498 | |
Formosa Petrochemical Corp. (a) | | | 44 | | | | 168 | |
Formosa Plastics Corp. | | | 175 | | | | 647 | |
Foxconn Technology Co. Ltd. | | | 46 | | | | 108 | |
Fubon Financial Holding Co. Ltd. | | | 313 | | | | 830 | |
Giant Manufacturing Co. Ltd. | | | 15 | | | | 171 | |
Globalwafers Co. Ltd. | | | 10 | | | | 330 | |
Hiwin Technologies Corp. | | | 14 | | | | 198 | |
Hon Hai Precision Industry Co. Ltd. | | | 590 | | | | 2,369 | |
Hotai Motor Co. Ltd. | | | 13 | | | | 286 | |
Hua Nan Financial Holdings Co. Ltd. | | | 431 | | | | 285 | |
| | | | | | | | |
| SECURITY DESCRIPTION | |
SHARES | | | VALUE($) | |
| | | | | | | | |
Taiwan — continued | | | | | | | | |
Innolux Corp. (a) | | | 413 | | | | 307 | |
Inventec Corp. | | | 140 | | | | 132 | |
Largan Precision Co. Ltd. | | | 5 | | | | 556 | |
Lite-On Technology Corp., ADR | | | 85 | | | | 176 | |
MediaTek, Inc. | | | 72 | | | | 2,483 | |
Mega Financial Holding Co. Ltd. | | | 526 | | | | 620 | |
Micro-Star International Co. Ltd. | | | 29 | | | | 164 | |
Nan Ya Plastics Corp. | | | 244 | | | | 728 | |
Nan Ya Printed Circuit Board Corp. (a) | | | 9 | | | | 126 | |
Nanya Technology Corp. | | | 54 | | | | 154 | |
Nien Made Enterprise Co. Ltd. | | | 6 | | | | 89 | |
Novatek Microelectronics Corp. | | | 27 | | | | 483 | |
Oneness Biotech Co. Ltd. (a) | | | 8 | | | | 67 | |
Pegatron Corp. | | | 93 | | | | 230 | |
Phison Electronics Corp. | | | 7 | | | | 120 | |
Pou Chen Corp. | | | 141 | | | | 199 | |
Powertech Technology, Inc. | | | 31 | | | | 120 | |
President Chain Store Corp. | | | 30 | | | | 283 | |
Quanta Computer, Inc. | | | 134 | | | | 421 | |
Realtek Semiconductor Corp. | | | 21 | | | | 380 | |
Ruentex Development Co. Ltd. | | | 40 | | | | 81 | |
Shanghai Commercial & Savings Bank Ltd. (The) | | | 160 | | | | 260 | |
Shin Kong Financial Holding Co. Ltd. | | | 462 | | | | 158 | |
SinoPac Financial Holdings Co. Ltd. (a) | | | 484 | | | | 239 | |
Synnex Technology International Corp. | | | 76 | | | | 139 | |
Taishin Financial Holding Co. Ltd. | | | 507 | | | | 277 | |
Taiwan Business Bank | | | 402 | | | | 136 | |
Taiwan Cement Corp. | | | 220 | | | | 403 | |
Taiwan Cooperative Financial Holding Co. Ltd. | | | 455 | | | | 347 | |
Taiwan High Speed Rail Corp. | | | 86 | | | | 92 | |
Taiwan Mobile Co. Ltd. | | | 81 | | | | 297 | |
Taiwan Semiconductor Manufacturing Co. Ltd. | | | 1,164 | | | | 25,070 | |
Unimicron Technology Corp. | | | 52 | | | | 240 | |
Uni-President Enterprises Corp. | | | 223 | | | | 586 | |
United Microelectronics Corp. | | | 559 | | | | 1,060 | |
Vanguard International Semiconductor Corp. | | | 49 | | | | 208 | |
Walsin Technology Corp. | | | 15 | | | | 122 | |
Wan Hai Lines Ltd. | | | 27 | | | | 311 | |
Win Semiconductors Corp. | | | 15 | | | | 202 | |
Winbond Electronics Corp. | | | 129 | | | | 161 | |
Wistron Corp. | | | 118 | | | | 131 | |
Wiwynn Corp. | | | 4 | | | | 143 | |
WPG Holdings Ltd. | | | 107 | | | | 196 | |
Yageo Corp. (a) (bb) (cc) | | | 17 | | | | 339 | |
Yang Ming Marine Transport Corp. (a) | | | 76 | | | | 497 | |
Yuanta Financial Holding Co. Ltd. (a) | | | 443 | | | | 427 | |
Zhen Ding Technology Holding Ltd. | | | 39 | | | | 147 | |
| | | | | | | | |
| | |
| | | | | | | 56,152 | |
| | | | | | | | |
SEE NOTES TO FINANCIAL STATEMENTS.
| | | | | | | | | | |
| | | | | |
| JUNE 30, 2021 | | SIX CIRCLES TRUST | | | | | | | | 71 |
Six Circles International Unconstrained Equity Fund
SCHEDULE OF PORTFOLIO INVESTMENTS
AS OF JUNE 30, 2021 (Unaudited) (continued)
(Amounts in U.S. Dollars, unless otherwise noted)
(Amounts in thousands, except number of Futures contracts)
| | | | | | | | |
| SECURITY DESCRIPTION | |
SHARES | | | VALUE($) | |
Common Stocks — continued | | | | | | | | |
Thailand — 0.1% | | | | | | | | |
Advanced Info Service PCL, NVDR | | | 61 | | | | 327 | |
Airports of Thailand PCL, NVDR | | | 209 | | | | 405 | |
Asset World Corp. PCL, NVDR (a) | | | 322 | | | | 44 | |
B Grimm Power PCL, NVDR | | | 36 | | | | 47 | |
Bangkok Bank PCL (Registered) | | | 29 | | | | 102 | |
Bangkok Commercial Asset Management PCL, NVDR | | | 76 | | | | 44 | |
Bangkok Dusit Medical Services PCL, NVDR | | | 392 | | | | 282 | |
Bangkok Expressway & Metro PCL, NVDR | | | 505 | | | | 129 | |
Berli Jucker PCL, NVDR | | | 48 | | | | 53 | |
BTS Group Holdings PCL, NVDR | | | 494 | | | | 144 | |
Bumrungrad Hospital PCL, NVDR | | | 26 | | | | 104 | |
Carabao Group PCL, NVDR | | | 15 | | | | 65 | |
Central Pattana PCL, NVDR | | | 95 | | | | 156 | |
Central Retail Corp. PCL, NVDR | | | 78 | | | | 81 | |
Charoen Pokphand Foods PCL, NVDR | | | 179 | | | | 148 | |
CP ALL PCL, NVDR | | | 281 | | | | 526 | |
Delta Electronics Thailand PCL, NVDR | | | 14 | | | | 245 | |
Electricity Generating PCL, NVDR | | | 17 | | | | 93 | |
Energy Absolute PCL, NVDR | | | 86 | | | | 164 | |
Global Power Synergy PCL, NVDR | | | 31 | | | | 72 | |
Gulf Energy Development PCL, NVDR | | | 141 | | | | 151 | |
Home Product Center PCL, NVDR | | | 255 | | | | 115 | |
Indorama Ventures PCL, NVDR | | | 98 | | | | 125 | |
Intouch Holdings PCL, NVDR | | | 99 | | | | 201 | |
Krung Thai Bank PCL, NVDR | | | 191 | | | | 64 | |
Krungthai Card PCL, NVDR | | | 47 | | | | 99 | |
Land & Houses PCL, NVDR | | | 343 | | | | 85 | |
Minor International PCL, NVDR (a) | | | 171 | | | | 160 | |
Muangthai Capital PCL, NVDR | | | 34 | | | | 61 | |
Osotspa PCL, NVDR | | | 30 | | | | 36 | |
PTT Exploration & Production PCL, NVDR | | | 63 | | | | 231 | |
PTT Global Chemical PCL, NVDR | | | 96 | | | | 177 | |
PTT Oil & Retail Business PCL, NVDR | | | 168 | | | | 160 | |
PTT PCL, NVDR | | | 476 | | | | 584 | |
Ratch Group PCL, NVDR | | | 37 | | | | 53 | |
SCG Packaging PCL, NVDR | | | 63 | | | | 122 | |
Siam Cement PCL (The), NVDR | | | 37 | | | | 500 | |
Siam Commercial Bank PCL (The), NVDR | | | 42 | | | | 129 | |
Sri Trang Gloves Thailand PCL, NVDR | | | 41 | | | | 53 | |
Srisawad Corp. PCL, NVDR | | | 34 | | | | 73 | |
Thai Oil PCL, NVDR | | | 44 | | | | 75 | |
Thai Union Group PCL, NVDR | | | 148 | | | | 91 | |
True Corp. PCL, NVDR | | | 494 | | | | 49 | |
| | | | | | | | |
| | |
| | | | | | | 6,625 | |
| | | | | | | | |
Turkey — 0.0% (g) | | | | | | | | |
Akbank TAS | | | 128 | | | | 77 | |
Aselsan Elektronik Sanayi Ve Ticaret AS | | | 27 | | | | 45 | |
BIM Birlesik Magazalar AS | | | 20 | | | | 145 | |
Eregli Demir ve Celik Fabrikalari TAS | | | 57 | | | | 119 | |
Ford Otomotiv Sanayi AS | | | 3 | | | | 55 | |
KOC Holding AS | | | 32 | | | | 67 | |
| | | | | | | | |
| SECURITY DESCRIPTION | |
SHARES | | | VALUE($) | |
| | | | | | | | |
Turkey — continued | | | | | | | | |
Turkcell Iletisim Hizmetleri AS | | | 50 | | | | 92 | |
Turkiye Garanti Bankasi AS | | | 94 | | | | 90 | |
Turkiye Is Bankasi AS, Class C | | | 62 | | | | 36 | |
Turkiye Petrol Rafinerileri AS (a) | | | 5 | | | | 57 | |
Turkiye Sise ve Cam Fabrikalari AS | | | 54 | | | | 47 | |
| | | | | | | | |
| | |
| | | | | | | 830 | |
| | | | | | | | |
United Arab Emirates — 0.0% (g) | | | | | | | | |
Abu Dhabi Commercial Bank PJSC | | | 155 | | | | 289 | |
Abu Dhabi Islamic Bank PJSC | | | 104 | | | | 156 | |
Abu Dhabi National Oil Co. for Distribution PJSC | | | 137 | | | | 161 | |
Aldar Properties PJSC | | | 171 | | | | 178 | |
Dubai Islamic Bank PJSC | | | 132 | | | | 173 | |
Emaar Properties PJSC | | | 160 | | | | 182 | |
Emirates NBD Bank PJSC | | | 128 | | | | 463 | |
Emirates Telecommunications Group Co. PJSC | | | 92 | | | | 549 | |
First Abu Dhabi Bank PJSC | | | 216 | | | | 982 | |
NMC Health plc (a) (bb) (cc) | | | 116 | | | | — | |
| | | | | | | | |
| | |
| | | | | | | 3,133 | |
| | | | | | | | |
United Kingdom — 17.2% | | | | | | | | |
3i Group plc | | | 1,378 | | | | 22,370 | |
Admiral Group plc | | | 274 | | | | 11,917 | |
Anglo American plc | | | 494 | | | | 19,672 | |
Ashtead Group plc | | | 476 | | | | 35,346 | |
Associated British Foods plc | | | 291 | | | | 8,945 | |
AstraZeneca plc | | | 2,614 | | | | 314,075 | |
Auto Trader Group plc (a) (e) | | | 369 | | | | 3,231 | |
AVEVA Group plc | | | 130 | | | | 6,665 | |
Aviva plc | | | 5,562 | | | | 31,224 | |
BAE Systems plc | | | 3,408 | | | | 24,623 | |
Barclays plc | | | 24,574 | | | | 58,317 | |
Barratt Developments plc | | | 387 | | | | 3,725 | |
Berkeley Group Holdings plc | | | 47 | | | | 2,994 | |
BP plc | | | 7,767 | | | | 34,062 | |
British American Tobacco plc | | | 1,787 | | | | 69,391 | |
British Land Co. plc (The) | | | 337 | | | | 2,307 | |
BT Group plc (a) | | | 3,411 | | | | 9,165 | |
Bunzl plc | | | 356 | | | | 11,767 | |
Burberry Group plc (a) | | | 154 | | | | 4,395 | |
CNH Industrial NV | | | 773 | | | | 12,829 | |
Coca-Cola Europacific Partners plc | | | 106 | | | | 6,289 | |
Compass Group plc (a) | | | 681 | | | | 14,347 | |
Croda International plc | | | 53 | | | | 5,446 | |
Diageo plc | | | 1,919 | | | | 91,956 | |
Direct Line Insurance Group plc | | | 1,943 | | | | 7,664 | |
Evraz plc | | | 192 | | | | 1,572 | |
Ferguson plc | | | 238 | | | | 33,138 | |
GlaxoSmithKline plc | | | 10,019 | | | | 196,963 | |
Halma plc | | | 429 | | | | 15,986 | |
Hargreaves Lansdown plc | | | 501 | | | | 11,021 | |
HSBC Holdings plc | | | 28,832 | | | | 166,405 | |
SEE NOTES TO FINANCIAL STATEMENTS.
| | | | | | | | | | |
| | | | | |
| 72 | | | | | | | | SIX CIRCLES TRUST | | JUNE 30, 2021 |
| | | | | | | | |
| SECURITY DESCRIPTION | |
SHARES | | | VALUE($) | |
Common Stocks — continued | | | | | | | | |
United Kingdom — continued | | | | | | | | |
Imperial Brands plc | | | 776 | | | | 16,734 | |
Informa plc (a) | | | 571 | | | | 3,966 | |
InterContinental Hotels Group plc (a) | | | 70 | | | | 4,662 | |
Intertek Group plc | | | 172 | | | | 13,126 | |
J Sainsbury plc | | | 633 | | | | 2,381 | |
JD Sports Fashion plc | | | 197 | | | | 2,512 | |
Johnson Matthey plc | | | 74 | | | | 3,140 | |
Kingfisher plc | | | 802 | | | | 4,048 | |
Land Securities Group plc | | | 269 | | | | 2,514 | |
Legal & General Group plc | | | 8,447 | | | | 30,136 | |
Lloyds Banking Group plc | | | 100,302 | | | | 64,881 | |
London Stock Exchange Group plc | | | 460 | | | | 50,790 | |
M&G plc | | | 3,666 | | | | 11,612 | |
Melrose Industries plc | | | 5,152 | | | | 11,090 | |
Mondi plc | | | 186 | | | | 4,894 | |
National Grid plc | | | 1,355 | | | | 17,233 | |
Natwest Group plc | | | 6,909 | | | | 19,445 | |
Next plc (a) | | | 51 | | | | 5,527 | |
Ocado Group plc (a) | | | 186 | | | | 5,156 | |
Pearson plc | | | 287 | | | | 3,303 | |
Persimmon plc | | | 122 | | | | 4,995 | |
Phoenix Group Holdings plc | | | 915 | | | | 8,570 | |
Prudential plc | | | 3,694 | | | | 70,277 | |
Reckitt Benckiser Group plc | | | 272 | | | | 24,039 | |
RELX plc | | | 2,045 | | | | 54,232 | |
Rentokil Initial plc | | | 1,963 | | | | 13,447 | |
Rio Tinto plc | | | 428 | | | | 35,382 | |
Rolls-Royce Holdings plc (a) | | | 8,859 | | | | 12,128 | |
Sage Group plc (The) | | | 1,237 | | | | 11,720 | |
Schroders plc | | | 177 | | | | 8,587 | |
Segro plc | | | 455 | | | | 6,886 | |
Severn Trent plc | | | 91 | | | | 3,157 | |
Smith & Nephew plc | | | 336 | | | | 7,276 | |
Smiths Group plc | | | 419 | | | | 9,224 | |
Spirax-Sarco Engineering plc | | | 78 | | | | 14,704 | |
SSE plc | | | 398 | | | | 8,267 | |
St James’s Place plc | | | 762 | | | | 15,575 | |
Standard Chartered plc | | | 3,798 | | | | 24,238 | |
Standard Life Aberdeen plc | | | 3,075 | | | | 11,536 | |
Taylor Wimpey plc | | | 1,392 | | | | 3,063 | |
Tesco plc | | | 2,951 | | | | 9,118 | |
Unilever plc | | | 1,004 | | | | 58,648 | |
United Utilities Group plc | | | 260 | | | | 3,504 | |
Vodafone Group plc | | | 10,244 | | | | 17,169 | |
Whitbread plc (a) | | | 77 | | | | 3,324 | |
Wm Morrison Supermarkets plc | | | 924 | | | | 3,155 | |
WPP plc | | | 468 | | | | 6,323 | |
| | | | | | | | |
| | |
| | | | | | | 1,963,501 | |
| | | | | | | | |
Uruguay — 0.0% (g) | | | | | | | | |
Globant SA (a) | | | 2 | | | | 401 | |
| | | | | | | | |
Total Common Stocks (Cost $9,566,155) | | | | | | | 10,976,113 | |
| | | | | | | | |
| | | | | | | | |
| SECURITY DESCRIPTION | |
SHARES | | | VALUE($) | |
Preferred Stocks — 1.8% | | | | | | | | |
Brazil — 0.1% | | | | | | | | |
Alpargatas SA (a) | | | 10 | | | | 97 | |
Banco Bradesco SA | | | 230 | | | | 1,190 | |
Bradespar SA | | | 10 | | | | 154 | |
Braskem SA, Class A (a) | | | 9 | | | | 105 | |
Centrais Eletricas Brasileiras SA | | | 10 | | | | 89 | |
Cia Energetica de Minas Gerais | | | 43 | | | | 104 | |
Cia Paranaense de Energia | | | 51 | | | | 61 | |
Gerdau SA | | | 58 | | | | 345 | |
Itau Unibanco Holding SA | | | 221 | | | | 1,323 | |
Itausa SA | | | 214 | | | | 480 | |
Lojas Americanas SA | | | 39 | | | | 168 | |
Petroleo Brasileiro SA | | | 216 | | | | 1,281 | |
| | | | | | | | |
| | |
| | | | | | | 5,397 | |
| | | | | | | | |
Chile — 0.0% (g) | | | | | | | | |
Sociedad Quimica y Minera de Chile SA, Class B | | | 6 | | | | 293 | |
| | | | | | | | |
Colombia — 0.0% (g) | | | | | | | | |
Bancolombia SA | | | 22 | | | | 158 | |
| | | | | | | | |
Germany — 1.0% | | | | | | | | |
Bayerische Motoren Werke AG | | | 101 | | | | 9,053 | |
FUCHS PETROLUB SE | | | 5 | | | | 263 | |
Henkel AG & Co. KGaA | | | 14 | | | | 1,501 | |
Porsche Automobil Holding SE | | | 269 | | | | 28,853 | |
Sartorius AG | | | 2 | | | | 1,088 | |
Volkswagen AG | | | 326 | | | | 81,677 | |
| | | | | | | | |
| | |
| | | | | | | 122,435 | |
| | | | | | | | |
Russia — 0.0% (g) | | | | | | | | |
Surgutneftegas PJSC | | | 300 | | | | 190 | |
| | | | | | | | |
South Korea — 0.7% | | | | | | | | |
Hyundai Motor Co. | | | 3 | | | | 301 | |
LG Chem Ltd. | | | — | (h) | | | 143 | |
LG Household & Health Care Ltd. | | | — | (h) | | | 58 | |
Samsung Electronics Co. Ltd. | | | 1,253 | | | | 81,986 | |
| | | | | | | | |
| | |
| | | | | | | 82,488 | |
| | | | | | | | |
Total Preferred Stocks
(Cost $159,381) | | | | | | | 210,961 | |
| | | | | | | | |
| | |
| | | NUMBER OF
RIGHTS | | | | |
Rights — 0.0% (g) | | | | | | | | |
Brazil — 0.0% (g) | | | | | | | | |
Ultrapar Participacoes SA, expiring 09/28/2021 (a) (bb) (cc) | | | 50 | | | | — | |
| | | | | | | | |
Spain — 0.0% (g) | | | | | | | | |
ACS Actividades de Construccion y Servicios SA, expiring 07/23/2021 (a) | | | 179 | | | | 251 | |
| | | | | | | | |
Total Rights
(Cost $271) | | | | | | | 251 | |
| | | | | | | | |
SEE NOTES TO FINANCIAL STATEMENTS.
| | | | | | | | | | |
| | | | | |
| JUNE 30, 2021 | | SIX CIRCLES TRUST | | | | | | | | 73 |
Six Circles International Unconstrained Equity Fund
SCHEDULE OF PORTFOLIO INVESTMENTS
AS OF JUNE 30, 2021 (Unaudited) (continued)
(Amounts in U.S. Dollars, unless otherwise noted)
(Amounts in thousands, except number of Futures contracts)
| | | | | | | | |
| SECURITY DESCRIPTION | | PRINCIPAL
AMOUNT($) | | | VALUE($) | |
Short-Term Investments — 1.9% | | | | | | | | |
Time Deposits — 1.9% | | | | | | | | |
Barclays SA, 0.01%, 07/01/2021 | | | 3,971 | | | | 3,971 | |
BNP Paribas SA, | | | | | | | | |
(1.83%), 07/01/2021 | | CHF | 27,882 | | | | 30,135 | |
(0.78%), 07/01/2021 | | EUR | 78,159 | | | | 92,677 | |
(0.61%), 07/01/2021 | | SEK | 61,836 | | | | 7,225 | |
(0.48%), 07/01/2021 | | DKK | 33,426 | | | | 5,330 | |
0.01%, 07/01/2021 | | | 4,601 | | | | 4,601 | |
Brown Brothers Harriman, | | | | | | | | |
(1.83%), 07/01/2021 | | CHF | — | (h) | | | — | (h) |
(1.08%), 07/01/2021 | | NOK | 6,480 | | | | 753 | |
(0.78%), 07/01/2021 | | EUR | — | (h) | | | — | (h) |
(0.61%), 07/01/2021 | | SEK | — | (h) | | | — | (h) |
(0.48%), 07/01/2021 | | DKK | — | (h) | | | — | (h) |
0.00%, 07/02/2021 | | HKD | 3,211 | | | | 413 | |
0.01%, 07/01/2021 | | | — | (h) | | | — | (h) |
0.01%, 07/02/2021 | | CAD | — | (h) | | | — | (h) |
3.65%, 07/01/2021 | | ZAR | 269 | | | | 19 | |
| | | | | | | | |
| SECURITY DESCRIPTION | | PRINCIPAL
AMOUNT($) | | | VALUE($) | |
| | | | | | | | |
Time Deposits — continued | | | | | | | | |
Citibank NA, | | | | | | | | |
0.01%, 07/01/2021 | | GBP | 31,009 | | | | 42,895 | |
0.01%, 07/01/2021 | | | 16,495 | | | | 16,495 | |
Sumitomo Mitsui Trust Bank Ltd., 0.01%, 07/01/2021 | | | 9,682 | | | | 9,682 | |
| | | | | | | | |
Total Short-Term Investments
(Cost $214,196) | | | | | | | 214,196 | |
| | | | | | | | |
| | |
Total Investments — 99.6%
(Cost — $9,940,003)* | | | | | | | 11,401,523 | |
| |
Other Assets in Excess of Liabilities — 0.4% | | | | 43,384 | |
| | | | | | | | |
| | |
NET ASSETS — 100.0% | | | | | | | $11,444,907 | |
| | | | | | | | |
Percentages indicated are based on net assets.
| | | | | | | | | | | | | | | | | | | | |
| Futures contracts outstanding as of June 30, 2021: | |
| Exchange Traded | |
| DESCRIPTION | | NUMBER OF
CONTRACTS | | | EXPIRATION
DATE | | | TRADING
CURRENCY | | | NOTIONAL
AMOUNT($) | | | VALUE AND
UNREALIZED
APPRECIATION
(DEPRECIATION)($) | |
Long Contracts | | | | | | | | | | | | | | | | | | | | |
Euro STOXX 50 Index | | | 2,127 | | | | 09/2021 | | | | EUR | | | | 103,868 | | | | (1,585 | ) |
FTSE 100 Index | | | 642 | | | | 09/2021 | | | | GBP | | | | 62,896 | | | | (904 | ) |
MSCI Emerging Markets Index | | | 91 | | | | 09/2021 | | | | USD | | | | 6,225 | | | | (15 | ) |
| | | | | | | | | | | | | | | | | | | | |
Total unrealized appreciation (depreciation) | | | | | | | | | | | | (2,504 | ) |
| | | | | | | | | | | | | | | | | | | | |
NOTES TO SCHEDULE OF PORTFOLIO INVESTMENTS
| | |
| ADR | | — American Depositary Receipt |
| CVA | | — Dutch Certification |
| GDR | | — Global Depositary Receipt |
| NVDR | | — Non-Voting Depository Receipts |
| (a) | | — Non-income producing security. |
| (e) | | — Security is exempt from registration under Rule 144A of the Securities Act of 1933, as amended. Unless otherwise indicated, this security has been determined to be liquid under procedures established by the Board of Trustees and may be resold in transactions exempt from registration, normally to qualified institutional buyers. |
| (g) | | — Amount rounds to less than 0.05%. |
| (h) | | — Amount rounds to less than 500 shares or principal/ $500. |
| (bb) | | — Security has been valued using significant unobservable inputs. |
| (cc) | | — Security is valued in good faith at fair value by or under the direction of the Board of Trustees. |
| | |
| * | | — The cost of securities is substantially the same for federal income tax purposes. |
| CAD | | — Canadian Dollar |
| CHF | | — Swiss Franc |
| DKK | | — Danish Krone |
| EUR | | — Euro |
| GBP | | — British Pound |
| HKD | | — Hong Kong dollar |
| INR | | — Indian Rupee |
| NOK | | — Norwegian Krone |
| SEK | | — Swedish Krona |
| USD | | — United States Dollar |
| ZAR | | — South African Rand |
SEE NOTES TO FINANCIAL STATEMENTS.
| | | | | | | | | | |
| | | | | |
| 74 | | | | | | | | SIX CIRCLES TRUST | | JUNE 30, 2021 |
Summary of Investments by Industry, June 30, 2021
The following table represents the portfolio investments of the Fund by industry classifications as a percentage of total investments:
| | | | |
| INDUSTRY | | PERCENTAGE | |
| |
Pharmaceuticals | | | 24.8 | % |
| |
Banks | | | 9.7 | % |
| |
Semiconductors | | | 9.0 | % |
| |
Electric | | | 7.5 | % |
| |
Food | | | 7.5 | % |
| |
Insurance | | | 5.6 | % |
| |
Auto Manufacturers | | | 4.4 | % |
| |
Commercial Services | | | 2.7 | % |
| |
Beverages | | | 1.8 | % |
| |
Software | | | 1.7 | % |
| |
Diversified Financial Services | | | 1.5 | % |
| |
Aerospace/Defense | | | 1.3 | % |
| |
Transportation | | | 1.3 | % |
| |
Oil & Gas | | | 1.2 | % |
| |
Electrical Components & Equipment | | | 1.2 | % |
| |
Machinery — Diversified | | | 1.2 | % |
| |
Miscellaneous Manufacturers | | | 1.1 | % |
| |
Investment Companies | | | 1.1 | % |
| |
Others (Each less than 1.0%) | | | 13.5 | % |
| |
Short-Term Investments | | | 1.9 | % |
SEE NOTES TO FINANCIAL STATEMENTS.
| | | | | | | | | | |
| | | | | |
| JUNE 30, 2021 | | SIX CIRCLES TRUST | | | | | | | | 75 |
Six Circles Global Bond Fund
SCHEDULE OF PORTFOLIO INVESTMENTS
AS OF JUNE 30, 2021 (Unaudited)
(Amounts in U.S. Dollars, unless otherwise noted)
(Amounts in thousands, except number of Futures contracts)
| | | | | | | | |
| SECURITY DESCRIPTION | | PRINCIPAL
AMOUNT($) | | | VALUE($) | |
Long Positions — 101.4% | |
Asset-Backed Securities — 1.0% | |
Adams Mill CLO Ltd., (Cayman Islands), Series 2014-1A, Class A1R, (ICE LIBOR USD 3 Month + 1.10%), 1.28%, 07/15/2026 (e) (aa) | | | 131 | | | | 131 | |
American Express Credit Account Master Trust, Series 2019-3, Class A, 2.00%, 04/15/2025 | | | 615 | | | | 628 | |
ARES L CLO Ltd., (Cayman Islands), Series 2018-50A, Class AR, (ICE LIBOR USD 3 Month + 1.05%), 0.00%, 01/15/2032 (e) (aa) | | | 3,300 | | | | 3,296 | |
Atlas Senior Loan Fund Ltd., (Cayman Islands), Series 2017-8A, Class A, (ICE LIBOR USD 3 Month + 1.15%), 1.53%, 01/16/2030 (e) (aa) | | | 5,200 | | | | 5,201 | |
BlueMountain CLO Ltd., (Cayman Islands), Series 2015-2A, Class A1R, (ICE LIBOR USD 3 Month + 0.93%), 1.12%, 07/18/2027 (e) (aa) | | | 1,738 | | | | 1,739 | |
Capital One Multi-Asset Execution Trust, | | | | | | | | |
Series 2017-A3, Class A3, 2.43%, 01/15/2025 | | | 360 | | | | 366 | |
Series 2019-A2, Class A2, 1.72%, 08/15/2024 | | | 500 | | | | 508 | |
Carlyle Global Market Strategies CLO Ltd., (Cayman Islands), Series 2015-3A, Class A1R, (ICE LIBOR USD 3 Month + 1.00%), 1.18%, 07/28/2028 (e) (aa) | | | 1,186 | | | | 1,186 | |
Carmax Auto Owner Trust, | | | | | | | | |
Series 2019-4, Class A3, 2.02%, 11/15/2024 | | | 141 | | | | 143 | |
Series 2020-1, Class A3, 1.89%, 12/16/2024 | | | 300 | | | | 306 | |
Catamaran CLO Ltd., (Cayman Islands), Series 2016-1A, Class A1R, (ICE LIBOR USD 3 Month + 1.09%), 1.28%, 01/18/2029 (e) (aa) | | | 563 | | | | 563 | |
CBAM Ltd., (Cayman Islands), Series 2017-3A, Class A, (ICE LIBOR USD 3 Month + 1.23%), 1.42%, 10/17/2029 (e) (aa) | | | 2,000 | | | | 2,000 | |
CIFC Funding Ltd., (Cayman Islands), Series 2017-4A, Class A1R, (ICE LIBOR USD 3 Month + 0.95%), 1.04%, 10/24/2030 (e) (aa) | | | 3,200 | | | | 3,200 | |
Crown City CLO II, (Cayman Islands), Series 2020-2A, Class A1A, (ICE LIBOR USD 3 Month + 1.38%), 1.63%, 01/20/2032 (e) (aa) | | | 1,000 | | | | 1,002 | |
Dryden Senior Loan Fund, (Cayman Islands), Series 2014-36A, Class AR3, (ICE LIBOR USD 3 Month + 1.02%), 1.20%, 04/15/2029 (e) (aa) | | | 6,400 | | | | 6,401 | |
| | | | | | | | |
| SECURITY DESCRIPTION | | PRINCIPAL
AMOUNT($) | | | VALUE($) | |
| | | | | | | | |
| | | | | | | | |
Dryden XXVII-R Euro CLO BV, (Netherlands), Series 2017-27A, Class AR, (ICE LIBOR EUR 3 Month + 0.66%), 0.66%, 04/15/2033 (e) (aa) | | EUR | 7,600 | | | | 8,969 | |
Ford Credit Auto Owner Trust, Series 2020-B, Class A4, 0.79%, 11/15/2025 | | | 850 | | | | 856 | |
GM Financial Consumer Automobile Receivables Trust, Series 2020-2, Class A4, 1.74%, 08/18/2025 | | | 500 | | | | 514 | |
Hyundai Auto Receivables Trust, Series 2020-A, Class A3, 1.41%, 11/15/2024 | | | 131 | | | | 133 | |
KKR CLO Ltd., (Cayman Islands), Series 18, Class A, (ICE LIBOR USD 3 Month + 1.27%), 1.46%, 07/18/2030 (e) (aa) | | | 3,200 | | | | 3,201 | |
Marathon CLO IX Ltd., (Cayman Islands), Series 2017-9A, Class A1AR, (ICE LIBOR USD 3 Month + 1.15%), 1.33%, 04/15/2029 (e) (aa) | | | 450 | | | | 450 | |
Marble Point CLO X Ltd., (Cayman Islands), Series 2017-1A, Class AR, (ICE LIBOR USD 3 Month + 1.04%), 1.22%, 10/15/2030 (e) (aa) | | | 1,800 | | | | 1,800 | |
Mercedes-Benz Auto Lease Trust, Series 2020-A, Class A4, 1.88%, 09/15/2025 | | | 1,000 | | | | 1,016 | |
Mercedes-Benz Auto Receivables Trust, Series 2019-1, Class A4, 2.04%, 01/15/2026 | | | 1,000 | | | | 1,028 | |
Mountain View CLO LLC, (Cayman Islands), Series 2017-1A, Class AR, (ICE LIBOR USD 3 Month + 1.09%), 1.27%, 10/16/2029 (e) (aa) | | | 1,800 | | | | 1,800 | |
Nissan Auto Receivables Owner Trust, Series 2020-A, Class A3, 1.38%, 12/16/2024 | | | 131 | | | | 133 | |
Oaktree CLO, (Cayman Islands), Series 2014-1A, Class A1R, (ICE LIBOR USD 3 Month + 1.29%), 1.45%, 05/13/2029 (e) (aa) | | | 1,947 | | | | 1,947 | |
OCP CLO Ltd., (Cayman Islands), Series 2017-14A, Class A1A, (ICE LIBOR USD 3 Month + 1.15%), 1.31%, 11/20/2030 (e) (aa) | | | 5,000 | | | | 5,001 | |
OZLM XIV Ltd., (Cayman Islands), Series 2015-14A, Class A1AR, (ICE LIBOR USD 3 Month + 1.16%), 1.34%, 01/15/2029 (e) (aa) | | | 2,009 | | | | 2,009 | |
Palmer Square Loan Funding Ltd., (Cayman Islands), Series 2018-5A, Class A1, (ICE LIBOR USD 3 Month + 0.85%), 1.04%, 01/20/2027 (e) (aa) | | | 266 | | | | 266 | |
Sculptor CLO XXV Ltd., (Cayman Islands), Series 25A, Class A1, (ICE LIBOR USD 3 Month + 1.27%), 1.41%, 01/15/2031 (e) (aa) | | | 1,200 | | | | 1,199 | |
SEE NOTES TO FINANCIAL STATEMENTS.
| | | | | | | | | | |
| | | | | |
| 76 | | | | | | | | SIX CIRCLES TRUST | | JUNE 30, 2021 |
| | | | | | | | |
| SECURITY DESCRIPTION | | PRINCIPAL
AMOUNT($) | | | VALUE($) | |
Asset-Backed Securities — continued | |
Sound Point CLO XII Ltd., (Cayman Islands), Series 2016-2A, Class AR2, (ICE LIBOR USD 3 Month + 1.05%), 1.24%, 10/20/2028 (e) (aa) | | | 94 | | | | 94 | |
Venture CLO Ltd., (Cayman Islands), Series 2018-33A, Class A1LR, (ICE LIBOR USD 3 Month + 1.06%), 1.24%, 07/15/2031 (e) (aa) | | | 700 | | | | 699 | |
Venture XXI CLO Ltd., (Cayman Islands), Series 2015-21A, Class AR, (ICE LIBOR USD 3 Month + 0.88%), 1.06%, 07/15/2027 (e) (aa) | | | 1,250 | | | | 1,250 | |
Vibrant Clo VI Ltd., (Cayman Islands), Series 2017-6A, Class AR, (ICE LIBOR USD 3 Month + 0.95%), 1.08%, 06/20/2029 (e) (aa) | | | 4,600 | | | | 4,594 | |
Voya CLO Ltd., (Cayman Islands), Series 2017-1A, Class A1R, (ICE LIBOR USD 3 Month + 0.95%), 1.07%, 04/17/2030 (e) (aa) | | | 5,200 | | | | 5,196 | |
World Omni Auto Receivables Trust, Series 2020-A, Class A3, 1.10%, 04/15/2025 | | | 175 | | | | 176 | |
| | | | | | | | |
Total Asset-Backed Securities
(Cost $69,180) | | | | | | | 69,001 | |
| | | | | | | | |
Certificate of Deposit — 0.0% (g) | |
Financial — 0.0% (g) | |
Banks — 0.0% (g) | | | | | | | | |
China Development Bank, (China), 3.20%, 09/23/2021
(Cost $145) | | CNH | 1,000 | | | | 155 | |
| | | | | | | | |
Collateralized Mortgage Obligations — 1.5% | |
Citigroup Mortgage Loan Trust, Inc., Series 2021-INV1, Class A3A, 2.50%, 05/25/2051 (e) (z) (bb) | | | 6,900 | | | | 7,024 | |
FHLMC REMICS, | | | | | | | | |
Series 3404, Class SA, IF, IO, (6.00% — ICE LIBOR USD 1 Month), 5.93%, 01/15/2038 (aa) | | | 1,718 | | | | 311 | |
Series 3680, Class SA, IF, IO, (5.00% — ICE LIBOR USD 1 Month), 4.93%, 06/15/2040 (aa) | | | 4,552 | | | | 540 | |
Series 4023, Class S, IF, IO, (6.25% — ICE LIBOR USD 1 Month), 6.18%, 03/15/2042 (aa) | | | 1,627 | | | | 286 | |
Series 4056, Class GS, IF, IO, (6.65% — ICE LIBOR USD 1 Month), 6.58%, 12/15/2041 (aa) | | | 965 | | | | 146 | |
Series 4134, Class PI, IO, 3.00%, 11/15/2042 | | | 634 | | | | 67 | |
Series 4165, Class TI, IO, 3.00%, 12/15/2042 | | | 770 | | | | 55 | |
| | | | | | | | |
| SECURITY DESCRIPTION | | PRINCIPAL
AMOUNT($) | | | VALUE($) | |
| | | | | | | | |
Series 4479, Class AI, IO, 3.50%, 09/15/2025 | | | 10,204 | | | | 504 | |
Series 4598, Class IK, IO, 3.50%, 03/15/2046 | | | 896 | | | | 150 | |
Series 4710, Class EI, IO, 3.50%, 11/15/2031 | | | 6,285 | | | | 567 | |
Series 4825, Class SE, IF, IO, (6.20% — ICE LIBOR USD 1 Month), 6.13%, 09/15/2048 (aa) | | | 6,801 | | | | 1,416 | |
Series 4888, Class IB, IO, 4.00%, 03/15/2047 | | | 730 | | | | 75 | |
Series 4974, Class PO, PO, Zero Coupon, 08/25/2042 | | | 12 | | | | 11 | |
Series 4990, Class MI, IO, 4.00%, 07/25/2050 | | | 6,557 | | | | 1,080 | |
Series 5003, Class AS, IF, IO, (6.10% — ICE LIBOR USD 1 Month), 6.01%, 08/25/2050 (aa) | | | 7,590 | | | | 2,045 | |
Series 5016, Class PI, IO, 3.00%, 09/25/2050 | | | 14,684 | | | | 2,098 | |
Series 5034, Class YI, IO, 4.00%, 11/25/2050 | | | 4,537 | | | | 631 | |
Series 5045, Class DI, IO, 2.50%, 11/25/2050 | | | 3,512 | | | | 270 | |
Series 5047, Class CI, IO, 2.00%, 12/25/2050 | | | 2,186 | | | | 204 | |
Series 5056, Class PI, IO, 2.50%, 12/25/2050 | | | 10,668 | | | | 942 | |
Series 5062, Class EI, IO, 2.00%, 01/25/2051 | | | 4,602 | | | | 516 | |
Series 5065, Class IG, IO, 3.00%, 01/25/2051 | | | 4,498 | | | | 620 | |
Series 5069, Class DI, IO, 3.50%, 02/25/2041 | | | 1,959 | | | | 252 | |
Series 5069, Class LI, IO, 2.50%, 02/25/2051 | | | 19,456 | | | | 2,809 | |
Series 5071, Class IN, IO, 4.00%, 08/25/2050 | | | 8,401 | | | | 1,414 | |
Series 5087, Class IL, IO, 3.00%, 03/25/2051 | | | 3,108 | | | | 470 | |
FHLMC STRIPs, Series 365, Class C2, IO, 4.00%, 06/15/2049 | | | 6,839 | | | | 1,010 | |
FNMA Interest STRIP, | | | | | | | | |
Series 379, Class S56, IF, IO, (7.90% — ICE LIBOR USD 1 Month), 7.81%, 05/25/2037 (aa) | | | 612 | | | | 134 | |
Series 406, Class 23, IO, 6.00%, 11/25/2040 (z) | | | 222 | | | | 52 | |
FNMA REMICS, | | | | | | | | |
Series 2012-53, Class IO, IO, 3.50%, 05/25/2027 | | | 1,786 | | | | 75 | |
Series 2012-98, Class JI, IO, 3.00%, 04/25/2027 | | | 3,671 | | | | 144 | |
SEE NOTES TO FINANCIAL STATEMENTS.
| | | | | | | | | | |
| | | | | |
| JUNE 30, 2021 | | SIX CIRCLES TRUST | | | | | | | | 77 |
Six Circles Global Bond Fund
SCHEDULE OF PORTFOLIO INVESTMENTS
AS OF JUNE 30, 2021 (Unaudited) (continued)
(Amounts in U.S. Dollars, unless otherwise noted)
(Amounts in thousands, except number of Futures contracts)
| | | | | | | | |
| SECURITY DESCRIPTION | | PRINCIPAL
AMOUNT($) | | | VALUE($) | |
Collateralized Mortgage Obligations — continued | |
Series 2012-135, Class SB, IF, IO, (6.10% — ICE LIBOR USD 1 Month), 6.01%, 12/25/2042 (aa) | | | 1,538 | | | | 270 | |
Series 2013-109, Class BO, PO, Zero Coupon, 07/25/2043 | | | 676 | | | | 628 | |
Series 2014-34, Class US, IF, (8.60% — ICE LIBOR USD 1 Month), 8.42%, 06/25/2044 (aa) | | | 76 | | | | 83 | |
Series 2016-26, Class SY, IF, (7.03% — ICE LIBOR USD 1 Month), 6.82%, 11/25/2042 (aa) | | | 707 | | | | 725 | |
Series 2016-63, Class AS, IF, IO, (6.00% — ICE LIBOR USD 1 Month), 5.91%, 09/25/2046 (aa) | | | 1,457 | | | | 325 | |
Series 2018-67, Class SH, IF, IO, (6.20% — ICE LIBOR USD 1 Month), 6.11%, 09/25/2048 (aa) | | | 5,157 | | | | 1,094 | |
Series 2019-48, Class IB, IO, 0.68%, 06/25/2039 (z) | | | 29,938 | | | | 832 | |
Series 2019-68, Class US, IF, IO, (6.00% — ICE LIBOR USD 1 Month), 5.91%, 11/25/2049 (aa) | | | 9,434 | | | | 1,806 | |
Series 2019-78, Class DI, IO, 4.50%, 11/25/2049 | | | 1,167 | | | | 123 | |
Series 2020-42, Class CI, IO, 3.00%, 06/25/2050 | | | 15,992 | | | | 2,509 | |
Series 2020-60, Class BI, IO, 3.50%, 09/25/2050 | | | 15,960 | | | | 2,202 | |
Series 2020-68, Class CI, IO, 3.00%, 10/25/2050 | | | 12,222 | | | | 1,562 | |
Series 2020-86, Class PI, IO, 2.50%, 12/25/2050 | | | 3,946 | | | | 392 | |
Series 2020-89, Class IM, IO, 2.00%, 12/25/2050 | | | 11,874 | | | | 1,331 | |
Series 2020-89, Class LI, IO, 3.00%, 12/25/2050 | | | 15,428 | | | | 2,510 | |
Series 2020-93, Class JI, IO, 2.50%, 01/25/2051 | | | 4,160 | | | | 561 | |
Series 2020-99, Class IQ, IO, 3.00%, 01/25/2051 | | | 1,264 | | | | 171 | |
GNMA, | | | | | | | | |
Series 2015-H03, Class FA, (ICE LIBOR USD 1 Month + 0.50%), 0.61%, 12/20/2064 (aa) | | | 115 | | | | 115 | |
Series 2015-H33, Class FA, (ICE LIBOR USD 1 Month + 0.66%), 0.77%, 12/20/2065 (aa) | | | 9,602 | | | | 9,724 | |
Series 2019-H08, Class FE, (ICE LIBOR USD 1 Month + 0.65%), 0.76%, 01/20/2069 (aa) | | | 6,172 | | | | 6,299 | |
Series 2019-H16, Class FD, (ICE LIBOR USD 1 Month + 0.80%), 0.91%, 10/20/2069 (aa) | | | 3,695 | | | | 3,804 | |
| | | | | | | | |
| SECURITY DESCRIPTION | | PRINCIPAL
AMOUNT($) | | | VALUE($) | |
| | | | | | | | |
Series 2020-142, Class MT, IF, IO, (6.15% — ICE LIBOR USD 1 Month), 0.05%, 07/20/2047 (aa) | | | 20,975 | | | | 35 | |
Series 2020-142, Class TN, IF, IO, (6.20% — ICE LIBOR USD 1 Month), 0.10%, 09/20/2047 (aa) | | | 31,336 | | | | 105 | |
Series 2020-H14, Class FH, (ICE LIBOR USD 1 Month + 1.25%), 1.34%, 08/20/2070 (aa) | | | 10,031 | | | | 10,642 | |
Series 2020-H15, Class FH, (ICE LIBOR USD 1 Month + 1.05%), 1.14%, 07/20/2070 (aa) | | | 4,707 | | | | 4,913 | |
Series 2020-H15, Class FK, (ICE LIBOR USD 1 Month + 1.25%), 1.34%, 04/20/2070 (aa) | | | 8,000 | | | | 8,439 | |
Series 2020-H16, Class FN, (ICE LIBOR USD 1 Month + 1.25%), 1.34%, 09/20/2070 (aa) | | | 2,935 | | | | 3,111 | |
Series 2021-83, Class PU, 1.50%, 05/20/2051 | | | 6,839 | | | | 6,765 | |
IMS ECUADORIAN MORTGAGE TRUST, Series 2021-1, Class GA, 3.40%, 08/18/2043 (e) (bb) | | | 2,300 | | | | 2,386 | |
MFA Trust, Series 2020-NQM2, Class A1, 1.38%, 04/25/2065 (e) (z) | | | 10,425 | | | | 10,466 | |
| | | | | | | | |
Total Collateralized Mortgage Obligations
(Cost $111,675) | | | | | | | 109,846 | |
| | | | | | | | |
Commercial Mortgage-Backed Securities — 0.6% | |
Banc of America Commercial Mortgage Trust, Series 2015-UBS7, Class ASB, 3.43%, 09/15/2048 | | | 537 | | | | 569 | |
BANK, | | | | | | | | |
Series 2017-BNK7, Class AS, 3.75%, 09/15/2060 | | | 750 | | | | 828 | |
Series 2018-BN13, Class A5, 4.22%, 08/15/2061 (z) | | | 500 | | | | 577 | |
Barclays Commercial Mortgage Trust, | | | | | | | | |
Series 2019-C5, Class A4, 3.06%, 11/15/2052 | | | 1,000 | | | | 1,085 | |
Series 2019-C5, Class ASB, 2.99%, 11/15/2052 | | | 500 | | | | 540 | |
BBCMS Mortgage Trust, | | | | | | | | |
Series 2020-C6, Class ASB, 2.60%, 02/15/2053 | | | 600 | | | | 637 | |
Series 2020-C7, Class A5, 2.04%, 04/15/2053 | | | 210 | | | | 212 | |
Benchmark Mortgage Trust, | | | | | | | | |
Series 2020-B16, Class AM, 2.94%, 02/15/2053 (z) | | | 350 | | | | 371 | |
Series 2020-B17, Class A5, 2.29%, 03/15/2053 | | | 500 | | | | 513 | |
Series 2020-B20, Class A5, 2.03%, 10/15/2053 | | | 750 | | | | 751 | |
SEE NOTES TO FINANCIAL STATEMENTS.
| | | | | | | | | | |
| | | | | |
| 78 | | | | | | | | SIX CIRCLES TRUST | | JUNE 30, 2021 |
| | | | | | | | |
| SECURITY DESCRIPTION | | PRINCIPAL
AMOUNT($) | | | VALUE($) | |
Commercial Mortgage-Backed Securities — continued | |
Beneria Cowen & Pritzer Collateral Funding Corp., Series 2021-330N, Class A, (ICE LIBOR USD 1 Month + 0.80%), 0.90%, 06/15/2038 (e) (aa) | | | 2,800 | | | | 2,792 | |
CD Mortgage Trust, Series 2017-CD5, Class AAB, 3.22%, 08/15/2050 | | | 1,000 | | | | 1,072 | |
Citigroup Commercial Mortgage Trust, | | | | | | | | |
Series 2014-GC23, Class AS, 3.86%, 07/10/2047 | | | 250 | | | | 269 | |
Series 2014-GC25, Class A4, 3.64%, 10/10/2047 | | | 500 | | | | 541 | |
Series 2015-GC33, Class AS, 4.11%, 09/10/2058 | | | 500 | | | | 546 | |
Series 2019-GC41, Class AS, 3.02%, 08/10/2056 | | | 250 | | | | 267 | |
COMM Mortgage Trust, Series 2016-CR28, Class ASB, 3.53%, 02/10/2049 | | | 442 | | | | 468 | |
CSAIL Commercial Mortgage Trust, Series 2016-C7, Class ASB, 3.31%, 11/15/2049 | | | 375 | | | | 397 | |
CSMC, Series 2020-FACT, Class A, (ICE LIBOR USD 1 Month + 1.35%), 1.42%, 10/15/2037 (e) (aa) | | | 2,100 | | | | 2,108 | |
FHLMC Multifamily Structured Pass Through Certificates, | | | | | | | | |
Series K027, Class A2, 2.64%, 01/25/2023 | | | 805 | | | | 830 | |
Series K047, Class A2, 3.33%, 05/25/2025 (z) | | | 1,000 | | | | 1,089 | |
Series K049, Class A2, 3.01%, 07/25/2025 | | | 250 | | | | 270 | |
Series K057, Class A2, 2.57%, 07/25/2026 | | | 850 | | | | 909 | |
Series K063, Class A2, 3.43%, 01/25/2027 (z) | | | 1,000 | | | | 1,116 | |
Series K071, Class A2, 3.29%, 11/25/2027 | | | 500 | | | | 559 | |
Series K073, Class A2, 3.35%, 01/25/2028 | | | 1,000 | | | | 1,124 | |
Series K075, Class A2, 3.65%, 02/25/2028 (z) | | | 500 | | | | 572 | |
Series K094, Class A2, 2.90%, 06/25/2029 | | | 112 | | | | 124 | |
Series K103, Class A2, 2.65%, 11/25/2029 | | | 500 | | | | 546 | |
Series K108, Class A2, 1.52%, 03/25/2030 | | | 304 | | | | 305 | |
Series K117, Class A2, 1.41%, 08/25/2030 | | | 1,500 | | | | 1,487 | |
Series K118, Class A2, 1.49%, 09/25/2030 | | | 500 | | | | 500 | |
Series K725, Class A2, 3.00%, 01/25/2024 | | | 225 | | | | 238 | |
Series K726, Class A2, 2.91%, 04/25/2024 | | | 899 | | | | 944 | |
| | | | | | | | |
| SECURITY DESCRIPTION | | PRINCIPAL
AMOUNT($) | | | VALUE($) | |
| | | | | | | | |
Series K729, Class A2, 3.14%, 10/25/2024 | | | 200 | | | | 214 | |
Series K737, Class A2, 2.53%, 10/25/2026 | | | 650 | | | | 697 | |
FNMA-ACES, | | | | | | | | |
Series 2015-M10, Class A2, 3.09%, 04/25/2027 (z) | | | 672 | | | | 737 | |
Series 2016-M5, Class A2, 2.47%, 04/25/2026 | | | 500 | | | | 532 | |
Series 2017-M11, Class A2, 2.98%, 08/25/2029 | | | 1,000 | | | | 1,111 | |
Series 2017-M12, Class A2, 3.18%, 06/25/2027 (z) | | | 135 | | | | 149 | |
Series 2017-M13, Class A2, 3.02%, 09/25/2027 (z) | | | 597 | | | | 654 | |
Series 2020-M46, Class A2, 1.32%, 05/25/2030 | | | 1,000 | | | | 991 | |
GS Mortgage Securities Trust, | | | | | | | | |
Series 2013-GC12, Class AS, 3.38%, 06/10/2046 | | | 400 | | | | 416 | |
Series 2019-GSA1, Class A4, 3.05%, 11/10/2052 | | | 250 | | | | 270 | |
Morgan Stanley Bank of America Merrill Lynch Trust, | | | | | | | | |
Series 2012-C5, Class A4, 3.18%, 08/15/2045 | | | 1,000 | | | | 1,017 | |
Series 2016-C29, Class A4, 3.33%, 05/15/2049 | | | 500 | | | | 539 | |
Series 2016-C31, Class A5, 3.10%, 11/15/2049 | | | 500 | | | | 540 | |
Series 2016-C32, Class A4, 3.72%, 12/15/2049 | | | 1,000 | | | | 1,113 | |
UBS Commercial Mortgage Trust, | | | | | | | | |
Series 2018-C11, Class ASB, 4.12%, 06/15/2051 | | | 687 | | | | 766 | |
Series 2018-C12, Class A5, 4.30%, 08/15/2051 | | | 1,380 | | | | 1,592 | |
UBS-Barclays Commercial Mortgage Trust, | | | | | | | | |
Series 2012-C2, Class A4, 3.53%, 05/10/2063 | | | 200 | | | | 204 | |
Series 2012-C4, Class A5, 2.85%, 12/10/2045 | | | 500 | | | | 512 | |
Series 2013-C5, Class A4, 3.18%, 03/10/2046 | | | 415 | | | | 428 | |
Series 2013-C6, Class A4, 3.24%, 04/10/2046 | | | 400 | | | | 414 | |
Wells Fargo Commercial Mortgage Trust, | | | | | | | | |
Series 2014-LC18, Class A5, 3.41%, 12/15/2047 | | | 420 | | | | 452 | |
Series 2015-C27, Class A5, 3.45%, 02/15/2048 | | | 918 | | | | 992 | |
Series 2015-LC20, Class A5, 3.18%, 04/15/2050 | | | 500 | | | | 537 | |
Series 2017-C39, Class A5, 3.42%, 09/15/2050 | | | 1,000 | | | | 1,101 | |
SEE NOTES TO FINANCIAL STATEMENTS.
| | | | | | | | | | |
| | | | | |
| JUNE 30, 2021 | | SIX CIRCLES TRUST | | | | | | | | 79 |
Six Circles Global Bond Fund
SCHEDULE OF PORTFOLIO INVESTMENTS
AS OF JUNE 30, 2021 (Unaudited) (continued)
(Amounts in U.S. Dollars, unless otherwise noted)
(Amounts in thousands, except number of Futures contracts)
| | | | | | | | |
| SECURITY DESCRIPTION | | PRINCIPAL
AMOUNT($) | | | VALUE($) | |
Commercial Mortgage-Backed Securities — continued | |
Series 2017-C40, Class A4, 3.58%, 10/15/2050 | | | 550 | | | | 609 | |
WFRBS Commercial Mortgage Trust, | | | | | | | | |
Series 2013-C12, Class A4, 3.20%, 03/15/2048 | | | 390 | | | | 401 | |
Series 2014-C20, Class ASB, 3.64%, 05/15/2047 | | | 890 | | | | 927 | |
| | | | | | | | |
Total Commercial Mortgage-Backed Securities
(Cost $43,416) | | | | | | | 43,071 | |
| | | | | | | | |
Corporate Bonds — 19.3% | |
Basic Materials — 0.6% | |
Chemicals — 0.4% | | | | | | | | |
Air Liquide Finance SA, (France), | |
Reg. S, 0.63%, 06/20/2030 | | EUR | 400 | | | | 490 | |
Reg. S, 0.75%, 06/13/2024 | | EUR | 600 | | | | 731 | |
Air Products and Chemicals, Inc., | | | | | | | | |
1.00%, 02/12/2025 | | EUR | 1,550 | | | | 1,914 | |
2.80%, 05/15/2050 | | | 15 | | | | 15 | |
Albemarle New Holding GmbH, (Germany), Reg. S, 1.63%, 11/25/2028 | | EUR | 1,000 | | | | 1,269 | |
Argentum Netherlands BV for Givaudan SA, (Netherlands), | | | | | | | | |
Reg. S, 1.13%, 09/17/2025 | | EUR | 800 | | | | 994 | |
Reg. S, 2.00%, 09/17/2030 | | EUR | 2,200 | | | | 2,978 | |
Cabot Corp., 4.00%, 07/01/2029 | | | 50 | | | | 54 | |
Celanese US Holdings LLC, 2.13%, 03/01/2027 | | EUR | 900 | | | | 1,156 | |
CF Industries, Inc., 4.50%, 12/01/2026 (e) | | | 1,800 | | | | 2,067 | |
Covestro AG, (Germany), | | | | | | | | |
Reg. S, 0.88%, 02/03/2026 | | EUR | 1,875 | | | | 2,295 | |
Reg. S, 1.38%, 06/12/2030 | | EUR | 775 | | | | 977 | |
Dow Chemical Co. (The), | | | | | | | | |
4.55%, 11/30/2025 | | | 1,800 | | | | 2,050 | |
5.25%, 11/15/2041 | | | 600 | | | | 781 | |
Eastman Chemical Co., | | | | | | | | |
1.50%, 05/26/2023 | | EUR | 900 | | | | 1,095 | |
3.60%, 08/15/2022 | | | 2,900 | | | | 2,980 | |
Ecolab, Inc., 1.00%, 01/15/2024 | | EUR | 1,950 | | | | 2,372 | |
FMC Corp., 4.50%, 10/01/2049 | | | 25 | | | | 30 | |
Givaudan Finance Europe BV, (Netherlands), Reg. S, 1.00%, 04/22/2027 | | EUR | 100 | | | | 125 | |
Huntsman International LLC, 4.50%, 05/01/2029 | | | 248 | | | | 282 | |
Linde Finance BV, (Netherlands), | | | | | | | | |
Reg. S, 0.55%, 05/19/2032 | | EUR | 400 | | | | 481 | |
Reg. S, 1.88%, 05/22/2024 | | EUR | 425 | | | | 535 | |
LYB International Finance BV, (Netherlands), 4.88%, 03/15/2044 | | | 550 | | | | 685 | |
LYB International Finance III LLC, 4.20%, 10/15/2049 | | | 600 | | | | 682 | |
Mosaic Co. (The), 4.25%, 11/15/2023 | | | 45 | | | | 48 | |
PPG Industries, Inc., | | | | | | | | |
1.20%, 03/15/2026 | | | 45 | | | | 45 | |
2.55%, 06/15/2030 | | | 140 | | | | 145 | |
RPM International, Inc., 4.55%, 03/01/2029 | | | 60 | | | | 69 | |
| | | | | | | | |
| SECURITY DESCRIPTION | | PRINCIPAL
AMOUNT($) | | | VALUE($) | |
| | | | | | | | |
Chemicals — continued | | | | | | | | |
Sherwin-Williams Co. (The), | | | | | | | | |
3.13%, 06/01/2024 | | | 100 | | | | 107 | |
3.30%, 05/15/2050 | | | 70 | | | | 74 | |
3.45%, 08/01/2025 | | | 90 | | | | 98 | |
3.80%, 08/15/2049 | | | 90 | | | | 104 | |
4.50%, 06/01/2047 | | | 50 | | | | 63 | |
Westlake Chemical Corp., | | | | | | | | |
1.63%, 07/17/2029 | | EUR | 500 | | | | 620 | |
4.38%, 11/15/2047 | | | 40 | | | | 47 | |
5.00%, 08/15/2046 | | | 20 | | | | 25 | |
Yara International ASA, (Norway), 3.15%, 06/04/2030 (e) | | | 1,000 | | | | 1,071 | |
| | | | | | | | |
| | |
| | | | | | | 29,554 | |
| | | | | | | | |
Iron/Steel — 0.0% (g) | |
Reliance Steel & Aluminum Co., | | | | | | | | |
1.30%, 08/15/2025 | | | 20 | | | | 20 | |
2.15%, 08/15/2030 | | | 235 | | | | 232 | |
Steel Dynamics, Inc., 3.25%, 01/15/2031 | | | 2,100 | | | | 2,255 | |
Vale Overseas Ltd., (Cayman Islands), | | | | | | | | |
6.88%, 11/21/2036 | | | 90 | | | | 124 | |
6.88%, 11/10/2039 | | �� | 161 | | | | 224 | |
Vale SA, (Brazil), 5.63%, 09/11/2042 | | | 204 | | | | 255 | |
| | | | | | | | |
| | |
| | | | | | | 3,110 | |
| | | | | | | | |
Mining — 0.2% | |
Anglo American Capital plc, (United Kingdom), | | | | | | | | |
Reg. S, 1.63%, 03/11/2026 | | EUR | 500 | | | | 628 | |
Reg. S, 3.38%, 03/11/2029 | | GBP | 1,350 | | | | 2,042 | |
Barrick PD Australia Finance Pty Ltd., (Australia), 5.95%, 10/15/2039 | | | 920 | | | | 1,274 | |
BHP Billiton Finance Ltd., (Australia), Series 17, Reg. S, 1.50%, 04/29/2030 | | EUR | 775 | | | | 1,005 | |
Glencore Capital Finance DAC, (Ireland), Reg. S, 1.25%, 03/01/2033 | | EUR | 1,125 | | | | 1,301 | |
Kinross Gold Corp., (Canada), 4.50%, 07/15/2027 | | | 2,500 | | | | 2,857 | |
Newmont Corp., 4.88%, 03/15/2042 | | | 30 | | | | 38 | |
Norsk Hydro ASA, (Norway), Reg. S, 1.13%, 04/11/2025 | | EUR | 900 | | | | 1,103 | |
Southern Copper Corp., | | | | | | | | |
3.88%, 04/23/2025 | | | 35 | | | | 38 | |
5.88%, 04/23/2045 | | | 29 | | | | 41 | |
6.75%, 04/16/2040 | | | 10 | | | | 14 | |
Teck Resources Ltd., (Canada), 6.25%, 07/15/2041 | | | 1,100 | | | | 1,439 | |
| | | | | | | | |
| | | | | | | 11,780 | |
| | | | | | | | |
Total Basic Materials | | | | | | | 44,444 | |
| | | | | | | | |
Communications — 1.2% | |
Advertising — 0.0% (g) | |
Interpublic Group of Cos., Inc. (The), 3.38%, 03/01/2041 | | | 100 | | | | 104 | |
MMS USA Holdings, Inc., Reg. S, 1.75%, 06/13/2031 | | EUR | 1,000 | | | | 1,284 | |
SEE NOTES TO FINANCIAL STATEMENTS.
| | | | | | | | | | |
| | | | | |
| 80 | | | | | | | | SIX CIRCLES TRUST | | JUNE 30, 2021 |
| | | | | | | | |
| SECURITY DESCRIPTION | | PRINCIPAL
AMOUNT($) | | | VALUE($) | |
Corporate Bonds — continued | |
Advertising — continued | |
Omnicom Group, Inc., | | | | | | | | |
2.60%, 08/01/2031 | | | 105 | | | | 107 | |
4.20%, 06/01/2030 | | | 150 | | | | 173 | |
WPP Finance 2013, (United Kingdom), Reg. S, 2.88%, 09/14/2046 | | GBP | 425 | | | | 588 | |
| | | | | | | | |
| | |
| | | | | | | 2,256 | |
| | | | | | | | |
Internet — 0.1% | |
Alibaba Group Holding Ltd., (Cayman Islands), 3.15%, 02/09/2051 | | | 200 | | | | 197 | |
Alphabet, Inc., | | | | | | | | |
1.90%, 08/15/2040 | | | 700 | | | | 639 | |
2.25%, 08/15/2060 | | | 65 | | | | 58 | |
Amazon.com, Inc., | | | | | | | | |
2.10%, 05/12/2031 | | | 100 | | | | 102 | |
3.10%, 05/12/2051 | | | 100 | | | | 105 | |
3.88%, 08/22/2037 | | | 20 | | | | 24 | |
4.25%, 08/22/2057 | | | 30 | | | | 38 | |
Booking Holdings, Inc., | | | | | | | | |
0.50%, 03/08/2028 | | EUR | 1,000 | | | | 1,194 | |
1.80%, 03/03/2027 | | EUR | 1,000 | | | | 1,285 | |
4.63%, 04/13/2030 | | | 15 | | | | 18 | |
eBay, Inc., 1.90%, 03/11/2025 | | | 5 | | | | 5 | |
Expedia Group, Inc., | | | | | | | | |
2.50%, 06/03/2022 | | EUR | 500 | | | | 602 | |
3.60%, 12/15/2023 | | | 10 | | | | 11 | |
4.63%, 08/01/2027 | | | 5 | | | | 6 | |
Prosus NV, (Netherlands), Reg. S, 2.03%, 08/03/2032 | | EUR | 675 | | | | 822 | |
VeriSign, Inc., | | | | | | | | |
4.75%, 07/15/2027 | | | 77 | | | | 82 | |
5.25%, 04/01/2025 | | | 82 | | | | 93 | |
| | | | | | | | |
| | |
| | | | | | | 5,281 | |
| | | | | | | | |
Media — 0.4% | |
Charter Communications Operating LLC / Charter Communications Operating Capital, | | | | | | | | |
3.50%, 06/01/2041 | | | 35 | | | | 35 | |
3.90%, 06/01/2052 | | | 2,150 | | | | 2,191 | |
4.40%, 12/01/2061 | | | 65 | | | | 70 | |
4.46%, 07/23/2022 | | | 190 | | | | 197 | |
4.50%, 02/01/2024 | | | 115 | | | | 125 | |
4.80%, 03/01/2050 | | | 80 | | | | 92 | |
4.91%, 07/23/2025 | | | 1,545 | | | | 1,751 | |
6.38%, 10/23/2035 | | | 40 | | | | 53 | |
6.48%, 10/23/2045 | | | 30 | | | | 41 | |
Comcast Corp., | | | | | | | | |
1.50%, 02/15/2031 | | | 2,900 | | | | 2,749 | |
1.88%, 02/20/2036 | | GBP | 1,075 | | | | 1,468 | |
2.35%, 01/15/2027 | | | 2,000 | | | | 2,100 | |
2.65%, 08/15/2062 | | | 25 | | | | 23 | |
3.60%, 03/01/2024 | | | 200 | | | | 216 | |
3.97%, 11/01/2047 | | | 220 | | | | 256 | |
4.25%, 10/15/2030 | | | 120 | | | | 141 | |
4.60%, 10/15/2038 | | | 20 | | | | 25 | |
| | | | | | | | |
| SECURITY DESCRIPTION | | PRINCIPAL
AMOUNT($) | | | VALUE($) | |
| | | | | | | | |
Media — continued | |
Cox Communications, Inc., 3.50%, 08/15/2027 (e) | | | 3,180 | | | | 3,493 | |
Discovery Communications LLC, | | | | | | | | |
5.20%, 09/20/2047 | | | 1,100 | | | | 1,369 | |
5.30%, 05/15/2049 | | | 90 | | | | 114 | |
ITV plc, (United Kingdom), Reg. S, 1.38%, 09/26/2026 | | EUR | 1,300 | | | | 1,611 | |
Pearson Funding plc, (United Kingdom), Reg. S, 3.75%, 06/04/2030 | | GBP | 475 | | | | 732 | |
RELX Finance BV, (Netherlands), Reg. S, 0.00%, 03/18/2024 | | EUR | 100 | | | | 119 | |
Sky Ltd., (United Kingdom), | | | | | | | | |
Reg. S, 2.25%, 11/17/2025 | | EUR | 450 | | | | 586 | |
Reg. S, 2.50%, 09/15/2026 | | EUR | 850 | | | | 1,133 | |
Thomson Reuters Corp., (Canada), 4.30%, 11/23/2023 | | | 120 | | | | 129 | |
Time Warner Cable LLC, | | | | | | | | |
4.50%, 09/15/2042 | | | 80 | | | | 89 | |
5.50%, 09/01/2041 | | | 800 | | | | 994 | |
ViacomCBS, Inc., 5.85%, 09/01/2043 | | | 1,450 | | | | 1,988 | |
Vivendi SE, (France), | | | | | | | | |
Reg. S, 0.63%, 06/11/2025 | | EUR | 1,200 | | | | 1,450 | |
Reg. S, 1.13%, 12/11/2028 | | EUR | 1,200 | | | | 1,483 | |
Wolters Kluwer NV, (Netherlands), | | | | | | | | |
Reg. S, 0.75%, 07/03/2030 | | EUR | 775 | | | | 938 | |
Reg. S, 1.50%, 03/22/2027 | | EUR | 2,275 | | | | 2,900 | |
| | | | | | | | |
| | |
| | | | | | | 30,661 | |
| | | | | | | | |
Telecommunications — 0.7% | |
America Movil SAB de CV, (Mexico), 5.00%, 10/27/2026 | | GBP | 100 | | | | 164 | |
AT&T, Inc., | | | | | | | | |
0.90%, 03/25/2024 | | | 100 | | | | 100 | |
1.70%, 03/25/2026 | | | 405 | | | | 409 | |
1.80%, 09/05/2026 | | EUR | 1,150 | | | | 1,469 | |
1.80%, 09/14/2039 | | EUR | 1,200 | | | | 1,457 | |
2.05%, 05/19/2032 | | EUR | 100 | | | | 131 | |
2.45%, 03/15/2035 | | EUR | 425 | | | | 567 | |
3.30%, 02/01/2052 | | | 25 | | | | 24 | |
3.50%, 06/01/2041 | | | 1,700 | | | | 1,768 | |
3.50%, 02/01/2061 | | | 45 | | | | 44 | |
3.55%, 09/15/2055 (e) | | | 5 | | | | 5 | |
3.65%, 06/01/2051 | | | 1,800 | | | | 1,888 | |
3.80%, 12/01/2057 (e) | | | 82 | | | | 85 | |
3.85%, 06/01/2060 | | | 20 | | | | 21 | |
4.25%, 06/01/2043 | | GBP | 200 | | | | 350 | |
4.30%, 12/15/2042 | | | 25 | | | | 29 | |
4.45%, 04/01/2024 | | | 47 | | | | 51 | |
4.80%, 06/15/2044 | | | 20 | | | | 24 | |
4.85%, 03/01/2039 | | | 175 | | | | 213 | |
5.25%, 03/01/2037 | | | 60 | | | | 76 | |
Reg. S, 5.50%, 03/15/2027 | | GBP | 450 | | | | 762 | |
7.00%, 04/30/2040 | | GBP | 400 | | | | 915 | |
SEE NOTES TO FINANCIAL STATEMENTS.
| | | | | | | | | | |
| | | | | |
| JUNE 30, 2021 | | SIX CIRCLES TRUST | | | | | | | | 81 |
Six Circles Global Bond Fund
SCHEDULE OF PORTFOLIO INVESTMENTS
AS OF JUNE 30, 2021 (Unaudited) (continued)
(Amounts in U.S. Dollars, unless otherwise noted)
(Amounts in thousands, except number of Futures contracts)
| | | | | | | | |
| SECURITY DESCRIPTION | | PRINCIPAL
AMOUNT($) | | | VALUE($) | |
Corporate Bonds — continued | |
Telecommunications — continued | |
Bell Telephone Co. of Canada or Bell Canada (The), (Canada), Series US-3, 0.75%, 03/17/2024 | | | 100 | | | | 100 | |
CK Hutchison Group Telecom Finance SA, (Luxembourg), Reg. S, 0.38%, 10/17/2023 | | EUR | 1,300 | | | | 1,555 | |
Deutsche Telekom International Finance BV, (Netherlands), | | | | | | | | |
3.60%, 01/19/2027 (e) | | | 900 | | | | 990 | |
8.75%, 06/15/2030 | | | 236 | | | | 354 | |
Elisa OYJ, (Finland), Reg. S, 0.88%, 03/17/2024 | | EUR | 100 | | | | 122 | |
Global Switch Holdings Ltd., (British Virgin Islands), Reg. S, 1.50%, 01/31/2024 | | EUR | 450 | | | | 551 | |
Level 3 Financing, Inc., 3.40%, 03/01/2027 (e) | | | 2,000 | | | | 2,124 | |
Motorola Solutions, Inc., | | | | | | | | |
2.30%, 11/15/2030 | | | 47 | | | | 46 | |
2.75%, 05/24/2031 | | | 290 | | | | 296 | |
4.00%, 09/01/2024 | | | 15 | | | | 16 | |
4.60%, 02/23/2028 | | | 1,375 | | | | 1,604 | |
4.60%, 05/23/2029 | | | 40 | | | | 47 | |
5.50%, 09/01/2044 | | | 40 | | | | 52 | |
Orange SA, (France), Reg. S, 3.25%, 01/15/2032 | | GBP | 1,100 | | | | 1,729 | |
OTE plc, (United Kingdom), Reg. S, 0.88%, 09/24/2026 | | EUR | 100 | | | | 122 | |
Proximus SADP, (Belgium), Reg. S, 2.38%, 04/04/2024 | | EUR | 100 | | | | 127 | |
Sprint Corp., 7.63%, 02/15/2025 | | | 2,800 | | | | 3,327 | |
Telefonaktiebolaget LM Ericsson, (Sweden), | | | | | | | | |
Reg. S, 1.00%, 05/26/2029 | | EUR | 1,075 | | | | 1,283 | |
Reg. S, 1.88%, 03/01/2024 | | EUR | 1,000 | | | | 1,244 | |
Telenor ASA, (Norway), Reg. S, 0.25%, 02/14/2028 | | EUR | 700 | | | | 831 | |
Telstra Corp. Ltd., (Australia), 3.13%, 04/07/2025 (e) | | | 2,600 | | | | 2,784 | |
T-Mobile USA, Inc., | | | | | | | | |
1.50%, 02/15/2026 | | | 10 | | | | 10 | |
3.50%, 04/15/2025 | | | 2,525 | | | | 2,737 | |
3.88%, 04/15/2030 | | | 2,520 | | | | 2,813 | |
Verizon Communications, Inc., | | | | | | | | |
0.88%, 04/02/2025 | | EUR | 750 | | | | 919 | |
0.88%, 04/08/2027 | | EUR | 475 | | | | 582 | |
1.30%, 05/18/2033 | | EUR | 1,225 | | | | 1,496 | |
1.50%, 09/19/2039 | | EUR | 700 | | | | 849 | |
1.68%, 10/30/2030 | | | 78 | | | | 75 | |
1.88%, 11/03/2038 | | GBP | 200 | | | | 263 | |
2.50%, 04/08/2031 | | GBP | 1,000 | | | | 1,461 | |
2.55%, 03/21/2031 | | | 650 | | | | 665 | |
2.65%, 11/20/2040 | | | 970 | | | | 934 | |
2.88%, 11/20/2050 | | | 20 | | | | 19 | |
2.99%, 10/30/2056 | | | 35 | | | | 33 | |
3.00%, 11/20/2060 | | | 60 | | | | 56 | |
| | | | | | | | |
| SECURITY DESCRIPTION | | PRINCIPAL
AMOUNT($) | | | VALUE($) | |
| | | | | | | | |
Telecommunications — continued | |
3.25%, 02/17/2026 | | EUR | 200 | | | | 272 | |
3.38%, 02/15/2025 | | | 50 | | | | 54 | |
3.70%, 03/22/2061 | | | 350 | | | | 375 | |
4.07%, 06/18/2024 | | GBP | 100 | | | | 152 | |
4.13%, 08/15/2046 | | | 80 | | | | 95 | |
4.40%, 11/01/2034 | | | 20 | | | | 24 | |
4.50%, 08/10/2033 | | | 1,900 | | | | 2,273 | |
4.86%, 08/21/2046 | | | 170 | | | | 220 | |
| | | | | | | | |
| | | | | | | 46,233 | |
| | | | | | | | |
Total Communications | | | | | | | 84,431 | |
| | | | | | | | |
Consumer Cyclical — 1.2% | |
Airlines — 0.1% | |
easyJet FinCo. BV, (Netherlands), Reg. S, 1.88%, 03/03/2028 | | EUR | 301 | | | | 357 | |
Southwest Airlines Co., | | | | | | | | |
5.13%, 06/15/2027 | | | 1,150 | | | | 1,355 | |
5.25%, 05/04/2025 | | | 1,600 | | | | 1,826 | |
United Airlines, Inc., | | | | | | | | |
4.38%, 04/15/2026 (e) | | | 525 | | | | 543 | |
4.63%, 04/15/2029 (e) | | | 360 | | | | 373 | |
| | | | | | | | |
| | | | | | | 4,454 | |
| | | | | | | | |
Apparel — 0.0% (g) | | | | | | | | |
Burberry Group plc, (United Kingdom), Reg. S, 1.13%, 09/21/2025 | | GBP | 425 | | | | 586 | |
LVMH Moet Hennessy Louis Vuitton SE, (France), | | | | | | | | |
Reg. S, 0.13%, 02/11/2028 | | EUR | 800 | | | | 957 | |
Reg. S, 0.75%, 04/07/2025 | | EUR | 300 | | | | 368 | |
NIKE, Inc., 3.25%, 03/27/2040 | | | 216 | | | | 237 | |
Tapestry, Inc., 4.13%, 07/15/2027 | | | 52 | | | | 57 | |
VF Corp., 2.40%, 04/23/2025 | | | 25 | | | | 26 | |
| | | | | | | | |
| | | | | | | 2,231 | |
| | | | | | | | |
Auto Manufacturers — 0.8% | | | | | | | | |
American Honda Finance Corp., | | | | | | | | |
0.55%, 07/12/2024 | | | 112 | | | | 111 | |
0.75%, 11/25/2026 | | GBP | 4,800 | | | | 6,546 | |
BMW US Capital LLC, | | | | | | | | |
3.80%, 04/06/2023 (e) | | | 169 | | | | 179 | |
3.90%, 04/09/2025 (e) | | | 1,100 | | | | 1,213 | |
Cummins, Inc., 2.60%, 09/01/2050 | | | 30 | | | | 29 | |
Daimler AG, (Germany), | | | | | | | | |
Reg. S, 1.13%, 11/06/2031 | | EUR | 15 | | | | 18 | |
Reg. S, 1.63%, 08/22/2023 | | EUR | 20 | | | | 25 | |
Reg. S, 2.13%, 07/03/2037 | | EUR | 775 | | | | 1,060 | |
Reg. S, 2.63%, 04/07/2025 | | EUR | 1,760 | | | | 2,297 | |
Daimler International Finance BV, (Netherlands), Reg. S, 0.63%, 02/27/2023 | | EUR | 425 | | | | 512 | |
Ford Motor Credit Co. LLC, | | | | | | | | |
2.75%, 06/14/2024 | | | GBP 1,600 | | | | 2,244 | |
3.37%, 11/17/2023 | | | 2,000 | | | | 2,073 | |
4.00%, 11/13/2030 | | | 545 | | | | 571 | |
SEE NOTES TO FINANCIAL STATEMENTS.
| | | | | | | | | | |
| | | | | |
| 82 | | | | | | | | SIX CIRCLES TRUST | | JUNE 30, 2021 |
| | | | | | | | |
| SECURITY DESCRIPTION | | PRINCIPAL
AMOUNT($) | | | VALUE($) | |
Corporate Bonds — continued | |
Auto Manufacturers — continued | |
General Motors Co., | |
5.20%, 04/01/2045 | | | 425 | | | | 526 | |
5.40%, 04/01/2048 | | | 275 | | | | 350 | |
6.60%, 04/01/2036 | | | 520 | | | | 715 | |
6.75%, 04/01/2046 | | | 66 | | | | 95 | |
General Motors Financial Co., Inc., | | | | | | | | |
Reg. S, 1.69%, 03/26/2025 | | EUR | 775 | | | | 968 | |
1.70%, 08/18/2023 | | | 70 | | | | 71 | |
Reg. S, 2.20%, 04/01/2024 | | EUR | 100 | | | | 125 | |
Reg. S, 2.25%, 09/06/2024 | | GBP | 700 | | | | 1,000 | |
Reg. S, 2.35%, 09/03/2025 | | GBP | 1,225 | | | | 1,761 | |
2.70%, 08/20/2027 | | | 1,450 | | | | 1,507 | |
2.70%, 06/10/2031 | | | 785 | | | | 791 | |
2.75%, 06/20/2025 | | | 180 | | | | 190 | |
2.90%, 02/26/2025 | | | 45 | | | | 48 | |
3.45%, 04/10/2022 | | | 60 | | | | 61 | |
4.20%, 11/06/2021 | | | 200 | | | | 203 | |
5.20%, 03/20/2023 | | | 20 | | | | 22 | |
Harley-Davidson Financial Services, Inc., Reg. S, 3.88%, 05/19/2023 | | EUR | 425 | | | | 540 | |
Nissan Motor Co. Ltd., (Japan), 3.52%, 09/17/2025 (e) | | | 3,000 | | | | 3,205 | |
PACCAR Financial Europe BV, (Netherlands), | | | | | | | | |
Reg. S, 0.00%, 03/03/2023 | | EUR | 500 | | | | 596 | |
Reg. S, 0.13%, 03/07/2022 | | EUR | 100 | | | | 119 | |
Stellantis NV, (Netherlands), | | | | | | | | |
Reg. S, 0.63%, 03/30/2027 | | EUR | 2,600 | | | | 3,096 | |
Reg. S, 1.25%, 06/20/2033 | | EUR | 1,500 | | | | 1,755 | |
Reg. S, 2.75%, 05/15/2026 | | EUR | 800 | | | | 1,051 | |
Toyota Motor Credit Corp., 0.80%, 01/09/2026 | | | 100 | | | | 99 | |
Traton Finance Luxembourg SA, (Luxembourg), Reg. S, 0.13%, 03/24/2025 | | EUR | 1,500 | | | | 1,782 | |
Volkswagen Bank GmbH, (Germany), | | | | | | | | |
Reg. S, 0.75%, 06/15/2023 | | EUR | 300 | | | | 362 | |
Reg. S, 1.25%, 06/10/2024 | | EUR | 1,500 | | | | 1,843 | |
Volkswagen Financial Services AG, (Germany), | | | | | | | | |
Reg. S, 1.38%, 10/16/2023 | | EUR | 900 | | | | 1,103 | |
Reg. S, 2.25%, 10/16/2026 | | EUR | 10 | | | | 13 | |
Reg. S, 2.50%, 04/06/2023 | | EUR | 915 | | | | 1,135 | |
Reg. S, 3.00%, 04/06/2025 | | EUR | 20 | | | | 26 | |
Reg. S, 3.38%, 04/06/2028 | | EUR | 1,450 | | | | 2,046 | |
Volkswagen International Finance NV, (Netherlands), | | | | | | | | |
Reg. S, 0.05%, 06/10/2024 | | EUR | 400 | | | | 475 | |
Reg. S, 3.25%, 11/18/2030 | | EUR | 1,000 | | | | 1,456 | |
Reg. S, (EUR Swap Rate 5 Year + 3.75%), 3.50%, 06/17/2025 (x) (aa) | | EUR | 1,000 | | | | 1,280 | |
Reg. S, (EUR Swap Rate 9 Year + 3.96%), 3.88%, 06/17/2029 (x) (aa) | | EUR | 2,000 | | | | 2,633 | |
Reg. S, (EUR Swap Rate 12 Year + 2.97%), 4.63%, 03/24/2026 (x) (aa) | | EUR | 210 | | | | 283 | |
| | | | | | | | |
| SECURITY DESCRIPTION | | PRINCIPAL
AMOUNT($) | | | VALUE($) | |
| | | | | | | | |
Auto Manufacturers — continued | |
Volkswagen Leasing GmbH, (Germany), Reg. S, 0.63%, 07/19/2029 | | EUR | 1,275 | | | | 1,510 | |
Volvo Treasury AB, (Sweden), | | | | | | | | |
Reg. S, 0.13%, 09/17/2024 | | EUR | 425 | | | | 507 | |
Reg. S, (EUR Swap Rate 5 Year + 4.10%), 4.85%, 03/10/2078 (aa) | | EUR | 1,575 | | | | 2,003 | |
| | | | | | | | |
| | | | | | | 54,229 | |
| | | | | | | | |
Auto Parts & Equipment — 0.1% | |
Aptiv Corp., 4.15%, 03/15/2024 | | | 55 | | | | 60 | |
Aptiv plc, (Jersey), 1.50%, 03/10/2025 | | EUR | 425 | | | | 527 | |
Autoliv, Inc., Reg. S, 0.75%, 06/26/2023 | | EUR | 700 | | | | 842 | |
Cie Generale des Etablissements Michelin SCA, (France), Reg. S, 0.63%, 11/02/2040 | | EUR | 300 | | | | 338 | |
Lear Corp., 4.25%, 05/15/2029 | | | 30 | | | | 34 | |
Magna International, Inc., (Canada),
1.90%, 11/24/2023 | | EUR | 1,125 | | | | 1,395 | |
2.45%, 06/15/2030 | | | 1,165 | | | | 1,192 | |
4.15%, 10/01/2025 | | | 2,000 | | | | 2,235 | |
| | | | | | | | |
| | | | | | | 6,623 | |
| | | | | | | | |
Distribution/Wholesale — 0.0% (g) | | | | | | | | |
Bunzl Finance plc, (United Kingdom), Reg. S, 1.50%, 10/30/2030 | | GBP | 550 | | | | 743 | |
| | | | | | | | |
| | | | | | | | |
Home Builders — 0.0% (g) | | | | | | | | |
NVR, Inc., 3.00%, 05/15/2030 | | | 279 | | | | 296 | |
| | | | | | | | |
| | | | | | | | |
Home Furnishings — 0.0% (g) | | | | | | | | |
Whirlpool Finance Luxembourg Sarl, (Luxembourg), | | | | | | | | |
1.10%, 11/09/2027 | | EUR | 225 | | | | 279 | |
1.25%, 11/02/2026 | | EUR | 200 | | | | 250 | |
| | | | | | | | |
| | |
| | | | | | | 529 | |
| | | | | | | | |
Housewares — 0.0% (g) | | | | | | | | |
Newell Brands, Inc., 4.70%, 04/01/2026 | | | 650 | | | | 725 | |
| | | | | | | | |
| | | | | | | | |
Lodging — 0.0% (g) | | | | | | | | |
Choice Hotels International, Inc., 3.70%, 12/01/2029 | | | 40 | | | | 43 | |
InterContinental Hotels Group plc, (United Kingdom), | | | | | | | | |
Reg. S, 3.38%, 10/08/2028 | | GBP | 450 | | | | 672 | |
Reg. S, 3.75%, 08/14/2025 | | GBP | 100 | | | | 150 | |
Las Vegas Sands Corp., 3.20%, 08/08/2024 | | | 15 | | | | 16 | |
Marriott International, Inc., Series HH, 2.85%, 04/15/2031 | | | 1,125 | | | | 1,144 | |
| | | | | | | | |
| | |
| | | | | | | 2,025 | |
| | | | | | | | |
Retail — 0.2% | | | | | | | | |
AutoNation, Inc., 4.75%, 06/01/2030 | | | 1,309 | | | | 1,550 | |
AutoZone, Inc., 1.65%, 01/15/2031 | | | 2,595 | | | | 2,472 | |
Costco Wholesale Corp., 1.75%, 04/20/2032 | | | 87 | | | | 86 | |
SEE NOTES TO FINANCIAL STATEMENTS.
| | | | | | | | | | |
| | | | | |
| JUNE 30, 2021 | | SIX CIRCLES TRUST | | | | | | | | 83 |
Six Circles Global Bond Fund
SCHEDULE OF PORTFOLIO INVESTMENTS
AS OF JUNE 30, 2021 (Unaudited) (continued)
(Amounts in U.S. Dollars, unless otherwise noted)
(Amounts in thousands, except number of Futures contracts)
| | | | | | | | |
| SECURITY DESCRIPTION | | PRINCIPAL
AMOUNT($) | | | VALUE($) | |
Corporate Bonds — continued | |
Retail — continued | |
Dollar General Corp., 4.15%, 11/01/2025 | | | 10 | | | | 11 | |
Genuine Parts Co., 1.88%, 11/01/2030 | | | 280 | | | | 271 | |
Home Depot, Inc. (The), | | | | | | | | |
3.50%, 09/15/2056 | | | 75 | | | | 84 | |
4.20%, 04/01/2043 | | | 800 | | | | 981 | |
5.88%, 12/16/2036 | | | 90 | | | | 129 | |
Kohl’s Corp., 3.38%, 05/01/2031 | | | 15 | | | | 15 | |
Lowe’s Cos., Inc., 3.50%, 04/01/2051 | | | 95 | | | | 102 | |
McDonald’s Corp., | | | | | | | | |
Reg. S, 2.38%, 11/27/2024 | | EUR | 800 | | | | 1,029 | |
3.50%, 03/01/2027 | | | 100 | | | | 111 | |
Next Group plc, (United Kingdom), | | | | | | | | |
Reg. S, 3.00%, 08/26/2025 | | GBP | 225 | | | | 333 | |
Reg. S, 3.63%, 05/18/2028 | | GBP | 1,075 | | | | 1,637 | |
Reg. S, 4.38%, 10/02/2026 | | GBP | 300 | | | | 470 | |
Walgreens Boots Alliance, Inc., 3.30%, 11/18/2021 | | | 50 | | | | 50 | |
Walmart, Inc., | | | | | | | | |
2.55%, 04/08/2026 | | EUR | 2,550 | | | | 3,386 | |
2.95%, 09/24/2049 | | | 25 | | | | 27 | |
Reg. S, 5.25%, 09/28/2035 | | GBP | 550 | | | | 1,117 | |
| | | | | | | | |
| | |
| | | | | | | 13,861 | |
| | | | | | | | |
Textiles — 0.0% (g) | | | | | | | | |
Mohawk Industries, Inc., 2.00%, 01/14/2022 | | EUR | 550 | | | | 656 | |
| | | | | | | | |
Total Consumer Cyclical | | | | | | | 86,372 | |
| | | | | | | | |
Consumer Non-cyclical — 2.7% | | | | | | | | |
Agriculture — 0.3% | | | | | | | | |
Altria Group, Inc., | | | | | | | | |
2.20%, 06/15/2027 | | EUR | 1,000 | | | | 1,280 | |
3.40%, 02/04/2041 | | | 25 | | | | 24 | |
3.70%, 02/04/2051 | | | 120 | | | | 114 | |
3.88%, 09/16/2046 | | | 40 | | | | 40 | |
4.00%, 02/04/2061 | | | 120 | | | | 115 | |
5.38%, 01/31/2044 | | | 65 | | | | 77 | |
5.95%, 02/14/2049 | | | 10 | | | | 13 | |
6.20%, 02/14/2059 | | | 58 | | | | 75 | |
BAT Capital Corp., | | | | | | | | |
Reg. S, 1.13%, 11/16/2023 | | EUR | 100 | | | | 121 | |
2.79%, 09/06/2024 | | | 3,285 | | | | 3,451 | |
3.22%, 08/15/2024 | | | 100 | | | | 106 | |
3.73%, 09/25/2040 | | | 35 | | | | 35 | |
4.76%, 09/06/2049 | | | 50 | | | | 54 | |
BAT International Finance plc, (United Kingdom), | | | | | | | | |
Reg. S, 2.38%, 01/19/2023 | | EUR | 3,800 | | | | 4,672 | |
Reg. S, 7.25%, 03/12/2024 | | GBP | 235 | | | | 377 | |
Bunge Finance Europe BV, (Netherlands), 1.85%, 06/16/2023 | | EUR | 300 | | | | 367 | |
Bunge Ltd. Finance Corp., 3.75%, 09/25/2027 | | | 30 | | | | 33 | |
Cargill, Inc., 2.13%, 04/23/2030 (e) | | | 1,500 | | | | 1,521 | |
| | | | | | | | |
| SECURITY DESCRIPTION | | PRINCIPAL
AMOUNT($) | | | VALUE($) | |
| | | | | | | | |
Agriculture — continued | |
JT International Financial Services BV, (Netherlands), | | | | | | | | |
Reg. S, 1.13%, 09/28/2025 | | EUR | 100 | | | | 124 | |
Reg. S, 2.75%, 09/28/2033 | | GBP | 975 | | | | 1,461 | |
Philip Morris International, Inc., | | | | | | | | |
0.80%, 08/01/2031 | | EUR | 1,125 | | | | 1,327 | |
0.88%, 05/01/2026 | | | 1,715 | | | | 1,694 | |
2.88%, 03/03/2026 | | EUR | 1,000 | | | | 1,338 | |
2.88%, 05/14/2029 | | EUR | 1,250 | | | | 1,751 | |
4.25%, 11/10/2044 | | | 220 | | | | 256 | |
6.38%, 05/16/2038 | | | 155 | | | | 222 | |
STG Global Finance BV, (Netherlands), Reg. S, 1.38%, 09/24/2025 | | EUR | 1,025 | | | | 1,243 | |
| | | | | | | | |
| | |
| | | | | | | 21,891 | |
| | | | | | | | |
Beverages — 0.3% | | | | | | | | |
Anheuser-Busch Cos. LLC / Anheuser-Busch InBev Worldwide, Inc., | | | | | | | | |
4.70%, 02/01/2036 | | | 1,700 | | | | 2,090 | |
4.90%, 02/01/2046 | | | 1,100 | | | | 1,388 | |
Anheuser-Busch InBev SA, (Belgium), | | | | | | | | |
Reg. S, 2.75%, 03/17/2036 | | EUR | 10 | | | | 14 | |
Reg. S, 3.70%, 04/02/2040 | | EUR | 800 | | | | 1,287 | |
Anheuser-Busch InBev Worldwide, Inc., 5.55%, 01/23/2049 | | | 50 | | | | 69 | |
CCEP Finance Ireland DAC, (Ireland), Reg. S, 0.50%, 09/06/2029 | | EUR | 1,000 | | | | 1,184 | |
Coca-Cola Co. (The), | | | | | | | | |
0.13%, 03/09/2029 | | EUR | 3,500 | | | | 4,105 | |
0.13%, 03/15/2029 | | EUR | 1,700 | | | | 1,990 | |
0.50%, 03/09/2033 | | EUR | 500 | | | | 582 | |
1.00%, 03/09/2041 | | EUR | 400 | | | | 463 | |
3.00%, 03/05/2051 | | | 230 | | | | 240 | |
Constellation Brands, Inc., 3.70%, 12/06/2026 | | | 25 | | | | 28 | |
Diageo Capital plc, (United Kingdom), 3.88%, 04/29/2043 | | | 10 | | | | 12 | |
Diageo Finance plc, (United Kingdom), Reg. S, 1.88%, 03/27/2027 | | EUR | 1,000 | | | | 1,303 | |
Greene King Finance plc, (United Kingdom), Series A2, 5.32%, 09/15/2031 | | GBP | 31 | | | | 50 | |
Keurig Dr Pepper, Inc., | | | | | | | | |
3.13%, 12/15/2023 | | | 90 | | | | 95 | |
4.06%, 05/25/2023 | | | 26 | | | | 28 | |
PepsiCo., Inc., | | | | | | | | |
0.40%, 10/09/2032 | | EUR | 1,200 | | | | 1,402 | |
1.05%, 10/09/2050 | | EUR | 750 | | | | 859 | |
3.45%, 10/06/2046 | | | 15 | | | | 17 | |
Pernod Ricard SA, (France), Reg. S, 1.13%, 04/07/2025 | | EUR | 1,600 | | | | 1,980 | |
| | | | | | | | |
| | |
| | | | | | | 19,186 | |
| | | | | | | | |
Biotechnology — 0.0% (g) | | | | | | | | |
Amgen, Inc., 1.90%, 02/21/2025 | | | 100 | | | | 103 | |
SEE NOTES TO FINANCIAL STATEMENTS.
| | | | | | | | | | |
| | | | | |
| 84 | | | | | | | | SIX CIRCLES TRUST | | JUNE 30, 2021 |
| | | | | | | | |
| SECURITY DESCRIPTION | | PRINCIPAL
AMOUNT($) | | | VALUE($) | |
Corporate Bonds — continued | |
Biotechnology — continued | |
Regeneron Pharmaceuticals, Inc., 1.75%, 09/15/2030 | | | 1,000 | | | | 949 | |
| | | | | | | | |
| | |
| | | | | | | 1,052 | |
| | | | | | | | |
Commercial Services — 0.5% | | | | | | | | |
Abertis Infraestructuras SA, (Spain), Reg. S, 3.38%, 11/27/2026 | | GBP | 400 | | | | 599 | |
ALD SA, (France), Reg. S, 1.25%, 10/11/2022 | | EUR | 2,500 | | | | 3,022 | |
Amadeus IT Group SA, (Spain), Reg. S, 0.88%, 09/18/2023 | | EUR | 2,000 | | | | 2,413 | |
American University (The), Series 2019, 3.67%, 04/01/2049 | | | 30 | | | | 34 | |
Automatic Data Processing, Inc., | | | | | | | | |
1.25%, 09/01/2030 | | | 1,500 | | | | 1,432 | |
1.70%, 05/15/2028 | | | 90 | | | | 91 | |
Block Financial LLC, 3.88%, 08/15/2030 | | | 10 | | | | 11 | |
California Institute of Technology, 4.70%, 11/01/2111 | | | 25 | | | | 36 | |
Central Nippon Expressway Co. Ltd., (Japan), | | | | | | | | |
Reg. S, 0.89%, 09/29/2025 | | | 600 | | | | 593 | |
Reg. S, 1.87%, 09/26/2024 | | AUD | 1,000 | | | | 761 | |
Series 65, 0.03%, 07/14/2021 | | JPY | 100,000 | | | | 900 | |
Channel Link Enterprises Finance plc, (United Kingdom), Series A8, Reg. S, (ICE LIBOR EUR 6 Month + 5.90%), 2.71%, 06/30/2050 (aa) | | EUR | 100 | | | | 120 | |
Cintas Corp. No. 2, 3.70%, 04/01/2027 | | | 30 | | | | 34 | |
Cleveland Clinic Foundation (The), 4.86%, 01/01/2114 | | | 1,000 | | | | 1,420 | |
Duke University, Series 2020, 2.68%, 10/01/2044 | | | 20 | | | | 21 | |
East Nippon Expressway Co. Ltd., (Japan), Series 66, 0.10%, 12/18/2026 | | JPY | 100,000 | | | | 899 | |
Equifax, Inc., | | | | | | | | |
2.60%, 12/15/2025 | | | 110 | | | | 116 | |
3.10%, 05/15/2030 | | | 1,830 | | | | 1,967 | |
ERAC USA Finance LLC, | | | | | | | | |
2.70%, 11/01/2023 (e) | | | 3,200 | | | | 3,341 | |
3.85%, 11/15/2024 (e) | | | 160 | | | | 175 | |
4.50%, 02/15/2045 (e) | | | 400 | | | | 488 | |
7.00%, 10/15/2037 (e) | | | 800 | | | | 1,194 | |
Euronet Worldwide, Inc., 1.38%, 05/22/2026 | | EUR | 925 | | | | 1,111 | |
Experian Finance plc, (United Kingdom), | | | | | | | | |
Reg. S, 0.74%, 10/29/2025 | | GBP | 300 | | | | 410 | |
Reg. S, 1.38%, 06/25/2026 | | EUR | 1,125 | | | | 1,409 | |
Reg. S, 3.25%, 04/07/2032 | | GBP | 225 | | | | 354 | |
George Washington University (The), Series 2014, 4.30%, 09/15/2044 | | | 30 | | | | 38 | |
Global Payments, Inc., 1.20%, 03/01/2026 | | | 300 | | | | 297 | |
Holding d’Infrastructures de Transport SASU, (France), Reg. S, 2.50%, 05/04/2027 | | EUR | 1,900 | | | | 2,510 | |
| | | | | | | | |
| SECURITY DESCRIPTION | | PRINCIPAL
AMOUNT($) | | | VALUE($) | |
| | | | | | | | |
Commercial Services — continued | |
Johns Hopkins University, Series A, 2.81%, 01/01/2060 | | | 600 | | | | 602 | |
Massachusetts Institute of Technology, | | | | | | | | |
3.89%, 07/01/2116 | | | 663 | | | | 815 | |
4.68%, 07/01/2114 | | | 500 | | | | 727 | |
Series F, 2.99%, 07/01/2050 | | | 20 | | | | 22 | |
MMS USA Holdings, Inc., Reg. S, 0.63%, 06/13/2025 | | EUR | 1,500 | | | | 1,810 | |
Moody’s Corp., | | | | | | | | |
0.95%, 02/25/2030 | | EUR | 1,125 | | | | 1,375 | |
1.75%, 03/09/2027 | | EUR | 1,125 | | | | 1,444 | |
2.55%, 08/18/2060 | | | 20 | | | | 18 | |
Northwestern University, Series 2020, 2.64%, 12/01/2050 | | | 10 | | | | 10 | |
PayPal Holdings, Inc., | | | | | | | | |
2.40%, 10/01/2024 | | | 50 | | | | 52 | |
2.65%, 10/01/2026 | | | 90 | | | | 97 | |
3.25%, 06/01/2050 | | | 35 | | | | 38 | |
President and Fellows of Harvard College, 2.52%, 10/15/2050 | | | 10 | | | | 10 | |
Quanta Services, Inc., 2.90%, 10/01/2030 | | | 200 | | | | 208 | |
Rockefeller Foundation (The), Series 2020, 2.49%, 10/01/2050 | | | 5 | | | | 5 | |
S&P Global, Inc., | | | | | | | | |
1.25%, 08/15/2030 | | | 2,100 | | | | 1,990 | |
2.30%, 08/15/2060 | | | 311 | | | | 267 | |
Transurban Finance Co. Pty Ltd., (Australia), Reg. S, 3.00%, 04/08/2030 | | EUR | 100 | | | | 140 | |
Trustees of Princeton University (The), Series 2020, 2.52%, 07/01/2050 | | | 20 | | | | 20 | |
United Rentals North America, Inc., 3.88%, 11/15/2027 | | | 84 | | | | 88 | |
University of Southern California, | | | | | | | | |
2.81%, 10/01/2050 | | | 20 | | | | 20 | |
Series 21A, 2.95%, 10/01/2051 | | | 10 | | | | 11 | |
Verisk Analytics, Inc., 5.50%, 06/15/2045 | | | 43 | | | | 58 | |
West Nippon Expressway Co. Ltd., (Japan), Series 29, 0.31%, 02/12/2026 | | JPY | 200,000 | | | | 1,819 | |
| | | | | | | | |
| | |
| | | | | | | 37,442 | |
| | | | | | | | |
Cosmetics/Personal Care — 0.2% | | | | | | | | |
Colgate-Palmolive Co., 0.50%, 03/06/2026 | | EUR | 2,275 | | | | 2,765 | |
Estee Lauder Cos., Inc. (The), | | | | | | | | |
2.60%, 04/15/2030 | | | 60 | | | | 63 | |
3.13%, 12/01/2049 | | | 20 | | | | 22 | |
Procter & Gamble Co. (The), | | | | | | | | |
0.63%, 10/30/2024 | | EUR | 1,450 | | | | 1,768 | |
1.20%, 10/30/2028 | | EUR | 1,000 | | | | 1,279 | |
1.88%, 10/30/2038 | | EUR | 1,125 | | | | 1,583 | |
4.88%, 05/11/2027 | | EUR | 425 | | | | 649 | |
Unilever Finance Netherlands BV, (Netherlands), | | | | | | | | |
Reg. S, 0.50%, 08/12/2023 | | EUR | 1,400 | | | | 1,689 | |
Reg. S, 1.13%, 02/12/2027 | | EUR | 425 | | | | 536 | |
SEE NOTES TO FINANCIAL STATEMENTS.
| | | | | | | | | | |
| | | | | |
| JUNE 30, 2021 | | SIX CIRCLES TRUST | | | | | | | | 85 |
Six Circles Global Bond Fund
SCHEDULE OF PORTFOLIO INVESTMENTS
AS OF JUNE 30, 2021 (Unaudited) (continued)
(Amounts in U.S. Dollars, unless otherwise noted)
(Amounts in thousands, except number of Futures contracts)
| | | | | | | | |
| SECURITY DESCRIPTION | | PRINCIPAL
AMOUNT($) | | | VALUE($) | |
Corporate Bonds — continued | |
Cosmetics/Personal Care — continued | |
Unilever plc, (United Kingdom), Reg. S, 1.50%, 06/11/2039 | | EUR | 625 | | | | 820 | |
| | | | | | | | |
| | |
| | | | | | | 11,174 | |
| | | | | | | | |
Food — 0.1% | | | | | | | | |
Conagra Brands, Inc., 5.30%, 11/01/2038 | | | 10 | | | | 13 | |
Flowers Foods, Inc., 2.40%, 03/15/2031 | | | 5 | | | | 5 | |
General Mills, Inc., 3.00%, 02/01/2051 (e) | | | 20 | | | | 20 | |
Hershey Co. (The), 2.65%, 06/01/2050 | | | 10 | | | | 10 | |
Hormel Foods Corp., 1.80%, 06/11/2030 | | | 125 | | | | 124 | |
Kerry Group Financial Services Unltd Co., (Ireland), Reg. S, 2.38%, 09/10/2025 | | EUR | 1,400 | | | | 1,818 | |
Kroger Co. (The), 3.95%, 01/15/2050 | | | 5 | | | | 6 | |
Mars, Inc., 2.38%, 07/16/2040 (e) | | | 1,200 | | | | 1,156 | |
McCormick & Co., Inc., | | | | | | | | |
0.90%, 02/15/2026 | | | 100 | | | | 98 | |
3.15%, 08/15/2024 | | | 150 | | | | 160 | |
4.20%, 08/15/2047 | | | 5 | | | | 6 | |
Mondelez International Holdings Netherlands BV, (Netherlands), Reg. S, 0.38%, 09/22/2029 | | EUR | 100 | | | | 118 | |
Mondelez International, Inc., | | | | | | | | |
0.75%, 03/17/2033 | | EUR | 1,800 | | | | 2,089 | |
1.50%, 02/04/2031 | | | 1,000 | | | | 946 | |
1.88%, 10/15/2032 | | | 300 | | | | 291 | |
Tesco Corporate Treasury Services plc, (United Kingdom), | | | | | | | | |
Reg. S, 0.88%, 05/29/2026 | | EUR | 1,500 | | | | 1,828 | |
Reg. S, 1.38%, 10/24/2023 | | EUR | 100 | | | | 122 | |
Reg. S, 2.75%, 04/27/2030 | | GBP | 425 | | | | 628 | |
| | | | | | | | |
| | |
| | | | | | | 9,438 | |
| | | | | | | | |
Healthcare — Products — 0.3% | | | | | | | | |
Abbott Ireland Financing DAC, (Ireland), | | | | | | | | |
Reg. S, 0.10%, 11/19/2024 | | EUR | 700 | | | | 836 | |
Reg. S, 0.38%, 11/19/2027 | | EUR | 1,950 | | | | 2,342 | |
Abbott Laboratories, 4.90%, 11/30/2046 | | | 115 | | | | 157 | |
Becton Dickinson Euro Finance Sarl, (Luxembourg), 1.21%, 06/04/2026 | | EUR | 425 | | | | 527 | |
Boston Scientific Corp., 0.63%, 12/01/2027 | | EUR | 800 | | | | 962 | |
3.45%, 03/01/2024 | | | 100 | | | | 107 | |
Danaher Corp., 2.50%, 03/30/2030 | | EUR | 525 | | | | 722 | |
DH Europe Finance II Sarl, (Luxembourg), | | | | | | | | |
0.20%, 03/18/2026 | | EUR | 3,775 | | | | 4,498 | |
1.35%, 09/18/2039 | | EUR | 700 | | | | 843 | |
1.80%, 09/18/2049 | | EUR | 700 | | | | 869 | |
Edwards Lifesciences Corp., 4.30%, 06/15/2028 | | | 135 | | | | 157 | |
Koninklijke Philips NV, (Netherlands), Reg. S, 1.38%, 05/02/2028 | | EUR | 500 | | | | 639 | |
Medtronic Global Holdings SCA, (Luxembourg), | | | | | | | | |
0.00%, 03/15/2023 | | EUR | 325 | | | | 387 | |
0.38%, 03/07/2023 | | EUR | 100 | | | | 120 | |
| | | | | | | | |
| SECURITY DESCRIPTION | | PRINCIPAL
AMOUNT($) | | | VALUE($) | |
| | | | | | | | |
Healthcare — Products — continued | |
0.38%, 10/15/2028 | | EUR | 500 | | | | 598 | |
1.38%, 10/15/2040 | | EUR | 825 | | | | 995 | |
1.63%, 10/15/2050 | | EUR | 900 | | | | 1,094 | |
1.75%, 07/02/2049 | | EUR | 900 | | | | 1,134 | |
Molnlycke Holding AB, (Sweden), Reg. S, 0.63%, 01/15/2031 | | EUR | 1,625 | | | | 1,869 | |
Stryker Corp., 1.00%, 12/03/2031 | | | EUR 1,300 | | | | 1,590 | |
Thermo Fisher Scientific, Inc., | | | | | | | | |
1.88%, 10/01/2049 | | EUR | 1,125 | | | | 1,418 | |
0.13%, 03/01/2025 | | EUR | 1,000 | | | | 1,191 | |
1.75%, 04/15/2027 | | EUR | 100 | | | | 129 | |
2.88%, 07/24/2037 | | EUR | 625 | | | | 916 | |
4.10%, 08/15/2047 | | | 160 | | | | 195 | |
4.13%, 03/25/2025 | | | 70 | | | | 78 | |
Zimmer Biomet Holdings, Inc., | | | | | | | | |
3.70%, 03/19/2023 | | | 100 | | | | 105 | |
4.45%, 08/15/2045 | | | 10 | | | | 12 | |
| | | | | | | | |
| | |
| | | | | | | 24,490 | |
| | | | | | | | |
Healthcare — Services — 0.3% | | | | | | | | |
Advocate Health & Hospitals Corp., 3.39%, 10/15/2049 | | | 35 | | | | 38 | |
Aetna, Inc., 2.80%, 06/15/2023 | | | 30 | | | | 31 | |
AHS Hospital Corp., Series 2021, 2.78%, 07/01/2051 | | | 755 | | | | 746 | |
Allina Health System, Series 2019, 3.89%, 04/15/2049 | | | 40 | | | | 47 | |
Anthem, Inc., | | | | | | | | |
3.35%, 12/01/2024 | | | 100 | | | | 108 | |
4.10%, 03/01/2028 | | | 2,900 | | | | 3,317 | |
Ascension Health, 3.95%, 11/15/2046 | | | 70 | | | | 86 | |
City of Hope, Series 2013, 5.62%, 11/15/2043 | | | 35 | | | | 50 | |
CommonSpirit Health, 3.91%, 10/01/2050 | | | 18 | | | | 20 | |
Eurofins Scientific SE, (Luxembourg), | | | | | | | | |
Reg. S, 0.88%, 05/19/2031 | | EUR | 1,050 | | | | 1,234 | |
Reg. S, 2.13%, 07/25/2024 | | EUR | 396 | | | | 497 | |
Hackensack Meridian Health, Inc., | | | | | | | | |
Series 2020, 2.68%, 09/01/2041 | | | 1,335 | | | | 1,310 | |
Series 2020, 2.88%, 09/01/2050 | | | 35 | | | | 35 | |
HCA, Inc., | | | | | | | | |
3.50%, 07/15/2051 | | | 55 | | | | 55 | |
5.00%, 03/15/2024 | | | 1,383 | | | | 1,528 | |
5.13%, 06/15/2039 | | | 700 | | | | 875 | |
5.25%, 06/15/2049 | | | 140 | | | | 180 | |
5.50%, 06/15/2047 | | | 247 | | | | 323 | |
Health Care Service Corp. A Mutual Legal Reserve Co., 2.20%, 06/01/2030 (e) | | | 1,400 | | | | 1,406 | |
Humana, Inc., | | | | | | | | |
2.90%, 12/15/2022 | | | 50 | | | | 52 | |
3.85%, 10/01/2024 | | | 50 | | | | 54 | |
4.63%, 12/01/2042 | | | 30 | | | | 37 | |
Kaiser Foundation Hospitals, 4.15%, 05/01/2047 | | | 1,200 | | | | 1,497 | |
SEE NOTES TO FINANCIAL STATEMENTS.
| | | | | | | | | | |
| | | | | |
| 86 | | | | | | | | SIX CIRCLES TRUST | | JUNE 30, 2021 |
| | | | | | | | |
| SECURITY DESCRIPTION | | PRINCIPAL
AMOUNT($) | | | VALUE($) | |
Corporate Bonds — continued | |
Healthcare — Services — continued | |
Laboratory Corp. of America Holdings, 4.70%, 02/01/2045 | | | 210 | | | | 252 | |
Mayo Clinic, | | | | | | | | |
3.77%, 11/15/2043 | | | 30 | | | | 35 | |
Series 2013, 4.00%, 11/15/2047 | | | 25 | | | | 31 | |
Series 2021, 3.20%, 11/15/2061 | | | 440 | | | | 474 | |
Memorial Health Services, 3.45%, 11/01/2049 | | | 10 | | | | 11 | |
Memorial Sloan-Kettering Cancer Center, 4.13%, 07/01/2052 | | | 50 | | | | 63 | |
Methodist Hospital (The), Series 20A, 2.71%, 12/01/2050 | | | 1,500 | | | | 1,451 | |
MidMichigan Health, Series 2020, 3.41%, 06/01/2050 | | | 1,498 | | | | 1,610 | |
MultiCare Health System, 2.80%, 08/15/2050 | | | 1,000 | | | | 983 | |
New York and Presbyterian Hospital (The), | | | | | | | | |
2.26%, 08/01/2040 | | | 1,090 | | | | 1,026 | |
4.02%, 08/01/2045 | | | 20 | | | | 25 | |
Northwell Healthcare, Inc., 4.26%, 11/01/2047 | | | 25 | | | | 29 | |
OhioHealth Corp., Series 2020, 3.04%, 11/15/2050 | | | 535 | | | | 562 | |
PeaceHealth Obligated Group, | | | | | | | | |
Series 2020, 1.38%, 11/15/2025 | | | 700 | | | | 707 | |
Series 2020, 3.22%, 11/15/2050 | | | 849 | | | | 890 | |
Texas Health Resources, 2.33%, 11/15/2050 | | | 750 | | | | 680 | |
Trinity Health Corp., Series 2021, 2.63%, 12/01/2040 | | | 233 | | | | 230 | |
UnitedHealth Group, Inc., | | | | | | | | |
2.00%, 05/15/2030 | | | 160 | | | | 161 | |
3.13%, 05/15/2060 | | | 140 | | | | 145 | |
3.70%, 08/15/2049 | | | 1,100 | | | | 1,260 | |
3.75%, 07/15/2025 | | | 20 | | | | 22 | |
3.88%, 08/15/2059 | | | 50 | | | | 60 | |
4.25%, 03/15/2043 | | | 120 | | | | 147 | |
Universal Health Services, Inc., 2.65%, 10/15/2030 (e) | | | 194 | | | | 195 | |
| | | | | | | | |
| | |
| | | | | | | 24,575 | |
| | | | | | | | |
Household Products/Wares — 0.1% | | | | | | | | |
Avery Dennison Corp., | | | | | | | | |
1.25%, 03/03/2025 | | EUR | 2,026 | | | | 2,502 | |
2.65%, 04/30/2030 | | | 104 | | | | 107 | |
Clorox Co. (The), 1.80%, 05/15/2030 | | | 10 | | | | 10 | |
Kimberly-Clark Corp., 2.88%, 02/07/2050 | | | 45 | | | | 46 | |
Reckitt Benckiser Treasury Services plc, (United Kingdom), Reg. S, 1.75%, 05/19/2032 | | GBP | 1,675 | | | | 2,352 | |
| | | | | | | | |
| | |
| | | | | | | 5,017 | |
| | | | | | | | |
Pharmaceuticals — 0.6% | | | | | | | | |
AbbVie, Inc., | | | | | | | | |
2.60%, 11/21/2024 | | | 490 | | | | 516 | |
| | | | | | | | |
| SECURITY DESCRIPTION | | PRINCIPAL
AMOUNT($) | | | VALUE($) | |
| | | | | | | | |
Pharmaceuticals — continued | |
3.20%, 11/21/2029 | | | 4,960 | | | | 5,392 | |
4.25%, 11/21/2049 | | | 1,400 | | | | 1,683 | |
AmerisourceBergen Corp., | | | | | | | | |
2.70%, 03/15/2031 | | | 38 | | | | 39 | |
2.80%, 05/15/2030 | | | 5 | | | | 5 | |
3.25%, 03/01/2025 | | | 40 | | | | 43 | |
3.45%, 12/15/2027 | | | 300 | | | | 328 | |
4.30%, 12/15/2047 | | | 25 | | | | 29 | |
AstraZeneca plc, (United Kingdom), 0.70%, 04/08/2026 | | | 1,620 | | | | 1,578 | |
Becton Dickinson and Co., 2.89%, 06/06/2022 | | | 17 | | | | 17 | |
Bristol-Myers Squibb Co., | | | | | | | | |
2.35%, 11/13/2040 | | | 25 | | | | 24 | |
2.55%, 11/13/2050 | | | 110 | | | | 105 | |
3.40%, 07/26/2029 | | | 3,340 | | | | 3,741 | |
3.88%, 08/15/2025 | | | 24 | | | | 27 | |
4.55%, 02/20/2048 | | | 10 | | | | 13 | |
Cardinal Health, Inc., | | | | | | | | |
2.62%, 06/15/2022 | | | 28 | | | | 28 | |
3.08%, 06/15/2024 | | | 10 | | | | 11 | |
4.37%, 06/15/2047 | | | 2 | | | | 2 | |
Cigna Corp., | | | | | | | | |
2.40%, 03/15/2030 | | | 75 | | | | 77 | |
3.40%, 03/01/2027 | | | 2,800 | | | | 3,072 | |
4.90%, 12/15/2048 | | | 800 | | | | 1,031 | |
CVS Health Corp., | | | | | | | | |
1.30%, 08/21/2027 | | | 40 | | | | 39 | |
2.63%, 08/15/2024 | | | 60 | | | | 64 | |
3.70%, 03/09/2023 | | | 32 | | | | 34 | |
4.13%, 04/01/2040 | | | 1,200 | | | | 1,393 | |
4.30%, 03/25/2028 | | | 846 | | | | 973 | |
4.78%, 03/25/2038 | | | 75 | | | | 92 | |
5.05%, 03/25/2048 | | | 1,200 | | | | 1,559 | |
Eli Lilly & Co., | | | | | | | | |
0.63%, 11/01/2031 | | EUR | 2,500 | | | | 3,017 | |
4.15%, 03/15/2059 | | | 15 | | | | 19 | |
GlaxoSmithKline Capital plc, (United Kingdom), | | | | | | | | |
5.25%, 12/19/2033 | | GBP | 640 | | | | 1,243 | |
Reg. S, 5.25%, 04/10/2042 | | GBP | 50 | | | | 107 | |
Johnson & Johnson, | | | | | | | | |
2.10%, 09/01/2040 | | | 10 | | | | 10 | |
2.25%, 09/01/2050 | | | 30 | | | | 28 | |
2.45%, 09/01/2060 | | | 40 | | | | 38 | |
3.40%, 01/15/2038 | | | 50 | | | | 57 | |
3.55%, 03/01/2036 | | | 15 | | | | 17 | |
McKesson Corp., | | | | | | | | |
0.90%, 12/03/2025 | | | 70 | | | | 69 | |
3.13%, 02/17/2029 | | GBP | 925 | | | | 1,399 | |
Merck & Co., Inc.,
1.88%, 10/15/2026 | | EUR | 1,000 | | | | 1,300 | |
2.35%, 06/24/2040 | | | 50 | | | | 48 | |
3.70%, 02/10/2045 | | | 60 | | | | 69 | |
SEE NOTES TO FINANCIAL STATEMENTS.
| | | | | | | | | | |
| | | | | |
| JUNE 30, 2021 | | SIX CIRCLES TRUST | | | | | | | | 87 |
Six Circles Global Bond Fund
SCHEDULE OF PORTFOLIO INVESTMENTS
AS OF JUNE 30, 2021 (Unaudited) (continued)
(Amounts in U.S. Dollars, unless otherwise noted)
(Amounts in thousands, except number of Futures contracts)
| | | | | | | | |
| SECURITY DESCRIPTION | | PRINCIPAL
AMOUNT($) | | | VALUE($) | |
Corporate Bonds — continued | |
Pharmaceuticals — continued | |
Merck Financial Services GmbH, (Germany), Reg. S, 0.01%, 12/15/2023 | | EUR | 600 | | | | 715 | |
Merck KGaA, (Germany), | | | | | | | | |
Reg. S, (ICE EURIBOR Swap Rate 5 Year + 2.00%), 1.63%, 09/09/2080 (aa) | | EUR | 800 | | | | 977 | |
Reg. S, (ICE EURIBOR Swap Rate 5 Year + 2.94%), 2.88%, 06/25/2079 (aa) | | EUR | 400 | | | | 517 | |
Mylan, Inc., 5.20%, 04/15/2048 | | | 30 | | | | 37 | |
Novartis Capital Corp., 2.75%, 08/14/2050 | | | 61 | | | | 61 | |
Roche Finance Europe BV, (Netherlands), | | | | | | | | |
Reg. S, 0.50%, 02/27/2023 | | EUR | 200 | | | | 240 | |
Reg. S, 0.88%, 02/25/2025 | | EUR | 1,600 | | | | 1,970 | |
Sanofi, (France), | | | | | | | | |
Reg. S, 2.50%, 11/14/2023 | | EUR | 600 | | | | 755 | |
Series 20FX, Reg. S, 1.88%, 03/21/2038 | | EUR | 400 | | | | 568 | |
Takeda Pharmaceutical Co. Ltd., (Japan), Reg. S, 3.00%, 11/21/2030 | | EUR | 1,000 | | | | 1,421 | |
Upjohn Finance BV, (Netherlands), Reg. S, 1.91%, 06/23/2032 | | EUR | 1,400 | | | | 1,766 | |
Utah Acquisition Sub, Inc., 3.95%, 06/15/2026 | | | 30 | | | | 33 | |
Viatris, Inc., 3.85%, 06/22/2040 (e) | | | 2,200 | | | | 2,342 | |
Zoetis, Inc., | | | | | | | | |
3.90%, 08/20/2028 | | | 40 | | | | 46 | |
4.70%, 02/01/2043 | | | 190 | | | | 244 | |
| | | | | | | | |
| | | | | | | 41,028 | |
| | | | | | | | |
Total Consumer Non-cyclical | | | | | | | 195,293 | |
| | | | | | | | |
Energy — 1.0% | | | | | | | | |
Oil & Gas — 0.5% | | | | | | | | |
Aker BP ASA, (Norway), 2.88%, 01/15/2026 (e) | | | 1,400 | | | | 1,475 | |
BP Capital Markets plc, (United Kingdom), | | | | | | | | |
Reg. S, 1.53%, 09/26/2022 | | EUR | 175 | | | | 213 | |
Reg. S, (EUR Swap Rate 5 Year + 4.12%), 3.63%, 03/22/2029 (x) (aa) | | EUR | 1,300 | | | | 1,676 | |
Reg. S, (UK Gilts 5 Year + 4.17%), 4.25%, 03/22/2027 (x) (aa) | | GBP | 500 | | | | 732 | |
Canadian Natural Resources Ltd., (Canada), | | | | | | | | |
2.95%, 01/15/2023 | | | 10 | | | | 10 | |
3.85%, 06/01/2027 | | | 10 | | | | 11 | |
4.95%, 06/01/2047 | | | 55 | | | | 69 | |
6.25%, 03/15/2038 | | | 47 | | | | 63 | |
Cenovus Energy, Inc., (Canada), 4.40%, 04/15/2029 | | | 3,700 | | | | 4,188 | |
Cepsa Finance SA, (Spain), Reg. S, 2.25%, 02/13/2026 | | EUR | 100 | | | | 127 | |
Chevron Corp., 2.24%, 05/11/2030 | | | 80 | | | | 82 | |
Chevron USA, Inc., | | | | | | | | |
1.02%, 08/12/2027 | | | 3,000 | | | | 2,922 | |
5.25%, 11/15/2043 | | | 75 | | | | 102 | |
CNOOC Petroleum North America ULC, (Canada), 6.40%, 05/15/2037 | | | 40 | | | | 52 | |
ConocoPhillips,
2.40%, 02/15/2031 (e) | | | 2,100 | | | | 2,152 | |
4.88%, 10/01/2047 (e) | | | 20 | | | | 26 | |
| | | | | | | | |
| SECURITY DESCRIPTION | | PRINCIPAL
AMOUNT($) | | | VALUE($) | |
| | | | | | | | |
Oil & Gas — continued | |
Devon Energy Corp.,
5.88%, 06/15/2028 (e) | | | 350 | | | | 390 | |
Diamondback Energy, Inc., | | | | | | | | |
2.88%, 12/01/2024 | | | 3,100 | | | | 3,274 | |
3.13%, 03/24/2031 | | | 2,540 | | | | 2,635 | |
3.50%, 12/01/2029 | | | 450 | | | | 482 | |
4.40%, 03/24/2051 | | | 35 | | | | 40 | |
Equinor ASA, (Norway), | | | | | | | | |
Reg. S, 1.38%, 05/22/2032 | | EUR | 425 | | | | 545 | |
1.75%, 01/22/2026 | | | 200 | | | | 206 | |
2.38%, 05/22/2030 | | | 60 | | | | 62 | |
3.25%, 11/18/2049 | | | 30 | | | | 32 | |
3.63%, 04/06/2040 | | | 1,800 | | | | 2,054 | |
3.70%, 04/06/2050 | | | 15 | | | | 17 | |
Reg. S, 6.88%, 03/11/2031 | | GBP | 50 | | | | 102 | |
Exxon Mobil Corp., | | | | | | | | |
0.14%, 06/26/2024 | | EUR | 2,000 | | | | 2,390 | |
0.84%, 06/26/2032 | | EUR | 550 | | | | 651 | |
1.41%, 06/26/2039 | | EUR | 700 | | | | 816 | |
3.45%, 04/15/2051 | | | 145 | | | | 158 | |
Hess Corp., 3.50%, 07/15/2024 | | | 10 | | | | 11 | |
HollyFrontier Corp., 4.50%, 10/01/2030 | | | 24 | | | | 26 | |
Lundin Energy Finance BV, (Netherlands), | | | | | | | | |
2.00%, 07/15/2026 (e) | | | 1,360 | | | | 1,363 | |
3.10%, 07/15/2031 (e) | | | 585 | | | | 592 | |
Petroleos Mexicanos, (Mexico), | | | | | | | | |
(ICE LIBOR USD 3 Month + 0.43%), 0.59%, 02/15/2024 (aa) | | | 825 | | | | 827 | |
1.95%, 12/20/2022 | | | 1,200 | | | | 1,218 | |
Pioneer Natural Resources Co., | | | | | | | | |
1.90%, 08/15/2030 | | | 1,197 | | | | 1,154 | |
4.45%, 01/15/2026 | | | 100 | | | | 112 | |
TotalEnergies SE, (France), | | | | | | | | |
Reg. S, (EUR Swap Rate 5 Year + 2.75%), 2.71%, 05/05/2023 (x) (aa) | | EUR | 650 | | | | 802 | |
Reg. S, (EUR Swap Rate 5 Year + 3.35%), 3.37%, 10/06/2026 (x) (aa) | | EUR | 2,000 | | | | 2,629 | |
Series NC12, Reg. S, (EUR Swap Rate 5 Year + 2.51%),
2.13%, 07/25/2032 (x) (aa) | | EUR | 1,350 | | | | 1,575 | |
| | | | | | | | |
| | |
| | | | | | | 38,063 | |
| | | | | | | | |
Oil & Gas Services — 0.0% (g) | |
Baker Hughes a GE Co. LLC / Baker Hughes Co-Obligor, Inc., 4.08%, 12/15/2047 | | | 160 | | | | 183 | |
Halliburton Co., | | | | | | | | |
3.50%, 08/01/2023 | | | 60 | | | | 63 | |
5.00%, 11/15/2045 | | | 20 | | | | 25 | |
Schlumberger Finance BV, (Netherlands), Reg. S, 0.25%, 10/15/2027 | | EUR | 500 | | | | 593 | |
Schlumberger Finance Canada Ltd., (Canada), 1.40%, 09/17/2025 | | | 30 | | | | 30 | |
| | | | | | | | |
| | |
| | | | | | | 894 | |
| | | | | | | | |
SEE NOTES TO FINANCIAL STATEMENTS.
| | | | | | | | | | |
| | | | | |
| 88 | | | | | | | | SIX CIRCLES TRUST | | JUNE 30, 2021 |
| | | | | | | | |
| SECURITY DESCRIPTION | | PRINCIPAL
AMOUNT($) | | | VALUE($) | |
Corporate Bonds — continued | |
Pipelines — 0.5% | |
Cheniere Corpus Christi Holdings LLC, | | | | | | | | |
3.70%, 11/15/2029 | | | 478 | | | | 523 | |
5.88%, 03/31/2025 | | | 165 | | | | 189 | |
Colonial Enterprises, Inc., 3.25%, 05/15/2030 (e) | | | 1,330 | | | | 1,439 | |
Enbridge, Inc., (Canada), | | | | | | | | |
2.90%, 07/15/2022 | | | 20 | | | | 20 | |
4.00%, 10/01/2023 | | | 100 | | | | 107 | |
Energy Transfer LP, | | | | | | | | |
4.05%, 03/15/2025 | | | 100 | | | | 108 | |
4.20%, 04/15/2027 | | | 5,800 | | | | 6,409 | |
5.30%, 04/15/2047 | | | 35 | | | | 41 | |
5.35%, 05/15/2045 | | | 10 | | | | 12 | |
5.40%, 10/01/2047 | | | 52 | | | | 62 | |
Series H, (CMT Index 5 Year + 5.69%), 6.50%, 11/15/2026 (x) (aa) | | | 1,490 | | | | 1,511 | |
Enterprise Products Operating LLC, | | | | | | | | |
4.20%, 01/31/2050 | | | 40 | | | | 46 | |
5.10%, 02/15/2045 | | | 1,700 | | | | 2,149 | |
(ICE LIBOR USD 3 Month + 2.57%), 5.38%, 02/15/2078 (aa) | | | 600 | | | | 619 | |
Kinder Morgan Energy Partners LP, | | | | | | | | |
4.30%, 05/01/2024 | | | 3,200 | | | | 3,488 | |
4.70%, 11/01/2042 | | | 850 | | | | 994 | |
5.50%, 03/01/2044 | | | 49 | | | | 62 | |
Magellan Midstream Partners LP, | | | | | | | | |
3.95%, 03/01/2050 | | | 940 | | | | 1,020 | |
5.00%, 03/01/2026 | | | 10 | | | | 11 | |
MPLX LP, | | | | | | | | |
2.65%, 08/15/2030 | | | 1,745 | | | | 1,763 | |
4.50%, 04/15/2038 | | | 15 | | | | 17 | |
4.70%, 04/15/2048 | | | 1,273 | | | | 1,480 | |
4.88%, 06/01/2025 | | | 2,300 | | | | 2,597 | |
4.90%, 04/15/2058 | | | 40 | | | | 48 | |
5.20%, 03/01/2047 | | | 10 | | | | 12 | |
5.50%, 02/15/2049 | | | 130 | | | | 168 | |
ONEOK Partners LP, 4.90%, 03/15/2025 | | | 80 | | | | 90 | |
ONEOK, Inc., | | | | | | | | |
2.20%, 09/15/2025 | | | 1,000 | | | | 1,028 | |
2.75%, 09/01/2024 | | | 110 | | | | 116 | |
3.40%, 09/01/2029 | | | 60 | | | | 64 | |
4.45%, 09/01/2049 | | | 2,422 | | | | 2,679 | |
5.20%, 07/15/2048 | | | 35 | | | | 43 | |
6.35%, 01/15/2031 | | | 17 | | | | 22 | |
7.15%, 01/15/2051 | | | 20 | | | | 30 | |
Plains All American Pipeline LP / PAA Finance Corp., | | | | | | | | |
3.55%, 12/15/2029 | | | 65 | | | | 68 | |
5.15%, 06/01/2042 | | | 1,600 | | | | 1,797 | |
Sabine Pass Liquefaction LLC, | | | | | | | | |
4.20%, 03/15/2028 | | | 26 | | | | 29 | |
5.88%, 06/30/2026 | | | 70 | | | | 83 | |
TransCanada PipeLines Ltd., (Canada), 6.20%, 10/15/2037 | | | 10 | | | | 14 | |
| | | | | | | | |
| SECURITY DESCRIPTION | | PRINCIPAL
AMOUNT($) | | | VALUE($) | |
| | | | | | | | |
Pipelines — continued | |
Transcontinental Gas Pipe Line Co. LLC, | | | | | | | | |
3.25%, 05/15/2030 | | | 80 | | | | 87 | |
4.00%, 03/15/2028 | | | 20 | | | | 22 | |
Valero Energy Partners LP, 4.38%, 12/15/2026 | | | 1,736 | | | | 1,968 | |
Vier Gas Transport GmbH, (Germany), Reg. S, 0.50%, 09/10/2034 | | EUR | 400 | | | | 460 | |
Williams Cos., Inc. (The), | | | | | | | | |
3.50%, 11/15/2030 | | | 1,900 | | | | 2,076 | |
4.50%, 11/15/2023 | | | 80 | | | | 87 | |
5.10%, 09/15/2045 | | | 59 | | | | 73 | |
5.80%, 11/15/2043 | | | 15 | | | | 20 | |
| | | | | | | | |
| | |
| | | | | | | 35,751 | |
| | | | | | | | |
Total Energy | | | | | | | 74,708 | |
| | | | | | | | |
Financial — 7.5% | | | | | | | | |
Banks — 5.2% | | | | | | | | |
Abanca Corp. Bancaria SA, (Spain), Reg. S, 0.75%, 05/28/2029 | | EUR | 100 | | | | 125 | |
ABN AMRO Bank NV, (Netherlands), | | | | | | | | |
Reg. S, 0.60%, 01/15/2027 | | EUR | 1,600 | | | | 1,925 | |
Reg. S, 0.88%, 01/14/2026 | | EUR | 100 | | | | 125 | |
Reg. S, 1.00%, 06/02/2033 | | EUR | 400 | | | | 476 | |
Reg. S, 1.25%, 01/10/2033 | | EUR | 100 | | | | 133 | |
Reg. S, 1.45%, 04/12/2038 | | EUR | 100 | | | | 138 | |
Reg. S, 1.50%, 09/30/2030 | | EUR | 100 | | | | 134 | |
Reg. S, 3.50%, 09/21/2022 | | EUR | 200 | | | | 249 | |
Aegon Bank NV, (Netherlands), Reg. S, 0.01%, 11/16/2025 | | EUR | 100 | | | | 120 | |
Aktia Bank OYJ, (Finland), Reg. S, 0.38%, 05/30/2023 | | EUR | 100 | | | | 121 | |
AMCO — Asset Management Co. SpA, (Italy), Reg. S, 1.38%, 01/27/2025 | | EUR | 100 | | | | 123 | |
ANZ New Zealand Int’l Ltd., (New Zealand), Reg. S, 0.13%, 09/22/2023 | | EUR | 100 | | | | 120 | |
Argenta Spaarbank NV, (Belgium), Reg. S, 0.01%, 02/11/2031 | | EUR | 100 | | | | 118 | |
ASB Finance Ltd., (New Zealand), | | | | | | | | |
Reg. S, 0.25%, 05/21/2031 | | EUR | 100 | | | | 119 | |
Reg. S, 0.63%, 10/18/2024 | | EUR | 100 | | | | 122 | |
Australia & New Zealand Banking Group Ltd., (Australia), | | | | | | | | |
Reg. S, 0.25%, 11/29/2022 | | EUR | 100 | | | | 120 | |
Reg. S, (EUR Swap Rate 5 Year + 1.12%), 0.67%, 05/05/2031 (aa) | | EUR | 1,525 | | | | 1,801 | |
Banca Monte dei Paschi di Siena SpA, (Italy), | | | | | | | | |
Reg. S, 0.88%, 10/08/2026 | | EUR | 3,504 | | | | 4,318 | |
Reg. S, 2.00%, 01/29/2024 | | EUR | 100 | | | | 126 | |
Series 16, Reg. S, 2.88%, 07/16/2024 | | EUR | 100 | | | | 129 | |
Banco Bilbao Vizcaya Argentaria SA, (Spain), 0.88%, 09/18/2023 | | | 200 | | | | 201 | |
Reg. S, 0.88%, 11/22/2026 | | EUR | 100 | | | | 125 | |
Banco de Sabadell SA, (Spain), | | | | | | | | |
Reg. S, 0.88%, 03/05/2023 | | EUR | 1,300 | | | | 1,564 | |
SEE NOTES TO FINANCIAL STATEMENTS.
| | | | | | | | | | |
| | | | | |
| JUNE 30, 2021 | | SIX CIRCLES TRUST | | | | | | | | 89 |
Six Circles Global Bond Fund
SCHEDULE OF PORTFOLIO INVESTMENTS
AS OF JUNE 30, 2021 (Unaudited) (continued)
(Amounts in U.S. Dollars, unless otherwise noted)
(Amounts in thousands, except number of Futures contracts)
| | | | | | | | |
| SECURITY DESCRIPTION | | PRINCIPAL
AMOUNT($) | | | VALUE($) | |
Corporate Bonds — continued | |
Banks — continued | |
Reg. S, (ICE EURIBOR Swap Rate 1 Year + 1.15%), 0.88%, 06/16/2028 (aa) | | EUR | 900 | | | | 1,050 | |
Reg. S, 1.00%, 04/26/2027 | | EUR | 100 | | | | 126 | |
Reg. S, 1.63%, 03/07/2024 | | EUR | 1,200 | | | | 1,481 | |
Banco di Desio e della Brianza SpA, (Italy), Reg. S, 0.88%, 09/12/2024 | | EUR | 100 | | | | 123 | |
Banco Santander SA, (Spain), | | | | | | | | |
Reg. S, 0.10%, 02/27/2032 | | EUR | 200 | | | | 235 | |
Reg. S, 0.20%, 02/11/2028 | | EUR | 1,000 | | | | 1,176 | |
Reg. S, 0.75%, 09/09/2022 | | EUR | 100 | | | | 120 | |
Reg. S, 1.00%, 04/07/2025 | | EUR | 200 | | | | 249 | |
Reg. S, 1.38%, 01/05/2026 | | EUR | 100 | | | | 124 | |
Reg. S, 1.63%, 10/22/2030 | | EUR | 1,000 | | | | 1,221 | |
Reg. S, 1.75%, 02/17/2027 | | GBP | 500 | | | | 700 | |
1.85%, 03/25/2026 | | | 200 | | | | 202 | |
3.49%, 05/28/2030 | | | 2,000 | | | | 2,162 | |
3.80%, 02/23/2028 | | | 200 | | | | 221 | |
3.85%, 04/12/2023 | | | 200 | | | | 211 | |
Bank of America Corp., | | | | | | | | |
Reg. S, (ICE LIBOR EUR 3 Month + 0.75%), 0.81%, 05/09/2026 (aa) | | EUR | 2,300 | | | | 2,804 | |
(United States SOFR + 0.74%), 0.81%, 10/24/2024 (aa) | | | 240 | | | | 241 | |
(United States SOFR + 0.91%), 0.98%, 09/25/2025 (aa) | | | 30 | | | | 30 | |
Reg. S, (ICE LIBOR EUR 3 Month + 0.95%), 1.10%, 05/24/2032 (aa) | | EUR | 1,300 | | | | 1,580 | |
Reg. S, (ICE LIBOR EUR 3 Month + 0.91%), 1.38%, 05/09/2030 (aa) | | EUR | 1,150 | | | | 1,447 | |
(United States SOFR + 0.96%), 1.73%, 07/22/2027 (aa) | | | 1,415 | | | | 1,426 | |
(United States SOFR + 1.06%), 2.09%, 06/14/2029 (aa) | | | 2,900 | | | | 2,925 | |
(ICE LIBOR USD 3 Month + 0.87%), 2.46%, 10/22/2025 (aa) | | | 20 | | | | 21 | |
(ICE LIBOR USD 3 Month + 0.99%), 2.50%, 02/13/2031 (aa) | | | 3,300 | | | | 3,373 | |
(United States SOFR + 1.93%), 2.68%, 06/19/2041 (aa) | | | 1,870 | | | | 1,817 | |
(United States SOFR + 1.32%), 2.69%, 04/22/2032 (aa) | | | 2,295 | | | | 2,364 | |
(ICE LIBOR USD 3 Month + 1.02%), 2.88%, 04/24/2023 (aa) | | | 250 | | | | 255 | |
(ICE LIBOR USD 3 Month + 0.79%), 3.00%, 12/20/2023 (aa) | | | 250 | | | | 259 | |
(ICE LIBOR USD 3 Month + 1.09%), 3.09%, 10/01/2025 (aa) | | | 10 | | | | 11 | |
(ICE LIBOR USD 3 Month + 1.16%), 3.12%, 01/20/2023 (aa) | | | 25 | | | | 25 | |
(United States SOFR + 1.58%), 3.31%, 04/22/2042 (aa) | | | 1,020 | | | | 1,083 | |
(ICE LIBOR USD 3 Month + 1.04%), 3.42%, 12/20/2028 (aa) | | | 350 | | | | 381 | |
(ICE LIBOR USD 3 Month + 0.97%), 3.46%, 03/15/2025 (aa) | | | 25 | | | | 27 | |
| | | | | | | | |
| SECURITY DESCRIPTION | | PRINCIPAL
AMOUNT($) | | | VALUE($) | |
| | | | | | | | |
Banks — continued | |
(ICE LIBOR USD 3 Month + 0.78%), 3.55%, 03/05/2024 (aa) | | | 25 | | | | 26 | |
(ICE LIBOR USD 3 Month + 0.94%), 3.86%, 07/23/2024 (aa) | | | 120 | | | | 128 | |
4.00%, 01/22/2025 | | | 4,200 | | | | 4,610 | |
(ICE LIBOR USD 3 Month + 1.32%), 4.08%, 04/23/2040 (aa) | | | 170 | | | | 199 | |
(ICE LIBOR USD 3 Month + 3.15%), 4.08%, 03/20/2051 (aa) | | | 185 | | | | 221 | |
(ICE LIBOR USD 3 Month + 1.52%), 4.33%, 03/15/2050 (aa) | | | 115 | | | | 142 | |
4.88%, 04/01/2044 | | | 50 | | | | 65 | |
Reg. S, 7.00%, 07/31/2028 | | GBP | 350 | | | | 666 | |
Series N, (United States SOFR + 1.22%), 2.65%, 03/11/2032 (aa) | | | 1,000 | | | | 1,028 | |
Series N, (United States SOFR + 1.65%), 3.48%, 03/13/2052 (aa) | | | 150 | | | | 164 | |
Bank of Montreal, (Canada), | | | | | | | | |
Reg. S, 0.10%, 10/20/2023 | | EUR | 100 | | | | 120 | |
1.85%, 05/01/2025 | | | 120 | | | | 124 | |
Bank of New Zealand, (New Zealand), Reg. S, 0.01%, 06/15/2028 | | EUR | 100 | | | | 119 | |
Bank of Nova Scotia (The), (Canada), | | | | | | | | |
Reg. S, 0.01%, 01/14/2027 | | EUR | 100 | | | | 120 | |
Reg. S, 0.25%, 09/28/2022 | | EUR | 100 | | | | 119 | |
Reg. S, 0.38%, 10/23/2023 | | EUR | 100 | | | | 121 | |
0.70%, 04/15/2024 | | | 140 | | | | 140 | |
1.05%, 03/02/2026 | | | 120 | | | | 119 | |
Bankinter SA, (Spain), Reg. S, 0.88%, 08/03/2022 | | EUR | 100 | | | | 120 | |
Banque Federative du Credit Mutuel SA, (France), | | | | | | | | |
Reg. S, 0.50%, 11/16/2022 | | EUR | 1,200 | | | | 1,441 | |
0.65%, 02/27/2024 (e) | | | 1,300 | | | | 1,297 | |
Reg. S, 0.75%, 06/15/2023 | | EUR | 100 | | | | 121 | |
Reg. S, 1.88%, 11/04/2026 | | EUR | 1,200 | | | | 1,523 | |
Barclays Bank plc, (United Kingdom), 5.75%, 09/14/2026 | | GBP | 90 | | | | 151 | |
Barclays plc, (United Kingdom), | | | | | | | | |
(CMT Index 1 Year + 0.80%), 1.01%, 12/10/2024 (aa) | | | 200 | | | | 201 | |
Reg. S, (EUR Swap Rate 5 Year + 1.90%), 2.00%, 02/07/2028 (aa) | | EUR | 1,700 | | | | 2,066 | |
(United States SOFR + 2.71%), 2.85%, 05/07/2026 (aa) | | | 1,200 | | | | 1,268 | |
Reg. S, 3.25%, 02/12/2027 | | GBP | 600 | | | | 903 | |
Reg. S, (UK Gilts 5 Year + 3.75%), 3.75%, 11/22/2030 (aa) | | GBP | 425 | | | | 635 | |
4.34%, 01/10/2028 | | | 1,800 | | | | 2,014 | |
(ICE LIBOR USD 3 Month + 1.40%), 4.61%, 02/15/2023 (aa) | | | 900 | | | | 923 | |
Basellandschaftliche Kantonalbank, (Switzerland), Reg. S, 0.38%, 05/13/2030 | | CHF | 100 | | | | 111 | |
SEE NOTES TO FINANCIAL STATEMENTS.
| | | | | | | | | | |
| | | | | |
| 90 | | | | | | | | SIX CIRCLES TRUST | | JUNE 30, 2021 |
| | | | | | | | |
| SECURITY DESCRIPTION | | PRINCIPAL
AMOUNT($) | | | VALUE($) | |
Corporate Bonds — continued | | | | | | | | |
Banks — continued | |
BAWAG PSK Bank fuer Arbeit und Wirtschaft und Oesterreichische Postsparkasse AG, (Austria), | | | | | | | | |
Reg. S, 0.01%, 01/21/2028 | | EUR | 100 | | | | 120 | |
Reg. S, 0.10%, 05/12/2031 | | EUR | 100 | | | | 118 | |
Bayerische Landesbank, (Germany), Reg. S, 0.25%, 01/14/2025 | | EUR | 100 | | | | 121 | |
Belfius Bank SA, (Belgium), Reg. S, 0.13%, 01/28/2030 | | EUR | 100 | | | | 120 | |
Berlin Hyp AG, (Germany), | | | | | | | | |
Reg. S, 0.01%, 07/07/2028 | | EUR | 100 | | | | 120 | |
Reg. S, 0.01%, 01/27/2031 | | EUR | 100 | | | | 118 | |
Series 200, Reg. S, 0.38%, 02/21/2025 | | EUR | 100 | | | | 122 | |
BNP Paribas SA, (France), | | | | | | | | |
Reg. S, (ICE LIBOR EUR 3 Month + 0.95%), 0.50%, 09/01/2028 (aa) | | EUR | 1,100 | | | | 1,301 | |
Reg. S, 1.13%, 01/15/2023 | | EUR | 2,430 | | | | 2,947 | |
Reg. S, (EUR Swap Rate 5 Year + 1.20%), 1.13%, 01/15/2032 (aa) | | EUR | 800 | | | | 956 | |
(United States SOFR + 1.00%), 1.32%, 01/13/2027 (e) (aa) | | | 3,000 | | | | 2,965 | |
Reg. S, 1.38%, 05/28/2029 | | EUR | 100 | | | | 126 | |
Reg. S, 1.63%, 07/02/2031 | | EUR | 1,600 | | | | 1,978 | |
(United States SOFR + 0.91%), 1.68%, 06/30/2027 (e) (aa) | | | 1,250 | | | | 1,249 | |
(United States SOFR + 1.61%), 1.90%, 09/30/2028 (e) (aa) | | | 1,100 | | | | 1,093 | |
Reg. S, (EUR Swap Rate 5 Year + 1.85%), 2.38%, 11/20/2030 (aa) | | EUR | 800 | | | | 1,019 | |
(United States SOFR + 1.39%), 2.87%, 04/19/2032 (e) (aa) | | | 865 | | | | 889 | |
Reg. S, 2.88%, 10/01/2026 | | EUR | 100 | | | | 133 | |
Reg. S, 3.38%, 01/23/2026 | | GBP | 600 | | | | 906 | |
BNZ International Funding Ltd., (New Zealand), Reg. S, 0.38%, 09/14/2024 | | EUR | 1,450 | | | | 1,748 | |
BPCE SA, (France), | | | | | | | | |
Reg. S, 0.25%, 01/15/2026 | | EUR | 2,600 | | | | 3,110 | |
Reg. S, 0.50%, 02/24/2027 | | EUR | 1,300 | | | | 1,551 | |
Reg. S, 0.88%, 01/31/2024 | | EUR | 1,200 | | | | 1,458 | |
(United States SOFR + 1.52%), 1.65%, 10/06/2026 (e) (aa) | | | 1,145 | | | | 1,151 | |
4.63%, 07/11/2024 (e) | | | 1,800 | | | | 1,979 | |
BPER Banca, (Italy), Reg. S, 0.88%, 01/22/2022 | | EUR | 100 | | | | 119 | |
Caisse Centrale du Credit Immobilier de France SA, (France), | | | | | | | | |
Reg. S, 0.00%, 01/17/2024 | | EUR | 200 | | | | 239 | |
Reg. S, 0.13%, 10/26/2022 | | EUR | 400 | | | | 478 | |
Caixa Economica Montepio Geral Caixa Economica Bancaria SA, (Portugal), | | | | | | | | |
Reg. S, 0.13%, 11/14/2024 | | EUR | 100 | | | | 120 | |
Reg. S, 0.88%, 10/17/2022 | | EUR | 4,200 | | | | 5,050 | |
CaixaBank SA, (Spain), | | | | | | | | |
Reg. S, (ICE LIBOR EUR 3 Month + 1.00%), 0.75%, 05/26/2028 (aa) | | EUR | 1,100 | | | | 1,312 | |
| | | | | | | | |
| SECURITY DESCRIPTION | | PRINCIPAL
AMOUNT($) | | | VALUE($) | |
| | | | | | | | |
Banks — continued | |
Reg. S, 1.00%, 09/25/2025 | | EUR | 300 | | | | 374 | |
Reg. S, 1.25%, 01/11/2027 | | EUR | 200 | | | | 255 | |
Canadian Imperial Bank of Commerce, (Canada), | | | | | | | | |
Reg. S, 0.01%, 04/30/2029 | | EUR | 100 | | | | 118 | |
Reg. S, 0.04%, 07/09/2027 | | EUR | 100 | | | | 120 | |
Reg. S, 0.10%, 10/24/2023 | | CHF | 50 | | | | 55 | |
0.45%, 06/22/2023 | | | 110 | | | | 110 | |
3.10%, 04/02/2024 | | | 25 | | | | 27 | |
Cie de Financement Foncier SA, (France), | | | | | | | | |
Reg. S, 0.23%, 09/14/2026 | | EUR | 100 | | | | 121 | |
Reg. S, 0.25%, 04/11/2023 | | EUR | 100 | | | | 120 | |
Reg. S, 0.50%, 09/04/2024 | | EUR | 100 | | | | 122 | |
Reg. S, 0.75%, 05/29/2026 | | EUR | 100 | | | | 125 | |
Reg. S, 3.88%, 04/25/2055 | | EUR | 45 | | | | 99 | |
Citigroup, Inc., | | | | | | | | |
(United States SOFR + 0.69%), 0.78%, 10/30/2024 (aa) | | | 330 | | | | 331 | |
(United States SOFR + 0.67%), 0.98%, 05/01/2025 (aa) | | | 440 | | | | 441 | |
(United States SOFR + 0.77%), 1.12%, 01/28/2027 (aa) | | | 130 | | | | 128 | |
(United States SOFR + 0.77%), 1.46%, 06/09/2027 (aa) | | | 3,170 | | | | 3,159 | |
Reg. S, (ICE LIBOR EUR 3 Month + 1.07%), 1.50%, 07/24/2026 (aa) | | EUR | 3,400 | | | | 4,243 | |
Reg. S, 1.50%, 10/26/2028 | | EUR | 2,050 | | | | 2,614 | |
(United States SOFR + 1.17%), 2.56%, 05/01/2032 (aa) | | | 1,155 | | | | 1,178 | |
(United States SOFR + 2.11%), 2.57%, 06/03/2031 (aa) | | | 3,600 | | | | 3,705 | |
(United States SOFR + 2.84%), 3.11%, 04/08/2026 (aa) | | | 155 | | | | 166 | |
(ICE LIBOR USD 3 Month + 0.72%), 3.14%, 01/24/2023 (aa) | | | 150 | | | | 152 | |
(ICE LIBOR USD 3 Month + 0.90%), 3.35%, 04/24/2025 (aa) | | | 65 | | | | 69 | |
3.38%, 03/01/2023 | | | 150 | | | | 157 | |
(ICE LIBOR USD 3 Month + 1.84%), 4.28%, 04/24/2048 (aa) | | | 60 | | | | 75 | |
4.40%, 06/10/2025 | | | 3,500 | | | | 3,910 | |
(United States SOFR + 3.91%), 4.41%, 03/31/2031 (aa) | | | 175 | | | | 205 | |
4.65%, 07/23/2048 | | | 215 | | | | 282 | |
4.75%, 05/18/2046 | | | 50 | | | | 64 | |
Clydesdale Bank plc, (United Kingdom), Reg. S, 4.63%, 06/08/2026 | | GBP | 100 | | | | 164 | |
Commerzbank AG, (Germany), | | | | | | | | |
Reg. S, 0.01%, 03/11/2030 | | EUR | 100 | | | | 118 | |
Reg. S, 0.50%, 06/09/2026 | | EUR | 100 | | | | 123 | |
Reg. S, 2.00%, 11/27/2023 | | EUR | 100 | | | | 126 | |
Commonwealth Bank of Australia, (Australia), | | | | | | | | |
Reg. S, 0.88%, 02/19/2029 | | EUR | 100 | | | | 126 | |
SEE NOTES TO FINANCIAL STATEMENTS.
| | | | | | | | | | |
| | | | | |
| JUNE 30, 2021 | | SIX CIRCLES TRUST | | | | | | | | 91 |
Six Circles Global Bond Fund
SCHEDULE OF PORTFOLIO INVESTMENTS
AS OF JUNE 30, 2021 (Unaudited) (continued)
(Amounts in U.S. Dollars, unless otherwise noted)
(Amounts in thousands, except number of Futures contracts)
| | | | | | | | |
| SECURITY DESCRIPTION | | PRINCIPAL
AMOUNT($) | | | VALUE($) | |
Corporate Bonds — continued | | | | | | | | |
Banks — continued | |
Reg. S, (EUR Swap Rate 5 Year + 1.45%), 1.94%, 10/03/2029 (aa) | | EUR | 1,425 | | | | 1,769 | |
Reg. S, 3.00%, 05/03/2022 | | EUR | 100 | | | | 122 | |
Cooperatieve Rabobank UA, (Netherlands), | | | | | | | | |
Reg. S, 0.01%, 07/02/2030 | | EUR | 100 | | | | 118 | |
Reg. S, 0.01%, 11/27/2040 | | EUR | 100 | | | | 107 | |
Reg. S, 0.63%, 04/26/2026 | | EUR | 100 | | | | 124 | |
Reg. S, 0.88%, 02/08/2028 | | EUR | 100 | | | | 126 | |
Reg. S, 1.25%, 03/23/2026 | | EUR | 775 | | | | 978 | |
Reg. S, 1.38%, 02/03/2027 | | EUR | 25 | | | | 32 | |
Reg. S, 2.38%, 05/22/2023 | | EUR | 30 | | | | 38 | |
Reg. S, 4.13%, 09/14/2022 | | EUR | 1,950 | | | | 2,430 | |
4.38%, 08/04/2025 | | | 250 | | | | 279 | |
Reg. S, 5.25%, 05/23/2041 | | GBP | 50 | | | | 109 | |
Credit Agricole Italia SpA, (Italy), | | | | | | | | |
Reg. S, 0.13%, 03/15/2033 | | EUR | 100 | | | | 117 | |
Reg. S, 0.25%, 09/30/2024 | | EUR | 100 | | | | 121 | |
Reg. S, 0.25%, 01/17/2028 | | EUR | 100 | | | | 121 | |
Credit Agricole SA, (France), | | | | | | | | |
Reg. S, (ICE LIBOR EUR 3 Month + 1.25%), 1.00%, 04/22/2026 (aa) | | EUR | 3,000 | | | | 3,669 | |
Reg. S, 1.75%, 03/05/2029 | | EUR | 100 | | | | 129 | |
Reg. S, (UK Gilts 5 Year + 1.50%), 1.87%, 12/09/2031 (aa) | | GBP | 300 | | | | 416 | |
Reg. S, 2.38%, 05/20/2024 | | EUR | 100 | | | | 127 | |
3.75%, 04/24/2023 (e) | | | 2,200 | | | | 2,328 | |
Credit Suisse Group AG, (Switzerland), | | | | | | | | |
Reg. S, (EUR Swap Rate 1 Year + 0.75%), 1.25%, 07/17/2025 (aa) | | EUR | 1,400 | | | | 1,704 | |
(United States SOFR + 1.56%), 2.59%, 09/11/2025 (e) (aa) | | | 3,850 | | | | 4,004 | |
(United States SOFR + 1.73%), 3.09%, 05/14/2032 (e) (aa) | | | 495 | | | | 509 | |
(United States SOFR + 3.73%), 4.19%, 04/01/2031 (e) (aa) | | | 2,000 | | | | 2,250 | |
Credito Emiliano SpA, (Italy), Reg. S, 0.01%, 07/07/2028 (w) | | EUR | 100 | | | | 118 | |
Danske Bank A/S, (Denmark), | | | | | | | | |
Reg. S, 0.25%, 11/28/2022 | | EUR | 425 | | | | 508 | |
Reg. S, (ICE EURIBOR Swap Rate 1 Year + 1.15%), 0.50%, 08/27/2025 (aa) | | EUR | 425 | | | | 509 | |
(CMT Index 1 Year + 1.03%), 1.17%, 12/08/2023 (e) (aa) | | | 3,350 | | | | 3,367 | |
Reg. S, (UK Gilts 1 Year + 1.65%), 2.25%, 01/14/2028 (aa) | | GBP | 2,000 | | | | 2,838 | |
Reg. S, 3.75%, 06/23/2022 | | EUR | 50 | | | | 62 | |
Danske Hypotek AB, (Sweden), | | | | | | | | |
Series 2212, Reg. S, 1.00%, 12/21/2022 | | SEK | 2,000 | | | | 238 | |
Series 2512, Reg. S, 1.00%, 12/17/2025 | | SEK | 2,000 | | | | 240 | |
de Volksbank NV, (Netherlands), Reg. S, 1.00%, 03/08/2028 | | EUR | 100 | | | | 128 | |
Deutsche Apotheker-und Aerztebank eG, (Germany), Reg. S, 0.01%, 02/06/2029 | | EUR | 100 | | | | 119 | |
| | | | | | | | |
| SECURITY DESCRIPTION | | PRINCIPAL
AMOUNT($) | | | VALUE($) | |
| | | | | | | | |
Banks — continued | |
Deutsche Bank AG, (Germany), | | | | | | | | |
Reg. S, 0.13%, 01/21/2030 | | EUR | 75 | | | | 90 | |
Reg. S, 0.25%, 03/08/2024 | | EUR | 100 | | | | 121 | |
Reg. S, (ICE LIBOR EUR 3 Month + 1.60%), 1.00%, 11/19/2025 (aa) | | EUR | 400 | | | | 484 | |
Reg. S, 1.13%, 08/30/2023 | | EUR | 775 | | | | 944 | |
Reg. S, 1.13%, 03/17/2025 | | EUR | 400 | | | | 489 | |
(United States SOFR + 1.87%), 2.13%, 11/24/2026 (aa) | | | 1,120 | | | | 1,137 | |
(United States SOFR + 2.16%), 2.22%, 09/18/2024 (aa) | | | 435 | | | | 447 | |
3.95%, 02/27/2023 | | | 2,700 | | | | 2,833 | |
Deutsche Hypothekenbank AG, (Germany), | | | | | | | | |
Reg. S, 0.13%, 11/23/2023 | | EUR | 100 | | | | 120 | |
Reg. S, 0.50%, 06/29/2026 | | EUR | 50 | | | | 62 | |
Deutsche Kreditbank AG, (Germany), Reg. S, 0.01%, 11/07/2029 | | EUR | 50 | | | | 59 | |
Deutsche Pfandbriefbank AG, (Germany), Reg. S, 0.63%, 08/30/2027 | | EUR | 100 | | | | 124 | |
Dexia Credit Local SA, (France), | | | | | | | | |
Reg. S, 0.00%, 05/29/2024 | | EUR | 300 | | | | 359 | |
Reg. S, 0.01%, 01/22/2027 | | EUR | 200 | | | | 239 | |
Reg. S, 0.63%, 01/17/2026 | | EUR | 600 | | | | 738 | |
Reg. S, 1.25%, 11/26/2024 | | EUR | 700 | | | | 874 | |
Discover Bank, 3.45%, 07/27/2026 | | | 1,200 | | | | 1,309 | |
DNB Boligkreditt A/S, (Norway), | | | | | | | | |
Reg. S, 0.01%, 01/21/2031 | | EUR | 100 | | | | 117 | |
Reg. S, 0.25%, 01/23/2023 | | EUR | 200 | | | | 240 | |
Reg. S, 0.38%, 11/20/2024 | | EUR | 100 | | | | 122 | |
Reg. S, 1.88%, 11/21/2022 | | EUR | 100 | | | | 122 | |
DZ HYP AG, (Germany), | | | | | | | | |
Reg. S, 0.01%, 06/23/2028 | | EUR | 100 | | | | 120 | |
Reg. S, 0.01%, 10/27/2028 | | EUR | 25 | | | | 30 | |
Reg. S, 0.63%, 10/27/2023 | | EUR | 200 | | | | 243 | |
Reg. S, 0.88%, 04/17/2034 | | EUR | 100 | | | | 127 | |
Eika Boligkreditt A/S, (Norway), Reg. S, 0.38%, 02/26/2025 | | EUR | 100 | | | | 122 | |
Erste Group Bank AG, (Austria), | | | | | | | | |
Reg. S, 0.25%, 06/26/2024 | | EUR | 100 | | | | 121 | |
Reg. S, 0.75%, 02/05/2025 | | EUR | 100 | | | | 123 | |
Federation des Caisses Desjardins du Quebec, (Canada), Reg. S, 0.01%, 04/08/2026 | | EUR | 100 | | | | 120 | |
Goldman Sachs Group, Inc. (The), | | | | | | | | |
(United States SOFR + 0.61%), 0.86%, 02/12/2026 (aa) | | | 55 | | | | 55 | |
Reg. S, 0.88%, 01/21/2030 | | EUR | 350 | | | | 422 | |
(United States SOFR + 0.79%), 1.09%, 12/09/2026 (aa) | | | 270 | | | | 266 | |
Reg. S, 1.38%, 05/15/2024 | | EUR | 1,650 | | | | 2,008 | |
(United States SOFR + 0.80%), 1.43%, 03/09/2027 (aa) | | | 1,310 | | | | 1,307 | |
Reg. S, 2.00%, 03/22/2028 | | EUR | 1,000 | | | | 1,301 | |
2.60%, 02/07/2030 | | | 130 | | | | 135 | |
SEE NOTES TO FINANCIAL STATEMENTS.
| | | | | | | | | | |
| | | | | |
| 92 | | | | | | | | SIX CIRCLES TRUST | | JUNE 30, 2021 |
| | | | | | | | |
| SECURITY DESCRIPTION | | PRINCIPAL
AMOUNT($) | | | VALUE($) | |
Corporate Bonds — continued | | | | | | | | |
Banks — continued | |
(United States SOFR + 1.28%), 2.62%, 04/22/2032 (aa) | | | 4,150 | | | | 4,244 | |
Reg. S, 3.13%, 07/25/2029 | | GBP | 800 | | | | 1,228 | |
(ICE LIBOR USD 3 Month + 1.20%), 3.27%, 09/29/2025 (aa) | | | 2,500 | | | | 2,675 | |
3.50%, 04/01/2025 | | | 95 | | | | 103 | |
3.80%, 03/15/2030 | | | 3,200 | | | | 3,600 | |
(ICE LIBOR USD 3 Month + 1.37%), 4.02%, 10/31/2038 (aa) | | | 350 | | | | 411 | |
(ICE LIBOR USD 3 Month + 1.43%), 4.41%, 04/23/2039 (aa) | | | 85 | | | | 104 | |
4.75%, 10/21/2045 | | | 190 | | | | 250 | |
5.15%, 05/22/2045 | | | 116 | | | | 156 | |
6.25%, 02/01/2041 | | | 50 | | | | 74 | |
6.75%, 10/01/2037 | | | 50 | | | | 73 | |
6.88%, 01/18/2038 | | GBP | 225 | | | | 490 | |
Hamburg Commercial Bank AG, (Germany), Reg. S, 0.25%, 04/25/2022 | | EUR | 100 | | | | 119 | |
Heta Asset Resolution AG, (Austria), Reg. S, 2.38%, 12/13/2022 | | EUR | 800 | | | | 987 | |
HSBC Bank plc, (United Kingdom), Reg. S, 6.25%, 01/30/2041 | | GBP | 175 | | | | 381 | |
HSBC Holdings plc, (United Kingdom), | | | | | | | | |
(United States SOFR + 1.54%), 1.65%, 04/18/2026 (aa) | | | 1,000 | | | | 1,014 | |
(SONIA Interest Rate Benchmark + 1.31%), 1.75%, 07/24/2027 (aa) | | GBP | 800 | | | | 1,119 | |
(GBP Swap Rate 1 Year + 0.94%), 2.18%, 06/27/2023 (aa) | | GBP | 425 | | | | 597 | |
(GBP Swap Rate 1 Year + 1.65%), 3.00%, 07/22/2028 (aa) | | GBP | 1,000 | | | | 1,490 | |
(GBP Swap Rate 1 Year + 1.77%), 3.00%, 05/29/2030 (aa) | | GBP | 225 | | | | 336 | |
(ICE LIBOR USD 3 Month + 0.99%), 3.95%, 05/18/2024 (aa) | | | 200 | | | | 212 | |
(ICE LIBOR USD 3 Month + 1.61%), 3.97%, 05/22/2030 (aa) | | | 900 | | | | 1,007 | |
Reg. S, 7.00%, 04/07/2038 | | GBP | 300 | | | | 640 | |
ING Bank NV, (Netherlands), | | | | | | | | |
Reg. S, 0.75%, 02/18/2029 | | EUR | 100 | | | | 126 | |
Reg. S, 1.88%, 05/22/2023 | | EUR | 100 | | | | 124 | |
ING Belgium SA, (Belgium), Reg. S, 0.01%, 02/20/2030 | | EUR | 100 | | | | 118 | |
ING Groep NV, (Netherlands), | | | | | | | | |
Reg. S, (ICE LIBOR EUR 3 Month + 0.60%), 0.10%, 09/03/2025 (aa) | | EUR | 1,500 | | | | 1,781 | |
Reg. S, 1.13%, 02/14/2025 | | EUR | 1,200 | | | | 1,480 | |
Reg. S, (SONIA Interest Rate Benchmark + 0.91%), 1.13%, 12/07/2028 (aa) | | GBP | 900 | | | | 1,219 | |
(United States SOFR + 1.01%), 1.73%, 04/01/2027 (aa) | | | 1,265 | | | | 1,276 | |
Reg. S, 2.00%, 09/20/2028 | | EUR | 300 | | | | 394 | |
Reg. S, (EUR Swap Rate 5 Year + 2.40%), 2.13%, 05/26/2031 (aa) | | EUR | 300 | | | | 378 | |
| | | | | | | | |
| SECURITY DESCRIPTION | | PRINCIPAL
AMOUNT($) | | | VALUE($) | |
| | | | | | | | |
Banks — continued | |
Reg. S, (EUR Swap Rate 5 Year + 2.85%), 3.00%, 04/11/2028 (aa) | | EUR | 300 | | | | 373 | |
4.10%, 10/02/2023 | | | 200 | | | | 216 | |
Intesa Sanpaolo SpA, (Italy), | | | | | | | | |
Reg. S, 0.38%, 09/14/2026 | | EUR | 100 | | | | 122 | |
Reg. S, 0.63%, 03/23/2023 | | EUR | 100 | | | | 121 | |
Reg. S, 1.00%, 01/27/2023 | | EUR | 100 | | | | 121 | |
Reg. S, 1.50%, 04/10/2024 | | EUR | 2,100 | | | | 2,595 | |
Reg. S, 2.13%, 05/26/2025 | | EUR | 2,275 | | | | 2,895 | |
Reg. S, 3.38%, 01/24/2025 | | EUR | 100 | | | | 135 | |
Series XR, 3.25%, 09/23/2024 (e) | | | 2,900 | | | | 3,085 | |
Investitionsbank Berlin, (Germany), Series 208, 0.05%, 03/02/2035 | | EUR | 100 | | | | 114 | |
KBC Bank NV, (Belgium), Reg. S, 0.38%, 09/01/2022 | | EUR | 100 | | | | 120 | |
Kookmin Bank, (South Korea), Reg. S, 0.05%, 07/15/2025 | | EUR | 100 | | | | 120 | |
Kreditanstalt fuer Wiederaufbau, (Germany), | | | | | | | | |
Reg. S, 0.00%, 06/30/2023 | | EUR | 880 | | | | 1,056 | |
Reg. S, 0.00%, 02/18/2025 | | EUR | 120 | | | | 145 | |
Reg. S, 0.00%, 03/31/2027 | | EUR | 500 | | | | 603 | |
Reg. S, 0.00%, 09/15/2028 | | EUR | 270 | | | | 324 | |
Reg. S, 0.00%, 06/15/2029 | | EUR | 254 | | | | 304 | |
Reg. S, 0.00%, 09/17/2030 | | EUR | 150 | | | | 178 | |
Reg. S, 0.00%, 01/10/2031 | | EUR | 170 | | | | 202 | |
Reg. S, 0.01%, 05/05/2027 | | EUR | 520 | | | | 627 | |
0.05%, 02/28/2024 | | EUR | 500 | | | | 602 | |
Reg. S, 0.05%, 09/29/2034 | | EUR | 280 | | | | 324 | |
0.13%, 06/07/2023 | | EUR | 850 | | | | 1,022 | |
0.25%, 09/15/2025 | | EUR | 1,100 | | | | 1,342 | |
0.38%, 07/18/2025 | | | 200 | | | | 197 | |
Reg. S, 0.38%, 04/23/2030 | | EUR | 360 | | | | 443 | |
Reg. S, 0.50%, 09/28/2026 | | EUR | 520 | | | | 645 | |
0.50%, 09/15/2027 | | EUR | 500 | | | | 621 | |
Reg. S, 0.88%, 07/04/2039 | | EUR | 40 | | | | 51 | |
Reg. S, 1.00%, 12/15/2022 | | GBP | 1,650 | | | | 2,310 | |
Reg. S, 1.13%, 06/15/2037 | | EUR | 340 | | | | 451 | |
Reg. S, 1.38%, 12/15/2025 | | GBP | 225 | | | | 323 | |
Reg. S, 1.38%, 07/31/2035 | | EUR | 202 | | | | 276 | |
2.00%, 05/02/2025 | | | 195 | | | | 204 | |
2.13%, 08/15/2023 | | EUR | 1,100 | | | | 1,380 | |
2.38%, 12/29/2022 | | | 275 | | | | 284 | |
4.70%, 06/02/2037 | | CAD | 100 | | | | 104 | |
Reg. S, 4.88%, 03/15/2037 | | GBP | 425 | | | | 893 | |
6.00%, 12/07/2028 | | GBP | 500 | | | | 952 | |
Kutxabank SA, (Spain), Reg. S, 1.25%, 09/22/2025 | | EUR | 100 | | | | 126 | |
La Banque Postale SA, (France), | | | | | | | | |
Reg. S, 0.25%, 07/12/2026 | | EUR | 200 | | | | 240 | |
Reg. S, (EUR Swap Rate 5 Year + 2.25%), 2.75%, 11/19/2027 (aa) | | EUR | 2,000 | | | | 2,460 | |
Landesbank Baden-Wuerttemberg, (Germany), | | | | | | | | |
Reg. S, 0.38%, 02/18/2027 | | EUR | 200 | | | | 240 | |
SEE NOTES TO FINANCIAL STATEMENTS.
| | | | | | | | | | |
| | | | | |
| JUNE 30, 2021 | | SIX CIRCLES TRUST | | | | | | | | 93 |
Six Circles Global Bond Fund
SCHEDULE OF PORTFOLIO INVESTMENTS
AS OF JUNE 30, 2021 (Unaudited) (continued)
(Amounts in U.S. Dollars, unless otherwise noted)
(Amounts in thousands, except number of Futures contracts)
| | | | | | | | |
| SECURITY DESCRIPTION | | PRINCIPAL
AMOUNT($) | | | VALUE($) | |
Corporate Bonds — continued | | | | | | | | |
Banks — continued | |
Reg. S, 0.50%, 08/04/2022 | | EUR | 100 | | | | 120 | |
Reg. S, 0.88%, 09/15/2025 | | EUR | 100 | | | | 125 | |
Series 809, Reg. S, 0.38%, 07/29/2026 | | EUR | 100 | | | | 120 | |
Landesbank Hessen-Thueringen Girozentrale, (Germany), Reg. S, 0.63%, 01/12/2027 | | EUR | 200 | | | | 249 | |
Landwirtschaftliche Rentenbank, (Germany), | | | | | | | | |
Reg. S, 0.00%, 11/27/2029 | | EUR | 270 | | | | 322 | |
Reg. S, 0.05%, 06/12/2023 | | EUR | 270 | | | | 324 | |
Reg. S, 0.05%, 12/18/2029 | | EUR | 180 | | | | 216 | |
Reg. S, 0.25%, 08/29/2025 | | EUR | 300 | | | | 365 | |
Reg. S, 0.38%, 02/14/2028 | | EUR | 140 | | | | 173 | |
Reg. S, 0.63%, 02/20/2030 | | EUR | 140 | | | | 176 | |
Lansforsakringar Hypotek AB, (Sweden), | | | | | | | | |
Series 515, Reg. S, 2.25%, 09/21/2022 | | SEK | 700 | | | | 84 | |
Series 516, Reg. S, 1.25%, 09/20/2023 | | SEK | 1,000 | | | | 120 | |
Series 517, Reg. S, 1.50%, 09/18/2024 | | SEK | 600 | | | | 73 | |
Series 518, Reg. S, 1.25%, 09/17/2025 | | SEK | 500 | | | | 61 | |
Series 519, Reg. S, 1.50%, 09/16/2026 | | SEK | 400 | | | | 49 | |
Series 520, Reg. S, 1.00%, 09/15/2027 | | SEK | 500 | | | | 60 | |
Liberbank SA, (Spain), Reg. S, 0.25%, 09/25/2029 | | EUR | 100 | | | | 120 | |
Lloyds Bank plc, (United Kingdom), | | | | | | | | |
Reg. S, 0.13%, 06/18/2026 | | EUR | 100 | | | | 120 | |
Reg. S, 0.25%, 03/25/2024 | | EUR | 100 | | | | 121 | |
Reg. S, 4.88%, 03/30/2027 | | GBP | 100 | | | | 170 | |
Reg. S, 7.63%, 04/22/2025 | | GBP | 600 | | | | 1,029 | |
Lloyds Banking Group plc, (United Kingdom), | | | | | | | | |
Reg. S, (EUR Swap Rate 1 Year + 0.85%), 0.50%, 11/12/2025 (aa) | | EUR | 2,400 | | | | 2,886 | |
(CMT Index 1 Year + 0.55%), 0.70%, 05/11/2024 (aa) | | | 200 | | | | 201 | |
(UK Gilts 5 Year + 1.60%), 1.99%, 12/15/2031 (aa) | | GBP | 4,400 | | | | 6,121 | |
3.90%, 03/12/2024 | | | 2,500 | | | | 2,709 | |
Mediobanca Banca di Credito Finanziario SpA, (Italy), | | | | | | | | |
Reg. S, 0.75%, 07/15/2027 | | EUR | 425 | | | | 507 | |
Reg. S, 1.13%, 07/15/2025 | | EUR | 975 | | | | 1,198 | |
Series 4, Reg. S, 1.38%, 11/10/2025 | | EUR | 100 | | | | 127 | |
Mitsubishi UFJ Financial Group, Inc., (Japan), 3.76%, 07/26/2023 | | | 3,150 | | | | 3,365 | |
Mizuho Financial Group, Inc., (Japan), | | | | | | | | |
(ICE LIBOR USD 3 Month + 0.83%), 2.23%, 05/25/2026 (aa) | | | 3,000 | | | | 3,105 | |
(United States SOFR + 1.24%), 2.84%, 07/16/2025 (aa) | | | 200 | | | | 211 | |
Morgan Stanley, | | | | | | | | |
(ICE LIBOR EUR 3 Month + 0.70%), 0.41%, 10/29/2027 (aa) | | EUR | 5,625 | | | | 6,691 | |
(ICE LIBOR EUR 3 Month + 0.72%), 0.50%, 02/07/2031 (aa) | | EUR | 1,050 | | | | 1,222 | |
(ICE LIBOR EUR 3 Month + 0.75%), 0.64%, 07/26/2024 (aa) | | EUR | 1,675 | | | | 2,017 | |
| | | | | | | | |
| SECURITY DESCRIPTION | | PRINCIPAL
AMOUNT($) | | | VALUE($) | |
| | | | | | | | |
Banks — continued | |
(United States SOFR + 0.62%), 0.73%, 04/05/2024 (aa) | | | 100 | | | | 100 | |
(United States SOFR + 0.88%), 1.59%, 05/04/2027 (aa) | | | 1,085 | | | | 1,092 | |
(United States SOFR + 1.03%), 1.79%, 02/13/2032 (aa) | | | 215 | | | | 207 | |
1.88%, 04/27/2027 | | EUR | 1,300 | | | | 1,679 | |
(United States SOFR + 1.02%), 1.93%, 04/28/2032 (aa) | | | 1,350 | | | | 1,314 | |
2.63%, 03/09/2027 | | GBP | 725 | | | | 1,075 | |
(United States SOFR + 1.14%), 2.70%, 01/22/2031 (aa) | | | 3,900 | | | | 4,088 | |
(United States SOFR + 1.43%), 2.80%, 01/25/2052 (aa) | | | 185 | | | | 182 | |
(United States SOFR + 1.49%), 3.22%, 04/22/2042 (aa) | | | 65 | | | | 69 | |
(ICE LIBOR USD 3 Month + 1.46%), 3.97%, 07/22/2038 (aa) | | | 270 | | | | 317 | |
4.10%, 05/22/2023 | | | 2,700 | | | | 2,875 | |
4.30%, 01/27/2045 | | | 120 | | | | 149 | |
(ICE LIBOR USD 3 Month + 1.43%), 4.46%, 04/22/2039 (aa) | | | 10 | | | | 12 | |
4.88%, 11/01/2022 | | | 90 | | | | 95 | |
5.00%, 11/24/2025 | | | 140 | | | | 162 | |
(United States SOFR + 4.84%), 5.60%, 03/24/2051 (aa) | | | 215 | | | | 320 | |
Muenchener Hypothekenbank eG, (Germany), | | | | | | | | |
Reg. S, 0.01%, 11/02/2040 | | EUR | 50 | | | | 54 | |
Reg. S, 1.50%, 06/25/2024 | | EUR | 100 | | | | 125 | |
Reg. S, 2.50%, 07/04/2028 | | EUR | 100 | | | | 141 | |
National Australia Bank Ltd., (Australia), | | | | | | | | |
Reg. S, 0.01%, 01/06/2029 (w) | | EUR | 100 | | | | 118 | |
Reg. S, 0.75%, 01/30/2026 | | EUR | 100 | | | | 124 | |
National Bank of Canada, (Canada), Reg. S, 0.75%, 03/13/2025 | | EUR | 100 | | | | 123 | |
Nationale-Nederlanden Bank NV (The), (Netherlands), Reg. S, 0.01%, 07/08/2030 | | EUR | 100 | | | | 118 | |
Natwest Group plc, (United Kingdom), | | | | | | | | |
(CMT Index 1 Year + 0.90%), 1.64%, 06/14/2027 (aa) | | | 200 | | | | 200 | |
Reg. S, (ICE LIBOR EUR 3 Month + 1.08%), 1.75%, 03/02/2026 (aa) | | EUR | 1,200 | | | | 1,499 | |
Reg. S, (ICE LIBOR EUR 3 Month + 1.74%), 2.00%, 03/04/2025 (aa) | | EUR | 100 | | | | 125 | |
(CMT Index 1 Year + 2.15%), 2.36%, 05/22/2024 (aa) | | | 2,000 | | | | 2,060 | |
Reg. S, (UK Gilts 5 Year + 3.55%), 3.62%, 08/14/2030 (aa) | | GBP | 600 | | | | 885 | |
NIBC Bank NV, (Netherlands), | | | | | | | | |
Reg. S, 0.13%, 04/21/2031 | | EUR | 100 | | | | 118 | |
Reg. S, 0.63%, 06/01/2026 | | EUR | 100 | | | | 123 | |
NORD / LB Luxembourg SA Covered Bond Bank, (Luxembourg), Reg. S, 0.01%, 06/10/2027 | | EUR | 100 | | | | 119 | |
SEE NOTES TO FINANCIAL STATEMENTS.
| | | | | | | | | | |
| | | | | |
| 94 | | | | | | | | SIX CIRCLES TRUST | | JUNE 30, 2021 |
| | | | | | | | |
| SECURITY DESCRIPTION | | PRINCIPAL
AMOUNT($) | | | VALUE($) | |
Corporate Bonds — continued | | | | | | | | |
Banks — continued | |
Norddeutsche Landesbank-Girozentrale, (Germany), Reg. S, 0.25%, 10/28/2026 | | EUR | 20 | | | | 24 | |
Nordea Bank Abp, (Finland), | | | | | | | | |
Reg. S, 0.88%, 06/26/2023 | | EUR | 425 | | | | 515 | |
3.75%, 08/30/2023 (e) | | | 1,900 | | | | 2,028 | |
Nordea Hypotek AB, (Sweden), | | | | | | | | |
Series 5533, Reg. S, 1.25%, 09/20/2023 | | SEK | 1,700 | | | | 204 | |
Series 5534, Reg. S, 1.00%, 09/18/2024 | | SEK | 1,500 | | | | 180 | |
Series 5535, Reg. S, 1.00%, 09/17/2025 | | SEK | 1,800 | | | | 216 | |
Series 5536, Reg. S, 0.50%, 09/16/2026 | | SEK | 500 | | | | 59 | |
Nordea Kiinnitysluottopankki OYJ, (Finland), | | | | | | | | |
Reg. S, 0.13%, 06/18/2027 | | EUR | 100 | | | | 121 | |
Reg. S, 0.63%, 10/19/2022 | | EUR | 200 | | | | 241 | |
NRW Bank, (Germany), | | | | | | | | |
Reg. S, 0.10%, 07/09/2035 | | EUR | 100 | | | | 114 | |
Reg. S, 0.25%, 03/10/2025 | | EUR | 120 | | | | 146 | |
Reg. S, 0.50%, 05/26/2025 | | EUR | 320 | | | | 392 | |
Reg. S, 0.75%, 06/30/2028 | | EUR | 260 | | | | 327 | |
1.20%, 03/28/2039 | | EUR | 100 | | | | 132 | |
1.25%, 05/13/2049 | | EUR | 87 | | | | 120 | |
Nykredit Realkredit A/S, (Denmark), | | | | | | | | |
Series 01E, Reg. S, 1.00%, 10/01/2053 | | DKK | 41,765 | | | | 6,334 | |
Series 13HH, Reg. S, 1.00%, 07/01/2024 | | DKK | 200 | | | | 33 | |
Series 13H, Reg. S, 1.00%, 07/01/2026 | | DKK | 300 | | | | 50 | |
Series 13H, Reg. S, 1.00%, 01/01/2027 | | DKK | 100 | | | | 17 | |
Series 13H, Reg. S, 2.00%, 01/01/2025 | | DKK | 100 | | | | 17 | |
Series 13H, Reg. S, 2.00%, 01/01/2026 | | DKK | 500 | | | | 87 | |
Oesterreichische Kontrollbank AG, (Austria), | | | | | | | | |
Reg. S, 0.00%, 10/08/2026 | | EUR | 150 | | | | 180 | |
Reg. S, 0.25%, 09/26/2024 | | EUR | 300 | | | | 363 | |
OP Mortgage Bank, (Finland), | | | | | | | | |
Reg. S, 0.25%, 03/13/2024 | | EUR | 100 | | | | 121 | |
Reg. S, 0.63%, 02/15/2029 | | EUR | 100 | | | | 125 | |
Reg. S, 1.00%, 11/28/2024 | | EUR | 150 | | | | 186 | |
Pfandbriefbank schweizerischer Hypothekarinstitute AG, (Switzerland), | | | | | | | | |
Reg. S, 0.00%, 02/26/2030 | | CHF | 700 | | | | 760 | |
Series 642, Reg. S, 0.00%, 02/14/2022 | | CHF | 175 | | | | 190 | |
Series 670, Reg. S, 0.00%, 07/29/2024 | | CHF | 100 | | | | 110 | |
Series 675, Reg. S, 0.00%, 06/15/2027 | | CHF | 50 | | | | 55 | |
Series 678, Reg. S, 0.00%, 08/26/2049 | | CHF | 125 | | | | 127 | |
Series 680, Reg. S, 0.00%, 03/30/2026 | | CHF | 50 | | | | 55 | |
Series 682, Reg. S, 0.00%, 04/06/2027 | | CHF | 50 | | | | 55 | |
Series 683, Reg. S, 0.00%, 02/25/2028 | | CHF | 200 | | | | 219 | |
Series 684, Reg. S, 0.00%, 05/10/2045 | | CHF | 50 | | | | 51 | |
Series 696, Reg. S, 0.13%, 11/19/2032 | | CHF | 100 | | | | 108 | |
Series 697, Reg. S, 0.00%, 05/20/2041 | | CHF | 50 | | | | 51 | |
Series JUL, Reg. S, 0.13%, 06/20/2031 (w) | | CHF | 50 | | | | 54 | |
Series JUL, Reg. S, 0.38%, 01/24/2042 (w) | | CHF | 50 | | | | 55 | |
Pfandbriefzentrale der schweizerischen Kantonalbanken AG, (Switzerland), | | | | | | | | |
Series 472, Reg. S, 0.00%, 07/25/2023 | | CHF | 150 | | | | 164 | |
| | | | | | | | |
| SECURITY DESCRIPTION | | PRINCIPAL
AMOUNT($) | | | VALUE($) | |
| | | | | | | | |
Banks — continued | |
Series 483, Reg. S, 0.00%, 01/27/2027 | | CHF | 900 | | | | 989 | |
Series 485, Reg. S, 0.00%, 10/02/2026 | | CHF | 300 | | | | 329 | |
Series 524, Reg. S, 0.00%, 06/21/2028 | | CHF | 50 | | | | 55 | |
Series 526, Reg. S, 0.00%, 07/19/2030 | | CHF | 75 | | | | 81 | |
Series 528, Reg. S, 0.00%, 03/15/2030 | | CHF | 50 | | | | 54 | |
Series 531, Reg. S, 0.00%, 02/15/2036 | | CHF | 155 | | | | 163 | |
Series 536, Reg. S, 0.20%, 06/12/2035 | | CHF | 50 | | | | 54 | |
Prima Banka Slovensko A/S, (Slovakia),
Reg. S, 0.01%, 10/01/2026 | | EUR | 100 | | | | 119 | |
Raiffeisenlandesbank Niederoesterreich-Wien AG, (Austria), Reg. S, 0.63%, 08/28/2026 | | EUR | 100 | | | | 124 | |
Raiffeisenlandesbank Oberoesterreich AG, (Austria), Reg. S, 0.88%, 07/12/2028 | | EUR | 100 | | | | 127 | |
Rheinland-Pfalz Bank, (Germany), SUB, 6.88%, 02/23/2028 (e) | | | 200 | | | | 256 | |
Royal Bank of Canada, (Canada), | | | | | | | | |
Reg. S, 0.25%, 01/29/2024 | | EUR | 100 | | | | 121 | |
Reg. S, 0.25%, 05/02/2024 | | EUR | 700 | | | | 839 | |
Reg. S, 0.63%, 09/10/2025 | | EUR | 100 | | | | 123 | |
0.88%, 01/20/2026 | | | 130 | | | | 128 | |
1.15%, 06/10/2025 | | | 260 | | | | 262 | |
1.20%, 04/27/2026 | | | 70 | | | | 70 | |
2.25%, 11/01/2024 | | | 25 | | | | 26 | |
Santander Consumer Bank A/S, (Norway), | | | | | | | | |
Reg. S, 0.13%, 02/25/2025 | | EUR | 2,700 | | | | 3,205 | |
Reg. S, 0.75%, 03/01/2023 | | EUR | 2,000 | | | | 2,410 | |
Santander Holdings USA, Inc., 3.45%, 06/02/2025 | | | 50 | | | | 54 | |
Santander UK Group Holdings plc, (United Kingdom), 3.57%, 01/10/2023 | | | 200 | | | | 203 | |
Santander UK plc, (United Kingdom), | | | | | | | | |
Reg. S, 1.25%, 09/18/2024 | | EUR | 100 | | | | 124 | |
Reg. S, 5.75%, 03/02/2026 | | GBP | 100 | | | | 171 | |
Series 61, Reg. S, 0.25%, 04/21/2022 | | EUR | 100 | | | | 119 | |
Skandinaviska Enskilda Banken AB, (Sweden), | | | | | | | | |
Reg. S, 0.05%, 07/01/2024 | | EUR | 775 | | | | 927 | |
Reg. S, 0.25%, 05/19/2023 | | EUR | 325 | | | | 389 | |
Reg. S, 0.63%, 01/30/2023 | | EUR | 100 | | | | 121 | |
Reg. S, (EUR Swap Rate 5 Year + 1.35%), 1.38%, 10/31/2028 (aa) | | EUR | 425 | | | | 518 | |
Series 576, Reg. S, 1.00%, 12/20/2023 | | SEK | 2,000 | | | | 239 | |
Series 578, Reg. S, 4.25%, 12/01/2023 | | SEK | 500 | | | | 64 | |
Series 579, Reg. S, 1.00%, 12/18/2024 | | SEK | 2,000 | | | | 240 | |
Societe Generale SA, (France), | | | | | | | | |
Reg. S, 0.75%, 01/25/2027 | | EUR | 2,200 | | | | 2,637 | |
Reg. S, 1.13%, 01/23/2025 | | EUR | 100 | | | | 123 | |
Reg. S, (EUR Swap Rate 5 Year + 1.60%), 1.13%, 06/30/2031 (aa) | | EUR | 3,300 | | | | 3,911 | |
Reg. S, 1.25%, 12/07/2027 | | GBP | 500 | | | | 673 | |
(CMT Index 1 Year + 1.00%), 1.79%, 06/09/2027 (e) (aa) | | | 2,595 | | | | 2,590 | |
2.63%, 01/22/2025 (e) | | | 2,100 | | | | 2,191 | |
SpareBank 1 Boligkreditt A/S, (Norway), | | | | | | | | |
Reg. S, 0.01%, 09/22/2027 | | EUR | 100 | | | | 120 | |
SEE NOTES TO FINANCIAL STATEMENTS.
| | | | | | | | | | |
| | | | | |
| JUNE 30, 2021 | | SIX CIRCLES TRUST | | | | | | | | 95 |
Six Circles Global Bond Fund
SCHEDULE OF PORTFOLIO INVESTMENTS
AS OF JUNE 30, 2021 (Unaudited) (continued)
(Amounts in U.S. Dollars, unless otherwise noted)
(Amounts in thousands, except number of Futures contracts)
| | | | | | | | |
| SECURITY DESCRIPTION | | PRINCIPAL
AMOUNT($) | | | VALUE($) | |
Corporate Bonds — continued | | | | | | | | |
Banks — continued | |
Reg. S, 0.38%, 06/26/2024 | | EUR | 100 | | | | 121 | |
Reg. S, 1.00%, 01/30/2029 | | EUR | 100 | | | | 128 | |
Sparebank 1 Oestlandet, (Norway), Reg. S, 0.25%, 09/30/2024 | | EUR | 600 | | | | 720 | |
SpareBank 1 SR-Bank ASA, (Norway), Reg. S, 0.63%, 03/25/2024 | | EUR | 700 | | | | 847 | |
SR-Boligkreditt A/S, (Norway), | | | | | | | | |
Reg. S, 0.01%, 03/10/2031 | | EUR | 100 | | | | 117 | |
Reg. S, 0.75%, 10/17/2025 | | EUR | 100 | | | | 124 | |
Stadshypotek AB, (Sweden), | | | | | | | | |
Reg. S, 0.13%, 10/05/2026 | | EUR | 130 | | | | 157 | |
Reg. S, 0.38%, 02/22/2023 | | EUR | 100 | | | | 120 | |
Series 1587, Reg. S, 1.50%, 06/01/2023 | | SEK | 2,000 | | | | 241 | |
Series 1588, Reg. S, 1.50%, 03/01/2024 | | SEK | 2,000 | | | | 243 | |
Series 1589, Reg. S, 1.50%, 12/03/2024 | | SEK | 2,000 | | | | 244 | |
Series 1594, Reg. S, 2.00%, 09/01/2028 | | SEK | 2,000 | | | | 254 | |
Standard Chartered plc, (United Kingdom), (ICE LIBOR USD 3 Month + 1.21%), 2.82%, 01/30/2026 (e) (aa) | | | 1,800 | | | | 1,890 | |
Sumitomo Mitsui Banking Corp., (Japan), | | | | | | | | |
Reg. S, 0.41%, 11/07/2029 | | EUR | 4,100 | | | | 4,951 | |
Reg. S, 0.55%, 11/06/2023 | | EUR | 100 | | | | 121 | |
Sumitomo Mitsui Financial Group, Inc., (Japan), | | | | | | | | |
2.45%, 09/27/2024 | | | 200 | | | | 210 | |
2.70%, 07/16/2024 | | | 3,700 | | | | 3,912 | |
3.75%, 07/19/2023 | | | 20 | | | | 21 | |
3.94%, 10/16/2023 | | | 120 | | | | 129 | |
SVB Financial Group, | | | | | | | | |
1.80%, 02/02/2031 | | | 425 | | | | 407 | |
2.10%, 05/15/2028 | | | 120 | | | | 122 | |
Svenska Handelsbanken AB, (Sweden), | | | | | | | | |
Reg. S, 0.50%, 02/18/2030 | | EUR | 975 | | | | 1,155 | |
Reg. S, (EUR Swap Rate 5 Year + 0.80%), 1.25%, 03/02/2028 (aa) | | EUR | 1,675 | | | | 2,025 | |
Sveriges Sakerstallda Obligationer AB, (Sweden), | | | | | | | | |
Reg. S, 0.63%, 10/30/2025 | | EUR | 100 | | | | 123 | |
Series 144, Reg. S, 1.00%, 06/21/2023 | | SEK | 2,000 | | | | 238 | |
Series 146, Reg. S, 0.50%, 06/11/2025 | | SEK | 2,000 | | | | 236 | |
Series 147, Reg. S, 2.00%, 06/17/2026 | | SEK | 1,000 | | | | 126 | |
Swedbank AB, (Sweden), | | | | | | | | |
Reg. S, 0.75%, 05/05/2025 | | EUR | 700 | | | | 856 | |
Reg. S, 1.00%, 06/01/2022 | | EUR | 425 | | | | 511 | |
Reg. S, (EUR Swap Rate 5 Year + 1.28%), 1.50%, 09/18/2028 (aa) | | EUR | 1,900 | | | | 2,313 | |
Swedbank Hypotek AB, (Sweden), | | | | | | | | |
Reg. S, 0.05%, 05/28/2025 | | EUR | 100 | | | | 120 | |
Series 191, Reg. S, 1.00%, 06/15/2022 | | SEK | 1,700 | | | | 201 | |
Series 192, Reg. S, 1.00%, 03/15/2023 | | SEK | 1,000 | | | | 119 | |
Series 193, Reg. S, 1.00%, 12/20/2023 | | SEK | 500 | | | | 60 | |
Series 194, Reg. S, 1.00%, 09/18/2024 | | SEK | 1,100 | | | | 132 | |
Series 195, Reg. S, 1.00%, 06/18/2025 | | SEK | 1,500 | | | | 180 | |
| | | | | | | | |
| SECURITY DESCRIPTION | | PRINCIPAL
AMOUNT($) | | | VALUE($) | |
| | | | | | | | |
Banks — continued | |
Tesco Personal Finance Group plc, (United Kingdom), Reg. S, 3.50%, 07/25/2025 | | GBP | 100 | | | | 145 | |
Toronto-Dominion Bank (The), (Canada), | | | | | | | | |
Reg. S, 0.25%, 03/26/2024 | | EUR | 100 | | | | 121 | |
Reg. S, 0.38%, 04/27/2023 | | EUR | 100 | | | | 120 | |
2.65%, 06/12/2024 | | | 50 | | | | 53 | |
3.25%, 03/11/2024 | | | 20 | | | | 21 | |
Truist Financial Corp., | | | | | | | | |
1.20%, 08/05/2025 | | | 160 | | | | 162 | |
3.88%, 03/19/2029 | | | 1,400 | | | | 1,596 | |
UBS Group AG, (Switzerland), | | | | | | | | |
Reg. S, (EUR Swap Rate 1 Year + 0.77%), 0.25%, 11/05/2028 (aa) | | EUR | 1,200 | | | | 1,407 | |
Reg. S, (EUR Swap Rate 1 Year + 0.75%), 1.25%, 04/17/2025 (aa) | | EUR | 200 | | | | 245 | |
Reg. S, 1.75%, 11/16/2022 | | EUR | 1,450 | | | | 1,769 | |
(ICE LIBOR USD 3 Month + 0.95%), 2.86%, 08/15/2023 (e) (aa) | | | 3,900 | | | | 4,002 | |
UniCredit Bank AG, (Germany), | | | | | | | | |
Reg. S, 0.01%, 09/15/2028 | | EUR | 50 | | | | 60 | |
Reg. S, 0.01%, 03/10/2031 | | EUR | 125 | | | | 147 | |
Reg. S, 0.25%, 01/15/2032 | | EUR | 50 | | | | 60 | |
Reg. S, 0.85%, 05/22/2034 | | EUR | 50 | | | | 63 | |
Reg. S, 0.88%, 01/11/2029 | | EUR | 100 | | | | 127 | |
UniCredit Bank Austria AG, (Austria), Reg. S, 0.05%, 09/21/2035 | | EUR | 100 | | | | 113 | |
UniCredit SpA, (Italy), | | | | | | | | |
Reg. S, 0.38%, 10/31/2026 | | EUR | 100 | | | | 121 | |
Reg. S, (ICE LIBOR EUR 3 Month + 1.35%), 1.20%, 01/20/2026 (aa) | | EUR | 1,175 | | | | 1,421 | |
6.57%, 01/14/2022 (e) | | | 700 | | | | 722 | |
United Overseas Bank Ltd., (Singapore), Reg. S, 0.01%, 12/01/2027 | | EUR | 100 | | | | 119 | |
US Bancorp, 0.85%, 06/07/2024 | | EUR | 700 | | | | 853 | |
Valiant Bank AG, (Switzerland), Reg. S, 0.00%, 07/31/2029 | | CHF | 50 | | | | 54 | |
Virgin Money UK plc, (United Kingdom), | | | | | | | | |
Reg. S, (EUR Swap Rate 1 Year + 0.85%), 0.38%, 05/27/2024 (aa) | | EUR | 225 | | | | 269 | |
Reg. S, (UK Gilts 1 Year + 2.80%), 4.00%, 09/25/2026 (aa) | | GBP | 100 | | | | 151 | |
Reg. S, (UK Gilts 5 Year + 5.25%), 5.13%, 12/11/2030 (aa) | | GBP | 500 | | | | 771 | |
Vseobecna Uverova Banka A/S, (Slovakia), Reg. S, 0.25%, 03/26/2024 | | EUR | 100 | | | | 120 | |
Wells Fargo & Co., | | | | | | | | |
Reg. S, (ICE LIBOR EUR 3 Month + 1.85%), 1.74%, 05/04/2030 (aa) | | EUR | 1,200 | | | | 1,533 | |
Reg. S, 2.13%, 09/24/2031 | | GBP | 500 | | | | 702 | |
(United States SOFR + 1.09%), 2.41%, 10/30/2025 (aa) | | | 400 | | | | 419 | |
(United States SOFR + 2.53%), 3.07%, 04/30/2041 (aa) | | | 1,975 | | | | 2,022 | |
SEE NOTES TO FINANCIAL STATEMENTS.
| | | | | | | | | | |
| | | | | |
| 96 | | | | | | | | SIX CIRCLES TRUST | | JUNE 30, 2021 |
| | | | | | | | |
| SECURITY DESCRIPTION | | PRINCIPAL
AMOUNT($) | | | VALUE($) | |
Corporate Bonds — continued | | | | | | | | |
Banks — continued | |
(ICE LIBOR USD 3 Month + 1.17%), 3.20%, 06/17/2027 (aa) | | | 1,590 | | | | 1,717 | |
3.75%, 01/24/2024 | | | 265 | | | | 285 | |
4.75%, 12/07/2046 | | | 95 | | | | 120 | |
(United States SOFR + 4.50%), 5.01%, 04/04/2051 (aa) | | | 70 | | | | 96 | |
Westpac Banking Corp., (Australia), | | | | | | | | |
Reg. S, 0.38%, 04/02/2026 | | EUR | 100 | | | | 122 | |
Reg. S, (EUR Swap Rate 5 Year + 1.05%), 0.77%, 05/13/2031 (aa) | | EUR | 875 | | | | 1,036 | |
Westpac Securities NZ Ltd., (New Zealand), Reg. S, 0.25%, 04/06/2022 | | EUR | 100 | | | | 119 | |
Wirtschafts- und Infrastrukturbank Hessen, (Germany), 0.88%, 06/14/2028 | | EUR | 100 | | | | 126 | |
| | | | | | | | |
| | |
| | | | | | | 365,584 | |
| | | | | | | | |
Diversified Financial Services — 0.4% | | | | | | | | |
Aareal Bank AG, (Germany), | | | | | | | | |
Series 225, Reg. S, 0.13%, 02/01/2023 | | EUR | 100 | | | | 120 | |
Series 236, Reg. S, 0.01%, 02/01/2028 | | EUR | 100 | | | | 120 | |
AerCap Ireland Capital DAC / AerCap Global Aviation Trust, (Ireland), 4.50%, 09/15/2023 | | | 150 | | | | 161 | |
Affiliated Managers Group, Inc., | | | | | | | | |
3.30%, 06/15/2030 | | | 100 | | | | 108 | |
3.50%, 08/01/2025 | | | 20 | | | | 22 | |
Affordable Housing Finance plc, (United Kingdom), Reg. S, 2.89%, 08/11/2043 | | GBP | 100 | | | | 175 | |
Air Lease Corp., | | | | | | | | |
2.63%, 07/01/2022 | | | 95 | | | | 97 | |
3.50%, 01/15/2022 | | | 20 | | | | 20 | |
Ally Financial, Inc., | | | | | | | | |
1.45%, 10/02/2023 | | | 40 | | | | 40 | |
3.05%, 06/05/2023 | | | 40 | | | | 42 | |
Arkea Home Loans SFH SA, (France), Reg. S, 0.38%, 03/04/2024 | | EUR | 200 | | | | 242 | |
Artesian Finance II plc, (United Kingdom), 6.00%, 09/30/2033 | | GBP | 50 | | | | 101 | |
AXA Bank Europe SCF, (France), Reg. S, 0.50%, 04/18/2025 | | EUR | 200 | | | | 245 | |
AXA Home Loan SFH SA, (France), Reg. S, 0.13%, 06/25/2035 | | EUR | 100 | | | | 115 | |
AYT Cedulas Cajas Global FTA, (Spain), Series 3, 3.75%, 12/14/2022 | | EUR | 100 | | | | 126 | |
AyT Cedulas Cajas X Fondo de Titulizacion de Activos, (Spain), Series X, 3.75%, 06/30/2025 | | EUR | 100 | | | | 137 | |
BPCE SFH SA, (France), | | | | | | | | |
Reg. S, 0.01%, 05/27/2030 | | EUR | 100 | | | | 118 | |
Reg. S, 0.01%, 01/29/2036 | | EUR | 100 | | | | 112 | |
Reg. S, 0.63%, 09/22/2027 | | EUR | 100 | | | | 125 | |
Reg. S, 0.75%, 09/02/2025 | | EUR | 100 | | | | 124 | |
Reg. S, 2.38%, 11/29/2023 | | EUR | 200 | | | | 253 | |
| | | | | | | | |
| SECURITY DESCRIPTION | | PRINCIPAL
AMOUNT($) | | | VALUE($) | |
| | | | | | | | |
Diversified Financial Services — continued | |
Brookfield Finance, Inc., (Canada), 4.00%, 04/01/2024 | | | 40 | | | | 43 | |
Caisse de Refinancement de l’Habitat SA, (France), | | | | | | | | |
Reg. S, 0.01%, 10/08/2029 | | EUR | 100 | | | | 119 | |
Reg. S, 0.13%, 04/30/2027 | | EUR | 100 | | | | 121 | |
Reg. S, 2.38%, 03/05/2024 | | CHF | 50 | | | | 58 | |
3.30%, 09/23/2022 | | EUR | 100 | | | | 124 | |
3.90%, 10/20/2023 | | EUR | 100 | | | | 130 | |
Capital One Financial Corp., | | | | | | | | |
0.80%, 06/12/2024 | | EUR | 425 | | | | 515 | |
1.65%, 06/12/2029 | | EUR | 1,078 | | | | 1,353 | |
Cedulas TDA 6 Fondo de Titulizacion de Activos, (Spain), Series A6, 3.88%, 05/23/2025 | | EUR | 100 | | | | 138 | |
Charles Schwab Corp. (The), 1.15%, 05/13/2026 | | | 105 | | | | 105 | |
CI Financial Corp., (Canada), 4.10%, 06/15/2051 | | | 60 | | | | 62 | |
Clifford Capital Pte Ltd., (Singapore), Reg. S, 3.11%, 08/18/2032 | | | 200 | | | | 205 | |
CME Group, Inc., 5.30%, 09/15/2043 | | | 140 | | | | 202 | |
Credit Agricole Home Loan SFH SA, (France), | | | | | | | | |
Reg. S, 0.13%, 12/16/2024 | | EUR | 100 | | | | 121 | |
Reg. S, 0.38%, 09/30/2024 | | EUR | 100 | | | | 121 | |
Reg. S, 0.50%, 02/19/2026 | | EUR | 100 | | | | 123 | |
Reg. S, 0.63%, 11/28/2022 | | EUR | 100 | | | | 120 | |
Reg. S, 0.88%, 08/11/2028 | | EUR | 200 | | | | 254 | |
Reg. S, 0.88%, 05/06/2034 | | EUR | 100 | | | | 127 | |
Credit Agricole Public Sector SCF SA, (France), Reg. S, 0.88%, 08/02/2027 | | EUR | 100 | | | | 126 | |
Credit Mutuel Home Loan SFH SA, (France), | | | | | | | | |
Reg. S, 1.00%, 01/30/2029 | | EUR | 100 | | | | 128 | |
Reg. S, 4.13%, 01/19/2024 | | EUR | 100 | | | | 132 | |
Credit Suisse Schweiz AG, (Switzerland), Reg. S, 0.00%, 10/31/2030 | | CHF | 25 | | | | 27 | |
Danmarks Skibskredit A/S, (Denmark), Reg. S, 0.13%, 03/20/2025 | | EUR | 100 | | | | 119 | |
DLR Kredit A/S, (Denmark), Series B, Reg. S, 1.00%, 10/01/2022 | | DKK | 300 | | | | 49 | |
FCA Bank SpA, (Italy), | | | | | | | | |
Reg. S, 0.00%, 04/16/2024 | | EUR | 750 | | | | 889 | |
Reg. S, 0.25%, 02/28/2023 | | EUR | 3,000 | | | | 3,577 | |
GE Capital International Funding Co.Unlimited Co., (Ireland), 4.42%, 11/15/2035 | | | 200 | | | | 240 | |
GE Capital UK Funding Unlimited Co., (Ireland), Reg. S, 5.88%, 01/18/2033 | | GBP | 550 | | | | 1,040 | |
Harbour Funding plc, (United Kingdom), Reg. S, 5.28%, 03/31/2034 | | GBP | 25 | | | | 46 | |
Hypo Tirol Bank AG, (Austria), Reg. S, 0.01%, 03/11/2031 | | EUR | 100 | | | | 117 | |
Intercontinental Exchange, Inc., | | | | | | | | |
3.75%, 12/01/2025 | | | 25 | | | | 28 | |
4.25%, 09/21/2048 | | | 50 | | | | 59 | |
SEE NOTES TO FINANCIAL STATEMENTS.
| | | | | | | | | | |
| | | | | |
| JUNE 30, 2021 | | SIX CIRCLES TRUST | | | | | | | | 97 |
Six Circles Global Bond Fund
SCHEDULE OF PORTFOLIO INVESTMENTS
AS OF JUNE 30, 2021 (Unaudited) (continued)
(Amounts in U.S. Dollars, unless otherwise noted)
(Amounts in thousands, except number of Futures contracts)
| | | | | | | | |
| SECURITY DESCRIPTION | | PRINCIPAL
AMOUNT($) | | | VALUE($) | |
Corporate Bonds — continued | | | | | | | | |
Diversified Financial Services — continued | |
Jefferies Group LLC, 2.75%, 10/15/2032 | | | 1,420 | | | | 1,428 | |
Jyske Realkredit A/S, (Denmark), | | | | | | | | |
Reg. S, 0.25%, 07/01/2023 | | EUR | 100 | | | | 120 | |
Series 32lE, Reg. S, 1.00%, 04/01/2023 | | DKK | 200 | | | | 33 | |
Series CCE, Reg. S, 0.01%, 10/01/2027 | | EUR | 100 | | | | 119 | |
Series CCE, Reg. S, 1.00%, 10/01/2024 | | DKK | 100 | | | | 17 | |
La Banque Postale Home Loan SFH SA, (France), | | | | | | | | |
Reg. S, 0.50%, 01/30/2026 | | EUR | 100 | | | | 123 | |
Reg. S, 2.38%, 01/15/2024 | | EUR | 100 | | | | 127 | |
London Stock Exchange Group plc, (United Kingdom), Reg. S, 1.75%, 12/06/2027 | | EUR | 1,000 | | | | 1,300 | |
Mastercard, Inc., | | | | | | | | |
2.10%, 12/01/2027 | | EUR | 1,025 | | | | 1,360 | |
3.85%, 03/26/2050 | | | 40 | | | | 48 | |
Nasdaq, Inc., | | | | | | | | |
0.88%, 02/13/2030 | | EUR | 1,950 | | | | 2,346 | |
1.75%, 05/19/2023 | | EUR | 1,025 | | | | 1,253 | |
4.25%, 06/01/2024 | | | 60 | | | | 65 | |
Nomura Holdings, Inc., (Japan), 2.65%, 01/16/2025 | | | 2,200 | | | | 2,312 | |
Nordea Kredit Realkreditaktieselskab, (Denmark), | | | | | | | | |
Series CC2, Reg. S,
1.00%, 04/01/2025 (e) | | DKK | 200 | | | | 33 | |
Series CT2, Reg. S, 1.00%, 10/01/2022 | | DKK | 400 | | | | 65 | |
Private Export Funding Corp., | | | | | | | | |
0.55%, 07/30/2024 (e) | | | 300 | | | | 299 | |
1.40%, 07/15/2028 | | | 775 | | | | 777 | |
Programa Cedulas TDA Fondo de Titulizacion de Activos, (Spain), Series A6, 4.25%, 04/10/2031 | | EUR | 100 | | | | 165 | |
Prs Finance plc, (United Kingdom), | | | | | | | | |
Reg. S, 1.75%, 11/24/2026 | | GBP | 192 | | | | 280 | |
Reg. S, 2.00%, 01/23/2029 | | GBP | 700 | | | | 1,036 | |
Realkredit Danmark A/S, (Denmark), Series 22S, Reg. S, 0.00%, 10/01/2040 | | DKK | 48 | | | | 7 | |
Societe Generale SFH SA, (France), | | | | | | | | |
Reg. S, 0.50%, 01/20/2023 | | EUR | 100 | | | | 120 | |
Reg. S, 0.50%, 06/02/2025 | | EUR | 100 | | | | 123 | |
Reg. S, 0.50%, 01/28/2026 | | EUR | 100 | | | | 123 | |
Telereal Securitisation plc, (United Kingdom), Series B4, 6.16%, 12/10/2031 | | GBP | 44 | | | | 77 | |
THFC Funding No. 1 plc, (United Kingdom), Reg. S, 5.13%, 12/21/2035 | | GBP | 50 | | | | 95 | |
Visa, Inc., 2.70%, 04/15/2040 | | | 190 | | | | 197 | |
Wellcome Trust Finance plc, (United Kingdom), Reg. S, 4.63%, 07/25/2036 | | GBP | 225 | | | | 452 | |
Western Union Co. (The), 1.35%, 03/15/2026 | | | 1,900 | | | | 1,888 | |
| | | | | | | | |
| | |
| | | | | | | 29,609 | |
| | | | | | | | |
Insurance — 0.8% | | | | | | | | |
Aflac, Inc., 4.75%, 01/15/2049 | | | 190 | | | | 251 | |
| | | | | | | | |
| SECURITY DESCRIPTION | | PRINCIPAL
AMOUNT($) | | | VALUE($) | |
| | | | | | | | |
Insurance — continued | |
Ageas SA, (Belgium), Reg. S, (ICE LIBOR EUR 3 Month + 3.10%),
1.88%, 11/24/2051 (aa) | | EUR | 400 | | | | 477 | |
Allianz SE, (Germany), Reg. S, (ICE EURIBOR Swap Rate 10 Year + 3.20%),
3.38%, 09/18/2024 (x) (aa) | | EUR | 2,400 | | | | 3,102 | |
American International Group, Inc.,
3.40%, 06/30/2030 | | | 3,080 | | | | 3,381 | |
Aon Corp., 2.80%, 05/15/2030 | | | 50 | | | | 53 | |
Aon plc, (Ireland), 4.60%, 06/14/2044 | | | 10 | | | | 12 | |
Aquarius & Investments plc for Zurich Insurance Co. Ltd., (Ireland), Reg. S, (ICE LIBOR EUR 3 Month + 3.45%),
4.25%, 10/02/2043 (aa) | | EUR | 100 | | | | 129 | |
Assicurazioni Generali SpA, (Italy), | | | | | | | | |
Reg. S, 3.88%, 01/29/2029 | | EUR | 500 | | | | 699 | |
Reg. S, 4.13%, 05/04/2026 | | EUR | 100 | | | | 139 | |
Athene Global Funding,
2.50%, 01/14/2025 (e) | | | 20 | | | | 21 | |
Athene Holding Ltd., (Bermuda), 3.95%, 05/25/2051 | | | 25 | | | | 27 | |
Aviva plc, (United Kingdom), | | | | | | | | |
Reg. S, (UK Gilts 5 Year + 4.70%), 4.00%, 06/03/2055 (aa) | | GBP | 425 | | | | 654 | |
Reg. S, (UK Gilts 5 Year + 2.85%), 6.13%, 11/14/2036 (aa) | | GBP | 230 | | | | 389 | |
AXA SA, (France), | | | | | | | | |
Reg. S, (ICE LIBOR EUR 3 Month + 2.40%), 1.38%, 10/07/2041 (aa) | | EUR | 625 | | | | 740 | |
(ICE LIBOR GBP 3 Month + 2.75%), Reg. S, 6.69%, 07/06/2026 (x) (aa) | | GBP | 375 | | | | 633 | |
Berkshire Hathaway Finance Corp., 2.38%, 06/19/2039 | | GBP | 425 | | | | 631 | |
Berkshire Hathaway, Inc., 0.00%, 03/12/2025 | | EUR | 1,000 | | | | 1,189 | |
BNP Paribas Cardif SA, (France), Reg. S, 1.00%, 11/29/2024 | | EUR | 1,000 | | | | 1,215 | |
Brown & Brown, Inc., 4.20%, 09/15/2024 | | | 65 | | | | 71 | |
Chubb INA Holdings, Inc., 1.55%, 03/15/2028 | | EUR | 2,000 | | | | 2,552 | |
CNA Financial Corp., 2.05%, 08/15/2030 | | | 2,500 | | | | 2,458 | |
CNP Assurances, (France), Reg. S, 0.38%, 03/08/2028 | | EUR | 400 | | | | 464 | |
Credit Agricole Assurances SA, (France), | | | | | | | | |
Reg. S, 2.00%, 07/17/2030 | | EUR | 1,200 | | | | 1,490 | |
Reg. S, (EUR Swap Rate 5 Year + 4.35%), 4.50%, 10/14/2025 (x) (aa) | | EUR | 100 | | | | 135 | |
Enstar Group Ltd., (Bermuda), 4.95%, 06/01/2029 | | | 90 | | | | 103 | |
Everest Reinsurance Holdings, Inc., 3.50%, 10/15/2050 | | | 745 | | | | 795 | |
Fairfax Financial Holdings Ltd., (Canada), | | | | | | | | |
3.38%, 03/03/2031 (e) | | | 1,670 | | | | 1,742 | |
4.63%, 04/29/2030 | | | 317 | | | | 364 | |
SEE NOTES TO FINANCIAL STATEMENTS.
| | | | | | | | | | |
| | | | | |
| 98 | | | | | | | | SIX CIRCLES TRUST | | JUNE 30, 2021 |
| | | | | | | | |
| SECURITY DESCRIPTION | | PRINCIPAL
AMOUNT($) | | | VALUE($) | |
Corporate Bonds — continued | | | | | | | | |
Insurance — continued | |
Helvetia Europe SA, (Luxembourg), Reg. S, (EUR Swap Rate 5 Year + 3.95%),
2.75%, 09/30/2041 (aa) | | EUR | 1,500 | | | | 1,918 | |
Legal & General Finance plc, (United Kingdom), Reg. S, 5.88%, 04/05/2033 | | GBP | 225 | | | | 448 | |
Legal & General Group plc, (United Kingdom), | | | | | | | | |
Reg. S, (UK Gilts 5 Year + 5.25%),
4.50%, 11/01/2050 (aa) | | GBP | 425 | | | | 676 | |
Reg. S, (UK Gilts 5 Year + 4.58%),
5.38%, 10/27/2045 (aa) | | GBP | 300 | | | | 478 | |
Liberty Mutual Finance Europe DAC, (Ireland), Reg. S, 1.75%, 03/27/2024 | | EUR | 2,000 | | | | 2,478 | |
Liberty Mutual Group, Inc., 3.95%, 10/15/2050 (e) | | | 830 | | | | 920 | |
Loews Corp., 3.20%, 05/15/2030 | | | 10 | | | | 11 | |
M&G plc, (United Kingdom), Reg. S, (UK Gilts 5 Year + 4.16%),
5.56%, 07/20/2055 (aa) | | GBP | 425 | | | | 707 | |
Markel Corp., | | | | | | | | |
3.45%, 05/07/2052 | | | 1,000 | | | | 1,030 | |
3.50%, 11/01/2027 | | | 5 | | | | 6 | |
Marsh & McLennan Cos., Inc., | | | | | | | | |
1.98%, 03/21/2030 | | EUR | 3,150 | | | | 4,155 | |
4.20%, 03/01/2048 | | | 190 | | | | 235 | |
4.75%, 03/15/2039 | | | 179 | | | | 229 | |
4.90%, 03/15/2049 | | | 45 | | | | 62 | |
MetLife, Inc., 4.05%, 03/01/2045 | | | 75 | | | | 90 | |
Metropolitan Life Global Funding I, | | | | | | | | |
Reg. S, 0.38%, 04/09/2024 | | EUR | 1,125 | | | | 1,354 | |
Reg. S, 0.55%, 06/16/2027 | | EUR | 775 | | | | 943 | |
Reg. S, 1.63%, 09/21/2029 | | GBP | 1,125 | | | | 1,584 | |
Mutuelle Assurance Des Commercants et Industriels de France et Des Cadres et Sal, (France), | | | | | | | | |
Reg. S, 0.63%, 06/21/2027 | | EUR | 1,000 | | | | 1,179 | |
Reg. S, (ICE LIBOR EUR 3 Month + 3.45%), 2.13%, 06/21/2052 (aa) | | EUR | 1,000 | | | | 1,196 | |
NN Group NV, (Netherlands), Reg. S, (ICE LIBOR EUR 3 Month + 4.00%), 4.50%, 01/15/2026 (x) (aa) | | EUR | 1,350 | | | | 1,830 | |
Old Republic International Corp., 3.85%, 06/11/2051 | | | 95 | | | | 101 | |
Pension Insurance Corp. plc, (United Kingdom), Reg. S, 5.63%, 09/20/2030 | | GBP | 1,121 | | | | 1,904 | |
Phoenix Group Holdings plc, (United Kingdom), | | | | | | | | |
Reg. S, 5.63%, 04/28/2031 | | GBP | 1,400 | | | | 2,364 | |
Reg. S, 6.63%, 12/18/2025 | | GBP | 425 | | | | 710 | |
Principal Financial Group, Inc., 3.10%, 11/15/2026 | | | 1,400 | | | | 1,518 | |
Progressive Corp. (The), | | | | | | | | |
4.13%, 04/15/2047 | | | 190 | | | | 233 | |
4.20%, 03/15/2048 | | | 70 | | | | 87 | |
| | | | | | | | |
| SECURITY DESCRIPTION | | PRINCIPAL
AMOUNT($) | | | VALUE($) | |
| | | | | | | | |
Insurance — continued | |
Sampo OYJ, (Finland), | | | | | | | | |
Reg. S, (ICE LIBOR EUR 3 Month + 3.60%), 2.50%, 09/03/2052 (aa) | | EUR | 525 | | | | 660 | |
Reg. S, (ICE LIBOR EUR 3 Month + 4.05%), 3.38%, 05/23/2049 (aa) | | EUR | 675 | | | | 910 | |
Storebrand Livsforsikring A/S, (Norway), Reg. S, (ICE LIBOR EUR 6 Month + 2.95%), 1.88%, 09/30/2051 (aa) | | EUR | 600 | | | | 699 | |
Unum Group, 4.00%, 06/15/2029 | | | 1,700 | | | | 1,910 | |
W R Berkley Corp., 4.00%, 05/12/2050 | | | 700 | | | | 800 | |
Willis North America, Inc., | | | | | | | | |
2.95%, 09/15/2029 | | | 50 | | | | 53 | |
3.60%, 05/15/2024 | | | 100 | | | | 107 | |
XLIT Ltd., (Cayman Islands), (ICE LIBOR EUR 3 Month + 2.90%), 3.25%, 06/29/2047 (aa) | | EUR | 1,300 | | | | 1,727 | |
| | | | | | | | |
| | |
| | | | | | | 59,228 | |
| | | | | | | | |
Investment Companies — 0.1% | | | | | | | | |
Ares Capital Corp., | | | | | | | | |
2.15%, 07/15/2026 | | | 230 | | | | 229 | |
3.25%, 07/15/2025 | | | 90 | | | | 95 | |
3.50%, 02/10/2023 | | | 92 | | | | 95 | |
3.88%, 01/15/2026 | | | 87 | | | | 93 | |
4.25%, 03/01/2025 | | | 165 | | | | 178 | |
Bain Capital Specialty Finance, Inc., 2.95%, 03/10/2026 | | | 140 | | | | 143 | |
EXOR NV, (Netherlands), | | | | | | | | |
Reg. S, 0.88%, 01/19/2031 | | EUR | 450 | | | | 529 | |
Reg. S, 1.75%, 01/18/2028 | | EUR | 500 | | | | 638 | |
Reg. S, 2.13%, 12/02/2022 | | EUR | 225 | | | | 274 | |
FS KKR Capital Corp., | | | | | | | | |
2.63%, 01/15/2027 | | | 200 | | | | 198 | |
3.40%, 01/15/2026 | | | 240 | | | | 249 | |
Goldman Sachs BDC, Inc., 2.88%, 01/15/2026 | | | 345 | | | | 357 | |
Investor AB, (Sweden), | | | | | | | | |
Reg. S, 0.38%, 10/29/2035 | | EUR | 425 | | | | 477 | |
Reg. S, 1.50%, 09/12/2030 | | EUR | 700 | | | | 914 | |
Owl Rock Capital Corp., | | | | | | | | |
2.88%, 06/11/2028 | | | 10 | | | | 10 | |
3.40%, 07/15/2026 | | | 25 | | | | 26 | |
Prospect Capital Corp., 3.36%, 11/15/2026 | | | 75 | | | | 75 | |
Wendel SE, (France), Reg. S, 1.00%, 06/01/2031 | | EUR | 2,300 | | | | 2,729 | |
| | | | | | | | |
| | |
| | | | | | | 7,309 | |
| | | | | | | | |
Private Equity — 0.1% | | | | | | | | |
3i Group plc, (United Kingdom), Reg. S, 5.75%, 12/03/2032 | | GBP | 350 | | | | 653 | |
Blackstone Property Partners Europe Holdings Sarl, (Luxembourg), | | | | | | | | |
Reg. S, 0.50%, 09/12/2023 | | EUR | 2,200 | | | | 2,630 | |
Reg. S, 2.00%, 02/15/2024 | | EUR | 500 | | | | 618 | |
| | | | | | | | |
| | |
| | | | | | | 3,901 | |
| | | | | | | | |
SEE NOTES TO FINANCIAL STATEMENTS.
| | | | | | | | | | |
| | | | | |
| JUNE 30, 2021 | | SIX CIRCLES TRUST | | | | | | | | 99 |
Six Circles Global Bond Fund
SCHEDULE OF PORTFOLIO INVESTMENTS
AS OF JUNE 30, 2021 (Unaudited) (continued)
(Amounts in U.S. Dollars, unless otherwise noted)
(Amounts in thousands, except number of Futures contracts)
| | | | | | | | |
| SECURITY DESCRIPTION | | PRINCIPAL
AMOUNT($) | | | VALUE($) | |
Corporate Bonds — continued | | | | | | | | |
Real Estate — 0.3% | | | | | | | | |
Acef Holding SCA, (Luxembourg), Reg. S, 0.75%, 06/14/2028 | | EUR | 725 | | | | 857 | |
Annington Funding plc, (United Kingdom), Reg. S, 1.65%, 07/12/2024 | | EUR | 2,000 | | | | 2,478 | |
Broadgate Financing plc, (United Kingdom), Series A4, Reg. S, 4.82%, 07/05/2033 | | GBP | 50 | | | | 89 | |
CBRE Global Investors Open-Ended Fund SCA SICAV-SIF Pan European Core Fund, (Luxembourg), Reg. S, 0.50%, 01/27/2028 | | EUR | 775 | | | | 910 | |
CBRE Services, Inc., 2.50%, 04/01/2031 | | | 152 | | | | 154 | |
Citycon Treasury BV, (Netherlands), Reg. S, 2.50%, 10/01/2024 | | EUR | 1,575 | | | | 1,972 | |
Clarion Funding plc, (United Kingdom), Reg. S, 2.63%, 01/18/2029 | | GBP | 100 | | | | 150 | |
CTP NV, (Netherlands), Reg. S, 1.25%, 06/21/2029 | | EUR | 300 | | | | 351 | |
Fastighets AB Balder, (Sweden), Reg. S, 1.88%, 01/23/2026 | | EUR | 1,000 | | | | 1,251 | |
Heimstaden Bostad AB, (Sweden), Reg. S, 1.13%, 01/21/2026 | | EUR | 1,200 | | | | 1,462 | |
Logicor 2019-1 UK plc, (United Kingdom), Reg. S, 1.88%, 11/17/2026 | | GBP | 425 | | | | 612 | |
Logicor Financing Sarl, (Luxembourg), | | | | | | | | |
Reg. S, 0.75%, 07/15/2024 | | EUR | 1,500 | | | | 1,808 | |
Reg. S, 1.50%, 07/13/2026 | | EUR | 1,200 | | | | 1,495 | |
London & Quadrant Housing Trust, (United Kingdom), | | | | | | | | |
Reg. S, 2.00%, 10/20/2038 | | GBP | 425 | | | | 583 | |
Reg. S, 2.63%, 02/28/2028 | | GBP | 625 | | | | 934 | |
Reg. S, 2.75%, 07/20/2057 | | GBP | 225 | | | | 347 | |
Meadowhall Finance plc, (United Kingdom), Series A1, Reg. S, 4.99%, 01/12/2032 | | GBP | 32 | | | | 51 | |
Notting Hill Genesis, (United Kingdom), Reg. S, 2.00%, 06/03/2036 | | GBP | 300 | | | | 414 | |
Ontario Teachers’ Cadillac Fairview Properties Trust, (Canada), 4.13%, 02/01/2029 (e) | | | 900 | | | | 1,027 | |
Orbit Capital plc, (United Kingdom), Reg. S, 3.38%, 06/14/2048 | | GBP | 425 | | | | 717 | |
Samhallsbyggnadsbolaget i Norden AB, (Sweden), | | | | | | | | |
Reg. S, 1.00%, 08/12/2027 | | EUR | 1,575 | | | | 1,887 | |
Reg. S, 1.75%, 01/14/2025 | | EUR | 850 | | | | 1,055 | |
Tesco Property Finance 1 plc, (United Kingdom), Reg. S, 7.62%, 07/13/2039 | | GBP | 84 | | | | 172 | |
Tesco Property Finance 3 plc, (United Kingdom), Reg. S, 5.74%, 04/13/2040 | | GBP | 47 | | | | 88 | |
Trafford Centre Finance Ltd. (The), (Cayman Islands), Series A2, Reg. S, 6.50%, 07/28/2033 | | GBP | 37 | | | | 62 | |
Vonovia Finance BV, (Netherlands), | | | | | | | | |
Reg. S, 0.63%, 07/09/2026 | | EUR | 300 | | | | 363 | |
Reg. S, 0.88%, 07/03/2023 | | EUR | 100 | | | | 121 | |
| | | | | | | | |
| SECURITY DESCRIPTION | | PRINCIPAL
AMOUNT($) | | | VALUE($) | |
| | | | | | | | |
Real Estate — continued | | | | | | | | |
Reg. S, 1.63%, 04/07/2024 | | EUR | 500 | | | | 618 | |
| | | | | | | | |
| | |
| | | | | | | 22,028 | |
| | | | | | | | |
REITS — 0.6% | | | | | | | | |
Alexandria Real Estate Equities, Inc., 1.88%, 02/01/2033 | | | 40 | | | | 38 | |
Altarea SCA, (France), Reg. S, 1.75%, 01/16/2030 | | EUR | 200 | | | | 237 | |
American Campus Communities Operating Partnership LP, 3.30%, 07/15/2026 | | | 20 | | | | 21 | |
American Tower Corp., | | | | | | | | |
1.00%, 01/15/2032 | | EUR | 3,000 | | | | 3,566 | |
1.30%, 09/15/2025 | | | 60 | | | | 60 | |
1.38%, 04/04/2025 | | EUR | 1,050 | | | | 1,299 | |
3.38%, 05/15/2024 | | | 25 | | | | 27 | |
Brixmor Operating Partnership LP, | | | | | | | | |
4.05%, 07/01/2030 | | | 375 | | | | 420 | |
4.13%, 06/15/2026 | | | 2,300 | | | | 2,561 | |
4.13%, 05/15/2029 | | | 875 | | | | 981 | |
Camden Property Trust, 3.35%, 11/01/2049 | | | 10 | | | | 11 | |
Crown Castle International Corp., 1.35%, 07/15/2025 | | | 100 | | | | 101 | |
Digital Realty Trust LP, 4.75%, 10/01/2025 | | | 50 | | | | 57 | |
Digital Stout Holding LLC, Reg. S, 3.75%, 10/17/2030 | | GBP | 550 | | | | 870 | |
Equinix, Inc., | | | | | | | | |
1.00%, 03/15/2033 | | EUR | 1,000 | | | | 1,174 | |
2.63%, 11/18/2024 | | | 120 | | | | 126 | |
ERP Operating LP, 2.85%, 11/01/2026 | | | 50 | | | | 53 | |
GLP Capital LP / GLP Financing II, Inc., 3.35%, 09/01/2024 | | | 20 | | | | 21 | |
4.00%, 01/15/2030 | | | 5 | | | | 5 | |
4.00%, 01/15/2031 | | | 284 | | | | 306 | |
5.30%, 01/15/2029 | | | 135 | | | | 157 | |
5.38%, 11/01/2023 | | | 30 | | | | 33 | |
5.75%, 06/01/2028 | | | 60 | | | | 72 | |
Healthpeak Properties, Inc., 3.00%, 01/15/2030 | | | 1,400 | | | | 1,485 | |
Host Hotels & Resorts LP, Series H, 3.38%, 12/15/2029 | | | 29 | | | | 30 | |
Kimco Realty Corp., 2.70%, 10/01/2030 | | | 1,900 | | | | 1,954 | |
Life Storage LP, 3.88%, 12/15/2027 | | | 50 | | | | 56 | |
LifeStorage LP, 3.50%, 07/01/2026 | | | 205 | | | | 224 | |
Office Properties Income Trust, 2.65%, 06/15/2026 | | | 100 | | | | 102 | |
Omega Healthcare Investors, Inc., 4.50%, 04/01/2027 | | | 36 | | | | 40 | |
Prologis Euro Finance LLC, 0.25%, 09/10/2027 | | EUR | 1,425 | | | | 1,691 | |
Prologis LP, | | | | | | | | |
2.13%, 10/15/2050 | | | 20 | | | | 17 | |
2.25%, 06/30/2029 | | GBP | 600 | | | | 883 | |
3.25%, 10/01/2026 | | | 50 | | | | 55 | |
SEE NOTES TO FINANCIAL STATEMENTS.
| | | | | | | | | | |
| | | | | |
| 100 | | | | | | | | SIX CIRCLES TRUST | | JUNE 30, 2021 |
| | | | | | | | |
| SECURITY DESCRIPTION | | PRINCIPAL
AMOUNT($) | | | VALUE($) | |
Corporate Bonds — continued | | | | | | | | |
REITS — continued | | | | | | | | |
Public Storage, | | | | | | | | |
2.30%, 05/01/2031 | | | 200 | | | | 204 | |
3.09%, 09/15/2027 | | | 220 | | | | 241 | |
3.39%, 05/01/2029 | | | 145 | | | | 161 | |
Rayonier LP, 2.75%, 05/17/2031 | | | 145 | | | | 147 | |
Realty Income Corp., | | | | | | | | |
1.63%, 12/15/2030 | | GBP | 100 | | | | 137 | |
3.00%, 01/15/2027 | | | 2,000 | | | | 2,162 | |
3.88%, 07/15/2024 | | | 100 | | | | 108 | |
3.88%, 04/15/2025 | | | 100 | | | | 110 | |
Simon International Finance SCA, (Luxembourg), | | | | | | | | |
Reg. S, 1.13%, 03/19/2033 | | EUR | 1,000 | | | | 1,191 | |
Reg. S, 1.25%, 05/13/2025 | | EUR | 425 | | | | 527 | |
Simon Property Group LP, 3.50%, 09/01/2025 | | | 80 | | | | 88 | |
Unibail-Rodamco-Westfield SE, (France),
Reg. S, 1.38%, 12/04/2031 | | EUR | 800 | | | | 975 | |
Ventas Realty LP, 4.13%, 01/15/2026 | | | 2,300 | | | | 2,571 | |
VEREIT Operating Partnership LP, | | | | | | | | |
2.85%, 12/15/2032 | | | 800 | | | | 837 | |
3.10%, 12/15/2029 | | | 800 | | | | 855 | |
Welltower, Inc., | | | | | | | | |
2.75%, 01/15/2031 | | | 50 | | | | 52 | |
3.10%, 01/15/2030 | | | 1,500 | | | | 1,599 | |
4.50%, 01/15/2024 | | | 3,500 | | | | 3,793 | |
4.50%, 12/01/2034 | | GBP | 300 | | | | 507 | |
4.80%, 11/20/2028 | | GBP | 850 | | | | 1,405 | |
Weyerhaeuser Co., | | | | | | | | |
4.00%, 11/15/2029 | | | 35 | | | | 40 | |
4.00%, 04/15/2030 | | | 1,500 | | | | 1,708 | |
WP Carey, Inc., 2.25%, 04/01/2033 | | | 1,000 | | | | 959 | |
WPC Eurobond BV, (Netherlands), | | | | | | | | |
0.95%, 06/01/2030 | | EUR | 1,800 | | | | 2,098 | |
1.35%, 04/15/2028 | | EUR | 425 | | | | 521 | |
| | | | | | | | |
| | |
| | | | | | | 41,729 | |
| | | | | | | | |
Savings & Loans — 0.0% (g) | |
Nationwide Building Society, (United Kingdom), | | | | | | | | |
Reg. S, 0.63%, 03/25/2027 | | EUR | 100 | | | | 124 | |
Reg. S, 5.63%, 01/28/2026 | | GBP | 100 | | | | 169 | |
Yorkshire Building Society, (United Kingdom), Reg. S, 0.01%, 10/13/2027 | | EUR | 100 | | | | 119 | |
| | | | | | | | |
| | | | | | | 412 | |
| | | | | | | | |
Total Financial | | | | | | | 529,800 | |
| | | | | | | | |
Government — 1.7% | |
Multi-National — 1.0% | |
African Development Bank, (Supranational), | | | | | | | | |
0.25%, 11/21/2024 | | EUR | 925 | | | | 1,121 | |
0.88%, 05/24/2028 | | EUR | 200 | | | | 253 | |
1.63%, 09/16/2022 | | | 65 | | | | 66 | |
Asian Development Bank, (Supranational), | | | | | | | | |
Reg. S, 0.03%, 01/31/2030 | | EUR | 1,850 | | | | 2,196 | |
| | | | | | | | |
| SECURITY DESCRIPTION | | PRINCIPAL
AMOUNT($) | | | VALUE($) | |
| | | | | | | | |
Multi-National — continued | | | | | | | | |
1.63%, 01/24/2023 | | | 330 | | | | 337 | |
1.75%, 09/13/2022 | | | 270 | | | | 275 | |
2.63%, 01/30/2024 | | | 258 | | | | 272 | |
Council Of Europe Development Bank, (Supranational), | | | | | | | | |
Reg. S, 0.38%, 10/27/2022 | | EUR | 725 | | | | 870 | |
Reg. S, 0.38%, 03/27/2025 | | EUR | 175 | | | | 214 | |
Reg. S, 0.63%, 01/30/2029 | | EUR | 800 | | | | 1,005 | |
Reg. S, 0.75%, 06/09/2025 | | EUR | 50 | | | | 62 | |
Erste Abwicklungsanstalt, (Germany), Reg. S, 0.01%, 11/03/2023 | | EUR | 1,000 | | | | 1,199 | |
EUROFIMA, (Supranational), | | | | | | | | |
Reg. S, 0.25%, 04/25/2023 | | EUR | 825 | | | | 991 | |
4.55%, 03/30/2027 | | CAD | 400 | | | | 372 | |
5.50%, 06/07/2032 | | GBP | 300 | | | | 586 | |
European Bank for Reconstruction & Development, (Supranational), | | | | | | | | |
0.25%, 07/10/2023 | | | 95 | | | | 95 | |
6.45%, 12/13/2022 | | IDR | 10,000,000 | | | | 706 | |
European Investment Bank, (Supranational), | | | | | | | | |
0.00%, 10/16/2023 | | EUR | 3,200 | | | | 3,843 | |
0.00%, 03/15/2024 | | EUR | 300 | | | | 361 | |
0.00%, 03/25/2025 | | EUR | 10,200 | | | | 12,303 | |
Reg. S, 0.00%, 03/13/2026 | | EUR | 700 | | | | 845 | |
Reg. S, 0.00%, 06/17/2027 | | EUR | 1,500 | | | | 1,809 | |
Zero Coupon, 05/28/2037 (e) | | CAD | 150 | | | | 79 | |
Reg. S, 0.01%, 11/15/2035 | | EUR | 200 | | | | 227 | |
0.05%, 01/16/2030 | | EUR | 1,500 | | | | 1,797 | |
Reg. S, 0.25%, 06/15/2040 | | EUR | 50 | | | | 57 | |
Reg. S, 0.38%, 04/14/2026 | | EUR | 3,000 | | | | 3,688 | |
0.63%, 07/25/2025 | | | 20 | | | | 20 | |
Reg. S, 0.88%, 12/15/2023 | | GBP | 1,375 | | | | 1,930 | |
0.88%, 09/13/2047 | | EUR | 100 | | | | 127 | |
Reg. S, 1.00%, 04/14/2032 | | EUR | 1,675 | | | | 2,185 | |
Reg. S, 1.00%, 11/14/2042 | | EUR | 1,475 | | | | 1,940 | |
Reg. S, 1.13%, 09/15/2036 | | EUR | 2,050 | | | | 2,704 | |
Reg. S, 1.38%, 03/07/2025 | | GBP | 100 | | | | 143 | |
1.50%, 10/16/2048 | | EUR | 445 | | | | 648 | |
1.63%, 03/14/2025 | | | 150 | | | | 155 | |
Reg. S, 2.25%, 10/14/2022 | | EUR | 4,100 | | | | 5,042 | |
Reg. S, 2.50%, 10/31/2022 | | GBP | 1,000 | | | | 1,426 | |
2.50%, 03/15/2023 | | | 180 | | | | 187 | |
2.75%, 09/13/2030 | | EUR | 130 | | | | 194 | |
Reg. S, 3.00%, 09/28/2022 | | EUR | 4,600 | | | | 5,701 | |
3.13%, 12/14/2023 | | | 250 | | | | 267 | |
3.25%, 01/29/2024 | | | 315 | | | | 337 | |
Reg. S, 3.63%, 03/14/2042 | | EUR | 25 | | | | 48 | |
Reg. S, 4.50%, 03/07/2044 | | GBP | 1,100 | | | | 2,454 | |
Reg. S, 6.27%, 08/28/2024 | | IDR | 10,000,000 | | | | 719 | |
Series 1981, 2.63%, 03/15/2035 | | EUR | 40 | | | | 62 | |
Series DIP, Reg. S, 4.63%, 10/12/2054 | | GBP | 555 | | | | 1,419 | |
FMS Wertmanagement, (Germany),
Reg. S, 1.13%, 03/20/2023 | | GBP | 1,200 | | | | 1,686 | |
SEE NOTES TO FINANCIAL STATEMENTS.
| | | | | | | | | | |
| | | | | |
| JUNE 30, 2021 | | SIX CIRCLES TRUST | | | | | | | | 101 |
Six Circles Global Bond Fund
SCHEDULE OF PORTFOLIO INVESTMENTS
AS OF JUNE 30, 2021 (Unaudited) (continued)
(Amounts in U.S. Dollars, unless otherwise noted)
(Amounts in thousands, except number of Futures contracts)
| | | | | | | | |
| SECURITY DESCRIPTION | | PRINCIPAL
AMOUNT($) | | | VALUE($) | |
Corporate Bonds — continued | | | | | | | | |
Multi-National — continued | | | | | | | | |
Inter-American Development Bank, (Supranational), | | | | | | | | |
1.25%, 12/15/2023 | | GBP | 1,650 | | | | 2,337 | |
2.13%, 01/15/2025 | | | 250 | | | | 263 | |
2.50%, 01/18/2023 | | | 230 | | | | 238 | |
2.63%, 01/16/2024 | | | 130 | | | | 137 | |
3.00%, 02/21/2024 | | | 200 | | | | 213 | |
7.88%, 03/14/2023 | | IDR | 10,000,000 | | | | 726 | |
International Finance Corp., (Supranational), 2.88%, 07/31/2023 | | | 80 | | | | 84 | |
North American Development Bank, (Supranational), | | | | | | | | |
Reg. S, 0.20%, 11/28/2028 | | CHF | 200 | | | | 219 | |
2.40%, 10/26/2022 | | | 303 | | | | 309 | |
| | | | | | | | |
| | | | | | | 69,549 | |
| | | | | | | | |
Municipal — 0.0% (g) | |
Transport for London, (United Kingdom), Reg. S, 4.00%, 09/12/2033 | | GBP | 500 | | | | 858 | |
5.00%, 03/31/2035 | | GBP | 200 | | | | 359 | |
| | | | | | | | |
| | | | | | | 1,217 | |
| | | | | | | | |
Regional (State/Province) — 0.0% (g) | |
KAF Kaerntner Ausgleichszahlungs-Fonds, (Austria), Reg. S, Zero | | | | | | | | |
Coupon, 01/14/2032 | | EUR | 500 | | | | 567 | |
| | | | | | | | |
Sovereign — 0.7% | | | | | | | | |
European Financial Stability Facility, (Luxembourg), | | | | | | | | |
Reg. S, 0.00%, 10/13/2027 | | EUR | 1,325 | | | | 1,592 | |
Reg. S, 0.13%, 10/17/2023 | | EUR | 3,500 | | | | 4,211 | |
Reg. S, 0.40%, 02/17/2025 | | EUR | 1,000 | | | | 1,221 | |
Reg. S, 0.50%, 01/20/2023 | | EUR | 3,425 | | | | 4,131 | |
Reg. S, 0.50%, 07/11/2025 | | EUR | 1,000 | | | | 1,228 | |
Reg. S, 0.63%, 10/16/2026 | | EUR | 100 | | | | 124 | |
Reg. S, 0.70%, 01/20/2050 | | EUR | 1,300 | | | | 1,564 | |
Reg. S, 0.88%, 04/10/2035 | | EUR | 1,500 | | | | 1,913 | |
Reg. S, 1.20%, 02/17/2045 | | EUR | 1,225 | | | | 1,636 | |
Reg. S, 1.45%, 09/05/2040 | | EUR | 170 | | | | 236 | |
Reg. S, 1.75%, 07/17/2053 | | EUR | 1,050 | | | | 1,623 | |
Reg. S, 2.25%, 09/05/2022 | | EUR | 3,700 | | | | 4,537 | |
Reg. S, 2.75%, 12/03/2029 | | EUR | 520 | | | | 764 | |
European Stability Mechanism, (Supranational), | | | | | | | | |
Reg. S, 0.00%, 10/18/2022 | | EUR | 2,000 | | | | 2,389 | |
Reg. S, 0.00%, 02/10/2023 | | EUR | 100 | | | | 120 | |
Reg. S, 0.10%, 07/31/2023 | | EUR | 2,000 | | | | 2,403 | |
Reg. S, 0.50%, 03/02/2026 | | EUR | 400 | | | | 494 | |
Reg. S, 0.75%, 09/05/2028 | | EUR | 1,450 | | | | 1,833 | |
Reg. S, 0.88%, 07/18/2042 | | EUR | 20 | | | | 25 | |
Reg. S, 1.75%, 10/20/2045 | | EUR | 50 | | | | 75 | |
Reg. S, 1.80%, 11/02/2046 | | EUR | 920 | | | | 1,409 | |
Reg. S, 1.85%, 12/01/2055 | | EUR | 80 | | | | 130 | |
Reg. S, 2.13%, 11/20/2023 | | EUR | 700 | | | | 883 | |
| | | | | | | | |
| SECURITY DESCRIPTION | | PRINCIPAL
AMOUNT($) | | | VALUE($) | |
| | | | | | | | |
Sovereign — continued | | | | | | | | |
European Union, (Supranational), | | | | | | | | |
Reg. S, 0.00%, 11/04/2025 | | EUR | 698 | | | | 844 | |
Reg. S, 0.00%, 07/04/2035 | | EUR | 350 | | | | 396 | |
Reg. S, 0.10%, 10/04/2040 | | EUR | 975 | | | | 1,069 | |
Reg. S, 0.20%, 06/04/2036 | | | EUR 1,000 | | | | 1,156 | |
Reg. S, 0.30%, 11/04/2050 | | EUR | 1,220 | | | | 1,313 | |
Reg. S, 0.50%, 04/04/2025 | | EUR | 1,875 | | | | 2,305 | |
Reg. S, 0.63%, 11/04/2023 | | EUR | 925 | | | | 1,128 | |
Reg. S, 0.75%, 04/04/2031 | | EUR | 2,025 | | | | 2,571 | |
Reg. S, 1.13%, 04/04/2036 | | EUR | 665 | | | | 873 | |
Reg. S, 3.75%, 04/04/2042 | | EUR | 15 | | | | 29 | |
LCR Finance plc, (United Kingdom), | | | | | | | | |
Reg. S, 4.50%, 12/07/2028 | | GBP | 300 | | | | 523 | |
Reg. S, 4.50%, 12/07/2038 | | GBP | 110 | | | | 227 | |
5.10%, 03/07/2051 | | GBP | 50 | | | | 129 | |
| | | | | | | | |
| | | | | | | 47,104 | |
| | | | | | | | |
Total Government | | | | | | | 118,437 | |
| | | | | | | | |
Industrial — 1.3% | |
Aerospace/Defense — 0.1% | |
Airbus SE, (Netherlands), | | | | | | | | |
Reg. S, 2.00%, 04/07/2028 | | EUR | 100 | | | | 131 | |
Reg. S, 2.38%, 06/09/2040 | | EUR | 900 | | | | 1,237 | |
BAE Systems plc, (United Kingdom), 1.90%, 02/15/2031 (e) | | | 1,350 | | | | 1,302 | |
Boeing Co. (The), | | | | | | | | |
4.51%, 05/01/2023 | | | 250 | | | | 267 | |
4.88%, 05/01/2025 | | | 130 | | | | 146 | |
5.71%, 05/01/2040 | | | 2,300 | | | | 2,965 | |
5.81%, 05/01/2050 | | | 105 | | | | 141 | |
5.93%, 05/01/2060 | | | 30 | | | | 41 | |
General Dynamics Corp., 2.25%, 06/01/2031 | | | 100 | | | | 103 | |
Raytheon Technologies Corp., | | | | | | | | |
3.20%, 03/15/2024 | | | 30 | | | | 32 | |
3.95%, 08/16/2025 | | | 140 | | | | 156 | |
7.20%, 08/15/2027 | | | 20 | | | | 26 | |
Teledyne Technologies, Inc., 2.75%, 04/01/2031 | | | 2,635 | | | | 2,710 | |
| | | | | | | | |
| | | | | | | 9,257 | |
| | | | | | | | |
Building Materials — 0.2% | |
Buzzi Unicem SpA, (Italy), Reg. S, 2.13%, 04/28/2023 | | EUR | 1,225 | | | | 1,504 | |
Carrier Global Corp., | | | | | | | | |
2.24%, 02/15/2025 | | | 20 | | | | 21 | |
2.49%, 02/15/2027 | | | 10 | | | | 11 | |
3.38%, 04/05/2040 | | | 60 | | | | 63 | |
3.58%, 04/05/2050 | | | 85 | | | | 90 | |
Danfoss Finance I BV, (Netherlands),
Reg. S, 0.13%, 04/28/2026 | | EUR | 1,850 | | | | 2,190 | |
Eagle Materials, Inc.,
2.50%, 07/01/2031 (w) | | | 270 | | | | 268 | |
Fortune Brands Home & Security, Inc., 3.25%, 09/15/2029 | | | 31 | | | | 33 | |
SEE NOTES TO FINANCIAL STATEMENTS.
| | | | | | | | | | |
| | | | | |
| 102 | | | | | | | | SIX CIRCLES TRUST | | JUNE 30, 2021 |
| | | | | | | | |
| SECURITY DESCRIPTION | | PRINCIPAL
AMOUNT($) | | | VALUE($) | |
Corporate Bonds — continued | | | | | | | | |
Building Materials — continued | | | | | | | | |
HeidelbergCement Finance Luxembourg SA, (Luxembourg), | | | | | | | | |
Reg. S, 1.13%, 12/01/2027 | | EUR | 25 | | | | 31 | |
Reg. S, 2.50%, 10/09/2024 | | EUR | 30 | | | | 39 | |
Imerys SA, (France), | | | | | | | | |
Reg. S, 1.00%, 07/15/2031 | | EUR | 500 | | | | 589 | |
Reg. S, 2.00%, 12/10/2024 | | EUR | 600 | | | | 756 | |
LafargeHolcim Sterling Finance Netherlands BV, (Netherlands),
Reg. S, 3.00%, 05/12/2032 | | GBP | 425 | | | | 638 | |
Lennox International, Inc., 1.35%, 08/01/2025 | | | 27 | | | | 27 | |
Martin Marietta Materials, Inc., | | | | | | | | |
2.40%, 07/15/2031 (w) | | | 145 | | | | 145 | |
3.20%, 07/15/2051 (w) | | | 120 | | | | 120 | |
4.25%, 07/02/2024 | | | 4,540 | | | | 4,949 | |
Mohawk Capital Finance SA, (Luxembourg), 1.75%, 06/12/2027 | | EUR | 400 | | | | 508 | |
Owens Corning, | | | | | | | | |
3.88%, 06/01/2030 | | | 100 | | | | 111 | |
3.95%, 08/15/2029 | | | 1,000 | | | | 1,131 | |
Vulcan Materials Co., | | | | | | | | |
3.50%, 06/01/2030 | | | 60 | | | | 66 | |
4.50%, 04/01/2025 | | | 10 | | | | 11 | |
4.70%, 03/01/2048 | | | 900 | | | | 1,135 | |
| | | | | | | | |
| | | | | | | 14,436 | |
| | | | | | | | |
Electrical Components & Equipments — 0.1% | |
Eaton Capital Unlimited Co., (Ireland), Reg. S, 0.70%, 05/14/2025 | | EUR | 1,325 | | | | 1,613 | |
Schneider Electric SE, (France), Reg. S, 1.50%, 09/08/2023 | | EUR | 1,000 | | | | 1,227 | |
Signify NV, (Netherlands), | | | | | | | | |
Reg. S, 2.00%, 05/11/2024 | | EUR | 550 | | | | 687 | |
Reg. S, 2.38%, 05/11/2027 | | EUR | 175 | | | | 230 | |
| | | | | | | | |
| | | | | | | 3,757 | |
| | | | | | | | |
Electronics — 0.1% | |
Agilent Technologies, Inc., | | | | | | | | |
2.10%, 06/04/2030 | | | 282 | | | | 279 | |
2.30%, 03/12/2031 | | | 100 | | | | 100 | |
2.75%, 09/15/2029 | | | 60 | | | | 63 | |
3.05%, 09/22/2026 | | | 100 | | | | 108 | |
Allegion US Holding Co., Inc., 3.20%, 10/01/2024 | | | 85 | | | | 90 | |
Amphenol Corp., 2.80%, 02/15/2030 | | | 147 | | | | 156 | |
Amphenol Technologies Holding GmbH, (Germany), Reg. S, 0.75%, 05/04/2026 | | EUR | 1,325 | | | | 1,620 | |
Arrow Electronics, Inc., 3.88%, 01/12/2028 | | | 20 | | | | 23 | |
Flex Ltd., (Singapore), 3.75%, 02/01/2026 | | | 25 | | | | 27 | |
FLIR Systems, Inc., 2.50%, 08/01/2030 | | | 1,625 | | | | 1,639 | |
Keysight Technologies, Inc., | | | | | | | | |
4.55%, 10/30/2024 | | | 200 | | | | 222 | |
4.60%, 04/06/2027 | | | 55 | | | | 64 | |
| | | | | | | | |
| SECURITY DESCRIPTION | | PRINCIPAL
AMOUNT($) | | | VALUE($) | |
| | | | | | | | |
Electronics — continued | | | | | | | | |
Trimble, Inc., | | | | | | | | |
4.15%, 06/15/2023 | | | 100 | | | | 106 | |
4.90%, 06/15/2028 | | | 235 | | | | 276 | |
| | | | | | | | |
| | | | | | | 4,773 | |
| | | | | | | | |
Engineering & Construction — 0.1% | |
Aeroporti di Roma SpA, (Italy), Series A4, 5.44%, 02/20/2023 | | GBP | 50 | | | | 74 | |
Aeroports de Paris, (France), | | | | | | | | |
Reg. S, 1.00%, 01/05/2029 | | EUR | 300 | | | | 373 | |
Reg. S, 1.50%, 07/02/2032 | | EUR | 100 | | | | 128 | |
Reg. S, 2.75%, 04/02/2030 | | EUR | 1,200 | | | | 1,695 | |
Cellnex Finance Co. SA, (Spain), Reg. S, 2.00%, 02/15/2033 | | EUR | 1,200 | | | | 1,408 | |
Heathrow Funding Ltd., (Jersey), | | | | | | | | |
Reg. S, 4.63%, 10/31/2046 | | GBP | 325 | | | | 589 | |
Reg. S, 6.45%, 12/10/2031 | | GBP | 225 | | | | 427 | |
Reg. S, 6.75%, 12/03/2026 | | GBP | 50 | | | | 87 | |
Reg. S, 7.13%, 02/14/2024 | | GBP | 425 | | | | 671 | |
Royal Schiphol Group NV, (Netherlands),
Reg. S, 0.38%, 09/08/2027 | | EUR | 300 | | | | 360 | |
Vantage Towers AG, (Germany), Reg. S, 0.38%, 03/31/2027 | | EUR | 600 | | | | 710 | |
Worley US Finance Sub Ltd., Reg. S, 0.88%, 06/09/2026 | | EUR | 1,375 | | | | 1,631 | |
| | | | | | | | |
| | | | | | | 8,153 | |
| | | | | | | | |
Environmental Control — 0.0% (g) | |
Republic Services, Inc., 2.50%, 08/15/2024 | | | 50 | | | | 53 | |
Waste Connections, Inc., (Canada), | | | | | | | | |
2.60%, 02/01/2030 | | | 200 | | | | 207 | |
4.25%, 12/01/2028 | | | 30 | | | | 35 | |
| | | | | | | | |
| | | | | | | 295 | |
| | | | | | | | |
Hand/Machine Tools — 0.0% (g) | |
Snap-on, Inc., 3.10%, 05/01/2050 | | | 30 | | | | 32 | |
| | | | | | | | |
Machinery - Construction & Mining — 0.0% (g) | |
Caterpillar Financial Services Corp., 0.90%, 03/02/2026 | | | 265 | | | | 265 | |
Caterpillar, Inc., 3.25%, 04/09/2050 | | | 90 | | | | 99 | |
Metso Outotec OYJ, (Finland), Reg. S, 0.88%, 05/26/2028 | | EUR | 500 | | | | 602 | |
Oshkosh Corp., 3.10%, 03/01/2030 | | | 5 | | | | 5 | |
| | | | | | | | |
| | |
| | | | | | | 971 | |
| | | | | | | | |
Machinery — Diversified — 0.1% | | | | | | | | |
Atlas Copco AB, (Sweden), Reg. S, 0.63%, 08/30/2026 | | EUR | 425 | | | | 520 | |
CNH Industrial Finance Europe SA, (Luxembourg), Reg. S, 0.00%, 04/01/2024 | | EUR | 1,000 | | | | 1,184 | |
IDEX Corp., | | | | | | | | |
2.63%, 06/15/2031 | | | 100 | | | | 102 | |
3.00%, 05/01/2030 | | | 332 | | | | 351 | |
SEE NOTES TO FINANCIAL STATEMENTS.
| | | | | | | | | | |
| | | | | |
| JUNE 30, 2021 | | SIX CIRCLES TRUST | | | | | | | | 103 |
Six Circles Global Bond Fund
SCHEDULE OF PORTFOLIO INVESTMENTS
AS OF JUNE 30, 2021 (Unaudited) (continued)
(Amounts in U.S. Dollars, unless otherwise noted)
(Amounts in thousands, except number of Futures contracts)
| | | | | | | | |
| SECURITY DESCRIPTION | | PRINCIPAL
AMOUNT($) | | | VALUE($) | |
Corporate Bonds — continued | | | | | | | | |
Machinery — Diversified — continued | | | | | | | | |
John Deere Capital Corp., 2.60%, 03/07/2024 | | | 50 | | | | 53 | |
John Deere Cash Management SA, (Luxembourg), | | | | | | | | |
Reg. S, 1.38%, 04/02/2024 | | EUR | 1,600 | | | | 1,981 | |
Reg. S, 1.65%, 06/13/2039 | | EUR | 425 | | | | 574 | |
Reg. S, 2.20%, 04/02/2032 | | EUR | 825 | | | | 1,154 | |
Otis Worldwide Corp., | | | | | | | | |
2.06%, 04/05/2025 | | | 20 | | | | 21 | |
3.36%, 02/15/2050 | | | 10 | | | | 10 | |
Westinghouse Air Brake Technologies Corp., | | | | | | | | |
3.20%, 06/15/2025 | | | 50 | | | | 53 | |
4.40%, 03/15/2024 | | | 1,800 | | | | 1,951 | |
| | | | | | | | |
| | |
| | | | | | | 7,954 | |
| | | | | | | | |
Miscellaneous Manufacturers — 0.1% | | | | | | | | |
Alfa Laval Treasury International AB, (Sweden), Reg. S, 1.38%, 09/12/2022 | | EUR | 900 | | | | 1,083 | |
Alstom SA, (France), Reg. S, 0.00%, 01/11/2029 | | EUR | 200 | | | | 230 | |
General Electric Co., | | | | | | | | |
4.25%, 05/01/2040 | | | 30 | | | | 35 | |
4.35%, 05/01/2050 | | | 5 | | | | 6 | |
Reg. S, 5.38%, 12/18/2040 | | GBP | 4 | | | | 8 | |
6.75%, 03/15/2032 | | | 50 | | | | 69 | |
Illinois Tool Works, Inc., 1.25%, 05/22/2023 | | EUR | 1,025 | | | | 1,246 | |
Parker-Hannifin Corp., | | | | | | | | |
1.13%, 03/01/2025 | | EUR | 850 | | | | 1,047 | |
4.00%, 06/14/2049 | | | 25 | | | | 30 | |
Pentair Finance Sarl, (Luxembourg), 4.50%, 07/01/2029 | | | 2,000 | | | | 2,337 | |
Siemens Financieringsmaatschappij NV, (Netherlands), Reg. S, 0.30%, 02/28/2024 | | EUR | 20 | | | | 24 | |
Textron, Inc., 2.45%, 03/15/2031 | | | 1,900 | | | | 1,904 | |
Trane Technologies Luxembourg Finance SA, (Luxembourg), 4.50%, 03/21/2049 | | | 105 | | | | 132 | |
| | | | | | | | |
| | |
| | | | | | | 8,151 | |
| | | | | | | | |
Packaging & Containers — 0.1% | | | | | | | | |
Ball Corp., 0.88%, 03/15/2024 | | EUR | 2,000 | | | | 2,387 | |
DS Smith plc, (United Kingdom), Reg. S, 0.88%, 09/12/2026 | | EUR | 2,300 | | | | 2,786 | |
SIG Combibloc PurchaseCo. Sarl, (Luxembourg), Reg. S, 1.88%, 06/18/2023 | | EUR | 2,000 | | | | 2,451 | |
| | | | | | | | |
| | |
| | | | | | | 7,624 | |
| | | | | | | | |
Transportation — 0.4% | | | | | | | | |
AP Moller—Maersk A/S, (Denmark), | | | | | | | | |
Reg. S, 1.75%, 03/16/2026 | | EUR | 850 | | | | 1,082 | |
Reg. S, 4.00%, 04/04/2025 | | GBP | 800 | | | | 1,227 | |
Brambles Finance Ltd., (Australia), Reg. S, 2.38%, 06/12/2024 | | EUR | 425 | | | | 538 | |
| | | | | | | | |
| SECURITY DESCRIPTION | | PRINCIPAL
AMOUNT($) | | | VALUE($) | |
| | | | | | | | |
Transportation — continued | | | | | | | | |
Burlington Northern Santa Fe LLC, | | | | | | | | |
4.15%, 04/01/2045 | | | 50 | | | | 61 | |
4.55%, 09/01/2044 | | | 170 | | | | 218 | |
4.95%, 09/15/2041 | | | 700 | | | | 920 | |
5.40%, 06/01/2041 | | | 70 | | | | 96 | |
Deutsche Bahn Finance GMBH, (Germany), | | | | | | | | |
Reg. S, 0.10%, 01/28/2036 | | CHF | 150 | | | | 158 | |
Reg. S, 0.50%, 04/09/2027 | | EUR | 140 | | | | 171 | |
Reg. S, 1.38%, 03/28/2031 | | EUR | 2,000 | | | | 2,607 | |
Reg. S, 1.38%, 04/16/2040 | | EUR | 50 | | | | 64 | |
Reg. S, 1.50%, 08/26/2024 | | CHF | 500 | | | | 574 | |
Reg. S, 1.50%, 12/08/2032 | | EUR | 200 | | | | 266 | |
Reg. S, 1.63%, 08/16/2033 | | EUR | 100 | | | | 133 | |
1.99%, 07/08/2030 | | AUD | 200 | | | | 145 | |
Reg. S, 2.75%, 06/20/2022 | | GBP | 500 | | | | 708 | |
Reg. S, 3.50%, 09/27/2024 | | AUD | 300 | | | | 243 | |
Series CB, Reg. S, (EUR Swap Rate 5 Year + 1.89%), 1.60%, 07/18/2029 (x) (aa) | | EUR | 1,700 | | | | 2,034 | |
FedEx Corp., | | | | | | | | |
1.30%, 08/05/2031 | | EUR | 1,125 | | | | 1,400 | |
0.45%, 05/04/2029 | | EUR | 1,000 | | | | 1,181 | |
1.63%, 01/11/2027 | | EUR | 700 | | | | 891 | |
3.25%, 05/15/2041 | | | 50 | | | | 51 | |
Ferrovie dello Stato Italiane SpA, (Italy),
Reg. S, 1.50%, 06/27/2025 | | EUR | 810 | | | | 1,015 | |
Ile-de-France Mobilites, (France), Reg. S, 1.00%, 05/25/2034 | | EUR | 200 | | | | 249 | |
Kansas City Southern, 4.20%, 11/15/2069 | | | 10 | | | | 12 | |
La Poste SA, (France), | | | | | | | | |
Reg. S, 0.38%, 09/17/2027 | | EUR | 100 | | | | 120 | |
Reg. S, 0.63%, 10/21/2026 | | EUR | 1,300 | | | | 1,586 | |
Reg. S, 0.63%, 01/18/2036 | | EUR | 600 | | | | 679 | |
Reg. S, 1.38%, 04/21/2032 | | EUR | 1,000 | | | | 1,280 | |
Network Rail Infrastructure Finance plc, (United Kingdom), Reg. S, 4.38%, 12/09/2030 | | GBP | 190 | | | | 343 | |
Norfolk Southern Corp., 4.10%, 05/15/2121 | | | 15 | | | | 16 | |
OeBB-Infrastruktur AG, (Austria), | | | | | | | | |
2.25%, 05/28/2029 | | EUR | 325 | | | | 453 | |
3.00%, 10/24/2033 | | EUR | 100 | | | | 157 | |
Reg. S, 3.38%, 05/18/2032 | | EUR | 4 | | | | 6 | |
Reg. S, 3.88%, 06/30/2025 | | EUR | 80 | | | | 111 | |
Reg. S, 4.88%, 06/27/2022 | | EUR | 500 | | | | 625 | |
United Parcel Service, Inc., 1.50%, 11/15/2032 | | EUR | 1,125 | | | | 1,471 | |
5.30%, 04/01/2050 | | | 150 | | | | 220 | |
| | | | | | | | |
| | |
| | | | | | | 23,111 | |
| | | | | | | | |
Trucking & Leasing — 0.0% (g) | | | | | | | | |
Penske Truck Leasing Co. Lp / PTL Finance Corp., 4.88%, 07/11/2022 (e) | | | 2,800 | | | | 2,921 | |
| | | | | | | | |
Total Industrial | | | | | | | 91,435 | |
| | | | | | | | |
SEE NOTES TO FINANCIAL STATEMENTS.
| | | | | | | | | | |
| | | | | |
| 104 | | | | | | | | SIX CIRCLES TRUST | | JUNE 30, 2021 |
| | | | | | | | |
| SECURITY DESCRIPTION | | PRINCIPAL
AMOUNT($) | | | VALUE($) | |
Corporate Bonds — continued | | | | | | | | |
Technology — 0.5% | | | | | | | | |
Computers — 0.2% | | | | | | | | |
Amdocs Ltd., (Guernsey), 2.54%,
06/15/2030 | | | 177 | | | | 177 | |
Apple, Inc., | | | | | | | | |
1.00%, 11/10/2022 | | EUR | 700 | | | | 846 | |
1.38%, 05/24/2029 | | EUR | 100 | | | | 130 | |
1.63%, 11/10/2026 | | EUR | 1,125 | | | | 1,451 | |
2.05%, 09/11/2026 | | | 140 | | | | 147 | |
2.38%, 02/08/2041 | | | 35 | | | | 34 | |
2.65%, 02/08/2051 | | | 30 | | | | 29 | |
2.80%, 02/08/2061 | | | 20 | | | | 19 | |
3.05%, 07/31/2029 | | GBP | 425 | | | | 676 | |
3.25%, 02/23/2026 | | | 50 | | | | 55 | |
3.35%, 02/09/2027 | | | 15 | | | | 17 | |
3.75%, 11/13/2047 | | | 1,000 | | | | 1,172 | |
Capgemini SE, (France), Reg. S, 0.63%, 06/23/2025 | | EUR | 100 | | | | 122 | |
Dell International LLC / EMC Corp., | | | | | | | | |
5.45%, 06/15/2023 | | | 100 | | | | 109 | |
5.85%, 07/15/2025 | | | 10 | | | | 12 | |
6.02%, 06/15/2026 | | | 85 | | | | 102 | |
6.10%, 07/15/2027 | | | 5 | | | | 6 | |
6.20%, 07/15/2030 | | | 5 | | | | 6 | |
8.10%, 07/15/2036 | | | 123 | | | | 188 | |
8.35%, 07/15/2046 | | | 212 | | | | 347 | |
Fortinet, Inc., 2.20%, 03/15/2031 | | | 475 | | | | 474 | |
Genpact Luxembourg Sarl, (Luxembourg), | | | | | | | | |
3.38%, 12/01/2024 | | | 1,400 | | | | 1,496 | |
3.70%, 04/01/2022 | | | 100 | | | | 102 | |
Hewlett Packard Enterprise Co., | | | | | | | | |
4.45%, 10/02/2023 | | | 120 | | | | 130 | |
6.35%, 10/15/2045 | | | 15 | | | | 20 | |
HP, Inc., | | | | | | | | |
2.20%, 06/17/2025 | | | 100 | | | | 104 | |
2.65%, 06/17/2031 (e) | | | 340 | | | | 341 | |
3.00%, 06/17/2027 | | | 100 | | | | 107 | |
6.00%, 09/15/2041 | | | 47 | | | | 62 | |
NetApp, Inc., 1.88%, 06/22/2025 | | | 1,760 | | | | 1,811 | |
Teleperformance, (France), | | | | | | | | |
Reg. S, 0.25%, 11/26/2027 | | EUR | 500 | | | | 585 | |
Reg. S, 1.50%, 04/03/2024 | | EUR | 2,600 | | | | 3,195 | |
Reg. S, 1.88%, 07/02/2025 | | EUR | 200 | | | | 252 | |
| | | | | | | | |
| | | | | | | 14,324 | |
| | | | | | | | |
Semiconductors — 0.2% | | | | | | | | |
ASML Holding NV, (Netherlands), | | | | | | | | |
Reg. S, 0.63%, 05/07/2029 | | EUR | 100 | | | | 122 | |
Reg. S, 1.63%, 05/28/2027 | | EUR | 1,450 | | | | 1,872 | |
Broadcom, Inc., | | | | | | | | |
3.15%, 11/15/2025 | | | 7 | | | | 8 | |
3.42%, 04/15/2033 (e) | | | 73 | | | | 77 | |
3.46%, 09/15/2026 | | | 80 | | | | 87 | |
3.47%, 04/15/2034 (e) | | | 100 | | | | 105 | |
3.50%, 02/15/2041 (e) | | | 5 | | | | 5 | |
3.75%, 02/15/2051 (e) | | | 45 | | | | 47 | |
| | | | | | | | |
| SECURITY DESCRIPTION | | PRINCIPAL
AMOUNT($) | | | VALUE($) | |
| | | | | | | | |
Semiconductors — continued | | | | | | | | |
4.11%, 09/15/2028 | | | 20 | | | | 23 | |
5.00%, 04/15/2030 | | | 2,980 | | | | 3,522 | |
Infineon Technologies AG, (Germany), | | | | | | | | |
Reg. S, 0.75%, 06/24/2023 | | EUR | 800 | | | | 964 | |
Reg. S, 1.13%, 06/24/2026 | | EUR | 200 | | | | 248 | |
Micron Technology, Inc., 2.50%, 04/24/2023 | | | 110 | | | | 114 | |
4.66%, 02/15/2030 | | | 297 | | | | 345 | |
NVIDIA Corp., 3.70%, 04/01/2060 | | | 10 | | | | 12 | |
NXP BV / NXP Funding LLC / NXP USA, Inc., (Multinational), 3.40%, 05/01/2030 (e) | | | 1,000 | | | | 1,092 | |
NXP BV / NXP Funding LLC, (Multinational), 3.88%, 09/01/2022 (e) | | | 2,600 | | | | 2,696 | |
4.88%, 03/01/2024 (e) | | | 150 | | | | 165 | |
Texas Instruments, Inc., | | | | | | | | |
1.75%, 05/04/2030 | | | 90 | | | | 90 | |
4.15%, 05/15/2048 | | | 17 | | | | 21 | |
Xilinx, Inc., 2.38%, 06/01/2030 | | | 95 | | | | 97 | |
| | | | | | | | |
| | | | | | | 11,712 | |
| | | | | | | | |
Software — 0.1% | | | | | | | | |
Activision Blizzard, Inc., | | | | | | | | |
1.35%, 09/15/2030 | | | 2,000 | | | | 1,872 | |
2.50%, 09/15/2050 | | | 100 | | | | 90 | |
Adobe, Inc., 2.30%, 02/01/2030 | | | 88 | | | | 92 | |
Autodesk, Inc., 2.85%, 01/15/2030 | | | 71 | | | | 75 | |
Broadridge Financial Solutions, Inc., 2.60%, 05/01/2031 | | | 400 | | | | 408 | |
Electronic Arts, Inc., | | | | | | | | |
1.85%, 02/15/2031 | | | 25 | | | | 24 | |
2.95%, 02/15/2051 | | | 60 | | | | 59 | |
Fidelity National Information Services, Inc., 1.15%, 03/01/2026 | | | 100 | | | | 99 | |
2.25%, 03/01/2031 | | | 730 | | | | 730 | |
3.10%, 03/01/2041 | | | 180 | | | | 185 | |
3.36%, 05/21/2031 | | GBP | 100 | | | | 155 | |
Fiserv, Inc., 2.65%, 06/01/2030 | | | 155 | | | | 161 | |
Intuit, Inc., 1.65%, 07/15/2030 | | | 355 | | | | 349 | |
Microsoft Corp., | | | | | | | | |
2.53%, 06/01/2050 | | | 1,100 | | | | 1,081 | |
2.68%, 06/01/2060 | | | 110 | | | | 110 | |
3.04%, 03/17/2062 | | | 10 | | | | 11 | |
Oracle Corp., | | | | | | | | |
1.65%, 03/25/2026 | | | 40 | | | | 40 | |
2.50%, 04/01/2025 | | | 350 | | | | 368 | |
3.65%, 03/25/2041 | | | 95 | | | | 101 | |
3.85%, 04/01/2060 | | | 60 | | | | 64 | |
3.95%, 03/25/2051 | | | 70 | | | | 76 | |
4.10%, 03/25/2061 | | | 80 | | | | 89 | |
Roper Technologies, Inc., | | | | | | | | |
1.75%, 02/15/2031 | | | 2,000 | | | | 1,924 | |
2.35%, 09/15/2024 | | | 200 | | | | 210 | |
SAP SE, (Germany), Reg. S, 1.00%, 04/01/2025 | | EUR | 50 | | | | 62 | |
SEE NOTES TO FINANCIAL STATEMENTS.
| | | | | | | | | | |
| | | | | |
| JUNE 30, 2021 | | SIX CIRCLES TRUST | | | | | | | | 105 |
Six Circles Global Bond Fund
SCHEDULE OF PORTFOLIO INVESTMENTS
AS OF JUNE 30, 2021 (Unaudited) (continued)
(Amounts in U.S. Dollars, unless otherwise noted)
(Amounts in thousands, except number of Futures contracts)
| | | | | | | | |
| SECURITY DESCRIPTION | | PRINCIPAL
AMOUNT($) | | | VALUE($) | |
Corporate Bonds — continued | | | | | | | | |
Software — continued | | | | | | | | |
ServiceNow, Inc., 1.40%, 09/01/2030 | | | 2,025 | | | | 1,902 | |
VMware, Inc., 4.50%, 05/15/2025 | | | 95 | | | | 106 | |
| | | | | | | | |
| | |
| | | | | | | 10,443 | |
| | | | | | | | |
Total Technology | | | | | | | 36,479 | |
| | | | | | | | |
Utilities — 1.6% | | | | | | | | |
Electric — 1.2% | | | | | | | | |
A2A SpA, (Italy), Reg. S, 1.00%, 07/16/2029 | | EUR | 100 | | | | 124 | |
ACEA SpA, (Italy), | | | | | | | | |
Reg. S, 0.50%, 04/06/2029 | | EUR | 100 | | | | 118 | |
Reg. S, 2.63%, 07/15/2024 | | EUR | 100 | | | | 127 | |
AEP Texas, Inc., Series I, 2.10%, 07/01/2030 | | | 2,600 | | | | 2,554 | |
AES Corp. (The), 2.45%, 01/15/2031 (e) | | | 25 | | | | 25 | |
Alliander NV, (Netherlands), 2.88%, 06/14/2024 | | EUR | 100 | | | | 130 | |
Ameren Corp., | | | | | | | | |
2.50%, 09/15/2024 | | | 30 | | | | 32 | |
3.50%, 01/15/2031 | | | 10 | | | | 11 | |
Ameren Illinois Co., | | | | | | | | |
1.55%, 11/15/2030 | | | 30 | | | | 29 | |
3.25%, 03/15/2050 | | | 1,200 | | | | 1,298 | |
American Electric Power Co., Inc., | | | | | | | | |
2.30%, 03/01/2030 | | | 25 | | | | 25 | |
3.25%, 03/01/2050 | | | 20 | | | | 20 | |
Appalachian Power Co., | | | | | | | | |
Series Y, 4.50%, 03/01/2049 | | | 20 | | | | 24 | |
Series Z, 3.70%, 05/01/2050 | | | 45 | | | | 50 | |
Arizona Public Service Co., | | | | | | | | |
2.60%, 08/15/2029 | | | 84 | | | | 88 | |
3.35%, 05/15/2050 | | | 10 | | | | 11 | |
4.25%, 03/01/2049 | | | 10 | | | | 12 | |
Atlantic City Electric Co., 4.00%, 10/15/2028 | | | 50 | | | | 57 | |
Baltimore Gas and Electric Co., 2.90%, 06/15/2050 | | | 10 | | | | 10 | |
Berkshire Hathaway Energy Co., | | | | | | | | |
2.85%, 05/15/2051 | | | 10 | | | | 10 | |
4.25%, 10/15/2050 | | | 15 | | | | 18 | |
5.15%, 11/15/2043 | | | 60 | | | | 79 | |
Black Hills Corp., | | | | | | | | |
3.05%, 10/15/2029 | | | 20 | | | | 21 | |
3.88%, 10/15/2049 | | | 10 | | | | 11 | |
Cadent Finance plc, (United Kingdom), Reg. S, 2.63%, 09/22/2038 | | GBP | 1,325 | | | | 1,899 | |
CenterPoint Energy Houston Electric LLC, Series AD, 2.90%, 07/01/2050 | | | 45 | | | | 46 | |
CenterPoint Energy, Inc., | | | | | | | | |
2.95%, 03/01/2030 | | | 45 | | | | 47 | |
4.25%, 11/01/2028 | | | 10 | | | | 12 | |
Coentreprise de Transport d’Electricite SA, (France), | | | | | | | | |
Reg. S, 0.88%, 09/29/2024 | | EUR | 100 | | | | 122 | |
Reg. S, 2.13%, 07/29/2032 | | EUR | 100 | | | | 135 | |
| | | | | | | | |
| SECURITY DESCRIPTION | | PRINCIPAL
AMOUNT($) | | | VALUE($) | |
| | | | | | | | |
Electric — continued | | | | | | | | |
Commonwealth Edison Co., | | | | | | | | |
3.00%, 03/01/2050 | | | 100 | | | | 104 | |
3.70%, 08/15/2028 | | | 10 | | | | 11 | |
4.00%, 03/01/2048 | | | 25 | | | | 30 | |
4.00%, 03/01/2049 | | | 10 | | | | 12 | |
4.70%, 01/15/2044 | | | 1,000 | | | | 1,286 | |
Connecticut Light and Power Co. (The), Series A, 2.05%, 07/01/2031 | | | 905 | | | | 913 | |
Consolidated Edison Co. of New York, Inc., | | | | | | | | |
3.85%, 06/15/2046 | | | 10 | | | | 11 | |
Series 09-C, 5.50%, 12/01/2039 | | | 10 | | | | 13 | |
Series 20A, 3.35%, 04/01/2030 | | | 70 | | | | 77 | |
Series 20B, 3.95%, 04/01/2050 | | | 55 | | | | 63 | |
Series A, 4.13%, 05/15/2049 | | | 20 | | | | 23 | |
Series E, 4.65%, 12/01/2048 | | | 10 | | | | 12 | |
Consumers Energy Co., | | | | | | | | |
2.50%, 05/01/2060 | | | 10 | | | | 9 | |
3.10%, 08/15/2050 | | | 30 | | | | 32 | |
3.25%, 08/15/2046 | | | 1,100 | | | | 1,180 | |
3.75%, 02/15/2050 | | | 25 | | | | 29 | |
Dominion Energy South Carolina, Inc., 4.60%, 06/15/2043 | | | 1,400 | | | | 1,796 | |
Dominion Energy, Inc., | | | | | | | | |
3.90%, 10/01/2025 | | | 220 | | | | 243 | |
4.25%, 06/01/2028 | | | 20 | | | | 23 | |
Series A, 4.60%, 03/15/2049 | | | 10 | | | | 13 | |
Series C, 3.38%, 04/01/2030 | | | 20 | | | | 22 | |
DTE Electric Co., | | | | | | | | |
2.95%, 03/01/2050 | | | 25 | | | | 26 | |
3.70%, 03/15/2045 | | | 1,100 | | | | 1,257 | |
3.95%, 03/01/2049 | | | 10 | | | | 12 | |
DTE Energy Co., | | | | | | | | |
Series C, 3.40%, 06/15/2029 | | | 20 | | | | 22 | |
Series F, 1.05%, 06/01/2025 | | | 1,400 | | | | 1,400 | |
Duke Energy Carolinas LLC, 5.30%, 02/15/2040 | | | 10 | | | | 14 | |
Duke Energy Corp., | | | | | | | | |
2.45%, 06/01/2030 | | | 10 | | | | 10 | |
2.55%, 06/15/2031 | | | 10 | | | | 10 | |
2.65%, 09/01/2026 | | | 30 | | | | 32 | |
3.75%, 09/01/2046 | | | 10 | | | | 11 | |
4.20%, 06/15/2049 | | | 20 | | | | 22 | |
Duke Energy Florida LLC, 4.20%, 07/15/2048 | | | 10 | | | | 12 | |
Duke Energy Indiana LLC, | | | | | | | | |
2.75%, 04/01/2050 | | | 20 | | | | 20 | |
Series YYY, 3.25%, 10/01/2049 | | | 40 | | | | 42 | |
Duke Energy Ohio, Inc., | | | | | | | | |
3.65%, 02/01/2029 | | | 10 | | | | 11 | |
3.70%, 06/15/2046 | | | 1,700 | | | | 1,903 | |
4.30%, 02/01/2049 | | | 80 | | | | 99 | |
E.ON International Finance BV, (Netherlands), Reg. S, 6.13%, 07/06/2039 | | GBP | 350 | | | | 744 | |
E.ON SE, (Germany), Reg. S, 1.00%, 10/07/2025 | | EUR | 100 | | | | 123 | |
SEE NOTES TO FINANCIAL STATEMENTS.
| | | | | | | | | | |
| | | | | |
| 106 | | | | | | | | SIX CIRCLES TRUST | | JUNE 30, 2021 |
| | | | | | | | |
| SECURITY DESCRIPTION | | PRINCIPAL
AMOUNT($) | | | VALUE($) | |
Corporate Bonds — continued | | | | | | | | |
Electric — continued | | | | | | | | |
EDP — Energias de Portugal SA, (Portugal), Reg. S, 1.63%, 04/15/2027 | | EUR | 100 | | | | 127 | |
EDP Finance BV, (Netherlands), Reg. S, 2.00%, 04/22/2025 | | EUR | 700 | | | | 893 | |
Electricite de France SA, (France), | | | | | | | | |
Reg. S, 1.00%, 10/13/2026 | | EUR | 600 | | | | 744 | |
Reg. S, 1.88%, 10/13/2036 | | EUR | 100 | | | | 132 | |
Reg. S, 2.00%, 12/09/2049 | | EUR | 600 | | | | 763 | |
Reg. S, 5.13%, 09/22/2050 | | GBP | 400 | | | | 855 | |
Reg. S, (GBP Swap Rate 15 Year + 3.05%), 5.88%, 01/22/2029 (x) (aa) | | GBP | 300 | | | | 471 | |
5.88%, 07/18/2031 | | GBP | 265 | | | | 497 | |
Reg. S, (GBP Swap Rate 13 Year + 3.96%), 6.00%, 01/29/2026 (x) (aa) | | GBP | 100 | | | | 154 | |
Reg. S, 6.13%, 06/02/2034 | | GBP | 300 | | | | 602 | |
EnBW Energie Baden-Wuerttemberg AG, (Germany), Reg. S, (EUR Swap Rate 5 Year + 2.32%), 1.88%, 06/29/2080 (aa) | | EUR | 100 | | | | 122 | |
EnBW International Finance BV, (Netherlands), Reg. S, 0.63%, 04/17/2025 | | EUR | 200 | | | | 243 | |
Enel Finance International NV, (Netherlands), | | | | | | | | |
Reg. S, 0.00%, 06/17/2024 | | EUR | 2,275 | | | | 2,713 | |
2.65%, 09/10/2024 (e) | | | 3,500 | | | | 3,674 | |
3.50%, 04/06/2028 (e) | | | 1,700 | | | | 1,863 | |
Enel SpA, (Italy), Reg. S, (EUR Swap Rate 5 Year + 2.68%), 2.25%, 12/10/2026 (x) (aa) | | EUR | 350 | | | | 434 | |
e-netz Suedhessen AG, (Germany),
6.13%, 04/23/2041 | | EUR | 20 | | | | 38 | |
Enexis Holding NV, (Netherlands), | | | | | | | | |
Reg. S, 0.88%, 04/28/2026 | | EUR | 100 | | | | 124 | |
Reg. S, 1.50%, 10/20/2023 | | EUR | 100 | | | | 123 | |
Engie SA, (France), Reg. S, (EUR Swap Rate 5 Year + 3.17%), 3.25%, 11/28/2024 (x) (aa) | | | EUR 1,800 | | | | 2,310 | |
Entergy Corp., | | | | | | | | |
0.90%, 09/15/2025 | | | 30 | | | | 29 | |
3.75%, 06/15/2050 | | | 30 | | | | 33 | |
Entergy Louisiana LLC, | | | | | | | | |
1.60%, 12/15/2030 | | | 1,500 | | | | 1,442 | |
2.90%, 03/15/2051 | | | 30 | | | | 29 | |
3.12%, 09/01/2027 | | | 2,500 | | | | 2,727 | |
3.25%, 04/01/2028 | | | 10 | | | | 11 | |
4.20%, 09/01/2048 | | | 10 | | | | 12 | |
Entergy Texas, Inc., 4.00%, 03/30/2029 | | | 15 | | | | 17 | |
ESB Finance DAC, (Ireland), | | | | | | | | |
Reg. S, 1.75%, 02/07/2029 | | EUR | 100 | | | | 131 | |
Reg. S, 1.88%, 06/14/2031 | | EUR | 224 | | | | 300 | |
Reg. S, 2.13%, 06/08/2027 | | EUR | 100 | | | | 132 | |
Evergy Kansas Central, Inc., 3.45%, 04/15/2050 | | | 5 | | | | 5 | |
Evergy Metro, Inc., | | | | | | | | |
4.20%, 03/15/2048 | | | 10 | | | | 12 | |
| | | | | | | | |
| SECURITY DESCRIPTION | | PRINCIPAL
AMOUNT($) | | | VALUE($) | |
| | | | | | | | |
Electric — continued | | | | | | | | |
Series 2019, 4.13%, 04/01/2049 | | | 20 | | | | 24 | |
Series 2020, 2.25%, 06/01/2030 | | | 10 | | | | 10 | |
Evergy, Inc., 2.45%, 09/15/2024 | | | 3,000 | | | | 3,148 | |
Eversource Energy, | | | | | | | | |
3.45%, 01/15/2050 | | | 30 | | | | 32 | |
Series R, 1.65%, 08/15/2030 | | | 1,410 | | | | 1,351 | |
Exelon Corp., | | | | | | | | |
3.50%, 06/01/2022 | | | 2,649 | | | | 2,716 | |
4.05%, 04/15/2030 | | | 10 | | | | 11 | |
4.45%, 04/15/2046 | | | 10 | | | | 12 | |
4.70%, 04/15/2050 | | | 10 | | | | 13 | |
FirstEnergy Transmission LLC,
4.35%, 01/15/2025 (e) | | | 1,100 | | | | 1,207 | |
Florida Power & Light Co., | | | | | | | | |
3.15%, 10/01/2049 | | | 20 | | | | 22 | |
3.95%, 03/01/2048 | | | 500 | | | | 607 | |
4.13%, 06/01/2048 | | | 20 | | | | 25 | |
FLUVIUS System Operator CVBA, (Belgium), Reg. S, 2.88%, 10/09/2023 | | EUR | 400 | | | | 507 | |
Fortum OYJ, (Finland), | | | | | | | | |
Reg. S, 2.13%, 02/27/2029 | | EUR | 100 | | | | 133 | |
Reg. S, 0.88%, 02/27/2023 | | EUR | 170 | | | | 205 | |
Georgia Power Co., | | | | | | | | |
Series A, 3.25%, 03/15/2051 | | | 20 | | | | 20 | |
Series B, 3.70%, 01/30/2050 | | | 60 | | | | 65 | |
Hera SpA, (Italy), | | | | | | | | |
Reg. S, 0.25%, 12/03/2030 | | EUR | 160 | | | | 184 | |
Reg. S, 2.38%, 07/04/2024 | | EUR | 100 | | | | 127 | |
Iberdrola International BV, (Netherlands), | | | | | | | | |
Reg. S, 0.38%, 09/15/2025 | | EUR | 1,900 | | | | 2,296 | |
Reg. S, (EUR Swap Rate 5 Year + 1.59%), 1.88%, 02/22/2023 (x) (aa) | | EUR | 1,200 | | | | 1,459 | |
Series NC8, Reg. S, (EUR Swap Rate 5 Year + 2.57%), 2.25%, 01/28/2029 (x) (aa) | | EUR | 400 | | | | 490 | |
Interstate Power and Light Co.,
3.50%, 09/30/2049 | | | 10 | | | | 11 | |
Iren SpA, (Italy), Reg. S,
1.00%, 07/01/2030 | | EUR | 550 | | | | 668 | |
Kentucky Utilities Co., 3.30%, 06/01/2050 | | | 25 | | | | 26 | |
MidAmerican Energy Co., | | | | | | | | |
3.10%, 05/01/2027 | | | 10 | | | | 11 | |
6.75%, 12/30/2031 | | | 10 | | | | 14 | |
Mississippi Power Co., Series B, 3.10%, 07/30/2051 | | | 10 | | | | 10 | |
Narragansett Electric Co. (The), 3.40%, 04/09/2030 (e) | | | 200 | | | | 219 | |
National Grid Electricity Transmission plc, (United Kingdom), Reg. S, 2.00%, 04/17/2040 | | GBP | 425 | | | | 573 | |
National Grid plc, (United Kingdom),
Reg. S, 0.55%, 09/18/2029 | | EUR | 1,575 | | | | 1,863 | |
National Rural Utilities Cooperative Finance Corp., | | | | | | | | |
1.35%, 03/15/2031 | | | 50 | | | | 46 | |
4.30%, 03/15/2049 | | | 20 | | | | 25 | |
SEE NOTES TO FINANCIAL STATEMENTS.
| | | | | | | | | | |
| | | | | |
| JUNE 30, 2021 | | SIX CIRCLES TRUST | | | | | | | | 107 |
Six Circles Global Bond Fund
SCHEDULE OF PORTFOLIO INVESTMENTS
AS OF JUNE 30, 2021 (Unaudited) (continued)
(Amounts in U.S. Dollars, unless otherwise noted)
(Amounts in thousands, except number of Futures contracts)
| | | | | | | | |
| SECURITY DESCRIPTION | | PRINCIPAL
AMOUNT($) | | | VALUE($) | |
Corporate Bonds — continued | | | | | | | | |
Electric — continued | | | | | | | | |
Nevada Power Co., | | | | | | | | |
Series DD, 2.40%, 05/01/2030 | | | 100 | | | | 102 | |
Series EE, 3.13%, 08/01/2050 | | | 30 | | | | 31 | |
NextEra Energy Capital Holdings, Inc., | | | | | | | | |
2.25%, 06/01/2030 | | | 1,280 | | | | 1,291 | |
2.75%, 11/01/2029 | | | 35 | | | | 37 | |
Northern Powergrid Holdings Co., (United Kingdom), 7.25%, 12/15/2022 | | GBP | 450 | | | | 682 | |
Northern Powergrid Yorkshire plc, (United Kingdom), Reg. S, 5.13%, 05/04/2035 | | GBP | 50 | | | | 94 | |
Northern States Power Co., | | | | | | | | |
2.25%, 04/01/2031 | | | 1,450 | | | | 1,493 | |
2.60%, 06/01/2051 | | | 25 | | | | 24 | |
3.20%, 04/01/2052 | | | 10 | | | | 11 | |
NRG Energy, Inc., | | | | | | | | |
2.00%, 12/02/2025 (e) | | | 2,150 | | | | 2,183 | |
2.45%, 12/02/2027 (e) | | | 1,275 | | | | 1,284 | |
NSTAR Electric Co., 3.10%, 06/01/2051 | | | 10 | | | | 10 | |
Oglethorpe Power Corp.,
5.05%, 10/01/2048 | | | 20 | | | | 25 | |
Oklahoma Gas and Electric Co., 4.15%, 04/01/2047 | | | 920 | | | | 1,086 | |
Oncor Electric Delivery Co. LLC,
2.75%, 06/01/2024 | | | 20 | | | | 21 | |
3.10%, 09/15/2049 | | | 50 | | | | 53 | |
3.70%, 05/15/2050 | | | 5 | | | | 6 | |
Orsted A/S, (Denmark), | | | | | | | | |
Reg. S, 5.75%, 04/09/2040 | | GBP | 225 | | | | 492 | |
Reg. S, (EUR Swap Rate 5 Year + 4.75%), 6.25%, 06/26/3013 (aa) | | EUR | 119 | | | | 158 | |
Pacific Gas and Electric Co., | | | | | | | | |
1.75%, 06/16/2022 | | | 50 | | | | 50 | |
3.15%, 01/01/2026 | | | 35 | | | | 36 | |
3.50%, 08/01/2050 | | | 20 | | | | 18 | |
3.75%, 07/01/2028 | | | 10 | | | | 11 | |
4.50%, 07/01/2040 | | | 100 | | | | 100 | |
4.55%, 07/01/2030 | | | 10 | | | | 11 | |
4.95%, 07/01/2050 | | | 10 | | | | 10 | |
PacifiCorp., | | | | | | | | |
3.30%, 03/15/2051 | | | 800 | | | | 848 | |
4.15%, 02/15/2050 | | | 15 | | | | 18 | |
PECO Energy Co., | | | | | | | | |
2.80%, 06/15/2050 | | | 50 | | | | 50 | |
3.05%, 03/15/2051 | | | 435 | | | | 455 | |
PPL Capital Funding, Inc., 4.13%, 04/15/2030 | | | 120 | | | | 139 | |
Public Service Co. of Colorado, Series 36, 2.70%, 01/15/2051 | | | 10 | | | | 10 | |
Public Service Electric and Gas Co., | | | | | | | | |
2.05%, 08/01/2050 | | | 10 | | | | 8 | |
2.45%, 01/15/2030 | | | 20 | | | | 21 | |
3.65%, 09/01/2028 | | | 120 | | | | 135 | |
3.85%, 05/01/2049 | | | 10 | | | | 12 | |
Public Service Enterprise Group, Inc., 0.80%, 08/15/2025 | | | 3,000 | | | | 2,969 | |
| | | | | | | | |
| SECURITY DESCRIPTION | | PRINCIPAL
AMOUNT($) | | | VALUE($) | |
| | | | | | | | |
Electric — continued | | | | | | | | |
Puget Energy, Inc., | | | | | | | | |
2.38%, 06/15/2028 (e) | | | 1,040 | | | | 1,052 | |
4.10%, 06/15/2030 | | | 10 | | | | 11 | |
Puget Sound Energy, Inc.,
3.25%, 09/15/2049 | | | 20 | | | | 21 | |
Red Electrica Financiaciones SAU, (Spain), Reg. S, 1.13%, 04/24/2025 | | EUR | 100 | | | | 124 | |
RTE Reseau de Transport d’Electricite SADIR, (France), | | | | | | | | |
Reg. S, 1.50%, 09/27/2030 | | EUR | 200 | | | | 259 | |
Reg. S, 1.63%, 11/27/2025 | | EUR | 300 | | | | 381 | |
Reg. S, 2.00%, 04/18/2036 | | EUR | 100 | | | | 137 | |
San Diego Gas & Electric Co.,
4.15%, 05/15/2048 | | | 820 | | | | 994 | |
Sempra Energy, | | | | | | | | |
3.40%, 02/01/2028 | | | 10 | | | | 11 | |
4.00%, 02/01/2048 | | | 10 | | | | 11 | |
Southern California Edison Co., | | | | | | | | |
2.85%, 08/01/2029 | | | 10 | | | | 10 | |
3.65%, 02/01/2050 | | | 60 | | | | 60 | |
4.00%, 04/01/2047 | | | 20 | | | | 21 | |
4.05%, 03/15/2042 | | | 900 | | | | 967 | |
6.05%, 03/15/2039 | | | 10 | | | | 13 | |
Series 20A, 2.95%, 02/01/2051 | | | 6 | | | | 5 | |
Series B, 3.65%, 03/01/2028 | | | 25 | | | | 28 | |
Series D, 3.40%, 06/01/2023 | | | 1,400 | | | | 1,475 | |
Series E, 3.70%, 08/01/2025 | | | 10 | | | | 11 | |
Southern Co. (The), | | | | | | | | |
Series 21-A, 0.60%, 02/26/2024 | | | 60 | | | | 60 | |
Series A, 3.70%, 04/30/2030 | | | 75 | | | | 83 | |
Southwestern Electric Power Co., Series N, 1.65%, 03/15/2026 | | | 50 | | | | 51 | |
Southwestern Public Service Co., | | | | | | | | |
3.70%, 08/15/2047 | | | 1,000 | | | | 1,126 | |
Series 8, 3.15%, 05/01/2050 | | | 60 | | | | 63 | |
SP Transmission plc, (United Kingdom),
Reg. S, 2.00%, 11/13/2031 | | GBP | 100 | | | | 142 | |
SSE plc, (United Kingdom),
Reg. S, 1.75%, 04/16/2030 | | EUR | 1,300 | | | | 1,686 | |
Stedin Holding NV, (Netherlands), | | | | | | | | |
Reg. S, 0.88%, 10/24/2025 | | EUR | 100 | | | | 123 | |
Reg. S, (EUR Swap Rate 5 Year + 2.75%), 3.25%, 12/01/2021 (x) (aa) | | EUR | 100 | | | | 120 | |
Tampa Electric Co., 4.30%, 06/15/2048 | | | 30 | | | | 37 | |
TenneT Holding BV, (Netherlands), | | | | | | | | |
Reg. S, 0.88%, 06/03/2030 | | EUR | 120 | | | | 148 | |
Reg. S, 1.00%, 06/13/2026 | | EUR | 200 | | | | 249 | |
Reg. S, 1.75%, 06/04/2027 | | EUR | 300 | | | | 390 | |
Terna SPA, (Italy), | | | | | | | | |
Reg. S, 0.38%, 09/25/2030 | | EUR | 425 | | | | 494 | |
Reg. S, 0.75%, 07/24/2032 | | EUR | 100 | | | | 119 | |
Reg. S, 1.38%, 07/26/2027 | | EUR | 1,125 | | | | 1,422 | |
Tucson Electric Power Co., | | | | | | | | |
1.50%, 08/01/2030 | | | 30 | | | | 29 | |
SEE NOTES TO FINANCIAL STATEMENTS.
| | | | | | | | | | |
| | | | | |
| 108 | | | | | | | | SIX CIRCLES TRUST | | JUNE 30, 2021 |
| | | | | | | | |
| SECURITY DESCRIPTION | | PRINCIPAL
AMOUNT($) | | | VALUE($) | |
Corporate Bonds — continued | | | | | | | | |
Electric — continued | | | | | | | | |
3.25%, 05/01/2051 | | | 10 | | | | 10 | |
4.00%, 06/15/2050 | | | 10 | | | | 12 | |
Union Electric Co., 3.25%, 10/01/2049 | | | 40 | | | | 42 | |
Virginia Electric and Power Co., | | | | | | | | |
3.30%, 12/01/2049 | | | 50 | | | | 54 | |
Series B, 3.80%, 09/15/2047 | | | 60 | | | | 69 | |
Vistra Operations Co. LLC,
3.55%, 07/15/2024 (e) | | | 1,400 | | | | 1,478 | |
WEC Energy Group, Inc.,
3.55%, 06/15/2025 | | | 168 | | | | 184 | |
Western Power Distribution South West plc, (United Kingdom), Reg. S, 5.88%, 03/25/2027 | | GBP | 20 | | | | 35 | |
Wisconsin Electric Power Co., 1.70%, 06/15/2028 | | | 10 | | | | 10 | |
Wisconsin Power and Light Co., 3.00%, 07/01/2029 | | | 50 | | | | 54 | |
Wisconsin Public Service Corp., 3.30%, 09/01/2049 | | | 5 | | | | 5 | |
Xcel Energy, Inc., | | | | | | | | |
3.40%, 06/01/2030 | | | 20 | | | | 22 | |
3.50%, 12/01/2049 | | | 20 | | | | 22 | |
| | | | | | | | |
| | | | | | | 86,623 | |
| | | | | | | | |
Gas — 0.3% | | | | | | | | |
APT Pipelines Ltd., (Australia), Reg. S, 2.00%, 07/15/2030 | | EUR | 1,000 | | | | 1,282 | |
Atmos Energy Corp., | | | | | | | | |
1.50%, 01/15/2031 | | | 1,630 | | | | 1,548 | |
2.63%, 09/15/2029 | | | 15 | | | | 15 | |
3.38%, 09/15/2049 | | | 210 | | | | 227 | |
4.15%, 01/15/2043 | | | 10 | | | | 12 | |
Italgas SpA, (Italy), | | | | | | | | |
Reg. S, 1.00%, 12/11/2031 | | EUR | 1,125 | | | | 1,360 | |
Reg. S, 1.13%, 03/14/2024 | | EUR | 850 | | | | 1,040 | |
National Fuel Gas Co., 2.95%, 03/01/2031 | | | 25 | | | | 25 | |
National Grid Gas plc, (United Kingdom),
Reg. S, 1.38%, 02/07/2031 | | GBP | 1,600 | | | | 2,108 | |
Nederlandse Gasunie NV, (Netherlands),
Reg. S, 2.63%, 07/13/2022 | | EUR | 100 | | | | 122 | |
NiSource, Inc., | | | | | | | | |
0.95%, 08/15/2025 | | | 3,000 | | | | 2,976 | |
3.49%, 05/15/2027 | | | 130 | | | | 143 | |
3.60%, 05/01/2030 | | | 25 | | | | 28 | |
4.38%, 05/15/2047 | | | 15 | | | | 18 | |
4.80%, 02/15/2044 | | | 10 | | | | 12 | |
Piedmont Natural Gas Co.,Inc., | | | | | | | | |
2.50%, 03/15/2031 | | | 1,550 | | | | 1,576 | |
3.35%, 06/01/2050 | | | 15 | | | | 15 | |
Redexis Gas Finance BV, (Netherlands),
Reg. S, 1.88%, 05/28/2025 | | EUR | 1,300 | | | | 1,633 | |
Snam SpA, (Italy), Reg. S, 0.88%, 10/25/2026 | | EUR | 850 | | | | 1,043 | |
| | | | | | | | |
| SECURITY DESCRIPTION | | PRINCIPAL
AMOUNT($) | | | VALUE($) | |
| | | | | | | | |
Gas — continued | | | | | | | | |
Southern California Gas Co., | | | | | | | | |
Series VV, 4.30%, 01/15/2049 | | | 20 | | | | 25 | |
Series XX, 2.55%, 02/01/2030 | | | 25 | | | | 26 | |
Southern Co. Gas Capital Corp., | | | | | | | | |
3.95%, 10/01/2046 | | | 20 | | | | 23 | |
Series 20-A, 1.75%, 01/15/2031 | | | 3,700 | | | | 3,504 | |
Southern Gas Networks plc,
(United Kingdom), | | | | | | | | |
Reg. S, 2.50%, 02/03/2025 | | GBP | 425 | | | | 621 | |
6.38%, 05/15/2040 | | GBP | 425 | | | | 947 | |
Southwest Gas Corp., | | | | | | | | |
2.20%, 06/15/2030 | | | 45 | | | | 45 | |
4.15%, 06/01/2049 | | | 10 | | | | 11 | |
Wales & West Utilities Finance plc, (United Kingdom), Reg. S, 1.88%, 05/28/2041 | | GBP | 425 | | | | 557 | |
Washington Gas Light Co.,
3.65%, 09/15/2049 | | | 10 | | | | 11 | |
| | | | | | | | |
| | | | | | | 20,953 | |
| | | | | | | | |
Water — 0.1% | | | | | | | | |
Affinity Water Finance 2004 plc,
(United Kingdom), 5.88%, 07/13/2026 | | GBP | 30 | | | | 51 | |
American Water Capital Corp., | | | | | | | | |
2.80%, 05/01/2030 | | | 25 | | | | 26 | |
4.15%, 06/01/2049 | | | 60 | | | | 73 | |
Essential Utilities, Inc., 2.70%, 04/15/2030 | | | 40 | | | | 42 | |
Northumbrian Water Finance plc,
(United Kingdom), | | | | | | | | |
Reg. S, 1.63%, 10/11/2026 | | GBP | 425 | | | | 601 | |
Reg. S, 5.63%, 04/29/2033 | | GBP | 225 | | | | 438 | |
Thames Water Utilities Finance plc,
(United Kingdom), | | | | | | | | |
Reg. S, 2.38%, 04/22/2040 | | GBP | 300 | | | | 417 | |
Reg. S, 5.50%, 02/11/2041 | | GBP | 550 | | | | 1,126 | |
6.75%, 11/16/2028 | | GBP | 180 | | | | 336 | |
United Utilities Water Finance plc,
(United Kingdom),
Reg. S, 2.00%, 07/03/2033 | | GBP | 900 | | | | 1,288 | |
Wessex Water Services Finance plc,
(United Kingdom), | | | | | | | | |
Reg. S, 1.50%, 09/17/2029 | | GBP | 700 | | | | 959 | |
Reg. S, 5.38%, 03/10/2028 | | GBP | 225 | | | | 388 | |
Reg. S, 5.75%, 10/14/2033 | | GBP | 375 | | | | 741 | |
| | | | | | | | |
| | | | | | | 6,486 | |
| | | | | | | | |
Total Utilities | | | | | | | 114,062 | |
| | | | | | | | |
Total Corporate Bonds
(Cost $1,370,740) | | | | | | | 1,375,461 | |
| | | | | | | | |
Foreign Government Securities — 48.6% | | | | | | | | |
Action Logement Services, (France), Reg. S, 0.50%, 10/30/2034 | | EUR | 100 | | | | 117 | |
Adif Alta Velocidad, (Spain), | | | | | | | | |
Reg. S, 0.55%, 04/30/2030 | | EUR | 200 | | | | 239 | |
Reg. S, 1.88%, 09/22/2022 | | EUR | 600 | | | | 731 | |
Reg. S, 1.88%, 01/28/2025 | | EUR | 100 | | | | 128 | |
SEE NOTES TO FINANCIAL STATEMENTS.
| | | | | | | | | | |
| | | | | |
| JUNE 30, 2021 | | SIX CIRCLES TRUST | | | | | | | | 109 |
Six Circles Global Bond Fund
SCHEDULE OF PORTFOLIO INVESTMENTS
AS OF JUNE 30, 2021 (Unaudited) (continued)
(Amounts in U.S. Dollars, unless otherwise noted)
(Amounts in thousands, except number of Futures contracts)
| | | | | | | | |
| SECURITY DESCRIPTION | | PRINCIPAL
AMOUNT($) | | | VALUE($) | |
Foreign Government Securities — continued | |
Agence Francaise de Developpement EPIC, (France), | | | | | | | | |
Reg. S, 0.00%, 03/25/2025 | | EUR | 500 | | | | 601 | |
Reg. S, 0.25%, 07/21/2026 | | EUR | 500 | | | | 607 | |
Reg. S, 0.25%, 06/29/2029 | | EUR | 400 | | | | 481 | |
Reg. S, 0.38%, 04/30/2024 | | EUR | 400 | | | | 485 | |
Reg. S, 0.50%, 05/25/2030 | | EUR | 200 | | | | 245 | |
Reg. S, 0.50%, 05/31/2035 | | EUR | 300 | | | | 356 | |
Reg. S, 1.38%, 09/17/2024 | | EUR | 500 | | | | 626 | |
Reg. S, 1.50%, 10/31/2034 | | EUR | 100 | | | | 134 | |
Agence France Locale, (France), | | | | | | | | |
Reg. S, 0.00%, 09/20/2027 | | EUR | 500 | | | | 594 | |
Reg. S, 0.13%, 06/20/2026 | | EUR | 100 | | | | 120 | |
Reg. S, 1.13%, 06/20/2028 | | EUR | 1,000 | | | | 1,274 | |
Agricultural Development Bank of China, (China), | | | | | | | | |
Reg. S, 3.40%, 11/06/2024 | | CNH | 56,000 | | | | 8,830 | |
Series 1605, 3.33%, 01/06/2026 | | CNY | 17,000 | | | | 2,637 | |
Series 1705, 3.85%, 01/06/2027 | | CNY | 45,000 | | | | 7,134 | |
Series 1712, 4.21%, 08/23/2022 | | CNY | 20,000 | | | | 3,149 | |
Series 1806, 4.65%, 05/11/2028 | | CNY | 8,100 | | | | 1,342 | |
Series 1813, 3.55%, 11/21/2023 | | CNY | 600 | | | | 94 | |
Series 1901, 3.75%, 01/25/2029 | | CNY | 37,000 | | | | 5,815 | |
Series 1906, 3.74%, 07/12/2029 | | CNY | 100,000 | | | | 15,707 | |
Series 1907, 3.12%, 07/17/2022 | | CNY | 40,000 | | | | 6,225 | |
Series 1908, 3.63%, 07/19/2026 | | CNY | 105,300 | | | | 16,548 | |
Series 1909, 3.24%, 08/14/2024 | | CNY | 58,000 | | | | 9,023 | |
Series 2002, 2.20%, 04/01/2023 | | CNY | 141,200 | | | | 21,608 | |
Series 2004, 2.96%, 04/17/2030 | | CNY | 103,000 | | | | 15,264 | |
Series 2005, 2.25%, 04/22/2025 | | CNY | 150,700 | | | | 22,543 | |
Auckland Council, (New Zealand), | | | | | | | | |
Reg. S, 1.00%, 01/19/2027 | | EUR | 300 | | | | 378 | |
Reg. S, 1.50%, 11/28/2025 | | CHF | 300 | | | | 352 | |
Australia Government Bond, (Australia), | | | | | | | | |
Series 128, Reg. S, 5.75%, 07/15/2022 | | AUD | 5,500 | | | | 4,371 | |
Series 133, Reg. S, 5.50%, 04/21/2023 | | AUD | 5,600 | | | | 4,610 | |
Series 136, Reg. S, 4.75%, 04/21/2027 | | AUD | 10,000 | | | | 9,126 | |
Series 138, Reg. S, 3.25%, 04/21/2029 | | AUD | 365 | | | | 315 | |
Series 140, Reg. S, 4.50%, 04/21/2033 | | AUD | 12,300 | | | | 12,101 | |
Series 142, Reg. S, 4.25%, 04/21/2026 | | AUD | 5,000 | | | | 4,372 | |
Series 144, Reg. S, 3.75%, 04/21/2037 | | AUD | 1,950 | | | | 1,829 | |
Series 145, Reg. S, 2.75%, 06/21/2035 | | AUD | 1,250 | | | | 1,049 | |
Series 147, Reg. S, 3.25%, 06/21/2039 | | AUD | 500 | | | | 443 | |
Series 148, Reg. S, 2.75%, 11/21/2027 | | AUD | 3,250 | | | | 2,698 | |
Series 149, Reg. S, 2.25%, 05/21/2028 | | AUD | 200 | | | | 161 | |
Series 150, Reg. S, 3.00%, 03/21/2047 | | AUD | 980 | | | | 841 | |
Series 152, Reg. S, 2.75%, 11/21/2028 | | AUD | 1,400 | | | | 1,167 | |
Series 154, Reg. S, 2.75%, 11/21/2029 | | AUD | 34,155 | | | | 28,535 | |
Series 155, Reg. S, 2.50%, 05/21/2030 | | AUD | 4,350 | | | | 3,568 | |
Series 156, Reg. S, 2.75%, 05/21/2041 | | AUD | 5,491 | | | | 4,525 | |
Series 158, 1.25%, 05/21/2032 | | AUD | 1,000 | | | | 726 | |
Series 160, Reg. S, 1.00%, 12/21/2030 | | AUD | 6,750 | | | | 4,857 | |
Series 162, Reg. S, 1.75%, 06/21/2051 | | AUD | 3,150 | | | | 2,086 | |
Series 139, Reg. S, 3.25%, 04/21/2025 | | AUD | 7,475 | | | | 6,180 | |
| | | | | | | | |
| SECURITY DESCRIPTION | | PRINCIPAL
AMOUNT($) | | | VALUE($) | |
| |
Series 159, Reg. S, 0.25%, 11/21/2024 | | AUD | 16,883 | | | | 12,589 | |
Series 161, Reg. S, 0.25%, 11/21/2025 | | AUD | 9,600 | | | | 7,071 | |
Australian Capital Territory, (Australia),
Reg. S, 1.25%, 05/22/2025 | | AUD | 200 | | | | 153 | |
Autobahnen- und Schnell- strassen-Finanzierungs AG, (Austria), | | | | | | | | |
Reg. S, 0.10%, 07/09/2029 | | EUR | 500 | | | | 600 | |
Reg. S, 0.63%, 09/15/2022 | | EUR | 160 | | | | 192 | |
Reg. S, 2.75%, 06/20/2033 | | EUR | 130 | | | | 200 | |
Autonomous Community of Andalusia Spain, (Spain), | | | | | | | | |
Reg. S, 0.50%, 04/30/2031 | | EUR | 163 | | | | 192 | |
Reg. S, 1.38%, 04/30/2029 | | EUR | 30 | | | | 38 | |
Autonomous Community of Madrid Spain, (Spain), | | | | | | | | |
Reg. S, 0.42%, 04/30/2030 | | EUR | 161 | | | | 191 | |
Reg. S, 1.19%, 05/08/2022 | | EUR | 600 | | | | 721 | |
Reg. S, 1.83%, 04/30/2025 | | EUR | 270 | | | | 345 | |
4.30%, 09/15/2026 | | EUR | 500 | | | | 727 | |
Basque Government, (Spain), | | | | | | | | |
Reg. S, 0.25%, 04/30/2031 | | EUR | 100 | | | | 116 | |
Reg. S, 0.85%, 04/30/2030 | | EUR | 50 | | | | 62 | |
Reg. S, 1.75%, 03/16/2026 | | EUR | 170 | | | | 220 | |
Bermuda Government International Bond, (Bermuda), 2.38%, 08/20/2030 (e) | | | 670 | | | | 668 | |
BNG Bank NV, (Netherlands), | | | | | | | | |
Reg. S, 0.00%, 01/20/2031 | | EUR | 200 | | | | 236 | |
Reg. S, 0.10%, 01/15/2030 | | EUR | 320 | | | | 383 | |
Reg. S, 0.13%, 04/11/2026 | | EUR | 530 | | | | 641 | |
Reg. S, 0.13%, 07/09/2035 | | EUR | 130 | | | | 149 | |
Reg. S, 0.20%, 11/09/2024 | | EUR | 550 | | | | 666 | |
Reg. S, 0.88%, 10/17/2035 | | EUR | 100 | | | | 127 | |
Reg. S, 1.50%, 07/15/2039 | | EUR | 170 | | | | 237 | |
Reg. S, 3.88%, 05/26/2023 | | EUR | 470 | | | | 604 | |
Bonos de la Tesoreria de la Republica en pesos, (Chile), Reg. S, 4.70%, 09/01/2030 (e) | | CLP | 70,000 | | | | 98 | |
Bpifrance SACA, (France), | | | | | | | | |
Reg. S, 0.13%, 11/25/2023 | | EUR | 300 | | | | 361 | |
Reg. S, 0.13%, 03/25/2025 | | EUR | 400 | | | | 483 | |
Reg. S, 0.25%, 03/29/2030 | | EUR | 200 | | | | 240 | |
Reg. S, 0.63%, 05/25/2026 | | EUR | 500 | | | | 620 | |
Reg. S, 0.75%, 07/22/2022 | | GBP | 200 | | | | 278 | |
Reg. S, 0.88%, 09/26/2028 | | EUR | 200 | | | | 253 | |
Reg. S, 1.00%, 05/25/2027 | | EUR | 500 | | | | 633 | |
Bulgaria Government International Bond, (Bulgaria), | | | | | | | | |
Reg. S, 2.95%, 09/03/2024 | | EUR | 400 | | | | 522 | |
Series 12YR, Reg. S, 3.00%, 03/21/2028 | | EUR | 400 | | | | 562 | |
Bundesobligation, (Germany), | | | | | | | | |
Series 176, Reg. S, 0.00%, 10/07/2022 | | EUR | 2,020 | | | | 2,416 | |
Series 177, Reg. S, 0.00%, 04/14/2023 | | EUR | 460 | | | | 552 | |
Series 178, Reg. S, 0.00%, 10/13/2023 | | EUR | 2,790 | | | | 3,362 | |
Series 179, Reg. S, 0.00%, 04/05/2024 | | EUR | 838 | | | | 1,012 | |
SEE NOTES TO FINANCIAL STATEMENTS.
| | | | | | | | | | |
| | | | | |
| 110 | | | | | | | | SIX CIRCLES TRUST | | JUNE 30, 2021 |
| | | | | | | | |
| SECURITY DESCRIPTION | | PRINCIPAL
AMOUNT($) | | | VALUE($) | |
Foreign Government Securities — continued | |
Series 180, Reg. S, 0.00%, 10/18/2024 | | EUR | 1,926 | | | | 2,335 | |
Series 181, Reg. S, 0.00%, 04/11/2025 | | EUR | 790 | | | | 960 | |
Series 182, Reg. S, 0.00%, 10/10/2025 | | EUR | 4,670 | | | | 5,688 | |
Series 183, Reg. S, 0.00%, 04/10/2026 | | EUR | 636 | | | | 776 | |
Bundesrepublik Deutschland Bundesanleihe, (Germany), | | | | | | | | |
Reg. S, 0.00%, 08/15/2026 | | EUR | 1,900 | | | | 2,320 | |
Reg. S, 0.00%, 11/15/2027 | | EUR | 1,093 | | | | 1,336 | |
Reg. S, 0.00%, 11/15/2028 | | EUR | 624 | | | | 762 | |
Reg. S, 0.00%, 08/15/2029 | | EUR | 2,212 | | | | 2,702 | |
Reg. S, 0.00%, 02/15/2030 | | EUR | 890 | | | | 1,086 | |
Reg. S, 0.00%, 08/15/2030 | | EUR | 1,120 | | | | 1,365 | |
Reg. S, 0.00%, 02/15/2031 | | EUR | 1,589 | | | | 1,930 | |
Reg. S, 0.00%, 05/15/2035 | | EUR | 2,465 | | | | 2,927 | |
Reg. S, 0.00%, 05/15/2036 | | EUR | 323 | | | | 380 | |
Reg. S, 0.00%, 08/15/2050 | | EUR | 1,240 | | | | 1,352 | |
Reg. S, 0.25%, 02/15/2027 | | EUR | 2,557 | | | | 3,169 | |
Reg. S, 0.25%, 08/15/2028 | | EUR | 420 | | | | 523 | |
Reg. S, 0.25%, 02/15/2029 | | EUR | 210 | | | | 262 | |
Reg. S, 0.50%, 02/15/2025 | | EUR | 227 | | | | 281 | |
Reg. S, 0.50%, 02/15/2026 | | EUR | 344 | | | | 429 | |
Reg. S, 0.50%, 08/15/2027 | | EUR | 2,160 | | | | 2,723 | |
Reg. S, 0.50%, 02/15/2028 | | EUR | 230 | | | | 291 | |
Reg. S, 1.00%, 08/15/2024 | | EUR | 250 | | | | 312 | |
Reg. S, 1.00%, 08/15/2025 | | EUR | 1,130 | | | | 1,432 | |
Reg. S, 1.25%, 08/15/2048 | | EUR | 1,050 | | | | 1,570 | |
Reg. S, 1.50%, 09/04/2022 | | EUR | 530 | | | | 645 | |
Reg. S, 1.50%, 05/15/2024 | | EUR | 2,590 | | | | 3,267 | |
Reg. S, 1.75%, 07/04/2022 | | EUR | 2,100 | | | | 2,551 | |
Reg. S, 1.75%, 02/15/2024 | | EUR | 1,701 | | | | 2,148 | |
Reg. S, 2.00%, 08/15/2023 | | EUR | 1,002 | | | | 1,257 | |
Reg. S, 2.50%, 07/04/2044 | | EUR | 1,533 | | | | 2,788 | |
Reg. S, 2.50%, 08/15/2046 | | EUR | 2,552 | | | | 4,733 | |
Reg. S, 3.25%, 07/04/2042 | | EUR | 749 | | | | 1,471 | |
Reg. S, 5.50%, 01/04/2031 | | EUR | 700 | | | | 1,301 | |
Reg. S, 6.25%, 01/04/2030 | | EUR | 775 | | | | 1,451 | |
Series 3, Reg. S, 4.75%, 07/04/2034 | | EUR | 1,244 | | | | 2,429 | |
Series 5, Reg. S, 4.00%, 01/04/2037 | | EUR | 1,064 | | | | 2,055 | |
Series 8, Reg. S, 4.75%, 07/04/2040 | | EUR | 731 | | | | 1,641 | |
Series 97, Reg. S, 6.50%, 07/04/2027 | | EUR | 1,410 | | | | 2,396 | |
Series 98, Reg. S, 4.75%, 07/04/2028 | | EUR | 1,060 | | | | 1,730 | |
Series 98, Reg. S, 5.63%, 01/04/2028 | | EUR | 780 | | | | 1,304 | |
Series 2007, Reg. S, 4.25%, 07/04/2039 | | EUR | 1,020 | | | | 2,131 | |
Series G, Reg. S, 0.00%, 08/15/2030 | | EUR | 770 | | | | 942 | |
Series G, Reg. S, 0.00%, 08/15/2050 | | EUR | 512 | | | | 563 | |
Bundesschatzanweisungen, (Germany), | | | | | | | | |
Reg. S, 0.00%, 12/15/2022 | | EUR | 1,335 | | | | 1,599 | |
Reg. S, 0.00%, 03/10/2023 | | EUR | 860 | | | | 1,031 | |
Caisse d’Amortissement de la Dette Sociale, (France), | | | | | | | | |
Reg. S, 0.00%, 02/25/2028 | | EUR | 200 | | | | 239 | |
Reg. S, 0.00%, 11/25/2030 | | EUR | 300 | | | | 351 | |
Reg. S, 0.00%, 05/25/2031 | | EUR | 100 | | | | 117 | |
Reg. S, 0.13%, 10/25/2023 | | EUR | 1,800 | | | | 2,165 | |
| | | | | | | | |
| SECURITY DESCRIPTION | | PRINCIPAL
AMOUNT($) | | | VALUE($) | |
| |
Reg. S, 4.00%, 12/15/2025 | | EUR | 1,383 | | | | 1,961 | |
Series DIP, Reg. S, 0.13%, 11/25/2022 | | EUR | 300 | | | | 359 | |
Caisse des Depots et Consignations, (France), Reg. S, 0.00%, 06/19/2024 | | EUR | 300 | | | | 361 | |
Caisse Francaise de Financement Local, (France), | | | | | | | | |
Reg. S, 0.01%, 05/07/2025 | | EUR | 100 | | | | 120 | |
Reg. S, 0.13%, 06/30/2031 | | EUR | 100 | | | | 118 | |
Reg. S, 1.00%, 04/25/2028 | | EUR | 100 | | | | 128 | |
Reg. S, 1.25%, 05/11/2032 | | EUR | 100 | | | | 132 | |
Reg. S, 1.50%, 06/28/2038 | | EUR | 200 | | | | 279 | |
Series 12, Reg. S, 0.63%, 01/26/2023 | | EUR | 200 | | | | 241 | |
Canada Housing Trust No. 1, (Canada), 0.95%, 06/15/2025 (e) | | CAD | 1,000 | | | | 805 | |
Canadian Government Bond, (Canada), | | | | | | | | |
1.00%, 06/01/2027 | | CAD | 200 | | | | 160 | |
1.50%, 06/01/2031 | | CAD | 600 | | | | 487 | |
2.00%, 09/01/2023 | | CAD | 1,900 | | | | 1,582 | |
3.50%, 12/01/2045 | | CAD | 1,800 | | | | 1,941 | |
4.00%, 06/01/2041 | | CAD | 150 | | | | 168 | |
Canton of Geneva Switzerland, (Switzerland), Reg. S, 0.02%, 11/27/2024 | | CHF | 240 | | | | 264 | |
Canton of Zurich, (Switzerland), Reg. S, 0.10%, 06/23/2045 | | CHF | 50 | | | | 53 | |
Cassa Depositi e Prestiti SpA, (Italy), | | | | | | | | |
Reg. S, 0.75%, 11/21/2022 | | EUR | 600 | | | | 721 | |
Reg. S, 1.00%, 09/21/2028 | | EUR | 100 | | | | 122 | |
Reg. S, 2.00%, 04/20/2027 | | EUR | 100 | | | | 130 | |
Reg. S, 2.13%, 09/27/2023 | | EUR | 200 | | | | 249 | |
Chile Government International Bond, (Chile), | | | | | | | | |
0.83%, 07/02/2031 | | EUR | 550 | | | | 661 | |
1.25%, 01/22/2051 | | EUR | 200 | | | | 212 | |
2.55%, 01/27/2032 | | | 200 | | | | 204 | |
China Development Bank, (China), | | | | | | | | |
Reg. S, 4.20%, 01/19/2027 | | CNH | 10,000 | | | | 1,643 | |
Reg. S, 4.30%, 08/02/2032 | | CNH | 3,000 | | | | 506 | |
Reg. S, 4.35%, 08/06/2024 | | CNH | 5,000 | | | | 809 | |
Reg. S, 4.35%, 09/19/2024 | | CNH | 1,000 | | | | 162 | |
Series 1518, 3.74%, 09/10/2025 | | CNY | 28,000 | | | | 4,417 | |
Series 1605, 3.80%, 01/25/2036 | | CNY | 20,000 | | | | 3,112 | |
Series 1706, 4.02%, 04/17/2022 | | CNY | 12,000 | | | | 1,878 | |
Series 1710, 4.04%, 04/10/2027 | | CNY | 70,000 | | | | 11,179 | |
Series 1804, 4.69%, 03/23/2023 | | CNY | 143,000 | | | | 22,820 | |
Series 1805, 4.88%, 02/09/2028 | | CNY | 17,000 | | | | 2,852 | |
Series 1806, 4.73%, 04/02/2025 | | CNY | 20,230 | | | | 3,298 | |
Series 1810, 4.04%, 07/06/2028 | | CNY | 17,000 | | | | 2,723 | |
Series 1811, 3.76%, 08/14/2023 | | CNY | 16,000 | | | | 2,518 | |
Series 1903, 3.30%, 02/01/2024 | | CNY | 45,000 | | | | 7,011 | |
Series 1905, 3.48%, 01/08/2029 | | CNY | 226,500 | | | | 35,009 | |
Series 1908, 3.42%, 07/02/2024 | | CNY | 121,000 | | | | 18,935 | |
Series 1909, 3.50%, 08/13/2026 | | CNY | 64,600 | | | | 10,083 | |
Series 1910, 3.65%, 05/21/2029 | | CNY | 187,900 | | | | 29,355 | |
Series 1915, 3.45%, 09/20/2029 | | CNY | 147,000 | | | | 22,624 | |
Series 2003, 3.23%, 01/10/2025 | | CNY | 232,300 | | | | 36,082 | |
SEE NOTES TO FINANCIAL STATEMENTS.
| | | | | | | | | | |
| | | | | |
| JUNE 30, 2021 | | SIX CIRCLES TRUST | | | | | | | | 111 |
Six Circles Global Bond Fund
SCHEDULE OF PORTFOLIO INVESTMENTS
AS OF JUNE 30, 2021 (Unaudited) (continued)
(Amounts in U.S. Dollars, unless otherwise noted)
(Amounts in thousands, except number of Futures contracts)
| | | | | | | | |
| SECURITY DESCRIPTION | | PRINCIPAL
AMOUNT($) | | | VALUE($) | |
Foreign Government Securities — continued | |
Series 2004, 3.43%, 01/14/2027 | | CNY | 88,000 | | | | 13,658 | |
Series 2005, 3.07%, 03/10/2030 | | CNY | 10,000 | | | | 1,496 | |
Series 2008, 2.89%, 06/22/2025 | | CNY | 15,000 | | | | 2,294 | |
Series 2010, 3.09%, 06/18/2030 | | CNY | 20,000 | | | | 2,990 | |
China Government Bond, (China), | | | | | | | | |
1.99%, 04/09/2025 | | CNY | 421,000 | | | | 63,017 | |
2.36%, 07/02/2023 | | CNY | 352,500 | | | | 54,179 | |
2.64%, 08/13/2022 | | CNY | 271,000 | | | | 41,877 | |
2.68%, 05/21/2030 | | CNY | 173,000 | | | | 25,765 | |
2.85%, 06/04/2027 | | CNY | 606,500 | | | | 92,858 | |
Reg. S, 3.30%, 07/04/2023 | | CNH | 2,000 | | | | 314 | |
Reg. S, 3.31%, 11/30/2025 | | CNH | 2,000 | | | | 318 | |
Reg. S, 3.38%, 11/21/2024 | | CNH | 3,000 | | | | 476 | |
Reg. S, 3.38%, 07/04/2026 | | CNH | 24,000 | | | | 3,838 | |
3.39%, 03/16/2050 | | CNY | 277,100 | | | | 40,544 | |
Reg. S, 3.60%, 06/27/2028 | | CNH | 8,500 | | | | 1,386 | |
Reg. S, 3.60%, 05/21/2030 | | CNH | 7,000 | | | | 1,150 | |
3.73%, 05/25/2070 | | CNY | 34,800 | | | | 5,332 | |
3.76%, 03/22/2071 | | CNY | 60,000 | | | | 9,296 | |
3.81%, 09/14/2050 | | CNY | 151,000 | | | | 23,967 | |
Reg. S, 3.85%, 12/12/2026 | | CNH | 19,000 | | | | 3,115 | |
Reg. S, 4.00%, 05/22/2024 | | CNH | 8,500 | | | | 1,367 | |
Reg. S, 4.00%, 11/30/2035 | | CNH | 6,500 | | | | 1,109 | |
Reg. S, 4.15%, 12/04/2027 | | CNH | 20,000 | | | | 3,356 | |
Reg. S, 4.29%, 05/22/2029 | | CNH | 3,000 | | | | 514 | |
Reg. S, 4.40%, 12/12/2046 | | CNH | 25,000 | | | | 4,595 | |
Series 1809, 3.17%, 04/19/2023 | | CNY | 17,000 | | | | 2,656 | |
Series 1819, 3.54%, 08/16/2028 | | CNY | 500 | | | | 80 | |
Series 1824, 4.08%, 10/22/2048 | | CNY | 22,100 | | | | 3,661 | |
Series 1827, 3.25%, 11/22/2028 | | CNY | 143,100 | | | | 22,373 | |
Series 1906, 3.29%, 05/23/2029 | | CNY | 52,000 | | | | 8,148 | |
Series 1907, 3.25%, 06/06/2026 | | CNY | 15,700 | | | | 2,463 | |
Series 1908, 4.00%, 06/24/2069 | | CNY | 5,000 | | | | 812 | |
Series 1910, 3.86%, 07/22/2049 | | CNY | 2,500 | | | | 398 | |
Series 1911, 2.75%, 08/08/2022 | | CNY | 31,000 | | | | 4,809 | |
Series 1915, 3.13%, 11/21/2029 | | CNY | 8,000 | | | | 1,237 | |
Series 1916, 3.12%, 12/05/2026 | | CNY | 15,000 | | | | 2,337 | |
China Government International Bond, (China), | | | | | | | | |
Reg. S, 0.13%, 11/12/2026 | | EUR | 200 | | | | 237 | |
Reg. S, 0.50%, 11/12/2031 | | EUR | 650 | | | | 767 | |
City of Milan Italy, (Italy), 4.02%, 06/29/2035 | | EUR | 40 | | | | 62 | |
City of Montreal Canada, (Canada), 2.30%, 09/01/2029 | | CAD | 600 | | | | 498 | |
City of Quebec Canada, (Canada), 2.65%, 12/20/2027 | | CAD | 565 | | | | 482 | |
City of Toronto Canada, (Canada),
2.95%, 04/28/2035 | | CAD | 200 | | | | 171 | |
3.50%, 06/02/2036 | | CAD | 300 | | | | 273 | |
Colombia Government International Bond, (Colombia), | | | | | | | | |
3.00%, 01/30/2030 | | | 200 | | | | 196 | |
3.88%, 03/22/2026 | | EUR | 200 | | | | 265 | |
| | | | | | | | |
| SECURITY DESCRIPTION | | PRINCIPAL
AMOUNT($) | | | VALUE($) | |
| |
Corp. de Reservas Estrategicas de Productos Petroliferos Cores, (Spain), Reg. S, 1.50%, 11/27/2022 | | EUR | 600 | | | | 729 | |
CPPIB Capital, Inc., (Canada), | | | | | | | | |
Reg. S, 0.25%, 04/06/2027 | | EUR | 1,450 | | | | 1,758 | |
Reg. S, 0.38%, 06/20/2024 | | EUR | 300 | | | | 364 | |
Reg. S, 0.75%, 07/15/2049 | | EUR | 300 | | | | 352 | |
Croatia Government International Bond, (Croatia), Reg. S, 1.13%, 03/04/2033 | | EUR | 500 | | | | 588 | |
Cyprus Government International Bond, (Cyprus), | | | | | | | | |
Reg. S, 0.63%, 01/21/2030 | | EUR | 235 | | | | 285 | |
Reg. S, 1.25%, 01/21/2040 | | EUR | 720 | | | | 871 | |
Reg. S, 2.25%, 04/16/2050 | | EUR | 10 | | | | 14 | |
Czech Republic Government Bond, (Czech Republic), | | | | | | | | |
Series 49, Reg. S, 4.20%, 12/04/2036 | | CZK | 5,390 | | | | 326 | |
Series 58, Reg. S, 5.70%, 05/25/2024 | | CZK | 140 | | | | 7 | |
Series 78, Reg. S, 2.50%, 08/25/2028 | | CZK | 7,890 | | | | 384 | |
Series 89, Reg. S, 2.40%, 09/17/2025 | | CZK | 16,910 | | | | 810 | |
Series 95, Reg. S, 1.00%, 06/26/2026 | | CZK | 500 | | | | 23 | |
Series 97, Reg. S, 0.45%, 10/25/2023 | | CZK | 12,000 | | | | 546 | |
Series 100, 0.25%, 02/10/2027 | | CZK | 15,380 | | | | 659 | |
Series 103, 2.00%, 10/13/2033 | | CZK | 2,260 | | | | 107 | |
Series 105, 2.75%, 07/23/2029 | | CZK | 11,450 | | | | 570 | |
Series 121, 1.20%, 03/13/2031 | | CZK | 15,770 | | | | 693 | |
Series 125, 1.50%, 04/24/2040 | | CZK | 3,380 | | | | 142 | |
Denmark Government Bond, (Denmark), | | | | | | | | |
1.50%, 11/15/2023 | | DKK | 3,960 | | | | 662 | |
1.75%, 11/15/2025 | | DKK | 1,380 | | | | 241 | |
4.50%, 11/15/2039 | | DKK | 5,350 | | | | 1,500 | |
7.00%, 11/10/2024 | | DKK | 1,470 | | | | 294 | |
Series 10Y, Reg. S, 0.00%, 11/15/2031 (e) | | DKK | 1,780 | | | | 281 | |
Series 10Y, 0.50%, 11/15/2027 | | DKK | 4,540 | | | | 759 | |
Series 10YR, Reg. S, 0.50%, 11/15/2029 (e) | | DKK | 9,644 | | | | 1,615 | |
Series 30Y, Reg. S, 0.25%, 11/15/2052 (e) | | DKK | 2,004 | | | | 297 | |
Development Bank of Japan, Inc., (Japan), | | | | | | | | |
Reg. S, 0.88%, 10/10/2025 | | EUR | 1,000 | | | | 1,236 | |
Reg. S, 1.13%, 04/28/2023 | | GBP | 600 | | | | 841 | |
4.75%, 11/26/2027 | | EUR | 900 | | | | 1,388 | |
Series 86, 0.24%, 10/13/2027 | | JPY | 100,000 | | | | 908 | |
Estonia Government International Bond, (Estonia), Reg. S, 0.13%, 06/10/2030 | | EUR | 200 | | | | 237 | |
European Union, (Supranational), Reg. S, 3.38%, 04/04/2032 | | EUR | 600 | | | | 958 | |
Export-Import Bank of China (The), (China), | | | | | | | | |
Series 1514, 3.87%, 09/14/2025 | | CNY | 31,000 | | | | 4,911 | |
Series 1603, 3.33%, 02/22/2026 | | CNY | 100 | | | | 16 | |
Series 1610, 3.18%, 09/05/2026 | | CNY | 10,000 | | | | 1,538 | |
Series 1703, 4.11%, 03/20/2027 | | CNY | 10,000 | | | | 1,604 | |
Series 1905, 3.28%, 02/11/2024 | | CNY | 63,000 | | | | 9,819 | |
Series 1908, 3.23%, 11/04/2022 | | CNY | 8,000 | | | | 1,246 | |
SEE NOTES TO FINANCIAL STATEMENTS.
| | | | | | | | | | |
| | | | | |
| 112 | | | | | | | | SIX CIRCLES TRUST | | JUNE 30, 2021 |
| | | | | | | | |
| SECURITY DESCRIPTION | | PRINCIPAL
AMOUNT($) | | | VALUE($) | |
Foreign Government Securities — continued | |
Series 1910, 3.86%, 05/20/2029 | | CNY | 75,800 | | | | 11,977 | |
Series 2003, 2.17%, 04/07/2023 | | CNY | 47,500 | | | | 7,266 | |
Series 2005, 2.93%, 03/02/2025 | | CNY | 114,600 | | | | 17,585 | |
Series 2007, 3.26%, 02/24/2027 | | CNY | 48,000 | | | | 7,383 | |
Series 2010, 3.23%, 03/23/2030 | | CNY | 57,500 | | | | 8,696 | |
Series 2011, 3.74%, 11/16/2030 | | CNY | 10,000 | | | | 1,573 | |
Series 2012, 2.95%, 08/10/2022 | | CNY | 36,000 | | | | 5,592 | |
Series 2013, 3.34%, 09/04/2023 | | CNY | 40,000 | | | | 6,246 | |
Export-Import Bank of Korea, (South Korea), | | | | | | | | |
Reg. S, 2.60%, 11/08/2023 | | AUD | 1,100 | | | | 854 | |
Reg. S, 8.00%, 05/15/2024 | | IDR | 400,000 | | | | 29 | |
Finland Government Bond, (Finland), | | | | | | | | |
Reg. S, 0.00%, 09/15/2023 (e) | | EUR | 330 | | | | 397 | |
Reg. S, 0.00%, 09/15/2030 (e) | | EUR | 50 | | | | 60 | |
Reg. S, 0.13%, 04/15/2036 (e) | | EUR | 120 | | | | 139 | |
Reg. S, 0.13%, 04/15/2052 (e) | | EUR | 150 | | | | 156 | |
Reg. S, 0.25%, 09/15/2040 (e) | | EUR | 220 | | | | 254 | |
Reg. S, 0.50%, 04/15/2026 (e) | | EUR | 820 | | | | 1,019 | |
Reg. S, 0.50%, 09/15/2027 (e) | | EUR | 280 | | | | 350 | |
Reg. S, 0.50%, 09/15/2029 (e) | | EUR | 610 | | | | 763 | |
Reg. S, 0.75%, 04/15/2031 (e) | | EUR | 321 | | | | 410 | |
Reg. S, 0.88%, 09/15/2025 (e) | | EUR | 430 | | | | 541 | |
Reg. S, 1.13%, 04/15/2034 (e) | | EUR | 437 | | | | 581 | |
Reg. S, 1.50%, 04/15/2023 (e) | | EUR | 454 | | | | 559 | |
Reg. S, 2.00%, 04/15/2024 (e) | | EUR | 250 | | | | 318 | |
Reg. S, 2.63%, 07/04/2042 (e) | | EUR | 170 | | | | 293 | |
Series 30Y, Reg. S, 1.38%, 04/15/2047 (e) | | EUR | 270 | | | | 391 | |
Finnvera OYJ, (Finland), | | | | | | | | |
Reg. S, 0.38%, 04/09/2029 | | EUR | 100 | | | | 122 | |
Reg. S, 0.75%, 08/07/2028 | | EUR | 100 | | | | 126 | |
Fondo De Titulizacion Del Deficit Del Sistema Electrico FTA, (Spain), | | | | | | | | |
Reg. S, 0.01%, 09/17/2025 | | EUR | 100 | | | | 120 | |
Reg. S, 0.85%, 12/17/2023 | | EUR | 600 | | | | 732 | |
Free and Hanseatic City of Hamburg, (Germany), | | | | | | | | |
Reg. S, 0.00%, 04/07/2026 | | EUR | 280 | | | | 337 | |
Reg. S, 0.01%, 06/30/2028 | | EUR | 180 | | | | 216 | |
0.01%, 11/05/2035 | | EUR | 70 | | | | 79 | |
Reg. S, 0.20%, 09/03/2049 | | EUR | 70 | | | | 74 | |
Free State of Bavaria, (Germany), Reg. S, 0.01%, 01/18/2035 | | EUR | 352 | | | | 401 | |
French Republic Government Bond OAT, (France), | | | | | | | | |
Reg. S, 0.00%, 11/25/2029 | | EUR | 2,540 | | | | 3,029 | |
Reg. S, 1.00%, 11/25/2025 | | EUR | 1,150 | | | | 1,453 | |
Reg. S, 0.00%, 02/25/2023 | | EUR | 1,850 | | | | 2,217 | |
Reg. S, 0.00%, 03/25/2023 | | EUR | 3,301 | | | | 3,958 | |
Reg. S, 0.00%, 02/25/2024 | | EUR | 727 | | | | 876 | |
Reg. S, 0.00%, 03/25/2024 | | EUR | 1,300 | | | | 1,567 | |
Reg. S, 0.00%, 03/25/2025 | | EUR | 3,340 | | | | 4,039 | |
Reg. S, 0.00%, 02/25/2026 | | EUR | 85 | | | | 103 | |
| | | | | | | | |
| SECURITY DESCRIPTION | | PRINCIPAL
AMOUNT($) | | | VALUE($) | |
| |
Reg. S, 0.00%, 02/25/2027 | | EUR | 348 | | | | 420 | |
Reg. S, 0.00%, 11/25/2030 | | EUR | 2,490 | | | | 2,944 | |
Reg. S, 0.00%, 11/25/2031 | | EUR | 149 | | | | 174 | |
Reg. S, 0.25%, 11/25/2026 | | EUR | 2,730 | | | | 3,349 | |
Reg. S, 0.50%, 05/25/2025 | | EUR | 2,513 | | | | 3,099 | |
Reg. S, 0.50%, 05/25/2026 | | EUR | 609 | | | | 756 | |
Reg. S, 0.50%, 05/25/2029 | | EUR | 1,920 | | | | 2,389 | |
Reg. S, 0.50%, 05/25/2040 (e) | | EUR | 2,476 | | | | 2,875 | |
Reg. S, 0.50%, 06/25/2044 (e) | | EUR | 225 | | | | 255 | |
Reg. S, 0.50%, 05/25/2072 (e) | | EUR | 470 | | | | 429 | |
Reg. S, 0.75%, 05/25/2028 | | EUR | 1,663 | | | | 2,105 | |
Reg. S, 0.75%, 11/25/2028 | | EUR | 1,140 | | | | 1,445 | |
Reg. S, 0.75%, 05/25/2052 (e) | | EUR | 2,800 | | | | 3,172 | |
Reg. S, 1.00%, 05/25/2027 | | EUR | 2,841 | | | | 3,634 | |
Reg. S, 1.25%, 05/25/2034 | | EUR | 1,879 | | | | 2,495 | |
Reg. S, 1.25%, 05/25/2036 (e) | | EUR | 1,564 | | | | 2,076 | |
Reg. S, 1.50%, 05/25/2031 | | EUR | 1,728 | | | | 2,340 | |
Reg. S, 1.50%, 05/25/2050 (e) | | EUR | 1,537 | | | | 2,117 | |
Reg. S, 1.75%, 05/25/2023 | | EUR | 1,840 | | | | 2,281 | |
Reg. S, 1.75%, 11/25/2024 | | EUR | 2,526 | | | | 3,234 | |
Reg. S, 1.75%, 06/25/2039 (e) | | EUR | 1,110 | | | | 1,597 | |
Reg. S, 1.75%, 05/25/2066 (e) | | EUR | 686 | | | | 1,023 | |
Reg. S, 2.00%, 05/25/2048 (e) | | EUR | 1,548 | | | | 2,362 | |
Reg. S, 2.25%, 10/25/2022 | | EUR | 900 | | | | 1,108 | |
Reg. S, 2.25%, 05/25/2024 | | EUR | 300 | | | | 385 | |
Reg. S, 2.50%, 05/25/2030 | | EUR | 6,088 | | | | 8,860 | |
Reg. S, 2.75%, 10/25/2027 | | EUR | 1,560 | | | | 2,211 | |
Reg. S, 3.25%, 05/25/2045 | | EUR | 1,086 | | | | 2,005 | |
Reg. S, 3.50%, 04/25/2026 | | EUR | 36 | | | | 51 | |
Reg. S, 4.00%, 10/25/2038 | | EUR | 825 | | | | 1,552 | |
Reg. S, 4.00%, 04/25/2055 (e) | | EUR | 966 | | | | 2,168 | |
Reg. S, 4.00%, 04/25/2060 | | EUR | 734 | | | | 1,721 | |
Reg. S, 4.25%, 10/25/2023 | | EUR | 332 | | | | 439 | |
Reg. S, 4.50%, 04/25/2041 | | EUR | 1,907 | | | | 3,920 | |
Reg. S, 4.75%, 04/25/2035 | | EUR | 2,007 | | | | 3,816 | |
Reg. S, 5.50%, 04/25/2029 | | EUR | 2,037 | | | | 3,493 | |
Reg. S, 5.75%, 10/25/2032 | | EUR | 1,159 | | | | 2,244 | |
Reg. S, 6.00%, 10/25/2025 | | EUR | 2,740 | | | | 4,174 | |
Reg. S, 8.50%, 04/25/2023 | | EUR | 1,220 | | | | 1,688 | |
Gemeinsame Deutsche Bundeslaender, (Germany), | | | | | | | | |
Series 46, Reg. S, 1.13%, 09/30/2024 | | EUR | 720 | | | | 897 | |
Series 58, Reg. S, 0.00%, 02/19/2027 | | EUR | 220 | | | | 265 | |
Gestion Securite de Stocks Securite SA, (France), Reg. S, 4.00%, 01/24/2024 | | EUR | 100 | | | | 132 | |
Hong Kong Government Bond Programme, (Hong Kong), 1.97%, 01/17/2029 | | HKD | 1,300 | | | | 178 | |
Housing & Development Board, (Singapore), | | | | | | | | |
Reg. S, 1.76%, 02/24/2027 | | SGD | 250 | | | | 191 | |
2.09%, 08/30/2022 | | SGD | 500 | | | | 379 | |
Reg. S, 2.25%, 11/21/2024 | | SGD | 750 | | | | 582 | |
Reg. S, 2.32%, 01/24/2028 | | SGD | 250 | | | | 197 | |
Reg. S, 2.60%, 10/30/2029 | | SGD | 1,500 | | | | 1,209 | |
Hungary Government Bond, (Hungary), | | | | | | | | |
Series 24/C, 2.50%, 10/24/2024 | | HUF | 281,740 | | | | 974 | |
SEE NOTES TO FINANCIAL STATEMENTS.
| | | | | | | | | | |
| | | | | |
| JUNE 30, 2021 | | SIX CIRCLES TRUST | | | | | | | | 113 |
Six Circles Global Bond Fund
SCHEDULE OF PORTFOLIO INVESTMENTS
AS OF JUNE 30, 2021 (Unaudited) (continued)
(Amounts in U.S. Dollars, unless otherwise noted)
(Amounts in thousands, except number of Futures contracts)
| | | | | | | | |
| SECURITY DESCRIPTION | | PRINCIPAL
AMOUNT($) | | | VALUE($) | |
Foreign Government Securities — continued | |
Series 26/E, 1.50%, 04/22/2026 | | HUF | 100,410 | | | | 330 | |
Series 27/A, 3.00%, 10/27/2027 | | HUF | 194,780 | | | | 687 | |
Series 28/A, 6.75%, 10/22/2028 | | HUF | 25,000 | | | | 109 | |
Series 30/A, 3.00%, 08/21/2030 | | HUF | 157,350 | | | | 553 | |
Series 33/A, 2.25%, 04/20/2033 | | HUF | 57,020 | | | | 180 | |
Series 41/A, 3.00%, 04/25/2041 | | HUF | 27,170 | | | | 87 | |
Hungary Government International Bond, (Hungary), | | | | | | | | |
Reg. S, 0.50%, 11/18/2030 | | EUR | 500 | | | | 581 | |
Reg. S, 1.63%, 04/28/2032 | | EUR | 500 | | | | 631 | |
Reg. S, 1.75%, 10/10/2027 | | EUR | 425 | | | | 550 | |
Hydro-Quebec, (Canada), | | | | | | | | |
6.00%, 02/15/2040 | | CAD | 300 | | | | 369 | |
SUB, 8.40%, 03/28/2025 | | | 200 | | | | 251 | |
SUB, 8.91%, 11/18/2024 | | | 500 | | | | 631 | |
Indonesia Government International Bond, (Indonesia), | | | | | | | | |
0.90%, 02/14/2027 | | EUR | 1,600 | | | | 1,916 | |
1.85%, 03/12/2031 | | | 234 | | | | 229 | |
Reg. S, 2.15%, 07/18/2024 | | EUR | 550 | | | | 690 | |
Reg. S, 3.75%, 06/14/2028 | | EUR | 500 | | | | 703 | |
Indonesia Treasury Bond, (Indonesia), | | | | | | | | |
Series FR63, 5.63%, 05/15/2023 | | IDR | 55,000,000 | | | | 3,876 | |
Series FR64, 6.13%, 05/15/2028 | | IDR | 20,000,000 | | | | 1,378 | |
Series FR74, 7.50%, 08/15/2032 | | IDR | 90,000,000 | | | | 6,539 | |
Series FR75, 7.50%, 05/15/2038 | | IDR | 101,000,000 | | | | 7,129 | |
Series FR80, 7.50%, 06/15/2035 | | IDR | 10,000,000 | | | | 712 | |
Series FR81, 6.50%, 06/15/2025 | | IDR | 119,400,000 | | | | 8,633 | |
Series FR82, 7.00%, 09/15/2030 | | IDR | 83,820,000 | | | | 5,970 | |
Series FR83, 7.50%, 04/15/2040 | | IDR | 39,000,000 | | | | 2,752 | |
Series FR85, 7.75%, 04/15/2031 | | IDR | 30,000,000 | | | | 2,237 | |
Series FR86, 5.50%, 04/15/2026 | | IDR | 52,000,000 | | | | 3,598 | |
Series FR87, 6.50%, 02/15/2031 | | IDR | 20,000,000 | | | | 1,368 | |
Infraestruturas de Portugal SA, (Portugal), Reg. S, 4.68%, 10/16/2024 | | EUR | 150 | | | | 207 | |
Instituto de Credito Oficial, (Spain), Reg. S, 0.25%, 04/30/2024 | | EUR | 50 | | | | 60 | |
International Bank for Reconstruction & Development, (Supranational), | | | | | | | | |
0.00%, 01/15/2027 | | EUR | 1,125 | | | | 1,353 | |
Zero Coupon, 10/31/2030 | | | 1,000 | | | | 820 | |
0.10%, 09/17/2035 | | EUR | 775 | | | | 889 | |
Reg. S, 0.20%, 01/21/2061 | | EUR | 500 | | | | 496 | |
0.25%, 09/23/2027 | | GBP | 900 | | | | 1,211 | |
0.38%, 07/28/2025 | | | 50 | | | | 49 | |
0.50%, 07/24/2023 | | GBP | 1,450 | | | | 2,017 | |
0.50%, 06/21/2035 | | EUR | 50 | | | | 61 | |
0.88%, 12/13/2024 | | GBP | 50 | | | | 70 | |
1.63%, 01/15/2025 | | | 215 | | | | 223 | |
2.00%, 01/26/2022 | | | 165 | | | | 167 | |
2.50%, 03/19/2024 | | | 365 | | | | 385 | |
3.00%, 09/27/2023 | | | 200 | | | | 212 | |
Investitionsbank Schleswig-Holstein, (Germany), Reg. S, 0.01%, 05/15/2026 | | EUR | 100 | | | | 120 | |
| | | | | | | | |
| SECURITY DESCRIPTION | | PRINCIPAL
AMOUNT($) | | | VALUE($) | |
| |
Ireland Government Bond, (Ireland), | | | | | | | | |
Reg. S, 0.20%, 10/18/2030 | | EUR | 881 | | | | 1,057 | |
Reg. S, 0.40%, 05/15/2035 | | EUR | 610 | | | | 726 | |
Reg. S, 0.00%, 10/18/2022 | | EUR | 330 | | | | 394 | |
Reg. S, 0.00%, 10/18/2031 | | EUR | 152 | | | | 177 | |
Reg. S, 0.20%, 05/15/2027 | | EUR | 880 | | | | 1,073 | |
Reg. S, 0.55%, 04/22/2041 | | EUR | 230 | | | | 267 | |
Reg. S, 0.90%, 05/15/2028 | | EUR | 12 | | | | 15 | |
Reg. S, 1.10%, 05/15/2029 | | EUR | 240 | | | | 311 | |
Reg. S, 1.35%, 03/18/2031 | | EUR | 365 | | | | 486 | |
Reg. S, 1.50%, 05/15/2050 | | EUR | 416 | | | | 573 | |
Reg. S, 1.70%, 05/15/2037 | | EUR | 290 | | | | 408 | |
Reg. S, 2.00%, 02/18/2045 | | EUR | 385 | | | | 585 | |
Reg. S, 2.40%, 05/15/2030 | | EUR | 590 | | | | 849 | |
Reg. S, 3.40%, 03/18/2024 | | EUR | 490 | | | | 643 | |
Reg. S, 3.90%, 03/20/2023 | | EUR | 270 | | | | 345 | |
5.40%, 03/13/2025 | | EUR | 790 | | | | 1,142 | |
Israel Government AID Bond, (Israel), 5.50%, 09/18/2033 | | | 900 | | | | 1,271 | |
Israel Government Bond — Fixed, (Israel), | | | | | | | | |
Series 142, 5.50%, 01/31/2042 | | ILS | 290 | | | | 143 | |
Series 327, 2.00%, 03/31/2027 | | ILS | 800 | | | | 266 | |
Series 330, 1.00%, 03/31/2030 | | ILS | 1,200 | | | | 365 | |
Series 537, 1.50%, 05/31/2037 | | ILS | 305 | | | | 89 | |
Israel Government International Bond, (Israel), | | | | | | | | |
Reg. S, 2.50%, 01/16/2049 | | EUR | 425 | | | | 634 | |
2.75%, 07/03/2030 | | | 200 | | | | 213 | |
Italy Buoni Poliennali Del Tesoro, (Italy), | | | | | | | | |
Reg. S, 0.85%, 01/15/2027 (e) | | EUR | 6,435 | | | | 7,894 | |
Reg. S, 1.80%, 03/01/2041 (e) | | EUR | 1,073 | | | | 1,328 | |
Reg. S, 0.00%, 01/15/2024 | | EUR | 1,045 | | | | 1,247 | |
Reg. S, 0.00%, 04/15/2024 | | EUR | 348 | | | | 415 | |
Reg. S, 0.30%, 08/15/2023 (e) | | EUR | 1,640 | | | | 1,970 | |
Reg. S, 0.35%, 02/01/2025 | | | EUR 380 | | | | 458 | |
Reg. S, 0.50%, 07/15/2028 (e) | | EUR | 154 | | | | 183 | |
Reg. S, 0.60%, 06/15/2023 | | EUR | 1,640 | | | | 1,981 | |
Reg. S, 0.60%, 08/01/2031 (e) | | EUR | 110 | | | | 128 | |
Reg. S, 0.65%, 10/15/2023 | | EUR | 1,000 | | | | 1,212 | |
Reg. S, 0.90%, 08/01/2022 | | EUR | 2,380 | | | | 2,863 | |
Reg. S, 0.90%, 04/01/2031 | | EUR | 927 | | | | 1,112 | |
Reg. S, 0.95%, 09/15/2027 (e) | | EUR | 685 | | | | 843 | |
Reg. S, 0.95%, 08/01/2030 | | EUR | 1,510 | | | | 1,829 | |
Reg. S, 0.95%, 03/01/2037 (e) | | EUR | 203 | | | | 229 | |
Reg. S, 1.00%, 07/15/2022 | | EUR | 992 | | | | 1,194 | |
Reg. S, 1.25%, 12/01/2026 | | EUR | 520 | | | | 652 | |
Reg. S, 1.35%, 04/01/2030 | | EUR | 1,390 | | | | 1,746 | |
Reg. S, 1.45%, 11/15/2024 | | EUR | 1,900 | | | | 2,374 | |
Reg. S, 1.45%, 05/15/2025 | | EUR | 1,013 | | | | 1,271 | |
Reg. S, 1.45%, 03/01/2036 (e) | | EUR | 829 | | | | 1,013 | |
Reg. S, 1.50%, 06/01/2025 | | EUR | 1,620 | | | | 2,038 | |
Reg. S, 1.50%, 04/30/2045 (e) | | EUR | 571 | | | | 657 | |
Reg. S, 1.65%, 12/01/2030 (e) | | EUR | 2,329 | | | | 2,989 | |
Reg. S, 1.65%, 03/01/2032 (e) | | EUR | 513 | | | | 657 | |
Reg. S, 1.70%, 09/01/2051 (e) | | EUR | 637 | | | | 731 | |
SEE NOTES TO FINANCIAL STATEMENTS.
| | | | | | | | | | |
| | | | | |
| 114 | | | | | | | | SIX CIRCLES TRUST | | JUNE 30, 2021 |
| | | | | | | | |
| SECURITY DESCRIPTION | | PRINCIPAL
AMOUNT($) | | | VALUE($) | |
Foreign Government Securities — continued | |
Reg. S, 1.75%, 07/01/2024 | | EUR | 1,140 | | | | 1,430 | |
Reg. S, 1.85%, 07/01/2025 (e) | | EUR | 2,260 | | | | 2,881 | |
Reg. S, 2.00%, 12/01/2025 | | EUR | 760 | | | | 980 | |
Reg. S, 2.00%, 02/01/2028 | | EUR | 140 | | | | 184 | |
Reg. S, 2.05%, 08/01/2027 | | EUR | 1,290 | | | | 1,691 | |
Reg. S, 2.10%, 07/15/2026 | | EUR | 1,480 | | | | 1,928 | |
Reg. S, 2.15%, 03/01/2072 (e) | | EUR | 233 | | | | 270 | |
Reg. S, 2.20%, 06/01/2027 | | EUR | 2,407 | | | | 3,177 | |
Reg. S, 2.25%, 09/01/2036 (e) | | EUR | 660 | | | | 891 | |
Reg. S, 2.45%, 09/01/2033 (e) | | EUR | 1,194 | | | | 1,646 | |
Reg. S, 2.50%, 12/01/2024 | | EUR | 500 | | | | 646 | |
Reg. S, 2.50%, 11/15/2025 | | EUR | 279 | | | | 367 | |
Reg. S, 2.70%, 03/01/2047 (e) | | EUR | 370 | | | | 526 | |
Reg. S, 2.80%, 12/01/2028 | | EUR | 590 | | | | 817 | |
Reg. S, 2.80%, 03/01/2067 (e) | | EUR | 540 | | | | 756 | |
Reg. S, 2.95%, 09/01/2038 (e) | | EUR | 514 | | | | 755 | |
Reg. S, 3.00%, 08/01/2029 | | EUR | 900 | | | | 1,272 | |
Reg. S, 3.10%, 03/01/2040 (e) | | EUR | 791 | | | | 1,186 | |
Reg. S, 3.25%, 09/01/2046 (e) | | EUR | 1,090 | | | | 1,696 | |
Reg. S, 3.35%, 03/01/2035 (e) | | EUR | 2,860 | | | | 4,327 | |
Reg. S, 3.45%, 03/01/2048 (e) | | EUR | 562 | | | | 906 | |
Reg. S, 3.50%, 03/01/2030 (e) | | EUR | 1,306 | | | | 1,923 | |
Reg. S, 3.75%, 09/01/2024 | | EUR | 1,230 | | | | 1,640 | |
Reg. S, 3.85%, 09/01/2049 (e) | | EUR | 612 | | | | 1,057 | |
Reg. S, 4.00%, 02/01/2037 (e) | | EUR | 1,310 | | | | 2,143 | |
Reg. S, 4.50%, 05/01/2023 | | EUR | 1,891 | | | | 2,443 | |
Reg. S, 4.50%, 03/01/2024 | | EUR | 59 | | | | 79 | |
Reg. S, 4.50%, 03/01/2026 (e) | | EUR | 3 | | | | 4 | |
Reg. S, 4.75%, 08/01/2023 (e) | | EUR | 1,000 | | | | 1,312 | |
Reg. S, 4.75%, 09/01/2028 (e) | | EUR | 1,593 | | | | 2,459 | |
Reg. S, 4.75%, 09/01/2044 (e) | | EUR | 2,050 | | | | 3,888 | |
Reg. S, 5.00%, 03/01/2025 (e) | | EUR | 890 | | | | 1,253 | |
Reg. S, 5.00%, 08/01/2034 (e) | | EUR | 1,080 | | | | 1,887 | |
Reg. S, 5.00%, 08/01/2039 (e) | | EUR | 963 | | | | 1,796 | |
Reg. S, 5.00%, 09/01/2040 (e) | | EUR | 960 | | | | 1,806 | |
Reg. S, 5.25%, 11/01/2029 | | EUR | 1,407 | | | | 2,302 | |
Reg. S, 5.50%, 09/01/2022 | | EUR | 760 | | | | 963 | |
Reg. S, 5.50%, 11/01/2022 | | EUR | 1,414 | | | | 1,809 | |
Reg. S, 5.75%, 02/01/2033 | | EUR | 937 | | | | 1,697 | |
Reg. S, 6.00%, 05/01/2031 | | EUR | 1,150 | | | | 2,042 | |
Reg. S, 6.50%, 11/01/2027 | | EUR | 890 | | | | 1,462 | |
Reg. S, 7.25%, 11/01/2026 | | EUR | 1,580 | | | | 2,580 | |
Series 5Y, Reg. S, 2.45%, 10/01/2023 | | EUR | 1,062 | | | | 1,338 | |
Series CAC, Reg. S, 2.45%,
09/01/2050 (e) | | EUR | 856 | | | | 1,160 | |
Italy Certificati di Credito del Tesoro Zero Coupon, (Italy), Zero Coupon, 09/28/2022 | | EUR | 700 | | | | 834 | |
Japan Bank for International Cooperation, (Japan), 2.38%, 07/21/2022 | | | 200 | | | | 204 | |
Japan Expressway Holding and Debt Repayment Agency, (Japan), | | | | | | | | |
Series 37, 2.42%, 06/20/2028 | | JPY | 100,000 | | | | 1,044 | |
Series 75, 1.96%, 09/19/2031 | | JPY | 100,000 | | | | 1,059 | |
| | | | | | | | |
| SECURITY DESCRIPTION | | PRINCIPAL
AMOUNT($) | | | VALUE($) | |
| |
Japan Finance Corp., (Japan), | |
Series 57, 0.00%, 10/17/2025 | | JPY | 400,000 | | | | 3,600 | |
Series 62, 0.00%, 07/31/2024 | | JPY | 1,870,000 | | | | 16,830 | |
Japan Finance Organization for Municipalities, (Japan), | | | | | | | | |
Reg. S, 0.05%, 02/12/2027 | | EUR | 200 | | | | 239 | |
Series 4, 0.31%, 07/28/2023 | | JPY | 1,000,000 | | | | 9,058 | |
Series 39, 0.82%, 08/26/2022 | | JPY | 10,000 | | | | 91 | |
Series 55, 0.78%, 12/28/2023 | | JPY | 100,000 | | | | 917 | |
Series 69, 0.48%, 02/28/2025 | | JPY | 100,000 | | | | 915 | |
Series 72, 0.51%, 05/23/2025 | | JPY | 1,016,000 | | | | 9,327 | |
Series 2022, 2.32%, 06/18/2027 | | JPY | 1,400,000 | | | | 14,277 | |
Japan Government Five Year Bond, (Japan), | | | | | | | | |
Series 135, 0.10%, 03/20/2023 | | JPY | 3,819,750 | | | | 34,507 | |
Series 143, 0.10%, 03/20/2025 | | JPY | 934,600 | | | | 8,483 | |
Series 144, 0.10%, 06/20/2025 | | JPY | 329,000 | | | | 2,988 | |
Japan Government Forty Year Bond, (Japan), | | | | | | | | |
Series 1, 2.40%, 03/20/2048 | | JPY | 100,000 | | | | 1,294 | |
Series 3, 2.20%, 03/20/2050 | | JPY | 2,683,300 | | | | 33,779 | |
Series 4, 2.20%, 03/20/2051 | | JPY | 540,200 | | | | 6,822 | |
Series 5, 2.00%, 03/20/2052 | | JPY | 362,900 | | | | 4,430 | |
Series 7, 1.70%, 03/20/2054 | | JPY | 50,200 | | | | 580 | |
Series 8, 1.40%, 03/20/2055 | | JPY | 393,750 | | | | 4,253 | |
Series 9, 0.40%, 03/20/2056 | | JPY | 36,500 | | | | 295 | |
Series 10, 0.90%, 03/20/2057 | | JPY | 202,850 | | | | 1,917 | |
Series 11, 0.80%, 03/20/2058 | | JPY | 802,900 | | | | 7,351 | |
Series 12, 0.50%, 03/20/2059 | | JPY | 1,099,550 | | | | 9,090 | |
Series 13, 0.50%, 03/20/2060 | | JPY | 650,050 | | | | 5,355 | |
Series 14, 0.70%, 03/20/2061 | | JPY | 177,350 | | | | 1,562 | |
Japan Government Ten Year Bond, (Japan), | | | | | | | | |
Series 329, 0.80%, 06/20/2023 | | JPY | 731,950 | | | | 6,706 | |
Series 330, 0.80%, 09/20/2023 | | JPY | 5,612,350 | | | | 51,549 | |
Series 334, 0.60%, 06/20/2024 | | JPY | 839,500 | | | | 7,720 | |
Series 336, 0.50%, 12/20/2024 | | JPY | 523,900 | | | | 4,819 | |
Series 342, 0.10%, 03/20/2026 | | JPY | 288,000 | | | | 2,617 | |
Series 343, 0.10%, 06/20/2026 | | JPY | 1,308,950 | | | | 11,897 | |
Series 344, 0.10%, 09/20/2026 | | JPY | 2,222,800 | | | | 20,202 | |
Series 345, 0.10%, 12/20/2026 | | JPY | 7,942,800 | | | | 72,241 | |
Series 346, 0.10%, 03/20/2027 | | JPY | 1,000,000 | | | | 9,097 | |
Series 347, 0.10%, 06/20/2027 | | JPY | 1,381,350 | | | | 12,573 | |
Series 348, 0.10%, 09/20/2027 | | JPY | 3,407,900 | | | | 31,023 | |
Series 349, 0.10%, 12/20/2027 | | JPY | 2,115,800 | | | | 19,265 | |
Series 350, 0.10%, 03/20/2028 | | JPY | 1,368,900 | | | | 12,464 | |
Series 351, 0.10%, 06/20/2028 | | JPY | 823,800 | | | | 7,501 | |
Series 352, 0.10%, 09/20/2028 | | JPY | 743,400 | | | | 6,767 | |
Series 354, 0.10%, 03/20/2029 | | JPY | 142,650 | | | | 1,298 | |
Series 355, 0.10%, 06/20/2029 | | JPY | 156,050 | | | | 1,419 | |
Series 356, 0.10%, 09/20/2029 | | JPY | 2,192,650 | | | | 19,926 | |
Series 357, 0.10%, 12/20/2029 | | JPY | 972,650 | | | | 8,833 | |
Series 358, 0.10%, 03/20/2030 | | JPY | 1,115,100 | | | | 10,118 | |
Series 359, 0.10%, 06/20/2030 | | JPY | 4,656,500 | | | | 42,228 | |
SEE NOTES TO FINANCIAL STATEMENTS.
| | | | | | | | | | |
| | | | | |
| JUNE 30, 2021 | | SIX CIRCLES TRUST | | | | | | | | 115 |
Six Circles Global Bond Fund
SCHEDULE OF PORTFOLIO INVESTMENTS
AS OF JUNE 30, 2021 (Unaudited) (continued)
(Amounts in U.S. Dollars, unless otherwise noted)
(Amounts in thousands, except number of Futures contracts)
| | | | | | | | |
| SECURITY DESCRIPTION | | PRINCIPAL
AMOUNT($) | | | VALUE($) | |
Foreign Government Securities — continued | |
Series 360, 0.10%, 09/20/2030 | | JPY | 910,250 | | | | 8,246 | |
Series 361, 0.10%, 12/20/2030 | | JPY | 571,000 | | | | 5,166 | |
Japan Government Thirty Year Bond, (Japan), | | | | | | | | |
Series 4, 2.90%, 11/20/2030 | | JPY | 149,300 | | | | 1,704 | |
Series 5, 2.20%, 05/20/2031 | | JPY | 143,400 | | | | 1,562 | |
Series 11, 1.70%, 06/20/2033 | | JPY | 100,000 | | | | 1,066 | |
Series 19, 2.30%, 06/20/2035 | | JPY | 3,067,700 | | | | 35,489 | |
Series 20, 2.50%, 09/20/2035 | | JPY | 156,800 | | | | 1,858 | |
Series 21, 2.30%, 12/20/2035 | | JPY | 749,850 | | | | 8,720 | |
Series 29, 2.40%, 09/20/2038 | | JPY | 110,100 | | | | 1,328 | |
Series 32, 2.30%, 03/20/2040 | | JPY | 271,450 | | | | 3,272 | |
Series 33, 2.00%, 09/20/2040 | | JPY | 3,575,400 | | | | 41,442 | |
Series 34, 2.20%, 03/20/2041 | | JPY | 622,350 | | | | 7,444 | |
Series 35, 2.00%, 09/20/2041 | | JPY | 646,200 | | | | 7,535 | |
Series 37, 1.90%, 09/20/2042 | | JPY | 1,558,300 | | | | 18,006 | |
Series 38, 1.80%, 03/20/2043 | | JPY | 103,400 | | | | 1,179 | |
Series 39, 1.90%, 06/20/2043 | | JPY | 316,950 | | | | 3,676 | |
Series 42, 1.70%, 03/20/2044 | | JPY | 688,300 | | | | 7,752 | |
Series 44, 1.70%, 09/20/2044 | | JPY | 224,350 | | | | 2,534 | |
Series 45, 1.50%, 12/20/2044 | | JPY | 2,900 | | | | 32 | |
Series 46, 1.50%, 03/20/2045 | | JPY | 761,350 | | | | 8,305 | |
Series 47, 1.60%, 06/20/2045 | | JPY | 627,000 | | | | 6,967 | |
Series 48, 1.40%, 09/20/2045 | | JPY | 2,360,800 | | | | 25,307 | |
Series 49, 1.40%, 12/20/2045 | | JPY | 438,550 | | | | 4,702 | |
Series 50, 0.80%, 03/20/2046 | | JPY | 131,550 | | | | 1,247 | |
Series 51, 0.30%, 06/20/2046 | | JPY | 327,200 | | | | 2,758 | |
Series 52, 0.50%, 09/20/2046 | | JPY | 125,050 | | | | 1,104 | |
Series 53, 0.60%, 12/20/2046 | | JPY | 9,550 | | | | 86 | |
Series 56, 0.80%, 09/20/2047 | | JPY | 2,286,950 | | | | 21,525 | |
Series 57, 0.80%, 12/20/2047 | | JPY | 414,950 | | | | 3,904 | |
Series 58, 0.80%, 03/20/2048 | | JPY | 237,450 | | | | 2,232 | |
Series 61, 0.70%, 12/20/2048 | | JPY | 231,950 | | | | 2,118 | |
Series 62, 0.50%, 03/20/2049 | | JPY | 2,351,650 | | | | 20,385 | |
Series 63, 0.40%, 06/20/2049 | | JPY | 156,850 | | | | 1,321 | |
Series 64, 0.40%, 09/20/2049 | | JPY | 135,300 | | | | 1,136 | |
Series 65, 0.40%, 12/20/2049 | | JPY | 517,250 | | | | 4,333 | |
Series 66, 0.40%, 03/20/2050 | | JPY | 455,350 | | | | 3,810 | |
Series 67, 0.60%, 06/20/2050 | | JPY | 477,500 | | | | 4,208 | |
Series 68, 0.60%, 09/20/2050 | | JPY | 131,500 | | | | 1,157 | |
Series 69, 0.70%, 12/20/2050 | | JPY | 418,350 | | | | 3,779 | |
Series 70, 0.70%, 03/20/2051 | | JPY | 493,700 | | | | 4,450 | |
Japan Government Twenty Year Bond, (Japan), | | | | | | | | |
Series 75, 2.10%, 03/20/2025 | | JPY | 37,000 | | | | 361 | |
Series 80, 2.10%, 06/20/2025 | | JPY | 517,000 | | | | 5,064 | |
Series 82, 2.10%, 09/20/2025 | | JPY | 1,631,800 | | | | 16,064 | |
Series 92, 2.10%, 12/20/2026 | | JPY | 196,250 | | | | 1,979 | |
Series 94, 2.10%, 03/20/2027 | | JPY | 47,500 | | | | 481 | |
Series 96, 2.10%, 06/20/2027 | | JPY | 93,350 | | | | 950 | |
Series 99, 2.10%, 12/20/2027 | | JPY | 771,550 | | | | 7,928 | |
Series 105, 2.10%, 09/20/2028 | | JPY | 25,450 | | | | 265 | |
Series 109, 1.90%, 03/20/2029 | | JPY | 6,139,250 | | | | 63,544 | |
Series 113, 2.10%, 09/20/2029 | | JPY | 204,150 | | | | 2,157 | |
| | | | | | | | |
| SECURITY DESCRIPTION | | PRINCIPAL
AMOUNT($) | | | VALUE($) | |
| |
Series 118, 2.00%, 06/20/2030 | | JPY | 1,865,000 | | | | 19,769 | |
Series 121, 1.90%, 09/20/2030 | | JPY | 1,808,800 | | | | 19,078 | |
Series 122, 1.80%, 09/20/2030 | | JPY | 965,200 | | | | 10,100 | |
Series 123, 2.10%, 12/20/2030 | | JPY | 167,000 | | | | 1,795 | |
Series 124, 2.00%, 12/20/2030 | | JPY | 253,200 | | | | 2,701 | |
Series 125, 2.20%, 03/20/2031 | | JPY | 768,850 | | | | 8,355 | |
Series 126, 2.00%, 03/20/2031 | | JPY | 845,200 | | | | 9,038 | |
Series 127, 1.90%, 03/20/2031 | | JPY | 86,050 | | | | 913 | |
Series 128, 1.90%, 06/20/2031 | | JPY | 797,950 | | | | 8,490 | |
Series 133, 1.80%, 12/20/2031 | | JPY | 526,850 | | | | 5,587 | |
Series 140, 1.70%, 09/20/2032 | | JPY | 2,049,100 | | | | 21,691 | |
Series 145, 1.70%, 06/20/2033 | | JPY | 109,050 | | | | 1,162 | |
Series 146, 1.70%, 09/20/2033 | | JPY | 173,100 | | | | 1,849 | |
Series 148, 1.50%, 03/20/2034 | | JPY | 970,000 | | | | 10,181 | |
Series 149, 1.50%, 06/20/2034 | | JPY | 4,177,850 | | | | 43,920 | |
Series 150, 1.40%, 09/20/2034 | | JPY | 6,281,850 | | | | 65,395 | |
Series 151, 1.20%, 12/20/2034 | | JPY | 585,550 | | | | 5,965 | |
Series 152, 1.20%, 03/20/2035 | | JPY | 1,277,600 | | | | 13,022 | |
Series 153, 1.30%, 06/20/2035 | | JPY | 800,000 | | | | 8,265 | |
Series 154, 1.20%, 09/20/2035 | | JPY | 845,850 | | | | 8,640 | |
Series 155, 1.00%, 12/20/2035 | | JPY | 963,350 | | | | 9,604 | |
Series 156, 0.40%, 03/20/2036 | | JPY | 838,350 | | | | 7,705 | |
Series 157, 0.20%, 06/20/2036 | | JPY | 947,400 | | | | 8,452 | |
Series 159, 0.60%, 12/20/2036 | | JPY | 103,550 | | | | 977 | |
Series 161, 0.60%, 06/20/2037 | | JPY | 562,450 | | | | 5,297 | |
Series 164, 0.50%, 03/20/2038 | | JPY | 489,650 | | | | 4,526 | |
Series 165, 0.50%, 06/20/2038 | | JPY | 397,450 | | | | 3,669 | |
Series 166, 0.70%, 09/20/2038 | | JPY | 22,000 | | | | 209 | |
Series 167, 0.50%, 12/20/2038 | | JPY | 1,278,150 | | | | 11,768 | |
Series 168, 0.40%, 03/20/2039 | | JPY | 689,000 | | | | 6,227 | |
Series 172, 0.40%, 03/20/2040 | | JPY | 145,000 | | | | 1,302 | |
Series 173, 0.40%, 06/20/2040 | | JPY | 872,500 | | | | 7,813 | |
Series 174, 0.40%, 09/20/2040 | | JPY | 2,985,300 | | | | 26,711 | |
Series 175, 0.50%, 12/20/2040 | | JPY | 407,050 | | | | 3,703 | |
Series 176, 0.50%, 03/20/2041 | | JPY | 650,600 | | | | 5,910 | |
Japan Government Two Year Bond, (Japan), Series 415, 0.10%, 08/01/2022 | | JPY | 959,300 | | | | 8,655 | |
Japan Housing Finance Agency, (Japan), | | | | | | | | |
Series 71, 1.75%, 03/19/2026 | | JPY | 200,000 | | | | 1,944 | |
Series 108, 1.43%, 06/18/2027 | | JPY | 100,000 | | | | 972 | |
Japan International Cooperation Agency, (Japan), Series 35, 0.08%, 06/19/2026 | | JPY | 200,000 | | | | 1,804 | |
Japanese Government CPI Linked Bond, (Japan), Series 25, 0.20%, 03/10/2030 | | JPY | 99,315 | | | | 935 | |
Jersey International Bond, (Jersey), Reg. S, 3.75%, 06/09/2054 | | GBP | 400 | | | | 811 | |
Kazakhstan Government International Bond, (Kazakhstan), Reg. S, 1.50%, 09/30/2034 | | EUR | 200 | | | | 239 | |
Kingdom of Belgium Government Bond, (Belgium), | | | | | | | | |
Series 44, Reg. S, 5.00%, 03/28/2035 (e) | | EUR | 480 | | | | 932 | |
SEE NOTES TO FINANCIAL STATEMENTS.
| | | | | | | | | | |
| | | | | |
| 116 | | | | | | | | SIX CIRCLES TRUST | | JUNE 30, 2021 |
| | | | | | | | |
| SECURITY DESCRIPTION | | PRINCIPAL
AMOUNT($) | | | VALUE($) | |
Foreign Government Securities — continued | |
Series 60, Reg. S, 4.25%, 03/28/2041 (e) | | EUR | 710 | | | | 1,413 | |
Series 66, Reg. S, 4.00%, 03/28/2032 | | EUR | 530 | | | | 893 | |
Series 68, Reg. S, 2.25%, 06/22/2023 | | EUR | 762 | | | | 956 | |
Series 71, Reg. S, 3.75%, 06/22/2045 | | EUR | 470 | | | | 926 | |
Series 72, Reg. S, 2.60%,
06/22/2024 (e) | | EUR | 250 | | | | 325 | |
Series 73, Reg. S, 3.00%,
06/22/2034 (e) | | EUR | 2,150 | | | | 3,442 | |
Series 74, Reg. S, 0.80%,
06/22/2025 (e) | | EUR | 870 | | | | 1,087 | |
Series 75, Reg. S, 1.00%,
06/22/2031 (e) | | EUR | 477 | | | | 621 | |
Series 76, Reg. S, 1.90%,
06/22/2038 (e) | | EUR | 493 | | | | 718 | |
Series 77, Reg. S, 1.00%,
06/22/2026 (e) | | EUR | 1,200 | | | | 1,527 | |
Series 78, Reg. S, 1.60%,
06/22/2047 (e) | | EUR | 962 | | | | 1,346 | |
Series 79, Reg. S, 0.20%,
10/22/2023 (e) | | EUR | 247 | | | | 299 | |
Series 80, Reg. S, 2.15%,
06/22/2066 (e) | | EUR | 314 | | | | 520 | |
Series 81, Reg. S, 0.80%,
06/22/2027 (e) | | EUR | 100 | | | | 127 | |
Series 82, Reg. S, 0.50%,
10/22/2024 (e) | | EUR | 1,210 | | | | 1,488 | |
Series 83, Reg. S, 2.25%,
06/22/2057 (e) | | EUR | 293 | | | | 484 | |
Series 84, Reg. S, 1.45%,
06/22/2037 (e) | | EUR | 190 | | | | 260 | |
Series 85, Reg. S, 0.80%,
06/22/2028 (e) | | EUR | 1,400 | | | | 1,784 | |
Series 86, Reg. S, 1.25%, 04/22/2033 | | EUR | 700 | | | | 936 | |
Series 87, Reg. S, 0.90%,
06/22/2029 (e) | | EUR | 850 | | | | 1,092 | |
Series 88, Reg. S, 1.70%,
06/22/2050 (e) | | EUR | 510 | | | | 730 | |
Series 89, Reg. S, 0.10%, 06/22/2030 | | EUR | 722 | | | | 868 | |
Series 90, Reg. S, 0.40%,
06/22/2040 (e) | | EUR | 352 | | | | 401 | |
Series 91, Reg. S, 0.00%,
10/22/2027 (e) | | EUR | 1,040 | | | | 1,258 | |
Series 92, Reg. S, 0.00%,
10/22/2031 (e) | | EUR | 369 | | | | 433 | |
Series 93, Reg. S, 0.65%,
06/22/2071 (e) | | EUR | 258 | | | | 254 | |
Series 65, Reg. S, 4.25%,
09/28/2022 (e) | | EUR | 460 | | | | 579 | |
Kommunalbanken A/S, (Norway), | | | | | | | | |
Reg. S, 0.05%, 10/24/2029 | | EUR | 100 | | | | 119 | |
Reg. S, 0.63%, 04/20/2026 | | EUR | 1,000 | | | | 1,235 | |
Kommunekredit, (Denmark), | | | | | | | | |
Reg. S, 0.25%, 03/29/2023 | | EUR | 175 | | | | 210 | |
Reg. S, 0.50%, 01/24/2025 | | EUR | 700 | | | | 857 | |
| | | | | | | | |
| SECURITY DESCRIPTION | | PRINCIPAL
AMOUNT($) | | | VALUE($) | |
| |
Kommuninvest I Sverige AB, (Sweden), | | | | | | | | |
Reg. S, 1.50%, 05/12/2025 | | SEK | 3,000 | | | | 367 | |
Series 2505,Reg. S,1.00%, 05/12/2025 | | SEK | 5,000 | | | | 601 | |
Series 2602, Reg.S,0.75%, 02/04/2026 | | SEK | 2,880 | | | | 342 | |
Series G23, Reg. S, 0.63%, 06/01/2023 | | SEK | 100 | | | | 12 | |
Series G24, Reg. S, 0.38%, 03/27/2024 | | SEK | 4,880 | | | | 573 | |
Korea Development Bank (The), (South Korea), | | | | | | | | |
Reg. S, 1.83%, 08/10/2027 | | SE | K 1,000 | | | | 123 | |
6.00%, 01/22/2025 | | IDR | 15,000,000 | | | | 1,043 | |
Korea Expressway Corp., (South Korea) Reg. S, 3.10%, 06/08/2026 | | | 200 | | | | 209 | |
Korea Housing Finance Corp., (South Korea), | | | | | | | | |
Reg. S, 0.01%, 06/29/2026 | | EUR | 100 | | | | 119 | |
Reg. S, 0.10%, 06/18/2024 | | EUR | 100 | | | | 120 | |
Korea Hydro & Nuclear Power Co. Ltd., (South Korea), Reg. S, 0.00%, 07/19/2024 | | CHF | 300 | | | | 328 | |
Korea National Oil Corp., (South Korea), Reg. S, 0.00%, 10/04/2024 | | CHF | 300 | | | | 328 | |
Korea Treasury Bond, (South Korea), | | | | | | | | |
Series 2212, 1.25%, 12/10/2022 | | KRW | 5,550,000 | | | | 4,935 | |
Series 2306, 1.00%, 06/10/2023 | | KRW | 41,745,000 | | | | 36,833 | |
Series 2312, 0.88%, 12/10/2023 | | KRW | 1,000,000 | | | | 877 | |
Series 2509, 1.13%, 09/10/2025 | | KRW | 20,030,000 | | | | 17,368 | |
Series 2612, 1.50%, 12/10/2026 | | KRW | 9,600,000 | | | | 8,355 | |
Series 2912, 1.38%, 12/10/2029 | | KRW | 24,541,000 | | | | 20,656 | |
Series 3006, 1.38%, 06/10/2030 | | KRW | 3,900,000 | | | | 3,263 | |
Series 3609, 1.50%, 09/10/2036 | | KRW | 900,000 | | | | 725 | |
Series 3909, 1.13%, 09/10/2039 | | KRW | 39,443,630 | | | | 29,300 | |
Series 5003, 1.50%, 03/10/2050 | | KRW | 17,127,000 | | | | 12,901 | |
Series 6609, 1.50%, 09/10/2066 | | KRW | 2,340,000 | | | | 1,654 | |
Kuntarahoitus OYJ, (Finland), | | | | | | | | |
Reg. S, 0.05%, 09/06/2029 | | EUR | 400 | | | | 479 | |
Reg. S, 0.13%, 03/07/2024 | | EUR | 180 | | | | 217 | |
Reg. S, 1.25%, 02/23/2033 | | EUR | 200 | | | | 266 | |
Land Baden-Wuerttemberg, (Germany), | | | | | | | | |
Reg. S, 0.63%, 01/27/2026 | | EUR | 380 | | | | 471 | |
Series 120, Reg. S, 2.00%, 11/13/2023 | | EUR | 220 | | | | 276 | |
Land Berlin, (Germany), | | | | | | | | |
Reg. S, 0.01%, 07/02/2030 | | EUR | 490 | | | | 581 | |
Series 493, Reg. S, 0.63%, 02/08/2027 | | EUR | 570 | | | | 710 | |
Series 495, Reg. S, 1.38%, 06/05/2037 | | EUR | 260 | | | | 352 | |
Series 506, Reg. S, 1.38%, 08/27/2038 | | EUR | 115 | | | | 157 | |
Series 530, Reg. S, 0.10%, 01/18/2041 | | EUR | 80 | | | | 87 | |
SEE NOTES TO FINANCIAL STATEMENTS.
| | | | | | | | | | |
| | | | | |
| JUNE 30, 2021 | | SIX CIRCLES TRUST | | | | | | | | 117 |
Six Circles Global Bond Fund
SCHEDULE OF PORTFOLIO INVESTMENTS
AS OF JUNE 30, 2021 (Unaudited) (continued)
(Amounts in U.S. Dollars, unless otherwise noted)
(Amounts in thousands, except number of Futures contracts)
| | | | | | | | |
| SECURITY DESCRIPTION | | PRINCIPAL
AMOUNT($) | | | VALUE($) | |
Foreign Government Securities — continued | |
Land Thueringen, (Germany), Reg. S, 0.05%, 05/06/2030 | | EUR | 260 | | | | 310 | |
Latvia Government International Bond, (Latvia), | | | | | | | | |
Reg. S, 0.00%, 03/17/2031 | | EUR | 100 | | | | 117 | |
Reg. S, 1.13%, 05/30/2028 | | EUR | 390 | | | | 501 | |
Reg. S, 1.38%, 05/16/2036 | | EUR | 110 | | | | 150 | |
Lithuania Government International Bond, (Lithuania), | | | | | | | | |
Reg. S, 0.25%, 05/06/2025 | | EUR | 70 | | | | 85 | |
Reg. S, 0.50%, 07/28/2050 | | EUR | 140 | | | | 152 | |
Reg. S, 0.75%, 05/06/2030 | | EUR | 440 | | | | 551 | |
Luxembourg Government Bond, (Luxembourg), | | | | | | | | |
Reg. S, 0.00%, 04/28/2025 | | EUR | 240 | | | | 290 | |
Reg. S, 0.00%, 11/13/2026 | | EUR | 130 | | | | 157 | |
Reg. S, 0.00%, 04/28/2030 | | EUR | 150 | | | | 179 | |
Malaysia Government Bond, (Malaysia), | | | | | | | | |
Series 118, 3.88%, 03/14/2025 | | MYR | 2,000 | | | | 505 | |
Series 215, 3.80%, 09/30/2022 | | MYR | 1,000 | | | | 247 | |
Series 216, 4.74%, 03/15/2046 | | MYR | 10,700 | | | | 2,714 | |
Series 217, 4.06%, 09/30/2024 | | MYR | 12,000 | | | | 3,041 | |
Series 218, 3.76%, 04/20/2023 | | MYR | 15,000 | | | | 3,728 | |
Series 219, 3.89%, 08/15/2029 | | MYR | 6,600 | | | | 1,670 | |
Series 317, 4.76%, 04/07/2037 | | MYR | 2,200 | | | | 569 | |
Series 318, 4.64%, 11/07/2033 | | MYR | 10,000 | | | | 2,615 | |
Series 319, 3.48%, 06/14/2024 | | MYR | 5,500 | | | | 1,370 | |
Series 418, 4.89%, 06/08/2038 | | MYR | 11,600 | | | | 3,031 | |
Series 518, 4.92%, 07/06/2048 | | MYR | 1,800 | | | | 463 | |
Series 519, 3.76%, 05/22/2040 | | MYR | 30 | | | | 7 | |
Malaysia Government Investment Issue, (Malaysia), | | | | | | | | |
Series 119, 4.13%, 07/09/2029 | | MYR | 31,630 | | | | 8,072 | |
Series 217, 4.05%, 08/15/2024 | | MYR | 3,090 | | | | 781 | |
Series 218, 4.37%, 10/31/2028 | | MYR | 7,600 | | | | 1,976 | |
Series 417, 4.90%, 05/08/2047 | | MYR | 521 | | | | 134 | |
Series 418, 3.73%, 03/31/2022 | | MYR | 1,800 | | | | 440 | |
Series 517, 4.76%, 08/04/2037 | | MYR | 3,800 | | | | 983 | |
Series 519, 4.64%, 11/15/2049 | | MYR | 1,195 | | | | 295 | |
Series 615, 4.79%, 10/31/2035 | | MYR | 6,300 | | | | 1,654 | |
Series 617, 4.72%, 06/15/2033 | | MYR | 3,000 | | | | 794 | |
Series 719, 3.15%, 05/15/2023 | | MYR | 9,000 | | | | 2,214 | |
Metropolitano de Lisboa EPE, (Portugal), 7.30%, 12/23/2025 | | EUR | 500 | | | | 786 | |
Mexican Bonos, (Mexico), | | | | | | | | |
Series M, 7.75%, 05/29/2031 | | MXN | 12,000 | | | | 635 | |
Series M 20, 7.50%, 06/03/2027 | | MXN | 17,000 | | | | 889 | |
Series M 20, 8.50%, 05/31/2029 | | MXN | 1,000 | | | | 55 | |
Mexico Government International Bond, (Mexico), | | | | | | | | |
1.13%, 01/17/2030 | | EUR | 600 | | | | 698 | |
1.35%, 09/18/2027 | | EUR | 1,575 | | | | 1,935 | |
1.63%, 04/08/2026 | | EUR | 100 | | | | 125 | |
2.13%, 10/25/2051 | | EUR | 300 | | | | 300 | |
3.00%, 03/06/2045 | | EUR | 425 | | | | 529 | |
| | | | | | | | |
| SECURITY DESCRIPTION | | PRINCIPAL
AMOUNT($) | | | VALUE($) | |
| |
4.60%, 02/10/2048 | | | 250 | | | | 268 | |
5.75%, 10/12/2110 | | | 20 | | | | 24 | |
6.75%, 02/06/2024 | | GBP | 100 | | | | 159 | |
Ministeries Van de Vlaamse Gemeenschap, (Belgium), | | | | | | | | |
Reg. S, 0.01%, 06/23/2027 | | EUR | 500 | | | | 598 | |
Reg. S, 1.00%, 01/23/2051 | | EUR | 100 | | | | 118 | |
Reg. S, 1.38%, 11/21/2033 | | EUR | 300 | | | | 398 | |
Reg. S, 1.50%, 07/12/2038 | | EUR | 100 | | | | 134 | |
Municipal Finance Authority of British Columbia, (Canada), | | | | | | | | |
1.10%, 06/01/2025 | | CAD | 200 | | | | 161 | |
2.55%, 10/09/2029 | | CAD | 300 | | | | 255 | |
2.80%, 12/03/2023 | | CAD | 1,000 | | | | 848 | |
Nederlandse Waterschapsbank NV, (Netherlands), | | | | | | | | |
Reg. S, 0.05%, 01/28/2030 | | EUR | 374 | | | | 446 | |
0.13%, 09/25/2023 | | EUR | 400 | | | | 481 | |
Reg. S, 0.25%, 06/07/2024 | | EUR | 683 | | | | 827 | |
Reg. S, 0.50%, 01/19/2023 | | EUR | 260 | | | | 313 | |
Reg. S, 0.75%, 10/04/2041 | | EUR | 100 | | | | 123 | |
Reg. S, 1.00%, 03/01/2028 | | EUR | 300 | | | | 383 | |
Reg. S, 1.25%, 05/27/2036 | | EUR | 140 | | | | 185 | |
Reg. S, 1.50%, 06/15/2039 | | EUR | 160 | | | | 222 | |
5.20%, 03/31/2025 | | CAD | 1,000 | | | | 915 | |
Netherlands Government Bond, (Netherlands), | | | | | | | | |
Reg. S, 4.00%, 01/15/2037 (e) | | EUR | 846 | | | | 1,609 | |
Reg. S, 0.00%, 01/15/2024 (e) | | EUR | 771 | | | | 930 | |
Reg. S, 0.00%, 01/15/2027 (e) | | EUR | 990 | | | | 1,204 | |
Reg. S, 0.00%, 07/15/2030 (e) | | EUR | 620 | | | | 747 | |
Reg. S, 0.00%, 01/15/2038 (e) | | EUR | 65 | | | | 75 | |
Reg. S, 0.00%, 01/15/2052 (e) | | EUR | 399 | | | | 423 | |
Reg. S, 0.25%, 07/15/2029 (e) | | EUR | 423 | | | | 522 | |
Reg. S, 0.50%, 01/15/2040 (e) | | EUR | 540 | | | | 675 | |
Reg. S, 0.75%, 07/15/2027 (e) | | EUR | 1,520 | | | | 1,933 | |
Reg. S, 0.75%, 07/15/2028 (e) | | EUR | 120 | | | | 153 | |
Reg. S, 1.75%, 07/15/2023 (e) | | EUR | 1,605 | | | | 1,999 | |
Reg. S, 2.00%, 07/15/2024 (e) | | EUR | 891 | | | | 1,143 | |
Reg. S, 2.25%, 07/15/2022 (e) | | EUR | 812 | | | | 992 | |
Reg. S, 2.50%, 01/15/2033 (e) | | EUR | 2,507 | | | | 3,852 | |
Reg. S, 2.75%, 01/15/2047 (e) | | EUR | 1,177 | | | | 2,252 | |
Reg. S, 3.75%, 01/15/2042 (e) | | EUR | 710 | | | | 1,445 | |
Reg. S, 5.50%, 01/15/2028 (e) | | EUR | 666 | | | | 1,098 | |
New South Wales Treasury Corp., (Australia), | | | | | | | | |
Reg. S, 1.00%, 02/08/2024 | | AUD | 500 | | | | 382 | |
Reg. S, 1.25%, 03/20/2025 | | AUD | 3,000 | | | | 2,302 | |
Reg. S, 2.00%, 03/20/2031 | | AUD | 1,900 | | | | 1,452 | |
Reg. S, 2.00%, 03/08/2033 | | AUD | 1,500 | | | | 1,127 | |
2.25%, 05/07/2041 | | AUD | 700 | | | | 508 | |
Reg. S, 3.00%, 03/20/2028 | | AUD | 1,800 | | | | 1,496 | |
Reg. S, 3.00%, 02/20/2030 | | AUD | 200 | | | | 167 | |
Series 22, 6.00%, 03/01/2022 | | AUD | 600 | | | | 468 | |
Series 27, Reg. S, 3.00%, 05/20/2027 | | AUD | 4,100 | | | | 3,395 | |
SEE NOTES TO FINANCIAL STATEMENTS.
| | | | | | | | | | |
| | | | | |
| 118 | | | | | | | | SIX CIRCLES TRUST | | JUNE 30, 2021 |
| | | | | | | | |
| SECURITY DESCRIPTION | | PRINCIPAL
AMOUNT($) | | | VALUE($) | |
Foreign Government Securities — continued | |
New Zealand Government Bond, (New Zealand), | | | | | | | | |
0.25%, 05/15/2028 | | NZD | 4,400 | | | | 2,831 | |
0.50%, 05/15/2024 | | NZD | 5,500 | | | | 3,817 | |
0.50%, 05/15/2026 | | NZD | 2,000 | | | | 1,356 | |
1.50%, 05/15/2031 | | NZD | 2,700 | | | | 1,840 | |
1.75%, 05/15/2041 | | NZD | 630 | | | | 383 | |
Series 423, Reg. S, 5.50%, 04/15/2023 | | NZD | 3,250 | | | | 2,473 | |
Series 425, Reg. S, 2.75%, 04/15/2025 | | NZD | 600 | | | | 448 | |
Series 427, Reg. S, 4.50%, 04/15/2027 | | NZD | 730 | | | | 603 | |
Series 429, 3.00%, 04/20/2029 | | NZD | 280 | | | | 217 | |
Series 433, Reg. S, 3.50%, 04/14/2033 | | NZD | 1,980 | | | | 1,607 | |
Series 437, Reg. S, 2.75%, 04/15/2037 | | NZD | 2,050 | | | | 1,519 | |
New Zealand Local Government Funding Agency Bond, (New Zealand), | | | | | | | | |
Reg. S, 2.00%, 04/15/2037 | | NZD | 200 | | | | 126 | |
3.50%, 04/14/2033 | | NZD | 300 | | | | 233 | |
Northern Territory Treasury Corp., (Australia), | | | | | | | | |
Reg. S, 2.00%, 04/21/2031 | | AUD | 600 | | | | 449 | |
Reg. S, 2.75%, 04/21/2027 | | AUD | 2,200 | | | | 1,797 | |
Norway Government Bond, (Norway), | | | | | | | | |
Series 475, Reg. S, 2.00%, 05/24/2023 (e) | | NOK | 1,590 | | | | 189 | |
Series 476, Reg. S, 3.00%, 03/14/2024 (e) | | NOK | 3,240 | | | | 397 | |
Series 477, Reg. S,
1.75%, 03/13/2025 (e) | | NOK | 1,920 | | | | 229 | |
Series 478, Reg. S,
1.50%, 02/19/2026 (e) | | NOK | 2,520 | | | | 298 | |
Series 479, Reg. S,
1.75%, 02/17/2027 (e) | | NOK | 3,070 | | | | 368 | |
Series 480, Reg. S, 2.00%, 04/26/2028 (e) | | NOK | 1,450 | | | | 177 | |
Series 481, Reg. S, 1.75%,
09/06/2029 (e) | | NOK | 3,040 | | | | 365 | |
Series 483, Reg. S, 1.25%,
09/17/2031 (e) | | NOK | 2,794 | | | | 321 | |
Series 482, Reg. S, 1.38%,
08/19/2030 (e) | | NOK | 3,270 | | | | 381 | |
OMERS Finance Trust, (Canada), | | | | | | | | |
0.45%, 05/13/2025 (e) | | EUR | 250 | | | | 303 | |
Reg. S, 0.45%, 05/13/2025 | | EUR | 2,700 | | | | 3,273 | |
Ontario Electricity Financial Corp., (Canada), Series 40, Zero Coupon, 04/11/2031 | | CAD | 1,000 | | | | 644 | |
Ontario Teachers’ Finance Trust, (Canada), Reg. S, 0.50%, 05/06/2025 | | EUR | 2,100 | | | | 2,561 | |
Panama Government International Bond, (Panama), | | | | | | | | |
2.25%, 09/29/2032 | | | 235 | | | | 226 | |
6.70%, 01/26/2036 | | | 60 | | | | 81 | |
Peruvian Government International Bond, (Peru), | | | | | | | | |
Reg. S, 2.75%, 01/30/2026 | | EUR | 425 | | | | 558 | |
2.78%, 01/23/2031 | | | 110 | | | | 112 | |
3.55%, 03/10/2051 | | | 50 | | | | 52 | |
Reg. S, 6.90%, 08/12/2037 | | PEN | 1,000 | | | | 275 | |
| | | | | | | | |
| SECURITY DESCRIPTION | | PRINCIPAL
AMOUNT($) | | | VALUE($) | |
| |
Philippine Government International Bond, (Philippines), | | | | | | | | |
1.65%, 06/10/2031 | | | 200 | | | | 193 | |
9.50%, 02/02/2030 | | | 100 | | | | 158 | |
Portugal Obrigacoes do Tesouro OT, (Portugal), | | | | | | | | |
Reg. S, 0.48%, 10/18/2030 (e) | | EUR | 879 | | | | 1,062 | |
Reg. S, 0.70%, 10/15/2027 (e) | | EUR | 1,455 | | | | 1,814 | |
Reg. S, 0.90%, 10/12/2035 (e) | | EUR | 451 | | | | 548 | |
Reg. S, 1.00%, 04/12/2052 (e) | | EUR | 140 | | | | 151 | |
Reg. S, 1.95%, 06/15/2029 (e) | | EUR | 233 | | | | 317 | |
Reg. S, 2.13%, 10/17/2028 (e) | | EUR | 410 | | | | 562 | |
Reg. S, 2.20%, 10/17/2022 (e) | | EUR | 740 | | | | 910 | |
Reg. S, 2.88%, 10/15/2025 (e) | | EUR | 610 | | | | 826 | |
Reg. S, 2.88%, 07/21/2026 (e) | | EUR | 580 | | | | 799 | |
Reg. S, 3.88%, 02/15/2030 (e) | | EUR | 50 | | | | 78 | |
Reg. S, 4.10%, 04/15/2037 (e) | | EUR | 510 | | | | 906 | |
Reg. S, 4.10%, 02/15/2045 (e) | | EUR | 500 | | | | 959 | |
Reg. S, 4.13%, 04/14/2027 (e) | | EUR | 480 | | | | 713 | |
Reg. S, 5.65%, 02/15/2024 (e) | | EUR | 920 | | | | 1,270 | |
Series 15Y, Reg. S, 2.25%,
04/18/2034 (e) | | EUR | 300 | | | | 429 | |
Province of Alberta Canada, (Canada), | | | | | | | | |
Reg. S, 1.50%, 12/15/2022 | | GBP | 400 | | | | 563 | |
2.20%, 06/01/2026 | | CAD | 600 | | | | 505 | |
Province of British Columbia Canada, (Canada), | | | | | | | | |
2.80%, 06/18/2048 | | CAD | 200 | | | | 170 | |
7.25%, 09/01/2036 | | | 300 | | | | 497 | |
7.88%, 11/30/2023 | | CAD | 120 | | | | 112 | |
Province of Manitoba Canada, (Canada), 2.75%, 06/02/2029 | | CAD | 500 | | | | 432 | |
Province of Nova Scotia Canada, (Canada), 3.45%, 06/01/2045 | | CAD | 200 | | | | 186 | |
Province of Ontario Canada, (Canada), | | | | | | | | |
Reg. S, 0.25%, 12/15/2026 | | GBP | 1,000 | | | | 1,343 | |
Reg. S, 0.50%, 12/15/2023 | | GBP | 500 | | | | 695 | |
Reg. S, 0.63%, 04/17/2025 | | EUR | 400 | | | | 491 | |
5.60%, 06/02/2035 | | CAD | 300 | | | | 337 | |
Province of Quebec Canada, (Canada), | | | | | | | | |
Reg. S, 0.88%, 07/05/2028 | | EUR | 1,025 | | | | 1,289 | |
Reg. S, 2.38%, 01/22/2024 | | EUR | 425 | | | | 540 | |
3.50%, 12/01/2045 | | CAD | 200 | | | | 189 | |
Province of Saskatchewan Canada, (Canada), 3.30%, 06/02/2048 | | CAD | 300 | | | | 274 | |
Queensland Treasury Corp., (Australia), | | | | | | | | |
Reg. S, 1.75%, 08/21/2031 (e) | | AUD | 1,700 | | | | 1,268 | |
Reg. S, 1.75%, 07/20/2034 (e) | | AUD | 1,100 | | | | 787 | |
Reg. S, 2.25%, 04/16/2040 (e) | | AUD | 1,100 | | | | 803 | |
Reg. S, 3.25%, 08/21/2029 (e) | | AUD | 2,000 | | | | 1,698 | |
Reg. S, 3.50%, 08/21/2030 (e) | | AUD | 1,500 | | | | 1,303 | |
Series 23, Reg. S, 4.25%,
07/21/2023 (e) | | AUD | 3,500 | | | | 2,843 | |
Series 24, Reg. S, 5.75%,
07/22/2024 | | AUD | 1,100 | | | | 957 | |
Series 26, Reg. S, 3.25%,
07/21/2026 (e) | | AUD | 1,000 | | | | 834 | |
Series 27, Reg. S, 2.75%,
08/20/2027 (e) | | AUD | 800 | | | | 655 | |
SEE NOTES TO FINANCIAL STATEMENTS.
| | | | | | | | | | |
| | | | | |
| JUNE 30, 2021 | | SIX CIRCLES TRUST | | | | | | | | 119 |
Six Circles Global Bond Fund
SCHEDULE OF PORTFOLIO INVESTMENTS
AS OF JUNE 30, 2021 (Unaudited) (continued)
(Amounts in U.S. Dollars, unless otherwise noted)
(Amounts in thousands, except number of Futures contracts)
| | | | | | | | |
| SECURITY DESCRIPTION | | PRINCIPAL
AMOUNT($) | | | VALUE($) | |
Foreign Government Securities — continued | |
Series 28, Reg. S, 3.25%, 07/21/2028 (e) | | AUD | 2,100 | | | | 1,777 | |
Regiao Autonoma Madeira, (Portugal), 0.94%, 05/29/2032 | | EUR | 200 | | | | 240 | |
Regie Autonome des Transports Parisiens, (France), | | | | | | | | |
Reg. S, 0.38%, 06/15/2024 | | EUR | 300 | | | | 363 | |
Reg. S, 0.88%, 05/25/2027 | | EUR | 100 | | | | 125 | |
Reg. S, 1.75%, 05/25/2031 | | EUR | 500 | | | | 674 | |
Region of Ile de France, (France), | | | | | | | | |
Reg. S, 0.50%, 06/14/2025 | | EUR | 200 | | | | 245 | |
Reg. S, 3.63%, 03/27/2024 | | EUR | 100 | | | | 131 | |
Region Wallonne Belgium, (Belgium), | | | | | | | | |
Reg. S, 0.05%, 06/22/2025 | | EUR | 800 | | | | 959 | |
Reg. S, 0.25%, 05/03/2026 | | EUR | 300 | | | | 363 | |
Reg. S, 1.05%, 06/22/2040 | | EUR | 100 | | | | 121 | |
Republic of Austria Government Bond, (Austria), | | | | | | | | |
Reg. S, 0.00%, 09/20/2022 (e) | | EUR | 363 | | | | 434 | |
Reg. S, 0.00%, 04/20/2023 (e) | | EUR | 850 | | | | 1,019 | |
Reg. S, 0.00%, 07/15/2023 (e) | | EUR | 700 | | | | 840 | |
Reg. S, 0.00%, 07/15/2024 (e) | | EUR | 280 | | | | 338 | |
Reg. S, 0.00%, 02/20/2030 (e) | | EUR | 347 | | | | 415 | |
Reg. S, 0.00%, 02/20/2031 (e) | | EUR | 627 | | | | 743 | |
Reg. S, 0.00%, 10/20/2040 (e) | | EUR | 150 | | | | 163 | |
Reg. S, 0.50%, 04/20/2027 (e) | | EUR | 600 | | | | 748 | |
Reg. S, 0.50%, 02/20/2029 (e) | | EUR | 739 | | | | 923 | |
Reg. S, 0.75%, 10/20/2026 (e) | | EUR | 1,000 | | | | 1,260 | |
Reg. S, 0.75%, 02/20/2028 (e) | | EUR | 440 | | | | 558 | |
Reg. S, 0.75%, 03/20/2051 (e) | | EUR | 452 | | | | 553 | |
Reg. S, 0.85%, 06/30/2120 (e) | | EUR | 142 | | | | 153 | |
Reg. S, 1.50%, 02/20/2047 (e) | | EUR | 317 | | | | 460 | |
Reg. S, 1.50%, 11/02/2086 (e) | | EUR | 190 | | | | 294 | |
Reg. S, 2.10%, 09/20/2117 (e) | | EUR | 320 | | | | 625 | |
Reg. S, 2.40%, 05/23/2034 (e) | | EUR | 752 | | | | 1,145 | |
Reg. S, 3.15%, 06/20/2044 (e) | | EUR | 365 | | | | 687 | |
Reg. S, 3.80%, 01/26/2062 (e) | | EUR | 160 | | | | 394 | |
Reg. S, 4.15%, 03/15/2037 (e) | | EUR | 530 | | | | 1,004 | |
Reg. S, 4.85%, 03/15/2026 (e) | | EUR | 570 | | | | 848 | |
Reg. S, 6.25%, 07/15/2027 | | EUR | 133 | | | | 221 | |
Series 1, Reg. S, 1.65%, 10/21/2024 (e) | | EUR | 1,468 | | | | 1,871 | |
Republic of Italy Government International Bond, (Italy), | | | | | | | | |
2.88%, 10/17/2029 | | | 200 | | | | 208 | |
Reg. S, (ICE EURIBOR Swap Rate 30 Year + 0.00%), 4.25%, 06/28/2029 (aa) | | EUR | 1,000 | | | | 1,496 | |
Reg. S, 5.13%, 07/31/2024 | | EUR | 520 | | | | 713 | |
Reg. S, 6.00%, 08/04/2028 | | GBP | 1,050 | | | | 1,874 | |
Republic of Poland Government Bond, (Poland), | | | | | | | | |
Series 424, 2.50%, 04/25/2024 | | PLN | 1,639 | | | | 453 | |
Series 428, 2.75%, 04/25/2028 | | PLN | 500 | | | | 142 | |
Series 429, 5.75%, 04/25/2029 | | PLN | 530 | | | | 181 | |
Series 447, 4.00%, 04/25/2047 | | PLN | 373 | | | | 128 | |
Series 722, Zero Coupon, 07/25/2022 | | PLN | 2,880 | | | | 754 | |
| | | | | | | | |
| SECURITY DESCRIPTION | | PRINCIPAL
AMOUNT($) | | | VALUE($) | |
| |
Series 726, 2.50%, 07/25/2026 | | PLN | 770 | | | | 214 | |
Series 727, 2.50%, 07/25/2027 | | PLN | 6,920 | | | | 1,931 | |
Series 922, 5.75%, 09/23/2022 | | PLN | 1,690 | | | | 474 | |
Series 1024, 2.25%, 10/25/2024 | | PLN | 5,960 | | | | 1,640 | |
Series 1026, 0.25%, 10/25/2026 | | PLN | 1,390 | | | | 342 | |
Series 1029, 2.75%, 10/25/2029 | | PLN | 2,800 | | | | 804 | |
Series 1030, 1.25%, 10/25/2030 | | PLN | 579 | | | | 147 | |
Republic of Poland Government International Bond, (Poland), | | | | | | | | |
Reg. S, 0.00%, 07/07/2023 | | EUR | 425 | | | | 507 | |
Reg. S, 0.00%, 02/10/2025 | | EUR | 60 | | | | 72 | |
Reg. S, 0.88%, 05/10/2027 | | EUR | 1,000 | | | | 1,251 | |
Reg. S, 1.13%, 08/07/2026 | | EUR | 925 | | | | 1,168 | |
Reg. S, 2.00%, 03/08/2049 | | EUR | 53 | | | | 77 | |
Romania Government Bond, (Romania), | | | | | | | | |
Series 3Y, 4.00%, 10/25/2023 | | RON | 4,550 | | | | 1,135 | |
Series 5Y, 3.25%, 06/24/2026 | | RON | 2,215 | | | | 544 | |
Series 5Y, 3.65%, 07/28/2025 | | RON | 1,600 | | | | 400 | |
Series 10YR, 4.15%, 10/24/2030 | | RON | 1,855 | | | | 473 | |
Romanian Government International Bond, (Romania), | | | | | | | | |
Reg. S, 2.00%, 04/14/2033 | | EUR | 800 | | | | 941 | |
Reg. S, 2.75%, 02/26/2026 | | EUR | 15 | | | | 20 | |
Reg. S, 2.88%, 10/28/2024 | | EUR | 775 | | | | 1,003 | |
Reg. S, 3.38%, 02/08/2038 | | EUR | 225 | | | | 292 | |
Reg. S, 3.38%, 01/28/2050 | | EUR | 665 | | | | 840 | |
Reg. S, 3.62%, 05/26/2030 | | EUR | 975 | | | | 1,336 | |
Russian Federal Bond — OFZ, (Russia), | | | | | | | | |
Series 6207, 8.15%, 02/03/2027 | | RUB | 32,780 | | | | 474 | |
Series 6212, 7.05%, 01/19/2028 | | RUB | 53,210 | | | | 732 | |
Series 6220, 7.40%, 12/07/2022 | | RUB | 20,430 | | | | 283 | |
Series 6221, 7.70%, 03/23/2033 | | RUB | 27,810 | | | | 399 | |
Series 6222, 7.10%, 10/16/2024 | | RUB | 69,940 | | | | 965 | |
Series 6223, 6.50%, 02/28/2024 | | RUB | 70,390 | | | | 958 | |
Series 6225, 7.25%, 05/10/2034 | | RUB | 22,444 | | | | 311 | |
Series 6226, 7.95%, 10/07/2026 | | RUB | 50,622 | | | | 724 | |
Series 6228, 7.65%, 04/10/2030 | | RUB | 94,968 | | | | 1,351 | |
Series 6233, 6.10%, 07/18/2035 | | RUB | 17,890 | | | | 223 | |
Series 6235, 5.90%, 03/12/2031 | | RUB | 21,328 | | | | 268 | |
Russian Foreign Bond - Eurobond, (Russia), Reg. S, 2.88%, 12/04/2025 | | EUR | 300 | | | | 389 | |
Saitama Prefecture, (Japan), Series 7, 2.29%, 06/22/2029 | | JPY | 500,000 | | | | 5,291 | |
Saudi Government International Bond, (Saudi Arabia), | | | | | | | | |
Reg. S, 0.75%, 07/09/2027 | | EUR | 100 | | | | 121 | |
Reg. S, 2.00%, 07/09/2039 | | EUR | 300 | | | | 367 | |
SFIL SA, (France), | | | | | | | | |
Reg. S, 0.00%, 05/24/2024 | | EUR | 200 | | | | 240 | |
Reg. S, 0.13%, 10/18/2024 | | EUR | 500 | | | | 602 | |
Singapore Government Bond, (Singapore), | | | | | | | | |
2.00%, 02/01/2024 | | SGD | 7,700 | | | | 5,941 | |
2.13%, 06/01/2026 | | SGD | 1,200 | | | | 943 | |
2.25%, 08/01/2036 | | SGD | 600 | | | | 468 | |
2.38%, 07/01/2039 | | SGD | 1,320 | | | | 1,054 | |
SEE NOTES TO FINANCIAL STATEMENTS.
| | | | | | | | | | |
| | | | | |
| 120 | | | | | | | | SIX CIRCLES TRUST | | JUNE 30, 2021 |
| | | | | | | | |
| SECURITY DESCRIPTION | | PRINCIPAL
AMOUNT($) | | | VALUE($) | |
Foreign Government Securities — continued | |
2.63%, 05/01/2028 | | SGD | 5,450 | | | | 4,423 | |
2.75%, 04/01/2042 | | SGD | 2,710 | | | | 2,301 | |
2.75%, 03/01/2046 | | SGD | 960 | | | | 829 | |
2.88%, 09/01/2030 | | SGD | 2,715 | | | | 2,244 | |
3.38%, 09/01/2033 | | SGD | 1,150 | | | | 1,006 | |
3.50%, 03/01/2027 | | SGD | 1,800 | | | | 1,515 | |
Slovakia Government Bond, (Slovakia), | | | | | | | | |
Series 225, Reg. S, 3.00%, 02/28/2023 | | EUR | 370 | | | | 465 | |
Series 231, 0.63%, 05/22/2026 | | EUR | 860 | | | | 1,072 | |
Series 233, Reg. S, 2.00%, 10/17/2047 | | EUR | 180 | | | | 269 | |
Series 235, Reg. S, 2.25%, 06/12/2068 | | EUR | 21 | | | | 36 | |
Series 239, Reg. S, 1.00%, 05/14/2032 | | EUR | 868 | | | | 1,122 | |
Series 241, Reg. S, 0.13%, 06/17/2027 | | EUR | 162 | | | | 197 | |
Slovenia Government Bond, (Slovenia), | | | | | | | | |
Series RS70, Reg. S, 5.13%, 03/30/2026 | | EUR | 470 | | | | 706 | |
Series RS74, Reg. S, 1.50%, 03/25/2035 | | EUR | 120 | | | | 162 | |
Series RS76, Reg. S, 3.13%, 08/07/2045 | | EUR | 160 | | | | 288 | |
Series RS77, Reg. S, 2.25%, 03/03/2032 | | EUR | 130 | | | | 187 | |
Series RS78, Reg. S, 1.75%, 11/03/2040 | | EUR | 112 | | | | 159 | |
Series RS82, Reg. S, 0.28%, 01/14/2030 | | EUR | 316 | | | | 383 | |
Series RS84, Reg. S, 0.88%, 07/15/2030 | | EUR | 190 | | | | 242 | |
SNCF Reseau, (France), | | | | | | | | |
Reg. S, 0.88%, 01/22/2029 | | EUR | 200 | | | | 251 | |
Reg. S, 1.13%, 05/19/2027 | | EUR | 400 | | | | 507 | |
Reg. S, 1.50%, 05/29/2037 | | EUR | 300 | | | | 398 | |
Reg. S, 2.00%, 11/12/2026 | | CHF | 300 | | | | 364 | |
Reg. S, 2.00%, 02/05/2048 | | EUR | 100 | | | | 140 | |
Reg. S, 5.00%, 10/10/2033 | | EUR | 200 | | | | 364 | |
Reg. S, 5.00%, 03/11/2052 | | GBP | 145 | | | | 346 | |
Reg. S, 5.25%, 12/07/2028 | | GBP | 300 | | | | 540 | |
Societe Du Grand Paris EPIC, (France), | | | | | | | | |
Reg. S, 0.70%, 10/15/2060 | | EUR | 200 | | | | 202 | |
Reg. S, 1.13%, 10/22/2028 | | EUR | 700 | | | | 899 | |
Reg. S, 1.13%, 05/25/2034 | | EUR | 200 | | | | 256 | |
Reg. S, 1.70%, 05/25/2050 | | EUR | 300 | | | | 414 | |
Societe Nationale SNCF SA, (France), | | | | | | | | |
Reg. S, 0.63%, 04/17/2030 | | EUR | 300 | | | | 367 | |
Reg. S, 1.00%, 05/25/2040 | | EUR | 100 | | | | 117 | |
Reg. S, 1.50%, 02/02/2029 | | EUR | 100 | | | | 130 | |
Reg. S, 4.63%, 02/02/2024 | | EUR | 300 | | | | 402 | |
Reg. S, 5.38%, 03/18/2027 | | GBP | 400 | | | | 685 | |
South Australian Government Financing Authority, (Australia), | | | | | | | | |
2.75%, 05/24/2030 | | AUD | 2,000 | | | | 1,633 | |
Series 23, 4.25%, 11/20/2023 | | AUD | 350 | | | | 288 | |
Series 24, Reg. S, 2.25%, 08/15/2024 | | AUD | 400 | | | | 316 | |
Series 26, Reg. S, 3.00%, 07/20/2026 | | AUD | 1,600 | | | | 1,318 | |
Spain Government Bond, (Spain), | | | | | | | | |
Reg. S, 1.25%, 10/31/2030 (e) | | EUR | 2,170 | | | | 2,786 | |
Reg. S, 2.15%, 10/31/2025 (e) | | EUR | 3,525 | | | | 4,629 | |
0.00%, 04/30/2023 | | EUR | 1,757 | | | | 2,103 | |
Reg. S, 0.00%, 05/31/2024 | | EUR | 509 | | | | 611 | |
0.00%, 01/31/2025 | | EUR | 1,479 | | | | 1,777 | |
0.35%, 07/30/2023 | | EUR | 1,880 | | | | 2,268 | |
0.45%, 10/31/2022 | | EUR | 766 | | | | 920 | |
| | | | | | | | |
| SECURITY DESCRIPTION | | PRINCIPAL
AMOUNT($) | | | VALUE($) | |
| |
Reg. S, 0.50%, 04/30/2030 (e) | | EUR | 1,128 | | | | 1,362 | |
Reg. S, 0.60%, 10/31/2029 (e) | | EUR | 680 | | | | 831 | |
Reg. S, 0.80%, 07/30/2027 (e) | | EUR | 1,880 | | | | 2,345 | |
Reg. S, 0.85%, 07/30/2037 (e) | | EUR | 73 | | | | 85 | |
Reg. S, 1.00%, 10/31/2050 (e) | | EUR | 1,270 | | | | 1,360 | |
Reg. S, 1.20%, 10/31/2040 (e) | | EUR | 1,060 | | | | 1,275 | |
Reg. S, 1.30%, 10/31/2026 (e) | | EUR | 1,121 | | | | 1,435 | |
Reg. S, 1.40%, 04/30/2028 (e) | | EUR | 666 | | | | 863 | |
Reg. S, 1.45%, 10/31/2027 (e) | | EUR | 1,840 | | | | 2,387 | |
Reg. S, 1.45%, 04/30/2029 (e) | | EUR | 3,020 | | | | 3,941 | |
Reg. S, 1.45%, 10/31/2071 (e) | | EUR | 230 | | | | 240 | |
Reg. S, 1.50%, 04/30/2027 (e) | | EUR | 1,585 | | | | 2,057 | |
Reg. S, 1.60%, 04/30/2025 (e) | | EUR | 430 | | | | 549 | |
Reg. S, 1.85%, 07/30/2035 (e) | | EUR | 1,613 | | | | 2,184 | |
Reg. S, 1.95%, 04/30/2026 (e) | | EUR | 340 | | | | 446 | |
Reg. S, 1.95%, 07/30/2030 (e) | | EUR | 1,340 | | | | 1,823 | |
Reg. S, 2.35%, 07/30/2033 (e) | | EUR | 1,047 | | | | 1,492 | |
Reg. S, 2.75%, 10/31/2024 (e) | | EUR | 1,693 | | | | 2,221 | |
Reg. S, 2.90%, 10/31/2046 (e) | | EUR | 600 | | | | 960 | |
Reg. S, 3.45%, 07/30/2066 (e) | | EUR | 794 | | | | 1,448 | |
Reg. S, 3.80%, 04/30/2024 (e) | | EUR | 940 | | | | 1,249 | |
Reg. S, 4.20%, 01/31/2037 (e) | | EUR | 946 | | | | 1,674 | |
Reg. S, 4.40%, 10/31/2023 (e) | | EUR | 770 | | | | 1,018 | |
Reg. S, 4.65%, 07/30/2025 (e) | | EUR | 2,226 | | | | 3,183 | |
Reg. S, 4.70%, 07/30/2041 (e) | | EUR | 1,064 | | | | 2,084 | |
Reg. S, 4.90%, 07/30/2040 (e) | | EUR | 936 | | | | 1,859 | |
Reg. S, 5.15%, 10/31/2028 (e) | | EUR | 1,623 | | | | 2,637 | |
Reg. S, 5.15%, 10/31/2044 (e) | | EUR | 850 | | | | 1,820 | |
5.75%, 07/30/2032 | | EUR | 1,764 | | | | 3,277 | |
Reg. S, 5.90%, 07/30/2026 (e) | | EUR | 16 | | | | 25 | |
6.00%, 01/31/2029 | | EUR | 1,430 | | | | 2,452 | |
Series 5YR, Reg. S, 0.25%, 07/30/2024 (e) | | EUR | 313 | | | | 379 | |
Series 30Y, Reg. S, 2.70%, 10/31/2048 (e) | | EUR | 741 | | | | 1,152 | |
State of Brandenburg, (Germany), | | | | | | | | |
Reg. S, 0.13%, 01/26/2046 | | EUR | 70 | | | | 74 | |
Reg. S, 1.45%, 11/26/2038 | | EUR | 180 | | | | 248 | |
State of Bremen, (Germany), | | | | | | | | |
Series 191, Reg. S, 1.88%, 03/18/2024 | | EUR | 580 | | | | 731 | |
Series 215, Reg. S, 1.20%, 01/30/2034 | | EUR | 40 | | | | 53 | |
Series 224, Reg. S, 0.40%, 08/20/2049 | | EUR | 30 | | | | 34 | |
Series 232, Reg. S, 0.55%, 02/04/2050 | | EUR | 30 | | | | 35 | |
Series 258, Reg. S, 0.50%, 05/06/2041 | | EUR | 138 | | | | 162 | |
State of Hesse, (Germany), | | | | | | | | |
Reg. S, 0.88%, 12/10/2024 | | EUR | 600 | | | | 744 | |
Reg. S, 1.38%, 06/10/2024 | | EUR | 490 | | | | 613 | |
Series 1701, Reg. S, 0.13%, 01/25/2024 | | EUR | 492 | | | | 592 | |
Series 1801, Reg. S, 0.63%, 08/02/2028 | | EUR | 230 | | | | 288 | |
State of Lower Saxony, (Germany), | | | | | | | | |
Reg. S, 0.01%, 01/10/2031 | | EUR | 479 | | | | 566 | |
Reg. S, 0.05%, 03/09/2035 | | EUR | 277 | | | | 315 | |
Reg. S, 0.25%, 02/06/2024 | | EUR | 325 | | | | 393 | |
Series 884, Reg. S, 0.88%, 10/25/2028 | | EUR | 320 | | | | 407 | |
SEE NOTES TO FINANCIAL STATEMENTS.
| | | | | | | | | | |
| | | | | |
| JUNE 30, 2021 | | SIX CIRCLES TRUST | | | | | | | | 121 |
Six Circles Global Bond Fund
SCHEDULE OF PORTFOLIO INVESTMENTS
AS OF JUNE 30, 2021 (Unaudited) (continued)
(Amounts in U.S. Dollars, unless otherwise noted)
(Amounts in thousands, except number of Futures contracts)
| | | | | | | | |
| SECURITY DESCRIPTION | | PRINCIPAL
AMOUNT($) | | | VALUE($) | |
Foreign Government Securities — continued | |
State of North Rhine-Westphalia Germany, (Germany), | | | | | | | | |
Reg. S, 0.20%, 04/09/2030 | | EUR | 100 | | | | 121 | |
Reg. S, 0.20%, 01/27/2051 | | EUR | 80 | | | | 84 | |
Reg. S, 0.38%, 02/16/2023 | | EUR | 400 | | | | 481 | |
Reg. S, 0.38%, 09/02/2050 | | EUR | 210 | | | | 234 | |
Reg. S, 0.50%, 11/25/2039 | | EUR | 110 | | | | 130 | |
Reg. S, 0.75%, 08/16/2041 | | EUR | 360 | | | | 444 | |
Reg. S, 0.80%, 07/30/2049 | | EUR | 100 | | | | 125 | |
Reg. S, 0.95%, 03/13/2028 | | EUR | 144 | | | | 184 | |
Reg. S, 0.95%, 01/10/2121 | | EUR | 120 | | | | 130 | |
Reg. S, 1.38%, 01/15/2120 | | EUR | 140 | | | | 187 | |
Reg. S, 1.45%, 02/16/2043 | | EUR | 100 | | | | 140 | |
Reg. S, 1.65%, 02/22/2038 | | EUR | 110 | | | | 155 | |
Reg. S, 1.65%, 05/16/2047 | | EUR | 80 | | | | 118 | |
Reg. S, 1.75%, 10/26/2057 | | EUR | 172 | | | | 271 | |
Reg. S, 1.75%, 07/11/2068 | | EUR | 70 | | | | 110 | |
Reg. S, 1.88%, 09/15/2022 | | EUR | 600 | | | | 732 | |
Reg. S, 1.88%, 03/15/2024 | | EUR | 630 | | | | 795 | |
Reg. S, 2.15%, 03/21/2119 | | EUR | 202 | | | | 375 | |
Series 15YR, Reg. S, 0.00%, 10/12/2035 | | EUR | 147 | | | | 165 | |
Series 15YR, Reg. S, 1.10%, 03/13/2034 | | EUR | 110 | | | | 144 | |
Series 1250, Reg. S, 2.38%, 05/13/2033 | | EUR | 350 | | | | 519 | |
Series 1409, Reg. S, 0.50%, 04/16/2026 | | EUR | 360 | | | | 444 | |
State of Rhineland-Palatinate, (Germany), | | | | | | | | |
Reg. S, 0.38%, 01/26/2027 | | EUR | 220 | | | | 270 | |
Reg. S, 0.75%, 01/19/2026 | | EUR | 350 | | | | 436 | |
State of Saxony-Anhalt, (Germany), Reg. S, 1.88%, 04/10/2024 | | EUR | 300 | | | | 379 | |
State of Schleswig-Holstein Germany, (Germany), | | | | | | | | |
Reg. S, 0.13%, 06/12/2029 | | EUR | 160 | | | | 193 | |
Reg. S, 0.50%, 03/22/2029 | | EUR | 140 | | | | 174 | |
Reg. S, 0.63%, 08/31/2028 | | EUR | 140 | | | | 175 | |
State of the Grand-Duchy of Luxembourg, (Luxembourg), Reg. S, 0.00%, 03/24/2031 | | EUR | 103 | | | | 122 | |
States of Guernsey Bond, (Guernsey), Reg. S, 3.38%, 12/12/2046 | | GBP | 200 | | | | 363 | |
Svensk Exportkredit AB, (Sweden), Zero Coupon, 05/11/2037 | | | 224 | | | | 149 | |
Sweden Government Bond, (Sweden), | | | | | | | | |
Series 1053, 3.50%, 03/30/2039 | | SEK | 2,210 | | | | 378 | |
Series 1056, Reg. S, 2.25%, 06/01/2032 | | SEK | 1,925 | | | | 269 | |
Series 1057, Reg. S, 1.50%, 11/13/2023 (e) | | SEK | 7,010 | | | | 853 | |
Series 1059, Reg. S, 1.00%, 11/12/2026 | | SEK | 4,770 | | | | 588 | |
Series 1060, Reg. S, 0.75%, 05/12/2028 (e) | | SEK | 3,560 | | | | 433 | |
Series 1061, Reg. S, 0.75%, 11/12/2029 (e) | | SEK | 2,490 | | | | 303 | |
Series 1062, Reg. S, 0.13%, 05/12/2031 (e) | | SEK | 3,640 | | | | 415 | |
Series 1063, Reg. S, 0.50%, 11/24/2045 | | SEK | 640 | | | | 69 | |
Series 1064, Reg. S, 1.38%,
06/23/2071 (e) | | SEK | 570 | | | | 70 | |
| | | | | | | | |
| SECURITY DESCRIPTION | | PRINCIPAL
AMOUNT($) | | | VALUE($) | |
| |
Sweden Government International Bond, (Sweden), Reg. S, 0.13%, 04/24/2023 | | EUR | 700 | | | | 840 | |
Swiss Confederation Government Bond, (Switzerland), | | | | | | | | |
Reg. S, 0.00%, 06/22/2029 | | CHF | 240 | | | | 267 | |
Reg. S, 0.00%, 06/26/2034 | | CHF | 520 | | | | 570 | |
Reg. S, 0.00%, 07/24/2039 | | CHF | 229 | | | | 247 | |
Reg. S, 0.50%, 05/27/2030 | | CHF | 330 | | | | 382 | |
Reg. S, 0.50%, 06/28/2045 | | CHF | 60 | | | | 72 | |
Reg. S, 0.50%, 05/30/2058 | | CHF | 160 | | | | 204 | |
Reg. S, 1.25%, 06/11/2024 | | CHF | 410 | | | | 469 | |
Reg. S, 1.25%, 06/27/2037 | | CHF | 230 | | | | 299 | |
Reg. S, 1.50%, 07/24/2025 | | CHF | 190 | | | | 224 | |
Reg. S, 1.50%, 04/30/2042 | | CHF | 140 | | | | 198 | |
Reg. S, 2.00%, 06/25/2064 | | CHF | 90 | | | | 179 | |
Reg. S, 2.25%, 06/22/2031 | | CHF | 52 | | | | 70 | |
Reg. S, 3.25%, 06/27/2027 | | CHF | 510 | | | | 677 | |
Reg. S, 4.00%, 04/08/2028 | | CHF | 273 | | | | 386 | |
Reg. S, 4.00%, 01/06/2049 | | CHF | 130 | | | | 292 | |
Thailand Government Bond, (Thailand), | | | | | | | | |
1.45%, 12/17/2024 | | THB | 108,000 | | | | 3,464 | |
1.60%, 12/17/2029 | | THB | 54,000 | | | | 1,686 | |
1.88%, 06/17/2049 | | THB | 64,000 | | | | 1,668 | |
2.00%, 06/17/2042 | | THB | 19,000 | | | | 550 | |
2.13%, 12/17/2026 | | THB | 1,570 | | | | 52 | |
2.40%, 12/17/2023 | | THB | 220,000 | | | | 7,173 | |
2.88%, 12/17/2028 | | THB | 312,000 | | | | 10,756 | |
2.88%, 06/17/2046 | | THB | 15,000 | | | | 491 | |
3.30%, 06/17/2038 | | THB | 202,300 | | | | 7,109 | |
3.40%, 06/17/2036 | | THB | 25,000 | | | | 887 | |
3.60%, 06/17/2067 | | THB | 53,000 | | | | 1,900 | |
3.65%, 06/20/2031 | | THB | 50,000 | | | | 1,823 | |
Tokyo Metropolitan Government, (Japan), | | | | | | | | |
Reg. S, 0.75%, 07/16/2025 | | | 1,000 | | | | 989 | |
Series 716, 0.77%, 12/20/2022 | | JPY | 100,000 | | | | 910 | |
Series 726, 0.73%, 12/20/2023 | | JPY | 1,800,000 | | | | 16,488 | |
Series 727, 0.72%, 12/20/2023 | | JPY | 1,200,000 | | | | 10,989 | |
Series 747, 0.48%, 09/19/2025 | | JPY | 200,000 | | | | 1,835 | |
Treasury Corp. of Victoria, (Australia), | | | | | | | | |
0.50%, 11/20/2025 | | AUD | 2,500 | | | | 1,848 | |
1.00%, 11/20/2023 | | AUD | 3,650 | | | | 2,788 | |
1.25%, 11/19/2027 | | AUD | 1,600 | | | | 1,198 | |
Reg. S, 1.50%, 09/10/2031 | | AUD | 2,400 | | | | 1,743 | |
Reg. S, 2.25%, 11/20/2034 | | AUD | 3,800 | | | | 2,885 | |
2.25%, 11/20/2041 | | AUD | 500 | | | | 358 | |
Reg. S, 3.00%, 10/20/2028 | | AUD | 1,200 | | | | 1,000 | |
Tyollisyysrahasto, (Finland), 0.01%, 06/16/2027 | | EUR | 200 | | | | 239 | |
UNEDIC ASSEO, (France), | | | | | | | | |
Reg. S, 0.00%, 03/05/2030 | | EUR | 100 | | | | 118 | |
Reg. S, 0.00%, 11/19/2030 | | EUR | 200 | | | | 234 | |
Reg. S, 0.10%, 11/25/2026 | | EUR | 600 | | | | 724 | |
Reg. S, 0.25%, 11/25/2029 | | EUR | 1,000 | | | | 1,207 | |
Reg. S, 0.25%, 07/16/2035 | | EUR | 200 | | | | 232 | |
SEE NOTES TO FINANCIAL STATEMENTS.
| | | | | | | | | | |
| | | | | |
| 122 | | | | | | | | SIX CIRCLES TRUST | | JUNE 30, 2021 |
| | | | | | | | |
| SECURITY DESCRIPTION | | PRINCIPAL
AMOUNT($) | | | VALUE($) | |
Foreign Government Securities — continued | |
Reg. S, 0.63%, 03/03/2026 | | EUR | 100 | | | | 124 | |
Reg. S, 0.88%, 10/25/2022 | | EUR | 1,100 | | | | 1,329 | |
Reg. S, 1.25%, 10/21/2027 | | EUR | 200 | | | | 258 | |
United Kingdom Gilt, (United Kingdom), | | | | | | | | |
Reg. S, 0.13%, 01/31/2023 | | GBP | 1,688 | | | | 2,337 | |
Reg. S, 0.13%, 01/31/2024 | | GBP | 1,180 | | | | 1,630 | |
Reg. S, 0.13%, 01/30/2026 | | GBP | 350 | | | | 479 | |
Reg. S, 0.13%, 01/31/2028 | | GBP | 651 | | | | 877 | |
Reg. S, 0.25%, 07/31/2031 | | GBP | 1,077 | | | | 1,406 | |
Reg. S, 0.38%, 10/22/2030 | | GBP | 1,770 | | | | 2,365 | |
Reg. S, 0.50%, 07/22/2022 | | GBP | 675 | | | | 938 | |
Reg. S, 0.50%, 10/22/2061 | | GBP | 929 | | | | 1,015 | |
Reg. S, 0.63%, 06/07/2025 | | GBP | 2,921 | | | | 4,100 | |
Reg. S, 0.63%, 07/31/2035 | | GBP | 887 | | | | 1,155 | |
Reg. S, 0.63%, 10/22/2050 | | GBP | 1,389 | | | | 1,633 | |
Reg. S, 0.75%, 07/22/2023 | | GBP | 1,850 | | | | 2,595 | |
Reg. S, 0.88%, 10/22/2029 | | GBP | 2,290 | | | | 3,222 | |
Reg. S, 0.88%, 01/31/2046 | | GBP | 231 | | | | 294 | |
Reg. S, 1.00%, 04/22/2024 | | GBP | 1,510 | | | | 2,138 | |
Reg. S, 1.25%, 07/22/2027 | | GBP | 2,124 | | | | 3,079 | |
Reg. S, 1.25%, 10/22/2041 | | GBP | 908 | | | | 1,264 | |
Reg. S, 1.25%, 07/31/2051 | | GBP | 370 | | | | 512 | |
Reg. S, 1.50%, 07/22/2026 | | GBP | 2,420 | | | | 3,539 | |
Reg. S, 1.50%, 07/22/2047 | | GBP | 1,483 | | | | 2,170 | |
Reg. S, 1.63%, 10/22/2028 | | GBP | 1,285 | | | | 1,915 | |
Reg. S, 1.63%, 10/22/2054 | | GBP | 960 | | | | 1,473 | |
Reg. S, 1.63%, 10/22/2071 | | GBP | 802 | | | | 1,346 | |
Reg. S, 1.75%, 09/07/2022 | | GBP | 647 | | | | 913 | |
Reg. S, 1.75%, 09/07/2037 | | GBP | 1,420 | | | | 2,148 | |
Reg. S, 1.75%, 01/22/2049 | | GBP | 1,486 | | | | 2,302 | |
Reg. S, 1.75%, 07/22/2057 | | GBP | 1,190 | | | | 1,914 | |
Reg. S, 2.00%, 09/07/2025 | | GBP | 1,980 | | | | 2,936 | |
Reg. S, 2.25%, 09/07/2023 | | GBP | 2,190 | | | | 3,173 | |
Reg. S, 2.50%, 07/22/2065 | | GBP | 860 | | | | 1,748 | |
Reg. S, 2.75%, 09/07/2024 | | GBP | 1,260 | | | | 1,884 | |
Reg. S, 3.25%, 01/22/2044 | | GBP | 2,308 | | | | 4,468 | |
Reg. S, 3.50%, 01/22/2045 | | GBP | 2,231 | | | | 4,521 | |
Reg. S, 3.50%, 07/22/2068 | | GBP | 987 | | | | 2,549 | |
Reg. S, 3.75%, 07/22/2052 | | GBP | 1,102 | | | | 2,518 | |
Reg. S, 4.00%, 01/22/2060 | | GBP | 1,070 | | | | 2,783 | |
Reg. S, 4.25%, 12/07/2027 | | GBP | 1,620 | | | | 2,777 | |
Reg. S, 4.25%, 06/07/2032 | | GBP | 1,800 | | | | 3,374 | |
Reg. S, 4.25%, 03/07/2036 | | GBP | 1,130 | | | | 2,247 | |
Reg. S, 4.25%, 09/07/2039 | | GBP | 1,450 | | | | 3,029 | |
Reg. S, 4.25%, 12/07/2040 | | GBP | 1,840 | | | | 3,909 | |
Reg. S, 4.25%, 12/07/2046 | | GBP | 3,115 | | | | 7,140 | |
Reg. S, 4.25%, 12/07/2049 | | GBP | 1,214 | | | | 2,899 | |
Reg. S, 4.25%, 12/07/2055 | | GBP | 1,274 | | | | 3,274 | |
Reg. S, 4.50%, 09/07/2034 | | GBP | 1,730 | | | | 3,437 | |
Reg. S, 4.50%, 12/07/2042 | | GBP | 1,219 | | | | 2,739 | |
Reg. S, 4.75%, 12/07/2030 | | GBP | 2,244 | | | | 4,243 | |
Reg. S, 4.75%, 12/07/2038 | | GBP | 1,632 | | | | 3,561 | |
Reg. S, 5.00%, 03/07/2025 | | GBP | 1,355 | | | | 2,202 | |
Reg. S, 6.00%, 12/07/2028 | | GBP | 940 | | | | 1,813 | |
| | | | | | | | |
| SECURITY DESCRIPTION | | PRINCIPAL
AMOUNT($) | | | VALUE($) | |
| | | | | | | | |
United States International Development Finance Corp., 3.37%, 10/05/2034 | | | 93 | | | | 106 | |
Uruguay Government International Bond, (Uruguay), | | | | | | | | |
4.98%, 04/20/2055 | | | 50 | | | | 64 | |
5.10%, 06/18/2050 | | | 100 | | | | 131 | |
Ville de Paris, (France), | | | | | | | | |
Reg. S, 1.38%, 11/20/2034 | | EUR | 100 | | | | 130 | |
Reg. S, 1.75%, 05/25/2031 | | EUR | 200 | | | | 269 | |
3.88%, 12/29/2025 | | EUR | 500 | | | | 698 | |
Western Australian Treasury Corp., (Australia), | | | | | | | | |
Reg. S, 1.75%, 10/22/2031 | | AUD | 800 | | | | 598 | |
Series 24, Reg. S, 2.50%, 07/23/2024 | | AUD | 2,800 | | | | 2,229 | |
Series 25, Reg. S, 5.00%, 07/23/2025 | | AUD | 2,000 | | | | 1,756 | |
Series 26, Reg. S, 3.00%, 10/21/2026 | | AUD | 400 | | | | 331 | |
Series 28, Reg. S, 3.25%, 07/20/2028 | | AUD | 1,400 | | | | 1,186 | |
| | | | | | | | |
Total Foreign Government Securities
(Cost $3,526,122) | | | | | | | 3,460,043 | |
| | | | | | | | |
Mortgage-Backed Securities — 22.0% | | | | | | | | |
FHLMC Gold Pool, | | | | | | | | |
3.00%, 10/01/2046 | | | 330 | | | | 339 | |
3.50%, 12/01/2044 | | | 615 | | | | 640 | |
3.50%, 06/01/2045 | | | 862 | | | | 899 | |
3.50%, 05/01/2046 | | | 281 | | | | 292 | |
3.50%, 10/01/2046 | | | 311 | | | | 323 | |
FHLMC Gold Pool, Single Family, 15 years, 3.00%, 05/01/2029 | | | 9,648 | | | | 10,213 | |
FHLMC Gold Pool, Single Family, 30 years, | | | | | | | | |
3.00%, 03/01/2046 | | | 28 | | | | 30 | |
3.00%, 12/01/2046 | | | 45 | | | | 47 | |
4.00%, 08/01/2040 | | | 469 | | | | 514 | |
4.00%, 10/01/2040 | | | 3,499 | | | | 3,850 | |
4.00%, 11/01/2040 | | | 834 | | | | 914 | |
4.00%, 11/01/2047 | | | 3,291 | | | | 3,531 | |
4.00%, 01/01/2048 | | | 71 | | | | 76 | |
FHLMC Non Gold Pool, ARM, (ICE LIBOR USD 1 Year + 1.64%), 3.54%, 01/01/2050 (aa) | | | 122 | | | | 127 | |
FHLMC Pool, | | | | | | | | |
3.00%, 09/01/2029 | | | 1,808 | | | | 1,899 | |
3.50%, 02/01/2043 | | | 113 | | | | 122 | |
3.50%, 02/01/2044 | | | 133 | | | | 144 | |
6.00%, 08/01/2035 | | | 59 | | | | 63 | |
FHLMC Pool, Single Family, 15 years, | | | | | | | | |
2.00%, 02/01/2036 | | | 6,911 | | | | 7,151 | |
1.50%, 12/01/2035 | | | 511 | | | | 518 | |
2.00%, 12/01/2035 | | | 1,067 | | | | 1,101 | |
2.00%, 03/01/2036 | | | 557 | | | | 577 | |
2.50%, 07/01/2032 | | | 3,573 | | | | 3,760 | |
2.50%, 10/01/2035 | | | 11,655 | | | | 12,200 | |
3.00%, 10/01/2028 | | | 2,388 | | | | 2,525 | |
3.00%, 04/01/2029 | | | 100 | | | | 106 | |
3.00%, 05/01/2030 | | | 9 | | | | 10 | |
SEE NOTES TO FINANCIAL STATEMENTS.
| | | | | | | | | | |
| | | | | |
| JUNE 30, 2021 | | SIX CIRCLES TRUST | | | | | | | | 123 |
Six Circles Global Bond Fund
SCHEDULE OF PORTFOLIO INVESTMENTS
AS OF JUNE 30, 2021 (Unaudited) (continued)
(Amounts in U.S. Dollars, unless otherwise noted)
(Amounts in thousands, except number of Futures contracts)
| | | | | | | | |
| SECURITY DESCRIPTION | | PRINCIPAL
AMOUNT($) | | | VALUE($) | |
Mortgage-Backed Securities — continued | | | | | | | | |
3.00%, 11/01/2030 | | | 192 | | | | 203 | |
3.00%, 11/01/2031 | | | 76 | | | | 80 | |
3.00%, 02/01/2032 | | | 47 | | | | 50 | |
3.00%, 11/01/2032 | | | 197 | | | | 208 | |
3.00%, 01/01/2033 | | | 92 | | | | 97 | |
3.00%, 12/01/2034 | | | 136 | | | | 142 | |
3.00%, 05/01/2035 | | | 4,172 | | | | 4,387 | |
3.50%, 02/01/2034 | | | 1,225 | | | | 1,314 | |
FHLMC Pool, Single Family, 20 years, | | | | | | | | |
3.50%, 06/01/2039 | | | 517 | | | | 547 | |
3.50%, 07/01/2039 | | | 304 | | | | 320 | |
3.50%, 08/01/2039 | | | 1,090 | | | | 1,149 | |
3.50%, 09/01/2039 | | | 642 | | | | 679 | |
FHLMC Pool, Single Family, 30 years, | | | | | | | | |
2.50%, 11/01/2050 (hh) | | | 37,040 | | | | 38,461 | |
2.00%, 10/01/2050 | | | 4,070 | | | | 4,119 | |
2.00%, 02/01/2051 | | | 4,851 | | | | 4,909 | |
2.00%, 03/01/2051 | | | 2,111 | | | | 2,137 | |
2.00%, 05/01/2051 | | | 13,526 | | | | 13,686 | |
2.00%, 06/01/2051 | | | 1,580 | | | | 1,599 | |
3.50%, 09/01/2049 | | | 3,814 | | | | 4,056 | |
1.50%, 12/01/2050 | | | 2,269 | | | | 2,228 | |
3.00%, 11/01/2049 | | | 3,061 | | | | 3,215 | |
3.00%, 05/01/2050 | | | 5,073 | | | | 5,407 | |
3.00%, 07/01/2050 | | | 277 | | | | 291 | |
3.00%, 08/01/2050 | | | 2,462 | | | | 2,587 | |
3.00%, 06/01/2051 | | | 4,000 | | | | 4,261 | |
3.50%, 03/01/2048 | | | 453 | | | | 490 | |
3.50%, 05/01/2048 | | | 6,456 | | | | 6,874 | |
3.50%, 01/01/2049 | | | 105 | | | | 112 | |
3.50%, 02/01/2049 | | | 808 | | | | 873 | |
3.50%, 07/01/2049 | | | 4,000 | | | | 4,209 | |
3.50%, 10/01/2049 | | | 854 | | | | 916 | |
3.50%, 12/01/2049 | | | 1,000 | | | | 1,052 | |
3.50%, 04/01/2050 | | | 4,639 | | | | 5,017 | |
3.50%, 05/01/2050 | | | 401 | | | | 422 | |
4.00%, 10/01/2048 | | | 5,161 | | | | 5,549 | |
4.00%, 04/01/2049 | | | 5,194 | | | | 5,567 | |
4.00%, 09/01/2049 | | | 2,403 | | | | 2,612 | |
4.00%, 05/01/2050 | | | 2,000 | | | | 2,131 | |
4.00%, 08/01/2050 | | | 2,610 | | | | 2,783 | |
4.00%, 09/01/2050 | | | 15,526 | | | | 16,904 | |
4.00%, 12/01/2050 | | | 452 | | | | 481 | |
4.50%, 05/01/2048 | | | 8,106 | | | | 8,745 | |
4.50%, 06/01/2048 | | | 248 | | | | 268 | |
4.50%, 08/01/2048 | | | 45 | | | | 49 | |
4.50%, 02/01/2049 | | | 3,968 | | | | 4,269 | |
4.50%, 03/01/2049 | | | 4,749 | | | | 5,115 | |
4.50%, 04/01/2049 | | | 143 | | | | 153 | |
4.50%, 06/01/2049 | | | 15 | | | | 16 | |
4.50%, 08/01/2049 | | | 2,377 | | | | 2,620 | |
4.50%, 09/01/2049 | | | 874 | | | | 942 | |
4.50%, 03/01/2050 | | | 314 | | | | 339 | |
4.50%, 10/01/2050 | | | 6,544 | | | | 7,103 | |
5.00%, 12/01/2049 | | | 667 | | | | 743 | |
| | | | | | | | |
| SECURITY DESCRIPTION | | PRINCIPAL
AMOUNT($) | | | VALUE($) | |
| | | | | | | | |
FNMA or FHLMC, Single Family, 30 years, TBA, 4.00%, 07/01/2051 (w) | | | 1,025 | | | | 1,092 | |
FNMA or FHLMC, Single Family, 15 years, | | | | | | | | |
TBA, 1.50%, 07/01/2036 (w) | | | 14,975 | | | | 15,161 | |
TBA, 2.00%, 07/01/2036 (w) | | | 44,775 | | | | 46,197 | |
TBA, 2.00%, 08/01/2036 (w) | | | 43,000 | | | | 44,309 | |
TBA, 2.50%, 07/01/2036 (w) | | | 3,150 | | | | 3,285 | |
TBA, 2.50%, 08/01/2036 (w) | | | 23,000 | | | | 23,966 | |
TBA, 3.00%, 07/01/2051 (w) | | | 4,675 | | | | 4,913 | |
TBA, 3.50%, 07/01/2036 (w) | | | 3,250 | | | | 3,471 | |
TBA, 3.50%, 08/01/2036 (w) | | | 5,000 | | | | 5,338 | |
TBA, 4.00%, 07/01/2036 (w) | | | 7,250 | | | | 7,706 | |
FNMA or FHLMC, Single Family, 30 years, | | | | | | | | |
TBA, 1.50%, 07/01/2051 (w) | | | 10,575 | | | | 10,375 | |
TBA, 1.50%, 08/01/2051 (w) | | | 7,950 | | | | 7,785 | |
TBA, 2.00%, 07/01/2050 (w) | | | 37,847 | | | | 38,265 | |
TBA, 2.00%, 08/01/2051 (w) | | | 56,525 | | | | 57,037 | |
TBA, 2.50%, 07/01/2051 (w) | | | 29,967 | | | | 31,015 | |
TBA, 2.50%, 08/01/2051 (w) | | | 77,500 | | | | 80,055 | |
TBA, 2.50%, 09/01/2051 (w) | | | 4,000 | | | | 4,123 | |
TBA, 3.00%, 07/01/2051 (w) | | | 24,692 | | | | 25,744 | |
TBA, 3.00%, 08/01/2051 (w) | | | 48,500 | | | | 50,535 | |
TBA, 3.00%, 09/01/2051 (w) | | | 27,000 | | | | 28,107 | |
TBA, 3.50%, 07/01/2051 (w) | | | 55,666 | | | | 58,607 | |
TBA, 4.00%, 08/01/2051 (w) | | | 25,700 | | | | 27,396 | |
TBA, 4.50%, 07/01/2051 (w) | | | 6,950 | | | | 7,482 | |
TBA, 5.00%, 07/01/2051 (w) | | | 1,150 | | | | 1,263 | |
FNMA Pool, | | | | | | | | |
3.50%, 02/01/2045 | | | 416 | | | | 449 | |
3.00%, 05/01/2045 | | | 582 | | | | 599 | |
3.00%, 03/01/2060 | | | 27,777 | | | | 30,067 | |
3.50%, 08/01/2032 | | | 106 | | | | 113 | |
3.50%, 12/01/2042 | | | 231 | | | | 247 | |
3.50%, 04/01/2043 | | | 347 | | | | 375 | |
3.50%, 11/01/2043 | | | 166 | | | | 180 | |
3.50%, 09/01/2048 | | | 204 | | | | 212 | |
3.50%, 07/01/2049 | | | 456 | | | | 472 | |
4.00%, 04/01/2041 | | | 201 | | | | 219 | |
4.00%, 08/01/2046 | | | 165 | | | | 182 | |
5.39%, 07/01/2024 | | | 611 | | | | 658 | |
FNMA Pool, Single Family, 15 years, | | | | | | | | |
2.00%, 12/01/2035 | | | 3,594 | | | | 3,713 | |
2.00%, 02/01/2036 | | | 8,720 | | | | 9,011 | |
2.00%, 03/01/2036 | | | 651 | | | | 673 | |
2.00%, 09/01/2028 | | | 202 | | | | 210 | |
3.00%, 02/01/2028 | | | 469 | | | | 495 | |
3.00%, 09/01/2030 | | | 1,135 | | | | 1,201 | |
2.00%, 02/01/2028 | | | 24 | | | | 25 | |
2.00%, 11/01/2028 | | | 190 | | | | 196 | |
2.00%, 07/01/2032 | | | 14 | | | | 15 | |
2.00%, 11/01/2034 | | | 862 | | | | 891 | |
2.00%, 07/01/2036 | | | 28,500 | | | | 29,429 | |
2.50%, 08/01/2035 | | | 379 | | | | 396 | |
2.50%, 03/01/2036 | | | 2,934 | | | | 3,101 | |
3.00%, 04/01/2027 | | | 1,052 | | | | 1,108 | |
SEE NOTES TO FINANCIAL STATEMENTS.
| | | | | | | | | | |
| | | | | |
| 124 | | | | | | | | SIX CIRCLES TRUST | | JUNE 30, 2021 |
| | | | | | | | |
| SECURITY DESCRIPTION | | PRINCIPAL
AMOUNT($) | | | VALUE($) | |
Mortgage-Backed Securities — continued | | | | | | | | |
3.00%, 11/01/2027 | | | 75 | | | | 79 | |
3.00%, 10/01/2029 | | | 109 | | | | 116 | |
3.00%, 05/01/2030 | | | 45 | | | | 48 | |
3.00%, 07/01/2030 | | | 38 | | | | 40 | |
3.00%, 12/01/2030 | | | 50 | | | | 53 | |
3.00%, 04/01/2031 | | | 186 | | | | 196 | |
3.00%, 12/01/2031 | | | 448 | | | | 474 | |
3.00%, 07/01/2032 | | | 176 | | | | 186 | |
3.00%, 01/01/2033 | | | 118 | | | | 125 | |
3.00%, 02/01/2033 | | | 18 | | | | 19 | |
3.00%, 07/01/2033 | | | 201 | | | | 212 | |
3.00%, 02/01/2034 | | | 2,389 | | | | 2,522 | |
3.00%, 12/01/2034 | | | 102 | | | | 108 | |
3.00%, 03/01/2035 | | | 611 | | | | 642 | |
3.00%, 08/01/2035 | | | 2,515 | | | | 2,650 | |
3.50%, 03/01/2035 | | | 2,517 | | | | 2,712 | |
3.50%, 05/01/2035 | | | 55 | | | | 59 | |
FNMA Pool, Single Family, 20 years, | | | | | | | | |
3.50%, 03/01/2037 | | | 668 | | | | 723 | |
3.50%, 08/01/2038 | | | 205 | | | | 216 | |
3.50%, 04/01/2039 | | | 27 | | | | 28 | |
3.50%, 08/01/2039 | | | 324 | | | | 341 | |
4.50%, 06/01/2039 | | | 47 | | | | 51 | |
FNMA Pool, Single Family, 30 years, | | | | | | | | |
2.00%, 04/01/2051 | | | 4,465 | | | | 4,525 | |
2.00%, 06/01/2051 | | | 6,947 | | | | 7,035 | |
3.50%, 03/01/2050 | | | 7,999 | | | | 8,428 | |
2.00%, 09/01/2050 | | | 1,560 | | | | 1,579 | |
2.00%, 02/01/2051 | | | 1,646 | | | | 1,666 | |
2.50%, 12/01/2050 | | | 16,844 | | | | 17,514 | |
2.50%, 03/01/2051 | | | 6,899 | | | | 7,168 | |
3.00%, 01/01/2050 | | | 5,190 | | | | 5,444 | |
3.00%, 07/01/2050 | | | 11,794 | | | | 12,483 | |
3.50%, 02/01/2048 | | | 3,804 | | | | 4,025 | |
3.50%, 02/01/2050 | | | 5,173 | | | | 5,439 | |
3.50%, 04/01/2050 | | | 4,288 | | | | 4,519 | |
3.50%, 05/01/2050 | | | 4,680 | | | | 4,936 | |
4.50%, 08/01/2049 | | | 503 | | | | 543 | |
2.00%, 12/01/2050 | | | 10,034 | | | | 10,151 | |
2.00%, 01/01/2051 | | | 4,866 | | | | 4,927 | |
2.00%, 03/01/2051 | | | 2,463 | | | | 2,495 | |
2.00%, 07/01/2051 | | | 2,970 | | | | 3,005 | |
2.50%, 08/01/2046 | | | 7,823 | | | | 8,128 | |
2.50%, 08/01/2050 | | | 24 | | | | 25 | |
2.50%, 10/01/2050 | | | 2,790 | | | | 2,905 | |
2.50%, 05/01/2051 | | | 10,665 | | | | 11,049 | |
2.50%, 06/01/2051 | | | 9,632 | | | | 9,978 | |
3.00%, 08/01/2046 | | | 1,887 | | | | 1,982 | |
3.00%, 04/01/2048 | | | 8,926 | | | | 9,486 | |
3.00%, 03/01/2050 | | | 2,287 | | | | 2,422 | |
3.00%, 12/01/2050 | | | 5,281 | | | | 5,648 | |
3.00%, 01/01/2051 | | | 2,220 | | | | 2,351 | |
3.00%, 05/01/2051 | | | 13,967 | | | | 14,877 | |
3.50%, 12/01/2045 | | | 3,390 | | | | 3,622 | |
3.50%, 07/01/2046 | | | 6,007 | | | | 6,495 | |
| | | | | | | | |
| SECURITY DESCRIPTION | | PRINCIPAL
AMOUNT($) | | | VALUE($) | |
| | | | | | | | |
3.50%, 07/01/2047 | | | 781 | | | | 826 | |
3.50%, 09/01/2047 | | | 115 | | | | 122 | |
3.50%, 03/01/2048 | | | 296 | | | | 320 | |
3.50%, 06/01/2049 | | | 3,221 | | | | 3,385 | |
3.50%, 08/01/2049 | | | 59 | | | | 62 | |
3.50%, 09/01/2049 | | | 4,000 | | | | 4,211 | |
3.50%, 10/01/2049 | | | 4,000 | | | | 4,211 | |
3.50%, 11/01/2049 | | | 1,941 | | | | 2,043 | |
3.50%, 07/01/2050 | | | 14,188 | | | | 15,197 | |
3.50%, 01/01/2051 | | | 7,326 | | | | 7,698 | |
4.00%, 04/01/2039 | | | 2,073 | | | | 2,280 | |
4.00%, 03/01/2042 | | | 857 | | | | 951 | |
4.00%, 04/01/2043 | | | 342 | | | | 372 | |
4.00%, 02/01/2045 | | | 383 | | | | 419 | |
4.00%, 09/01/2046 | | | 217 | | | | 239 | |
4.00%, 09/01/2047 | | | 74 | | | | 80 | |
4.00%, 10/01/2047 | | | 928 | | | | 994 | |
4.00%, 03/01/2048 | | | 145 | | | | 155 | |
4.00%, 04/01/2048 | | | 790 | | | | 842 | |
4.00%, 06/01/2048 | | | 64 | | | | 68 | |
4.00%, 12/01/2048 | | | 103 | | | | 110 | |
4.00%, 06/01/2049 | | | 1,995 | | | | 2,158 | |
4.00%, 07/01/2049 | | | 50 | | | | 53 | |
4.00%, 10/01/2049 | | | 48 | | | | 51 | |
4.00%, 11/01/2049 | | | 360 | | | | 391 | |
4.00%, 05/01/2050 | | | 1,946 | | | | 2,074 | |
4.00%, 06/01/2050 | | | 4,188 | | | | 4,463 | |
4.50%, 01/01/2048 | | | 46 | | | | 49 | |
4.50%, 07/01/2048 | | | 3,607 | | | | 3,891 | |
4.50%, 08/01/2048 | | | 34 | | | | 37 | |
4.50%, 09/01/2048 | | | 1,196 | | | | 1,293 | |
4.50%, 11/01/2048 | | | 10,567 | | | | 11,391 | |
4.50%, 02/01/2049 | | | 12,474 | | | | 13,445 | |
4.50%, 03/01/2049 | | | 346 | | | | 373 | |
4.50%, 04/01/2049 | | | 1,147 | | | | 1,232 | |
4.50%, 05/01/2049 | | | 1,142 | | | | 1,226 | |
4.50%, 09/01/2049 | | | 882 | | | | 950 | |
4.50%, 11/01/2049 | | | 696 | | | | 750 | |
4.50%, 10/01/2050 | | | 867 | | | | 934 | |
5.00%, 09/01/2049 | | | 2,134 | | | | 2,377 | |
FNMA Pool, 10 years, | | | | | | | | |
3.00%, 03/01/2026 | | | 276 | | | | 290 | |
3.00%, 09/01/2025 | | | 906 | | | | 951 | |
3.00%, 03/01/2024 | | | 460 | | | | 483 | |
3.00%, 07/01/2026 | | | 1,595 | | | | 1,673 | |
2.00%, 11/01/2027 | | | 796 | | | | 822 | |
3.00%, 10/01/2027 | | | 558 | | | | 586 | |
3.00%, 09/01/2027 | | | 1,557 | | | | 1,634 | |
3.00%, 01/01/2023 | | | 42 | | | | 44 | |
3.00%, 07/01/2023 | | | 40 | | | | 42 | |
3.00%, 09/01/2023 | | | 108 | | | | 114 | |
3.00%, 02/01/2024 | | | 1,463 | | | | 1,535 | |
3.00%, 06/01/2024 | | | 420 | | | | 441 | |
3.00%, 10/01/2024 | | | 972 | | | | 1,021 | |
3.00%, 11/01/2024 | | | 231 | | | | 242 | |
SEE NOTES TO FINANCIAL STATEMENTS.
| | | | | | | | | | |
| | | | | |
| JUNE 30, 2021 | | SIX CIRCLES TRUST | | | | | | | | 125 |
Six Circles Global Bond Fund
SCHEDULE OF PORTFOLIO INVESTMENTS
AS OF JUNE 30, 2021 (Unaudited) (continued)
(Amounts in U.S. Dollars, unless otherwise noted)
(Amounts in thousands, except number of Futures contracts)
| | | | | | | | |
| SECURITY DESCRIPTION | | PRINCIPAL
AMOUNT($) | | | VALUE($) | |
Mortgage-Backed Securities — continued | | | | | | | | |
3.00%, 04/01/2025 | | | 126 | | | | 133 | |
3.00%, 05/01/2025 | | | 271 | | | | 285 | |
3.00%, 12/01/2025 | | | 415 | | | | 435 | |
3.00%, 04/01/2026 | | | 474 | | | | 497 | |
3.00%, 11/01/2026 | | | 123 | | | | 129 | |
3.00%, 12/01/2026 | | | 33 | | | | 34 | |
3.00%, 04/01/2027 | | | 293 | | | | 307 | |
3.00%, 06/01/2027 | | | 23 | | | | 24 | |
3.00%, 10/01/2027 | | | 198 | | | | 208 | |
FHA/VA, 3.00%, 01/01/2047 | | | 1,292 | | | | 1,355 | |
GNMA II Pool, | | | | | | | | |
(ICE LIBOR USD 1 Month + 2.20%), 2.31%, 02/20/2071 (aa) | | | 4,868 | | | | 5,297 | |
3.50%, 06/20/2048 | | | 129 | | | | 133 | |
3.50%, 07/20/2048 | | | 107 | | | | 110 | |
3.50%, 08/20/2049 | | | 301 | | | | 307 | |
3.50%, 11/20/2049 | | | 495 | | | | 512 | |
4.00%, 11/20/2041 | | | 36 | | | | 38 | |
4.50%, 08/20/2040 | | | 38 | | | | 41 | |
4.50%, 10/20/2040 | | | 52 | | | | 56 | |
GNMA II Pool, Single Family, 15 years, 2.00%, 12/20/2035 | | | 4,773 | | | | 4,934 | |
GNMA II Pool, Single Family, 30 years, | | | | | | | | |
4.50%, 05/20/2048 | | | 14,303 | | | | 15,533 | |
4.50%, 11/20/2048 | | | 1,272 | | | | 1,396 | |
2.00%, 04/20/2051 | | | 6,555 | | | | 6,688 | |
2.50%, 12/20/2050 | | | 4,459 | | | | 4,619 | |
2.50%, 01/20/2051 | | | 488 | | | | 507 | |
2.50%, 02/20/2051 | | | 3,597 | | | | 3,725 | |
2.50%, 05/20/2051 | | | 8,671 | | | | 8,970 | |
3.00%, 09/20/2046 | | | 3,884 | | | | 4,096 | |
3.00%, 04/20/2049 | | | 60 | | | | 63 | |
3.00%, 07/20/2050 | | | 7,387 | | | | 7,720 | |
3.00%, 08/20/2050 | | | 11,816 | | | | 12,390 | |
3.00%, 01/20/2051 | | | 3,303 | | | | 3,455 | |
3.50%, 09/20/2045 | | | 4,702 | | | | 5,006 | |
3.50%, 09/20/2047 | | | 5,571 | | | | 5,892 | |
3.50%, 08/20/2048 | | | 349 | | | | 368 | |
3.50%, 11/20/2048 | | | 405 | | | | 426 | |
3.50%, 12/20/2048 | | | 11 | | | | 12 | |
3.50%, 07/20/2049 | | | 2,175 | | | | 2,283 | |
3.50%, 01/20/2050 | | | 1,484 | | | | 1,556 | |
3.50%, 04/20/2050 | | | 261 | | | | 274 | |
4.00%, 07/20/2048 | | | 2,183 | | | | 2,320 | |
4.00%, 11/20/2048 | | | 63 | | | | 66 | |
4.00%, 05/20/2049 | | | 1,254 | | | | 1,328 | |
4.00%, 03/20/2050 | | | 43,253 | | | | 45,600 | |
4.50%, 03/20/2047 | | | 656 | | | | 719 | |
4.50%, 06/20/2047 | | | 1,517 | | | | 1,680 | |
4.50%, 10/20/2047 | | | 493 | | | | 534 | |
4.50%, 11/20/2047 | | | 1,838 | | | | 2,003 | |
4.50%, 09/20/2048 | | | 573 | | | | 616 | |
4.50%, 10/20/2049 | | | 1,662 | | | | 1,773 | |
4.50%, 02/20/2050 | | | 5,999 | | | | 6,389 | |
4.50%, 10/20/2050 | | | 16,500 | | | | 17,605 | |
| | | | | | | | |
| SECURITY DESCRIPTION | | PRINCIPAL
AMOUNT($) | | | VALUE($) | |
| | | | | | | | |
5.00%, 12/20/2048 | | | 438 | | | | 479 | |
5.00%, 06/20/2049 | | | 920 | | | | 993 | |
GNMA, Single Family, 30 years, | | | | | | | | |
TBA, 1.50%, 07/01/2051 (w) | | | 100 | | | | 99 | |
TBA, 2.00%, 07/01/2051 (w) | | | 23,200 | | | | 23,648 | |
TBA, 2.00%, 08/01/2051 (w) | | | 6,500 | | | | 6,613 | |
TBA, 2.50%, 07/01/2051 (w) | | | 24,425 | | | | 25,283 | |
TBA, 2.50%, 08/01/2051 (w) | | | 46,200 | | | | 47,737 | |
TBA, 3.00%, 08/01/2051 (w) | | | 39,200 | | | | 40,881 | |
TBA, 3.50%, 07/01/2051 (w) | | | 16,175 | | | | 16,969 | |
TBA, 3.50%, 08/01/2051 (w) | | | 100 | | | | 105 | |
TBA, 4.00%, 07/01/2051 (w) | | | 9,275 | | | | 9,794 | |
TBA, 4.50%, 07/01/2051 (w) | | | 8,850 | | | | 9,431 | |
TBA, 5.00%, 07/01/2051 (w) | | | 675 | | | | 728 | |
| | | | | | | | |
Total Mortgage-Backed Securities
(Cost $1,566,387) | | | | | | | 1,563,179 | |
| | | | | | | | |
Municipal Bonds — 0.0% (g) (t) | |
Arizona — 0.0% (g) | |
Salt River Project, Agricultural Improvement & Power District, Build America Bonds, Series A, Rev., 4.84%, 01/01/2041 | | | 100 | | | | 132 | |
| | | | | | | | |
California — 0.0% (g) | |
Bay Area Toll Authority, San Francisco Bay Area, Rev., 2.57%, 04/01/2031 | | | 100 | | | | 105 | |
California State University, Taxable Systemwide, Series E, Rev., 2.90%, 11/01/2051 | | | 15 | | | | 15 | |
Los Angeles County Metropolitan Transportation Authority, Build America Bonds, Rev., 5.74%, 06/01/2039 | | | 50 | | | | 66 | |
Los Angeles Department of Water & Power Power System Revenue, Build America Bonds, Rev., 6.60%, 07/01/2050 | | | 30 | | | | 51 | |
Los Angeles Unified School District, Build America Bond, GO, 5.75%, 07/01/2034 | | | 25 | | | | 34 | |
State of California, Build America Bonds, | | | | | | | | |
GO, 7.50%, 04/01/2034 | | | 50 | | | | 79 | |
GO, 7.55%, 04/01/2039 | | | 50 | | | | 85 | |
GO, 7.60%, 11/01/2040 | | | 50 | | | | 87 | |
University of California, Build America Bonds, Rev., 5.95%, 05/15/2045 | | | 35 | | | | 50 | |
University of California, Taxable, | | | | | | | | |
Series AQ, Rev., 4.77%, 05/15/2115 | | | 20 | | | | 28 | |
Series BJ, Rev., 3.07%, 05/15/2051 | | | 5 | | | | 5 | |
| | | | | | | | |
| | | | | | | 605 | |
| | | | | | | | |
District of Columbia — 0.0% (g) | |
District of Columbia, Water & Sewer Authority, Senior Lien, Green Bonds,
Series A, Rev., 4.81%, 10/01/2114 | | | 895 | | | | 1,269 | |
| | | | | | | | |
Illinois — 0.0% (g) | |
State of Illinois, Taxable Pension, GO, 5.10%, 06/01/2033 | | | 100 | | | | 118 | |
| | | | | | | | |
SEE NOTES TO FINANCIAL STATEMENTS.
| | | | | | | | | | |
| | | | | |
| 126 | | | | | | | | SIX CIRCLES TRUST | | JUNE 30, 2021 |
| | | | | | | | |
| SECURITY DESCRIPTION | | PRINCIPAL
AMOUNT($) | | | VALUE($) | |
Municipal Bonds — continued | |
Massachusetts — 0.0% (g) | |
Commonwealth of Massachusetts, Taxable Consolidated Loan, Series H, GO, 2.90%, 09/01/2049 | | | 15 | | | | 16 | |
| | | | | | | | |
Michigan — 0.0% (g) | |
University of Michigan, Taxable, Series B, Rev., 2.56%, 04/01/2050 | | | 25 | | | | 25 | |
| | | | | | | | |
Missouri — 0.0% (g) | |
Health & Educational Facilities Authority of the State of Missouri, Washington University, Series A, Rev., 3.23%, 05/15/2050 | | | 35 | | | | 38 | |
| | | | | | | | |
New Jersey — 0.0% (g) | |
New Jersey Transportation Trust Fund Authority, Build America Bonds, Series B, Rev., 6.56%, 12/15/2040 | | | 25 | | | | 37 | |
New Jersey Turnpike Authority, Build America Bonds, Series F, Rev., 7.41%, 01/01/2040 | | | 30 | | | | 49 | |
| | | | | | | | |
| | |
| | | | | | | 86 | |
| | | | | | | | |
New York — 0.0% (g) | |
City of New York, Build America Bonds, GO, 5.52%, 10/01/2037 | | | 25 | | | | 34 | |
New York City Water & Sewer System, Build America Bonds, Second General Resolution, Rev., 5.44%, 06/15/2043 | | | 30 | | | | 44 | |
Port Authority of New York & New Jersey, | | | | | | | | |
Series 174, Rev., 4.46%, 10/01/2062 | | | 20 | | | | 27 | |
Series 21, Rev., 3.29%, 08/01/2069 | | | 40 | | | | 42 | |
| | | | | | | | |
| | |
| | | | | | | 147 | |
| | | | | | | | |
Oregon — 0.0% (g) | |
Oregon State University, Taxable, Rev., BAM, 3.42%, 03/01/2060 | | | 10 | | | | 10 | |
State of Oregon Department of Transportation, Taxable Subordinated, Build America Bonds, Series A, Rev., 5.83%, 11/15/2034 | | | 50 | | | | 70 | |
| | | | | | | | |
| | |
| | | | | | | 80 | |
| | | | | | | | |
Pennsylvania — 0.0% (g) | |
City of Philadelphia, Water & Wastewater Revenue, Rev., 2.93%, 07/01/2045 | | | 10 | | | | 10 | |
| | | | | | | | |
Texas — 0.0% (g) | |
City of San Antonio, Electric & Gas Systems Revenue, Build America Bonds, Rev., 5.99%, 02/01/2039 | | | 20 | | | | 29 | |
Dallas Area Rapid Transit, Build America Bonds, Rev., 5.02%, 12/01/2048 | | | 30 | | | | 42 | |
North Texas Tollway Authority, Build America Bonds, Series B, Rev., 6.72%, 01/01/2049 | | | 15 | | | | 25 | |
| | | | | | | | |
| SECURITY DESCRIPTION | | PRINCIPAL
AMOUNT($) | | | VALUE($) | |
| | | | | | | | |
Texas — continued | |
Texas Transportation Commission, Taxable Mobility Fund, GO, 2.47%, 10/01/2044 | | | 10 | | | | 10 | |
University of Texas System, Build America Bonds, Series C, Rev., 4.79%, 08/15/2046 | | | 10 | | | | 13 | |
| | | | | | | | |
| | |
| | | | | | | 119 | |
| | | | | | | | |
Virginia — 0.0% (g) | |
University of Virginia, Taxable, Series C, Rev., 4.18%, 09/01/2117 | | | 40 | | | | 50 | |
| | | | | | | | |
Total Municipal Bonds
(Cost $2,739) | | | | | | | 2,695 | |
| | | | | | | | |
U.S. Government Agency Securities — 0.3% | |
FHLBs, | | | | | | | | |
0.50%, 04/14/2025 | | | 2,000 | | | | 1,989 | |
3.25%, 11/16/2028 | | | 650 | | | | 739 | |
5.50%, 07/15/2036 | | | 200 | | | | 296 | |
FHLMC, | | | | | | | | |
Zero Coupon, 12/14/2029 | | | 925 | | | | 813 | |
Zero Coupon, 12/17/2029 | | | 32 | | | | 28 | |
Zero Coupon, 01/02/2034 | | | 550 | | | | 432 | |
0.13%, 07/25/2022 | | | 5 | | | | 5 | |
0.25%, 08/24/2023 | | | 2,650 | | | | 2,649 | |
0.38%, 07/21/2025 | | | 1,000 | | | | 986 | |
1.50%, 02/12/2025 | | | 107 | | | | 110 | |
6.25%, 07/15/2032 | | | 207 | | | | 305 | |
6.75%, 03/15/2031 | | | 400 | | | | 589 | |
FHLMC Coupon STRIPs, Zero Coupon, 03/15/2030 | | | 235 | | | | 205 | |
FHLMC STRIPs, Zero Coupon, 03/15/2031 | | | 700 | | | | 596 | |
FNMA, | | | | | | | | |
0.25%, 05/22/2023 | | | 3,000 | | | | 3,000 | |
0.30%, 08/03/2023 | | | 100 | | | | 100 | |
0.35%, 08/18/2023 | | | 1,500 | | | | 1,501 | |
0.88%, 08/05/2030 | | | 1,310 | | | | 1,242 | |
5.38%, 12/07/2028 | | | GBP 260 | | | | 469 | |
6.25%, 05/15/2029 | | | 1,000 | | | | 1,363 | |
FNMA Interest STRIP, | | | | | | | | |
Zero Coupon, 09/23/2027 | | | 117 | | | | 109 | |
Zero Coupon, 07/15/2030 | | | 14 | | | | 12 | |
Zero Coupon, 11/15/2030 | | | 13 | | | | 11 | |
Resolution Funding Corp. Interest STRIP, | | | | | | | | |
Zero Coupon, 10/15/2028 | | | 50 | | | | 45 | |
Zero Coupon, 07/15/2029 | | | 355 | | | | 315 | |
Zero Coupon, 10/15/2029 | | | 40 | | | | 35 | |
Zero Coupon, 01/15/2030 | | | 285 | | | | 249 | |
Resolution Funding Corp. Principal STRIP, Zero Coupon, 01/15/2030 | | | 50 | | | | 44 | |
Tennessee Valley Authority, | | | | | | | | |
4.63%, 06/07/2043 | | GBP | 200 | | | | 417 | |
5.88%, 04/01/2036 | | | 400 | | | | 596 | |
| | | | | | | | |
Total U.S. Government Agency Securities (Cost $19,488) | | | | | | | 19,250 | |
| | | | | | | | |
SEE NOTES TO FINANCIAL STATEMENTS.
| | | | | | | | | | |
| | | | | |
| JUNE 30, 2021 | | SIX CIRCLES TRUST | | | | | | | | 127 |
Six Circles Global Bond Fund
SCHEDULE OF PORTFOLIO INVESTMENTS
AS OF JUNE 30, 2021 (Unaudited) (continued)
(Amounts in U.S. Dollars, unless otherwise noted)
(Amounts in thousands, except number of Futures contracts)
| | | | | | | | |
| SECURITY DESCRIPTION | | PRINCIPAL
AMOUNT($) | | | VALUE($) | |
U.S. Treasury Obligations — 8.1% | |
U.S. Treasury Bonds, | | | | | | | | |
1.13%, 05/15/2040 | | | 6,482 | | | | 5,602 | |
1.13%, 08/15/2040 | | | 3,225 | | | | 2,776 | |
1.25%, 05/15/2050 (ii) | | | 9,680 | | | | 7,909 | |
1.38%, 11/15/2040 | | | 470 | | | | 422 | |
1.38%, 08/15/2050 | | | 3,626 | | | | 3,059 | |
1.63%, 11/15/2050 | | | 1,700 | | | | 1,528 | |
1.88%, 02/15/2041 | | | 400 | | | | 392 | |
1.88%, 02/15/2051 | | | 2,700 | | | | 2,579 | |
2.00%, 02/15/2050 | | | 2,609 | | | | 2,565 | |
2.25%, 05/15/2041 | | | 1,000 | | | | 1,042 | |
2.25%, 08/15/2046 | | | 3,000 | | | | 3,104 | |
2.25%, 08/15/2049 | | | 3,300 | | | | 3,420 | |
2.38%, 11/15/2049 | | | 2,200 | | | | 2,344 | |
2.38%, 05/15/2051 | | | 1,250 | | | | 1,336 | |
2.50%, 02/15/2045 | | | 5,500 | | | | 5,955 | |
2.50%, 02/15/2046 | | | 1,000 | | | | 1,084 | |
2.50%, 05/15/2046 | | | 1,975 | | | | 2,141 | |
2.75%, 11/15/2042 | | | 2,000 | | | | 2,254 | |
2.75%, 08/15/2047 | | | 900 | | | | 1,024 | |
2.75%, 11/15/2047 | | | 900 | | | | 1,025 | |
2.88%, 05/15/2043 | | | 2,000 | | | | 2,302 | |
2.88%, 11/15/2046 | | | 1,500 | | | | 1,742 | |
2.88%, 05/15/2049 | | | 3,000 | | | | 3,515 | |
3.00%, 05/15/2042 | | | 800 | | | | 937 | |
3.00%, 11/15/2044 | | | 900 | | | | 1,060 | |
3.00%, 05/15/2045 | | | 1,730 | | | | 2,041 | |
3.00%, 11/15/2045 | | | 4,229 | | | | 5,003 | |
3.00%, 02/15/2047 | | | 4,588 | | | | 5,453 | |
3.00%, 08/15/2048 | | | 2,020 | | | | 2,413 | |
3.00%, 02/15/2049 | | | 2,400 | | | | 2,875 | |
3.13%, 11/15/2041 | | | 800 | | | | 954 | |
3.13%, 02/15/2043 | | | 860 | | | | 1,028 | |
3.38%, 11/15/2048 | | | 3,700 | | | | 4,726 | |
3.63%, 08/15/2043 | | | 4,090 | | | | 5,271 | |
3.63%, 02/15/2044 | | | 3,000 | | | | 3,880 | |
3.75%, 11/15/2043 | | | 3,115 | | | | 4,091 | |
3.88%, 08/15/2040 | | | 900 | | | | 1,184 | |
4.25%, 11/15/2040 | | | 1,769 | | | | 2,441 | |
4.38%, 05/15/2041 | | | 410 | | | | 576 | |
4.50%, 02/15/2036 | | | 1,805 | | | | 2,480 | |
4.63%, 02/15/2040 | | | 1,000 | | | | 1,436 | |
4.75%, 02/15/2037 | | | 300 | | | | 426 | |
4.75%, 02/15/2041 | | | 800 | | | | 1,174 | |
5.00%, 05/15/2037 | | | 300 | | | | 438 | |
U.S. Treasury Inflation Indexed Notes, 0.13%, 04/15/2025 | | | 41 | | | | 45 | |
U.S. Treasury Notes, | | | | | | | | |
0.13%, 04/30/2022 | | | 512 | | | | 512 | |
0.13%, 06/30/2022 | | | 21,000 | | | | 21,005 | |
0.13%, 07/31/2022 | | | 8,200 | | | | 8,201 | |
0.13%, 09/30/2022 | | | 2,500 | | | | 2,500 | |
0.13%, 10/31/2022 | | | 18,000 | | | | 17,992 | |
0.13%, 05/15/2023 | | | 300 | | | | 299 | |
0.13%, 05/31/2023 | | | 500 | | | | 499 | |
| | | | | | | | |
| SECURITY DESCRIPTION | | PRINCIPAL
AMOUNT($) | | | VALUE($) | |
| |
0.13%, 06/30/2023 | | | 8,900 | | | | 8,878 | |
0.13%, 07/15/2023 | | | 13,000 | | | | 12,965 | |
0.13%, 08/15/2023 | | | 45 | | | | 45 | |
0.13%, 01/15/2024 | | | 100 | | | | 99 | |
0.25%, 04/15/2023 | | | 1,203 | | | | 1,204 | |
0.25%, 06/15/2023 | | | 11,000 | | | | 11,001 | |
0.25%, 03/15/2024 | | | 2,000 | | | | 1,992 | |
0.25%, 05/15/2024 | | | 2,000 | | | | 1,989 | |
0.25%, 06/15/2024 | | | 3,000 | | | | 2,982 | |
0.25%, 05/31/2025 | | | 10,000 | | | | 9,835 | |
0.25%, 06/30/2025 | | | 10,000 | | | | 9,826 | |
0.25%, 07/31/2025 | | | 19,920 | | | | 19,550 | |
0.25%, 09/30/2025 | | | 2,500 | | | | 2,448 | |
0.25%, 10/31/2025 | | | 600 | | | | 587 | |
0.38%, 04/15/2024 | | | 1,000 | | | | 999 | |
0.38%, 04/30/2025 | | | 1,085 | | | | 1,074 | |
0.38%, 11/30/2025 | | | 3,500 | | | | 3,438 | |
0.38%, 12/31/2025 | | | 4,990 | | | | 4,897 | |
0.38%, 01/31/2026 | | | 600 | | | | 588 | |
0.38%, 07/31/2027 | | | 6,215 | | | | 5,960 | |
0.38%, 09/30/2027 | | | 5,500 | | | | 5,257 | |
0.50%, 03/15/2023 | | | 8,000 | | | | 8,040 | |
0.50%, 04/30/2027 | | | 532 | | | | 516 | |
0.50%, 05/31/2027 | | | 4,500 | | | | 4,359 | |
0.50%, 06/30/2027 | | | 5,000 | | | | 4,839 | |
0.50%, 08/31/2027 | | | 2,400 | | | | 2,316 | |
0.63%, 11/30/2027 | | | 2,200 | | | | 2,131 | |
0.63%, 12/31/2027 | | | 3,600 | | | | 3,483 | |
0.63%, 05/15/2030 | | | 13,078 | | | | 12,235 | |
0.63%, 08/15/2030 | | | 4,555 | | | | 4,247 | |
0.75%, 03/31/2026 | | | 1,500 | | | | 1,494 | |
0.75%, 04/30/2026 | | | 2,500 | | | | 2,489 | |
0.75%, 05/31/2026 | | | 2,400 | | | | 2,387 | |
0.75%, 01/31/2028 | | | 3,000 | | | | 2,923 | |
0.88%, 06/30/2026 | | | 1,000 | | | | 1,000 | |
0.88%, 11/15/2030 | | | 4,700 | | | | 4,473 | |
1.13%, 02/28/2027 | | | 4,000 | | | | 4,031 | |
1.13%, 02/29/2028 | | | 500 | | | | 499 | |
1.13%, 02/15/2031 | | | 5,000 | | | | 4,859 | |
1.25%, 07/31/2023 | | | 8,100 | | | | 8,265 | |
1.25%, 03/31/2028 | | | 2,500 | | | | 2,512 | |
1.25%, 04/30/2028 | | | 2,300 | | | | 2,309 | |
1.25%, 05/31/2028 (ee) (gg) | | | 9,400 | | | | 9,431 | |
1.25%, 06/30/2028 | | | 2,190 | | | | 2,195 | |
1.50%, 08/15/2026 | | | 1,000 | | | | 1,030 | |
1.50%, 02/15/2030 | | | 3,399 | | | | 3,435 | |
1.63%, 02/15/2026 | | | 5,500 | | | | 5,703 | |
1.63%, 05/15/2026 | | | 2,500 | | | | 2,592 | |
1.63%, 08/15/2029 | | | 2,000 | | | | 2,047 | |
1.63%, 05/15/2031 | | | 3,370 | | | | 3,426 | |
1.75%, 09/30/2022 | | | 1,400 | | | | 1,428 | |
1.75%, 05/15/2023 | | | 140 | | | | 144 | |
1.75%, 12/31/2026 | | | 840 | | | | 876 | |
1.75%, 11/15/2029 | | | 2,000 | | | | 2,066 | |
1.88%, 07/31/2022 | | | 4,000 | | | | 4,076 | |
SEE NOTES TO FINANCIAL STATEMENTS.
| | | | | | | | | | |
| | | | | |
| 128 | | | | | | | | SIX CIRCLES TRUST | | JUNE 30, 2021 |
| | | | | | | | |
| SECURITY DESCRIPTION | | PRINCIPAL
AMOUNT($) | | | VALUE($) | |
U.S. Treasury Obligations — continued | |
1.88%, 08/31/2022 | | | 675 | | | | 689 | |
2.00%, 07/31/2022 | | | 1,600 | | | | 1,633 | |
2.00%, 11/30/2022 | | | 1,560 | | | | 1,600 | |
2.00%, 02/15/2023 | | | 500 | | | | 515 | |
2.00%, 08/15/2025 | | | 3,000 | | | | 3,158 | |
2.00%, 11/15/2026 | | | 6,700 | | | | 7,074 | |
2.13%, 02/29/2024 | | | 55 | | | | 58 | |
2.13%, 03/31/2024 | | | 12,000 | | | | 12,563 | |
2.13%, 07/31/2024 | | | 3,000 | | | | 3,151 | |
2.13%, 09/30/2024 | | | 10,400 | | | | 10,940 | |
2.13%, 05/15/2025 | | | 11,000 | | | | 11,618 | |
2.25%, 11/15/2024 | | | 10,700 | | | | 11,312 | |
2.25%, 11/15/2025 | | | 2,575 | | | | 2,740 | |
2.25%, 03/31/2026 | | | 400 | | | | 426 | |
2.25%, 02/15/2027 | | | 5,000 | | | | 5,347 | |
2.25%, 08/15/2027 | | | 4,200 | | | | 4,494 | |
2.38%, 01/31/2023 | | | 1,600 | | | | 1,655 | |
2.38%, 08/15/2024 | | | 3,800 | | | | 4,024 | |
2.38%, 05/15/2027 | | | 8,000 | | | | 8,617 | |
2.38%, 05/15/2029 | | | 3,500 | | | | 3,779 | |
2.63%, 02/15/2029 | | | 1,600 | | | | 1,756 | |
2.75%, 07/31/2023 | | | 7,000 | | | | 7,361 | |
2.75%, 11/15/2023 | | | 4,300 | | | | 4,547 | |
2.75%, 02/15/2024 | | | 3,000 | | | | 3,186 | |
2.75%, 02/28/2025 | | | 13,800 | | | | 14,874 | |
2.75%, 02/15/2028 | | | 4,660 | | | | 5,138 | |
2.88%, 11/15/2021 | | | 1 | | | | 1 | |
2.88%, 09/30/2023 | | | 3,000 | | | | 3,173 | |
2.88%, 10/31/2023 | | | 1,524 | | | | 1,615 | |
2.88%, 04/30/2025 | | | 10,900 | | | | 11,825 | |
2.88%, 11/30/2025 | | | 1,300 | | | | 1,419 | |
2.88%, 05/15/2028 | | | 4,500 | | | | 5,002 | |
2.88%, 08/15/2028 | | | 1,800 | | | | 2,003 | |
3.00%, 09/30/2025 | | | 120 | | | | 131 | |
3.13%, 11/15/2028 | | | 6,390 | | | | 7,234 | |
U.S. Treasury STRIP Coupon Bonds, | | | | | | | | |
Zero Coupon, 05/15/2024 | | | 800 | | | | 790 | |
Zero Coupon, 05/15/2026 | | | 5,000 | | | | 4,779 | |
Zero Coupon, 11/15/2026 | | | 5,000 | | | | 4,728 | |
Zero Coupon, 11/15/2028 (ee) (ff) | | | 12,000 | | | | 10,854 | |
Zero Coupon, 11/15/2038 | | | 6,250 | | | | 4,376 | |
Zero Coupon, 11/15/2041 (ee) | | | 200 | | | | 128 | |
Zero Coupon, 08/15/2045 | | | 600 | | | | 353 | |
| | | | | | | | |
Total U.S. Treasury Obligations
(Cost $596,494) | | | | | | | 574,196 | |
| | | | | | | | |
Short-Term Investments — 9.3% | | | | | | | | |
Repurchase Agreement — 0.8% | | | | | | | | |
BNP Paribas, 0.03%, dated 06/30/2021 due 07/01/2021, repurchase price $56,100, collateralized by U.S. Treasury Security, 1.00%, due 02/15/2049, with a value of $57,448. | | | 56,100 | | | | 56,100 | |
| | | | | | | | |
| | | | | | | | |
| SECURITY DESCRIPTION | | PRINCIPAL
AMOUNT($) | | | VALUE($) | |
| |
Time Deposits — 8.0% | | | | | | | | |
Australia & New Zealand Banking Group Ltd., 0.01%, 07/01/2021 | | | 258,488 | | | | 258,488 | |
Barclays SA, 0.01%, 07/01/2021 | | | 904 | | | | 904 | |
BNP Paribas SA, | | | | | | | | |
(1.83%), 07/01/2021 | | CHF | 71 | | | | 76 | |
(0.78%), 07/01/2021 | | EUR | 8,561 | | | | 10,151 | |
(0.61%), 07/01/2021 | | SEK | 961 | | | | 112 | |
(0.48%), 07/01/2021 | | DKK | 1,179 | | | | 188 | |
0.01%, 07/01/2021 | | | 28,465 | | | | 28,465 | |
Brown Brothers Harriman, | | | | | | | | |
(1.83%), 07/01/2021 | | CHF | — | (h) | | | — | (h) |
(1.08%), 07/01/2021 | | NOK | 793 | | | | 92 | |
(0.60%), 07/01/2021 | | NZD | 1,155 | | | | 807 | |
(0.44%), 07/01/2021 | | AUD | 1,842 | | | | 1,382 | |
0.00%, 07/01/2021 | | SGD | 1,075 | | | | 800 | |
0.00%, 07/02/2021 | | HKD | 8,152 | | | | 1,050 | |
0.01%, 07/01/2021 | | GBP | — | (h) | | | — | (h) |
0.01%, 07/01/2021 | | | — | (h) | | | — | (h) |
0.01%, 07/02/2021 | | CAD | 108 | | | | 87 | |
Citibank NA, | | | | | | | | |
0.01%, 07/01/2021 | | GBP | 358 | | | | 495 | |
0.01%, 07/01/2021 | | | 23,413 | | | | 23,413 | |
Sumitomo Mitsui Banking Corp., (0.31%), 07/01/2021 | | JPY | 27,258,821 | | | | 245,365 | |
| | | | | | | | |
Total Time Deposits | | | | | | | 571,875 | |
| | | | | | | | |
U.S. Treasury Obligations — 0.5% | | | | | | | | |
U.S. Treasury Bills, | | | | | | | | |
Zero Coupon, 07/27/2021 | | | 1,600 | | | | 1,600 | |
Zero Coupon, 07/29/2021 (ee) | | | 752 | | | | 752 | |
Zero Coupon, 08/19/2021 (ee) (gg) | | | 2,642 | | | | 2,642 | |
Zero Coupon, 09/23/2021 | | | 27,500 | | | | 27,497 | |
| | | | | | | | |
Total U.S. Treasury Obligations | | | | | | | 32,491 | |
| | | | | | | | |
Total Short-Term Investments
(Cost $660,466) | | | | | | | 660,466 | |
| | | | | | | | |
| | |
Total Investments, Before Short Positions — 110.7%
(Cost - $7,966,852)* | | | | | | | 7,877,363 | |
| |
Liabilities in Excess of Other Assets —(10.7)% | | | | (761,768 | ) |
| | | | | | | | |
| | |
NET ASSETS — 100.0% | | | | | | $ | 7,115,595 | |
| | | | | | | | |
Short Positions — 4.1% | | | | | | | | |
| |
Foreign Government Security — 0.0% (g) | | | | | |
China Development Bank, (China), Series 1706, 4.02%, 04/17/2022 (Proceeds $1,815) | | CNY | 12,000 | | | | 1,878 | |
| | | | | | | | |
Mortgage-Backed Securities — 4.1% | | | | | | | | |
FNMA or FHLMC, Single Family, 15 years, | | | | | | | | |
TBA, 2.00%, 07/01/2036 (w) | | | 64,600 | | | | 66,652 | |
TBA, 3.00%, 07/01/2051 (w) | | | 25,500 | | | | 26,798 | |
SEE NOTES TO FINANCIAL STATEMENTS.
| | | | | | | | | | |
| | | | | |
| JUNE 30, 2021 | | SIX CIRCLES TRUST | | | | | | | | 129 |
Six Circles Global Bond Fund
SCHEDULE OF PORTFOLIO INVESTMENTS
AS OF JUNE 30, 2021 (Unaudited) (continued)
(Amounts in U.S. Dollars, unless otherwise noted)
(Amounts in thousands, except number of Futures contracts)
| | | | | | | | |
| SECURITY DESCRIPTION | | PRINCIPAL
AMOUNT($) | | | VALUE($) | |
Mortgage-Backed Securities — continued | | | | | | | | |
FNMA or FHLMC, Single Family, 30 years, | | | | | | | | |
TBA, 2.00%, 07/01/2050 (w) | | | 8,500 | | | | 8,594 | |
TBA, 2.50%, 07/01/2051 (w) | | | 21,000 | | | | 21,734 | |
TBA, 3.50%, 07/01/2051 (w) | | | 36,700 | | | | 38,639 | |
TBA, 3.50%, 08/01/2051 (w) | | | 11,200 | | | | 11,799 | |
TBA, 4.50%, 07/01/2051 (w) | | | 52,000 | | | | 55,979 | |
GNMA, Single Family, 30 years, | | | | | | | | |
TBA, 4.00%, 07/01/2051 (w) | | | 34,200 | | | | 36,113 | |
TBA, 4.50%, 07/01/2051 (w) | | | 22,500 | | | | 23,977 | |
| | | | | | | | |
| | |
Total Mortgage-Backed Securities
(Proceeds $290,631) | | | | | | | 290,285 | |
| | | | | | | | |
| | |
Total Securities Sold Short — 4.1%
(Procedds $292,446)* | | | | | | | 292,163 | |
| | | | | | | | |
Percentages indicated are based on net assets.
| | | | | | | | | | | | | | | | | | | | |
| Futures contracts outstanding as of June 30, 2021: | |
| Exchange Traded | |
| DESCRIPTION | | NUMBER OF
CONTRACTS | | | EXPIRATION
DATE | | | TRADING
CURRENCY | | | NOTIONAL
AMOUNT($) | | | VALUE AND
UNREALIZED
APPRECIATION
(DEPRECIATION)($) | |
Long Contracts | | | | | | | | | | | | | | | | | | | | |
3 Month Eurodollar | | | 20 | | | | 12/2021 | | | | USD | | | | 4,989 | | | | 1 | |
Euro BOBL | | | 12 | | | | 09/2021 | | | | EUR | | | | 1,903 | | | | 6 | |
Euro Bund | | | 158 | | | | 09/2021 | | | | EUR | | | | 32,129 | | | | 209 | |
Euro Buxl | | | 16 | | | | 09/2021 | | | | EUR | | | | 3,794 | | | | 62 | |
Euro Schatz | | | 82 | | | | 09/2021 | | | | EUR | | | | 10,905 | | | | (2 | ) |
Long Gilt | | | 32 | | | | 09/2021 | | | | GBP | | | | 5,620 | | | | 50 | |
Swiss Confederation Bond | | | 20 | | | | 09/2021 | | | | CHF | | | | 3,620 | | | | 17 | |
U.S. Treasury 10 Year Note | | | 297 | | | | 09/2021 | | | | USD | | | | 39,236 | | | | 117 | |
U.S. Treasury 2 Year Note | | | 129 | | | | 09/2021 | | | | USD | | | | 28,463 | | | | (41 | ) |
U.S. Treasury 5 Year Note | | | 8 | | | | 09/2021 | | | | USD | | | | 990 | | | | (2 | ) |
U.S. Treasury Long Bond | | | 104 | | | | 09/2021 | | | | USD | | | | 16,313 | | | | 405 | |
U.S. Treasury Ultra Bond | | | 95 | | | | 09/2021 | | | | USD | | | | 17,724 | | | | 581 | |
| | | | | | | | | | | | | | | | | | | | |
| | | | | | | | | | | | | | | | | | | 1,403 | |
| | | | | | | | | | | | | | | | | | | | |
| | | | | |
Short Contracts | | | | | | | | | | | | | | | | | | | | |
Euro BOBL | | | (5 | ) | | | 09/2021 | | | | EUR | | | | (795 | ) | | | (1 | ) |
Euro Buxl | | | (3 | ) | | | 09/2021 | | | | EUR | | | | (710 | ) | | | (13 | ) |
U.S. Treasury 10 Year Note | | | (834 | ) | | | 09/2021 | | | | USD | | | | (109,855 | ) | | | (650 | ) |
U.S. Treasury 5 Year Note | | | (115 | ) | | | 09/2021 | | | | USD | | | | (14,236 | ) | | | 41 | |
U.S. Treasury Long Bond | | | (33 | ) | | | 09/2021 | | | | USD | | | | (5,159 | ) | | | (145 | ) |
U.S. Treasury Ultra Bond | | | (6 | ) | | | 09/2021 | | | | USD | | | | (1,122 | ) | | | (35 | ) |
U.S. Ultra Treasury 10 Year Note | | | (30 | ) | | | 09/2021 | | | | USD | | | | (4,347 | ) | | | (69 | ) |
| | | | | | | | | | | | | | | | | | | | |
| | | | | | | | | | | | | | | | | | | (872 | ) |
| | | | | | | | | | | | | | | | | | | | |
Total unrealized appreciation (depreciation) | | | | | | | | | | | | | | | | | | | 531 | |
| | | | | | | | | | | | | | | | | | | | |
SEE NOTES TO FINANCIAL STATEMENTS.
| | | | | | | | | | |
| | | | | |
| 130 | | | | | | | | SIX CIRCLES TRUST | | JUNE 30, 2021 |
| | | | | | | | | | | | | | | | | | | | |
| Forward foreign currency exchange contracts outstanding as of June 30, 2021: | |
| CURRENCY PURCHASED | | | CURRENCY SOLD | | | COUNTERPARTY | | SETTLEMENT
DATE | | | UNREALIZED
APPRECIATION
(DEPRECIATION)($) | |
USD | | | 2,322 | | | AUD | | | 3,000 | | | Deutsche Bank AG | | | 07/02/2021 | | | | 73 | |
USD | | | 77,249 | | | AUD | | | 99,900 | | | Goldman Sachs International | | | 07/02/2021 | | | | 2,329 | |
USD | | | 7,028 | | | AUD | | | 9,066 | | | Goldman Sachs International | | | 07/02/2021 | | | | 228 | |
USD | | | 1,006 | | | AUD | | | 1,300 | | | Morgan Stanley & Co. | | | 07/02/2021 | | | | 31 | |
USD | | | 77,280 | | | AUD | | | 99,900 | | | UBS AG LONDON | | | 07/02/2021 | | | | 2,360 | |
USD | | | 11,254 | | | CAD | | | 13,563 | | | Citibank, NA | | | 07/02/2021 | | | | 312 | |
USD | | | 3,890 | | | CHF | | | 3,500 | | | Citibank, NA | | | 07/02/2021 | | | | 108 | |
USD | | | 28 | | | CHF | | | 25 | | | Citibank, NA | | | 07/02/2021 | | | | 1 | |
USD | | | 2,264 | | | CHF | | | 2,027 | | | HSBC Bank plc | | | 07/02/2021 | | | | 73 | |
USD | | | 5,347 | | | CHF | | | 4,810 | | | Morgan Stanley & Co. | | | 07/02/2021 | | | | 149 | |
USD | | | 433,816 | | | CNY | | | 2,765,620 | | | Brown Brothers Harriman & Co. | | | 07/02/2021 | | | | 5,797 | |
USD | | | 400,069 | | | CNY | | | 2,552,880 | | | Brown Brothers Harriman & Co. | | | 07/02/2021 | | | | 4,975 | |
USD | | | 4,251 | | | CNY | | | 27,100 | | | Brown Brothers Harriman & Co. | | | 07/02/2021 | | | | 57 | |
USD | | | 1,592 | | | CNY | | | 10,200 | | | Brown Brothers Harriman & Co. | | | 07/02/2021 | | | | 13 | |
USD | | | 3,741 | | | CZK | | | 78,280 | | | Citibank, NA | | | 07/02/2021 | | | | 101 | |
USD | | | 66 | | | DKK | | | 400 | | | Goldman Sachs International | | | 07/02/2021 | | | | 2 | |
USD | | | 4,838 | | | DKK | | | 29,513 | | | Goldman Sachs International | | | 07/02/2021 | | | | 132 | |
USD | | | 376 | | | DKK | | | 2,290 | | | UBS AG LONDON | | | 07/02/2021 | | | | 10 | |
USD | | | 1,417 | | | EUR | | | 1,157 | | | Bank of America, NA | | | 07/02/2021 | | | | 45 | |
USD | | | 700 | | | EUR | | | 588 | | | Bank of America, NA | | | 07/02/2021 | | | | 2 | |
USD | | | 3,815 | | | EUR | | | 3,200 | | | Bank of America, NA | | | 07/02/2021 | | | | 20 | |
USD | | | 467,849 | | | EUR | | | 383,535 | | | Bank of America, NA | | | 07/02/2021 | | | | 13,072 | |
USD | | | 25,063 | | | EUR | | | 20,546 | | | Bank of America, NA | | | 07/02/2021 | | | | 700 | |
USD | | | 509 | | | EUR | | | 427 | | | Bank of America, NA | | | 07/02/2021 | | | | 3 | |
USD | | | 449 | | | EUR | | | 375 | | | Bank of America, NA | | | 07/02/2021 | | | | 4 | |
USD | | | 24,274 | | | EUR | | | 19,842 | | | BNP Paribas | | | 07/02/2021 | | | | 746 | |
USD | | | 163,712 | | | EUR | | | 134,104 | | | Citibank, NA | | | 07/02/2021 | | | | 4,698 | |
USD | | | 41,588 | | | EUR | | | 33,974 | | | Citibank, NA | | | 07/02/2021 | | | | 1,303 | |
USD | | | 87,555 | | | EUR | | | 71,525 | | | Citibank, NA | | | 07/02/2021 | | | | 2,744 | |
USD | | | 163,229 | | | EUR | | | 133,705 | | | Morgan Stanley & Co. | | | 07/02/2021 | | | | 4,688 | |
USD | | | 87,740 | | | EUR | | | 71,525 | | | Morgan Stanley & Co. | | | 07/02/2021 | | | | 2,929 | |
USD | | | 48 | | | EUR | | | 40 | | | Morgan Stanley & Co. | | | 07/02/2021 | | | | 1 | |
USD | | | 41,676 | | | EUR | | | 33,974 | | | Morgan Stanley & Co. | | | 07/02/2021 | | | | 1,391 | |
USD | | | 227 | | | EUR | | | 190 | | | UBS AG LONDON | | | 07/02/2021 | | | | 2 | |
USD | | | 1,223 | | | EUR | | | 1,000 | | | UBS AG LONDON | | | 07/02/2021 | | | | 38 | |
USD | | | 128 | | | EUR | | | 107 | | | UBS AG LONDON | | | 07/02/2021 | | | | 1 | |
USD | | | 163,231 | | | EUR | | | 133,705 | | | Westpac Banking Corp. | | | 07/02/2021 | | | | 4,690 | |
USD | | | 23,978 | | | GBP | | | 16,933 | | | Bank of America, NA | | | 07/02/2021 | | | | 555 | |
USD | | | 30,678 | | | GBP | | | 21,664 | | | Bank of America, NA | | | 07/02/2021 | | | | 710 | |
GBP | | | 26,435 | | | USD | | | 36,546 | | | Bank of America, NA | | | 07/02/2021 | | | | 21 | |
USD | | | 192 | | | GBP | | | 138 | | | Bank of America, NA | | | 07/02/2021 | | | | 1 | |
USD | | | 1,391 | | | GBP | | | 1,000 | | | Bank of America, NA | | | 07/02/2021 | | | | 8 | |
USD | | | 37,685 | | | GBP | | | 26,567 | | | Citibank, NA | | | 07/02/2021 | | | | 934 | |
GBP | | | 26,435 | | | USD | | | 36,543 | | | Citibank, NA | | | 07/02/2021 | | | | 24 | |
USD | | | 1,425 | | | GBP | | | 1,006 | | | Morgan Stanley & Co. | | | 07/02/2021 | | | | 34 | |
USD | | | 91,382 | | | GBP | | | 64,502 | | | Morgan Stanley & Co. | | | 07/02/2021 | | | | 2,156 | |
USD | | | 433 | | | GBP | | | 310 | | | Morgan Stanley & Co. | | | 07/02/2021 | | | | 4 | |
USD | | | 4,330 | | | GBP | | | 3,071 | | | Morgan Stanley & Co. | | | 07/02/2021 | | | | 82 | |
USD | | | 37,576 | | | GBP | | | 26,490 | | | Morgan Stanley & Co. | | | 07/02/2021 | | | | 932 | |
USD | | | 321 | | | GBP | | | 229 | | | UBS AG LONDON | | | 07/02/2021 | | | | 4 | |
USD | | | 37,574 | | | GBP | | | 26,490 | | | Westpac Banking Corp. | | | 07/02/2021 | | | | 931 | |
USD | | | 511 | | | GBP | | | 362 | | | Westpac Banking Corp. | | | 07/02/2021 | | | | 10 | |
USD | | | 2,610 | | | HUF | | | 744,903 | | | Citibank, NA | | | 07/02/2021 | | | | 97 | |
IDR | | | 580,279,800 | | | USD | | | 39,882 | | | Brown Brothers Harriman & Co. | | | 07/02/2021 | | | | 138 | |
SEE NOTES TO FINANCIAL STATEMENTS.
| | | | | | | | | | |
| | | | | |
| JUNE 30, 2021 | | SIX CIRCLES TRUST | | | | | | | | 131 |
Six Circles Global Bond Fund
SCHEDULE OF PORTFOLIO INVESTMENTS
AS OF JUNE 30, 2021 (Unaudited) (continued)
(Amounts in U.S. Dollars, unless otherwise noted)
(Amounts in thousands, except number of Futures contracts)
| | | | | | | | | | | | | | | | | | | | |
| Forward foreign currency exchange contracts outstanding as of June 30, 2021: | |
| CURRENCY PURCHASED | | | CURRENCY SOLD | | | COUNTERPARTY | | SETTLEMENT
DATE | | | UNREALIZED
APPRECIATION
(DEPRECIATION)($) | |
USD | | | 40,504 | | | IDR | | | 580,279,800 | | | Brown Brothers Harriman & Co. | | | 07/02/2021 | | | | 485 | |
USD | | | 8,217 | | | JPY | | | 900,000 | | | Bank of America, NA | | | 07/02/2021 | | | | 116 | |
USD | | | 501,164 | | | JPY | | | 55,009,865 | | | BNP Paribas | | | 07/02/2021 | | | | 6,003 | |
USD | | | 501,649 | | | JPY | | | 55,018,120 | | | Citibank, NA | | | 07/02/2021 | | | | 6,414 | |
USD | | | 69,923 | | | JPY | | | 7,609,178 | | | Citibank, NA | | | 07/02/2021 | | | | 1,431 | |
USD | | | 501,722 | | | JPY | | | 55,018,115 | | | Deutsche Bank AG | | | 07/02/2021 | | | | 6,487 | |
USD | | | 233 | | | JPY | | | 25,884 | | | HSBC Bank plc | | | 07/02/2021 | | | | —(h) | |
USD | | | 20,106 | | | JPY | | | 2,200,000 | | | Standard Chartered Bank | | | 07/02/2021 | | | | 303 | |
USD | | | 31,119 | | | MYR | | | 128,900 | | | Deutsche Bank AG | | | 07/02/2021 | | | | 71 | |
MYR | | | 128,900 | | | USD | | | 31,042 | | | Standard Chartered Bank | | | 07/02/2021 | | | | 8 | |
USD | | | 255 | | | NOK | | | 2,131 | | | Bank of America, NA | | | 07/02/2021 | | | | 8 | |
USD | | | 2,342 | | | NOK | | | 19,632 | | | Goldman Sachs International | | | 07/02/2021 | | | | 62 | |
USD | | | 359 | | | NZD | | | 498 | | | Citibank, NA | | | 07/02/2021 | | | | 11 | |
USD | | | 18,134 | | | NZD | | | 25,000 | | | Citibank, NA | | | 07/02/2021 | | | | 660 | |
USD | | | 254 | | | PLN | | | 931 | | | Bank of America, NA | | | 07/02/2021 | | | | 10 | |
USD | | | 6,154 | | | PLN | | | 22,646 | | | Goldman Sachs International | | | 07/02/2021 | | | | 215 | |
USD | | | 510 | | | RON | | | 2,105 | | | Bank of America, NA | | | 07/02/2021 | | | | 3 | |
USD | | | 638 | | | RON | | | 2,590 | | | UBS AG LONDON | | | 07/02/2021 | | | | 14 | |
USD | | | 4,256 | | | SEK | | | 35,330 | | | Bank of America, NA | | | 07/02/2021 | | | | 128 | |
USD | | | 5,284 | | | SEK | | | 43,928 | | | Bank of America, NA | | | 07/02/2021 | | | | 151 | |
USD | | | 133 | | | SEK | | | 1,100 | | | Goldman Sachs International | | | 07/02/2021 | | | | 5 | |
USD | | | 954 | | | SEK | | | 7,936 | | | HSBC Bank plc | | | 07/02/2021 | | | | 27 | |
SGD | | | 29,800 | | | USD | | | 22,159 | | | BNP Paribas | | | 07/02/2021 | | | | 3 | |
USD | | | 22,079 | | | SGD | | | 29,200 | | | Citibank, NA | | | 07/02/2021 | | | | 364 | |
USD | | | 454 | | | SGD | | | 600 | | | Morgan Stanley & Co. | | | 07/02/2021 | | | | 8 | |
USD | | | 36,298 | | | THB | | | 1,135,900 | | | Bank of America, NA | | | 07/02/2021 | | | | 856 | |
THB | | | 1,135,900 | | | USD | | | 35,436 | | | Goldman Sachs International | | | 07/02/2021 | | | | 5 | |
HKD | | | 9,600 | | | USD | | | 1,236 | | | UBS AG LONDON | | | 07/06/2021 | | | | — | (h) |
USD | | | 1,237 | | | HKD | | | 9,600 | | | UBS AG LONDON | | | 07/06/2021 | | | | 1 | |
USD | | | 3,611 | | | IDR | | | 51,679,000 | | | Goldman Sachs International | | | 07/14/2021 | | | | 51 | |
USD | | | 138,756 | | | KRW | | | 154,120,800 | | | Bank of America, NA | | | 07/14/2021 | | | | 1,911 | |
USD | | | 3,672 | | | MYR | | | 15,130 | | | Goldman Sachs International | | | 07/14/2021 | | | | 30 | |
USD | | | 220 | | | CZK | | | 4,615 | | | Goldman Sachs International | | | 07/19/2021 | | | | 6 | |
USD | | | 776 | | | DKK | | | 4,831 | | | Bank of America, NA | | | 07/19/2021 | | | | 6 | |
USD | | | 175 | | | DKK | | | 1,090 | | | HSBC Bank plc | | | 07/19/2021 | | | | 1 | |
USD | | | 1,270 | | | EUR | | | 1,044 | | | Bank of America, NA | | | 07/19/2021 | | | | 32 | |
USD | | | 191 | | | GBP | | | 138 | | | Bank of America, NA | | | 07/19/2021 | | | | — | (h) |
USD | | | 471 | | | GBP | | | 339 | | | HSBC Bank plc | | | 07/19/2021 | | | | 2 | |
USD | | | 678 | | | PLN | | | 2,581 | | | Citibank, NA | | | 07/19/2021 | | | | 1 | |
USD | | | 424 | | | PLN | | | 1,606 | | | Morgan Stanley & Co. | | | 07/19/2021 | | | | 2 | |
USD | | | 245 | | | RON | | | 1,017 | | | Goldman Sachs International | | | 07/19/2021 | | | | 1 | |
USD | | | 155 | | | RON | | | 643 | | | Goldman Sachs International | | | 07/19/2021 | | | | 1 | |
USD | | | 216 | | | AUD | | | 280 | | | Bank of America, NA | | | 07/20/2021 | | | | 6 | |
USD | | | 231 | | | AUD | | | 298 | | | Goldman Sachs International | | | 07/20/2021 | | | | 7 | |
USD | | | 6,873 | | | AUD | | | 9,066 | | | Bank of America, NA | | | 08/03/2021 | | | | 72 | |
USD | | | 11,033 | | | CAD | | | 13,563 | | | Barclays Bank plc | | | 08/03/2021 | | | | 92 | |
USD | | | 2,210 | | | CHF | | | 2,027 | | | Bank of America, NA | | | 08/03/2021 | | | | 17 | |
USD | | | 5,219 | | | CHF | | | 4,810 | | | Goldman Sachs International | | | 08/03/2021 | | | | 16 | |
USD | | | 3,825 | | | CHF | | | 3,525 | | | Goldman Sachs International | | | 08/03/2021 | | | | 12 | |
USD | | | 162 | | | CHF | | | 150 | | | UBS AG LONDON | | | 08/03/2021 | | | | — | (h) |
USD | | | 830,791 | | | CNY | | | 5,375,800 | | | Brown Brothers Harriman & Co. | | | 08/03/2021 | | | | 656 | |
USD | | | 30,891 | | | CNY | | | 200,000 | | | Brown Brothers Harriman & Co. | | | 08/03/2021 | | | | 7 | |
USD | | | 3,652 | | | CZK | | | 78,280 | | | UBS AG LONDON | | | 08/03/2021 | | | | 13 | |
USD | | | 431 | | | DKK | | | 2,690 | | | Bank of America, NA | | | 08/03/2021 | | | | 1 | |
SEE NOTES TO FINANCIAL STATEMENTS.
| | | | | | | | | | |
| | | | | |
| 132 | | | | | | | | SIX CIRCLES TRUST | | JUNE 30, 2021 |
| | | | | | | | | | | | | | | | | | | | |
| Forward foreign currency exchange contracts outstanding as of June 30, 2021: | |
| CURRENCY PURCHASED | | | CURRENCY SOLD | | | COUNTERPARTY | | SETTLEMENT
DATE | | | UNREALIZED
APPRECIATION
(DEPRECIATION)($) | |
USD | | | 4,724 | | | DKK | | | 29,513 | | | Bank of America, NA | | | 08/03/2021 | | | | 15 | |
USD | | | 157,452 | | | EUR | | | 132,540 | | | Bank of America, NA | | | 08/03/2021 | | | | 186 | |
USD | | | 13,134 | | | EUR | | | 11,068 | | | Bank of America, NA | | | 08/03/2021 | | | | 1 | |
USD | | | 23,546 | | | EUR | | | 19,842 | | | BNP Paribas | | | 08/03/2021 | | | | 2 | |
USD | | | 157,465 | | | EUR | | | 132,540 | | | Citibank, NA | | | 08/03/2021 | | | | 199 | |
USD | | | 85,993 | | | EUR | | | 72,104 | | | Citibank, NA | | | 08/03/2021 | | | | 438 | |
USD | | | 40,518 | | | EUR | | | 33,974 | | | Citibank, NA | | | 08/03/2021 | | | | 206 | |
USD | | | 501 | | | EUR | | | 422 | | | Goldman Sachs International | | | 08/03/2021 | | | | — | (h) |
USD | | | 460,344 | | | EUR | | | 386,735 | | | Goldman Sachs International | | | 08/03/2021 | | | | 1,463 | |
USD | | | 158,038 | | | EUR | | | 132,933 | | | Morgan Stanley & Co. | | | 08/03/2021 | | | | 305 | |
USD | | | 40,602 | | | EUR | | | 33,974 | | | Morgan Stanley & Co. | | | 08/03/2021 | | | | 290 | |
USD | | | 1,014 | | | EUR | | | 849 | | | Morgan Stanley & Co. | | | 08/03/2021 | | | | 6 | |
USD | | | 86,171 | | | EUR | | | 72,104 | | | Morgan Stanley & Co. | | | 08/03/2021 | | | | 616 | |
USD | | | 1,424 | | | EUR | | | 1,200 | | | Morgan Stanley & Co. | | | 08/03/2021 | | | | — | (h) |
USD | | | 600 | | | EUR | | | 506 | | | Morgan Stanley & Co. | | | 08/03/2021 | | | | — | (h) |
USD | | | 487 | | | EUR | | | 410 | | | UBS AG LONDON | | | 08/03/2021 | | | | — | (h) |
USD | | | 12,460 | | | EUR | | | 10,500 | | | UBS AG LONDON | | | 08/03/2021 | | | | 1 | |
USD | | | 24,552 | | | EUR | | | 20,626 | | | Westpac Banking Corp. | | | 08/03/2021 | | | | 78 | |
USD | | | 34,422 | | | GBP | | | 24,735 | | | Morgan Stanley & Co. | | | 08/03/2021 | | | | 203 | |
USD | | | 23,492 | | | GBP | | | 16,881 | | | Morgan Stanley & Co. | | | 08/03/2021 | | | | 138 | |
USD | | | 36,712 | | | GBP | | | 26,516 | | | Morgan Stanley & Co. | | | 08/03/2021 | | | | 29 | |
USD | | | 1,392 | | | GBP | | | 1,006 | | | Morgan Stanley & Co. | | | 08/03/2021 | | | | 1 | |
USD | | | 90,666 | | | GBP | | | 65,502 | | | Morgan Stanley & Co. | | | 08/03/2021 | | | | 48 | |
USD | | | 127 | | | HUF | | | 37,733 | | | Bank of America, NA | | | 08/03/2021 | | | | — | (h) |
USD | | | 2,519 | | | HUF | | | 744,903 | | | Bank of America, NA | | | 08/03/2021 | | | | 6 | |
USD | | | 233 | | | JPY | | | 25,884 | | | Bank of America, NA | | | 08/03/2021 | | | | — | (h) |
USD | | | 68,737 | | | JPY | | | 7,609,178 | | | Citibank, NA | | | 08/03/2021 | | | | 226 | |
USD | | | 507,456 | | | JPY | | | 56,051,505 | | | Deutsche Bank AG | | | 08/03/2021 | | | | 2,782 | |
USD | | | 507,403 | | | JPY | | | 56,043,095 | | | Goldman Sachs International | | | 08/03/2021 | | | | 2,805 | |
USD | | | 507,481 | | | JPY | | | 56,051,500 | | | Standard Chartered Bank | | | 08/03/2021 | | | | 2,807 | |
USD | | | 1,540 | | | MYR | | | 6,400 | | | Standard Chartered Bank | | | 08/03/2021 | | | | 1 | |
USD | | | 250 | | | NOK | | | 2,131 | | | Bank of America, NA | | | 08/03/2021 | | | | 3 | |
USD | | | 127 | | | NOK | | | 1,094 | | | Bank of America, NA | | | 08/03/2021 | | | | — | (h) |
USD | | | 2,292 | | | NOK | | | 19,632 | | | Citibank, NA | | | 08/03/2021 | | | | 12 | |
USD | | | 179 | | | NOK | | | 1,532 | | | Morgan Stanley & Co. | | | 08/03/2021 | | | | 1 | |
USD | | | 17,491 | | | NZD | | | 25,000 | | | Bank of America, NA | | | 08/03/2021 | | | | 18 | |
USD | | | 446 | | | NZD | | | 637 | | | Goldman Sachs International | | | 08/03/2021 | | | | — | (h) |
USD | | | 352 | | | NZD | | | 498 | | | HSBC Bank plc | | | 08/03/2021 | | | | 3 | |
USD | | | 127 | | | PLN | | | 485 | | | Bank of America, NA | | | 08/03/2021 | | | | — | (h) |
USD | | | 6,213 | | | PLN | | | 23,577 | | | Goldman Sachs International | | | 08/03/2021 | | | | 29 | |
USD | | | 1,132 | | | RON | | | 4,695 | | | Bank of America, NA | | | 08/03/2021 | | | | 4 | |
USD | | | 1,146 | | | RON | | | 4,765 | | | Bank of America, NA | | | 08/03/2021 | | | | 1 | |
USD | | | 938 | | | SEK | | | 7,936 | | | Bank of America, NA | | | 08/03/2021 | | | | 10 | |
USD | | | 5,161 | | | SEK | | | 43,928 | | | Goldman Sachs International | | | 08/03/2021 | | | | 27 | |
USD | | | 4,280 | | | SEK | | | 36,430 | | | Goldman Sachs International | | | 08/03/2021 | | | | 22 | |
USD | | | 4 | | | SEK | | | 30 | | | Morgan Stanley & Co. | | | 08/03/2021 | | | | — | (h) |
USD | | | 177 | | | SEK | | | 1,510 | | | UBS AG LONDON | | | 08/03/2021 | | | | — | (h) |
USD | | | 4,516 | | | AUD | | | 6,000 | | | Bank of America, NA | | | 08/04/2021 | | | | 15 | |
USD | | | 76,793 | | | AUD | | | 102,050 | | | Bank of America, NA | | | 08/04/2021 | | | | 248 | |
USD | | | 76,579 | | | AUD | | | 102,050 | | | Citibank, NA | | | 08/04/2021 | | | | 34 | |
USD | | | 412 | | | CNH | | | 2,639 | | | Goldman Sachs International | | | 08/18/2021 | | | | 6 | |
USD | | | 32,874 | | | CNH | | | 212,380 | | | HSBC Bank plc | | | 08/18/2021 | | | | 151 | |
USD | | | 1,383 | | | CNH | | | 8,965 | | | HSBC Bank plc | | | 08/18/2021 | | | | 2 | |
USD | | | 625 | | | CNY | | | 4,045 | | | Citibank, NA | | | 08/18/2021 | | | | 1 | |
SEE NOTES TO FINANCIAL STATEMENTS.
| | | | | | | | | | |
| | | | | |
| JUNE 30, 2021 | | SIX CIRCLES TRUST | | | | | | | | 133 |
Six Circles Global Bond Fund
SCHEDULE OF PORTFOLIO INVESTMENTS
AS OF JUNE 30, 2021 (Unaudited) (continued)
(Amounts in U.S. Dollars, unless otherwise noted)
(Amounts in thousands, except number of Futures contracts)
| | | | | | | | | | | | | | | | | | | | | | |
| Forward foreign currency exchange contracts outstanding as of June 30, 2021: | |
| CURRENCY PURCHASED | | | CURRENCY SOLD | | | COUNTERPARTY | | SETTLEMENT
DATE | | | UNREALIZED
APPRECIATION
(DEPRECIATION)($) | |
USD | | | 3,434 | | | | IDR | | | | 49,417,649 | | | Citibank, NA | | | 09/15/2021 | | | | 47 | |
USD | | | 1,154 | | | | MXN | | | | 22,914 | | | Citibank, NA | | | 09/15/2021 | | | | 16 | |
USD | | | 487 | | | | MXN | | | | 9,719 | | | Goldman Sachs International | | | 09/15/2021 | | | | 4 | |
USD | | | 1,018 | | | | MYR | | | | 4,196 | | | Morgan Stanley & Co. | | | 09/15/2021 | | | | 11 | |
USD | | | 157 | | | | PEN | | | | 592 | | | Goldman Sachs International | | | 09/15/2021 | | | | 2 | |
USD | | | 63 | | | | RUB | | | | 4,663 | | | Citibank, NA | | | 09/15/2021 | | | | — | (h) |
USD | | | 495 | | | | RUB | | | | 36,139 | | | Citibank, NA | | | 09/15/2021 | | | | 7 | |
USD | | | 256 | | | | RUB | | | | 18,855 | | | Goldman Sachs International | | | 09/15/2021 | | | | 1 | |
USD | | | 5,802 | | | | RUB | | | | 424,951 | | | Morgan Stanley & Co. | | | 09/15/2021 | | | | 60 | |
USD | | | 894 | | | | SGD | | | | 1,185 | | | Barclays Bank plc | | | 09/15/2021 | | | | 13 | |
USD | | | 1,220 | | | | THB | | | | 38,077 | | | HSBC Bank plc | | | 09/15/2021 | | | | 32 | |
USD | | | 529 | | | | ILS | | | | 1,717 | | | Citibank, NA | | | 09/17/2021 | | | | 2 | |
USD | | | 366 | | | | ILS | | | | 1,190 | | | Morgan Stanley & Co. | | | 09/17/2021 | | | | 1 | |
USD | | | 2,243 | | | | DKK | | | | 13,942 | | | Morgan Stanley & Co. | | | 10/01/2021 | | | | 16 | |
USD | | | 4,376 | | | | DKK | | | | 27,315 | | | Morgan Stanley & Co. | | | 10/01/2021 | | | | 13 | |
| | | | | | | | | | | | | | | | | | | | | | |
Total unrealized appreciation | | | | | | | 100,925 | |
| | | | | | | | | | | | | | | | | | | | | | |
USD | | | 2,556 | | | | DKK | | | | 16,062 | | | Bank of America, NA | | | 07/01/2021 | | | | (5) | |
USD | | | 4,181 | | | | DKK | | | | 26,338 | | | BNP Paribas | | | 07/01/2021 | | | | (19) | |
DKK | | | 13,942 | | | | USD | | | | 2,239 | | | Morgan Stanley & Co. | | | 07/01/2021 | | | | (16) | |
PLN | | | 1,606 | | | | USD | | | | 424 | | | Morgan Stanley & Co. | | | 07/01/2021 | | | | (2) | |
RON | | | 643 | | | | USD | | | | 155 | | | Goldman Sachs International | | | 07/01/2021 | | | | (1) | |
AUD | | | 102,050 | | | | USD | | | | 76,782 | | | Bank of America, NA | | | 07/02/2021 | | | | (250) | |
AUD | | | 9,066 | | | | USD | | | | 6,872 | | | Bank of America, NA | | | 07/02/2021 | | | | (72) | |
AUD | | | 102,050 | | | | USD | | | | 76,568 | | | Citibank, NA | | | 07/02/2021 | | | | (36) | |
CAD | | | 13,563 | | | | USD | | | | 11,033 | | | Barclays Bank plc | | | 07/02/2021 | | | | (92) | |
CAD | | | 919 | | | | USD | | | | 762 | | | Morgan Stanley & Co. | | | 07/02/2021 | | | | (20) | |
CHF | | | 2,027 | | | | USD | | | | 2,208 | | | Bank of America, NA | | | 07/02/2021 | | | | (17) | |
CHF | | | 3,525 | | | | USD | | | | 3,822 | | | Goldman Sachs International | | | 07/02/2021 | | | | (12) | |
CHF | | | 4,810 | | | | USD | | | | 5,214 | | | Goldman Sachs International | | | 07/02/2021 | | | | (16) | |
CNY | | | 5,375,800 | | | | USD | | | | 832,683 | | | Brown Brothers Harriman & Co. | | | 07/02/2021 | | | | (702) | |
USD | | | 3,088 | | | | CNY | | | | 20,000 | | | Brown Brothers Harriman & Co. | | | 07/02/2021 | | | | (8) | |
CZK | | | 78,280 | | | | USD | | | | 3,652 | | | UBS AG LONDON | | | 07/02/2021 | | | | (14) | |
DKK | | | 29,513 | | | | USD | | | | 4,721 | | | Bank of America, NA | | | 07/02/2021 | | | | (15) | |
DKK | | | 2,690 | | | | USD | | | | 430 | | | Bank of America, NA | | | 07/02/2021 | | | | (1) | |
EUR | | | 3,945 | | | | USD | | | | 4,826 | | | Bank of America, NA | | | 07/02/2021 | | | | (148) | |
EUR | | | 132,540 | | | | USD | | | | 157,351 | | | Bank of America, NA | | | 07/02/2021 | | | | (192) | |
EUR | | | 72,104 | | | | USD | | | | 85,939 | | | Citibank, NA | | | 07/02/2021 | | | | (442) | |
EUR | | | 132,540 | | | | USD | | | | 157,362 | | | Citibank, NA | | | 07/02/2021 | | | | (203) | |
EUR | | | 33,974 | | | | USD | | | | 40,493 | | | Citibank, NA | | | 07/02/2021 | | | | (208) | |
EUR | | | 386,735 | | | | USD | | | | 460,048 | | | Goldman Sachs International | | | 07/02/2021 | | | | (1,477) | |
EUR | | | 72,104 | | | | USD | | | | 86,115 | | | Morgan Stanley & Co. | | | 07/02/2021 | | | | (618) | |
EUR | | | 465 | | | | USD | | | | 569 | | | Morgan Stanley & Co. | | | 07/02/2021 | | | | (17) | |
EUR | | | 150 | | | | USD | | | | 183 | | | Morgan Stanley & Co. | | | 07/02/2021 | | | | (5) | |
EUR | | | 132,933 | | | | USD | | | | 157,935 | | | Morgan Stanley & Co. | | | 07/02/2021 | | | | (310) | |
EUR | | | 33,974 | | | | USD | | | | 40,576 | | | Morgan Stanley & Co. | | | 07/02/2021 | | | | (291) | |
EUR | | | 1,000 | | | | USD | | | | 1,223 | | | Morgan Stanley & Co. | | | 07/02/2021 | | | | (38) | |
EUR | | | 574 | | | | USD | | | | 700 | | | UBS AG LONDON | | | 07/02/2021 | | | | (20) | |
EUR | | | 20,626 | | | | USD | | | | 24,536 | | | Westpac Banking Corp. | | | 07/02/2021 | | | | (79) | |
GBP | | | 223 | | | | USD | | | | 317 | | | Bank of America, NA | | | 07/02/2021 | | | | (8) | |
GBP | | | 362 | | | | USD | | | | 513 | | | Barclays Bank plc | | | 07/02/2021 | | | | (13) | |
GBP | | | 667 | | | | USD | | | | 947 | | | Morgan Stanley & Co. | | | 07/02/2021 | | | | (23) | |
GBP | | | 26,516 | | | | USD | | | | 36,709 | | | Morgan Stanley & Co. | | | 07/02/2021 | | | | (29) | |
GBP | | | 1,006 | | | | USD | | | | 1,392 | | | Morgan Stanley & Co. | | | 07/02/2021 | | | | (1) | |
SEE NOTES TO FINANCIAL STATEMENTS.
| | | | | | | | | | |
| | | | | |
| 134 | | | | | | | | SIX CIRCLES TRUST | | JUNE 30, 2021 |
| | | | | | | | | | | | | | | | | | | | | | |
| Forward foreign currency exchange contracts outstanding as of June 30, 2021: | |
| CURRENCY PURCHASED | | | CURRENCY SOLD | | | COUNTERPARTY | | SETTLEMENT
DATE | | | UNREALIZED
APPRECIATION
(DEPRECIATION)($) | |
GBP | | | 65,502 | | | | USD | | | | 90,658 | | | Morgan Stanley & Co. | | | 07/02/2021 | | | | (49) | |
GBP | | | 16,881 | | | | USD | | | | 23,491 | | | Morgan Stanley & Co. | | | 07/02/2021 | | | | (139) | |
GBP | | | 24,735 | | | | USD | | | | 34,420 | | | Morgan Stanley & Co. | | | 07/02/2021 | | | | (204) | |
HUF | | | 744,903 | | | | USD | | | | 2,520 | | | Bank of America, NA | | | 07/02/2021 | | | | (6) | |
JPY | | | 7,609,178 | | | | USD | | | | 68,718 | | | Citibank, NA | | | 07/02/2021 | | | | (226) | |
JPY | | | 56,051,505 | | | | USD | | | | 507,322 | | | Deutsche Bank AG | | | 07/02/2021 | | | | (2,786) | |
JPY | | | 56,043,095 | | | | USD | | | | 507,269 | | | Goldman Sachs International | | | 07/02/2021 | | | | (2,808) | |
JPY | | | 56,051,500 | | | | USD | | | | 507,345 | | | Standard Chartered Bank | | | 07/02/2021 | | | | (2,809) | |
NOK | | | 2,131 | | | | USD | | | | 250 | | | Bank of America, NA | | | 07/02/2021 | | | | (3) | |
NOK | | | 19,632 | | | | USD | | | | 2,292 | | | Citibank, NA | | | 07/02/2021 | | | | (12) | |
NZD | | | 25,000 | | | | USD | | | | 17,493 | | | Bank of America, NA | | | 07/02/2021 | | | | (17) | |
NZD | | | 498 | | | | USD | | | | 352 | | | HSBC Bank plc | | | 07/02/2021 | | | | (3) | |
PLN | | | 23,577 | | | | USD | | | | 6,212 | | | Goldman Sachs International | | | 07/02/2021 | | | | (29) | |
RON | | | 4,695 | | | | USD | | | | 1,133 | | | Bank of America, NA | | | 07/02/2021 | | | | (4) | |
SEK | | | 7,936 | | | | USD | | | | 937 | | | Bank of America, NA | | | 07/02/2021 | | | | (10) | |
SEK | | | 43,928 | | | | USD | | | | 5,160 | | | Goldman Sachs International | | | 07/02/2021 | | | | (27) | |
SEK | | | 36,430 | | | | USD | | | | 4,279 | | | Goldman Sachs International | | | 07/02/2021 | | | | (22) | |
USD | | | 799 | | | | KRW | | | | 900,000 | | | Bank of America, NA | | | 07/14/2021 | | | | — | (h) |
USD | | | 484 | | | | CZK | | | | 10,510 | | | HSBC Bank plc | | | 07/19/2021 | | | | (4) | |
EUR | | | 689 | | | | USD | | | | 830 | | | Goldman Sachs International | | | 07/19/2021 | | | | (14) | |
USD | | | 265 | | | | GBP | | | | 192 | | | Goldman Sachs International | | | 07/19/2021 | | | | — | (h) |
USD | | | 440 | | | | HUF | | | | 133,297 | | | Barclays Bank plc | | | 07/19/2021 | | | | (9) | |
USD | | | 1,505 | | | | CAD | | | | 1,866 | | | Citibank, NA | | | 08/03/2021 | | | | (1) | |
EUR | | | 588 | | | | USD | | | | 700 | | | Bank of America, NA | | | 08/03/2021 | | | | (2) | |
USD | | | 36,549 | | | | GBP | | | | 26,435 | | | Bank of America, NA | | | 08/03/2021 | | | | (22) | |
USD | | | 2,810 | | | | GBP | | | | 2,034 | | | Bank of America, NA | | | 08/03/2021 | | | | (4) | |
USD | | | 36,546 | | | | GBP | | | | 26,435 | | | Citibank, NA | | | 08/03/2021 | | | | (24) | |
USD | | | 703 | | | | GBP | | | | 509 | | | Goldman Sachs International | | | 08/03/2021 | | | | (1) | |
USD | | | 402 | | | | GBP | | | | 291 | | | Morgan Stanley & Co. | | | 08/03/2021 | | | | (1) | |
USD | | | 691 | | | | GBP | | | | 500 | | | Morgan Stanley & Co. | | | 08/03/2021 | | | | (1) | |
USD | | | 14 | | | | GBP | | | | 10 | | | Morgan Stanley & Co. | | | 08/03/2021 | | | | — | (h) |
USD | | | 1,382 | | | | GBP | | | | 1,000 | | | UBS AG LONDON | | | 08/03/2021 | | | | (2) | |
USD | | | 55 | | | | GBP | | | | 40 | | | UBS AG LONDON | | | 08/03/2021 | | | | — | (h) |
USD | | | 1,236 | | | | HKD | | | | 9,600 | | | UBS AG LONDON | | | 08/03/2021 | | | | — | (h) |
USD | | | 2,182 | | | | IDR | | | | 31,800,000 | | | Brown Brothers Harriman & Co. | | | 08/03/2021 | | | | (5) | |
USD | | | 39,775 | | | | IDR | | | | 580,279,800 | | | Brown Brothers Harriman & Co. | | | 08/03/2021 | | | | (141) | |
USD | | | 31,000 | | | | MYR | | | | 128,900 | | | Standard Chartered Bank | | | 08/03/2021 | | | | (5) | |
SEK | | | 4,905 | | | | USD | | | | 574 | | | Bank of America, NA | | | 08/03/2021 | | | | — | (h) |
USD | | | 743 | | | | SGD | | | | 1,000 | | | BNP Paribas | | | 08/03/2021 | | | | — | (h) |
USD | | | 22,157 | | | | SGD | | | | 29,800 | | | BNP Paribas | | | 08/03/2021 | | | | (4) | |
USD | | | 623 | | | | THB | | | | 20,000 | | | BNP Paribas | | | 08/03/2021 | | | | (1) | |
USD | | | 35,370 | | | | THB | | | | 1,135,900 | | | Goldman Sachs International | | | 08/03/2021 | | | | (68) | |
USD | | | 280 | | | | THB | | | | 9,000 | | | Goldman Sachs International | | | 08/03/2021 | | | | (1) | |
USD | | | 332 | | | | CNH | | | | 2,154 | | | Goldman Sachs International | | | 08/18/2021 | | | | — | (h) |
KRW | | | 346,425 | | | | USD | | | | 311 | | | Citibank, NA | | | 09/15/2021 | | | | (3) | |
USD | | | 710 | | | | MYR | | | | 2,959 | | | Morgan Stanley & Co. | | | 09/15/2021 | | | | — | (h) |
USD | | | 157 | | | | PEN | | | | 613 | | | Morgan Stanley & Co. | | | 09/15/2021 | | | | (3) | |
USD | | | 497 | | | | RUB | | | | 36,948 | | | Morgan Stanley & Co. | | | 09/15/2021 | | | | (2) | |
USD | | | 167 | | | | SGD | | | | 225 | | | Bank of America, NA | | | 09/15/2021 | | | | — | (h) |
USD | | | 535 | | | | THB | | | | 17,208 | | | Morgan Stanley & Co. | | | 09/15/2021 | | | | (2) | |
| | | | | | | | | | | | | | | | | | | | | | |
Total unrealized depreciation | | | | | | | (14,894) | |
| | | | | | | | | | | | | | | | | | | | | | |
Net unrealized appreciation (depreciation) | | | | | | | 86,031 | |
| | | | | | | | | | | | | | | | | | | | | | |
SEE NOTES TO FINANCIAL STATEMENTS.
| | | | | | | | | | |
| | | | | |
| JUNE 30, 2021 | | SIX CIRCLES TRUST | | | | | | | | 135 |
Six Circles Global Bond Fund
SCHEDULE OF PORTFOLIO INVESTMENTS
AS OF JUNE 30, 2021 (Unaudited) (continued)
(Amounts in U.S. Dollars, unless otherwise noted)
(Amounts in thousands, except number of Futures contracts)
| | | | | | | | | | | | | | | | | | | | | | | | | | | | | | | | | | | | |
| OTC Interest Rate Swap contracts outstanding as of June 30, 2021: | | | | | | | |
FLOATING RATE
INDEX (a) | | FIXED RATE | | | PAY/RECEIVE
FLOATING RATE | | | COUNTERPARTY | | | MATURITY DATE | | | NOTIONAL
AMOUNT | | | UPFRONT
PAYMENTS
(RECEIPTS)($) | | | UNREALIZED
APPRECIATION
(DEPRECIATION)($) | | | VALUE($) | |
Bank Negara Malaysia KLIBOR Interbank Offered Rate Fixing 3 Month | | | 2.44 | % quarterly | | | Pay | | | | Morgan Stanley | | �� | | 11/17/2030 | | | | MYR | | | | 5,000 | | | | (— | )(h) | | | (61 | ) | | | (61 | ) |
| | | | | | | | | | | | | | | | | | | | | | | | | | | | | | | | | | | | |
| | | | | | | | | | | | | | | | | | | | | | | | | | | (— | )(h) | | | (61 | ) | | | (61 | ) |
| | | | | | | | | | | | | | | | | | | | | | | | | | | | | | | | | | | | |
| | | | | | | | | | | | | | | | | | | | | | | | | | | | | | | | |
| Centrally Cleared Interest Rate Swap contracts outstanding as of June 30, 2021: | |
| FLOATING RATE INDEX (a) | | FIXED RATE | | | PAY/RECEIVE
FLOATING RATE | | | MATURITY
DATE | | | NOTIONAL AMOUNT | | | UPFRONT
PAYMENTS
(RECEIPTS)($) | | | UNREALIZED
APPRECIATION
(DEPRECIATION)($) | | | VALUE($) | |
Bank of Thailand BIBOR Fixings 6 Month | | | 1.15% semi-annually | | | | Pay | | | | 11/19/2030 | | | | THB | | | | 31,000 | | | | — | (h) | | | (34 | ) | | | (34 | ) |
BBSW ASX Australian 6 Month | | | 2.50% semi-annually | | | | Pay | | | | 12/03/2025 | | | | AUD | | | | 3,390 | | | | 269 | | | | (76 | ) | | | 193 | |
BBSW ASX Australian 6 Month | | | 2.75% semi-annually | | | | Pay | | | | 12/03/2030 | | | | AUD | | | | 1,035 | | | | 144 | | | | (57 | ) | | | 87 | |
Canada Bankers Acceptances 3 Month | | | 2.45% semi-annually | | | | Pay | | | | 12/03/2022 | | | | CAD | | | | 4,125 | | | | 136 | | | | (44 | ) | | | 92 | |
Canada Bankers Acceptances 3 Month | | | 2.50% semi-annually | | | | Pay | | | | 12/03/2025 | | | | CAD | | | | 8,915 | | | | 563 | | | | (198 | ) | | | 365 | |
Canada Bankers Acceptances 3 Month | | | 2.65% semi-annually | | | | Pay | | | | 12/03/2030 | | | | CAD | | | | 4,555 | | | | 434 | | | | (151 | ) | | | 283 | |
Canada Bankers Acceptances 3 Month | | | 2.80% semi-annually | | | | Pay | | | | 12/03/2040 | | | | CAD | | | | 1,585 | | | | 308 | | | | (175 | ) | | | 133 | |
Canada Bankers Acceptances 3 Month | | | 2.80% semi-annually | | | | Pay | | | | 12/03/2049 | | | | CAD | | | | 1,245 | | | | 322 | | | | (191 | ) | | | 131 | |
CFETS China Fixing Repo Rates 7 Day | | | 2.81% quarterly | | | | Pay | | | | 04/12/2026 | | | | CNY | | | | 3,590 | | | | — | (h) | | | 2 | | | | 2 | |
Colombia IBR Overnight Nominal Interbank Reference Rate | | | 4.44% quarterly | | | | Pay | | | | 09/10/2030 | | | | COP | | | | 2,257,000 | | | | — | (h) | | | (56 | ) | | | (56 | ) |
ICE LIBOR JPY 6 Month | | | (0.05%) semi-annually | | | | Pay | | | | 11/12/2022 | | | | JPY | | | | 9,220,978 | | | | 1 | | | | (14 | ) | | | (13 | ) |
ICE LIBOR JPY 6 Month | | | (0.06%) semi-annually | | | | Pay | | | | 02/16/2023 | | | | JPY | | | | 1,438,763 | | | | — | (h) | | | (4 | ) | | | (4 | ) |
ICE LIBOR JPY 6 Month | | | (0.03%) semi-annually | | | | Pay | | | | 04/13/2023 | | | | JPY | | | | 400,000 | | | | — | (h) | | | — | (h) | | | — | (h) |
ICE LIBOR JPY 6 Month | | | (0.04%) semi-annually | | | | Pay | | | | 03/17/2024 | | | | JPY | | | | 14,868,300 | | | | 1 | | | | (74 | ) | | | (73 | ) |
ICE LIBOR JPY 6 Month | | | (0.04%) semi-annually | | | | Pay | | | | 04/26/2024 | | | | JPY | | | | 886,010 | | | | — | (h) | | | (2 | ) | | | (2 | ) |
ICE LIBOR JPY 6 Month | | | (0.02%) semi-annually | | | | Pay | | | | 05/20/2024 | | | | JPY | | | | 1,452,100 | | | | — | (h) | | | — | (h) | | | — | (h) |
ICE LIBOR JPY 6 Month | | | (0.03%) semi-annually | | | | Pay | | | | 11/12/2025 | | | | JPY | | | | 2,490,466 | | | | — | (h) | | | (18 | ) | | | (18 | ) |
ICE LIBOR JPY 6 Month | | | (0.05%) semi-annually | | | | Pay | | | | 11/17/2025 | | | | JPY | | | | 873,680 | | | | — | (h) | | | (11 | ) | | | (11 | ) |
ICE LIBOR JPY 6 Month | | | (0.04%) semi-annually | | | | Pay | | | | 12/02/2025 | | | | JPY | | | | 1,479,353 | | | | — | (h) | | | (14 | ) | | | (14 | ) |
ICE LIBOR JPY 6 Month | | | 0.10% semi-annually | | | | Pay | | | | 12/03/2025 | | | | JPY | | | | 140,000 | | | | 9 | | | | (2 | ) | | | 7 | |
ICE LIBOR JPY 6 Month | | | (0.03%) semi-annually | | | | Pay | | | | 03/17/2026 | | | | JPY | | | | 1,900,000 | | | | — | (h) | | | (12 | ) | | | (12 | ) |
ICE LIBOR JPY 6 Month | | | 0.30% semi-annually | | | | Pay | | | | 12/03/2030 | | | | JPY | | | | 143,500 | | | | 35 | | | | (7 | ) | | | 28 | |
ICE LIBOR JPY 6 Month | | | 0.14% semi-annually | | | | Pay | | | | 04/06/2031 | | | | JPY | | | | 100,000 | | | | — | (h) | | | 5 | | | | 5 | |
ICE LIBOR JPY 6 Month | | | 0.43% semi-annually | | | | Pay | | | | 04/13/2041 | | | | JPY | | | | 40,000 | | | | — | (h) | | | 8 | | | | 8 | |
ICE LIBOR USD 3 Month | | | 0.25% semi-annually | | | | Receive | | | | 06/16/2023 | | | | USD | | | | 76,100 | | | | 64 | | | | 20 | | | | 84 | |
ICE LIBOR USD 3 Month | | | 0.25% semi-annually | | | | Receive | | | | 06/16/2024 | | | | USD | | | | 41,220 | | | | 311 | | | | 43 | | | | 354 | |
ICE LIBOR USD 3 Month | | | 0.50% semi-annually | | | | Pay | | | | 06/16/2028 | | | | USD | | | | 2,300 | | | | (118 | ) | | | 11 | | | | (107 | ) |
ICE LIBOR USD 3 Month | | | 1.50% semi-annually | | | | Pay | | | | 12/15/2028 | | | | USD | | | | 13,900 | | | | 120 | | | | 57 | | | | 177 | |
ICE LIBOR USD 3 Month | | | 1.50% semi-annually | | | | Receive | | | | 12/15/2028 | | | | USD | | | | 3,300 | | | | (40 | ) | | | (2 | ) | | | (42 | ) |
ICE LIBOR USD 3 Month | | | 1.00% semi-annually | | | | Receive | | | | 12/16/2030 | | | | USD | | | | 2,020 | | | | (10 | ) | | | (60 | ) | | | (70 | ) |
ICE LIBOR USD 3 Month | | | 0.75% semi-annually | | | | Pay | | | | 03/17/2031 | | | | USD | | | | 400 | | | | (9 | ) | | | (14 | ) | | | (23 | ) |
SEE NOTES TO FINANCIAL STATEMENTS.
| | | | | | | | | | |
| | | | | |
| 136 | | | | | | | | SIX CIRCLES TRUST | | JUNE 30, 2021 |
| | | | | | | | | | | | | | | | | | | | | | | | | | | | | | | | |
| Centrally Cleared Interest Rate Swap contracts outstanding as of June 30, 2021: | |
| FLOATING RATE INDEX (a) | | FIXED RATE | | | PAY/RECEIVE
FLOATING RATE | | | MATURITY
DATE | | | NOTIONAL AMOUNT | | | UPFRONT
PAYMENTS
(RECEIPTS)($) | | | UNREALIZED
APPRECIATION
(DEPRECIATION)($) | | | VALUE($) | |
ICE LIBOR USD 3 Month | | | 0.75% semi-annually | | | | Pay | | | | 06/16/2031 | | | | USD | | | | 34,300 | | | | (2,792 | ) | | | 631 | | | | (2,161 | ) |
ICE LIBOR USD 3 Month | | | 0.75% semi-annually | | | | Pay | | | | 06/16/2031 | | | | USD | | | | 23,400 | | | | (1,371 | ) | | | (103 | ) | | | (1,474 | ) |
KRW Certificate of Deposit 3 Month | | | 1.00% quarterly | | | | Pay | | | | 09/01/2025 | | | | KRW | | | | 2,400,000 | | | | — | (h) | | | (51 | ) | | | (51 | ) |
KRW Certificate of Deposit 3 Month | | | 1.07% quarterly | | | | Pay | | | | 04/27/2030 | | | | KRW | | | | 200,000 | | | | (8 | ) | | | (2 | ) | | | (10 | ) |
KRW Certificate of Deposit 3 Month | | | 0.97% quarterly | | | | Pay | | | | 08/14/2030 | | | | KRW | | | | 2,100,000 | | | | — | (h) | | | (125 | ) | | | (125 | ) |
KRW Certificate of Deposit 3 Month | | | 0.94% quarterly | | | | Pay | | | | 08/19/2030 | | | | KRW | | | | 3,575,000 | | | | — | (h) | | | (218 | ) | | | (218 | ) |
SONIA Interest Rate Benchmark | | | 0.45% annually | | | | Pay | | | | 03/31/2026 | | | | GBP | | | | 1,250 | | | | — | (h) | | | 1 | | | | 1 | |
SONIA Interest Rate Benchmark | | | 0.11% annually | | | | Receive | | | | 09/30/2030 | | | | GBP | | | | 500 | | | | — | (h) | | | 35 | | | | 35 | |
SONIA Interest Rate Benchmark | | | 0.26% annually | | | | Receive | | | | 09/30/2040 | | | | GBP | | | | 275 | | | | — | (h) | | | 39 | | | | 39 | |
SONIA Interest Rate Benchmark | | | 0.26% annually | | | | Receive | | | | 09/30/2050 | | | | GBP | | | | 200 | | | | — | (h) | | | 40 | | | | 40 | |
United States FEDEF | | | 0.03% annually | | | | Receive | | | | 06/12/2022 | | | | USD | | | | 450 | | | | — | (h) | | | — | (h) | | | — | (h) |
United States FEDEF | | | 0.10% maturity | | | | Receive | | | | 01/13/2023 | | | | USD | | | | 442,600 | | | | 37 | | | | 353 | | | | 390 | |
United States FEDEF | | | 0.20% maturity | | | | Receive | | | | 04/29/2023 | | | | USD | | | | 22,600 | | | | 1 | | | | 16 | | | | 17 | |
| | | | | | | | | | | | | | | | | | | | | | | | | | | | | | | | |
Total | | | | (1,593 | ) | | | (454 | ) | | | (2,047 | ) |
| | | | | | | | | | | | | | | | | | | | | | | | | | | | | | | | |
| (a) | Value of floating rate index as of June 30, 2021 was as follows: |
| | | | |
| FLOATING RATE INDEX | | | |
Bank of Thailand BIBOR Fixings 6 Month | | | 0.73% | |
Bank Negara Malaysia Klibor Interbank Offerred rate Fixing 3 Month | | | 1.94% | |
BBSW ASX Australian 6 Month | | | 0.65% | |
Canada Bankers Acceptances 3 Month | | | 0.44% | |
CFETS China Fixing Repo Rates 7 Day | | | 3.10% | |
Colombia IBR Overnight Nominal Interbank Reference Rate | | | 1.71% | |
ICE LIBOR JPY 6 Month | | | (0.07)% | |
ICE LIBOR USD 3 Month | | | 0.15% | |
KRW Certificate of Deposit 3 Month | | | 0.68% | |
SONIA Interest Rate Benchmark | | | 0.05% | |
United States FEDEF | | | 0.08% | |
| | | | | | | | | | | | | | | | | | | | | | | | | | | | | | |
| Written Call Option Contracts on securities as of June 30, 2021 | |
| DESCRIPTION | | COUNTERPARTY | | NUMBER OF
CONTRACTS | | | NOTIONAL
AMOUNT | | | EXERCISE
PRICE | | | EXPIRATION
DATE | | | VALUE | |
FNMA or FHLMC, Single Family,
30 years, TBA, 2.00%, 08/01/2051 | | Citigroup Global Markets, Inc. | | | 15,000 | | | | USD | | | | 2,089 | | | | USD | | | | 101.79 | | | | 08/05/2021 | | | $ | (20 | ) |
FNMA or FHLMC, Single Family,
30 years, TBA, 2.00%, 9/14/2051 | | Citigroup Global Markets, Inc. | | | 15,000 | | | | USD | | | | 6,057 | | | | USD | | | | 101.33 | | | | 09/07/2021 | | | | (60 | ) |
FNMA or FHLMC, Single Family,
30 years, TBA, 2.00%, 08/01/2051 | | Citigroup Global Markets, Inc. | | | 14,000 | | | | USD | | | | 3,361 | | | | USD | | | | 101.48 | | | | 08/05/2021 | | | | (33 | ) |
FNMA or FHLMC, Single Family,
30 years, TBA, 2.50%, 08/01/2051 | | Citigroup Global Markets, Inc. | | | 8,000 | | | | USD | | | | 1,697 | | | | USD | | | | 103.59 | | | | 08/05/2021 | | | | (16 | ) |
FNMA or FHLMC, Single Family,
30 years, TBA, 2.00%, 07/01/2050 | | Citigroup Global Markets, Inc. | | | 4,000 | | | | USD | | | | 643 | | | | USD | | | | 101.23 | | | | 07/07/2021 | | | | (6 | ) |
FNMA or FHLMC, Single Family,
30 years, TBA, 2.00%, 9/14/2051 | | Citigroup Global Markets, Inc. | | | 15,000 | | | | USD | | | | 7,146 | | | | USD | | | | 101.17 | | | | 09/07/2021 | | | | (71 | ) |
FNMA or FHLMC, Single Family,
30 years, TBA, 2.00%, 9/14/2051 | | Citigroup Global Markets, Inc. | | | 14,000 | | | | USD | | | | 5,949 | | | | USD | | | | 101.28 | | | | 09/07/2021 | | | | (59 | ) |
FNMA or FHLMC, Single Family,
30 years, TBA, 2.00%, 08/01/2051 | | Citigroup Global Markets, Inc. | | | 20,000 | | | | USD | | | | 4,742 | | | | USD | | | | 101.48 | | | | 08/05/2021 | | | | (47 | ) |
| | | | | | | | | | | | | | | | | | | | | | | | | | | | | | |
| | | | (312 | ) |
| | | | | |
SEE NOTES TO FINANCIAL STATEMENTS.
| | | | | | | | | | |
| | | | | |
| JUNE 30, 2021 | | SIX CIRCLES TRUST | | | | | | | | 137 |
Six Circles Global Bond Fund
SCHEDULE OF PORTFOLIO INVESTMENTS
AS OF JUNE 30, 2021 (Unaudited) (continued)
(Amounts in U.S. Dollars, unless otherwise noted)
(Amounts in thousands, except number of Futures contracts)
| | | | | | | | | | | | | | | | | | | | | | | | | | | | | | |
| Written Put Option Contracts on securities as of June 30, 2021 | |
| DESCRIPTION | | COUNTERPARTY | | NUMBER
OF
CONTRACTS | | | NOTIONAL
AMOUNT | | | EXERCISE
PRICE | | | EXPIRATION
DATE | | | VALUE | |
FNMA or FHLMC, Single Family,
30 years, TBA, 2.00%, 9/14/2051 | | Citigroup Global Markets, Inc. | | | 15,000 | | | | USD | | | | 5,747 | | | | USD | | | | 99.17 | | | | 09/07/2021 | | | | (58 | ) |
FNMA or FHLMC, Single Family,
30 years, TBA, 2.00%, 9/14/2051 | | Citigroup Global Markets, Inc. | | | 7,000 | | | | USD | | | | 2,820 | | | | USD | | | | 99.28 | | | | 09/07/2021 | | | | (28 | ) |
FNMA or FHLMC, Single Family,
30 years, TBA, 2.50%, 08/01/2051 | | Citigroup Global Markets, Inc. | | | 15,000 | | | | USD | | | | 2,942 | | | | USD | | | | 102.59 | | | | 08/05/2021 | | | | (29 | ) |
FNMA or FHLMC, Single Family,
30 years, TBA, 2.00%, 08/01/2051 | | Citigroup Global Markets, Inc. | | | 14,000 | | | | USD | | | | 2,553 | | | | USD | | | | 99.39 | | | | 08/05/2021 | | | | (26 | ) |
FNMA or FHLMC, Single Family,
30 years, TBA, 2.00%, 9/14/2051 | | Citigroup Global Markets, Inc. | | | 15,000 | | | | USD | | | | 4,824 | | | | USD | | | | 98.78 | | | | 09/07/2021 | | | | (49 | ) |
FNMA or FHLMC, Single Family,
30 years, TBA, 2.00%, 08/01/2051 | | Citigroup Global Markets, Inc. | | | 20,000 | | | | USD | | | | 3,974 | | | | USD | | | | 99.52 | | | | 08/05/2021 | | | | (40 | ) |
| | | | | | | | | | | | | | | | | | | | | | | | | | | | | | |
| | | | (230 | ) |
| | | | | |
Total Written Options Contracts (Premiums Received $677) | | | | (542 | ) |
| | | | | |
NOTES TO SCHEDULE OF PORTFOLIO INVESTMENTS
AS OF JUNE 30, 2021
| | |
| ACES | | — Alternative Credit Enhancement Securities |
| ARM | | — Adjustable Rate Mortgage. The interest rate shown is the rate in effect as of June 30, 2021. |
| ASX | | — Australian Stock Exchange |
| BAM | | — Insured by Build America Mutual |
| BBSW | | — Bank Bill Swap Rate |
| BIBOR | | — Bangkok Interbank Offered Rate |
| BofA | | — Bank of America |
| CFETS | | — China Foreign Exchange Trade System |
| CLO | | — Collateralized Loan Obligations |
| CMT | | — Constant Maturity Treasury |
| CPI | | — Consumer Price Index |
| EURIBOR | | — Euro Interbank Offered Rate |
| FHA | | — Federal Housing Administration |
| FEDEF | | — Federal Fund Effective Rate (Continuous Series) |
| FHLB | | — Federal Home Loan Bank |
| FHLMC | | — Federal Home Loan Mortgage Corp. |
| FNMA | | — Federal National Mortgage Association |
| GO | | — General Obligation |
| GNMA | | — Government National Mortgage Association |
| IBR | | — Indicador Bancario de Referencia |
| ICE | | — Intercontinental Exchange |
| IF | | — Inverse Floaters represent securities that pay interest at a rate that increases (decreases) with a decline (incline) in a specified index. The interest rate shown is the rate in effect as of June 30, 2021. The rate may be subject to a cap and floor. |
| IO | | — Interest Only represents the right to receive the monthly interest payments on an underlying pool of mortgage loans. The principal amount shown represents the par value on the underlying pool. The yields on these securities are subject to accelerated principal paydowns as a result of prepayment or refinancing of the underlying pool of mortgage instruments. As a result, interest income may be reduced considerably. |
| LIBOR | | — London Interbank Offered Rate |
| OYJ | | — Public Limited Company |
| | |
| PO | | — Principal Only represents the right to receive the principal portion only on an underlying pool of mortgage loans. The market value of these securities is extremely volatile in response to changes in market interest rates. As prepayments on the underlying mortgages of these securities increase, the yield on these securities increases. |
| Reg. S | | — Security was purchased pursuant to Regulation S under the Securities Act of 1933, as amended (the “Securities Act”), which exempts from registration securities offered and sold outside of the United States. Such a security cannot be sold in the United States without either an effective registration statement filed pursuant to the Securities Act, or pursuant to an exemption from registration. |
| REIT | | — Real Estate Investment Trust |
| REMICS | | — Real Estate Mortgage Investment Conduit |
| Rev. | | — Revenue |
| SOFR | | — Secured Overnight Financing Rate |
| SONIA | | — Sterling Overnight Interbank Average Rate |
| STRIPS | | — Separate Trading of Registered Interest and Principal of Securities. The STRIPS Program lets investors hold and trade individual interest and principal components of eligible notes and bonds as separate securities. |
| SUB | | — Step-Up Bond. The interest rate shown is the rate in effect as of June 30, 2021. |
| TBA | | — To Be Announced |
| VA | | — Veterans Administration |
| (e) | | — Security is exempt from registration under Rule 144A of the Securities Act of 1933, as amended. Unless otherwise indicated, this security has been determined to be liquid under procedures established by the Board of Trustees and may be resold in transactions exempt from registration, normally to qualified institutional buyers. |
| (g) | | — Amount rounds to less than 0.05%. |
| (h) | | — Amount rounds to less than 500. |
SEE NOTES TO FINANCIAL STATEMENTS.
| | | | | | | | | | |
| | | | | |
| 138 | | | | | | | | SIX CIRCLES TRUST | | JUNE 30, 2021 |
| | |
| (t) | | — The date shown represents the earliest of the next put date or final maturity date. |
| (w) | | — All or a portion of the security is a when-issued security, delayed delivery security, or forward commitment. |
| (x) | | — Security is perpetual and thus, does not have a predetermined maturity date. The coupon rate for this security is fixed for a period of time and may be structured to adjust thereafter. The date shown, if applicable, reflects the next call date. The coupon rate shown is the rate in effect as of June 30, 2021. |
| (z) | | — Variable or floating rate security, the interest rate of which adjusts periodically based on changes in current interest rates and prepayments on the underlying pool of assets. The interest rate shown is the current rate as of June 30, 2021. |
| (aa) | | — Variable or floating rate security, linked to the referenced benchmark. The interest rate shown is the current rate as of June 30, 2021. |
| (bb) | | — Security has been valued using significant unobservable inputs. |
| (ee) | | — Approximately $5,166,259 of these investments is restricted as collateral for swaps to various brokers. |
| (ff) | | — Approximately $616,858 of this investment is restricted as collateral for futures to Citigroup Global Markets, Inc. |
| (gg) | | — Approximately $587,870 of these investments is restricted as collateral for options to various brokers. |
| (hh) | | — Approximately $332,534 of these investments is restricted as collateral for TBAs to Morgan Stanley. |
| (ii) | | — Approximately $31,866 of these investments is restricted as collateral for forwards to Barclays Bank plc. |
| * | | — The cost of securities is substantially the same for federal income tax purposes. |
| | |
| AUD | | — Australian Dollar |
| CAD | | — Canadian Dollar |
| CHF | | — Swiss Franc |
| CLP | | — Chilean Peso |
| CNH | | — Chinese Yuan |
| CNY | | — Chinese Yuan |
| COP | | — Colombian Peso |
| CZK | | — Czech Koruna |
| DKK | | — Danish Krone |
| EUR | | — Euro |
| GBP | | — British Pound |
| HKD | | — Hong Kong Dollar |
| HUF | | — Hungarian Forint |
| IDR | | — Indonesian Rupiah |
| ILS | | — Israeli New Shekel |
| JPY | | — Japanese Yen |
| KRW | | — Korean Won |
| MXN | | — Mexican Peso |
| MYR | | — Malaysian Ringgit |
| NOK | | — Norwegian Krone |
| NZD | | — New Zealand Dollar |
| PEN | | — Peruvian Nuevo Sol |
| PLN | | — Polish Zloty |
| RON | | — Romanian Leu |
| RUB | | — Russian Ruble |
| SEK | | — Swedish Krona |
| SGD | | — Singapore Dollar |
| THB | | — Thai Baht |
| USD | | — United States Dollar |
SEE NOTES TO FINANCIAL STATEMENTS.
| | | | | | | | | | |
| | | | | |
| JUNE 30, 2021 | | SIX CIRCLES TRUST | | | | | | | | 139 |
Six Circles Tax Aware Bond Fund
SCHEDULE OF PORTFOLIO INVESTMENTS
AS OF JUNE 30, 2021 (Unaudited)
(Amounts in U.S. Dollars, unless otherwise noted)
(Amounts in thousands, except number of Futures contracts)
| | | | | | | | |
| SECURITY DESCRIPTION | | PRINCIPAL
AMOUNT($) | | | VALUE($) | |
Commercial Mortgage-Backed Security — 0.0% (g) | | | | | |
FHLMC Multifamily ML Certificates, Series 2021-ML10, Class AUS, 2.03%, 01/25/2038 (Cost $359) | | | 345 | | | | 358 | |
| | | | | | | | |
Corporate Bond — 0.0% (g) | | | | | | | | |
Consumer Non-cyclical — 0.0% (g) | | | | | | | | |
Healthcare — Services — 0.0% (g) | | | | | | | | |
Tower Health, Series 2020, 4.45%, 02/01/2050 (Cost $861) | | | 1,000 | | | | 845 | |
| | | | | | | | |
Municipal Bonds — 93.8% (t) | | | | | | | | |
Alabama — 2.2% | | | | | | | | |
Alabama Federal Aid Highway Finance Authority, Series A, Rev., 5.00%, 09/01/2035 | | | 2,000 | | | | 2,425 | |
Alabama Housing Finance Authority, Capstone At Kinsey Cove Project, Rev., 0.35%, 12/01/2023 (z) | | | 1,005 | | | | 1,007 | |
Alabama Public School and College Authority, Social Bonds, | | | | | | | | |
Series A, Rev., 5.00%, 11/01/2035 | | | 5,000 | | | | 6,647 | |
Series A, Rev., 5.00%, 11/01/2039 | | | 10,000 | | | | 13,172 | |
Alabama Special Care Facilities Financing Authority, Ascension Senior Credit Group, Series C, Rev., 5.00%, 11/15/2046 | | | 5,000 | | | | 5,942 | |
Baldwin County Board of Education, School Warrants, | | | | | | | | |
Rev., 5.00%, 06/01/2024 (p) | | | 2,605 | | | | 2,721 | |
Rev., 5.00%, 06/01/2026 (p) | | | 2,870 | | | | 2,997 | |
Black Belt Energy Gas District, Rev., LIQ: Royal Bank of Canada, 4.00%, 06/01/2051 (z) | | | 12,535 | | | | 15,634 | |
Black Belt Energy Gas District, Project No. 4, Series A1, Rev., 4.00%, 12/01/2049 (z) | | | 1,175 | | | | 1,341 | |
Black Belt Energy Gas District, Project No. 5, Series A1, Rev., 4.00%, 10/01/2049 (z) | | | 5,000 | | | | 5,826 | |
City of Birmingham, Series A, GO, 5.00%, 03/01/2043 (p) | | | 1,935 | | | | 2,090 | |
City of Birmingham, Warrants, Series A, GO, 4.00%, 06/01/2032 | | | 4,075 | | | | 5,023 | |
City of Huntsville, Warrants, Series A, GO, 5.00%, 09/01/2028 | | | 2,030 | | | | 2,624 | |
City of Oxford, Warrants, Series C, GO, 5.00%, 10/01/2029 (p) | | | 1,435 | | | | 1,522 | |
County of Jefferson, Sewer Revenue, Senior Lien, Warrants, Series A, Rev., AGM, 5.50%, 10/01/2053 | | | 500 | | | | 563 | |
County of Jefferson, Sewer Revenue, Subordinated Lien, Series D, Rev., 6.50%, 10/01/2053 | | | 220 | | | | 258 | |
Health Care Authority of the City of Huntsville, Health System, | | | | | | | | |
Series B1, Rev., 4.00%, 06/01/2045 | | | 1,750 | | | | 2,049 | |
Series B1, Rev., 5.00%, 06/01/2038 | | | 1,000 | | | | 1,283 | |
Hoover Industrial Development Board, Green Bonds, Rev., AMT, 6.38%, 11/01/2050 (z) | | | 3,020 | | | | 3,867 | |
| | | | | | | | |
| SECURITY DESCRIPTION | | PRINCIPAL
AMOUNT($) | | | VALUE($) | |
| | | | | | | | |
Alabama — continued | | | | | | | | |
Industrial Development Board of the City of Mobile Alabama, Power Co., Barry Plant, Rev., 2.90%, 07/15/2034 (z) | | | 2,000 | | | | 2,120 | |
Morgan County Board of Education, Rev., 5.00%, 03/01/2035 (p) | | | 2,720 | | | | 2,863 | |
Selma Industrial Development Board, International Paper Co. Project, Rev., 1.38%, 05/01/2034 (z) | | | 1,000 | | | | 1,033 | |
Southeast Alabama Gas Supply District (The), Project No. 2, Series A, Rev., 4.00%, 06/01/2049 (z) | | | 100 | | | | 110 | |
Southeast Energy Authority A Cooperative District, Project 1, Series A, Rev., 4.00%, 11/01/2051 (z) | | | 11,625 | | | | 13,887 | |
Southeast Energy Authority A Cooperative District, Project 2, Series B, Rev., 4.00%, 12/01/2051 (z) | | | 10,000 | | | | 12,338 | |
State of Alabama Docks Department, Docks, | | | | | | | | |
Series A, Rev., AGM, AMT, 5.00%, 10/01/2025 | | | 1,750 | | | | 2,052 | |
Series A, Rev., AGM, AMT, 5.00%, 10/01/2026 | | | 1,890 | | | | 2,273 | |
Tuscaloosa City Board of Education, Warrants, Rev., 5.00%, 08/01/2041 (p) | | | 2,525 | | | | 3,087 | |
UAB Medicine Finance Authority, | | | | | | | | |
Rev., 5.00%, 09/01/2032 | | | 1,800 | | | | 2,334 | |
Series B, Rev., 5.00%, 09/01/2041 | | | 1,450 | | | | 1,741 | |
Water Works Board of the City of Birmingham, Series B, Rev., 5.00%, 01/01/2038 (p) | | | 3,000 | | | | 3,217 | |
| | | | | | | | |
| | |
| | | | | | | 124,046 | |
| | | | | | | | |
Alaska — 0.2% | | | | | | | | |
Alaska Housing Finance Corp., | | | | | | | | |
Series A, Rev., 5.00%, 12/01/2032 (p) | | | 1,425 | | | | 1,590 | |
Series A, Rev., 5.00%, 12/01/2033 (p) | | | 685 | | | | 764 | |
Alaska Housing Finance Corp., General Mortgage, Series B, Rev., 3.25%, 12/01/2044 | | | 6,745 | | | | 7,439 | |
Alaska Housing Finance Corp., State Capital Project, Rev., 5.00%, 12/01/2031 (p) | | | 1,690 | | | | 1,764 | |
| | | | | | | | |
| | |
| | | | | | | 11,557 | |
| | | | | | | | |
Arizona — 1.7% | | | | | | | | |
Arizona Board of Regents, Arizona State University, Series C, Rev., 5.00%, 07/01/2031 | | | 1,000 | | | | 1,363 | |
Arizona Health Facilities Authority, Banner Health, Series A, Rev., 5.00%, 01/01/2044 | | | 1,055 | | | | 1,158 | |
Arizona Health Facilities Authority, Scottsdale Lincoln Hospital Project, Rev., 5.00%, 12/01/2029 | | | 2,705 | | | | 3,104 | |
Arizona Industrial Development Authority, | | | | | | | | |
Series 2019-2, Rev., 3.63%, 05/20/2033 | | | 972 | | | | 1,107 | |
Series A, Rev., 4.00%, 09/01/2035 | | | 225 | | | | 270 | |
Series A, Rev., 4.00%, 09/01/2036 | | | 250 | | | | 299 | |
SEE NOTES TO FINANCIAL STATEMENTS.
| | | | | | | | | | |
| | | | | |
| 140 | | | | | | | | SIX CIRCLES TRUST | | JUNE 30, 2021 |
| | | | | | | | |
| SECURITY DESCRIPTION | | PRINCIPAL
AMOUNT($) | | | VALUE($) | |
Municipal Bonds — continued | | | | | | | | |
Arizona — continued | | | | | | | | |
Arizona Industrial Development Authority, Greathearts Arizona Project, | | | | | | | | |
Series A, Rev., 5.00%, 07/01/2024 | | | 125 | | | | 142 | |
Series A, Rev., 5.00%, 07/01/2026 | | | 125 | | | | 150 | |
Arizona Industrial Development Authority, Somerset Acacdemy of Las Vegas, Aliante, | | | | | | | | |
Rev., 3.00%, 12/15/2031 (e) | | | 525 | | | | 556 | |
Rev., 4.00%, 12/15/2041 (e) | | | 500 | | | | 552 | |
Rev., 4.00%, 12/15/2051 (e) | | | 700 | | | | 762 | |
Arizona State University, | | | | | | | | |
Series B, Rev., VRDO, 0.02%, 07/07/2021 (z) | | | 2,005 | | | | 2,005 | |
Series C, Rev., 5.00%, 07/01/2042 | | | 2,000 | | | | 2,381 | |
Arizona State University, Board of Regents, | | | | | | | | |
Series A, Rev., 5.00%, 07/01/2043 (p) | | | 1,500 | | | | 1,572 | |
Series B, Rev., 5.00%, 07/01/2026 | | | 100 | | | | 122 | |
Series B, Rev., 5.00%, 07/01/2042 | | | 2,000 | | | | 2,434 | |
Arizona Water Infrastructure Finance Authority, Unrefunded, Water Quality, Rev., 5.00%, 10/01/2023 (p) | | | 1,665 | | | | 1,766 | |
Chandler Industrial Development Authority, Intel Corp. Project, Rev., 2.40%, 12/01/2035 (z) | | | 775 | | | | 808 | |
City of Mesa Excise Tax Revenue, Rev., 5.00%, 07/01/2028 | | | 600 | | | | 770 | |
City of Phoenix Civic Improvement Corp., | | | | | | | | |
Series A, Rev., 5.00%, 07/01/2029 | | | 1,000 | | | | 1,222 | |
Series A, Rev., 5.00%, 07/01/2031 | | | 2,000 | | | | 2,416 | |
Series A, Rev., 5.00%, 07/01/2032 | | | 1,000 | | | | 1,205 | |
City of Phoenix Civic Improvement Corp., Junior Lien, | | | | | | | | |
Series A, Rev., 4.00%, 07/01/2021 | | | 1,000 | | | | 1,000 | |
Series A, Rev., 5.00%, 07/01/2029 | | | 1,515 | | | | 1,995 | |
Series B, Rev., 5.00%, 07/01/2026 | | | 1,750 | | | | 2,136 | |
City of Phoenix, Civic Improvement Corp., | | | | | | | | |
Series A, Rev., 5.00%, 07/01/2034 | | | 2,185 | | | | 2,619 | |
Series B, Rev., 5.00%, 07/01/2024 | | | 130 | | | | 148 | |
City of Phoenix, Civic Improvement Corp., Airport Revenue, Junior Lien, | | | | | | | | |
Series A, Rev., 5.00%, 07/01/2044 | | | 1,000 | | | | 1,262 | |
Series B, Rev., AMT, 5.00%, 07/01/2027 | | | 1,500 | | | | 1,857 | |
Series B, Rev., AMT, 5.00%, 07/01/2033 | | | 2,000 | | | | 2,548 | |
City of Phoenix, Civic Improvement Corp., Senior Lien, Series B, Rev., 5.00%, 07/01/2021 | | | 1,500 | | | | 1,500 | |
County of Pima, Sewer System Revenue, | | | | | | | | |
Series A, Rev., 5.00%, 07/01/2021 | | | 2,100 | | | | 2,100 | |
Series B, Rev., 5.00%, 07/01/2024 (p) | | | 760 | | | | 760 | |
Series B, Rev., 5.00%, 07/01/2025 (p) | | | 4,500 | | | | 4,500 | |
Industrial Development Authority of the City of Phoenix, Republic Services, Inc. Project, Rev., AMT, 0.20%, 12/01/2035 (z) | | | 2,325 | | | | 2,325 | |
Industrial Development Authority of the County of Yavapai, Waste Management, Inc. Project, Rev., AMT, 1.30%, 06/01/2027 | | | 2,610 | | | | 2,634 | |
| | | | | | | | |
| SECURITY DESCRIPTION | | PRINCIPAL
AMOUNT($) | | | VALUE($) | |
| | | | | | | | |
Arizona — continued | | | | | | | | |
Kyrene Elementary School District No. 28, School Improvement Project 2010, | | | | | | | | |
Series B, GO, 4.50%, 07/01/2024 | | | 315 | | | | 342 | |
Series B, GO, 4.50%, 07/01/2025 | | | 255 | | | | 277 | |
Maricopa County Industrial Development Authority, Banner Health Obligated Group, Rev., 5.00%, 01/01/2026 | | | 2,500 | | | | 2,994 | |
Maricopa County Pollution Control Corp., Public Service Company of New Mexico, Rev., 1.05%, 01/01/2038 (z) | | | 695 | | | | 700 | |
Maricopa County Special Health Care District, Series C, GO, 4.00%, 07/01/2037 | | | 21,910 | | | | 25,524 | |
Northern Arizona University, Speed Stimulas Plan Economic Education, Rev., 5.00%, 08/01/2032 (p) | | | 3,145 | | | | 3,455 | |
Salt River Project Agricultural Improvement & Power, Series A, Rev., 5.00%, 12/01/2045 | | | 7,300 | | | | 8,444 | |
Salt River Project Agricultural Improvement & Power District, | | | | | | | | |
Series A, Rev., 5.00%, 01/01/2022 | | | 1,000 | | | | 1,024 | |
Series A, Rev., 5.00%, 12/01/2024 | | | 1,305 | | | | 1,331 | |
Salt Verde Financial Corp., Rev., 5.00%, 12/01/2032 | | | 420 | | | | 557 | |
Salt Verde Financial Corp., Senior, | | | | | | | | |
Rev., 5.25%, 12/01/2021 | | | 600 | | | | 612 | |
Rev., 5.50%, 12/01/2029 | | | 1,475 | | | | 1,943 | |
State of Arizona, Series A, COP, 5.00%, 10/01/2021 | | | 80 | | | | 81 | |
| | | | | | | | |
| | |
| | | | | | | 100,832 | |
| | | | | | | | |
Arkansas — 0.0% (g) | | | | | | | | |
Arkansas Development Finance Authority Public Safety Charges Revenue, Division of Emergency Management Project, Rev., 5.00%, 06/01/2024 | | | 1,000 | | | | 1,132 | |
Arkansas Development Finance Authority, Big River Steel Project, Rev., AMT, 4.50%, 09/01/2049 (e) | | | 630 | | | | 705 | |
| | | | | | | | |
| | |
| | | | | | | 1,837 | |
| | | | | | | | |
California — 10.4% | | | | | | | | |
Alameda County, Oakland Unified School District, | | | | | | | | |
GO, 5.00%, 08/01/2027 | | | 65 | | | | 79 | |
Series A, GO, 5.00%, 08/01/2040 | | | 300 | | | | 351 | |
Anaheim Housing & Public Improvements Authority, | | | | | | | | |
Series A, Rev., 5.00%, 10/01/2035 | | | 250 | | | | 294 | |
Series A, Rev., 5.00%, 10/01/2050 | | | 1,780 | | | | 2,083 | |
Anaheim Public Financing Authority, Senior Public Improvement Project, Series A, Rev., BAM, 5.00%, 09/01/2036 | | | 2,250 | | | | 2,726 | |
Bay Area Toll Authority, San Francisco Bay, Series A, Rev., 2.00%, 04/01/2056 (z) | | | 1,565 | | | | 1,670 | |
SEE NOTES TO FINANCIAL STATEMENTS.
| | | | | | | | | | |
| | | | | |
| JUNE 30, 2021 | | SIX CIRCLES TRUST | | | | | | | | 141 |
Six Circles Tax Aware Bond Fund
SCHEDULE OF PORTFOLIO INVESTMENTS
AS OF JUNE 30, 2021 (Unaudited) (continued)
(Amounts in U.S. Dollars, unless otherwise noted)
(Amounts in thousands, except number of Futures contracts)
| | | | | | | | |
| SECURITY DESCRIPTION | | PRINCIPAL
AMOUNT($) | | | VALUE($) | |
Municipal Bonds — continued | | | | | | | | |
California — continued | | | | | | | | |
Bay Area Toll Authority, San Francisco Bay Area, | | | | | | | | |
Rev., 2.00%, 04/01/2053 (z) | | | 2,200 | | | | 2,278 | |
Series C, Rev., (SIFMA Municipal Swap Index + 0.45%), 0.48%, 04/01/2056 (aa) | | | 2,675 | | | | 2,678 | |
Bay Area Toll Authority, Subordinated, Series S4, Rev., 5.00%, 04/01/2031 (p) | | | 4,000 | | | | 4,340 | |
Beverly Hills Unified School District, 2008 Election, GO, 2.00%, 08/01/2022 | | | 1,400 | | | | 1,428 | |
Cabrillo Unified School District, Election 2018, Series B, GO, 5.00%, 08/01/2050 | | | 5,000 | | | | 6,191 | |
California County, Tobacco Securitization Agency, Series A, Rev., 5.00%, 06/01/2027 | | | 10 | | | | 13 | |
California County, Tobacco Securitization Agency, Senior Bonds, Merced County Tobacco Funding Corporation, | | | | | | | | |
Rev., 5.00%, 06/01/2032 | | | 340 | | | | 458 | |
Rev., 5.00%, 06/01/2033 | | | 170 | | | | 228 | |
California County, Tobacco Securitization Agency, Sonoma County Securitization, | | | | | | | | |
Rev., 5.00%, 06/01/2031 | | | 255 | | | | 345 | |
Rev., 5.00%, 06/01/2032 | | | 250 | | | | 336 | |
Rev., 5.00%, 06/01/2033 | | | 300 | | | | 401 | |
Rev., 5.00%, 06/01/2049 | | | 405 | | | | 506 | |
California Educational Facilities Authority, University Southern California, Series C, Rev., 5.25%, 10/01/2024 (p) | | | 210 | | | | 244 | |
California Health Facilities Financing Authority, Adventist Health System, Rev., 3.00%, 03/01/2041 (z) | | | 1,905 | | | | 2,002 | |
California Health Facilities Financing Authority, City of Hope, Rev., 5.00%, 11/15/2049 | | | 3,000 | | | | 3,592 | |
California Health Facilities Financing Authority, Commonspirit Health, | | | | | | | | |
Series A, Rev., 4.00%, 04/01/2038 | | | 3,500 | | | | 4,187 | |
Series A, Rev., 5.00%, 04/01/2033 | | | 3,000 | | | | 3,927 | |
California Health Facilities Financing Authority, Kaiser Permanente, | | | | | | | | |
Series B, Rev., 5.00%, 11/01/2029 (z) | | | 2,705 | | | | 2,877 | |
Series C, Rev., 5.00%, 06/01/2041 (z) | | | 1,000 | | | | 1,319 | |
California Health Facilities Financing Authority, Lucile Salter Packard Chil, Rev., 5.00%, 05/15/2025 (w) | | | 960 | | | | 1,079 | |
California Health Facilities Financing Authority, Pih Health, Series A, Rev., 5.00%, 06/01/2035 | | | 3,010 | | | | 3,937 | |
California Health Facilities Financing Authority, Providence St. Josephs, Rev., 5.00%, 10/01/2039 (z) | | | 2,000 | | | | 2,386 | |
California Health Facilities Financing Authority, Stanford Health Care, Rev., 3.00%, 08/15/2054 (z) | | | 3,335 | | | | 3,683 | |
| | | | | | | | |
| SECURITY DESCRIPTION | | PRINCIPAL
AMOUNT($) | | | VALUE($) | |
| | | | | | | | |
California — continued | | | | | | | | |
California Health Facilities Financing Authority, Sutter Health, Series A, Rev., 5.00%, 08/15/2043 (p) | | | 465 | | | | 552 | |
California Housing Finance, Series 2021-1A, Rev., 3.50%, 11/20/2035 | | | 3,911 | | | | 4,579 | |
California Infrastructure & Economic Development Bank, Brightline West Passenger, Rev., AMT, VRDO, 0.45%, 07/01/2021 (e) (z) | | | 22,535 | | | | 22,535 | |
California Infrastructure & Economic Development Bank, Brightline West Passenger Rail, Rev., AMT, 0.00%, 01/01/2050 (e) (w) (z) | | | 17,640 | | | | 17,639 | |
California Infrastructure & Economic Development Bank, Los Angeles County, Series B, Rev., (SIFMA Municipal Swap Index + 0.70%), 0.73%, 12/01/2050 (aa) | | | 1,370 | | | | 1,388 | |
California Infrastructure & Economic Development Bank, Sanford Consortium Project, Series A, Rev., 5.00%, 05/15/2031 | | | 1,230 | | | | 1,478 | |
California Infrastructure & Economic Development Bank, The Broad-Sustainability, Rev., 5.00%, 06/01/2026 | | | 1,300 | | | | 1,588 | |
California Municipal Finance Authority, Anaheim Electric Utility District System, Rev., 5.00%, 10/01/2022 | | | 1,175 | | | | 1,246 | |
California Municipal Finance Authority, Palomar Health, COP, 5.00%, 11/01/2027 (e) | | | 445 | | | | 525 | |
California Municipal Finance Authority, Republic Services, Rev., 0.16%, 09/01/2021 (w) | | | 1,740 | | | | 1,740 | |
California Municipal Finance Authority, Republic Services, Inc. Project, | | | | | | | | |
Series A, Rev., AMT, 0.00%, 07/01/2041 (w) (z) | | | 3,085 | | | | 3,085 | |
Series B, Rev., AMT, 0.00%, 07/01/2051 (w) (z) | | | 930 | | | | 930 | |
California Municipal Finance Authority, Simpson University, Series A, Rev., 6.00%, 10/01/2050 (e) | | | 2,000 | | | | 2,128 | |
California Municipal Finance Authority, Southern California Insitute, Rev., 5.00%, 12/01/2037 | | | 745 | | | | 862 | |
California Municipal Finance Authority, Waste Management, Inc. Project, | | | | | | | | |
Rev., AMT, 0.20%, 10/01/2045 (z) | | | 8,000 | | | | 8,000 | |
Rev., AMT, 0.70%, 12/01/2044 (z) | | | 1,670 | | | | 1,684 | |
Series A, Rev., AMT, 2.40%, 10/01/2044 (z) | | | 2,960 | | | | 3,252 | |
California Pollution Control Financing Authority, Republic Services, Series A, Rev., AMT, 0.20%, 08/01/2023 (e) (z) | | | 2,000 | | | | 2,000 | |
California Pollution Control Financing Authority, Republic Services, Inc., Rev., AMT, 0.18%, 11/01/2042 (e) (z) | | | 1,750 | | | | 1,750 | |
SEE NOTES TO FINANCIAL STATEMENTS.
| | | | | | | | | | |
| | | | | |
| 142 | | | | | | | | SIX CIRCLES TRUST | | JUNE 30, 2021 |
| | | | | | | | |
| SECURITY DESCRIPTION | | PRINCIPAL
AMOUNT($) | | | VALUE($) | |
Municipal Bonds — continued | | | | | | | | |
California — continued | | | | | | | | |
California Public Finance Authority, Enso Village Project, Rev., 2.13%, 11/15/2027 (e) | | | 1,000 | | | | 1,013 | |
California Public Finance Authority, Enso Village Project, Green Bond, Rev., 5.00%, 11/15/2036 (e) | | | 325 | | | | 386 | |
California Public Finance Authority, Henry Mayo Newhall Hospital, | | | | | | | | |
Rev., 5.00%, 10/15/2030 | | | 1,165 | | | | 1,394 | |
Rev., 5.00%, 10/15/2032 | | | 1,000 | | | | 1,194 | |
Series A, Rev., 4.00%, 10/15/2022 | | | 110 | | | | 115 | |
Series A, Rev., 4.00%, 10/15/2023 | | | 130 | | | | 140 | |
California School Finance Authority, Rocketship Education Obligated, Series A, Rev., 5.00%, 06/01/2034 (e) | | | 1,230 | | | | 1,389 | |
California State Public Works Board, Capital Projects, Series D, Rev., 5.00%, 11/01/2029 | | | 925 | | | | 1,220 | |
California State Public Works Board, Corrections Facilities, Series A, Rev., 5.00%, 09/01/2039 | | | 7,560 | | | | 8,566 | |
California State Public Works Board, Davidson Library, Series C, Rev., 5.00%, 03/01/2031 (p) | | | 1,250 | | | | 1,351 | |
California State Public Works Board, Various Capital Project, | | | | | | | | |
Series B, Rev., 5.00%, 05/01/2026 | | | 400 | | | | 485 | |
Series B, Rev., 5.00%, 05/01/2033 | | | 1,000 | | | | 1,345 | |
California State Public Works Board, Various Purpose, | | | | | | | | |
Series A, Rev., 5.00%, 08/01/2025 (w) | | | 1,275 | | | | 1,458 | |
Series A, Rev., 5.00%, 08/01/2028 (w) | | | 375 | | | | 465 | |
California State University, Series A, Rev., 5.00%, 11/01/2044 | | | 2,640 | | | | 3,410 | |
California State University, Systemwide, | | | | | | | | |
Series A, Rev., 5.00%, 11/01/2037 (p) | | | 9,200 | | | | 9,347 | |
Series A, Rev., 5.00%, 11/01/2039 | | | 5,035 | | | | 5,763 | |
Series A, Rev., 5.00%, 11/01/2042 (p) | | | 3,980 | | | | 4,238 | |
Series C, Rev., 5.00%, 11/01/2026 | | | 1,685 | | | | 2,079 | |
California State, Public Works Board, | | | | | | | | |
Series B, Rev., 5.00%, 10/01/2028 | | | 110 | | | | 138 | |
Series E, Rev., 5.00%, 09/01/2024 (p) | | | 1,865 | | | | 1,971 | |
California State, Public Works Board Projects, Series D, Rev., 5.00%, 09/01/2024 (p) | | | 1,700 | | | | 1,796 | |
California Statewide Communities Development Authority, Series B, Special Assessment, 4.00%, 09/02/2040 | | | 1,120 | | | | 1,280 | |
California Statewide Communities Development Authority, Health Facility, Dignity Health, Rev., AGM, 0.17%, 07/01/2041 (z) | | | 2,000 | | | | 2,000 | |
California Statewide Communities Development Authority, Kaiser Permanente, Series 2004L, Rev., 5.00%, 04/01/2038 (z) | | | 5,000 | | | | 6,593 | |
California Statewide Communities Development Authority, Loma Linda University Medical Center, | | | | | | | | |
Rev., 5.25%, 12/01/2044 | | | 6,065 | | | | 6,878 | |
| | | | | | | | |
| SECURITY DESCRIPTION | | PRINCIPAL
AMOUNT($) | | | VALUE($) | |
| | | | | | | | |
California — continued | | | | | | | | |
Rev., 5.50%, 12/01/2054 | | | 1,100 | | | | 1,249 | |
Series A, Rev., 5.00%, 12/01/2026 (e) | | | 300 | | | | 359 | |
California Statewide Communities Development Authority, South California Edison Co., Rev., 2.63%, 11/01/2033 (z) | | | 275 | | | | 290 | |
California Statewide Communities Development Authority, Villa Del Sol Apartments, Rev., 0.39%, 10/01/2023 (z) | | | 560 | | | | 560 | |
California Statewide Communities Development Authority, Washington Court Apartments, Rev., HUD, 0.22%, 08/01/2023 (z) | | | 260 | | | | 260 | |
Chino Basin Regional Financing Authority, Series B, Rev., 4.00%, 11/01/2025 | | | 3,000 | | | | 3,430 | |
City & County of San Francisco, | | | | | | | | |
Series D1, GO, 4.00%, 06/15/2041 | | | 1,215 | | | | 1,441 | |
Series R2, GO, 5.00%, 06/15/2023 (w) | | | 980 | | | | 1,061 | |
Series R2, GO, 5.00%, 06/15/2024 (w) | | | 3,715 | | | | 4,197 | |
City & County of San Francisco, 49 South Van Ness Project, Green Bond, Series A, COP, 4.00%, 04/01/2035 | | | 810 | | | | 951 | |
City & County of San Francisco, Special Tax District No. 2020-1, Mission Rock Facilities and Services, Special Tax, 4.00%, 09/01/2031 (e) | | | 300 | | | | 350 | |
City of Dixon, Community Facilities District Improvement, Special Tax, 4.00%, 09/01/2036 | | | 200 | | | | 230 | |
City of Los Angeles Department of Airports, Los Angeles International Airport, | | | | | | | | |
Rev., AMT, 5.00%, 05/15/2032 | | | 2,000 | | | | 2,552 | |
Series A, Rev., 5.00%, 05/15/2040 | | | 500 | | | | 646 | |
City of Los Angeles Department of Airports, Senior, | | | | | | | | |
Series A, Rev., AMT, 4.75%, 05/15/2040 | | | 2,415 | | | | 2,728 | |
Series B, Rev., 5.00%, 05/15/2027 | | | 2,570 | | | | 3,218 | |
Series C, Rev., AMT, 5.00%, 05/15/2036 | | | 4,090 | | | | 5,270 | |
City of Los Angeles Department of Airports, Subordinated, | | | | | | | | |
Series C, Rev., AMT, 5.00%, 05/15/2033 | | | 1,330 | | | | 1,650 | |
Series E, Rev., 5.00%, 05/15/2039 | | | 1,510 | | | | 1,918 | |
Series E, Rev., 5.00%, 05/15/2044 | | | 1,000 | | | | 1,261 | |
City of Los Angeles, Department of Airports, Los Angeles International Airport, Rev., AMT, 5.00%, 05/15/2023 | | | 150 | | | | 163 | |
City of Los Angeles, Department of Airports, Senior, | | | | | | | | |
Series B, Rev., 5.00%, 05/15/2026 | | | 2,000 | | | | 2,432 | |
Series B, Rev., 5.00%, 05/15/2034 | | | 1,600 | | | | 2,109 | |
City of Los Angeles, Wastewater System Revenue, Subordinated, Series A, Rev., 5.00%, 06/01/2025 | | | 1,040 | | | | 1,135 | |
City of Roseville, Special Tax, 5.00%, 09/01/2035 | | | 1,160 | | | | 1,384 | |
SEE NOTES TO FINANCIAL STATEMENTS.
| | | | | | | | | | |
| | | | | |
| JUNE 30, 2021 | | SIX CIRCLES TRUST | | | | | | | | 143 |
Six Circles Tax Aware Bond Fund
SCHEDULE OF PORTFOLIO INVESTMENTS
AS OF JUNE 30, 2021 (Unaudited) (continued)
(Amounts in U.S. Dollars, unless otherwise noted)
(Amounts in thousands, except number of Futures contracts)
| | | | | | | | |
| SECURITY DESCRIPTION | | PRINCIPAL
AMOUNT($) | | | VALUE($) | |
Municipal Bonds — continued | | | | | | | | |
California — continued | | | | | | | | |
City of Roseville, Special Tax, Special Tax, 4.00%, 09/01/2040 | | | 1,000 | | | | 1,121 | |
City of San Francisco CA Public Utilities Commission Water Revenue, Regional Water, Series B, Rev., 5.00%, 11/01/2050 | | | 4,235 | | | | 5,246 | |
City of Santa Rosa Wastewater Revenue, Series A, Rev., 5.00%, 09/01/2033 | | | 1,770 | | | | 2,351 | |
Coast Community College District, Series F, GO, 4.00%, 08/01/2022 | | | 100 | | | | 104 | |
Compton Unified School District, Series B, GO, BAM, Zero Coupon, 06/01/2036 | | | 1,400 | | | | 938 | |
Contra Costa Water District, Series F, Rev., 2.00%, 10/01/2021 | | | 125 | | | | 125 | |
County of Sacramento, Airport System Revenue, Senior, Rev., 4.00%, 07/01/2037 | | | 2,000 | | | | 2,412 | |
County of Sacramento, Airport System Revenue, Subordinated, Series E, Rev., 5.00%, 07/01/2029 | | | 1,025 | | | | 1,298 | |
CSCDA Community Improvement Authority, Series A, Rev., 5.00%, 01/01/2054 (e) | | | 3,295 | | | | 3,893 | |
CSCDA Community Improvement Authority, Renaissance at City Center, Series A, Rev., 5.00%, 07/01/2051 (e) | | | 215 | | | | 252 | |
CSCDA Community Improvement Authority, Social Bonds, Rev., 4.00%, 08/01/2056 (e) | | | 410 | | | | 454 | |
Department of Veterans Affairs, Veteran’s Farm & Home Purchase Program, Series A, Rev., 3.00%, 12/01/2050 | | | 990 | | | | 1,080 | |
Deutsche Bank Spears/Lifers Trust, Series DBE-8061, Rev., LOC: Deutsche Bank AG, LIQ: Deutsche Bank AG, 0.49%, 01/01/2060 (e) (z) | | | 5,000 | | | | 5,000 | |
East Bay Municipal Utility District Water System Revenue, Green Bond, Series A, Rev., 5.00%, 06/01/2035 | | | 1,200 | | | | 1,487 | |
East Side Union High School District, 2008 Election, Series D, GO, 5.00%, 08/01/2037 (p) | | | 10,000 | | | | 10,527 | |
Eastern Municipal Water District, | | | | | | | | |
Series A, Rev., 3.00%, 07/01/2024 | | | 340 | | | | 368 | |
Series A, Rev., 3.00%, 07/01/2025 | | | 6,455 | | | | 7,129 | |
Elk Grove Finance Authority, Special Tax, 4.00%, 09/01/2040 | | | 1,280 | | | | 1,436 | |
Foothill-De Anza Community College District, Series C, GO, 5.00%, 08/01/2040 (p) | | | 1,430 | | | | 1,436 | |
Fresno Unified School District, | | | | | | | | |
Series D, GO, 2.00%, 08/01/2023 | | | 220 | | | | 228 | |
Series D, GO, 2.00%, 08/01/2024 | | | 100 | | | | 105 | |
Gilroy School Facilities Financing Authority, General Obligations, Series A, Rev., 5.00%, 08/01/2046 (p) | | | 5,000 | | | | 5,504 | |
Golden State Tobacco Securitization Corp., Series A2, Rev., 5.00%, 06/01/2047 | | | 1,000 | | | | 1,034 | |
| | | | | | | | |
| SECURITY DESCRIPTION | | PRINCIPAL
AMOUNT($) | | | VALUE($) | |
| | | | | | | | |
California — continued | | | | | | | | |
Kern Community College District, GO, BAN, Zero Coupon, 08/01/2023 | | | 280 | | | | 278 | |
Los Angeles Community College District, Series C, GO, 5.00%, 08/01/2021 | | | 2,300 | | | | 2,309 | |
Los Angeles County Development Authority, Sunny Garden Apartments, Rev., HUD, 0.20%, 07/01/2024 (z) | | | 155 | | | | 155 | |
Los Angeles County Metropolitan Transportation Authority, Series A, Rev., 5.00%, 06/01/2023 | | | 305 | | | | 333 | |
Los Angeles County Metropolitan Transportation Authority, Measure R Junior Subordinated, Green Bonds, | | | | | | | | |
Series A, Rev., 5.00%, 06/01/2024 | | | 3,365 | | | | 3,825 | |
Series A, Rev., 5.00%, 06/01/2034 | | | 7,000 | | | | 8,706 | |
Los Angeles County Metropolitan Transportation Authority, Measure R Junior, Green Bond, Subordinated, | | | | | | | | |
Series A, Rev., 5.00%, 06/01/2026 | | | 500 | | | | 608 | |
Series A, Rev., 5.00%, 06/01/2033 | | | 3,000 | | | | 3,989 | |
Los Angeles County Metropolitan Transportation Authority, Prop A, First Tier, Senior, Series A, Rev., 5.00%, 07/01/2021 | | | 1,260 | | | | 1,260 | |
Los Angeles County Metropolitan Transportation Authority, Senior Proposition, Series B, Rev., 5.00%, 07/01/2022 (p) | | | 1,000 | | | | 1,000 | |
Los Angeles County, Metropolitan Transportation Authority, Green Bond, Measure R Junior Subordinated, Series A, Rev., 5.00%, 06/01/2030 | | | 3,000 | | | | 4,028 | |
Los Angeles Department of Water, | | | | | | | | |
Series B, Rev., 4.00%, 07/01/2027 | | | 1,500 | | | | 1,803 | |
Series B, Rev., 4.00%, 07/01/2029 | | | 1,000 | | | | 1,249 | |
Series B, Rev., 5.00%, 07/01/2037 | | | 740 | | | | 938 | |
Series C, Rev., 5.00%, 07/01/2033 | | | 2,765 | | | | 3,706 | |
Los Angeles Department of Water & Power Power System Revenue, | | | | | | | | |
Series A, Rev., 5.25%, 07/01/2049 | | | 9,500 | | | | 12,200 | |
Series B, Rev., 4.00%, 01/01/2022 | | | 120 | | | | 122 | |
Series B, Rev., 5.00%, 07/01/2038 | | | 1,000 | | | | 1,217 | |
Series A, Rev., 5.00%, 07/01/2021 | | | 5,640 | | | | 5,640 | |
Los Angeles Department of Water & Power, Power System Revenue, Series B, Rev., 5.00%, 07/01/2023 | | | 155 | | | | 170 | |
Los Angeles Unified School District, | | | | | | | | |
Series C, GO, 4.00%, 07/01/2040 | | | 1,000 | | | | 1,200 | |
Series C, GO, 5.00%, 07/01/2026 | | | 2,285 | | | | 2,790 | |
Series C, GO, 5.00%, 07/01/2027 | | | 5,000 | | | | 6,282 | |
Series C, GO, 5.00%, 07/01/2028 | | | 1,000 | | | | 1,287 | |
Los Angeles Unified School District, Election 2008, Series B1, GO, BAM, 5.00%, 07/01/2029 | | | 100 | | | | 127 | |
SEE NOTES TO FINANCIAL STATEMENTS.
| | | | | | | | | | |
| | | | | |
| 144 | | | | | | | | SIX CIRCLES TRUST | | JUNE 30, 2021 |
| | | | | | | | |
| SECURITY DESCRIPTION | | PRINCIPAL
AMOUNT($) | | | VALUE($) | |
Municipal Bonds — continued | | | | | | | | |
California — continued | | | | | | | | |
Metropolitan Water District of Southern California, | | | | | | | | |
Rev., 5.00%, 01/01/2038 | | | 3,015 | | | | 3,836 | |
Series A1, Rev., VRDO, 0.01%, 07/01/2021 (z) | | | 2,050 | | | | 2,050 | |
Metropolitan Water District of Southern California, Subordinated, Series B, Rev., 4.00%, 08/01/2021 | | | 1,620 | | | | 1,620 | |
Monterey Peninsula Unified School District, Election 2010, Series A, GO, AGM, 5.75%, 08/01/2041 (p) | | | 6,000 | | | | 6,027 | |
Municipal Improvement Corp. of Los Angeles, Real Property, Series B, Rev., 5.00%, 11/01/2039 | | | 2,535 | | | | 3,300 | |
Natomas Unified School District, | | | | | | | | |
Series A, GO, AGM, 4.00%, 08/01/2045 | | | 7,740 | | | | 8,815 | |
Series A, GO, AGM, 4.00%, 08/01/2049 | | | 2,655 | | | | 3,017 | |
Norman Y Mineta San Jose International Airport SJC, | | | | | | | | |
Series A, Rev., AMT, 5.00%, 03/01/2023 (p) | | | 100 | | | | 108 | |
Series A, Rev., AMT, 5.00%, 03/01/2024 | | | 1,435 | | | | 1,609 | |
Series A, Rev., AMT, 5.00%, 03/01/2031 | | | 1,000 | | | | 1,331 | |
Series A, Rev., AMT, 5.00%, 03/01/2032 | | | 2,000 | | | | 2,649 | |
Northern California Power Agency, Hydroelectric Project, Series A, Rev., 5.00%, 07/01/2023 | | | 145 | | | | 159 | |
Orange County Water District, Interim Obligations, Series A, COP, 2.00%, 08/15/2023 | | | 1,540 | | | | 1,584 | |
Oxnard Union High School District, Series B, GO, 5.00%, 08/01/2045 | | | 3,000 | | | | 3,717 | |
Palomar Health, Rev., 5.00%, 11/01/2039 | | | 4,000 | | | | 4,596 | |
Palomar Health, Capital Appreciation, Electric Of 2004, Series A, GO, AGC, Zero Coupon, 08/01/2028 | | | 500 | | | | 454 | |
Paramount Unified School District, Election of 2006, GO, AGM, 5.00%, 08/01/2046 (p) | | | 2,270 | | | | 2,279 | |
Pomona Unified School District, 2016 Election, Series D, GO, 4.00%, 08/01/2038 | | | 1,745 | | | | 2,128 | |
Port of Oakland, Intermediate Lien, | | | | | | | | |
Series H, Rev., AMT, 5.00%, 05/01/2022 | | | 1,700 | | | | 1,763 | |
Series H, Rev., AMT, 5.00%, 05/01/2027 | | | 2,500 | | | | 3,070 | |
Series H, Rev., AMT, 5.00%, 05/01/2028 | | | 1,875 | | | | 2,355 | |
Series H, Rev., AMT, 5.00%, 05/01/2029 | | | 405 | | | | 519 | |
Port of Oakland, Senior Lien, Series P, Rev., AMT, 5.00%, 05/01/2026 (p) | | | 1,110 | | | | 1,154 | |
Redondo Beach Unified School District, Election of 2008, Series E, GO, 5.50%, 08/01/2034 (p) | | | 1,000 | | | | 1,004 | |
Sacramento Municipal Utility District, Electric, Series H, Rev., 4.00%, 08/15/2040 | | | 2,000 | | | | 2,436 | |
San Bernardino City Unified School District, | | | | | | | | |
Series A, GO, AGM, 5.00%, 08/01/2021 | | | 1,150 | | | | 1,154 | |
Series A, GO, AGM, 5.00%, 08/01/2022 | | | 1,500 | | | | 1,578 | |
| | | | | | | | |
| SECURITY DESCRIPTION | | PRINCIPAL
AMOUNT($) | | | VALUE($) | |
| | | | | | | | |
California — continued | | | | | | | | |
San Diego Community College District, | | | | | | | | |
GO, 4.00%, 08/01/2032 | | | 2,910 | | | | 3,367 | |
GO, 5.00%, 08/01/2025 (p) | | | 10,000 | | | | 10,527 | |
San Diego County Regional Airport Authority, Subordinate Airport Revenue Bonds, | | | | | | | | |
Rev., 5.00%, 07/01/2026 | | | 2,120 | | | | 2,579 | |
Rev., 5.00%, 07/01/2027 | | | 2,000 | | | | 2,495 | |
San Diego County Regional Airport Authority, Subordinated, | | | | | | | | |
Rev., 5.00%, 07/01/2034 | | | 2,000 | | | | 2,617 | |
Series B, Rev., AMT, 5.00%, 07/01/2031 | | | 775 | | | | 947 | |
San Diego County Regional Transportation Commission, Series A, Rev., 5.00%, 10/01/2022 | | | 6,455 | | | | 6,844 | |
San Diego Public Facilities Financing Authority, Series A, Rev., 5.00%, 05/15/2039 | | | 1,565 | | | | 1,880 | |
San Diego Unified School District, | | | | | | | | |
Series L2, GO, 4.00%, 07/01/2022 | | | 1,350 | | | | 1,402 | |
Series R4, GO, 5.00%, 07/01/2026 | | | 2,500 | | | | 2,955 | |
San Diego Unified School District, Measure YY Bonds, Series D2, GO, 5.00%, 07/01/2022 | | | 2,000 | | | | 2,097 | |
San Dieguito School Facilities Financing Authority, Special Tax, 5.00%, 03/01/2031 | | | 1,030 | | | | 1,277 | |
San Francisco Bay Area Rapid Transit District, Election 2004, Green Bond, GO, 5.00%, 08/01/2036 | | | 1,875 | | | | 2,332 | |
San Francisco Bay Area Rapid Transit District, Green Bonds, Series C1, GO, 5.00%, 08/01/2026 | | | 1,000 | | | | 1,226 | |
San Francisco City & County Airport Comm-San Francisco International Airport, | | | | | | | | |
Series A, Rev., 5.00%, 05/01/2031 | | | 205 | | | | 245 | |
Series A, Rev., AMT, 5.00%, 05/01/2032 | | | 2,000 | | | | 2,656 | |
Series C, Rev., 5.00%, 05/01/2046 | | | 1,920 | | | | 2,292 | |
San Francisco Unified School District, | | | | | | | | |
Series B, GO, 4.00%, 06/15/2022 | | | 2,000 | | | | 2,074 | |
Series B, GO, 4.00%, 06/15/2027 | | | 1,000 | | | | 1,195 | |
San Jose Financing Authority, Civic Center Project, Series A, Rev., 5.00%, 06/01/2028 (p) | | | 1,010 | | | | 1,103 | |
San Jose Unified School District, Taxable, GO, 1.01%, 08/01/2027 | | | 1,700 | | | | 1,674 | |
San Mateo Foster City Public Financing Authority, Series B, Rev., 5.00%, 08/01/2025 (w) | | | 2,780 | | | | 3,288 | |
Santa Clara Unified School District, GO, 5.00%, 07/01/2024 | | | 100 | | | | 114 | |
Santa Clara Valley Water District, Water System Utility Improvement, COP, 5.00%, 06/01/2038 | | | 2,495 | | | | 3,261 | |
Saugus Union School District School Facilities Improvement District No. 2014-1, Series C, GO, 3.00%, 08/01/2022 | | | 1,000 | | | | 1,031 | |
SEE NOTES TO FINANCIAL STATEMENTS.
| | | | | | | | | | |
| | | | | |
| JUNE 30, 2021 | | SIX CIRCLES TRUST | | | | | | | | 145 |
Six Circles Tax Aware Bond Fund
SCHEDULE OF PORTFOLIO INVESTMENTS
AS OF JUNE 30, 2021 (Unaudited) (continued)
(Amounts in U.S. Dollars, unless otherwise noted)
(Amounts in thousands, except number of Futures contracts)
| | | | | | | | |
| SECURITY DESCRIPTION | | PRINCIPAL
AMOUNT($) | | | VALUE($) | |
Municipal Bonds — continued | | | | | | | | |
California — continued | | | | | | | | |
Sierra View Local Health Care District, Tulare Co., | | | | | | | | |
Rev., 4.00%, 07/01/2022 | | | 460 | | | | 475 | |
Rev., 4.00%, 07/01/2024 | | | 475 | | | | 522 | |
Southern California Public Power Authority, Canyon Power Project, Series A, Rev., 5.00%, 07/01/2034 | | | 1,000 | | | | 1,169 | |
Southern California Public Power Authority, Green Bond Milford Wind Co., | | | | | | | | |
Rev., 5.00%, 07/01/2023 | | | 135 | | | | 148 | |
Rev., 5.00%, 07/01/2024 | | | 40 | | | | 45 | |
Rev., 5.00%, 07/01/2025 | | | 250 | | | | 296 | |
Southern California Public Power Authority, Subordinated, Series A, Rev., 5.00%, 07/01/2023 | | | 2,195 | | | | 2,404 | |
State of California, | | | | | | | | |
GO, 4.00%, 03/01/2036 | | | 8,850 | | | | 10,817 | |
GO, 4.00%, 11/01/2041 | | | 2,750 | | | | 3,111 | |
GO, 4.00%, 11/01/2045 | | | 2,000 | | | | 2,252 | |
GO, 5.00%, 11/01/2022 | | | 120 | | | | 128 | |
GO, 5.00%, 09/01/2023 (w) | | | 2,525 | | | | 2,768 | |
GO, 5.00%, 12/01/2026 | | | 9,915 | | | | 12,255 | |
GO, 5.00%, 09/01/2029 (w) | | | 1,000 | | | | 1,311 | |
GO, 5.00%, 12/01/2029 | | | 700 | | | | 927 | |
GO, 5.00%, 11/01/2030 | | | 10,910 | | | | 14,691 | |
GO, 5.00%, 12/01/2030 | | | 55 | | | | 74 | |
GO, 5.00%, 10/01/2047 | | | 1,500 | | | | 1,789 | |
GO, AGM, 5.25%, 08/01/2032 | | | 1,000 | | | | 1,413 | |
State of California Department of Water Resources, Water System, Series AT, Rev., (SIFMA Municipal Swap Index + 0.37%), 0.40%, 12/01/2035 (aa) | | | 1,250 | | | | 1,253 | |
State of California, Bid Group, GO, 5.00%, 08/01/2027 | | | 3,065 | | | | 3,751 | |
State of California, Department of Water Resources, Series BB, Rev., 5.00%, 12/01/2027 | | | 1,855 | | | | 2,370 | |
State of California, Veterans Bonds, GO, 5.00%, 12/01/2031 | | | 5,500 | | | | 6,299 | |
Tobacco Securitization Authority of Northern California, Senior Bonds, Sacramento County, Series B1, Rev., 0.45%, 06/01/2030 | | | 15 | | | | 15 | |
Tuolumne Wind Project Authority, Series A, Rev., 5.00%, 01/01/2023 | | | 4,425 | | | | 4,748 | |
Turlock Public Financing Authority Water Revenue, Rev., BAN, 4.00%, 03/01/2027 | | | 18,500 | | | | 18,616 | |
University of California, | | | | | | | | |
Series AR, Rev., 5.00%, 05/15/2041 | | | 2,000 | | | | 2,392 | |
Series BH, Rev., 5.00%, 05/15/2026 | | | 90 | | | | 110 | |
Series S, Rev., 5.00%, 05/15/2026 (w) | | | 1,190 | | | | 1,400 | |
University of California, Limited Proj, | | | | | | | | |
Series K, Rev., 5.00%, 05/15/2035 | | | 1,980 | | | | 2,379 | |
Series M, Rev., 4.00%, 05/15/2047 | | | 1,300 | | | | 1,479 | |
| | | | | | | | |
| SECURITY DESCRIPTION | | PRINCIPAL
AMOUNT($) | | | VALUE($) | |
| | | | | | | | |
California — continued | | | | | | | | |
University of California, Limited Project, Series K, Rev., 4.00%, 05/15/2046 | | | 300 | | | | 338 | |
University of California, Limited Project Revenue Bonds, | | | | | | | | |
Series Q, Rev., 5.00%, 05/15/2032 | | | 350 | | | | 476 | |
Series Q, Rev., 5.00%, 05/15/2035 | | | 1,000 | | | | 1,350 | |
Upper Santa Clara Valley Joint Powers Authority, | | | | | | | | |
Series A, Rev., 4.00%, 08/01/2045 | | | 1,500 | | | | 1,682 | |
Series A, Rev., 4.00%, 08/01/2050 | | | 2,000 | | | | 2,238 | |
Ventura County Public Financing Authority, | | | | | | | | |
Series A, Rev., 5.00%, 11/01/2024 (p) | | | 1,000 | | | | 1,065 | |
Series A, Rev., 5.00%, 11/01/2025 (p) | | | 1,000 | | | | 1,065 | |
Series A, Rev., 5.00%, 11/01/2026 (p) | | | 1,000 | | | | 1,065 | |
| | | | | | | | |
| | |
| | | | | | | 594,683 | |
| | | | | | | | |
Colorado — 1.7% | | | | | | | | |
Adams & Weld Counties School District No. 27J Brighton, GO, 5.00%, 12/01/2042 | | | 1,000 | | | | 1,230 | |
Arapahoe County School District No. 6 Littleton, GO, 5.00%, 12/01/2023 | | | 670 | | | | 746 | |
Brighton Crossing Metropolitan District No. 6, Series A, GO, 5.00%, 12/01/2035 | | | 525 | | | | 591 | |
Castle Oaks Metropolitan District No. 3, GO, AGM, 4.00%, 12/01/2026 | | | 220 | | | | 255 | |
City & County of Denver, Airport System Revenue, | | | | | | | | |
Series A, Rev., AMT, 5.00%, 11/15/2027 | | | 2,000 | | | | 2,498 | |
Series A, Rev., AMT, 5.00%, 11/15/2028 | | | 2,500 | | | | 3,102 | |
Series A, Rev., AMT, 5.00%, 12/01/2030 | | | 3,000 | | | | 3,943 | |
Series B2, Rev., AMT, 5.00%, 11/15/2031 (z) | | | 1,000 | | | | 1,187 | |
Series C, Rev., 2.24%, 11/15/2030 | | | 3,690 | | | | 3,800 | |
City & County of Denver, Airport System Revenue, Subordinated, Series A, Rev., AMT, 5.00%, 12/01/2027 | | | 2,000 | | | | 2,495 | |
City & County of Denver, Airport System Revenue, Subordinated System, Series A, Rev., AMT, 5.00%, 12/01/2043 | | | 3,000 | | | | 3,684 | |
City of Aurora, Water Revenue, Green Bond, Rev., 5.00%, 08/01/2041 | | | 1,800 | | | | 2,166 | |
City of Colorado Springs, Utilities System Revenue, | | | | | | | | |
Series A, Rev., 5.00%, 11/15/2021 | | | 2,500 | | | | 2,545 | |
Series A, Rev., 5.00%, 11/15/2022 | | | 1,195 | | | | 1,275 | |
Series B, Rev., 5.00%, 11/15/2021 | | | 135 | | | | 137 | |
Colorado Bridge Enterprise, Central 70 Project, | | | | | | | | |
Rev., AMT, 4.00%, 12/31/2025 | | | 1,000 | | | | 1,142 | |
Rev., AMT, 4.00%, 12/31/2030 | | | 1,505 | | | | 1,740 | |
Colorado Educational & Cultural Facilities Authority, Aspen View Academy Project, | | | | | | | | |
Rev., 4.00%, 05/01/2036 | | | 175 | | | | 199 | |
Rev., 4.00%, 05/01/2041 | | | 175 | | | | 196 | |
SEE NOTES TO FINANCIAL STATEMENTS.
| | | | | | | | | | |
| | | | | |
| 146 | | | | | | | | SIX CIRCLES TRUST | | JUNE 30, 2021 |
| | | | | | | | |
| SECURITY DESCRIPTION | | PRINCIPAL
AMOUNT($) | | | VALUE($) | |
Municipal Bonds — continued | | | | | | | | |
Colorado — continued | | | | | | | | |
Colorado Health Facilities Authority, Adventhealth Obligated, Rev., 4.00%, 11/15/2038 | | | 2,000 | | | | 2,391 | |
Colorado Health Facilities Authority, Adventhealth Obligated Group, Rev., 5.00%, 11/15/2038 (w) | | | 1,000 | | | | 1,336 | |
Colorado Health Facilities Authority, Childrens Hospital, Series C, Rev., 5.00%, 12/01/2030 | | | 1,000 | | | | 1,201 | |
Colorado Health Facilities Authority, Commonspirit Health, | | | | | | | | |
Series A1, Rev., 5.00%, 08/01/2027 | | | 1,025 | | | | 1,276 | |
Series A1, Rev., 5.00%, 08/01/2034 | | | 1,240 | | | | 1,571 | |
Series A2, Rev., 5.00%, 08/01/2028 | | | 2,215 | | | | 2,817 | |
Series A2, Rev., 5.00%, 08/01/2044 | | | 4,010 | | | | 4,982 | |
Colorado Health Facilities Authority, Covenant Retirement Communities, Series A, Rev., 5.00%, 12/01/2033 (p) | | | 500 | | | | 534 | |
Colorado Health Facilities Authority, Sanford Health, Series A, Rev., 5.00%, 11/01/2029 | | | 1,000 | | | | 1,312 | |
Colorado Health Facilities Authority, SCL Health System, Series A, Rev., 5.00%, 01/01/2030 | | | 1,175 | | | | 1,547 | |
Colorado Housing and Finance Authority, Series H, Rev., GNMA COLL, 3.00%, 05/01/2050 | | | 2,485 | | | | 2,685 | |
Colorado Housing and Finance Authority, Social Bond, Series B, Rev., GNMA, 3.00%, 05/01/2051 | | | 6,815 | | | | 7,434 | |
Colorado Housing and Finance Authority, Social Bonds, Series E, Rev., GNMA, 3.00%, 11/01/2051 | | | 2,150 | | | | 2,355 | |
Copperleaf Metropolitan District No. 2, | | | | | | | | |
GO, BAM, 4.00%, 12/01/2023 | | | 305 | | | | 332 | |
GO, BAM, 4.00%, 12/01/2025 | | | 470 | | | | 539 | |
Crystal Valley, Metropolitan District No. 2, | | | | | | | | |
Series A, GO, AGM, 5.00%, 12/01/2028 | | | 500 | | | | 638 | |
Series A, GO, AGM, 5.00%, 12/01/2029 | | | 405 | | | | 526 | |
Series A, GO, AGM, 5.00%, 12/01/2030 | | | 360 | | | | 475 | |
Denver City & County, School District No. 1, GO, 5.00%, 12/01/2029 | | | 1,000 | | | | 1,228 | |
Denver Urban Renewal Authority, Senior Subordinated Stapleton, Series B, Tax Allocation, 5.00%, 12/01/2025 | | | 500 | | | | 594 | |
E-470 Public Highway Authority, Series B, Rev., (United States SOFR * 0.67 + 0.35%), 0.38%, 09/01/2039 (aa) | | | 1,485 | | | | 1,486 | |
E-470 Public Highway Authority, Capital Appreciation School Reform, Series B, Rev., NATL, Zero Coupon, 09/01/2030 | | | 130 | | | | 111 | |
E-470 Public Highway Authority, Senior, | | | | | | | | |
Series A, Rev., 5.00%, 09/01/2027 | | | 1,000 | | | | 1,244 | |
Series A, Rev., 5.00%, 09/01/2028 | | | 1,000 | | | | 1,273 | |
Series A, Rev., 5.00%, 09/01/2040 | | | 2,775 | | | | 3,139 | |
Great Western Metropolitan District, GO, 4.75%, 12/01/2050 | | | 500 | | | | 547 | |
| | | | | | | | |
| SECURITY DESCRIPTION | | PRINCIPAL
AMOUNT($) | | | VALUE($) | |
| | | | | | | | |
Colorado — continued | | | | | | | | |
Jefferson Center Metropolitan District No. 1, | | | | | | | | |
Series A2, Rev., 4.13%, 12/01/2040 | | | 575 | | | | 614 | |
Series A2, Rev., 4.38%, 12/01/2047 | | | 795 | | | | 850 | |
Jefferson County School District, Series R1, GO, 5.00%, 12/15/2031 | | | 2,000 | | | | 2,570 | |
Poudre Tech Metropolitan District, GO, AGM, 3.00%, 12/01/2022 | | | 420 | | | | 435 | |
Public Authority for Colorado Energy, Rev., 6.50%, 11/15/2038 | | | 3,000 | | | | 4,695 | |
Pueblo County School District No. 70, Series A, GO, 4.00%, 12/01/2026 | | | 1,355 | | | | 1,603 | |
Pueblo Urban Renewal Authority, Everaz Project Tax Increment, Tax Allocation, 4.75%, 12/01/2045 (e) | | | 635 | | | | 729 | |
Regional Transportation District, Denver Transit Partners Eagle, | | | | | | | | |
Series A, Rev., 5.00%, 07/15/2026 | | | 575 | | | | 689 | |
Series A, Rev., 5.00%, 01/15/2027 | | | 1,000 | | | | 1,214 | |
Series A, Rev., 5.00%, 01/15/2032 | | | 1,470 | | | | 1,925 | |
State of Colorado, Series A, COP, 5.00%, 09/01/2026 | | | 1,500 | | | | 1,834 | |
Sterling Ranch Metropolitan District No. 1, GO, 5.00%, 12/01/2040 | | | 500 | | | | 556 | |
Verve Metropolitan District No. 1, GO, 5.00%, 12/01/2036 | | | 1,500 | | | | 1,678 | |
Village Metropolitan District (The), GO, 4.15%, 12/01/2030 | | | 500 | | | | 558 | |
Villages at Johnstown Metropolitan District No. 3, Senior Bond, Series A, GO, 5.00%, 12/01/2040 | | | 585 | | | | 641 | |
| | | | | | | | |
| | |
| | | | | | | 97,095 | |
| | | | | | | | |
Connecticut — 1.4% | | | | | | | | |
City of Bridgeport, Series A, GO, 4.00%, 06/01/2039 | | | 250 | | | | 288 | |
Connecticut Housing Finance Authority, Series E1, Rev., 3.00%, 11/15/2050 | | | 1,955 | | | | 2,118 | |
Connecticut Housing Finance Authority, Mortgage Finance Program, Series A1, Rev., 3.50%, 11/15/2045 | | | 3,865 | | | | 4,303 | |
Connecticut Housing Finance Authority, Social Bonds, Series B1, Rev., GNMA/FNMA/FHLMC, 3.00%, 11/15/2049 | | | 1,595 | | | | 1,750 | |
Connecticut State Health & Educational Facilities Authority, Series A, Rev., 0.38%, 07/01/2035 (w) (z) | | | 6,415 | | | | 6,417 | |
Connecticut State Health & Educational Facilities Authority, Hartford Healthcare, Series A, Rev., 5.00%, 07/01/2041 (p) | | | 1,780 | | | | 1,780 | |
Connecticut State Health & Educational Facilities Authority, Yale New Haven, Series B, Rev., 1.80%, 07/01/2049 (z) | | | 4,000 | | | | 4,144 | |
Connecticut State, Health & Educational Facilities Authority, Yale University, | | | | | | | | |
Series A, Rev., 2.05%, 07/01/2035 (z) | | | 7,025 | | | | 7,029 | |
SEE NOTES TO FINANCIAL STATEMENTS.
| | | | | | | | | | |
| | | | | |
| JUNE 30, 2021 | | SIX CIRCLES TRUST | | | | | | | | 147 |
Six Circles Tax Aware Bond Fund
SCHEDULE OF PORTFOLIO INVESTMENTS
AS OF JUNE 30, 2021 (Unaudited) (continued)
(Amounts in U.S. Dollars, unless otherwise noted)
(Amounts in thousands, except number of Futures contracts)
| | | | | | | | |
| SECURITY DESCRIPTION | | PRINCIPAL
AMOUNT($) | | | VALUE($) | |
Municipal Bonds — continued | | | | | | | | |
Connecticut — continued | | | | | | | | |
Series U2, Rev., 2.00%, 07/01/2033 (z) | | | 250 | | | | 253 | |
Connecticut State Higher Education Supplement Loan Authority, Chesla Loan Program, Series B, Rev., AMT, 5.00%, 11/15/2030 | | | 500 | | | | 645 | |
Connecticut State, Health & Educational Facilities Authority, Series J, Rev., 5.00%, 11/01/2025 (p) | | | 1,000 | | | | 1,016 | |
Connecticut State, Health & Educational Facilities Authority, Bridgeport Hospital, Series D, Rev., 5.00%, 07/01/2025 | | | 3,565 | | | | 3,732 | |
Connecticut State, Health & Educational Facilities Authority, Sacred Heart University, | | | | | | | | |
Series K, Rev., 4.00%, 07/01/2045 | | | 750 | | | | 866 | |
Series K, Rev., 5.00%, 07/01/2037 | | | 950 | | | | 1,219 | |
Connecticut State, Health & Educational Facilities Authority, Yale University, | | | | | | | | |
Series A2, Rev., 2.00%, 07/01/2042 (z) | | | 3,575 | | | | 3,817 | |
Series A, Rev., 1.10%, 07/01/2048 (z) | | | 1,755 | | | | 1,780 | |
Series C1, Rev., 5.00%, 07/01/2040 (z) | | | 2,515 | | | | 3,183 | |
East Hartford Housing Authority, Veterans Terrace Project, Rev., HUD, 0.25%, 06/01/2023 (z) | | | 285 | | | | 285 | |
State of Connecticut, | | | | | | | | |
Series 2021A, GO, 3.00%, 01/15/2022 | | | 1,655 | | | | 1,681 | |
Series 2021A, GO, 3.00%, 01/15/2026 | | | 5,000 | | | | 5,542 | |
Series 2021A, GO, 4.00%, 01/15/2027 | | | 7,000 | | | | 8,243 | |
Series 2021A, GO, 4.00%, 01/15/2028 | | | 3,500 | | | | 4,197 | |
Series A, GO, 4.00%, 03/15/2032 | | | 850 | | | | 945 | |
Series B, GO, 5.00%, 06/15/2026 | | | 1,000 | | | | 1,177 | |
Series E, GO, 5.00%, 10/15/2026 | | | 1,500 | | | | 1,843 | |
State of Connecticut, Special Tax Obligation Bonds, | | | | | | | | |
Rev., 5.00%, 05/01/2025 | | | 1,150 | | | | 1,351 | |
Rev., 5.00%, 05/01/2040 | | | 300 | | | | 388 | |
State of Connecticut, Special Tax Revenue, Transportation Infrastructure, Series A, Rev., 5.00%, 09/01/2031 | | | 1,220 | | | | 1,386 | |
State of Connecticut, Transportation Infrastructure, Series B, Rev., 5.00%, 08/01/2021 | | | 1,405 | | | | 1,410 | |
Town of Hamden, Series A, GO, BAM, 5.00%, 08/01/2032 | | | 500 | | | | 638 | |
University of Connecticut, | | | | | | | | |
Series A, Rev., 5.00%, 02/15/2025 | | | 2,590 | | | | 3,006 | |
Series A, Rev., 5.00%, 08/15/2026 | | | 1,400 | | | | 1,531 | |
Series A, Rev., 5.00%, 01/15/2037 | | | 3,000 | | | | 3,615 | |
| | | | | | | | |
| | |
| | | | | | | 81,578 | |
| | | | | | | | |
Delaware — 0.5% | | | | | | | | |
Delaware State Economic Development Authority, Nrg Energy Project, Rev., 1.25%, 10/01/2045 (z) | | | 4,065 | | | | 4,099 | |
| | | | | | | | |
| SECURITY DESCRIPTION | | PRINCIPAL
AMOUNT($) | | | VALUE($) | |
| | | | | | | | |
Delaware — continued | | | | | | | | |
Delaware State Health Facilities Authority, Christiana Health Care System, Rev., 5.00%, 10/01/2039 | | | 5,345 | | | | 6,859 | |
Delaware Transportation Authority, | | | | | | | | |
Rev., 5.00%, 07/01/2027 | | | 1,000 | | | | 1,256 | |
Rev., 5.00%, 07/01/2033 | | | 2,265 | | | | 3,011 | |
State of Delaware, | | | | | | | | |
GO, 4.00%, 02/01/2031 | | | 3,000 | | | | 3,656 | |
GO, 5.00%, 02/01/2028 | | | 5,020 | | | | 6,412 | |
Series B, GO, 4.00%, 07/01/2024 | | | 1,750 | | | | 1,946 | |
State of Delaware, Unrefunded, Series B, GO, 5.00%, 07/01/2021 | | | 90 | | | | 90 | |
| | | | | | | | |
| | |
| | | | | | | 27,329 | |
| | | | | | | | |
District of Columbia — 2.0% | | | | | | | | |
District of Columbia, | | | | | | | | |
Rev., 5.00%, 06/01/2040 | | | 1,725 | | | | 2,043 | |
Series A, Rev., 4.00%, 03/01/2037 | | | 2,000 | | | | 2,404 | |
Series A, Rev., 4.00%, 03/01/2040 | | | 12,345 | | | | 14,751 | |
Series A, GO, 5.00%, 06/01/2022 | | | 2,175 | | | | 2,272 | |
Series A, Rev., 5.00%, 12/01/2022 | | | 2,000 | | | | 2,138 | |
Series A, Rev., 5.00%, 03/01/2031 | | | 1,500 | | | | 1,965 | |
Series C, Rev., 4.00%, 05/01/2039 | | | 2,500 | | | | 3,018 | |
Series C, Rev., 5.00%, 05/01/2023 | | | 100 | | | | 109 | |
Series C, Rev., 5.00%, 10/01/2030 | | | 4,500 | | | | 5,909 | |
Series D, GO, 5.00%, 06/01/2026 | | | 3,500 | | | | 4,267 | |
District of Columbia Housing Finance Agency, 218 Vine St Project, Rev., 0.30%, 01/01/2040 (z) | | | 2,500 | | | | 2,506 | |
District of Columbia, Association American Medical Colleges, | | | | | | | | |
Series B, Rev., 5.00%, 10/01/2041 (p) | | | 1,850 | | | | 1,872 | |
Series B, Rev., 5.25%, 10/01/2036 (p) | | | 12,425 | | | | 12,583 | |
District of Columbia, Income Tax, Series B, Rev., 5.00%, 12/01/2026 | | | 3,440 | | | | 3,671 | |
District of Columbia, Latin American Montessori, Rev., 4.00%, 06/01/2030 | | | 745 | | | | 849 | |
District of Columbia, National Public Radio, Rev., 4.00%, 04/01/2032 (p) | | | 1,500 | | | | 1,744 | |
District of Columbia, Water & Sewer Authority, Subordinated Lien, Series A, Rev., 5.00%, 10/01/2027 | | | 615 | | | | 652 | |
Metropolitan Washington Airports Authority, | | | | | | | | |
Rev., AMT, 5.00%, 10/01/2026 | | | 1,335 | | | | 1,625 | |
Rev., AMT, 5.00%, 10/01/2029 | | | 2,000 | | | | 2,489 | |
Series A, Rev., AMT, 5.00%, 10/01/2027 | | | 5,000 | | | | 6,231 | |
Series A, Rev., AMT, 5.00%, 10/01/2031 | | | 5,000 | | | | 6,432 | |
Series A, Rev., AMT, 5.00%, 10/01/2032 | | | 2,000 | | | | 2,627 | |
Metropolitan Washington Airports Authority Aviation Revenue, | | | | | | | | |
Series A, Rev., AMT, 5.00%, 10/01/2022 (w) | | | 850 | | | | 900 | |
Series A, Rev., AMT, 5.00%, 10/01/2023 (w) | | | 1,000 | | | | 1,105 | |
SEE NOTES TO FINANCIAL STATEMENTS.
| | | | | | | | | | |
| | | | | |
| 148 | | | | | | | | SIX CIRCLES TRUST | | JUNE 30, 2021 |
| | | | | | | | |
| SECURITY DESCRIPTION | | PRINCIPAL
AMOUNT($) | | | VALUE($) | |
Municipal Bonds — continued | | | | | | | | |
District of Columbia — continued | | | | | | | | |
Series A, Rev., AMT, 5.00%, 10/01/2025 (w) | | | 2,000 | | | | 2,369 | |
Series A, Rev., AMT, 5.00%, 10/01/2026 (w) | | | 1,500 | | | | 1,825 | |
Metropolitan Washington Airports Authority, Airport System Revenue, | | | | | | | | |
Series A, Rev., AMT, 5.00%, 10/01/2028 | | | 2,025 | | | | 2,581 | |
Series A, Rev., AMT, 5.00%, 10/01/2034 | | | 395 | | | | 506 | |
Metropolitan Washington Airports Authority, Dulles Toll Road Revenue, Series B, Rev., 4.00%, 10/01/2049 | | | 1,000 | | | | 1,146 | |
Metropolitan Washington Airports Authority, Dulles Toll Road Revenue, Second Lien, Series C, Rev., AGC, 6.50%, 10/01/2041 | | | 350 | | | | 449 | |
Washington Convention & Sports Authority, | | | | | | | | |
Series A, Rev., 4.00%, 10/01/2034 | | | 1,015 | | | | 1,229 | |
Series A, Rev., 4.00%, 10/01/2036 | | | 330 | | | | 398 | |
Series A, Rev., 5.00%, 10/01/2033 | | | 1,000 | | | | 1,306 | |
Washington Convention & Sports Authority, Senior Lien, | | | | | | | | |
Series B, Tax Allocation, 5.00%, 10/01/2029 | | | 1,000 | | | | 1,301 | |
Series B, Tax Allocation, 5.00%, 10/01/2030 | | | 1,500 | | | | 1,986 | |
Washington Metropolitan Area Transit Authority, | | | | | | | | |
Series A, Rev., 5.00%, 07/15/2026 | | | 1,650 | | | | 2,013 | |
Series A, Rev., 5.00%, 07/15/2031 | | | 4,240 | | | | 5,648 | |
Series A, Rev., 5.00%, 07/15/2037 | | | 2,000 | | | | 2,619 | |
Washington Metropolitan Area Transit Authority, Green Bond, | | | | | | | | |
Series A, Rev., 5.00%, 07/15/2028 | | | 2,280 | | | | 2,931 | |
Series A, Rev., 5.00%, 07/15/2029 | | | 1,540 | | | | 2,024 | |
| | | | | | | | |
| | |
| | | | | | | 114,493 | |
| | | | | | | | |
Florida — 3.3% | | | | | | | | |
Alachua County, Health Facilities Authority, Shands Teaching Hospital and Clinic, Rev., 5.00%, 12/01/2032 | | | 1,000 | | | | 1,295 | |
Belmond Reserve Community Development District, 202 Project, Special Assessment, 4.00%, 05/01/2040 | | | 345 | | | | 371 | |
Belmont II Community Development District, 2020 Assessment Area, | | | | | | | | |
Special Assessment, 2.50%, 12/15/2025 | | | 25 | | | | 25 | |
Special Assessment, 3.13%, 12/15/2030 | | | 125 | | | | 131 | |
Boggy Branch Community Development District, Special Assessment, 2.50%, 05/01/2026 | | | 395 | | | | 399 | |
Brevard County Health Facilities Authority, Health First, Inc., Rev., 5.00%, 04/01/2025 | | | 1,600 | | | | 1,803 | |
Brevard County Housing Finance Authority, Tropical Manor Apartaments, Rev., 0.25%, 12/01/2023 (z) | | | 270 | | | | 270 | |
Capital Projects Finance Authority, Florida University Project, Series A1, Rev., 5.00%, 10/01/2032 | | | 1,350 | | | | 1,707 | |
| | | | | | | | |
| SECURITY DESCRIPTION | | PRINCIPAL
AMOUNT($) | | | VALUE($) | |
| | | | | | | | |
Florida — continued | | | | | | | | |
Capital Trust Agency, Inc., Imagine School at North Manate, Rev., 5.00%, 06/01/2041 (e) | | | 325 | | | | 362 | |
Capital Trust Agency, Inc., Liza Jackson Preparatory School, Rev., 5.00%, 08/01/2040 | | | 150 | | | | 180 | |
Capital Trust Agency, Inc., Lutz Perparatory School, Inc. Project, Series A, Rev., 4.00%, 06/01/2041 | | | 300 | | | | 326 | |
Chapel Creek Community Development District, Special Assessment, 3.00%, 05/01/2031 (e) | | | 260 | | | | 262 | |
Citizens Property Insurance, Inc., Senior Secured, Series A1, Rev., 5.00%, 06/01/2022 | | | 320 | | | | 334 | |
City of Cape Coral, Water & Sewer Revenue, Rev., 5.00%, 10/01/2029 | | | 250 | | | | 314 | |
City of Jacksonville, Series A, Rev., 5.00%, 10/01/2034 | | | 1,250 | | | | 1,645 | |
City of Jacksonville, Brooks Rehabilitation Project, | | | | | | | | |
Rev., 4.00%, 11/01/2034 | | | 500 | | | | 588 | |
Rev., 4.00%, 11/01/2045 | | | 1,500 | | | | 1,726 | |
City of Lake Worth Beach Consolidated Utility Revenue, | | | | | | | | |
Rev., BAM, 5.00%, 10/01/2029 | | | 1,930 | | | | 2,526 | |
Rev., BAM, 5.00%, 10/01/2030 | | | 2,135 | | | | 2,850 | |
City Of South Miami, Health Facilities Authority, Inc., Baptist Health South Florida, Rev., 5.00%, 08/15/2023 | | | 100 | | | | 110 | |
City of Tallahassee, Energy System Revenue, Rev., 5.00%, 10/01/2028 | | | 3,000 | | | | 3,858 | |
County of Broward Airport System Revenue, Series P1, Rev., AMT, 5.00%, 10/01/2026 (p) | | | 1,120 | | | | 1,186 | |
County of Broward, Airport System Revenue, | | | | | | | | |
Rev., AMT, 5.00%, 10/01/2033 | | | 655 | | | | 805 | |
Series A, Rev., AMT, 5.00%, 10/01/2028 | | | 800 | | | | 1,019 | |
Series A, Rev., AMT, 5.00%, 10/01/2036 | | | 2,000 | | | | 2,548 | |
County of Broward, Port Facilities Revenue, Senior Bond, Series B, Rev., AMT, 4.00%, 09/01/2044 | | | 3,000 | | | | 3,468 | |
County of Hillsborough, Rev., 4.00%, 08/01/2034 | | | 4,370 | | | | 5,283 | |
County of Miami-Dade Aviation Revenue, | | | | | | | | |
Series A, Rev., 5.00%, 10/01/2025 | | | 1,250 | | | | 1,484 | |
Series A, Rev., AMT, 5.00%, 10/01/2025 (p) | | | 2,250 | | | | 2,384 | |
Series A, Rev., 5.00%, 10/01/2031 | | | 2,000 | | | | 2,630 | |
Series A, Rev., AMT, 5.00%, 10/01/2031 (p) | | | 1,000 | | | | 1,059 | |
Series A, Rev., AMT, 5.00%, 10/01/2032 (p) | | | 1,000 | | | | 1,059 | |
County of Miami-Dade, Aviation Revenue, | | | | | | | | |
Rev., AMT, 5.00%, 10/01/2028 | | | 7,000 | | | | 7,961 | |
Series A, Rev., AMT, 5.00%, 10/01/2030 | | | 2,000 | | | | 2,327 | |
Series A, Rev., AMT, 5.00%, 10/01/2027 (p) | | | 1,455 | | | | 1,645 | |
SEE NOTES TO FINANCIAL STATEMENTS.
| | | | | | | | | | |
| | | | | |
| JUNE 30, 2021 | | SIX CIRCLES TRUST | | | | | | | | 149 |
Six Circles Tax Aware Bond Fund
SCHEDULE OF PORTFOLIO INVESTMENTS
AS OF JUNE 30, 2021 (Unaudited) (continued)
(Amounts in U.S. Dollars, unless otherwise noted)
(Amounts in thousands, except number of Futures contracts)
| | | | | | | | |
| SECURITY DESCRIPTION | | PRINCIPAL
AMOUNT($) | | | VALUE($) | |
Municipal Bonds — continued | | | | | | | | |
Florida — continued | | | | | | | | |
County of Miami-Dade, Building Better Communities Project, Series A, GO, 4.00%, 07/01/2044 | | | 350 | | | | 418 | |
County of Miami-Dade, Transit System, Sales Tax, | | | | | | | | |
Rev., 5.00%, 07/01/2025 (p) | | | 35 | | | | 37 | |
Rev., 5.00%, 07/01/2042 (p) | | | 5,000 | | | | 5,242 | |
County of Miami-Dade, Water & Sewer System Revenue, | | | | | | | | |
Rev., 5.00%, 10/01/2031 | | | 1,500 | | | | 2,032 | |
Series B, Rev., 5.00%, 10/01/2031 | | | 500 | | | | 594 | |
Series B, Rev., 5.00%, 10/01/2033 | | | 1,000 | | | | 1,184 | |
Series B, Rev., AGM, 5.25%, 10/01/2022 | | | 1,125 | | | | 1,197 | |
Cypress Bluff Community, Development District, Delaware Webb Project, Series A, Special Assessment, 2.70%, 05/01/2025 (e) | | | 190 | | | | 194 | |
DG Farms Community Development District, Special Assessment, 3.75%, 05/01/2040 | | | 400 | | | | 414 | |
Eden Hills Community Development District, Special Assessment, 4.00%, 05/01/2040 | | | 300 | | | | 321 | |
Epperson North Community Development District, Assessment Area, Special Assessment, 2.50%, 05/01/2026 | | | 300 | | | | 303 | |
Florida Development Finance Corp., Series A, Rev., 4.00%, 06/01/2030 | | | 500 | | | | 537 | |
Florida Development Finance Corp., Brightline Florida Passenger Rail, Series B, Rev., AMT, 7.38%, 01/01/2049 (e) | | | 9,500 | | | | 10,446 | |
Florida Development Finance Corp., Discovery High School Project, Series A, Rev., 4.00%, 06/01/2030 (e) | | | 1,500 | | | | 1,635 | |
Florida Development Finance Corp., Mater Academy Project, Series A, Rev., 5.00%, 06/15/2040 (e) | | | 400 | | | | 459 | |
Florida Development Finance Corp., Virgin Trains USA Passenger, | | | | | | | | |
Series A, Rev., AMT, 6.38%, 01/01/2049 (e) (z) | | | 3,225 | | | | 3,323 | |
Series A, Rev., AMT, 6.50%, 01/01/2049 (e) (z) | | | 2,000 | | | | 2,057 | |
Florida Housing Finance Corp., Social Bond, Social Bond, Series 1, Rev., GNMA/FNMA/FHLMC, 3.00%, 01/01/2052 | | | 2,650 | | | | 2,902 | |
Florida Housing Finance Corp., Social Bonds, Series 2, Rev., GNMA/FNMA/FHLMC, 3.00%, 07/01/2051 | | | 12,000 | | | | 13,075 | |
Florida Housing Finance Corp., Valencia Park Apartments, Series A, Rev., 0.25%, 12/01/2023 (z) | | | 2,450 | | | | 2,449 | |
Florida State Board of Governors Florida International University Dormitory Rev, Series A, Rev., BAM, 5.00%, 07/01/2029 | | | 1,900 | | | | 2,458 | |
Greater Orlando Aviation Authority, Series A, Rev., AMT, 5.00%, 10/01/2032 | | | 1,500 | | | | 1,931 | |
| | | | | | | | |
| SECURITY DESCRIPTION | | PRINCIPAL
AMOUNT($) | | | VALUE($) | |
| | | | | | | | |
Florida — continued | | | | | | | | |
Greater Orlando Aviation Authority, Priority Subordinated, | | | | | | | | |
Series A, Rev., AMT, 5.00%, 10/01/2033 | | | 1,500 | | | | 1,843 | |
Series A, Rev., AMT, 5.00%, 10/01/2036 | | | 2,230 | | | | 2,728 | |
Hammock Reserve Community Development District, Assesment Area One Project, Special Assessment, 4.00%, 05/01/2040 | | | 545 | | | | 583 | |
Highlands County Health Facilities Authority, Adventist Health System/Sunbelt Obligated Group, Series A, Rev., VRDO, 0.03%, 07/07/2021 (z) | | | 6,000 | | | | 6,000 | |
Hillsborough County Industrial Development Authority, Tampa General Hospital Project, Series A, Rev., 4.00%, 08/01/2045 | | | 3,275 | | | | 3,882 | |
Hillsborough County, School Board, Master Lease Program, Series A, COP, 5.00%, 07/01/2029 (p) | | | 200 | | | | 210 | |
JEA Electric System, Series 3A, Rev., 5.00%, 10/01/2022 | | | 370 | | | | 392 | |
JEA Electric System Revenue, | | | | | | | | |
Series 3A, Rev., 5.00%, 10/01/2021 | | | 500 | | | | 506 | |
Series 3A, Rev., 5.00%, 10/01/2035 | | | 5,000 | | | | 6,488 | |
Series IIIB, Rev., 5.00%, 10/01/2032 | | | 1,295 | | | | 1,603 | |
JEA Water & Sewer System Revenue, Series A, Rev., 5.00%, 10/01/2025 | | | 1,000 | | | | 1,189 | |
JEA Water & Sewer System Revenue, Subordinated, Series A, Rev., 5.00%, 10/01/2031 | | | 885 | | | | 1,102 | |
Lakewood Ranch Stewardship District, Lorraine Lakes Project, Special Assessment, 3.13%, 05/01/2030 (e) | | | 315 | | | | 329 | |
Lakewood Ranch Stewardship District, Northeast Sector Project, | | | | | | | | |
Special Assessment, 2.50%, 05/01/2025 (e) | | | 1,165 | | | | 1,182 | |
Special Assessment, 3.20%, 05/01/2030 (e) | | | 545 | | | | 571 | |
Special Assessment, 3.50%, 05/01/2040 | | | 925 | | | | 959 | |
Lakewood Ranch Stewardship District, Zario Project, Special Assessment, 2.63%, 05/01/2025 | | | 560 | | | | 571 | |
Miami-Dade County Housing Finance Authority, Platform 3750 LLC, Rev., 0.25%, 08/01/2024 (z) | | | 2,810 | | | | 2,813 | |
Miami-Dade County Housing Finance Authority, Sunset Bay Apartments, Rev., 0.25%, 12/01/2023 (z) | | | 945 | | | | 945 | |
Midtown Miami Community Development District, Series A, Special Assessment, 5.00%, 05/01/2037 | | | 350 | | | | 363 | |
North Powerline Road Community Development District, Special Assessment, 3.63%, 05/01/2040 | | | 1,345 | | | | 1,395 | |
SEE NOTES TO FINANCIAL STATEMENTS.
| | | | | | | | | | |
| | | | | |
| 150 | | | | | | | | SIX CIRCLES TRUST | | JUNE 30, 2021 |
| | | | | | | | |
| SECURITY DESCRIPTION | | PRINCIPAL
AMOUNT($) | | | VALUE($) | |
Municipal Bonds — continued | | | | | | | | |
Florida — continued | | | | | | | | |
Old Hickory Community Development District, Special Assessment, 2.50%, 06/15/2025 | | | 220 | | | | 224 | |
Orange County Health Facilities Authority, Rev., 5.00%, 10/01/2025 | | | 1,970 | | | | 2,333 | |
Orlando Utilities Commission, | | | | | | | | |
Series 2018A, Rev., 5.00%, 10/01/2035 | | | 2,480 | | | | 3,078 | |
Series C, Rev., 5.00%, 10/01/2022 | | | 3,010 | | | | 3,194 | |
Palm Beach County Health Facilities Authority, Retirement Life Communities, Rev., 5.00%, 11/15/2032 | | | 2,270 | | | | 2,707 | |
Parkview at Long Lake Ranch Community Development District, Special Assessment, 4.00%, 05/01/2051 | | | 800 | | | | 844 | |
Pine Ridge Plantation Community Development District, Senior Lien, | | | | | | | | |
Series A1, Special Assessment, AGM, 3.00%, 05/01/2022 | | | 470 | | | | 479 | |
Series A1, Special Assessment, AGM, 3.00%, 05/01/2023 | | | 480 | | | | 500 | |
Pinellas County Housing Finance Authority, Lexington Club Renaissance, Rev., 0.30%, 04/01/2023 (z) | | | 2,000 | | | | 2,000 | |
Saddle Creek Preserve of Polk County Community Development District, Special Assessment, 4.00%, 06/15/2040 | | | 500 | | | | 540 | |
Sarasota County Health Facilities Authority, Sunnyside Village Project, Rev., 5.00%, 05/15/2048 | | | 425 | | | | 479 | |
Sarasota County Public Hospital District, Series B, Rev., VRDO, LOC: Wells Fargo Bank NA, 0.03%, 07/07/2021 (z) | | | 6,035 | | | | 6,035 | |
Sarasota National Community Development District, Special Assessment, 4.00%, 05/01/2039 | | | 615 | | | | 669 | |
School District of Broward County, Series A, COP, 5.00%, 07/01/2025 (p) | | | 2,830 | | | | 2,964 | |
State of Florida Department of Transportation, Rev., 5.00%, 07/01/2024 | | | 430 | | | | 490 | |
State of Florida Department of Transportation Turnpike System Revenue, Series B, Rev., 5.00%, 07/01/2021 | | | 335 | | | | 335 | |
State of Florida Department of Transportation Turnpike System Revenue, Department Transportation, Series A, Rev., 5.00%, 07/01/2023 | | | 1,000 | | | | 1,000 | |
State of Florida Department of Transportation, Indirect Garvee, Series A, Rev., 5.00%, 07/01/2023 | | | 5,000 | | | | 5,476 | |
State of Florida Lottery Revenue, Series A, Rev., 5.00%, 07/01/2022 | | | 1,625 | | | | 1,625 | |
State of Florida, Department of Transportation, Turnpike System Revenue, | | | | | | | | |
Series A, Rev., 5.00%, 07/01/2022 | | | 1,310 | | | | 1,374 | |
Series A, Rev., 5.00%, 07/01/2029 | | | 2,000 | | | | 2,622 | |
| | | | | | | | |
| SECURITY DESCRIPTION | | PRINCIPAL
AMOUNT($) | | | VALUE($) | |
| | | | | | | | |
Florida — continued | | | | | | | | |
Series B, Rev., 5.00%, 07/01/2023 | | | 125 | | | | 137 | |
Stillwater Community Development District, Project 2021, Special Assessment, 3.00%, 06/15/2031 (e) | | | 225 | | | | 230 | |
Stoneybrook South Community Development District, Fox South Assessment Area, | | | | | | | | |
Special Assessment, 2.50%, 12/15/2025 (e) | | | 675 | | | | 684 | |
Special Assessment, 3.00%, 12/15/2030 (e) | | | 475 | | | | 489 | |
Special Assessment, 3.50%, 12/15/2040 (e) | | | 1,030 | | | | 1,070 | |
Storey Park Community Development District, Assessment Area Four Project, | | | | | | | | |
Special Assessment, 2.38%, 06/15/2026 (e) | | | 40 | | | | 40 | |
Special Assessment, 2.88%, 06/15/2031 (e) | | | 60 | | | | 61 | |
Towne Park Community Development District, Assessment Area 3D Project, Special Assessment, 2.63%, 05/01/2025 (e) | | | 500 | | | | 507 | |
Village Community Development District No. 13, | | | | | | | | |
Special Assessment, 1.88%, 05/01/2025 (e) | | | 1,000 | | | | 1,020 | |
Special Assessment, 2.63%, 05/01/2030 (e) | | | 1,500 | | | | 1,580 | |
Villamar Community Development District, Special Assessment, 3.75%, 05/01/2040 | | | 655 | | | | 691 | |
| | | | | | | | |
| | |
| | | | | | | 190,279 | |
| | | | | | | | |
Georgia — 2.3% | | | | | | | | |
Savannah Economic Development Authority, Series A, Rev., Zero Coupon, 12/01/2021 (p) | | | 4,000 | | | | 3,998 | |
Atlanta Urban Residential Finance Authority, Sylvan Senior Apartments, Rev., FHA, 0.41%, 12/01/2025 (z) | | | 575 | | | | 575 | |
Board of Water Light & Sinking Fund Commissioners of The City of Dalton, Combined Utilities Revenue Bonds, | | | | | | | | |
Rev., 4.00%, 03/01/2035 | | | 1,100 | | | | 1,319 | |
Rev., 4.00%, 03/01/2036 | | | 1,000 | | | | 1,196 | |
Rev., 4.00%, 03/01/2037 | | | 1,135 | | | | 1,349 | |
Rev., 4.00%, 03/01/2038 | | | 1,000 | | | | 1,186 | |
Brookhaven Development Authority, Children’s Healthcare of Atlanta Obligated Group, | | | | | | | | |
Series A, Rev., 4.00%, 07/01/2044 | | | 3,000 | | | | 3,534 | |
Series A, Rev., 4.00%, 07/01/2049 | | | 4,150 | | | | 4,846 | |
Carroll County, School District, GO, 5.00%, 04/01/2024 | | | 1,000 | | | | 1,129 | |
City of Atlanta, Airport Passenger Facility, Subordinated Lien, Series C, Rev., 5.00%, 07/01/2040 | | | 3,000 | | | | 3,817 | |
City of Atlanta, Department of Aviation, Series B, Rev., AMT, 5.00%, 07/01/2028 | | | 3,300 | | | | 4,189 | |
SEE NOTES TO FINANCIAL STATEMENTS.
| | | | | | | | | | |
| | | | | |
| JUNE 30, 2021 | | SIX CIRCLES TRUST | | | | | | | | 151 |
Six Circles Tax Aware Bond Fund
SCHEDULE OF PORTFOLIO INVESTMENTS
AS OF JUNE 30, 2021 (Unaudited) (continued)
(Amounts in U.S. Dollars, unless otherwise noted)
(Amounts in thousands, except number of Futures contracts)
| | | | | | | | |
| SECURITY DESCRIPTION | | PRINCIPAL
AMOUNT($) | | | VALUE($) | |
Municipal Bonds — continued | | | | | | | | |
Georgia — continued | | | | | | | | |
City of Atlanta, Department of Aviation, Airport Revenue, Series B, Rev., AMT, 5.00%, 07/01/2031 | | | 1,155 | | | | 1,477 | |
City of Atlanta, Water & Wastewater Revenue, Rev., 5.00%, 11/01/2024 | | | 3,110 | | | | 3,593 | |
Cobb County, Kennestone Hospital Authority, Wellstar Health System, Inc., Rev., 4.00%, 04/01/2033 | | | 500 | | | | 603 | |
Development Authority of Burke County (The), Oglethorpe Power Corp. Scherer Project, Series A, Rev., 1.50%, 01/01/2040 (z) | | | 250 | | | | 256 | |
Development Authority of Monroe County (The), Oglethorpe Power Corporation Scherer Project, Series A, Rev., 1.50%, 01/01/2039 (z) | | | 125 | | | | 128 | |
George L Smith II Congress Center Authority, Convention Center Hotel, | | | | | | | | |
Series 1, Rev., 4.00%, 01/01/2036 | | | 95 | | | | 114 | |
Series 2, Rev., 5.00%, 01/01/2054 (e) | | | 1,000 | | | | 1,198 | |
Georgia Housing & Finance Authority, Series A, Rev., 4.00%, 06/01/2050 | | | 3,860 | | | | 4,339 | |
Georgia State Road & Tollway Authority, | | | | | | | | |
Rev., 5.00%, 06/01/2026 | | | 3,200 | | | | 3,884 | |
Rev., 5.00%, 06/01/2027 | | | 5,250 | | | | 6,557 | |
Rev., 5.00%, 06/01/2028 | | | 5,500 | | | | 7,045 | |
Rev., 5.00%, 06/01/2030 | | | 6,205 | | | | 8,257 | |
Main Street Natural Gas, Inc., | | | | | | | | |
Series A, Rev., LIQ: Royal Bank of Canada, 4.00%, 04/01/2048 (z) | | | 5,000 | | | | 5,364 | |
Series B, Rev., 4.00%, 08/01/2049 (z) | | | 2,675 | | | | 2,981 | |
Series C, Rev., LIQ: Royal Bank of Canada, 4.00%, 08/01/2048 (z) | | | 105 | | | | 113 | |
Series C, Rev., 4.00%, 03/01/2050 (z) | | | 7,350 | | | | 8,498 | |
Metropolitan Atlanta Rapid Transit Authority, Series B, Rev., 5.00%, 07/01/2045 | | | 10,000 | | | | 12,077 | |
Milledgeville & Baldwin County Development Authority, Georgia College & State University Projects, | | | | | | | | |
Rev., 5.00%, 06/15/2024 | | | 470 | | | | 533 | |
Rev., 5.00%, 06/15/2025 | | | 360 | | | | 423 | |
Municipal Electric Authority of Georgia, Combined Cycle Project, | | | | | | | | |
Series A, Rev., 4.00%, 11/01/2023 | | | 2,750 | | | | 2,984 | |
Series A, Rev., 5.00%, 11/01/2027 | | | 250 | | | | 314 | |
Series A, Rev., 5.00%, 11/01/2029 | | | 250 | | | | 327 | |
Municipal Electric Authority of Georgia, General Resolution Project, Series A, Rev., 4.00%, 01/01/2037 | | | 1,125 | | | | 1,337 | |
Municipal Electric Authority of Georgia, Project One, Subordinated, | | | | | | | | |
Series B, Rev., 4.00%, 01/01/2039 | | | 1,400 | | | | 1,656 | |
Series B, Rev., 5.00%, 01/01/2023 | | | 1,000 | | | | 1,071 | |
Northwest Georgia Housing Authority, Dallas Manor Apartments Projects, Rev., HUD, 0.25%, 10/01/2024 (z) | | | 260 | | | | 260 | |
| | | | | | | | |
| SECURITY DESCRIPTION | | PRINCIPAL
AMOUNT($) | | | VALUE($) | |
| | | | | | | | |
Georgia — continued | | | | | | | | |
Private Colleges & Universities Authority, Emory University, Series A, Rev., 5.00%, 09/01/2041 (p) | | | 2,000 | | | | 2,016 | |
Private Colleges & Universities Authority, Various Emory University, Series B, Rev., (SIFMA Municipal Swap Index + 0.42%), 0.45%, 10/01/2039 (aa) | | | 1,000 | | | | 1,000 | |
Richmond County Development Authority, Subordinated, Series C, Rev., Zero Coupon, 12/01/2021 (p) | | | 3,645 | | | | 3,643 | |
Savannah Economic Development Authority, International Paper Company Project, Rev., 1.90%, 08/01/2024 | | | 150 | | | | 157 | |
State of Georgia, | | | | | | | | |
Series A1, GO, 5.00%, 02/01/2024 | | | 100 | | | | 112 | |
Series A, GO, 5.00%, 08/01/2023 | | | 1,010 | | | | 1,111 | |
Series C, GO, 4.00%, 09/01/2021 | | | 95 | | | | 96 | |
Series C, GO, 4.00%, 10/01/2022 | | | 2,015 | | | | 2,113 | |
Series E, GO, 5.00%, 12/01/2021 | | | 1,865 | | | | 1,903 | |
State of Georgia, Group 1, Series A, GO, 5.00%, 08/01/2026 | | | 2,500 | | | | 3,065 | |
State of Georgia, Group 2, Series A, GO, 4.00%, 08/01/2034 | | | 2,000 | | | | 2,475 | |
State of Georgia, Tranche 2, Series A, GO, 5.00%, 07/01/2030 | | | 2,000 | | | | 2,623 | |
Tender Option Bond Trust Receipts/Certificates, Series 2017-ZF0589, Rev., LIQ: Bank of America NA, 0.00%, 06/01/2049 (e) (z) | | | 3,750 | | | | 3,750 | |
Thomaston Housing Authority, Fairview Apartments Project, Series A, Rev., FNMA HUD, 0.34%, 12/01/2023 (z) | | | 4,250 | | | | 4,256 | |
Valdosta & Lowndes County Hospital Authority, South Medical Center Project, Series B, Rev., CNTY GTD, 5.00%, 10/01/2041 (p) | | | 4,100 | | | | 4,150 | |
| | | | | | | | |
| | |
| | | | | | | 134,997 | |
| | | | | | | | |
Guam — 0.0% (g) | | | | | | | | |
Territory of Guam, Series F, Rev., 4.00%, 01/01/2042 (w) | | | 1,000 | | | | 1,139 | |
| | | | | | | | |
Hawaii — 0.5% | | | | | | | | |
City & County Honolulu, Wastewater System Revenue, Senior, Series A, Rev., 4.50%, 07/01/2030 (p) | | | 2,000 | | | | 2,000 | |
City & County of Honolulu, | | | | | | | | |
Series A, GO, 5.00%, 10/01/2025 | | | 15 | | | | 18 | |
Series A, GO, 5.00%, 09/01/2027 | | | 30 | | | | 38 | |
City & County of Honolulu, Wastewater System, Senior, Series A, Rev., 4.50%, 07/01/2028 (p) | | | 1,000 | | | | 1,000 | |
County of Maui, GO, 5.00%, 03/01/2028 | | | 1,175 | | | | 1,494 | |
State of Hawaii, | | | | | | | | |
Series EA, GO, 5.00%, 12/01/2023 | | | 2,000 | | | | 2,040 | |
Series FE, GO, 5.00%, 10/01/2021 | | | 2,500 | | | | 2,530 | |
Series FG, GO, 4.00%, 10/01/2032 | | | 2,000 | | | | 2,328 | |
SEE NOTES TO FINANCIAL STATEMENTS.
| | | | | | | | | | |
| | | | | |
| 152 | | | | | | | | SIX CIRCLES TRUST | | JUNE 30, 2021 |
| | | | | | | | |
| SECURITY DESCRIPTION | | PRINCIPAL
AMOUNT($) | | | VALUE($) | |
Municipal Bonds — continued | | | | | | | | |
Hawaii — continued | | | | | | | | |
State of Hawaii Airports System Revenue, | | | | | | | | |
Rev., AMT, 5.00%, 07/01/2021 (p) | | | 2,500 | | | | 2,500 | |
Series A, Rev., AMT, 5.00%, 07/01/2032 | | | 1,500 | | | | 1,879 | |
Series A, Rev., AMT, 5.00%, 07/01/2033 | | | 1,630 | | | | 2,037 | |
Series B, Rev., 5.00%, 07/01/2026 | | | 1,250 | | | | 1,521 | |
State of Hawaii Harbor System Revenue, | | | | | | | | |
Series A, Rev., AMT, 4.00%, 07/01/2031 | | | 250 | | | | 302 | |
Series A, Rev., AMT, 4.00%, 07/01/2032 | | | 500 | | | | 603 | |
Series A, Rev., AMT, 4.00%, 07/01/2033 | | | 750 | | | | 902 | |
Series A, Rev., AMT, 4.00%, 07/01/2034 | | | 3,555 | | | | 4,261 | |
Series A, Rev., AMT, 5.00%, 07/01/2027 | | | 250 | | | | 309 | |
Series A, Rev., AMT, 5.00%, 07/01/2028 | | | 500 | | | | 632 | |
Series A, Rev., AMT, 5.00%, 07/01/2029 | | | 250 | | | | 323 | |
Series C, Rev., 4.00%, 07/01/2032 | | | 200 | | | | 246 | |
State of Hawaii State Highway Fund, Rev., 5.00%, 01/01/2029 | | | 1,000 | | | | 1,297 | |
State of Hawaii, Airports System Revenue, Series D, Rev., 5.00%, 07/01/2030 | | | 1,000 | | | | 1,334 | |
| | | | | | | | |
| | |
| | | | | | | 29,594 | |
| | | | | | | | |
Idaho — 0.1% | | | | | | | | |
Idaho Health Facilities Authority, Trinity Health Credit Group, Series A, Rev., 5.00%, 12/01/2047 | | | 1,715 | | | | 2,123 | |
Idaho Housing & Finance Association, Garvee, | | | | | | | | |
Series A, Rev., 5.00%, 07/15/2029 | | | 280 | | | | 365 | |
Series A, Rev., 5.00%, 07/15/2030 | | | 1,250 | | | | 1,658 | |
Series A, Rev., 5.00%, 07/15/2031 | | | 750 | | | | 1,012 | |
| | | | | | | | |
| | |
| | | | | | | 5,158 | |
| | | | | | | | |
Illinois — 5.8% | | | | | | | | |
Champaign County Community Unit School District No. 4 Champaign, GO, 5.00%, 01/01/2029 | | | 1,765 | | | | 2,109 | |
Chicago Board of Education, | | | | | | | | |
Series A, GO, AGM, 5.00%, 12/01/2026 | | | 10 | | | | 12 | |
Series A, GO, 5.00%, 12/01/2041 | | | 1,000 | | | | 1,277 | |
Chicago Board of Education, Capital Appreciation School Reform, | | | | | | | | |
Series A, GO, NATL, Zero Coupon, 12/01/2024 | | | 480 | | | | 465 | |
Series A, GO, NATL, Zero Coupon, 12/01/2029 | | | 1,005 | | | | 864 | |
Series B1, GO, NATL, Zero Coupon, 12/01/2022 | | | 1,105 | | | | 1,096 | |
Series B1, GO, NATL, Zero Coupon, 12/01/2028 | | | 200 | | | | 177 | |
Series B1, GO, NATL, Zero Coupon, 12/01/2029 | | | 1,105 | | | | 950 | |
Chicago Board of Education, Dedicated, Series C, GO, 5.00%, 12/01/2034 | | | 2,000 | | | | 2,450 | |
Chicago O’Hare International Airport, General Senior Lien, Series B, Rev., AMT, 5.00%, 01/01/2025 (p) | | | 1,200 | | | | 1,228 | |
| | | | | | | | |
| SECURITY DESCRIPTION | | PRINCIPAL
AMOUNT($) | | | VALUE($) | |
| | | | | | | | |
Illinois — continued | | | | | | | | |
Chicago O’Hare International Airport, Senior Lien, | | | | | | | | |
Series A, Rev., 4.00%, 01/01/2035 | | | 3,500 | | | | 4,172 | |
Series A, Rev., BAM, 4.00%, 01/01/2036 | | | 3,000 | | | | 3,601 | |
Series A, Rev., 5.00%, 01/01/2035 | | | 6,000 | | | | 7,743 | |
Chicago Transit Authority Capital Grant Receipts Revenue, Section 5307, Rev., 5.00%, 06/01/2023 | | | 700 | | | | 763 | |
Chicago Transit Authority Capital Grant Receipts Revenue, Section 5357, Rev., 5.00%, 06/01/2028 | | | 1,000 | | | | 1,269 | |
Chicago Transit Authority, Sales Tax Receipts Fund, | | | | | | | | |
Rev., AGM, 5.00%, 12/01/2044 | | | 1,000 | | | | 1,142 | |
Rev., 5.25%, 12/01/2036 (p) | | | 10,600 | | | | 10,826 | |
Rev., 5.25%, 12/01/2049 | | | 3,000 | | | | 3,466 | |
Series A, Rev., 5.00%, 12/01/2045 | | | 6,750 | | | | 8,437 | |
City of Berwyn, Series A, GO, 5.00%, 12/01/2029 | | | 1,000 | | | | 1,152 | |
City of Chicago, | | | | | | | | |
Series 20023B, GO, 5.00%, 01/01/2024 | | | 30 | | | | 33 | |
Series A, GO, 5.00%, 01/01/2027 | | | 2,180 | | | | 2,401 | |
Series A, GO, 5.50%, 01/01/2033 | | | 1,815 | | | | 2,084 | |
Series A, GO, 6.00%, 01/01/2038 | | | 9,260 | | | | 11,619 | |
Series C, GO, Zero Coupon, 01/01/2027 | | | 500 | | | | 444 | |
Series C, GO, 5.00%, 01/01/2025 | | | 45 | | | | 52 | |
Series C, GO, 5.00%, 01/01/2028 | | | 1,450 | | | | 1,701 | |
City of Chicago Waterworks Revenue, Second Lien Project, Rev., 5.00%, 11/01/2023 | | | 100 | | | | 110 | |
City of Chicago, Capital Appreciation City Colleges, GO, NATL, Zero Coupon, 01/01/2031 | | | 75 | | | | 59 | |
City of Chicago, Waterworks Revenue, Second Lien, Rev., 4.00%, 11/01/2021 | | | 200 | | | | 202 | |
City of Granite City, Waste Management, Inc., Rev., AMT, 1.25%, 05/01/2027 | | | 5,000 | | | | 5,031 | |
Cook County Community Consolidated School District No. 34 Glenview, GO, 4.00%, 12/01/2029 | | | 2,000 | | | | 2,464 | |
Cook County High School District No. 214 Arlington Heights, GO, 4.00%, 12/01/2026 | | | 1,910 | | | | 2,236 | |
Cook County, Community School District No. 97, Oak Park, GO, 4.00%, 01/01/2034 | | | 2,000 | | | | 2,343 | |
Cook County, Community Unit School District No. 401, Elmwood Park, | | | | | | | | |
GO, 3.00%, 12/01/2021 | | | 715 | | | | 723 | |
GO, 3.00%, 12/01/2022 | | | 500 | | | | 519 | |
County of Cook, | | | | | | | | |
Series A, GO, AGM, 5.00%, 11/15/2026 | | | 1,000 | | | | 1,225 | |
Series A, GO, 5.00%, 11/15/2026 | | | 3,900 | | | | 4,754 | |
Series A, GO, 5.00%, 11/15/2028 | | | 2,300 | | | | 2,934 | |
County of Cook, Sales Tax Revenue, Series A, Rev., 5.00%, 11/15/2038 | | | 1,240 | | | | 1,607 | |
SEE NOTES TO FINANCIAL STATEMENTS.
| | | | | | | | | | |
| | | | | |
| JUNE 30, 2021 | | SIX CIRCLES TRUST | | | | | | | | 153 |
Six Circles Tax Aware Bond Fund
SCHEDULE OF PORTFOLIO INVESTMENTS
AS OF JUNE 30, 2021 (Unaudited) (continued)
(Amounts in U.S. Dollars, unless otherwise noted)
(Amounts in thousands, except number of Futures contracts)
| | | | | | | | |
| SECURITY DESCRIPTION | | PRINCIPAL
AMOUNT($) | | | VALUE($) | |
Municipal Bonds — continued | | | | | | | | |
Illinois — continued | | | | | | | | |
Illinois Finance Authority, Series B2, Rev., 5.00%, 05/15/2050 (z) | | | 2,550 | | | | 3,058 | |
Illinois Finance Authority, Advocate Health Care, Rev., 5.00%, 06/01/2042 (p) | | | 1,000 | | | | 1,044 | |
Illinois Finance Authority, Advocate Health Care Network Project, | | | | | | | | |
Rev., 4.00%, 11/01/2030 | | | 2,000 | | | | 2,258 | |
Rev., 4.00%, 06/01/2047 (p) | | | 2,550 | | | | 2,638 | |
Rev., 5.00%, 05/01/2022 | | | 1,000 | | | | 1,040 | |
Illinois Finance Authority, American Water Capital Corp. Project, Rev., 0.70%, 05/01/2040 (z) | | | 895 | | | | 896 | |
Illinois Finance Authority, Ann & Robert H. Lurie Children’s Hospital of Chicago, Rev., 5.00%, 08/15/2035 | | | 500 | | | | 612 | |
Illinois Finance Authority, Ascension Health, Series A, Rev., 5.00%, 11/15/2037 (p) | | | 1,530 | | | | 1,558 | |
Illinois Finance Authority, Ascension Health Credit, Series C, Rev., 5.00%, 02/15/2036 | | | 1,355 | | | | 1,646 | |
Illinois Finance Authority, Bradley University, Series B, Rev., VRDO, LOC: PNC Bank NA, 0.03%, 07/07/2021 (z) | | | 6,000 | | | | 6,000 | |
Illinois Finance Authority, Centegra Health System, | | | | | | | | |
Series A, Rev., 5.00%, 09/01/2025 | | | 1,495 | | | | 1,713 | |
Series A, Rev., 5.00%, 09/01/2027 | | | 1,200 | | | | 1,362 | |
Illinois Finance Authority, Clean Water Initiative, Rev., 5.00%, 07/01/2021 | | | 7,305 | | | | 7,305 | |
Illinois Finance Authority, Green Bond, Rev., 4.00%, 07/01/2038 | | | 4,160 | | | | 5,071 | |
Illinois Finance Authority, Green Bonds, | | | | | | | | |
Rev., 4.00%, 01/01/2033 | | | 8,190 | | | | 10,143 | |
Rev., 4.00%, 07/01/2040 | | | 1,500 | | | | 1,822 | |
Rev., 5.00%, 01/01/2022 | | | 1,500 | | | | 1,536 | |
Illinois Finance Authority, Health Services Facility Lease Revenue, Provident Group UIC Surgery, | | | | | | | | |
Rev., 4.00%, 10/01/2040 | | | 1,750 | | | | 2,032 | |
Rev., 5.00%, 10/01/2032 | | | 750 | | | | 964 | |
Rev., 5.00%, 10/01/2034 | | | 125 | | | | 159 | |
Illinois Finance Authority, Illinois State Clean Water Initiative, Green Bond, | | | | | | | | |
Rev., 5.00%, 01/01/2022 | | | 220 | | | | 225 | |
Rev., 5.00%, 07/01/2023 | | | 1,650 | | | | 1,809 | |
Rev., 5.00%, 01/01/2028 | | | 100 | | | | 127 | |
Illinois Finance Authority, Mercy Health Corp., Rev., 5.00%, 12/01/2040 | | | 1,080 | | | | 1,286 | |
Illinois Finance Authority, Northshore University Health System, | | | | | | | | |
Rev., 5.00%, 08/15/2031 | | | 1,000 | | | | 1,328 | |
Rev., 5.00%, 08/15/2035 | | | 1,500 | | | | 1,967 | |
Illinois Finance Authority, Northwest Community Hospital, Series A, Rev., 5.00%, 07/01/2027 | | | 1,000 | | | | 1,215 | |
| | | | | | | | |
| SECURITY DESCRIPTION | | PRINCIPAL
AMOUNT($) | | | VALUE($) | |
| | | | | | | | |
Illinois — continued | | | | | | | | |
Illinois Finance Authority, OSF Healthcare System, Series B1, Rev., 5.00%, 05/15/2050 (z) | | | 2,250 | | | | 2,538 | |
Illinois Finance Authority, Plymouth Place, Inc., Rev., 5.00%, 05/15/2041 | | | 400 | | | | 478 | |
Illinois Finance Authority, Presbyterian Homes, Series B, Rev., (SIFMA Municipal Swap Index + 0.70%), 0.73%, 05/01/2042 (aa) | | | 180 | | | | 180 | |
Illinois Finance Authority, Southern Illinois Healthcare, Rev., 5.00%, 03/01/2031 | | | 2,135 | | | | 2,564 | |
Illinois Finance Authority, Swedish Covenant Hospital, Series A, Rev., 5.00%, 08/15/2026 (p) | | | 1,690 | | | | 2,060 | |
Illinois Finance Authority, The Carle Foundation, | | | | | | | | |
Series A, Rev., 5.00%, 08/15/2031 | | | 2,530 | | | | 3,421 | |
Series B, Rev., 5.00%, 08/15/2053 (z) | | | 285 | | | | 385 | |
Illinois Finance Authority, University of Chicago, | | | | | | | | |
Series A, Rev., 5.00%, 10/01/2025 (w) | | | 545 | | | | 647 | |
Series A, Rev., 5.00%, 10/01/2028 (w) | | | 3,000 | | | | 3,864 | |
Series A, Rev., 5.00%, 10/01/2034 (w) | | | 1,750 | | | | 2,503 | |
Series A, Rev., 5.00%, 10/01/2035 (w) | | | 1,400 | | | | 2,036 | |
Illinois Housing Development Authority, Series D, Rev., GNMA/FNMA/FHLMC COLL, 3.75%, 04/01/2050 | | | 1,445 | | | | 1,603 | |
Illinois Housing Development Authority, Concord Commons, Rev., 0.25%, 02/01/2024 (z) | | | 1,745 | | | | 1,745 | |
Illinois Housing Development Authority, Social Bonds, | | | | | | | | |
Series A, Rev., GNMA/FNMA/FHLMC COLL, 3.00%, 04/01/2051 | | | 4,480 | | | | 4,902 | |
Series B, Rev., GNMA/FNMA/FHLMC COLL, 3.00%, 04/01/2051 | | | 460 | | | | 506 | |
Illinois State Toll Highway Authority, | | | | | | | | |
Series A, Rev., 5.00%, 01/01/2044 | | | 1,000 | | | | 1,256 | |
Series B, Rev., 5.00%, 01/01/2029 | | | 100 | | | | 120 | |
Series C, Rev., 5.00%, 01/01/2023 | | | 60 | | | | 64 | |
Series A, Rev., 5.00%, 01/01/2028 | | | 185 | | | | 217 | |
Illinois State Toll Highway Authority, Senior, | | | | | | | | |
Series A, Rev., 5.00%, 12/01/2031 | | | 5,115 | | | | 6,084 | |
Series B, Rev., 5.00%, 01/01/2028 | | | 7,020 | | | | 8,866 | |
Series B, Rev., 5.00%, 01/01/2041 | | | 2,000 | | | | 2,380 | |
Illinois State Toll Highway Authority, Toll Highway Revenue, | | | | | | | | |
Series A, Rev., 5.00%, 01/01/2036 | | | 1,000 | | | | 1,324 | |
Series A, Rev., 5.00%, 01/01/2037 | | | 1,555 | | | | 2,053 | |
Illinois State Toll Highway Authority, Toll Highway Revenue, Senior, | | | | | | | | |
Rev., 5.00%, 01/01/2027 | | | 500 | | | | 615 | |
Rev., 5.00%, 01/01/2031 | | | 1,000 | | | | 1,312 | |
Macon County, School District No. 61 Decatur, | | | | | | | | |
GO, AGM, 4.00%, 01/01/2040 | | | 1,420 | | | | 1,578 | |
GO, AGM, 4.00%, 01/01/2045 | | | 3,000 | | | | 3,308 | |
Metropolitan Pier & Exposition Authority, Rev., NATL, Zero Coupon, 12/15/2034 | | | 1,500 | | | | 1,099 | |
Metropolitan Pier & Exposition Authority Revenue, Mccormick Place Expansion, Rev., 5.00%, 06/15/2042 | | | 2,500 | | | | 3,208 | |
SEE NOTES TO FINANCIAL STATEMENTS.
| | | | | | | | | | |
| | | | | |
| 154 | | | | | | | | SIX CIRCLES TRUST | | JUNE 30, 2021 |
| | | | | | | | |
| SECURITY DESCRIPTION | | PRINCIPAL
AMOUNT($) | | | VALUE($) | |
Municipal Bonds — continued | | | | | | | | |
Illinois — continued | | | | | | | | |
Metropolitan Pier & Exposition Authority, Capital Appreciation, Mccormick, Series B, Rev., AGM, Zero Coupon, 06/15/2027 | | | 660 | | | | 607 | |
Metropolitan Water Reclamation District of Greater Chicago, Green Bonds, Series E, GO, 5.00%, 12/01/2036 | | | 2,065 | | | | 2,513 | |
Northern Illinois University, Board of Trustees Auxiliary Facilities, Rev., BAM, 4.00%, 10/01/2033 (w) | | | 1,000 | | | | 1,191 | |
Railsplitter Tobacco Settlement Authority, | | | | | | | | |
Rev., 5.00%, 06/01/2022 | | | 1,250 | | | | 1,304 | |
Rev., 5.00%, 06/01/2023 | | | 130 | | | | 142 | |
Regional Transportation Authority, Series A, Rev., NATL, 6.00%, 07/01/2025 | | | 25 | | | | 30 | |
Sales Tax Securitization Corp., Second Lien, Series A, Rev., BAM, 5.00%, 01/01/2037 | | | 750 | | | | 960 | |
Southern Illinois University, Housing, Rev., BAM, 5.00%, 04/01/2032 | | | 650 | | | | 844 | |
Southwestern Illinois Development Authority, Southwestern Il Flood Prevention, Rev., 4.00%, 10/15/2035 | | | 1,215 | | | | 1,449 | |
State of Illinois, | | | | | | | | |
GO, 4.00%, 06/01/2036 | | | 485 | | | | 536 | |
GO, 5.00%, 07/01/2023 | | | 1,000 | | | | 1,091 | |
GO, 5.00%, 08/01/2024 | | | 850 | | | | 894 | |
GO, 5.00%, 02/01/2026 | | | 1,000 | | | | 1,185 | |
GO, 5.00%, 01/01/2028 | | | 6,810 | | | | 7,968 | |
GO, 5.00%, 02/01/2028 | | | 3,000 | | | | 3,615 | |
GO, 5.00%, 01/01/2029 | | | 2,085 | | | | 2,427 | |
GO, 5.00%, 02/01/2029 | | | 2,000 | | | | 2,394 | |
GO, 5.25%, 02/01/2030 | | | 2,000 | | | | 2,213 | |
GO, 5.50%, 05/01/2030 | | | 2,000 | | | | 2,662 | |
Series A, GO, 4.00%, 01/01/2026 | | | 1,050 | | | | 1,069 | |
Series A, GO, 5.00%, 10/01/2021 | | | 80 | | | | 81 | |
Series A, GO, 5.00%, 10/01/2023 | | | 300 | | | | 330 | |
Series A, GO, 5.00%, 11/01/2026 | | | 2,500 | | | | 3,018 | |
Series A, GO, 5.00%, 03/01/2027 | | | 2,355 | | | | 2,861 | |
Series A, GO, 5.00%, 03/01/2028 | | | 2,500 | | | | 3,099 | |
Series B, GO, 5.00%, 10/01/2026 | | | 1,000 | | | | 1,204 | |
Series B, GO, 5.00%, 10/01/2029 | | | 1,000 | | | | 1,277 | |
Series B, GO, 5.00%, 10/01/2031 | | | 5,000 | | | | 6,454 | |
Series B, GO, 5.50%, 05/01/2039 | | | 250 | | | | 324 | |
Series C, GO, 5.00%, 11/01/2029 | | | 2,900 | | | | 3,539 | |
Series D, GO, 5.00%, 11/01/2021 | | | 4,515 | | | | 4,587 | |
Series D, GO, 5.00%, 11/01/2026 | | | 1,980 | | | | 2,390 | |
Series D, GO, 5.00%, 11/01/2027 | | | 6,130 | | | | 7,546 | |
Series D, GO, 5.00%, 11/01/2028 | | | 2,750 | | | | 3,368 | |
State of Illinois, Build America Bonds, GO, 7.35%, 07/01/2035 | | | 4,000 | | | | 5,167 | |
Tender Option Bond Trust Receipts/Certificates, Series 2018-XL0082, Rev., VRDO, LIQ: Barclays Bank plc, 0.08%, 07/07/2021 (e) (z) | | | 15,370 | | | | 15,370 | |
| | | | | | | | |
| SECURITY DESCRIPTION | | PRINCIPAL
AMOUNT($) | | | VALUE($) | |
| | | | | | | | |
Illinois — continued | | | | | | | | |
University of Illinois, Auxiliary Facilities System, | | | | | | | | |
Series A, Rev., 5.00%, 04/01/2022 | | | 300 | | | | 311 | |
Series A, Rev., 5.00%, 04/01/2025 | | | 140 | | | | 157 | |
Village of Rosemont, Series A, GO, BAM, 5.00%, 12/01/2042 | | | 10,000 | | | | 12,591 | |
Will Grundy Etc Counties Community College District No. 525, Alternative Revenue Source, Series B, GO, 5.50%, 06/01/2031 (p) | | | 3,375 | | | | 3,801 | |
| | | | | | | | |
| | |
| | | | | | | 332,039 | |
| | | | | | | | |
Indiana — 2.4% | | | | | | | | |
City of Franklin, Otterbeit Homes, Series B, Rev., 5.00%, 07/01/2023 | | | 115 | | | | 125 | |
City of Mount Vernon, Southern Industry Gas And Electric Company, Rev., AMT, 0.88%, 09/01/2055 (z) | | | 250 | | | | 250 | |
City of Rockport, Industry Pollution Control, Michigan Power Company Project, Rev., 2.75%, 06/01/2025 | | | 100 | | | | 109 | |
City of Rockport, Rockport Pollution Control, Aep Generating Company Project, Series A, Rev., 1.35%, 07/01/2025 (z) | | | 20 | | | | 20 | |
City of Whiting, BP Products North America, Inc. Project, Rev., AMT, 5.00%, 11/01/2047 (z) | | | 5,000 | | | | 5,776 | |
City of Whiting, Whiting Industry Environmental Facilities, Bp Products North America, Inc., Series A, Rev., AMT, 5.00%, 03/01/2046 (z) | | | 1,585 | | | | 1,711 | |
County of Knox, Good Samaritan Hospital, Series A, Rev., 5.00%, 04/01/2037 | | | 1,200 | | | | 1,234 | |
Indiana Finance Authority, Citizens Water Westfield Project, Series A, Rev., 4.00%, 10/01/2048 | | | 1,500 | | | | 1,748 | |
Indiana Finance Authority, Community Foundation Northwest Industry, Rev., 4.00%, 03/01/2034 (p) | | | 150 | | | | 154 | |
Indiana Finance Authority, Community Health Network, Series A, Rev., 5.00%, 05/01/2042 (p) | | | 665 | | | | 724 | |
Indiana Finance Authority, Cwa Authority Project, Green Bonds, Rev., 5.00%, 10/01/2031 | | | 500 | | | | 666 | |
Indiana Finance Authority, Cwa Authority, First Lien, Series A, Rev., 5.25%, 10/01/2025 | | | 1,325 | | | | 1,342 | |
Indiana Finance Authority, Duke Energy Industry Project, Series A4, Rev., VRDO, LOC: Sumitomo Mitsui Banking Corp., 0.02%, 07/01/2021 (z) | | | 2,500 | | | | 2,500 | |
Indiana Finance Authority, First Lien, CWA Authority Project, | | | | | | | | |
Rev., 5.00%, 10/01/2023 (w) | | | 550 | | | | 609 | |
Rev., 5.00%, 10/01/2025 (w) | | | 1,095 | | | | 1,304 | |
Rev., 5.00%, 10/01/2034 (w) | | | 5,000 | | | | 6,760 | |
SEE NOTES TO FINANCIAL STATEMENTS.
| | | | | | | | | | |
| | | | | |
| JUNE 30, 2021 | | SIX CIRCLES TRUST | | | | | | | | 155 |
Six Circles Tax Aware Bond Fund
SCHEDULE OF PORTFOLIO INVESTMENTS
AS OF JUNE 30, 2021 (Unaudited) (continued)
(Amounts in U.S. Dollars, unless otherwise noted)
(Amounts in thousands, except number of Futures contracts)
| | | | | | | | |
| SECURITY DESCRIPTION | | PRINCIPAL
AMOUNT($) | | | VALUE($) | |
Municipal Bonds — continued | | | | | | | | |
Indiana — continued | | | | | | | | |
Indiana Finance Authority, Green Bond, State Revolving Fund, Rev., 5.00%, 02/01/2047 (p) | | | 7,000 | | | | 9,134 | |
Indiana Finance Authority, Indiana University Health, Series C, Rev., 5.00%, 12/01/2022 | | | 250 | | | | 267 | |
Indiana Finance Authority, Indianapolis Power, | | | | | | | | |
Series A, Rev., 0.75%, 12/01/2038 (z) | | | 4,875 | | | | 4,871 | |
Series B, Rev., AMT, 0.95%, 12/01/2038 (z) | | | 7,025 | | | | 7,036 | |
Indiana Finance Authority, Marion General Hospital, Series A, Rev., 4.00%, 07/01/2045 | | | 5,000 | | | | 5,803 | |
Indiana Finance Authority, Parkview Health, Series A, Rev., 5.00%, 11/01/2025 | | | 1,105 | | | | 1,316 | |
Indiana Finance Authority, Second Lien, CWA Authority Project, | | | | | | | | |
Rev., 5.00%, 10/01/2022 (w) | | | 450 | | | | 477 | |
Rev., 5.00%, 10/01/2023 (w) | | | 190 | | | | 210 | |
Rev., 5.00%, 10/01/2034 (w) | | | 2,000 | | | | 2,682 | |
Rev., 5.00%, 10/01/2035 (w) | | | 3,000 | | | | 4,018 | |
Indiana Finance Authority, United States Steel Corp., Series A, Rev., 4.13%, 12/01/2026 | | | 145 | | | | 159 | |
Indiana Finance Authority, Valley Electric Corporation Project, Series B, Rev., 3.00%, 11/01/2030 | | | 1,000 | | | | 1,076 | |
Indiana Finance Authority, Valparaiso University Project, Rev., 4.00%, 10/01/2034 | | | 1,315 | | | | 1,536 | |
Indiana Health Facility Financing Authority, Ascension Health Substitute Credit Group, Series A, Rev., 4.00%, 11/01/2023 | | | 85 | | | | 92 | |
Indiana Housing & Community Development Authority, Series A, Rev., GNMA/FNMA/FHLMC, 3.00%, 07/01/2051 | | | 650 | | | | 711 | |
Indiana Housing & Community Development Authority , RD Moving Forward Justus Project, Rev., 0.33%, 06/01/2024 (z) | | | 1,545 | | | | 1,545 | |
Indiana University, Series X, Rev., 3.00%, 08/01/2029 | | | 1,000 | | | | 1,092 | |
Indianapolis Local Public Improvement Bond Bank, | | | | | | | | |
Series A, Rev., AGM, 4.00%, 06/01/2041 | | | 9,000 | | | | 10,610 | |
Series A, Rev., 5.00%, 06/01/2022 | | | 1,000 | | | | 1,043 | |
Series A, Rev., 5.00%, 06/01/2024 | | | 165 | | | | 186 | |
Series A, Rev., 5.00%, 06/01/2025 | | | 500 | | | | 580 | |
Series B, Rev., 5.00%, 02/01/2024 | | | 175 | | | | 195 | |
Series B, Rev., 5.00%, 02/01/2025 | | | 205 | | | | 229 | |
Indianapolis Local Public Improvement Bond Bank, Airport Authority, Series A1, Rev., AMT, 5.00%, 01/01/2028 | | | 200 | | | | 239 | |
Indianapolis Local Public Improvement Bond Bank, Indianapolis Airport, | | | | | | | | |
Rev., AMT, 5.00%, 01/01/2026 | | | 1,050 | | | | 1,249 | |
Rev., AMT, 5.00%, 01/01/2029 | | | 2,855 | | | | 3,649 | |
Indianapolis Local Public Improvement Bond Bank, Indianapolis Airport Authority, | | | | | | | | |
Series D, Rev., AMT, 5.00%, 01/01/2028 | | | 3,715 | | | | 4,111 | |
| | | | | | | | |
| SECURITY DESCRIPTION | | PRINCIPAL
AMOUNT($) | | | VALUE($) | |
| | | | | | | | |
Indiana — continued | | | | | | | | |
Series D, Rev., AMT, 5.00%, 01/01/2029 | | | 3,000 | | | | 3,310 | |
Series D, Rev., AMT, 5.00%, 01/01/2030 | | | 2,000 | | | | 2,204 | |
Series D, Rev., AMT, 5.00%, 01/01/2031 | | | 4,000 | | | | 4,408 | |
Series D, Rev., AMT, 5.00%, 01/01/2032 | | | 4,500 | | | | 4,960 | |
Series D, Rev., AMT, 5.00%, 01/01/2033 | | | 3,500 | | | | 3,857 | |
Series I, Rev., AMT, 5.00%, 01/01/2032 | | | 4,885 | | | | 5,561 | |
Series I, Rev., AMT, 5.00%, 01/01/2033 | | | 5,000 | | | | 5,692 | |
Indianapolis Local Public Improvement Bond Bank, Metropolitan Thoroughfare District, Series D, Rev., 4.00%, 01/01/2041 | | | 10,000 | | | | 11,940 | |
Purdue University, Series EE, Rev., 5.00%, 07/01/2034 | | | 1,500 | | | | 1,988 | |
Southwest Allen Multi School Building Corp., 1st Mortgage, Rev., 5.00%, 01/15/2030 | | | 1,200 | | | | 1,523 | |
Tippecanoe School Corp., GO, 4.00%, 07/15/2023 | | | 1,080 | | | | 1,158 | |
| | | | | | | | |
| | |
| | | | | | | 135,749 | |
| | | | | | | | |
Iowa — 0.6% | | | | | | | | |
Clinton Community School District, | | | | | | | | |
GO, AGM, 5.00%, 06/01/2024 | | | 1,425 | | | | 1,611 | |
GO, AGM, 5.00%, 06/01/2026 | | | 1,290 | | | | 1,550 | |
Iowa Finance Authority, Series D, Rev., GNMA/FNMA/FHLMC, 3.50%, 01/01/2049 | | | 410 | | | | 457 | |
Iowa Finance Authority, Cj Bio America, Incorporate Project, Rev., VRDO, LOC: Korea Development Bank, 0.09%, 07/07/2021 (z) | | | 12,000 | | | | 12,000 | |
Iowa Finance Authority, Fertilizer Co. Project, Rev., 5.25%, 12/01/2025 | | | 3,550 | | | | 3,886 | |
Iowa Finance Authority, Green Bond, Gevo NW Iowa Renewable Natural Gas Project, Rev., AMT, LOC: Citibank NA, 1.50%, 01/01/2042 (z) | | | 790 | | | | 798 | |
Iowa Finance Authority, Social Bonds, Series A, Rev., GNMA/FNMA/FHLMC, 3.00%, 01/01/2047 | | | 2,305 | | | | 2,521 | |
PEFA, Inc., Rev., 5.00%, 09/01/2049 (z) | | | 1,000 | | | | 1,202 | |
Sioux City Community School District, Rev., BAM, 3.00%, 10/01/2025 | | | 3,625 | | | | 3,954 | |
Southeast Polk Community School District, Series A, GO, 5.00%, 05/01/2028 | | | 5,185 | | | | 6,601 | |
| | | | | | | | |
| | |
| | | | | | | 34,580 | |
| | | | | | | | |
Kansas — 0.4% | | | | | | | | |
City of Olathe , Temporary Notes, Series A, GO, 4.00%, 08/01/2022 (w) | | | 5,000 | | | | 5,202 | |
State of Kansas, Department of Transportation, Series C3, Rev., (ICE LIBOR USD 1 Month * 0.70 + 0.40%), 0.47%, 09/01/2023 (aa) | | | 2,000 | | | | 2,007 | |
University of Kansas Hospital Authority, Rev., 5.00%, 03/01/2031 | | | 1,230 | | | | 1,618 | |
University of Kansas Hospital Authority, University Kansas Health System, Series A, Rev., 5.00%, 03/01/2047 | | | 10,000 | | | | 11,944 | |
SEE NOTES TO FINANCIAL STATEMENTS.
| | | | | | | | | | |
| | | | | |
| 156 | | | | | | | | SIX CIRCLES TRUST | | JUNE 30, 2021 |
| | | | | | | | |
| SECURITY DESCRIPTION | | PRINCIPAL
AMOUNT($) | | | VALUE($) | |
Municipal Bonds — continued | | | | | | | | |
Kansas — continued | | | | | | | | |
Wyandotte County-Kansas City Unified Government Utility System Revenue, Improvement, Series B, Rev., 5.00%, 09/01/2026 (p) | | | 210 | | | | 222 | |
| | | | | | | | |
| | |
| | | | | | | 20,993 | |
| | | | | | | | |
Kentucky — 0.9% | | | | | | | | |
County of Carroll, Utilities Company Project, Rev., AMT, 2.00%, 02/01/2032 | | | 7,620 | | | | 7,741 | |
County of Trimble, Louisville Gas & Electricity, Rev., AMT, 1.35%, 11/01/2027 | | | 8,100 | | | | 8,167 | |
County of Trimble, Louisville Gas And Electric Company, Rev., AMT, 1.30%, 09/01/2044 (z) | | | 1,000 | | | | 1,008 | |
Kentucky Asset Liability Commission, Project Notes, Series A, Rev., 5.00%, 09/01/2022 | | | 2,000 | | | | 2,110 | |
Kentucky Bond Development Corp., Centre College, Rev., 4.00%, 06/01/2040 | | | 420 | | | | 503 | |
Kentucky Economic Development Finance Authority, Baptist Healthcare System, Rev., 5.00%, 08/15/2042 (p) | | | 175 | | | | 176 | |
Kentucky Economic Development Finance Authority, Norton Healthcare, Inc., | | | | | | | | |
Series B, Rev., NATL, Zero Coupon, 10/01/2026 | | | 3,930 | | | | 3,602 | |
Series B, Rev., NATL, Zero Coupon, 10/01/2027 | | | 1,995 | | | | 1,780 | |
Kentucky Housing Corp., City View Park Project, Rev., 1.16%, 02/01/2023 (z) | | | 3,500 | | | | 3,520 | |
Kentucky Housing Corp., New Hope Properties Portfolio, Rev., HUD, 0.41%, 04/01/2024 (z) | | | 3,170 | | | | 3,176 | |
Kentucky Housing Corp., Winterwood II Rural Housing, Rev., 0.37%, 10/01/2024 (z) | | | 1,295 | | | | 1,296 | |
Kentucky Public Energy Authority, Gas Supply, Series B, Rev., 4.00%, 01/01/2049 (z) | | | 3,475 | | | | 3,860 | |
Kentucky State Property & Building Commission, Project 125, Series A, Rev., 5.00%, 09/01/2022 (w) | | | 345 | | | | 364 | |
Kentucky State Property & Building Commission, Project No. 100, Series A, Rev., 5.00%, 08/01/2026 (p) | | | 2,000 | | | | 2,008 | |
Louisville and Jefferson County Metropolitan Government, Louisville Gas And Electric Co. Project, Series A, Rev., 0.90%, 09/01/2026 | | | 2,750 | | | | 2,734 | |
Louisville and Jefferson County Metropolitan Government, Norton Healthcare, Inc., Rev., 5.00%, 10/01/2031 | | | 670 | | | | 804 | |
Louisville/Jefferson County Metropolitan Government, Louisville Gas & Electric, Rev., 2.00%, 10/01/2033 | | | 2,000 | | | | 2,028 | |
Louisville/Jefferson County Metropolitan Government, Louisville Gas & Electric Co. Project, Rev., AMT, 1.35%, 11/01/2027 | | | 2,000 | | | | 2,018 | |
| | | | | | | | |
| SECURITY DESCRIPTION | | PRINCIPAL
AMOUNT($) | | | VALUE($) | |
| | | | | | | | |
Kentucky — continued | | | | | | | | |
Louisville/Jefferson County Metropolitan Government, Norton Healthcare, Inc., Rev., 4.00%, 10/01/2035 | | | 500 | | | | 564 | |
Tender Option Bond Trust Receipts/Certificates, Series 2018-XG0161, Rev., AGM, LOC: Bank of America NA, LIQ: Bank of America NA, 0.00%, 12/01/2041 (e) (z) | | | 5,460 | | | | 5,460 | |
| | | | | | | | |
| | |
| | | | | | | 52,919 | |
| | | | | | | | |
Louisiana — 1.5% | | | | | | | | |
City of Alexandria, Utilities Revenue, Series A, Rev., 5.00%, 05/01/2038 (p) | | | 4,000 | | | | 4,352 | |
City of Shreveport, GO, 5.00%, 08/01/2029 (p) | | | 4,790 | | | | 4,809 | |
Consolidated Government of the City of Baton Rouge & Parish of East Baton Rouge, Sales Tax, | | | | | | | | |
Rev., AGM, 5.00%, 08/01/2022 | | | 80 | | | | 84 | |
Rev., AGM, 5.00%, 08/01/2027 | | | 1,400 | | | | 1,746 | |
East Baton Rouge Parish, Sewerage Commission, Series B, Rev., 5.00%, 02/01/2039 (p) | | | 1,200 | | | | 1,398 | |
East Baton Rouge Sewerage Commission, Series A, Rev., 1.30%, 02/01/2041 (z) | | | 4,500 | | | | 4,611 | |
Ernest N. Morial New Orleans Exhibition Hall Authority, Special Tax, 5.00%, 07/15/2027 | | | 900 | | | | 943 | |
Lakeshore Villages Master Community Development District, Parish of St Tammany, Special Assessment, 3.20%, 06/01/2041 (e) | | | 630 | | | | 632 | |
Louisiana Housing Corp., Arbours at Lafayette Project, Rev., 0.35%, 04/01/2024 (z) | | | 2,320 | | | | 2,323 | |
Louisiana Housing Corp., Stone Vista Apartments Project, Rev., 0.32%, 12/01/2023 (z) | | | 1,250 | | | | 1,250 | |
Louisiana Local Government Environmental Facilities & Community Development Authority, East Baton Rouge Sewage Commission, Subordinated Lien, | | | | | | | | |
Rev., 5.00%, 02/01/2028 (p) | | | 1,655 | | | | 1,857 | |
Series A, Rev., 4.00%, 02/01/2048 (p) | | | 1,660 | | | | 1,761 | |
Louisiana Local Government Environmental Facilities & Community Development Authority, Entergy Louisiana LLC Project, | | | | | | | | |
Rev., 2.00%, 06/01/2030 | | | 2,755 | | | | 2,810 | |
Rev., 2.50%, 04/01/2036 | | | 750 | | | | 766 | |
Louisiana Public Facilities Authority, Lafayette General Health, Series A, Rev., 5.00%, 11/01/2041 (p) | | | 800 | | | | 957 | |
Louisiana Public Facilities Authority, Loyola University Project, Rev., 4.00%, 10/01/2037 (w) | | | 2,020 | | | | 2,445 | |
Louisiana Public Facilities Authority, Ochsner Clinic Foundation, Series B, Rev., 5.00%, 05/15/2050 (z) | | | 2,935 | | | | 3,434 | |
SEE NOTES TO FINANCIAL STATEMENTS.
| | | | | | | | | | |
| | | | | |
| JUNE 30, 2021 | | SIX CIRCLES TRUST | | | | | | | | 157 |
Six Circles Tax Aware Bond Fund
SCHEDULE OF PORTFOLIO INVESTMENTS
AS OF JUNE 30, 2021 (Unaudited) (continued)
(Amounts in U.S. Dollars, unless otherwise noted)
(Amounts in thousands, except number of Futures contracts)
| | | | | | | | |
| SECURITY DESCRIPTION | | PRINCIPAL
AMOUNT($) | | | VALUE($) | |
Municipal Bonds — continued | | | | | | | | |
Louisiana — continued | | | | | | | | |
Louisiana Public Facilities Authority, Ochsner Clinic Foundation Project, Rev., 5.00%, 05/15/2042 | | | 1,480 | | | | 1,769 | |
Louisiana State University & Agricultural & Mechanical College, Auxiliary, Series A, Rev., 5.00%, 07/01/2021 | | | 1,285 | | | | 1,285 | |
New Orleans Aviation Board, Series B, Rev., AMT, 5.00%, 01/01/2040 | | | 3,000 | | | | 3,418 | |
New Orleans Aviation Board, General Airport, Series D2, Rev., AMT, 5.00%, 01/01/2033 | | | 1,100 | | | | 1,324 | |
New Orleans Aviation Board, General Airport North Terminal, | | | | | | | | |
Series B, Rev., AMT, 5.00%, 01/01/2038 | | | 1,000 | | | | 1,193 | |
Series B, Rev., AMT, 5.00%, 01/01/2048 | | | 5,000 | | | | 5,921 | |
Parish of St. James, Various Nucor Steel Louisiana, Series A1, Rev., VRDO, 0.09%, 07/07/2021 (z) | | | 5,000 | | | | 5,000 | |
Parish of St. John the Baptist, Marathon Oil Corp. Project, Series B1, Rev., 2.13%, 06/01/2037 (z) | | | 875 | | | | 906 | |
Port New Orleans Board of Commissioners, Series E, Rev., AMT, 5.00%, 04/01/2039 | | | 1,170 | | | | 1,459 | |
Regional Transit Authority Sales Tax Revenue, Series A, Rev., AGM, 5.00%, 01/01/2029 | | | 3,000 | | | | 3,845 | |
St Tammany Parish Hospital Service District No. 1, | | | | | | | | |
Series A, Rev., 5.00%, 07/01/2032 | | | 1,615 | | | | 2,002 | |
Series A, Rev., 5.00%, 07/01/2034 | | | 1,655 | | | | 2,040 | |
State of Louisiana, Series A, GO, 5.00%, 03/01/2037 | | | 9,555 | | | | 12,168 | |
State of Louisiana Gasoline & Fuels Tax Revenue, Second Lien, | | | | | | | | |
Series A, Rev., 0.60%, 05/01/2043 (z) | | | 4,135 | | | | 4,140 | |
Series D, Rev., 0.55%, 05/01/2043 (z) | | | 2,295 | | | | 2,295 | |
Series D, Rev., 0.60%, 05/01/2043 (z) | | | 1,605 | | | | 1,607 | |
Tobacco Settlement Financing Corp., Asset Backed, Series A, Rev., 5.00%, 05/15/2023 | | | 125 | | | | 136 | |
| | | | | | | | |
| | |
| | | | | | | 86,686 | |
| | | | | | | | |
Maine — 0.2% | | | | | | | | |
Finance Authority of Maine, Supplemental Educational Loan Program, | | | | | | | | |
Series A1, Rev., AGM, AMT, 2.38%, 12/01/2033 | | | 705 | | | | 705 | |
Series A1, Rev., AGM, AMT, 5.00%, 12/01/2023 | | | 165 | | | | 182 | |
Series A1, Rev., AGM, AMT, 5.00%, 12/01/2024 | | | 75 | | | | 86 | |
Series A1, Rev., AGM, AMT, 5.00%, 12/01/2025 | | | 85 | | | | 100 | |
Maine Health & Higher Educational Facilities Authority, | | | | | | | | |
Series A, Rev., AGM, 5.00%, 07/01/2030 | | | 50 | | | | 66 | |
| | | | | | | | |
| SECURITY DESCRIPTION | | PRINCIPAL
AMOUNT($) | | | VALUE($) | |
| | | | | | | | |
Maine — continued | | | | | | | | |
Series A, Rev., AGM, 5.00%, 07/01/2031 | | | 295 | | | | 398 | |
Series A, Rev., AGM, 5.00%, 07/01/2032 | | | 315 | | | | 424 | |
Maine Turnpike Authority, | | | | | | | | |
Rev., 4.00%, 07/01/2045 | | | 9,000 | | | | 10,641 | |
Rev., 5.00%, 07/01/2031 | | | 400 | | | | 530 | |
Rev., 5.00%, 07/01/2033 | | | 1,155 | | | | 1,523 | |
| | | | | | | | |
| | |
| | | | | | | 14,655 | |
| | | | | | | | |
Maryland — 2.4% | | | | | | | | |
City of Baltimore, Water Project, Series A, Rev., 5.00%, 07/01/2050 | | | 3,200 | | | | 4,115 | |
City of Brunswick, Brunswick Crossing Special Tax, Special Tax, 4.00%, 07/01/2029 | | | 500 | | | | 591 | |
County of Baltimore, Series 83, GO, 5.00%, 03/01/2024 | | | 555 | | | | 625 | |
County of Howard, Metropolitan District, Series E, GO, 5.00%, 02/15/2027 | | | 1,850 | | | | 2,300 | |
County of Montgomery, | | | | | | | | |
Series A, GO, 4.00%, 08/01/2031 | | | 5,000 | | | | 6,266 | |
Series B, GO, 4.00%, 11/01/2028 | | | 7,985 | | | | 9,787 | |
Series C, GO, 5.00%, 10/01/2026 | | | 1,000 | | | | 1,231 | |
County of Prince George’s, Behavioral Health Facility, | | | | | | | | |
COP, 5.00%, 10/01/2022 | | | 830 | | | | 880 | |
COP, 5.00%, 10/01/2023 | | | 650 | | | | 720 | |
County of Prince George’s, Chesapeake Lighthouse Obligations, Series A, Rev., 6.50%, 08/01/2035 (e) | | | 750 | | | | 859 | |
County of Prince George’s, Consolidated Public Improvement, Series A, GO, 5.00%, 09/15/2026 (p) | | | 65 | | | | 66 | |
County of Prince George’s, Public Improvement, Series A, GO, 4.00%, 07/15/2032 | | | 5,000 | | | | 6,120 | |
Maryland Community Development Administration, | | | | | | | | |
Series B, Rev., 4.00%, 09/01/2049 | | | 2,335 | | | | 2,584 | |
Series D, Rev., 3.25%, 09/01/2050 | | | 500 | | | | 549 | |
Maryland Community Development Administration, Residential, | | | | | | | | |
Series A, Rev., 3.75%, 03/01/2050 | | | 1,420 | | | | 1,576 | |
Series A, Rev., 4.50%, 09/01/2048 | | | 6,490 | | | | 7,309 | |
Series B, Rev., AMT, 4.50%, 09/01/2048 | | | 5,770 | | | | 6,450 | |
Maryland Economic Development Corp., Morgan State University Project, Rev., 4.00%, 07/01/2040 | | | 665 | | | | 770 | |
Maryland Economic Development Corp., Port Covington Project, | | | | | | | | |
Tax Allocation, 3.25%, 09/01/2030 | | | 1,405 | | | | 1,593 | |
Tax Allocation, 4.00%, 09/01/2040 | | | 1,280 | | | | 1,500 | |
Maryland Health & Higher Educational Facilities Authority, Series A, Rev., 5.00%, 07/01/2043 (p) | | | 2,000 | | | | 2,097 | |
Maryland Health & Higher Educational Facilities Authority, Adventist Healthcare, | | | | | | | | |
Rev., 4.00%, 01/01/2038 | | | 1,155 | | | | 1,294 | |
Rev., 5.00%, 01/01/2025 (w) | | | 470 | | | | 519 | |
SEE NOTES TO FINANCIAL STATEMENTS.
| | | | | | | | | | |
| | | | | |
| 158 | | | | | | | | SIX CIRCLES TRUST | | JUNE 30, 2021 |
| | | | | | | | |
| SECURITY DESCRIPTION | | PRINCIPAL
AMOUNT($) | | | VALUE($) | |
Municipal Bonds — continued | | | | | | | | |
Maryland — continued | | | | | | | | |
Rev., 5.00%, 01/01/2036 (w) | | | 2,290 | | | | 2,799 | |
Maryland Health & Higher Educational Facilities Authority, Ascension Health, Series B, Rev., 5.00%, 11/15/2051 (p) | | | 1,150 | | | | 1,171 | |
Maryland Health & Higher Educational Facilities Authority, Carroll Hospital, Series A, Rev., 5.00%, 07/01/2023 (p) | | | 1,415 | | | | 1,483 | |
Maryland Health & Higher Educational Facilities Authority, Loyola University Maryland, Series A, Rev., 5.00%, 10/01/2039 (p) | | | 5,275 | | | | 5,594 | |
Maryland Health & Higher Educational Facilities Authority, Meritus Medical Center, Rev., 5.00%, 07/01/2028 | | | 1,300 | | | | 1,509 | |
Maryland Health & Higher Educational Facilities Authority, Western Maryland Health System, Rev., 5.00%, 07/01/2024 (p) | | | 2,500 | | | | 2,844 | |
State of Maryland, | | | | | | | | |
Series A, GO, 2.75%, 08/01/2025 | | | 1,735 | | | | 1,823 | |
Series B, GO, 5.00%, 08/01/2022 | | | 430 | | | | 453 | |
State of Maryland, First, | | | | | | | | |
Series A, GO, 5.00%, 03/01/2024 (p) | | | 1,000 | | | | 1,032 | |
Series B, GO, 4.50%, 08/01/2021 | | | 1,305 | | | | 1,310 | |
State of Maryland, Group 1, Series A, GO, 5.00%, 08/01/2028 | | | 1,500 | | | | 1,937 | |
State of Maryland, Group 2, State and Local Facilities Loan, GO, 5.00%, 08/01/2033 | | | 2,000 | | | | 2,676 | |
State of Maryland, Local Facilities Loan, | | | | | | | | |
Series A, GO, 4.00%, 03/15/2034 | | | 18,070 | | | | 22,277 | |
Series A, GO, 5.00%, 08/01/2028 | | | 7,000 | | | | 9,041 | |
State of Maryland, Second, Series B, GO, 5.00%, 08/01/2025 (p) | | | 505 | | | | 531 | |
Tender Option Bond Trust Receipts/Certificates, Series 2018-XF0605, Rev., LIQ: Bank of America NA, 0.00%, 05/01/2047 (e) (z) | | | 3,300 | | | | 3,300 | |
Washington Suburban Sanitary Commission, | | | | | | | | |
Rev., CNTY GTD, 5.00%, 06/01/2028 | | | 1,000 | | | | 1,286 | |
Rev., CNTY GTD, 5.00%, 06/01/2029 | | | 4,000 | | | | 5,265 | |
Series A, Rev., VRDO, BAN, CNTY GTD, 0.02%, 07/07/2021 (z) | | | 3,400 | | | | 3,400 | |
Washington Suburban Sanitary Commission, Consolidated Public Improvement, | | | | | | | | |
Rev., CNTY GTD, 4.00%, 06/01/2022 | | | 75 | | | | 78 | |
Rev., CNTY GTD, 5.00%, 06/01/2029 | | | 1,500 | | | | 1,917 | |
Series 2, Rev., CNTY GTD, 5.00%, 06/01/2022 | | | 1,200 | | | | 1,253 | |
Washington Suburban Sanitary Commission, Consolidated Public Improvement Bonds, Rev., CNTY GTD, 5.00%, 06/01/2033 | | | 3,000 | | | | 3,819 | |
Washington Suburban Sanitary Commission, Green Bond, Series 2, Rev., CNTY GTD, 5.00%, 12/01/2026 | | | 1,180 | | | | 1,460 | |
| | | | | | | | |
| | |
| | | | | | | 138,059 | |
| | | | | | | | |
| | | | | | | | |
| SECURITY DESCRIPTION | | PRINCIPAL
AMOUNT($) | | | VALUE($) | |
| | | | | | | | |
Massachusetts — 1.5% | | | | | | | | |
Commonwealth of Massachusetts, | | | | | | | | |
Series A, GO, 5.00%, 06/01/2044 (z) | | | 1,500 | | | | 1,638 | |
Series D, GO, 4.00%, 11/01/2036 | | | 2,500 | | | | 3,091 | |
Series D, GO, 4.00%, 11/01/2041 | | | 4,000 | | | | 4,840 | |
Commonwealth of Massachusetts Transportation Fund Revenue, Rail Enhancement Project, Series B, Rev., 5.00%, 06/01/2025 | | | 375 | | | | 442 | |
Commonwealth of Massachusetts, Consolidated Loan, | | | | | | | | |
Series D2, GO, 1.70%, 08/01/2043 (z) | | | 1,000 | | | | 1,016 | |
Series E, GO, 5.00%, 08/01/2024 (p) | | | 2,000 | | | | 2,008 | |
Massachusetts Development Finance Agency, | | | | | | | | |
Series A1, Rev., 5.00%, 07/01/2050 (z) | | | 5,000 | | | | 6,516 | |
Series B, Rev., 0.25%, 07/01/2024 (z) | | | 370 | | | | 369 | |
Massachusetts Development Finance Agency, Milford Regional Medical Center, Rev., 5.00%, 07/15/2046 (e) | | | 1,000 | | | | 1,185 | |
Massachusetts Development Finance Agency, Suffolk University Project, Rev., 4.00%, 07/01/2051 | | | 1,250 | | | | 1,475 | |
Massachusetts Development Finance Agency, Williams College Project, Rev., 0.45%, 07/01/2041 (w) (z) | | | 310 | | | | 309 | |
Massachusetts Educational Financing Authority, | | | | | | | | |
Series B, Rev., AMT, 2.63%, 07/01/2036 | | | 5,460 | | | | 5,576 | |
Series B, Rev., AMT, 5.00%, 07/01/2023 | | | 250 | | | | 273 | |
Series B, Rev., AMT, 5.00%, 07/01/2024 | | | 615 | | | | 696 | |
Series I, Rev., AMT, 5.00%, 01/01/2025 | | | 3,000 | | | | 3,448 | |
Massachusetts Educational Financing Authority, Educational Loan Revenue Bonds, Rev., AMT, 2.00%, 07/01/2037 (w) | | | 180 | | | | 180 | |
Massachusetts Health & Educational Facilities Authority, Massachusetts Institute Technology, Series J2, Rev., VRDO, 0.02%, 07/07/2021 (z) | | | 4,015 | | | | 4,015 | |
Massachusetts Health & Educational Facilities Authority, University of Massachusetts, Series A, Rev., 1.85%, 11/01/2030 (z) | | | 1,250 | | | | 1,265 | |
Massachusetts Housing Finance Agency, Social Bond, | | | | | | | | |
Series 220, Rev., GNMA/FNMA/FHLMC, 3.00%, 12/01/2050 | | | 3,750 | | | | 4,095 | |
Series 220, Rev., GNMA/FNMA/FHLMC, 5.00%, 12/01/2023 | | | 500 | | | | 557 | |
Massachusetts Housing Finance Agency, Substainability Bonds, | | | | | | | | |
Series A2, Rev., HUD, 0.30%, 12/01/2023 | | | 105 | | | | 105 | |
Series A2, Rev., HUD, 0.40%, 06/01/2024 | | | 140 | | | | 140 | |
Massachusetts Port Authority, | | | | | | | | |
Series A, Rev., 5.00%, 07/01/2037 | | | 1,000 | | | | 1,344 | |
Series B, Rev., AMT, 5.00%, 07/01/2033 | | | 465 | | | | 618 | |
Series B, Rev., AMT, 5.00%, 07/01/2034 | | | 415 | | | | 549 | |
Series B, Rev., AMT, 5.00%, 07/01/2035 | | | 495 | | | | 654 | |
SEE NOTES TO FINANCIAL STATEMENTS.
| | | | | | | | | | |
| | | | | |
| JUNE 30, 2021 | | SIX CIRCLES TRUST | | | | | | | | 159 |
Six Circles Tax Aware Bond Fund
SCHEDULE OF PORTFOLIO INVESTMENTS
AS OF JUNE 30, 2021 (Unaudited) (continued)
(Amounts in U.S. Dollars, unless otherwise noted)
(Amounts in thousands, except number of Futures contracts)
| | | | | | | | |
| SECURITY DESCRIPTION | | PRINCIPAL
AMOUNT($) | | | VALUE($) | |
Municipal Bonds — continued | | | | | | | | |
Massachusetts — continued | | | | | | | | |
Series E, Rev., AMT, 5.00%, 07/01/2031 | | | 1,495 | | | | 1,998 | |
Series E, Rev., AMT, 5.00%, 07/01/2032 | | | 2,000 | | | | 2,665 | |
Series E, Rev., AMT, 5.00%, 07/01/2046 | | | 6,500 | | | | 8,349 | |
Massachusetts School Building Authority, Senior, | | | | | | | | |
Series B, Rev., 5.00%, 08/15/2028 (p) | | | 5,000 | | | | 5,272 | |
Series B, Rev., 5.00%, 10/15/2041 (p) | | | 1,355 | | | | 1,374 | |
Massachusetts School Building Authority, Subordinated, Series A, Rev., 5.00%, 02/15/2036 | | | 7,190 | | | | 8,024 | |
Massachusetts Water Resources Authority, Series C, Rev., 4.00%, 08/01/2022 (p) | | | 3,180 | | | | 3,311 | |
Massachusetts Water Resources Authority, Green Bonds, Series C, Rev., 4.00%, 08/01/2022 (p) | | | 700 | | | | 729 | |
Metropolitan Boston Transit Parking Corp., Rev., 5.25%, 07/01/2036 | | | 300 | | | | 300 | |
University of Massachusetts Building Authority, Series 2021, Rev., 5.00%, 11/01/2026 | | | 5,000 | | | | 6,165 | |
| | | | | | | | |
| | |
| | | | | | | 84,591 | |
| | | | | | | | |
Michigan — 1.2% | | | | | | | | |
City of Detroit, Sewage Disposal System Revenue, Senior Lien, Series A, Rev., 5.00%, 07/01/2023 | | | 5,000 | | | | 5,239 | |
City of Detroit, Social Bonds, | | | | | | | | |
Series A, GO, 4.00%, 04/01/2041 | | | 500 | | | | 565 | |
Series A, GO, 5.00%, 04/01/2039 | | | 115 | | | | 142 | |
Series A, GO, 5.00%, 04/01/2046 | | | 35 | | | | 43 | |
Series A, GO, 5.00%, 04/01/2050 | | | 30 | | | | 36 | |
City of Lansing, GO, AGM, 5.00%, 05/01/2028 | | | 515 | | | | 651 | |
Great Lakes Water Authority, Sewage Disposal System, Second Lien, Series C, Rev., 5.00%, 07/01/2032 | | | 75 | | | | 90 | |
Great Lakes Water Authority, Sewage Disposal System, Senior Lien, Series B, Rev., 5.00%, 07/01/2030 | | | 3,200 | | | | 3,873 | |
L’Anse Creuse Public Schools, GO, Q-SBLF, 5.00%, 05/01/2029 (p) | | | 2,405 | | | | 2,820 | |
Michigan Finance Authority, | | | | | | | | |
Rev., 5.00%, 11/15/2022 | | | 125 | | | | 133 | |
Rev., 5.00%, 11/15/2023 | | | 1,375 | | | | 1,527 | |
Rev., 5.00%, 11/15/2025 | | | 435 | | | | 508 | |
Series A, Rev., 5.00%, 06/01/2039 (p) | | | 5,085 | | | | 5,309 | |
Michigan Finance Authority, Aquinas College Project, Rev., 5.00%, 05/01/2036 (w) | | | 300 | | | | 334 | |
Michigan Finance Authority, Higher Educational Facilities Authority, | | | | | | | | |
Rev., 5.00%, 09/01/2032 | | | 690 | | | | 901 | |
Rev., 5.00%, 09/01/2033 | | | 800 | | | | 1,041 | |
Rev., 5.00%, 09/01/2034 | | | 570 | | | | 740 | |
Rev., 5.00%, 09/01/2035 | | | 1,200 | | | | 1,555 | |
Michigan Finance Authority, Holland Community Hospital, Series A, Rev., 5.00%, 01/01/2040 | | | 1,980 | | | | 2,094 | |
| | | | | | | | |
| SECURITY DESCRIPTION | | PRINCIPAL
AMOUNT($) | | | VALUE($) | |
| | | | | | | | |
Michigan — continued | | | | | | | | |
Michigan Finance Authority, Local Government Loan Program, Series D1, Rev., 5.00%, 07/01/2021 | | | 1,300 | | | | 1,300 | |
Michigan Finance Authority, Senior, | | | | | | | | |
Series A, Rev., 4.00%, 06/01/2022 | | | 1,500 | | | | 1,550 | |
Series A, Rev., 5.00%, 06/01/2024 | | | 2,000 | | | | 2,278 | |
Michigan Finance Authority, Trinity Health Co., Rev., 5.00%, 12/01/2034 (p) | | | 2,560 | | | | 2,674 | |
Michigan Finance Authority,Refunded, Hospital Trinity Health, Rev., 5.00%, 12/01/2039 (p) | | | 1,000 | | | | 1,020 | |
Michigan State Building Authority, | | | | | | | | |
Series I, Rev., 5.00%, 10/15/2027 | | | 2,500 | | | | 3,151 | |
Series I, Rev., 5.00%, 10/15/2029 | | | 1,750 | | | | 2,309 | |
Michigan State Building Authority, Facilities Program, | | | | | | | | |
Series IA, Rev., 5.00%, 10/15/2023 (p) | | | 1,140 | | | | 1,156 | |
Series IA, Rev., 5.50%, 10/15/2045 (p) | | | 2,770 | | | | 2,813 | |
Michigan State Building Authority, Multi Modal Facilities Program, Rev., VRDO, 0.08%, 07/07/2021 (z) | | | 3,500 | | | | 3,500 | |
Michigan State Hospital Finance Authority, Hospital Trinity Health Credit, Series C, Rev., 5.00%, 12/01/2027 | | | 100 | | | | 126 | |
Michigan State Hospital Finance Authority, Trinity Health, Rev., 5.00%, 12/01/2034 (p) | | | 1,000 | | | | 1,044 | |
Michigan State Hospital Finance Authority, Trinity Health Credit, Series C, Rev., 5.00%, 12/01/2029 | | | 1,010 | | | | 1,272 | |
Michigan State Hospital Finance Authority, Trinity Health Credit Group, | | | | | | | | |
Rev., 5.00%, 12/01/2026 (p) | | | 810 | | | | 846 | |
Series B, Rev., 5.00%, 12/01/2048 (p) | | | 755 | | | | 788 | |
Michigan State Housing Development Authority, | | | | | | | | |
Rev., 0.32%, 12/01/2023 (z) | | | 4,150 | | | | 4,158 | |
Series A, Rev., 0.55%, 04/01/2025 | | | 375 | | | | 375 | |
Series C, Rev., 3.00%, 06/01/2051 | | | 2,750 | | | | 2,998 | |
Michigan State University, | | | | | | | | |
Series A, Rev., 5.00%, 08/15/2022 | | | 705 | | | | 743 | |
Series A, Rev., 5.00%, 08/15/2029 | | | 2,000 | | | | 2,626 | |
Series A, Rev., 5.00%, 08/15/2038 | | | 250 | | | | 273 | |
Michigan State University, Board of Trustees, Series B, Rev., 4.00%, 02/15/2024 | | | 300 | | | | 329 | |
Monroe County Economic Development Corp., Collateral Detroit Edison Co., Series AA, Rev., NATL, 6.95%, 09/01/2022 | | | 2,500 | | | | 2,695 | |
State of Michigan, Environmental Program Bonds, Series A, GO, 5.00%, 05/15/2030 | | | 400 | | | | 536 | |
State of Michigan, Garvee, Rev., GAN, 5.00%, 03/15/2024 | | | 1,435 | | | | 1,616 | |
Wayne County Airport Authority, Series F, Rev., AMT, 5.00%, 12/01/2034 | | | 1,470 | | | | 1,718 | |
| | | | | | | | |
| | |
| | | | | | | 71,495 | |
| | | | | | | | |
SEE NOTES TO FINANCIAL STATEMENTS.
| | | | | | | | | | |
| | | | | |
| 160 | | | | | | | | SIX CIRCLES TRUST | | JUNE 30, 2021 |
| | | | | | | | |
| SECURITY DESCRIPTION | | PRINCIPAL
AMOUNT($) | | | VALUE($) | |
Municipal Bonds — continued | | | | | | | | |
Minnesota — 1.0% | | | | | | | | |
Burnsville-Eagan-Savage Independent School District No. 191, GO, 4.00%, 02/01/2026 | | | 1,210 | | | | 1,400 | |
City of Hopkins, Raspberry Ridge Project, Rev., HUD, 0.26%, 02/01/2024 (z) | | | 1,105 | | | | 1,105 | |
City of Mahtomedi, Lincoln Place, Rev., HUD, 0.25%, 08/01/2023 (z) | | | 620 | | | | 620 | |
City of Shakopee, Shakopee Housing, Rev., 0.25%, 08/01/2024 (w) (z) | | | 290 | | | | 290 | |
County of Hennepin, Series C, GO, 5.00%, 12/15/2032 | | | 3,000 | | | | 3,942 | |
Dakota County Community Development Agency, Aster House Apartments Project, Rev., 0.35%, 06/01/2024 (z) | | | 4,815 | | | | 4,823 | |
Farmington Independent School District No. 192, Series A, GO, 5.00%, 02/01/2025 | | | 2,680 | | | | 3,006 | |
Housing & Redevelopment Authority of The City of St. Paul Minnesota, Fairview Health Services, Series A, Rev., 5.00%, 11/15/2047 | | | 9,000 | | | | 10,950 | |
Housing & Redevelopment Authority of The City of St. Paul Minnesota, Hope Community Academy Project, Series A, Rev., 5.00%, 12/01/2043 | | | 1,000 | | | | 1,041 | |
Minnesota Housing Finance Agency, | | | | | | | | |
Series B, Rev., GNMA/FNMA/FHLMC, 3.00%, 07/01/2051 | | | 395 | | | | 433 | |
Series D, Rev., GNMA/FNMA/FHLMC COLL, 3.00%, 01/01/2052 | | | 1,145 | | | | 1,258 | |
Series G, Rev., GNMA/FNMA/FHLMC, 3.00%, 01/01/2051 | | | 3,845 | | | | 4,188 | |
Series I, Rev., GNMA/FNMA/FHLMC, 2.80%, 12/01/2047 | | | 517 | | | | 542 | |
Series I, Rev., 3.00%, 01/01/2051 | | | 2,555 | | | | 2,790 | |
Minnesota Office of Higher Education, Supplemental Student Loan, Rev., AMT, 4.00%, 11/01/2037 | | | 3,315 | | | | 3,647 | |
Shakopee Independent School District No. 720, Series D, GO, 5.00%, 02/01/2024 | | | 3,685 | | | | 4,120 | |
St. Paul Port Authority, Solid Gerdau St. Paul Steel Mill Project, Rev., AMT, 4.50%, 10/01/2037 (e) | | | 1,500 | | | | 1,534 | |
State of Minnesota, | | | | | | | | |
Series A, GO, 5.00%, 08/01/2026 | | | 250 | | | | 306 | |
Series A, GO, 5.00%, 10/01/2029 | | | 45 | | | | 57 | |
Series A, GO, 5.00%, 08/01/2031 | | | 2,340 | | | | 3,072 | |
Series A, GO, 5.00%, 08/01/2034 | | | 2,000 | | | | 2,563 | |
Series B, GO, 4.00%, 08/01/2028 | | | 2,000 | | | | 2,442 | |
Series B, GO, 5.00%, 08/01/2022 | | | 100 | | | | 105 | |
Series E, GO, 3.00%, 08/01/2026 | | | 710 | | | | 798 | |
State of Minnesota, Various Purpose, Series F, GO, 5.00%, 10/01/2021 | | | 1,000 | | | | 1,012 | |
| | | | | | | | |
| | |
| | | | | | | 56,044 | |
| | | | | | | | |
| | | | | | | | |
| SECURITY DESCRIPTION | | PRINCIPAL
AMOUNT($) | | | VALUE($) | |
| | | | | | | | |
Mississippi — 0.1% | | | | | | | | |
Mississippi Business Finance Corp., System Energy Resources, Inc. Project, Rev., 2.38%, 06/01/2044 | | | 175 | | | | 176 | |
Mississippi Home Corp., Gateway Affordable Cmntys, Rev., HUD, 2.40%, 02/01/2022 (p) (z) | | | 4,500 | | | | 4,508 | |
Mississippi Home Corp., J&A Development Portfolio Project, Series 1, Rev., 0.30%, 02/01/2024 (z) | | | 470 | | | | 469 | |
Mississippi Hospital Equipment & Facilities Authority, Baptist Memorial Health Care, Rev., 5.00%, 09/01/2044 (z) | | | 250 | | | | 287 | |
State of Mississippi, Series F, GO, 5.00%, 11/01/2030 (p) | | | 1,000 | | | | 1,196 | |
| | | | | | | | |
| | |
| | | | | | | 6,636 | |
| | | | | | | | |
Missouri — 1.1% | | | | | | | | |
Cape Girardeau County Industrial Development Authority, Southeasthealth, Rev., 4.00%, 03/01/2041 | | | 355 | | | | 412 | |
City of Kansas City Airport Revenue, General Improvement, Series A, Rev., AMT, 5.00%, 09/01/2023 (p) | | | 1,000 | | | | 1,008 | |
City of St. Charles, Series B, COP, 4.00%, 02/01/2029 | | | 515 | | | | 619 | |
Curators of the University of Missouri (The), | | | | | | | | |
Series A, Rev., 4.00%, 11/01/2034 | | | 2,500 | | | | 2,773 | |
Series A, Rev., 4.00%, 11/01/2035 | | | 1,000 | | | | 1,108 | |
Hanley Road Corridor Transportation Development District, Rev., 1.00%, 10/01/2027 | | | 320 | | | | 315 | |
Health & Educational Facilities Authority of the State of Missouri, Series C, Rev., 5.00%, 05/01/2052 (z) | | | 2,695 | | | | 3,419 | |
Health & Educational Facilities Authority of the State of Missouri, BJC Health System, Series B, Rev., 4.00%, 05/01/2051 (z) | | | 6,750 | | | | 7,834 | |
Health & Educational Facilities Authority of the State of Missouri, Capital Region Medical Center, Rev., 5.00%, 11/01/2035 | | | 1,700 | | | | 2,039 | |
Health & Educational Facilities Authority of the State of Missouri, Lukes Health System, Rev., 4.00%, 11/15/2038 | | | 2,000 | | | | 2,380 | |
Health & Educational Facilities Authority of the State of Missouri, Lutheran Senior Service Projects, Series A, Rev., 5.00%, 02/01/2029 | | | 1,410 | | | | 1,602 | |
Health & Educational Facilities Authority of the State of Missouri, Lutheran Senior Services, Rev., 4.00%, 02/01/2034 | | | 500 | | | | 579 | |
Kansas City Industrial Development Authority, Rev., AMT, 5.00%, 03/01/2032 | | | 900 | | | | 1,157 | |
Kansas City Industrial Development Authority, Cathedral Towers, Rev., 0.35%, 12/01/2024 (z) | | | 6,000 | | | | 6,006 | |
SEE NOTES TO FINANCIAL STATEMENTS.
| | | | | | | | | | |
| | | | | |
| JUNE 30, 2021 | | SIX CIRCLES TRUST | | | | | | | | 161 |
Six Circles Tax Aware Bond Fund
SCHEDULE OF PORTFOLIO INVESTMENTS
AS OF JUNE 30, 2021 (Unaudited) (continued)
(Amounts in U.S. Dollars, unless otherwise noted)
(Amounts in thousands, except number of Futures contracts)
| | | | | | | | |
| SECURITY DESCRIPTION | | PRINCIPAL
AMOUNT($) | | | VALUE($) | |
Municipal Bonds — continued | | | | | | | | |
Missouri — continued | | | | | | | | |
Kansas City Industrial Development Authority, Kansas City International Airport, | | | | | | | | |
Rev., AMT, 4.00%, 03/01/2036 | | | 1,250 | | | | 1,478 | |
Rev., AMT, 4.00%, 03/01/2040 | | | 2,500 | | | | 2,920 | |
Rev., AMT, 5.00%, 03/01/2029 | | | 3,050 | | | | 3,896 | |
Missouri Development Finance Board, Procter & Gamble Paper Products, Rev., AMT, 5.20%, 03/15/2029 | | | 370 | | | | 472 | |
Missouri Housing Development Commission, First Place Homeownership Loan, | | | | | | | | |
Rev., GNMA/FNMA/FHLMC COLL, 3.00%, 05/01/2052 | | | 560 | | | | 614 | |
Series D, Rev., GNMA/FNMA/FHLMC, 3.25%, 05/01/2051 | | | 1,990 | | | | 2,194 | |
Missouri State Environmental Improvement & Energy Resources Authority, Revolving Funds Program, Series A, Rev., 5.00%, 01/01/2023 (p) | | | 1,100 | | | | 1,127 | |
Missouri State Environmental Improvement & Energy Resources Authority, Union Electric Company Project, Series AR, Rev., 2.90%, 09/01/2033 | | | 2,000 | | | | 2,164 | |
Orchard Farm R-V School District, | | | | | | | | |
COP, 4.00%, 04/01/2027 | | | 400 | | | | 463 | |
COP, 4.00%, 04/01/2028 | | | 410 | | | | 480 | |
Plaza at Noah’s Ark Community Improvement District, Rev., 3.00%, 05/01/2030 | | | 575 | | | | 586 | |
RBC Municipal Products, Inc. Trust, Floater Certificates, Series C16, Rev., VRDO, LOC: Royal Bank of Canada, LIQ: Royal Bank of Canada, 0.09%, 07/07/2021 (e) (z) | | | 11,000 | | | | 11,000 | |
St Louis Municipal Finance Corp., Convention Center Expansion, Rev., AGM, 5.00%, 10/01/2045 | | | 3,215 | | | | 4,033 | |
State of Missouri, Health & Educational Facilities, Saint Lukes Health System, Inc., Rev., 5.00%, 11/15/2023 | | | 290 | | | | 322 | |
| | | | | | | | |
| | |
| | | | | | | 63,000 | |
| | | | | | | | |
Montana — 0.2% | | | | | | | | |
Montana Board of Housing, | | | | | | | | |
Rev., 3.00%, 12/01/2050 | | | 2,575 | | | | 2,804 | |
Series A1, Rev., 3.00%, 06/01/2051 | | | 4,800 | | | | 5,253 | |
Series B2, Rev., AMT, 3.50%, 12/01/2042 | | | 650 | | | | 685 | |
Montana Facility Finance Authority, Rev., 5.00%, 02/15/2033 | | | 1,000 | | | | 1,195 | |
| | | | | | | | |
| | |
| | | | | | | 9,937 | |
| | | | | | | | |
Nebraska — 0.5% | | | | | | | | |
Central Plains Energy Project, | | | | | | | | |
Rev., LIQ: Royal Bank of Canada, 4.00%, 12/01/2049 (z) | | | 4,000 | | | | 4,531 | |
Rev., 5.00%, 09/01/2042 | | | 625 | | | | 659 | |
| | | | | | | | |
| SECURITY DESCRIPTION | | PRINCIPAL
AMOUNT($) | | | VALUE($) | |
| | | | | | | | |
Nebraska — continued | | | | | | | | |
City of Omaha, Various Purpose, | | | | | | | | |
Series A, GO, 4.00%, 04/15/2022 | | | 1,125 | | | | 1,159 | |
Series A, GO, 4.00%, 04/15/2023 | | | 1,675 | | | | 1,788 | |
County of Washington, Cargill, Inc. Project, Rev., AMT, 0.90%, 09/01/2030 (z) | | | 350 | | | | 354 | |
Douglas County Hospital Authority No. 2, Health Facilities Childrens Hospital, Rev., 5.00%, 11/15/2047 | | | 3,000 | | | | 3,596 | |
Douglas County Hospital Authority No. 2, Madonna Rehabilitation Hospital, Rev., 4.00%, 05/15/2033 | | | 2,100 | | | | 2,240 | |
Douglas County, Hospital Authority No. 2, Childrens Hospital Obligated Group, Rev., 5.00%, 11/15/2053 (z) | | | 2,190 | | | | 2,577 | |
Nebraska Educational Health Cultural & Social Services Finance Authority, Immanuel Obligated Group, Rev., 4.00%, 01/01/2037 | | | 1,000 | | | | 1,124 | |
Nebraska Public Power District, Series A, Rev., 0.60%, 01/01/2051 (z) | | | 9,000 | | | | 9,055 | |
| | | | | | | | |
| | |
| | | | | | | 27,083 | |
| | | | | | | | |
Nevada — 1.3% | | | | | | | | |
City of Carson City, Carson Tahoe Regional Medical Center, Rev., 5.00%, 09/01/2047 | | | 1,000 | | | | 1,189 | |
City of Las Vegas Special Improvement District No. 612 Skye Hills, Special Assessment, 3.50%, 06/01/2035 | | | 210 | | | | 222 | |
City of North Las Vegas, GO, BAM, 5.00%, 06/01/2027 | | | 2,000 | | | | 2,485 | |
Clark County School District, Building, | | | | | | | | |
Series A, GO, 5.00%, 06/15/2029 | | | 500 | | | | 633 | |
Series B, GO, AGM-CR, 5.00%, 06/15/2033 | | | 3,000 | | | | 3,803 | |
County of Clark Department of Aviation, Airport Systems, Subordinate, Rev., 5.00%, 07/01/2033 | | | 1,010 | | | | 1,360 | |
County of Clark Department of Aviation, Subordinate, | | | | | | | | |
Series B, Rev., AMT, 5.00%, 07/01/2025 | | | 1,235 | | | | 1,449 | |
Series B, Rev., AMT, 5.00%, 07/01/2027 | | | 6,000 | | | | 7,423 | |
County of Clark Passenger Facility Charge Revenue, Mccarran International, | | | | | | | | |
Rev., 5.00%, 07/01/2029 | | | 5,000 | | | | 6,561 | |
Rev., 5.00%, 07/01/2031 | | | 1,950 | | | | 2,527 | |
Rev., 5.00%, 07/01/2032 | | | 2,385 | | | | 3,087 | |
County of Clark, Detention Center, GO, 4.00%, 06/01/2034 | | | 3,335 | | | | 3,992 | |
County of Clark, Limited Tax, Flood Control, GO, 5.00%, 11/01/2038 (p) | | | 2,000 | | | | 2,224 | |
County of Clark, Passenger Facility Charge Revenue, Las Vegas McCarran International Airport, Rev., 5.00%, 07/01/2030 | | | 1,425 | | | | 1,855 | |
County of Washoe, Sierra Pacific Power Company, | | | | | | | | |
Rev., AMT, 0.63%, 03/01/2036 (z) | | | 900 | | | | 902 | |
SEE NOTES TO FINANCIAL STATEMENTS.
| | | | | | | | | | |
| | | | | |
| 162 | | | | | | | | SIX CIRCLES TRUST | | JUNE 30, 2021 |
| | | | | | | | |
| SECURITY DESCRIPTION | | PRINCIPAL
AMOUNT($) | | | VALUE($) | |
Municipal Bonds — continued | | | | | | | | |
Nevada — continued | | | | | | | | |
Series B, Rev., 3.00%, 03/01/2036 (z) | | | 10 | | | | 10 | |
Las Vegas Convention & Visitors Authority, Series B, Rev., 5.00%, 07/01/2043 | | | 4,900 | | | | 5,963 | |
Las Vegas Valley Water District, | | | | | | | | |
Series B, GO, 5.00%, 06/01/2022 | | | 1,000 | | | | 1,044 | |
Series B, GO, 5.00%, 12/01/2021 | | | 1,500 | | | | 1,530 | |
Series B, GO, 5.00%, 06/01/2023 | | | 5,065 | | | | 5,533 | |
Series D, GO, 5.00%, 06/01/2023 | | | 1,180 | | | | 1,289 | |
Series A, GO, 5.00%, 06/01/2022 | | | 6,000 | | | | 6,267 | |
Las Vegas Valley Water District, Water Improvement, Series A, GO, 5.00%, 06/01/2046 | | | 5,000 | | | | 5,909 | |
Las Vegas Valley, Water District, Series B, GO, 5.00%, 12/01/2023 | | | 70 | | | | 78 | |
Nevada Housing Division, Pinewood Terrace Apartments, Rev., 0.26%, 04/01/2024 (z) | | | 500 | | | | 500 | |
Nevada Housing Division, Whittell Pointe, Rev., 0.30%, 10/01/2023 (z) | | | 3,665 | | | | 3,668 | |
State of Nevada Department of Business & Industry, Brightline West Passenger Rail, Rev., AMT, 0.00%, 01/01/2050 (e) (w) (z) | | | 2,630 | | | | 2,630 | |
State of Nevada, Department of Business & Industry, Republic Services, Inc. Project, Rev., AMT, 0.25%, 12/01/2026 (e) (z) | | | 665 | | | | 665 | |
| | | | | | | | |
| | |
| | | | | | | 74,798 | |
| | | | | | | | |
New Hampshire — 0.2% | | | | | | | | |
New Hampshire Business Finance Authority, Rev., 4.13%, 01/20/2034 | | | 981 | | | | 1,181 | |
New Hampshire Business Finance Authority, Caritas Oregon Project, Series A, Rev., 4.13%, 08/15/2040 (e) | | | 2,000 | | | | 2,127 | |
New Hampshire Business Finance Authority, Springpoint Senior Living, | | | | | | | | |
Rev., 4.00%, 01/01/2026 | | | 270 | | | | 311 | |
Rev., 4.00%, 01/01/2027 | | | 250 | | | | 293 | |
Rev., 4.00%, 01/01/2028 | | | 290 | | | | 338 | |
Rev., 4.00%, 01/01/2029 | | | 300 | | | | 347 | |
Rev., 4.00%, 01/01/2030 | | | 280 | | | | 322 | |
Rev., 4.00%, 01/01/2031 | | | 290 | | | | 331 | |
New Hampshire Business Finance Authority, Waste Management, Series A2, Rev., AMT, 0.20%, 09/01/2021 (z) | | | 3,710 | | | | 3,710 | |
| | | | | | | | |
| | | | | | | 8,960 | |
| | | | | | | | |
New Jersey — 3.6% | | | | | | | | |
City of Newark, | | | | | | | | |
Series A, GO, AGM, 5.00%, 10/01/2027 | | | 100 | | | | 123 | |
Series A, GO, AGM, 5.00%, 10/01/2028 | | | 750 | | | | 943 | |
Garden State Preservation Trust, Capital Appreciation, Series B, Rev., AGM, Zero Coupon, 11/01/2026 | | | 1,000 | | | | 933 | |
| | | | | | | | |
| SECURITY DESCRIPTION | | PRINCIPAL
AMOUNT($) | | | VALUE($) | |
| | | | | | | | |
New Jersey — continued | | | | | | | | |
Gloucester County Improvement Authority, The Rowan University Fossil Park, | | | | | | | | |
Rev., BAM, 4.00%, 07/01/2046 | | | 725 | | | | 852 | |
Rev., BAM, 4.00%, 07/01/2051 | | | 1,000 | | | | 1,169 | |
Hudson County Improvement Authority, Hudson County Courthouse Project, Rev., 5.00%, 10/01/2028 | | | 150 | | | | 193 | |
New Brunswick Parking Authority, City Guaranteed Parking, Series A, Rev., BAM, 5.00%, 09/01/2026 | | | 1,000 | | | | 1,210 | |
New Jersey Economic Development Authority, | | | | | | | | |
Series A, Rev., 5.00%, 11/01/2027 | | | 2,500 | | | | 3,112 | |
Series AAA, Rev., 5.50%, 06/15/2028 | | | 5,000 | | | | 6,218 | |
Series B, Rev., 5.00%, 11/01/2023 | | | 75 | | | | 83 | |
Series DDD, Rev., 5.00%, 06/15/2033 | | | 1,500 | | | | 1,814 | |
New Jersey Economic Development Authority, American Water Company, | | | | | | | | |
Series B, Rev., AMT, 1.20%, 11/01/2034 (z) | | | 1,265 | | | | 1,280 | |
Series C, Rev., AMT, 1.15%, 06/01/2023 | | | 1,550 | | | | 1,570 | |
New Jersey Economic Development Authority, Continental Airlines, Inc. Project, Rev., AMT, 5.13%, 09/15/2023 | | | 2,000 | | | | 2,114 | |
New Jersey Economic Development Authority, Higher Education Capital Improvement Fund, Series A, Rev., 5.00%, 09/01/2025 | | | 245 | | | | 280 | |
New Jersey Economic Development Authority, Municipal Rehabilitation, Series A, Rev., 5.25%, 04/01/2027 (z) | | | 5,000 | | | | 6,188 | |
New Jersey Economic Development Authority, New Jersey American Water Company, Inc., | | | | | | | | |
Rev., AMT, 1.10%, 11/01/2029 (z) | | | 2,610 | | | | 2,593 | |
Series E, Rev., AMT, 0.85%, 12/01/2025 | | | 2,205 | | | | 2,190 | |
New Jersey Economic Development Authority, School Facilities, Series GG, Rev., 5.00%, 09/01/2021 | | | 3,000 | | | | 3,009 | |
New Jersey Economic Development Authority, School Facilities Construction, | | | | | | | | |
Rev., 5.00%, 03/01/2031 | | | 1,190 | | | | 1,275 | |
Series GGG, Rev., 5.25%, 09/01/2026 (e) | | | 3,000 | | | | 3,657 | |
New Jersey Economic Development Authority, School Facilities Construction Sifma, Series I, Rev., (SIFMA Municipal Swap Index + 1.60%), 1.63%, 03/01/2028 (aa) | | | 10,000 | | | | 10,159 | |
New Jersey Economic Development Authority, Self Designated Social Bonds, | | | | | | | | |
Series QQQ, Rev., 4.00%, 06/15/2034 | | | 500 | | | | 598 | |
Series QQQ, Rev., 4.00%, 06/15/2035 | | | 500 | | | | 597 | |
Series QQQ, Rev., 5.00%, 06/15/2026 | | | 555 | | | | 668 | |
Series QQQ, Rev., 5.00%, 06/15/2027 | | | 410 | | | | 506 | |
Series QQQ, Rev., 5.00%, 06/15/2028 | | | 400 | | | | 504 | |
New Jersey Economic Development Authority, State House Project, | | | | | | | | |
Series B, Rev., 5.00%, 06/15/2027 | | | 10,690 | | | | 13,186 | |
Series B, Rev., 5.00%, 06/15/2028 | | | 8,635 | | | | 10,870 | |
SEE NOTES TO FINANCIAL STATEMENTS.
| | | | | | | | | | |
| | | | | |
| JUNE 30, 2021 | | SIX CIRCLES TRUST | | | | | | | | 163 |
Six Circles Tax Aware Bond Fund
SCHEDULE OF PORTFOLIO INVESTMENTS
AS OF JUNE 30, 2021 (Unaudited) (continued)
(Amounts in U.S. Dollars, unless otherwise noted)
(Amounts in thousands, except number of Futures contracts)
| | | | | | | | |
| SECURITY DESCRIPTION | | PRINCIPAL
AMOUNT($) | | | VALUE($) | |
Municipal Bonds — continued | | | | | | | | |
New Jersey — continued | | | | | | | | |
New Jersey Educational Facilities Authority, Montclair State University, Series D, Rev., 5.00%, 07/01/2028 | | | 2,000 | | | | 2,328 | |
New Jersey Educational Facilities Authority, Princeton University, | | | | | | | | |
Series A, Rev., 5.00%, 07/01/2022 | | | 1,710 | | | | 1,793 | |
Series B, Rev., 5.00%, 07/01/2024 | | | 3,505 | | | | 4,003 | |
Series I, Rev., 5.00%, 07/01/2024 | | | 1,290 | | | | 1,474 | |
Series I, Rev., 5.00%, 07/01/2036 | | | 1,015 | | | | 1,259 | |
New Jersey Health Care Facilities Financing Authority, Inspira Health Obligated Group, Rev., 5.00%, 07/01/2037 | | | 1,600 | | | | 1,954 | |
New Jersey Health Care Facilities Financing Authority, Princeton Health Care, Rev., 5.00%, 07/01/2025 | | | 1,320 | | | | 1,556 | |
New Jersey Higher Education Student Assistance Authority, | | | | | | | | |
Series B, Rev., AMT, 5.00%, 12/01/2024 | | | 570 | | | | 653 | |
Series B, Rev., AMT, 5.00%, 12/01/2027 | | | 1,340 | | | | 1,652 | |
Series B, Rev., AMT, 5.00%, 12/01/2028 | | | 1,480 | | | | 1,857 | |
Series B, Rev., AMT, 5.00%, 12/01/2029 | | | 1,440 | | | | 1,833 | |
New Jersey Higher Education Student Assistance Authority, Senior Bonds, Series B, Rev., AMT, 5.00%, 12/01/2024 | | | 300 | | | | 344 | |
New Jersey Higher Education Student Assistance Authority, Senior Student Loan, Rev., AMT, 5.00%, 12/01/2023 | | | 215 | | | | 238 | |
New Jersey Higher Education Student Assistance Authority, Subordinated, Series C, Rev., AMT, 4.00%, 12/01/2048 | | | 1,195 | | | | 1,289 | |
New Jersey Housing & Mortgage Finance Agency, Series E, Rev., 3.50%, 04/01/2051 | | | 3,045 | | | | 3,383 | |
New Jersey Housing & Mortgage Finance Agency, Pilgrim Baptist Village, Rev., HUD, 1.50%, 09/01/2022 (z) | | | 165 | | | | 165 | |
New Jersey Transportation Trust Fund Authority, | | | | | | | | |
Series A, Rev., 5.00%, 12/15/2028 | | | 300 | | | | 382 | |
Series A, Rev., 5.00%, 06/15/2030 | | | 3,000 | | | | 3,890 | |
Series AA, Rev., 4.00%, 06/15/2040 | | | 3,750 | | | | 4,429 | |
Series AA, Rev., 5.00%, 06/15/2035 | | | 3,000 | | | | 3,870 | |
Series AA, Rev., 5.00%, 06/15/2045 | | | 660 | | | | 832 | |
New Jersey Transportation Trust Fund Authority, Capital Appreciation, Series A, Rev., BAM, Zero Coupon, 12/15/2038 | | | 3,250 | | | | 2,193 | |
New Jersey Transportation Trust Fund Authority, Transportation System Bond, Rev., 4.00%, 12/15/2039 | | | 2,000 | | | | 2,329 | |
New Jersey Transportation Trust Fund Authority,Transportation System Bond, | | | | | | | | |
Rev., 5.00%, 12/15/2028 | | | 1,000 | | | | 1,272 | |
Rev., 5.00%, 12/15/2031 | | | 1,560 | | | | 1,991 | |
New Jersey Turnpike Authority, | | | | | | | | |
Series A, Rev., 4.00%, 01/01/2042 | | | 1,000 | | | | 1,201 | |
Series A, Rev., 5.00%, 01/01/2030 (p) | | | 1,000 | | | | 1,049 | |
| | | | | | | | |
| SECURITY DESCRIPTION | | PRINCIPAL
AMOUNT($) | | | VALUE($) | |
| | | | | | | | |
New Jersey — continued | | | | | | | | |
Series E, Rev., 5.00%, 01/01/2027 | | | 1,000 | | | | 1,231 | |
Princeton, GO, 2.00%, 12/15/2023 | | | 1,735 | | | | 1,809 | |
Rutgers The State University of New Jersey, Series L, Rev., 5.00%, 05/01/2043 (p) | | | 1,805 | | | | 1,964 | |
South Jersey Port Corp., Marine Terminal, | | | | | | | | |
Series B, Rev., AMT, 5.00%, 01/01/2025 | | | 500 | | | | 572 | |
Series B, Rev., AMT, 5.00%, 01/01/2026 | | | 1,015 | | | | 1,196 | |
South Jersey Port Corp., Marine Terminal, Subordinated, Series B, Rev., AMT, 5.00%, 01/01/2037 | | | 1,000 | | | | 1,195 | |
South Jersey Transportation Authority, | | | | | | | | |
Series A, Rev., AGM, 5.00%, 11/01/2030 | | | 500 | | | | 648 | |
Series A, Rev., AGM, 5.00%, 11/01/2033 | | | 1,215 | | | | 1,559 | |
Series A, Rev., BAM, 5.00%, 11/01/2041 | | | 2,925 | | | | 3,737 | |
State of New Jersey, Covid-19 Emergency Bonds, General Obligations, | | | | | | | | |
Series A, GO, 4.00%, 06/01/2030 | | | 2,000 | | | | 2,457 | |
Series A, GO, 4.00%, 06/01/2031 | | | 8,340 | | | | 10,385 | |
Series A, GO, 5.00%, 06/01/2028 | | | 4,245 | | | | 5,392 | |
Series A, GO, 5.00%, 06/01/2029 | | | 15,000 | | | | 19,424 | |
Tender Option Bond Trust Receipts/Certificates, Series 2019-XG0258, Rev., VRDO, LOC: Barclays Bank plc, LIQ: Barclays Bank plc, 0.06%, 07/07/2021 (e) (z) | | | 13,300 | | | | 13,300 | |
Tender Option Bond Trust Receipts/Certificates, Floaters, | | | | | | | | |
Series 2016-XM0226, Rev., BHAC-CR, NATL-RE, LIQ: Bank of America NA, 0.00%, 07/01/2026 (e) (z) | | | 4,720 | | | | 4,720 | |
Series 2018-XX1093, Rev., VRDO, LOC: Barclays Bank plc, LIQ: Barclays Bank plc, 0.06%, 07/07/2021 (e) (z) | | | 9,500 | | | | 9,500 | |
Tobacco Settlement Financing Corp., Series A, Rev., 5.00%, 06/01/2022 | | | 2,055 | | | | 2,144 | |
| | | | | | | | |
| | | | | | | 208,346 | |
| | | | | | | | |
New Mexico — 0.5% | | | | | | | | |
Albuquerque Municipal School District No. 12, | | | | | | | | |
Series A, GO, 5.00%, 08/01/2024 | | | 250 | | | | 286 | |
Series B, GO, 5.00%, 08/01/2024 | | | 330 | | | | 377 | |
City of Farmington, Pollution Control Revenue, Public Service Company, New Mexico Sanitary, Series E, Rev., 1.15%, 06/01/2040 (z) | | | 4,635 | | | | 4,715 | |
New Mexico Finance Authority,Subordinated Lien, Public Project Revolving Fund, Rev., 5.00%, 06/15/2024 | | | 1,000 | | | | 1,138 | |
New Mexico Hospital Equipment Loan Council, | | | | | | | | |
Rev., 5.00%, 06/01/2030 | | | 1,050 | | | | 1,365 | |
Rev., 5.00%, 06/01/2032 | | | 1,000 | | | | 1,288 | |
New Mexico Hospital Equipment Loan Council, Presbyterian Healthcare, Rev., 4.00%, 08/01/2037 | | | 305 | | | | 349 | |
SEE NOTES TO FINANCIAL STATEMENTS.
| | | | | | | | | | |
| | | | | |
| 164 | | | | | | | | SIX CIRCLES TRUST | | JUNE 30, 2021 |
| | | | | | | | |
| SECURITY DESCRIPTION | | PRINCIPAL
AMOUNT($) | | | VALUE($) | |
Municipal Bonds — continued | | | | | | | | |
New Mexico — continued | | | | | | | | |
New Mexico Mortgage Finance Authority, | | | | | | | | |
Series A, Rev., GNMA/FNMA/FHLMC, 3.00%, 01/01/2052 | | | 2,240 | | | | 2,459 | |
Series B, Rev., GNMA/FNMA/FHLMC, 3.00%, 01/01/2051 | | | 3,360 | | | | 3,668 | |
New Mexico Mortgage Finance Authority, Single Family Mortgage Program, Series C, Rev., GNMA/FNMA/FHLMC, 4.00%, 01/01/2049 | | | 6,260 | | | | 6,899 | |
New Mexico Municipal Energy Acquisition Authority, | | | | | | | | |
Series A, Rev., LIQ: Royal Bank of Canada, 4.00%, 05/01/2022 | | | 95 | | | | 98 | |
Series A, Rev., LIQ: Royal Bank of Canada, 5.00%, 11/01/2039 (z) | | | 3,925 | | | | 4,564 | |
Santa Fe Public School District, GO, 5.00%, 08/01/2029 | | | 1,375 | | | | 1,756 | |
| | | | | | | | |
| | | | | | | 28,962 | |
| | | | | | | | |
New York — 11.5% | | | | | | | | |
Albany County, Airport Authority, Series B, Rev., AMT, 5.00%, 12/15/2023 | | | 1,225 | | | | 1,360 | |
Broome County, Local Development Corp., United Health Services Hospital, | | | | | | | | |
Rev., AGM, 4.00%, 04/01/2039 | | | 2,750 | | | | 3,238 | |
Rev., AGM, 5.00%, 04/01/2026 | | | 500 | | | | 601 | |
Build NYC Resource Corp., Rev., 5.00%, 07/01/2026 | | | 325 | | | | 376 | |
Build NYC Resource Corp., Academic Leadership Charter School, | | | | | | | | |
Rev., 4.00%, 06/15/2023 | | | 100 | | | | 106 | |
Rev., 4.00%, 06/15/2024 | | | 70 | | | | 77 | |
Build NYC Resource Corp., Family Life Academy Charter, Series A1, Rev., 5.25%, 06/01/2040 (e) | | | 1,220 | | | | 1,271 | |
Build NYC Resource Corp., Friends of Hellenic Classical, Series A, Rev., 4.00%, 12/01/2031 (e) | | | 700 | | | | 783 | |
City of Long Beach, | | | | | | | | |
Series A, GO, 5.00%, 09/01/2025 | | | 1,990 | | | | 2,304 | |
Series A, GO, 5.00%, 09/01/2027 | | | 1,500 | | | | 1,817 | |
City of New York, | | | | | | | | |
Series 1I, GO, 5.00%, 03/01/2026 | | | 360 | | | | 404 | |
Series A1, GO, 4.00%, 08/01/2034 | | | 3,000 | | | | 3,672 | |
Series A1, GO, 5.00%, 08/01/2026 | | | 2,000 | | | | 2,439 | |
Series A1, GO, 5.00%, 08/01/2029 | | | 2,900 | | | | 3,791 | |
Series A1, GO, 5.00%, 08/01/2041 | | | 3,000 | | | | 3,796 | |
Series A, GO, 5.00%, 08/01/2028 | | | 100 | | | | 125 | |
Series C1, GO, 4.00%, 08/01/2022 | | | 1,800 | | | | 1,875 | |
Series C, GO, 5.00%, 08/01/2022 | | | 60 | | | | 63 | |
Series C, GO, 5.00%, 08/01/2027 | | | 1,870 | | | | 2,342 | |
Series D1, GO, 5.00%, 12/01/2024 | | | 150 | | | | 174 | |
Series D1, GO, 5.00%, 12/01/2031 | | | 1,380 | | | | 1,762 | |
Series D1, GO, 5.00%, 12/01/2036 | | | 11,955 | | | | 15,089 | |
Series D1, GO, 5.00%, 12/01/2044 | | | 2,560 | | | | 3,187 | |
| | | | | | | | |
| SECURITY DESCRIPTION | | PRINCIPAL
AMOUNT($) | | | VALUE($) | |
| | | | | | | | |
New York — continued | | | | | | | | |
Series D, GO, 5.00%, 08/01/2023 | | | 1,000 | | | | 1,100 | |
Series E, GO, 5.00%, 08/01/2028 | | | 1,625 | | | | 2,083 | |
Series F1, GO, 5.00%, 04/01/2037 | | | 2,730 | | | | 3,381 | |
Series F1, GO, 5.00%, 04/01/2039 | | | 5,000 | | | | 6,170 | |
Series F1, GO, 5.00%, 03/01/2043 | | | 1,000 | | | | 1,293 | |
Series J3, GO, AGM, 0.19%, 06/01/2036 (z) | | | 2,000 | | | | 2,000 | |
Series J, GO, 5.00%, 08/01/2025 | | | 2,320 | | | | 2,544 | |
City of New York NY, Series C4, GO, AGC, 0.19%, 10/01/2027 (z) | | | 2,000 | | | | 2,000 | |
City of New York Prerefunded, Series F1, GO, 5.00%, 03/01/2037 (p) | | | 745 | | | | 804 | |
City of New York, Fiscal 2001, | | | | | | | | |
Series 2, GO, VRDO, 0.16%, 07/01/2021 (z) | | | 1,400 | | | | 1,400 | |
Series 3, GO, VRDO, 0.16%, 07/07/2021 (z) | | | 1,065 | | | | 1,065 | |
City of New York, Fiscal 2008, Series J10, GO, 5.00%, 08/01/2026 | | | 1,755 | | | | 2,140 | |
City of New York, Fiscal 2015, Series F4, GO, 5.00%, 06/01/2044 (z) | | | 1,455 | | | | 1,700 | |
City of New York, Fiscal 2020, | | | | | | | | |
Series B1, GO, 4.00%, 10/01/2023 | | | 990 | | | | 1,074 | |
Series B1, GO, 5.00%, 10/01/2038 | | | 5,000 | | | | 6,390 | |
City of New York, Fiscal 2021, | | | | | | | | |
Series C, GO, 4.00%, 08/01/2037 | | | 450 | | | | 544 | |
Series C, GO, 5.00%, 08/01/2033 | | | 2,000 | | | | 2,635 | |
Series C, GO, 5.00%, 08/01/2035 | | | 4,740 | | | | 6,204 | |
City of New York, Unrefunded, Series F1, GO, 5.00%, 03/01/2037 | | | 5 | | | | 5 | |
County of Dutchess, Local Development Corp., Marist College Project, Series A, Rev., 5.00%, 07/01/2045 | | | 485 | | | | 562 | |
County of Nassau, | | | | | | | | |
Series B, GO, BAM, 5.00%, 10/01/2027 | | | 1,450 | | | | 1,772 | |
Series C, GO, 5.00%, 10/01/2025 | | | 1,005 | | | | 1,190 | |
Dutchess County, Local Development Corp., Health Quest System, Inc. Project, Series B, Rev., 5.00%, 07/01/2046 | | | 1,250 | | | | 1,479 | |
Geneva Development Corp., Hobart & William Smith College, Rev., 5.00%, 09/01/2032 (p) | | | 530 | | | | 560 | |
Hudson Yards Infrastructure Corp., | | | | | | | | |
Rev., 4.00%, 02/15/2044 | | | 9,335 | | | | 10,493 | |
Series A, Rev., 5.00%, 02/15/2026 | | | 1,050 | | | | 1,258 | |
Series A, Rev., 5.00%, 02/15/2045 | | | 2,210 | | | | 2,642 | |
Long Island Power Authority, | | | | | | | | |
Rev., 5.00%, 09/01/2042 | | | 2,070 | | | | 2,538 | |
Series A, Rev., 5.00%, 09/01/2037 | | | 1,250 | | | | 1,641 | |
Series C, Rev., (ICE LIBOR USD 1 Month * 0.70 + 0.75%), 0.81%, 05/01/2033 (aa) | | | 5,000 | | | | 5,017 | |
Long Island Power Authority, Notes, Rev., 1.00%, 09/01/2025 | | | 2,680 | | | | 2,711 | |
Long Island Power Authority, Unrefunded, Series A, Rev., 5.00%, 09/01/2042 | | | 500 | | | | 527 | |
Metropolitan Transportation Authority, | | | | | | | | |
Rev., AGM, (United States SOFR * 0.67 + 0.55%), 0.58%, 11/01/2032 (aa) | | | 1,770 | | | | 1,782 | |
SEE NOTES TO FINANCIAL STATEMENTS.
| | | | | | | | | | |
| | | | | |
| JUNE 30, 2021 | | SIX CIRCLES TRUST | | | | | | | | 165 |
Six Circles Tax Aware Bond Fund
SCHEDULE OF PORTFOLIO INVESTMENTS
AS OF JUNE 30, 2021 (Unaudited) (continued)
(Amounts in U.S. Dollars, unless otherwise noted)
(Amounts in thousands, except number of Futures contracts)
| | | | | | | | |
| SECURITY DESCRIPTION | | PRINCIPAL
AMOUNT($) | | | VALUE($) | |
Municipal Bonds — continued | | | | | | | | |
New York — continued | | | | | | | | |
Rev., AGM, (United States SOFR * 0.67 + 0.80%), 0.83%, 11/01/2032 (aa) | | | 430 | | | | 438 | |
Series A, Rev., BAN, 4.00%, 02/01/2022 | | | 4,645 | | | | 4,745 | |
Series B1, Rev., BAN, 5.00%, 05/15/2022 | | | 4,000 | | | | 4,166 | |
Series B, Rev., 5.00%, 11/15/2024 | | | 1,095 | | | | 1,258 | |
Series B, Rev., 5.00%, 11/15/2025 | | | 540 | | | | 641 | |
Series B, Rev., AMBAC, 5.25%, 11/15/2024 | | | 500 | | | | 581 | |
Series C, Rev., 5.00%, 11/15/2022 | | | 1,000 | | | | 1,063 | |
Series C, Rev., 5.00%, 11/15/2047 (p) | | | 4,375 | | | | 4,666 | |
Series D1, Rev., BAN, 5.00%, 09/01/2022 | | | 3,000 | | | | 3,164 | |
Series D1, Rev., 5.00%, 11/01/2028 | | | 2,000 | | | | 2,111 | |
Series D, Rev., 5.00%, 11/15/2027 | | | 1,200 | | | | 1,459 | |
Series D, Rev., 5.00%, 11/15/2038 | | | 600 | | | | 653 | |
Series F, Rev., 5.00%, 11/15/2022 | | | 135 | | | | 144 | |
Series F, Rev., BAN, 5.00%, 11/15/2022 | | | 3,375 | | | | 3,592 | |
Metropolitan Transportation Authority, Build America Bonds, Rev., 6.67%, 11/15/2039 | | | 2,500 | | | | 3,639 | |
Metropolitan Transportation Authority, Green Bond, | | | | | | | | |
Series A1, Rev., BAN, 5.00%, 02/01/2023 | | | 1,575 | | | | 1,690 | |
Series A2, Rev., 5.00%, 11/15/2024 | | | 1,815 | | | | 2,085 | |
Series A2, Rev., 5.00%, 11/15/2027 | | | 1,085 | | | | 1,319 | |
Series B, Rev., 5.00%, 11/15/2021 | | | 125 | | | | 127 | |
Series B, Rev., 5.00%, 11/15/2023 | | | 100 | | | | 111 | |
Metropolitan Transportation Authority, Green Bonds, | | | | | | | | |
Series A2, Rev., 5.00%, 11/15/2025 | | | 1,000 | | | | 1,187 | |
Series B1, Rev., 5.00%, 11/15/2046 | | | 2,000 | | | | 2,355 | |
Series C1, Rev., 5.00%, 11/15/2024 | | | 340 | | | | 391 | |
Series C1, Rev., 5.00%, 11/15/2027 | | | 1,115 | | | | 1,394 | |
Series D1, Rev., 5.00%, 11/15/2043 | | | 2,000 | | | | 2,539 | |
Series D3, Rev., 4.00%, 11/15/2049 | | | 2,000 | | | | 2,323 | |
Metropolitan Transportation Authority, Green Bonds, Subordinated, Series B1, Rev., 5.00%, 11/15/2036 | | | 10,000 | | | | 11,944 | |
Metropolitan Transportation Authority, Refunding, Transportation Subordinated, Series C1, Rev., 5.00%, 11/15/2025 | | | 1,055 | | | | 1,252 | |
Metropolitan Transportation Authority, Transportation, | | | | | | | | |
Series A1, Rev., 5.00%, 11/15/2044 | | | 4,500 | | | | 4,879 | |
Series A1, Rev., 5.25%, 11/15/2039 | | | 1,000 | | | | 1,096 | |
Series C1, Rev., 5.00%, 11/15/2026 | | | 305 | | | | 361 | |
Series C2, Rev., BAN, 5.00%, 09/01/2021 | | | 3,000 | | | | 3,023 | |
Metropolitan Transportation Authority, Transportation Green Bonds, Series B, Rev., 5.00%, 11/15/2026 | | | 1,720 | | | | 2,102 | |
Metropolitan Transportation Authority, Transportation, Green Bonds, Series B, Rev., 5.00%, 11/15/2022 | | | 605 | | | | 643 | |
Metropolitan Transportation Authority, Unrefunded Balance, Transportation, Series A, Rev., 5.00%, 11/15/2041 (p) | | | 4,000 | | | | 4,072 | |
| | | | | | | | |
| SECURITY DESCRIPTION | | PRINCIPAL
AMOUNT($) | | | VALUE($) | |
| | | | | | | | |
New York — continued | | | | | | | | |
Monroe County Industrial Development Corp., Rochester Regional Health Project, | | | | | | | | |
Rev., 5.00%, 12/01/2022 | | | 600 | | | | 638 | |
Rev., 5.00%, 12/01/2027 | | | 1,000 | | | | 1,241 | |
Rev., 5.00%, 12/01/2028 | | | 1,700 | | | | 2,153 | |
Rev., 5.00%, 12/01/2029 | | | 1,900 | | | | 2,448 | |
Nassau County Interim Finance Authority, Taxable, Series B, Rev., 1.28%, 11/15/2028 | | | 3,000 | | | | 2,941 | |
New York City Health and Hospitals Corp., | | | | | | | | |
Series A, Rev., 4.00%, 02/15/2025 | | | 1,250 | | | | 1,408 | |
Series A, Rev., 5.00%, 02/15/2024 | | | 270 | | | | 303 | |
Series A, Rev., 5.00%, 02/15/2025 | | | 2,225 | | | | 2,587 | |
Series A, Rev., 5.00%, 02/15/2026 | | | 6,055 | | | | 7,274 | |
Series A, Rev., 5.00%, 02/15/2027 | | | 5,360 | | | | 6,624 | |
Series A, Rev., 5.00%, 02/15/2028 | | | 3,760 | | | | 4,763 | |
Series A, Rev., 5.00%, 02/15/2029 | | | 2,485 | | | | 3,215 | |
New York City Housing Development Corp., Sustainability Bonds, | | | | | | | | |
Rev., FHA, 0.70%, 11/01/2060 (z) | | | 9,490 | | | | 9,503 | |
Series C2, Rev., 0.23%, 05/01/2050 (z) | | | 385 | | | | 385 | |
Series C2, Rev., 0.70%, 11/01/2060 (z) | | | 1,790 | | | | 1,790 | |
Series C3-A, Rev., 0.20%, 05/01/2022 | | | 325 | | | | 325 | |
New York City Housing Development Corp., Sustainable Development Bonds, Series D2, Rev., FHA, 0.70%, 05/01/2060 (z) | | | 1,000 | | | | 1,003 | |
New York City Housing Development Corp., Sustainable Neighborhood Bonds, Rev., 1.75%, 05/01/2059 (z) | | | 1,000 | | | | 1,006 | |
New York City Industrial Development Agency, Queens Baseball Stadium Project, | | | | | | | | |
Series A, Rev., AGM, 4.00%, 01/01/2032 | | | 1,000 | | | | 1,235 | |
Series A, Rev., AGM, 5.00%, 01/01/2025 | | | 250 | | | | 290 | |
Series A, Rev., AGM, 5.00%, 01/01/2027 | | | 625 | | | | 768 | |
Series A, Rev., AGM, 5.00%, 01/01/2029 | | | 1,000 | | | | 1,287 | |
Series A, Rev., AGM, 5.00%, 01/01/2030 | | | 1,500 | | | | 1,967 | |
New York City Industrial Development Agency, Yankee Stadium Project Pilot, | | | | | | | | |
Rev., AGM, 4.00%, 03/01/2045 | | | 8,825 | | | | 10,331 | |
Rev., AGM, 5.00%, 03/01/2028 | | | 1,250 | | | | 1,561 | |
Rev., AGM, 5.00%, 03/01/2029 | | | 1,500 | | | | 1,911 | |
Rev., AGM, 5.00%, 03/01/2030 | | | 3,900 | | | | 5,057 | |
New York City Transitional Finance Authority Building Aid Revenue, Fiscal 2015, Subordinate, Series S, Rev., 5.00%, 07/15/2040 | | | 17,800 | | | | 20,786 | |
New York City Transitional Finance Authority Building Aid Revenue, Fiscal Year 2015, Series S1, Rev., 5.00%, 07/15/2035 | | | 585 | | | | 676 | |
New York City Transitional Finance Authority Building Aid Revenue, Subordinate, Series S1, Rev., 5.00%, 07/15/2043 | | | 1,505 | | | | 1,770 | |
New York City Transitional Finance Authority Future Tax Secured, | | | | | | | | |
Rev., 5.00%, 11/01/2028 | | | 1,000 | | | | 1,292 | |
SEE NOTES TO FINANCIAL STATEMENTS.
| | | | | | | | | | |
| | | | | |
| 166 | | | | | | | | SIX CIRCLES TRUST | | JUNE 30, 2021 |
| | | | | | | | |
| SECURITY DESCRIPTION | | PRINCIPAL
AMOUNT($) | | | VALUE($) | |
Municipal Bonds — continued | | | | | | | | |
New York — continued | | | | | | | | |
Rev., 5.00%, 08/01/2029 | | | 5,000 | | | | 6,559 | |
New York City Transitional Finance Authority Future Tax Secured Revenue, | | | | | | | | |
Series A1, Rev., 5.00%, 05/01/2022 | | | 65 | | | | 68 | |
Series D, Rev., 5.00%, 11/01/2024 | | | 1,985 | | | | 2,292 | |
Series E1, Rev., 3.00%, 02/01/2028 | | | 730 | | | | 833 | |
Series E1, Rev., 5.00%, 02/01/2023 | | | 135 | | | | 145 | |
New York City Transitional Finance Authority Future Tax Secured Revenue, Future Tax Secured, | | | | | | | | |
Rev., 4.00%, 11/01/2035 | | | 7,000 | | | | 8,560 | |
Rev., 5.00%, 11/01/2021 | | | 920 | | | | 935 | |
New York City Transitional Finance Authority Future Tax Secured Revenue, Subordinate, | | | | | | | | |
Rev., 4.00%, 05/01/2038 | | | 2,000 | | | | 2,417 | |
Series A1, Rev., 5.00%, 08/01/2042 | | | 2,000 | | | | 2,501 | |
Series A3, Rev., 4.00%, 05/01/2041 | | | 11,000 | | | | 12,997 | |
Series C1, Rev., 5.00%, 11/01/2021 | | | 1,970 | | | | 2,002 | |
Series DS, Rev., 4.00%, 11/01/2038 | | | 4,000 | | | | 4,830 | |
New York City Transitional Finance Authority Future Tax Secured Revenue, Subordinate, Future Tax Secured, | | | | | | | | |
Rev., 3.75%, 11/01/2025 | | | 8,000 | | | | 8,540 | |
Series A1, Rev., 5.00%, 08/01/2021 (p) | | | 1,000 | | | | 1,004 | |
New York City Transitional Finance Authority Future Tax Secured Revenue, Subordinated, | | | | | | | | |
Rev., 5.00%, 05/01/2031 | | | 1,000 | | | | 1,342 | |
Series A3, Rev., 4.00%, 05/01/2042 | | | 2,000 | | | | 2,358 | |
Series A3, Rev., 5.00%, 08/01/2040 | | | 1,720 | | | | 2,131 | |
Series C1, Rev., 5.00%, 05/01/2024 | | | 1,000 | | | | 1,133 | |
New York City Transitional Finance Authority Future Tax Secured, Future Tax Secured Subordinated Fiscal, Series 1, Rev., 5.00%, 11/01/2026 | | | 3,345 | | | | 4,116 | |
New York City Transitional Finance Authority, Future Tax Secured, Rev., 5.00%, 11/01/2026 | | | 375 | | | | 462 | |
New York City Transitional Finance Authority, Future Tax Secured Revenue, | | | | | | | | |
Rev., 5.00%, 11/01/2024 | | | 2,755 | | | | 3,181 | |
Series I, Rev., 5.00%, 05/01/2027 | | | 345 | | | | 375 | |
New York City Trust for Cultural Resources, Refunding Lincoln Center, Series A, Rev., 5.00%, 12/01/2032 | | | 500 | | | | 658 | |
New York City Water & Sewer System, | | | | | | | | |
Series AA2, Rev., 5.00%, 06/15/2029 | | | 2,850 | | | | 3,746 | |
Series FF, Rev., 5.00%, 06/15/2041 | | | 2,000 | | | | 2,588 | |
Series GG1, Rev., 5.00%, 06/15/2030 | | | 1,000 | | | | 1,341 | |
Series GG, Rev., 5.00%, 06/15/2039 | | | 2,660 | | | | 3,094 | |
New York City Water & Sewer System, Second General Resolution, | | | | | | | | |
Rev., 5.00%, 06/15/2026 | | | 880 | | | | 1,073 | |
Rev., 5.00%, 06/15/2029 | | | 870 | | | | 1,144 | |
Rev., 5.00%, 06/15/2047 | | | 14,655 | | | | 15,891 | |
| | | | | | | | |
| SECURITY DESCRIPTION | | PRINCIPAL
AMOUNT($) | | | VALUE($) | |
| | | | | | | | |
New York — continued | | | | | | | | |
Series CC1, Rev., 5.00%, 06/15/2048 | | | 2,730 | | | | 3,321 | |
Series CC1, Rev., 5.25%, 06/15/2037 | | | 2,345 | | | | 2,917 | |
Series DD1, Rev., 5.00%, 06/15/2048 | | | 3,115 | | | | 3,844 | |
Series DD2, Rev., 5.00%, 06/15/2040 | | | 2,000 | | | | 2,490 | |
Series DD, Rev., 5.00%, 06/15/2047 | | | 6,550 | | | | 7,987 | |
Series FF, Rev., 5.00%, 06/15/2045 | | | 500 | | | | 523 | |
New York City Water & Sewer System, Various Second General Resolution, Series BB4, Rev., VRDO, 0.01%, 07/01/2021 (z) | | | 2,000 | | | | 2,000 | |
New York City Water & Sewer System, Water And Sewer System Revenue Second General Resolution, Series BB2, Rev., 4.00%, 06/15/2042 | | | 1,180 | | | | 1,414 | |
New York City, Water & Sewer System, Series BB1, Rev., 5.00%, 06/15/2049 | | | 500 | | | | 640 | |
New York Liberty Development Corp., World Trade Center Project, | | | | | | | | |
Rev., 5.75%, 11/15/2051 | | | 10,165 | | | | 10,361 | |
Series 1, Rev., 5.00%, 11/15/2044 (e) | | | 1,700 | | | | 1,882 | |
New York State Dormitory Authority, | | | | | | | | |
Series A, Rev., 5.00%, 03/15/2024 | | | 100 | | | | 113 | |
Series A, Rev., 5.00%, 03/15/2029 | | | 3,000 | | | | 3,900 | |
Series A, Rev., 5.00%, 03/15/2034 | | | 2,000 | | | | 2,436 | |
Series A, Rev., 5.00%, 03/15/2040 | | | 1,000 | | | | 1,262 | |
Series D, Rev., 4.00%, 02/15/2037 | | | 2,000 | | | | 2,391 | |
New York State Dormitory Authority, Conrell University, Series A, Rev., 5.00%, 07/01/2031 | | | 1,000 | | | | 1,378 | |
New York State Dormitory Authority, General Purpose, Series D, Rev., 5.00%, 02/15/2026 | | | 100 | | | | 121 | |
New York State Dormitory Authority, General Purpose, Unrefunded, Series A, Rev., 5.00%, 02/15/2022 | | | 250 | | | | 258 | |
New York State Dormitory Authority, Group 1, Series A, Rev., 5.00%, 03/15/2024 | | | 2,000 | | | | 2,254 | |
New York State Dormitory Authority, Group 2, | | | | | | | | |
Series A, Rev., 5.00%, 03/15/2033 | | | 2,000 | | | | 2,652 | |
Series A, Rev., 5.00%, 03/15/2036 | | | 2,015 | | | | 2,570 | |
New York State Dormitory Authority, Group 3, Series A, Rev., 5.00%, 03/15/2037 | | | 5,000 | | | | 6,361 | |
New York State Dormitory Authority, Montefiore Obligated Group, | | | | | | | | |
Series A, Rev., 5.00%, 08/01/2025 | | | 2,035 | | | | 2,380 | |
Series A, Rev., 5.00%, 08/01/2026 | | | 900 | | | | 1,082 | |
Series A, Rev., 5.00%, 08/01/2031 | | | 1,010 | | | | 1,254 | |
New York State Dormitory Authority, Municipal Health Facilities, Rev., 4.00%, 01/15/2023 | | | 50 | | | | 50 | |
New York State Dormitory Authority, New York University, Series A, Rev., 4.00%, 07/01/2035 | | | 620 | | | | 713 | |
New York State Dormitory Authority, Rockefeller University, Series A, Rev., 5.00%, 07/01/2038 | | | 1,000 | | | | 1,046 | |
SEE NOTES TO FINANCIAL STATEMENTS.
| | | | | | | | | | |
| | | | | |
| JUNE 30, 2021 | | SIX CIRCLES TRUST | | | | | | | | 167 |
Six Circles Tax Aware Bond Fund
SCHEDULE OF PORTFOLIO INVESTMENTS
AS OF JUNE 30, 2021 (Unaudited) (continued)
(Amounts in U.S. Dollars, unless otherwise noted)
(Amounts in thousands, except number of Futures contracts)
| | | | | | | | |
| SECURITY DESCRIPTION | | PRINCIPAL
AMOUNT($) | | | VALUE($) | |
Municipal Bonds — continued | | | | | | | | |
New York — continued | | | | | | | | |
New York State Dormitory Authority, School Districts Financing Program, Series A, Rev., AGM, 5.00%, 10/01/2025 | | | 1,460 | | | | 1,737 | |
New York State Dormitory Authority, St Johns University, Series A, Rev., 4.00%, 07/01/2048 | | | 1,000 | | | | 1,198 | |
New York State Dormitory Authority, State University Dormitory Facilities, Series A, Rev., 5.00%, 07/01/2023 (p) | | | 150 | | | | 157 | |
New York State Dormitory Authority, State University New York Dormitory Facilities, Series B, Rev., 5.00%, 07/01/2031 | | | 1,365 | | | | 1,600 | |
New York State Environmental Facilities Corp., Series B, Rev., 5.00%, 06/15/2023 | | | 1,000 | | | | 1,094 | |
New York State Environmental Facilities Corp., Municipal Water, Subordinated, Rev., 5.00%, 06/15/2042 | | | 2,655 | | | | 3,268 | |
New York State Environmental Facilities Corp., Solid Waste Disposal Revenue, Casella Waste System, Inc. Project, Rev., AMT, 2.75%, 09/01/2050 (e) (z) | | | 250 | | | | 264 | |
New York State Housing Finance Agency, Sustainability Bonds, | | | | | | | | |
SONYMA, Rev., 0.65%, 11/01/2056 (z) | | | 1,380 | | | | 1,380 | |
Series K, SONYMA, Rev., 0.70%, 11/01/2024 | | | 1,085 | | | | 1,089 | |
Series P, Rev., 1.55%, 11/01/2023 | | | 300 | | | | 302 | |
New York State Thruway Authority, | | | | | | | | |
Series K, Rev., 5.00%, 01/01/2022 | | | 105 | | | | 107 | |
Series L, Rev., 5.00%, 01/01/2024 | | | 75 | | | | 84 | |
New York State Thruway Authority, General Revenue, Series I, Rev., 5.00%, 01/01/2032 (p) | | | 2,050 | | | | 2,100 | |
New York State Thruway Authority, Group 2, Series N, Rev., 4.00%, 01/01/2041 | | | 4,120 | | | | 4,848 | |
New York State Thruway Authority, Transportation, Series A, Rev., 5.00%, 03/15/2024 | | | 100 | | | | 101 | |
New York State Urban Development Corp., Series A, Rev., 4.00%, 03/15/2049 | | | 1,300 | | | | 1,531 | |
New York State Urban Development Corp., Personal Income Tax, | | | | | | | | |
Rev., 4.00%, 03/15/2037 | | | 2,000 | | | | 2,411 | |
Rev., 4.00%, 03/15/2041 | | | 5,000 | | | | 5,966 | |
Rev., 5.00%, 03/15/2030 | | | 500 | | | | 663 | |
Series C3, Rev., 5.00%, 03/15/2038 | | | 1,685 | | | | 2,085 | |
New York State Urban Development Corp., State Personal Income Tax, | | | | | | | | |
Rev., 5.00%, 03/15/2028 | | | 1,250 | | | | 1,590 | |
Rev., 5.00%, 03/15/2034 | | | 3,000 | | | | 3,358 | |
Series A, Rev., 5.00%, 03/15/2024 | | | 8,000 | | | | 9,019 | |
New York State Urban Development Corp., State Personal Income Tax, General Purpose, | | | | | | | | |
Series A, Rev., 5.00%, 03/15/2042 | | | 5,000 | | | | 6,223 | |
| | | | | | | | |
| SECURITY DESCRIPTION | | PRINCIPAL
AMOUNT($) | | | VALUE($) | |
| | | | | | | | |
New York — continued | | | | | | | | |
Series B, Rev., 3.54%, 03/15/2028 | | | 7,000 | | | | 7,881 | |
New York State Urban Development Corp., State Personal Income Taxes Facilities, Rev., NATL, 5.50%, 03/15/2024 | | | 6,000 | | | | 6,845 | |
New York Transportation Development Corp., American Airlines, Inc., Rev., AMT, 2.25%, 08/01/2026 | | | 945 | | | | 969 | |
New York Transportation Development Corp., Delta Air Lines, Inc., Laguardia, Rev., AMT, 5.00%, 10/01/2035 | | | 10,000 | | | | 12,961 | |
New York Transportation Development Corp., Laguardia Airport Terminal B, Rev., AMT, 5.25%, 01/01/2050 | | | 2,000 | | | | 2,263 | |
New York Transportation Development Corp., New York State Thruway, Rev., AMT, 4.00%, 10/31/2034 | | | 600 | | | | 722 | |
New York Transportation Development Corp., Terminal 4 John F Kennedy International, | | | | | | | | |
Rev., AMT, 4.00%, 12/01/2038 | | | 300 | | | | 357 | |
Rev., AMT, 4.00%, 12/01/2039 | | | 300 | | | | 356 | |
Rev., AMT, 4.00%, 12/01/2040 | | | 1,475 | | | | 1,747 | |
Rev., AMT, 4.00%, 12/01/2041 | | | 300 | | | | 354 | |
Rev., AMT, 4.00%, 12/01/2042 | | | 300 | | | | 353 | |
Rev., 5.00%, 12/01/2024 | | | 200 | | | | 231 | |
Rev., 5.00%, 12/01/2025 | | | 200 | | | | 238 | |
Rev., 5.00%, 12/01/2026 | | | 200 | | | | 246 | |
Rev., 5.00%, 12/01/2027 | | | 200 | | | | 251 | |
Rev., 5.00%, 12/01/2028 | | | 200 | | | | 257 | |
Rev., 5.00%, 12/01/2037 | | | 250 | | | | 326 | |
Rev., 5.00%, 12/01/2038 | | | 250 | | | | 326 | |
Port Authority of New York & New Jersey, | | | | | | | | |
Series 207, Rev., AMT, 5.00%, 09/15/2031 | | | 5,000 | | | | 6,201 | |
Series 223, Rev., AMT, 5.00%, 07/15/2023 | | | 1,220 | | | | 1,336 | |
Series 226, Rev., AMT, 5.00%, 10/15/2031 (w) | | | 2,500 | | | | 3,346 | |
Port Authority of New York & New Jersey, Consolidated, | | | | | | | | |
Series 197, Rev., AMT, 5.00%, 11/15/2032 | | | 3,000 | | | | 3,631 | |
Series 221, Rev., AMT, 5.00%, 07/15/2031 | | | 1,620 | | | | 2,116 | |
Series 221, Rev., AMT, 5.00%, 07/15/2032 | | | 1,500 | | | | 1,952 | |
Port Authority of New York & New Jersey, Consolidated One Hundred Eighty, | | | | | | | | |
Rev., AMT, 5.00%, 09/01/2026 | | | 3,000 | | | | 3,405 | |
Series 222, Rev., 4.00%, 07/15/2036 | | | 10,250 | | | | 12,397 | |
Series 222, Rev., 5.00%, 07/15/2034 | | | 5,000 | | | | 6,588 | |
Tender Option Bond Trust Receipts/Certificates, Series 2020-ZF0950, Rev., VRDO, LIQ: Toronto Dominion Bank, 0.06%, 07/07/2021 (e) (z) | | | 7,020 | | | | 7,020 | |
Triborough Bridge & Tunnel Authority, | | | | | | | | |
Series A1, Rev., 5.00%, 05/15/2051 | | | 7,175 | | | | 9,358 | |
Series A, Rev., BAN, 5.00%, 11/01/2025 | | | 3,165 | | | | 3,774 | |
Series A, Rev., 5.00%, 11/15/2038 | | | 1,000 | | | | 1,062 | |
Series A, Rev., 5.00%, 11/15/2041 | | | 1,975 | | | | 2,333 | |
SEE NOTES TO FINANCIAL STATEMENTS.
| | | | | | | | | | |
| | | | | |
| 168 | | | | | | | | SIX CIRCLES TRUST | | JUNE 30, 2021 |
| | | | | | | | |
| SECURITY DESCRIPTION | | PRINCIPAL
AMOUNT($) | | | VALUE($) | |
Municipal Bonds — continued | | | | | | | | |
New York — continued | | | | | | | | |
Series A, Rev., 5.00%, 11/15/2049 | | | 3,040 | | | | 3,925 | |
Series A2, Rev., 2.00%, 05/15/2045 (z) | | | 8,250 | | | | 8,855 | |
Triborough Bridge & Tunnel Authority, MTA Bridges & Tunnels, Series C1, Rev., 5.00%, 11/15/2025 | | | 2,960 | | | | 3,538 | |
Triborough Bridge & Tunnel Authority, Subordinated, Series A, Rev., 5.00%, 11/15/2025 | | | 50 | | | | 54 | |
Troy Capital Resource Corp., Rensselaer Polytechnic Institute, Rev., 4.00%, 09/01/2036 | | | 750 | | | | 899 | |
Trust for Cultural Resources of The City of New York (The), American Museum of Natural History, Series B1, Rev., (SIFMA Municipal Swap Index + 0.10%), 0.13%, 04/01/2044 (aa) | | | 750 | | | | 750 | |
TSASC, Inc., Series B, Rev., 5.00%, 06/01/2048 | | | 6,780 | | | | 7,479 | |
Utility Debt Securitization Authority, Restructuring, | | | | | | | | |
Rev., 5.00%, 12/15/2025 | | | 175 | | | | 195 | |
Series TE, Rev., 5.00%, 12/15/2033 | | | 3,150 | | | | 3,512 | |
Westchester County Industrial Development Agency, Eg Mount Vernon Preservation, Rev., FNMA COLL, 0.30%, 12/01/2023 (z) | | | 1,525 | | | | 1,526 | |
Westchester County Industrial Development Agency, Marble Hall Tuckahoe Limited, Rev., FHA, 0.28%, 04/01/2024 (z) | | | 3,135 | | | | 3,133 | |
| | | | | | | | |
| | |
| | | | | | | 660,266 | |
| | | | | | | | |
North Carolina — 1.9% | | | | | | | | |
Burlington Housing Authority, Thetford Portfolio, Rev., 0.30%, 11/01/2024 (z) | | | 2,280 | | | | 2,279 | |
Charlotte-Mecklenburg Hospital Authority, Atrium Health, | | | | | | | | |
Series B, Rev., 5.00%, 01/15/2048 (z) | | | 1,000 | | | | 1,031 | |
Series B, Rev., 5.00%, 01/15/2050 (z) | | | 6,870 | | | | 7,955 | |
Charlotte-Mecklenburg Hospital Authority, Atrium Health Obligated Group, Rev., 5.00%, 01/15/2050 (z) | | | 880 | | | | 1,137 | |
City of Charlotte Airport Special Facilities Revenue, Charlotte Douglas International, | | | | | | | | |
Rev., 5.00%, 07/01/2049 | | | 5,000 | | | | 6,295 | |
Rev., AMT, 5.00%, 07/01/2049 | | | 5,000 | | | | 6,210 | |
City of Charlotte, 2003 Governmental Facilities Project, VRDO, COP, LIQ: Wells Fargo Bank NA, 0.02%, 07/07/2021 (z) | | | 2,800 | | | | 2,800 | |
City of Charlotte, Airport Special Facilities Revenue, Series B, Rev., AMT, 5.00%, 07/01/2027 | | | 1,315 | | | | 1,633 | |
City of Charlotte, Water & Sewer System Revenue, | | | | | | | | |
Rev., 5.00%, 07/01/2026 | | | 3,190 | | | | 3,901 | |
Rev., 5.00%, 07/01/2027 | | | 1,000 | | | | 1,259 | |
| | | | | | | | |
| SECURITY DESCRIPTION | | PRINCIPAL
AMOUNT($) | | | VALUE($) | |
| | | | | | | | |
North Carolina — continued | | | | | | | | |
City of Goldsboro, Grand At Day Point Project, Rev., HUD, GNMA COLL, 0.28%, 05/01/2024 (z) | | | 3,460 | | | | 3,456 | |
County of Wake, | | | | | | | | |
Rev., 5.00%, 03/01/2023 | | | 1,390 | | | | 1,502 | |
Series A, Rev., 5.00%, 08/01/2021 | | | 50 | | | | 50 | |
Series B, GO, 5.00%, 08/01/2023 | | | 1,400 | | | | 1,541 | |
County of Wake, Public Improvement, GO, 5.00%, 09/01/2021 | | | 110 | | | | 111 | |
Durham Housing Authority, Jj Henderson, Rev., HUD, 0.30%, 06/01/2024 (z) | | | 1,920 | | | | 1,917 | |
Durham Housing Authority, Oakley Square Apartments Project, Series A, Rev., 0.30%, 05/01/2024 (z) | | | 2,000 | | | | 2,001 | |
North Carolina Capital Facilities Finance Agency, Republic Services, Inc. Project, Rev., AMT, 0.19%, 06/01/2038 (z) | | | 6,500 | | | | 6,500 | |
North Carolina Eastern Municipal Power Agency, Prerefunded, Series A, Rev., 6.00%, 01/01/2026 (p) | | | 1,000 | | | | 1,029 | |
North Carolina Housing Finance Agency, | | | | | | | | |
Series 37A, Rev., AMT, 3.50%, 07/01/2039 | | | 100 | | | | 105 | |
Series 44, Rev., 4.00%, 07/01/2050 | | | 410 | | | | 461 | |
Series 45, Rev., GNMA/FNMA/FHLMC COLL, 1.90%, 01/01/2032 | | | 1,680 | | | | 1,704 | |
Series 45, Rev., GNMA/FNMA/FHLMC COLL, 3.00%, 07/01/2051 | | | 3,850 | | | | 4,202 | |
North Carolina Housing Finance Agency, Wind Crest Senior Living, Rev., 0.36%, 06/01/2024 (w) (z) | | | 825 | | | | 825 | |
North Carolina Medical Care Commission, Caromont Health, Series B, Rev., 5.00%, 02/01/2051 (z) | | | 790 | | | | 948 | |
North Carolina Medical Care Commission, Lutheran Services for the Aging, Rev., 4.00%, 03/01/2041 | | | 1,050 | | | | 1,161 | |
North Carolina Medical Care Commission, Presbyterian Homes Obligations, | | | | | | | | |
Series A, Rev., 4.00%, 10/01/2027 | | | 600 | | | | 714 | |
Series A, Rev., 4.00%, 10/01/2040 | | | 1,200 | | | | 1,386 | |
Series A, Rev., 4.00%, 10/01/2045 | | | 1,750 | | | | 1,999 | |
North Carolina Medical Care Commission, Rex Healthcare, Series A, Rev., 5.00%, 07/01/2031 | | | 1,760 | | | | 2,287 | |
North Carolina Medical Care Commission, The Forest at Duke Project, Rev., 4.00%, 09/01/2041 | | | 830 | | | | 971 | |
North Carolina Municipal Power Agency No. 1, Series B, Rev., 5.00%, 01/01/2027 (p) | | | 1,000 | | | | 1,024 | |
North Carolina Turnpike Authority, Rev., BAN, 5.00%, 02/01/2024 | | | 4,130 | | | | 4,620 | |
North Carolina Turnpike Authority, Senior Lien, Rev., AGM, 5.00%, 01/01/2038 | | | 2,375 | | | | 2,975 | |
SEE NOTES TO FINANCIAL STATEMENTS.
| | | | | | | | | | |
| | | | | |
| JUNE 30, 2021 | | SIX CIRCLES TRUST | | | | | | | | 169 |
Six Circles Tax Aware Bond Fund
SCHEDULE OF PORTFOLIO INVESTMENTS
AS OF JUNE 30, 2021 (Unaudited) (continued)
(Amounts in U.S. Dollars, unless otherwise noted)
(Amounts in thousands, except number of Futures contracts)
| | | | | | | | |
| SECURITY DESCRIPTION | | PRINCIPAL
AMOUNT($) | | | VALUE($) | |
Municipal Bonds — continued | | | | | | | | |
North Carolina — continued | | | | | | | | |
North Carolina Turnpike Authority, Triangle Expressway System, Senior Lien, Rev., AGM, 5.00%, 01/01/2049 | | | 1,000 | | | | 1,259 | |
Raleigh Durham Airport Authority, | | | | | | | | |
Series A, Rev., AMT, 5.00%, 05/01/2032 | | | 1,200 | | | | 1,518 | |
Sanford Housing Authority, Matthews Garden Gilmore, Rev., HUD, 0.30%, 10/01/2023 (z) | | | 3,750 | | | | 3,753 | |
State of North Carolina, | | | | | | | | |
Series A, GO, 5.00%, 06/01/2022 | | | 1,440 | | | | 1,505 | |
Series A, GO, 5.00%, 06/01/2026 | | | 3,000 | | | | 3,659 | |
State of North Carolina, Build Nc Programs, | | | | | | | | |
Series B, Rev., 5.00%, 05/01/2026 | | | 2,255 | | | | 2,735 | |
Series B, Rev., 5.00%, 05/01/2027 | | | 2,750 | | | | 3,434 | |
State of North Carolina, Public Improvement, Series A, GO, 5.00%, 06/01/2024 | | | 1,005 | | | | 1,144 | |
University of North Carolina at Chapel Hill, Series B, Rev., (ICE LIBOR USD 1 Month * 0.67 + 0.40%), 0.46%, 12/01/2041 (aa) | | | 3,000 | | | | 3,007 | |
University of North Carolina at Chapel Hill Hospital, Rev., 5.00%, 02/01/2045 | | | 5,140 | | | | 7,793 | |
Western Carolina University, Series B, Rev., 5.00%, 04/01/2031 | | | 2,120 | | | | 2,785 | |
| | | | | | | | |
| | |
| | | | | | | 110,581 | |
| | | | | | | | |
North Dakota — 0.3% | | | | | | | | |
Cass County Joint Water Resource District, Series A, GO, 0.48%, 05/01/2024 | | | 3,635 | | | | 3,628 | |
City of West Fargo, | | | | | | | | |
Series A, GO, 2.00%, 05/01/2022 | | | 500 | | | | 507 | |
Series A, GO, 2.00%, 05/01/2023 | | | 525 | | | | 542 | |
North Dakota Housing Finance Agency, | | | | | | | | |
Series B, Rev., 3.00%, 07/01/2051 | | | 2,365 | | | | 2,580 | |
Series C, Rev., 4.00%, 01/01/2050 | | | 985 | | | | 1,117 | |
North Dakota Housing Finance Agency, Home Mortgage Financing Program, Series A, Rev., 3.00%, 01/01/2052 | | | 560 | | | | 615 | |
North Dakota Housing Finance Agency, Housing Finance Program, Home Mortgage Finance, Series D, Rev., 4.25%, 01/01/2049 | | | 6,535 | | | | 7,220 | |
West Fargo Public School District No. 6, Series C, GO, 4.00%, 08/01/2026 | | | 300 | | | | 351 | |
| | | | | | | | |
| | |
| | | | | | | 16,560 | |
| | | | | | | | |
Ohio — 2.4% | | | | | | | | |
Akron Bath Copley Joint Township Hospital District, Rev., 5.25%, 11/15/2046 | | | 1,605 | | | | 1,894 | |
Akron Bath Copley Joint Township Hospital District, Summa Health Obligations, | | | | | | | | |
Rev., 4.00%, 11/15/2034 | | | 500 | | | | 597 | |
Rev., 4.00%, 11/15/2035 | | | 1,000 | | | | 1,192 | |
Rev., 4.00%, 11/15/2038 | | | 750 | | | | 887 | |
American Municipal Power, Inc., Series A, Rev., 5.25%, 02/15/2033 (p) | | | 2,430 | | | | 2,507 | |
| | | | | | | | |
| SECURITY DESCRIPTION | | PRINCIPAL
AMOUNT($) | | | VALUE($) | |
| | | | | | | | |
Ohio — continued | | | | | | | | |
Buckeye Tobacco Settlement Financing Authority, Series B2, Rev., 5.00%, 06/01/2055 | | | 5,000 | | | | 5,841 | |
Buckeye Tobacco Settlement Financing Authority, Capital Appreciation, Series A3, Rev., 6.25%, 06/01/2037 (p) | | | 2,820 | | | | 2,977 | |
Buckeye Tobacco Settlement Financing Authority, Senior, Series A2, Rev., 4.00%, 06/01/2048 | | | 2,210 | | | | 2,583 | |
City of Cincinnati, Water System Revenue, Series A, Rev., 5.00%, 12/01/2036 (p) | | | 2,500 | | | | 2,551 | |
City of Cleveland, Airport System Revenue, Series A, Rev., AGM, 5.00%, 01/01/2031 (p) | | | 1,000 | | | | 1,024 | |
City of Columbus, | | | | | | | | |
Series 1, GO, 5.00%, 07/01/2026 (p) | | | 1,000 | | | | 1,096 | |
Series A, GO, 5.00%, 04/01/2032 | | | 2,200 | | | | 2,957 | |
Cleveland Department of Public Utilities, Division of Water, Series FF, Rev., 5.00%, 01/01/2026 | | | 300 | | | | 360 | |
County of Allen Hospital Facilities Revenue, Catholic Health Partners, Series A, Rev., 5.00%, 05/01/2042 (p) | | | 1,465 | | | | 1,524 | |
County of Allen, Hospital Facilities Revenue, Series A, Rev., 5.00%, 08/01/2027 | | | 50 | | | | 63 | |
County of Cuyahoga, Series D, Rev., 5.00%, 12/01/2026 | | | 3,500 | | | | 4,290 | |
County of Geauga, South Franklin Circle Project, Series A, Rev., 8.00%, 12/31/2047 (p) (z) | | | 6,035 | | | | 6,822 | |
County of Hamilton, Trihealth, Inc. Obligated Group, Rev., 5.00%, 08/15/2040 | | | 1,510 | | | | 1,935 | |
County of Montgomery, Kettering Health Network Obligations, | | | | | | | | |
Rev., 4.00%, 08/01/2037 | | | 525 | | | | 632 | |
Rev., 4.00%, 08/01/2041 | | | 1,200 | | | | 1,427 | |
Dayton Metro Library, Library Improvement, Series A, GO, 5.00%, 12/01/2038 (p) | | | 145 | | | | 148 | |
Hamilton City School District, Various Purpose, | | | | | | | | |
GO, 3.50%, 12/01/2031 (p) | | | 1,000 | | | | 1,108 | |
GO, 5.00%, 12/01/2034 (p) | | | 1,500 | | | | 1,740 | |
Lancaster Port Authority, Series A, Rev., LIQ: Royal Bank of Canada, 5.00%, 08/01/2049 (z) | | | 5,000 | | | | 5,759 | |
Miami University, Series A, Rev., 5.00%, 09/01/2031 | | | 600 | | | | 820 | |
Northeast Ohio Medical University, Series A, Rev., 4.00%, 12/01/2035 | | | 250 | | | | 293 | |
Ohio Air Quality Development Authority, American Electric Power Company, Series A, Rev., AMT, 2.10%, 01/01/2029 (z) | | | 1,250 | | | | 1,306 | |
Ohio Air Quality Development Authority, Ohio Valley Electric Corp., Rev., AMT, 2.50%, 11/01/2042 (z) | | | 1,000 | | | | 1,106 | |
SEE NOTES TO FINANCIAL STATEMENTS.
| | | | | | | | | | |
| | | | | |
| 170 | | | | | | | | SIX CIRCLES TRUST | | JUNE 30, 2021 |
| | | | | | | | |
| SECURITY DESCRIPTION | | PRINCIPAL
AMOUNT($) | | | VALUE($) | |
Municipal Bonds — continued | | | | | | | | |
Ohio — continued | | | | | | | | |
Ohio Higher Educational Facility Commission, University Of Dayton, Rev., 5.00%, 02/01/2034 | | | 1,125 | | | | 1,446 | |
Ohio Housing Finance Agency, Series A, Rev., GNMA/FNMA/FHLMC, 4.50%, 09/01/2048 | | | 1,385 | | | | 1,541 | |
Ohio Housing Finance Agency, Chevybrook Estates Apartments Project, Rev., 0.35%, 03/01/2024 (z) | | | 410 | | | | 410 | |
Ohio Housing Finance Agency, Glen Meadows Apartments, Rev., HUD, 0.40%, 11/01/2024 (z) | | | 620 | | | | 620 | |
Ohio Housing Finance Agency, Pinzone Tower Apartments Project, Rev., HUD, 0.28%, 12/01/2023 (z) | | | 1,330 | | | | 1,329 | |
Ohio Housing Finance Agency, The Arts Apartments Project, Series A, Rev., HUD, 0.35%, 12/01/2023 (z) | | | 2,750 | | | | 2,754 | |
Ohio Turnpike & Infrastructure Commission, Junior Lien, Infrastructure Project, Rev., 5.00%, 02/15/2025 | | | 455 | | | | 489 | |
Ohio Water Development Authority, | | | | | | | | |
Series A, Rev., 5.00%, 06/01/2029 | | | 500 | | | | 652 | |
Series A, Rev., 5.00%, 12/01/2035 | | | 1,000 | | | | 1,354 | |
Ohio Water Development Authority Water Pollution Control Loan Fund, | | | | | | | | |
Series B, Rev., 5.00%, 06/01/2024 | | | 1,000 | | | | 1,138 | |
Series B, Rev., 5.00%, 06/01/2025 | | | 1,300 | | | | 1,533 | |
Ohio Water Development Authority, Fresh Water, Series A, Rev., 5.00%, 06/01/2023 | | | 155 | | | | 169 | |
Ohio Water Development Authority, Water Pollution Control Loan Fund, Series A, Rev., VRDO, 0.02%, 07/07/2021 (z) | | | 3,500 | | | | 3,500 | |
State of Ohio, | | | | | | | | |
Series A, GO, 5.00%, 08/01/2021 | | | 1,500 | | | | 1,506 | |
Series A, GO, 5.00%, 09/15/2022 | | | 95 | | | | 101 | |
Series A, GO, 5.00%, 12/15/2022 | | | 75 | | | | 80 | |
Series A, GO, 5.00%, 02/01/2024 | | | 2,000 | | | | 2,245 | |
Series A, GO, 5.00%, 09/01/2024 | | | 1,500 | | | | 1,722 | |
Series A, GO, 5.00%, 02/01/2038 (p) | | | 3,000 | | | | 3,609 | |
State of Ohio, Cleveland Clinic Health System, Series A, Rev., 5.00%, 01/01/2027 | | | 940 | | | | 1,163 | |
State of Ohio, Common School, Series A, GO, 5.00%, 06/15/2022 | | | 825 | | | | 863 | |
State of Ohio, Common Shares, Series C, GO, 4.00%, 09/15/2022 | | | 5,000 | | | | 5,233 | |
State of Ohio, Conservation Project, | | | | | | | | |
Series B, GO, 4.00%, 03/01/2022 | | | 1,145 | | | | 1,175 | |
Series B, GO, 4.00%, 03/01/2023 | | | 1,000 | | | | 1,064 | |
State of Ohio, Conservation Projects, Series A, GO, 2.00%, 03/01/2022 | | | 135 | | | | 137 | |
State of Ohio, Garvee, | | | | | | | | |
Series 1A, Rev., 5.00%, 12/15/2025 | | | 800 | | | | 959 | |
Series 1A, Rev., 5.00%, 12/15/2028 | | | 1,000 | | | | 1,297 | |
| | | | | | | | |
| SECURITY DESCRIPTION | | PRINCIPAL
AMOUNT($) | | | VALUE($) | |
| | | | | | | | |
Ohio — continued | | | | | | | | |
State of Ohio, Higher Education, | | | | | | | | |
Series A, GO, 5.00%, 05/01/2025 | | | 320 | | | | 376 | |
Series A, GO, 5.00%, 05/01/2026 | | | 1,000 | | | | 1,213 | |
Series A, GO, 5.00%, 05/01/2032 | | | 10,000 | | | | 12,418 | |
Series C, GO, 5.00%, 08/01/2028 | | | 5,500 | | | | 7,082 | |
State of Ohio, Mental Health Facilities Improvement, | | | | | | | | |
Series A, Rev., 5.00%, 02/01/2024 | | | 1,045 | | | | 1,172 | |
Series A, Rev., 5.00%, 02/01/2025 | | | 1,000 | | | | 1,164 | |
State of Ohio, Natural Resources, Series S, GO, 5.00%, 04/01/2024 (p) | | | 180 | | | | 195 | |
State of Ohio, Portsmouth Bypass Project P3, Rev., AMT, 5.00%, 06/30/2022 | | | 160 | | | | 167 | |
State of Ohio, Premier Health Partners, | | | | | | | | |
Rev., 4.00%, 11/15/2039 | | | 1,320 | | | | 1,515 | |
Rev., 4.00%, 11/15/2041 | | | 1,450 | | | | 1,658 | |
Rev., 5.00%, 11/15/2028 | | | 680 | | | | 860 | |
State of Ohio, University Hospitals Health System, Series A, Rev., 5.00%, 01/15/2041 | | | 1,000 | | | | 1,167 | |
Tender Option Bond Trust Receipts/Certificates, Series 2020, Rev., LIQ: Bank of America NA, 0.00%, 08/01/2037 (e) (z) | | | 9,560 | | | | 9,560 | |
Toledo City School District, School Facilities Improvement, | | | | | | | | |
GO, 5.00%, 12/01/2030 (p) | | | 1,125 | | | | 1,255 | |
Series B, GO, 5.00%, 12/01/2024 (p) | | | 2,920 | | | | 3,120 | |
| | | | | | | | |
| | |
| | | | | | | 136,450 | |
| | | | | | | | |
| Oklahoma — 0.1% | | | | | | |
Oklahoma Development Finance Authority, Gilcrease Expressway West, Rev., AMT, 1.63%, 07/06/2023 | | | 1,100 | | | | 1,108 | |
Oklahoma Housing Finance Agency, Homeownership Loan Program, Series B, Rev., GNMA/FNMA/FHLMC, 3.25%, 09/01/2050 | | | 1,990 | | | | 2,194 | |
Oklahoma Turnpike Authority, Second, Series C, Rev., 5.00%, 01/01/2031 (p) | | | 3,000 | | | | 3,074 | |
| | | | | | | | |
| | |
| | | | | | | 6,376 | |
| | | | | | | | |
| Oregon — 1.0% | | | | | | |
City of Portland Sewer System Revenue, Second Lien, Series A, Rev., 4.00%, 03/01/2033 | | | 3,850 | | | | 4,776 | |
City of Portland Water System Revenue, Second Lien, Series A, Rev., 5.00%, 05/01/2033 | | | 1,825 | | | | 2,386 | |
Jackson County School District No. 5 Ashland, GO, SCH BD GTY, 5.00%, 06/15/2030 | | | 1,000 | | | | 1,306 | |
Medford Hospital Facilities Authority, Asante Project, Series A, Rev., AGM, 4.00%, 08/15/2045 | | | 1,330 | | | | 1,574 | |
Multnomah County School District No. 1 Portland, | | | | | | | | |
GO, SCH BD GTY, 5.00%, 06/15/2028 | | | 1,850 | | | | 2,373 | |
Series B, GO, SCH BD GTY, 5.00%, 06/15/2022 | | | 10,000 | | | | 10,466 | |
SEE NOTES TO FINANCIAL STATEMENTS.
| | | | | | | | | | |
| | | | | |
| JUNE 30, 2021 | | SIX CIRCLES TRUST | | | | | | | | 171 |
Six Circles Tax Aware Bond Fund
SCHEDULE OF PORTFOLIO INVESTMENTS
AS OF JUNE 30, 2021 (Unaudited) (continued)
(Amounts in U.S. Dollars, unless otherwise noted)
(Amounts in thousands, except number of Futures contracts)
| | | | | | | | |
| SECURITY DESCRIPTION | | PRINCIPAL
AMOUNT($) | | | VALUE($) | |
Municipal Bonds — continued | | | | | | | | |
Oregon — continued | | | | | | | | |
Oregon State Business Development Commission, Intel Corp. Project, Series 232, Rev., 2.40%, 12/01/2040 (z) | | | 200 | | | | 208 | |
Oregon State Facilities Authority, Providence Health and Services, Series A, Rev., 5.00%, 10/01/2022 | | | 80 | | | | 85 | |
Port of Portland Airport Revenue, | | | | | | | | |
Series 27A, Rev., AMT, 5.00%, 07/01/2028 | | | 1,595 | | | | 2,016 | |
Series 27A, Rev., AMT, 5.00%, 07/01/2036 | | | 2,000 | | | | 2,554 | |
Port of Portland Airport Revenue, Portland International Airport, Series 25B, Rev., AMT, 5.00%, 07/01/2039 | | | 1,020 | | | | 1,280 | |
Salem Hospital Facility Authority, Multi Model, Salem Health Projects, Series A, Rev., 5.00%, 05/15/2023 | | | 100 | | | | 109 | |
State of Oregon, Series N, GO, 5.00%, 12/01/2023 | | | 2,070 | | | | 2,112 | |
State of Oregon Department of Transportation, Series A, Rev., 5.00%, 11/15/2025 (p) | | | 2,000 | | | | 2,133 | |
State of Oregon Department of Transportation, Subordinate, Series A, Rev., 5.00%, 11/15/2036 | | | 9,095 | | | | 11,905 | |
State of Oregon Housing & Community Services Department, The Sunsan Emmons Apartment, Rev., HUD, 0.38%, 06/01/2024 (z) | | | 3,695 | | | | 3,695 | |
State of Oregon Housing & Community Services Department, Westwind Apartments Project, Rev., HUD, 0.25%, 03/01/2024 (z) | | | 360 | | | | 360 | |
State of Oregon, Article XI Q, Series F, GO, 5.00%, 05/01/2030 | | | 100 | | | | 121 | |
State of Oregon, Article Xi-M & Xi-N Seismic, GO, 5.00%, 06/01/2030 | | | 1,995 | | | | 2,674 | |
University of Oregon, Series A, Rev., 5.00%, 04/01/2048 | | | 1,000 | | | | 1,219 | |
Yamhill County Hospital Authority, Friendsview, Series B3, Rev., 1.75%, 11/15/2026 | | | 2,000 | | | | 2,002 | |
| | | | | | | | |
| | |
| | | | | | | 55,354 | |
| | | | | | | | |
Pennsylvania — 4.6% | | | | | | | | |
Allegheny County Airport Authority, Pittsburgh International Airport, Series B, Rev., 4.00%, 01/01/2030 (p) | | | 670 | | | | 683 | |
Allegheny County Hospital Development Authority, Health Network Obligations, | | | | | | | | |
Rev., 5.00%, 04/01/2033 | | | 1,000 | | | | 1,239 | |
Series A, Rev., 5.00%, 04/01/2047 | | | 3,000 | | | | 3,631 | |
Allegheny County Hospital Development Authority, University Pittsburgh Medical Center, Rev., 4.00%, 07/15/2038 | | | 1,375 | | | | 1,622 | |
Allegheny County, Hospital Development Authority, Health Network Obligations, Series A, Rev., 5.00%, 04/01/2023 | | | 1,000 | | | | 1,082 | |
| | | | | | | | |
| SECURITY DESCRIPTION | | PRINCIPAL
AMOUNT($) | | | VALUE($) | |
| | | | | | | | |
Pennsylvania — continued | | | | | | | | |
Allegheny County, Hospital Development Authority, Pittsburg University Medical Center, | | | | | | | | |
Series A, Rev., 4.00%, 07/15/2036 | | | 2,200 | | | | 2,607 | |
Series A, Rev., 5.00%, 07/15/2027 | | | 765 | | | | 953 | |
Allegheny County, Sanitary Authority, | | | | | | | | |
Series B, Rev., 4.00%, 06/01/2035 | | | 400 | | | | 492 | |
Series B, Rev., 4.00%, 06/01/2036 | | | 675 | | | | 827 | |
Series B, Rev., 5.00%, 06/01/2030 | | | 500 | | | | 651 | |
Series B, Rev., 5.00%, 06/01/2032 | | | 550 | | | | 738 | |
Series B, Rev., 5.00%, 06/01/2033 | | | 600 | | | | 800 | |
Allentown Neighborhood Improvement Zone Development Authority, Senior Tax Revenue, Rev., 6.00%, 05/01/2042 (e) | | | 280 | | | | 354 | |
Bentworth School District, Series A, GO, BAM, 4.00%, 03/15/2025 | | | 1,380 | | | | 1,547 | |
Berks County Industrial Development Authority, Tower Health Project, | | | | | | | | |
Rev., 4.00%, 11/01/2050 | | | 1,500 | | | | 1,467 | |
Rev., 5.00%, 11/01/2047 | | | 3,155 | | | | 3,394 | |
Bucks County, Industrial Development Authority, Waste Management, Inc. Project, Rev., AMT, 2.75%, 12/01/2022 | | | 100 | | | | 104 | |
Capital Region Water Water Revenue, Rev., 5.00%, 07/15/2032 | | | 1,000 | | | | 1,269 | |
Chester County Health and Education Facilities Authority, Main Line Health System, Series B, Rev., 5.00%, 06/01/2024 | | | 1,000 | | | | 1,138 | |
City of Philadelphia, | | | | | | | | |
GO, AGM, 5.00%, 08/01/2031 | | | 1,795 | | | | 2,220 | |
Series A, GO, 5.00%, 08/01/2030 | | | 4,000 | | | | 4,697 | |
City of Philadelphia Airport Revenue, | | | | | | | | |
Series A, Rev., 5.00%, 07/01/2047 | | | 5,000 | | | | 6,158 | |
Series C, Rev., AMT, 4.00%, 07/01/2050 | | | 1,500 | | | | 1,726 | |
Series C, Rev., AMT, 5.00%, 07/01/2028 | | | 10,000 | | | | 12,641 | |
City of Philadelphia, Airport Revenue, Series B, Rev., AMT, 5.00%, 07/01/2035 | | | 2,235 | | | | 2,720 | |
City of Philadelphia, Airport Revenue, Private Activity, Rev., AGM, AMT, 4.00%, 07/01/2046 (w) | | | 1,000 | | | | 1,177 | |
City of Philadelphia, Water & Wastewater Revenue, Series A, Rev., 5.00%, 11/01/2040 | | | 2,790 | | | | 3,652 | |
City of Pittsburgh, | | | | | | | | |
GO, 5.00%, 09/01/2030 | | | 500 | | | | 623 | |
Series B, GO, 5.00%, 09/01/2025 (p) | | | 3,000 | | | | 3,169 | |
Series B, GO, 5.00%, 09/01/2026 (p) | | | 1,000 | | | | 1,057 | |
Commonwealth Financing Authority, Series B, Rev., 5.00%, 06/01/2027 (p) | | | 500 | | | | 522 | |
Commonwealth of Pennsylvania, | | | | | | | | |
Series 1, GO, 4.00%, 03/15/2034 | | | 5,000 | | | | 5,601 | |
Series 1, GO, 4.00%, 03/01/2035 | | | 3,650 | | | | 4,269 | |
Series 1, GO, 4.00%, 03/15/2035 | | | 2,000 | | | | 2,238 | |
Series 1, GO, 5.00%, 11/15/2026 (p) | | | 1,000 | | | | 1,018 | |
SEE NOTES TO FINANCIAL STATEMENTS.
| | | | | | | | | | |
| | | | | |
| 172 | | | | | | | | SIX CIRCLES TRUST | | JUNE 30, 2021 |
| | | | | | | | |
| SECURITY DESCRIPTION | | PRINCIPAL
AMOUNT($) | | | VALUE($) | |
Municipal Bonds — continued | | | | | | | | |
Pennsylvania — continued | | | | | | | | |
County of Allegheny, Series C75, GO, 5.00%, 11/01/2028 | | | 2,305 | | | | 2,826 | |
County of Berks, GO, 4.00%, 11/15/2027 (p) | | | 225 | | | | 245 | |
Cumberland County Municipal Authority, Rev., 5.00%, 05/01/2030 | | | 1,000 | | | | 1,190 | |
Cumberland Valley School District, | | | | | | | | |
GO, 5.00%, 11/15/2032 (p) | | | 150 | | | | 167 | |
GO, 5.00%, 11/15/2034 (p) | | | 140 | | | | 156 | |
Delaware River Joint Toll Bridge Commission, Series A, Rev., 5.00%, 07/01/2025 (p) | | | 1,020 | | | | 1,069 | |
Delaware River Port Authority, | | | | | | | | |
Rev., 5.00%, 01/01/2030 | | | 2,500 | | | | 2,794 | |
Rev., 5.00%, 01/01/2037 | | | 3,000 | | | | 3,329 | |
Delaware Valley Regional Finance Authority, | | | | | | | | |
Series A, Rev., AMBAC, 5.50%, 08/01/2028 | | | 5,000 | | | | 6,506 | |
Series C, Rev., (ICE LIBOR USD 3 Month * 0.67 + 0.75%), 0.84%, 06/01/2037 (aa) | | | 500 | | | | 482 | |
DuBois Hospital Authority, Penn Highlands Healthcare, | | | | | | | | |
Rev., 4.00%, 07/15/2045 | | | 1,400 | | | | 1,572 | |
Rev., 5.00%, 07/15/2043 | | | 3,410 | | | | 4,057 | |
Emmaus General Authority, Rev., VRDO, AGM, 0.03%, 07/07/2021 (z) | | | 4,710 | | | | 4,710 | |
Geisinger Authority, Geisinger Health System, Series C, Rev., 5.00%, 04/01/2043 (z) | | | 2,630 | | | | 3,402 | |
Health Care Facilities Authority of Sayre, Guthrie Health, Rev., (ICE LIBOR USD 3 Month * 0.67 + 0.78%), 0.87%, 12/01/2024 (aa) | | | 1,665 | | | | 1,668 | |
Lancaster County Hospital Authority, Health Facilities St. Annes, Rev., 5.00%, 04/01/2033 | | | 1,830 | | | | 1,863 | |
Lehigh County Industrial Development Authority, Electricity Utilities Corp., Rev., 1.80%, 09/01/2029 (z) | | | 2,000 | | | | 2,034 | |
Lycoming County Authority, Pennsylvania College Technology, Rev., 5.00%, 05/01/2026 (p) | | | 2,000 | | | | 2,080 | |
Montgomery County Higher Education and Health Authority, Thomas Jefferson University Project, Rev., 4.00%, 09/01/2044 | | | 1,610 | | | | 1,866 | |
Montgomery County Industrial Development Authority, Retirement, | | | | | | | | |
Rev., 5.00%, 11/15/2025 (p) | | | 1,500 | | | | 1,563 | |
Rev., 5.00%, 11/15/2028 (p) | | | 1,600 | | | | 1,668 | |
Montgomery County Industrial Development Authority, Retirement Life Cmntys, | | | | | | | | |
Rev., 5.00%, 11/15/2033 | | | 1,500 | | | | 1,782 | |
Series C, Rev., 5.00%, 11/15/2045 | | | 2,585 | | | | 3,129 | |
New Castle Sanitation Authority, | | | | | | | | |
Series A, Rev., AGM, 3.00%, 06/01/2029 | | | 500 | | | | 555 | |
Series A, Rev., AGM, 3.00%, 06/01/2030 | | | 500 | | | | 551 | |
Norristown Area School District, GO, 5.00%, 09/01/2026 | | | 1,500 | | | | 1,795 | |
| | | | | | | | |
| SECURITY DESCRIPTION | | PRINCIPAL
AMOUNT($) | | | VALUE($) | |
| | | | | | | | |
Pennsylvania — continued | | | | | | | | |
Pennsylvania Economic Development Financing Authority, | | | | | | | | |
Rev., AMT, 5.00%, 06/30/2022 | | | 1,000 | | | | 1,045 | |
Series A, Rev., 5.00%, 11/15/2023 | | | 1,665 | | | | 1,851 | |
Pennsylvania Economic Development Financing Authority, Bridges Finco Project, Rev., AMT, 5.00%, 06/30/2023 | | | 495 | | | | 540 | |
Pennsylvania Economic Development Financing Authority, Philadelphia Bioslides Facility, | | | | | | | | |
Rev., 4.00%, 01/01/2028 | | | 1,590 | | | | 1,837 | |
Rev., 4.00%, 01/01/2029 | | | 450 | | | | 525 | |
Rev., 4.00%, 01/01/2031 | | | 800 | | | | 944 | |
Pennsylvania Economic Development Financing Authority, PPL Energy Supply LLC, Series B, Rev., VRDO, LOC: MUFG Bank Ltd., 0.08%, 07/07/2021 (z) | | | 7,000 | | | | 7,000 | |
Pennsylvania Economic Development Financing Authority, PSEG, Rev., VRDO, LOC: TD Bank NA, 0.03%, 07/07/2021 (z) | | | 6,000 | | | | 6,000 | |
Pennsylvania Economic Development Financing Authority, Republic Services, Series B, Rev., 0.15%, 12/01/2030 (w) (z) | | | 250 | | | | 250 | |
Pennsylvania Economic Development Financing Authority, Republic Services, Inc. Project, Series B1, Rev., AMT, 0.18%, 04/01/2049 (z) | | | 3,630 | | | | 3,630 | |
Pennsylvania Economic Development Financing Authority, Upmc, Series A1, Rev., 4.00%, 04/15/2045 | | | 5,440 | | | | 6,381 | |
Pennsylvania Economic Development Financing Authority, Waste Management, Inc. Project, | | | | | | | | |
Rev., AMT, (SIFMA Municipal Swap Index + 0.40%), 0.43%, 06/01/2041 (aa) | | | 805 | | | | 805 | |
Rev., AMT, 1.75%, 08/01/2038 (z) | | | 5,000 | | | | 5,191 | |
Pennsylvania Higher Education Assistance Agency, | | | | | | | | |
Series A, Rev., AMT, 2.63%, 06/01/2042 | | | 895 | | | | 899 | |
Series A, Rev., AMT, 5.00%, 06/01/2026 | | | 95 | | | | 113 | |
Pennsylvania Higher Educational Facilities Authority, Temple University, | | | | | | | | |
Rev., 5.00%, 04/01/2035 (p) | | | 5,000 | | | | 5,182 | |
Rev., 5.00%, 04/01/2042 (p) | | | 3,025 | | | | 3,135 | |
Pennsylvania Higher Educational Facilities Authority, University Of Pennsylvania, Rev., 5.00%, 08/15/2036 | | | 1,935 | | | | 2,588 | |
Pennsylvania Higher Educational Facilities Authority, University Pennsylvania Health System, Series A, Rev., 4.00%, 08/15/2035 | | | 1,170 | | | | 1,354 | |
Pennsylvania Housing Finance Agency, Series 133, Rev., 3.00%, 10/01/2050 | | | 3,600 | | | | 3,918 | |
Pennsylvania Housing Finance Agency, Harrison Senior Tower, Rev., 0.25%, 06/01/2024 (z) | | | 2,125 | | | | 2,123 | |
SEE NOTES TO FINANCIAL STATEMENTS.
| | | | | | | | | | |
| | | | | |
| JUNE 30, 2021 | | SIX CIRCLES TRUST | | | | | | | | 173 |
Six Circles Tax Aware Bond Fund
SCHEDULE OF PORTFOLIO INVESTMENTS
AS OF JUNE 30, 2021 (Unaudited) (continued)
(Amounts in U.S. Dollars, unless otherwise noted)
(Amounts in thousands, except number of Futures contracts)
| | | | | | | | |
| SECURITY DESCRIPTION | | PRINCIPAL
AMOUNT($) | | | VALUE($) | |
Municipal Bonds — continued | | | | | | | | |
Pennsylvania — continued | | | | | | | | |
Pennsylvania Housing Finance Agency, Social Bonds, Series 135A, Rev., 3.00%, 10/01/2051 | | | 1,145 | | | | 1,242 | |
Pennsylvania Housing Finance Agencyl, Social Bonds, | | | | | | | | |
Series 134B, Rev., AMT, 5.00%, 04/01/2022 | | | 1,000 | | | | 1,035 | |
Series 134B, Rev., AMT, 5.00%, 10/01/2022 | | | 1,000 | | | | 1,059 | |
Pennsylvania Turnpike Commission, | | | | | | | | |
Series A1, Rev., 5.00%, 12/01/2027 | | | 1,000 | | | | 1,263 | |
Series A1, Rev., 5.00%, 12/01/2031 | | | 250 | | | | 313 | |
Series A1, Rev., 5.00%, 12/01/2034 | | | 1,000 | | | | 1,246 | |
Series A1, Rev., 5.00%, 12/01/2046 | | | 1,000 | | | | 1,192 | |
Series A2, Rev., 5.00%, 12/01/2024 | | | 100 | | | | 116 | |
Series A2, Rev., 5.00%, 12/01/2025 | | | 1,300 | | | | 1,557 | |
Series A, Rev., 5.00%, 12/01/2044 | | | 2,000 | | | | 2,552 | |
Series A, Rev., AGM, 5.25%, 07/15/2028 | | | 300 | | | | 390 | |
Series A, Rev., 5.25%, 12/01/2044 | | | 2,500 | | | | 3,225 | |
Series B, Rev., 5.00%, 12/01/2022 (w) | | | 400 | | | | 427 | |
Series B, Rev., 5.00%, 12/01/2026 | | | 400 | | | | 493 | |
Series B, Rev., 5.00%, 12/01/2027 | | | 900 | | | | 1,137 | |
Series B, Rev., 5.00%, 12/01/2028 | | | 700 | | | | 905 | |
Pennsylvania Turnpike Commission, Motor License, Rev., 5.00%, 12/01/2040 | | | 1,000 | | | | 1,209 | |
Pennsylvania Turnpike Commission, Senior Lien, Series A, Rev., 5.00%, 12/01/2042 (p) | | | 2,000 | | | | 2,137 | |
Pennsylvania Turnpike Commission, Subordinate, Series A, Rev., 4.00%, 12/01/2043 | | | 2,135 | | | | 2,540 | |
Pennsylvania Turnpike Commission, Subordinated, | | | | | | | | |
Series A, Rev., 5.00%, 12/01/2036 | | | 2,775 | | | | 3,360 | |
Series B, Rev., 5.25%, 12/01/2031 (p) | | | 1,000 | | | | 1,021 | |
Philadelphia Authority for Industrial Development, Rev., 5.00%, 05/01/2033 | | | 1,250 | | | | 1,566 | |
Philadelphia Authority for Industrial Development, String Theory Charter School, Rev., 5.00%, 06/15/2040 (e) | | | 900 | | | | 1,065 | |
Philadelphia Authority for Industrial Development, Thomas Jefferson University, | | | | | | | | |
Series A, Rev., 5.00%, 09/01/2032 | | | 1,110 | | | | 1,346 | |
Series A, Rev., 5.00%, 09/01/2035 | | | 1,105 | | | | 1,333 | |
Series A, Rev., 5.00%, 09/01/2047 | | | 1,000 | | | | 1,187 | |
Philadelphia Gas Works Co., Series A, Rev., AGM, 4.00%, 08/01/2045 | | | 5,000 | | | | 5,883 | |
Pittsburgh Water & Sewer Authority, | | | | | | | | |
Series B, Rev., AGM, 4.00%, 09/01/2036 | | | 500 | | | | 610 | |
Series B, Rev., AGM, 4.00%, 09/01/2038 | | | 500 | | | | 605 | |
Series B, Rev., AGM, 4.00%, 09/01/2045 | | | 2,250 | | | | 2,680 | |
Series C, Rev., AGM, (SIFMA Municipal Swap Index + 0.65%), 0.68%, 09/01/2040 (aa) | | | 4,275 | | | | 4,314 | |
| | | | | | | | |
| SECURITY DESCRIPTION | | PRINCIPAL
AMOUNT($) | | | VALUE($) | |
| | | | | | | | |
Pennsylvania — continued | | | | | | | | |
Pittsburgh Water & Sewer Authority, Subordinated, Series B, Rev., AGM, 5.00%, 09/01/2031 | | | 1,750 | | | | 2,357 | |
Scranton School District, Series E, GO, BAM, 4.00%, 12/01/2037 | | | 1,025 | | | | 1,190 | |
Sports & Exhibition Authority of Pittsburgh and Allegheny County, | | | | | | | | |
Rev., AGM, 5.00%, 02/01/2027 | | | 2,250 | | | | 2,776 | |
Rev., AGM, 5.00%, 02/01/2028 | | | 2,590 | | | | 3,278 | |
State Public School Building Authority, Montgomery County Community College, Rev., 5.50%, 05/01/2033 (p) | | | 1,000 | | | | 1,096 | |
State Public School Building Authority, Northampton County Area Community, | | | | | | | | |
Rev., BAM, 4.00%, 03/01/2029 | | | 1,000 | | | | 1,193 | |
Rev., BAM, 4.00%, 03/01/2030 | | | 640 | | | | 756 | |
Rev., BAM, 4.00%, 03/01/2031 | | | 500 | | | | 590 | |
Rev., BAM, 5.00%, 03/01/2027 | | | 715 | | | | 870 | |
Rev., BAM, 5.00%, 03/01/2028 | | | 755 | | | | 940 | |
State Public School Building Authority, Philadelphia Community College Project, Rev., 5.00%, 06/15/2022 | | | 250 | | | | 261 | |
State Public School Building Authority, Philadelphia School District, Rev., AGM, 5.00%, 06/01/2030 | | | 3,480 | | | | 4,239 | |
State Public School Building Authority, School District of Philadelphia, | | | | | | | | |
Rev., 5.00%, 04/01/2024 (p) | | | 2,000 | | | | 2,073 | |
Rev., 5.00%, 04/01/2030 (p) | | | 3,000 | | | | 3,109 | |
Westmoreland County Industrial Development Authority, Excela Health Project, | | | | | | | | |
Series A, Rev., 4.00%, 07/01/2025 | | | 575 | | | | 649 | |
Series A, Rev., 4.00%, 07/01/2026 | | | 1,250 | | | | 1,442 | |
Series A, Rev., 5.00%, 07/01/2028 | | | 1,400 | | | | 1,765 | |
| | | | | | | | |
| | |
| | | | | | | 264,048 | |
| | | | | | | | |
Puerto Rico — 0.3% | | | | | | | | |
Puerto Rico Electric Power Authority, | | | | | | | | |
Series DDD, Rev., 5.00%, 07/01/2020 (d) | | | 570 | | | | 552 | |
Series TT, Rev., 5.00%, 07/01/2020 (d) | | | 270 | | | | 262 | |
Series TT, Rev., 5.00%, 07/01/2037 (d) | | | 930 | | | | 902 | |
Series ZZ, Rev., 4.25%, 07/01/2020 (d) | | | 470 | | | | 450 | |
Series ZZ, Rev., 5.25%, 07/01/2019 (d) | | | 520 | | | | 502 | |
Series ZZ, Rev., 5.25%, 07/01/2023 (d) | | | 500 | | | | 486 | |
Puerto Rico Sales Tax Financing Corp. Sales Tax Revenue, Restructured, Series A1, Rev., Zero Coupon, 07/01/2031 | | | 2,825 | | | | 2,277 | |
Puerto Rico Sales Tax Financing Corp., Sales Tax Revenue, Restructured, | | | | | | | | |
Series A1, Rev., 4.55%, 07/01/2040 | | | 1,095 | | | | 1,244 | |
Series A2, Rev., 4.33%, 07/01/2040 | | | 7,950 | | | | 8,910 | |
| | | | | | | | |
| | |
| | | | | | | 15,585 | |
| | | | | | | | |
SEE NOTES TO FINANCIAL STATEMENTS.
| | | | | | | | | | |
| | | | | |
| 174 | | | | | | | | SIX CIRCLES TRUST | | JUNE 30, 2021 |
| | | | | | | | |
| SECURITY DESCRIPTION | | PRINCIPAL
AMOUNT($) | | | VALUE($) | |
Municipal Bonds — continued | | | | | | | | |
Rhode Island — 0.1% | | | | | | | | |
Rhode Island Housing and Mortgage Finance Corp., Homeownership Opportunity, | | | | | | | | |
Series 73A, Rev., 0.95%, 04/01/2026 | | | 500 | | | | 500 | |
Series 73A, Rev., 1.10%, 04/01/2027 | | | 300 | | | | 300 | |
Series 73A, Rev., 1.65%, 10/01/2029 | | | 715 | | | | 725 | |
Series 73A, Rev., 3.00%, 10/01/2050 | | | 1,490 | | | | 1,623 | |
Rhode Island Student Loan Authority, Senior Bond, Series A, Rev., AMT, 5.00%, 12/01/2029 | | | 370 | | | | 471 | |
| | | | | | | | |
| | |
| | | | | | | 3,619 | |
| | | | | | | | |
South Carolina — 1.1% | | | | | | | | |
City of Rock Hill, Combined Utility System, Rev., 5.00%, 01/01/2027 | | | 250 | | | | 297 | |
Columbia Housing Authority, Palmetto Terrace Apartment, Rev., 0.31%, 06/01/2024 (z) | | | 935 | | | | 934 | |
Lexington County Health Services District, Inc., Lexmed Obligated Group, | | | | | | | | |
Rev., 4.00%, 11/01/2030 | | | 1,000 | | | | 1,163 | |
Rev., 4.00%, 11/01/2031 | | | 1,000 | | | | 1,159 | |
Patriots Energy Group Financing Agency, Series A, Rev., LIQ: Royal Bank of Canada, 4.00%, 10/01/2048 (z) | | | 40 | | | | 44 | |
South Carolina Jobs-Economic Development Authority, Bon Secours Mercy Health, Series S, Rev., 5.00%, 12/01/2048 (z) | | | 1,000 | | | | 1,185 | |
South Carolina Jobs-Economic Development Authority, McLeod Health Projects, Rev., 5.00%, 11/01/2048 | | | 1,000 | | | | 1,214 | |
South Carolina Jobs-Economic Development Authority, Prisma Health Obligated Group, Series A, Rev., 5.00%, 05/01/2030 | | | 1,500 | | | | 1,862 | |
South Carolina Ports Authority, Rev., AMT, 5.00%, 07/01/2043 | | | 5,680 | | | | 7,004 | |
South Carolina Public Service Authority, | | | | | | | | |
Series A, Rev., 4.00%, 12/01/2033 | | | 1,000 | | | | 1,201 | |
Series A, Rev., 4.00%, 12/01/2034 | | | 2,000 | | | | 2,397 | |
Series A, Rev., 5.00%, 12/01/2024 | | | 500 | | | | 577 | |
Series A, Rev., 5.00%, 12/01/2028 | | | 1,700 | | | | 1,977 | |
Series A, Rev., 5.00%, 12/01/2031 | | | 4,500 | | | | 5,953 | |
Series A, Rev., 5.00%, 12/01/2032 | | | 1,000 | | | | 1,317 | |
Series A, Rev., 5.00%, 12/01/2050 | | | 5,000 | | | | 5,762 | |
Series B, Rev., 5.00%, 12/01/2041 | | | 1,000 | | | | 1,204 | |
Series C, Rev., 5.00%, 12/01/2021 | | | 500 | | | | 510 | |
South Carolina Public Service Authority, Santee Cooper, Series A, Rev., 5.75%, 12/01/2043 (p) | | | 4,445 | | | | 5,033 | |
South Carolina Public Service Authority, Santee Cooper Project, | | | | | | | | |
Series C, Rev., 5.00%, 12/01/2036 | | | 715 | | | | 728 | |
Series D, Rev., 5.00%, 12/01/2043 (p) | | | 3,125 | | | | 3,264 | |
South Carolina State Housing Finance & Development Authority, | | | | | | | | |
Series A, Rev., 4.00%, 07/01/2050 | | | 3,245 | | | | 3,666 | |
Series B, Rev., 3.25%, 01/01/2052 | | | 8,140 | | | | 8,955 | |
| | | | | | | | |
| SECURITY DESCRIPTION | | PRINCIPAL
AMOUNT($) | | | VALUE($) | |
| | | | | | | | |
South Carolina — continued | | | | | | | | |
South Carolina Transportation Infrastructure Bank, Series 2003B, Rev., (ICE LIBOR USD 1 Month * 0.67 + 0.45%), 0.51%, 10/01/2031 (aa) | | | 7,000 | | | | 7,003 | |
| | | | | | | | |
| | | | | | | 64,409 | |
| | | | | | | | |
South Dakota — 0.0% (g) | | | | | | | | |
County of Lincoln, Augustana College Association, Rev., 4.00%, 08/01/2041 | | | 250 | | | | 286 | |
Harrisburg School District No. 41-2, GO, 4.50%, 07/15/2036 (p) | | | 1,000 | | | | 1,023 | |
| | | | | | | | |
| | | | | | | 1,309 | |
| | | | | | | | |
Tennessee — 1.3% | | | | | | | | |
Chattanooga Health Educational & Housing Facility Board, Commonspirit Health, Series A1, Rev., 5.00%, 08/01/2028 | | | 305 | | | | 388 | |
City of Knoxville, Wastewater System Revenue, | | | | | | | | |
Series A, Rev., 5.00%, 04/01/2028 | | | 2,000 | | | | 2,559 | |
Series A, Rev., 5.00%, 04/01/2032 | | | 2,000 | | | | 2,794 | |
City of Memphis, Gas System Revenue, Rev., 4.00%, 12/01/2045 | | | 2,175 | | | | 2,622 | |
City of Memphis, Sanitary Sewerage System Revenue, | | | | | | | | |
Series B, Rev., 5.00%, 10/01/2022 | | | 1,430 | | | | 1,517 | |
Series B, Rev., 5.00%, 10/01/2023 | | | 1,000 | | | | 1,108 | |
Series B, Rev., 5.00%, 10/01/2027 | | | 1,000 | | | | 1,262 | |
County of Coffee, GO, 5.00%, 06/01/2026 | | | 250 | | | | 303 | |
Greeneville Health & Educational Facilities Board, People Road Portfolio Project, Rev., 1.45%, 12/01/2022 (z) | | | 1,115 | | | | 1,121 | |
Health Educational and Housing Facility Board of the City of Memphis, Memphis Towers Apartments, Rev., 0.25%, 12/01/2023 (z) | | | 3,875 | | | | 3,881 | |
Knoxville’s Community Development Corp., Austin 1B Apartments Project, Rev., 0.22%, 10/01/2024 (z) | | | 320 | | | | 320 | |
Memphis-Shelby County Airport Authority, | | | | | | | | |
Rev., AMT, 5.00%, 07/01/2032 | | | 270 | | | | 335 | |
Rev., AMT, 5.00%, 07/01/2043 | | | 2,055 | | | | 2,499 | |
Metropolitan Government Nashville & Davidson County Health & Educational Facs Bd, Vanderbilt University Medical Center, Series A, Rev., 5.00%, 07/01/2040 | | | 2,685 | | | | 3,215 | |
Metropolitan Government of Nashville & Davidson County, Electric Revenue, Series A, Rev., 5.00%, 05/15/2030 | | | 1,000 | | | | 1,335 | |
Metropolitan Government of Nashville & Davidson County, Improvement, Series A, GO, 5.00%, 01/01/2025 (p) | | | 1,400 | | | | 1,501 | |
Metropolitan Government of Nashville & Davidson County, Water & Sewer Revenue, Rev., 5.00%, 07/01/2025 | | | 560 | | | | 613 | |
SEE NOTES TO FINANCIAL STATEMENTS.
| | | | | | | | | | |
| | | | | |
| JUNE 30, 2021 | | SIX CIRCLES TRUST | | | | | | | | 175 |
Six Circles Tax Aware Bond Fund
SCHEDULE OF PORTFOLIO INVESTMENTS
AS OF JUNE 30, 2021 (Unaudited) (continued)
(Amounts in U.S. Dollars, unless otherwise noted)
(Amounts in thousands, except number of Futures contracts)
| | | | | | | | |
| SECURITY DESCRIPTION | | PRINCIPAL
AMOUNT($) | | | VALUE($) | |
Municipal Bonds — continued | | | | | | | | |
Tennessee — continued | | | | | | | | |
Metropolitan Nashville Airport Authority, Subordinated, Series A, Rev., 5.00%, 07/01/2054 | | | 1,000 | | | | 1,256 | |
Tennergy Corp., Series A, Rev., 4.00%, 12/01/2051 (z) | | | 12,500 | | | | 14,997 | |
Tennessee Energy Acquisition Corp., | | | | | | | | |
Rev., 4.00%, 11/01/2049 (z) | | | 3,250 | | | | 3,679 | |
Rev., 5.00%, 05/01/2052 (z) | | | 14,595 | | | | 19,339 | |
Tennessee Energy Acquisition Corp., Junior, Series B, Rev., 5.63%, 09/01/2026 | | | 1,410 | | | | 1,726 | |
Tennessee Housing Development Agency, Residental Financial Program, Rev., 3.00%, 07/01/2051 | | | 460 | | | | 505 | |
Tennessee Housing Development Agency, Residential Finance Program Bonds, Rev., 4.00%, 01/01/2048 | | | 2,800 | | | | 3,142 | |
| | | | | | | | |
| | | | | | | 72,017 | |
| | | | | | | | |
Texas — 10.2% | | | | | | | | |
Abilene Independent School District, School Building, GO, PSF-GTD, 5.00%, 02/15/2024 (p) | | | 2,800 | | | | 3,019 | |
Alamito Public Facility Corp., Hacep Rad Convertible Program Cramer, Rev., 0.25%, 11/01/2021 | | | 10,000 | | | | 9,999 | |
Angleton Independent School District, GO, PSF-GTD, 4.00%, 02/15/2022 | | | 2,880 | | | | 2,948 | |
Argyle Independent School District, Series A, GO, PSF-GTD, 5.00%, 08/15/2027 | | | 1,000 | | | | 1,252 | |
Arlington Higher Education Finance Corp., | | | | | | | | |
Series A, Rev., PSF-GTD, 4.00%, 08/15/2024 | | | 200 | | | | 222 | |
Series A, Rev., PSF-GTD, 4.00%, 08/15/2025 | | | 445 | | | | 506 | |
Series A, Rev., PSF-GTD, 4.00%, 08/15/2026 | | | 265 | | | | 307 | |
Series A, Rev., PSF-GTD, 4.00%, 08/15/2030 | | | 425 | | | | 523 | |
Series A, Rev., PSF-GTD, 4.00%, 08/15/2036 | | | 500 | | | | 622 | |
Series A, Rev., PSF-GTD, 5.00%, 08/15/2031 | | | 555 | | | | 747 | |
Austin Affordable Public Facility Corp., Inc., Bridge at Turtle Creek, Rev., 0.42%, 12/01/2040 (z) | | | 6,000 | | | | 6,009 | |
Austin Independent School District, GO, PSF-GTD, 5.00%, 08/01/2028 | | | 1,000 | | | | 1,288 | |
Balmorhea Independent School District, Series A, GO, PSF-GTD, 4.00%, 02/15/2050 | | | 2,500 | | | | 2,664 | |
Barbers Hill Independent School District, GO, PSF-GTD, 5.00%, 02/15/2029 | | | 4,370 | | | | 5,684 | |
Bexar County Hospital District, Certificates Obligation, GO, 5.00%, 02/15/2031 | | | 1,000 | | | | 1,290 | |
| | | | | | | | |
| SECURITY DESCRIPTION | | PRINCIPAL
AMOUNT($) | | | VALUE($) | |
| | | | | | | | |
Texas — continued | | | | | | | | |
Board of Regents of the University of Texas System, | | | | | | | | |
Series A, Rev., 5.00%, 08/15/2030 | | | 2,000 | | | | 2,685 | |
Series E, Rev., 5.00%, 08/15/2027 | | | 1,000 | | | | 1,258 | |
Board of Regents of the University of Texas System, Green Bond, Series B, Rev., 2.50%, 08/15/2036 (z) | | | 5,000 | | | | 5,000 | |
Boerne Public Facilities Corp., Liv At Boerne Senior Apartments, Rev., 2.75%, 11/01/2022 (z) | | | 100 | | | | 101 | |
Boerne School District, School Building, GO, PSF-GTD, 5.00%, 02/01/2043 (p) | | | 1,800 | | | | 1,851 | |
Brazoria County Toll Road Authority, Subordinated Lien, Series A, Rev., CNTY GTD, 5.00%, 03/01/2033 | | | 1,670 | | | | 2,028 | |
Brazosport Independent School District, | | | | | | | | |
GO, PSF-GTD, 5.00%, 02/15/2022 | | | 6,000 | | | | 6,181 | |
GO, PSF-GTD, 5.00%, 02/15/2027 | | | 2,500 | | | | 3,103 | |
GO, PSF-GTD, 5.00%, 02/15/2028 | | | 2,500 | | | | 3,183 | |
GO, PSF-GTD, 5.00%, 02/15/2029 | | | 3,000 | | | | 3,908 | |
GO, PSF-GTD, 5.00%, 02/15/2030 | | | 3,000 | | | | 3,882 | |
Capital Area Housing Finance Corp., Redwood Apartments, Rev., 0.41%, 01/01/2041 (z) | | | 9,205 | | | | 9,220 | |
Carrollton-Farmers Branch Independent School District, GO, PSF-GTD, 5.00%, 02/15/2023 | | | 935 | | | | 1,008 | |
Central Texas Regional Mobility Authority, | | | | | | | | |
Series B, Rev., 4.00%, 01/01/2040 | | | 800 | | | | 955 | |
Series B, Rev., 4.00%, 01/01/2051 | | | 1,250 | | | | 1,462 | |
Series B, Rev., 5.00%, 01/01/2046 | | | 1,500 | | | | 1,916 | |
Central Texas Regional Mobility Authority, Senior Lien, | | | | | | | | |
Series B, Rev., 4.00%, 01/01/2039 | | | 600 | | | | 706 | |
Series B, Rev., 4.00%, 01/01/2040 | | | 500 | | | | 588 | |
Series B, Rev., 5.00%, 01/01/2024 | | | 230 | | | | 256 | |
Series B, Rev., 5.00%, 01/01/2045 | | | 3,595 | | | | 4,502 | |
Series E, Rev., 5.00%, 01/01/2045 | | | 2,665 | | | | 3,337 | |
Central Texas Regional Mobility Authority, Subordinated, Series F, Rev., BAN, 5.00%, 01/01/2025 | | | 4,770 | | | | 5,398 | |
Central Texas Regional Mobility Authority, Subordinated Lien, Rev., 5.00%, 01/01/2042 (p) | | | 3,000 | | | | 3,217 | |
Central Texas Turnpike System, First Tier, Series A, Rev., 5.00%, 08/15/2041 (p) | | | 7,045 | | | | 7,428 | |
City Austin, Certificates Obligation, | | | | | | | | |
GO, 5.00%, 09/01/2032 | | | 1,750 | | | | 2,337 | |
GO, 5.00%, 09/01/2033 | | | 1,100 | | | | 1,463 | |
GO, 5.00%, 09/01/2034 | | | 1,750 | | | | 2,320 | |
City of Arlington, Water & Wastewater System Revenue, Rev., 5.00%, 06/01/2023 (w) | | | 1,020 | | | | 1,112 | |
City of Austin, GO, 5.00%, 11/01/2021 | | | 1,520 | | | | 1,545 | |
City of Austin, Airport System Revenue, | | | | | | | | |
Rev., AMT, 5.00%, 11/15/2025 | | | 3,000 | | | | 3,560 | |
Series B, Rev., AMT, 5.00%, 11/15/2030 | | | 1,000 | | | | 1,292 | |
SEE NOTES TO FINANCIAL STATEMENTS.
| | | | | | | | | | |
| | | | | |
| 176 | | | | | | | | SIX CIRCLES TRUST | | JUNE 30, 2021 |
| | | | | | | | |
| SECURITY DESCRIPTION | | PRINCIPAL
AMOUNT($) | | | VALUE($) | |
Municipal Bonds — continued | | | | | | | | |
Texas — continued | | | | | | | | |
Series B, Rev., AMT, 5.00%, 11/15/2033 | | | 1,130 | | | | 1,362 | |
Series B, Rev., AMT, 5.00%, 11/15/2036 | | | 3,335 | | | | 4,112 | |
City of Austin, Electric Utility Revenue, | | | | | | | | |
Series B, Rev., 5.00%, 11/15/2037 | | | 1,505 | | | | 1,948 | |
Series B, Rev., 5.00%, 11/15/2038 | | | 1,340 | | | | 1,732 | |
Series B, Rev., 5.00%, 11/15/2044 | | | 2,000 | | | | 2,564 | |
City of Austin, Refunding & Public Improvement, GO, 5.00%, 09/01/2033 | | | 620 | | | | 825 | |
City of Austin, Water & Wastewater System Revenue, Rev., 5.00%, 11/15/2041 | | | 7,000 | | | | 8,504 | |
City of Dallas Housing Finance Corp., Midpark Towers, Rev., 0.35%, 01/01/2024 (z) | | | 1,380 | | | | 1,380 | |
City of Dallas, Waterworks & Sewer System Revenue, | | | | | | | | |
Series C, Rev., 4.00%, 10/01/2039 | | | 7,470 | | | | 9,115 | |
Series C, Rev., 4.00%, 10/01/2040 | | | 1,000 | | | | 1,217 | |
Series C, Rev., 5.00%, 10/01/2029 | | | 1,125 | | | | 1,485 | |
Series C, Rev., 5.00%, 10/01/2032 | | | 3,450 | | | | 4,615 | |
City of Denton Utility System Revenue, Rev., 5.00%, 12/01/2022 | | | 1,000 | | | | 1,066 | |
City of Eagle Pass, Certificates Obligation, | | | | | | | | |
GO, AGM, 4.00%, 03/01/2039 (w) | | | 500 | | | | 606 | |
GO, AGM, 4.00%, 03/01/2041 (w) | | | 680 | | | | 820 | |
City of Garland, Certificates Obligation, GO, 5.00%, 02/15/2024 | | | 275 | | | | 309 | |
City of Houston Airport System Revenue, Subordinated Lien, | | | | | | | | |
Series A, Rev., AMT, 4.00%, 07/01/2040 | | | 3,570 | | | | 4,213 | |
Series A, Rev., AMT, 5.00%, 07/01/2023 (p) | | | 10,000 | | | | 10,469 | |
Series A, Rev., AMT, 5.00%, 07/01/2024 | | | 1,000 | | | | 1,138 | |
Series A, Rev., AMT, 5.00%, 07/01/2028 | | | 1,000 | | | | 1,265 | |
Series A, Rev., AMT, 5.00%, 07/01/2034 | | | 2,500 | | | | 3,232 | |
Series B, Rev., 5.00%, 07/01/2027 | | | 1,995 | | | | 2,493 | |
City of Houston Combined Utility System Revenue, First Lien, Series C, Rev., (ICE LIBOR USD 1 Month * 0.70 + 0.36%), 0.42%, 05/15/2034 (aa) | | | 1,250 | | | | 1,250 | |
City of Houston, Airport System Revenue, Series C, Rev., AMT, 5.00%, 07/01/2028 | | | 470 | | | | 596 | |
City of Houston, Airport System Revenue, Special Facilities, United Airlines, Inc., Rev., AMT, 5.00%, 07/15/2028 | | | 600 | | | | 724 | |
City of Houston, Airport System Revenue, Subordinated Lien, | | | | | | | | |
Series A, Rev., AMT, 5.00%, 07/01/2028 | | | 890 | | | | 1,126 | |
Series B, Rev., 5.00%, 07/01/2026 | | | 1,000 | | | | 1,217 | |
Series B, Rev., 5.00%, 07/01/2030 | | | 1,000 | | | | 1,333 | |
City of Houston, Combined Utility System Revenue, First Lien, | | | | | | | | |
Series A, Rev., 5.00%, 11/15/2029 | | | 1,100 | | | | 1,454 | |
Series A, Rev., 5.00%, 11/15/2030 | | | 1,000 | | | | 1,349 | |
Series C, Rev., 5.00%, 11/15/2029 | | | 2,850 | | | | 3,766 | |
Series D, Rev., 5.00%, 11/15/2026 (p) | | | 460 | | | | 468 | |
| | | | | | | | |
| SECURITY DESCRIPTION | | PRINCIPAL
AMOUNT($) | | | VALUE($) | |
| | | | | | | | |
Texas — continued | | | | | | | | |
City of Kyle, 6 Creeks Public Improvement, Special Assessment, 2.63%, 09/01/2025 (e) | | | 500 | | | | 504 | |
City of Laredo, Certificates Obligation, GO, 5.00%, 02/15/2033 | | | 1,070 | | | | 1,305 | |
City of Lubbock Water & Wastewater System, | | | | | | | | |
Series B, Rev., 5.00%, 02/15/2023 | | | 400 | | | | 431 | |
Series B, Rev., 5.00%, 02/15/2024 | | | 490 | | | | 550 | |
City of Mesquite, Waterworks & Sewer System Revenue, Rev., 4.00%, 03/01/2023 (w) | | | 1,130 | | | | 1,201 | |
City of San Antonio, GO, 5.00%, 02/01/2022 | | | 550 | | | | 565 | |
City of San Antonio Electric & Gas Systems Revenue, Junior Lien, | | | | | | | | |
Rev., 5.00%, 02/01/2048 (p) | | | 3,660 | | | | 3,937 | |
Series D, Rev., 1.13%, 12/01/2045 (z) | | | 6,510 | | | | 6,605 | |
City of San Antonio, Electric & Gas Systems Revenue, | | | | | | | | |
Rev., 4.00%, 02/01/2027 | | | 3,000 | | | | 3,547 | |
Series B, Rev., 2.00%, 02/01/2033 (z) | | | 1,370 | | | | 1,372 | |
City of San Antonio, Electric & Gas Systems Revenue, Junior Lien, | | | | | | | | |
Rev., 5.00%, 02/01/2043 (p) | | | 4,350 | | | | 4,678 | |
Series A, Rev., 5.00%, 02/01/2038 | | | 1,750 | | | | 2,303 | |
City of San Antonio, General Improvement, GO, 5.00%, 02/01/2023 (p) | | | 1,240 | | | | 1,275 | |
Cleburne Independent School District, School Building, GO, PSF-GTD, 5.00%, 02/15/2036 | | | 1,065 | | | | 1,261 | |
Clifton Higher Education Finance Corp., Idea Public Schools, Rev., PSF-GTD, 5.00%, 08/15/2026 | | | 1,840 | | | | 2,244 | |
Clifton Higher Education Finance Corp., International Leadership of Texas, | | | | | | | | |
Rev., PSF-GTD, 4.00%, 08/15/2023 | | | 75 | | | | 81 | |
Rev., PSF-GTD, 4.00%, 08/15/2024 | | | 115 | | | | 127 | |
Rev., PSF-GTD, 4.00%, 08/15/2025 | | | 145 | | | | 165 | |
College Station Independent School District, GO, PSF-GTD, 5.00%, 08/15/2024 | | | 2,285 | | | | 2,617 | |
Collin County, Community College District, GO, 4.00%, 08/15/2021 | | | 85 | | | | 85 | |
Conroe Independent School District, | | | | | | | | |
Series A, GO, PSF-GTD, 5.00%, 02/15/2024 | | | 750 | | | | 843 | |
Series A, GO, PSF-GTD, 5.00%, 02/15/2026 | | | 2,450 | | | | 2,947 | |
County of Bexar, | | | | | | | | |
GO, 4.00%, 06/15/2040 | | | 11,085 | | | | 12,334 | |
GO, 5.00%, 06/15/2031 | | | 1,500 | | | | 1,814 | |
County of Bexar, Certificates Obligation, | | | | | | | | |
Series A, GO, 4.00%, 06/15/2036 (p) | | | 1,145 | | | | 1,230 | |
Series B, GO, 5.00%, 06/15/2043 (p) | | | 1,000 | | | | 1,094 | |
County of El Paso, Series A, GO, 5.00%, 02/15/2027 | | | 1,430 | | | | 1,717 | |
County of Harris, | | | | | | | | |
Series A, GO, 5.00%, 10/01/2022 | | | 4,615 | | | | 4,896 | |
Series A, GO, 5.00%, 10/01/2024 | | | 3,500 | | | | 4,029 | |
Series A, GO, 5.00%, 10/01/2026 | | | 2,390 | | | | 2,937 | |
Series A, GO, 5.00%, 10/01/2029 | | | 1,150 | | | | 1,520 | |
SEE NOTES TO FINANCIAL STATEMENTS.
| | | | | | | | | | |
| | | | | |
| JUNE 30, 2021 | | SIX CIRCLES TRUST | | | | | | | | 177 |
Six Circles Tax Aware Bond Fund
SCHEDULE OF PORTFOLIO INVESTMENTS
AS OF JUNE 30, 2021 (Unaudited) (continued)
(Amounts in U.S. Dollars, unless otherwise noted)
(Amounts in thousands, except number of Futures contracts)
| | | | | | | | |
| SECURITY DESCRIPTION | | PRINCIPAL
AMOUNT($) | | | VALUE($) | |
Municipal Bonds — continued | | | | | | | | |
Texas — continued | | | | | | | | |
County of Harris TX, GO, 5.00%, 10/01/2022 | | | 1,185 | | | | 1,257 | |
County of Harris, Cultural Education Facilities Finance Corp., Teco Project, Rev., 5.00%, 11/15/2022 | | | 1,000 | | | | 1,064 | |
County of Harris, Flood Control District, Series A, GO, 4.00%, 10/01/2036 | | | 2,800 | | | | 3,416 | |
County of Harris, Refunding Road, Series A, GO, 5.00%, 10/01/2029 | | | 1,090 | | | | 1,295 | |
County of Nueces, GO, 5.00%, 02/15/2029 | | | 460 | | | | 596 | |
County of Williams, GO, 5.00%, 02/15/2027 | | | 1,000 | | | | 1,237 | |
Crowley Independent School District, School Building, GO, PSF-GTD, 5.00%, 08/01/2045 (p) | | | 2,000 | | | | 2,366 | |
Dallas Area Rapid Transit, Series A, Rev., 5.00%, 12/01/2046 | | | 5,000 | | | | 5,875 | |
Dallas Area Rapid Transit, Senior Lien, Rev., 5.00%, 12/01/2032 | | | 1,000 | | | | 1,306 | |
Dallas Fort Worth International Airport, | | | | | | | | |
Series B, Rev., 4.00%, 11/01/2034 | | | 1,395 | | | | 1,720 | |
Series B, Rev., AMT, 4.50%, 11/01/2045 | | | 1,000 | | | | 1,048 | |
Series E, Rev., 5.00%, 11/01/2023 | | | 1,000 | | | | 1,063 | |
Dallas Fort Worth International Airport, Joint Improvement, | | | | | | | | |
Series D, Rev., AMT, 5.00%, 11/01/2038 (p) | | | 210 | | | | 213 | |
Series D, Rev., AMT, 5.00%, 11/01/2042 (p) | | | 11,550 | | | | 11,733 | |
Dallas Independent School District, | | | | | | | | |
GO, PSF-GTD, 4.00%, 02/15/2022 | | | 1,510 | | | | 1,547 | |
GO, PSF-GTD, 4.00%, 02/15/2023 | | | 540 | | | | 573 | |
Series A, GO, PSF-GTD, 5.00%, 08/15/2023 | | | 130 | | | | 143 | |
Series A, GO, PSF-GTD, 5.00%, 08/15/2034 (p) | | | 1,000 | | | | 1,146 | |
Dallas/Fort Worth, International Airport, Series C, Rev., AMT, 5.13%, 11/01/2043 | | | 350 | | | | 372 | |
Denton Independent School District, GO, PSF-GTD, 5.00%, 08/15/2027 | | | 1,000 | | | | 1,255 | |
Fort Bend Independent School District, | | | | | | | | |
GO, PSF-GTD, 5.00%, 08/15/2023 | | | 1,190 | | | | 1,311 | |
Series B, GO, PSF-GTD, 0.72%, 08/01/2051 (z) | | | 1,490 | | | | 1,487 | |
Series B, GO, PSF-GTD, 0.88%, 08/01/2050 (z) | | | 1,100 | | | | 1,110 | |
Frisco Independent School District, GO, PSF-GTD, 3.00%, 02/15/2022 | | | 1,625 | | | | 1,654 | |
Frisco Independent School District, school Building, Series A, GO, PSF-GTD, 4.00%, 08/15/2032 | | | 2,140 | | | | 2,439 | |
Garland Independent School District, GO, PSF-GTD, 5.00%, 02/15/2023 | | | 4,000 | | | | 4,310 | |
Goose Creek Consolidated Independent School District, | | | | | | | | |
GO, PSF-GTD, 5.00%, 02/15/2022 | | | 1,000 | | | | 1,030 | |
GO, PSF-GTD, 5.00%, 02/15/2026 | | | 900 | | | | 1,083 | |
Series A, GO, PSF-GTD, 5.00%, 02/15/2028 | | | 2,000 | | | | 2,396 | |
| | | | | | | | |
| SECURITY DESCRIPTION | | PRINCIPAL
AMOUNT($) | | | VALUE($) | |
| | | | | | | | |
Texas — continued | | | | | | | | |
Grand Parkway Transportation Corp., Grand Parkway System, Rev., 4.00%, 10/01/2045 | | | 10,125 | | | | 11,959 | |
Grand Parkway Transportation Corp., Subordinated Tier Toll, Series B, Rev., 5.00%, 04/01/2053 (p) | | | 100 | | | | 111 | |
Gregory-Portland Independent School District, Series A, GO, PSF-GTD, 5.00%, 02/15/2023 | | | 3,220 | | | | 3,471 | |
Harlandale Independent School District, GO, PSF-GTD, 0.75%, 08/15/2045 (z) | | | 465 | | | | 465 | |
Harlandale Independent School District, Variable Maintenance Tax Notes, GO, BAM, 2.00%, 08/15/2040 (z) | | | 375 | | | | 381 | |
Harlingen Consolidated Independent School District, | | | | | | | | |
GO, PSF-GTD, 5.00%, 08/15/2024 | | | 80 | | | | 91 | |
GO, PSF-GTD, 5.00%, 08/15/2026 | | | 105 | | | | 128 | |
Harris County Cultural Education Facilities Finance Corp., Baylor College, Rev., 5.00%, 11/15/2037 (p) | | | 1,515 | | | | 1,615 | |
Harris County Cultural Education Facilities Finance Corp., Memorial Herman Health System, Series A, Rev., 5.00%, 12/01/2024 | | | 2,000 | | | | 2,307 | |
Harris County Cultural Education Facilities Finance Corp., Texas Medical Center, Series A, Rev., 0.90%, 05/15/2050 (z) | | | 6,315 | | | | 6,317 | |
Harris County Toll Road Authority, First Lien, Rev., 5.00%, 08/15/2030 | | | 2,200 | | | | 2,940 | |
Harris County, Cultural Education Facilities Finance Corp., Memorial Hermann, Rev., 5.00%, 06/01/2032 (z) | | | 1,000 | | | | 1,154 | |
Harris County, Metropolitan Transit Authority, Sales & Use Tax Revenue, Series A, Rev., 5.00%, 11/01/2021 | | | 100 | | | | 102 | |
Harris County, Toll Road Authority, Senior Lien, Series A, Rev., 5.00%, 08/15/2024 | | | 100 | | | | 115 | |
Harris County-Houston Sports Authority, Prefunded, Senior Lien, Series A, Rev., AGM, 5.00%, 11/15/2022 (p) | | | 650 | | | | 693 | |
Houston Community College System, | | | | | | | | |
Series A, GO, 3.00%, 02/15/2022 | | | 300 | | | | 306 | |
Series A, GO, 4.00%, 02/15/2023 | | | 725 | | | | 769 | |
Houston Higher Education Finance Corp., Houston Baptist University, Rev., 4.00%, 10/01/2051 | | | 1,100 | | | | 1,223 | |
Houston Independent School District, GO, PSF-GTD, 5.00%, 02/15/2022 | | | 1,725 | | | | 1,777 | |
Houston Independent School District, Maintenance Tax Notes, | | | | | | | | |
GO, 5.00%, 07/15/2021 | | | 1,500 | | | | 1,503 | |
GO, 5.00%, 07/15/2022 | | | 80 | | | | 84 | |
Humble Independent School District, School Building, Series A, GO, PSF-GTD, 5.00%, 02/15/2022 | | | 1,200 | | | | 1,236 | |
SEE NOTES TO FINANCIAL STATEMENTS.
| | | | | | | | | | |
| | | | | |
| 178 | | | | | | | | SIX CIRCLES TRUST | | JUNE 30, 2021 |
| | | | | | | | |
| SECURITY DESCRIPTION | | PRINCIPAL
AMOUNT($) | | | VALUE($) | |
Municipal Bonds — continued | | | | | | | | |
Texas — continued | | | | | | | | |
Katy Independent School District, Series B, GO, PSF-GTD, 5.00%, 02/15/2036 | | | 2,475 | | | | 2,965 | |
Katy Independent School District, School Building, Series A, GO, PSF-GTD, 5.00%, 02/15/2031 (p) | | | 1,000 | | | | 1,030 | |
Klein Independent School District, GO, PSF-GTD, 5.00%, 08/01/2021 | | | 1,500 | | | | 1,506 | |
Lake Houston Redevelopment Authority, Rev., 4.00%, 09/01/2035 | | | 250 | | | | 298 | |
Lamar Consolidated Independent School District, GO, PSF-GTD, 5.00%, 02/15/2027 | | | 1,315 | | | | 1,632 | |
Lewisville Independent School District, Series A, GO, PSF-GTD, 5.00%, 08/15/2024 | | | 1,000 | | | | 1,147 | |
Lewisville Independent School District, School Building, Series E, GO, PSF-GTD, 5.00%, 08/15/2029 (p) | | | 4,000 | | | | 4,217 | |
Longview Independent School District, GO, PSF-GTD, 5.00%, 02/15/2023 | | | 575 | | | | 620 | |
Lower Colorado River Authority, Lcra Transmission Services, | | | | | | | | |
Rev., 5.00%, 05/15/2027 | | | 700 | | | | 867 | |
Series A, Rev., 5.00%, 05/15/2022 | | | 1,000 | | | | 1,042 | |
Lower Colorado River Authority, Transmission Services Co., Rev., 5.00%, 05/15/2022 | | | 5,000 | | | | 5,208 | |
Lower Colorado, River Authority, Transmission Services Contract, Rev., 5.00%, 05/15/2029 | | | 100 | | | | 129 | |
Lumberton Independent School District, GO, PSF-GTD, 4.00%, 02/15/2023 | | | 1,125 | | | | 1,192 | |
Matagorda County Navigation District No. 1, Central Power and Light Co., Rev., AMT, 0.90%, 05/01/2030 (z) | | | 4,945 | | | | 4,971 | |
Medina Valley Independent School District, GO, PSF-GTD, 0.82%, 02/15/2051 (z) | | | 655 | | | | 652 | |
Metropolitan Transit Authority of Harris County Sales & Use Tax Revenue, Series A, Rev., 5.00%, 11/01/2028 (p) | | | 1,000 | | | | 1,016 | |
Metropolitan Transit Authority of Harris County, Sales & Use Tax Revenue, Series A, Rev., 5.00%, 11/01/2036 (p) | | | 1,785 | | | | 1,814 | |
Midland County Public Facility Corp., Palladium West Francis, Rev., 0.35%, 06/01/2024 (z) | | | 8,500 | | | | 8,515 | |
Midlothian Independent School District, GO, PSF-GTD, 5.00%, 02/15/2023 | | | 1,410 | | | | 1,518 | |
Mission Economic Development Corp., Republic Services, Rev., AMT, 0.20%, 01/01/2026 (z) | | | 4,000 | | | | 4,000 | |
New Hope Cultural Education Facilities Finance Corp., Childrens Health System, Series A, Rev., 5.00%, 08/15/2047 | | | 1,000 | | | | 1,203 | |
New Hope Cultural Education Facilities Finance Corp., Westminster Project, Rev., 4.00%, 11/01/2049 (w) | | | 50 | | | | 57 | |
North Fort Bend Water Authority, Series B, Rev., 5.00%, 12/15/2029 | | | 1,130 | | | | 1,486 | |
| | | | | | | | |
| SECURITY DESCRIPTION | | PRINCIPAL
AMOUNT($) | | | VALUE($) | |
| | | | | | | | |
Texas — continued | | | | | | | | |
North Texas Municipal Water District Water System Revenue, | | | | | | | | |
Rev., 3.00%, 09/01/2041 (w) | | | 575 | | | | 627 | |
Rev., 5.00%, 09/01/2022 (w) | | | 345 | | | | 363 | |
North Texas Tollway Authority, Series A, Rev., 5.00%, 01/01/2028 | | | 1,750 | | | | 2,085 | |
North Texas Tollway Authority, Capital Appreciation, First Tier, Rev., AGC, Zero Coupon, 01/01/2030 | | | 1,500 | | | | 1,319 | |
North Texas Tollway Authority, First Tier, | | | | | | | | |
Series A, Rev., 5.00%, 01/01/2025 | | | 390 | | | | 418 | |
Series A, Rev., 5.00%, 01/01/2029 (p) | | | 1,000 | | | | 1,024 | |
Series D, Rev., 5.00%, 01/01/2038 (p) | | | 2,120 | | | | 2,171 | |
North Texas Tollway Authority, First Tier Bonds, Series A, Rev., 4.00%, 01/01/2035 | | | 2,000 | | | | 2,383 | |
North Texas Tollway Authority, Second Tier, | | | | | | | | |
Series B, Rev., 4.00%, 01/01/2035 | | | 1,000 | | | | 1,224 | |
Series B, Rev., 5.00%, 01/01/2033 | | | 1,000 | | | | 1,207 | |
Northside Independent School District, GO, PSF-GTD, 0.70%, 06/01/2050 (z) | | | 16,850 | | | | 16,911 | |
Odessa Housing Finance Corp., Rev., 0.37%, 02/01/2024 (z) | | | 1,540 | | | | 1,542 | |
Pasadena Independent School District, School Building, | | | | | | | | |
GO, PSF-GTD, 5.00%, 02/15/2038 | | | 7,500 | | | | 8,062 | |
Series A, GO, PSF-GTD, 5.00%, 02/15/2035 (p) | | | 1,000 | | | | 1,030 | |
Pearland Independent School District, | | | | | | | | |
GO, PSF-GTD, 5.00%, 02/15/2026 | | | 5,505 | | | | 6,613 | |
GO, PSF-GTD, 5.00%, 02/15/2027 | | | 3,490 | | | | 4,315 | |
Plano Independent School District, | | | | | | | | |
GO, PSF-GTD, 5.00%, 02/15/2023 | | | 2,665 | | | | 2,873 | |
Series A, GO, PSF-GTD, 4.00%, 02/15/2023 | | | 100 | | | | 103 | |
Round Rock Independent School District, | | | | | | | | |
Series A, GO, PSF-GTD, 5.00%, 08/01/2021 | | | 1,700 | | | | 1,706 | |
Series A, GO, PSF-GTD, 5.00%, 08/01/2031 | | | 2,000 | | | | 2,635 | |
San Antonio Housing Trust Finance Corp., Alsbury Park Apartments, Rev., FHA, 1.38%, 09/01/2022 (z) | | | 25 | | | | 25 | |
San Antonio Independent School District, Series B, GO, PSF-GTD, 5.00%, 08/15/2027 | | | 1,255 | | | | 1,576 | |
Schertz-Cibolo-Universal City Independent School District, Series A, GO, PSF-GTD, 5.00%, 08/01/2022 | | | 1,000 | | | | 1,053 | |
Socorro Independent School District, School Building, GO, PSF-GTD, 5.00%, 08/15/2023 (p) | | | 565 | | | | 568 | |
Spring Branch Independent School District, GO, PSF-GTD, 5.00%, 02/01/2023 | | | 65 | | | | 70 | |
State of Texas, Transportation Commission Highway Improvement, GO, 5.00%, 04/01/2022 | | | 3,000 | | | | 3,109 | |
State of Texas, Veterans, GO, VRDO, 0.05%, 07/07/2021 (z) | | | 10,000 | | | | 10,000 | |
SEE NOTES TO FINANCIAL STATEMENTS.
| | | | | | | | | | |
| | | | | |
| JUNE 30, 2021 | | SIX CIRCLES TRUST | | | | | | | | 179 |
Six Circles Tax Aware Bond Fund
SCHEDULE OF PORTFOLIO INVESTMENTS
AS OF JUNE 30, 2021 (Unaudited) (continued)
(Amounts in U.S. Dollars, unless otherwise noted)
(Amounts in thousands, except number of Futures contracts)
| | | | | | | | |
| SECURITY DESCRIPTION | | PRINCIPAL
AMOUNT($) | | | VALUE($) | |
Municipal Bonds — continued | | | | | | | | |
Texas — continued | | | | | | | | |
State of Texas, Water Financial Assistance, GO, 5.00%, 08/01/2024 | | | 125 | | | | 143 | |
Tarrant County Cultural Education Facilities Finance Corp., Baylor Scott & White Health, Series A, Rev., 5.00%, 11/15/2045 | | | 2,195 | | | | 2,588 | |
Tarrant County Cultural Education Facilities Finance Corp., Christus Health, Series B, Rev., 5.00%, 07/01/2035 | | | 1,110 | | | | 1,387 | |
Tarrant County Cultural Education Facilities Finance Corp., Hendrick Medical Center, Taxable, | | | | | | | | |
Rev., AGM, 1.36%, 09/01/2024 | | | 800 | | | | 808 | |
Rev., AGM, 1.39%, 09/01/2025 | | | 600 | | | | 603 | |
Tarrant Regional Water District, City of Dallas Project, Series A, Rev., 4.00%, 09/01/2024 | | | 3,000 | | | | 3,355 | |
Texas Department of Housing & Community Affairs, OSO Bay Apartments Mandatory, Rev., 0.27%, 09/01/2024 (z) | | | 700 | | | | 700 | |
Texas Department of Housing & Community Affairs, Palladium Simpson Stuart Apartments, Rev., 0.35%, 01/01/2025 (z) | | | 1,290 | | | | 1,290 | |
Texas Department of Housing & Community Affairs, Social Bonds, Series A, Rev., GNMA, 3.00%, 01/01/2052 | | | 2,340 | | | | 2,582 | |
Texas Municipal Gas Acquisition & Supply Corp. III, | | | | | | | | |
Rev., 5.00%, 12/15/2022 | | | 200 | | | | 213 | |
Rev., 5.00%, 12/15/2023 | | | 1,215 | | | | 1,350 | |
Rev., 5.00%, 12/15/2024 | | | 835 | | | | 961 | |
Rev., 5.00%, 12/15/2025 | | | 2,400 | | | | 2,851 | |
Rev., 5.00%, 12/15/2026 | | | 2,435 | | | | 2,974 | |
Rev., 5.00%, 12/15/2030 | | | 2,905 | | | | 3,812 | |
Rev., 5.00%, 12/15/2032 | | | 3,300 | | | | 4,458 | |
Texas Municipal Gas Acquisition and Supply Corp. I, Series D, Rev., 6.25%, 12/15/2026 | | | 7,285 | | | | 8,584 | |
Texas Private Activity Bond Surface Transportation Corp., Rev., AMT, 5.00%, 06/30/2058 | | | 4,420 | | | | 5,445 | |
Texas Private Activity Bond Surface Transportation Corp., Lbj Infrastructure Group, | | | | | | | | |
Rev., 4.00%, 12/31/2030 | | | 3,970 | | | | 4,851 | |
Rev., 4.00%, 06/30/2033 | | | 1,000 | | | | 1,206 | |
Texas Transportation Commission State Highway Fund, Series A, Rev., 5.00%, 10/01/2021 | | | 1,000 | | | | 1,012 | |
Texas Transportation Commission State Highway Fund, First Tier, | | | | | | | | |
Rev., 5.00%, 10/01/2022 | | | 2,195 | | | | 2,328 | |
Series A, Rev., 5.00%, 04/01/2022 | | | 1,000 | | | | 1,037 | |
Texas Water Development Board, Master Trust, | | | | | | | | |
Rev., 4.00%, 10/15/2033 | | | 1,000 | | | | 1,246 | |
Rev., 5.00%, 10/15/2026 | | | 3,310 | | | | 4,076 | |
| | | | | | | | |
| SECURITY DESCRIPTION | | PRINCIPAL
AMOUNT($) | | | VALUE($) | |
| | | | | | | | |
Texas — continued | | | | | | | | |
Texas Water Development Board, Revolving Fund, | | | | | | | | |
Rev., 4.00%, 08/01/2038 | | | 500 | | | | 611 | |
Rev., 5.00%, 08/01/2024 | | | 250 | | | | 286 | |
Rev., 5.00%, 08/01/2028 | | | 125 | | | | 161 | |
Series A, Rev., 5.00%, 10/15/2028 | | | 100 | | | | 128 | |
Texas Water Development Board, St Revolving Fund, Rev., 5.00%, 08/01/2022 | | | 1,000 | | | | 1,053 | |
Texas Water Development Board, St Wtrust Implementation Fund, | | | | | | | | |
Series A, Rev., 4.00%, 10/15/2033 | | | 1,900 | | | | 2,253 | |
Series A, Rev., 5.00%, 10/15/2047 | | | 2,480 | | | | 3,059 | |
Series B, Rev., 5.00%, 04/15/2049 | | | 11,535 | | | | 14,479 | |
Texas Water Development Board, St Wtrust Implementation Revenue, Rev., 5.25%, 10/15/2046 | | | 2,000 | | | | 2,455 | |
Texas Water Development Board, State Water Implementation Fund, | | | | | | | | |
Series A, Rev., 5.00%, 04/15/2026 | | | 100 | | | | 121 | |
Series A, Rev., 5.00%, 10/15/2030 | | | 500 | | | | 595 | |
Texas Water Development Board, Water Implementation Fund, Series A, Rev., 4.00%, 10/15/2049 | | | 1,000 | | | | 1,188 | |
Tomball Independent School District, Series A, GO, PSF-GTD, 5.00%, 02/15/2023 | | | 1,870 | | | | 2,012 | |
Travis County Housing Finance Corp., Montopolis Apartments, Rev., 0.40%, 07/01/2041 (z) | | | 1,930 | | | | 1,931 | |
Trinity River Authority Central Regional Wastewater System Revenue, Rev., 5.00%, 08/01/2029 | | | 1,500 | | | | 1,973 | |
University of Houston, Series A, Rev., 5.00%, 02/15/2026 | | | 2,050 | | | | 2,466 | |
University of Texas, Series C, Rev., 5.00%, 08/15/2028 | | | 100 | | | | 129 | |
Upper Trinity Regional Water District, Rev., 4.00%, 08/01/2024 | | | 900 | | | | 995 | |
Upper Trinity Regional Water District, Reglional Treated Water Supply, Rev., BAM, 3.00%, 08/01/2023 (w) | | | 715 | | | | 756 | |
Waco Educational Finance Corp., Baylor University Issue, Series A, Rev., 4.00%, 03/01/2036 | | | 750 | | | | 897 | |
| | | | | | | | |
| | | | | | | 586,146 | |
| | | | | | | | |
Utah — 0.5% | | | | | | | | |
County of Utah, Ihc Health Services, Inc., Series B, Rev., 5.00%, 05/15/2060 (z) | | | 2,125 | | | | 2,581 | |
Emery County School District, GO, SCH BD GTY, 5.00%, 06/15/2025 | | | 1,740 | | | | 2,056 | |
Granite School District Board of Education, GO, SCH BD GTY, 5.00%, 06/01/2024 | | | 1,755 | | | | 1,997 | |
Metropolitan Water District of Salt Lake & Sandy, Series A, Rev., 5.00%, 07/01/2023 (p) | | | 1,000 | | | | 1,048 | |
SEE NOTES TO FINANCIAL STATEMENTS.
| | | | | | | | | | |
| | | | | |
| 180 | | | | | | | | SIX CIRCLES TRUST | | JUNE 30, 2021 |
| | | | | | | | |
| SECURITY DESCRIPTION | | PRINCIPAL
AMOUNT($) | | | VALUE($) | |
Municipal Bonds — continued | | | | | | | | |
Utah — continued | | | | | | | | |
Provo School District, GO, SCH BD GTY, 5.00%, 06/15/2028 | | | 2,000 | | | | 2,564 | |
State of Utah, | | | | | | | | |
GO, 5.00%, 07/01/2024 | | | 100 | | | | 114 | |
GO, 5.00%, 07/01/2025 | | | 3,000 | | | | 3,547 | |
GO, 5.00%, 07/01/2026 | | | 2,000 | | | | 2,442 | |
GO, 5.00%, 07/01/2030 | | | 4,500 | | | | 5,818 | |
Series B, GO, 5.00%, 07/01/2021 | | | 90 | | | | 90 | |
Series B, GO, 5.00%, 07/01/2022 | | | 1,000 | | | | 1,049 | |
Series B, GO, 5.00%, 07/01/2029 | | | 100 | | | | 130 | |
University of Utah (The), Series A, Rev., 5.00%, 08/01/2039 | | | 1,505 | | | | 1,839 | |
University of Utah, Board of Regents, Series A, Rev., 4.00%, 08/01/2040 | | | 1,750 | | | | 2,115 | |
Utah Transit Authority, Series A, Rev., 5.25%, 06/15/2023 | | | 85 | | | | 93 | |
| | | | | | | | |
| | | | | | | 27,483 | |
| | | | | | | | |
Vermont — 0.0% (g) | | | | | | | | |
Vermont Housing Finance Agency, Series A, Rev., GNMA/FNMA/FHLMC COLL, 4.00%, 11/01/2049 | | | 375 | | | | 424 | |
Vermont Municipal Bond Bank, Vermont State Colleges System, Series A, Rev., 4.00%, 10/01/2034 | | | 250 | | | | 305 | |
Vermont Student Assistance Corp., Series A, Rev., AMT, 2.38%, 06/15/2039 | | | 955 | | | | 949 | |
| | | | | | | | |
| | | | | | | 1,678 | |
| | | | | | | | |
Virginia — 1.5% | | | | | | | | |
Chesapeake Hospital Authority, Chesapeake Regional Medical Center, Rev., 5.00%, 07/01/2030 | | | 300 | | | | 384 | |
Chesapeake Hospital Authority, Regional Medical Center, Rev., 5.00%, 07/01/2028 | | | 550 | | | | 692 | |
City of Richmond Public Utility Revenue, Taxable, Series B, Rev., 2.35%, 01/15/2027 | | | 3,000 | | | | 3,187 | |
County of Fairfax, Series A, GO, 5.00%, 10/01/2031 | | | 1,000 | | | | 1,328 | |
County of Fairfax, Public Improvement, | | | | | | | | |
Series A, GO, 5.00%, 10/01/2031 (p) | | | 945 | | | | 1,143 | |
Series B, GO, 5.00%, 10/01/2022 | | | 2,795 | | | | 2,965 | |
County of Fairfax, Sewer Revenue, Series B, Rev., 4.00%, 07/15/2038 | | | 1,500 | | | | 1,863 | |
County of Loudoun, Series A, GO, 4.00%, 12/01/2030 | | | 3,000 | | | | 3,634 | |
Fairfax County Redevelopment & Housing Authority, Arrowbrook Apartments Project, Rev., 0.41%, 01/01/2041 (z) | | | 5,250 | | | | 5,261 | |
Halifax County Industrial Development Authority, Electric & Power Co. Project, Rev., 0.45%, 12/01/2041 (z) | | | 1,000 | | | | 1,001 | |
Hampton Roads Transportation Accountability Commission, Senior Lien, | | | | | | | | |
Series A, Rev., 5.00%, 07/01/2031 | | | 1,500 | | | | 2,016 | |
| | | | | | | | |
| SECURITY DESCRIPTION | | PRINCIPAL
AMOUNT($) | | | VALUE($) | |
| | | | | | | | |
Virginia — continued | | | | | | | | |
Series A, Rev., 5.00%, 07/01/2032 | | | 4,495 | | | | 6,020 | |
Series A, Rev., 5.00%, 07/01/2038 | | | 1,000 | | | | 1,238 | |
Series A, Rev., 5.00%, 07/01/2039 | | | 2,100 | | | | 2,746 | |
Loudoun County Economic Development Authority, | | | | | | | | |
Series A, Rev., 5.00%, 12/01/2024 | | | 2,520 | | | | 2,917 | |
Series A, Rev., 5.00%, 12/01/2025 | | | 2,665 | | | | 3,189 | |
Louisa Industrial Development Authority, Virginia Electric And Power Co. Project, Series B, Rev., 0.75%, 11/01/2035 (z) | | | 2,125 | | | | 2,132 | |
Norfolk Airport Authority, Rev., 5.00%, 07/01/2038 | | | 1,175 | | | | 1,496 | |
Roanoke Economic Development Authority, Carilion Clinic, Rev., 5.00%, 07/01/2053 (z) | | | 4,000 | | | | 5,220 | |
University of Virginia, Series B, Rev., 5.00%, 08/01/2021 (p) | | | 1,420 | | | | 1,426 | |
Virginia Beach Development Authority, Westminster Canterbury, Rev., 5.00%, 09/01/2044 | | | 2,215 | | | | 2,532 | |
Virginia College Building Authority, Series A, Rev., 5.00%, 02/01/2023 | | | 1,505 | | | | 1,620 | |
Virginia College Building Authority, 21st Century Century College And Equipment, Rev., 5.00%, 02/01/2033 | | | 3,750 | | | | 4,925 | |
Virginia College Building Authority, 21st Century College, Rev., 5.00%, 02/01/2025 | | | 1,300 | | | | 1,512 | |
Virginia College Building Authority, 21st Century College and Equipment, Rev., 5.00%, 02/01/2029 | | | 1,000 | | | | 1,302 | |
Virginia College Building Authority, Regent University Project, Rev., 5.00%, 06/01/2023 | | | 165 | | | | 179 | |
Virginia Public Building Authority, Series A, Rev., 5.00%, 08/01/2021 | | | 1,175 | | | | 1,180 | |
Virginia Resources Authority, Series A, Rev., 5.00%, 11/01/2024 (p) | | | 1,190 | | | | 1,322 | |
Virginia Resources Authority, Revolving Fund, Series A, Rev., 5.00%, 08/01/2023 | | | 700 | | | | 703 | |
Virginia Small Business Financing Authority, 95 Express Lanes LLC Project, Rev., AMT, 5.00%, 01/01/2044 | | | 1,500 | | | | 1,534 | |
Virginia Small Business Financing Authority, National Senior Campuses, | | | | | | | | |
Series A, Rev., 5.00%, 01/01/2024 | | | 755 | | | | 837 | |
Series A, Rev., 5.00%, 01/01/2025 | | | 700 | | | | 802 | |
Series A, Rev., 5.00%, 01/01/2026 | | | 1,100 | | | | 1,296 | |
Series A, Rev., 5.00%, 01/01/2031 | | | 1,500 | | | | 1,843 | |
Series A, Rev., 5.00%, 01/01/2032 | | | 1,500 | | | | 1,837 | |
Virginia Small Business Financing Authority, Senior Lien, Express Lanes LLC Project, Rev., AMT, 5.00%, 01/01/2040 | | | 1,450 | | | | 1,483 | |
Virginia Small Business Financing Authority, Transform 66 P3 Project, | | | | | | | | |
Rev., AMT, 5.00%, 12/31/2049 | | | 1,500 | | | | 1,806 | |
Rev., AMT, 5.00%, 12/31/2052 | | | 4,000 | | | | 4,795 | |
Rev., AMT, 5.00%, 12/31/2056 | | | 1,000 | | | | 1,198 | |
SEE NOTES TO FINANCIAL STATEMENTS.
| | | | | | | | | | |
| | | | | |
| JUNE 30, 2021 | | SIX CIRCLES TRUST | | | | | | | | 181 |
Six Circles Tax Aware Bond Fund
SCHEDULE OF PORTFOLIO INVESTMENTS
AS OF JUNE 30, 2021 (Unaudited) (continued)
(Amounts in U.S. Dollars, unless otherwise noted)
(Amounts in thousands, except number of Futures contracts)
| | | | | | | | |
| SECURITY DESCRIPTION | | PRINCIPAL
AMOUNT($) | | | VALUE($) | |
Municipal Bonds — continued | | | | | | | | |
Virginia — continued | | | | | | | | |
Wise County Industrial Development Authority, Electric and Power Company Project, Series A, Rev., 0.75%, 10/01/2040 (z) | | | 5,575 | | | | 5,626 | |
Wise County Industrial Development Authority, Virginia Electric & Power Company Project, Series A, Rev., 1.20%, 11/01/2040 (z) | | | 15 | | | | 15 | |
| | | | | | | | |
| | |
| | | | | | | 88,205 | |
| | | | | | | | |
Washington — 3.1% | | | | | | | | |
Central Puget Sound Regional Transit Authority, Green Bond, Series S1, Rev., 5.00%, 11/01/2035 | | | 1,085 | | | | 1,284 | |
Chelan County Public Utility District No. 1, Series C, Rev., AMT, 5.00%, 07/01/2026 | | | 1,285 | | | | 1,532 | |
City of Seattle Municipal Light & Power Revenue, Green Bond, Series A, Rev., 4.00%, 07/01/2040 | | | 1,300 | | | | 1,574 | |
City of Seattle, Drainage & Wastewater Revenue, Rev., 4.00%, 05/01/2044 | | | 945 | | | | 1,016 | |
City of Seattle, Municipal Light & Power Revenue, Rev., 4.00%, 09/01/2040 | | | 1,000 | | | | 1,095 | |
Clark County School District No. 37 Vancouver, GO, SCH BD GTY, 4.00%, 12/01/2023 | | | 3,765 | | | | 4,111 | |
County of King, Series A, GO, 5.00%, 12/01/2034 | | | 1,335 | | | | 1,782 | |
County of King, Sewer Revenue, | | | | | | | | |
Rev., 5.00%, 01/01/2024 (p) | | | 1,570 | | | | 1,608 | |
Rev., AGM, 5.00%, 01/01/2047 | | | 5,000 | | | | 5,594 | |
Energy Northwest Washington, Project 3 Electric Revenue, Series C, Rev., 5.00%, 07/01/2027 | | | 100 | | | | 125 | |
Energy Northwest, Columbia Generating, Series A, Rev., 5.00%, 07/01/2022 | | | 1,125 | | | | 1,125 | |
Everett Housing Authority, Baker Heights Legacy, Rev., 0.30%, 09/01/2024 (z) | | | 575 | | | | 574 | |
Grant County Public Utility District No. 2 Priest Rapids Hydroelectric Project, Series B, Rev., AMT, 5.00%, 01/01/2022 (p) | | | 1,330 | | | | 1,361 | |
Grant County, Public Utility District No. 2, Electric Revenue, | | | | | | | | |
Series 2017-O, Rev., 5.00%, 01/01/2047 | | | 4,950 | | | | 5,999 | |
Series R, Rev., 2.00%, 01/01/2044 (z) | | | 1,500 | | | | 1,586 | |
King & Snohomish Counties School District No. 417 Northshore, GO, SCH BD GTY, 4.00%, 12/01/2032 | | | 1,000 | | | | 1,099 | |
King County Housing Authority, Rev., 5.00%, 11/01/2029 | | | 1,325 | | | | 1,702 | |
King County School District No. 210 Federal Way, GO, SCH BD GTY, 4.00%, 12/01/2025 | | | 2,000 | | | | 2,311 | |
Pierce County School District No. 10 Tacoma, Social Bonds, Series B, GO, SCH BD GTY, 4.00%, 12/01/2042 | | | 10,000 | | | | 12,152 | |
Port of Seattle, Series C, Rev., AMT, 5.00%, 04/01/2028 | | | 500 | | | | 566 | |
Port of Seattle, Intermediate Lien, | | | | | | | | |
Rev., AMT, 5.00%, 04/01/2028 | | | 2,250 | | | | 2,819 | |
| | | | | | | | |
| SECURITY DESCRIPTION | | PRINCIPAL
AMOUNT($) | | | VALUE($) | |
| | | | | | | | |
Washington — continued | | | | | | | | |
Rev., AMT, 5.00%, 04/01/2030 | | | 4,000 | | | | 5,064 | |
Rev., AMT, 5.00%, 04/01/2044 | | | 2,000 | | | | 2,443 | |
Series C, Rev., AMT, 5.00%, 08/01/2034 | | | 5,000 | | | | 6,566 | |
Seattle Housing Authority, Northgate Plaza Project, Rev., 1.00%, 06/01/2026 | | | 2,045 | | | | 2,043 | |
Skagit County Public Hospital District No. 1, Improvement Skagit Regional Health, Rev., 5.00%, 12/01/2031 | | | 2,145 | | | | 2,493 | |
Skagit County Public Hospital District No. 2, GO, 5.00%, 12/01/2025 (p) | | | 1,020 | | | | 1,089 | |
Snohomish County School District No. 201 Snohomish, GO, SCH BD GTY, 5.00%, 12/01/2028 | | | 1,500 | | | | 1,944 | |
Spokane County School District No. 81 Spokane, Series C, GO, SCH BD GTY, 5.00%, 12/01/2034 | | | 2,000 | | | | 2,499 | |
State of Washington, | | | | | | | | |
GO, 5.00%, 06/01/2040 | | | 4,250 | | | | 5,532 | |
Series 2020A, GO, 5.00%, 08/01/2036 | | | 8,000 | | | | 10,355 | |
Series 2020A, GO, 5.00%, 08/01/2038 | | | 1,500 | | | | 1,933 | |
Series 2021A, GO, 5.00%, 06/01/2034 | | | 1,000 | | | | 1,319 | |
Series A1, GO, 5.00%, 08/01/2040 | | | 13,645 | | | | 15,938 | |
Series A, GO, 5.00%, 08/01/2022 | | | 85 | | | | 90 | |
Series A, GO, 5.00%, 08/01/2040 | | | 3,890 | | | | 5,084 | |
Series B, GO, 5.00%, 07/01/2025 | | | 75 | | | | 89 | |
Series B, GO, 5.00%, 06/01/2035 | | | 4,760 | | | | 6,268 | |
Series E, GO, 5.00%, 02/01/2023 | | | 1,250 | | | | 1,346 | |
Series RC, GO, 5.00%, 08/01/2029 | | | 100 | | | | 125 | |
Series RD, GO, 5.00%, 08/01/2024 | | | 1,025 | | | | 1,174 | |
Series R-2017A, GO, 5.00%, 08/01/2022 | | | 975 | | | | 1,026 | |
Series R-2017A, GO, 5.00%, 08/01/2034 | | | 1,840 | | | | 2,228 | |
Series R-2020B, GO, 5.00%, 01/01/2026 | | | 2,500 | | | | 3,004 | |
State of Washington, Bid Group, Series C, GO, 5.00%, 02/01/2024 | | | 4,650 | | | | 5,222 | |
State of Washington, Motor Vehicle, Series R-2012D, GO, 5.00%, 07/01/2023 | | | 1,000 | | | | 1,048 | |
State of Washington, Motor Vehicle Fuel Tax, Series B, GO, 5.00%, 07/01/2021 | | | 105 | | | | 105 | |
State of Washington, Various Purpose, | | | | | | | | |
Series 2015A1, GO, 5.00%, 08/01/2036 | | | 11,200 | | | | 12,717 | |
Series A, GO, 5.00%, 08/01/2024 (p) | | | 4,750 | | | | 4,769 | |
Thurston County School District No. 111 Olympia, GO, SCH BD GTY, 5.00%, 12/01/2026 | | | 1,275 | | | | 1,577 | |
University of Washington, Forward Delivery, | | | | | | | | |
Series C, Rev., 5.00%, 04/01/2022 | | | 1,250 | | | | 1,295 | |
Series C, Rev., 5.00%, 04/01/2025 | | | 1,750 | | | | 2,051 | |
Series C, Rev., 5.00%, 04/01/2026 | | | 1,750 | | | | 2,118 | |
Washington Health Care Facilities Authority, Fred Hutchinson Cancer, | | | | | | | | |
Rev., (ICE LIBOR USD 1 Month * 0.67 + 1.10%), 1.16%, 01/01/2042 (aa) | | | 550 | | | | 552 | |
Series C, Rev., (SIFMA Municipal Swap Index + 1.05%), 1.08%, 01/01/2042 (aa) | | | 3,000 | | | | 3,021 | |
SEE NOTES TO FINANCIAL STATEMENTS.
| | | | | | | | | | |
| | | | | |
| 182 | | | | | | | | SIX CIRCLES TRUST | | JUNE 30, 2021 |
| | | | | | | | |
| SECURITY DESCRIPTION | | PRINCIPAL
AMOUNT($) | | | VALUE($) | |
Municipal Bonds — continued | | | | | | | | |
Washington — continued | | | | | | | | |
Washington Health Care Facilities Authority, Multicare Health System, Series B, Rev., 5.00%, 08/15/2037 | | | 1,200 | | | | 1,475 | |
Washington Health Care Facilities Authority, Providence Health & Services, Series B, Rev., 5.00%, 10/01/2042 (z) | | | 345 | | | | 349 | |
Washington Health Care Facilities Authority, Seattle Cancer Care Alliance, | | | | | | | | |
Rev., 4.00%, 12/01/2040 (e) | | | 860 | | | | 1,038 | |
Rev., 4.00%, 12/01/2048 (e) | | | 870 | | | | 1,035 | |
Rev., 5.00%, 09/01/2045 | | | 1,000 | | | | 1,287 | |
Washington State Housing Finance Commission, Social Certificate, Series A1, Rev., 3.50%, 12/20/2035 | | | 1,214 | | | | 1,416 | |
Washington State Housing Finance Commission, Series 2N, Rev., GNMA/FNMA/FHLMC COLL, 3.00%, 12/01/2050 | | | 830 | | | | 905 | |
Washington State Housing Finance Commission, College Glen Apartments Project, Series A, Rev., FHA, 1.55%, 07/01/2022 (z) | | | 1,000 | | | | 1,007 | |
Washington State Housing Finance Commission, Downtowner Apartments Project, Rev., LIQ: FHLMC, 3.70%, 07/01/2030 | | | 2,000 | | | | 2,272 | |
Washington State Housing Finance Commission, Garden Haus Apartaments Project, Rev., 0.37%, 07/01/2024 (z) | | | 350 | | | | 350 | |
Washington State Housing Finance Commission, Horizon House Project, Rev., 5.00%, 01/01/2023 (e) | | | 275 | | | | 293 | |
Washington State Housing Finance Commission, Rockwood Retirement Communities, Rev., 3.00%, 07/01/2027 (e) | | | 1,000 | | | | 1,025 | |
| | | | | | | | |
| | |
| | | | | | | 177,594 | |
| | | | | | | | |
West Virginia — 0.2% | | | | | | | | |
Marshall University, Series A, Rev., AGM, 5.00%, 05/01/2030 | | | 300 | | | | 393 | |
Monongalia County Commission Excise Tax District, Series A, Rev., 4.13%, 06/01/2043 (e) | | | 500 | | | | 563 | |
Monongalia County Commission Special District, Refunding and Improvement, University Town Center, Series A, Rev., 5.50%, 06/01/2037 (e) | | | 1,050 | | | | 1,213 | |
Monongalia County Commission Special District, University Town Center, Series A, Rev., 5.75%, 06/01/2043 (e) | | | 500 | | | | 578 | |
West Virginia Economic Development Authority, Appalachian Power Company Amos Project, Rev., AMT, 1.00%, 01/01/2041 (z) | | | 2,765 | | | | 2,781 | |
West Virginia Housing Development Fund, Charles Towers, Rev., FHA, 0.21%, 09/01/2023 (z) | | | 480 | | | | 480 | |
West Virginia Parkways Authority, Senior Lien, Rev., 5.00%, 06/01/2038 | | | 1,000 | | | | 1,321 | |
| | | | | | | | |
| SECURITY DESCRIPTION | | PRINCIPAL
AMOUNT($) | | | VALUE($) | |
| | | | | | | | |
West Virginia — continued | | | | | | | | |
West Virginia University, Series A, Rev., 5.00%, 10/01/2029 (p) | | | 1,500 | | | | 1,591 | |
West Virginia University Project, Series A, Rev., 5.00%, 10/01/2032 (p) | | | 1,000 | | | | 1,060 | |
| | | | | | | | |
| | |
| | | | | | | 9,980 | |
| | | | | | | | |
Wisconsin — 1.8% | | | | | | | | |
City of Milwaukee, Corporate Purpose Bonds, Series B4, GO, 5.00%, 04/01/2030 | | | 1,800 | | | | 2,207 | |
City of Milwaukee, Promissory Notes, Series N4, GO, 5.00%, 04/01/2030 | | | 10,150 | | | | 13,354 | |
City of Milwaukee, Sewerage System Revenue, Series S7, Rev., 5.00%, 06/01/2026 | | | 2,665 | | | | 3,235 | |
City of Superior, Collateral Midwest Energy Resources, Series E, Rev., NATL, 6.90%, 08/01/2021 | | | 510 | | | | 513 | |
County of Milwaukee, Airport Revenue, Series A, Rev., 5.00%, 12/01/2028 | | | 250 | | | | 323 | |
Fox Valley Technical College District, School Facilities, Series C, GO, 3.00%, 12/01/2027 (p) | | | 5,000 | | | | 5,200 | |
Public Finance Authority, Appalachian Healthcare System, | | | | | | | | |
Rev., 5.00%, 07/01/2036 | | | 350 | | | | 450 | |
Rev., 5.00%, 07/01/2037 | | | 300 | | | | 385 | |
Rev., 5.00%, 07/01/2039 | | | 350 | | | | 447 | |
Public Finance Authority, Carmelite System, Social Bonds, Rev., 5.00%, 01/01/2045 | | | 1,105 | | | | 1,320 | |
Public Finance Authority, Point College Prep Project, | | | | | | | | |
Rev., 4.00%, 06/15/2030 (e) | | | 200 | | | | 214 | |
Rev., 5.00%, 06/15/2041 (e) | | | 250 | | | | 272 | |
Public Finance Authority, Renown Regional Medical Center Project, | | | | | | | | |
Rev., 5.00%, 06/01/2026 | | | 500 | | | | 604 | |
Rev., 5.00%, 06/01/2027 | | | 425 | | | | 528 | |
Rev., 5.00%, 06/01/2028 | | | 600 | | | | 763 | |
Rev., 5.00%, 06/01/2034 | | | 1,000 | | | | 1,298 | |
Public Finance Authority, Waste Management, Inc. Project, | | | | | | | | |
Rev., AMT, 0.20%, 09/01/2027 (z) | | | 4,500 | | | | 4,500 | |
Rev., AMT, 1.10%, 07/01/2029 (z) | | | 1,445 | | | | 1,454 | |
Rev., AMT, 2.63%, 11/01/2025 | | | 5,000 | | | | 5,443 | |
State of Wisconsin, | | | | | | | | |
Series 1, GO, 5.00%, 05/01/2027 | | | 2,400 | | | | 3,002 | |
Series 1, GO, 5.00%, 05/01/2030 | | | 2,500 | | | | 3,354 | |
Series 20212, GO, 5.00%, 05/01/2026 | | | 5,850 | | | | 7,105 | |
Series B, GO, 5.00%, 05/01/2026 | | | 4,000 | | | | 4,858 | |
Series B, GO, 5.00%, 05/01/2035 | | | 10,580 | | | | 13,645 | |
Wisconsin Center District, Capital Appreciation Senior Dedicated, | | | | | | | | |
Series C, Rev., AGM, Zero Coupon, 12/15/2036 | | | 1,550 | | | | 1,058 | |
Series C, Rev., AGM, Zero Coupon, 12/15/2039 | | | 1,750 | | | | 1,055 | |
SEE NOTES TO FINANCIAL STATEMENTS.
| | | | | | | | | | |
| | | | | |
| JUNE 30, 2021 | | SIX CIRCLES TRUST | | | | | | | | 183 |
Six Circles Tax Aware Bond Fund
SCHEDULE OF PORTFOLIO INVESTMENTS
AS OF JUNE 30, 2021 (Unaudited) (continued)
(Amounts in U.S. Dollars, unless otherwise noted)
(Amounts in thousands, except number of Futures contracts)
| | | | | | | | |
| SECURITY DESCRIPTION | | PRINCIPAL
AMOUNT($) | | | VALUE($) | |
Municipal Bonds — continued | | | | | | | | |
Wisconsin — continued | | | | | | | | |
Series C, Rev., AGM, Zero Coupon, 12/15/2040 | | | 1,650 | | | | 953 | |
Series D, Rev., AGM, Zero Coupon, 12/15/2028 | | | 545 | | | | 491 | |
Series D, Rev., AGM, Zero Coupon, 12/15/2029 | | | 395 | | | | 347 | |
Wisconsin Department of Transportation, | | | | | | | | |
Series 1, Rev., 5.00%, 07/01/2024 (p) | | | 1,940 | | | | 2,034 | |
Series A, Rev., 5.00%, 07/01/2027 | | | 1,675 | | | | 2,104 | |
Wisconsin Health & Educational Facilities Authority, Ascension Health Credit Group, Series A, Rev., 5.00%, 11/15/2021 | | | 180 | | | | 183 | |
Wisconsin Health & Educational Facilities Authority, Ascension Senior Credit Group, | | | | | | | | |
Rev., 5.00%, 11/15/2027 | | | 500 | | | | 632 | |
Rev., 5.00%, 11/15/2029 | | | 1,000 | | | | 1,320 | |
Rev., 5.00%, 11/15/2036 | | | 1,500 | | | | 1,798 | |
Wisconsin Health & Educational Facilities Authority, Marshfield Clinic Health System, | | | | | | | | |
Rev., 5.00%, 02/15/2051 (z) | | | 2,600 | | | | 3,117 | |
Series B1, Rev., 5.00%, 02/15/2052 (z) | | | 2,000 | | | | 2,267 | |
Series B, Rev., 5.00%, 02/15/2042 | | | 1,000 | | | | 1,148 | |
Series B, Rev., 5.00%, 02/15/2046 | | | 4,550 | | | | 5,204 | |
Wisconsin Housing & Economic Development Authority, | | | | | | | | |
Series B, Rev., HUD, 0.40%, 05/01/2045 (z) | | | 195 | | | | 195 | |
Series B, Rev., HUD, 0.50%, 11/01/2050 (z) | | | 245 | | | | 245 | |
Series D, Rev., 4.00%, 03/01/2047 | | | 3,670 | | | | 4,027 | |
Wisconsin Housing & Economic Development Authority, Social Bond, Series A, Rev., 3.00%, 03/01/2052 | | | 955 | | | | 1,050 | |
Wisconsin Rapids School District, GO, 5.00%, 04/01/2026 | | | 1,110 | | | | 1,338 | |
| | | | | | | | |
| | | | | | | 105,040 | |
| | | | | | | | |
Wyoming — 0.2% | | | | | | | | |
County of Laramie, Cheyenne Regional Medical Center, | | | | | | | | |
Rev., 4.00%, 05/01/2026 | | | 615 | | | | 710 | |
Rev., 4.00%, 05/01/2028 | | | 460 | | | | 548 | |
County of Sweetwater, Idaho Power Company Project, Rev., 1.70%, 07/15/2026 | | | 1,045 | | | | 1,078 | |
Wyoming Community Development Authority, | | | | | | | | |
Series 1, Rev., 3.00%, 06/01/2050 | | | 2,180 | | | | 2,391 | |
Series 2, Rev., VRDO, LIQ: Royal Bank of Canada, 0.03%, 07/07/2021 (z) | | | 3,000 | | | | 3,000 | |
Series 2, Rev., 3.00%, 06/01/2049 | | | 1,500 | | | | 1,634 | |
| | | | | | | | |
| | | | | | | 9,361 | |
| | | | | | | | |
Total Municipal Bonds
(Cost $5,312,394) | | | | | | | 5,382,210 | |
| | | | | | | | |
Short-Term Investments — 7.3% | | | | | | | | |
Municipal Bonds — 1.9% (t) | | | | | | | | |
California Public Finance Authority, Henry Mayo Newhall Hospital, Series A, Rev., 4.00%, 10/15/2021 | | | 95 | | | | 96 | |
| | | | | | | | |
| SECURITY DESCRIPTION | | PRINCIPAL
AMOUNT($) | | | VALUE($) | |
| | | | | | | | |
Municipal Bonds — continued | | | | | | | | |
City of Boston, Series A, GO, 5.00%, 11/01/2021 | | | 2,850 | | | | 2,896 | |
City of Garland, Certificates Obligation, GO, 5.00%, 02/15/2022 | | | 790 | | | | 814 | |
City of Los Angeles, Rev., TRAN, 4.00%, 06/23/2022 (w) | | | 3,000 | | | | 3,114 | |
City of San Antonio, Certificates Obligation, GO, 5.00%, 08/01/2021 | | | 1,620 | | | | 1,626 | |
City of San Antonio, Tax Notes, GO, 5.00%, 08/01/2021 | | | 2,245 | | | | 2,254 | |
City of Wichita, Temporary Notes, Series 302, GO, 3.50%, 10/15/2021 | | | 2,000 | | | | 2,020 | |
Consolidated Government of the City of Baton Rouge & Parish of East Baton Rouge, Sales Tax, Rev., 5.00%, 08/01/2021 | | | 440 | | | | 442 | |
County of Los Angeles, Rev., TRAN, 4.00%, 06/30/2022 (w) | | | 6,565 | | | | 6,819 | |
County of Nassau, Series B, GO, TAN, 2.00%, 12/10/2021 | | | 5,000 | | | | 5,042 | |
County of Suffolk, | | | | | | | | |
Series I, GO, TAN, 2.00%, 07/22/2021 | | | 4,000 | | | | 4,004 | |
Series I, GO, TAN, 3.00%, 09/24/2021 | | | 5,000 | | | | 5,031 | |
Series II, GO, TAN, 2.00%, 08/19/2021 | | | 2,000 | | | | 2,005 | |
Harlandale Independent School District, GO, PSF-GTD, 3.00%, 08/15/2021 | | | 1,355 | | | | 1,360 | |
Indiana Finance Authority, First Lien, CWA Authority Project, Rev., 5.00%, 10/01/2021 (w) | | | 460 | | | | 465 | |
Indiana Finance Authority, Second Lien, CWA Authority Project, Rev., 5.00%, 10/01/2021 (w) | | | 105 | | | | 106 | |
Kentucky Asset Liability Commission, Project Notes, Series A, Rev., 5.00%, 09/01/2021 | | | 2,000 | | | | 2,016 | |
Kentucky Rural Water Finance Corp., Public Projects Construction, Rev., 0.43%, 12/01/2021 | | | 4,460 | | | | 4,460 | |
Lone Star College System, | | | | | | | | |
Series A, GO, 5.00%, 02/15/2022 (w) | | | 145 | | | | 149 | |
Series B, GO, 5.00%, 02/15/2022 (w) | | | 275 | | | | 283 | |
Los Angeles Department of Water, Series C, Rev., 5.00%, 07/01/2021 | | | 1,000 | | | | 1,000 | |
Metropolitan District, GO, BAN, 3.00%, 09/01/2021 | | | 7,000 | | | | 7,034 | |
Michigan State University, Series A, Rev., 5.00%, 08/15/2021 | | | 720 | | | | 724 | |
Mount San Jacinto Community College District, Election of 2014, Series C, GO, 3.00%, 08/01/2021 | | | 2,750 | | | | 2,756 | |
Piedmont Municipal Power Agency, Series A, Rev., 3.00%, 01/01/2022 | | | 2,000 | | | | 2,028 | |
Richardson Independent School District, GO, PSF-GTD, 5.00%, 02/15/2022 (w) | | | 725 | | | | 745 | |
State of Florida Department of Transportation Turnpike System Revenue, Series B, Rev., 5.00%, 07/01/2021 | | | 1,810 | | | | 1,810 | |
SEE NOTES TO FINANCIAL STATEMENTS.
| | | | | | | | | | |
| | | | | |
| 184 | | | | | | | | SIX CIRCLES TRUST | | JUNE 30, 2021 |
| | | | | | | | |
| SECURITY DESCRIPTION | | PRINCIPAL
AMOUNT($) | | | VALUE($) | |
Short-Term Investments — continued | | | | | | | | |
Municipal Bonds — continued | | | | | | | | |
State of Illinois, Series C, GO, 4.00%, 03/01/2022 | | | 820 | | | | 841 | |
State of Texas, Rev., TRAN, 4.00%, 08/26/2021 | | | 37,295 | | | | 37,519 | |
State of Washington, Bid Group, Series C, GO, 5.00%, 02/01/2022 | | | 6,165 | | | | 6,340 | |
Texas Municipal Gas Acquisition & Supply Corp. III, Rev., 5.00%, 12/15/2021 | | | 245 | | | | 250 | |
Town of Stratford, Series B, GO, BAN, 2.00%, 12/16/2021 | | | 2,500 | | | | 2,521 | |
Weld County School District No. Re-5J, GO, 5.00%, 12/01/2021 | | | 565 | | | | 576 | |
Wisconsin Rapids School District, Rev., BAN, 2.00%, 01/06/2022 (w) | | | 760 | | | | 762 | |
| | | | | | | | |
Total Municipal Bonds | | | | | | | 109,908 | |
| | | | | | | | |
| | | | | | | | |
| SECURITY DESCRIPTION | | PRINCIPAL
AMOUNT($) | | | VALUE($) | |
| | | | | | | | |
Time Deposits — 5.4% | | | | | | | | |
Australia & New Zealand Banking Group Ltd., 0.01%, 07/01/2021 | | | 72,111 | | | | 72,111 | |
Barclays SA, 0.01%, 07/01/2021 | | | 81,712 | | | | 81,712 | |
BNP Paribas SA, 0.01%, 07/01/2021 | | | 22,899 | | | | 22,899 | |
Citibank NA, 0.01%, 07/01/2021 | | | 33,211 | | | | 33,211 | |
Sumitomo Mitsui Banking Corp., 0.01%, 07/01/2021 | | | 100,371 | | | | 100,371 | |
| | | | | | | | |
Total Time Deposits | | | | | | | 310,304 | |
| | | | | | | | |
Total Short-Term Investments
(Cost $420,198) | | | | | | | 420,212 | |
| | | | | | | | |
| | |
Total Investments — 101.1%
(Cost - $5,733,812) * | | | | | | | 5,803,625 | |
| | |
Liabilities in Excess of Other Assets — (1.1)% | | | | | | | (65,299 | ) |
| | | | | | | | |
| | |
NET ASSETS — 100.0% | | | | | | $ | 5,738,326 | |
| | | | | | | | |
Percentages indicated are based on net assets
| | | | | | | | | | | | | | | | | | | | |
| Futures contracts outstanding as of June 30, 2021: | |
| Exchange Traded | |
| DESCRIPTION | | NUMBER OF
CONTRACTS | | | EXPIRATION
DATE | | | TRADING
CURRENCY | | | NOTIONAL
AMOUNT($) | | | VALUE AND
UNREALIZED
APPRECIATION
(DEPRECIATION)($) | |
Long Contracts | | | | | | | | | | | | | | | | | | | | |
U.S. Treasury 5 Year Note | | | 365 | | | | 09/2021 | | | | USD | | | | 45,203 | | | | (152 | ) |
| | | | | |
Short Contracts | | | | | | | | | | | | | | | | | | | | |
U.S. Treasury 10 Year Note | | | (102 | ) | | | 09/2021 | | | | USD | | | | (13,452 | ) | | | (63 | ) |
| | | | | | | | | | | | | | | | | | | | |
Total unrealized appreciation (depreciation) | | | | | | | | | | | | | | | | | | | (215 | ) |
| | | | | | | | | | | | | | | | | | | | |
NOTES TO SCHEDULE OF PORTFOLIO INVESTMENTS
| | |
| AGC | | — Insured by Assured Guaranty Corp. |
| AGM | | — Insured by Assured Guaranty Municipal Corp. |
| AMBAC | | — Insured by American Municipal Bond Assurance Corp. |
| AMT | | — Alternative Minimum Tax |
| BAM | | — Insured by Build America Mutual |
| BAN | | — Bond Anticipation Note |
| BHAC | | — Insured by Berkshire Hathaway Assurance Corp. |
| CNTY | | — County |
| COLL | | — Collateral |
| COP | | — Certificate of Participation |
| CR | | — Custodial Receipts |
| FHA | | — Federal Housing Administration |
| FHLMC | | — Federal Home Loan Mortgage Corp. |
| FNMA | | — Federal National Mortgage Association |
| GAN | | — Grant Anticipation Notes |
| GNMA | | — Government National Mortgage Association |
| GO | | — General Obligation |
| GTD | | — Guaranteed |
| | |
| HUD | | — U.S. Department of Housing and Urban Development |
| ICE | | — Intercontinental Exchange |
| LIBOR | | — London Interbank Offered Rate |
| LIQ | | — Liquidity Agreement |
| LOC | | — Letter of Credit |
| NATL | | — Insured by National Public Finance Guarantee Corp. |
| PSF | | — Permanent School Fund |
| Q-SBLF | | — Qualified School Bond Loan Fund |
| RE | | — Reinsured |
| Rev. | | — Revenue |
| SCH BD GTY | | — School Bond Guaranty |
| SIFMA | | — Securities Industry and Financial Markets Association |
| SOFR | | — Secured Overnight Financing Rate |
| SONYMA | | —Stateof New York Mortgage Agency |
| TAN | | — Tax Anticipation Note |
| TRAN | | —Tax& Revenue Anticipation Note |
| VRDO | | — Variable Rate Demand Obligation. The interest rate shown is the rate in effect as of June 30, 2021. |
SEE NOTES TO FINANCIAL STATEMENTS.
| | | | | | | | | | |
| | | | | |
| JUNE 30, 2021 | | SIX CIRCLES TRUST | | | | | | | | 185 |
Six Circles Tax Aware Bond Fund
SCHEDULE OF PORTFOLIO INVESTMENTS
AS OF JUNE 30, 2021 (Unaudited) (continued)
(Amounts in U.S. Dollars, unless otherwise noted)
(Amounts in thousands, except number of Futures contracts)
| | |
| (d) | | — Defaulted Security. Security has not paid its last interest payment and/or interest is not being accrued. |
| (e) | | — Security is exempt from registration under Rule 144A of the Securities Act of 1933, as amended. Unless otherwise indicated, this security has been determined to be liquid under procedures established by the Board of Trustees and may be resold in transactions exempt from registration, normally to qualified institutional buyers. |
| (g) | | — Amount rounds to less than 0.05%. |
| (p) | | — Security is prerefunded or escrowed to maturity. |
| (t) | | — The date shown represents the earliest of the next put date or final maturity date. |
| | |
| (w) | | — All or a portion of the security is a when-issued security, delayed delivery security, or forward commitment. |
| (z) | | — Variable or floating rate security, the interest rate of which adjusts periodically based on changes in current interest rates and prepayments on the underlying pool of assets. The interest rate shown is the current rate as of June 30, 2021. |
| (aa) | | — Variable or floating rate security, linked to the referenced benchmark. The interest rate shown is the current rate as of June 30, 2021. |
| * | | — The cost of securities is substantially the same for federal income tax purposes. |
| USD | | — United States Dollar |
SEE NOTES TO FINANCIAL STATEMENTS.
| | | | | | | | | | |
| | | | | |
| 186 | | | | | | | | SIX CIRCLES TRUST | | JUNE 30, 2021 |
Six Circles Credit Opportunities Fund
SCHEDULE OF PORTFOLIO INVESTMENTS
AS OF JUNE 30, 2021 (Unaudited)
(Amounts in U.S. Dollars, unless otherwise noted)
(Amounts in thousands, except number of Futures contracts)
| | | | | | | | |
| SECURITY DESCRIPTION | | PRINCIPAL
AMOUNT($) | | | VALUE($) | |
Asset-Backed Securities — 5.4% | |
Ally Auto Receivables Trust, Series 2019-3, Class A3, 1.93%, 05/15/2024 | | | 630 | | | | 637 | |
American Credit Acceptance Receivables Trust, Series 2020-3, Class A, 0.62%, 10/13/2023 (e) | | | 2,835 | | | | 2,836 | |
Apidos CLO XXXI, (Cayman Islands), Series 2019-31A, Class A1R, (ICE LIBOR USD 3 Month + 1.10%), 0.00%, 04/15/2031 (e) (aa) | | | 1,750 | | | | 1,751 | |
ARES L CLO Ltd., (Cayman Islands), Series 2018-50A, Class AR, (ICE LIBOR USD 3 Month + 1.05%), 0.00%, 01/15/2032 (e) (aa) | | | 1,710 | | | | 1,708 | |
Avis Budget Rental Car Funding AESOP LLC, | | | | | | | | |
Series 2018-2A, Class A, 4.00%, 03/20/2025 (e) | | | 4,000 | | | | 4,321 | |
Series 2019-3A, Class A, 2.36%, 03/20/2026 (e) | | | 1,320 | | | | 1,381 | |
Series 2020-2A, Class A, 2.02%, 02/20/2027 (e) | | | 1,150 | | | | 1,185 | |
Bain Capital Credit CLO Ltd., (Cayman Islands), Series 2017-1A, Class A1R, (ICE LIBOR USD 3 Month + 0.97%), 0.00%, 07/20/2030 (e) (aa) | | | 1,700 | | | | 1,698 | |
Barings CLO Ltd., (Cayman Islands), Series 2019-3A, Class A1R, (ICE LIBOR USD 3 Month + 1.07%), 1.19%, 04/20/2031 (e) (aa) | | | 1,640 | | | | 1,639 | |
Benefit Street Partners CLO III Ltd., (Cayman Islands), Series 2013-IIIA, Class A1R2, (ICE LIBOR USD 3 Month + 1.00%), 1.19%, 07/20/2029 (e) (aa) | | | 2,500 | | | | 2,499 | |
BMW Vehicle Lease Trust, Series 2021-1, Class A3, 0.29%, 01/25/2024 | | | 6,100 | | | | 6,105 | |
Carlyle Global Market Strategies CLO Ltd., (Cayman Islands), Series 2015-1A, Class AR3, (ICE LIBOR USD 3 Month + 0.98%), 0.00%, 07/20/2031 (e) (aa) | | | 1,130 | | | | 1,130 | |
Carlyle US CLO Ltd., (Cayman Islands), Series 2017-2A, Class A1R, (ICE LIBOR USD 3 Month + 1.05%), 0.00%, 07/20/2031 (e) (aa) | | | 1,240 | | | | 1,239 | |
Carvana Auto Receivables Trust, | | | | | | | | |
Series 2019-2A, Class C, 3.00%, 06/17/2024 (e) | | | 330 | | | | 337 | |
Series 2021-N1, Class A, 0.70%, 01/10/2028 | | | 576 | | | | 576 | |
Cedar Funding VIII CLO Ltd., (Cayman Islands), Series 2017-8A, Class A1, (ICE LIBOR USD 3 Month + 1.25%), 1.44%, 10/17/2030 (e) (aa) | | | 300 | | | | 300 | |
Cedar Funding XI CLO Ltd., (Cayman Islands), Series 2019-11A, Class A1R, (ICE LIBOR USD 3 Month + 1.05%), 0.00%, 05/29/2032 (e) (aa) | | | 1,600 | | | | 1,598 | |
| | | | | | | | |
| SECURITY DESCRIPTION | | PRINCIPAL
AMOUNT($) | | | VALUE($) | |
| |
Credit Acceptance Auto Loan Trust, Series 2021-3A, Class A, 1.00%, 05/15/2030 (e) | | | 675 | | | | 676 | |
Drive Auto Receivables Trust, | | | | | | | | |
Series 2019-4, Class C, 2.51%, 11/17/2025 | | | 2,000 | | | | 2,029 | |
Series 2020-2, Class B, 1.42%, 03/17/2025 | | | 3,155 | | | | 3,186 | |
Exeter Automobile Receivables Trust, | | | | | | | | |
Series 2019-4A, Class B, 2.30%, 12/15/2023 (e) | | | 1,686 | | | | 1,691 | |
Series 2020-2A, Class A, 1.13%, 08/15/2023 (e) | | | 2,001 | | | | 2,002 | |
Series 2021-2A, Class A2, 0.27%, 01/16/2024 | | | 620 | | | | 620 | |
Series 2021-2A, Class C, 0.98%, 06/15/2026 | | | 420 | | | | 421 | |
Series 2021-2A, Class D, 1.40%, 04/15/2027 | | | 735 | | | | 734 | |
Ford Credit Auto Owner Trust, | | | | | | | | |
Series 2017-2, Class A, 2.36%, 03/15/2029 (e) | | | 4,000 | | | | 4,059 | |
Series 2018-1, Class A, 3.19%, 07/15/2031 (e) | | | 3,600 | | | | 3,885 | |
Series 2021-1, Class A, 1.37%, 10/17/2033 (e) | | | 1,075 | | | | 1,083 | |
Galaxy XIX CLO Ltd., (Cayman Islands), Series 2015-19A, Class A1RR, (ICE LIBOR USD 3 Month + 0.95%), 1.13%, 07/24/2030 (e) (aa) | | | 4,000 | | | | 3,997 | |
GM Financial Automobile Leasing Trust, Series 2020-2, Class A3, 0.80%, 07/20/2023 | | | 1,200 | | | | 1,206 | |
Grand Avenue CRE, (Cayman Islands), | | | | | | | | |
Series 2019-FL1, Class A, (ICE LIBOR USD 1 Month + 1.12%), 1.19%, 06/15/2037 (e) (aa) | | | 1,865 | | | | 1,865 | |
Series 2019-FL1, Class AS, (ICE LIBOR USD 1 Month + 1.50%), 1.57%, 06/15/2037 (e) (aa) | | | 1,500 | | | | 1,499 | |
GREYWOLF CLO VI Ltd., (Cayman Islands), Series 2018-1A, Class A1, (ICE LIBOR USD 3 Month + 1.03%), 1.21%, 04/26/2031 (e) (aa) | | | 3,460 | | | | 3,461 | |
Honda Auto Receivables Owner Trust, | | | | | | | | |
Series 2021-1, Class A2, 0.16%, 07/21/2023 | | | 2,801 | | | | 2,801 | |
Series 2021-2, Class A2, 0.17%, 11/15/2023 | | | 2,020 | | | | 2,020 | |
HPEFS Equipment Trust, Series 2020-2A, Class A2, 0.65%, 07/22/2030 (e) | | | 3,614 | | | | 3,618 | |
KKR CLO Ltd., (Cayman Islands), Series 18, Class A, (ICE LIBOR USD 3 Month + 1.27%), 1.46%, 07/18/2030 (e) (aa) | | | 4,000 | | | | 4,001 | |
SEE NOTES TO FINANCIAL STATEMENTS.
| | | | | | | | | | |
| | | | | |
| JUNE 30, 2021 | | SIX CIRCLES TRUST | | | | | | | | 187 |
Six Circles Credit Opportunities Fund
SCHEDULE OF PORTFOLIO INVESTMENTS
AS OF JUNE 30, 2021 (Unaudited) (continued)
(Amounts in U.S. Dollars, unless otherwise noted)
(Amounts in thousands, except number of Futures contracts)
| | | | | | | | |
| SECURITY DESCRIPTION | | PRINCIPAL
AMOUNT($) | | | VALUE($) | |
Asset-Backed Securities — continued | |
Lendmark Funding Trust, Series 2021-1A, Class A, 1.90%, 11/20/2031 (e) | | | 2,795 | | | | 2,822 | |
Madison Park Funding XXXV Ltd., (Cayman Islands), Series 2019-35A, Class A1R, (ICE LIBOR USD 3 Month + 0.99%), 1.18%, 04/20/2032 (e) (aa) | | | 1,920 | | | | 1,919 | |
Magnetite XXII Ltd., (Cayman Islands), Series 2019-22A, Class AR, (ICE LIBOR USD 3 Month + 1.06%), 1.21%, 04/15/2031 (e) (aa) | | | 2,500 | | | | 2,498 | |
Magnetite Xxix Ltd., (Cayman Islands), Series 2021-29A, Class A, (ICE LIBOR USD 3 Month + 0.99%), 1.09%, 01/15/2034 (e) (aa) | | | 250 | | | | 250 | |
Mountain View CLO LLC, (Cayman Islands), Series 2017-2A, Class A, (ICE LIBOR USD 3 Month + 1.21%), 1.39%, 01/16/2031 (e) (aa) | | | 550 | | | | 550 | |
MRA Issuance Trust, Series 2021-8, Class A1Y, (ICE LIBOR USD 1 Month + 1.15%), 1.26%, 10/15/2021 (e) (aa) | | | 7,800 | | | | 7,800 | |
Nelnet Student Loan Trust, Series 2021-A, Class APT1, 1.36%, 04/20/2062 (e) | | | 950 | | | | 950 | |
NextGear Floorplan Master Owner Trust, | | | | | | | | |
Series 2018-2A, Class A2, 3.69%, 10/15/2023 (e) | | | 1,623 | | | | 1,639 | |
Series 2019-2A, Class A2, 2.07%, 10/15/2024 (e) | | | 6,000 | | | | 6,134 | |
OCP Clo Ltd., (Cayman Islands), Series 2019-17A, Class A1R, (ICE LIBOR USD 3 Month + 1.04%), 0.00%, 07/20/2032 (e) (w) (aa) | | | 2,210 | | | | 2,210 | |
Octagon Investment Partners 32 Ltd., (Cayman Islands), Series 2017-1A, Class A1R, (ICE LIBOR USD 3 Month + 0.95%), 1.13%, 07/15/2029 (e) (aa) | | | 4,000 | | | | 3,995 | |
Octagon Investment Partners 48 Ltd., (Cayman Islands), Series 2020-3A, Class B, (ICE LIBOR USD 3 Month + 1.85%), 2.04%, 10/20/2031 (e) (aa) | | | 3,530 | | | | 3,530 | |
Octagon Loan Funding Ltd., (Cayman Islands), Series 2014-1A, Class ARR, (ICE LIBOR USD 3 Month + 1.18%), 1.34%, 11/18/2031 (e) (aa) | | | 5,022 | | | | 5,034 | |
OneMain Financial Issuance Trust, | | | | | | | | |
Series 2019-2A, Class A, 3.14%, 10/14/2036 (e) | | | 3,800 | | | | 4,085 | |
Series 2020-2A, Class A, 1.75%, 09/14/2035 (e) | | | 4,000 | | | | 4,077 | |
PFS Financing Corp., Series 2018-F, Class A, 3.52%, 10/15/2023 (e) | | | 4,800 | | | | 4,846 | |
Regatta Funding LP, (Cayman Islands), Series 2013-2A, Class A1R3, (ICE LIBOR USD 3 Month + 0.85%), 1.03%, 01/15/2029 (e) (aa) | | | 2,727 | | | | 2,721 | |
| | | | | | | | |
| SECURITY DESCRIPTION | | PRINCIPAL
AMOUNT($) | | | VALUE($) | |
| |
Santander Consumer Auto Receivables Trust, Series 2020-BA, Class C, 1.29%, 04/15/2026 (e) | | | 1,066 | | | | 1,076 | |
Santander Drive Auto Receivables Trust, | | | | | | | | |
Series 2017-2, Class D, 3.49%, 07/17/2023 | | | 590 | | | | 592 | |
Series 2021-2, Class A2, 0.28%, 04/15/2024 | | | 1,625 | | | | 1,625 | |
Series 2021-2, Class D, 1.35%, 07/15/2027 | | | 1,815 | | | | 1,817 | |
Santander Retail Auto Lease Trust, Series 2021-A, Class A3, 0.51%, 07/22/2024 (e) | | | 2,175 | | | | 2,176 | |
SCF Equipment Leasing LLC, | | | | | | | | |
Series 2019-2A, Class B, 2.76%, 08/20/2026 (e) | | | 1,905 | | | | 1,973 | |
Series 2021-1A, Class A2, 0.42%, 08/20/2026 (e) | | | 500 | | | | 500 | |
Series 2021-1A, Class A3, 0.83%, 08/21/2028 (e) | | | 500 | | | | 497 | |
Series 2021-1A, Class B, 1.37%, 08/20/2029 (e) | | | 1,000 | | | | 994 | |
Summer BidCo BV, (Netherlands), Reg. S, 9.00% (cash), 11/15/2025 (v) | | EUR | 105 | | | | 127 | |
Synchrony Card Funding LLC, Series 2019-A1, Class A, 2.95%, 03/15/2025 | | | 1,594 | | | | 1,625 | |
Synchrony Card Issuance Trust, Series 2018-A1, Class A, 3.38%, 09/15/2024 | | | 6,005 | | | | 6,044 | |
TCI-Flatiron CLO Ltd., (Cayman Islands), Series 2017-1A, Class AR, (ICE LIBOR USD 3 Month + 0.96%), 1.12%, 11/18/2030 (e) (aa) | | | 4,000 | | | | 4,000 | |
Tesla Auto Lease Trust, Series 2020-A, Class A2, 0.55%, 05/22/2023 (e) | | | 3,330 | | | | 3,335 | |
THL Credit Wind River CLO Ltd., (Cayman Islands), Series 2013-2A, Class AR, (ICE LIBOR USD 3 Month + 1.23%), 1.42%, 10/18/2030 (e) (aa) | | | 320 | | | | 320 | |
TICP CLO XII Ltd., (Cayman Islands), Series 2018-12A, Class A, (ICE LIBOR USD 3 Month + 1.11%), 1.29%, 01/15/2031 (e) (aa) | | | 3,000 | | | | 3,001 | |
Toyota Auto Loan Extended Note Trust, Series 2021-1A, Class A, 1.07%, 02/27/2034 (e) | | | 3,500 | | | | 3,504 | |
Verizon Owner Trust, Series 2020-C, Class A, 0.41%, 04/21/2025 | | | 6,000 | | | | 6,009 | |
Westlake Automobile Receivables Trust, Series 2020-1A, Class B, 1.94%, 04/15/2025 (e) | | | 4,200 | | | | 4,250 | |
SEE NOTES TO FINANCIAL STATEMENTS.
| | | | | | | | | | |
| | | | | |
| 188 | | | | | | | | SIX CIRCLES TRUST | | JUNE 30, 2021 |
| | | | | | | | |
| SECURITY DESCRIPTION | | PRINCIPAL
AMOUNT($) | | | VALUE($) | |
Asset-Backed Securities — continued | |
World Financial Network Credit Card Master Trust, | | | | | | | | |
Series 2018-C, Class A, 3.55%, 08/15/2025 | | | 4,000 | | | | 4,039 | |
Series 2019-B, Class A, 2.49%, 04/15/2026 | | | 1,970 | | | | 2,012 | |
York CLO Ltd., (Cayman Islands), Series 2015-1A, Class AR, (ICE LIBOR USD 3 Month + 1.15%), 1.33%, 01/22/2031 (e) (aa) | | | 4,170 | | | | 4,171 | |
| | | | | | | | |
Total Asset-Backed Securities
(Cost $184,819) | | | | | | | 184,541 | |
| | | | | | | | |
Collateralized Mortgage Obligations — 0.3% | |
CSMC, | | | | | | | | |
Series 2021-NQM1, Class A1, 0.81%, 05/25/2065 (e) (z) | | | 1,429 | | | | 1,425 | |
Series 2021-NQM3, Class A1, 1.02%, 04/25/2066 (e) (z) | | | 655 | | | | 654 | |
CSMC Trust, Series 2021-AFC1, Class A1, 0.83%, 03/25/2056 (e) (z) | | | 1,953 | | | | 1,948 | |
Ellington Financial Mortgage Trust 2017-1, Series 2021-1, Class A1, 0.80%, 02/25/2066 (e) (z) | | | 2,406 | | | | 2,399 | |
Verus Securitization Trust, | | | | | | | | |
Series 2021-1, Class A1, 0.82%, 01/25/2066 (e) (z) | | | 452 | | | | 452 | |
Series 2021-3, Class A1, 1.05%, 06/25/2066 (e) (z) | | | 975 | | | | 975 | |
Series 2021-R2, Class A1, 0.92%, 02/25/2064 (e) (z) | | | 1,651 | | | | 1,652 | |
Series 2021-R3, Class A1, 1.02%, 04/25/2064 (e) (z) | | | 976 | | | | 975 | |
| | | | | | | | |
Total Collateralized Mortgage Obligations (Cost $10,492) | | | | | | | 10,480 | |
| | | | | | | | |
Commercial Mortgage-Backed Securities — 2.8% | |
BBCMS Mortgage Trust, Series 2018-TALL, Class C, (ICE LIBOR USD 1 Month + 1.12%), 1.19%, 03/15/2037 (e) (aa) | | | 1,600 | | | | 1,564 | |
BFLD, Series 2019-DPLO, Class E, (ICE LIBOR USD 1 Month + 2.24%), 2.31%, 10/15/2034 (e) (aa) | | | 2,502 | | | | 2,486 | |
BWAY Mortgage Trust, Series 2015-1740, Class C, 3.34%, 01/10/2035 (e) | | | 2,750 | | | | 2,748 | |
BX Commercial Mortgage Trust, | | | | | | | | |
Series 2019-IMC, Class A, (ICE LIBOR USD 1 Month + 1.00%), 1.07%, 04/15/2034 (e) (aa) | | | 3,690 | | | | 3,690 | |
Series 2019-XL, Class D, (ICE LIBOR USD 1 Month + 1.45%), 1.52%, 10/15/2036 (e) (aa) | | | 3,911 | | | | 3,915 | |
BX Trust, Series 2017-SLCT, Class F, (ICE LIBOR USD 1 Month + 4.25%), 4.32%, 07/15/2034 (e) (aa) | | | 1,700 | | | | 1,703 | |
| | | | | | | | |
| SECURITY DESCRIPTION | | PRINCIPAL
AMOUNT($) | | | VALUE($) | |
| |
CHT Mortgage Trust, | | | | | | | | |
Series 2017-CSMO, Class B, (ICE LIBOR USD 1 Month + 1.40%), 1.47%, 11/15/2036 (e) (aa) | | | 1,494 | | | | 1,496 | |
Series 2017-CSMO, Class E, (ICE LIBOR USD 1 Month + 3.00%), 3.07%, 11/15/2036 (e) (aa) | | | 5,310 | | | | 5,320 | |
Citigroup Commercial Mortgage Trust, Series 2020-GC46, Class XA, IO, 1.11%, 02/15/2053 (z) | | | 45,285 | | | | 3,164 | |
Credit Suisse Commercial Mortgage Securities Corp., Series 2019-SKLZ, Class A, (ICE LIBOR USD 1 Month + 1.25%), 1.32%, 01/15/2034 (e) (aa) | | | 6,000 | | | | 6,023 | |
DBWF Mortgage Trust, Series 2018-GLKS, Class A, (ICE LIBOR USD 1 Month + 1.03%), 1.12%, 12/19/2030 (e) (aa) | | | 452 | | | | 452 | |
Eleven Madison Trust Mortgage Trust, Series 2015-11MD, Class A, 3.67%, 09/10/2035 (e) (z) | | | 3,845 | | | | 4,168 | |
Great Wolf Trust, | | | | | | | | |
Series 2019-WOLF, Class D, (ICE LIBOR USD 1 Month + 1.93%), 2.01%, 12/15/2036 (e) (aa) | | | 3,000 | | | | 2,981 | |
Series 2019-WOLF, Class E, (ICE LIBOR USD 1 Month + 2.73%), 2.81%, 12/15/2036 (e) (aa) | | | 2,000 | | | | 1,963 | |
GS Mortgage Securities Corp. Trust, | | | | | | | | |
Series 2018-RIVR, Class A, (ICE LIBOR USD 1 Month + 0.95%), 1.02%, 07/15/2035 (e) (aa) | | | 2,036 | | | | 2,036 | |
Series 2019-70P, Class A, (ICE LIBOR USD 1 Month + 1.00%), 1.07%, 10/15/2036 (e) (aa) | | | 1,252 | | | | 1,252 | |
Series 2021-ROSS, Class A, (ICE LIBOR USD 1 Month + 1.15%), 1.22%, 05/15/2026 (e) (aa) | | | 720 | | | | 720 | |
Series 2021-ROSS, Class H, (ICE LIBOR USD 1 Month + 5.90%), 5.97%, 05/15/2026 (e) (aa) | | | 270 | | | | 270 | |
GS Mortgage Securities Trust, Series 2015-GC34, Class A4, 3.51%, 10/10/2048 | | | 3,129 | | | | 3,408 | |
Life Mortgage Trust, Series 2021-BMR, Class A, (ICE LIBOR USD 1 Month + 0.70%), 0.77%, 03/15/2038 (e) (aa) | | | 4,000 | | | | 4,005 | |
Morgan Stanley Bank of America Merrill Lynch Trust, | | | | | | | | |
Series 2013-C7, Class A4, 2.92%, 02/15/2046 | | | 1,860 | | | | 1,914 | |
Series 2016-C29, Class A4, 3.33%, 05/15/2049 | | | 900 | | | | 969 | |
One Bryant Park Trust, Series 2019-OBP, Class A, 2.52%, 09/15/2054 (e) | | | 7,045 | | | | 7,302 | |
SEE NOTES TO FINANCIAL STATEMENTS.
| | | | | | | | | | |
| | | | | |
| JUNE 30, 2021 | | SIX CIRCLES TRUST | | | | | | | | 189 |
Six Circles Credit Opportunities Fund
SCHEDULE OF PORTFOLIO INVESTMENTS
AS OF JUNE 30, 2021 (Unaudited) (continued)
(Amounts in U.S. Dollars, unless otherwise noted)
(Amounts in thousands, except number of Futures contracts)
| | | | | | | | |
| SECURITY DESCRIPTION | | PRINCIPAL
AMOUNT($) | | | VALUE($) | |
Commercial Mortgage-Backed Securities — continued | |
ONE Mortgage Trust, Series 2021-PARK, Class A, (ICE LIBOR USD 1 Month + 0.70%), 0.77%, 03/15/2036 (e) (aa) | | | 3,800 | | | | 3,801 | |
One New York Plaza Trust, | | | | | | | | |
Series 2020-1NYP, Class AJ, (ICE LIBOR USD 1 Month + 1.25%), 1.32%, 01/15/2026 (e) (aa) | | | 1,970 | | | | 1,982 | |
Series 2020-1NYP, Class B, (ICE LIBOR USD 1 Month + 1.50%), 1.57%, 01/15/2026 (e) (aa) | | | 1,200 | | | | 1,209 | |
PFP Ltd., (Cayman Islands), | | | | | | | | |
Series 2019-5, Class A, (ICE LIBOR USD 1 Month + 0.97%), 1.04%, 04/14/2036 (e) (aa) | | | 658 | | | | 658 | |
Series 2019-6, Class C, (ICE LIBOR USD 1 Month + 2.10%), 2.17%, 04/14/2037 (e) (aa) | | | 1,297 | | | | 1,296 | |
Series 2021-7, Class A, (ICE LIBOR USD 1 Month + 0.85%), 0.92%, 04/14/2038 (e) (aa) | | | 10,000 | | | | 9,976 | |
VASA Trust, Series 2021-VASA, Class B, (ICE LIBOR USD 1 Month + 1.25%), 1.32%, 07/15/2039 (e) (aa) | | | 7,960 | | | | 7,962 | |
VNDO Mortgage Trust, Series 2012-6AVE, Class A, 3.00%, 11/15/2030 (e) | | | 700 | | | | 719 | |
Waikiki Beach Hotel Trust, Series 2019-WBM, Class D, (ICE LIBOR USD 1 Month + 2.03%), 2.10%, 12/15/2033 (e) (aa) | | | 600 | | | | 596 | |
WFRBS Commercial Mortgage Trust, | | | | | | | | |
Series 2013-C15, Class AS, 4.36%, 08/15/2046 (z) | | | 1,000 | | | | 1,050 | |
Series 2014-C19, Class A5, 4.10%, 03/15/2047 | | | 2,745 | | | | 2,965 | |
| | | | | | | | |
Total Commercial Mortgage-Backed Securities (Cost $95,745) | | | | | | | 95,763 | |
| | | | | | | | |
Convertible Bonds — 2.2% | |
Basic Materials — 0.0% (g) | |
Mining — 0.0% (g) | | | | | | | | |
Glencore Funding LLC, Reg. S, Zero Coupon, 03/27/2025 | | | 200 | | | | 195 | |
| | | | | | | | |
Communications — 0.8% | |
Internet — 0.4% | |
Airbnb, Inc., Zero Coupon, 03/15/2026 (e) | | | 2,020 | | | | 1,904 | |
Booking Holdings, Inc., 0.75%, 05/01/2025 | | | 2,617 | | | | 3,701 | |
Uber Technologies, Inc., Zero Coupon, 12/15/2025 (e) | �� | | 5,875 | | | | 5,957 | |
Zillow Group, Inc., 1.38%, 09/01/2026 | | | 194 | | | | 548 | |
| | | | | | | | |
| | |
| | | | | | | 12,110 | |
| | | | | | | | |
Media — 0.4% | |
Cable One, Inc., 1.13%, 03/15/2028 (e) | | | 3,716 | | | | 3,779 | |
DISH Network Corp., | | | | | | | | |
2.38%, 03/15/2024 | | | 1,042 | | | | 1,010 | |
3.38%, 08/15/2026 | | | 3,522 | | | | 3,594 | |
| | | | | | | | |
| SECURITY DESCRIPTION | | PRINCIPAL
AMOUNT($) | | | VALUE($) | |
| |
Media — continued | |
Liberty Broadband Corp., | | | | | | | | |
1.25%, 09/30/2050 (e) | | | 1,822 | | | | 1,834 | |
2.75%, 09/30/2050 (e) | | | 3,517 | | | | 3,693 | |
| | | | | | | | |
| | |
| | | | | | | 13,910 | |
| | | | | | | | |
Total Communications | | | | | | | 26,020 | |
| | | | | | | | |
Consumer Cyclical — 0.2% | |
Airlines — 0.0% (g) | |
International Consolidated Airlines Group SA, (Spain), | | | | | | | | |
Series IAG, Reg. S, 0.63%, 11/17/2022 | | EUR | 100 | | | | 114 | |
Series IAG, Reg. S, 1.13%, 05/18/2028 | | EUR | 200 | | | | 226 | |
| | | | | | | | |
| | |
| | | | | | | 340 | |
| | | | | | | | |
Auto Manufacturers — 0.0% (g) | | | | | | | | |
Ford Motor Co., Zero Coupon, 03/15/2026 (e) | | | 814 | | | | 900 | |
| | | | | | | | |
Entertainment — 0.2% | | | | | | | | |
Live Nation Entertainment, Inc., | | | | | | | | |
2.00%, 02/15/2025 | | | 3,280 | | | | 3,661 | |
2.50%, 03/15/2023 | | | 1,633 | | | | 2,280 | |
| | | | | | | | |
| | |
| | | | | | | 5,941 | |
| | | | | | | | |
| | | | | | | | |
Retail — 0.0% (g) | | | | | | | | |
National Vision Holdings, Inc., 2.50%, 05/15/2025 | | | 869 | | | | 1,531 | |
| | | | | | | | |
Total Consumer Cyclical | | | | | | | 8,712 | |
| | | | | | | | |
Consumer Non-cyclical — 0.1% | | | | | | | | |
Commercial Services — 0.0% (g) | | | | | | | | |
Nexi SpA, (Italy), Reg. S, Zero Coupon, 02/24/2028 | | EUR | 100 | | | | 120 | |
Shift4 Payments, Inc., Zero Coupon, 12/15/2025 (e) | | | 1,244 | | | | 1,677 | |
| | | | | | | | |
| | |
| | | | | | | 1,797 | |
| | | | | | | | |
Healthcare — Services — 0.1% | | | | | | | | |
Anthem, Inc., 2.75%, 10/15/2042 | | | 440 | | | | 2,375 | |
| | | | | | | | |
Total Consumer Non-cyclical | | | | | | | 4,172 | |
| | | | | | | | |
Energy — 0.4% | | | | | | | | |
Oil & Gas — 0.4% | | | | | | | | |
BP Capital Markets plc, (United Kingdom), Reg. S, 1.00%, 04/28/2023 | | GBP | 200 | | | | 284 | |
Centennial Resource Production LLC, 3.25%, 04/01/2028 | | | 3,249 | | | | 4,274 | |
CNX Resources Corp., 2.25%, 05/01/2026 | | | 1,965 | | | | 2,547 | |
EQT Corp., 1.75%, 05/01/2026 | | | 1,472 | | | | 2,452 | |
PDC Energy, Inc., 1.13%, 09/15/2021 | | | 892 | | | | 884 | |
Pioneer Natural Resources Co., 0.25%, 05/15/2025 | | | 1,971 | | | | 3,137 | |
| | | | | | | | |
Total Energy | | | | | | | 13,578 | |
| | | | | | | | |
SEE NOTES TO FINANCIAL STATEMENTS.
| | | | | | | | | | |
| | | | | |
| 190 | | | | | | | | SIX CIRCLES TRUST | | JUNE 30, 2021 |
| | | | | | | | |
| SECURITY DESCRIPTION | | PRINCIPAL
AMOUNT($) | | | VALUE($) | |
Convertible Bonds — continued | |
Financial — 0.6% | | | | | | | | |
Banks — 0.6% | | | | | | | | |
Barclays Bank plc, (United Kingdom), | | | | | | | | |
Zero Coupon, 02/04/2025 | | | 6,000 | | | | 8,606 | |
Series VUN, Zero Coupon, 02/18/2025 | | | 3,818 | | | | 4,262 | |
BofA Finance LLC, 0.13%, 09/01/2022 | | | 4,720 | | | | 5,711 | |
Cembra Money Bank AG, (Switzerland), Reg. S, Zero Coupon, 07/09/2026 | | CHF | 200 | | | | 222 | |
| | | | | | | | |
Total Financial | | | | | | | 18,801 | |
| | | | | | | | |
Industrial — 0.0% (g) | | | | | | | | |
Engineering & Construction — 0.0% (g) | | | | | | | | |
Cellnex Telecom SA, (Spain), Reg. S, 0.75%, 11/20/2031 | | EUR | 600 | | | | 695 | |
| | | | | | | | |
Technology — 0.1% | | | | | | | | |
Semiconductors — 0.1% | | | | | | | | |
ams AG, (Austria), Reg. S, Zero Coupon, 03/05/2025 | | EUR | 200 | | | | 204 | |
Microchip Technology, Inc., | | | | | | | | |
0.13%, 11/15/2024 | | | 847 | | | | 953 | |
1.63%, 02/15/2025 | | | 91 | | | | 300 | |
1.63%, 02/15/2027 | | | 591 | | | | 1,315 | |
ON Semiconductor Corp., 1.63%, 10/15/2023 | | | 1,004 | | | | 1,908 | |
| | | | | | | | |
Total Technology | | | | | | | 4,680 | |
| | | | | | | | |
Total Convertible Bonds
(Cost $73,977) | | | | | | | 76,853 | |
| | | | | | | | |
Corporate Bonds — 77.6% | | | | | | | | |
Basic Materials — 3.6% | | | | | | | | |
Chemicals — 1.4% | | | | | | | | |
Ashland Services BV, (Netherlands), Reg. S, 2.00%, 01/30/2028 | | EUR | 100 | | | | 120 | |
Axalta Coating Systems LLC, 3.38%, 02/15/2029 (e) | | | 1,518 | | | | 1,484 | |
Axalta Coating Systems LLC / Axalta Coating Systems Dutch Holding B BV, (Multinational), 4.75%, 06/15/2027 (e) | | | 932 | | | | 976 | |
CeramTec BondCo GmbH, (Germany), Reg. S, 5.25%, 12/15/2025 | | EUR | 200 | | | | 240 | |
Chemours Co. (The), | | | | | | | | |
4.00%, 05/15/2026 | | EUR | 200 | | | | 243 | |
5.75%, 11/15/2028 (e) | | | 127 | | | | 136 | |
7.00%, 05/15/2025 | | | 3,399 | | | | 3,505 | |
Element Solutions, Inc., 3.88%, 09/01/2028 (e) | | | 6,077 | | | | 6,200 | |
GCP Applied Technologies, Inc., 5.50%, 04/15/2026 (e) | | | 344 | | | | 354 | |
HB Fuller Co., 4.25%, 10/15/2028 | | | 600 | | | | 619 | |
Herens Holdco Sarl, (Luxembourg), 4.75%, 05/15/2028 (e) | | | 1,881 | | | | 1,872 | |
Herens Midco Sarl, (Luxembourg), Reg. S, 5.25%, 05/15/2029 | | EUR | 135 | | | | 157 | |
Hexion, Inc., 7.88%, 07/15/2027 (e) | | | 2,815 | | | | 3,037 | |
| | | | | | | | |
| SECURITY DESCRIPTION | | PRINCIPAL
AMOUNT($) | | | VALUE($) | |
| | | | | | | | |
Chemicals — continued | | | | | | | | |
Illuminate Buyer LLC / Illuminate Holdings IV, Inc., 9.00%, 07/01/2028 (e) | | | 2,407 | | | | 2,687 | |
INEOS Finance plc, (United Kingdom), Reg. S, 3.38%, 03/31/2026 | | EUR | 200 | | | | 245 | |
INEOS Quattro Finance 2 Plc, (United Kingdom), 3.38%, 01/15/2026 (e) | | | 200 | | | | 203 | |
LYB International Finance III LLC, (ICE LIBOR USD 3 Month + 1.00%), 1.14%, 10/01/2023 (aa) | | | 1,104 | | | | 1,106 | |
Minerals Technologies, Inc., 5.00%, 07/01/2028 (e) | | | 310 | | | | 322 | |
Monitchem HoldCo 3 SA, (Luxembourg), Reg. S, 5.25%, 03/15/2025 | | EUR | 200 | | | | 244 | |
Mosaic Co. (The), 3.25%, 11/15/2022 | | | 493 | | | | 510 | |
Nouryon Holding BV, (Netherlands), 8.00%, 10/01/2026 (e) | | | 5,359 | | | | 5,681 | |
Orbia Advance Corp. SAB de CV, (Mexico), 1.88%, 05/11/2026 (e) | | | 374 | | | | 378 | |
Polar US Borrower LLC / Schenectady International Group, Inc., 6.75%, 05/15/2026 (e) | | | 600 | | | | 601 | |
PQ Corp., 5.75%, 12/15/2025 (e) | | | 370 | | | | 380 | |
Rain CII Carbon LLC / CII Carbon Corp., 7.25%, 04/01/2025 (e) | | | 700 | | | | 723 | |
SCIH Salt Holdings, Inc., 6.63%, 05/01/2029 (e) | | | 525 | | | | 526 | |
TPC Group, Inc., | | | | | | | | |
10.50%, 08/01/2024 (e) | | | 1,150 | | | | 1,081 | |
10.88%, 08/01/2024 (e) | | | 283 | | | | 303 | |
Tronox, Inc., | | | | | | | | |
4.63%, 03/15/2029 (e) | | | 1,475 | | | | 1,492 | |
6.50%, 05/01/2025 (e) | | | 3,932 | | | | 4,161 | |
Valvoline, Inc., | | | | | | | | |
3.63%, 06/15/2031 (e) | | | 550 | | | | 550 | |
4.25%, 02/15/2030 (e) | | | 1,150 | | | | 1,187 | |
Venator Finance Sarl / Venator Materials LLC, (Multinational), | | | | | | | | |
5.75%, 07/15/2025 (e) | | | 1,600 | | | | 1,572 | |
9.50%, 07/01/2025 (e) | | | 1,000 | | | | 1,124 | |
WR Grace & Co-Conn, | | | | | | | | |
4.88%, 06/15/2027 (e) | | | 1,515 | | | | 1,606 | |
5.63%, 10/01/2024 (e) | | | 830 | | | | 918 | |
| | | | | | | | |
| | |
| | | | | | | 46,543 | |
| | | | | | | | |
Forest Products & Paper — 0.0% (g) | | | | | | | | |
Clearwater Paper Corp., 4.75%, 08/15/2028 (e) | | | 1,086 | | | | 1,082 | |
Suzano Austria GmbH, (Austria), 5.75%, 07/14/2026 (e) | | | 200 | | | | 235 | |
| | | | | | | | |
| | |
| | | | | | | 1,317 | |
| | | | | | | | |
Iron/Steel — 0.5% | | | | | | | | |
Allegheny Technologies, Inc., 7.88%, 08/15/2023 | | | 46 | | | | 50 | |
SEE NOTES TO FINANCIAL STATEMENTS.
| | | | | | | | | | |
| | | | | |
| JUNE 30, 2021 | | SIX CIRCLES TRUST | | | | | | | | 191 |
Six Circles Credit Opportunities Fund
SCHEDULE OF PORTFOLIO INVESTMENTS
AS OF JUNE 30, 2021 (Unaudited) (continued)
(Amounts in U.S. Dollars, unless otherwise noted)
(Amounts in thousands, except number of Futures contracts)
| | | | | | | | |
| SECURITY DESCRIPTION | | PRINCIPAL
AMOUNT($) | | | VALUE($) | |
Corporate Bonds — continued | | | | | | | | |
Iron/Steel — continued | | | | | | | | |
Baffinland Iron Mines Corp. / Baffinland Iron Mines LP, (Canada), 8.75%, 07/15/2026 (e) | | | 776 | | | | 823 | |
Big River Steel LLC / BRS Finance Corp., 6.63%, 01/31/2029 (e) | | | 6,237 | | | | 6,869 | |
Cleveland-Cliffs, Inc., | | | | | | | | |
4.63%, 03/01/2029 (e) | | | 650 | | | | 684 | |
4.88%, 03/01/2031 (e) | | | 825 | | | | 866 | |
CSN Resources SA, (Luxembourg), | | | | | | | | |
7.63%, 02/13/2023 (e) | | | 400 | | | | 416 | |
7.63%, 04/17/2026 (e) | | | 770 | | | | 830 | |
POSCO, (South Korea), 2.38%, 11/12/2022 (e) | | | 2,095 | | | | 2,140 | |
thyssenkrupp AG, (Germany), Reg. S, 2.88%, 02/22/2024 | | EUR | 100 | | | | 120 | |
TMS International Corp., 6.25%, 04/15/2029 (e) | | | 797 | | | | 837 | |
United States Steel Corp., | | | | | | | | |
6.25%, 03/15/2026 | | | 49 | | | | 51 | |
6.88%, 03/01/2029 | | | 3,650 | | | | 3,905 | |
| | | | | | | | |
| | |
| | | | | | | 17,591 | |
| | | | | | | | |
Mining — 1.7% | | | | | | | | |
Alcoa Nederland Holding BV, (Netherlands), | | | | | | | | |
5.50%, 12/15/2027 (e) | | | 846 | | | | 918 | |
7.00%, 09/30/2026 (e) | | | 200 | | | | 209 | |
Anglo American Capital plc, (United Kingdom), 4.88%, 05/14/2025 (e) | | | 544 | | | | 616 | |
Arconic Corp., | | | | | | | | |
6.00%, 05/15/2025 (e) | | | 570 | | | | 608 | |
6.13%, 02/15/2028 (e) | | | 2,173 | | | | 2,331 | |
Coeur Mining, Inc., 5.13%, 02/15/2029 (e) | | | 625 | | | | 619 | |
Compass Minerals International, Inc., 4.88%, 07/15/2024 (e) | | | 750 | | | | 774 | |
Constellium SE, (France), | | | | | | | | |
3.75%, 04/15/2029 (e) | | | 4,202 | | | | 4,160 | |
5.63%, 06/15/2028 (e) | | | 1,876 | | | | 2,012 | |
Eldorado Gold Corp., (Canada), 9.50%, 06/01/2024 (e) | | | 1,576 | | | | 1,706 | |
First Quantum Minerals Ltd., (Canada), | | | | | | | | |
6.50%, 03/01/2024 (e) | | | 485 | | | | 495 | |
6.88%, 03/01/2026 (e) | | | 2,300 | | | | 2,409 | |
7.25%, 04/01/2023 (e) | | | 4,725 | | | | 4,817 | |
FMG Resources August 2006 Pty Ltd., (Australia), 5.13%, 05/15/2024 (e) | | | 924 | | | | 1,006 | |
Freeport-McMoRan, Inc., | | | | | | | | |
4.25%, 03/01/2030 | | | 50 | | | | 54 | |
4.38%, 08/01/2028 | | | 100 | | | | 106 | |
4.55%, 11/14/2024 | | | 2,690 | | | | 2,925 | |
5.00%, 09/01/2027 | | | 925 | | | | 977 | |
5.25%, 09/01/2029 | | | 900 | | | | 993 | |
5.40%, 11/14/2034 | | | 347 | | | | 419 | |
5.45%, 03/15/2043 | | | 4,187 | | | | 5,118 | |
| | | | | | | | |
| SECURITY DESCRIPTION | | PRINCIPAL
AMOUNT($) | | | VALUE($) | |
| | | | | | | | |
Mining — continued | | | | | | | | |
Glencore Finance Canada Ltd., (Canada), 4.25%, 10/25/2022 (e) | | | 465 | | | | 486 | |
Glencore Funding LLC, | | | | | | | | |
1.63%, 04/27/2026 (e) | | | 396 | | | | 398 | |
4.13%, 05/30/2023 (e) | | | 2,804 | | | | 2,982 | |
4.13%, 03/12/2024 (e) | | | 2,000 | | | | 2,156 | |
4.63%, 04/29/2024 (e) | | | 558 | | | | 612 | |
Hecla Mining Co., 7.25%, 02/15/2028 | | | 1,000 | | | | 1,092 | |
Hudbay Minerals, Inc., (Canada), | | | | | | | | |
4.50%, 04/01/2026 (e) | | | 375 | | | | 376 | |
6.13%, 04/01/2029 (e) | | | 2,075 | | | | 2,210 | |
IAMGOLD Corp., (Canada), 5.75%, 10/15/2028 (e) | | | 1,345 | | | | 1,399 | |
Joseph T Ryerson & Son, Inc., 8.50%, 08/01/2028 (e) | | | 650 | | | | 722 | |
Kaiser Aluminum Corp., 4.50%, 06/01/2031 (e) | | | 494 | | | | 507 | |
Kinross Gold Corp., (Canada), 5.95%, 03/15/2024 | | | 206 | | | | 230 | |
KME SE, (Germany), Reg. S, 6.75%, 02/01/2023 | | EUR | 100 | | | | 110 | |
New Gold, Inc., (Canada), | | | | | | | | |
6.38%, 05/15/2025 (e) | | | 350 | | | | 361 | |
7.50%, 07/15/2027 (e) | | | 4,440 | | | | 4,818 | |
Novelis Corp., | | | | | | | | |
4.75%, 01/30/2030 (e) | | | 2,616 | | | | 2,747 | |
5.88%, 09/30/2026 (e) | | | 3,090 | | | | 3,214 | |
Vedanta Resources Finance II plc, (United Kingdom), 8.95%, 03/11/2025 (e) | | | 957 | | | | 938 | |
| | | | | | | | |
| | |
| | | | | | | 58,630 | |
| | | | | | | | |
Total Basic Materials | | | | | | | 124,081 | |
| | | | | | | | |
Communications — 11.8% | | | | | | | | |
Advertising — 0.6% | | | | | | | | |
Clear Channel International BV, (Netherlands), 6.63%, 08/01/2025 (e) | | | 2,099 | | | | 2,206 | |
Clear Channel Outdoor Holdings, Inc., | | | | | | | | |
7.50%, 06/01/2029 (e) | | | 2,587 | | | | 2,678 | |
7.75%, 04/15/2028 (e) | | | 2,066 | | | | 2,164 | |
Lamar Media Corp., | | | | | | | | |
3.63%, 01/15/2031 (e) | | | 350 | | | | 342 | |
4.88%, 01/15/2029 | | | 100 | | | | 106 | |
Outfront Media Capital LLC / Outfront Media Capital Corp., | | | | | | | | |
4.25%, 01/15/2029 (e) | | | 741 | | | | 746 | |
4.63%, 03/15/2030 (e) | | | 200 | | | | 203 | |
5.00%, 08/15/2027 (e) | | | 307 | | | | 318 | |
6.25%, 06/15/2025 (e) | | | 500 | | | | 528 | |
Summer BC Holdco A Sarl, (Luxembourg), Reg. S, 9.25%, 10/31/2027 | | EUR | 90 | | | | 116 | |
Summer BC Holdco B Sarl, (Luxembourg), Reg. S, 5.75%, 10/31/2026 | | EUR | 300 | | | | 372 | |
SEE NOTES TO FINANCIAL STATEMENTS.
| | | | | | | | | | |
| | | | | |
| 192 | | | | | | | | SIX CIRCLES TRUST | | JUNE 30, 2021 |
| | | | | | | | |
| SECURITY DESCRIPTION | | PRINCIPAL
AMOUNT($) | | | VALUE($) | |
Corporate Bonds — continued | | | | | | | | |
Advertising — continued | | | | | | | | |
Terrier Media Buyer, Inc., 8.88%, 12/15/2027 (e) | | | 9,020 | | | | 9,756 | |
| | | | | | | | |
| | |
| | | | | | | 19,535 | |
| | | | | | | | |
Internet — 1.0% | | | | | | | | |
Acuris Finance US, Inc. / Acuris Finance Sarl, 5.00%, 05/01/2028 (e) | | | 1,437 | | | | 1,433 | |
ANGI Group LLC, 3.88%, 08/15/2028 (e) | | | 1,003 | | | | 997 | |
Arches Buyer, Inc., | | | | | | | | |
4.25%, 06/01/2028 (e) | | | 115 | | | | 114 | |
6.13%, 12/01/2028 (e) | | | 38 | | | | 39 | |
Baidu, Inc., (Cayman Islands), 3.08%, 04/07/2025 | | | 3,000 | | | | 3,168 | |
Cablevision Lightpath LLC, | | | | | | | | |
3.88%, 09/15/2027 (e) | | | 2,258 | | | | 2,238 | |
5.63%, 09/15/2028 (e) | | | 2,412 | | | | 2,460 | |
Cars.com, Inc., 6.38%, 11/01/2028 (e) | | | 900 | | | | 960 | |
Expedia Group, Inc., 3.60%, 12/15/2023 | | | 1,086 | | | | 1,154 | |
Go Daddy Operating Co. LLC / GD Finance Co., Inc., | | | | | | | | |
3.50%, 03/01/2029 (e) | | | 974 | | | | 968 | |
5.25%, 12/01/2027 (e) | | | 1,000 | | | | 1,050 | |
HSE Finance Sarl, (Luxembourg), Reg. S, 5.63%, 10/15/2026 | | EUR | 100 | | | | 122 | |
ION Trading Technologies Sarl, (Luxembourg), 5.75%, 05/15/2028 (e) | | | 687 | | | | 713 | |
Match Group Holdings II LLC, | | | | | | | | |
4.63%, 06/01/2028 (e) | | | 769 | | | | 797 | |
5.00%, 12/15/2027 (e) | | | 1,000 | | | | 1,051 | |
Meituan, (Cayman Islands), 2.13%, 10/28/2025 (e) | | | 800 | | | | 794 | |
Netflix, Inc., | | | | | | | | |
Reg. S, 3.63%, 06/15/2030 | | EUR | 200 | | | | 282 | |
4.88%, 06/15/2030 (e) | | | 1,031 | | | | 1,226 | |
5.38%, 11/15/2029 (e) | | | 1,539 | | | | 1,869 | |
5.88%, 11/15/2028 | | | 876 | | | | 1,075 | |
Northwest Fiber LLC / Northwest Fiber Finance Sub, Inc., 6.00%, 02/15/2028 (e) | | | 1,588 | | | | 1,591 | |
NortonLifeLock, Inc., 5.00%, 04/15/2025 (e) | | | 1,160 | | | | 1,176 | |
Rakuten Group, Inc., (Japan), Reg. S, (EUR Swap Rate 5 Year + 4.74%), 4.25%, 04/22/2027 (x) (aa) | | EUR | 200 | | | | 244 | |
Twitter, Inc., 3.88%, 12/15/2027 (e) | | | 1,219 | | | | 1,295 | |
Uber Technologies, Inc., | | | | | | | | |
6.25%, 01/15/2028 (e) | | | 5 | | | | 5 | |
7.50%, 05/15/2025 (e) | | | 1,769 | | | | 1,909 | |
7.50%, 09/15/2027 (e) | | | 2,645 | | | | 2,907 | |
8.00%, 11/01/2026 (e) | | | 2,143 | | | | 2,309 | |
United Group BV, (Netherlands), Reg. S, 4.00%, 11/15/2027 | | EUR | 100 | | | | 118 | |
VeriSign, Inc., 5.25%, 04/01/2025 | | | 1,045 | | | | 1,187 | |
| | | | | | | | |
| | |
| | | | | | | 35,251 | |
| | | | | | | | |
| | | | | | | | |
| SECURITY DESCRIPTION | | PRINCIPAL
AMOUNT($) | | | VALUE($) | |
| | | | | | | | |
Media — 5.3% | | | | | | | | |
Altice Financing SA, (Luxembourg), | | | | | | | | |
Reg. S, 3.00%, 01/15/2028 | | EUR | 100 | | | | 113 | |
5.00%, 01/15/2028 (e) | | | 1,543 | | | | 1,512 | |
7.50%, 05/15/2026 (e) | | | 2,989 | | | | 3,113 | |
AMC Networks, Inc., 4.25%, 02/15/2029 | | | 1,444 | | | | 1,457 | |
Audacy Capital Corp., | | | | | | | | |
6.50%, 05/01/2027 (e) | | | 925 | | | | 962 | |
6.75%, 03/31/2029 (e) | | | 425 | | | | 441 | |
Cable One, Inc., 4.00%, 11/15/2030 (e) | | | 353 | | | | 354 | |
CCO Holdings LLC / CCO Holdings Capital Corp., | | | | | | | | |
4.25%, 02/01/2031 (e) | | | 6,976 | | | | 7,107 | |
4.50%, 08/15/2030 (e) | | | 3,175 | | | | 3,310 | |
4.50%, 05/01/2032 | | | 16,588 | | | | 17,189 | |
4.50%, 06/01/2033 (e) | | | 2,291 | | | | 2,344 | |
4.75%, 03/01/2030 (e) | | | 7,346 | | | | 7,759 | |
5.00%, 02/01/2028 (e) | | | 525 | | | | 551 | |
5.13%, 05/01/2027 (e) | | | 2,810 | | | | 2,947 | |
5.50%, 05/01/2026 (e) | | | 1,500 | | | | 1,551 | |
5.75%, 02/15/2026 (e) | | | 1,035 | | | | 1,070 | |
Clear Channel Worldwide Holdings, Inc., 5.13%, 08/15/2027 (e) | | | 4,344 | | | | 4,430 | |
CSC Holdings LLC, | | | | | | | | |
3.38%, 02/15/2031 (e) | | | 1,065 | | | | 1,006 | |
4.13%, 12/01/2030 (e) | | | 2,500 | | | | 2,484 | |
4.50%, 11/15/2031 (e) | | | 1,732 | | | | 1,743 | |
4.63%, 12/01/2030 (e) | | | 10,656 | | | | 10,455 | |
5.00%, 11/15/2031 (e) | | | 987 | | | | 992 | |
5.25%, 06/01/2024 | | | 1,000 | | | | 1,085 | |
5.38%, 02/01/2028 (e) | | | 1,500 | | | | 1,586 | |
5.75%, 01/15/2030 (e) | | | 2,624 | | | | 2,726 | |
6.50%, 02/01/2029 (e) | | | 825 | | | | 914 | |
6.75%, 11/15/2021 | | | 5,600 | | | | 5,710 | |
Cumulus Media New Holdings, Inc., 6.75%, 07/01/2026 (e) | | | 723 | | | | 756 | |
Diamond Sports Group LLC / Diamond Sports Finance Co., | | | | | | | | |
5.38%, 08/15/2026 (e) | | | 2,985 | | | | 1,936 | |
6.63%, 08/15/2027 (e) | | | 10,050 | | | | 4,925 | |
DISH DBS Corp., | | | | | | | | |
5.13%, 06/01/2029 (e) | | | 4,994 | | | | 4,936 | |
5.88%, 07/15/2022 | | | 3,642 | | | | 3,799 | |
5.88%, 11/15/2024 | | | 2,115 | | | | 2,271 | |
7.38%, 07/01/2028 | | | 1,625 | | | | 1,749 | |
7.75%, 07/01/2026 | | | 4,639 | | | | 5,253 | |
Gray Television, Inc., | | | | | | | | |
4.75%, 10/15/2030 (e) | | | 3,080 | | | | 3,069 | |
5.88%, 07/15/2026 (e) | | | 605 | | | | 625 | |
7.00%, 05/15/2027 (e) | | | 350 | | | | 378 | |
iHeartCommunications, Inc., | | | | | | | | |
4.75%, 01/15/2028 (e) | | | 525 | | | | 540 | |
5.25%, 08/15/2027 (e) | | | 775 | | | | 810 | |
6.38%, 05/01/2026 | | | 730 | | | | 777 | |
8.38%, 05/01/2027 | | | 2,023 | | | | 2,167 | |
SEE NOTES TO FINANCIAL STATEMENTS.
| | | | | | | | | | |
| | | | | |
| JUNE 30, 2021 | | SIX CIRCLES TRUST | | | | | | | | 193 |
Six Circles Credit Opportunities Fund
SCHEDULE OF PORTFOLIO INVESTMENTS
AS OF JUNE 30, 2021 (Unaudited) (continued)
(Amounts in U.S. Dollars, unless otherwise noted)
(Amounts in thousands, except number of Futures contracts)
| | | | | | | | |
| SECURITY DESCRIPTION | | PRINCIPAL
AMOUNT($) | | | VALUE($) | |
Corporate Bonds — continued | | | | | | | | |
Media — continued | | | | | | | | |
LCPR Senior Secured Financing DAC, (Ireland), | | | | | | | | |
5.13%, 07/15/2029 (e) | | | 1,535 | | | | 1,584 | |
6.75%, 10/15/2027 (e) | | | 1,039 | | | | 1,119 | |
Midcontinent Communications / Midcontinent Finance Corp., 5.38%, 08/15/2027 (e) | | | 350 | | | | 368 | |
News Corp., 3.88%, 05/15/2029 (e) | | | 1,159 | | | | 1,171 | |
Nexstar Broadcasting, Inc., | | | | | | | | |
4.75%, 11/01/2028 (e) | | | 2,650 | | | | 2,723 | |
5.63%, 07/15/2027 (e) | | | 1,550 | | | | 1,643 | |
Radiate Holdco LLC / Radiate Finance, Inc., | | | | | | | | |
4.50%, 09/15/2026 (e) | | | 3,911 | | | | 4,048 | |
6.50%, 09/15/2028 (e) | | | 7,287 | | | | 7,655 | |
Scripps Escrow II, Inc., | | | | | | | | |
3.88%, 01/15/2029 (e) | | | 750 | | | | 744 | |
5.38%, 01/15/2031 (e) | | | 683 | | | | 681 | |
Scripps Escrow, Inc., 5.88%, 07/15/2027 (e) | | | 875 | | | | 903 | |
Sinclair Television Group, Inc., | | | | | | | | |
4.13%, 12/01/2030 (e) | | | 1,654 | | | | 1,625 | |
5.13%, 02/15/2027 (e) | | | 61 | | | | 61 | |
5.50%, 03/01/2030 (e) | | | 800 | | | | 812 | |
5.88%, 03/15/2026 (e) | | | 1,100 | | | | 1,136 | |
Sirius XM Radio, Inc., | | | | | | | | |
3.88%, 08/01/2022 (e) | | | 150 | | | | 150 | |
4.00%, 07/15/2028 (e) | | | 1,922 | | | | 1,982 | |
4.13%, 07/01/2030 (e) | | | 1,308 | | | | 1,325 | |
5.38%, 07/15/2026 (e) | | | 2,585 | | | | 2,669 | |
5.50%, 07/01/2029 (e) | | | 617 | | | | 672 | |
TEGNA, Inc., 5.00%, 09/15/2029 | | | 1,050 | | | | 1,099 | |
Telenet Finance Luxembourg Notes Sarl, (Luxembourg), 5.50%, 03/01/2028 (e) | | | 1,600 | | | | 1,683 | |
Townsquare Media, Inc., 6.88%, 02/01/2026 (e) | | | 225 | | | | 241 | |
Univision Communications, Inc., | | | | | | | | |
4.50%, 05/01/2029 (e) | | | 950 | | | | 957 | |
5.13%, 02/15/2025 (e) | | | 3,101 | | | | 3,164 | |
6.63%, 06/01/2027 (e) | | | 4,003 | | | | 4,339 | |
9.50%, 05/01/2025 (e) | | | 2,184 | | | | 2,408 | |
UPC Broadband Finco BV, (Netherlands), 4.88%, 07/15/2031 (e) | | | 2,877 | | | | 2,884 | |
UPC Holding BV, (Netherlands), Reg. S, 3.88%, 06/15/2029 | | EUR | 200 | | | | 240 | |
UPCB Finance VII Ltd., (Cayman Islands), Reg. S, 3.63%, 06/15/2029 | | EUR | 244 | | | | 295 | |
Urban One, Inc., 7.38%, 02/01/2028 (e) | | | 1,110 | | | | 1,199 | |
Videotron Ltd., (Canada), 3.63%, 06/15/2029 (e) | | | 1,465 | | | | 1,487 | |
Virgin Media Finance plc, (United Kingdom), | | | | | | | | |
Reg. S, 3.75%, 07/15/2030 | | EUR | 200 | | | | 237 | |
5.00%, 07/15/2030 (e) | | | 1,650 | | | | 1,658 | |
Virgin Media Secured Finance plc, (United Kingdom), | | | | | | | | |
5.50%, 08/15/2026 (e) | | | 775 | | | | 800 | |
5.50%, 05/15/2029 (e) | | | 922 | | | | 991 | |
| | | | | | | | |
| SECURITY DESCRIPTION | | PRINCIPAL
AMOUNT($) | | | VALUE($) | |
| | | | | | | | |
Media — continued | | | | | | | | |
Virgin Media Vendor Financing Notes IV DAC, (Ireland), 5.00%, 07/15/2028 (e) | | | 3,116 | | | | 3,178 | |
Ziggo Bond Co. BV, (Netherlands), | | | | | | | | |
5.13%, 02/28/2030 (e) | | | 955 | | | | 977 | |
6.00%, 01/15/2027 (e) | | | 1,775 | | | | 1,855 | |
Ziggo BV, (Netherlands), 4.88%, 01/15/2030 (e) | | | 1,047 | | | | 1,073 | |
| | | | | | | | |
| | |
| | | | | | | 182,738 | |
| | | | | | | | |
Telecommunications — 4.9% | | | | | | | | |
Altice France Holding SA, (Luxembourg), | | | | | | | | |
6.00%, 02/15/2028 (e) | | | 2,565 | | | | 2,545 | |
10.50%, 05/15/2027 (e) | | | 9,661 | | | | 10,736 | |
Altice France SA, (France), | | | | | | | | |
Reg. S, 4.13%, 01/15/2029 | | EUR | 400 | | | | 475 | |
5.13%, 07/15/2029 (e) | | | 5,499 | | | | 5,526 | |
5.50%, 01/15/2028 (e) | | | 1,338 | | | | 1,388 | |
7.38%, 05/01/2026 (e) | | | 5,668 | | | | 5,894 | |
8.13%, 02/01/2027 (e) | | | 1,078 | | | | 1,175 | |
Avaya, Inc., 6.13%, 09/15/2028 (e) | | | 3,513 | | | | 3,760 | |
CommScope Technologies LLC, | | | | | | | | |
5.00%, 03/15/2027 (e) | | | 1,096 | | | | 1,122 | |
6.00%, 06/15/2025 (e) | | | 2,482 | | | | 2,535 | |
CommScope, Inc., | | | | | | | | |
5.50%, 03/01/2024 (e) | | | 994 | | | | 1,022 | |
6.00%, 03/01/2026 (e) | | | 3,055 | | | | 3,225 | |
7.13%, 07/01/2028 (e) | | | 831 | | | | 901 | |
Connect Finco Sarl / Connect US Finco LLC, (Multinational), 6.75%, 10/01/2026 (e) | | | 8,569 | | | | 9,070 | |
Consolidated Communications, Inc., 6.50%, 10/01/2028 (e) | | | 2,296 | | | | 2,470 | |
Digicel Group Holdings Ltd., (Bermuda), 10.00% (Blend (cash 8.00% + PIK 2.00%)), 04/01/2024 (v) | | | 1,313 | | | | 1,278 | |
Digicel International Finance Ltd. / Digicel international Holdings Ltd., (Multinational), | | | | | | | | |
8.75%, 05/25/2024 (e) | | | 1,545 | | | | 1,609 | |
8.00%, 12/31/2026 (e) | | | 4,725 | | | | 4,630 | |
13.00% (Blend (cash 6.00% + PIK 7.00%)), 12/31/2025 (e) (v) | | | 2,070 | | | | 2,075 | |
Digicel Ltd., (Bermuda), 6.75%, 03/01/2023 (e) | | | 6,500 | | | | 6,191 | |
Frontier Communications Holdings LLC, | | | | | | | | |
5.00%, 05/01/2028 (e) | | | 3,660 | | | | 3,784 | |
5.88%, 10/15/2027 (e) | | | 2,236 | | | | 2,395 | |
6.75%, 05/01/2029 (e) | | | 1,012 | | | | 1,076 | |
Intelsat Jackson Holdings SA, (Luxembourg), 9.75%, 07/15/2025 (d) (e) | | | 1,875 | | | | 1,092 | |
Intrado Corp., 8.50%, 10/15/2025 (e) | | | 1,000 | | | | 978 | |
Level 3 Financing, Inc., | | | | | | | | |
3.75%, 07/15/2029 (e) | | | 1,795 | | | | 1,746 | |
4.25%, 07/01/2028 (e) | | | 1,139 | | | | 1,156 | |
5.25%, 03/15/2026 | | | 1,200 | | | | 1,236 | |
SEE NOTES TO FINANCIAL STATEMENTS.
| | | | | | | | | | |
| | | | | |
| 194 | | | | | | | | SIX CIRCLES TRUST | | JUNE 30, 2021 |
| | | | | | | | |
| SECURITY DESCRIPTION | | PRINCIPAL
AMOUNT($) | | | VALUE($) | |
Corporate Bonds — continued | | | | | | | | |
Telecommunications — continued | | | | | | | | |
Ligado Networks LLC, 15.50% (PIK), 11/01/2023 (e) (v) | | | 547 | | | | 539 | |
LogMeIn, Inc., 5.50%, 09/01/2027 (e) | | | 675 | | | | 699 | |
Lorca Telecom Bondco SA, (Spain), Reg. S, 4.00%, 09/18/2027 | | EUR | 200 | | | | 241 | |
Lumen Technologies, Inc., | | | | | | | | |
4.00%, 02/15/2027 (e) | | | 1,102 | | | | 1,124 | |
4.50%, 01/15/2029 (e) | | | 3,251 | | | | 3,173 | |
5.13%, 12/15/2026 (e) | | | 1,917 | | | | 1,991 | |
5.38%, 06/15/2029 (e) | | | 1,647 | | | | 1,674 | |
Series P, 7.60%, 09/15/2039 | | | 2,942 | | | | 3,347 | |
Series T, 5.80%, 03/15/2022 | | | 3,000 | | | | 3,087 | |
Series U, 7.65%, 03/15/2042 | | | 2,983 | | | | 3,348 | |
Series W, 6.75%, 12/01/2023 | | | 225 | | | | 250 | |
Matterhorn Telecom SA, (Luxembourg), Reg. S, 4.00%, 11/15/2027 | | EUR | 300 | | | | 365 | |
Nokia OYJ, (Finland), 6.63%, 05/15/2039 | | | 275 | | | | 356 | |
Oi SA, (Brazil), Reg. S, 10.00% (cash), 07/27/2025 (v) | | | 100 | | | | 103 | |
QualityTech LP / QTS Finance Corp., 3.88%, 10/01/2028 (e) | | | 783 | | | | 837 | |
Qwest Corp., 6.75%, 12/01/2021 | | | 1,000 | | | | 1,024 | |
SoftBank Group Corp., (Japan), | | | | | | | | |
Reg. S, 5.00%, 04/15/2028 | | EUR | 100 | | | | 133 | |
Reg. S, (USD ICE Swap Rate 5 Year + 4.23%), 6.00%, 07/19/2023 (x) (aa) | | | 600 | | | | 606 | |
Sprint Capital Corp., | | | | | | | | |
6.88%, 11/15/2028 | | | 4,366 | | | | 5,600 | |
8.75%, 03/15/2032 | | | 3,385 | | | | 5,145 | |
Sprint Communications, Inc., | | | | | | | | |
6.00%, 11/15/2022 | | | 100 | | | | 106 | |
11.50%, 11/15/2021 | | | 1,959 | | | | 2,029 | |
Sprint Corp., | | | | | | | | |
7.13%, 06/15/2024 | | | 400 | | | | 461 | |
7.25%, 09/15/2021 | | | 200 | | | | 203 | |
7.63%, 02/15/2025 | | | 4,000 | | | | 4,752 | |
7.63%, 03/01/2026 | | | 6,671 | | | | 8,139 | |
7.88%, 09/15/2023 | | | 2,885 | | | | 3,278 | |
Switch Ltd., | | | | | | | | |
3.75%, 09/15/2028 (e) | | | 1,438 | | | | 1,456 | |
4.13%, 06/15/2029 (e) | | | 1,333 | | | | 1,368 | |
Telecom Italia Capital SA, (Luxembourg), 6.00%, 09/30/2034 | | | 2,835 | | | | 3,271 | |
Telecom Italia Finance SA, (Luxembourg), Reg. S, 7.75%, 01/24/2033 | | EUR | 400 | | | | 695 | |
Telecom Italia SpA, (Italy), | | | | | | | | |
Reg. S, 1.63%, 01/18/2029 | | EUR | 200 | | | | 233 | |
5.30%, 05/30/2024 (e) | | | 1,172 | | | | 1,283 | |
Telefonica Europe BV, (Netherlands), Reg. S, (EUR Swap Rate 6 Year + 4.11%), 4.38%, 12/14/2024 (x) (aa) | | EUR | 300 | | | | 386 | |
Telesat Canada / Telesat LLC, (Canada), 4.88%, 06/01/2027 (e) | | | 733 | | | | 707 | |
| | | | | | | | |
| SECURITY DESCRIPTION | | PRINCIPAL
AMOUNT($) | | | VALUE($) | |
| | | | | | | | |
Telecommunications — continued | | | | | | | | |
T-Mobile USA, Inc., | | | | | | | | |
2.63%, 02/15/2029 | | | 274 | | | | 271 | |
2.88%, 02/15/2031 | | | 844 | | | | 838 | |
3.38%, 04/15/2029 (e) | | | 475 | | | | 490 | |
3.50%, 04/15/2031 (e) | | | 2,370 | | | | 2,452 | |
4.50%, 02/01/2026 | | | 3,500 | | | | 3,567 | |
4.75%, 02/01/2028 | | | 1,000 | | | | 1,071 | |
Viasat, Inc., | | | | | | | | |
5.63%, 09/15/2025 (e) | | | 765 | | | | 779 | |
5.63%, 04/15/2027 (e) | | | 1,185 | | | | 1,237 | |
6.50%, 07/15/2028 (e) | | | 3,446 | | | | 3,675 | |
Vmed O2 UK Financing I plc, (United Kingdom), | | | | | | | | |
Reg. S, 4.00%, 01/31/2029 | | GBP | 200 | | | | 273 | |
4.75%, 07/15/2031 (e) (w) | | | 385 | | | | 391 | |
Vodafone Group plc, (United Kingdom), | | | | | | | | |
Reg. S, (USD Semi-annual Swap Rate 5 Year + 3.05%), 6.25%, 10/03/2078 (aa) | | | 200 | | | | 221 | |
Reg. S, (EUR Swap Rate 5 Year + 3.23%), 3.00%, 08/27/2080 (aa) | | EUR | 100 | | | | 122 | |
Windstream Escrow LLC / Windstream Escrow Finance Corp., 7.75%, 08/15/2028 (e) | | | 365 | | | | 376 | |
Zayo Group Holdings, Inc., | | | | | | | | |
4.00%, 03/01/2027 (e) | | | 3,962 | | | | 3,935 | |
6.13%, 03/01/2028 (e) | | | 8,152 | | | | 8,325 | |
| | | | | | | | |
| | |
| | | | | | | 171,122 | |
| | | | | | | | |
Total Communications | | | | | | | 408,646 | |
| | | | | | | | |
Consumer Cyclical — 14.7% | | | | | | | | |
Airlines — 1.0% | | | | | | | | |
Air France-KLM, (France), Reg. S, 3.88%, 07/01/2026 (w) | | EUR | 100 | | | | 117 | |
American Airlines Group, Inc., 3.75%, 03/01/2025 (e) | | | 1,030 | | | | 949 | |
American Airlines, Inc., 11.75%, 07/15/2025 (e) | | | 4,863 | | | | 6,103 | |
American Airlines, Inc. / AAdvantage Loyalty IP Ltd., (Multinational), | | | | | | | | |
5.50%, 04/20/2026 (e) | | | 1,849 | | | | 1,957 | |
5.75%, 04/20/2029 (e) | | | 5,000 | | | | 5,398 | |
Delta Air Lines, Inc., 7.00%, 05/01/2025 (e) | | | 1,623 | | | | 1,895 | |
Delta Air Lines, Inc. / SkyMiles IP Ltd., (Multinational), 4.75%, 10/20/2028 (e) | | | 2,560 | | | | 2,848 | |
Deutsche Lufthansa AG, (Germany), Reg. S, 2.88%, 02/11/2025 | | EUR | 100 | | | | 120 | |
Finnair Oyj, (Finland), Reg. S, 4.25%, 05/19/2025 | | EUR | 125 | | | | 151 | |
Hawaiian Brand Intellectual Property Ltd. / HawaiianMiles Loyalty Ltd., (Cayman Islands), 5.75%, 01/20/2026 (e) (e) | | | 1,983 | | | | 2,132 | |
International Consolidated Airlines Group SA, (Spain), | | | | | | | | |
Reg. S, 1.50%, 07/04/2027 | | EUR | 100 | | | | 107 | |
SEE NOTES TO FINANCIAL STATEMENTS.
| | | | | | | | | | |
| | | | | |
| JUNE 30, 2021 | | SIX CIRCLES TRUST | | | | | | | | 195 |
Six Circles Credit Opportunities Fund
SCHEDULE OF PORTFOLIO INVESTMENTS
AS OF JUNE 30, 2021 (Unaudited) (continued)
(Amounts in U.S. Dollars, unless otherwise noted)
(Amounts in thousands, except number of Futures contracts)
| | | | | | | | |
| SECURITY DESCRIPTION | | PRINCIPAL
AMOUNT($) | | | VALUE($) | |
Corporate Bonds — continued | | | | | | | | |
Airlines — continued | | | | | | | | |
Reg. S, 2.75%, 03/25/2025 | | EUR | 100 | | | | 119 | |
Reg. S, 3.75%, 03/25/2029 | | EUR | 100 | | | | 119 | |
Mileage Plus Holdings LLC / Mileage Plus Intellectual Property Assets Ltd., 6.50%, 06/20/2027 (e) | | | 3,444 | | | | 3,792 | |
Spirit Loyalty Cayman Ltd. / Spirit IP Cayman Ltd., (Cayman Islands), 8.00%, 09/20/2025 (e) | | | 674 | | | | 762 | |
United Airlines 2020-1 Class A Pass Through Trust, Series 20-1, 5.88%, 10/15/2027 | | | 3,011 | | | | 3,342 | |
United Airlines 2020-1 Class B Pass Through Trust, 4.88%, 01/15/2026 | | | 58 | | | | 62 | |
United Airlines, Inc., | | | | | | | | |
4.38%, 04/15/2026 (e) | | | 3,565 | | | | 3,690 | |
4.63%, 04/15/2029 (e) | | | 2,350 | | | | 2,432 | |
| | | | | | | | |
| | |
| | | | | | | 36,095 | |
| | | | | | | | |
Apparel — 0.3% | | | | | | | | |
Crocs, Inc., 4.25%, 03/15/2029 (e) | | | 535 | | | | 546 | |
Hanesbrands, Inc., 4.63%, 05/15/2024 (e) | | | 500 | | | | 530 | |
Levi Strauss & Co., | | | | | | | | |
3.50%, 03/01/2031 (e) | | | 280 | | | | 278 | |
5.00%, 05/01/2025 | | | 200 | | | | 204 | |
PVH Corp., 4.63%, 07/10/2025 | | | 1,590 | | | | 1,775 | |
Tapestry, Inc., 4.25%, 04/01/2025 | | | 1,000 | | | | 1,088 | |
William Carter Co. (The), | | | | | | | | |
5.50%, 05/15/2025 (e) | | | 686 | | | | 726 | |
5.63%, 03/15/2027 (e) | | | 1,000 | | | | 1,052 | |
Wolverine World Wide, Inc., | | | | | | | | |
5.00%, 09/01/2026 (e) | | | 325 | | | | 333 | |
6.38%, 05/15/2025 (e) | | | 2,225 | | | | 2,367 | |
| | | | | | | | |
| | |
| | | | | | | 8,899 | |
| | | | | | | | |
Auto Manufacturers — 2.5% | | | | | | | | |
Allison Transmission, Inc., | | | | | | | | |
3.75%, 01/30/2031 (e) | | | 2,492 | | | | 2,449 | |
5.88%, 06/01/2029 (e) | | | 1,474 | | | | 1,614 | |
Daimler Finance North America LLC, | | | | | | | | |
3.65%, 02/22/2024 (e) | | | 2,800 | | | | 3,004 | |
3.88%, 09/15/2021 (e) | | | 964 | | | | 971 | |
Ford Motor Co., | | | | | | | | |
4.75%, 01/15/2043 | | | 7,125 | | | | 7,570 | |
5.29%, 12/08/2046 | | | 5,875 | | | | 6,562 | |
7.40%, 11/01/2046 | | | 275 | | | | 361 | |
8.50%, 04/21/2023 | | | 250 | | | | 279 | |
9.00%, 04/22/2025 | | | 8,670 | | | | 10,689 | |
9.63%, 04/22/2030 | | | 750 | | | | 1,076 | |
Ford Motor Credit Co. LLC, | | | | | | | | |
2.90%, 02/16/2028 | | | 623 | | | | 620 | |
2.98%, 08/03/2022 | | | 5,210 | | | | 5,282 | |
3.38%, 11/13/2025 | | | 2,250 | | | | 2,332 | |
3.82%, 11/02/2027 | | | 200 | | | | 208 | |
4.00%, 11/13/2030 | | | 2,468 | | | | 2,585 | |
4.13%, 08/17/2027 | | | 315 | | | | 334 | |
| | | | | | | | |
| SECURITY DESCRIPTION | | PRINCIPAL
AMOUNT($) | | | VALUE($) | |
| | | | | | | | |
Auto Manufacturers — continued | | | | | | | | |
4.13%, 08/04/2025 | | | 1,577 | | | | 1,685 | |
4.39%, 01/08/2026 | | | 2,500 | | | | 2,700 | |
4.54%, 03/06/2025 | | GBP | 100 | | | | 148 | |
5.11%, 05/03/2029 | | | 1,176 | | | | 1,317 | |
5.13%, 06/16/2025 | | | 2,570 | | | | 2,830 | |
5.58%, 03/18/2024 | | | 3,635 | | | | 3,981 | |
General Motors Co., | | | | | | | | |
5.40%, 10/02/2023 | | | 1,016 | | | | 1,119 | |
6.13%, 10/01/2025 | | | 50 | | | | 59 | |
General Motors Financial Co., Inc., | | | | | | | | |
2.75%, 06/20/2025 | | | 2,724 | | | | 2,869 | |
3.15%, 06/30/2022 | | | 988 | | | | 1,012 | |
3.95%, 04/13/2024 | | | 681 | | | | 733 | |
5.10%, 01/17/2024 | | | 1,658 | | | | 1,825 | |
5.20%, 03/20/2023 | | | 104 | | | | 112 | |
5.25%, 03/01/2026 | | | 451 | | | | 521 | |
Series C, (CMT Index 5 Year + 5.00%), 5.70%, 09/30/2030 (x) (aa) | | | 5 | | | | 6 | |
Hyundai Capital America, | | | | | | | | |
0.88%, 06/14/2024 (e) | | | 852 | | | | 848 | |
1.50%, 06/15/2026 (e) | | | 674 | | | | 669 | |
Jaguar Land Rover Automotive plc, (United Kingdom), Reg. S, 6.88%, 11/15/2026 | | EUR | 100 | | | | 138 | |
JB Poindexter & Co., Inc., 7.13%, 04/15/2026 (e) | | | 950 | | | | 1,005 | |
Kia Corp., (South Korea), 1.75%, 10/16/2026 (e) | | | 973 | | | | 982 | |
Navistar International Corp., | | | | | | | | |
6.63%, 11/01/2025 (e) | | | 25 | | | | 26 | |
9.50%, 05/01/2025 (e) | | | 3,775 | | | | 4,047 | |
PM General Purchaser LLC, 9.50%, 10/01/2028 (e) | | | 2,175 | | | | 2,291 | |
RCI Banque SA, (France), Reg. S, (EUR Swap Rate 5 Year + 2.85%), 2.63%, 02/18/2030 (aa) | | EUR | 200 | | | | 239 | |
Stellantis NV, (Netherlands), 5.25%, 04/15/2023 | | | 3,754 | | | | 4,048 | |
Tesla, Inc., 5.30%, 08/15/2025 (e) | | | 2,095 | | | | 2,166 | |
Volkswagen Group of America Finance LLC, | | | | | | | | |
2.90%, 05/13/2022 (e) | | | 222 | | | | 227 | |
3.35%, 05/13/2025 (e) | | | 1,110 | | | | 1,198 | |
4.25%, 11/13/2023 (e) | | | 278 | | | | 300 | |
Volkswagen International Finance NV, (Netherlands), | | | | | | | | |
Reg. S, (EUR Swap Rate 5 Year + 3.75%), 3.50%, 06/17/2025 (x) (aa) | | EUR | 100 | | | | 128 | |
Reg. S, (EUR Swap Rate 10 Year + 3.37%), 3.88%, 06/14/2027 (x) (aa) | | EUR | 100 | | | | 131 | |
Wabash National Corp., 5.50%, 10/01/2025 (e) | | | 349 | | | | 356 | |
| | | | | | | | |
| | |
| | | | | | | 85,652 | |
| | | | | | | | |
SEE NOTES TO FINANCIAL STATEMENTS.
| | | | | | | | | | |
| | | | | |
| 196 | | | | | | | | SIX CIRCLES TRUST | | JUNE 30, 2021 |
| | | | | | | | |
| SECURITY DESCRIPTION | | PRINCIPAL
AMOUNT($) | | | VALUE($) | |
Corporate Bonds — continued | | | | | | | | |
Auto Parts & Equipment — 1.3% | | | | | | | | |
Adient Global Holdings Ltd., (Jersey), 4.88%, 08/15/2026 (e) | | | 5,025 | | | | 5,172 | |
Adient US LLC, 9.00%, 04/15/2025 (e) | | | 427 | | | | 470 | |
American Axle & Manufacturing, Inc., | | | | | | | | |
6.25%, 04/01/2025 | | | 50 | | | | 52 | |
6.25%, 03/15/2026 | | | 1,675 | | | | 1,727 | |
6.50%, 04/01/2027 | | | 950 | | | | 1,006 | |
6.88%, 07/01/2028 | | | 1,500 | | | | 1,637 | |
Clarios Global LP / Clarios US Finance Co., (Multinational), | | | | | | | | |
Reg. S, 4.38%, 05/15/2026 | | EUR | 300 | | | | 368 | |
6.25%, 05/15/2026 (e) | | | 1,783 | | | | 1,899 | |
8.50%, 05/15/2027 (e) | | | 9,488 | | | | 10,344 | |
Clarios Global LP, (Canada), 6.75%, 05/15/2025 (e) | | | 3,150 | | | | 3,355 | |
Cooper-Standard Automotive, Inc., 5.63%, 11/15/2026 (e) | | | 1,375 | | | | 1,293 | |
Dana Financing Luxembourg Sarl, (Luxembourg), 5.75%, 04/15/2025 (e) | | | 75 | | | | 77 | |
Dana, Inc., | | | | | | | | |
4.25%, 09/01/2030 | | | 425 | | | | 437 | |
5.38%, 11/15/2027 | | | 775 | | | | 826 | |
5.63%, 06/15/2028 | | | 2,541 | | | | 2,750 | |
Dealer Tire LLC / DT Issuer LLC, 8.00%, 02/01/2028 (e) | | | 1,095 | | | | 1,181 | |
Faurecia SE, (France), Reg. S, 3.75%, 06/15/2028 | | EUR | 100 | | | | 125 | |
Goodyear Tire & Rubber Co. (The), | | | | | | | | |
5.00%, 07/15/2029 (e) | | | 491 | | | | 514 | |
5.25%, 07/15/2031 (e) | | | 1,427 | | | | 1,491 | |
5.63%, 04/30/2033 | | | 1,105 | | | | 1,165 | |
9.50%, 05/31/2025 | | | 199 | | | | 223 | |
Grupo Antolin-Irausa SA, (Spain), Reg. S, 3.50%, 04/30/2028 | | EUR | 100 | | | | 118 | |
IHO Verwaltungs GmbH, (Germany), | | | | | | | | |
4.75% (cash), 09/15/2026 (e) (v) | | | 1,265 | | | | 1,293 | |
6.00% (cash), 05/15/2027 (e) (v) | | | 325 | | | | 341 | |
6.38% (cash), 05/15/2029 (e) (v) | | | 1,000 | | | | 1,090 | |
Meritor, Inc., 4.50%, 12/15/2028 (e) | | | 71 | | | | 72 | |
Real Hero Merger Sub 2, Inc., 6.25%, 02/01/2029 (e) | | | 1,450 | | | | 1,508 | |
Tenneco, Inc., | | | | | | | | |
5.13%, 04/15/2029 (e) | | | 2,575 | | | | 2,646 | |
7.88%, 01/15/2029 (e) | | | 164 | | | | 185 | |
Titan International, Inc., 7.00%, 04/30/2028 (e) | | | 945 | | | | 989 | |
ZF Finance GmbH, (Germany), | | | | | | | | |
Reg. S, 2.00%, 05/06/2027 | | EUR | 100 | | | | 119 | |
Reg. S, 3.75%, 09/21/2028 | | EUR | 100 | | | | 130 | |
ZF North America Capital, Inc., 4.75%, 04/29/2025 (e) | | | 1,465 | | | | 1,582 | |
| | | | | | | | |
| | |
| | | | | | | 46,185 | |
| | | | | | | | |
| | | | | | | | |
| SECURITY DESCRIPTION | | PRINCIPAL
AMOUNT($) | | | VALUE($) | |
| | | | | | | | |
Distribution/Wholesale — 0.5% | | | | | | | | |
American Builders & Contractors Supply Co., Inc., 3.88%, 11/15/2029 (e) | | | 496 | | | | 493 | |
BCPE Empire Holdings, Inc., 7.63%, 05/01/2027 (e) | | | 1,594 | | | | 1,632 | |
Core & Main Holdings LP, 8.63% (cash), 09/15/2024 (e) (v) | | | 1,882 | | | | 1,920 | |
Core & Main LP, 6.13%, 08/15/2025 (e) | | | 7,365 | | | | 7,512 | |
H&E Equipment Services, Inc., 3.88%, 12/15/2028 (e) | | | 4,554 | | | | 4,481 | |
IAA, Inc., 5.50%, 06/15/2027 (e) | | | 28 | | | | 29 | |
KAR Auction Services, Inc., 5.13%, 06/01/2025 (e) | | | 975 | | | | 1,001 | |
| | | | | | | | |
| | |
| | | | | | | 17,068 | |
| | | | | | | | |
Entertainment — 2.8% | | | | | | | | |
Affinity Gaming, 6.88%, 12/15/2027 (e) | | | 1,273 | | | | 1,351 | |
Bally’s Corp., 6.75%, 06/01/2027 (e) | | | 4,255 | | | | 4,534 | |
Banijay Group SAS, (France), Reg. S, 6.50%, 03/01/2026 | | EUR | 200 | | | | 245 | |
Boyne USA, Inc., 4.75%, 05/15/2029 (e) | | | 828 | | | | 854 | |
Caesars Entertainment, Inc., | | | | | | | | |
6.25%, 07/01/2025 (e) | | | 8,299 | | | | 8,801 | |
8.13%, 07/01/2027 (e) | | | 6,509 | | | | 7,239 | |
Caesars Resort Collection LLC / CRC Finco, Inc., | | | | | | | | |
5.25%, 10/15/2025 (e) | | | 4,405 | | | | 4,467 | |
5.75%, 07/01/2025 (e) | | | 2,059 | | | | 2,170 | |
CCM Merger, Inc., 6.38%, 05/01/2026 (e) | | | 875 | | | | 919 | |
Cedar Fair LP, 5.25%, 07/15/2029 | | | 1,125 | | | | 1,159 | |
Cedar Fair LP / Canada’s Wonderland Co. / Magnum Management Corp. / Millennium Op, | | | | | | | | |
5.50%, 05/01/2025 (e) | | | 2,876 | | | | 3,002 | |
6.50%, 10/01/2028 (e) | | | 3 | | | | 3 | |
Churchill Downs, Inc., | | | | | | | | |
4.75%, 01/15/2028 (e) | | | 2,362 | | | | 2,444 | |
5.50%, 04/01/2027 (e) | | | 161 | | | | 168 | |
Cinemark USA, Inc., 5.25%, 07/15/2028 (e) | | | 379 | | | | 388 | |
Cirsa Finance International Sarl, (Luxembourg), Reg. S, 4.75%, 05/22/2025 | | EUR | 200 | | | | 238 | |
CPUK Finance Ltd., (Jersey), | | | | | | | | |
Reg. S, 4.50%, 08/28/2027 | | GBP | 100 | | | | 140 | |
Reg. S, 4.88%, 08/28/2025 | | GBP | 200 | | | | 280 | |
Everi Holdings, Inc., 5.00%, 07/15/2029 (e) (w) (bb) | | | 438 | | | | 438 | |
Gamma Bidco SpA, (Italy), Reg. S, 6.25%, 07/15/2025 | | EUR | 100 | | | | 125 | |
Golden Entertainment, Inc., 7.63%, 04/15/2026 (e) | | | 1,500 | | | | 1,594 | |
International Game Technology plc, (United Kingdom), | | | | | | | | |
Reg. S, 3.50%, 06/15/2026 | | EUR | 200 | | | | 243 | |
4.13%, 04/15/2026 (e) | | | 200 | | | | 208 | |
SEE NOTES TO FINANCIAL STATEMENTS.
| | | | | | | | | | |
| | | | | |
| JUNE 30, 2021 | | SIX CIRCLES TRUST | | | | | | | | 197 |
Six Circles Credit Opportunities Fund
SCHEDULE OF PORTFOLIO INVESTMENTS
AS OF JUNE 30, 2021 (Unaudited) (continued)
(Amounts in U.S. Dollars, unless otherwise noted)
(Amounts in thousands, except number of Futures contracts)
| | | | | | | | |
| SECURITY DESCRIPTION | | PRINCIPAL
AMOUNT($) | | | VALUE($) | |
Corporate Bonds — continued | | | | | | | | |
Entertainment — continued | | | | | | | | |
5.25%, 01/15/2029 (e) | | | 1,050 | | | | 1,126 | |
6.25%, 01/15/2027 (e) | | | 1,055 | | | | 1,203 | |
6.50%, 02/15/2025 (e) | | | 1,250 | | | | 1,402 | |
Jacobs Entertainment, Inc., 7.88%, 02/01/2024 (e) | | | 622 | | | | 650 | |
Lions Gate Capital Holdings LLC, 5.50%, 04/15/2029 (e) | | | 228 | | | | 240 | |
Live Nation Entertainment, Inc., | | | | | | | | |
3.75%, 01/15/2028 (e) | | | 200 | | | | 201 | |
4.75%, 10/15/2027 (e) | | | 906 | | | | 940 | |
4.88%, 11/01/2024 (e) | | | 412 | | | | 418 | |
6.50%, 05/15/2027 (e) | | | 2,885 | | | | 3,202 | |
Merlin Entertainments Ltd., (United Kingdom), 5.75%, 06/15/2026 (e) | | | 420 | | | | 441 | |
Midwest Gaming Borrower LLC / Midwest Gaming Finance Corp., 4.88%, 05/01/2029 (e) | | | 2,234 | | | | 2,237 | |
Mohegan Gaming & Entertainment, | | | | | | | | |
7.88%, 10/15/2024 (e) | | | 200 | | | | 210 | |
8.00%, 02/01/2026 (e) | | | 1,475 | | | | 1,541 | |
Motion Bondco DAC, (Ireland), 6.63%, 11/15/2027 (e) | | | 2,475 | | | | 2,506 | |
Peninsula Pacific Entertainment LLC / Peninsula Pacific Entertainment Finance In, 8.50%, 11/15/2027 (e) | | | 2,761 | | | | 2,965 | |
Penn National Gaming, Inc., | | | | | | | | |
4.13%, 07/01/2029 (e) (w) | | | 1,093 | | | | 1,088 | |
5.63%, 01/15/2027 (e) | | | 3,225 | | | | 3,350 | |
Powdr Corp., 6.00%, 08/01/2025 (e) | | | 186 | | | | 195 | |
Raptor Acquisition Corp. / Raptor Co-Issuer LLC, 4.88%, 11/01/2026 (e) | | | 718 | | | | 728 | |
Scientific Games International, Inc., | | | | | | | | |
5.00%, 10/15/2025 (e) | | | 396 | | | | 409 | |
7.00%, 05/15/2028 (e) | | | 818 | | | | 894 | |
7.25%, 11/15/2029 (e) | | | 575 | | | | 648 | |
8.25%, 03/15/2026 (e) | | | 5,963 | | | | 6,395 | |
8.63%, 07/01/2025 (e) | | | 5,683 | | | | 6,223 | |
Six Flags Entertainment Corp., 4.88%, 07/31/2024 (e) | | | 850 | | | | 853 | |
Six Flags Theme Parks, Inc., 7.00%, 07/01/2025 (e) | | | 2,994 | | | | 3,227 | |
Stars Group Holdings BV / Stars Group US Co-Borrower LLC, (Netherlands), 7.00%, 07/15/2026 (e) | | | 1,650 | | | | 1,711 | |
Vail Resorts, Inc., 6.25%, 05/15/2025 (e) | | | 921 | | | | 986 | |
WMG Acquisition Corp., | | | | | | | | |
3.00%, 02/15/2031 (e) | | | 500 | | | | 474 | |
3.88%, 07/15/2030 (e) | | | 25 | | | | 25 | |
Wynn Resorts Finance LLC / Wynn Resorts Capital Corp., | | | | | | | | |
5.13%, 10/01/2029 (e) | | | 6,306 | | | | 6,653 | |
7.75%, 04/15/2025 (e) | | | 1,220 | | | | 1,314 | |
| | | | | | | | |
| | |
| | | | | | | 95,465 | |
| | | | | | | | |
| | | | | | | | |
| SECURITY DESCRIPTION | | PRINCIPAL
AMOUNT($) | | | VALUE($) | |
| | | | | | | | |
Food Service — 0.1% | | | | | | | | |
Aramark Services, Inc., | | | | | | | | |
5.00%, 04/01/2025 (e) | | | 600 | | | | 615 | |
5.00%, 02/01/2028 (e) | | | 41 | | | | 43 | |
6.38%, 05/01/2025 (e) | | | 1,501 | | | | 1,595 | |
| | | | | | | | |
| | |
| | | | | | | 2,253 | |
| | | | | | | | |
Home Builders — 1.9% | | | | | | | | |
Ashton Woods USA LLC / Ashton Woods Finance Co., | | | | | | | | |
6.63%, 01/15/2028 (e) | | | 700 | | | | 746 | |
6.75%, 08/01/2025 (e) | | | 2,950 | | | | 3,057 | |
Beazer Homes USA, Inc., | | | | | | | | |
5.88%, 10/15/2027 | | | 2,925 | | | | 3,064 | |
6.75%, 03/15/2025 | | | 2,150 | | | | 2,220 | |
7.25%, 10/15/2029 | | | 1,950 | | | | 2,165 | |
Brookfield Residential Properties, Inc. / Brookfield Residential US LLC, (Canada), | | | | | | | | |
4.88%, 02/15/2030 (e) | | | 2,563 | | | | 2,538 | |
5.00%, 06/15/2029 (e) | | | 1,271 | | | | 1,280 | |
6.25%, 09/15/2027 (e) | | | 5,575 | | | | 5,889 | |
Century Communities, Inc., | | | | | | | | |
5.88%, 07/15/2025 | | | 752 | | | | 778 | |
6.75%, 06/01/2027 | | | 1,850 | | | | 1,963 | |
Forestar Group, Inc., | | | | | | | | |
3.85%, 05/15/2026 (e) | | | 1,540 | | | | 1,554 | |
5.00%, 03/01/2028 (e) | | | 1,100 | | | | 1,138 | |
KB Home, | | | | | | | | |
4.00%, 06/15/2031 | | | 1,003 | | | | 1,012 | |
4.80%, 11/15/2029 | | | 2,175 | | | | 2,356 | |
6.88%, 06/15/2027 | | | 800 | | | | 952 | |
Lennar Corp., | | | | | | | | |
4.50%, 04/30/2024 | | | 1,818 | | | | 1,989 | |
4.75%, 11/15/2022 | | | 1,434 | | | | 1,500 | |
4.75%, 05/30/2025 | | | 915 | | | | 1,026 | |
5.38%, 10/01/2022 | | | 1,000 | | | | 1,056 | |
LGI Homes, Inc., | | | | | | | | |
4.00%, 07/15/2029 (e) | | | 285 | | | | 286 | |
6.88%, 07/15/2026 (e) | | | 1,108 | | | | 1,149 | |
M/I Homes, Inc., 4.95%, 02/01/2028 | | | 1,880 | | | | 1,961 | |
Mattamy Group Corp., (Canada), | | | | | | | | |
4.63%, 03/01/2030 (e) | | | 3,784 | | | | 3,866 | |
5.25%, 12/15/2027 (e) | | | 250 | | | | 261 | |
Meritage Homes Corp., | | | | | | | | |
5.13%, 06/06/2027 | | | 1,375 | | | | 1,537 | |
6.00%, 06/01/2025 | | | 2,575 | | | | 2,935 | |
Picasso Finance Sub, Inc., 6.13%, 06/15/2025 (e) | | | 1,614 | | | | 1,706 | |
Shea Homes LP / Shea Homes Funding Corp., | | | | | | | | |
4.75%, 02/15/2028 (e) | | | 1,300 | | | | 1,336 | |
4.75%, 04/01/2029 (e) | | | 1,150 | | | | 1,181 | |
STL Holding Co. LLC, 7.50%, 02/15/2026 (e) | | | 1,100 | | | | 1,158 | |
Taylor Morrison Communities, Inc., | | | | | | | | |
5.13%, 08/01/2030 (e) | | | 2,752 | | | | 2,976 | |
5.75%, 01/15/2028 (e) | | | 900 | | | | 1,016 | |
SEE NOTES TO FINANCIAL STATEMENTS.
| | | | | | | | | | |
| | | | | |
| 198 | | | | | | | | SIX CIRCLES TRUST | | JUNE 30, 2021 |
| | | | | | | | |
| SECURITY DESCRIPTION | | PRINCIPAL
AMOUNT($) | | | VALUE($) | |
Corporate Bonds — continued | | | | | | | | |
Home Builders — continued | | | | | | | | |
5.88%, 06/15/2027 (e) | | | 2,922 | | | | 3,305 | |
6.63%, 07/15/2027 (e) | | | 2,800 | | | | 2,996 | |
Tri Pointe Homes, Inc., | | | | | | | | |
5.25%, 06/01/2027 | | | 175 | | | | 190 | |
5.70%, 06/15/2028 | | | 975 | | | | 1,075 | |
Williams Scotsman International, Inc., 4.63%, 08/15/2028 (e) | | | 771 | | | | 796 | |
| | | | | | | | |
| | |
| | | | | | | 66,013 | |
| | | | | | | | |
Home Furnishings — 0.1% | | | | | | | | |
Tempur Sealy International, Inc., 4.00%, 04/15/2029 (e) | | | 1,730 | | | | 1,752 | |
WASH Multifamily Acquisition, Inc., 5.75%, 04/15/2026 (e) | | | 633 | | | | 661 | |
| | | | | | | | |
| | |
| | | | | | | 2,413 | |
| | | | | | | | |
Housewares — 0.2% | | | | | | | | |
CD&R Smokey Buyer, Inc., 6.75%, 07/15/2025 (e) | | | 641 | | | | 687 | |
Newell Brands, Inc., | | | | | | | | |
4.88%, 06/01/2025 | | | 1,150 | | | | 1,272 | |
6.00%, 04/01/2046 | | | 137 | | | | 174 | |
Scotts Miracle-Gro Co. (The), | | | | | | | | |
4.00%, 04/01/2031 (e) | | | 2,073 | | | | 2,071 | |
4.50%, 10/15/2029 | | | 1,927 | | | | 2,006 | |
| | | | | | | | |
| | |
| | | | | | | 6,210 | |
| | | | | | | | |
Leisure Time — 0.7% | | | | | | | | |
Carnival Corp., (Panama), | | | | | | | | |
5.75%, 03/01/2027 (e) | | | 5,143 | | | | 5,387 | |
9.88%, 08/01/2027 (e) | | | 1,123 | | | | 1,311 | |
Reg. S, 10.13%, 02/01/2026 | | EUR | 200 | | | | 277 | |
11.50%, 04/01/2023 (e) | | | 4,900 | | | | 5,543 | |
Life Time, Inc., | | | | | | | | |
5.75%, 01/15/2026 (e) | | | 1,408 | | | | 1,459 | |
8.00%, 04/15/2026 (e) | | | 847 | | | | 905 | |
MajorDrive Holdings IV LLC, 6.38%, 06/01/2029 (e) | | | 370 | | | | 369 | |
NCL Corp. Ltd., (Bermuda), | | | | | | | | |
5.88%, 03/15/2026 (e) | | | 860 | | | | 901 | |
10.25%, 02/01/2026 (e) | | | 540 | | | | 628 | |
NCL Finance Ltd., (Bermuda), 6.13%, 03/15/2028 (e) | | | 1,414 | | | | 1,482 | |
Royal Caribbean Cruises Ltd., (Liberia), | | | | | | | | |
5.50%, 04/01/2028 (e) | | | 2,038 | | | | 2,135 | |
9.13%, 06/15/2023 (e) | | | 772 | | | | 847 | |
11.50%, 06/01/2025 (e) | | | 2,170 | | | | 2,501 | |
Viking Cruises Ltd., (Bermuda), | | | | | | | | |
5.88%, 09/15/2027 (e) | | | 200 | | | | 198 | |
6.25%, 05/15/2025 (e) | | | 500 | | | | 497 | |
7.00%, 02/15/2029 (e) | | | 54 | | | | 56 | |
Viking Ocean Cruises Ship VII Ltd., (Bermuda), 5.63%, 02/15/2029 (e) | | | 762 | | | | 770 | |
Vista Outdoor, Inc., 4.50%, 03/15/2029 (e) | | | 575 | | | | 585 | |
| | | | | | | | |
| | |
| | | | | | | 25,851 | |
| | | | | | | | |
| | | | | | | | |
| SECURITY DESCRIPTION | | PRINCIPAL
AMOUNT($) | | | VALUE($) | |
| | | | | | | | |
Lodging — 1.1% | | | | | | | | |
Accor SA, (France), Reg. S, (EUR Swap Rate 5 Year + 4.56%), 4.38%, 01/30/2024 (x) (aa) | | EUR | 200 | | | | 249 | |
Boyd Gaming Corp., | | | | | | | | |
4.75%, 12/01/2027 | | | 3,641 | | | | 3,768 | |
4.75%, 06/15/2031 (e) | | | 2,765 | | | | 2,873 | |
8.63%, 06/01/2025 (e) | | | 721 | | | | 795 | |
Full House Resorts, Inc., 8.25%, 02/15/2028 (e) | | | 113 | | | | 123 | |
Hilton Domestic Operating Co., Inc., | | | | | | | | |
3.63%, 02/15/2032 (e) | | | 2,850 | | | | 2,815 | |
3.75%, 05/01/2029 (e) | | | 1,600 | | | | 1,612 | |
4.00%, 05/01/2031 (e) | | | 915 | | | | 923 | |
4.88%, 01/15/2030 | | | 1,958 | | | | 2,090 | |
5.38%, 05/01/2025 (e) | | | 425 | | | | 447 | |
5.75%, 05/01/2028 (e) | | | 315 | | | | 341 | |
Hilton Worldwide Finance LLC / Hilton Worldwide Finance Corp., 4.88%, 04/01/2027 | | | 1,567 | | | | 1,634 | |
Marriott International, Inc., Series EE, 5.75%, 05/01/2025 | | | 637 | | | | 736 | |
Marriott Ownership Resorts, Inc., 4.50%, 06/15/2029 (e) | | | 558 | | | | 566 | |
MGM Resorts International, | | | | | | | | |
4.63%, 09/01/2026 | | | 500 | | | | 528 | |
4.75%, 10/15/2028 | | | 3,855 | | | | 4,096 | |
5.50%, 04/15/2027 | | | 1,900 | | | | 2,085 | |
6.00%, 03/15/2023 | | | 465 | | | | 498 | |
6.75%, 05/01/2025 | | | 2,590 | | | | 2,774 | |
Station Casinos LLC, | | | | | | | | |
4.50%, 02/15/2028 (e) | | | 900 | | | | 915 | |
5.00%, 10/01/2025 (e) | | | 701 | | | | 712 | |
Sugarhouse HSP Gaming Prop Mezz LP / Sugarhouse HSP Gaming Finance Corp., 5.88%, 05/15/2025 (e) | | | 900 | | | | 889 | |
Travel + Leisure Co., | | | | | | | | |
6.60%, 10/01/2025 | | | 1,090 | | | | 1,229 | |
6.63%, 07/31/2026 (e) | | | 754 | | | | 854 | |
Wyndham Hotels & Resorts, Inc., 4.38%, 08/15/2028 (e) | | | 319 | | | | 331 | |
Wynn Las Vegas LLC / Wynn Las Vegas Capital Corp., 4.25%, 05/30/2023 (e) | | | 840 | | | | 871 | |
Wynn Macau Ltd., (Cayman Islands), | | | | | | | | |
4.88%, 10/01/2024 (e) | | | 750 | | | | 757 | |
5.13%, 12/15/2029 (e) | | | 525 | | | | 541 | |
5.50%, 10/01/2027 (e) | | | 1,330 | | | | 1,383 | |
| | | | | | | | |
| | |
| | | | | | | 37,435 | |
| | | | | | | | |
Office Furnishings — 0.0% (g) | | | | | | | | |
Interface, Inc., 5.50%, 12/01/2028 (e) | | | 475 | | | | 497 | |
| | | | | | | | |
Retail — 2.1% | | | | | | | | |
1011778 BC ULC / New Red Finance, Inc., (Canada), | | | | | | | | |
3.50%, 02/15/2029 (e) | | | 1,300 | | | | 1,284 | |
SEE NOTES TO FINANCIAL STATEMENTS.
| | | | | | | | | | |
| | | | | |
| JUNE 30, 2021 | | SIX CIRCLES TRUST | | | | | | | | 199 |
Six Circles Credit Opportunities Fund
SCHEDULE OF PORTFOLIO INVESTMENTS
AS OF JUNE 30, 2021 (Unaudited) (continued)
(Amounts in U.S. Dollars, unless otherwise noted)
(Amounts in thousands, except number of Futures contracts)
| | | | | | | | |
| SECURITY DESCRIPTION | | PRINCIPAL
AMOUNT($) | | | VALUE($) | |
Corporate Bonds — continued | | | | | | | | |
Retail — continued | | | | | | | | |
3.88%, 01/15/2028 (e) | | | 1,182 | | | | 1,197 | |
4.00%, 10/15/2030 (e) | | | 6,075 | | | | 5,877 | |
4.38%, 01/15/2028 (e) | | | 1,943 | | | | 1,970 | |
5.75%, 04/15/2025 (e) | | | 77 | | | | 81 | |
Academy Ltd., 6.00%, 11/15/2027 (e) | | | 350 | | | | 374 | |
Ambience Merger Sub, Inc., | | | | | | | | |
4.88%, 07/15/2028 (e) (w) | | | 175 | | | | 176 | |
7.13%, 07/15/2029 (e) (w) | | | 759 | | | | 765 | |
Arcos Dorados Holdings, Inc., (British Virgin Islands), | | | | | | | | |
5.88%, 04/04/2027 (e) | | | 200 | | | | 210 | |
6.63%, 09/27/2023 (e) | | | 500 | | | | 548 | |
Asbury Automotive Group, Inc., | | | | | | | | |
4.50%, 03/01/2028 | | | 388 | | | | 399 | |
4.75%, 03/01/2030 | | | 3 | | | | 3 | |
BCPE Ulysses Intermediate, Inc., 7.75% (cash), 04/01/2027 (e) (v) | | | 707 | | | | 725 | |
Beacon Roofing Supply, Inc., 4.13%, 05/15/2029 (e) | | | 356 | | | | 355 | |
Brinker International, Inc., | | | | | | | | |
3.88%, 05/15/2023 | | | 675 | | | | 695 | |
5.00%, 10/01/2024 (e) | | | 1,781 | | | | 1,875 | |
Burger King France SAS, (France), Reg. S, 6.00%, 05/01/2024 | | EUR | 100 | | | | 121 | |
Caleres, Inc., 6.25%, 08/15/2023 | | | 500 | | | | 501 | |
Carvana Co., 5.50%, 04/15/2027 (e) | | | 999 | | | | 1,033 | |
Dufry One BV, (Netherlands), Reg. S, 2.50%, 10/15/2024 | | EUR | 200 | | | | 236 | |
eG Global Finance plc, (United Kingdom), | | | | | | | | |
Reg. S, 6.25%, 10/30/2025 | | EUR | 200 | | | | 243 | |
Reg. S, 6.25%, 03/30/2026 | | GBP | 119 | | | | 165 | |
6.75%, 02/07/2025 (e) | | | 1,018 | | | | 1,052 | |
8.50%, 10/30/2025 (e) | | | 1,193 | | | | 1,262 | |
Foundation Building Materials, Inc., 6.00%, 03/01/2029 (e) | | | 2,152 | | | | 2,125 | |
Gap, Inc. (The), 8.88%, 05/15/2027 (e) | | | 275 | | | | 318 | |
Golden Nugget, Inc., 6.75%, 10/15/2024 (e) | | | 2,205 | | | | 2,228 | |
Goldstory SASU, (France), Reg. S, 5.38%, 03/01/2026 | | EUR | 100 | | | | 121 | |
GYP Holdings III Corp., 4.63%, 05/01/2029 (e) | | | 1,477 | | | | 1,483 | |
IRB Holding Corp., | | | | | | | | |
6.75%, 02/15/2026 (e) | | | 369 | | | | 382 | |
7.00%, 06/15/2025 (e) | | | 263 | | | | 284 | |
Ken Garff Automotive LLC, 4.88%, 09/15/2028 (e) | | | 3 | | | | 3 | |
L Brands, Inc., | | | | | | | | |
6.63%, 10/01/2030 (e) | | | 3 | | | | 3 | |
6.88%, 11/01/2035 | | | 1,441 | | | | 1,827 | |
9.38%, 07/01/2025 (e) | | | 606 | | | | 783 | |
LBM Acquisition LLC, 6.25%, 01/15/2029 (e) | | | 2,032 | | | | 2,048 | |
| | | | | | | | |
| SECURITY DESCRIPTION | | PRINCIPAL
AMOUNT($) | | | VALUE($) | |
| | | | | | | | |
Retail — continued | | | | | | | | |
LCM Investments Holdings II LLC, 4.88%, 05/01/2029 (e) | | | 1,351 | | | | 1,385 | |
Lithia Motors, Inc., 3.88%, 06/01/2029 (e) | | | 492 | | | | 510 | |
Macy’s, Inc., 8.38%, 06/15/2025 (e) | | | 722 | | | | 795 | |
Marks & Spencer plc, (United Kingdom), Reg. S, 4.50%, 07/10/2027 | | GBP | 100 | | | | 148 | |
Murphy Oil USA, Inc., 3.75%, 02/15/2031 (e) | | | 150 | | | | 148 | |
NMG Holding Co., Inc. / Neiman Marcus Group LLC, 7.13%, 04/01/2026 (e) | | | 2,044 | | | | 2,177 | |
Park River Holdings, Inc., 5.63%, 02/01/2029 (e) | | | 2,850 | | | | 2,771 | |
Penske Automotive Group, Inc., | | | | | | | | |
3.50%, 09/01/2025 | | | 438 | | | | 454 | |
3.75%, 06/15/2029 (e) | | | 252 | | | | 253 | |
PetSmart, Inc. / PetSmart Finance Corp., | | | | | | | | |
4.75%, 02/15/2028 (e) | | | 2,081 | | | | 2,161 | |
7.75%, 02/15/2029 (e) | | | 4,357 | | | | 4,792 | |
Sally Holdings LLC / Sally Capital, Inc., | | | | | | | | |
5.63%, 12/01/2025 | | | 1,250 | | | | 1,291 | |
8.75%, 04/30/2025 (e) | | | 3,000 | | | | 3,285 | |
Specialty Building Products Holdings LLC / SBP Finance Corp., 6.38%, 09/30/2026 (e) | | | 1,706 | | | | 1,782 | |
SRS Distribution, Inc., | | | | | | | | |
4.63%, 07/01/2028 (e) | | | 1,569 | | | | 1,604 | |
6.13%, 07/01/2029 (e) | | | 1,841 | | | | 1,895 | |
Staples, Inc., | | | | | | | | |
7.50%, 04/15/2026 (e) | | | 2,561 | | | | 2,657 | |
10.75%, 04/15/2027 (e) | | | 700 | | | | 712 | |
Stonegate Pub Co. Financing 2019 plc, (United Kingdom), Reg. S, 8.25%, 07/31/2025 | | GBP | 200 | | | | 289 | |
Suburban Propane Partners LP / Suburban Energy Finance Corp., | | | | | | | | |
5.00%, 06/01/2031 (e) | | | 1,493 | | | | 1,528 | |
5.88%, 03/01/2027 | | | 1,675 | | | | 1,759 | |
Superior Plus LP / Superior General Partner, Inc., (Canada), 4.50%, 03/15/2029 (e) | | | 1,432 | | | | 1,475 | |
Tendam Brands SAU, (Spain), Reg. S, (ICE LIBOR EUR 3 Month + 5.25%), 5.25%, 09/15/2024 (aa) | | EUR | 100 | | | | 117 | |
Very Group Funding Plc (The), (United Kingdom), Reg. S, 7.75%, 11/15/2022 | | GBP | 100 | | | | 139 | |
White Cap Buyer LLC, 6.88%, 10/15/2028 (e) | | | 3,310 | | | | 3,542 | |
White Cap Parent LLC, 8.25% (cash), 03/15/2026 (e) (v) | | | 1,510 | | | | 1,562 | |
Yum! Brands, Inc., | | | | | | | | |
3.63%, 03/15/2031 | | | 1,300 | | | | 1,294 | |
4.63%, 01/31/2032 | | | 100 | | | | 105 | |
4.75%, 01/15/2030 (e) | | | 527 | | | | 570 | |
| | | | | | | | |
| | |
| | | | | | | 73,952 | |
| | | | | | | | |
SEE NOTES TO FINANCIAL STATEMENTS.
| | | | | | | | | | |
| | | | | |
| 200 | | | | | | | | SIX CIRCLES TRUST | | JUNE 30, 2021 |
| | | | | | | | |
| SECURITY DESCRIPTION | | PRINCIPAL
AMOUNT($) | | | VALUE($) | |
Corporate Bonds — continued | | | | | | | | |
Toys/Games/Hobbies — 0.1% | | | | | | | | |
Mattel, Inc., | | | | | | | | |
3.38%, 04/01/2026 (e) | | | 630 | | | | 653 | |
3.75%, 04/01/2029 (e) | | | 776 | | | | 807 | |
5.45%, 11/01/2041 | | | 300 | | | | 346 | |
6.20%, 10/01/2040 | | | 722 | | | | 890 | |
6.75%, 12/31/2025 (e) | | | 161 | | | | 169 | |
| | | | | | | | |
| | |
| | | | | | | 2,865 | |
| | | | | | | | |
Total Consumer Cyclical | | | | | | | 506,853 | |
| | | | | | | | |
Consumer Non-cyclical — 12.8% | | | | | | | | |
Agriculture — 0.3% | | | | | | | | |
BAT Capital Corp., 3.22%, 08/15/2024 | | | 86 | | | | 91 | |
BAT International Finance plc, (United Kingdom), | | | | | | | | |
1.67%, 03/25/2026 | | | 906 | | | | 906 | |
3.95%, 06/15/2025 (e) | | | 1,108 | | | | 1,211 | |
Imperial Brands Finance plc, (United Kingdom), | | | | | | | | |
3.13%, 07/26/2024 (e) | | | 1,223 | | | | 1,287 | |
3.75%, 07/21/2022 (e) | | | 342 | | | | 351 | |
Reynolds American, Inc., 4.45%, 06/12/2025 | | | 332 | | | | 368 | |
Tereos Finance Groupe I SA, (France), Reg. S, 7.50%, 10/30/2025 | | EUR | 100 | | | | 127 | |
Vector Group Ltd., 5.75%, 02/01/2029 (e) | | | 2,650 | | | | 2,706 | |
Viterra Finance BV, (Netherlands), 2.00%, 04/21/2026 (e) | | | 1,342 | | | | 1,344 | |
| | | | | | | | |
| | |
| | | | | | | 8,391 | |
| | | | | | | | |
Beverages — 0.0% (g) | | | | | | | | |
Bacardi Ltd., (Bermuda), 4.45%, 05/15/2025 (e) | | | 223 | | | | 248 | |
Central American Bottling Corp., (British Virgin Islands), 5.75%, 01/31/2027 (e) | | | 750 | | | | 783 | |
Triton Water Holdings, Inc., 6.25%, 04/01/2029 (e) | | | 402 | | | | 403 | |
| | | | | | | | |
| | |
| | | | | | | 1,434 | |
| | | | | | | | |
Biotechnology — 0.1% | | | | | | | | |
Royalty Pharma plc, (United Kingdom), | | | | | | | | |
0.75%, 09/02/2023 (e) | | | 2,000 | | | | 2,006 | |
1.20%, 09/02/2025 (e) | | | 160 | | | | 158 | |
| | | | | | | | |
| | |
| | | | | | | 2,164 | |
| | | | | | | | |
Commercial Services — 3.1% | | | | | | | | |
Adani Ports & Special Economic Zone Ltd., (India), 3.38%, 07/24/2024 (e) | | | 800 | | | | 831 | |
ADT Security Corp. (The), 4.88%, 07/15/2032 (e) | | | 1,581 | | | | 1,666 | |
Adtalem Global Education, Inc., 5.50%, 03/01/2028 (e) | | | 475 | | | | 484 | |
Allied Universal Holdco LLC / Allied Universal Finance Corp., | | | | | | | | |
6.00%, 06/01/2029 (e) | | | 3,888 | | | | 3,942 | |
| | | | | | | | |
| SECURITY DESCRIPTION | | PRINCIPAL
AMOUNT($) | | | VALUE($) | |
| | | | | | | | |
Commercial Services — continued | | | | | | | | |
6.63%, 07/15/2026 (e) | | | 7,462 | | | | 7,911 | |
9.75%, 07/15/2027 (e) | | | 6,852 | | | | 7,546 | |
Allied Universal Holdco LLC / Allied Universal Finance Corp. / Atlas Luxco 4 Sarl, (Multinational), | | | | | | | | |
4.63%, 06/01/2028 (e) | | | 7,469 | | | | 7,482 | |
Reg. S, 3.63%, 06/01/2028 | | EUR | 117 | | | | 138 | |
Reg. S, 4.88%, 06/01/2028 | | GBP | 100 | | | | 137 | |
AMN Healthcare, Inc., | | | | | | | | |
4.00%, 04/15/2029 (e) | | | 1,875 | | | | 1,888 | |
4.63%, 10/01/2027 (e) | | | 303 | | | | 315 | |
APX Group, Inc., 6.75%, 02/15/2027 (e) | | | 1,804 | | | | 1,921 | |
Autostrade per l’Italia SpA, (Italy), Reg. S, 1.88%, 11/04/2025 | | EUR | 100 | | | | 123 | |
Avis Budget Car Rental LLC / Avis Budget Finance, Inc., | | | | | | | | |
4.75%, 04/01/2028 (e) | | | 925 | | | | 950 | |
5.38%, 03/01/2029 (e) | | | 305 | | | | 318 | |
5.75%, 07/15/2027 (e) | | | 500 | | | | 521 | |
Avis Budget Finance plc, (Jersey), Reg. S, 4.75%, 01/30/2026 | | EUR | 300 | | | | 363 | |
Bidfair Holdings, Inc., 5.88%, 06/01/2029 (e) | | | 253 | | | | 257 | |
Brink’s Co. (The), 5.50%, 07/15/2025 (e) | | | 550 | | | | 583 | |
Carriage Services, Inc., 4.25%, 05/15/2029 (e) | | | 550 | | | | 549 | |
CoreLogic, Inc., 4.50%, 05/01/2028 (e) | | | 2,222 | | | | 2,203 | |
EC Finance plc, (United Kingdom), Reg. S, 2.38%, 11/15/2022 | | EUR | 126 | | | | 147 | |
Garda World Security Corp., (Canada), | | | | | | | | |
4.63%, 02/15/2027 (e) | | | 1,801 | | | | 1,810 | |
6.00%, 06/01/2029 (e) | | | 250 | | | | 248 | |
9.50%, 11/01/2027 (e) | | | 3,383 | | | | 3,747 | |
Gartner, Inc., | | | | | | | | |
3.63%, 06/15/2029 (e) | | | 1,326 | | | | 1,346 | |
3.75%, 10/01/2030 (e) | | | 1,968 | | | | 2,013 | |
4.50%, 07/01/2028 (e) | | | 928 | | | | 980 | |
Herc Holdings, Inc., 5.50%, 07/15/2027 (e) | | | 899 | | | | 948 | |
House of Finance NV (The), (Belgium), Reg. S, 4.38%, 07/15/2026 | | EUR | 100 | | | | 120 | |
IHS Markit Ltd., (Bermuda), 4.13%, 08/01/2023 | | | 731 | | | | 780 | |
Intertrust Group BV, (Netherlands), Reg. S, 3.38%, 11/15/2025 | | EUR | 100 | | | | 121 | |
IPD 3 BV, (Netherlands), Reg. S, 5.50%, 12/01/2025 | | EUR | 200 | | | | 247 | |
Jaguar Holding Co. II / PPD Development LP, | | | | | | | | |
4.63%, 06/15/2025 (e) | | | 1,406 | | | | 1,476 | |
5.00%, 06/15/2028 (e) | | | 1,787 | | | | 1,937 | |
La Financiere Atalian SASU, (France), Reg. S, 6.63%, 05/15/2025 | | GBP | 100 | | | | 139 | |
Legends Hospitality Holding Co. LLC / Legends Hospitality Co-Issuer, Inc., 5.00%, 02/01/2026 (e) | | | 166 | | | | 173 | |
SEE NOTES TO FINANCIAL STATEMENTS.
| | | | | | | | | | |
| | | | | |
| JUNE 30, 2021 | | SIX CIRCLES TRUST | | | | | | | | 201 |
Six Circles Credit Opportunities Fund
SCHEDULE OF PORTFOLIO INVESTMENTS
AS OF JUNE 30, 2021 (Unaudited) (continued)
(Amounts in U.S. Dollars, unless otherwise noted)
(Amounts in thousands, except number of Futures contracts)
| | | | | | | | |
| SECURITY DESCRIPTION | | PRINCIPAL
AMOUNT($) | | | VALUE($) | |
Corporate Bonds — continued | | | | | | | | |
Commercial Services — continued | | | | | | | | |
Loxam SAS, (France), | | | | | | | | |
Reg. S, 3.75%, 07/15/2026 | | EUR | 100 | | | | 121 | |
Reg. S, 5.75%, 07/15/2027 | | EUR | 100 | | | | 123 | |
Metis Merger Sub LLC, 6.50%, 05/15/2029 (e) | | | 2,998 | | | | 2,969 | |
MPH Acquisition Holdings LLC, 5.75%, 11/01/2028 (e) | | | 4,098 | | | | 4,118 | |
NESCO Holdings II, Inc., 5.50%, 04/15/2029 (e) | | | 2,184 | | | | 2,279 | |
Nielsen Co. Luxembourg Sarl (The), (Luxembourg), 5.00%, 02/01/2025 (e) | | | 825 | | | | 849 | |
Nielsen Finance LLC / Nielsen Finance Co., | | | | | | | | |
4.50%, 07/15/2029 (e) | | | 775 | | | | 778 | |
4.75%, 07/15/2031 (e) | | | 1,287 | | | | 1,290 | |
5.63%, 10/01/2028 (e) | | | 3,101 | | | | 3,277 | |
5.88%, 10/01/2030 (e) | | | 765 | | | | 833 | |
Prime Security Services Borrower LLC / Prime Finance, Inc., | | | | | | | | |
3.38%, 08/31/2027 (e) | | | 646 | | | | 627 | |
5.75%, 04/15/2026 (e) | | | 266 | | | | 294 | |
6.25%, 01/15/2028 (e) | | | 1,498 | | | | 1,593 | |
Rekeep SpA, (Italy), Reg. S, 7.25%, 02/01/2026 | | EUR | 200 | | | | 255 | |
Sabre GLBL, Inc., | | | | | | | | |
7.38%, 09/01/2025 (e) | | | 2,237 | | | | 2,433 | |
9.25%, 04/15/2025 (e) | | | 1,841 | | | | 2,188 | |
Service Corp. International, | | | | | | | | |
3.38%, 08/15/2030 | | | 2,072 | | | | 2,030 | |
4.00%, 05/15/2031 | | | 2,194 | | | | 2,239 | |
Shift4 Payments LLC / Shift4 Payments Finance Sub, Inc., 4.63%, 11/01/2026 (e) | | | 1,341 | | | | 1,400 | |
Signal Parent, Inc., 6.13%, 04/01/2029 (e) | | | 750 | | | | 720 | |
Sotheby’s, 7.38%, 10/15/2027 (e) | | | 2,403 | | | | 2,592 | |
Square, Inc., | | | | | | | | |
2.75%, 06/01/2026 (e) | | | 280 | | | | 285 | |
3.50%, 06/01/2031 (e) | | | 2,483 | | | | 2,505 | |
Techem Verwaltungsgesellschaft 674 mbH, (Germany), Reg. S, 6.00%, 07/30/2026 | | EUR | 100 | | | | 122 | |
Triton Container International Ltd., (Bermuda), 1.15%, 06/07/2024 (e) | | | 223 | | | | 223 | |
United Rentals North America, Inc., | | | | | | | | |
3.88%, 02/15/2031 | | | 2,100 | | | | 2,137 | |
4.00%, 07/15/2030 | | | 375 | | | | 386 | |
4.88%, 01/15/2028 | | | 4,000 | | | | 4,245 | |
5.25%, 01/15/2030 | | | 1,000 | | | | 1,096 | |
5.88%, 09/15/2026 | | | 1,500 | | | | 1,552 | |
Verisure Holding AB, (Sweden), Reg. S, 3.25%, 02/15/2027 | | EUR | 100 | | | | 119 | |
Verscend Escrow Corp., 9.75%, 08/15/2026 (e) | | | 5,913 | | | | 6,231 | |
| | | | | | | | |
| | |
| | | | | | | 108,269 | |
| | | | | | | | |
| | | | | | | | |
| SECURITY DESCRIPTION | | PRINCIPAL
AMOUNT($) | | | VALUE($) | |
| | | | | | | | |
Cosmetics/Personal Care — 0.0% (g) | | | | | | | | |
Coty, Inc., Reg. S, 4.00%, 04/15/2023 | | EUR | 300 | | | | 353 | |
Edgewell Personal Care Co., 4.13%, 04/01/2029 (e) | | | 625 | | | | 631 | |
| | | | | | | | |
| | |
| | | | | | | 984 | |
| | | | | | | | |
Food — 2.4% | | | | | | | | |
Albertsons Cos., Inc. / Safeway, Inc. / New Albertsons LP / Albertsons LLC, | | | | | | | | |
3.25%, 03/15/2026 (e) | | | 230 | | | | 234 | |
3.50%, 02/15/2023 (e) | | | 25 | | | | 26 | |
3.50%, 03/15/2029 (e) | | | 2,891 | | | | 2,859 | |
4.63%, 01/15/2027 (e) | | | 2,906 | | | | 3,039 | |
4.88%, 02/15/2030 (e) | | | 968 | | | | 1,032 | |
5.88%, 02/15/2028 (e) | | | 2,087 | | | | 2,249 | |
7.50%, 03/15/2026 (e) | | | 1,500 | | | | 1,646 | |
B&G Foods, Inc., 5.25%, 09/15/2027 | | | 2,236 | | | | 2,329 | |
Bellis Acquisition Co. plc, (United Kingdom), Reg. S, 3.25%, 02/16/2026 | | GBP | 100 | | | | 138 | |
C&S Group Enterprises LLC, 5.00%, 12/15/2028 (e) | | | 1,425 | | | | 1,412 | |
Casino Guichard Perrachon SA, (France), Reg. S, (ICE EURIBOR Swap Rate 5 Year + 3.82%), 3.99%, 01/31/2024 (x) (aa) | | EUR | 100 | | | | 87 | |
Chobani LLC / Chobani Finance Corp., Inc., | | | | | | | | |
4.63%, 11/15/2028 (e) | | | 1,226 | | | | 1,271 | |
7.50%, 04/15/2025 (e) | | | 3,616 | | | | 3,762 | |
Iceland Bondco plc, (United Kingdom), | | | | | | | | |
Reg. S, 4.38%, 05/15/2028 | | GBP | 200 | | | | 260 | |
Reg. S, 4.63%, 03/15/2025 | | GBP | 100 | | | | 136 | |
JBS USA LUX SA / JBS USA Finance, Inc., (Multinational), 6.75%, 02/15/2028 (e) | | | 732 | | | | 804 | |
JBS USA LUX SA / JBS USA Food Co. / JBS USA Finance, Inc., (Multinational), | | | | | | | | |
3.75%, 12/01/2031 (e) | | | 1,985 | | | | 2,031 | |
5.50%, 01/15/2030 (e) | | | 762 | | | | 852 | |
6.50%, 04/15/2029 (e) | | | 5,470 | | | | 6,147 | |
Kraft Heinz Foods Co., | | | | | | | | |
3.00%, 06/01/2026 | | | 758 | | | | 807 | |
4.25%, 03/01/2031 | | | 4,612 | | | | 5,245 | |
4.38%, 06/01/2046 | | | 4,770 | | | | 5,402 | |
4.88%, 10/01/2049 | | | 7,616 | | | | 9,240 | |
5.00%, 07/15/2035 | | | 400 | | | | 491 | |
5.00%, 06/04/2042 | | | 525 | | | | 641 | |
5.20%, 07/15/2045 | | | 4,585 | | | | 5,686 | |
5.50%, 06/01/2050 | | | 5,490 | | | | 7,130 | |
6.88%, 01/26/2039 | | | 1,250 | | | | 1,795 | |
NBM US Holdings, Inc., 7.00%, 05/14/2026 (e) | | | 1,000 | | | | 1,078 | |
Picard Groupe SAS, (France), Reg. S, (ICE LIBOR EUR 3 Month + 3.00%), 3.00%, 11/30/2023 (aa) | | EUR | 200 | | | | 237 | |
Pilgrim’s Pride Corp., | | | | | | | | |
4.25%, 04/15/2031 (e) | | | 2,550 | | | | 2,643 | |
5.88%, 09/30/2027 (e) | | | 1,650 | | | | 1,757 | |
SEE NOTES TO FINANCIAL STATEMENTS.
| | | | | | | | | | |
| | | | | |
| 202 | | | | | | | | SIX CIRCLES TRUST | | JUNE 30, 2021 |
| | | | | | | | |
| SECURITY DESCRIPTION | | PRINCIPAL
AMOUNT($) | | | VALUE($) | |
Corporate Bonds — continued | | | | | | | | |
Food — continued | | | | | | | | |
Post Holdings, Inc., | | | | | | | | |
4.50%, 09/15/2031 (e) | | | 1,765 | | | | 1,761 | |
4.63%, 04/15/2030 (e) | | | 1,804 | | | | 1,831 | |
5.63%, 01/15/2028 (e) | | | 1,216 | | | | 1,289 | |
5.75%, 03/01/2027 (e) | | | 1,075 | | | | 1,125 | |
Premier Foods Finance plc, (United Kingdom), Reg. S, 3.50%, 10/15/2026 | | GBP | 100 | | | | 138 | |
Quatrim SASU, (France), Reg. S, 5.88%, 01/15/2024 | | EUR | 200 | | | | 246 | |
Simmons Foods, Inc. / Simmons Prepared Foods, Inc. / Simmons Pet Food, Inc. / Simmons Feed, 4.63%, 03/01/2029 (e) | | | 881 | | | | 889 | |
US Foods, Inc., 4.75%, 02/15/2029 (e) | | | 2,738 | | | | 2,793 | |
| | | | | | | | |
| | |
| | | | | | | 82,538 | |
| | | | | | | | |
Healthcare — Products — 0.3% | | | | | | | | |
Avantor Funding, Inc., 4.63%, 07/15/2028 (e) | | | 3,579 | | | | 3,779 | |
Hologic, Inc., 3.25%, 02/15/2029 (e) | | | 177 | | | | 175 | |
Ortho-Clinical Diagnostics, Inc. / Ortho-Clinical Diagnostics SA, | | | | | | | | |
7.25%, 02/01/2028 (e) | | | 3,326 | | | | 3,633 | |
7.38%, 06/01/2025 (e) | | | 2,066 | | | | 2,218 | |
| | | | | | | | |
| | |
| | | | | | | 9,805 | |
| | | | | | | | |
Healthcare — Services — 4.0% | | | | | | | | |
Acadia Healthcare Co., Inc., 5.00%, 04/15/2029 (e) | | | 592 | | | | 617 | |
AHP Health Partners, Inc., | | | | | | | | |
5.75%, 07/15/2029 (e) (w) | | | 1,240 | | | | 1,257 | |
9.75%, 07/15/2026 (e) | | | 374 | | | | 402 | |
Akumin, Inc., (Canada), 7.00%, 11/01/2025 (e) | | | 100 | | | | 104 | |
CAB SELAS, (France), Reg. S, 3.38%, 02/01/2028 | | EUR | 200 | | | | 236 | |
Catalent Pharma Solutions, Inc., | | | | | | | | |
Reg. S, 2.38%, 03/01/2028 | | EUR | 300 | | | | 356 | |
3.13%, 02/15/2029 (e) | | | 647 | | | | 627 | |
5.00%, 07/15/2027 (e) | | | 768 | | | | 803 | |
Centene Corp., | | | | | | | | |
2.50%, 03/01/2031 | | | 2,618 | | | | 2,582 | |
3.00%, 10/15/2030 | | | 5,845 | | | | 6,005 | |
4.63%, 12/15/2029 | | | 3,046 | | | | 3,350 | |
5.38%, 06/01/2026 (e) | | | 832 | | | | 868 | |
5.38%, 08/15/2026 (e) | | | 6,133 | | | | 6,409 | |
Charles River Laboratories International, Inc., | | | | | | | | |
3.75%, 03/15/2029 (e) | | | 1,360 | | | | 1,379 | |
4.00%, 03/15/2031 (e) | | | 942 | | | | 980 | |
4.25%, 05/01/2028 (e) | | | 405 | | | | 418 | |
CHS / Community Health Systems, Inc., | | | | | | | | |
5.63%, 03/15/2027 (e) | | | 672 | | | | 716 | |
6.00%, 01/15/2029 (e) | | | 601 | | | | 643 | |
6.63%, 02/15/2025 (e) | | | 5,779 | | | | 6,111 | |
| | | | | | | | |
| SECURITY DESCRIPTION | | PRINCIPAL
AMOUNT($) | | | VALUE($) | |
| | | | | | | | |
Healthcare — Services — continued | | | | | | | | |
8.00%, 03/15/2026 (e) | | | 6,501 | | | | 7,005 | |
CHS/Community Health Systems, Inc., | | | | | | | | |
6.13%, 04/01/2030 (e) | | | 993 | | | | 1,008 | |
6.88%, 04/15/2029 (e) | | | 1,835 | | | | 1,920 | |
DaVita, Inc., | | | | | | | | |
3.75%, 02/15/2031 (e) | | | 4,675 | | | | 4,488 | |
4.63%, 06/01/2030 (e) | | | 2,818 | | | | 2,893 | |
Encompass Health Corp., | | | | | | | | |
4.50%, 02/01/2028 | | | 170 | | | | 176 | |
4.63%, 04/01/2031 | | | 667 | | | | 715 | |
4.75%, 02/01/2030 | | | 1,369 | | | | 1,455 | |
Fresenius Medical Care US Finance II, Inc., 5.88%, 01/31/2022 (e) | | | 276 | | | | 284 | |
Fresenius Medical Care US Finance III, Inc., 1.88%, 12/01/2026 (e) | | | 736 | | | | 736 | |
Global Medical Response, Inc., 6.50%, 10/01/2025 (e) | | | 1,450 | | | | 1,492 | |
HCA, Inc., | | | | | | | | |
3.50%, 09/01/2030 | | | 5,118 | | | | 5,453 | |
5.25%, 04/15/2025 | | | 1,686 | | | | 1,930 | |
5.25%, 06/15/2026 | | | 1,516 | | | | 1,756 | |
5.38%, 02/01/2025 | | | 5,027 | | | | 5,670 | |
5.38%, 09/01/2026 | | | 1,089 | | | | 1,252 | |
5.63%, 09/01/2028 | | | 2,654 | | | | 3,145 | |
5.88%, 05/01/2023 | | | 50 | | | | 54 | |
5.88%, 02/01/2029 | | | 725 | | | | 875 | |
Indigo Merger Sub, Inc., 2.88%, 07/15/2026 (e) (w) | | | 1,397 | | | | 1,421 | |
IQVIA, Inc., | | | | | | | | |
5.00%, 10/15/2026 (e) | | | 897 | | | | 926 | |
5.00%, 05/15/2027 (e) | | | 480 | | | | 503 | |
Korian SA, (France), Reg. S, (UK Gilts 5 Year + 9.08%), 4.13%, 03/15/2024 (x) (aa) | | GBP | 100 | | | | 140 | |
Legacy LifePoint Health LLC, | | | | | | | | |
4.38%, 02/15/2027 (e) | | | 790 | | | | 797 | |
6.75%, 04/15/2025 (e) | | | 1,253 | | | | 1,333 | |
LifePoint Health, Inc., 5.38%, 01/15/2029 (e) | | | 2,538 | | | | 2,475 | |
MEDNAX, Inc., 6.25%, 01/15/2027 (e) | | | 2,987 | | | | 3,163 | |
Molina Healthcare, Inc., | | | | | | | | |
3.88%, 11/15/2030 (e) | | | 1,509 | | | | 1,571 | |
4.38%, 06/15/2028 (e) | | | 1,256 | | | | 1,310 | |
Prime Healthcare Services, Inc., 7.25%, 11/01/2025 (e) | | | 3,049 | | | | 3,285 | |
RegionalCare Hospital Partners Holdings, Inc. / LifePoint Health, Inc., 9.75%, 12/01/2026 (e) | | | 6,373 | | | | 6,859 | |
RP Escrow Issuer LLC, 5.25%, 12/15/2025 (e) | | | 165 | | | | 172 | |
Select Medical Corp., 6.25%, 08/15/2026 (e) | | | 1,190 | | | | 1,267 | |
Surgery Center Holdings, Inc., | | | | | | | | |
6.75%, 07/01/2025 (e) | | | 2,266 | | | | 2,311 | |
10.00%, 04/15/2027 (e) | | | 2,798 | | | | 3,071 | |
SEE NOTES TO FINANCIAL STATEMENTS.
| | | | | | | | | | |
| | | | | |
| JUNE 30, 2021 | | SIX CIRCLES TRUST | | | | | | | | 203 |
Six Circles Credit Opportunities Fund
SCHEDULE OF PORTFOLIO INVESTMENTS
AS OF JUNE 30, 2021 (Unaudited) (continued)
(Amounts in U.S. Dollars, unless otherwise noted)
(Amounts in thousands, except number of Futures contracts)
| | | | | | | | |
| SECURITY DESCRIPTION | | PRINCIPAL
AMOUNT($) | | | VALUE($) | |
Corporate Bonds — continued | | | | | | | | |
Healthcare — Services — continued | | | | | | | | |
Syneos Health, Inc., 3.63%, 01/15/2029 (e) | | | 1,978 | | | | 1,958 | |
Tenet Healthcare Corp., | | | | | | | | |
4.25%, 06/01/2029 (e) | | | 5,181 | | | | 5,246 | |
4.63%, 07/15/2024 | | | 525 | | | | 533 | |
4.63%, 09/01/2024 (e) | | | 1,501 | | | | 1,540 | |
4.88%, 01/01/2026 (e) | | | 2,276 | | | | 2,361 | |
5.13%, 11/01/2027 (e) | | | 1,188 | | | | 1,246 | |
6.13%, 10/01/2028 (e) | | | 14,064 | | | | 15,003 | |
6.25%, 02/01/2027 (e) | | | 3,775 | | | | 3,940 | |
7.50%, 04/01/2025 (e) | | | 98 | | | | 106 | |
US Acute Care Solutions LLC, 6.38%, 03/01/2026 (e) | | | 122 | | | | 126 | |
| | | | | | | | |
| | |
| | | | | | | 138,833 | |
| | | | | | | | |
Household Products/Wares — 0.2% | | | | | | | | |
ACCO Brands Corp., 4.25%, 03/15/2029 (e) | | | 1,275 | | | | 1,262 | |
Central Garden & Pet Co., | | | | | | | | |
4.13%, 10/15/2030 | | | 834 | | | | 852 | |
4.13%, 04/30/2031 (e) | | | 300 | | | | 303 | |
Kronos Acquisition Holdings, Inc. / KIK Custom Products, Inc., | | | | | | | | |
5.00%, 12/31/2026 (e) | | | 704 | | | | 714 | |
7.00%, 12/31/2027 (e) | | | 1,250 | | | | 1,255 | |
Ontex Group NV, (Belgium), Reg. S, 3.50%, 07/15/2026 (w) | | EUR | 100 | | | | 119 | |
Spectrum Brands, Inc., | | | | | | | | |
3.88%, 03/15/2031 (e) | | | 349 | | | | 343 | |
5.50%, 07/15/2030 (e) | | | 1,871 | | | | 2,016 | |
| | | | | | | | |
| | | | | | | 6,864 | |
| | | | | | | | |
Pharmaceuticals — 2.4% | | | | | | | | |
AdaptHealth LLC, | | | | | | | | |
4.63%, 08/01/2029 (e) | | | 1,186 | | | | 1,201 | |
6.13%, 08/01/2028 (e) | | | 1,750 | | | | 1,863 | |
Bausch Health Americas, Inc., 8.50%, 01/31/2027 (e) | | | 2,400 | | | | 2,609 | |
Bausch Health Cos., Inc., (Canada), | | | | | | | | |
4.88%, 06/01/2028 (e) | | | 4,462 | | | | 4,557 | |
5.00%, 01/30/2028 (e) | | | 2,075 | | | | 1,968 | |
5.00%, 02/15/2029 (e) | | | 2,701 | | | | 2,519 | |
5.25%, 01/30/2030 (e) | | | 4,297 | | | | 3,996 | |
5.25%, 02/15/2031 (e) | | | 6,200 | | | | 5,787 | |
5.75%, 08/15/2027 (e) | | | 1,165 | | | | 1,237 | |
6.13%, 04/15/2025 (e) | | | 4,287 | | | | 4,394 | |
6.25%, 02/15/2029 (e) | | | 11,029 | | | | 10,908 | |
7.00%, 01/15/2028 (e) | | | 2,398 | | | | 2,470 | |
7.25%, 05/30/2029 (e) | | | 2,500 | | | | 2,555 | |
9.00%, 12/15/2025 (e) | | | 1,172 | | | | 1,257 | |
Bayer US Finance II LLC, | | | | | | | | |
3.88%, 12/15/2023 (e) | | | 554 | | | | 593 | |
4.25%, 12/15/2025 (e) | | | 2,940 | | | | 3,277 | |
Cheplapharm Arzneimittel GmbH, (Germany), | | | | | | | | |
Reg. S, 4.38%, 01/15/2028 | | EUR | 200 | | | | 246 | |
5.50%, 01/15/2028 (e) | | | 1,019 | | | | 1,045 | |
| | | | | | | | |
| SECURITY DESCRIPTION | | PRINCIPAL
AMOUNT($) | | | VALUE($) | |
| | | | | | | | |
Pharmaceuticals — continued | | | | | | | | |
Diocle Spa, (Italy), Reg. S, (ICE LIBOR EUR 3 Month + 3.88%), 3.88%, 06/30/2026 (aa) | | EUR | 90 | | | | 107 | |
Endo Dac / Endo Finance LLC / Endo Finco, Inc., (Multinational), | | | | | | | | |
6.00%, 06/30/2028 (e) | | | 725 | | | | 489 | |
9.50%, 07/31/2027 (e) | | | 2,228 | | | | 2,272 | |
Endo Luxembourg Finance Co. I Sarl / Endo US, Inc., (Luxembourg), 6.13%, 04/01/2029 (e) | | | 2,761 | | | | 2,706 | |
Gruenenthal GmbH, (Germany), Reg. S, 3.63%, 11/15/2026 | | EUR | 100 | | | | 122 | |
Jazz Securities DAC, (Ireland), 4.38%, 01/15/2029 (e) | | | 2,634 | | | | 2,731 | |
Mylan, Inc., 3.13%, 01/15/2023 (e) | | | 1,950 | | | | 2,020 | |
Nidda BondCo GmbH, (Germany), Reg. S, 5.00%, 09/30/2025 | | EUR | 100 | | | | 119 | |
Organon & Co. / Organon Foreign Debt Co-Issuer BV, | | | | | | | | |
4.13%, 04/30/2028 (e) | | | 2,948 | | | | 3,006 | |
5.13%, 04/30/2031 (e) | | | 3,704 | | | | 3,816 | |
P&L Development LLC / PLD Finance Corp., 7.75%, 11/15/2025 (e) | | | 2,427 | | | | 2,548 | |
Par Pharmaceutical, Inc., 7.50%, 04/01/2027 (e) | | | 5,810 | | | | 5,941 | |
Prestige Brands, Inc., | | | | | | | | |
3.75%, 04/01/2031 (e) | | | 1,690 | | | | 1,629 | |
5.13%, 01/15/2028 (e) | | | 50 | | | | 53 | |
Rossini Sarl, (Luxembourg), Reg. S, 6.75%, 10/30/2025 | | EUR | 200 | | | | 248 | |
Teva Pharmaceutical Finance Netherlands II BV, (Netherlands), | | | | | | | | |
4.50%, 03/01/2025 | | EUR | 200 | | | | 245 | |
6.00%, 01/31/2025 | | EUR | 100 | | | | 128 | |
Vizient, Inc., 6.25%, 05/15/2027 (e) | | | 935 | | | | 985 | |
| | | | | | | | |
| | |
| | | | | | | 81,647 | |
| | | | | | | | |
Total Consumer Non-cyclical | | | | | | | 440,929 | |
| | | | | | | | |
Diversified — 0.0% (g) | |
Holding Companies — Diversified — 0.0% (g) | |
Stena International SA, (Luxembourg), 6.13%, 02/01/2025 (e) | | | 550 | | | | 572 | |
| | | | | | | | |
Energy — 10.8% | |
Coal — 0.0% (g) | |
Coronado Finance Pty Ltd., (Australia), 10.75%, 05/15/2026 (e) | | | 650 | | | | 692 | |
| | | | | | | | |
Energy — Alternate Sources — 0.1% | |
Enviva Partners LP / Enviva Partners Finance Corp., 6.50%, 01/15/2026 (e) | | | 1,298 | | | | 1,357 | |
TerraForm Power Operating LLC, | | | | | | | | |
4.25%, 01/31/2023 (e) | | | 1,550 | | | | 1,591 | |
4.75%, 01/15/2030 (e) | | | 471 | | | | 482 | |
| | | | | | | | |
| | |
| | | | | | | 3,430 | |
| | | | | | | | |
SEE NOTES TO FINANCIAL STATEMENTS.
| | | | | | | | | | |
| | | | | |
| 204 | | | | | | | | SIX CIRCLES TRUST | | JUNE 30, 2021 |
| | | | | | | | |
| SECURITY DESCRIPTION | | PRINCIPAL
AMOUNT($) | | | VALUE($) | |
Corporate Bonds — continued | | | | | | | | |
Oil & Gas — 6.7% | |
Aethon United BR LP / Aethon United Finance Corp., 8.25%, 02/15/2026 (e) | | | 3,601 | | | | 3,899 | |
Antero Resources Corp., | | | | | | | | |
5.00%, 03/01/2025 | | | 2,400 | | | | 2,456 | |
5.38%, 03/01/2030 (e) | | | 2,225 | | | | 2,271 | |
7.63%, 02/01/2029 (e) | | | 2,952 | | | | 3,277 | |
8.38%, 07/15/2026 (e) | | | 2,275 | | | | 2,588 | |
Apache Corp., | | | | | | | | |
4.25%, 01/15/2030 | | | 604 | | | | 637 | |
4.38%, 10/15/2028 | | | 287 | | | | 306 | |
4.75%, 04/15/2043 | | | 2,262 | | | | 2,310 | |
4.88%, 11/15/2027 | | | 1,677 | | | | 1,816 | |
5.10%, 09/01/2040 | | | 1,550 | | | | 1,624 | |
5.25%, 02/01/2042 | | | 78 | | | | 82 | |
5.35%, 07/01/2049 | | | 25 | | | | 26 | |
7.75%, 12/15/2029 | | | 1,450 | | | | 1,726 | |
Ascent Resources Utica Holdings LLC / ARU Finance Corp., | | | | | | | | |
5.88%, 06/30/2029 (e) | | | 1,431 | | | | 1,431 | |
7.00%, 11/01/2026 (e) | | | 4,425 | | | | 4,629 | |
8.25%, 12/31/2028 (e) | | | 1,875 | | | | 2,063 | |
9.00%, 11/01/2027 (e) | | | 1,942 | | | | 2,684 | |
BP Capital Markets plc, (United Kingdom), Reg. S, (UK Gilts 5 Year + 4.17%), 4.25%, 03/22/2027 (x) (aa) | | GBP | 100 | | | | 146 | |
Callon Petroleum Co., | | | | | | | | |
6.13%, 10/01/2024 | | | 1,012 | | | | 998 | |
6.25%, 04/15/2023 | | | 1,570 | | | | 1,572 | |
8.00%, 08/01/2028 (e) (w) | | | 4,040 | | | | 4,085 | |
9.00%, 04/01/2025 (e) | | | 4,060 | | | | 4,425 | |
Cenovus Energy, Inc., (Canada), | | | | | | | | |
3.00%, 08/15/2022 | | | 3,026 | | | | 3,087 | |
3.80%, 09/15/2023 | | | 1,987 | | | | 2,096 | |
5.38%, 07/15/2025 | | | 2,081 | | | | 2,382 | |
Centennial Resource Production LLC, 6.88%, 04/01/2027 (e) | | | 863 | | | | 882 | |
Chesapeake Energy Corp., | | | | | | | | |
5.50%, 02/01/2026 (e) | | | 726 | | | | 766 | |
5.88%, 02/01/2029 (e) | | | 350 | | | | 379 | |
Cimarex Energy Co., 4.38%, 06/01/2024 | | | 1,255 | | | | 1,366 | |
Citgo Holding, Inc., 9.25%, 08/01/2024 (e) | | | 1,345 | | | | 1,372 | |
CITGO Petroleum Corp., 7.00%, 06/15/2025 (e) | | | 699 | | | | 728 | |
CNX Resources Corp., | | | | | | | | |
6.00%, 01/15/2029 (e) | | | 1,916 | | | | 2,072 | |
7.25%, 03/14/2027 (e) | | | 1,275 | | | | 1,366 | |
Colgate Energy Partners III LLC, | | | | | | | | |
5.88%, 07/01/2029 (e) | | | 2,166 | | | | 2,244 | |
7.75%, 02/15/2026 (e) | | | 422 | | | | 463 | |
Comstock Resources, Inc., | | | | | | | | |
5.88%, 01/15/2030 (e) | | | 2,829 | | | | 2,886 | |
6.75%, 03/01/2029 (e) | | | 5,119 | | | | 5,453 | |
7.50%, 05/15/2025 (e) | | | 1,155 | | | | 1,198 | |
| | | | | | | | |
| SECURITY DESCRIPTION | | PRINCIPAL
AMOUNT($) | | | VALUE($) | |
| | | | | | | | |
Oil & Gas — continued | |
Continental Resources, Inc., | | | | | | | | |
3.80%, 06/01/2024 | | | 2,430 | | | | 2,570 | |
4.90%, 06/01/2044 | | | 364 | | | | 412 | |
5.75%, 01/15/2031 (e) | | | 2,497 | | | | 2,991 | |
CrownRock LP / CrownRock Finance, Inc., | | | | | | | | |
5.00%, 05/01/2029 (e) | | | 450 | | | | 473 | |
5.63%, 10/15/2025 (e) | | | 6,058 | | | | 6,270 | |
Devon Energy Corp., | | | | | | | | |
5.25%, 09/15/2024 (e) | | | 2,188 | | | | 2,439 | |
5.25%, 10/15/2027 (e) | | | 1,765 | | | | 1,903 | |
5.88%, 06/15/2028 (e) | | | 32 | | | | 36 | |
8.25%, 08/01/2023 (e) | | | 569 | | | | 648 | |
Diamondback Energy, Inc., | | | | | | | | |
0.90%, 03/24/2023 | | | 2,150 | | | | 2,151 | |
2.88%, 12/01/2024 | | | 1,410 | | | | 1,489 | |
4.75%, 05/31/2025 | | | 342 | | | | 385 | |
5.38%, 05/31/2025 | | | 3,500 | | | | 3,596 | |
Endeavor Energy Resources LP / EER Finance, Inc., | | | | | | | | |
5.50%, 01/30/2026 (e) | | | 5,184 | | | | 5,385 | |
5.75%, 01/30/2028 (e) | | | 1,206 | | | | 1,284 | |
6.63%, 07/15/2025 (e) | | | 1,275 | | | | 1,364 | |
EQT Corp., | | | | | | | | |
3.13%, 05/15/2026 (e) | | | 762 | | | | 779 | |
3.63%, 05/15/2031 (e) | | | 312 | | | | 325 | |
3.90%, 10/01/2027 | | | 3,513 | | | | 3,763 | |
5.00%, 01/15/2029 | | | 969 | | | | 1,081 | |
8.50%, 02/01/2030 | | | 1,085 | | | | 1,414 | |
Great Western Petroleum LLC / Great Western Finance Corp., 12.00%, 09/01/2025 (e) | | | 68 | | | | 68 | |
Harvest Operations Corp., (Canada), 1.00%, 04/26/2024 (e) | | | 330 | | | | 330 | |
Hilcorp Energy I LP / Hilcorp Finance Co., | | | | | | | | |
5.75%, 10/01/2025 (e) | | | 250 | | | | 254 | |
5.75%, 02/01/2029 (e) | | | 1,348 | | | | 1,405 | |
6.00%, 02/01/2031 (e) | | | 1,896 | | | | 2,008 | |
6.25%, 11/01/2028 (e) | | | 1,000 | | | | 1,062 | |
Independence Energy Finance LLC, 7.25%, 05/01/2026 (e) | | | 2,789 | | | | 2,929 | |
Indigo Natural Resources LLC, 5.38%, 02/01/2029 (e) | | | 1,898 | | | | 1,983 | |
Laredo Petroleum, Inc., 9.50%, 01/15/2025 | | | 575 | | | | 606 | |
Lundin Energy Finance BV, (Netherlands), 2.00%, 07/15/2026 (e) | | | 826 | | | | 828 | |
Matador Resources Co., 5.88%, 09/15/2026 | | | 3,990 | | | | 4,110 | |
MEG Energy Corp., (Canada), | | | | | | | | |
5.88%, 02/01/2029 (e) | | | 1,230 | | | | 1,283 | |
6.50%, 01/15/2025 (e) | | | 2,750 | | | | 2,847 | |
7.13%, 02/01/2027 (e) | | | 2,299 | | | | 2,449 | |
Murphy Oil Corp., 6.88%, 08/15/2024 | | | 850 | | | | 869 | |
Nabors Industries Ltd., (Bermuda), | | | | | | | | |
7.25%, 01/15/2026 (e) | | | 2,300 | | | | 2,254 | |
7.50%, 01/15/2028 (e) | | | 1,875 | | | | 1,800 | |
Nabors Industries, Inc., 5.75%, 02/01/2025 | | | 2,350 | | | | 2,162 | |
SEE NOTES TO FINANCIAL STATEMENTS.
| | | | | | | | | | |
| | | | | |
| JUNE 30, 2021 | | SIX CIRCLES TRUST | | | | | | | | 205 |
Six Circles Credit Opportunities Fund
SCHEDULE OF PORTFOLIO INVESTMENTS
AS OF JUNE 30, 2021 (Unaudited) (continued)
(Amounts in U.S. Dollars, unless otherwise noted)
(Amounts in thousands, except number of Futures contracts)
| | | | | | | | |
| SECURITY DESCRIPTION | | PRINCIPAL
AMOUNT($) | | | VALUE($) | |
Corporate Bonds — continued | | | | | | | | |
Oil & Gas — continued | |
Neptune Energy Bondco plc, (United Kingdom), 6.63%, 05/15/2025 (e) | | | 400 | | | | 411 | |
Northern Oil and Gas, Inc., 8.13%, 03/01/2028 (e) | | | 2,780 | | | | 2,995 | |
Occidental Petroleum Corp., | | | | | | | | |
(ICE LIBOR USD 3 Month + 1.45%), 1.61%, 08/15/2022 (aa) | | | 1,810 | | | | 1,801 | |
2.70%, 02/15/2023 | | | 1,357 | | | | 1,387 | |
2.90%, 08/15/2024 | | | 6,379 | | | | 6,523 | |
3.00%, 02/15/2027 | | | 250 | | | | 248 | |
3.40%, 04/15/2026 | | | 50 | | | | 51 | |
3.50%, 06/15/2025 | | | 450 | | | | 460 | |
3.50%, 08/15/2029 | | | 112 | | | | 112 | |
4.10%, 02/15/2047 | | | 1,033 | | | | 962 | |
4.20%, 03/15/2048 | | | 668 | | | | 625 | |
4.40%, 04/15/2046 | | | 2,660 | | | | 2,555 | |
4.50%, 07/15/2044 | | | 2,183 | | | | 2,101 | |
4.63%, 06/15/2045 | | | 2,020 | | | | 1,969 | |
5.50%, 12/01/2025 | | | 1,975 | | | | 2,181 | |
5.55%, 03/15/2026 | | | 61 | | | | 67 | |
5.88%, 09/01/2025 | | | 3,175 | | | | 3,532 | |
6.13%, 01/01/2031 | | | 2,554 | | | | 2,998 | |
6.20%, 03/15/2040 | | | 2,495 | | | | 2,821 | |
6.45%, 09/15/2036 | | | 1,625 | | | | 1,943 | |
6.63%, 09/01/2030 | | | 1,725 | | | | 2,085 | |
6.95%, 07/01/2024 | | | 31 | | | | 35 | |
7.15%, 05/15/2028 | | | 675 | | | | 769 | |
7.50%, 05/01/2031 | | | 1,300 | | | | 1,638 | |
8.50%, 07/15/2027 | | | 1,250 | | | | 1,574 | |
8.88%, 07/15/2030 | | | 850 | | | | 1,137 | |
Ovintiv, Inc., | | | | | | | | |
6.50%, 08/15/2034 | | | 782 | | | | 1,032 | |
6.50%, 02/01/2038 | | | 150 | | | | 200 | |
6.63%, 08/15/2037 | | | 75 | | | | 100 | |
7.38%, 11/01/2031 | | | 219 | | | | 291 | |
Parkland Corp., (Canada), 4.50%, 10/01/2029 (e) | | | 1,229 | | | | 1,249 | |
Parsley Energy LLC / Parsley Finance Corp., 5.63%, 10/15/2027 (e) | | | 1,178 | | | | 1,272 | |
PBF Holding Co. LLC / PBF Finance Corp., 9.25%, 05/15/2025 (e) | | | 5,274 | | | | 5,313 | |
PDC Energy, Inc., | | | | | | | | |
5.75%, 05/15/2026 | | | 1,048 | | | | 1,095 | |
6.13%, 09/15/2024 | | | 505 | | | | 516 | |
Petroleos Mexicanos, (Mexico), | | | | | | | | |
(ICE LIBOR USD 3 Month + 3.65%), 3.77%, 03/11/2022 (aa) | | | 1,000 | | | | 1,008 | |
4.25%, 01/15/2025 | | | 1,200 | | | | 1,228 | |
6.88%, 10/16/2025 (e) | | | 191 | | | | 211 | |
6.88%, 08/04/2026 | | | 525 | | | | 574 | |
Precision Drilling Corp., (Canada), 6.88%, 01/15/2029 (e) | | | 825 | | | | 850 | |
Range Resources Corp., | | | | | | | | |
4.88%, 05/15/2025 | | | 2,775 | | | | 2,872 | |
| | | | | | | | |
| SECURITY DESCRIPTION | | PRINCIPAL
AMOUNT($) | | | VALUE($) | |
| | | | | | | | |
Oil & Gas — continued | |
8.25%, 01/15/2029 (e) | | | 436 | | | | 492 | |
9.25%, 02/01/2026 | | | 2,195 | | | | 2,420 | |
Repsol International Finance BV, (Netherlands), Reg. S, (EUR Swap Rate 5 Year + 4.41%), 4.25%, 09/11/2028 (x) (aa) | | EUR | 300 | | | | 391 | |
Saudi Arabian Oil Co., (Saudi Arabia), | | | | | | | | |
1.63%, 11/24/2025 (e) | | | 400 | | | | 404 | |
2.88%, 04/16/2024 (e) | | | 450 | | | | 474 | |
SM Energy Co., | | | | | | | | |
5.63%, 06/01/2025 | | | 701 | | | | 694 | |
6.50%, 07/15/2028 | | | 1,769 | | | | 1,817 | |
6.63%, 01/15/2027 | | | 67 | | | | 69 | |
6.75%, 09/15/2026 | | | 269 | | | | 274 | |
10.00%, 01/15/2025 (e) | | | 4,981 | | | | 5,620 | |
Southwestern Energy Co., | | | | | | | | |
6.45%, 01/23/2025 | | | 20 | | | | 22 | |
8.38%, 09/15/2028 | | | 1,286 | | | | 1,453 | |
Suncor Energy, Inc., (Canada), 7.88%, 06/15/2026 | | | 650 | | | | 824 | |
Sunoco LP / Sunoco Finance Corp., | | | | | | | | |
4.50%, 05/15/2029 (e) | | | 1,419 | | | | 1,444 | |
5.50%, 02/15/2026 | | | 1,475 | | | | 1,520 | |
Tengizchevroil Finance Co. International Ltd., (Bermuda), 2.63%, 08/15/2025 (e) | | | 800 | | | | 821 | |
Transocean, Inc., (Cayman Islands), 11.50%, 01/30/2027 (e) | | | 1,200 | | | | 1,282 | |
Valero Energy Corp., | | | | | | | | |
1.20%, 03/15/2024 | | | 129 | | | | 130 | |
2.70%, 04/15/2023 | | | 556 | | | | 576 | |
2.85%, 04/15/2025 | | | 696 | | | | 738 | |
3.65%, 03/15/2025 | | | 593 | | | | 646 | |
Vine Energy Holdings LLC, 6.75%, 04/15/2029 (e) | | | 3,273 | | | | 3,448 | |
Viper Energy Partners LP, 5.38%, 11/01/2027 (e) | | | 547 | | | | 570 | |
| | | | | | | | |
| | |
| | | | | | | 230,716 | |
| | | | | | | | |
Oil & Gas Services — 0.4% | |
Archrock Partners LP / Archrock Partners Finance Corp., | | | | | | | | |
6.25%, 04/01/2028 (e) | | | 4,362 | | | | 4,553 | |
6.88%, 04/01/2027 (e) | | | 1,577 | | | | 1,674 | |
TechnipFMC plc, (United Kingdom), 6.50%, 02/01/2026 (e) | | | 1,605 | | | | 1,733 | |
USA Compression Partners LP / USA Compression Finance Corp., | | | | | | | | |
6.88%, 04/01/2026 | | | 1,734 | | | | 1,817 | |
6.88%, 09/01/2027 | | | 2,904 | | | | 3,102 | |
| | | | | | | | |
| | |
| | | | | | | 12,879 | |
| | | | | | | | |
Pipelines — 3.6% | |
Antero Midstream Partners LP / Antero Midstream Finance Corp., | | | | | | | | |
5.38%, 06/15/2029 (e) | | | 2,118 | | | | 2,208 | |
SEE NOTES TO FINANCIAL STATEMENTS.
| | | | | | | | | | |
| | | | | |
| 206 | | | | | | | | SIX CIRCLES TRUST | | JUNE 30, 2021 |
| | | | | | | | |
| SECURITY DESCRIPTION | | PRINCIPAL
AMOUNT($) | | | VALUE($) | |
Corporate Bonds — continued | | | | | | | | |
Pipelines — continued | |
5.75%, 03/01/2027 (e) | | | 2,372 | | | | 2,467 | |
5.75%, 01/15/2028 (e) | | | 3,476 | | | | 3,658 | |
7.88%, 05/15/2026 (e) | | | 2,756 | | | | 3,080 | |
Buckeye Partners LP, | | | | | | | | |
5.60%, 10/15/2044 | | | 1,033 | | | | 1,002 | |
5.85%, 11/15/2043 | | | 17 | | | | 17 | |
Cheniere Corpus Christi Holdings LLC, | | | | | | | | |
5.88%, 03/31/2025 | | | 2,787 | | | | 3,195 | |
7.00%, 06/30/2024 | | | 1,866 | | | | 2,138 | |
Cheniere Energy Partners LP, | | | | | | | | |
4.00%, 03/01/2031 (e) | | | 3,907 | | | | 4,083 | |
4.50%, 10/01/2029 | | | 4,071 | | | | 4,376 | |
Cheniere Energy, Inc., 4.63%, 10/15/2028 (e) | | | 10,726 | | | | 11,316 | |
CNX Midstream Partners LP / CNX Midstream Finance Corp., 6.50%, 03/15/2026 (e) | | | 1,150 | | | | 1,206 | |
CQP Holdco LP / BIP-V Chinook Holdco LLC, 5.50%, 06/15/2031 (e) | | | 1,334 | | | | 1,390 | |
DCP Midstream Operating LP, | | | | | | | | |
5.63%, 07/15/2027 | | | 1,000 | | | | 1,138 | |
6.75%, 09/15/2037 (e) | | | 658 | | | | 791 | |
DT Midstream, Inc., | | | | | | | | |
4.13%, 06/15/2029 (e) | | | 584 | | | | 593 | |
4.38%, 06/15/2031 (e) | | | 3,322 | | | | 3,384 | |
Energy Transfer LP, | | | | | | | | |
4.25%, 03/15/2023 | | | 581 | | | | 609 | |
Series H, (CMT Index 5 Year + 5.69%), 6.50%, 11/15/2026 (x) (aa) | | | 2,157 | | | | 2,188 | |
EnLink Midstream LLC, 5.63%, 01/15/2028 (e) | | | 692 | | | | 731 | |
EnLink Midstream Partners LP, | | | | | | | | |
4.15%, 06/01/2025 | | | 241 | | | | 252 | |
4.40%, 04/01/2024 | | | 879 | | | | 923 | |
4.85%, 07/15/2026 | | | 20 | | | | 21 | |
5.05%, 04/01/2045 | | | 14 | | | | 12 | |
5.60%, 04/01/2044 | | | 1,390 | | | | 1,258 | |
EQM Midstream Partners LP, | | | | | | | | |
4.50%, 01/15/2029 (e) | | | 1,735 | | | | 1,765 | |
4.75%, 01/15/2031 (e) | | | 789 | | | | 813 | |
5.50%, 07/15/2028 | | | 1,625 | | | | 1,756 | |
6.00%, 07/01/2025 (e) | | | 1,870 | | | | 2,034 | |
6.50%, 07/01/2027 (e) | | | 1,816 | | | | 2,025 | |
6.50%, 07/15/2048 | | | 600 | | | | 642 | |
Genesis Energy LP / Genesis Energy Finance Corp., 8.00%, 01/15/2027 | | | 242 | | | | 254 | |
Global Partners LP / GLP Finance Corp., | | | | | | | | |
6.88%, 01/15/2029 | | | 375 | | | | 402 | |
7.00%, 08/01/2027 | | | 600 | | | | 636 | |
Harvest Midstream I LP, 7.50%, 09/01/2028 (e) | | | 531 | | | | 577 | |
Hess Midstream Operations LP, 5.13%, 06/15/2028 (e) | | | 775 | | | | 813 | |
Holly Energy Partners LP / Holly Energy Finance Corp., 5.00%, 02/01/2028 (e) | | | 650 | | | | 665 | |
| | | | | | | | |
| SECURITY DESCRIPTION | | PRINCIPAL
AMOUNT($) | | | VALUE($) | |
| | | | | | | | |
Pipelines — continued | |
ITT Holdings LLC, 6.50%, 08/01/2029 (e) (w) | | | 1,255 | | | | 1,282 | |
New Fortress Energy, Inc., | | | | | | | | |
6.50%, 09/30/2026 (e) | | | 4,238 | | | | 4,330 | |
6.75%, 09/15/2025 (e) | | | 4,592 | | | | 4,713 | |
NGL Energy Operating LLC / NGL Energy Finance Corp., 7.50%, 02/01/2026 (e) | | | 2,041 | | | | 2,143 | |
NGPL PipeCo. LLC, 7.77%, 12/15/2037 (e) | | | 1,166 | | | | 1,663 | |
NOVA Gas Transmission Ltd., (Canada), 7.88%, 04/01/2023 | | | 564 | | | | 632 | |
NuStar Logistics LP, | | | | | | | | |
5.63%, 04/28/2027 | | | 50 | | | | 54 | |
5.75%, 10/01/2025 | | | 728 | | | | 792 | |
6.00%, 06/01/2026 | | | 1,825 | | | | 1,980 | |
6.38%, 10/01/2030 | | | 13 | | | | 14 | |
Oasis Midstream Partners LP / OMP Finance Corp., 8.00%, 04/01/2029 (e) | | | 400 | | | | 425 | |
Rockies Express Pipeline LLC, | | | | | | | | |
3.60%, 05/15/2025 (e) | | | 50 | | | | 51 | |
6.88%, 04/15/2040 (e) | | | 1,500 | | | | 1,586 | |
7.50%, 07/15/2038 (e) | | | 1,000 | | | | 1,105 | |
Rubis Terminal Infra SAS, (France), Reg. S, 5.63%, 05/15/2025 | | EUR | 100 | | | | 125 | |
Sabine Pass Liquefaction LLC, | | | | | | | | |
5.63%, 04/15/2023 | | | 1,354 | | | | 1,454 | |
5.75%, 05/15/2024 | | | 3,792 | | | | 4,256 | |
Summit Midstream Holdings LLC / Summit Midstream Finance Corp., | | | | | | | | |
5.50%, 08/15/2022 | | | 275 | | | | 272 | |
5.75%, 04/15/2025 | | | 675 | | | | 619 | |
Tallgrass Energy Partners LP / Tallgrass Energy Finance Corp., | | | | | | | | |
5.50%, 09/15/2024 (e) | | | 541 | | | | 548 | |
5.50%, 01/15/2028 (e) | | | 850 | | | | 865 | |
6.00%, 03/01/2027 (e) | | | 1,438 | | | | 1,481 | |
6.00%, 12/31/2030 (e) | | | 1,554 | | | | 1,616 | |
7.50%, 10/01/2025 (e) | | | 816 | | | | 893 | |
Targa Resources Partners LP / Targa Resources Partners Finance Corp., | | | | | | | | |
4.00%, 01/15/2032 (e) | | | 155 | | | | 159 | |
4.88%, 02/01/2031 (e) | | | 2,153 | | | | 2,331 | |
5.38%, 02/01/2027 | | | 2,000 | | | | 2,083 | |
5.50%, 03/01/2030 | | | 3,754 | | | | 4,128 | |
5.88%, 04/15/2026 | | | 2,250 | | | | 2,363 | |
6.50%, 07/15/2027 | | | 1,665 | | | | 1,804 | |
6.88%, 01/15/2029 | | | 8 | | | | 9 | |
Western Midstream Operating LP, | | | | | | | | |
(ICE LIBOR USD 3 Month + 2.10%), 2.29%, 01/13/2023 (aa) | | | 835 | | | | 831 | |
3.95%, 06/01/2025 | | | 1,204 | | | | 1,251 | |
4.35%, 02/01/2025 | | | 1,250 | | | | 1,321 | |
4.75%, 08/15/2028 | | | 700 | | | | 756 | |
5.30%, 02/01/2030 | | | 1,250 | | | | 1,400 | |
5.30%, 03/01/2048 | | | 2,313 | | | | 2,463 | |
SEE NOTES TO FINANCIAL STATEMENTS.
| | | | | | | | | | |
| | | | | |
| JUNE 30, 2021 | | SIX CIRCLES TRUST | | | | | | | | 207 |
Six Circles Credit Opportunities Fund
SCHEDULE OF PORTFOLIO INVESTMENTS
AS OF JUNE 30, 2021 (Unaudited) (continued)
(Amounts in U.S. Dollars, unless otherwise noted)
(Amounts in thousands, except number of Futures contracts)
| | | | | | | | |
| SECURITY DESCRIPTION | | PRINCIPAL
AMOUNT($) | | | VALUE($) | |
Corporate Bonds — continued | | | | | | | | |
Pipelines — continued | |
5.45%, 04/01/2044 | | | 2,018 | | | | 2,174 | |
5.50%, 08/15/2048 | | | 251 | | | | 273 | |
6.50%, 02/01/2050 | | | 3,374 | | | | 3,889 | |
| | | | | | | | |
| | |
| | | | | | | 124,552 | |
| | | | | | | | |
Total Energy | | | | | | | 372,269 | |
| | | | | | | | |
Financial — 9.4% | |
Banks — 3.1% | |
ABN AMRO Bank NV, (Netherlands), 4.75%, 07/28/2025 (e) | | | 1,879 | | | | 2,106 | |
AIB Group plc, (Ireland), | | | | | | | | |
(ICE LIBOR USD 3 Month + 1.87%), 4.26%, 04/10/2025 (e) (aa) | | | 2,983 | | | | 3,214 | |
4.75%, 10/12/2023 (e) | | | 3,203 | | | | 3,479 | |
Reg. S, (EUR Swap Rate 5 Year + 6.63%), 6.25%, 06/23/2025 (x) (aa) | | EUR | 200 | | | | 270 | |
Australia & New Zealand Banking Group Ltd., (Australia), | | | | | | | | |
4.40%, 05/19/2026 (e) | | | 2,114 | | | | 2,384 | |
4.50%, 03/19/2024 (e) | | | 280 | | | | 306 | |
Banco BPM SpA, (Italy), Reg. S, (EUR Swap Rate 5 Year + 5.42%), 5.00%, 09/14/2030 (aa) | | EUR | 100 | | | | 130 | |
Banco de Sabadell SA, (Spain), Reg. S, (EUR Swap Rate 5 Year + 2.95%), 2.50%, 04/15/2031 (aa) | | EUR | 100 | | | | 119 | |
Bank of America Corp., | | | | | | | | |
(United States SOFR + 0.41%), 0.52%, 06/14/2024 (aa) | | | 1,114 | | | | 1,114 | |
(United States SOFR + 1.01%), 1.20%, 10/24/2026 (aa) | | | 1,014 | | | | 1,005 | |
(United States SOFR + 1.15%), 1.32%, 06/19/2026 (aa) | | | 408 | | | | 409 | |
(ICE LIBOR USD 3 Month + 1.09%), 3.09%, 10/01/2025 (aa) | | | 85 | | | | 90 | |
Series DD, (ICE LIBOR USD 3 Month + 4.55%), 6.30%, 03/10/2026 (x) (aa) | | | 732 | | | | 851 | |
Series L, 3.95%, 04/21/2025 | | | 279 | | | | 306 | |
Bank of Cyprus PCL, (Cyprus), Reg. S, (EUR Swap Rate 5 Year + 2.79%), 2.50%, 06/24/2027 (aa) | | EUR | 100 | | | | 116 | |
Bank of Ireland Group plc, (Ireland), 4.50%, 11/25/2023 (e) | | | 1,589 | | | | 1,717 | |
BankUnited, Inc., 4.88%, 11/17/2025 | | | 864 | | | | 983 | |
Barclays plc, (United Kingdom), | | | | | | | | |
4.38%, 09/11/2024 | | | 200 | | | | 218 | |
(ICE LIBOR USD 3 Month + 1.40%), 4.61%, 02/15/2023 (aa) | | | 2,741 | | | | 2,811 | |
5.20%, 05/12/2026 | | | 720 | | | | 822 | |
Reg. S, (UK Gilts 5 Year + 6.02%), 6.38%, 12/15/2025 (x) (aa) | | GBP | 200 | | | | 310 | |
(UK Gilts 5 Year + 6.58%), 7.13%, 06/15/2025 (x) (aa) | | GBP | 200 | | | | 316 | |
| | | | | | | | |
| SECURITY DESCRIPTION | | PRINCIPAL
AMOUNT($) | | | VALUE($) | |
| | | | | | | | |
Banks — continued | |
BBVA Bancomer SA, (Mexico), 4.38%, 04/10/2024 (e) | | | 1,400 | | | | 1,521 | |
BNP Paribas SA, (France), (United States SOFR + 1.00%), 1.32%, 01/13/2027 (e) (aa) | | | 221 | | | | 218 | |
Citigroup, Inc., | | | | | | | | |
(United States SOFR + 2.84%), 3.11%, 04/08/2026 (aa) | | | 1,202 | | | | 1,287 | |
3.70%, 01/12/2026 | | | 608 | | | | 673 | |
3.88%, 03/26/2025 | | | 67 | | | | 74 | |
(CMT Index 5 Year + 3.42%), 3.88%, 02/18/2026 (x) (aa) | | | 625 | | | | 638 | |
4.40%, 06/10/2025 | | | 1,273 | | | | 1,422 | |
Series W, (CMT Index 5 Year + 3.60%), 4.00%, 12/10/2025 (x) (aa) | | | 888 | | | | 915 | |
Credit Suisse AG, (Switzerland), 3.63%, 09/09/2024 | | | 748 | | | | 813 | |
Credit Suisse Group AG, (Switzerland), | | | | | | | | |
(United States SOFR + 0.98%), 1.31%, 02/02/2027 (e) (aa) | | | 276 | | | | 270 | |
(United States SOFR + 2.04%), 2.19%, 06/05/2026 (e) (aa) | | | 1,106 | | | | 1,133 | |
(United States SOFR + 1.56%), 2.59%, 09/11/2025 (e) (aa) | | | 388 | | | | 404 | |
(ICE LIBOR USD 3 Month + 1.20%), 3.00%, 12/14/2023 (e) (aa) | | | 4,689 | | | | 4,842 | |
(ICE LIBOR USD 3 Month + 1.24%), 4.21%, 06/12/2024 (e) (aa) | | | 1,818 | | | | 1,936 | |
(CMT Index 5 Year + 3.55%), 4.50%, 09/03/2030 (e) (x) (aa) | | | 220 | | | | 218 | |
Reg. S, (USD Semi-annual Swap Rate 5 Year + 3.46%), 6.25%, 12/18/2024 (x) (aa) | | | 200 | | | | 219 | |
(CMT Index 5 Year + 4.82%), 6.38%, 08/21/2026 (e) (x) (aa) | | | 1,660 | | | | 1,848 | |
Reg. S, (USD ICE Swap Rate 5 Year + 4.33%), 7.25%, 09/12/2025 (x) (aa) | | | 400 | | | | 452 | |
Danske Bank A/S, (Denmark), | | | | | | | | |
(CMT Index 1 Year + 1.03%), 1.17%, 12/08/2023 (e) (aa) | | | 1,172 | | | | 1,178 | |
1.23%, 06/22/2024 (e) | | | 2,125 | | | | 2,147 | |
(CMT Index 1 Year + 1.35%), 1.62%, 09/11/2026 (e) (aa) | | | 2,585 | | | | 2,588 | |
(ICE LIBOR USD 3 Month + 1.59%), 3.24%, 12/20/2025 (e) (aa) | | | 1,943 | | | | 2,068 | |
(CMT Index 1 Year + 1.73%), 5.00%, 01/12/2023 (e) (aa) | | | 221 | | | | 226 | |
5.38%, 01/12/2024 (e) | | | 3,312 | | | | 3,673 | |
Freedom Mortgage Corp., 7.63%, 05/01/2026 (e) | | | 508 | | | | 529 | |
Goldman Sachs Group, Inc. (The), | | | | | | | | |
(United States SOFR + 0.51%), 0.66%, 09/10/2024 (aa) | | | 1,114 | | | | 1,112 | |
SEE NOTES TO FINANCIAL STATEMENTS.
| | | | | | | | | | |
| | | | | |
| 208 | | | | | | | | SIX CIRCLES TRUST | | JUNE 30, 2021 |
| | | | | | | | |
| SECURITY DESCRIPTION | | PRINCIPAL
AMOUNT($) | | | VALUE($) | |
Corporate Bonds — continued | | | | | | | | |
Banks — continued | |
(ICE LIBOR USD 3 Month + 1.20%), 3.27%, 09/29/2025 (aa) | | | 316 | | | | 338 | |
3.50%, 01/23/2025 | | | 79 | | | | 85 | |
3.50%, 04/01/2025 | | | 500 | | | | 543 | |
Series R, (CMT Index 5 Year + 3.22%), 4.95%, 02/10/2025 (x) (aa) | | | 2,036 | | | | 2,176 | |
HSBC Bank plc, (United Kingdom), Series 1M, (ICE LIBOR USD 6 Month + 0.25%), 0.42%, 12/31/2021 (x) (aa) | | | 90 | | | | 84 | |
HSBC Holdings plc, (United Kingdom), | | | | | | | | |
(United States SOFR + 0.71%), 0.98%, 05/24/2025 (aa) | | | 318 | | | | 317 | |
4.25%, 03/14/2024 | | | 672 | | | | 728 | |
(CMT Index 5 Year + 3.65%), 4.60%, 12/17/2030 (x) (aa) | | | 1,568 | | | | 1,627 | |
ING Groep NV, (Netherlands), (CMT Index 5 Year + 4.34%), 5.75%, 11/16/2026 (x) (aa) | | | 200 | | | | 222 | |
Intesa Sanpaolo SpA, (Italy), | | | | | | | | |
3.38%, 01/12/2023 (e) | | | 1,457 | | | | 1,516 | |
5.02%, 06/26/2024 (e) | | | 1,972 | | | | 2,146 | |
Reg. S, (EUR Swap Rate 5 Year + 7.19%), 7.75%, 01/11/2027 (x) (aa) | | EUR | 200 | | | | 290 | |
Series XR, 3.25%, 09/23/2024 (e) | | | 4,141 | | | | 4,406 | |
Itau Unibanco Holding SA, (Brazil), 2.90%, 01/24/2023 (e) | | | 800 | | | | 817 | |
Lloyds Banking Group plc, (United Kingdom), 4.58%, 12/10/2025 | | | 444 | | | | 499 | |
Macquarie Bank Ltd., (Australia), 4.88%, 06/10/2025 (e) | | | 3,034 | | | | 3,395 | |
Macquarie Group Ltd., (Australia), | | | | | | | | |
(ICE LIBOR USD 3 Month + 1.02%), 1.16%, 11/28/2023 (e) (aa) | | | 1,574 | | | | 1,590 | |
(United States SOFR + 1.07%), 1.34%, 01/12/2027 (e) (aa) | | | 446 | | | | 442 | |
(ICE LIBOR USD 3 Month + 1.02%), 3.19%, 11/28/2023 (e) (aa) | | | 277 | | | | 287 | |
Morgan Stanley, (United States SOFR + 0.53%), 0.79%, 05/30/2025 (aa) | | | 1,279 | | | | 1,274 | |
National Westminster Bank plc, (United Kingdom), Series B, (ICE LIBOR USD 6 Month + 0.25%), 0.50%, 08/14/2021 (x) (aa) | | | 200 | | | | 199 | |
Natwest Group plc, (United Kingdom), | | | | | | | | |
(ICE LIBOR USD 3 Month + 1.48%), 3.50%, 05/15/2023 (aa) | | | 539 | | | | 553 | |
3.88%, 09/12/2023 | | | 607 | | | | 648 | |
5.13%, 05/28/2024 | | | 2,636 | | | | 2,928 | |
Popular, Inc., (Puerto Rico), 6.13%, 09/14/2023 | | | 985 | | | | 1,063 | |
Santander Holdings USA, Inc., | | | | | | | | |
3.40%, 01/18/2023 | | | 621 | | | | 646 | |
3.45%, 06/02/2025 | | | 470 | | | | 505 | |
3.50%, 06/07/2024 | | | 444 | | | | 475 | |
| | | | | | | | |
| SECURITY DESCRIPTION | | PRINCIPAL
AMOUNT($) | | | VALUE($) | |
| | | | | | | | |
Banks — continued | |
Standard Chartered plc, (United Kingdom), | | | | | | | | |
(CMT Index 1 Year + 0.78%), 0.99%, 01/12/2025 (e) (aa) | | | 1,034 | | | | 1,031 | |
(CMT Index 1 Year + 0.88%), 1.21%, 03/23/2025 (e) (aa) | | | 200 | | | | 201 | |
(CMT Index 1 Year + 1.17%), 1.32%, 10/14/2023 (e) (aa) | | | 221 | | | | 223 | |
(ICE LIBOR USD 3 Month + 1.21%), 2.82%, 01/30/2026 (e) (aa) | | | 2,207 | | | | 2,317 | |
3.20%, 04/17/2025 (e) | | | 682 | | | | 727 | |
(ICE LIBOR USD 3 Month + 1.15%), 4.25%, 01/20/2023 (e) (aa) | | | 1,936 | | | | 1,975 | |
5.20%, 01/26/2024 (e) | | | 585 | | | | 642 | |
Stichting AK Rabobank Certificaten, (Netherlands), Reg. S, SUB, 2.19% (x) | | EUR | 118 | | | | 189 | |
Turkiye Vakiflar Bankasi TAO, (Turkey), 5.75%, 01/30/2023 (e) | | | 1,300 | | | | 1,338 | |
UBS AG, (Switzerland), | | | | | | | | |
Reg. S, 5.13%, 05/15/2024 | | | 2,637 | | | | 2,907 | |
7.63%, 08/17/2022 | | | 4,228 | | | | 4,548 | |
UBS Group AG, (Switzerland), (CMT Index 5 Year + 3.31%), 4.38%, 02/10/2031 (e) (x) (aa) | | | 817 | | | | 835 | |
UniCredit SpA, (Italy), | | | | | | | | |
Reg. S, (ICE EURIBOR Swap Rate 5 Year + 4.08%), 3.88%, 06/03/2027 (x) (aa) | | EUR | 200 | | | | 227 | |
Reg. S, (ICE EURIBOR Swap Rate 5 Year + 7.33%), 7.50%, 06/03/2026 (x) (aa) | | EUR | 200 | | | | 281 | |
7.83%, 12/04/2023 (e) | | | 700 | | | | 807 | |
Wells Fargo & Co., | | | | | | | | |
(United States SOFR + 1.09%), 2.41%, 10/30/2025 (aa) | | | 336 | | | | 352 | |
Series BB, (CMT Index 5 Year + 3.45%), 3.90%, 03/15/2026 (x) (aa) | | | 2,300 | | | | 2,381 | |
| | | | | | | | |
| | |
| | | | | | | 106,260 | |
| | | | | | | | |
Diversified Financial Services — 2.4% | | | | | | | | |
AerCap Ireland Capital DAC / AerCap Global Aviation Trust, (Ireland), | | | | | | | | |
2.88%, 08/14/2024 | | | 336 | | | | 351 | |
3.15%, 02/15/2024 | | | 524 | | | | 550 | |
3.50%, 01/15/2025 | | | 662 | | | | 702 | |
Air Lease Corp., 3.00%, 09/15/2023 | | | 2,500 | | | | 2,613 | |
Aircastle Ltd., (Bermuda), | | | | | | | | |
4.40%, 09/25/2023 | | | 448 | | | | 480 | |
5.00%, 04/01/2023 | | | 636 | | | | 680 | |
5.50%, 02/15/2022 | | | 186 | | | | 191 | |
Alliance Data Systems Corp., | | | | | | | | |
4.75%, 12/15/2024 (e) | | | 2,080 | | | | 2,137 | |
7.00%, 01/15/2026 (e) | | | 1,146 | | | | 1,228 | |
Ally Financial, Inc., | | | | | | | | |
1.45%, 10/02/2023 | | | 80 | | | | 81 | |
3.88%, 05/21/2024 | | | 858 | | | | 925 | |
4.63%, 03/30/2025 | | | 208 | | | | 233 | |
SEE NOTES TO FINANCIAL STATEMENTS.
| | | | | | | | | | |
| | | | | |
| JUNE 30, 2021 | | SIX CIRCLES TRUST | | | | | | | | 209 |
Six Circles Credit Opportunities Fund
SCHEDULE OF PORTFOLIO INVESTMENTS
AS OF JUNE 30, 2021 (Unaudited) (continued)
(Amounts in U.S. Dollars, unless otherwise noted)
(Amounts in thousands, except number of Futures contracts)
| | | | | | | | |
| SECURITY DESCRIPTION | | PRINCIPAL
AMOUNT($) | | | VALUE($) | |
Corporate Bonds — continued | | | | | | | | |
Diversified Financial Services — continued | |
5.13%, 09/30/2024 | | | 2,352 | | | | 2,650 | |
5.75%, 11/20/2025 | | | 2,342 | | | | 2,690 | |
Aretec Escrow Issuer, Inc., 7.50%, 04/01/2029 (e) | | | 385 | | | | 396 | |
Arrow Global Finance plc, (United Kingdom), Reg. S, 5.13%, 09/15/2024 | | GBP | 200 | | | | 278 | |
Aviation Capital Group LLC, | | | | | | | | |
1.95%, 01/30/2026 (e) | | | 354 | | | | 354 | |
5.50%, 12/15/2024 (e) | | | 1,476 | | | | 1,669 | |
Avolon Holdings Funding Ltd., (Cayman Islands), | | | | | | | | |
2.13%, 02/21/2026 (e) | | | 298 | | | | 297 | |
3.63%, 05/01/2022 (e) | | | 1,848 | | | | 1,890 | |
4.25%, 04/15/2026 (e) | | | 439 | | | | 476 | |
5.13%, 10/01/2023 (e) | | | 580 | | | | 627 | |
Charles Schwab Corp. (The), Series H, (CMT Index 10 Year + 3.08%), 4.00%, 12/01/2030 (x) (aa) | | | 3,136 | | | | 3,208 | |
Citigroup Global Markets Holdings, Inc., 0.75%, 06/07/2024 | | | 874 | | | | 870 | |
Drawbridge Special Opportunities Fund LP / Drawbridge Special Opportunities Fin, 3.88%, 02/15/2026 (e) | | | 250 | | | | 259 | |
Enact Holdings, Inc., 6.50%, 08/15/2025 (e) | | | 1,838 | | | | 2,026 | |
Encore Capital Group, Inc., | | | | | | | | |
Reg. S, 4.25%, 06/01/2028 | | GBP | 159 | | | | 220 | |
Reg. S, 5.38%, 02/15/2026 | | GBP | 300 | | | | 437 | |
Fairstone Financial, Inc., (Canada), 7.88%, 07/15/2024 (e) | | | 1,300 | | | | 1,355 | |
Garfunkelux Holdco 3 SA, (Luxembourg), | | | | | | | | |
Reg. S, 6.75%, 11/01/2025 | | EUR | 200 | | | | 247 | |
Reg. S, 7.75%, 11/01/2025 | | GBP | 100 | | | | 144 | |
Global Aircraft Leasing Co. Ltd., (Cayman Islands), 6.50% (cash), 09/15/2024 (e) (v) | | | 1,670 | | | | 1,679 | |
goeasy Ltd., (Canada), | | | | | | | | |
4.38%, 05/01/2026 (e) | | | 675 | | | | 692 | |
5.38%, 12/01/2024 (e) | | | 700 | | | | 722 | |
Home Point Capital, Inc., 5.00%, 02/01/2026 (e) | | | 2,316 | | | | 2,160 | |
Intrum AB, (Sweden), Reg. S, 4.88%, 08/15/2025 | | EUR | 300 | | | | 374 | |
Jerrold Finco plc, (United Kingdom), Reg. S, 5.25%, 01/15/2027 | | GBP | 100 | | | | 143 | |
LD Holdings Group LLC, 6.13%, 04/01/2028 (e) | | | 1,200 | | | | 1,196 | |
LPL Holdings, Inc., 4.00%, 03/15/2029 (e) | | | 2,150 | | | | 2,161 | |
Nationstar Mortgage Holdings, Inc., | | | | | | | | |
5.13%, 12/15/2030 (e) | | | 1,160 | | | | 1,154 | |
5.50%, 08/15/2028 (e) | | | 4,576 | | | | 4,619 | |
Navient Corp., | | | | | | | | |
4.88%, 03/15/2028 | | | 250 | | | | 251 | |
5.88%, 10/25/2024 | | | 740 | | | | 798 | |
| | | | | | | | |
| SECURITY DESCRIPTION | | PRINCIPAL
AMOUNT($) | | | VALUE($) | |
| | | | | | | | |
Diversified Financial Services — continued | |
6.13%, 03/25/2024 | | | 875 | | | | 944 | |
6.50%, 06/15/2022 | | | 1,755 | | | | 1,830 | |
6.75%, 06/25/2025 | | | 426 | | | | 471 | |
6.75%, 06/15/2026 | | | 1,200 | | | | 1,340 | |
7.25%, 01/25/2022 | | | 834 | | | | 865 | |
7.25%, 09/25/2023 | | | 441 | | | | 487 | |
NFP Corp., | | | | | | | | |
4.88%, 08/15/2028 (e) | | | 1,008 | | | | 1,024 | |
6.88%, 08/15/2028 (e) | | | 6,394 | | | | 6,731 | |
OneMain Finance Corp., | | | | | | | | |
3.50%, 01/15/2027 | | | 1,109 | | | | 1,117 | |
4.00%, 09/15/2030 | | | 829 | | | | 821 | |
5.38%, 11/15/2029 | | | 3,000 | | | | 3,263 | |
5.63%, 03/15/2023 | | | 994 | | | | 1,064 | |
6.13%, 05/15/2022 | | | 350 | | | | 364 | |
6.13%, 03/15/2024 | | | 1,596 | | | | 1,718 | |
6.63%, 01/15/2028 | | | 2,496 | | | | 2,861 | |
6.88%, 03/15/2025 | | | 1,175 | | | | 1,326 | |
7.13%, 03/15/2026 | | | 1,920 | | | | 2,236 | |
8.25%, 10/01/2023 | | | 305 | | | | 343 | |
8.88%, 06/01/2025 | | | 357 | | | | 396 | |
Park Aerospace Holdings Ltd., (Cayman Islands), | | | | | | | | |
4.50%, 03/15/2023 (e) | | | 1,614 | | | | 1,696 | |
5.50%, 02/15/2024 (e) | | | 1,590 | | | | 1,748 | |
PennyMac Financial Services, Inc., | | | | | | | | |
4.25%, 02/15/2029 (e) | | | 925 | | | | 891 | |
5.38%, 10/15/2025 (e) | | | 890 | | | | 937 | |
Quicken Loans LLC, 5.25%, 01/15/2028 (e) | | | 1,525 | | | | 1,601 | |
Quicken Loans LLC / Quicken Loans Co-Issuer, Inc., 3.88%, 03/01/2031 (e) | | | 50 | | | | 50 | |
United Wholesale Mortgage LLC, | | | | | | | | |
5.50%, 11/15/2025 (e) | | | 1,250 | | | | 1,294 | |
5.50%, 04/15/2029 (e) | | | 699 | | | | 699 | |
| | | | | | | | |
| | |
| | | | | | | 84,330 | |
| | | | | | | | |
Insurance — 1.0% | | | | | | | | |
Alliant Holdings Intermediate LLC / Alliant Holdings Co-Issuer, | | | | | | | | |
4.25%, 10/15/2027 (e) | | | 4,663 | | | | 4,733 | |
6.75%, 10/15/2027 (e) | | | 7,873 | | | | 8,274 | |
AmWINS Group, Inc., 7.75%, 07/01/2026 (e) | | | 1,924 | | | | 2,041 | |
Ardonagh Midco 2 plc, (United Kingdom), 11.50% (cash), 01/15/2027 (e) (v) | | | 685 | | | | 750 | |
AssuredPartners, Inc., 5.63%, 01/15/2029 (e) | | | 1,695 | | | | 1,695 | |
BroadStreet Partners, Inc., 5.88%, 04/15/2029 (e) | | | 1,998 | | | | 2,038 | |
CNO Financial Group, Inc., 5.25%, 05/30/2025 | | | 2,028 | | | | 2,301 | |
F&G Global Funding, 1.75%, 06/30/2026 (e) | | | 416 | | | | 418 | |
SEE NOTES TO FINANCIAL STATEMENTS.
| | | | | | | | | | |
| | | | | |
| 210 | | | | | | | | SIX CIRCLES TRUST | | JUNE 30, 2021 |
| | | | | | | | |
| SECURITY DESCRIPTION | | PRINCIPAL
AMOUNT($) | | | VALUE($) | |
Corporate Bonds — continued | | | | | | | | |
Insurance — continued | | | | | | | | |
Fidelity & Guaranty Life Holdings, Inc., 5.50%, 05/01/2025 (e) | | | 804 | | | | 926 | |
Galaxy Bidco Ltd., (Jersey), Reg. S, 6.50%, 07/31/2026 | | GBP | 300 | | | | 437 | |
GTCR AP Finance, Inc., 8.00%, 05/15/2027 (e) | | | 2,067 | | | | 2,201 | |
Highlands Holdings Bond Issuer Ltd. / Highlands Holdings Bond Co-Issuer, Inc., (Bermuda), 7.63% (cash), 10/15/2025 (e) (v) | | | 567 | | | | 600 | |
HUB International Ltd., 7.00%, 05/01/2026 (e) | | | 4,633 | | | | 4,805 | |
Legal & General Group plc, (United Kingdom), Reg. S, (UK Gilts 5 Year + 5.38%), 5.63%, 03/24/2031 (x) (aa) | | GBP | 200 | | | | 310 | |
Liberty Mutual Group, Inc., Reg. S, (EUR Swap Rate 5 Year + 3.70%), 3.63%, 05/23/2059 (aa) | | EUR | 200 | | | | 247 | |
MGIC Investment Corp., 5.25%, 08/15/2028 | | | 300 | | | | 318 | |
Unipol Gruppo SpA, (Italy), Reg. S, 3.25%, 09/23/2030 | | EUR | 100 | | | | 133 | |
USI, Inc., 6.88%, 05/01/2025 (e) | | | 1,901 | | | | 1,925 | |
| | | | | | | | |
| | |
| | | | | | | 34,152 | |
| | | | | | | | |
Investment Companies — 0.1% | | | | | | | | |
Icahn Enterprises LP / Icahn Enterprises Finance Corp., | | | | | | | | |
5.25%, 05/15/2027 (e) | | | 1,786 | | | | 1,846 | |
4.38%, 02/01/2029 (e) | | | 1,293 | | | | 1,287 | |
6.25%, 05/15/2026 | | | 837 | | | | 888 | |
Owl Rock Technology Finance Corp., 3.75%, 06/17/2026 (e) | | | 145 | | | | 152 | |
| | | | | | | | |
| | |
| | | | | | | 4,173 | |
| | | | | | | | |
Real Estate — 0.5% | | | | | | | | |
ADLER Group SA, (Luxembourg), | | | | | | | | |
Reg. S, 2.75%, 11/13/2026 | | EUR | 100 | | | | 120 | |
Reg. S, 3.25%, 08/05/2025 | | EUR | 100 | | | | 122 | |
Aroundtown SA, (Luxembourg), Reg. S, (EUR Swap Rate 5 Year + 3.98%), 3.38%, 09/23/2024 (x) (aa) | | EUR | 100 | | | | 123 | |
Canary Wharf Group Investment Holdings plc, (United Kingdom), | | | | | | | | |
Reg. S, 1.75%, 04/07/2026 | | EUR | 100 | | | | 119 | |
Reg. S, 3.38%, 04/23/2028 | | GBP | 100 | | | | 140 | |
Citycon OYJ, (Finland), Reg. S, (EUR Swap Rate 5 Year + 4.71%), 4.50%, 11/24/2024 (x) (aa) | | EUR | 100 | | | | 123 | |
Cushman & Wakefield US Borrower LLC, 6.75%, 05/15/2028 (e) | | | 1,303 | | | | 1,405 | |
DEMIRE Deutsche Mittelstand Real Estate AG, (Germany), Reg. S, 1.88%, 10/15/2024 | | EUR | 100 | | | | 116 | |
Fastighets AB Balder, (Sweden), Reg. S, (EUR Swap Rate 5 Year + 3.19%), 2.87%, 06/02/2081 (aa) | | EUR | 100 | | | | 117 | |
| | | | | | | | |
| SECURITY DESCRIPTION | | PRINCIPAL
AMOUNT($) | | | VALUE($) | |
| | | | | | | | |
Real Estate — continued | | | | | | | | |
Five Point Operating Co. LP / Five Point Capital Corp., 7.88%, 11/15/2025 (e) | | | 3,450 | | | | 3,644 | |
Greystar Real Estate Partners LLC, 5.75%, 12/01/2025 (e) | | | 1,750 | | | | 1,799 | |
Heimstaden Bostad AB, (Sweden), | | | | | | | | |
Reg. S, (EUR Swap Rate 5 Year + 3.15%), 2.63%, 02/01/2027 (x) (aa) | | EUR | 100 | | | | 117 | |
Reg. S, (EUR Swap Rate 5 Year + 3.91%), 3.38%, 01/15/2026 (x) (aa) | | EUR | 100 | | | | 123 | |
Howard Hughes Corp. (The), | | | | | | | | |
4.13%, 02/01/2029 (e) | | | 706 | | | | 706 | |
4.38%, 02/01/2031 (e) | | | 1,607 | | | | 1,601 | |
5.38%, 08/01/2028 (e) | | | 2,607 | | | | 2,768 | |
Hunt Cos., Inc., 5.25%, 04/15/2029 (e) | | | 2,600 | | | | 2,522 | |
Realogy Group LLC / Realogy Co-Issuer Corp., 5.75%, 01/15/2029 (e) | | | 522 | | | | 546 | |
| | | | | | | | |
| | |
| | | | | | | 16,211 | |
| | | | | | | | |
REITS — 2.3% | | | | | | | | |
Brookfield Property REIT, Inc. / BPR Cumulus LLC / BPR Nimbus LLC / GGSI Sellco LL, 5.75%, 05/15/2026 (e) | | | 16 | | | | 17 | |
CTR Partnership LP / CareTrust Capital Corp., 3.88%, 06/30/2028 (e) | | | 592 | | | | 605 | |
Diversified Healthcare Trust, | | | | | | | | |
4.38%, 03/01/2031 | | | 250 | | | | 239 | |
4.75%, 02/15/2028 | | | 3,975 | | | | 3,915 | |
9.75%, 06/15/2025 | | | 1,958 | | | | 2,169 | |
EPR Properties, 4.75%, 12/15/2026 | | | 780 | | | | 847 | |
ESH Hospitality, Inc., 5.25%, 05/01/2025 (e) | | | 2,645 | | | | 2,694 | |
Global Net Lease, Inc. / Global Net Lease Operating Partnership LP, 3.75%, 12/15/2027 (e) | | | 964 | | | | 955 | |
GLP Capital LP / GLP Financing II, Inc., | | | | | | | | |
4.00%, 01/15/2031 | | | 57 | | | | 61 | |
5.25%, 06/01/2025 | | | 834 | | | | 939 | |
HAT Holdings I LLC / HAT Holdings II LLC, | | | | | | | | |
3.38%, 06/15/2026 (e) | | | 1,158 | | | | 1,167 | |
6.00%, 04/15/2025 (e) | | | 1,375 | | | | 1,449 | |
Iron Mountain UK plc, (United Kingdom), Reg. S, 3.88%, 11/15/2025 | | GBP | 100 | | | | 140 | |
Iron Mountain, Inc., | | | | | | | | |
5.25%, 07/15/2030 (e) | | | 1,511 | | | | 1,600 | |
5.63%, 07/15/2032 (e) | | | 1,087 | | | | 1,163 | |
iStar, Inc., 5.50%, 02/15/2026 | | | 746 | | | | 781 | |
Ladder Capital Finance Holdings LLLP / Ladder Capital Finance Corp., | | | | | | | | |
4.25%, 02/01/2027 (e) | | | 1,180 | | | | 1,175 | |
4.75%, 06/15/2029 (e) | | | 498 | | | | 499 | |
5.25%, 03/15/2022 (e) | | | 1,912 | | | | 1,921 | |
MGM Growth Properties Operating Partnership LP / MGP Finance Co-Issuer, Inc., | | | | | | | | |
3.88%, 02/15/2029 (e) | | | 1,838 | | | | 1,866 | |
SEE NOTES TO FINANCIAL STATEMENTS.
| | | | | | | | | | |
| | | | | |
| JUNE 30, 2021 | | SIX CIRCLES TRUST | | | | | | | | 211 |
Six Circles Credit Opportunities Fund
SCHEDULE OF PORTFOLIO INVESTMENTS
AS OF JUNE 30, 2021 (Unaudited) (continued)
(Amounts in U.S. Dollars, unless otherwise noted)
(Amounts in thousands, except number of Futures contracts)
| | | | | | | | |
| SECURITY DESCRIPTION | | PRINCIPAL
AMOUNT($) | | | VALUE($) | |
Corporate Bonds — continued | | | | | | | | |
REITS — continued | | | | | | | | |
4.50%, 09/01/2026 | | | 1,210 | | | | 1,292 | |
4.50%, 01/15/2028 | | | 2,440 | | | | 2,580 | |
4.63%, 06/15/2025 (e) | | | 506 | | | | 541 | |
5.63%, 05/01/2024 | | | 1,818 | | | | 1,969 | |
5.75%, 02/01/2027 | | | 569 | | | | 633 | |
MPT Operating Partnership LP / MPT Finance Corp., | | | | | | | | |
3.50%, 03/15/2031 | | | 4,544 | | | | 4,589 | |
4.63%, 08/01/2029 | | | 2,085 | | | | 2,232 | |
5.00%, 10/15/2027 | | | 2,507 | | | | 2,652 | |
5.25%, 08/01/2026 | | | 250 | | | | 258 | |
Park Intermediate Holdings LLC / PK Domestic Property LLC / PK Finance Co-Issuer, | | | | | | | | |
5.88%, 10/01/2028 (e) | | | 1,075 | | | | 1,145 | |
7.50%, 06/01/2025 (e) | | | 3,550 | | | | 3,847 | |
RHP Hotel Properties LP / RHP Finance Corp., | | | | | | | | |
4.50%, 02/15/2029 (e) | | | 793 | | | | 793 | |
4.75%, 10/15/2027 | | | 1,690 | | | | 1,736 | |
RLJ Lodging Trust LP, 3.75%, 07/01/2026 (e) | | | 917 | | | | 926 | |
Sabra Health Care LP, 5.13%, 08/15/2026 | | | 75 | | | | 84 | |
SBA Communications Corp., | | | | | | | | |
3.13%, 02/01/2029 (e) | | | 275 | | | | 265 | |
3.88%, 02/15/2027 | | | 2,568 | | | | 2,637 | |
4.88%, 09/01/2024 | | | 1,605 | | | | 1,633 | |
Service Properties Trust, | | | | | | | | |
5.50%, 12/15/2027 | | | 150 | | | | 160 | |
7.50%, 09/15/2025 | | | 1,524 | | | | 1,726 | |
SL Green Operating Partnership LP, 3.25%, 10/15/2022 | | | 1,060 | | | | 1,091 | |
Starwood Property Trust, Inc., 5.50%, 11/01/2023 (e) | | | 2 | | | | 2 | |
Uniti Group LP / Uniti Fiber Holdings, Inc. / CSL Capital LLC, | | | | | | | | |
7.13%, 12/15/2024 (e) | | | 535 | | | | 553 | |
7.88%, 02/15/2025 (e) | | | 5,320 | | | | 5,686 | |
Uniti Group LP / Uniti Group Finance, Inc. / CSL Capital LLC, | | | | | | | | |
4.75%, 04/15/2028 (e) | | | 700 | | | | 698 | |
6.50%, 02/15/2029 (e) | | | 2,192 | | | | 2,198 | |
VEREIT Operating Partnership LP, 4.63%, 11/01/2025 | | | 736 | | | | 834 | |
VICI Properties LP / VICI Note Co., Inc., | | | | | | | | |
3.75%, 02/15/2027 (e) | | | 5,843 | | | | 5,943 | |
4.13%, 08/15/2030 (e) | | | 2,918 | | | | 2,996 | |
4.25%, 12/01/2026 (e) | | | 2,376 | | | | 2,472 | |
4.63%, 12/01/2029 (e) | | | 1,200 | | | | 1,275 | |
Vornado Realty LP, 2.15%, 06/01/2026 | | | 135 | | | | 137 | |
XHR LP, 4.88%, 06/01/2029 (e) | | | 234 | | | | 242 | |
| | | | | | | | |
| | |
| | | | | | | 80,027 | |
| | | | | | | | |
Total Financial | | | | | | | 325,153 | |
| | | | | | | | |
| | | | | | | | |
| SECURITY DESCRIPTION | | PRINCIPAL
AMOUNT($) | | | VALUE($) | |
| | | | | | | | |
Industrial — 7.5% | | | | | | | | |
Aerospace/Defense — 1.9% | | | | | | | | |
BAE Systems plc, (United Kingdom), 4.75%, 10/11/2021 (e) | | | 1,120 | | | | 1,133 | |
Boeing Co. (The), | | | | | | | | |
2.80%, 03/01/2023 | | | 988 | | | | 1,021 | |
4.51%, 05/01/2023 | | | 2,286 | | | | 2,437 | |
4.88%, 05/01/2025 | | | 2,274 | | | | 2,549 | |
5.15%, 05/01/2030 | | | 458 | | | | 543 | |
5.81%, 05/01/2050 | | | 3,485 | | | | 4,696 | |
5.93%, 05/01/2060 | | | 7,623 | | | | 10,534 | |
F-Brasile SpA / F-Brasile US LLC, (Italy), Series XR, 7.38%, 08/15/2026 (e) | | | 1,396 | | | | 1,438 | |
Kratos Defense & Security Solutions, Inc., 6.50%, 11/30/2025 (e) | | | 124 | | | | 130 | |
Rolls-Royce plc, (United Kingdom), | | | | | | | | |
5.75%, 10/15/2027 (e) | | | 2,611 | | | | 2,876 | |
Reg. S, 5.75%, 10/15/2027 | | GBP | 300 | | | | 454 | |
Spirit AeroSystems, Inc., | | | | | | | | |
5.50%, 01/15/2025 (e) | | | 803 | | | | 853 | |
7.50%, 04/15/2025 (e) | | | 550 | | | | 587 | |
SSL Robotics LLC, 9.75%, 12/31/2023 (e) | | | 1,832 | | | | 2,027 | |
TransDigm UK Holdings plc, (United Kingdom), 6.88%, 05/15/2026 | | | 2,700 | | | | 2,849 | |
TransDigm, Inc., | | | | | | | | |
4.63%, 01/15/2029 (e) | | | 2,085 | | | | 2,086 | |
4.88%, 05/01/2029 (e) | | | 1,104 | | | | 1,115 | |
5.50%, 11/15/2027 | | | 2,300 | | | | 2,398 | |
6.25%, 03/15/2026 (e) | | | 11,828 | | | | 12,478 | |
6.38%, 06/15/2026 | | | 416 | | | | 431 | |
7.50%, 03/15/2027 | | | 427 | | | | 454 | |
8.00%, 12/15/2025 (e) | | | 8,458 | | | | 9,139 | |
Triumph Group, Inc., 8.88%, 06/01/2024 (e) | | | 2,880 | | | | 3,204 | |
| | | | | | | | |
| | |
| | | | | | | 65,432 | |
| | | | | | | | |
Building Materials — 1.0% | | | | | | | | |
APi Group DE, Inc., 4.13%, 07/15/2029 (e) | | | 480 | | | | 478 | |
Cemex SAB de CV, (Mexico), Reg. S, 3.13%, 03/19/2026 | | EUR | 100 | | | | 122 | |
Cornerstone Building Brands, Inc., 6.13%, 01/15/2029 (e) | | | 3,527 | | | | 3,783 | |
CP Atlas Buyer, Inc., 7.00%, 12/01/2028 (e) | | | 2,337 | | | | 2,422 | |
Forterra Finance LLC / FRTA Finance Corp., 6.50%, 07/15/2025 (e) | | | 765 | | | | 824 | |
Griffon Corp., 5.75%, 03/01/2028 | | | 2,600 | | | | 2,762 | |
HT Troplast GmbH, (Germany), Reg. S, 9.25%, 07/15/2025 | | EUR | 100 | | | | 131 | |
JELD-WEN, Inc., 4.63%, 12/15/2025 (e) | | | 1,000 | | | | 1,022 | |
Koppers, Inc., 6.00%, 02/15/2025 (e) | | | 1,400 | | | | 1,445 | |
Masonite International Corp., (Canada), 5.38%, 02/01/2028 (e) | | | 854 | | | | 905 | |
Patrick Industries, Inc., | | | | | | | | |
4.75%, 05/01/2029 (e) | | | 899 | | | | 894 | |
7.50%, 10/15/2027 (e) | | | 1,000 | | | | 1,081 | |
SEE NOTES TO FINANCIAL STATEMENTS.
| | | | | | | | | | |
| | | | | |
| 212 | | | | | | | | SIX CIRCLES TRUST | | JUNE 30, 2021 |
| | | | | | | | |
| SECURITY DESCRIPTION | | PRINCIPAL
AMOUNT($) | | | VALUE($) | |
Corporate Bonds — continued | | | | | | | | |
Building Materials — continued | | | | | | | | |
SRM Escrow Issuer LLC, 6.00%, 11/01/2028 (e) | | | 4,621 | | | | 4,898 | |
Standard Industries, Inc., | | | | | | | | |
Reg. S, 2.25%, 11/21/2026 | | EUR | 100 | | | | 118 | |
3.38%, 01/15/2031 (e) | | | 4,568 | | | | 4,372 | |
4.38%, 07/15/2030 (e) | | | 3,711 | | | | 3,827 | |
4.75%, 01/15/2028 (e) | | | 1,325 | | | | 1,387 | |
5.00%, 02/15/2027 (e) | | | 100 | | | | 104 | |
Summit Materials LLC / Summit Materials Finance Corp., | | | | | | | | |
5.25%, 01/15/2029 (e) | | | 1,129 | | | | 1,199 | |
6.50%, 03/15/2027 (e) | | | 850 | | | | 900 | |
US Concrete, Inc., 5.13%, 03/01/2029 (e) | | | 1,500 | | | | 1,639 | |
Victors Merger Corp., 6.38%, 05/15/2029 (e) | | | 700 | | | | 705 | |
| | | | | | | | |
| | |
| | | | | | | 35,018 | |
| | | | | | | | |
Electrical Components & Equipments — 0.3% | |
Belden, Inc., Reg. S, 3.88%, 03/15/2028 | | EUR | 100 | | | | 124 | |
Energizer Holdings, Inc., | | | | | | | | |
4.38%, 03/31/2029 (e) | | | 500 | | | | 500 | |
4.75%, 06/15/2028 (e) | | | 1,558 | | | | 1,597 | |
WESCO Distribution, Inc., | | | | | | | | |
5.38%, 06/15/2024 | | | 125 | | | | 127 | |
7.13%, 06/15/2025 (e) | | | 4,856 | | | | 5,248 | |
7.25%, 06/15/2028 (e) | | | 1,707 | | | | 1,901 | |
| | | | | | | | |
| | |
| | | | | | | 9,497 | |
| | | | | | | | |
Electronics — 0.3% | |
Atkore, Inc., 4.25%, 06/01/2031 (e) | | | 484 | | | | 490 | |
Brightstar Escrow Corp., 9.75%, 10/15/2025 (e) | | | 1,250 | | | | 1,345 | |
Flex Ltd., (Singapore), 3.75%, 02/01/2026 | | | 1,000 | | | | 1,093 | |
Imola Merger Corp., 4.75%, 05/15/2029 (e) | | | 1,894 | | | | 1,948 | |
Sensata Technologies BV, (Netherlands), 4.00%, 04/15/2029 (e) | | | 2,130 | | | | 2,162 | |
Sensata Technologies, Inc., | | | | | | | | |
3.75%, 02/15/2031 (e) | | | 268 | | | | 265 | |
4.38%, 02/15/2030 (e) | | | 2,480 | | | | 2,614 | |
| | | | | | | | |
| | |
| | | | | | | 9,917 | |
| | | | | | | | |
Engineering & Construction — 0.3% | | | | | | | | |
Abertis Infraestructuras Finance BV, (Netherlands), Reg. S, (EUR Swap Rate 5 Year + 3.69%), 3.25%, 11/24/2025 (x) (aa) | | EUR | 300 | | | | 368 | |
AECOM, 5.13%, 03/15/2027 | | | 2,325 | | | | 2,589 | |
Arcosa, Inc., 4.38%, 04/15/2029 (e) | | | 374 | | | | 380 | |
Brand Industrial Services, Inc., 8.50%, 07/15/2025 (e) | | | 1,477 | | | | 1,502 | |
Dycom Industries, Inc., 4.50%, 04/15/2029 (e) | | | 353 | | | | 356 | |
Fluor Corp., 3.50%, 12/15/2024 | | | 47 | | | | 50 | |
Heathrow Finance plc, (United Kingdom), Reg. S, SUB, 4.63%, 09/01/2029 | | GBP | 300 | | | | 427 | |
| | | | | | | | |
| SECURITY DESCRIPTION | | PRINCIPAL
AMOUNT($) | | | VALUE($) | |
| | | | | | | | |
Engineering & Construction — continued | | | | | | | | |
MasTec, Inc., 4.50%, 08/15/2028 (e) | | | 342 | | | | 360 | |
PowerTeam Services LLC, 9.03%, 12/04/2025 (e) | | | 1,000 | | | | 1,100 | |
TopBuild Corp., 3.63%, 03/15/2029 (e) | | | 1,425 | | | | 1,411 | |
| | | | | | | | |
| | |
| | | | | | | 8,543 | |
| | | | | | | | |
Environmental Control — 0.4% | | | | | | | | |
Clean Harbors, Inc., 5.13%, 07/15/2029 (e) | | | 517 | | | | 562 | |
Covanta Holding Corp., 5.00%, 09/01/2030 | | | 71 | | | | 75 | |
GFL Environmental, Inc., (Canada), | | | | | | | | |
3.50%, 09/01/2028 (e) | | | 356 | | | | 355 | |
3.75%, 08/01/2025 (e) | | | 547 | | | | 562 | |
4.00%, 08/01/2028 (e) | | | 1,770 | | | | 1,749 | |
4.75%, 06/15/2029 (e) | | | 1,392 | | | | 1,439 | |
5.13%, 12/15/2026 (e) | | | 1,705 | | | | 1,804 | |
Madison IAQ LLC, | | | | | | | | |
4.13%, 06/30/2028 (e) | | | 1,028 | | | | 1,038 | |
5.88%, 06/30/2029 (e) | | | 2,937 | | | | 2,989 | |
Paprec Holding SA, (France), Reg. S, 3.50%, 07/01/2028 (w) | | EUR | 100 | | | | 118 | |
Stericycle, Inc., 3.88%, 01/15/2029 (e) | | | 176 | | | | 176 | |
Tervita Corp., (Canada), 11.00%, 12/01/2025 (e) | | | 1,065 | | | | 1,192 | |
Waste Pro USA, Inc., 5.50%, 02/15/2026 (e) | | | 1,938 | | | | 2,000 | |
| | | | | | | | |
| | |
| | | | | | | 14,059 | |
| | | | | | | | |
Machinery — Construction & Mining — 0.1% | | | | | | | | |
BWX Technologies, Inc., | | | | | | | | |
4.13%, 06/30/2028 (e) | | | 1,426 | | | | 1,451 | |
4.13%, 04/15/2029 (e) | | | 399 | | | | 406 | |
Terex Corp., 5.00%, 05/15/2029 (e) | | | 2,729 | | | | 2,845 | |
| | | | | | | | |
| | |
| | | | | | | 4,702 | |
| | | | | | | | |
Machinery — Diversified — 0.6% | | | | | | | | |
ATS Automation Tooling Systems, Inc., (Canada), 4.13%, 12/15/2028 (e) | | | 114 | | | | 117 | |
CNH Industrial NV, (Netherlands), 4.50%, 08/15/2023 | | | 562 | | | | 606 | |
Colfax Corp., 6.38%, 02/15/2026 (e) | | | 682 | | | | 720 | |
GrafTech Finance, Inc., 4.63%, 12/15/2028 (e) | | | 644 | | | | 661 | |
Husky III Holding Ltd., (Canada), 13.00% (cash), 02/15/2025 (e) (v) | | | 1,401 | | | | 1,511 | |
Maxim Crane Works Holdings Capital LLC, 10.13%, 08/01/2024 (e) | | | 4,281 | | | | 4,415 | |
Mueller Water Products, Inc., 4.00%, 06/15/2029 (e) | | | 523 | | | | 537 | |
Novafives SAS, (France), Reg. S, 5.00%, 06/15/2025 | | EUR | 100 | | | | 111 | |
Renk AG/Frankfurt am Main, (Germany), Series JUN, Reg. S, 5.75%, 07/15/2025 | | EUR | 100 | | | | 123 | |
Sofima Holding SPA, (Italy), Reg. S, 3.75%, 01/15/2028 | | EUR | 100 | | | | 119 | |
SEE NOTES TO FINANCIAL STATEMENTS.
| | | | | | | | | | |
| | | | | |
| JUNE 30, 2021 | | SIX CIRCLES TRUST | | | | | | | | 213 |
Six Circles Credit Opportunities Fund
SCHEDULE OF PORTFOLIO INVESTMENTS
AS OF JUNE 30, 2021 (Unaudited) (continued)
(Amounts in U.S. Dollars, unless otherwise noted)
(Amounts in thousands, except number of Futures contracts)
| | | | | | | | |
| SECURITY DESCRIPTION | | PRINCIPAL
AMOUNT($) | | | VALUE($) | |
Corporate Bonds — continued | | | | | | | | |
Machinery—Diversified — continued | | | | | | | | |
Titan Acquisition Ltd. / Titan Co-Borrower LLC, (Multinational), 7.75%, 04/15/2026 (e) | | | 1,902 | | | | 1,971 | |
TK Elevator Midco GmbH, (Germany), Reg. S, 4.38%, 07/15/2027 | | EUR | 200 | | | | 248 | |
TK Elevator US Newco, Inc., 5.25%, 07/15/2027 (e) | | | 3,754 | | | | 3,956 | |
Vertical Holdco GmbH, (Germany), | | | | | | | | |
Reg. S, 6.63%, 07/15/2028 | | EUR | 100 | | | | 126 | |
7.63%, 07/15/2028 (e) | | | 4,040 | | | | 4,379 | |
Westinghouse Air Brake Technologies Corp., | | | | | | | | |
3.20%, 06/15/2025 | | | 58 | | | | 62 | |
4.38%, 08/15/2023 | | | 1,117 | | | | 1,183 | |
| | | | | | | | |
| | |
| | | | | | | 20,845 | |
| | | | | | | | |
Metal Fabricate/Hardware — 0.1% | | | | | | | | |
Hillman Group, Inc. (The), 6.38%, 07/15/2022 (e) | | | 1,672 | | | | 1,674 | |
| | | | | | | | |
Miscellaneous Manufacturers — 0.7% | | | | | | | | |
Amsted Industries, Inc., | | | | | | | | |
4.63%, 05/15/2030 (e) | | | 1,908 | | | | 1,956 | |
5.63%, 07/01/2027 (e) | | | 122 | | | | 128 | |
Bombardier, Inc., (Canada), | | | | | | | | |
7.13%, 06/15/2026 (e) | | | 3,484 | | | | 3,632 | |
7.45%, 05/01/2034 (e) | | | 151 | | | | 162 | |
7.50%, 12/01/2024 (e) | | | 3,455 | | | | 3,610 | |
7.50%, 03/15/2025 (e) | | | 1,500 | | | | 1,542 | |
7.88%, 04/15/2027 (e) | | | 9,241 | | | | 9,588 | |
Gates Global LLC / Gates Corp., 6.25%, 01/15/2026 (e) | | | 3,228 | | | | 3,382 | |
| | | | | | | | |
| | |
| | | | | | | 24,000 | |
| | | | | | | | |
Packaging & Containers — 1.6% | | | | | | | | |
ARD Finance SA, (Luxembourg), 6.50% (cash), 06/30/2027 (e) (v) | | | 6,932 | | | | 7,279 | |
Ardagh Metal Packaging Finance USA LLC / Ardagh Metal Packaging Finance plc, (Multinational), | | | | | | | | |
Reg. S, 2.00%, 09/01/2028 | | EUR | 100 | | | | 119 | |
Reg. S, 3.00%, 09/01/2029 | | EUR | 100 | | | | 118 | |
4.00%, 09/01/2029 (e) | | | 3,641 | | | | 3,613 | |
Ardagh Packaging Finance plc / Ardagh Holdings USA, Inc., (Multinational), | | | | | | | | |
4.13%, 08/15/2026 (e) | | | 910 | | | | 939 | |
5.25%, 08/15/2027 (e) | | | 5,580 | | | | 5,692 | |
6.00%, 02/15/2025 (e) | | | 1,900 | | | | 1,960 | |
Ball Corp., 2.88%, 08/15/2030 | | | 775 | | | | 761 | |
Berry Global, Inc., | | | | | | | | |
4.88%, 07/15/2026 (e) | | | 75 | | | | 79 | |
5.13%, 07/15/2023 | | | 1,068 | | | | 1,069 | |
Crown Americas LLC / Crown Americas Capital Corp. IV, 4.50%, 01/15/2023 | | | 625 | | | | 653 | |
Crown Americas LLC / Crown Americas Capital Corp. V, 4.25%, 09/30/2026 | | | 146 | | | | 157 | |
| | | | | | | | |
| SECURITY DESCRIPTION | | PRINCIPAL
AMOUNT($) | | | VALUE($) | |
| | | | | | | | |
Packaging & Containers — continued | | | | | | | | |
Crown Americas LLC / Crown Americas Capital Corp. VI, 4.75%, 02/01/2026 | | | 350 | | | | 363 | |
Flex Acquisition Co., Inc., | | | | | | | | |
6.88%, 01/15/2025 (e) | | | 175 | | | | 178 | |
7.88%, 07/15/2026 (e) | | | 2,700 | | | | 2,808 | |
Graham Packaging Co., Inc., 7.13%, 08/15/2028 (e) | | | 400 | | | | 431 | |
Intelligent Packaging Holdco Issuer LP, (Canada), 9.00% (cash), 01/15/2026 (e) (v) | | | 425 | | | | 436 | |
Intelligent Packaging Ltd. Finco, Inc. / Intelligent Packaging Ltd. Co-Issuer LLC, (Canada), 6.00%, 09/15/2028 (e) | | | 1,522 | | | | 1,583 | |
Intertape Polymer Group, Inc., (Canada), 4.38%, 06/15/2029 (e) | | | 502 | | | | 509 | |
Kleopatra Finco Sarl, (Luxembourg), Reg. S, 4.25%, 03/01/2026 | | EUR | 100 | | | | 119 | |
LABL Escrow Issuer LLC, | | | | | | | | |
6.75%, 07/15/2026 (e) | | | 1,014 | | | | 1,082 | |
10.50%, 07/15/2027 (e) | | | 621 | | | | 684 | |
Mauser Packaging Solutions Holding Co., | | | | | | | | |
5.50%, 04/15/2024 (e) | | | 2,012 | | | | 2,032 | |
7.25%, 04/15/2025 (e) | | | 1,175 | | | | 1,152 | |
OI European Group BV, (Netherlands), Reg. S, 2.88%, 02/15/2025 | | EUR | 100 | | | | 120 | |
Owens-Brockway Glass Container, Inc., | | | | | | | | |
5.38%, 01/15/2025 (e) | | | 50 | | | | 53 | |
6.63%, 05/13/2027 (e) | | | 3,075 | | | | 3,352 | |
Reynolds Group Issuer, Inc. / Reynolds Group Issuer LLC / Reynolds Group Issuer Lu, 4.00%, 10/15/2027 (e) | | | 825 | | | | 819 | |
Sealed Air Corp., | | | | | | | | |
4.00%, 12/01/2027 (e) | | | 89 | | | | 94 | |
5.25%, 04/01/2023 (e) | | | 750 | | | | 793 | |
Trident TPI Holdings, Inc., | | | | | | | | |
6.63%, 11/01/2025 (e) | | | 25 | | | | 25 | |
9.25%, 08/01/2024 (e) | | | 1,175 | | | | 1,228 | |
TriMas Corp., 4.13%, 04/15/2029 (e) | | | 4,900 | | | | 4,960 | |
Trivium Packaging Finance BV, (Netherlands), | | | | | | | | |
Reg. S, 3.75%, 08/15/2026 | | EUR | 100 | | | | 120 | |
5.50%, 08/15/2026 (e) | | | 3,420 | | | | 3,594 | |
8.50%, 08/15/2027 (e) | | | 6,699 | | | | 7,283 | |
| | | | | | | | |
| | |
| | | | | | | 56,257 | |
| | | | | | | | |
Shipbuilding — 0.0% (g) | | | | | | | | |
Huntington Ingalls Industries, Inc., 3.84%, 05/01/2025 | | | 743 | | | | 810 | |
| | | | | | | | |
Transportation — 0.2% | | | | | | | | |
CMA CGM SA, (France), Reg. S, 7.50%, 01/15/2026 | | EUR | 100 | | | | 132 | |
Danaos Corp., (Marshall Island), 8.50%, 03/01/2028 (e) | | | 285 | | | | 312 | |
Getlink SE, (France), Reg. S, 3.50%, 10/30/2025 | | EUR | 100 | | | | 123 | |
SEE NOTES TO FINANCIAL STATEMENTS.
| | | | | | | | | | |
| | | | | |
| 214 | | | | | | | | SIX CIRCLES TRUST | | JUNE 30, 2021 |
| | | | | | | | |
| SECURITY DESCRIPTION | | PRINCIPAL
AMOUNT($) | | | VALUE($) | |
Corporate Bonds — continued | | | | | | | | |
Transportation — continued | | | | | | | | |
National Express Group plc, (United Kingdom), Reg. S, (UK Gilts 5 Year + 4.14%), 4.25%, 11/26/2025 (x) (aa) | | GBP | 100 | | | | 143 | |
Rumo Luxembourg Sarl, (Luxembourg), 5.88%, 01/18/2025 (e) | | | 400 | | | | 419 | |
Watco Cos. LLC / Watco Finance Corp., 6.50%, 06/15/2027 (e) | | | 725 | | | | 776 | |
XPO Logistics, Inc., | | | | | | | | |
6.13%, 09/01/2023 (e) | | | 150 | | | | 151 | |
6.25%, 05/01/2025 (e) | | | 4,820 | | | | 5,140 | |
| | | | | | | | |
| | |
| | | | | | | 7,196 | |
| | | | | | | | |
Trucking & Leasing — 0.0% (g) | | | | | | | | |
Fortress Transportation and Infrastructure Investors LLC, | | | | | | | | |
5.50%, 05/01/2028 (e) | | | 1,416 | | | | 1,475 | |
6.50%, 10/01/2025 (e) | | | 81 | | | | 84 | |
| | | | | | | | |
| | | | | | | 1,559 | |
| | | | | | | | |
Total Industrial | | | | | | | 259,509 | |
| | | | | | | | |
Technology — 4.1% | | | | | | | | |
Computers — 1.6% | | | | | | | | |
Ahead DB Holdings LLC, 6.63%, 05/01/2028 (e) | | | 510 | | | | 527 | |
Austin BidCo., Inc., 7.13%, 12/15/2028 (e) | | | 83 | | | | 85 | |
Banff Merger Sub, Inc., 9.75%, 09/01/2026 (e) | | | 13,204 | | | | 13,897 | |
Booz Allen Hamilton, Inc., | | | | | | | | |
3.88%, 09/01/2028 (e) | | | 1,389 | | | | 1,417 | |
4.00%, 07/01/2029 (e) | | | 1,384 | | | | 1,415 | |
Centurion Bidco SpA, (Italy), Reg. S, 5.88%, 09/30/2026 | | EUR | 200 | | | | 248 | |
Crowdstrike Holdings, Inc., 3.00%, 02/15/2029 | | | 1,101 | | | | 1,102 | |
Dell International LLC / EMC Corp., | | | | | | | | |
4.00%, 07/15/2024 | | | 674 | | | | 733 | |
5.45%, 06/15/2023 | | | 4,824 | | | | 5,233 | |
7.13%, 06/15/2024 (e) | | | 5,310 | | | | 5,446 | |
Diebold Nixdorf, Inc., 9.38%, 07/15/2025 (e) | | | 175 | | | | 194 | |
Everi Payments, Inc., 7.50%, 12/15/2025 (e) | | | 2,225 | | | | 2,310 | |
KBR, Inc., 4.75%, 09/30/2028 (e) | | | 6 | | | | 6 | |
NCR Corp., | | | | | | | | |
5.00%, 10/01/2028 (e) | | | 591 | | | | 611 | |
5.13%, 04/15/2029 (e) | | | 2,622 | | | | 2,704 | |
5.25%, 10/01/2030 (e) | | | 3,175 | | | | 3,294 | |
6.13%, 09/01/2029 (e) | | | 1,213 | | | | 1,322 | |
Science Applications International Corp., 4.88%, 04/01/2028 (e) | | | 817 | | | | 857 | |
Seagate HDD Cayman, (Cayman Islands), | | | | | | | | |
3.13%, 07/15/2029 (e) | | | 600 | | | | 581 | |
3.38%, 07/15/2031 (e) | | | 375 | | | | 363 | |
| | | | | | | | |
| SECURITY DESCRIPTION | | PRINCIPAL
AMOUNT($) | | | VALUE($) | |
| | | | | | | | |
Computers — continued | | | | | | | | |
Tempo Acquisition LLC / Tempo Acquisition Finance Corp., | | | | | | | | |
5.75%, 06/01/2025 (e) | | | 2,130 | | | | 2,242 | |
6.75%, 06/01/2025 (e) | | | 9,841 | | | | 10,007 | |
| | | | | | | | |
| | |
| | | | | | | 54,594 | |
| | | | | | | | |
Office/Business & Equipments — 0.1% | | | | | | | | |
CDW LLC / CDW Finance Corp., | | | | | | | | |
3.25%, 02/15/2029 | | | 2,161 | | | | 2,188 | |
4.13%, 05/01/2025 | | | 23 | | | | 24 | |
| | | | | | | | |
| | |
| | | | | | | 2,212 | |
| | | | | | | | |
Semiconductors — 0.6% | | | | | | | | |
ams AG, (Austria), 7.00%, 07/31/2025 (e) | | | 425 | | | | 458 | |
Broadcom, Inc., | | | | | | | | |
3.15%, 11/15/2025 | | | 1,662 | | | | 1,783 | |
4.70%, 04/15/2025 | | | 146 | | | | 165 | |
Entegris, Inc., | | | | | | | | |
3.63%, 05/01/2029 (e) | | | 666 | | | | 674 | |
4.38%, 04/15/2028 (e) | | | 858 | | | | 896 | |
Infineon Technologies AG, (Germany), Reg. S, (EUR Swap Rate 5 Year + 4.00%), 3.63%, 01/01/2028 (x) (aa) | | EUR | 100 | | | | 131 | |
Microchip Technology, Inc., | | | | | | | | |
0.97%, 02/15/2024 (e) | | | 889 | | | | 888 | |
2.67%, 09/01/2023 | | | 1,446 | | | | 1,506 | |
4.25%, 09/01/2025 | | | 4,943 | | | | 5,190 | |
4.33%, 06/01/2023 | | | 438 | | | | 467 | |
NXP BV / NXP Funding LLC, (Multinational), 3.88%, 09/01/2022 (e) | | | 1,008 | | | | 1,045 | |
ON Semiconductor Corp., 3.88%, 09/01/2028 (e) | | | 1,018 | | | | 1,049 | |
Qorvo, Inc., 3.38%, 04/01/2031 (e) | | | 550 | | | | 573 | |
SK Hynix, Inc., (South Korea), 1.50%, 01/19/2026 (e) | | | 1,200 | | | | 1,184 | |
Skyworks Solutions, Inc., 0.90%, 06/01/2023 | | | 3,725 | | | | 3,736 | |
Synaptics, Inc., 4.00%, 06/15/2029 (e) | | | 657 | | | | 660 | |
| | | | | | | | |
| | |
| | | | | | | 20,405 | |
| | | | | | | | |
Software — 1.8% | | | | | | | | |
Black Knight InfoServ LLC, 3.63%, 09/01/2028 (e) | | | 4,451 | | | | 4,429 | |
Boxer Parent Co., Inc., | | | | | | | | |
Reg. S, 6.50%, 10/02/2025 | | EUR | 300 | | | | 377 | |
7.13%, 10/02/2025 (e) | | | 1,551 | | | | 1,660 | |
9.13%, 03/01/2026 (e) | | | 3,344 | | | | 3,530 | |
Brunello Bidco SpA, (Italy), Reg. S, (ICE LIBOR EUR 3 Month + 3.75%), 3.75%, 02/15/2028 (aa) | | EUR | 100 | | | | 118 | |
BY Crown Parent LLC, 7.38%, 10/15/2024 (e) | | | 640 | | | | 652 | |
BY Crown Parent LLC / BY Bond Finance, Inc., 4.25%, 01/31/2026 (e) | | | 5,812 | | | | 6,088 | |
SEE NOTES TO FINANCIAL STATEMENTS.
| | | | | | | | | | |
| | | | | |
| JUNE 30, 2021 | | SIX CIRCLES TRUST | | | | | | | | 215 |
Six Circles Credit Opportunities Fund
SCHEDULE OF PORTFOLIO INVESTMENTS
AS OF JUNE 30, 2021 (Unaudited) (continued)
(Amounts in U.S. Dollars, unless otherwise noted)
(Amounts in thousands, except number of Futures contracts)
| | | | | | | | |
| SECURITY DESCRIPTION | | PRINCIPAL
AMOUNT($) | | | VALUE($) | |
Corporate Bonds — continued | | | | | | | | |
Software — continued | | | | | | | | |
Camelot Finance SA, (Luxembourg), 4.50%, 11/01/2026 (e) | | | 1,348 | | | | 1,410 | |
Change Healthcare Holdings LLC / Change Healthcare Finance, Inc., 5.75%, 03/01/2025 (e) | | | 3,214 | | | | 3,266 | |
Clarivate Science Holdings Corp., | | | | | | | | |
3.88%, 06/30/2028 (e) | | | 1,492 | | | | 1,500 | |
4.88%, 06/30/2029 (e) | | | 2,870 | | | | 2,945 | |
Dun & Bradstreet Corp. (The), | | | | | | | | |
6.88%, 08/15/2026 (e) | | | 1,502 | | | | 1,592 | |
10.25%, 02/15/2027 (e) | | | 4,476 | | | | 4,943 | |
Elastic NV, (Netherlands), 4.13%, 07/15/2029 (e) (w) (bb) | | | 1,016 | | | | 1,016 | |
Helios Software Holdings, Inc. / ION Corporate Solutions Finance Sarl, 4.63%, 05/01/2028 (e) | | | 1,374 | | | | 1,345 | |
MicroStrategy, Inc., 6.13%, 06/15/2028 (e) | | | 1,738 | | | | 1,736 | |
MSCI, Inc., | | | | | | | | |
3.63%, 09/01/2030 (e) | | | 1,031 | | | | 1,053 | |
3.63%, 11/01/2031 (e) | | | 694 | | | | 712 | |
3.88%, 02/15/2031 (e) | | | 1,022 | | | | 1,060 | |
Open Text Corp., (Canada), 3.88%, 02/15/2028 (e) | | | 692 | | | | 701 | |
Open Text Holdings, Inc., 4.13%, 02/15/2030 (e) | | | 574 | | | | 585 | |
Playtika Holding Corp., 4.25%, 03/15/2029 (e) | | | 1,837 | | | | 1,836 | |
PTC, Inc., | | | | | | | | |
3.63%, 02/15/2025 (e) | | | 350 | | | | 361 | |
4.00%, 02/15/2028 (e) | | | 400 | | | | 413 | |
Rackspace Technology Global, Inc., | | | | | | | | |
3.50%, 02/15/2028 (e) | | | 975 | | | | 943 | |
5.38%, 12/01/2028 (e) | | | 2,222 | | | | 2,280 | |
Rocket Software, Inc., 6.50%, 02/15/2029 (e) | | | 2,764 | | | | 2,743 | |
SS&C Technologies, Inc., 5.50%, 09/30/2027 (e) | | | 5,947 | | | | 6,302 | |
Twilio, Inc., 3.88%, 03/15/2031 | | | 715 | | | | 734 | |
Veritas US, Inc. / Veritas Bermuda Ltd., 7.50%, 09/01/2025 (e) | | | 6,131 | | | | 6,384 | |
ZoomInfo Technologies LLC / ZoomInfo Finance Corp., 3.88%, 02/01/2029 (e) | | | 907 | | | | 901 | |
| | | | | | | | |
| | |
| | | | | | | 63,615 | |
| | | | | | | | |
Total Technology | | | | | | | 140,826 | |
| | | | | | | | |
Utilities — 2.9% | | | | | | | | |
Electric — 2.6% | | | | | | | | |
AES Corp. (The), 3.30%, 07/15/2025 (e) | | | 997 | | | | 1,064 | |
Alexander Funding Trust, 1.84%, 11/15/2023 (e) | | | 1,472 | | | | 1,499 | |
American Transmission Systems, Inc., 5.25%, 01/15/2022 (e) | | | 2,500 | | | | 2,560 | |
Calpine Corp., | | | | | | | | |
3.75%, 03/01/2031 (e) | | | 1,673 | | | | 1,593 | |
| | | | | | | | |
| SECURITY DESCRIPTION | | PRINCIPAL
AMOUNT($) | | | VALUE($) | |
| | | | | | | | |
Electric — continued | | | | | | | | |
4.50%, 02/15/2028 (e) | | | 2,814 | | | | 2,870 | |
4.63%, 02/01/2029 (e) | | | 6,568 | | | | 6,457 | |
5.00%, 02/01/2031 (e) | | | 3,130 | | | | 3,115 | |
5.13%, 03/15/2028 (e) | | | 8,512 | | | | 8,672 | |
5.25%, 06/01/2026 (e) | | | 1,044 | | | | 1,074 | |
Cemig Geracao e Transmissao SA, (Brazil), 9.25%, 12/05/2024 (e) | | | 400 | | | | 462 | |
Clearway Energy Operating LLC, 4.75%, 03/15/2028 (e) | | | 254 | | | | 266 | |
Comision Federal de Electricidad, (Mexico), 4.88%, 01/15/2024 (e) | | | 1,200 | | | | 1,305 | |
Edison International, | | | | | | | | |
3.13%, 11/15/2022 | | | 1,500 | | | | 1,545 | |
Series A, (CMT Index 5 Year + 4.70%), 5.38%, 03/15/2026 (x) (aa) | | | 1,500 | | | | 1,511 | |
Electricite de France SA, (France), Reg. S, (EUR Swap Rate 5 Year + 4.00%), 3.38%, 06/15/2030 (x) (aa) | | EUR | 600 | | | | 743 | |
Enel Finance International NV, (Netherlands), | | | | | | | | |
4.25%, 09/14/2023 (e) | | | 2,174 | | | | 2,342 | |
4.63%, 09/14/2025 (e) | | | 1,672 | | | | 1,897 | |
FirstEnergy Corp., | | | | | | | | |
2.05%, 03/01/2025 | | | 2,380 | | | | 2,398 | |
2.65%, 03/01/2030 | | | 29 | | | | 29 | |
Series B, 2.25%, 09/01/2030 | | | 24 | | | | 23 | |
Series B, 4.40%, 07/15/2027 | | | 621 | | | | 675 | |
Series B, 4.75%, 03/15/2023 | | | 720 | | | | 760 | |
Series C, 3.40%, 03/01/2050 | | | 348 | | | | 338 | |
Series C, 5.35%, 07/15/2047 | | | 2,203 | | | | 2,641 | |
FirstEnergy Transmission LLC, | | | | | | | | |
4.55%, 04/01/2049 (e) | | | 36 | | | | 42 | |
5.45%, 07/15/2044 (e) | | | 1,734 | | | | 2,166 | |
NRG Energy, Inc., | | | | | | | | |
3.38%, 02/15/2029 (e) | | | 1,525 | | | | 1,493 | |
3.63%, 02/15/2031 (e) | | | 2,224 | | | | 2,185 | |
3.75%, 06/15/2024 (e) | | | 1,793 | | | | 1,911 | |
5.25%, 06/15/2029 (e) | | | 975 | | | | 1,037 | |
5.75%, 01/15/2028 | | | 775 | | | | 825 | |
6.63%, 01/15/2027 | | | 3,557 | | | | 3,682 | |
7.25%, 05/15/2026 | | | 75 | | | | 78 | |
Orano SA, (France), Reg. S, 2.75%, 03/08/2028 | | EUR | 100 | | | | 124 | |
Pacific Gas and Electric Co., | | | | | | | | |
1.37%, 03/10/2023 | | | 900 | | | | 900 | |
3.15%, 01/01/2026 | | | 2,350 | | | | 2,425 | |
3.25%, 06/15/2023 | | | 776 | | | | 802 | |
3.75%, 02/15/2024 | | | 1,250 | | | | 1,311 | |
Pattern Energy Operations LP / Pattern Energy Operations, Inc., 4.50%, 08/15/2028 (e) | | | 1,367 | | | | 1,415 | |
PG&E Corp., | | | | | | | | |
5.00%, 07/01/2028 | | | 3,100 | | | | 3,134 | |
5.25%, 07/01/2030 | | | 3,434 | | | | 3,467 | |
Pike Corp., 5.50%, 09/01/2028 (e) | | | 5 | | | | 5 | |
SEE NOTES TO FINANCIAL STATEMENTS.
| | | | | | | | | | |
| | | | | |
| 216 | | | | | | | | SIX CIRCLES TRUST | | JUNE 30, 2021 |
| | | | | | | | |
| SECURITY DESCRIPTION | | PRINCIPAL
AMOUNT($) | | | VALUE($) | |
Corporate Bonds — continued | | | | | | | | |
Electric — continued | | | | | | | | |
TransAlta Corp., (Canada), 4.50%, 11/15/2022 | | | 800 | | | | 829 | |
Vistra Operations Co. LLC, | | | | | | | | |
3.55%, 07/15/2024 (e) | | | 2,188 | | | | 2,310 | |
4.38%, 05/01/2029 (e) | | | 1,920 | | | | 1,930 | |
5.00%, 07/31/2027 (e) | | | 3,525 | | | | 3,613 | |
5.50%, 09/01/2026 (e) | | | 4,600 | | | | 4,744 | |
5.63%, 02/15/2027 (e) | | | 2,088 | | | | 2,166 | |
| | | | | | | | |
| | |
| | | | | | | 88,433 | |
| | | | | | | | |
Gas — 0.3% | | | | | | | | |
AmeriGas Partners LP / AmeriGas Finance Corp., | | | | | |
5.50%, 05/20/2025 | | | 1,505 | | | | 1,652 | |
5.63%, 05/20/2024 | | | 2,000 | | | | 2,185 | |
5.75%, 05/20/2027 | | | 600 | | | | 669 | |
5.88%, 08/20/2026 | | | 4,170 | | | | 4,666 | |
Atmos Energy Corp., 0.63%, 03/09/2023 | | | 443 | | | | 443 | |
ONE Gas, Inc., | | | | | | | | |
0.85%, 03/11/2023 | | | 929 | | | | 930 | |
1.10%, 03/11/2024 | | | 1,310 | | | | 1,311 | |
| | | | | | | | |
| | |
| | | | | | | 11,856 | |
| | | | | | | | |
Water — 0.0% (g) | | | | | | | | |
Solaris Midstream Holdings LLC, 7.63%, 04/01/2026 (e) | | | 499 | | | | 529 | |
Thames Water Kemble Finance plc, (United Kingdom), Reg. S, 4.63%, 05/19/2026 | | GBP | 268 | | | | 379 | |
| | | | | | | | |
| | |
| | | | | | | 908 | |
| | | | | | | | |
Total Utilities | | | | | | | 101,197 | |
| | | | | | | | |
Total Corporate Bonds
(Cost $2,656,635) | | | | | | | 2,680,035 | |
| | | | | | | | |
Foreign Government Securities — 0.1% | | | | | | | | |
Egypt Government International Bond, (Egypt), 6.13%, 01/31/2022 (e) | | | 800 | | | | 817 | |
Kenya Government International Bond, (Kenya), 6.88%, 06/24/2024 (e) | | | 1,000 | | | | 1,099 | |
Morocco Government International Bond, (Morocco), 4.25%, 12/11/2022 (e) | | | 800 | | | | 840 | |
| | | | | | | | |
Total Foreign Government Securities
(Cost $2,752) | | | | | | | 2,756 | |
| | | | | | | | |
U.S. Treasury Obligations — 3.0% | | | | | | | | |
U.S. Treasury Notes, | | | | | | | | |
0.13%, 03/31/2023 | | | 21,740 | | | | 21,705 | |
0.13%, 05/31/2023 | | | 82,218 | | | | 82,038 | |
| | | | | | | | |
Total U.S. Treasury Obligations
(Cost $103,902) | | | | | | | 103,743 | |
| | | | | | | | |
| |
| | | SHARES | |
Preferred Stock — 0.1% | | | | | | | | |
Consumer Cyclical — 0.1% | | | | | | | | |
Retail — 0.1% | | | | | | | | |
Ferrellgas Escrow LLC, expiring 03/30/2031 (a) (bb) (cc)
(Cost $5,117) | | | 5 | | | | 5,275 | |
| | | | | | | | |
| | | | | | | | |
| SECURITY DESCRIPTION | |
SHARES | | | VALUE($) | |
Loan Assignments — 5.0% (o) | | | | | | | | |
Basic Materials — 0.3% | | | | | | | | |
Chemicals — 0.3% | | | | | | | | |
Alpha 3 BV, Initial Dollar Term Loan, (Netherlands), (ICE LIBOR USD 3 Month + 2.50%), 3.00%, 03/18/2028 (aa) | | | 1,588 | | | | 1,579 | |
Ascend Performance Materials Operations LLC, 2021 Refinancing Term Loan, (ICE LIBOR USD 3 Month + 4.75%), 5.50%, 08/27/2026 (aa) | | | 443 | | | | 449 | |
Diamond, Initial USD Term Loan, (Netherlands), (ICE LIBOR USD 3 Month + 3.00%), 3.19%, 09/06/2024 (aa) | | | 2,159 | | | | 2,146 | |
Lummus Technology Holdings V LLC, 2021 Refinancing Term B Loan, (ICE LIBOR USD 1 Month + 3.50%), 3.60%, 06/30/2027 (aa) | | | 1,486 | | | | 1,476 | |
Nutrition & Biosciences, Inc., 3-Year Delayed Draw Term Loan, (ICE LIBOR USD 3 Month + 1.25%), 1.43%, 01/17/2023 (aa) | | | 64 | | | | 64 | |
Nutrition & Biosciences, Inc., 5-year Delayed Draw Term Loan, (ICE LIBOR USD 3 Month + 1.63%), 1.80%, 01/17/2025 (aa) | | | 113 | | | | 112 | |
Solenis Holdings LLC, Initial Dollar Term Loan (First Lien), (ICE LIBOR USD 3 Month + 4.00%), 4.14%, 06/26/2025 (aa) | | | 1,233 | | | | 1,232 | |
Solenis Holdings LLC, Initial Term Loan (Second Lien), (ICE LIBOR USD 3 Month + 8.50%), 8.64%, 06/26/2026 (aa) | | | 2,256 | | | | 2,249 | |
| | | | | | | | |
Total Basic Materials | | | | | | | 9,307 | |
| | | | | | | | |
Communications — 0.9% | | | | | | | | |
Advertising — 0.1% | | | | | | | | |
Clear Channel Outdoor Holdings, Inc., Term B Loan, (ICE LIBOR USD 3 Month + 3.50%), 3.69%, 08/21/2026 (aa) | | | 2,827 | | | | 2,758 | |
| | | | | | | | |
Internet — 0.2% | | | | | | | | |
Acuris Finance US, Inc., Initial Dollar Term Loan, (ICE LIBOR USD 3 Month + 4.00%), 4.50%, 02/16/2028 (aa) | | | 178 | | | | 179 | |
Barracuda Networks, Inc., Term Loan (Second Lien), (ICE LIBOR USD 3 Month + 6.75%), 7.50%, 10/30/2028 (aa) | | | 827 | | | | 841 | |
CNT Holdings I Corp., Initial Term Loan (First Lien), (ICE LIBOR USD 3 Month + 3.75%), 4.50%, 11/08/2027 (aa) | | | 448 | | | | 448 | |
Comcast Hulu Holdings LLC, Term Loan A, (ICE LIBOR USD 1 Month + 0.88%), 0.98%, 03/15/2024 (aa) | | | 1,750 | | | | 1,732 | |
MH Sub I LLC, 2021 Replacement Term Loan (Second Lien), (ICE LIBOR USD 1 Month + 6.25%), 6.35%, 02/23/2029 (aa) | | | 109 | | | | 111 | |
Northwest Fiber LLC, Term B-2 Loan (First Lien), (ICE LIBOR USD 1 Month + 3.75%), 3.82%, 04/30/2027 (u) (aa) | | | 430 | | | | 430 | |
Proofpoint, Term Loan, (ICE LIBOR USD 3 Month + 3.75%), 3.89%, 06/09/2028 (u) (aa) | | | 877 | | | | 872 | |
SEE NOTES TO FINANCIAL STATEMENTS.
| | | | | | | | | | |
| | | | | |
| JUNE 30, 2021 | | SIX CIRCLES TRUST | | | | | | | | 217 |
Six Circles Credit Opportunities Fund
SCHEDULE OF PORTFOLIO INVESTMENTS
AS OF JUNE 30, 2021 (Unaudited) (continued)
(Amounts in U.S. Dollars, unless otherwise noted)
(Amounts in thousands, except number of Futures contracts)
| | | | | | | | |
| SECURITY DESCRIPTION | |
SHARES | | | VALUE($) | |
Loan Assignments — continued | | | | | | | | |
Internet — continued | | | | | | | | |
ProQuest LLC, Initial Term Loan, (ICE LIBOR USD 1 Month + 3.25%), 3.35%, 10/23/2026 (u) (aa) | | | 668 | | | | 667 | |
Uber Technologies, Inc., 2021 Incremental Term Loan, (ICE LIBOR USD 1 Month + 3.50%), 3.60%, 04/04/2025 (aa) | | | 246 | | | | 245 | |
| | | | | | | | |
| | |
| | | | | | | 5,525 | |
| | | | | | | | |
Media — 0.2% | | | | | | | | |
Charter Communications Operating LLC, Term B-1 Loan, (ICE LIBOR USD 1 Month + 1.75%), 1.86%, 04/30/2025 (u) (aa) | | | 1,820 | | | | 1,816 | |
Diamond Sports Group LLC, Term Loan, (ICE LIBOR USD 1 Month + 3.25%), 3.36%, 08/24/2026 (u) (aa) | | | 499 | | | | 299 | |
iHeartCommunications, Inc., Second Amendment Incremental Term Loan, (ICE LIBOR USD 1 Month + 4.00%), 4.75%, 05/01/2026 (aa) | | | 992 | | | | 992 | |
Nexstar Broadcasting, Inc., Term A-5 Loan, (ICE LIBOR USD 1 Month + 1.75%), 1.84%, 09/19/2024 (u) (aa) | | | 877 | | | | 872 | |
Nielsen Finance LLC, Class B-4 Term Loan, (ICE LIBOR USD 1 Month + 2.00%), 2.08%, 10/04/2023 (aa) | | | 3,024 | | | | 3,020 | |
Radiate HoldCo LLC, Term B Loan, (ICE LIBOR USD 1 Month + 3.50%), 4.25%, 09/25/2026 (aa) | | | 463 | | | | 463 | |
| | | | | | | | |
| | |
| | | | | | | 7,462 | |
| | | | | | | | |
Telecommunications — 0.4% | | | | | | | | |
AT&T, Inc., Advance, (ICE LIBOR USD 1 Month + 1.00%), 1.09%, 03/23/2022 (aa) | | | 1,275 | | | | 1,273 | |
Connect Finco SARL, Amendment No. 1 Refinancing Term Loan, (Luxembourg), (ICE LIBOR USD 1 Month + 3.50%), 4.50%, 12/11/2026 (aa) | | | 738 | | | | 739 | |
Crown Subsea Communications Holding, Inc., Initial Term Loan, (ICE LIBOR USD 1 Month + 5.00%), 5.75%, 04/27/2027 (aa) | | | 1,035 | | | | 1,041 | |
Delta Topco, Inc., Initial Term Loan (First Lien), (ICE LIBOR USD 3 Month + 3.75%), 4.50%, 12/01/2027 (aa) | | | 601 | | | | 602 | |
Digicel International Finance Limited, Initial Term B Loan (First Lien), (Saint Lucia), (ICE LIBOR USD 3 Month + 3.25%), 3.43%, 05/27/2024 (aa) | | | 687 | | | | 659 | |
Intelsat Jackson Holdings S.A., Tranche B-5 Term Loan, (Luxembourg), 8.63%, 01/02/2024 | | | 2,006 | | | | 2,038 | |
Intrado Corp., Initial Term B Loan, (ICE LIBOR USD 3 Month + 4.00%), 5.00%, 10/10/2024 (aa) | | | 5,314 | | | | 5,195 | |
Intrado Corp., Incremental Term B-1 Loan, (ICE LIBOR USD 3 Month + 3.50%), 4.50%, 10/10/2024 (aa) | | | 1,348 | | | | 1,305 | |
| | | | | | | | |
| SECURITY DESCRIPTION | |
SHARES | | | VALUE($) | |
| | | | | | | | |
Telecommunications — continued | | | | | | | | |
Xplornet Communications, Inc., Initial Term Loan, (ICE LIBOR USD 1 Month + 4.75%), 4.85%, 06/10/2027 (aa) | | | 2,144 | | | | 2,143 | |
Zayo Group Holdings, Inc., Initial Dollar Term Loan, (ICE LIBOR USD 1 Month + 3.00%), 3.10%, 03/09/2027 (aa) | | | 1,055 | | | | 1,043 | |
| | | | | | | | |
| | |
| | | | | | | 16,038 | |
| | | | | | | | |
Total Communications | | | | | | | 31,783 | |
| | | | | | | | |
Consumer Cyclical — 0.7% | | | | | | | | |
Airlines — 0.3% | | | | | | | | |
AAdvantage Loyality IP Ltd., Initial Term Loan, (Cayman Islands), (ICE LIBOR USD 3 Month + 4.75%), 5.50%, 04/20/2028 (u) (aa) | | | 3,845 | | | | 4,005 | |
SkyMiles IP Ltd., Initial Term Loan, (Cayman Islands), (ICE LIBOR USD 3 Month + 3.75%), 4.75%, 10/20/2027 (aa) | | | 490 | | | | 517 | |
United AirLines, Inc., Class B Term Loan, (ICE LIBOR USD 3 Month + 3.75%), 4.50%, 04/21/2028 (aa) | | | 5,088 | | | | 5,151 | |
| | | | | | | | |
| | |
| | | | | | | 9,673 | |
| | | | | | | | |
Auto Manufacturers — 0.0% (g) | | | | | | | | |
Ford Motor Co., Term Loan, (ICE LIBOR USD 1 Month + 1.75%), 1.85%, 12/31/2022 (aa) | | | 850 | | | | 840 | |
| | | | | | | | |
Entertainment — 0.0% (g) | | | | | | | | |
Flutter Entertainment plc, USD Term Loan, (Ireland), (ICE LIBOR USD 3 Month + 3.50%), 3.65%, 07/10/2025 (aa) | | | 172 | | | | 172 | |
Raptor Acquisition Corp., Term Loan B, (ICE LIBOR USD 3 Month + 4.50%), 5.25%, 11/01/2026 (u) (aa) | | | 201 | | | | 201 | |
| | | | | | | | |
| | |
| | | | | | | 373 | |
| | | | | | | | |
Leisure Time — 0.0% (g) | | | | | | | | |
Life Time, Inc., 2021 Refinancing Term Loan, (ICE LIBOR USD 3 Month + 4.75%), 5.75%, 12/16/2024 (aa) | | | 1,045 | | | | 1,047 | |
| | | | | | | | |
Lodging — 0.1% | | | | | | | | |
Caesars Resort Collection LLC, Term B-1 Loan, (ICE LIBOR USD 1 Month + 4.50%), 4.60%, 07/21/2025 (aa) | | | 1,262 | | | | 1,265 | |
Diamond Resorts International, Inc., 2018 Refinancing Term B Loan (First Lien), (ICE LIBOR USD 1 Month + 3.75%), 4.75%, 09/02/2023 (aa) | | | 716 | | | | 716 | |
Golden Nugget, Inc., Initial B Term Loan, (ICE LIBOR USD 2 Month + 2.50%), 3.25%, 10/04/2023 (aa) | | | 910 | | | | 902 | |
Hilton Worldwide Finance LLC, Refinanced Series B-2 Term Loan, (ICE LIBOR USD 1 Month + 1.75%), 1.84%, 06/22/2026 (aa) | | | 1,141 | | | | 1,131 | |
| | | | | | | | |
| | |
| | | | | | | 4,014 | |
| | | | | | | | |
SEE NOTES TO FINANCIAL STATEMENTS.
| | | | | | | | | | |
| | | | | |
| 218 | | | | | | | | SIX CIRCLES TRUST | | JUNE 30, 2021 |
| | | | | | | | |
| SECURITY DESCRIPTION | |
SHARES | | | VALUE($) | |
Loan Assignments — continued | | | | | | | | |
Retail — 0.3% | | | | | | | | |
BJ’s Wholesale Club, Inc., Tranche B Term Loan (First Lien), (ICE LIBOR USD 1 Month + 2.00%), 2.07%, 02/03/2024 (aa) | | | 1,041 | | | | 1,040 | |
Foundation Building Materials, Inc., Initial Term Loan (First Lien), (ICE LIBOR USD 3 Month + 3.25%), 3.75%, 01/31/2028 (aa) | | | 186 | | | | 185 | |
IRB Holding Corp., Fourth Amendment Incremental Term Loan, (ICE LIBOR USD 3 Month + 3.25%), 4.25%, 12/15/2027 (aa) | | | 1,861 | | | | 1,860 | |
LBM Acquisition LLC, Initial Delayed Draw Term Loan (First Lien), (ICE LIBOR USD 3 Month + 3.75%), 4.50%, 12/17/2027 (aa) | | | 7 | | | | 7 | |
LBM Acquisition LLC, Initial Term Loan (First Lien), (ICE LIBOR USD 3 Month + 3.75%), 4.50%, 12/17/2027 (aa) | | | 45 | | | | 44 | |
PetSmart LLC, Initial Term Loan, (ICE LIBOR USD 3 Month + 3.75%), 4.50%, 02/11/2028 (aa) | | | 3,192 | | | | 3,193 | |
Staples, Inc., 2019 Refinancing New Term B-1 Loan, (ICE LIBOR USD 3 Month + 5.00%), 5.18%, 04/16/2026 (aa) | �� | | 506 | | | | 492 | |
SRS Distribution, (ICE LIBOR USD 1 Month + 4.25%), 4.34%, 05/23/2025 (aa) | | | — | (h) | | | — | (h) |
White Cap Buyer LLC, Initial Closing Date Term Loan, (ICE LIBOR USD 3 Month + 4.00%), 4.50%, 10/19/2027 (aa) | | | 2,905 | | | | 2,908 | |
| | | | | | | | |
| | |
| | | | | | | 9,729 | |
| | | | | | | | |
Total Consumer Cyclical | | | | | | | 25,676 | |
| | | | | | | | |
Consumer Non-cyclical — 0.6% | | | | | | | | |
Commercial Services — 0.2% | | | | | | | | |
Parexel International Corp., Initial Term Loan, (ICE LIBOR USD 1 Month + 2.75%), 2.85%, 09/27/2024 (aa) | | | 369 | | | | 366 | |
Sabre GLBL, Inc., 2020 Other Term B Loan, (ICE LIBOR USD 1 Month + 4.00%), 4.75%, 12/17/2027 (aa) | | | 100 | | | | 100 | |
Sotheby’s, 2021 Refinancing Term Loan, (ICE LIBOR USD 3 Month + 4.75%), 5.50%, 01/15/2027 (aa) | | | 192 | | | | 193 | |
Verscend Holding Corp., Term B-1 Loan, (ICE LIBOR USD 1 Month + 4.00%), 4.10%, 08/27/2025 (aa) | | | 5,000 | | | | 5,008 | |
| | | | | | | | |
| | |
| | | | | | | 5,667 | |
| | | | | | | | |
Food — 0.1% | | | | | | | | |
US Foods, Inc., Initial Term Loan, (ICE LIBOR USD 1 Month + 1.75%), 1.85%, 06/27/2023 (aa) | | | 1,385 | | | | 1,371 | |
| | | | | | | | |
Healthcare — Products — 0.0% (g) | | | | | | | | |
Ortho-Clinical Diagnostics, Inc., Second Amendment New Term Loan, (ICE LIBOR USD 1 Month + 3.00%), 3.09%, 06/30/2025 (aa) | | | 845 | | | | 844 | |
| | | | | | | | |
Healthcare — Services — 0.2% | | | | | | | | |
DaVita, Inc., Tranche B-1 Term Loan, (ICE LIBOR USD 1 Month + 1.75%), 1.85%, 08/12/2026 (u) (aa) | | | 1,634 | | | | 1,624 | |
| | | | | | | | |
| SECURITY DESCRIPTION | |
SHARES | | | VALUE($) | |
| | | | | | | | |
Healthcare — Services — continued | | | | | | | | |
Envision Healthcare Corp., Initial Term Loan, (ICE LIBOR USD 1 Month + 3.75%), 3.85%, 10/10/2025 (aa) | | | 2,122 | | | | 1,812 | |
Gentiva Health Services, Inc., Term B-1 Loan (First Lien), (ICE LIBOR USD 1 Month + 2.75%), 2.85%, 07/02/2025 (u) (aa) | | | 1,037 | | | | 1,034 | |
ICON Luxembourg S.A.R.L., Term Loan B, (Luxembourg) | | | | | | | | |
(ICE LIBOR USD 3 Month + 2.50%), 3.00%, 06/16/2028 (u) (aa) | | | 357 | | | | 358 | |
(ICE LIBOR USD 3 Month + 2.50%), 3.25%, 06/16/2028 (u) (aa) | | | 1,434 | | | | 1,436 | |
LifePoint Health, Inc., Term B Loan (First Lien), (ICE LIBOR USD 1 Month + 3.75%), 3.85%, 11/16/2025 (aa) | | | 592 | | | | 590 | |
Quorum Health Corp., Term Loan (Exit), (ICE LIBOR USD 3 Month + 8.25%), 9.25%, 04/29/2025 (u) (aa) | | | 670 | | | | 677 | |
WCG Purchaser Corp., Initial Term Loan (First Lien), (ICE LIBOR USD 3 Month + 4.00%), 5.00%, 01/08/2027 (aa) | | | 292 | | | | 292 | |
| | | | | | | | |
| | |
| | | | | | | 7,823 | |
| | | | | | | | |
Pharmaceuticals — 0.1% | | | | | | | | |
Alphabet Holding Co., Inc., Initial Term Loan (First Lien), (ICE LIBOR USD 1 Month + 3.50%), 3.60%, 09/26/2024 (aa) | | | 793 | | | | 792 | |
Change Healthcare Holdings LLC, Closing Date Term Loan, (ICE LIBOR USD 1 Month + 2.50%), 3.50%, 03/01/2024 (aa) | | | 1,084 | | | | 1,083 | |
Endo Luxembourg Finance Co. I S.a r.l., 2021 Term Loan, (Luxembourg), (ICE LIBOR USD 1 Month + 5.00%), 5.75%, 03/27/2028 (u) (aa) | | | 2,395 | | | | 2,307 | |
NVA Holdings, Inc., Term A-5 Loan, (ICE LIBOR USD 1 Month + 2.50%), 2.63%, 02/19/2025 (aa) | | | 731 | | | | 716 | |
| | | | | | | | |
| | |
| | | | | | | 4,898 | |
| | | | | | | | |
Total Consumer Non-cyclical | | | | | | | 20,603 | |
| | | | | | | | |
Energy — 0.2% | | | | | | | | |
Gas & Oil — 0.2% | | | | | | | | |
Ascent Resources Utica Holdings Llc / Aru Finance Corp., Term Loan (Second Lien), (ICE LIBOR USD 3 Month + 9.00%), 10.00%, 11/01/2025 (u) (aa) | | | 5,059 | | | | 5,580 | |
Hess Corp., Term Loan, (ICE LIBOR USD 1 Month + 2.25%), 2.61%, 03/16/2023 (aa) | | | 762 | | | | 754 | |
| | | | | | | | |
| | |
| | | | | | | 6,334 | |
| | | | | | | | |
Pipelines — 0.0% (g) | | | | | | | | |
Cheniere Corpus Christi Holdings LLC, Tranche 2, (ICE LIBOR USD 3 Month + 1.75%), 1.90%, 06/30/2024 (u) (aa) | | | 754 | | | | 752 | |
| | | | | | | | |
Total Energy | | | | | | | 7,086 | |
| | | | | | | | |
SEE NOTES TO FINANCIAL STATEMENTS.
| | | | | | | | | | |
| | | | | |
| JUNE 30, 2021 | | SIX CIRCLES TRUST | | | | | | | | 219 |
Six Circles Credit Opportunities Fund
SCHEDULE OF PORTFOLIO INVESTMENTS
AS OF JUNE 30, 2021 (Unaudited) (continued)
(Amounts in U.S. Dollars, unless otherwise noted)
(Amounts in thousands, except number of Futures contracts)
| | | | | | | | |
| SECURITY DESCRIPTION | |
SHARES | | | VALUE($) | |
Loan Assignments — continued | | | | | | | | |
Financial — 0.5% | | | | | | | | |
Diversified Financial Services — 0.1% | | | | | | | | |
Avolon TLB Borrower 1, Term B-3 Loan, (ICE LIBOR USD 3 Month + 1.75%), 2.50%, 01/15/2025 (u) (aa) | | | 852 | | | | 849 | |
Deerfield Dakota Holding LLC, 2021 Replacement Term Loan (Second Lien), (ICE LIBOR USD 1 Month + 6.75%), 7.50%, 04/07/2028 (aa) | | | 763 | | | | 780 | |
Delos Finance S.a r.l., New Loan (2018), (Luxembourg), (ICE LIBOR USD 3 Month + 1.75%), 1.87%, 10/06/2023 (u) (aa) | | | 1,080 | | | | 1,079 | |
| | | | | | | | |
| | |
| | | | | | | 2,708 | |
| | | | | | | | |
Insurance — 0.2% | | | | | | | | |
Alliant Holdings Intermediate LLC, 2020 New Term Loan, (ICE LIBOR USD 1 Month + 3.75%), 4.25%, 11/05/2027 (u) (aa) | | | 495 | | | | 495 | |
Alliant Holdings Intermediate LLC, Initial Term Loan (2018), (ICE LIBOR USD 1 Month + 3.25%), 3.35%, 05/09/2025 (aa) | | | 596 | | | | 589 | |
Asurion LLC, New B-3 Term Loan (Second Lien), (ICE LIBOR USD 1 Month + 5.25%), 5.35%, 01/31/2028 (aa) | | | 1,794 | | | | 1,807 | |
Asurion LLC, Replacement B-6 Term Loan, (ICE LIBOR USD 1 Month + 3.00%), 3.10%, 11/03/2023 (aa) | | | 1,448 | | | | 1,440 | |
Hub International Limited, B-3 Incremental Term Loan, (ICE LIBOR USD 3 Month + 3.25%), 4.00%, 04/25/2025 (aa) | | | 740 | | | | 740 | |
Sedgwick Claims Management Services, Inc., 2020 Term Loan, (ICE LIBOR USD 1 Month + 4.25%), 5.25%, 09/03/2026 (aa) | | | 293 | | | | 294 | |
Sedgwick Claims Management Services, Inc., Initial Term Loan, (ICE LIBOR USD 1 Month + 3.25%), 3.35%, 12/31/2025 (aa) | | | 1,830 | | | | 1,809 | |
| | | | | | | | |
| | |
| | | | | | | 7,174 | |
| | | | | | | | |
REITS — 0.2% | | | | | | | | |
Invitation Homes Operating Partnership LP, Term Loan A, (ICE LIBOR USD 1 Month + 1.00%), 1.08%, 01/31/2025 (u) (aa) | | | 3,302 | | | | 3,269 | |
VICI Properties 1 LLC, Term B Loan, (ICE LIBOR USD 1 Month + 1.75%), 1.84%, 12/20/2024 (aa) | | | 2,668 | | | | 2,644 | |
| | | | | | | | |
| | |
| | | | | | | 5,913 | |
| | | | | | | | |
Total Financial | | | | | | | 15,795 | |
| | | | | | | | |
Industrial — 0.6% | | | | | | | | |
Aerospace/Defense — 0.1% | | | | | | | | |
Boeing Co., The, Delayed Draw Term Loan, (ICE LIBOR USD 3 Month + 1.25%), 1.37%, 02/07/2022 (aa) | | | 3,929 | | | | 3,922 | |
Sequa Mezzanine Holdings L.L.C., Extended Term Loan (First Lien), (ICE LIBOR USD 3 Month + 6.75%), 7.75%, 11/28/2023 (aa) | | | 291 | | | | 293 | |
| | | | | | | | |
| SECURITY DESCRIPTION | |
SHARES | | | VALUE($) | |
| | | | | | | | |
Aerospace/Defense — continued | | | | | | | | |
Spirit Aerosystems, Inc., Initial Term Loan, (ICE LIBOR USD 1 Month + 5.25%), 6.00%, 01/15/2025 (aa) | | | 310 | | | | 312 | |
| | | | | | | | |
| | |
| | | | | | | 4,527 | |
| | | | | | | | |
Building Materials — 0.1% | | | | | | | | |
CP Atlas Buyer, Inc., Term B Loan, (ICE LIBOR USD 1 Month + 3.75%), 4.25%, 11/23/2027 (aa) | | | 628 | | | | 627 | |
CPG International LLC, New Term Loan, (ICE LIBOR USD 3 Month + 2.50%), 3.25%, 05/05/2024 (aa) | | | 725 | | | | 724 | |
| | | | | | | | |
| | |
| | | | | | | 1,351 | |
| | | | | | | | |
Engineering & Construction — 0.2% | | | | | | | | |
Brand Energy & Infrastructure Services, Inc., Initial Term Loan, (ICE LIBOR USD 3 Month + 4.25%), 5.25%, 06/21/2024 (aa) | | | 5,628 | | | | 5,532 | |
| | | | | | | | |
Machinery — Construction & Mining — 0.0% (g) | | | | | | | | |
Vertiv Group Corp., Term B Loan, (ICE LIBOR USD 1 Month + 2.75%), 2.84%, 03/02/2027 (aa) | | | 449 | | | | 445 | |
| | | | | | | | |
Machinery — Diversified — 0.1% | | | | | | | | |
Titan Acquisition Limited, Initial Term Loan, (Canada), (ICE LIBOR USD 3 Month + 3.00%), 3.17%, 03/28/2025 (aa) | | | 2,864 | | | | 2,812 | |
| | | | | | | | |
Miscellaneous Manufactur — 0.0% (g) | | | | | | | | |
Momentive Performance Materials, Inc., Initial Dollar Term Loan (First Lien), (ICE LIBOR USD 1 Month + 3.25%), 3.36%, 05/15/2024 (aa) | | | 507 | | | | 504 | |
| | | | | | | | |
Packaging & Containers — 0.1% | | | | | | | | |
Mauser Packaging Solutions Holding Co., Initial Term Loan, (ICE LIBOR USD 1 Month + 3.25%), 3.35%, 04/03/2024 (u) (aa) | | | 1,598 | | | | 1,559 | |
Owens-Illinois Group, Inc., Tranche A TLA, (ICE LIBOR USD 1 Month + 1.50%), 1.60%, 06/25/2024 (aa) | | | 995 | | | | 984 | |
| | | | | | | | |
| | |
| | | | | | | 2,543 | |
| | | | | | | | |
Shipbuilding — 0.0% (g) | | | | | | | | |
MHI Holdings LLC, Initial Term Loan, (ICE LIBOR USD 1 Month + 5.00%), 5.10%, 09/21/2026 (aa) | | | 541 | | | | 542 | |
| | | | | | | | |
Transportation — 0.0% (g) | | | | | | | | |
AIT Worldwide Logistics Holdings, Inc., Initial Term Loan (First Lien), (ICE LIBOR USD 3 Month + 4.75%), 5.50%, 04/06/2028 (aa) | | | 244 | | | | 244 | |
| | | | | | | | |
Total Industrial | | | | | | | 18,500 | |
| | | | | | | | |
Technology — 1.2% | | | | | | | | |
Computers — 0.3% | | | | | | | | |
Magenta Buyer LLC, Term Loan (First Lien), (ICE LIBOR USD 3 Month + 5.00%), 5.75%, 05/03/2028 (u) (aa) | | | 1,988 | | | | 1,986 | |
Magenta Buyer LLC, Term Loan (Second Lien), (ICE LIBOR USD 3 Month + 8.25%), 9.00%, 05/03/2029 (u) (aa) | | | 1,262 | | | | 1,246 | |
SEE NOTES TO FINANCIAL STATEMENTS.
| | | | | | | | | | |
| | | | | |
| 220 | | | | | | | | SIX CIRCLES TRUST | | JUNE 30, 2021 |
| | | | | | | | |
| SECURITY DESCRIPTION | |
SHARES | | | VALUE($) | |
Loan Assignments — continued | | | | | | | | |
Computers — continued | | | | | | | | |
McAfee LLC, Term B USD Loan, (ICE LIBOR USD 1 Month + 3.75%), 3.85%, 09/30/2024 (u) (aa) | | | 2,785 | | | | 2,784 | |
Peraton Corp., Term B Loan (First Lien), (ICE LIBOR USD 1 Month + 3.75%), 4.50%, 02/01/2028 (u) (aa) | | | 2,997 | | | | 3,004 | |
| | | | | | | | |
| | |
| | | | | | | 9,020 | |
| | | | | | | | |
Software — 0.9% | | | | | | | | |
Azalea TopCo, Inc., Initial Term Loan (First Lien), (ICE LIBOR USD 3 Month + 3.50%), 3.69%, 07/24/2026 (u) (aa) | | | 720 | | | | 715 | |
Boxer Parent Co., Inc., 2021 Replacement Dollar Term Loan, (ICE LIBOR USD 1 Month + 3.75%), 3.85%, 10/02/2025 (aa) | | | 1,506 | | | | 1,497 | |
Camelot U.S. Acquisition 1 Co., Amendment No. 2 Incremental Term Loan, (ICE LIBOR USD 1 Month + 3.00%), 4.00%, 10/30/2026 (aa) | | | 2,507 | | | | 2,507 | |
Castle US Holding Corp., Initial Dollar Term Loan, (ICE LIBOR USD 3 Month + 3.75%), 3.90%, 01/29/2027 (aa) | | | 1,095 | | | | 1,080 | |
Dun & Bradstreet Corp., The, Initial Term Borrowing, (ICE LIBOR USD 1 Month + 3.25%), 3.35%, 02/06/2026 (aa) | | | 1,692 | | | | 1,683 | |
Epicor Software Corp., Term C Loan, (ICE LIBOR USD 1 Month + 3.25%), 4.00%, 07/30/2027 (aa) | | | 1,428 | | | | 1,426 | |
Greeneden U.S. Holdings I LLC, Initial Dollar Term Loan (2020), (ICE LIBOR USD 1 Month + 4.00%), 4.75%, 12/01/2027 (aa) | | | 1,868 | | | | 1,871 | |
Helios Software Holdings, Inc., Initial Dollar Term Loan (2021), (ICE LIBOR USD 3 Month + 3.75%), 3.92%, 03/11/2028 (aa) | | | 407 | | | | 407 | |
Informatica LLC, Dollar 2020 Term Loan, (ICE LIBOR USD 1 Month + 3.25%), 3.35%, 02/25/2027 (aa) | | | 1,666 | | | | 1,654 | |
Informatica LLC, Initial Loan (Second Lien), 7.13%, 02/25/2025 | | | 558 | | | | 569 | |
Misys Limited, Dollar Term Loan (First Lien), (United Kingdom), (ICE LIBOR USD 3 Month + 3.50%), 4.50%, 06/13/2024 (u) (aa) | | | 1,997 | | | | 1,965 | |
Misys Limited, Dollar Term Loan (Second Lien), (United Kingdom), (ICE LIBOR USD 3 Month + 7.25%), 8.25%, 06/13/2025 (aa) | | | 1,000 | | | | 1,010 | |
Mitchell International, Inc., Initial Term Loan (First Lien), (ICE LIBOR USD 1 Month + 3.25%), 3.35%, 11/29/2024 (aa) | | | 890 | | | | 881 | |
Planview Parent, Inc., Closing Date Loan (Second Lien), (ICE LIBOR USD 3 Month + 7.25%), 8.00%, 12/18/2028 (aa) | | | 180 | | | | 179 | |
Polaris Newco LLC, Dollar Term Loan (First Lien), (ICE LIBOR USD 3 Month + 4.00%), 5.00%, 06/02/2028 (u) (aa) | | | 1,394 | | | | 1,397 | |
| | | | | | | | |
| SECURITY DESCRIPTION | |
SHARES | | | VALUE($) | |
| | | | | | | | |
Software — continued | | | | | | | | |
Project Alpha Intermediate Holding, Inc., 2021 Refinancing Term Loan, (ICE LIBOR USD 1 Month + 4.00%), 4.11%, 04/26/2024 (aa) | | | 277 | | | | 277 | |
Rackspace Technology Global, Inc., 2021 Term B Loan (First Lien), (ICE LIBOR USD 3 Month + 2.75%), 3.50%, 02/15/2028 (aa) | | | 794 | | | | 789 | |
RealPage, Inc., Initial Term Loan (First Lien), (ICE LIBOR USD 1 Month + 3.25%), 3.75%, 04/24/2028 (aa) | | | 1,707 | | | | 1,701 | |
Renaissance Holding Corp., Initial Term Loan (First Lien), (ICE LIBOR USD 1 Month + 3.25%), 3.35%, 05/30/2025 (aa) | | | 420 | | | | 415 | |
Salesforce.com, Inc., Delayed Term Loan, (ICE LIBOR USD 1 Month + 0.75%), 0.84%, 12/23/2023 (u) (aa) | | | 1,118 | | | | 1,116 | |
Sophia, L.P., Closing Date Term Loan, (ICE LIBOR USD 3 Month + 3.75%), 3.90%, 10/07/2027 (aa) | | | 3,889 | | | | 3,890 | |
TIBCO Software, Inc., Term Loan (Second Lien), (ICE LIBOR USD 1 Month + 7.25%), 7.36%, 03/03/2028 (aa) | | | 455 | | | | 461 | |
UKG, Inc., 2021 Incremental Term Loan (First Lien), (ICE LIBOR USD 3 Month + 3.25%), 4.00%, 05/04/2026 (aa) | | | 443 | | | | 443 | |
UKG, Inc., Initial Term Loan (First Lien), (ICE LIBOR USD 1 Month + 3.75%), 3.85%, 05/04/2026 (aa) | | | 792 | | | | 792 | |
Veritas US, Inc., Dollar Term B-2021 Loan, (ICE LIBOR USD 3 Month + 5.00%), 6.00%, 09/01/2025 (aa) | | | 3,643 | | | | 3,662 | |
| | |
| | | | | | | 32,387 | |
| | | | | | | | |
Total Technology | | | | | | | 41,407 | |
| | | | | | | | |
Utilities — 0.0% (g) | | | | | | | | |
Electric — 0.0% (g) | | | | | | | | |
Heritage Power LLC, Term Loan, (ICE LIBOR USD 3 Month + 6.00%), 7.00%, 07/30/2026 (aa) | | | 1,489 | | | | 1,315 | |
| | | | | | | | |
Total Loan Assignments
(Cost $171,812) | | | | | | | 171,472 | |
| | | | | | | | |
Short-Term Investments — 3.3% | | | | | | | | |
Commercial Papers — 0.2% | | | | | | | | |
Enel Finance America LLC, 0.45%, 02/04/2022 (e) (n) | | | 1,000 | | | | 998 | |
Jabil, Inc., | | | | | | | | |
0.47%, 07/01/2021 (e) (n) | | | 3,934 | | | | 3,934 | |
0.48%, 07/06/2021 (e) (n) | | | 2,146 | | | | 2,146 | |
| | | | | | | | |
Total Commercial Papers | | | | | | | 7,078 | |
| | | | | | | | |
Time Deposits — 2.8% | | | | | | | | |
BNP Paribas SA, | | | | | | | | |
(1.83%), 07/01/2021 | | CHF | — | (h) | | | 1 | |
(0.78%), 07/01/2021 | | EUR | 149 | | | | 177 | |
SEE NOTES TO FINANCIAL STATEMENTS.
| | | | | | | | | | |
| | | | | |
| JUNE 30, 2021 | | SIX CIRCLES TRUST | | | | | | | | 221 |
Six Circles Credit Opportunities Fund
SCHEDULE OF PORTFOLIO INVESTMENTS
AS OF JUNE 30, 2021 (Unaudited) (continued)
(Amounts in U.S. Dollars, unless otherwise noted)
(Amounts in thousands, except number of Futures contracts)
| | | | | | | | |
| SECURITY DESCRIPTION | |
SHARES | | | VALUE($) | |
Short-Term Investments — continued | | | | | | | | |
Time Deposits — continued | | | | | | | | |
0.01%, 07/01/2021 | | | 52,892 | | | | 52,892 | |
Citibank NA, | | | | | | | | |
0.01%, 07/01/2021 | | GBP | 218 | | | | 300 | |
0.01%, 07/01/2021 | | | 42,769 | | | | 42,769 | |
| | | | | | | | |
Total Time Deposits | | | | | | | 96,139 | |
| | | | | | | | |
| | | | | | | | |
| SECURITY DESCRIPTION | |
SHARES | | | VALUE($) | |
| | | | | | | | |
U.S. Treasury Obligation — 0.3% | | | | | | | | |
U.S. Treasury Bill, Zero Coupon, 07/29/2021 | | | 11,750 | | | | 11,750 | |
| | | | | | | | |
Total Short-Term Investments
(Cost $114,967) | | | | | | | 114,967 | |
| | | | | | | | |
| | |
Total Investments — 99.8%
(Cost — $3,420,218)* | | | | | | | 3,445,885 | |
| | |
Other Assets in Excess of Liabilities — 0.2% | | | | | | | 5,912 | |
| | | | | | | | |
| | |
NET ASSETS — 100.0% | | | | | | $ | 3,451,797 | |
| | | | | | | | |
Percentages indicated are based on net assets
| | | | | | | | | | | | | | | | | | | | |
| Futures contracts outstanding as of June 30, 2021: | | | | |
| Exchange Traded | | | | | | | | | | | | | | | |
| DESCRIPTION | | NUMBER OF
CONTRACTS | | | EXPIRATION
DATE | | | TRADING
CURRENCY | | | NOTIONAL
AMOUNT($) | | | VALUE AND
UNREALIZED
APPRECIATION
(DEPRECIATION)($) | |
Long Contracts | | | | | | | | | | | | | | | | | | | | |
Euro Schatz | | | 2 | | | | 09/2021 | | | | EUR | | | | 266 | | | | — | (h) |
U.S. Treasury 10 Year Note | | | 127 | | | | 09/2021 | | | | USD | | | | 16,778 | | | | 49 | |
U.S. Treasury 2 Year Note | | | 849 | | | | 09/2021 | | | | USD | | | | 187,366 | | | | (314 | ) |
U.S. Treasury 5 Year Note | | | 330 | | | | 09/2021 | | | | USD | | | | 40,863 | | | | (131 | ) |
U.S. Treasury Long Bond | | | 45 | | | | 09/2021 | | | | USD | | | | 7,031 | | | | 203 | |
| | | | | | | | | | | | | | | | | | | | |
| | | | | | | | | | | | | | | | | | | (193 | ) |
| | | | | | | | | | | | | | | | | | | | |
Short Contracts | | | | | | | | | | | | | | | | | | | | |
Euro BOBL | | | (1 | ) | | | 09/2021 | | | | EUR | | | | (159 | ) | | | — | (h) |
Euro Bund | | | (3 | ) | | | 09/2021 | | | | EUR | | | | (610 | ) | | | (4 | ) |
Long Gilt | | | (2 | ) | | | 09/2021 | | | | GBP | | | | (353 | ) | | | (2 | ) |
U.S. Treasury 10 Year Note | | | (4 | ) | | | 09/2021 | | | | USD | | | | (528 | ) | | | (2 | ) |
U.S. Treasury 5 Year Note | | | (609 | ) | | | 09/2021 | | | | USD | | | | (75,427 | ) | | | 259 | |
U.S. Treasury Ultra Bond | | | (73 | ) | | | 09/2021 | | | | USD | | | | (13,407 | ) | | | (660 | ) |
| | | | | | | | | | | | | | | | | | | | |
| | | | | | | | | | | | | | | | | | | (409 | ) |
| | | | | | | | | | | | | | | | | | | | |
Total unrealized appreciation (depreciation) | | | | | | | | | | | | | | | | | | | (602 | ) |
| | | | | | | | | | | | | | | | | | | | |
| | | | | | | | | | | | | | | | | | | | |
| Forward foreign currency exchange contracts outstanding as of June 30, 2021: | |
| CURRENCY PURCHASED | | | CURRENCY SOLD | | | COUNTERPARTY | | SETTLEMENT
DATE | | | UNREALIZED
APPRECIATION
(DEPRECIATION)($) | |
USD | | | 380 | | | EUR | | | 311 | | | HSBC Bank Plc | | | 07/02/2021 | | | | 11 | |
USD | | | 226 | | | CHF | | | 202 | | | Morgan Stanley & Co. | | | 09/15/2021 | | | | 7 | |
USD | | | 25,423 | | | EUR | | | 20,972 | | | BNP Paribas | | | 09/15/2021 | | | | 516 | |
USD | | | 95 | | | EUR | | | 78 | | | Morgan Stanley & Co. | | | 09/15/2021 | | | | 2 | |
USD | | | 292 | | | GBP | | | 206 | | | Bank of America, NA | | | 09/15/2021 | | | | 7 | |
USD | | | 130 | | | GBP | | | 92 | | | Bank of America, NA | | | 09/15/2021 | | | | 2 | |
USD | | | 7,179 | | | GBP | | | 5,080 | | | Citibank, NA | | | 09/15/2021 | | | | 150 | |
USD | | | 140 | | | GBP | | | 99 | | | Morgan Stanley & Co. | | | 09/15/2021 | | | | 3 | |
| | | | | | | | | | | | | | | | | | | | |
Total unrealized appreciation | | | | | | | | | | 698 | |
| | | | | | | | | | | | | | | | | | | | |
USD | | | 369 | | | EUR | | | 311 | | | Citibank, NA | | | 08/03/2021 | | | | (—) | (h) |
| | | | | | | | | | | | | | | | | | | | |
Net unrealized appreciation (depreciation) | | | | | | | | | | 698 | |
| | | | | | | | | | | |
SEE NOTES TO FINANCIAL STATEMENTS.
| | | | | | | | | | |
| | | | | |
| 222 | | | | | | | | SIX CIRCLES TRUST | | JUNE 30, 2021 |
| | | | | | | | | | | | | | | | | | | | | | | | | | | | | | | | | | | | | | | | |
| Over the Counter (“OTC”) Credit default swap contracts outstanding — sell protection (1) of June 30, 2021: | | | | |
REFERENCE
OBLIGATION/ INDEX | | FINANCING
RATE RECEIVED
BY THE FUND(%) | | | PAYMENT
FREQUENCY | | | COUNTERPARTY | | | MATURITY
DATE | | | IMPLIED CREDIT
SPREAD (%) (2) | | | NOTIONAL
AMOUNT | | | UPFRONT
PAYMENTS
(RECEIPTS) ($) | | | UNREALIZED
APPRECIATION
(DEPRECIATION) ($) | | | VALUE
($) | |
Adler Real Estate AG, 1.50%, 12/06/2021 | | | 5.00% | | | | Quarterly | | | | Morgan Stanley | | | | 12/20/2025 | | | | 2.19 | | | | EUR | | | | 30 | | | | 5 | | | | (1 | ) | | | 4 | |
CMA CGM SA, 7.50%, 01/15/2026 | | | 5.00% | | | | Quarterly | | | | Goldman Sachs | | | | 6/20/2026 | | | | 3.37 | | | | EUR | | | | 10 | | | | 1 | | | | (— | )(h) | | | 1 | |
| | | | | | | | | | | | | | | | | | | | | | | | | | | | | | | | | | | | | | | | |
Total | | | | | | | | | | | | | | | | | | | | | | | | | | | | | | | 6 | | | | (1 | ) | | | 5 | |
| | | | | | | | | | | | | | | | | | | | | | | | | | | | | | | | | | | | | | | | |
| | | | | | | | | | | | | | | | | | | | | | | | | | | | | | | | | | | | |
| Centrally Cleared Credit default swap contracts outstanding — sell protection (1) as of June 30, 2021: | | | | |
REFERENCE
OBLIGATION/
INDEX | | FINANCING
RATE RECEIVED
BY THE FUND(%) | | | PAYMENT
FREQUENCY | | | MATURITY
DATE | | | IMPLIED CREDIT
SPREAD (%) (2) | | | NOTIONAL
AMOUNT (3) | | | UPFRONT
PAYMENTS
(RECEIPTS) ($) (4) | | | UNREALIZED
APPRECIATION
(DEPRECIATION) ($) | | | VALUE ($) | |
CDX.NA.HY.36-V1 | | | 5.00 | | | | Quarterly | | | | 6/20/26 | | | | 2.74 | | | | USD | | | | 22,325 | | | | 2,180 | | | | 120 | | | | 2,300 | |
| | | | | | | | | | | | | | | | | | | | | | | | | | | | | | | | | | | | |
Total | | | | | | | | | | | | | | | | | | | | | | | | | | | 2,180 | | | | 120 | | | | 2,300 | |
| | | | | | | | | | | | | | | | | | | | | | | | | | | | | | | | | | | | |
| (1) | The Fund, as a seller of credit protection, receives periodic payments and may also receive or pay an upfront premium from or to the protection buyer, and is obligated to make a contingent payment, upon occurrence of a credit event with respect to an underlying reference obligation, as defined under the terms of individual swap contracts. |
| (2) | Implied credit spreads are an indication of the seller’s performance risk, related to the likelihood of a credit event occurring that would require a seller to make payment to a buyer. Implied credit spreads are used to determine the value of swap contracts and reflect the cost of buying/selling protection, which may include upfront payments made to enter into the contract. Therefore, higher spreads would indicate a greater likelihood that a seller will be obligated to perform (i.e. make payment) under the swap contract. Increasing values, in absolute terms and relative to notional amounts, are also indicative of greater performance risk. Implied credit spreads for credit default swaps on credit indices are linked to the weighted average spread across the underlying reference obligations included in a particular index. |
| (3) | The notional amount is the maximum amount that a seller of credit protection would be obligated to pay and a buyer of credit protection would receive, upon occurrence of a credit event. |
| (4) | Upfront payments and receipts generally represent premiums paid or received at the initiation of the agreement to compensate the differences between the stated terms of the swap agreement and current market conditions (credit spreads, interest rates and other relevant factors). |
NOTES TO SCHEDULE OF PORTFOLIO INVESTMENTS
AS OF JUNE 30, 2021
| | |
| CDX | | — Credit Default Swap Index |
| CLO | | — Collateralized Loan Obligations |
| CMT | | — Constant Maturity Treasury |
| EURIBOR | | — Euro Interbank Offered Rate |
| ICE | | — Intercontinental Exchange |
| IO | | — Interest Only represents the right to receive the monthly interest payments on an underlying pool of mortgage loans. The principal amount shown represents the par value on the underlying pool. The yields on these securities are subject to accelerated principal paydowns as a result of prepayment or refinancing of the underlying pool of mortgage instruments. As a result, interest income may be reduced considerably. |
| LIBOR | | — London Interbank Offered Rate |
| Reg. S | | — Security was purchased pursuant to Regulation S under the Securities Act of 1933, as amended (the “Securities Act”), which exempts from registration securities offered and sold outside of the United States. Such a security cannot be sold in the United States without either an effective registration statement filed pursuant to the Securities Act, or pursuant to an exemption from registration. |
| REIT | | — Real Estate Investment Trust |
| SOFR | | — Secured Overnight Financing Rate |
| | |
| SUB | | — Step-Up Bond. The interest rate shown is the rate in effect as of June 30, 2021. |
| (a) | | — Non-income producing security. |
| (d) | | — Defaulted Security. Security has not paid its last interest payment and/or interest is not being accrued. |
| (e) | | — Security is exempt from registration under Rule 144A of the Securities Act of 1933, as amended. Unless otherwise indicated, this security has been determined to be liquid under procedures established by the Board of Trustees and may be resold in transactions exempt from registration, normally to qualified institutional buyers. |
| (g) | | — Amount rounds to less than 0.05%. |
| (h) | | — Amount rounds to less than 500 shares or principal/ $500. |
| (o) | | — Loan assignments are presented by obligor. Each Series or loan tranche underlying each obligor may have varying terms. |
| (n) | | — The rate shown is the effective yield as of June 30, 2021. |
| (u) | | — All or a portion of the security is unsettled as of June 30, 2021. Unless otherwise indicated, the coupon rate is undetermined. |
| (v) | | — Security has the ability to pay in kind (“PIK”) or pay income in cash. When applicable, separate rates of such payments are disclosed. |
SEE NOTES TO FINANCIAL STATEMENTS.
| | | | | | | | | | |
| | | | | |
| JUNE 30, 2021 | | SIX CIRCLES TRUST | | | | | | | | 223 |
Six Circles Credit Opportunities Fund
SCHEDULE OF PORTFOLIO INVESTMENTS
AS OF JUNE 30, 2021 (Unaudited) (continued)
(Amounts in U.S. Dollars, unless otherwise noted)
(Amounts in thousands, except number of Futures contracts)
| | |
| (w) | | — All or a portion of the security is a when-issued security, delayed delivery security, or forward commitment. |
| (x) | | — Security is perpetual and thus, does not have a predetermined maturity date. The coupon rate for this security is fixed for a period of time and may be structured to adjust thereafter. The date shown, if applicable, reflects the next call date. The coupon rate shown is the rate in effect as of June 30, 2021. |
| (z) | | — Variable or floating rate security, the interest rate of which adjusts periodically based on changes in current interest rates and prepayments on the underlying pool of assets. The interest rate shown is the current rate as of June 30, 2021. |
| | |
| (aa) | | — Variable or floating rate security, linked to the referenced benchmark. The interest rate shown is the current rate as of June 30, 2021. |
| (bb) | | — Security has been valued using significant unobservable inputs. |
| (cc) | | — Security is valued in good faith at fair value by or under the direction of the Board of Trustees. |
| * | | — The cost of securities is substantially the same for federal income tax purposes. |
| CHF | | — Swiss Franc |
| EUR | | — Euro |
| GBP | | — British Pound |
| USD | | — United States Dollar |
SEE NOTES TO FINANCIAL STATEMENTS.
| | | | | | | | | | |
| | | | | |
| 224 | | | | | | | | SIX CIRCLES TRUST | | JUNE 30, 2021 |
STATEMENTS OF ASSETS AND LIABILITIES
AS OF JUNE 30, 2021 (Unaudited)
(Amounts in thousands, except per share amounts)
| | | | |
| | | Six Circles Ultra
Short Duration
Fund | |
ASSETS: | | | | |
Investments in non-affiliates, at value | | $ | 552,887 | |
Cash | | | — | (a) |
Foreign currency, at value | | | 3 | |
Deposits at broker for futures contracts | | | 299 | |
Deposits at broker for centrally cleared swaps | | | 243 | |
Prepaid expenses | | | 1 | |
Receivables: | | | | |
Investment securities sold | | | 1,056 | |
Fund shares sold | | | 383 | |
Interest and dividends from non-affiliates | | | 1,825 | |
Variation margin on futures contracts | | | 19 | |
Variation margin on centrally cleared swaps (net upfront receipts of $257) | | | 11 | |
Unrealized appreciation on forward foreign currency exchange contracts | | | 856 | |
| | | | |
Total Assets | | | 557,583 | |
| | | | |
| |
LIABILITIES: | | | | |
Payables: | | | | |
Deposits from broker for OTC contracts | | | 537 | |
Investment securities purchased | | | 4,437 | |
Fund shares redeemed | | | 175 | |
Unrealized depreciation on forward foreign currency exchange contracts | | | 24 | |
Accrued liabilities: | | | | |
Investment advisory fees | | | 52 | |
Administration fees | | | 20 | |
Custodian and accounting fees | | | 32 | |
Trustees’ fees | | | 6 | |
Registration and filing fees | | | 2 | |
Other | | | 49 | |
| | | | |
Total Liabilities | | | 5,334 | |
| | | | |
Net Assets | | $ | 552,249 | |
| | | | |
| |
NET ASSETS: | | | | |
Paid-in capital | | $ | 555,366 | |
Total distributable earnings (loss) | | | (3,117 | ) |
| | | | |
Total Net Assets | | $ | 552,249 | |
| | | | |
Outstanding units of beneficial interest (shares)
($0.0001 par value; unlimited number of shares authorized): | | | 55,137 | |
Net Asset Value, offering and redemption price per share (b): | | $ | 10.02 | |
Cost of investments in non-affiliates | | $ | 551,577 | |
Cost of foreign currency | | | 3 | |
| (a) | Amount rounds to less than $500. |
| (b) | Per share amounts may not recalculate due to rounding of net assets and/or shares outstanding. |
SEE NOTES TO FINANCIAL STATEMENTS.
| | | | | | | | | | |
| | | | | |
| JUNE 30, 2021 | | SIX CIRCLES TRUST | | | | | | | | 225 |
STATEMENTS OF ASSETS AND LIABILITIES
AS OF JUNE 30, 2021 (Unaudited) (continued)
(Amounts in thousands, except per share amounts)
| | | | |
| | | Six Circles Tax
Aware Ultra
Short Duration
Fund | |
ASSETS: | | | | |
Investments in non-affiliates, at value | | $ | 599,177 | |
Cash | | | 12 | |
Foreign currency, at value | | | 10 | |
Deposits at broker for futures contracts | | | 335 | |
Deposits at broker for centrally cleared swaps | | | 298 | |
Prepaid expenses | | | 1 | |
Receivables: | | | | |
Fund shares sold | | | 388 | |
Interest and dividends from non-affiliates | | | 4,699 | |
Variation margin on futures contracts | | | 12 | |
Variation margin on centrally cleared swaps (net upfront receipts of $331) | | | 6 | |
Unrealized appreciation on forward foreign currency exchange contracts | | | 602 | |
| | | | |
Total Assets | | | 605,540 | |
| | | | |
| |
LIABILITIES: | | | | |
Payables: | | | | |
Deposits from broker for OTC contracts | | | 536 | |
Investment securities purchased | | | 3,906 | |
Fund shares redeemed | | | 304 | |
Unrealized depreciation on forward foreign currency exchange contracts | | | 26 | |
Accrued liabilities: | | | | |
Investment advisory fees | | | 47 | |
Administration fees | | | 25 | |
Custodian and accounting fees | | | 28 | |
Trustees’ fees | | | 6 | |
Registration and filing fees | | | 5 | |
Other | | | 42 | |
| | | | |
Total Liabilities | | | 4,925 | |
| | | | |
Net Assets | | $ | 600,615 | |
| | | | |
| |
NET ASSETS: | | | | |
Paid-in capital | | $ | 602,992 | |
Total distributable earnings (loss) | | | (2,377 | ) |
| | | | |
Total Net Assets | | $ | 600,615 | |
| | | | |
Outstanding units of beneficial interest (shares)
($0.0001 par value; unlimited number of shares authorized): | | | 60,057 | |
Net Asset Value, offering and redemption price per share (a): | | $ | 10.00 | |
Cost of investments in non-affiliates | | $ | 596,813 | |
Cost of foreign currency | | | 10 | |
| (a) | Per share amounts may not recalculate due to rounding of net assets and/or shares outstanding. |
SEE NOTES TO FINANCIAL STATEMENTS.
| | | | | | | | | | |
| | | | | |
| 226 | | | | | | | | SIX CIRCLES TRUST | | JUNE 30, 2021 |
| | | | |
| | | Six Circles U.S.
Unconstrained
Equity Fund | |
ASSETS: | | | | |
Investments in non-affiliates, at value | | $ | 18,189,155 | |
Cash | | | 24 | |
Deposits at broker for futures contracts | | | 6,088 | |
Prepaid expenses | | | 2 | |
Receivables: | | | | |
Fund shares sold | | | 6,714 | |
Interest and dividends from non-affiliates | | | 11,182 | |
Tax reclaims | | | 105 | |
Variation margin on futures contracts | | | 62 | |
| | | | |
Total Assets | | | 18,213,332 | |
| | | | |
| |
LIABILITIES: | | | | |
Payables: | | | | |
Investment securities purchased | | | 30,241 | |
Fund shares redeemed | | | 7,927 | |
Accrued liabilities: | | | | |
Investment advisory fees | | | 564 | |
Administration fees | | | 95 | |
Custodian and accounting fees | | | 56 | |
Trustees’ fees | | | 64 | |
Registration and filing fees | | | 143 | |
Other | | | 250 | |
| | | | |
Total Liabilities | | | 39,340 | |
| | | | |
Net Assets | | $ | 18,173,992 | |
| | | | |
| |
NET ASSETS: | | | | |
Paid-in capital | | $ | 12,033,085 | |
Total distributable earnings (loss) | | | 6,140,907 | |
| | | | |
Total Net Assets | | $ | 18,173,992 | |
| | | | |
Outstanding units of beneficial interest (shares)
($0.0001 par value; unlimited number of shares authorized): | | | 1,134,928 | |
Net Asset Value, offering and redemption price per share (a): | | $ | 16.01 | |
Cost of investments in non-affiliates | | $ | 13,886,374 | |
| (a) | Per share amounts may not recalculate due to rounding of net assets and/or shares outstanding. |
SEE NOTES TO FINANCIAL STATEMENTS.
| | | | | | | | | | |
| | | | | |
| JUNE 30, 2021 | | SIX CIRCLES TRUST | | | | | | | | 227 |
STATEMENTS OF ASSETS AND LIABILITIES
AS OF JUNE 30, 2021 (Unaudited) (continued)
(Amounts in thousands, except per share amounts)
| | | | |
| | | Six Circles
International
Unconstrained
Equity Fund | |
ASSETS: | | | | |
Investments in non-affiliates, at value | | $ | 11,401,523 | |
Foreign currency, at value | | | 895 | |
Deposits at broker for futures contracts | | | 14,681 | |
Prepaid expenses | | | 9 | |
Receivables: | | | | |
Investment securities sold | | | — | (a) |
Fund shares sold | | | 5,443 | |
Interest and dividends from non-affiliates | | | 12,249 | |
Tax reclaims | | | 33,646 | |
| | | | |
Total Assets | | | 11,468,446 | |
| | | | |
| |
LIABILITIES: | | | | |
Payables: | | | | |
Due to custodian — cash | | | 73 | |
Investment securities purchased | | | 16,666 | |
Fund shares redeemed | | | 3,767 | |
Variation margin on futures contracts | | | 1,614 | |
Accrued liabilities: | | | | |
Investment advisory fees | | | 474 | |
Administration fees | | | 94 | |
Custodian and accounting fees | | | 578 | |
Trustees’ fees | | | 39 | |
Registration and filing fees | | | 6 | |
Other | | | 228 | |
| | �� | | |
Total Liabilities | | | 23,539 | |
| | | | |
Net Assets | | $ | 11,444,907 | |
| | | | |
| |
NET ASSETS: | | | | |
Paid-in capital | | $ | 10,016,131 | |
Total distributable earnings (loss) | | | 1,428,776 | |
| | | | |
Total Net Assets | | $ | 11,444,907 | |
| | | | |
Outstanding units of beneficial interest (shares)
($0.0001 par value; unlimited number of shares authorized): | | | 1,038,529 | |
Net Asset Value, offering and redemption price per share (b): | | $ | 11.02 | |
Cost of investments in non-affiliates | | $ | 9,940,003 | |
Cost of foreign currency | | | 895 | |
| (a) | Amount rounds to less than $500. |
| (b) | Per share amounts may not recalculate due to rounding of net assets and/or shares outstanding. |
SEE NOTES TO FINANCIAL STATEMENTS.
| | | | | | | | | | |
| | | | | |
| 228 | | | | | | | | SIX CIRCLES TRUST | | JUNE 30, 2021 |
| | | | |
| | | Six Circles
Global Bond
Fund | |
ASSETS: | | | | |
Investments in non-affiliates, at value | | $ | 7,821,263 | |
Repurchase agreements, at value | | | 56,100 | |
Cash | | | 3 | |
Foreign currency, at value | | | 2,916 | |
Deposits at broker for futures contracts | | | 1,976 | |
Deposits at broker for centrally cleared swaps | | | 2,902 | |
Prepaid expenses | | | 2 | |
Receivables: | | | | |
Investment securities sold | | | 38,400 | |
Investment securities sold — delayed delivery securities | | | 814,059 | |
Fund shares sold | | | 4,594 | |
Interest and dividends from non-affiliates | | | 35,787 | |
Variation margin on futures contracts | | | 115 | |
Variation margin on centrally cleared swaps (net upfront receipts of $1,593) | | | 669 | |
Unrealized appreciation on forward foreign currency exchange contracts | | | 100,925 | |
| | | | |
Total Assets | | | 8,879,711 | |
| | | | |
| |
LIABILITIES: | | | | |
Payables: | | | | |
Securities sold short, at value | | | 292,163 | |
Deposits from broker for OTC contracts | | | 13,124 | |
Deposits from broker for delayed delivery securities | | | 280 | |
Interest expense | | | 16 | |
Investment securities purchased | | | 151,504 | |
Investment securities purchased — delayed delivery securities | | | 1,287,781 | |
Fund shares redeemed | | | 2,484 | |
Outstanding options written, at fair value | | | 542 | |
Unrealized depreciation on forward foreign currency exchange contracts | | | 14,894 | |
Outstanding OTC swap contracts, at value (net upfront receipts of $-(a)) | | | 61 | |
Accrued liabilities: | | | | |
Investment advisory fees | | | 348 | |
Administration fees | | | 88 | |
Custodian and accounting fees | | | 571 | |
Trustees’ fees | | | 32 | |
Registration and filing fees | | | 139 | |
Other | | | 89 | |
| | | | |
Total Liabilities | | | 1,764,116 | |
| | | | |
Net Assets | | $ | 7,115,595 | |
| | | | |
| |
NET ASSETS: | | | | |
Paid-in capital | | $ | 7,202,305 | |
Total distributable earnings (loss) | | | (86,710 | ) |
| | | | |
Total Net Assets | | $ | 7,115,595 | |
| | | | |
Outstanding units of beneficial interest (shares)
($0.0001 par value; unlimited number of shares authorized): | | | 707,414 | |
Net Asset Value, offering and redemption price per share (b): | | $ | 10.06 | |
Cost of investments in non-affiliates | | $ | 7,910,752 | |
Cost of repurchase agreements | | | 56,100 | |
Cost of foreign currency | | | 2,916 | |
Proceeds from securities sold short | | | (292,446 | ) |
Premiums received from options written | | | (677 | ) |
| (a) | Amount rounds to less than $500. |
| (b) | Per share amounts may not recalculate due to rounding of net assets and/or shares outstanding. |
SEE NOTES TO FINANCIAL STATEMENTS.
| | | | | | | | | | |
| | | | | |
| JUNE 30, 2021 | | SIX CIRCLES TRUST | | | | | | | | 229 |
STATEMENTS OF ASSETS AND LIABILITIES
AS OF JUNE 30, 2021 (Unaudited) (continued)
(Amounts in thousands, except per share amounts)
| | | | |
| | | Six Circles Tax
Aware Bond
Fund | |
ASSETS: | | | | |
Investments in non-affiliates, at value | | $ | 5,803,625 | |
Cash | | | 3 | |
Deposits at broker for futures contracts | | | 458 | |
Prepaid expenses | | | 2 | |
Receivables: | | | | |
Investment securities sold | | | 2,760 | |
Fund shares sold | | | 3,781 | |
Interest and dividends from non-affiliates | | | 55,110 | |
| | | | |
Total Assets | | | 5,865,739 | |
| | | | |
| |
LIABILITIES: | | | | |
Payables: | | | | |
Investment securities purchased | | | 123,560 | |
Fund shares redeemed | | | 3,031 | |
Variation margin on futures contracts | | | 1 | |
Accrued liabilities: | | | | |
Investment advisory fees | | | 489 | |
Administration fees | | | 98 | |
Custodian and accounting fees | | | 87 | |
Trustees’ fees | | | 18 | |
Registration and filing fees | | | 49 | |
Other | | | 80 | |
| | | | |
Total Liabilities | | | 127,413 | |
| | | | |
Net Assets | | $ | 5,738,326 | |
| | | | |
| |
NET ASSETS: | | | | |
Paid-in capital | | $ | 5,667,672 | |
Total distributable earnings (loss) | | | 70,654 | |
| | | | |
Total Net Assets | | $ | 5,738,326 | |
| | | | |
Outstanding units of beneficial interest (shares)
($0.0001 par value; unlimited number of shares authorized): | | | 547,293 | |
Net Asset Value, offering and redemption price per share (a): | | $ | 10.48 | |
Cost of investments in non-affiliates | | $ | 5,733,812 | |
| (a) | Per share amounts may not recalculate due to rounding of net assets and/or shares outstanding. |
SEE NOTES TO FINANCIAL STATEMENTS.
| | | | | | | | | | |
| | | | | |
| 230 | | | | | | | | SIX CIRCLES TRUST | | JUNE 30, 2021 |
| | | | |
| | | Six Circles
Credit
Opportunities
Fund | |
ASSETS: | | | | |
Investments in non-affiliates, at value | | $ | 3,445,885 | |
Cash | | | 2 | |
Deposits at broker for futures contracts | | | 703 | |
Deposits at broker for centrally cleared swaps | | | 1,910 | |
Deferred offering costs | | | 11 | |
Receivables: | | | | |
Investment securities sold | | | 27,667 | |
Fund shares sold | | | 2,238 | |
Interest and dividends from non-affiliates | | | 40,699 | |
Variation margin on futures contracts | | | 263 | |
Unrealized appreciation on forward foreign currency exchange contracts | | | 698 | |
Outstanding OTC swap contracts, at value (net upfront payments of $6) | | | 5 | |
| | | | |
Total Assets | | | 3,520,081 | |
| | | | |
| |
LIABILITIES: | | | | |
Payables: | | | | |
Due to custodian — foreign currency | | | — | (a) |
Investment securities purchased | | | 66,575 | |
Fund shares redeemed | | | 866 | |
Variation margin on centrally cleared swaps (net upfront payments of $2,180) | | | 5 | |
Unrealized depreciation on forward foreign currency exchange contracts | | | — | (a) |
Accrued liabilities: | | | | |
Investment advisory fees | | | 539 | |
Administration fees | | | 42 | |
Custodian and accounting fees | | | 74 | |
Trustees’ fees | | | 1 | |
Registration and filing fees | | | 125 | |
Other | | | 57 | |
| | | | |
Total Liabilities | | | 68,284 | |
| | | | |
Net Assets | | $ | 3,451,797 | |
| | | | |
| |
NET ASSETS: | | | | |
Paid-in capital | | $ | 3,424,106 | |
Total distributable earnings (loss) | | | 27,691 | |
| | | | |
Total Net Assets | | $ | 3,451,797 | |
| | | | |
Outstanding units of beneficial interest (shares)
($0.0001 par value; unlimited number of shares authorized): | | | 333,519 | |
Net Asset Value, offering and redemption price per share (b): | | $ | 10.35 | |
Cost of investments in non-affiliates | | $ | 3,420,218 | |
| (a) | Amount rounds to less than $500. |
| (b) | Per share amounts may not recalculate due to rounding of net assets and/or shares outstanding. |
SEE NOTES TO FINANCIAL STATEMENTS.
| | | | | | | | | | |
| | | | | |
| JUNE 30, 2021 | | SIX CIRCLES TRUST | | | | | | | | 231 |
STATEMENTS OF OPERATIONS
FOR THE SIX MONTHS ENDED JUNE 30, 2020 (Unaudited)
(Amounts in thousands)
| | | | |
| | | Six Circles
Ultra Short
Duration Fund | |
INVESTMENT INCOME: | | | | |
Interest income from non-affiliates | | $ | 2,648 | |
| | | | |
Total investment income | | | 2,648 | |
| | | | |
| |
EXPENSES: | | | | |
Investment advisory fees | | | 661 | |
Administration fees | | | 33 | |
Custodian and accounting fees | | | 59 | |
Professional fees | | | 37 | |
Trustees’ fees | | | 7 | |
Registration and filing fees | | | 12 | |
Transfer agency fees | | | 14 | |
Other | | | 9 | |
| | | | |
Total expenses | | | 832 | |
| | | | |
Less advisory fees waived | | | (354 | ) |
| | | | |
Net expenses | | | 478 | |
| | | | |
Net investment income (loss) | | | 2,170 | |
| | | | |
| |
REALIZED/UNREALIZED GAINS (LOSSES): | | | | |
Net realized gain (loss) on: | | | | |
Investments in non-affiliates | | | (602 | ) |
Futures contracts | | | 274 | |
Foreign currency transactions | | | 352 | |
Forward foreign currency exchange contracts | | | (104 | ) |
Swaps | | | (91 | ) |
| | | | |
Net realized gain (loss) | | | (171 | ) |
| | | | |
Change in net unrealized appreciation (depreciation) of: | | | | |
Investments in non-affiliates | | | (2,339 | ) |
Futures contracts | | | (336 | ) |
Foreign currency translations | | | (153 | ) |
Forward foreign currency exchange contracts | | | 2,203 | |
Swaps | | | 22 | |
| | | | |
Change in net unrealized appreciation (depreciation) | | | (603 | ) |
| | | | |
Net realized/unrealized gains (losses) | | | (774 | ) |
| | | | |
Change in net assets resulting from operations | | $ | 1,396 | |
| | | | |
SEE NOTES TO FINANCIAL STATEMENTS.
| | | | | | | | | | |
| | | | | |
| 232 | | | | | | | | SIX CIRCLES TRUST | | JUNE 30, 2021 |
| | | | |
| | | Six Circles
Tax Aware
Ultra Short
Duration Fund | |
INVESTMENT INCOME: | | | | |
Interest income from non-affiliates | | $ | 2,645 | |
| | | | |
Total investment income | | | 2,645 | |
| | | | |
| |
EXPENSES: | | | | |
Investment advisory fees | | | 718 | |
Administration fees | | | 36 | |
Custodian and accounting fees | | | 52 | |
Professional fees | | | 28 | |
Trustees’ fees | | | 8 | |
Printing and mailing costs | | | 3 | |
Registration and filing fees | | | 11 | |
Transfer agency fees | | | 14 | |
Other | | | 5 | |
| | | | |
Total expenses | | | 875 | |
| | | | |
Less advisory fees waived | | | (445 | ) |
| | | | |
Net expenses | | | 430 | |
| | | | |
Net investment income (loss) | | | 2,215 | |
| | | | |
| |
REALIZED/UNREALIZED GAINS (LOSSES): | | | | |
Net realized gain (loss) on: | | | | |
Investments in non-affiliates | | | 756 | |
Futures contracts | | | 324 | |
Foreign currency transactions | | | (331 | ) |
Forward foreign currency exchange contracts | | | (1,000 | ) |
Swaps | | | (112 | ) |
| | | | |
Net realized gain (loss) | | | (363 | ) |
| | | | |
Change in net unrealized appreciation (depreciation) of: | | | | |
Investments in non-affiliates | | | (1,388 | ) |
Futures contracts | | | (392 | ) |
Foreign currency translations | | | (21 | ) |
Forward foreign currency exchange contracts | | | 1,037 | |
Swaps | | | 20 | |
| | | | |
Change in net unrealized appreciation (depreciation) | | | (744 | ) |
| | | | |
Net realized/unrealized gains (losses) | | | (1,107 | ) |
| | | | |
Change in net assets resulting from operations | | $ | 1,108 | |
| | | | |
SEE NOTES TO FINANCIAL STATEMENTS.
| | | | | | | | | | |
| | | | | |
| JUNE 30, 2021 | | SIX CIRCLES TRUST | | | | | | | | 233 |
STATEMENTS OF OPERATIONS
FOR THE PERIOD ENDED JUNE 30, 2021 (Unaudited) (continued)
(Amounts in thousands)
| | | | |
| | | Six Circles U.S.
Unconstrained
Equity Fund | |
INVESTMENT INCOME: | | | | |
Interest income from non-affiliates | | $ | 4 | |
Dividend income from non-affiliates | | | 111,494 | |
Foreign taxes withheld | | | (26 | ) |
| | | | |
Total investment income | | | 111,472 | |
| | | | |
| |
EXPENSES: | | | | |
Investment advisory fees | | | 19,849 | |
Administration fees | | | 193 | |
Custodian and accounting fees | | | 194 | |
Professional fees | | | 127 | |
Trustees’ fees | | | 197 | |
Printing and mailing costs | | | 3 | |
Registration and filing fees | | | 152 | |
Transfer agency fees | | | 14 | |
Interest expense | | | 5 | |
Other | | | 26 | |
| | | | |
Total expenses | | | 20,760 | |
| | | | |
Less advisory fees waived | | | (16,689 | ) |
| | | | |
Net expenses | | | 4,071 | |
| | | | |
Net investment income (loss) | | | 107,401 | |
| | | | |
| |
REALIZED/UNREALIZED GAINS (LOSSES): | | | | |
Net realized gain (loss) on: | | | | |
Investments in non-affiliates | | | 1,534,295 | |
Futures contracts | | | 14,687 | |
| | | | |
Net realized gain (loss) | | | 1,548,982 | |
| | | | |
Change in net unrealized appreciation (depreciation) of: | | | | |
Investments in non-affiliates | | | 1,123,017 | |
Futures contracts | | | 628 | |
| | | | |
Change in net unrealized appreciation (depreciation) | | | 1,123,645 | |
| | | | |
Net realized/unrealized gains (losses) | | | 2,672,627 | |
| | | | |
Change in net assets resulting from operations | | $ | 2,780,028 | |
| | | | |
SEE NOTES TO FINANCIAL STATEMENTS.
| | | | | | | | | | |
| | | | | |
| 234 | | | | | | | | SIX CIRCLES TRUST | | JUNE 30, 2021 |
| | | | |
| | | Six Circles
International
Unconstrained
Equity Fund | |
INVESTMENT INCOME: | | | | |
Interest income from non-affiliates | | | — | (a) |
Dividend income from non-affiliates | | | 238,691 | |
Foreign taxes withheld | | | (28,351 | ) |
| | | | |
Total investment income | | | 210,340 | |
| | | | |
| |
EXPENSES: | | | | |
Investment advisory fees | | | 12,299 | |
Administration fees | | | 190 | |
Custodian and accounting fees | | | 1,325 | |
Professional fees | | | 129 | |
Trustees’ fees | | | 124 | |
Printing and mailing costs | | | 4 | |
Registration and filing fees | | | 103 | |
Transfer agency fees | | | 14 | |
Interest expense | | | 602 | |
Other | | | 33 | |
| | | | |
Total expenses | | | 14,823 | |
| | | | |
Less advisory fees waived | | | (9,850 | ) |
| | | | |
Net expenses | | | 4,973 | |
| | | | |
Net investment income (loss) | | | 205,367 | |
| | | | |
| |
REALIZED/UNREALIZED GAINS (LOSSES): | | | | |
Net realized gain (loss) on: | | | | |
Investments in non-affiliates | | | 477,335 | |
Futures contracts | | | 26,304 | |
Foreign currency transactions | | | 298 | |
Forward foreign currency exchange contracts | | | 1,443 | |
| | | | |
Net realized gain (loss) | | | 505,380 | |
| | | | |
Change in net unrealized appreciation (depreciation) of: | | | | |
Investments in non-affiliates | | | 239,835 | |
Futures contracts | | | (3,056 | ) |
Foreign currency translations | | | (5,335 | ) |
| | | | |
Change in net unrealized appreciation (depreciation) | | | 231,444 | |
| | | | |
Net realized/unrealized gains (losses) | | | 736,824 | |
| | | | |
Change in net assets resulting from operations | | $ | 942,191 | |
| | | | |
| (a) | Amount rounds to less than $500. |
SEE NOTES TO FINANCIAL STATEMENTS.
| | | | | | | | | | |
| | | | | |
| JUNE 30, 2021 | | SIX CIRCLES TRUST | | | | | | | | 235 |
STATEMENTS OF OPERATIONS
FOR THE PERIOD ENDED JUNE 30, 2021 (Unaudited) (continued)
(Amounts in thousands)
| | | | |
| | | Six Circles
Global Bond
Fund | |
INVESTMENT INCOME: | |
Interest income from non-affiliates | | $ | 32,632 | |
Foreign taxes withheld | | | (434 | ) |
| | | | |
Total investment income | | | 32,198 | |
| | | | |
| |
EXPENSES: | | | | |
Investment advisory fees | | | 8,477 | |
Administration fees | | | 193 | |
Custodian and accounting fees | | | 1,106 | |
Professional fees | | | 82 | |
Trustees’ fees | | | 95 | |
Printing and mailing costs | | | — | (a) |
Registration and filing fees | | | 5 | |
Transfer agency fees | | | 14 | |
Offering costs | | | 55 | |
Interest expense | | | 32 | |
Other | | | 17 | |
| | | | |
Total expenses | | | 10,076 | |
| | | | |
Less advisory fees waived | | | (6,447 | ) |
| | | | |
Net expenses | | | 3,629 | |
| | | | |
Net investment income (loss) | | | 28,569 | |
| | | | |
| |
REALIZED/UNREALIZED GAINS (LOSSES): | | | | |
Net realized gain (loss) on: | | | | |
Investments in non-affiliates | | | (5,436 | ) |
Futures contracts | | | 637 | |
Securities sold short | | | 1,406 | |
Foreign currency transactions | | | (13,019 | ) |
Forward foreign currency exchange contracts | | | 4,693 | |
Swaps | | | (12 | ) |
| | | | |
Net realized gain (loss) | | | (11,731 | ) |
| | | | |
Change in net unrealized appreciation (depreciation) of: | | | | |
Investments in non-affiliates | | | (218,863 | ) |
Futures contracts | | | 840 | |
Options written | | | 135 | |
Foreign currency translations | | | (5,705 | ) |
Forward foreign currency exchange contracts | | | 147,374 | |
Securities sold short | | | 1,867 | |
Swaps | | | (328 | ) |
| | | | |
Change in net unrealized appreciation (depreciation) | | | (74,680 | ) |
| | | | |
Net realized/unrealized gains (losses) | | | (86,411 | ) |
| | | | |
Change in net assets resulting from operations | | $ | (57,842 | ) |
| | | | |
| (a) | Amount rounds to less than $500. |
SEE NOTES TO FINANCIAL STATEMENTS.
| | | | | | | | | | |
| | | | | |
| 236 | | | | | | | | SIX CIRCLES TRUST | | JUNE 30, 2021 |
| | | | |
| | | Six Circles Tax
Aware Bond
Fund | |
INVESTMENT INCOME: | |
Interest income from non-affiliates | | $ | 31,087 | |
| | | | |
Total investment income | | | 31,087 | |
| | | | |
| |
EXPENSES: | | | | |
Investment advisory fees | | | 6,661 | |
Administration fees | | | 188 | |
Custodian and accounting fees | | | 220 | |
Professional fees | | | 64 | |
Trustees’ fees | | | 71 | |
Printing and mailing costs | | | 5 | |
Registration and filing fees | | | 16 | |
Transfer agency fees | | | 13 | |
Offering costs | | | 47 | |
Other | | | 10 | |
| | | | |
Total expenses | | | 7,295 | |
| | | | |
Less advisory fees waived | | | (3,871 | ) |
| | | | |
Net expenses | | | 3,424 | |
| | | | |
Net investment income (loss) | | | 27,663 | |
| | | | |
| |
REALIZED/UNREALIZED GAINS (LOSSES): | | | | |
Net realized gain (loss) on: | | | | |
Investments in non-affiliates | | | 2,173 | |
Futures contracts | | | (915 | ) |
| | | | |
Net realized gain (loss) | | | 1,258 | |
| | | | |
Change in net unrealized appreciation (depreciation) of: | | | | |
Investments in non-affiliates | | | 20,071 | |
Futures contracts | | | (449 | ) |
| | | | |
Change in net unrealized appreciation (depreciation) | | | 19,622 | |
| | | | |
Net realized/unrealized gains (losses) | | | 20,880 | |
| | | | |
Change in net assets resulting from operations | | $ | 48,543 | |
| | | | |
SEE NOTES TO FINANCIAL STATEMENTS.
| | | | | | | | | | |
| | | | | |
| JUNE 30, 2021 | | SIX CIRCLES TRUST | | | | | | | | 237 |
STATEMENTS OF OPERATIONS
FOR THE PERIOD ENDED JUNE 30, 2021 (Unaudited) (continued)
(Amounts in thousands)
| | | | |
| | | Six Circles
Credit
Opportunities
Fund | |
INVESTMENT INCOME: | |
Interest income from non-affiliates | | $ | 47,229 | |
Dividend income from non-affiliates | | | 253 | |
Foreign taxes withheld | | | (67 | ) |
| | | | |
Total investment income | | | 47,415 | |
| | | | |
| |
EXPENSES: | | | | |
Investment advisory fees | | | 10,129 | |
Administration fees | | | 84 | |
Custodian and accounting fees | | | 198 | |
Professional fees | | | 121 | |
Trustees’ fees | | | 30 | |
Printing and mailing costs | | | 15 | |
Registration and filing fees | | | 104 | |
Transfer agency fees | | | 14 | |
Offering costs | | | 73 | |
Other | | | 7 | |
| | | | |
Total expenses | | | 10,775 | |
| | | | |
Less advisory fees waived | | | (7,473 | ) |
| | | | |
Net expenses | | | 3,302 | |
| | | | |
Net investment income (loss) | | | 44,113 | |
| | | | |
| |
REALIZED/UNREALIZED GAINS (LOSSES): | | | | |
Net realized gain (loss) on: | | | | |
Investments in non-affiliates | | | (65 | ) |
Futures contracts | | | 2,360 | |
Foreign currency transactions | | | 12 | |
Forward foreign currency exchange contracts | | | (95 | ) |
Swaps | | | 960 | |
| | | | |
Net realized gain (loss) | | | 3,172 | |
| | | | |
Change in net unrealized appreciation (depreciation) of: | | | | |
Investments in non-affiliates | | | 11,062 | |
Futures contracts | | | (646 | ) |
Foreign currency translations | | | (12 | ) |
Forward foreign currency exchange contracts | | | 769 | |
Swaps | | | (102 | ) |
| | | | |
Change in net unrealized appreciation (depreciation) | | | 11,071 | |
| | | | |
Net realized/unrealized gains (losses) | | | 14,243 | |
| | | | |
Change in net assets resulting from operations | | $ | 58,356 | |
| | | | |
SEE NOTES TO FINANCIAL STATEMENTS.
| | | | | | | | | | |
| | | | | |
| 238 | | | | | | | | SIX CIRCLES TRUST | | JUNE 30, 2021 |
STATEMENTS OF CHANGES IN NET ASSETS
FOR THE PERIODS INDICATED (Unaudited)
(Amounts in thousands)
| | | | | | | | |
| | | Six Circles Ultra Short Duration Fund | |
| | | Six Months
Ended
2021 | | | Year Ended
December 31,
2020 | |
CHANGE IN NET ASSETS RESULTING FROM OPERATIONS: | | | | | | | | |
Net investment income (loss) | | $ | 2,170 | | | $ | 12,057 | |
Net realized gain (loss) | | | (171 | ) | | | 2,163 | |
Change in net unrealized appreciation (depreciation) | | | (603 | ) | | | (618 | ) |
| | | | | | | | |
Change in net assets resulting from operations | | | 1,396 | | | | 13,602 | |
| | | | | | | | |
| | |
DISTRIBUTIONS TO SHAREHOLDERS: | | | | | | | | |
Distributions to shareholders | | | (2,346 | ) | | | (13,072 | ) |
| | |
CAPITAL TRANSACTIONS: | | | | | | | | |
Change in net assets resulting from capital transactions | | | 36,671 | | | | (684,169 | ) |
| | | | | | | | |
| | |
NET ASSETS: | | | | | | | | |
Change in net assets | | | 35,721 | | | | (683,639 | ) |
Beginning of period | | | 516,528 | | | | 1,200,167 | |
| | | | | | | | |
End of period | | $ | 552,249 | | | $ | 516,528 | |
| | | | | | | | |
| | |
CAPITAL TRANSACTIONS: | | | | | | | | |
Proceeds from shares issued | | $ | 65,255 | | | $ | 125,901 | |
Distributions reinvested | | | 2,346 | | | | 13,072 | |
Cost of shares redeemed | | | (30,930 | ) | | | (823,142 | ) |
| | | | | | | | |
Total change in net assets resulting from capital transactions | | $ | 36,671 | | | $ | (684,169 | ) |
| | | | | | | | |
| | |
SHARE TRANSACTIONS: | | | | | | | | |
Issued | | | 6,505 | | | | 12,585 | |
Reinvested | | | 234 | | | | 1,309 | |
Redeemed | | | (3,083 | ) | | | (82,592 | ) |
| | | | | | | | |
Change in Shares | | | 3,656 | | | | (68,698 | ) |
| | | | | | | | |
SEE NOTES TO FINANCIAL STATEMENTS.
| | | | | | | | | | |
| | | | | |
| JUNE 30, 2021 | | SIX CIRCLES TRUST | | | | | | | | 239 |
STATEMENTS OF CHANGES IN NET ASSETS
FOR THE PERIODS INDICATED (Unaudited) (continued)
(Amounts in thousands)
| | | | | | | | |
| | | Six Circles Tax Aware Ultra Short Duration Fund | |
| | | Six Months
Ended
June 30, 2021 | | | Year Ended
December 31,
2020 | |
CHANGE IN NET ASSETS RESULTING FROM OPERATIONS: | | | | | | | | |
Net investment income (loss) | | $ | 2,215 | | | $ | 11,491 | |
Net realized gain (loss) | | | (363 | ) | | | 2,902 | |
Change in net unrealized appreciation (depreciation) | | | (744 | ) | | | (716 | ) |
| | | | | | | | |
Change in net assets resulting from operations | | | 1,108 | | | | 13,677 | |
| | | | | | | | |
| | |
DISTRIBUTIONS TO SHAREHOLDERS: | | | | | | | | |
Distributions to shareholders | | | (1,996 | ) | | | (12,744 | ) |
| | |
CAPITAL TRANSACTIONS: | | | | | | | | |
Change in net assets resulting from capital transactions | | | 32,677 | | | | (787,847 | ) |
| | | | | | | | |
| | |
NET ASSETS: | | | | | | | | |
Change in net assets | | | 31,789 | | | | (786,914 | ) |
Beginning of period | | | 568,826 | | | | 1,355,740 | |
| | | | | | | | |
End of period | | $ | 600,615 | | | $ | 568,826 | |
| | | | | | | | |
| | |
CAPITAL TRANSACTIONS: | | | | | | | | |
Proceeds from shares issued | | $ | 73,764 | | | $ | 154,132 | |
Distributions reinvested | | | 1,996 | | | | 12,744 | |
Cost of shares redeemed | | | (43,083 | ) | | | (954,723 | ) |
| | | | | | | | |
Total change in net assets resulting from capital transactions | | $ | 32,677 | | | $ | (787,847 | ) |
| | | | | | | | |
| | |
SHARE TRANSACTIONS: | | | | | | | | |
Issued | | | 7,363 | | | | 15,408 | |
Reinvested | | | 199 | | | | 1,277 | |
Redeemed | | | (4,299 | ) | | | (95,727 | ) |
| | | | | | | | |
Change in Shares | | | 3,263 | | | | (79,042 | ) |
| | | | | | | | |
SEE NOTES TO FINANCIAL STATEMENTS.
| | | | | | | | | | |
| | | | | |
| 240 | | | | | | | | SIX CIRCLES TRUST | | JUNE 30, 2021 |
| | | | | | | | |
| | | Six Circles U.S. Unconstrained Equity Fund | |
| | | Six Months
Ended
June 30, 2021 | | | Year Ended
December 31,
2020 | |
CHANGE IN NET ASSETS RESULTING FROM OPERATIONS: | | | | | | | | |
Net investment income (loss) | | $ | 107,401 | | | $ | 198,563 | |
Net realized gain (loss) | | | 1,548,982 | | | | 883,137 | |
Change in net unrealized appreciation (depreciation) | | | 1,123,645 | | | | 1,835,845 | |
| | | | | | | | |
Change in net assets resulting from operations | | | 2,780,028 | | | | 2,917,545 | |
| | | | | | | | |
| | |
DISTRIBUTIONS TO SHAREHOLDERS: | | | | | | | | |
Distributions to shareholders | | | — | | | | (710,202 | ) |
| | |
CAPITAL TRANSACTIONS: | | | | | | | | |
Change in net assets resulting from capital transactions | | | 2,329,546 | | | | (379,993 | ) |
| | | | | | | | |
| | |
NET ASSETS: | | | | | | | | |
Change in net assets | | | 5,109,574 | | | | 1,827,350 | |
Beginning of period | | | 13,064,418 | | | | 11,237,068 | |
| | | | | | | | |
End of period | | $ | 18,173,992 | | | $ | 13,064,418 | |
| | | | | | | | |
| | |
CAPITAL TRANSACTIONS: | | | | | | | | |
Proceeds from shares issued | | $ | 3,235,207 | | | $ | 1,742,825 | |
Distributions reinvested | | | — | | | | 710,202 | |
Cost of shares redeemed | | | (905,661 | ) | | | (2,833,020 | ) |
| | | | | | | | |
Total change in net assets resulting from capital transactions | | $ | 2,329,546 | | | $ | (379,993 | ) |
| | | | | | | | |
| | |
SHARE TRANSACTIONS: | | | | | | | | |
Issued | | | 224,591 | | | | 151,713 | |
Reinvested | | | — | | | | 53,238 | |
Redeemed | | | (61,502 | ) | | | (243,375 | ) |
| | | | | | | | |
Change in Shares | | | 163,089 | | | | (38,424 | ) |
| | | | | | | | |
SEE NOTES TO FINANCIAL STATEMENTS.
| | | | | | | | | | |
| | | | | |
| JUNE 30, 2021 | | SIX CIRCLES TRUST | | | | | | | | 241 |
STATEMENTS OF CHANGES IN NET ASSETS
FOR THE PERIODS INDICATED (Unaudited) (continued)
(Amounts in thousands)
| | | | | | | | |
| | | Six Circles International Unconstrained Equity Fund | |
| | | Six Months Ended,
June 30, 2021 | | | Year Ended
December 31, 2020 | |
CHANGE IN NET ASSETS RESULTING FROM OPERATIONS: | | | | | | | | |
Net investment income (loss) | | $ | 205,367 | | | $ | 155,850 | |
Net realized gain (loss) | | | 505,380 | | | | (743,794 | ) |
Change in net unrealized appreciation (depreciation) | | | 231,444 | | | | 1,009,048 | |
| | | | | | | | |
Change in net assets resulting from operations | | | 942,191 | | | | 421,104 | |
| | | | | | | | |
| | |
DISTRIBUTIONS TO SHAREHOLDERS: | | | | | | | | |
Distributions to shareholders | | | — | | | | (156,694 | ) |
| | |
CAPITAL TRANSACTIONS: | | | | | | | | |
Change in net assets resulting from capital transactions | | | 1,881,078 | | | | 3,001,643 | |
| | | | | | | | |
| | |
NET ASSETS: | | | | | | | | |
Change in net assets | | | 2,823,269 | | | | 3,266,053 | |
Beginning of period | | | 8,621,638 | | | | 5,355,585 | |
| | | | | | | | |
End of period | | $ | 11,444,907 | | | $ | 8,621,638 | |
| | | | | | | | |
| | |
CAPITAL TRANSACTIONS: | | | | | | | | |
Proceeds from shares issued | | $ | 2,273,754 | | | $ | 4,422,231 | |
Distributions reinvested | | | — | | | | 156,694 | |
Cost of shares redeemed | | | (392,676 | ) | | | (1,577,282 | ) |
| | | | | | | | |
Total change in net assets resulting from capital transactions | | $ | 1,881,078 | | | $ | 3,001,643 | |
| | | | | | | | |
| | |
SHARE TRANSACTIONS: | | | | | | | | |
Issued | | | 212,112 | | | | 479,556 | |
Reinvested | | | — | | | | 15,908 | |
Redeemed | | | (37,188 | ) | | | (190,455 | ) |
| | | | | | | | |
Change in Shares | | | 174,924 | | | | 305,009 | |
| | | | | | | | |
SEE NOTES TO FINANCIAL STATEMENTS.
| | | | | | | | | | |
| | | | | |
| 242 | | | | | | | | SIX CIRCLES TRUST | | JUNE 30, 2021 |
| | | | | | | | |
| | | Six Circles Global Bond Fund | |
| | | Six Months
Ended
June 30, 2021 | | | Period Ended
December 31,
2020* | |
CHANGE IN NET ASSETS RESULTING FROM OPERATIONS: | | | | | | | | |
Net investment income (loss) | | $ | 28,569 | | | $ | 12,333 | |
Net realized gain (loss) | | | (11,731 | ) | | | (43,503 | ) |
Change in net unrealized appreciation (depreciation) | | | (74,680 | ) | | | 68,324 | |
| | | | | | | | |
Change in net assets resulting from operations | | | (57,842 | ) | | | 37,154 | |
| | | | | | | | |
| | |
DISTRIBUTIONS TO SHAREHOLDERS: | | | | | | | | |
Distributions to shareholders | | | (38,113 | ) | | | (27,909 | ) |
| | |
CAPITAL TRANSACTIONS: | | | | | | | | |
Change in net assets resulting from capital transactions | | | 591,842 | | | | 6,610,463 | |
| | | | | | | | |
| | |
NET ASSETS: | | | | | | | | |
Change in net assets | | | 495,887 | | | | 6,619,708 | |
Beginning of period | | | 6,619,708 | | | | — | |
| | | | | | | | |
End of period | | $ | 7,115,595 | | | $ | 6,619,708 | |
| | | | | | | | |
| | |
CAPITAL TRANSACTIONS: | | | | | | | | |
Proceeds from shares issued | | $ | 954,489 | | | $ | 6,824,832 | |
Distributions reinvested | | | 38,113 | | | | 27,909 | |
Cost of shares redeemed | | | (400,760 | ) | | | (242,278 | ) |
| | | | | | | | |
Total change in net assets resulting from capital transactions | | $ | 591,842 | | | $ | 6,610,463 | |
| | | | | | | | |
| | |
SHARE TRANSACTIONS: | | | | | | | | |
Issued | | | 94,682 | | | | 669,761 | |
Reinvested | | | 3,793 | | | | 2,737 | |
Redeemed | | | (39,792 | ) | | | (23,767 | ) |
| | | | | | | | |
Change in Shares | | | 58,683 | | | | 648,731 | |
| | | | | | | | |
| * | Six Circles Global Bond Fund was launched on May 19, 2020. |
SEE NOTES TO FINANCIAL STATEMENTS.
| | | | | | | | | | |
| | | | | |
| JUNE 30, 2021 | | SIX CIRCLES TRUST | | | | | | | | 243 |
STATEMENTS OF CHANGES IN NET ASSETS
FOR THE PERIODS INDICATED (Unaudited) (continued)
(Amounts in thousands)
| | | | | | | | |
| | | Six Circles Tax Aware Bond Fund | |
| | | Six Months
Ended
June 30, 2021 | | | Period Ended
December 31,
2020* | |
CHANGE IN NET ASSETS RESULTING FROM OPERATIONS: | | | | | | | | |
Net investment income (loss) | | $ | 27,663 | | | $ | 8,224 | |
Net realized gain (loss) | | | 1,258 | | | | 107 | |
Change in net unrealized appreciation (depreciation) | | | 19,622 | | | | 49,976 | |
| | | | | | | | |
Change in net assets resulting from operations | | | 48,543 | | | | 58,307 | |
| | | | | | | | |
| | |
DISTRIBUTIONS TO SHAREHOLDERS: | | | | | | | | |
Distributions to shareholders | | | (27,720 | ) | | | (8,476 | ) |
| | |
CAPITAL TRANSACTIONS: | | | | | | | | |
Change in net assets resulting from capital transactions | | | 687,853 | | | | 4,979,819 | |
| | | | | | | | |
| | |
NET ASSETS: | | | | | | | | |
Change in net assets | | | 708,676 | | | | 5,029,650 | |
Beginning of period | | | 5,029,650 | | | | — | |
| | | | | | | | |
End of period | | $ | 5,738,326 | | | $ | 5,029,650 | |
| | | | | | | | |
| | |
CAPITAL TRANSACTIONS: | | | | | | | | |
Proceeds from shares issued | | $ | 973,521 | | | $ | 5,104,736 | |
Distributions reinvested | | | 27,720 | | | | 8,476 | |
Cost of shares redeemed | | | (313,388 | ) | | | (133,393 | ) |
| | | | | | | | |
Total change in net assets resulting from capital transactions | | $ | 687,853 | | | $ | 4,979,819 | |
| | | | | | | | |
| | |
SHARE TRANSACTIONS: | | | | | | | | |
Issued | | | 93,169 | | | | 493,510 | |
Reinvested | | | 2,657 | | | | 816 | |
Redeemed | | | (29,999 | ) | | | (12,860 | ) |
| | | | | | | | |
Change in Shares | | | 65,827 | | | | 481,466 | |
| | | | | | | | |
| * | Six Circles Tax Aware Bond Fund was launched on May 19, 2020. |
SEE NOTES TO FINANCIAL STATEMENTS.
| | | | | | | | | | |
| | | | | |
| 244 | | | | | | | | SIX CIRCLES TRUST | | JUNE 30, 2021 |
| | | | | | | | |
| | | Six Circles Credit Opportunities Fund | |
| | | Six Months
Ended
June 30, 2021 | | | Period Ended
December 31,
2020* | |
CHANGE IN NET ASSETS RESULTING FROM OPERATIONS: | | | | | | | | |
Net investment income (loss) | | $ | 44,113 | | | $ | 4,714 | |
Net realized gain (loss) | | | 3,172 | | | | 340 | |
Change in net unrealized appreciation (depreciation) | | | 11,071 | | | | 14,802 | |
| | | | | | | | |
Change in net assets resulting from operations | | | 58,356 | | | | 19,856 | |
| | | | | | | | |
| | |
DISTRIBUTIONS TO SHAREHOLDERS: | | | | | | | | |
Distributions to shareholders | | | (45,502 | ) | | | (5,019 | ) |
| | |
CAPITAL TRANSACTIONS: | | | | | | | | |
Change in net assets resulting from capital transactions | | | 2,362,418 | | | | 1,061,688 | |
| | | | | | | | |
| | |
NET ASSETS: | | | | | | | | |
Change in net assets | | | 2,375,272 | | | | 1,076,525 | |
Beginning of period | | | 1,076,525 | | | | — | |
| | | | | | | | |
End of period | | $ | 3,451,797 | | | $ | 1,076,525 | |
| | | | | | | | |
| | |
CAPITAL TRANSACTIONS: | | | | | | | | |
Proceeds from shares issued | | $ | 2,473,690 | | | $ | 1,095,506 | |
Distributions reinvested | | | 45,502 | | | | 5,019 | |
Cost of shares redeemed | | | (156,774 | ) | | | (38,837 | ) |
| | | | | | | | |
Total change in net assets resulting from capital transactions | | $ | 2,362,418 | | | $ | 1,061,688 | |
| | | | | | | | |
| | |
SHARE TRANSACTIONS: | | | | | | | | |
Issued | | | 239,717 | | | | 107,950 | |
Reinvested | | | 4,429 | | | | 490 | |
Redeemed | | | (15,245 | ) | | | (3,822 | ) |
| | | | | | | | |
Change in Shares | | | 228,901 | | | | 104,618 | |
| | | | | | | | |
| * | Six Circles Credit Opportunities Fund was launched on August 19, 2020. |
SEE NOTES TO FINANCIAL STATEMENTS.
| | | | | | | | | | |
| | | | | |
| JUNE 30, 2021 | | SIX CIRCLES TRUST | | | | | | | | 245 |
FINANCIAL HIGHLIGHTS
FOR THE PERIODS INDICATED
| | | | | | | | | | | | | | | | | | | | | | | | | | | | |
| | | Per share operating performance | |
| | | | | | Investment operations | | | Distributions | |
| | | Net asset
value,
beginning
of period | | | Net
investment
income
(loss) (b) | | | Net realized
and unrealized
gains
(losses) on
investments
and foreign
currency
transactions | | | Total from
investment
operations | | | Net
investment
income | | | Net
realized
gain | | | Total
distributions | |
| | | | | | | |
Six Circles Ultra Short Duration Fund | | | | | | | | | | | | | | | | | | | | | | | | | | | | |
Six Months Ended June 30, 2021 (Unaudited) | | $ | 10.03 | | | $ | 0.04 | | | $ | (0.01 | ) | | $ | 0.03 | | | $ | (0.04 | ) | | $ | — | | | $ | (0.04 | ) |
Year Ended December 31, 2020 | | | 9.99 | | | | 0.15 | | | | 0.05 | | | | 0.20 | | | | (0.16 | ) | | | — | | | | (0.16 | ) |
Year Ended December 31, 2019 | | | 9.98 | | | | 0.26 | | | | 0.02 | | | | 0.28 | | | | (0.27 | ) | | | — | | | | (0.27 | ) |
Period Ended December 31, 2018* | | | 10.00 | | | | 0.11 | | | | (0.04 | ) | | | 0.07 | | | | (0.09 | ) | | | — | | | | (0.09 | ) |
| * | Six Circles Ultra Short Duration Fund was launched on July 9, 2018. |
| (a) | Annualized except for certain expenses for periods less than one year, unless otherwise noted. |
| (b) | Calculated based upon average shares outstanding. |
| (c) | Not annualized for periods less than one year. |
| (d) | Includes adjustments in accordance with accounting principles generally accepted in the United States of America and as such, the net asset values for financial reporting purposes and the returns based upon those net asset values may differ from the net asset values and returns for shareholder transactions. |
| (e) | Includes interest expense, if applicable, which is less than 0.005% unless otherwise noted. |
SEE NOTES TO FINANCIAL STATEMENTS.
| | | | | | |
| | | |
| 246 | | | | SIX CIRCLES TRUST | | JUNE 30, 2021 |
| | | | | | | | | | | | | | | | | | | | | | | | | | | | | | |
| | | Ratios/Supplemental data | |
| | | | | | | | | | Ratios to average net assets (a) | | | | |
Net asset
value,
end of
period | | | Total
return (c)(d) | | | Net assets,
end of
period (000’s) | | | Net expenses,
with interest
expense | | | Net expenses,
without interest
expense | | | Net
investment
income
(loss) | | | Expenses
without waivers
and reimbursements | | | Portfolio
turnover
rate (c) | |
| | | | | | | |
| | | | | | | | | | | | | | | | | | | | | | | | | | | | | | |
| $ | 10.02 | | | | 0.34 | % | | $ | 552,249 | | | | 0.18 | % | | | 0.18 | % | | | 0.82 | % | | | 0.31 | % | | | 30.71 | % |
| | 10.03 | | | | 2.05 | | | | 516,528 | | | | 0.17 | (e) | | | 0.17 | | | | 1.47 | | | | 0.31 | | | | 121.23 | |
| | 9.99 | | | | 2.84 | | | | 1,200,167 | | | | 0.25 | | | | 0.20 | | | | 2.56 | | | | 0.41 | | | | 61.40 | |
| | 9.98 | | | | 0.74 | | | | 1,082,850 | | | | 0.23 | (e) | | | 0.23 | | | | 2.46 | | | | 0.63 | | | | 24.56 | |
SEE NOTES TO FINANCIAL STATEMENTS.
| | | | | | | | |
| | | |
| JUNE 30, 2021 | | SIX CIRCLES TRUST | | | | | 247 | |
FINANCIAL HIGHLIGHTS
FOR THE PERIODS INDICATED
| | | | | | | | | | | | | | | | | | | | | | | | | | | | |
| | | Per share operating performance | |
| | | | | | Investment operations | | | Distributions | |
| | | Net asset
value,
beginning
of period | | | Net
investment
income
(loss) (b) | | | Net realized
and unrealized gains (losses) on investments and foreign currency transactions | | | Total from
investment
operations | | | Net
investment
income | | | Net
realized
gain | | | Total
distributions | |
| | | | | | | |
Six Circles Tax Aware Ultra Short Duration Fund | | | | | | | | | | | | | | | | | | | | | | | | | | | | |
Six Months Ended June 30, 2021 (Unaudited) | | $ | 10.02 | | | $ | 0.04 | | | $ | (0.03 | ) | | $ | 0.01 | | | $ | (0.03 | ) | | $ | — | | | $ | (0.03 | ) |
Year Ended December 31, 2020 | | | 9.98 | | | | 0.12 | | | | 0.06 | | | | 0.18 | | | | (0.14 | ) | | | — | | | | (0.14 | ) |
Year Ended December 31, 2019 | | | 9.98 | | | | 0.19 | | | | 0.01 | | | | 0.20 | | | | (0.20 | ) | | | — | | | | (0.20 | ) |
Period Ended December 31, 2018* | | | 10.00 | | | | 0.08 | | | | (0.03 | ) | | | 0.05 | | | | (0.07 | ) | | | — | | | | (0.07 | ) |
| * | Six Circles Tax Aware Ultra Short Duration Fund was launched on July 9, 2018. |
| (a) | Annualized except for certain expenses for periods less than one year, unless otherwise noted. |
| (b) | Calculated based upon average shares outstanding. |
| (c) | Not annualized for periods less than one year. |
| (d) | Includes adjustments in accordance with accounting principles generally accepted in the United States of America and as such, the net asset values for financial reporting purposes and the returns based upon those net asset values may differ from the net asset values and returns for shareholder transactions. |
| (e) | Includes interest expense, if applicable, which is less than 0.005% unless otherwise noted. |
SEE NOTES TO FINANCIAL STATEMENTS.
| | | | | | |
| | | |
| 248 | | | | SIX CIRCLES TRUST | | JUNE 30, 2021 |
| | | | | | | | | | | | | | | | | | | | | | | | | | | | | | |
| | | Ratios/Supplemental data | |
| | | | | | | | | | Ratios to average net assets (a) | | | | |
Net asset
value,
end of
period | | | Total
return (c)(d) | | | Net assets,
end of
period (000’s) | | | Net expenses, with interest expense | | | Net expenses,
without interest
expense | | | Net
investment
income
(loss) | | | Expenses
without waivers
and reimbursements | | | Portfolio
turnover
rate (c) | |
| | | | | | | |
| | | | | | | | | | | | | | | | | | | | | | | | | | | | | | |
| $ | 10.00 | | | | 0.24 | % | | $ | 600,615 | | | | 0.15 | %(e) | | | 0.15 | % | | | 0.77 | % | | | 0.30 | % | | | 12.04 | % |
| | 10.02 | | | | 1.81 | | | | 568,826 | | | | 0.14 | (e) | | | 0.14 | | | | 1.22 | | | | 0.30 | | | | 89.21 | |
| | 9.98 | | | | 1.98 | | | | 1,355,740 | | | | 0.21 | | | | 0.17 | | | | 1.85 | | | | 0.37 | | | | 49.82 | |
| | 9.98 | | | | 0.48 | | | | 1,098,004 | | | | 0.22 | (e) | | | 0.22 | | | | 1.90 | | | | 0.64 | | | | 33.02 | |
SEE NOTES TO FINANCIAL STATEMENTS.
| | | | | | | | |
| | | |
| JUNE 30, 2021 | | SIX CIRCLES TRUST | | | | | 249 | |
FINANCIAL HIGHLIGHTS
FOR THE PERIODS INDICATED
| | | | | | | | | | | | | | | | | | | | | | | | | | | | |
| | | Per share operating performance | |
| | | | | | Investment operations | | | Distributions | |
| | | Net asset
value,
beginning
of period | | | Net
investment
income
(loss) (b) | | | Net realized
and unrealized
gains
(losses) on
investments
and foreign
currency
transactions | | | Total from
investment
operations | | | Net
investment
income | | | Net
realized
gain | | | Total
distributions | |
| | | | | | | |
Six Circles U.S. Unconstrained Equity Fund | | | | | | | | | | | | | | | | | | | | | | | | | | | | |
Six Months Ended June 30, 2021 (Unaudited) | | $ | 13.44 | | | | 0.10 | | | $ | 2.47 | | | $ | 2.57 | | | $ | — | | | $ | — | | | $ | — | |
Year Ended December 31, 2020 | | | 11.12 | | | | 0.20 | | | | 2.87 | | | | 3.07 | | | | (0.21 | ) | | | (0.54 | ) | | | (0.75 | ) |
Year Ended December 31, 2019 | | | 9.05 | | | | 0.21 | | | | 2.05 | | | | 2.26 | | | | (0.19 | ) | | | — | (f) | | | (0.19 | ) |
Period Ended December 31, 2018* | | | 10.00 | | | | 0.10 | | | | (1.01 | ) | | | (0.91 | ) | | | (0.04 | ) | | | — | (f) | | | (0.04 | ) |
| * | Six Circles U.S. Unconstrained Equity Fund was launched on July 9, 2018. |
| (a) | Annualized except for certain expenses for periods less than one year, unless otherwise noted. |
| (b) | Calculated based upon average shares outstanding. |
| (c) | Not annualized for periods less than one year. |
| (d) | Includes adjustments in accordance with accounting principles generally accepted in the United States of America and as such, the net asset values for financial reporting purposes and the returns based upon those net asset values may differ from the net asset values and returns for shareholder transactions. |
| (e) | Includes interest expense, if applicable, which is less than 0.005% unless otherwise noted. |
| (f) | Amount rounds to less than $0.005. |
SEE NOTES TO FINANCIAL STATEMENTS.
| | | | | | |
| | | |
| 250 | | | | SIX CIRCLES TRUST | | JUNE 30, 2021 |
| | | | | | | | | | | | | | | | | | | | | | | | | | |
| | | Ratios/Supplemental data | |
| | | | | | | | | | Ratios to average net assets (a) | | | | |
Net asset
value,
end of
period | | | Total
return (c)(d) | | | Net assets,
end of
period (000’s) | | | Net
expenses (e) | | | Net
investment
income
(loss) | | | Expenses
without waivers
and reimbursements | | | Portfolio
turnover
rate (c) | |
| | | | | | |
| | | | | | | | | | | | | | | | | | | | | | | | | | |
| $ | 16.01 | | | | 19.12 | % | | $ | 18,173,992 | | | | 0.05 | % | | | 1.35 | % | | | 0.26 | % | | | 34.12 | % |
| | 13.44 | | | | 27.64 | | | | 13,064,418 | | | | 0.06 | | | | 1.71 | | | | 0.27 | | | | 71.32 | |
| | 11.12 | | | | 24.94 | | | | 11,237,068 | | | | 0.08 | | | | 2.05 | | | | 0.29 | | | | 58.71 | |
| | 9.05 | | | | (9.13 | ) | | | 4,979,458 | | | | 0.14 | | | | 2.27 | | | | 0.42 | | | | 15.24 | |
SEE NOTES TO FINANCIAL STATEMENTS.
| | | | | | | | |
| | | |
| JUNE 30, 2021 | | SIX CIRCLES TRUST | | | | | 251 | |
FINANCIAL HIGHLIGHTS
FOR THE PERIODS INDICATED
| | | | | | | | | | | | | | | | | | | | | | | | | | | | |
| | | Per share operating performance | |
| | | | | | Investment operations | | | Distributions | |
| | | Net asset
value,
beginning
of period | | | Net
investment
income
(loss) (b) | | | Net realized
and unrealized gains (losses) on investments
and foreign
currency
transactions | | | Total from
investment
operations | | | Net
investment
income | | | Net
realized
gain | | | Total
distributions | |
| | | | | | | |
Six Circles International Unconstrained Equity Fund | | | | | | | | | | | | | | | | | | | | | | | | | | | | |
Six Months Ended June 30, 2021 (Unaudited) | | $ | 9.98 | | | $ | 0.22 | | | $ | 0.82 | | | $ | 1.04 | | | $ | — | | | $ | — | | | $ | — | |
Year Ended December 31, 2020 | | | 9.59 | | | | 0.22 | | | | 0.37 | | | | 0.59 | | | | (0.16 | ) | | | (0.04 | ) | | | (0.20 | ) |
Year Ended December 31, 2019 | | | 8.30 | | | | 0.31 | | | | 1.26 | | | | 1.57 | | | | (0.28 | ) | | | — | | | | (0.28 | ) |
Period Ended December 31, 2018* | | | 10.00 | | | | 0.07 | | | | (1.75 | ) | | | (1.68 | ) | | | (0.02 | ) | | | — | | | | (0.02 | ) |
| * | Six Circles International Unconstrained Equity Fund was launched on July 9, 2018. |
| (a) | Annualized except for certain expenses for periods less than one year, unless otherwise noted. |
| (b) | Calculated based upon average shares outstanding. |
| (c) | Not annualized for periods less than one year. |
| (d) | Includes adjustments in accordance with accounting principles generally accepted in the United States of America and as such, the net asset values for financial reporting purposes and the returns based upon those net asset values may differ from the net asset values and returns for shareholder transactions. |
| (e) | Includes interest expense, if applicable, which is less than 0.005% unless otherwise noted. |
| (f) | Includes interest expense, which was 0.006% for the six months ended June 30, 2021. |
| (g) | Includes interest expense, which was 0.009% for the year ended December 31, 2020. |
| (h) | Includes interest expense, which was 0.006% for the period ended December 31, 2018. |
SEE NOTES TO FINANCIAL STATEMENTS.
| | | | | | |
| | | |
| 252 | | | | SIX CIRCLES TRUST | | JUNE 30, 2021 |
| | | | | | | | | | | | | | | | | | | | | | | | | | |
| | | Ratios/Supplemental data | |
| | | | | | | | | | Ratios to average net assets (a) | | | | |
Net asset
value,
end of
period | | | Total
return (c)(d) | | | Net assets,
end of
period (000’s) | | | Net
expenses (e) | | | Net
investment
income
(loss) | | | Expenses
without waivers
and reimbursements | | | Portfolio
turnover
rate (c) | |
| | | | | | |
| | | | | | | | | | | | | | | | | | | | | | | | | | |
| $ | 11.02 | | | | 10.42 | % | | $ | 11,444,907 | | | | 0.09 | %(f) | | | 4.18 | % | | | 0.30 | % | | | 40.47 | % |
| | 9.98 | | | | 6.17 | | | | 8,621,638 | | | | 0.10 | (g) | | | 2.52 | | | | 0.30 | | | | 104.24 | |
| | 9.59 | | | | 18.90 | | | | 5,355,585 | | | | 0.13 | | | | 3.35 | | | | 0.33 | | | | 135.39 | |
| | 8.30 | | | | (16.83 | ) | | | 2,504,508 | | | | 0.21 | (h) | | | 1.84 | | | | 0.55 | | | | 76.24 | |
SEE NOTES TO FINANCIAL STATEMENTS.
| | | | | | | | |
| | | |
| JUNE 30, 2021 | | SIX CIRCLES TRUST | | | | | 253 | |
FINANCIAL HIGHLIGHTS
FOR THE PERIODS INDICATED
| | | | | | | | | | | | | | | | | | | | | | | | | | | | |
| | | Per share operating performance | |
| | | | | | Investment operations | | | Distributions | |
| | | Net asset
value,
beginning
of period | | | Net
investment
income
(loss) (b) | | | Net realized
and unrealized
gains
(losses) on
investments
and foreign
currency
transactions | | | Total from
investment
operations | | | Net
investment
income | | | Net
realized
gain | | | Total
distributions | |
| | | | | |
Six Circles Global Bond Fund | | | | | | | | | | | | | | | | | | | | | |
Six Months Ended June 30, 2021 (Unaudited) | | $ | 10.20 | | | $ | 0.04 | | | $ | (0.12 | ) | | $ | (0.08 | ) | | $ | (0.06 | ) | | $ | — | | | $ | (0.06 | ) |
Period Ended December 31, 2020* | | | 10.00 | | | | 0.05 | | | | 0.22 | | | | 0.27 | | | | (0.07 | ) | | | — | | | | (0.07 | ) |
| * | Six Circles Global Bond Fund was launched on May 19, 2020. |
| (a) | Certain expenses incurred by the Fund were not annualized for the period. |
| (b) | Calculated based upon average shares outstanding. |
| (c) | Not annualized for periods less than one year. |
| (d) | Includes adjustments in accordance with accounting principles generally accepted in the United States of America and as such, the net asset values for financial reporting purposes and the returns based upon those net asset values may differ from the net asset values and returns for shareholder transactions. |
| (e) | Includes interest expense, if applicable, which is less than 0.005% unless otherwise noted. |
SEE NOTES TO FINANCIAL STATEMENTS.
| | | | | | |
| | | |
| 254 | | | | SIX CIRCLES TRUST | | JUNE 30, 2021 |
| | | | | | | | | | | | | | | | | | | | | | | | | | |
| | | Ratios/Supplemental data | |
| | | | | | | | | | Ratios to average net assets (a) | | | | |
Net asset
value,
end of
period | | | Total
return (c)(d) | | | Net assets,
end of
period (000’s) | | | Net
expenses (e) | | | Net
investment
income
(loss) | | | Expenses
without waivers
and reimbursements | | | Portfolio
turnover
rate (c) | |
| | | | | | |
| | | | | | | | | | | | | | | | | | | | | | | | | | | |
| $ | 10.06 | | | | (0.82 | )% | | $ | 7,115,595 | | | | 0.11 | % | | | 0.84 | % | | | 0.30 | % | | | 158.24 | % |
| | 10.20 | | | | 2.67 | | | | 6,619,708 | | | | 0.16 | | | | 0.74 | | | | 0.36 | | | | 198.77 | |
SEE NOTES TO FINANCIAL STATEMENTS.
| | | | | | | | |
| | | |
| JUNE 30, 2021 | | SIX CIRCLES TRUST | | | | | 255 | |
FINANCIAL HIGHLIGHTS
FOR THE PERIODS INDICATED
| | | | | | | | | | | | | | | | | | | | | | | | | | | | |
| | | Per share operating performance | |
| | | | | | Investment operations | | | Distributions | |
| | | Net asset
value,
beginning
of period | | | Net
investment
income
(loss) (b) | | | Net realized
and unrealized
gains
(losses) on
investments
and foreign
currency
transactions | | | Total from
investment
operations | | | Net
investment
income | | | Net
realized
gain | | | Total
distributions | |
| | | | | |
Six Circles Tax Aware Bond Fund | | | | | | | | | | | | | | | | | | | | | |
Six Months Ended June 30, 2021 (Unaudited) | | $ | 10.45 | | | $ | 0.05 | | | $ | 0.03 | | | $ | 0.08 | | | $ | (0.05 | ) | | $ | — | | | $ | (0.05 | ) |
Period Ended December 31, 2020* | | | 10.00 | | | | 0.05 | | | | 0.45 | | | | 0.50 | | | | (0.05 | ) | | | — | | | | (0.05 | ) |
| * | Six Circles Tax Aware Bond Fund was launched on May 19, 2020. |
| (a) | Certain expenses incurred by the Fund were not annualized for the period. |
| (b) | Calculated based upon average shares outstanding. |
| (c) | Not annualized for periods less than one year. |
| (d) | Includes adjustments in accordance with accounting principles generally accepted in the United States of America and as such, the net asset values for financial reporting purposes and the returns based upon those net asset values may differ from the net asset values and returns for shareholder transactions. |
| (e) | Includes interest expense, if applicable, which is less than 0.005% unless otherwise noted. |
SEE NOTES TO FINANCIAL STATEMENTS.
| | | | | | |
| | | |
| 256 | | | | SIX CIRCLES TRUST | | JUNE 30, 2021 |
| | | | | | | | | | | | | | | | | | | | | | | | | | |
| | | Ratios/Supplemental data | |
| | | | | | | | | | Ratios to average net assets (a) | | | | |
Net asset
value,
end of
period | | | Total
return (c)(d) | | | Net assets,
end of
period (000’s) | | | Net
expenses (e) | | | Net
investment
income
(loss) | | | Expenses
without waivers
and reimbursements | | | Portfolio
turnover
rate (c) | |
| | | | | | |
| | | | | | | | | | | | | | | | | | | | | | | | | | | |
| $ | 10.48 | | | | 0.80 | % | | $ | 5,738,326 | | | | 0.13 | % | | | 1.04 | % | | | 0.27 | % | | | 6.92 | % |
| | 10.45 | | | | 5.03 | | | | 5,029,650 | | | | 0.18 | | | | 0.85 | | | | 0.35 | | | | 35.13 | |
SEE NOTES TO FINANCIAL STATEMENTS.
| | | | | | | | |
| | | |
| JUNE 30, 2021 | | SIX CIRCLES TRUST | | | | | 257 | |
FINANCIAL HIGHLIGHTS
FOR THE PERIODS INDICATED
| | | | | | | | | | | | | | | | | | | | | | | | | | | | |
| | | Per share operating performance | |
| | | | | | Investment operations | | | Distributions | |
| | | Net asset
value,
beginning
of period | | | Net
investment
income
(loss) (b) | | | Net realized
and unrealized gains (losses) on investments and foreign currency transactions | | | Total from
investment
operations | | | Net
investment
income | | | Net
realized
gain | | | Total
distributions | |
| | | | | | | |
Six Circles Credit Opportunities Fund | | | | | | | | | | | | | | | | | | | | | | | | | | | | |
Six Months Ended June 30, 2021 (Unaudited) | | $ | 10.29 | | | $ | 0.17 | | | $ | 0.05 | | | $ | 0.22 | | | $ | (0.16 | ) | | $ | — | | | $ | (0.16 | ) |
Period Ended December 31, 2020* | | | 10.00 | | | | 0.13 | | | | 0.28 | | | | 0.41 | | | | (0.12 | ) | | | — | | | | (0.12 | ) |
| * | Six Circles Credit Opportunities Fund was launched on August 19, 2020. |
| (a) | Certain expenses incurred by the Fund were not annualized for the period. |
| (b) | Calculated based upon average shares outstanding. |
| (c) | Not annualized for periods less than one year. |
| (d) | Includes adjustments in accordance with accounting principles generally accepted in the United States of America and as such, the net asset values for financial reporting purposes and the returns based upon those net asset values may differ from the net asset values and returns for shareholder transactions. |
| (e) | Includes interest expense, if applicable, which is less than 0.005% unless otherwise noted. |
SEE NOTES TO FINANCIAL STATEMENTS.
| | | | | | |
| | | |
| 258 | | | | SIX CIRCLES TRUST | | JUNE 30, 2021 |
| | | | | | | | | | | | | | | | | | | | | | | | | | |
| | | Ratios/Supplemental data | |
| | | | | | | | | | Ratios to average net assets (a) | | | | |
Net asset
value,
end of
period | | | Total
return (c)(d) | | | Net assets,
end of
period (000’s) | | | Net
expenses (e) | | | Net
investment
income
(loss) | | | Expenses
without waivers
and reimbursements | | | Portfolio
turnover
rate (c) | |
| | | | | | |
| | | | | | | | | | | | | | | | | | | | | | | | | | |
| $ | 10.35 | | | | 2.20 | % | | $ | 3,451,797 | | | | 0.24 | % | | | 3.27 | % | | | 0.80 | % | | | 32.15 | % |
| | 10.29 | | | | 4.11 | | | | 1,076,525 | | | | 0.44 | | | | 3.40 | | | | 1.11 | | | | 11.35 | |
SEE NOTES TO FINANCIAL STATEMENTS.
| | | | | | | | |
| | | |
| JUNE 30, 2021 | | SIX CIRCLES TRUST | | | | | 259 | |
NOTES TO FINANCIAL STATEMENTS
AS OF JUNE 30, 2021 (Unaudited)
1. Organization
Six Circles Trust (the “Trust”) was formed on November 8, 2017, as a Delaware statutory trust, pursuant to a Declaration of Trust dated November 8, 2017, as amended and restated June 12, 2018, and further amended to add fund series on September 21, 2018, November 19, 2019, and April 13, 2020, and is registered under the Investment Company Act of 1940, as amended (the “1940 Act”), as an open-end management investment company.
The following are seven separate series of the Trust (each, a “Fund” and collectively, the “Funds”) covered by this report. Each Fund currently offers one class of shares.
| | | | |
| Fund | | Commencement of Operations | | Diversification Status |
Six Circles Ultra Short Duration Fund | | July 9, 2018 | | Non-Diversified* |
Six Circles Tax Aware Ultra Short Duration Fund | | July 9, 2018 | | Non-Diversified* |
Six Circles U.S. Unconstrained Equity Fund | | July 9, 2018 | | Non-Diversified |
Six Circles International Unconstrained Equity Fund | | July 9, 2018 | | Non-Diversified |
Six Circles Global Bond Fund | | May 19, 2020 | | Non-Diversified |
Six Circles Tax Aware Bond Fund | | May 19, 2020 | | Non-Diversified |
Six Circles Credit Opportunities Fund | | August 19, 2020 | | Non-Diversified |
| * | Effective July 7,2021, The Six Circles Ultra Short Duration Fund and Six Circles Tax Aware Ultra Short Duration Fund are operating as Diversified Funds. |
The investment objective of each of the Six Circles Ultra Short Duration Fund and the Six Circles Tax Aware Ultra Short Duration Fund is to generate current income consistent with capital preservation.
The investment objective of each of the Six Circles U.S. Unconstrained Equity Fund and the Six Circles International Unconstrained Equity Fund is to provide capital appreciation.
The investment objective of the Six Circles Global Bond Fund and the Six Circles Credit Opportunities Fund is to provide total return.
The investment objective of the Six Circles Tax Aware Bond Fund is to provide after-tax total return.
J.P. Morgan Private Investments Inc. (“JPMPI”), an indirect, wholly-owned subsidiary of JPMorgan Chase & Co. (“JPMorgan”), acts as the Funds’ investment adviser (the “Adviser”). The Adviser has engaged certain Sub-Advisers to manage the assets of the Funds.
2. Significant Accounting Policies
The following is a summary of significant accounting policies followed by the Funds in the preparation of their financial statements. The Funds are investment companies and, accordingly, follow the investment company accounting and reporting guidance of the Financial Accounting Standards Board (“FASB”) Accounting Standards Codification Topic 946 — Investment Companies, which is part of U.S. generally accepted accounting principles (“GAAP”). The preparation of financial statements in conformity with GAAP requires management to make estimates and assumptions that affect the reported amounts of assets and liabilities and disclosure of contingent assets and liabilities at the date of the financial statements and the reported amounts of increases and decreases in net assets from operations during the reporting period. Actual results could differ from those estimates.
A. Valuation of Investments — The valuation of investments is in accordance with GAAP and the Funds’ valuation policies set forth by and under the supervision and responsibility of the Board of Trustees (the “Board”), which established the following approach to valuation, as described more fully below: (i) investments for which market quotations are readily available shall be valued at unadjusted quoted prices and (ii) all other investments for which market quotations are not readily available shall be valued at their fair value as determined in good faith by the Board.
The Board has appointed the Six Circles Funds Valuation Committee (“VC”), comprised of officers of the Funds and other personnel of the Adviser, to assist the Board with the oversight and monitoring of the valuation of the Funds’ investments. The VC oversees and carries out policies and procedures for the valuation of investments held by the Funds. This includes monitoring the appropriateness of fair values based on results of ongoing valuation oversight including, but not limited to, consideration of macro or security specific events, market events and pricing vendor due diligence. The VC, through the Adviser, is responsible for assessing the potential impacts to the fair values on an ongoing basis, and discussing this on at least a quarterly basis with the Board.
A market-based approach is primarily used to value the Funds’ investments for which market quotations are readily available and which are generally valued at their current market value. Other securities and assets, including securities for which market quotations are not readily available, market quotations are determined not to be reliable, or whose value has been materially affected by events occurring after the close of trading on the exchange or market on which the security is principally traded but before a Fund’s net asset value (“NAV”) is calculated, are valued by approved pricing vendors or third party broker-dealers (collectively referred to as “Pricing Services”) or may be internally fair valued using methods set forth by the valuation policies approved by the Board. The valuation may include related or comparable assets or liabilities, recent transactions, market multiples, book values and other relevant information for the investment in order to determine the fair value of the investment. An income-based valuation approach may be used in which the anticipated future cash flows of the investment are discounted to calculate the fair value. Discounts may be applied due to the nature or duration of any restrictions on the disposition of the investments. Valuations may be based on current market prices of securities that are comparable in coupon, rating, maturity and industry. It is possible that the estimated values may differ significantly from the values that would have been used, had a ready market for the investments existed, and such differences could be material.
| | | | | | | | | | |
| | | | | |
| 260 | �� | | | | | | | SIX CIRCLES TRUST | | JUNE 30, 2021 |
Equity securities listed on a North American, Central American, South American or Caribbean (“Americas”) securities exchange are generally valued at the last sale price or official market closing price on the primary exchange on which the security is principally traded that is reported before the time when the net assets values of the Funds are calculated on a valuation date. The Funds calculate their NAV as of 4 p.m. Eastern time each day the New York Stock Exchange (NYSE) is open for trading.
Foreign equity securities are valued as of the close of trading on the stock exchange on which the security is primarily traded, or as of 4 p.m. Eastern time. The value is then converted into its U.S. dollar equivalent at the foreign exchange rate in effect at 4 p.m. Eastern time on the day that the value of the security is determined. Generally foreign equity securities, as well as certain derivatives with equity reference obligations, are valued by applying international fair value factors provided by approved Pricing Services.
The factors seek to adjust the local closing price for movements of local markets post-closing, but prior to the time the NAVs are calculated. The fair valued securities are converted at the exchange rates available at 4 p.m. Eastern time.
Fixed income securities are valued based on prices received from Pricing Services. In instances where sufficient market activity exists, the Pricing Services may utilize a market-based approach through which trades or quotes from market makers are used to determine the valuation of these instruments. In instances where sufficient market activity may not exist, Pricing Services may consider a variety of inputs and factors, including, but not limited to proprietary models that may take into account market transactions in securities with comparable characteristics, yield curves, option-adjusted spreads, credit spreads, estimated default rates, coupon rates, underlying collateral and estimated cash flows.
Pricing services generally value fixed-income securities assuming orderly transactions of an institutional round lot size, but a fund may hold or transact in such securities in smaller, odd lot sizes. Odd lots may trade at lower prices than institutional round lots.
Shares of exchange-traded funds (“ETFs”) are generally valued at the last sale price on the exchange on which the ETF is principally traded. Shares of open-end investment companies are valued at their respective NAVs.
Futures contracts and options are generally valued on the basis of available market quotations. Swaps and forward foreign currency exchange contracts are valued utilizing market quotations from approved Pricing Services.
Valuations reflected in this report are as of the report date. As a result, changes in valuation due to market events and/or issuer related events after the report date and prior to issuance of the report are not reflected herein.
The various inputs that are used in determining the valuation of the Funds’ investments are summarized into the three broad levels listed below.
| • | | Level 1 —Unadjusted inputs using quoted prices in active markets for identical investments. |
| • | | Level 2 —Other significant observable inputs including, but not limited to, quoted prices for similar investments, inputs other than quoted prices that are observable for investments (such as interest rates, prepayment speeds, credit risk, etc.) or other market corroborated inputs. |
| • | | Level 3 —Significant inputs based on the best information available in the circumstances, to the extent observable inputs are not available (including the Funds’ assumptions in determining the fair value of investments). |
A financial instrument’s level within the fair value hierarchy is based on the lowest level of any input, both individually and in the aggregate, that is significant to the fair value measurement. The inputs or methodology used for valuing instruments are not necessarily an indication of the risk associated with investing in those instruments.
The following tables represent each valuation input as presented on the Schedules of Portfolio Investments (“SOIs”) (amounts in thousands):
Six Circles Ultra Short Duration Fund
| | | | | | | | | | | | | | | | |
| | | Level 1
Quoted prices | | | Level 2
Other significant
observable inputs | | | Level 3
Significant
unobservable inputs | | | Total | |
Investments in Securities | | | | | | | | | | | | | | | | |
Debt Securities | | | | | | | | | | | | | | | | |
Asset-Backed Securities | | $ | — | | | $ | 73,194 | | | $ | — | | | $ | 73,194 | |
Certificates of Deposit | | | | | | | | | | | | | | | | |
Financial | | | — | | | | 10,814 | | | | — | | | | 10,814 | |
Collateralized Mortgage Obligations | | | — | | | | 22,650 | | | | 1,742 | | | | 24,392 | |
Commercial Mortgage-Backed Securities | | | — | | | | 23,266 | | | | — | | | | 23,266 | |
Corporate Bonds | | | | | | | | | | | | | | | | |
Basic Materials | | | — | | | | 4,805 | | | | — | | | | 4,805 | |
Communications | | | — | | | | 21,529 | | | | — | | | | 21,529 | |
Consumer Cyclical | | | — | | | | 35,312 | | | | — | | | | 35,312 | |
Consumer Non-cyclical | | | — | | | | 43,683 | | | | — | | | | 43,683 | |
Diversified | | | — | | | | 933 | | | | — | | | | 933 | |
Energy | | | — | | | | 10,765 | | | | — | | | | 10,765 | |
Financial | | | — | | | | 142,048 | | | | — | | | | 142,048 | |
| | | | | | | | | | |
| | | | | |
| JUNE 30, 2021 | | SIX CIRCLES TRUST | | | | | | | | 261 |
NOTES TO FINANCIAL STATEMENTS
AS OF JUNE 30, 2021 (Unaudited) (continued)
Six Circles Ultra Short Duration Fund (Continued)
| | | | | | | | | | | | | | | | |
| | | Level 1
Quoted prices | | | Level 2
Other significant
observable inputs | | | Level 3
Significant
unobservable inputs | | | Total | |
Industrial | | $ | — | | | $ | 8,511 | | | $ | — | | | $ | 8,511 | |
Technology | | | — | | | | 8,305 | | | | — | | | | 8,305 | |
Utilities | | | — | | | | 12,904 | | | | — | | | | 12,904 | |
| | | | | | | | | | | | | | | | |
Total Corporate Bonds | | | — | | | | 288,795 | | | | — | | | | 288,795 | |
| | | | | | | | | | | | | | | | |
Foreign Government Securities | | | — | | | | 12,689 | | | | — | | | | 12,689 | |
Municipal Bonds | | | — | | | | 3,645 | | | | — | | | | 3,645 | |
U.S. Government Agency Securities | | | — | | | | 11,035 | | | | — | | | | 11,035 | |
Short-Term Investments | | | | | | | | | | | | | | | | |
Certificates of Deposit | | | — | | | | 17,554 | | | | — | | | | 17,554 | |
Commercial Papers | | | — | | | | 9,484 | | | | — | | | | 9,484 | |
Corporate Bonds | | | — | | | | 2,402 | | | | — | | | | 2,402 | |
Foreign Government Securities | | | — | | | | 27,652 | | | | — | | | | 27,652 | |
Municipal Bonds | | | — | | | | 1,195 | | | | — | | | | 1,195 | |
Time Deposits | | | — | | | | 34,571 | | | | — | | | | 34,571 | |
U.S. Government Agency Security | | | — | | | | 8,699 | | | | — | | | | 8,699 | |
U.S. Treasury Obligations | | | — | | | | 3,500 | | | | — | | | | 3,500 | |
| | | | | | | | | | | | | | | | |
Total Short-Term Investments | | | — | | | | 105,057 | | | | — | | | | 105,057 | |
| | | | | | | | | | | | | | | | |
Total Investments in Securities | | $ | — | | | $ | 551,145 | | | $ | 1,742 | | | $ | 552,887 | |
| | | | | | | | | | | | | | | | |
Appreciation in Other Financial Instruments | | | | | | | | | | | | | | | | |
Future contract | | $ | 37 | | | $ | — | | | $ | — | | | $ | 37 | |
Forward Foreign Currency Exchange contracts | | | — | | | | 856 | | | | — | | | | 856 | |
| | | | | | | | | | | | | | | | |
Total Appreciation in Other Financial Instruments | | $ | 37 | | | $ | 856 | | | $ | — | | | $ | 893 | |
| | | | | | | | | | | | | | | | |
Depreciation in Other Financial Instruments | | | | | | | | | | | | | | | | |
Futures contracts | | $ | (404 | ) | | $ | — | | | $ | — | | | $ | (404 | ) |
Forward Foreign Currency Exchange contracts | | | — | | | | (24 | ) | | | — | | | | (24 | ) |
Centrally Cleared Interest Rate Swap contracts | | | — | | | | (10 | ) | | | — | | | | (10 | ) |
Centrally Cleared Credit default swap contracts | | | — | | | | (34 | ) | | | — | | | | (34 | ) |
| | | | | | | | | | | | | | | | |
Total Depreciation in Other Financial Instruments | | $ | (404 | ) | | $ | (68 | ) | | $ | — | | | $ | (472 | ) |
| | | | | | | | | | | | | | | | |
Six Circles Tax Aware Ultra Short Duration Fund
| | | | | | | | | | | | | | | | |
| | | Level 1
Quoted prices | | | Level 2
Other significant
observable inputs | | | Level 3
Significant
unobservable inputs | | | Total | |
Investments in Securities | | | | | | | | | | | | | | | | |
Debt Securities | | | | | | | | | | | | | | | | |
Asset-Backed Securities | | $ | — | | | $ | 23,132 | | | $ | — | | | $ | 23,132 | |
Collateralized Mortgage Obligations | | | — | | | | 24,153 | | | | 1,851 | | | | 26,004 | |
Commercial Mortgage-Backed Securities | | | — | | | | 6,065 | | | | — | | | | 6,065 | |
Corporate Bonds | | | | | | | | | | | | | | | | |
Communications | | | — | | | | 2,608 | | | | — | | | | 2,608 | |
Consumer Cyclical | | | — | | | | 7,086 | | | | — | | | | 7,086 | |
Consumer Non-cyclical | | | — | | | | 15,260 | | | | — | | | | 15,260 | |
Diversified | | | — | | | | 1,270 | | | | — | | | | 1,270 | |
Energy | | | — | | | | 2,690 | | | | — | | | | 2,690 | |
Financial | | | — | | | | 51,058 | | | | — | | | | 51,058 | |
Industrial | | | — | | | | 2,797 | | | | — | | | | 2,797 | |
Technology | | | — | | | | 415 | | | | — | | | | 415 | |
Utilities | | | — | | | | 6,319 | | | | — | | | | 6,319 | |
| | | | | | | | | | | | | | | | |
Total Corporate Bonds | | | — | | | | 89,503 | | | | — | | | | 89,503 | |
| | | | | | | | | | | | | | | | |
Foreign Government Securities | | | — | | | | 6,684 | | | | — | | | | 6,684 | |
Municipal Bonds | | | — | | | | 394,513 | | | | — | | | | 394,513 | |
U.S. Government Agency Securities | | | — | | | | 11,524 | | | | — | | | | 11,524 | |
| | | | | | | | | | |
| | | | | |
| 262 | | | | | | | | SIX CIRCLES TRUST | | JUNE 30, 2021 |
Six Circles Tax Aware Ultra Short Duration Fund (Continued)
| | | | | | | | | | | | | | | | |
| | | Level 1
Quoted prices | | | Level 2
Other significant
observable inputs | | | Level 3
Significant
unobservable inputs | | | Total | |
Short-Term Investments | | | | | | | | | | | | | | | | |
Foreign Government Security | | $ | — | | | $ | 6,779 | | | $ | — | | | $ | 6,779 | |
Municipal Bonds | | | — | | | | 16,532 | | | | — | | | | 16,532 | |
Time Deposits | | | — | | | | 9,942 | | | | — | | | | 9,942 | |
U.S. Government Agency Security | | | — | | | | 900 | | | | — | | | | 900 | |
U.S. Treasury Obligations | | | — | | | | 7,599 | | | | — | | | | 7,599 | |
| | | | | | | | | | | | | | | | |
Total Short-Term Investments | | | — | | | | 41,752 | | | | — | | | | 41,752 | |
| | | | | | | | | | | | | | | | |
Total Investments in Securities | | $ | — | | | $ | 597,326 | | | $ | 1,851 | | | $ | 599,177 | |
| | | | | | | | | | | | | | | | |
Appreciation in Other Financial Instruments | | | | | | | | | | | | | | | | |
Futures contracts | | $ | 42 | | | $ | — | | | $ | — | | | $ | 42 | |
Forward Foreign Currency Exchange contracts | | | — | | | | 602 | | | | — | | | | 602 | |
| | | | | | | | | | | | | | | | |
Total Appreciation in Other Financial Instruments | �� | $ | 42 | | | $ | 602 | | | $ | — | | | $ | 644 | |
| | | | | | | | | | | | | | | | |
Depreciation in Other Financial Instruments | | | | | | | | | | | | | | | | |
Futures contracts | | $ | (467 | ) | | $ | — | | | $ | — | | | $ | (467 | ) |
Forward Foreign Currency Exchange contracts | | | — | | | | (26 | ) | | | — | | | | (26 | ) |
Centrally Cleared Interest Rate Swap contracts | | | — | | | | (11 | ) | | | — | | | | (11 | ) |
Centrally Cleared Credit default swap contracts | | | — | | | | (45 | ) | | | — | | | | (45 | ) |
| | | | | | | | | | | | | | | | |
Total Depreciation in Other Financial Instruments | | $ | (467 | ) | | $ | (82 | ) | | $ | — | | | $ | (549 | ) |
| | | | | | | | | | | | | | | | |
Six Circles U.S. Unconstrained Equity Fund
| | | | | | | | | | | | | | | | |
| | | Level 1
Quoted prices | | | Level 2
Other significant
observable inputs | | | Level 3
Significant
unobservable inputs | | | Total | |
Investments in Securities | | | | | | | | | | | | | | | | |
Common Stocks | | | | | | | | | | | | | | | | |
Basic Materials | | $ | 119,110 | | | $ | — | | | $ | — | | | $ | 119,110 | |
Communications | | | 3,961,620 | | | | — | | | | — | | | | 3,961,620 | |
Consumer Cyclical | | | 528,655 | | | | — | | | | — | | | | 528,655 | |
Consumer Non-cyclical | | | 3,237,446 | | | | — | | | | — | | | | 3,237,446 | |
Energy | | | 169,993 | | | | — | | | | — | | | | 169,993 | |
Financial | | | 2,652,621 | | | | — | | | | — | | | | 2,652,621 | |
Industrial | | | 2,578,730 | | | | — | | | | — | | | | 2,578,730 | |
Technology | | | 4,630,849 | | | | — | | | | — | | | | 4,630,849 | |
Utilities | | | 173,608 | | | | — | | | | — | | | | 173,608 | |
| | | | | | | | | | | | | | | | |
Total Common Stocks | | | 18,052,632 | | | | — | | | | — | | | | 18,052,632 | |
| | | | | | | | | | | | | | | | |
Short-Term Investments | | | | | | | | | | | | | | | | |
Time Deposits | | | — | | | | 136,523 | | | | — | | | | 136,523 | |
| | | | | | | | | | | | | | | | |
Total Investments in Securities | | $ | 18,052,632 | | | $ | 136,523 | | | $ | — | | | $ | 18,189,155 | |
| | | | | | | | | | | | | | | | |
Appreciation in Other Financial Instruments | | | | | | | | | | | | | | | | |
Futures contracts | | $ | 1,996 | | | $ | — | | | $ | — | | | $ | 1,996 | |
| | | | | | | | | | | | | | | | |
Depreciation in Other Financial Instruments | | | | | | | | | | | | | | | | |
Futures contracts | | $ | (61) | | | $ | — | | | $ | — | | | $ | (61 | ) |
| | | | | | | | | | | | | | | | |
| | | | | | | | | | |
| | | | | |
| JUNE 30, 2021 | | SIX CIRCLES TRUST | | | | | | | | 263 |
NOTES TO FINANCIAL STATEMENTS
AS OF JUNE 30, 2021 (Unaudited) (continued)
Six Circles International Unconstrained Equity Fund
| | | | | | | | | | | | | | | | |
| | | Level 1
Quoted prices | | | Level 2
Other significant
observable inputs | | | Level 3
Significant
unobservable inputs | | | Total | |
Investments in Securities | | | | | | | | | | | | | | | | |
Debt Securities | | | | | | | | | | | | | | | | |
Corporate Bond | | | | | | | | | | | | | | | | |
Consumer Non-cyclical | | $ | — | | | $ | 2 | | | $ | — | | | $ | 2 | |
Common Stocks | | | | | | | | | | | | | | | | |
Argentina | | | 85 | | | | — | | | | — | | | | 85 | |
Australia | | | — | | | | 23,909 | | | | — | | | | 23,909 | |
Austria | | | — | | | | 32,017 | | | | — | | | | 32,017 | |
Belgium | | | 262 | | | | 114,824 | | | | — | | | | 115,086 | |
Brazil | | | 15,900 | | | | — | | | | — | | | | 15,900 | |
Chile | | | 1,428 | | | | 2,990 | | | | — | | | | 4,418 | |
China | | | 27,316 | | | | 117,078 | | | | 67 | | | | 144,461 | |
Colombia | | | 379 | | | | — | | | | — | | | | 379 | |
Cyprus | | | — | | | | 850 | | | | — | | | | 850 | |
Czech Republic | | | — | | | | 457 | | | | — | | | | 457 | |
Denmark | | | 770 | | | | 441,564 | | | | — | | | | 442,334 | |
Egypt | | | — | | | | 254 | | | | — | | | | 254 | |
Finland | | | — | | | | 160,722 | | | | — | | | | 160,722 | |
France | | | — | | | | 1,093,656 | | | | — | | | | 1,093,656 | |
Germany | | | 7,344 | | | | 1,150,466 | | | | — | | | | 1,157,810 | |
Greece | | | — | | | | 579 | | | | — | | | | 579 | |
Hong Kong | | | 127 | | | | 8,522 | | | | 76 | | | | 8,725 | |
Hungary | | | — | | | | 842 | | | | — | | | | 842 | |
India | | | — | | | | 40,019 | | | | — | | | | 40,019 | |
Indonesia | | | — | | | | 4,448 | | | | — | | | | 4,448 | |
Ireland | | | — | | | | 75,410 | | | | — | | | | 75,410 | |
Isle of Man | | | — | | | | 5,405 | | | | — | | | | 5,405 | |
Italy | | | — | | | | 467,835 | | | | — | | | | 467,835 | |
Jordan | | | — | | | | 11,695 | | | | — | | | | 11,695 | |
Kuwait | | | 1,608 | | | | 218 | | | | — | | | | 1,826 | |
Luxembourg | | | 174 | | | | 4,031 | | | | — | | | | 4,205 | |
Malaysia | | | 3,010 | | | | 1,968 | | | | — | | | | 4,978 | |
Mexico | | | 7,168 | | | | — | | | | — | | | | 7,168 | |
Netherlands | | | — | | | | 587,432 | | | | — | | | | 587,432 | |
Norway | | | 374 | | | | 41,952 | | | | — | | | | 42,326 | |
Pakistan | | | 1 | | | | 114 | | | | — | | | | 115 | |
Peru | | | 810 | | | | — | | | | — | | | | 810 | |
Philippines | | | 1,790 | | | | 740 | | | | — | | | | 2,530 | |
Poland | | | 3,537 | | | | 2,432 | | | | — | | | | 5,969 | |
Portugal | | | 38,375 | | | | 433 | | | | — | | | | 38,808 | |
Qatar | | | 1,911 | | | | 879 | | | | — | | | | 2,790 | |
Romania | | | 190 | | | | — | | | | — | | | | 190 | |
Russia | | | 575 | | | | 12,215 | | | | — | | | | 12,790 | |
Saudi Arabia | | | 3,801 | | | | 8,108 | | | | — | | | | 11,909 | |
Singapore | | | — | | | | 77 | | | | — | | | | 77 | |
South Africa | | | 3,207 | | | | 10,766 | | | | — | | | | 13,973 | |
South Korea | | | 738 | | | | 622,768 | | | | — | | | | 623,506 | |
Spain | | | 16,688 | | | | 449,262 | | | | — | | | | 465,950 | |
Sweden | | | 24,514 | | | | 378,734 | | | | — | | | | 403,248 | |
Switzerland | | | 42,723 | | | | 2,864,852 | | | | — | | | | 2,907,575 | |
Taiwan | | | 364 | | | | 55,449 | | | | 339 | | | | 56,152 | |
Thailand | | | — | | | | 6,625 | | | | — | | | | 6,625 | |
Turkey | | | 304 | | | | 526 | | | | — | | | | 830 | |
United Arab Emirates | | | 2,444 | | | | 689 | | | | — | | | | 3,133 | |
United Kingdom | | | 9,444 | | | | 1,954,057 | | | | — | | | | 1,963,501 | |
| | | | | | | | | | |
| | | | | |
| 264 | | | | | | | | SIX CIRCLES TRUST | | JUNE 30, 2021 |
Six Circles International Unconstrained Equity Fund (Continued)
| | | | | | | | | | | | | | | | |
| | | Level 1
Quoted prices | | | Level 2
Other significant
observable inputs | | | Level 3
Significant
unobservable inputs | | | Total | |
Uruguay | | $ | 401 | | | $ | — | | | $ | — | | | $ | 401 | |
| | | | | | | | | | | | | | | | |
Total Common Stocks | | | 217,762 | | | | 10,757,869 | | | | 482 | | | | 10,976,113 | |
| | | | | | | | | | | | | | | | |
Preferred Stocks | | | | | | | | | | | | | | | | |
Brazil | | | 5,397 | | | | — | | | | — | | | | 5,397 | |
Chile | | | 293 | | | | — | | | | — | | | | 293 | |
Colombia | | | 158 | | | | — | | | | — | | | | 158 | |
Germany | | | — | | | | 122,435 | | | | — | | | | 122,435 | |
Russia | | | — | | | | 190 | | | | — | | | | 190 | |
South Korea | | | — | | | | 82,488 | | | | — | | | | 82,488 | |
| | | | | | | | | | | | | | | | |
Total Preferred Stocks | | | 5,848 | | | | 205,113 | | | | — | | | | 210,961 | |
| | | | | | | | | | | | | | | | |
Right | | | | | | | | | | | | | | | | |
Spain | | | 251 | | | | — | | | | — | | | | 251 | |
| | | | | | | | | | | | | | | | |
Short-Term Investments | | | | | | | | | | | | | | | | |
Time Deposits | | | — | | | | 214,196 | | | | — | | | | 214,196 | |
| | | | | | | | | | | | | | | | |
Total Investments in Securities | | $ | 223,861 | | | $ | 11,177,180 | | | $ | 482 | | | $ | 11,401,523 | |
| | | | | | | | | | | | | | | | |
Depreciation in Other Financial Instruments | | | | | | | | | | | | | | | | |
Futures contracts | | $ | (2,504 | ) | | $ | — | | | $ | — | | | $ | (2,504 | ) |
| | | | | | | | | | | | | | | | |
Six Circles Global Bond Fund
| | | | | | | | | | | | | | | | |
| | | Level 1
Quoted prices | | | Level 2
Other significant
observable inputs | | | Level 3
Significant
unobservable inputs | | | Total | |
Investments in Securities | | | | | | | | | | | | | | | | |
Debt Securities | | | | | | | | | | | | | | | | |
Asset-Backed Securities | | $ | — | | | $ | 69,001 | | | $ | — | | | $ | 69,001 | |
Certificate of Deposit | | | | | | | | | | | | | | | | |
Financial | | | — | | | | 155 | | | | — | | | | 155 | |
Collateralized Mortgage Obligations | | | — | | | | 100,436 | | | | 9,410 | | | | 109,846 | |
Commercial Mortgage-Backed Securities | | | — | | | | 43,071 | | | | — | | | | 43,071 | |
Corporate Bonds | | | | | | | | | | | | | | | | |
Basic Materials | | | — | | | | 44,444 | | | | — | | | | 44,444 | |
Communications | | | — | | | | 84,431 | | | | — | | | | 84,431 | |
Consumer Cyclical | | | — | | | | 86,372 | | | | — | | | | 86,372 | |
Consumer Non-cyclical | | | — | | | | 195,293 | | | | — | | | | 195,293 | |
Energy | | | — | | | | 74,708 | | | | — | | | | 74,708 | |
Financial | | | — | | | | 529,800 | | | | — | | | | 529,800 | |
Government | | | — | | | | 118,437 | | | | — | | | | 118,437 | |
Industrial | | | — | | | | 91,435 | | | | — | | | | 91,435 | |
Technology | | | — | | | | 36,479 | | | | — | | | | 36,479 | |
Utilities | | | — | | | | 114,062 | | | | — | | | | 114,062 | |
| | | | | | | | | | | | | | | | |
Total Corporate Bonds | | | — | | | | 1,375,461 | | | | — | | | | 1,375,461 | |
| | | | | | | | | | | | | | | | |
Foreign Government Securities | | �� | — | | | | 3,460,043 | | | | — | | | | 3,460,043 | |
Mortgage-Backed Securities | | | — | | | | 1,563,179 | | | | — | | | | 1,563,179 | |
Municipal Bonds | | | — | | | | 2,695 | | | | — | | | | 2,695 | |
U.S. Government Agency Securities | | | — | | | | 19,250 | | | | — | | | | 19,250 | |
U.S. Treasury Obligations | | | — | | | | 574,196 | | | | — | | | | 574,196 | |
Short-Term Investments | | | | | | | | | | | | |
Repurchase Agreement | | | — | | | | 56,100 | | | | — | | | | 56,100 | |
Time Deposits | | | — | | | | 571,875 | | | | — | | | | 571,875 | |
U.S. Treasury Obligations | | | — | | | | 32,491 | | | | — | | | | 32,491 | |
| | | | | | | | | | | | | | | | |
Total Short-Term Investments | | | — | | | | 660,466 | | | | — | | | | 660,466 | |
| | | | | | | | | | | | | | | | |
Total Investments in Securities | | $ | — | | | $ | 7,867,953 | | | $ | 9,410 | | | $ | 7,877,363 | |
| | | | | | | | | | | | | | | | |
| | | | | | | | | | |
| | | | | |
| JUNE 30, 2021 | | SIX CIRCLES TRUST | | | | | | | | 265 |
NOTES TO FINANCIAL STATEMENTS
AS OF JUNE 30, 2021 (Unaudited) (continued)
Six Circles Global Bond Fund (Continued)
| | | | | | | | | | | | | | | | |
| | | Level 1
Quoted prices | | | Level 2
Other significant
observable inputs | | | Level 3
Significant
unobservable inputs | | | Total | |
Liabilities | | | | | | | | | | | | | | | | |
Debt Securities | | | | | | | | | | | | | | | | |
Foreign Government Security | | $ | — | | | $ | 1,878 | | | $ | — | | | $ | 1,878 | |
Mortgage-Backed Securities | | | — | | | | 290,285 | | | | — | | | | 290,285 | |
| | | | | | | | | | | | | | | | |
Total Securities Sold Short | | $ | — | | | $ | 292,163 | | | $ | — | | | $ | 292,163 | |
| | | | | | | | | | | | | | | | |
Appreciation in Other Financial Instruments | | | | | | | | | | | | |
Futures contracts | | $ | 1,489 | | | $ | — | | | $ | — | | | $ | 1,489 | |
Forward Foreign Currency Exchange contracts | | | — | | | | 100,925 | | | | — | | | | 100,925 | |
Centrally Cleared Interest Rate Swap contracts | | | — | | | | 1,261 | | | | — | | | | 1,261 | |
| | | | | | | | | | | | | | | | |
Total Appreciation in Other Financial Instruments | | $ | 1,489 | | | $ | 102,186 | | | $ | — | | | $ | 103,675 | |
| | | | | | | | | | | | | | | | |
Depreciation in Other Financial Instruments | | | | | | | | | | | | |
Futures contracts | | $ | (958 | ) | | $ | — | | | $ | — | | | $ | (958 | ) |
Forward Foreign Currency Exchange contracts | | | — | | | | (14,894 | ) | | | — | | | | (14,894 | ) |
OTC Cleared Interest Rate Swap contracts | | | — | | | | (61 | ) | | | — | | | | (61 | ) |
Centrally Cleared Interest Rate Swap contracts | | | — | | | | (1,715 | ) | | | — | | | | (1,715 | ) |
Options Written | | | | | | | | | | | | | | | | |
Call Options Written | | | — | | | | (312 | ) | | | — | | | | (312 | ) |
Put Options Written | | | — | | | | (230 | ) | | | — | | | | (230 | ) |
| | | | | | | | | | | | | | | | |
Total Options Written | | | — | | | | (542 | ) | | | — | | | | (542 | ) |
| | | | | | | | | | | | | | | | |
Total Depreciation in Other Financial Instruments | | $ | (958 | ) | | $ | (17,212 | ) | | $ | — | | | $ | (18,170 | ) |
| | | | | | | | | | | | | | | | |
Six Circles Tax Aware Bond Fund
| | | | | | | | | | | | | | | | |
| | | Level 1
Quoted prices | | | Level 2
Other significant
observable inputs | | | Level 3
Significant
unobservable inputs | | | Total | |
Investments in Securities | | | | | | | | | | | | | | | | |
Debt Securities | | | | | | | | | | | | | | | | |
Commercial Mortgage-Backed Security | | $ | — | | | $ | 358 | | | $ | — | | | $ | 358 | |
Corporate Bond | | | | | | | | | | | | | | | | |
Consumer Non-cyclical | | | — | | | | 845 | | | | — | | | | 845 | |
Municipal Bonds | | | — | | | | 5,382,210 | | | | — | | | | 5,382,210 | |
Short-Term Investments | | | | | | | | | | | | | | | | |
Municipal Bonds | | | — | | | | 109,908 | | | | — | | | | 109,908 | |
Time Deposits | | | — | | | | 310,304 | | | | — | | | | 310,304 | |
| | | | | | | | | | | | | | | | |
Total Short-Term Investments | | | — | | | | 420,212 | | | | — | | | | 420,212 | |
| | | | | | | | | | | | | | | | |
Total Investments in Securities | | $ | — | | | $ | 5,803,625 | | | $ | — | | | $ | 5,803,625 | |
| | | | | | | | | | | | | | | | |
Depreciation in Other Financial Instruments | | | | | | | | | | | | | | | | |
Futures contracts | | $ | (215 | ) | | $ | — | | | $ | — | | | $ | (215 | ) |
| | | | | | | | | | | | | | | | |
Six Circles Credit Opportunities Fund
| | | | | | | | | | | | | | | | |
| | | Level 1
Quoted prices | | | Level 2
Other significant
observable inputs | | | Level 3
Significant
unobservable inputs | | | Total | |
Investments in Securities | | | | | | | | | | | | | | | | |
Debt Securities | | | | | | | | | | | | | | | | |
Asset-Backed Securities | | $ | — | | | $ | 184,541 | | | $ | — | | | $ | 184,541 | |
Collateralized Mortgage Obligations | | | — | | | | 10,480 | | | | — | | | | 10,480 | |
Commercial Mortgage-Backed Securities | | | — | | | | 95,763 | | | | — | | | | 95,763 | |
Convertible Bonds | | | | | | | | | | | | | | | | |
Basic Materials | | | — | | | | 195 | | | | — | | | | 195 | |
Communications | | | — | | | | 26,020 | | | | — | | | | 26,020 | |
Consumer Cyclical | | | — | | | | 8,712 | | | | — | | | | 8,712 | |
Consumer Non-cyclical | | | — | | | | 4,172 | | | | — | | | | 4,172 | |
Energy | | | — | | | | 13,578 | | | | — | | | | 13,578 | |
Financial | | | — | | | | 18,801 | | | | — | | | | 18,801 | |
| | | | | | | | | | |
| | | | | |
| 266 | | | | | | | | SIX CIRCLES TRUST | | JUNE 30, 2021 |
Six Circles Credit Opportunities Fund (Continued)
| | | | | | | | | | | | | | | | |
| | | Level 1
Quoted prices | | | Level 2
Other significant
observable inputs | | | Level 3
Significant
unobservable inputs | | | Total | |
Industrial | | $ | — | | | $ | 695 | | | $ | — | | | $ | 695 | |
Technology | | | — | | | | 4,680 | | | | — | | | | 4,680 | |
| | | | | | | | | | | | | | | | |
Total Convertible Bonds | | | — | | | | 76,853 | | | | — | | | | 76,853 | |
| | | | | | | | | | | | | | | | |
Corporate Bonds | | | | | | | | | | | | | | | | |
Basic Materials | | | — | | | | 124,081 | | | | — | | | | 124,081 | |
Communications | | | — | | | | 408,646 | | | | — | | | | 408,646 | |
Consumer Cyclical | | | — | | | | 506,415 | | | | 438 | | | | 506,853 | |
Consumer Non-cyclical | | | — | | | | 440,929 | | | | — | | | | 440,929 | |
Diversified | | | — | | | | 572 | | | | — | | | | 572 | |
Energy | | | — | | | | 372,269 | | | | — | | | | 372,269 | |
Financial | | | — | | | | 325,153 | | | | — | | | | 325,153 | |
Industrial | | | — | | | | 259,509 | | | | — | | | | 259,509 | |
Technology | | | — | | �� | | 139,810 | | | | 1,016 | | | | 140,826 | |
Utilities | | | — | | | | 101,197 | | | | — | | | | 101,197 | |
| | | | | | | | | | | | | | | | |
Total Corporate Bonds | | | — | | | | 2,678,581 | | | | 1,454 | | | | 2,680,035 | |
| | | | | | | | | | | | | | | | |
Foreign Government Securities | | | — | | | | 2,756 | | | | — | | | | 2,756 | |
U.S. Treasury Obligations | | | — | | | | 103,743 | | | | — | | | | 103,743 | |
Preferred Stock | | | — | | | | — | | | | 5,275 | | | | 5,275 | |
Loan Assignments | | | | | | | | | | | | | | | | |
Basic Materials | | | — | | | | 9,307 | | | | — | | | | 9,307 | |
Communications | | | — | | | | 31,783 | | | | — | | | | 31,783 | |
Consumer Cyclical | | | — | | | | 25,676 | | | | — | | | | 25,676 | |
Consumer Non-cyclical | | | — | | | | 20,603 | | | | — | | | | 20,603 | |
Energy | | | — | | | | 7,086 | | | | — | | | | 7,086 | |
Financial | | | — | | | | 15,795 | | | | — | | | | 15,795 | |
Industrial | | | — | | | | 18,500 | | | | — | | | | 18,500 | |
Technology | | | — | | | | 41,407 | | | | — | | | | 41,407 | |
Utilities | | | — | | | | 1,315 | | | | — | | | | 1,315 | |
| | | | | | | | | | | | | | | | |
Total Loan Assignments | | | — | | | | 171,472 | | | | — | | | | 171,472 | |
| | | | | | | | | | | | | | | | |
Short-Term Investments | | | | | | | | | | | | | | | | |
Commercial Papers | | | — | | | | 7,078 | | | | — | | | | 7,078 | |
Time Deposits | | | — | | | | 96,139 | | | | — | | | | 96,139 | |
U.S. Treasury Obligation | | | — | | | | 11,750 | | | | — | | | | 11,750 | |
| | | | | | | | | | | | | | | | |
Total Short-Term Investments | | | — | | | | 114,967 | | | | — | | | | 114,967 | |
| | | | | | | | | | | | | | | | |
Total Investments in Securities | | $ | — | | | $ | 3,439,156 | | | $ | 6,729 | | | $ | 3,445,885 | |
| | | | | | | | | | | | | | | | |
Appreciation in Other Financial Instruments | | | | | | | | | | | | | | | | |
Futures contracts | | $ | 511 | | | $ | — | | | $ | — | | | $ | 511 | |
Forward Foreign Currency Exchange contracts | | | — | | | | 698 | | | | — | | | | 698 | |
Centrally Cleared Credit default swap contracts | | | — | | | | 120 | | | | — | | | | 120 | |
| | | | | | | | | | | | | | | | |
Total Appreciation in Other Financial Instruments | | $ | 511 | | | $ | 818 | | | $ | — | | | $ | 1,329 | |
| | | | | | | | | | | | | | | | |
Depreciation in Other Financial Instruments | | | | | | | | | | | | | | | | |
Futures contracts | | $ | (1,113 | ) | | $ | — | | | $ | — | | | $ | (1,113 | ) |
Forward Foreign Currency Exchange contracts | | | — | | | | (— | )(a) | | | — | | | | (— | )(a) |
OTC Credit default swap contracts | | | — | | | | (1 | ) | | | — | | | | (1 | ) |
| | | | | | | | | | | | | | | | |
Total Depreciation in Other Financial Instruments | | $ | (1,113 | ) | | $ | (1 | ) | | $ | — | | | $ | (1,114 | ) |
| | | | | | | | | | | | | | | | |
| (a) | — Amount rounds to less than $500. |
B. Restricted Securities — Certain securities held by the Funds may be subject to legal or contractual restrictions on resale. Restricted securities generally are resold in transactions exempt from registration under the Securities Act of 1933 (the “Securities Act”). Disposal of these securities may involve time-consuming negotiations and expense. Prompt sale at the current valuation may be difficult and could adversely affect the net asset value of the Funds.
C. When-Issued Securities, Delayed Delivery Securities and Forward Commitments — The Funds may purchase when-issued securities, including To Be Announced (“TBA”) securities, and enter into contracts to purchase or sell securities for a fixed price that may be settled a month or more after the trade date, or purchase delayed delivery securities which generally settle seven days after the trade date. When-issued securities are
| | | | | | | | | | |
| | | | | |
| JUNE 30, 2021 | | SIX CIRCLES TRUST | | | | | | | | 267 |
NOTES TO FINANCIAL STATEMENTS
AS OF JUNE 30, 2021 (Unaudited) (continued)
Six Circles Credit Opportunities Fund—(Continued)
securities that have been authorized, but not issued in the market. A forward commitment involves entering into a contract to purchase or sell securities for a fixed price at a future date that may be settled a month or more after the trade date. A delayed delivery security is agreed upon in advance between the buyer and the seller of the security and is generally delivered beyond seven days of the agreed upon date. The purchase of securities on a when-issued, delayed delivery or forward commitment basis involves the risk that the value of the security to be purchased declines before the settlement date. The sale of securities on a forward commitment basis involves the risk that the value of the securities sold may increase before the settlement date. The Funds may be exposed to credit risk if the counterparty fails to perform under the terms of the transaction. Interest income for securities purchased on a when-issued, delayed delivery or forward commitment basis is not accrued until the settlement date.
D. Loan Assignments — The Six Circles Credit Opportunities Fund invests in debt instruments that are interests in amounts owed to lenders or lending syndicates (a “Lender”) by corporate, governmental or other borrowers (a “Borrower”). A loan is typically originated, negotiated and structured by a U.S. or foreign bank, insurance company or other financial institution (the “Agent”) for a group of loan investors (“Loan Investors”). The Agent administers the terms of the loan, as specified in the loan agreement. When a Fund purchases a loan assignment, the Fund has direct rights against the Borrower on a loan, provided, however, the Fund’s rights may be more limited than the lender from which it acquired the assignment and the Fund may be able to enforce its rights only through the Agent. As a result, the Fund assumes the credit risk of the Borrower, the selling participant and any other persons interpositioned between each Fund and the Borrower (“Intermediate Participants”). In the event that the Borrower, selling participant or Intermediate Participants become insolvent or enter into bankruptcy, the Fund may incur certain costs and delays in realizing payment or may suffer a loss of principal and/or interest. The Adviser or Sub-Advisers may have access to material non-public information regarding the Borrower.
Certain loan assignments are also subject to the risks associated with high yield securities described under Note 5.
Unfunded commitments represent the remaining obligation of each Fund to the Borrower. At any point in time, up to the maturity date of the issue, the Borrower may demand the unfunded portion. The unrealized appreciation/depreciation from unfunded commitments is reported on the Statements of Assets and Liabilities, if any. As of June 30, 2021, The Six Circles Credit Opportunities Fund had the following loan commitments outstanding in which all or a portion of the commitment was unfunded (amounts in thousands):
| | | | | | | | | | | | | | | | | | | | | | | | | | | | | | | | | | | | | | |
| | | | | | | | | | | | | | Unfunded
Commitment | | | Funded
Commitment | | | Total
Commitment | |
| Security Description | | Term | | Maturity Date | | | Commitment
Fee Rate | | | Rate if
Funded | | | Par | | | Value | | | Par | | | Value | | | Par | | | Value | |
LBM Acquisition, LLC | | Initial Delayed Draw Term
Loan (First Lien) | | | 12/17/2027 | | | | 3.75 | % | | | 4.50 | % | | | 3 | | | | 3 | | | | 7 | | | | 7 | | | | 10 | | | | 10 | |
| | | | | | | | | | | | | | | | | | | | | | | | | | | | | | | | | | | | | | |
E. Derivatives — The Funds used derivative instruments including options, futures contracts, forward foreign currency exchange contracts and swaps, in connection with their respective investment strategies. Derivative instruments may be used as substitutes for securities in which the Funds can invest, to hedge portfolio investments or to generate income or gain to the Funds. Derivatives may also be used to manage duration, sector and yield curve exposures as well as credit and spread volatility.
The Funds may be subject to various risks from the use of derivatives including the risk that changes in the value of a derivative may not correlate perfectly with the underlying asset, rate or index; counterparty credit risk related to derivatives counterparties’ failure to perform under contract terms; liquidity risk related to the lack of a liquid market for these contracts allowing a Fund to close out its position(s); and documentation risk relating to disagreement over contract terms. Investing in certain derivatives also results in a form of leverage and as such, the Funds’ risk of loss associated with these instruments may exceed their value, as recorded on the Statements of Assets and Liabilities.
The Funds are party to various derivative contracts governed by International Swaps and Derivatives Association master agreements (“ISDA agreements”). The Funds’ ISDA agreements, which are separately negotiated by the Sub-Advisers, with each dealer counterparty, may contain provisions allowing, absent other considerations, a counterparty to exercise rights, to the extent not otherwise waived, against the Funds in the event the Funds’ net assets decline over time by a pre-determined percentage or fall below a pre-determined floor. The ISDA agreements may also contain provisions allowing, absent other conditions, the Funds to exercise rights, to the extent not otherwise waived, against a counterparty (e.g., decline in a counterparty’s credit rating below a specified level). Such rights for both a counterparty and the Funds often include the ability to terminate (i.e., close out) open contracts at prices which may favor a counterparty, which could have an adverse effect on the Funds. The ISDA agreements give the Funds and a counterparty the right, upon an event of default, to close out all transactions traded under such agreements and to net amounts owed or due across all transactions and offset such net payable or receivable with collateral posted to a segregated account by one party to the other.
Counterparty credit risk may be mitigated to the extent a counterparty posts collateral for mark to market gains to the Fund.
Notes E(1) — E(4) below describe the various derivatives used by the Funds.
(1) Options — The Six Circles Global Bond Fund sold (“wrote”) put and call options on securities to manage and hedge interest rate risks within their portfolios and also to gain long or short exposure to the underlying instrument. A purchaser of a put option has the right, but not the obligation, to sell the underlying instrument at an agreed upon price (“strike price”) to the option seller. A purchaser of a call option has the right, but not the obligation, to purchase the underlying instrument at the strike price from the option seller.
| | | | | | | | | | |
| | | | | |
| 268 | | | | | | | | SIX CIRCLES TRUST | | JUNE 30, 2021 |
Options Written — Premiums received by the Funds for options written are included on the Statements of Assets and Liabilities as a liability. The amount of the liability is adjusted daily to reflect the current market value of the option written and the change in market value is recorded as Change in net unrealized appreciation/depreciation on options written on the Statements of Operations. Premiums received from options written that expire are treated as realized gains. If a written option is closed, the Funds record a realized gain or loss on options written based on whether the cost of the closing transaction exceeds the premium received. If a call option is exercised by the option buyer, the premium received by the Funds is added to the proceeds from the sale of the underlying security to the option buyer and compared to the cost of the closing transaction to determine whether there has been a realized gain or loss. If a put option is exercised by an option buyer, the premium received by the option seller reduces the cost basis of the purchased security.
Written uncovered call options subject the Funds to unlimited risk of loss. Written covered call options limit the upside potential of a security above the strike price. Written put options subject the Funds to risk of loss if the value of the security declines below the exercise price minus the put premium.
The Funds are not subject to credit risk on options written as the counterparty has already performed its obligation by paying the premium at the inception of the contract.
The Fund’s option contracts are subject to master netting arrangements.
(2) Futures Contracts — The Six Circles Ultra Short Duration Fund, Six Circles Tax Aware Ultra Short Duration Fund, Six Circles Global Bond Fund, and Six Circles Credit Opportunities Fund used interest rate futures to manage interest rate risks associated with portfolio investments. The Six Circles U.S. Unconstrained Equity Fund and Six Circles International Unconstrained Equity Fund used index futures to gain or reduce exposure to certain countries or regions, to maintain liquidity or minimize transaction costs.
Futures contracts may provide for the delayed delivery of the underlying instrument at a fixed price or are settled for a cash amount based on the change in the value of the underlying instrument at a specific date in the future. Upon entering into a futures contract, the Funds are required to
deposit with the broker, cash or securities in an amount equal to a certain percentage of the contract amount, which is referred to as the initial margin deposit. Subsequent payments, referred to as variation margin, are made or received by the Funds periodically and are based on changes in the market value of open futures contracts. Changes in the market value of open futures contracts are recorded as Change in net unrealized appreciation/depreciation on the Statements of Operations. Realized gains or losses, representing the difference between the value of the contract at the time it was opened and the value at the time it was closed, are reported on the Statements of Operations at the closing or expiration of the futures contract. Securities deposited as initial margin are designated on the SOIs and cash deposited is recorded on the Statements of Assets and Liabilities. A receivable from and/or a payable to brokers for the daily variation margin is also recorded on the Statements of Assets and Liabilities. Futures contracts outstanding at period end, if any, are listed after each Fund’s SOI.
The use of futures contracts may expose the Funds to interest rate and equity price risks. The Funds may be subject to the risk that the change in the value of the futures contract may not correlate perfectly with the underlying instrument. Use of long futures contracts subjects the Fund to risk of loss in excess of the amounts shown on the Statements of Assets and Liabilities, up to the notional amount of the futures contracts. Use of short futures contracts subjects the Fund to unlimited risk of loss. The Funds may enter into futures contracts only on exchanges or boards of trade. The exchange or board of trade acts as the counterparty to each futures transaction; therefore, the Funds credit risk is limited to failure of the exchange or board of trade. Under some circumstances, futures exchanges may establish daily limits on the amount that the price of a futures contract can vary from the previous day’s settlement price, which could effectively prevent the liquidation of positions.
The Funds’ futures contracts are not subject to master netting arrangements (the right to close out all transactions traded with a counterparty and net amounts owed or due across transactions).
(3) Forward Foreign Currency Exchange Contracts — The Six Circles International Unconstrained Equity Fund, Six Circles Ultra Short Duration Fund, Six Circles Tax Aware Ultra Short Duration Fund, Six Circles Global Bond Fund and Six Circles Credit Opportunities Fund may be exposed to foreign currency risks associated with some or all of the portfolio investments and used forward foreign currency exchange contracts to hedge or manage certain of these exposures as part of an investment strategy. The Funds also bought forward foreign currency exchange contracts to gain exposure to currencies. Forward foreign currency exchange contracts represent obligations to purchase or sell foreign currency on a specified future date at a price fixed at the time the contracts are entered into. Non-deliverable forward foreign currency exchange contracts are settled with the counterparty in U.S. Dollars without the delivery of foreign currency. Forward contracts outstanding at period end, if any, are listed after each Fund’s SOI.
The values of the forward foreign currency exchange contracts are adjusted daily based on the applicable exchange rate of the underlying currency. Changes in the value of these contracts are recorded as unrealized appreciation/depreciation until the contract settlement date. When the forward foreign currency exchange contract is closed, the Fund records a realized gain or loss equal to the difference between the value at the time the contract was opened and the value at the time it was closed. The Fund also records a realized gain or loss when a forward foreign currency exchange contract offsets another forward foreign currency exchange contract with the same counterparty upon settlement.
The Funds’ forward foreign currency exchange contracts may be subject to master netting arrangements (the right to close out all transactions with a counterparty and net amounts owed or due across transactions). The Funds may be required to post or receive collateral for non-deliverable forward foreign currency exchange contracts.
| | | | | | | | | | |
| | | | | |
| JUNE 30, 2021 | | SIX CIRCLES TRUST | | | | | | | | 269 |
NOTES TO FINANCIAL STATEMENTS
AS OF JUNE 30, 2021 (Unaudited) (continued)
Six Circles Credit Opportunities Fund—(Continued)
(4) Swaps — The Six Circles Ultra Short Duration Fund, Six Circles Tax Aware Ultra Short Duration Fund, Six Circles Global Bond Fund, and the Six Circles Credit Opportunities Fund engaged in various swap transactions, including interest swaps, to manage interest rate (e.g., duration, yield curve) risks within their respective portfolios. The Funds also used swaps as alternatives to direct investments. Swap transactions are negotiated contracts over the counter (“OTC swaps”) between a fund and a counterparty or centrally cleared (“centrally cleared swaps”) with a central clearinghouse through a Futures Commission Merchant (“FCM”), to exchange investment cash flows, assets, foreign currencies or market-linked returns at specified, future intervals. Swap contracts outstanding at period end, if any, are listed after each Fund’s SOI.
Upfront payments made and/or received are recorded as assets or liabilities, respectively on the Statements of Assets and Liabilities and amortized over the term of the swap. The value of an OTC swap agreement is recorded as either an asset or a liability on the Statements of Assets and Liabilities at the beginning of the measurement period.
Upon entering into a centrally cleared swap, the Funds are required to deposit with the FCM cash or securities, which is referred to as initial margin deposit. Securities deposited as initial margin are designated on the SOIs and cash deposited is recorded on the Statements of Assets and Liabilities. Daily changes in valuation of centrally cleared swaps, if any, are recorded as a variation margin receivable or payable on the Statements of Assets and Liabilities. The change in the value of swaps, including accruals of periodic amounts of interest to be paid or received on swaps, is reported as Change in net unrealized appreciation/depreciation on the Statements of Operations. A realized gain or loss is recorded upon payment or receipt of a periodic payment or payment made upon termination of a swap agreement.
The central clearing house acts as the counterparty to each centrally cleared swap transaction, therefore credit risk is limited to the failure of the clearing house.
The Funds may be required to post or receive collateral in the form of cash or securities based on the net value of the Fund’s outstanding OTC swap contracts with the counterparty. Daily movement of collateral is subject to minimum threshold amounts. Collateral posted by the Funds is held in a segregated account at the Funds’ custodian bank. Collateral received by the Funds is held in escrow in segregated accounts maintained by Brown Brothers Harriman & Co.
The Funds’ swap contracts (excluding centrally cleared swaps) are subject to master netting arrangements.
Credit Default Swaps
Six Circles Ultra Short Duration Fund, Six Circles Tax Aware Ultra Short Duration Fund and Six Circles Credit Opportunities Fund entered into credit default swaps to simulate long and short bond positions or to take an active long or short position with respect to the likelihood of a default or credit event by the issuer of the underlying reference obligation.
The underlying reference obligation may be a single issuer of corporate or sovereign debt, a basket of issuers or a credit index. A credit index is a list of credit instruments or exposures that reference a fixed number of obligors with shared characteristics that represents some part of the credit market as a whole. Index credit default swaps have standardized terms including a fixed spread and standard maturity dates. The composition of the obligations within a particular index changes periodically.
Credit default swaps involve one party, the protection buyer, making a stream of payments to another party, the protection seller, in exchange for the right to receive a contingent payment if there is a credit event related to the underlying reference obligation. In the event that the reference obligation matures prior to the termination date of the contract, a similar security will be substituted for the duration of the contract term. Credit events are defined under individual swap agreements and generally include bankruptcy, failure to pay, restructuring, repudiation/moratorium, obligation acceleration and obligation default.
If a credit event occurs, the Funds, as protection sellers, would be obligated to make a payment, which may be either: (i) a net cash settlement equal to the notional amount of the swap less the auction value of the reference obligation or (ii) the notional amount of the swap in exchange for the delivery of the reference obligation. Selling protection effectively adds leverage to a Fund’s portfolio up to the notional amount of swap agreements. The notional amount represents the maximum potential liability under a contract and is not reflected on the Statements of Assets and Liabilities. Potential liabilities under these contracts may be reduced by: the auction rates of the underlying reference obligations; upfront payments received at the inception of a swap; and net amounts received from credit default swaps purchased with the identical reference obligation.
Interest Rate Swaps
The Six Circles Ultra Short Duration Fund, Six Circles Tax Aware Ultra Short Duration Fund and Six Circles Global Bond Fund entered into interest rate swap contracts to manage fund exposure to interest rates and/or to preserve or generate a return on a particular investment or portion of its portfolio. These are agreements between counterparties to exchange periodic payments based on interest rates. One cash flow stream will typically be a floating rate payment based upon a specified interest rate while the other is typically a fixed interest rate.
| | | | | | | | | | |
| | | | | |
| 270 | | | | | | | | SIX CIRCLES TRUST | | JUNE 30, 2021 |
(4) Summary of Derivatives Information
The following tables present the value of derivatives held as of June 30, 2021, by their primary underlying risk exposure and respective location on the Statements of Assets and Liabilities (amounts in thousands):
Six Circles Ultra Short Duration Fund
| | | | | | | | | | | | | | | | | | |
| Derivative Contracts | | Statements of Assets and Liabilities Location | | | |
| Gross Assets: | | | | Futures
Contracts (a) | | | Forward
Foreign Currency
Exchange
Contracts | | | Centrally
Cleared
Swaps (b) | | | Total | |
Interest rate contracts | | Receivables, Net Assets — Unrealized Appreciation | | $ | 37 | | | $ | — | | | $ | — | | | $ | 37 | |
Foreign exchange contracts | | Receivables | | | — | | | | 856 | | | | — | | | | 856 | |
| | | | | | | | | | | | | | | | | | |
Total | | | | $ | 37 | | | $ | 856 | | | $ | — | | | $ | 893 | |
| | | | | | | | | | | | | | | | | | |
| | | | | |
Gross Liabilities: | | | | | | | | | | | | | | |
Credit contracts | | Payables | | $ | — | | | $ | — | | | $ | (291 | ) | | | (291 | ) |
Interest rate contracts | | Payables, Net Assets — Unrealized Depreciation | | | (404 | ) | | | — | | | | (10 | ) | | | (414 | ) |
Foreign exchange contracts | | Payables | | | — | | | | (24 | ) | | | — | | | | (24 | ) |
| | | | | | | | | | | | | | | | | | |
Total | | | | $ | (404 | ) | | $ | (24 | ) | | $ | (301 | ) | | $ | (729 | ) |
| | | | | | | | | | | | | | | | | | |
| (a) | This amount represents the cumulative appreciation (depreciation) of futures contracts as reported on the SOIs. The Statements of Assets and Liabilities only reflect the current day variation margin receivable/payable from/to brokers. |
| (b) | This amount represents the value of centrally cleared swaps as reported on the SOIs. The Statements of Assets and Liabilities only reflect the current day variation margin receivable/payable from/to brokers. |
Six Circles Tax Aware Ultra Short Duration Fund
| | | | | | | | | | | | | | | | | | |
| Derivative Contracts | | Statements of Assets and Liabilities Location | | | |
| Gross Assets: | | | | Futures
Contracts (a) | | | Forward
Foreign Currency
Exchange Contracts | | | Centrally
Cleared
Swaps (b) | | | Total | |
Interest rate contracts | | Receivables, Net Assets — Unrealized Appreciation | | $ | 42 | | | $ | — | | | $ | — | | | $ | 42 | |
Foreign exchange contracts | | Receivables | | | — | | | | 602 | | | | — | | | | 602 | |
| | | | | | | | | | | | | | | | | | |
Total | | | | $ | 42 | | | $ | 602 | | | $ | — | | | $ | 644 | |
| | | | | | | | | | | | | | | | | | |
| | | | | |
Gross Liabilities: | | | | | | | | | | | | | | |
Credit contracts | | Payables | | $ | — | | | $ | — | | | $ | (376 | ) | | $ | (376 | ) |
Interest rate contracts | | Payables, Net Assets — Unrealized Depreciation | | | (467 | ) | | | — | | | | (11 | ) | | | (478 | ) |
Foreign exchange contracts | | Payables | | | — | | | | (26 | ) | | | — | | | | (26 | ) |
| | | | | | | | | | | | | | | | | | |
Total | | | | $ | (467 | ) | | $ | (26 | ) | | $ | (387 | ) | | $ | (880 | ) |
| | | | | | | | | | | | | | | | | | |
| (a) | This amount represents the cumulative appreciation (depreciation) of futures contracts as reported on the SOIs. The Statements of Assets and Liabilities only reflect the current day variation margin receivable/payable from/to brokers. |
| (b) | This amount represents the value of centrally cleared swaps as reported on the SOIs. The Statements of Assets and Liabilities only reflect the current day variation margin receivable/payable from/to brokers. |
Six Circles U.S. Unconstrained Equity Fund
| | | | | | |
| Derivative Contracts | | Statements of Assets and Liabilities Location | | | |
| Gross Assets: | | | | Futures
Contracts (a) | |
Equity contracts | | Receivables, Net Assets — Unrealized Appreciation | | $ | 1,996 | |
| | | | | | |
| Gross Liabilities: | | | | | |
Equity contracts | | Payables, Net Assets — Unrealized Depreciation | | | $(61) | |
| | | | | | |
| (a) | This amount represents the cumulative appreciation (depreciation) of futures contracts as reported on the SOIs. |
| | The Statements of Assets and Liabilities only reflect the current day variation margin receivable/payable from/to brokers. |
| | | | | | | | | | |
| | | | | |
| JUNE 30, 2021 | | SIX CIRCLES TRUST | | | | | | | | 271 |
NOTES TO FINANCIAL STATEMENTS
AS OF JUNE 30, 2021 (Unaudited) (continued)
Six Circles International Unconstrained Equity Fund
| | | | | | |
| Derivative Contracts | | Statements of Assets and Liabilities Location | |
| Gross Liabilities: | | | | Futures
Contracts (a) | |
Equity contracts | | Payables, Net Assets — Unrealized Depreciation | | $ | (2,504 | ) |
| | | | | | |
| (a) | This amount represents the cumulative appreciation (depreciation) of futures contracts as reported on the SOIs. |
| | The Statements of Assets and Liabilities only reflect the current day variation margin receivable/payable from/to brokers. |
Six Circles Global Bond Fund
| | | | | | | | | | | | | | | | | | | | | | | | | | |
| Derivative Contracts | | Statements of Assets and Liabilities Location | |
| Gross Assets: | | | | Futures
Contracts (a) | | | Forward
Foreign Currency
Exchange
Contracts | | | Centrally
Cleared
Swaps (b) | | | OTC
Swaps | | | OTC
Options
Written | | | Total | |
Interest rate contracts | | Receivables, Net Assets — Unrealized Appreciation | | $ | 1,489 | | | $ | — | | | $ | 2,471 | | | $ | — | | | $ | — | | | $ | 3,960 | |
Foreign exchange contracts | | Receivables | | | — | | | | 100,925 | | | | — | | | | — | | | | — | | | | 100,925 | |
| | | | | | | | | | | | | | | | | | | | | | | | | | |
Total | | | | $ | 1,489 | | | $ | 100,925 | | | $ | 2,471 | | | $ | — | | | $ | — | | | $ | 104,885 | |
| | | | | | | | | | | | | | | | | | | | | | | | | | |
| | | | | | | |
Gross Liabilities: | | | | | | | | | | | | | | | | | | | | |
Interest rate contracts | | Payables, Net Assets — Unrealized Depreciation | | $ | (958 | ) | | $ | — | | | $ | (4,518 | ) | | $ | (61 | ) | | $ | (542 | ) | | $ | (6,079 | ) |
Foreign exchange contracts | | Payables | | | — | | | | (14,894 | ) | | | — | | | | — | | | | — | | | | (14,894 | ) |
| | | | | | | | | | | | | | | | | | | | | | | | | | |
Total | | | | $ | (958 | ) | | $ | (14,894 | ) | | $ | (4,518 | ) | | $ | (61 | ) | | $ | (542 | ) | | $ | (20,973 | ) |
| | | | | | | | | | | | | | | | | | | | | | | | | | |
| (a) | This amount represents the cumulative appreciation (depreciation) of futures contracts as reported on the SOIs. The Statements of Assets and Liabilities only reflect the current day variation margin receivable/payable from/to brokers. |
| (b) | This amount represents the value of centrally cleared swaps as reported on the SOIs. The Statements of Assets and Liabilities only reflect the current day variation margin receivable/payable from/to brokers. |
Six Circles Tax Aware Bond Fund
| | | | | | |
| Derivative Contracts | | Statements of Assets and Liabilities Location | | | |
| Gross Liabilities: | | | | Futures
Contracts (a) | |
Interest rate contracts | | Payables, Net Assets — Unrealized Depreciation | | $ | (215 | ) |
| | | | | | |
| (a) | This amount represents the cumulative appreciation (depreciation) of futures contracts as reported on the SOIs. The Statements of Assets and Liabilities only reflect the current day variation margin receivable/payable from/to brokers. |
Six Circles Credit Opportunities Fund
| | | | | | | | | | | | | | | | | | | | | | |
| Derivative Contracts | | Statements of Assets and Liabilities Location | |
| Gross Assets: | | | | Futures
Contracts (a) | | | Forward
Foreign Currency
Exchange
Contracts | | | Centrally
Cleared
Swaps (b) | | | OTC
Swaps | | | Total | |
Credit contracts | | Receivables | | $ | — | | | $ | — | | | $ | 2,300 | | | $ | 5 | | | $ | 2,305 | |
Interest rate contracts | | Receivables, Net Assets — Unrealized Appreciation | | | 511 | | | | — | | | | — | | | | — | | | | 511 | |
Foreign exchange contracts | | Receivables | | | — | | | | 698 | | | | — | | | | — | | | | 698 | |
| | | | | | | | | | | | | | | | | | | | | | |
Total | | | | $ | 511 | | | $ | 698 | | | $ | 2,300 | | | $ | 5 | | | $ | 3,514 | |
| | | | | | | | | | | | | | | | | | | | | | |
| | | | | | |
Gross Liabilities: | | | | | | | | | | | | | | | | | |
Interest rate contracts | | Payables, Net Assets — Unrealized Depreciation | | $ | (1,113 | ) | | $ | — | | | $ | — | | | $ | — | | | $ | (1,113 | ) |
Foreign exchange contracts | | Payables | | | — | | | | (— | )(h) | | | — | | | | — | | | | (— | )(h) |
| | | | | | | | | | | | | | | | | | | | | | |
Total | | | | $ | (1,113 | ) | | $ | (— | )(h) | | $ | — | | | $ | — | | | | (1,113 | ) |
| | | | | | | | | | | | | | | | | | | | | | |
| | | | | | | | | | |
| | | | | |
| 272 | | | | | | | | SIX CIRCLES TRUST | | JUNE 30, 2021 |
| (a) | This amount represents the cumulative appreciation (depreciation) of futures contracts as reported on the SOIs. The Statements of Assets and Liabilities only reflect the current day variation margin receivable/payable from/to brokers. |
| (b) | This amount represents the value of centrally cleared swaps as reported on the SOIs. The Statements of Assets and Liabilities only reflect the current day variation margin receivable/payable from/to brokers. |
The following tables present the Funds’ gross derivative assets and liabilities by counterparty net of amounts available for offset under netting arrangements and any related collateral received or posted by the Fund as of June 30, 2021 (amounts in thousands):
Six Circles Ultra Short Duration Fund
| | | | | | | | | | | | | | | | |
| | | Gross Amount of
Derivative Assets
Subject to Netting
Arrangements
Presented on the
Statements of
Assets and
Liabilities (a) | | | Derivatives
Available
for offset | | | Collateral
Received | | | Net Amount Due
From Counterparty
(Not less than zero) | |
Bank of America, NA | | $ | 453 | | | $ | (9 | ) | | $ | (430 | ) | | $ | 14 | |
Barclays Bank plc | | | 116 | | | | — | | | | (107 | ) | | | 9 | |
BNP Paribas | | | 109 | | | | — | | | | — | | | | 109 | |
Citibank NA | | | 145 | | | | — | | | | — | | | | 145 | |
Morgan Stanley & Co. | | | 33 | | | | (15 | ) | | | — | | | | 18 | |
| | | | | | | | | | | | | | | | |
| | $ | 856 | | | $ | (24 | ) | | $ | (537 | ) | | $ | 295 | |
| | | | | | | | | | | | | | | | |
| | | | | | | | | | | | | | | | |
| | | Gross Amount of
Derivative Liabilities
Subject to Netting
Arrangements
Presented on the
Statements of
Assets and
Liabilities (a) | | | Derivatives
Available
for offset | | | Collateral
Posted | | | Net Amount Due
To Counterparty
(Not less than zero) | |
Bank of America, NA | | $ | 9 | | | $ | (9 | ) | | $ | — | | | $ | — | |
Morgan Stanley & Co. | | | 15 | | | | (15 | ) | | | — | | | | — | |
| | | | | | | | | | | | | | | | |
| | $ | 24 | | | $ | (24 | ) | | $ | — | | | $ | — | |
| | | | | | | | | | | | | | | | |
| (a) | For financial reporting purposes, the Fund does not offset derivative assets and derivative liabilities subject to master netting arrangements on the Statements of Assets and Liabilities. |
Six Circles Tax Aware Ultra Short Duration Fund
| | | | | | | | | | | | | | | | |
| | | Gross Amount of
Derivative Assets
Subject to Netting
Arrangements
Presented on the
Statements of
Assets and
Liabilities (a) | | | Derivatives
Available
for offset | | | Collateral
Received | | | Net Amount Due
From Counterparty
(Not less than zero) | |
Bank of America, NA | | $ | 446 | | | $ | (9 | ) | | $ | (420 | ) | | $ | 17 | |
Barclays Bank plc | | | 125 | | | | — | | | | (116 | ) | | | 9 | |
Morgan Stanley & Co. | | | 31 | | | | (17 | ) | | | — | | | | 14 | |
| | | | | | | | | | | | | | | | |
| | $ | 602 | | | $ | (26 | ) | | $ | (536 | ) | | $ | 40 | |
| | | | | | | | | | | | | | | | |
| | | | | | | | | | |
| | | | | |
| JUNE 30, 2021 | | SIX CIRCLES TRUST | | | | | | | | 273 |
NOTES TO FINANCIAL STATEMENTS
AS OF JUNE 30, 2021 (Unaudited) (continued)
| | | | | | | | | | | | | | | | |
| | | Gross Amount of
Derivative Liabilities
Subject to Netting
Arrangements
Presented on the
Statements of Assets
and Liabilities (a) | | | Derivatives
Available
for offset | | | Collateral
Posted | | | Net Amount Due
To Counterparty
(Not less than zero) | |
Bank of America, NA | | $ | 9 | | | $ | (9 | ) | | $ | — | | | $ | — | |
Morgan Stanley & Co. | | | 17 | | | | (17 | ) | | | — | | | | — | |
| | | | | | | | | | | | | | | | |
| | $ | 26 | | | $ | (26 | ) | | $ | — | | | $ | — | |
| | | | | | | | | | | | | | | | |
| (a) | For financial reporting purposes, the Fund does not offset derivative assets and derivative liabilities subject to master netting arrangements on the Statements of Assets and Liabilities. |
Six Circles Global Bond Fund
| | | | | | | | | | | | | | | | |
| Counterparty | | Gross Amount of
Derivative Assets
Subject to Netting
Arrangements
Presented on the
Statements of
Assets and
Liabilities (a) | | | Derivatives
Available
for offset | | | Collateral
Received | | | Net Amount Due
From Counterparty
(Not less than zero) | |
Bank of America, NA | | $ | 18,965 | | | $ | (776 | ) | | $ | (3,999 | ) | | $ | 14,190 | |
Barclays Bank plc | | | 105 | | | | (105 | ) | | | — | | | | — | |
BNP Paribas | | | 6,754 | | | | (24 | ) | | | (530 | ) | | | 6,200 | |
Brown Brothers Harriman & Co. | | | 12,128 | | | | (856 | ) | | | — | | | | 11,272 | |
Citibank, NA | | | 20,391 | | | | (1,155 | ) | | | (5,002 | ) | | | 14,234 | |
Deutsche Bank AG | | | 9,413 | | | | (2,786 | ) | | | — | | | | 6,627 | |
Goldman Sachs International | | | 7,461 | | | | (4,476 | ) | | | (180 | ) | | | 2,805 | |
HSBC Bank plc | | | 291 | | | | (7 | ) | | | (251 | ) | | | 33 | |
Morgan Stanley & Co. | | | 14,145 | | | | (1,832 | ) | | | (3,822 | ) | | | 8,491 | |
Standard Chartered Bank | | | 3,119 | | | | (2,814 | ) | | | — | | | | 305 | |
UBS AG LONDON | | | 2,444 | | | | (36 | ) | | | — | | | | 2,408 | |
Westpac Banking Corp. | | | 5,709 | | | | (79 | ) | | | — | | | | 5,630 | |
| | | | | | | | | | | | | | | | |
Total | | $ | 100,925 | | | $ | (14,946 | ) | | $ | (13,784 | ) | | $ | 72,195 | |
| | | | | | | | | | | | | | | | |
| | | | | | | | | | | | | | | | |
| Counterparty | | Gross Amount of
Derivative Liabilities
Subject to Netting
Arrangements
Presented on the
Statements of Assets and Liabilities (a) | | | Derivatives
Available
for offset | | | Collateral
Posted | | | Net Amount Due To Counterparty
(Not less than zero) | |
Bank of America, NA | | $ | 776 | | | $ | (776 | ) | | $ | — | | | $ | — | |
Barclays Bank plc | | | 114 | | | | (105 | ) | | | (9 | ) | | | — | |
BNP Paribas | | | 24 | | | | (24 | ) | | | — | | | | — | |
Brown Brothers Harriman & Co. | | | 856 | | | | (856 | ) | | | — | | | | — | |
Citibank, NA | | | 1,155 | | | | (1,155 | ) | | | — | | | | — | |
Citigroup Global Markets, Inc. | | | 542 | | | | — | | | | (542 | ) | | | — | |
Deutsche Bank AG | | | 2,786 | | | | (2,786 | ) | | | — | | | | — | |
Goldman Sachs International | | | 4,476 | | | | (4,476 | ) | | | — | | | | — | |
HSBC Bank plc | | | 7 | | | | (7 | ) | | | — | | | | — | |
Morgan Stanley & Co. | | | 1,832 | | | | (1,832 | ) | | | — | | | | — | |
Standard Chartered Bank | | | 2,814 | | | | (2,814 | ) | | | — | | | | — | |
UBS AG LONDON | | | 36 | | | | (36 | ) | | | — | | | | — | |
Westpac Banking Corp. | | | 79 | | | | (79 | ) | | | — | | | | — | |
| | | | | | | | | | | | | | | | |
Total | | $ | 15,497 | | | $ | (14,946 | ) | | $ | (551 | ) | | $ | — | |
| | | | | | | | | | | | | | | | |
| (a) | For financial reporting purposes, the Fund does not offset derivative assets and derivative liabilities subject to master netting arrangements on the Statements of Assets and Liabilities. |
| | | | | | | | | | |
| | | | | |
| 274 | | | | | | | | SIX CIRCLES TRUST | | JUNE 30, 2021 |
Six Circles Credit Opportunities Fund
| | | | | | | | | | | | | | | | |
| | | Gross Amount of
Derivative Asset
Subject to Netting
Arrangements
Presented on the
Statements of
Assets and
Liabilities (a) | | | Derivatives
Available
for offset | | | Collateral Received | | | Net Amount Due
From Counterparty
(Not less than
zero) | |
Bank of America, NA | | $ | 9 | | | $ | — | | | $ | — | | | $ | 9 | |
BNP Paribas | | | 516 | | | | — | | | | — | | | | 516 | |
Citibank, NA | | | 150 | | | | (— | )(h) | | | — | | | | 150 | |
HSBC Bank Plc | | | 11 | | | | — | | | | — | | | | 11 | |
Morgan Stanley & Co. | | | 12 | | | | (1 | ) | | | — | | | | 11 | |
| | | | | | | | | | | | | | | | |
| | $ | 698 | | | $ | (1 | ) | | $ | — | | | $ | 697 | |
| | | | | | | | | | | | | | | | |
| | | | | | | | | | | | | | | | |
| | | Gross Amount of
Derivative Liabilities
Subject to Netting
Arrangements
Presented on the
Statements of
Assets and
Liabilities (a) | | | Derivatives
Available
for offset | | | Collateral
Posted | | | Net Amount Due
To Counterparty
(Not less than
zero) | |
Citibank, NA | | $ | — | (h) | | $ | (— | )(h) | | $ | — | | | $ | — | |
Goldman Sachs | | | — | (h) | | | — | | | | — | | | | — | (h) |
Morgan Stanley & Co. | | | 1 | | | | (1 | ) | | | — | | | | — | |
| | | | | | | | | | | | | | | | |
| | $ | 1 | | | $ | (1 | ) | | $ | — | | | $ | — | (h) |
| | | | | | | | | | | | | | | | |
| (a) | For financial reporting purposes, the Fund does not offset derivative assets and derivative liabilities subject to master netting arrangements on the Statements of Assets and Liabilities. |
The following tables present the effect of derivatives on the Statements of Operations for the period ended June 30, 2021, by primary underlying risk exposure (amounts in thousands):
Six Circles Ultra Short Duration Fund
| | | | | | | | | | | | | | | | |
| Amount of Realized Gain (Loss) on Derivatives Recognized on the Statements of Operations | |
| Derivative Contracts | | Futures
Contracts | | | Forward Foreign
Currency Exchange
Contracts | | | Swaps | | | Total | |
Credit contracts | | $ | — | | | $ | — | | | $ | (91 | ) | | $ | (91 | ) |
Interest rate contracts | | | 274 | | | | — | | | | — | | | | 274 | |
Foreign exchange contracts | | | — | | | | (104 | ) | | | — | | | | (104 | ) |
| | | | | | | | | | | | | | | | |
Total | | $ | 274 | | | $ | (104 | ) | | $ | (91 | ) | | $ | 79 | |
| | | | | | | | | | | | | | | | |
| | | | | | | | | | | | | | | | |
| Amount of Change in Unrealized Appreciation (Depreciation) on Derivatives Recognized on the Statements of Operations | |
| Derivative Contracts | | Futures
Contracts | | | Forward Foreign
Currency Exchange
Contracts | | | Swaps | | | Total | |
Credit contracts | | $ | — | | | $ | — | | | $ | 20 | | | $ | 20 | |
Interest rate contracts | | | (336 | ) | | | — | | | | 2 | | | | (334 | ) |
Foreign exchange contracts | | | — | | | | 2,203 | | | | — | | | | 2,203 | |
| | | | | | | | | | | | | | | | |
Total | | $ | (336 | ) | | $ | 2,203 | | | $ | 22 | | | $ | 1,889 | |
| | | | | | | | | | | | | | | | |
| | | | | | | | | | |
| | | | | |
| JUNE 30, 2021 | | SIX CIRCLES TRUST | | | | | | | | 275 |
NOTES TO FINANCIAL STATEMENTS
AS OF JUNE 30, 2021 (Unaudited) (continued)
Six Circles Tax Aware Ultra Short Duration Fund
| | | | | | | | | | | | | | | | |
| Amount of Realized Gain (Loss) on Derivatives Recognized on the Statements of Operations | |
| Derivative Contracts | | Futures
Contracts | | | Forward Foreign
Currency Exchange
Contracts | | | Swaps | | | Total | |
Credit contracts | | $ | — | | | $ | — | | | $ | (112 | ) | | $ | (112 | ) |
Interest rate contracts | | | 324 | | | | — | | | | — | | | | 324 | |
Foreign exchange contracts | | | — | | | | (1,000 | ) | | | — | | | | (1,000 | ) |
| | | | | | | | | | | | | | | | |
Total | | $ | 324 | | | $ | (1,000 | ) | | $ | (112 | ) | | $ | (788 | ) |
| | | | | | | | | | | | | | | | |
| | | | | | | | | | | | | | | | |
| Amount of Change in Unrealized Appreciation (Depreciation) on Derivatives Recognized on the Statements of Operations | |
| Derivative Contracts | | Futures
Contracts | | | Forward Foreign
Currency Exchange
Contracts | | | Swaps | | | Total | |
Credit contracts | | $ | — | | | $ | — | | | $ | 18 | | | $ | 18 | |
Interest rate contracts | | | (392 | ) | | | — | | | | 2 | | | | (390 | ) |
Foreign exchange contracts | | | — | | | | 1,037 | | | | — | | | | 1,037 | |
| | | | | | | | | | | | | | | | |
Total | | $ | (392 | ) | | $ | 1,037 | | | $ | 20 | | | $ | 665 | |
| | | | | | | | | | | | | | | | |
Six Circles U.S. Unconstrained Equity Fund
| | | | |
| Amount of Realized Gain (Loss) on Derivatives Recognized on the Statements of Operations | |
| Derivative Contracts | | Futures
Contracts | |
Equity contracts | | $ | 14,687 | |
| | | | |
| | | | |
| Amount of Change in Unrealized Appreciation (Depreciation) on Derivatives Recognized on the Statements of Operations | |
| Derivative Contracts | | Futures
Contracts | |
Equity contracts | | $ | 628 | |
| | | | |
Six Circles International Unconstrained Equity Fund
| | | | | | | | | | | | |
| Amount of Realized Gain (Loss) on Derivatives Recognized on the Statements of Operations | |
| Derivative Contracts | | Futures Contracts | | | Forward Foreign
Currency Exchange
Contracts | | | Total | |
Equity contracts | | $ | 26,304 | | | $ | — | | | $ | 26,304 | |
Foreign exchange contracts | | | — | | | | 1,443 | | | | 1,443 | |
| | | | | | | | | | | | |
Total | | $ | 26,304 | | | $ | 1,443 | | | $ | 27,747 | |
| | | | | | | | | | | | |
| | | | | | | | | | | | |
Amount of Change in Unrealized Appreciation (Depreciation) on Derivatives Recognized on the Statements of Operations | |
| Derivative Contracts | | Futures
Contracts | | | Forward Foreign
Currency Exchange
Contracts | | | Total | |
Equity contracts | | $ | (3,056 | ) | | $ | — | | | $ | (3,056 | ) |
| | | | | | | | | | | | |
| | | | | | | | | | |
| | | | | |
| 276 | | | | | | | | SIX CIRCLES TRUST | | JUNE 30, 2021 |
Six Circles Global Bond Fund
| | | | | | | | | | | | | | | | |
| Amount of Realized Gain (Loss) on Derivatives Recognized on the Statements of Operations | |
| Derivative Contracts | | Futures
Contracts | | | Forward Foreign
Currency Exchange
Contracts | | | Swaps | | | Total | |
Interest rate contracts | | $ | 637 | | | $ | — | | | $ | (12 | ) | | $ | 625 | |
Foreign exchange contracts | | | — | | | | 4,693 | | | | — | | | | 4,693 | |
| | | | | | | | | | | | | | | | |
Total | | $ | 637 | | | $ | 4,693 | | | $ | (12 | ) | | $ | 5,318 | |
| | | | | | | | | | | | | | | | |
| | | | | | | | | | | | | | | | | | | | |
| Amount of Change in Unrealized Appreciation (Depreciation) on Derivatives Recognized on the Statements of Operations | | | | |
| Derivative Contracts | | Futures
Contracts | | | Forward Foreign
Currency Exchange
Contracts | | | Swaps | | | Options
written | | | Total | |
Interest rate contracts | | $ | 840 | | | $ | — | | | $ | (328 | ) | | $ | 135 | | | $ | 647 | |
Foreign exchange contracts | | | — | | | | 147,374 | | | | — | | | | — | | | | 147,374 | |
| | | | | | | | | | | | | | | | | | | | |
Total | | $ | 840 | | | $ | 147,374 | | | $ | (328 | ) | | $ | 135 | | | $ | 148,021 | |
| | | | | | | | | | | | | | | | | | | | |
Six Circles Tax Aware Bond Fund
| | | | |
| Amount of Realized Gain (Loss) on Derivatives Recognized on the Statements of Operations | |
| Derivative Contracts | | Futures
Contracts | |
Interest rate contracts | | $ | (915 | ) |
| | | | |
| | | | |
| Amount of Change in Unrealized Appreciation (Depreciation) on Derivatives Recognized on the Statements of Operations | |
| Derivative Contracts | | Futures
Contracts | |
Interest rate contracts | | $ | (449 | ) |
| | | | |
Six Circles Credit Opportunities Fund
| | | | | | | | | | | | | | | | |
Amount of Realized Gain (Loss) on Derivatives Recognized on the Statements of Operations | |
| Derivative Contracts | | Futures
Contracts | | | Forward Foreign
Currency Exchange
Contracts | | | Swaps | | | Total | |
Credit contracts | | $ | — | | | $ | — | | | $ | 960 | | | $ | 960 | |
Equity contracts | | | 37 | | | | — | | | | — | | | | 37 | |
Interest rate contracts | | | 2,323 | | | | — | | | | — | | | | 2,323 | |
Foreign exchange contracts | | | — | | | | (95 | ) | | | — | | | | (95 | ) |
| | | | | | | | | | | | | | | | |
Total | | $ | 2,360 | | | $ | (95 | ) | | $ | 960 | | | $ | 3,225 | |
| | | | | | | | | | | | | | | | |
|
Amount of Change in Unrealized Appreciation (Depreciation) on Derivatives Recognized on the Statements of Operations | |
| Derivative Contracts | | Futures
Contracts | | | Forward Foreign
Currency Exchange
Contracts | | | Swaps | | | Total | |
Credit contracts | | $ | — | | | $ | — | | | $ | (102 | ) | | $ | (102 | ) |
Interest rate contracts | | | (646 | ) | | | — | | | | | | | | (646 | ) |
Foreign exchange contracts | | | — | | | | 769 | | | | — | | | | 769 | |
| | | | | | | | | | | | | | | | |
Total | | $ | (646 | ) | | $ | 769 | | | $ | (102 | ) | | $ | 21 | |
| | | | | | | | | | | | | | | | |
| | | | | | | | | | |
| | | | | |
| JUNE 30, 2021 | | SIX CIRCLES TRUST | | | | | | | | 277 |
NOTES TO FINANCIAL STATEMENTS
AS OF JUNE 30, 2021 (Unaudited) (continued)
Derivatives Volume
The tables below disclose the volume of the Funds’ options, futures contracts, forward foreign currency exchange contracts and swaps activity during the period ended June 30, 2021 (amounts in thousands, except number of contracts). Please refer to the tables in the Summary of Derivative Information for derivative-related gains and losses associated with volume activity (amounts in thousands).
| | | | | | | | | | | | | | | | | | | | | | | | | | | | |
| | | Six Circles
Ultra Short
Duration Fund | | | Six Circles Tax
Aware Ultra
Short
Duration Fund | | | Six Circles U.S.
Unconstrained
Equity Fund | | | Six Circles
International
Unconstrained
Equity Fund | | | Six Circles
Global
Bond Fund | | | Six Circles
Tax Aware
Bond Fund | | | Six Circles
Credit
Opportunities
Fund | |
Futures Contracts: | | | | | | | | | | | | | | | | | | | | | | | | | | | | |
Average Notional Amount Long | | $ | 91,979 | | | $ | 105,812 | | | $ | 106,112 | | | $ | 187,243 | | | $ | 136,196 | | | $ | 79,272 | | | $ | 162,306 | |
Average Notional Amount Short | | | 26,203 | | | | 30,096 | | | | — | | | | — | | | | 151,379 | | | | 6,760 | | | | 71,620 | |
Forward Foreign Currency Exchange: | | | | | | | | | | | | | | | | | | | | | | | | | | | | |
Average Principal Amount Purchased | | | 15,600 | (a) | | | 12,162 | (a) | | | — | | | | 64,523 | (b) | | | 1,930,202 | | | | — | | | | 165 | (b) |
Average Principal Amount Sold | | | 71,427 | | | | 28,130 | | | | — | | | | 63,810 | (b) | | | 6,350,768 | | | | — | | | | 25,883 | |
Credit Default Swaps: | | | | | | | | | | | | | | | | | | | | | | | | | | | | |
Average Notional Amount — Buy Protection | | | 12,286 | | | | 15,600 | | | | — | | | | — | | | | — | | | | — | | | | 11,275 | (b) |
Average Notional Amount — Sell Protection | | | — | | | | — | | | | — | | | | — | | | | 1,000 | (c) | | | — | | | | 19,227 | (d) |
Interest Rate Swaps: | | | | | | | | | | | | | | | | | | | | | | | | | | | | |
Average Notional Amount | | | 22,100 | | | | 25,000 | | | | — | | | | — | | | | 863,171 | | | | — | | | | — | |
Options Written: | | | | | | | | | | | | | | | | | | | | | | | | | | | | |
Average Notional Amount | | | — | | | | — | | | | — | | | | — | | | | 73,879 | (e) | | | — | | | | — | |
| (a) | Positions were open for 5 months during the period. |
| (b) | Positions were open for 2 months during the period. |
| (c) | Positions were open for 1 month during the period. |
| (d) | Positions were open for 4 months during the period. |
| (e) | Positions were open for 3 months during the period. |
F. Foreign Currency Translation — The books and records of the Funds are maintained in U.S. dollars. Foreign currency amounts are translated into U.S. dollars at the prevailing exchange rates of such currencies against the U.S. dollar. The market value of investment securities and other assets and liabilities are translated at the exchange rate as of the valuation date. Purchases and sales of investment securities, income and expenses are translated at the exchange rate prevailing on the respective dates of such transactions.
The Funds do not isolate the effect of changes in foreign exchange rates from changes in market prices on securities held. Accordingly, such changes are included within the Change in net unrealized appreciation/depreciation on investments on the Statements of Operations.
Reported realized foreign currency gains and losses arise from the disposition of foreign currency. Currency gains or losses may be realized between the trade and settlement dates on securities transactions, and the difference between the amounts of dividends, interest and foreign withholding taxes recorded on each Fund’s books on the transaction date and the U.S. dollar equivalent of the amounts actually received or paid. These reported realized foreign currency gains and losses are included in Net realized gain (loss) on foreign currency transactions on the Statements of Operations. Unrealized foreign currency gains and losses arise from changes (due to changes in exchange rates) in the value of foreign currency and other assets and liabilities denominated in foreign currencies, which are held at period end and are included in Change in net unrealized appreciation/depreciation on foreign currency translations on the Statements of Operations.
G. Short Sales — The Funds may engage in short sales as part of their normal investment activities. In a short sale, the Funds sell securities they do not own in anticipation of a decline in the market value of those securities. In order to deliver securities to the purchaser, the Funds borrow securities from a broker. To close out a short position, the Funds deliver the same securities to the broker.
The Funds are required to pledge cash or securities to the broker as collateral for the securities sold short. Collateral requirements are calculated daily based on the current market value of the short positions. Cash collateral deposited with the custodian is recorded as Restricted cash on the Statements of Assets and Liabilities. Securities segregated as collateral are denoted on the SOIs. The Funds may receive or pay the net of the following amounts: (i) a portion of the income from the investment of cash collateral; (ii) the broker’s fee on the borrowed securities (calculated daily based upon the market value of each borrowed security and a variable rate that is dependent on availability of the security); and (iii) a financing charge for the difference between the market value of the short position and cash collateral deposited with the broker. The net income or fee is reported as Interest income or Interest expense, respectively, on securities sold short on the Statements of Operations. The Funds are obligated to pay the broker dividends declared on short positions when a position is open on the record date. Dividends on short positions are reported on ex-dividend date on the Statements of Operations as Dividend expense on securities sold short.
Liabilities for securities sold short are reported at market value on the Statements of Assets and Liabilities and the change in market value is recorded as Change in net unrealized appreciation (depreciation) on the Statements of Operations. Short sale transactions may result in unlimited losses as the security’s price increases and the short position loses value. There is no upward limit on the price a borrowed security could attain. The
| | | | | | | | | | |
| | | | | |
| 278 | | | | | | | | SIX CIRCLES TRUST | | JUNE 30, 2021 |
Funds are also subject to risk of loss if the broker were to fail to perform its obligations under the contractual terms. The Funds will record a realized loss if the price of the borrowed security increases between the date of the short sale and the date on which the Funds replace the borrowed security. The Funds will record a realized gain if the price of the borrowed security declines between those dates.
H. Security Transactions, Investment Income and Expense Allocation — Securities transactions are recorded on a trade date basis. Realized gain and loss from securities transactions are recorded on an identified cost basis for financial reporting and federal income tax purposes. Interest income is determined on the basis of coupon interest accrued using the effective interest method which adjusts for amortization of premiums and accretion of discounts. Dividend income, net of foreign taxes withheld, if any, is recorded on the ex-dividend date or when the Fund first learns of the dividend. Non-cash dividends, if any, are recorded on the ex-dividend date or corporate action date at fair value. Six Circles Credit Opportunities Fund may receive income from investments in loan assignments and/or unfunded commitments, including amendment fees, consent fees and commitment fees. These fees are recorded as income when received by the Fund. These amounts are included in Interest income on the Statements of Operations.
Distributions received from certain investments held by the Funds may be comprised of dividends, realized gains and returns of capital. The Funds originally estimate the expected classification of such payments. The amounts may subsequently be reclassified upon receipt of information from the issuer.
The Funds are charged for those expenses of the Trust that are directly attributable to each Fund. Expenses that are not directly attributable to a Fund are typically allocated among the Funds in proportion to their respective net assets.
I. Repurchase Agreements — The Funds may invest in repurchase agreements, which are short term investments whereby the Funds acquire ownership of a debt security and the seller agrees to repurchase the security at a future date at a specified price. When entering into repurchase agreements, it is the Funds’ policy that their custodian take possession of the underlying collateral securities, the market value of which, at all times, shall equal at least 100% of the principal amount of the repurchase transaction. The repurchase agreements further authorize the Funds to demand additional collateral in the event that the dollar value of the collateral falls below 100%. The Funds will make payments for such securities only upon physical delivery or upon evidence of book entry transfer to the account of the custodian.
The Funds’ repurchase agreements are not subject to master netting arrangements.
J. Reverse Repurchase Agreements — In a reverse repurchase agreement, a Fund delivers a security in exchange for cash to a financial institution, the counterparty, with a simultaneous agreement to repurchase the same or substantially the same security at an agreed upon price and date. In an open maturity reverse repurchase agreement, there is no pre-determined repurchase date and the agreement can be terminated by the Fund or counterparty at any time. A Fund is entitled to receive principal and interest payments, if any, made on the security delivered to the counterparty during the term of the agreement. Cash received in exchange for securities delivered plus accrued interest payments to be made by a Fund to counterparties are reflected as a liability on the Statements of Assets and Liabilities. Interest payments made by a Fund to counterparties are recorded as a component of interest expense on the Statements of Operations. A Fund will segregate assets determined to be liquid by the Adviser or will otherwise cover its obligations under reverse repurchase agreements.
Six Circles Global Bond Fund had an average amount of borrowings outstanding during the period ended June 30, 2021 of $3,079,762 at a weighted average interest rate of 0.183%
K. Federal Income Tax — Each Fund is treated as a separate taxable entity for Federal income tax purposes. Each Fund’s policy is to comply with the provisions of Subchapter M of the Internal Revenue Code of 1986, as amended (the “Code”) applicable to regulated investment companies. Each Fund intends to distribute to shareholders, substantially all of its distributable net investment income and net realized capital gains on investments. Accordingly, no provision for Federal income tax is necessary.
The Funds follow the provisions of FASB Codification Section 740 (“ASC Section 740”) “Accounting for Uncertainty in Income Taxes” which clarifies the accounting for uncertainty in tax positions taken or expected to be taken on a tax return. ASC Section 740 sets forth a threshold for financial statement recognition, measurement and disclosure of tax positions taken or expected to be taken on a tax return. The Funds are required to recognize the tax effects of certain tax positions under a “more likely than not” standard, that based on their technical merits, have more than 50 percent likelihood of being sustained upon examination. Management has analyzed the tax positions taken on the Funds’ federal income tax returns for all open years, and has concluded that no provision for federal income tax is required in the Funds’ financial statements. At June 30, 2021, the Funds did not have any uncertain tax benefits that require recognition, de-recognition or disclosure. The Funds’ federal, state and local income and federal excise tax returns for which the applicable statutes of limitations have not expired are subject to examination by the Internal Revenue Service and state departments of revenue.
L. Foreign Tax — The Funds may be subject to foreign taxes on income, gains on investments or currency purchases/repatriation, a portion of which may be recoverable. The Funds will accrue such taxes and recoveries as applicable, based upon its current interpretation of tax rules and regulations that exist in the markets in which it invests. When capital gain tax is determined to apply, the Funds record an estimated deferred tax liability in an amount that would be payable if the securities were disposed of on the valuation date.
| | | | | | | | | | |
| | | | | |
| JUNE 30, 2021 | | SIX CIRCLES TRUST | | | | | | | | 279 |
NOTES TO FINANCIAL STATEMENTS
AS OF JUNE 30, 2021 (Unaudited) (continued)
M. Distributions to Shareholders — Distributions to shareholders are recorded on the ex-dividend date. Distributions from net investment income and net realized capital gains are generally declared and paid according to the following schedule:
| | | | | | | | |
| Fund Name | | Net Investment Income | | | Net Realized Capital Gains | |
Six Circles Ultra Short Duration Fund | | | Monthly | | | | Annual | |
Six Circles Tax Aware Ultra Short Duration Fund | | | Monthly | | | | Annual | |
Six Circles U.S. Unconstrained Equity Fund | | | Annual | | | | Annual | |
Six Circles International Unconstrained Equity Fund | | | Annual | | | | Annual | |
Six Circles Global Bond Fund | | | Monthly | | | | Annual | |
Six Circles Tax Aware Bond Fund | | | Monthly | | | | Annual | |
Six Circles Credit Opportunities Fund | | | Monthly | | | | Annual | |
Income and capital gain distributions will be determined in accordance with federal income tax regulations which may differ from GAAP. Differences may be permanent or temporary. Permanent differences are reclassified among capital accounts in the financial statements to reflect their tax character.
Temporary differences arise when certain items of income, expense, gain, or loss are recognized in different periods for financial statement and tax purposes. These differences will reverse at some time in the future. Differences in classification may also result from the treatment of short- term gains as ordinary income for tax purposes. As a result, income dividends and capital gain distributions declared during a fiscal period may differ significantly from the net investment income (loss) and realized gain (loss) reported on the Fund financial statements presented under GAAP.
Distributions classified as a tax basis return of capital, if any, are reflected on the Statement of Changes in Net Assets and have been recorded to paid-in capital.
3. Fees and Other Transactions with Affiliates
A. Investment Advisory Fees — The Adviser serves as the Funds’ investment adviser pursuant to an investment advisory agreement (the “Investment Advisory Agreement”). Under the terms of the Investment Advisory Agreement, the Adviser generally manages the Funds’ investments in accordance with the stated policies of each Fund, subject to the supervision of the Funds’ Board of Trustees. For the services provided to the Funds, the Adviser is entitled to a fee, accrued daily and paid monthly, at the annual rate of 0.25% of the average daily net assets of each Fund except Six Circles Credit Opportunities Fund. The fee for the Six Circles Credit Opportunities Fund is 0.75% of the average daily net assets.
The Adviser selects and oversees professional money managers (the “Sub-Advisers”) who are responsible for investing the assets of the Funds under sub-advisory agreements (the “Sub-Advisory Agreements”). Pursuant to each respective Sub-Advisory Agreement, the Adviser agrees to pay each Sub-Adviser a sub-advisory fee from its investment advisory fees. BlackRock Investment Management, LLC (“BlackRock”), BlueBay Asset Management (“BlueBay”), BNY Mellon Asset Management North America Corporation, (now known as Mellon Investments Corporation) (“Mellon”), Capital International, Inc. (“Capital”), Goldman Sachs Asset Management, L.P. (“Goldman”), Muzinich & Co. (“Muzinich”), Nuveen Asset Management, LLC (“Nuveen”) , Pacific Investment Management Company LLC (“PIMCO”), PGIM, Inc. (“PGIM”), Wells Capital Management Incorporated (“WellsCap”), Federated Investment Management Company (“Federated”) and Lord Abbett & Co. LLC (“Lord Abbett”) currently serve as the Sub-Advisers to the Funds. The Sub-Advisers are paid a management fee by the Adviser pursuant to their individually negotiated Sub-Advisory Agreements.
On October 5, 2018, the Adviser entered into an agreement to allow Russell Investments Implementation Services, LLC (“Russell”) to provide stand-by interim sub-advisory services, as well as transition management services, for each Fund, to be utilized as needed in certain transitional circumstances involving a Fund Sub-Adviser. During the reporting period, the Funds have not allocated assets to Russell.
During the reporting period, affiliates of the Adviser made payments to the Six Circles Global Bond Fund of $8,309 and $791, relating to trade errors.
The Adviser waived Investment Advisory fees and/or reimbursed expenses as outlined in Note 3G and reflected on the Statement of Operations.
B. Administration and Accounting Fees — Pursuant to an Administrative Agency Agreement, Brown Brothers Harriman & Co. (the “Administrator”) provides certain administration and fund accounting services to the Funds.
C. Distribution Fees — Pursuant to a Distribution Agreement, Foreside Fund Services, LLC (the “Distributor”), will serve as the Funds’ principal underwriter and acts as the agent of the Funds’ in connection with the continuous offering of shares of each Fund. The Distributor and its officers have no role in determining the investment policies or which securities are to be purchased or sold by the Funds. The Distributor does not receive compensation from the Funds, but instead is compensated by the Adviser for certain distribution-related expenses.
D. Custodian — Pursuant to a Custodian Agreement, Brown Brothers Harriman & Co. serves as the custodian (the “Custodian”) for each of the Funds and is responsible for holding portfolio securities and cash and maintaining the books of account and records of portfolio transactions.
E. Transfer Agent — Pursuant to a Transfer Agency and Service Agreement, DST Asset Manager Solutions, Inc. (the “Transfer Agent”) serves as each Fund’s transfer and dividend disbursing agent. The Transfer Agent is responsible for maintaining account records, detailing the ownership of Fund shares and for crediting income, capital gains and other changes in share ownership to shareholder accounts.
| | | | | | | | | | |
| | | | | |
| 280 | | | | | | | | SIX CIRCLES TRUST | | JUNE 30, 2021 |
F. Offering Costs — Offering costs, including professional fees, printing fees and initial registration costs, have been amortized over a period not longer than twelve months from the date the Fund commenced operations.
G. Waivers and Reimbursements — The Adviser has contractually agreed through at least April 30, 2022, to waive any management fees that exceed the aggregate management fees the Adviser is contractually required to pay the Fund’s Sub-Advisers. Thereafter, this waiver will continue for subsequent one year terms unless terminated in accordance with its terms. Such waivers are not subject to reimbursement by the Fund. The Adviser has also contractually agreed through at least April 30, 2022, to reimburse expenses to the extent Total Annual Fund Operating Expenses (excluding acquired fund fees and expenses, if any, dividend and interest expenses related to short sales, brokerage fees, interest on borrowings, taxes, expenses related to litigation and potential litigation, and extraordinary expenses) exceed the following percentages of the average daily net assets of each Fund (the “Expense Cap”):
| | | | |
| Fund | | Expense Cap | |
Six Circles Ultra Short Duration Fund | | | 0.40 | % |
Six Circles Tax Aware Ultra Short Duration Fund | | | 0.40 | % |
Six Circles U.S. Unconstrained Equity Fund | | | 0.45 | % |
Six Circles International Unconstrained Equity Fund | | | 0.50 | % |
Six Circles Global Bond Fund | | | 0.40 | % |
Six Circles Tax Aware Bond Fund | | | 0.40 | % |
Six Circles Credit Opportunities Fund | | | 0.95 | % |
An expense reimbursement by the Fund’s Adviser is subject to repayment by the Fund only to the extent it can be made within thirty-six months following the date of such reimbursement by the Adviser. Repayment must be limited to amounts that would not cause the Fund’s operating expenses (taking into account any reimbursements by the Adviser and repayments by the Fund) to exceed the Expense Cap in effect at the time of the reimbursement by the Adviser or at the time of repayment by the Fund. This expense reimbursement is in effect through April 30, 2022, at which time the Adviser and/or its affiliates will determine whether to renew or revise it.
For the period ended June 30, 2021, there were no amounts reimbursed by the Adviser, as well as the amounts available for potential future recoupment by the Adviser.
H. Cross Trades — The Funds may participate in purchase and sale transactions with other Six Circles Funds. These cross trades are executed in accordance with procedures adopted by the Trust’s Board and comply with Rule 17a-7 of the 1940 Act, which require, among other things, that such cross trades be effected at the independent current market price of the security. During the period ended June 30, 2021, the aggregate value of purchases and sale cross trades with other Six Circles Funds were as follows (amounts in thousands):
| | | | | | | | | | | | |
| Fund Name | | Purchases | | | Sales | | | Realized
gain/loss | |
Six Circles U.S. Unconstrained Equity Fund | | $ | 939 | | | $ | 195 | | | $ | (9 | ) |
Six Circles International Unconstrained Equity Fund | | | 5 | | | | 2,057 | | | | 199 | |
4. Investment Transactions
During the period ended June 30, 2021, purchases and sales of investments (excluding short-term investments) were as follows (amounts in thousands):
| | | | | | | | | | | | | | | | |
| | | Purchases
(excluding U.S.
Government) | | | Sales
(excluding U.S.
Government) | | | Purchases of U.S.
Government | | | Sales of U.S.
Government | |
Six Circles Ultra Short Duration Fund | | $ | 217,434 | | | $ | 117,352 | | | $ | 12,842 | | | $ | 8,742 | |
Six Circles Tax Aware Ultra Short Duration Fund | | | 91,989 | | | | 64,391 | | | | 3,400 | | | | — | |
Six Circles U.S. Unconstrained Equity Fund | | | 7,783,207 | | | | 5,369,670 | | | | — | | | | — | |
Six Circles International Unconstrained Equity Fund | | | 5,954,815 | | | | 3,887,090 | | | | — | | | | — | |
Six Circles Global Bond Fund | | | 1,760,550 | | | | 1,118,478 | | | | 9,806,281 | | | | 9,758,110 | |
Six Circles Tax Aware Bond Fund | | | 1,401,087 | | | | 338,481 | | | | — | | | | — | |
Six Circles Credit Opportunities Fund | | | 2,890,771 | | | | 530,735 | | | | 391,237 | | | | 287,168 | |
5. Risks, Concentrations and Indemnifications
In the normal course of business, the Funds enter into contracts that contain a variety of representations which provide general indemnifications. The Funds’ maximum exposure under these arrangements is unknown. The amount of exposure would depend on future claims that may be made against the Funds that have not yet occurred. However, based on experience, the Funds expect the risk of loss to be remote.
Since the Funds are non-diversified, they may invest a greater percentage of their assets in a particular issuer or group of issuers than a diversified fund would. This increased investment in fewer issuers may result in the Funds` shares being more sensitive to economic results among those issuing the securities.
| | | | | | | | | | |
| | | | | |
| JUNE 30, 2021 | | SIX CIRCLES TRUST | | | | | | | | 281 |
NOTES TO FINANCIAL STATEMENTS
AS OF JUNE 30, 2021 (Unaudited) (continued)
The Six Circles Ultra Short Duration Fund, Six Circles International Unconstrained Equity Fund and Six Circles Global Bond Fund may have elements of risk not typically associated with investments in the United States of America due to concentrated investments in a limited number of countries or regions, which may vary throughout the period depending on the Funds. Such concentrations may subject the Funds to additional risks resulting from political or economic conditions in such countries or regions and the possible imposition of adverse governmental laws or currency exchange restrictions could cause the securities and their markets to be less liquid and their prices to be more volatile than those of comparable U.S. securities.
As of June 30, 2021, the Six Circles Ultra Short Duration Fund had non-U.S. country allocations representing greater than 10% of Net Assets allocated as follows:
As of June 30, 2021, the Six Circles International Unconstrained Equity Fund had non-U.S. country allocations representing greater than 10% of Net Assets as follows:
| | | | | | | | | | | | | | | | |
| Germany | | Switzerland | | | United Kingdom | | | | | | | |
| 11.1% | | | 25.4 | % | | | 17.2 | % | | | | | | | | |
As of June 30, 2021, the Six Circles Global Bond Fund had non-U.S. country allocations representing greater than 10% of Net Assets allocated as follows:
As of June 30, 2021, a significant portion of the Six Circles International Unconstrained Equity and Six Circles Global Bond Funds’ net assets consisted of securities that were denominated in foreign currencies. Changes in currency exchange rates will affect the value of, and investment income from, such securities.
Overnight bank deposits of foreign currency can result in negative interest rates based on monetary policies in that respective country.
The Six Circles Ultra Short Duration Fund, Six Circles Tax Aware Ultra Short Duration Fund, Six Circles Global Bond Fund, Six Circles Tax Aware Bond Fund and Six Circles Credit Opportunities Fund are subject to risks associated with securities with contractual cash flows including asset-backed and mortgage related securities such as collateralized mortgage obligations, mortgage pass-through securities and commercial mortgage-backed securities, including securities backed by sub-prime mortgage loans. The value, liquidity and related income of these securities are sensitive to changes in economic conditions, including real estate value, pre-payments, delinquencies and/or defaults, and may be adversely affected by shifts in the market’s perception of the issuers and changes in interest rates.
The Six Circles Ultra Short Duration Fund, Six Circles Tax Aware Ultra Short Duration Fund, Six Circles Global Bond Fund, Six Circles Tax Aware Bond Fund and Six Circles Credit Opportunities Fund may be subject to leveraging risk, which is the risk that certain transactions of the Fund, such as loans of portfolio securities, and the use of when-issued, delayed delivery or forward commitment transactions, or derivative instruments, may give rise to leverage, magnifying gains and losses and causing the Fund to be more volatile than if it had not been leveraged.
The Six Circles Ultra Short Duration Fund, Six Circles Tax Aware Ultra Short Duration Fund, Six Circles Global Bond Fund, Six Circles Tax Aware Bond Fund and Six Circles Credit Opportunities Fund may invest in high yield securities that are not rated or rated below investment grade (commonly known as “junk bonds”). These securities are considered to be high risk investments. Investments in lower-rated securities or unrated securities of comparable quality tend to be more sensitive to economic conditions than higher rated securities. Junk bonds involve a greater risk of default by the issuer because such securities are generally unsecured and are often subordinated to other creditors’ claims. The market price of these securities can change suddenly and unexpectedly. As a result, the Funds are intended for investors who are able and willing to assume a high degree of risk.
Six Circles Credit Opportunities Fund may invest a substantial portion of the Fund’s total assets in below investment grade credit instruments including “high-yield” instruments (also known as “junk bonds”) and “distressed” debt instruments.
The Funds are subject to the risk that, should the Funds decide to sell an illiquid investment when a ready buyer is not available at a price the Funds deem to be representative of its value, the value of the Funds’ net assets could be adversely affected.
The Six Circles Credit Opportunities Fund invests in Loan Assignments. Loan assignments are vulnerable to market conditions such that economic conditions or other events may reduce the demand for assignments and certain assignments which were liquid, when purchased, may become illiquid and they may be difficult to value. In addition, the settlement period for loans is uncertain as there is no standardized settlement schedule applicable to such investments. Therefore, a Fund may not receive the proceeds from a sale of such investments for a period after the sale. Certain loan assignments are also subject to the risks associated with high yield securities described above.
The value of the Funds’ investments may be negatively affected by the occurrence of global events such as war, terrorism, environmental disasters, natural disasters or events, country instability, and infectious disease epidemics or pandemics. For example, the outbreak of COVID-19, a novel coronavirus disease, has negatively affected economies, markets and individual companies throughout the world, including those in which the Funds invest. The effects of this pandemic to public health and business and market conditions, including exchange trading suspensions and closures, may
| | | | | | | | | | |
| | | | | |
| 282 | | | | | | | | SIX CIRCLES TRUST | | JUNE 30, 2021 |
continue to have a significant negative impact on the performance of the Funds’ investments, increase the Funds’ volatility, exacerbate pre-existing political, social and economic risks to the Funds, and negatively impact broad segments of businesses and populations. The Funds’ operations may be interrupted as a result, which may contribute to the negative impact on investment performance. In addition, governments, their regulatory agencies, or self-regulatory organizations may take actions in response to the pandemic that affect the instruments in which the Funds invest, or the issuers of such instruments, in ways that could have a significant negative impact on the Funds’ investment performance. The full impact of the COVID-19 pandemic, or other future epidemics or pandemics, is currently unknown.
The Funds may also invest in shares of other investment companies and ETFs. ETFs are ownership interests in unit investment trusts, depositary receipts, and other pooled investment vehicles that hold a portfolio of securities or stocks designed to track the price performance and dividend yield of a particular broad-based, sector or international index. ETFs include a wide range of investments. Shareholders bear both their proportionate share of the Fund’s expenses and similar expenses of the underlying investment company or ETF when the Fund invests in shares of another investment company or ETF. The Fund is subject to the risks associated with the ETF’s or investment company’s investments. ETFs, investment companies and other investment vehicles that invest in commodities or currencies are subject to the risks associated with direct investments in commodities or currencies. The price and movement of an ETF or closed-end fund designed to track an index may not track the index and may result in a loss. In addition, closed-end funds that trade on an exchange often trade at a price below their net asset value (also known as a discount). Certain ETFs or closed-end funds traded on exchanges may be thinly-traded and experience large spreads between the “ask” price quoted by a seller and the “bid” price offered by a buyer.
Derivatives may be riskier than other types of investments because they may be more sensitive to changes in economic or market conditions than other types of investments and could result in losses that significantly exceed each Fund’s original investment. Many derivatives create leverage thereby causing the Funds to be more volatile than they would have been if they had not used derivatives. Derivatives also expose the Funds to counterparty risk (the risk that the derivative counterparty will not fulfill its contractual obligations), including credit risk of the derivative counterparty.
The Funds are also subject to counterparty credit risk, which is the risk that a counterparty fails to perform on agreements with the Funds such as swap and option contracts and forward foreign currency exchange contracts.
The Funds are subject to interest rate and credit risk. The value of debt securities may decline as interest rates increase. The Funds could lose money if the issuer of a fixed income security is unable to pay interest or repay principal when it is due. The Fund may invest in variable and floating rate securities. Although these instruments are generally less sensitive to interest rate changes than fixed rate instruments, the value of variable and floating rate securities may decline if their interest rates do not rise as quickly, or as much, as general interest rates. Many factors can cause interest rates to rise. Some examples include central bank monetary policy, rising inflation rates and general economic conditions. The ability of the issuers of debt to meet their obligations may be affected by the economic and political developments in a specific industry or region.
The Six Circles Tax Aware Ultra Short Duration Fund and Six Circles Tax Aware Bond Fund invest primarily in a portfolio of debt obligations issued by states, territories and possessions of the United States and by the District of Columbia, and by their political subdivisions and duly constituted authorities. These debt obligations may be insured by private insurers who guarantee the payment of principal and interest in the event of issuer default. The value of these investments may be impacted by changes to bond insurers’ ratings and the Fund’s ability to collect principal and interest in the event of an issuer’s default may be limited if the private insurer does not have the wherewithal to satisfy its obligation.
LIBOR is intended to represent the rate at which contributing banks may obtain short-term borrowings from each other in the London interbank market. On March 5, 2021, the U.K. Financial Conduct Authority ("FCA") publicly announced that (i) immediately after December 31, 2021, publication of the 1-week and 2-month U.S. Dollar LIBOR settings will permanently cease; (ii) immediately after June 30, 2023, publication of the overnight and 12-month U.S. Dollar LIBOR settings will permanently cease; and (iii) immediately after June 30, 2023, the 1-month, 3-month and 6-month U.S. Dollar LIBOR settings will cease to be provided or, subject to the FCA’s consideration of the case, be provided on a synthetic basis and no longer be representative of the underlying market and economic reality they are intended to measure and that representativeness will not be restored. There is no assurance that the dates announced by the FCA will not change or that the administrator of LIBOR and/or regulators will not take further action that could impact the availability, composition or characteristics of LIBOR or the currencies and/or tenors for which LIBOR is published. Public and private sector industry initiatives are currently underway to implement new or alternative reference rates to be used in place of LIBOR. There is no assurance that any such alternative reference rate will be similar to or produce the same value or economic equivalence as LIBOR or that it will have the same volume or liquidity as did LIBOR prior to its discontinuance or unavailability, which may affect the value or liquidity or return on certain of a Fund’s loans, notes, derivatives and other instruments or investments comprising some or all of a Fund’s investments and result in costs incurred in connection with closing out positions and entering into new trades. These risks may also apply with respect to changes in connection with other interbank offering rates (e.g., Euribor) and a wide range of other index levels, rates and values that are treated as "benchmarks" and are the subject of recent regulatory reform.
| | | | | | | | | | |
| | | | | |
| JUNE 30, 2021 | | SIX CIRCLES TRUST | | | | | | | | 283 |
NOTES TO FINANCIAL STATEMENTS
AS OF JUNE 30, 2021 (Unaudited) (continued)
6. Income Taxes and Distributions to Shareholders
For Federal income tax purposes, the estimated cost and unrealized appreciation (depreciation) in value of investments held at June 30, 2021 were as follows (amounts in thousands):
| | | | | | | | | | | | | | | | |
| | | Aggregate Tax Cost | | | Gross Unrealized Appreciation | | | Gross Unrealized Depreciation | | | Net Unrealized Appreciation (Depreciation) | |
Six Circles Ultra Short Duration Fund | | | 551,320 | | | | 3,096 | | | | (1,365 | ) | | | 1,731 | |
Six Circles Tax Aware Ultra Short Duration Fund | | | 596,482 | | | | 3,510 | | | | (1,051 | ) | | | 2,459 | |
Six Circles U.S. Unconstrained Equity Fund | | | 13,886,374 | | | | 4,338,411 | | | | (33,695 | ) | | | 4,304,716 | |
Six Circles International Unconstrained Equity Fund | | | 9,940,003 | | | | 1,648,096 | | | | (189,080 | ) | | | 1,459,016 | |
Six Circles Global Bond Fund | | | 7,965,259 | | | | 176,942 | | | | (180,384 | ) | | | (3,442 | ) |
Six Circles Tax Aware Bond Fund | | | 5,733,812 | | | | 75,749 | | | | (6,151 | ) | | | 69,598 | |
Six Circles Credit Opportunities Fund | | | 3,422,404 | | | | 38,892 | | | | (13,009 | ) | | | 25,883 | |
As of December 31, 2020, the following Funds had the following post-enactment net capital loss carryforwards (amounts in thousands):
| | | | | | | | |
| | | Capital Loss Carryforward Character | |
| | | Short-Term | | | Long-Term | |
Six Circles Ultra Short Duration Fund | | $ | 2,729 | | | $ | 1,837 | |
Six Circles Tax Aware Ultra Short Duration Fund | | | — | | | | 4,637 | |
Six Circles International Unconstrained Equity Fund | | | 376,703 | | | | 274,981 | |
During the year ended December 31, 2020, the following Funds utilized capital loss carryforwards as follows (amounts in thousands):
| | | | | | | | |
| | | Capital Loss Utilized | |
| | | Short-Term | | | Long-Term | |
Six Circles Ultra Short Duration Fund | | $ | (569 | ) | | $ | (19 | ) |
Six Circles Tax Aware Ultra Short Duration Fund | | | (3,664 | ) | | | — | |
Six Circles U.S. Unconstrained Equity Fund | | | (110,956 | ) | | | (6,354 | ) |
Specified ordinary losses incurred after October 31 within the taxable year are deemed to arise on the first business day of the Funds’ next taxable year. For the year ended December 31, 2020, the Funds deferred to January 1, 2021 the following specified ordinary losses of (amounts in thousands):
| | | | |
| | | Specified
Ordinary Loss | |
Six Circles Ultra Short Duration Fund | | $ | 1,157 | |
Six Circles Tax Aware Ultra Short Duration Fund | | | 539 | |
Six Circles Global Bond Fund | | | 62,012 | |
7. Ownership Concentration
As of June 30, 2021, Six Circles Ultra Short Duration Fund, Six Circles Tax Aware Ultra Short Duration Fund, Six Circles U.S. Unconstrained Equity Fund, Six Circles International Unconstrained Equity Fund, Six Circles Global Bond Fund, Six Circles Tax Aware Bond Fund and Six Circles Credit Opportunities Fund each had one affiliated omnibus account for the benefit of its clients which owned 99.9% of its outstanding shares.
8. New Accounting Pronouncement
In March 2020, the FASB issued Accounting Standard Update (“ASU”) No. 2020-04, “Reference Rate Reform (Topic 848): Facilitation of the Effects of Reference Rate Reform on Financial Reporting.” This ASU provides optional exceptions for applying GAAP to contract modifications, hedging relationships and other transactions affected reference rate reform if certain criteria are met. ASU 2020-04 is elective and is effective on March 12, 2020 through December 31, 2022. Management expects that the adoption of this guidance will not have a material impact on the Funds’ financial statements.
9. Subsequent Events
The Funds have evaluated subsequent events through the date of issuance of this report and have determined that there are no material events that need disclosure other than those disclosed above.
| | | | | | | | | | |
| | | | | |
| 284 | | | | | | | | SIX CIRCLES TRUST | | JUNE 30, 2021 |
SCHEDULE OF SHAREHOLDER EXPENSES
(Unaudited)
Hypothetical $1,000 Investment
As a shareholder of the Funds, you incur two types of costs: (1) transaction costs, including sales charges (loads) on purchase payments and redemption fees and (2) ongoing costs, including investment advisory fees, administration fees, distribution fees and other Fund expenses. The examples below are intended to help you understand your ongoing costs (in dollars) of investing in the Funds and to compare these ongoing costs with the ongoing costs of investing in other mutual funds. The examples assume that you had a $1,000 investment in each fund at the beginning of the reporting period, January 1, 2021, and continued to hold your shares at the end of the reporting period, June 30, 2021.
Actual Expenses
For each Fund in the table below, the first line provides information about actual account values and actual expenses. You may use the information in this line, together with the amount you invested, to estimate the expenses that you paid over the period. Simply divide your account value by $1,000 (for example, an $8,600 account value divided by $1,000 = 8.6), then multiply the result by the number in the first line under the heading entitled “Expenses Paid During the Period” to estimate the expenses you paid on your account during this period.
Hypothetical Example for Comparison Purposes
The second line in the table below provides information about hypothetical account values and hypothetical expenses based on the Fund’s actual expense ratio and an assumed rate of return of 5% per year before expenses, which is not the actual return. The hypothetical account values and expenses may not be used to estimate the actual ending account balance or expenses you paid for the period. You may use this information to compare the ongoing costs of investing in the Fund and other funds. To do so, compare this 5% hypothetical example with the 5% hypothetical examples that appear in the shareholder reports of the other funds. Please note that the expenses shown in the table are meant to highlight your ongoing costs only and do not reflect any transaction costs, such as sales charges (loads) or redemption fees. Therefore, the second line in the table is useful in comparing ongoing costs only, and will not help you determine the relative total costs of owning different funds. In addition, if these transaction costs were included, your costs would have been higher. The examples also assume all dividends and distributions have been reinvested.
| | | | | | | | | | | | | | | | |
| | | Beginning
Account Value
January 1, 2021 | | | Ending
Account Value
June 30, 2021 | | | Expenses
Paid During
the Period* | | | Annualized Expense Ratio | |
Six Circles Ultra Short Duration Fund | | | | | | | | | | | | | | | | |
Actual | | $ | 1,000.00 | | | $ | 1,003.40 | | | $ | 0.89 | | | | 0.18 | % |
Hypothetical | | | 1,000.00 | | | | 1,023.90 | | | | 0.90 | | | | 0.18 | % |
Six Circles Tax Aware Ultra Short Duration Fund | | | | | | | | | | | | | | | | |
Actual | | | 1,000.00 | | | | 1,002.40 | | | | 0.74 | | | | 0.15 | % |
Hypothetical | | | 1,000.00 | | | | 1,024.05 | | | | 0.75 | | | | 0.15 | % |
Six Circles U.S. Unconstrained Equity Fund | | | | | | | | | | | | | | | | |
Actual | | | 1,000.00 | | | | 1,191.20 | | | | 0.27 | | | | 0.05 | % |
Hypothetical | | | 1,000.00 | | | | 1,024.55 | | | | 0.25 | | | | 0.05 | % |
Six Circles International Unconstrained Equity Fund | | | | | | | | | | | | | | | | |
Actual | | | 1,000.00 | | | | 1,104.20 | | | | 0.47 | | | | 0.09 | % |
Hypothetical | | | 1,000.00 | | | | 1,024.35 | | | | 0.45 | | | | 0.09 | % |
Six Circles Global Bond Fund | | | | | | | | | | | | | | | | |
Actual | | | 1,000.00 | | | | 991.80 | | | | 0.54 | | | | 0.11 | % |
Hypothetical | | | 1,000.00 | | | | 1,024.25 | | | | 0.55 | | | | 0.11 | % |
Six Circles Tax Aware Bond Fund | | | | | | | | | | | | | | | | |
Actual | | | 1,000.00 | | | | 1,008.00 | | | | 0.65 | | | | 0.13 | % |
Hypothetical | | | 1,000.00 | | | | 1,024.15 | | | | 0.65 | | | | 0.13 | % |
Six Circles Credit Opportunities Fund | | | | | | | | | | | | | | | | |
Actual | | | 1,000.00 | | | | 1,022.00 | | | | 1.20 | | | | 0.24 | % |
Hypothetical | | | 1,000.00 | | | | 1,023.60 | | | | 1.20 | | | | 0.24 | % |
| * | Expenses are equal to each Fund’s respective annualized expense ratio, multiplied by the average account value over the period, multiplied by 181/365 (to reflect the one-half year period). |
| | | | | | | | | | |
| | | | | |
| JUNE 30, 2021 | | SIX CIRCLES TRUST | | | | | | | | 285 |
BOARD APPROVAL OF INVESTMENT ADVISORY AGREEMENTS
Board Review and Approval of the Continuation of the Advisory and Sub-Advisory Agreements
The Board of Trustees (the “Board”) of the Six Circles Trust (the “Trust”), including the Trustees who are not “interested persons” (as defined in the Investment Company Act of 1940, as amended, the “1940 Act”) of J.P. Morgan Private Investments Inc. (“JPMPI” or the “Adviser”), the Sub-Advisers (as defined below) or their affiliates (the “Independent Trustees”) met on May 25-26, 2021 (the “Meeting”) to consider and approve (i) the continuation of the Investment Advisory Agreement (the “Advisory Agreement”) between the Trust, on behalf of the Six Circles U.S. Unconstrained Equity Fund (the “U.S. Equity Fund”), the Six Circles International Unconstrained Equity Fund (the “International Equity Fund”), the Six Circles Tax Aware Ultra Short Duration Fund (the “Tax Aware Fund”), the Six Circles Ultra Short Duration Fund (the “Ultra Short Fund”), the Six Circles Global Bond Fund (the “Global Bond Fund”) and the Six Circles Tax Aware Bond Fund (the “Tax Aware Bond Fund”) (collectively the “Renewal Funds”), and JPMPI; and (ii) the Sub-Advisory Agreements in respect of the Renewal Funds between JPMPI and BlackRock Investment Management, LLC (“BlackRock”), Pacific Investment Management Company (“PIMCO”), Mellon Investments Corporation (“Mellon”), Goldman Sachs Asset Management LP (“GSAM”), PGIM, Inc. (“PGIM”), Capital International, Inc. (“Capital”), Nuveen Asset Management, LLC (“Nuveen”), and Russell Investments Implementation Services, LLC (“RIIS”) (as stand-by Interim Sub-Adviser) (each, a “Sub-Adviser” and collectively, the “Sub-Advisers”) and the Sub-Sub-Advisory Agreements between BlackRock and each of BlackRock International Limited (“BIL”) and BlackRock (Singapore) Limited (“BSL”) as well as the Sub-Sub-Advisory Agreement between PGIM and PGIM Limited (“PGIML”) (each of BIL, BSL and PGIML, a “Sub-Sub-Adviser” and collectively, the “Sub-Sub-Advisers”). At the Meeting, the Board, including the Independent Trustees, unanimously approved the Advisory Agreement and each Sub-Advisory Agreement.
Materials Requested Prior to Meeting. Prior to the Meeting, Ropes & Gray LLP (“Ropes & Gray”), counsel to the Independent Trustees, had prepared letters on behalf of the Independent Trustees requesting detailed information from JPMPI and each Sub-Adviser in connection with the proposed Advisory Agreement and Sub-Advisory Agreements in an effort to observe the requirement under Section 15(c) of the 1940 Act that the Trustees request and evaluate, and that the investment adviser and sub-advisers furnish, such information as may be necessary to evaluate the terms of the proposed agreements. JPMPI and each Sub-Adviser responded to the information requests and provided memoranda and related materials and information for consideration by the Trustees, which were included in the materials for the Meeting (together, the “15(c) Materials”). Following receipt and review, the Independent Trustees and their counsel, Ropes & Gray, held a separate conference call on May 20, 2021 to consider the 15(c) Materials and related
proposed advisory and sub-advisory arrangements, during which the Independent Trustees raised various questions and requests for additional information to be responded to by JPMPI. Subsequent calls were held with representatives from JPMPI to communicate the Independent Trustees’ additional questions and requests for information, each of which was responded to by JPMPI either in writing or orally at the Meeting.
Set forth below is a summary of the material factors evaluated by the Trustees that formed the basis for the Board’s approval of the continuation of the Advisory Agreement and the Sub-Advisory Agreements. The Trustees’ conclusions as to the approval of the continuation of the Agreements were based on a comprehensive consideration of all information provided to the Trustees. In deciding to approve the continuation of the Advisory Agreement and Sub-Advisory Agreements, the Board did not identify any single factor or particular information that, in isolation, was controlling. Some of the factors that figured particularly in the Trustees’ deliberations are described below, although individual Trustees may have evaluated the information presented differently from one another, attributing different weights to various factors.
Materials Reviewed. In considering the approval of the continuation of the Investment Advisory Agreement (the “Advisory Agreement”) between the Trust and J.P. Morgan Private Investments Inc. (“JPMPI” or the “Adviser”) for the Six Circles U.S. Unconstrained Equity Fund (the “U.S. Equity Fund”), the Six Circles International Unconstrained Equity Fund (the “International Equity Fund”), the Six Circles Tax Aware Ultra Short Duration Fund (the “Tax Aware Fund”), the Six Circles Ultra Short Duration Fund (the “Ultra Short Fund”), the Six Circles Managed Equity Portfolio U.S. Unconstrained Fund (the “MEP U.S. Fund”), the Six Circles Managed Equity Portfolio International Unconstrained Fund (the “MEP International Fund”), the Six Circles Global Bond Fund (the “Global Bond Fund”) and the Six Circles Tax Aware Bond Fund (the “Tax Aware Bond Fund”) (collectively the “Renewal Funds”), the Sub-Advisory Agreements in respect of the Renewal Funds between JPMPI and BlackRock Investment Management, LLC (“BlackRock”), Pacific Investment Management Company (“PIMCO”), Mellon Investments Corporation (“Mellon”), Goldman Sachs Asset Management LP (“GSAM”), PGIM, Inc. (“PGIM”), Capital International, Inc. (“Capital”), Nuveen Asset Management, LLC (“Nuveen”), and Russell Investments Implementation Services, LLC (“RIIS”) (as stand-by Interim Sub-Adviser) (each, a “Sub-Adviser” and collectively, the “Sub-Advisers”) and the Sub-Sub-Advisory Agreements between BlackRock and each of BlackRock International Limited (“BIL”) and BlackRock (Singapore) Limited (“BSL”) as well as the Sub-Sub-Advisory Agreement between PGIM and PGIM Limited (“PGIML”) (each of BIL, BSL and PGIML, a “Sub-Sub-Adviser” and collectively, the “Sub-Sub-Advisers”), the Trustees took into account the wide variety of materials
| | | | | | | | | | |
| | | | | |
| 286 | | | | | | | | SIX CIRCLES TRUST | | JUNE 30, 2021 |
(the “15(c) Materials”) relating to the services provided by JPMPI, the Sub-Advisers and Sub-Sub-Advisers provided prior to and during the Meeting, the presentations made during the Meeting, and the extensive discussions during the Meeting. It was noted that, to date, RIIS had not been called to act as Interim Sub-Adviser to the Renewal Funds. The Trustees reviewed information relating to, among other things, the investment management services provided by the Adviser, the Sub-Adviser and Sub-Sub-Advisers to the Renewal Funds, including the compliance programs of the Adviser, the Sub-Advisers and Sub-Sub-Advisers, valuation, and other information related to personnel of the Adviser, Sub-Advisers and Sub-Sub-Advisers who provide investment management services to the Renewal Funds. They also reviewed comparative fee information prepared by Broadridge, a memorandum prepared by Independent Legal Counsel regarding the responsibilities of the Trustees in considering the approval of the continuation of advisory and sub-advisory agreements.
Representatives of JPMPI also participated in the Meeting, at which the Trustees discussed the advisory and sub-advisory arrangements with the Adviser and the Sub-Advisers for the Renewal Funds. Representatives of PGIM and PIMCO also attended the Meeting, and it was noted that representatives of the other Sub-Advisers had attended board meetings in the last year.
Review Process. In connection with the approval of the Advisory Agreement, Sub-Advisory Agreements and Sub-Sub-Advisory Agreements, the Trustees reviewed written materials provided by JPMPI, which included, among other things, comparative fee data prepared by Broadridge, an independent provider of investment company performance and fee and expense data. The Trustees also requested and received assistance and advice regarding applicable legal standards from Independent Legal Counsel. The Trustees additionally considered the written information provided by JPMPI, the Sub-Advisers and Sub-Sub-Advisers in response to the Trustees’ requests for information and other information provided by JPMPI. The Trustees also received oral presentations during regular meetings throughout the prior year on matters related to the Advisory Agreement, the Sub-Advisory Agreements and the Sub-Sub-Advisory Agreements, as well as related arrangements with RIIS. The Independent Trustees held separate telephonic meetings prior to the Meeting, which were attended by Independent Trustee Counsel, to discuss the proposed continuation of the Advisory Agreement and Sub-Advisory Agreement and the related materials and information provided by JPMPI and the Sub-Advisers. Based on their deliberations during the prior meetings, the Independent Trustees formulated a number of questions and requests for follow-up information from management, with respect to which JPMPI had responded in writing or orally during the Meeting. In addition, the Independent Trustees discussed the proposed continuation of the Advisory Agreement and Sub-Advisory Agreement during an executive session held as part of the Meeting with
Independent Trustee Counsel at which no representatives of JPMPI, the Sub-Advisers or other representatives from management were present.
In deciding to approve the Advisory Agreement, Sub-Advisory Agreements and Sub-Sub-Advisory Agreements, the Trustees did not identify any single factor or particular information that, in isolation, was controlling.
Nature, Extent and Quality of Services. The Trustees considered the depth and quality of the investment management process of JPMPI, the Sub-Advisers and Sub-Sub-Advisers, including for each entity, the experience and capabilities of its senior management, investment and other personnel, and the overall financial strength and stability of the organizations. The Trustees also considered the nature, extent and quality of the various services that JPMPI would provide under the Advisory Agreement. The Trustees also noted JPMPI’s commitment to investing in information technology, supporting compliance, as well as JPMPI’s continuing efforts to attract and retain qualified personnel and to maintain and enhance its resources and systems. The Trustees considered JPMPI’s review of its policies, procedures and systems to assure compliance with applicable laws and regulations and to conduct effective oversight of each Sub-Adviser and Sub-Sub-Adviser; and its processes to keep the Trustees informed about matters relevant to the Renewal Funds and their shareholders.
Similarly, the Trustees considered the sub-advisory services provided by each Sub-Adviser and Sub-Sub-Adviser to the Renewal Funds. The Trustees also considered information about the investment personnel of BlackRock, BIL, BSL, PIMCO, Mellon, GSAM, PGIM, PGIML, Capital, Nuveen, and RIIS who are responsible for providing services under the Sub-Advisory Agreements and Sub-Sub-Advisory Agreements. For each of BlackRock, BIL, BSL, PIMCO, Mellon, GSAM, PGIM, PGIML, Capital, Nuveen, and RIIS, the Trustees reviewed the nature and quality of the investment management, trading, risk management, compliance capabilities and resources, research capabilities, and the experience and capabilities of its portfolio management personnel, and the overall financial strength of each organization. The Trustees noted the certificates received from JPMPI and the Sub-Advisers regarding both their compliance programs and codes of ethics, which noted that that each of JPMPI, BlackRock, BIL, BSL, PIMCO, Mellon, GSAM, PGIM, PGIML, Capital, Nuveen, and RIIS had compliance policies and procedures in place that were reasonably designed to prevent violations of the federal securities laws with respect to the services provided by them and had each adopted a code of ethics that included provisions reasonably necessary to prevent access persons from (i) engaging in certain specified conduct and (ii) violating the code of ethics.
Ultimately, the Board concluded that the nature, extent and quality of services proposed to be provided by the Adviser, Sub-Advisers and Sub-Sub-Advisers under the Advisory,
| | | | | | | | | | |
| | | | | |
| JUNE 30, 2021 | | SIX CIRCLES TRUST | | | | | | | | 287 |
BOARD APPROVAL OF INVESTMENT ADVISORY AGREEMENTS
(continued)
Sub-Advisory and Sub-Sub-Advisory Agreements were likely to benefit the Renewal Funds and their shareholders.
Investment Performance. As part of their review of the services provided by JPMPI, BlackRock, BIL, BSL, PIMCO, Mellon, GSAM, PGIM, PGIML, Capital, Nuveen, the Trustees reviewed the performance of each of the Renewal Funds, including the Broadridge report containing comparative performance information of a peer group of similar funds selected by Broadridge. In reviewing the comparative information, the Trustees took into account JPMPI’s explanation that the peer funds selected by Broadridge do not provide particularly apt comparisons, given the Renewal Funds’ intended role as completion portfolios for the broader J.P. Morgan managed account portfolios and the bespoke and highly tailored structures of the Renewal Funds’ portfolios. The Trustees considered JPMPI’s view that since the role of the Renewal Funds is to enhance the relative performance of the total managed account portfolios in which they are held, the Trustees should also take into account and evaluate the performance of the Renewal Funds in the context of the broader portfolios they are intended to complete and on the basis of whether the Renewal Funds serve their intended purpose. In this regard, the Board received representations from the JPMPI CIO team regarding the utility of the Renewal Funds in serving their intended purpose, including how they have served to enhance access to investment ideas and have increased portfolio efficiency for the managed account strategies. In this regard, the Trustees received supplemental information regarding (i) Sub-Adviser/Sub-Sub-Adviser sleeve performance and (ii) performance of the J.P. Morgan managed account strategies that invest in the Renewal Funds.
To evaluate Sub-Adviser/Sub-Sub-Adviser sleeve performance, the Trustees reviewed performance information of each of the Sub-Adviser sleeves against their performance benchmark(s), which included customized benchmarks in certain cases. The Trustees also considered that Sub-Adviser performance is reviewed independently by the J.P. Morgan Investment Performance Governance Committee (“IPGC”), and reviewed related materials from IPGC reports.
Regarding Renewal Fund performance, in addition to the performance information comparing each of the Renewal Funds against their Broadridge peers and their prospectus stated benchmarks, the Board reviewed composite performance information for J.P. Morgan managed account portfolios that invest in the Renewal Funds, along with 2020 portfolio attribution reports pointing out the main contributors to and detractors from the performance of the managed account portfolios, including the role of the Renewal Funds as components of the broader portfolios. The Trustees also considered that Fund performance is reviewed independently by the J.P. Morgan Portfolio Governance Committee (“PGC”), a committee responsible for providing ongoing oversight of its internal investment strategies, including the investment
strategies inclusive of the Renewal Funds and reviewed related materials. The Board considered that PGC to date has been satisfied with the performance of the Renewal Funds and each Sub-Adviser and that the Renewal Funds have to date and continue to serve their intended purpose.
Based on these reviews, the Trustees concluded that they were satisfied with the investment performance provided by each of JPMPI under the Advisory Agreement and BlackRock, BIL, BSL, PIMCO, Mellon, GSAM, PGIM, PGIML, Capital, Nuveen, and RIIS under the respective Sub-Advisory and Sub-Sub-Advisory Agreements.
Fees and Total Expenses. In considering the fees and expenses of each Renewal Fund, the Trustees took into account a number of factors, including the type and complexity of the services to be provided, the estimated cost of providing services, the risk assumed by JPMPI in the provision of services, the impact on potential returns from different levels of fees, the competitive marketplace for financial products, and the attractiveness of potential returns to investors in the Renewal Funds. The Trustees noted JPMPI’s explanation that the advisory fee rate is consistent across all of the Renewal Funds as the fee covers sub-advisory fees and each Renewal Fund receives similar investment management services from JPMPI, including asset allocation, investment oversight and other management services. The Trustees also took into account that the Adviser had: (1) agreed to contractually reimburse expenses for the Renewal Funds to the extent the total expense ratio for each Renewal Fund exceeded a certain specified limit; and (2) agreed to contractually waive any advisory fees that exceeded the aggregate advisory fees JPMPI is contractually required to pay to the Sub-Advisers. The Trustees considered how these agreements affect the expenses borne by shareholders.
The Trustees reviewed the advisory fee and total expenses of each Renewal Fund (each as a percentage of average net assets) and compared such amounts with the average and median fees and expense levels of other similar funds. With respect to advisory fees, the Trustees reviewed data from Broadridge that compared the average and median advisory fees of other funds in a peer group of comparable funds. The Trustees compared each of the Renewal Funds’ total expenses to other funds in the applicable peer group provided by Broadridge and found the total expenses of each Renewal Fund to be reasonable. The Trustees noted that the Broadridge information showed that the advisory fee for each Renewal Fund was in the low range of the applicable Broadridge peer group and universe. They further noted that the total expense ratio for each Renewal Fund was also within the low range of total expenses within its peer group, when taking into account the fee waiver and expense reimbursement arrangements for each Renewal Fund. The Trustees also found that the fees paid by JPMPI to BlackRock, PIMCO, Mellon, GSAM, PGIM, Capital, Nuveen, and RIIS were reasonable, noting that the Renewal
| | | | | | | | | | |
| | | | | |
| 288 | | | | | | | | SIX CIRCLES TRUST | | JUNE 30, 2021 |
Funds do not pay the fees to the Sub-Advisers directly, but that JPMPI compensates them out of the advisory fee it receives from the Renewal Funds. The Trustees also considered that the sub-sub-advisory fees paid to the Sub-Advisers are paid out of the sub-advisory fees paid to the Sub-Advisers by JPMPI. The Trustees noted that neither JPMPI nor BlackRock (with respect to the U.S. Equity Fund, International Equity Fund, MEP U.S. Fund, MEP International Fund and Global Bond Fund), PIMCO (with respect to the Global Bond Fund), Mellon, PGIM, Capital and RIIS identified any funds or accounts with comparable investment objectives and strategies as the Renewal Funds. They reviewed the fee rates of funds or accounts with comparable investment objectives and strategies identified by BlackRock (with respect to the Ultra Short Fund), GSAM (with respect to the Ultra Short Fund and Tax Aware Fund), PIMCO (with respect to the Ultra Short Fund and Tax Aware Ultra Short Fund) and Nuveen (with respect to the Global Bond Fund), noting the Adviser’s views regarding the limitations of fee comparisons to other funds and separately managed accounts that are not registered under the Investment Company Act of 1940, as amended (the “1940 Act”), in light of the differences in services provided to the Renewal Funds compared to those provided to other funds and other accounts that are not registered under the 1940 Act. Further, the Board noted the limitations of fee comparisons to other funds for which the Sub-Advisers serve as primary investment adviser, as opposed to fees charged to funds that Sub-Advisers sub-advise, in light of the differences in sub-advisory services provided to the Renewal Funds compared to those provided to other funds for which the Sub-Advisers serve as primary adviser. Additionally, the Trustees noted the most-favored nation provisions agreed to by BlackRock, PIMCO, Mellon, GSAM, PGIM, Capital, Nuveen, and RIIS, which help ensure that sub-advisory fee rates charged by each such Sub-Adviser to the Renewal Funds are no higher than the fees the Sub-Adviser charges to similar clients.
Based on the information presented by JPMPI, BlackRock, PIMCO, Mellon, GSAM, PGIM, Capital, Nuveen, and RIIS and Broadridge, the Trustees determined that the level of the advisory fees charged by JPMPI, the level of the sub-advisory fees to be paid by JPMPI to BlackRock, PIMCO, Mellon, GSAM, PGIM, Capital, Nuveen, and RIIS, the level of sub-sub-advisory fees to be paid by BlackRock to BIL and BSL, the level of sub-sub-advisory fees to be paid by PGIM to PGIML, as well as the total expenses of each Renewal Fund, are reasonable, fair and equitable and that approval of the continuation of the Advisory Agreement, Sub-Advisory Agreements and Sub-Sub-Advisory Agreements benefits each Renewal Fund and its shareholders.
Adviser Costs, Level of Profits and Economies of Scale. The Trustees considered the estimated profits realized by the Adviser in connection with the operation of the Renewal Funds as well as the estimated profits realized by the Sub-Advisers and Sub-Sub-Advisers in connection with the operation of the
Renewal Funds based on profitability information included in the Meeting Materials, and whether the amount of profits represented a fair entrepreneurial profit for the management of the Renewal Funds. In doing so, the Trustees also took into account the entrepreneurial and business risk JPMPI undertakes as investment manager and sponsor of the Renewal Funds. The Trustees also considered the Renewal Funds’ operating expenses and the impact of the expense limitation agreement and fee waiver agreement observed by JPMPI on the Adviser’s estimated profits. The Trustees took into account that JPMPI’s estimates indicated that the Adviser has been unprofitable with respect to each of the Renewal Funds from inception through December 31, 2020. The Trustees also took into account that, although JPMPI has not realized profits with respect to the Renewal Funds, J.P. Morgan and its affiliates could be profitable with respect to the managed accounts that invest in the Renewal Funds and received related information and input from JPMPI in this regard.
The Trustees further noted that the advisory fee rates to be paid to JPMPI do not have break points, but due to the fee waiver arrangements, JPMPI does not retain any portion of the advisory fees paid by the Renewal Funds. The Trustees took into account that the Sub-Advisory Agreements for the BlackRock, PIMCO, Mellon, GSAM, PGIM, Nuveen and RIIS include breakpoints to certain of the sub-advisory fee in light of the anticipated size of those Renewal Funds.
Ultimately, the Trustees concluded that each of the Renewal Funds’ fee and expense structure is reasonable, fair and equitable.
Ancillary Benefits. The Trustees next considered whether the Adviser, BlackRock, BIL, BSL, PIMCO, Mellon, GSAM, PGIM, PGIML, Capital, Nuveen, and RIIS or any of their affiliates may receive other benefits as a result of the relationship with the Trust or the Renewal Funds. The Trustees considered that the Renewal Funds benefit the Adviser and its affiliates by enhancing the current discretionary product offering to J.P. Morgan Private Bank, J.P. Morgan Securities and Chase Wealth Management clients. Specifically, the Board considered that the Renewal Funds serve to expand the CIO investments toolkit; expand the current capacity to invest, and reduce unintended portfolio dispersion. The Board also considered that, apart from the Adviser, who does not retain any fees under the Advisory Agreement for managing the Renewal Funds, the Renewal Funds are not engaging any JPMC affiliates as fund service providers. Instead, the Renewal Funds are utilizing third party service providers and restrict any transactions with affiliates. In this regard, the Trustees took into account JPMPI’s representation that no JPMC affiliate is profiting financially directly from the Renewal Funds themselves. [The Trustees considered that the Adviser] does receive a portfolio management fee (“PMF”) outside of the Renewal Funds based on funds held in the Adviser’s discretionary client accounts, including on assets
| | | | | | | | | | |
| | | | | |
| JUNE 30, 2021 | | SIX CIRCLES TRUST | | | | | | | | 289 |
BOARD APPROVAL OF INVESTMENT ADVISORY AGREEMENTS
(continued)
attributable to shares of the Renewal Funds held in such accounts. The Trustees took into account, however, JPMPI’s representation that it would receive this PMF independent of whether the discretionary accounts allocated investments to the Renewal Funds or allocated the same assets to a third party fund or other investment.
The Trustees additionally considered that BlackRock, BIL, BSL, PIMCO, Mellon, GSAM, PGIM, PGIML, Capital, Nuveen, and RIIS were not affiliated with any of the Renewal Funds’ service providers, and therefore do not benefit from those contractual relationships. The Trustees also considered portfolio trading practices of RIIS, noting the relatively low trading costs that RIIS expects to incur in completing portfolio transactions for the Renewal Funds, should the services be used. Additionally, the Trustees considered that RIIS may receive ancillary benefits of receiving fees from serving as transition manager to the Renewal Funds under the Implementation Services Agreement between the Adviser and RIIS, but noted that those fees are not contingent on RIIS serving as an interim sub-adviser and would be for services that are distinct from RIIS sub-advisory services. The Trustees also considered the proprietary nature of the Renewal Funds and whether any benefits result to the Adviser by placing assets of J.P. Morgan managed account clients into the Renewal Funds. The Trustees also considered portfolio trading practices, noting that while the Adviser was affiliated with a broker-dealer, the broker-dealer affiliate does not execute portfolio transactions on behalf of the Renewal Funds and would not receive the benefit of research provided by any such broker-dealer.
The Trustees also took into account that, although the Adviser does not retain any of the advisory fees it receives from the Renewal Funds and has to date been unprofitable with respect to its management of the Renewal Funds themselves, that the Adviser and its affiliates receive fees for managing the J.P. Morgan managed accounts that invest in the Renewal Funds. In this regard, the Trustees discussed with management possible approaches to estimating any imputed profitability to the Adviser or J.P. Morgan from their operation of the Renewal Funds taking into account the managed account fees they receive that are attributable to assets invested in the Renewal Funds and related expenses, and reviewed related information provided by the Adviser. In this regard, the Trustees took into account the Adviser’s representation that J.P. Morgan would continue to receive the same level of fees from its managed accounts whether the accounts invested in the Renewal Funds or in other funds and/or individual securities.
Conclusions. Having requested and received such information from the Adviser, BlackRock, BIL, BSL, PIMCO, Mellon, GSAM, PGIM, PGIML, Capital, Nuveen, and RIIS as the Trustees believed to be reasonably necessary to evaluate the continuation of the terms of the Advisory Agreement, Sub-Advisory Agreements and Sub-Sub-Advisory Agreements, the Trustees, including the
Independent Trustees, unanimously concluded that the advisory fee and sub-advisory fee structures were reasonable and, in light of the matters that the Trustees considered to be relevant in the exercise of their reasonable business judgment, approved the continuation of the Advisory Agreement, Sub-Advisory Agreements and Sub-Sub-Advisory Agreements for an additional one year term.
Board Review and Approval of Lord Abbett Sub-Advisory Agreement for the Six Circles Credit Opportunities Fund
The Board of Trustees (the “Board” or the “Trustees”) of the Six Circles Trust (the “Trust”), including the Trustees who are not “interested persons” (as defined in the Investment Company Act of 1940, as amended, the “1940 Act”) of J.P. Morgan Private Investments Inc. (“JPMPI” or the “Adviser”), Lord Abbett (as defined below) or their affiliates (the “Independent Trustees”) met on November 18, 2020 (the “Meeting”) to consider and approve proposed Investment Sub-Advisory Agreement (the “New Sub-Advisory Agreement”) between JPMPI and Lord, Abbett & Co. LLC (“Lord Abbett”) (the “New Sub-Advisory Agreement”) for sub-advisory services to be provided to the Six Circles Credit Opportunities Fund (the “Fund”). At the Meeting, the Board, including the Independent Trustees, unanimously approved the New Sub-Advisory Agreement.
Lord Abbett had been sent a letter on behalf of the Independent Trustees requesting detailed information from the prospective sub-adviser in connection with the proposed New Sub-Advisory Agreement in an effort to observe the requirement under Section 15(c) of the 1940 Act that the Trustees request and evaluate, and that the sub-adviser furnish, such information as may be necessary to evaluate the terms of the proposed agreement. Lord Abbett responded to the information request and provided memoranda and related materials and information for consideration by the Trustees, which were provided to the Board. Representatives of Lord Abbett also participated in the meeting, at which the Board discussed the proposed arrangements with Lord Abbett extensively. The Trustees also discussed the proposed New Sub-Advisory Agreement in an executive session of the Meeting with independent legal counsel at which no representatives of the Adviser or Lord Abbett were present.
Set forth below is a summary of the material factors evaluated by the Board that formed the basis for the Board’s approval of the New Sub-Advisory Agreement. The Board’s conclusions as to the approval of the New Sub-Advisory Agreement was based on a comprehensive consideration of all information provided to the Trustees. In deciding to approve the New Sub-Advisory Agreement, the Board did not identify any single factor or particular information that, in isolation, was controlling. Some of the factors that figured particularly in the Boards’ deliberations are described below, although individual Trustees may have evaluated the information presented differently from one another, attributing different weights to various factors.
| | | | | | | | | | |
| | | | | |
| 290 | | | | | | | | SIX CIRCLES TRUST | | JUNE 30, 2021 |
Materials Reviewed. In considering the approval of the New Sub-Advisory Agreement, the Board took into account the wide variety of materials relating to the services to be provided by Lord Abbett provided prior to and during the Meeting, the presentations made during the Meeting, and the extensive discussions during the Meeting. The Board reviewed information relating to, among other things, proposed investment management services to be provided by Lord Abbett to the Fund, including the compliance program of Lord Abbett and other information related to personnel of Lord Abbett that would be providing investment management services to the Fund. Among other items, the Board discussed a memorandum prepared by independent legal counsel regarding the responsibilities of the Board in approving advisory and sub-advisory agreements and information regarding Lord Abbett personnel who would be providing investment management services to the Fund.
Review Process. In connection with the approval of the New Sub-Advisory Agreement, the Board reviewed written materials provided by Lord Abbett. The Board also requested and received assistance and advice regarding applicable legal standards from independent legal counsel. The Board additionally considered the written information provided by Lord Abbett in response to the Board’s request for information. The Board also heard oral presentations on matters related to the New Sub-Advisory Agreement. In deciding to approve the New Sub-Advisory Agreement, the Board did not identify any single factor or particular information that, in isolation, was controlling.
Nature, Extent and Quality of Services. The Board considered the depth and quality of the investment management process of Lord Abbett to be used for the Fund, including the experience and capabilities of its senior management, investment and other personnel, and the overall financial strength and stability of the organization. The Board considered the sub-advisory services proposed to be provided by Lord Abbett to the Fund. The Board also considered information about Lord Abbett’s investment personnel responsible for providing services under the New Sub-Advisory Agreement. The Board reviewed the nature and quality of Lord Abbett’s investment management, trading, risk management, compliance capabilities and resources, research capabilities, and the experience and capabilities of its portfolio management personnel, and the overall financial strength of the organization. The Board noted the certificates received from Lord Abbett regarding both its compliance program and code of ethics, which noted that Lord Abbett has compliance policies and procedures in place that are reasonably designed to prevent violations of the federal securities laws with respect to the services provided by Lord Abbett and that Lord Abbett has adopted a code of ethics that includes provisions reasonably necessary to prevent access persons from: (i) engaging in certain specified conduct; and (ii) violating the code of ethics.
Ultimately, the Board concluded that the nature, extent and quality of services proposed to be provided by Lord Abbett under the New Sub-Advisory Agreement were likely to benefit the Fund and its shareholders.
Investment Performance. Since the Fund had not yet utilized Lord Abbett’s sub-advisory services, the Board did not receive or consider investment performance information related to the Fund’s performance with Lord Abbett as a Sub-Adviser. The Board considered the manner in which Lord Abbett proposed to manage a particular sleeve of the Fund, as well as Lord Abbett’s performance records in managing accounts similar to the strategy it will use to manage its respective sleeve of the Fund, as described in the Meeting materials. The Board also discussed the background and experience of Lord Abbett and its personnel. The Board concluded that based on the experience of Lord Abbett, Lord Abbett had a reasonable expectation of delivering acceptable performance to shareholders of the Fund.
Advisory Fees and Total Expenses. The Adviser reported to the Board that, in proposing the sub-advisory fees to be paid to Lord Abbett by the Adviser for the Fund, the Adviser considered a number of factors, including the type and complexity of the services to be provided, the estimated cost of providing services, the impact on potential returns from different levels of fees, the competitive marketplace for financial products, and the attractiveness of potential returns to prospective investors in the Fund.
The Board also reviewed the proposed sub-advisory fee schedule under the New Sub-Advisory Agreement for the Fund. The Board noted that the Adviser had agreed to contractually waive any advisory fees that exceeded the aggregate advisory fees the Adviser is contractually required to pay to the Sub-Advisers. The Board considered how these agreements would affect the expenses borne by Fund shareholders with respect to the New Sub-Advisory Agreement.
The Board found the fees to be paid by the Adviser to Lord Abbett to be reasonable. In doing so, they noted that the Fund will not pay the fees to Lord Abbett directly, but that the Adviser will compensate Lord Abbett out of the advisory fee it receives from the Fund. The Board noted the funds advised by Lord Abbett with similar investment objectives and strategies as the sleeve of the Fund to be managed by Lord Abbett, noting the Adviser’s views regarding the limitations of fee comparisons to other funds and accounts that are not registered under the 1940 Act, in light of the differences in services provided to the Fund compared to those provided to other funds and other accounts that are not registered under the 1940 Act. Further, the Board noted the limitations of fee comparisons to other funds for which Lord Abbett serves as primary investment adviser, as opposed to fees charged to funds that Lord Abbett sub-advises, in light of the differences in sub-advisory services provided to the Fund compared to those
| | | | | | | | | | |
| | | | | |
| JUNE 30, 2021 | | SIX CIRCLES TRUST | | | | | | | | 291 |
BOARD APPROVAL OF INVESTMENT ADVISORY AGREEMENTS
(continued)
provided to other funds for which Lord Abbett serves as primary adviser. Additionally, the Board noted the most-favored nation provision agreed to by Lord Abbett in the New Sub-Advisory Agreement, which it determined should help ensure that the sub-advisory fee rates paid to Lord Abbett with respect to the Fund are no greater than the range of fees it charges to similar clients.
Based on the information presented by Lord Abbett and the Adviser, the Board determined that the level of the sub-advisory fees to be paid by the Adviser to Lord Abbett are reasonable, fair and equitable and that approval of the New Sub-Advisory Agreement would likely benefit the Fund and its shareholders.
Adviser Costs, Level of Profits and Economies of Scale. As the Fund had not yet utilized Lord Abbett’s sub-advisory services, information regarding Lord Abbett’s costs in providing services to the Fund was not available. The Board further noted that the sub-advisory fees paid to Lord Abbett have breakpoints, which may help to reflect economies of scale.
Ancillary Benefits. The Board next considered whether Lord Abbett may receive other benefits as a result of Lord Abbett’s proposed relationship with the Trust or the Fund. The Board considered that Lord Abbett was not affiliated with any of the Fund’s service providers, and therefore would not benefit from those contractual relationships. Taking these considerations into account, the Board concluded that Lord Abbett would not receive collateral benefits that would materially affect the reasonableness of the proposed sub-advisory fee under the New Sub-Advisory Agreement.
Conclusions. Having requested and received such information from Lord Abbett as the Board believed to be reasonably necessary to evaluate the terms of the proposed New Sub-Advisory Agreement, the Board, including the Independent Trustees, unanimously concluded that the proposed sub-advisory fee structure was reasonable and, in light of the matters that the Board had considered to be relevant in the exercise of its reasonable judgment, approved the New Sub-Advisory Agreement for an initial term of two years.
Board Review and Approval of each of Bluebay and Muzinich Sub-Advisory Agreements for the Six Circles Credit Opportunities Fund
The Board of Trustees (the “Board” or the “Trustees”) of the Six Circles Trust (the “Trust”), including the Trustees who are not “interested persons” (as defined in the Investment Company Act of 1940, as amended, the “1940 Act”) of J.P. Morgan Private Investments Inc. (“JPMPI” or the “Adviser”), the Sub-Advisers (as defined below) or their affiliates (the “Independent Trustees”) met on March 3, 2021 (the “Meeting”) to consider and approve proposed Investment Sub-Advisory Agreements (the “New Sub-Advisory Agreements”) between JPMPI and each of BlueBay Asset Management LLP (“BlueBay”) and Muzinich & Co., Inc. (“Muzinich”) (each, a “New Sub-Advisory Agreement” and
together the “New Sub-Advisory Agreements”) for sub-advisory services to be provided to the Six Circles Credit Opportunities Fund (the “Fund”). At the Meeting, the Board, including the Independent Trustees, unanimously approved the New Sub-Advisory Agreements.
Each of BlueBay and Muzinich had been sent letters on behalf of the Independent Trustees requesting detailed information from the prospective sub-advisers in connection with the proposed New Sub-Advisory Agreements in an effort to observe the requirement under Section 15(c) of the 1940 Act that the Trustees request and evaluate, and that the sub-advisers furnish, such information as may be necessary to evaluate the terms of the proposed agreements. Both BlueBay and Muzinich each responded to the information request and provided memoranda and related materials and information for consideration by the Trustees, which were provided to the Board. Representatives of each of BlueBay and Muzinich also participated in a meeting, at which the Board discussed the proposed arrangements with both BlueBay and Muzinich extensively. The Trustees also discussed the proposed New Sub-Advisory Agreements in an executive session of the Meeting with independent legal counsel at which no representatives of the Adviser, BlueBay or Muzinich were present.
Set forth below is a summary of the material factors evaluated by the Board that formed the basis for the Board’s approval of the New Sub-Advisory Agreements. The Board’s conclusions as to the approval of the New Sub-Advisory Agreements was based on a comprehensive consideration of all information provided to the Trustees. In deciding to approve the New Sub-Advisory Agreements, the Board did not identify any single factor or particular information that, in isolation, was controlling. Some of the factors that figured particularly in the Boards’ deliberations are described below, although individual Trustees may have evaluated the information presented differently from one another, attributing different weights to various factors.
Materials Reviewed. In considering the approval of the New Sub-Advisory Agreements, the Board took into account the wide variety of materials relating to the services to be provided by BlueBay and Muzinich provided prior to and during the Meeting and during a prior meeting of the Board to consider the proposed arrangements held on February 18, 2021, the presentations made prior to and during the Meeting, and the related discussions during the Meeting. The Board reviewed information relating to, among other things, proposed investment management services to be provided by each of BlueBay and Muzinich to the Fund, including the compliance programs of BlueBay and Muzinich and other information related to personnel of BlueBay and Muzinich that would be providing investment management services to the Fund. Among other items, the Board discussed a memorandum prepared by independent legal counsel regarding the responsibilities of the Board in approving advisory and sub-advisory agreements. The
| | | | | | | | | | |
| | | | | |
| 292 | | | | | | | | SIX CIRCLES TRUST | | JUNE 30, 2021 |
Board also considered information regarding the BlueBay and Muzinich personnel who would be providing investment management services to the Fund.
Review Process. In connection with the approval of the New Sub-Advisory Agreements, the Board reviewed written materials provided by the Adviser, BlueBay and Muzinich. The Board also requested and received assistance and advice regarding applicable legal standards from independent legal counsel. The Board additionally considered the written information provided by the Adviser, BlueBay and Muzinich in response to the Board’s request for information. The Board also heard oral presentations on matters related to the New Sub-Advisory Agreements. In deciding to approve the New Sub-Advisory Agreements, the Board did not identify any single factor or particular information that, in isolation, was controlling.
Nature, Extent and Quality of Services. The Board considered the depth and quality of the investment management processes of BlueBay and Muzinich to be used for the Fund, including the experience and capabilities of its senior management, investment and other personnel, and the overall financial strength and stability of each organization. The Board considered the sub-advisory services proposed to be provided by BlueBay and Muzinich to the Fund. The Board also considered information about BlueBay’s and Muzinich’s investment personnel responsible for providing services under the New Sub-Advisory Agreements. The Board reviewed the nature and quality of BlueBay’s and Muzinich’s investment management, trading, risk management, compliance capabilities and resources, research capabilities, and the experience and capabilities of their portfolio management personnel, and the overall financial strength of the organizations. The Board noted the certificates received from BlueBay and Muzinich regarding their compliance programs and codes of ethics, which noted that BlueBay and Muzinich each have compliance policies and procedures in place that are reasonably designed to prevent violations of the federal securities laws with respect to the services proposed to be provided by BlueBay and Muzinich and that BlueBay and Muzinich each have adopted a code of ethics that includes provisions reasonably necessary to prevent access persons from: (i) engaging in certain specified conduct; and (ii) violating the codes of ethics.
Ultimately, the Board concluded that the nature, extent and quality of services proposed to be provided by BlueBay and Muzinich under the New Sub-Advisory Agreements were likely to benefit the Fund and its shareholders.
Investment Performance. Since the Fund had not yet utilized BlueBay’s and Muzinich’s sub-advisory services, the Board did not receive or consider investment performance information related to the Fund’s performance with BlueBay and Muzinich as Sub-Advisers. The Board considered the manner in which BlueBay and Muzinich proposed to manage particular sleeves of the Fund, as well as BlueBay’s and Muzinich’s performance
records in managing accounts with strategies similar to those that they will use to manage their respective sleeves of the Fund, as described in the Meeting materials. The Board also discussed the background and experience of BlueBay and Muzinich and their personnel. The Board concluded that based on the experience of BlueBay and Muzinich, BlueBay and Muzinich had a reasonable expectation of delivering acceptable performance to shareholders of the Fund.
Advisory Fees and Total Expenses. The Adviser reported to the Board that, in proposing the sub-advisory fees to be paid to BlueBay and Muzinich by the Adviser for the Fund, the Adviser considered a number of factors, including the type and complexity of the services to be provided, the estimated cost of providing services, the impact on potential returns from different levels of fees, the competitive marketplace for financial products, and the attractiveness of potential returns to prospective investors in the Fund.
The Board also reviewed the proposed sub-advisory fee schedules under the New Sub-Advisory Agreements for the Fund. The Board noted that the Adviser had agreed to contractually waive any advisory fees that exceeded the aggregate advisory fees the Adviser is contractually required to pay to the Sub-Advisers. The Board considered how these agreements would affect the expenses borne by Fund shareholders with respect to the New Sub-Advisory Agreements.
The Board found the fees to be paid by the Adviser to BlueBay and Muzinich to be reasonable. In doing so, they noted that the Fund will not pay the fees to BlueBay and Muzinich directly, but that the Adviser will compensate BlueBay and Muzinich out of the advisory fee it receives from the Fund. The Board noted the funds and accounts advised by BlueBay and Muzinich with similar investment objectives and strategies as the sleeves of the Fund to be managed by BlueBay and Muzinich, noting the Adviser’s views regarding the limitations of fee comparisons to other funds and accounts that are not registered under the 1940 Act, in light of the differences in services provided to the Fund compared to those provided to other funds and other accounts that are not registered under the 1940 Act. Further, the Board noted the limitations of fee comparisons to other funds for which BlueBay and Muzinich serve as primary investment adviser, as opposed to fees charged to funds that BlueBay and Muzinich sub-advise, in light of the differences in sub-advisory services provided to the Fund compared to those provided to other funds for which BlueBay and Muzinich serve as primary adviser. Additionally, the Board noted the “most-favored nation” provisions agreed to by BlueBay and Muzinich in the New Sub-Advisory Agreements, which it determined should help ensure that the sub-advisory fee rates paid to BlueBay and Muzinich with respect to the Fund are no greater than the range of fees the particular firm charges to similar clients.
| | | | | | | | | | |
| | | | | |
| JUNE 30, 2021 | | SIX CIRCLES TRUST | | | | | | | | 293 |
BOARD APPROVAL OF INVESTMENT ADVISORY AGREEMENTS
(continued)
Based on the information presented by BlueBay, Muzinich and the Adviser, the Board determined that the level of the sub-advisory fees to be paid by the Adviser to BlueBay and Muzinich are reasonable, fair and equitable and that approval of the New Sub-Advisory Agreements would likely benefit the Fund and its shareholders.
Adviser Costs, Level of Profits and Economies of Scale. As the Fund had not yet utilized BlueBay’s and Muzinich’s sub-advisory services, information regarding BlueBay’s and Muzinich’s costs in providing services to the Fund was not available. The Board further noted that the sub-advisory fees paid to BlueBay and Muzinich have breakpoints, which may help to reflect economies of scale.
Ancillary Benefits. The Board next considered whether BlueBay and Muzinich may receive other benefits as a result of BlueBay’s and Muzinich’s proposed relationship with the Trust or the Fund. The Board considered that BlueBay and Muzinich were not affiliated with any of the Fund’s service providers, and therefore would not benefit from those contractual relationships. Taking these considerations into account, the Board concluded that BlueBay and Muzinich would not receive collateral benefits that would materially affect the reasonableness of the proposed sub-advisory fee under the New Sub-Advisory Agreements.
Conclusions. Having requested and received such information from BlueBay and Muzinich as the Board believed to be reasonably necessary to evaluate the terms of the proposed New Sub-Advisory Agreements, the Board, including the Independent Trustees, unanimously concluded that the proposed sub-advisory fee structures were reasonable and, in light of the matters that the Board had considered to be relevant in the exercise of its reasonable judgment, approved the New Sub-Advisory Agreements for an initial term of two years.
Board Review and Approval of PIMCO Amended Sub-Advisory Agreement for the Six Circles Credit Opportunities Fund
The Board of Trustees (the “Board” or the “Trustees”) of the Six Circles Trust (the “Trust”), including the Trustees who are not “interested persons” (as defined in the Investment Company Act of 1940, as amended, the “1940 Act”) of J.P. Morgan Private Investments Inc. (“JPMPI” or the “Adviser”), PIMCO (as defined below) or their affiliates (the “Independent Trustees”) met on April 22, 2021 (the “Meeting”) to consider and approve the proposed amendment to the Investment Sub-Advisory Agreement (the “Amended Sub-Advisory Agreement”) between JPMPI and Pacific Investment Management Company LLC (“PIMCO”) for sub-advisory services to be provided to the Six Circles Credit Opportunities Fund (the “Fund”). At the Meeting, the Board, including the Independent Trustees, unanimously approved the Amended Sub-Advisory Agreement.
PIMCO had been sent a letter on behalf of the Independent Trustees requesting detailed information from PIMCO in connection with the proposed Amended Sub-Advisory Agreement in an effort to observe the requirement under Section 15(c) of the 1940 Act that the Trustees request and evaluate, and that the sub-advisers furnish, such information as may be necessary to evaluate the terms of the proposed agreements. PIMCO responded to the information request and provided memoranda and related materials and information for consideration by the Trustees, which were provided to the Board. Representatives of PIMCO also participated in the meeting, at which the Board discussed the proposed arrangements PIMCO extensively. The Trustees also discussed the proposed Amended Sub-Advisory Agreement in an executive session of the Meeting with independent legal counsel at which no representatives of the Adviser orPIMCO were present.
Set forth below is a summary of the material factors evaluated by the Board that formed the basis for the Board’s approval of the Amended Sub-Advisory Agreement. The Board’s conclusions as to the approval of the Amended Sub-Advisory Agreement was based on a comprehensive consideration of all information provided to the Trustees. In deciding to approve the Amended Sub-Advisory Agreement, the Board did not identify any single factor or particular information that, in isolation, was controlling. Some of the factors that figured particularly in the Boards’ deliberations are described below, although individual Trustees may have evaluated the information presented differently from one another, attributing different weights to various factors.
Materials Reviewed. In considering the approval of the proposed Sub-Advisory Agreement Amendment with PIMCO for the Credit Opportunities Fund the Board took into account the wide variety of materials (the “15(c) Materials”) relating to the services to be provided by JPMPI and PIMCO provided prior to and during the Meeting, the presentations made during the Meeting, and the related discussions during the Meeting. The Board reviewed information relating to, among other things, proposed investment management services to be provided by PIMCO to the Credit Opportunities Fund including the compliance program of PIMCO and other information related to personnel of PIMCO that would be providing investment management services to the Fund. Among other items, the Board discussed a memorandum prepared by independent legal counsel regarding the responsibilities of the Board in considering approval of advisory and sub-advisory agreement. The Board also considered information regarding PIMCO personnel who would be providing investment management services to the Credit Opportunities Fund.
Review Process. In connection with the approval of the Proposed Sub-Advisory Agreement Amendment, the Board reviewed written materials provided by JPMPI and PIMCO. The Board also requested and received assistance and advice
| | | | | | | | | | |
| | | | | |
| 294 | | | | | | | | SIX CIRCLES TRUST | | JUNE 30, 2021 |
regarding applicable legal standards from independent legal counsel. The Board additionally considered the written information provided by PIMCO in response to the Independent Trustees’ request for information. The Board also heard oral presentations on matters related to the Proposed Sub-Advisory Agreement Amendment. In deciding to approve the Proposed Sub-Advisory Agreement Amendment, the Board did not identify any single factor or particular information that, in isolation, was controlling.
Nature, Extent and Quality of Services. The Board considered the depth and quality of the investment management process of PIMCO to be used for the applicable sleeves of the Credit Opportunities Fund including the experience and capabilities of their senior management, investment and other personnel, and the overall financial strength and stability of each organization. The Board considered the sub-advisory services proposed to be provided by PIMCO to the Credit Opportunities Fund. The Board also considered information about PIMCO’s investment personnel responsible for providing services under the Proposed Sub-Advisory Agreement Amendments. The Board reviewed the nature and quality of PIMCO’s investment management, trading, risk management, compliance capabilities and resources, research capabilities, and the experience and capabilities of its portfolio management personnel, and the overall financial strength of the organizations. The Board noted the certificates received from PIMCO regarding their compliance programs and codes of ethics, which noted that PIMCO has compliance policies and procedures in place that are reasonably designed to prevent violations of the federal securities laws with respect to the services provided by PIMCO and that PIMCO has adopted a code of ethics that includes provisions reasonably necessary to prevent access persons from: (i) engaging in certain specified conduct; and (ii) violating the codes of ethics.
Ultimately, the Board concluded that the nature, extent and quality of services proposed to be provided by PIMCO under the Proposed Sub-Advisory Agreement Amendment were likely to benefit the Credit Opportunities Fund and their shareholders.
Investment Performance. Since the Credit Opportunities Fund had not yet utilized PIMCO’s sub-advisory services, the Board did not receive or consider investment performance information related to the Fund’s performance with PIMCO as Sub-Adviser. The Board considered the manner in which PIMCO proposed to manage particular sleeves of the Credit Opportunities Fund as well as PIMCO’s performance record in managing an account with a strategy similar to the strategy that they will use to manage the emerging markets debt sleeve of the Credit Opportunities Fund, as described in the Meeting Materials. The Board also discussed the background and experience of PIMCO and its personnel. The Board concluded that based on the experience of PIMCO, PIMCO had a reasonable expectation of delivering acceptable performance to shareholders of the Credit Opportunities Fund.
Advisory Fees and Total Expenses. The Adviser reported to the Board that, in proposing the sub-advisory fees to be paid to PIMCO by the Adviser for the Funds, the Adviser considered a number of factors, including the type and complexity of the services to be provided, the estimated cost of providing services, the impact on potential returns from different levels of fees, the competitive marketplace for financial products, and the attractiveness of potential returns to prospective investors in the Funds.
The Board also reviewed the proposed sub-advisory fee schedule under the Proposed Sub-Advisory Agreement Amendment with PIMCO for the Credit Opportunities Fund. The Board noted that the Adviser had agreed to contractually waive any advisory fees that exceeded the aggregate advisory fees the Adviser is contractually required to pay to the Sub-Advisers. The Board considered how these agreements would affect the expenses borne by Credit Opportunities Fund shareholders with respect to the Proposed Sub-Advisory Agreement Amendment.
The Board found the fees proposed to be paid by the Adviser to PIMCO to be reasonable. In doing so, they noted that the Fund will not pay the fees to PIMCO directly, but that the Adviser will compensate PIMCO out of the advisory fee it receives from the Credit Opportunities Fund. The Board reviewed the data from Broadridge that compared the average and median advisory fees of other funds in peer groups of comparable funds and noted that the average and median fees in the various categories of comparable mutual funds and separately managed accounts were substantially higher than the sub-advisory fees agreed to between JPMPI and PIMCO. The Board also noted the Adviser’s views regarding the limitations of fee comparisons to other funds and accounts that are not registered under the Investment Company Act of 1940, as amended (the “1940 Act”), in light of the differences in services provided to the Credit Opportunities Fund compared to those provided to other funds and other accounts that are not registered under the 1940 Act. Further, the Board noted the limitations of fee comparisons to other funds for which an adviser serves as primary investment adviser, as opposed to fees charged to funds which are sub-advised, in light of the differences in sub-advisory services provided to funds compared to those provided to other funds for which an adviser serves as primary adviser. Additionally, the Board noted the “most-favored nation” provisions agreed to by PIMCO in the Proposed Sub-Advisory Agreement Amendment, which it determined should help ensure that the sub-advisory fee rates paid to PIMCO with respect to the Credit Opportunities Fund are no greater than the range of fees the particular firm charges to similar clients.
Based on the information presented by PIMCO and the Adviser, the Board determined that the level of the sub-advisory fees to be paid by the Adviser to PIMCO is reasonable, fair and equitable and that approval of the Proposed Sub-Advisory Agreement Amendment would likely benefit the Credit Opportunities Fund and its shareholders.
| | | | | | | | | | |
| | | | | |
| JUNE 30, 2021 | | SIX CIRCLES TRUST | | | | | | | | 295 |
BOARD APPROVAL OF INVESTMENT ADVISORY AGREEMENTS
(continued)
Adviser Costs, Level of Profits and Economies of Scale. As the Credit Opportunities Fund had not yet utilized PIMCO’s sub-advisory services, information regarding PIMCO’s costs in providing services to the Fund was not available. The Board further noted that the sub-advisory fees paid to PIMCO have breakpoints, which may help to reflect economies of scale. The Board also considered information estimating the profitability to the Adviser from managing the Credit Opportunities Fund and management’s indication that the Adviser’s estimated profitability would not change meaningfully taking into account the Proposed Sub-Advisory Agreement Amendment.
Ancillary Benefits. The Board next considered whether PIMCO may receive other benefits as a result of PIMCO’s proposed relationship with the Trust or the Credit Opportunities Fund. The Board considered that PIMCO is not affiliated with any of the Credit Opportunities Fund’s service providers, respectively,
and therefore would not benefit from those contractual relationships. Taking these considerations into account, the Board concluded that PIMCO would not receive collateral benefits that would materially affect the reasonableness of the proposed sub-advisory fee under the Proposed Sub-Advisory Agreement Amendment.
Conclusions. Having requested and received such information from PIMCO as the Board believed to be reasonably necessary to evaluate the terms of the Proposed Sub-Advisory Agreement Amendment, the Board, including the Independent Trustees, unanimously concluded that the proposed sub-advisory fee structure was reasonable and, in light of the matters that the Board had considered to be relevant in the exercise of its reasonable judgment, approved the Proposed Sub-Advisory Agreement Amendment.
| | | | | | | | | | |
| | | | | |
| 296 | | | | | | | | SIX CIRCLES TRUST | | JUNE 30, 2021 |
LIQUIDITY RISK MANAGEMENT PROGRAM
(Unaudited)
Each of the Funds has adopted the Six Circles Funds Liquidity Risk Management Program (the “Program”) under Rule 22e-4 under the 1940 Act (the “Liquidity Rule”). The Program seeks to assess, manage and review each Fund’s Liquidity Risk. “Liquidity Risk” is defined as the risk that a fund could not meet requests to redeem shares issued by the fund without significant dilution of remaining investors’ interests in the fund. Among other things, the Liquidity Rule requires that a written report be provided to the Boards of Trustees (the “Board”) on an annual basis that addresses the operation of the Program and assesses the adequacy and effectiveness of its implementation and any material changes to the Program.
JPMPI’s Liquidity Risk Forum (the “Liquidity Forum”) is the program administrator for the Program (the “Program Administrator”). On May 26, 2021, the Board of Trustees reviewed the Program Administrator’s initial written report (the “Report”) concerning the operation of the Program for the period from January 1, 2020 through December 31, 2020 (the “Program Reporting Period”). The Report addressed the operation of the Program and assessed its adequacy and effectiveness of implementation. The Report summarized the operation of the Program and the information and factors considered by the Program Administrator in assessing whether the Program has been adequately and effectively implemented with respect to each Fund. Such information and factors included, among other things: (1) the liquidity risk framework used to assess, manage, and periodically review each Fund’s Liquidity Risk and the results of this assessment; (2) the methodology and inputs for classifying each of the Fund’s investments into one of four liquidity categories that reflect an estimate of their liquidity under current market conditions; (3) whether a Fund invested primarily in “Highly Liquid Investments” (as defined under the Liquidity Rule) and whether a Highly Liquid Investment Minimum {“HLIM”) should be established for a Fund and the procedures for monitoring for this limit; with the assessment that each Fund was invested primarily in “Highly Liquid Investments and therefore no HLIM needed to be established for any Fund (4) whether a Fund invested more than 15% of its assets in “Illiquid Investments” (as defined under the Liquidity Rule) and the procedures for monitoring for this limit, with the assessment that each Fund was under the 15% limit during the Program Reporting Period; and (5) specific liquidity events arising during the Program Reporting Period, including the impact on Fund liquidity caused by extended non-U.S. market closures. There were no material changes to the Program during the Program Reporting Period, although adjustments were made to the “reasonably anticipated trade size” calculation methodology description to account for actual fund trade experience as the Funds have seasoned.
Based on this review, the Report concluded that: (1) the Program continues to be reasonably designed to effectively assess and manage each Fund’s Liquidity Risk; and (2) the Program has been adequately and effectively implemented with respect to each Fund during the Program Reporting Period.
| | | | | | | | | | |
| | | | | |
| JUNE 30, 2021 | | SIX CIRCLES TRUST | | | | | | | | 297 |
For more complete information about the Funds, including the Funds’ objectives, risks, charges and expenses, call your J.P. Morgan team or call 1-212-464-2070 or go to www.sixcirclesfunds.com for a prospectus. Read the prospectus carefully. An investment in these Funds and any other Fund is not designed to be a complete investment program. The Funds are NOT designed to be used as a stand-alone investments. J.P. Morgan is committed to making our products and services accessible to meet the financial services needs of all our clients. If you are a person with a disability and need additional support accessing this material, please contact your J.P. Morgan team or email us at accessibility.support@jpmorgan.com for assistance.
The Six Circles Funds are distributed by Foreside Fund Services, LLC a member of FINRA.
Contact Six Circles Funds collect at 1-212-464-2070 for a fund prospectus. You can also visit us at www.sixcirclesfunds.com. Investors should carefully consider the investment objectives and risk as well as charges and expenses of the Six Circles Funds before investing. The prospectus contains this and other information about the Six Circles Funds. Read the prospectus carefully before investing.
The Six Circles Funds file complete schedules of their fund holdings for the first and third quarters of their fiscal year with the SEC on Form N-PORT. The Six Circles Funds’ Forms N-PORT are available on the SEC’s website at http://www.sec.gov. Each Fund’s quarterly holdings can be found by visiting the Six Circles Funds’ website at www.sixcirclesfunds.com/literature.
A description of the Six Circles Funds’ policies and procedures with respect to the disclosure of the Six Circles Funds’ holdings is available in the prospectuses and Statements of Additional Information.
A copy of proxy policies and procedures is available without charge upon request by calling collect 1-212-464-2070 or on the Six Circles Funds’ website at www.sixcirclesfunds.com. A description of such policies and procedures is in the Statement of Additional Information available on the SEC’s website at www.sec.gov. The Trustees have delegated the authority to vote proxies for securities owned by the Fund to the Adviser, and the Adviser in turn has delegated such authority to the Sub-Advisers. A copy of the Six Circles Funds’ voting record for the most recent 12-month period ended June 30 is available on the SEC’s website at www.sec.gov or at the Six Circles Funds’ website at www.sixcirclesfunds.com no later than August 31 of each year. The Six Circles Funds’ proxy voting record will include, among other things, a brief description of the matter voted on for each fund security, and will state how each vote was cast, for example, for or against the proposal.
©JPMorgan Chase & Co. 2021. All rights reserved. June 30, 2021.
Semi-Annual Report
SIX CIRCLES® FUNDS
June 30, 2021
Six Circles Managed Equity Portfolio U.S. Unconstrained Fund
Six Circles Managed Equity Portfolio International Unconstrained Fund
CONTENTS
Investments in a Fund are not deposits or obligations of, or guaranteed or endorsed by, any bank and are not insured or guaranteed by the FDIC, the Federal Reserve Board or any other government agency. You could lose money if you sell when a Fund’s share price is lower than when you invested.
Past performance is no guarantee of future performance. The general market views expressed in this report are opinions based on market and other conditions through the end of the reporting period and are subject to change without notice. These views are not intended to predict the future performance of a Fund or the securities markets. References to specific securities and their issuers are for illustrative purposes only and are not intended to be, and should not be interpreted as, recommendations to purchase or sell such securities. Such views are not meant as investment advice and may not be relied on as an indication of trading intent on behalf of any Fund.
For more complete information about the Funds, including the Funds’ objectives, risks, charges and expenses, call your J.P. Morgan representative or call 1-212-464-2070 or go to www.sixcirclesfunds.com for a prospectus. Read the prospectus carefully. An investment in these Funds and any other Fund is not designed to be a complete investment program. The Funds are NOT designed to be used as stand-alone investments.
PRESIDENT’S LETTER
JUNE 30, 2021 (Unaudited)
Dear Shareholder,
As many of us begin a cautious, yet hopeful, transition to a new normal, we remain keenly aware that in some regions of the world, challenges remain. Our thoughts are with all of those who have been, and continue to be impacted by the COVID-19 virus, and we look forward to the day when we can confidently say for all that the worst is behind us.
Following a 12-month period of unprecedented market volatility, the six months covered by this report were characterized by recovery, as the markets responded positively to the rollout of COVID-19 vaccination programs. Against this backdrop, the Six Circles Funds provided us with the means to target key themes within our discretionary portfolios. On the following pages, we provide detailed discussions on the strategies we implemented in each of the Six Circles Funds during this time, and how they performed.
As a reminder, the Six Circles Funds are not meant to be standalone investments. They are purposefully constructed as
completion funds and, as such, we believe they should be reviewed and evaluated within the context of your broader portfolio for a complete picture of their performance.
I hope you find the information on these pages to be informative and helpful. If you should have any questions about the Funds, you can contact your J.P. Morgan team, visit the Fund’s website at www.sixcirclesfunds.com, or call us at 212-464-2070.
Sincerely,

Mary Savino
President, Six Circles Funds
| | | | | | | | | | |
| | | | | |
| JUNE 30, 2021 | | SIX CIRCLES TRUST | | | | | | | | 1 |
Market Overview
As Of June 30, 2021 (Unaudited)
Equity markets across the globe posted positive returns in the first half of 2021. The successful rollout of COVID-19 vaccinations in the U.S. is helping the economy to recover and is boosting company earnings leading to equity markets trading at or near an all-time highs. While certain international regions are behind in the COVID-19 recovery, we expect them to follow the path of the U.S. The MSCI USA Index was up 14.9% in the first half of 2021, with Developed Non-U.S. and Emerging Markets Equities also closing in positive territory with the MSCI World ex-USA Index and the MSCI Emerging Markets Index up 9.9% and 7.5% respectively.
Global Bond and cash markets trailed equities; the Bloomberg Barclays U.S. 1-3 Month Treasury Bills Index returned 0.02%
and the Bloomberg Barclays Global Aggregate Hedged Index had a negative return of -1.5%, while the MSCI World Index was up 13.1% in the first half of 2021.
The Federal Open Market Committee decided to maintain the target range for the federal funds rate at 0 – 0.25%, with the view that this level is appropriate to support economic activity, the labor market, and inflation. The Committee stated that it anticipates maintaining an accommodative stance of monetary policy until its employment targets are achieved and inflation has risen to 2% and is on track to moderately exceed 2% for some time. The Committee will continue to monitor economic data to assess any future changes to the target federal funds range.
| | | | | | | | | | |
| | | | | |
| 2 | | | | | | | | SIX CIRCLES TRUST | | JUNE 30, 2021 |
Six Circles Managed Equity Portfolio U.S. Unconstrained Fund
FUND COMMENTARY
Period January 1, 2021 Through June 30, 2021 (Unaudited)
| | | | |
| REPORTING PERIOD RETURN | |
| Fund* | | | 15.57% | |
| MSCI USA Index | | | 14.87% | |
| |
| Net Assets as of 06/30/2021 (In Thousands) | | $ | 3,752,851 | |
INVESTMENT OBJECTIVES AND STRATEGY**
Six Circles Managed Equity Portfolio U.S. Unconstrained Fund (the “Fund”) seeks to provide capital appreciation. The Fund invests at least 80% of its net assets in equity securities issued by U.S. companies and other instruments with economic characteristics similar to equity securities issued by U.S. companies. The Fund is generally unconstrained by any particular capitalization, style or industry sector.
INVESTMENT APPROACH
J.P. Morgan Private Investments Inc., the Fund’s investment adviser (“JPMPI” or the “Adviser”), actively allocates the Fund’s investments among a range of indexed investment strategies that are managed by the current sub-adviser, BlackRock Investment Management, LLC (the “Sub-Adviser” or “BlackRock”). For each indexed investment strategy, the Sub-Adviser seeks to replicate the performance of an index or sub-index selected by the Adviser. The Fund is specifically designed to serve as a completion portfolio and accomplish particular goals within discretionary Managed Equity Portfolios managed by JPMPI or its affiliates (the “Portfolios”). The Adviser utilizes the Fund to express targeted investment views, while taking into consideration positions held at the aggregate level in the broader Portfolios. As such, the Fund’s allocations and performance should be evaluated in the context of the broader Portfolios and not on a standalone basis.
WHAT WERE THE MAIN DRIVERS OF THE FUND’S PERFORMANCE?
During the period January 1, 2021 through June 30, 2021 (the “reporting period”), the Fund posted a positive return on an absolute basis, and outperformed relative to the MSCI USA Index (the “Index”). References to the Index are for informational purposes. The use of the Index does not imply the Fund is being managed to the Index, but rather is disclosed to allow for comparison of the Fund’s performance to that of a well- known and widely-recognized index.
Consumer Staples, Industrials, Information Technology and Communication Services sectors comprised approximately 69% of the Fund’s sector exposure on a look-through basis at the end of the reporting period, and were the Fund’s largest sector overweights relative to the Index. During the reporting period,
all the four sectors contributed to the Fund’s performance on an absolute basis as well as relative to the Index.
Real Estate and Financials sectors comprised approximately 3% of the Fund’s sector exposure on a look-through basis at the end of the reporting period, and were the Fund’s largest sector underweights relative to the Index. During the reporting period, both the sectors contributed to the Fund’s performance on an absolute basis but detracted relative to the Index.
On the sleeve level, the Fund’s allocation to Broad U.S.A was the largest contributor to the Fund’s performance with no investment strategy detracting from the Fund’s return on an absolute basis during the reporting period.
HOW WAS THE FUND POSITIONED?
At the end of the reporting period, the Fund was allocated to seventeen strategies managed by one Sub-Adviser, across various sector and sub-industry exposures as follows.
| | | | |
| PORTFOLIO ALLOCATION*** | | | |
| USA | | | 25 | % |
| U.S. Software | | | 11 | |
| U.S. Pharmaceuticals | | | 9 | |
| U.S. Interactive Media & Services | | | 8 | |
| U.S. Information Technology | | | 7 | |
| U.S. Internet Retail | | | 6 | |
| U.S. Air Freight & Logistics | | | 5 | |
| U.S. Tech Hardware Equipment | | | 5 | |
| U.S. Communication Services | | | 4 | |
| U.S. Beverages | | | 4 | |
| U.S. Semiconductors & Semiconductor Equipment | | | 4 | |
| U.S. Tobacco | | | 3 | |
| U.S. Home Entertainment Software | | | 3 | |
| U.S. Biotechnology | | | 2 | |
| U.S. Machinery | | | 2 | |
| U.S. Airlines | | | 1 | |
| U.S. Automobiles | | | 1 | |
| * | | The return shown is based on the net asset value calculated for shareholder transactions. Certain adjustments were made to the net assets of the Fund at June 30, 2021 for financial reporting purposes, and as a result, the net asset value for shareholder transactions and the total return based on that net asset value |
| | | | | | | | | | |
| | | | | |
| JUNE 30, 2021 | | SIX CIRCLES TRUST | | | | | | | | 3 |
Six Circles Managed Equity Portfolio U.S. Unconstrained Fund
FUND COMMENTARY
Period January 1, 2021 Through June 30, 2021 (Unaudited) (continued)
| | may differ from the adjusted net assets and the total return for financial reporting. |
| ** | | The Adviser seeks to achieve the Fund’s objective. There can be no guarantee it will be achieved. |
| *** | | Percentages are based on total investments as of June 30, 2021. The portfolio allocation is subject to change. |
Allocation to Broad USA, which was approximately 25% of the Fund as of June 30, 2021, provides what the Adviser believes to be an ability to tactically allocate to broad U.S. large cap exposure and use as a potential funding source for future targeted allocations.
Allocations to U.S. Software and U.S. Internet Retail provide what the Adviser believes is a multi-year opportunity for the leaders in this space to take advantage of businesses shifting workloads onto Cloud platforms. These exposures comprised approximately 17% of the Fund as of June 30, 2021.
Allocations to U.S. Pharmaceuticals and U.S. Biotechnology comprised approximately 11% of the Fund as of June 30, 2021, and provide what the Adviser believes is an opportunity as the market may be overestimating the risks potential policy changes would have, given the industry’s long-term growth tailwinds.
Allocation to U.S. Interactive Media & Services focuses on companies engaged in content and information creation or distribution through proprietary platforms, where revenues are derived primarily through pay-per-click advertisements. This allocation was approximately 8% of the Fund as of June 30, 2021. The Adviser believes in the opportunities available in the cloud market and views this exposure as potential for continued strength in earnings growth.
Allocation to U.S. Information Technology, which allows the Adviser to access specific exposures within the Technology sector, was approximately 7% of the Fund as of June 30, 2021.
The Adviser believes that allocation to U.S. Air Freight & Logistics has benefited from COVID-19 given the sector’s e-commerce networks. This allocation comprised approximately 5% of the Fund as of June 30, 2021.
Allocation to U.S. Technology Hardware Storage & Peripherals, which allows the Adviser to access specific exposures within the Technology sector, was approximately 5% of the Fund as of June 30, 2021.
Allocation to Communications Services, allows the Adviser to gain specific exposures within the mega cap technology sectors. The allocation was approximately 4% of the Fund as of June 30, 2021.
Allocation to U.S. Beverages was approximately 4% of the Fund’s exposure as of June 30, 2021 and reflects the Adviser’s belief that major players of this sector are going through structural changes and are set to improve free cash flow conversion.
The Adviser believes that allocation to U.S. Semis & Semi Equipment industries are attractive industries within the broader Information Technology Sector. This allocation comprised approximately 4% of the Fund as of June 30, 2021.
Allocation to U.S. Tobacco comprised approximately 3% of the Fund as of June 30, 2021, reflecting what the Adviser believes to be a defensive sub-industry exposure, within the context of the broader Portfolios.
Allocation to U.S. Home Entertainment Software comprised approximately 3% of the Fund as of June 30, 2021, reflecting the Adviser’s belief that strong secular tailwinds and high barrier to entry could allow companies within this index to outperform.
Allocation to the U.S. Machinery, which is a sub-industry of the Industrials sector, is comprised of concentrated exposure to companies in which the Adviser has high conviction. The allocation was approximately 2% of the Fund as of June 30, 2021.
The Adviser believes that allocation to U.S. Airlines takes advantage of the continued global recovery and rebound in travel. This allocation comprised approximately 1% of the Fund as of June 30, 2021.
The Adviser believes that allocation to U.S. Automobiles helps target direct exposure to a concentrated segment of the market in order to manage risk related to the sector. This allocation comprised approximately 1% of the Fund as of June 30, 2021.
| | | | | | | | | | |
| | | | | |
| 4 | | | | | | | | SIX CIRCLES TRUST | | JUNE 30, 2021 |
| | | | | | | | | | | | |
AVERAGE ANNUAL TOTAL RETURNS
AS OF JUNE 30, 2021 | |
| | | 6 Months* | | | 1 Year | | | Since
Inception
(April 10, 2019) | |
| Six Circles Managed Equity Portfolio U.S. Unconstrained Fund | | | 15.57 | % | | | 43.96 | % | | | 25.94 | % |
GROWTH OF $10,000 REPORT (04/10/19 to 06/30/21)
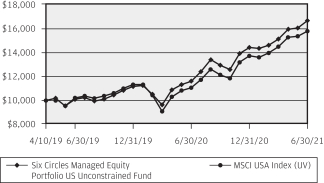
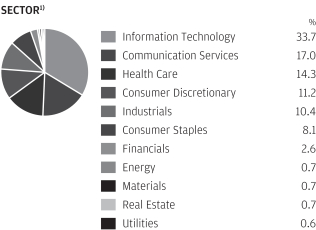
| 1) | Presented percentages may not sum to 100% due to rounding to the nearest percent. Cash and mark-to-market value on derivatives contracts represent less than 0.5%. The above Sector allocation uses The Global Industry Classification Standard (GICS®) and may differ from categories listed within the Schedule of Investments. |
The allocation of the various strategies employed by the Fund may shift and therefore, the performance shown may not be a true indication of how the Fund may perform going forward. Performance quoted is past performance and is no guarantee of future results. Investment returns and principal value will fluctuate, so shares, when sold, may be worth more or less than original
cost. Current performance may be higher or lower than returns shown. As of the latest prospectus, the gross and net expense ratios for the Fund were 0.30% and 0.09% respectively. Contact your J.P. Morgan representative or call 1-212-464-2070 for the most recent month-end performance.
The Fund commenced operations on April 10, 2019.
The graph illustrates comparative performance for $10,000 invested in the Six Circles Managed Equity Portfolio U.S. Unconstrained Fund and the MSCI USA Index from April 10, 2019 to June 30, 2021. The performance of the Fund reflects the deduction of Fund expenses and assumes reinvestment of all dividends and capital gain distributions, if any. The performance of the MSCI USA Index does not reflect the deduction of expenses associated with a mutual fund and has been adjusted to reflect reinvestment of all dividends and capital gain distributions of the securities included in the Index, if applicable.
The MSCI USA Index is designed to measure the performance of the large and mid-cap segments of the U.S. market. With 627 constituents, the index covers approximately 85% of the free float-adjusted market capitalization in the United States. Investors cannot invest directly in an index.
Fund performance may reflect the waiver of the Fund’s fees and/or reimbursement of expenses for certain periods since the inception date. Without these waivers and reimbursements, performance would have been lower. Also, performance shown in this section does not reflect the deduction of taxes that a shareholder may pay on Fund distributions or redemptions or sales of Fund shares.
The MSCI information may only be used for your internal use, may not be reproduced or redisseminated in any form and may not be used as a basis for or a component of any financial instruments or products or indices. None of the MSCI information is intended to constitute investment advice or a recommendation to make (or refrain from making) any kind of investment decision and may not be relied on as such. Historical data and analysis should not be taken as an indication or guarantee of any future performance analysis, forecast or prediction. The MSCI information is provided on an “as is” basis and the user of this information assumes the entire risk of any use made of this information. MSCI, each of its affiliates and each other person involved in or related to compiling, computing or creating any MSCI information (collectively, the “MSCI Parties”) expressly disclaims all warranties (including, without limitation, any warranties of originality, accuracy, completeness, timeliness, non-infringement, merchantability and fitness for a particular purpose) with respect this information. Without limiting any of the foregoing, in no event shall any MSCI Party have any liability for any direct, indirect, special, incidental, punitive, consequential (including, without limitation, lost profits) or any other damages. (www.msci.com)
The Global Industry Classification Standard (“GICS”) was developed by and is the exclusive property and a service mark of MSCI Inc. (“MSCI”) and Standard & Poor’s, a division of The McGraw-Hill Companies, Inc. (“S&P”) and is licensed for use by JP MORGAN CHASE BANK NA. Neither MSCI, S&P nor any third party involved in making or compiling the GICS or any GICS classifications makes any express or implied warranties or representations with respect to such standard or classification (or the results to be obtained by the use thereof), and all such parties hereby expressly disclaim all warranties of originality, accuracy, completeness, merchantability and fitness for a particular purpose with respect to any of such standard or classification. Without limiting any of the foregoing, in no event shall MSCI, S&P, any of their affiliates or any third party involved in making or compiling the GICS or any GICS classifications have any liability for any direct, indirect, special, punitive, consequential or any other damages (including lost profits) even if notified of the possibility of such damages.
| | | | | | | | | | |
| | | | | |
| JUNE 30, 2021 | | SIX CIRCLES TRUST | | | | | | | | 5 |
Six Circles Managed Equity Portfolio International Unconstrained Fund
FUND COMMENTARY
Period January 1, 2021 Through June 30, 2021 (Unaudited)
| | | | |
| REPORTING PERIOD RETURN | |
| Fund* | | | 13.15% | |
| MSCI World ex USA Index | | | 9.92% | |
| |
| Net Assets as of 06/30/2021 (In Thousands) | | $ | 1,936,585 | |
INVESTMENT OBJECTIVES AND STRATEGY**
Six Circles Managed Equity Portfolio International Unconstrained Fund (the “Fund”) seeks to provide capital appreciation. The Fund invests at least 80% of its net assets in equity securities and other instruments with economic characteristics similar to equity securities. The Fund primarily invests in the equity securities of non-U.S. companies and is generally unconstrained by any particular capitalization, style or sector or non-U.S. country.
INVESTMENT APPROACH
J.P. Morgan Private Investments Inc., the Fund’s investment adviser (“JPMPI” or the “Adviser”), actively allocates the Fund’s investments among a range of indexed investment strategies that are managed by the current sub-adviser, BlackRock Investment Management, LLC (the “Sub-Adviser” or “BlackRock”). For each indexed investment strategy, the Sub-Adviser seeks to replicate the performance of an index or sub-index selected by the Adviser. The Fund is specifically designed to serve as a completion portfolio and accomplish particular goals within discretionary Managed Equity Portfolios managed by JPMPI or its affiliates (the “Portfolios”). The Adviser utilizes the Fund to express targeted investment views, while taking into consideration positions held at the aggregate level in the Portfolios. As such, the Fund’s allocations and performance should be evaluated in the context of the broader Portfolios and not on a standalone basis.
WHAT WERE THE MAIN DRIVERS OF THE FUND’S PERFORMANCE?
During the period January 1, 2021 through June 30, 2021 (the “reporting period”), the Fund posted a positive return on an absolute basis, and outperformed the MSCI World ex USA Index (the “Index”). References to the Index are for informational purposes. The use of the Index does not imply the Fund is being managed to the Index, and is disclosed to allow for comparison of the Fund’s performance to that of a well-known and widely-recognized index.
Financials, Utilities and Health Care sectors comprised approximately 52% of the Fund’s sector exposure on a look-through basis at the end of the reporting period, and were the Fund’s largest sector overweights relative to the Index. The Financials and Health Care sectors contributed to the Fund’s performance
on an absolute basis, while Utilities detracted. Relative to index, Health Care contributed, while Financials and Utilities detracted from performance.
Consumer Discretionary, Communication Services, Materials and Real Estate comprised approximately 9% of the Fund’s sector exposure on a look-through basis at the end of the reporting period, and were the Fund’s largest sector underweights relative to the Index. During the reporting period, the Fund had no exposure to the Communication Services and Real Estate sectors, hence, the sectors did not contribute on an absolute basis. While only Consumer Discretionary and Materials contributed to the Fund’s performance on an absolute basis, all the four sectors contributed from the Fund’s performance relative to the Index.
On the sleeve level, the Fund’s allocation to Europe Semiconductors was the largest contributor, while the allocation to Europe ex-UK Utilities was the largest detractor from the Fund’s return on an absolute basis during the reporting period.
The allocation to Europe Insurance, which the Adviser believes allowed the portfolio to be broadly underweight European Equities but allow the portfolio to target an overall overweight to European Insurance was eliminated during the reporting period.
HOW WAS THE FUND POSITIONED?
At the end of the reporting period, the Fund was allocated to ten strategies managed by one Sub-Adviser, across various sector and sub-industry exposures as follows.
| | | | |
| PORTFOLIO ALLOCATION*** | | | |
| Europe Financials | | | 24 | % |
| Europe Pharmaceuticals | | | 19 | |
| Europe Industrials | | | 14 | |
| Europe Beverages | | | 11 | |
| Europe ex-UK Utilities | | | 9 | |
| Europe Semiconductors | | | 7 | |
| European Metals & Mining | | | 6 | |
| Europe Automobiles | | | 4 | |
| Europe Integrated Oil & Gas | | | 4 | |
| Korea Technology, Hardware, Storage & Peripherals | | | 2 | |
| * | | The return shown is based on the net asset value calculated for shareholder transactions. Certain adjustments were made to the |
| | | | | | | | | | |
| | | | | |
| 6 | | | | | | | | SIX CIRCLES TRUST | | JUNE 30, 2021 |
| | net assets of the Fund at June 30, 2021 for financial reporting purposes, and as a result, the net asset value for shareholder transactions and the total return based on that net asset value may differ from the adjusted net assets and the total return for financial reporting. |
| ** | | The Adviser seeks to achieve the Fund’s objective. There can be no guarantee it will be achieved. |
| *** | | Percentages are based on total investments as of June 30, 2021. The portfolio allocation is subject to change. |
Allocation to the Europe Financials was approximately 24% of the Fund as of June 30, 2021. The Adviser believes in the capital adequacy and the capacity of the sector to pay dividends. Valuations have been compelling and the market has become more realistic about the outlook for credit costs.
Allocation to Europe Pharmaceuticals comprised approximately 19% of the Fund as of June 30, 2021 and provides what the Adviser believes to be a defensive exposure with attractive fundamentals, within the context of the broader Portfolios.
Allocation to the Europe Industrials was approximately 14% of the Fund as of June 30, 2021 and provides an exposure that the Adviser believes will benefit from economic growth and recovery.
Allocation to Europe Beverages was approximately 11% of the Fund’s exposure as of June 30, 2021 and reflects the Adviser’s belief that the market is underestimating the strength of these international companies within a recovery industry.
The Adviser believes that allocation to Europe ex-UK utilities serves as a defensive position with exposure to renewable energy, which helps diversify against European Energy positions and provides a growth dynamic to the sector. This allocation was approximately 9% of the Fund as of June 30, 2021.
The Adviser believes that companies within the Europe Semiconductors sector have stable long term growth prospects and strong balance sheets. The sector comprised approximately 7% of the Fund as of June 30, 2021.
The allocation Europe Metal and Mining provides what the Adviser believes is a cyclical exposure to companies with strong balance sheets. The allocation was approximately 6% of the Fund as of June 30, 2021.
The Adviser believes that allocation to Europe Automobiles is expected to perform well as the economy recovers. The focus on electric vehicles are likely to be a tailwind. This allocation comprised approximately 4% of the Fund as of June 30, 2021.
Allocation to Europe Integrated Oil & Gas provides exposure to cyclical industry that the Adviser believes will take advantage of the early cycle environment, and comprised approximately 4% of the Fund as of June 30, 2021.
The allocation to Korea Technology Hardware, Software and Peripherals provides what the Adviser believes is exposure to a strong player within the global technology supply chain. The allocation was approximately 2% of the Fund as of June 30, 2021.
| | | | | | | | | | |
| | | | | |
| JUNE 30, 2021 | | SIX CIRCLES TRUST | | | | | | | | 7 |
Six Circles Managed Equity Portfolio International Unconstrained Fund
FUND COMMENTARY
Period January 1, 2021 Through June 30, 2021 (Unaudited) (continued)
| | | | | | | | | | | | |
AVERAGE ANNUAL TOTAL RETURNS
AS OF JUNE 30, 2021 | |
| | | 6 Months* | | | 1 Year | | | Since
Inception
(April 10, 2019) | |
| Six Circles Managed Equity Portfolio International Unconstrained Fund | | | 13.15 | % | | | 42.77 | % | | | 12.17 | % |
GROWTH OF $10,000 REPORT (04/10/19 to 06/30/21)
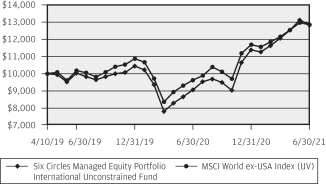
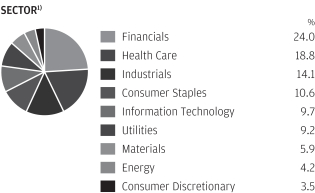
| 1) | Presented percentages may not sum to 100% due to rounding to the nearest percent. Cash and mark-to-market value on derivatives contracts represent less than 0.5%. The above Sector allocation uses The Global Industry Classification Standard (GICS®) and may differ from categories listed within the Schedule of Investments. |
The allocation of the various strategies employed by the Fund may shift and therefore, the performance shown may not be a true indication of how the Fund may perform going forward. Performance quoted is past performance and is no guarantee of future results. Investment returns and principal value will fluctuate, so shares, when sold, may be worth more or less than original cost. Current performance may be higher or lower than returns shown. As of the latest prospectus, the gross and net expense ratios for the Fund were 0.40% and 0.20% respectively. Contact your J.P. Morgan representative or call 1-212-464-2070 for the most recent month-end performance.
The Fund commenced operations on April 10, 2019.
The graph illustrates comparative performance for $10,000 invested in the Six Circles Managed Equity Portfolio International Unconstrained Fund and the MSCI World ex-USA Index from April 10, 2019 to June 30, 2021. The performance of the Fund reflects the deduction of Fund expenses and assumes reinvestment of all dividends and capital gain distributions, if any. The performance of the MSCI World ex-USA Index does not reflect the deduction of expenses associated with a mutual fund and has been adjusted to reflect reinvestment of all dividends and capital gain distributions of the securities included in the Index, if applicable.
The MSCI World ex USA Index captures large and mid-cap representation across 22 of 23 Developed Markets (DM) countries—excluding the United States. With 1016 constituents, the index covers approximately 85% of the free float-adjusted market capitalization in each country. Investors cannot invest directly in an index.
Fund performance may reflect the waiver of the Fund’s fees and/or reimbursement of expenses for certain periods since the inception date. Without these waivers and reimbursements, performance would have been lower. Also, performance shown in this section does not reflect the deduction of taxes that a shareholder may pay on Fund distributions or redemptions or sales of Fund shares.
International investing has a greater degree of risk and increased volatility due to political and economic instability of some overseas markets. Changes in currency exchange rates and different accounting and taxation policies outside the U.S. can affect returns.
The MSCI information may only be used for your internal use, may not be reproduced or redisseminated in any form and may not be used as a basis for or a component of any financial instruments or products or indices. None of the MSCI information is intended to constitute investment advice or a recommendation to make (or refrain from making) any kind of investment decision and may not be relied on as such. Historical data and analysis should not be taken as an indication or guarantee of any future performance analysis, forecast or prediction. The MSCI information is provided on an “as is” basis and the user of this information assumes the entire risk of any use made of this information. MSCI, each of its affiliates and each other person involved in or related to compiling, computing or creating any MSCI information (collectively, the “MSCI Parties”) expressly disclaims all warranties (including, without limitation, any warranties of originality, accuracy, completeness, timeliness, non-infringement, merchantability and fitness for a particular purpose) with respect this information. Without limiting any of the foregoing, in no event shall any MSCI Party have any liability for any direct, indirect, special, incidental, punitive, consequential (including, without limitation, lost profits) or any other damages. (www.msci.com)
The Global Industry Classification Standard (“GICS”) was developed by and is the exclusive property and a service mark of MSCI Inc. (“MSCI”) and Standard & Poor’s, a division of The McGraw-Hill Companies, Inc. (“S&P”) and is licensed for use by JP MORGAN CHASE BANK NA. Neither MSCI, S&P nor any third party involved in making or compiling the GICS or any GICS classifications makes any express or implied warranties or representations with respect to such standard or classification (or the results to be obtained by the use thereof), and all such parties hereby expressly disclaim all warranties of originality, accuracy, completeness, merchantability and fitness for a particular purpose with respect to any of such standard or classification. Without limiting any of the foregoing, in no event shall MSCI, S&P, any of their affiliates or any third party involved in making or compiling the GICS or any GICS classifications have any liability for any direct, indirect, special, punitive, consequential or any other damages (including lost profits) even if notified of the possibility of such damages.
| | | | | | | | | | |
| | | | | |
| 8 | | | | | | | | SIX CIRCLES TRUST | | JUNE 30, 2021 |
Six Circles Managed Equity Portfolio U.S. Unconstrained Fund
SCHEDULE OF PORTFOLIO INVESTMENTS
AS OF JUNE 30, 2021 (Unaudited)
(Amounts in U.S. Dollars, unless otherwise noted)
(Amounts in thousands, except number of Futures contracts)
| | | | | | | | |
| SECURITY DESCRIPTION | | SHARES | | | VALUE ($) | |
Common Stocks — 98.9% | | | | | | | | |
Basic Materials — 0.5% | | | | | | | | |
Chemicals — 0.4% | | | | | | | | |
Air Products & Chemicals, Inc. | | | 5 | | | | 1,562 | |
Albemarle Corp. | | | 3 | | | | 462 | |
Celanese Corp., Class A | | | 3 | | | | 471 | |
CF Industries Holdings, Inc. | | | 7 | | | | 335 | |
Dow, Inc. | | | 18 | | | | 1,150 | |
DuPont de Nemours, Inc. | | | 13 | | | | 1,029 | |
Eastman Chemical Co. | | | 4 | | | | 435 | |
Ecolab, Inc. | | | 7 | | | | 1,341 | |
FMC Corp. | | | 2 | | | | 259 | |
International Flavors & Fragrances, Inc. | | | 6 | | | | 887 | |
Linde plc, (United Kingdom) | | | 13 | | | | 3,645 | |
LyondellBasell Industries NV, Class A | | | 7 | | | | 701 | |
Mosaic Co. (The) | | | 11 | | | | 339 | |
PPG Industries, Inc. | | | 6 | | | | 1,016 | |
RPM International, Inc. | | | 2 | | | | 213 | |
Sherwin-Williams Co. (The) | | | 6 | | | | 1,627 | |
| | | | | | | | |
| | |
| | | | | | | 15,472 | |
| | | | | | | | |
Forest Products & Paper — 0.0% (g) | | | | | | | | |
International Paper Co. | | | 10 | | | | 605 | |
| | | | | | | | |
Iron/Steel — 0.0% (g) | | | | | | | | |
Nucor Corp. | | | 8 | | | | 741 | |
Steel Dynamics, Inc. | | | 7 | | | | 430 | |
| | | | | | | | |
| | |
| | | | | | | 1,171 | |
| | | | | | | | |
Mining — 0.1% | | | | | | | | |
Freeport-McMoRan, Inc. | | | 33 | | | | 1,241 | |
Newmont Corp. | | | 18 | | | | 1,164 | |
| | | | | | | | |
| | |
| | | | | | | 2,405 | |
| | | | | | | | |
Total Basic Materials | | | | | | | 19,653 | |
| | | | | | | | |
Communications — 23.1% | | | | | | | | |
Advertising — 0.2% | | | | | | | | |
Interpublic Group of Cos., Inc. (The) | | | 24 | | | | 771 | |
Omnicom Group, Inc. | | | 13 | | | | 1,019 | |
Trade Desk, Inc. (The), Class A (a) | | | 65 | | | | 5,028 | |
| | | | | | | | |
| | |
| | | | | | | 6,818 | |
| | | | | | | | |
Internet — 19.9% | | | | | | | | |
Airbnb, Inc., Class A (a) | | | 1 | | | | 222 | |
Alphabet, Inc., Class A (a) | | | 50 | | | | 123,223 | |
Alphabet, Inc., Class C (a) | | | 49 | | | | 123,980 | |
Amazon.com, Inc. (a) | | | 74 | | | | 253,075 | |
Booking Holdings, Inc. (a) | | | 1 | | | | 2,131 | |
CDW Corp. | | | 15 | | | | 2,591 | |
Chewy, Inc., Class A (a) | | | 14 | | | | 1,095 | |
eBay, Inc. | | | 117 | | | | 8,241 | |
Etsy, Inc. (a) | | | 21 | | | | 4,423 | |
Expedia Group, Inc. (a) | | | 3 | | | | 493 | |
F5 Networks, Inc. (a) | | | 7 | | | | 1,254 | |
Facebook, Inc., Class A (a) | | | 404 | | | | 140,339 | |
| | | | | | | | |
| SECURITY DESCRIPTION | | SHARES | | | VALUE ($) | |
| | | | | | | | |
Internet — continued | | | | | | | | |
GoDaddy, Inc., Class A (a) | | | 8 | | | | 666 | |
IAC/InterActiveCorp. (a) | | | 13 | | | | 2,039 | |
Lyft, Inc., Class A (a) | | | 6 | | | | 359 | |
Match Group, Inc. (a) | | | 42 | | | | 6,824 | |
MercadoLibre, Inc., (Argentina) (a) | | | 8 | | | | 12,050 | |
Netflix, Inc. (a) | | | 24 | | | | 12,878 | |
NortonLifeLock, Inc. | | | 92 | | | | 2,502 | |
Okta, Inc., Class A (a) | | | 6 | | | | 1,385 | |
Palo Alto Networks, Inc. (a) | | | 15 | | | | 5,472 | |
Pinterest, Inc., Class A (a) | | | 89 | | | | 7,039 | |
Roku, Inc., Class A (a) | | | 6 | | | | 2,726 | |
Snap, Inc., Class A (a) | | | 158 | | | | 10,746 | |
Twitter, Inc. (a) | | | 133 | | | | 9,162 | |
Uber Technologies, Inc. (a) | | | 29 | | | | 1,478 | |
VeriSign, Inc. (a) | | | 5 | | | | 1,058 | |
Wayfair, Inc., Class A (a) | | | 13 | | | | 3,968 | |
Zendesk, Inc. (a) | | | 18 | | | | 2,589 | |
Zillow Group, Inc., Class A (a) | | | 10 | | | | 1,239 | |
Zillow Group, Inc., Class C (a) | | | 26 | | | | 3,207 | |
| | | | | | | | |
| | |
| | | | | | | 748,454 | |
| | | | | | | | |
Media — 1.3% | | | | | | | | |
Altice USA, Inc., Class A (a) | | | 12 | | | | 393 | |
Cable One, Inc. | | | — | (h) | | | 495 | |
Charter Communications, Inc., Class A (a) | | | 7 | | | | 5,293 | |
Comcast Corp., Class A | | | 252 | | | | 14,374 | |
Discovery, Inc., Class A (a) | | | 9 | | | | 287 | |
Discovery, Inc., Class C (a) | | | 17 | | | | 503 | |
DISH Network Corp., Class A (a) | | | 15 | | | | 633 | |
FactSet Research Systems, Inc. | | | 1 | | | | 380 | |
Fox Corp., Class A | | | 20 | | | | 739 | |
Fox Corp., Class B | | | 11 | | | | 377 | |
Liberty Broadband Corp., Class A (a) | | | 1 | | | | 190 | |
Liberty Broadband Corp., Class C (a) | | | 8 | | | | 1,427 | |
Liberty Global plc, (United Kingdom), Class A (a) | | | 11 | | | | 308 | |
Liberty Global plc, (United Kingdom), Class C (a) | | | 21 | | | | 564 | |
Liberty Media Corp.-Liberty Formula One, Class C (a) | | | 10 | | | | 479 | |
Liberty Media Corp.-Liberty SiriusXM, Class A (a) | | | 5 | | | | 248 | |
Liberty Media Corp.-Liberty SiriusXM, Class C (a) | | | 9 | | | | 414 | |
News Corp., Class A | | | 24 | | | | 630 | |
Sirius XM Holdings, Inc. | | | 55 | | | | 360 | |
ViacomCBS, Inc., Class B | | | 33 | | | | 1,469 | |
Walt Disney Co. (The) (a) | | | 100 | | | | 17,577 | |
| | | | | | | | |
| | |
| | | | | | | 47,140 | |
| | | | | | | | |
SEE NOTES TO FINANCIAL STATEMENTS.
| | | | | | | | | | |
| | | | | |
| JUNE 30, 2021 | | SIX CIRCLES TRUST | | | | | | | | 9 |
Six Circles Managed Equity Portfolio U.S. Unconstrained Fund
SCHEDULE OF PORTFOLIO INVESTMENTS
AS OF JUNE 30, 2021 (Unaudited) (continued)
(Amounts in U.S. Dollars, unless otherwise noted)
(Amounts in thousands, except number of Futures contracts)
| | | | | | | | |
| SECURITY DESCRIPTION | | SHARES | | | VALUE ($) | |
Common Stocks — continued | | | | | | | | |
Telecommunications — 1.7% | | | | | | | | |
Arista Networks, Inc. (a) | | | 6 | | | | 2,257 | |
AT&T, Inc. | | | 392 | | | | 11,286 | |
Cisco Systems, Inc. | | | 450 | | | | 23,875 | |
Corning, Inc. | | | 84 | | | | 3,456 | |
Juniper Networks, Inc. | | | 38 | | | | 1,039 | |
Lumen Technologies, Inc. | | | 53 | | | | 722 | |
Motorola Solutions, Inc. | | | 18 | | | | 3,886 | |
T-Mobile US, Inc. (a) | | | 34 | | | | 4,968 | |
Verizon Communications, Inc. | | | 228 | | | | 12,796 | |
| | | | | | | | |
| | |
| | | | | | | 64,285 | |
| | | | | | | | |
Total Communications | | | | | | | 866,697 | |
| | | | | | | | |
Consumer Cyclical — 5.0% | | | | | | | | |
Airlines — 1.1% | | | | | | | | |
Alaska Air Group, Inc. (a) | | | 51 | | | | 3,058 | |
American Airlines Group, Inc. (a) | | | 261 | | | | 5,542 | |
Delta Air Lines, Inc. (a) | | | 266 | | | | 11,511 | |
Southwest Airlines Co. (a) | | | 245 | | | | 13,029 | |
United Airlines Holdings, Inc. (a) | | | 132 | | | | 6,893 | |
| | | | | | | | |
| | |
| | | | | | | 40,033 | |
| | | | | | | | |
Apparel — 0.1% | | | | | | | | |
NIKE, Inc., Class B | | | 30 | | | | 4,709 | |
VF Corp. | | | 8 | | | | 654 | |
| | | | | | | | |
| | |
| | | | | | | 5,363 | |
| | | | | | | | |
Auto Manufacturers — 2.2% | | | | | | | | |
Cummins, Inc. | | | 20 | | | | 4,959 | |
Ford Motor Co. (a) | | | 443 | | | | 6,588 | |
General Motors Co. (a) | | | 148 | | | | 8,734 | |
PACCAR, Inc. | | | 48 | | | | 4,305 | |
Tesla, Inc. (a) | | | 87 | | | | 58,857 | |
| | | | | | | | |
| | |
| | | | | | | 83,443 | |
| | | | | | | | |
Auto Parts & Equipment — 0.0% (g) | | | | | | | | |
Aptiv plc, (Ireland) (a) | | | 6 | | | | 973 | |
Autoliv, Inc., (Sweden) | | | 1 | | | | 118 | |
BorgWarner, Inc. | | | 5 | | | | 254 | |
Lear Corp. | | | 1 | | | | 220 | |
| | | | | | | | |
| | |
| | | | | | | 1,565 | |
| | | | | | | | |
Distribution/Wholesale — 0.1% | | | | | | | | |
Copart, Inc. (a) | | | 5 | | | | 719 | |
Fastenal Co. | | | 14 | | | | 742 | |
LKQ Corp. (a) | | | 7 | | | | 343 | |
Pool Corp. | | | 1 | | | | 350 | |
WW Grainger, Inc. | | | 1 | | | | 521 | |
| | | | | | | | |
| | |
| | | | | | | 2,675 | |
| | | | | | | | |
Entertainment — 0.0% (g) | | | | | | | | |
Caesars Entertainment, Inc. (a) | | | 4 | | | | 438 | |
DraftKings, Inc., Class A (a) | | | 4 | | | | 224 | |
| | | | | | | | |
| SECURITY DESCRIPTION | | SHARES | | | VALUE ($) | |
| | | | | | | | |
Entertainment — continued | | | | | | | | |
Live Nation Entertainment, Inc. (a) | | | 9 | | | | 820 | |
Vail Resorts, Inc. (a) | | | 1 | | | | 374 | |
| | | | | | | | |
| | |
| | | | | | | 1,856 | |
| | | | | | | | |
| | | | | | | | |
Food Service — 0.0% (g) | | | | | | | | |
Aramark | | | 6 | | | | 234 | |
| | | | | | | | |
Home Builders — 0.1% | | | | | | | | |
DR Horton, Inc. | | | 9 | | | | 804 | |
Lennar Corp., Class A | | | 6 | | | | 620 | |
NVR, Inc. (a) | | | — | (h) | | �� | 323 | |
PulteGroup, Inc. | | | 5 | | | | 267 | |
| | | | | | | | |
| | |
| | | | | | | 2,014 | |
| | | | | | | | |
Home Furnishings — 0.0% (g) | | | | | | | | |
Whirlpool Corp. | | | 2 | | | | 393 | |
| | | | | | | | |
Housewares — 0.0% (g) | | | | | | | | |
Newell Brands, Inc. | | | 10 | | | | 271 | |
| | | | | | | | |
Leisure Time — 0.1% | | | | | | | | |
Carnival Corp. (a) | | | 22 | | | | 579 | |
Peloton Interactive, Inc., Class A (a) | | | 6 | | | | 761 | |
Royal Caribbean Cruises Ltd. (a) | | | 6 | | | | 533 | |
| | | | | | | | |
| | |
| | | | | | | 1,873 | |
| | | | | | | | |
Lodging — 0.1% | | | | | | | | |
Hilton Worldwide Holdings, Inc. (a) | | | 7 | | | | 827 | |
Las Vegas Sands Corp. (a) | | | 7 | | | | 349 | |
Marriott International, Inc., Class A (a) | | | 7 | | | | 934 | |
MGM Resorts International | | | 12 | | | | 492 | |
Wynn Resorts Ltd. (a) | | | 2 | | | | 233 | |
| | | | | | | | |
| | |
| | | | | | | 2,835 | |
| | | | | | | | |
Retail — 1.2% | | | | | | | | |
Advance Auto Parts, Inc. | | | 1 | | | | 292 | |
AutoZone, Inc. (a) | | | 1 | | | | 755 | |
Best Buy Co., Inc. | | | 6 | | | | 666 | |
Burlington Stores, Inc. (a) | | | 1 | | | | 425 | |
CarMax, Inc. (a) | | | 4 | | | | 503 | |
Carvana Co., Class A (a) | | | 2 | | | | 459 | |
Chipotle Mexican Grill, Inc., Class A (a) | | | 1 | | | | 1,082 | |
Costco Wholesale Corp. | | | 11 | | | | 4,230 | |
Darden Restaurants, Inc. | | | 4 | | | | 523 | |
Dollar General Corp. | | | 6 | | | | 1,223 | |
Dollar Tree, Inc. (a) | | | 6 | | | | 588 | |
Domino’s Pizza, Inc. | | | 1 | | | | 384 | |
Genuine Parts Co. | | | 3 | | | | 418 | |
Home Depot, Inc. (The) | | | 25 | | | | 8,067 | |
L Brands, Inc. | | | 5 | | | | 355 | |
Lowe’s Cos., Inc. | | | 17 | | | | 3,365 | |
Lululemon Athletica, Inc., (Canada) (a) | | | 3 | | | | 1,112 | |
McDonald’s Corp. | | | 18 | | | | 4,067 | |
SEE NOTES TO FINANCIAL STATEMENTS.
| | | | | | | | | | |
| | | | | |
| 10 | | | | | | | | SIX CIRCLES TRUST | | JUNE 30, 2021 |
| | | | | | | | |
| SECURITY DESCRIPTION | | SHARES | | | VALUE ($) | |
Common Stocks — continued | | | | | | | | |
Retail — continued | | | | | | | | |
O’Reilly Automotive, Inc. (a) | | | 2 | | | | 878 | |
Ross Stores, Inc. | | | 9 | | | | 1,074 | |
Starbucks Corp. | | | 28 | | | | 3,112 | |
Target Corp. | | | 12 | | | | 2,848 | |
TJX Cos., Inc. (The) | | | 28 | | | | 1,875 | |
Tractor Supply Co. | | | 2 | | | | 431 | |
Ulta Beauty, Inc. (a) | | | 1 | | | | 402 | |
Walgreens Boots Alliance, Inc. | | | 18 | | | | 966 | |
Walmart, Inc. | | | 38 | | | | 5,353 | |
Yum! Brands, Inc. | | | 7 | | | | 754 | |
| | | | | | | | |
| | |
| | | | | | | 46,207 | |
| | | | | | | | |
Textiles — 0.0% (g) | | | | | | | | |
Mohawk Industries, Inc. (a) | | | 2 | | | | 331 | |
| | | | | | | | |
Toys/Games/Hobbies — 0.0% (g) | | | | | | | | |
Hasbro, Inc. | | | 3 | | | | 252 | |
| | | | | | | | |
Total Consumer Cyclical | | | | | | | 189,345 | |
| | | | | | | | |
Consumer Non-cyclical — 23.0% | | | | | | | | |
Agriculture — 3.2% | | | | | | | | |
Altria Group, Inc. | | | 923 | | | | 43,987 | |
Archer-Daniels-Midland Co. | | | 14 | | | | 850 | |
Bunge Ltd. | | | 4 | | | | 328 | |
Philip Morris International, Inc. | | | 774 | | | | 76,673 | |
| | | | | | | | |
| | |
| | | | | | | 121,838 | |
| | | | | | | | |
Beverages — 4.0% | | | | | | | | |
Boston Beer Co., Inc. (The), Class A (a) | | | 2 | | | | 2,374 | |
Brown-Forman Corp., Class B | | | 80 | | | | 6,031 | |
Coca-Cola Co. (The) | | | 1,075 | | | | 58,148 | |
Constellation Brands, Inc., Class A | | | 45 | | | | 10,413 | |
Keurig Dr Pepper, Inc. | | | 184 | | | | 6,481 | |
Molson Coors Beverage Co., Class B (a) | | | 50 | | | | 2,658 | |
Monster Beverage Corp. (a) | | | 103 | | | | 9,432 | |
PepsiCo., Inc. | | | 362 | | | | 53,687 | |
| | | | | | | | |
| | |
| | | | | | | 149,224 | |
| | | | | | | | |
Biotechnology — 1.9% | | | | | | | | |
Alexion Pharmaceuticals, Inc. (a) | | | 23 | | | | 4,317 | |
Alnylam Pharmaceuticals, Inc. (a) | | | 12 | | | | 2,012 | |
Amgen, Inc. | | | 61 | | | | 14,892 | |
Biogen, Inc. (a) | | | 16 | | | | 5,610 | |
BioMarin Pharmaceutical, Inc. (a) | | | 19 | | | | 1,581 | |
Bio-Rad Laboratories, Inc., Class A (a) | | | 1 | | | | 399 | |
Corteva, Inc. | | | 19 | | | | 848 | |
Exact Sciences Corp. (a) | | | 17 | | | | 2,167 | |
Gilead Sciences, Inc. | | | 133 | | | | 9,137 | |
Horizon Therapeutics Plc (a) | | | 22 | | | | 2,052 | |
Illumina, Inc. (a) | | | 4 | | | | 1,665 | |
Incyte Corp. (a) | | | 19 | | | | 1,621 | |
Moderna, Inc. (a) | | | 33 | | | | 7,839 | |
Novavax, Inc. (a) | | | 7 | | | | 1,512 | |
| | | | | | | | |
| SECURITY DESCRIPTION | | SHARES | | | VALUE ($) | |
| | | | | | | | |
Biotechnology — continued | | | | | | | | |
Regeneron Pharmaceuticals, Inc. (a) | | | 11 | | | | 6,224 | |
Royalty Pharma plc, Class A | | | 5 | | | | 207 | |
Seagen, Inc. (a) | | | 14 | | | | 2,214 | |
Vertex Pharmaceuticals, Inc. (a) | | | 28 | | | | 5,594 | |
| | | | | | | | |
| | |
| | | | | | | 69,891 | |
| | | | | | | | |
Commercial Services — 1.1% | | | | | | | | |
AMERCO | | | — | (h) | | | 200 | |
Automatic Data Processing, Inc. | | | 21 | | | | 4,158 | |
Avalara, Inc. (a) | | | 13 | | | | 2,089 | |
Booz Allen Hamilton Holding Corp., Class A | | | 3 | | | | 219 | |
Cintas Corp. | | | 2 | | | | 925 | |
CoStar Group, Inc. (a) | | | 9 | | | | 750 | |
Equifax, Inc. | | | 3 | | | | 747 | |
FleetCor Technologies, Inc. (a) | | | 4 | | | | 974 | |
Gartner, Inc. (a) | | | 5 | | | | 1,115 | |
Global Payments, Inc. | | | 14 | | | | 2,708 | |
IHS Markit Ltd., (United Kingdom) | | | 9 | | | | 1,059 | |
MarketAxess Holdings, Inc. | | | 1 | | | | 487 | |
Moody’s Corp. | | | 4 | | | | 1,483 | |
PayPal Holdings, Inc. (a) | | | 54 | | | | 15,779 | |
Robert Half International, Inc. | | | 4 | | | | 317 | |
Rollins, Inc. | | | 6 | | | | 196 | |
S&P Global, Inc. | | | 6 | | | | 2,386 | |
Square, Inc., Class A (a) | | | 19 | | | | 4,600 | |
TransUnion | | | 5 | | | | 547 | |
United Rentals, Inc. (a) | | | 2 | | | | 621 | |
Verisk Analytics, Inc., Class A | | | 4 | | | | 657 | |
| | | | | | | | |
| | |
| | | | | | | 42,017 | |
| | | | | | | | |
Cosmetics/Personal Care — 0.3% | | | | | | | | |
Colgate-Palmolive Co. | | | 18 | | | | 1,501 | |
Estee Lauder Cos., Inc. (The), Class A | | | 5 | | | | 1,725 | |
Procter & Gamble Co. (The) | | | 59 | | | | 7,932 | |
| | | | | | | | |
| | |
| | | | | | | 11,158 | |
| | | | | | | | |
Food — 0.2% | | | | | | | | |
Campbell Soup Co. | | | 3 | | | | 150 | |
Conagra Brands, Inc. | | | 13 | | | | 489 | |
General Mills, Inc. | | | 15 | | | | 923 | |
Hershey Co. (The) | | | 3 | | | | 578 | |
Hormel Foods Corp. | | | 9 | | | | 416 | |
J M Smucker Co. (The) | | | 3 | | | | 401 | |
Kellogg Co. | | | 7 | | | | 465 | |
Kraft Heinz Co. (The) | | | 17 | | | | 700 | |
Kroger Co. (The) | | | 19 | | | | 741 | |
Lamb Weston Holdings, Inc. | | | 3 | | | | 203 | |
McCormick & Co., Inc. | | | 5 | | | | 464 | |
Mondelez International, Inc., Class A | | | 34 | | | | 2,132 | |
Sysco Corp. | | | 12 | | | | 906 | |
SEE NOTES TO FINANCIAL STATEMENTS.
| | | | | | | | | | |
| | | | | |
| JUNE 30, 2021 | | SIX CIRCLES TRUST | | | | | | | | 11 |
Six Circles Managed Equity Portfolio U.S. Unconstrained Fund
SCHEDULE OF PORTFOLIO INVESTMENTS
AS OF JUNE 30, 2021 (Unaudited) (continued)
(Amounts in U.S. Dollars, unless otherwise noted)
(Amounts in thousands, except number of Futures contracts)
| | | | | | | | |
| SECURITY DESCRIPTION | | SHARES | | | VALUE ($) | |
Common Stocks — continued | | | | | | | | |
Food — continued | | | | | | | | |
Tyson Foods, Inc., Class A | | | 8 | | | | 574 | |
| | | | | | | | |
| | |
| | | | | | | 9,142 | |
| | | | | | | | |
Healthcare — Products — 1.0% | | | | | | | | |
10X Genomics, Inc., Class A (a) | | | 2 | | | | 343 | |
Abbott Laboratories | | | 42 | | | | 4,926 | |
ABIOMED, Inc. (a) | | | 1 | | | | 315 | |
Align Technology, Inc. (a) | | | 2 | | | | 1,095 | |
Avantor, Inc. (a) | | | 11 | | | | 407 | |
Baxter International, Inc. | | | 13 | | | | 1,012 | |
Bio-Techne Corp. | | | 1 | | | | 373 | |
Boston Scientific Corp. (a) | | | 35 | | | | 1,501 | |
Cooper Cos., Inc. (The) | | | 1 | | | | 468 | |
Danaher Corp. | | | 16 | | | | 4,183 | |
DENTSPLY SIRONA, Inc. | | | 5 | | | | 293 | |
Edwards Lifesciences Corp. (a) | | | 15 | | | | 1,516 | |
Henry Schein, Inc. (a) | | | 5 | | | | 378 | |
Hologic, Inc. (a) | | | 6 | | | | 418 | |
IDEXX Laboratories, Inc. (a) | | | 2 | | | | 1,233 | |
Insulet Corp. (a) | | | 1 | | | | 355 | |
Intuitive Surgical, Inc. (a) | | | 3 | | | | 2,568 | |
Masimo Corp. (a) | | | 1 | | | | 240 | |
Medtronic plc, (Ireland) | | | 32 | | | | 4,024 | |
Novocure Ltd., (Jersey) (a) | | | 2 | | | | 423 | |
PerkinElmer, Inc. | | | 3 | | | | 476 | |
ResMed, Inc. | | | 3 | | | | 838 | |
STERIS plc | | | 2 | | | | 455 | |
Stryker Corp. | | | 8 | | | | 2,152 | |
Teleflex, Inc. | | | 1 | | | | 380 | |
Thermo Fisher Scientific, Inc. | | | 9 | | | | 4,770 | |
West Pharmaceutical Services, Inc. | | | 2 | | | | 608 | |
Zimmer Biomet Holdings, Inc. | | | 5 | | | | 826 | |
| | | | | | | | |
| | |
| | | | | | | 36,576 | |
| | | | | | | | |
Healthcare — Services — 0.6% | | | | | | | | |
Anthem, Inc. | | | 6 | | | | 2,184 | |
Catalent, Inc. (a) | | | 47 | | | | 5,094 | |
Centene Corp. (a) | | | 15 | | | | 1,074 | |
Charles River Laboratories International, Inc. (a) | | | 1 | | | | 394 | |
DaVita, Inc. (a) | | | 2 | | | | 191 | |
HCA Healthcare, Inc. | | | 6 | | | | 1,342 | |
Humana, Inc. | | | 3 | | | | 1,287 | |
IQVIA Holdings, Inc. (a) | | | 5 | | | | 1,106 | |
Laboratory Corp. of America Holdings (a) | | | 3 | | | | 690 | |
Molina Healthcare, Inc. (a) | | | 1 | | | | 310 | |
Oak Street Health, Inc. (a) | | | 2 | | | | 121 | |
PPD, Inc. (a) | | | 2 | | | | 80 | |
Quest Diagnostics, Inc. | | | 3 | | | | 451 | |
Teladoc Health, Inc. (a) | | | 3 | | | | 509 | |
UnitedHealth Group, Inc. | | | 23 | | | | 9,010 | |
| | | | | | | | |
| SECURITY DESCRIPTION | | SHARES | | | VALUE ($) | |
| | | | | | | | |
Healthcare — Services — continued | | | | | | | | |
Universal Health Services, Inc., Class B | | | 2 | | | | 336 | |
| | | | | | | | |
| | |
| | | | | | | 24,179 | |
| | | | | | | | |
Household Products/Wares — 0.1% | | | | | | | | |
Avery Dennison Corp. | | | 2 | | | | 490 | |
Church & Dwight Co., Inc. | | | 5 | | | | 445 | |
Clorox Co. (The) | | | 3 | | | | 483 | |
Kimberly-Clark Corp. | | | 8 | | | | 1,005 | |
| | | | | | | | |
| | |
| | | | | | | 2,423 | |
| | | | | | | | |
Pharmaceuticals — 10.6% | | | | | | | | |
AbbVie, Inc. | | | 185 | | | | 20,854 | |
AmerisourceBergen Corp., Class A | | | 3 | | | | 385 | |
Becton Dickinson and Co. | | | 7 | | | | 1,753 | |
Bristol-Myers Squibb Co. | | | 628 | | | | 41,934 | |
Cardinal Health, Inc. | | | 7 | | | | 410 | |
Cigna Corp. | | | 9 | | | | 2,056 | |
CVS Health Corp. | | | 32 | | | | 2,692 | |
Dexcom, Inc. (a) | | | 2 | | | | 941 | |
Elanco Animal Health, Inc. (a) | | | 10 | | | | 348 | |
Eli Lilly & Co. | | | 224 | | | | 51,419 | |
Jazz Pharmaceuticals plc, (Ireland) (a) | | | 1 | | | | 198 | |
Johnson & Johnson | | | 740 | | | | 121,966 | |
McKesson Corp. | | | 4 | | | | 712 | |
Merck & Co., Inc. | | | 713 | | | | 55,417 | |
Neurocrine Biosciences, Inc. (a) | | | 10 | | | | 926 | |
Organon & Co. (a) | | | 65 | | | | 1,956 | |
Perrigo Co. plc, (Ireland) | | | 34 | | | | 1,574 | |
Pfizer, Inc. | | | 1,573 | | | | 61,607 | |
Viatris, Inc. | | | 344 | | | | 4,912 | |
Zoetis, Inc., Class A | | | 134 | | | | 24,891 | |
| | | | | | | | |
| | |
| | | | | | | 396,951 | |
| | | | | | | | |
Total Consumer Non-cyclical | | | | | | | 863,399 | |
| | | | | | | | |
Energy — 0.8% | | | | | | | | |
Energy — Alternate Sources — 0.1% | | | | | | | | |
Enphase Energy, Inc. (a) | | | 14 | | | | 2,580 | |
Plug Power, Inc. (a) | | | 13 | | | | 432 | |
SolarEdge Technologies, Inc., (Israel) (a) | | | 6 | | | | 1,624 | |
Sunrun, Inc. (a) | | | 4 | | | | 217 | |
| | | | | | | | |
| | |
| | | | | | | 4,853 | |
| | | | | | | | |
Oil & Gas — 0.5% | | | | | | | | |
Chevron Corp. | | | 46 | | | | 4,828 | |
ConocoPhillips | | | 34 | | | | 2,057 | |
Devon Energy Corp. | | | 18 | | | | 523 | |
EOG Resources, Inc. | | | 15 | | | | 1,214 | |
Exxon Mobil Corp. | | | 101 | | | | 6,340 | |
Hess Corp. | | | 7 | | | | 613 | |
Marathon Petroleum Corp. | | | 14 | | | | 870 | |
Occidental Petroleum Corp. | | | 22 | | | | 689 | |
Phillips 66 | | | 9 | | | | 812 | |
SEE NOTES TO FINANCIAL STATEMENTS.
| | | | | | | | | | |
| | | | | |
| 12 | | | | | | | | SIX CIRCLES TRUST | | JUNE 30, 2021 |
| | | | | | | | |
| SECURITY DESCRIPTION | | SHARES | | | VALUE ($) | |
Common Stocks — continued | | | | | | | | |
Oil & Gas — continued | | | | | | | | |
Pioneer Natural Resources Co. | | | 5 | | | | 845 | |
Valero Energy Corp. | | | 9 | | | | 739 | |
| | | | | | | | |
| | |
| | | | | | | 19,530 | |
| | | | | | | | |
Oil & Gas Services — 0.1% | | | | | | | | |
Baker Hughes Co., Class A | | | 20 | | | | 459 | |
Halliburton Co. | | | 24 | | | | 554 | |
Schlumberger NV | | | 34 | | | | 1,094 | |
| | | | | | | | |
| | |
| | | | | | | 2,107 | |
| | | | | | | | |
Pipelines — 0.1% | | | | | | | | |
Cheniere Energy, Inc. (a) | | | 5 | | | | 451 | |
Kinder Morgan, Inc. | | | 44 | | | | 801 | |
ONEOK, Inc. | | | 10 | | | | 529 | |
Williams Cos., Inc. (The) | | | 28 | | | | 739 | |
| | | | | | | | |
| | |
| | | | | | | 2,520 | |
| | | | | | | | |
Total Energy | | | | | | | 29,010 | |
| | | | | | | | |
Financial — 4.0% | | | | | | | | |
Banks — 1.0% | | | | | | | | |
Bank of America Corp. | | | 187 | | | | 7,707 | |
Bank of New York Mellon Corp. (The) | | | 21 | | | | 1,061 | |
Citigroup, Inc. | | | 52 | | | | 3,650 | |
Citizens Financial Group, Inc. | | | 15 | | | | 671 | |
Fifth Third Bancorp | | | 22 | | | | 848 | |
First Republic Bank | | | 5 | | | | 982 | |
Goldman Sachs Group, Inc. (The) | | | 9 | | | | 3,251 | |
Huntington Bancshares, Inc. | | | 50 | | | | 714 | |
KeyCorp. | | | 33 | | | | 679 | |
M&T Bank Corp. | | | 4 | | | | 647 | |
Morgan Stanley | | | 35 | | | | 3,248 | |
Northern Trust Corp. | | | 5 | | | | 605 | |
PNC Financial Services Group, Inc. (The) | | | 11 | | | | 2,115 | |
Regions Financial Corp. | | | 33 | | | | 664 | |
State Street Corp. | | | 9 | | | | 743 | |
SVB Financial Group (a) | | | 2 | | | | 897 | |
Truist Financial Corp. | | | 35 | | | | 1,962 | |
US Bancorp | | | 37 | | | | 2,116 | |
Wells Fargo & Co. | | | 102 | | | | 4,598 | |
| | | | | | | | |
| | |
| | | | | | | 37,158 | |
| | | | | | | | |
Diversified Financial Services — 1.5% | | | | | | | | |
Ally Financial, Inc. | | | 11 | | | | 529 | |
American Express Co. | | | 17 | | | | 2,869 | |
Ameriprise Financial, Inc. | | | 3 | | | | 748 | |
Apollo Global Management, Inc., Class A | | | 5 | | | | 326 | |
BlackRock, Inc., Class A | | | 2 | | | | 1,654 | |
Capital One Financial Corp. | | | 11 | | | | 1,732 | |
Cboe Global Markets, Inc. | | | 3 | | | | 385 | |
Charles Schwab Corp. (The) | | | 36 | | | | 2,615 | |
CME Group, Inc., Class A | | | 9 | | | | 2,000 | |
Discover Financial Services | | | 9 | | | | 1,063 | |
| | | | | | | | |
| SECURITY DESCRIPTION | | SHARES | | | VALUE ($) | |
| | | | | | | | |
Diversified Financial Services — continued | | | | | |
Franklin Resources, Inc. | | | 10 | | | | 326 | |
Intercontinental Exchange, Inc. | | | 15 | | | | 1,795 | |
Invesco Ltd. | | | 11 | | | | 303 | |
Mastercard, Inc., Class A | | | 43 | | | | 15,714 | |
Nasdaq, Inc. | | | 4 | | | | 702 | |
Raymond James Financial, Inc. | | | 3 | | | | 451 | |
SEI Investments Co. | | | 5 | | | | 287 | |
Synchrony Financial | | | 15 | | | | 737 | |
T Rowe Price Group, Inc. | | | 6 | | | | 1,285 | |
Tradeweb Markets, Inc., Class A | | | 3 | | | | 286 | |
Visa, Inc., Class A | | | 82 | | | | 19,274 | |
Western Union Co. (The) | | | 18 | | | | 416 | |
| | | | | | | | |
| | |
| | | | | | | 55,497 | |
| | | | | | | | |
Insurance — 0.8% | | | | | | | | |
Aflac, Inc. | | | 16 | | | | 883 | |
Alleghany Corp. (a) | | | — | (h) | | | 294 | |
Allstate Corp. (The) | | | 8 | | | | 978 | |
American Financial Group, Inc. | | | 2 | | | | 291 | |
American International Group, Inc. | | | 20 | | | | 936 | |
Aon plc, Class A | | | 6 | | | | 1,338 | |
Arch Capital Group Ltd., (Bermuda) (a) | | | 12 | | | | 472 | |
Arthur J Gallagher & Co. | | | 5 | | | | 702 | |
Assurant, Inc. | | | 2 | | | | 291 | |
Athene Holding Ltd., (Bermuda), Class A (a) | | | 4 | | | | 300 | |
Berkshire Hathaway, Inc., Class B (a) | | | 33 | | | | 9,121 | |
Brown & Brown, Inc. | | | 7 | | | | 364 | |
Chubb Ltd., (Switzerland) | | | 11 | | | | 1,742 | |
Cincinnati Financial Corp. | | | 4 | | | | 498 | |
Equitable Holdings, Inc. | | | 12 | | | | 373 | |
Erie Indemnity Co., Class A | | | 1 | | | | 174 | |
Everest Re Group Ltd., (Bermuda) | | | 1 | | | | 313 | |
Fidelity National Financial, Inc. | | | 5 | | | | 196 | |
Globe Life, Inc. | | | 3 | | | | 291 | |
Hartford Financial Services Group, Inc. (The) | | | 9 | | | | 587 | |
Lincoln National Corp. | | | 5 | | | | 340 | |
Loews Corp. | | | 7 | | | | 359 | |
Markel Corp. (a) | | | — | (h) | | | 443 | |
Marsh & McLennan Cos., Inc. | | | 12 | | | | 1,749 | |
MetLife, Inc. | | | 18 | | | | 1,105 | |
Principal Financial Group, Inc. | | | 8 | | | | 476 | |
Progressive Corp. (The) | | | 15 | | | | 1,425 | |
Prudential Financial, Inc. | | | 11 | | | | 1,151 | |
Reinsurance Group of America, Inc. | | | 2 | | | | 247 | |
RenaissanceRe Holdings Ltd., (Bermuda) | | | 2 | | | | 256 | |
Travelers Cos., Inc. (The) | | | 6 | | | | 943 | |
Voya Financial, Inc. | | | 4 | | | | 254 | |
Willis Towers Watson plc, (United Kingdom) | | | 3 | | | | 768 | |
SEE NOTES TO FINANCIAL STATEMENTS.
| | | | | | | | | | |
| | | | | |
| JUNE 30, 2021 | | SIX CIRCLES TRUST | | | | | | | | 13 |
Six Circles Managed Equity Portfolio U.S. Unconstrained Fund
SCHEDULE OF PORTFOLIO INVESTMENTS
AS OF JUNE 30, 2021 (Unaudited) (continued)
(Amounts in U.S. Dollars, unless otherwise noted)
(Amounts in thousands, except number of Futures contracts)
| | | | | | | | |
| SECURITY DESCRIPTION | | SHARES | | | VALUE ($) | |
Common Stocks — continued | | | | | | | | |
Insurance — continued | | | | | | | | |
WR Berkley Corp. | | | 4 | | | | 323 | |
| | | | | | | | |
| | |
| | | | | | | 29,983 | |
| | | | | | | | |
Private Equity — 0.1% | | | | | | | | |
Blackstone Group, Inc. (The) | | | 18 | | | | 1,781 | |
Carlyle Group, Inc. (The) | | | 6 | | | | 263 | |
KKR & Co., Inc. | | | 11 | | | | 653 | |
| | | | | | | | |
| | |
| | | | | | | 2,697 | |
| | | | | | | | |
Real Estate — 0.0% (g) | | | | | | | | |
CBRE Group, Inc., Class A (a) | | | 9 | | | | 735 | |
| | | | | | | | |
REITS — 0.6% | | | | | | | | |
AGNC Investment Corp. | | | 8 | | | | 143 | |
Alexandria Real Estate Equities, Inc. | | | 3 | | | | 536 | |
American Tower Corp. | | | 11 | | | | 2,845 | |
Annaly Capital Management, Inc. | | | 26 | | | | 235 | |
AvalonBay Communities, Inc. | | | 4 | | | | 763 | |
Boston Properties, Inc. | | | 4 | | | | 431 | |
Camden Property Trust | | | 2 | | | | 239 | |
Crown Castle International Corp. | | | 10 | | | | 1,955 | |
Digital Realty Trust, Inc. | | | 6 | | | | 968 | |
Duke Realty Corp. | | | 8 | | | | 374 | |
Equinix, Inc. | | | 2 | | | | 1,647 | |
Equity LifeStyle Properties, Inc. | | | 3 | | | | 249 | |
Equity Residential | | | 9 | | | | 680 | |
Essex Property Trust, Inc. | | | 1 | | | | 436 | |
Extra Space Storage, Inc. | | | 3 | | | | 445 | |
Healthpeak Properties, Inc. | | | 12 | | | | 385 | |
Host Hotels & Resorts, Inc. (a) | | | 15 | | | | 262 | |
Invitation Homes, Inc. | | | 12 | | | | 431 | |
Iron Mountain, Inc. | | | 5 | | | | 222 | |
Medical Properties Trust, Inc. | | | 11 | | | | 216 | |
Mid-America Apartment Communities, Inc. | | | 2 | | | | 383 | |
Omega Healthcare Investors, Inc. | | | 4 | | | | 161 | |
Prologis, Inc. | | | 18 | | | | 2,116 | |
Public Storage | | | 4 | | | | 1,057 | |
Realty Income Corp. | | | 9 | | | | 567 | |
Regency Centers Corp. | | | 4 | | | | 238 | |
SBA Communications Corp., Class A | | | 2 | | | | 780 | |
Simon Property Group, Inc. | | | 7 | | | | 975 | |
Sun Communities, Inc. | | | 2 | | | | 394 | |
UDR, Inc. | | | 5 | | | | 261 | |
Ventas, Inc. | | | 10 | | | | 543 | |
VEREIT, Inc. | | | 7 | | | | 301 | |
VICI Properties, Inc. | | | 12 | | | | 375 | |
Vornado Realty Trust | | | 6 | | | | 259 | |
Welltower, Inc. | | | 11 | | | | 882 | |
Weyerhaeuser Co. | | | 20 | | | | 700 | |
WP Carey, Inc. | | | 3 | | | | 229 | |
| | | | | | | | |
| | |
| | | | | | | 23,683 | |
| | | | | | | | |
Total Financial | | | | | | | 149,753 | |
| | | | | | | | |
| | | | | | | | |
| SECURITY DESCRIPTION | | SHARES | | | VALUE ($) | |
| | | | | | | | |
Industrial — 9.3% | | | | | | | | |
Aerospace/Defense — 0.4% | | | | | | | | |
Boeing Co. (The) (a) | | | 13 | | | | 3,150 | |
General Dynamics Corp. | | | 6 | | | | 1,119 | |
HEICO Corp. | | | 1 | | | | 112 | |
HEICO Corp., Class A | | | 1 | | | | 158 | |
Howmet Aerospace, Inc. (a) | | | 9 | | | | 304 | |
L3Harris Technologies, Inc. | | | 5 | | | | 1,051 | |
Lockheed Martin Corp. | | | 6 | | | | 2,280 | |
Northrop Grumman Corp. | | | 4 | | | | 1,395 | |
Raytheon Technologies Corp. | | | 37 | | | | 3,171 | |
Teledyne Technologies, Inc. (a) | | | 1 | | | | 433 | |
TransDigm Group, Inc. (a) | | | 1 | | | | 859 | |
| | | | | | | | |
| | |
| | | | | | | 14,032 | |
| | | | | | | | |
Building Materials — 0.1% | | | | | | | | |
Carrier Global Corp. | | | 18 | | | | 895 | |
Fortune Brands Home & Security, Inc. | | | 3 | | | | 302 | |
Johnson Controls International plc | | | 18 | | | | 1,237 | |
Lennox International, Inc. | | | 1 | | | | 223 | |
Martin Marietta Materials, Inc. | | | 2 | | | | 583 | |
Masco Corp. | | | 5 | | | | 285 | |
Owens Corning | | | 3 | | | | 315 | |
Vulcan Materials Co. | | | 4 | | | | 621 | |
| | | | | | | | |
| | |
| | | | | | | 4,461 | |
| | | | | | | | |
Electrical Components & Equipments — 0.1% | |
AMETEK, Inc. | | | 6 | | | | 800 | |
Emerson Electric Co. | | | 15 | | | | 1,406 | |
Generac Holdings, Inc. (a) | | | 2 | | | | 642 | |
| | | | | | | | |
| | |
| | | | | | | 2,848 | |
| | | | | | | | |
Electronics — 0.7% | | | | | | | | |
Agilent Technologies, Inc. | | | 7 | | | | 1,061 | |
Allegion plc, (Ireland) | | | 2 | | | | 237 | |
Amphenol Corp., Class A | | | 65 | | | | 4,436 | |
Arrow Electronics, Inc. (a) | | | 9 | | | | 980 | |
Fortive Corp. | | | 44 | | | | 3,094 | |
Garmin Ltd., (Switzerland) | | | 4 | | | | 562 | |
Honeywell International, Inc. | | | 17 | | | | 3,719 | |
Keysight Technologies, Inc. (a) | | | 20 | | | | 3,028 | |
Mettler-Toledo International, Inc. (a) | | | 1 | | | | 719 | |
Sensata Technologies Holding plc (a) | | | 4 | | | | 242 | |
TE Connectivity Ltd., (Switzerland) | | | 36 | | | | 4,845 | |
Trimble, Inc. (a) | | | 26 | | | | 2,155 | |
Waters Corp. (a) | | | 1 | | | | 426 | |
| | | | | | | | |
| | |
| | | | | | | 25,504 | |
| | | | | | | | |
Engineering & Construction — 0.0% (g) | | | | | | | | |
Jacobs Engineering Group, Inc. | | | 3 | | | | 442 | |
| | | | | | | | |
Environmental Control — 0.1% | | | | | | | | |
Pentair plc, (United Kingdom) | | | 24 | | | | 1,599 | |
Republic Services, Inc., Class A | | | 6 | | | | 647 | |
SEE NOTES TO FINANCIAL STATEMENTS.
| | | | | | | | | | |
| | | | | |
| 14 | | | | | | | | SIX CIRCLES TRUST | | JUNE 30, 2021 |
| | | | | | | | |
| SECURITY DESCRIPTION | | SHARES | | | VALUE ($) | |
Common Stocks — continued | | | | | | | | |
Environmental Control — continued | | | | | | | | |
Waste Connections, Inc. | | | 7 | | | | 820 | |
Waste Management, Inc. | | | 10 | | | | 1,464 | |
| | | | | | | | |
| | |
| | | | | | | 4,530 | |
| | | | | | | | |
Hand/Machine Tools — 0.2% | | | | | | | | |
Snap-on, Inc. | | | 8 | | | | 1,715 | |
Stanley Black & Decker, Inc. | | | 22 | | | | 4,530 | |
| | | | | | | | |
| | |
| | | | | | | 6,245 | |
| | | | | | | | |
Machinery — Construction & Mining — 0.4% | |
Caterpillar, Inc. | | | 75 | | | | 16,237 | |
| | | | | | | | |
Machinery — Diversified — 0.9% | | | | | | | | |
Cognex Corp. | | | 18 | | | | 1,551 | |
Deere & Co. | | | 41 | | | | 14,297 | |
Dover Corp. | | | 19 | | | | 2,888 | |
IDEX Corp. | | | 10 | | | | 2,186 | |
Ingersoll Rand, Inc. (a) | | | 50 | | | | 2,433 | |
Nordson Corp. | | | 7 | | | | 1,513 | |
Otis Worldwide Corp. | | | 55 | | | | 4,494 | |
Rockwell Automation, Inc. | | | 3 | | | | 873 | |
Westinghouse Air Brake Technologies Corp. | | | 25 | | | | 2,083 | |
Xylem, Inc. | | | 24 | | | | 2,889 | |
| | | | | | | | |
| | |
| | | | | | | 35,207 | |
| | | | | | | | |
Miscellaneous Manufacturers — 0.6% | | | | | | | | |
3M Co. | | | 14 | | | | 2,828 | |
AO Smith Corp. | | | 2 | | | | 137 | |
Eaton Corp. plc | | | 10 | | | | 1,435 | |
General Electric Co. | | | 215 | | | | 2,889 | |
Illinois Tool Works, Inc. | | | 43 | | | | 9,601 | |
Parker-Hannifin Corp. | | | 18 | | | | 5,491 | |
Textron, Inc. | | | 6 | | | | 443 | |
Trane Technologies plc, (Ireland) | | | 6 | | | | 1,094 | |
| | | | | | | | |
| | |
| | | | | | | 23,918 | |
| | | | | | | | |
Packaging & Containers — 0.1% | | | | | | | | |
Amcor plc, (United Kingdom) | | | 43 | | | | 492 | |
Ball Corp. | | | 9 | | | | 720 | |
Crown Holdings, Inc. | | | 4 | | | | 421 | |
Packaging Corp. of America | | | 3 | | | | 366 | |
Sealed Air Corp. | | | 5 | | | | 302 | |
Westrock Co. | | | 8 | | | | 406 | |
| | | | | | | | |
| | |
| | | | | | | 2,707 | |
| | | | | | | | |
Shipbuilding — 0.0% (g) | | | | | | | | |
Huntington Ingalls Industries, Inc. | | | 1 | | | | 209 | |
| | | | | | | | |
Transportation — 5.7% | | | | | | | | |
CH Robinson Worldwide, Inc. | | | 106 | | | | 9,944 | |
CSX Corp. | | | 55 | | | | 1,778 | |
Expeditors International of Washington, Inc. | | | 134 | | | | 17,022 | |
| | | | | | | | |
| SECURITY DESCRIPTION | | SHARES | | | VALUE ($) | |
| | | | | | | | |
Transportation — continued | | | | | | | | |
FedEx Corp. | | | 194 | | | | 57,807 | |
JB Hunt Transport Services, Inc. | | | 2 | | | | 389 | |
Kansas City Southern | | | 2 | | | | 654 | |
Knight-Swift Transportation Holdings, Inc., Class A | | | 5 | | | | 244 | |
Norfolk Southern Corp. | | | 6 | | | | 1,681 | |
Old Dominion Freight Line, Inc. | | | 3 | | | | 658 | |
Union Pacific Corp. | | | 16 | | | | 3,594 | |
United Parcel Service, Inc., Class B | | | 574 | | | | 119,276 | |
XPO Logistics, Inc. (a) | | | 3 | | | | 378 | |
| | | | | | | | |
| | |
| | | | | | | 213,425 | |
| | | | | | | | |
Total Industrial | | | | | | | 349,765 | |
| | | | | | | | |
Technology — 32.6% | | | | | | | | |
Computers — 7.8% | | | | | | | | |
Accenture plc, (Ireland), Class A | | | 31 | | | | 9,138 | |
Apple, Inc. | | | 1,789 | | | | 245,017 | |
Cognizant Technology Solutions Corp., Class A | | | 26 | | | | 1,824 | |
Crowdstrike Holdings, Inc., Class A (a) | | | 27 | | | | 6,883 | |
Dell Technologies, Inc., Class C (a) | | | 28 | | | | 2,765 | |
EPAM Systems, Inc. (a) | | | 3 | | | | 1,401 | |
Fortinet, Inc. (a) | | | 21 | | | | 5,106 | |
Hewlett Packard Enterprise Co. | | | 139 | | | | 2,022 | |
HP, Inc. | | | 135 | | | | 4,061 | |
International Business Machines Corp. | | | 44 | | | | 6,428 | |
Leidos Holdings, Inc. | | | 3 | | | | 345 | |
NetApp, Inc. | | | 23 | | | | 1,904 | |
Seagate Technology Holdings plc, (Ireland) | | | 23 | | | | 2,043 | |
Western Digital Corp. (a) | | | 34 | | | | 2,397 | |
Zscaler, Inc. (a) | | | 12 | | | | 2,601 | |
| | | | | | | | |
| | |
| | | | | | | 293,935 | |
| | | | | | | | |
Office/Business Equipment — 0.1% | | | | | | | | |
Zebra Technologies Corp., Class A (a) | | | 6 | | | | 3,043 | |
| | | | | | | | |
Semiconductors — 6.6% | | | | | | | | |
Advanced Micro Devices, Inc. (a) | | | 140 | | | | 13,142 | |
Analog Devices, Inc. | | | 43 | | | | 7,384 | |
Applied Materials, Inc. | | | 106 | | | | 15,131 | |
Broadcom, Inc. | | | 47 | | | | 22,544 | |
Intel Corp. | | | 469 | | | | 26,352 | |
IPG Photonics Corp. (a) | | | 4 | | | | 853 | |
KLA Corp. | | | 18 | | | | 5,723 | |
Lam Research Corp. | | | 16 | | | | 10,720 | |
Marvell Technology, Inc. | | | 91 | | | | 5,302 | |
Maxim Integrated Products, Inc. | | | 31 | | | | 3,301 | |
Microchip Technology, Inc. | | | 31 | | | | 4,616 | |
Micron Technology, Inc. (a) | | | 130 | | | | 11,010 | |
Monolithic Power Systems, Inc. | | | 5 | | | | 1,849 | |
NVIDIA Corp. | | | 71 | | | | 57,170 | |
SEE NOTES TO FINANCIAL STATEMENTS.
| | | | | | | | | | |
| | | | | |
| JUNE 30, 2021 | | SIX CIRCLES TRUST | | | | | | | | 15 |
Six Circles Managed Equity Portfolio U.S. Unconstrained Fund
SCHEDULE OF PORTFOLIO INVESTMENTS
AS OF JUNE 30, 2021 (Unaudited) (continued)
(Amounts in U.S. Dollars, unless otherwise noted)
(Amounts in thousands, except number of Futures contracts)
| | | | | | | | |
| SECURITY DESCRIPTION | | SHARES | | | VALUE ($) | |
Common Stocks — continued | | | | | | | | |
Semiconductors — continued | | | | | | | | |
NXP Semiconductors NV, (Netherlands) | | | 32 | | | | 6,627 | |
ON Semiconductor Corp. (a) | | | 50 | | | | 1,899 | |
Qorvo, Inc. (a) | | | 13 | | | | 2,542 | |
QUALCOMM, Inc. | | | 131 | | | | 18,776 | |
Skyworks Solutions, Inc. | | | 19 | | | | 3,719 | |
Teradyne, Inc. | | | 19 | | | | 2,548 | |
Texas Instruments, Inc. | | | 107 | | | | 20,515 | |
Xilinx, Inc. | | | 28 | | | | 4,002 | |
| | | | | | | | |
| | |
| | | | | | | 245,725 | |
| | | | | | | | |
Software — 18.1% | | | | | | | | |
Activision Blizzard, Inc. | | | 659 | | | | 62,902 | |
Adobe, Inc. (a) | | | 74 | | | | 43,279 | |
Akamai Technologies, Inc. (a) | | | 8 | | | | 958 | |
ANSYS, Inc. (a) | | | 13 | | | | 4,536 | |
Autodesk, Inc. (a) | | | 34 | | | | 9,843 | |
Bentley Systems, Inc., Class B | | | 27 | | | | 1,739 | |
Black Knight, Inc. (a) | | | 24 | | | | 1,872 | |
Broadridge Financial Solutions, Inc. | | | 5 | | | | 835 | |
Cadence Design Systems, Inc. (a) | | | 43 | | | | 5,861 | |
Ceridian HCM Holding, Inc. (a) | | | 21 | | | | 1,971 | |
Cerner Corp. | | | 8 | | | | 641 | |
Citrix Systems, Inc. | | | 18 | | | | 2,162 | |
Clarivate plc, (United Kingdom) (a) | | | 8 | | | | 229 | |
Cloudflare, Inc., Class A (a) | | | 35 | | | | 3,680 | |
Coupa Software, Inc. (a) | | | 11 | | | | 2,896 | |
Datadog, Inc., Class A (a) | | | 27 | | | | 2,861 | |
DocuSign, Inc., Class A (a) | | | 28 | | | | 7,961 | |
Dropbox, Inc., Class A (a) | | | 50 | | | | 1,502 | |
Dynatrace, Inc. (a) | | | 28 | | | | 1,660 | |
Electronic Arts, Inc. | | | 243 | | | | 34,945 | |
Fair Isaac Corp. (a) | | | 4 | | | | 2,189 | |
Fidelity National Information Services, Inc. | | | 31 | | | | 4,329 | |
Fiserv, Inc. (a) | | | 30 | | | | 3,188 | |
Guidewire Software, Inc. (a) | | | 12 | | | | 1,331 | |
HubSpot, Inc. (a) | | | 7 | | | | 3,938 | |
Intuit, Inc. | | | 42 | | | | 20,767 | |
Jack Henry & Associates, Inc. | | | 3 | | | | 563 | |
Microsoft Corp. | | | 1,105 | | | | 299,285 | |
MongoDB, Inc., Class A (a) | | | 2 | | | | 863 | |
MSCI, Inc., Class A | | | 2 | | | | 1,102 | |
Oracle Corp. | | | 295 | | | | 22,973 | |
Palantir Technologies, Inc., Class A (a) | | | 82 | | | | 2,151 | |
Paychex, Inc. | | | 16 | | | | 1,746 | |
Paycom Software, Inc. (a) | | | 8 | | | | 2,789 | |
PTC, Inc. (a) | | | 17 | | | | 2,378 | |
RingCentral, Inc., Class A (a) | | | 11 | | | | 3,308 | |
Roper Technologies, Inc. | | | 2 | | | | 1,148 | |
salesforce.com, Inc. (a) | | | 142 | | | | 34,645 | |
ServiceNow, Inc. (a) | | | 30 | | | | 16,603 | |
Slack Technologies, Inc., Class A (a) | | | 73 | | | | 3,225 | |
Snowflake, Inc., Class A (a) | | | 1 | | | | 321 | |
| | | | | | | | |
| SECURITY DESCRIPTION | | SHARES | | | VALUE ($) | |
| | | | | | | | |
Software — continued | | | | | | | | |
Splunk, Inc. (a) | | | 25 | | | | 3,565 | |
SS&C Technologies Holdings, Inc. | | | 37 | | | | 2,643 | |
Synopsys, Inc. (a) | | | 24 | | | | 6,543 | |
Take-Two Interactive Software, Inc. (a) | | | 98 | | | | 17,426 | |
Twilio, Inc., Class A (a) | | | 8 | | | | 3,058 | |
Tyler Technologies, Inc. (a) | | | 6 | | | | 2,794 | |
Unity Software, Inc. (a) | | | 8 | | | | 916 | |
Veeva Systems, Inc., Class A (a) | | | 3 | | | | 1,045 | |
VMware, Inc., Class A (a) | | | 13 | | | | 2,107 | |
Workday, Inc., Class A (a) | | | 28 | | | | 6,679 | |
Zoom Video Communications, Inc., Class A (a) | | | 31 | | | | 12,165 | |
| | | | | | | | |
| | |
| | | | | | | 680,116 | |
| | | | | | | | |
Total Technology | | | | | | | 1,222,819 | |
| | | | | | | | |
Utilities — 0.6% | | | | | | | | |
Electric — 0.6% | | | | | | | | |
AES Corp. (The) | | | 13 | | | | 350 | |
Alliant Energy Corp. | | | 5 | | | | 263 | |
Ameren Corp. | | | 5 | | | | 415 | |
American Electric Power Co., Inc. | | | 12 | | | | 1,043 | |
CenterPoint Energy, Inc. | | | 12 | | | | 306 | |
CMS Energy Corp. | | | 6 | | | | 376 | |
Consolidated Edison, Inc. | | | 9 | | | | 643 | |
Dominion Energy, Inc. | | | 19 | | | | 1,428 | |
DTE Energy Co. | | | 5 | | | | 660 | |
Duke Energy Corp. | | | 19 | | | | 1,839 | |
Edison International | | | 10 | | | | 575 | |
Entergy Corp. | | | 5 | | | | 508 | |
Evergy, Inc. | | | 5 | | | | 276 | |
Eversource Energy | | | 8 | | | | 613 | |
Exelon Corp. | | | 24 | | | | 1,070 | |
FirstEnergy Corp. | | | 12 | | | | 431 | |
NextEra Energy, Inc. | | | 47 | | | | 3,468 | |
NRG Energy, Inc. | | | 7 | | | | 269 | |
PG&E Corp. (a) | | | 36 | | | | 371 | |
Pinnacle West Capital Corp. | | | 3 | | | | 211 | |
PPL Corp. | | | 20 | | | | 560 | |
Public Service Enterprise Group, Inc. | | | 13 | | | | 749 | |
Sempra Energy | | | 8 | | | | 1,084 | |
Southern Co. (The) | | | 27 | | | | 1,608 | |
Vistra Corp. | | | 10 | | | | 195 | |
WEC Energy Group, Inc. | | | 7 | | | | 591 | |
Xcel Energy, Inc. | | | 13 | | | | 831 | |
| | | | | | | | |
| | |
| | | | | | | 20,733 | |
| | | | | | | | |
Gas — 0.0% (g) | | | | | | | | |
Atmos Energy Corp. | | | 3 | | | | 256 | |
NiSource, Inc. | | | 9 | | | | 215 | |
UGI Corp. | | | 6 | | | | 277 | |
| | | | | | | | |
| | |
| | | | | | | 748 | |
| | | | | | | | |
SEE NOTES TO FINANCIAL STATEMENTS.
| | | | | | | | | | |
| | | | | |
| 16 | | | | | | | | SIX CIRCLES TRUST | | JUNE 30, 2021 |
| | | | | | | | |
| SECURITY DESCRIPTION | | SHARES | | | VALUE ($) | |
Common Stocks — continued | | | | | | | | |
Water — 0.0% (g) | | | | | | | | |
American Water Works Co., Inc. | | | 4 | | | | 633 | |
Essential Utilities, Inc. | | | 5 | | | | 224 | |
| | | | | | | | |
| | |
| | | | | | | 857 | |
| | | | | | | | |
Total Utilities | | | | | | | 22,338 | |
| | | | | | | | |
Total Common Stocks
(Cost $2,895,843) | | | | | | | 3,712,779 | |
| | | | | | | | |
| | |
| | | PRINCIPAL
AMOUNT ($) | | | | |
Short-Term Investments — 1.7% | | | | | | | | |
Time Deposits — 1.7% | | | | | | | | |
Australia & New Zealand Banking Group Ltd., 0.01%, 07/01/2021 | | | 6,762 | | | | 6,762 | |
Barclays SA, 0.01%, 07/01/2021 | | | 6,937 | | | | 6,937 | |
BNP Paribas SA, 0.01%, 07/01/2021 | | | 25,693 | | | | 25,693 | |
Brown Brothers Harriman, 0.01%, 07/01/2021 | | | — | (h) | | | — | (h) |
Citibank NA, 0.01%, 07/01/2021 | | | 22,171 | | | | 22,171 | |
Sumitomo Mitsui Trust Bank Ltd., 0.01%, 07/01/2021 | | | 1,435 | | | | 1,435 | |
| | | | | | | | |
Total Short-Term Investments (Cost $62,998) | | | | | | | 62,998 | |
| | | | | | | | |
| | |
Total Investments — 100.6% (Cost — $2,958,841)* | | | | | | | 3,775,777 | |
| | |
Liabilities in Excess of Other Assets — (0.6)% | | | | | | | (22,926) | |
| | | | | | | | |
| | |
NET ASSETS — 100.0% | | | | | | | $3,752,851 | |
| | | | | | | | |
Percentages indicated are based on net assets.
| | | | | | | | | | | | | | | | | | | | |
| Futures contracts outstanding as of June 30, 2021: | |
| Exchange Traded | |
| DESCRIPTION | | NUMBER OF
CONTRACTS | | | EXPIRATION
DATE | | | TRADING
CURRENCY | | | NOTIONAL
AMOUNT ($) | | | VALUE AND
UNREALIZED
APPRECIATION
(DEPRECIATION) ($) | |
| | | | | |
Long Contracts | | | | | | | | | | | | | | | | | | | | |
| | | | | |
| Micro E-mini NASDAQ 100 Index | | | 221 | | | | 09/2021 | | | | USD | | | | 6,184 | | | | 246 | |
| | | | | |
| Micro E-mini S&P 500 Index | | | 466 | | | | 09/2021 | | | | USD | | | | 9,869 | | | | 124 | |
| | | | | |
| NASDAQ 100 E-mini Index | | | 11 | | | | 09/2021 | | | | USD | | | | 3,104 | | | | 97 | |
| | | | | |
| S&P 500 E-mini Index | | | 39 | | | | 09/2021 | | | | USD | | | | 8,235 | | | | 127 | |
| | | | | |
| S&P MidCap 400 E-mini Index | | | 1 | | | | 09/2021 | | | | USD | | | | 273 | | | | (3 | ) |
| | | | | | | | | | | | | | | | | | | | |
| | | | | |
| Total unrealized appreciation (depreciation) | | | | | | | | | | | | | | | | | | | 591 | |
| | | | | | | | | | | | | | | | | | | | |
SEE NOTES TO FINANCIAL STATEMENTS.
| | | | | | | | | | |
| | | | | |
| JUNE 30, 2021 | | SIX CIRCLES TRUST | | | | | | | | 17 |
Six Circles Managed Equity Portfolio U.S. Unconstrained Fund
SCHEDULE OF PORTFOLIO INVESTMENTS
AS OF JUNE 30, 2021 (Unaudited) (continued)
(Amounts in U.S. Dollars, unless otherwise noted)
(Amounts in thousands, except number of Futures contracts)
NOTES TO SCHEDULE OF PORTFOLIO INVESTMENTS
AS OF JUNE 30, 2021
| | |
| REIT | | — Real Estate Investment Trust |
| (a) | | — Non-income producing security. |
| (g) | | — Amount rounds to less than 0.05%. |
| (h) | | — Amount rounds to less than 500. |
| * | | — The cost of securities is substantially the same for federal income tax purposes. |
| USD | | — United States Dollar |
Summary of Investments by Industry, June 30, 2021
The following table represents the portfolio investments of the Fund by industry classifications as a percentage of total investments:
| | | | |
| INDUSTRY | | PERCENTAGE | |
| |
Internet | | | 19.8 | % |
| |
Software | | | 18.0 | % |
| |
Pharmaceuticals | | | 10.5 | % |
| |
Computers | | | 7.8 | % |
| |
Semiconductors | | | 6.5 | % |
| |
Transportation | | | 5.7 | % |
| |
Beverages | | | 4.0 | % |
| |
Agriculture | | | 3.2 | % |
| |
Auto Manufacturers | | | 2.2 | % |
| |
Biotechnology | | | 1.8 | % |
| |
Telecommunications | | | 1.7 | % |
| |
Diversified Financial Services | | | 1.5 | % |
| |
Media | | | 1.2 | % |
| |
Retail | | | 1.2 | % |
| |
Commercial Services | | | 1.1 | % |
| |
Airlines | | | 1.1 | % |
| |
Others (Each less than 1.0%) | | | 11.0 | % |
| |
Short-Term Investments | | | 1.7 | % |
SEE NOTES TO FINANCIAL STATEMENTS.
| | | | | | | | | | |
| | | | | |
| 18 | | | | | | | | SIX CIRCLES TRUST | | JUNE 30, 2021 |
Six Circles Managed Equity Portfolio International Unconstrained Fund
SCHEDULE OF PORTFOLIO INVESTMENTS
AS OF JUNE 30, 2021 (Unaudited)
(Amounts in U.S. Dollars, unless otherwise noted)
(Amounts in thousands, except number of Futures contracts)
| | | | | | | | |
| SECURITY DESCRIPTION | |
SHARES | | | VALUE ($) | |
Common Stocks — 95.9% | | | | | | | | |
Australia — 1.2% | | | | | | | | |
BHP Group plc | | | 759 | | | | 22,462 | |
| | | | | | | | |
Austria — 0.5% | | | | | | | | |
Erste Group Bank AG | | | 74 | | | | 2,706 | |
OMV AG | | | 27 | | | | 1,515 | |
Raiffeisen Bank International AG | | | 39 | | | | 886 | |
Verbund AG | | | 31 | | | | 2,866 | |
voestalpine AG | | | 42 | | | | 1,701 | |
| | | | | | | | |
| | |
| | | | | | | 9,674 | |
| | | | | | | | |
Belgium — 2.8% | | | | | | | | |
Ageas SA | | | 46 | | | | 2,564 | |
Anheuser-Busch InBev SA | | | 495 | | | | 35,664 | |
Elia Group SA | | | 15 | | | | 1,553 | |
Groupe Bruxelles Lambert SA | | | 30 | | | | 3,333 | |
KBC Group NV | | | 66 | | | | 5,030 | |
Sofina SA | | | 4 | | | | 1,755 | |
UCB SA | | | 40 | | | | 4,156 | |
| | | | | | | | |
| | |
| | | | | | | 54,055 | |
| | | | | | | | |
Chile — 0.1% | | | | | | | | |
Antofagasta plc | | | 142 | | | | 2,818 | |
| | | | | | | | |
Denmark — 4.9% | | | | | | | | |
AP Moller — Maersk A/S, Class A | | | 1 | | | | 1,474 | |
AP Moller — Maersk A/S, Class B | | | 1 | | | | 2,916 | |
Carlsberg AS, Class B | | | 67 | | | | 12,482 | |
Danske Bank A/S | | | 182 | | | | 3,201 | |
DSV PANALPINA A/S | | | 34 | | | | 7,984 | |
Novo Nordisk A/S, Class B | | | 540 | | | | 45,243 | |
Orsted AS (e) | | | 87 | | | | 12,236 | |
ROCKWOOL International A/S, Class B | | | 1 | | | | 689 | |
Tryg A/S | | | 95 | | | | 2,331 | |
Vestas Wind Systems A/S | | | 167 | | | | 6,520 | |
| | | | | | | | |
| | |
| | | | | | | 95,076 | |
| | | | | | | | |
Finland — 1.5% | | | | | | | | |
Fortum OYJ | | | 205 | | | | 5,657 | |
Kone OYJ, Class B | | | 56 | | | | 4,583 | |
Nordea Bank Abp | | | 854 | | | | 9,508 | |
Orion OYJ, Class B | | | 33 | | | | 1,434 | |
Sampo OYJ, Class A | | | 131 | | | | 6,044 | |
Wartsila OYJ Abp | | | 78 | | | | 1,162 | |
| | | | | | | | |
| | |
| | | | | | | 28,388 | |
| | | | | | | | |
France — 12.3% | | | | | | | | |
Aeroports de Paris (a) | | | 5 | | | | 640 | |
Airbus SE (a) | | | 97 | | | | 12,521 | |
Alstom SA (a) | | | 46 | | | | 2,324 | |
Amundi SA (e) | | | 16 | | | | 1,413 | |
AXA SA | | | 510 | | | | 12,946 | |
BNP Paribas SA | | | 296 | | | | 18,603 | |
Bouygues SA | | | 38 | | | | 1,399 | |
Bureau Veritas SA (a) | | | 48 | | | | 1,536 | |
| | | | | | | | |
| SECURITY DESCRIPTION | |
SHARES | | | VALUE ($) | |
| | | | | | | | |
France — continued | | | | | | | | |
Cie de Saint-Gobain | | | 84 | | | | 5,518 | |
CNP Assurances | | | 45 | | | | 771 | |
Credit Agricole SA | | | 307 | | | | 4,310 | |
Dassault Aviation SA | | | — | (h) | | | 491 | |
Eiffage SA | | | 14 | | | | 1,407 | |
Electricite de France SA | | | 216 | | | | 2,955 | |
Engie SA | | | 850 | | | | 11,651 | |
Eurazeo SE | | | 10 | | | | 908 | |
Getlink SE | | | 73 | | | | 1,140 | |
Ipsen SA | | | 12 | | | | 1,231 | |
Legrand SA | | | 44 | | | | 4,683 | |
Natixis SA | | | 249 | | | | 1,185 | |
Pernod Ricard SA | | | 136 | | | | 30,233 | |
Remy Cointreau SA | | | 15 | | | | 3,048 | |
Renault SA (a) | | | 48 | | | | 1,939 | |
Safran SA | | | 56 | | | | 7,838 | |
Sanofi | | | 356 | | | | 37,366 | |
Schneider Electric SE | | | 89 | | | | 14,032 | |
SCOR SE (a) | | | 42 | | | | 1,330 | |
Societe Generale SA | | | 214 | | | | 6,320 | |
Suez SA | | | 160 | | | | 3,817 | |
Teleperformance | | | 10 | | | | 3,941 | |
Thales SA | | | 18 | | | | 1,792 | |
TotalEnergies SE | | | 450 | | | | 20,401 | |
Veolia Environnement SA | | | 250 | | | | 7,567 | |
Vinci SA | | | 88 | | | | 9,403 | |
Wendel SE | | | 7 | | | | 952 | |
| | | | | | | | |
| | |
| | | | | | | 237,611 | |
| | | | | | | | |
Germany — 10.4% | | | | | | | | |
Allianz SE (Registered) | | | 109 | | | | 27,114 | |
Bayer AG (Registered) | | | 308 | | | | 18,747 | |
Bayerische Motoren Werke AG | | | 82 | | | | 8,735 | |
Brenntag SE | | | 26 | | | | 2,376 | |
Commerzbank AG (a) | | | 264 | | | | 1,875 | |
Daimler AG (Registered) | | | 213 | | | | 19,032 | |
Deutsche Bank AG (Registered) (a) | | | 545 | | | | 7,101 | |
Deutsche Boerse AG | | | 50 | | | | 8,739 | |
Deutsche Lufthansa AG (Registered) (a) | | | 50 | | | | 558 | |
Deutsche Post AG (Registered) | | | 164 | | | | 11,154 | |
E.ON SE | | | 1,044 | | | | 12,080 | |
GEA Group AG | | | 25 | | | | 1,021 | |
Hannover Rueck SE | | | 16 | | | | 2,660 | |
Infineon Technologies AG | | | 478 | | | | 19,210 | |
KION Group AG | | | 12 | | | | 1,276 | |
Knorr-Bremse AG | | | 12 | | | | 1,383 | |
Merck KGaA | | | 41 | | | | 7,784 | |
MTU Aero Engines AG | | | 9 | | | | 2,187 | |
Muenchener Rueckversicherungs-Gesellschaft AG in Muenchen (Registered) | | | 37 | | | | 10,118 | |
Rational AG | | | 1 | | | | 760 | |
RWE AG | | | 297 | | | | 10,786 | |
SEE NOTES TO FINANCIAL STATEMENTS.
| | | | | | | | | | |
| | | | | |
| JUNE 30, 2021 | | SIX CIRCLES TRUST | | | | | | | | 19 |
Six Circles Managed Equity Portfolio International Unconstrained Fund
SCHEDULE OF PORTFOLIO INVESTMENTS
AS OF JUNE 30, 2021 (Unaudited) (continued)
(Amounts in U.S. Dollars, unless otherwise noted)
(Amounts in thousands, except number of Futures contracts)
| | | | | | | | |
| SECURITY DESCRIPTION | |
SHARES | | | VALUE ($) | |
Common Stocks — continued | | | | | | | | |
Germany — continued | | | | | | | | |
Siemens AG (Registered) | | | 126 | | | | 20,070 | |
Siemens Energy AG (a) | | | 66 | | | | 1,981 | |
Uniper SE | | | 45 | | | | 1,669 | |
Volkswagen AG | | | 8 | | | | 2,655 | |
Zalando SE (a) (e) | | | 9 | | | | 1,148 | |
| | | | | | | | |
| | |
| | | | | | | 202,219 | |
| | | | | | | | |
Ireland — 0.5% | | | | | | | | |
DCC plc | | | 16 | | | | 1,339 | |
Experian plc | | | 152 | | | | 5,852 | |
Kingspan Group plc | | | 26 | | | | 2,411 | |
| | | | | | | | |
| | |
| | | | | | | 9,602 | |
| | | | | | | | |
Italy — 5.0% | | | | | | | | |
Assicurazioni Generali SpA | | | 291 | | | | 5,837 | |
Atlantia SpA (a) | | | 81 | | | | 1,478 | |
Bio On Spa (a) (bb) (cc) | | | 1 | | | | — | |
Davide Campari-Milano NV | | | 339 | | | | 4,549 | |
Enel SpA | | | 3,763 | | | | 34,965 | |
Eni SpA | | | 455 | | | | 5,546 | |
Ferrari NV | | | 31 | | | | 6,476 | |
FinecoBank Banca Fineco SpA (a) | | | 124 | | | | 2,172 | |
Intesa Sanpaolo SpA | | | 4,352 | | | | 12,040 | |
Mediobanca Banca di Credito Finanziario SpA (a) | | | 164 | | | | 1,915 | |
Poste Italiane SpA (e) | | | 138 | | | | 1,822 | |
Prysmian SpA | | | 42 | | | | 1,516 | |
Recordati Industria Chimica e Farmaceutica SpA | | | 33 | | | | 1,877 | |
Snam SpA | | | 990 | | | | 5,729 | |
Terna SPA | | | 673 | | | | 5,019 | |
UniCredit SpA | | | 560 | | | | 6,622 | |
| | | | | | | | |
| | |
| | | | | | | 97,563 | |
| | | | | | | | |
Jordan — 0.1% | | | | | | | | |
Hikma Pharmaceuticals plc | | | 54 | | | | 1,836 | |
| | | | | | | | |
Luxembourg — 0.4% | | | | | | | | |
ArcelorMittal SA | | | 258 | | | | 7,932 | |
| | | | | | | | |
Netherlands — 10.6% | | | | | | | | |
ABN AMRO Bank NV, GDR, CVA (a) (e) | | | 111 | | | | 1,351 | |
Aegon NV | | | 472 | | | | 1,961 | |
ASM International NV | | | 17 | | | | 5,706 | |
ASML Holding NV | | | 153 | | | | 105,903 | |
EXOR NV | | | 29 | | | | 2,294 | |
Heineken Holding NV | | | 75 | | | | 7,548 | |
Heineken NV | | | 168 | | | | 20,431 | |
ING Groep NV | | | 1,028 | | | | 13,645 | |
NN Group NV | | | 74 | | | | 3,495 | |
Randstad NV | | | 20 | | | | 1,507 | |
Royal Dutch Shell plc, Class A | | | 739 | | | | 14,820 | |
Royal Dutch Shell plc, Class B | | | 668 | | | | 12,969 | |
Stellantis NV | | | 505 | | | | 9,928 | |
| | | | | | | | |
| SECURITY DESCRIPTION | |
SHARES | | | VALUE ($) | |
| | | | | | | | |
Netherlands — continued | | | | | | | | |
Wolters Kluwer NV | | | 44 | | | | 4,443 | |
| | | | | | | | |
| | |
| | | | | | | 206,001 | |
| | | | | | | | |
Norway — 0.7% | | | | | | | | |
DNB ASA | | | 245 | | | | 5,342 | |
Equinor ASA | | | 176 | | | | 3,729 | |
Gjensidige Forsikring ASA | | | 53 | | | | 1,162 | |
Norsk Hydro ASA | | | 483 | | | | 3,086 | |
| | | | | | | | |
| | |
| | | | | | | 13,319 | |
| | | | | | | | |
Poland — 0.0% (g) | | | | | | | | |
InPost SA (a) | | | 33 | | | | 662 | |
| | | | | | | | |
Portugal — 0.4% | | | | | | | | |
EDP — Energias de Portugal SA | | | 1,311 | | | | 6,950 | |
Galp Energia SGPS SA | | | 90 | | | | 982 | |
| | | | | | | | |
| | |
| | | | | | | 7,932 | |
| | | | | | | | |
South Korea — 1.9% | | | | | | | | |
Samsung Electronics Co. Ltd. | | | 506 | | | | 36,197 | |
Samsung Electronics Co. Ltd. (Registered), GDR | | | — | (h) | | | 3 | |
| | | | | | | | |
| | |
| | | | | | | 36,200 | |
| | | | | | | | |
Spain — 4.7% | | | | | | | | |
ACS Actividades de Construccion y Servicios SA | | | 39 | | | | 1,033 | |
Aena SME SA (a) (e) | | | 12 | | | | 2,024 | |
Banco Bilbao Vizcaya Argentaria SA | | | 1,757 | | | | 10,899 | |
Banco Santander SA | | | 4,570 | | | | 17,479 | |
CaixaBank SA | | | 1,171 | | | | 3,607 | |
EDP Renovaveis SA | | | 132 | | | | 3,050 | |
Enagas SA | | | 73 | | | | 1,692 | |
Endesa SA | | | 159 | | | | 3,868 | |
Ferrovial SA | | | 79 | | | | 2,332 | |
Iberdrola SA | | | 2,695 | | | | 32,862 | |
Naturgy Energy Group SA | | | 144 | | | | 3,704 | |
Red Electrica Corp. SA | | | 156 | | | | 2,888 | |
Repsol SA | | | 268 | | | | 3,373 | |
Siemens Gamesa Renewable Energy SA | | | 40 | | | | 1,323 | |
| | | | | | | | |
| | |
| | | | | | | 90,134 | |
| | | | | | | | |
Sweden — 4.0% | | | | | | | | |
Alfa Laval AB | | | 52 | | | | 1,845 | |
Assa Abloy AB, Class B | | | 166 | | | | 4,993 | |
Atlas Copco AB, Class A | | | 111 | | | | 6,813 | |
Atlas Copco AB, Class B | | | 64 | | | | 3,396 | |
Boliden AB | | | 98 | | | | 3,759 | |
Epiroc AB, Class A | | | 109 | | | | 2,479 | |
Epiroc AB, Class B | | | 64 | | | | 1,258 | |
EQT AB | | | 63 | | | | 2,281 | |
Industrivarden AB, Class A | | | 28 | | | | 1,095 | |
Industrivarden AB, Class C | | | 42 | | | | 1,540 | |
Investment AB Latour, Class B | | | 25 | | | | 807 | |
SEE NOTES TO FINANCIAL STATEMENTS.
| | | | | | | | | | |
| | | | | |
| 20 | | | | | | | | SIX CIRCLES TRUST | | JUNE 30, 2021 |
| | | | | | | | |
| SECURITY DESCRIPTION | |
SHARES | | | VALUE ($) | |
Common Stocks — continued | | | | | | | | |
Sweden — continued | | | | | | | | |
Investor AB, Class B | | | 480 | | | | 11,067 | |
Kinnevik AB, Class B (a) | | | 64 | | | | 2,553 | |
L E Lundbergforetagen AB, Class B | | | 20 | | | | 1,292 | |
Nibe Industrier AB, Class B | | | 236 | | | | 2,482 | |
Sandvik AB | | | 187 | | | | 4,769 | |
Securitas AB, Class B | | | 52 | | | | 817 | |
Skandinaviska Enskilda Banken AB, Class A | | | 429 | | | | 5,544 | |
Skanska AB, Class B | | | 56 | | | | 1,490 | |
SKF AB, Class B | | | 63 | | | | 1,603 | |
Svenska Handelsbanken AB, Class A | | | 384 | | | | 4,339 | |
Swedbank AB, Class A | | | 239 | | | | 4,443 | |
Volvo AB, Class A | | | 33 | | | | 827 | |
Volvo AB, Class B | | | 236 | | | | 5,693 | |
| | | | | | | | |
| | |
| | | | | | | 77,185 | |
| | | | | | | | |
Switzerland — 14.0% | | | | | | | | |
ABB Ltd. (Registered) | | | 287 | | | | 9,737 | |
Adecco Group AG (Registered) | | | 26 | | | | 1,742 | |
Baloise Holding AG (Registered) | | | 12 | | | | 1,908 | |
Banque Cantonale Vaudoise (Registered) | | | 8 | | | | 713 | |
Coca-Cola HBC AG | | | 130 | | | | 4,709 | |
Credit Suisse Group AG (Registered) | | | 645 | | | | 6,752 | |
Geberit AG (Registered) | | | 6 | | | | 4,597 | |
Glencore plc (a) | | | 3,592 | | | | 15,415 | |
Julius Baer Group Ltd. | | | 59 | | | | 3,852 | |
Kuehne + Nagel International AG (Registered) | | | 9 | | | | 3,054 | |
Novartis AG (Registered) | | | 697 | | | | 63,579 | |
Partners Group Holding AG | | | 6 | | | | 9,067 | |
Roche Holding AG | | | 231 | | | | 87,186 | |
Schindler Holding AG | | | 7 | | | | 2,065 | |
Schindler Holding AG (Registered) | | | 3 | | | | 968 | |
SGS SA (Registered) | | | 1 | | | | 3,087 | |
STMicroelectronics NV | | | 250 | | | | 9,082 | |
Swiss Life Holding AG (Registered) | | | 8 | | | | 4,104 | |
Swiss Re AG | | | 79 | | | | 7,179 | |
UBS Group AG (Registered) | | | 966 | | | | 14,798 | |
Vifor Pharma AG | | | 15 | | | | 1,983 | |
Zurich Insurance Group AG | | | 40 | | | | 15,926 | |
| | | | | | | | |
| | |
| | | | | | | 271,503 | |
| | | | | | | | |
United Arab Emirates — 0.0% | | | | | | | | |
NMC Health plc (a) (bb) (cc) | | | 16 | | | | — | |
| | | | | | | | |
United Kingdom — 19.9% | | | | | | | | |
3i Group plc | | | 256 | | | | 4,162 | |
Admiral Group plc | | | 51 | | | | 2,211 | |
Anglo American plc | | | 465 | | | | 18,521 | |
Ashtead Group plc | | | 74 | | | | 5,518 | |
AstraZeneca plc | | | 412 | | | | 49,503 | |
Aviva plc | | | 1,035 | | | | 5,812 | |
BAE Systems plc | | | 532 | | | | 3,844 | |
Barclays plc | | | 4,575 | | | | 10,857 | |
BP plc | | | 3,668 | | | | 16,084 | |
| | | | | | | | |
| SECURITY DESCRIPTION | |
SHARES | | | VALUE ($) | |
| | | | | | | | |
United Kingdom — continued | | | | | | | | |
Bunzl plc | | | 55 | | | | 1,835 | |
CNH Industrial NV | | | 169 | | | | 2,805 | |
Coca-Cola Europacific Partners plc | | | 133 | | | | 7,883 | |
Diageo plc | | | 1,519 | | | | 72,810 | |
Direct Line Insurance Group plc | | | 360 | | | | 1,418 | |
Evraz plc | | | 183 | | | | 1,504 | |
Ferguson plc | | | 37 | | | | 5,173 | |
GlaxoSmithKline plc | | | 1,579 | | | | 31,045 | |
Hargreaves Lansdown plc | | | 94 | | | | 2,063 | |
HSBC Holdings plc | | | 5,368 | | | | 30,979 | |
Intertek Group plc | | | 27 | | | | 2,045 | |
Legal & General Group plc | | | 1,573 | | | | 5,610 | |
Lloyds Banking Group plc | | | 18,673 | | | | 12,079 | |
London Stock Exchange Group plc | | | 86 | | | | 9,456 | |
M&G plc | | | 685 | | | | 2,170 | |
Melrose Industries plc | | | 801 | | | | 1,723 | |
Natwest Group plc | | | 1,283 | | | | 3,611 | |
Phoenix Group Holdings plc | | | 171 | | | | 1,598 | |
Prudential plc | | | 688 | | | | 13,083 | |
RELX plc | | | 319 | | | | 8,467 | |
Rentokil Initial plc | | | 307 | | | | 2,102 | |
Rio Tinto plc | | | 403 | | | | 33,312 | |
Rolls-Royce Holdings plc (a) | | | 1,386 | | | | 1,897 | |
Schroders plc | | | 33 | | | | 1,593 | |
Smiths Group plc | | | 65 | | | | 1,442 | |
Spirax-Sarco Engineering plc | | | 12 | | | | 2,295 | |
St James’s Place plc | | | 142 | | | | 2,900 | |
Standard Chartered plc | | | 707 | | | | 4,512 | |
Standard Life Aberdeen plc | | | 575 | | | | 2,157 | |
| | | | | | | | |
| | | | | | | 386,079 | |
| | | | | | | | |
Total Common Stocks
(Cost $1,501,894) | | | | | | | 1,858,251 | |
| | | | | | | | |
Preferred Stocks — 1.2% | | | | |
| | |
Germany — 0.9% | | | | | | | | |
Bayerische Motoren Werke AG | | | 14 | | | | 1,273 | |
Porsche Automobil Holding SE | | | 38 | | | | 4,091 | |
Volkswagen AG | | | 46 | | | | 11,580 | |
| | | | | | | | |
| | |
| | | | | | | 16,944 | |
| | | | | | | | |
South Korea — 0.3% | | | | | | | | |
Samsung Electronics Co. Ltd. | | | 87 | | | | 5,702 | |
| | | | | | | | |
Total Preferred Stocks
(Cost $12,819) | | | | | | | 22,646 | |
| | | | | | | | |
| | |
| | | NUMBER OF
RIGHTS | | | | |
Right — 0.0% (g) | |
Spain — 0.0% (g) | | | | | | | | |
ACS Actividades de Construccion y Servicios SA, expiring 07/23/2021 (a) | | | | | | | | |
(Cost $57) | | | 38 | | | | 53 | |
| | | | | | | | |
SEE NOTES TO FINANCIAL STATEMENTS.
| | | | | | | | | | |
| | | | | |
| JUNE 30, 2021 | | SIX CIRCLES TRUST | | | | | | | | 21 |
Six Circles Managed Equity Portfolio International Unconstrained Fund
SCHEDULE OF PORTFOLIO INVESTMENTS
AS OF JUNE 30, 2021 (Unaudited) (continued)
(Amounts in U.S. Dollars, unless otherwise noted)
(Amounts in thousands, except number of Futures contracts)
| | | | | | | | |
| SECURITY DESCRIPTION | | PRINCIPAL
AMOUNT ($) | | | VALUE ($) | |
Short-Term Investments — 2.7% | |
Time Deposits — 2.7% | | | | | | | | |
Australia & New Zealand Banking Group Ltd., 0.01%, 07/01/2021 | | | 846 | | | | 846 | |
Barclays SA, 0.01%, 07/01/2021 | | | — | (h) | | | — | (h) |
BNP Paribas SA, | | | | | | | | |
(1.83%), 07/01/2021 | | CHF | 5,221 | �� | | | 5,643 | |
(0.78%), 07/01/2021 | | EUR | 22,343 | | | | 26,493 | |
(0.61%), 07/01/2021 | | SEK | 12,147 | | | | 1,419 | |
(0.48%), 07/01/2021 | | DKK | 10,415 | | | | 1,661 | |
0.01%, 07/01/2021 | | | 2,415 | | | | 2,415 | |
Brown Brothers Harriman, | | | | | | | | |
(1.83%), 07/01/2021 | | CHF | — | (h) | | | — | (h) |
(1.08%), 07/01/2021 | | NOK | 1,752 | | | | 203 | |
(0.78%), 07/01/2021 | | EUR | — | (h) | | | — | (h) |
(0.61%), 07/01/2021 | | SEK | — | (h) | | | — | (h) |
(0.48%), 07/01/2021 | | DKK | — | (h) | | | — | (h) |
0.00%, 07/01/2021 | | SGD | — | (h) | | | — | (h) |
0.00%, 07/02/2021 | | HKD | — | (h) | | | — | (h) |
0.01%, 07/01/2021 | | GBP | — | (h) | | | — | (h) |
0.01%, 07/01/2021 | | | — | (h) | | | — | (h) |
0.01%, 07/02/2021 | | CAD | — | (h) | | | — | (h) |
3.65%, 07/01/2021 | | ZAR | — | (h) | | | — | |
| | | | | | | | |
| SECURITY DESCRIPTION | | PRINCIPAL
AMOUNT ($) | | | VALUE ($) | |
| |
Time Deposits — continued | | | | | | | | |
Citibank NA, | | | | | | | | |
0.01%, 07/01/2021 | | GBP | 6,935 | | | | 9,594 | |
0.01%, 07/01/2021 | | | 2,762 | | | | 2,762 | |
Sumitomo Mitsui Trust Bank Ltd., 0.01%, 07/01/2021 | | | 211 | | | | 211 | |
| | | | | | | | |
Total Short-Term Investments
(Cost $51,247) | | | | | | | 51,247 | |
| | | | | | | | |
| | |
Total Investments — 99.8%
(Cost — $1,566,018)* | | | | | | | 1,932,197 | |
| |
Other Assets in Excess of Liabilities — 0.2% | | | | 4,388 | |
| | | | | | | | |
| | |
NET ASSETS — 100.0% | | | | | | $ | 1,936,585 | |
| | | | | | | | |
Percentages indicated are based on net assets.
| | | | | | | | | | | | | | | | | | |
| Futures contracts outstanding as of June 30, 2021: | |
| Exchange Traded | |
| DESCRIPTION | | NUMBER OF
CONTRACTS | | | EXPIRATION
DATE | | | TRADING
CURRENCY | | NOTIONAL
AMOUNT ($) | | | VALUE AND
UNREALIZED
APPRECIATION
(DEPRECIATION) ($) | |
|
Long Contracts | |
| | | | | |
| Amsterdam Index | | | 12 | | | | 07/2021 | | | EUR | | | 2,080 | | | | (4 | ) |
| | | | | |
| Euro STOXX 50 Index | | | 377 | | | | 09/2021 | | | EUR | | | 18,365 | | | | (236 | ) |
| | | | | |
| FTSE 100 Index | | | 163 | | | | 09/2021 | | | GBP | | | 15,897 | | | | (158 | ) |
| | | | | |
| MSCI Emerging Markets Index | | | 5 | | | | 09/2021 | | | USD | | | 342 | | | | (1 | ) |
| | | | | | | | | | | | | | | | | | |
| |
Total unrealized appreciation (depreciation) | | | | (399 | ) |
| | | | | |
SEE NOTES TO FINANCIAL STATEMENTS.
| | | | | | | | | | |
| | | | | |
| 22 | | | | | | | �� | SIX CIRCLES TRUST | | JUNE 30, 2021 |
Summary of Investments by Industry, June 30, 2021
The following table represents the portfolio investments of the Fund by industry classifications as a percentage of total investments:
| | | | |
| INDUSTRY | | PERCENTAGE | |
| |
Pharmaceuticals | | | 18.3 | % |
| |
Banks | | | 12.1 | % |
| |
Beverages | | | 10.3 | % |
| |
Semiconductors | | | 9.4 | % |
| |
Electric | | | 7.8 | % |
| |
Insurance | | | 7.2 | % |
| |
Mining | | | 5.1 | % |
| |
Oil & Gas | | | 4.2 | % |
| |
Auto Manufacturers | | | 3.7 | % |
| |
Commercial Services | | | 1.8 | % |
| |
Diversified Financial Services | | | 1.7 | % |
| |
Aerospace/Defense | | | 1.6 | % |
| |
Transportation | | | 1.6 | % |
| |
Electrical Components & Equipment | | | 1.6 | % |
| |
Investment Companies | | | 1.4 | % |
| |
Miscellaneous Manufacturers | | | 1.4 | % |
| |
Machinery — Diversified | | | 1.1 | % |
| |
Engineering & Construction | | | 1.0 | % |
| |
Others (Each less than 1.0%) | | | 6.0 | % |
| |
Short-Term Investments | | | 2.7 | % |
NOTES TO SCHEDULE OF PORTFOLIO INVESTMENTS
AS OF JUNE 30, 2021
| | |
| CVA | | — Dutch Certification |
| GDR | | — Global Depositary Receipt |
| (a) | | — Non-income producing security. |
| (e) | | — Security is exempt from registration under Rule 144A of the Securities Act of 1933, as amended. Unless otherwise indicated, this security has been determined to be liquid under procedures established by the Board of Trustees and may be resold in transactions exempt from registration, normally to qualified institutional buyers. |
| (g) | | — Amount rounds to less than 0.05%. |
| (h) | | — Amount rounds to less than 500 shares or principal/ $500. |
| (bb) | | — Security has been valued using significant unobservable inputs. |
| (cc) | | — Security is valued in good faith at fair value by or under the direction of the Board of Trustees. |
| * | | — The cost of securities is substantially the same for federal income tax purposes. |
| CAD | | — Canadian Dollar |
| CHF | | — Swiss Franc |
| DKK | | — Danish Krone |
| HKD | | — Hong Kong Dollar |
| NOK | | — Norwegian korone |
| EUR | | — Euro |
| GBP | | — British Pound |
| NOK | | — Norwegian Krone |
| SEK | | — Swedish Krona |
| SGD | | — Singapore Dollar |
| USD | | — United States Dollar |
| ZAR | | — South African Rand |
SEE NOTES TO FINANCIAL STATEMENTS.
| | | | | | | | | | |
| | | | | |
| JUNE 30, 2021 | | SIX CIRCLES TRUST | | | | | | | | 23 |
STATEMENTS OF ASSETS AND LIABILITIES
AS OF JUNE 30,2021 (Unaudited)
(Amounts in thousands, except per share amounts)
| | | | |
| | | Six Circles
Managed
Equity Portfolio
U.S.
Unconstrained
Fund | |
ASSETS: | | | | |
Investments in non-affiliates, at value | | $ | 3,775,777 | |
Cash (a) | | | — | |
Deposits at broker for futures contracts | | | 1,565 | |
Prepaid expenses | | | 2 | |
Receivables: | | | | |
Fund shares sold | | | 8,875 | |
Interest and dividends from non-affiliates | | | 3,381 | |
Tax reclaims | | | 12 | |
Variation margin on futures contracts | | | 18 | |
| | | | |
Total Assets | | | 3,789,630 | |
| | | | |
| |
LIABILITIES: | | | | |
Payables: | | | | |
Investment securities purchased | | | 35,170 | |
Fund shares redeemed | | | 1,319 | |
Accrued liabilities: | | | | |
Investment advisory fees | | | 115 | |
Administration fees | | | 26 | |
Custodian and accounting fees | | | 54 | |
Trustees’ fees | | | 9 | |
Registration and filing fees | | | 23 | |
Other | | | 63 | |
| | | | |
Total Liabilities | | | 36,779 | |
| | | | |
Net Assets | | $ | 3,752,851 | |
| | | | |
| |
NET ASSETS: | | | | |
Paid-in capital | | $ | 2,830,222 | |
Total distributable earnings (loss) | | | 922,629 | |
| | | | |
Total Net Assets | | $ | 3,752,851 | |
| | | | |
Outstanding units of beneficial interest (shares)
($0.0001 par value; unlimited number of shares authorized): | | | 236,314 | |
Net Asset Value, offering and redemption price per share (b): | | $ | 15.88 | |
Cost of investments in non-affiliates | | $ | 2,958,841 | |
| (a) | Amount rounds to less than $500 |
| (b) | Per share amounts may not recalculate due to rounding of net assets and/or shares outstanding. |
SEE NOTES TO FINANCIAL STATEMENTS.
| | | | | | | | | | |
| | | | | |
| 24 | | | | | | | | SIX CIRCLES TRUST | | JUNE 30, 2021 |
| | | | |
| | | Six Circles
Managed
Equity Portfolio
International
Unconstrained
Fund | |
ASSETS: | | | | |
Investments in non-affiliates, at value | | $ | 1,932,197 | |
Foreign currency, at value | | | 108 | |
Deposits at broker for futures contracts | | | 2,852 | |
Prepaid expenses | | | 1 | |
Receivables: | | | | |
Investment securities sold | | | — | (a) |
Fund shares sold | | | 5,089 | |
Interest and dividends from non-affiliates | | | 1,636 | |
Tax reclaims | | | 4,926 | |
| | | | |
Total Assets | | | 1,946,809 | |
| | | | |
| |
LIABILITIES: | | | | |
Payable for reverse repurchase agreements | | | | |
Payables: | | | | |
Due to custodian—cash | | | 18 | |
Investment securities purchased | | | 8,855 | |
Fund shares redeemed | | | 650 | |
Variation margin on futures contracts | | | 298 | |
Accrued liabilities: | | | | |
Investment advisory fees | | | 76 | |
Administration fees | | | 18 | |
Custodian and accounting fees | | | 197 | |
Trustees’ fees | | | 6 | |
Registration and filing fees | | | 25 | |
Other | | | 81 | |
| | | | |
Total Liabilities | | | 10,224 | |
| | | | |
Net Assets | | $ | 1,936,585 | |
| | | | |
| |
NET ASSETS: | | | | |
Paid-in capital | | $ | 1,593,213 | |
Total distributable earnings (loss) | | | 343,372 | |
| | | | |
Total Net Assets | | $ | 1,936,585 | |
| | | | |
Outstanding units of beneficial interest (shares)
($0.0001 par value; unlimited number of shares authorized): | | | 155,189 | |
Net Asset Value, offering and redemption price per share (b): | | $ | 12.48 | |
Cost of investments in non-affiliates | | $ | 1,566,018 | |
Cost of foreign currency | | | 108 | |
| (a) | Amount rounds to less than $500 |
| (b) | Per share amounts may not recalculate due to rounding of net assets and/or shares outstanding. |
SEE NOTES TO FINANCIAL STATEMENTS.
| | | | | | | | | | |
| | | | | |
| JUNE 30, 2021 | | SIX CIRCLES TRUST | | | | | | | | 25 |
STATEMENTS OF OPERATIONS
FOR THE PERIOD ENDED JUNE 30, 2021 (Unaudited)
(Amounts in thousands)
| | | | |
| | | Six Circles
Managed
Equity Portfolio
U.S.
Unconstrained
Fund | |
INVESTMENT INCOME: | | | | |
Interest income from non-affiliates | | $ | 1 | |
Dividend income from non-affiliates | | | 19,817 | |
Foreign taxes withheld | | | (5 | ) |
| | | | |
Total investment income | | | 19,813 | |
| | | | |
| |
EXPENSES: | | | | |
Investment advisory fees | | | 3,565 | |
Administration fees | | | 77 | |
Custodian and accounting fees | | | 165 | |
Professional fees | | | 42 | |
Trustees’ fees | | | 36 | |
Printing and mailing costs | | | 4 | |
Registration and filing fees | | | 43 | |
Transfer agency fees | | | 14 | |
Interest expense (a) | | | — | |
Other | | | 5 | |
| | | | |
Total expenses | | | 3,951 | |
| | | | |
Less advisory fees waived | | | (2,996 | ) |
| | | | |
Net expenses | | | 955 | |
| | | | |
Net investment income (loss) | | | 18,858 | |
| | | | |
| |
REALIZED/UNREALIZED GAINS (LOSSES): | | | | |
Net realized gain (loss) on: | | | | |
Investments in non-affiliates | | | 89,386 | |
Futures contracts | | | 2,449 | |
| | | | |
Net realized gain (loss) | | | 91,835 | |
| | | | |
Change in net unrealized appreciation (depreciation) of:
Investments in non-affiliates | | | 327,393 | |
Futures contracts | | | 336 | |
| | | | |
Change in net unrealized appreciation (depreciation) | | | 327,729 | |
| | | | |
Net realized/unrealized gains (losses) | | | 419,564 | |
| | | | |
Change in net assets resulting from operations | | $ | 438,422 | |
| | | | |
| (a) | Amount rounds to less than $500 |
SEE NOTES TO FINANCIAL STATEMENTS.
| | | | | | | | | | |
| | | | | |
| 26 | | | | | | | | SIX CIRCLES TRUST | | JUNE 30, 2021 |
| | | | |
| | | Six Circles
Managed
Equity Portfolio
International
Unconstrained
Fund | |
INVESTMENT INCOME: | | | | |
Interest income from non-affiliates | | | - | (a) |
Dividend income from non-affiliates | | $ | 38,577 | |
Foreign taxes withheld | | | (4,314 | ) |
| | | | |
Total investment income | | | 34,263 | |
| | | | |
| |
EXPENSES: | | | | |
Investment advisory fees | | | 2,068 | |
Administration fees | | | 54 | |
Custodian and accounting fees | | | 351 | |
Professional fees | | | 58 | |
Trustees’ fees | | | 21 | |
Registration and filing fees | | | 34 | |
Transfer agency fees | | | 14 | |
Interest expense | | | 105 | |
Other | | | 5 | |
| | | | |
Total expenses | | | 2,710 | |
| | | | |
Less advisory fees waived | | | (1,664 | ) |
| | | | |
Net expenses | | | 1,046 | |
| | | | |
Net investment income (loss) | | | 33,217 | |
| | | | |
| |
REALIZED/UNREALIZED GAINS (LOSSES): | | | | |
Net realized gain (loss) on: | | | | |
Investments in non-affiliates | | | 65,045 | |
Futures contracts | | | 4,523 | |
Foreign currency transactions | | | (52 | ) |
Forward foreign currency exchange contracts | | | (46 | ) |
| | | | |
Net realized gain (loss) | | | 69,470 | |
| | | | |
Change in net unrealized appreciation (depreciation) of: | | | | |
Investments in non-affiliates | | | 97,040 | |
Futures contracts | | | (444 | ) |
Foreign currency translations | | | (957 | ) |
| | | | |
Change in net unrealized appreciation (depreciation) | | | 95,639 | |
| | | | |
Net realized/unrealized gains (losses) | | | 165,109 | |
| | | | |
Change in net assets resulting from operations | | $ | 198,326 | |
| | | | |
SEE NOTES TO FINANCIAL STATEMENTS.
| | | | | | | | | | |
| | | | | |
| JUNE 30, 2021 | | SIX CIRCLES TRUST | | | | | | | | 27 |
STATEMENTS OF CHANGES IN NET ASSETS
FOR THE PERIODS INDICATED (Unaudited)
(Amounts in thousands)
| | | | | | | | |
| | | Six Circles Managed Equity
Portfolio U.S. Unconstrained Fund | |
| | | Period Ended
June 30, 2021 | | | Year Ended
December 31,
2020 | |
CHANGE IN NET ASSETS RESULTING FROM OPERATIONS: | | | | | | | | |
Net investment income (loss) | | $ | 18,858 | | | $ | 28,886 | |
Net realized gain (loss) | | | 91,835 | | | | 28,822 | |
Change in net unrealized appreciation (depreciation) | | | 327,729 | | | | 376,202 | |
| | | | | | | | |
Change in net assets resulting from operations | | | 438,422 | | | | 433,910 | |
| | | | | | | | |
| | |
DISTRIBUTIONS TO SHAREHOLDERS: | | | | | | | | |
Distributions to shareholders | | | – | | | | (65,182 | ) |
| | |
CAPITAL TRANSACTIONS: | | | | | | | | |
Change in net assets resulting from capital transactions | | | 1,232,917 | | | | 292,159 | |
| | | | | | | | |
| | |
NET ASSETS: | | | | | | | | |
Change in net assets | | | 1,671,339 | | | | 660,887 | |
Beginning of period | | | 2,081,512 | | | | 1,420,625 | |
| | | | | | | | |
End of period | | $ | 3,752,851 | | | $ | 2,081,512 | |
| | | | | | | | |
| | |
CAPITAL TRANSACTIONS: | | | | | | | | |
Proceeds from shares issued | | $ | 1,335,502 | | | $ | 685,743 | |
Distributions reinvested | | | – | | | | 65,182 | |
Cost of shares redeemed | | | (102,585 | ) | | | (458,766 | ) |
| | | | | | | | |
Total change in net assets resulting from capital transactions | | $ | 1,232,917 | | | $ | 292,159 | |
| | | | | | | | |
| | |
SHARE TRANSACTIONS: | | | | | | | | |
Issued | | | 91,801 | | | | 58,727 | |
Reinvested | | | – | | | | 4,758 | |
Redeemed | | | (6,997 | ) | | | (41,110 | ) |
| | | | | | | | |
Change in Shares | | | 84,804 | | | | 22,375 | |
| | | | | | | | |
SEE NOTES TO FINANCIAL STATEMENTS.
| | | | | | | | | | |
| | | | | |
| 28 | | | | | | | | SIX CIRCLES TRUST | | JUNE 30, 2021 |
| | | | | | | | |
| | | Six Circles Managed Equity Portfolio
International Unconstrained Fund | |
| | | Period Ended
June 30, 2021 | | | Year Ended
December 31, 2020 | |
CHANGE IN NET ASSETS RESULTING FROM OPERATIONS: | | | | | | | | |
Net investment income (loss) | | $ | 33,217 | | | $ | 22,282 | |
Net realized gain (loss) | | | 69,470 | | | | (113,990 | ) |
Change in net unrealized appreciation (depreciation) | | | 95,639 | | | | 229,242 | |
| | | | | | | | |
Change in net assets resulting from operations | | | 198,326 | | | | 137,534 | |
| | | | | | | | |
| | |
DISTRIBUTIONS TO SHAREHOLDERS: | | | | | | | | |
Distributions to shareholders | | | – | | | | (24,506 | ) |
| | |
CAPITAL TRANSACTIONS: | | | | | | | | |
Change in net assets resulting from capital transactions | | | 349,636 | | | | 373,969 | |
| | | | | | | | |
| | |
NET ASSETS: | | | | | | | | |
Change in net assets | | | 547,962 | | | | 486,997 | |
Beginning of period | | | 1,388,623 | | | | 901,626 | |
| | | | | | | | |
End of period | | $ | 1,936,585 | | | $ | 1,388,623 | |
| | | | | | | | |
| | |
CAPITAL TRANSACTIONS: | | | | | | | | |
Proceeds from shares issued | | $ | 419,607 | | | $ | 688,801 | |
Distributions reinvested | | | – | | | | 24,506 | |
Cost of shares redeemed | | | (69,971 | ) | | | (339,338 | ) |
| | | | | | | | |
Total change in net assets resulting from capital transactions | | $ | 349,636 | | | $ | 373,969 | |
| | | | | | | | |
| | |
SHARE TRANSACTIONS: | | | | | | | | |
Issued | | | 35,217 | | | | 75,174 | |
Reinvested | | | – | | | | 2,236 | |
Redeemed | | | (5,948 | ) | | | (39,169 | ) |
| | | | | | | | |
Change in Shares | | | 29,269 | | | | 38,241 | |
| | | | | | | | |
SEE NOTES TO FINANCIAL STATEMENTS.
| | | | | | | | | | |
| | | | | |
| JUNE 30, 2021 | | SIX CIRCLES TRUST | | | | | | | | 29 |
FINANCIAL HIGHLIGHTS
FOR THE PERIODS INDICATED
| | | | | | | | | | | | | | | | | | | | | | | | | | | | |
| | | Per share operating performance | |
| | | | | | Investment operations | | | Distributions | |
| | | Net asset
value,
beginning
of period | | | Net
investment
income
(loss) (b) | | | Net realized
and unrealized
gains
(losses) on
investments
and foreign
currency
transactions | | | Total from
investment
operations | �� | | Net
investment
income | | | Net
realized
gain | | | Total
distributions | |
| |
Six Circles Managed Equity Portfolio U.S. Unconstrained Fund | | | | | |
Six Months Ended June 30, 2021 (Unaudited) | | $ | 13.74 | | | $ | 0.10 | | | $ | 2.04 | | | $ | 2.14 | | | $ | – | | | $ | – | | | $ | – | |
Year Ended December, 2020 | | | 11.00 | | | | 0.21 | | | | 2.99 | | | | 3.20 | | | | (0.20 | ) | | | (0.26 | ) | | | (0.46 | ) |
Period Ended December 31, 2019* | | | 10.00 | | | | 0.14 | | | | 1.05 | | | | 1.19 | | | | (0.12 | ) | | | (0.07 | ) | | | (0.19 | ) |
| * | Six Circles Managed Equity Portfolio U.S. Unconstrained Fund was launched on April 10, 2019. |
| (a) | Certain expenses incurred by the Fund were not annualized for the period. |
| (b) | Calculated based upon average shares outstanding. |
| (c) | Not annualized for periods less than one year. |
| (d) | Includes adjustments in accordance with accounting principles generally accepted in the United States of America and as such, the net asset values for financial reporting purposes and the returns based upon those net asset values may differ from the net asset values and returns for shareholder transactions. |
| (e) | Includes interest expense, if applicable, which is less than 0.005% unless otherwise noted. |
SEE NOTES TO FINANCIAL STATEMENTS.
| | | | | | |
| | | |
| 30 | | | | SIX CIRCLES TRUST | | DECEMBER 31, 2020 |
| | | | | | | | | | | | | | | | | | | | | | | | | | |
| | | Ratios/Supplemental data | |
| | | | | | | | | | Ratios to average net assets (a) | |
Net asset
value,
end of
period | | | Total
return (c)(d) | | | Net assets,
end of
period (000’s) | | | Net expenses (e) | | | Net
investment
income
(loss) | | | Expenses
without waivers
and reimbursements | | | Portfolio
turnover
rate (c) | |
| | | | | | |
| | | | | | | | | | | | | | | | | | | | | | | | | | | |
| $ | 15.88 | | | | 15.57 | % | | $ | 3,752,851 | | | | 0.07 | % | | | 1.32 | % | | | 0.28 | % | | | 13.94 | % |
| | 13.74 | | | | 29.09 | | | | 2,081,512 | | | | 0.09 | | | | 1.79 | | | | 0.30 | | | | 54.88 | |
| | 11.00 | | | | 11.90 | | | | 1,420,625 | | | | 0.11 | | | | 1.94 | | | | 0.33 | | | | 44.20 | |
SEE NOTES TO FINANCIAL STATEMENTS.
| | | | | | | | |
| | | |
| DECEMBER 31, 2020 | | SIX CIRCLES TRUST | | | | | 31 | |
FINANCIAL HIGHLIGHTS
FOR THE PERIODS INDICATED (continued)
| | | | | | | | | | | | | | | | | | | | | | | | | | | | |
| | | Per share operating performance: | |
| | | | | | Investment operations | | | Distributions | |
| | | Net asset
value,
beginning
of period | | | Net
investment
income
(loss) (b) | | | Net realized
and unrealized
gains
(losses) on
investments
and foreign
currency
transactions | | | Total from
investment
operations | | | Net
investment
income | | | Net
realized
gain | | | Total
distributions | |
| | | | | |
Six Circles Managed Equity Portfolio International Unconstrained Fund | | | | | | | | | | | | | | | | | | | | | |
Six Months Ended June 30, 2021 (Unaudited) | | $ | 11.03 | | | $ | 0.24 | | | $ | 1.21 | | | $ | 1.45 | | | $ | — | | | $ | — | | | $ | — | |
Year Ended December, 2020 | | | 10.28 | | | | 0.21 | | | | 0.74 | | | | 0.95 | | | | (0.20 | ) | | | — | | | | (0.20 | ) |
Period Ended December 31, 2019* | | | 10.00 | | | | 0.20 | | | | 0.24 | | | | 0.44 | | | | (0.16 | ) | | | — | | | | (0.16 | ) |
| * | Six Circles Managed Equity Portfolio International Unconstrained Fund was launched on April 10, 2019. |
| (a) | Certain expenses incurred by the Fund were not annualized for the period. |
| (b) | Calculated based upon average shares outstanding. |
| (c) | Not annualized for periods less than one year. |
| (d) | Includes adjustments in accordance with accounting principles generally accepted in the United States of America and as such, the net asset values for financial reporting purposes and the returns based upon those net asset values may differ from the net asset values and returns for shareholder transactions. |
| (e) | Includes interest expense, if applicable, which is less than 0.005% unless otherwise noted. |
SEE NOTES TO FINANCIAL STATEMENTS.
| | | | | | |
| | | |
| 32 | | | | SIX CIRCLES TRUST | | DECEMBER 31, 2020 |
| | | | | | | | | | | | | | | | | | | | | | | | | | | | | | |
| | | Ratios/Supplemental data | |
| | | | | | | | | | Ratios to average net assets (a) | | | | |
Net asset
value,
end of
period | | | Total
return (c)(d) | | | Net assets,
end of
period (000’s) | | | Net
expenses,
with
interest
expense | | | Net
expenses,
without
interest
expense | | | Net
investment
income
(loss) | | | Expenses
without waivers
and reimbursements | | | Portfolio
turnover
rate (c) | |
| | | | | | | |
| | | | | | | | | | | | | | | | | | | | | | | | | | | | | | | |
| $ | 12.48 | | | | 13.15 | % | | $ | 1,936,585 | | | | 0.12 | % | | | 0.11 | % | | | 4.02 | % | | | 0.32 | % | | | 23.92 | % |
| | 11.03 | | | | 9.25 | | | | 1,388,623 | | | | 0.20 | | | | 0.19 | | | | 2.22 | | | | 0.40 | | | | 91.56 | |
| | 10.28 | | | | 4.41 | | | | 901,626 | | | | 0.26 | (e) | | | 0.26 | | | | 2.86 | | | | 0.48 | | | | 62.67 | |
SEE NOTES TO FINANCIAL STATEMENTS.
| | | | | | | | |
| | | |
| DECEMBER 31, 2020 | | SIX CIRCLES TRUST | | | | | 33 | |
NOTES TO FINANCIAL STATEMENTS
AS OF JUNE 30, 2021 (Unaudited)
1. Organization
Six Circles Trust (the “Trust”) was formed on November 8, 2017, as a Delaware statutory trust, pursuant to a Declaration of Trust dated November 8, 2017, as amended and restated June 12, 2018, and further amended to add fund series on September 21, 2018, November 19, 2019, and April 13, 2020, and is registered under the Investment Company Act of 1940, as amended (the “1940 Act”), as an open-end management investment company.
Six Circles Managed Equity Portfolio U.S. Unconstrained Fund and Six Circles Managed Equity Portfolio International Unconstrained Fund are two separate series of the Trust (each, a “Fund” and collectively, the “Funds”) covered by this report. The Funds are classified as “non-diversified” funds. Each Fund currently offers one class of shares. The Funds commenced operations on April 10, 2019.
The investment objective of each of the Six Circles Managed Equity Portfolio U.S. Unconstrained Fund and Six Circles Managed Equity Portfolio International Unconstrained Fund is to provide capital appreciation.
J.P. Morgan Private Investments Inc. (“JPMPI”), an indirect, wholly-owned subsidiary of JPMorgan Chase & Co. (“JPMorgan”), acts as the Funds’ investment adviser (the “Adviser”). The Adviser has engaged a Sub-Adviser to manage the assets of the Funds.
2. Significant Accounting Policies
The following is a summary of significant accounting policies followed by the Funds in the preparation of their financial statements. The Funds are investment companies and, accordingly, follow the investment company accounting and reporting guidance of the Financial Accounting Standards Board (“FASB”) Accounting Standards Codification Topic 946 — Investment Companies, which is part of U.S. generally accepted accounting principles (“GAAP”). The preparation of financial statements in conformity with GAAP requires management to make estimates and assumptions that affect the reported amounts of assets and liabilities and disclosure of contingent assets and liabilities at the date of the financial statements and the reported amounts of increases and decreases in net assets from operations during the reporting period. Actual results could differ from those estimates.
A. Valuation of Investments — The valuation of investments is in accordance with GAAP and the Funds’ valuation policies set forth by and under the supervision and responsibility of the Board of Trustees (the “Board”), which established the following approach to valuation, as described more fully below: (i) investments for which market quotations are readily available shall be valued at unadjusted quoted prices and (ii) all other investments for which market quotations are not readily available shall be valued at their fair value as determined in good faith by the Board.
The Board has appointed the Six Circles Funds Valuation Committee (“VC”), comprised of officers of the Funds and other personnel of the Adviser, to assist the Board with the oversight and monitoring of the valuation of the Funds’ investments. The VC oversees and carries out policies and procedures for the valuation of investments held by the Funds. This includes monitoring the appropriateness of fair values based on results of ongoing valuation oversight including, but not limited to, consideration of macro or security specific events, market events and pricing vendor due diligence. The VC, through the Adviser, is responsible for assessing the potential impacts to the fair values on an ongoing basis, and discussing this on at least a quarterly basis with the Board.
A market-based approach is primarily used to value the Funds’ investments for which market quotations are readily available and which are generally valued at their current market value. Other securities and assets, including securities for which market quotations are not readily available, market quotations are determined not to be reliable, or whose value has been materially affected by events occurring after the close of trading on the exchange or market on which the security is principally traded but before a Fund’s net asset value (“NAV”) is calculated, are valued by approved pricing vendors or third party broker-dealers (collectively referred to as “Pricing Services”) or may be internally fair valued using methods set forth by the valuation policies approved by the Board. The valuation may include related or comparable assets or liabilities, recent transactions, market multiples, book values and other relevant information for the investment in order to determine the fair value of the investment. An income-based valuation approach may be used in which the anticipated future cash flows of the investment are discounted to calculate the fair value. Discounts may be applied due to the nature or duration of any restrictions on the disposition of the investments. Valuations may be based on current market prices of securities that are comparable in coupon, rating, maturity and industry. It is possible that the estimated values may differ significantly from the values that would have been used, had a ready market for the investments existed, and such differences could be material.
Equity securities listed on a North American, Central American, South American or Caribbean (“Americas”) securities exchange are generally valued at the last sale price or official market closing price on the primary exchange on which the security is principally traded that is reported before the time when the net assets values of the Funds are calculated on a valuation date. The Funds calculate their NAV as of 4 p.m. Eastern time each day the New York Stock Exchange (NYSE) is open for trading.
Foreign equity securities are valued as of the close of trading on the stock exchange on which the security is primarily traded, or as of 4 p.m. Eastern time. The value is then converted into its U.S. dollar equivalent at the foreign exchange rate in effect at 4 p.m. Eastern time on the day that the value of the security is determined. Generally, foreign equity securities, as well as certain derivatives with equity reference obligations, are valued by applying international fair value factors provided by approved Pricing Services.
The factors seek to adjust the local closing price for movements of local markets post-closing, but prior to the time the NAVs are calculated. The fair valued securities are converted at the exchange rates available at 4 p.m. Eastern time.
Fixed income securities are valued based on prices received from Pricing Services. In instances where sufficient market activity exists, the Pricing Services may utilize a market-based approach through which trades or quotes from market makers are used to determine the valuation of these instruments. In instances where sufficient market activity may not exist, Pricing Services may consider a variety of inputs and factors, including, but
| | | | | | |
| | | |
| 34 | | | | SIX CIRCLES TRUST | | JUNE 30, 2021 |
not limited to proprietary models that may take into account market transactions in securities with comparable characteristics, yield curves, option-adjusted spreads, credit spreads, estimated default rates, coupon rates, underlying collateral and estimated cash flows.
Pricing services generally value fixed-income securities assuming orderly transactions of an institutional round lot size, but a fund may hold or transact in such securities in smaller, odd lot sizes. Odd lots may trade at lower prices than institutional round lots.
Shares of exchange-traded funds (“ETFs”) are generally valued at the last sale price on the exchange on which the ETF is principally traded. Shares of open-end investment companies are valued at their respective NAVs.
Futures are generally valued on the basis of available market quotations. Forward foreign currency exchange contracts are valued utilizing market quotations from approved Pricing Services.
Valuations reflected in this report are as of the report date. As a result, changes in valuation due to market events and/or issuer related events after the report date and prior to issuance of the report are not reflected herein.
The various inputs that are used in determining the valuation of the Funds’ investments are summarized into the three broad levels listed below.
| • | | Level 1 — Unadjusted inputs using quoted prices in active markets for identical investments. |
| • | | Level 2 — Other significant observable inputs including, but not limited to, quoted prices for similar investments, inputs other than quoted prices that are observable for investments (such as interest rates, prepayment speeds, credit risk, etc.) or other market corroborated inputs. |
| • | | Level 3 — Significant inputs based on the best information available in the circumstances, to the extent observable inputs are not available (including the Funds’ assumptions in determining the fair value of investments). |
A financial instrument’s level within the fair value hierarchy is based on the lowest level of any input, both individually and in the aggregate, that is significant to the fair value measurement. The inputs or methodology used for valuing instruments are not necessarily an indication of the risk associated with investing in those instruments.
The following tables represent each valuation input as presented on the Schedules of Portfolio Investments (“SOIs”) (amounts in thousands):
Six Circles Managed Equity Portfolio U.S. Unconstrained Fund
| | | | | | | | | | | | | | | | |
| | | Level 1 Quoted prices | | | Level 2 Other significant
observable inputs | | | Level 3 Significant
unobservable inputs | | | Total | |
Investments in Securities | | | | | | | | | | | | | | | | |
Common Stocks | | | | | | | | | | | | | | | | |
Basic Materials | | $ | 19,653 | | | $ | — | | | $ | — | | | $ | 19,653 | |
Communications | | | 866,697 | | | | — | | | | — | | | | 866,697 | |
Consumer Cyclical | | | 189,345 | | | | — | | | | — | | | | 189,345 | |
Consumer Non-cyclical | | | 863,399 | | | | — | | | | — | | | | 863,399 | |
Energy | | | 29,010 | | | | — | | | | — | | | | 29,010 | |
Financial | | | 149,753 | | | | — | | | | — | | | | 149,753 | |
Industrial | | | 349,765 | | | | — | | | | — | | | | 349,765 | |
Technology | | | 1,222,819 | | | | — | | | | — | | | | 1,222,819 | |
Utilities | | | 22,338 | | | | — | | | | — | | | | 22,338 | |
| | | | | | | | | | | | | | | | |
Total Common Stocks | | | 3,712,779 | | | | — | | | | — | | | | 3,712,779 | |
| | | | | | | | | | | | | | | | |
Short-Term Investments | | | | | | | | | | | | | | | | |
Time Deposits | | | — | | | | 62,998 | | | | — | | | | 62,998 | |
| | | | | | | | | | | | | | | | |
Total Investments in Securities | | $ | 3,712,779 | | | $ | 62,998 | | | $ | — | | | $ | 3,775,777 | |
| | | | | | | | | | | | | | | | |
Appreciation in Other Financial Instruments | | | | | | | | | | | | | | | | |
Futures contracts | | $ | 594 | | | $ | — | | | $ | — | | | $ | 594 | |
| | | | | | | | | | | | | | | | |
Depreciation in Other Financial Instruments | | | | | | | | | | | | | | | | |
Futures contracts | | $ | (3 | ) | | $ | — | | | $ | — | | | $ | (3 | ) |
| | | | | | | | | | | | | | | | |
| | | | | | | | | | |
| | | | | |
| JUNE 30, 2021 | | SIX CIRCLES TRUST | | | | | | | | 35 |
NOTES TO FINANCIAL STATEMENTS
AS OF JUNE 30, 2021 (Unaudited) (continued)
Six Circles Managed Equity Portfolio International Unconstrained Fund
| | | | | | | | | | | | | | | | |
| | | Level 1 Quoted prices | | | Level 2 Other significant
observable inputs | | | Level 3
Significant
unobservable inputs | | | Total | |
Investments in Securities | | | | | | | | | | | | | | | | |
Common Stocks | | | | | | | | | | | | | | | | |
Australia | | $ | — | | | $ | 22,462 | | | $ | — | | | $ | 22,462 | |
Austria | | | — | | | | 9,674 | | | | — | | | | 9,674 | |
Belgium | | | — | | | | 54,055 | | | | — | | | | 54,055 | |
Chile | | | — | | | | 2,818 | | | | — | | | | 2,818 | |
Denmark | | | — | | | | 95,076 | | | | — | | | | 95,076 | |
Finland | | | — | | | | 28,388 | | | | — | | | | 28,388 | |
France | | | — | | | | 237,611 | | | | — | | | | 237,611 | |
Germany | | | 1,148 | | | | 201,071 | | | | — | | | | 202,219 | |
Ireland | | | — | | | | 9,602 | | | | — | | | | 9,602 | |
Italy | | | — | | | | 97,563 | | | | — | | | | 97,563 | |
Jordan | | | — | | | | 1,836 | | | | — | | | | 1,836 | |
Luxembourg | | | — | | | | 7,932 | | | | — | | | | 7,932 | |
Netherlands | | | — | | | | 206,001 | | | | — | | | | 206,001 | |
Norway | | | — | | | | 13,319 | | | | — | | | | 13,319 | |
Poland | | | 662 | | | | — | | | | — | | | | 662 | |
Portugal | | | 6,950 | | | | 982 | | | | — | | | | 7,932 | |
South Korea | | | — | | | | 36,200 | | | | — | | | | 36,200 | |
Spain | | | 3,050 | | | | 87,084 | | | | — | | | | 90,134 | |
Sweden | | | — | | | | 77,185 | | | | — | | | | 77,185 | |
Switzerland | | | — | | | | 271,503 | | | | — | | | | 271,503 | |
United Arab Emirates | | | — | | | | — | | | | — | | | | — | |
United Kingdom | | | 7,883 | | | | 378,196 | | | | — | | | | 386,079 | |
| | | | | | | | | | | | | | | | |
Total Common Stocks | | | 19,693 | | | | 1,838,558 | | | | — | | | | 1,858,251 | |
| | | | | | | | | | | | | | | | |
Preferred Stocks | | | | | | | | | | | | | | | | |
Germany | | | — | | | | 16,944 | | | | — | | | | 16,944 | |
South Korea | | | — | | | | 5,702 | | | | — | | | | 5,702 | |
| | | | | | | | | | | | | | | | |
Total Preferred Stocks | | | — | | | | 22,646 | | | | — | | | | 22,646 | |
| | | | | | | | | | | | | | | | |
Right | | | | | | | | | | | | | | | | |
Spain | | | 53 | | | | — | | | | — | | | | 53 | |
| | | | | | | | | | | | | | | | |
Short-Term Investments | | | | | | | | | | | | | | | | |
Time Deposits | | | — | | | | 51,247 | | | | — | | | | 51,247 | |
| | | | | | | | | | | | | | | | |
Total Investments in Securities | | $ | 19,746 | | | $ | 1,912,451 | | | $ | — | | | $ | 1,932,197 | |
| | | | | | | | | | | | | | | | |
Depreciation in Other Financial Instruments | | | | | | | | | | | | | | | | |
Futures contracts | | $ | (399 | ) | | $ | — | | | $ | — | | | $ | (399 | ) |
| | | | | | | | | | | | | | | | |
B. Restricted Securities — Certain securities held by the Funds may be subject to legal or contractual restrictions on resale. Restricted securities generally are resold in transactions exempt from registration under the Securities Act of 1933 (the “Securities Act”). Disposal of these securities may involve time-consuming negotiations and expense. Prompt sale at the current valuation may be difficult and could adversely affect the net asset value of the Funds.
As of June 30, 2021, the Funds had no investments in restricted securities other than securities sold to the Funds under Rule 144A or Regulation S under the Securities Act.
C. Derivatives — The Funds used derivative instruments including futures, in connection with their respective investment strategies. Derivative instruments may be used as substitutes for securities in which the Funds can invest, to hedge portfolio investments or to generate income or gain to the Funds. Derivatives may also be used to manage duration, sector and yield curve exposures as well as credit and spread volatility.
The Funds may be subject to various risks from the use of derivatives including the risk that changes in the value of a derivative may not correlate perfectly with the underlying asset, rate or index; counterparty credit risk related to derivatives counterparties’ failure to perform under contract terms; liquidity risk related to the lack of a liquid market for these contracts allowing a Fund to close out its position(s); and documentation risk relating to disagreement over contract terms. Investing in certain derivatives also results in a form of leverage and as such, the Funds’ risk of loss associated with these instruments may exceed their value, as recorded on the Statements of Assets and Liabilities.
| | | | | | | | | | |
| | | | | |
| 36 | | | | | | | | SIX CIRCLES TRUST | | JUNE 30, 2021 |
The Funds are party to various derivative contracts governed by International Swaps and Derivatives Association master agreements (“ISDA agreements”). The Funds’ ISDA agreements, which are separately negotiated by the Sub-Advisers, with each dealer counterparty, may contain provisions allowing, absent other considerations, a counterparty to exercise rights, to the extent not otherwise waived, against the Funds in the event the Funds’ net assets decline over time by a pre-determined percentage or fall below a pre-determined floor. The ISDA agreements may also contain provisions allowing, absent other conditions, the Funds to exercise rights, to the extent not otherwise waived, against a counterparty (e.g., decline in a counterparty’s credit rating below a specified level). Such rights for both a counterparty and the Funds often include the ability to terminate (i.e., close out) open contracts at prices which may favor a counterparty, which could have an adverse effect on the Funds. The ISDA agreements give the Funds and a counterparty the right, upon an event of default, to close out all transactions traded under such agreements and to net amounts owed or due across all transactions and offset such net payable or receivable with collateral posted to a segregated account by one party to the other.
Counterparty credit risk may be mitigated to the extent a counterparty posts collateral for mark to market gains to the Fund.
Note C(1) – C(2) below describe the various derivatives used by the Funds.
(1) Futures Contracts — The Funds used index futures to gain or reduce exposure to certain countries or regions, to maintain liquidity or minimize transaction costs.
Futures contracts may provide for the delayed delivery of the underlying instrument at a fixed price or are settled for a cash amount based on the change in the value of the underlying instrument at a specific date in the future. Upon entering into a futures contract, the Funds are required to deposit with the broker, cash or securities in an amount equal to a certain percentage of the contract amount, which is referred to as the initial margin deposit.
Subsequent payments, referred to as variation margin, are made or received by the Funds periodically and are based on changes in the market value of open futures contracts. Changes in the market value of open futures contracts are recorded as Change in net unrealized appreciation/depreciation on the Statements of Operations. Realized gains or losses, representing the difference between the value of the contract at the time it was opened and the value at the time it was closed, are reported on the Statements of Operations at the closing or expiration of the futures contract. Securities deposited as initial margin are designated on the SOIs and cash deposited is recorded on the Statements of Assets and Liabilities. A receivable from and/or a payable to brokers for the daily variation margin is also recorded on the Statements of Assets and Liabilities. Futures contracts outstanding at period end, if any, are listed after each Fund’s SOI.
The use of futures contracts may expose the Funds to equity price risk. The Funds may be subject to the risk that the change in the value of the futures contract may not correlate perfectly with the underlying instrument. Use of long futures contracts subjects the Funds to risk of loss in excess of the amounts shown on the Statements of Assets and Liabilities, up to the notional amount of the futures contracts. Use of short futures contracts subjects the Funds to unlimited risk of loss. The Funds may enter into futures contracts only on exchanges or boards of trade. The exchange or board of trade acts as the counterparty to each futures transaction; therefore, the Funds credit risk is limited to failure of the exchange or board of trade.
Under some circumstances, futures exchanges may establish daily limits on the amount that the price of a futures contract can vary from the previous day’s settlement price, which could effectively prevent the liquidation of positions.
The Funds’ futures contracts are not subject to master netting arrangements (the right to close out all transactions traded with a counterparty and net amounts owed or due across transactions).
(2) Forward Foreign Currency Exchange Contracts — The Funds may be exposed to foreign currency risks associated with some or all of the portfolio investments and used forward foreign currency exchange contracts to hedge or manage certain of these exposures as part of an investment strategy. The Funds also bought forward foreign currency exchange contracts to gain exposure to currencies. Forward foreign currency exchange contracts represent obligations to purchase or sell foreign currency on a specified future date at a price fixed at the time the contracts are entered into. Non-deliverable forward foreign currency exchange contracts are settled with the counterparty in U.S. Dollars without the delivery of foreign currency. Forward contracts outstanding at period end, if any, are listed after each Fund’s SOI.
The values of the forward foreign currency exchange contracts are adjusted daily based on the applicable exchange rate of the underlying currency. Changes in the value of these contracts are recorded as unrealized appreciation/depreciation until the contract settlement date. When the forward foreign currency exchange contract is closed, the Fund records a realized gain or loss equal to the difference between the value at the time the contract was opened and the value at the time it was closed. The Fund also records a realized gain or loss when a forward foreign currency exchange contract offsets another forward foreign currency exchange contract with the same counterparty upon settlement.
The Funds’ forward foreign currency exchange contracts may be subject to master netting arrangements (the right to close out all transactions with a counterparty and net amounts owed or due across transactions). The Funds may be required to post or receive collateral for non-deliverable forward foreign currency exchange contracts. As of June 30, 2021, the Funds did not receive or post collateral for forward foreign currency exchange contracts.
| | | | | | | | | | |
| | | | | |
| JUNE 30, 2021 | | SIX CIRCLES TRUST | | | | | | | | 37 |
NOTES TO FINANCIAL STATEMENTS
AS OF JUNE 30, 2021 (Unaudited) (continued)
(3) Summary of Derivatives Information
The following tables present the value of derivatives held as of June 30, 2021, by their primary underlying risk exposure and respective location on the Statements of Assets and Liabilities (amounts in thousands):
Six Circles Managed Equity Portfolio U.S. Unconstrained Fund
| | | | | | |
| Derivative Contracts | | Statements of Assets and Liabilities Location | |
| Gross Assets: | | | | Futures
Contracts | |
Equity contracts | | Receivables, Net Assets — Unrealized Appreciation | | $ | 594 | |
| | | | | | |
| | |
Gross Liabilities: | | | | | |
Equity contracts | | Payables, Net Assets — Unrealized Depreciation | | $ | (3 | ) |
| | | | | | |
Six Circles Managed Equity Portfolio International Unconstrained
| | | | | | |
| Derivative Contracts | | Statements of Assets and Liabilities Location | |
| Gross Liabilities: | | | | Futures Contracts | |
Equity contracts | | Payables, Net Assets — Unrealized Depreciation | | $ | (399 | ) |
| | | | | | |
| (a) | This amount represents the cumulative appreciation (depreciation) of futures contracts as reported on the SOIs. |
| | The Statements of Assets and Liabilities only reflect the current day variation margin receivable/payable from/to brokers. |
The following tables present the effect of derivatives on the Statements of Operations for the period ended June 30, 2021, by primary underlying risk exposure (amounts in thousands):
Six Circles Managed Equity Portfolio U.S. Unconstrained Fund
| | | | |
| Amount of Realized Gain (Loss) on Derivatives Recognized on the Statements of Operations | |
| Derivative Contracts | | Futures
Contracts | |
Equity contracts | | $ | 2,449 | |
| | | | |
| | | | |
Amount of Change in Unrealized Appreciation (Depreciation) on Derivatives Recognized on the Statements of Operations | |
| Derivative Contracts | | Futures
Contracts | |
Equity contracts | | $ | 336 | |
| | | | |
Six Circles Managed Equity Portfolio International Unconstrained
| | | | | | | | | | | | |
| Amount of Realized Gain (Loss) on Derivatives Recognized on the Statements of Operations | |
| Derivative Contracts | | Futures Contracts | | | Forward Foreign Currency Exchange Contracts | | | Total | |
Equity contracts | | $ | 4,523 | | | $ | – | | | $ | 4,523 | |
Foreign exchange contracts | | | – | | | | (46 | ) | | | (46 | ) |
| | | | | | | | | | | | |
Total | | $ | 4,523 | | | $ | (46 | ) | | $ | 4,477 | |
| | | | | | | | | | | | |
| | | | |
Amount of Change in Unrealized Appreciation (Depreciation) on Derivatives Recognized on the Statements of Operations | |
| Derivative Contracts | | Futures
Contracts | |
Equity contracts | | $ | (444 | ) |
| | | | |
| | | | | | | | | | |
| | | | | |
| 38 | | | | | | | | SIX CIRCLES TRUST | | JUNE 30, 2021 |
Derivatives Volume
The tables below disclose the volume of the Funds’ options, futures contracts, forward foreign currency exchange contracts and swaps activity during the period ended June 30, 2021 (amounts in thousands, except number of contracts). Please refer to the tables in the Summary of Derivative Information for derivative-related gains and losses associated with volume activity (amounts in thousands).
| | | | | | | | |
| | | Six Circles Managed
Equity Portfolio U.S.
Unconstrained��Fund | | | Six Circles Managed
Equity Portfolio
International
Unconstrained | |
Futures Contracts: | | | | | | | | |
Average Notional Amount Long | | $ | 21,614 | | | $ | 32,191 | |
Average Notional Amount Short | | | – | | | | – | |
Forward Foreign Currency Exchange: | | | | | | | | |
Average Principal Amount Purchased | | | – | | | | 2,196 | (a) |
Average Principal Amount Sold | | | – | | | | 473 | (b) |
| (a) | Positions were open for 1 month during the period. |
| (b) | Positions were open for 2 months during the period. |
D. Foreign Currency Translation — The books and records of the Funds are maintained in U.S. dollars. Foreign currency amounts are translated into U.S. dollars at the prevailing exchange rates of such currencies against the U.S. dollar. The market value of investment securities and other assets and liabilities are translated at the exchange rate as of the valuation date. Purchases and sales of investment securities, income and expenses are translated at the exchange rate prevailing on the respective dates of such transactions.
The Funds do not isolate the effect of changes in foreign exchange rates from changes in market prices on securities held. Accordingly, such changes are included within the Change in net unrealized appreciation/depreciation on investments on the Statements of Operations.
Reported realized foreign currency gains and losses arise from the disposition of foreign currency. Currency gains or losses may be realized between the trade and settlement dates on securities transactions, and the difference between the amounts of dividends, interest and foreign withholding taxes recorded on each Fund’s books on the transaction date and the U.S. dollar equivalent of the amounts actually received or paid. These reported realized foreign currency gains and losses are included in Net realized gain (loss) on foreign currency transactions on the Statements of Operations. Unrealized foreign currency gains and losses arise from changes (due to changes in exchange rates) in the value of foreign currency and other assets and liabilities denominated in foreign currencies, which are held at period end and are included in Change in net unrealized appreciation/depreciation on foreign currency translations on the Statements of Operations.
E. Security Transactions, Investment Income and Expense Allocation — Securities transactions are recorded on a trade date basis. Realized gain and loss from securities transactions are recorded on an identified cost basis for financial reporting and federal income tax purposes. Interest income is determined on the basis of coupon interest accrued using the effective interest method which adjusts for amortization of premiums and accretion of discounts. Dividend income, net of foreign taxes withheld, if any, is recorded on the ex-dividend date or when the Fund first learns of the dividend. Non-cash dividends, if any, are recorded on the ex-dividend date or corporate action date at fair value. Coupon payments are based on the adjusted principal at the time the interest is paid. Distributions received from certain investments held by the Funds may be comprised of dividends, realized gains and returns of capital. The Funds originally estimate the expected classification of such payments. The amounts may subsequently be reclassified upon receipt of information from the issuer.
The Funds are charged for those expenses of the Trust that are directly attributable to each Fund. Expenses that are not directly attributable to a Fund are typically allocated among the Funds in proportion to their respective net assets.
F. Federal Income Tax — Each Fund is treated as a separate taxable entity for Federal income tax purposes. Each Fund’s policy is to comply with the provisions of Subchapter M of the Internal Revenue Code of 1986, as amended (the “Code”) applicable to regulated investment companies. Each Fund intends to distribute to shareholders, substantially all of its distributable net investment income and net realized capital gains on investments. Accordingly, no provision for Federal income tax is necessary.
The Funds follow the provisions of FASB Codification Section 740 (“ASC Section 740”) “Accounting for Uncertainty in Income Taxes” which clarifies the accounting for uncertainty in tax positions taken or expected to be taken on a tax return. ASC Section 740 sets forth a threshold for financial statement recognition, measurement and disclosure of tax positions taken or expected to be taken on a tax return. The Funds are required to recognize the tax effects of certain tax positions under a “more likely than not” standard, that based on their technical merits, have more than 50 percent likelihood of being sustained upon examination. Management has analyzed the tax positions taken on the Funds’ federal income tax returns for all open periods, and has concluded that no provision for federal income tax is required in the Funds’ financial statements. At June 30, 2021, the Funds did not have any uncertain tax benefits that require recognition, de-recognition or disclosure. The Funds’ federal, state and local income and federal excise tax returns for which the applicable statutes of limitations have not expired are subject to examination by the Internal Revenue Service and state departments of revenue.
| | | | | | | | | | |
| | | | | |
| JUNE 30, 2021 | | SIX CIRCLES TRUST | | | | | | | | 39 |
NOTES TO FINANCIAL STATEMENTS
AS OF JUNE 30, 2021 (Unaudited) (continued)
G. Foreign Tax — The Funds may be subject to foreign taxes on income, gains on investments or currency purchases/repatriation, a portion of which may be recoverable. The Funds will accrue such taxes and recoveries as applicable, based upon its current interpretation of tax rules and regulations that exist in the markets in which it invests. When capital gain tax is determined to apply, the Funds record an estimated deferred tax liability in an amount that would be payable if the securities were disposed of on the valuation date.
H. Distributions to Shareholders — Distributions to shareholders are recorded on the ex-dividend date. Distributions from net investment income and net realized capital gains are generally declared and paid according to the following schedule:
| | | | | | | | |
| Fund Name | | Net Investment Income | | | Net Realized Capital Gains | |
Six Circles Managed Equity Portfolio U.S. Unconstrained Fund | | | Annual | | | | Annual | |
Six Circles Managed Equity Portfolio International Unconstrained Fund | | | Annual | | | | Annual | |
Income and capital gain distributions will be determined in accordance with federal income tax regulations which may differ from GAAP. Differences may be permanent or temporary. Permanent differences are reclassified among capital accounts in the financial statements to reflect their tax character.
Temporary differences arise when certain items of income, expense, gain, or loss are recognized in different periods for financial statement and tax purposes. These differences will reverse at some time in the future. Differences in classification may also result from the treatment of short-term gains as ordinary income for tax purposes. As a result, income dividends and capital gain distributions declared during a fiscal period may differ significantly from the net investment income (loss) and realized gain (loss) reported on the Fund financial statements presented under GAAP.
Distributions classified as a tax basis return of capital, if any, are reflected on the Statement of Changes in Net Assets and have been recorded to paid-in capital.
3. Fees and Other Transactions with Affiliates
A. Investment Advisory Fees — The Adviser serves as the Funds’ investment adviser pursuant to an investment advisory agreement (the “Investment Advisory Agreement”). Under the terms of the Investment Advisory Agreement, the Adviser generally manages the Funds’ investments in accordance with the stated policies of each Fund, subject to the supervision of the Funds’ Board of Trustees. For the services provided to the Funds, the Adviser is entitled to a fee, accrued daily and paid monthly, at the annual rate of 0.25% of the average daily net assets of each Fund.
The Adviser selects and oversees professional money managers (the “Sub-Advisers”) who are responsible for investing the assets of the Funds under sub-advisory agreements (the “Sub-Advisory Agreements”). Pursuant to each respective Sub-Advisory Agreement, the Adviser agrees to pay each Sub-Adviser a sub-advisory fee from its investment advisory fees. BlackRock Investment Management, LLC (“BlackRock”) currently serves as the Sub-Adviser to the Funds. The Sub-Adviser is paid a management fee by the Adviser pursuant to their individually negotiated Sub-Advisory Agreement.
The Adviser engaged Russell Investments Implementation Services, LLC (“Russell”) to provide stand-by interim sub-advisory services, as well as transition management services, for each Fund, to be utilized as needed in certain transitional circumstances involving a Fund Sub-Adviser. During the reporting period, the Funds have not allocated assets to Russell.
The Adviser waived Investment Advisory fees and/or reimbursed expenses as outlined in Note 3G and reflected on the Statement of Operations.
B. Administration and Accounting Fees — Pursuant to an Administrative Agency Agreement, Brown Brothers Harriman & Co. (the “Administrator”) provides certain administration and fund accounting services to the Funds.
C. Distribution Fees — Pursuant to a Distribution Agreement, Foreside Fund Services, LLC (the “Distributor”), will serve as the Funds’ principal underwriter and acts as the agent of the Funds’ in connection with the continuous offering of shares of each Fund. The Distributor and its officers have no role in determining the investment policies or which securities are to be purchased or sold by the Funds. The Distributor does not receive compensation from the Funds, but instead is compensated by the Adviser for certain distribution-related expenses.
D. Custodian — Pursuant to a Custodian Agreement, Brown Brothers Harriman & Co. serves as the custodian (the “Custodian”) for each of the Funds and is responsible for holding portfolio securities and cash and maintaining the books of account and records of portfolio transactions.
E. Transfer Agent — Pursuant to a Transfer Agency and Service Agreement, DST Asset Manager Solutions, Inc. (the “Transfer Agent”) serves as each Fund’s transfer and dividend disbursing agent. The Transfer Agent is responsible for maintaining account records, detailing the ownership of Fund shares and for crediting income, capital gains and other changes in share ownership to shareholder accounts.
F. Offering Costs — Offering costs, including professional fees, printing fees and initial registration costs, are amortized over a period not longer than twelve months from the date the Fund commenced operations.
G. Waivers and Reimbursements — The Adviser has contractually agreed through at least April 30, 2022, to waive any management fees that exceed the aggregate management fees the Adviser is contractually required to pay the Fund’s Sub-Adviser. Thereafter, this waiver will continue for subsequent one year terms unless terminated in accordance with its terms. Such waivers are not subject to reimbursement by the Fund. The Adviser has also contractually agreed through at least April 30, 2022, to reimburse expenses to the extent Total Annual Fund Operating Expenses (excluding acquired fund fees and expenses, if any, dividend and interest expenses related to short sales, brokerage fees, interest on borrowings, taxes,
| | | | | | | | | | |
| | | | | |
| 40 | | | | | | | | SIX CIRCLES TRUST | | JUNE 30, 2021 |
expenses related to litigation and potential litigation, and extraordinary expenses) exceed the following percentages of the average daily net assets of each Fund (the “Expense Cap”):
| | | | |
| Fund | | Expense Cap | |
Six Circles Managed Equity Portfolio U.S. Unconstrained Fund | | | 0.45 | % |
Six Circles Managed Equity Portfolio International Unconstrained Fund | | | 0.50 | % |
An expense reimbursement by the Fund’s Adviser is subject to repayment by the Fund only to the extent it can be made within thirty-six months following the date of such reimbursement by the Adviser. Repayment must be limited to amounts that would not cause the Fund’s operating expenses (taking into account any reimbursements by the Adviser and repayments by the Fund) to exceed the Expense Cap in effect at the time of the reimbursement by the Adviser or at the time of repayment by the Fund. This expense reimbursement is in effect through April 30, 2022, at which time the Adviser and/or its affiliates will determine whether to renew or revise it.
For the period ended June 30, 2021, there were no amounts reimbursed by the Adviser, as well as the amounts available for potential future recoupment by the Adviser.
H. Cross Trades — The Funds may participate in purchase and sale transactions with other Six Circles Funds. These cross trades are executed in accordance with procedures adopted by the Trust’s Board and comply with Rule 17a-7 of the 1940 Act, which require, among other things, that such cross trades be effected at the independent current market price of the security.
During the period ended June 30, 2021, the aggregate value of purchase and sale cross trades with other Six Circles Funds were as follows (amounts in thousands):
| | | | | | | | | | | | |
| Fund Name | | Purchases | | | Sales | | | Realized
gain/loss | |
Six Circles Managed Equity Portfolio U.S. Unconstrained Fund | | $ | 195 | | | $ | 939 | | | $ | (85 | ) |
Six Circles Managed Equity Portfolio International Unconstrained Fund | | | 2,057 | | | | 5 | | | | (-) (a | ) |
| (a) | — Amount rounds to less than $500. |
4. Investment Transactions
During the period ended June 30, 2021, purchases and sales of investments (excluding short-term investments) were as follows (amounts in thousands):
| | | | | | | | | | | | | | | | |
| | | Purchases
(excluding U.S.
Government) | | | Sales
(excluding U.S.
Government) | | | Purchases
of U.S.
Government | | | Sales
of U.S.
Government | |
Six Circles Managed Equity Portfolio U.S. Unconstrained Fund | | $ | 1,636,722 | | | $ | 395,886 | | | $ | — | | | $ | — | |
Six Circles Managed Equity Portfolio International Unconstrained | | | 758,385 | | | | 382,915 | | | | — | | | | — | |
5. Risks, Concentrations and Indemnifications
In the normal course of business, the Funds enter into contracts that contain a variety of representations which provide general indemnifications. The Funds’ maximum exposure under these arrangements is unknown. The amount of exposure would depend on future claims that may be made against the Funds that have not yet occurred. However, based on experience, the Funds expect the risk of loss to be remote.
Since the Funds are non-diversified, they may invest a greater percentage of their assets in a particular issuer or group of issuers than a diversified fund would. This increased investment in fewer issuers may result in the Funds` shares being more sensitive to economic results among those issuing the securities.
The Funds may have elements of risk not typically associated with investments in the United States of America due to concentrated investments in a limited number of countries or regions, which may vary throughout the period depending on the Funds. Such concentrations may subject the Funds to additional risks resulting from political or economic conditions in such countries or regions and the possible imposition of adverse governmental laws or currency exchange restrictions could cause the securities and their markets to be less liquid and their prices to be more volatile than those of comparable U.S. securities.
As of June 30, 2021, the Six Circles Managed Equity Portfolio International Unconstrained Fund had non-U.S. country allocations representing greater than 10% of Net Assets as follows:
| | | | | | | | | | |
| Germany | | | Switzerland | | | United Kingdom | |
| | 11.2 | % | | | 25.4 | % | | | 17.2 | % |
As of June 30, 2021, a significant portion of the Six Circles Managed Equity Portfolio International Unconstrained Fund net assets consisted of securities that were denominated in foreign currencies. Changes in currency exchange rates will affect the value of, and investment income from, such securities.
| | | | | | | | | | |
| | | | | |
| JUNE 30, 2021 | | SIX CIRCLES TRUST | | | | | | | | 41 |
NOTES TO FINANCIAL STATEMENTS
AS OF JUNE 30, 2021 (Unaudited) (continued)
The Funds are subject to the risk that, should the Funds decide to sell an illiquid investment when a ready buyer is not available at a price the Funds deem to be representative of its value, the value of the Funds’ net assets could be adversely affected.
The value of the Fund’s investments may be negatively affected by the occurrence of global events such as war, terrorism, environmental disasters, natural disasters or events, country instability, and infectious disease epidemics or pandemics. For example, the outbreak of COVID-19, a novel coronavirus disease, has negatively affected economies, markets and individual companies throughout the world, including those in which the Fund invests. The effects of this pandemic to public health and business and market conditions, including exchange trading suspensions and closures, may continue to have a significant negative impact on the performance of the Fund’s investments, increase the Fund’s volatility, exacerbate pre-existing political, social and economic risks to the Fund, and negatively impact broad segments of businesses and populations. The Fund’s operations may be interrupted as a result, which may contribute to the negative impact on investment performance. In addition, governments, their regulatory agencies, or self-regulatory organizations may take actions in response to the pandemic that affect the instruments in which the Fund invests, or the issuers of such instruments, in ways that could have a significant negative impact on the Fund’s investment performance. The full impact of the COVID-19 pandemic, or other future epidemics or pandemics, is currently unknown.
The Funds may also invest in shares of other investment companies and ETFs. ETFs are ownership interests in unit investment trusts, depositary receipts, and other pooled investment vehicles that hold a portfolio of securities or stocks designed to track the price performance and dividend yield of a particular broad-based, sector or international index. ETFs include a wide range of investments. Shareholders bear both their proportionate share of the Fund’s expenses and similar expenses of the underlying investment company or ETF when the Fund invests in shares of another investment company or ETF. The Fund is subject to the risks associated with the ETF’s or investment company’s investments. ETFs, investment companies and other investment vehicles that invest in commodities or currencies are subject to the risks associated with direct investments in commodities or currencies. The price and movement of an ETF or closed-end fund designed to track an index may not track the index and may result in a loss. In addition, closed-end funds that trade on an exchange often trade at a price below their net asset value (also known as a discount). Certain ETFs or closed-end funds traded on exchanges may be thinly-traded and experience large spreads between the “ask” price quoted by a seller and the “bid” price offered by a buyer.
Derivatives may be riskier than other types of investments because they may be more sensitive to changes in economic or market conditions than other types of investments and could result in losses that significantly exceed each Fund’s original investment. Many derivatives create leverage thereby causing the Funds to be more volatile than they would have been if they had not used derivatives. Derivatives also expose the Funds to counterparty risk (the risk that the derivative counterparty will not fulfill its contractual obligations), including credit risk of the derivative counterparty.
The Funds are also subject to counterparty credit risk, which is the risk that a counterparty fails to perform on agreements with the Funds such as swap contracts and forward foreign currency exchange contracts.
LIBOR is intended to represent the rate at which contributing banks may obtain short-term borrowings from each other in the London interbank market. On March 5, 2021, the U.K. Financial Conduct Authority (“FCA”) publicly announced that (i) immediately after December 31, 2021, publication of the 1-week and 2-month U.S. Dollar LIBOR settings will permanently cease; (ii) immediately after June 30, 2023, publication of the overnight and 12-month U.S. Dollar LIBOR settings will permanently cease; and (iii) immediately after June 30, 2023, the 1-month, 3-month and 6-month U.S. Dollar LIBOR settings will cease to be provided or, subject to the FCA’s consideration of the case, be provided on a synthetic basis and no longer be representative of the underlying market and economic reality they are intended to measure and that representativeness will not be restored. There is no assurance that the dates announced by the FCA will not change or that the administrator of LIBOR and/or regulators will not take further action that could impact the availability, composition or characteristics of LIBOR or the currencies and/or tenors for which LIBOR is published. Public and private sector industry initiatives are currently underway to implement new or alternative reference rates to be used in place of LIBOR. There is no assurance that any such alternative reference rate will be similar to or produce the same value or economic equivalence as LIBOR or that it will have the same volume or liquidity as did LIBOR prior to its discontinuance or unavailability, which may affect the value or liquidity or return on certain of a Fund’s loans, notes, derivatives and other instruments or investments comprising some or all of a Fund’s investments and result in costs incurred in connection with closing out positions and entering into new trades. These risks may also apply with respect to changes in connection with other interbank offering rates (e.g., Euribor) and a wide range of other index levels, rates and values that are treated as “benchmarks” and are the subject of recent regulatory reform.
6. Income Taxes and Distributions to Shareholders
For Federal income tax purposes, the estimated cost and unrealized appreciation (depreciation) in value of investments held at June 30, 2021
were as follows (amounts in thousands):
| | | | | | | | | | | | | | | | |
| | | Aggregate
Tax Cost | | | Gross
Unrealized
Appreciation | | | Gross
Unrealized
Depreciation | | | Net
Unrealized
Appreciation
(Depreciation) | |
Six Circles Managed Equity Portfolio U.S. Unconstrained Fund | | $ | 2,958,841 | | | $ | 825,646 | | | $ | (8,119 | ) | | $ | 817,527 | |
Six Circles Managed Equity Portfolio International Unconstrained Fund | | | 1,566,018 | | | | 381,427 | | | | (15,647 | ) | | | 365,780 | |
| | | | | | | | | | |
| | | | | |
| 42 | | | | | | | | SIX CIRCLES TRUST | | JUNE 30, 2021 |
As of December 31, 2020, the following Fund had the following post-enactment net capital loss carryforwards (amounts in thousands):
| | | | | | | | |
| | | Capital Loss Carryforward Character | |
| | | Short-Term | | | Long-Term | |
Six Circles Managed Equity Portfolio International Unconstrained Fund | | $ | 69,110 | | | $ | 27,149 | |
7. Ownership Concentration
As of June 30, 2021, Six Circles Managed Equity Portfolio U.S. Unconstrained Fund and Six Circles Managed Equity Portfolio International Unconstrained Fund had one affiliated omnibus account for the benefit of its clients which owned 99.96% of its outstanding shares.
8. New Accounting Pronouncement
In March 2020, the FASB issued Accounting Standard Update (“ASU”) No. 2020-04, “Reference Rate Reform (Topic 848): Facilitation of the Effects of Reference Rate Reform on Financial Reporting.” This ASU provides optional exceptions for applying GAAP to contract modifications, hedging relationships and other transactions affected reference rate reform if certain criteria are met. ASU 2020-04 is elective and is effective on March 12, 2020 through December 31, 2022. Management expects that the adoption of this guidance will not have a material impact on the Funds’ financial statements.
9. Subsequent Events
The Funds have evaluated subsequent events through the date of issuance of this report and have determined that there are no material events that need disclosure.
| | | | | | | | | | |
| | | | | |
| JUNE 30, 2021 | | SIX CIRCLES TRUST | | | | | | | | 43 |
SCHEDULE OF SHAREHOLDER EXPENSES
(Unaudited)
Hypothetical $1,000 Investment
As a shareholder of the Funds, you incur two types of costs: (1) transaction costs, including sales charges (loads) on purchase payments and redemption fees and (2) ongoing costs, including investment advisory fees, administration fees, distribution fees and other Fund expenses. The examples below are intended to help you understand your ongoing costs (in dollars) of investing in the Funds and to compare these ongoing costs with the ongoing costs of investing in other mutual funds. The examples assume that you had a $1,000 investment in each Fund on January 1, 2021, and continued to hold your shares at the end of the reporting period, June 30, 2021.
Actual Expenses
For each Fund in the table below, the first line provides information about actual account values and actual expenses. You may use the information in this line, together with the amount you invested, to estimate the expenses that you paid over the period. Simply divide your account value by $1,000 (for example, an $8,600 account value divided by $1,000 = 8.6), then multiply the result by the number in the first line under the heading entitled “Expenses Paid During the Period” to estimate the expenses you paid on your account during this period.
Hypothetical Example for Comparison Purposes
The second line in the table below provides information about hypothetical account values and hypothetical expenses based on the Fund’s actual expense ratio and an assumed rate of return of 5% per year before expenses, which is not the actual return. The hypothetical account values and expenses may not be used to estimate the actual ending account balance or expenses you paid for the period. You may use this information to compare the ongoing costs of investing in the Fund and other funds. To do so, compare this 5% hypothetical example with the 5% hypothetical examples that appear in the shareholder reports of the other funds. Please note that the expenses shown in the table are meant to highlight your ongoing costs only and do not reflect any transaction costs, such as sales charges (loads) or redemption fees. Therefore, the second line in the table is useful in comparing ongoing costs only, and will not help you determine the relative total costs of owning different funds. In addition, if these transaction costs were included, your costs would have been higher. The examples also assume all dividends and distributions have been reinvested.
| | | | | | | | | | | | | | | | |
| | | Beginning Account Value January 1, 2021 | | | Ending Account Value June 30, 2021 | | | Expenses Paid During the Period* | | | Annualized Expense Ratio | |
Six Circles Managed Equity Portfolio U.S. Unconstrained Fund | | | | | | | | | | | | | | | | |
Actual | | $ | 1,000.00 | | | $ | 1,155.70 | | | $ | 0.37 | | | | 0.07 | % |
Hypothetical | | | 1,000.00 | | | | 1,024.45 | | | | 0.35 | | | | 0.07 | % |
Six Circles Managed Equity Portfolio International Unconstrained Fund | | | | | | | | | | | | | | | | |
Actual | | | 1,000.00 | | | | 1,131.50 | | | | 0.63 | | | | 0.12 | % |
Hypothetical | | | 1,000.00 | | | | 1,024.20 | | | | 0.60 | | | | 0.12 | % |
| * | Expenses are equal to each Fund’s respective annualized expense ratio, multiplied by the average account value over the period, multiplied by 181/365 (to reflect the one-half year period). |
| | | | | | | | | | |
| | | | | |
| 44 | | | | | | | | SIX CIRCLES TRUST | | JUNE 30, 2021 |
BOARD APPROVAL OF INVESTMENT ADVISORY AGREEMENTS
Board Review and Approval of the Continuation of the Advisory and Sub-Advisory Agreements
The Board of Trustees (the “Board”) of the Six Circles Trust (the “Trust”), including the Trustees who are not “interested persons” (as defined in the Investment Company Act of 1940, as amended, the “1940 Act”) of J.P. Morgan Private Investments Inc. (“JPMPI” or the “Adviser”), the Sub-Advisers (as defined below) or their affiliates (the “Independent Trustees”) met on May 25-26, 2021 (the “Meeting”) to consider and approve (i) the continuation of the Investment Advisory Agreement (the “Advisory Agreement”) between the Trust, on behalf of the Six Circles Managed Equity Portfolio U.S. Unconstrained Fund (the “MEP U.S. Fund”), the Six Circles Managed Equity Portfolio International Unconstrained Fund (the “MEP International Fund”) (collectively the “Renewal Funds”), and JPMPI; and (ii) the Sub-Advisory Agreements in respect of the Renewal Funds between JPMPI and BlackRock Investment Management, LLC (“BlackRock”) and Russell Investments Implementation Services, LLC (“RIIS”) (as stand-by Interim Sub-Adviser) (each, a “Sub-Adviser” and collectively, the “Sub-Advisers”). At the Meeting, the Board, including the Independent Trustees, unanimously approved the Advisory Agreement and each Sub-Advisory Agreement.
Materials Requested Prior to Meeting. Prior to the Meeting, Ropes & Gray LLP (“Ropes & Gray”), counsel to the Independent Trustees, had prepared letters on behalf of the Independent Trustees requesting detailed information from JPMPI and each Sub-Adviser in connection with the proposed Advisory Agreement and Sub-Advisory Agreements in an effort to observe the requirement under Section 15(c) of the 1940 Act that the Trustees request and evaluate, and that the investment adviser and sub-advisers furnish, such information as may be necessary to evaluate the terms of the proposed agreements. JPMPI and each Sub-Adviser responded to the information requests and provided memoranda and related materials and information for consideration by the Trustees, which were included in the materials for the Meeting (together, the “15(c) Materials”). Following receipt and review, the Independent Trustees and their counsel, Ropes & Gray, held a separate conference call on May 20, 2021 to consider the 15(c) Materials and related proposed advisory and sub-advisory arrangements, during which the Independent Trustees raised various questions and requests for additional information to be responded to by JPMPI. Subsequent calls were held with representatives from JPMPI to communicate the Independent Trustees’ additional questions and requests for information, each of which was responded to by JPMPI either in writing or orally at the Meeting.
Set forth below is a summary of the material factors evaluated by the Trustees that formed the basis for the Board’s approval of the continuation of the Advisory Agreement and the Sub-Advisory Agreements. The Trustees’ conclusions as to the approval of the continuation of the Agreements were based on
a comprehensive consideration of all information provided to the Trustees. In deciding to approve the continuation of the Advisory Agreement and Sub-Advisory Agreements, the Board did not identify any single factor or particular information that, in isolation, was controlling. Some of the factors that figured particularly in the Trustees’ deliberations are described below, although individual Trustees may have evaluated the information presented differently from one another, attributing different weights to various factors.
Materials Reviewed. In considering the approval of the continuation of the Investment Advisory Agreement (the “Advisory Agreement”) between the Trust and J.P. Morgan Private Investments Inc. (“JPMPI” or the “Adviser”) for the Six Circles Managed Equity Portfolio U.S. Unconstrained Fund (the “MEP U.S. Fund”), the Six Circles Managed Equity Portfolio International Unconstrained Fund (the “MEP International Fund”) (collectively the “Renewal Funds”), the Sub-Advisory Agreements in respect of the Renewal Funds between JPMPI and BlackRock Investment Management, LLC (“BlackRock”) and Russell Investments Implementation Services, LLC (“RIIS”) (as stand-by Interim Sub-Adviser) (each, a “Sub-Adviser” and collectively, the “Sub-Advisers”) the Trustees took into account the wide variety of materials (the “15(c) Materials”) relating to the services provided by JPMPI, the Sub-Advisers and Sub-Sub-Advisers provided prior to and during the Meeting, the presentations made during the Meeting, and the extensive discussions during the Meeting. It was noted that, to date, RIIS had not been called to act as Interim Sub-Adviser to the Renewal Funds. The Trustees reviewed information relating to, among other things, the investment management services provided by the Adviserand the Sub-Advisers to the Renewal Funds, including the compliance programs of the Adviser and the Sub-Advisers, valuation, and other information related to personnel of the Adviser and Sub-Advisers who provide investment management services to the Renewal Funds. They also reviewed comparative fee information prepared by Broadridge, a memorandum prepared by Independent Legal Counsel regarding the responsibilities of the Trustees in considering the approval of the continuation of advisory and sub-advisory agreements.
Representatives of JPMPI also participated in the Meeting, at which the Trustees discussed the advisory and sub-advisory arrangements with the Adviser and the Sub-Advisers for the Renewal Funds. It was noted that representatives of the Sub-Advisers had attended board meetings in the last year.
Review Process. In connection with the approval of the Advisory Agreement and Sub-Advisory Agreements, the Trustees reviewed written materials provided by JPMPI, which included, among other things, comparative fee data prepared by Broadridge, an independent provider of investment company performance and fee and expense data. The Trustees also requested and received assistance and advice regarding
| | | | | | | | | | |
| | | | | |
| JUNE 30, 2021 | | SIX CIRCLES TRUST | | | | | | | | 45 |
BOARD APPROVAL OF INVESTMENT ADVISORY AGREEMENTS
(continued)
applicable legal standards from Independent Legal Counsel. The Trustees additionally considered the written information provided by JPMPI and the Sub-Advisers in response to the Trustees’ requests for information and other information provided by JPMPI. The Trustees also received oral presentations during regular meetings throughout the prior year on matters related to the Advisory Agreement and the Sub-Advisory Agreements, as well as related arrangements with RIIS. The Independent Trustees held separate telephonic meetings prior to the Meeting, which were attended by Independent Trustee Counsel, to discuss the proposed continuation of the Advisory Agreement and Sub-Advisory Agreement and the related materials and information provided by JPMPI and the Sub-Advisers. Based on their deliberations during the prior meetings, the Independent Trustees formulated a number of questions and requests for follow-up information from management, with respect to which JPMPI had responded in writing or orally during the Meeting. In addition, the Independent Trustees discussed the proposed continuation of the Advisory Agreement and Sub-Advisory Agreement during an executive session held as part of the Meeting with Independent Trustee Counsel at which no representatives of JPMPI, the Sub-Advisers or other representatives from management were present.
In deciding to approve the Advisory Agreement and Sub-Advisory Agreements, the Trustees did not identify any single factor or particular information that, in isolation, was controlling.
Nature, Extent and Quality of Services. The Trustees considered the depth and quality of the investment management process of JPMPI and the Sub-Advisers, including for each entity, the experience and capabilities of its senior management, investment and other personnel, and the overall financial strength and stability of the organizations. The Trustees also considered the nature, extent and quality of the various services that JPMPI would provide under the Advisory Agreement. The Trustees also noted JPMPI’s commitment to investing in information technology, supporting compliance, as well as JPMPI’s continuing efforts to attract and retain qualified personnel and to maintain and enhance its resources and systems. The Trustees considered JPMPI’s review of its policies, procedures and systems to assure compliance with applicable laws and regulations and to conduct effective oversight of each Sub-Adviser; and its processes to keep the Trustees informed about matters relevant to the Renewal Funds and their shareholders.
Similarly, the Trustees considered the sub-advisory services provided by each Sub-Adviser to the Renewal Funds. The Trustees also considered information about the investment personnel of BlackRock and RIIS who are responsible for providing services under the Sub-Advisory Agreements. For each of BlackRock and RIIS, the Trustees reviewed the nature and quality of the investment management, trading, risk management, compliance capabilities and resources, research
capabilities, and the experience and capabilities of its portfolio management personnel, and the overall financial strength of each organization. The Trustees noted the certificates received from JPMPI and the Sub-Advisers regarding both their compliance programs and codes of ethics, which noted that that each of JPMPI, BlackRock and RIIS had compliance policies and procedures in place that were reasonably designed to prevent violations of the federal securities laws with respect to the services provided by them and had each adopted a code of ethics that included provisions reasonably necessary to prevent access persons from (i) engaging in certain specified conduct and (ii) violating the code of ethics.
Ultimately, the Board concluded that the nature, extent and quality of services proposed to be provided by the Adviser, and Sub-Advisers under the Advisory and Sub-Advisory Agreements were likely to benefit the Renewal Funds and their shareholders.
Investment Performance. As part of their review of the services provided by JPMPI and BlackRock, the Trustees reviewed the performance of each of the Renewal Funds, including the Broadridge report containing comparative performance information of a peer group of similar funds selected by Broadridge. In reviewing the comparative information, the Trustees took into account JPMPI’s explanation that the peer funds selected by Broadridge do not provide particularly apt comparisons, given the Renewal Funds’ intended role as completion portfolios for the broader J.P. Morgan managed account portfolios and the bespoke and highly tailored structures of the Renewal Funds’ portfolios. The Trustees considered JPMPI’s view that since the role of the Renewal Funds is to enhance the relative performance of the total managed account portfolios in which they are held, the Trustees should also take into account and evaluate the performance of the Renewal Funds in the context of the broader portfolios they are intended to complete and on the basis of whether the Renewal Funds serve their intended purpose. In this regard, the Board received representations from the JPMPI CIO team regarding the utility of the Renewal Funds in serving their intended purpose, including how they have served to enhance access to investment ideas and have increased portfolio efficiency for the managed account strategies. In this regard, the Trustees received supplemental information regarding (i) Sub-Adviser/Sub-Sub-Adviser sleeve performance and (ii) performance of the J.P. Morgan managed account strategies that invest in the Renewal Funds.
To evaluate Sub-Adviser sleeve performance, the Trustees reviewed performance information of each of the Sub-Adviser sleeves against their performance benchmark(s), which included customized benchmarks in certain cases. The Trustees also considered that Sub-Adviser performance is reviewed independently by the J.P. Morgan Investment Performance Governance Committee (“IPGC”), and reviewed related materials from IPGC reports.
| | | | | | | | | | |
| | | | | |
| 46 | | | | | | | | SIX CIRCLES TRUST | | JUNE 30, 2021 |
Regarding Renewal Fund performance, in addition to the performance information comparing each of the Renewal Funds against their Broadridge peers and their prospectus stated benchmarks, the Board reviewed composite performance information for J.P. Morgan managed account portfolios that invest in the Renewal Funds, along with 2020 portfolio attribution reports pointing out the main contributors to and detractors from the performance of the managed account portfolios, including the role of the Renewal Funds as components of the broader portfolios. The Trustees also considered that Fund performance is reviewed independently by the J.P. Morgan Portfolio Governance Committee (“PGC”), a committee responsible for providing ongoing oversight of its internal investment strategies, including the investment strategies inclusive of the Renewal Funds and reviewed related materials. The Board considered that PGC to date has been satisfied with the performance of the Renewal Funds and each Sub-Adviser and that the Renewal Funds have to date and continue to serve their intended purpose.
Based on these reviews, the Trustees concluded that they were satisfied with the investment performance provided by each of JPMPI under the Advisory Agreement and BlackRock and RIIS under the respective Sub-Advisory Agreements.
Fees and Total Expenses. In considering the fees and expenses of each Renewal Fund, the Trustees took into account a number of factors, including the type and complexity of the services to be provided, the estimated cost of providing services, the risk assumed by JPMPI in the provision of services, the impact on potential returns from different levels of fees, the competitive marketplace for financial products, and the attractiveness of potential returns to investors in the Renewal Funds. The Trustees noted JPMPI’s explanation that the advisory fee rate is consistent across all of the Renewal Funds as the fee covers sub-advisory fees and each Renewal Fund receives similar investment management services from JPMPI, including asset allocation, investment oversight and other management services. The Trustees also took into account that the Adviser had: (1) agreed to contractually reimburse expenses for the Renewal Funds to the extent the total expense ratio for each Renewal Fund exceeded a certain specified limit; and (2) agreed to contractually waive any advisory fees that exceeded the aggregate advisory fees JPMPI is contractually required to pay to the Sub-Advisers. The Trustees considered how these agreements affect the expenses borne by shareholders.
The Trustees reviewed the advisory fee and total expenses of each Renewal Fund (each as a percentage of average net assets) and compared such amounts with the average and median fees and expense levels of other similar funds. With respect to advisory fees, the Trustees reviewed data from Broadridge that compared the average and median advisory fees of other funds in a peer group of comparable funds. The Trustees compared each of the Renewal Funds’ total expenses
to other funds in the applicable peer group provided by Broadridge and found the total expenses of each Renewal Fund to be reasonable. The Trustees noted that the Broadridge information showed that the advisory fee for each Renewal Fund was in the low range of the applicable Broadridge peer group and universe. They further noted that the total expense ratio for each Renewal Fund was also within the low range of total expenses within its peer group, when taking into account the fee waiver and expense reimbursement arrangements for each Renewal Fund. The Trustees also found that the fees paid by JPMPI to BlackRock and RIIS were reasonable, noting that the Renewal Funds do not pay the fees to the Sub-Advisers directly, but that JPMPI compensates them out of the advisory fee it receives from the Renewal Funds. The Trustees also considered that the sub-sub-advisory fees paid to the Sub-Advisers are paid out of the sub-advisory fees paid to the Sub-Advisers by JPMPI. The Trustees noted that neither JPMPI nor BlackRock (with respect to the MEP U.S. Fund and MEP International Fund), and RIIS identified any funds or accounts with comparable investment objectives and strategies as the Renewal Funds. They noted the Adviser’s views regarding the limitations of fee comparisons to other funds and separately managed accounts that are not registered under the Investment Company Act of 1940, as amended (the “1940 Act”), in light of the differences in services provided to the Renewal Funds compared to those provided to other funds and other accounts that are not registered under the 1940 Act. Further, the Board noted the limitations of fee comparisons to other funds for which the Sub-Advisers serve as primary investment adviser, as opposed to fees charged to funds that Sub-Advisers sub-advise, in light of the differences in sub-advisory services provided to the Renewal Funds compared to those provided to other funds for which the Sub-Advisers serve as primary adviser. Additionally, the Trustees noted the most-favored nation provisions agreed to by BlackRock and RIIS, which help ensure that sub-advisory fee rates charged by each such Sub-Adviser to the Renewal Funds are no higher than the fees the Sub-Adviser charges to similar clients.
Based on the information presented by JPMPI, BlackRock and RIIS and Broadridge, the Trustees determined that the level of the advisory fees charged by JPMPI, the level of the sub-advisory fees to be paid by JPMPI to BlackRock and RIIS, as well as the total expenses of each Renewal Fund, are reasonable, fair and equitable and that approval of the continuation of the Advisory Agreement, Sub-Advisory Agreements and Sub-Sub-Advisory Agreements benefits each Renewal Fund and its shareholders.
Adviser Costs, Level of Profits and Economies of Scale. The Trustees considered the estimated profits realized by the Adviser in connection with the operation of the Renewal Funds as well as the estimated profits realized by the Sub-Advisers in connection with the operation of the Renewal Funds based on profitability information included in the Meeting Materials, and whether the amount of profits represented a fair entrepreneurial profit for
| | | | | | | | | | |
| | | | | |
| JUNE 30, 2021 | | SIX CIRCLES TRUST | | | | | | | | 47 |
BOARD APPROVAL OF INVESTMENT ADVISORY AGREEMENTS
(continued)
the management of the Renewal Funds. In doing so, the Trustees also took into account the entrepreneurial and business risk JPMPI undertakes as investment manager and sponsor of the Renewal Funds. The Trustees also considered the Renewal Funds’ operating expenses and the impact of the expense limitation agreement and fee waiver agreement observed by JPMPI on the Adviser’s estimated profits. The Trustees took into account that JPMPI’s estimates indicated that the Adviser has been unprofitable with respect to each of the Renewal Funds from inception through December 31, 2020. The Trustees also took into account that, although JPMPI has not realized profits with respect to the Renewal Funds, J.P. Morgan and its affiliates could be profitable with respect to the managed accounts that invest in the Renewal Funds and received related information and input from JPMPI in this regard.
The Trustees further noted that the advisory fee rates to be paid to JPMPI do not have break points, but due to the fee waiver arrangements, JPMPI does not retain any portion of the advisory fees paid by the Renewal Funds. The Trustees took into account that the Sub-Advisory Agreements for the BlackRock and RIIS include breakpoints to certain of the sub-advisory fee in light of the anticipated size of those Renewal Funds.
Ultimately, the Trustees concluded that each of the Renewal Funds’ fee and expense structure is reasonable, fair and equitable.
Ancillary Benefits. The Trustees next considered whether the Adviser, BlackRock and RIIS or any of their affiliates may receive other benefits as a result of the relationship with the Trust or the Renewal Funds. The Trustees considered that the Renewal Funds benefit the Adviser and its affiliates by enhancing the current discretionary product offering to J.P. Morgan Private Bank, J.P. Morgan Securities and Chase Wealth Management clients. Specifically, the Board considered that the Renewal Funds serve to expand the CIO investments toolkit; expand the current capacity to invest, and reduce unintended portfolio dispersion. The Board also considered that, apart from the Adviser, who does not retain any fees under the Advisory Agreement for managing the Renewal Funds, the Renewal Funds are not engaging any JPMC affiliates as fund service providers. Instead, the Renewal Funds are utilizing third party service providers and restrict any transactions with affiliates. In this regard, the Trustees took into account JPMPI’s representation that no JPMC affiliate is profiting financially directly from the Renewal Funds themselves. [The Trustees considered that the Adviser] does receive a portfolio management fee (“PMF”) outside of the Renewal Funds based on funds held in the Adviser’s discretionary client accounts, including on assets attributable to shares of the Renewal Funds held in such accounts. The Trustees took into account, however, JPMPI’s representation that it would receive this PMF independent of whether the discretionary accounts allocated investments to
the Renewal Funds or allocated the same assets to a third party fund or other investment.
The Trustees additionally considered that BlackRock and RIIS were not affiliated with any of the Renewal Funds’ service providers, and therefore do not benefit from those contractual relationships. The Trustees also considered portfolio trading practices of RIIS, noting the relatively low trading costs that RIIS expects to incur in completing portfolio transactions for the Renewal Funds, should the services be used. Additionally, the Trustees considered that RIIS may receive ancillary benefits of receiving fees from serving as transition manager to the Renewal Funds under the Implementation Services Agreement between the Adviser and RIIS, but noted that those fees are not contingent on RIIS serving as an interim sub-adviser and would be for services that are distinct from RIIS sub-advisory services. The Trustees also considered the proprietary nature of the Renewal Funds and whether any benefits result to the Adviser by placing assets of J.P. Morgan managed account clients into the Renewal Funds. The Trustees also considered portfolio trading practices, noting that while the Adviser was affiliated with a broker-dealer, the broker-dealer affiliate does not execute portfolio transactions on behalf of the Renewal Funds and would not receive the benefit of research provided by any such broker-dealer.
The Trustees also took into account that, although the Adviser does not retain any of the advisory fees it receives from the Renewal Funds and has to date been unprofitable with respect to its management of the Renewal Funds themselves, that the Adviser and its affiliates receive fees for managing the J.P. Morgan managed accounts that invest in the Renewal Funds. In this regard, the Trustees discussed with management possible approaches to estimating any imputed profitability to the Adviser or J.P. Morgan from their operation of the Renewal Funds taking into account the managed account fees they receive that are attributable to assets invested in the Renewal Funds and related expenses, and reviewed related information provided by the Adviser. In this regard, the Trustees took into account the Adviser’s representation that J.P. Morgan would continue to receive the same level of fees from its managed accounts whether the accounts invested in the Renewal Funds or in other funds and/or individual securities.
Conclusions. Having requested and received such information from the Adviser, BlackRock and RIIS as the Trustees believed to be reasonably necessary to evaluate the continuation of the terms of the Advisory Agreement and Sub-Advisory Agreements, the Trustees, including the Independent Trustees, unanimously concluded that the advisory fee and sub-advisory fee structures were reasonable and, in light of the matters that the Trustees considered to be relevant in the exercise of their reasonable business judgment, approved the continuation of the Advisory Agreement and Sub-Advisory Agreements for an additional one year term.
| | | | | | | | | | |
| | | | | |
| 48 | | | | | | | | SIX CIRCLES TRUST | | JUNE 30, 2021 |
LIQUIDITY RISK MANAGEMENT PROGRAM
(Unaudited)
Both of the Funds have adopted the Six Circles Funds Liquidity Risk Management Program (the “Program”) under Rule 22e-4 under the 1940 Act (the “Liquidity Rule”). The Program seeks to assess, manage and review each Fund’s Liquidity Risk. “Liquidity Risk” is defined as the risk that a fund could not meet requests to redeem shares issued by the fund without significant dilution of remaining investors’ interests in the fund. Among other things, the Liquidity Rule requires that a written report be provided to the Boards of Trustees (the “Board”) on an annual basis that addresses the operation of the Program and assesses the adequacy and effectiveness of its implementation and any material changes to the Program.
JPMPI’s Liquidity Risk Forum (the “Liquidity Forum”) is the program administrator for the Program (the “Program Administrator”). On May 26, 2021, the Board of Trustees reviewed the Program Administrator’s initial written report (the “Report”) concerning the operation of the Program for the period from January 1, 2020 through December 31, 2020 (the “Program Reporting Period”). The Report addressed the operation of the Program and assessed its adequacy and effectiveness of implementation. The Report summarized the operation of the Program and the information and factors considered by the Program Administrator in assessing whether the Program has been adequately and effectively implemented with respect to each Fund. Such information and factors included, among other things: (1) the liquidity risk framework used to assess, manage, and periodically review each Fund’s Liquidity Risk and the results of this assessment; (2) the methodology and inputs for classifying each of the Fund’s investments into one of four liquidity categories that reflect an estimate of their liquidity under current market conditions; (3) whether a Fund invested primarily in “Highly Liquid Investments” (as defined under the Liquidity Rule) and whether a Highly Liquid Investment Minimum {“HLIM”) should be established for a Fund and the procedures for monitoring for this limit; with the assessment that each Fund was invested primarily in “Highly Liquid Investments and therefore no HLIM needed to be established for any Fund (4) whether a Fund invested more than 15% of its assets in “Illiquid Investments” (as defined under the Liquidity Rule) and the procedures for monitoring for this limit, with the assessment that each Fund was under the 15% limit during the Program Reporting Period; and (5) specific liquidity events arising during the Program Reporting Period, including the impact on Fund liquidity caused by extended non-U.S. market closures. There were no material changes to the Program during the Program Reporting Period, although adjustments were made to the “reasonably anticipated trade size” calculation methodology description to account for actual fund trade experience as the Funds have seasoned.
Based on this review, the Report concluded that: (1) the Program continues to be reasonably designed to effectively assess and manage each Fund’s Liquidity Risk; and (2) the Program has been adequately and effectively implemented June 30, 2021 with respect to each Fund during the Program Reporting Period.
| | | | | | | | | | |
| | | | | |
| JUNE 30, 2021 | | SIX CIRCLES TRUST | | | | | | | | 49 |
For more complete information about the Funds, including the Funds’ objectives, risks, charges and expenses, call your J.P. Morgan team or call 1-212-464-2070 or go to www.sixcirclesfunds.com for a prospectus. Read the prospectus carefully. An investment in these Funds and any other Fund is not designed to be a complete investment program. The Funds are NOT designed to be used as stand-alone investments. J.P. Morgan is committed to making our products and services accessible to meet the financial services needs of all our clients. If you are a person with a disability and need additional support accessing this material, please contact your J.P. Morgan team or email us at accessibility.support@jpmorgan.com for assistance.
The Six Circles Funds are distributed by Foreside Fund Services, LLC a member of FINRA.
Contact Six Circles Funds collect at 1-212-464-2070 for a fund prospectus. You can also visit us at www.sixcirclesfunds.com. Investors should carefully consider the investment objectives and risk as well as charges and expenses of the Six Circles Funds before investing. The prospectus contains this and other information about the Six Circles Funds. Read the prospectus carefully before investing.
The Six Circles Funds file complete schedules of their fund holdings for the first and third quarters of their fiscal year with the SEC on Form N-PORT. The Six Circles Funds’ Forms N-PORT are available on the SEC’s website at http://www.sec.gov. Each Fund’s quarterly holdings can be found by visiting the Six Circles Funds’ website at www.sixcirclesfunds.com/literature.
A description of the Six Circles Funds’ policies and procedures with respect to the disclosure of the Six Circles Funds’ holdings is available in the prospectuses and Statements of Additional Information.
A copy of proxy policies and procedures is available without charge upon request by calling collect 1-212-464-2070 or on the Six Circles Funds’ website at www.sixcirclesfunds.com. A description of such policies and procedures is in the Statement of Additional Information available on the SEC’s website at www.sec.gov. The Trustees have delegated the authority to vote proxies for securities owned by the Fund to the Adviser, and the Adviser in turn has delegated such authority to the Sub-Advisers. A copy of the Six Circles Funds’ voting record for the most recent 12-month period ended June 30 is available on the SEC’s website at www.sec.gov or at the Six Circles Funds’ website at www.sixcirclesfunds.com no later than August 31 of each year. The Six Circles Funds’ proxy voting record will include, among other things, a brief description of the matter voted on for each fund security, and will state how each vote was cast, for example, for or against the proposal.
©JPMorgan Chase & Co. 2021. All rights reserved. June 30, 2021.
Item 2. Code of Ethics.
Not Applicable. This item is only required in an annual report on Form N-CSR.
Item 3. Audit Committee Financial Expert.
Not Applicable. This item is only required in an annual report on Form N-CSR.
Item 4. Principal Accountant Fees and Services.
Not Applicable. This item is only required in an annual report on Form N-CSR.
Item 5. Audit Committee of Listed Registrants.
Not Applicable. This item is only required in an annual report on Form N-CSR.
Item 6. Investments.
| (a) | A Schedule of Investments in securities of unaffiliated issuers as of the close of the Reporting Period is included as part of the report to shareholders filed under Item 1 of this Form N-CSR. |
Item 7. Disclosure of Proxy Voting Policies and Procedures for Closed-End Management Investment Companies.
Not applicable.
Item 8. Portfolio Managers of Closed-End Management Investment Companies.
Not applicable.
Item 9. Purchases of Equity Securities by Closed-End Management Investment Company and Affiliated Purchasers.
Not applicable.
Item 10. Submission of Matters to a Vote of Security Holders.
Not applicable.
Item 11. Controls and Procedures.
| (a) | The Registrant’s principal executive and financial officers have concluded that the Registrant’s disclosure controls and procedures (as defined in Rule 30a-3(c) under the Investment Company Act of 1940, as amended (the “1940 Act”)) are effective, as of a date within 90 days of the filing date of this Form N-CSR, based on their evaluation of these controls and procedures required by Rule 30a-3(b) under the 1940 Act and Rules 13a-15(b) or 15d-15(b) under the Securities Exchange Act of 1934, as amended (the “Exchange Act”). |
| (b) | There were no changes in the Registrant’s internal control over financial reporting (as defined in Rule 30a-3(d) under the 1940 Act) that occurred during the period covered by this Form N-CSR, that have materially affected, or are reasonably likely to materially affect, the Registrant’s internal control over financial reporting. |
Item 12. Disclosure of Securities Lending Activities for Closed-End Management Investment Companies.
Not applicable.
Item 13. Exhibits.
SIGNATURES
Pursuant to the requirements of the Securities Exchange Act of 1934 and the Investment Company Act of 1940, the Registrant has duly caused this report to be signed on its behalf by the undersigned, thereunto duly authorized.
(Registrant) Six Circles Trust
By: (Signature and Title)
/s/Mary Savino
Mary Savino
Title: President - Principal Executive Officer
Date: September 2, 2021
Pursuant to the requirements of the Securities Exchange Act of 1934 and the Investment Company Act of 1940, this report has been signed below by the following persons on behalf of the Registrant and in the capacities and on the dates indicated.
By: (Signature and Title)
/s/Mary Savino
Mary Savino
Title: President - Principal Executive Officer
Date: September 2, 2021
By: (Signature and Title)
/s/Gregory McNeil
Gregory McNeil
Title: Treasurer - Principal Financial Officer
Date: September 2, 2021